EDUCATIONAL SLIDE MODULES - Boehringer Ingelheim
69
Diabetic kidney disease EDUCATIONAL SLIDE MODULES Date of preparation: April 2016 Version 1.0
-
Upload
khangminh22 -
Category
Documents
-
view
1 -
download
0
Transcript of EDUCATIONAL SLIDE MODULES - Boehringer Ingelheim

Diabetic kidney diseaseEDUCATIONAL SLIDE MODULES
Date of preparation: April 2016Version 1.0

Module content
Diabetic kidney disease
Current management
Consequences of diabetic kidney disease
Prevalence
Basic concepts and definitions
Diabetes complications and kidney disease

Module content
Diabetic kidney disease
Current management
Consequences of diabetic kidney disease
Prevalence
Basic concepts and definitions
Diabetes complications and kidney disease
Diabetes is a leading cause of cardiovascular disease, kidney failure, blindness and lower-limb amputation1
29% of people with diabetes aged ≥40 years have
diabetic retinopathy3
16% of people aged >65 years with diabetes die of stroke4
60% of non-traumatic lower-limb amputations
occur in diabetes patients ≥20 years old3
50–80% of people with diabetes die of cardiovascular
disease2
44% of new kidney failure cases are
observed in patients with diabetes3
A significant unmet need exists to reduce complications of diabetes
1. International Diabetes Federation. IDF Diabetes Atlas. 7th edn. 2015. www.idf.org/diabetesatlas (accessed 22 Feb 2016); 2. WHO. 10 Facts about Diabetes: www.who.int/features/factfiles/diabetes/facts/en/index5.html (accessed 22 Feb 2016); 3. Adapted from: CDC 2014 National Diabetes Fact Sheet: www.cdc.gov/diabetes/pubs/statsreport14/national-diabetes-report-web.pdf (accessed 22 Feb 2016); 4. American Heart Association. Statistical Fact Sheet. 2014 www.heart.org/idc/groups/heart-public/@wcm/@sop/@smd/documents/downloadable/ucm_462019.pdf (accessed 22 Feb 2016)
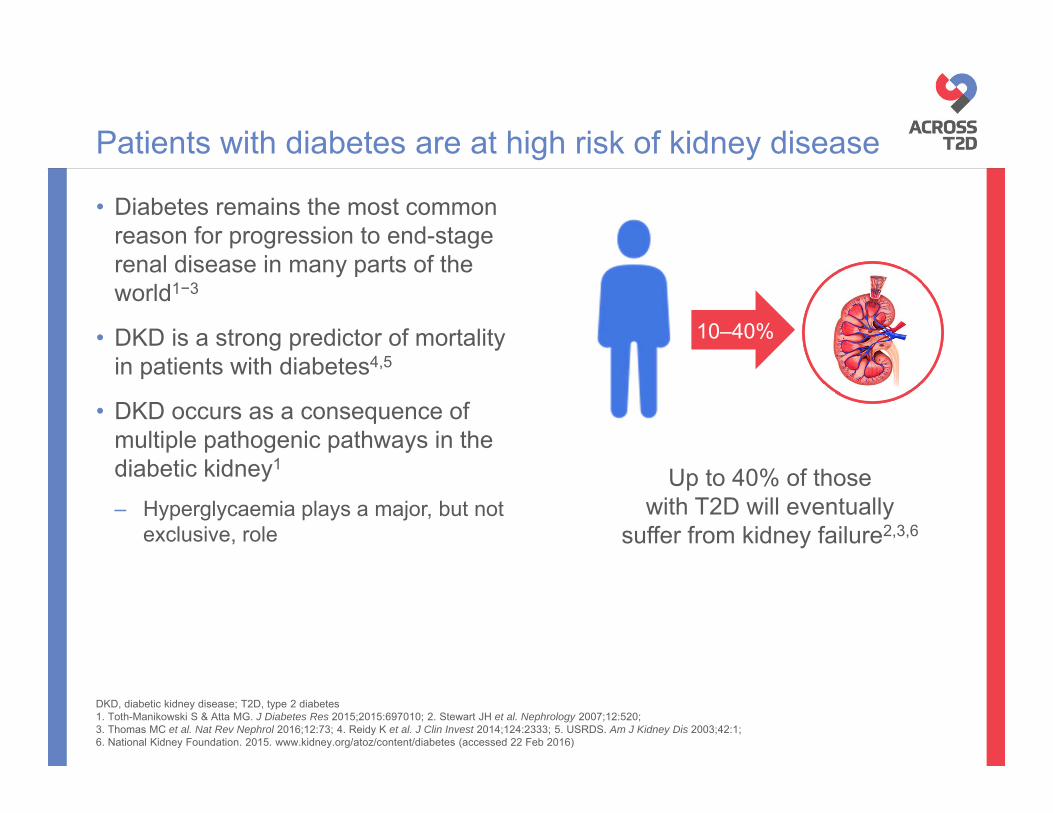
• Diabetes remains the most common reason for progression to end-stage renal disease in many parts of the world1−3
• DKD is a strong predictor of mortality in patients with diabetes4,5
• DKD occurs as a consequence of multiple pathogenic pathways in the diabetic kidney1
– Hyperglycaemia plays a major, but not exclusive, role
DKD, diabetic kidney disease; T2D, type 2 diabetes1. Toth-Manikowski S & Atta MG. J Diabetes Res 2015;2015:697010; 2. Stewart JH et al. Nephrology 2007;12:520; 3. Thomas MC et al. Nat Rev Nephrol 2016;12:73; 4. Reidy K et al. J Clin Invest 2014;124:2333; 5. USRDS. Am J Kidney Dis 2003;42:1; 6. National Kidney Foundation. 2015. www.kidney.org/atoz/content/diabetes (accessed 22 Feb 2016)
Patients with diabetes are at high risk of kidney disease
Up to 40% of those with T2D will eventually
suffer from kidney failure2,3,6
10–40%

Module content
Diabetic kidney disease
Current management
Consequences of diabetic kidney disease
Prevalence
Basic concepts and definitions
Diabetes complications and kidney disease

GFR, glomerular filtration rate; SGLT2, sodium-glucose co-transporter-2 Adapted from Kurts C et al. Nat Rev Immunol 2013;13:738 and Cherney DZ et al. Circulation 2014;129:587
Basic anatomical concepts: the kidney,
Ureter

GFR, glomerular filtration rate; SGLT2, sodium-glucose co-transporter-2 Adapted from Kurts C et al. Nat Rev Immunol 2013;13:738 and Cherney DZ et al. Circulation 2014;129:587
Basic anatomical concepts: the kidney, the nephron,
Ureter
Proximal convoluted tubule
Distal convoluted tubule
GlomerulusJuxtaglomerular apparatus
(macula densa)
SGLT2
Collecting duct
Loop of Henle
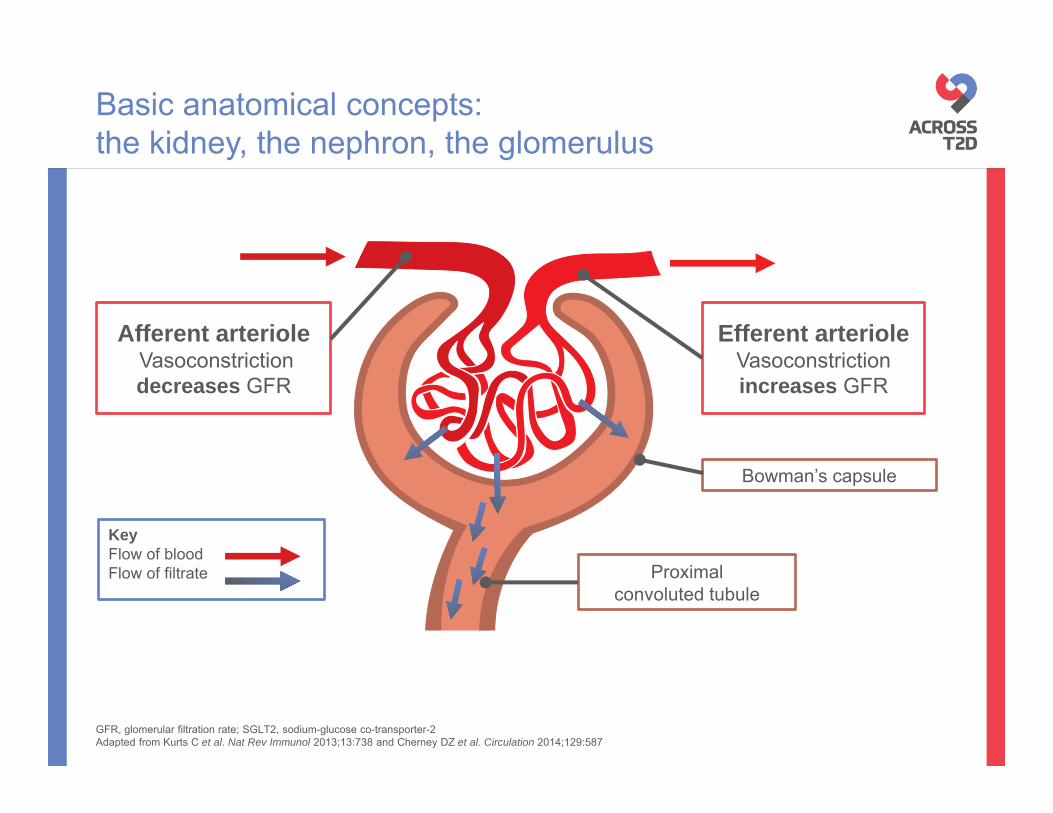
Basic anatomical concepts: the kidney, the nephron, the glomerulus
KeyFlow of bloodFlow of filtrate
Afferent arterioleVasoconstriction decreases GFR
Efferent arterioleVasoconstriction increases GFR
Bowman’s capsule
Proximal convoluted tubule
GFR, glomerular filtration rate; SGLT2, sodium-glucose co-transporter-2 Adapted from Kurts C et al. Nat Rev Immunol 2013;13:738 and Cherney DZ et al. Circulation 2014;129:587
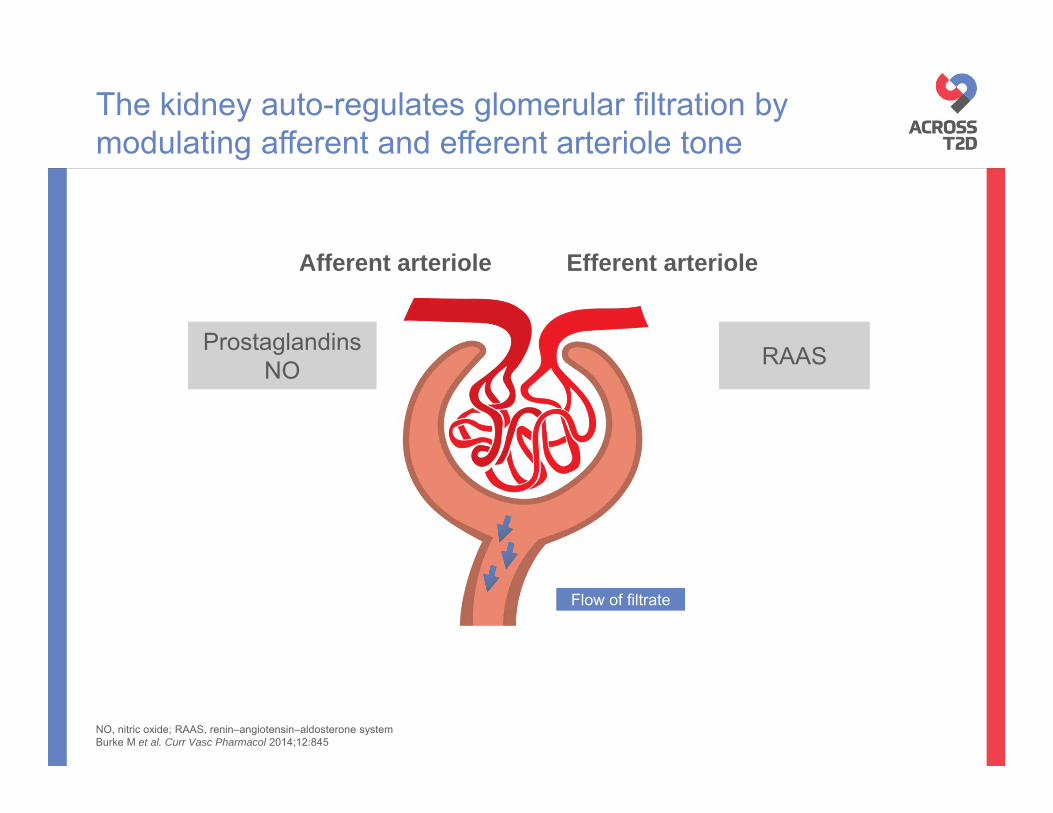
NO, nitric oxide; RAAS, renin–angiotensin–aldosterone systemBurke M et al. Curr Vasc Pharmacol 2014;12:845
The kidney auto-regulates glomerular filtration by modulating afferent and efferent arteriole tone
ProstaglandinsNO RAAS
Afferent arteriole Efferent arteriole
Flow of filtrate

NO, nitric oxide; RAAS, renin–angiotensin–aldosterone systemBurke M et al. Curr Vasc Pharmacol 2014;12:845
The kidney auto-regulates glomerular filtration by modulating afferent and efferent arteriole tone
ProstaglandinsNO RAAS
Afferent arteriole Efferent arteriole
Flow of filtrate

NO, nitric oxide; RAAS, renin–angiotensin–aldosterone systemBurke M et al. Curr Vasc Pharmacol 2014;12:845
The kidney auto-regulates glomerular filtration by modulating afferent and efferent arteriole tone
ProstaglandinsNO RAAS
Afferent arteriole Efferent arteriole
Increased filtration

NO, nitric oxide; RAAS, renin–angiotensin–aldosterone systemBurke M et al. Curr Vasc Pharmacol 2014;12:845
The kidney auto-regulates glomerular filtration by modulating afferent and efferent arteriole tone
ProstaglandinsNO RAAS
Afferent arteriole Efferent arteriole

NO, nitric oxide; RAAS, renin–angiotensin–aldosterone systemBurke M et al. Curr Vasc Pharmacol 2014;12:845
The kidney auto-regulates glomerular filtration by modulating afferent and efferent arteriole tone
ProstaglandinsNO RAAS
Afferent arteriole Efferent arteriole

NO, nitric oxide; RAAS, renin–angiotensin–aldosterone systemBurke M et al. Curr Vasc Pharmacol 2014;12:845
The kidney auto-regulates glomerular filtration by modulating afferent and efferent arteriole tone
ProstaglandinsNO RAAS
Afferent arteriole Efferent arteriole
Increased filtration

The renin–angiotensin–aldosterone system is the gatekeeper of systemic and glomerular blood pressure
Lungs
Vascular endothelial cells
Renal epithelial cells
ACE
Angiotensin IIAngiotensin I
Liver
Angiotensinogen
Adrenalgland
+
ACTH
Pituitary gland
Vasoconstriction
+Kidney
Aldosterone
Kidney
Renin
↓ Blood pressure
+
-
↑ Blood pressure
ACE, angiotensin-converting enzyme; ACTH, adrenocorticotropic hormoneAdapted from Zaman MA et al. Nat Rev Drug Discov 2005;1:621, Skandalakis JE et al. In Skandalakis’ Surgical Anatomy. 2006; Chapter 27. Available at http://ueu.co/accesssurgery-print-27/ (accessed 16 Mar 2016) and Bernstein KE et al. Pharmacol Rev 2013;65:1

• Stable GFR maintained by net 10 mmHg outward pressure
Renal auto-regulation keeps glomerular pressure and filtration rate stable
Glomerular blood hydrostatic pressure
(GBHP)
= 55 mmHg
Blood colloid osmotic pressure (BCOP)
= 30 mmHg
Net filtration pressure (NFP)= GBHP – BCOP – CHP
= 55 – 30 – 15
= 10 mmHg
Capsular hydrostatic pressure (CHP)
= 15 mmHg
GFR, glomerular filtration rate. Adapted from Tandon OP. In Synopsis of human physiology – Part two. Ch 5, 1998; 2nd edn and Burke et al. Current Vascular Pharmacology 2014;12:845
• Glomerular hypertension leads to glomerular barotrauma

Renal auto-regulation keeps glomerular pressure and filtration rate stable
Blood colloid osmotic pressure (BCOP)
= 30 mmHg
Net filtration pressure (NFP)= GBHP – BCOP – CHP
= 55 – 30 – 15
= 10 mmHg
Capsular hydrostatic pressure (CHP)
= 15 mmHg
Glomerular blood hydrostatic pressure
(GBHP)
= 65 mmHg
Increasing pressure by 10 mmHg
GFR, glomerular filtration rate. Adapted from Tandon OP. In Synopsis of human physiology – Part two. Ch 5, 1998; 2nd edn and Burke et al. Current Vascular Pharmacology 2014;12:845
• Glomerular hypertension leads to glomerular barotrauma

Renal auto-regulation keeps glomerular pressure and filtration rate stable
Blood colloid osmotic pressure (BCOP)
= 30 mmHg
Capsular hydrostatic pressure (CHP)
= 15 mmHg
Glomerular blood hydrostatic pressure
(GBHP)
= 65 mmHgNet filtration pressure (NFP)
= GBHP – BCOP – CHP= 65 – 30 – 15
= 20 mmHgDouble net filtration pressure
Doubling of net filtration pressure
Increased GFR
Increasing pressure by 10 mmHg
GFR, glomerular filtration rate. Adapted from Tandon OP. In Synopsis of human physiology – Part two. Ch 5, 1998; 2nd edn and Burke et al. Current Vascular Pharmacology 2014;12:845
• Glomerular hypertension leads to glomerular barotrauma

Typical pattern of kidney damage in T2D patients
Glomerulus from a patient with near-normal renal structure
Glomerulus from a patient with typical diabetic nephropathology
Minimal mesangial expansion Diffuse mesangial expansion
Advanced arteriolar hyalinosis
Mild interstitial fibrosis
T2D, type 2 diabetesFioretto P et al. Diabetologia 1996;39:1569Photographs courtesy of Dr Fioretto

Definitions of kidney disease
The terms DKD and DN are often used interchangeably; both ultimately lead to CKD1–3
Chronic kidney disease (CKD): abnormalities of kidney structure or function, present for >3 months, with implications for health1
Diabetic kidney disease (DKD): refers to kidney disease that is specific to diabetes; based primarily on the presence of elevated albumin in the urine2
Diabetic nephropathy (DN): damage to the kidney caused by diabetes; kidney biopsy may help for definitive diagnosis2,3
1. Kidney Disease: Improving Global Outcomes (KDIGO) CKD Work Group. Kidney Int Suppl 2013;3:1; 2. National Kidney Foundation. KDOQI™ Clinical Practice Guidelines and Clinical Practice Recommendations for Diabetes and Chronic Kidney Disease. Am J Kidney Dis 2007;49:S1-S180; 3. Haneda M et al. J Diabetes Invest 2015;6:242

• eGFR is generally reduced after widespread structural damage to the kidney • It is categorised as follows:
Estimated glomerular filtration rate is the most commonly used index of renal function
Kidney failure
<15
Normal
≥90
Mildlydecreased
60–89
Mildly to moderately decreased
45–59
Moderately to severely decreased
30–44
Severelydecreased
15–29
eGFR (ml/min/1.73 m2)
eGFR, estimated glomerular filtration rateKidney Disease: Improving Global Outcomes (KDIGO) CKD Work Group. Kidney Int Suppl 2013;3:1

• Albuminuria indicates increased glomerular permeability• Albuminuria can be categorised according to urine albumin-to-creatinine ratio or
to 24 h urine albumin excretion, as follows:
Albuminuria is a key marker of kidney damage
UACR (mg/g)
24 h UAE (mg/24 h)
Macroalbuminuria/severely increased*
>300
>300
Microalbuminuria/moderately increased*
30–300
30–300
Normal to mildly increased
<30
<30
*Note that KDIGO 2012 guidelines recommend avoiding the terms microalbuminuria and macroalbuminuriaUACR, urine albumin-to-creatinine ratio; UAE, urine albumin excretionKidney Disease: Improving Global Outcomes (KDIGO) CKD Work Group. Kidney Int Suppl 2013;3:1

eGFR category Description eGFR
(ml/min/1.73 m2)G1 Normal or high ≥90G2 Mildly decreased 60–89G3a Mildly to moderately decreased 45–59G3b Moderately to severely decreased 30–44G4 Severely decreased 15–29G5 Kidney failure <15
Stages of CKD are classified according to eGFR and degree of albuminuria
CKD
Albuminuriacategory Description
UACR (approx. equivalent)mg/g mg/mmol
A1 Normal to mildly increased <30 <3A2 Moderately increased 30–300 3–30A3 Severely increased >300 >30
CKD
CKD, chronic kidney disease; eGFR, estimated glomerular filtration rate; UACR, urine albumin-to-creatinine ratioKidney Disease: Improving Global Outcomes (KDIGO) CKD Work Group. Kidney Int Suppl 2013;3:1

Albuminuria stages, description and range (mg/g)
A1 A2 A3Normal to mildly
increasedModeratelyincreased
Severely increased
<30 30–300 >300
GFR
cat
egor
ies,
des
crip
tion
and
rang
e (m
l/min
/1.7
3 m
2 ) G1 Normal or high ≥90
G2 Mild decrease 60–89
G3a Mild–moderate decrease 45–59
G3b Moderate–severe decrease 30–44
G4 Severe decrease 15–29
G5 Kidney failure <15
CKD, chronic kidney disease; eGFR, estimated glomerular filtration rateKidney Disease: Improving Global Outcomes (KDIGO) CKD Work Group. Kidney Int Suppl 2013;3:1
eGFR and albuminuria categories indicate CKD prognosis
Green: low CKD risk (if no other markers of kidney disease, no CKD); yellow: moderately increased risk; orange: high risk; red, very high risk.

• GFR is not easy to measure directly in clinical practice1
• Instead, it is estimated from equations using serum creatinine level, age, race, sex and body size:
– MDRD formula: estimates glomerular filtration rate (eGFR)2
– CKD-EPI equation: developed to provide a more precise eGFR than the MDRD formula in the higher range of GFR2,3
– Cockcroft–Gault formula: estimates creatinine clearance (eCrCl)4
• GFR is considered the best overall index of renal function5
– UACR evaluation may be more relevant in specific clinical contexts; both should be used in clinical assessment6
Measuring renal function
CKD-EPI, Chronic Kidney Disease Epidemiology Collaboration; eGFR, estimated glomerular filtration rate; MDRD, Modification of Diet in Renal Disease; UACR, urine albumin-to-creatinine ratio1. Levey AS et al. Ann Intern Med 2009;150:604; 2. Levey AS et al. Ann Intern Med 1999;130:461; 3. Levey AS et al. Ann Intern Med 2006;145:247; 4. Cockcroft DW & Gault MH. Nephron 1976;16:31; 5. Kidney Disease: Improving Global Outcomes (KDIGO) CKD Work Group. Kidney Int Suppl 2013;3:1; 6. Polkinghorne KR et al. Clin Biochem Rev 2014;35:67

Module content
Diabetic kidney disease
Current management
Consequences of diabetic kidney disease
Prevalence
Basic concepts and definitions
Diabetes complications and kidney disease
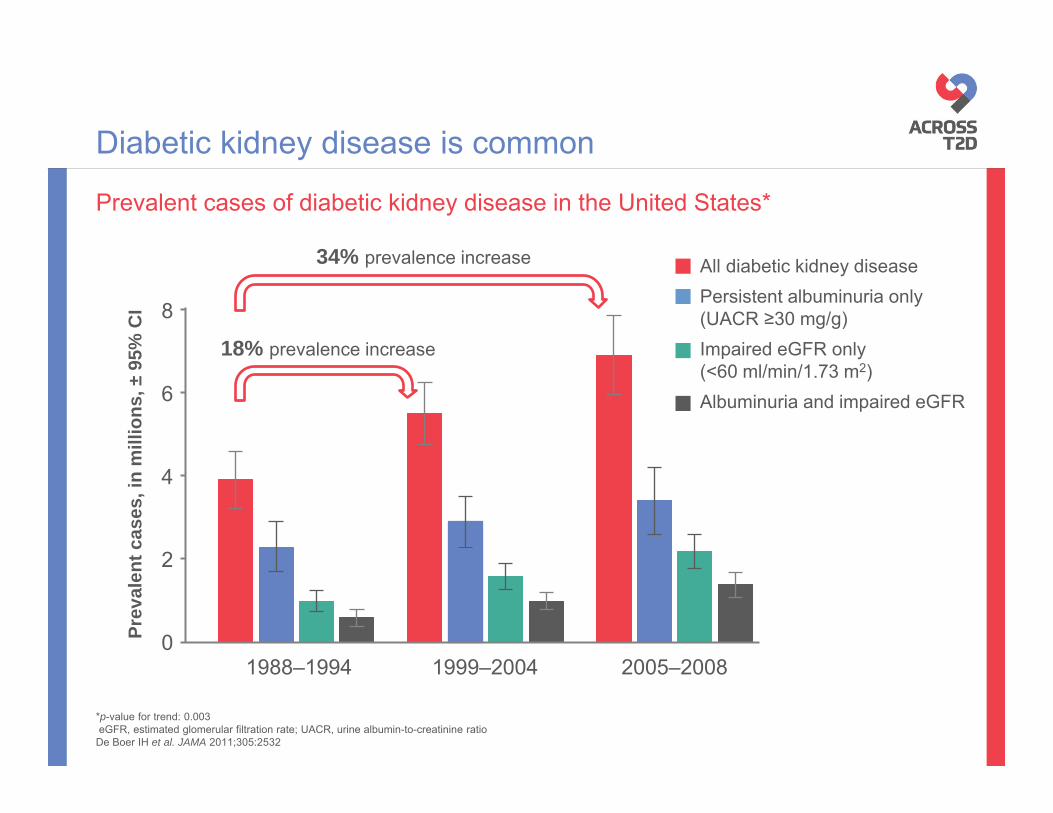
*p-value for trend: 0.003eGFR, estimated glomerular filtration rate; UACR, urine albumin-to-creatinine ratio
De Boer IH et al. JAMA 2011;305:2532
Prevalent cases of diabetic kidney disease in the United States*
Diabetic kidney disease is common
0
2
4
6
8
1988–1994 1999–2004 2005–2008
Prev
alen
t cas
es, i
n m
illio
ns, ±
95%
CI
All diabetic kidney diseasePersistent albuminuria only(UACR ≥30 mg/g)Impaired eGFR only (<60 ml/min/1.73 m2)Albuminuria and impaired eGFR
18% prevalence increase
34% prevalence increase

CKD, chronic kidney disease; DKD, diabetic kidney diseaseUnited States Renal Data System. Annual Data Report, 2015 www.usrds.org/adr.aspx (accessed 22 Feb 2016)
Point prevalence from a 5% sample of US Medicare patients
Proportion of diabetes patients with kidney disease has increased
2.7%
97%
1996
13.8%
86,2%
2013 Diabetes + CKD
All diabetes
Patients with diabetes = 3,844,800Patients with DKD = 103,660
Patients with diabetes = 7,164,020Patients with DKD = 986,560

CKD, chronic kidney disease; T2D, type 2 diabetesChan JC et al. Am J Med 2014;127:616
Late-onset diabetes accelerates the occurrence of diabetic kidney disease
Duration of diabetes (year)
Cum
ulat
ive
inci
denc
e of
CK
D (%
)
Young-onset T2D
0
100
Late-onset T2D80
60
40
20
0
10 30 50 70604020

Improved diabetes care has been associated with reduced CV outcomes, but not renal complications
Year
0
50
100
150
1990 2000 2010
Even
ts p
er 1
0,00
0 ad
ult
popu
latio
n w
ith d
iabe
tes
MI Stroke ESRD
CV, cardiovascular; ESRD, end-stage renal disease; MI, myocardial infarctionAdapted from Gregg EW et al. N Engl J Med 2014;370:1514

CKD, chronic kidney disease*Austria, Belgium, Denmark, Finland, Greece, Iceland, Italy, Netherlands, Norway, Spain, Sweden, UKKainz A et al. Nephrol Dial Transplant 2015;30:iv1113 (Supplementary data)
Projection of CKD in patients with diabetes in 12 European countries*
Prevalence of diabetic kidney disease is projected to increase even further
Estim
ated
rela
tive
prev
alen
ce
rate
(per
mill
ion
popu
latio
n)
0
20.000
40.000
60.000
80.000
100.000
120.000
140.000
160.000
180.000
200.000
2010 2015 2020 20250
2.000
4.000
6.000
8.000
10.000
12.000
14.000
2010 2015 2020 2025
Year Year
CKD stage 3
CKD stage 4
CKD stage 5

Module content
Diabetic kidney disease
Current management
Consequences of diabetic kidney disease
Prevalence
Basic concepts and definitions
Diabetes complications and kidney disease

• Markers of DKD (declining eGFR and worsening albuminuria)are associated with:
CV, cardiovascular; DKD, diabetic kidney disease; eGFR, estimated glomerular filtration rateKDIGO 2012 Clinical Practice Guideline for the Evaluation and Management of Chronic Kidney Disease. Kidney Int. 2013;3:1
Diabetic kidney disease has serious consequences
Increasedmortality
Impairedcognition
Renal events
CV eventsCV death

Percentages indicate absolute excess mortality above the reference group (individuals with no diabetes or kidney disease)*No diabetes and no kidney disease; GFR, glomerular filtration rate; T2D, type 2 diabetesAfkarian M et al. J Am Soc Nephrol 2013;24:302
Mortality is more frequent in T2D patients with kidney disease than in those without
Stan
dard
ised
10-
year
cum
ulat
ive
inci
denc
e of
mor
talit
y (9
5% C
I)
4.1%
17.8%
23.9%
47.0%
7.7%
0
10
20
30
40
50
60
70
No kidneydisease
Albuminuria Impaired GFR Albuminuria &impaired GFR
No diabetes, nokidney disease
Excess mortality
Increased mortality
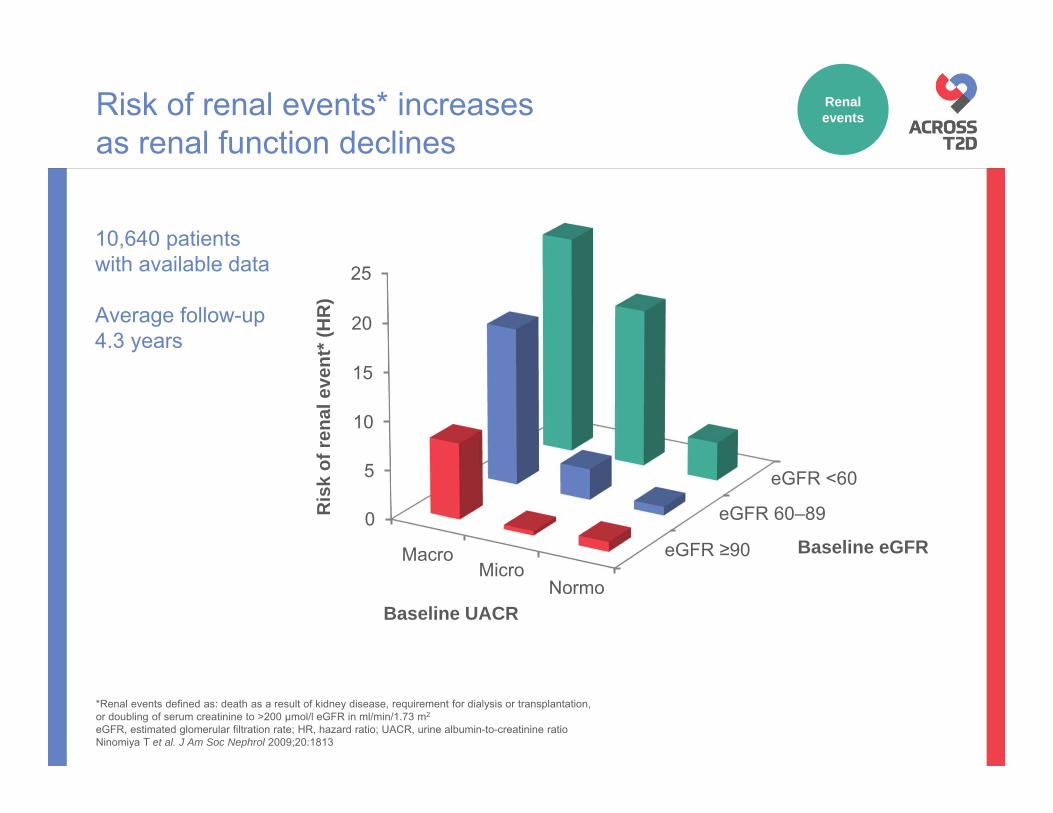
Risk of renal events* increases as renal function declines
eGFR ≥90
eGFR 60–89
eGFR <60
0
5
10
15
20
25
MacroMicro
Normo
Ris
k of
rena
l eve
nt* (
HR
)
10,640 patients with available data
Average follow-up4.3 years
Baseline UACR
Baseline eGFR
*Renal events defined as: death as a result of kidney disease, requirement for dialysis or transplantation, or doubling of serum creatinine to >200 μmol/l eGFR in ml/min/1.73 m2
eGFR, estimated glomerular filtration rate; HR, hazard ratio; UACR, urine albumin-to-creatinine ratioNinomiya T et al. J Am Soc Nephrol 2009;20:1813
Renal events

• Renal and cardiac systems are inextricably linked; acute or chronic disorder of one can induce dysfunction in the other1
• Elderly patients with CKD are more likely to die of heart disease than advance to ESRD and dialysis2
Kidney disease is associated with significant impairment of cardiac function
Organ damage/dysfunction
Renal and cardiac systems should be considered together
CKD, chronic kidney disease; CV, cardiovascular; ESRD, end-stage renal disease1. Ronco C et al. J Am Coll Cardiol 2008;52:1527; 2. Dalrymple L et al. J Gen Intern Med 2011;26:379
CV events
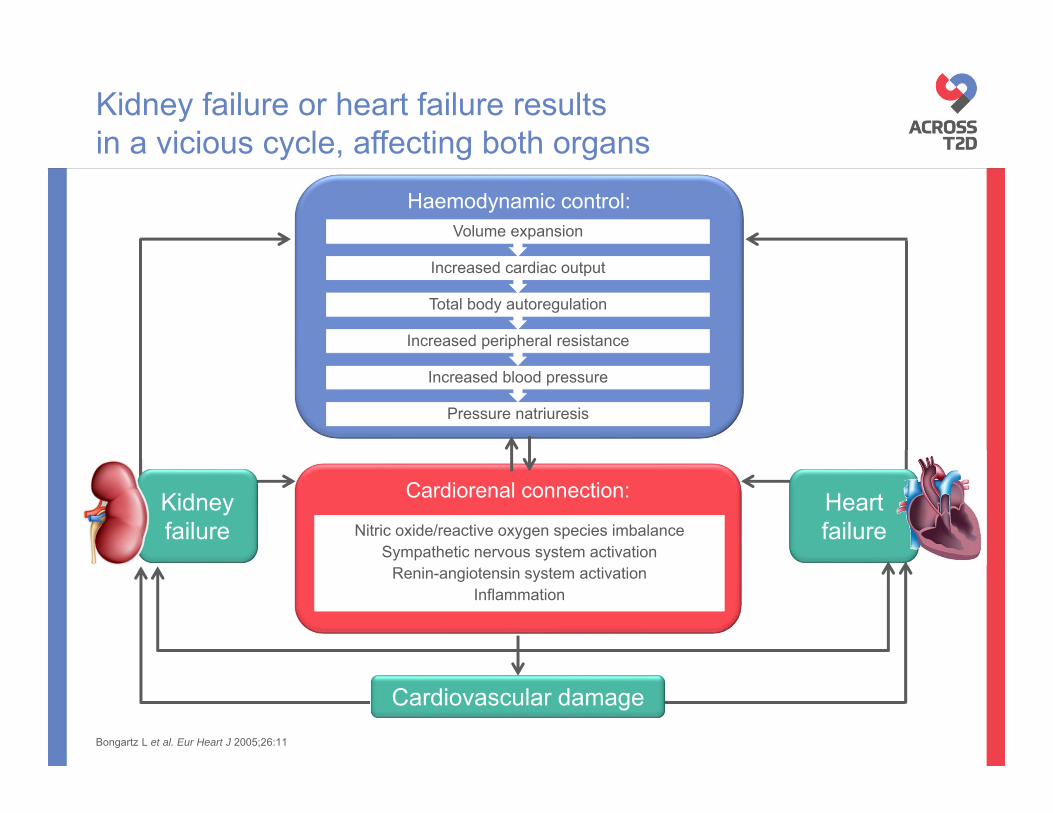
Cardiorenal connection:
Haemodynamic control:
Kidney failure or heart failure results in a vicious cycle, affecting both organs
Nitric oxide/reactive oxygen species imbalanceSympathetic nervous system activation
Renin-angiotensin system activation Inflammation
Nitric oxide/reactive oxygen species imbalanceSympathetic nervous system activation
Renin-angiotensin system activation Inflammation
Kidneyfailure
Heart failure
Pressure natriuresis
Increased blood pressure
Increased peripheral resistance
Total body autoregulation
Increased cardiac output
Volume expansion
Cardiovascular damageBongartz L et al. Eur Heart J 2005;26:11

<1010–29
30–299≥3000
2
4
6
8
10
12
14
UACR (mg/g)eGFR (ml/min/1.73 m2)
Risk of CV death increases as renal function declines
Low eGFR and high UACR are independent predictors of CV mortality
Adj
uste
d H
R105,872 patients
730,577 person-years
CV, cardiovascular; eGFR, estimated glomerular filtration rate; HR, hazard ratio; UACR, urine albumin-to-creatinine ratioMatsushita K et al. Lancet 2010;375:2073
CV death

Declining eGFR is a risk factor for CV death and all-cause mortality
All-cause mortality Cardiovascular mortality
6015
1.5
4
2
1
8
45 75 90 105 12030
Adj
uste
d H
R (9
5% C
I)
eGFR ml/min/1.73 m2eGFR ml/min/1.73 m2
1.5
4
2
1
8
15 45 60 75 90 105 12030
Adj
uste
d H
R (9
5% C
I)
CKD CKD
HRs adjusted for age, sex, race, smoking, history of cardiovascular disease, diabetes, serum total cholesterol concentration, body mass index and albuminuriaCKD, chronic kidney disease; CV, cardiovascular; eGFR, estimated glomerular filtration rate; HR, hazard ratioMahmoodi BK et al. Lancet 2012;380:1649
347,256 hypertensive individuals2,970,318 patient-years
CV death/ all-cause mortality

Adj
uste
d H
R (9
5% C
I)Increasing UACR is a risk factor for CV death and all-cause mortality
UACR (mg/g)
Adj
uste
d H
R (9
5% C
I)
0.5
1
2
4
8
2.5 5 10 30 300 1000
UACR (mg/g)
2.5 5 10 30 300 10000.5
1
2
4
8
HRs adjusted for age, sex, race, smoking, history of cardiovascular disease, diabetes, serum total cholesterol concentration, body mass index and eGFR splinesCKD, chronic kidney disease; CV, cardiovascular; eGFR, estimated glomerular filtration rate; HR, hazard ratio; UACR, urine albumin-to-creatinine ratioMahmoodi BK et al. Lancet 2012;380:1649
All-cause mortality Cardiovascular mortality
CKD CKD
347,256 hypertensive individuals2,970,318 patient-years
CV death/ all-cause mortality

Impaired renal function can be a stronger predictor of mortality than history of MI
History of MI RR (95% CI) p-value
No
Yes 0.0367
eGFR (ml/min)
>76 –
76–59 0.1749
58–44 0.0001
<44 0.0000
0,1 1 10
Risk of all-cause mortality in patients with chronic heart failureN=1906, of whom 394 (20.7%) with diabetes
eGFR, estimated glomerular filtration rate; MI, myocardial infarction; RR, risk ratioHillege HL et al. Circulation 2000;102:203

• Albuminuria is significantly associated with poor performance of verbal memory, executive function and processing speed
• The effect of albuminuria on performance was equivalent to an additional ~3.5 years of age at baseline
Albuminuria is correlated with impaired cognition in T2D
ACCORD-MIND study OR for performance in the lowest tertile (95% CI)
DSST p-value
Model 4 0.001
Model 3 0.001
Model 2 0.001
Model 1 <0.001
Unadjusted <0.001
RAVLT
Model 4 0.006
Model 3 0.006
Model 2 0.003
Model 1 0.002
Unadjusted <0.001
0,5 1 2 4
Model 1 + history of CVD, including stroke
Model 2 + diabetes duration and HbA1c
Model 3 + hyperlipidaemia, hypertension, alcohol consumption, current smoking status, BMI, depression
BMI, body mass index; CVD, cardiovascular disease; DSST, digit symbol substitution test; HbA1c, glycated haemoglobin; OR, odd ratio; RAVLT, Rey auditory verbal learning test; T2D, type 2 diabetesMurray AM et al. Diabetes Care 2011;34:1827
Impaired cognition
Adjusted by age, gender, race, education
Module content
Diabetic kidney disease
Current management
Consequences of diabetic kidney disease
Prevalence
Basic concepts and definitions
Diabetes complications and kidney disease

The aim of treatment:to prevent the complications of diabetes
Microvascular complications
Diabetic retinopathy
Diabetic kidney disease
Diabetic neuropathy
Diabetes
Macrovascular complications
Limb amputation Coronary heart
diseaseStroke
Myocardial infarctionPeripheral artery
disease
Adapted from Grobbee DE. Metabolism 2003;52:24

A multifactorial intervention strategy is recommended in DKD
Glucose
BP
Lipids
ACEi/ ARB
HbA1c target individualised, but generally ~7%1
Target of <130/80 mmHg2
Use ACEi or ARBs when albumin excretion ≥30 mg/g1
Lipid-lowering recommended to reduce risk of atherosclerotic events; statins not recommended in patients on haemodialysis1
ACEi, angiotensin-converting-enzyme inhibitor; ARB, angiotensin receptor blocker; BP, blood pressure; DKD, diabetic kidney disease; HbA1c, glycated haemoglobin1. National Kidney Foundation. Am J Kidney Dis 2012;60:850; 2. NICE. Clinical guideline: Type 2 diabetes (CG87), May 2009
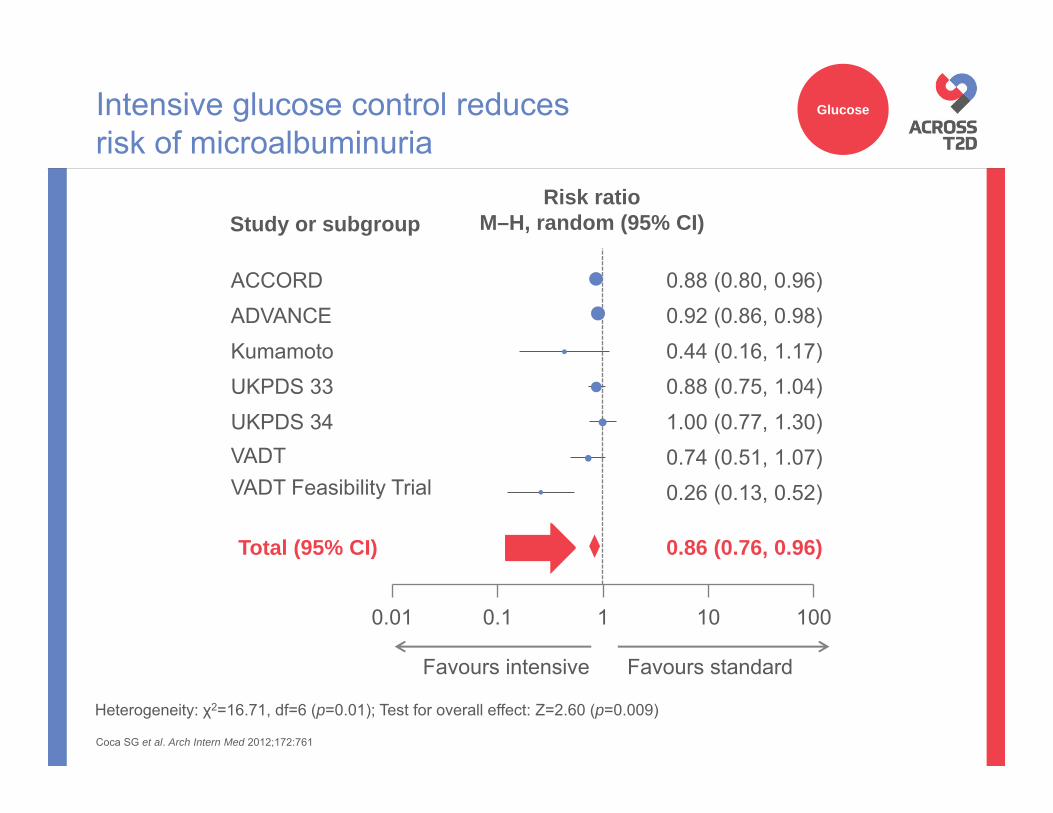
Intensive glucose control reduces risk of microalbuminuria
Heterogeneity: χ2=16.71, df=6 (p=0.01); Test for overall effect: Z=2.60 (p=0.009)
Coca SG et al. Arch Intern Med 2012;172:761
0.01 0.1 1 10 100
Favours intensive Favours standard
Total (95% CI) 0.86 (0.76, 0.96)
0.88 (0.80, 0.96)
0.26 (0.13, 0.52)0.74 (0.51, 1.07)1.00 (0.77, 1.30)0.88 (0.75, 1.04)0.44 (0.16, 1.17)0.92 (0.86, 0.98)
VADT Feasibility Trial
ACCORD
VADTUKPDS 34UKPDS 33KumamotoADVANCE
Risk ratioM–H, random (95% CI)Study or subgroup
Glucose

Intensive glucose control reduces risk of macroalbuminuria
Heterogeneity: χ2=16.71, df=6 (p=0.01); Test for overall effect: Z=2.60 (p=0.009)
Coca SG et al. Arch Intern Med 2012;172:761
Glucose
0.72 (0.60, 0.86)
VADT Feasibility Trial
VADT
UKPDS 33
Kumamoto
Risk ratioM–H, random (95% CI)Study or subgroup
0.01 0.1 1 10 100
0.74 (0.65, 0.85)
0.35 (0.11, 1.13)
0.56 (0.33, 0.96)
0.90 (0.60, 1.35)
0.11 (0.01, 1.94)
0.79 (0.67, 0.93)
Total (95% CI)
ACCORD
ADVANCE
Favours intensive Favours standard

HR 0.54 95% CI 0.34; 0.85
p=0.007
2
Patie
nts
with
end
-sta
ge
rena
l dis
ease
* (%
)
1
04 6 10
Follow-up (years)
2 80
*Defined as requirement for renal-replacement therapyHR, hazard ratioZoungas S et al. N Engl J Med 2014;371:1392
ADVANCE-ON study
Intensive glucose control associated with significantly reduced risk of ESRD
Standard control
Intensive control
No. at riskIntensive 5571 5402 5186 4124 3764 2811Standard 5569 5400 5173 4041 3681 2683
Glucose

• Risk of severe hypoglycaemia is increased in patients with kidney disease1
– Hypoglycaemia is associated with increased risk of CV events2
Kidney disease complicates glucose control
0123456789
10
--
+-
-+
++
Ris
k fo
r sev
ere
hypo
glyc
aem
ia1
(inci
denc
e ra
te ra
tio)
CKDDiabetes
CKD, chronic kidney disease; CV, cardiovascular1. Moen MF et al. Clin J Am Soc Nephrol 2009;4:1121; 2. Sanon VP et al. Clin Cardiol 2014;37:499
Glucose

In the ADVANCE-BP study, rate of all renal events* significantly associated with achieved systolic BP levels (p<0.0001 for trend)
*New-onset microalbuminuria or nephropathy, doubling of serum creatinine to >200 μmol/l, or ESRD BP, blood pressure; ESRD, end-stage renal disease; T2D, type 2 diabetesde Galan B et al. J Am Soc Nephrol 2009;20:883
Lower blood pressure is associated with lower frequency of renal events in T2D
Ann
ual p
atie
nt e
vent
rate
(%)
Achieved systolic BP (mmHg)
100 110 120 130 140 150 160 1704
5
6
7
8
910
Median systolic BP (mmHg)No. of person years
106 116 125 135 144 154 1681431 4266 8974 11983 9138 4942 3470
BP

ACE inhibitors slow progression of albuminuriaand renal function decline in patients with T2D
*p=0.047 vs placebo; †p=0.042 vs placeboACE, angiotensin-converting enzyme; CrCl, creatinine clearance; SD, standard deviation; T2D, type 2 diabetes Ravid M et al. Ann Intern Med 1998;128:982
ACEi/ARB
Follow-up (years)
10
20
30
0
40
Albuminuria
Mea
n al
bum
in e
xcre
tion,
mg/
24 h
(±SD
)
0 1 3 652 4
Placebo
Enalapril
p=0.001
Renal function (CrCl)
Mea
n C
rCl,
ml/s
(±SD
)
Follow-up (years)
1.6
1.7
1.8
1.5
2.0
0 1 3 652 4
1.9
Placebo
Enalapril
*†

ARBs have demonstrated beneficial impact on markers of kidney disease
Impact on serum creatinine levels1 Impact on microalbuminuria2
Hyp
erte
nsiv
e pa
tient
s w
ith
mic
roal
bum
inur
ia(%
)
0 6 12 18 24 36 480
5
10
15
20
30 42
25Placebo
Olmesartan
HR 0.7595% CI 0.61, 0.92
p=0.0068*
HR 0.7195% CI 0.54, 0.92
p=0.009
Placebo
Irbesartan
Patie
nts
with
dou
bllin
g of
BL
sCR
(%)
0 6 12 18 24 36 54
10
20
30
60
030 42 48
40
50
70
*Exploratory p-valueARB, angiotensin receptor blocker; BL sCR, baseline serum creatinine; HR, hazard ratio1. Lewis et al. N Engl J Med 2001;345:851; 2. Menne J et al. J Hypertens 2012;30:811
ACEi/ARB
Follow-up (months) Follow-up (months)

0,5
Variable p-valueCoronary events
Non-fatal MI 0.12CHD death 0.95Subtotal 0.37
Non-haemorrhagic strokeIschaemic 0.0073Unknown type 0.85Subtotal 0.01
Revascularisation proceduresCoronary 0.0027Non-coronary 0.36Subtotal 0.0036
Any major atherosclerotic event
0.0021
• In the SHARP study, simvastatin plus ezetimibe reduced the risk of any major atherosclerotic event by 17% (p=0.0021) in patients with advanced CKD1
– However, the combination has not shown renal protection in this population2
• Statin effects on renal parameters have been inconsistent3
– Recommended by guidelines to reduce major atherosclerotic events in patients with CKD and diabetes4
– Initiation not recommended in patients on dialysis4
CHD, coronary heart disease; CKD, chronic kidney disease; MI, myocardial infarction1. Baigent C et al. Lancet 2011;377:2181; 2. Haynes R et al. J Am Soc Nephrol 2014;25:1825; 3. Fellström B et al. Curr Med Res Opin 2009;25:271; 4. National Kidney Foundation. Am J Kidney Dis 2012;60:850
Statins can help to reduce cardiovascularrisk in patients with CKD
SHARP3 (CKD patients N=9270, 2094 with diabetes)
21
Lipids
Favours simvastin + ezetimibe Favours placebo

Attaining multiple treatment targets is associated with lower risk of ESRD and related death in T2D
~60%risk reduction
Predefined protocol and targetsHbA1c <7%
BP <130/80mmHgLDL-C <2.6 mM (100 mg/dl)
Triglyceride <2 mM (177 mg/dl)Persistence with RAS inhibitors
Prim
ary
com
posi
te e
ndpo
int*
(%)
<3 treatment targets attained
0.00
Months of follow-up
50
≥3 treatment targets attained
40
30
20
10
0
5.00 10.00 15.00 20.00 25.00
RR 0.4395% CI 0.21, 0.86
*Death and/or ESRD, defined as the need for dialysis, or plasma creatinine level 500 µmol/lBP, blood pressure; ESRD, end-stage renal disease; HbA1c, glycated haemoglobin; LDL-C, Low-density lipoprotein cholesterol; RAS, renin-angiotensin system; RR, risk ratioChan JC et al Diabetes Care 2009;32:977

Steno-2 study: randomised controlled trial of intensified vs conventional multifactorial treatment in patients with T2D and microalbuminuria
Intensified multifactorial intervention helps achievement of treatment goals
Patients reaching treatment goal at 8 years (%)1
Intensified treatment (i.e. strict goals; n=67)Conventional treatment (i.e. goals indicated by DMA; n=63)
HbA1c<6.5%
Cholesterol<4.5 mmol/l
Triglycerides<1.7 mmol/l
Diastolic BP<80 mmHg
0
20
40
60
80
Patie
nts
(%)
p=0.06
p<0.001
p=0.19
p=0.001
p=0.21
100
Systolic BP<130 mmHg
HbA1c<6.5%
Cholesterol<4.5 mmol/l
Triglycerides<1.7 mmol/l
Diastolic BP<80 mmHg
Systolic BP<130 mmHg
p=0.31
p=0.35 p=0.005
p=0.27
p=0.14
0
20
40
60
80
Patie
nts
(%)
100
Patients reaching treatment goal at 13 years (%)2
Treatment goals Treatment goals
Intensified treatment (i.e. strict goals; n=55)Conventional treatment (i.e. goals indicated by DMA; n=38)
BP, blood pressure; DMA, Danish Medical Association; HbA1c, glycated haemoglobin1. Gaede P et al. N Engl J Med 2003;348:383; 2. Gaede P et al. N Engl J Med 2008;358:580

Steno-2 study: randomised controlled trial of intensified vs conventional multifactorial treatment in patients with T2D and microalbuminuria
CV, cardiovascular; HR, hazard ratio; MI, myocardial infarctionGaede P et al. N Engl J Med 2008;358:580
Intensified multifactorial intervention reduces CV risk
*Death from CV causes, non-fatal MI, coronary-artery bypass grafting, percutaneous coronary intervention, non-fatal stroke, amputation, or surgery for peripheral atherosclerotic artery disease
Intensive therapy 80 72 65 61 56 50 47 31
Conventional therapy 80 70 60 46 38 29 25 14
Patients at risk
Conventional
Intensive
0
10
20
30
40
50
60
70
80
0 1 2 3 4 5 6 7 8 9 10 11 12 13
Cum
ulat
ive
inci
denc
e (%
)
Years of follow-up
Risk for composite CV endpoint*
HR 0.4195% CI 0.25, 0.67
p<0.001

0,1 1 10
VariableRelative risk
p-value HR (95% CI)(95% Cl)
Nephropathy 0.39 (0.17, 0.87) 0.003
Retinopathy 0.42 (0.21, 0.86) 0.02
Autonomic neuropathy 0.37 (0.18, 0.79) 0.002
Peripheral neuropathy 1.09 (0.54, 2.22) 0.66
Steno-2 study: randomised controlled trial of intensified vs conventional multifactorial treatment in patients with T2D and microalbuminuria
HR, hazard ratioGaede P et al. N Engl J Med 2003;348:383
Intensified multifactorial intervention reduces risk of microvascular events
n=80 for each group; average follow-up 7.8 years Favours intensive therapy
Favours conventional therapy
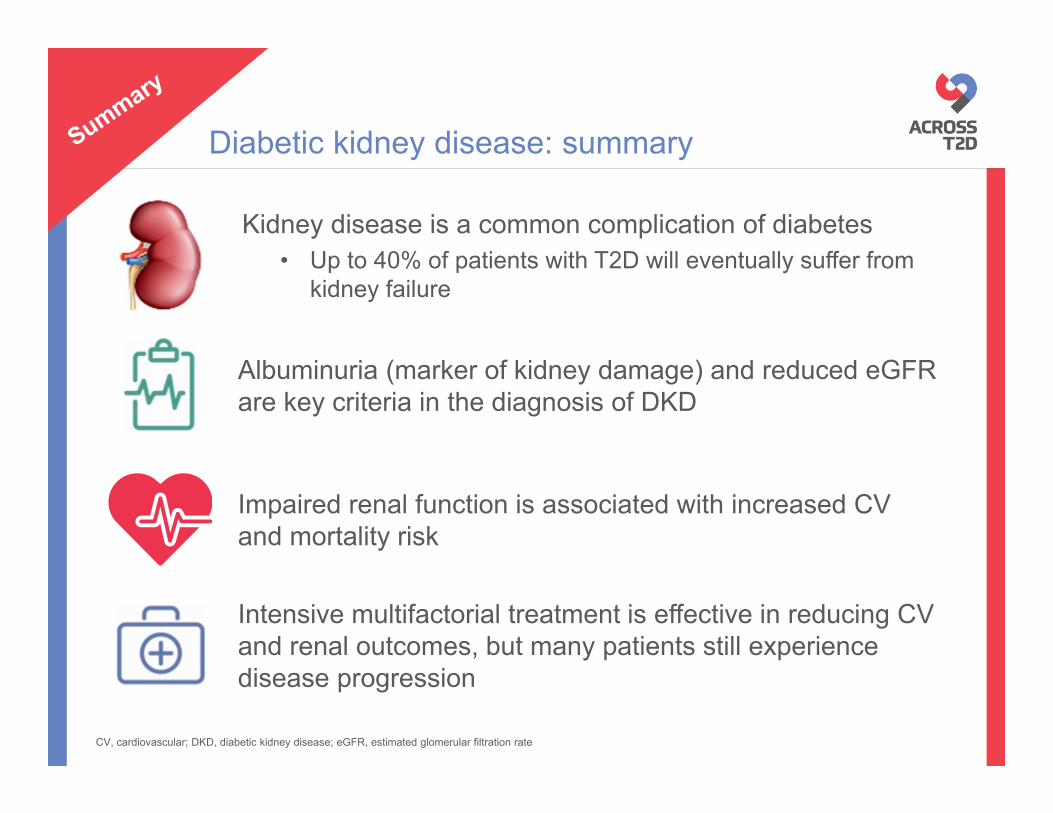
Diabetic kidney disease: summary
Kidney disease is a common complication of diabetes• Up to 40% of patients with T2D will eventually suffer from
kidney failure
Albuminuria (marker of kidney damage) and reduced eGFR are key criteria in the diagnosis of DKD
Impaired renal function is associated with increased CV and mortality risk
Intensive multifactorial treatment is effective in reducing CV and renal outcomes, but many patients still experience disease progression
CV, cardiovascular; DKD, diabetic kidney disease; eGFR, estimated glomerular filtration rate

Back-up slides

Diabetes is the leading cause of end-stage renal disease in the US
0
10.000
20.000
30.000
40.000
50.000
60.000
Num
ber o
f pat
ient
s w
ith E
SRD
Year
Diabetes
Hypertension
Glomerulonephritis
Cystic kidney disease
ESRD, end-stage renal diseaseUS Renal Data System. Annual data report 2014. www.usrds.org/adr.aspx (accessed 22 Feb 2016)
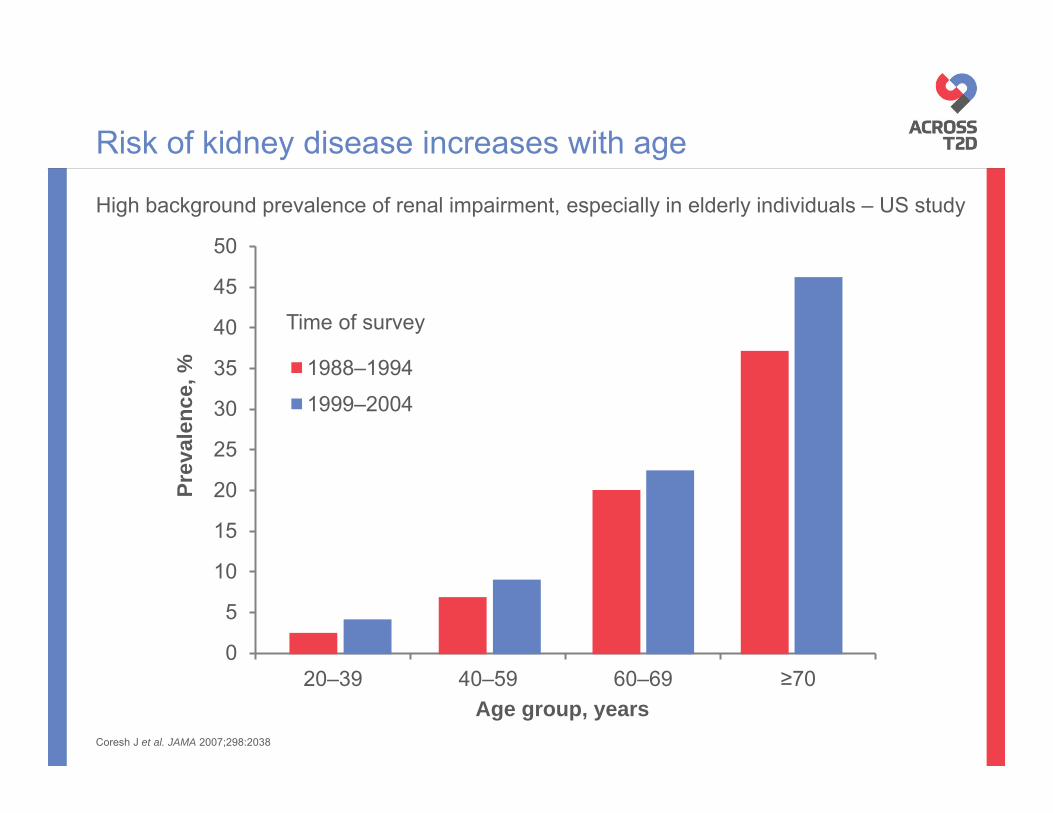
High background prevalence of renal impairment, especially in elderly individuals – US study
Coresh J et al. JAMA 2007;298:2038
Risk of kidney disease increases with age
0
5
10
15
20
25
30
35
40
45
50
20–39 40–59 60–69 ≥70
Prev
alen
ce, %
Age group, years
1988–19941999–2004
Time of survey

ADVANCE: observational analyses examining the association between albuminuria and eGFR at baseline or during follow-up and the risk for CV events and renal events in T2D
Albuminuria and reduced eGFR are associated with increased risk of CV events
eGFR ≥90
eGFR 60–89
eGFR <60
0
1
2
3
4
MacroMicro
Normo
Ris
k of
CV
even
t* (H
R)
10,640 patients with available data
Average follow-up4.3 years
Baseline UACRBaseline eGFR
*CV events defined as: CV death, non-fatal myocardial infarction or nonfatal stroke. eGFR in ml/min/1.73 m2
CV, cardiovascular; eGFR, estimated glomerular filtration rate; UACR, urine albumin-to-creatinine ratioNinomiya T et al. J Am Soc Nephrol 2009;20:1813

ADVANCE: Observational analyses examining the association between albuminuria and eGFR at baseline or during follow-up and the risk for CV events and renal events in T2D
Albuminuria and reduced eGFR are associated with increased risk of CV death
eGFR ≥90
eGFR 60–89
eGFR <60
0
1
2
3
4
5
6
MacroMicro
Normo
Ris
k of
CV
deat
h (H
R)
eGFR in ml/min/1.73 m2
CV, cardiovascular; eGFR, estimated glomerular filtration rate; UACR, urine albumin-to-creatinine ratioNinomiya T et al. J Am Soc Nephrol 2009;20:1813
Baseline UACRBaseline eGFR
10,640 patients with available data
Average follow-up4.3 years

HR calculated using lowest normal albuminuria as reference; CV, cardiovascular; HR, hazard ratio1. Solomon SD et al. Circulation 2007;116:2687; 2. Stehouwer C et al. Kidney Int 2004;92:S42
Proportion of patients with T2D in each category (%)
CV mortality risk increases with increasing albuminuria in patients with stable coronary disease
1 0,89 0,991,35
1,891,68
0
0,5
1
1,5
2
2,5
3
3,5
4
Lowest normal(<5.0 mg/g)
Low normal (5.0–6.5 mg/g)
Medium normal (6.6–9.4 mg/g)
High normal (9.5–16.9 mg/g)
Low-to-medium microalbuminuria
(17.0–125.0 mg/g)
Highmicroalbuminuria tomacroalbuminuria
(>125.0 mg/g)
Adj
uste
d H
R1
Microalbuminuria may represent an early marker of vascular endothelial dysfunction2
7,2 10,6 15,2 19,2 28,344,6
Albuminuria

Declining eGFR is associated with mortality and ESRD in diabetes
ESRD and eGFRMortality and eGFR
00.5
1248
163264
Adj
uste
d H
R ±
95%
CI
15 30 45 60
eGFR (ml/min per 1.73 m2)
15 30 45 60 75 90 105 1200
1
1.52
4
8
Adj
uste
d H
R ±
95%
CI
eGFR (ml/min per 1.73 m2)
Cardiovascular mortality
Includes data from participants with type 1 and type 2 diabetes
0
1
1.52
4
8
Adj
uste
d H
R ±
95%
CI
All-cause mortalityNo diabetes, 95% CIDiabetes, 95% CI
15 30 45 60 75 90 105 120eGFR (ml/min per 1.73 m2)
HRs adjusted for age, sex, race, smoking, history of cardiovascular disease, serum total cholesterol concentration, body-mass index and albuminuria
eGFR, estimated glomerular filtration rate; ESRD, end-stage renal disease; HR, hazard ratio. Fox CS et al. Lancet 2012;380:1662

Increasing UACR is associated with mortality and ESRD in diabetes
3000
Adj
uste
d H
R ±
95%
CI
00.5
1248
163264
10 20 100030030UACR (mg/g)
No diabetes, 95% CIDiabetes, 95% CI
No diabetes, 95% CIDiabetes, 95% CI
0
1
1.52
4
8All-cause mortality
2.5 5 10 30 300 1000UACR (mg/g)
2.5 5 10 30 300 10000
1
1.52
4
8
UACR (mg/g)
Cardiovascular mortality
ESRD, end-stage renal disease; HR, hazard ratio; UACR, urine albumin-to-creatine ratio. Fox CS et al. Lancet 2012;380:1662
HRs adjusted for age, sex, race, smoking, history of cardiovascular disease, serum total cholesterol concentration, body-mass index and albuminuria
Includes data from participants with type 1 and type 2 diabetes
Mortality and UACR ESRD and UACR
Adj
uste
d H
R ±
95%
CI
Adj
uste
d H
R ±
95%
CI