Our educational modules - Path Medical
129
PATH medical Our educational modules education are made for providing information on how the hearing organ works and which test procedures are used to test the functionality of the sound processing elements along the auditory pathway. With that knowledge the user of our devices should be prepared to use our test modules efficiently.
-
Upload
khangminh22 -
Category
Documents
-
view
2 -
download
0
Transcript of Our educational modules - Path Medical
PATH medical
Our educational modules
educ
atio
n
are made for providing information on how the hearing organ works and which test procedures are used to test the functionality of the sound processing elements along the auditory pathway.
With that knowledge the user of our devices should be prepared to use our test modules efficiently.
0 Sound 1 Physiology/Pathophysiology of Hearing 2 Audiology (hearing assessment) 3 Hearing Screening (newborn, pre-school/school
children, elderly) 4 Tracking 5 Occupational medicine
We have six educational modules
PATH medical
educ
atio
n
2
What is sound? 0
PATH medical
You can hear it, but you can not see it !
Phy
sics
3

What is sound? 0
PATH medical
Phy
sics
4
Sound are audible motions of molecules in gaseous, liquid and solid mediums.
The hearing organ is able to percept sound - via air, that sets the tympanic membrane and the
middle ear ossicles in motion and successively the basilar membrane with the auditory sensory cells on it which are embedded into the cochlear fluids
- via bone, that directly sets the cochlear fluids in motion
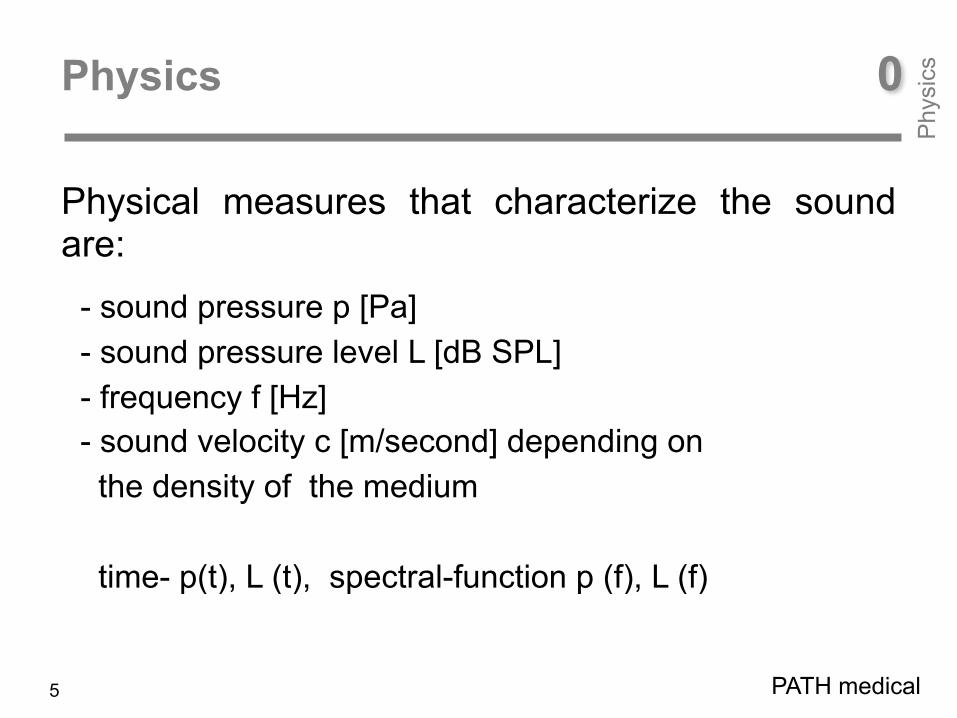
- sound pressure p [Pa] - sound pressure level L [dB SPL] - frequency f [Hz] - sound velocity c [m/second] depending on the density of the medium time- p(t), L (t), spectral-function p (f), L (f)
Physics 0
PATH medical
Phy
sics
5
Physical measures that characterize the sound are:
0 threshold1020 swinging leaves3040 water5060 speech (1m)70 80 car90 100 factory110 120 dB SPL air craft
20 x 10-6
20 x 10-5
20 x 10-4
20 x 10-3
0,2
2
20 Pa
p[Pa] = 1 N/m2
L [dBSPL] = 20 log p/p0
p0 =
0Sound pressure p [Pa] sound pressure level L [dBSPL] P
hysi
cs
PATH medical6
0Sound pressure p [Pa] sound pressure level L [dBSPL] P
hysi
cs
PATH medical7
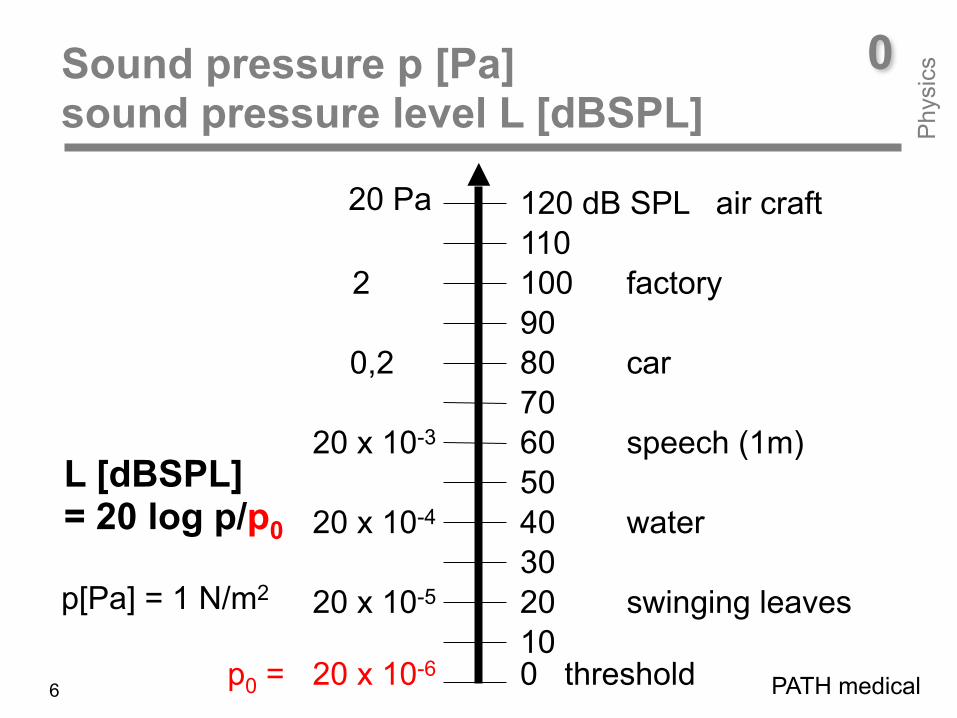
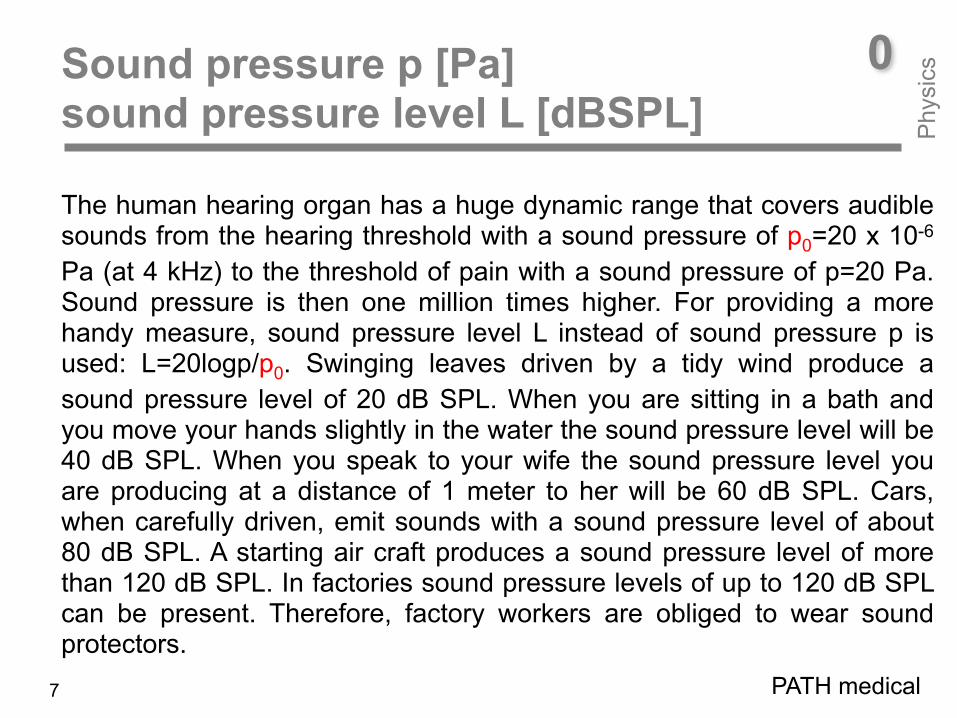
The human hearing organ has a huge dynamic range that covers audible sounds from the hearing threshold with a sound pressure of p0=20 x 10-6
Pa (at 4 kHz) to the threshold of pain with a sound pressure of p=20 Pa. Sound pressure is then one million times higher. For providing a more handy measure, sound pressure level L instead of sound pressure p is used: L=20logp/p0. Swinging leaves driven by a tidy wind produce a sound pressure level of 20 dB SPL. When you are sitting in a bath and you move your hands slightly in the water the sound pressure level will be 40 dB SPL. When you speak to your wife the sound pressure level you are producing at a distance of 1 meter to her will be 60 dB SPL. Cars, when carefully driven, emit sounds with a sound pressure level of about 80 dB SPL. A starting air craft produces a sound pressure level of more than 120 dB SPL. In factories sound pressure levels of up to 120 dB SPL can be present. Therefore, factory workers are obliged to wear sound protectors.
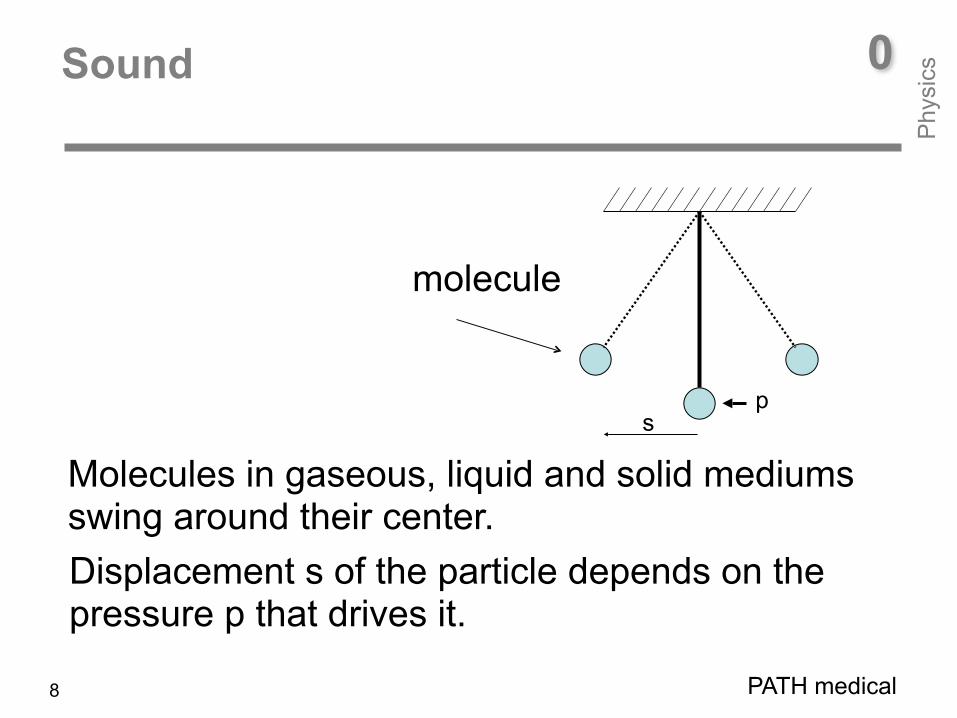
Displacement s of the particle depends on the pressure p that drives it.
0Sound
PATH medical
Phy
sics
8
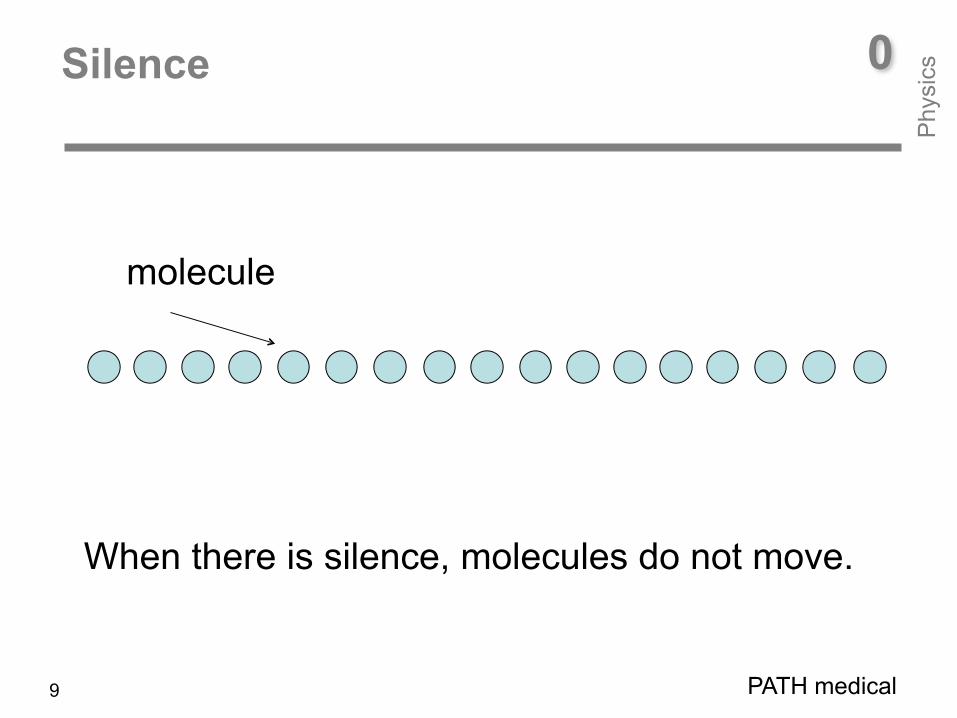
Molecules in gaseous, liquid and solid mediums swing around their center.
p
molecule
s
molecule
0Silence
PATH medical
When there is silence, molecules do not move.
Phy
sics
9

condensation condensation
rarefaction
p
0Sound
X
PATH medical
Phy
sics
10
When there is sound, molecules do move.
condensation condensation
rarefaction
cycle period Tp
frequency f = 1/T [1/s=Hz]
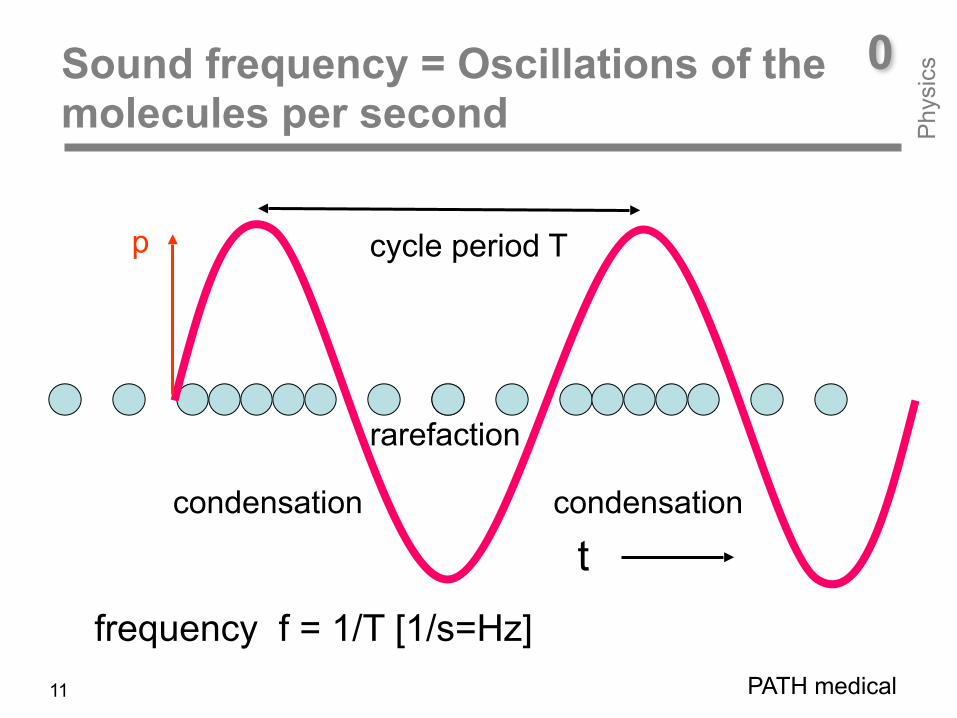
0Sound frequency = Oscillations of the molecules per second
t
PATH medical
Phy
sics
11
0
Phy
sics
PATH medical12
Molecules, when set into vibration by sound create zones in space where molecules are close to each other (condensation) or apart (rarefaction). Number of these oscillations per second is given by frequency f. Cycle period T is the time distance between zones of rarefaction and condensation. Frequency and cycle time are connected by f=1/T [1/second] or [Hz].
0Sound = Molecules do move
Phy
sics

frequency [kHz]soun
d pr
essu
re p
[Pa]
1 2 3
p1
p2
0Sound spectrum: two tones (red, blue) and a transient (green)
1 kHz - tone
2 kHz - tonetransient
Lines indicate frequency (x-axis) and pressure (y-axis) of the tones. Transient stimulus has a broad spectrum.
PATH medical
Phy
sics
13
0
Phy
sics
PATH medical14
A sinusoidal signal (a tone) is presented in a sound spectrum as a line. Its place at the x-axis indicates its frequency f. Its length on the y-axis gives the sound pressure p. In our figure, the pressure of the 1-kHz tone is twice of the pressure of the 2-kHz tone. A transient stimulus (e.g. a click) has a broad spectrum. Due to the transfer characteristic of the electro-acoustic transducer used (head-phones, loud-speaker) its band-width is limited. Due to mass and stiffness, low and high frequency tones are transferred with minor amplitude. The higher the quality of the transducer the broader the bandwidth. For audiology purposes, transducer quality has to be high to guaranty transfer of defined sound pressure at all test-frequencies.
0Sound spectrum
Phy
sics
Overview on how the hearing organ‘s work works
- Outer ear function/Middle ear function - Cochlea function - Neural sound processing and perception
PATH medical
Phy
siol
ogy
15
1Physiology

PATH medical
Phy
siol
ogy
16
1Physiology
Before talking about the different methods for assessing the functionality of hearing on the different stages of the auditory pathway we will give an overview on the hearing organ‘s work. In the following, outer ear and middle ear function (air-conduction), cochlear function (air-/bone-conduction), and neural sound processing and perception will be addressed. First of all, we look at what is happening in the cochlea, when the ear is stimulated by tones (e.g. 2 kHz and 4 kHz) or a transient stimulus (click). After that, we learn about the performance of the human hearing organ with respect to (i) the sound pressure range the ear is able to cover, (ii) the lowest and highest tone frequency the ear is able to hear, and (iii) frequency selectivity.
1Basilar membrane vibration
PATH medical
Phy
siol
ogy
17
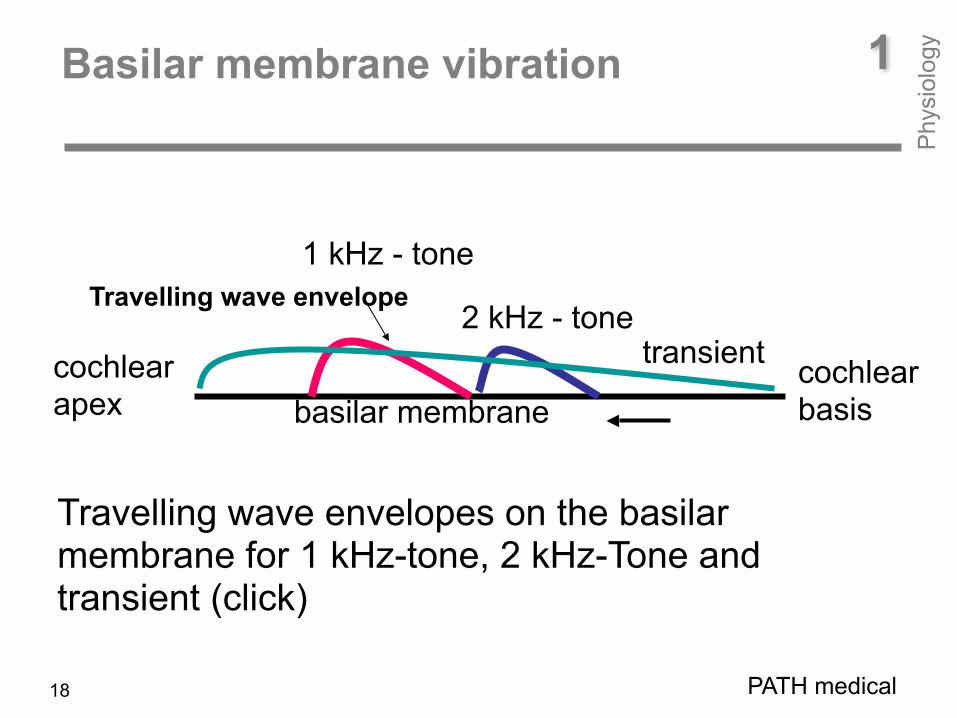
Tones generate travelling waves on the basilar membrane. High frequency tones lead to displacement near cochlear basis, low frequency tones near cochlear apex. The physicist Georg von Békésy was the first to observe - by means of stroboscopy - that travelling waves are generated on the basilar membrane. Thus, Hermann von Helmholtz’ theory, that tones of different frequency lead to a stimulation at different sites in the cochlea (Einortstheorie) was confirmed. However, Georg von Békésy could show that the cochlea is managing this sound frequency/cochlear-place-transformation not by standing waves but by travelling waves. For this observation Békésy got the Nobel price in medicine in 1961.
cochlear apex
cochlear basisbasilar membrane
Travelling wave envelope
1Basilar membrane vibration
PATH medical
1 kHz - tone
2 kHz - tonetransient
Travelling wave envelopes on the basilar membrane for 1 kHz-tone, 2 kHz-Tone and transient (click)
Phy
siol
ogy
18
1Performance of the human hearing organ: audible sound pressure P
hysi
olog
y
PATH medical
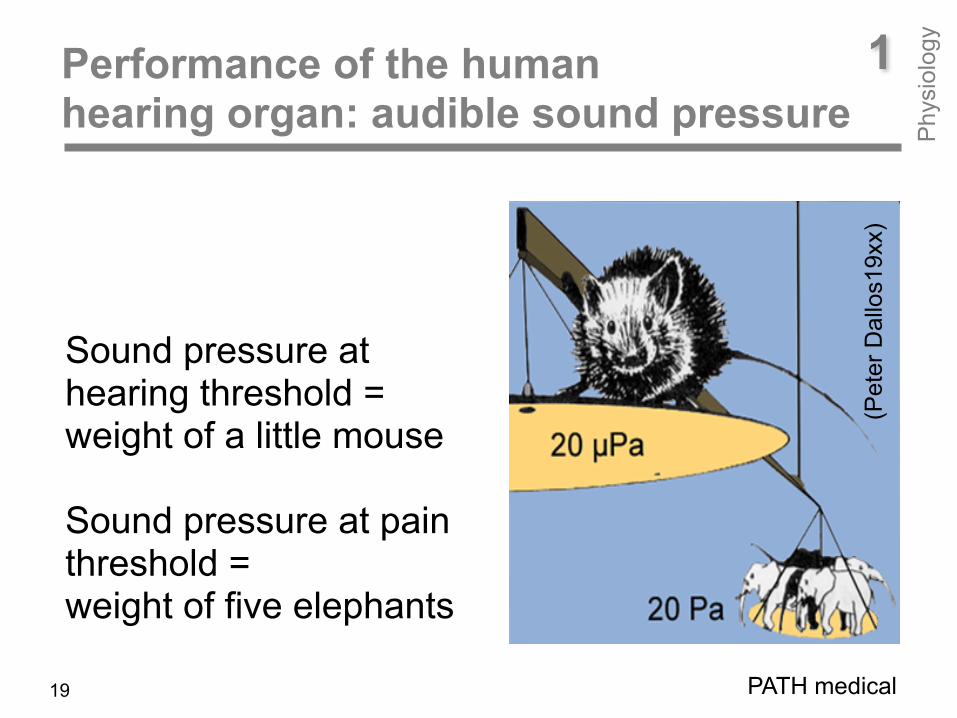
Sound pressure at hearing threshold = weight of a little mouse
Sound pressure at pain threshold = weight of five elephants
(Pet
er D
allo
s19x
x)
19

1Frequency range: 16 Hz – 16 kHZ Frequency resolution: 0.2 % P
hysi
olog
y
The human ear is able to hear 600 tones between 16 Hz and 16 kHz. 1000 Hz and 1002 Hz can be differentiated (0.2%).
(Peter Dallos19xx)
1002 1005 1010 2000 Hz
PATH medical20

PATH medical21
As already mentioned, the human hearing organ has a huge dynamic range. The mouse/elephant cartoon from Peter Dallos shall illustrate this huge range. In this cartoon, the weight of the mouse represents the sound pressure at hearing threshold, whereas the weight of the five elephants represents the sound pressure at the threshold of pain. Also, the human hearing organ covers a huge frequency range. The lowest sound frequency the ear is able to hear is 16 Hz, the highest sound frequency is 16 kHz. Audible frequencies cover 6 octaves. In this range the ear is able to differentiate about 600 frequencies. Thus, the ear can discriminate two sounds whose frequencies are only 0.2% apart. That means, the ear is able to differentiate a 1000 Hz tone from a 1002 Hz tone. For comparison, two adjacent keys on a piano are approximately 6% apart. See corresponding cartoon from Dallos.
1Performance of the human hearing organ: audible sound P
hysi
olog
y
p
frequency f 20 µ Pa
16 Hz 16 kHz
200 Pa125 Hz audiometer 8 kHz
0 dB HL
0 dB SPL
120 dB SPL
L H
earin
g lo
ss
1Sound pressure p / sound pressure level L at hearing threshold P
hysi
olog
y
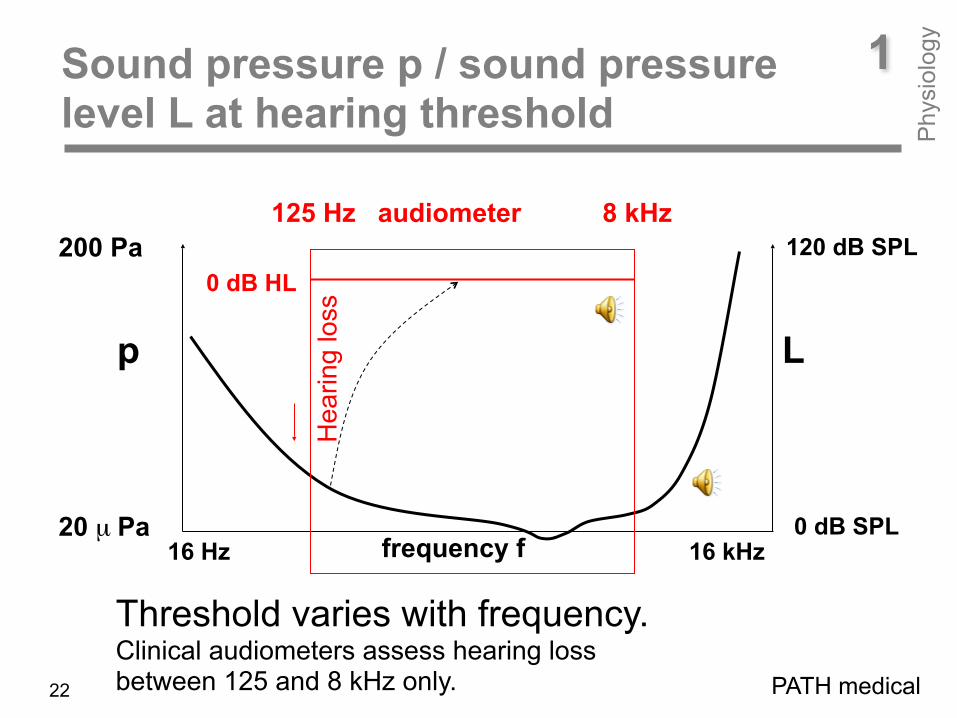
Threshold varies with frequency. Clinical audiometers assess hearing loss between 125 and 8 kHz only. PATH medical22
1Sound pressure p / sound pressure level L at hearing threshold P
hysi
olog
y
PATH medical23
The ear’s sensitivity varies with frequency. At mid frequencies - the range of speech - the ear’s sensitivity is highest. Towards the lowest and highest sound frequencies, hearing threshold increases dramatically. Here, the sound pressure to make a sound audible is many times higher than that in the mid frequency region. For clinical diagnosis, hearing threshold is assessed at frequencies between 125 Hz and 8 kHz only. This is done at selected frequencies with a distance of an octave: 125, 250, 500, 1000, 2000, 4000, and 8000 Hz. Additionally, 750, 1500, 3000, and 6000Hz are used as test frequencies. Sound pressure p and sound pressure level L are indicated on both sides of the graph. For a better reading of the threshold, an up-side down presentation is used where the hearing loss relative to the threshold of normal hearing subjects is used. In doing this, the crooked physiological threshold becomes then a straight line.
1 A look inside the human hearing organ outer ear, middle ear, cochlea, neural pathway
Phy
siol
ogy
PATH medical24Quelle?
1
Phy
siol
ogy
PATH medical25
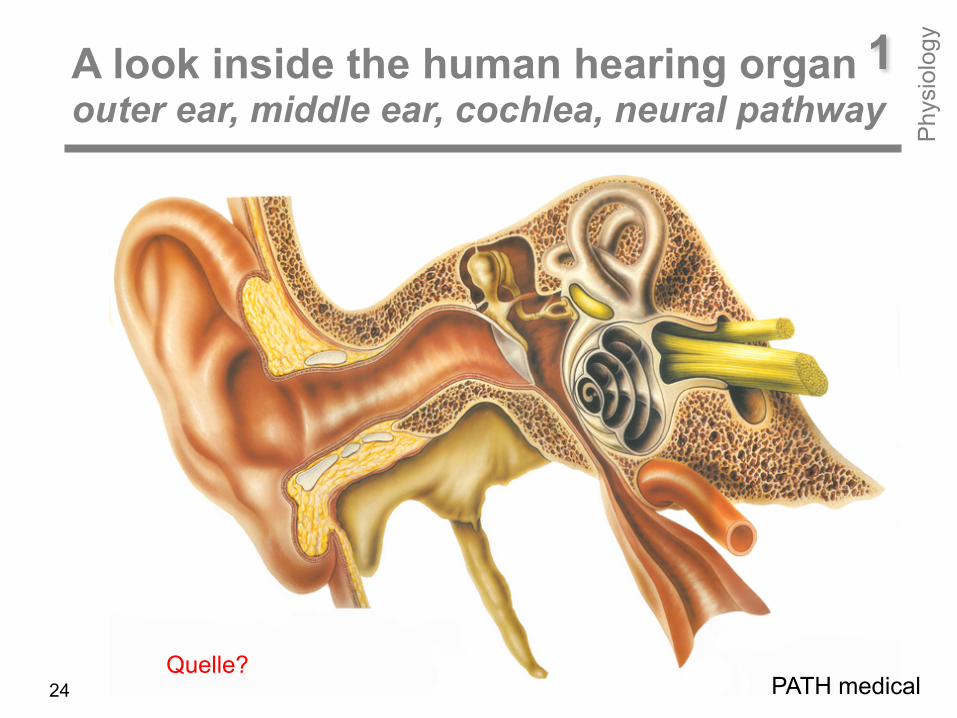
A mammalian hearing organ – including that of human beings – consists of three main parts: • outer ear with pinna and ear canal • middle-ear with ear drum, malleus, incus, stapes (ossicular chain), and muscles (tensor tympani, tensor stapedius) • cochlea that looks like a snail shell with 2 ½ windings having three fluid filled spaces (scala vestibuli, scala tympani, scala media). Unlike a snail shell, the cochlea has two openings: the oval window with the stapedius footplate in it and the round window. Via oval window sound is transferred from the middle ear to the cochlear fluids. The oval window membrane is necessary for balancing cochlear fluid pressure. Without oval window, there was no stimulation of the sensory cells in the cochlea at all. Before talking about the work of the sound processing elements, a review on famous researchers and their findings to reveal the secrets of hearing is given.
A look inside the human hearing organ outer ear, middle ear, cochlea, neural pathway
Platon (428-348 before Christ) - the famous greek philosopher - thought air molecules to enter the body via external ear canal into the body and to force the liver -which was considered as the hearing organ - to vibrate.
Garbriello Fallopia (1562) and Jean Philippe Rameau (1737) considered the auditory nerves to vibrate like a stringed instrument from which sensations for tones and harmony are delivered to the soul.
Philipp Friedrich Meckel (1724 – 7774) smashed a temporal of a corpse in winter time and found the cochlea to be filled by frozen liquid. Since then, the theory of air to be the carrier for bringing messages to the brain was obsolete.
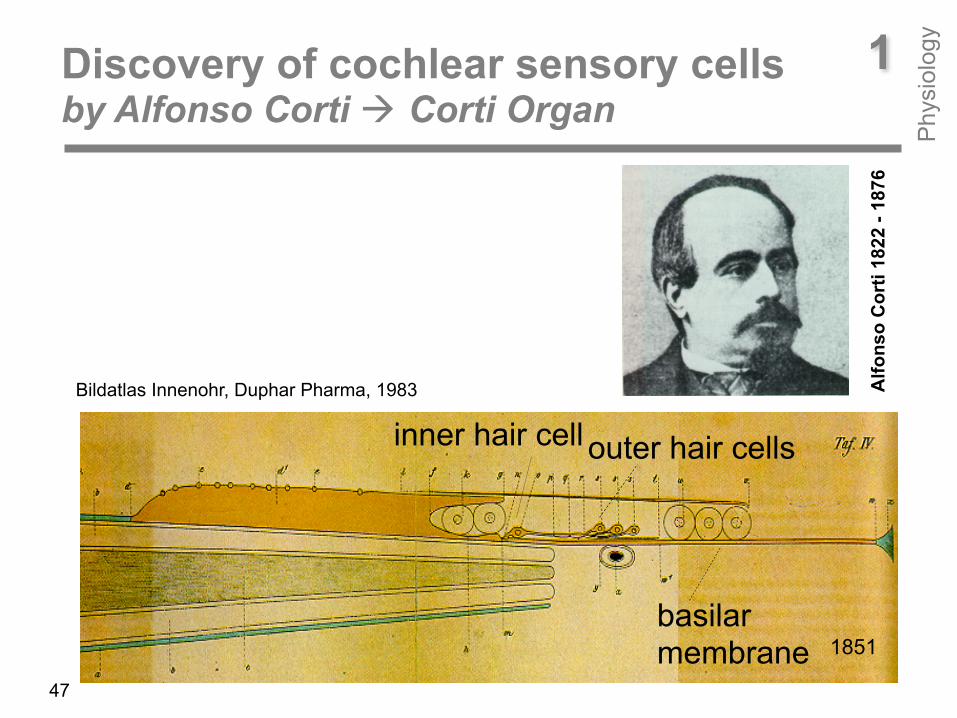
Alfonso Corti (1822 – 1876) was the first to discover the sensory end organ of hearing – with the help of a microscope he saw the basilar membrane, the outer and inner hair cells. With the knowledge of the phenomenon of electricity in that time it became evident that the transfer of messages to the brain is done electrically and not mechanically.
A short look at hearing research history
PATH medical26
1
Phy
siol
ogy
Hermann von Helmholtz (821-1894) established the „Einortstheorie des Hörens“: He believed that each single tone has its own place on the cochlea. High-frequency tones excite sensory cells in the basal, low-frequency tones in the apical region of the cochlea.
Georg von Békésy (1999-1972) discovered that not standing waves but travelling waves move the basilar membrane resulting in a frequency-specific displacement at different cochlea sites.
Thomas Gold (1920 – 2004) was the first one to question passive sound processing mechanism within the cochlea. He postulated active, non-linear processes for explaining the huge dynamic rang and the high frequency selectivity of the hearing organ.
PATH medical27
A short look at hearing research history1
Phy
siol
ogy
David Kemp finally discovered in 1978 that the hearing organ is able to emit sound by itself. These otoacoustic emissions (OAEs) confirm the presence of active processes in the cochlea. Later, Brownell (1985), Hudspeth (1989) and co-workers could show that Actin is the basis for the contractile characteristics of outer hair cells. Since then, a lot of researchers dedicate their work in the field of OAEs. Today, transient evoked OAEs (TEOAEs) and distortion product OAEs (DPOAEs) are instruments for diagnosing cochlear function in newborns and children.
Davis and colleagues (1939) initially described auditory evoked cortical potentials seen in raw EEG tracings
Sohmer and Feinmesser (1967) were the first to measure click-evoked auditory brain-stem potentials (ABRs) from the human scalp.
PATH medical28
A short look at hearing research history1
Phy
siol
ogy
Jewett, Williston, and co-workers (1970, 1971) definitively identified the origin of far-field scalp recorded ABRs. Since then, a lot of researchers dedicate their work in the field of auditory evoked potentials (AEPs). Today, ABRs, middle and late AEPs are the instrument for diagnosing hearing impairment along the auditory pathway.
Nowadays, auditory steady state responses (ASSRs) elicited by tone
bursts of different carrier frequencies are used for assessing the hearing loss frequency specificely.
PATH medical29
A short look at hearing research history1
Phy
siol
ogy
outer ear middle ear
basilar membrane
outer hair cell
inner hair celle
auditory nerve
brain- stem
cortex
Cochlea
sound Impedance matching
Frequency dispersion, amplification sensory transduktion
sound processing and perception
Nervus facialis Medial olivo-cochlear bundle
1 The hearing organ’s work Survey of sound prossessing elements P
hysi
olog
y
PATH medical30
1 The hearing organ’s work Survey of sound prossessing elements P
hysi
olog
y
PATH medical31
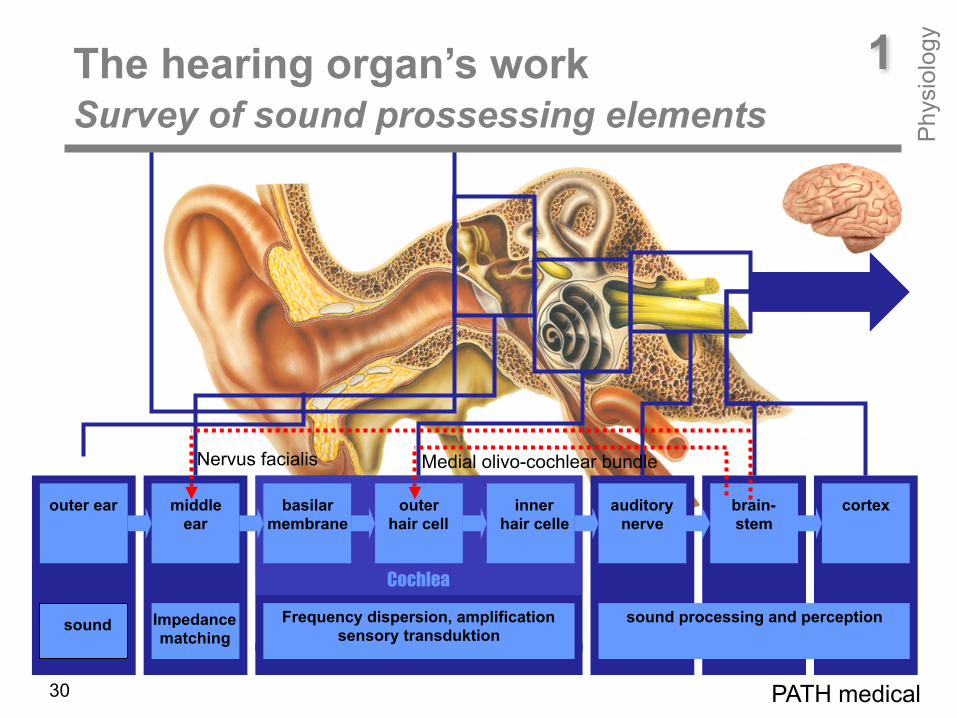
What has nature thought up to equip the hearing organ with such enormous capabilities? First of all, the pinna and the outer ear canal recieve and amplify the sound signal. The middle ear matches the different impedances of air and fluid. Outer hair cells in the cochlea amplify the sound mechanically and thus make the hearing organ more sensitive. The inner hair cells in the cochlea are the real mechano-electrical transducers. Electrical signals are running on their afferent nerve fibers which are processed at the different stages of the ascending auditory pathway and are finally analized and evaluated by the brain: We hear! Beside this, the hearing organ also provides a descending pathway by its efferent nerve fibers which is made for controlling the hearing organ‘s mechanical periphery: Via the fascial nerve middle ear muscles are activited at too loud sounds resulting in an increase of the middle ear‘s impedance. Also, the outer hair cell amplifiers are controlled by the efferent system. Their amplification is decreased at a loud sound. Both are done for protecting the ear from injury.
ear canal
ear drumamplifies
sound and helps to localize the sound source
1External ear acts like a funnel
Phy
siol
ogy
external ear
PATH medical32
1External ear acts like a funnel
Phy
siol
ogy
PATH medical33
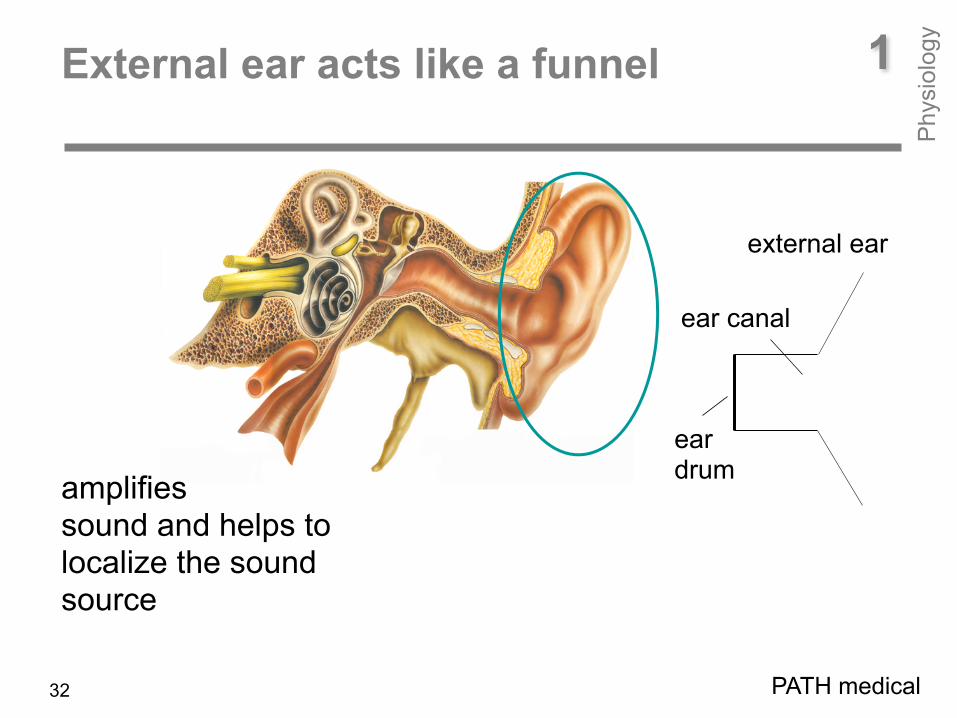
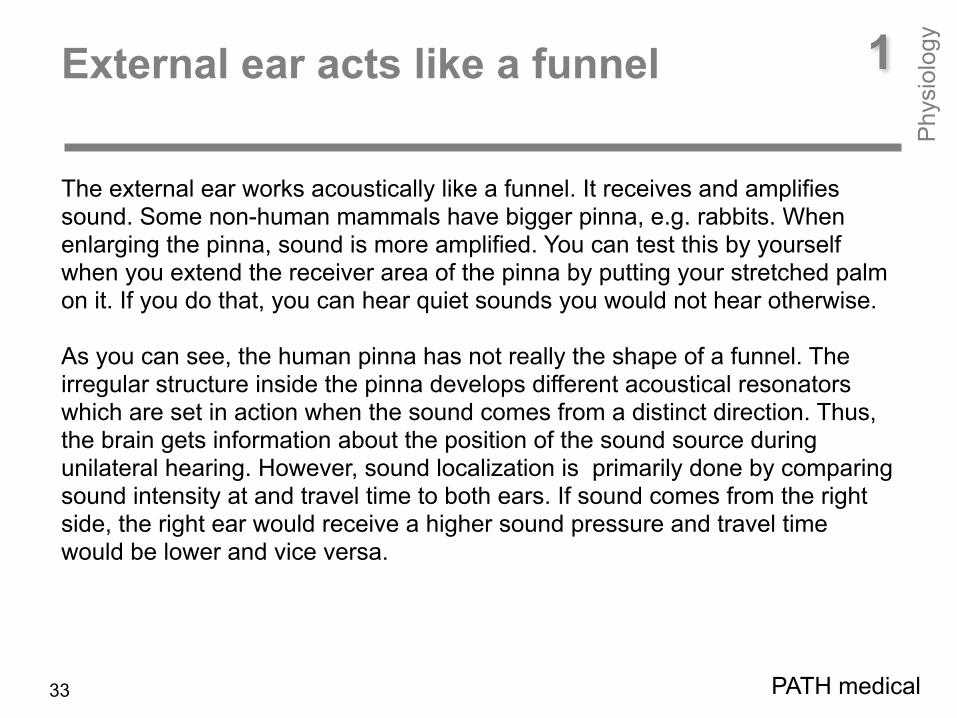
The external ear works acoustically like a funnel. It receives and amplifies sound. Some non-human mammals have bigger pinna, e.g. rabbits. When enlarging the pinna, sound is more amplified. You can test this by yourself when you extend the receiver area of the pinna by putting your stretched palm on it. If you do that, you can hear quiet sounds you would not hear otherwise. As you can see, the human pinna has not really the shape of a funnel. The irregular structure inside the pinna develops different acoustical resonators which are set in action when the sound comes from a distinct direction. Thus, the brain gets information about the position of the sound source during unilateral hearing. However, sound localization is primarily done by comparing sound intensity at and travel time to both ears. If sound comes from the right side, the right ear would receive a higher sound pressure and travel time would be lower and vice versa.
ear canal A18 mm
lg = 25 mm
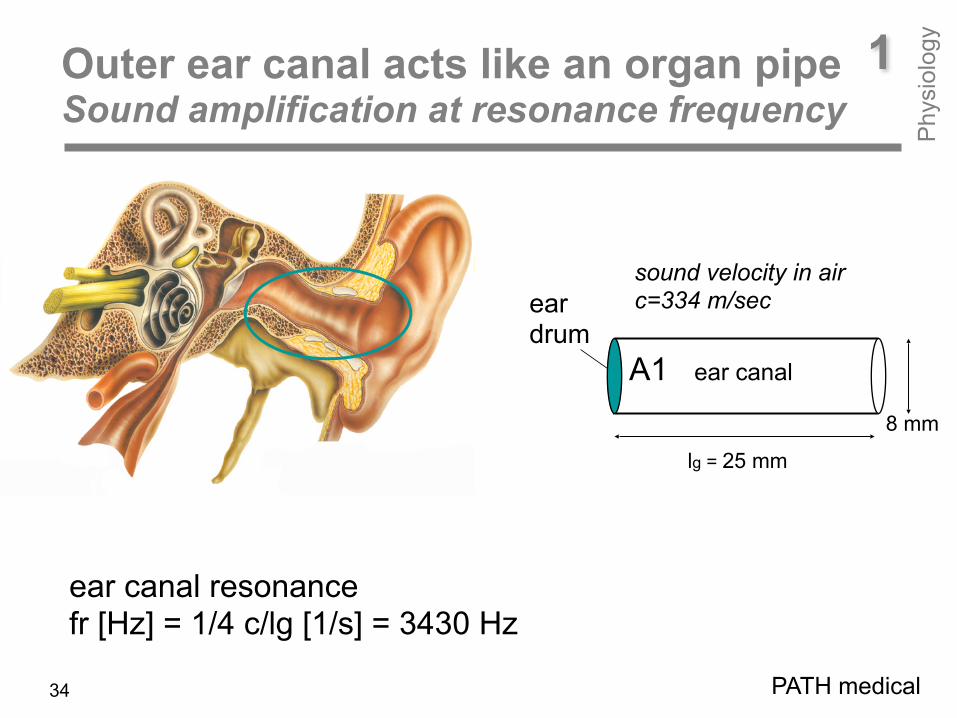
1Outer ear canal acts like an organ pipe Sound amplification at resonance frequency
Phy
siol
ogy
ear canal resonance fr [Hz] = 1/4 c/lg [1/s] = 3430 Hz
sound velocity in air c=334 m/sec
PATH medical
ear drum
34

PATH medical35
The outer ear canal’s length amounts to about 30 mm. It acts like a short organ pipe. From the organ we know that the shortest pipes produce high-frequency tones whereas the longest pipes produce low-frequency tones. That means, frequency and length are in a reverse order. Assuming your ear canal is 25 mm long. With the sound velocity in air of 330 m per second your ear canal has a resonance frequency of 3430 Hz corresponding to a g4 tone. You can test this, if you blow in a tube of different length while putting your finger tip on the other side. The ear canal’s task is not only to prevent the ear drum from injury but also to increase the ear’s sensitivity in the frequency range of best hearing.
1Outer ear canal acts like an organ pipe Sound amplification at resonance frequency
Phy
siol
ogy
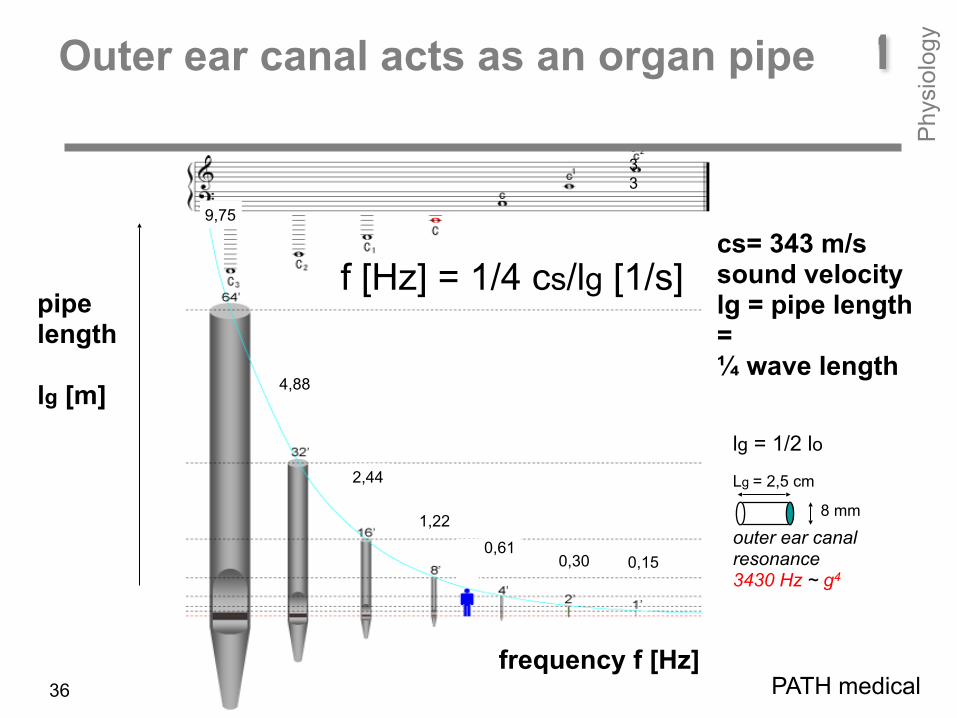
outer ear canal resonance 3430 Hz ~ g4
pipe length lg [m]
f [Hz] = 1/4 cs/lg [1/s]
frequency f [Hz]
9,75
4,88
1,22
0,610,30 0,15
cs= 343 m/s sound velocity lg = pipe length = ¼ wave length
2,44
lg = 1/2 lo
8 mm
Lg = 2,5 cm
533
c3 = 1046 Hz : 7,50 cm c4 = 2093 Hz : 3,52 cm c5 = 4186 Hz : 1,75 cm
1Outer ear canal acts as an organ pipe
PATH medical36
Phy
siol
ogy
35 mm
Apex
0,125 0,25 0,5 1 2 4 8 16 frequency [kHz]
Basila rmembrane
Cochlea
ear drum
ossi
cles
Bildatlas Innenohr, Duphar Pharma, 1983
A1
stapes A2
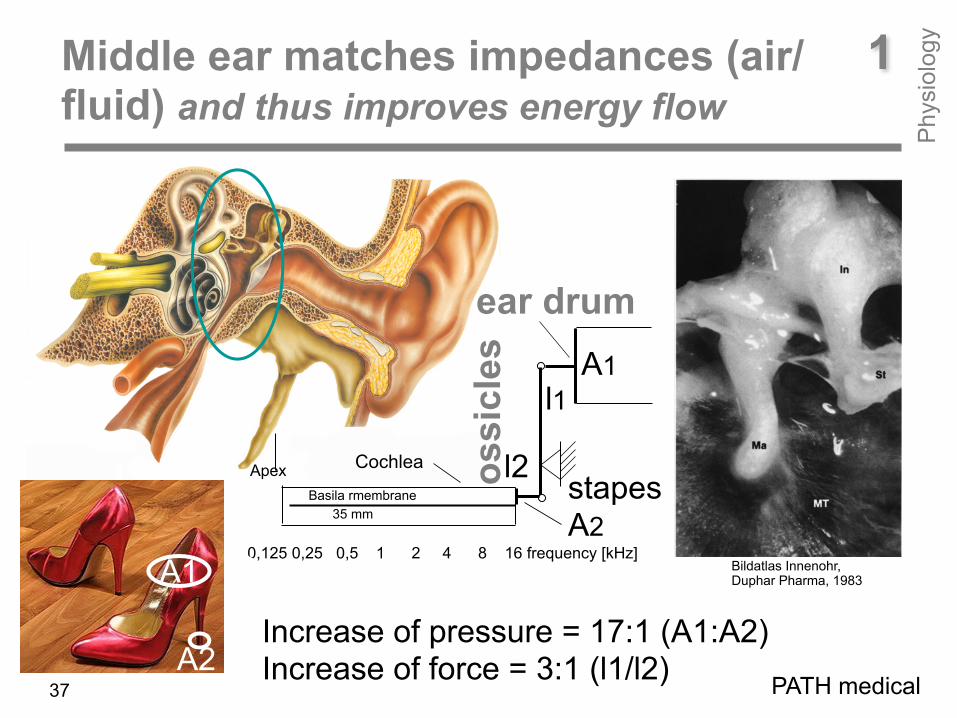
Increase of pressure = 17:1 (A1:A2) Increase of force = 3:1 (l1/l2)
l1
l2
A1
A2
1Middle ear matches impedances (air/ fluid) and thus improves energy flow
Phy
siol
ogy
PATH medical37
1Middle ear matches impedances (air/ fluid) and thus improves energy flow
Phy
siol
ogy
PATH medical38
The middle ear is an acoustic transformer. For matching the different impedances of air and fluid, nature provides two mechanisms: increase of pressure and increase of forth. First one is due to the different areas of the tympanic membrane and the footplate of the stapes with a ratio of 17:1, second one is due to the lever mechanism of malleus and incus which have different lengths with a ratio of 3:1. Increase of pressure and increase of force in sum, bring about that 60% of the sound energy is transferred to cochlear fluids.
35 mm
apex
0,125 0,25 0,5 1 2 4 8 16 frequency [kHz]
Cochleaaus: Bildatlas Innenohr, Duphar Pharma, 1983
A1
A2
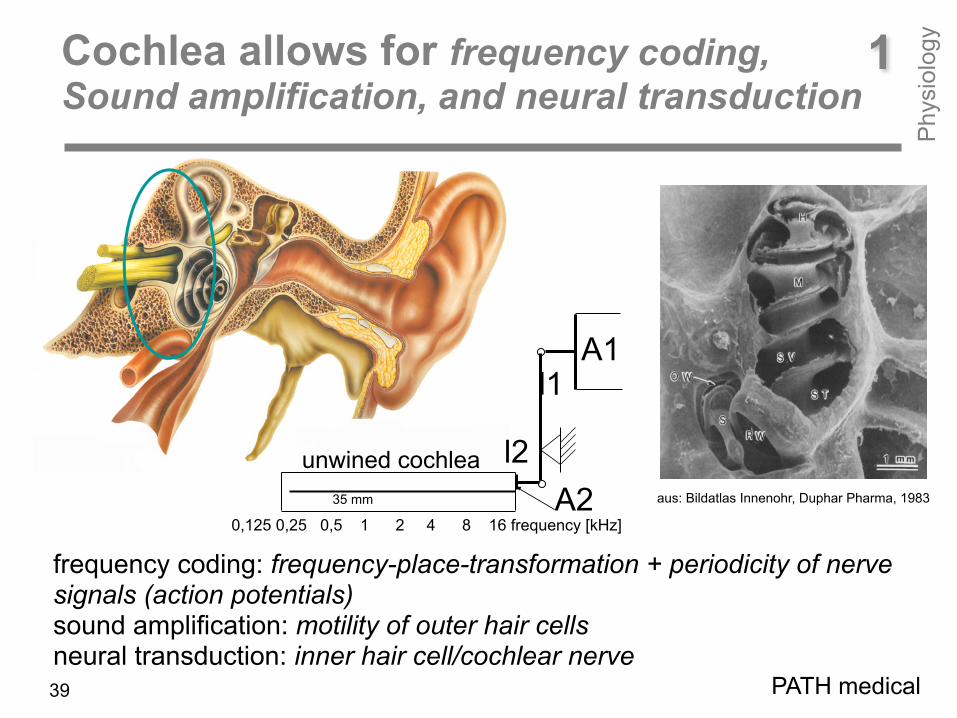
frequency coding: frequency-place-transformation + periodicity of nerve signals (action potentials) sound amplification: motility of outer hair cells neural transduction: inner hair cell/cochlear nerve
l1
l2
1Cochlea allows for frequency coding, Sound amplification, and neural transduction
Phy
siol
ogy
unwined cochlea
PATH medical39

1Cochlea allows for frequency coding, Sound amplification, and neural transduction
Phy
siol
ogy
PATH medical
Coming now to the cochlea. As already stated, cochlea’ s work is to transfer a mechanical signal (i.e. stereocilia displacement) to an electrical signal (i.e. action potential on the nerve fiber). However, this has to be done such that the cochlea ‘knows’ about the frequency and the intensity of the incoming sound.

35 mm
ear canal
Apex
basilar membrane
0 800 1600 2400 3200 sensory cell rows
0,125 0,25 0,5 1 2 4 8 16 frequency [kHz]0 8 16 24 32 distance from apex [mm]
basilar membrane
Cochlea
ear drum
2 kHz
500 Hz
soft stiff
T
1Cochlear frequency coding Frequency (f)-Place (z)-Transformation
Phy
siol
ogy
Due to descreasing stiffness of the basilar membrane from apex to basis, travelling waves are generated. Low frequency tones (e.g. 500 Hz) generate vibrations near apex, high frequency tones (e.g. 2 kHz) near basis.
PATH medical41
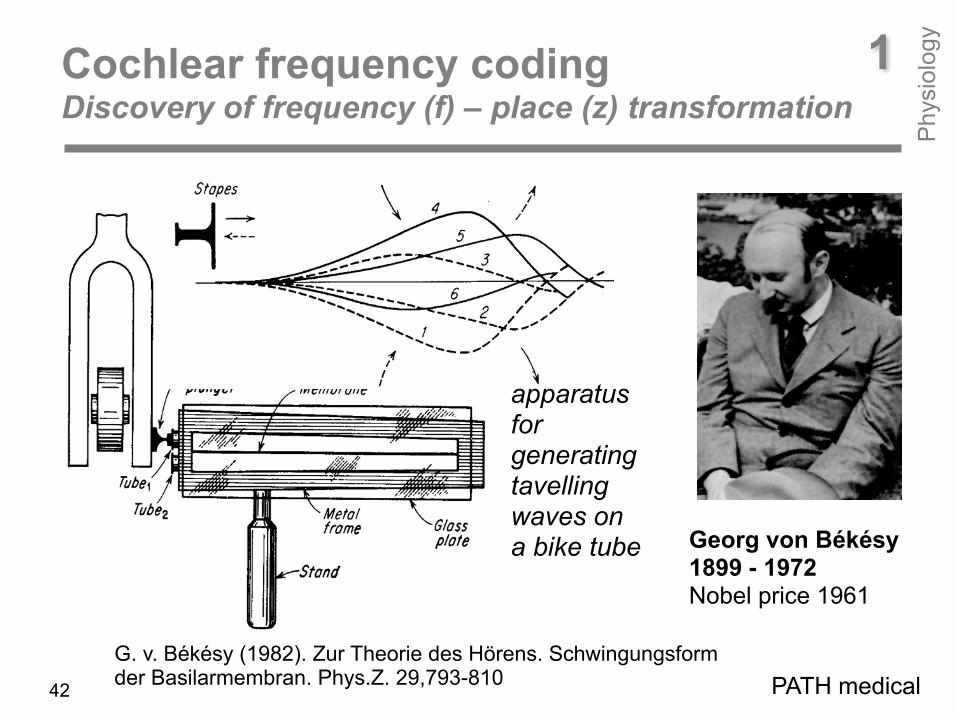
Georg von Békésy 1899 - 1972 Nobel price 1961
G. v. Békésy (1982). Zur Theorie des Hörens. Schwingungsform der Basilarmembran. Phys.Z. 29,793-810
1Cochlear frequency coding Discovery of frequency (f) – place (z) transformation
Phy
siol
ogy
PATH medical
apparatus for generating tavelling waves on a bike tube
42
Bild
atla
s In
neno
hr, D
upha
r Pha
rma,
198
3
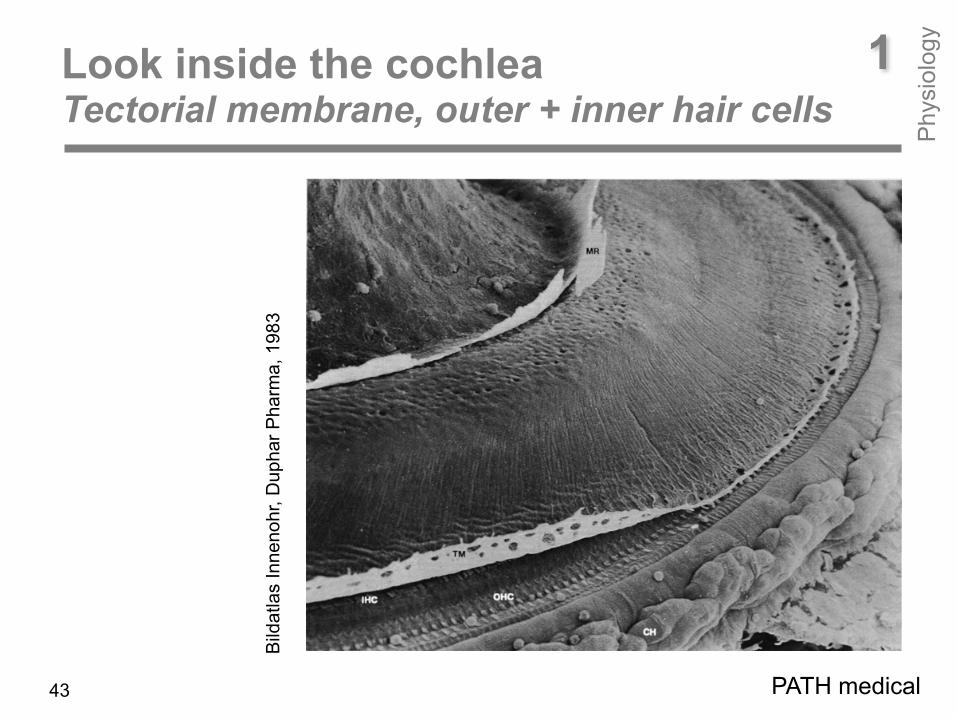
1Look inside the cochlea Tectorial membrane, outer + inner hair cells
Phy
siol
ogy
PATH medical43

35 mm
ear canal
Apex
basilar membrane 0,001 mm
motility IHC
cochlear amplifier
tektorial membrane
OHC
basilar membrane
0 800 1600 2400 3200 sensory cell rows
0,125 0,25 0,5 1 2 4 8 16 frequency [kHz]0 8 16 24 32 distance from apex [mm]
basilar membrane
cochlea
tympanic membrane
2 kHz
500 Hz
soft stiff
8
1
6
2
4
32
[mm
]
t
T
t
UT
APT
T
1Cochlear frequency coding Periodicity of neural signals
Phy
siol
ogy
With decreasing tone frequency, distance T between action potentials increases.
PATH medical44

0,5
mm
basilar membrane
apex travelling wave
z
A [nm]
t [ms]
t
p [Pa]sound
generator fh, fm, fl
Click
t [ms]
f-z transformation +
Tl
periodicity
TlTh
Tl
Thaction potentials on auditory afferents
Tm
Thf = 1/T
1Cochlear frequency coding
Phy
siol
ogy
PATH medical
Travelling wave A(z) and time course of basilar membrane displacement A(t) for click, low- (l), mid- (m), and high-frequency tones (h).45
35 mm
outer ear canal
Apex
basilar membrane0,001 mm
audi
tory
affe
rent
s
IHC
cochlear amplifier
tektorial membrane
OHC motility
basilar membrane
0 800 1600 2400 3200 sensory cell rows
0,125 0,25 0,5 1 2 4 8 16 frequency [kHz]0 8 16 24 32 distance from apex [mm]
GS
Cortex
basilar membrane
cochlea
ear drum
500 Hz
T
1Cochlear sound amplification Outer hair cells = sound amplifiers
Phy
siol
ogy
PATH medical
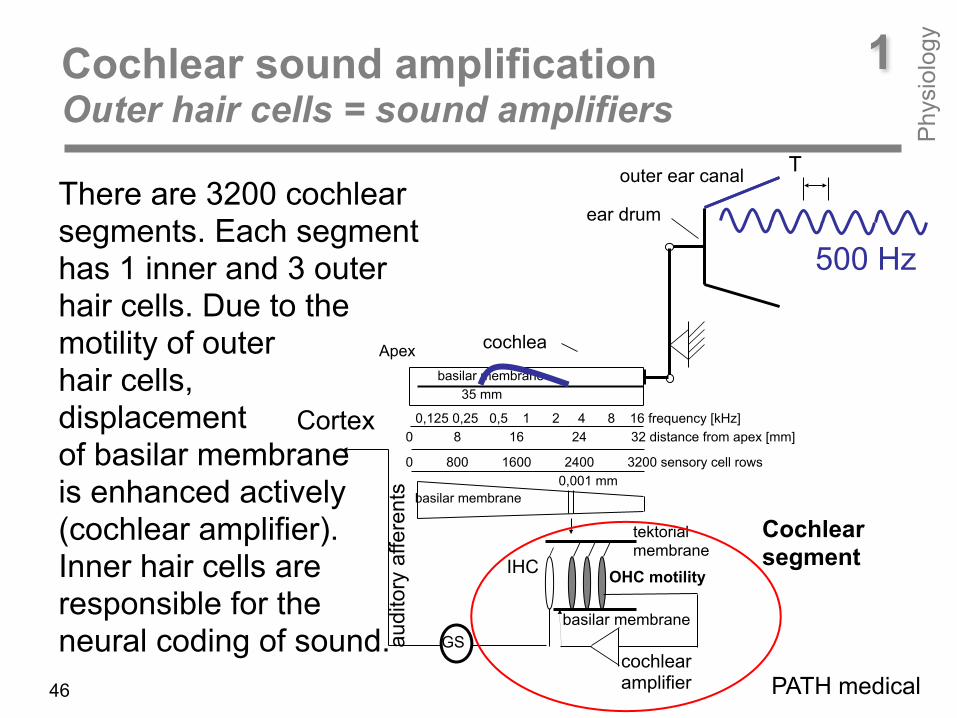
There are 3200 cochlear segments. Each segment has 1 inner and 3 outer hair cells. Due to the motility of outer hair cells, displacement of basilar membrane is enhanced actively (cochlear amplifier). Inner hair cells are responsible for the neural coding of sound.
Cochlear segment
46
Alfo
nso
Cor
ti 18
22 -
1876
1851
inner hair cell outer hair cells
basilar membrane
1Discovery of cochlear sensory cells by Alfonso Corti ! Corti Organ
Phy
siol
ogy
47
Bildatlas Innenohr, Duphar Pharma, 1983

Mod
iolu
s
Corti Organ
Outer hair cell amplifiers care for an enhancement of the hearing organ‘s sensitivity. Due to a feed back mechanism, displacement of the basilar membrane is increased.
basilar- membrane
tektorial membrane
supporting cells
outer hair cells
Innere Haarzelle
stereo cilia
Mod
iolu
s
S.v. S.t.
afferent nerve fibre efferent nerve fibre
feed back
1Cochlear sound amplification Outer hair cells = sound amplifiers
Phy
siol
ogy
Cochlear segment
outer hair cells stereo cilia
cochlear nerve48
Bild
atla
s In
neno
hr, D
upha
r Pha
rma,
198
3
T =1/f
K+ K+
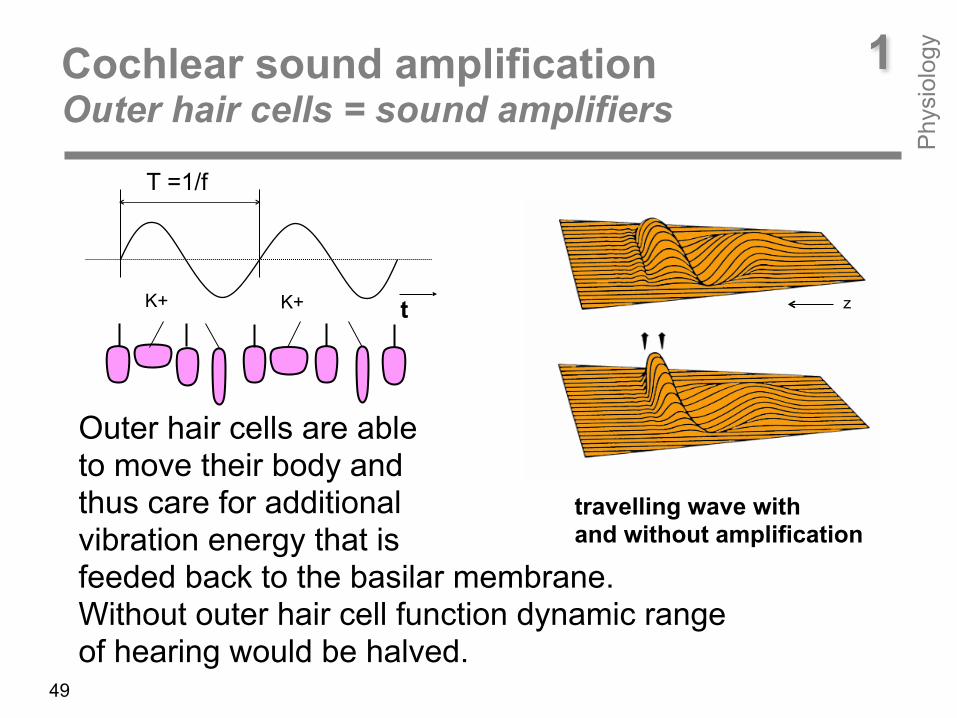
Outer hair cells are able to move their body and thus care for additional vibration energy that is feeded back to the basilar membrane. Without outer hair cell function dynamic range of hearing would be halved.
1Cochlear sound amplification Outer hair cells = sound amplifiers
Phy
siol
ogy
travelling wave with and without amplification
zt
49

1Rocking outer hair cells by Jonathan Ashmore (1987)
Phy
siol
ogy
Isolated outer hair cell that is moving following the rhythm of „rock around the clock“ (youtube video).
50
dis
plac
emen
t 60
dB d
ynam
ic
10-9 [m]2 x 10⁻⁵ [Pa] 200 [Pa] sound pressure 140 dB dynamic
10-6 [m]
outer hair cell function
inner hair cell function
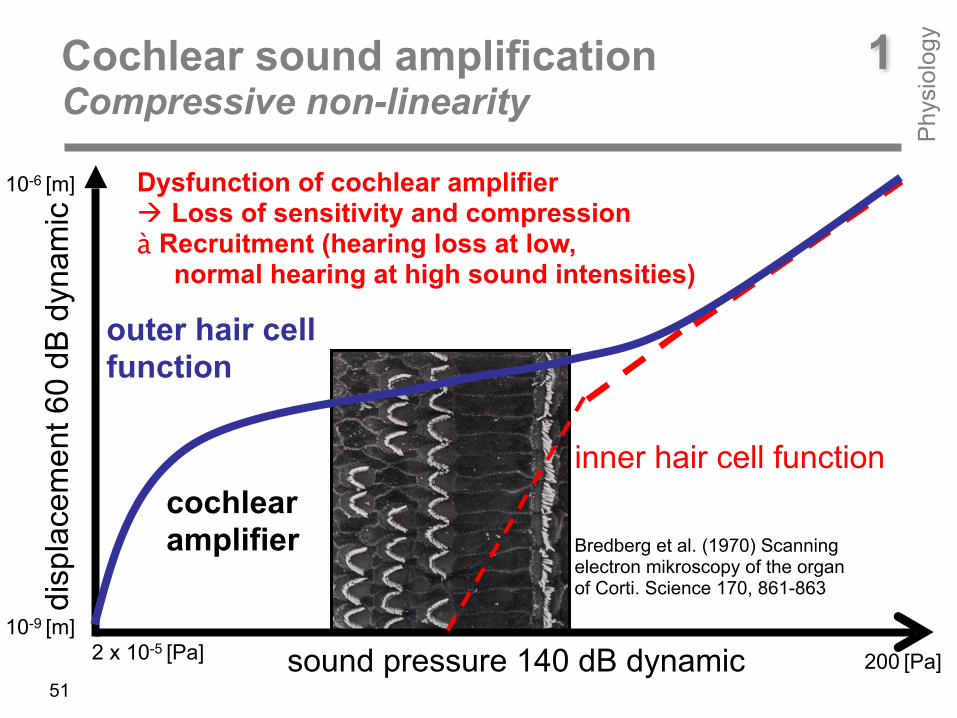
Dysfunction of cochlear amplifier ! Loss of sensitivity and compression à Recruitment (hearing loss at low, normal hearing at high sound intensities)
cochlear amplifier
1Cochlear sound amplification Compressive non-linearity
Phy
siol
ogy
51
Bredberg et al. (1970) Scanning electron mikroscopy of the organ of Corti. Science 170, 861-863

Dallos (1996) Overview: Cochlear Neurobiology. In: Dallos et al. (Editors) The Cochlea
1 nm = 1/1000 000 000 m For comparison: diameter of a human hair = 100 µm= 1/1000 000)
outer hair cells 3 – 4 rows
inner hair cells
Corti-Organ
1Sensitivity of cochlear sensory cells ! highly vulnerable
Phy
siol
ogy
52
Bildatlas Innenohr, Duphar Pharma, 1983
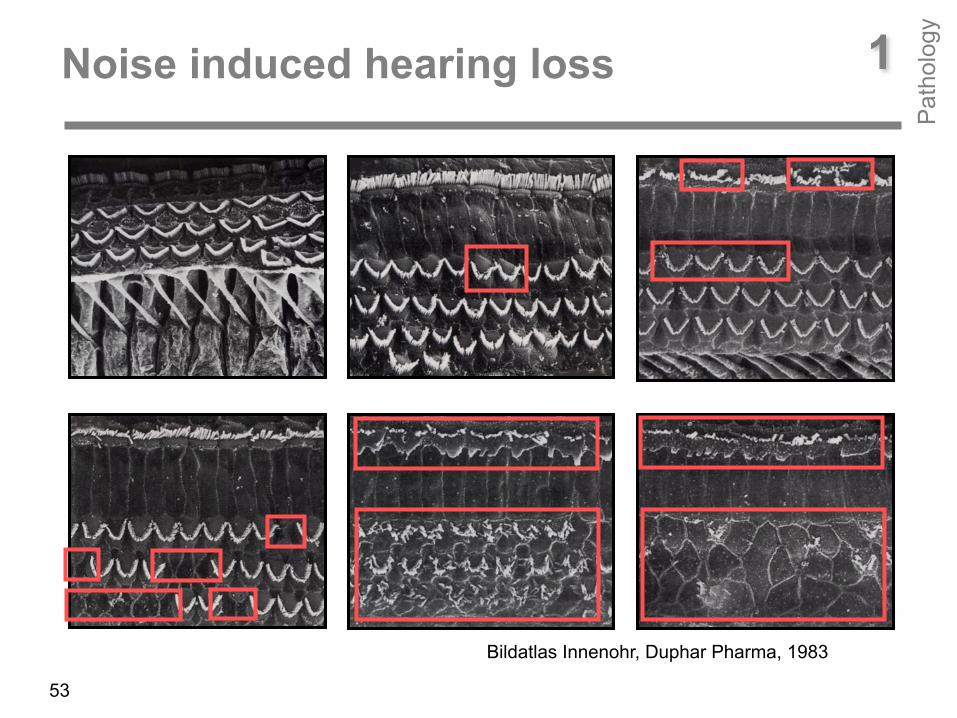
1Noise induced hearing loss
Pat
holo
gy
53
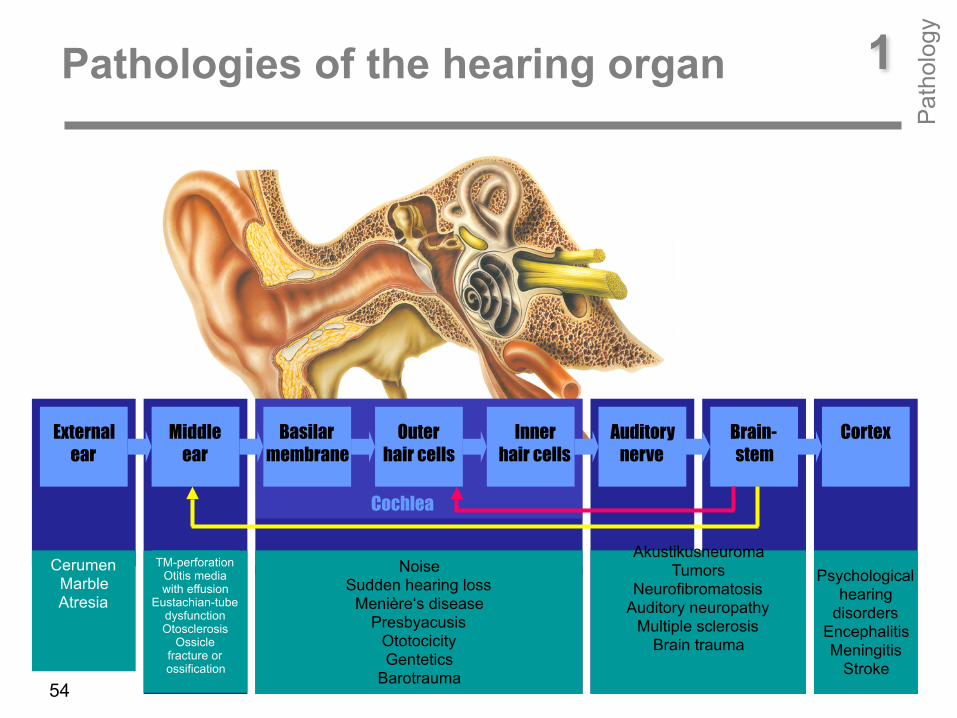
External ear
Middle ear
Basilar membrane
Outer hair cells
Inner hair cells
Auditory nerve
Brain- stem
Cortex
Cochlea
TM-perforation Otitis media with effusion
Eustachian-tube dysfunction Otosclerosis
Ossicle fracture or ossification
Cerumen Fremd- körper Atresie
Cerumen Marble Atresia
Noise Sudden hearing loss
Menière‘s disease Presbyacusis
Ototocicity Gentetics
Barotrauma
Akustikusneuroma Tumors
Neurofibromatosis Auditory neuropathy
Multiple sclerosis Brain trauma
Psychological hearing
disorders Encephalitis Meningitis
Stroke
1Pathologies of the hearing organ
Pat
holo
gy
54
“Oma und das Gewitter” youtube video
1What means a hearing loss for people concerned P
atho
logy
55
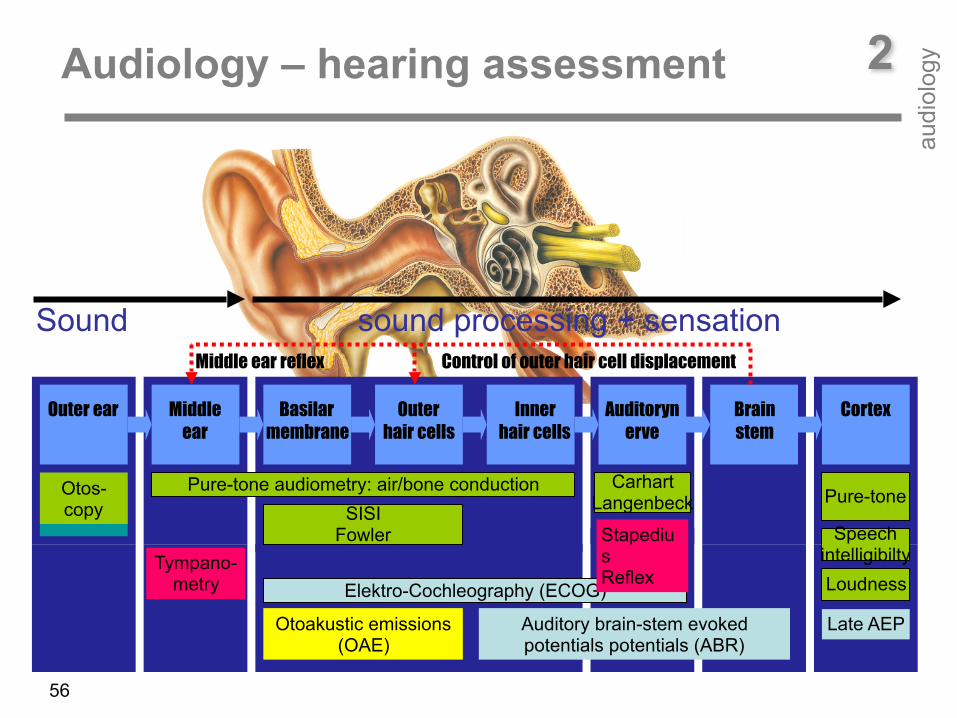
Outer ear Middle ear
Basilar membrane
Outer hair cells
Inner hair cells
Auditorynerve
Brain stem
Cortex
Otos-copy
Tympano-metry
Otoakustic emissions (OAE)
Auditory brain-stem evoked potentials potentials (ABR)
Late AEP
Elektro-Cochleography (ECOG)
Pure-tone audiometry: air/bone conduction
Speech intelligibiltyLoudness
SISI Fowler
Carhart Langenbeck Pure-tone
Stapedius Reflex
Sound sound processing + sensationMiddle ear reflex Control of outer hair cell displacement
2Audiology – hearing assessment
audi
olog
y
56
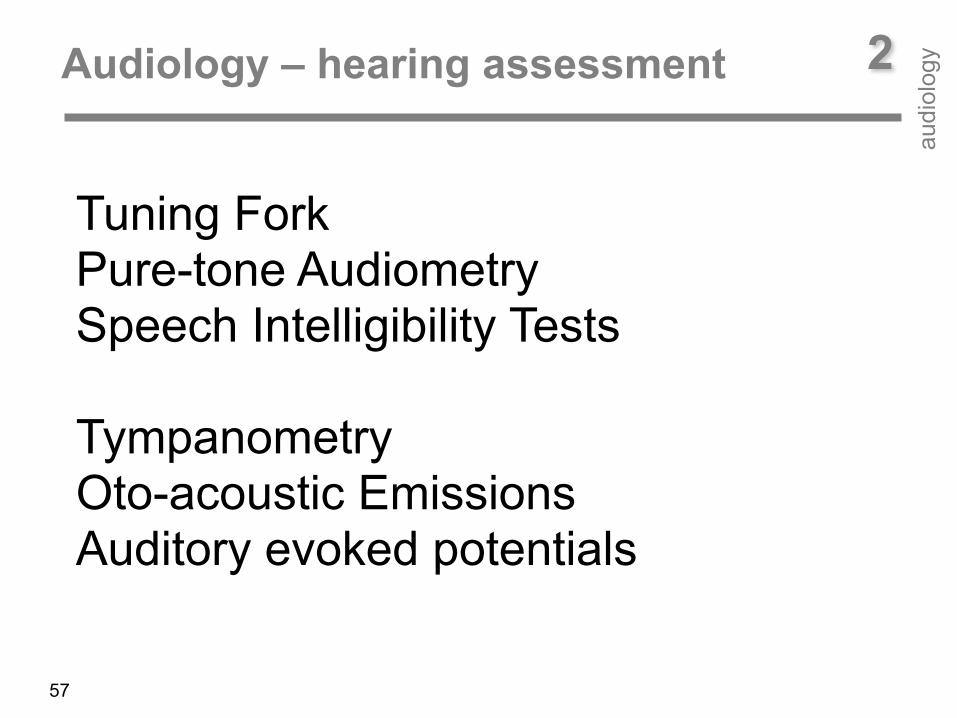
Tuning Fork Pure-tone Audiometry Speech Intelligibility Tests
Tympanometry Oto-acoustic Emissions Auditory evoked potentials
2Audiology – hearing assessment
audi
olog
y
57

What is louder: • infront - Air Conduction (AC) • behind the ear - Bone Conduction (BC)?
Where do you hear the sound, in the left or in the right ear?
AC is louder than BC àRinne +
BC is louder than AC ! Rinne -
normal middle ear
hearing loss
tone is heard in the better inner ear tone is heard in the worse middle ear
2Tuning folk
audi
olog
y
58
mastoid
vertex
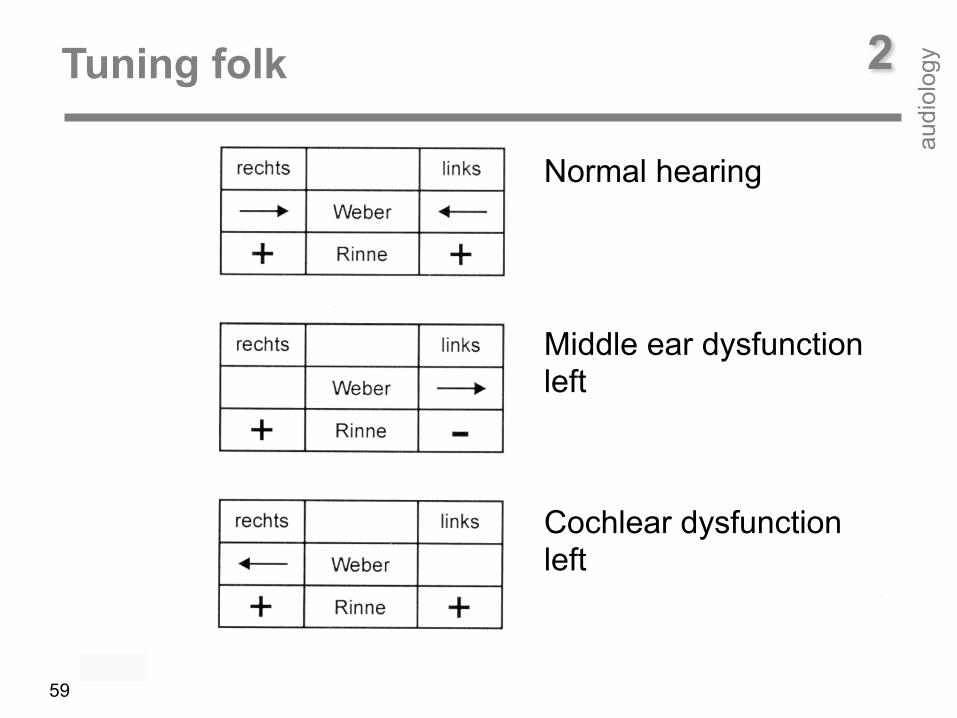
Normal hearing
Middle ear dysfunction left
Cochlear dysfunction left
2Tuning folk
audi
olog
y
59
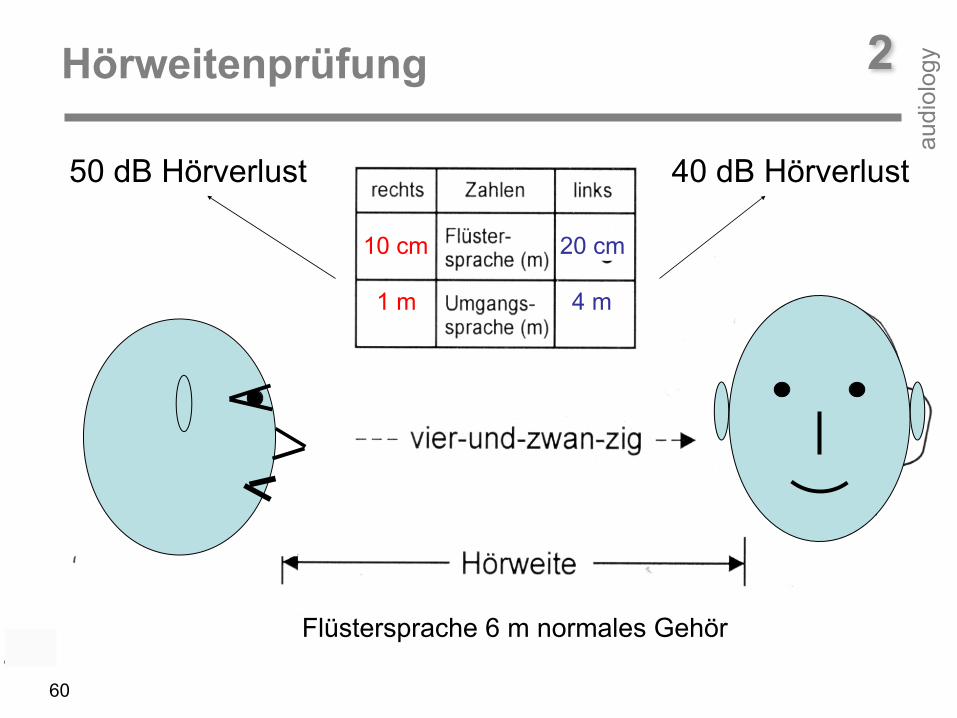
20 cm10 cm
4 m1 m
50 dB Hörverlust 40 dB Hörverlust
Flüstersprache 6 m normales Gehör
2Hörweitenprüfung
audi
olog
y
60

basic frequency
vocals
consonants Outer Hair Cells
Inner Hair Cells
2Pure-tone audiogram
audi
olog
y
61Air Conduction (AC)
Bone Conduction (BC)
x x

0 dB HL
Hea
ring
loss Head-
phones
Bone conductor
> > > > > > >
normal normal
2Pure-tone air and bone conduction Normal hearing
audi
olog
y
125 Hz frequency 8 kHz
62
Outer-/ Middle- ear
Cochlea/ Neural pathway

125 Hz frequency 8 kHz
0 dB HL
Hea
ring
loss
Outer-/ Middle- ear
Cochlea/ Neural pathway
Head phones
Bone conductor
> > > > > > >
disease normalair-bone conduction difference
Outer-/ Middle-ear disease
2Pure-tone audiogram Air conduction deficit
audi
olog
y
63
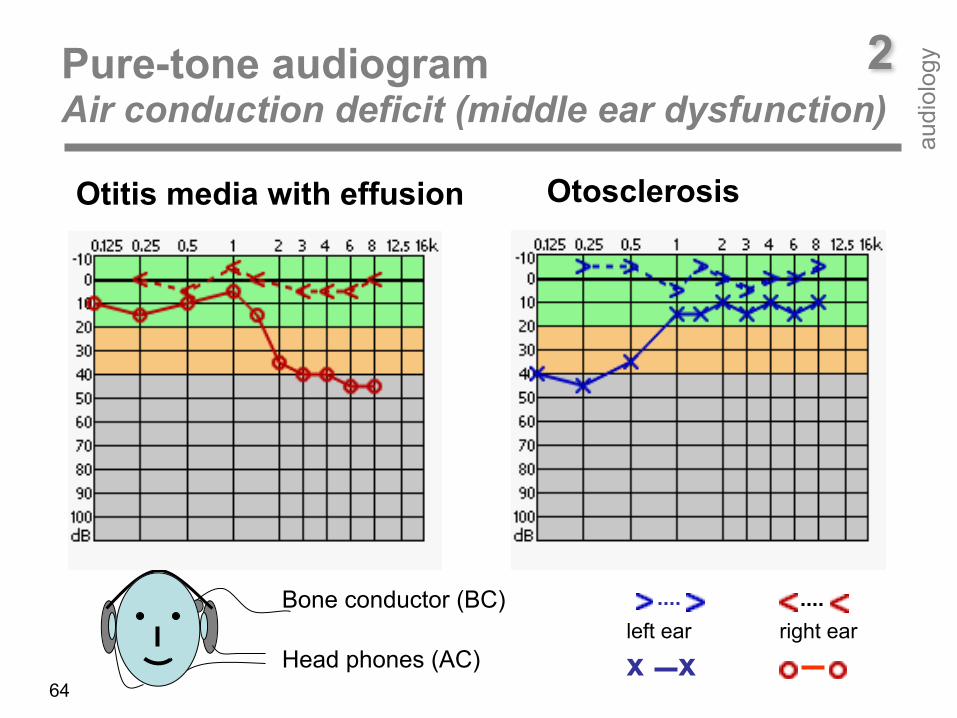
Otitis media with effusion Otosclerosis
Head phones (AC)
Bone conductor (BC)left ear right ear
x x
2Pure-tone audiogram Air conduction deficit (middle ear dysfunction)
audi
olog
y
64
125 Hz frequency 8 kHz
0 dB HL
Hea
ring
loss
Outer/ Middle ear
Cochlea/neural
Head phones
Bone conductor
> > > > > > >
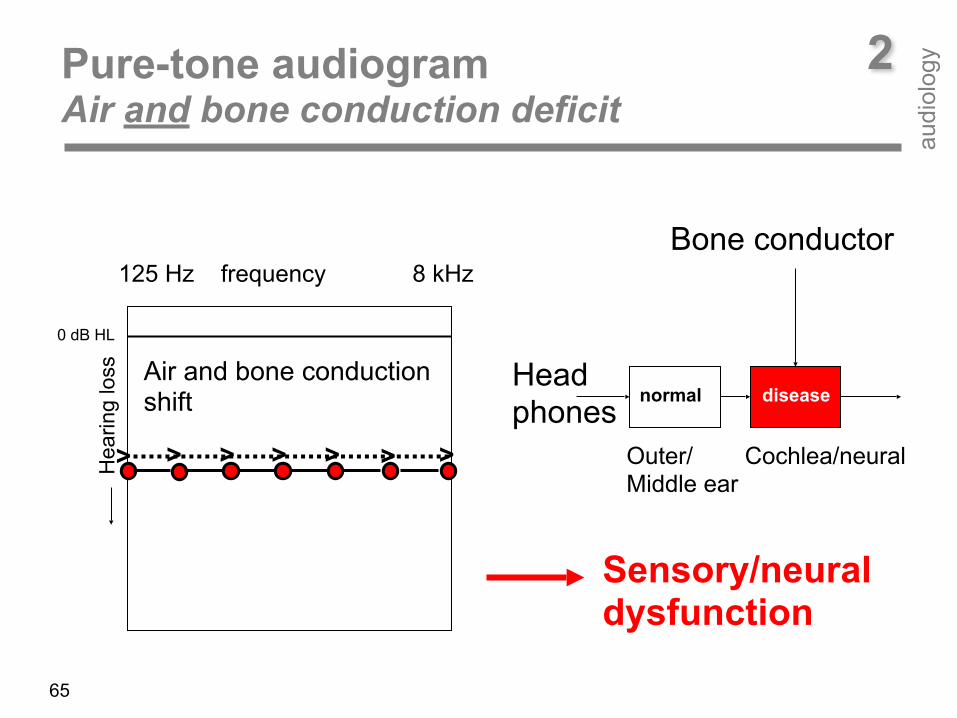
normal diseaseAir and bone conduction shift
Sensory/neural dysfunction
2Pure-tone audiogram Air and bone conduction deficit
audi
olog
y
65
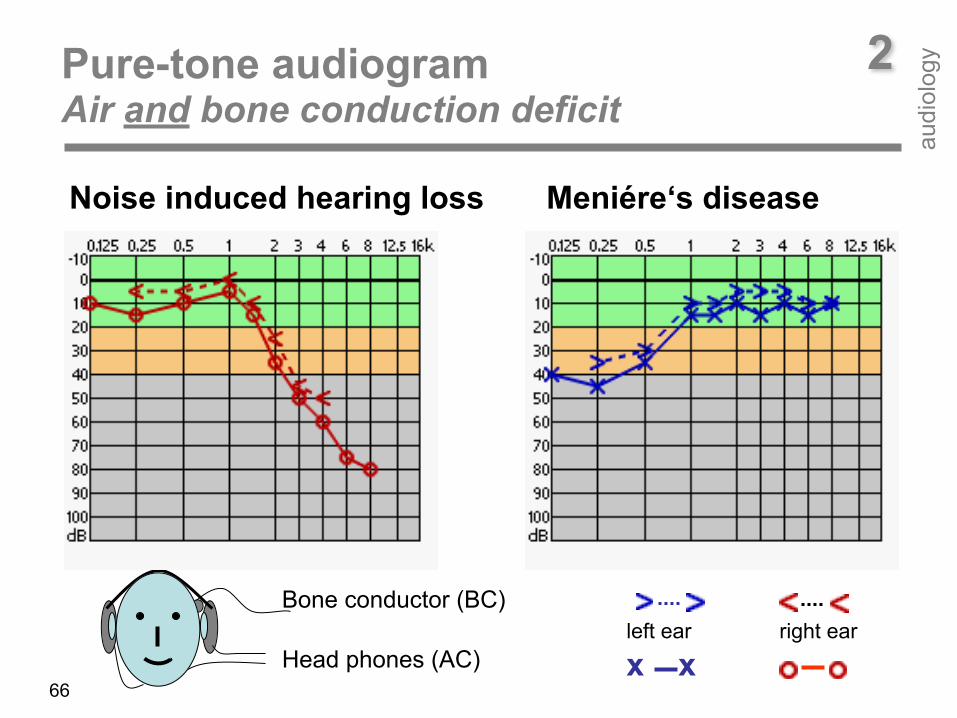
2Pure-tone audiogram Air and bone conduction deficit
audi
olog
y
66Head phones (AC)
Bone conductor (BC)
Noise induced hearing loss Meniére‘s disease
left ear right ear
x x

Menière‘s disease
noise induced hearing loss Presbyacusis Ototoxicity Sudden hearing loss
u aoe i
m ts
2Pure-tone audiogram Cochlear/neural hearing loss
audi
olog
y
67
air = bone conduction

Women
2Presbycusis hearing loss at high frequencies
audi
olog
y
68
Men
Median air conduction haering loss according to ISO 7029 a) 30 years b) 50 years c) 70 years
a
b
c
ab
c
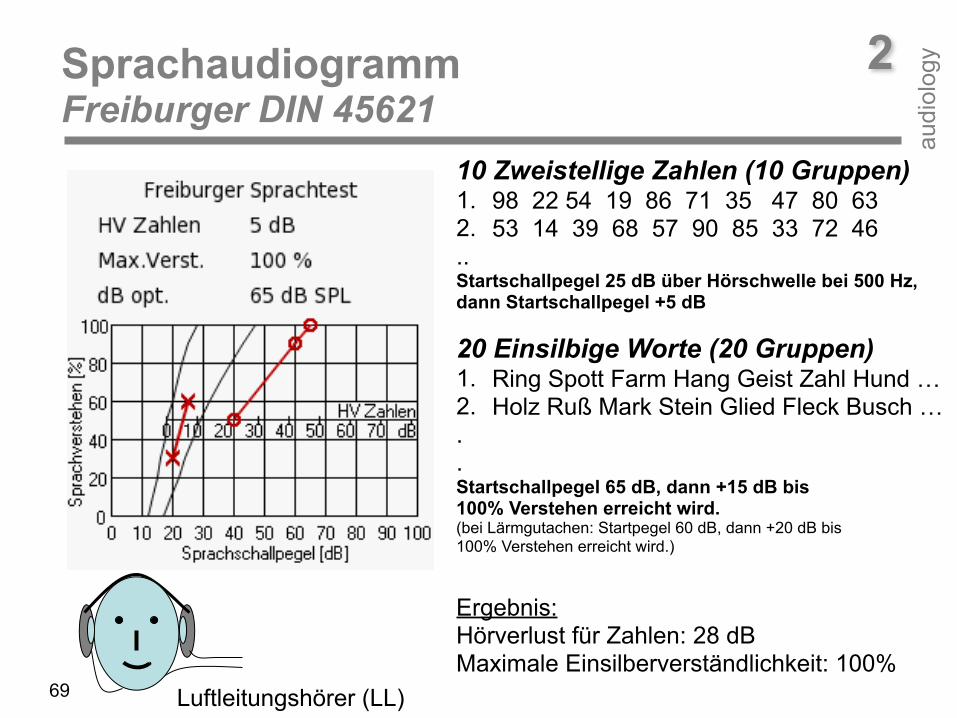
Luftleitungshörer (LL)
10 Zweistellige Zahlen (10 Gruppen) 1. 98 22 54 19 86 71 35 47 80 63 2. 53 14 39 68 57 90 85 33 72 46 .. Startschallpegel 25 dB über Hörschwelle bei 500 Hz, dann Startschallpegel +5 dB 20 Einsilbige Worte (20 Gruppen) 1. Ring Spott Farm Hang Geist Zahl Hund … 2. Holz Ruß Mark Stein Glied Fleck Busch … . . Startschallpegel 65 dB, dann +15 dB bis 100% Verstehen erreicht wird. (bei Lärmgutachen: Startpegel 60 dB, dann +20 dB bis 100% Verstehen erreicht wird.) Ergebnis: Hörverlust für Zahlen: 28 dB Maximale Einsilberverständlichkeit: 100%
2Sprachaudiogramm Freiburger DIN 45621
audi
olog
y
69

acousticallyacousticallyacoustically
Otoacoustic Emissions
Evoked PotentialsTympanometry
external/middle ear Cochlea neural pathway
acoustically electrically
2Physiological tests
audi
olog
y
70
acoustically
2Physiological tests
audi
olog
y
71
Physiological test procedures reflect the mechanical and neural function of the auditory system. Therefore, physiological tests are used for reliably detecting the site of impairment along the auditory pathway. Tympanometry (Tymp), oto-acoustic emission (OAE) and auditory evoked potential (AEP) are able to differentiate between middle-ear, cochlear, and neural disorders. In case of Tymp and OAE, both, stimulus and response are acoustic signals. In contrast, in case of AEP there is an acoustical input-signal and an electrical output-signal.
In view of an adequate therapy of a hearing impairment, it is important to known which stage of the auditory pathway is concerned. Tymp, OAE, and AEP allow for selectively assessing middl-ear, sensory (cochlear) and neural disorders. Behavioural testing is less reliable. This is true, especially, in infants and other non-cooperative patients, where psycho-acoustical tests cannot reliably be performed.
2Tympanometry
audi
olog
y
72
35 mm
Outer ear canal
Apex
basilar membrane
Cochlea
Tympanic membrane
Probe tone 226 Hz, 667 Hz or 1000 Hz
Sound probe
Pump for ear canal pressurization
Stapes
Incus
Malleus
2Tympanometry
audi
olog
y
73
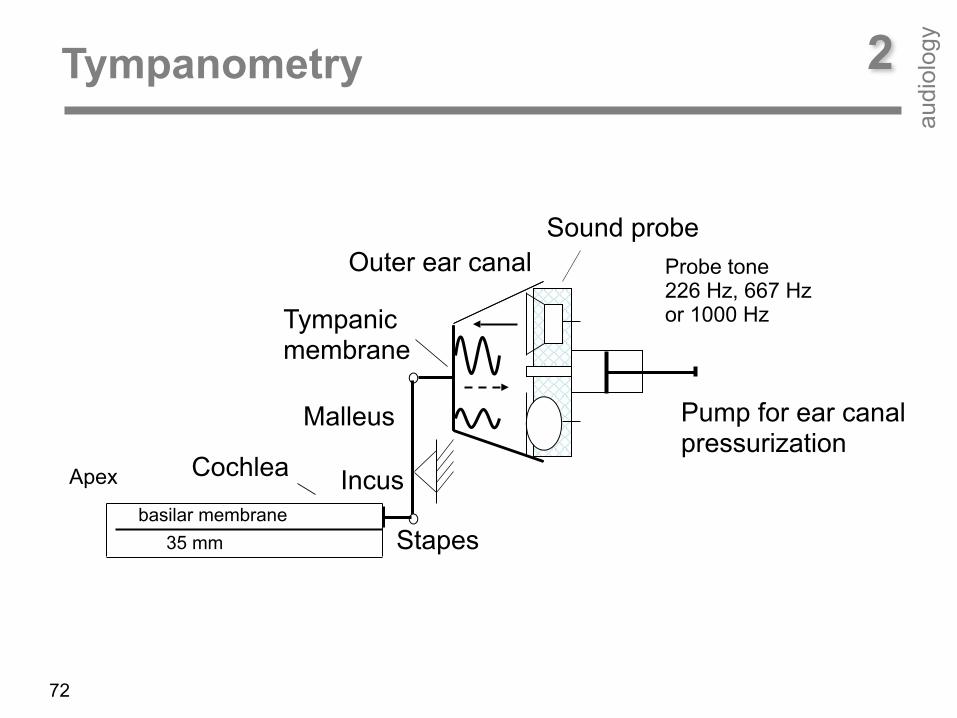
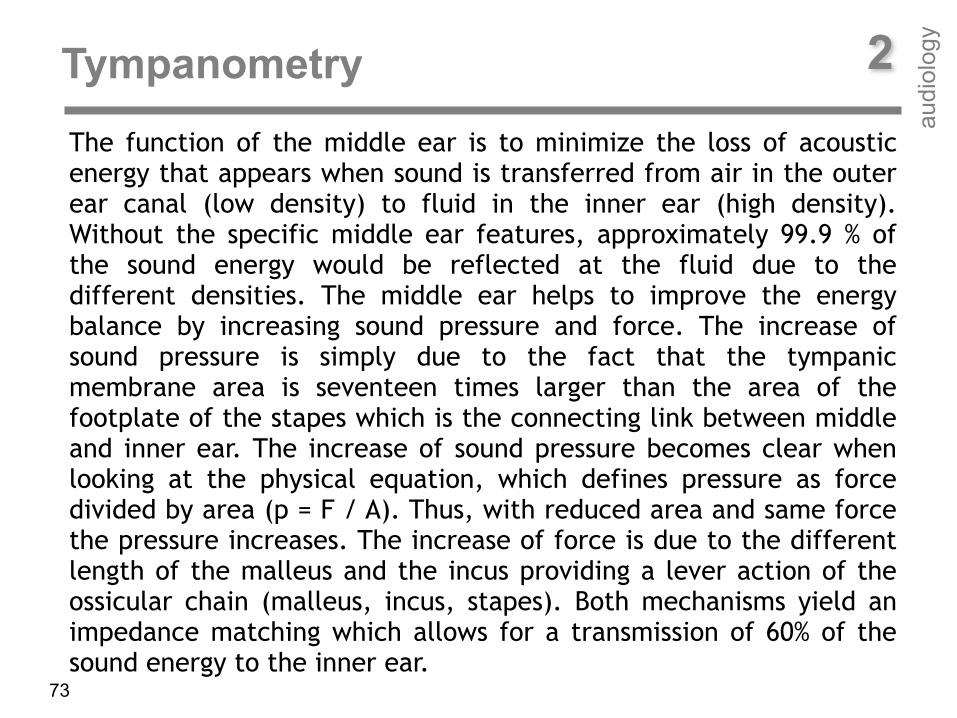
The function of the middle ear is to minimize the loss of acoustic energy that appears when sound is transferred from air in the outer ear canal (low density) to fluid in the inner ear (high density). Without the specific middle ear features, approximately 99.9 % of the sound energy would be reflected at the fluid due to the different densities. The middle ear helps to improve the energy balance by increasing sound pressure and force. The increase of sound pressure is simply due to the fact that the tympanic membrane area is seventeen times larger than the area of the footplate of the stapes which is the connecting link between middle and inner ear. The increase of sound pressure becomes clear when looking at the physical equation, which defines pressure as force divided by area (p = F / A). Thus, with reduced area and same force the pressure increases. The increase of force is due to the different length of the malleus and the incus providing a lever action of the ossicular chain (malleus, incus, stapes). Both mechanisms yield an impedance matching which allows for a transmission of 60% of the sound energy to the inner ear.
2Tympanometry
audi
olog
y
normal
Com
plia
nce
tube dysfunction
74
-400 daPa +200 dPa
otitis media effusion
Compliance [ml]
2Tympanometry
audi
olog
y
75
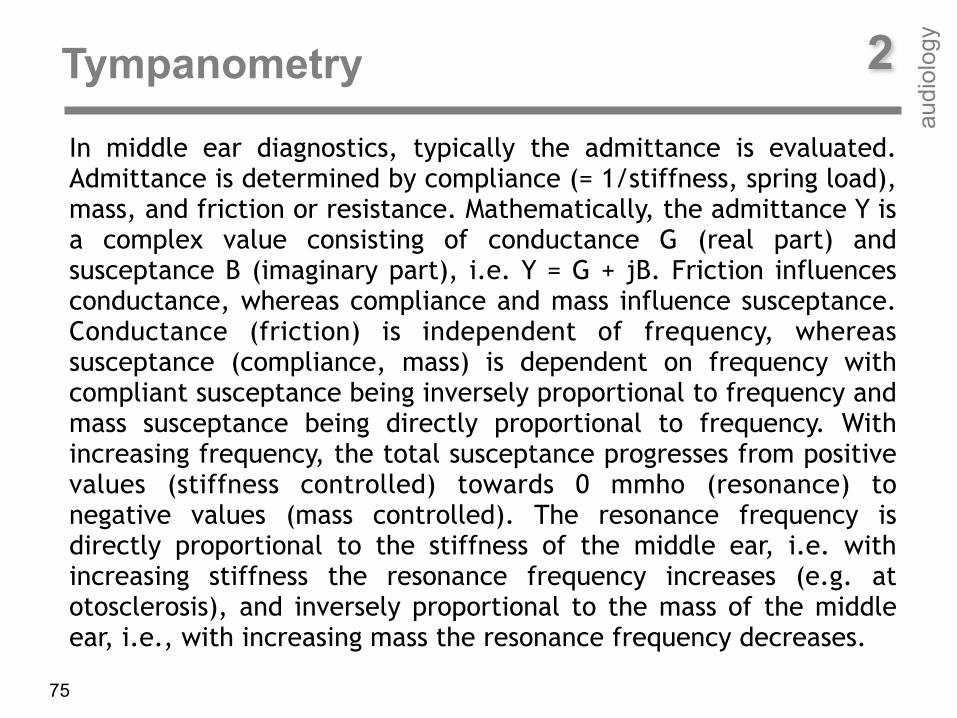
In middle ear diagnostics, typically the admittance is evaluated. Admittance is determined by compliance (= 1/stiffness, spring load), mass, and friction or resistance. Mathematically, the admittance Y is a complex value consisting of conductance G (real part) and susceptance B (imaginary part), i.e. Y = G + jB. Friction influences conductance, whereas compliance and mass influence susceptance. Conductance (friction) is independent of frequency, whereas susceptance (compliance, mass) is dependent on frequency with compliant susceptance being inversely proportional to frequency and mass susceptance being directly proportional to frequency. With increasing frequency, the total susceptance progresses from positive values (stiffness controlled) towards 0 mmho (resonance) to negative values (mass controlled). The resonance frequency is directly proportional to the stiffness of the middle ear, i.e. with increasing stiffness the resonance frequency increases (e.g. at otosclerosis), and inversely proportional to the mass of the middle ear, i.e., with increasing mass the resonance frequency decreases.

2Tympanometry
audi
olog
y
Com
plia
nce
76
otosclerosischain interruption

2Tympanometry
audi
olog
y
77
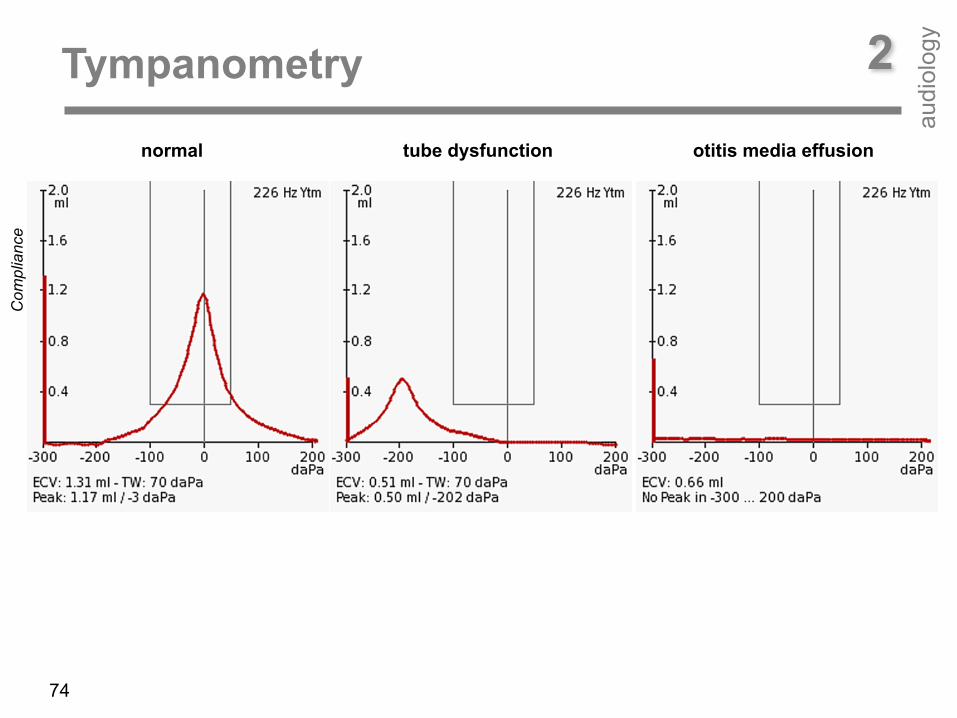
Tympanometry is usually performed at low test-tone frequency (220 or 226 Hz). At low frequencies, the normal-middle ear system is stiffness-controlled and susceptance (stiffness element) contributes more to overall admittance than conductance (frictional element). Typically, static air pressure varied from +200 daPa to -200 daPa. The result is a graphic display called a tympanogram which plots middle ear admittance over static air pressure. Different middle-ear pathologies exhibit different tympanogram shapes. In case of normal middle-ear function the tympanogram shape corresponds to a Gaussian bell curve with its maximum being around zero static pressure, i.e., maximum energy is transferred into the cochlea. In case of Eustachian-tube dysfunction the peak of the Gaussian bell curve is shifted towards negative pressure. In case of otosclerosis, the peak of the Gaussian bell curve is small (due to decreased mobility), however located within the zero static pressure range. In case of an interruption of the ossicular chain (due to increased motility) there is a open curve.
central auditory pathway
Reflex pathway
2Tympanometry, acoustic reflex
audi
olog
y
left auditory cortex right auditory cortex
C F
O
F C
O
audi
tory
ner
ve
fascialis nerve
left ear
right ear
contra-lateral ipsi-lateral
78
79
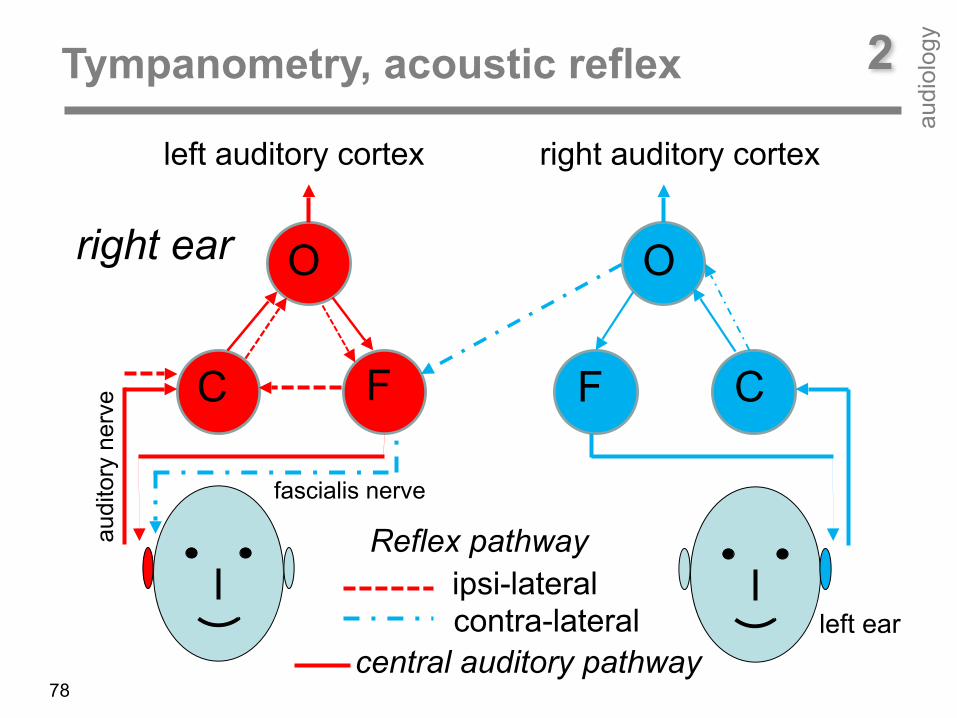
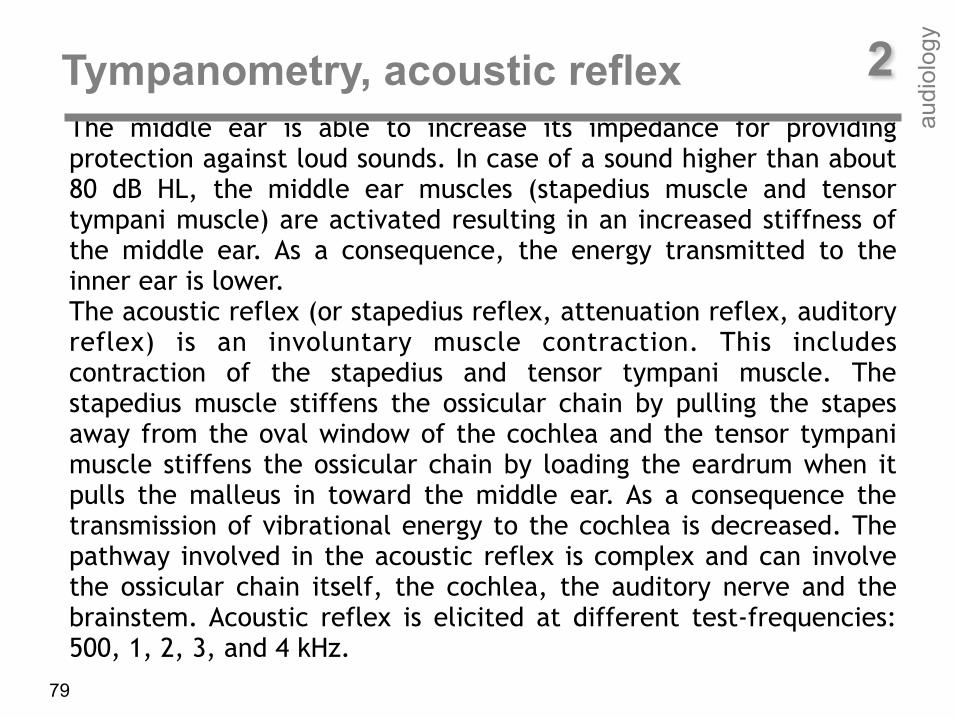
The middle ear is able to increase its impedance for providing protection against loud sounds. In case of a sound higher than about 80 dB HL, the middle ear muscles (stapedius muscle and tensor tympani muscle) are activated resulting in an increased stiffness of the middle ear. As a consequence, the energy transmitted to the inner ear is lower. The acoustic reflex (or stapedius reflex, attenuation reflex, auditory reflex) is an involuntary muscle contraction. This includes contraction of the stapedius and tensor tympani muscle. The stapedius muscle stiffens the ossicular chain by pulling the stapes away from the oval window of the cochlea and the tensor tympani muscle stiffens the ossicular chain by loading the eardrum when it pulls the malleus in toward the middle ear. As a consequence the transmission of vibrational energy to the cochlea is decreased. The pathway involved in the acoustic reflex is complex and can involve the ossicular chain itself, the cochlea, the auditory nerve and the brainstem. Acoustic reflex is elicited at different test-frequencies: 500, 1, 2, 3, and 4 kHz.
2Tympanometry, acoustic reflex
audi
olog
y

tympanogram acoustic reflex
2Tympanometry, acoustic reflex
audi
olog
y
80
Reflex threshold = 70 dB HL

Reflex at different test-frequencies
2Tympanometry, acoustic reflex
audi
olog
y
81
2Oto-Acoustic Emission (OAE) Discovered by David Kemp in 1978
audi
olog
y
82
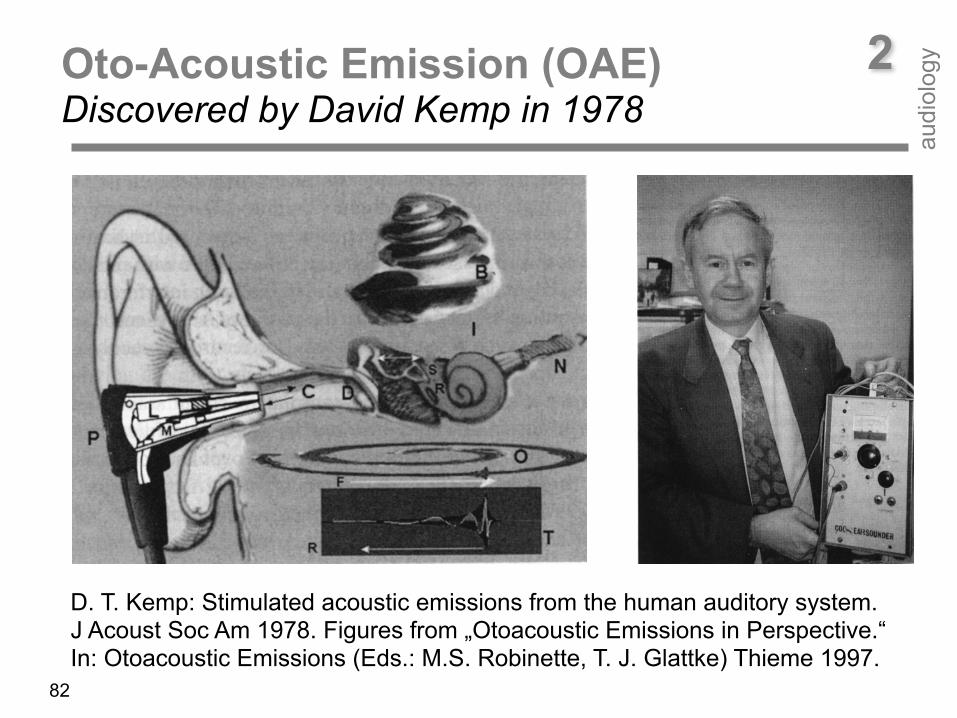
D. T. Kemp: Stimulated acoustic emissions from the human auditory system. J Acoust Soc Am 1978. Figures from „Otoacoustic Emissions in Perspective.“ In: Otoacoustic Emissions (Eds.: M.S. Robinette, T. J. Glattke) Thieme 1997.

2Oto-Acoustic Emission (OAE)
audi
olog
y
83
The discovery of oto-acoustic emissions (OAEs) by David Kemp in 1978 has produced a fast, powerful, and versatile tool for diagnosing cochlear integrity. OAE measurements are today a standard part of the audiometric test battery. OAEs are elicited and measured by means of electro-acoustic transducers (loudspeaker and microphone) within an ear probe placed in the outer ear canal. There are spontaneous (SOAEs) and evoked OAEs (EOAEs). EOAEs are the by-product of the non-linear sound amplification process in the cochlea. OAEs are low-level sound emissions generated by the outer hair cells (OHCs) within the cochlea. OAE levels depend on the number of functioning outer hair cells given a normal middle-ear function. OAE levels depend on the ear canal volume. Because of the smaller ear canal volume, OAE amplitude in newborns and infants is higher compared to that in adults. Thus, OAEs are easier to measure and thus provide a suited tool for newborn-hearing screening and follow-up diagnostics.
Transient Evoked Oto-Acoustic Emission (TEOAE)
35 mm
ear canal
ossicles
Apex
Basilar membrane 0,001 mm
OHC motilityIHC cochlear amplifier
Tektorial membrane
Basilar membrane
0 800 1600 2400 3200 sensory cell rows
0,125 0,25 0,5 1 2 4 8 16 frequency [kHz]0 8 16 24 32 distance from apex [mm]
afferent NF
sound probe
Click
TEOAE
audi
olog
y
84
2
TEOAEL
[dB
SP
L]
f [Hz]
noise
8
16
2
4
3
2 [m
m]
t [ms]
Σ
8ms
4ms
2ms
1ms
Outer hair cell response
Recording window
p [Pa]
audi
olog
y
85
2Transient Evoked Oto-Acoustic Emission (TEOAE)
evaluation window
apex
TEOAEnoise

2Transient Evoked Oto-Acoustic Emission (TEOAE)
audi
olog
y
86
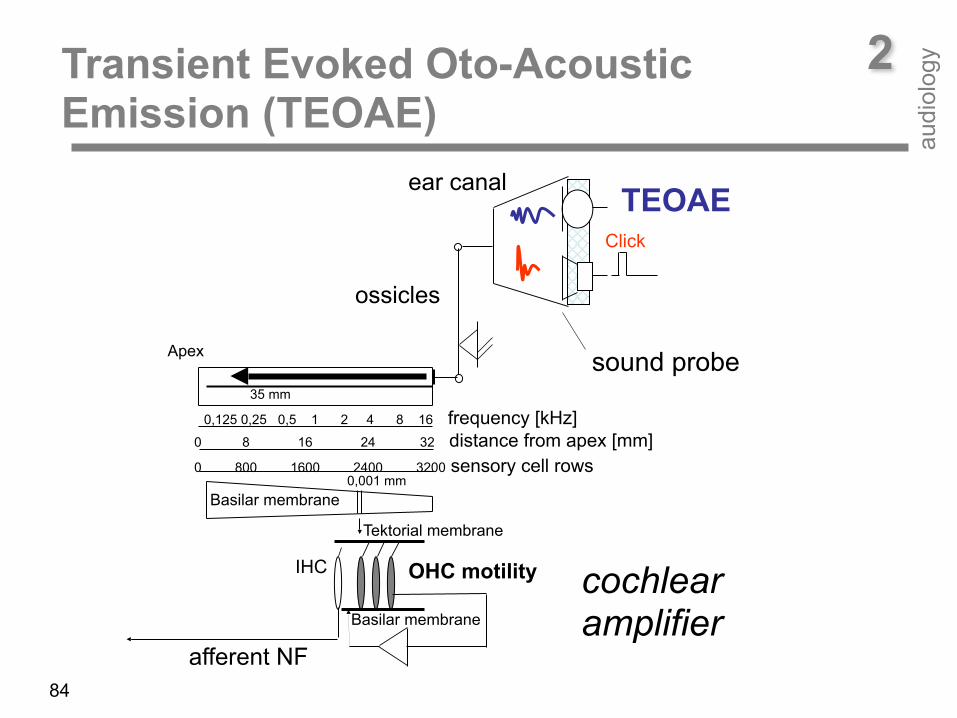
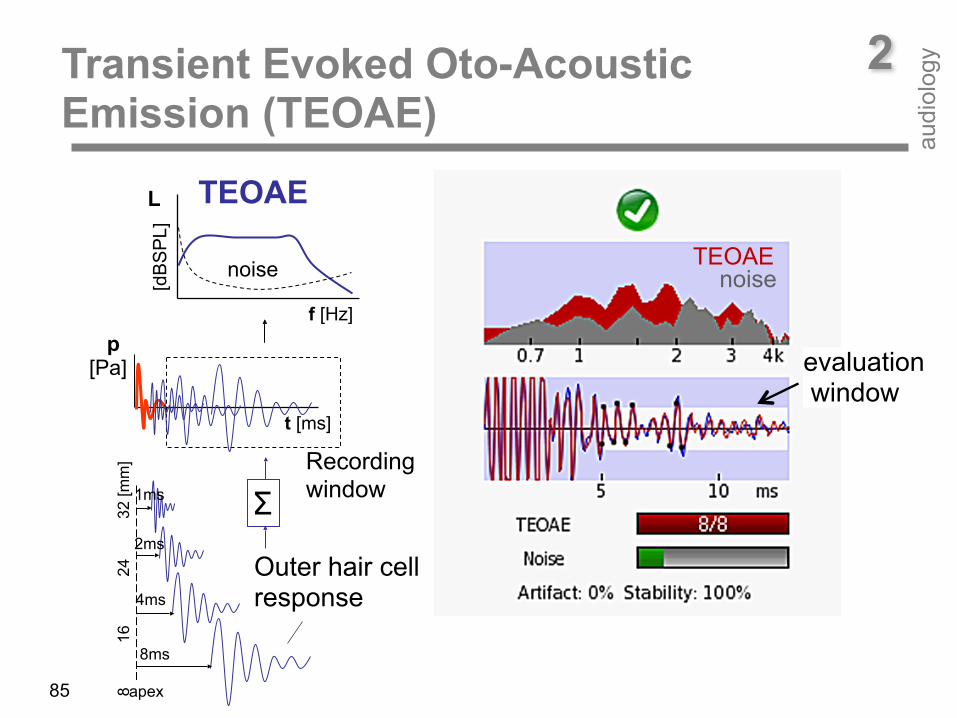
Transient oto-acoustic emissions are elicited by transient acoustic stimuli (clicks ore tone-bursts). TEOAEs represent the sum of acoustic impulse- responses of OHCs along the cochlea. At click-stimulation, almost all OHCs along the cochlear partition are set into movement. When using tone-bursts of different carrier-frequencies a specific part of OHCs along the cochlea is stimulated. Due to cochlear frequency dispersion, TEOAE components can be directly traced to a specific place. As the basilar membrane at basal sites moves faster than at more apical sites, high-frequency TEOAE components stem from basal cochlear sites, whereas low-frequency TEOAE components come from more apical ones. As a consequence, basal responses appear at the beginning and apical responses at the end of the TEOAE time function. TEOAEs thus provide a rough frequency-specific estimation of cochlear hearing loss. TEOAE‘s sound pressure level is very low varying from about 10 to -30 dBSPL. Thus, measurement and averaging of several hundred signal-epochs are necessary for extracting TEOAE response from noise.
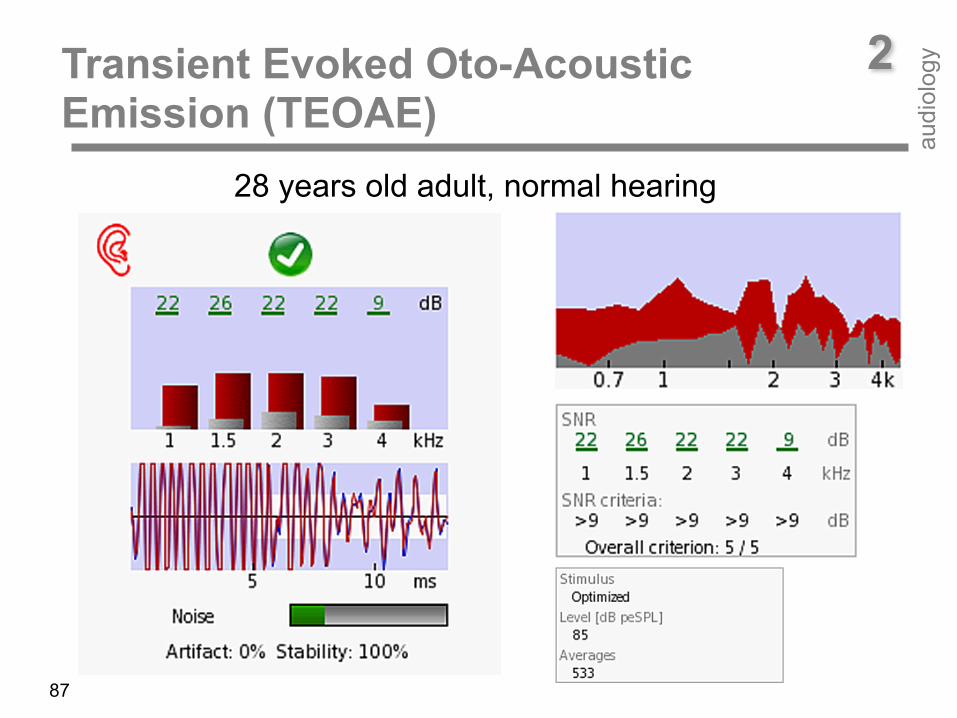
28 years old adult, normal hearing
2Transient Evoked Oto-Acoustic Emission (TEOAE)
audi
olog
y
87
Transient Evoked Oto-Acoustic Emission (TEOAE)
audi
olog
y
88
2
A normally hearing adults exhibits TEOAEs having high levels and a broad signal spectrum. Signal-to-Noise-Ratio (SNR) is high (more than 20 dB with the exception at 4 kHz (9 dB) in the case example). SNR criterion for accepting a response as valid was set to 9 dB. In contrast, in a newborn at birth with a temorary sound conduction deficit due to amniotic fluid in the tympanic cavity (see case example), TEOAE components have lower levels SNRs (10, 13, 18, 17, 7 dB). However, SNR criterion is fullfilled at all test frequencies with exception at the highest test frequency (4 kHz). The reason for this is a high frequency hearing loss due to a reduced sound conduction because of the amniotic fluid. In contrast, in a six days old newborn no TEOAEs could be measured. SNRs are below the selected criterion (< 9 dB). There was a normal tympanogram (not shown). In this case, a dysfunction of outer hair cells is most likely. TEOAEs already disappear at mild hearing losses and are therefore commonly used in hearing screening programs.
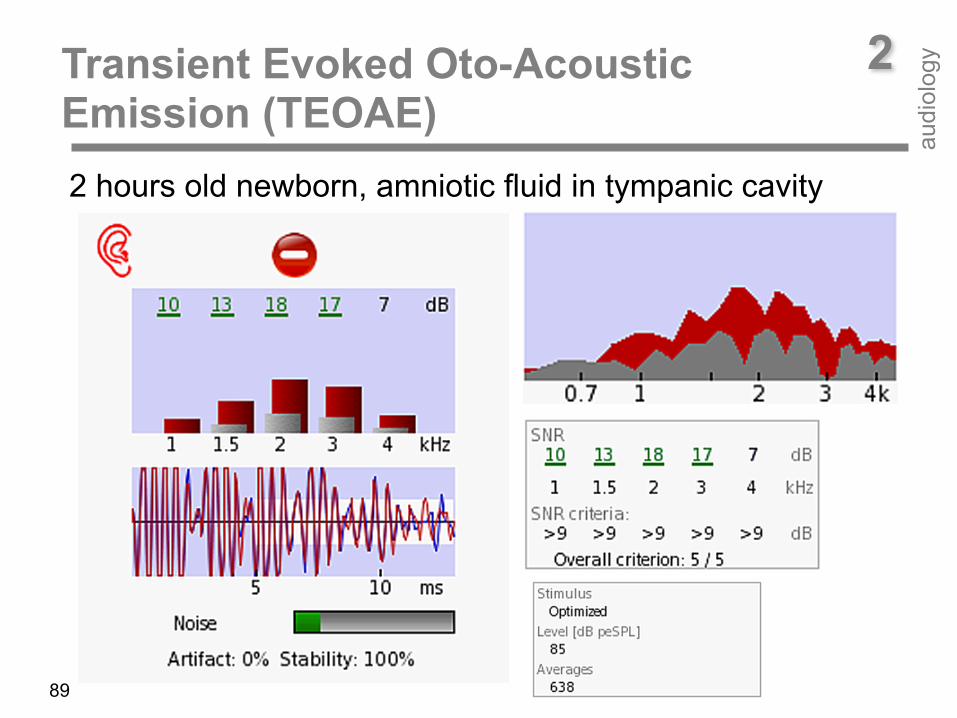
2 hours old newborn, amniotic fluid in tympanic cavity
2Transient Evoked Oto-Acoustic Emission (TEOAE)
audi
olog
y
89
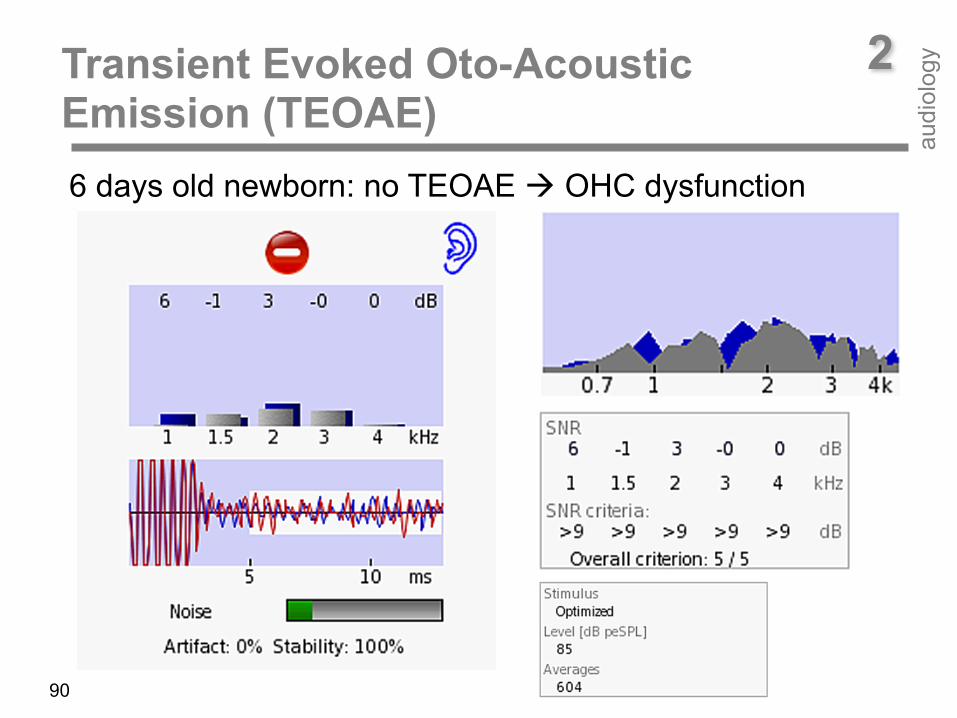
6 days old newborn: no TEOAE ! OHC dysfunction
2Transient Evoked Oto-Acoustic Emission (TEOAE)
audi
olog
y
90
91
2Distortion Product Oto-Acoustic Emission (DPOAE)
audi
olog
y
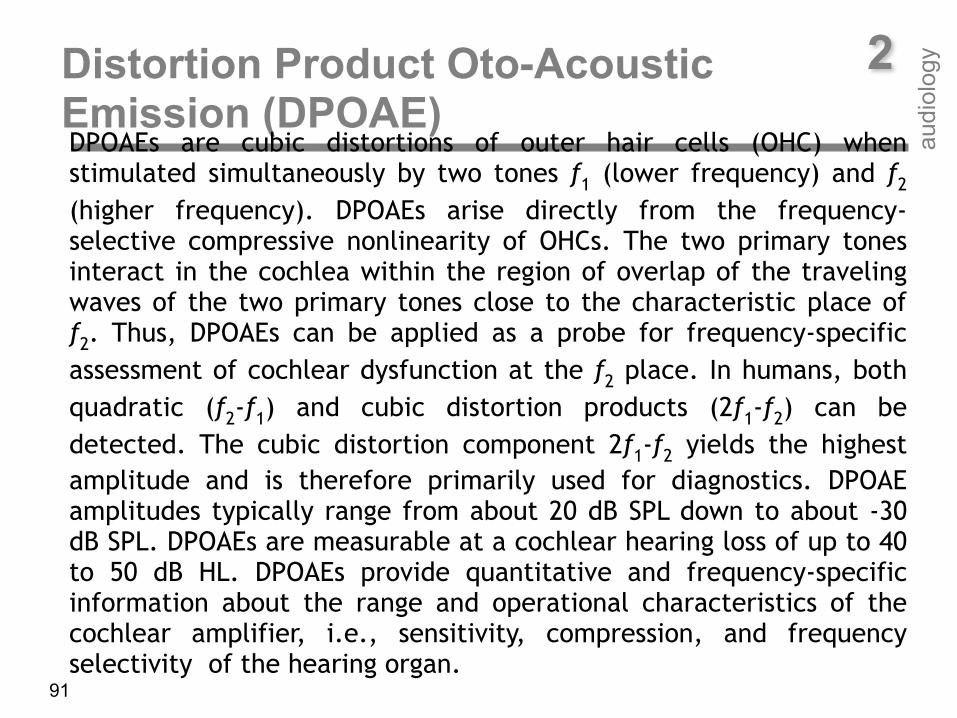
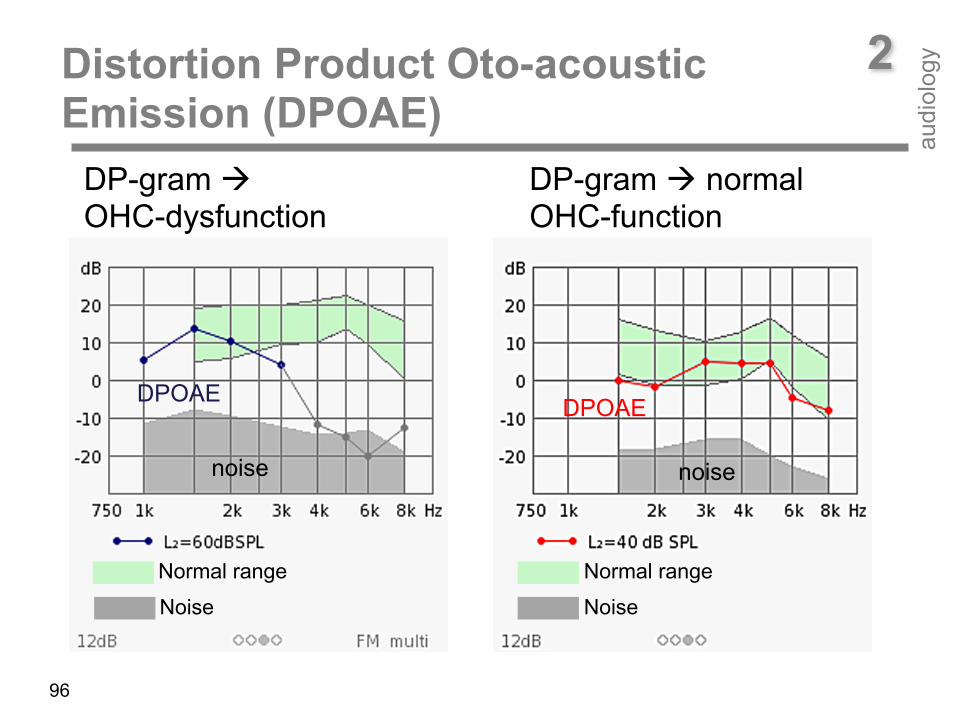
DPOAEs are cubic distortions of outer hair cells (OHC) when stimulated simultaneously by two tones f1 (lower frequency) and f2 (higher frequency). DPOAEs arise directly from the frequency-selective compressive nonlinearity of OHCs. The two primary tones interact in the cochlea within the region of overlap of the traveling waves of the two primary tones close to the characteristic place of f2. Thus, DPOAEs can be applied as a probe for frequency-specific assessment of cochlear dysfunction at the f2 place. In humans, both quadratic (f2-f1) and cubic distortion products (2f1-f2) can be detected. The cubic distortion component 2f1-f2 yields the highest amplitude and is therefore primarily used for diagnostics. DPOAE amplitudes typically range from about 20 dB SPL down to about -30 dB SPL. DPOAEs are measurable at a cochlear hearing loss of up to 40 to 50 dB HL. DPOAEs provide quantitative and frequency-specific information about the range and operational characteristics of the cochlear amplifier, i.e., sensitivity, compression, and frequency selectivity of the hearing organ.
92
35 mm
basilar membrane 0,001 mm
OHC motilityIHC
tektorial membrane
basilar membrane
0 800 1600 2400 3200 sensory cell rows
0,125 0,25 0,5 1 2 4 8 16 frequency [kHz]0 8 16 24 32 distance from apex [mm]
afferent NF
sound probe
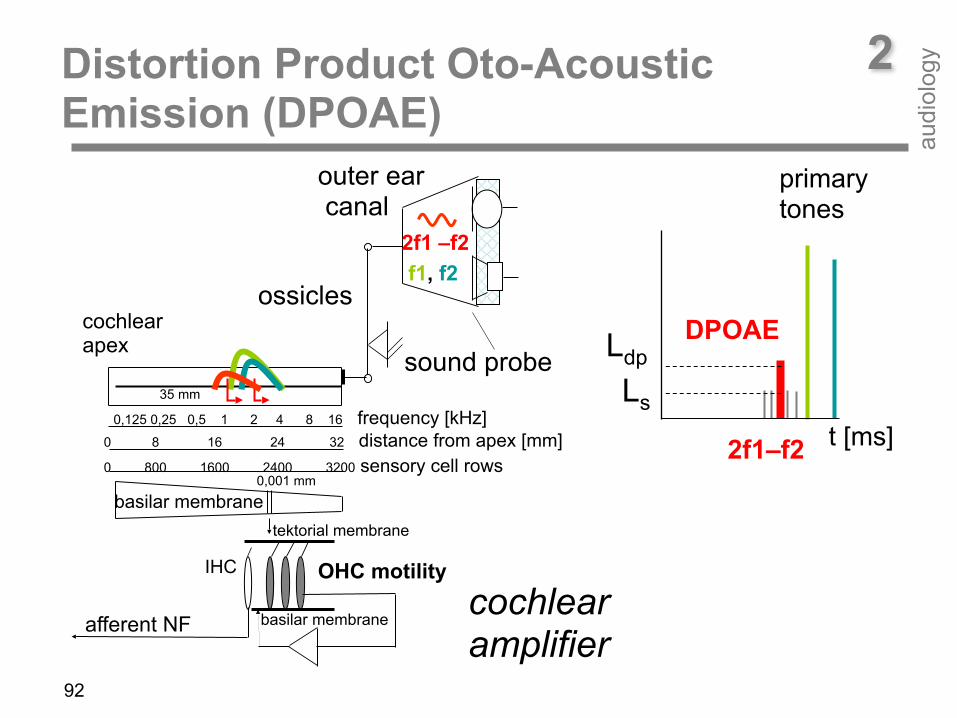
2f1 –f2
2Distortion Product Oto-Acoustic Emission (DPOAE)
audi
olog
y
f1, f2
outer ear canal
ossicles cochlear apex
cochlear amplifier
primary tones
DPOAE Ldp
Ls
2f1–f2 t [ms]

93
2Distortion Product Oto-Acoustic Emission (DPOAE)
audi
olog
y
The number of OHCs contributing to DPOAE generation depends on the size of the overlapping region, which is determined by the primary tone levels L1 and L2, and the frequency ratio f2/f1. A frequency ratio of about 1.2 has been found to be optimal.
A primary tone level setting, which accounts for the different compression of the primary tone traveling waves at the f2 place, is the scissor paradigm (see below) DPOAE-grams plot the DPOAE level Ldp as a function of f2 (the main DPOAE generation site) for a selected combination of primary-tone levels L1 and L2.
DPOAE-grams reflect the sensitivity of the cochlear amplifier (CA) best when recorded at close-to-threshold stimulus levels. In normal hearing (normal CA), DPOAE-grams are close to each other at high and more separated at low stimulus levels reflecting cochlear non-linear sound processing. In cochlear hearing loss ears (impaired CA), DPOAE-grams are more separated even at high stimulus levels, revealing loss of CA compression.
94
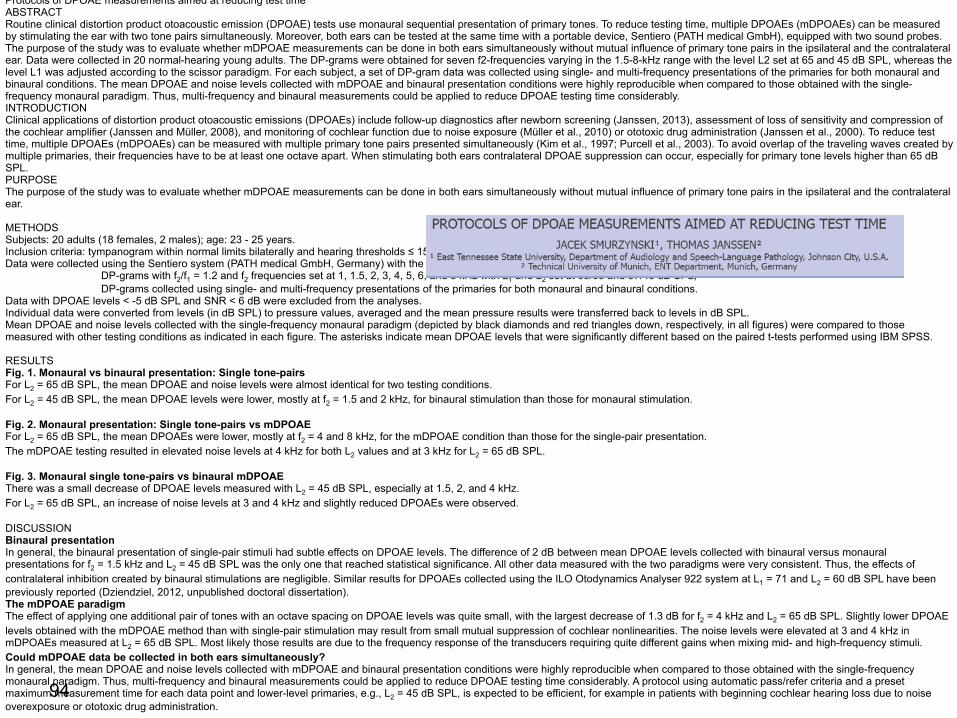
Protocols of DPOAE measurements aimed at reducing test time ABSTRACT Routine clinical distortion product otoacoustic emission (DPOAE) tests use monaural sequential presentation of primary tones. To reduce testing time, multiple DPOAEs (mDPOAEs) can be measured by stimulating the ear with two tone pairs simultaneously. Moreover, both ears can be tested at the same time with a portable device, Sentiero (PATH medical GmbH), equipped with two sound probes. The purpose of the study was to evaluate whether mDPOAE measurements can be done in both ears simultaneously without mutual influence of primary tone pairs in the ipsilateral and the contralateral ear. Data were collected in 20 normal-hearing young adults. The DP-grams were obtained for seven f2-frequencies varying in the 1.5-8-kHz range with the level L2 set at 65 and 45 dB SPL, whereas the level L1 was adjusted according to the scissor paradigm. For each subject, a set of DP-gram data was collected using single- and multi-frequency presentations of the primaries for both monaural and binaural conditions. The mean DPOAE and noise levels collected with mDPOAE and binaural presentation conditions were highly reproducible when compared to those obtained with the single-frequency monaural paradigm. Thus, multi-frequency and binaural measurements could be applied to reduce DPOAE testing time considerably. INTRODUCTION Clinical applications of distortion product otoacoustic emissions (DPOAEs) include follow-up diagnostics after newborn screening (Janssen, 2013), assessment of loss of sensitivity and compression of the cochlear amplifier (Janssen and Müller, 2008), and monitoring of cochlear function due to noise exposure (Müller et al., 2010) or ototoxic drug administration (Janssen et al., 2000). To reduce test time, multiple DPOAEs (mDPOAEs) can be measured with multiple primary tone pairs presented simultaneously (Kim et al., 1997; Purcell et al., 2003). To avoid overlap of the traveling waves created by multiple primaries, their frequencies have to be at least one octave apart. When stimulating both ears contralateral DPOAE suppression can occur, especially for primary tone levels higher than 65 dB SPL. PURPOSE The purpose of the study was to evaluate whether mDPOAE measurements can be done in both ears simultaneously without mutual influence of primary tone pairs in the ipsilateral and the contralateral ear. METHODS Subjects: 20 adults (18 females, 2 males); age: 23 - 25 years. Inclusion criteria: tympanogram within normal limits bilaterally and hearing thresholds ≤ 15 dB HL from 0.25 to 8 kHz bilaterally. Data were collected using the Sentiero system (PATH medical GmbH, Germany) with the subjects seated in a sound-treated room; DP-grams with f2/f1 = 1.2 and f2 frequencies set at 1, 1.5, 2, 3, 4, 5, 6, and 8 kHz with L1 and L2 set at 65/65 and 57/45 dB SPL; DP-grams collected using single- and multi-frequency presentations of the primaries for both monaural and binaural conditions. Data with DPOAE levels < -5 dB SPL and SNR < 6 dB were excluded from the analyses. Individual data were converted from levels (in dB SPL) to pressure values, averaged and the mean pressure results were transferred back to levels in dB SPL. Mean DPOAE and noise levels collected with the single-frequency monaural paradigm (depicted by black diamonds and red triangles down, respectively, in all figures) were compared to those measured with other testing conditions as indicated in each figure. The asterisks indicate mean DPOAE levels that were significantly different based on the paired t-tests performed using IBM SPSS. RESULTS Fig. 1. Monaural vs binaural presentation: Single tone-pairs For L2 = 65 dB SPL, the mean DPOAE and noise levels were almost identical for two testing conditions. For L2 = 45 dB SPL, the mean DPOAE levels were lower, mostly at f2 = 1.5 and 2 kHz, for binaural stimulation than those for monaural stimulation. Fig. 2. Monaural presentation: Single tone-pairs vs mDPOAE For L2 = 65 dB SPL, the mean DPOAEs were lower, mostly at f2 = 4 and 8 kHz, for the mDPOAE condition than those for the single-pair presentation. The mDPOAE testing resulted in elevated noise levels at 4 kHz for both L2 values and at 3 kHz for L2 = 65 dB SPL. Fig. 3. Monaural single tone-pairs vs binaural mDPOAE There was a small decrease of DPOAE levels measured with L2 = 45 dB SPL, especially at 1.5, 2, and 4 kHz. For L2 = 65 dB SPL, an increase of noise levels at 3 and 4 kHz and slightly reduced DPOAEs were observed. DISCUSSION Binaural presentation In general, the binaural presentation of single-pair stimuli had subtle effects on DPOAE levels. The difference of 2 dB between mean DPOAE levels collected with binaural versus monaural presentations for f2 = 1.5 kHz and L2 = 45 dB SPL was the only one that reached statistical significance. All other data measured with the two paradigms were very consistent. Thus, the effects of contralateral inhibition created by binaural stimulations are negligible. Similar results for DPOAEs collected using the ILO Otodynamics Analyser 922 system at L1 = 71 and L2 = 60 dB SPL have been previously reported (Dziendziel, 2012, unpublished doctoral dissertation). The mDPOAE paradigm The effect of applying one additional pair of tones with an octave spacing on DPOAE levels was quite small, with the largest decrease of 1.3 dB for f2 = 4 kHz and L2 = 65 dB SPL. Slightly lower DPOAE levels obtained with the mDPOAE method than with single-pair stimulation may result from small mutual suppression of cochlear nonlinearities. The noise levels were elevated at 3 and 4 kHz in mDPOAEs measured at L2 = 65 dB SPL. Most likely those results are due to the frequency response of the transducers requiring quite different gains when mixing mid- and high-frequency stimuli. Could mDPOAE data be collected in both ears simultaneously? In general, the mean DPOAE and noise levels collected with mDPOAE and binaural presentation conditions were highly reproducible when compared to those obtained with the single-frequency monaural paradigm. Thus, multi-frequency and binaural measurements could be applied to reduce DPOAE testing time considerably. A protocol using automatic pass/refer criteria and a preset maximum measurement time for each data point and lower-level primaries, e.g., L2 = 45 dB SPL, is expected to be efficient, for example in patients with beginning cochlear hearing loss due to noise overexposure or ototoxic drug administration.
95
2Distortion Product Oto-Acoustic Emission (DPOAE)
audi
olog
y
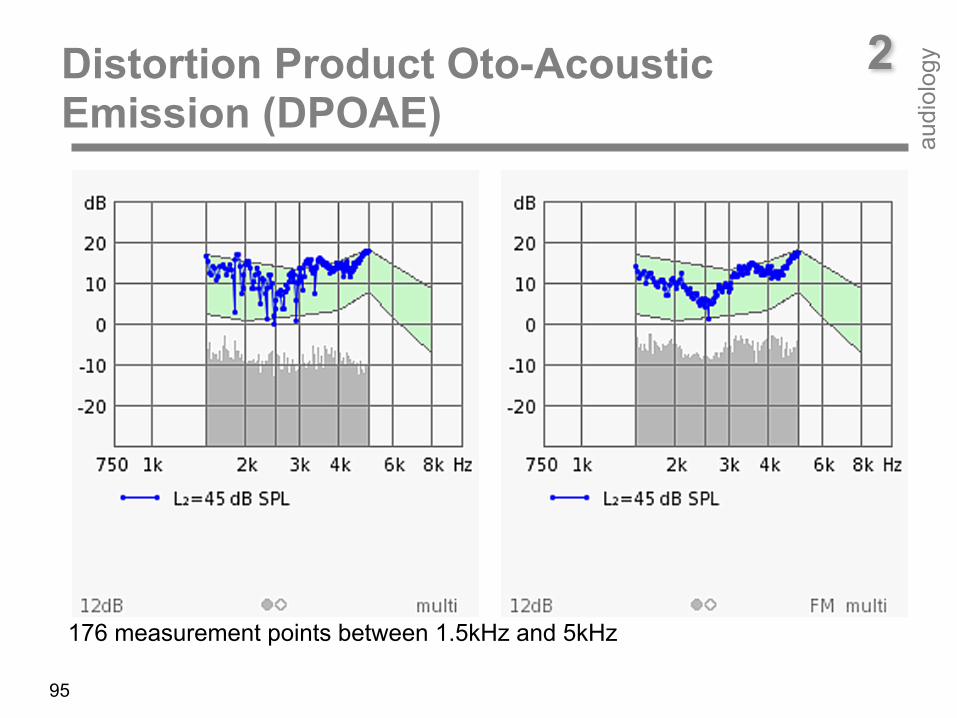
176 measurement points between 1.5kHz and 5kHz
2Distortion Product Oto-acoustic Emission (DPOAE)
audi
olog
y
96
DP-gram ! normal OHC-function
DP-gram ! OHC-dysfunction
DPOAE
noise
DPOAE
noise
Normal range Normal range
NoiseNoise
97
2Distortion Product Oto-Acoustic Emission (DPOAE)
audi
olog
y
Especially, extrapolated DPOAE I/O functions allow for assessing loss of cochlear sensitivity and compression. The number of OHCs contributing to DPOAE generation depends on the size of the overlapping region, which is determined by the primary tone levels L1 and L2, and the frequency ratio f2/f1. A frequency ratio of about 1.2 has been found to be optimal for yielding highest amplitudes. A primary tone level setting, which accounts for the different compression of the primary tone traveling waves at the f2 place, is the scissor paradigm. Due to the steep slope of the traveling wave towards the cochlear apex, the maximum interaction site is close to the f2 place in the cochlea. To preserve optimum overlap of the primary tone traveling waves at a constant frequency ratio, the primary tone level difference has to be increased with decreasing stimulus level. This results in a decrease of L1 being lower than the decrease of L2 (scissor paradigm: L=0.4 L2 + 39 dB SPL).

98
2Distortion Product Oto-acoustic Emission (DPOAE) Threshold
audi
olog
y
Ldp
[dB
SP
L]
SNRnoise
L2 [dB SPL]
0
30 40 50 60
20
-20
sound pressure level L sound pressure p
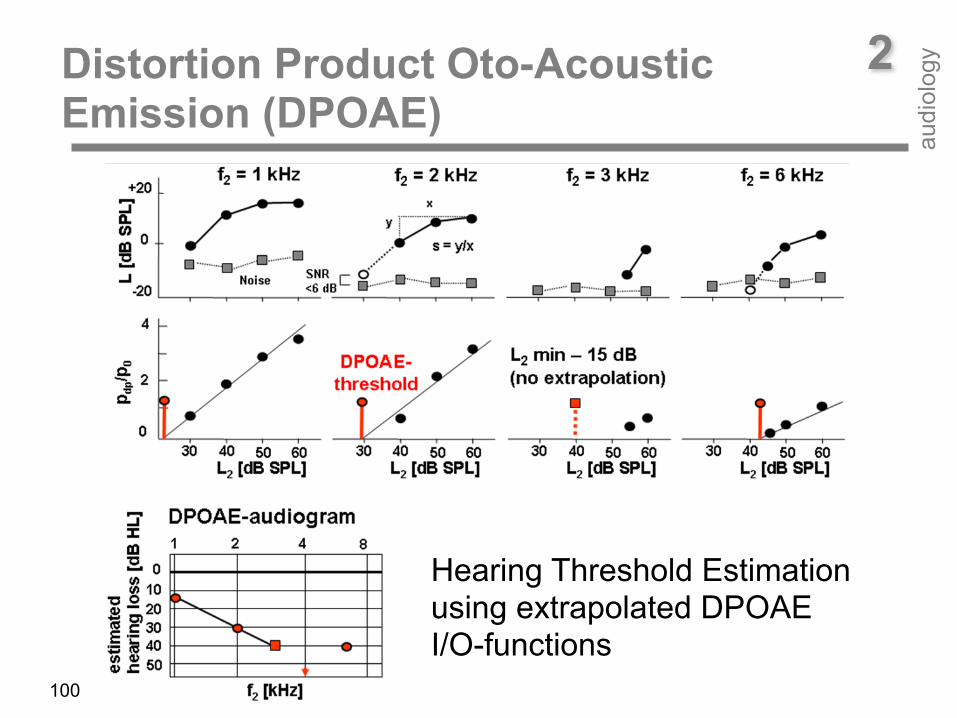
Hearing threshold estimation by means of extrapolated DPOAE pressure I/O-function: intersection between L2-axis and linear regression line
pdp
/ p0
[Pa]
L2 [dB SPL]
5
30 40 50 60
10 DPOAE Threshold
0
99
2Distortion Product Oto-acoustic Emission (DPOAE) Threshold
audi
olog
y
DPOAE level I/O-functions plot the DPOAE level Ldp as a function of primary-tone level L2 for a selected f2 and thus reflect cochlear amplification at the f2 place. In normal hearing, in response to low-level stimuli, DPOAE level I/O-functions exhibit steep slopes, while at high stimulus levels slopes decrease, thus mirroring the strong amplification at low and decreasing amplification (saturation) at moderate sound levels. However, this is only true when a specific stimulus level setting is used which accounts for the different compression of the primary-tones at the f2 place (scissor paradigm). DPOAE pressure I/O-functions plot the DPOAE pressure pdp (instead of the DPOAE level Ldp) as a function of the primary-tone level L2. Due to the logarithmic dependency of the DPOAE level on the primary tone level there is a linear dependency between DPOAE pressure pdp and primary tone level L2. Thus, DPOAE data can easily be fitted by linear regression analysis. The intersection point of the linear regression line with the L2-axis at pdp = 0 Pa can then serve as an estimate of DPOAE threshold.
100
2Distortion Product Oto-Acoustic Emission (DPOAE)
audi
olog
y
Hearing Threshold Estimation using extrapolated DPOAE I/O-functions

101
2Distortion Product Oto-Acoustic Emission (DPOAE)
audi
olog
y
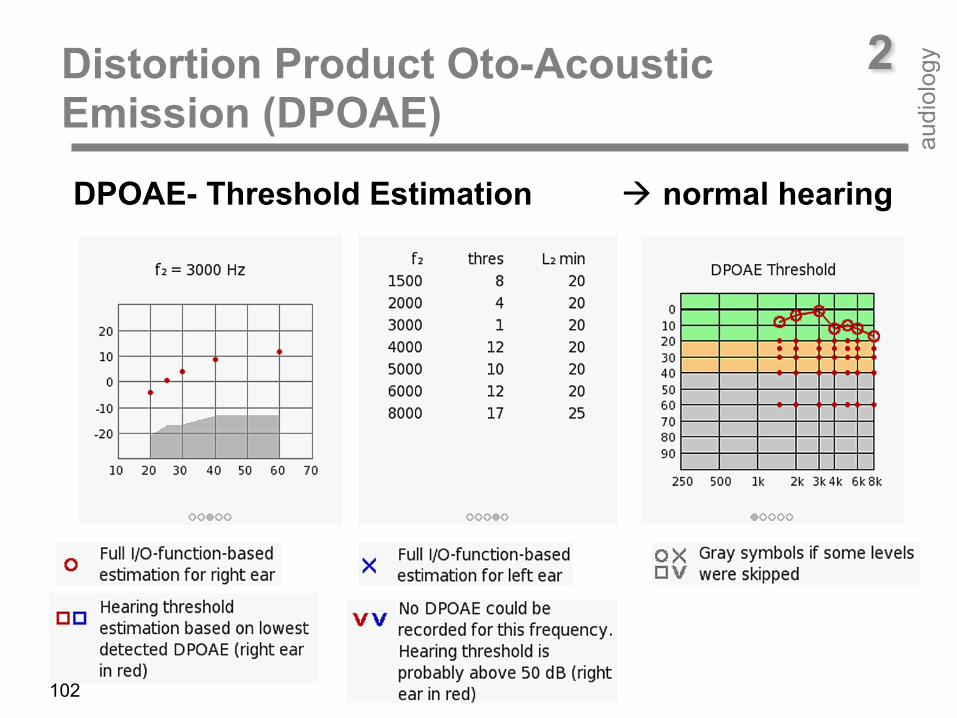
When converting DPOAE level from dB SPL to dB HL (hearing level), estimated DPOAE thresholds can be plotted in an audiogram form (DPOAE audiogram). DPOAE audiograms can be applied in babies due to Eustachian tube dysfunction and/or amniotic fluid in the tympanic cavity or to confirm a persisting cochlear hearing loss in follow-up diagnostics. In case of mild and moderate hearing loss DPOAE audiograms are an alternative method to behavioural audiometry or auditory brainstem responses (ABR, ASSR). Especially in infants where the conditioned free-field audiogram does not reliably reflect hearing threshold. DPOAE audiograms may assess cochlear hearing loss more precisely than behavioural tests. Moreover, unilateral hearing loss can be detected. DPOAE audiograms are able to quantitatively assess the hearing loss at distinct frequencies in a couple of minutes. Predicting hearing loss at five frequencies by tone burst ABR or ASSR may take half an hour and more. Thus, DPOAE audiograms can serve as a suited tool for bridging the gap between screening and behavioural testing in paediatric audiology.
102
2Distortion Product Oto-Acoustic Emission (DPOAE)
audi
olog
y
DPOAE- Threshold Estimation ! normal hearing

2Distortion Product Oto-Acoustic Emission (DPOAE)
audi
olog
y
DPOAE- Threshold estimation ! cochlear hearing loss
103
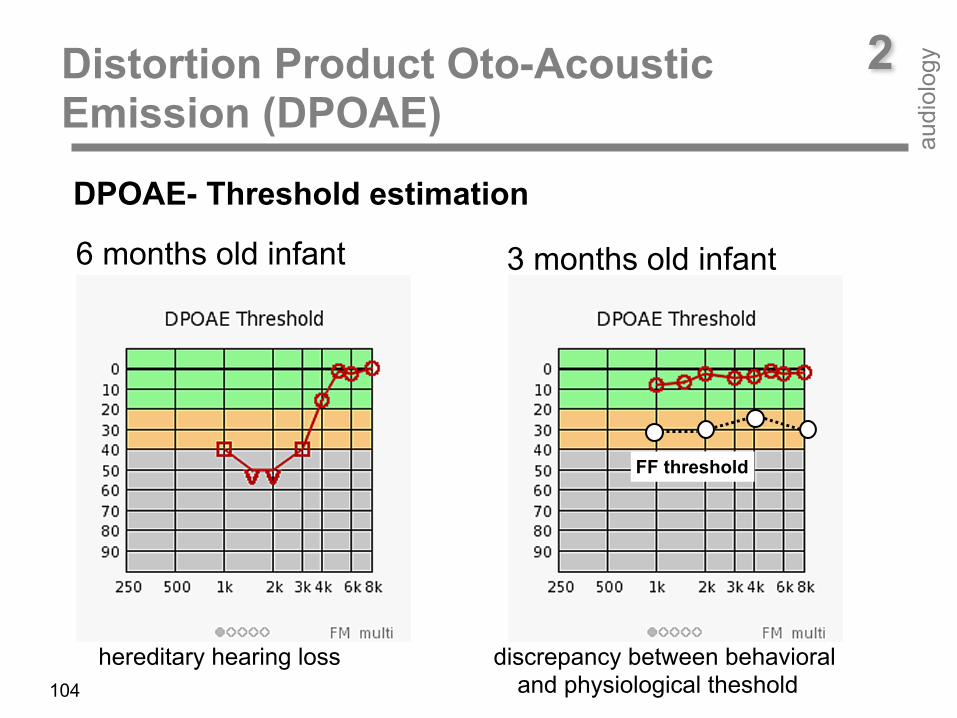
3 months old infant
FF threshold
6 months old infant
2Distortion Product Oto-Acoustic Emission (DPOAE)
audi
olog
y
104
DPOAE- Threshold estimation
hereditary hearing loss discrepancy between behavioral and physiological theshold
2Distortion Product Oto-Acoustic Emission (DPOAE)
audi
olog
y
0
10
20
30
40 50
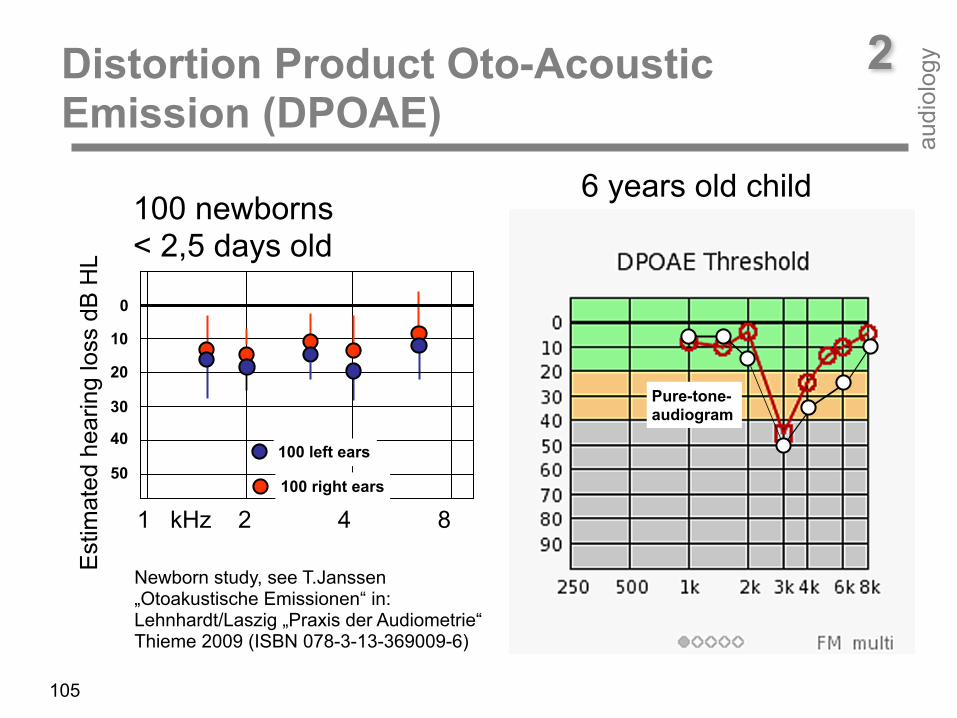
100 newborns < 2,5 days old
Pure-tone- audiogram
6 years old child
100 left ears
100 right earsestim
ated
es
ring
loss
[dB
HL]
105
Newborn study, see T.Janssen „Otoakustische Emissionen“ in: Lehnhardt/Laszig „Praxis der Audiometrie“ Thieme 2009 (ISBN 078-3-13-369009-6)
1 kHz 2 4 8
Est
imat
ed h
earin
g lo
ss d
B H
L
• Newborn hearing screening and Follow-up • Pediatric audiology
• Clinical Diagnostics à Confirmation of cochlear hearing loss (topological
diagnostic, report noise induced hearing loss)
• Simulation und Aggravation à Difference between pure-tone threshold and OAE
• Follow up: Sudden Hearing Loss and Ototoxic Medication
2Oto-Acoustic Emission Clinical applications
audi
olog
y
106

2Oto-Acoustic Emission Clinical applications
audi
olog
y
107
OHCs are reported to be impaired by sound overexposure, ototoxic drugs (e.g. therapeutic antibiotics), infections (e.g. meningitis, mumps, materno-fetal infection), and anoxia (e.g. birth trauma), or to be partly missing in genetic hearing loss. OHC impairment results in a loss of sensitivity and frequency selectivity of the hearing organ. OAEs, as a by-product of cochlear non-linear sound amplification, then appear with reduced amplitude or disappear. Since OAEs are a by-product of the non-linear sound amplification process of OHCs in the cochlea they can only serve as a measure for evaluating OHC integrity. Lesions of inner hair cells or retro-cochlear defects (e.g. neural defects, auditory processing disorders) are not detectable by means of OAE. In sound-conductive hearing-loss, both the stimulus and the response amplitude are reduced. OAEs are not present even at a mild hearing-loss. At a cochlear hearing loss exceeding 20-30 dB HL (TEOAE) or 40-50 dB HL (DPOAE) no OAEs are measurable. In these cases, tympanometry, ABR, and ASSR should be performed to determine type and degree of the hearing loss.
2Oto-Acoustic Emission Clinical applications
audi
olog
y
108
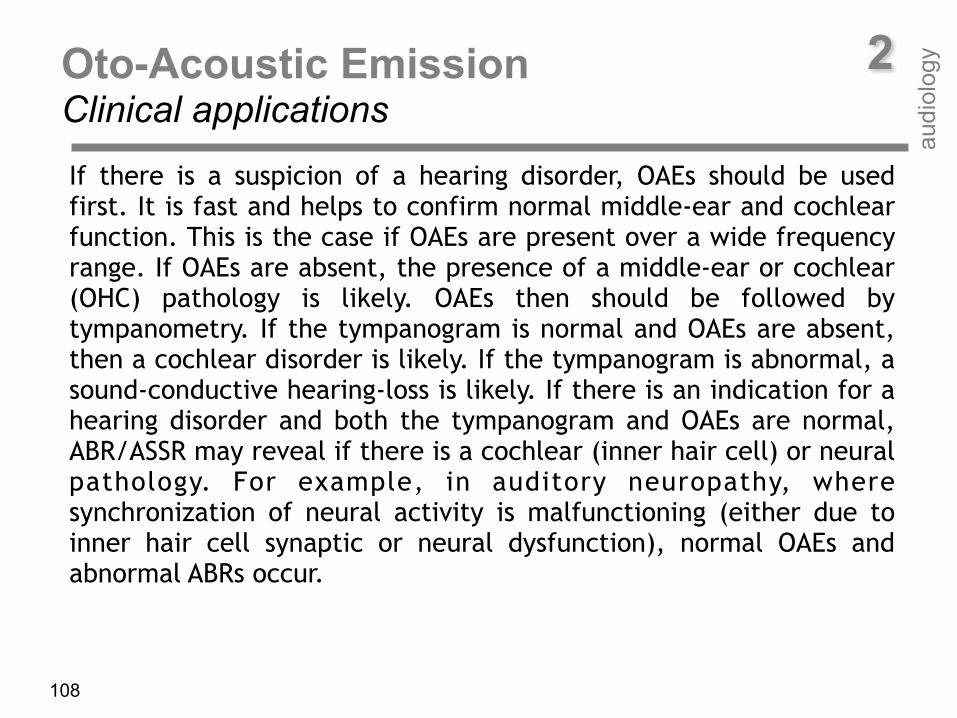
If there is a suspicion of a hearing disorder, OAEs should be used first. It is fast and helps to confirm normal middle-ear and cochlear function. This is the case if OAEs are present over a wide frequency range. If OAEs are absent, the presence of a middle-ear or cochlear (OHC) pathology is likely. OAEs then should be followed by tympanometry. If the tympanogram is normal and OAEs are absent, then a cochlear disorder is likely. If the tympanogram is abnormal, a sound-conductive hearing-loss is likely. If there is an indication for a hearing disorder and both the tympanogram and OAEs are normal, ABR/ASSR may reveal if there is a cochlear (inner hair cell) or neural pathology. For example, in auditory neuropathy, where synchronization of neural activity is malfunctioning (either due to inner hair cell synaptic or neural dysfunction), normal OAEs and abnormal ABRs occur.

2Oto-Acoustic Emission Clinical applications
audi
olog
y
109
Typical clinical applications of OAEs are: hearing screening, follow-up diagnostics after newborn hearing screening, confirmation of cochlear hearing loss (together with tympanometry and ABR), quantitative evaluation of hearing loss and recruitment for providing hearing aid fitting parameters, early detection and monitoring of OHC impairment after noise over-exposure or ototoxic drug administration, topological diagnostics, as well as identifying subjects simulating a hearing loss.
2Far-field Auditory Evoked Potential (AEP)
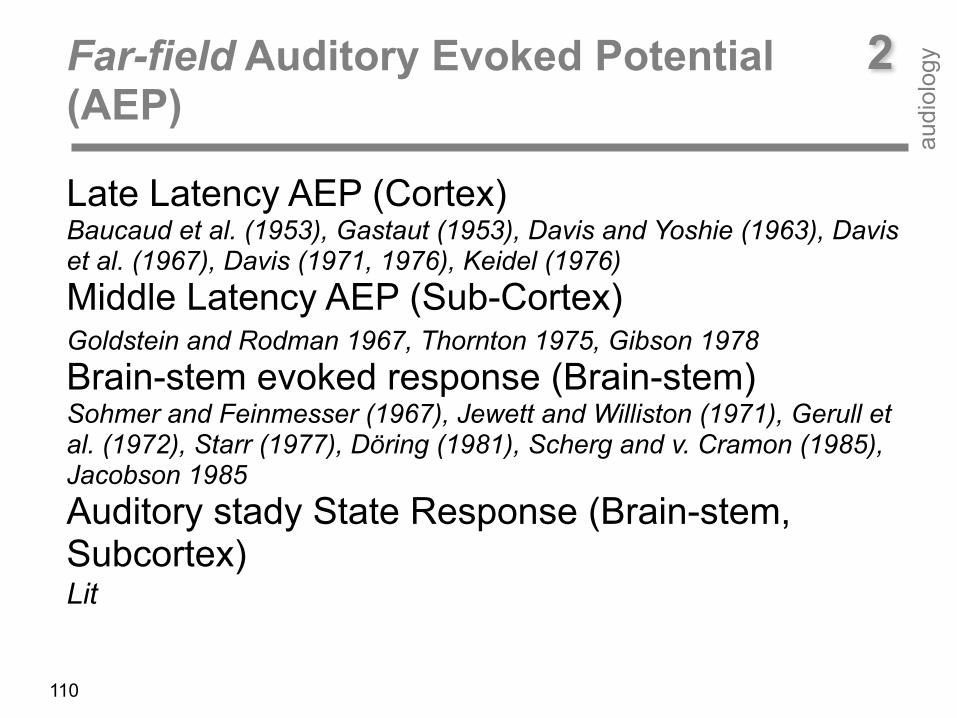
Late Latency AEP (Cortex) Baucaud et al. (1953), Gastaut (1953), Davis and Yoshie (1963), Davis et al. (1967), Davis (1971, 1976), Keidel (1976) Middle Latency AEP (Sub-Cortex) Goldstein and Rodman 1967, Thornton 1975, Gibson 1978 Brain-stem evoked response (Brain-stem) Sohmer and Feinmesser (1967), Jewett and Williston (1971), Gerull et al. (1972), Starr (1977), Döring (1981), Scherg and v. Cramon (1985), Jacobson 1985 Auditory stady State Response (Brain-stem, Subcortex) Lit
audi
olog
y
110
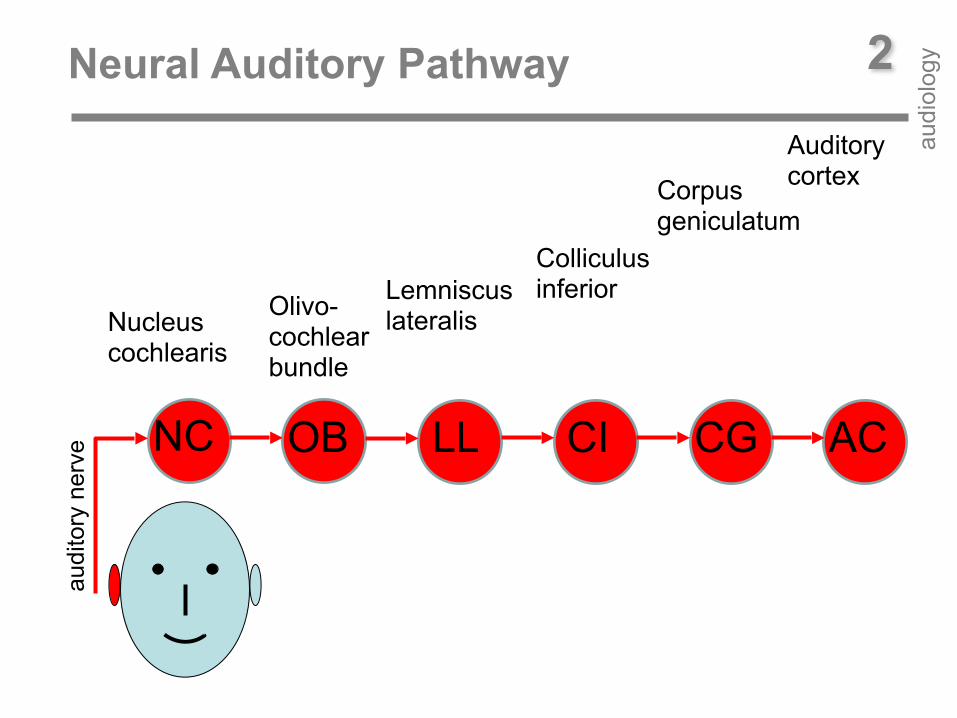
2Neural Auditory Pathway
audi
olog
y
NC OB
audi
tory
ner
ve LL CI CG AC
Nucleus cochlearis
Olivo- cochlear bundle
Lemniscus lateralis
Colliculus inferior
Corpus geniculatum
Auditory cortex
stimulus
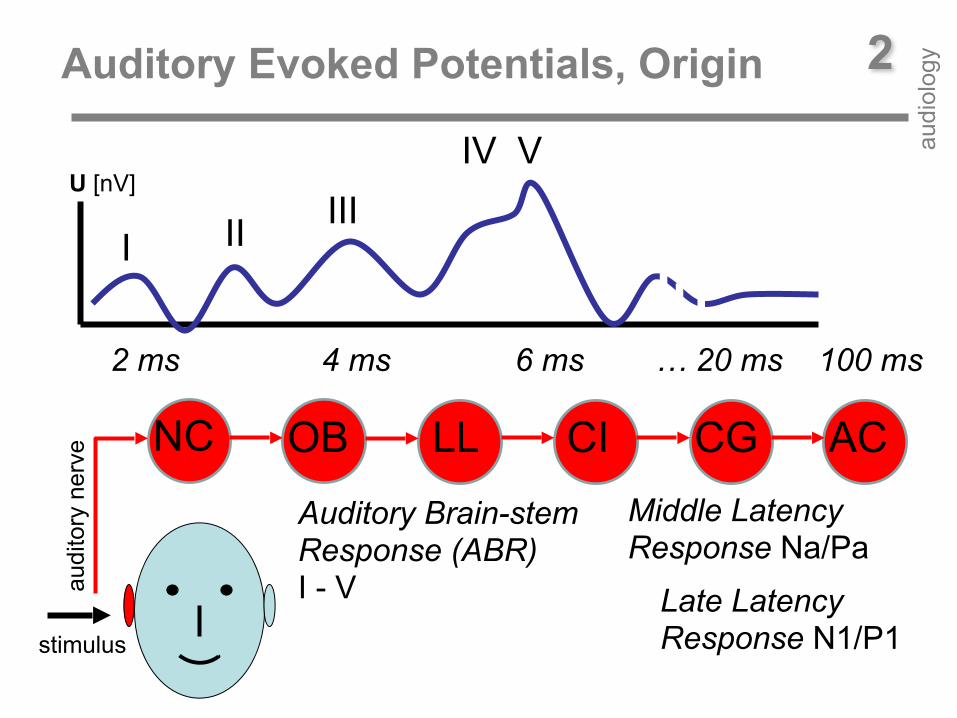
2Auditory Evoked Potentials, Origin
audi
olog
y
NC OB
audi
tory
ner
ve LL CI CG AC
U [nV]
I II IIIIV V
2 ms 4 ms 6 ms … 20 ms 100 ms
Middle Latency Response Na/Pa
Late Latency Response N1/P1
Auditory Brain-stem Response (ABR) I - V
v v
35 mm
ossicles t [ms]
U [nV]
Apex
Basilar membrane 0,2 mm
Motilität
Affe
rent
NF
IHC
Cochleärer amplifier
Tektorial membrane
äHz
Basilar membrane
O L
+-
Vertex
Mastoid
0 800 1600 2400 3000. hair cell row
0,125 0,25 0,5 1 2 4 8 16 frequency [kHz]
Click
0 8 16 24 32 distance from Apex [mm]
ABR 8
16
24
32 [m
m]
8 ms
4 ms
2ms
1ms
Action potential
C
HN
ΣI II
IIIV
IPL
tV
I
V III
Click
sound probe
113
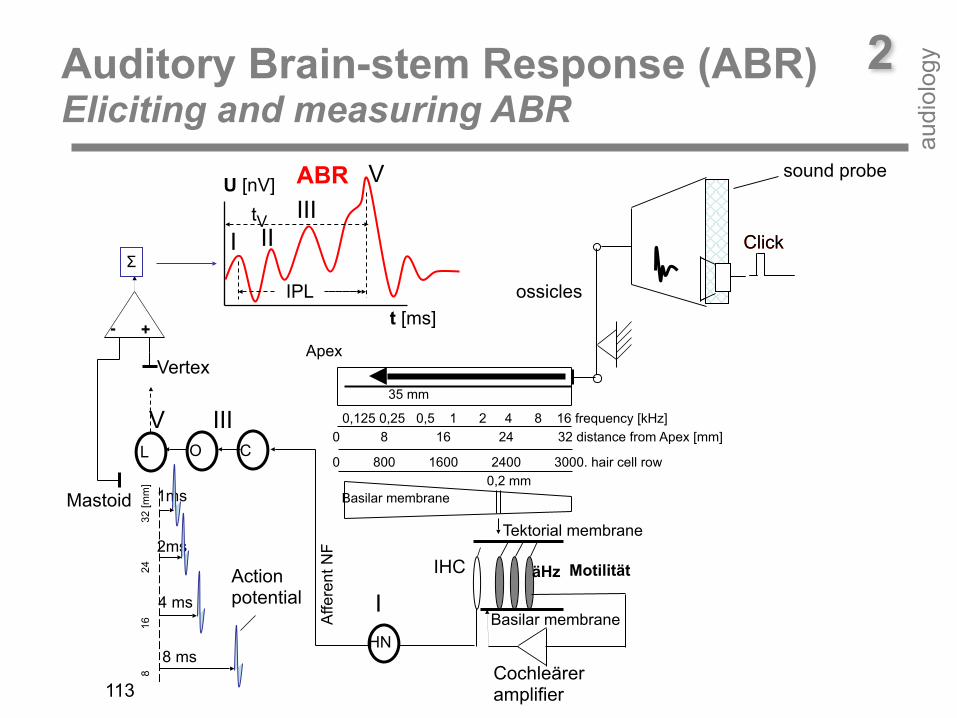
2Auditory Brain-stem Response (ABR) Eliciting and measuring ABR
audi
olog
y
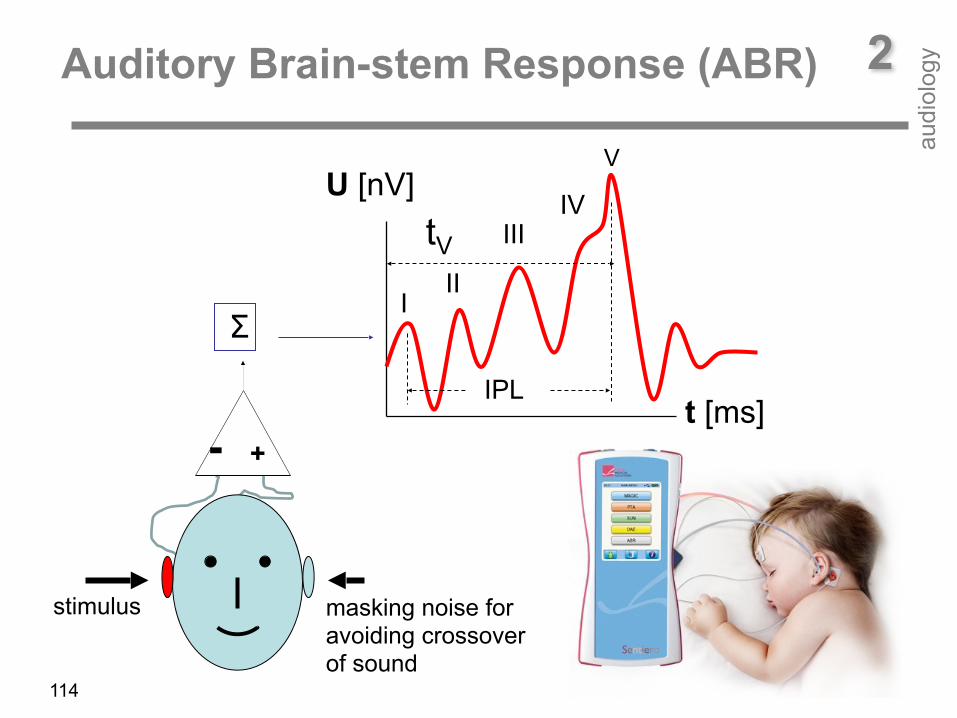
2Auditory Brain-stem Response (ABR)
audi
olog
y
t [ms]
U [nV]
+-
ΣI
II
III
IPL
tV
stimulus
IV
V
masking noise for avoiding crossover of sound
114
Air conduction deficit
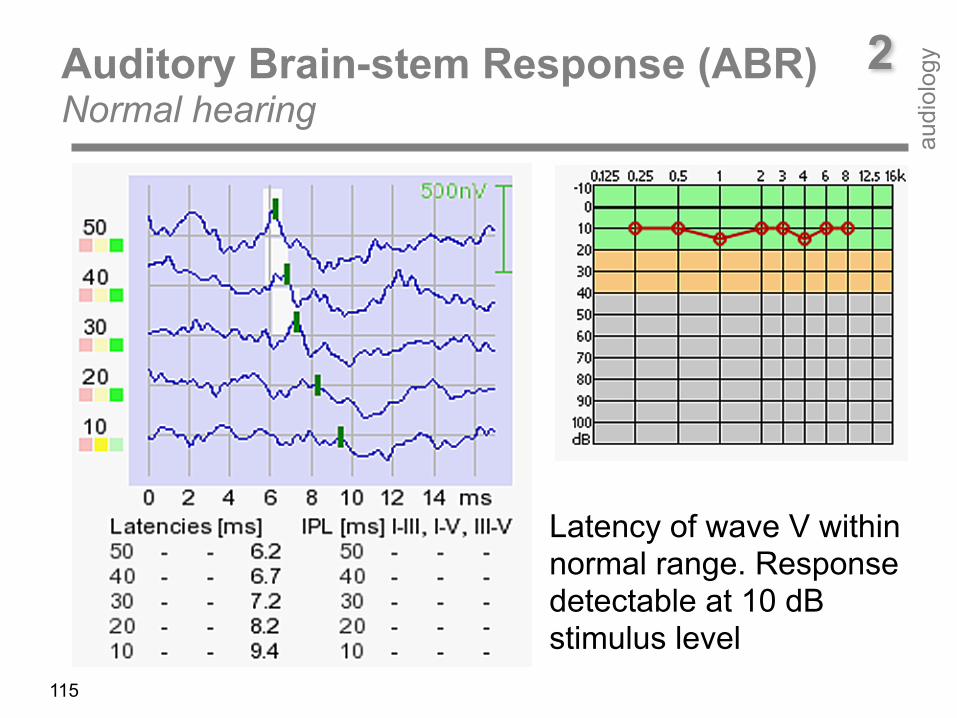
2Auditory Brain-stem Response (ABR) Normal hearing
audi
olog
y
115
Latency of wave V within normal range. Response detectable at 10 dB stimulus level
Air conduction deficit
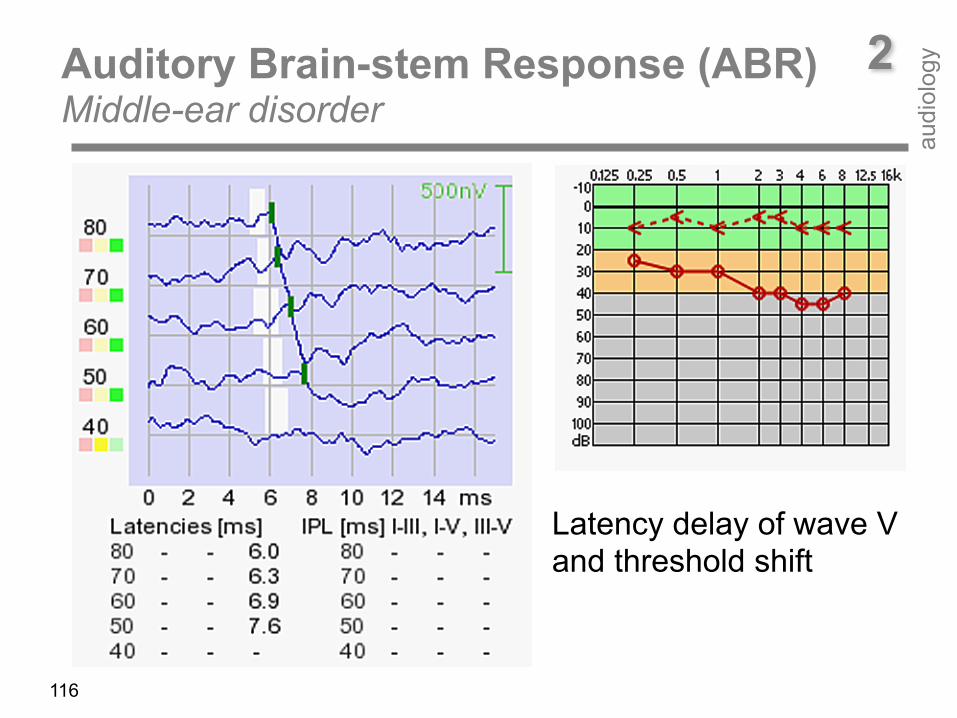
2Auditory Brain-stem Response (ABR) Middle-ear disorder
audi
olog
y
116
Latency delay of wave V and threshold shift
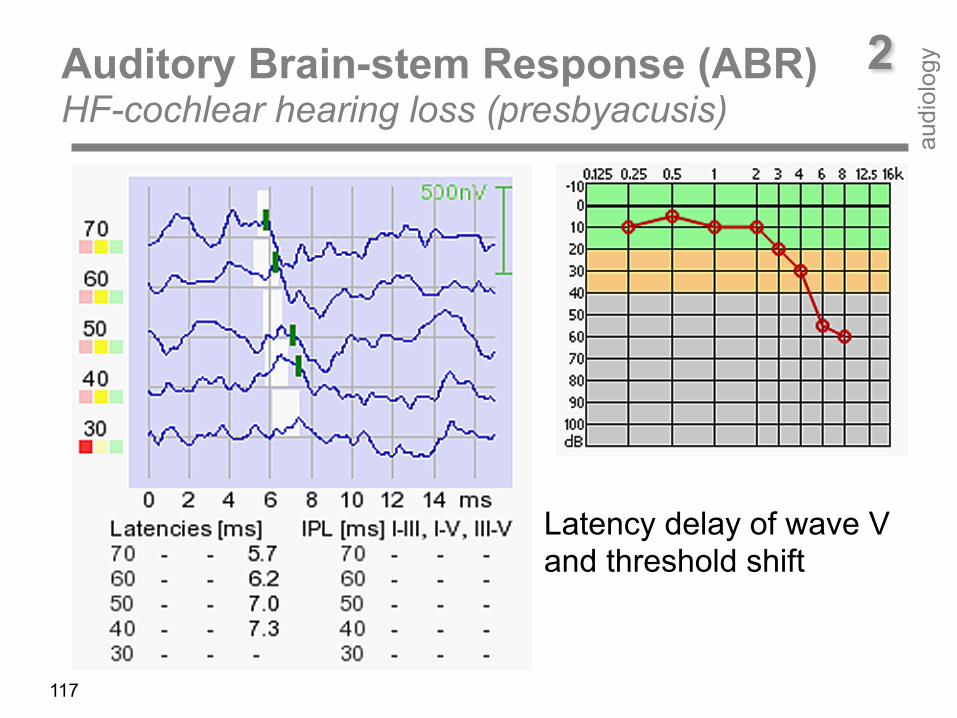
117
Air conduction deficit
2Auditory Brain-stem Response (ABR) HF-cochlear hearing loss (presbyacusis)
audi
olog
y
Latency delay of wave V and threshold shift
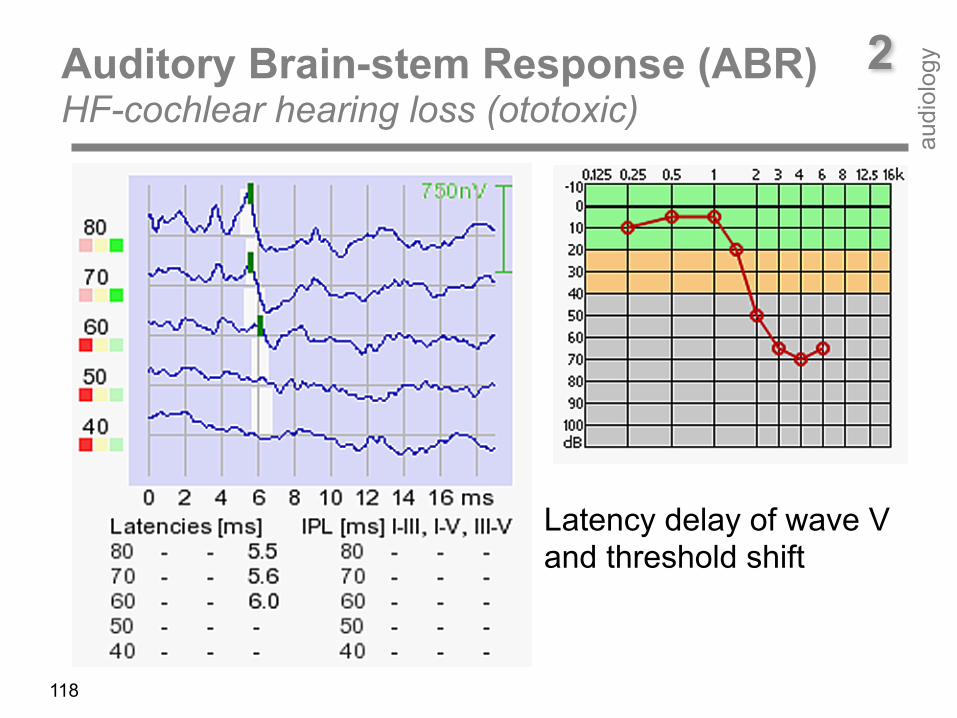
118
Air conduction deficit
2Auditory Brain-stem Response (ABR) HF-cochlear hearing loss (ototoxic)
audi
olog
y
Latency delay of wave V and threshold shift
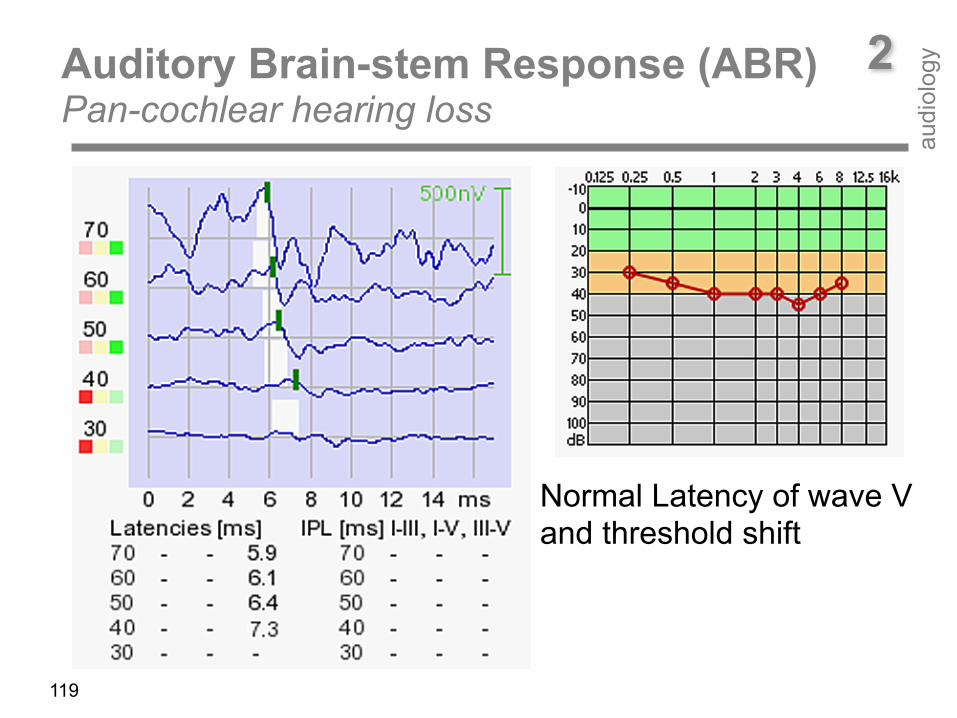
119
Air conduction deficit
2Auditory Brain-stem Response (ABR) Pan-cochlear hearing loss
audi
olog
y
Normal Latency of wave V and threshold shift
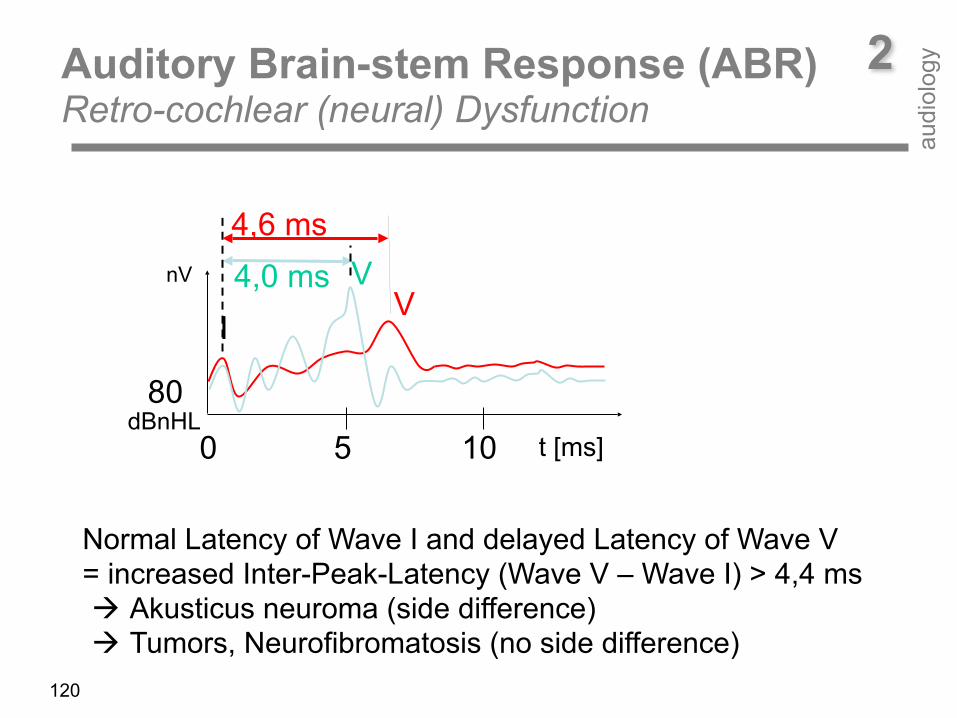
Normal Latency of Wave I and delayed Latency of Wave V = increased Inter-Peak-Latency (Wave V – Wave I) > 4,4 ms ! Akusticus neuroma (side difference) ! Tumors, Neurofibromatosis (no side difference)
80dBnHL
nV V
IV
t [ms]0 5 10
4,0 ms4,6 ms
120
Auditory Brain-stem Response (ABR) Retro-cochlear (neural) Dysfunction
2
audi
olog
y
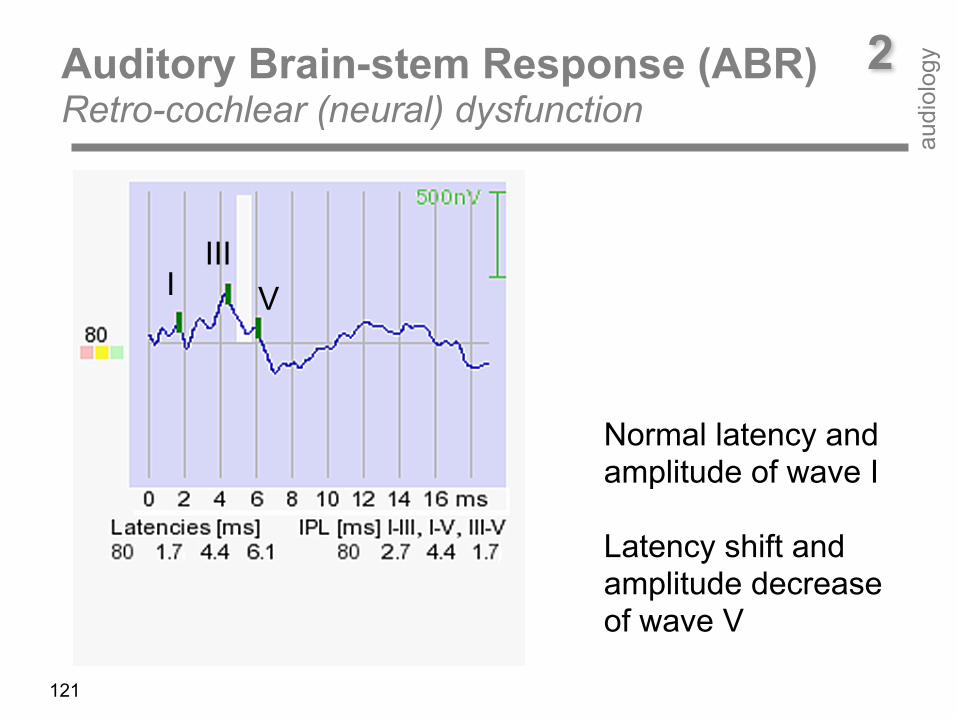
Auditory Brain-stem Response (ABR) Retro-cochlear (neural) dysfunction
121
2
audi
olog
y
IIIVI
Normal latency and amplitude of wave I Latency shift and amplitude decrease of wave V
Auditory Steady State Responses (ASSR) – Stimulus
2
audi
olog
y
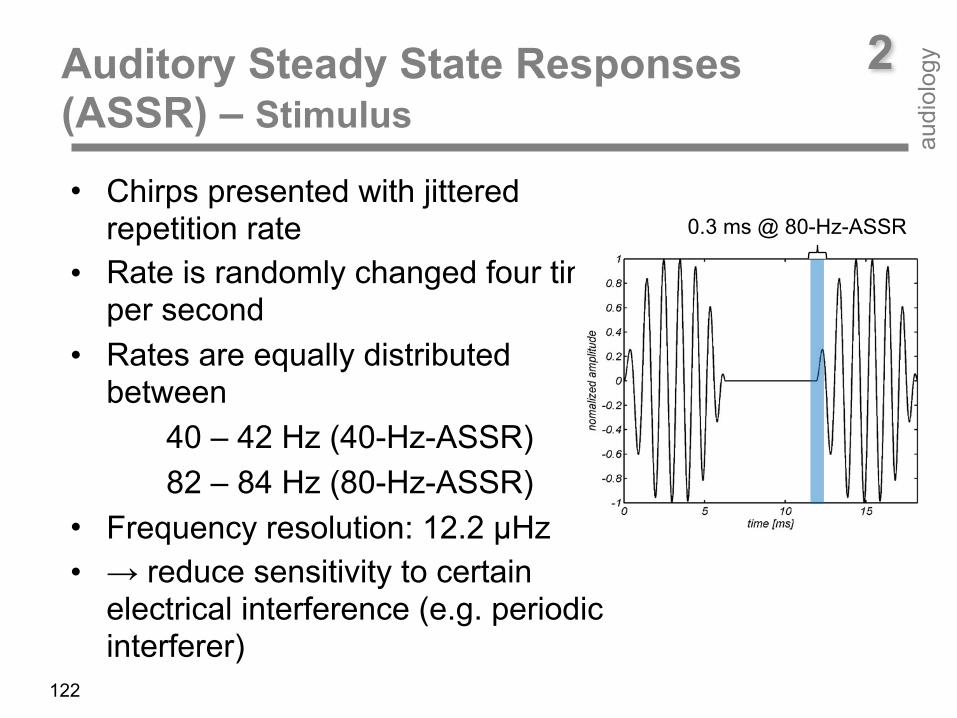
• Chirps presented with jittered repetition rate
• Rate is randomly changed four times per second
• Rates are equally distributed between 40 – 42 Hz (40-Hz-ASSR) 82 – 84 Hz (80-Hz-ASSR)
• Frequency resolution: 12.2 µHz • → reduce sensitivity to certain
electrical interference (e.g. periodic interferer)
122
0.3 ms @ 80-Hz-ASSR
ASSR
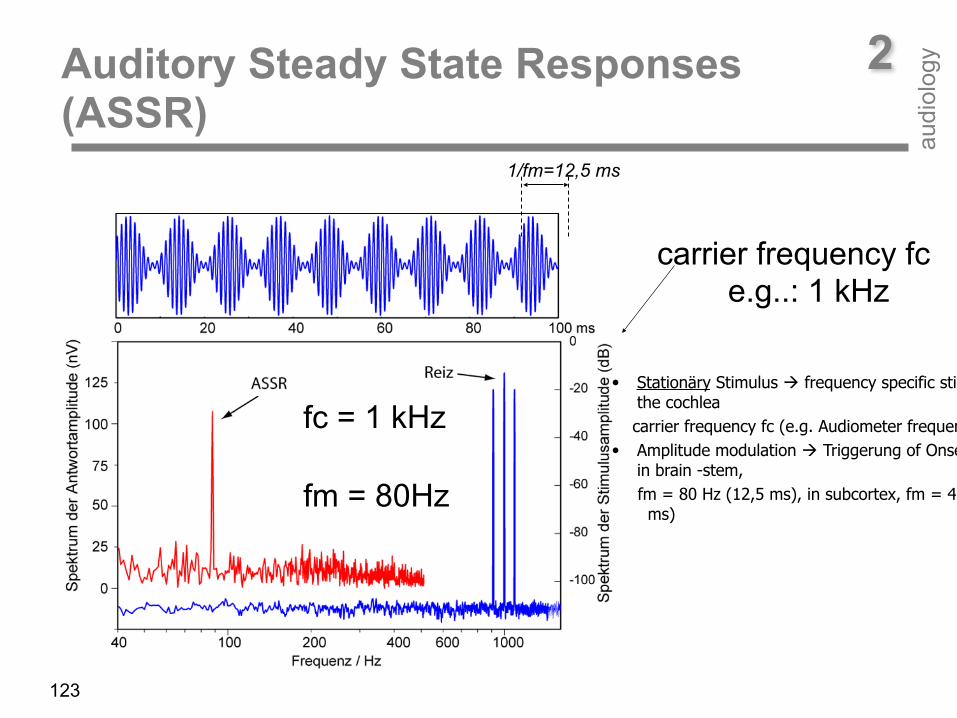
carrier frequency fc e.g..: 1 kHz
fm = 80Hz
1/fm=12,5 ms
fc = 1 kHz
123
Auditory Steady State Responses (ASSR)
2
audi
olog
y
• Stationäry Stimulus ! frequency specific stimulation of the cochlea
carrier frequency fc (e.g. Audiometer frequencies) • Amplitude modulation ! Triggerung of Onset-Neurons
in brain -stem, fm = 80 Hz (12,5 ms), in subcortex, fm = 40 Hz (25
ms)
•
124
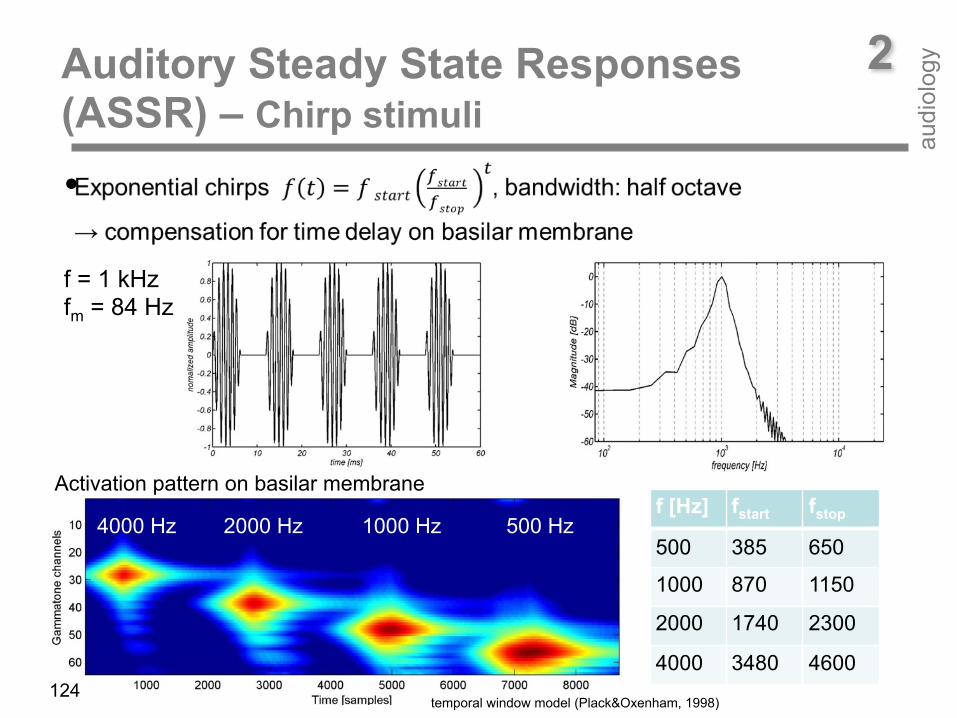
Activation pattern on basilar membrane
4000 Hz 2000 Hz 1000 Hz 500 Hzf [Hz] fstart fstop
500 385 650
1000 870 1150
2000 1740 2300
4000 3480 4600
f = 1 kHz fm = 84 Hz
temporal window model (Plack&Oxenham, 1998)
Auditory Steady State Responses (ASSR) – Chirp stimuli
2
audi
olog
y
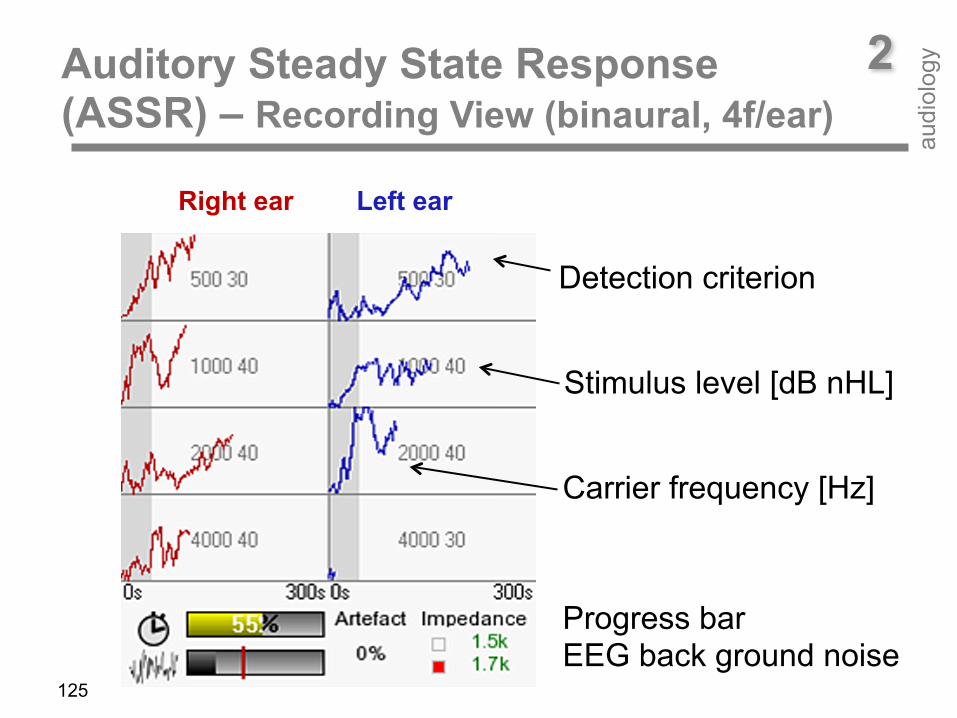
Auditory Steady State Response (ASSR) – Recording View (binaural, 4f/ear)
2
audi
olog
y
125
Detection criterion
Stimulus level [dB nHL]
Carrier frequency [Hz]
Progress bar EEG back ground noise
Right ear Left ear
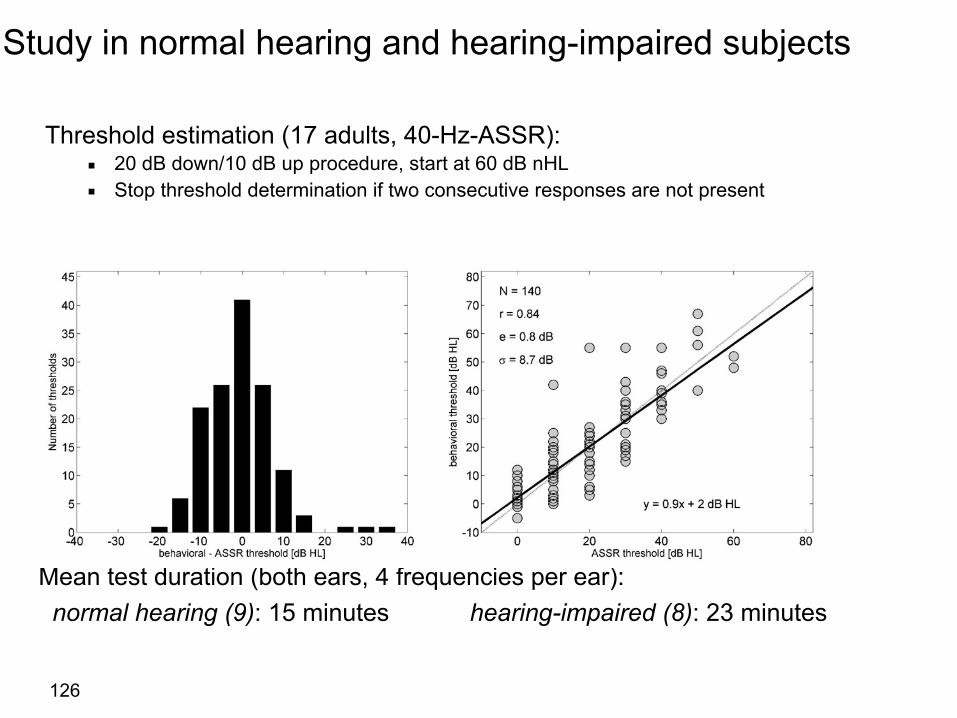
Study in normal hearing and hearing-impaired subjects
Threshold estimation (17 adults, 40-Hz-ASSR): ▪ 20 dB down/10 dB up procedure, start at 60 dB nHL ▪ Stop threshold determination if two consecutive responses are not present
Mean test duration (both ears, 4 frequencies per ear): normal hearing (9): 15 minutes hearing-impaired (8): 23 minutes
126
Conclusion• Resource efficient signal processing and jittered stimulus
presentation make ASSR recording achievable on a handheld device
• Short overall test time – Chirps to compensate delay on basilar membrane – Independent response analyzers for fast test
sequence – High resistance against electrical interference
• Record ASSR anywhere: Child‘s bed, surgery, audiometry booth, etc.
127
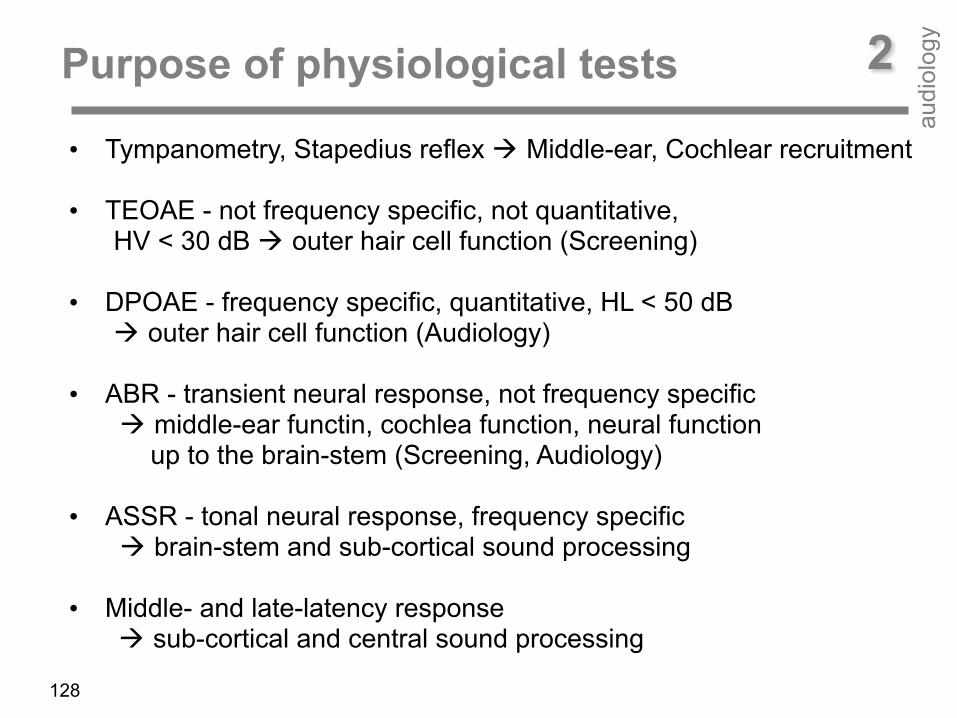
• Tympanometry, Stapedius reflex ! Middle-ear, Cochlear recruitment • TEOAE - not frequency specific, not quantitative, HV < 30 dB ! outer hair cell function (Screening)
• DPOAE - frequency specific, quantitative, HL < 50 dB ! outer hair cell function (Audiology) • ABR - transient neural response, not frequency specific ! middle-ear functin, cochlea function, neural function up to the brain-stem (Screening, Audiology)
• ASSR - tonal neural response, frequency specific ! brain-stem and sub-cortical sound processing
• Middle- and late-latency response ! sub-cortical and central sound processing
128
Purpose of physiological tests 2
audi
olog
y
129
Do you hear the bees flying around the flowers? If not - you should go to somebody to test your hearing using Path medical products!
Purpose of Tests 2
audi
olog
y