Quantum Rod-Sensitized Solar Cell: Nanocrystal Shape Effect on the Photovoltaic Properties
Upload
khangminh22Category
view
2download
0
Understanding Solar Photovoltaic System Performance An Assessment of 75 Federal Photovoltaic Systems
December 2021

Understanding Solar Photovoltaic System Performance
ii
Disclaimer This work was prepared as an account of work sponsored by an agency of the United States Government. Neither the United States Government nor any agency thereof, nor any of their employees, nor any of their contractors, subcontractors or their employees, makes any warranty, express or implied, or assumes any legal liability or responsibility for the accuracy, completeness, or any third party’s use or the results of such use of any information, apparatus, product, or process disclosed, or represents that its use would not infringe privately owned rights. Reference herein to any specific commercial product, process, or service by trade name, trademark, manufacturer, or otherwise, does not necessarily constitute or imply its endorsement, recommendation, or favoring by the United States Government or any agency thereof or its contractors or subcontractors. The views and opinions of authors expressed herein do not necessarily state or reflect those of the United States Government or any agency thereof, its contractors or subcontractors.

Understanding Solar Photovoltaic System Performance
iii
Authors The authors of this report are:
Andy Walker, National Renewable Energy Laboratory (NREL)
Jal Desai, NREL.
Acknowledgments Support for this work from the U.S. Department of Energy’s Federal Energy Management Program (FEMP) is gratefully acknowledged. Within FEMP, the authors would especially like to thank Program Manager Rachel Shepherd and American Association for the Advancement of Science (AAAS) Science & Technology Policy Fellow Nichole Liebov. The assistance of the staff of 16 federal agencies and subagencies that provided system descriptions and performance data is gratefully acknowledged. Jake Bever and Pragadeesh Meenakumar of NREL processed site data, performed computer simulations, and prepared reports for each site. The assistance of Katie Wensuc and Caitlin Dorsey in editing the document is gratefully acknowledged.

Understanding Solar Photovoltaic System Performance
iv
List of Acronyms ANSI American National Standards Institute
API Application Programming Interface
ARRA American Recovery and Reinvestment Act
DC direct current
DHS Department of Homeland Security
DoD Department of Defense
DOE Department of Energy
DOI Department of the Interior
DOT Department of Transportation
EERE Energy Efficiency and Renewable Energy
FEMP Federal Energy Management Program
GSA General Services Administration
IEC International Electrotechnical Commission
NASA National Aeronautics and Space Administration
NREL National Renewable Energy Laboratory
NSRDB National Solar Radiation Database
O&M operations and maintenance
POA Plane of Array
PV photovoltaic
SAM System Advisor Model
TWC The Weather Company
USACE U.S. Army Corps of Engineers
USDA U.S. Department of Agriculture
VA Veterans Affairs

Understanding Solar Photovoltaic System Performance
v
Nomenclature δ Temperature coefficient of power (1/°C), for example, 0.004 /°C
ηBOS Balance-of-system efficiency; typically, 80% to 90%, but stipulated based on published inverter efficiency and other system details such as wiring losses.
A Availability, (total time – downtime)/total time
CV coefficient of variation for population
degr An age degradation factor that is 1.0 initially but degrades at the rate Rd (per year) to represent the cumulative lost production over a multiyear analysis period
E Energy, expressed in units of kWh
ER Energy Ratio, total measured production divided by total model production, thus considering the effects of both Availability and Performance Ratio.
G Irradiance, incident flux of radiant power per unit area, expressed in units of W/m2
G ref Reference value of Irradiance, equal to 1000 W/m2
G POA Plane of Array Irradiance, the sum of direct, diffuse, and ground-reflected irradiance incident upon an inclined surface parallel to the plane of the modules in the photovoltaic array, also known as POA Irradiance and expressed in units of W/m2.
H Irradiation, irradiance integrated over a specified time interval expressed in units of kWh/m2
P Power, instantaneous power, or product of current and voltage, expressed in units of kW
PR Performance Ratio based on measured production divided by model-estimated production over the same time period, considering only when the plant is “available.”
PTC PV USA test conditions, reference values of in-plane irradiance (1,000 W/m2), ambient air temperature (20°C), and the reference spectral irradiance defined in International Electrochemical Commission Standard 60904-3
r desired relative error
STC Standard test conditions, reference values of in-plane irradiance (1,000 W/m2), photovoltaic cell junction temperature (25°C), and the reference spectral irradiance defined in International Electrochemical Commission Standard 60904-3
Tambient Ambient temperature (°C), averaged over the duration of the time interval t2 ‒ t1

Understanding Solar Photovoltaic System Performance
vi
Rd Degradation rate expressed as percentage reduction in output from the previous year; reportedly on the order of 0.6% to 1% per year (Kurtz et al. 2016)

Understanding Solar Photovoltaic System Performance
vii
Executive Summary This report presents a performance analysis of 75 solar photovoltaic (PV) systems installed at federal sites, conducted by the Federal Energy Management Program (FEMP) with support from National Renewable Energy Laboratory and Lawrence Berkeley National Laboratory. Results are based on production data collected from these systems, provided by federal agencies participating in the FEMP’s Solar PV Performance Initiative. Production data was combined with coincident insolation and ambient temperature to analyze how actual performance compares with a performance model. FEMP collaborated with staff of 16 federal agencies and subagencies to collect the information required to analyze the performance of each PV system. The systems represent a total capacity of 30,714 kW and range in size from 1 kW to 4,043 kW, with an average size of 410 kW, and were installed between 2011 and 2020.
System data is analyzed for key performance indicators including availability, performance ratio, and energy ratio by comparing the measured production data to modeled production data. The analysis utilized the National Renewable Energy Laboratory’s System Advisor Model (SAM), which combines a description of the system (such as inverter capacity, temperature derating, and balance-of-system efficiency) with environmental parameters (coincident solar and temperature data) to calculate predicted performance. The performance metrics are calculated by aligning the measured production data with the model estimate on an hour-by-hour, day-by-day, or month-by-month basis (depending on the interval resolution of the production data). A report with a system description, photographs of the system, special assumptions made for the site, a graph of measured and modeled production, a table of key performance indicators, and links to operations and maintenance resources that might improve performance was produced and delivered to site and agency staff with a short online briefing. This report summarizes the results across the 75 systems for which this analysis was conducted.
Table ES-1 shows data for each site anonymized and combined in a statistical analysis to characterize performance of the entire set of federal PV systems analyzed.
Table ES-1. Key Performance Indicators Resulting From the Analysis of 75 Federal PV Systems
Minimum Average Median Maximum Standard Deviation
Availability 31.0% 95.1% 98.0% 100.0% 8.8%
Performance Ratio 46.0% 78.6% 79.0% 101.0% 11.7%
Energy Ratio 29.0% 74.6% 76.0% 101.0% 14.1%
Average availability of this sample of federal systems was measured at 95%, suggesting that federal agencies are doing a good job of reacting quickly and minimizing downtime. When available, these systems delivered, on average, 79% of the power estimated by the model. In contrast, the energy ratio, which combines the effects of both downtime and partial performance, averaged 75%. The performance ratio featured a standard deviation of 11.7%, indicating
Understanding Solar Photovoltaic System Performance
viii
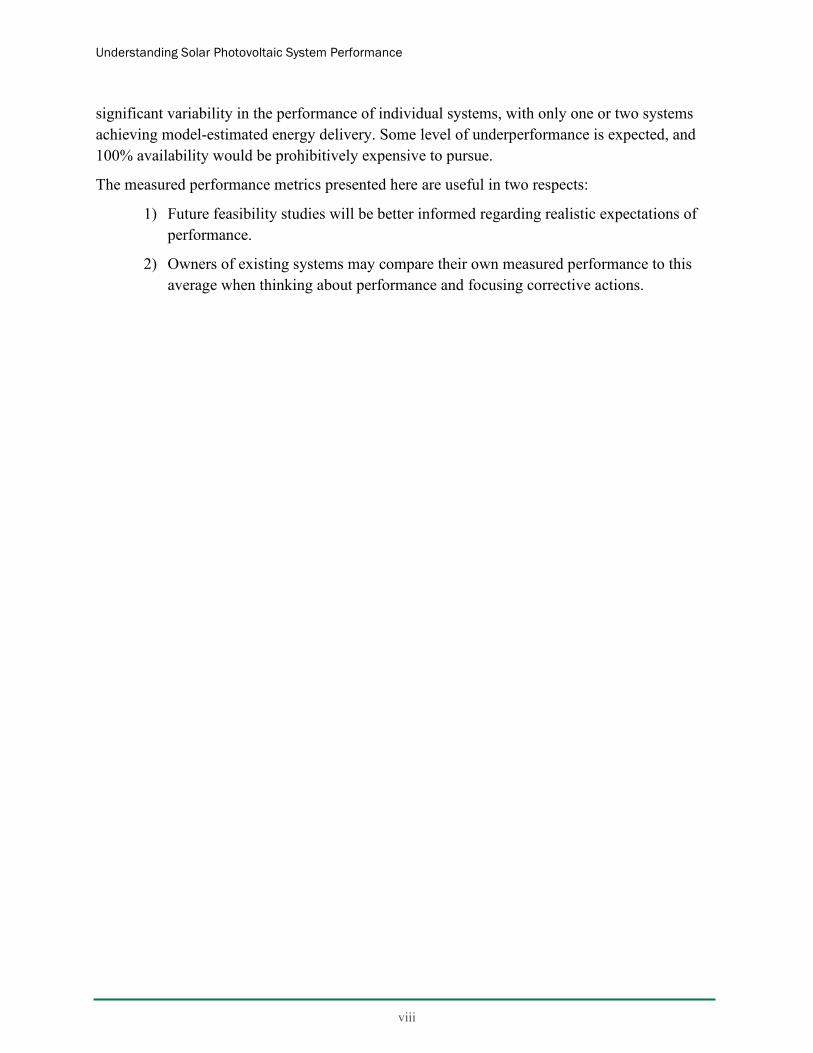
significant variability in the performance of individual systems, with only one or two systems achieving model-estimated energy delivery. Some level of underperformance is expected, and 100% availability would be prohibitively expensive to pursue.
The measured performance metrics presented here are useful in two respects:
1) Future feasibility studies will be better informed regarding realistic expectations of performance.
2) Owners of existing systems may compare their own measured performance to this average when thinking about performance and focusing corrective actions.

Understanding Solar Photovoltaic System Performance
ix
Table of Contents Executive Summary .......................................................................................................................................... vii
1 Introduction ................................................................................................................................................... 1
2 Background ................................................................................................................................................... 3 2.1 Key Performance Indicators of PV Systems Measured in Other Studies ....................................... 4
3 Research Methodology ................................................................................................................................. 4 3.1 Data Collection ............................................................................................................................... 5 3.2 Data Analysis .................................................................................................................................. 7 3.3 Report for Each PV System ............................................................................................................ 9 3.4 Limitations and Uncertainty ......................................................................................................... 10
4 Key Findings .............................................................................................................................................. 11 4.1 Availability ................................................................................................................................... 12 4.2 Performance Ratio ........................................................................................................................ 12 4.3 Energy Ratio ................................................................................................................................. 13
5 Conclusion and Discussion ....................................................................................................................... 14 5.1 Key Performance Indicators ......................................................................................................... 14 5.2 Interpretation and Use of Results ................................................................................................. 15 5.3 Other Observations From Site Staff ............................................................................................. 15 5.4 Next Steps And Resources for Agencies Interested in Improving Photovoltaic System
Performance .................................................................................................................................. 16
References ......................................................................................................................................................... 18
Appendix ........................................................................................................................................................... 21

Understanding Solar Photovoltaic System Performance
x
List of Figures
Figure 1. Number of PV systems installed by federal agency. Excludes agencies reporting fewer than 30 systems. ......................................................................................................................................................... 1
Figure 2. Number of federal solar PV systems by year of installation. ........................................................... 2
Figure 3. Methodology of the performance assessment to compare records of actual measured production with computer models based on system description and climate data. ..................................................... 5
Figure 4. User interface for SAM used to predict modeled performance of each system. ............................. 8
Figure 5. Total daily measured PV production (darker shade) compared to expected modeled production (lighter shade) across five years. ................................................................................................................. 9
Figure 6. Distribution of values of "Availability" across all 75 PV systems. .............................................. 12
Figure 7. Distribution of values of "Performance Ratio" across all 75 PV systems. ................................... 13
Figure 8. Distribution of values for "Energy Ratio" across all 75 PV systems. ........................................... 14
List of Tables Table ES-1. Key Performance Indicators Resulting From the Analysis of 75 Federal PV Systems ........... vii
Table 1. Minimum, Average, Median, and Maximum Size (kW DC) of PV Systems Included in the Sample of 75 Systems .................................................................................................................................. 6
Table 2. Expected Energy Loss Assumptions Used in the SAM Estimate of Production .............................. 8
Table 3. Example Site Annual PV Performance Metrics Including Availability, Performance, and Energy Ratio ........................................................................................................................................................... 10
Table 4. Statistical Summary of Key Performance Indicators Across All 75 PV Systems ......................... 11
Table 5. Availability Statistics ......................................................................................................................... 12
Table 6. Performance Ratio Statistics ............................................................................................................. 12
Table 7. Energy Ratio Statistics ...................................................................................................................... 13

Understanding Solar Photovoltaic System Performance
1
1 Introduction As of 2020, the federal government has installed more than 3,000 solar photovoltaic (PV) systems. PV systems can have 20- to 30-year life spans. As these systems age, their performance can be optimized through proper operations and maintenance (O&M). This report presents the findings of the Federal Energy Management Program’s (FEMP’s) Solar PV Performance Initiative, which aims to understand the performance of the federal PV fleet as compared to expected performance. The study was motivated by a desire to help agencies to understand system performance, address underperformance, and anticipate realistic performance in future feasibility studies. The study also supports FEMP in making recommendations to agencies regarding the design, implementation, and maintenance of PV systems. Figure 1 displays the distribution of 3,041 federal PV systems among agencies, including National Aeronautics and Space Administration (NASA), Army Corps of Engineers (USACE), Department of Transportation (DOT), Veterans Affairs (VA), General Services Administration (GSA), U.S. Department of Agriculture (USDA), Department of Homeland Security (DHS), Department of Energy (DOE), Department of the Interior (DOI), and Department of Defense (DoD). As the largest energy consumer in the federal government, DoD predictably has the greatest number of PV systems installed. With many small, remote sites, DOI has a large number of small systems.
Figure 1. Number of PV systems installed by federal agency. Excludes agencies reporting fewer than 30 systems.
Source: DOE (2021)
Figure 2 groups quantities of federal solar PV systems according to the year in which they were placed in service. Many federal PV systems were installed between 2010 and 2014, funded through the 2009 American Recovery and Reinvestment Act (ARRA). Over a decade later, the way in which these PV assets are performing in real-world conditions may provide valuable insights to agencies and other entities considering installing solar PV systems.
1251981
350174
1138885
673730
0 200 400 600 800 1000 1200 1400
DoDDOI
DOEDHS
USDAGSA
VADOT
USACENASA
Number of systems
Number of Federal PV Systems by Agency

Understanding Solar Photovoltaic System Performance
2
Figure 2. Number of federal solar PV systems by year of installation.
Source: DOE (2021)
Three key metrics are useful for understanding PV performance and reliability: availability, performance ratio (sometimes abbreviated as PR), and energy ratio.
• Availability is the actual measured hours of production divided by the modeled hours of production. An unavailable hour is easily identified by an output of zero, but values are often not exactly zero—an hour is therefore tallied as unavailable if the measured output is less than 5% of the model output.
• Performance ratio is the measured production divided by modeled production during timesteps when the system is available.
• Energy ratio is the total measured production divided by total modeled production, and thus includes both the effects of availability (downtime) and performance ratio (inefficiency) in the same metric.
Availability and performance definitions may be found in International Electrotechnical Commission (IEC) standards 63019 (2019) and 61724 (2017). Availability and performance ratio are reported separately because they affect management actions and life cycle cost in different ways as described in Walker et al. (2020b)—lower availability reduces operating hours and a lower performance ratio reduces power output. After presenting early reports to agency staff, we realized what staff are really interested in is the “bottom line”—how much energy was produced (in kWh or MWh) in each year—so we introduce an energy ratio metric as the ratio of measured

Understanding Solar Photovoltaic System Performance
3
energy delivery to model-prediction of energy delivery, thus including the effects of both availability and performance ratio.
These three performance indicators were calculated for each system for which agencies provided data, and the data for each was anonymized and consolidated to provide distributions for these three performance indicators across the sample of 75 systems.
2 Background Performance ratings of PV modules are measured under standard test conditions (STC) of 1,000 W/m2 of sunlight and 25°C cell temperature. In practice, however, the intensity of sunlight is usually less than 1,000 W/m2, and the cell temperature is typically hotter than 25°C. Additionally, once PV systems are deployed, several factors can impact their expected production (electric energy generated), including solar resource, temperature, and degradation due to the age of the system. Although the solar resource is variable, most of the variability is predictable based on time of day, time of year, and the angle that sunlight hits the PV module surface. In fact, the solar resource would be perfectly predictable based on clear-sky models if not for clouds, which are not as predictable. Therefore, we rely on reported satellite data for clouds and solar resource at each location when assessing the expected performance of a PV system. PV module output decreases with temperature according to a temperature coefficient, δ, which is the percent reduction in power per degree Celsius above a reference temperature. PV module efficiency unavoidably degrades with age at a rate, degr, of about 0.5% per year. Electrical losses will also occur throughout the balance of system, which can be estimated. Failure rates are also higher in later years as the equipment ages, increasing downtime. Events such as severe weather can also impact PV system performance in unpredictable ways. A comparison of the system’s actual output with the expected output can be used to quantify underperformance.
Standard methods to characterize PV system performance have evolved over time and methods still vary among different reports. Even IEC 61724-1, a single standard, outlines three different calculations of performance ratio. The definition of PR is in all three cases the quotient of the system’s final yield to its reference yield, which is an expectation of performance. The three cases in IEC 61724-1 differ in the definition of the reference yield. Reference yield may be based on STC rating; on PVUSA Test Conditions (PTC) rating; on PTC rating adjusted for solar resource and temperature, or as determined by simulation model results. When interpreting results, the definition of “reference yield” should be specified explicitly, and when comparing values, it is important to consider the calculation method. Dierauf et al. (2012) describe how to account for weather patterns and adjust the performance ratio based on sunlight and temperature to give consistent results and to use as a metric for performance guarantees. In this study, we use the National Renewable Energy Laboratory’s (NREL’s) System Advisor Model (SAM) to calculate the reference yield in the denominator of the PR because this is the most detailed, non-proprietary, and widely recognized performance assessment software (NREL 2021).

Understanding Solar Photovoltaic System Performance
4
2.1 Key Performance Indicators of PV Systems Measured in Other Studies In the paper “Performance ratio revisited: is PR > 90% realistic?” Reich et al. (2012a) report the performance ratio (based on STC, called PRSTC) of 100 systems in Germany to be between 70% and 90% for the year 2010, with a median of 84%. They also found that measurements based on irradiance from reference cells were 2%‒4% higher than those based on more accurate pyranometers. In “Review of PV Performance Ratio Development,” Reich et al. (2012b) present performance ratio data and how it has evolved over the past 30 years, ranging from as low as 50% in the 1980s to over 90% currently due to improvements in components and reductions in shading. In the book chapter “Introduction to Photovoltaic System Performance,” Pearsall (2017) covers the basics of PV system performance and the different parameters that may affect the PV system performance ratio. “Weather-Adjusted Performance Guarantees” (Hollingsworth 2010) illustrates a methodology that uses the monthly production data set and location-specific solar index to calculate accurate weather-based performance of PV systems, which can be useful to suppliers and insurers when they offer performance guarantees.
Deline et al. (2020) reported on the performance of 250 PV systems throughout the United States, comprising 157 megawatts (MW) direct current (DC) capacity, to have an average PR of 93.5%. First-year start-up issues, snowfall, and inverter downtime were cited as the reasons for PR averaging less than 1. Analysis from 2,200 PV systems in California reporting into the open System Performance and Reliability Clearinghouse reports an average weather adjusted performance ratio of 91.7% (Walker et al. 2019).
While these other studies use differing definitions and calculations of performance ratio, they all indicate that performance equivalent to 100% of reference yield is an unrealistic expectation. Based on the authors’ judgement as well as the above data, and considering that phenomena like soiling are not included in our reference yield (so that we can measure soiling as underperformance in actual data), availability of 95%, performance ratio of 85%, and energy ratio of 79% may be realistic expectations.
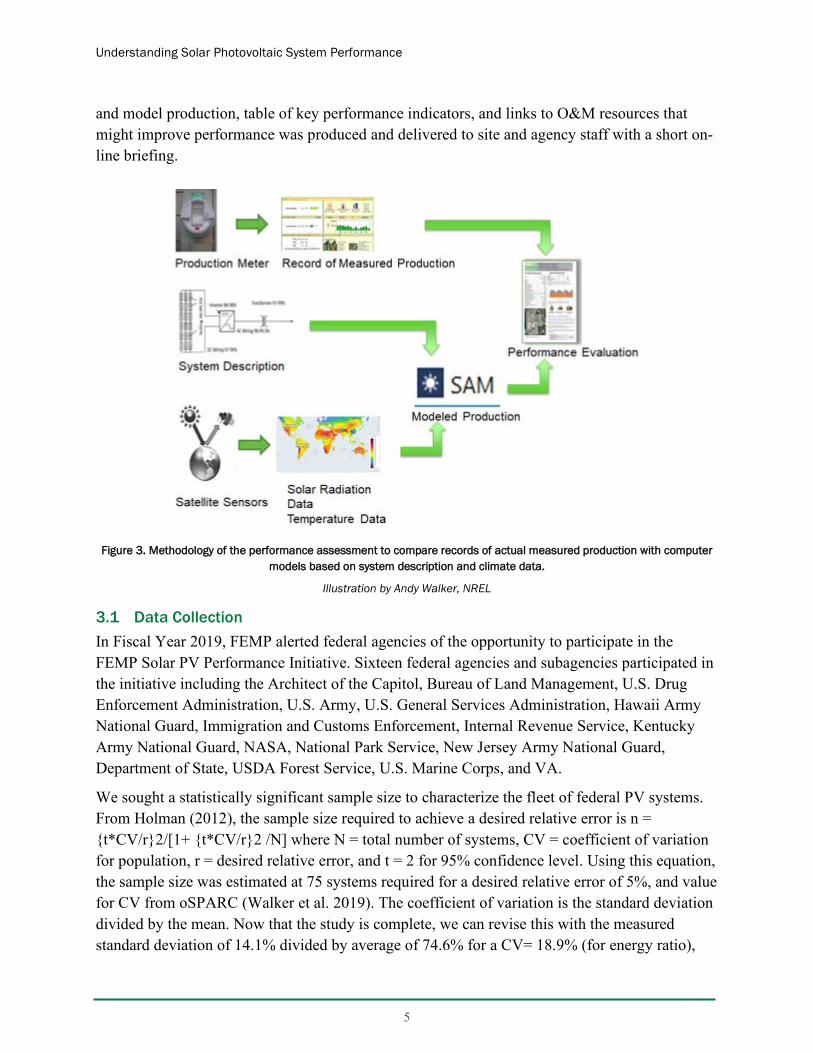
3 Research Methodology The research methodology is illustrated in Figure 3. For each PV system, the agency provided the record of measured production over a time period (often several years) and the system description. The production data was often delivered as an Excel spreadsheet of time series data but in many cases the agency provided NREL with log-in credentials to the monitoring platform to download the production data. Solar radiation and temperature data was then obtained from the National Solar Radiation Database (NSRDB) or The Weather Company (TWC, an IBM data company), depending on the year of measured production provided by the agency. NREL staff estimated the modeled hourly production in SAM based on the system description and solar resource data. An hour-by-hour comparison of measured production to model production was then used to calculate the key metrics of system performance. A report with system description, photograph of the system, special assumptions made for the site, graph of measured production
Understanding Solar Photovoltaic System Performance
5
and model production, table of key performance indicators, and links to O&M resources that might improve performance was produced and delivered to site and agency staff with a short on-line briefing.
Figure 3. Methodology of the performance assessment to compare records of actual measured production with computer
models based on system description and climate data.
Illustration by Andy Walker, NREL
3.1 Data Collection In Fiscal Year 2019, FEMP alerted federal agencies of the opportunity to participate in the FEMP Solar PV Performance Initiative. Sixteen federal agencies and subagencies participated in the initiative including the Architect of the Capitol, Bureau of Land Management, U.S. Drug Enforcement Administration, U.S. Army, U.S. General Services Administration, Hawaii Army National Guard, Immigration and Customs Enforcement, Internal Revenue Service, Kentucky Army National Guard, NASA, National Park Service, New Jersey Army National Guard, Department of State, USDA Forest Service, U.S. Marine Corps, and VA.
We sought a statistically significant sample size to characterize the fleet of federal PV systems. From Holman (2012), the sample size required to achieve a desired relative error is n = {t*CV/r}2/[1+ {t*CV/r}2 /N] where N = total number of systems, CV = coefficient of variation for population, r = desired relative error, and t = 2 for 95% confidence level. Using this equation, the sample size was estimated at 75 systems required for a desired relative error of 5%, and value for CV from oSPARC (Walker et al. 2019). The coefficient of variation is the standard deviation divided by the mean. Now that the study is complete, we can revise this with the measured standard deviation of 14.1% divided by average of 74.6% for a CV= 18.9% (for energy ratio),

Understanding Solar Photovoltaic System Performance
6
and update the population to N = 3,041 systems. These revisions result in a relative error of 4.3% associated with the sample of 75 systems actually analyzed.
The 75 fielded systems analyzed represent a total 30.7 MW of installed capacity. While the average system size was 409.6 kW DC (Table 1), the system sizes range from 1 kW to 4,043 kW. The high proportion of small systems contributes to a median value of 56.7 kW.
Table 1. Minimum, Average, Median, and Maximum Size (kW DC) of PV Systems Included in the Sample of 75 Systems
Minimum Average Median Maximum
System Size (kW DC) 1.0 409.6 56.7 4043.2
System Description NREL and FEMP requested a “system description” from each agency or subagency with information about each PV system sufficient to inform the SAM inputs, including:
1. Location (longitude and latitude)
2. System size (kW DC)
3. System installation date
4. Tilt angle up from the horizontal
5. Azimuth angle east or west of due south
6. Tracking option (fixed tilt or tracking)
7. PV module make and model number
8. Inverter make, model, and topology of inverter arrangement.
The SAM computer program includes a library of PV modules and inverters, and for most sites the exact make and model could be selected. When not already in the library, NREL staff obtained the product specifications from manufacturers’ websites and added the inverter or PV module to the program library. Important information on PV modules includes rated capacity (Watts) and a temperature coefficient affecting efficiency. For the inverter, important information includes the rated capacity and curve of efficiency versus power level.
Coincident Weather Data The SAM model computes power output each hour based on coincident solar radiation and temperature obtained from satellite data rather than on-site measurements. Most of the sites do not have on-site solar measurements, and some of those that do are affected by sensor calibration and maintenance, sensor cleaning, and data connectivity. High-spatial-and-temporal-resolution satellite-based weather data for the location of each PV system and the coincident times was obtained from either The Weather Company,1 an IBM data service that provides solar resource
1 https://www.ibm.com/weather

Understanding Solar Photovoltaic System Performance
7
information, or from the National Solar Radiation Database (NSRDB)2 (Sengupta 2018). The NSRDB data set is serially complete, is available at high (four-kilometer) spatial resolution across the United States, has a 30-minute time resolution, and avoids the complications of imperfect instrument maintenance. The selection of the weather source was dependent on the proximity to the actual site and year of production data received. NSRDB has data for preceding years, whereas data from TWC has more recent data and was used for the current year. NSRDB coverage is limited to the United States, Puerto Rico, and Guam, so TWC was used for international sites. The data for each location was downloaded on an hourly basis to match hourly production data, or down-sampled to match data provided at daily rather than hourly intervals. The important parameters in the weather data for each timestep are the direct normal solar radiation, diffuse radiation, and the temperature. With these weather parameters, SAM can calculate the incident solar radiation in the Plane of Array (POA), the PV module and inverter efficiency, and the power output for each hour.
3.2 Data Analysis NREL used the PV system characteristics and weather data to model estimated performance using SAM, and then compared modeled generation to measured generation.
Inputs to SAM are chosen strategically to include the effect of some losses and isolate other losses in the measurement of performance. For example, losses in wiring resistance are included in SAM but losses due to soiling or system age are not. A PV system operator might only be interested in the magnitude of losses that can be measured by comparison to a model that does not correct for those losses (“measurable losses”), such as soiling, whereas predictable sources of losses like wiring resistance are included in the expected model energy calculation and reduce the model estimate, so losses due to these “predictable” losses do not show up in the analysis as a source of underperformance because the model has been corrected for them. For this effort, we choose to include losses for predictable effects like wiring loss and other balance-of-system efficiencies while omitting measurable losses like array soiling and inverter downtime from the expected energy production. Table 2 shows a complete listing of both measurable and predictable loss assumptions. Figure 4 shows the SAM user interface by which site-specific parameters are entered into the SAM computer program for analysis.
2 https://nsrdb.nrel.gov/

Understanding Solar Photovoltaic System Performance
8
Table 2. Expected Energy Loss Assumptions Used in the SAM Estimate of Production
Predictable Losses Value in SAM
Mismatch 2%
Wiring 2%
Connections 0.5%
Light Induced Degradation 1.5%
Nameplate 1%
Measurable Losses
Soiling 0%
Snow Cover 0%
Shading 0%
Availability 0%
Degradation Due to Age 0%
In other words, by setting the effect of measurable losses to zero in the model, these losses will be exposed as underperformance in a comparison of measured to modeled production. For example, the measured performance ratio might decline from the model performance over the years, exposing degradation due to age.
An hour-by-hour comparison of measured production to modeled production was then used to calculate the three key metrics of system performance—availability, performance ratio, and energy ratio.
Figure 4. User interface for SAM used to predict modeled performance of each system.

Understanding Solar Photovoltaic System Performance
9
3.3 Report for Each PV System NREL provided individual site assessments with these PV reliability metrics to participating sites and agencies or subagencies, followed by phone consultations to review results.
Each report includes:
• System description as provided by the agency (including photo if available) and assumptions
• Graph comparing measured output and modeled production over time
• Key performance indicators (availability, PR, and energy ratio) for each year of the analysis period
• Links to FEMP resources related to O&M online trainings, procurement specifications for O&M contracts, and other useful information regarding PV system O&M.
Figure 5 provides an example of a graph comparing the measured (darker shade) versus modeled (lighter shade) daily production of a PV system over a five-year period. Table 3 provides the annual key performance metrics for this same system. Year-over-year performance metrics show noticeable declines in performance and energy ratios for 2018 and 2019. This was attributed to a problem with the inverter. Site staff worked with their O&M contractor to identify the issue. After the repair was completed, PV production returned to expected levels.
Figure 5. Total daily measured PV production (darker shade) compared to expected modeled production (lighter shade)
across five years.

Understanding Solar Photovoltaic System Performance
10
Table 3. Example Site Annual PV Performance Metrics Including Availability, Performance, and Energy Ratio
2015 2016 2017 2018 2019 2020
Availability 85% 98% 98% 97% 89% 97%
Performance 99% 91% 91% 78% 66% 91%
Energy Ratio 81% 90% 90% 77% 58% 98%
An example of the deliverable that was provided for each system can be found in the Appendix. For the purpose of this report, all the data from the individual reports was then aggregated and anonymized to calculate the key performance metrics of the sample of federal PV systems.
3.4 Limitations and Uncertainty Identified sources of uncertainty and limitations of the method are described below. Combining these measurement uncertainties in a root-square calculation results in an overall uncertainty of +/-10.6% in the calculation of performance ratio.
Gaps in PV performance data: Some PV assessments relied on incomplete or low-resolution measured production data, which affects calculation of availability metrics. In some cases, the data was missing for ranges of dates. If the team could ascertain that the system was down during that period, it was tallied as “unavailable,” but if the status was unknown, the missing dates were simply excluded from the analysis and calculation of performance metrics. To be included in the analysis, a site had to provide a minimum of one year of production data, although most sites provided multiple years of data.
Moreover, for some sites, the research team received low-resolution (e.g., monthly, quarterly, daily) measured production data instead of the ideal 15-minute or hourly interval data. In these cases, the performance ratio and the energy ratio are meaningful over the monthly time period, but the system would have to be down all month to affect the availability calculations. Many systems or individual inverters are indeed down for months at a time, as reflected in the data. When averaging availability across a population of systems, the data of different time resolutions. Therefore, the fleet-wide average of availability is higher than it would be if high-resolution data were available for all sites.
Sample size limitations: The sample of 75 systems for this assessment was small and not randomly selected—systems lacking good monitoring would be more likely to volunteer for the FEMP assessment. A small sample size increases the relative error; with 75 systems, the relative error would be +/- 5%. Similarly, while the sample has some geographic diversity, located across 20 states and three countries, a large number of sites (31) were provided by one subagency and were all located in the same state. This limited sample size limits our ability to pinpoint specific PV system characteristics based on location and environmental conditions. The small sample size also makes it hard to draw statistical conclusions about the influence of system type (e.g., roof, ground, carport, tracking) on performance.

Understanding Solar Photovoltaic System Performance
11
Uncertain climate data: There is some uncertainty regarding NSRDB and TWC weather files. Expected energy production from the resulting SAM model forms the denominator of the PR calculation; therefore, weather accuracy directly affects the accuracy of the calculations. The accuracy of the NSRDB satellite irradiance resource data is +/- 10% at the 95% confidence interval. This is based on two components of uncertainty: uncertainty of the global horizontal irradiance reported from the NSRDB taken from Habte and Sengupta (2017) to be +/- 8.3%; and an uncertainty component for horizontal-to-tilted transposition error taken from Hay and McKay (1988) to be +/- 5%.
Accuracy of meter data: Other sources of uncertainty in the method include meter accuracy. According to American National Standards Institute (ANSI) Standard C12.20, meters may have accuracies of 0.1%, 0.2% or 0.5% depending on class of meter (ANSI 2015). For this we assume 0.2% accuracy typical of a revenue meter, although that is negligible compared to other sources of uncertainty.
Other sources of uncertainty: Other sources of uncertainty in the analysis can include uncertainty in inverter efficiency and uncertainty about system DC nameplate rating. Uncertainties in these values could result in over- or underestimates of 1%–2% for modeled energy. Another source of uncertainty is the thermal model used to calculate PV module temperature, which could contribute approximately 2% to uncertainty. In at least one case, modules facing off in different directions were treated as one array in a single orientation, and such assumptions introduce an undetermined amount of error.
4 Key Findings As of June 2021, FEMP assessed the performance of 75 PV systems using data provided by 16 federal agencies and subagencies located across the United States. Table 4 lists the three key performance indicators—availability, performance ratio, and energy ratio—across the entire sample of systems. Table 4 also lists the standard deviation of the average. While several of these PV systems are performing quite well, as demonstrated by availability and PR approaching and even achieving 100%, the average values are in line with the other performance surveys described in the Introduction; there is meaningful variability in the measured performance as indicated by the minimum values and the significant standard deviation.
Table 4. Statistical Summary of Key Performance Indicators Across All 75 PV Systems
Minimum Average Median Maximum Standard Deviation
Availability 31.0% 95.1% 98.0% 100.0% 8.8%
Performance Ratio 46.0% 78.6% 79.0% 101.0% 11.7%
Energy Ratio 29.0% 74.6% 76.0% 101.0% 14.1%
Understanding Solar Photovoltaic System Performance
12
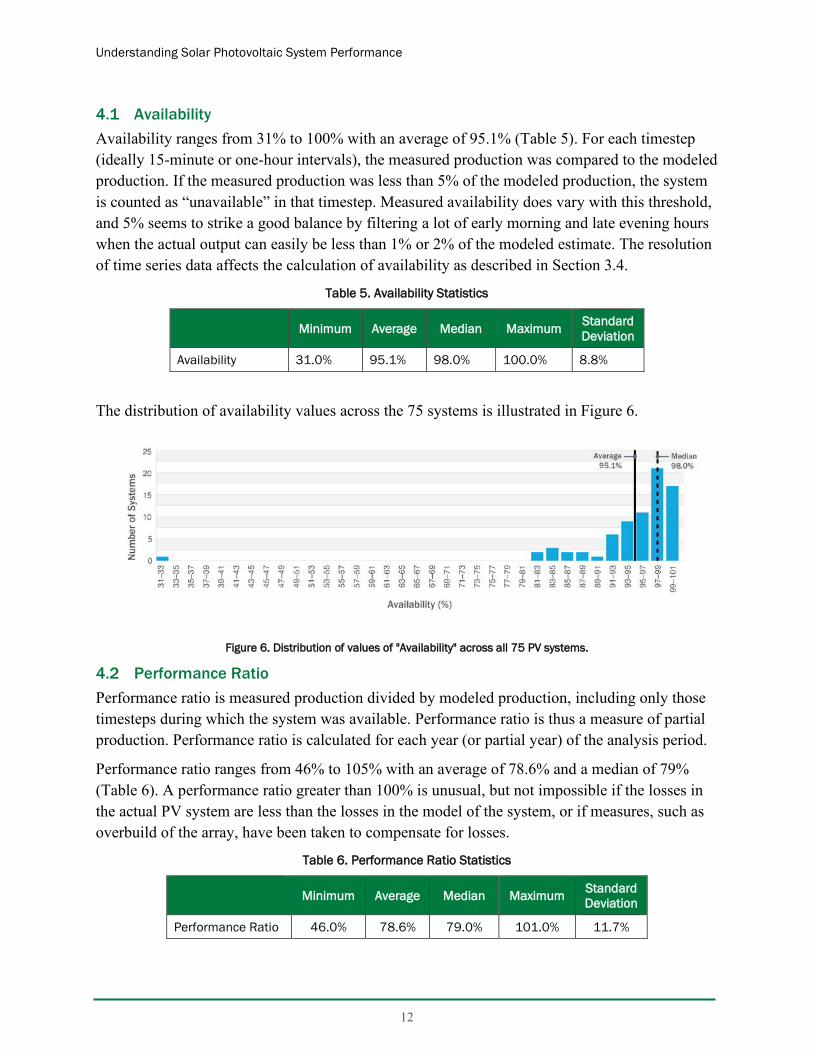
4.1 Availability Availability ranges from 31% to 100% with an average of 95.1% (Table 5). For each timestep (ideally 15-minute or one-hour intervals), the measured production was compared to the modeled production. If the measured production was less than 5% of the modeled production, the system is counted as “unavailable” in that timestep. Measured availability does vary with this threshold, and 5% seems to strike a good balance by filtering a lot of early morning and late evening hours when the actual output can easily be less than 1% or 2% of the modeled estimate. The resolution of time series data affects the calculation of availability as described in Section 3.4.
Table 5. Availability Statistics
Minimum Average Median Maximum Standard Deviation
Availability 31.0% 95.1% 98.0% 100.0% 8.8%
The distribution of availability values across the 75 systems is illustrated in Figure 6.
Figure 6. Distribution of values of "Availability" across all 75 PV systems.
4.2 Performance Ratio Performance ratio is measured production divided by modeled production, including only those timesteps during which the system was available. Performance ratio is thus a measure of partial production. Performance ratio is calculated for each year (or partial year) of the analysis period.
Performance ratio ranges from 46% to 105% with an average of 78.6% and a median of 79% (Table 6). A performance ratio greater than 100% is unusual, but not impossible if the losses in the actual PV system are less than the losses in the model of the system, or if measures, such as overbuild of the array, have been taken to compensate for losses.
Table 6. Performance Ratio Statistics
Minimum Average Median Maximum Standard Deviation
Performance Ratio 46.0% 78.6% 79.0% 101.0% 11.7%

Understanding Solar Photovoltaic System Performance
13
The distribution of performance ratio values across the 75 systems is illustrated in Figure 7.
Figure 7. Distribution of values of "Performance Ratio" across all 75 PV systems.
4.3 Energy Ratio Energy ratio is the total measured production divided by total modeled production, and thus includes both the effects of availability (downtime) and performance ratio (inefficiency) in the same metric.
Energy ratio ranges from 29% to 100% with an average of 74.6% (Table 7).
Table 7. Energy Ratio Statistics
Minimum Average Median Maximum Standard Deviation
Energy Ratio 29.0% 74.6% 76.0% 101.0% 14.1%

Understanding Solar Photovoltaic System Performance
14
The distribution of energy ratio values is illustrated in Figure 8.
Figure 8. Distribution of values for "Energy Ratio" across all 75 PV systems.
5 Conclusion and Discussion 5.1 Key Performance Indicators The key performance metrics evaluated in the assessment and presented in this report lead to several important conclusions.
1. Availability: All of the systems analyzed were at least partially operational for at least part of the time. Without exception, each system reported delivery of renewable energy, contributing to the achievement of federal renewable energy and sustainability goals. Most of the systems had very high availability as indicated by a median availability value of 98%. Significant, long-duration downtimes caused by delay in repair bring the average availability down to 95%. An availability of 95% might qualitatively be considered to be very good, and expectations of availability higher than 95% are probably not realistic.
2. Performance ratio: When available, the PV systems delivered on average 78.6% of the reference yield as modeled in SAM. While this does indicate some room for improvement through attentive monitoring and optimal O&M, the value is consistent with fleet averages reported in the other referenced studies. The median PR of 79.0% is close to the average value of 78.6%, indicating a symmetrical distribution and an average that is not dominated by outliers. However, the standard deviation of 12% and the difference between maximum and minimum values of PR indicate that there is a wide variation in the performance of different systems. A PR value of 85% is probably realistically achievable through optimal O&M, especially addressing the underperforming minority of systems.
3. Energy ratio: Combining the effects of availability and performance ratio, the average energy ratio of 79% demonstrates that the systems are delivering the preponderance of their expected energy production. Nevertheless, there is room for improvement. Future performance assessments may gauge improvement in this average as technology and maintenance practices improve. Agencies may also consider this a realistic level of

Understanding Solar Photovoltaic System Performance
15
performance. The average energy ratio of 74.6% is close to the median of 76.0%, confirming that the distribution is not dominated by the outliers.
5.2 Interpretation and Use of Results It is unrealistic to assume the PV systems will deliver 100% of the model-estimated performance due to the associated maintenance, staff time and attention, and expense required. The statistics presented in this report may be useful in three respects:
1. Owners of existing systems may compare their own measured performance to this median value when thinking about performance and focusing corrective actions. If a system has an energy ratio greater than 75%, they may take comfort that their system is performing as well as others in the federal fleet. If the metrics are much lower than the average values in this report, it indicates that a system would be a candidate for inspection, electrical testing, and corrective maintenance to bring the performance in line with expectations. Many of the underperforming systems in this study had already undertaken diagnostic or corrective actions.
2. Future feasibility studies are better informed regarding realistic expectations of performance. It is not easy to account for possible future downtime or underperformance in a feasibility study. Impacts on the calculated cost effectiveness would be affected by exactly when the downtime occurs (e.g., winter versus summer; at noon versus at sunset). Similarly, underperformance of components is difficult to predict and account for in a feasibility study using conventional means (such as SAM, used in this study to predict performance). One could simply “derate” estimated energy production to account for underperformance in a feasibility study, but availability and performance ratio affect utility cost savings in different ways. Walker (2020b) presents a method based on a duration curve rather than hourly time-series simulation that provides a simple way to calculate the impact of availability and performance ratio on life cycle cost and levelized cost of energy, enlisting a simplified fixed utility rate ($/kWh delivered).
3. Information on actual performance of fielded PV systems helps organizations such as FEMP refine recommendations to agencies planning their approach to renewable energy and on the design, implementation, and maintenance of systems.
5.3 Other Observations From Site Staff Discussions with staff and in-person site visits to select PV systems revealed key areas of improvement:
1. Arrays that are not evaluated through a routine O&M program often suffer from underperformance and in most extreme cases may be offline altogether. Unaddressed problems may introduce safety concerns in addition to decreasing cost savings.
2. Power meters and weather stations are often not reporting out due to a number of reasons—including unreliable internet connectivity and new, stricter cybersecurity rules precluding

Understanding Solar Photovoltaic System Performance
16
the use of site networks. Consistent monitoring of PV performance across multiple sites can be a challenge, with specific problems including loss of internet connectivity, loss of internal site network connectivity, programming of parameters if monitoring is performed using a building control system, and staff changes leading to loss of monitoring platform log-in credentials.
3. It is often a lengthy process (e.g., annual) for agencies to budget and allocate funds for diagnosis and repair of PV systems.
4. A variety of approaches to service delivery was encountered. Most sites rely on the installer for continued service, or other providers selected through a bidding process. O&M providers also include on-site federal maintenance staff; on-site base operating contractors; providers affiliated with the installing contractor; providers affiliated with the inverter company (especially for inverter-specific corrective maintenance); and solar companies in the area or traveling to the site in response to site solicitations for system repairs. All of these can be effective but sometimes lead to a disconnected succession of services to keep plants running properly.
5. For small-capacity systems that are underperforming, it can be difficult to make the financial justification for an O&M contract (the per-system savings are small).
6. Sites struggled to get inverter and other failures resolved in a timely manner, thereby losing several months’ worth of generation. In many cases, performance assessments show a return to expected generation after repairs.
5.4 Next Steps And Resources for Agencies Interested in Improving Photovoltaic System Performance
Management strategies for improving PV system performance include the following:
1. Check operational indicators often, such as energy production meter and error messages displayed on the inverter faceplate. Consider a subscription to a monitoring service which can report on energy delivery and key performance metrics, send notifications to staff, and diagnose some problems automatically.
2. Consider “bundling” small systems together for more efficient management of contracted services and delivery of preventative O&M services.
3. Develop and/or update an O&M plan and budget that includes contact information, an as-built description of the system, descriptions of operational indicators, a troubleshooting guide with error messages, preventative maintenance measures, an inventory of parts, and sources of replacement parts.
4. Plan ahead for repairs. Private PV system owners have hazard insurance to recover from storm damage, as well as reserve accounts and lines of credit to fund timely repairs and avoid downtime. The government is self-insured, so discuss rapid-access funding of repairs with budget personnel and avoid long delays in funding repairs. Plan ahead for the

Understanding Solar Photovoltaic System Performance
17
replacement of components like inverters, which typically have a shorter lifespan than that of the PV panels.
5. Pursue trainings and certifications for on-site staff involved with PV system maintenance. In addition to available commercial trainings, FEMP offers online training courses:
a) Whole Building Design Guide O&M Best Practices for Small-Scale PV Systems3
b) Operations and Maintenance for Optimal Photovoltaic System Performance4
c) Planning, Procuring, and Managing Solar PV Systems For Long-Term Performance: Operations & Maintenance.5
6. Consider contracting O&M to local service providers or a base operating contractor. FEMP offers a sample O&M contract template which agencies can adapt and customize as needed.6
7. Consider performance contracting as a way to deliver O&M on a basis of cents-per-kWh-delivered. Energy Savings Performance Contracts are often thought of as a way to finance new systems, but are also authorized for use in delivering O&M. O&M for an existing PV system could be provided under an Energy Savings Performance Contract Energy Sales Agreement wherein the agency pays for delivered energy (for example, an O&M cost of $15/kW/year divided by production of 1,500 kWh/kW/year would equate to 1¢/kWh delivered).7
FEMP offers these resources, along with other activities related to PV system performance, including publications, sample procurement specifications, and training materials.8 In future years, FEMP seeks to conduct additional PV performance assessments for agency sites, thereby expanding and diversifying the sample of systems to enable more analysis of performance by system type and component selection, as well as performance by location and environmental conditions. This will improve the statistical significance of the results presented in this report, diagnose issues at individual sites, and further inform opportunities for the federal government to realize additional savings from deployed renewable energy systems.
3 https://www.wbdg.org/continuing-education/femp-courses/fempfts27. 4 http://www.wbdg.org/continuing-education/femp-courses/femp56. 5 https://www.wbdg.org/continuing-education/femp-courses/femplw07132021. 6 https://www.energy.gov/eere/femp/articles/operations-and-maintenance-om-request-proposal-template-government-owned-solar. 7 For more information see https://www.energy.gov/eere/femp/energy-savings-performance-contract-energy-sales-agreements. 8 Visit https://www.energy.gov/eere/femp/optimizing-solar-photovoltaic-performance-longevity for further detail on these and other FEMP resources.

Understanding Solar Photovoltaic System Performance
18
References ANSI. 2015. ANSI C12.20-2015: Electricity Meters - 0.1, 0.2, And 0.5 Accuracy Classes. https://webstore.ansi.org/Standards/NEMA/ANSIC12202015?source=blog&_ga=2.129443594.784227525.1633975838-2055424442.1633975838.
Deline, Chris, Kevin Anderson, Dirk Jordan, Andy Walker, Jal Desai, Kirsten Perry, Matt Muller, Bill Marion, and Robert White. 2021. PV Fleet Performance Data Initiative: Performance Index–Based Analysis. Golden, CO: National Renewable Energy Laboratory. NREL/TP-5K00-78720. https://www.nrel.gov/docs/fy21osti/78720.pdf.
Dierauf, T., A. Growitz, S. Kurtz, J.L.B. Cruz, E. Riley, and C. Hansen. 2012. Weather-Corrected Performance Ratio. Golden, CO: National Renewable Energy Laboratory. NREL/TP-5200-57991. https://www.nrel.gov/docs/fy13osti/57991.pdf.
FEMP. 2018. “O&M Best Practices for Small-Scale PV Systems.” Accessed October 11, 2021. https://www.wbdg.org/continuing-education/femp-courses/fempfts27.
FEMP. 2019. “Operations and Maintenance for Optimal Photovoltaic System Performance.” Accessed October 11, 2021. http://www.wbdg.org/continuing-education/femp-courses/femp56.
Habte, A. and M. Sengupta. 2017. Best Practices of Uncertainty Estimation for the National Solar Radiation Database (NSRDB 1998-2015). Presented at the European PV Solar Energy Conference and Exhibition Amsterdam, The Netherlands, September 25–29, 2017. Golden, CO: National Renewable Energy Laboratory. NREL/CP-5D00-70165. https://www.nrel.gov/docs/fy18osti/70165.pdf.
Hay, J. and D. McKay. 1988. Final Report IEA Task IX – Calculation of Solar Irradiances for Inclined Surfaces: Verification of Models which use Hourly and Daily Data. International Energy Agency Solar Heating and Cooling Programme.
Hollingsworth, M., J. Ressler, and R. Perez. 2010. “Weather-Adjusted Performance Guarantees.” Presented at the American Solar Energy Society National Solar Conference, Phoenix, Arizona, May 2010. Clean Power Research, LLC. http://www.cleanpower.com/wp-content/uploads/2012/02/078_WeatherAdjustedPerformanceGuarantees.pdf.
Holman, J. P. 2012. Experimental Methods for Engineers—8th ed. McGraw-Hill Series in Mechanical Engineering. New York, NY: McGraw Hill. ISBN-13: 978-0-07-352930-1
IEC. 2017. Standard IEC 61724: Photovoltaic system performance monitoring – Guidelines for measurement, data exchange and analysis. https://webstore.iec.ch/publication/33622.
IEC. 2019. Standard IEC 63019. Photovoltaic power systems (PVPS) - Information model for availability. https://webstore.iec.ch/publication/27253.
Kats, Greg, David Mills, Andy Walker, Larry Bean, Robert Bergman, John Cowan, Charles Eley, Mark Fitzgerald, Ellen Franconi, Charles Gray, Jeff Harberl, Maury Hepner, Anne Grete

Understanding Solar Photovoltaic System Performance
19
Hestnes, Steve Kromer, Satish Kumar, Kenneth Langer, Ron Lehr, Peter Lowenthal, Katie McCormack, Mathew Salkeld, Steven R. Schiller, Arlene Thompson, Ed Vine, Satoshi Hirano, and Peter Varadi. 2003. “International performance measurement and verification protocol: Concepts and Practices for Determining Energy Savings in Renewable Energy Technologies Applications.” IPMPV. http://smartenergyform.arch.illinois.edu/pdf/Archive/IPMVPNewConstruction.pdf.
Jordan, Dirk, Sarah R. Kurtz, Kaitlyn VanSant, and Jeff Newmiller. 2016. “Compendium of photovoltaic degradation rates.” Progress in Photovoltaics: Research and Applications 24(7): 978-989. https://doi.org/10.1002/pip.2744.
National Renewable Energy Laboratory, Sandia National Laboratory, SunSpec Alliance, and the SunShot National Laboratory Multiyear Partnership (SuNLaMP) PV O&M Best Practices Working Group. 2018. Best Practices for Operation and Maintenance of Photovoltaic and Energy Storage Systems; 3rd Edition. Golden, CO: National Renewable Energy Laboratory. NREL/TP-7A40-73822. https://www.nrel.gov/docs/fy19osti/73822.pdf.
NREL. 2021. “System Advisor Model.” Accessed October 11, 2021. https://sam.nrel.gov/.
Pearsall, Nicola. 2017. Introduction to photovoltaic system performance. In N. Pearsall (Ed.), The Performance of Photovoltaic (PV) Systems: Modelling, Measurement and Assessment (1-19). Woodhead Publishing Series in Energy. Elsevier. https://doi.org/10.1016/B978-1-78242-336-2.00001-X.
Reich, N.H., Mueller, B., Armbruster, A., van Sark, W.G.J.H.M., Kiefer, K. and Reise, C. 2012a. “Performance ratio revisited: is PR > 90% realistic?” Prog. Photovolt: Res. Appl. 20: 717-726. https://doi.org/10.1002/pip.1219.
Reich, N., B. Mueller, A. Armbruster, V. Sark, K. Kiefer, and C. Reise. 2012b. “Review of PV performance ratio development.” DOI:10.13140/2.1.2138.7204
Sengupta, Manajit, Yu Xie, Anthony Lopez, Aron Habte, Galen Maclaurin, and James Shelby. 2018. “The National Solar Radiation Data Base (NSRDB).” Renewable and Sustainable Energy Reviews 89, June 2018: 51-60. DOI: 10.1016/j.rser.2018.03.003
Walker, Andy. 2013. Solar Energy: Technologies and Project Delivery for Buildings. Hoboken NJ: John Wiley and Sons Inc. ISBN 978-1-118-13924-0
Walker, Andy, Jal Desai, and Donna Heimiller. 2019. “Performance of Photovoltaic Systems Recorded by Open Solar Performance and Reliability Clearinghouse (oSPARC).” Golden, CO: National Renewable Energy Laboratory. NREL/TP-5C00-75162. https://www.nrel.gov/docs/fy19osti/75162.pdf.
Walker, Andy, Jal Desai, and Ammar Qusaibaty. 2020. “Life-Cycle Cost and Optimization of PV Systems Based on Power Duration Curve with Variable Performance Ratio and

Understanding Solar Photovoltaic System Performance
20
Availability.” Golden, CO: National Renewable Energy Laboratory. NREL/TP-5C00-73850. https://www.nrel.gov/docs/fy20osti/73850.pdf.
U.S. Department of Energy. 2021. “Comprehensive Annual Energy Data and Sustainability Performance Data.” Accessed October 8, 2021. https://ctsedwweb.ee.doe.gov/Annual/Report/Report.aspx.
Understanding Solar Photovoltaic System Performance
21
Appendix The following four pages provide an example of the report that was generated for each agency PV system.

Understanding Solar Photovoltaic System Performance
22

Understanding Solar Photovoltaic System Performance
23

Understanding Solar Photovoltaic System Performance
24

Understanding Solar Photovoltaic System Performance
25

DOE/GO-102021-5627 ▪ December 2021
For more information, visit: energy.gov/eere/femp
Copyright © 2022 FDOKUMEN