Solar radiation distribution inside a greenhouse with south-oriented photovoltaic roofs and effects...
12
Solar radiation distribution inside a greenhouse with south-oriented photovoltaic roofs and effects on crop productivity Marco Cossu a,⇑ , Lelia Murgia a , Luigi Ledda b , Paola A. Deligios b , Antonella Sirigu c , Francesco Chessa c , Antonio Pazzona a a Dipartimento di Agraria, Sezione di Ingegneria del Territorio, Università di Sassari, Viale Italia 39, 07100 Sassari, Italy b Dipartimento di Agraria, Sezione di Agronomia e Genetica Vegetale Agraria, Università di Sassari, Viale Italia 39, 07100 Sassari, Italy c Agris Sardegna, Dipartimento per la ricerca nelle produzioni vegetali, Viale Trieste 111, 09123 Cagliari, Italy highlights The solar radiation distribution inside photovoltaic greenhouses has been studied. A greenhouse with 50% of the roof area covered with solar panels was considered. The yearly solar light reduction was 64%, with a transversal north–south gradient. The reduction was 82% under the solar panels and 46% under the plastic cover. We provided suggestions for a better agronomic sustainability of PV greenhouses. article info Article history: Received 17 February 2014 Received in revised form 18 July 2014 Accepted 20 July 2014 Keywords: Solar photovoltaic greenhouses Solar radiation distribution Agronomic sustainability Supplementary light Tomato crop abstract This study assessed the climate conditions inside a greenhouse in which 50% of the roof area was replaced with photovoltaic (PV) modules, describing the solar radiation distribution and the variability of temper- ature and humidity. The effects of shading from the PV array on crop productivity were described on tomato, also integrating the natural radiation with supplementary lighting powered by PV energy. Exper- iments were performed inside an east–west oriented greenhouse (total area of 960 m 2 ), where the south- oriented roofs were completely covered with multi-crystalline silicon PV modules, with a total rated power of 68 kWp. The PV system reduced the availability of solar radiation inside the greenhouse by 64%, compared to the situation without PV system (2684 MJ m 2 on yearly basis). The solar radiation dis- tribution followed a north–south gradient, with more solar energy on the sidewalls and decreasing towards the center of the span, except in winter, where it was similar in all plant rows. The reduction under the plastic and PV covers was respectively 46% and 82% on yearly basis. Only a 18% reduction was observed on the plant rows farthest from the PV cover of the span. The supplementary lighting, pow- ered without exceeding the energy produced by the PV array, was not enough to affect the crop produc- tion, whose revenue was lower than the cost for heating and lighting. The distribution of the solar radiation observed is useful for choosing the most suitable crops and for designing PV greenhouses with the attitude for both energy and crop production. Ó 2014 Elsevier Ltd. All rights reserved. 1. Introduction During the last decade solar photovoltaic (PV) greenhouses became widely spread in southern Europe, especially in Spain and Italy. The fast penetration of this technology was facilitated by the combination of the abundance of solar energy and the advantageous public policy support for renewable electricity generation. This fact has led to an impressive growth rate of new PV installations whose number, in Italy, has been more than double every year over the last 5 years [1]. Currently, the total PV power installed in Italy has achieved 16.4 GW: about 48% of this capacity is installed on buildings and 6% on greenhouses and platform roofs, while 41% refers to ground-mounted modules. The incentives pro- vided for the energy production of grid-connected systems vary depending on the nominal power and usually increase when mod- ules are integrated on buildings or structures (rooftops, walls). According to this, PV greenhouses appear to be an interesting http://dx.doi.org/10.1016/j.apenergy.2014.07.070 0306-2619/Ó 2014 Elsevier Ltd. All rights reserved. ⇑ Corresponding author. Tel.: +39 333 5200129. E-mail address: [email protected] (M. Cossu). Applied Energy 133 (2014) 89–100 Contents lists available at ScienceDirect Applied Energy journal homepage: www.elsevier.com/locate/apenergy
Transcript of Solar radiation distribution inside a greenhouse with south-oriented photovoltaic roofs and effects...

Applied Energy 133 (2014) 89–100
Contents lists available at ScienceDirect
Applied Energy
journal homepage: www.elsevier .com/locate /apenergy
Solar radiation distribution inside a greenhouse with south-orientedphotovoltaic roofs and effects on crop productivity
http://dx.doi.org/10.1016/j.apenergy.2014.07.0700306-2619/� 2014 Elsevier Ltd. All rights reserved.
⇑ Corresponding author. Tel.: +39 333 5200129.E-mail address: [email protected] (M. Cossu).
Marco Cossu a,⇑, Lelia Murgia a, Luigi Ledda b, Paola A. Deligios b, Antonella Sirigu c, Francesco Chessa c,Antonio Pazzona a
a Dipartimento di Agraria, Sezione di Ingegneria del Territorio, Università di Sassari, Viale Italia 39, 07100 Sassari, Italyb Dipartimento di Agraria, Sezione di Agronomia e Genetica Vegetale Agraria, Università di Sassari, Viale Italia 39, 07100 Sassari, Italyc Agris Sardegna, Dipartimento per la ricerca nelle produzioni vegetali, Viale Trieste 111, 09123 Cagliari, Italy
h i g h l i g h t s
� The solar radiation distribution inside photovoltaic greenhouses has been studied.� A greenhouse with 50% of the roof area covered with solar panels was considered.� The yearly solar light reduction was 64%, with a transversal north–south gradient.� The reduction was 82% under the solar panels and 46% under the plastic cover.� We provided suggestions for a better agronomic sustainability of PV greenhouses.
a r t i c l e i n f o
Article history:Received 17 February 2014Received in revised form 18 July 2014Accepted 20 July 2014
Keywords:Solar photovoltaic greenhousesSolar radiation distributionAgronomic sustainabilitySupplementary lightTomato crop
a b s t r a c t
This study assessed the climate conditions inside a greenhouse in which 50% of the roof area was replacedwith photovoltaic (PV) modules, describing the solar radiation distribution and the variability of temper-ature and humidity. The effects of shading from the PV array on crop productivity were described ontomato, also integrating the natural radiation with supplementary lighting powered by PV energy. Exper-iments were performed inside an east–west oriented greenhouse (total area of 960 m2), where the south-oriented roofs were completely covered with multi-crystalline silicon PV modules, with a total ratedpower of 68 kWp. The PV system reduced the availability of solar radiation inside the greenhouse by64%, compared to the situation without PV system (2684 MJ m�2 on yearly basis). The solar radiation dis-tribution followed a north–south gradient, with more solar energy on the sidewalls and decreasingtowards the center of the span, except in winter, where it was similar in all plant rows. The reductionunder the plastic and PV covers was respectively 46% and 82% on yearly basis. Only a 18% reductionwas observed on the plant rows farthest from the PV cover of the span. The supplementary lighting, pow-ered without exceeding the energy produced by the PV array, was not enough to affect the crop produc-tion, whose revenue was lower than the cost for heating and lighting. The distribution of the solarradiation observed is useful for choosing the most suitable crops and for designing PV greenhouses withthe attitude for both energy and crop production.
� 2014 Elsevier Ltd. All rights reserved.
1. Introduction
During the last decade solar photovoltaic (PV) greenhousesbecame widely spread in southern Europe, especially in Spainand Italy. The fast penetration of this technology was facilitatedby the combination of the abundance of solar energy and theadvantageous public policy support for renewable electricity
generation. This fact has led to an impressive growth rate of newPV installations whose number, in Italy, has been more than doubleevery year over the last 5 years [1]. Currently, the total PV powerinstalled in Italy has achieved 16.4 GW: about 48% of this capacityis installed on buildings and 6% on greenhouses and platform roofs,while 41% refers to ground-mounted modules. The incentives pro-vided for the energy production of grid-connected systems varydepending on the nominal power and usually increase when mod-ules are integrated on buildings or structures (rooftops, walls).According to this, PV greenhouses appear to be an interesting

90 M. Cossu et al. / Applied Energy 133 (2014) 89–100
option to diversify the agricultural activities and improve the econ-omy of the horticultural sector. They can also contribute to securethe energy access also in rural and decentralised territories, usingelectricity locally produced and reducing the dependence ofagricultural farms and communities on foreign and fossil fuels [2].
The electricity generated from the PV panels can be injectedinto grid, providing an additional income to the farm, or consumedfor powering climate control appliances of the same greenhouse,thus contributing to a better environmental sustainability ofgreenhouse cultivations [3–8].
The main challenge that this technology poses is to conciliateenergy and food production on the same land unit, with the goalof optimizing the economic productivity of this mixed system[9]. This aspect is strictly connected to the positioning of the PVarray on the greenhouse roof and becomes more critical as the roofcoverage factor increases. In fact, replacing the existing glazingsurface with a PV array leads to an internal shading which affectsgrowth, development and productivity of the cultivated crops.These effects are strongly related to the shading level, type of crop,cultivation season, climate characteristics.
The inhibitory effect of shading caused by PV modules on theaccumulation of fresh and dry-weight was observed on welshonion cultivated under a 13% PV roof coverage, with an averagecrop yield loss of 25% [10]. Solar modules covering 9.8% of thegreenhouse roof did not affect the marketable production of toma-toes, but they had a negative effect on fruit size, hardness and color[11]. No significant effects on biomass production and yield weredetected on basil and cucumber when the PV area on thegreenhouse roof was lower than 20% [12]. Furthermore, a high tol-erance to PV shade up to 70% was observed on lettuce, which com-pensated the light shortage by modifying the leaf development.However, this crop performance was observed in a ‘‘agrivoltaic-system’’, where the PV array was installed above a field crop, there-fore they should not be strictly compared to a PV greenhouse [13].
Most of the literature data is referred to low shading level onthe crops, which are not actually common in commercial PV green-houses. These structures are often configured as large-scale invest-ments to maximize the electricity generation. For this reason, moststructures have been designed covering 50% or 100% of the roofarea with conventional silicon PV panels, which concern about85% of the PV market [14,15], without properly considering thesunlight needs of cultivated crops. Given the huge initial invest-ment required, the high financial profits from PV energy produc-tion in the greenhouse sector will be sustainable only untilconspicuous public subsidies are available. Furthermore, they oftenoccupy large abandoned agricultural areas, replacing conventionalactivities and changing the initial land use or vocation. To limit thisspeculative trend in rural areas in Italy, the national and regionaladministrations have introduced some restrictions for PV green-houses, such as: (1) prevalence of the agricultural income, whichshould be equal or higher than the revenue deriving from energyproduction, when the PV power exceeds 200 kWp; (2) percentageof PV coverage, whose ground projection must not exceed 50% ofthe total greenhouse area [16–20]. Furthermore, the suitable cropsand cultivation techniques should be specified before the construc-tion, and subsequently the conduction of agricultural activity hasto be proved. These constraints potentially prevent the investorfrom building structures without the proper greenhouse technolo-gies. However, at present no characterization of the microclimateinside PV greenhouses with high levels of shading can be foundin literature. This makes difficult for the grower to identify themost profitable crops, which revenue allows to fully abide by thegovernment policy. For this reason, the study of the greenhouse cli-mate conditions is crucial for choosing the best combination ofsolar panels and crops, in order to optimize both the energy andcrop production [9]. Particularly, the knowledge of the spatial
distribution of the microclimate parameters is essential for model-ing both the greenhouse environment and the crop growth [21,22].
According to the remarkable spread of greenhouses with 50% PVcover, this paper aims to study the microclimate conditions insidethese already existing structures and produce the scientificinformation about their agronomic sustainability. More specifi-cally, the spatial and temporal distribution of solar radiation,temperature and humidity inside a greenhouse are described inorder to quantify the variability of the internal climate conditionsand provide data for cultivation support purposes. The agronomicand economic feasibility, with and without supplementary lightingpowered by PV energy, was assessed on tomato, chosen as a testcrop.
2. Materials and methods
2.1. Location
The experiment was carried out at Decimomannu (Sardinia,Italy, 39�1905900N, 8�5901900E) in a commercial east–west (E–W) ori-ented greenhouse (Fig. 1) for horticulture, thus not expresslydesigned for PV energy generation.
2.2. Greenhouse
The preexisting pitched-roof greenhouse had an area of 960 m2,with two spans (50.0 m long and 9.6 m wide each), gutter height of2.5 m and roof slope of 22� even though, according to the latitudeof the place, the optimal slope should have been around 30�. Thewalls and the north (N)-oriented roofs were made with PVC(Ondex Bio, Renolit, France), with up to 90% global transmissivitydeclared by the manufacturer, while the openings, positioned onlyin the side walls, were clad with a polyethylene film (PE). The clad-ding materials and the PV panels were supported by a steelstructure.
2.3. PV system and inverters
The south (S)-oriented roof of each span was replaced with 144multi-crystalline silicon PV modules (REC 235PE, REC Solar, USA),resulting in 50% of the roof area covered with PV modules (Table 1).The total PV area was 475 m2 total PV area (238 m2 per PV roof),while the total active cell area was 420 m2.
The peak rated power of the PV system was 68 kWp, providedusing four inverters (Sinvert PVM17, Siemens AG, Germany). Thedaily electric energy produced by the PV system was recorded bythe inverters.
2.4. Layout of experiment
Four experimental areas have been set up in order to describethe variability of the internal microclimate conditions: A (N-W ori-ented), B (N-E), C (S-E), D (S-W), 103 m2 each (13.0 m long and7.9 m wide), placed at the center of the greenhouse, two in eachspan (Fig. 1). The distribution of the solar radiation was studiedby identifying six observation points (from 1 to 6) in each area,placed 1.5 m above the ground level at the center of the crop rows(see paragraph 2.6 for crop details) and spaced 1.33 m. Theobservation points from 1 to 3 were under the plastic roofs, whilepoints from 4 to 6 were under the PV roofs.
The solar radiation distribution was investigated both on thelongitudinal (E–W) and transversal (N–S) direction, calculatingthe solar radiation incident in each observation point and area(average of the six observation points).
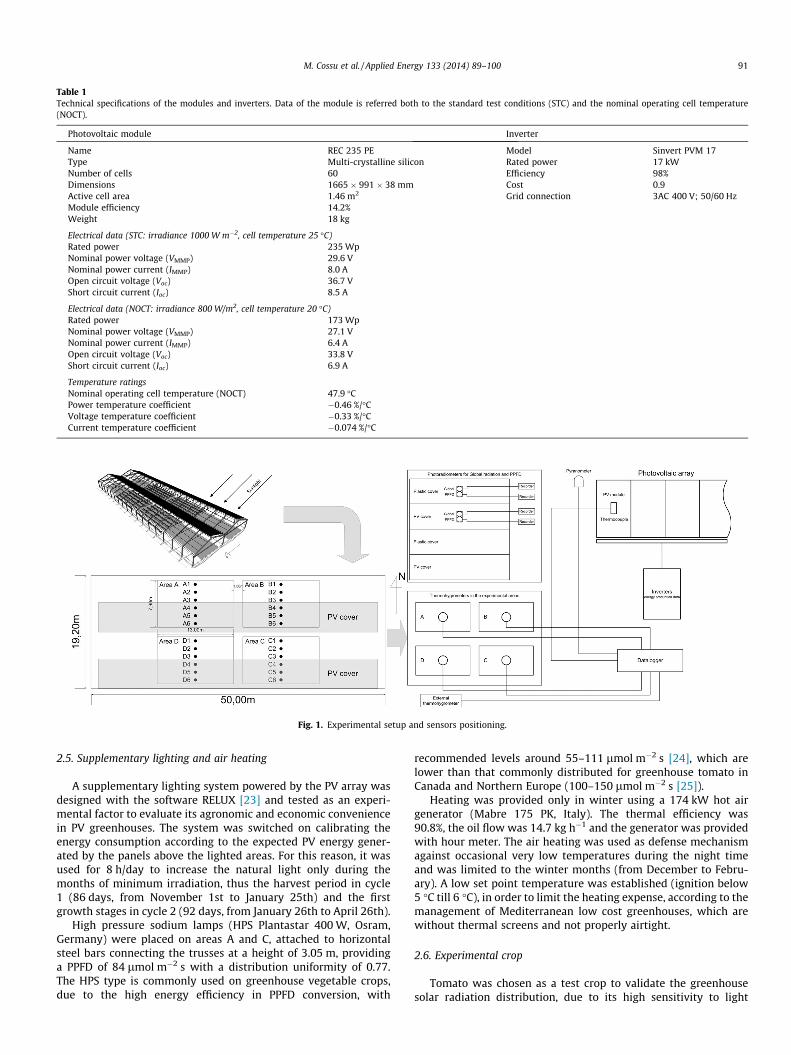
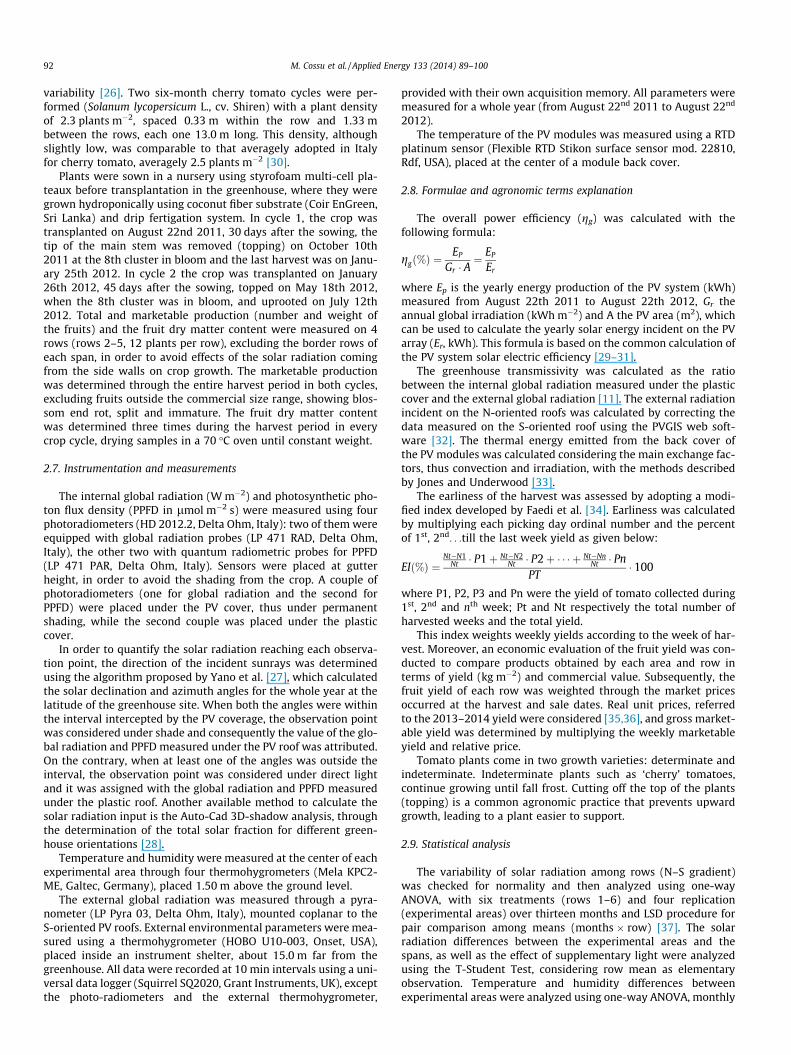
Table 1Technical specifications of the modules and inverters. Data of the module is referred both to the standard test conditions (STC) and the nominal operating cell temperature(NOCT).
Photovoltaic module Inverter
Name REC 235 PE Model Sinvert PVM 17Type Multi-crystalline silicon Rated power 17 kWNumber of cells 60 Efficiency 98%Dimensions 1665 � 991 � 38 mm Cost 0.9Active cell area 1.46 m2 Grid connection 3AC 400 V; 50/60 HzModule efficiency 14.2%Weight 18 kg
Electrical data (STC: irradiance 1000 W m�2, cell temperature 25 �C)Rated power 235 WpNominal power voltage (VMMP) 29.6 VNominal power current (IMMP) 8.0 AOpen circuit voltage (Voc) 36.7 VShort circuit current (Ioc) 8.5 A
Electrical data (NOCT: irradiance 800 W/m2, cell temperature 20 �C)Rated power 173 WpNominal power voltage (VMMP) 27.1 VNominal power current (IMMP) 6.4 AOpen circuit voltage (Voc) 33.8 VShort circuit current (Ioc) 6.9 A
Temperature ratingsNominal operating cell temperature (NOCT) 47.9 �CPower temperature coefficient �0.46 %/�CVoltage temperature coefficient �0.33 %/�CCurrent temperature coefficient �0.074 %/�C
Fig. 1. Experimental setup and sensors positioning.
M. Cossu et al. / Applied Energy 133 (2014) 89–100 91
2.5. Supplementary lighting and air heating
A supplementary lighting system powered by the PV array wasdesigned with the software RELUX [23] and tested as an experi-mental factor to evaluate its agronomic and economic conveniencein PV greenhouses. The system was switched on calibrating theenergy consumption according to the expected PV energy gener-ated by the panels above the lighted areas. For this reason, it wasused for 8 h/day to increase the natural light only during themonths of minimum irradiation, thus the harvest period in cycle1 (86 days, from November 1st to January 25th) and the firstgrowth stages in cycle 2 (92 days, from January 26th to April 26th).
High pressure sodium lamps (HPS Plantastar 400 W, Osram,Germany) were placed on areas A and C, attached to horizontalsteel bars connecting the trusses at a height of 3.05 m, providinga PPFD of 84 lmol m�2 s with a distribution uniformity of 0.77.The HPS type is commonly used on greenhouse vegetable crops,due to the high energy efficiency in PPFD conversion, with
recommended levels around 55–111 lmol m�2 s [24], which arelower than that commonly distributed for greenhouse tomato inCanada and Northern Europe (100–150 lmol m�2 s [25]).
Heating was provided only in winter using a 174 kW hot airgenerator (Mabre 175 PK, Italy). The thermal efficiency was90.8%, the oil flow was 14.7 kg h�1 and the generator was providedwith hour meter. The air heating was used as defense mechanismagainst occasional very low temperatures during the night timeand was limited to the winter months (from December to Febru-ary). A low set point temperature was established (ignition below5 �C till 6 �C), in order to limit the heating expense, according to themanagement of Mediterranean low cost greenhouses, which arewithout thermal screens and not properly airtight.
2.6. Experimental crop
Tomato was chosen as a test crop to validate the greenhousesolar radiation distribution, due to its high sensitivity to light
92 M. Cossu et al. / Applied Energy 133 (2014) 89–100
variability [26]. Two six-month cherry tomato cycles were per-formed (Solanum lycopersicum L., cv. Shiren) with a plant densityof 2.3 plants m�2, spaced 0.33 m within the row and 1.33 mbetween the rows, each one 13.0 m long. This density, althoughslightly low, was comparable to that averagely adopted in Italyfor cherry tomato, averagely 2.5 plants m�2 [30].
Plants were sown in a nursery using styrofoam multi-cell pla-teaux before transplantation in the greenhouse, where they weregrown hydroponically using coconut fiber substrate (Coir EnGreen,Sri Lanka) and drip fertigation system. In cycle 1, the crop wastransplanted on August 22nd 2011, 30 days after the sowing, thetip of the main stem was removed (topping) on October 10th2011 at the 8th cluster in bloom and the last harvest was on Janu-ary 25th 2012. In cycle 2 the crop was transplanted on January26th 2012, 45 days after the sowing, topped on May 18th 2012,when the 8th cluster was in bloom, and uprooted on July 12th2012. Total and marketable production (number and weight ofthe fruits) and the fruit dry matter content were measured on 4rows (rows 2–5, 12 plants per row), excluding the border rows ofeach span, in order to avoid effects of the solar radiation comingfrom the side walls on crop growth. The marketable productionwas determined through the entire harvest period in both cycles,excluding fruits outside the commercial size range, showing blos-som end rot, split and immature. The fruit dry matter contentwas determined three times during the harvest period in everycrop cycle, drying samples in a 70 �C oven until constant weight.
2.7. Instrumentation and measurements
The internal global radiation (W m�2) and photosynthetic pho-ton flux density (PPFD in lmol m�2 s) were measured using fourphotoradiometers (HD 2012.2, Delta Ohm, Italy): two of them wereequipped with global radiation probes (LP 471 RAD, Delta Ohm,Italy), the other two with quantum radiometric probes for PPFD(LP 471 PAR, Delta Ohm, Italy). Sensors were placed at gutterheight, in order to avoid the shading from the crop. A couple ofphotoradiometers (one for global radiation and the second forPPFD) were placed under the PV cover, thus under permanentshading, while the second couple was placed under the plasticcover.
In order to quantify the solar radiation reaching each observa-tion point, the direction of the incident sunrays was determinedusing the algorithm proposed by Yano et al. [27], which calculatedthe solar declination and azimuth angles for the whole year at thelatitude of the greenhouse site. When both the angles were withinthe interval intercepted by the PV coverage, the observation pointwas considered under shade and consequently the value of the glo-bal radiation and PPFD measured under the PV roof was attributed.On the contrary, when at least one of the angles was outside theinterval, the observation point was considered under direct lightand it was assigned with the global radiation and PPFD measuredunder the plastic roof. Another available method to calculate thesolar radiation input is the Auto-Cad 3D-shadow analysis, throughthe determination of the total solar fraction for different green-house orientations [28].
Temperature and humidity were measured at the center of eachexperimental area through four thermohygrometers (Mela KPC2-ME, Galtec, Germany), placed 1.50 m above the ground level.
The external global radiation was measured through a pyra-nometer (LP Pyra 03, Delta Ohm, Italy), mounted coplanar to theS-oriented PV roofs. External environmental parameters were mea-sured using a thermohygrometer (HOBO U10-003, Onset, USA),placed inside an instrument shelter, about 15.0 m far from thegreenhouse. All data were recorded at 10 min intervals using a uni-versal data logger (Squirrel SQ2020, Grant Instruments, UK), exceptthe photo-radiometers and the external thermohygrometer,
provided with their own acquisition memory. All parameters weremeasured for a whole year (from August 22nd 2011 to August 22nd
2012).The temperature of the PV modules was measured using a RTD
platinum sensor (Flexible RTD Stikon surface sensor mod. 22810,Rdf, USA), placed at the center of a module back cover.
2.8. Formulae and agronomic terms explanation
The overall power efficiency (gg) was calculated with thefollowing formula:
ggð%Þ ¼EP
Gr � A¼ EP
Er
where Ep is the yearly energy production of the PV system (kWh)measured from August 22th 2011 to August 22th 2012, Gr theannual global irradiation (kWh m�2) and A the PV area (m2), whichcan be used to calculate the yearly solar energy incident on the PVarray (Er, kWh). This formula is based on the common calculation ofthe PV system solar electric efficiency [29–31].
The greenhouse transmissivity was calculated as the ratiobetween the internal global radiation measured under the plasticcover and the external global radiation [11]. The external radiationincident on the N-oriented roofs was calculated by correcting thedata measured on the S-oriented roof using the PVGIS web soft-ware [32]. The thermal energy emitted from the back cover ofthe PV modules was calculated considering the main exchange fac-tors, thus convection and irradiation, with the methods describedby Jones and Underwood [33].
The earliness of the harvest was assessed by adopting a modi-fied index developed by Faedi et al. [34]. Earliness was calculatedby multiplying each picking day ordinal number and the percentof 1st, 2nd. . .till the last week yield as given below:
EIð%Þ ¼Nt�N1
Nt � P1þ Nt�N2Nt � P2þ � � � þ Nt�Nn
Nt � PnPT
� 100
where P1, P2, P3 and Pn were the yield of tomato collected during1st, 2nd and nth week; Pt and Nt respectively the total number ofharvested weeks and the total yield.
This index weights weekly yields according to the week of har-vest. Moreover, an economic evaluation of the fruit yield was con-ducted to compare products obtained by each area and row interms of yield (kg m�2) and commercial value. Subsequently, thefruit yield of each row was weighted through the market pricesoccurred at the harvest and sale dates. Real unit prices, referredto the 2013–2014 yield were considered [35,36], and gross market-able yield was determined by multiplying the weekly marketableyield and relative price.
Tomato plants come in two growth varieties: determinate andindeterminate. Indeterminate plants such as ‘cherry’ tomatoes,continue growing until fall frost. Cutting off the top of the plants(topping) is a common agronomic practice that prevents upwardgrowth, leading to a plant easier to support.
2.9. Statistical analysis
The variability of solar radiation among rows (N–S gradient)was checked for normality and then analyzed using one-wayANOVA, with six treatments (rows 1–6) and four replication(experimental areas) over thirteen months and LSD procedure forpair comparison among means (months � row) [37]. The solarradiation differences between the experimental areas and thespans, as well as the effect of supplementary light were analyzedusing the T-Student Test, considering row mean as elementaryobservation. Temperature and humidity differences betweenexperimental areas were analyzed using one-way ANOVA, monthly
M. Cossu et al. / Applied Energy 133 (2014) 89–100 93
data as replication and LSD procedure for pair comparison amongmeans. Analysis of variance of crop productivity data betweenrows 2 and 5 was carried out according to a randomized completeblock design with four replicates (experimental areas) and LSDprocedure for means discrimination.
3. Results
3.1. Internal temperature and humidity
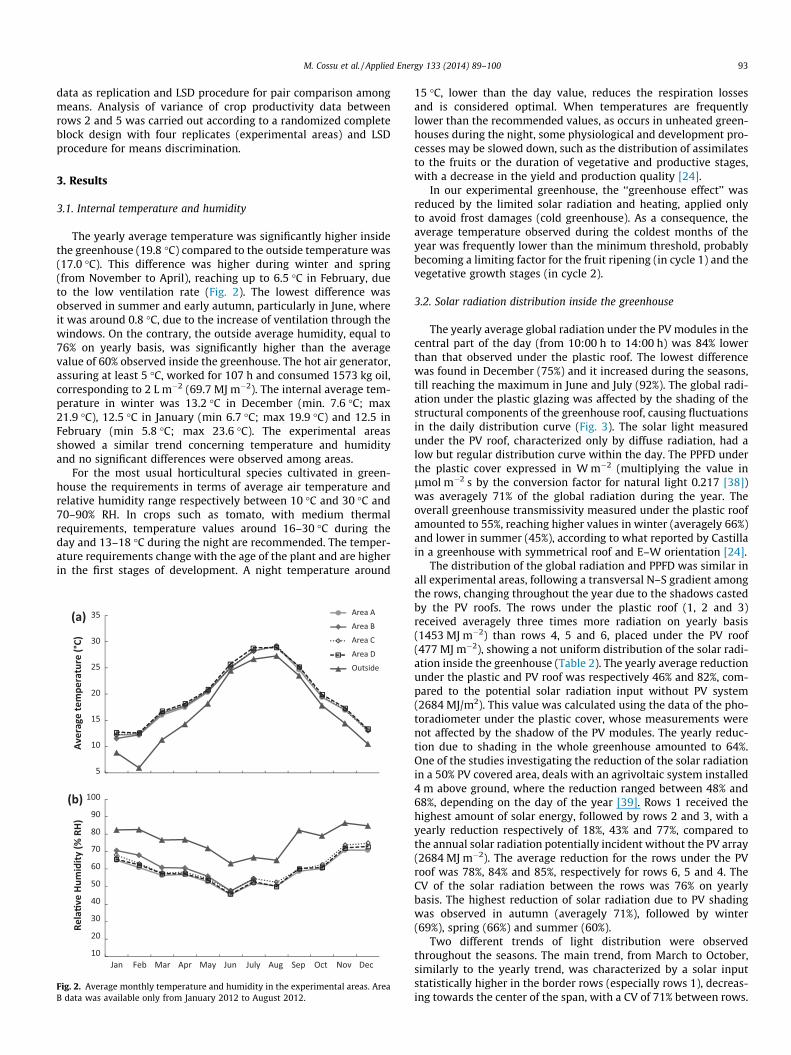
The yearly average temperature was significantly higher insidethe greenhouse (19.8 �C) compared to the outside temperature was(17.0 �C). This difference was higher during winter and spring(from November to April), reaching up to 6.5 �C in February, dueto the low ventilation rate (Fig. 2). The lowest difference wasobserved in summer and early autumn, particularly in June, whereit was around 0.8 �C, due to the increase of ventilation through thewindows. On the contrary, the outside average humidity, equal to76% on yearly basis, was significantly higher than the averagevalue of 60% observed inside the greenhouse. The hot air generator,assuring at least 5 �C, worked for 107 h and consumed 1573 kg oil,corresponding to 2 L m�2 (69.7 MJ m�2). The internal average tem-perature in winter was 13.2 �C in December (min. 7.6 �C; max21.9 �C), 12.5 �C in January (min 6.7 �C; max 19.9 �C) and 12.5 inFebruary (min 5.8 �C; max 23.6 �C). The experimental areasshowed a similar trend concerning temperature and humidityand no significant differences were observed among areas.
For the most usual horticultural species cultivated in green-house the requirements in terms of average air temperature andrelative humidity range respectively between 10 �C and 30 �C and70–90% RH. In crops such as tomato, with medium thermalrequirements, temperature values around 16–30 �C during theday and 13–18 �C during the night are recommended. The temper-ature requirements change with the age of the plant and are higherin the first stages of development. A night temperature around
5
10
15
20
25
30
35
Ave
rage
tem
pera
ture
(°C)
Area A
Area B
Area C
Area D
Outside
(a)
10
20
30
40
50
60
70
80
90
100
Jan Feb Mar Apr May Jun July Aug Sep Oct Nov Dec
Rela
�ve
Hum
idit
y (%
RH
)
(b)
Fig. 2. Average monthly temperature and humidity in the experimental areas. AreaB data was available only from January 2012 to August 2012.
15 �C, lower than the day value, reduces the respiration lossesand is considered optimal. When temperatures are frequentlylower than the recommended values, as occurs in unheated green-houses during the night, some physiological and development pro-cesses may be slowed down, such as the distribution of assimilatesto the fruits or the duration of vegetative and productive stages,with a decrease in the yield and production quality [24].
In our experimental greenhouse, the ‘‘greenhouse effect’’ wasreduced by the limited solar radiation and heating, applied onlyto avoid frost damages (cold greenhouse). As a consequence, theaverage temperature observed during the coldest months of theyear was frequently lower than the minimum threshold, probablybecoming a limiting factor for the fruit ripening (in cycle 1) and thevegetative growth stages (in cycle 2).
3.2. Solar radiation distribution inside the greenhouse
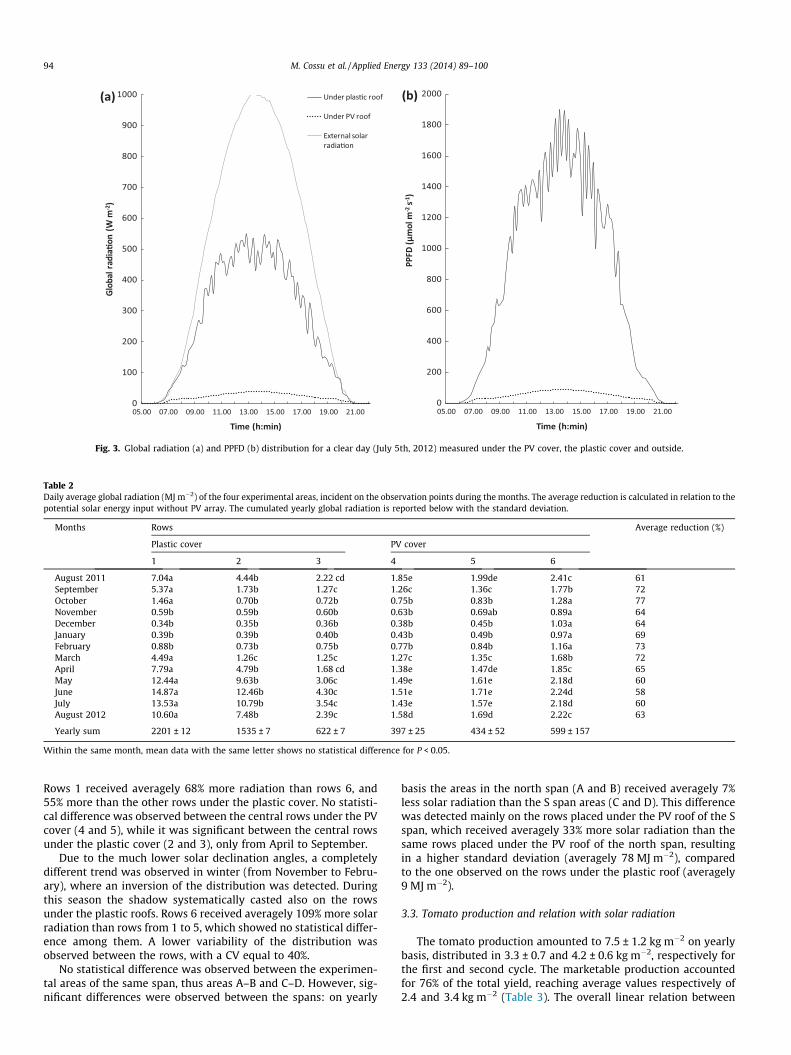
The yearly average global radiation under the PV modules in thecentral part of the day (from 10:00 h to 14:00 h) was 84% lowerthan that observed under the plastic roof. The lowest differencewas found in December (75%) and it increased during the seasons,till reaching the maximum in June and July (92%). The global radi-ation under the plastic glazing was affected by the shading of thestructural components of the greenhouse roof, causing fluctuationsin the daily distribution curve (Fig. 3). The solar light measuredunder the PV roof, characterized only by diffuse radiation, had alow but regular distribution curve within the day. The PPFD underthe plastic cover expressed in W m�2 (multiplying the value inlmol m�2 s by the conversion factor for natural light 0.217 [38])was averagely 71% of the global radiation during the year. Theoverall greenhouse transmissivity measured under the plastic roofamounted to 55%, reaching higher values in winter (averagely 66%)and lower in summer (45%), according to what reported by Castillain a greenhouse with symmetrical roof and E–W orientation [24].
The distribution of the global radiation and PPFD was similar inall experimental areas, following a transversal N–S gradient amongthe rows, changing throughout the year due to the shadows castedby the PV roofs. The rows under the plastic roof (1, 2 and 3)received averagely three times more radiation on yearly basis(1453 MJ m�2) than rows 4, 5 and 6, placed under the PV roof(477 MJ m�2), showing a not uniform distribution of the solar radi-ation inside the greenhouse (Table 2). The yearly average reductionunder the plastic and PV roof was respectively 46% and 82%, com-pared to the potential solar radiation input without PV system(2684 MJ/m2). This value was calculated using the data of the pho-toradiometer under the plastic cover, whose measurements werenot affected by the shadow of the PV modules. The yearly reduc-tion due to shading in the whole greenhouse amounted to 64%.One of the studies investigating the reduction of the solar radiationin a 50% PV covered area, deals with an agrivoltaic system installed4 m above ground, where the reduction ranged between 48% and68%, depending on the day of the year [39]. Rows 1 received thehighest amount of solar energy, followed by rows 2 and 3, with ayearly reduction respectively of 18%, 43% and 77%, compared tothe annual solar radiation potentially incident without the PV array(2684 MJ m�2). The average reduction for the rows under the PVroof was 78%, 84% and 85%, respectively for rows 6, 5 and 4. TheCV of the solar radiation between the rows was 76% on yearlybasis. The highest reduction of solar radiation due to PV shadingwas observed in autumn (averagely 71%), followed by winter(69%), spring (66%) and summer (60%).
Two different trends of light distribution were observedthroughout the seasons. The main trend, from March to October,similarly to the yearly trend, was characterized by a solar inputstatistically higher in the border rows (especially rows 1), decreas-ing towards the center of the span, with a CV of 71% between rows.
0
100
200
300
400
500
600
700
800
900
1000
05.00 07.00 09.00 11.00 13.00 15.00 17.00 19.00 21.00
Glo
bal r
adia
�on
(W m
-2)
Time (h:min)
Under plas�c roof
Under PV roof
External solar radia�on
0
200
400
600
800
1000
1200
1400
1600
1800
2000
05.00 07.00 09.00 11.00 13.00 15.00 17.00 19.00 21.00PP
FD (μ
mol
m-2
s- 1)
Time (h:min)
(a) (b)
Fig. 3. Global radiation (a) and PPFD (b) distribution for a clear day (July 5th, 2012) measured under the PV cover, the plastic cover and outside.
Table 2Daily average global radiation (MJ m�2) of the four experimental areas, incident on the observation points during the months. The average reduction is calculated in relation to thepotential solar energy input without PV array. The cumulated yearly global radiation is reported below with the standard deviation.
Months Rows Average reduction (%)
Plastic cover PV cover
1 2 3 4 5 6
August 2011 7.04a 4.44b 2.22 cd 1.85e 1.99de 2.41c 61September 5.37a 1.73b 1.27c 1.26c 1.36c 1.77b 72October 1.46a 0.70b 0.72b 0.75b 0.83b 1.28a 77November 0.59b 0.59b 0.60b 0.63b 0.69ab 0.89a 64December 0.34b 0.35b 0.36b 0.38b 0.45b 1.03a 64January 0.39b 0.39b 0.40b 0.43b 0.49b 0.97a 69February 0.88b 0.73b 0.75b 0.77b 0.84b 1.16a 73March 4.49a 1.26c 1.25c 1.27c 1.35c 1.68b 72April 7.79a 4.79b 1.68 cd 1.38e 1.47de 1.85c 65May 12.44a 9.63b 3.06c 1.49e 1.61e 2.18d 60June 14.87a 12.46b 4.30c 1.51e 1.71e 2.24d 58July 13.53a 10.79b 3.54c 1.43e 1.57e 2.18d 60August 2012 10.60a 7.48b 2.39c 1.58d 1.69d 2.22c 63
Yearly sum 2201 ± 12 1535 ± 7 622 ± 7 397 ± 25 434 ± 52 599 ± 157
Within the same month, mean data with the same letter shows no statistical difference for P < 0.05.
94 M. Cossu et al. / Applied Energy 133 (2014) 89–100
Rows 1 received averagely 68% more radiation than rows 6, and55% more than the other rows under the plastic cover. No statisti-cal difference was observed between the central rows under the PVcover (4 and 5), while it was significant between the central rowsunder the plastic cover (2 and 3), only from April to September.
Due to the much lower solar declination angles, a completelydifferent trend was observed in winter (from November to Febru-ary), where an inversion of the distribution was detected. Duringthis season the shadow systematically casted also on the rowsunder the plastic roofs. Rows 6 received averagely 109% more solarradiation than rows from 1 to 5, which showed no statistical differ-ence among them. A lower variability of the distribution wasobserved between the rows, with a CV equal to 40%.
No statistical difference was observed between the experimen-tal areas of the same span, thus areas A–B and C–D. However, sig-nificant differences were observed between the spans: on yearly
basis the areas in the north span (A and B) received averagely 7%less solar radiation than the S span areas (C and D). This differencewas detected mainly on the rows placed under the PV roof of the Sspan, which received averagely 33% more solar radiation than thesame rows placed under the PV roof of the north span, resultingin a higher standard deviation (averagely 78 MJ m�2), comparedto the one observed on the rows under the plastic roof (averagely9 MJ m�2).
3.3. Tomato production and relation with solar radiation
The tomato production amounted to 7.5 ± 1.2 kg m�2 on yearlybasis, distributed in 3.3 ± 0.7 and 4.2 ± 0.6 kg m�2, respectively forthe first and second cycle. The marketable production accountedfor 76% of the total yield, reaching average values respectively of2.4 and 3.4 kg m�2 (Table 3). The overall linear relation between
M. Cossu et al. / Applied Energy 133 (2014) 89–100 95
solar radiation including the supplementary light (St) and the totalcrop yield (Ct) was 0.3 kg m�2 for every 100 MJ m�2 PPFD, with acorrelation of 81% (Ct = 5.830 + 0.003St).
Total and marketable yield were affected by the decrease ofPPFD along to the north–south gradient and consequently signifi-cant differences have been observed among the rows.
On the yearly basis, the significantly highest yields wereachieved in the rows 2 and 3, under the plastic roofs, and the low-est under the photovoltaic roofs (rows 4 and 5), accordingly to thePPFD cumulative values received. However, in the cycle 1 not sig-nificant differences between total and marketable yield of rows 3,4 and 5 were found, while the ‘Earliness Index’ values were signif-icantly higher in the rows under the plastic roofs compared to therows under the PV roofs. The fruit dry matter content did notchange significantly among the rows, reaching averagely 7.5%.
At the end of the first cycle, the cumulated PPFD in the green-house was averagely 72% lower than the potential value, calculatedas no PV system was installed on the roof (410 MJ m�2). The naturalPPFD on the central rows (from 2 to 5) was averagely 0.52 MJ m�2
day�1, which was below the minimum value of 2.60 MJ m�2 day�1,necessary for a good tomato productivity [40,41]. The supplemen-tary light provided an integration of 97%, compared to natural radi-ation inside the greenhouse from November to January, with theattempt to partly compensate the lack of natural light, with an addi-tional PPFD of 39.44 MJ m�2 (0.45 MJ m�2 day�1), but did not signif-icantly affect the tomato production.
In the second cycle, the PPFD was 63% lower than the potentialvalue (1112 MJ m�2, averagely 6.57 MJ m�2 day�1) and the differ-ences between the rows were higher than those found in the firstcycle. Even if the natural PPFD observed inside the greenhouse wassimilar to the optimal level commonly indicated for most horticul-tural crops (6.00 MJ m�2 day�1 [24,38]), the average productionremained slightly below the most common cherry tomato yieldin short cycle (5–10 kg m�2 [42,43]), probably due to the low irra-diation during the first growth stages in January, February andMarch, where the average PPFD radiation on the central rowswas respectively 0.27, 0.53 and 0.94 MJ m�2 day�1. In fact, theaverage total yield amounted to 4.7 (rows 2 and 3) and 3.7 kg m�2
(rows 4 and 5), with significant differences between rows underthe plastic and PV roofs. The ‘Earliness Index’ values showed a sim-ilar trend, while a lower marketable yield in the row 2 compared tothe row 3 was observed, due to a high incidence of fruit affected byblossom end rot (BER) and fruit cracking recorded in the row 2with respect to the other rows. The average fruit dry matter con-tent of the crop was 8.8%, thus 15% higher than that observed inthe first cycle, and significant differences along the north–southgradient were found. The integration with artificial light was 69%
Table 3Cumulated PPFD, yield and fruit characteristic in response to row positions.
Row 2 Row 3 Row 4 Row 5
Cycle 1Total PPFD (MJ m�2) 102a 76bc 75c 85bTotal yield (kg m�2) 4.2a 3.2b 2.8b 2.9bMarketable yield (kg m�2) 3.0a 2.3b 2.0b 2.1bEarliness index 38.9a 35.8b 31.4c 31.5cFruit dry weight (%) 7.50 7.30 7.60 7.80
Cycle 2Total PPFD (MJ m�2) 713a 263b 142c 156cTotal yield (kg m�2) 4.7a 4.8a 4.1b 3.3cMarketable yield (kg m�2) 3.4a 3.8a 3.4b 2.9cEarliness index 37.5a 31.8b 29.8c 30.8bcFruit dry weight (%) 10.7a 9.0b 8.2c 7.6d
Cycle (1 + 2)Total yield (kg m�2) 8.9a 7.9b 6.9c 6.2cMarketable yield (kg m�2) 6.4a 6.1a 5.4b 4.9c
Means followed by the same letters did not differed per P 6 0.05.
compared to the natural radiation received from January to April,with an additional PPFD of 36.69 MJ m�2 (0.40 MJ m�2 day�1) andno effect on the yields was observed.
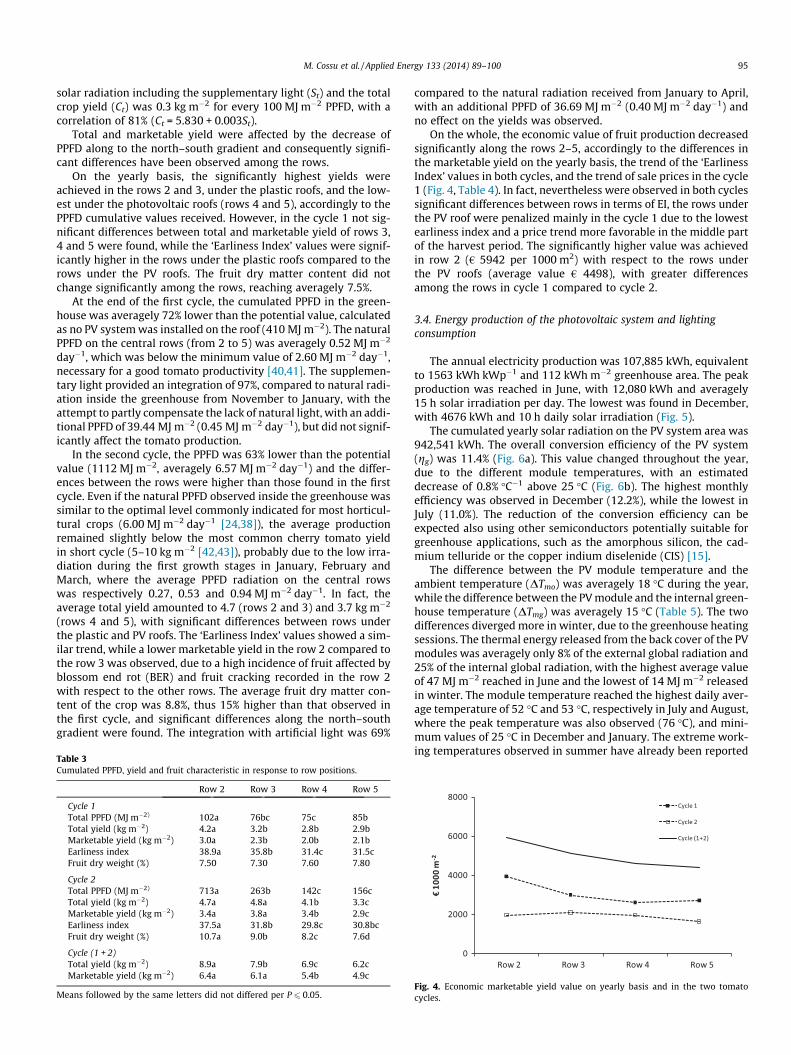
On the whole, the economic value of fruit production decreasedsignificantly along the rows 2–5, accordingly to the differences inthe marketable yield on the yearly basis, the trend of the ‘EarlinessIndex’ values in both cycles, and the trend of sale prices in the cycle1 (Fig. 4, Table 4). In fact, nevertheless were observed in both cyclessignificant differences between rows in terms of EI, the rows underthe PV roof were penalized mainly in the cycle 1 due to the lowestearliness index and a price trend more favorable in the middle partof the harvest period. The significantly higher value was achievedin row 2 (€ 5942 per 1000 m2) with respect to the rows underthe PV roofs (average value € 4498), with greater differencesamong the rows in cycle 1 compared to cycle 2.
3.4. Energy production of the photovoltaic system and lightingconsumption
The annual electricity production was 107,885 kWh, equivalentto 1563 kWh kWp�1 and 112 kWh m�2 greenhouse area. The peakproduction was reached in June, with 12,080 kWh and averagely15 h solar irradiation per day. The lowest was found in December,with 4676 kWh and 10 h daily solar irradiation (Fig. 5).
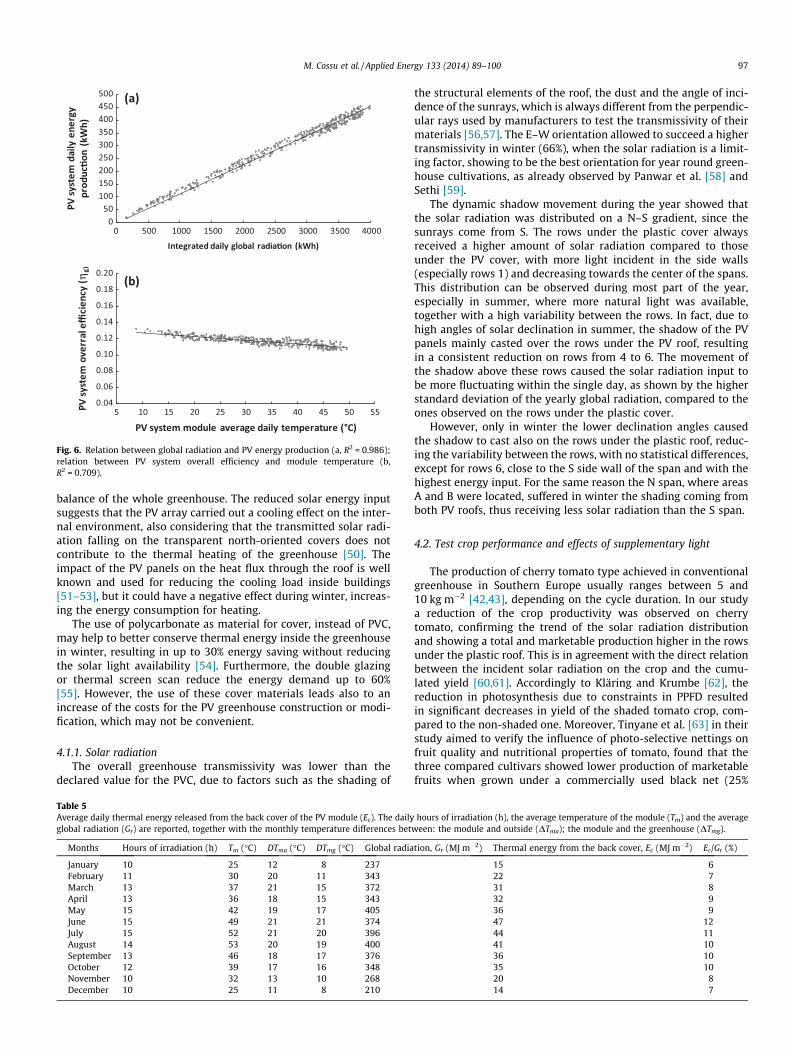
The cumulated yearly solar radiation on the PV system area was942,541 kWh. The overall conversion efficiency of the PV system(gg) was 11.4% (Fig. 6a). This value changed throughout the year,due to the different module temperatures, with an estimateddecrease of 0.8% �C�1 above 25 �C (Fig. 6b). The highest monthlyefficiency was observed in December (12.2%), while the lowest inJuly (11.0%). The reduction of the conversion efficiency can beexpected also using other semiconductors potentially suitable forgreenhouse applications, such as the amorphous silicon, the cad-mium telluride or the copper indium diselenide (CIS) [15].
The difference between the PV module temperature and theambient temperature (DTmo) was averagely 18 �C during the year,while the difference between the PV module and the internal green-house temperature (DTmg) was averagely 15 �C (Table 5). The twodifferences diverged more in winter, due to the greenhouse heatingsessions. The thermal energy released from the back cover of the PVmodules was averagely only 8% of the external global radiation and25% of the internal global radiation, with the highest average valueof 47 MJ m�2 reached in June and the lowest of 14 MJ m�2 releasedin winter. The module temperature reached the highest daily aver-age temperature of 52 �C and 53 �C, respectively in July and August,where the peak temperature was also observed (76 �C), and mini-mum values of 25 �C in December and January. The extreme work-ing temperatures observed in summer have already been reported
0
2000
4000
6000
8000
Row 2 Row 3 Row 4 Row 5
€10
00 m
- 2
Cycle 1
Cycle 2
Cycle (1+2)
Fig. 4. Economic marketable yield value on yearly basis and in the two tomatocycles.
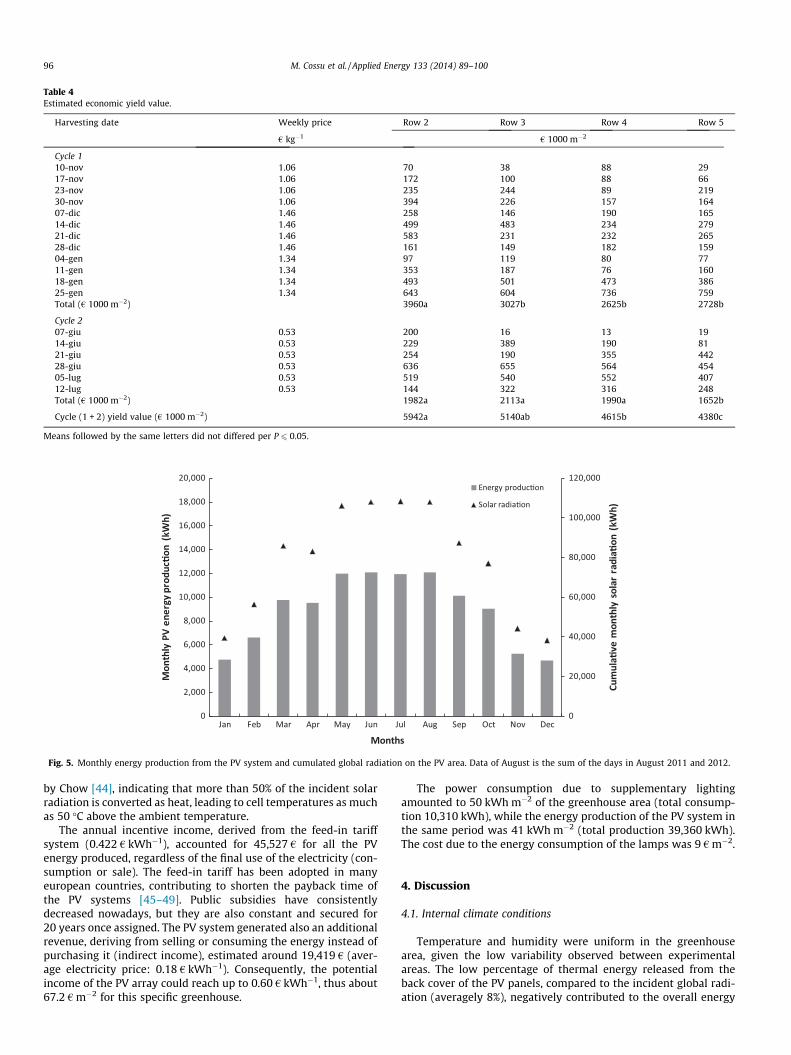
Table 4Estimated economic yield value.
Harvesting date Weekly price Row 2 Row 3 Row 4 Row 5
€ kg�1 € 1000 m�2
Cycle 110-nov 1.06 70 38 88 2917-nov 1.06 172 100 88 6623-nov 1.06 235 244 89 21930-nov 1.06 394 226 157 16407-dic 1.46 258 146 190 16514-dic 1.46 499 483 234 27921-dic 1.46 583 231 232 26528-dic 1.46 161 149 182 15904-gen 1.34 97 119 80 7711-gen 1.34 353 187 76 16018-gen 1.34 493 501 473 38625-gen 1.34 643 604 736 759Total (€ 1000 m�2) 3960a 3027b 2625b 2728b
Cycle 207-giu 0.53 200 16 13 1914-giu 0.53 229 389 190 8121-giu 0.53 254 190 355 44228-giu 0.53 636 655 564 45405-lug 0.53 519 540 552 40712-lug 0.53 144 322 316 248Total (€ 1000 m�2) 1982a 2113a 1990a 1652b
Cycle (1 + 2) yield value (€ 1000 m�2) 5942a 5140ab 4615b 4380c
Means followed by the same letters did not differed per P 6 0.05.
0
20,000
40,000
60,000
80,000
100,000
120,000
0
2,000
4,000
6,000
8,000
10,000
12,000
14,000
16,000
18,000
20,000
Jan Feb Mar Apr May Jun Jul Aug Sep Oct Nov Dec
Cum
ula�
ve m
onth
ly s
olar
rad
ia�o
n (k
Wh)
Mon
thly
PV
ener
gy p
rodu
c�on
(kW
h)
Months
Energy produc�on
Solar radia�on
Fig. 5. Monthly energy production from the PV system and cumulated global radiation on the PV area. Data of August is the sum of the days in August 2011 and 2012.
96 M. Cossu et al. / Applied Energy 133 (2014) 89–100
by Chow [44], indicating that more than 50% of the incident solarradiation is converted as heat, leading to cell temperatures as muchas 50 �C above the ambient temperature.
The annual incentive income, derived from the feed-in tariffsystem (0.422 € kWh�1), accounted for 45,527 € for all the PVenergy produced, regardless of the final use of the electricity (con-sumption or sale). The feed-in tariff has been adopted in manyeuropean countries, contributing to shorten the payback time ofthe PV systems [45–49]. Public subsidies have consistentlydecreased nowadays, but they are also constant and secured for20 years once assigned. The PV system generated also an additionalrevenue, deriving from selling or consuming the energy instead ofpurchasing it (indirect income), estimated around 19,419 € (aver-age electricity price: 0.18 € kWh�1). Consequently, the potentialincome of the PV array could reach up to 0.60 € kWh�1, thus about67.2 € m�2 for this specific greenhouse.
The power consumption due to supplementary lightingamounted to 50 kWh m�2 of the greenhouse area (total consump-tion 10,310 kWh), while the energy production of the PV system inthe same period was 41 kWh m�2 (total production 39,360 kWh).The cost due to the energy consumption of the lamps was 9 € m�2.
4. Discussion
4.1. Internal climate conditions
Temperature and humidity were uniform in the greenhousearea, given the low variability observed between experimentalareas. The low percentage of thermal energy released from theback cover of the PV panels, compared to the incident global radi-ation (averagely 8%), negatively contributed to the overall energy
050
100150200250300350400450500
0 500 1000 1500 2000 2500 3000 3500 4000
PV s
yste
m d
aily
ene
rgy
prod
uc�o
n (k
Wh)
Integrated daily global radia�on (kWh)
(a)
0.04
0.06
0.08
0.10
0.12
0.14
0.16
0.18
0.20
5 10 15 20 25 30 35 40 45 50 55PV s
yste
m o
verr
al e
ffici
ency
(η
g)
PV system module average daily temperature (°C)
(b)
Fig. 6. Relation between global radiation and PV energy production (a, R2 = 0.986);relation between PV system overall efficiency and module temperature (b,R2 = 0.709).
M. Cossu et al. / Applied Energy 133 (2014) 89–100 97
balance of the whole greenhouse. The reduced solar energy inputsuggests that the PV array carried out a cooling effect on the inter-nal environment, also considering that the transmitted solar radi-ation falling on the transparent north-oriented covers does notcontribute to the thermal heating of the greenhouse [50]. Theimpact of the PV panels on the heat flux through the roof is wellknown and used for reducing the cooling load inside buildings[51–53], but it could have a negative effect during winter, increas-ing the energy consumption for heating.
The use of polycarbonate as material for cover, instead of PVC,may help to better conserve thermal energy inside the greenhousein winter, resulting in up to 30% energy saving without reducingthe solar light availability [54]. Furthermore, the double glazingor thermal screen scan reduce the energy demand up to 60%[55]. However, the use of these cover materials leads also to anincrease of the costs for the PV greenhouse construction or modi-fication, which may not be convenient.
4.1.1. Solar radiationThe overall greenhouse transmissivity was lower than the
declared value for the PVC, due to factors such as the shading of
Table 5Average daily thermal energy released from the back cover of the PV module (Ec). The dailyglobal radiation (Gr) are reported, together with the monthly temperature differences bet
Months Hours of irradiation (h) Tm (�C) DTma (�C) DTmg (�C) Global radia
January 10 25 12 8 237February 11 30 20 11 343March 13 37 21 15 372April 13 36 18 15 343May 15 42 19 17 405June 15 49 21 21 374July 15 52 21 20 396August 14 53 20 19 400September 13 46 18 17 376October 12 39 17 16 348November 10 32 13 10 268December 10 25 11 8 210
the structural elements of the roof, the dust and the angle of inci-dence of the sunrays, which is always different from the perpendic-ular rays used by manufacturers to test the transmissivity of theirmaterials [56,57]. The E–W orientation allowed to succeed a highertransmissivity in winter (66%), when the solar radiation is a limit-ing factor, showing to be the best orientation for year round green-house cultivations, as already observed by Panwar et al. [58] andSethi [59].
The dynamic shadow movement during the year showed thatthe solar radiation was distributed on a N–S gradient, since thesunrays come from S. The rows under the plastic cover alwaysreceived a higher amount of solar radiation compared to thoseunder the PV cover, with more light incident in the side walls(especially rows 1) and decreasing towards the center of the spans.This distribution can be observed during most part of the year,especially in summer, where more natural light was available,together with a high variability between the rows. In fact, due tohigh angles of solar declination in summer, the shadow of the PVpanels mainly casted over the rows under the PV roof, resultingin a consistent reduction on rows from 4 to 6. The movement ofthe shadow above these rows caused the solar radiation input tobe more fluctuating within the single day, as shown by the higherstandard deviation of the yearly global radiation, compared to theones observed on the rows under the plastic cover.
However, only in winter the lower declination angles causedthe shadow to cast also on the rows under the plastic roof, reduc-ing the variability between the rows, with no statistical differences,except for rows 6, close to the S side wall of the span and with thehighest energy input. For the same reason the N span, where areasA and B were located, suffered in winter the shading coming fromboth PV roofs, thus receiving less solar radiation than the S span.
4.2. Test crop performance and effects of supplementary light
The production of cherry tomato type achieved in conventionalgreenhouse in Southern Europe usually ranges between 5 and10 kg m�2 [42,43], depending on the cycle duration. In our studya reduction of the crop productivity was observed on cherrytomato, confirming the trend of the solar radiation distributionand showing a total and marketable production higher in the rowsunder the plastic roof. This is in agreement with the direct relationbetween the incident solar radiation on the crop and the cumu-lated yield [60,61]. Accordingly to Kläring and Krumbe [62], thereduction in photosynthesis due to constraints in PPFD resultedin significant decreases in yield of the shaded tomato crop, com-pared to the non-shaded one. Moreover, Tinyane et al. [63] in theirstudy aimed to verify the influence of photo-selective nettings onfruit quality and nutritional properties of tomato, found that thethree compared cultivars showed lower production of marketablefruits when grown under a commercially used black net (25%
hours of irradiation (h), the average temperature of the module (Tm) and the averageween: the module and outside (DTma); the module and the greenhouse (DTmg).
tion, Gr (MJ m�2) Thermal energy from the back cover, Ec (MJ m�2) Ec/Gr (%)
15 622 731 832 936 947 1244 1141 1036 1035 1020 814 7
98 M. Cossu et al. / Applied Energy 133 (2014) 89–100
shading). On the contrary, in studies carried out at low latitudesites (Granada, Spain) and when solar radiation was reduced bymore than 40 compared to outside, total and commercial tomatoyield reached the highest values. In this latter study, the yieldreduction due to shading probably appeared to have been offsetby combined application with cooling (fogging) [64]. Similarresults were found in another study on the effects of shading withnetting (0%, 35%, 51% or 63% shade) in Egypt [65], which showedthat greater shading of the tomato crop boosted total productionby 50%.
As regard the supplementary lighting system, nevertheless itwas designed with a limited power and used only in winter, theenergy consumption of the lamps was slightly higher than theenergy produced in the same period by the PV panels above thesupplied experimental areas. The cost of the energy consumedwas considerably higher than the entire income of the marketableproduction achieved. In addition, the artificial light did not posi-tively affect the low crop productivity, even with an integrationclose to 100%, supplied during the first cycle. The yields were lowerthan the average yearly values of 13 kg m�2 obtained on cherrytomato using HPS lamps [66], thus with an increase up to 3 kg m�2,compared to the yield with natural light (5–10 kg m�2). This wasprobably due to the insufficient hours of additional irradiation sup-plied. In fact, by using the correlation between yield and PPFD, theeffect of the supplementary lighting can be estimated in0.12 kg m�2 and 0.11 kg m�2, respectively after the first and secondcycle. These values were considerably lower than the standarddeviation observed on the resulting crop yield of both cycles (0.7and 0.6 kg m�2), resulting in a negligible statistical difference,compared to the experimental areas without additional PPFD.Therefore the supplementary light in PV greenhouses is not profit-able both under an agronomic and economic point of view, becausethe energy cost can hardly be covered by an adequate increase ofcrop productivity and the energy consumed is not available forpowering other users. Improving the light conditions inside PVgreenhouses by using an artificial light source may have effectsonly increasing power and hours of irradiation, thus consumingmore energy than that produced by the PV array.
4.3. Considerations on the agronomic sustainability of the photovoltaicgreenhouse
The advantage of greenhouses with 50% of the roof area coveredwith PV modules is mainly related to the huge amount of PV elec-tricity produced. This study demonstrated that the income derivingfrom the energy production is considerably higher than that result-ing from the crops, whose yields are strongly penalized by themodules shading. In fact, the income from PV electricity was esti-mated up to 67.2 € m�2, while the income from tomato productionreached 5.9 € m�2, only in the measured plant rows receiving thehighest amount of solar radiation (rows 2). The total cost for heat-ing (2.12 € m�2; oil price 1.06 € L�1) and supplementary lightingamounted to 11.12 € m�2, thus higher than the income from cropproduction. Consequently, until now the minor role of crop cultiva-tion has led the greenhouse roof to be covered with PV panels asmuch as possible. However, the local laws compel the grower tosucceed and prove income from agricultural activity, hence theneed for solutions able to improve the agronomic sustainabilityof such PV greenhouses, influenced by the reduction of solar radi-ation and thermal load. The limitation to new PV greenhouse con-struction was due to their high land use impact (LUI) in agriculturalareas, since single installations can involve several hectares. TheLUI can be estimated using the total area required, the time ofoccupation of land and the change in the quality of land for a spe-cific activity [67]. This means that it can be considered negligiblewhen the PV systems are integrated in preexisting greenhouses.
A decrease of the PV power installed on the roof of these PVgreenhouses would be a simple answer to the poor crop yieldand quality, but it can also increase or compromise the pay-backtime of the investment. In fact, the few PV greenhouses reportedin literature have been designed with the specific attempt toimprove their compatibility with the common greenhouse crops,by covering only a small portion of the roof area, ranging between8.9% and 12.9%, with yields similar to those achieved in conven-tional greenhouses [10,11,68,69]. These structures may affect thequality of the marketable production, but they already representa good compromise between energy generation and crop cultiva-tion. Therefore, these coverage levels should be carefully consid-ered even when adapting preexisting structures.
The increase of the gutter height, the introduction of differentinstallation patterns of the PV panels on the roof, such as thecheckerboard scheme, or the installation of PV panels also onnorth-facing roofs, may contribute to a better distribution of theshading on the canopy without reducing the installed PV power[27,69,70].
Furthermore, some promising PV technologies, such as the flex-ible PV and thin films, the semi-transparent PV panels, the spher-ical micro-cells, the CIS and CIGS (copper, indium and galliumdiselenide) semiconductors, can increase the amount of solar lightentering the greenhouse [71–74]. Other solutions include theapplication of selective plastic films on the greenhouse cover,reflecting the near infrared radiation (NIR) and transmitting thePPFD inside. The roof acts as a solar concentrator, which reflectsthe NIR radiation on a focal line where the PV cells are placed[75,76]. Although most of these technologies have been specificallydeveloped for greenhouse applications, they are often expensiveand still require further investigation for testing the performanceon the field and the impact on the crops.
In the already existing greenhouses with 50% PV coverage, theonly way to increase the internal irradiation seems to be eitherthe partial removal of PV panels or their allocation on N and Sroofs. Both solutions, which require additional investments, reducethe electricity production, but allow a better shade distribution,thus reducing the impact on the crop growth and development.In this study, the solar radiation distribution showed that thegreenhouse areas with less light reductions were those under theplastic covers, mainly the portions close to the side walls, asexpected. In multi-span greenhouses, the span facing S alwaysreceives a slightly higher irradiation and may contribute to ahigher crop productivity, compared to average greenhouse cropyields. As for the cultivation period, the best lighting conditionsof the year can be found in summer under the transparent covers,while the performance of a crop in winter could be compromisedby the lack of natural light. This consideration implies that the sea-sonality heavily affects the productivity of the crop, depending onthe position of the plant inside the PV greenhouse [10]. Further-more, the variability of the microclimate in PV greenhouses interms of solar radiation may cause a heterogeneous crop waterdemand on the cultivation area, deriving from different transpira-tion rates. This aspect requires a specific crop management, such asa different distribution rate of mineral solution among the plantrows.
5. Conclusions
Nevertheless high persistent shading levels should be avoidedin protected cultivation, PV greenhouses with 50% coveragealready represent a considerable part of the PV greenhouse areain southern Europe. This study quantified their occurring reductionof solar radiation, which was averagely 64% on yearly basis, up to82% for the areas under the PV covers, and 46% under the transpar-ent covers. This condition decreased the yield of tomato if
M. Cossu et al. / Applied Energy 133 (2014) 89–100 99
compared to conventional greenhouses, but generated a hugeincome from PV energy. The performed characterization of thesolar radiation distribution provides the decision support informa-tion for choosing the most suitable crops to cultivate when 50% ofthe roof area is covered with PV panels. Some solutions for design-ing new PV greenhouses or adapting existing structures are sug-gested, considering the plant physiology and the economicconvenience of the investment. The variability of the microclimatein PV greenhouses may cause different crop water demand, thusrequiring a specific crop management, which can include a differ-ent distribution of mineral solution between the plant rows. Fur-thermore, the high humidity rates and the agrochemicals couldaffect the long-term life of the PV arrays integrated on the green-house roofs. All these aspects can help to improve the informationfor supporting the grower, thus contributing to make the PV green-house capable of producing income from both electric power andagricultural activity.
Acknowledgements
The authors acknowledge the financial support of RegioneSardegna (Italy) for the fundamental research projects, LR 7/2007‘‘ORTILUX: Energy from photovoltaic greenhouse: study of theenvironmental parameters limiting the cultivation of tomato’’(Energia da fotovoltaico in serra: studio dei parametri ambientalilimitanti la coltivazione del pomodoro). We would like to thankalso the Sardaflora-Cidam company and Mr. Murtas for the collab-oration and the technical support.
References
[1] GSE – Gestore dei servizi elettrici – Rapporto statistico – Solare fotovoltaico2012; 2012. <http://www.gse.it/it/Statistiche/RapportiStatistici/Pagine/default.aspx> [downloaded 02.05.14] [in Italian].
[2] Silva Herran D, Nakata T. Design of decentralized energy systems for ruralelectrification in developing countries considering regional disparity. ApplEnergy 2012;91:130–45. http://dx.doi.org/10.1016/j.apenergy.2011.09.022.
[3] Al-Ibrahim A, Al-Abbadi N, Al-Helal I. PV greenhouse system – systemdescription, performance and lesson learned. Acta Hort 2006;710:251–64.
[4] Al-Shamiry FMS, Ahmad D, Sharif ARM, Aris I, Janius R, Kamaruddin R. Designand development of photovoltaic power system for tropical greenhousecooling. Am J Appl Sci 2007;4(6):386–9.
[5] Carlini M, Honorati T, Castellucci S. Photovoltaic greenhouses: comparison ofoptical and thermal behavior for energy savings. Math Probl Eng; 2012. p. 10.http://dx.doi.org/10.1155/2012/743764 [Article ID 743764].
[6] Esen M, Yuksel T. Experimental evaluation of using various Renew Energysources for heating a greenhouse. J En Build 2013;65:340–51. http://dx.doi.org/10.1016/j.enbuild.2013.06.018.
[7] Rocamora MC, Tripanagnostopoulos Y. Aspects of PV/T solar systemapplication for ventilation needs in greenhouses. Acta Hort 2006;719:239–46.
[8] Yano A, Tsuchiya K, Nishi K, Moriyama T, Ide O. Development of a greenhouseside-ventilation controller drive by photovoltaic energy. Biosyst Eng2007;96(4):633–41. http://dx.doi.org/10.1016/j.biosystemseng.2009.02.020.
[9] Dupraz C, Marrou H, Talbot G, Dufour L, Nogier A, Ferard Y. Combining solarphotovoltaic panels and food crops for optimising land use: towards newagrivoltaic schemes. Renew Energ 2011;36(10):2725–32. http://dx.doi.org/10.1016/j.renene.2011.03.005.
[10] Kadowaki M, Yano A, Ishizu F, Tanaka T, Noda S. Effects of greenhousephotovoltaic array shading on Welsh onion growth. Biosyst Eng 2012;3:290–7.http://dx.doi.org/10.1016/j.biosystemseng.2011.12.006.
[11] Ureña-Sánchez R, Callejón-Ferre ÁJ, Pérez-Alonso J, Carreño-Ortega Á.Greenhouse tomato production with electricity generation by roof-mountedflexible solar panels. Sci Agric 2012;69(4):233–9. http://dx.doi.org/10.1590/S0103-90162012000400001.
[12] Minuto G, Bruzzone C, Tinivella F, Delfino G, Minuto A. Fotovoltaico sui tettidelle serre per produrre anche energia. Suppl L’Inform Agrario 2009;10:16–21.
[13] Marrou H, Guilioni L, Dufour L, Dupraz C, Wery J. Microclimate underagrivoltaic systems: is crop growth rate affected in the partial shade of solarpanels? Agr Forest Meteorol 2013;177:117–32. http://dx.doi.org/10.1016/j.agrformet.2013.04.012.
[14] Bloem JJ. Evaluation of a PV-integrated building application in a wellcontrolled outdoor test environment. Build Environ 2008;43:205–16.
[15] Vats K, Tiwari GN. Energy and exergy analysis of a building integratedsemitransparent photovoltaic thermal (BISPVT) system. Appl Energy2012;96:409–16.
[16] GSE – Gestore dei Servizi Elettrici. D.M. 5 Luglio 2012. Quinto Conto Energia.
[17] Agenzia delle Entrate. National Tax Agency. Circolare N�32/E, July 6th; 2009.[18] Regione Puglia. Deliberazione G.R. 23 gennaio 2012, n. 107; 2012. Circolare n.
1/2012 – Criteri-Modalità e Procedimenti Amministrativi connessiall’autorizzazione per la realizzazione di serre Fotovoltaiche sul territorioregionale. [downloaded 02.05.14] [in Italian].
[19] Regione Sardegna. Allegato n. 4 alla Delibera G.R. n. 25/40 del 1.7.2010; 2010.Criteri per la individuazione delle serre fotovoltaiche effettive e controlli.<https://www.regione.sardegna.it/documenti/1_274_20100719134102.pdf>.[downloaded 02.05.14] [in Italian].
[20] Regione Sardegna. D.G.R. 1495/Dec/A/50 del 29.07.2011; 2011. Linee Guidaper l’autorizzazione degli impianti alimentati da fonti rinnovabili approvatecon D.G.R n. 27/16 del 1 giugno 2011 – Revisione Allegato A5 ‘‘Criteri perl’individuazione delle serre fotovoltaiche effettive e controlli’’. <http://www.regione.sardegna.it/documenti/1_38_20110808130226.pdf>[downloaded 02.05.14] [in Italian].
[21] Bojacá CR, Gil R, Cooman A. Use of geostatistical and crop growth modeling toassess the variability of greenhouse tomato yield caused by spatialtemperature variations. Comput Electron Agric 2009;65:219–27. http://dx.doi.org/10.1016/j.compag.2008.10.001.
[22] Kittas C, Bartzanas T. Greenhouse microclimate and effectiveness underdifferent ventilator configurations. Build Environ 2007;42:3774–84. http://dx.doi.org/10.1016/j.buildenv.2006.06.020.
[23] RELUX. Light simulation tools, 2011. Version 1.1. RELUX Informatik AG,Switzerland.
[24] Castilla N. Greenhouse technology and management. 2nd ed. CABI; 2013.[25] Dorais M, Charbonneau J, Gosselin A. Échanges gazeux de la tomate de
serrecultivé e sous éclairage d’appoint. Can J Plant Sci 1993;73:577–85 [InFrench with abstract in English].
[26] Wittwer SH, Honma S. Greenhouse tomatoes, lettuce & cucumber. EastLansing: Michigan State University Press; 1979.
[27] Yano A, Furue A, Kadowaki M, Tanaka T, Hiraki E, Miyamoto M. Electricalenergy generated by photovoltaic modules mounted inside the roof of a north-S oriented greenhouse. Biosyst Eng 2009;103(2):228–38. http://dx.doi.org/10.1016/j.biosystemseng.2009.02.020.
[28] Gupta R, Tiwari GN, Kumar A, Gupta Y. Calculation of total solar fraction fordifferent orientation of greenhouse using 3D-shadow analysis in Auto-CAD. JEn Build 2012;47:27–34. http://dx.doi.org/10.1016/j.enbuild.2011.11.010.
[29] Desideri U, Campana PE. Analysis and comparison between a concentratingsolar and a photovoltaic power plant. Appl Energy 2014;113:422–33. http://dx.doi.org/10.1016/j.apenergy.2013.07.046.
[30] Kim JY, Jeon GY, Hong WH. The performance and economical analysis of grid-connected photovoltaic systems in Daegu, Korea. Appl Energy2009;86:265–72. http://dx.doi.org/10.1016/j.apenergy.2008.04.006.
[31] Trieb F, Schillings C, O’Sullivan M, Pregger T, Hoyer-Klick C. Global potentialof concentrating solar power. In: Solar Paces conference 2009, Berlin(Germany).
[32] Photovoltaic Geographical Information System (PVGIS). EuropeanCommission. <http://re.jrc.ec.europa.eu/pvgis>.
[33] Jones AD, Underwood CP. A thermal model for photovoltaic systems. Sol Energy2001;70(4):349–59. http://dx.doi.org/10.1016/S0038-092X(00)00149-3.
[34] Faedi W, Rosati P, D’Ercole N. The strawberry breeding program for North Italy.Acta Hort 1988;265:53–68.
[35] ISMEA, Istituto di servizi per il mercato agricolo e alimentare (2013). Schedasettore: ortaggi, legumi, patate. <www.ismeaservizi.it> [downloaded 02.05.14][in Italian].
[36] ISMEA, Istituto di servizi per il mercato agricolo e alimentare (2014). Prezzimedi mensili degli ortaggi. <http://www.ismea.it/flex/cm/pages/ServeBLOB.php/L/IT/IDPagina/133#IsmeaAnchPMO2> [downloaded 01.05.14][in Italian].
[37] SAS Software, 1999. Version 9.02. SAS Institute Inc., Cary.[38] Dorais M. The use of supplemental lighting for vegetable crop production:
light intensity, crop response, nutrition, crop management, culturalpractices. Canadian Greenhouse Conference, Toronto, Ontario, [Canada];2003.
[39] Marrou H, Wery J, Dufour L, Dupraz C. Productivity and radiation use efficiencyof lettuces grown in the partial shade of photovoltaic panels. Eur J Agron2013;44:54–66. http://dx.doi.org/10.1016/j.eja.2012.08.003.
[40] Spaargaren Ir JJ. Supplemental lighting for greenhouse crop. Hortilux SchrederB.V. and P.L. Light System, Inc., Netherlands; 2001.
[41] Blacquiere T, Spaargaren JJ. Necessity of supplemental lighting for year-roundproduction of greenhouse vegetables. Acta Hort 2003;611:75–8.
[42] Ena S. Coltivare su substrato inerte per ridurre il costo del lavoro. ColtureProtette 2008;8:50–3.
[43] Mori A, Amato M, Di Mola I, Caputo R, Quaglietta Chiarandà F, Di Tommaso T.Productive behaviour of ‘‘cherry’’-type tomato irrigated with saline water inrelation to nitrogen fertilisation. Eur J Agron 2008;29:135–43.
[44] Chow TT. A review on photovoltaic/thermal hybrid solar technology.Appl Energy 2010;87:365–79. http://dx.doi.org/10.1016/j.apenergy.2009.06.037.
[45] Campoccia A, Dusonchet L, Telaretti E, Zizzo G. Comparative analysis ofdifferent supporting measures for the production of electrical energy by solarPV and wind systems: four representative European cases. Sol Energy2009;83(3):287–97. http://dx.doi.org/10.1016/j.solener.2008.08.001.
[46] Hsu CW. Using a system dynamics model to assess the effects of capitalsubsidies and feed-in tariffs on solar PV installations. Appl Energy2012;100:205–17. http://dx.doi.org/10.1016/j.apenergy.2012.02.039.
100 M. Cossu et al. / Applied Energy 133 (2014) 89–100
[47] Li DHW, Cheung KL, Lam TNT, Chan WWH. A study of grid-connectedphotovoltaic (PV) system in Hong Kong. Appl Energy 2012;90:122–7. http://dx.doi.org/10.1016/j.apenergy.2011.01.054.
[48] Mondol JD, Yohanis YG, Norton B. Optimising the economic viability of grid-connected photovoltaic systems. Appl Energy 2009;86(7–8):985–99. http://dx.doi.org/10.1016/j.apenergy.2008.10.001.
[49] Wand R, Leuthold F. Feed-in tariffs for photovoltaics: learning by doing inGermany? Appl Energy 2011;88:4387–99. http://dx.doi.org/10.1016/j.apenergy.2011.05.015.
[50] Tiwari GN, Din M, Shrivastava NSL, Jain D, Sodha MS. Evaluation of solarfraction (Fn) for north wall of a controlled environment greenhouse: anexperimental validation. Int J Energy Res 2002;26:203–15.
[51] Dominguez A, Kleissl J, Luvall JC. Effects of solar photovoltaic panels on roofheat transfer. Sol Energy 2011;85:2244–55.
[52] Peng J, Lu L, Yang H, Han J. Investigation on the annual thermal performance ofa photovoltaic wall mounted on a multi-layer façade. Appl Energy2013;112:646–56. http://dx.doi.org/10.1016/j.apenergy.2012.12.026.
[53] DeBlois J, Bilec M, Schaefer L. Simulating home cooling load reductions for anovel opaque roof solar chimney configuration. Appl Energy 2013;91:130–45.http://dx.doi.org/10.1016/j.apenergy.2013.05.084.
[54] Fabrizio E. Energy reduction measures in agricultural greenhouses heating:envelope, systems and solar energy collection. J En Build 2012;53:57–63.http://dx.doi.org/10.1016/j.enbuild.2012.07.003.
[55] Vadiee A, Martin V. Energy management strategies for commercialgreenhouses. Appl Energy 2014;114:880–8. http://dx.doi.org/10.1016/j.apenergy.2013.08.089.
[56] Pieters JG, Deltour JM. Modelling solar energy input in greenhouses. Sol Energy2000;67(1-3):119–30. http://dx.doi.org/10.1016/S0038-092X(00)00054-2.
[57] Teitel M, Deriugin M, Haslavsky V, Tanny J. Light distribution in multi spangutter-connected greenhouses: effects of gutters and roof openings. BiosystEng 2012;113:120–8. http://dx.doi.org/10.1016/j.biosystemseng.2012.06.014.
[58] Panwar NL, Kaushik SC, Kothari S. Solar greenhouse an option for renewableand sustainable farming. Renew Sust Energy Rev 2011;15:3934–45. http://dx.doi.org/10.1016/j.rser.2011.07.030.
[59] Sethi VP. On the selection of shape and orientation of a greenhouse: thermalmodeling and experimental validation. Sol Energy 2008;83:21–38. http://dx.doi.org/10.1016/j.solener.2008.05.018.
[60] Cockshull KE, Graves CJ, Cave CRJ. The influence of shading on yield ofglasshouse tomatoes. J Hortic Sci 1992;67:11–24.
[61] Heuvelink E. Growth, development and yield of a tomato crop: periodicdestructive measurements in a greenhouse. Sci Hortic 1994;61:77–99. http://dx.doi.org/10.1016/0304-4238(94)00729-Y.
[62] Kläring H-P, Krumbein A. The effect of constraining the intensity of solarradiation on the photosynthesis, growth, yield and product quality of tomato. JAgro Crop Sci 2013;199:351–9.
[63] Tinyane PP, Sivakumar D, Soundy P. Influence of photo-selective netting onfruit quality parameters and bioactive compounds in selected tomatocultivars. Sci Hortic 2013;161:340–9.
[64] Leyva R, Constàn-Aguilar C, Blasco B, Sanchez-Rodrìguez E, Romero L, SorianoT, et al. Effects of climatic control on tomato yield and nutritional quality inMediterranean greenhouse. J Sci Food Agric 2013;94(1):63–70.
[65] El-Gizawy AM, Abdallah MMF, Gomaa HM, Mohamed SS. Effect of differentshading levels on tomato plants. 2. Yield and fruit quality. Acta Hortic1993;323:349–54.
[66] Demers DA, Dorais M, Wien CH, Gosselin A. Effects of supplemental lightduration on greenhouse tomato (Lycopersicon esculentum Mill.) plants and fruityields. Sci Hortic 1998;74:295–306. http://dx.doi.org/10.1016/S0304-4238(98)00097-1.
[67] Lakhani R, Doluweera G, Bergerson J. Internalizing land use impacts for lifecycle cost analysis of energy systems: a case of California’s photovoltaicimplementation. Appl Energy 2014;116:253–9. http://dx.doi.org/10.1016/j.apenergy.2013.11.038.
[68] Pérez-Alonso J, Pérez-García M, Pasamontes-Romera M, Callejón-Ferre AJ.Performance analysis and neural modelling of a greenhouse integratedphotovoltaic system. Renew Sust Energy Rev 2012;16:4675–85. http://dx.doi.org/10.1016/j.rser.2012.04.002.
[69] Yano A, Kadowaki M, Furue A, Tamaki N, Tanaka T, Hiraki E, et al. Shading andelectrical features of a photovoltaic array mounted inside the roof of an east-west oriented greenhouse. Biosyst Eng 2010;106:367–77. http://dx.doi.org/10.1016/j.biosystemseng.2010.04.007.
[70] Cossu M, Murgia L, Caria M, Pazzona A. Economic feasibility study ofsemitransparent photovoltaic technology integrated on greenhouse coveringstructures. In: Proceedings of the international conference Ragusa SHWA,Work Safety and Risk Prevention in Agro-food and Forest Systems. Ragusa IblaCampus, Italy; 2010. p. 648–55.
[71] Marucci A, Monarca D, Cecchini M, Colantoni A, Manzo A, Cappuccini A. Thesemitransparent photovoltaic films for Mediterranean greenhouse: a newsustainable technology. Math Probl Eng; 2012. p. 14. http://dx.doi.org/10.1155/2012/451934 [Article ID 451934].
[72] Minuto G, Tinivella F, Bruzzone C, Minuto A. Con il fotovoltaico sul tetto laserra raddoppia la sua utilità. Suppl L’Inform Agrario 2011;38:2–6.
[73] Poncet C, Muller MM, Brun R, Fatnassi H. Photovoltaic greenhouses, non-senseor a real opportunity for the greenhouse systems? Acta Hort 2010;927:75–9.
[74] Yano A, Onoe M, Nakata Y. Prototype semi-transparent photovoltaic modulesfor greenhouse roof applications. Biosyst Eng 2014;122:62–73. http://dx.doi.org/10.1016/j.biosystemseng.2014.04.003.
[75] Sonneveld PJ, Swingels GLAM, Van Tuijl BAJ, Janssen HJJ, Campen J, Bot GPA.Performance of a concentrated photovoltaic energy system with static linearFresnel lenses. Sol Energy 2011;85:432–42. http://dx.doi.org/10.1016/j.solener.2010.12.001.
[76] Sonneveld PJ, Swinkels GLAM, Campen J, van Tuijl BAJ, Janssen HJJ, Bot GPA.Performance results of a solar greenhouse combining electrical and thermalenergy production. Biosyst Eng 2010;106(1):48–57. http://dx.doi.org/10.1016/j.biosystemseng.2010.02.003.