Qualifying the Competitiveness of Solar Photovoltaic ...
157
Wesleyan University The Honors College 50 States and 50 Markets: Qualifying the Competitiveness of Solar Photovoltaic Electricity in the United States by Alexander Speiser Class of 2013 A thesis submitted to the faculty of Wesleyan University in partial fulfillment of the requirements for the Degree of Bachelor of Arts with Departmental Honors from the College of Social Studies Middletown, Connecticut April, 2013
-
Upload
khangminh22 -
Category
Documents
-
view
2 -
download
0
Transcript of Qualifying the Competitiveness of Solar Photovoltaic ...

Wesleyan University The Honors College
50 States and 50 Markets: Qualifying the Competitiveness of Solar Photovoltaic Electricity in the
United States
by
Alexander Speiser Class of 2013
A thesis submitted to the faculty of Wesleyan University
in partial fulfillment of the requirements for the Degree of Bachelor of Arts
with Departmental Honors from the College of Social Studies Middletown, Connecticut April, 2013

1
Table of Contents Acknowledgements…...…..………………………………………………………….2
Figures………………………………………………………………………………...3
Introduction……....…..………………………………………………………..……..4
Background………………………………………………………………………4 Policy Specifics…………………………………………………………………..8 Chapter Roadmaps……………………………………………………………...11 Review of Existing Literature………………………………………………......16
I. PV’s Topsy-Turvy Road to Development………………………………………19
The Federal Government’s Sporadic Support of PV……………………………19 The Current Status of the American PV Industry…………...…….……………32 Room for Improvement and Regulation………………………………….……..45
II. The Relics of Electricity Regulation and the Inhibitors of PV Markets….….48
Regulation’s Role in the Electrification of the U.S……………………….…….48 Defining PV Cost-Competitiveness…….……………………………….……...52 Modern Electricity Market Inefficiencies….………………………….………..58 Market Inhibitors to PV Development….………………………….….………..61 Towards More Efficient Electricity Markets……………………….….……….69
III. Net Metering: A 21st Century Policy for a 20th Century Relationship.….….73
Accounting for Solar PV’s Unique Production Cycle….……………………….73 Policy Specifics and Experiences….………………….…………….…………..79 Reforms to Complement Demand-Side Priorities………………………………85 Automation and Optimizing Net Metering………………………….……….…92 Conclusion………………………………………………………………………97
IV. Realizing Cooperation rather than Collision………………...…..…..……...102
Background…………………….…….…….….………………………………102 The Design of Deliberate PV Promotion Through RPS………………………106 Assessing SREC Markets Through the Experience of the Garden State……...111 Connecticut’s National Model for Renewable Portfolio Standards…………...118 Conclusion: A Fiscally Practical Solution to Deliberate PV Promotion………125
V. Conclusion……………………………...………………………………………129

2
Figures Figure 1. Renewable Energy Consumption in the nation’s energy supply, 2011……6 Figure 2: Framework for policy stacking……………………………………………10 Figure 3. Basic Schematic of a PV Module……………………………….………...15 Figure 4. Example of Standard Residential Photovoltaic System……….…..….…..16 Figure 5. Number of State Renewable Portfolio Standards Since 1997…….……....29 Figure 6. Federal Clean Technology Policy Support is Falling off a Cliff….………31 Figure 7. Data Sample Compared to Total U.S. Grid-Connected PV Capacity.……33 Figure 8. Installed Price of Residential & Commercial PV over Time…….………..34 Figure 9: Case Studies of Residential Solar Power in Five U.S. cities…….………..35 Figure 10. The Steady Fall of Solar Panel Prices……………….…………………...37 Figure 11. Balance of System Costs for Silicon and Cadmium PV Systems………..42 Figure 12. Vertical Third Party Financing Model………………….………………..43 Figure 13. Broadway and St. John before and after Regulated Electricity………......51 Figure 14. Photovoltaic Solar Resource of the United States………………….…….55 Figure 15. Load and Generation Mix………………………………………………..57 Figure 16. Customer Acquisition Costs in Germany vs. U.S………………………..64 Figure 17. The Basics of a Rooftop Net Metered System…………………………...74 Figure 18. The Phases of PV System Operation……………………………………..75 Figure 19. Net Metering Policy Grades in the United States as of April 2013….…...79 Figure 20. Net Metering Landscape as of March 2013………………..….….……...82 Figure 21. PV’s influence on Tiered Electricity Prices……………………………...86 Figure 22. The Traditional Electricity Meter and the Smart Meter……………...…..93 Figure 23. RPS Policies with Solar and Distributed Generation Requirements.…...107 Figure 24. The General Schema of RPS……………………..……………………..108 Figure 25. Mid-Atlantic SREC Market Trends………………….……….…………113 Figure 26. NJ Solar Carve-Out: PV Megawatt Obligations Prior Vs. S. 1925……..114 Tables Table 1. Mean Cumulative Capacity per FTG Net Metering Grade Group…..…..…80 Table 2. Results from May, 2012 ZREC Auctions……………..…………………..120 Table 3. 2012 Top Ten States: Ranked by Grid-Connected PV Capacity (2012),,,,,125
3
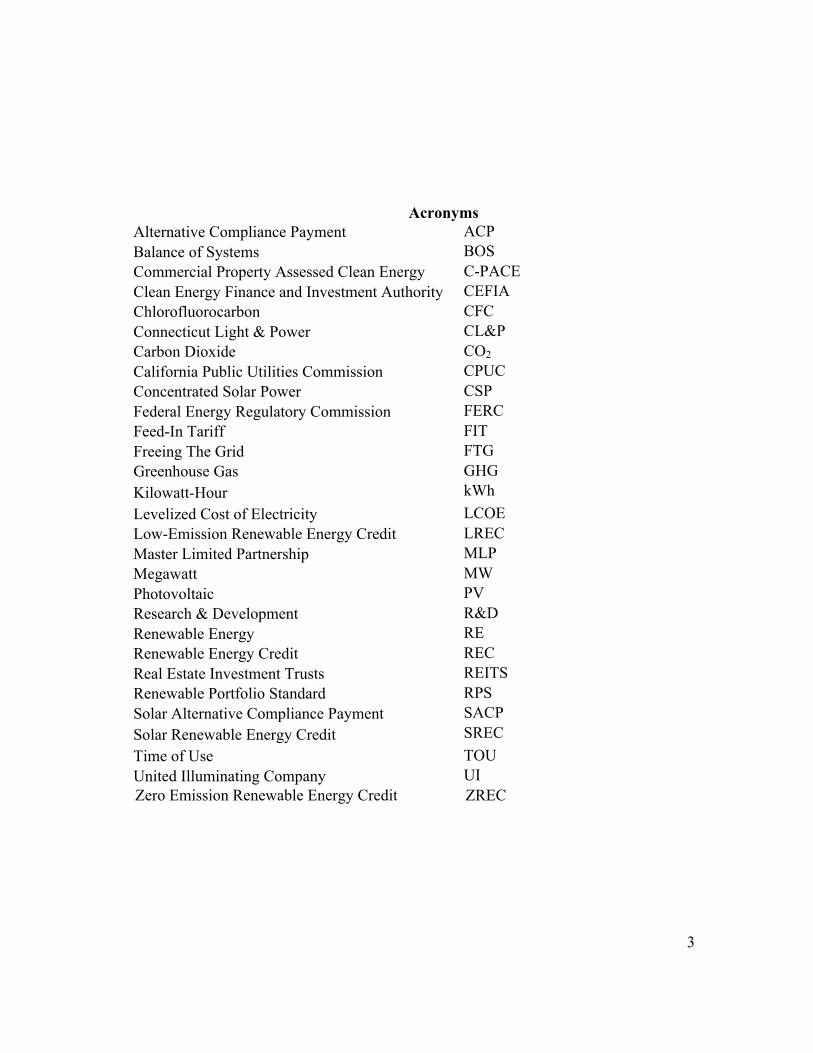
Acronyms Alternative Compliance Payment ACP Balance of Systems BOS Commercial Property Assessed Clean Energy C-PACE Clean Energy Finance and Investment Authority CEFIA Chlorofluorocarbon CFC Connecticut Light & Power CL&P Carbon Dioxide CO2 California Public Utilities Commission CPUC Concentrated Solar Power CSP Federal Energy Regulatory Commission FERC Feed-In Tariff FIT Freeing The Grid FTG Greenhouse Gas GHG Kilowatt-Hour kWh Levelized Cost of Electricity LCOE Low-Emission Renewable Energy Credit LREC Master Limited Partnership MLP Megawatt MW Photovoltaic PV Research & Development R&D Renewable Energy RE Renewable Energy Credit REC Real Estate Investment Trusts REITS Renewable Portfolio Standard RPS Solar Alternative Compliance Payment SACP Solar Renewable Energy Credit SREC Time of Use TOU United Illuminating Company UI
Zero Emission Renewable Energy Credit ZREC

4
Acknowledgements This would be more fun if it were for a wedding speech, maybe even a quinceanera. With that said, I hope that years from now I can be at some sort of event with everyone I acknowledge here and this project comes up, so that I can tell them once more how grateful I will forever be for their contributions to my thesis. First of all, my deepest and most sincere thanks goes to my advisor, Professor Gary Yohe. Without your reassuring guidance and insight, I would have never come this far.
I would also like to express my wholehearted gratitude to everybody who helped me grow as a thinker during the thesis process: Professor Gilbert Skillman, for taking me “out of the clouds” over countless hours of challenging my ideals and then my arguments; Professor Cecilia Miller, for her candor and constructive criticism, which I much needed and appreciated; Professor Michael Dorsey, for challenging me to ask for what I want; Barry Chernoff for his devotion to the COE, which I am so glad was apart of my Wesleyan experience. I’d like to extend my further thanks to Prof. Richard Elphick, Prof. Brian Fay, and Prof. Don Moon, who were formative in my development as a student in the CSS. I owe a great deal to those who generously worked to proofread and provided feedback on this work, especially Grace Kuipers, Max Bevilacqua, and Ilana Bondell. Additionally, to my buddies, who allowed themselves to also be coaxed into my editing process: Yosh Kule, Adam Hirschberg, and especially Sam Walker, with whom I look forward to joining forces and taking over the solar industry. Thanks also to members of the solar and renewables industries, who took the time to speak to a lowly student and offer more than their two-cents to my questions: Ben Higgins, Rhone Resch, Richard Kaufman, Alec Guettel, Joshua Paradise, Alan Bernheimer, Kerinia Kusick, Joachim Seel, Larry Sherwood, Sloane Morgan, Mike Jacobs, Chris Lotspeech, Mike Hill, Omay Elphick, Gary Sheehan, Andrew McKenna, Ryan Gilchrist, John Nordeman, and Kate Gerlach. To my partners in crime in CSS, Michael Zazzaro and Luke Wherry. These last three years would have been a whole lot harder without you. If it were not for Luke, the thesis process would have been to quote our friend, Alvy Singer, “full of misery, loneliness, and suffering.” To my roommates at 53 Home, my Horace Mann boys, my mom, and my brother, you will not read this (it is 3:52 PM)—I love you. -ABS

5
Introduction
[T]he question of the relation of the States to the federal government is the cardinal question of our constitutional system. At every turn of our national development, we have been brought face to face with it, and no definition either of statesmen or of judges has ever quieted or decided it. It cannot, indeed, be settled by the opinion of any one generation, because it is a question of growth, and every successive stage of our political and economic development gives it a new aspect, makes it a new question.
-Woodrow Wilson1
I. Background
A dire reality confronts the electrical apparatus underpinning modern
civilization: climate change. To be more specific, close to 40 percent of the United
States’ carbon dioxide emissions come from the production of electricity used in
homes, factories, stores, and offices.2 The global climate is changing as a result of the
buildup of atmospheric greenhouse gases (GHGs) such as carbon dioxide (CO2),
methane, nitrous, and chlorofluorocarbons (CFCs), which in the United States come
1Woodrow Wilson, Constitutional Government in the United States. (New York: Columbia Univ. Pr., 1921),173. 2"Carbon Dioxide Emissions," Environmental Protection Agency, accessed November 29, 2012, http://www.epa.gov/climatechange/ghgemissions/gases/co2.html.
Précis: The story of solar photovoltaic electricity (PV) in the United States is one of auspicious potential curtailed by inconsistent policies. The public sector’s support is essential for PV to compete with conventional forms of electricity. Yet, the role of federal and state policymaking on PV has, alas, amounted to negligible contributions to the American energy system. Mindful of the public sector’s budget belt tightening, this thesis focuses on how regulatory measures, not financial incentives, affect PV's cost competitiveness and market development. First, this Introduction provides necessary background on PV, the American Energy System, and climate change. Second, the Introduction transitions into a brief survey of the policies that will be assessed in this thesis. Finally, it concludes with a statement of the thesis’ structure, goals, and sources.

6
primarily from the combustion of fossil fuels used to power our industrial, residential,
and commercial systems. The work of globally renowned scientific bodies such as the
United Nation’s Intergovernmental Panel on Climate Change confirms the urgency to
slash emissions,3 as do farmland bakes from historic droughts and subway floods
from surging seas.4 Public policies promoting renewable energy (hereafter
“renewable(s)” or RE) address this link between conventional electricity production
and climate change. RE, especially solar and wind electricity, have the potential to
play a crucial role in mitigating climate change.5 Unlike fossil fuels, renewables
provide desired energy services with little or no emissions.6 They offer the possibility
of continuous supplies of energy in perpetuity that are many orders of magnitude
greater than humanity’s entire use of energy.7 The promise of REs, however, is
diminished by their inability to compete with conventional electricity in the majority
3Through the use of climate models and analysis of past climate variations from the impact science of painstaking studies published in the world’s leading peer-reviewed journals, the IPCC expects that significant climate changes will occur in the coming decades and beyond due to the accumulation of GHGs in the atmosphere. In the absence of measures restricting the emission of GHGs, particularly
CO2, it is projected that global surface temperature will rise over this century between 1.1–6.4◦C, precipitation and evaporation will increase, and sea levels will rise 10-90 cm. (S Solomon, D. Qin, M. Manning, Z. Chen, M. Marquis, K.B. Averyt, M. Tignor and H.L. Miller, Climate Change 2007: The Physical Basis of Climate Change-Contribution of Working Group I to the Fourth Assessment Report of the Intergovernmental Panel on Climate Change (Cambridge: Cambridge University Press, 2007) 4While climate change regulation is generally beyond the scope of this paper, the pages that follow do identify ways in which renewable energy regulation, specifically of solar electric power, can be fine-tuned to achieve climate change mitigation objectives. 5The IPCC defines a renewable energy as “any form of energy from solar, geophysical or biological sources that is replenished by natural processes at a rate that equals or exceeds its rate of use.” (O. Edenhofer, R. Pichs-Madruga, Y. Sokona, K. Seyboth, P. Matschoss, S., T. Zwickel, P. Eickemeier, G. Hansen, S. Schloemer, C. von Stechow, Renewable Energy Sources and Climate Change Mitigation, (Cambridge: Cambridge University Press, 2011), 164). 6Ibid, 164 7For instance, the amount of sunlight reaching the earth is over 10,000 times greater than the total human direct use of energy. (Ramez Naam, "Smaller, cheaper, faster: Does Moore’s law apply to solar cells?," Scientific America, (March 2011) Accessed 11/02/12: http://blogs.scientificamerican.com/guest-blog/2011/03/16/smaller-cheaper-faster-does-moores-law-apply-to-solar-cells/)

7
of states. Indeed, renewables contribute a relatively slim portion to the overall
American energy system, as shown in Figure 1.
Figure 1. Renewable Energy Consumption in the nation’s energy supply, 20118
Though renewable sources have experienced significant growth in the last decade,
they contribute to a very small portion of total electricity generation today due to their
high direct costs.
In contrast to the telecommunications and computing industries, where
incumbents saw potential opportunities and threats of new technologies and therefore
took it upon themselves to innovate, most utilities have not deviated from the status
quo of conventional generation. Unlike innovations in cellphones or laptops, a
premium is not placed on a kilowatt hour (kWh) of renewable electricity because the
cost of conventional power does not include the environmental, health, and other
social costs of GHG emissions.9 “Investors are most concerned with a positive returns
on their investment,” Joshua Paradise, Director of Research at the Renewable Energy
8 One BTU (British Thermal Unit) is the amount of energy required to raise the temperature of one pound of water by one degree Fahrenheit. One quadrillion BTUs is equivalent to the annual energy consumption of ten million U.S. households: U.S. Department of Energy, Energy Information Administration, Annual Energy Review 2011, 2012, accessed December 01, 2012, http://www.eia.gov/totalenergy/data/annual/pdf/aer.pdf. 9Utilities charge their customers in terms of kilowatt-hours (kWh). A kWh is the unit of energy equal to 1000 watts of power used over the course of an hour. It is also the energy required to run a 100 watt light bulb for 10 hours.

8
Consulting Firm, PHOTON, remarked. “Other factors like environmental attributes
are secondary.”10 Paradise’s comment touches on the problem of placing a cost on
environmental externalities. Since Arthur Pigou’s seminal work in 1920 on the topic,
11 economists have understood that pricing externalities is likely to be the best way to
move consumer and producer behavior towards market efficiency. In the context of
electricity, this means placing a price on fossil fuels’ GHG emissions through taxes or a
tradable permits system.12 By placing a price on carbon, the social costs of emissions
would be embedded in the price of related goods. Such mechanisms would provoke
fundamental changes in the electricity behavior of millions of American people and
businesses, who would now have to account for the damages resulting from
conventional electricity generation. However, carbon-pricing policies have been
eschewed by Congress and only implemented in a minority of states.13
Instead, government responses have centered on programs encouraging the
use of renewable energies that less directly address the social costs of energy
production.14 These tools are implemented to render renewables more competitive
10Interview with Joshua Paradise January 10, 2013. 11Arthur C. Pigou, The Economics of Welfare, (London: Macmillan and Co., 1920). 12There is a substantial literature addressing the role of a carbon a tax or a cap-and-trade system on energy consumption. For instance: William D. Nordhaus, “A Review of the Stern Review on the Economics of Climate Change,” Journal of Economic Literature, Vol. XLV (September, 2007), 686-702. (“in plain English, it is critical to have a harmonized carbon tax or the equivalent both to provide incentives to individual firms and households and to stimulate research and development in low-carbon technologies.”) 13 A minority of states price carbon through cap and trade system. For example, “The New England Governors released an action plan in 2001 that calls for a 10 percent reduction in GHGs below 1990 levels by 2020 (Regional Greenhouse Gas Initiative [RGGI], 2007). New York State’s energy plan requires a 5 percent reduction in GHG levels by 2010 and a 10 percent decrease below 1990 levels by 2020.” (Daniel C. Matisoff, "The Adoption of State Climate Change Policies and Renewable Portfolio Standards: Regional Diffusion or Internal Determinants?," Review of Policy Research 25, no. 6 (2008): p.3, doi:10.1111/j.1541-1338.2008.00360.x.) 14For more information on the concept of the social cost of carbon: Laurie T. Johnson and Chris Hope, "The Social Cost of Carbon in U.S. Regulatory Impact Analyses: An Introduction and Critique," Journal of Environmental Studies and Sciences 2, no. 3 (September 2012), accessed November 07, 2012, http://link.springer.com/article/10.1007%2Fs13412-012-0087-7. /

9
against conventional sources (fossil fuels, nuclear, and hydropower facilities), all of
which were significantly supported by the government in their development stages.15
On a federal, state, and local level, a patchwork of incentives and regulations
promotes grid-connected solar photovoltaic (hereafter PV) electricity. PV
technologies transform sunlight into electricity (refer to “Background Information” at
the end of this introduction) and potentially represent one of the most promising
sources of alternative energy. These policies have been implemented so that PV can
be economically competitive with conventional sources of generation. For the party
investing in PV, cost-competitive means that the cost of the system, or levelized cost
per kWh,16 after inclusion of all state and federal benefits, is at or below the
applicable price of conventional generation.
II. Policy Specifics
Today, American RE policymaking takes place in the context of a
decentralized system. Both states and the national government share responsibility for
approaches to climate change. The prospects of these practices can be determined
from an analysis of the historical experiences of the various American policies
intended to encourage the usage and promote the financial success of PV. It is widely
15According to the Congressional Research Service, “For the 63-year period from 1948 through 2010, nearly 12% [of DOE R&D spending] went to renewables, compared with 9% for efficiency, 25%for fossil, and 50% for nuclear.” Fred Sissine, CRS, “Renewable Energy R&D Funding History: A Comparison with Funding for Nuclear Energy, Fossil Energy, and Energy Efficiency R&D” 16 (January 26, 2011). 16With more description to come in Chapters One and Two, the levelized cost of electricity for a given PV system is the constant (in real terms) price for power that would equate the net present value of revenue from the system’s output with the net present value of the cost of production (Severin Borenstein, "The Private and Public Economics of Renewable Electricity Generation," NBER Working Paper, no. 17695 (December 2011), accessed March 01, 2013, http://www.nber.org/papers/w17695.)
10
accepted that a level of fiscal austerity has been adopted among policymakers.17
Using this budgetary restraint as a point of departure, this thesis focuses on how
regulatory measures, not financial incentives, affect PV’s cost competitiveness and
affect the development of PV markets. It emphasizes the overlooked role that state
regulations play in stimulating PV markets and addressing inefficiencies in electricity
markets. I argue that while financial incentives have served as the sporadic engine of
the U.S.’s PV industry, regulation is the road to long term viability.
Despite the fact that it does not contribute a significant portion to the overall
American Energy System, RE carries tremendous promise. Central to this outlook is
the proactive role that state policymaking has had. Today, almost every state has
adopted one RE policy or another. These policies are often grouped in two categories.
Policies in the first category provide financial incentives to promote PV through
grants, tax incentives, and loans, resembling the policies already established by the
federal government. The second category includes rules and regulations that mandate
certain action promoting RE from obligated entities like utilities.18 Federal financial
incentives have been crucial to PV’s evolution into a rapidly growing industry over
the past decade.19 Regulation, however, carries a more complicated history. Since
there are no federal mandates to accompany state regulations and because state
17Such behavior has been demonstrated in statehouses throughout the U.S. For instance, in his 2013 State of the State Address, New York Governor Andrew Cuomo offered solutions suited for “a time of severe budget conditions.” Governor Andrew Cuomo, NY Rising: 2013 State of the States (Albany, NY: Office of the Governor, 2013), p.29, accessed February 26, 2013, http://www.governor.ny.gov/sites/default/themes/governor/sos2013/2013SOSBook.pd 18Magali A. Delmas and Maria J. Montes-Sancho, "U.S. State Policies for Renewable Energy: Context and Effectiveness," Energy Policy 39, no. 5 (May 2011); Fredric C. Menz and Stephan Vachon, "The Effectiveness of Different Policy Regimes for Promoting Wind Power: Experiences from the States," Energy Policy 34, no. 14 (2006), doi:10.1016/j.enpol.2004.12.018. 19The United States’ net generation of solar electric power grew about 245%, while overall electricity generation increased 8.5%. (Energy Information Administration, "Electric Power Annual 2011.”)

11
financial incentives resemble federal ones, states operate on a voluntary basis. Thus,
regulation has only come from the so-called “laboratory” of the states. As Ford
School of Public Policy’s Barry Rabe points out, the federal government’s political
“gridlock” has meant that, throughout the last decade of the 20th century and
throughout the 21st, the federal government has been relatively absent in climate
change and RE policymaking.20 In turn, the states have adopted a suite of policy
tools, including various forms of standards, mandates, and incentives.21 By analyzing
the role of state policies on the viability of PV, my assessment of the American
regulatory landscape is complementary to Rabe’s on the U.S.’s decentralized
approach to climate change and RE.
Figure 2: Framework for policy stacking22
20Barry G. Rabe, Statehouse and Greenhouse: The Emerging Politics of American Climate Change Policy, (Washington, D.C.: Brookings Institution Press, 2004). 21Table 1 in the Appendix provides a snapshot of government and utility rules, regulations and policies that promote RE in the U.S. It is from DSIRE, the Database of State Incentives for Renewable Energy and Efficiency, and includes public benefit funds, renewable portfolio standards, net metering, interconnection standard, renewable access, construction and design, and required green power policies. 22Elizabeth Dorris, “Policy Building Blocks: Helping Policymakers Determine Policy Staging for the Development of Distributed PV Markets,” report no. NREL/CP-7A30-54801, accessed January 21, 2013, http://www.nrel.gov/docs/fy12osti/54801.pdf.

12
Net metering is a market preparation policy for distributed generation, which allows
system owners who generate their own electricity to receive full retail credit for the
electricity they do not consume but contribute to the grid. Renewable portfolio
standards require that electricity suppliers purchase a growing amount of RE over
time. They are a promotional market mechanism for renewables, as they deliberately
mandate RE deployment. I hope to prove that net metering and renewable portfolio
standards are crucial to growing and competitive PV markets.
In the pages to come, I hope to orient the reader’s perspective on American
RE policymaking to show that PV’s viability depends upon regulation, not incentives.
Cost-competitive PV markets have emerged in states with regulations that take
advantage of federal incentives and establish stable, attractive investment
environments for project financing. In sum, the U.S.’s decentralized approach to RE
promotion has facilitated PV’s gradual emergence as a cost-competitive source in a
minority of electricity markets. In order for PV to compete on a national scale, best-
practice regulatory measures must be implemented on a broader scale.
III. Chapter Roadmaps
My first chapter is a historical survey expanding on the role of the federal
government in the development of PV technologies and markets in the U.S that I
hope will elucidate the issues facing its regulation. Through a qualitative analysis of
the PV industry, I assess the policy and market changes that propelled PV’s
unprecedented growth. Due to the steep drop in solar panel costs, PV is an
increasingly attractive investment in a minority of states with the right blend of
incentives and regulation. However, non-panel expenses that come with

13
implementation now hold the majority share of PV system price and limit PV’s cost-
competitiveness in the majority of states. The end of Chapter One details these softer
costs, leading into the question: can regulation facilitate PV’s cost competitiveness?
Chapter Two identifies several of the market inefficiencies inhibiting PV’s
cost-competitiveness against conventional electricity. It details the historic role that
regulation played in the development of the modern American electricity apparatus.
With the intention of preventing inefficient markets, regulations were implemented to
serve as substitutes for competition in the electricity industry. Beginning with the
“natural monopoly” treatment given to utilities, which have been considered–
correctly or not– incapable of being subject to competition,23 legislators have
recognized that, left alone, the electricity markets may operate inefficiently,
restricting production, offering poor quality, and charging high prices. Almost a
century later, RE policies are meant to solve the same problems created by the
deployment of renewables. Now that there is least one RE regulation in every state,
the question of whether or not policy can successfully promote renewables,
specifically PV, is pertinent. This chapter lays the foundations for the role of
regulation in addressing market barriers and failures to provide context for net
metering and renewable portfolio standards.
The aim of Chapters Three and Four is to exploit the variation in the diversity
of PV policy regulations. I build upon Rabe’s work on decentralized regulatory
23As will be discussed in Chapter Two, natural monopoly mandates were created for utilities to charge “just and reasonable” prices, refrain from discrimination, and provide reliable service. The movement for performance-based rates proceeded from the idea that utilities needed more impetus to satisfy customer demand and become efficient. For almost a century, state governments have regulated electricity through state public utility commissions that make fundamental decisions on pricing, approval of new facilities and technologies, and environmental considerations.

14
climate and RE policymaking to analyze the state net metering and renewable
portfolio standards that have been adopted in the absence of serious action by the
federal government. These chapters attempt to understand which approaches work
well and why. Through qualitative analyses, along with basic quantitative
descriptions that use statistical information on PV capacity provided by Larry
Sherwood, COO of the Interstate Renewable Energy Council and reports jointly
issued by the Solar Energy Industry Association and Greentech Media, I provide
positive details on the policies and draw normative conclusions on the policy’s role in
PV’s cost-competitiveness, which shapes the attractiveness of investments in PV
capacity. Because states have implemented such diverse mechanisms, a comparison
of individual policies allows for valuable analyses and conclusions.
Lastly, the Conclusion brings together the normative conclusions on best
practices from Chapters Three and Four and expands upon their role in improving the
financials of PV federal implementation of net-metering and RPS. The conclusion
brings together the analysis of the preceding chapters. This thesis builds upon the
work of peer-reviewed journals and articles24 with analyses and from PV industry
analysts, executives, and regulators to create a positive analysis and normative
conclusions. The conclusion finishes with a description of the potential for further
analysis brought on by this thesis.
24By peer reviewed, I mean that the articles and journals are assessed for quality by the following criteria provided by the CUNY Library, such as “The author of the article must submit it to the journal editor who forwards the article to experts in the field. Because the reviewers specialize in the same scholarly area as the author, they are considered the author’s peers (hence “peer review”).” ("Evaluating Information Sources," CUNY Library, accessed March 10, 2013, http://guides.lib.jjay.cuny.edu/content.php?pid=209679.)

15
Due to the limited time period and extent to which RE policies have been
implemented, analysis surrounding its implementation has been relatively brief. As a
result, limited evaluation has taken place and the most effective policy designs and
their direct impacts on RE capacity are not always well understood. Of the dozens of
studies that have been conducted regarding the effectiveness of state leadership on
public policy issues, few have specifically examined the U.S.’s decentralized
approach to encouraging the deployment of PV (refer to section below on
technological information). Additionally, in academic literature, the attention paid to
the American climate change policy usually focuses on the failure of Congress to
place a price on carbon. Less effort has been devoted to federal renewable energy
policy, and significantly less effort has been focused on state carbon pricing and
renewable energy efforts.25 This thesis attempts to fill the void in analysis on the role
of regulation in PV’s cost-competitiveness and market development.
General Background Information on PV
The first modern solar cell was invented at the Bell Telephone Laboratories in 1954.
As shown in Figure 3, the Bell researchers discovered that when silicon is specially
treated to form an electric field (positive on one side and negative on the other) light
energy (in the form of photons) is able to knock the electrons loose from the atoms in
the silicon.
Figure 3. Basic Schematic of a PV Module26 25Andrea Sarzynski, Jeremy Larrieu, and Gireesh Shrimali, "The impact of state financial incentives on market deployment of solar technology," Energy Policy, Vol 46, July (2012), p. 550-557 (Motivated by their belief that existing research on state-level financial incentives “has not kept up with the increasing interest in solar from consumers, utilities, and legislators,”). The dearth in financial incentives analysis pales in comparison to that of academic literature on regulation’s impact on solar markets. 26Gil Knier, "How Do Photovoltaics Work?," NASA Science, 2002, accessed January 12, 2013, http://science.nasa.gov/science-news/science-at-nasa/2002/solarcells/.

16
These electrons can then be captured in the form of electric current if conductors are
attached to the positive and negative sides, forming an electric circuit. Under the
general category of PV panels there are several competing sub-technologies relying
on a range of different semiconductor materials and manufacturing processes, with
varying costs ($/Wp) and solar conversion efficiencies.27 Generally, mentions of
“panels” or “modules” refer to crystalline silicon (si) photovoltaic modules, which
represent about 80% to 90% of the PV market and have efficiencies for converting
sunlight into electricity currently range from 14% to 19%.28 Additionally, there are
several non-panel components to a photovoltaic system, as shown in Figure 4.
Figure 4. Example of Standard Residential Photovoltaic System29
27PV sub-technologies are generally classified into two groups: crystalline and thin-film. As will be elaborated in Chapter 1, crystalline panels are composed of silicon and consist of solar wafers that resemble the original Bell Laboratory’s cell. Thin-film panels. The front-runner materials for thin-film modules include amorphous silicon (a- Si), copper indium diselenide (CIS), cadmium telluride (CdTe), and thin-film polycrystalline. Due to the innovations of First Solar, which will be discussed in Chapter 1, CdTe modules have achieved the highest technical efficiency levels in laboratory cells. 28Greentech Media Research and Association, "Solar Market Insight Report 2012 Q3," SEIA, accessed December 01, 2012, http://www.seia.org/research-resources/solar-market-insight-report-2012-q3. 29"Home Owner Ecosoluation," Ecosolargy, accessed December 05, 2012, http://www.ecosolargy.com/solutions/home-owners.

17
The other non-module costs that make up PV system include racking, wires, switches,
inverters, and labor for installing the system.30 Grid-connected solar PV electricity,
whose markets subdivide into large central-station facilities in unused parcels of land
and distributed applications, or “behind the meter,” located near or at the point of use,
is increasing in sophistication, adoption and efficiency. Although other solar
technologies exist such as solar water heating, concentrating solar power (CSP)
systems,31 this report focuses on solar PV electricity generation.
IV. Review of Existing Literature
Existing literature has not, up to this point, addressed the issues I hope to resolve in
my thesis. Studies on decentralized RE policymaking have yet to analyze the direct
impact of policies on PV, specifically the role of regulations in PV’s viability.
Although I draw heavily on the work of Barry Rabe, a leading scholar on state action 30Stephen Smith and MJ Shiao, "Solar PV Balance of System (BOS) Markets: Technologies, Costs and Leading Companies, 2013-2016," GTM Research, accessed January 11, 2013, http://www.greentechmedia.com/research/report/solar-pv-bos-2013. 31CSP systems produce electricity use mirrors to concentrate direct-beam solar radiance onto collecting receivers filled with liquid, solid, or gas to produce heat that is run through a traditional turbine power generator or Stirling engine, producing electricity.
18
in climate change and RE policy,32 and that of his colleagues Victor, House, and Joy
(2005), Carolyn Fischer and Richard G. Newell (2007), 33 their work generally
focuses on the factors encouraging RE policy adoption, not the effects of the policies
concerning PV. When similar studies examine decentralized policymaking’s
influence of PV, they typically focus on financial incentives, not regulation. For
instance, Gouchoe et al. (2002) and Sarzynski et al. (2012) discuss the role of
financial incentives in driving PV, not regulations.34 Additionally, work on
regulation’s role in solving electricity market inefficiencies has yet to extend to PV,
particularly the non-panel costs of a PV system. Alfred Kahn’s work (1998) on
electricity regulation, which is relied upon in Chapter Two, came before the RE and
PV had come to prominence in the U.S. as legitimate alternatives to conventional
electricity.35 More recently, Gillingham and Sweeney (2010) focus on how
regulations address externalities.36 Their work serves as background for claims that
heretofore have not been made on electricity market inefficiencies’ restricting the
32Rabe, Statehouse and Greenhouse: The Emerging Politics of American Climate Change Policy, 2004; Rabe, "The Aversion to Direct Cost Imposition: Selecting Climate Policy Tools in the United States," Governance, Vol. 23, No. 4 (October, 2010), 583-608. Accessed 11/04/12: http://onlinelibrary.wiley.com/doi/10.1111/j.1468-0491.2010.01499.x/ 33David Victor, Joshua C. House, Sarah Joy, "A Madisonian Approach to Climate Policy," Science, Vol. 309, No. 5742 (September, 2005), p. 1820-1821; Carolyn Fischer and Richard G. Newell, "Environmental and Technology Policies for Climate Mitigation," Discussion Paper Prepared for Resources for the Future (April, 2007). Accessed 01/07/2013: http://www.rff.org/Documents/RFF-DP-04-05-REV.pdf 34S. Gouchoe, V. Everette, and R. Haynes, "Case Studies on the Effectiveness of State Financial Incentives for Renewable Energy," NREL/SR-620-32819. Golden, CO: National Renewable Energy Laboratory (June, 2002). Accessed 10/27/12: http://www.nrel.gov/docs/fy02osti/32819.pdf;Andrea Sarzynski, Jeremy Larrieu, Gireesh Shrimali, "The Impact of State Financial Incentives on Market Deployment of Solar Technology," Energy Policy, Vol. 46 (July, 2012), p. 550-557. Accessed January 09, 2013: http://www.sciencedirect.com/science/article/pii/S0301421512003321. 35Alfred E. Kahn, The Economics of Regulation: Principles and Institutions, vol. 1 (Cambridge: Massachusetts Institute of Technology Press, 1998). 36Kenneth Gillingham and James Sweeney, "Market Failure and the Structure of Externalities," in Boaz Moselle, Jorge Padilla, Richard Schmalensee, Harnessing Renewable Energy in Electric Power Systems: Theory, Practice, Policy, (London: Earthscan, 2010). Accessed 3/10/13: http://www.yale.edu/gillingham/Market%20Failure%20and%20the%20Structure%20of%20Externalities.pdf

19
cost-competitiveness of PV. Existing studies on net metering and RPS differ from my
own assessments in several ways. Studies and reports on net metering and RPS,
perhaps because of their infancy, have been limited in both their scope and analysis.
Studies often focus on single states and are not prescriptive. I also aim to depart from
these existing studies by correlating policy analysis to the components of PV’s
financials like non-hardware costs and placing emphasis on PV’s cost-
competitiveness and market development. As such Chapters Three and Four assess
policy specific in terms of effects on PV economics and markets, examine a variety of
state historical experiences, and offer prescriptions regarding best practice parameters
for the regulations. In sum, this thesis hopes to contribute to the field through its
original suggestion of the interrelationship of these important factors.

20
Chapter One
Solar Photovoltaic Technology’s Topsy-Turvy Road To Development
We are like tenant farmers, chopping down the fence around our house for fuel, when we should be using Nature's inexhaustible sources of energy — sun, wind and tide. I'd put my money on the sun and solar energy. What a source of power! I hope we don't wait till oil and coal run out before we tackle that.
-- Thomas Edison in conversation with Henry Ford and Harvey Firestone (1931)37
I. The Federal Government’s Sporadic Support of Solar
The fundamental concern of the viability of solar electricity is its link to
public policy. This is a given for industry leaders, executives, and thinkers, who point
to government’s nurturing other emerging energy technologies as proof of this
assertion. As a recent white paper issued by First Solar states, “no major energy
technology has achieved the necessary cost reduction and scale without sustained
37James Newton, Uncommon Friends: Life with Thomas Edison, Henry Ford, Harvey Firestone, Alexis Carrel & Charles Lindbergh, (New York: Mariner Books, 1989), 31.
Précis: The federal government has been inconsistently supportive of solar photovoltaic technologies (PV). Federal policies have been at times to the benefit and at other times to the detriment of PV’s technological and market development. This chapter assesses the relationship between the federal government and the American PV industry. It begins with a brief survey of the federal government’s RE policymaking, describing the impact of its erratic support on PV’s viability. The chapter then provides a description of recent developments in PV pricing that have enabled its broader affordability and deployment. It concludes with an examination of the components holding back PV’s cost competitiveness, laying the groundwork for the role of regulation in improving PV’s financials.

21
government support, even well after initial maturation.”38 As one one of the leading
American PV companies, First Solar knows this historical reality all too well. In
2004, after its first small manufacturing line became operational, First Solar “started
looking around for markets that would give us the scale that we needed, that would
drive big volumes, so we could get more efficient,” explains former CEO Mike
Ahearn. Founded in Toledo, Ohio, the company wanted to remain in the United
States, so “we came to Washington and then went to many states in the southwest,”
recalls Ahearn “We said to a couple of American utilities, ‘We will lose money to just
get going,’ because we knew that as we scaled, costs would go down. And we still
could not get any takers… We talked to Arizona and Ohio congressmen. They were
all [unsupportive].” The company did not get any traction until they “decided to go to
Germany.”39 The details of First Solar’s story and the influential American and
German policy parameters, of course, need clarification. The intricacies of both
provide material for much of this chapter and will be assessed in the pages to come,
but a significant question begs to be addressed along the way: Have American
policymakers inhibited the growth of PV electricity generation?
The United States hosted the most pivotal breakthroughs in PV technologies.
Nevertheless, the American PV industry is immature, currently contributing mere
basis points to the overall American energy system.40 On page one of its April 26,
38Received from Alan Bernheimer, Public Relations Director, Americas at First Solar, Inc: Solar Institute, Energy Incentives: The Power Behind the Power, The George Washington University, March 12, 2012, p. 3, accessed November 15, 2012, http://solar.gwu.edu/Research/GW_EnergyIncentives.pdf. 39Story and details are borrowed from Thomas Friedman, Hot, Flat, and Crowded: Why we need a green revolution- and how it can renew America, (New York: Farrar, Straus and Giroux, 2008), 386-91. 40In 2011, of the net generation of 4,125,060 thousand megatthours of electricity, solar thermal and photovoltaic accounted for 1,212 thousand megawatthours. (U.S. Department of Energy, Energy

22
1954 issue, The New York Times proclaimed a new technology had the potential to
mark “the beginning of a new era, leading eventually to the realization of one of
mankind’s most cherished dreams -- the harnessing of the almost limitless energy of
the sun for the uses of civilization.”41 With the development of the quantum theory of
light and solid state physics in the early 20th century, PV technologies advanced
significantly in the United States, culminating in the invention of the first modern
silicon solar cell at the Bell Telephone Laboratories in 1954. In order to leave the
laboratory stage, this technology required funding for the development of and
research into the potential of solar for electricity generation.42 Yet, the federal
government made the strategic decision in the 1950s to support nuclear energy as the
alternative of the future,43 despite warnings from J. Robert Oppenheimer, who served
as Chairman of the Atomic Energy Commission’s General Advisory Committee.44 As
a result, the realization of solar energy’s potential as a serious alternative to nuclear
energy or fossil fuels was stymied. Assessing American energy policy through the
Johnson administration, political scientist Frank Laird concludes, “solar never got
serious consideration as a source that might be a major part of the future U.S. energy
Information Administration, Annual Energy Review 2011, 2012, accessed December 01, 2012, http://www.eia.gov/totalenergy/data/annual/pdf/aer.pdf.) 41Unknown, "Vast Power of the Sun Is Tapped by Battery Using Sand Ingredient," New York Times (New York), April 26, 1954, accessed 10/21/12 on: http://www.nytimes.com/packages/pdf/science/TOPICS_SOLAR_TIMELINE/solar1954.pdf 11/07/12 42Darryl Chapin, one of the three Bell engineers that collaborated to invent the modern silicon solar cell, recognized the need for further funding: “we tried to avoid making too much claim for it because we knew it was in the laboratory stage, and there was much to be done before we could speak of lots of power” (Ken Butti and John Perlin, A Golden Thread: 2500 Years of Solar Architecture and Technology, fwd. Amory Lovins (Palo Alto: Cheshire Book, 1980), 231). 43For an elaboration on the influence of Cold War politics on the pursuit of Nuclear Energy from the Presidencies of Dwight D. Eisenhower to George H.W. Bush, please refer to: George A. Gonzalez, Energy and Empire: The Politics of Nuclear and Solar Power in the United States (Albany: State University of New York Press, 2012). 44Ibid, 32.

23
system and so it lacked the support that such a role might have entailed.”45 As a
percentage of inflation-adjusted federal spending, nuclear received more than 1% of
the federal budget over its first 15 years of development, and oil and gas received half
a percent of the total budget,46 while solar received significantly less than a tenth of a
percent: federal support for terrestrial applications of solar energy was only about
$100,000 a year between 1950 and 1970.47
It took the oil crises of the 1970s for the federal government to provide the
research and development (R&D) funding necessary to begin making solar
technologies economically feasible. Although it never matched the funding for fossil
fuels or nuclear technology budgets, the federal solar R&D budget grew to $484
million in 1979, a 12,100 percent increase in just six years. Of the almost $1.2 billion
(in fiscal 1982 dollars) of federal government expenditures on terrestrial photovoltaic
from 1971-91, about 50% of the funding occurred during the Carter administration.48
But during the comparatively oil-rich administration of Ronald Reagan, solar
incentives lapsed. The potential of these nascent initiatives is underscored by their
successes in countries like Germany, where the very same companies started during
the Carter administration were purchased after they lost financial support in the
United States. These firms have contributed effectively to these country’s burgeoning
45Frank Laird, Solar Energy, Technology Policy, and Institutional Values (New York: Cambridge University Press, 2001), 53. 46From the recommendation of Ben Higgins, head of Government Affairs at REC Solar: Nancy Pfund and Ben Healey, Double Bottom Line Investors, report, September 2011, accessed February 17, 2013, http://www.dblinvestors.com/documents/What-Would-Jefferson-Do-Final-Version.pdf. 47Estimate of The United States, Senate, Select Committee on Small Business, Energy Research and Development and Small Business, by John Teem, vol. 1, 94 Congress 1 Sess (Washington D.C.: Government Printing Office, 1975), p. 169-245. 48Linda Cohen and Roger Noll, The Technology Pork Barrel, (Washington: Brookings Institution, 1991), 326.

24
solar electric industries and the restructuring of their energy systems.49 Through the
history of its involvement with solar energy investment, the federal government has
failed to support its homegrown innovations, limiting the development of its PV
industry.
The federal government is responsible for the American PV market’s paradox
of conceiving but not nurturing its innovations. Since spending on R&D technology is
typically framed as a public good, providing widespread benefits such as the
improved quality of life, the government is depended on as the sponsor of basic
research and development in the United States. As MIT economist Robert Solow
emphasized in his Nobel Prize lecture, “stimulation of investment” is crucial to
innovation, transferring a technology “from the laboratory to factory.”50 Unlike its
support of other energies,51 the federal government has been inconsistently committed
to solving PV’s appropriability problems. The funding that Bell Laboratories needed
to fully develop did not occur until a surge in funding in the 70s, but the promises of
these innovations were dulled when the Reagan administration did not consider the
long-term support that is needed for energy innovation, less it fall vulnerable to
volatility, stop-and-go in funding, and uncertainty. With the lone exception of
President Carter, from President Eisenhower to President George H.W. Bush, the
federal government did not provide PV with the support necessary to bridge the gap
49For more information: Osha Gray Davidson, Clean Break: The Story of Germany's Energy Transformation and What Americans Can Learn from It, (InsideClimate News: Amazon Digital Services, 2012) 50Robert M. Solow, "Prize Lecture," The Official Website of the Nobel Prize, accessed February 02, 2013, http://www.nobelprize.org/nobel_prizes/economics/laureates/1987/solow-lecture.html. 51According to the Congressional Research Service, “For the 63-year period from 1948 through 2010, nearly 12% [of DOE R&D spending] went to renewables, compared with 9% for efficiency, 25%for fossil, and 50% for nuclear.” Fred Sissine, CRS Report for Congress, report no. 7-5700, March 07, 2012, accessed February 17, 2013, http://www.fas.org/sgp/crs/misc/RS22858.pdf.

25
from invention and demonstration to adoption and commercialization. Veterans of the
PV industry refer to the funding cuts of 1980s as the Valley of Death, a perhaps
appropriate comparison of the political impasse that was the lack of support to a
spectacular, murderous chasm. Solar advocates were not wrong about what it would
take for their industry to become increasingly cost-competitive. Rather, as Bella
Energy’s Andrew McKenna put it, “we overestimated the political support to
facilitate [it].”52
Germany’s story of political support here offers a useful point of contrast. In
the latter decades of the 20th century, Germany adopted comprehensive solar-
supportive policies that allowed its PV market to mature and scale. Most notable
among these is the German feed-in-tariff (FIT). It requires utility companies to buy
electricity from renewable energy operators at a fixed rate that is guaranteed for 20
years, thereby providing entrepreneurs and lenders with a stable investment
environment. Germany’s FIT put its own spin on American policy: Section 210 of the
Public Utility Regulatory Policies Act of 1978, which authorized utilities to buy
power output from competitive nonutility generators.53 The FIT purchases electricity
from renewable generators at higher fixed rates and then subsidizes those rates by
spreading them across their national electricity market so that the added costs blend
into the mean price of electricity. Such policies facilitated industry growth rates that
averaged 21% per annum between 1982 and 1997,54 providing an outlet for otherwise
52Interview with Andrew McKenna February 22nd, 2013. 53As will be described below, this measure did not stimulate distributed energy production until FERC mandated for electricity market’s restructuring in 1997. 54Tim Jackson and Mark Oliver, "The Viability of Solar Photovoltaics," Energy Policy 28, no. 14 (November 2000): pg. #, doi:10.1016/S0301-4215(00)00085-9.

26
uncompetitive PV energy to be fed into the grid and an opportunity for system owners
to make a profit. Surveying renewable energy (RE) literature from this time, it is clear
that the immense growth in renewable’s share of German electricity consumption,
14% in 2007, was unexpected. As a result of their unexpectedly high rate of RE
deployment, Germany had to establish more aggressive mandates than the ones they
agreed to as part of the European Union, whose target had been to reach 12%
renewable electricity by 2010.55 Germany has led the charge in PV’s international
scaling, significantly influencing the steep decline in the average global price per
Watt of solar panels from $22 in 1980 to under $3 in 2010.56 While the U.S. has yet
to solve many of PV’s scaling and maturation issues, Germany demonstrates that it
has built upon under-appreciated American political and technological developments
to bolster its own solar industry.
German policymakers, however, benefit from a more streamlined process of
regulating RE. In the United States, the federal government and the fifty states share
the responsibilities for government functions in policymaking, administration, and
finance. The lack of precise intergovernmental dividing lines has drawn scholarly
attention towards the expanding and contracting role of the federal government in the
U.S. economy and society (and vice-as-versa with the states).57 States have been
55"European Renewable Energy Council," Renewable Energy Policy Review: Germany, December 27, 2012, pg. #, accessed January 17, 2013, http://www.erec.org/fileadmin/erec_docs/Projcet_Documents/RES2020/GERMANY_RES_Policy_Review_09_Final.pdf 56"2008 Solar Technologies Market Report," National Renewable Energy Laboratory, January 2008, p. 131, accessed November 29, 2013, http://www.nrel.gov/analysis/pdfs/46025.pdf. 57Other scholarly examinations include: Craig Volden, Michael M. Ting, and Daniel P. Carpenter, "A Formal Model of Learning and Policy Diffusion," American Political Science Review 102, no. 03 (2008), doi:10.1017/S0003055408080271; Paul E. Peterson, The Price of Federalism (Washington, D.C.: Brookings Institution, 1995).

27
particularly proactive in making efforts to reduce GHGs, adopting a variety of
policies in recent years. In Statehouse and Greenhouse (2004), Rabe details the
process through which policy entrepreneurs framed various climate policy tools as
advantageous to state economic development while also reducing GHGs. “For
renewable energy, mandates to steadily increase their use on an in-state basis have
commonly been presented as a commitment to new technology that would tap into
“home-grown” energy sources,” Rabe retells. “Under this framing, states would no
longer have to import fuel sources such as coal, natural gas or uranium and instead
could foster ‘high-paying, high-technology’ jobs to take advantage of these more
localized renewable sources.”58 In these cases, states do not view climate change in
terms of its impending environmental challenges but identify it as a problem with
solutions that offer promising economic opportunities.
Much of the impetus for state policy action can be linked to the specific
developments at the federal level. In 1997, under the auspices of the Byrd-Hagel
Resolution, Congress refused to sign the Kyoto Protocol. The resolution forbade the
United States from entering into any global warming treaty that leaves out developing
nations and marked the beginning of a trend of inaction on climate policies. 59 In the
same year, the federal government (through the Federal Energy Regulatory
Commission (FERC)) implemented its only significant regulation to stimulate RE
deployment, FERC 888 and FERC 889. These orders sought to further restructure, or
58Barry G. Rabe, "The Aversion to Direct Cost-Imposition: Selecting Climate Policy Tools in the United States," Governance: An International Journal of Policy, Administrations, and Institutions, Vol. 23, No. 4, (October 2010), p. 589. 59Senator Robert Byrd and Senator Chuck Hagel, “Senate Resolution 98 of the 105th Congress,” Accessed on 11/02/12 on http://www.nationalcenter.org/KyotoSenate.html

28
“deregulate,” electricity markets to allow for more competition in state electricity
provision. While FERC 888 issued guidelines for the implementation of Independent
System Owners to oversee utility-owned transmission lines and ensure no
discrimination would occur against competitive suppliers, FERC 889 created
Regional Transmission Organizations, an extension of sorts of ISOs, to monitor grid
functioning, non-discrimination, security, and other aspects of the electrical
distribution system. The natural monopoly structure of utilities--- controlling
electricity transmission, generation, and distribution assets--- inhibits distributed
electricity generation in the United States, as will be elaborated in Chapter Two.
These orders were implemented to provide oversight and ensure equal access to
transmission services between utilities, competitive suppliers, and prosumers, who
can be defined as distributed generators that produce their own on-site electricity and
consume electricity from the grid when necessary. In sum, along with its widely
publicized rejection of GHG emission restrictions, the federal government spurred the
states to lead on climate change mitigation and RE development through FERC
regulatory measures.60
Since the 1997 FERC measures, state governments have taken a leadership
role on issues with global significance.61 Solar supportive states share the global
priority of increasing PV’s affordability and viability. Figure 5 demonstrates the
spread of state renewable portfolio standards since 1997.
60This topic will be expanded on in Chapter Two. 61William D. Nordhaus, "To Tax or Not to Tax: Alternative Approaches to Slowing Global Warming," Review of Environmental Economics and Policy 26 (2007): 26, 27-28. (State or local governments are thought to regulate small-scale problems (e.g. contaminated properties), the federal government should regulate where interstate spillovers are problematic (e.g. acid rain), and international regimes should be established to deal with global problems (e.g. climate change)).

29
Figure 5. Number of State Renewable Portfolio Standards Policies62
As Figure 1 shows, in the absence of federal leadership, the number of state RPS
policies has risen sharply. States have adopted regulatory measures like RPS and net-
metering in hopes of encouraging renewable energy generation, reducing demand on
an increasingly strained electric grid, facilitating energy self-reliance, reducing GHG
emissions, or promoting in-state economic development. It has been posited by states
as a promising economic opportunity. As Pennsylvania Governor Edward Rendell
said in a 2007 address to his states’ General Assembly, which had endorsed a range of
renewable energy policy initiatives: “I believe renewable energy will dominate the
economy of the next two decades the way information technology and life sciences
have dominated the economy of the last two decades. For too long, Pennsylvania has
been held back because so much of our employment was in industries that were
shrinking. But with renewable energy, we have a chance to be a leader in one of the
62"DSIRE: : Quantitative RPS Data Project Database of Energy Efficiency, Renewable Energy Solar Incentives, Rebates, Programs, Policy," DSIRE USA, accessed April 12, 2013, http://www.dsireusa.org/rpsdata/.

30
fastest-growing segments of this new economy.”63 Emerging from statehouses, policy
entrepreneurs, and pundits around the nation, 64 65 variations on this rhetoric and the
accompanying financial forecasts have compelled states to adopt alternative energy
policies. These statehouses promoted PV policies as a vehicle for economic growth
and the prospect of gaining a “first mover” advantage, by fostering PV innovation and
industries in their jurisdictions.66 Given a lack of federal direction, the states have
taken a more proactive role in shaping their individual energy systems, acting with
virtual free rein in selecting policy tools to improve the viability of their PV markets.
The federal component of the U.S.’ federalist power sharing arrangement in
RE primarily consists of financial incentives. Under the Clinton Administration, the
federal government began its trend of indirectly addressing climate change by
incentivizing RE technologies: from the 15% tax production credit introduced under
President Clinton, to President Bush’s signing the Energy Policy Act of 2005, which
included, amongst other things, an expansion of the federal tax credit to 30%, and
President Obama’s 2009 American Reinvestment and Recovery Act (ARRA) in
which $16.8 billion has been allocated to a wide variety of efficient and renewable
energies. Each of these Presidents has in turn declared renewable energies necessary
investments in the future. Barack Obama, for example, has made a point to mention
63Edward Rendell, “Address to the Special Session of the Pennsylvania General Assembly,” (September 17, 2007) (from Rabe, Ibid). 64This paper is not concerned with the policy development process. For further information on the development process: Barry G. Rabe, Statehouse and Greenhouse: The Emerging Politics of American Climate Change Policy, (Washington, D.C.: Brookings Institution Press, 2004). 65Nor is it concerned with state policy adoption theory: Daniel Judah. Elazar, American Federalism: A View from the States (New York: Harper & Row, 1972); F. Berry & W. Berry, “State lottery adoptions as policy innovations: An event history analysis,” American Political Science Review, Vol. 84, No. 2 (1990), 395–415. 66Maryann Feldman and Roger Martin, "Constructing Jurisdictional Advantage," Research Policy 34, no. 8 (2005), doi:10.1016/j.respol.2005.03.015.

31
this imperative in several of his State of the Union speeches.67 However, these
incentive programs have been insufficient to match the administrations’ very own
promises of the role renewables would play in restructuring the American energy
system to address modern realities like climate change.
The vast majority of federal PV incentive programs suffer from the
unpredictability that comes from the sunset dates and volumetric limits that are often
imposed on them from their beginning. For instance, the federal production tax credit
has been extended seven times since it was first created.68 Figure 2 shows how more
than 70 percent of federal clean technology programs will expire by the end of 2014.
Figure 6. Federal Clean Technology Policy Support is Falling off a Cliff69
Of this policy support from 2009-2014, renewable electricity technologies like wind
67For instance: “We need to encourage American innovation,” Obama told Congress in his 2010 State of the Union Address. “And no area’s more ripe for such innovation than energy.” ("Remarks by the President in State of the Union Address," The White House, accessed March 02, 2013, http://www.whitehouse.gov/the-press-office/remarks-president-state-union-address..) 68Jesse Jenkins, Mark Muro, Ted Nordhaus, Michael Shellenberger, Letha Tawney and Alex Trembath, "Beyond Boom and Bust: Putting Clean Tech On a Path To Subsidy Independence," Brookings Institute (April 2012). Accessed 2/21/13: http://www.brookings.edu/research/papers/2012/04/18-clean-investments-muro) 69Clean Technologies produce energy without the environmental effects of fossil fuels. (Ibid)

32
and solar will have received 32.1%, or 48.4 billion dollars.70 When President Obama
signed ARRA, which contributed $51 billion of the cumulative $150 billion federally
allocated between 2009 and 2014 to clean technologies, he said he hoped that the
clean-technology-related portions of the stimulus would inspire Americans the same
way that President Kennedy's goal to put a man on the moon did in the 1960s.71 At
the time, investors and analysts believed the ARRA stimulus was the start of a more
comprehensive energy policy, marking a more consistent commitment to RE.72 Yet,
federal government’s relationship with renewable energies remains blemished by
inconsistent policy and unrealized market potential. In part, the subsidies exist as a
mere stopgap for more systematic problems brought on by international competition.
As a report recently issued by the Brookings Institute describes: “[RE] markets in
America have lurched from boom to bust for decades, and the root cause remains the
same: the higher costs and risks of emerging US products relative to either incumbent
fossil energy technologies or lower-cost international competitors, which make US
clean tech sectors dependent on subsidy and policy support.”73 Many in the PV
community predicted ARRA as a mark of the beginning of a sustained federal effort
to promote RE, but few could have imagined the budget showdowns occupying
Congress’ time. Now that the federal government has gone over the “fiscal cliff,” the
same predictors are providing more pessimistic forecasts.
70Ibid, 18. 71Martin LaMonica, "Obama Signs Stimulus Plan, Touts Clean Energy," CNET News, February 17, 2009, accessed January 17, 2013, http://news.cnet.com/8301-11128_3-10165605-54.html. ("I hope this investment will ignite our imagination once more in science, medicine, energy and make our economy stronger, our nation more secure, and our planet safer for our children," President Obama said before signing the bill.) 72Ibid. 73Jenkins et al., "Beyond Boom and Bust.”

33
II. The Current Status of the American PV Industry
Despite drastically diminishing federal financial support, America’s PV
market will not be cast back into the Valley of Death. The unprecedented growth
experienced over the last few years by a handful of states, where an effective blend of
incentives and regulations makes PV cost-competitive, offers a hopeful look for PV’s
viability. From a consumer perspective, PV has been increasingly attractive as an
investment over the last decade, driving down prices and injecting new choices into
the marketplace dominated by century old technologies. The United States’ net
generation of solar electric power grew 245% over the first decade of the 21st century,
while overall generation increased 8.5%.74 Figure 7 illustrates this marked increase.
Figure 7. Data Sample Compared to Total U.S. Grid-Connected PV Capacity75
74"U.S. Energy Information Administration - EIA - Independent Statistics and Analysis," Electric Power Annual 2011, accessed October 10, 2012, http://www.eia.gov/electricity/annual/. 75Galen L. Barbose, Naïm Darghouth, Ryan Wiser, Tracking the Sun V An Historical Summary of the Installed Price of Photovoltaics in the United States from 1998 to 2011, (Berkeley: Lawrence Berkeley National Laboratory, 2012), 9 using Larry Sherwood, U.S. Solar Market Trends 2011, (Latham, NY: Interstate Renewable Energy Council Inc., 2012).

34
Inversely, from 1998-2009, wholesale panel, or module, prices dropped by $1.9/W
(40%), while from 1998-2007, implied non-panel costs, including installation labor,
power electronics, permitting and other regulatory costs, and installer profit, fell by
$2.5/W (40%).76 In 2011, installed prices continued to precipitously fall. Over the
course of 2011, the median installed price among projects was $6.1/W for systems
≤10 kW in size, $5.6/W for systems 10-100 kW, and $4.9/W for systems >100 kW.
According to researchers at the Lawrence Berkeley National Laboratory, “this
represent a year over-year decline of $0.7/W (11%) for systems ≤10 kW 10 kW,
$0.9/W (14%) for systems 10-100 kW, and $0.8/W (14%) for systems >100 kW.” As
shown in Figure 8, these price reductions continues a decade long trend of drastically
decreasing system prices in the residential and commercial PV segments.
Figure 8. Installed Price of Residential & Commercial PV over Time77
These trends are also apparent in the utility PV sector,78 in which the Berkeley Lab
76Ibid, Barbose et al., Tracking the Sun. 77Ibid, Barbose et al., Tracking the Sun, p. 12. 78For the sake of terminology clarification: residential PV refers to systems installed at residential customer sites, regardless of size; commercial PV, unless otherwise indicated, includes rooftop systems of any size and ground-mounted systems up to 2 MW in size installed at non- residential

35
approximates “the capacity-weighted average installed price declined from $6.2/W
for projects installed during 2004-2008, to $3.9/W for projects installed during 2009-
2010, and to $3.4/W for projects installed in 2011.”79 The inverse relationship
between the solar industry’s growth and solar system costs is due to the fact that
unlike traditional energy-production technologies that have ongoing consumables
costs, nearly all of the costs for PV systems must be paid at the time of installation.
The nature of the costs involved in adopting solar energy technology positions
it to benefit greatly from government support. Since a solar panel system is almost all
up-front costs and requires very little operations and management expenses after
installation, reducing initial capital costs is crucial to reducing the cost of solar
electricity. As shown in Figure 9, with financial incentives and regulatory measures,
PV system payback times can be relatively short and provide significant cumulative
savings.
Figure 9: Case Studies of Residential Solar Power in Five U.S. cities80
customer sites, regardless of whether the host customer is a for-profit, non-profit, or public-sector entity, and utility-scale PV refers to ground- mounted systems larger than 2 MW.78 Regardless of the sector, PV is an increasingly attractive investment. 79Ibid, Barbose et al., Tracking the Sun, p 1. 80Yuliya Chernova, "The Economics of Installing Solar: Figuring out Whether You save Money Depends on a Lot of Factors—especially Where You Live," Wall Street Journal, September 17, 2012, accessed September 18, 2012, online.wsj.com/article/SB10000872396390444506004577615662289766558.html.

36
Additionally, third party financing offers customers the benefits of a PV
system without the upfront cost, allowing residential and commercial users the ability
to pay a monthly amount for their system rather than an overwhelming upfront cost.
81 This arrangement means that as long as this amount is less than their typical
monthly utility bills, it is in the customer’s best interest to put panels on their roof.
PV’s increasing affordability can be traced to specific developments in solar
panel pricing over the last few years. From 2004 to the third market quarter of 2008,
the price of PV modules remained relatively unchanged at $3.50-$4.00/W. The flat
panel prices were due to two factors. Firstly, German, and then Spanish, tariff
81“A host pays to the third-party financier either a series of payments via a lease ($/month) or PPA payments linked to the system's performance ($/kWh), usually based on a 10– 25 year contract. Effectively, the lease/PPA is a loan agreement between the customer and the third-party financier.” Bloomberg New Energy Finance, "Re-imagining U.S. Solar Financing," National Renewable Energy Laboratory, June 2012, accessed December 04, 2012, https://financere.nrel.gov/finance/content/re-imagining-us-solar-financing.

37
incentives allowed project developers to buy the technology at a standardized price.
Secondly, a worldwide polysilicon shortage constrained effective pricing competition
in the production of the wafers that comprise solar cells. With a global demand
surging and unchanging prices, the 18 largest quoted solar companies followed by
Bloomberg made average operating margins of 14.6%-16.3% from 2005 to 2008.82
As a result, manufacturers and polysilicon companies expanded to meet the demand.
When the global financial crisis hit, however, governments downscaled their
commitments to RE, despite a fixed level of demand. While the availability of
polysilicon increased at least 32%, which is enough to make 8.5 GW of modules,
demand grew only about 1 GW, reaching 7.7 GW in 2009. With a glut of PV
production potential, wafer and module makers suddenly needed to compete on price,
giving up their margins. Panel prices were driven down from a global average of
$4.00/W in 2008 to $2.00 in 2009 (see Figure 10).
Figure 10. The Steady Fall of Solar Panel Prices83
82Morgan Bazilian, Ijeoma Onyeji, Michael Liebreich, Ian MacGill, Jennifer Chase, Jigar Shah, Dolf Gielen, Doug Arent, Doug Landfear, and Shi Zhengrong, "Re-considering the Economics of Photovoltaic Power," Bloomberg New Energy Finance (2012), 3. 83This graph was featured in a variety of presentations by Tom Dinwoodie, CTO and founder of SunPower and Dan Shugar, former president of SunPower and current CEO of Solaria, and Adam Browning, the executive director of the Vote Solar. (Zachary Shahan, "Solar Power Graphs to Make You Smile," CleanTechnica, June 06, 2012, accessed January 13, 2013, http://cleantechnica.com/2011/06/10/solar-power-graphs-to-make-you-smile)

38
The affordability of solar panels can be linked to improvements in the manufacturing
process. Bloomberg News Energy Finance has noted that “The ability of
manufacturers to drop their prices by 50%, and still make a positive operating margin,
was due to the reductions in costs achieved over the previous four years,”84
Companies have made significant advancements in wafer, cell, and module
manufacturing processes, leading to cost evolutions in panel manufacturing. The
adoption of these important improvements by Chinese companies in particular has
created devastating competition for American companies.
The most infamous effect of Chinese companies’ success can be seen in the
story of Solyndra, a California-based solar-panel manufacturing company that went
bankrupt in August 2011. Solyndra, whose design avoided the use of silicon, could 84Bazilian et al., "Re-considering the Economics of Photovoltaic Power," 3.

39
not keep up with the cost decreases in polysilicon panels. Solyndra’s story is perhaps
most effective as a demonstration of the federal government’s inadequacy at
appropriately allocating funds. As a part of ARRA, the Department of Energy gave
Solyndra $528 in federal loan guarantees. Unfortunately, this support came just as
silicon’s glut was about to reshape the manufacturing market. The skepticism
surrounding Solyndra’s failure, which rightfully questions the federal government’s
approach to renewable energy,85 overshadows a significant insight it revealed about
the solar industry. Solyndra’s bankruptcy was caused by the maturation of the
polysilicon solar panel market. With a few exceptions, like First Solar, which also
does not use silicon as its semiconductor but unlike Solyndra had achieved scale,86
American upstream manufacturers cannot keep up with their Chinese rivals’ cost-
innovation. In order to remedy such companies’ woes, the U.S. Commerce
Department instituted tariffs of twenty-four to thirty-six percent on solar panels
imported from China. These tariffs are a punishment for “dumping” solar panels on
the United States market for less than it cost to manufacture and ship them,87
attempting to compensate for the supposedly unfair advantages the Chinese have
gained from their manufacturing and subsidy policies. These measures are intended to
address the market failure of Chinese manufacturer’s learning from the advancements
85George Kats, “Before the House Committee on Oversight and Government Reform Evaluation of the DOE Loan Guarantee Programs, including support for Abound” (July 2012), accessed on 12/01/12: http://mercatus.org/publication/assessing-department-energy-loan-guarantee-program 86First Solar reached a dollar-per-manufactured-watt standard of less than one dollar in in the final quarter of 2008.(Tom Cheyney, "Exclusive: A conversation with First Solar’s Bruce Sohn, Part I—Developing ‘copy smart’" Accessed 2/27/13: www.pv-tech.org/chip_shots_blog/exclusive_a_conversation_with_first_solars_bruce_sohn_part_i--developing_co) 87Keith Bradsher And Matthew L. Wald; Keith Bradsher Reported From Hong Kong And Matthew L. Wald From Washington., "A Measured Rebuttal to China," The New York Times, March 21, 2012, accessed December 04, 2012, http://nytimes.com/2012/03/21/business/energy-environment/us-to-place-tariffs-on-chinese-solar-panels.html.

40
of their rival American companies.88 However, unlike the other market failures and
barriers discussed in Chapter Two, the technology spillover to Chinese panel
manufacturers provide benefits to downstream American companies.
With the drop in panel prices, developers offering increasingly affordable PV
systems have experienced significant growth, as demonstrated in Figure 3. Thus,
whether it’s providing a stream of R&D funding decades after PV technologies most
needed it or imposing tariffs upon an abundance of “artificially” cheap solar panels
that encourage PV’s deployment, the Obama administration continues the federal
government’s pattern of inconsistent support for RE. The erratic nature of federal
policymaking creates scenarios in which companies developing new technologies
vainly hope they can survive the “Valley of Death” until they can reduce costs
enough to gain scale. Instead, the Chinese use scale of “good enough” technologies to
lower costs faster. If addressing environmental externalities and creating jobs are the
underlying motivations for their interest in PV, federal policymakers should note that
the best policies are those that allow market incentives to work, and damage is
accrued when policies are undependable. Federal policymakers’ inconsistency
reinforces the cyclical investment patterns that have hindered PV’s development.
When it comes to solar, the United States did not take advantage of two stages
of Schumpeter’s trichotomy model on technology advancements and is now wrestling
with the third. The U.S. experienced “invention,” when the first modern solar cell
88The concept of learning by doing (LBD) is based on the theoretical work of Kenneth Arrow, “The economic implications of learning by doing,” Review of Economic Studies, Vol. 29, 155–173. Arrow argues that the cost of producing a good declines with the cumulative production of the good, corresponding to the firm “learning” about how to better produce the good.

41
created a new technological possibility, and “innovation,” when a short wave of R&D
funding reinserted solar into the mainstream and improved its commercial viability.
Now, the American energy system is at the point of “diffusion,” which Schumpeter
defines as the adoption by firms or individuals of the commercially available
product.89 Since Chinese subsidies and cost innovations “dwarf U.S. efforts,”90
federal governance should focus less on the market failures that have created China’s
specialization and more on its own market failures and barriers. Federal governance
undermined the U.S.’s ability to take advantage of the considerable amount of
invention and innovation that has occurred. The benefits of diffusions remain
attainable if policies are adopted to enable the U.S. to profit from the silicon panels
that they no longer have a comparative advantage in producing. The tariffs impede
diffusion because neither panels nor manufacturing hold the majority share of PV
system prices or solar jobs, respectively.91 Strategies promoting deployment are better
suited for addressing PV system costs and stimulating robust PV markets.
Today, we are at a moment when the American PV industry could
tremendously benefit from stable support. Historically, panels made up over 60% of
the total system cost, but today, according to Stephen Smith of Solvida Energy
89Joseph A. Schumpeter, Business Cycles, vol. 1&2 (New York: McGraw-Hill, 1939).; For an empirical analysis of the diffusion of energy-efficient technologies, see Adam B. Jaffee and Robert N. Stavins, "Dynamic incentives of environmental regulations: The effects of alternative policy instruments on technology diffusion,” Journal of Environmental Economics and Management, Vol 29, (1995), S43–S63. 90Alan Goodrich, Ted James, and Adam Jaffe, National Renewable Energy Laboratory, report no. NREL/PR-6A20-53938, October 10, 2011, accessed February 14, 2013, http://www.nrel.gov/docs/fy12osti/53938.pdf. 91The majority (approximately 75%) of solar jobs are related to construction and installation, representing local jobs that cannot be outsourced. These are high quality jobs representing a broad range of education requirements, salary levels and fields. The remaining 25% of solar jobs are related to manufacturing. (Max Wei et al, “Putting Renewables to Work: How Many Jobs Can the Clean Energy Industry Create?” Energy Policy, Vol 38, No. 2, February 2010. )

42
Group, “the majority of system costs are in non-module components, which includes
a variety of structural and electrical components, labor and soft costs.”92 These costs
are collectively referred to as balance of system (BOS). They are the non-module
components of the PV system: wires, switches, inverters, and labor for installing the
system. In a report he recently co-authored, Smith writes: “In 2008, 67 percent of an
average project’s total cost was in the PV module, but today, thanks to an industry sea
change, 68 percent of total cost resides in BOS, which includes a variety of structural
and electrical components, labor and soft costs.”93 The step-function reductions
needed to help PV’s broader cost-competitiveness rest in BOS costs. Now that the
production of PV technologies matured with the experience gained by manufacturers,
the more rudimentary components of PV systems need to undergo cost reductions.
Unlike the innovations that propelled the first cell phones to the smart phones
of today, PV does not have any “game changing” developments on the horizon.
Neither industry experts nor academic speculators know how PV or other new
sources of clean electrons will come to replace dirty fossil molecules in the decades to
come, but in order for PV to compete in the near-term with conventional electricity, it
must compare financially by reducing BOS costs. Figure 11 displays the average cost
per BOS component, including structural (raw materials used to support PV modules)
BOS, electrical BOS costs like monitoring and wires, Labor for soft costs like
permitting, the inverter which converts the electrical output of PV from direct current
into the alternating current that can be fed into a grid, and Miscellaneous costs (Misc.)
92Interview with Stephen Smith January 12th, 2013. 93Stephen Smith and MJ Shiao, "Solar PV Balance of System (BOS) Markets: Technologies, Costs and Leading Companies, 2013-2016," Accessed January 1/11/13: www.greentechmedia.com/research/report/solar-pv-bos-2013

43
such as customer acquisition.
Figure 11. Balance of System Costs for Silicon and Cadmium PV
Systems94
The shift in the cost structure of PV systems has not only heightened the emphasis
from the private sector but also the public sector for reducing non-module costs and,
particularly, business process (or “soft”) costs. The increasing adoption of solar will
in turn lead to continuing increases in BOS efficiency and lower costs, as has been the
case with other technologies after maturation.
The American PV industry currently resembles the nascent American Oil
industry in the Reconstruction Era when soft costs like transportation and wooden
barrels were responsible for the majority of Oil prices. Many PV companies are
taking advantage of strategies to foster economies of scale that John D. Rockefeller
pioneered and contributed to his role as the single most important figure in shaping
the U.S. oil industry.95 Third-party financing companies like Solar City have adopted
Rockefeller’s model of vertical integration, the process of bringing or consolidating 94Ibid 95For more information on John D. Rockefeller and Standard Oil’s innovations refer to Daniel Yergin, The Prize: The Epic Quest for Oil, Money, and Power (New York: Simon & Schuster, 1991), Chapters 1-2.

44
supply and distribution functions inside one organization.
Figure 12. Vertical Third Party Financing Model96
SolarCity is considered a Vertical Third Party Financier. It handles customer
origination, installation, engineering, maintenance and financing services via a lease
or power purchase agreement, in which the customer purchases the system’s electric
output from the solar services provider for a predetermined period.97 Using the
technique that propelled Standard Oil to its industry dominance, SolarCity (SCTY) is
the leading developer in the residential solar segment. . Its successful IPO, the first
successful solar IPO since the financial recession, raised over $100 million, giving
96Bloomberg New Energy Finance, "Re-imagining U.S. Solar Financing," 8. 97Ibid.

45
SolarCity a market cap around $600 million.98 Its $8-a-share initial public offering
price has more than doubled today to $16. A little less directly, First Solar’s Copy
Smart production approach bears resemblance to Standard Oil’s intent of providing a
“standard quality of oil” at a time when overly flammable kerosene made its purchase
an inappropriately dangerous act.99 First Solar was able to scale its manufacturing
processes after its first manufacturing line (which required $150 million dollars in
investment for the machinery that First Solar initially designed and built) because the
very high volumes of the unique telluride solar cells it produced could be received by
the German market’s demand from the FIT. First Solar’s Copy Smart production
approach utilizes the manufacturing processes and facility designs standardized in
their first German plant. These processes and designs have been far less expensively
replicated throughout the world, enabling an annual production rate that increased
800 percent from its initial output.100 Both First Solar and Solar City are leaders in the
PV industry because of the innovations that they have undertaken, but obstacles are
still imposed by the American regulatory landscape that inhibit their growth.
III. Conclusion: Room for Improvement and Regulation
With the current nature of the U.S. regulatory landscape, each state and
market possesses barriers to BOS reductions. First Solar’s former CEO remarked that
due to the American market’s fragmentation, his company “could not imagine scaling
98Adam Lashinsky, "SolarCity Is Making Solar Power Pay,” (February, 2013): http://money.cnn.com/2013/02/28/technology/solarcity-lyndon-rive.pr.fortune/index.html 99Yergin, The Prize, 24. 100Details are from Friedman, Hot Flat and Crowded, 386-391

46
a business here.”101 Kerinia Kusick, Head of Government Affairs at SunEdison,
reinforced this comment: “Foreign companies recoil in horror when they look at the
regulatory landscape in the U.S.”102 Foreign market entrants are often befuddled by
the fact that the U.S. consists of 50 different solar markets due to the variance of state
regulatory and incentive measures. As shown above, PV has grown and is becoming
an increasingly attractive investment, but the BOS costs that are now holding it back
cannot be reduced as a function of volume similar to panel prices. The dominance of
BOS provides a reasonable approximation for the American PV industry’s longer-
term trend of immaturity. Its conventional energy counterparts had to overcome
similar hurdles in their development. Much of their success can be attributed to
regulation. In the case of oil, such regulations included production control to ensure
that oil producers avoided their temptation to draw up from the reservoir lying under
their land and that of their neighbors. Such measures are required for the PV industry
to mature. As I will argue in the next chapter, customer information failures and
financing barriers are the major market inefficiencies that are inhibiting PV’s cost-
competitiveness.
The growth of PV electricity generation has had a conflicting relationship
with American policy makers. While its relationship with state-level policy has been
agreeable and has produced promising results, PV has had a less productive past with
federal policy that was marked by inefficiency and unpredictability. The ebb and flow
that PV undergoes with federal support has been repeated several times over. “The
root cause remains the same each time,” explains the Brookings Institute “the higher
101Ibid, Friedman, 390. 102Interview with Kerinia Cusick February 5, 2013

47
cost and risk of [PV] relative to either mature fossil energy technologies or lower-cost
international competitors.”103 On a national level, the public sector is inconsistently
hot and cold towards PV, respectively succumbing to idealizations of its potential and
concerns over its viability. Federal policies, therefore, possess the dichotomous
quality of enabling and inhibiting, or stifling, PV’s growth. Although state policy’s
role in PV markets is complicated, the states have had a more positive impact on
solar’s growth. Literature from the start of the 21st century no longer applies to a
minority of states in which the energy industry’s entrenched infrastructure is no
longer impossible to compete against.104 Several state programs facilitated markets
that take advantage of the developments in PV over the last few years. It is important,
however, that we do not oversimplify the story. Perhaps the majority of states without
PV markets have not stifled growth, but these states do not have PV markets that are
susceptible to policymaker’s interference because they do not have the regulatory
foundations, which PV requires to become cost-competitive. In other words, the
majority of states have neither enabled PV’s growth nor taken advantage of the
precipitous changes in the global PV market. Clearly, such a simple evaluation is
unsatisfactory. It demands further assessment; especially considering market
developments are such that the majority of PV system costs now reside in BOS, soft
costs that mature industries historically overcome. Thus, another question that now
lurks: how can BOS costs be reduced?
103Jenkins et al., "Beyond Boom and Bust: Putting Clean Tech On a Path To Subsidy Independence.” 104For instance: Marshall Goldberg, Renewable Energy Policy Project, “Federal Energy Subsidies: Not All Technologies are Created Equal” (July 2000).

48
Chapter Two
The Relics of Electricity Regulation and the Inhibitors of Photovoltaic Markets
One interference with competition necessitates another and yet another, and an industry of ‘rugged individualists’ becomes more and more tightly enmeshed with the government to which they originally turned in hope of protecting themselves from competition.
-Alfred Kahn. 105
I. Regulation’s role in the Electrification of the U.S.
If it were not for the public and private partnership between utilities and
regulators, the feat of electrifying the United States would not have been possible. For
a number of years after the first successful operation of a utility, Thomas Edison’s
Pearl Street Station’s lighting the offices J.P. Morgan on the afternoon of September
4, 1882, electricity remained a luxury product. It was not until the pricing model was
105Alfred E. Kahn, former Professor Emeritus of Political Economy at Cornell University and a leading regulatory scholar, The Economics of Regulation: Principles and Institutions, vol. 1 (Cambridge, MA: MIT Press, 1988), p. 29.
Précis: This chapter provides basic context for electricity markets and regulations. First, a brief survey is given of the public and private partnership between utilities and regulators that enabled the development of the modern electrical apparatus. These historical details serve as a parallel to the necessary role of regulation to enable solar photovoltaic technologies to overcome the market inefficiencies inhibiting its cost competitiveness; both of which are defined in the middle section of this chapter in order to clarify the financials of PV. Third, an analysis is conducted as to how market failures and barriers impact calculations and perceptions on the attractiveness of PV investments. Finally, the chapter returns to the role of regulation, seguing into the role of net metering and renewable portfolio standards in improving PV’s viability. Regardless of this order, the sections should serve the same purpose if read independently.

49
reworked to charge based on kWh consumption, not the numbers of bulbs installed in
a customers home, that it became accessible to a wider base of consumers.
Responsible for this development was Samuel Insull, Edison’s protégé, who
developed the first metering system that allowed customers to moderate their
electricity usage.Among Insull’s contributions to the modern electrical apparatus was
the assertion that federal and state policies recognize the industry as a natural
monopoly. 106 Legislators granted utilities exclusive privileges to grow with little
competition. This regulatory pact struck between electricity companies and regulators
deemed it wasteful for multiple utilities to install the same capital-intensive
infrastructure (wires, operational facilities, etc) in order to compete head-to-head over
the same customer.107 With the help of these arrangements with local and state
regulatory boards, the utility system was constructed to meet the overarching
obligations to serve electricity to everyone in its territory and provide dependable
service at a reasonable cost. The regulators, in turn, were expected to ensure “fair
interpretation of a bargain,”108 overseeing the operations of the natural monopoly,
such as infrastructure expansions. After more than a century, the core of this system is
106For a more complete history on Samuel Insull and the formation of the United States’ electrical apparatus: Robert L. Bradley, Edison to Enron: Energy Markets and Political Strategies (Salem, MA: Scrivener Pub., 2011) 107If “the business was a natural monopoly,” Insull said, “it must of necessity be regulated by some form of governmental authority.” For, he said, “competition is an unsound economic regulator” in the electricity business. Samuel Insull, The Memoirs of Samuel Insull, ed. Larry Plachno (Polo, IL: Transportation Trails, 1992), p. 89-90. 108Kahn, The Economics of Regulation, 43. Quoting Cedar Rapids Gas Light Co. v. Cedar Rapids, 223 U.S. 655, 669 (1912). (“On the one side, if the franchise is taken to mean that the most profitable return that could be got, free from competition, is protected by the 14th Amendment, then the power to regulate is null. On the other hand, if the power to regulate withdraws the protection of the Amendment altogether, then the property is nought. This is not a matter of economic theory, but of fair interpretation of a bargain. Neither extreme can have been meant. A midway between them must be hit.”

50
unchanged.109 Today, there are 3,251 electric utility companies in the U.S. that serve
as the heart of the United States’ energy system.110 Electricity is the blood of
modernity, powering our industrial, digital, and various other networking processes.
Under the natural monopoly model,111 electricity utilities were apart of one of
the two sectors of the economy to which the competitive market model did not apply.
In principle, this model lends itself easily to disaster. According to Alfred Kahn, an
uncontrolled economy, in which individuals separately pursue his or her own
interests,112 does not produce orderly and efficiently work from the public sector or
utilities. In the public sector, the allocation of resources “is determined not by the
autonomous market but by political decisions,” explains Kahn. As for utilities, “the
organization and management is for the most part (in the United States- not in most
other countries) private but the central economic decisions are subject to direct
governmental regulation.”113 The model works, however, because electrical utilities
share the same technological and economic features, which are subject to enormous
initial capital investment. Policymakers oversaw the provision of electricity because it
is a commodity that is considered in the public interest. A single provider is often able
to service a region’s overall demand at a lower total cost than a combination of
smaller entities. Such conditions stifle competition because all firms but one 109Joseph P. Tomain, "The Dominant Model of United States Energy Policy," University of Cincinnative College of Law Faculty Articles and Other Publications, accessed April 03, 2013, http://scholarship.law.uc.edu/fac_pubs/130/. 110"2012-2013 Annual Directory & Statistical Report," American Public Power Association, section goes here, accessed January 03, 2013, http://www.publicpower.org/files/PDFs/USElectricUtilityIndustryStatistics.pdf. 111In general, modern electricity regulation is beyond the scope of this paper. 112Reference to Adam Smith, An Inquiry into the Nature and Causes of the Wealth of Nations, 4th ed. (Oxford: Clarendon Press, 1976), p. 421. (“[H]e intends only his own gain, and he is in this, as in many other cases, led by an invisible hand to promote an end which was no part of his intention. Nor is it always the worse for the society that it was not part of it. By pursuing his own interest he frequently promotes that of the society more effectually than when he really intends to promote it.”) 113Kahn, The Economics of Regulation, 2.

51
eventually exit the market or fail. The surviving utility in a region is called a natural
monopoly. For fear that these natural monopolies behave like other monopolies,
restricting production, charging higher prices than are economically justified, and
offering poor services, regulatory measures were imposed upon the burgeoning
electricity markets.114 Governmental interventions into the electricity industry sought
to ensure that monopolized utilities behaved as if competition in the provisioning of
electricity existed.
Early electricity regulation essentially substituted market competition in the
development of utilities. Regulation made electricity markets more efficient and,
therefore, assisted in the scaling and maturation of new entrants (utilities).
Figure 12. Broadway and St. John before and after Regulated Electricity115
This can be seen in (Figure 12) the change from before and after natural monopoly
status was granted to Manhattan utilities. The layers of electricity wires were
inefficient because one could do the work of ten. The city mandated their going
114Theory has its roots in the work of John Stewart Mill, cited in Paul J. Garfield and Wallace F. Lovejoy, Public Utility Economics (Englewood Cliffs, NJ: Prentice-Hall, 1964), p. 15. 115"Building the Invisible City," Virtual New York, accessed March 01, 2013, http://www.vny.cuny.edu/blizzard/building/building_fr_set.html.

52
below ground to remove vulnerability to the wind tunnels between streets during
storms. Utility regulation went beyond infrastructure; it efficiently matched the
supplies of producers with the demands of consumers. Utilities were guaranteed a
customer base, and these consumers were charged “just and reasonable” prices,
provided with reliable service, and serviced without discrimination. 116 In other
words, the regulation of utilities was deemed essential for the efficient provision of
electricity. In their guide to “Electricity Regulation in the U.S.,” the Regulatory
Assistance Project states: “regulation is an exercise of the police power of the state,
over an industry that is ‘affected with the public interest.’”117 As will be argued in this
Chapter, modern electricity markets, however, are not regulated to ensure efficient or
prescient behavior from utilities. Previous regulations, as Kahn states in this
Chapter’s starting quote, now require alterations and new regulations to meet the
demands of the 21st century.
II. Defining Cost-Competitiveness
Thus far, “cost-competitiveness” has been generally defined as a condition
when solar photovoltaic (PV), after the inclusion of available state and federal policy
benefits, is at or below the applicable price of conventional generation. The simplicity
of this generalization was useful for the preceding pages, but now the complexities
embedded in this phrase must be explained for the purpose of the analysis that will be
offered in the following chapters.
While the economic benefits of investments are typically evaluated by
116Received from Ben Higgins, REC Solar: "Electricity Regulation in the U.S.," Regulatory Assistance Project, accessed February 17, 2013, www.raponline.org/document/download/id/645 117Ibid, 5.

53
metrics, such as return on investment, internal rate of return, or long run marginal
cost, the levelized cost of electricity (LCOE) is most commonly used to determine the
cost competitiveness of electricity technologies.118 Since PV systems are all upfront
capital investments, LCOE analysis distributes all of the costs from physical assets
and resources over the system’s lifetime. For a given generation system, the LCOE is
the constant (in real terms) price per kWh that equates the net present value of
revenue from the system’s electricity output with the net present value of the cost of
production.119 The LCOE is the break-even value that would need to be obtained for
every kWh in order to justify an investment in an electricity generating system. The
2007 MIT study on “The Future of Coal” elaborates on this concept of the break-even
interpretation of LCOE with the following definition: “the levelized cost of electricity
is the constant dollar electricity price that would be required over the life of the plant to
cover all operating expenses, payment of debt and accrued interest on initial project
expenses, and the payment of an acceptable return to investors.”120 This break-even
calculation amounts to a discounted cash flow analysis, so as to indicate to investors and
118For an elaboration on work on LCOE calculation methods and analysis: Parm Pal Singh and Sukhmeet Singh, "Realistic Generation Cost of Solar Photovoltaic Electricity," Renewable Energy 35, no. 3 (March 2010): 563-569, doi:10.1016/j.renene.2009.07.020; Ken Zweibel, "Should Solar Photovoltaics Be Deployed Sooner Because of Long Operating Life at Low, Predictable Cost?," Energy Policy 38, no. 11 (2010): p. 7519-7530, doi:10.1016/j.enpol.2010.07.040. 119Severin Borenstein, "The Private and Public Economics of Renewable Electricity Generation," Energy Institute at Haas (EI @ Haas) Working Paper Series, December 2011, accessed March 11, 2013, http://ei.haas.berkeley.edu/pdf/working_papers/WP221.pdf.)If a plant lasts N periods and produces qn in period n, then discounting future cash flows at the real cost of capital r, the levelized cost of electricity is defined by:
Where Cn(q1 , .., qN ) is the real (in period 0 dollars) expenditures in period n to produce the stream of output (q1 , .., qN ). As [1] suggests, some capital costs are borne before any production can take place.)
120MIT, “The Future of Coal,” (2007) Accessed on 3/02/13:http://web.mit.edu/coal/The_Future_of_Coal.pdf

54
creditors whether or not the output of the system obtains a net-present value of zero.
Despite widespread references to the LCOE concept amongst PV developers and
policymakers, the calculation methodology varies due to assumptions about inflation
rates, real interest rates, how much the generator is used, future input costs, and, most
relevantly, the discount rate held by the individual conducting the calculation. Using
Corporate Finance theory, if the potential firm in questions keeps their leverage ratio
(debt over total assets) constant, then the appropriate discount rate applied to the system
is the Weighted Average Cost of Capital.121 Referring back to the above quote, debt
holders will receive “accrued interest on initial project expenses” and equity holders will
receive “an acceptable return.” According to Insull’s biographer, Forrest McDonald,
levelized cost calculations have been the starting point for cost competitive
comparisons since the nascent stages of electricity generation.122
Yet, when it is applied to renewable energy (RE), levelized costs are not the
final word because of the temporal and spatial production qualities of these
technologies in generating electricity. Solar panels, of course, only produce electricity
when the sun is out. As seen in Figure 3, the electricity generating potential varies
with geographic factors. Usually expressed as mean figures in kWh/m^2/year or as
kWh/m^2/day, solar insolation, which refers to the amount of solar radiation a given
location receives, changes daily and yearly. The amount of solar insolation a PV
system receives drastically affects its cost-competitiveness.
121Richard A. Brealey, Stewart C. Myers, and Franklin Allen, Corporate Finance (New York: McGraw-Hill Irwin, 2006), p. 357. 122McDonald, Insull, 38.

55
Figure 13. Photovoltaic Solar Resource of the United States123
For the typical U.S. insolation (1800 kWh/m^2 year) and a typical system efficiency
of 77%, the 5 kW system considered in the above residential rooftop applications
produces 6900 kWh/yr, which is more than half the average annual electricity
consumption rate for U.S. households.124 This system results in an LCOE calculation
of $27,500 to install and operate a PV system over 25 years which yields
approximately 170,000 kWh over the lifetime of the PV system would result in an
LCOE of $.17/kWh. Depending on the state, such a rate (excluding incentives) may
be competitive with grid electricity rates. Depending on the pace of innovation and
cost reductions, PV is within striking distance of unsubsidized retail competitiveness,
123"Solar Maps," NREL: Dynamic Maps, GIS Data, and Analysis Tools -, Photovoltaics, accessed February 28, 2013, http://www.nrel.gov/gis/solar.html. 124Calculations and claims based off of those in Richard Duke, Robert Williams, and Adam Payne, "Accelerating Residential PV Expansion: Demand Analysis for Competitive Electricity Markets," Energy Policy 33, no. 15 (2005): 1920, doi:10.1016/j.enpol.2004.03.005.
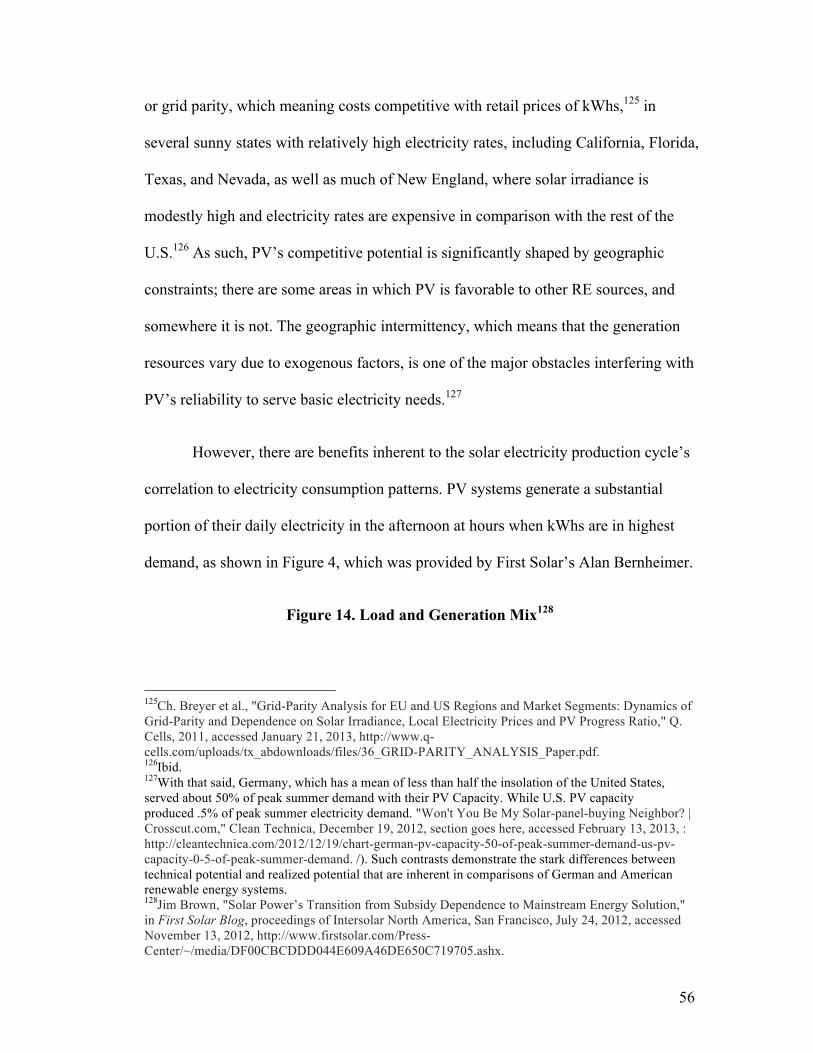
56
or grid parity, which meaning costs competitive with retail prices of kWhs,125 in
several sunny states with relatively high electricity rates, including California, Florida,
Texas, and Nevada, as well as much of New England, where solar irradiance is
modestly high and electricity rates are expensive in comparison with the rest of the
U.S.126 As such, PV’s competitive potential is significantly shaped by geographic
constraints; there are some areas in which PV is favorable to other RE sources, and
somewhere it is not. The geographic intermittency, which means that the generation
resources vary due to exogenous factors, is one of the major obstacles interfering with
PV’s reliability to serve basic electricity needs.127
However, there are benefits inherent to the solar electricity production cycle’s
correlation to electricity consumption patterns. PV systems generate a substantial
portion of their daily electricity in the afternoon at hours when kWhs are in highest
demand, as shown in Figure 4, which was provided by First Solar’s Alan Bernheimer.
Figure 14. Load and Generation Mix128
125Ch. Breyer et al., "Grid-Parity Analysis for EU and US Regions and Market Segments: Dynamics of Grid-Parity and Dependence on Solar Irradiance, Local Electricity Prices and PV Progress Ratio," Q. Cells, 2011, accessed January 21, 2013, http://www.q-cells.com/uploads/tx_abdownloads/files/36_GRID-PARITY_ANALYSIS_Paper.pdf. 126Ibid. 127With that said, Germany, which has a mean of less than half the insolation of the United States, served about 50% of peak summer demand with their PV Capacity. While U.S. PV capacity produced .5% of peak summer electricity demand. "Won't You Be My Solar-panel-buying Neighbor? | Crosscut.com," Clean Technica, December 19, 2012, section goes here, accessed February 13, 2013, : http://cleantechnica.com/2012/12/19/chart-german-pv-capacity-50-of-peak-summer-demand-us-pv-capacity-0-5-of-peak-summer-demand. /). Such contrasts demonstrate the stark differences between technical potential and realized potential that are inherent in comparisons of German and American renewable energy systems. 128Jim Brown, "Solar Power’s Transition from Subsidy Dependence to Mainstream Energy Solution," in First Solar Blog, proceedings of Intersolar North America, San Francisco, July 24, 2012, accessed November 13, 2012, http://www.firstsolar.com/Press-Center/~/media/DF00CBCDDD044E609A46DE650C719705.ashx.

57
Both utilities and PV system owners benefit from the correlation between peak
demand and PV’s peak output. Firstly, utility companies normally build and operate
extra plants to deal with these peaks in energy demand. According to the Co-Director
of the Energy Institute at the Haas School of Business, Severin Borenstein: “Among
conventional gas and coal plants, there are constraints on how quickly a plant’s output
level can be increased or decreased (‘ramping rates’), how long the plant must remain
off once it has been shut down, and how frequently it must be shut down for planned
or unplanned maintenance, as well as the cost of starting the plant.”129 Utilities often
build extra natural gas-fired ‘peaker’ plants in order to remedy the constraints placed
on conventional plants during peak times.130 Since PV produces electricity
disproportionately at peak times, grid-connected systems that are generating more
electricity than is being consumed help utilities save fuel and prevent them from
pushing their conventional plants beyond engineering specifications when they do not
have gas-fired peakers. Utilities can benefit from avoiding these costs by serving the
demands of consumers nearby the PV system contributing to the grid with its excess
129Borenstein, “The Private and Public Economics of Renewable Electricity,” 8. 130Ibid, 8.

58
kWh.131 To the extent that PV output is correlated with high electricity prices,
consumers and firms deciding to install or invest in a new PV unit can take into
account the benefits of their system’s peak production. Since electricity is very costly
to store and is intended to be consumed when it is produced, understanding the
manner and degree to which rate design changes the economics of PV systems is
critical for cost considerations, as will be elaborated in the next chapter.
For now, it suffices to say that PV’s cost competitiveness is augmented when
regulatory measures are in place that credit system owners for their RE contributions.
In the case of net-metering, residential and commercial PV system owners receive
credits for the electricity they produce but do not consume. Over time, the net
metering credits contribute to the cost savings that are already received from the
consumption of electricity generated on-site. As for renewable portfolio standards,
qualifying system owners are provided credits for their contributions to meeting the
states’ requirement on the amount of renewable energy in each utility’s electricity
generation mix. With more details to come, one of the ways in which these two
regulatory mechanisms facilitate PV’s cost-competitiveness is by providing streams
of credit.
III. Modern Electricity Market Inefficiencies
Just as regulations solved the natural monopoly failure of utilities and
facilitated a nascent industry’s development, policies promoting renewables have the
power to induce the electricity industry to restructure to the externalities driving
131This statement is a simplification and will be clarified in the next chapter.

59
climate change and make PV more cost-competitive. 132 Adapting to climate change is
in the public interest. It requires addressing the market inefficiencies that encourage
the use of conventional energy sources and inhibit the cost-competitiveness of
renewables. Regulations ought to return to their role, which, as Kahn summarized, “is
generally conceived as one of maintaining the institutions within whose framework
the free market can continue to function, of enforcing, supplementing, and removing
the imperfection of competition.”133 Policymakers need only provide an entry by
which renewables might compete with traditional sources of energy. If the history of
utility regulation in the United States is any indication, policymakers will not need to
decide what renewable should be produced and how or by whom, nor will they fix
prices on the basis of its own calculations of how much is economically desirable. PV
is just one option, but it will succeed in displacing environmentally toxic sources of
energy when the environmental conditions (see Figure 3) like latitude and solar
insolation are ripe for producers, consumers, and prosumers over other renewables.
Friedrich Hayek’s belief in competition as an economic regulator is useful for
considering the role of policy in PV’s viability. Hayek distinguishes between
governmental interventions that are consistent and inconsistent with competition as
the economic regulator. It is the latter, not the former, Hayek argues that is is
politically toxic and poses a threat to our basic political and social freedoms.134
Because of the widely held belief in government intervention, environmentalists often
recoil at the mention of Hayek. I would like to argue, though, that when it comes to
132As stated in the Introduction, American producers and consumers do not account for the costs of emissions resulting from fossil fuels. A carbon-pricing system is required to 133Kahn, The Economics of Regulation, 2. 134From Kahn: Friedrich A. Von Hayek, The Road to Serfdom (Chicago, IL: University of Chicago Press, 1944), p. 88-100.

60
renewables, a close eye on the factors shaping competition in electricity markets will
be the way to push PV closer to its apex. Regulators played a consistent role in
overseeing the burgeoning utility industry, providing them natural monopoly statuses
to prevent market forces from stifling their development. Similar treatment is
necessary for PV’s broader cost competitiveness and market development.
To encourage the substitution from conventional sources of electricity to
renewables like PV, regulations are required to address market inefficiencies that
inhibit PV’s cost-competitiveness. Economic theory suggests that economic
efficiency is improved when policy instruments are matched to market failures and
barriers.135 Although markets are not perfect, the concept of market efficiency
provides a benchmark for the evaluation of actual PV markets. The structure and
nature of the problem creating market inefficiency must influence the resulting policy.
In this case, a set of actions are required to correct for the market failures and barriers
of the electricity industry, so that the American energy industry can move closer to an
optimal transition to renewable energy.
In the case of electricity consumption and production, privately optimal
decisions deviate from economically efficient ones. Economic theory provides
guidance on how decision-making is influenced by responses to market failures and
barriers or products of behavioral failures.136 As Stanford University Precourt Energy
Efficiency Center's Kenneth Gillingham and James Sweeney argue, “economic theory
135Welfare economic theory provides the basis for the notion that absent market or behavioral failures, competition in an unfettered market produces an economically efficient outcome. Economically efficient is defined as a Pareto optimal allocation of resources, where Pareto optimal means that no re-allocation could benefit an individual without imposing a cost on any others. 136 Jason F. Shogren, Gregory M. Parkhurst, and Prasenjit Banerjee, "Two Cheers and a Qualm for Behavioral Environmental Economics," Environmental and Resource Economics 46, no. 2 (February 27, 2010), doi:10.1007/s10640-010-9376-3..

61
indicates that policy measures to mitigate these deviations can improve net social
welfare, as long as the cost of implementing the policy is less than the gains if the
deviations can be successfully mitigated.”137 The cost of dealing with long-term
climate change is high but less than the economic cost of failing to act.138 PV-
supportive policies are included in this realm of “high costs” in adapting to the
realities of climate change. Electricity markets do not take into account the costs of
conventional sources of production, which can be marginally priced in terms of their
emissions impact and varies with equity weighing.139 Similar to regulations’ that
acted as a substitute for competition amongst utilities, PV-supportive policies induce
the electricity markets and electricity production to account for its externalities,
current market failures, and market barriers.
III. Market Inhibitors to PV Development
Information market failures are most relevant to the adoption of onsite PV
electricity generation, often classified as “behind the meter” or distributed generation.
The design of the American electrical apparatus, as technology historian Thomas 137"Market Failure and the Structure of Externalities," in Harnessing Renewable Energy in Electric Power Systems: Theory, Practice, Policy, ed. Boaz Moselle, Jorge Padilla, and Richard Schmalensee, by Kenneth Gillingham and James Sweeney (Washington, DC: RFF Press, 2010), accessed March 10, 2010, http://www.yale.edu/gillingham/Market%20Failure%20and%20the%20Structure%20of%20Externalities.pdf, 138 For instance, United Kingdom, Parliament, Prime Minister, Stern Review on the Economics of Climate Change, by Nicholas Stern, Sir, accessed October 27, 2012, http://webarchive.nationalarchives.gov.uk/+/http:/www.hm-treasury.gov.uk/sternreview_index.htm; My logic follows that of Jody Freeman and Andrew Guzman, "Climate Change and U.S. Interests," Columbia Law Review 109, no. 153 (August 28, 2012): 1597, accessed December 02, 2012, http://scholarship.law.berkeley.edu/facpubs/36 (“If one accepts the estimate of a 15.4% [derived from Stern] impact on the United States (or even if one were to cut that estimate in half), and if one accepts that the global cost of action would be about 4.6% of U.S. GDP… [they would conclude that] the United States would be better off paying the full cost of mitigating the impact of climate change by itself (even if no other country cooperates) rather than allowing the world to continue in a “business as usual” fashion”) 139Richard S.J. Tol, "The Marginal Damage Costs of Carbon Dioxide Emissions: An Assessment of the Uncertainties," Energy Policy 33, no. 16 (November 2005), doi:10.1016/j.enpol.2004.04.002.; Gary Yohe, "More Trouble for Cost-Benefit Analysis," Climatic Change 56, no. 3 (February 2003).
62
Hughes identifies, inhibited personal considerations on energy usage as it was not
controlled by the consumer but managed by “hierarchy, specialization,
standardization, centralization, expertise and bureaucracy.”140 There is no commodity
that consumers know so little about and yet depend upon more than electricity.
According to Insull’s model, electricity is reliably and cheaply delivered, and so
consumers usually do not ask any questions. Although the electrical apparatus
developed in accordance to utilities’ natural monopoly status, the modern electricity
menu extends beyond conventional technologies into grid-connected renewables. In a
minority of states, residential and commercial PV systems are increasingly attractive
investments for consumers due to policies implemented to stimulate the transition to
renewable electricity. However, uninformed electricity consumers are not taking
advantage of these new opportunities, as evinced by PV’s relatively small
contribution to the American electric system. 141
The increasingly attractive nature of investments into and financing options
for PV in a minority of states is not complemented by similar consumer enthusiasm.
This disconnect between solar developers and potential customers was a common
theme throughout the interviews conducted for this thesis. Downstream PV
companies like Sungevity, a leading Third Party Residential Developer based in
Oakland, California, must devote significant resources to removing the
misconceptions held by their potential clients towards PV. Indeed, Sungevity’s CEO
140Thomas Parke. Hughes, Human-built World: How to Think about Technology and Culture (Chicago: University of Chicago Press, 2004), p. 101. 141U.S. Department of Energy, Energy Information Administration, Annual Energy Review 2011, 2012, accessed December 01, 2012, http://www.eia.gov/totalenergy/data/annual/pdf/aer.pdf.

63
Danny Kennedy argues that the biggest barrier his company faces with potential
customers is not financial but rather education and awareness.142 “If households have
limited information about the effectiveness and benefits of distributed generation
renewable energy, there may be an information market failure,” notes Gillingham and
Sweeney. If so, “one would expect profit-maximizing firms to undertake marketing
campaigns to inform potential customers.”143 The American PV industry
demonstrates this trait. Most Americans’ perception towards PV systems is generally
a mix of skepticism and apprehension, and so customer acquisition costs are much
higher in the U.S. than in Germany: $.07/W in Germany and $.69/W in the U.S (see
figure 2).144
142Confirmed in interviews with Alec Guettel (March 8, 2013) and Sloane Morgan (September, 13, 2012). Additionally, this is something he repeatedly says in interviews. For instance, Jeff Himmelman, "The Secret to Solar Power," New York Times Magazine, August 12, 2012, http://www.nytimes.com/2012/08/12/magazine/the-secret-to-solar-power.html?pagewanted=all&_r=0. 143 Gillingham and Sweeney, "Market Failure and the Structure of Externalities," 10. 144Joachim Seel, Galen Barbose, and Ryan Wiser, "Why Are Residential PV Prices in Germany So Much Lower Than in the United States?," Lawrence Berkeley National Laboratory, February 2013, accessed February 27, 2013, http://eetd.lbl.gov/ea/ems/reports/german-us-pv-price-ppt.pdf.

64
Figure 15. Customer Acquisition Costs in Germany vs. U.S.145
In line with Chapter One’s example of a Brooklyn 5000 watt system, the customer
acquisition cost would be $3450, or about 13% of total system costs.146 American
developers face significantly larger “non-project specific marketing and advertising”
and “other project-specific customer acquisition” costs in securing their customers
than Germany. In the case of the commercial and residential sectors in applicable
states, where PV systems are cost competitive, consumers with limited information
about the financial benefits of solar will not profit-maximize. Marketing and
advertising campaigns attempt to correct this market failure, which is evident in all
states with emerging PV markets.
Behavioral failures associated with heuristic decision-making produce
145Ibid. 146For a 5000 watt system costing $27500, if the customer acquisition cost is .69 cents per watts, the weighted cost per watt is $5.5/W. The customer acquisition cost is about 13% of the per watt cost (.69/5.5), amounting to 13% of the total system costs (27500x(.69/5.5)=3450).

65
information market failures, constraining PV deployment and investments.147
Imperfect foresight and risk aversion by consumers and lenders leads to the
inaccurately high discount rates given to PV systems. Discount rates that are too high
affect PV deployment in several ways. Firstly, if potential investors in PV have
distorted discounts rates, this could lead to underinvestment relative to the
economically efficient level, which can be measured in terms of cost-competitiveness
and investment attractiveness. In turn, the discount rate interferes with the consumer’s
enjoying the financial benefits of PV, such as cumulative electricity bill savings. In
related analysis, economists have calculated implicit discount rates for consumers
purchasing RE technologies that exceed market interest rates (25 percent and often
much higher).148 This behavioral pattern is demonstrated in PV markets, in which
inflated discount rates add to skepticism on project affordability, reducing PV’s
attractiveness and demanding expensive marketing campaigns.
Secondly, when lenders hold distorted discount rates, they overestimate the
applicable interest rate. Capital market barriers inhibit PV market development by
limiting access to affordable financing. Lenders, whose views are susceptible to
imperfect information, tend to underestimate PV’s attractiveness as an investment and
overestimate the necessary interest rate. For instance, Third Party Financiers, whose
pitch is providing easy access and a consistent approach to financing, struggle to
147Gillingham and Sweeney, "Market Failure and the Structure of Externalities," 10. 148Richard G. Newell, Adam B. Jaffe, and Robert N. Stavins, "The Effects of Economic and Policy Incentives on Carbon Mitigation Technologies," Energy Economics 28, no. 5-6 (November 2006): 570-571, doi:10.1016/j.eneco.2006.07.004.

66
secure the necessary capital for their business model’s success.149 “Our lenders are
only getting over Solyndra now,” remarked Alec Guettel, Chairman of Sungevity.150
Solyndra was not only a setback for the Obama administration but also for
developers, who now had to reassure creditors that the press’ main story on solar
actually reflected their segment’s strengths, not weaknesses. Guettel remarked that his
company generally receives loans with 14-15% rates. This is about three times higher
than Sungevity’s German counterparts, which have creditors with designated funds
and operations that accommodate PV, providing rates of 4-5%.151 As is the case with
its third party financing counterparts, Sungevity’s growth is constrained by the risk
premium resulting from inflated discount rates. It is natural for a growing or emerging
market to carry higher interest rates due to the “risk premium” associated with the
uncertainty towards a new product. However, PV is a technology that has existed for
more than half a century. Its legitimacy is affirmed by the significant contributions it
makes to countries like Germany. PV’s market information failures and capital
market barriers have been exacerbated by the federal government’s inconsistent
support. Now that PV is more broadly establishing itself as an attractive investment, it
must overcome the misconceptions held by consumers and lenders regarding its
viability.
Lastly and simply, people lack faith in the PV market because it has proven
volatile time and time again. As such, PV has limited appeal in the capital markets
149Shayle Kann, "U.S. Residential Solar PV Financing: The Vendor, Installer and Financier Landscape, 2013-2016," GTM Research, February 11, 2013, accessed April 04, 2013, http://www.greentechmedia.com/research/report/u.s.-residential-solar-pv-financing. 150Interview with Alec Guettel March 8, 2013. 151Received from Ben Higgins: Joseph CG Eisenberg, "U.S. Solar PV Market – an Overview," Renewable Analytics 10, no. 1 (September 2010)..

67
because potential debt and equity investor’s lack faith in its stability, despite its
increasing affordability and despite its proven record abroad in countries like
Germany. Particularly, the volatility of the manufacturing markets diminished
investor confidence. In the public equity markets, including initial public offerings
and secondary and private investment in public equity deals, new equity investments
in solar decreased 23% from 2010 to 2011.152 As noted earlier, project developers
gained from the plunging hardware prices that were hurting manufacturers, but as
Bloomberg New Energy Finance notes, “developers are often unquoted companies;
and even if they are quoted, uncertainty over future policy dampened their shares
prices too.”153 The dearth of financing options in the equity markets also extends into
the debt capital markets. In an informal interview with Richard Kaufman, New
York’s newly appointed Energy Czar, he stated his intentions to expand convertible
bond financing options for PV projects. Kaufman hopes to strengthen the market
presence of PV real estate investment trusts (REITS) and PV master limited
partnerships (MLP). Simply, both of these convertible bonds would recognize PV as a
mature technology, signifying to capital lenders that PV possesses the characteristics
that warrant interest rates of other commodities, natural resources, and real estate. In
the meantime, however, Kaufman’s policy designs to support affordable financing are
merely intentions that may or may not be implemented during Andrew Cuomo’s term
as New York’s Governor. Currently, PV’s deployment in New York remains
constrained by apprehensive investors. In sum, the combination of misinformation
152Interview with Richard Kaufman March 13, 2013 153Bloomberg New Energy Finance, Global Trends in Renewable Energy Investment 2012, publication, June 11, 2012, p. 57, accessed March 09, 2013, http://fs-unep-centre.org/sites/default/files/publications/globaltrendsreport2012final.pdf.

68
and apprehension leads to risk-aversion. The underestimation of PV’s viability makes
financing development through capital market mechanisms much more difficult than
for mature, traditional investments.
Although relevant academic literature exists on dispelling misconceptions on
PV,154 few have identified ways to overcome these barriers other than through
diffusion. Studies exploring the peer effects on solar information markets suggest that
increased PV adoption tacitly encourages market development by dispelling
misinformation about its cost-competitiveness.155 For instance, "Peer Effects in the
Diffusion of Solar Photovoltaic Panels” confirms the role of diffusion in correcting
misconceptions on PV. “In solar adoption, peer effects may be due to a variety of
pathways, including social learning about the value of solar…The presence of peer
effects in solar improves our understanding of the process of adoption of a critical
renewable energy technology,” the authors, Gillingham and NYU Stern’s Bryan
Bollinger, explain.156 A neighbor’s rooftop’s panels or a utility-scale project on a
nearby field legitimizes PV, stimulating further deployment. Broader PV markets
reduce the BOS costs that result from consumer, lender, and investor misconceptions.
As PV becomes a more common, legitimized, and attractive investment, the balance
of system (BOS) costs added by market inefficiencies are reduced. Once marketing
154Various economic studies have been performed to assess the sensitivity of the consumer’s cost-effectiveness calculation for solar technologies to changes in energy alternatives, prices, incentives, or solar resources: Salvatore Lazzari, "An Economic Evaluation of Federal Tax Credits for Residential Energy Conservation," in Studies in Taxation, Public Finance, and Related Subjects: A Compendium, Volume 7. (Washington: Fund for Public Policy Research, 1983); K. Hassett, "Energy Tax Credits and Residential Conservation Investment: Evidence from Panel Data," Journal of Public Economics 57, no. 2 (1995), doi:10.1016/0047-2727(94)01452-T. 155Kenneth Gillingham and Bryan Bollinger, report, August 5, 2012, accessed February 23, 2013, http://people.stern.nyu.edu/bbolling/index_files/BollingerGillingham_PeerEffectsSolar.pdf. 156Ibid, 11

69
and advertising campaigns, for instance, dispel misinformation on PV, the customer
acquisition costs slowly decrease. As more customers are acquired, a peer-effect
forms and then influences the choices of whether or not to adopt PV. Overtime, the
legitimacy PV has within a community and the resulting peer effect serve the purpose
of marketing and advertising campaigns. However, only a few states and their
respective zip codes possess the market traits of California and Sacramento, which
were the general and specific (respective) subjects of Gillingham and Bollinger’s
study. California possesses the largest residential and consumers PV markets and the
second largest utility PV market.157 In the majority of state PV markets, the diffusion
of PV not only requires significant consumer/lender knowledge and patience but also
stronger policy foundations to make PV cost-competitive.
Conclusion: Towards More Efficient Electricity Markets
Unfettered market forces stymie the development and deployment of socially
optimal electricity technologies. Historically, regulators exerted influence over
nascent electricity markets in order to prevent counterproductive competition
amongst utilities. The private-public partnership of natural monopolies was founded
upon the fact that market competition did not foster benefits for electricity producers
and consumers, as market forces can in other industries. Economic theory indicates
that such policy measures can mitigate deviations from socially optimal conditions
and thus improve net social welfare. There is, of course, a caveat: the measure leads
157In 2011, California possessed 1.5 GW of the 3.3 GW of PV in the U.S: 487.5 MW in Residential PV, 742 in Commercial PV, and 283.9 in Utility PV. (SEIA/GTM Research, "U.S. Solar Market Insight Report 2011 Year-in-Review," Solar Energy Industry Association, section goes here, accessed December 04, 2012, http://www.seia.org/research-resources/us-solar-market-insight-report-2011-year-review.)
70
to a socially optimal outcome when the implementation cost is less than the gains of
successfully mitigating the deviation. In the context of global warming policies,
economists have shown that pricing the emissions from conventional electricity
production would significantly benefit PV’s cost competitiveness with fossil fuels.158
Placing a price on carbon is the most direct parallel to the natural monopoly status
granted to utilities at the start of the century. Although the regulatory measures
involved in carbon pricing and natural monopolies bear no resemblance, they share
the same intention of exerting influence over electricity markets to change the
behavior of electricity producers to a more socially optimal level. Yet, as is the case
with American market inefficiencies related to climate change, the politically feasible
options often are not the first-choice instruments but rather are second-choice
instruments that address the market inefficiencies less directly.
The next two chapters are devoted to examining net metering and RPS.
Neither net metering nor RPS demand the sort of changes in behavior from electricity
producers and consumers that are compelled by pricing carbon, but both policies have
the stated intentions of and have demonstrated the capability to overcome current
electricity market failures and barriers. In the same regard, it should be said that the
natural monopoly status granted to utilities produced tangible benefits but was not
perfect. Despite its faults, which were revealed in the decades following electricity’s
spread throughout the U.S.,159 the pact struck between utilities and regulators enabled
158Allen A. Fawcett et al., "Overview of EMF 22 U.S. Transition Scenarios," Energy Economics 31 (December 2009): pg. #, doi:10.1016/j.eneco.2009.10.015. 159This arena of electricity regulation is beyond the scope of this paper. For information: Richard F. Hirsh, Power Loss: The Origins of Deregulation and Restructuring in the American Electric Utility System (Cambridge, MA: MIT Press, 1999).

71
the maturation of a burgeoning technology and industry. The various interferences of
policymakers into the electricity market now requires more actions to correct modern
market inefficiencies inhibiting the deployment of PV.
In this chapter, the market inefficiencies that were detailed related to inflated
discount rates. Underestimation of the reward and overestimation of the risk by
investors and lenders (respectively) inhibit the cost competitiveness of PV. Investors
have demonstrated the trend of overestimating the costs of PV and, as a result,
underinvest in PV relative to the economically efficient level in states where PV is
cost-competitive. This underestimation of the potential benefits of solar investments,
which is produced by informational market failures, stymies PV’s deployment by
necessitating more expensive customer acquisition campaigns. Similarly, capital
market barriers detract from PV’s cost competitiveness by overestimating the
required interest rate and placing a risk premium on the capital for PV projects.
Misconceptions on the financial viability of PV produce significant expenditures for
developers that are insignificant in mature markets like Germany. PV is cost-
competitive in Germany because it has been able to shed costs like those in customer
acquisition and financing. The majority share of American PV system costs now
reside in softer costs of this sort. Since there are no “game changing” developments
on PV’s horizon like those that occurred in modules markets, regulation is critical to
changing PV electricity from a luxury product to an economically feasible one, as
regulators did in Insull’s time. The increasing adoption of solar will in turn lead to
increasing BOS efficiency, lower costs, and benefits from peer effects has been the
case in other markets like Germany after maturation. Building upon the details

72
provided in this chapter, the remainder of this thesis assesses how the best practices
of net metering and RPS can facilitate PV’s overcoming the hurdles imposed by the
current electricity market in its race to cost competitiveness.160
160The use of “race” goes beyond wordplays because the window for mitigating the effects of human interference in the climate system is closing, as will be discussed in the conclusion.

73
Chapter Three
The Challenges of Net Metering: A 21st Century Policy for a 20th Century Relationship
I. Accounting for Solar Photovoltaic Technology’s Unique Production
Cycle
The introduction and proliferation of distributed systems like PV rooftop
installations challenges the traditional interaction between utility and their customers.
When distributed generation is introduced into a state’s or region’s electricity system
the dynamics between electricity generation and consumption fundamentally change.
Regulations, in turn, have been implemented to address these changes and have the
capability of promoting the benefits of electricity generation from distributed sources
like PV.
Net metering is a billing arrangement that enables customers to install clean,
on-site distributed generation that is interconnected to the electric grid. The policy
Précis: As is the nature with PV-promoting policies, the variance amongst state net metering regulations provides an opportunity to analyze the elements that do or do not promote participation, expand PV capacity, or otherwise advance the goals sought by net metering. Chapter Three builds on previous literature regarding net metering and its role in PV markets. The chapter provides positive analysis on capacity limits, credit rollovers, and the impact of electricity pricing schemes. Each of these policy components has been implemented differently across the U.S., with accompanying benefits and pitfalls. These will be determined through the experiences of several groupings of states and then correlated to the electricity market inefficiencies that were laid out in Chapter Two. Lastly, the chapter concludes with normative conclusions on the role of smart meters in facilitating net metering’s benefits for PV markets and deployment.

74
allows residential and commercial customers who generate their own electricity from
solar power to feed electricity they do not use back into the grid (refer to Figure 16).
Figure 16. The Basics of a Rooftop Net Metered System161
With net metering, the customer’s meter runs both forward and backward in terms of
the electricity they consume from or contribute to the grid. The policy provides a way
to calculate a bill, which considers that the customer at times imports electricity from
the grid and at other times exports power to the grid. At the end of the billing period
the customer simply pays for the net energy used, or receives a credit at the retail rate
if more energy is produced than consumed.
By ensuring that system owners can, technically and legally, take advantage
of the unique attributes of their distributed systems, net metering is essential for the
development of PV markets. Through the course of a day, a net metered PV system
will operate in one of three different phases: (1): retail customer phase—the sun is
down and so the electricity consumed flows from the grid without PV production, (2): 161"Net Metering At Legislative Crossroads," Everblue, accessed January 12, 2013, http://www.everblue.edu/blog/net-metering-legislative-crossroads.

75
energy efficiency phase—the sun is up but the PV production does not service all of
the PV system owner’s consumption, and (3): the power export phase—the sun is
high overhead and PV production exceeds the customer’s instantaneous use (refer to
Figure 17).
Figure 17. The Phases of PV System Operation162
The bill credits prosumers, who can be defined as distributed generators that produce
their own on-site electricity and consume electricity from the grid when their on-site
electricity production is inadequate to their demands, gains over time offsets their
consumption when their distributed system isn’t generating electricity. For example,
if a residential customer has a PV system on their home's rooftop, it may generate
more electricity than the home uses during daylight hours. If the home is net-metered,
the electricity meter will run backwards to provide a credit against what electricity is
162The diagram and above concepts: R. Thomas Beach and Patrick G. McGuire, "Evaluating the Benefits and Costs of Net Energy Metering in California," Vote Solar, January 2013, p. 10, accessed March 08, 2013, http://mseia.net/site/wp-content/uploads/2012/05/Crossborder-Energy-CA-Net-Metering-Cost-Benefit-Jan-2013-final.pdf.

76
consumed at night or other periods where the home's electricity use exceeds the
system's output. In other words, when a user creates more power than it needs, the
excess is put onto the electric grid. When this occurs, the utility company pays the
‘‘avoided cost’’ rate,163 which is simply the cost the utility avoids bearing through the
acquisition of other sources of energy. Customers are only billed for their "net"
energy use.
If PV system owners did not export power to the grid and consumed all of
their electricity generation on site, there would be no need for net metering. Net
metering is crucial for compensating system owners for the possibility that their PV
output may not perfectly match the on-site demand for electricity. On average, 20-
40% of a PV system’s output goes into the grid.164 The resulting credits that
businesses and homeowners receive for their excess electricity help them more
effectively finance their PV systems. Additionally, since net metering never ends, it
indicates to developers and investors that there is a long-term public commitment to
facilitating PV deployment and market development. In sum, net metering is a
principal policy for creating PV markets. In 2011, more than 93% of the distributed
PV installations were net-metered.165According to Ben Higgins, Director of
Government Affairs at REC Solar, net metering “has arguably been the policy
163The avoided cost payment structure is based off of clauses in Public Utility Regulatory Policy Act (PURPA) in 1978. Net metering policies undo the utility-friendly payback rate established under PURPA, which mandated a customers’ ability to sell back excess power but does guarantee the full retail rate back. 164"SEIA," Research & Resources, Net Metering, March 09, 2013, http://www.seia.org/research-resources/net-metering-state. 165Larry Sherwood, "U.S. Solar Market Trends," Interstate Renewable Energy Council, p. 8 Accessed 1/13/13: http://www.irecusa.org/wp-content/uploads/IRECSolarMarketTrends-2012-Web-8-28-12.pdf

77
foundation of the U.S. small-scale solar industry.”166 The majority of the more than
8,000 systems installed by REC Solar, which is one of the nation’s largest
commercial and residential PV developers, are net-metered. This is the norm for
developers throughout the country because of the fact that all of the PV generated on
site is not consumed by the prosumer.
In recognition of the essential role of net metering in fostering PV market
development, numerous reports have been conducted on the policy. These sources
depend upon the Database of State Incentives for Renewables & Efficiency (DSIRE),
particularly Heinemann (2011),167 for background information on policy specifics and
how policies vary per state. Building upon these details, the literature generally
focuses on the role of net metering on electricity rates (vice versa) in California. Mills
et al., (2008) examine how rate design impacts the cost competitiveness of
commercial PV system in California;168 Dargouth et al., (2009) examine how
electricity rate designs effects the electricity bills of net metering participants and
non-participants.169 Similarly, other players in the California electricity market have
offered their takes: Energy and Environmental Consulting (2010) conducted a study
on behalf of the California Public Utilities Commission to assess the cost
166This quote bares resemblance to a similar statement made in an interview: Ben Higgins, "Net Metering at a Crossroads," REC Solar Blog, April 10, 2012, accessed March 05, 2013, http://blog.recsolar.com/2012/04/net-metering-at-a-crossroads/. 167Amy Heinemann, "Net Metering," DSIRE Solar Portal, accessed January 05, 2013, http://www.dsireusa.org/solar/solarpolicyguide/?id=17. [Herein: Heinemann, “Net Metering,” DSIRE] 168Andrew Mills, Ryan Wiser, Galen Barbose, William Golove, "The Impact of Retail Rate Structures on the Economics of Commercial Photovoltaic Systems in California," Energy Policy 36, no. 9, accessed February 07, 2013, www.sciencedirect.com/science/article/pii/S0301421508002309. [Herein: Mills et al., “The Impact of Retail Rate.”] 169Galen Barbose, Ryan Wiser, and N. Dargouth, The Economic Value of PV and Net Metering to Residential Customers in California, report no. LBNL-3276E, April 2010, section goes here, accessed January 04, 2013, http://eetd.lbl.gov/ea/emp/reports/lbnl-3276e.pdf. [Herein: Barbose et al., “The Impact of Retail Rate,”]
78
effectiveness of net metering programs;170 Beach and McGuire (2013) to understand
the effect of net metering on non-participating ratepayers and California’s utilities.171
Much of this cost analysis work is based upon studies conducted by Severin
Borenstein, the Co-Director of the Energy Institute at the Haas School of Business. 172
The Freeing the Grid report (FTG) is an accessible guide to the basics of net-
metering.173 Much of their analysis is based upon findings in the literature above. The
report dilutes these reports to provide grades that are based on the likelihood that the
policy would achieve increased distributed generation goals that are often described
in the parameters of the related legislation. This chapter advances FTG’s grading
system to assess capacity limits and credit rollovers influence PV systems and then
incorporate the work done by Borenstein and his counterparts to analyze how net
metering is shaped by electricity pricing mechanisms. The analyses and conclusions
that are provided advance the understanding of how net metering impacts the cost-
competitiveness of PV. Ultimately, this chapter offers specific prescriptions for
optimal policies to maximize the benefits of net metering and distributed generation
to both non-participating ratepayers and participating ratepayers.
170Energy and Environmental Consulting, "Net Energy Metering Cost Effectiveness Evaluation," March 2010, accessed March 12, 2013, http://www.cpuc.ca.gov/NR/rdonlyres/0F42385AFDBE-4B76-9AB3-E6AD522DB862/0/nem_combined.pdf. [Herein: E&E Consulting, “Net Energy Metering Cost Effectiveness Evaluation,”] 171R. Thomas Beach and Patrick G. McGuire, “Evaluating the Benefits and Costs of Net Energy Metering in California,” Accessed 3/21/13: http://mseia.net/site/wp-content/uploads/2012/05/Crossborder-Energy-CA-Net-Metering-Cost-Benefit-Jan-2013-final.pdf [Herein: Beach& McGuire, “Evaluating the Benefits and Costs of Net Energy Metering in California,”] 172Severin Borenstein, "The Private and Public Economics of Renewable Electricity Generation," Energy Institute at Haas (EI @ Haas) Working Paper Series, December 2011, accessed March 11, 2013, http://ei.haas.berkeley.edu/pdf/working_papers/WP221.pdf; Severin Borenstein, "The Market Value and Cost of Solar Photovoltaic Electricity Production," Center for the Study of Energy Markets Working Paper 176. Accessed 2/27/13: http://www.ucei.berkeley.edu/PDF/csemwp176.pdf; 173Vote Solar, "Freeing the Grid Report 2013," Freeing the Grid, January 2013, accessed January 06, 2013, http://freeingthegrid.org. [Herein: Vote Solar, “Freeing the Grid.”]

79
II. Policy Specifics and Experiences
Most states that have created and/or revised their net metering policies have
done so in pursuit of a variety of renewable energy (RE) promotional goals, including
encouraging greater RE generation and rewarding investment in renewable
technologies. The basics of these policies are consistent, but the specific parameters
of the policy vary by state. Figure 18 depicts the current status of net metering in the
United States and provides a visual snapshot of the net metering landscape with the
states filled in with their applicable FTG grade.
Figure 18. Net Metering Policy Grades in the United States as of April 2013174
Since the rejection of Kyoto at the adoption of FERC 888 and 889,175 the amount of
state with net metering has increase from 7 to 43, including the District of Columbia
and with three states possessing voluntary programs. Figure 18 takes into account a
graded view of net metering policies by using the scoring methods of policy best
practices as defined by the “Freeing the Grid Report” (FTG). The accompanying
174Ibid. 175Refer to p. 29 on the role of Congress’ rejecting Kyoto and FERC 888 and 889 in stimulating state action on renewable energy absent federal support.

80
rhetoric for such regulatory intentions states is generally something along the lines of:
net metering ought to be instituted because it ‘‘encourages private investment in
renewable energy resources, stimulates the economic growth of this state, encourages
energy independence and security, and enhances the continued diversification of this
state’s energy resources’’ (Idaho State Legislature, 2002, S1368:§8-61-801). States
believe that net metering is essential ‘‘in order to balance the interests of retail
customers.”176
Intentions, however, do not always match results, and in the above case of
Idaho, the bill was not adopted and net metering is not in place. As demonstrated in
the FTG grading scale, policy specifics vary across the 44 jurisdictions with net
metering.177 Utilizing the FTG grading scale, statistical analyses were conducted for
this thesis to examine the benefits of best and the pitfalls of worst practices on a
variety of metric gauging a state’s PV market. As shown in Table 1, the differences in
mean cumulative capacity across the net metered groups demonstrates the benefits of
best practice net metering on PV market development.
Table 1. Mean Cumulative Capacity per FTG Net Metering Grade Group178
Year Net Metering Grade
Group Mean Cumulative
Capacity (MW) 2011 A 188.24118 2011 B 34.311765 2011 C 3.4 2011 D 42.75
176State Affairs Committee, "Senate Bill No. 1368," Legislature of the State of Idaho. Accessed 3/10/13: http://legislature.idaho.gov/legislation/2002/S1368.html 177Vote Solar, “Freeing the Grid.” 178Larry Sherwood, IREC Historical Installation Data.xls, raw data, Received Through Email, New York. (refer to appendix)
81
2011 F 4
The drastic differences in mean cumulative capacity down the best-policy grade
groups substantiates the claim that best practice net metering policies promote PV
deployment. North Carolina is the outlier in Table 1’s data set, with a PV capacity of
88.5 MW, while its other “D” counterpart, North Dakota, had 0 MW of PV attributed
to it in 2011. In 2010, these marked differences amongst higher and lower grades
were also exhibited in mean MW/Population: 5.21 for A, 3.70 for B, 1.95 for C, .56
for D and F, and .24 for no grade.179 As for the numbers of mean total installations
per grade, A states had 2890.471, B had 838.9334, C had 142.2, D had 145, and F had
34.5 Thus, best and worst practices can be quantitatively demonstrated in terms of the
differences in the graded groups’ PV capacity and customer participation, as shown in
the results on installations and per-capita capacity. The specifics of a net metering
policy’s capacity limit, credit rollover, and credit pricing mechanism impact a state’s
cumulative PV capacity, number of installations, and per capita PV capacity. In order
to qualify these simple statistical results, a more granular analysis of the parameters
of net metering is required to determine best and worst practices.
Regulatory limitations on the size of technologies eligible for net metering are
antithetical to the policy’s intention of increasing renewable energy generation and
rewarding investment in renewable technologies. Individual capacity limits prevent
system owners from correctly sizing a PV system to meet their electricity
consumption demands. As FTG explains, “there is no policy justification for limiting
179Ibid.

82
system size to an arbitrary level.”180 Instead, customer load and demand should
determine the system’s capacity characteristics. The numbers in Figure Four indicate
the individual system limit in kilowatts, which can vary by customer type, technology,
and/or application. This map shows the ends of the spectrum in mandated capacity
limits.
Figure 19. Net Metering Landscape as of March 2013181
As the map indicates, several states including New Jersey, Ohio, Colorado, and
Arizona do not have stated capacity limits. Close to twenty states, including the
District of Columbia, allow net metering for systems up to one thousand kW or one
megawatt (MW) or greater. At the upper ends of this category, New Mexico allows
180Vote Solar, “Freeing the Grid,” 105. 181Heinemann, "Net Metering," DSIRE Solar Portal
83
net metering for certain systems up to 80 (MW).182
States with small capacity limitations have the propensity of obstructing their
statutory intentions of net metering, such as encouraging greater RE generation and
promoting distributed generation, by inhibiting the growth in the average size of
large-scale (multi-family) residential and commercial distributed installation. As
such, caps interfere with market development and resulting benefits like peer effects.
Along with the increase in installations that has occurred over the past few years, the
average size of large-scale (multi-family) residential and commercial distributed PV
installations has been steadily growing.183 According to the National Renewable
Energy Laboratory’s Ben Kroposki and Ryan Margolis, “lifting net metering caps and
establishing net metering have significant effects on projected PV market penetration
in some states.”184 In their theoretical analysis on capacity limits, cumulative installed
PV increased 50% with the lifting of arbitrary system limits.185 Statistical analyses
conducted for this thesis ind that states with higher limits have larger overall PV
capacities. For instance, in 2011, states with capacity limits above 1 MW had a mean
PV capacity of 169.3 MW while states with capacity limits less than 1 MW had a
mean PV capacity of 8.5 MW.186 While there is a clear increase in the installed PV
capacity once system limitations are expanded, it is difficult to say that it is the direct
cause. Nonetheless, the correlation between increases in PV capacity and PV system
limits is pertinent to understanding the development of broader PV markets.
182Ibid 183Sherwood, IREC Data. 184Ben Kroposki and Ryan Margolis, National Renewable Resource Laboratory, technical paper no. NREL/TP-581-42292, February 2008, accessed March 28, 2012. 185Ibid. 186Appendix

84
To be successful, a net metering program must ensure that a kWh generated
by distributed systems has the exact same value as 1 kWh produced by conventional
means. This allows for prosumers receiving credit for excess electricity generated
during seasons when their system output is highest and applying it toward their
consumption when output is lowest. In solar industry jargon, excess kWhs are
referred to as “solar rollover minutes.” Like roll over minutes on a cell phone bill, net
metering systems allow PV system owners to enjoy the benefits of their unused
electricity, by spinning their meter backwards to ensure that they receive credit for
any electricity that they put back on the grid rather than consuming themselves. As a
matter of physics, these excess kWhs will serve neighboring loads with 100%
renewable energy, displacing power that the utility would otherwise generate at a
more distant power plant. Some of the least effective net metering programs—those
in the “D” and “F” range in FTG rankings—prohibit kWh credit rollover. Instead, the
PV system owner is credited with a wholesale rate payment for their excess
electricity, which is significantly less than the retail rate.187
Understanding the manner and degree to which retail rate design affects the
economics of PV systems, and the relative value of net metering per pricing
mechanism, is critical for policymakers seeking to support PV. Again, the ideal net
metering program to support PV gives excess kWhs credits at full retail value. How
the full retail value is determined, however, varies significantly by state and utility.
Electricity bills are generally composed of charges relating to the generation,
transmission, distribution, and transition costs that go into consuming a kWh. 187Richard Duke, Robert Williams, and Adam Payne, "Accelerating Residential Pv Expansion: Demand Analysis for Competitive Electricity Markets," Energy Policy 33, no. 15 (2005): p. 1919.
85
Delivering the electricity (transmission consists of moving high voltage onto the set
of distribution infrastructure to deliver electricity to end user) generally accounts for
40 percent of a consumer’s electricity bill. The remaining 60 percent of a cost per
kWh relates to a utility’s expenses in producing electricity.188 In the majority of
states, each of the above rates are agreed upon and then set by regulators every few
years. This system limits the benefits provided by/to PV distributed generation. Prices
are delayed in responding to potential additions of excess PV electricity or in the
price of alternative commodities like natural gas.189 The decreased costs of
transmission and utility electricity generation, therefore, are not reflected in the price
per kWh.
Operating much like it has since Insull’s time,190 the standard electricity
pricing model limits consumer choice and engagement between utilities and their
consumers. Now that an array of demand-side priorities have come to prominence
like interests in conservation and renewable energy generation, the interaction
between electricity producer and consumer is fundamentally changing. In a minority
of states, utilities have shifted away from the conventional schema for pricing
electricity. These supply-side changes attempt to account for the new dynamics
between utilities and customers.
III. Reforms to Complement Demand-Side Priorities
188 "Electricity Bill Breakdown: Understanding Your Electric Bill," Pennsylvania Public Utilities Commission, July 2011, accessed March 12, 2013, http://www.puc.state.pa.us/general/consumer_ed/pdf/Electric_Bill_Breakdown-PECO.pdf. 189The natural gas boom is the elephant in the room of sorts in this thesis and will be addressed in the conclusion. 190Refer to introduction of Chapter Two.
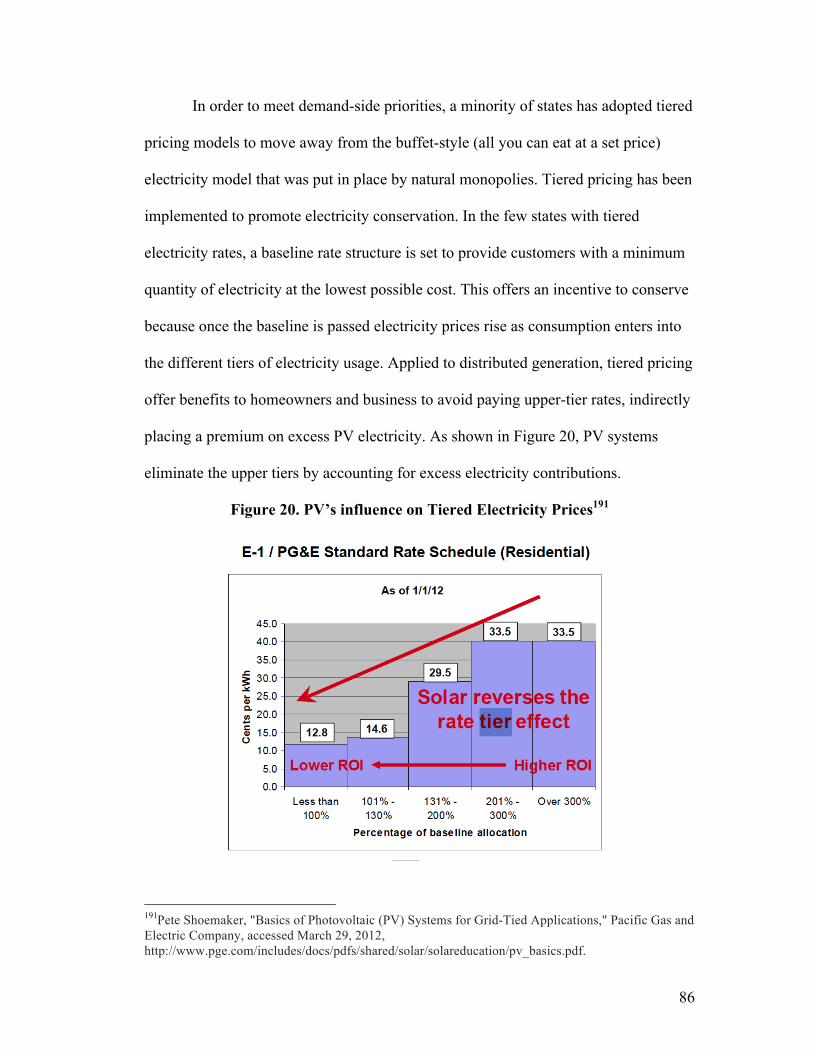
86
In order to meet demand-side priorities, a minority of states has adopted tiered
pricing models to move away from the buffet-style (all you can eat at a set price)
electricity model that was put in place by natural monopolies. Tiered pricing has been
implemented to promote electricity conservation. In the few states with tiered
electricity rates, a baseline rate structure is set to provide customers with a minimum
quantity of electricity at the lowest possible cost. This offers an incentive to conserve
because once the baseline is passed electricity prices rise as consumption enters into
the different tiers of electricity usage. Applied to distributed generation, tiered pricing
offer benefits to homeowners and business to avoid paying upper-tier rates, indirectly
placing a premium on excess PV electricity. As shown in Figure 20, PV systems
eliminate the upper tiers by accounting for excess electricity contributions.
Figure 20. PV’s influence on Tiered Electricity Prices191
191Pete Shoemaker, "Basics of Photovoltaic (PV) Systems for Grid-Tied Applications," Pacific Gas and Electric Company, accessed March 29, 2012, http://www.pge.com/includes/docs/pdfs/shared/solar/solareducation/pv_basics.pdf.

87
Net metering reveres the rate tier effect by rolling back a system owner’s
meter. PV system owners can maintain lower electricity rates because net metering
credits and on-site electricity consumption prevent their entering higher tiers. In the
minority of states with electricity tiers, the cumulative savings a system owner
receives are significant, especially considering the fact that utilities like California’s
PG&E have increased the prices accompanying their tiers several times over the last
few years.192 Time of use electricity rates are the most beneficial pricing mechanism
for promoting PV systems. When time of use (TOU) rates are in place, the price per
kWh varies depending on the time of day. PV system owners are rewarded for their
excess electricity production during peak demand periods, when electricity is priced
more expensively.193 At these times, system owners benefit from the premium given
to their net metering credits. TOU distinguishes itself from tiered pricing because it is
not determined by overall electricity consumption but by the time a system owner
consumes, prosumes, or contributes electricity. Under tiered pricing, the variation in
bill savings between a high-usage customer and low-usage customer ultimately
provides more rewards to the high-usage customer. Tiered pricing indirectly places a
premium on the kWhs produced by a high-usage electricity customer. The benefits a
high-usage customer receives from entering lower tiers are greater than the benefits a
lower-usage customer receives from maintaining their position in the lower-tiers with
their excess electricity. Lower-usage customers receive less value from remaining in
the lower tier while higher-usage ones receive more value from going down tiers.
192For instance, the top tier reached 49.8 cents per kWh in the summer of 2010 for PG&E, which is close to four times the national average residential electricity rate of 11.8 cents per kWh. (Ibid) 193Severin Borenstein, National Bureau of Economic Research, report no. NBER Reporter: Research Summary 2009 Number 1, accessed April 03, 2013, http://www.nber.org/reporter/2009number1/borenstein.html.
88
TOU rates do not distinguish between the electricity behavior of prosumers. Under
TOU, the price and credit for a kWh varies in terms of the time in which it is
produced/consumed. Whether a PV system owner consumes a lot or a little electricity
is irrelevant. Instead, differences in TOU prices take into account supply and demand
patterns in electricity.194
Unlike tiered-pricing, TOU rates and the resulting net metering credits given
to a kWh of excess PV electricity are determined by market dynamics. In TOU
pricing, the premium placed on a kWh accounts for the correlation between peak PV
production and peak electricity demand. TOU rates alert customers at all ends of the
consumption spectrum that a kWh consumed at 4 P.M. on a hot summer afternoon is
not the same as a kWh consumed at 4 A.M. Under tiered or flat tariff regimes, an
electricity bill is determined by total consumption and does not factor in the supply
and demand dynamics occurring at different times of the day. Severin Borenstein
quantifies the benefits of TOU pricing in California and finds that under tiered pricing
PV electricity is currently undervalued by 20%.195 The report, "The Market Value and
Cost of Solar Photovoltaic Electricity Production," concludes that the undervaluing of
PV electricity could rise to 30-50% if California’s electricity apparatus were managed
with more reliance on price-responsive demand and peaking prices. Such mechanisms
would further compensate PV output for its contributions at peak demand. TOU
would improve PV cost-competitiveness by placing a premium on peak contributions
and peak demands. However, TOU rates are not widely used. According to the latest
194Ibid 195Severin Borenstein, "The Market Value and Cost of Solar Photovoltaic Electricity Production," Center for the Study of Energy Markets Working Paper 176. Accessed 2/27/13: http://www.ucei.berkeley.edu/PDF/csemwp176.pdf.

89
survey from the federal government, about 1% of the United States’ residential
customers (1.1 million out of 114 million) are on TOU rates.196 Of this 1%, 67% of
that percentage is in Arizona.197 Although TOU has the potential of greatly benefiting
PV markets by improving its cost competitiveness, the integration of best practice
pricing mechanisms in net metering systems has a ways to go.
In the above cases of capacity limits, rollover credits, and pricing mechanism,
the best practice elements of net metering favor PV system owners. Of course this
thesis advocates for broader PV markets and is supportive of any alterations in
regulations or policies improving PV cost competitiveness. However, it does not
support the advancement of PV electricity to the detriment of consumers that do not
or cannot enjoy the financial benefits of PV. Throughout the nation, utilities are
coming out in opposition against net metering. Utilities claim that the policy causes
substantial cost shifts between customers with PV systems and other non-solar
customers, particularly in the residential market. “Low-income customers can’t put on
solar panels — let’s be blunt,” said David K. Owens, executive vice president of the
Edison Electric Institute, which represents utilities. “So why should a low-income
customer have their rates go up for the benefit of someone who puts on a solar panel
and wants to be credited the retail rate?”198 The question rightfully should be begged
about whether the impact of excess PV generation is a net cost or benefit for other
ratepayers. 196Data from Ahmad Faruqui, Principal, The Brattle Group, "One Third of U.S. Households Have Smart Meters - Yet Not Smart Rates," Smart Grid Observer, May 18, 2012, accessed March 28, 2013, http://www.smartgridobserver.com/n5-18-12-1.htm. 197Ibid. 198Diane Cardwell, "A Solar Fairness Debate," Diane Cardell, June 05, 2012, accessed January 29, 2013, http://www.nytimes.com/2012/06/05/business/solar-payments-set-off-a-fairness debate.html?pagewanted=all.
90
However, Owen’s comments and that of his counterparts across the U.S on
net-metering’s negative impacts on non-participating customers does not account for
the fact that the costs/benefits depend on the design of the electricity rate. In a recent
paper exploring this issue, R. Thomas Beach and Patrick G. McGuire, consultants at
Crossborder Energy, a comprehensive consulting company for the North American
Energy Industry, utilize the work of researchers like Borenstein to show that
modifications to rate design are beneficial to non-solar customers.199 When TOU rates
are used in California, Beach and McGuire argue that net metering “does not impose
costs on non-participating ratepayers, and instead creates a small net benefit.”200 In
their analysis, the net costs or benefits of net metering for non-participating
residential ratepayers will amount to a few cents added or subtracted to the average
residential customer’s monthly bill, even if the use of net metering were to increase
four-fold. Contrastingly, a study recently conducted by California’s Public Utilities
Commission shows that a larger “cost shift,” which means that net-metering benefits
received by a participating customer come to the detriment of a non-participating
ratepayer, occurs under tiered electricity rates. When high-usage customers install PV
systems that move them out of the expensive upper Tiers 3-5 of the state’s rate
structure and provide them benefits from the low Tier 1 and 2 rates for their
remaining usage, non-participating members end up receiving higher charges for the
various tiers because of utilities’ attempts to maintain their revenue streams.201 As
199Beach and McGuire, “Evaluating the Benefits and Costs of Net Energy Metering in California,” 200Ibid, “under today’s mix of increasing block (IB) and time of- use (TOU) residential rates impose a small cost on other ratepayers ($0.013 per kWh exported), as a result of [utilities’] higher upper tier IB rates and lower avoided costs. However, this small cost is offset by the net benefits of [net metering (NEM) in the] residential markets (benefits of $0.007 and $0.028 per kWh exported, respectively), where upper tier IB rates are lower and the costs avoided by NEM generation are higher.” 201E&E Consulting, “Net Energy Metering Cost Effectiveness Evaluation,”

91
demonstrated by these two studies, retail rate design significantly impacts on the
economics of net metering.
Less desirable policies on system capacity, credit rollover, and electricity
pricing inhibit a consumer’s ability to enjoy the financial benefits of PV. Utilities
oppose best-practice policies in these cases because they perceive distributed
generation as a threat to their profitability. In a nod to utility concerns, some states
have ratified worst-practice policies, but, as FTG argues in the case of capacity limits,
“utilities do not have an inherent right to charge for electricity that customers could
otherwise generate more efficiently and more cleanly on their own.”202 Capacity
limits restrict the expansion of distributed generation, curtailing the market for PV
systems. Utility priorities can conflict with the priority of broader RE deployment.
Yet, the priorities of utilities and increased RE development are not necessarily
incompatible.
Due to their large consumer base and infrastructure, utility cooperation is
essential for the expansion of PV and the improvement of its cost-competitiveness.
Since utilities have been the prime-mover in electricity, they dictate much of the
terms of their relationship with consumers.203 However, advancements in consumer
choice for electricity are challenging the conventional of the interaction between
utilities and their consumers. Both sides can now win or lose as consumer choice
provokes a reformation of the supply and demand relationship in electricity. The
objective in modern electricity policymaking should be to foster behavior so that both
202Vote Solar, “Freeing the Grid,” 11. 203Refer to Chapter Two on Natural Monopolies.
92
sides benefit more than they lose. A growing body of research indicates how when
neither utilities nor customers are prepared for the transition to consumer activism in
utilities and consumers behavior is suboptimal. As the American Enterprise Institute’s
Peter Honebein et al. show, “when neither utilities nor customers are prepared for the
transition to customer choice, customers reject the utility's plans and advice, and
exercise their freedom to make decisions, often seen as ill-informed and even bad.”204
Consumer behavior research suggests that for the great majority of consumers, taking
advantage of best policy mechanisms, such as reacting to TOU rates without the help
of an outside party like a utility is too much of a bother.205 Utilities, on the other hand,
obstruct PV-supportive measures because they are fearful of decreases in their
revenue streams, which are predicated on volumetric kWh consumption.
IV. Automation and Optimizing Net Metering
Solutions offered by automation processes allow for incorporation of best
practice net metering policies. Typically, net metering is accomplished through the
use of a single, two-way (bi-directional) meter. These electric meters have never been
expected to do more than accurately record the flow of electricity, and in some cases
measure the customer’s demand requirements. Advancements in metering
technology, specifically, “smart meters” enable the integration of several of the best
practice net metering policies outlined above. The intelligence attributed to smart
204Peter C. Honebein, Roy F. Cammarano, and Craig Boice, "From Authority to Trusted Advisor: The Utility's Changing Role," The Electricity Journal 25 (December 2012): p. 50, accessed February 21, 2013, http://www.sciencedirect.com/science/article/pii/S1040619012002722. 205Editors, “California's Tiered Rates Turn Off Heavy Users, Literally,” The Electricity Journal, Vol 25, (August 2012), 10. Accessed 2/21/13: http://www.sciencedirect.com/science/article/pii/S1040619012002126
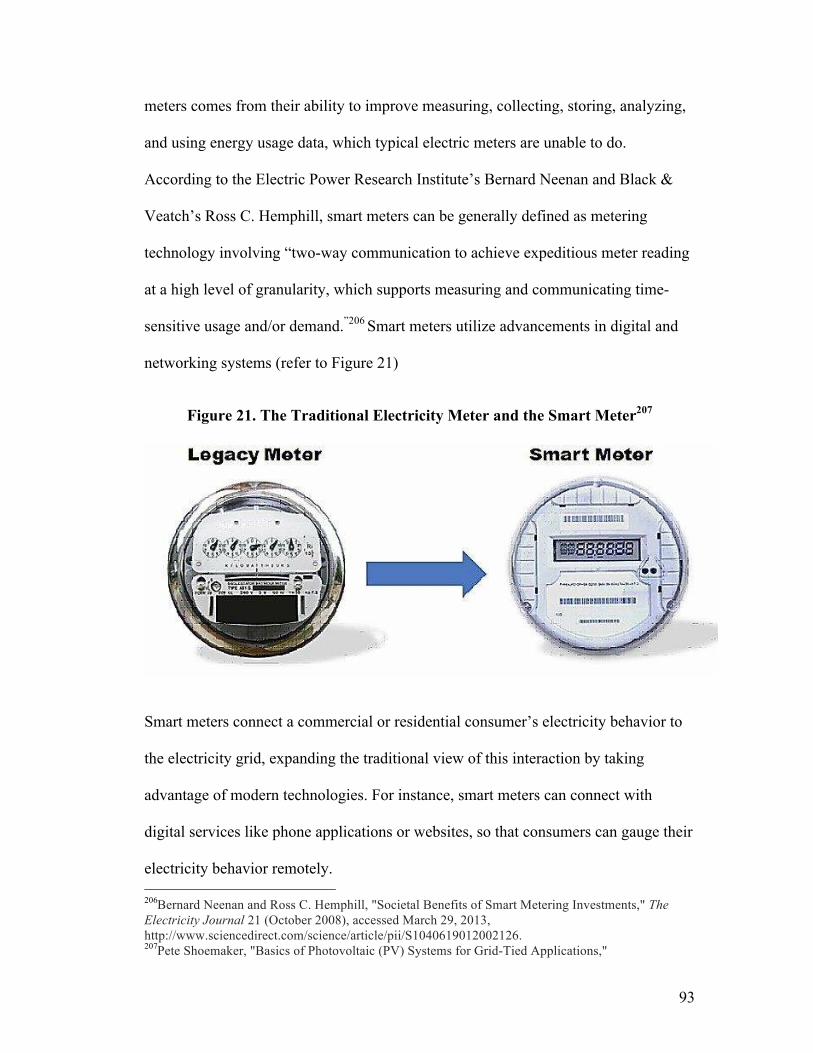
93
meters comes from their ability to improve measuring, collecting, storing, analyzing,
and using energy usage data, which typical electric meters are unable to do.
According to the Electric Power Research Institute’s Bernard Neenan and Black &
Veatch’s Ross C. Hemphill, smart meters can be generally defined as metering
technology involving “two-way communication to achieve expeditious meter reading
at a high level of granularity, which supports measuring and communicating time-
sensitive usage and/or demand.”206 Smart meters utilize advancements in digital and
networking systems (refer to Figure 21)
Figure 21. The Traditional Electricity Meter and the Smart Meter207
Smart meters connect a commercial or residential consumer’s electricity behavior to
the electricity grid, expanding the traditional view of this interaction by taking
advantage of modern technologies. For instance, smart meters can connect with
digital services like phone applications or websites, so that consumers can gauge their
electricity behavior remotely. 206Bernard Neenan and Ross C. Hemphill, "Societal Benefits of Smart Metering Investments," The Electricity Journal 21 (October 2008), accessed March 29, 2013, http://www.sciencedirect.com/science/article/pii/S1040619012002126. 207Pete Shoemaker, "Basics of Photovoltaic (PV) Systems for Grid-Tied Applications,"

94
Utilizing modern communication and digital systems, smart meters offer
benefits to utilities and their consumers. Firstly, smart meters provide operational
savings for utilities that are measurable in reduced labor and transportation expenses,
which are associated with the conventional practice of on-premise meter reading.
Relevantly to PV, one of the biggest and costliest problems that arises for utilities
with the increase in PV installations is the associated billing system. In a report issued
by the Solar Electric Power Association and Interstate Renewable Energy Council,
most of the utilities polled stated that their billing systems were unable to easily
accommodate net-metered systems.208 Smart metering facilitates the necessary
adjustments that are required to ensure proper documentation of electricity
consumption and contributions, by automatically providing this information through
digital systems. Another source of operational savings for utilities involve capital cost
savings, which are, as Neenan and Hemphill explain, “associated with reduced levels
of, or longer lifetimes for, the equipment and materials required to operate and
maintain the electric delivery system.”209 For instance, by transmitting excess PV
kWhs to a neighboring consumer, the ware and tear on wiring infrastructure is less
than that of long-distance transmission. Additionally, the efficiency of the electricity
delivery system, which is also improved by automated data because it is able to more
accurately gauge supply and demand, benefits from this technological advancement.
This enhances the benefits of PV’s peak electricity contributions because smart
meters can more efficiently and cost-effectively facilitate the delivery of renewable
208Steven Letendre and Mike Taylor, Interstate Renewable Energy Council RSS, technical paper no. SEPA REPORT # 01-08, March 2008, accessed April 01, 2013, http://www.irecusa.org/2008/03/new-report-on-grid-connected-pv-metering-interconnection-practices/. 209Neenan and Hemphill, "Societal Benefits of Smart Metering Investments," 33.

95
electricity to meet neighboring demands.
Secondly, smart meters enable many of the demand-side benefits of best
practice net metering.210 The information processing systems involved in smart
metering allow for TOU rates. Unlike traditional meters, smart meters produce and
engage with the data that is necessary for TOU pricing such as the time of, amount of,
and closest demand for electricity consumption/production. Without this relevant
information and communication, TOU would not be possible. Smart meters,
therefore, allow for the ideal valuation of net metering credits, providing the highest
retail credits for excess PV kWhs through TOU rates. These benefits extend to non-
participating consumers who are not significantly impacted by contributions of
distributed electricity to the grid, as shown in the above comparison of the CPUC and
Beach and McGuire reports. Non-participating ratepayers can also take advantage of
the other non-distributed generation related benefits of smart meters that are not
directly related to distributed generation, such as a cell-phone application that turns
off the heater of ones pool when they are away from home.211
Lastly, smart meters solve an information market inefficiency associated with
net metering. Conventionally, a PV system’s net metering credit offsets electricity
consumption at a single meter. This works fine in most cases, but does not efficiently
distribute the benefits associated with net metering in cases like a shopping mall
owner who wants to reduce electricity costs for tenants. Smart meters create the
210There are a variety of consumer-benefits to transitioning from traditional electricity meters to smart meters, but for the purposes of this paper the scope will be limited to smart meters relation to net metering. 211Steven Castle, "GE Touts the IPhone-Connected Hybrid Water Heater," Green Tech Advocates, October 25, 2012, accessed April 10, 2013, http://greentechadvocates.com/2012/10/25/ge-touts-the-iphone-connected-hybrid-water-heater/.

96
opportunity for virtual net metering, which, according to Connecticut’s recently
passed Public Act 11-80, An Act Concerning the Establishment of the Department of
Energy and Environmental Protection and Planning for Connecticut's Energy Future,
“‘Virtual net metering’ means the process of combining the electric meter readings
and billings, including any virtual net metering credits, for a customer host and a
beneficial account through an electric distribution company billing process related
solely to the generation service charges on such billings.”212 Virtual net metering
allows the hypothetical mall owner to assign net metering credits from a single
account to their tenants, who are not physically connected to the distributed generator.
The unrestricted attribution of net metering credits also enables community initiatives
promoting PV. For instance, in Colorado, the forthcoming Solar Rewards Community
program will allow individuals to build PV systems and then market the output to
other consumers, who will receive the net metering benefits on a subscription basis.213
Thus, integrating modern systems and innovations into the traditional
electricity model enables a variety of benefits to electricity players. PV system
owners benefit from smart meters as they enable TOU rates and can facilitate
advancements in utilizing renewable electricity across all areas of their consumption;
the application that turns off the pool can also adjust one’s thermostat to their liking,
not their kid’s or spouse’s preferences.214 At the most basic level, non-participating
members in net metering are not financially affected by the transition from traditional 212United States, Connecticut Senate and House of Representatives in General Assembly, Public Act No. 11-80, accessed March 29, 2013, http://www.cga.ct.gov/2011/act/pa/2011PA-00080-R00SB-01243-PA.htm. 213"Xcel Community Solar: Community Solar, Solar Farms, Solar Gardens, Community-based Renewable Energy," Xcel Community Solar: Community Solar, Solar Farms, Solar Gardens, Community-based Renewable Energy, section goes here, accessed March 30, 2013, http://www.coloradocommunitysolar.com/. 214Castle, "GE Touts the IPhone-Connected Hybrid Water Heater.”

97
or tiered rates to TOU. They can take advantage of smart metering to more efficiently
and effectively consume electricity, while also profit from investments in community
PV programs that would not be possible without smart meters.
V. Conclusion
Accounting for the unique fact that during periods of peak sunlight PV
systems tend to produce more electricity than the system owner consumes, net
metering is an essential policy for robust PV markets. Without net metering, excess
PV electricity would be valued, at best, in terms of the wholesale rate, which is
typically about one-third of the retail residential rate,215 limiting the financial
benefits a system owner would receive. Nonetheless, it requires best practices to
foster optimal market development. Best practices promote PV deployment and
support the substitution away from conventional, GHG emitting electricity
generation. Less desirable practices, however, stifle the adoption of PV and other
distributed generation systems. As shown above, PV system capacity limitations
inhibit potential customers from adopting systems that are best suited to their
consumption needs. Loosening or removing capacity limits, on the other hand,
matches the stated intentions of net metering as a policy that “stimulates the
economic growth of this state, encourages energy independence and security, and
enhances the continued diversification of this state’s energy resources.” 216
Similarly, credit rollovers are crucial to the efficacy of net-metering’s effects on PV
market growth, by ensuring that net metered customers receive the full retail 215Duke et al., "Accelerating residential PV expansion: demand analysis.” 216State Affairs Committee, "Senate Bill No. 1368," Legislature of the State of Idaho. Accessed 3/10/13: http://legislature.idaho.gov/legislation/2002/S1368.html
98
benefits of their excess electricity contributions to the grid. The pricing mechanism
used in crediting the rollover, however, is crucial to net metering’s impact on the
electricity bills of participating and non-participating members.
Now that the technology for real time pricing is being implemented
throughout the nation, (it has been estimated that approximately 50 percent of all
U.S. households will have smart meters by 205,217) smart meters should be
incorporated into net metering program. Specifically, smart meters ought to be
utilized to optimize net metering’s objectives, by facilitating the incorporation and
operation of best practices. TOU rates maximize the economic benefits inherent in
the correlation between PV’s peak output and peak electricity demand. PV system
owners rightfully receive higher credits for their excess output because the
transmission and creation of electricity is most expensive at times of peak demand,
which coincides with peak PV output. Founded upon fixed cost recovery models,218
traditional retail pricing systems founded on fixed rates fail to account for both
geographic and temporal variations in the value of electricity produced and
consumed. Smart meter’s communication systems limit the costs of peak demand
by digitally communicating with the grid to meet the electricity demands of the
nearest consumers, reducing the inefficiencies that are symptomatic to electricity
grids like electricity transmission loses. 219 While non-participating ratepayers
benefit from smart meters because of the improvement in transmission processes,
217Institute for Electric Efficiency, “Utility Scale Smart Meter Deployments, Plans, & Proposals,” (September, 2010) Accessed 03/29/13: http://www.edisonfoundation.net/iee/Documents/IEE_SmartMeterRollouts_0512.pdf 218Kahn, The Economics of Regulation, Ch. 1. 219According to Duke et al., "Accelerating residential PV expansion: demand analysis,” the transmission and distribution efficiency for residential customers is estimated to be 93% during off-peak periods and 85% during peaking periods.
99
electricity companies benefit from reduced labor and transportation costs that were
apart of the traditional practice of on-premise meter reading. Utilities have
exhibited resistant behavior to net metering, justifying their opposition by citing
increased cost to non-participating electricity consumers.220 However, as has been
shown, smart meters facilitate best practices like TOU rates, which have the
potential of benefiting all ratepayers.
Additionally, smart meters correct informational market failures in electricity
markets. Along with alerting consumers to price fluctuations, smart meters provoke
fundamental considerations within electricity consumers as to their consumption
habits and the dynamics underlying their monthly electricity bill. With the capacity
to provide modern conveniences like cell phone alerts, smart meters inform
consumptions habits in ways that were not possible with traditional meters. This
information has the capability of remedying market informational failures as to
PV’s viability and profitability. Smart meters provide consumption and pricing
facts that can potentially provoke consumers to consider how a PV system would
factor into their monthly electricity bill. With a better understanding of the financial
repercussions of their electricity behavior, consumers may want to play a more
active role and look into investments in distributed solutions.
Smart metering has the potential to resolve a number of market inefficiencies
that inhibit PV cost competitiveness and market development, but utility
cooperation is a necessary condition for the successful realization of these benefits.
Specifically, utility support is necessary in the installation and utilization of the
220Generally speaking, the impact of distributed generation to utility revenue streams is beyond the scope of this paper. Some related topics will be addressed in the next chapter and conclusion.

100
technology. On the most basic level, utilities must agree to the installation of smart
meters. Replacing conventional meters would, of course, be an expense, but in the
long run, the marginal benefits the utility receives are greater than the marginal
costs of the smart meter. Many utilities have come to recognize the benefits of
installing smart meters, as evinced by the Institute of Energy Efficiency’s finding
that as of May 2012 36 million smart meters have been installed and that
approximately 65 million smart meters will be deployed by 2015.221
What has yet to widely occur is utility participation in extending the benefits of
smart meters to their consumers. In a recent survey by the Smart Grid Collaborative
of at least 1,000 consumers throughout the U.S., reflecting American
demographics, 54% of the consumers who are heads of households have never
heard of “smart” metering and related technologies.222 Considering that utilities
began their programs of rolling out new, digital, “smart” systems in 2010 and
several are nearing completion, this study suggests the obstacles in customer’s
taking advantage of modern opportunities. “There continues to be a real need for
consumer education around smart grid,” said Patty Durand, Executive Director of
the Smart Grid Consumer Collaborate. “The current low levels of public awareness
on this issue represent both a challenge and an opportunity, but they must be acted
upon.”223 Either through educational programs or through integrating automated
systems, which take care of metering and informational responses that the
221Institute for Electric Efficiency, “Utility Scale Smart Meter Deployments, Plans, & Proposals.” 222 Market Strategies International, "New Research: Consumer Pulse Wave 3," Smart Grid Consumer Collaborative, September 05, 2012, accessed April 01, 2013, http://smartgridcc.org/news-events/new-research-consumer-pulse-wave-3. 223Patty Durand inJim Pierobon, "If Half of U.S. Consumers Don't Know What a 'smart Meter' Is, How Are They Supposed to Engage?," The Energy Collective, October 30, 2012, accessed April 12, 2013, http://theenergycollective.com/jimpierobon/137011/if-half-us-consumers-don-t-know-what-smart-meter-how-are-they-supposed-engage.
101
consumer may find too onerous, utility cooperation is essential for consumers to
take advantage of smart meters.
By having a smart meter, a commercial or residential consumer can better
understand the variety of options that are ushering in the fundamental shift away
from the one-way power system of the 20th century. The growth of distributed
generation demands significant changes in the interaction between electricity
producers and consumers. 21st century consumer options require institutional and
regulatory changes to the 20th century’s one-way power system that exists in most
of the United States. As has been argued above, best-practice net metering policies
enable PV system owners to enjoy the greatest benefits from their investment. All
ratepayers can enjoy the potential to benefit from the institution of mechanisms and
policies that foster collaboration rather than collision. Utilities have shown
themselves generally resistant to these changes, while consumers have yet to
proactively take advantage of new opportunities at their disposal. If states are truly
devoted to the statutory objectives of net metering, they must take heed to the fact
that best practice net metering parameters augment PV market development and
cost competitiveness.

102
Chapter Four
Navigating the Booms and Busts of Deliberate Solar Promotion
I. Background
Among the available options for promoting the deployment of renewable
energy (RE), renewables portfolio standards (RPS) have emerged as among the most
popular since the late 1990s. The concept of a RPS dates back to 1983, when the first
RPS was enacted in Iowa’s Alternative Energy Production law.224 Thirty years later,
twenty-nine states in total and the District of Columbia have established an RPS. An
additional eight states have adopted non-mandatory renewable energy goals. As
shown in (Chapter 1), the last decade witnessed widespread adoption of RPS by state
government. By design, a state’s RPS requires utilities and other load-serving entities
224For the sake of historical context and details, now-outdated peer-reviewed studies were reviewed for this analysis: Richard Norgaard and Nancy Rader, “Efficiency and Sustainability in Restructured Electricity Markets: The Renewables Portfolio Standard,” Electricity Journal, Vol. 9, No. 6 (July, 1996); Brent Haddad and Paul Jefferiss, “Forging Consensus on National Renewables Policy: The Renewables Portfolio Standard and the National Public Benefits Trust Fund,” Electricity Journal, Vol. 12, No. 2 (March, 1999).
Précis: In order to deliberately promote the usage of renewable energy (RE), states have widely adopted renewable portfolio standards (RPS). Following the same structure of the analysis in Chapter Three, Chapter Four assesses the renewable portfolio standard’s basic structure, how the differences in parameters across states reveals best and less desirable practices, and concludes with a proposal of best practice solutions to optimize the policy’s intentions of increasing RE deployment. The comparative experiences described herein illustrate the challenges and opportunities of adopting an RPS to encourage solar photovoltaic usage (PV) cost competitiveness and market development. It concludes with a proposal on the institution of state “green banks.”
Précis: In order to deliberately promote the usage of renewable energy (RE), states have widely adopted renewable portfolio standards (RPS). Following a similar structure as Chapter Three, Chapter Four assesses the renewable portfolio standard’s basic structure, how the differences in parameters across states reveal best and less desirable practices, and concludes with a proposal of best practice solutions to optimize the policy’s intentions of increasing RE deployment. The comparative experiences described herein illustrate the challenges and opportunities of adopting an RPS to encourage solar photovoltaic usage (PV) cost competitiveness and market development. It concludes with a proposal on the institution of state “green banks.”

103
to sell, generate, or purchase a certain percentage of their portfolios as RE. These
states were compelled to enact RPSs because they anticipated “significant economic
development benefits from promoting renewables, particularly given the promise of
developing home-grown energy sources that could lead to instate job creation,” Barry
Rabe explains.225 Yet, whether or not this anticipation has been affirmed by RE
market development and states reception of the ensuing economic benefits, is not
clear-cut. State experiences in supporting RE, specifically PV, with RPS programs are
mixed. The comparative experiences detailed in this Chapter highlight the
opportunities and challenges for fostering PV market development and cost
competitiveness with RPS.
Without federal leadership or mandates,226 states have crafted their own RE
strategy that are oriented around RPS programs. In fact, the leadership role that states
have taken on RE has led some scholars like Kevin Doran, fellow at the Energy and
Environmental Security Initiative, to declare that RPSs are the “epitom[e] . . . of state
action in the absence of strong federal support for renewable energy.”227 Across this
regulatory landscape, RPS policies demonstrate significant variance on issues such as
the very definition of eligible renewable electricity sources, treatment of electricity
generated within and beyond state boundaries, and the levels of renewables required
225Barry Rabe, "Race to the Top: The Expanding Role of U.S. State Renewable Portfolio Standards," Center for Climate and Energy Solutions, June 2006, accessed February 11, 2013, http://www.c2es.org/publications/race-top-expanding-role-us-state-renewable-portfolio-standards. 226As has been said, federal political gridlock on climate change and RE has meant that policies promoting RE have primarily emerged from the so-called laboratory of the states. Yet, the U.S. House of Representatives and Senate have, at different times, each passed versions of a Federal RPS; a Federal RPS, however, has not yet been signed into law. The popularity of mandatory state RPS policies has grown in recent years. 227Kevin L. Doran, "Can the U.S. Achieve a Sustainable Energy Economy from the Bottom-Up?: An Assessment of State Sustainable Energy Initiatives," Vermont Journal of Environmental Law 7 (2005-2006), p. 95, 107.

104
over time. As is the case with net metering, the general structure of the policy is the
same across different states. Yet, due to states’ individual policy objectives, political
contexts and constituencies, states have structured the specifics of their RPSs
differently.
To put it simply, RPS is a RE market promotional policy tool. Placing
emphasis on supply rather than on demand, RPS intends to promote RE market
development by requiring its usage. For example, a state could require utilities to
increase their renewable generation by 2% each year for the next ten years, resulting
in 20% renewable power in that state. “Although RPS has been described in policy
circles as a “market-friendly” approach to achieving renewable energy targets
because it does not mandate a specific allocation of government money,” explains
U.C.L.A.’s Magali Delmas and Maria J. Montes-Sancho. “RPS in fact resembles a
command and control policy where the regulator requires the producer to adopt a
specific technology.”228 In other words, RPS bares similarities to some climate
change policies,229 but the measure focuses on the use of clean technology rather than
directly addressing greenhouse gas (GHG) emissions. RPS indirectly mitigates
climate change by deliberately mandating the substitution of GHG emitting
conventional fuels for renewables.
A major concern regarding RPS is whether they can offer adequate support to
a wide range of RE, or whether, alternatively, RPS programs will favor a small
228Magali A. Delmas and Maria J. Montes-Sancho, "U.S. State Policies for Renewable Energy: Context and Effectiveness," Energy Policy 39, no. 5 (May 2011).2276 229Command and control policies refer to environmental policies that rely on regulatory mechanisms that serve to prohibit or set standards for enforcement as opposed to financial incentives.

105
number of the least-cost forms of RE. 230 For instance, wind power represented 94%
of all RPS-driven RE capacity additions in the U.S. from 1998-2009.231 California
State University’s Robert J. Michaels argues that RPSs are “best viewed as special
interest legislation for wind-driven generators, rather than rational responses to
climate change and fossil-fuel powerplant emissions.”232 Menz and Vachon (2006)
affirmed Michael’s statement on the positive impact RPS had on wind capacity.233
Similarly, Yin and Powers (2010) and Shrimali et al., (2012) conclude that RPSs have
a positive effect on renewable development.234 On the other hand, Carley (2009)
argues that RPS was not significant in affecting state RE policy;235 Delmas et al.
(2007) also refuted RPS’s impact in renewable generation.236 None of these studies,
however, focused on RPS’s specific effect on PV. Since the above studies were
primarily empirical or econometric analyses, the analysis provided here adds another,
more qualitative and historical perspective to RPS literature. This Chapter focuses on
230For more information on such concerns: Alan Nogee, Jeff Deyette, Steve Clemmer, "The Projected Impacts of a National Renewable Portfolio Standard," The Electricity Journal, Vol. 20, No. 4 (May, 2007) 231Statistic from Ryan Wiser, Galen Barbose, and Edward Holt, “Supporting Solar Power in Renewables Portfolio Standards: Experience from the United States,” Prepared for Lawrence Berkeley National Laboratory, October 2010), p. 16. Accesible url: http://eetd.lbl.gov/ea/ems/reports/lbnl-3984e.pdf 232Robert J. Michaels, "Intermittent Currents: The Failure of Renewable Electricity Requirements," (October, 2007). Accessed 4/01/13: http://papers.ssrn.com/sol3/papers.cfm?abstract_id=1026318 233Fredric C. Menz and Stephan Vachon, "The effectiveness of different policy regimes for promoting wind power: Experiences from the states," Energy Policy, Vol. 34, No. 14 (September, 2006). Accessed 02/08/13: http://ideas.repec.org/a/eee/enepol/v34y2006i14p1786-1796.html 234Haitao Yin and Nicholas Powers, "Do state renewable portfolio standards promote in-state renewable generation?" Energy Policy, Vol. 38, No. 2 (February, 2010), 1140-1149; Gireesh Shrimali, Steffen Jenner, Felix Groba, Gabe Chan, Joe Indvik, "Have State Renewable Portfolio Standards Really Worked?Synthesizing past policy assessments to build an integrated econometric analysis ofRPS effectiveness in the U.S.," USAEE Working Paper No. 12-099, (October, 2012). Accessed 3/29/13: http://papers.ssrn.com/sol3/papers.cfm?abstract_id=2166815 235Sanya Carley, "State renewable energy electricity policies: An empirical evaluation of effectiveness," Energy Policy, Vol. 37, No. 8 (August 2009). 236Magali Delmas, Michael V. Russo, Maria J. Montes-Sancho, "Deregulation and environmental differentiation in the electric utility industry," Strategic Management Journal, Vol. 28, No. 2 (February, 2007).

106
deliberate PV promotion in certain RPS programs. The technical literature that is
cited, particularly Bird et al. (2011) and Wiser et al. (2010),237 which were conducted
for National Laboratories on the role of RPS in PV promotion, provide background
on PV-related policies for my analyses and conclusions on best practices. More
specifically, Hart (2008) provides crucial historical context and analysis on direct PV
promotion, but unlike this Chapter, the study does not offer prescriptions to the
problems identified in New Jersey.238
The Design of Deliberate PV Promotion Through RPS
PV has historically tended to be less economically attractive than wind in
most regions of the U.S. Therefore, until PV’s recent price developments, which were
described in Chapter One, it generally was not selected through the RPS procurement
process.239 In response to concerns over pricing and to encourage a wider diversity of
RE technologies, a growing number of states incorporated solar carve-outs into their
RPS policies. These carve-outs are shown in Figure 22.
Figure 22. RPS Policies with Solar and Distributed Generation Requirements240
237Edward Holt, Ryan Wiser, and Galen Barbose, "Supporting Solar Power in Renewable Portfolio Standards: Experience from the United States," NREL/TP-6A20-52868, October 2010. Accessed 3/03/13: http://eetd.lbl.gov/ea/ems/reports/lbnl-3984e.pdf; Lori Bird, Jenny Heeter, and Claire Kreycik, "Solar Renewable Energy Certificate (SREC) Markets: Status and Trends," NREL/TP-6A20-52868, November 2011. 238David M. Hart, "Making, breaking, and (partially) remaking markets: State regulation and photovoltaic electricity in New Jersey," Energy Policy, Vol. 38, (November 2010), 6664. 239Wiser et al., “Supporting Solar Power in Renewables Portfolio Standards: Experience from the United States.” 240"Solar Carve-Outs in Renewables Portfolio Standards," DSIRE Solar Portal, accessed April 08, 2013, http://www.dsireusa.org/solar/solarpolicyguide/?id=21.

107
Solar carve-outs stipulate that a portion of the overall retail sales or mandated
renewable energy percentage must be derived from solar sources.241 As the map
indicates, Arizona, Maryland, the District of Columbia, Delaware, Arizona and New
Mexico have all set aggressive standards of 2% or greater of the state’s electricity
generation be from solar PV. 11 other states have adopted their own less-ambitious
solar carve-outs and/or distributed generation provisions.242
In order to ensure their mandated percentage of total annual production or
sales of RE, obligated entities must obtain renewable energy certificates or credits
(RECs). A REC is created for every megawatt hour (MWh) of renewable energy, 241For the sake of simplicity, the term “solar” will be referred to throughout this chapter. This is because, along with PV, CSP and other variants on solar systems are eligible in solar carve-outs. Yet, due to its market prominence, PV is generally the dominant solar resource in cases when carve-outs do not specifically call for PV, not solar. 242Multipliers, which multiply the value received for renewable energy production, are also in place in five states to induce solar deployment. (For the sake of brevity and in recognition of the suggestion that state policymakers find the advantages of carve-outs to be greater than those of multipliers, as shown by the greater popularity of carve-outs, this chapter will limit its analysis to carve-outs.)

108
serving as proof that the MWh has been generated by RE sources. By surrendering
RECs, obligated entities demonstrate compliance with RPS requirements (refer to
Figure 23).
Figure 23. The General Schema of RPS243
The obligated entity is allowed to independently decide whether or not they want to
invest in RE generation to create their own RECs, purchase RECs from others, or pay
a penalty. Alternative compliance payments represent the penalty in dollars that an
electricity supplier has to pay for each MWh of RE that its portfolio fails to satisfy for
the mandated RPS quota.244 Alternative compliance payments set a ceiling on REC
prices, as obligated entities will not pay more than the penalty to acquire RECs for
compliance.
An RPS’ success is dictated by the enforcement of REC retiring or alternative
243Hart, "Making, breaking, and (partially) remaking markets: State regulation and photovoltaic electricity in New Jersey," 6664. 244Bird et al., "Solar Renewable Energy Certificate (SREC) Markets: Status and Trends," 8-9.

109
compliance payments. Often the political gains of ratifying an RPS are sufficient for
policymakers, who do not ultimately ensure the policy’s success by enforcing its
requirements. RPSs are politically easy to implement because it is not difficult “to
specify legislatively and the cost of compliance might be more easily concealed in
utility bills than an outright tax on conventional power or subsidy to renewables,”245
Michaels explains. Yet, “having enacted seemingly stringent new standards,
legislators may have little to gain politically by vigorously enforcing them.”246
Alternative compliance payments (ACP) are a crucial component to enforcement, but
some states have not instituted non-compliance penalties to ensure the fulfillment of
RE generation requirements. North Carolina, for instance, has no specific penalty or
mechanism for enforcing alternative compliance, leaving it up to the North Carolina
Public Utilities Commission to enforce compliance.247 In states without ACPs or
mechanisms for enforcing ACPs, conventionally-minded utilities have a greater
capability of eschewing compliance, by influencing legislators to not follow RPS
ratification with enforcement.248
In contrast, potential developers are less interested in taking part in state RPSs
when the RECs are not owned by the generating facility. A common stipulation in
state RE grant programs is that the utility purchasing RE generation owns the
resulting RECs. For example, California’s RPS requires that utilities receive the
245R. J. Michaels, “National Renewable Portfolio Standard: Smart policy or misguided gesture?” Energy Law Journal, Vol. 29, No. 79 (April 2008), 86. 246Ibid, 106. 247Bird et al., "Solar Renewable Energy Certificate (SREC) Markets: Status and Trends," 9. 248 Ryan Wiser and Galen Barbose, State of the States: Update on the Implementation of U.S. Renewables Portfolio Standards, 2011 National Summit on RPS (Washington, DC, Oct. 26, 2011), 23.
110
RECs bundled with the electricity they purchase from a system.249 RECs only serve
as financial incentives when they are unbundled and sold separately from electricity.
“The presence of renewable energy certificate (REC) unbundling has a statistically
significant and positive impact,” argue Shrimali et al. in a recent econometric analysis
of RPS for the United States Association for Energy Economics. “In fact, this impact
is about 2 to 3% – in states with REC unbundling there is 2 to 3% higher renewable
share than in states with bundled REC trading, everything else held constant.”250
Applied to solar renewable energy credits (SRECs), owners of PV systems often sell
their SRECs on the open market to obligated entities that have not made investments
to meeting their solar carve-out obligations. In markets with solar carve-outs, SRECs
offer additional financial incentive to install PV by providing streams of credit that
contribute to PV’s cost competitiveness. PV developers have responded to these
benefits, as evinced by SREC program’s accounting for nearly 25 percent of the PV
capacity installed in 2012.251
Assessing SREC Markets through the Experience of the Garden State
Given the SREC market structure, where the year-over-year demand is
incrementally fixed, the supply of SRECs in the marketplace significantly impacts
price. This SREC supply dynamic is volatile, as it can fundamentally change in a
matter of months due to (for instance) the rapid expansion in PV capacity within a
249"Renewable Energy Credits," Last Modified: 2/1/2012, http://www.cpuc.ca.gov/PUC/energy/Renewables/FAQs/05REcertificates.htm 250Shrimali et al., , "Have State Renewable Portfolio Standards Really Worked?”), p. 18. 251Staff, "SRECTrade and GTM Research Launch Report Series on US SREC Market Dynamics," Greentech Media, September 21, 2012. Accessed 3/29/13: http://www.greentechmedia.com/articles/read/SRECTrade-and-GTM-Research-Launch-Report-Series-on-U.S.-SREC-Market-Dynamic

111
state. Such developments create an oversupply and reduce the price that obligated
entities are willing to pay for SRECs. As a result, Ben Higgins explains, “this market
volatility can make prospective solar customers, financiers, investors, and many
others nervous about the future of the solar market.”252 Thus, the market structures
that are implemented in some states to meet RPS requirements are susceptible to
instability.
The history of New Jersey’s PV market over the past decade demonstrates the
boom and bust cycle that can be spurred on by solar carve-outs. New Jersey currently
has the third largest installed PV capacity (close to 1 GW), following Arizona and
California, which are significantly larger and sunnier.253 The state has received a
variety of accolades for its RE supportive policies, such as the State Leadership in
Clean Energy Award, which honored its SREC program in 2009.254 Yet, as George
Mason University’s David M. Hart explains, “New Jersey’s pathway to this position
has been a crooked one, and it faces significant current and future challenges, awards
notwithstanding.”255 Beginning with the election of Governor Jim McGreevy in 2002,
New Jersey became the first state to rely heavily on RPS mechanisms to stimulate PV
deployment. It adopted an ambitious solar carve-out calling for 90 MW of PV system
capacity to be installed in New Jersey by New Year’s Day of 2009 (from about 2 MW
in 2004) and 1500 MW by 2020.256257 In 2005, the first year in which obligated
252Ben Higgins, "Bringing Solar to the Blogosphere," REC Solar Blog, July 24, 2012, accessed April 10, 2013, http://blog.recsolar.com/page/3/. 253GTM and SEIA, "U.S. Solar Market Insight Year-in-Review 2012," Accessed 4/3/13: http://www.seia.org/research-resources/us-solar-market-insight-2012-year-review 254"Solar Carve-Outs in Renewables Portfolio Standards," DSIRE 255Hart, "Making, breaking, and (partially) remaking markets: State regulation and photovoltaic electricity in New Jersey," 6663. 256Statement based off of Sherwood data.

112
entities had to comply to the carve-out, New Jersey ratified a renewable energy
budget devoted almost entirely to PV-related programs. Stimulated by the
implementation of these programs, the rate of solar installation and the ensuing SREC
production significantly outpaced the state’s requirements. The high use of solar
rebates quickly exhausted the budget set aside for PV.258 In 2007, New Jersey
restructured its RPS from a rebate-intensive program to greater-reliance on SREC
markets to encourage PV development. For the following years, New Jersey’s SREC
market remained perpetually oversupplied. The price of SRECs dropped from over
$600 to well under $200, due to the fact that the deployment of PV outpaced the
mandated solar carve-out.259
The uncertainty and instability resulting from the glut in New Jersey’s SREC
market wreaked havoc on its PV market. Development was constrained by customers,
financiers, and investors, who were rightfully nervous about the long-term viability of
the New Jersey SREC market. This experience has been shared by other state SREC
markets, which exhibit a similarly tenuous balance between supply and demand. Of
the states with solar carve-outs, those in the mid-Atlantic predominantly use SRECs
to ensure obligated entities meet their solar requirements. SRECs only play a
significant role in the following jurisdiction, which use SREC markets to accompany
their carve-outs: Pennsylvania (2005), Delaware (2007), Washington D.C. (2007),
Maryland (2008), Ohio (2009), North Carolina (2010), New Hampshire (2010), and 257Hart, "Making, breaking, and (partially) remaking markets: State regulation and photovoltaic electricity in New Jersey," 6665 258It has been calculated that the average cost of the rebate per watt over the program’s lifetime was about 50% of the cost ($3.88 in rebates for an average of $8 per watt): Summit Blue Consulting, “Assessment of the New Jersey Renewable Energy Market,” Vol. 1, (2008), 6. 259Hart, "Making, breaking, and (partially) remaking markets: State regulation and photovoltaic electricity in New Jersey," 6665

113
Massachusetts (2010). In the other states with solar carve-outs, SRECs are used to
track compliance but are not actively traded on a market.260 As shown in Figure 24’s
map, which demonstrates the mid-Atlantic’s particularly high concentration of solar
carve-outs, SREC markets exhibit an oversupply, where the average prices have
plummeted far below the price of ACPs, removing the stimulus for new investment.
Figure 24. Mid-Atlantic SREC Market Trends261
The SREC markets in which the SACP is several times that of the SREC are not well-
functioning. The plummeted price of SRECs relative to SACP penalties reflects the
supply-side glut that is particularly extreme in NJ, DE, OH, and PA. In these states,
obligated entities are able to meet their requirements by purchasing SRECs at a price
that is significantly cheaper than the penalty for not fulfilling obligations. These
260The use of SRECs in states without trading systems is beyond the scope of this paper. A coherent background description or analysis would require an in-depth understanding of energy and environmental law behind electricity restructuring. Articles used for basic understanding: Richard J. Pierce, Jr., “Completing the Process of Restructuring the Electricity Market,” Wake Forest Law Review, Vol. 40 (2005); Joseph P. Tomain, “Electricity Restructuring: A Case Study in Government Regulation,” Tulsa Law Journal, Vol. 33 (1998). 261Staff, "SRECTrade and GTM Research Launch Report Series on US SREC Market Dynamics," Greentech Media.

114
SRECs do not allure potential financiers or investors. Their low price, accompanying
instability and unpredictability detract from the attractiveness of potential systems or
projects. Under these circumstances, solar carve-outs fail to stimulate the transition
from conventional generation to RE generation.
Responding to the SREC over-supply, many of the relevant jurisdictions have
instituted policies to readjust and revise their solar carve-outs. In June 2012, the New
Jersey State Assembly and Senate passed legislation (S. 1925) to increase the state’s
SREC procurement requirements from previous levels262 in an effort to alleviate the
growth-stifling oversupply of SRECs. Figure 25 illustrates the changes in mandated
RPS growth curves.
Figure 25. NJ Solar Carve Out: PV Megawatt Obligations Prior vs. S. 1925263
In addition to ramping up the solar carve-out over the next few years, New Jersey
262New Jersey Legislation, “S.1925 Revises certain solar renewable energy programs and requirements; provides for aggregated net metering of electricity consumption related to properties owned by certain governmental bodies and school districts,” Accessed 4/3/13: http://www.njleg.state.nj.us/bills/BillView.asp?BillNumber=S1925. 263"NJ Governor Christie Signs Bill to Increase Solar Requirements « SRECTrade Blog," SRECTrade, July 23, 2012, accessed April 08, 2013, http://www.srectrade.com/blog/srec-markets/nj-governor-christie-signs-bill-to-increase-solar-requirements.

115
proposed lowering its ACP approximately 50% in order to bring penalty payments
closer to SREC values.264 These measures hope to increase the value given to SRECs
in the currently overly supplied market. Time will reveal the effectiveness of these,
but New Jersey’s past experience suggests that quantity mandates like SRECs are
susceptible to problematic cycles, interfering with the intentions of the policy. New
Jersey’s policy initiatives fueled market euphoria amongst businesses, which took
advantage of high initial subsidies to overcome cost barriers that were a product of
PV’s qualities at the time (panel price reductions had yet to occur). As a result, a large
influx of SRECs removed their ability to serve as a long-term financing stream due to
revenue uncertainty.
One could argue that the SREC market volatility is caused by developments
that this thesis supports like consumer enthusiasm towards PV and increased PV
deployment. In turn, it would be said that the oversupply is a testament to the system
working. If what this thesis advocates for is more PV capacity, then RPS policies
resembling New Jersey’s should be implemented, right? Such an argument is
interesting but overlooks the consequences of market euphoria. The New Jersey
SREC glut resembles the housing bubble, so, as DSIRE’s Justin Barns argues,
“seeing this as a good thing is akin to seeing the housing bubble as a good thing
because it increased home ownership.”265 SREC gluts diminish the effectiveness of
solar carve-outs. Market participants lose confidence in SRECs as stable streams of
capital, limiting the attractiveness of investments in PV. SREC instability hurt the
264Ibid. 265DSIRE’s Justin Barnes, "Why Tradable SRECs Are Ruining Distributed Solar," Greentech Media, September 24, 2012, accessed April 12, 2013, http://www.greentechmedia.com/articles/read/guest-post-why-tradable-srecs-are-ruining-distributed-solar.
116
residential PV sector more than the commercial or utility sector. Since PV system
pricing is dictated by scale, (with the weighted price for U.S. systems $5.04/W in the
residential market, $4.27/W in the non-residential market, and $2.27/W in the utility
market by the end of 2012,266) the revenues from SRECs are more influential to the
cost-competitiveness and financial attractiveness of residential systems.
Pennsylvania most harshly exhibits the detrimental effects of SREC gluts on
PV market development. Pennsylvania’s residential market was the only major state
in the United States with decreasing growth rates in 2012, falling from 17 MW of
additions in 2011 to 7 MW in 2012.267 Adopted in 2004, Pennsylvania’s RPS
consisted of a 0.5 percent carve-out for solar. Yet, as Eastern US Operations Manager
for Conenergy’s SunTechnics Energy Systems,268 Gary Sheehan, explained, the solar
carve-out “created a glut in the market, so Pennsylvania now is experiencing very low
demand.”269 The solar carve-out was too small to match the increase in PV
installations from consumer enthusiasm and could also be met by SRECs from
anywhere on its thirteen-state transmission system.270 Pennsylvania’s SREC market
remains the only one that unrestrictedly allows for the procurement of out-of-state
credits to meet in-state requirements. Counterpart SREC markets like Ohio allow a
portion (50%) of the credits to come from out of state, while New Jersey limits the 266"U.S. Solar Market Grows 76% in 2012; Now an Increasingly-Competitive Energy Source for Millions of Americans Today," SEIA, March 13, 2013, accessed April 12, 2013, http://www.seia.org/news/us-solar-market-grows-76-2012-now-increasingly-competitive-energy-source-millions-americans. 267Ibid. 268According to its official website, “Conergy and its brands SunTechnics and Epuron have supplied, developed or constructed more solar energy projects than any other company on the planet.” ("An Investment in the Future, with Benefits Today Solar Energy," SunTechnics Energy Systems, accessed March 03, 2013, http://www.suntechnicsusa.com/us/about_us.html.) 269Interview with Gary Sheehan February 22, 2012. 270Staff, "SRECTrade and GTM Research Launch Report Series on US SREC Market Dynamics," Greentech Media.

117
eligibility of SRECs to in-state projects. The Constitutionality of these restrictive
policies in relation to the Commerce Clause, particularly whether or not a state's
jurisdiction over its natural resources extends to solar, 271 is beyond the scope of this
analysis. Yet, Constitutionally sensitive solutions have been offered to solve
Pennsylvania’s PV market contraction. Prominent figures within the state’s PV
market like Sheehan and PennEnvironment Executive Director David Masur have
called for restricting obligated entities’ access of SRECs. “The fix is really easy,”
Masur argues. “Close the out-of-state production loophole, which would clamp down
on the supply side. And ramp up the timeline to get to the 0.5 percent, which would
give a little jolt on the demand side.”272 Regardless of the constitutionality of this
alteration, it does not introduce best-practice changes to stabilize the SREC market or
optimally induce PV deployment.
In sum, SREC markets can add a risk factor to PV, which is a technology with
a history defined by volatility. In fact, unstable SREC markets validate capital market
barriers. Solar carve-outs can affirm the skepticism that persists amongst financiers
due to the revenue uncertainty of a PV project. The attractiveness of an investment, in
terms cost-competitive calculations, cannot be reliably determined with unstable
SREC prices. The fundamental flaw of solar carve-outs, and REC markets more
generally, is that they cannot adequately incentivize RPS compliance without over
incentivizing development. When the rate of PV deployment outpaces a solar carve- 271Given that electricity is a commodity that flows uncontrollably across state lines, the Commerce Clause of the U.S. Constitution is relevant to states’ restricting REC obligations to in-state sources. For further information: Nathan E. Endrud, “State Renewable Portfolio Standards: Their Continued Validity and Relevance in Light of the Dormant Commerce Clause, the Supremacy Clause, and Possible Federal Legislation,” Harvard Journal on Legislation, Vol. 45, (2008), 259, 265-66 272Herman K. Trabish, "What’s Wrong With Pennsylvania Solar?" (April 2013) Accessed 4/02/13: www.greentechmedia.com/articles/read/whats-wrong-with-pennsylvania-solar

118
out’s time frame and incremental increases, an SREC glut occurs, destabilizing the
market. As such, Cost competitive calculations based on long-term SREC payment
streams is very difficult. In cases like New Jersey’s volatile SREC market, the already
difficult process of PV project financing became even more arduous. PV cost-
competitiveness can be cast in further doubt when the long-term value of SRECs is
uncertain. The conditional was used in this paragraph because best practice policies
have emerged that fix many of the problems endemic to SREC markets. Specifically,
Connecticut has innovated the traditional RPS model to better support the financing
needs of RE developers.
Connecticut’s National Model for Renewable Portfolio Standards
Through the leadership of Governor Dannel Malloy and his administration,
Connecticut has emerged as a leader in RE policy innovation. In July 2011, when the
Connecticut General Assembly adopted Public Act 11-80, restructuring its RPS and
instating a quasi-public institution, the Clean Energy Finance and Investment
Authority (CEFIA), it proved its commitment to facilitating the state’s goals of
fostering renewable deployment and market development. While Connecticut’s RPS
was repurposed to fix the problems plaguing its mid-Atlantic and Northeastern
counterparts, CEFIA restructured the Connecticut Clean Energy Fund, which directly
funded RE projects, such as residential PV, to spur private investment and improve
financing in the industry.
Rather than incentivizing the compliance of RPS with REC trading systems,
Connecticut now requires its two electric utilities, which service the majority of the

119
state, Connecticut Light & Power (CL&P) and United Illuminating Company (UI), to
solicit and enter into 15-year contracts to procure RECs from sources that produce no
emissions (ZRECs, e.g. solar and wind) and from sources that have low emissions
(LRECs, e.g. fuel cells, biomass and others). For potential projects, according to its
official website, CL&P “will request that the public respond to Requests for
Proposals (RFPs) that CL&P will issue.”273 Developers offer bids for REC pricing
under 15-year contracts for the purchase of the LREC/ZREC for each MWh
produced by their project. Ultimately, the utilities award contracts to the least cost
bidders, until the $8 million in ZREC annual purchases and $4 million in LREC
annual purchases are consumed. Relevant to PV, in order to qualify for ZRECs,
projects must be monitored by a meter (what does this mean?) and have a smart meter
for reporting purposes, emit no pollutants, be from a solar, wind, small hydro, or
other zero emission facility, and the potential project must be no larger than 1 MW.
Projects are broken down by size into large projects (250 kW – 1,000 kW) and
medium projects (100 kW – under 250 kW). These two sizing levels undergo separate
auctions. For smaller projects (under 100 kW), developers participate in a small
ZREC tariff program. Using the remainder of the funds from the larger and medium
sized auctions, the small ZRECs are completed on a first-come, first served basis.274
Smaller projects are thus excluded from the competitive forces of REC that have
obstructed growth, as is the case in Pennsylvania.
273"LREC/ZREC Program," Connecticut Light & Power : Renewable Energy Credits, Competitive Solicitation for LRECs and Large and Medium ZRECs, accessed April 09, 2013, http://www.cl-p.com/Home/SaveEnergy/GoingGreen/Renewable_Energy_Credits/. 274"Connecticut," DSIRE USA, accessed April 11, 2013, http://www.dsireusa.org/incentives/incentive.cfm?Incentive_Code=CT04R.

120
Through its unique reverse auction, Connecticut’s program is the first budget-
driven and market-driven approach to promoting RE purchases by utilities. While Act
11-80 predetermines the budget, the market is shaped by the competition amongst
developers to offer utilities the most cost-effective projects for meeting their RPS. As
is the case with reverse auctions, in which sellers compete to obtain business from
buyers, Connecticut’s market is set up to decrease REC prices as the sellers undercut
each other for business. Such was the case on May 1, 2012 when CL&P and UI
jointly issued their first Request for Proposals. Bids were limited to $350 per REC for
ZREC projects and $200 per REC for LREC projects, but the results showed that the
market forces inherent in reverse auctions successfully drove ZREC bids far below
the limit. In July 2012, bidders were selected based on the pricing provided and their
ability to meet the qualifications. Limiting our scope back to PV, table Two shows the
ZREC results.
Table 2. Results from May, 2012 ZREC auctions.
Connecticut Light & Power275 ZREC
Project Size # of Bids # of Bids
Accepted Total MW
Bid Total MW Accepted
Weighted Average of Accepted
Bids ($/ZREC)
Medium (100-250
kW)
113 47 21.5 8.881 $149.29
Large (250-1000 kW)
140 21 94.3 12.21 $101.36
Total 253 68 115.8 21.02
United Illuminating276
275Connecticut, Clean Energy Finance and Investment Authority, C-PACE + ZREC-LREC A Win-WIn Opportunity for Clean Energy Development in Connecticut, accessed March 21, 2013, http://s3.honestbuildings.com/client/c-pace/CP-ACE_ZREC-LREC_Jan_22_Preso.pdf. 276Alan Trotta and Christie Bradway, "Esults of the ZREC/LREC Solicitations," Environmental

121
ZREC Project Size
# of Bids # of Bids Accepted
Total MW Bid
Total MW Accepted
Weighted Average of Accepted
Bids ($/ZREC)
Medium (100-250
kW)
37 13 7.1 2.48 $135.36
Large (250-1000 kW)
22 6 12.1 2.57 $117.27
Total 59 19 19.2 5.05 As for small ZRECs, the tariff program began on January 8th, 2013. Each utilities rate
was as follows: UI Rate: $148.89/ZREC and CL&P Rate: $164.22/ZREC.
Connecticut’s market fosters a weighted average of ZRECs far below the floor that is
set. The next competitive solicitation will be conducted in April and the bidding results
coincide with Wesleyan’s honors results for this thesis.277
By rewarding the projects that require the lowest streams of credit with long-
term contracts, the program incentivizes the RE industry to drive down costs. While
utilities receive RE at a set rate that is far below the REC and ACP prices in many
other states,278 ZREC winners enjoy the assurance that the REC prices paid for their
project’s generation will be constant during the 15-year terms of their contracts. The
consistent prices of Connecticut’s RPS program assure project financing and
investor’s perceived stability of RE markets. “This is the key to the program because
these [REC price] commitments enable the developers to get private sector loans to
build out the projects,” argued Dan Esty, Connecticut’s Department of Energy and
Business Council New England, September 27, 2012, accessed April 10, 2013, http://www.ebcne.org/fileadmin/pres/9-27-12_MASTER_Bradway_and_Trotta.pdf. 277Governor Dennel Malloy is scheduled for a press conference to comment on the significance of both events. 278Staff, "SRECTrade and GTM Research Launch Report Series on US SREC Market Dynamics," Greentech Media.

122
Environmental Protection Commissioner, Dan Esty, who Governor Malloy sought out
to come up with the legislative proposal for invigorating clean energy incentives.
“We believe that the key innovations required for renewable energy development is
much less in the area of technology than it is in the area of financing – particularly
with government funding for subsidies being so limited.”279 Through Esty’s forward
thinking leadership and vision of the public’s role in RE, Connecticut is fostering the
key innovations required for broader PV deployment. The LREC and ZREC program
is the most innovative market established by any state to solve the difficulty of
securing long-term financing due to the revenue uncertainty of RECs.
Consolidating several existing programs into CEFIA and then securing its
ability to raise and leverage funds from private sources, Connecticut is the first state
to have its own “green bank.” As described in a report recently issued by CEFIA,
Connecticut’s green bank “promotes clean energy by investing its own funds and
attracting private investment in clean energy initiatives in the state.”280 CEFIA is
categorized as a quasi-public institution because it utilizes the funds in Connecticut’s
previous clean energy and energy efficiency funds to accrue private sector capital,
participation, and expertise. CEFIA will earn at least $30 million per year, much of it
coming from fees on electric ratepayers and revenue from carbon trading auctions
within the Regional Greenhouse Gas Initiative. “The goal really is to leverage private
capital,” says Etsy.281 By providing loans or loan guarantees to clean energy projects,
279Dan Etsy to Phil Zahodiakin, "Connecticut Auction Cuts Clean Energy Costs While Providing a Template for Other States," AOL Energy, December 7, 2012, accessed April 11, 2013, http://energy.aol.com/2012/12/07/connecticut-auction-cuts-clean-energy-costs-while-providing 280Clean Energy Finance Investment Authority, Progress Through Partnerships: Annual Report Fiscal Year 2012, report (Hartford, 2012). 281Jim Malewitz, "As Washington Gridlock Persists, States Get Creative in Funding Renewable Energy," The Pew Charitable Trusts, April 27, 2012, accessed April 11, 2013,

123
CEFIA has established a program of revolving funds, which stands in contrasts to
grants like the federal government’s support for Solyndra. CEFIA functions like an
investment bank that leverages capital to provide low-cost financing to RE projects
that a commercial bank would not likely touch.
For instance, CEFIA’s Commercial Property Assessed Clean Energy (C-
PACE) allows commercial and industrial property owners to pay for energy-related
improvements, such as rooftop PV, to their properties using a financing program that
offers lower fixed rates and longer repayments than traditional loans. Through C-
PACE, CEFIA will work with municipalities and entities like the Connecticut
Bankers Association to offer a specific bond to investors. The capital from these
bonds is then turned around and loaned to the commercial and industrial property
owners to pay for the upfront costs of an energy retrofit. As CEFIA explains: “C-
PACE spreads the cost of energy improvements over the expected life of the
measures and allows the repayment obligation to transfer automatically, like other
property assessments, to the next owner if the property is sold.”282 The C-PACE loans
are repaid over an assigned period via an annual assessment on their property tax bill.
“C-PACE is a ‘win’ for all involved, as it will encourage and enable local institutions
to invest in commercial clean energy projects and help Connecticut’s businesses
stabilize their energy costs and continue to increase their competitiveness,” CEFIA’s
http://www.pewstates.org/projects/stateline/headlines/as-washington-gridlock-persists-states-get-creative-in-funding-renewable-energy-85899383075. 282"Program Will Provide Energy Financing for Connecticut's Commercial and Industrial Customers," Connecticut Clean Energy Finance and Investment Authority, June 27, 2012, section goes here, accessed April 06, 2013, http://www.ctcleanenergy.com/NewsEvents/PressRoom/tabid/118/ctl/ViewItem/mid/1364/ItemId/259/Default.aspx?SkinSrc=/Portals/_default/Skins/subpages/subpage_level0.
124
President Bryan Garcia argued.283 C-PACE is a fiscally practical policy for promoting
PV development, providing benefits to all players involved.
Thus, the underlying ambition of Connecticut’s new clean energy initiatives is
to harness market forces to cost-effectively drive price reductions in RE. By offering
winning bidders long-contracts, the restructured RPS program intends to optimize the
value of RECs for both the utilities and developers. The latter can attract less-costly
financing from lenders, who assured by CT’s market’s stability, while the former
gains from the market’s reverse auction format, which encourages the development of
the most cost-effective programs. Yet, as is expected with new reforms, there have
been and will be bumps along the way. Soon after they contacted developers in July
2012 to start the process of executing contracts, CL&P and UI learned that many of
the winning bids were speculative and were unlikely to develop the agreed upon
projects. Additionally, other developers have had to drop out of the program due to
their inability to obtain and secure financing for their projects. As a result, some of
the projects on the “standby” list of unaccepted bids have been offered these contracts
if they were able to demonstrate the financing requirements of the program.284 To be
clear, the mandated amount of RE and ZRECs/LRECs to be distributed will be met
because of the tremendous amount of bids each utility received. Capital market
barriers, however, cannot be overcome in a single year. Commercial banks and
lenders still have much to learn about RE financing. One of the many roles of CEFIA
is to smooth this process over.
283Ibid. 284"LREC/ZREC Program," Connecticut Light & Power: Renewable Energy Credits.”
125
As CEFIA transitions Connecticut away from its subsidy-driven model
towards a low-cost financing and credit enhancement model, it hopes to catalyze
market activity and lower borrowing costs, in turn improving PV’s cost-
competitiveness.285 Through a variety of programs like C-PACE, CEFIA offers low
cost funding, so that when matched by commercial funding, the tranche issued by the
bank will make the project financially viable for the developer. When averaged, the
rate of return on the public and private funds allows CEFIA to make low interest
loans. No state has as definitively committed itself to RE as Connecticut; CEFIA’s
authorization to finance up to 80 percent of the cost to develop and deploy a clean
energy project with its funds, most of which are allocated by the state. To borrow
Garcia’s words, "it is clearly Connecticut displaying a sign of 'Open for business for
clean energy… The level of interest in Connecticut has risen dramatically” because of
these changes.286
Conclusion: A Fiscally Practical Solution to Deliberate PV Development
Assessing the regulatory landscape of states with deliberate PV promotion,
there are various levels of best practices. First, more than 40% of the U.S. does not
have a RPS. RPS’ benefit to PV deployment is shown in table 3.
Table 3. 2012 Top Ten States: Ranked by Grid-Connected PV Capacity Installed in 2012287
285Kema, Connecticut Electric Residential, Commercial, and Industrial Energy Efficiency Potential Studies, Prepared for the Connecticut Energy Conservation Management Board (ECMB), April 2010. 286Brad Kane, "Bryan Garcia: Making CT a Clean Energy Leader," Hartford Business Journal, June 4, 2012, accessed April 12, 2013, http://www.hartfordbusiness.com/article/20120109/PRINTEDITION/301099983. 287GTM and SEIA, "U.S. Solar Market Insight Year-in-Review 2012," Accessed 4/3/13: http://www.seia.org/research-resources/us-solar-market-insight-2012-year-review
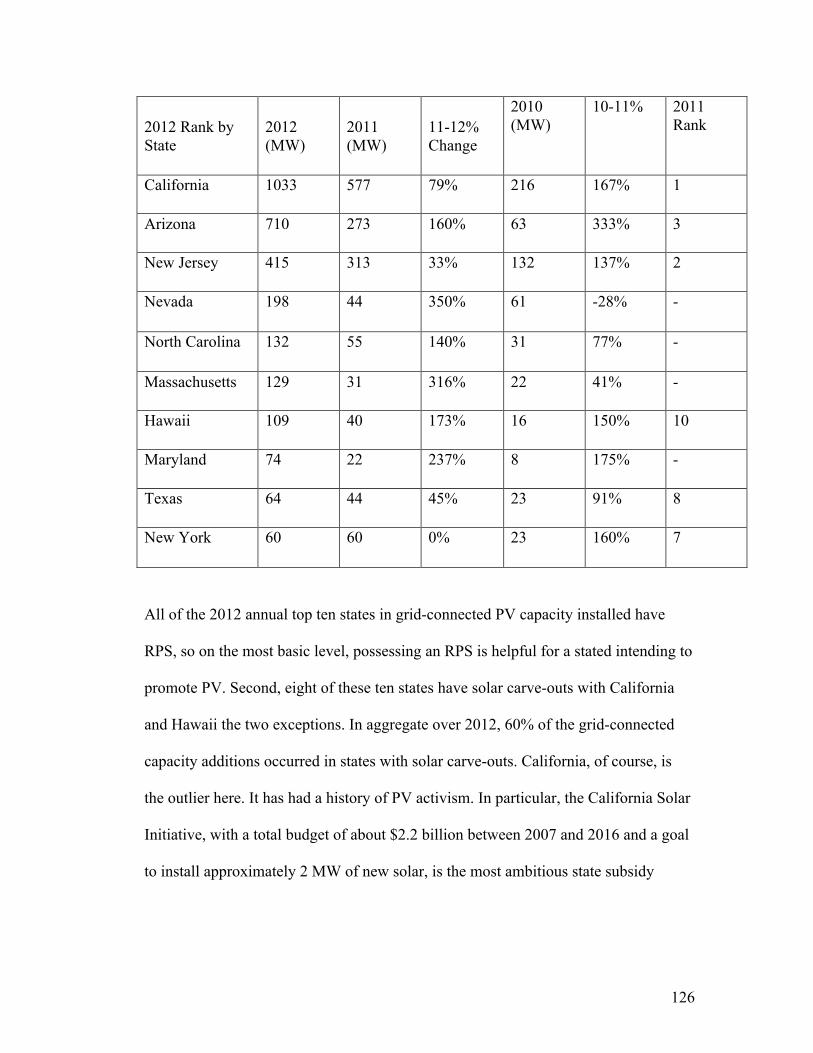
126
2012 Rank by State
2012 (MW)
2011 (MW)
11-12% Change
2010 (MW)
10-11% 2011 Rank
California 1033 577 79% 216 167% 1
Arizona 710 273 160% 63 333% 3
New Jersey 415 313 33% 132 137% 2
Nevada 198 44 350% 61 -28% -
North Carolina 132 55 140% 31 77% -
Massachusetts 129 31 316% 22 41% -
Hawaii 109 40 173% 16 150% 10
Maryland 74 22 237% 8 175% -
Texas 64 44 45% 23 91% 8
New York 60 60 0% 23 160% 7
All of the 2012 annual top ten states in grid-connected PV capacity installed have
RPS, so on the most basic level, possessing an RPS is helpful for a stated intending to
promote PV. Second, eight of these ten states have solar carve-outs with California
and Hawaii the two exceptions. In aggregate over 2012, 60% of the grid-connected
capacity additions occurred in states with solar carve-outs. California, of course, is
the outlier here. It has had a history of PV activism. In particular, the California Solar
Initiative, with a total budget of about $2.2 billion between 2007 and 2016 and a goal
to install approximately 2 MW of new solar, is the most ambitious state subsidy
127
program in the country.288 Such subsidy programs have been influential in the growth
of state PV markets by reducing upfront capital costs of systems and increasing the
attractiveness of investment, but they were not the locus of this chapter. Rather, I
have identified and analyzed the design features of REC trading system to show the
difference between effective and ineffective policies.
In the case of deliberate PV promotion, best practices establish a stable
environment for PV development, concurrently stimulating deployment and
improving its cost competitiveness. Limited data exists as to how effective solar
carve-outs are for developing a mechanism of tracking, verifying, and assuring
compliance with RPS. For instance, the Lawrence Berkeley National Laboratory data
on solar compliance (refer to appendix) is unavailable for 75% of the relevant states.
However, much more is known on SREC markets in these states. All in all, the
historical experience of SREC demonstrates that spot-markets, in which the yearly
prices depend on the supply of SRECs relative to the demand imposed by the
incremental SREC, are susceptible to volatility. In the case of New Jersey, SREC
production outpaced the state’s requirements, creating a glut. This oversupply limits
the value of SRECs in two key ways: the price of SRECs drastically decreases and
the resulting instability in the market constrains the confidence of financiers, who are
subsequently unable to have long-term price certainty. PV development, in turn, has
been inhibited in these states. These developments add to the capital market barriers,
already inhibiting the growth of PV. Referring back to Table 3, New Jersey
experienced the sharpest decrease in the year-to-year growth of all the states shown.
288"About the California Solar Initiative (CSI) - Go Solar California," About the California Solar Initiative (CSI) - Go Solar California, accessed April 04, 2013, http://www.gosolarcalifornia.ca.gov/about/csi.php.

128
The market remains one of the biggest in the nation, but it cannot be described as
robust due to the steep decline (-104%) in its capacity additions from 2010-2011 and
2011-2012.
In a time of severe budget conditions, states need to also ensure that their
policies are cost-effective ways of promoting the shift away from conventional
technologies to renewables. Thanks to strong, forward thinking leadership,
Connecticut has developed policies that serve as national standards for offering cost-
effective and workable solutions to the problem of financing RE deployment. Until
these recent reforms, Connecticut’s PV market, ranking 18th in the U.S. as of 2011,289
had been held back by a lack of sufficient, affordable capital to help developers scale.
Now that CEFIA is facilitating relationships with a variety of investors and lenders to
spur their interest in clean energy for the sake of programs like C-PACE,
Connecticut’s developers can address the other costs holding back PV’s cost
competitiveness. Overtime, if the restructured RPS’ reverse auction continues to drive
down bids by awarding contracts to projects that require the cheapest REC, the
successful developers will be those that take other necessary steps to improve PV’s
affordability, such as reducing installation soft costs.
289Data provided by Larry Sherwood.

129
Conclusion
Some argue that the consumer can purchase warmth or work or mobility at less cost by means of coal or oil or nuclear energy than by means of sunshine or wind or biomass. The argument concludes that this fact, in and of itself, relegates renewable energy resources to a small place in the national energy budget. The argument would be valid if energy prices were set in perfectly competitive markets. They are not. The costs of energy production have been underwritten unevenly among energy resources by the Federal Government.290
-August 1981 report of the DOE Battelle Pacific Northwest National Laboratory
The obstacles to greater adoption of solar photovoltaic electricity (PV) in the
U.S. relate mostly to market inefficiencies and to poor regulation. The nature of the
costs involved in adopting PV positions it to benefit greatly from government support.
Since a solar panel system is almost all up-front costs and requires very little
operations and management expenses after installation, reducing initial costs is
290R.J. Cole, An Analysis of Federal Incentives Used to Stimulate Energy Consumption, report no. DOE Battelle Pacific Northwest Laboratory (August 1981).
Précis: In the United States, there are fifty states and fifty solar photovoltaic electricity (PV) markets. Since PV policymaking takes place in the context of a decentralized system, the diversity within PV policy strategies creates a learning opportunity. It furthers that best, and less desirable, practices can be gleamed from the experiences of states that have adopted the same regulations but implemented the regulations differently in pursuit of their own strategies. Specifically, the first section of the Conclusion brings together the positive analyses conducted on net metering and renewable portfolio standards (RPS). The normative conclusions on both measures are also repeated to provide a stronger basis for the prescriptions offered in the second section to maximize the benefits of net metering and RPS on PV. Two forms of line of sight are used: a footnote is given for citations when explanation may be necessary. CH. (Chapter) #, S. (Section) # or P. (page) # is used fore more general references.

130
crucial to reducing the cost of solar electricity. Now that the majority of PV project
costs are in non-panel components, referred to as balance of system (BOS), financial
incentives are no longer the best policy measure to foster PV’s long-term affordability.
Best practice regulations foster the market conditions to reduce BOS costs, including
labor, financing, and other soft costs. Unlike incentives, such as the federal
production tax credit, which has been extended seven times since it was first
created,291 regulations do not suffer from the unpredictability that comes from the
sunset dates and volumetric limits that are often imposed on incentives from their
beginning (CH. 1, S. I) the stability and consistency, which regulations have the
potential to provide to a market, create conditions ripe for lowering BOS costs.
Broadly stated, the goal of electricity regulation is to replicate competition.292
Regulations attempt to influence behaviors and set prices similar to those that would
prevail were the market is optimally competitive. When it comes to American climate
change policies, instead of pricing externalities, the far more prevalent response has
been targeted programs to promote RE alternatives to conventional electricity
generation technologies. Justifications for such programs have generally begun with
environmental concerns, but often expanded to include co-benefits of energy security,
291Jesse Jenkins, Mark Muro, Ted Nordhaus, Michael Shellenberger, Letha Tawney and Alex Trembath, "Beyond Boom and Bust: Putting Clean Tech On a Path To Subsidy Independence," Brookings Institute (April 2012). Accessed 2/21/13: http://www.brookings.edu/research/papers/2012/04/18-clean-investments-muro) 292In their guide to “Electricity Regulation in the U.S.,” the Regulatory Assistance Project states: “regulation is an exercise of the police power of the state, over an industry that is ‘affected with the public interest.’” ("Electricity Regulation in the U.S.," Regulatory Assistance Project, accessed February 17, 2013, www.raponline.org/document/download/id/645)

131
job creation, and driving down fossil fuel prices.293 Despite the fact that they are less
efficient, conventional generators and incumbent practices prevent alternatives, like
PV, from entering into electricity market. A relevant parallel exist between the
suboptimal competition prevalent in burgeoning utilities markets and the suboptimal
competition prevalent today, inhibiting the greater use of PV (CH. 2, S. 2). There is a
historic pattern in the electricity industry for unfettered market forces to stymie
development and deployment of socially optimal electricity technologies.294 Today,
electricity markets do not take into account the costs of conventional sources of
production, which can be marginally priced in terms of their emissions impact and
varies with equity weighing.295 The public sector’s support is essential for PV to
compete with conventional forms of electricity.296 In Chapters Three and Four, the
influence of two key public sector regulations, net metering and renewable portfolio
standards (PV), on PV were assessed. Neither net metering nor RPS, no matter how
cleverly applied, can equal the efficiency with which pricing carbon would allocate
293Barry G. Rabe, "The Aversion to Direct Cost-Imposition: Selecting Climate Policy Tools in the United States," Governance: An International Journal of Policy, Administrations, and Institutions, Vol. 23, No. 4, (October 2010), p. 589. 294A crucial assumption of this thesis is that the marginal benefits of dealing with climate change and its accompanying costs are greater than the marginal costs of inaction. For instance, United Kingdom, Parliament, Prime Minister, Stern Review on the Economics of Climate Change, by Nicholas Stern, Sir, accessed October 27, 2012, http://webarchive.nationalarchives.gov.uk/+/http:/www.hm-treasury.gov.uk/sternreview_index.htm; My logic follows that of Jody Freeman and Andrew Guzman, "Climate Change and U.S. Interests," Columbia Law Review 109, no. 153 (August 28, 2012): 1597, accessed December 02, 2012, http://scholarship.law.berkeley.edu/facpubs/36 (“If one accepts the estimate of a 15.4% [derived from Stern] impact on the United States (or even if one were to cut that estimate in half), and if one accepts that the global cost of action would be about 4.6% of U.S. GDP… [they would conclude that] the United States would be better off paying the full cost of mitigating the impact of climate change by itself (even if no other country cooperates) rather than allowing the world to continue in a “business as usual” fashion”) 295Richard S.J. Tol, "The Marginal Damage Costs of Carbon Dioxide Emissions: An Assessment of the Uncertainties," Energy Policy 33, no. 16 (November 2005), doi:10.1016/j.enpol.2004.04.002.; Gary Yohe, "More Trouble for Cost-Benefit Analysis," Climatic Change 56, no. 3 (February 2003). 296This evinced by reports demonstrating that pricing the emissions from conventional electricity production would significantly benefit PV’s cost competitiveness with fossil fuels. (Allen A. Fawcett et al., "Overview of EMF 22 U.S. Transition Scenarios," Energy Economics 31 (December 2009): pg. #, doi:10.1016/j.eneco.2009.10.015.)

132
electricity resources in a competitive market.297 Yet, they play an important role in
remedying the inefficiencies inherent in modern electricity markets indirectly.
Specifically, the cost competitiveness of PV is inhibited by the
underestimation of the reward and overestimation of the risk by investors and lenders
in RE (respectively). Investors have demonstrated the trend of overestimating the
costs of PV and, as a result, underinvest in PV relative to the economically efficient
level in states where PV is cost-competitive.298 These misconceptions on the financial
viability of PV produce significant expenditures for developers, such as marketing,
which are insignificant in mature markets like Germany (CH. 2, S. 3). Since there are
no “game changing” developments on PV’s horizon like those that occurred in
modules markets in the two-year period starting in 2008, regulation is critical to
changing PV electricity from a luxury product to an economically feasible one.
Chapter Three analyzed state net metering programs and attempted to
understand, which approaches have worked well and why. Net Metering enables
customers to take advantage of on-site distributed generation that is interconnected to
the electric grid. Due to the fact that during periods of peak sunlight PV systems tend
to produce more electricity than the system owner consumes, net metering is a vital
catalyst for PV markets. Without net metering, excess PV electricity would be
credited, at best, at the wholesale rate, which is typically about one-third of the retail
297Allen A. Fawcett et al., "Overview of EMF 22 U.S. Transition Scenarios," Energy Economics 31 (December 2009): pg. #, doi:10.1016/j.eneco.2009.10.015. 298Such fears have been evinced in the following surveys: C. Dymond, PV Focus Group Report. (Portland, OR: Energy Trust of Oregon, 2002) www.energytrust.org/Pages/about/library/reports/02_PVFocusGroup.pdf; B. Farhar and J. Buhrmann, Public Response to Residential Grid-Tied PV Systems in Colorado: A
Qualitative Market Assessment. Golden, Colorado, NREL, July 1998.

133
residential rate.299 Although net metering is a foundational PV market policy, it
requires best practices to foster market development. Best practices promote PV
deployment and support the substitution away from conventional, GHG emitting
electricity generation. Less desirable practices, however, stifle the adoption of PV and
other distributed generation systems. PV system capacity limitations inhibit potential
customers from adopting systems that are best suited to their consumption needs.
Larger capacity limits or no capacity limits, on the other hand, matches the stated
intentions of net metering as a policy that “stimulates the economic growth of this
state, encourages energy independence and security, and enhances the continued
diversification of this state’s energy resources.”300 Similarly, credit rollovers are
important to net metering’s fostering PV markets, by ensuring that net metered
customers receive the full retail benefits of their excess electricity contributions to the
grid. The pricing mechanism used in crediting the rollover credited, however, is
crucial to net metering’s impact on the electricity bills of participating and non-
participating members. (CH. 3, S.2).
With the technology for real time pricing permeating throughout the nation,301
smart meters ought to be utilized to optimize net metering’s objectives, by facilitating
the incorporation and operation of best practices. Time of use (TOU) rates maximize
the economic benefits inherent in the correlation between PV’s peak output and peak
299Richard Duke, Robert Williams, and Adam Payne, "Accelerating Residential PV Expansion: Demand Analysis for Competitive Electricity Markets," Energy Policy 33, no. 15 (2005): 1920, doi:10.1016/j.enpol.2004.03.005. 300State Affairs Committee, "Senate Bill No. 1368," Legislature of the State of Idaho. Accessed 3/10/13: http://legislature.idaho.gov/legislation/2002/S1368.html 301It has been estimated that approximately 50 percent of all U.S. households will have smart meters by 2015. (Institute for Electric Efficiency, “Utility Scale Smart Meter Deployments, Plans, & Proposals,” (September, 2010) Accessed 03/29/13: www.edisonfoundation.net/IEE)

134
electricity demand. Under TOU’s pricing schema, PV system owners rightfully
receive higher credits for their excess output because the transmission and creation of
electricity is most expensive at times of peak demand, which coincides with peak PV
output.302 Traditional retail prices do not reflect locational or time variation in
electricity costs.303 Smart meter’s communication systems limit the transmission
losses that occur during peak demand by digitally communicating with the grid to
ensure excess PV is transmitted to meet the electricity demands of the nearest
consumer. When applied to electricity transmission and delivery processes, smart
meters reduce the inefficiencies that are symptomatic of electricity grids. Although
utilities receive these benefits in reduced labor and transportation costs that are apart
of the traditional practice of on-premise meter reading, they have shown themselves
resistant to these policies (CH. 3, S. 3). By provoking fundamental considerations
within electricity consumers as to their consumption habits and the dynamics
underlying their monthly electricity bill, smart meters have the potential to correct
informational market failures in electricity markets. Smart meters inform
consumption habits in ways that were not possible with traditional meters, through
mechanisms like cell phone alerts (CH. 3, S.5) Such mechanisms provide
consumption and pricing information that can potentially provoke consumers to
consider how a PV system would factor into their monthly electricity bill.304 In sum,
with a better understanding of the financials behind their electricity behavior,
302Kahn, The Economics of Regulation, Ch. 1. 303Richard Duke, Robert Williams, and Adam Payne, "Accelerating Residential PV Expansion: Demand Analysis for Competitive Electricity Markets," Energy Policy 33, no. 15 (2005): 1920, doi:10.1016/j.enpol.2004.03.005. 304Steven Castle, "GE Touts the IPhone-Connected Hybrid Water Heater," Green Tech Advocates, October 25, 2012, accessed April 10, 2013, http://greentechadvocates.com/2012/10/25/ge-touts-the-iphone-connected-hybrid-water-heater/
135
consumers may want to play a more active role and look into investments in
distributed solutions, such as PV.
Similarly to the structure of Chapter Three, Chapter Four assesses the
renewable portfolio standard’s basic structure, how the differences in parameters
across states reveal best and least desirable practices. The chapter concludes with a
proposal of best practice solutions to optimize the policy’s intentions of increasing
RE deployment. More specifically, the design features of REC trading systems are
identified and analyzed to determine the difference between best and worst policies.
In the case of deliberate PV promotion, best practices establish a stable environment
for PV development, concurrently stimulating deployment and improving its cost
competitiveness. Highlighting the experience of New Jersey, I demonstrate how
SREC production has the tendency to outpace state requirements (CH.4, S. 3). As a
consequence of this SREC oversupply, the price of SRECs drastically decreases and
the resulting instability in the market constrains the confidence of financiers, who are
subsequently unable to have long-term price certainty. Connecticut has offered the
first solution to the volatility inherent in SREC markets.
Along with their restructured RPS, Connecticut has introduced the United
Stats’ first quasi-public green bank. These policy innovations complemented each
other in offering cost-effective and workable solutions to the problem of financing RE
deployment (CH. 4, S.4). Rather than incentivizing the compliance of RPS with REC
trading systems, Connecticut now requires its two electric utilities, which service the
majority of the state, Connecticut Light & Power (CL&P) and United Illuminating
Company (UI), to solicit and enter into 15-year contracts to procure RECs from

136
sources that produce no emissions (ZRECs, e.g. solar and wind) and from sources that
have low emissions (LRECs, e.g. fuel cells, biomass and others). Like a project in any
other state, the bids proposed in Connecticut must have financing that is secure and
cost-effective for the developer. The stability of these contracts provide lenders, who
are susceptible to risk aversion (CH. 2, S. 3), assurance in a project’s financial
viability, as evinced by its securing consistent streams of capital. However, the capital
market barriers inherent in RE markets are significant and cannot be swiftly
overcome. Connecticut’s Green Bank, the Clean Energy Finance and Investment
Authority, was created to facilitate relationships with a variety of investors and
lenders to spur their interest in clean energy. CEFIA utilizes the funds in
Connecticut’s previous clean energy and energy efficiency funds to accrue private
sector capital, participation, and expertise.305 Transitioning Connecticut away from its
subsidy-driven model for moving towards a low-cost financing and credit
enhancement model, CEFIA was introduced to catalyze market activity and lower
borrowing costs, improving PV’s cost-competitiveness(CH. 4, S.4).306
In response to CEFIA’s model, New York’s Governor, Andrew Cuomo,
recently proposed a $1 billion Green Bank to spur New York’s RE market, which
experienced an estimated year-over-year change in PV capacity of 0% in 2012 (CH. 4,
S. 4). Governor Cuomo’s goals are perhaps verbatim with the prescriptions offered in
this thesis: “The NY Green Bank leverages private capital in a fashion that mitigates
investment risk, catalyzes market activity and lowers borrowing costs, in turn
305Connecticut, Clean Energy Finance and Investment Authority, C-PACE + ZREC-LREC A Win-WIn Opportunity for Clean Energy Development in Connecticut, accessed March 21, 2013, http://s3.honestbuildings.com/client/c-pace/CP-ACE_ZREC-LREC_Jan_22_Preso.pdf. 306Kema, Connecticut Electric Residential, Commercial, and Industrial Energy Efficiency Potential Studies, Prepared for the Connecticut Energy Conservation Management Board (ECMB), April 2010.

137
bringing down the prices paid by consumer.”307 Green Banks are forward looking
entities. They are the first public-private partnership in RE that offers the promise of
fostering the long-term growth of renewables, much likely natural monopoly statuses
allowed for utilities to scale (CH. 2, S. 1). The leadership behind these entities,
particularly Richard Kaufman and Dan Esty, understand the need to promote clean
energy by harnessing market forces that are beneficial to PV development, not
corrosive (CH. 4, S. 4). In Connecticut’s case, after sparking the interests of state
players like developers and investors, CEFIA has established programs so that
financing remains consistent and does not jeopardize the long-term viability of PV, as
is historically the case in SREC spot-markets (CH. 4, S. 3).
Kaufman and Esty have led the way in proactive state governance in
providing resources and programs to foster stable PV markets. As the NY and CT,
Green Banks work towards legitimizing PV, therefore, lowering BOS costs like
lending and customer acquisition rates (CH. 2, S. 3), developers can devote their
resources to addressing other impediments to PV’s cost-competitiveness such as
installation costs. In a similar regard, TOU rates account for the supply and demand
dynamics of electricity consumption. PV customers are rightfully provided greater
value for their excess electricity at times of peak demand because of the fact that
supply-costs increase when there is more strain on the grid.308 Smart meters enable
the implementation of these rates and provide solutions to inefficient relics of the
307Governor Andrew Cuomo, NY Rising: 2013 State of the States (Albany, NY: Office of the Governor, 2013), p.29, accessed February 26, 2013, http://www.governor.ny.gov/sites/default/themes/governor/sos2013/2013SOSBook.pdf 308Richard Duke, Robert Williams, and Adam Payne, "Accelerating Residential PV Expansion: Demand Analysis for Competitive Electricity Markets," Energy Policy 33, no. 15 (2005): 1920, doi:10.1016/j.enpol.2004.03.005.

138
traditional utility model (CH. 3, S. 5). Thus, when it comes to promoting the
competitiveness of PV, states should look towards solutions like Green Banks and
smart meters, which optimize the effectiveness of regulations.

139
Appendix 1. Cumulative PV Capacity Data Provided by Larry Sherwood
State 2004 2005 2006 2007 2008 2009 2010 2011 Total
Alabama 0 130 213 63 461
Alaska 0 American Samoa 0
Arizona 2,341 1,559 2,148 2,802 6,163 21,141 63,626 287,760 397,562
Arkansas 0 187 650 64 939
California 48,881 65,763 71,243 100,530 197,626 214,287 255,582 537,797 1,563,571
Colorado 1 460 1,447 11,490 21,658 23,392 62,032 75,521 196,675
Connecticut 31 153 672 2,526 7,850 10,055 5,577 5,124 32,082
Delaware 39 3 259 450 613 1,419 2,350 20,830 26,423 District of Columbia 0 25 30 31 205 334 3,480 7,151 11,626
Florida 0 0 170 959 947 35,708 34,800 21,482 94,982
Georgia 133 1,619 5,105 6,914
Guam 0
Hawaii 259 452 708 2,861 8,586 12,675 18,513 40,480 85,193
Idaho 109 200 350
Illinois 392 176 133 241 372 1,723 11,022 712 16,215
Indiana 301 184 2,952 3,456
Iowa 10 16 28 105
Kansas 130 39 169
Kentucky 54 155 3,037 3,283
Louisiana 0 223 2,410 10,792 13,425
Maine 0 30 46 61 67 22 159 645 1,122
Maryland 0 59 99 321 1,921 4,659 5,294 24,340 37,101
Massachusetts 583 640 1,452 1,381 3,483 9,620 20,424 36,386 74,556
Michigan 103 301 1,919 6,218 8,796
Minnesota 105 69 110 284 330 895 1,727 1,207 4,841
Mississippi 30 64 143 332 615
Missouri 56 124 467 1,295 1,951
Montana 72 26 13 190 142 73 6 730
Nebraska 3 165 133 301
Nevada 100 478 2,357 15,672 14,872 2,531 68,287 19,419 124,104 New Hampshire 0 50 81 519 1,309 1,047 3,102
New Jersey 2,037 9,908 18,320 15,258 22,711 57,255 132,416 306,139 565,937
New Mexico 0 0 192 218 550 1,403 40,893 122,129 165,465
New York 1,530 2,022 2,968 3,794 7,027 12,060 21,563 68,314 123,819
North Carolina 47 0 96 401 4,006 6,633 28,676 45,456 85,462
North Dakota 14 14
Ohio 33 96 144 142 386 642 18,667 10,918 31,583
Oklahoma 10 30 117 163

140
Oregon 358 353 529 1,123 4,832 6,358 9,879 11,871 35,759
Pennsylvania 128 167 221 103 3,000 4,436 46,455 78,223 133,052
Puerto Rico 0
Rhode Island 103 119 163 53 8 577 1,151
South Carolina 36 170 151 217 326 3,171 4,086
South Dakota 0
Tennessee 31 23 83 517 4,756 16,300 21,961
Texas 145 593 714 632 1,183 4,198 25,883 51,105 85,614
Utah 423 1,428 2,304 4,357
Vermont 166 44 100 236 396 592 2,229 7,757 11,691
Virgin Islands 450 450
Virginia 40 38 78 140 224 343 1,908 1,809 4,792
Washington 0 207 414 1,205 824 2,132 2,893 4,213 12,271
West Virginia 33 575 608
Wisconsin 85 59 258 643 1,689 2,141 3,464 4,205 12,888
Wyoming 5 7 15 15 27 18 121 227
Total 57,643 83,581 105,216 163,932 311,986 439,997 904,146 1,845,612 4,012,000 2. Cumulative Installation Capacity by FTG Grading Groups Yeah Grade Capacity
2007
11.05 2007 A 5.825 2007 B 4.6 2007 C 80.34 2007 D 1.8666667 2007 F 1 2008
2.4
2008 - 2008 A 20.6
2008 B 52.891667 2008 C 2.3571429 2008 D 2.3333333 2008 F 2.55 2009
1.6833333
2009 A 99.081818 2009 B 5.2615385 2009 C 5.0142857 2009 D 17.233333 2009 F 0.25 2010
13.2
2010
0.3 2010 - 0.4 2010 A 126.38571 2010 B 16.127778

141
2010 C 3.3666667 2010 D 20.25 2010 F 1 2011
18.183333
2011 A 188.24118 2011 B 34.311765 2011 C 3.4 2011 D 42.75 2011 F 4
3. Year Grade Installations
2007
274 2008
226
2009
119 2010
273
2011
351.66666 2010
4
2008 - 2010 - 26
2007 A 1922.8 2008 A 409.5 2009 A 2353.5 2010 A 2510.3999 2011 A 2752.25 2007 B 74.285713 2008 B 1109.4546 2009 B 134.92308 2010 B 456.29413 2011 B 857 2007 C 57 2008 C 63 2009 C 282.14285 2010 C 96.333336 2011 C 141 2007 D 247 2008 D 88 2009 D 447 2010 D 62.5 2011 D
2007 F 51.666668 2008 F 132

142
2009 F 17 2010 F 19 2011 F 15
4. Mean Installations by FTG Grading Group Year Grade Installations
2007
312 2007 A 2195.6001 2007 B 98 2007 C 90.625 2007 D 352.66666 2007 F 57.333332 2008
287
2008 - 2008 A 503
2008 B 1185.4166 2008 C 117.42857 2008 D 223.5 2008 F 169 2009
114.5
2009 A 2453.5454 2009 B 140.57143 2009 C 421.28571 2009 D 534 2009 F 29.5 2010
367.66666
2010
7 2010 - 32 2010 A 2714.0667 2010 B 486.05554 2010 C 106 2010 D 118.5 2010 F 29 2011
396.5
2011 A 2890.4707 2011 B 838.93335 2011 C 142.2 2011 D 145 2011 F 34.5

143
Bibliography
"2008 Solar Technologies Market Report." National Renewable Energy Laboratory. January 2008. Accessed November 29, 2013. http://www.nrel.gov/analysis/pdfs/46025.pdf.
"2012-2013 Annual Directory & Statistical Report." American Public Power Association.
Accessed January 03, 2013. http://www.publicpower.org/files/PDFs/USElectricUtilityIndustryStatistics.pdf.
"About the California Solar Initiative (CSI) - Go Solar California." About the California
Solar Initiative (CSI) - Go Solar California. Accessed April 04, 2013. http://www.gosolarcalifornia.ca.gov/about/csi.php.
Arrow, Kenneth. "The Economic Implications of Learning by Doing,”." Review of
Economic Studies 29:155-73. Barbose, Galen L., Naïm Darghouth, and Ryan Wiser. "Tracking the Sun V An Historical
Summary of the Installed Price of Photovoltaics in the United States from 1998 to 2011." Electricity Market and Policy. November 2012. Accessed April 01, 2013. http://emp.lbl.gov/publications/tracking-sun-v-historical-summary-installed-price-photovoltaics-united-states-1998-2011.
Barbose, Galen, Ryan Wiser, and N. Dargouth. The Economic Value of PV and Net
Metering to Residential Customers in California. Report no. LBNL-3276E. April 2010. Accessed January 04, 2013. http://eetd.lbl.gov/ea/emp/reports/lbnl-3276e.pdf.
Barnes, Justin. "Why Tradable SRECs Are Ruining Distributed Solar." Greentech Media.
September 24, 2012. Accessed April 12, 2013. http://www.greentechmedia.com/articles/read/guest-post-why-tradable-srecs-are-ruining-distributed-solar.
Bazilian, Morgan, Ijeoma Onyeji, Michael Liebreich, and Ian MacGill. "Re-considering
the Economics of Photovoltaic Power." Bloomberg New Energy Finance, 2012. Beach, R. Thomas, and Patrick G. McGuire. "Evaluating the Benefits and Costs of Net
Energy Metering in California." Vote Solar. January 2013. Accessed March 08, 2013. http://mseia.net/site/wp-content/uploads/2012/05/Crossborder-Energy-CA-Net-Metering-Cost-Benefit-Jan-2013-final.pdf.
Bloomberg New Energy Finance. Global Trends in Renewable Energy Investment 2012.
Publication. June 11, 2012. Accessed March 09, 2013. http://fs-unep-centre.org/sites/default/files/publications/globaltrendsreport2012final.pdf.

144
Bloomberg New Energy Finance. "Re-imagining U.S. Solar Financing." National Renewable Energy Laboratory. June 2012. Accessed December 04, 2012. https://financere.nrel.gov/finance/content/re-imagining-us-solar-financing.
Borenstein, Severin. The Market Value and Cost of Solar Photovoltaic Electricity
Production. Working paper no. Center for the Study of Energy Markets Working Paper 176. Accessed February 27, 2013. http://www.ucei.berkeley.edu/PDF/csemwp176.pdf.
Borenstein, Severin. National Bureau of Economic Research. Report no. NBER Reporter:
Research Summary 2009 Number 1. Accessed April 03, 2013. http://www.nber.org/reporter/2009number1/borenstein.html.
Borenstein, Severin. "The Private and Public Economics of Renewable Electricity
Generation." Energy Institute at Haas (EI @ Haas) Working Paper Series, December 2011. Accessed March 11, 2013. http://ei.haas.berkeley.edu/pdf/working_papers/WP221.pdf.
Borenstein, Severin. "The Private and Public Economics of Renewable Electricity
Generation." NBER Working Paper, no. 17695 (December 2011). Accessed March 01, 2013. http://www.nber.org/papers/w17695.
Bradley, Robert L. Edison to Enron: Energy Markets and Political Strategies. Salem,
MA: Scrivener Pub., 2011. Brealey, Richard A., Stewart C. Myers, and Franklin Allen. Corporate Finance. New
York: McGraw-Hill Irwin, 2006. Breyer, Ch., A. Gerlach, J. Mueller, H. Behacker, and A. Milner. "Grid-Parity Analysis
for EU and US Regions and Market Segments: Dynamics of Grid-Parity and Dependence on Solar Irradiance, Local Electricity Prices and PV Progress Ratio." Q. Cells. 2011. Accessed January 21, 2013. http://www.q-cells.com/uploads/tx_abdownloads/files/36_GRID-PARITY_ANALYSIS_Paper.pdf.
Brown, Jim. "Solar Power’s Transition from Subsidy Dependence to Mainstream Energy
Solution." In First Solar Blog. Proceedings of Intersolar North America, San Francisco. July 24, 2012. Accessed November 13, 2012. http://www.firstsolar.com/Press-Center/~/media/DF00CBCDDD044E609A46DE650C719705.ashx.
"Building the Invisible City." Virtual New York. Accessed March 01, 2013.
http://www.vny.cuny.edu/blizzard/building/building_fr_set.html. Butti, Ken, and John Perlin. A Golden Thread: 2500 Years of Solar Architecture and
Technology. Palo Alto: Cheshire Books, 1980.

145
"Carbon Dioxide Emissions." EPA. Accessed November 29, 2012.
http://www.epa.gov/climatechange/ghgemissions/gases/co2.html. Cardwell, Diane. "A Solar Fairness Debate." Diane Cardell. June 05, 2012. Accessed
January 29, 2013. http://www.nytimes.com/2012/06/05/business/solar-payments-set-off-a-fairness-debate.html?pagewanted=all.
Castle, Steven. "GE Touts the IPhone-Connected Hybrid Water Heater." Green Tech
Advocates. October 25, 2012. Accessed April 10, 2013. http://greentechadvocates.com/2012/10/25/ge-touts-the-iphone-connected-hybrid-water-heater/.
Chernova, Yuliya. "The Economics of Installing Solar: Figuring out Whether You save
Money Depends on a Lot of Factors—especially Where You Live." Wall Street Journal. September 17, 2012. Accessed September 18, 2012. online.wsj.com/article/SB10000872396390444506004577615662289766558.html.
Clean Energy Finance Investment Authority. Progress Through Partnerships: Annual
Report Fiscal Year 2012. Report. Hartford, 2012. Cohen, Linda R., and Roger G. Noll. The Technology Pork Barrel. Washington, D.C.:
Brookings Institution, 1991. Cohen, Linda R., and Roger G. Noll. The Technology Pork Barrel. Washington, D.C.:
Brookings Institution, 1991. Cole, R.J. An Analysis of Federal Incentives Used to Stimulate Energy Consumption.
Report no. DOE Battelle Pacific Northwest Laboratory. August 1981. Connecticut. Clean Energy Finance and Investment Authority. C-PACE + ZREC-LREC
A Win-WIn Opportunity for Clean Energy Development in Connecticut. Accessed March 21, 2013. http://s3.honestbuildings.com/client/c-pace/CP-ACE_ZREC-LREC_Jan_22_Preso.pdf.
"Connecticut." DSIRE USA. Accessed April 11, 2013.
http://www.dsireusa.org/incentives/incentive.cfm?Incentive_Code=CT04R. Cuomo, Governor Andrew. NY Rising: 2013 State of the States. Albany, NY: Office of
the Governor, 2013. Accessed February 26, 2013. http://www.governor.ny.gov/sites/default/themes/governor/sos2013/2013SOSBook.pdf.
Davidson, Osha Gray. Clean Break: The Story of Germany's Energy Transformation and
What Americans Can Learn from It. InsideClimate News. InsideClimate News, 2012. Amazon Digital Services.

146
Delmas, Magali A., and Maria J. Montes-Sancho. "U.S. State Policies for Renewable
Energy: Context and Effectiveness." Energy Policy 39, no. 5 (May 2011): 2273-288.
Doran, Kevin L. "Can the U.S. Achieve a Sustainable Energy Economy from the Bottom-
Up?: An Assessment of State Sustainable Energy Initiatives." Vermont Journal of Environmental Law 7 (2005-2006).
Dorris, Elizabeth. Policy Building Blocks: Helping Policymakers Determine Policy
Staging for the Development of Distributed PV Markets. Report no. NREL/CP-7A30-54801. Accessed January 21, 2013. http://www.nrel.gov/docs/fy12osti/54801.pdf.
Dorris, Elizabeth. “Proceedings of To Be Presented at the 2012 World Renewable Energy
Forum,” Denver, Colorado. Accessed May 13-17, 2013. http://www.nrel.gov/docs/fy12osti/54801.pdf.
Duke, Richard, Robert Williams, and Adam Payne. "Accelerating Residential Pv
Expansion: Demand Analysis for Competitive Electricity Markets." Energy Policy 33, no. 15 (2005): 1912-929.
Edenhofer, O., Madruga R. Pichs, and Y. Sokona. Renewable Energy Sources and
Climate Change Mitigation. Special Report of the Intergovernmental Panel on Climate Change (IPCC). Geneva (CH): IPCC, 2012.
"The Effectiveness of Different Policy Regimes for Promoting Wind Power: Experiences
from the States." ScienceDirect.com. Accessed April 11, 2013. http://www.sciencedirect.com/science/article/pii/S0301421505000091.
Eisenberg, Joseph CG. "U.S. Solar PV Market – an Overview." Renewable Analytics 10,
no. 1 (September 2010). Elazar, Daniel Judah. American Federalism: A View from the States. New York: Harper
& Row, 1972. "Electricity Bill Breakdown: Understanding Your Electric Bill." Pennsylvania Public
Utilities Commission. July 2011. Accessed March 12, 2013. http://www.puc.state.pa.us/general/consumer_ed/pdf/Electric_Bill_Breakdown-PECO.pdf.
"Electricity Regulation in the U.S." Regulatory Assistance Project. Accessed February 17,
2013. www.raponline.org/document/download/id/645.

147
Endrud, Nathan E. "State Renewable Portfolio Standards: Their Continued Validity and Relevance in Light of the Dormant Commerce Clause, the Supremacy Clause, and Possible Federal Legislation." Harvard Journal on Legislation 45 (2008).
Energy and Environmental Consulting. "Net Energy Metering Cost Effectiveness
Evaluation." March 2010. Accessed March 12, 2013. http://www.cpuc.ca.gov/NR/rdonlyres/0F42385AFDBE-4B76-9AB3-E6AD522DB862/0/nem_combined.pdf.
"European Renewable Energy Council." Renewable Energy Policy Review: Germany,
December 27, 2012. Accessed January 17, 2013. http://www.erec.org/fileadmin/erec_docs/Projcet_Documents/RES2020/GERMANY_RES_Policy_Review_09_Final.pdf.
"Evaluating Information Sources ." CUNY Library. Accessed March 10, 2013.
http://guides.lib.jjay.cuny.edu/content.php?pid=209679. Faruqui, Ahmad. "One Third of U.S. Households Have Smart Meters - Yet Not Smart
Rates." Smart Grid Observer. May 18, 2012. Accessed March 28, 2013. http://www.smartgridobserver.com/n5-18-12-1.htm.
Fawcett, Allen A., Katherine V. Calvin, Francisco C. De La Chesnaye, John M. Reilly,
and John P. Weyant. "Overview of EMF 22 U.S. Transition Scenarios." Energy Economics 31 (December 2009): S198-211. doi:10.1016/j.eneco.2009.10.015.
Feldman, Maryann, and Roger Martin. "Constructing Jurisdictional Advantage."
Research Policy 34, no. 8 (2005): 1235-249. doi:10.1016/j.respol.2005.03.015. Freeman, Jody, and Andrew Guzman. "Climate Change and U.S. Interests." Columbia
Law Review 109, no. 153 (August 28, 2012). Accessed December 02, 2012. http://scholarship.law.berkeley.edu/facpubs/36.
Friedman, Thomas L. Hot, Flat, and Crowded: Why We Need a Green Revolution-- and
How It Can Renew America. New York: Farrar, Straus and Giroux, 2008. Garfield, Paul J., and Wallace F. Lovejoy. Public Utility Economics. Englewood Cliffs,
NJ: Prentice-Hall, 1964. Gillingham, Kenneth, and Bryan Bollinger. Report. August 5, 2012. Accessed February
23, 2013. http://people.stern.nyu.edu/bbolling/index_files/BollingerGillingham_PeerEffectsSolar.pdf.
Goldberg, Marshall. "Federal Energy Subsidies: Not All Technologies Are Created
Equal." Renewable Energy Policy Project, no. 11 (2000).

148
Gonzalez, George A. Energy and Empire: The Politics of Nuclear and Solar Power in the United States. Albany: State University of New York Press, 2012.
Goodrich, Alan, Ted James, and Adam Jaffe. National Renewable Energy Laboratory.
Report no. NREL/PR-6A20-53938. October 10, 2011. Accessed February 14, 2013. http://www.nrel.gov/docs/fy12osti/53938.pdf.
Greentech Media Research, and Association. "Solar Market Insight Report 2012 Q3."
SEIA. Accessed December 01, 2012. http://www.seia.org/research-resources/solar-market-insight-report-2012-q3.
Haddad, B., and P. Jefferiss. "Forging Consensus on National Renewables PolicyThe
Renewables Portfolio Standard and the National Public Benefits Trust Fund." The Electricity Journal 12, no. 2 (March 1999): 68-80. doi:10.1016/S1040-6190(98)00125-0.
Haddad, Brent, and Paul Jefferiss. "Forging Consensus on National Renewables Policy:
The Renewables Portfolio Standard and the National Public Benefits Trust Fund." Electricity Journal 12, no. 2 (March 1999).
Hart, David M. "Making, Breaking, and (partially) Remaking Markets: State Regulation
and Photovoltaic Electricity in New Jersey." Energy Policy 38, no. 11 (2010): 6662-673. doi:10.1016/j.enpol.2010.06.036.
Hassett, K. "Energy Tax Credits and Residential Conservation Investment: Evidence
from Panel Data." Journal of Public Economics 57, no. 2 (1995): 201-17. doi:10.1016/0047-2727(94)01452-T.
Hayek, Friedrich A. Von. The Road to Serfdom. Chicago, IL: University of Chicago Press,
1944. Heinemann, Amy. "Net Metering." DSIRE Solar Portal. Accessed January 05, 2013.
http://www.dsireusa.org/solar/solarpolicyguide/?id=17. Higgins, Ben. "Bringing Solar to the Blogosphere." REC Solar Blog. July 24, 2012.
Accessed April 10, 2013. http://blog.recsolar.com/page/3/. Higgins, Ben. "Net Metering at a Crossroads." REC Solar Blog. April 10, 2012. Accessed
March 05, 2013. http://blog.recsolar.com/2012/04/net-metering-at-a-crossroads/. Himmelman, Jeff. "The Secret to Solar Power." New York Times Magazine, August 12,
2012. http://www.nytimes.com/2012/08/12/magazine/the-secret-to-solar-power.html?pagewanted=all&_r=0.
Hirsh, Richard F. Power Loss: The Origins of Deregulation and Restructuring in the
American Electric Utility System. Cambridge, MA: MIT Press, 1999.
149
"Home Owner Ecosoluation." Ecosolargy. Accessed December 05, 2012.
http://www.ecosolargy.com/solutions/home-owners. Honebein, Peter C., Roy F. Cammarano, and Craig Boice. "From Authority to Trusted
Advisor: The Utility's Changing Role." The Electricity Journal 25 (December 2012). Accessed February 21, 2013. http://www.sciencedirect.com/science/article/pii/S1040619012002722.
Hughes, Thomas Parke. Human-built World: How to Think about Technology and
Culture. Chicago: University of Chicago Press, 2004. Insull, Samuel. The Memoirs of Samuel Insull. Edited by Larry Plachno. Polo, IL:
Transportation Trails, 1992. "An Investment in the Future, with Benefits Today Solar Energy." SunTechnics Energy
Systems. Accessed March 03, 2013. http://www.suntechnicsusa.com/us/about_us.html.
Isaacson, Walter. Einstein: The Life of a Genius. New York, NY: Collins Design, 2009. Jackson, Tim, and Mark Oliver. "The Viability of Solar Photovoltaics." Energy Policy 28,
no. 14 (November 2000): 983-88. doi:10.1016/S0301-4215(00)00085-9. Jenkins, Jesse, and Mark Buro. "Beyond Boom and Bust: Putting Clean Tech On a Path
To Subsidy Independence." The Brookings Institution. April 2012. Accessed February 21, 2013. http://www.brookings.edu/research/papers/2012/04/18-clean-investments-muro.
Johnson, Laurie T., and Chris Hope. "The Social Cost of Carbon in U.S. Regulatory
Impact Analyses: An Introduction and Critique." Journal of Environmental Studies and Sciences 2, no. 3 (September 2012): 205-21. Accessed November 07, 2012. http://link.springer.com/article/10.1007%2Fs13412-012-0087-7.
Kahn, Alfred E. The Economics of Regulation: Principles and Institutions. Vol. 1.
Cambridge, MA: MIT Press, 1988. Kane, Brad. "Bryan Garcia: Making CT a Clean Energy Leader." Hartford Business
Journal. June 4, 2012. Accessed April 12, 2013. http://www.hartfordbusiness.com/article/20120109/PRINTEDITION/301099983.
Kann, Shayle. "U.S. Residential Solar PV Financing: The Vendor, Installer and Financier
Landscape, 2013-2016." GTM Research. February 11, 2013. Accessed April 04, 2013. http://www.greentechmedia.com/research/report/u.s.-residential-solar-pv-financing.

150
Kats, George. "Before the House Committee on Oversight and Government Reform Evaluation of the DOE Loan Guarantee Programs, including Support for Abound." Assessing the Department of Energy Loan Guarantee Program. Accessed January 03, 2013. George Kats.
Kaufman, Richard. "Obstacles to Renewable Energy and Energy Efficiency." In From
Silos to Systems: Issues in Clean Energy and Climate Change, 21-24. New Haven: REIL Network, 2008-2010. Accessed March 08, 2013. http://www.reilproject.org/03-Kauffman.pdf.
Kema. Connecticut Electric Residential, Commercial, and Industrial Energy Efficiency
Potential Studies. Working paper no. Prepared for the Connecticut Energy Conservation Management Board (ECMB). April 2010.
Knier, Gil. "How Do Photovoltaics Work?" NASA Science. 2002. Accessed January 12,
2013. http://science.nasa.gov/science-news/science-at-nasa/2002/solarcells/. Kroposki, Ben, and Ryan Margolis. National Renewable Resource Laboratory. Technical
paper no. NREL/TP-581-42292. February 2008. Accessed March 28, 2012. Laird, Frank N. Solar Energy, Technology Policy, and Institutional Values. Cambridge:
Cambridge University Press, 2001. LaMonica, Martin. "Obama Signs Stimulus Plan, Touts Clean Energy." CNET News.
February 17, 2009. Accessed January 17, 2013. http://news.cnet.com/8301-11128_3-10165605-54.html.
Lazzari, Salvatore. "An Economic Evaluation of Federal Tax Credits for Residential
Energy Conservation." In Studies in Taxation, Public Finance, and Related Subjects: A Compendium, Volume 7., 82-119. Washington: Fund for Public Policy Research, 1983.
Letendre, Steven, and Mike Taylor. Interstate Renewable Energy Council RSS. Technical
paper no. SEPA REPORT # 01-08. March 2008. Accessed April 01, 2013. http://www.irecusa.org/2008/03/new-report-on-grid-connected-pv-metering-interconnection-practices/.
"LREC/ZREC Program." Connecticut Light & Power : Renewable Energy Credits.
Accessed April 09, 2013. http://www.cl-p.com/Home/SaveEnergy/GoingGreen/Renewable_Energy_Credits/.
Malewitz, Jim. "As Washington Gridlock Persists, States Get Creative in Funding
Renewable Energy." The Pew Charitable Trusts. April 27, 2012. Accessed April 11, 2013. http://www.pewstates.org/projects/stateline/headlines/as-washington-gridlock-persists-states-get-creative-in-funding-renewable-energy-85899383075.

151
"Market Failure and the Structure of Externalities." In Harnessing Renewable Energy in Electric Power Systems: Theory, Practice, Policy, edited by Boaz Moselle, Jorge Padilla, and Richard Schmalensee, by Kenneth Gillingham and James Sweeney. Washington, DC: RFF Press, 2010. Accessed March 10, 2010. http://www.yale.edu/gillingham/Market%20Failure%20and%20the%20Structure%20of%20Externalities.pdf.
Market Strategies International. "New Research: Consumer Pulse Wave 3." Smart Grid
Consumer Collaborative. September 05, 2012. Accessed April 01, 2013. http://smartgridcc.org/news-events/new-research-consumer-pulse-wave-3.
Matisoff, Daniel C. "The Adoption of State Climate Change Policies and Renewable
Portfolio Standards: Regional Diffusion or Internal Determinants?" Review of Policy Research 25, no. 6 (2008): 527-46. doi:10.1111/j.1541-1338.2008.00360.x.
Menz, Fredric C., and Stephan Vachon. "The Effectiveness of Different Policy Regimes
for Promoting Wind Power: Experiences from the States." Energy Policy 34, no. 14 (2006): 1786-796. doi:10.1016/j.enpol.2004.12.018.
Metz, Bert. Climate Change 2007: Mitigation : Summary for Policymakers and
Technical Summary. [S. L.]: Intergovernmental Panel on Climate Change, 2007. Mills, Andrew, Ryan Wiser, Galen Barbose, and William Golove. "The Impact of Retail
Rate Structures on the Economics of Commercial Photovoltaic Systems in California." Energy Policy 36, no. 9, 3266-3277. Accessed February 07, 2013. www.sciencedirect.com/science/article/pii/S0301421508002309.
MIT. "The Future of Coal." Accessed February 22, 2013.
http://web.mit.edu/coal/The_Future_of_Coal.pdf. Naam, Ramez. "Smaller, Cheaper, Faster: Does Moore’s Law Apply to Solar Cells?"
Scientific America. March 2011. Accessed November 02, 2012. http://blogs.scientificamerican.com/guest-blog/2011/03/16/smaller-cheaper-faster-does-moores-law-apply-to-solar-cells/).
Neenan, Bernard, and Ross C. Hemphill. "Societal Benefits of Smart Metering
Investments." The Electricity Journal 21 (October 2008). Accessed March 29, 2013. http://www.sciencedirect.com/science/article/pii/S1040619012002126.
"Net Metering At Legislative Crossroads." Everblue. Accessed January 12, 2013.
http://www.everblue.edu/blog/net-metering-legislative-crossroads. Newell, Richard G., Adam B. Jaffe, and Robert N. Stavins. "The Effects of Economic
and Policy Incentives on Carbon Mitigation Technologies." Energy Economics 28, no. 5-6 (November 2006): 563-78. doi:10.1016/j.eneco.2006.07.004.

152
Newton, James D. Uncommon Friends: Life with Thomas Edison, Henry Ford, Harvey Firestone, Alexis Carrel & Charles Lindbergh. San Diego, CA: Harcourt Brace Jovanovich, 1987.
"NJ Governor Christie Signs Bill to Increase Solar Requirements « SRECTrade Blog."
SRECTrade. July 23, 2012. Accessed April 08, 2013. http://www.srectrade.com/blog/srec-markets/nj-governor-christie-signs-bill-to-increase-solar-requirements.
Nogee, A., J. Deyette, and S. Clemmer. "The Projected Impacts of a National Renewable
Portfolio Standard." The Electricity Journal 20, no. 4 (2007): 33-47. Nogee, Alan, Jeff Deyette, and Steve Clemmer. "The Projected Impacts of a National
Renewable Portfolio Standard." The Electricity Journal 20, no. 4 (May 2007). Nordhaus, William D. "To Tax or Not to Tax: Alternative Approaches to Slowing Global
Warming." Review of Environmental Economics and Policy 26 (2007). Norgaard, Richard, and Nancy Rader. "Efficiency and Sustainability in Restructured
Electricity Markets: The Renewables Portfolio Standard." Electricity Journal 9, no. 6 (July 1996).
Peterson, Paul E. The Price of Federalism. Washington, D.C.: Brookings Institution,
1995. Pfund, Nancy, and Ben Healey. Double Bottom Line Investors. Report. September 2011.
Accessed February 17, 2013. http://www.dblinvestors.com/documents/What-Would-Jefferson-Do-Final-Version.pdf.
Pierobon, Jim. "If Half of U.S. Consumers Don't Know What a 'smart Meter' Is, How Are
They Supposed to Engage?" The Energy Collective. October 30, 2012. Accessed April 12, 2013. http://theenergycollective.com/jimpierobon/137011/if-half-us-consumers-don-t-know-what-smart-meter-how-are-they-supposed-engage.
Pigou, A. C. The Economics of Welfare,. London: Macmillan and, 1920. "Program Will Provide Energy Financing for Connecticut's Commercial and Industrial
Customers." CLean Energy Finance and Investment Authority. June 27, 2012. Accessed April 06, 2013. http://www.ctcleanenergy.com/NewsEvents/PressRoom/tabid/118/ctl/ViewItem/mid/1364/ItemId/259/Default.aspx?SkinSrc=/Portals/_default/Skins/subpages/subpage_level0.
Rabe, Barry G. Statehouse and Greenhouse: The Stealth Politics of American Climate
Change Policy. Washington, D.C.: Brookings Institution, 2003.

153
Rabe, Barry. "Race to the Top: The Expanding Role of U.S. State Renewable Portfolio Standards." ," Prepared for the Pew Center on Global Climate Change, June 2006.
Rabe, Barry. "Race to the Top: The Expanding Role of U.S. State Renewable Portfolio
Standards." Center for Climate and Energy Solutions. June 2006. Accessed February 11, 2013. http://www.c2es.org/publications/race-top-expanding-role-us-state-renewable-portfolio-standards.
"Remarks by the President in State of the Union Address." The White House. Accessed
March 02, 2013. http://www.whitehouse.gov/the-press-office/remarks-president-state-union-address.
Schumpeter, Joseph A. Business Cycles. Vol. 1&2. New York: McGraw-Hill, 1939. Seel, Joachim, Galen Barbose, and Ryan Wiser. "Why Are Residential PV Prices in
Germany So Much Lower Than in the United States?" Lawrence Berkeley National Laboratory. February 2013. Accessed February 27, 2013. http://eetd.lbl.gov/ea/ems/reports/german-us-pv-price-ppt.pdf.
"SEIA." Research & Resources. Accessed March 09, 2013. http://www.seia.org/research-
resources/net-metering-state. Senate Resolution 98, 105 Cong. (enacted). Shahan, Zachary. "Solar Power Graphs to Make You Smile." CleanTechnica. June 06,
2012. Accessed January 13, 2013. http://cleantechnica.com/2011/06/10/solar-power-graphs-to-make-you-smile/.
Sherwood, Larry. IREC Historical Installation Data.xls. Raw data. Received Through
Email, New York. Shoemaker, Pete. "Basics of Photovoltaic (PV) Systems for Grid-Tied Applications."
Pacific Gas and Electric Company. Accessed March 29, 2012. http://www.pge.com/includes/docs/pdfs/shared/solar/solareducation/pv_basics.pdf.
Shogren, Jason F., Gregory M. Parkhurst, and Prasenjit Banerjee. "Two Cheers and a
Qualm for Behavioral Environmental Economics." Environmental and Resource Economics 46, no. 2 (February 27, 2010): 235-47. doi:10.1007/s10640-010-9376-3.
Singh, Parm Pal, and Sukhmeet Singh. "Realistic Generation Cost of Solar Photovoltaic
Electricity." Renewable Energy 35, no. 3 (March 2010): 563-69. doi:10.1016/j.renene.2009.07.020.

154
Sissine, Fred. CRS Report for Congress. Report no. 7-5700. March 07, 2012. Accessed February 17, 2013. http://www.fas.org/sgp/crs/misc/RS22858.pdf.
Smith, Adam. An Inquiry into the Nature and Causes of the Wealth of Nations. 4th ed.
Oxford: Clarendon Press, 1976. Smith, Stephen, and MJ Shiao. "Solar PV Balance of System (BOS) Markets:
Technologies, Costs and Leading Companies, 2013-2016." GTM Research. Accessed January 11, 2013. http://www.greentechmedia.com/research/report/solar-pv-bos-2013.
"Solar Carve-Outs in Renewables Portfolio Standards." DSIRE Solar Portal. Accessed
April 08, 2013. http://www.dsireusa.org/solar/solarpolicyguide/?id=21. Solar Institute. Energy Incentives: The Power Behind the Power. The George
Washington University. March 12, 2012. Accessed November 15, 2012. http://solar.gwu.edu/Research/GW_EnergyIncentives.pdf.
"Solar Maps." NREL: Dynamic Maps, GIS Data, and Analysis Tools -. Accessed
February 28, 2013. http://www.nrel.gov/gis/solar.html. Solow, Robert M. "Prize Lecture." The Official Website of the Nobel Prize. Accessed
February 02, 2013. http://www.nobelprize.org/nobel_prizes/economics/laureates/1987/solow-lecture.html.
Tol, Richard S.J. "The Marginal Damage Costs of Carbon Dioxide Emissions: An
Assessment of the Uncertainties." Energy Policy 33, no. 16 (November 2005): 2064-074. doi:10.1016/j.enpol.2004.04.002.
Tomain, Joseph P. "The Dominant Model of United States Energy Policy." University of
Cincinnative College of Law Faculty Articles and Other Publications. Accessed April 03, 2013. http://scholarship.law.uc.edu/fac_pubs/130/.
Trotta, Alan, and Christie Bradway. "Esults of the ZREC/LREC Solicitations."
Environmental Business Council New England. September 27, 2012. Accessed April 10, 2013. http://www.ebcne.org/fileadmin/pres/9-27-12_MASTER_Bradway_and_Trotta.pdf.
United Kingdom. Parliament. Prime Minister. Stern Review on the Economics of Climate
Change. By Nicholas Stern, Sir. Accessed October 27, 2012. http://webarchive.nationalarchives.gov.uk/+/http:/www.hm-treasury.gov.uk/sternreview_index.htm.
United States. Congress. Congressional Research Office. Renewable Energy R&D
Funding History: A Comparison with Funding for Nuclear Energy, Fossil Energy,

155
and Energy Efficiency R&D. By Fred Sissine. Vol. RS22858. Accessed January 26, 2013. http://www.fas.org/sgp/crs/misc/RS22858.pdf.
United States. Connecticut Senate and House of Representatives in General Assembly.
Public Act No. 11-80. Accessed March 29, 2013. http://www.cga.ct.gov/2011/act/pa/2011PA-00080-R00SB-01243-PA.htm.
The United States. Senate. Select Committee on Small Business. Energy Research and
Development and Small Business. By John Teem. Vol. 1. 94 Congress 1 Sess. Washington D.C.: Government Printing Office, 1975.
Unknown. "Vast Power of the Sun Is Tapped by Battery Using Sand Ingredient." New
York Times (New York), April 26, 1954. U.S. Department of Energy. Energy Information Administration. Annual Energy Review
2011. 2012. Accessed December 01, 2012. http://www.eia.gov/totalenergy/data/annual/pdf/aer.pdf.
"U.S. Energy Information Administration - EIA - Independent Statistics and Analysis."
Electric Power Annual 2011. Accessed October 10, 2012. http://www.eia.gov/electricity/annual/.
"U.S. Energy Information Administration - EIA - Independent Statistics and Analysis."
Electric Power Annual 2011. Accessed October 10, 2012. http://www.eia.gov/electricity/annual/.
"U.S. Solar Market Grows 76% in 2012; Now an Increasingly-Competitive Energy
Source for Millions of Americans Today." SEIA. March 13, 2013. Accessed April 12, 2013. http://www.seia.org/news/us-solar-market-grows-76-2012-now-increasingly-competitive-energy-source-millions-americans.
Volden, Craig, Michael M. Ting, and Daniel P. Carpenter. "A Formal Model of Learning
and Policy Diffusion." American Political Science Review 102, no. 03 (2008). doi:10.1017/S0003055408080271.
Vote Solar. "Freeing the Grid Report 2013." Freeing the Grid. January 2013. Accessed
January 06, 2013. http://freeingthegrid.org. Washington., Keith Bradsher And Matthew L. Wald; Keith Bradsher Reported From
Hong Kong And Matthew L. Wald From. "A Measured Rebuttal to China." The New York Times. March 21, 2012. Accessed December 04, 2012. http://nytimes.com/2012/03/21/business/energy-environment/us-to-place-tariffs-on-chinese-solar-panels.html.

156
Wei, Max. "Putting Renewables to Work: How Many Jobs Can the Clean Energy Industry Create." Energy Policy 38, no. 2 (2010). Accessed January 12, 2013. http://rael.berkeley.edu/node/585.
Wilson, Woodrow. Constitutional Government in the United States. New York:
Columbia Univ. Pr., 1921. Wiser, Ryan, Galen Barbose, and Edward Holt. "Supporting Solar Power in Renewables
Portfolio Standards: Experience from the United States." Energy Policy 39, no. 7 (2011): 3894-905. doi:10.1016/j.enpol.2010.11.025.
"Won't You Be My Solar-panel-buying Neighbor? | Crosscut.com." Clean Technica.
December 19, 2012. Accessed February 13, 2013. : http://cleantechnica.com/2012/12/19/chart-german-pv-capacity-50-of-peak-summer-demand-us-pv-capacity-0-5-of-peak-summer-demand.
"Xcel Community Solar: Community Solar, Solar Farms, Solar Gardens, Community-
based Renewable Energy." Xcel Community Solar: Community Solar, Solar Farms, Solar Gardens, Community-based Renewable Energy. Accessed March 30, 2013. http://www.coloradocommunitysolar.com/.
Yergin, Daniel. The Prize: The Epic Quest for Oil, Money, and Power. New York: Simon
& Schuster, 1991. Yohe, Gary. "More Trouble for Cost-Benefit Analysis." Climatic Change 56, no. 3
(February 2003): 235-44. Yohe, Gary W., and Richard S. J. Tol. "The Stern Review and the Economics of Climate
Change: An Editorial Essay." Climatic Change 89, no. 3-4 (2008): 231-40. doi:10.1007/s10584-008-9431-z.
Zahodiakin, Phil. "Connecticut Auction Cuts Clean Energy Costs While Providing a
Template for Other States." AOL Energy. December 7, 2012. Accessed April 11, 2013. http://energy.aol.com/2012/12/07/connecticut-auction-cuts-clean-energy-costs-while-providing-a-te/.
Zweibel, Ken. "Should Solar Photovoltaics Be Deployed Sooner Because of Long
Operating Life at Low, Predictable Cost?" Energy Policy 38, no. 11 (2010): 7519-530. doi:10.1016/j.enpol.2010.07.040.