The arrival of the tipping point of solar photovoltaic technology
108
The arrival of the tipping point of solar photovoltaic technology Ying Yang Mälardalen University Doctoral Dissertation 334
-
Upload
khangminh22 -
Category
Documents
-
view
1 -
download
0
Transcript of The arrival of the tipping point of solar photovoltaic technology

Yin
g Ya
ng
THE A
RR
IVA
L OF TH
E TIPP
ING
PO
INT O
F SOLA
R PH
OTO
VO
LTAIC
TECH
NO
LOG
Y 2021
ISBN 978-91-7485-503-6 ISSN 1651-4238
Address: P.O. Box 883, SE-721 23 Västerås. SwedenAddress: P.O. Box 325, SE-631 05 Eskilstuna. SwedenE-mail: [email protected] Web: www.mdh.se
The arrival of the tipping point of solar photovoltaic technologyYing Yang
Mälardalen University Doctoral Dissertation 334

Mälardalen University Press DissertationsNo. 334
THE ARRIVAL OF THE TIPPING POINT OFSOLAR PHOTOVOLTAIC TECHNOLOGY
Ying Yang
2021
School of Business, Society and Engineering
Mälardalen University Press DissertationsNo. 334
THE ARRIVAL OF THE TIPPING POINT OFSOLAR PHOTOVOLTAIC TECHNOLOGY
Ying Yang
2021
School of Business, Society and Engineering
1

Copyright © Ying Yang, 2021ISBN 978-91-7485-503-6ISSN 1651-4238Printed by E-Print AB, Stockholm, Sweden
Copyright © Ying Yang, 2021ISBN 978-91-7485-503-6ISSN 1651-4238Printed by E-Print AB, Stockholm, Sweden
2

Mälardalen University Press DissertationsNo. 334
THE ARRIVAL OF THE TIPPING POINT OF SOLAR PHOTOVOLTAIC TECHNOLOGY
Ying Yang
Akademisk avhandling
som för avläggande av filosofie doktorsexamen i industriell ekonomi och organisation vid Akademin för ekonomi, samhälle och teknik kommer att offentligen försvaras
fredagen den 30 april 2021, 09.00 i R1-343 + (via Zoom), Mälardalens högskola, Västerås.
Fakultetsopponent: Professor Reinhard Madlener, RWTH Aachen University
Akademin för ekonomi, samhälle och teknik
3

AbstractSolar photovoltaic (PV) technology has become well-established for addressing both greenhouse gas emission reductions and regional air pollution. Rapid developments within the solar PV sector are still facing various technical barriers, economic impediments, and institutional barriers. The technical system innovations and their uses in society co-evolve with the engagement of multi-actors between scientific communities, users, investors, policymakers, and other stakeholders. Therefore, a holistic and interdisciplinary approach is called to analyze the complexities and solve the issues.
This doctoral thesis takes a social science perspective in conjunction with technical considerations. China is a major producer and market for solar PV. But it is still not clear that how economically competitive solar PV electricity is, compared with the traditional coal-fired power generation without subsidies. Compared with China, the energy transition in Sweden has been progressively proceeding, which enables it to build a low-carbon economy with the lowest share of fossil fuels in the primary energy supply. An interesting part is to explore how solar PV applications, along with smart city transformation, change the electricity market logic with the emerging of new actors. Further, it is vital to assess the potential availability of solar applications for policymaking and grid accommodation.
In this thesis, economic feasibility, grid party capability, and investment values in the market of China are modeled, calculated, and analyzed. The geographical and technical potential of solar PV applications is explored in Sweden. Also, based on a Service-Dominant logic perspective, the new players and their roles in the transformation of smart cities are explored, using the Swedish electricity market as an example. The results of the grid parity analysis show that distributed solar PV projects have reached a tipping point of cost-effectiveness, when solar PV can be guaranteed to be competitive with conventional power sources in the context of a subsidy-free in China. This also implies a gradual replacement of currently operating coal power plants. The investment return examination shows that profitability levels vary from city to city, taking into account local resource endowments and local economic conditions. By highlighting the flexibility issues associated with integrating a higher percentage of solar power, key performance indicators are presented to assess the performance of current individual technology components and combined system modules. Zooming out to the macro level, we show the theoretical explanation of how the Swedish electricity market is being changed by renewable energies and the emergence of new actors.
ISBN 978-91-7485-503-6ISSN 1651-4238
4

This thesis is dedicated to my family.
This thesis is dedicated to my family.
5

Acknowledgement
This doctoral thesis was conducted at the School of Business, Society and En-
gineering, Mälardalen University, Västerås, Sweden. I gratefully
acknowledge the financial support from the China Scholarship Council, and
The Swedish (National) Research School of Management and Information
Technology.
I would like to express my profound gratitude toward my supervisors Pro-
fessor Jinyue Yan, Associate Professor Peter Ekman, and Professor Ulf An-
dersson for the continuous support. Thank you for giving me the opportunity
to pursue my Ph.D., and your invaluable guidance, support, and encourage-
ment have been excellent! I am grateful that you fundamentally challenged
me on this journey and made it a truly rewarding experience.
My deep and sincere gratitude goes to my senior colleague and co-author
Associate Professor Pietro Elia Campana for his continuous comments, guid-
ance, and patience in reviewing my papers. Pietro, thank you for taking the
time to help me, give constructive criticism and positive appreciation, and
drive me to higher standards. I would like to pay tribute to Dr. Bengt Stridh
and Dr. Yang Zhang, for their vast knowledge and comments, which led to the
successful completion of my research work. I thank my fellow Ph.D. candi-
dates at the School of Business, Society and Engineering. You have given to
and shared in my time as a Ph.D. student. Special thanks are due to my admin-
istrative colleagues for your seamless administrative support.
I acknowledge the friends from Agape and La Familia, who mean a lot to
me, for accompanying me, feeding me, sharing life with me, and helping me
grow in faith. My friends in China have also been a major source of support.
I could not have made it through the journey on my own without them being
aside. I would like to express my wholehearted gratitude to my friend Pelle.
Your wisdom, warm-heartedness, and care carry a special depth to me.
I would like to give very special thanks to my parents, parents-in-law, and
siblings for supporting me throughout this process and throughout my life in
general. Thank you, my mom and dad, who have always given me the liberty
to pursue what I desire with the selfless love and care. Ultimately, this would
have been impossible without my husband and my best friend Johannes. You
are always around at times with love. You are the one whom I can depend on,
share hardships with, and celebrate each accomplishment with. Most im-
portantly, I thank God for the numerous blessings He has bestowed upon me
throughout my journey.
6

Summary
Solar energy is one of the best options for meeting future energy needs be-
cause of its advantages in terms of availability, accessibility, efficiency, and
cost-effectiveness compared to many other energy sources. Solar photovoltaic
(PV) technology has become well-established for addressing both greenhouse
gas emission reductions and regional air pollution. As one of the main drivers
of the energy transition, an in-depth understanding of the characteristics and
economics of the solar industry is needed in order to integrate with policy
interventions. Rapid developments within the solar technology sector are still
facing various technical barriers, economic impediments, and institutional
barriers. The technical system innovations and their uses in society co-evolve
with the engagement of multi-actors between scientific communities, users,
investors, policymakers, and other stakeholders. Therefore, a holistic and in-
terdisciplinary approach is called to analyze the complexities and solve the
issues.
This doctoral thesis takes a social science perspective in conjunction with
technical considerations. In recent years, there has been growing concern
about solar tariffs in China, not only as a major producer but also as a major
market for solar PV. Advances in technology and declining costs have driven
significant cuts in solar subsidies by the authorities. The cost of solar PV is
influenced by many local factors, so it is a challenge to know whether China
has reached the threshold for grid-connected solar PV systems to supply elec-
tricity to end-users at the same price as grid-supplied electricity or desulfu-
rized coal electricity or even lower. Further raised question is how economi-
cally competitive solar PV electricity is, compared with the traditional coal-
fired power generation.
Compared with China, the energy transition in Sweden has been progres-
sively proceeding, which enables it to build a low-carbon economy with the
lowest share of fossil fuels in the primary energy supply. Sweden's energy
transition has been achieved through information and communication technol-
ogies, policy frameworks, and market instruments that have been able to fun-
damentally change society and the actors within it. Smart cities are therefore
relevant as a context for articulating the market transformation with regard to
revising the understanding of actor roles, resources and business logic that is
relevant for understanding the smart city transition. An interesting part is to
explore how smart city transformation changes energy market logic with the
emerging of new actors in the Swedish electricity market.
7

In this thesis, economic feasibility, grid party capability, and investment
values in the market of China are modeled, calculated, and analyzed. The ge-
ographical and technical potential of solar PV applications is explored in Swe-
den. Also, based on a Service-Dominant logic perspective, the new players
and their roles in the transformation of smart cities are explored, using the
Swedish electricity market as an example. The results of the grid parity anal-
ysis show that distributed solar PV projects have reached a tipping point of
cost-effectiveness, when solar PV can be guaranteed to be competitive with
conventional power sources in the context of a subsidy-free in China. This
also implies a gradual replacement of currently operating coal power plants.
The investment return examination shows that profitability levels vary from
city to city, taking into account local resource endowments and local economic
conditions. By highlighting the flexibility issues associated with integrating a
higher percentage of solar power, key performance indicators are presented to
assess the performance of current individual technology components and com-
bined system modules. This is achieved by quantifying the system perfor-
mance in four different categories, i.e. technical, economic, environmental,
and social/policy. Zooming out to the macro level, it shows the theoretical
explanation of how the Swedish electricity market is being changed by renew-
able energies and the emergence of new actors.
8

Sammanfattning
Solenergi är ett av de bästa alternativen för att tillgodose framtida energi-
behov på grund av dess fördelar när det gäller tillgänglighet, tillgänglig-
het, effektivitet och kostnadseffektivitet jämfört med många andra ener-
gikällor. Solceller (PV) har blivit väletablerade för att hantera både mins-
kade utsläpp av växthusgaser och regional luftförorening. Som en av de
viktigaste drivkrafterna för energiövergången behövs en djupgående för-
ståelse för solindustrins egenskaper och ekonomi för att integreras med
politiska ingripanden. Den snabba utvecklingen inom soltekniksektorn
står fortfarande inför olika tekniska hinder, ekonomiska hinder och in-
stitutionella hinder. De tekniska systeminnovationerna och deras använd-
ning i samhället utvecklas tillsammans med engagemanget av flera aktö-
rer mellan vetenskapssamhällen, användare, investerare, beslutsfattare
och andra intressenter. Därför kallas ett holistiskt och tvärvetenskapligt
tillvägagångssätt för att analysera komplexiteten och lösa problemen.
Denna doktorsavhandling tar ett samhällsvetenskapligt perspektiv i
samband med tekniska lösningar. Under de senaste åren har det funnits en
växande oro kring ökat oro kring solavgifter i Kina, inte bara som en stor
producent utan också som en stor marknad för solceller. Framsteg inom
teknik och sjunkande kostnader har lett till betydande minskningar av sol-
bidragen från myndigheter. Kostnaden för solceller påverkas av många
lokala faktorer, så det är en utmaning att veta om Kina har nått tröskeln
för nätanslutna solcellssystem att leverera el till slutanvändare till samma
pris som elnätet eller avsvavlat kol el eller ännu lägre. Ytterligare en upp-
dragen fråga är hur ekonomiskt konkurrenskraftig solcellsenergi är jäm-
fört med traditionell koleldad kraftproduktion.
Jämfört med Kina har energiövergången i Sverige successivt fortgått,
vilket gör det möjligt att bygga en koldioxidsnål ekonomi med den lägsta
andelen fossila bränslen i primärenergiförsörjningen. Sveriges energiö-
vergång har uppnåtts genom informations- och kommunikationsteknik,
policyramar och marknadsinstrument som har kunnat förändra samhället
och aktörerna inom det. Smarta städer är därför relevanta som ett sam-
manhang för att formulera marknadsomvandlingen när det gäller att revi-
dera förståelsen för aktörsroller, resurser och affärslogik som är relevant
för att förstå smartstadens övergång. En intressant del är att utforska hur
smart stadsomvandling förändrar energimarknadslogiken med nya aktö-
rer på den svenska elmarknaden.
9

I denna avhandling modelleras, beräknas och analyseras ekonomisk
genomförbarhet, kapacitet för rutnät och investeringsvärden på Kinas
marknad. Den geografiska och tekniska potentialen för solcelleanlägg-
ningar undersöks i Sverige. Baserat på ett Service-Dominant logikper-
spektiv utforskas också de nya aktörerna och deras roller i omvandlingen
av smarta städer med den svenska elmarknaden som ett exempel. Resul-
taten av nätparitetsanalysen visar att distribuerade solcellsprojekt har nått
en brytpunkt för kostnadseffektivitet när solceller kan garanteras vara
konkurrenskraftiga med konventionella kraftkällor i samband med fria
subventioner Kina. Detta innebär också en gradvis ersättning av nuva-
rande kolkraftverk. Investeringens avkastningsundersökning visar att lön-
samhetsnivåerna varierar från stad till stad med hänsyn till lokala resurser
och lokala ekonomiska förhållanden. Genom att lyfta fram de flexibili-
tetsproblem som är förknippade med att integrera en högre andel solkraft
presenteras viktiga prestandaindikatorer för att bedöma prestandan hos
nuvarande enskilda teknikkomponenter och kombinerade systemmodu-
ler. Detta uppnås genom att kvantifiera systemets prestanda i fyra olika
kategorier, dvs. teknisk, ekonomisk, miljömässig och social/politik. Ge-
nom att zooma ut till makronivå visar det den teoretiska förklaringen till
hur den svenska elmarknaden förändras genom förnybar energi och fram-
växten av nya aktörer.
10

List of Papers
This thesis is based on the following papers, which are referred to in the text
by their Roman numerals.
I Yan J, Yang Y*, Campana PE, He J. City-level analysis of sub-
sidy-free solar photovoltaic electricity price, profits and grid par-
ity in China. Nature Energy. 2019 Aug;4(8):709-17.
II Yang Y*, Campana PE, Yan J. Potential of unsubsidized distrib-
uted solar PV to replace coal-fired power plants, and profits clas-
sification in Chinese cities. Renewable and Sustainable Energy
Reviews. 2020 Oct 1;131:109967.
III Ekman P, Röndell J, Yang Y. Exploring smart cities and market
transformations from a Service-Dominant logic perspective. Sus-
tainable Cities and Society. 2019 Jul 25:101731.
IV Yang Y*, Jurasz J, Li H, Syrri A, Yan J. Key performance indi-
cators on flexibility of a multi-energy system. Applied Energy
Symposium: Low carbon cities and urban energy systems (CUE).
2019 Oct, Xiamen University, Fujian, China.
V Yang Y*, Campana PE, Stridh B, Yan J. Potential analysis of
roof-mounted solar photovoltaics in Sweden. Applied Energy.
2020 Dec 1;279:115786.
List of papers not included in this thesis
VI Yang Y, Zhang Y, Campana PE, Yan J. Peak-shaving and profit-
sharing model by Aggregators in residential buildings with PV:
a case study in Eskilstuna, Sweden. Energy Procedia. 2017 Dec
1;142:3182-93.
VII Zhang Y, Campana PE, Yang Y, Stridh B, Lundblad A, Yan J.
Energy flexibility from the consumer: Integrating local electric-
ity and heat supplies in a building. Applied Energy. 2018 Aug
1;223:430-42.
VIII Zhang Y, Campana PE, Yang Y, Lundblad A, Yan J. Energy
flexibility through the integrated energy supply system in build-
ings: a case study in Sweden. Energy Procedia. 2018 Jul
1;145:564-9.
11

IX Yang Y, Yan J. Potential roof area for photovoltaics in a Swedish
municipality. Applied Energy Symposium: MIT A+B, 2019 May,
Massachusetts Institute of Technology, Cambridge, USA.
X Syrri ALA, Bindner H, Li H, Jurasz J, Yan J, Yang Y. KPIs and
assessment procedure. European Union’s Horizon 2020 research
and innovation programme under grant agreement No 774309.
Ref. Ares(2019)3992146 - 24/06/2019.
12

Contents
Acknowledgement ..........................................................................................ii
Summary ....................................................................................................... iii
Sammanfattning .............................................................................................. v
List of Papers ................................................................................................vii
List of Figures ................................................................................................ xi
List of Tables ................................................................................................xii
Abbreviations .............................................................................................. xiii
Symbols ....................................................................................................... xiv
1 Introduction ........................................................................................... 1 1.1 Background .......................................................................................... 1 1.2 Research gaps and challenges .............................................................. 4 1.3 Scope and objectives ............................................................................ 6 1.4 Thesis contributions ............................................................................. 6 1.5 Thesis structure .................................................................................... 7
2 Previous studies ..................................................................................... 9 2.1 Subsidy and economics in solar PV industry ....................................... 9
2.1.1 Policy and subsidy in Chinese solar PV industry ......................... 9 2.1.2 Subsidy and economic analysis in the literatures ....................... 10
2.2 Flexibility in the electricity system .................................................... 13 2.3 New market actor - aggregator ........................................................... 15 2.4 Service-Dominant logic ...................................................................... 18 2.5 The geographical and technical potential availability ........................ 21
3 Methods ............................................................................................... 24 3.1 Economic viability indices ................................................................. 24
3.1.1 Levelized Cost of Electricity and cost crossover ........................ 24 3.1.2 Levelized Profit of Electricity and other three indices ............... 25 3.1.3 Grid parity indices ...................................................................... 26
3.2 Monte Carlo Analysis ......................................................................... 27 3.3 K-means clustering algorithm ............................................................ 27
13

3.4 Case study and questionnaire survey .................................................. 30 3.4.1 Case study ................................................................................... 30 3.4.2 Questionnaire survey ................................................................ 31
3.5 Potential availability analysis ............................................................. 32 3.5.1 Usable roof area estimation ........................................................ 33 3.5.2 Configurations of PV module and energy conversion ................ 34
4 Results ................................................................................................. 37 4.1 Grid parity of user-side and plant-side (Paper I) ................................ 37 4.2 Investment profitability (Paper I & II) ............................................... 38 4.3 Electricity market in transformation (Paper III) ................................. 43
4.3.1 The traditional linear value chain market logic ...................... 43 4.3.2 The networked market and an emerging new role - aggregator . 46
4.4 Selected key performance indicators (Paper IV) ................................ 48 4.5 Potential availability analysis (Paper V) ............................................ 50
5 Discussions and policy implications .................................................... 55 5.1 “Soft” cost .......................................................................................... 55 5.2 “Additional cost” ................................................................................ 57 5.3 Self-consumption rate ........................................................................ 58 5.4 Capital subsidy ................................................................................... 59
6 Conclusions ......................................................................................... 62
7 Future work.......................................................................................... 66
References ..................................................................................................... 67
14

List of Figures
Figure 1. Schematic diagram showing the relationship between the research
topics and the papers. ......................................................................... 6 Figure 2. Historical policies and installed capacity of China's solar PV
industry. ........................................................................................... 10 Figure 3. The narrative and process of S-D logic. ........................................ 19 Figure 4. Categorization of clustering algorithms. ....................................... 28 Figure 5. K-means clustering algorithm procedure in Paper II. .................... 29 Figure 6. Summary of KPI categories, stakeholders and their roles. ............ 31 Figure 7. Schematic diagram of the required distance between rows of solar
panels in scenario A. ........................................................................ 35 Figure 8. East-West orientation configuration with a low tilt angle in
scenario C. ....................................................................................... 36 Figure 9. Grid Parity Indices for distributed PV projects in 344 cities without
subsidies. .......................................................................................... 38 Figure 10. Economic feasibility and profitability of solar PV in 344 cities
without subsidies. ............................................................................. 39 Figure 11. Current running coal-fired power plants cost-risk levels and city
number percent in China and the US. .............................................. 40 Figure 12. The four cost-risk levels of current coal-fired power plants and
their corresponding cities in China. ................................................. 41 Figure 13. Four city clusters of distributed solar PV investment-profits. ..... 42 Figure 14. A simplified illustration of the Swedish energy system’s
traditional linear value chain market logic. ...................................... 45 Figure 15. A future smart and dynamic networked market logic. ................ 47 Figure 16. The percent of electricity losses using different row distances and
tilt angles due to mutual shading. .................................................... 51 Figure 17. The potential area for roof-mounted solar PV systems (a), and the
potential installed capacity on pitched roofs and flat roofs with three
scenarios (b-d). ................................................................................. 53 Figure 18. Different self-consumption rates of 0%, 25%, 50%, 75% and
100% impact economic performances. ............................................ 59 Figure 19. The historical direct subsidy percent and the budgets for solar
industry. ........................................................................................... 60
15

List of Tables
Table 1. The S-D logic foundational premises. ............................................ 18
Table 2. Summary results of statistical parameters. (T: technology, En:
environmental, Ec: economics, S/P: social/policy) ........................ 48
Table 3. Five most important KPIs without categories. ................................ 49
Table 4. The selected KPIs from the questionnaire analysis in different
categories. ....................................................................................... 49
Table 5. The usable area, potential installed capacity, and electricity
generation for pitched roofs. ........................................................... 50
Table 6. The usable area, potential installed capacity, and electricity
generation for flat roofs in three scenarios. .................................... 52
16

Abbreviations
BiPV Building Integrated with Photovoltaics
CF cash flow
CV coefficient of variation
DCB desulfurized coal benchmark price
DPBP discounted payback period
DSM digital surface models
DSO distribution system operator
DR demand response
EV electric vehicle
FiT feed-in tariff
FP foundational premise
GHG greenhouse gasses
GIS Geographic Information System
GPIp grid parity index of the plant-side
GPIu grid parity index of the user-side
ICT information and communications technology
IRR internal rate of return
I&C industrial and commercial
KPI key performance indicator
LCOE levelized cost of electricity
LiDAR Light Detection and Ranging
LPOE levelized profit of electricity
MCA Monte Carlo Analysis
MP electricity market purchasing price
NDRC National Development and Reform Commission
NEA National Energy Administration
NPV net present value
PF Packing Factor
PV photovoltaic
STD standard deviation
S-D Service-Dominant
TSO transmission system operator
VAT Value-added Tax
ZIP Zoning Improvement Plan
17
Symbols
a , b the 𝑎𝑡ℎ and 𝑏𝑡ℎ iteration (a ≠ b)
A𝑟𝑜𝑜𝑓 surface roof area (𝑘𝑚2)
𝐴𝑏𝑎𝑠𝑒 base area (𝑘𝑚2)
𝐴𝑏𝑎𝑠𝑒𝑚 building base area of the 𝑚𝑡ℎ municipality (𝑚2)
𝐴𝑝𝑣𝑆𝐸 usable area for roof-mounted PV systems in Sweden (𝑘𝑚2)
𝑐𝑘(𝑎)
, 𝑐𝑘(𝑏)
the cluster k at 𝑎𝑡ℎ or 𝑏𝑡ℎ iteration
𝐶𝐹0 initial investment
𝐶𝐹1, 𝐶𝐹2, … 𝐶𝐹𝑡 cash flow of year 1, 2, … , 𝑡
𝐶1(1)
,
𝐶2(1)
, …,𝐶4(1)
the center for initial cluster 1, 2, …, 4
𝑑 distance between the front row and the back row of PV panels
(meter)
d(p, q) the Euclidean Distance
𝑘 the 𝑘𝑡ℎ cluster, k =1,2,...,4
𝑙 width of a solar PV panel (meter)
𝑚 length of the ridge (meter)
m(p, q) the Mahalanobis Distance
mu municipality, mu = 1,2,3 … ,290
𝑁𝑣𝑜𝑡𝑒 normalized numbers of votes
𝑁𝐶𝑉 normalized Coefficient of Variation
𝑝 length of counter beam (meter)
𝑞 length of the hanging beam (meter)
𝑟 discount rate for 𝑡 (%)
𝑟𝑓𝑙𝑎 orientation role for flat roofs
𝑟𝑛_𝑝𝑖𝑡 orientation role for not-applicable orientations
𝑟𝑢_𝑝𝑖𝑡 orientation role for applicable orientations
𝑅𝑓𝑙𝑎 flat roof percentage (%)
𝑅𝑛_𝑝𝑖𝑡 not-applicable orientations for solar PV installations (%)
𝑅𝑢_𝑝𝑖𝑡 applicable orientations for solar PV installations (%)
𝑅𝑛, 𝑅𝑛𝑒, 𝑅𝑛𝑤 orientation of North, North East, and North West, respectively (%)
18

𝑅𝑠, 𝑅𝑠𝑤,
𝑅𝑠𝑒, 𝑅𝑤, 𝑅𝑒
orientation of South, South West, South East, West, and East, re-
spectively (%)
𝑡 the year t
𝑇 life of the project (years)
𝑈𝑜𝑟𝑖 utilization factor of orientation
𝑈𝑜𝑟𝑖𝑖𝑛𝑑 utilization factor of orientation for industrial buildings
𝑈𝑜𝑟𝑖𝑛𝑜𝑛_𝑖𝑛𝑑
utilization factor of orientation for non-industrial buildings
𝑈𝑠𝑜 utilization factor due to shadows and obstacles
𝑈𝑠𝑜𝑖𝑛𝑑 utilization factor due to shadows and obstacles for industrial build-
ings
𝑈𝑠𝑜𝑛𝑜_𝑖𝑛𝑑
utilization factor due to shadows and obstacles for non-industrial
buildings
𝑈𝑎𝑏𝑠𝑖𝑛𝑑 percent of absolute reduction on industrial buildings
𝑈𝑎𝑏𝑠𝑛𝑜𝑛_𝑖𝑛𝑑
percent of absolute reduction on non-industrial buildings
𝑥1, 𝑥2, … , 𝑥𝑘 risk factors for Monte Carlo Analysis
𝑥𝑝𝑖, 𝑥𝑞𝑖 p, q are any two points, p, q =1,2,…,344. i is the dimension (i.e.
LPOE, NPV, IRR, and DPBP), i =1,2,…,4
𝑌 financial indicators of investment projects
𝑍 the calculated KPI value
𝛼 solar altitude (or elevation) angle (°)
𝛼𝑟𝑜𝑜𝑓 slope angle of the roof (°)
𝛼𝑓𝑙𝑎𝑡 slope angle of the flat roofs (°)
𝛼𝑝𝑖𝑡 slope angle of the pitched roofs (°)
𝛽 tilt angle of PV module (°)
𝛽𝑜𝑝𝑡 optimal tilt angle of PV module (°) in scenario A
𝜃𝑧 solar zenith angle (°)
𝛾 solar azimuth angle (°)
𝛿 earth’s declination (°)
𝜙 latitude (°)
𝜔 hour angle (°)
𝜎 the standard deviation
𝜇 the mean
19

1
1 Introduction
This chapter presents the background of the study, the research questions for-
mulated based on the research gaps, scope and objectives, contributions, and
the structure of the thesis. The relationship between the research topics and
the papers is also described.
1.1 Background
Human concerns about fossil fuel depletion, energy security, and environmen-
tal degradation have led to an increasing demand for renewable energy
sources. Currently, fossil fuels still account for 87% of the global primary sup-
ply, but the overall share of renewable energy is about to reach 10% (Armaroli
and Balzani, 2016). Solar energy is considered to be a non-polluting, reliable,
and clean energy source. The adoption of solar energy technology has signif-
icantly alleviated and mitigated the problems associated with air pollutants
and greenhouse gas emissions compared to fossil fuel-based power genera-
tion. Solar photovoltaic (PV) technology, as one of the emerging technologies,
has received increasing attention from academia and industry.
The energy transition is a pathway toward the transformation of the global
energy sector which requires urgent action on a global scale. Some countries,
such as China and Sweden, are expected to take the lead on the global efforts
to achieve clean energy and greenhouse gas emissions reduction. China has
made energy transition a long-term strategy and achieved consistent and meas-
urable progress over the past years. Whereas, Sweden is helping lead the way
and is for the third year in a row ranked number one in the global Energy
Transition Index (Bocca, 2020). For China, it is imperative to explore the eco-
nomic viability of unsubsidized solar energy and the profitability of invest-
ments to assess the inclusion of renewables. At the other end of the spectrum,
Sweden is faced with the integration of renewable energy into the current en-
ergy market and the transition to smart cities. In Sweden, a new era of power
systems marked by large-scale renewables is dawning. The energy transition
will be achieved through information and communication technology (ICT),
smart technologies, policy frameworks, and market instruments that can fun-
damentally change society and the players in it. In the regional evaluation,
Sweden scored high in several relevant areas such as innovativeness, infor-
mation and communications technology, and sustainability (Strand, Freeman
20

2
and Hockerts, 2015), which makes it a suitable environment for understanding
the smart city transition.
China is strongly committed to reducing CO2 emissions from power gen-
eration by building and deploying renewable energy sources such as solar en-
ergy. As part of the Paris Agreement commitment, China has set a target to
increase the share of renewable energy and non-fossil fuel energy consump-
tion to 15% by 2020 and 20% by 2030 (Liu et al., 2018). In regards to the
decarbonization of China’s power system, renewable energy will account for
27% of China's total power generation by 2020 (Gosens, Kåberger and Wang,
2017) (National Development and Reform Commission (NDRC) and National
Energy Administration (NEA), 2016). Remarkable progress has been made in
this by deploying 23%-33% renewable energy in the electricity mix during the
first three quarters of 2020 (International Energy Agency (IEA), 2020). Dur-
ing the same period, the electricity demand increased by 1.3%, and solar PV
power generation increased by 16.9%, regardless of the pandemic lockdown
measures being putting (National Energy Agency (NEA), 2020). The propor-
tion of solar PV electricity is increasing substantially every year, although it
still provides a relatively small share. China is the largest manufacturer of so-
lar PV, and with declining local costs, and potential co-benefits of reduced
pollution and health, domestic use of solar PV may rise even more dramati-
cally in the near future.
While market reforms have addressed some of China's previous problems
in integrating solar energy, the power of administrative measures continues to
actively intervene in the market with various government policies and incen-
tives. Since 2018, the authorities have issued numerous regulations that sig-
nificantly reduced the amount of subsidies on solar PV projects. Previously,
the subsidies were allocated based on the quantity of solar power generation,
rather than quality. The “531 New Policy” subsidy cuts in 2018 were a clear
signal from the government that the solar PV industry needs to reduce its re-
liance on subsidies and shift its focus from scale growth to quality improve-
ment. At the beginning of 2019, however, the government proposed subsidy-
free grid parity for PV electricity. As such, the Chinese solar market is moving
from subsidy-driven towards unsubsidized grid parity. Grid parity is a tipping
point for the diffusion of solar PV technology. In China, the potential for such
grid parity exists due to innovations in solar PV technology and declining
costs. However, there are few uniform conclusions from previous studies as
to whether and when grid parity can be achieved for solar PV. Future research
opportunities exist to explore the required system and financial costs associ-
ated with grid parity. The attractive economics of solar and other renewable
resources present a challenge to coal-fired generation. Cost is often a major
consideration when planning the transition from coal-fired generation to green
power. It is worth comparing the costs of unsubsidized solar PV and coal-fired
generation to meet the goals of the energy transition.
21

3
The concept of "smart" refers to a forward-looking approach (Chourabi et
al., 2012), where smart cities are composed of a smart economy, people, gov-
ernance, mobility, and environment. It is reasonable to assume that smart cit-
ies may also need to include the concept of "smart markets", which should be
understood beyond traditional neoclassical economics. Sweden has surpassed
the environmental targets set by the EU with an explicit goal of reaching 60%
of renewable energy systems by 2030. The adoption of renewable energies,
such as solar PV power, wind power, hydropower, is closely related to the
initiatives and growth of smart cities. On the other hand, the introduction of
renewable energy brings transitional challenges and new possibilities to the
existing electricity market in Sweden. It alters the roles of traditional market
actors as well as business models. For example, the distributed solar PV ap-
plication transforms customers of different kinds, e.g. households, companies,
and public organizations, from being “pure” consumers to producers. With the
varying availability of solar energy and unstable consumption profiles, the
balance of electricity demand and supply becomes unbalanced. The electricity
prices become more volatile, subject to the changes of supply and demand.
Power system operations, managerial control, and new forming laws and reg-
ulations in regard to distributed renewable electricity require an enhanced un-
derstanding of market logic. In summary, it is of interest to explore how Swe-
den's adoption of solar and other renewable energy sources changes the market
- a change associated with smart cities that incorporate multiple technologies
and services - involving a revised understanding of actors' roles, resources,
and business logic.
A co-evolving set of economic and technical developments have built suf-
ficient momentum for solar PV technology to become accepted as an estab-
lished part of the energy provision system. Extensive efforts are being made
to explore the role of solar PV technologies in the energy transition and smart
city transformation. It is usually associated with the implementation of tech-
nology in order to solve urban problems with a holistic and interdisciplinary
approach. Grubler et al. defined energy transition as "a change in the state of
the energy system" rather than a change in individual energy technologies or
fuel sources (Grubler, Wilson and Nemet, 2016). Similarly, smart city trans-
formation needs to be considered from a broader economic, environmental,
technological, and social perspective to address urban sustainability issues and
improve the quality of urban services (Ekman and Lindh, 2013) (Giourka et
al., 2020). The natural science in complex energy systems draws on wider
insights across different disciplines. In particular, the techno-economic frame-
work illustrates this point clearly. The techno-economic analysis is rooted in
energy systems analysis and various domains of economics, and it focuses on
energy systems and energy deliver services valued by people (Cherp et al.,
2018). In the theories and models of techno-economic analysis, the physical
production and consumption of energy and the trade of services in energy
markets are intertwined.
22

4
1.2 Research gaps and challenges
The advancement in solar panel technology, driven by the efficiency break-
throughs of cell materials from silicon to perovskites (Honrubia-Escribano et
al., 2018), has facilitated the adoption of solar PV systems at increasingly
competitive costs. Supportive policies from central and local governments -
including the solar PV national Feed-in Tariff (FiT) program, financial fund-
ing and services, demonstration projects, grid access support, and favorable
tax and other measures (Zhao, Wan and Yang, 2015) (Long, Cui and Li, 2017)
- have played an important role in stimulating and attracting investment in the
solar PV industry. However, there is a knowledge gap in large-scale and high-
resolution market analysis, especially in the context of subsidy-free in coun-
tries, for example in China, with considerable geographical differences. Re-
searchers point out that subsidies are an important tool used by governments
to intervene in specific industries, which is one of the main factors contrib-
uting to solar PV growth and overcapacity (Wang, Luo and Guo, 2014) (Zhang
et al., 2016). They also recommend a prudent reform of the subsidy policy for
solar companies. Is it time to withdraw subsidies? A large body of literature
has examined the technological progress and social equity of solar power as
an alternative to coal. However, little effort has been made in terms of eco-
nomic competitiveness and affordability at the large-scale city level in a sub-
sidy-free context. Thus, the first research question is: how do subsidy-free
solar PV projects in China compete economically with conventional coal-
fired generation? (RQ1).
The reduction and the elimination of subsidies in the near future would re-
shuffle China’s solar PV industry, so that only the most technologically ad-
vanced and economically competitive companies can thrive. For solar PV
companies that used to factor subsidies into their revenues, this creates a great
deal of uncertainty because investment and entrepreneurial behavior may
change in response to the policy changes. As a result, this necessitates the
investment evaluation of solar PV projects in China (Ming et al., 2014). Some
researchers have studied the cost-benefit of solar PV projects in China. How-
ever, they focus on the current status of individual solar PV projects/systems
(Wei, Liu and Yang, 2014), or on future scenarios for individual cities (Wang,
Zhou and Huo, 2014). The current study uses government subsidies as the
default parameter to evaluate investments (Wang, Zhou and Huo, 2014). Con-
sequently, their results lack comprehensive analysis of the investment poten-
tial of distributed solar PV projects in various Chinese cities, especially in a
zero-subsidy scenario. Based on this, the second research question is: how do
investment profits of unsubsidized solar PV projects differ from city to
city? (RQ2).
The expansion of small-scale solar applications enables flexible and alter-
native power to the consumers. However, the characters of being spatially dis-
tributed, highly variable, and less predictable thereby impose challenges to the
23

5
current power grid operators, electricity producers, and consumers. The cus-
tomers use the power grid as a means to balance their own generation of solar
electricity and their own demands. So that the power grids become their last
resource (to purchase) when the generation is unavailable. Meanwhile, the ex-
cess electricity is expected to be delivered back to the power grids and be
financially compensated. Due to the intermittent nature of solar electricity
generation, it creates unpredictable supplies and therefore unstable demands
to the electricity producers. To meet those needs, the power grids have to up-
grade the architecture, adopt new technologies, and operate in new ways. Nev-
ertheless, the unbalance between demand and supply makes the electricity
prices volatile. Increasingly, new market actors are needed to address the chal-
lenges including the technical integrations, new regulations, and new business
models. This is incorporated in the smart city transformation in Swedish prac-
tices, where the physical, ICT, business, social, and policy infrastructure are
connected to leverage the collective intelligence of a city. By providing valu-
able power services at scale and breaking regulatory arbitrage, aggregators
can help provide the desired level of customer engagement, value-added ser-
vices, and viable levels of power market unbundling. However, the use of ag-
gregators has mostly been studied as a black box in a single or several energy
systems, and their concepts and practices have not yet been developed or dis-
cussed at a more macro level. Therefore, the following research question is
posed: how do the solar PV applications change the Swedish electricity
market and alter the actor roles in the smart city transformation? (RQ3).
A reasonable assessment of the potential of solar PV energy is essential for
not only policymaking and urban planning, but also the fore-mentioned grid
capacity enhancement. Energy policymakers use this information to determine
whether additional and new types of subsidies are needed. For the power grid
operators and electricity producers, the estimation of potential solar power is
important in forecasting their production, the available capacity of solar power
injected into the grid, accommodation of peak power, and power distribution
& transmission. But the detailed information deficit has become an unfavora-
ble factor to them. Up to date, there is no comprehensive assessment of the
geographical and technical potential analysis regarding solar PV applications
in the Swedish built environment. We also need necessary and sufficient in-
formation, especially scientific and technical information, as a solid basis for
developing evidence-based policies for appropriate investments of public
funds. Therefore, the fourth research question is: what is the potential avail-
ability of solar PV energy in the Swedish built environment? (RQ4).
24

6
Figure 1. Schematic diagram showing the relationship between the research topics
and the papers.
Figure 1 is a schematic representation of the relationship between the re-
search questions and the papers. Associated with these research questions is
the need for increased commitment to interdisciplinary research with a holistic
perspective that can enable technological and policy interventions.
1.3 Scope and objectives
The overall objective of this thesis is to assess the economic feasibility and
potential of solar PV applications and to explore the new market actor and its
services in the era of energy transition. Corresponding to the raised research
questions, the specific goals include:
• investigating the economical competitivity of unsubsidized solar PV
systems at the city-level;
• estimating the investment profitability of unsubsidized solar PV sys-
tems at the city-level;
• analyzing the new emerging actor and new services brought by solar
energy in smart city transformation;
• evaluating potential geographical and technical availability and sub-
sidy feasibility of solar PV systems.
1.4 Thesis contributions
This thesis is unique in that it takes an interdisciplinary approach that inte-
grates the analysis of technical systems, economic feasibility, and policy in-
terventions. In this way, it goes further than conducting research based on only
25

7
one theoretical framework and actually contributes to the acquisition of new
knowledge that cannot be achieved using a non-interdisciplinary approach.
Corresponding to the appended papers, the main contributions of this thesis
consist of:
• developing an integrated framework between technical, economic,
and social components of solar PV energy;
• providing a detailed economic analysis with high-resolution data for
Chinese cities, and elaborating of an existing model (LCOE) to a new
model (LPOE) which can be universally used in the other research
works;
• proposing two new indicators and their calculation to measure the grid
parity, which can be universally used in the other research works;
• proposing the concept of a new market actor (aggregator) and its ser-
vices that smart cities need to incorporate;
• offering a new theoretical explanation of how smart city transfor-
mation changes the market logic and thus the prior of resource inte-
gration and actor roles;
• developing a comprehensive approach to assess the technical and ge-
ographical potential of roof-mounted solar applications in Sweden,
and revealing the availabilities to help policymaking, electricity
scheduling, and grid enhancement.
Especially, the Paper I was the first comprehensive study of the feasibility
of unsubsidized solar PV systems at the city-level. It theoretically drove the
solar PV industry to the tipping point, representing a key step in the expansion
of renewable energy sources. This grid parity was a critical milestone made
even more remarkable by the fact that the solar electricity costs estimated did
not include subsidies. The published results in 2019 were reported and shared
by over sixty international media, including CNN, Independent, Daily Mail,
Xinhua News, and other local media in China. Meanwhile, the National De-
velopment and Reform Commission (NDRC) and National Energy Admin-
istration (NEA) approved the first batch of 15 GW subsidy-free grid-parity
solar projects in 2019 and over 33 GW in 2020. Many studies started to em-
ploy the concept of “grid parity” in different scenarios that brought this topic
to a deeper level. The era of grid-parity of solar power has begun since then.
1.5 Thesis structure
This thesis is written based on the appended papers and contains the following
chapters:
26

8
Chapter 1 Introduction
To introduce the thesis background, research gaps and
challenges, scope and objectives, thesis contributions, and
thesis outline.
Chapter 2 Previous studies
To review the situation of the current maturity of solar PV
energy, the flexibility challenge, the Service-Dominant
logic, and the potential availability.
Chapter 3 Methods
To describe the methods, theory and models adopted to
answer the research questions.
Chapter 4 Results
To present the main results achieved in the appended pa-
pers of this thesis.
Chapter 5 Discussions and policy implications
To highlight the main discussion points and policy impli-
cations.
Chapter 6 Conclusions
To draw the main findings of this doctoral thesis.
Chapter 7 Future work
To define the limitations of this doctoral thesis and to in-
troduce the potential future research areas.
27

9
2 Previous studies
This chapter provides a summary of previous studies conducted on the follow-
ing topics: subsidy and economics in solar PV industry, flexibility in electric-
ity systems, the new actor and new services, Service-Dominant logic, and po-
tential availability analysis.
2.1 Subsidy and economics in solar PV industry
2.1.1 Policy and subsidy in Chinese solar PV industry
Policy support - including grid support, operation specification, and operation
supervision from central and local governments - is an important policy in-
strument available to governments for supporting renewable energy indus-
tries. Policy has played a critical role in China’s stunning achievements in the
fiercely competitive PV markets. There are, in total, over 300 renewable en-
ergy and PV industry policies that have been implemented from 1994 to 2020,
both nationally and regionally. Among them, there have been over 110 pieces
from the central government that specifically target the PV industry (Long,
Cui and Li, 2017).
In 2009, China launched two national solar subsidy programs: the Building
Integrated Photovoltaic (BiPV) (also known as the Solar Rooftop Program)
and the Golden Sun Demonstration Program. These programs were a clear
indication of China's commitment to supporting PV applications. In the first
solar subsidy program, BiPV subsidies covered 30% - 50% of the cost of the
PV system. And in the second program, a 50% investment subsidy was given
to solar power plants and related transmission and distribution systems that
were connected to the grid. In addition, a nationwide solar PV subsidy pro-
gram was first introduced in July 2011 shortly after these two programs, and
has been in place for nearly a decade now. It makes a significant contribution
to stimulating and attracting investment in the solar PV industry. Since then,
policy incentives have continued to be introduced to stimulate the develop-
ment of China's solar PV industry (Figure 2).
28

10
Figure 2. Historical policies and installed capacity of China's solar PV industry.
Solar PV is one of the more rapidly growing industries in China. China’s
13th Five Year Plan for Renewable Energy Development (2016 - 2020) set a
105-GW target for new solar PV capacity by 2020. This target was met almost
three years earlier, by the end of 2017. Cumulative installed capacity experi-
enced a more than 200-fold increase over the 2000 level and China grew into
world’s largest market. Subsidy is a major instrument of government expendi-
ture policy (Dong, Zhou and Li, 2021). It has sometimes been argued that the
concept of a subsidy is just too elusive. In the most general sense, a subsidy
can be defined as any government aid. In this study, we discuss the direct
government payments to PV system owners. In which, the “subsidy” refers to
the government financial support that raises the owners’ incomes beyond
those that would be earned without this intervention (Dong, Zhou and Li,
2021). We exclude other types of subsidies, such as credit subsidies, tax sub-
sidies, equity subsidies, in-kind subsidies, procurement subsidies, regulatory
subsidies, and so on.
2.1.2 Subsidy and economic analysis in the literatures
Illuminating studies were conducted in subsidy analysis in Chinese solar PV
projects with mainly four perspectives: 1) the evolution of subsidies, 2) the
effectiveness of subsidies, 3) the optimal design of subsidies, and 4) the exit-
ing occasion of subsidies.
Some studies used mostly qualitative methods to review the evolution of
subsidies on the PV industry, the type of subsidies, and learning from policy
implementation experiences. Zhang et al. (Zhang, Qin and Wei, 2019) sum-
marized and compared China’s distributed energy policies at national,
29

11
provincial, and municipal levels, from 1989 to 2016. They pointed out the
particularly abundant numbers and types regarding solar energy. They also
highlighted the challenges and proposed recommendations, accordingly.
Zhang et al. (Zhang, Andrews-Speed and Ji, 2014) conducted a similar study
by examining four phases of Chinese solar PV policy from the mid-1990s to
2013 and proposed a different combination of policy options for each phase.
Zhi et al. (Zhi et al., 2014) also examined the development of China's PV in-
dustry policy system around 1980 to 2013 and compared China's approach
with that of the United States, Germany, and Japan in terms of supply-side and
demand-side policies. The subsidies were integrated as one of the policy in-
struments. Zhou et al. (Zhou, Chong and Wang, 2020) applied a two-dimen-
sional framework (basic policy instrument (x-dimension) and project lifecycle
(y-dimension)) to analyze PV power application policies by using content
analysis. Similar to (Zhi et al., 2014) and (Zhang, Andrews-Speed and Ji,
2014), the subsidies were recognized as the main policy instrument for stim-
ulating solar PV industry; whereas, the subsidy itself was not comprehensively
examined. Zhao et al. (Zhao, Zeng and Zhao, 2015) reviewed and classified
three modes of subsidies in Chinese solar PV industry, historically. They also
evaluated the economic performance of a specific distributed PV system in
five Chinese cities and showed a good level of efficiency of subsidies. These
types of research were featured with a comprehensive historical review of sub-
sidies on Chinese soar PV industry in descriptive ways, covering the longitu-
dinal evolution, the classification, the challenges, and the implications. They
mostly employed a theoretical framework in framing a qualitative study.
Significant number of literatures discussed the effectiveness of subsidies
on solar projects. Torani et al. (Torani, Rausser and Zilberman, 2016) devel-
oped a stochastic dynamic model of solar PV adoption under two sources of
uncertainty. The authors aimed to investigate the effectiveness of four policies
on accelerating PV adoption. The results indicated that subsidies became in-
creasingly ineffective as the rate of technological change increases. Wang et
al. (Wang et al. 2016) investigated the effect of downstream FiT policies using
quarterly data of solar PV listed companies from 2009 to 2015. Their results
showed that FiT policy had a significant positive effect on inventory turnover
of listed PV companies, midstream companies, and private companies. This
paper confirmed the effectiveness of the FiT policy on the sustainable devel-
opment of the Chinese solar PV industry. Such a positive correlation can also
be found in studies, such as Peng & Liu (Peng and Liu, 2018), Lin & Luan
(Lin and Luan, 2020), Chen et al.(Chen, 2019), He et al. (He et al. 2018), Xu
et al. (Xu et al., 2020), and Jia et al. (Jia et al., 2020). Studies of (Wang et al.,
2016), (Peng and Liu, 2018), (Lin and Luan, 2020), and (Chen, 2019) all em-
ployed regression models to examine the government subsidy with the perfor-
mance of the Chinese PV industry (inventory turnover, entrepreneurial com-
panies' growth, innovation, and corporate value, respectively). Studies of (He
et al., 2018), (Xu et al., 2020), and (Jia et al., 2020) used different quantitative
30

12
methods, such as combination of economic cost & environmental benefit sim-
ulation and regression analysis, dynamic game model, and techno-economic
evaluation. These papers reported different, both positive and negative, im-
pacts in different subsidy scenarios. Some studies, such as Yu et al. (Yu et al.,
2016) reported a significant crowding-out effect of government subsidies on
firms' Research & Development investment behavior. Shen & Luo (Shen and
Luo, 2015) also showed the subsidies may have some negative effect on re-
newable energy of different types. There was no simple answer regarding the
effect of government subsidies. These quantitative analysis methods were of-
ten applied with scenarios.
Some studies attempted to design an optimal scale of subsidies. Research-
ers, such as Jeon et al. (Jeon, Lee and Shin, 2015), Zhang et al. (Zhang et al.,
2016), employed system dynamics with real option models to optimize finan-
cial subsidies in Korean and China. An early study (in 2010) by Rigter & Vid-
ican (Rigter and Vidican, 2010) calculated the theoretically optimal FiT for
Chinese small-scale commercial and residential PV installations. If comparing
with the real FiTs from 2010 to 2019, this study significantly overestimated
the level of FiTs. Some studies revealed that subsidies led an overcapacity of
solar companies, such as Zhang et al. (Zhang et al., 2016). This study revealed
that even that even if subsidies fell into relatively effective intervals, they still
exacerbated the risk of overcapacity. Therefore, the results conducted by
Chong et al. (Chong, Zhou and Wang, 2019) showed that the cancellation of
subsidies would have little impacts on the development of distributed renew-
able energy power generation, such as solar PV power. Similar implications
that the gradual cancellation of solar subsidies were made in (Zhou, Chong
and Wang, 2020), (Zhao, Zeng and Zhao, 2015) and (Xiong and Yang, 2016).
A considerable number of techno-economic and policy studies have been
published. As a result, researchers have developed a well-established toolbox
of techno-economic indicators that guide the decisions of profit-maximizing
firms and have also been widely applied to PV systems (Sommerfeldt and
Madani, 2017). The analysis framework always includes 1) the system com-
ponents, which are the basic physical components of the PV system and the
building (if applicable), 2) the economic components, which include the costs
of the PV system and electricity bill (if applicable), and benefits of exporting
electricity to the power grid. The technical analysis of PV systems includes
some sub-models of the climate and irradiance, PV system, electric loads, and
so on. The economic analysis representing by the calculation of costs and ben-
efits, includes wide range of indicators, such as Levelized Cost of Electricity
(LCOE), Net Present Value (NPV), Internal Rate of Return (IRR), Discounted
Payback Period (DPBP) and so on. The literature reviewed 25 indicators
which deviated slightly (Sommerfeldt and Madani, 2017). Most of the availa-
ble studies covered all costs and benefits in detail, especially regarding subsi-
dies. However, as markets move towards de-subsidization, the real economic
31

13
situation of solar PV projects with the consideration of zero subsidies should
be revealed.
2.2 Flexibility in the electricity system
The transition to renewable energy sources such as solar energy is not an easy
task. Technical problems arise in the aspects of power quality, voltage stabil-
ity, frequency, and congestion (Johansson, Vendel and Nuur, 2020), due to the
increasing levels of solar power generation and its intermittency. The interests
and publications on this topic have been surging. In the face of the technical
complexity, researchers have come to a consensus that the “flexibility” capac-
ity of the power system is able to help integrate the intermittent nature of re-
newable energy resources (Ma et al. 2013) (Emmanuel et al., 2020). In the
literal sense, the term “flexibility” describes the ability to respond to change.
In the earlier and many current studies, the term “flexibility” was used to de-
scribe “the ability of a power system to cope with variability and uncertainty
in both generation and demand, while maintaining a satisfactory level of reli-
ability at a reasonable cost, over different time horizons” (Ma et al., 2013).
Wide-spread deployment of renewable energy sources have led to highly fluc-
tuating and neither perfectly predictable nor fully controllable power market.
In more recent studies, the perspectives of institutional frameworks and mar-
ket designs were integrated (Emmanuel et al., 2020).
A fairly large body of research on providing physical flexibility resources
focused on solving the technical problems on generation-side flexibility re-
sources, demand-side flexibility resources, energy storage flexibility re-
sources, and grid flexibility resources.
The possibility to modify generation injections according to signals (e.g.,
price signals or other types of signals) in required time and duration is a means
to provide generation-side flexibility services. This can be obtained in the
form of dynamically fast responding conventional flexible power plants, such
as gas- or oil-fueled turbines or rather flexible modern coal-fired power plants
(Ulbig and Andersson, 2015), or unit commitment and economic dispatch in
volatile renewable power generations (Wang, Shahidehpour and Li, 2008).
Chen et al. (Chen et al., 2015) proposed a linear centralized dispatch model to
balance power and heat demands in multiple areas in Northern China, at mul-
tiple time periods. This was a representative study in providing generation-
side flexibility resources. In similar studies, stochastic optimization was ex-
tensively used, which explicitly incorporated uncertainty in the decision pro-
cess (Pappala et al., 2009) (Zhang et al., 2011). However, relying on genera-
tors alone to provide flexibility is expensive, as it often involves using more
flexible but less efficient generating units to produce energy, or operating
thermal plants at loads below their maximum efficiency (Carreiro, Jorge and
Antunes, 2017).
32

14
Demand-side flexibility is achieved by allowing the system operators to
control or provide price signals to various sources of electricity demands, in
order to reduce, increase, shift, or shave the portion of demands in the system
within a specific duration. The types of demand include power-to-heat, power-
to-hydrogen, electric-vehicle charging, smart appliances and industrial de-
mand response. Razmara et al. (Razmara et al., 2017) considered two common
building-integrated configuration topologies for demand-side energy storage
systems and renewable energy. The authors designed a real-time optimization
framework to a commercial building in Michigan, US. Their framework,
Model Predictive Control, utilized the building's inherent thermal mass stor-
age and energy storage systems as a means of providing demand-side flexibil-
ity. This framework included different modeling, such as building thermal
model, PV and battery model, and distribution grid model. The results showed
it can significantly reduce the maximum load slope of the grid and prevent the
duck-curve problem, i.e. provide demand-side flexibility for the electric grid.
And it can further decrease the building operational cost. Such research can
also be found in Zhang et al. (Zhang et al. 2018), in which the authors used
the Mixed Integer Linear Programming to optimize the energy system under
given economic assumptions. The heat pump, electrical heater, battery and hot
water storage tank were integrated into the electricity and heat supply system
of a Swedish office building. The result showed such system could provide
great flexibility to the electrical grid. Helistö et al. (Helistö, Kiviluoma and
Holttinen, 2018) presented a potential role for thermal power generation in
future power systems with a high proportion of solar power, while integrating
different sources of demand-side flexibility, such as heat pumps and storage
in district heating, industrial and electric vehicle demand response. These
studies, Razmara et al. (Razmara et al., 2017), Zhang et al. (Zhang et al.,
2018), and Helistö et al. (Helistö, Kiviluoma and Holttinen, 2018) presented
how different technical solutions can be formed at demand-side to provide
power grid flexibility; meanwhile, the energy storage flexibility resources
were integrated. Much more efforts have been made on demand-side flexibil-
ity, such as Golmohamadi et al. (Golmohamadi et al., 2019). As presented
above, such studies tended to investigate the coupling of power systems with
various demand-side technologies, such as energy storage, heat pumps, dis-
trict heating, electric vehicles, hydrogen production, etc.
Lastly, some researchers studied the grid flexibility resources. Chen et al.
(Chen et al. 2018) investigated distribution-level power aggregation strategies
for transmission and distribution interactions. The authors proposed a method
to model and quantify the total power flexibility in an unbalanced distribution
system over time. Heleno et al. (Heleno et al., 2015) used Monte Carlo simu-
lation to estimate the range of active and reactive power flexibility at the
boundary nodes of the transmission and distribution system, considering the
available flexibility at the distribution level (e.g., with on-load tap-changer
transformers).
33

15
More and more studies on power system flexibility have combined the
technical solutions with market designs. Mechanism flexibility resources refer
to the mechanism designs that can make full use of the physical flexibility
resources of the power system, including the design of the power market and
power system regulation mechanisms. In the power market, the mechanism
flexibility resources are transformed as effective price signals and quantity of
electricity determined by the suppliers and demanders (Kiyak and de Vries,
2017). Ma et al. (Ma et al., 2013) provided a systematic approach to evaluate
the flexibility level of both individual generators and the whole system by
proposing an index. They also introduced a new optimization algorithm (Unit
Construction and Commitment) to determine the optimal investment for addi-
tional flexible units. Based on this tool, the authors assessed the impact of the
market design on the profitability of providing flexibility. Fonteijn et al.
(Fonteijn et al., 2020) introduced a generic four-step approach to operational-
ize the flexibility needs of distribution system operator. The proposed method
was implemented on a Dutch’ H2020 InterFlex demonstrator. The implemen-
tation results showed that the proposed steps enabled distribution system op-
erators (DSOs) to predict congestion, assign a monetary value to flexibility,
and use that value to evaluate the flexibility offered through the flexibility
market of the studied case.
Overall, the research on providing physical flexibility resources focused on
solving the technical problems with different system components, using dif-
ferent mathematical models and simulation & optimization algorithms, apply-
ing in different cases and locations. Flexibility is system-specific, which
means that a "one-size-fits-all" approach cannot be applied to all power sys-
tems.
2.3 New market actor - aggregator
The use of ICT, smart devices, and autonomous controllers are integrated into
the entire energy system with advanced data management and two-way com-
munication means, from generation to end-user consumption. The progressive
implementation of these technologies is expected to improve the overall effi-
ciency, reliability, and flexibility of the grid. All stakeholders are increasingly
interested in evaluating and improving the response of their systems to the
new conditions brought about by the rapidly evolving power system. With the
opportunities and challenges presented by PV installations, a new actor has
emerged on the scene. The aggregator, also known as the intermediary or me-
diators/brokers (Gkatzikis, Koutsopoulos and Salonidis, 2013) or middleman
company (Carreiro, Jorge and Antunes, 2017) between users and the utility
operators, are coming into sight.
34

16
The concept of aggregator has received special attention from the European
Commission. Aggregators can provide flexibility services such as load shed-
ding and better load analysis to different power system entities (i.e., utilities,
DSOs, independent system operators, capacity markets, etc.) (Force,
2015).The aggregators can effectively integrate the distributed energies such
as solar PV energy, into electricity networks using ICT and industry
knowledge (Ponds et al., 2018). Such grid-oriented players as an entity can
provide new services to electricity markets and system operators by aggregat-
ing flexible distributed energy resources, including demand response, genera-
tion resources, and transmission and distribution networks (Di Somma,
Graditi and Siano, 2019).
The concept of aggregator was widely used in demand response (DR). The
aggregators accumulated and managed the electricity demands from end-users,
including residential, commercial, and industrial customers and helped reduce
imbalances by shifting flexible loads (Okur et al., 2019) (Rafique et al., 2019)
(Golmohamadi et al., 2019). Aggregators had the technology to perform DR
and were responsible for installing communication and control devices (i.e.,
smart meters) in end-users’ side. Since each aggregator represented a signifi-
cant amount of total demand in the DR market, it can negotiate more effec-
tively with the operator on behalf of the homeowner. The aggregator's role
was to make monthly payments to contracted end-users (mainly industrial) for
direct control of their equipment. As a result, they can turn off the user's en-
ergy-intensive equipment, such as air conditioners, for a short period of time
in case of emergency during peak demand (Gkatzikis, Koutsopoulos and
Salonidis, 2013).
More specifically, at the top level of the hierarchical DR market model,
utility operators provided monetary incentives for aggregators to provide DR
services. The goal was to minimize its own operating costs. In the middle tier,
aggregators provided demand response services to operators by providing ag-
gregated demand profiles, thereby minimizing the cost to the operator of sup-
porting that demand. Aggregators attempted to achieve this by providing mon-
etary incentives to end-users to change their demand patterns. Each aggrega-
tor's goal was to maximize its own net profit, i.e., the revenue it received from
the operator minus the compensation it provided to end-user subscribers. At a
lower level, the end-user negotiated with the aggregator to receive monetary
compensation to change its consumption pattern. The end-user weighed the
inconvenience of deviating from its preferred or customary usage pattern in
order to lower its electricity bill. Given compensation, the goal of each end-
user was to determine the best balanced consumption pattern to achieve this
tradeoff by maximizing the net benefit function (Gkatzikis, Koutsopoulos and
Salonidis, 2013). By managing the loads and optimally use the available en-
ergy resources for their customers, the aggregators could minimize the cost of
energy consumption and maximize the profit of the market participants
(Rafique et al., 2019) (Golmohamadi et al., 2019). For example, Deng et al.
35
17
(Deng et al., 2020) used the concept of aggregator to manage the power re-
serve between the power system operator and vehicle owners. A dispatching
strategy of electric vehicles aggregator for balancing the load demand and user
trip was proposed. A dispatching strategy of electric vehicles (EV) aggregator
for balancing the load demand and user trip was proposed. The dispatching
guidance was used to dynamically modify the trip chain, the EV’s spatial dis-
tribution and State of Charge were re-determined after the EV’s participation
in the flexibility response.
Some studies combined the role of aggregators with power grid at a trans-
mission and distribution network level. Olivella-Rosell et al. (Olivella-Rosell
et al., 2018) proposed a framework where aggregators acted as supervisors of
local market operators and local energy community flexibility transactions.
Aggregators can also aggregate and optimize the net injection power of sub-
stations in an unbalanced distribution system over time for transmission and
distribution interaction (Chen et al., 2018). In (Lampropoulos et al., 2019), the
authors focused on the interactions between the aggregators and the grid/mar-
ket operators by proposing a hierarchical control framework. In the applica-
tion of their case study, the framework enabled demand-side resources,
through aggregators, to participate in energy transactions in wholesale mar-
kets, as well as the provision of ancillary services to the grid both at the trans-
mission and distribution levels.
According to the current studies, the services of an aggregator included the
management of energy and financial interactions between the market and local
energy systems (Di Somma, Graditi and Siano, 2019), through modeling dis-
tributed energy devices, modeling the behavior of consumption units
(Rahnama et al., 2014), designing optimal bidding strategies, designing opti-
mal operation strategies, designing incentive compatible mechanism (Di
Somma, Graditi and Siano, 2019) and so on. In some cases, the aggregators
could theoretically act in an applicable and profitable way (a case in the Nor-
dic Electricity Market (Golmohamadi et al., 2019)). In some cases, aggrega-
tors had no financial incentive to implement demand response to achieve in-
ternal balancing after assessing the imbalance caused by uncertain solar gen-
eration (a case in the Netherland (Okur et al., 2019)). In some cases, there was
a tradeoff between the size of aggregators and benefits (Di Somma, Graditi
and Siano, 2019).
Johansson et al. (Johansson, Vendel and Nuur, 2020) studied the challenges,
activities and capabilities of Swedish DSOs in managing the integration of
distributed energy resources and found that there were regulatory and organi-
zational barriers to the adoption of distributed energy resources. As such, the
Swedish authorities recommended increasing the level of collaboration and
coordination between DSOs and other actors in the electricity market and re-
ducing barriers to market entry for aggregators (Johansson, Vendel and Nuur,
2020). Swedish DSOs have also been mandated to adopt new ICT-solutions,
for example, diffusing smart meters to the customers.
36

18
2.4 Service-Dominant logic
In order to improve the understanding of tomorrow’s electricity markets, a
more suitable theoretical perspective, Service-Dominant (S-D) logic, is em-
ployed (Vargo and Lusch, 2016). The S-D logic goes beyond the goods-dom-
inant logic. In good-dominant logic, the exchange of tangible goods and dis-
crete transactions are considered primary (Vargo and Lusch, 2004). S-D logic
provides a more holistic, dynamic, and realistic view on the value creation
through exchange, as well as a more comprehensive configuration of actors
(more than suppliers and customers). In this way, S-D logic offers a new un-
derstanding of the market actors, resources, and service, associated with value
co-creation in the electricity market. The following Table 1 shows the eleven
fundamental premises (FP) and five axioms, which formulate the core con-
cepts of S-D logic (Lusch and Vargo, 2014) (Vargo and Lusch, 2016)
(Vargo and Lusch, 2017).
Table 1. The S-D logic foundational premises.
Axiom Foundational premise (FP)
Description
A1 FP1 Service is the fundamental basis of exchange.
FP2 Indirect exchange masks the fundamental basis of ex-change.
FP3 Goods are a distribution mechanism for service provi-sion.
FP4 Operant resources are the fundamental source of strategic benefit.
FP5 All economies are service economies. A2 FP6 Value is cocreated by multiple actors, always including
the beneficiary. FP7 Actors cannot deliver value but can participate in the cre-
ation and offering of value propositions. FP8 A service-centered view is inherently beneficiary ori-
ented and relational. A3 FP9 All social and economic actors are resource integrators.
A4 FP10 Value is always uniquely and phenomenologically deter-mined by the beneficiary.
A5 FP11 Value cocreation is coordinated through actor-generated institutions and institutional arrangements.
The actor, such as an individual, a group, or an organization, is put at the
center of S-D logic, because the actor is the resources integrating unity. In the
treatment of S-D logic, all market actors are seen as operant and endogenous
resources to the process of value exchange and value creation. All of them can
be value creators and value beneficiaries.
The actors engage in the activities of resource integration, based on their
specialized competences (knowledge or skills, or expectations emanating
from experiences) and the relationship with other market actors. The resources
37

19
that come into play are operand resources, which means the resources that
require activities to become valuable (e.g. raw materials), and operant re-
sources, which are often dynamic and intangible (e.g. knowledge and capaci-
ties). The resources, especially higher-order and core competences resources,
are identified and integrated to obtain competitive advantage and perfor-
mance. Notably, the resources must be developed and coordinated to generate
a “service” (e.g., benefits as solutions to a problem) and the (future) elec-
tricity market hold a multitude of services (Fell, 2017).
The “service” could be viewed as a “process of doing something for some-
one” but not the “units of output” (Lusch and Vargo, 2006). Services are of-
fered directly traditionally, such as a customer is offered a haircut and received
at a certain time. Nevertheless, service could be offered indirectly, such as an
“app” for multimodal travel supported by ICT service (Kramers et al., 2014)
which is designed and then “activated” by the customer when needed.
S-D logic claims that value could be co-created by multiple actors with
the integration and transformation of resources (FP6 and FP9, in Table 1),
which also requires interaction and implies network. S-D logic prescribes
the concept of "value in context", which means that resources are only
transformed according to context and through the combination of resource
integration with other resources. This is analogous to the fact that energy
is neither created nor destroyed, but simply transformed from one form to
another (i.e., the first law of thermodynamics). A value proposition can
originate from any actor (e.g., provider or customer) or have a bilateral
origin (Ekman, Raggio and Thompson, 2016) (Vargo and Lusch, 2016).
In line with the above, the core components of S-D logic are shown in Fig-
ure 3.
Figure 3. The narrative and process of S-D logic.
38

20
In S-D logic, the conceptualization of actor challenges the limiting view of
a “seller” and “buyer” engaged in market transactions. It avoids separating
market actors into either active or passive roles. It requires acknowledging and
understanding the dynamic role and perceived identity of actors regarding the
potential input to other actors’ value creation activities and functions in a
smart electricity market holds (Chourabi et al., 2012). In the process where
an electricity market strives to become “smart”, new actors can be ex-
pected and old actors might disappear or be integrated, as an effect of dis-
ruptive technologies and new business models. Values are created in a setting
colored by a variety of actors with interdependencies. The actors engage as
providers and beneficiaries of value cocreation simultaneously but might
not be the originators of a value proposition or the final recipient of a core
offering. They might act as an intermediary, which enables the value co-
creation among multi-actors (Nätti et al., 2014). Previous studies showed
that some actors could act as knowledge brokers to influence and imprint
business practices (Truong, Simmons and Palmer, 2012). In a similar way,
the “aggregator” role identified in the energy research (Burger et al., 2016)
(Carreiro, Jorge and Antunes, 2017)(Giordano and Fulli, 2012), i.e.,
offering services to address the challenges of a dynamic electric grid, re-
assembles many of the characteristics of a knowledge broker (Von
Malmborg, 2004). The knowledge broker offers expertise in areas such as
technology, markets, and business processes (Theeke, Polidoro Jr and
Fredrickson, 2018), and they offer support and resources to others in the
service ecosystem. This transition from a linear value-chain system to a
service ecosystem (where activities are bilateral or networked) is well rep-
resented in the smart city transformation, which is used as a backdrop for
the upcoming case study.
By exploring multiple market actors in the market, a smart city can be
depicted as a service ecosystem where the creation of value in various de-
grees involves different actors, activities, and resources (Lusch and
Nambisan, 2015). The term “ecosystem” roots in natural science; whereas,
the “service ecosystem” emphasizes the more general role of institutions.
Service ecosystems could be seen as resource-integration networks to col-
laborate with in the co-creation of service (Vargo and Akaka, 2009). It can
be defined as “relatively self-contained, self-adjusting system[s] of re-
source-integrating actors connected by shared institutional arrangements
and mutual value creation through service exchange” (Lusch and Vargo,
2014). Service ecosystem is similar to a market or business network
(Truong, Simmons and Palmer, 2012). A common aspect is that the system
as a whole has a structure in which power flows dynamically through the
network in relation to the ability to respond to external changes. The tra-
ditional marketing and economics literature perceived the marketing ac-
tivities adhere to a predetermined set of structural and behavioral aspects.
In that sense, the intra-organizational and marketing activities were
39

21
considered controllable. A service ecosystem includes the dynamics of in-
ter-organizational relationships in which activities need to be related to
those of other actors. This means that service ecosystems cannot be con-
trolled and managed by a single actor; instead, they are dynamic and based
on the relationships of multiple actors. This market perspective coincides
with the development of smart cities, which require smart grids (Kylili and
Fokaides, 2015) and renewable energy systems (Calvillo, Sánchez-
Miralles and Villar, 2016), which induce dynamism in energy systems,
interrupting the linear demand-response logic of the previous producer-
distributor-consumer structure. Thus, the management challenges in ser-
vice ecosystems go beyond the company and include the coordination of
multiple actors in the value constellation. Thus, management in service
ecosystems implies managing interdependencies in terms of resource port-
folios and actor portfolios.
2.5 The geographical and technical potential availability
Spatial information technology, especially Geographical Information Systems
(GIS), has been widely used to evaluate the feasibility of solar power plants
in a given region and to determine the best locations. GIS is a powerful tool
for spatial analysis and integration of geospatial data to provide a comprehen-
sive feasibility assessment of solar energy potential on a regional scale. The
estimation of PV power potential is challenging, but essential for relevant re-
newable energy decisions. The assessment of sufficient available roof surface
is one of the most critical stages in the implementation of rooftop integrated
PV applications (Li and Liu, 2017).
Previous studies have examined the spatial distribution of PV applications
and its determinants. Snape (Snape, 2016) revealed the evolution of the spatial
and temporal distribution of PV applications in the UK. The spatial distribu-
tion highlighted the number of systems installed per spatial unit, the system
capacity, the proportion of households with rooftop PV, and the variation over
time. The apparent distribution pattern was found to coincide with the an-
nouncement of the feed-in tariff policy. Balta-ozkan et al. (Balta-ozkan,
Yildirim and Connor, 2020) presented a spatial econometric approach to study
the regional distribution of PV deployment in the UK and its determinants.
Their study showed that accumulated capital (represented by home owner-
ship) and financial savings - rather than income - were the key factors driving
PV adoption in the U.K. Using Zoning Improvement Program (ZIP) code level
data, Lee Kwan (Lee Kwan, 2012) investigated the impact of local environ-
mental, social, economic, and political variables on the distribution of residen-
tial solar PV arrays in the United States. In terms of spatial performance, the
Southwest and Florida performed poorly in terms of the number of residential
units installed with solar PV. California was considered to have the ideal
40
22
combination of environmental, economic, social, and political characteristics
to promote solar PV. The authors identified solar insolation, cost of electricity,
and available financial incentives as important factors influencing the adop-
tion of residential solar PV systems. Sun et al. (Sun et al., 2013) evaluated the
combined potential of solar PV in Fujian Province, China, using a high-reso-
lution solar radiation grid map with geographic constraints. The study pro-
posed a GIS-based approach to facilitate feasibility analysis of geographic and
technical potential, and based on this, investigated the economic feasibility
under two feed-in tariff scenarios. He and Kammen (He and Kammen, 2016)
developed provincial solar availability curves using hourly solar radiation data
from 200 representative sites from 2001 to 2010. The authors combined GIS
modeling with solar PV simulations. The results found that the potential sta-
tionary solar capacity ranged from 4,700 GWp to 39,300 GWp and distributed
solar of about 200 GWp, reaching 6,900 TWh to 70,100 TWh of annual solar
power. Under the homogeneous approach, Israel (Vardimon, 2011), Slovakia
(Hofierka and Kaňuk, 2009), Andalusia (Spain) (Jadraque et al., 2010),
Bangladesh (Hossain and Islam, 2011), Piedmont Region (Italy) (Bergamasco
and Asinari, 2011), Pennsylvania (USA) (Choi et al., 2011), Germany
(Strzalka et al., 2012) (Mainzer et al., 2014), Greece (Theodoridou, Karteris
and Mallinis, 2012), and Karachi (Pakistan) (Khan and Arsalan, 2016) have
done extensive work.
In addition, several researchers have demonstrated that the use of Light
Detection and Ranging (LiDAR) point cloud data can significantly improve
the identification of roof geometry and thus the estimation of PV power gen-
eration. Nguyen et al. (Nguyen et al., 2012) provided a methodology for ap-
plying LiDAR point cloud data to analyze PV deployment on a regional scale.
Based on the proposed method, the authors identified and quantified the chal-
lenges in solar PV deployment assessment. Szabo et al. (Szabo et al., 2020)
extracted building and roof models from LiDAR data and UAV surveys.
Multi-resolution segmentation and orthophoto overlays were applied to the
digital surface model (DSM) to identify buildings and roof planes. This ap-
proach was then validated and applied to 50 buildings in Debrecen, Hungary.
A similar study was conducted by Song et al. (Song et al., 2018) in Chaoyang
District, Beijing, China. To estimate the solar PV power potential, the authors
developed a method to simulate monthly and annual solar radiation on roof-
tops for hourly time steps. The method combined remotely sensed images and
roof retrieval by DSM. The method was then applied to a region in China to
calculate the number of available roofs, available roof area, and annual PV
generation potential. Similar studies were conducted in Georgetown, Malaysia
(Latif et al., 2012), Arizona, USA (Kucuksari et al., 2014), and Seoul, South
Korea (Byrne et al., 2015) , using LiDAR data to model buildings and energy
systems.
Vector maps, digital cadastral services and national GIS are reference
sources for the evaluation of potential buildings for the installation of PV
41

23
systems (Bu, Grassi and Raubal, 2018). These sources provide the building
footprint and certain useful data such as height or building type classification
(e.g. residential, commercial or industrial buildings). In some cases, all these
data are used together with a digital surface model of the urban area. Moreo-
ver, aerial imagery is a good complement to examine the objects, which con-
stitute the city model (Szabo et al., 2020). When calculating the solar potential,
the results are influenced not only by the condition of each building, but also
by the size and type of the roof (flat or sloping). In this sense, these data are
sufficient to provide an overview of the study area, provided that appropriate
assumptions are made. Taking into account the general characteristics of the
buildings, it is possible to estimate the number of different types of roofs and
to determine the parameters needed to determine the solar PV capacity poten-
tial. In order to evaluate building roofs at the urban scale, it is fundamental to
have a 3D city model with LiDAR point cloud data (Machete et al., 2018).
However, an important aspect to consider is that the extent of the study area
is sometimes limited by the available data (Bu, Grassi and Raubal, 2018)
(Africani et al., 2013). Researchers such as Lingfors and Widén studied the
Swedish municipalities of Blekinge (Lingfors and Widén, 2014), Skåne
(Lingfors and Widén, 2018b), and Dalarna (Widén and Weiss, 2012). With
these reports they used a consistent methodology to estimate the available area
and potential solar energy conversion in Västmanland County, to which the
municipality of Västerås belongs. The authors presented the order of magni-
tude of the potential (Lingfors and Widén, 2018a).
To our knowledge, a rigorous and comprehensive assessment of the geo-
graphic and technical potential of rooftop PV in our study area has not been
published. Furthermore, it is still not self-explanatory how to evaluate the cur-
rent solar PV policy and how to optimize the use of funds. The problems and
experiences of Sweden are by no means unique. Indeed, necessary and suffi-
cient information, especially scientific and technical, is needed as a solid basis
for developing evidence-based policies on appropriate investments of public
funds.
42

24
3 Methods
This chapter illustrates the methods for solving the research questions, includ-
ing models and theories.
A (mono) disciplinary approach, be it a technical or economic one, is too
limited to capture the interaction and mutual shaping between solar PV sys-
tems and society. This requires the joint involvement and collaboration of
mixed methods cross disciplinary borders. A co-evolution of the technical and
the economic takes place both at the micro-level of the practical use of the
technology and at more structural levels of society where investments and pol-
icies are interdependent with technological infrastructures and knowledge
production. Techno-economic analysis intends to inform investors and poli-
cymakers regarding in the decision making process in light of new information
(Sommerfeldt and Madani, 2017).
3.1 Economic viability indices
3.1.1 Levelized Cost of Electricity and cost crossover
Levelized Cost of Electricity (LCOE) is a simple metric commonly used to
compare the cost of electricity from different energy technologies. LCOE is a
measure of the average construction and operating costs of a generation asset
over its lifetime divided by the total amount of electricity generated by the
asset over its lifetime (Lai and McCulloch, 2016).
In Paper I, in order to estimate the LCOE of solar PV systems in different
Chinese cities, it required an integrated knowledge of economics and technol-
ogies. In this study, both the cost analyses and physical design of a solar PV
system were considered. From the point of economic analysis, the calculation
included the costs of land area, module prices, taxes, bank loan and interest,
insurances, and so on. From the point of technical analysis, the mechanical
specifications were considered, including the power capacities, inverter, life-
time, and so on. Cost and electricity production varied based on locations,
capacities for generation, and other factors, which were considered in Paper I.
The solar PV system efficiencies and lifetime were taken as given. From the
point of the lifetime of a solar PV system, the LCOE calculation included the
cost of electricity generation, pre-development costs, construction costs, op-
eration and maintenance costs, as well as the discount rate, fixed asset
43

25
depreciation and/or asset salvage value considered for a fixed period. One of
the criticisms of using the LCOE is that the use of outdated data (Branker,
Pathak and Pearce, 2011) which was overcome in this research with the utili-
zation of the most updated data and of the high-resolution data.
It is understandable that the present value of LCOE multiplies by the elec-
tricity generation in the given period should be equal to the present valued net
costs, as shown in Equation (1), where 𝑡 represents the year and 𝑇 represents
the life of the project.
∑ (𝐿𝐶𝑂𝐸𝑡
(1+𝑑𝑖𝑠𝑐𝑜𝑢𝑛𝑡 𝑟𝑎𝑡𝑒)𝑡 ∗ (𝑒𝑙𝑒𝑐𝑡𝑟𝑖𝑐𝑖𝑡𝑦)𝑡) 𝑇
𝑡=0 = ∑ ((𝑐𝑜𝑠𝑡)𝑡
(1+𝑑𝑖𝑠𝑐𝑜𝑢𝑛𝑡 𝑟𝑎𝑡𝑒)𝑡 )𝑇𝑡=0 (1)
Through the rearrangement, the LCOE could be expressed as Equation (2).
𝐿𝐶𝑂𝐸 = ∑ (
(𝑐𝑜𝑠𝑡)𝑡(1+𝑑𝑖𝑠𝑐𝑜𝑢𝑛𝑡 𝑟𝑎𝑡𝑒)𝑡 )𝑇
𝑡=0
∑ ((𝑒𝑙𝑒𝑐𝑡𝑟𝑖𝑐𝑖𝑡𝑦)𝑡
(1+𝑑𝑖𝑠𝑐𝑜𝑢𝑛𝑡 𝑟𝑎𝑡𝑒)𝑡) 𝑇𝑡=0
(2)
Coal power has always dominated the electricity supply in China. Similar
to the United States, coal power in China is currently in a "cost crossover"
situation (Yuan et al., 2018). To investigate this issue, Paper II compared the
desulfurized coal benchmark (DCB) prices and LCOEs for distributed solar
PV projects in 344 cities, and after making this comparison, as in the United
States, the study of Paper II identified four levels of cost-risk for operating
coal plants (Gimon et al., 2019):
1) Deemed no cost-risk: if DCB is > 25% lower than LCOE.
2) Potentially at cost-risk: if DCB is 0-25% lower than LCOE.
3) At cost-risk: if DCB is 0-25% higher than LCOE.
4) Substantially at cost-risk: if DCB is > 25% higher than LCOE.
These levels of cost-risk can be reliable means to determine the less expen-
sive option between traditional desulfurized coal generation and distributed
solar PV power generation.
3.1.2 Levelized Profit of Electricity and other three indices
As an analogue and complement to LCOE, the Levelized Profit of Electricity
(LPOE) was proposed, which measured the net revenue per kWh of solar PV
generation without subsidies. It took into account not only the project costs
over the life of the project, but also the various potential revenues, i.e., savings
from selling surplus electricity to the grid and savings from avoiding power
purchases from the grid. In the calculation, the LPOE was the discounted net
profit divided by the electricity generation, where the discounted net profit
included both discounted net revenue and net costs. The LPOE formula in
Paper I (Equation (3)) was developed on the basis of the LCOE.
𝐿𝑃𝑂𝐸 = ∑ (
(𝑝𝑟𝑜𝑓𝑖𝑡)𝑡(1+𝑑𝑖𝑠𝑐𝑜𝑢𝑛𝑡 𝑟𝑎𝑡𝑒)𝑡 )𝑇
𝑡=0
∑ ((𝑒𝑙𝑒𝑐𝑡𝑟𝑖𝑐𝑖𝑡𝑦)𝑡
(1+𝑑𝑖𝑠𝑐𝑜𝑢𝑛𝑡 𝑟𝑎𝑡𝑒)𝑡) 𝑇𝑡=0
(3)
Net Present Value (NPV) is the difference between the present value of all
cash inflows and outflows associated with the investment (Equation (4))
44

26
(Yujia and Finenko, 2016). It measures if an investment project is profitable
or not, which depends on a designated return required by an investor. Internal
Rate of Return (IRR) is the value of the discount rate at which the NPV equals
to zero. It is the weighted average cost of financing a distributed PV project,
taking into account the time value of money. From an economic point of view,
a distributed solar PV project is profitable if the IRR exceeds the cost of cap-
ital. Discounted Payback Period (DPBP) represents the number of years re-
quired to recover the investment cost, which means the year when the cumu-
lative cashflows turn positive. A shorter DPBP is preferred than a longer one.
Like the NPV and IRR, the DPBP takes into account the value of money over
time (Rodrigues, Chen and Morgado-Dias, 2017).
NPV = −𝐶𝐹0 + 𝐶𝐹1
1+𝑟+
𝐶𝐹2
(1+𝑟)2 + ⋯ + 𝐶𝐹𝑇
(1+𝑟)𝑇 = ∑𝐶𝐹𝑡
(1+𝑟)𝑡𝑇𝑡=0 − 𝐶𝐹0 (4)
Where, 𝑟 is the discount rate, 𝐶𝐹0 is the initial investment, 𝐶𝐹1, 𝐶𝐹2, … 𝐶𝐹𝑡
are the cash flow of year 1, 2, … , 𝑡
3.1.3 Grid parity indices
Grid parity is a phenomenon that the cost of electricity from deploying a solar
PV system becomes lower than or equal to the conventional electricity price.
Specifically, it was defined as the intersection of solar PV LCOE with: the
electricity market price for the end-users (Spertino, Leo and Cocina, 2014)
(Breyer and Gerlach, 2013), or the electricity price from the power grid
(Biondi and Moretto, 2015) (Bhandari and Stadler, 2009). This was always
analyzed with the consideration of all kinds of subsidies in the previous liter-
ature. In Paper I and Paper II, we defined the grid parity as an unsubsidized
LCOE lower than or equal to the electricity market price, or the conventional
coal-fired power price. Therefore, the grid parity was developed into two in-
dices based on two different scenarios: the Grid Parity Index of User-side
(GPIu) and the Grid Parity Index of Plant-side (GPIp). In Equation (5), if GPIu
is lower than or equal to 1, the unsubsidized LCOE is lower than or equal to
the local electricity purchasing cost, and the region is considered to have
reached the level of User-side Grid Parity.
GPIu= 𝐿𝐶𝑂𝐸𝑀𝑃⁄ (5)
Where 𝑀𝑃 is the electricity market price.
In Equation (6), if GPIp is lower than or equal to 1, the unsubsidized LCOE
is lower than or equal to the local desulfurized coal benchmark price, and the
region is considered to have reached the level of Plant-side Grid Parity.
GPIp= 𝐿𝐶𝑂𝐸𝐷𝐶𝐵⁄ (6)
Where 𝐷𝐶𝐵 is the desulfurized coal benchmark price.
45

27
3.2 Monte Carlo Analysis
In a techno-economic analysis model on solar power generation, many varia-
bles are subject to variability over time, consequently, will cause variations in
economic indicators. For example, the market prices for electricity will vary
over time. In Monte Carlo Analysis (MCA), the inputs are chosen randomly
from a range of values based on a probability distribution or generated using
a random model. Then multiple iterations (ranging from thousands to mil-
lions) of a given mathematical simulation are performed (Sommerfeldt and
Madani, 2017). Likewise, Paper I used Monte Carlo simulations for the sen-
sitivity analysis as a useful tool for approximating reality.
Such a sensitivity analysis can determine the extent to which risk factors
affect the objectives of the investment project and is therefore a critical part
of the risk analysis of investment projects. Suppose there are 𝑘 risk factors,
which are represented by 𝑥1, 𝑥2, … , 𝑥𝑘 respectively. Indicator 𝑌 indicates the
financial indicators of the strengths and weaknesses of investment projects,
such as NPV, IRR, etc. 𝑌 is a function of these risk factors, namely: 𝑌 =
f(𝑥1, 𝑥2, … , 𝑥𝑘), where 𝑥𝑖 represents the i-th risk factor of the model. Sensitiv-
ity analysis is the study and prediction of the extent to which these inputs af-
fect the output value. The magnitude of the degree of influence can be referred
to as the sensitivity coefficient of the input. Obviously, the greater the absolute
value of the sensitivity coefficient, the greater the impact of the risk factor on
the investment project. The key to sensitivity analysis is to find the sensitivity
coefficient of each risk factor, and then get the importance ranking of each
risk factor.
In Paper I, bank interest rate, PV module cost, rooftop rent, power genera-
tion, desulfurized coal price, electricity market price, and self-consumption
ratio were used as hypothetical risk variables for the project. We performed
10,000 Monte Carlo simulations to study the effects of those variables on the
LCOE and LPOE. We assumed a) Uniform Distribution for PV module cost,
rooftop rent, self-consumption ratio, desulfurized coal benchmark price, and
electricity market price; b) Normal Distribution for bank interest rates, and
power generation.
3.3 K-means clustering algorithm
Data clustering is an effective approach to discover the structure in certain
datasets. For example, researchers have used the clustering algorithm to find
distinctive groups of electricity consumption profiles (Kim, Ko and Choi,
2011), to find the driving factors behind those groups (Rhodes et al., 2014),
and further to forecast the loads (Kwac, Flora and Rajagopal, 2014) (Zhou,
Yang and Shen, 2013). The K-means clustering algorithm is an incremental
approach to cluster data points, in which the “clustering” could be understood
46

28
as finding homogeneous groups in a given dataset. The main idea of K-means
clustering is to select some initial partition of data units and then change the
membership of the clusters to obtain better partitions. It uses an iterative pro-
cedure in the clustering process.
In statistical analysis, cluster analysis can be divided into hierarchical and
non-hierarchical clustering. The classification of clustering algorithms can be
described as in Figure 4 (Ma and Chow, 2004). The difference is that the for-
mer data structure has hierarchical classes (in a bottom-up or top-down man-
ner). The data used in Paper II were cross-sectional data of cities, without sub-
ordination or overlap. Therefore, non-hierarchical clustering was appropriate.
Figure 4. Categorization of clustering algorithms.
Before the clustering, an underlying assumption is that these numerical
measures of distance are comparable to each other (Das, 2003). Then the fol-
lowing sequential steps were conducted.
1) Each item in the dataset is assigned into one specified cluster on the
basis that it has the nearest distance to the assigned cluster centroid
(mean). The traditional K-means clustering algorithm uses the Euclid-
ean Distance (Equation (7) (Su and Chou, 2001) ) to measure similar-
ity.
d(p, q) = √∑ |𝑥𝑝𝑖 − 𝑥𝑞𝑖|2𝑛𝑖=1 (7)
where, i =1,2,...,n
The Euclidean Distance treats the difference between different attrib-
utes of the sample equally, which ignores the variables’ dimensions.
Moreover, it does not consider the correlation between variables, or
the relative importance of each variable when processing data. In or-
der to remedy these disadvantages, Mahalanobis Distance was used
in Paper II instead of the traditional Euclidean Distance (Equation (8)).
47

29
m(p, q) = √∑ (𝑥𝑝𝑖 − 𝑥𝑞𝑖)𝑇𝑛𝑖=1 Σ−1(𝑥𝑝𝑖 − 𝑥𝑞𝑖) (8)
In Paper II, p, q were any two points; p, q =1,2,…,344. i was the di-
mension (i.e. LPOE, NPV, IRR, and DPBP); i =1,2,3,4.
2) Recalculate the centroid (mean) for each cluster and decide the new
center. If √∑ (𝑥𝑝𝑖 − 𝑐𝑘(𝑏)
)𝑇𝑛𝑖=1 Σ−1(𝑥𝑝𝑖 − 𝑐𝑘
(𝑏)) <
√∑ (𝑥𝑝𝑖 − 𝑐𝑘(𝑎)
)𝑇𝑛𝑖=1 Σ−1(𝑥𝑝𝑖 − 𝑐𝑘
(𝑎)), then 𝑥𝑝𝑖 ∈ 𝑐𝑘
(𝑏). a and b are
𝑎𝑡ℎ and 𝑏𝑡ℎ iteration (a ≠ b). k is the 𝑘𝑡ℎ cluster, k =1,2,...,4.
In this Step, four new centroids (mean) were generated.
3) Then Step 2) was re-conducted so that each cluster receives new items.
This process was iterated until no more reassignments take place, i.e.
minimizing the distance between each item and the centroids (mean).
The process of K-means clustering algorithm in Paper II can be graphically
shown in Figure 5.
Figure 5. K-means clustering algorithm procedure in Paper II.
48

30
3.4 Case study and questionnaire survey
3.4.1 Case study
Case studies can actually use qualitative or quantitative data that may come
from different sources such as fieldwork, archival records, oral reports, obser-
vations, etc. (Yin, 2003). The main difference between quantitative and qual-
itative research methods is that when using case studies, quantitative research
uses only a few variables but many cases, while qualitative research uses many
variables but only a few cases. A case study can be either a single case or
multiple cases, numerous levels of analysis, either at the company level or at
the industry level, or a cross-case analysis. In this sense, it can be a good re-
search design that gives the researcher a holistic, in-depth view of a phenom-
enon or series of events that can provide a rounded picture. Case studies be-
come particularly useful when one needs to gain insight into particular issues
or situations, and informative cases can be identified.
As Ragin and Becker put it (Ragin and Becker, 1992), the empirical
world is infinite in its detail, complexity, specificity, and uniqueness. In
contrast, theoretical concepts are relatively simple and general. Empirical
research is often conducted without the explicit guidance of theory. Mak-
ing something into a case or casing it can bring operational closure to some
problematic relationship between ideas and evidence, between theory and
data. When cases are made, the process of casing consists of matching
ideas and evidence.
In Paper III, we conducted a case study of the Swedish energy market
transition to explore the theoretical explanation of new actors in smart city
transformation (Yin, 2003). In this case study, the managers, policymakers,
and other practitioners were involved in the research process. The study
followed the Swedish VR/CODEX ethical guidelines (inform, consent,
acknowledge and use requirements) and the case descriptions did not include
the names and positions of the participants (i.e., all participants were anony-
mous).
Sweden aspires to reach 100% renewable energy system in 2040 and
has the highest share (more than 55 % of energy consumption in 2019) of
renewable energy of all EU countries (Eurostat, 2021). Sweden also scored
high in terms of multiple fields including innovativeness, ICT, and sus-
tainability (Strand, Freeman and Hockerts, 2015). These make Sweden a
suitable case to understand future electricity market transformation. The
archival materials, such as data gathered by other researchers, electricity
suppliers, real estate organizations, and service organizations, and the in-
terviews on the project participants were taken into account. The abundant
information was repeatedly revisited to disentangle empirical findings
(Dubois and Gadde, 2002). In this process, we iteratively refined the the-
oretical explanation of future electricity transformation, which implied the
49

31
establishment of a smart market. Paper III adopted an explanation-oriented
lens in several analytical iterations, and produced the finalized and con-
densed empirical renderings.
3.4.2 Questionnaire survey
The methodology used in the key performance indicator (KPI) analysis sec-
tion consisted of four steps in Paper IV. First, we aggregated potential KPIs
from the literature based on four different categories (i.e., technical, economic,
environmental, and social/policy). Second, a questionnaire was formed based
on the literature survey, which was then sent to different stakeholders. Third,
we collected feedback and analyzed the data to identify the most important
KPIs. finally, the list of selected KPIs was determined based on the results of
the statistical analysis. There was a rich body of literature on the appropriate
strategy for selecting the right set of KPIs. Due to its complex nature, while
being important to all parties, selecting the proper set of KPIs was a critical
process. The literature review generated a library of KPIs; and the survey pro-
vided important assistance in the selection of KPIs. A summary of the KPI
categories, issue numbers for each category, stakeholders and their roles is
shown in Figure 6.
Figure 6. Summary of KPI categories, stakeholders and their roles.
The purpose of the questionnaire was to conduct an initial screening of
KPIs and to make a draft selection by screening a certain number of KPIs in
each category. Subsequently, the different levels of importance of the KPI
candidates can be determined. The questionnaire should include the organiza-
tion responsible for the flexibility solution or its representatives; the parties
affected by the flexibility selection; and experts in various fields as consultants
and evaluators of the analysis results. It was also important to decide on the
number of KPIs that should be sufficient to demonstrate the flexibility
50

32
performance of the multi-energy systems. The greater the number of KPIs, the
less focused they were on the specific objectives they were intended to demon-
strate. Therefore, five KPIs in the "Technical" category, five KPIs in the "Eco-
nomic" category, three KPIs in the "Environmental" category, and three KPIs
in the "Social/Policy" category should be selected from the questionnaire anal-
ysis.
The selection of the most important KPIs was identified based on the num-
ber of votes, the mean of votes (ranging from 0 to 7), and the standard devia-
tion of votes (STD). The Coefficient of Variation (CV) could very well repre-
sent the mean of votes and the STD, defining as the ratio of the STD 𝜎 to the
mean 𝜇 (Equation (9)). CV was a measure that showed the degree of variation
relative to the population mean, and in Paper IV, it showed the overall agree-
ment of respondents on the importance of the KPI.
𝐶𝑉 =𝜎
𝜇 (9)
For each KPI, a 𝑍 value was calculated as Equation (10). The goal was to
find the highest value of 𝑍-value. This objective ensured that the selected KPIs
have both: a) the highest number of respondents selecting them and b) the
lowest CV value (combining the mean and STD of the scores). This meant
that the questionnaire respondents were consistent in their importance for the
given KPIs.
𝑍 = 𝑁𝑣𝑜𝑡𝑒 + (1-𝑁𝐶𝑉) (10)
Here, 𝑁𝑣𝑜𝑡𝑒 represents the normalized numbers of votes, and. 𝑁𝐶𝑉 repre-
sents the normalized CV (“min-max” normalization was performed).
3.5 Potential availability analysis
Paper V proposed a GIS-based approach combined with energy system mod-
eling to facilitate a feasibility analysis of the geographic and technical poten-
tial of roof-mounted solar PV systems. The methodology consisted of three
phases. The first phase was to assess the geographical potential for the exploi-
tation of rooftop solar energy on buildings in Västerås, Sweden, including res-
idential buildings, industrial buildings, buildings of social function, buildings
of commercial function, buildings of economic/agricultural function, build-
ings of complementary function, and buildings of other unknown function. A
step-by-step procedure for estimating the total rooftop solar PV potential was
established, including geographic data division and classification, surface area
calculation, roof orientation analysis, and roof shading and obstruction analy-
sis. The second stage was to assess the technical potential for installing solar
PV systems. For flat roofs, the distance between rows of solar panels and the
tilt angle were designed according to three scenarios. And the electricity gen-
eration could be calculated corresponding to different scenarios, based on the
51
33
commercial solar PV modules. The third stage was to extrapolate the method-
ology from the city scale to the national scale to reveal the potential available
roof area and installed capacity for the entire country.
3.5.1 Usable roof area estimation
In the geographical potential analysis, both absolute and relative reductions of
the roof area were performed. The absolute reductions were applied to the
roofs of special use, e.g. with cultural-heritage value, and thus difficult to ob-
tain building permits. The relative reductions were applied to the roofs with
different utilization factors, due to orientation, shadows and obstructions.
Different roof shapes exist in Sweden, for example, gable roofs, mansard
roofs, flat roofs, and so on (Swedish Wood (Svenskt Trä), 2020) (Kamp,
2013). In Paper V, an assumption about the roof type and the slope of pitched
roofs was obtained from Lingfors and Widén (Lingfors and Widén, 2014)
(Lingfors and Widén, 2018b) and Kamp (Kamp, 2013). The pitched roof sur-
face area could be calculated according to Equation (11).
𝐴𝑟𝑜𝑜𝑓 = 2 ∙ 𝑚 ∙ 𝑞 = 2 ∙𝑝
𝑐𝑜𝑠 𝛼𝑟𝑜𝑜𝑓∙ 𝑞 =
𝐴𝑏𝑎𝑠𝑒
𝑐𝑜𝑠 𝛼𝑟𝑜𝑜𝑓 (11)
Where 𝐴𝑟𝑜𝑜𝑓 is the surface roof area, 𝐴𝑏𝑎𝑠𝑒 is the base area, 𝛼𝑟𝑜𝑜𝑓 is the
slope angle of the roof. 𝑚 , 𝑝 , and 𝑞 are the length of the roof ridge, counter
beam, and hanging beam. The calculations gave the total area of ideal ceiling
surfaces. More information of calculating could be found in Paper V.
To determine the orientation of the roofs, Paper V used the sampling
method within the first ring road of the city of Västerås as a sample, where six
types of buildings were involved (excluding the industrial buildings). Then
the roof orientation was obtained by the use of Google Earth ProTM. Only the
roofs facing South, South West, South East, West, and East were considered
to be applicable for solar PV systems. Considering building orientations, the
fraction of property oriented roof area can be computed as follows (Equation
(12)), using the approach (Mansouri et al., 2019):
𝑈𝑜𝑟𝑖 = 𝑅𝑓𝑙𝑎 ∙ 𝑟𝑓𝑙𝑎 + 𝑅𝑢_𝑝𝑖𝑡 ∙ 𝑟𝑢_𝑝𝑖𝑡 + 𝑅𝑛_𝑝𝑖𝑡 ∙ 𝑟𝑛_𝑝𝑖𝑡 (12)
Where 𝑈𝑜𝑟𝑖 is the utilization factor of orientation, 𝑅𝑓𝑙𝑎 is the flat roof per-
cent, 𝑟𝑓𝑙𝑎 is the orientation role for flat roofs, 𝑅𝑢_𝑝𝑖𝑡 is the percent of applica-
ble orientations for solar PV installations,𝑟𝑢_𝑝𝑖𝑡 is the orientation role for roofs
with applicable orientations, 𝑅𝑛_𝑝𝑖𝑡 is the percent of not-applicable orienta-
tions for solar PV installations, and 𝑟𝑛_𝑝𝑖𝑡 is the orientation role for roofs with
not-applicable orientations. 𝑅𝑢_𝑝𝑖𝑡 = 𝑅𝑠 + 𝑅𝑠𝑤 + 𝑅𝑠𝑒 + 𝑅𝑤 + 𝑅𝑒 , and
𝑅𝑛_𝑝𝑖𝑡 = 𝑅𝑛 + 𝑅𝑛𝑒 + 𝑅𝑛𝑤 ; 𝑅𝑠 , 𝑅𝑠𝑤 , 𝑅𝑠𝑒 ,𝑅𝑤 , 𝑅𝑒 , 𝑅𝑛 , 𝑅𝑛𝑒 , 𝑅𝑛𝑤 are the per-
cent with the orientation of South, South West, South East, West, East, North,
North East, and North West, respectively. The sampling took place only on
non-industrial buildings.
In considering the shadows and obstacles, different utilization factors were
extracted from literatures (Equations (13) and (14)(Kamp, 2013))
52

34
𝑈𝑠𝑜𝑖𝑛𝑑 = 1 − 0.3 = 0.7 (13)
𝑈𝑠𝑜𝑛𝑜_𝑖𝑛𝑑 = 1 − 0.25 = 0.75 (14)
Where, 𝑈𝑠𝑜𝑖𝑛𝑑 is the utilization factor due to shadows and obstacles for in-
dustrial buildings. 𝑈𝑠𝑜𝑛𝑜_𝑖𝑛𝑑
is the utilization factor due to shadows and obsta-
cles for non-industrial buildings.
The total useable roof area for solar PV systems in entire Sweden was cal-
culated based on Equation (15).
𝐴𝑝𝑣𝑆𝐸 = ∑ (
𝐴𝑏𝑎𝑠𝑒𝑚 ∙𝑈𝑎𝑏𝑠
cos 𝛼𝑟𝑜𝑜𝑓 ∙ 𝑈𝑜𝑟𝑖 ∙ 𝑈𝑠𝑜)290𝑚𝑢=1 (15)
Where 𝐴𝑝𝑣𝑆𝐸 is the usable area for roof-mounted PV systems in Sweden,
𝑚𝑢 = 1,2,3 … ,290 (290 municipalities), 𝐴𝑏𝑎𝑠𝑒𝑚 is the building base area of
the 𝑚𝑡ℎ municipality, 𝑈𝑎𝑏𝑠 is the absolute reduction factor due to the cultural
and religious purpose of buildings, 𝛼𝑟𝑜𝑜𝑓 is the slope angle of the roof, 𝑈𝑜𝑟𝑖
is the utilization factor of orientation, 𝑈𝑠𝑜 is the shadows and obstacles factor.
3.5.2 Configurations of PV module and energy conversion
In paper V, the angle of PV modules was in parallel to the roof plane for in-
stallations on pitched roofs (Mainzer et al., 2014). Three scenarios, i.e., Sce-
nario A, Scenario B, and Scenario C, were applied to determine the angles of
PV modules and appropriate inter-row distances, for those mounted on flat
roofs. This was to consider that power generation could be affected by mutual
shading effects between each row. In Scenarios A and B, the PV modules were
installed in rows and oriented true South. In scenario C, the PV modules were
installed in the East-West direction with a relatively small tilt angle. These
three scenarios were compared as theoretical design (Scenario A) and com-
mercial solutions (Scenario B and Scenario C).
Scenarios A and Scenario B investigated two different combinations of tilt
angle and row spacing to cope with different inter-row shading effects. In Sce-
nario A, Paper V employed the longer row spacing to minimize the mutual
shading effects. Firstly, the tilt angle was calculated in Equation (16)
(Campana et al., 2020) (Swedish Meteorological and Hydrological Institute
(SMHI), 2017). Then the distance between two rows was determined by Pack-
ing Factor (PF) (Equation (17)) (Martín-chivelet, 2016) to avoid mutual shad-
ing at noon of winter solstice. The Figure 7 shows the schematic diagram of
the required distance between rows of solar panels corresponding to different
solar elevation angles in Scenario A.
𝛽𝑜𝑝𝑡 = −0.1101𝜙2 + 14.003𝜙 − 404.77 (16)
Where 𝛽𝑜𝑝𝑡 is the optimal tilt angle of PV module. 𝜙 is the latitude.
𝑃𝐹 =𝑙
𝑑= (𝑐𝑜𝑠 𝛽 +
𝑠𝑖𝑛 𝛽
𝑡𝑎𝑛 𝛼𝑐𝑜𝑠 𝛾)−1 (17)
Where 𝛽 is the tilt angle of the PV array, 𝛼 is the solar elevation defined
by Equation (18) and 𝛾 is the solar azimuth.
𝑐𝑜𝑠 𝛼 = 𝑠𝑖𝑛 𝛿 𝑠𝑖𝑛 𝜙 + 𝑐𝑜𝑠 𝛿 𝑐𝑜𝑠 𝜙 𝑐𝑜𝑠 𝜔 (18)
53

35
Where 𝛿 is the earth’s declination, and 𝜔 is the hour angle.
Figure 7. Schematic diagram of the required distance between rows of solar panels
in scenario A.
In scenario B, Paper V redefined a 35 kWp solar PV system in 10 rows as
the reference system. In this scenario, we looked for the tilt angle and row
distance which could enable higher electricity generation in a given area
(higher value of kWh/m2), higher potential installed capacity (with smaller
inter-row distances), and lower shading losses. Parametric simulations were
run in PVsyst software (V6.87) using the most accurate simulation method
that considered shadings according to modules orientation and strings defini-
tion.
In Scenario C shown in Figure 8 as a comparison to scenario A and B, an
East-West orientation with a low tilt angle was employed in the analysis.
Proven by previous studies (Asgharzadeh et al., 2018) and (Hartner et al.,
2015), this configuration has become popular on flat roofs. Because it enabled
the modules to fit more tightly together, therefore, gave higher installed ca-
pacities with more economic land-use. Although such an installation gener-
ated less electricity per installed kWp comparing to South-oriented system, it
also made less significant mutual shadings.
54

36
Figure 8. East-West orientation configuration with a low tilt angle in scenario C.
In Paper V, Jinko Solar PV modules (JKMS 350M-72V Maxim) were used
with 350Wp of STC Power Rating, 20.5 % of cells area efficiency, and a 0.992
x 1.956 m² module size. The potential capacity and electricity generation were
calculated in PVsyst (V6.87) with the geographical data, module data, and
system assumptions.
55

37
4 Results
This chapter presents the results from the analysis of the grid party capability,
economic feasibility, and investment values in the market of China, Service-
Dominant logic explanation in smart city transformation in Sweden, and po-
tential availability. This chapter also presents the interpretation of the results
from the investigations.
4.1 Grid parity of user-side and plant-side (Paper I)
In Paper I, the results revealed all Chinese cities could achieve 100% grid
parity of user-side as shown in Figure 9(a). The darker the color, the better the
User-side Grid Parity condition. The cities marked with name and locations
were those with GPIu ≤ 0.40 or ≥ 0.80. The MCA showed the electricity gen-
eration was the most sensitive to the LCOE values. This factor together with
electricity market price determined the GPIu value. Cities with better GPIu
conditions located in northwestern Tibet, northeastern provinces, Inner Mon-
golia, and so on, due to the higher solar radiation and higher electricity market
prices. In Inner Mongolia, four cities of East Grid had better GPIu conditions
than those eight cities of West Grid under similar solar radiation resources
(Resource Zone I). This could be explained by the higher electricity market
prices in the East Grid (0.77 CNY/kWh compared to 0.59 CNY/kWh). An-
other example is that four cities in the province of Sichuan performed signifi-
cantly better than the other 17 cities with the same electricity market price,
since those four cities located on a plateau with more abundant solar radiation.
Cities in Chongqing province, locating in the eastern part of the Sichuan Ba-
sin, had the worst GPIu values. Chongqing province had the lowest average
solar availability capacity, less than 100 GW. Still, despite its meteorological
disadvantages, Chongqing could nevertheless achieve a lower LCOE than the
electricity market price.
56

38
Figure 9. Grid Parity Indices for distributed PV projects in 344 cities without subsi-
dies.
Among 344 cities, 76 cities (22.09%) had GPIp strictly below 1, i.e., LCOE
achieved below the desulfurized coal benchmark price (Figure 9(b)). Dalian,
Liaoning Province, had the highest GPIp level, followed by cities in Hainan,
Heilongjiang, Sichuan, and Qinghai provinces. Accordingly, 58.6% of prov-
inces (18 out of 31) have achieved plant-side grid parity, including most of the
northeastern provinces, northern provinces, western provinces, and some
southern provinces. Through the MCA, the abundance level of solar radiation
was one of the main contributors to GPIp, similar to GPIu. The local desulfu-
rized coal benchmark price was another sensitive factor. Chongqing had the
worst Plant-side Grid Parity condition because of low average solar radiation
and relatively low desulfurized coal benchmark price. Apart from the 76 cities
with Plant-side Grid Parity, notably, another 99 cities had GPIp values slightly
higher than but very close to 1.0 (they range from 1.01 to 1.09). That was a
positive sign that the expected grid parity of solar PV was close to becoming
widespread in many cities.
4.2 Investment profitability (Paper I & II)
Both GPIu and GPIp compared the cost of solar PV generation to external
costs, and neither included revenue in Paper I. Therefore, the Levelized Profit
of Electricity (LPOE) was proposed which measured the net revenue per kWh
of electricity from solar PV generation without subsidies. LPOE was defined
as the discounted net profit divided by the discounted net power generation,
where the discounted net profit included the discounted net income and net
cost. In the analysis, there were 92.73% of the cities reached the net profit
status of electricity based on 50% self-generation and 50% feed-in (See Figure
10(a). The cities marked with name and locations were those with: LPOE ≤
57

39
0.0, or LPOE ≥ 0.20). A more detailed city analysis could be found in Paper
I.
For the investors, the investment indices, such as IRR, could be more pre-
ferred, as it indicated that an applicable investment when the IRR was higher
than the cost of capital. In Paper I, 83.72% of the cities had an IRR higher than
8%. This indicated that investing in distributed solar PV systems in those cities
could bring a higher economic return based on pre-assumed investment costs
(e.g. an 8% bank interest rate and a 5-year loan period) (See Figure 10(b). The
cities marked with name and locations were those with: IRR ≤ 5.0% or IRR ≥
20.0%). Approximately, there were 83% of the cities with an IRR higher than
8% and 10% of the cities with an IRR higher than 20% - very high profitabil-
ity. 67% of the cities’ DPBPs were less than 15 years (See Figure 10(c). The
cities marked with name and locations were those with: DPBP ≤5.0, or DPBP
≥ 20.0).
Figure 10. Economic feasibility and profitability of solar PV in 344 cities without
subsidies.
58

40
In the United States and China, two of the world's most important econo-
mies, coal remained firmly the largest (66.54% by 2018) and second-largest
(27.90% by 2018) source of electricity among other energy sources (Dudley,
2018). In the coming years, coal-fired power plants were scheduled to be shut
down as non-fossil fuels such as solar energy gradually replace them. In the
United States, coal plants have already been decommissioned since 2010. One
of the main reasons for these continued retirements was the poor economics
of coal power plants. In China, the retirement of coal plants has not yet started
despite the expansion of alternative energy sources. In this section, the cost-
risk analysis was used to determine the different levels of cost-risk for cur-
rently operating coal-fired power plants versus the distributed solar PV pro-
jects.
Using a cost crossover algorithm, this study identified 76 cities with oper-
ating coal-fired power plants that were at cost-risk from distributed solar PV
projects, i.e., these operating coal-fired power plants can be replaced by dis-
tributed solar PV projects that were 0-25% cheaper in cost. There were 217
cities with coal-fired power plants that were potentially at cost-risk from dis-
tributed solar PV projects, i.e., where the local DCB price was 0-25% lower
than the distributed PV LCOE. Finally, 51 cities had operating coal-fired
power plants that were considered to be deemed no cost-risk, i.e., the local
DCB price was more than 25% lower than the local solar PV LCOE. Overall,
85% of the coal-fired power plants in the surveyed cities were currently gen-
erally at risk. The results are shown in Figure 11. A more detailed cost com-
parison analysis between China and the United States could be found in Paper
II.
Figure 11. Current running coal-fired power plants cost-risk levels and city number
percent in China and the US.
59

41
From the geographical map below (Figure 12), operating coal-fired power
plants in the northwest and Sichuan basin were at low-level risk in costs. A
more detailed geographical analysis could be found in Paper II.
Figure 12. The four cost-risk levels of current coal-fired power plants and their cor-
responding cities in China.
After running the K-means clustering algorithm in SPSS® software, all 344
cities were divided into four clusters. The clustering results can be shown in
Figure 13. City cluster 1 had the superiority of investment-profits over the
other three city clusters.
60
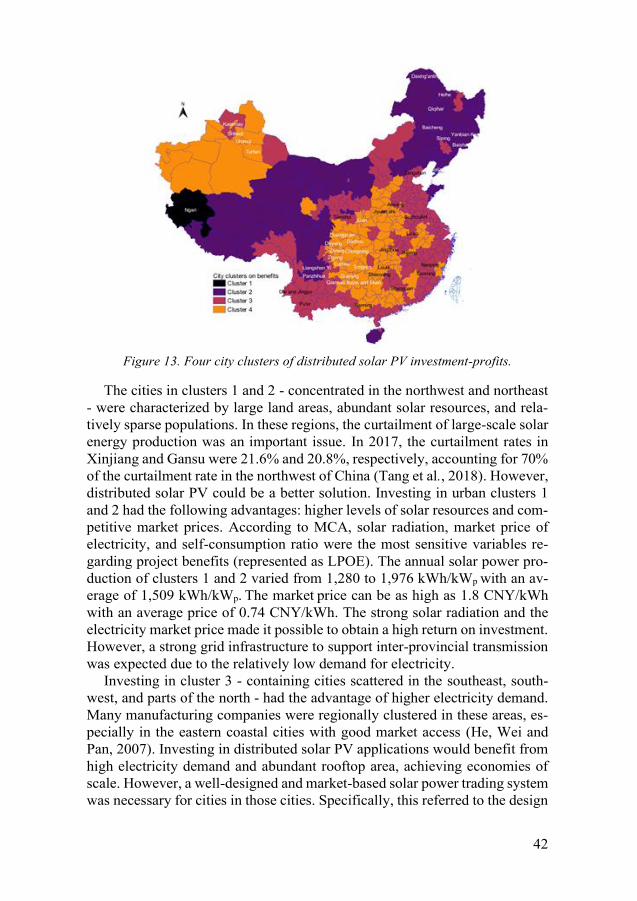
42
Figure 13. Four city clusters of distributed solar PV investment-profits.
The cities in clusters 1 and 2 - concentrated in the northwest and northeast
- were characterized by large land areas, abundant solar resources, and rela-
tively sparse populations. In these regions, the curtailment of large-scale solar
energy production was an important issue. In 2017, the curtailment rates in
Xinjiang and Gansu were 21.6% and 20.8%, respectively, accounting for 70%
of the curtailment rate in the northwest of China (Tang et al., 2018). However,
distributed solar PV could be a better solution. Investing in urban clusters 1
and 2 had the following advantages: higher levels of solar resources and com-
petitive market prices. According to MCA, solar radiation, market price of
electricity, and self-consumption ratio were the most sensitive variables re-
garding project benefits (represented as LPOE). The annual solar power pro-
duction of clusters 1 and 2 varied from 1,280 to 1,976 kWh/kWp with an av-
erage of 1,509 kWh/kWp. The market price can be as high as 1.8 CNY/kWh
with an average price of 0.74 CNY/kWh. The strong solar radiation and the
electricity market price made it possible to obtain a high return on investment.
However, a strong grid infrastructure to support inter-provincial transmission
was expected due to the relatively low demand for electricity. Investing in cluster 3 - containing cities scattered in the southeast, south-
west, and parts of the north - had the advantage of higher electricity demand.
Many manufacturing companies were regionally clustered in these areas, es-
pecially in the eastern coastal cities with good market access (He, Wei and
Pan, 2007). Investing in distributed solar PV applications would benefit from
high electricity demand and abundant rooftop area, achieving economies of
scale. However, a well-designed and market-based solar power trading system
was necessary for cities in those cities. Specifically, this referred to the design
61

43
of tariffs regarding load matching and differences between grid inputs/out-
puts. This required the deregulation of the retail electricity market and the de-
velopment of interregional electricity trading, which would change the inter-
action between grid companies, generators, and end-users (Zhang, Andrews-
Speed and Li, 2018).
Compared to the other three city clusters, investing in cluster 4 was less
advantageous. However, investments can still be made in poverty alleviation
projects and public use projects, such as in urban lighting and traffic signals.
The PV poverty alleviation project launched in 2014 had an ambitious goal of
adding more than 10 GWp and benefiting more than 2 million households by
2020 (Zhang, Andrews-Speed and Li, 2018). Qinghai, Sichuan, Yunnan, and
Shaanxi provinces were among the major provinces with various incentives,
such as credit support from China Development Bank and special funds from
local governments (Li et al., 2018).
4.3 Electricity market in transformation (Paper III)
4.3.1 The traditional linear value chain market logic
Most forms of renewable energy production are spatially distributed, highly
variable, and less predictable than non-renewable energy sources such as oil
and coal as well as nuclear energy. In addition, some forms of renewable en-
ergy allow for small-scale, such as solar PV systems, and medium-scale en-
ergy production, which present challenges to current energy producers who are
often in oligopolistic positions. This challenges the operational and manage-
ment control of the power system, including the distribution of the generated
electricity, the financial results, and the laws and regulations to be followed.
Through the application of renewable energy, customers (households, compa-
nies, and public organizations) can move from being "pure" electricity users
and consumers to - through the installation of renewable energy products -
having ownership of energy production equipment and real-time monitoring
through mobile "apps". However, this also challenges the behavior of other
established actors (e.g. roles and practices) and the structure of the distribution
system. This new environment means that households, commercial com-
panies, and public organizations can be independent of the grid and can
also contribute to the overall energy production of the city.
The Swedish electricity market is technically and commercially part of
the Nordic electricity market. Since the 1990s it has been a deregulated
market, formalized by the Norwegian-Swedish Exchange (Nord Pool), the
world's first multinational exchange for trading electricity and utility
power contracts. The deregulation in the Nordic countries initially led to a
marked increase in price competition. However, the Swedish government
decided to separate the generation and supply of electricity (which became
62

44
competitive) from grid and distribution activities (which remained non-
competitive).
The Swedish electricity market has traditionally followed a value chain
design (see Figure 14), starting with power generators and delivering elec-
tricity to the distribution network. The main part of electricity has tradi-
tionally been produced by hydro and nuclear power plants, while recently
there has been an increase in the production of wind power, biofuels, and
solar PV power. Producers sell the generated electricity to electricity trad-
ers or end-users. The five largest electricity producers in Sweden are Vat-
tenfall, Fortum, E.ON Sverige, Statkraft Sverige, and Skellefteå Kraft.
The electricity network established by distributors transports electricity
from the production sites to the end-users. This grid network is divided
into a national grid, a regional grid, and a local grid. Svenska Kraftnät
owns the national grid and plays the role of Transmission System Operator
(TSO), which means ensuring that power plants work together in a reliable
way and that production and imports correspond to consumption and ex-
ports. The TSO is responsible for maintaining a balance between national
production and consumption. It is regulated and reviewed by the Swedish
Energy Market Inspectorate. The regional network transmits electricity
from the grid to the local network and, in some cases, to large users such
as industry. Three large regional grid owners - E.ON Elnät Sverige, Vat-
tenfall Eldistribution, and Fortum Distribution - own most of the regional
grid in Sweden. As a result, these companies have both production and
distribution business units, which need to be strictly separated for legal
and regulatory reasons. Local grids distribute electricity to end-users
within a certain geographical area. Owners of local networks include gov-
ernments, municipalities, companies and non-governmental organizations,
and licenses for grid concessions are issued by the Swedish Energy Market
Inspectorate.
63

45
Figure 14. A simplified illustration of the Swedish energy system’s traditional linear
value chain market logic.
Further down the line, electricity retailers trade in the electricity market,
competing with other retailers for sales under different electricity con-
tracts. They thus act as intermediaries between producers and consumers,
which means that this role is also known as a distribution system operator
(DSO). In order to assume balancing responsibilities, the DSO first has to
enter into a balancing service contract with the TSO and then legally bal-
ance all electricity produced or consumed at the input and output points of
the network, in accordance with the provisions of the Swedish Electricity
Act.
At the end of the chain are the electricity customers (various actors in-
cluding households, companies, consumers, etc.), who are the end-users
of electricity. Customers buy electricity from retailers or producers and
use it for their own value creation. Customers need to enter into agree-
ments with grid owners and electricity traders to gain access to the grid
and to purchase electricity at an agreed price. Such agreements are often
arranged by a single actor, such as a power distributor, and the service
resulting from the agreement are limited. Given that traditional metering
64
46
systems are based on invoice accuracy rather than user-friendliness, cus-
tomers who are interested in their real-time energy usage have historically
received little such service from electricity producers or retailers. As a re-
sult, customers who want to know their energy usage in real-time need to
purchase third-party solutions (e.g., generic mobile "apps") that have lim-
ited control possibilities.
4.3.2 The networked market and an emerging new role - aggregator
The need to coordinate and deal with decentralized energy systems has given
rise to so-called "aggregators" (i.e. third parties). These aggregators are both
assemblers and operators of renewable energy sources, as well as connectors,
balancers, and re-constructors of electricity codes/rules. In addition to instal-
lation, operation and maintenance services for distributed energy systems, ag-
gregators frame distributed energy systems as controllable and manageable
smart grid communities. Physical electricity is produced, traded, consumed,
and balanced within the local microgrid and is complementary to the larger
regional grid. Electricity is offered as a package for customers to choose from,
usually below the retail market price. The collector is responsible for the over-
all electricity price balancing and price negotiation for its customers, thus be-
coming a kind of energy system ombudsman.
Aggregators participate in the process of energy conversion and distribu-
tion, thus acting as intermediaries between the actors in the grid (see Figure
15). Power aggregators bring in resources in the form of expertise, information
distribution and new technologies to take advantage of the ongoing electricity
market failures. The growth of energy micro-production, such as PV systems,
has led to information asymmetries and imperfect coordination of actors in
terms of economic and technical (electricity) signals (i.e., mismatch between
real-time demand and supply), resulting in irrational and unstable prices. Ag-
gregators are coordinating the load and generation of all demand and supply
units with the aim of making the production and use of electricity technically
and economically optimal.
65

47
Figure 15. A future smart and dynamic networked market logic.
As shown in Figure 15, different actors interact with each other based on
power flows, information flows, and cash flows. The function of the aggrega-
tor is to secure and transfer the dynamic flows of the system and the value
generated by the system to ensure that each actor in the system receives a fair
share of the costs and benefits for its part of the value generated. For example,
aggregators can offer leases or "power purchase agreements" to households,
companies, or organizations to enable them to access PV systems or other re-
newable power systems. Aggregators can also install and maintain renewable
power systems and provide electricity to customers when the PV system's out-
put is too low. In addition, aggregators can control the demand for electricity
from the aggregated consumption of the system. Thus, the aggregator physi-
cally connects the PV system owner to the grid, but matches this with an in-
creased level of information generation among all partners. Basically, from
interconnection and net metering, aggregators import power from the grid or
export power when needed or when dealing with a surplus. From power trad-
ing, aggregators gain a share by coordinating the costs and benefits of relevant
actors. In addition, there may be additional key ancillary transactions to stabi-
lize the power system. In this sense, aggregators act as a bridge between end-
users and other actors, providing services to end-users, grid owners, and large
power companies. Finally, aggregators also have the ability to deal with laws
and regulations related to energy production and distribution-something that
users do not have to consider before becoming their own generators.
Due to the increasing penetration of renewable energy sources in smart cit-
ies, there is a lack of connection between end-users, the grid, and energy pro-
ducers. The introduction of renewable energy resources changes the tradi-
tional roles and there will be no clear boundaries between who is a producer
and who is a user (in fact, it can be the same actor). Aggregators will thus
reduce the transaction costs of individual participation and provide ancillary
66

48
services. From the grid perspective, aggregators help organize demand and
supply and maintain grid stability by "peak-shaving" (i.e., controlling some of
the energy used by grid actors) and "load shifting" (distributing energy among
actors). Thus, aggregators act as intermediary actors between energy suppliers
and users by collecting distributed generation from grid actors and organizing
intra-grid transactions.
4.4 Selected key performance indicators (Paper IV)
In order to distinguish the five most important KPIs, the entire pool of poten-
tial candidates was analyzed. The Table 2 summarizes the statistical parame-
ters of the questionnaire results. Due to content limitations, this table only
shows the results for the top 5 and the last 5 KPI candidates.
Table 2. Summary results of statistical parameters. (T: technology, En: environmen-tal, Ec: economics, S/P: social/policy)
No. KPI candidate Category Count STD AVG CV Z
value
1 Energy efficiency T 16 1.06 5.94 0.18 1.95
2 Greenhouse gasses
(GHG) emission
En 16 1.63 5.63 0.29 1.87
3 Ramp rate T 14 1.45 5.50 0.26 1.74
4 Availability Factor T 13 1.12 5.62 0.20 1.72
5 Energy Price Ec 11 1.29 5.64 0.23 1.56
… … … … … … … …
35 Revenue for the net-
work operator from
the service
Ec 4 1.89 3.75 0.50 0.84
36 Duration and fre-
quency of interrup-
tions per customer
T 4 2.71 5.00 0.54 0.82
37 Public safety S/P 4 2.65 4.50 0.59 0.78
38 Reduction of the
number of communi-
cation channels
S/P 2 2.12 1.50 1.41 0.00
39 System minutes lost T 2 4.95 3.50 1.41 0.00
Based on the results in Table 2, it was found that the most important KPIs
were the energy efficiency followed by GHG emission. The top five KPIs are
presented in Table 3. The selected KPIs were characterized by the lowest co-
efficient of variation and highest number of votes (Count) both normalized
and presented as objective (Normalized objective).
67

49
Table 3. Five most important KPIs without categories.
No. Chosen KPIs
1 Energy efficiency
2 GHG emission
3 Availability factor
4 Ramp rate
5 Market price of provided energy and services
In the second part of the analysis, the five most important KPIs were dis-
tinguished from each category (technical, economic, environmental, and so-
cial/policy). The results of this analysis are as the following Table 4.
Table 4. The selected KPIs from the questionnaire analysis in different categories.
Category Chosen KPIs
Technical Energy efficiency
Ramp rate
Availability factor
Start up time
Share of electrical energy produced by renewable sources
Economic Market price of provided energy and services
Production cost
Energy conversion plant profitability
Costs and revenues arising from system operation
Operational failure risk
Environmental GHG emission
Fuel energy savings ratio
Generated pollutant element
Social/policy Abiotic depletion potential
Public safety and acceptability
Reduction of the number of communication channels
Paper IV summarized the process of identifying and selecting the most im-
portant KPIs that can be used to assess the achievement of a simulated flexi-
bility program. The selection of KPIs was based on a mixed-method approach,
including literature review, questionnaire analysis, and expert knowledge.
Considering the range of the nature of multi-energy systems, the KPIs were
classified into four categories: technical, economic, environmental, and so-
cial/policy. In Paper IV, 16 KPIs were selected by ranking the KPI candidates
of different importance through statistical analysis of the questionnaire. These
indicators were selected based on the statistical importance of the respondents'
votes.
68

50
KPIs are used to communicate goals, progress, and room for improvement
in flexible performance. Therefore, the compiled list of recommended KPIs
should be quantifiable and clearly defined. The implementation of KPIs and
further feedback was essential to obtain the necessary data and information.
In order to achieve an efficient and stable multi-energy system, more techno-
logical innovations are needed to maximize the flexibility potential of variable
energy sources. In addition, decisionmakers should encourage progress on all
KPIs through appropriate incentives.
4.5 Potential availability analysis (Paper V)
The estimated roof area for solar PV systems in Västerås was 5.74 𝑘𝑚2, with
1.12 𝑘𝑚2 area of industrial buildings and 4.63 𝑘𝑚2 area of non-industrial
buildings. For building types, it was investigated that 3.68 𝑘𝑚2 were pitched
roofs, and 2.06 𝑘𝑚2 were flat roofs.
For the pitched roofs, different orientation gave different electricity yields,
which ranged from 814 kWh/kWp (West-oriented) to 1022 kWh/kWp (South-
oriented). The total potential installed capacity was estimated to be 664 MWp
and yearly electricity generation 565 GWh. The results are presented in Table
5.
Table 5. The usable area, potential installed capacity, and electricity generation for pitched roofs.
Roof type: pitched roofs
Usable area (𝑘𝑚2)
Tilt angle of PV modules (°)
Specific yield (kWh/kWp)
Potential in-stalled capa-city (MWp)
Potential yearly electric-ity generation (GWh)
East 1.06 30 820 191 149
South East 0.16 30 966 28 26
South 1.08 30 1023 195 190
South West 0.31 30 966 56 51
West 1.07 30 814 193 150 Total 3.68 N/A N/A 664 565
For scenario A of the flat roofs, a 5.9-meter row distance was calculated
with 39° tilt angle. The potential installed capacity was estimated to be 63
MWp and yearly electricity generation 60 GWh (Table 6).
For scenario B of the flat roofs, the simulation results of a 35 kWp system
(Figure 16) suggested a 20° tilt angle and 2-meter row distance that gave the
lowest shading losses. This design was also consistent with existing commer-
cial solutions, for example, IBC Solar suggested 1.6-meter and 10°, 1.8-meter
and 15° on flat roofs for the South-oriented solar PV systems in Germany (IBC
Solar, 2019). In this particular scenario, the losses due to mutual-shading
69

51
effect were estimated to be 5.3%. The potential installed capacity was esti-
mated to be 184 MWp and yearly electricity generation 155 GWh (Table 6).
Figure 16. The percent of electricity losses using different row distances and tilt an-
gles due to mutual shading.
For scenario C of the flat roofs, a 2.5-meter row distance and 0.05-meter
top spacing were employed. Suggested by (Malmsten, 2015) and (IBC Solar,
2019), we used the 10° as tilt angle. With the same module parameters and
technical assumptions, this configuration was estimated to be 292 MWp and
yearly electricity generation 235 GWh (Table 6).
To sum up, 5.74 𝑘𝑚2 usable area in Västerås gave potential installed ca-
pacity as 727 MWp, 848 MWp, and 956 MWp, and potential yearly electricity
generation as 626 GWh, 720 GWh, and 801 GWh on pitched roofs and flat
roofs with three scenarios, respectively. This potential generation corres-
ponded to 55%-70% of Västerås’ annual electricity demand (Statistics
Sweden (SCB), 2019). It was noteworthy that this did not consider the hourly
or seasonal electricity supply and demand balance. Around noon in summer,
there would be an excess of PV electricity that had to be exported. According
to the statistics from Swedish Energy Agency, 14.46 MWp of grid-connected
systems was installed in Västerås municipality at the end of 2019 (Swedish
Energy Agency (Energimyndigheten), 2020a). Comparing with the potential,
this was still a very small share.
70

52
Table 6. The usable area, potential installed capacity, and electricity generation for flat roofs in three scenarios.
Roof type: flat roofs
Usable area (𝑘𝑚2)
Tilt an-gle of PV modules (°)
PV mo-dule orientat-ion
Row distance (𝑚)
Specific yield (kWh/kWp)
Potential installed capacity (MWp)
Potential yearly elec-tricity gener-ation (GWh)
Scenario A
2.06 39 South 5.9 1010 63 60
Scenario B
2.06 20 South 2 933 184 155
Scenario C
2.06 10 East-West
2.5 849 292 235
The overall results for the roof area in Sweden and the geographical distri-
bution for each municipality can be found in Figure 17(a). The total available
roof area for different building types in Sweden was estimated to be 504 km2,
with 327 km2 pitched roofs and 178 km2 flat roofs.
Based on this method, the potential installed capacity was calculated for
290 cities. Three scenarios (Scenarios A, B, and C) were designed on flat
roofs. Nationwide, the total potential installed capacity of solar PV systems
under the three scenarios for pitched and flat roofs was 65, 75, and 84 GWp,
respectively. The geographical distribution of the potential installed capacity
of roof-mounted solar PV systems is in Figure 17(b) - (d). In Paper V, the
latest geographic data and statistics were used as much as possible to calculate
the solar PV power potential and technical software was used to simulate solar
power generation.
71

53
Figure 17. The potential area for roof-mounted solar PV systems (a), and the poten-
tial installed capacity on pitched roofs and flat roofs with three scenarios (b-d).
The usable roof area for solar PV installation per capita was 49 m2 for Swe-
den on average, and 38 m2 for Västerås municipality, which were within the
range of results obtained by other authors. Izquierdo et al. (Izquierdo,
Rodrigues and Fueyo, 2008) reported an available roof area per capita to be
14.0±4.5 m2/capita for Spain. The values ranged from 6.2 m2/capita to 76.4
m2/capita. Wiginton et al. (Wiginton, Nguyen and Pearce, 2010) reported a
roof area per capita of 70.0 m2/ca±6.2% in the Canadian context, after reduc-
tion of constraint factors. Analysis of potential installed capacity yielded a
value of 6-8 kWp/capita for Sweden and 5-6 kWp/capita for Västerås munici-
pality. The results also showed a potential of 129-167 MWp/km2 for Sweden
and 127-166 MWp/km2 for Västerås. As a comparison, a value of 149
MWp/km2 was found in the US (Phillips et al., 2018), 95.06 MWp/km2 in the
residential rooftop area in Baden-Württemberg, Germany (Mainzer et al.,
2014), and 91.98 MWp/km2 in Lethbridge, Canada (Mansouri et al., 2019).
This indicated that Sweden might have better potential for PV system instal-
lation than Germany and Canada. By the end of 2019, a record of 287 MWp
72

54
annual installation was made, which brought the total capacity to 698 MWp
(Swedish Energy Agency (Energimyndigheten), 2020b). However, compared
with the potential, there was still huge space for the solar PV market in Swe-
den to grow.
54
annual installation was made, which brought the total capacity to 698 MWp
(Swedish Energy Agency (Energimyndigheten), 2020b). However, compared
with the potential, there was still huge space for the solar PV market in Swe-
den to grow.
73

55
5 Discussions and policy implications
This chapter highlights the main discussion points and policy implications.
5.1 “Soft” cost
In Paper I and Paper II, solar PV hardware costs (including PV modules, inte-
gration, inverters, wiring, and junction boxes) accounted for slightly less than
50% of the total costs, while the remaining 50 % were non-hardware or "soft"
costs - such as roof rent, financing, design and installation, and operations and
maintenance. In the United States, this figure was 59% in the first quarter of
2017. While hardware costs (especially PV module costs) have fallen signifi-
cantly, high soft costs combined with low electricity prices in some cities
made grid parity more difficult to achieve. For large projects (utility-scale),
soft costs had a greater impact, but to a relatively lesser extent. For smaller
projects in the industrial and commercial (I&C) market, the impact of soft
costs was very high and can actually make many projects financially dis-
tressed. In China, soft costs and their reduction potential were clearly high-
lighted in January 2019 in China's new policy "Notice on actively promoting
the work related to subsidy-free wind power and PV power generation for grid
parity". Soft costs involved in China's solar PV industry may include financing
costs, land acquisition costs, grid connection costs, and various fees for per-
mitting, inspection, and grid connection. Labor costs were not high due to the
relatively low wages of direct labor and related installation overhead. In
China, customer acquisition has been largely achieved due to market maturity,
customer familiarity with PV systems, and the perception that PV systems
were a reliable technology. However, policymakers should consider strength-
ening targeted policies for the following soft costs.
Financing cost referred to the cost of raising funds from banks, insurance
companies, investment cooperation, and other financial institutions. In China,
the existing financing mechanisms for distributed solar PV projects were tra-
ditional bank loans, local financing platforms, industrial investment funds,
lease financing, Internet financing, etc. Because, first of all, distributed solar
PV owners were usually small and medium-sized enterprises or natural per-
sons with low credibility; secondly, the roof property rights were complicated
to define, the cost of land acquisition was high, and traditional banks needed
a long process to identify the project risks and assess the investment returns.
74

56
In addition, traditional banks had high interest rates and short loan terms. The
sensitivity analysis in Paper I also proved that bank interest was one of the
most critical factors in determining the cost and return of distributed solar PV
projects. As for other financing methods, to some extent they failed in practice
due to low performance, limited funding sources, legality issues, or invest-
ment security issues. Although as early as 2013, the National Energy Admin-
istration and the National Development Bank jointly issued a policy calling
for a supportive financing environment for the distributed solar PV industry,
until recently, this policy did not provide for specific measures. Therefore, the
provision of innovative financing solutions and business modules at both pol-
icy and commercial levels was believed to be of critical importance in achiev-
ing grid parity.
The cost of grid connection referred to the reluctance and complicated pro-
cedures for grid companies to integrate solar PV. To provide undifferentiated
and convenient access to solar PV, the State Grid Corporation of China and
China Southern Power Grid - two of China's largest state-owned power com-
panies - have been offering free and full access to the grid for distributed solar
PV projects since 2012. They also provided free services including grid con-
nection solutions, metering, equipment testing, and purchase of all electricity
generated by the solar PV projects. This was also clearly confirmed and writ-
ten into policy by the NDRC in 2013. However, every kilowatt hour of solar
PV power generated for self-consumption would directly reduce grid revenue.
Assuming 50% self-generation and an average power purchase price of 0.74
CNY/kWh, this reduction could be as much as 19 billion CNY by the end of
September 2018. This was a concern for grid companies facing a high pene-
tration of solar PV. In addition, grid companies needed to pay for the addi-
tional costs of system integration and grid reinforcement. Assuming an invest-
ment of 8 CNY/Watt, this amount was estimated to reach 11-19 billion CNY
by the end of September 2018. Thus, the passive attitude and reluctance of
grid companies indirectly added soft costs to the grid connection approval pro-
cess. For example, additional procedures and "lobbying" costs were added to
distributed solar PV project owners. We recommended that the government
may design a comprehensive operating cost compensation mechanism for grid
companies. The compensation could come from the current FiT and renewable
energy subsidies for the solar PV industry.
The various tax costs were the taxes and fees for solar PV projects and the
administrative costs for project permitting, inspection, and grid connection.
The various types of taxes and fees for solar PV projects were income tax
15%, Value-added Tax (VAT) 17%, land-use tax 1.2%, city construction tax
5%, and so on. The taxes and fees significantly increased the soft cost of solar
PV power. The approval process for a typical solar PV project may involve
multiple local departments and companies, such as the local development and
reform commission, city planning department, energy management depart-
ment, ecology department, construction department, grid company, banks, etc.
75
57
The diversity of permit requirements, zoning applications, physical inspec-
tions, and various fees further increased the soft costs of solar PV projects. It
was recommended that more targeted policies be introduced to simplify these
procedures and thus reduce taxes and fees.
5.2 “Additional cost”
On the one hand, the reduced cost of solar PV provided cheaper and cleaner
electricity for end-users. Local regulators and utilities should consider
smoothing the closure of older coal-fired power plants. On the other hand, the
high share of solar and other renewable energy sources posed a significant
flexibility problem for the power system (Denholm, Clark and O’Connell,
2016). Specifically, solar power generation can vary with weather fluctuations
or the passage of clouds, resulting in inaccurate power supply forecasts
(Creutzig et al., 2017). "Over-generation" and "under-generation" may occur
spontaneously, leading to curtailment and rapid adjustment of power. "Addi-
tional costs" were incurred to maintain the balance between electricity supply
and demand. The spread of solar PV also added challenges to the frequency
of the grid system. Therefore, another "additional cost" was required to main-
tain the stability of the power system. These "additional costs" increased as
the penetration of solar power increased (Merei et al., 2016). When solar PV
generation increased to about 15% (in kWh of generation), the average whole-
sale price of solar PV decreased by 45% to 55% per kWh relative to zero pen-
etration. When penetration increased to 30%, the price decrease can be around
70% (Sivaram and Kann, 2016). According to a study by UKERC
(Heptonstall and Gross, 2017), when renewable energy penetration reached
50%, there would be an additional cost of 15-45 GBP/MWh (132-397
CNY/MWh (OECD, 2018)) for reserve requirements and an additional cost of
5-20 GBP/MWh (44-176 CNY/MWh) for upgrading the transmission net-
work. As the price of solar PV systems fell, less money was spent on energy,
but more money was spent on these "services".
As noted in Paper II, 85.17% of coal-fired power plants in operation were
at cost-risk due to solar PV applications. Investing in city clusters 1, 2, and 3
- which accounted for 66% of China's cities - can yield an IRR above 8% and
a DPBP of up to 15 years. however, this only meant that the investment was
profitable for individual investors and did not indicate that solar power was
profitable on a societal level. The full energy value of solar technology can
only be understood in the context of the entire generation system, taking into
account the flexibility challenges described above.
In this case, technical and management options should be considered to
mitigate these challenges. First, it was recommended to increase the self-con-
sumption rate to directly offset the demand. Currently, a higher self-consump-
tion rate not only provided a cheaper source of electricity, but also implied a
76

58
stable power supply. The use of battery storage and/or electric-to-thermal
(thermal storage) schemes can be beneficial to increase the self-consumption
rate (Creutzig et al., 2017). Second, from a policy perspective, well-designed
incentive schemes can increase self-consumption, reduce the use of transmis-
sion lines, and increase the independence of customers from central grid
power. China was taking steps towards peer-to-peer trading of distributed gen-
eration (National Development and Reform Commission (NDRC); National
Energy Administration (NEA), 2017). Three business models between distrib-
uted generators, end-users, and local grid companies were proposed for the
pilot: direct sales, entrust sales, and sales to the grid. This was expected to
redefine the distributed generation business model and bring new opportuni-
ties for investments to serve commercial and industrial customers. A new
player, the aggregator, who would integrate customers' electricity consump-
tion behavior and grid services, was expected to emerge in a mature market
(Ekman, Röndell and Yang, 2019), which was discussed in Paper III. A single
aggregator can provide a limited number of services to customers and the grid.
However, a relatively large number of aggregators can form a single, large,
predictable entity and provide new services to the system over a longer period
of time. However, due to its complexity, this policy only gave an overview of
new ideas, and many details remained to be decided. For example, the ability
to coordinate the grid for inter-provincial and inter-regional transactions, the
compensation mechanism for distributed resources, etc.
5.3 Self-consumption rate
Sensitivity analysis showed that analyzing different self-consumption rates
would help to understand how these rates affect various economic parameters.
The decentralized nature of solar PV technology allowed producers to con-
sume the generated electricity directly on site. In Paper II, the self-consump-
tion rate was defined as the ratio of the direct consumption of solar PV elec-
tricity by end-users to the total amount of solar PV electricity generated
(Luthander et al., 2015). This was an attractive proposition for commercial
energy users, especially when the cost of solar power generation was lower
than the cost of purchased electricity. The self-consumption share varied
widely among users. From the results, the cost of solar power generation was
lower than the cost of purchasing power from the grid in all cities. In China,
self-generation was more economical than purchasing power from the grid. It
was predicted that the continued decline in the cost of solar PV generation
would provide more economic incentives for self-generation than purchasing
power from the grid.
Increasing the self-consumption rate can also increase the profitability of
solar PV systems. In Paper II, a self-consumption rate of 50% was assumed.
Since the market price of electricity in all Chinese cities was higher than the
77

59
DCB price, increasing the self-consumption rate implied more financial sav-
ings, which can be considered as a potential benefit. Looking at the five dif-
ferent self-consumption rate scenarios below (Figure 18), the higher the self-
consumption rate, the better the financial performance. In fact, studies in many
cases have shown that self-consumption was economically viable, although
different regulatory policies may affect its profitability (Kästel and Gilroy-
Scott, 2015). Self-consumption provided a degree of independence against un-
stable grid and electricity market price increases. It also reduced the pressure
on the distribution grid by offsetting demand on the generation side (Creutzig
et al., 2017).
Figure 18. Different self-consumption rates of 0%, 25%, 50%, 75% and 100% im-
pact economic performances.
5.4 Capital subsidy
Since 2009, Sweden has provided direct capital subsidies for the installation
of grid-connected PV systems at 60% of the installation cost in 2009 and 20%
in 2020. Along with this direct capital subsidy, a tax credit of SEK 0.6
SEK/kWh on electricity sold was introduced in 2015 for purchases of up to
30,000 kWh or so per year (Palm, Eidenskog and Luthander, 2018). To meet
the increased interest in solar PV in Sweden, the current authorities decided
in autumn 2015 to significantly increase the annual budget for 2016-2019 by
235, 390, and 390 million SEK, respectively. In 2017, it was decided to further
78

60
increase the budget for 2017 and 2018 to 585.6 - 1,085 million SEK. Follow-
ing revisions in autumn 2018 and spring 2019, a total of 1.2 billion SEK was
allocated for 2019. The historical budgets and historical direct capital subsi-
dies are summarized in Figure 19 (Lindahl et al., 2019).
Figure 19. The historical direct subsidy percent and the budgets for solar industry.
As a young and growing industry, the Swedish solar PV industry still
needed access to external funding at various times. Subsidies were an im-
portant tool for the government to support the renewable energy industry. By
using prudent policy measures, policymakers had the means to increase the
use of PV and thus stimulated related innovation and increase economic com-
petitiveness through economies of scale.
Sweden's ambition is to become one of the world's fossil-free welfare
states. The government will continue to promote the expansion of solar energy
as a suitable energy source that can mitigate aspects of the current climate
crisis (Ministry of the Environment - Government Offices of Sweden, 2016).
According to the results of this study, the maximum installed capacity of Swe-
dish rooftops had a theoretical potential of 65 GWp to 84 GWp. Although it
was not possible to fully utilize the theoretically available rooftop resources,
these unrealized quantities highlighted key issues for investors and authorities.
At the same time, the increased interest and awareness of solar PV projects
have significantly accelerated their deployment. Since 2009, the direct capital
subsidy program has attracted many investors, which has always resulted in
the authorities' budget allocations being less than the amount requested by so-
lar PV owners. For example, the average waiting time that occurred in 2016
was 722 days.
As in the early stages, subsidies (especially in the form of direct capital
subsidies) were sufficient and necessary to strengthen a nascent industry.
79

61
Examples such as China, Greece and Spain showed how strong support from
the authorities can strengthen the solar PV industry. In Sweden, similar effects
have been seen in the solar PV industry in recent years. Until 2018, subsidies
have supported about 79 % (337 MW) of the total installed capacity (Lindahl
et al., 2019). However, subsidies should be designed to be realistic and con-
trollable. In the later stage, the authorities should phase out direct financial
subsidies. More efforts should be focused on other forms of incentives, such
as reducing or eliminating energy taxes for customers with PV systems larger
than 255 kWp, enhancing self-consumption, and, as some have suggested (Fan
et al., 2019) to strengthen tax credits for "green" investments. Otherwise, the
policy risks associated with the policy may lead to overcapacity and subsidy
shortfalls.
Reflected on Paper I and II, it was recommended that government policies
should be more geographically targeted. Financial subsidies were an effective
economic lever to promote new industries by facilitating technological break-
throughs, lowering cost curves, and increasing investment. The cost of solar
PV has been reduced to the point where it was competitive with market prices
in all cities studied, with 22% of them being able to compete with the cost of
traditional forms of energy. Some 83% of the cities achieved IRRs higher than
8%, and 67% have a DPBP of less than 15 years. Considering the widening
subsidy gap (45.5 billion CNY by the end of 2017), it was suggested that sub-
sidies for the solar PV industry should be more targeted to different cities to
maximize benefits. For cities that have achieved the desired grid parity and
therefore did not "need" subsidies, market-based programs ("invisible hand")
rather than government intervention ("visible hand") were needed. The devel-
opment of market-based trading for distributed generation was an actor-based
framework that allowed for the bottom-up design of future electricity markets.
Distributed generation was encouraged to be traded directly with electricity
consumers or power sales companies under bilateral or centralized auction
mechanisms. Market-based trading will reduce transmission and distribution
charges, provide more options for purchasing electricity at favorable prices,
and stimulate the spread of solar PV. At the same time, green certificate trad-
ing combined with a mandatory quota system could serve as an alternative
economic incentive to increase the use of solar PV and generate profits for
solar PV project owners. In short, there was a high priority on consolidation
and stabilization of the solar industry, rather than retaining top-down hierar-
chical government subsidies. In cities that have not achieved grid parity on the
plant side, local governments can continue to provide appropriate financial
incentives. In addition, as mentioned above, policymakers should develop pol-
icies to further reduce the soft costs of PV projects wherever possible. More
targeted policies would take into account the different geographic PV markets
across the country with the goal of promoting sustainable development of the
solar industry and grid parity.
80

62
6 Conclusions
This chapter presents the major conclusions of the thesis. RQ 1: how do subsidy-free solar PV projects in China compete eco-
nomically with conventional coal-fired generation?
This study revealed a clearer and more accurate discussion based on the
analysis of the latest data. This study focused on the grid parity and investment
value of I&C distributed PV projects in the absence of state financial subsi-
dies. Under the same circumstances, with certain assumptions on PV system
investment and operating costs, 344 cities can all achieve grid parity on the
user side, and about 76 cities (22.09%) can achieve grid parity on the plant
side. Among them, cities in Tibet, Gansu, Inner Mongolia and Heilongjiang
had the best conditions for user-side grid parity. Cities in Tibet, Qinghai,
northeastern provinces, northern provinces and some southern provinces had
the highest level of plant-side grid parity. 92.73% of cities can achieve positive
net profit of electricity, and the average net profit was 0.13 CNY/kWh based
on 50% self-generation and 50% feed-into-grid. In general, investments in cit-
ies of Tibet, northeastern, and Gansu can be profitable, but not in Sichuan,
Guizhou, and Xinjiang.
RQ 2: how do investment profits of unsubsidized solar PV projects dif-
fer from city to city?
The results showed that 85.17% of the currently operating coal-fired power
plants were under cost-risk considering the LCOE comparison with distrib-
uted solar PV projects. This revealed that most distributed solar PV projects
in different cities in China can reach a levelized cost that was sufficiently com-
petitive with the current published DCB prices. Approximately 36.63% of
China's coal-fired power plants can currently be replaced by distributed solar
PV projects.
Examining the return on investment, 21.8% of the surveyed cities had a
medium or high rate of return. 44.19% of the cities can generate a medium
return. Investing in city clusters 1, 2, and 3 found in this study can lead to an
IRR higher than 8% and a DPBP of up to 15 years. Investing in distributed
solar PV facilities in these cities can benefit from: abundant solar resources,
competitive electricity market prices, high electricity demand, and sufficient
rooftop area. At the same time, investing in city cluster 4 would not guarantee
capital recovery over the life of a solar PV project. However, investing in pov-
erty-alleviation projects can be a beneficiary with preferential support from
local governments.
81
63
Different self-generation and self-consumption rates affected profitability.
In China, the LCOE of distributed solar PV projects has reached a level that
was excessively competitive with the purchase price of electricity. Therefore,
a higher self-generation rate meant more financial savings. Battery and/or
thermal storage could be a technical solution. A well-developed electricity
trading market mechanism can fully exploit the economic potential of PV self-
generation and self-consumption. Distributed generation was encouraged at
the demand-side with self-consumption and excess electricity fed into the grid,
so as to realize the optimum allocation of distributed resources.
The "additional costs" due to distributed generation penetration should be
taken into account, e.g., the cost of rapid power adjustment, the cost of system
reserves to meet short-term balancing requirements, and the cost of strength-
ening the transmission and distribution network. In this sense, the current low
LCOE of distributed solar PV applications cannot simply be considered as an
absolute economic advantage. More research should continue on how to max-
imize the use of variable renewable energy generation while minimizing "ad-
ditional costs" by increasing system flexibility.
RQ 3: how do the solar PV applications change the Swedish electricity
market and alter the actor roles in the smart city transformation?
The study showed that the underlying logic for understanding the possibil-
ities and challenges associated with smart city development from the perspec-
tive of policy and business practice was related to understanding the logic of
the 'new' market. Shifts in activities and actor roles (e.g., the need for
knowledge brokers) were interlinked with the introduction of "new" actors,
resources, and service provision that can move beyond the traditional view of
the market (actors in a variety of roles engaged in linear transactions) toward
a service ecosystem view of the market. In this service ecosystem view, the
role of knowledge brokers constituted an example of the need to revise the
understanding of actors in the transformation of smart cities.
Building on the S-D logic, our research suggested that further attention
needed to be paid to the "intermediary" functions in such service ecosystems,
exploring how knowledge-mediating functions (e.g., actors and activities)
contributed to the conceptualization of how markets were transformed and
why new combinations of actors emerged in policy and management prac-
tices. For example, knowledge about energy systems for sustainable urban de-
velopment often lacked intermediary actors that "translated" the possibilities
and constraints of such transformations. Regardless of which part of the smart
city was studied, a high level of understanding of evolving markets and po-
tential new actors would facilitate future smart city research, as well as offer
conceptual accounts of smart markets for smart cities.
The recognition of the need to assess new services that went beyond tradi-
tional value creation changed the need, nature and quality of information, and
how this information can be translated into applicable knowledge (as a re-
source). This change was likely to generate a need for higher intensity of
82

64
interaction, not only among existing actors, but also with other actors in the
service ecosystem. The concept of "service ecosystems" in the S-D logic was
therefore essential to facilitate the development of "new" practices and to in-
ject smart markets into the concept of smart cities.
The need for improved information quality and interaction requirements
would also increase the potential knowledge demand for future energy sys-
tems. On the one hand, this may raise the barriers to entry for actors, but this
can be mitigated if actors play the role of intermediaries and knowledge bro-
kers. Research has shown that such knowledge brokers function to both facil-
itate and ease the burden for actors by managing the integration of some re-
sources at the actor and service ecosystem levels. Thus, the future energy mar-
ket and smart city transformation would benefit from being viewed as a ser-
vice ecosystem rather than as an isolated, pre-defined market. By
understanding the energy systems of smart cities as service ecosystems, future
energy markets would be understood as more dynamic, as they develop sym-
biotically with the market and smart city transformation. There would be a
need to support third-party actions, which have the potential to increase the
total value generation of future energy markets. A common description of
these new players in smart cities was as knowledge brokers.
RQ 4: what is the potential availability of solar PV energy in the Swe-
dish built environment?
In this study, the results showed that the city of Västerås had a huge poten-
tial for utilizing solar energy on its building surfaces. A total of 5.74 km2 of
roof area was identified as available for solar panels on building roofs. Sec-
ondly, this study calculated the technical potential by considering the technical
characteristics and estimated the available solar PV capacity, as well as the
geographical potential. The amount of electricity that can be generated by pre-
dicting the roof utilization was calculated by considering the PV inter-row
distance design and the characteristics of the panels. The total power genera-
tion capacity of the available roof area converted into three cases of pitched
and flat roofs ranged from 727 MWp to 956 MWp. The potential annual PV
power generation capacity of rooftop solar applications in Västerås was 626-
801 GWh, which corresponded to 55%-70% of the annual electricity demand
in Västerås. It was worth noting that this only took into account the total elec-
tricity consumption. In order to achieve a real-time power balance, hourly
power demand and supply profiles should be analyzed. Third, this study ex-
trapolated the methodology from the municipal level to the national level. Ap-
proximately 504 km2 available rooftop area was identified, and a total poten-
tial capacity of 65 GWp to 84 GWp calculated for Sweden. Current policies,
especially direct capital subsidies in Sweden, have been helping to meet the
prerequisites for further promotion of solar technology in Sweden. The anal-
ysis showed that the PV potential was huge, which suggested that the author-
ities needed to take prudent, realistic, and manageable policy measures. The
83

65
further market formation should be time-limited and subsidy-independent in
order to stimulate market-based entrepreneurship.
These policy implications can also be transferred to other countries, both
developed and developing. Solar energy would continue to grow globally and
in Sweden in the coming decades. At this stage, technological barriers to the
solar industry have been significantly reduced due to advances in technology.
In countries with relatively mature market infrastructures, more emphasis can
be placed on the development of potential solar resources. As early adopter
countries, it was recommended that the authorities continued to provide in-
centives. Policy instruments can take many forms, such as subsidies, loans,
tax exemptions and other financial and non-financial support.
84

66
7 Future work
This chapter discusses some of the limitations of this study and the issues that
require further investigation.
This thesis provides a first attempt on the transition to lower-emitting and
more flexible electricity systems while delivering economic benefits to con-
sumers and investors. The novelty of this research is the establishment of sub-
stitution possibility from an economic perspective and the estimation of in-
vestment profitability in all cities in China, which is unique. In the future, the
work could be enhanced by performing a more complete and robust analysis
by combining technical, economic, and social factors. The analysis could be
extended to both the utility-scale and distributed generation projects. It is also
worthy of discussing more market designs in order to safeguard the integration
of renewables without harassing the economic viability and system flexibility
in current power generation units.
The outcomes of this study will also be an established reference point for
validating with other methods and LiDAR data at the regional and national
levels. Further research might usefully consider the temporal diffusion pat-
terns of PV uptake interacting with other socio-economic factors. Further re-
search could also adopt a more local level analysis to explore how the potential
of solar PV energy generation could be integrated with load profiles of differ-
ent uses.
85

67
References
Africani, P. et al. (2013) ‘Integration of Lidar Data Into a Municipal Gis To Study Solar Radiation’, ISPRS - International Archives of the Photogrammetry, Remote Sensing and Spatial Information Sciences, XL-1/W1(May), pp. 1–6. doi: 10.5194/isprsarchives-xl-1-w1-1-2013.
Armaroli, N. and Balzani, V. (2016) ‘Solar Electricity and Solar Fuels: Status and Perspectives in the Context of the Energy Transition’, Chemistry - A European Journal, 22(1), pp. 32–57. doi: 10.1002/chem.201503580.
Asgharzadeh, A. et al. (2018) ‘A Comparison Study of the Performance of South/North-facing vs East/West-facing Bifacial Modules under Shading Conditi’, 2018 IEEE 7th World Conference on Photovoltaic Energy Conversion, WCPEC 2018 - A Joint Conference of 45th IEEE PVSC, 28th PVSEC and 34th EU PVSEC. IEEE, pp. 1730–1734. doi: 10.1109/PVSC.2018.8548185.
Balta-ozkan, N., Yildirim, J. and Connor, P. M. (2020) ‘Regional distribution of photovoltaic deployment in the UK and its determinants : A spatial econometric approach’, Energy Economics. Elsevier B.V., 51(2015), pp. 417–429. doi: 10.1016/j.eneco.2015.08.003.
Bergamasco, L. and Asinari, P. (2011) ‘Scalable methodology for the photovoltaic solar energy potential assessment based on available roof surface area : Application to Piedmont Region (Italy)’, Solar Energy. Elsevier Ltd, 85(5), pp. 1041–1055. doi: 10.1016/j.solener.2011.02.022.
Bhandari, R. and Stadler, I. (2009) ‘Grid parity analysis of solar photovoltaic systems in Germany using experience curves’, Solar Energy. Elsevier Ltd, 83(9), pp. 1634–1644. doi: 10.1016/j.solener.2009.06.001.
Biondi, T. and Moretto, M. (2015) ‘Solar Grid Parity dynamics in Italy: A real option approach’, Energy. Elsevier Ltd, 80, pp. 293–302. doi: 10.1016/j.energy.2014.11.072.
Bocca, R. (2020) ‘Fostering Effective Energy Transition. 2020 edition.’, World Economic Forum, March(May), pp. 1–40. Available at: www.weforum.org.
Branker, K., Pathak, M. J. M. and Pearce, J. M. (2011) ‘A review of solar photovoltaic levelized cost of electricity’, Renewable and Sustainable Energy Reviews. Elsevier Ltd, 15(9), pp. 4470–4482. doi: 10.1016/j.rser.2011.07.104.
Breyer, C. and Gerlach, A. (2013) ‘Global overview on grid‐parity’, Progress in photovoltaics: Research and Applications. Wiley Online Library, 21(1), pp. 121–136.
Bu, R., Grassi, S. and Raubal, M. (2018) ‘A scalable method for estimating rooftop solar irradiation potential over large regions’, Applied Energy, 216(November 2017), pp. 389–401. doi: 10.1016/j.apenergy.2018.02.008.
Burger, S. et al. (2016) ‘The value of aggregators in electricity systems’, MIT Center for Energy and Environment Policy Research: Cambridge, MA, USA.
Byrne, J. et al. (2015) ‘A review of the solar city concept and methods to assess rooftop solar electric potential, with an illustrative application to the city of
86

68
Seoul’, Renewable and Sustainable Energy Reviews. Elsevier, 41, pp. 830–844. doi: 10.1016/j.rser.2014.08.023.
Calvillo, C. F., Sánchez-Miralles, A. and Villar, J. (2016) ‘Energy management and planning in smart cities’, Renewable and Sustainable Energy Reviews. Elsevier, 55, pp. 273–287. doi: 10.1016/j.rser.2015.10.133.
Campana, P. E. et al. (2020) ‘A gridded optimization model for photovoltaic applications’, Solar Energy. Elsevier, 202(September 2019), pp. 465–484. doi: 10.1016/j.solener.2020.03.076.
Carreiro, A. M., Jorge, H. M. and Antunes, C. H. (2017) ‘Energy management systems aggregators: A literature survey’, Renewable and Sustainable Energy Reviews. Elsevier Ltd, 73(January), pp. 1160–1172. doi: 10.1016/j.rser.2017.01.179.
Chen, X. et al. (2015) ‘Increasing the Flexibility of Combined Heat and Power for Wind Power Integration in China: Modeling and Implications’, IEEE Transactions on Power Systems. IEEE, 30(4), pp. 1848–1857. doi: 10.1109/TPWRS.2014.2356723.
Chen, X. et al. (2018) ‘Aggregate Power Flexibility in Unbalanced Distribution Systems’, arXiv, 11(1), pp. 258–269.
Chen, Z. (2019) ‘Supporting or Not: Does Government Subsidies Enhance the Value of Photovoltaic Enterprises? Research on Quantile Regression on Least Square Regression’, Journal of Management Policy and Practice, 20(4). doi: 10.33423/jmpp.v20i4.2377.
Cherp, A. et al. (2018) ‘Integrating techno-economic, socio-technical and political perspectives on national energy transitions: A meta-theoretical framework’, Energy Research and Social Science. Elsevier, 37(September), pp. 175–190. doi: 10.1016/j.erss.2017.09.015.
Choi, Y. et al. (2011) ‘PV Analyst: Coupling ArcGIS with TRNSYS to assess distributed photovoltaic potential in urban areas’, Solar Energy. Elsevier Ltd, 85(11), pp. 2924–2939. doi: 10.1016/j.solener.2011.08.034.
Chong, Z., Zhou, D. and Wang, Q. (2019) ‘Without Subsidy, Will Chinese Renewable Energy Power Generation Have a Bright Future?’, Emerging Markets Finance and Trade. Routledge, 00(00), pp. 1–34. doi: 10.1080/1540496X.2019.1696191.
Chourabi, H. et al. (2012) ‘Understanding smart cities: An integrative framework’, in 2012 45th Hawaii international conference on system sciences. IEEE, pp. 2289–2297.
Creutzig, F. et al. (2017) ‘The underestimated potential of solar energy to mitigate climate change’, Nature Energy. Nature Publishing Group, 2(9), p. 17140.
Das, N. (2003) ‘Hedge Fund classification using K-means clustering Method’, 9th International conference on computing in, (September 2003), pp. 1–27. Available at: https://www.researchgate.net/publication/24128136%0Ahttp://depts.washington.edu/sce2003/Papers/284.pdf.
Deng, R. et al. (2020) ‘Exploring flexibility of electric vehicle aggregators as energy reserve’, Electric Power Systems Research, 184(March). doi: 10.1016/j.epsr.2020.106305.
Denholm, P., Clark, K. and O’Connell, M. (2016) ‘On the Path to Sunshot: Emerging Issues and Challenges in Integrating High Levels of Solar into the Electrical Generation and Transmission System’, (May), p. 68. doi: 10.2172/1344204.
Dong, C., Zhou, R. and Li, J. (2021) ‘Rushing for subsidies: The impact of feed-in tariffs on solar photovoltaic capacity development in China’, Applied Energy. Elsevier Ltd, 281(June 2020), p. 116007. doi: 10.1016/j.apenergy.2020.116007.
87

69
Dubois, A. and Gadde, L. E. (2002) ‘Systematic combining: An abductive approach to case research’, Journal of Business Research, 55(7), pp. 553–560. doi: 10.1016/S0148-2963(00)00195-8.
Dudley, B. (2018) ‘BP statistical review of world energy’, BP Statistical Review, London, UK, accessed Aug, 6, p. 2018.
Ekman, P. and Lindh, C. (2013) A smart city study: the status of companies in the Mälardalen business region. School of Business, Society and Technology, Mälardalen University.
Ekman, P., Raggio, R. D. and Thompson, S. M. (2016) ‘Service network value co-creation: Defining the roles of the generic actor’, Industrial Marketing Management. Elsevier Inc., 56, pp. 51–62. doi: 10.1016/j.indmarman.2016.03.002.
Ekman, P., Röndell, J. and Yang, Y. (2019) ‘Exploring smart cities and market transformations from a service-dominant logic perspective’, Sustainable Cities and Society. Elsevier, 51(June), p. 101731. doi: 10.1016/j.scs.2019.101731.
Emmanuel, M. et al. (2020) ‘A review of power system planning and operational models for flexibility assessment in high solar energy penetration scenarios’, Solar Energy, 210(July), pp. 169–180. doi: 10.1016/j.solener.2020.07.017.
Eurostat (2021) Share of Energy from Renewable Sources: Heating and Cooling, European Union. Available at: http://ec.europa.eu/eurostat/statistics-explained/images/8/8b/Share_of_renewable_energy_sources_in_heating_and_cooling_%28%25%29.png.
Fan, J. L. et al. (2019) ‘Optimization of China’s provincial renewable energy installation plan for the 13th five-year plan based on renewable portfolio standards’, Applied Energy. Elsevier, 254(August 2019), p. 113757. doi: 10.1016/j.apenergy.2019.113757.
Fell, M. J. (2017) ‘Energy services: A conceptual review’, Energy Research and Social Science. Elsevier Ltd, 27, pp. 129–140. doi: 10.1016/j.erss.2017.02.010.
Fonteijn, R. et al. (2020) ‘Demonstrating a generic four-step approach for applying flexibility for congestion management in daily operation’, Sustainable Energy, Grids and Networks. Elsevier Ltd, 23, p. 100378. doi: 10.1016/j.segan.2020.100378.
Force, S. G. T. (2015) ‘Regulatory recommendations for the deployment of flexibility’, EU SGTF-EG3 Report. Available at: https://www.interregeurope.eu/fileadmin/user_upload/tx_tevprojects/library/EG3 Final - January 2015.pdf.
Gimon, E. et al. (2019) ‘The coal cost crossover: Economic viability of existing coal compared to new local wind and solar resources’, Energy Innovation, (September 2018), p. 24. Available at: https://energyinnovation.org/publication/the-coal-cost-crossover/#:~:text=America has officially entered the,quarters of the coal fleet.
Giordano, V. and Fulli, G. (2012) ‘A business case for smart grid technologies: A systemic perspective’, Energy Policy. Elsevier, 40(1), pp. 252–259. doi: 10.1016/j.enpol.2011.09.066.
Giourka, P. et al. (2020) ‘The Nexus between Market Needs and Value Attributes of Smart City Solutions towards Energy Transition. An Empirical Evidence of Two European Union (EU) Smart Cities, Evora and Alkmaar’, Smart Cities, 3(3), pp. 604–641. doi: 10.3390/smartcities3030032.
Gkatzikis, L., Koutsopoulos, I. and Salonidis, T. (2013) ‘The role of aggregators in smart grid demand response markets’, IEEE Journal on Selected Areas in Communications. IEEE, 31(7), pp. 1247–1257. doi: 10.1109/JSAC.2013.130708.
Golmohamadi, H. et al. (2019) ‘A multi-agent based optimization of residential and industrial demand response aggregators’, International Journal of Electrical
88

70
Power and Energy Systems. Elsevier, 107(November 2018), pp. 472–485. doi: 10.1016/j.ijepes.2018.12.020.
Gosens, J., Kåberger, T. and Wang, Y. (2017) ‘China’s next renewable energy revolution: goals and mechanisms in the 13th Five Year Plan for energy’, Energy Science & Engineering. Wiley Online Library, 5(3), pp. 141–155.
Grubler, A., Wilson, C. and Nemet, G. (2016) ‘Apples, oranges, and consistent comparisons of the temporal dynamics of energy transitions’, Energy Research and Social Science. Elsevier Ltd, 22, pp. 18–25. doi: 10.1016/j.erss.2016.08.015.
Hartner, M. et al. (2015) ‘East to west - The optimal tilt angle and orientation of photovoltaic panels from an electricity system perspective’, Applied Energy. Elsevier Ltd, 160, pp. 94–107. doi: 10.1016/j.apenergy.2015.08.097.
He, C., Wei, Y. H. D. and Pan, F. (2007) ‘Geographical concentration of manufacturing industries in China: The importance of spatial and industrial scales’, Eurasian Geography and Economics, 48(5), pp. 603–625. doi: 10.2747/1538-7216.48.5.603.
He, G. and Kammen, D. M. (2016) ‘Where , when and how much solar is available ? A provincial-scale solar resource assessment for China’, Renewable Energy. Elsevier Ltd, 85, pp. 74–82. doi: 10.1016/j.renene.2015.06.027.
He, Y. et al. (2018) ‘Dynamic subsidy model of photovoltaic distributed generation in China’, Renewable Energy. Elsevier Ltd, 118, pp. 555–564. doi: 10.1016/j.renene.2017.11.042.
Heleno, M. et al. (2015) ‘Estimation of the flexibility range in the transmission-distribution boundary’, 2015 IEEE Eindhoven PowerTech, PowerTech 2015. IEEE, (608732). doi: 10.1109/PTC.2015.7232524.
Helistö, N., Kiviluoma, J. and Holttinen, H. (2018) ‘Long-term impact of variable generation and demand side flexibility on thermal power generation’, IET Renewable Power Generation, 12(6), pp. 718–726. doi: 10.1049/iet-rpg.2017.0107.
Heptonstall, P. and Gross, R. (2017) ‘The EU referendum : Implications for UK Energy Policy The costs and impacts of intermittency – 2016 update electricity generation technologies’, (February). Available at: https://d2e1qxpsswcpgz.cloudfront.net/uploads/2020/03/intermittency-report-february-2017-2.pdf.
Hofierka, J. and Kaňuk, J. (2009) ‘Assessment of photovoltaic potential in urban areas using open-source solar radiation tools’, Renewable Energy, 34(10), pp. 2206–2214. doi: 10.1016/j.renene.2009.02.021.
Honrubia-Escribano, A. et al. (2018) ‘Influence of solar technology in the economic performance of PV power plants in Europe. A comprehensive analysis’, Renewable and Sustainable Energy Reviews. Elsevier Ltd, 82(July 2017), pp. 488–501. doi: 10.1016/j.rser.2017.09.061.
Hossain, A. and Islam, A. K. M. S. (2011) ‘Potential and viability of grid-connected solar PV system in Bangladesh’, Renewable Energy. Elsevier Ltd, 36(6), pp. 1869–1874. doi: 10.1016/j.renene.2010.11.033.
IBC Solar (2019) Installation Instructions, QBase Anaesthesia. Bad Staffelstein, Germany. doi: 10.1017/cbo9781316529881.002.
International Energy Agency (IEA) (2020) Electricity mix in China, January-September 2020. Available at: https://www.iea.org/data-and-statistics/charts/electricity-mix-in-china-january-september-2020.
Izquierdo, S., Rodrigues, M. and Fueyo, N. (2008) ‘A method for estimating the geographical distribution of the available roof surface area for large-scale photovoltaic energy-potential evaluations’, Solar Energy, 82, pp. 929–939. doi: 10.1016/j.solener.2008.03.007.
89

71
Jadraque, E. et al. (2010) ‘Analysis of the photovoltaic solar energy capacity of residential rooftops in Andalusia (Spain)’, Renewable and Sustainable Energy Reviews, 14(2010), pp. 2122–2130. doi: 10.1016/j.rser.2010.01.001.
Jeon, C., Lee, J. and Shin, J. (2015) ‘Optimal subsidy estimation method using system dynamics and the real option model: Photovoltaic technology case’, Applied Energy. Elsevier Ltd, 142, pp. 33–43. doi: 10.1016/j.apenergy.2014.12.067.
Jia, X. et al. (2020) ‘Assessing the effectiveness of China’s net-metering subsidies for household distributed photovoltaic systems’, Journal of Cleaner Production. Elsevier Ltd, 262, p. 121161. doi: 10.1016/j.jclepro.2020.121161.
Johansson, P., Vendel, M. and Nuur, C. (2020) ‘Integrating distributed energy resources in electricity distribution systems: An explorative study of challenges facing DSOs in Sweden’, Utilities Policy. Elsevier Ltd, 67(August), p. 101117. doi: 10.1016/j.jup.2020.101117.
Kamp, S. (2013) The electric potential for roof mounted solar panels in Sweden. Uppsala University. Available at: http://www.teknat.uu.se/student (Accessed: 17 April 2020).
Kästel, P. and Gilroy-Scott, B. (2015) ‘Economics of pooling small local electricity prosumers - LCOE & self-consumption’, Renewable and Sustainable Energy Reviews. Elsevier, 51, pp. 718–729. doi: 10.1016/j.rser.2015.06.057.
Khan, J. and Arsalan, M. H. (2016) ‘Implementation of Open Source GIS Tools to Identify Bright Rooftops for Solar Photovoltaic Applications – A Case Study of Creek Lanes, DHA, Karachi’, Journal of Basic & Applied Sciences, (January). doi: 10.6000/1927-5129.2016.12.03.
Kim, Y.-I., Ko, J.-M. and Choi, S.-H. (2011) ‘Methods for generating TLPs (typical load profiles) for smart grid-based energy programs’. doi: 10.1109/CIASG.2011.5953331.
Kiyak, C. and de Vries, A. (2017) ‘Electricity Market Mechanism regarding the Operational Flexibility of Power Plants’, Modern Economy, 08(04), pp. 567–589. doi: 10.4236/me.2017.84043.
Kramers, A. et al. (2014) ‘Smart sustainable cities - Exploring ICT solutions for reduced energy use in cities’, Environmental Modelling and Software, 56, pp. 52–62. doi: 10.1016/j.envsoft.2013.12.019.
Kucuksari, S. et al. (2014) ‘An Integrated GIS, optimization and simulation framework for optimal PV size and location in campus area environments’, Applied Energy. Elsevier Ltd, 113, pp. 1601–1613. doi: 10.1016/j.apenergy.2013.09.002.
Kwac, J., Flora, J. and Rajagopal, R. (2014) ‘Household Energy Consumption Segmentation Using Hourly Data’, IEEE Transactions on Smart Grid, 5(1), pp. 420–430. doi: 10.1109/TSG.2013.2278477.
Kylili, A. and Fokaides, P. A. (2015) ‘European smart cities: The role of zero energy buildings’, Sustainable Cities and Society. Elsevier B.V., 15(2015), pp. 86–95. doi: 10.1016/j.scs.2014.12.003.
Lai, C. S. and McCulloch, M. D. (2016) ‘Levelized Cost of Energy for PV and Grid Scale Energy Storage Systems’, pp. 1–11. Available at: http://arxiv.org/abs/1609.06000.
Lampropoulos, I. et al. (2019) ‘A framework for the provision of flexibility services at the transmission and distribution levels through aggregator companies’, Sustainable Energy, Grids and Networks. Elsevier Ltd, 17, p. 100187. doi: 10.1016/j.segan.2018.100187.
Latif, Z. A. et al. (2012) ‘GIS-based estimation of rooftop solar photovoltaic potential using LiDAR’, in 2012 IEEE 8th International Colloquium on Signal Processing and its Applications, pp. 388–392. doi: 10.1109/CSPA.2012.6194755.
90

72
Lee Kwan, C. (2012) ‘Influence of local environmental, social, economic and political variables on the spatial distribution of residential solar PV arrays across the United States’, Energy Policy. Elsevier, 47, pp. 332–344. doi: 10.1016/j.enpol.2012.04.074.
Li, Y. et al. (2018) ‘A review of photovoltaic poverty alleviation projects in China: Current status, challenge and policy recommendations’, Renewable and Sustainable Energy Reviews. Elsevier Ltd, 94(May), pp. 214–223. doi: 10.1016/j.rser.2018.06.012.
Li, Y. and Liu, C. (2017) ‘Estimating solar energy potentials on pitched roofs’, Energy & Buildings. Elsevier B.V., 139, pp. 101–107. doi: 10.1016/j.enbuild.2016.12.070.
Lin, B. and Luan, R. (2020) ‘Do government subsidies promote efficiency in technological innovation of China’s photovoltaic enterprises?’, Journal of Cleaner Production. Elsevier Ltd, 254, p. 120108. doi: 10.1016/j.jclepro.2020.120108.
Lindahl, J. et al. (2019) ‘National Survey Report of PV Power Applications in Sweden 2018: Task 1 Strategic PV Analysis and Outreach’. Available at: www.iea-pvps.org.
Lingfors, D. and Widén, J. (2014) The solar energy potential for Blekinge’s development - according to two future scenarios, Blekinge County Administrative Board-Sweden. Available at: https://www.lansstyrelsen.se/blekinge/tjanster/publikationer/2014/201410-solenergipotentialen-for-blekinges-bebyggelse-enligt-tva-framtidsscenarier.html (Accessed: 17 April 2020).
Lingfors, D. and Widén, J. (2018a) The solar energy potential according to two future scenarios for the development in Västmanland County and the municipalities. Uppsala-Sweden.
Lingfors, D. and Widén, J. (2018b) The solar energy potential for Skåne’s development - according to two future scenarios., Blekinge County Administrative Board-Sweden. Available at: https://www.lansstyrelsen.se/blekinge/tjanster/publikationer/2014/201410-solenergipotentialen-for-blekinges-bebyggelse-enligt-tva-framtidsscenarier.html (Accessed: 17 April 2020).
Liu, Q. et al. (2018) ‘China’s energy revolution strategy into 2030’, Resources, Conservation and Recycling. doi: 10.1016/j.resconrec.2017.09.028.
Long, R., Cui, W. and Li, Q. (2017) ‘The evolution and effect evaluation of photovoltaic industry policy in China’, Sustainability (Switzerland), 9(12). doi: 10.3390/su9122147.
Lusch, R. F. and Nambisan, S. (2015) ‘Service innovation: A service-dominant logic perspective’, MIS Quarterly: Management Information Systems, 39(1), pp. 155–175. doi: 10.25300/MISQ/2015/39.1.07.
Lusch, R. F. and Vargo, S. L. (2006) ‘Service-dominant logic: Reactions, reflections and refinements’, Marketing Theory, 6(3), pp. 281–288. doi: 10.1177/1470593106066781.
Lusch, R. F. and Vargo, S. L. (2014) Service-dominant logic: Premises, perspectives, possibilities. Cambridge University Press.
Luthander, R. et al. (2015) ‘Photovoltaic self-consumption in buildings: A review’, Applied Energy. Elsevier Ltd, 142, pp. 80–94. doi: 10.1016/j.apenergy.2014.12.028.
Ma, E. W. M. and Chow, T. W. S. (2004) ‘A new shifting grid clustering algorithm’, Pattern Recognition. doi: 10.1016/j.patcog.2003.08.014.
91

73
Ma, J. et al. (2013) ‘Evaluating and planning flexibility in sustainable power systems’, IEEE Power and Energy Society General Meeting. IEEE, pp. 1–11. doi: 10.1109/PESMG.2013.6672221.
Machete, R. et al. (2018) ‘The use of 3D GIS to analyse the influence of urban context on buildings’ solar energy potential’, Energy and Buildings. doi: 10.1016/j.enbuild.2018.07.064.
Mainzer, K. et al. (2014) ‘A high-resolution determination of the technical potential for residential-roof-mounted photovoltaic systems in Germany’, Solar Energy. Elsevier Ltd, 105, pp. 715–731. doi: 10.1016/j.solener.2014.04.015.
Von Malmborg, F. (2004) ‘Networking for knowledge transfer: towards an understanding of local authority roles in regional industrial ecosystem management’, Business Strategy and the Environment. Wiley Online Library, 13(5), pp. 334–346.
Malmsten, J. (2015) Solar cells on roof: opportunities and pitfalls. Stockholm, Sweden. Available at: http://belok.se/download/genomforda_projekt/Solceller på tak_handbok.pdf.
Mansouri, F. et al. (2019) ‘Evaluating solar energy technical and economic potential on rooftops in an urban setting: the city of Lethbridge, Canada’, International Journal of Energy and Environmental Engineering. Springer Berlin Heidelberg, pp. 13–32.
Martín-chivelet, N. (2016) ‘Photovoltaic potential and land-use estimation methodology’, Energy. Elsevier Ltd, 94, pp. 233–242. doi: 10.1016/j.energy.2015.10.108.
Merei, G. et al. (2016) ‘Optimization of self-consumption and techno-economic analysis of PV-battery systems in commercial applications’, Applied Energy. doi: 10.1016/j.apenergy.2016.01.083.
Ming, Z. et al. (2014) ‘Review of renewable energy investment and financing in China: Status, mode, issues and countermeasures’, Renewable and Sustainable Energy Reviews. Elsevier, 31, pp. 23–37. doi: 10.1016/j.rser.2013.11.026.
Ministry of the Environment - Government Offices of Sweden (2016) Summary of the Government’s budget initiatives in the areas of environment, climate and energy. Available at: https://www.government.se/articles/2016/09/summary-of-the-governments-budget-initiatives-in-the-areas-of-environment-climate-and-energy/%3E (Accessed: 17 April 2020).
National Development and Reform Commission (NDRC); National Energy Administration (NEA) (2017) Notice on piloting market-based trading for distributed power generation. Available at: http://zfxxgk.nea.gov.cn/auto87/201711/t20171113_3055.htm (Accessed: 3 April 2020).
National Development and Reform Commission (NDRC) and National Energy Administration (NEA) (2016) 13th Five-Year Plan for Energy Development. Beijing. Available at: https://www.ndrc.gov.cn/fggz/fzzlgh/gjjzxgh/201706/t20170614_1196797.html.
National Energy Agency (NEA) (2020) The National Energy Administration introduces the national energy production and consumption, and the grid-connected operation of renewable energy in 2020 first-three quarters. Available at: http://www.gov.cn/xinwen/2020-10/30/content_5556247.htm.
Nätti, S. et al. (2014) ‘The intermediator role in value co-creation within a triadic business service relationship’, Industrial Marketing Management. Elsevier Inc., 43(6), pp. 977–984. doi: 10.1016/j.indmarman.2014.05.010.
92

74
Nguyen, H. T. et al. (2012) ‘The Application of LiDAR to Assessment of Rooftop Solar Photovoltaic Deployment Potential in a Municipal District Unit’, Sensors, pp. 4534–4558. doi: 10.3390/s120404534.
OECD (2018) OECD Exchange rates (indicator), OECD. doi: 10.1787/037ed317-en. Okur, Ö. et al. (2019) ‘Aggregator-mediated demand response: Minimizing
imbalances caused by uncertainty of solar generation’, Applied Energy. Elsevier, 247(March), pp. 426–437. doi: 10.1016/j.apenergy.2019.04.035.
Olivella-Rosell, P. et al. (2018) ‘Local flexibility market design for aggregators providing multiple flexibility services at distribution network level’, Energies, 11(4), pp. 1–19. doi: 10.3390/en11040822.
Palm, J., Eidenskog, M. and Luthander, R. (2018) ‘Sufficiency, change, and flexibility: Critically examining the energy consumption profiles of solar PV prosumers in Sweden’, Energy Research and Social Science. doi: 10.1016/j.erss.2017.10.006.
Pappala, V. S. et al. (2009) ‘A Stochastic Model for the Optimal Operation of a Wind-Thermal Power System’, IEEE Transactions on Power Systems, 24(2), pp. 940–950. doi: 10.1109/TPWRS.2009.2016504.
Peng, H. and Liu, Y. (2018) ‘How government subsidies promote the growth of entrepreneurial companies in clean energy industry: An empirical study in China’, Journal of Cleaner Production. Elsevier Ltd, 188, pp. 508–520. doi: 10.1016/j.jclepro.2018.03.126.
Phillips, C. et al. (2018) ‘A data mining approach to estimating rooftop photovoltaic potential in the US’, Journal of Applied Statistics. Taylor & Francis, 0(0), pp. 1–10. doi: 10.1080/02664763.2018.1492525.
Ponds, K. T. et al. (2018) ‘Aggregator of demand response for renewable integration and customer engagement: Strengths, weaknesses, opportunities, and threats’, Energies, 11(9). doi: 10.3390/en11092391.
Rafique, S. et al. (2019) ‘A customer-based-strategy to minimize the cost of energy consumption by optimal utilization of energy resources in an apartment building’, IOP Conference Series: Earth and Environmental Science, 322(1). doi: 10.1088/1755-1315/322/1/012018.
Ragin, C. C. and Becker, H. S. (1992) What is a case?: exploring the foundations of social inquiry. Cambridge university press.
Rahnama, S. et al. (2014) Evaluation of aggregators for integration of large-scale consumers in smart grid, IFAC Proceedings Volumes (IFAC-PapersOnline). IFAC. doi: 10.3182/20140824-6-za-1003.00601.
Razmara, M. et al. (2017) ‘Building-to-grid predictive power flow control for demand response and demand flexibility programs’, Applied Energy. Elsevier Ltd, 203, pp. 128–141. doi: 10.1016/j.apenergy.2017.06.040.
Rhodes, J. D. et al. (2014) ‘Clustering analysis of residential electricity demand profiles’, Applied Energy. Elsevier Ltd, 135, pp. 461–471. doi: 10.1016/j.apenergy.2014.08.111.
Rigter, J. and Vidican, G. (2010) ‘Cost and optimal feed-in tariff for small scale photovoltaic systems in China’, Energy Policy. Elsevier, 38(11), pp. 6989–7000. doi: 10.1016/j.enpol.2010.07.014.
Rodrigues, S., Chen, X. and Morgado-Dias, F. (2017) ‘Economic analysis of photovoltaic systems for the residential market under China’s new regulation’, Energy Policy. Elsevier, 101(October 2016), pp. 467–472. doi: 10.1016/j.enpol.2016.10.039.
Shen, J. and Luo, C. (2015) ‘Overall review of renewable energy subsidy policies in China–Contradictions of intentions and effects’, Renewable and Sustainable
93

75
Energy Reviews. Elsevier, 41, pp. 1478–1488. Available at: https://www.sciencedirect.com/science/article/pii/S1364032114007801.
Sivaram, V. and Kann, S. (2016) ‘Solar power needs a more ambitious cost target’, Nature Energy. Nature Publishing Group, 1(4), pp. 1–3. doi: 10.1038/nenergy.2016.36.
Snape, J. R. (2016) ‘Spatial and Temporal Characteristics of PV Adoption in the UK and Their Implications for the Smart Grid’, Energies, pp. 1–18. doi: 10.3390/en9030210.
Di Somma, M., Graditi, G. and Siano, P. (2019) ‘Optimal Bidding Strategy for a DER Aggregator in the Day-Ahead Market in the Presence of Demand Flexibility’, IEEE Transactions on Industrial Electronics. IEEE, 66(2), pp. 1509–1519. doi: 10.1109/TIE.2018.2829677.
Sommerfeldt, N. and Madani, H. (2017) ‘Revisiting the techno-economic analysis process for building-mounted, grid-connected solar photovoltaic systems: Part one – Review’, Renewable and Sustainable Energy Reviews. Elsevier Ltd, 74(November 2016), pp. 1379–1393. doi: 10.1016/j.rser.2016.11.232.
Song, X. et al. (2018) ‘An Approach for Estimating Solar Photovoltaic Sensing Images’, Energies, 11(11), p. 3172. doi: 10.3390/en11113172.
Spertino, F., Leo, P. Di and Cocina, V. (2014) ‘Which are the constraints to the photovoltaic grid-parity in the main European markets?’, Solar Energy. Elsevier Ltd, 105, pp. 390–400. doi: 10.1016/j.solener.2014.03.021.
Statistics Sweden (SCB) (2019) End use (MWh), by county and municipality, consumer category and fuel type. Year 2009 - 2017. . Available at: http://www.statistikdatabasen.scb.se/pxweb/sv/ssd/START__EN__EN0203/SlutAnvSektor/# (Accessed: 17 April 2020).
Strand, R., Freeman, R. E. and Hockerts, K. (2015) ‘Corporate Social Responsibility and Sustainability in Scandinavia: An Overview’, Journal of Business Ethics, 127(1), pp. 1–15. doi: 10.1007/s10551-014-2224-6.
Strzalka, A. et al. (2012) ‘Large scale integration of photovoltaics in cities’, Applied Energy. Elsevier Ltd, 93, pp. 413–421. doi: 10.1016/j.apenergy.2011.12.033.
Su, M.-C. and Chou, C.-H. (2001) ‘A modified version of the K-means algorithm with a distance based on cluster symmetry’, IEEE Transactions on Pattern Analysis and Machine Intelligence, 23(6), pp. 674–680. doi: 10.1109/34.927466.
Sun, Y. et al. (2013) ‘GIS-based approach for potential analysis of solar PV generation at the regional scale: A case study of Fujian Province’, Energy Policy. Elsevier, 58(2013), pp. 248–259. doi: 10.1016/j.enpol.2013.03.002.
Swedish Energy Agency (Energimyndigheten) (2020a) Grid-connected solar cell installations, number and installed power. Available at: https://pxexternal.energimyndigheten.se/pxweb/sv/Nätanslutna solcellsanläggningar/-/EN0123_1.px/?rxid=5e71cfb4-134c-4f1d-8fc5-15e530dd975c (Accessed: 19 May 2020).
Swedish Energy Agency (Energimyndigheten) (2020b) Grid-connected solar power plants. Available at: http://www.energimyndigheten.se/statistik/den-officiella-statistiken/statistikprodukter/natanslutna-solcellsanlaggningar/ (Accessed: 27 April 2020).
Swedish Meteorological and Hydrological Institute (SMHI) (2017) STRÅNG - a mesoscale model for solar radiation. Available at: http://strang.smhi.se/ (Accessed: 22 June 2020).
Swedish Wood (Svenskt Trä) (2020) Roof - shape, material and construction. Available at: https://www.traguiden.se/konstruktion/konstruktiv-utformning/stomkomplettering/tak/form-material-och-konstruktion/ (Accessed: 17 April 2020).
94

76
Szabo, S. et al. (2020) ‘Automated registration of potential locations for solar energy production with Light Detection And Ranging (LiDAR) and small format photogrammetry’, Journal of Cleaner Production, 112(2016), pp. 3820–3829. doi: 10.1016/j.jclepro.2015.07.117.
Tang, N. et al. (2018) ‘Solar energy curtailment in China: Status quo, reasons and solutions’, Renewable and Sustainable Energy Reviews. Elsevier Ltd, 97(July 2018), pp. 509–528. doi: 10.1016/j.rser.2018.07.021.
Theeke, M., Polidoro Jr, F. and Fredrickson, J. W. (2018) ‘Path-dependent routines in the evaluation of novelty: the effects of innovators’ new knowledge use on brokerage firms’ coverage’, Administrative Science Quarterly. SAGE Publications Sage CA: Los Angeles, CA, 63(4), pp. 910–942.
Theodoridou, I., Karteris, M. and Mallinis, G. (2012) ‘Assessment of retrofitting measures and solar systems’ potential in urban areas using Geographical Information Systems: Application to a Mediterranean city’, Renewable and Sustainable Energy Reviews. Elsevier, 16(8), pp. 6239–6261. doi: 10.1016/j.rser.2012.03.075.
Torani, K., Rausser, G. and Zilberman, D. (2016) ‘Innovation subsidies versus consumer subsidies: A real options analysis of solar energy’, Energy Policy. Elsevier, 92, pp. 255–269. doi: 10.1016/j.enpol.2015.07.010.
Truong, Y., Simmons, G. and Palmer, M. (2012) ‘Reciprocal value propositions in practice: Constraints in digital markets’, Industrial Marketing Management. Elsevier Inc., 41(1), pp. 197–206. doi: 10.1016/j.indmarman.2011.11.007.
Ulbig, A. and Andersson, G. (2015) ‘Analyzing operational flexibility of electric power systems’, International Journal of Electrical Power and Energy Systems. Elsevier Ltd, 72, pp. 155–164. doi: 10.1016/j.ijepes.2015.02.028.
Vardimon, R. (2011) ‘Assessment of the potential for distributed photovoltaic electricity production in Israel’, Renewable Energy. Elsevier Ltd, 36(2), pp. 591–594. doi: 10.1016/j.renene.2010.07.030.
Vargo, S. L. and Akaka, M. A. (2009) ‘Service-Dominant Logic as a Foundation for Service Science: Clarifications’, Service Science, 1(1), pp. 32–41. Available at: https://pubsonline.informs.org/doi/10.1287/serv.1.1.32.
Vargo, S. L. and Lusch, R. F. (2004) ‘Evolving to a new dominant logic for marketing’, The Service-Dominant Logic of Marketing: Dialog, Debate, and Directions, 68(January), pp. 3–28. Available at: https://journals.sagepub.com/doi/10.1509/jmkg.68.1.1.24036.
Vargo, S. L. and Lusch, R. F. (2016) ‘Institutions and axioms: an extension and update of service-dominant logic’, Journal of the Academy of Marketing Science, 44(1), pp. 5–23. doi: 10.1007/s11747-015-0456-3.
Vargo, S. L. and Lusch, R. F. (2017) ‘Service-dominant logic 2025’, International Journal of Research in Marketing. Elsevier B.V., 34(1), pp. 46–67. doi: 10.1016/j.ijresmar.2016.11.001.
Wang, H. et al. (2016) ‘Analysis of the policy effects of downstream Feed-In Tariff on China’s solar photovoltaic industry’, Energy Policy. Elsevier, 95, pp. 479–488. doi: 10.1016/j.enpol.2016.03.026.
Wang, J., Shahidehpour, M. and Li, Z. (2008) ‘Security-Constrained Unit Commitment With Volatile Wind Power Generation’, IEEE Transactions on Power Systems, 23(3), pp. 1319–1327. doi: 10.1109/TPWRS.2008.926719.
Wang, Y., Luo, G. and Guo, Y. (2014) ‘Why is there overcapacity in China’s PV industry in its early growth stage?’, Renewable Energy. Elsevier Ltd, 72, pp. 188–194. doi: 10.1016/j.renene.2014.07.008.
95

77
Wang, Y., Zhou, S. and Huo, H. (2014) ‘Cost and CO2 reductions of solar photovoltaic power generation in China: Perspectives for 2020’, Renewable and Sustainable Energy Reviews. doi: 10.1016/j.rser.2014.07.027.
Wei, H., Liu, J. and Yang, B. (2014) ‘Cost-benefit comparison between Domestic Solar Water Heater (DSHW) and Building Integrated Photovoltaic (BIPV) systems for households in urban China’, Applied Energy. doi: 10.1016/j.apenergy.2014.04.003.
Widén, J. and Weiss, P. (2012) Solar energy in Dalarna’s development - Potential for 2020 and 2050, Dalarna County Administrative Board-Sweden. Dalarna. Available at: www.lansstyrelsen.se/dalarna (Accessed: 17 April 2020).
Wiginton, L. K., Nguyen, H. T. and Pearce, J. M. (2010) ‘Computers, Environment and Urban Systems Quantifying rooftop solar photovoltaic potential for regional renewable energy policy’, Computers, Environment and Urban Systems. Elsevier Ltd, 34(4), pp. 345–357. doi: 10.1016/j.compenvurbsys.2010.01.001.
Xiong, Y. and Yang, X. (2016) ‘Government subsidies for the Chinese photovoltaic industry’, Energy Policy. Elsevier, 99(January), pp. 111–119. doi: 10.1016/j.enpol.2016.09.013.
Xu, L. et al. (2020) ‘Subsidies, loans, and companies’ performance: evidence from China’s photovoltaic industry’, Applied Energy, 260(November 2019). doi: 10.1016/j.apenergy.2019.114280.
Yin, R. K. (2003) ‘Case study research: Design and methods (Vol. 5)’. Thousand Oaks, CA: Sage.
Yu, F. et al. (2016) ‘The impact of government subsidies and enterprises’ R&D investment: A panel data study from renewable energy in China’, Energy Policy. Elsevier, 89, pp. 106–113. Available at: http://dx.doi.org/10.1016/j.enpol.2015.11.009.
Yuan, J. et al. (2018) ‘Coal use for power generation in China’, Resources, Conservation and Recycling. doi: 10.1016/j.resconrec.2016.03.021.
Yujia, J. and Finenko, A. (2016) ‘Moving beyond LCOE : impact of various fi nancing methods on PV pro fi tability for SIDS’, 98, pp. 749–758. doi: 10.1016/j.enpol.2016.03.021.
Zhang, H. et al. (2016) ‘The impact of subsidies on overcapacity: A comparison of wind and solar energy companies in China’, Energy. Elsevier Ltd, 94, pp. 821–827. doi: 10.1016/j.energy.2015.11.054.
Zhang, L., Qin, Q. and Wei, Y. M. (2019) ‘China’s distributed energy policies: Evolution, instruments and recommendation’, Energy Policy. Elsevier Ltd, 125(September 2018), pp. 55–64. doi: 10.1016/j.enpol.2018.10.028.
Zhang, M. et al. (2016) ‘Optimal feed-in tariff for solar photovoltaic power generation in China: A real options analysis’, Energy Policy. Elsevier, 97, pp. 181–192. doi: 10.1016/j.enpol.2016.07.028.
Zhang, S., Andrews-Speed, P. and Ji, M. (2014) ‘The erratic path of the low-carbon transition in China: Evolution of solar PV policy’, Energy Policy. Elsevier, 67, pp. 903–912. doi: 10.1016/j.enpol.2013.12.063.
Zhang, S., Andrews-Speed, P. and Li, S. (2018) ‘To what extent will China’s ongoing electricity market reforms assist the integration of renewable energy?’, Energy Policy. doi: 10.1016/j.enpol.2017.12.002.
Zhang, X. et al. (2011) ‘Economic dispatch considering volatile wind power generation with lower-semi-deviation risk measure’, in 2011 4th International Conference on Electric Utility Deregulation and Restructuring and Power Technologies (DRPT), pp. 140–144. doi: 10.1109/DRPT.2011.5993877.
96

78
Zhang, Y. et al. (2018) ‘Energy flexibility from the consumer: Integrating local electricity and heat supplies in a building’, Applied Energy. doi: 10.1016/j.apenergy.2018.04.041.
Zhao, X. G., Wan, G. and Yang, Y. (2015) ‘The turning point of solar photovoltaic industry in China: Will it come?’, Renewable and Sustainable Energy Reviews. Elsevier, 41, pp. 178–188. doi: 10.1016/j.rser.2014.08.045.
Zhao, X., Zeng, Y. and Zhao, D. (2015) ‘Distributed solar photovoltaics in China: Policies and economic performance’, Energy. Elsevier Ltd, 88(June 2015), pp. 572–583. doi: 10.1016/j.energy.2015.05.084.
Zhi, Q. et al. (2014) ‘China’s solar photovoltaic policy: An analysis based on policy instruments’, Applied Energy. Elsevier Ltd, 129, pp. 308–319. doi: 10.1016/j.apenergy.2014.05.014.
Zhou, D., Chong, Z. and Wang, Q. (2020) ‘What is the future policy for photovoltaic power applications in China? Lessons from the past’, Resources Policy. Elsevier Ltd, 65(June 2019), p. 101575. doi: 10.1016/j.resourpol.2019.101575.
Zhou, K. Le, Yang, S. L. and Shen, C. (2013) ‘A review of electric load classification in smart grid environment’, Renewable and Sustainable Energy Reviews. doi: 10.1016/j.rser.2013.03.023.
97

The Swedish Research School of Management and Information Technology (MIT) is one of 16
national research schools supported by the Swedish Government. MIT is jointly operated by the
following institutions: Blekinge Institute of Technology, Chalmers University of Technology,
University of Gothenburg, Jönköping International Business School, Karlstad University,
Linköping University, Linnaeus University Växjö, Lund University, Mälardalen University
College, Stockholm University, Umeå University, Örebro University, and Uppsala University, host
to the research school. At the Swedish Research School of Management and Information
Technology (MIT), research is conducted, and doctoral education provided, in three fields:
management information systems, business administration, and informatics.
DISSERTATIONS FROM THE SWEDISH RESEARCH
SCHOOL OF MANAGEMENT AND INFORMATION
TECHNOLOGY
Doctoral theses (2003- )
1. Baraldi, Enrico (2003), When Information Technology Faces Resource Interaction: Using IT
Tools to Handle Products at IKEA and Edsbyn. Department of Business Studies, Uppsala
University, Doctoral Thesis No. 105.
2. Wang, Zhiping (2004), Capacity-Constrained Production-Inventory Systems: Modelling and
Analysis in both a Traditional and an E-Business Context. IDA-EIS, Linköpings universitet
och Tekniska Högskolan i Linköping, Dissertation No. 889
3. Ekman, Peter (2006), Enterprise Systems & Business Relationships: The Utilization of IT in the
Business with Customers and Suppliers. School of Business, Mälardalen University, Doctoral
Dissertation No 29.
4. Lindh, Cecilia (2006), Business Relationships and Integration of Information Technology.
School of Business, Mälardalen University, Doctoral Dissertation No 28.
5. Frimanson, Lars (2006), Management Accounting and Business Relationships from a Supplier
Perspective. Department of Business Studies, Uppsala University, Doctoral Thesis No. 119.
6. Johansson, Niklas (2007), Self-Service Recovery. Information Systems, Faculty of Economic
Sciences, Communication and IT, Karlstad University, Dissertation KUS 2006:68.
7. Sonesson, Olle (2007), Tjänsteutveckling med personal medverkan: En studie av banktjänster.
Företagsekonomi, Fakulteten för ekonomi, kommunikation och IT, Karlstads universitet,
Doktorsavhandling, Karlstad University Studies 2007:9.
The Swedish Research School of
Management and Information Technology
MIT
98

8. Maaninen-Olsson, Eva (2007), Projekt i tid och rum: Kunskapsintegrering mellan
projektet och dess historiska och organisatoriska kontext. Företagsekonomiska
institutionen, Uppsala universitet, Doctoral Thesis No. 126.
9. Keller, Christina (2007), Virtual learning environments in higher education: A study of
user acceptance. Linköping Studies in Science and Technology, Dissertation No. 1114.
10. Abelli, Björn (2007), On Stage! Playwriting, Directing and Enacting the Informing Processes.
School of Business, Mälardalen University, Doctoral Dissertation No. 46.
11. Cöster, Mathias (2007), The Digital Transformation of the Swedish Graphic Industry.
Linköping Studies in Science and Technology, Linköping University, Dissertation No. 1126.
12. Dahlin, Peter (2007), Turbulence in Business Networks: A Longitudinal Study of Mergers,
Acquisitions and Bankruptcies Involving Swedish IT-companies. School of Business,
Mälardalen University, Doctoral Thesis No. 53.
13. Myreteg, Gunilla (2007), Förändringens vindar: En studie om aktörsgrupper och konsten att
välja och införa ett affärssystem. Företagsekonomiska institutionen, Uppsala universitet,
Doctoral Thesis No. 131.
14. Hrastinski, Stefan (2007), Participating in Synchronous Online Education. School of
Economics and Management, Lund University, Lund Studies in Informatics No. 6.
15. Granebring, Annika (2007), Service-Oriented Architecture: An Innovation Process
Perspective. School of Business, Mälardalen University, Doctoral Thesis No. 51.
16. Lövstål, Eva (2008), Management Control Systems in Entrepreneurial Organizations: A
Balancing Challenge. Jönköping International Business School, Jönköping University, JIBS
Dissertation Series No. 045.
17. Hansson, Magnus (2008), On Closedowns: Towards a Pattern of Explanation to the
Closedown Effect. Örebro University School of Business, Örebro University, Doctoral Thesis
No. 1.
18. Fridriksson, Helgi-Valur (2008), Learning processes in an inter-organizational context: A
study of krAft project. Jönköping International Business School, Jönköping University, JIBS
Dissertation Series No. 046.
19. Selander, Lisen (2008), Call Me Call Me for some Overtime: On Organizational
Consequences of System Changes. Institute of Economic Research, Lund Studies in Economics
and Management No. 99.
20. Henningsson, Stefan (2008), Managing Information Systems Integration in Corporate
Mergers & Acquisitions. Institute of Economic Research, Lund Studies in Economics and
Management No. 101.
21. Ahlström, Petter (2008), Strategier och styrsystem för seniorboende-marknaden. IEI-EIS,
Linköping universitetet och Tekniska Högskolan i Linköping, Doktorsavhandling, Nr. 1188.
22. Sörhammar, David (2008), Consumer-firm business relationship and network: The case of
”Store” versus Internet. Department of Business Studies, Uppsala University, Doctoral Thesis
No. 137.
99

23. Caesarius, Leon Michael (2008), In Search of Known Unknowns: An Empirical Investigation
of the Peripety of a Knowledge Management System. Department of Business Studies, Uppsala
University, Doctoral Thesis No. 139.
24. Cederström, Carl (2009), The Other Side of Technology: Lacan and the Desire for the Purity
of Non-Being. Institute of Economic Research, Lund University, Doctoral Thesis, ISBN: 91-
85113-37-9.
25. Fryk, Pontus, (2009), Modern Perspectives on the Digital Economy: With Insights from the
Health Care Sector. Department of Business Studies, Uppsala University, Doctoral Thesis No.
145.
26. Wingkvist, Anna (2009), Understanding Scalability and Sustainability in Mobile Learning: A
Systems Development Framework. School of Mathematics and Systems Engineering, Växjö
University, Acta Wexionesia, No. 192, ISBN: 978-91-7636-687-5.
27. Sällberg, Henrik (2010), Customer Rewards Programs: Designing Incentives for Repeated
Purchase. Blekinge Institute of Technology, School of Management, Doctoral Dissertation
Series No. 2010:01.
28. Verma, Sanjay (2010), New Product Newness and Benefits: A Study of Software Products
from the Firms’ Perspective. Mälardalen University Press, Doctoral Thesis.
29. Iveroth, Einar (2010), Leading IT-Enabled Change Inside Ericsson: A Transformation Into a
Global Network of Shared Service Centres. Department of Business Studies, Uppsala
University, Doctoral Thesis No. 146.
30. Nilsson, Erik (2010), Strategi, styrning och konkurrenskraft: En longitudinell studie av
Saab AB. IEI-EIS, Linköpings universitet och Tekniska Högskolan i Linköping,
Doktorsavhandling, Nr. 1318.
31. Sjöström, Jonas (2010), Designing Information Systems: A pragmatic account. Department
of Informatics and Media, Uppsala University, Doctoral Thesis.
32. Numminen, Emil (2010), On the Economic Return of a Software Investment: Managing Cost,
Benefit and Uncertainty. Blekinge Institute of Technology, School of Management, Doctoral
Thesis.
33. Frisk, Elisabeth (2011), Evaluating as Designing: Towards a Balanced IT Investment
Approach. IT University, Göteborg, Doctoral Thesis.
34. Karlsudd, Peter (2011), Support for Learning: Possibilities and Obstacles in Learning
Applications. Mälardalen University, Doctoral Thesis.
35. Wicander, Gudrun (2011), Mobile Supported e-Government Systems: Analysis of the
Education Management Information System (EMIS) in Tanzania. Karlstad University,
Doctoral Thesis. Karlstad University Studies 2011:49.
36. Åkesson, Maria (2011), Role Constellations in Value Co-Creation: A Study of Resource
Integration in an e-Government Context. Karlstad University, Doctoral Thesis. Karlstad
University Studies 2011:36.
100

37. Nfuka, Edephonce N. (2012), IT Governance in Tanzanian Public Sector Organisations.
Department of Computer and Systems Sciences, Stockholm University, Doctoral Thesis.
38. Larsson, Anders Olof (2012), Doing Things in Relation to Machines: Studies on Online
Interactivity. Department of Informatics and Media, Uppsala University, Doctoral Thesis.
39. Andersson, Bo (2012), Harnessing Handheld Computing: Framework, Toolkit and Design
Propositions. Lund University, Doctoral Thesis.
40. Erixon, Cecilia (2012), Information System Providers and Business Relationships: A Study on
the Impact of Connections. Mälardalen University, Doctoral Thesis.
41. Svensson, Martin (2012), Routes, Routines and Emotions in Decision Making of Emergency
Call Takers. Blekinge Institute of Technology, Doctoral Dissertation Series No. 2012:04.
42. Svensson, Ann (2012), Kunskapsintegrering med informationssystem I professionsorienterade
praktiker. Institutionen för tillämpad IT, Göteborgs universitet, Doktorsavhandling.
43. Pareigis, Jörg (2012), Customer Experiences of Resource Integration: Reframing
Servicescapes Using Scripts and Practices. Karlstad University, Doctoral Thesis. Karlstad
University Studies 2012:38.
44. Röndell, Jimmie (2012), From Marketing to, to Marketing with Consumers. Department of
Business Studies, Uppsala University, Doctoral Thesis No. 155.
45. Lippert, Marcus (2013), Communities in the Digital Age: Towards a Theoretical Model of
Communities of Practice and Information Technology. Department of Business Studies,
Uppsala University, Doctoral Thesis No. 156.
46. Netz, Joakim (2013), Diffusa spänningar eller spännande tillväxt? Företagsledning i tider av
snabb förändring. Mälardalens högskola, Doktorsavhandling nr 135.
47. Thorén, Claes (2013), Print or Perish? A Study of Inertia in a Regional Newspaper Industry.
Karlstad University, Doctoral Thesis. Karlstad University Studies 2014:10 (Ny uppl.).
Stockhult, Helén (2013), Medarbetare i dialog: en studie om viljan att göra mer än det
formellt förväntade. Örebro universitet, Örebro Studies in Business Dissertations, 4.
48. Mihailescu, Daniela (2013), Explaining the Use of Implementation Methodology in Enterprise
Systems Implementation Context: A Critical Realist Perspective. Lund University, Doctoral
Thesis.
49. Ghazawneh, Ahmad (2012), Towards a Boundary Resources Theory of Software Platforms.
Jönköping International Business School, Doctoral Thesis.
50. Shams, Poja (2013), What Does it Take to Get your Attention? The Influence of In-Store and
Out-of-Store Factors on Visual Attention and Decision Making for Fast-Moving Consumer
Goods. Karlstad University, Doctoral Thesis. Karlstad University Studies 2013:5.
51. Osowski, Dariusz (2013), From Illusiveness to Genuineness: Routines, Trading Zones, Tools
and Emotions in Sales Work. Department of Business Studies, Uppsala University, Doctoral
Thesis No. 160.
101

52. Höglund, Linda (2013), Discursive Practises in Strategic Entrepreneurship: Discourses and
Repertoires in Two Firms. Örebro University, Doctoral Thesis.
53. Persson Ridell, Oscar (2013), Who is the Active Consumer? Insight into Contemporary
Innovation and Marketing Practices. Department of Business Studies, Uppsala University,
Doctoral Thesis.
54. Kask, Johan (2013), On business relationships as Darwinian systems: An exploration into
how Darwinian systems thinking can support business relationship research. Örebro
University, Doctoral Thesis.
55. Paulsson, Wipawee Victoria (2013), The Complementary Use of IS Technologies to Support
Flexibility and Integration Needs in Budgeting. Lund University, Doctoral Thesis.
56. Kajtazi, Miranda (2013), Assessing Escalation of Commitment as an Antecedent of
Noncompliance with Information Security Policy. Linnaeus University, Doctoral Thesis.
57. Hasche, Nina (2013), Value Co-Creating Processes in International Business Relationships:
Three empirical stories of co-operation between Chinese customers and Swedish suppliers.
Örebro University, Doctoral Thesis.
58. Pierce, Paul (2013), Using Alliances to Increase ICT Capabilities. Lund University, Doctoral
Thesis.
59. Mansour, Osama (2013), The Bureaucracy of Social Media: An Empirical Account in
Organizations. Linnaeus University, Doctoral Thesis.
60. Osmonalieva, Zarina (2013), Factors Determining Exploitation of Innovative Venture Ideas:
A study of nascent entrepreneurs in an advisory system. Mälardalen University, Doctoral
Thesis.
61. Holmberg, Nicklas (2014), The Purity of Separation of Concerns: The Service Oriented
Business Process - a Design Approach for Business Agility. Lund University, Doctoral Thesis.
62. Poth, Susanna (2014), Competitive Advantage in the Service Industry. The Importance of
Strategic Congruence, Integrated Control and Coherent Organisational Structure: A
Longitudinal Case Study of an Insurance Company. Department of Business Studies, Uppsala
University, Doctoral Thesis.
63. Safari, Aswo (2014), Consumer Foreign Online Purchasing: Uncertainty in the Consumer-
Retailer Relationship. Department of Business Studies, Uppsala University, Doctoral Thesis.
64. Sandberg, Johan (2014), Digital Capability: Investigating Coevolution of IT and Business
Strategies. Umeå University, Doctoral Thesis.
65. Eklinder Frick, Jens (2014), Sowing Seeds for Innovation: The Impact of Social Capital in
Regional Strategic Networks. Mälardalen University, Doctoral Thesis.
66. Löfberg, Nina (2014), Service Orientation in Manufacturing Firms: Understanding
Challenges with Service Business Logic. Karlstad University, Doctoral Thesis. Karlstad
University Studies 2014:30.
102

67. Gullberg, Cecilia (2014), Roles of Accounting Information in Managerial Work. Department
of Business Studies, Uppsala University, Doctoral Thesis No. 171.
68. Bergkvist, Linda (2014), Towards a Framework for Relational-Oriented Management of
Information Systems Outsourcing: Key Conditions Connected to Actors, Relationships and
Process. Karlstad University, Doctoral Thesis. Karlstad University Studies 2014:31.
69. Tavassoli, Sam (2014), Determinants and Effects of Innovation: Context Matters. Blekinge
Institute of Technology, Doctoral Thesis No. 2014:10.
70. Högström, Claes (2014), Fit In to Stand Out: An Experience Perspective on Value Creation.
Karlstad University, Doctoral Thesis. Karlstad University Studies 2014:44.
71. Jansson, Tomas (2015), Agila projektledningsmetoder och motivation. Karlstads universitet,
Doctoral Thesis. Karlstad University Studies 2015:9.
72. Ryzhkova, Natalia (2015), Web-Enabled Customer Involvement: A Firms’ Perspective.
Blekinge Institute of Technology, Doctoral Thesis.
73. Sundberg, Klas (2015), Strategisk utveckling och ekonomistyrning: Ett livscykelperspektiv.
Företagsekonomiska institutionen, Uppsala universitet, Doctoral Thesis No. 173.
74. Nylén, Daniel (2015), Digital Innovation and Changing Identities: Investigating
Organizational Implications of Digitalization. Umeå University, Doctoral Thesis.
75. Chowdhury, Soumitra (2015), Service Logic in Digitalized Product Platforms: A Study of
Digital Service Innovation in the Vehicle Industry. Gothenburg University, Doctoral Thesis.
76. Jogmark, Marina (2015), Den regionala transformationsprocessens sociala dimension.
Karlskrona 1989-2002. Blekinge Tekniska Högskola, Doctoral Thesis.
77. Sundström, Angelina (2015), Old Swedish Business in New International Clothes: Case
Studies on the Management of Strategic Resources in Foreign-Acquired Swedish R&D Firms.
Mälardalen University, Doctoral Thesis.
78. Öbrand, Lars (2015), Information Infrastructure Risk: Perspectives, Practices &
Technologies. Umeå University, Doctoral Thesis.
79. Brozović, Danilo (2016), Service Provider Flexibility: A Strategic Perspective. Stockholm
University, Doctoral Thesis.
80. Siegert, Steffi (2016), Enacting Boundaries through Social Technologies: A Dance between
Work and Private Life. Stockholm University, Doctoral Thesis.
81. Linton, Gabriel (2016), Entrepreneurial Orientation: Reflections from a Contingency
Perspective. Örebro University, Doctoral Thesis.
82. Akram, Asif (2016), Value Network Transformation: Digital Service Innovation in the Vehicle
Industry. Department of Applied Information Technology, Chalmers University of Technology
and University of Gothenburg, Doctoral Thesis.
103

83. Hadjikhani, Annoch (2016), Executive Expectation in the Internationalization Process of
Banks: The Study of Two Swedish Banks Foreign Activities. Department of Business Studies,
Uppsala University, Doctoral Thesis No. 177.
84. El-Mekawy, Mohamed (2016), From Theory to Practice of Business-IT Alignment: Barriers,
an Evaluation Framework and Relationships with Organizational Culture. DSV, Stockholm
University, Doctoral Thesis.
85. Salavati, Sadaf (2016), Use of Digital Technologies in Education: The Complexity of
Teachers’ Everyday Practice. Linnaeus University, Doctoral Thesis.
86. Pashkevich, Natallia (2016), Information Worker Productivity Enabled by IT System Usage:
A Complementary-Based Approach. Stockholm Business School, Stockholm University,
Doctoral Thesis.
87. Stone, Trudy-Ann (2016), Firms in Global Value Chains. Blekinge Institute of Technology
(BTH), Doctoral Thesis.
88. Saarikko, Ted (2016), An Inquiry into the Nature and Causes of Digital Platforms. Umeå
University, Doctoral Thesis.
89. Tona, Olgerta (2017), The Journey of Mobile Business Intelligence: From Vision to Use.
Lund University, Doctoral Thesis.
90. Fredin, Sabrina (2017), History and Geography Matter: The Cultural Dimension of
Entrepreneurship. Blekinge Institute of Technology, Doctoral Thesis.
91. Giovacchini, Elia (2017), Weaving the Symbiotic Relationship: A Longitudinal Study of a
Firm-Sponsored Open Source Community Relationship Maintenance. Stockholm Business
School, Stockholm University, Doctoral Thesis.
92. Gillmore, Edward (2017), Four Essays on Subsidiary Evolution: Exploring the Antecedents,
Contexts and Outcomes of Mandate Loss. School of Business, Mälardalen University, Doctoral
Thesis.
93. Crawford, Jason (2017), Regulation’s Influence on Risk Management and Management
Control Systems in Banks. Department of Business Studies, Uppsala University, Doctoral
Thesis.
94. Von Schantz, Hanna (2017), Well, that makes sense! Investigating opportunity development
in a technology start-up. Stockholm Business School, Stockholm University, Doctoral Thesis.
95. Wass, Sofie (2017), The Importance of eHealth Innovations: Lessons about Patient Accessible
Information. Jönköping International Business School, Doctoral Thesis.
96. Imre, Özgün (2018), Adopting Information Systems: Perspectives from Small Organizations.
Department of Management and Engineering (IEI), Linköping University, Doctoral Thesis.
97. Lövgren, Daniel (2017), Dancing Together Alone: Inconsistencies and Contradictions of
Strategic Communication in Swedish Universities. Informatics and Media, Uppsala University,
Doctoral Thesis.
104

98. Charitsis, Vasileios (2018), Self-Tracking, Datafication and the Biopolitical Prosumption of
Life. Karlstad University, Doctoral Thesis.
99. Lammi, Inti (2018), A Practice Theory in Practice: Analytical Consequences in the Study of
Organization and Socio-Technical Change. Department of Business Studies, Uppsala
University, Doctoral Thesis.
100. Leite, Emilene (2018), Complexity in the ‘Extended’ Business Network: A study of Business,
Social and Political Relationships in Smart City Solutions. Department of Business Studies,
Uppsala University, Doctoral Thesis.
101. Aasi, Parisa (2018), Information Technology Governance: The Role of Organizational
Culture and Structure. Department of Computer and Systems Sciences, Stockholm
University, Doctoral Thesis.
102. Servadio, Luigi (2018), Customer Rituals: Ethnographic Explorations of Wine Rituals with
Families and Friends. Stockholm Business School, Stockholm University, Doctoral Thesis.
103. Ahlgren, Kajsa (2018), Travelling Business Models: On Adapting Business Models to New
Contexts. Design Sciences, Faculty of Engineering, Lund University, Doctoral Thesis.
104. Markowski, Peter (2018), Collaboration Routines: A Study of Interdisciplinary Healthcare.
Stockholm Business School, Stockholm University, Doctoral Thesis.
105. Zaffar, Fahd Omair (2018), The Value of Social Media: What Social Networking Sites
Afford Organizations. Division of Informatics, Department of Applied Information
Technology, University of Gothenburg, Doctoral Thesis.
106. Stendahl, Emma (2018), Headquarters Involvement in Managing Subsidiaries.
Stockholm Business School, Stockholm University, Doctoral Thesis.
107. Fischer, Christian (2018), Business Intelligence through a Sociomaterial Lens: The
Imbrication of People and Technology in a Sales Process. Department of Business Studies,
Uppsala University, Doctoral Thesis.
108. Lagin, Madelen (2018), The Price We Pay: The Autonomy of Store Managers in Making
Price Decisions. Department of Business Studies, Örebro University, Doctoral Thesis.
109. Odar, Susanne (2019), Managementinitiativ, mening och verksamhetsresultat: En
retrospektiv studie av en teknikintensiv verksamhet. Department of Management and
Engineering (IEI), Linköping University, Linköping Studies in Science and Technology,
Doctoral Thesis.
110. Radits, Markus (2019), A Business Ecology Perspective on Community-Driven Open
Source: The Case of the Free and Open Source Content Management System Joomla.
Department of Management and Engineering (IEI), Linköping University, Linköping Studies
in Science and Technology, Doctoral Thesis No. 1937.
111. Skog, Daniel A. (2019), The Dynamics of Digital Transformation: The Role of Digital
Innovation, Ecosystems and Logics in Fundamental Organizational Change. Umeå
University, Doctoral Thesis.
105

112. Ek, Peter (2019), Managing Digital Open Innovation with User Communities: A Study
of Community Sensing and Product Openness Capabilities in the Video Game Industry.
Department of Business Studies, Uppsala University, Doctoral Thesis No. 199
113. Muhic, Mirella (2019), Transition to Cloud sourcing – Innovation and competitive
advantage. Design Sciences, Faculty of Engineering, Lund University, Doctoral Thesis.
114. Mankevich, Vasili (2019), Digital Innovation Management: Investigating Digital Trace
Data in Online Communities. Umeå University, Doctoral Thesis.
115. Vink, Josina (2019), In/visible - Conceptualizing Service Ecosystem Design. Karlstad
University, Doctoral Thesis.
116. Bäckström, Izabelle (2019), Mirror, mirror on the wall, who’s the innovator after all?
An explorative study of a management-initiated employee innovation process.
Department of Design Sciences, Faculty of Engineering, Lund University, Doctoral
Thesis No. 116.
117. Bani-Hani, Imad (2020), Self-Service Business Analytics and the Path to Insights:
Integrating Resources for Generating Insights, Department of Informatics, School of
Economics and Management, Lund University, Doctoral Thesis.
118. Kashyap, Shruti Rangan (2020), Monsoon Paper Dragons: Transparency,
Accountability, Risk, and Compliance in Banking Regulation and Practice, Department
of Business Studies, Uppsala University, Doctoral Thesis No. 201.
119. Havemo, Emelie (2020), Den visuella bilden av organisationen: Perspektiv på visualitet
i accounting, Linköping Studies in Science and Technology, Institutionen för ekonomisk
och industriell utveckling, Linköpings universitet, Doktorsavhandling nr. 2075.
120. Nyende, Hawa (2020), Maternal Healthcare in Low Resource Settings: Investigations of
IT as a resource, Department of Applied Information Technology, University of
Gothenburg, Doctoral Thesis.
121. Kizito, Michael (2020), Enacting ambidextrous IT Governance in healthcare,
Department of Applied Information Technology, University of Gothenburg, Doctoral
Thesis.
122. Ofe, Hosea Ayaba (2020), Orchestrating Emerging Digital Ecosystems: Investigating
the Establishment of an Open Data Platform in the Swedish Public Transport Industry.,
Department of Informatics, Umeå University, Doctoral Thesis.
123. Kurti, Erdelina (2020), Institutional Tensions and Complexity in the Digital Innovation
of Incumbent Business Models, Linnaeus University, Doctoral Thesis.
124. Gustavsson, Tomas (2020), Inter-team Coordination in Large-Scale Agile Software
Development Projects, Karlstad University, Doctoral Thesis.
125. Hedrén, Andreas (2021), With Lives on the Line: How Users Respond to a Highly
Mandated Information System Implementation – A Longitudinal Study, Department of
Informatics and Media, Uppsala University, Doctoral Thesis.
106

126. Nykvist, Rasmus (2021), Essays on the Interaction Between Regulation and
Technology: Understanding Agency and Context Through Multiple Levels of Inquiry,
Örebro University School of Business, Örebro University, Doctoral Thesis.
127. Geissinger, Andrea (2021), Platforms in Liquid Modernity: Essays about the Sharing
Economy, Digital Platforms, and Institutions, Örebro University School of Business,
Örebro University, Doctoral Thesis.
128. Yang, Ying (2021), The Arrival of the Tipping Point of Solar Photovoltaic Technology,
Mälardalen University, Doctoral Thesis.
Contact person: Professor Christina Keller, Director of MIT, Uppsala University [email protected] Address: The Swedish Research School of Management and Information Technology, Department of Informatics and Media, Uppsala University, Box 513, 751 20 Uppsala Web site: www.mit.uu.se
107