Solar Photovoltaic Investment Changes across China Regions ...
14
energies Article Solar Photovoltaic Investment Changes across China Regions Using a Spatial Shift-Share Analysis Ruxu Sheng 1 , Juntian Du 1 , Songqi Liu 1 , Changan Wang 2, *, Zidi Wang 1 and Xiaoqian Liu 2 Citation: Sheng, R.; Du, J.; Liu, S.; Wang, C.; Wang, Z.; Liu, X. Solar Photovoltaic Investment Changes across China Regions Using a Spatial Shift-Share Analysis. Energies 2021, 14, 6418. https://doi.org/10.3390/ en14196418 Academic Editor: Frauke Urban Received: 17 August 2021 Accepted: 27 September 2021 Published: 8 October 2021 Publisher’s Note: MDPI stays neutral with regard to jurisdictional claims in published maps and institutional affil- iations. Copyright: © 2021 by the authors. Licensee MDPI, Basel, Switzerland. This article is an open access article distributed under the terms and conditions of the Creative Commons Attribution (CC BY) license (https:// creativecommons.org/licenses/by/ 4.0/). 1 School of Public Policy and Management, Tsinghua University, Beijing 100084, China; [email protected] (R.S.); [email protected] (J.D.); [email protected] (S.L.); [email protected] (Z.W.) 2 Research Institute of Economics and Management, Southwestern University of Finance and Economics, Chengdu 611130, China; [email protected] * Correspondence: [email protected] Abstract: Solar photovoltaic (PV) has become the fastest-growing new energy in China and one of the main contributors to China’s clean energy transition. From 2013 to 2019, China’s solar PV installed capacity grew from 15,890 MW to 204,180 MW, increasing by 11.85 times. To explore solar PV investment changes across China regions, we use spatial shift-share analysis model to decompose solar PV investment changes from 2013 to 2019 into four components: national energy investment growth effect (NEG), national energy investment structure effect (NES), neighbor–nation solar PV investment competitive effect (NNC), and region–neighbor solar PV investment competitive effect (RNC). Based on the decomposition results, we find that the value of NNC of most western provinces is negative for the entire period, while the NNC of most central and eastern provinces is in the middle and lower range. There is little difference in RNC among these regions. While comparing the influence caused by the four effects, NNC and RNC play dominant roles in solar PV investment changes in eastern and central provinces, which means NEG and NES have relatively small impacts. By contrast, NEG and NES affect the solar PV investment changes at a larger scale in most western provinces. Comparing the NNC and RNC, we find that RNC played a prominent role in the eastern and central regions, while NNC played a dominant role in the west. Keywords: solar photovoltaic investment; spatial shift-share analysis; regional analysis 1. Introduction In response to global warming, China puts forward two goals: “Emission Peak” and “Carbon Neutrality”, and these goals have received global attention. “Emission Peak” refers to the inflection point where carbon dioxide emissions reach the peak and then gradually decline. Meanwhile, “Carbon Neutrality” means balancing carbon dioxide removal with its emissions to achieve net-zero carbon dioxide emissions. At the 75th UN General Assembly, China announced its target to have carbon dioxide emissions peak before 2030 and realize the goal of “Carbon Neutrality” before 2060. To demonstrate this determination, the Chinese government has continuously reiterated these two goals at some essential conferences, such as the Central Economic Working Conference and the National People’s Congress. Replacing traditional energy with clean energy at a grand scale is the core way to achieve “Carbon Neutrality”. Furthermore, China made a series of initiatives to support renewable-energy industries. As the first step, China drew up a phased target, planning to increase the proportion of wind power and solar PV power generation to 11% by 2021 and make sure that the ratio of non-fossil energy consumption to primary energy consumption becomes one to five before 2025, and further to one to four by 2030 [1]. Meanwhile, the Chinese government provided CNY 500 million as the subsidy budget to the solar PV industry [1] and eagerly pursued cooperation with financial institutions to support the development of renewable-energy companies [2]. Furthermore, Energies 2021, 14, 6418. https://doi.org/10.3390/en14196418 https://www.mdpi.com/journal/energies
-
Upload
khangminh22 -
Category
Documents
-
view
2 -
download
0
Transcript of Solar Photovoltaic Investment Changes across China Regions ...

energies
Article
Solar Photovoltaic Investment Changes across China RegionsUsing a Spatial Shift-Share Analysis
Ruxu Sheng 1, Juntian Du 1, Songqi Liu 1, Changan Wang 2,*, Zidi Wang 1 and Xiaoqian Liu 2
�����������������
Citation: Sheng, R.; Du, J.; Liu, S.;
Wang, C.; Wang, Z.; Liu, X. Solar
Photovoltaic Investment Changes
across China Regions Using a Spatial
Shift-Share Analysis. Energies 2021,
14, 6418. https://doi.org/10.3390/
en14196418
Academic Editor: Frauke Urban
Received: 17 August 2021
Accepted: 27 September 2021
Published: 8 October 2021
Publisher’s Note: MDPI stays neutral
with regard to jurisdictional claims in
published maps and institutional affil-
iations.
Copyright: © 2021 by the authors.
Licensee MDPI, Basel, Switzerland.
This article is an open access article
distributed under the terms and
conditions of the Creative Commons
Attribution (CC BY) license (https://
creativecommons.org/licenses/by/
4.0/).
1 School of Public Policy and Management, Tsinghua University, Beijing 100084, China;[email protected] (R.S.); [email protected] (J.D.);[email protected] (S.L.); [email protected] (Z.W.)
2 Research Institute of Economics and Management, Southwestern University of Finance and Economics,Chengdu 611130, China; [email protected]
* Correspondence: [email protected]
Abstract: Solar photovoltaic (PV) has become the fastest-growing new energy in China and oneof the main contributors to China’s clean energy transition. From 2013 to 2019, China’s solar PVinstalled capacity grew from 15,890 MW to 204,180 MW, increasing by 11.85 times. To explore solarPV investment changes across China regions, we use spatial shift-share analysis model to decomposesolar PV investment changes from 2013 to 2019 into four components: national energy investmentgrowth effect (NEG), national energy investment structure effect (NES), neighbor–nation solar PVinvestment competitive effect (NNC), and region–neighbor solar PV investment competitive effect(RNC). Based on the decomposition results, we find that the value of NNC of most western provincesis negative for the entire period, while the NNC of most central and eastern provinces is in themiddle and lower range. There is little difference in RNC among these regions. While comparingthe influence caused by the four effects, NNC and RNC play dominant roles in solar PV investmentchanges in eastern and central provinces, which means NEG and NES have relatively small impacts.By contrast, NEG and NES affect the solar PV investment changes at a larger scale in most westernprovinces. Comparing the NNC and RNC, we find that RNC played a prominent role in the easternand central regions, while NNC played a dominant role in the west.
Keywords: solar photovoltaic investment; spatial shift-share analysis; regional analysis
1. Introduction
In response to global warming, China puts forward two goals: “Emission Peak” and“Carbon Neutrality”, and these goals have received global attention. “Emission Peak”refers to the inflection point where carbon dioxide emissions reach the peak and thengradually decline. Meanwhile, “Carbon Neutrality” means balancing carbon dioxideremoval with its emissions to achieve net-zero carbon dioxide emissions. At the 75th UNGeneral Assembly, China announced its target to have carbon dioxide emissions peakbefore 2030 and realize the goal of “Carbon Neutrality” before 2060. To demonstrate thisdetermination, the Chinese government has continuously reiterated these two goals atsome essential conferences, such as the Central Economic Working Conference and theNational People’s Congress. Replacing traditional energy with clean energy at a grandscale is the core way to achieve “Carbon Neutrality”. Furthermore, China made a seriesof initiatives to support renewable-energy industries. As the first step, China drew up aphased target, planning to increase the proportion of wind power and solar PV powergeneration to 11% by 2021 and make sure that the ratio of non-fossil energy consumptionto primary energy consumption becomes one to five before 2025, and further to one tofour by 2030 [1]. Meanwhile, the Chinese government provided CNY 500 million as thesubsidy budget to the solar PV industry [1] and eagerly pursued cooperation with financialinstitutions to support the development of renewable-energy companies [2]. Furthermore,
Energies 2021, 14, 6418. https://doi.org/10.3390/en14196418 https://www.mdpi.com/journal/energies

Energies 2021, 14, 6418 2 of 14
China put a lot of effort into constructing the regulatory framework, such as establishingindustry norms and strengthening supervision.
As the country consuming the most energy, China has made progress in transi-tioning towards clean energy. Regarding the ability to generate energy, China reached630.2 billion kWh in renewable-energy generation in 2019, taking up 8.6% of the country’stotal electricity generation capacity [3]. The annual growth rate reached 16%, accountingfor 41% of the global increase in primary energy that year. At the same time, if we considerthe amounts of energy consumption, the increase in renewable-energy consumption inChina, being a total of 0.8 GJ, was ranked first in the world rankings, followed by theUnited States with only 0.3 GJ [4]. This means that China is in the global-standing leadingposition in both production and consumption of renewable energy.
In particular, solar PV has become the fastest-growing new energy source in China.The rapid development of solar PV was mainly shown in two aspects: power generationand installed capacity. In terms of power generation, statistics released by the NationalEnergy Administration indicate that China’s solar PV power generation rose from 224 kWhin 2019 to 261 kWh in 2020, with a growth rate of 16.5%. Moreover, in 2020, solar poweraccounts for 3.4% of the total energy consumption, which was 0.3% higher than in 2019 [5].As for the installed capacity, according to the National Energy Administration, China’sinstalled capacity reached 253 GW by the end of 2020, accounting for one-third of theworld’s total installed capacity. Moreover, more than 18GW of renewable-energy capacitywas added in China in 2020. Overall, these two capacities ranked first globally [6]. Chinanow owns the world’s largest solar PV market while still having great growth potential.
Solar PV investment shows a higher growth rate in most regions of China compared tohydropower and wind power, while the latter two sources of renewable energy both requirerelatively demanding conditions to generate electricity. If we consider the different situa-tions for each province, the growth in solar PV investment not only means the generationof more clean electricity, but brings windows of opportunity for green industry transforma-tion and green technology innovation from the perspective of industrial development [7].In this way, all opportunities brought may create some chances of leading the region toclose the innovation gap in various aspects, such as technology, markets and institutions [8].Meanwhile, both the integration of multidisciplinary knowledge and knowledge networkswill facilitate the emergence and diffusion of emerging technologies [9], ultimately formingvarious clusters of green innovation in different regions [10]. Besides, an innovation cluster,like the one in the solar PV industry, cannot be successfully developed without cooperationamong various aspects, such as entrepreneurs, universities and government. In China,local governments are likely to use policy mixes to resolve conflicts in existing policies tosupport firms’ green technological innovation and technology diffusion [11,12]. These actshave led to different policies for the solar PV industry among different regions, which maycause heterogeneous characteristics of solar PV investment changes across regions.
To explore the components of solar PV investment changes across China regions, weuse spatial shift-share analysis (SSA) to decompose the solar PV investment changes inprovinces from 2013 to 2019 into four effects: national energy investment growth effect(NEG), national energy investment structure effect (NES), neighbor–nation solar PV in-vestment competitive effect (NNC), and region–neighbor solar PV investment competitiveeffect (RNC). Based on the regional decomposition results for the entire period and threesubperiods, we mainly need to focus on regional differences caused by NNC and RNC,which are two vital effects in the spatial SSA, and compare the contribution differences ofthe four effects in each region.
The rest of this paper is organized as follows: Section 2 reviews the previous relevantresearch literature from the perspectives of solar PV investment and SSA models. Section 3builds the spatial SSA model and reports data sources. Section 4 presents the decompositionresults and discussion. Section 5 is a summary of this study.
Energies 2021, 14, 6418 3 of 14
2. Literature Review2.1. Solar Photovoltaic Investment
Solar photovoltaic (PV) investment needs investors and policymakers to have certaincapabilities due to its uncertainty and a long payback period. Chang et al. calculatethe average payback period of a solar PV system in Texas to be in the range of 2 to20 years and emphasize the importance of incentives to the payback period for solar PVsystems [13]. Through analyzing the solar PV market in the U.S., Assereto et al. findthat the most concerned factors for renewable-energy investors are appropriate marketconditions and policies, as well as electricity price stability [14]. Souza et al. demonstratethat the countries that excelled in global renewable-energy markets are almost the same asthose with appropriate regulations, which have favored technological upgrading and localvalue chain development [15]. Meanwhile, solar PV investment is also essential for thedevelopment of a country, especially for emerging economies. Carstens et al. highlight theinfluence of technological niche developments on national economic growth and regionaldevelopment, using Brazil’s solar PV energy industry as a good example [16].
Individual differences emerge when the study focuses on the different charactersinvolved in solar PV investment. Kim et al. find that stakeholders invested in solar PV mayperceive the importance of factors from different views. For example, people managingpower plants might be more concerned with commercial risk, while financial investorsfocus more on economic factors [17]. Gastaldo et al. pay more attention to the psychologicalfactors of household solar PV investors and find that benevolence and universalism tendto promote altruistic, cooperative and environmentally friendly behaviors [18].
As we pay attention to the industry chain, Formica et al. include the maintenance andreplacement costs associated with inverters in their study of the return on investment ofsolar PV systems [19]. Moreover, similar studies reflect the impact of companies up anddown the chain on solar PV investment. Goodrich et al. emphasize the importance ofinnovation, economies of scale and worldwide cooperation. They find that China’s priceadvantage in the solar PV field is driven by scale and supply chain development [20]. Pillairealizes the reduction in the cost of raw materials is a key factor. With more solar panelmanufacturers emerging in China, technological innovations and increased investmentat the industry level have become essential factors leading to cost reduction worldwidein solar PV [21]. In terms of how policies are implemented in different countries aroundthe world, Ahmad et al. [22] and Wen et al. [23] indicate that the feed-in tariff (FIT) policyintroduced by the government is the main reason for the rapid growth of solar PV capacityinstalled in Malaysia and Japan.
In China, solar PV investment not only stands for industrial upgrading and technolog-ical innovation but also helps alleviate poverty in rural areas to some extent, which can betaken as one of the core poverty alleviation strategies [24]. Therefore, we focus on researchin industrial development and technological innovation.
Among the studies discussing solar PV investment in China, many researchers focuson the determinants of solar PV investment and discuss the effects these factors haveon the investment. Zhao et al. select five main factors impacting the development ofthe solar PV industry in China: technology research and development, industrial plans,laws and regulations, electricity price policies, and projects incentive policies [25]. Byadopting a real options model to evaluate renewable-energy investment, Zhang et al. findthat increasing unit-generating capacity and the market price of electricity can positivelyinfluence investment value and optimal investment timing in the solar PV field [26].Furthermore, they suggest that maintaining market stability and increasing subsidies forcarbon dioxide absorption are both critical for attracting immediate investment. As forother constraints on investing in solar PV, Kayser identifies severe cash-flow uncertainty,unreliable supply chains and weak regulatory environment as the most prominent riskfactors limiting the sustainability of solar PV markets in China [27]. By comparing thepolicies implemented by the Chinese government with policies set by several westerncountries, Zhi et al. find that the Chinese government tends to focus more on whether
Energies 2021, 14, 6418 4 of 14
related commercial products become popularized in society than on paying sufficientattention to investment in R&D [28].
Concerning incentive policies, Ye et al. show that the FIT policies successfully stimu-late the PV domestic market based on the historical development and implementation ofFIT policies in China from 2011 to 2016 [29]. Cheng et al. prove that the FIT policies signif-icantly help accelerate solar PV investment in a free market than other elements do [30].They point out that different support schemes used to reform the electricity market canhelp increase solar PV investment. Moreover, the FIT policies implemented in downstreampower generation have obviously improved the profitability of listed companies in thefield of solar PV in China and have obvious effects on increasing the inventory turnoverof private enterprises [31]. In recent studies, Qiu et al. find that household investment inPV in China has reached a balance of payments even without any incentives under thecondition of the rapid withdrawal of PV subsidies [32].
2.2. Shift-Share Analysis
Shift-share analysis (SSA) is a practical and easily understood model in regionalanalysis, first formally proposed by Dunn in 1960 [33]. After the proposition, various math-ematical construction methods of SSA components and their economic implications weregradually raised by scholars. Therefore, different theories extended beyond the classicalSSA model. Among these studies, we believe that there are two major developments. Thefirst one is the development in component independence, which was mainly discussedbefore the 21st century. To solve the interwoven effect of components that existed in classi-cal SSA, Eteban-Marquillas creatively introduces “homothetic variables” and constructshomothetic SSA [34]. From then on, much research dealing with component independencehas been done [35,36]. A more comprehensive review of component-independent SSAextensions can be found in Loveridge and Selting [37].
The second one is the introduction of spatial interaction, bringing in the spatial SSA.Being a regional analysis model of importance, classical SSA did not initially considerthe geographical interactions among economic units that might happen. Although theimportance of spatial influence has been mentioned in some articles [38], the first timethat spatial influence is formally introduced is when Nazara and Hewings construct thespatial SSA [39]. Based on the original spatial SSA model, many scholars propose furtherstudies [40–42]. A relatively comprehensive overview of the various studies of spatialSSA can be found in the research done by Montanía et al. [42]. Furthermore, in the fieldof environment and energy, some scholars start to use the spatial SSA model instead ofthe classical SSA due to the spatial interaction of the indicators. For example, Grossi andMussini [43] and Lin et al. [44] use spatial SSA to decompose Italy’s electricity consumptionand China’s energy consumption, respectively.
Based on the analysis of previous literature reviews, scholars are interested in factorsinfluencing solar PV investment from both the macro perspective of the industry andthe micro perspective of investors. For an industry like solar PV, which heavily relieson technological innovation, scholars worldwide have focused on the role played by thegovernment. The government can provide investors with necessary factors to investsuccessfully, such as a stable market environment, favorable incentives and comprehensiveindustry planning, and these elements will increase solar PV investment to some extent.Among these many policies, the feed-in tariffs (FIT) policy has undoubtedly receivedwidespread attention. Generally speaking, scholars have consistent understandings ofthe impact of state intervention and government policy on solar PV investment whileconducting well-developed studies on the factors that may influence solar PV investment.However, there is still a lack of study on the differences in the drivers of solar PV investmentchanges among different regions in China.
Energies 2021, 14, 6418 5 of 14
3. Methodology and Data3.1. Shift-Share Analysis and Its Spatial Extension
This study analyzes the growth of solar photovoltaic (PV) investment in variousregions in China. To better introduce the spatial shift-share analysis (SSA) used in thisstudy, we build a model based on the classical SSA. By using the classical SSA, we candecompose the growth of solar PV investment in region i as follows in Equation (1):
∆PVIi = gi × PVIi = G× PVIi + (g− G)× PVIi + (gi − g)× PVIi = NEG + NES + RC, (1)
where ∆PVIi is the growth of solar PV investment in region i. PVIi is the initial solarPV investment in region i and gi is the growth rate of solar PV investment in region i.g and G are growth rates of national solar PV investment and national total energyinvestment, respectively.
In Equation (1), the classical SSA is used to decompose the growth of a region’s solarPV investment into three effects: national energy investment growth effect (NEG), nationalenergy investment structure effect (NES), and regional solar PV investment competitiveeffect (RC). Their explanations are as follows: (1) NEG is the national total energy invest-ment growth rate (G) multiplied by the initial solar PV investment in region i (PVIi). NEGindicates how much the regional solar PV investment will grow if it increases at the growthrate of national total energy investment. (2) NES is measured as the difference between thegrowth rate of national solar PV investment and that of national energy investment (g− G)multiplied by the initial solar PV investment of region i (PVIi), reflecting the influence ofnational energy investment structure on regional solar PV investment growth. If the growthrate of national solar PV investment is greater than that of national energy investment,which is g− G > 0, NES is positive. (3) RC is measured as the difference in the growth rateof solar PV investment between region i and the nation (gi − g) multiplied by the initialsolar PV investment in region i (PVIi). RC is the competitiveness of region i’s solar PVinvestment growth rate among all regions in the country. A positive RC means the solarPV investment in region i grows faster than it does in the nation.
There are regional correlations in solar PV investment between provinces and theirneighboring provinces mainly for the following reasons. First, there exists spatial technol-ogy diffusion in almost every part of the solar PV industry chain among various regions.As an emerging industry, technology is crucial to the development of the solar PV industryand the diffusion of technology among different regions is not negligible. Secondly, thereexists spatial diffusion of industry clusters in the solar PV industry among various regions.Industrial clusters, such as industrial parks, have become the fundamental developingpattern for emerging sectors of strategic importance in China. The geographical relevanceof solar PV industry development is also one of the factors leading to the regional rele-vance of solar PV investment. Thirdly, the promotion of regional integration has led toan increased spatial correlation of core elements responsible for industrial development,such as infrastructure, ecological environment, and public services, among provinces. Thespatial correlation of these elements also leads to the regional relevance of PV investment.
Considering the possible spatial interactions among regions, Nazara and Hewingsfirst propose the spatial SSA to deal with spatial interaction, bridging the gap of classicalSSA in this regard [39]. Meanwhile, they provide a spatial SSA that includes a stepwisedecomposition form of spatial interactions. Based on these studies, this study uses thedevelopment in spatial SSA proposed by Espa et al. [41] and Herath et al. [40] to analyzeChina’s regional solar PV investment. To construct the spatial SSA of solar PV investment,we use the most classical adjacency matrix, (W), to define the spatial relationship betweenregions. The four-component spatial SSA of solar PV investment change in region i isconstructed as Equation (2):
∆PVIi = G× PVIi + (g− G)× PVIi + (gi − g)× PVIi + (gi − gi)× PVIi = NEG + NES + NNC + RNC, (2)
Energies 2021, 14, 6418 6 of 14
where all variables are the same as in Equation (1) except gi. gi is the growth rate of solarPV investment in the neighbor regions of region i, and its definition formula is given asEquation (3):
gi =K
∑k=1
wikPVIt+1k /
K
∑k=1
wikPVItk − 1, (3)
where PVIt+1k and PVIt
k are the solar PV investment of region k at the end and beginning ofthe period, respectively. wik is the kth element of row i in the spatial matrix W, indicatingthe spatial interaction between region i and region k. Since W is the spatial adjacency matrix,the value of wik is 1 when region i and k are adjacent. Otherwise, wik is 0. Obviously, Nazaraand Hewings introduce the spatial interaction into SSA by adopting gi in Equation (2) [39].
As opposed to in the classical SSA model, spatial SSA can be used to decompose aregion’s solar PV investment growth into four effects: national energy investment growtheffect (NEG), national energy investment structure effect (NES), neighbor–nation solarPV investment competitive effect (NNC), and region–neighbor solar PV investment com-petitive effect (RNC), which correspond to the four components in Equation (2). Theirexplanations are as follows: (1) NEG of spatial SSA is the same as classical SSA. (2) NESof spatial SSA is the same as classical SSA. (3) NNC is the amount of change in solar PVinvestment in region i due to the difference in solar PV investment growth rate betweenneighboring regions of region i and the nation (gi − g). NNC reflects the competitivenessof solar PV investment growth rate of neighboring regions of region i in the nation. NNCis positive if the growth rate of solar PV investment in neighboring regions is greater thanthat of the nation, which is gi − g > 0. (4) RNC is measured as the difference in solar PVinvestment growth rates between region i and its neighbor regions (gi − gi) multipliedby the initial solar PV investment of region i (PVIi), reflecting the competitiveness of theregion i’s solar PV investment compared with that of neighboring regions. A positiveRNC means that solar PV investment in region i is growing faster than investments ofneighboring regions do.
The most meaningful development in spatial SSA when compared with classical SSA isthe introduction of the solar PV investment growth rate into the spatial neighbor region (gi).By comparing Equation (1) to Equation (2), we find that the classical SSA model includesthree components, while spatial SSA includes four components. Among these components,the first two effects of spatial SSA, which are NEG and NES, are the same in both SSAmodels, and neither of these two components involves the neighbor regions. Consideringthe rest of the components, spatial SSA decomposes the third effect of classical SSA, whichis named RC, into NNC and RNC, and these two effects involve spatial interaction. BothNNC and RNC indicate the competitiveness effect of solar PV investment growth rate.The difference is that NNC represents the competitiveness of region i’s neighbor regionsrelative to that of the nation, while RNC represents the competitiveness of region i relativeto that of its neighbor regions.
The differences in NEG and NES for each region in the same period are derived fromeach region’s initial solar PV investment. Therefore, in the result section, we mainly focuson the difference between NNC and RNC in each region, which is unique in the spatialSSA model.
It is important to note that the SSA model does not thoroughly explain the causalrelationship between investment in solar PV in each province and related effects. The spatialSSA is an accounting identity about the change in solar PV investments by decomposingthem into components.
3.2. Data
To explore the components of provincial solar PV investment growth in China usingthe spatial SSA, we utilize three types of data: provincial solar PV investment, provincialtotal energy investment, and spatial weight matrix among provinces of China. The nationaland provincial growth rates on solar PV investment and total energy investment can be
Energies 2021, 14, 6418 7 of 14
calculated by the corresponding investment data. Considering the difficulty of directlyobtaining statistical data on the amount of solar PV investment data in China, we usedata measuring capacities of solar PV and total energy to have equipment installed asproxy variables for solar PV investment and total energy investment, respectively, andthese two kinds of data for each province are obtained from the China Electricity Yearbook2014–2020. Furthermore, the authors calculate the data of the spatial adjacency matrix foreach province. Specifically, for two adjacent provinces, the distance between them is set asthe value of 1. Otherwise, the value is 0. The spatial adjacency matrix is composed of thedistances of all provinces.
4. Results and Discussion4.1. National and Provincial Solar Photovoltaic Investment Growth from 2013 to 2019
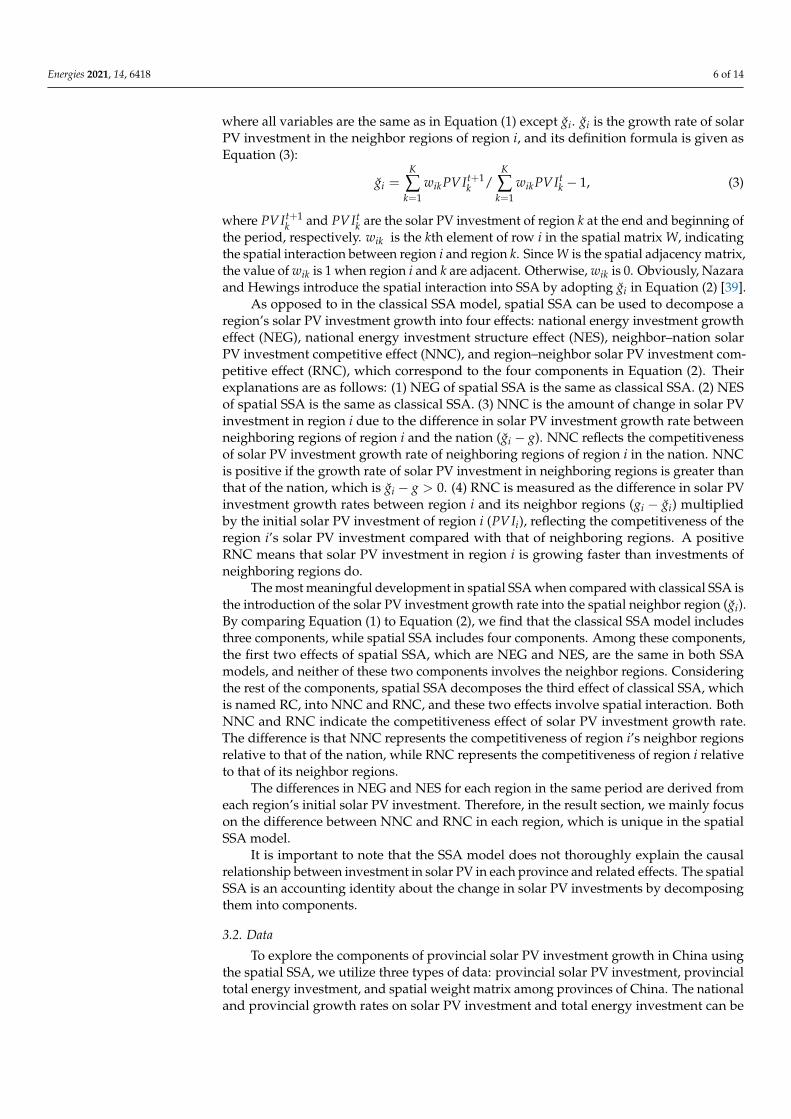
Figure 1 shows the proportion of solar photovoltaic (PV) investment to total energyinvestment in China and the growth rate of solar PV investment in China on the primaryand secondary axes, respectively. In general, China’s solar PV investment and the pro-portion of solar PV investment in total energy investment maintained rapid growth from2013 to 2019. Specifically, China’s solar PV investment grew from 15,890 MW in 2013 to204,180 MW in 2019, increasing about 11.85 times and at an average growth rate of 53.04%annually. Meanwhile, as a share of total energy investment, China’s solar PV investmentgrew from 1.26% in 2013 to 10.16% in 2019, increasing by 8.89% during these seven years.In 2016, China’s growth rate of solar PV investment was 80.92%, which is the highest valueduring the entire period. However, after 2016 the growth rates declined, likely due to thelarger solar PV investment base.
Energies 2021, 14, x FOR PEER REVIEW 7 of 14
3.2. Data To explore the components of provincial solar PV investment growth in China using
the spatial SSA, we utilize three types of data: provincial solar PV investment, provincial total energy investment, and spatial weight matrix among provinces of China. The na-tional and provincial growth rates on solar PV investment and total energy investment can be calculated by the corresponding investment data. Considering the difficulty of di-rectly obtaining statistical data on the amount of solar PV investment data in China, we use data measuring capacities of solar PV and total energy to have equipment installed as proxy variables for solar PV investment and total energy investment, respectively, and these two kinds of data for each province are obtained from the China Electricity Yearbook 2014–2020. Furthermore, the authors calculate the data of the spatial adjacency matrix for each province. Specifically, for two adjacent provinces, the distance between them is set as the value of 1. Otherwise, the value is 0. The spatial adjacency matrix is composed of the distances of all provinces.
4. Results and Discussion 4.1. National and Provincial Solar Photovoltaic Investment Growth from 2013 to 2019
Figure 1 shows the proportion of solar photovoltaic (PV) investment to total energy investment in China and the growth rate of solar PV investment in China on the primary and secondary axes, respectively. In general, China’s solar PV investment and the propor-tion of solar PV investment in total energy investment maintained rapid growth from 2013 to 2019. Specifically, China’s solar PV investment grew from 15,890 MW in 2013 to 204,180 MW in 2019, increasing about 11.85 times and at an average growth rate of 53.04% annu-ally. Meanwhile, as a share of total energy investment, China’s solar PV investment grew from 1.26% in 2013 to 10.16% in 2019, increasing by 8.89% during these seven years. In 2016, China’s growth rate of solar PV investment was 80.92%, which is the highest value during the entire period. However, after 2016 the growth rates declined, likely due to the larger solar PV investment base.
Figure 1. The proportion of solar PV investment to total energy investment and solar PV invest-ment growth rate, 2013–2019.
Figure 2 shows the change in solar PV investment and in the proportion of solar PV investment to total energy investment by province from 2013 to 2019 on the vertical and
Figure 1. The proportion of solar PV investment to total energy investment and solar PV investmentgrowth rate, 2013–2019.
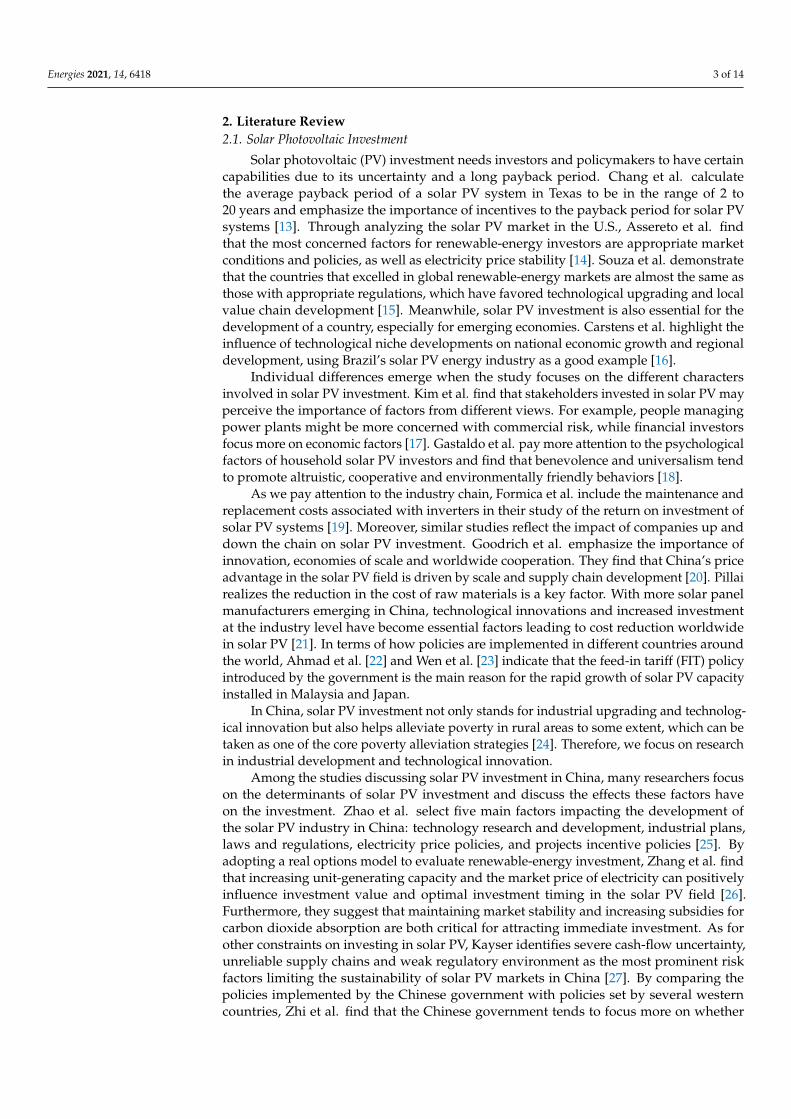
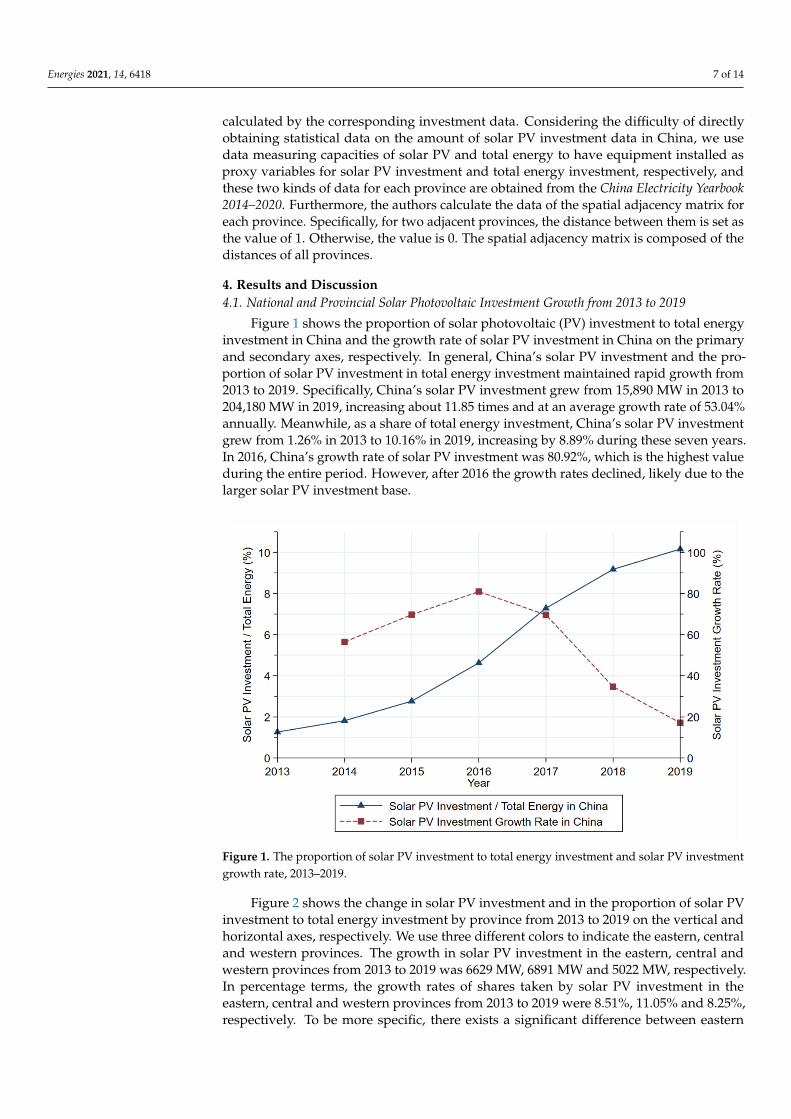
Figure 2 shows the change in solar PV investment and in the proportion of solar PVinvestment to total energy investment by province from 2013 to 2019 on the vertical andhorizontal axes, respectively. We use three different colors to indicate the eastern, centraland western provinces. The growth in solar PV investment in the eastern, central andwestern provinces from 2013 to 2019 was 6629 MW, 6891 MW and 5022 MW, respectively.In percentage terms, the growth rates of shares taken by solar PV investment in theeastern, central and western provinces from 2013 to 2019 were 8.51%, 11.05% and 8.25%,respectively. To be more specific, there exists a significant difference between eastern
Energies 2021, 14, 6418 8 of 14
and western provinces in the growth of solar PV investment proportion. In contrast, thedifference is smaller among the central provinces. HN has the lowest growth rate, at7.36%, of solar PV investment share in the central regions. From 2013 to 2019, neithersolar PV investment growth nor solar PV investment proportion growth in the chosenprovinces showed obvious regional heterogeneity. This means that solar PV does not haveobvious regional restrictions like clean energy, such as hydropower, nuclear and tidalpower. Therefore, there is reason to believe that changes in solar PV investment in China’sprovinces are largely influenced by local policies, local market conditions and other factors,rather than merely dominated by geographical and natural factors.
Energies 2021, 14, x FOR PEER REVIEW 8 of 14
horizontal axes, respectively. We use three different colors to indicate the eastern, central and western provinces. The growth in solar PV investment in the eastern, central and western provinces from 2013 to 2019 was 6629 MW, 6891 MW and 5022 MW, respectively. In percentage terms, the growth rates of shares taken by solar PV investment in the east-ern, central and western provinces from 2013 to 2019 were 8.51%, 11.05% and 8.25%, re-spectively. To be more specific, there exists a significant difference between eastern and western provinces in the growth of solar PV investment proportion. In contrast, the dif-ference is smaller among the central provinces. HN has the lowest growth rate, at 7.36%, of solar PV investment share in the central regions. From 2013 to 2019, neither solar PV investment growth nor solar PV investment proportion growth in the chosen provinces showed obvious regional heterogeneity. This means that solar PV does not have obvious regional restrictions like clean energy, such as hydropower, nuclear and tidal power. Therefore, there is reason to believe that changes in solar PV investment in China’s prov-inces are largely influenced by local policies, local market conditions and other factors, rather than merely dominated by geographical and natural factors.
Figure 2. Growth in solar PV investment and growth in the proportion of solar PV investment to total energy investment, 2013–2019.
4.2. Neighbor–Nation Solar PV Investment Competitive Effect (NNC) across China Regions Figure 3a–d show the NNC for the entire period and three subperiods, respectively.
The values of NNC reflect the competitiveness effect of regional neighbors’ solar PV in-vestment relative to the national level. Regarding the value for each province, we label provinces with negative NNC as light yellow. According to the tertiles, we divide prov-inces with positive NNC into three ranges, which are upper, middle and lower, and label these values with different colors. As shown in Figure 3a, most western provinces have negative values of NNC, while most central and eastern provinces have the numbers in the middle and lower ranges. To be more specific, 8 out of 12 western provinces rest in the negative range. By contrast, only two provinces in the central and none of the eastern provinces are with negative NNC. We can conclude that most neighbors of the western provinces tend to curb their solar PV investment. On the contrary, most neighbors of the
Figure 2. Growth in solar PV investment and growth in the proportion of solar PV investment tototal energy investment, 2013–2019.
4.2. Neighbor–Nation Solar PV Investment Competitive Effect (NNC) across China Regions
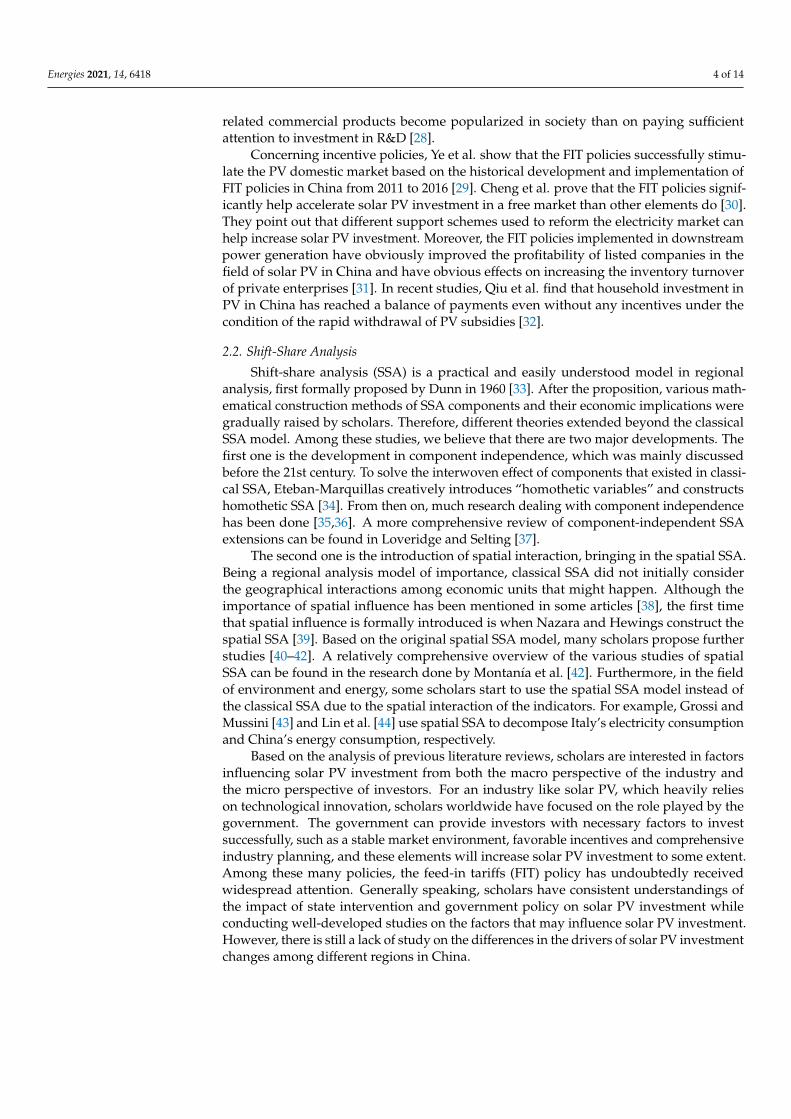
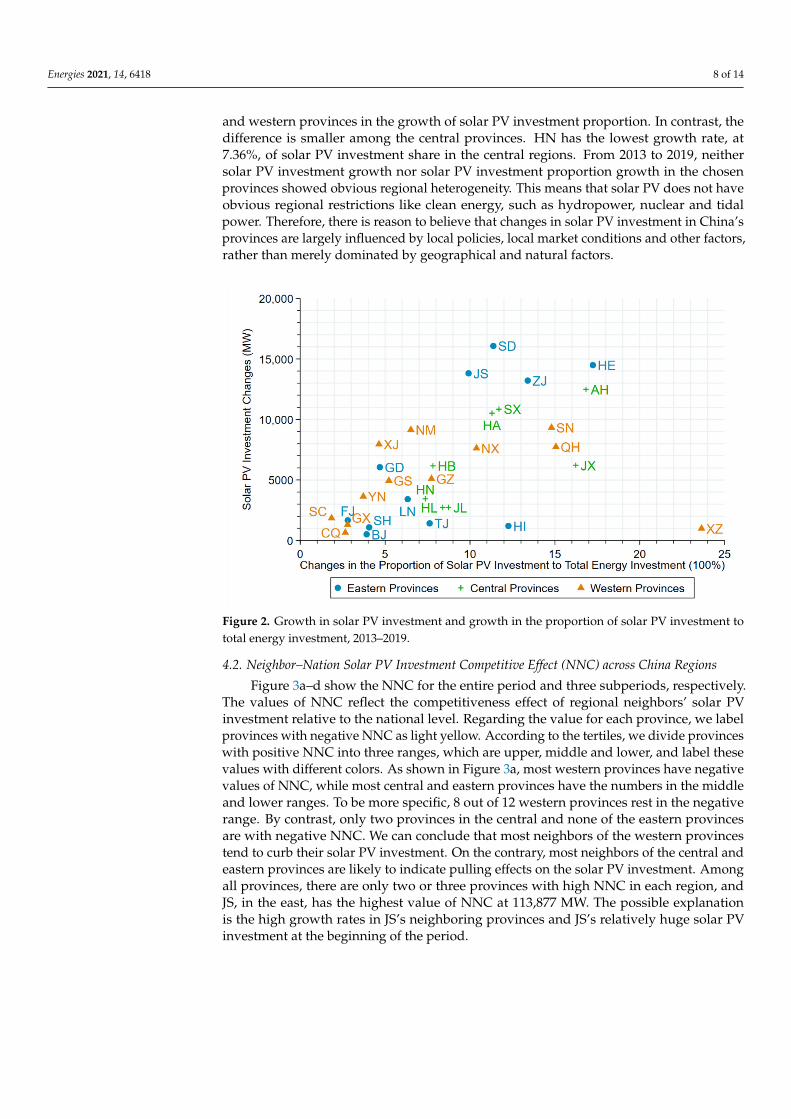
Figure 3a–d show the NNC for the entire period and three subperiods, respectively.The values of NNC reflect the competitiveness effect of regional neighbors’ solar PVinvestment relative to the national level. Regarding the value for each province, we labelprovinces with negative NNC as light yellow. According to the tertiles, we divide provinceswith positive NNC into three ranges, which are upper, middle and lower, and label thesevalues with different colors. As shown in Figure 3a, most western provinces have negativevalues of NNC, while most central and eastern provinces have the numbers in the middleand lower ranges. To be more specific, 8 out of 12 western provinces rest in the negativerange. By contrast, only two provinces in the central and none of the eastern provincesare with negative NNC. We can conclude that most neighbors of the western provincestend to curb their solar PV investment. On the contrary, most neighbors of the central andeastern provinces are likely to indicate pulling effects on the solar PV investment. Amongall provinces, there are only two or three provinces with high NNC in each region, andJS, in the east, has the highest value of NNC at 113,877 MW. The possible explanationis the high growth rates in JS’s neighboring provinces and JS’s relatively huge solar PVinvestment at the beginning of the period.
Energies 2021, 14, 6418 9 of 14
Energies 2021, 14, x FOR PEER REVIEW 9 of 14
central and eastern provinces are likely to indicate pulling effects on the solar PV invest-ment. Among all provinces, there are only two or three provinces with high NNC in each region, and JS, in the east, has the highest value of NNC at 113,877 MW. The possible explanation is the high growth rates in JS’s neighboring provinces and JS’s relatively huge solar PV investment at the beginning of the period.
Figure 3. Neighbor–Nation Solar PV Investment Competitive Effect (NNC) Across China Regions: (a) all periods; (b) 2013–2015; (c) 2015–2017; (d) 2017–2019.
Figure 3b–d display the NNC in the three subperiods, which are 2013–2015, 2015–2017 and 2017–2019, respectively. In general, the first two periods showed similar regional characteristics to the entire period, while the latter showed a significantly worse pattern of NNC in eastern provinces than the first two periods. To be more specific, the numbers of provinces with negative NNC in the west are eight, eight and six in chronological order, with an improvement in the third period. Comparatively, during the third period, the values of NNC in the east decreased significantly relative to the data in the previous two periods, and the number of provinces in the east with negative NNC became four, while none of the eastern provinces had high NNC.
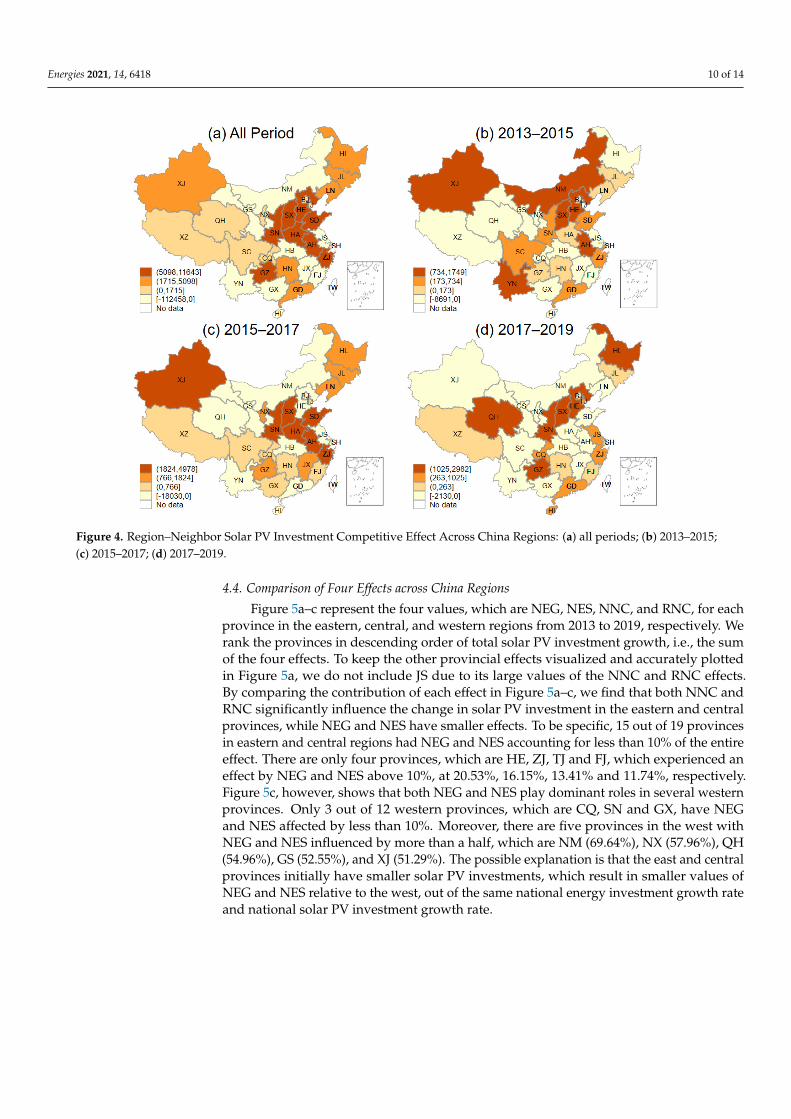
4.3. Region–Neighbor Solar PV Investment Competitive Effect (RNC) across China Regions Figure 4a–d present the values of RNC for the entire period and three subperiods,
respectively. The data reflect the competitiveness effect of provincial solar PV investment relative to its neighbors. As Figure 4a indicates, considering the entire period, there is a relatively small extent of regional heterogeneity in RNC across the three major regions. Specifically, the number of provinces with negative RNC in the east, central and west are three, two and four, respectively, with no significantly large difference. Moreover, the number of provinces with high RNC in the eastern, central, and western regions are three, three and two, respectively, with merely no difference.
Figure 3. Neighbor–Nation Solar PV Investment Competitive Effect (NNC) Across China Regions: (a) all periods;(b) 2013–2015; (c) 2015–2017; (d) 2017–2019.
Figure 3b–d display the NNC in the three subperiods, which are 2013–2015, 2015–2017and 2017–2019, respectively. In general, the first two periods showed similar regionalcharacteristics to the entire period, while the latter showed a significantly worse pattern ofNNC in eastern provinces than the first two periods. To be more specific, the numbers ofprovinces with negative NNC in the west are eight, eight and six in chronological order,with an improvement in the third period. Comparatively, during the third period, thevalues of NNC in the east decreased significantly relative to the data in the previous twoperiods, and the number of provinces in the east with negative NNC became four, whilenone of the eastern provinces had high NNC.
4.3. Region–Neighbor Solar PV Investment Competitive Effect (RNC) across China Regions
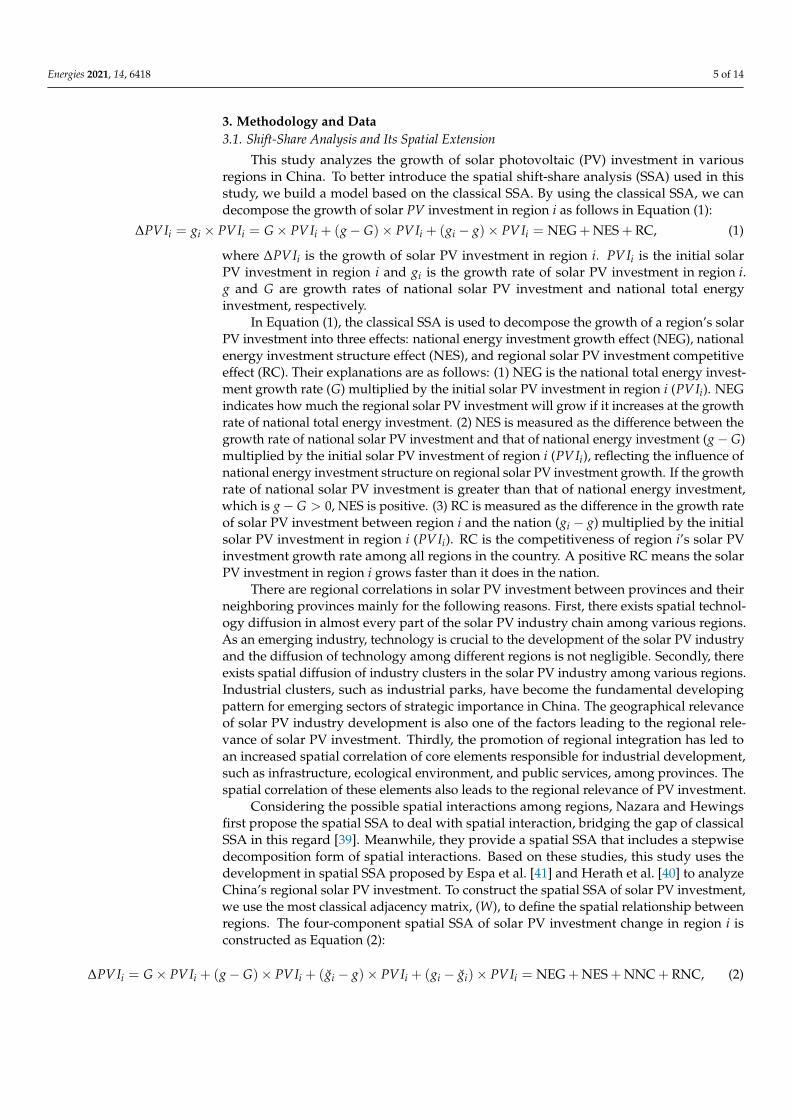
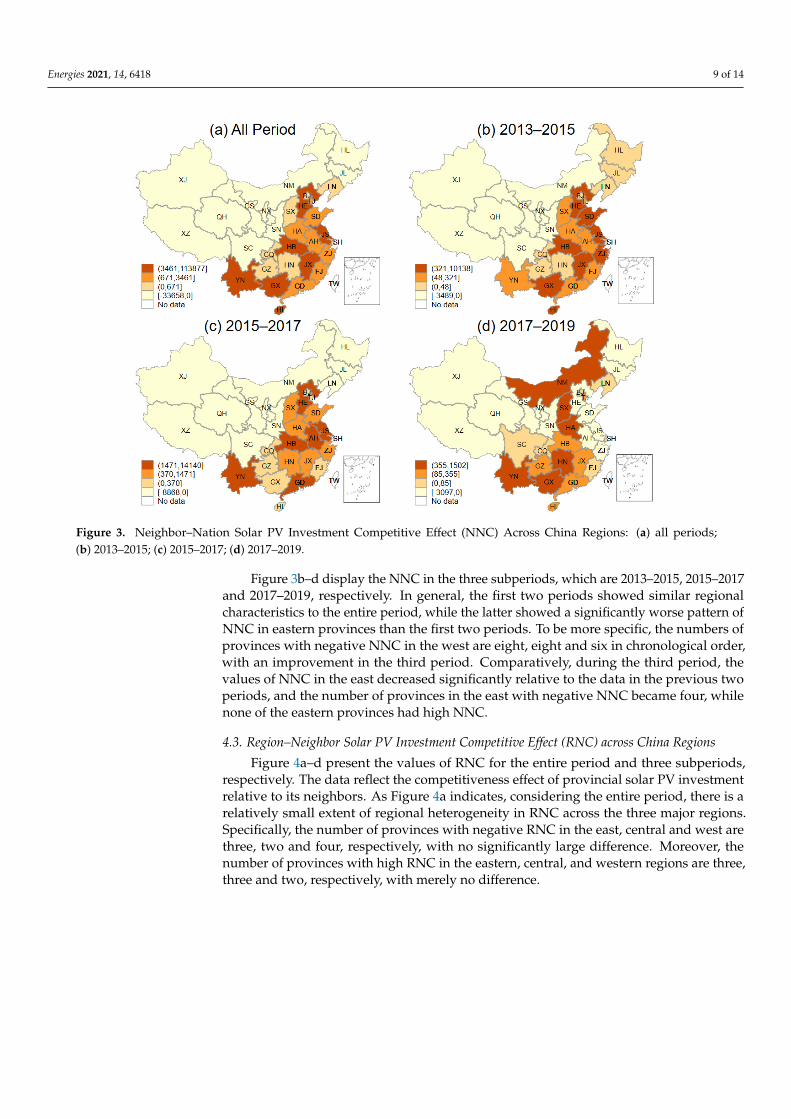
Figure 4a–d present the values of RNC for the entire period and three subperiods,respectively. The data reflect the competitiveness effect of provincial solar PV investmentrelative to its neighbors. As Figure 4a indicates, considering the entire period, there is arelatively small extent of regional heterogeneity in RNC across the three major regions.Specifically, the number of provinces with negative RNC in the east, central and west arethree, two and four, respectively, with no significantly large difference. Moreover, thenumber of provinces with high RNC in the eastern, central, and western regions are three,three and two, respectively, with merely no difference.
Energies 2021, 14, 6418 10 of 14Energies 2021, 14, x FOR PEER REVIEW 10 of 14
Figure 4. Region–Neighbor Solar PV Investment Competitive Effect Across China Regions: (a) all periods; (b) 2013–2015; (c) 2015–2017; (d) 2017–2019.
4.4. Comparison of Four Effects across China Regions Figure 5a–c represent the four values, which are NEG, NES, NNC, and RNC, for each
province in the eastern, central, and western regions from 2013 to 2019, respectively. We rank the provinces in descending order of total solar PV investment growth, i.e., the sum of the four effects. To keep the other provincial effects visualized and accurately plotted in Figure 5a, we do not include JS due to its large values of the NNC and RNC effects. By comparing the contribution of each effect in Figure 5a–c, we find that both NNC and RNC significantly influence the change in solar PV investment in the eastern and central prov-inces, while NEG and NES have smaller effects. To be specific, 15 out of 19 provinces in eastern and central regions had NEG and NES accounting for less than 10% of the entire effect. There are only four provinces, which are HE, ZJ, TJ and FJ, which experienced an effect by NEG and NES above 10%, at 20.53%, 16.15%, 13.41% and 11.74%, respectively. Figure 5c, however, shows that both NEG and NES play dominant roles in several western provinces. Only 3 out of 12 western provinces, which are CQ, SN and GX, have NEG and NES affected by less than 10%. Moreover, there are five provinces in the west with NEG and NES influenced by more than a half, which are NM (69.64%), NX (57.96%), QH (54.96%), GS (52.55%), and XJ (51.29%). The possible explanation is that the east and cen-tral provinces initially have smaller solar PV investments, which result in smaller values of NEG and NES relative to the west, out of the same national energy investment growth rate and national solar PV investment growth rate.
By comparing how much NNC and RNC effects contributed in Figure 5a–c, we find that RNC is likely to play a dominant role in the eastern and central regions. In contrast, NNC plays a dominant role in the west. Specifically, in the east, central and west, there are seven, six, and four provinces with a contribution of RNC greater than that of NNC. Moreover, six provinces in the east have RNC contributions of more than 50%, namely BJ
Figure 4. Region–Neighbor Solar PV Investment Competitive Effect Across China Regions: (a) all periods; (b) 2013–2015;(c) 2015–2017; (d) 2017–2019.
4.4. Comparison of Four Effects across China Regions
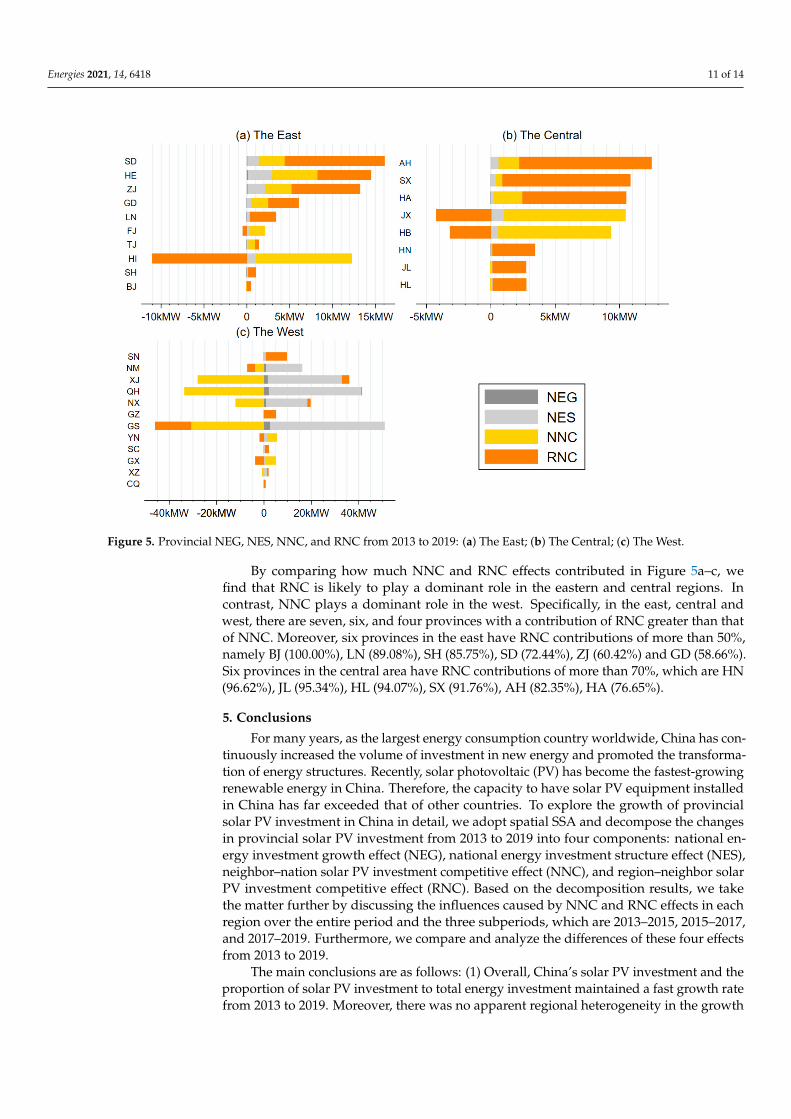
Figure 5a–c represent the four values, which are NEG, NES, NNC, and RNC, for eachprovince in the eastern, central, and western regions from 2013 to 2019, respectively. Werank the provinces in descending order of total solar PV investment growth, i.e., the sumof the four effects. To keep the other provincial effects visualized and accurately plottedin Figure 5a, we do not include JS due to its large values of the NNC and RNC effects.By comparing the contribution of each effect in Figure 5a–c, we find that both NNC andRNC significantly influence the change in solar PV investment in the eastern and centralprovinces, while NEG and NES have smaller effects. To be specific, 15 out of 19 provincesin eastern and central regions had NEG and NES accounting for less than 10% of the entireeffect. There are only four provinces, which are HE, ZJ, TJ and FJ, which experienced aneffect by NEG and NES above 10%, at 20.53%, 16.15%, 13.41% and 11.74%, respectively.Figure 5c, however, shows that both NEG and NES play dominant roles in several westernprovinces. Only 3 out of 12 western provinces, which are CQ, SN and GX, have NEGand NES affected by less than 10%. Moreover, there are five provinces in the west withNEG and NES influenced by more than a half, which are NM (69.64%), NX (57.96%), QH(54.96%), GS (52.55%), and XJ (51.29%). The possible explanation is that the east and centralprovinces initially have smaller solar PV investments, which result in smaller values ofNEG and NES relative to the west, out of the same national energy investment growth rateand national solar PV investment growth rate.
Energies 2021, 14, 6418 11 of 14
Energies 2021, 14, x FOR PEER REVIEW 11 of 14
(100.00%), LN (89.08%), SH (85.75%), SD (72.44%), ZJ (60.42%) and GD (58.66%). Six prov-inces in the central area have RNC contributions of more than 70%, which are HN (96.62%), JL (95.34%), HL (94.07%), SX (91.76%), AH (82.35%), HA (76.65%).
Figure 5. Provincial NEG, NES, NNC, and RNC from 2013 to 2019: (a) The East; (b) The Central; (c) The West.
5. Conclusions For many years, as the largest energy consumption country worldwide, China has
continuously increased the volume of investment in new energy and promoted the trans-formation of energy structures. Recently, solar photovoltaic (PV) has become the fastest-growing renewable energy in China. Therefore, the capacity to have solar PV equipment installed in China has far exceeded that of other countries. To explore the growth of pro-vincial solar PV investment in China in detail, we adopt spatial SSA and decompose the changes in provincial solar PV investment from 2013 to 2019 into four components: na-tional energy investment growth effect (NEG), national energy investment structure effect (NES), neighbor–nation solar PV investment competitive effect (NNC), and region–neigh-bor solar PV investment competitive effect (RNC). Based on the decomposition results, we take the matter further by discussing the influences caused by NNC and RNC effects in each region over the entire period and the three subperiods, which are 2013–2015, 2015–2017, and 2017–2019. Furthermore, we compare and analyze the differences of these four effects from 2013 to 2019.
The main conclusions are as follows: (1) Overall, China’s solar PV investment and the proportion of solar PV investment to total energy investment maintained a fast growth rate from 2013 to 2019. Moreover, there was no apparent regional heterogeneity in the growth of solar PV investment and solar PV investment shares in the eastern, central and western regions. (2) Regarding both NNC and RNC, from 2013 to 2019, the NNC of most western provinces was negative, while the NNC of most central and eastern provinces was in the middle and lower range. In terms of subperiods, the regional characteristics of the first two periods (2013–2015, 2015–2017) were more similar to the entire period, while
Figure 5. Provincial NEG, NES, NNC, and RNC from 2013 to 2019: (a) The East; (b) The Central; (c) The West.
By comparing how much NNC and RNC effects contributed in Figure 5a–c, wefind that RNC is likely to play a dominant role in the eastern and central regions. Incontrast, NNC plays a dominant role in the west. Specifically, in the east, central andwest, there are seven, six, and four provinces with a contribution of RNC greater than thatof NNC. Moreover, six provinces in the east have RNC contributions of more than 50%,namely BJ (100.00%), LN (89.08%), SH (85.75%), SD (72.44%), ZJ (60.42%) and GD (58.66%).Six provinces in the central area have RNC contributions of more than 70%, which are HN(96.62%), JL (95.34%), HL (94.07%), SX (91.76%), AH (82.35%), HA (76.65%).
5. Conclusions
For many years, as the largest energy consumption country worldwide, China has con-tinuously increased the volume of investment in new energy and promoted the transforma-tion of energy structures. Recently, solar photovoltaic (PV) has become the fastest-growingrenewable energy in China. Therefore, the capacity to have solar PV equipment installedin China has far exceeded that of other countries. To explore the growth of provincialsolar PV investment in China in detail, we adopt spatial SSA and decompose the changesin provincial solar PV investment from 2013 to 2019 into four components: national en-ergy investment growth effect (NEG), national energy investment structure effect (NES),neighbor–nation solar PV investment competitive effect (NNC), and region–neighbor solarPV investment competitive effect (RNC). Based on the decomposition results, we takethe matter further by discussing the influences caused by NNC and RNC effects in eachregion over the entire period and the three subperiods, which are 2013–2015, 2015–2017,and 2017–2019. Furthermore, we compare and analyze the differences of these four effectsfrom 2013 to 2019.
The main conclusions are as follows: (1) Overall, China’s solar PV investment and theproportion of solar PV investment to total energy investment maintained a fast growth ratefrom 2013 to 2019. Moreover, there was no apparent regional heterogeneity in the growth
Energies 2021, 14, 6418 12 of 14
of solar PV investment and solar PV investment shares in the eastern, central and westernregions. (2) Regarding both NNC and RNC, from 2013 to 2019, the NNC of most westernprovinces was negative, while the NNC of most central and eastern provinces was in themiddle and lower range. In terms of subperiods, the regional characteristics of the first twoperiods (2013–2015, 2015–2017) were more similar to the entire period, while the NNC ofeastern provinces in the third period (2017–2019) showed a significantly worse pattern thanthat of the first two periods. There was little difference in RNC among the three regions.(3) While comparing the four effects, NNC and RNC significantly influence the change ofsolar PV investment in eastern and central provinces, while NEG and NES have smallerimpacts. NEG and NES tend to have larger influences in the western provinces. If wediscuss NNC and RNC more, it is clear that RNC plays a prominent role in the eastern andcentral regions, while NNC is taken as the dominant role in the west.
This study also provides implications for policymakers. By encouraging enterprises inthe solar PV industry chain to strengthen technical cooperation and industrial division oflabor, industrial compartmentalization caused by the original regional administrative divi-sions can be broken, thereby improving the regional spillover effect of solar PV investment.In this way, the government can continue to cultivate more industry clusters of solar PVand further motivate the agglomerated development of solar PV industry. Furthermore, theinter-regional spillover effect of solar PV investment can be promoted by adopting variousstrategies. For example, related departments can improve inter-regional infrastructures,break down barriers to enable resources to flow among different regions, and strengtheninter-regional policy synergy.
Nonetheless, this study still has limitations to some extent. Firstly, although we usethe spatial SSA decomposition method to analyze the changes of solar PV investment, thecausal relationship needs a more rigorous exploration as further study develops. Secondly,besides the four components of regional solar PV investment changes discussed in thisstudy, some other influential factors may not have been considered, such as industry policy,technology accumulation and geographical features, etc. Thirdly, the installation capacityof solar PV was adopted as a proxy variable for measuring solar PV investment in thisstudy. This approach did not include the installation prices of solar PV equipment ineach province in each period. Future research on solar PV investment can be done if theinstallation prices for each province become accessible. These constraints can be improvedin the future with more research focusing on related topics.
Author Contributions: Conceptualization, R.S.; methodology, R.S.; software, R.S.; validation, R.S.,C.W. and X.L.; formal analysis, R.S. and C.W.; investigation, R.S., J.D., S.L. and Z.W.; resources,R.S.; data curation, R.S. and X.L.; writing—original draft preparation, R.S., J.D., S.L. and Z.W.;writing—review and editing, R.S., J.D., S.L., C.W., Z.W. and X.L.; visualization, R.S. and C.W.;supervision, R.S.; project administration, R.S.; funding acquisition, R.S. All authors have read andagreed to the published version of the manuscript.
Funding: This research was funded by the National Natural Science Foundation of China (71704165,71974107, 72074132, 91646102, L1924058, L1824039, L1724034, L1624045, L1524015), the MOE (Min-istry of Education in China) Project of Humanities and Social Sciences (Engineering and TechnologyTalent Cultivation) (16JDGC011), the National Science and Technology Major Project “High-endNumerical Control and Fundamental Manufacturing Equipment” (2016ZX04005002), Beijing Nat-ural Science Foundation Project (9182013), the Chinese Academy of Engineering’s China Knowl-edge Centre for Engineering Sciences an Technology Project (CKCEST-2020-2-5, CKCEST-2019-2-13,CKCEST-2018-1-13, CKCEST-2017-1-10, CKCEST-2015-4-2), the UK-China Industry Academia Part-nership Programme (UK-CIAPP\260), the Volvo-supported Green Economy and Sustainable Devel-opment Tsinghua University (20183910020), China Postdoctoral Science Foundation (2020M680597,2021M691741), Tsinghua-Inditex Sustainable Development Foundation (TISD201901).
Institutional Review Board Statement: Not applicable.
Informed Consent Statement: Not applicable.

Energies 2021, 14, 6418 13 of 14
Data Availability Statement: The data presented in this study are available on request from thecorresponding author.
Acknowledgments: The authors would like to express thanks to Ying Zhang and Yihan Sun for theirhelp. The authors are grateful to the anonymous reviewers and editors for their detailed commentsand valuable suggestions.
Conflicts of Interest: The authors declare no conflict of interest.
References1. National Energy Administration. Notice of the National Energy Administration on the Development and Construction of Wind
Power and Photovoltaic Power Generation in 2021. Available online: http://zfxxgk.nea.gov.cn/2021-05/11/c_139958210.htm(accessed on 15 July 2021).
2. National Development and Reform Commission. Notice on Guiding Increased Financial Support to Promote the Healthyand Orderly Development of Wind Power and Photovoltaic Power Generation and Other Industries. Available online: https://www.ndrc.gov.cn/xxgk/zcfb/tz/202103/t20210312_1269410.html (accessed on 15 July 2021).
3. State Grid Energy Research Institution. 2020 China New Energy Power Generation Analysis Report. Available online: http://www.sgeri.sgcc.com.cn/html/sgeri/col1080000042/2020-12/03/20201203190155411181156_1.html (accessed on 15 July 2021).
4. BP. Statistical Review of World Energy 2020. Available online: https://www.bp.com/content/dam/bp/business-sites/en/global/corporate/pdfs/energy-economics/statistical-review/bp-stats-review-2020-full-report.pdf (accessed on 15 July 2021).
5. China Energy Transition Status Report 2021. Available online: https://www.energypartnership.cn/home/china-energy-transition-status-report-2021/ (accessed on 15 July 2021).
6. Renewables 2021 Global Status Report. Available online: https://www.ren21.net/reports/global-status-report/ (accessed on15 July 2021).
7. Zhou, Y.; Miao, Z.; Urban, F. China’s leadership in the hydropower sector: Identifying green windows of opportunity fortechnological catch-up. Ind. Corp. Chang. 2020, 29, 1319–1343. [CrossRef]
8. Kong, D.; Zhou, Y.; Liu, Y.; Xue, L. Using the data mining method to assess the innovation gap: A case of industrial robotics in acatching-up country. Technol. Forecast. Soc. Chang. 2017, 119, 80–97. [CrossRef]
9. Zhou, Y.; Dong, F.; Kong, D.; Liu, Y. Unfolding the convergence process of scientific knowledge for the early identification ofemerging technologies. Technol. Forecast. Soc. Chang. 2019, 144, 205–220. [CrossRef]
10. Zhou, Y.; Li, X.; Lema, R.; Urban, F. Comparing the knowledge bases of wind turbine firms in Asia and Europe: Patent trajectories,networks, and globalisation. Sci. Public Policy 2016, 43, 476–491. [CrossRef]
11. Zhou, Y.; Zhou, R.; Chen, L.; Zhao, Y.; Zhang, Q. Environmental Policy Mixes and Green Industrial Development: An EmpiricalStudy of the Chinese Textile Industry From 1998 to 2012. IEEE Trans. Eng. Manag. 2020, 1–13. [CrossRef]
12. Xu, G.; Zhou, Y.; Ji, H. How Can Government Promote Technology Diffusion in Manufacturing Paradigm Shift? Evidence FromChina. IEEE Trans. Eng. Manag. 2020, 1–13. [CrossRef]
13. Chang, B.; Starcher, K. Evaluation of wind and solar energy investments in Texas. Renew. Energy 2019, 132, 1348–1359. [CrossRef]14. Assereto, M.; Byrne, J. The Implications of Policy Uncertainty on Solar Photovoltaic Investment. Energies 2020, 13, 6233. [CrossRef]15. de Souza, L.E.V.; Cavalcante, A.M.G. Towards a sociology of energy and globalization: Interconnectedness, capital, and knowledge
in the Brazilian solar photovoltaic industry. Energy Res. Soc. Sci. 2016, 21, 145–154. [CrossRef]16. Carstens, D.D.d.S.; Cunha, S.K.d. Challenges and opportunities for the growth of solar photovoltaic energy in Brazil. Energy
Policy 2019, 125, 396–404. [CrossRef]17. Kim, B.; Kim, J.; Kim, J. Evaluation Model for Investment in Solar Photovoltaic Power Generation Using Fuzzy Analytic Hierarchy
Process. Sustainability 2019, 11, 2905. [CrossRef]18. Gava Gastaldo, N.; Rediske, G.; Donaduzzi Rigo, P.; Brum Rosa, C.; Michels, L.; Mairesse Siluk, J.C. What is the Profile of the
Investor in Household Solar Photovoltaic Energy Systems? Energies 2019, 12, 4451. [CrossRef]19. Formica, T.J.; Khan, H.A.; Pecht, M.G. The Effect of Inverter Failures on the Return on Investment of Solar Photovoltaic Systems.
IEEE Access 2017, 5, 21336–21343. [CrossRef]20. Goodrich, A.C.; Powell, D.M.; James, T.L.; Woodhouse, M.; Buonassisi, T. Assessing the drivers of regional trends in solar
photovoltaic manufacturing. Energy Environ. Sci. 2013, 6, 2811–2821. [CrossRef]21. Pillai, U. Drivers of cost reduction in solar photovoltaics. Energy Econ. 2015, 50, 286–293. [CrossRef]22. Ahmad, S.; Tahar, R.M.; Muhammad-Sukki, F.; Munir, A.B.; Rahim, R.A. Role of feed-in tariff policy in promoting solar
photovoltaic investments in Malaysia: A system dynamics approach. Energy 2015, 84, 808–815. [CrossRef]23. Wen, D.; Gao, W.; Kuroki, S.; Gu, Q.; Ren, J. The effects of the new Feed-In Tariff Act for solar photovoltaic (PV) energy in the
wake of the Fukushima accident in Japan. Energy Policy 2021, 156, 112414. [CrossRef]24. Zhang, H.; Wu, K.; Qiu, Y.; Chan, G.; Wang, S.; Zhou, D.; Ren, X. Solar photovoltaic interventions have reduced rural poverty in
China. Nat. Commun 2020, 11, 1969. [CrossRef] [PubMed]25. Zhao, Z.-Y.; Zhang, S.-Y.; Hubbard, B.; Yao, X. The emergence of the solar photovoltaic power industry in China. Renew. Sustain.
Energy Rev. 2013, 21, 229–236. [CrossRef]
Energies 2021, 14, 6418 14 of 14
26. Zhang, M.M.; Zhou, P.; Zhou, D.Q. A real options model for renewable energy investment with application to solar photovoltaicpower generation in China. Energy Econ. 2016, 59, 213–226. [CrossRef]
27. Kayser, D. Solar photovoltaic projects in China: High investment risks and the need for institutional response. Appl. Energy 2016,174, 144–152. [CrossRef]
28. Zhi, Q.; Sun, H.; Li, Y.; Xu, Y.; Su, J. China’s solar photovoltaic policy: An analysis based on policy instruments. Appl. Energy 2014,129, 308–319. [CrossRef]
29. Ye, L.-C.; Rodrigues, J.F.D.; Lin, H.X. Analysis of feed-in tariff policies for solar photovoltaic in China 2011–2016. Appl. Energy2017, 203, 496–505. [CrossRef]
30. Cheng, C.; Wang, Z.; Liu, M.; Chen, Q.; Gbatu, A.P.; Ren, X. Defer option valuation and optimal investment timing of solarphotovoltaic projects under different electricity market systems and support schemes. Energy 2017, 127, 594–610. [CrossRef]
31. Wang, H.; Zheng, S.; Zhang, Y.; Zhang, K. Analysis of the policy effects of downstream Feed-In Tariff on China’s solar photovoltaicindustry. Energy Policy 2016, 95, 479–488. [CrossRef]
32. Qiu, S.; Wang, K.; Lin, B.; Lin, P. Economic analysis of residential solar photovoltaic systems in China. J. Clean Prod. 2021, 282, 125297.[CrossRef]
33. Dunn, E.S. A Statistical And Analytical Technique For Regional-Analysis. J. Am. Stat. Assoc. 1960, 55, 359. [CrossRef]34. Esteban-Marquillas, J.M.I. A reinterpretation of shift-share analysis. Reg. Urban. Econ. 1972, 2, 249–255. [CrossRef]35. Arcelus, F.J. An Extension of Shift-Share Analysis. Growth Chang. 1984, 15, 3–8. [CrossRef]36. Artige, L.; van Neuss, L. A New Shift-Share Method. Growth Chang. 2014, 45, 667–683. [CrossRef]37. Loveridge, S.; Selting, A.C. A review and comparison of shift-share identities. Int. Reg. Sci. Rev. 1998, 21, 37–58. [CrossRef]38. Hewings, G.J.D. On the Accuracy of Alternative Models for Stepping-Down Multi-County Employment Projections to Counties.
Econ. Geogr. 1976, 52, 206–217. [CrossRef]39. Nazara, S.; Hewings, G.J.D. Spatial Structure and Taxonomy of Decomposition in Shift-Share Analysis. Growth Chang. 2004, 35,
476–490. [CrossRef]40. Herath, J.; Schaeffer, P.; Gebremedhin, T. Employment Change in LDs of West Virginia: A Dynamic Spatial Shift- Share Analysis.
Am. J. Rural. Dev. 2013, 1, 99–105.41. Espa, G.; Filipponi, D.; Giuliani, D.; Piacentino, D. Decomposing regional business change at plant level in Italy: A novel spatial
shift-share approach. Pap. Reg. Sci. 2014, 93, S113–S135. [CrossRef]42. Montanía, C.V.; Márquez, M.A.; Fernández-Núñez, T.; Hewings, G.J.D. Spatial shift-share analysis: Some new developments. Pap.
Reg. Sci. 2020, 100, 305–325. [CrossRef]43. Grossi, L.; Mussini, M. A spatial shift-share decomposition of electricity consumption changes across Italian regions. Energy
Policy 2018, 113, 278–293. [CrossRef]44. Lin, G.; Jiang, D.; Fu, J.; Wang, D.; Li, X. A spatial shift-share decomposition of energy consumption changes in China. Energy
Policy 2019, 135, 111034. [CrossRef]