Environmental Assessment of Dry Photovoltaic Etching
60
Vestlandsforsking report nr.6/2014 Environmental Assessment of Dry Photovoltaic Etching Otto Andersen and Geoffrey Gilpin Vestlandsforsking, Pb 163, 6851 Sogndal • Tlf.: 906 33 600 • Faks: 947 63 727 VF report 6/2014: Environmental Assessment of Dry Photovoltaic Etching Page 1 of 60
Transcript of Environmental Assessment of Dry Photovoltaic Etching

Vestlandsforsking report nr.6/2014
Environmental Assessment of Dry Photovoltaic Etching
Otto Andersen and Geoffrey Gilpin
Vestlandsforsking, Pb 163, 6851 Sogndal • Tlf.: 906 33 600 • Faks: 947 63 727
VF report 6/2014: Environmental Assessment of Dry Photovoltaic Etching Page 1 of 60
Vestlandsforsking report
Title Environmental Assessment of Dry Photovoltaic Etching
Report no. 6/2014
Date 05.05.2014
Classification Open
Project title Development of a competitive zero Global Warming Potential (GWP) dry process to reduce the dramatic water consumption in the ever expanding solar cell manufacturing industry - SOLNOWAT
No. of pages 60
Project no. 6223
Researchers Otto Andersen (project manager) Geoffrey Gilpin
Research manager Carlo Aall
Funding source European Commission, through the funding scheme "Capacities: Research for the benefit of SMEs"’, and managed by REA - Research Executive Agency (http://ec.europa.eu/research/rea) under grant agreement no. 286658.
Keywords Renewable energy Photovoltaic solar cells Life cycle assessment Environmental impact Industrial ecology
Abstract The report is summarizing the research contributions from VF as partner in the EU-project "Development of a competitive zero Global Warming Potential (GWP) dry process to reduce the dramatic water consumption in the ever expanding solar cell manufacturing industry – SOLNOWAT". In the project a new etching method for silicon crystalline solar cell wafers was developed. VF was responsible for two main parts of the project: 1) Compiling an overview of laws and regulatory requirements relevant for the new etching process, and 2) Conducting simplified life cycle assessment (LCA) of the dry chemical etching in comparison with current state of the art wet chemical etching. The overview of the regulatory framework was established through compiling up-to-date European and global emission regulations and requirements. This included a detailing of forthcoming regulations. The simplified LCA of the dry process gave as result a potential for a substantial reduction in water consumption, i.e. 85 % reduction in comparison with the wet acidic etching, and 89 % reduction in comparison with the alkaline wet etching. The emissions of climate (green house) gases were also determined to be reduced, with 63 % and 20 % respectively, when compared with current state of the art wet acidic and alkaline chemical etching. The toxicity impacts were assessed to be lower for the dry chemical etching, compared to the wet process, allthough the uncertainty was quite high for that impact category.
Other publications from the project Andersen, Otto. 2013. Unintended Consequences of Renewable Energy. Problems to be Solved. London: Springer. Andersen O (2013) Solar Cell Production. In: Unintended Consequences of Renewable Energy. Problems to be Solved. Springer, London, pp 81–89.
ISBN: 978-82-428-0347-4 Price: Free on website
VF report 6/2014: Environmental Assessment of Dry Photovoltaic Etching Page 2 of 60

Preface The SOLNOWAT project was funded by the European Commisssion through the 7th Framework Programme for Research and Technology Development, through the funding scheme "Capacities: Research for the benefit of SMEs"’, and managed by REA - Research Executive Agency (http://ec.europa.eu/research/rea) under grant agreement no. 286658.
The project was coordinated by ULTRA HIGH VACUUM SOLUTIONS LIMITED / Nines Engineering. The other SMEs was the Czech solar cell manufacturer Solartec, the French company Alyxan that developes technology for gas analysis and the German firm Zimmermann & Schilp Handhabungstechnik that develops wafer handling systems for the process. The providers of RTD also included the two German Fraunhofer Institutes ISE and IWS in addition to Vestlandsforsking. Researcher dr. Otto Andersen has been the project manager at Vestlandsfrosking and he has written the main parts of this report. He was also responsible for the compilation of regulatory requirements. Researcher Geoffrey Gilpin performed the SIMAPRO work in the life cycle assessment. We want to thank the project partners and in particular the project coordinator Laurent Clochard at Nines Engineering for an excellent dialogue throughout the project period and valuable ideas and feedback to the project. Vestlandsforsking, April 2014
VF report 6/2014: Environmental Assessment of Dry Photovoltaic Etching Page 3 of 60

Table of Contents Preface .................................................................................................................................................................... 3 Summary ................................................................................................................................................................. 7 Sammendrag ........................................................................................................................................................... 8 List of Abbreviations ................................................................................................................................................ 9 1 Introduction ......................................................................................................................................................... 11 2 The new PV etching process ................................................................................................................................. 14 3 Interpretation of results ....................................................................................................................................... 37 4 Conclusions ........................................................................................................................................................ 38 5 References ......................................................................................................................................................... 39 Appendix 1 – Life-cycle inventories ....................................................................................................................... 45 Appendix II – Results – Life-Cycle Impact Assessment (LCIA) .................................................................................... 48 Appendix III – Results – Contribution Analysis for Global Warming Potential ............................................................... 49 Appendix IV – Results – Uncertainty Analysis ............................................................................................................ 54 Appendix IV - Water consumption tables of results ..................................................................................................... 57
VF report 6/2014: Environmental Assessment of Dry Photovoltaic Etching Page 4 of 60

Index of Tables Table 1 Life cycle external costs of electricity generation in Germany, expressed in € cent per kWh (EC 2003) .. 13 Table 2 Air emission regulations for hydrogen fluoride gas (HF) in various countries ........................................... 15 Table 3 Air emission regulations for fluorine gas ................................................................................................... 18 Table 4 Air emission regulations for fluorides in general ....................................................................................... 20 Table 5 Emission regulations for fluoride ............................................................................................................... 21
Index of Appendix Tables Appendix Table 1 Life-cycle inventory for the acidic texturing process for one 4.3 W wafer ................................. 45 Appendix Table 2 Life-cycle inventory for the alkaline texturing process for one 4.5 W wafer .............................. 45 Appendix Table 3 Life-cycle inventory for the dry texturing process for one 4.3 W wafer ...................................... 46 Appendix Table 4 Life-cycle inventory for the dry texturing process for one 4.5 W wafer ...................................... 46 Appendix Table 5 Life-cycle inventory for the production of 1 kg of 50 wt. % hydrogen fluoride in deionised water .............................................................................................................................................................................. 46 Appendix Table 6 Life-cycle inventory for the production of 1 kg of 50 wt. % potassium hydroxide in deionised water ...................................................................................................................................................................... 47 Appendix Table 7 Life-cycle inventory for the production of Singulus MetaTEX200, based on: Singulus Technologies (2012), and discussion with J. Rentsch of Fraunhofer ISI ............................................................... 47 Appendix Table 8 Life-cycle inventory for the production of 1 kg of 30 wt. % hydrogen peroxide in deionised water .............................................................................................................................................................................. 47 Appendix Table 9 Life-cycle impact assessment results for all 4 etching process without data uncertainty .......... 48 Appendix Table 10 Uncertainty analysis, and impact assessment, of the acidic texturing of one 4.3 W wafer ..... 54 Appendix Table 11 Uncertainty analysis, and impact assessment of the alkaline texturing of one 4.5 W wafer. .. 55 Appendix Table 12 Uncertainty analysis, and impact assessment of the dry texturing of one 4.3 W wafer ........... 55 Appendix Table 13 Uncertainty analysis, and impact assessment of the dry texturing of one 4.5 W wafer ........... 56 Appendix Table 14 Water consumption inventory results, both direct and indirect, for the acidic texturing of one 4.3 W wafer (total does not include: water, cooling, unspecified natural origin/m3, or water, turbine use unspecified origin/m3) ............................................................................................................................................................... 57 Appendix Table 15 Water consumption inventory results, both direct and indirect, for the alkaline texturing of one 4.5 W wafer (total does not include: water, cooling, unspecified natural origin/m3, or water, turbine use unspecified origin/m3) .... 58 Appendix Table 16 Water consumption inventory results, both direct and indirect, for the dry texturing of one 4.3 W wafer (total does not include: water, cooling, unspecified natural origin/m3, or water, turbine use unspecified origin/m3) ............................................................................................................................................................... 59 Appendix Table 17 Water consumption inventory results, both direct and indirect, for the dry texturing of one 4.5 W wafer (total does not include: water, cooling, unspecified natural origin/m3, or water, turbine use unspecified origin/m3) ............................................................................................................................................................... 60
VF report 6/2014: Environmental Assessment of Dry Photovoltaic Etching Page 5 of 60
Index of Figures Figure 1 Methodolocial framework of life-cycle assessment according to ISO 14040 series ................................ 25 Figure 2 Process flow diagram of the SOLNOWAT dry-etch process ................................................................... 27 Figure 3 Life-cycle impact assessment results ...................................................................................................... 29 Figure 4 Life-cycle impact assessment results for GWP100 for all 4 texturing processes, including data uncertainty ............................................................................................................................................................. 30 Figure 5 Life-cycle impact assessment for total toxicity for all 4 texturing processes, including data uncertainty .. 31 Figure 6 Total water consumption of the acidic texturing process of a 4.3 W wafer .............................................. 32 Figure 7 Total water consumption of the alkaline texturing process of a 4.5 W wafer ........................................... 33 Figure 8 Total water consumption of the dry texturing process of a 4.3 W wafer .................................................. 34 Figure 9 Total water consumption of the dry texturing process of a 4.5 W wafer .................................................. 35 Figure 10 Collected water consumption results for all four texturing processes .................................................... 36
Index of Appendix Figures Appendix Figure 1 Contribution analysis tree for GWP – acidic texturing of one 4.3 W wafer ............................... 49 Appendix Figure 2 Contribution analysis tree for GWP – alkaline texturing of one 4.5 W wafer ............................ 50 Appendix Figure 3 Contribution analysis tree for GWP – dry texturing of one 4.3 W wafer ................................... 51 Appendix Figure 4 Contribution analysis tree for GWP – dry texturing of one 4.5 W wafer ................................... 52
VF report 6/2014: Environmental Assessment of Dry Photovoltaic Etching Page 6 of 60

Summary This report is summarizing the results of research conducted by VF on environmental issues connected to production of photovoltaic (PV) solar cells. The bulk of this research was carried out through the EU-project "Development of a competitive zero Global Warming Potential (GWP) dry process to reduce the dramatic water consumption in the ever expanding solar cell manufacturing industry – SOLNOWAT". In the introduction of this report we present some problematic environmental aspects of current wet chemical solar cell production. The high water consumption for rinsing of wafers between multible etching steps in chemical batchs is a key reason why new etching technologies need to be developed. Toxicity and explosion hazards are other issues that characterize PV production. The glimate gas emissions during the etching is a key factor contributing to the poor life-cycle performance of current solar cells in comparison with other technologies for converting renewable energy into electricity. The new etching process that has been developed in the SOLNOWAT project is takes place in dry conditions with the use of fluorine gas to obtain the desired structure of the wafers. This is of concern, because fluorine is a very toxic gas. Therefore it was important to obtain an overview of regulatory requirements for this nes production process. VF was responsible for compiling such an overview, which contains emission and exposure limits for the main types of emissions to air and water from the new process. The overview was established through compiling up-to-date European and global emission regulations and requirements. This also included some consideration regarding potential forthcoming regulations. The second task for VF in the project was to conduct a simplified life-cycle assessment (LCA) of the dry chemical etching process, in comparison with current state of the art wet chemical etching. This work gave as result that there is a substantial potential for reducing the water consumption by converting to the dry process. The LCA indicated that as much as 85 % of the water use could be saved in comparison with the current wet acidic etching, and a 89 % reduction in comparioson with the alkaline wet etching. The LCA gave as result that the emissions of climate (green-house) gases could be reduced by 63 % and 20 % respectively, when compared with current state of the art wet acidic and alkaline chemical etching. Even the toxicity impacts were assessed to be lower for the dry chemical etching, compared to the wet process, allthough the uncertainty was quite high for that impact category.
VF report 6/2014: Environmental Assessment of Dry Photovoltaic Etching Page 7 of 60

Sammendrag Denne rapporten oppsummerer resultatene av forskning utført av VF omkring miljøproblemer knyttet til produksjon av photovoltaiske (PV) solceller. Det meste av denne forskningen ble utført i EU - prosjektet "Development of a competitive zero Global Warming Potential (GWP) dry process to reduce the dramatic water consumption in the ever expanding solar cell manufacturing industry – SOLNOWAT ". Innledningsvis går denne rapporten gjennom noen problematiske miljøaspekter ved dagens våtkjemiske produksjon av solceller. Det høye vannforbruket til skylling av wafere mellom de mange etsetrinnene i kjemikaliebad er en viktig grunn til utvikling at ny etseteknologi. Toksisitet og eksplosjonsfare er andre problemer knyttet til dagens PV produksjon. Utslipp av klimagasser fra etsningen er en hovedgrunn til at dagens solceller kommer relativt dårlig ut i sammenligning med andre teknologier for å konvertere fornybar energi til elektrisitet når hele livssyklusen tas hensyn til. Den nye etseprosessen som er blitt utviklet i SOLNOWAT-prosjektet er basert på tørrkjemisk behandling med bruk av fluorgass for å oppnå den ønskede struktur på solcellewaferene. Dette kan være problematisk, fordi fluorgass er svært giftig. Derfor var det i prosjektet viktig å få en oversikt over lover og regler knyttet til denne produksjonsprosessen. VF var ansvarlig for å utarbeide en slik oversikt, som inneholder utslipps- og eksponeringsgrenser for de viktigste typer utslipp til luft og vann fra den nye prosessen. Oversikten ble etablert gjennom å gjennomgå oppdaterte europeiske og globale utslippsforskrifter og -krav. Dette inkluderte også noen vurdering om mulige kommende regelverk, som er tatt med i rapporten. Den andre oppgaven for VF i prosjektet var å gjennomføre en forenklet livsløpsvurderinger (LCA) av den tørre kjemisk etsing prosessen, sammenlignet med dagens våtkjemiske etsing. Dette arbeidet ga som resultat at det er et betydelig potensial for å redusere vannforbruket ved å gå over til den tørre prosessen. LCA-resultatene indikerte at så mye som 85% av vannforbruket kan bli spart, sammenlignet med nåværende våtkjemiske syrebaserte etsing, og en 89% reduksjon i sammenlikning med alkalisk våtkjemisk etsing. Den utførte LCA ga som resultat at utslippene av klimagasser kan reduseres med 63 % og 20 %, i sammenlikning med dagens syrebaserte våtkjemiske og alkalisk våtkjemisk etsing, henholdsvis. Til og med toksisitetsvurderingene ga bedre resultat for tørrkjemisk etsing, selv om usikkerheten var ganske høy for denne miljøbelastningskategorien.
VF report 6/2014: Environmental Assessment of Dry Photovoltaic Etching Page 8 of 60

List of Abbreviations
AAC Acceptable ambient concentration AC Air contaminant ACGIH American Conference of Governmental Industrial Hygienists ASIL Acceptable source impact level BAT Biologischer Arbeitsstoff-Toleranz-Wert (Biological tolerance value for
occupational exposures) BEI Biological exposure index BNA Bureau of National Affairs CDC Center for Disease Control and Prevention CDM Clean development mechanism CMP Conference of the parties serving as the Meeting of the Parties COP Conference of the Parties DB Dichlorobenzene DFG Deutsche Forschungsgemeinschaft (German Research Foundation) DWG Drinking water guideline DWS Drinking water standard EC European Commission EPA U.S. Environmental Protection Agency F- Fluoride GHG Greenhouse gas GQS Groundwater quality standard GS Groundwater standard GWP Global warming potential H2O2 Hydrogen peroxide H2SiF6 Fluorosilicic acid HCFC-22 Hydrochlorofluorocarbon-22 HF Hydrogen fluoride HFC-23 Hydrofluorocarbon-23 HOF Hypofluorous acid HSDB Hazardous Substances Data Bank HTP Haitalliseksi tunnetut pitoisuudet (Occupational exposure limits) IDLH Immediately dangerous to life or health LCA Life cycle assessment MAK Maximale Arbeitsplatz-Konzentration (Maximum workplace concentration) MCL Maximum contaminant level. Enforceable level, intended to prevent acute
and chronic illness. NF3 Nitrogen trifluoride NIOSH National Institute of Occupational Safety & Health O3 Ozone OEL Occupational exposure limit OF2 Oxygen difluoride OSHA Occupational Safety & Health Administration PEL Permissible exposure limit PPM Parts per million
VF report 6/2014: Environmental Assessment of Dry Photovoltaic Etching Page 9 of 60

PQL Practical quantification level PV Photovoltaic REL Recommended Exposure Limit. This refers to NIOSH time-weighted
average (TWA) concentrations for up to a 10-hour workday during a 40-hour workweek.
RL Reporting limit SBSTA Subsidiary Body for Scientific and Technological Advice (SBSTA) SCHER Scientific Committee on Health and Environmental Risk SCOEL Scientific Committee on Occupational Exposure Limits SER The Social and Economic Council of the Netherlands SiO2 Silicon oxide SF6 Sulphur hexafluoride SMCL Secondary maximum contaminant level. SoA State of the Art STEL Short-term exposure limit TA Technische Anleitung (technical guide) TAP Toxic air pollutant TLV Threshold limit value TWA Time-weighted average UNFCCC United Nations Framework Convention on Climate Change VDI Verein Deutscher Ingenieure (Association of German Engineers)
VF report 6/2014: Environmental Assessment of Dry Photovoltaic Etching Page 10 of 60

1 Introduction 1.1 The problematics of current solar cell production Solar photovoltaic cells (PV) are widely admired for the way they silently, and seemingly without pollution, extract clean energy from the sun’s rays. However, this is by no means the full picture, as the production of the solar cells contribute to specific environmental problems (Andersen 2013). There exist serious environmental issues connected not only to the way PV solar cell panels are currently manufactured, but also to the way they are disposed of at the end of their use phase (Zehner 2011).
1.1.1 The high water consumption A key problem with current PV cell production, is the high water consumption in the etching of the crystalline silicon wafers. The wet chemical process, which is State of the Art (SoA) in PV cell production, involves the processing of the wafers in a series of consecutive and different chemical baths. Between each chemical treatment, the wafers need to be rinsed free from chemicals, using tens of thousands of liters of clean water in the process. In 2011, a leading USA solar company with manufacturing plants in Malaysia and the Philippines stated that their wet chemical-based process required about 15000 liters of high purity process water per minute for a 1.4 GW production facility for PV solar cells (Duffy 2012). As such, major chemical waste treatment facilities are necessary to cope with the large volumes of contaminated water from the PV solar cell production when using the wet chemical process (Agostinelli et al. 2004). That is why alternative process types, using less water, are needed. 1.1.2 The toxicity and explosion hazard The manufacturing of PV cells relies on the use of a large number of different toxic chemicals and explosive compounds (Phylipsen and Alsema 1995; Kuemmel et al. 1997). Therefore, PV cell production in general, has potential hazardous impacts, from the chemicals being released during the various process steps, like volatile organic substances during panel laminating (Phylipsen and Alsema 1995). In addition, accidents connected to the operation of the factories, can lead to severe health consequences for workers in the manufacturing facilities, as well as for local residents.
1.1.3 The climate gas emissions The PV manufacturing industry is in addition one of the leading emitters of fluorinated compounds. This includes hexafluoroethane (C2F6), nitrogen trifluoride (NF3), and sulphur
VF report 6/2014: Environmental Assessment of Dry Photovoltaic Etching Page 11 of 60

hexafluoride (SF6). These are all extremely strong greenhouse gases, with global warming potentials (GWPs) of 12,200, 17,200, and 22,800 times that of CO2 on a 100 year time horizon (Forster et al. 2007). The use of SF6 is for example commonly used to remove damages to the wafers, so-called saw damages, that have occurred during the slicing of the crystalline silicon ingots1. The SF6 is also used during the oxide etching process step (Piechulla et al. 2011). The use of these strong greenhouse gases implies that an unintended effect of massive implementation of PV solar cells in the future is a considerable impact on climate, from their manufacturing phase (Alsema 2000; Alsema and de Wild-Scholten 2005; Fthenakis et al. 2008; Fthenakis and Kim 2010). This is in addition to the fact that production of silicon for crystalline PV solar cells also contributes substantially to the emission of GHGs (Pehnt 2006). These aspects explain why electricity production with the use of PV solar cells is worse than many other technologies, in terms of life cycle GHG emissions. Rather detrimental life cycle performance have been reported, with emissions as high as 110 g CO2eq/kWh (Jungbluth 2005; Fthenakis et al. 2008). In the European Commission ExternE project on external costs for energy the life-cycle emissions from PV installations in Germany were presented to be as high as 180 g CO2eq/kWh (EC 2003; Fthenakis and Kim 2007). In ExternE the use of PV solar cells was ranked even worse than natural gas in terms of life cycle GHG emissions and air pollution (EC 1995; EC 2003; Agostinelli et al. 2004).
1.1.4 Other environmental impacts When the combined external costs from impacts related to noise, health, material and crops in the life cycle of technologies for German electricity generation options were compared, only lignite and coal was worse than PV, as shown in Table 1. The renewable energy technologies wind and hydro came out substantially better (EC 2003).
1 The ingot is a casted chunk of crystalline silicon that is made from a molten smelt. It is cut into thin slices that ends up as wafers after several steps of processing VF report 6/2014: Environmental Assessment of Dry Photovoltaic Etching Page 12 of 60

Table 1 Life cycle external costs of electricity generation in Germany, expressed in € cent per kWh (EC 2003)
Coal Lignite Natural gas Nuclear PV Wind Hydro
Noise 0 0 0 0 0 0.0050 0
Health 0.7300 0.9900 0.3400 0.1700 0.4500 0.0720 0.0510
Material 0.0150 0.0200 0.0070 0.0020 0.0120 0.0020 0.0010
Crops 0 0 0 0 0 0.0007 0.0002
Total 0.7450 1.0100 0.3470 0.1720 0.4620 0.0797 0.0522
In addition to the impacts described above, some of the materials entering into PV cells are of concern. One example is the use of fullerenes, such as C60, also termed Buckminster fullerene2 or in short Bucky balls. These carbon nanomaterials are used in certain new types of solar cells (Manzetti and Andersen 2012; Manzetti et al. 2013). A series of studies has been conducted into toxicological properties and potentials for other adverse health effects of fullerenes, with regards to the way they interfere with cellular mechanisms both in humans and animals (Yamago et al. 1995; Oberdörster et al. 2006; Fujita et al. 2009; Nakagawa et al. 2011). However, much remains to be known about the impact of these carbon molecules on the human body and the environment.
2 The name Buckminster fullerene is homage to the American designer, author, and inventor Richard Buckminster "Bucky" Fuller, as C60 resembles the geodesic domes that were his trademark
VF report 6/2014: Environmental Assessment of Dry Photovoltaic Etching Page 13 of 60
2 The new PV etching process The "SOLNOWAT" process is an alternative to the current wet chemical etching process used in crystalline PV solar cell production. It has basis in the work on developing dry plasma-based processes (Rentsch et al. 2005; Agostinelli et al. 2005; Lopez et al. 2006; Lopez et al. 2007; Linaschke et al. 2008; Photovoltaics World 2011; Dresler et al. 2012; Piechulla et al. 2011). The new etching process is however taking place in atmospheric pressure and not in vacuum as has been common in dry plasma etching. It relies on the use of Fluorine (F2) as the etching gas. This is a very toxic gas, which require that emissions must be avoided. Therefore, a review of regulatory emission control requirements and exposure limits for fluorine and other relevant potential emissions was necessary, in order to implement the necessary precautionary actions in the development of the new etching process.
2.1 Regulatory requirements to the new PV etching process The work on the compilation of up-to-date European and global emission regulations and requirements are detailed in this paragraph. Some considerations regarding forthcoming regulations are also included. The compilation took as starting point that the relevant emissions from the new dry etching process for photovoltaic wafers are mainly made up of the four type of fluor-containing gases: 1) Hydrogen fluoride (HF) 2) Fluorine (F2) 3) Silicon fluorides in general (SiFx) 4) Silicon tetrafluoride (SiF4) In addition, emission regulations for fluoride (F-) was compiled, as these regulations are relevant in connection with the emission of fluoride-containing compounds escaping the plant in the etching process and potentially contaminating the environment. Other legal requirements and regulations regarding compounds escaping processing plants and entering the atmosphere are those pertaining to life cycle climate gas emissions and emissions from the scrubbers in the process facilities. Since only wet scrubbers were planned to be applied in the SOLNOWAT process, in theory no gases would be expected to escape from the scrubbers. The regulations pertaining to fluoride (F-) are thus relevant for scrubber effluents, particularly since hydrogen fluoride gas dissolves in water where it ionizes into F-.
VF report 6/2014: Environmental Assessment of Dry Photovoltaic Etching Page 14 of 60

Other chemical species potentially present in the discharge water from the scrubbers include various breakdown- and reaction products of the reaction between fluorine-containing compounds and water. Regarding the life cycle climate gas emissions, the two most obvious gases connected to plasma etching of solar cell wafers are nitrogen trifluoride (NF3) and sulphur hexafluoride (SF6). These fully fluorinated compounds are commonly used as plasma etch gases and they are extremely potent greenhouse gases. They have 100-year GWPs of 17 200 (NF3) and 22 800 (SF6). The Kyoto Protocol and the post-Kyoto process is the regulatory regime for these gases, with the resulting GHG reporting requirements. A key feature of the SOLNOWAT project was that of avoiding the use of these two gases, and developing systems based on gases with zero GWP. The Kyoto Protocol and the post-Kyoto process is in this report dealt with in the last paragraph, on recent and future regulations.
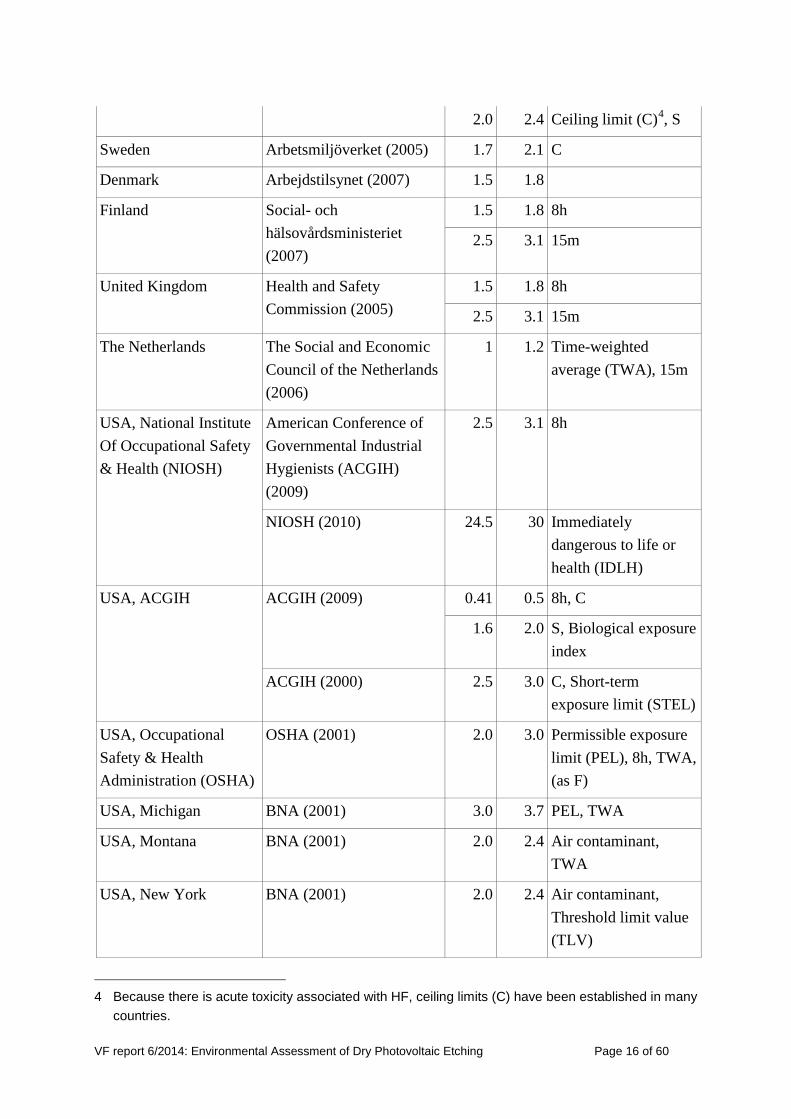
Most of the emission regulations are presented in terms of limit values, which are differing in the various regulations. For air emissions, when only PPM values are stated in the regulations, a conversion into mg/m3 is made. When the opposite is the case, that values only in mg/m3 are stated, values are converted into PPM. 2.1.1 Hydrogen fluoride (HF) HF is a human poison by inhalation (Lewis, 1997). It is a corrosive irritant to skin, eyes and mucous membranes. It also has teratogenic and reproductive effects as well giving skeletal damages. A compilation of air emission regulations for HF has been made by The Norwegian Labour Inspection Authority (Arbeidstilsynet, 2010). This has been supplemented with data from Tylenda (2003) and information from the SOLNOWAT partners. The compilation is shown in Table 2. Table 2 Air emission regulations for hydrogen fluoride gas (HF) in various countries
Country, organisation/state
Source Limit value Notation
mg/m3 ppm
European Union EC (2000) 1.5 1.8 8 hour (8h)
2.5 3.1 15 min (15m)
Norway Arbeidstilsynet (2010) 0.5 0.6 Skin uptake (S)3
3 There are indications that HF is taken up into the body through the skin and can cause swelling and redness. Therefore, a skin uptake notation (S) is implemented in many countries.
VF report 6/2014: Environmental Assessment of Dry Photovoltaic Etching Page 15 of 60
2.0 2.4 Ceiling limit (C)4, S
Sweden Arbetsmiljöverket (2005) 1.7 2.1 C
Denmark Arbejdstilsynet (2007) 1.5 1.8
Finland Social- och hälsovårdsministeriet (2007)
1.5 1.8 8h
2.5 3.1 15m
United Kingdom Health and Safety Commission (2005)
1.5 1.8 8h
2.5 3.1 15m
The Netherlands The Social and Economic Council of the Netherlands (2006)
1 1.2 Time-weighted average (TWA), 15m
USA, National Institute Of Occupational Safety & Health (NIOSH)
American Conference of Governmental Industrial Hygienists (ACGIH) (2009)
2.5 3.1 8h
NIOSH (2010) 24.5 30 Immediately dangerous to life or health (IDLH)
USA, ACGIH ACGIH (2009) 0.41 0.5 8h, C
1.6 2.0 S, Biological exposure index
ACGIH (2000) 2.5 3.0 C, Short-term exposure limit (STEL)
USA, Occupational Safety & Health Administration (OSHA)
OSHA (2001) 2.0 3.0 Permissible exposure limit (PEL), 8h, TWA, (as F)
USA, Michigan BNA (2001) 3.0 3.7 PEL, TWA
USA, Montana BNA (2001) 2.0 2.4 Air contaminant, TWA
USA, New York BNA (2001) 2.0 2.4 Air contaminant, Threshold limit value (TLV)
4 Because there is acute toxicity associated with HF, ceiling limits (C) have been established in many countries.
VF report 6/2014: Environmental Assessment of Dry Photovoltaic Etching Page 16 of 60

USA, Washington BNA (2001) 0.009 0.011 Toxic air pollutant, ASIL
2.5 3.0 PEL, STEL
Germany, Deutsche Forschungsgemeinschaft (DFG)
DFG (2008) 0.82 1.0 Risk during pregnancy, S
Germany, gov Bundesanstalt für Arbeitsschutz und Arbeitsmedizin (2007)
0.82 1.0 S
Germany, gov Gemeinsames Ministerialblatt (2002)
0.0004 0.0005 TWA, 1 year
0.0003 0.0004 High-sensitivity species and materials
Germany, Verein Deutscher Ingenieure (VDI)
VDI (2011) 0.05 0.06 TWA, 1 year
0.2 0.24 TWA, 30 min
The EU Scientific Committee on Occupational Exposure Limits (SCOEL) recommends in addition an 8-hour limit value of 2.5 mg/m3 for mixture of HF and inorganic fluorides (SCOEL, 1998). 2.1.2 Fluorine gas (F2) F2 is characterized as a poison gas (Lewis, 1997). It is a very powerful caustic irritant to tissue. It is also a very dangerous fire and explosion hazard. I the wet scrubber there are several possible reactions between fluorine gas and water, as shown below: (I) F2 (g) + H2O (l) → HOF (g) + HF (g) [T = -40°C]
(II) 2 HOF (g) → 2 HF (g) + O2 (g) [T = +20°C]
(III) F2 (g) + H2O (l) → 2 HF (g) + ½O2 (g) [T = +20°C] + small amounts of ozone
(IV) F2 (g) + 2 H2O (l)→ 2 HF (g) + H2O2 [pH<7]
(V) 2 F2 (g) + 2 OH- → 2 F- + OF2 (g) + H2O → O2 (g) + 4 F- + 2 H+ [pH approx. 14]
Reaction I shows the formation of the chemical compound hypofluorous acid (HOF). HOF is an intermediate in the oxidation of water by F2 and is decomposing at room temperature to HF and O2 as shown in reaction II. The hydrogen peroxide (H2O2) formed in reaction IV VF report 6/2014: Environmental Assessment of Dry Photovoltaic Etching Page 17 of 60

decomposes exothermically in the scrubber effluent to water and oxygen according to the following reaction: (VI) 2 H2O2 → 2 H2O (l) + O2 (g)
The scrubber must have enough water through-flow to avoid the concentration of hydrogen peroxide to reach levels where explosion might occur. In very alkaline conditions the strongly oxidizing compound oxygen difluoride (OF2) is formed, as shown in reaction equation V. However, since OF2 is only an intermediate in this reaction, and decomposes under alkaline conditions to oxygen and fluoride, it is not likely to possess additional emission regulatory challenges than those shown for fluoride later in this report. A compilation of air emission regulations for F2 has been made by U.S. Department of Health and Human Services, Public Health Service at Agency for Toxic Substances and Disease Registry (Tylenda, 2003). This is the main basis for the updated compilation shown in Table 3.
Table 3 Air emission regulations for fluorine gas
Country, organisation/state
Source Limit value Notation
mg/m3 ppm
USA, ACGIH ACGIH (2000) 1.6 1.0 TLV, TWA
3.1 2.0 STEL
USA, EPA EPA (2001) 3.9 2.5 Toxic end point
USA, OSHA OSHA (2001) 0.2 0.1 PEL, 8h TWA
USA, NIOSH NIOSH (2010) 0.2 0.1 Recommended exposure limit (REL), TWA
38.9 25 IDLH
USA, Idaho BNA (2001) 2 1.3 Occupational exposure limit (OEL)
0.1 0.06 Acceptable ambient concentration (AAC)
USA, Michigan BNA (2001) 0.2 0.1 PEL, TWA
USA, Montana BNA (2001) 0.2 0.1 Air contaminant, TWA
USA, New Mexico BNA (2001) 2.0 1.3 Toxic air pollutant
USA, New York BNA (2001) 0.2 0.1 Air contaminant, TLV
VF report 6/2014: Environmental Assessment of Dry Photovoltaic Etching Page 18 of 60

USA, Washington BNA (2001) 0.005 0.003 Toxic air pollutant, ASIL
0.2 0.1 PEL
2.1.3 Silicon fluorides (SiF4 and SiFx) Silicon tetrafluoride (SiF4) is the major emission gas, of the four gases HF, SiF4, SiFx and F2, constituting more than 90 % of these emissions. In the air, SiF4 is formed when hydrogen fluoride reacts with silica. When present in the air SiF4 is characterised as a poison and is moderately toxic by inhalation (Lewis, 1996). Furthermore, it is a corrosive irritant to skin, eyes and mucous membranes. In the wet scrubbers the emissions of SiF4 can react with water in the same manner as it can
react with moisture in the air, to form silicon oxide (SiO2), hydrofluoric acid (Voltaix, 2006)
and fluorosilicic acid (H2SiF6) (Tylenda, 2003; Lewis, 1997), as shown in the reaction
equations below:
(VII) SiF4 + 2 H2O → SiO2 + 4 HF
(VIII) 3 SiF4 + 2 H2O → SiO2 + 2 H2SiF6
HF, after its ionizing, contributes to the release of F- into the environment through the scrubber effluent water. Therefore, the emission regulations for F- in water (in the next sub-chapter) apply also to SiF4. In the USA and Canada H2SiF6 is commonly used in drinking water fluoridation and this has spurred a debate on health concerns. This has basis in reports of a relationship between water treated with H2SiF6 and elevated levels of lead (Pb) in children's blood (Masters and Coplan, 1999; Masters et al., 2000; Coplan et al., 2007). This association has been attributed to both the effect that incompletely dissociated fluorosilicates in drinking water have on increasing the body's cellular uptake of lead (Pb) (Masters and Coplan, 1999; Masters et al., 2000) and to increased corrosion of Pb-bearing plumbing by fluorosilicates (Coplan et al., 2007). However, the scientific rigour of these studies and the validity of their conclusions have been questioned by Urbansky and Schock (2000). They argue that fluorisilicates are completely hydrolysed before reaching the consumer's tap and therefore has no effect on the solubility and bioavailability of lead. The safety of using H2SiF6 in water fluoridation is however not established. As of 2003, no studies of the chronic effects of H2SiF6 use in water fluoridation had been conducted. Safety studies on fluoride have only been conducted using pharmaceutical-grade sodium fluoride, not industrial-grade silicon fluorides (Connett, 2012). Thus it can not be recommended to use VF report 6/2014: Environmental Assessment of Dry Photovoltaic Etching Page 19 of 60
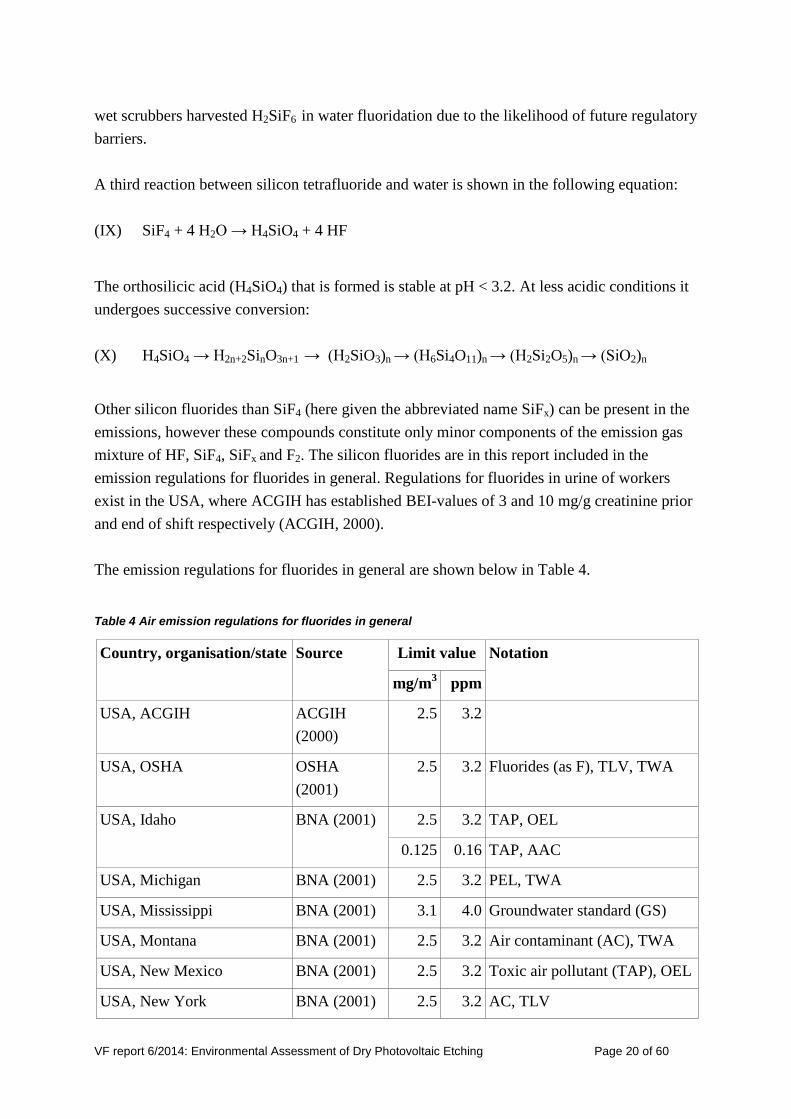
wet scrubbers harvested H2SiF6 in water fluoridation due to the likelihood of future regulatory barriers. A third reaction between silicon tetrafluoride and water is shown in the following equation: (IX) SiF4 + 4 H2O → H4SiO4 + 4 HF
The orthosilicic acid (H4SiO4) that is formed is stable at pH < 3.2. At less acidic conditions it undergoes successive conversion: (X) H4SiO4 → H2n+2SinO3n+1
→ (H2SiO3)n → (H6Si4O11)n → (H2Si2O5)n → (SiO2)n
Other silicon fluorides than SiF4 (here given the abbreviated name SiFx) can be present in the emissions, however these compounds constitute only minor components of the emission gas mixture of HF, SiF4, SiFx and F2. The silicon fluorides are in this report included in the emission regulations for fluorides in general. Regulations for fluorides in urine of workers exist in the USA, where ACGIH has established BEI-values of 3 and 10 mg/g creatinine prior and end of shift respectively (ACGIH, 2000). The emission regulations for fluorides in general are shown below in Table 4.
Table 4 Air emission regulations for fluorides in general
Country, organisation/state Source Limit value Notation
mg/m3 ppm
USA, ACGIH ACGIH (2000)
2.5 3.2
USA, OSHA OSHA (2001)
2.5 3.2 Fluorides (as F), TLV, TWA
USA, Idaho BNA (2001) 2.5 3.2 TAP, OEL
0.125 0.16 TAP, AAC
USA, Michigan BNA (2001) 2.5 3.2 PEL, TWA
USA, Mississippi BNA (2001) 3.1 4.0 Groundwater standard (GS)
USA, Montana BNA (2001) 2.5 3.2 Air contaminant (AC), TWA
USA, New Mexico BNA (2001) 2.5 3.2 Toxic air pollutant (TAP), OEL
USA, New York BNA (2001) 2.5 3.2 AC, TLV
VF report 6/2014: Environmental Assessment of Dry Photovoltaic Etching Page 20 of 60
USA, Washington BNA (2001) 0.008 0.010 TAP, ASIL
2.5 3.2 PEL
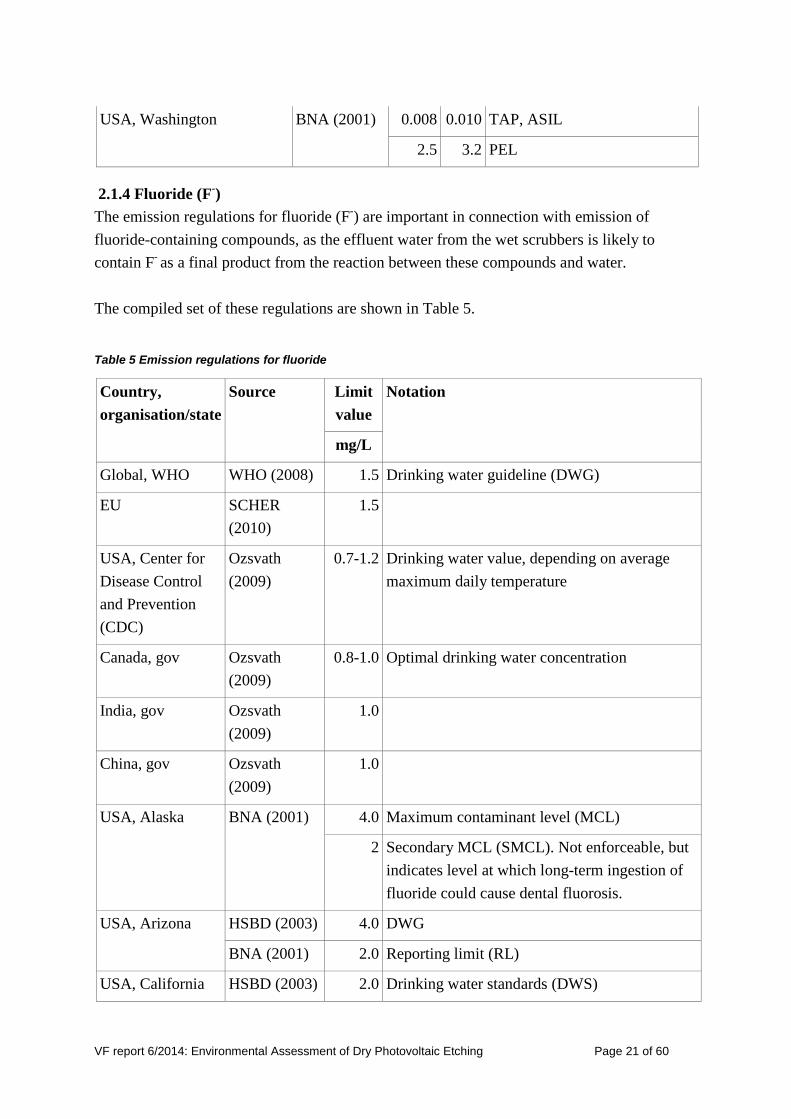
2.1.4 Fluoride (F-) The emission regulations for fluoride (F-) are important in connection with emission of fluoride-containing compounds, as the effluent water from the wet scrubbers is likely to contain F- as a final product from the reaction between these compounds and water. The compiled set of these regulations are shown in Table 5.
Table 5 Emission regulations for fluoride
Country, organisation/state
Source Limit value
Notation
mg/L
Global, WHO WHO (2008) 1.5 Drinking water guideline (DWG)
EU SCHER (2010)
1.5
USA, Center for Disease Control and Prevention (CDC)
Ozsvath (2009)
0.7-1.2 Drinking water value, depending on average maximum daily temperature
Canada, gov Ozsvath (2009)
0.8-1.0 Optimal drinking water concentration
India, gov Ozsvath (2009)
1.0
China, gov Ozsvath (2009)
1.0
USA, Alaska BNA (2001) 4.0 Maximum contaminant level (MCL)
2 Secondary MCL (SMCL). Not enforceable, but indicates level at which long-term ingestion of fluoride could cause dental fluorosis.
USA, Arizona HSBD (2003) 4.0 DWG
BNA (2001) 2.0 Reporting limit (RL)
USA, California HSBD (2003) 2.0 Drinking water standards (DWS)
VF report 6/2014: Environmental Assessment of Dry Photovoltaic Etching Page 21 of 60

USA, Connecticut BNA (2001) 4.0 MCL
USA, Delaware HSBD (2003) 1.8 DWS
USA, Georgia BNA (2001) 4.0 MCL
USA, Hawai HSBD (2003) 1.4-2.4 DWS
USA, Idaho BNA (2001) 4.0 Groundwater quality standard (GQS)
USA, Kansas BNA (2001) 2.0 Agriculture: Livestock
1.0 Agriculture: Irrigation
2.0 Domestic water supply
USA, Maine HSBD (2003) 2.4 DWG
BNA (2001) 2.4 Maximum exposure guideline
BNA (2001) 1.2 Action level
USA, Nebraska BNA (2001) 4.0 MCL
USA, New Jersey BNA (2001) 2.0 Groundwater quality criteria
0.5 PQL
USA, New York BNA (2001) 3.0 Groundwater effluent limit
2.2 MCL
USA, North Carolina
HSBD (2003) 4.0 DWS
USA, North Dakota
BNA (2001) 4.0
USA, Oklahoma BNA (2001) 4.0
USA, Pennsylvania
HSBD (2003) 2.0 DWS
The USA Health and Services Department lowered in January 2011 its recommended levels to 0.7 mg F- per litre due to the danger that some children might get tooth damage from too much fluorine intake (Reuters, 2011).
2.1.5 Recent and future regulations It is of strong interest for solar cell producers to know what to expect in terms of forthcoming regulations, so that they can adapt their production processes to secure future compliance. Therefore, the work also included an assessment of what can be expected in future regulatory regimes. VF report 6/2014: Environmental Assessment of Dry Photovoltaic Etching Page 22 of 60

Some general prospects of international climate efforts beyond 2012 was presented in the report from the meeting of a selected group of policymakers and stakeholders at Pocantico organised by Pew Center on Global Climate Change, which has been succeded by Center for Climate and Energy Solutions (Pew, 2005). However, the future emission regulations for fluorinated compounds are in part determined by outcomes of the Post-Kyoto Protocol negotiations, due to the high GWP of many of these compounds. These negotiations, which are part of the United Nations Framework Convention on Climate Change (UNFCCC), are attempting to reduce the global emission of GHG emissions. At the previous UNFCCC meeting in Cancun, Mexico in December 2010, officially referred to as the 16th session of the Conference of the Parties (COP 16), outcomes from the two ad-hoc working groups, on 1) long-term co-operative action and 2) the Kyoto Protocol, formed the so-called Cancun Agreements. These outcomes and the main topics of the Bali Action Plan (established at COP 13 in Bali in 2007) cover:
- a shared vision for long-term cooperative action - adaptation - mitigation - finance - technology - capacity building
The results for adaption was one of the topics presented at COP 17, which took place in Durban, South Africa 28 November to 9 December 2011. The primary focus at the Durban conference was however on securing the global climate agreement as the Kyoto Protocol's first commitment period, which covered the period 2008-2012. The future of the Kyoto Protocol was a key issue at his meeting, with the outcome being a second commitment period, with also China willing to take part in the negotiations. The topics coming out of the Cancun Agreements could potentially have implications for SOLNOWAT, due to the fact that they pertain to "co-operation on clean technology". Thus the topics of the Durban-conference that were most relevant for SOLNOWAT were those connected to mitigation of climate change by reductions in emission of greenhouse gases. The Subsidiary Body for Scientific and Technological Advice (SBSTA) is responsible for the Methods & Science topic "Scientific, Technical and Socio-Economic Aspects of Mitigation of Climate Change". The thirty-fifth session of SBSTA was organised during COP 17. On the agenda was one specific topic on fluorinated compounds, that can be relevant for SOLNOWAT. The topic of interest was "Implications of the establishment of new hydro-chlorofluorocarbon-22 (HCFC-22) facilities seeking to obtain certified emission reductions VF report 6/2014: Environmental Assessment of Dry Photovoltaic Etching Page 23 of 60
for the destruction of hydro-fluorocarbon-23 (HFC-23)" (UNFCCC, 2011a). This is an issue that SBSTA considers in collaboration with the clean development mechanism (CDM) (UNFCCC, 2011b). The outcome could have implications for technology based on the SOLNOWAT etching process, through potential certified emission reductions from the establishing of future dry PV production facilities, due to the avoidance of NF3 and SF6 emissions, possibly as a part of CDM.
2.2 Life Cycle Assessment
2.2.1 Purpose The purpose of the LCA was to compare the environmental impacts from the wet (current) and dry (SOLNOWAT) PV etching processes. Through the comparison, advantages and/or disadvantages associated with both processes was elucidated. The LCA determined environmental impacts (e.g. use of resources and the environmental consequences of releases) throughout a product’s life cycle from raw material acquisition through production, use, end‐of‐ life treatment, recycling and final disposal. 2.2.2 Methods LCA is both theoretically and methodologically defined by the International Standards Organisation through the 14040 Environmental management – life-cycle assessment – principles and framework (ISO, 2006) . Generally stated, LCA addresses the environmental aspects of the product system. The product system consists of raw material acquisition through production, use, end‐of‐ life treatment, recycling and final disposal. The methodolocial steps are outlined in the following subsections, and their interrelation is depicted in Figure 1.
VF report 6/2014: Environmental Assessment of Dry Photovoltaic Etching Page 24 of 60
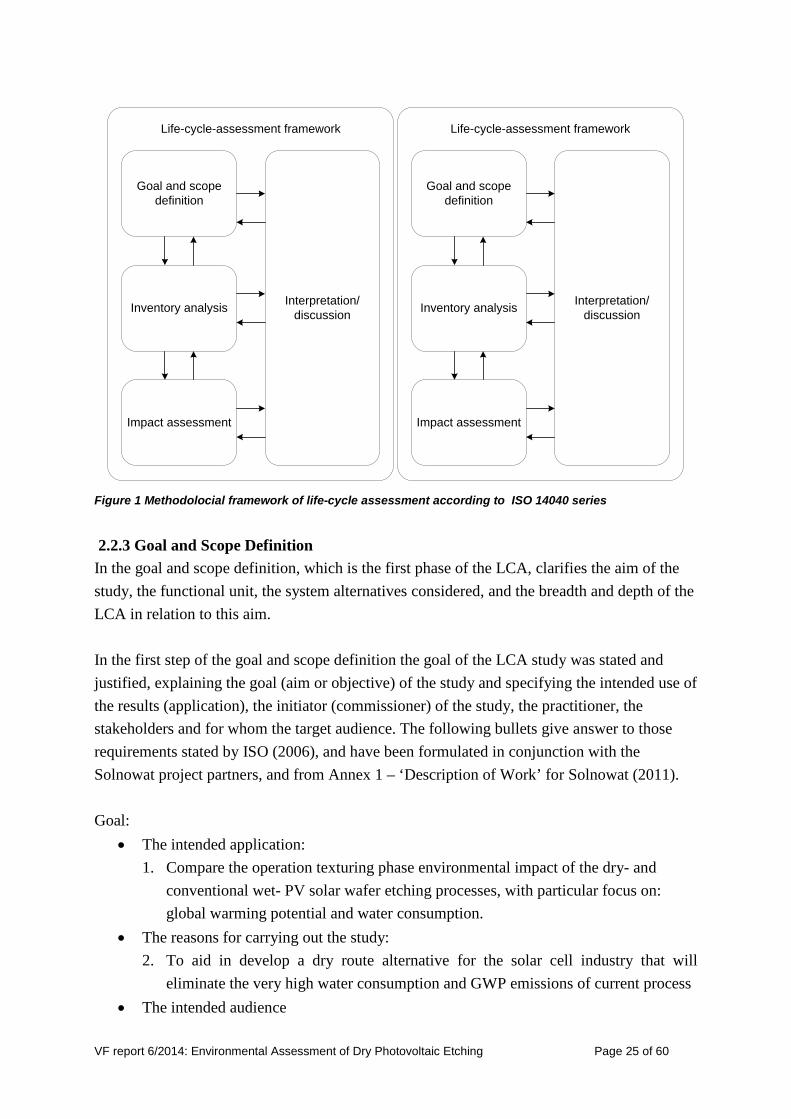
Figure 1 Methodolocial framework of life-cycle assessment according to ISO 14040 series
2.2.3 Goal and Scope Definition In the goal and scope definition, which is the first phase of the LCA, clarifies the aim of the study, the functional unit, the system alternatives considered, and the breadth and depth of the LCA in relation to this aim. In the first step of the goal and scope definition the goal of the LCA study was stated and justified, explaining the goal (aim or objective) of the study and specifying the intended use of the results (application), the initiator (commissioner) of the study, the practitioner, the stakeholders and for whom the target audience. The following bullets give answer to those requirements stated by ISO (2006), and have been formulated in conjunction with the Solnowat project partners, and from Annex 1 – ‘Description of Work’ for Solnowat (2011). Goal:
• The intended application: 1. Compare the operation texturing phase environmental impact of the dry- and
conventional wet- PV solar wafer etching processes, with particular focus on: global warming potential and water consumption.
• The reasons for carrying out the study: 2. To aid in develop a dry route alternative for the solar cell industry that will
eliminate the very high water consumption and GWP emissions of current process • The intended audience
Goal and scope definition
Inventory analysis
Impact assessment
Interpretation/discussion
Life-cycle-assessment framework
Goal and scope definition
Inventory analysis
Impact assessment
Interpretation/discussion
Life-cycle-assessment framework
VF report 6/2014: Environmental Assessment of Dry Photovoltaic Etching Page 25 of 60

3. Solnowat project partners • Level of disclosure
4. Internal document In following the CML guide (2001), it is in the scope definition step that the main characteristics of an intended LCA study are established, covering such issues as temporal, geographical and technology coverage, the mode of analysis employed and the overall level of sophistication of the study. The following bullets give answer to those requirements stated by ISO (2006), and have been formulated in conjunction with the Solnowat project partners, as well as from Annex 1 – ‘Description of Work’ for Solnowat (2011). Scope
− The product system to be studied o Specified in the document: Solnowat - Annex 1 ‘description of work’
− The function of the product system(s) o PV solar wafer etching
− The functional unit o One PV solar cell wafer
− The system boundary o Figure 2 depicts the system boundary for the dry-etch process. Corresponding
system boundaries have been adoped for the wet-etching process (based on information from Jochen Rentsch of Fraunhofer ISI).
VF report 6/2014: Environmental Assessment of Dry Photovoltaic Etching Page 26 of 60

Figure 2 Process flow diagram of the SOLNOWAT dry-etch process
− Allocation procedures
o No first order (direct) allocation used. For information concerning second order (indirect) allocation please refer to the life-cycle inventories applied from the Simapro/Ecoinvent database.
− Impact categories selected and methodology of impact assessment, and subsequent interpretation to be used:
o CML 2 Baseline impact categories and impact assessment methods, along with inventory results for water consumption.
− Data requirements o N/A
− Assumptions o N/A
− Limitations o This environmental assessment is only for the operation texturing phase and is
based on a several preliminary documents, and as such one should be careful to base claims solely on these results.
− Initial data quality requirements o N/A
− Type of critical review, if any: o None applied
VF report 6/2014: Environmental Assessment of Dry Photovoltaic Etching Page 27 of 60

− Type and format of the report required o Internal report
2.2.4 Life-cycle inventory According to the CML guide (2001), in the goal and scope definition phase the basic groundplan for the study was established. The second phase of the LCA is the inventory analysis. This phase was concerned with the collection of the data necessary to meet the goals of the defined study and with the associated data collection and calculation procedures, and was essentially an inventory of input/output data with respect to the system being studies. The process inventory was based on internal project documents provided by the SOLNOWAT coordinator NINES Photovoltaics:
• Nines Dry Etch Cost of Ownership Review v0.1, and • Operation_Cost_Calculation_Facilities 05102011 Ed(2).xls
Both received from E. Duffy 24.04.2012. Along with updated information concerning the wet, and dry processes:
• Solnowat_Texturing_ConsumptionWetChemicals_130704.xlsx • Solnowat_Texturing_Consumption Dry Chemicals.xlsx
Received from: E. Duffy 26.09.2013, and J. Rentsch 04.07.2013 respectively. The data was conditioned to the functional unit ‘per wafer’, detailes in the life-cycle inventories in Appendix I. 2.2.5 Results
Life-cycle impact assessment Figure 3 presents the life-cycle impact assessment results for all 4 texturing proceses, without uncertainty as determined by the CML 2 baseline mid-point impact assessment method.
VF report 6/2014: Environmental Assessment of Dry Photovoltaic Etching Page 28 of 60

Figure 3 Life-cycle impact assessment results
From the results presented in Figure 3 we see that the dry texturing processes provide reductions for all impact categories with respect to their corresponding wet texturing process. VF report 6/2014: Environmental Assessment of Dry Photovoltaic Etching Page 29 of 60

However, as included in Appendix IV we can see that several of the impact categories have been determined with great uncertainty. In the following graphs we have collected two relevant impact categories for comparison: GWP and toxicity. We have judged it appropriate to include a closer review of toxicity in this report. Total toxicity as presented includes the values from 4 separate impact categories: human toxicity, freshwater aquatic eco-toxicity, marine aquatic eco-toxicity, and terrestrial eco-toxicity measured in kg. 1.4 DB eq. The results are shown in Figure 4 and Figure 5.
Figure 4 Life-cycle impact assessment results for GWP100 for all 4 texturing processes, including data uncertainty
From Figure 4, based on data given in section Appendix IV, it can be observed that the dry texturing processes have led to reductions of 63 % and 20 % with respect to their corresponding wet texturing processes, i.e. 4.3 W per wafer, and 4.5 W per wafer respectively. Additionally the uncertainty determined is within an acceptable range.
VF report 6/2014: Environmental Assessment of Dry Photovoltaic Etching Page 30 of 60

Figure 5 Life-cycle impact assessment for total toxicity for all 4 texturing processes, including data uncertainty
From Figure 5, based on data given in Appendix IV, it can be observed that the dry texturing processes have led to reductions of 24 % and 44 % with respect to their corresponding wet texturing processes, i.e. 4.3 W per wafer, and 4.5 W per wafer respectively. The uncertainty determined is however high. In Appendix IV it can be seen that marine aquatic eco-toxicity is the predominant contributor for all texturing processes. This indicates that the final fate of toxic emissions is predominantly in the marine environment.
Water consumption (direct and indirect) Water consumption does not constitute an impact category in the CML 2 baseline mid-point impact assessment method. As such, total water consumption was determined by investigating the inventory results; including both the direct and indirect consumption of water. Water for cooling and water passing through turbines for the generation of electricity were not included in this determination, as it is assumed that this water leaves the system under study unchanged. The following four figures present the results for the texturing processes For the source data please refer to Appendix IV Water consumption tables of results.
VF report 6/2014: Environmental Assessment of Dry Photovoltaic Etching Page 31 of 60
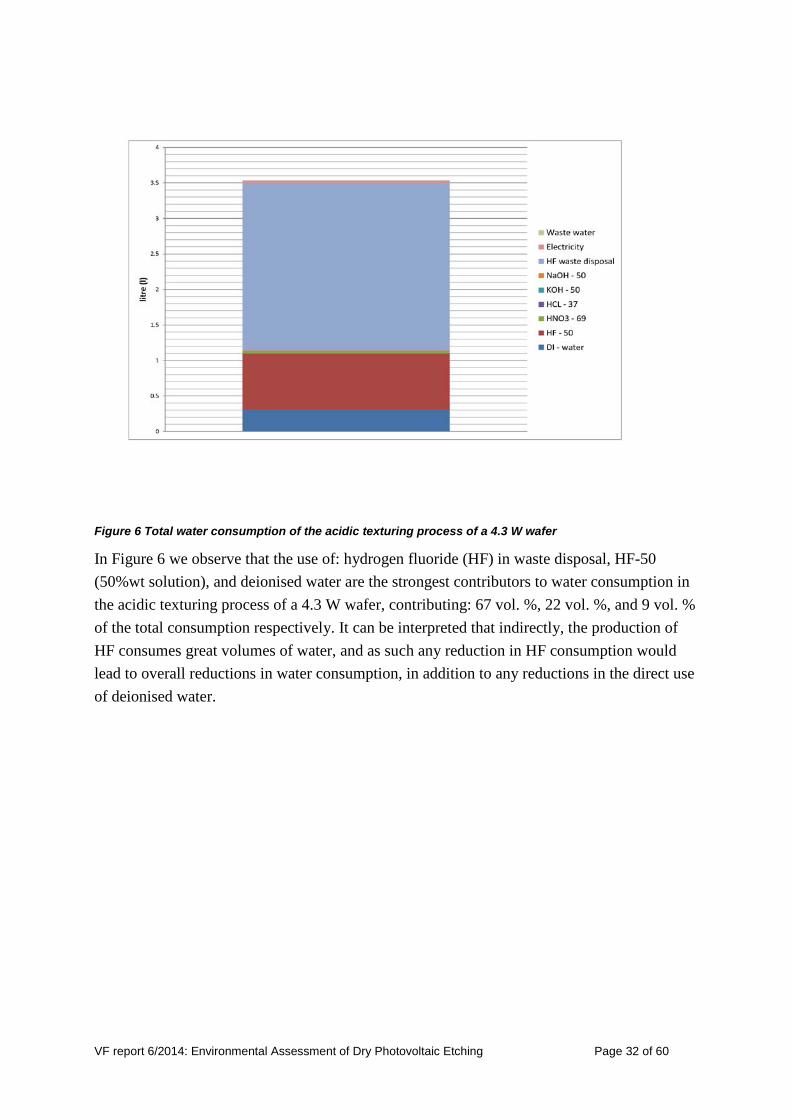
Figure 6 Total water consumption of the acidic texturing process of a 4.3 W wafer
In Figure 6 we observe that the use of: hydrogen fluoride (HF) in waste disposal, HF-50 (50%wt solution), and deionised water are the strongest contributors to water consumption in the acidic texturing process of a 4.3 W wafer, contributing: 67 vol. %, 22 vol. %, and 9 vol. % of the total consumption respectively. It can be interpreted that indirectly, the production of HF consumes great volumes of water, and as such any reduction in HF consumption would lead to overall reductions in water consumption, in addition to any reductions in the direct use of deionised water.
VF report 6/2014: Environmental Assessment of Dry Photovoltaic Etching Page 32 of 60

Figure 7 Total water consumption of the alkaline texturing process of a 4.5 W wafer
In Figure 7 we observe that the use of: deionised water and hydrogen fluoride (HF) in waste disposal are the strongest contributors to water consumption in the alkaline texturing process of a 4.5 W wafer, contributing: 73 vol. % and 23 vol. % of the total consumption respectively. It can be interpreted that indirectly, the production of HF consumes large volumes of water, and as such any reduction in HF consumption would lead to overall reductions in water consumption, in addition to any reductions in the direct use of deionised water.
VF report 6/2014: Environmental Assessment of Dry Photovoltaic Etching Page 33 of 60

Figure 8 Total water consumption of the dry texturing process of a 4.3 W wafer
In Figure 8 we san see that the use of: fluorine gas and hydrogen fluoride (HF) in waste disposal are the strongest contributors to water consumption in the dry texturing process of a 4.3 W wafer, contributing: 63 vol. % and 15 vol. % of the total consumption respectively. It can be interpreted that indirectly, the production of fluorine gas consumes large volumes of water, and as such any reduction in flourine consumption would lead to overall reductions in water consumption.
VF report 6/2014: Environmental Assessment of Dry Photovoltaic Etching Page 34 of 60

Figure 9 Total water consumption of the dry texturing process of a 4.5 W wafer
In Figure 9 we observe that the use of: fluorine gas and hydrogen fluoride (HF) in waste disposal are the strongest contributors to water consumption in the dry texturing process of a 4.5 W wafer, contributing: 64 vol. % and 15 vol. % of the total consumption respectively. Indirectly, the production of fluorine gas consumes large volumes of water, so reductions in flourine consumption would lead to overall reductions in water consumption. The collected results for water consumption are presented in Figure 10.
VF report 6/2014: Environmental Assessment of Dry Photovoltaic Etching Page 35 of 60

Figure 10 Collected water consumption results for all four texturing processes
In Figure 10 it is shown that with respect to watts per wafer, the dry texturing process leads to reductions of 86 vol. % and 89 vol. % for 4.3 W and 4.5 W per wafer respectively.
VF report 6/2014: Environmental Assessment of Dry Photovoltaic Etching Page 36 of 60

3 Interpretation of results The interprestation of the results is conducted in Appendix I-IX.
VF report 6/2014: Environmental Assessment of Dry Photovoltaic Etching Page 37 of 60

4 Conclusions The life cycle assessment of the dry etching (“Solnowat”) process in comparison with state of the art wet chemical etching for photovoltaic wafers has revealed that the Solnowat etching has significantly lower GHG emissions (GWP) and water consumption. This is foundto be true also after extensive uncertainty analysis. The dry texturing process implies GWP reductions of 63 % and 20 % with respect to their corresponding wet texturing processes, i.e. 4.3 W per wafer, and 4.5 W per wafer respectively. The dry texturing process leads to water reductions of 85 vol. % and 89 vol. % for 4.3 W and 4.5 W per wafer respectively. Thus the dry process is better in terms of both lower GWP and lower water consumption. Though the uncertainty determined is high, the dry texturing processes imply toxicity reductions of 24 % and 44 % with respect to their corresponding wet texturing processes, i.e. 4.3 W per wafer, and 4.5 W per wafer respectively. It can be seen that marine aquatic ecotoxicity is the predominant contributor for all texturing processes. This implies that the final fate of toxic emissions is predominantly in the marine environment.
VF report 6/2014: Environmental Assessment of Dry Photovoltaic Etching Page 38 of 60

5 References Agostinelli G, Choulat P, Dekkers HFW, De Wolf S and Beaucarne G (2005) Advanced dry
processes for crystalline silicon solar cells. Paper presented at the Photovoltaic Specialists Conference, 2005. Conference Record of the Thirty-first IEEE. IEEE, 1149–1152. Available at: http://b-dig.iie.org.mx/BibDig/P05-0850/pdffiles/papers/283_625.pdf.
Agostinelli G, Dekkers HFW, De Wolf S and Beaucarne G (2004) Dry Etching and Texturing Processes for Crystalline Silicon Solar cells: Sustainability for Mass Production. Paper presented at the 19th European Photovaltaic Solar Energy Conference. Paris, 423–426. Available at: http://www.docin.com/p-51912614.html.
Alsema E and de Wild-Scholten M (2005) Environmental Impact of Crystalline Silicon Photovoltaic Module Production. Paper presented at the Materials Research Society Symposium, G: Life Cycle Analysis Tools for” Green” Materials and Process Selection. Boston.
Alsema EA (2000) Energy pay-back time and CO2 emissions of PV systems. Progress in Photovoltaics: Research and Applications 8(1): 17–25.
Andersen O (2013) Unintended Consequences of Renewable Energy. Springer London, London
American Conference of Governmental Industrial Hygienists (ACGIH) (2000) Documentation of the threshold limit values and biological indices. American Conference of Governmental Industrial Hygienists, Cincinnati, OH.
American Conference of Governmental Industrial Hygienists (ACGIH) (2009) Guide to Occupational Exposure Values 2009.
Arbeidstilsynet (The Norwegian Labour Inspection Authority) (2010): Grunnlag for fastsettelse av administrativ norm for Hydrogenfluorid (Basis for setting occupational exposure limits for hydrogen fluoride). http://www.arbeidstilsynet.no/binfil/download2.php?tid=226418.
Arbejdstilsynet (The Danish Labour Inspection Authority) (2007) Stoffer og materialer. Grænseværdier for stoffer og materialer (Substances and Materials. Limit Values for Substances and Materials). At-Vejledning, C.0.1. http://arbejdstilsynet.dk/~/media/3FA26655715740ED84EA28EC1191FB62.ashx.
Arbetsmiljöverket (Swedish Work Environment Authority) (2005) Hygieniska gränsvärden och åtgärder mot luftföroreninga (Occupational exposure limits and measures against air pollution). Arbetsmiljöverkets författningssamling (Swedish Occupatuonal Health and Safety Directives),. http://www.av.se/dokument/afs/AFS2005_17.pdf.
Bundesanstalt für Arbeitsschutz und Arbeitsmedizin (2007) TRGS900 Arbeitsplatzgrenz-werte (Occupational exposure limits). http://www.baua.de/nn_16806/de/Themen-von-
VF report 6/2014: Environmental Assessment of Dry Photovoltaic Etching Page 39 of 60

A-Z/Gefahrstoffe/TRGS/pdf/TRGS-900.pdf.
Bureau of National Affairs (BNA) (2001) Environmental and Safety Library on the Web. States and Territories. Bureau of National Affairs, Inc., http://www.esweb.bna.com/ (Accessed May 25, 2001). Referred to in Tylenda (2003).
Connett P (2012) 50 Reasons to Oppose Fluoridation. FLUORIDEALERT.ORG - Fluoride Action Network September. http://www.fluoridealert.org/articles/50-reasons/
Coplan M, Patch R, Masters R and Bachmann M (2007) Confirmation of and explanation for elevated blood lead and other disorders in children exposed to water disinfection and fluoridation chemicals. Neurotoxicol, 28(5), 1032–1042, doi:10.1016/j.neuro.2007.02.01.
Deutsche Forschungsgemeinschaft (DFG) (2008) List of Maximale Arbeitsplatz-Konzentration (MAK) and Biological Tolerance Value for Occupational Exposures (Biologischer Arbeitsstoff-Toleranz-Wert - BAT). Report No. 44. Commision for the Investigation of Health hazards of Chemical Compounds in the Work Area. Wiley-VCH.
Dresler B, Köhler D, Mäder G, Kaskel S, Beyer E, Clochard L, Duffy E, Hoffman M and Rentch J (2012) Novel Industrial single sided dry etching and texturing process for silicon solar cell improvement. paper presented at the 27th European Photovoltaic Solar energy Conference and Exhibition. Poster. Frankfurt, Germany.
Duffy E (2012) SOLNOWAT - Development of a competitive zero Global Warming Potential (GWP) dry process to reduce the dramatic water consumption in the ever expanding solar cell manufacturing industry. D7.3 Exploitation Plan (interim). . Available at: www.SOLNOWAT.com.
European Commission (1995) ExternE: Externalities of Energy. Prepared by ETSU and IER for DGXII: Science, Research & Development, Study EUR 16520-5 EN. , Luxembourg.
European Commission (2000) COMMISSION DIRECTIVE 2000/39/EC of 8 June 2000 establishing a first list of indicative occupational exposure limit values in implementation of Council Directive 98/24/EC on the protection of the health and safety of workers from the risks related to chemical agents at work. Official Journal of the European Communities, L 142/47. http://eur-lex.europa.eu/LexUriServ/LexUriServ.do?uri=OJ:L:2000:142:0047:0050:EN:PDF.
European Commission (2003) External Costs. Research results on socio-environmental damages due to electricity and transport. Brussels: European Commission, Directorate-General for Research Information and Communication Unit.
Forster P, Ramaswamy V, Artaxo P, Berntsen T, Betts R, Fahey D, Haywood J, Lean J, Lowe D, Myhre G, Nganga J, Prinn R, Raga G, Schulz M and Van Dorland R (2007) Changes in Atmospheric Constituents and in Radiative Forcing. In: Climate Change 2007: The Physical Science Basis. Contribution of Working Group I to the Fourth Assessment Report of the Intergovernmental Panel on Climate Change. Cambridge
VF report 6/2014: Environmental Assessment of Dry Photovoltaic Etching Page 40 of 60

University Press, Cambridge, United Kingdom and New York, NY, USA. Available at: http://www.ipcc.ch/ publications_and_data/ar4/wg1/en/ch2s2-10-2.html.
Fthenakis VM and Kim HC (2007) Greenhouse-gas emissions from solar electric- and nuclear power: A life-cycle study. Energy Policy 35: 2549–2557.
Fthenakis VM and Kim HC (2010) Photovoltaics: Life-cycle analyses. Solar Energy 85(8): 1609–1628.
Fthenakis VM, Kim HC and Alsema E (2008) Emissions from Photovoltaic Life Cycles. Environ. Sci. Technol. 42: 2168–2174.
Fujita K, Morimoto Y, Ogami A, Myojyo T, Tanaka I, Shimada M, Wang W, Endoh S, Uchida K, Nakazato T, Yamamoto K, Fukui H, Horie M, Yoshida Y, Iwahashi H and Nakanishi J (2009) Gene expression profiles in rat lung after inhalation exposure to C60 fullerene particles. Toxicol 258: 47–55.
Gemeinsames Ministerialblatt (2002) Technische Anleitung zur Reinhaltung der Luft – TA Luft. http://www.bmu.de/files/pdfs/allgemein/application/pdf/taluft.pdf.
Hazardous Substances Data Bank (2003) Hazardous Substances Data Bank. http://toxnet.nlm.nih.gov/cgi-bin/sis/search. (Accessed March 27, 2001). Referred to in (2003).
Health and Safety Commission (2005) List of approved workplace exposure limits (as consolidated with amendments October 2007). http://www.hse.gov.uk/coshh/table1.pdf.
International Standards Organisation (2006) Environmental management – life cycle assessment – principles and framework. International Organization for Standardization, Geneva, Switzerland.
Jungbluth N (2005) Life cycle assessment of crystalline photovoltaics in the Swiss ecoinvent database. Progress in Photovoltaics: Research and Applications 13: 429–446.
Kuemmel B, Krüger Nielsen S and Sørensen B (1997) Life-Cycle Analysis of Energy Systems. Roskilde, Dk: Roskilde University Press.
Lewis, R.J. (1996) Sax’s Dangerous Properties of Industrial Materials. 9th ed. Van Nostrand Reinhold, New York.
Lewis, RJ, Sr ed (1997) Hawley’s Condensed Chemical Dictionary. 13th ed. John Wiley & Sons, Inc., New York.
Linaschke D, Leistner M, Mäder G, Grählert W, Dani I, Kaskel S, Lopez E, Hopfe V, Kirschmann M and Frenck J (2008) Plasma Enhanced Chemical Etching at Atmospheric Pressure for Crystalline Silicon Wafer Processing and Process Control by In-Line FTIR Gas Spetroscopy. EU PVSEC Proceedings. paper presented at the 23rd European Photovoltaic Solar Energy Conference and Exhibition. Valencia, Spain: WIP Wirtschaft und Infrastruktur GmbH & Co Planungs KG, Sylvensteinstr. 2, 81369 München, Germany, 1907 – 1910.
VF report 6/2014: Environmental Assessment of Dry Photovoltaic Etching Page 41 of 60
Lopez E, Beese H, Mäder G, Dani I, Hopfe V, Heintze M, Moeller R, Wanka H, Kirschmann M and Frenck J (2007) New developments in plasma enhanced chemical etching at atmospheric pressure for crystalline silicon wafer processing. The compiled state-of-the-art of PV solar technology and deployment. 22nd European Photovoltaic Solar Energy Conference, EU PVSEC 2007. Proceedings of the international conference. paper presented at the European Photovoltaic Solar Energy Conference and Exhibition (EU PVSEC). Milan, Italy: European Commission, Joint Research Centre.
Lopez E, Dani I, Hopfe V, Wanka H, Heintze M, Möller R and Hauser A (2006) Plasma enhanced chemical etching at atmospheric pressure for silicon wafer processing. Poortmans, J. ; European Commission, Joint Research Centre -JRC-: 21st European Photovoltaic Solar Energy Conference 2006. Proceedings. CD-ROM : Proceedings of the international conference held in Dresden, Germany, 4 - 8 September 2006. paper presented at the European Photovoltaic Solar Energy Conference. Dresden, Germany: München: WIP-Renewable Energies, 1161–1166. Available at: http://publica.fraunhofer.de/documents/N-63736.html (accessed 28/06/13).
Manzetti S and Andersen O (2012) Toxicological aspects of nanomaterials used in energy harvesting consumer electronics. Renewable & Sustainable Energy Reviews 16(1): 2102–2110.
Manzetti S, Behzadi H, Andersen O and Spool D van der (2013) Fullerenes toxicity and electronic properties. Environmental Chemistry Letters 11(2): 105–118.
Masters R, Coplan M, Hone B, and Dykes J (2000) Association of silicofluoride treated water with elevated blood lead. Neurotoxicol, 21(6),1091–1100.
Masters R and Coplan M (1999) Water treatment with silico-fluorides and lead toxicity. Int J Environ Sci (China), 56, 435–449.
Nakagawa Y, Suzuki T, Ishii H, Nakae D and Ogata A (2011) Cytotoxic effects of hydroxylated fullerenes on isolated rat hepatocytes via mitochondrial dysfunction. Arch Toxicol.
National Institute Of Occupational Safety & Health (2010) NIOSH Pocket Guide to Chemical Hazards (NPG). Centers for Disease Control and Prevention. Atlanta, GA. http://www.cdc.gov/niosh/npg/npgd0289.html.
Oberdörster E, Zhu S, Blickley T, McClellan-Green P and Haasch M (2006) Ecotoxicology of carbon-based engineered nanoparticles: Effects of fullerene (C60) on aquatic organisms. Carbon 44: 1112–1120.
Occupational Safety and Health Administration (2001) Limits for air contaminants. Code of Federal Regulations. 29 CFR 1910.1000, Table Z-1. U.S. Department of Labour. http://www.osha.gov/pls/oshaweb/owadisp.show_document?p_table=standards&p_id=9992.
Ozsvath D. (2009) Fluorides and environmental health: a review. Rev Environ Sci Biotechnol, 8, 59–79, doi:10.1007/s11157-008-9136-9. http://www.springerlink.com/content/d2ptm68862812894/fulltext.pdf
VF report 6/2014: Environmental Assessment of Dry Photovoltaic Etching Page 42 of 60

Pehnt M (2006) Dynamic life cycle assessment (LCA) of renewable energy technologies. Renewable Energy 31: 55–71.
Pew Center on Global Climate Change (2005) International Climate Efforts Beyond 2012. Report of the Climate dialogue at Pocantico. http://www.pewclimate.org/docUploads/PEW_Pocantico_Report05.pdf
Photovoltaics World (2011) Champions of Photovoltaics: Cells and Modules. Photovoltaics World (October).
Phylipsen G and Alsema E (1995) Environmental life-cycle assessment of multicrystalline silicon solar cell modules. Padualaan 14, NL-3584 CH Utrecht, The Netherlands: Utrecht University.
Piechulla P, Seiffe J, Hoffman M, Rentsch J and Preu R (2011) Increased Ion Energies for Texturing in a High-Throughput Plasma Tool. Proceedings at the 26th Euroean Photovoltaic Energy conference. paper presented at the 26th Euroean Photovoltaic Energy conference. Hamburg.
Rentsch J, Jaus J, Roth K and Preu R (2005) Economical and ecological aspects of plasma processing for industrial solar cell fabrication. IEEE Xplore. Digital library. paper presented at the Photovoltaic Specialists Conference, 2005. Conference Record of the Thirty-first IEEE. IEEE, 931 – 934.
Reuters (2011) U.S. lowers limits for fluoride in water. Reuters http://www.reuters.com/article/2011/01/08/us-usa-fluoride-idUSTRE7064CM20110108
Scientific Committee on Health and Environmental Risk (2010) Derogation on the Drinking Water Directive 98/83/EC. EU Directorate-General for Health & Consumers. http://ec.europa.eu/health/scientific_committees/environmental_risks/docs/scher_o_120.pdf
Scientific Committee on Occupational Exposure Limits (SCOEL) (1998) Recommendation from EU Scientific Committee on Occupational Exposure Limits for Fluorine, Hydrogen Fluoride and Inorganic Fluorides (not uranium hexafluoride). http://ec.europa.eu/social/BlobServlet?docId=3854&langId=en
Singulus Technologies (2012) MetaTEX200. Singulus Technologies AG, Kahl, Germany.
Social- och hälsovårdsministeriet (Ministry of Social- and Health Protection) (2007) HTP-värden 2007. Koncentrationer som befunnits skadlig (Concentrations found to be harmful). Social- och hälsovårdsministeriets publikationer (Publications from Ministry of Social- and Health Protection), 2007:20. http://www.stm.fi/c/document_library/get_file?folderId=39503&name=DLFE-6905.pdf.
The Social and Economic Council of the Netherlands (SER) (2006) Grenswaarden Fluorwaterstof (Limit values Hydrogen fluoride). http://www.ser.nl/nl/grenswaarden/fluorwaterstof%20%20als%20f.aspx.
VF report 6/2014: Environmental Assessment of Dry Photovoltaic Etching Page 43 of 60

Tylenda CA (2003) Toxicological Profile for Fluorides, Hydrogen Fluoride, and Fluorine (Update). U.S. Department of Health and Human Services. Public Health Service. Agency for Toxic Substances and Disease Registry, Atlanta, Georgia, http://books.google.no/books?id=geXFDm1yZ8QC&lpg=PA255&ots=HM-lk7wuBy&dq=fluorine%20regulations&pg=PA253#v=onepage&q=fluorine%20regulations&f=false
Urbansky ET and Schock MR (2000) Can fluoride affect lead (ii) in potable water? Hexafluorosilicate and fluoride equilibria in aqueous solution. In: Int J Environ Stu, 57, 597-637. http://www.tandfonline.com/doi/abs/10.1080/00207230008711299, DOI: 10.1080/00207230008711299.
United Nations Framework Convention on Climate Change (UNFCCC) (2011a) Subsidiary Body for Scientific and Technological Advice. Thirty-fifth session, Durban, 28 November to 3 December 2011. Provisional agenda and annotations. FCCC/SBSTA/2011/3. http://unfccc.int/resource/docs/2011/sbsta/eng/03.pdf
United Nations Framework Convention on Climate Change (UNFCCC) (2011b) Implications of the establishment of new hydrochlorofluorocarbon-22 (HCFC-22) facilities seeking to obtain certified emission reductions for the destruction of hydrofluorocarbon-23 (HFC-23). Technical paper. FCCC/TP/2011/2. http://unfccc.int/resource/docs/2011/tp/02.pdf
U.S. Environmental Protection Agency (EPA) (2001) Accidental release prevention. Appendix A to Part 68. Table of Toxic Endpoints. Code of Federal Regulations. http://www.epa.gov/oem/docs/chem/Appendix-A-final.pdf.
Verein Deutscher Ingenieure (VDI) (2011) Maximum immission values to protect vegetation - Maximum immission concentrations for hydrogen fluoride. VDI 2310.
Weidema BP and Wesnaes MS (1996) Data quality management for life cycle inventories – an example of using data quality indicators. Journal of Cleaner Production 4(3-4): 167-174.
World Health Organisation (WHO) (2008) Guidelines for Drinking-water Quality. Third Edition, incorporating the First and Second Addenda. Volume 1, Recommendations. http://www.who.int/water_sanitation_health/dwq/fulltext.pdf
Yamago S, Tokuyama H, Nakamura E, Kikuchi K, Kananishi S, Sueki K, Nakahara H, Enomoto S and Ambe F (1995) In vivo biological behavior of a water-miscible fullerene: 14C labeling, absorption, distribution, excretion and acute toxicity. Chem & Biol 2: 385–389.
Zehner O (2011) Unintended Consequences of Green Technologies. Green Technology. London: Sage, 427–432.
VF report 6/2014: Environmental Assessment of Dry Photovoltaic Etching Page 44 of 60

Appendix 1 – Life-cycle inventories As mentioned in Section Feil! Fant ikke referansekilden. Life-cycle inventory, the source for the inventories are primarily the two documents:
• Solnowat_Texturing_ConsumptionWetChemicals_130704.xlsx, provided by E. Duffy 26.09.2013
• Solnowat_Texturing_Consumption Dry Chemicals.xlsx, provided by J. Rentsch 04.07.2013
The original data was been conditioned based on commonly accepted values for density. Due to the absence of exact data for Sigulus Metatex (Singulus Technologies, 2012), the authors have assumed a mass ratio of: 4:48:48 for potassium hydroxide, Isoproturon (isopropyl alcohol), and deionized water respectively.
Appendix Table 1 Life-cycle inventory for the acidic texturing process for one 4.3 W wafer
Products Acidic Texturing - 4.3 W per wafer 1 p Materials/fuels Water, deionised, at plant/CH U 0,25071 kg HF - 50, Solnowat 0,00535 kg Nitric acid, 50% in H2O, at plant/RER U 0,00717 kg Hydrochloric acid, 36% in H2O, from reacting propylene and chlorine, at plant/RER U 0,00092 kg KOH - 50, Solnowat 0,00015 kg Sodium hydroxide, 50% in H2O, production mix, at plant/RER U 0,00064 kg Hydrogen fluoride, at plant/GLO U 0,00812 kg Electricity/heat Electricity, production mix RER/RER U 0,007 kWh Waste to treatment Treatment, wafer fabrication effluent, to wastewater treatment, class 2/CH U 0,30642 l
Appendix Table 2 Life-cycle inventory for the alkaline texturing process for one 4.5 W wafer
Products Alkaline Texturing - 4.5 W per wafer 1 p Materials/fuels Water, deionised, at plant/CH U 2,61074 kg Singulus MetaTEX200, Solnowat 0,0014 kg KOH - 50, Solnowat 0,00439 kg H2O2 - 30, Solnowat 0,00199 kg Hydrochloric acid, 36% in H2O, from reacting propylene and chlorine, at plant/RER U 0,00443 kg HF - 50, Solnowat 0,00029 kg Hydrogen fluoride, at plant/GLO U 0,00362 kg VF report 6/2014: Environmental Assessment of Dry Photovoltaic Etching Page 45 of 60

Electricity/heat Electricity, production mix RER/RER U 0,0071 kWh Waste to treatment Treatment, wafer fabrication effluent, to wastewater treatment, class 2/CH U 2,61767 l
Appendix Table 3 Life-cycle inventory for the dry texturing process for one 4.3 W wafer
Products Dry Texturing - 4.3 W per wafer 1 p Materials/fuels Hydrogen fluoride, at plant/GLO U 0,00026 kg Fluorine, liquid, at plant/RER U 0,00077 kg Nitrogen, liquid, at plant/RER U 0,00283 kg Compressed air, optimised generation, <30kW, 10 bar gauge, at compressor/RER U 27,12096 l Electricity/heat Electricity, production mix RER/RER U 0,01047 kWh Waste to treatment Treatment, wafer fabrication effluent, to wastewater treatment, class 2/CH U 0,02363 l
Appendix Table 4 Life-cycle inventory for the dry texturing process for one 4.5 W wafer
Products Dry Texturing - 4.5 W per wafer 1 p Materials/fuels Hydrogen fluoride, at plant/GLO U 0,00027 kg Fluorine, liquid, at plant/RER U 0,0008 kg Nitrogen, liquid, at plant/RER U 0,00296 kg Compressed air, optimised generation, <30kW, 10 bar gauge, at compressor/RER U 28,3824 l Electricity/heat Electricity, production mix RER/RER U 0,00974 kWh Waste to treatment Treatment, wafer fabrication effluent, to wastewater treatment, class 2/CH U 0,024732 l
Appendix Table 5 Life-cycle inventory for the production of 1 kg of 50 wt. % hydrogen fluoride in deionised water
Products HF - 50, Solnowat 1 kg Materials/fuels Hydrogen fluoride, at plant/GLO U 0,5 kg Water, deionised, at plant/CH U 0,5 kg
VF report 6/2014: Environmental Assessment of Dry Photovoltaic Etching Page 46 of 60

Appendix Table 6 Life-cycle inventory for the production of 1 kg of 50 wt. % potassium hydroxide in deionised water
Products KOH - 50, Solnowat 1 kg Materials/fuels Water, deionised, at plant/CH U 0,5 kg Potassium hydroxide, at regional storage/RER U 0,5 kg
Appendix Table 7 Life-cycle inventory for the production of Singulus MetaTEX200, based on: Singulus Technologies (2012), and discussion with J. Rentsch of Fraunhofer ISI
Products Singulus MetaTEX200, Solnowat 1 kg Materials/fuels Potassium hydroxide, at regional storage/RER U 0,04 kg Isoproturon, at regional storage/RER U 0,48 kg Water, deionised, at plant/CH U 0,48 kg
Appendix Table 8 Life-cycle inventory for the production of 1 kg of 30 wt. % hydrogen peroxide in deionised water
Products H2O2 - 30, Solnowat 1 kg Materials/fuels Hydrogen peroxide, 50% in H2O, at plant/RER U 0 kg Water, deionised, at plant/CH U 0 kg
VF report 6/2014: Environmental Assessment of Dry Photovoltaic Etching Page 47 of 60
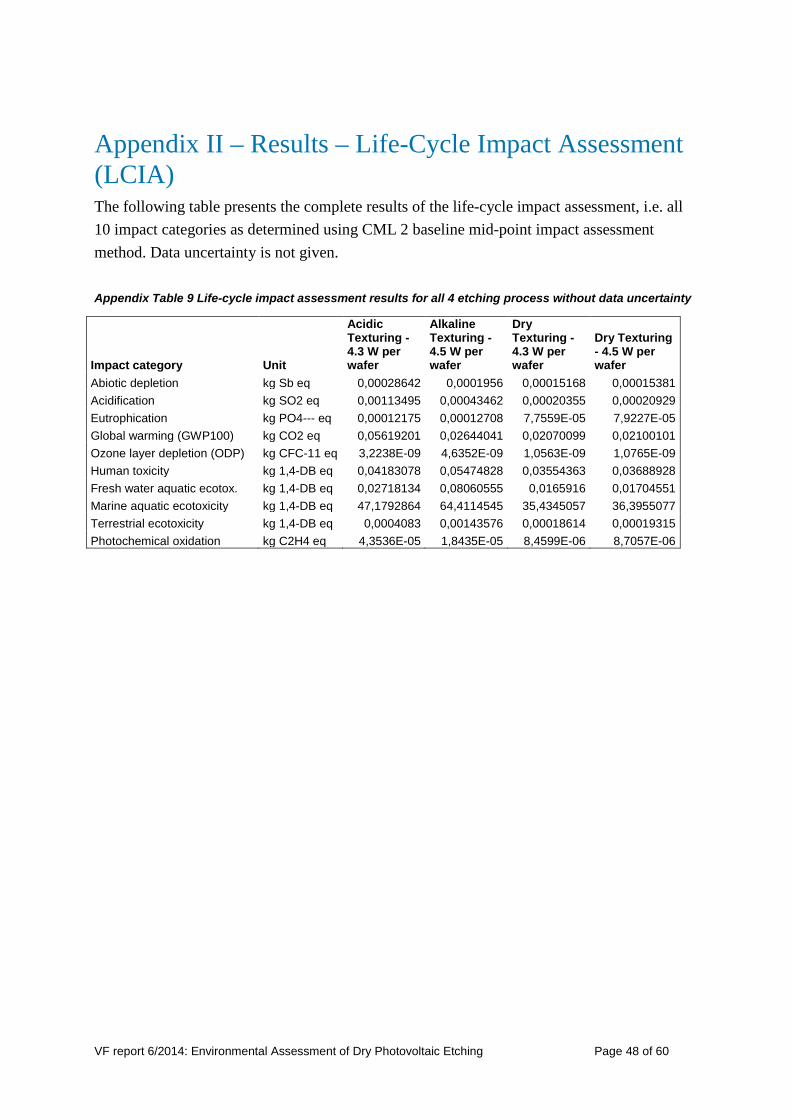
Appendix II – Results – Life-Cycle Impact Assessment (LCIA) The following table presents the complete results of the life-cycle impact assessment, i.e. all 10 impact categories as determined using CML 2 baseline mid-point impact assessment method. Data uncertainty is not given.
Appendix Table 9 Life-cycle impact assessment results for all 4 etching process without data uncertainty
Impact category Unit
Acidic Texturing - 4.3 W per wafer
Alkaline Texturing - 4.5 W per wafer
Dry Texturing - 4.3 W per wafer
Dry Texturing - 4.5 W per wafer
Abiotic depletion kg Sb eq 0,00028642 0,0001956 0,00015168 0,00015381 Acidification kg SO2 eq 0,00113495 0,00043462 0,00020355 0,00020929 Eutrophication kg PO4--- eq 0,00012175 0,00012708 7,7559E-05 7,9227E-05 Global warming (GWP100) kg CO2 eq 0,05619201 0,02644041 0,02070099 0,02100101 Ozone layer depletion (ODP) kg CFC-11 eq 3,2238E-09 4,6352E-09 1,0563E-09 1,0765E-09 Human toxicity kg 1,4-DB eq 0,04183078 0,05474828 0,03554363 0,03688928 Fresh water aquatic ecotox. kg 1,4-DB eq 0,02718134 0,08060555 0,0165916 0,01704551 Marine aquatic ecotoxicity kg 1,4-DB eq 47,1792864 64,4114545 35,4345057 36,3955077 Terrestrial ecotoxicity kg 1,4-DB eq 0,0004083 0,00143576 0,00018614 0,00019315 Photochemical oxidation kg C2H4 eq 4,3536E-05 1,8435E-05 8,4599E-06 8,7057E-06
VF report 6/2014: Environmental Assessment of Dry Photovoltaic Etching Page 48 of 60

Appendix III – Results – Contribution Analysis for Global Warming Potential
Contribution analysis reveals which processes are playing a significant role in the results. It is intended that with this information one can focus attention on these processes, and analyse if these processes are sufficiently representative, complete and if there are important assumptions within these processes. Here, contribution analysis is presented by a graphical representation of the process tree or network. In the process tree, a small thermometer indicates the relative contribution of the process. The advantage of this approach is that one can exactly see what the role of the process in the life- cycle is, adapted from Goedkoop et al. (2010).
Appendix Figure 1 Contribution analysis tree for GWP – acidic texturing of one 4.3 W wafer
VF report 6/2014: Environmental Assessment of Dry Photovoltaic Etching Page 49 of 60

As can be seen in this contribution analysis tree, the greatest contributors to GWP in the acidic texturing process are: the production of nitric acid, and hydrogen fluoride. Also revealed is that the provision of electricity contributes greatly to the GWP effect of hydrogen fluoride. As such, it can be interpreted that reductions in these two consumables, and careful selection of hydrogen fluoride whose production is based electricity with lower environmental effect would lead to an overall reduction in determined GWP.
Appendix Figure 2 Contribution analysis tree for GWP – alkaline texturing of one 4.5 W wafer
VF report 6/2014: Environmental Assessment of Dry Photovoltaic Etching Page 50 of 60

As can be seen in this contribution analysis tree, the greatest contributors to GWP in the alkaline texturing process are: the production of Singulus MetaTEX200, potassium hydroxide, hydrogen fluoride, and the provision of electricity based on European production mix averages. Due to the uncertainty in the inventory of Singulus MetaTEX200, see Appendix 1, one should be hesitant to base decisions this this particular result. It can though be interpreted that reductions in the remaining consumables, and particularly the careful selection of hydrogen fluoride whose production is based electricity with lower environmental effect would lead to an overall reduction in determined GWP.
Appendix Figure 3 Contribution analysis tree for GWP – dry texturing of one 4.3 W wafer
VF report 6/2014: Environmental Assessment of Dry Photovoltaic Etching Page 51 of 60

As can be seen in this contribution analysis tree, the greatest contributors to GWP in this dry texturing process are: the production of fluorine and the provision of compressed air and electricity based on European production mix averages. Considering that both fluorine production and compressed air consume large amounts of electricity, it can though be interpreted that reductions in electricity consumption, and/or the careful selection of electricity with lower environmental effect would lead to an overall reduction in determined GWP.
Appendix Figure 4 Contribution analysis tree for GWP – dry texturing of one 4.5 W wafer
VF report 6/2014: Environmental Assessment of Dry Photovoltaic Etching Page 52 of 60
Similar to the previous contribution analysis tree, the greatest contributors to GWP in this dry texturing process are: the production of fluorine and the provision of compressed air and electricity based on European production mix averages. Considering that both fluorine production and compressed air consume large amounts of electricity. Similarly it can be interpreted that reductions in electricity consumption, and/or the careful selection of electricity with lower environmental effect would lead to an overall reduction in determined GWP.
VF report 6/2014: Environmental Assessment of Dry Photovoltaic Etching Page 53 of 60

Appendix IV – Results – Uncertainty Analysis
Data uncertainty (standard deviation) with a 95 % confidence interval has been determined using Monte Carlo analysis with 1000 runs. Initial square geometric standard deviation has been determined using the pedigree matrix method developed by Weidema and Wesnaes (1996) included in the Ecoinvent database (Simapro 7) software. The square geometric standard deviation is 1.4 for all flows excluding Singulus MetaTEX200 which is 1.68, all with a logarithmic distribution.
Appendix Table 10 Uncertainty analysis, and impact assessment, of the acidic texturing of one 4.3 W wafer
Impact category Unit Mean Median SD
CV (Coefficient of
Variation) 2,5% 97,5% Std.err.of
mean Abiotic depletion kg Sb eq 0,000287 0,00028 0,0000572 19,9% 0,000203 0,000421 0,0063 Acidification kg SO2 eq 0,00107 0,000876 0,000803 75,4% 0,000561 0,00289 0,0238 Eutrophication kg PO4--- eq 0,000126 0,00011 0,000062 49,1% 0,000059 0,000297 0,0155
Fresh water aquatic ecotox.
kg 1,4-DB eq 0,0276 0,025 0,0117 42,3% 0,0145 0,053 0,0134
Global warming (GWP100) kg CO2 eq 0,056 0,055 0,00925 16,5% 0,0408 0,0764 0,00522
Human toxicity kg 1,4-DB eq 0,042 0,0368 0,0212 50,5% 0,0204 0,0964 0,016
Marine aquatic ecotoxicity
kg 1,4-DB eq 47,8 42,3 22,2 46,5% 23,2 113 0,0147
Ozone layer depletion (ODP)
kg CFC-11 eq 3,2E-09 3,04E-09 8,18E-10 25,6% 2E-09 5,37E-09 0,00809
Photochemical oxidation kg C2H4 eq 0,0000408 0,0000331 0,0000321 78,8% 0,0000206 0,000114 0,0249 Terrestrial ecotoxicity
kg 1,4-DB eq 0,000407 0,000383 0,000122 30,1% 0,000232 0,000716 0,00951
Confidence interval: 95
VF report 6/2014: Environmental Assessment of Dry Photovoltaic Etching Page 54 of 60
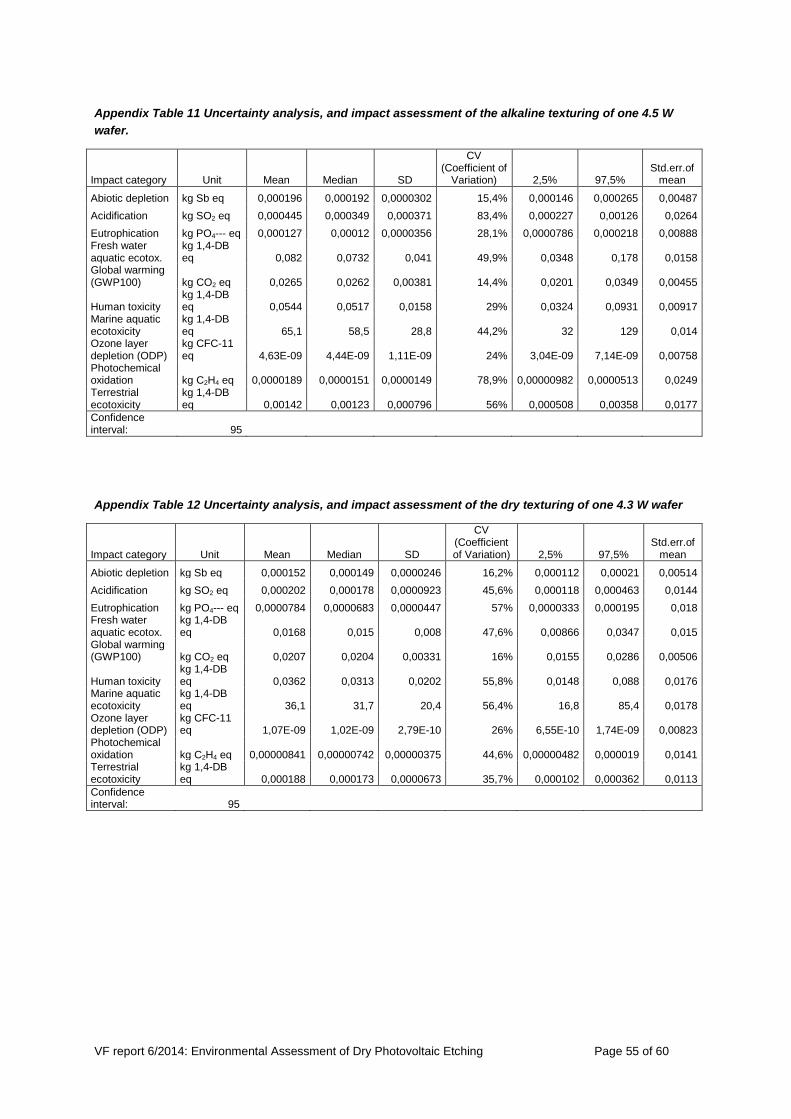
Appendix Table 11 Uncertainty analysis, and impact assessment of the alkaline texturing of one 4.5 W wafer.
Impact category Unit Mean Median SD
CV (Coefficient of
Variation) 2,5% 97,5% Std.err.of
mean Abiotic depletion kg Sb eq 0,000196 0,000192 0,0000302 15,4% 0,000146 0,000265 0,00487 Acidification kg SO2 eq 0,000445 0,000349 0,000371 83,4% 0,000227 0,00126 0,0264 Eutrophication kg PO4--- eq 0,000127 0,00012 0,0000356 28,1% 0,0000786 0,000218 0,00888 Fresh water aquatic ecotox.
kg 1,4-DB eq 0,082 0,0732 0,041 49,9% 0,0348 0,178 0,0158
Global warming (GWP100) kg CO2 eq 0,0265 0,0262 0,00381 14,4% 0,0201 0,0349 0,00455
Human toxicity kg 1,4-DB eq 0,0544 0,0517 0,0158 29% 0,0324 0,0931 0,00917
Marine aquatic ecotoxicity
kg 1,4-DB eq 65,1 58,5 28,8 44,2% 32 129 0,014
Ozone layer depletion (ODP)
kg CFC-11 eq 4,63E-09 4,44E-09 1,11E-09 24% 3,04E-09 7,14E-09 0,00758
Photochemical oxidation kg C2H4 eq 0,0000189 0,0000151 0,0000149 78,9% 0,00000982 0,0000513 0,0249 Terrestrial ecotoxicity
kg 1,4-DB eq 0,00142 0,00123 0,000796 56% 0,000508 0,00358 0,0177
Confidence interval: 95
Appendix Table 12 Uncertainty analysis, and impact assessment of the dry texturing of one 4.3 W wafer
Impact category Unit Mean Median SD
CV (Coefficient of Variation) 2,5% 97,5%
Std.err.of mean
Abiotic depletion kg Sb eq 0,000152 0,000149 0,0000246 16,2% 0,000112 0,00021 0,00514 Acidification kg SO2 eq 0,000202 0,000178 0,0000923 45,6% 0,000118 0,000463 0,0144 Eutrophication kg PO4--- eq 0,0000784 0,0000683 0,0000447 57% 0,0000333 0,000195 0,018 Fresh water aquatic ecotox.
kg 1,4-DB eq 0,0168 0,015 0,008 47,6% 0,00866 0,0347 0,015
Global warming (GWP100) kg CO2 eq 0,0207 0,0204 0,00331 16% 0,0155 0,0286 0,00506
Human toxicity kg 1,4-DB eq 0,0362 0,0313 0,0202 55,8% 0,0148 0,088 0,0176
Marine aquatic ecotoxicity
kg 1,4-DB eq 36,1 31,7 20,4 56,4% 16,8 85,4 0,0178
Ozone layer depletion (ODP)
kg CFC-11 eq 1,07E-09 1,02E-09 2,79E-10 26% 6,55E-10 1,74E-09 0,00823
Photochemical oxidation kg C2H4 eq 0,00000841 0,00000742 0,00000375 44,6% 0,00000482 0,000019 0,0141 Terrestrial ecotoxicity
kg 1,4-DB eq 0,000188 0,000173 0,0000673 35,7% 0,000102 0,000362 0,0113
Confidence interval: 95
VF report 6/2014: Environmental Assessment of Dry Photovoltaic Etching Page 55 of 60

Appendix Table 13 Uncertainty analysis, and impact assessment of the dry texturing of one 4.5 W wafer
Impact category Unit Mean Median SD
CV (Coefficient of
Variation) 2,5% 97,5% Std.err.of
mean
Abiotic depletion kg Sb eq 0,000155 0,000151 0,0000262 17% 0,000111 0,000213 0,00536 Acidification kg SO2 eq 0,000207 0,000185 0,0000875 42,3% 0,000119 0,000433 0,0134 Eutrophication kg PO4--- eq 0,0000764 0,0000681 0,0000386 50,5% 0,0000318 0,000166 0,016 Fresh water aquatic ecotox. kg 1,4-DB eq 0,0172 0,0157 0,009 52,4% 0,00823 0,0335 0,0166 Global warming (GWP100) kg CO2 eq 0,0211 0,0207 0,00358 17% 0,0151 0,0294 0,00536 Human toxicity kg 1,4-DB eq 0,0369 0,0325 0,0194 52,5% 0,0149 0,083 0,0166 Marine aquatic ecotoxicity kg 1,4-DB eq 36,5 32,1 18,3 50,2% 16,7 79,5 0,0159 Ozone layer depletion (ODP)
kg CFC-11 eq 1,08E-09 1,03E-09 2,84E-10 26,2% 6,54E-10 1,77E-09 0,00829
Photochemical oxidation kg C2H4 eq 0,00000862 0,00000774 0,00000358 41,6% 0,0000049 0,0000188 0,0131 Terrestrial ecotoxicity kg 1,4-DB eq 0,000195 0,000183 0,0000706 36,2% 0,000103 0,000366 0,0115 Confidence interval: 95
VF report 6/2014: Environmental Assessment of Dry Photovoltaic Etching Page 56 of 60

Appendix IV - Water consumption tables of results Appendix Table 14 Water consumption inventory results, both direct and indirect, for the acidic texturing of one 4.3 W wafer (total does not include: water, cooling, unspecified natural origin/m3, or water, turbine use unspecified origin/m3)
Acidic Texturing - 4.3 W per wafer
Substance Unit Total DI - water HF - 50 HNO3 - 69 HCL - 37 KOH - 50 NaOH - 50 HF waste disposal Electricity Waste water
Water, cooling, unspecified natural origin/m3 cm3 875.030066 9.7417028 165.751694 18.6811553 3.89934424 3.14274449 65.0234466 502.826075 103.384311 2.57959355
Water, lake cm3 58.5970802 57.117655 0.74230502 0.03706533 0.00081738 0.01895085 0.01270247 0.40334967 0.0474811 0.21675335
Water, river cm3 317.338544 144.233341 36.0184051 4.07448049 0.27126366 0.88275468 4.18756729 104.662942 21.8537264 1.15406371
Water, salt, ocean cm3 26.3470985 0.19062847 5.0547577 1.64490913 0.04061864 0.09214791 0.64727651 15.3376138 3.27950758 0.05963877
Water, salt, sole cm3 2.87569183 0.00725368 0.54088539 0.58408987 0.00169171 0.00598181 0.02021722 1.64163024 0.06905812 0.00488379 Water, turbine use, unspecified natural origin dm3 210.054652 2.04034601 41.6243748 6.75256377 0.2880095 0.67155149 5.0349685 126.28529 26.4065633 0.95098418 Water, unspecified natural origin/m3 cu.in 181.558632 0.05567523 44.5394 1.40115864 0.01537256 0.01025696 0.23639422 135.19817 0.04696891 0.05523612
Water, well, in ground cm3 154.271964 114.471013 8.97944512 1.10493059 0.05710866 0.1617644 0.99342805 23.5497423 4.44794558 0.50658666
Conditioned Water, cooling, unspecified natural origin/m3 l 0.87503007 0.0097417 0.16575169 0.01868116 0.00389934 0.00314274 0.06502345 0.50282607 0.10338431 0.00257959
Water, lake l 0.05859708 0.05711766 0.00074231 3.7065E-05 8.1738E-07 1.8951E-05 1.2702E-05 0.00040335 4.7481E-05 0.00021675
Water, river l 0.31733854 0.14423334 0.03601841 0.00407448 0.00027126 0.00088275 0.00418757 0.10466294 0.02185373 0.00115406
Water, salt, ocean l 0.0263471 0.00019063 0.00505476 0.00164491 4.0619E-05 9.2148E-05 0.00064728 0.01533761 0.00327951 5.9639E-05
Water, salt, sole l 0.00287569 7.2537E-06 0.00054089 0.00058409 1.6917E-06 5.9818E-06 2.0217E-05 0.00164163 6.9058E-05 4.8838E-06 Water, turbine use, unspecified natural origin l 210.054652 2.04034601 41.6243748 6.75256377 0.2880095 0.67155149 5.0349685 126.28529 26.4065633 0.95098418 Water, unspecified natural origin/m3 l 2.97524921 0.00091236 0.7298789 0.02296116 0.00025191 0.00016808 0.00387385 2.21552808 0.00076969 0.00090517
Water, well, in ground l 0.15427196 0.11447101 0.00897945 0.00110493 5.7109E-05 0.00016176 0.00099343 0.02354974 0.00444795 0.00050659 Total (excluding cooling and turbine use) l 3.53467959 0.31693226 0.7812147 0.03040663 0.00062341 0.00132968 0.00973505 2.36112335 0.03046741 0.002847
VF report 6/2014: Environmental Assessment of Dry Photovoltaic Etching Page 57 of 60

Appendix Table 15 Water consumption inventory results, both direct and indirect, for the alkaline texturing of one 4.5 W wafer (total does not include: water, cooling, unspecified natural origin/m3, or water, turbine use unspecified origin/m3)
Alkaline Texturing - 4.5 W per wafer
Substance Unit Total DI - water
Singulus Metatex, Solnowat KOH - 50 HCL - 37 HF - 50 HF waste disposal Electricity Waste water
Water, cooling, unspecified natural origin/m3 cm3 777.513059 101.444111 205.26607 91.9776554 18.7761902 8.98467124 224.166304 104.86123 22.0368274
Water, lake cm3 597.681232 594.788188 0.21459499 0.55462812 0.00393585 0.04023709 0.17981845 0.0481594 1.85167009
Water, river cu.in 98.9205033 91.6550894 0.68834875 1.57656632 0.07970884 0.11914276 2.84737347 1.35264791 0.6016259
Water, salt, ocean cm3 17.9110948 1.98508788 2.08601921 2.69686228 0.19558759 0.27399621 6.83770467 3.32635769 0.50947924
Water, salt, sole cm3 1.34728951 0.07553539 0.21559603 0.17506766 0.00814593 0.02931902 0.73185979 0.07004466 0.04172102 Water, turbine use, unspecified natural origin dm3 149.503042 21.2469106 13.751533 19.6540735 1.38682834 2.25627452 56.2996 26.7837999 8.12402186
Water, unspecified natural origin/m3 cu.in 65.5371604 0.57976762 1.37631429 0.30018696 0.07402222 2.41428523 60.2730757 0.0476399 0.47186845
Water, well, in ground cu.in 74.4328613 72.7422029 0.17519801 0.28890506 0.01678096 0.02970248 0.64067482 0.27530794 0.26408911
Conditioned Water, cooling, unspecified natural origin/m3 l 0.77751306 0.10144411 0.20526607 0.09197766 0.01877619 0.00898467 0.2241663 0.10486123 0.02203683
Water, lake l 0.59768123 0.59478819 0.00021459 0.00055463 3.9358E-06 4.0237E-05 0.00017982 4.8159E-05 0.00185167
Water, river l 1.62103639 1.50197613 0.01128015 0.02583561 0.00130621 0.00195242 0.04666066 0.0221662 0.009859
Water, salt, ocean l 0.01791109 0.00198509 0.00208602 0.00269686 0.00019559 0.000274 0.0068377 0.00332636 0.00050948
Water, salt, sole l 0.00134729 7.5535E-05 0.0002156 0.00017507 8.1459E-06 2.9319E-05 0.00073186 7.0045E-05 4.1721E-05 Water, turbine use, unspecified natural origin l 149.503042 21.2469106 13.751533 19.6540735 1.38682834 2.25627452 56.2996 26.7837999 8.12402186
Water, unspecified natural origin/m3 l 1.07397474 0.00950081 0.02255403 0.00491924 0.00121302 0.03956353 0.98771079 0.00078069 0.00773263
Water, well, in ground l 1.21975093 1.19204567 0.00287102 0.00473436 0.00027499 0.00048674 0.01049891 0.00451154 0.0043277 Total (excluding cooling and turbine use) l 4.53170167 3.30037142 0.0392214 0.03891577 0.00300189 0.04234625 1.05261974 0.03090299 0.0243222
VF report 6/2014: Environmental Assessment of Dry Photovoltaic Etching Page 58 of 60

Appendix Table 16 Water consumption inventory results, both direct and indirect, for the dry texturing of one 4.3 W wafer (total does not include: water, cooling, unspecified natural origin/m3, or water, turbine use unspecified origin/m3)
Dry Texturing - 4.3 W per wafer
Substance Unit Total HF waste disposal F2 N2 CDA Electricity Waste water
Water, cooling, unspecified natural origin/m3 cm3 595.761239 16.1003422 249.54476 45.8003866 129.48343 154.633391 0.19892891
Water, lake mm3 574.994335 12.915137 125.868246 15.5971122 332.880451 71.0181558 16.7152331
Water, river cm3 122.447779 3.35127644 51.4988987 7.82055824 27.0011178 32.6869307 0.08899721
Water, salt, ocean cm3 17.9389033 0.49110586 7.93516586 1.2227988 3.38002729 4.90520634 0.00459913
Water, salt, sole mm3 675.170288 52.5645146 318.731239 26.5873199 173.61938 103.291214 0.37662032
Water, turbine use, unspecified natural origin dm3 167.473593 4.04361763 59.8918253 8.96839596 54.9997433 39.496674 0.07333645
Water, unspecified natural origin/m3 cm3 326.740048 70.9396718 241.353657 0.29237817 12.9333131 1.151225 0.06980247
Water, well, in ground cm3 27.1689772 0.75405578 11.9402025 1.82693537 5.9558617 6.65285575 0.03906613
Conditioned
Water, cooling, unspecified natural origin/m3 l 0.59576124 0.01610034 0.24954476 0.04580039 0.12948343 0.15463339 0.00019893
Water, lake l 0.00057499 1.2915E-05 0.00012587 1.5597E-05 0.00033288 7.1018E-05 1.6715E-05
Water, river l 0.12244778 0.00335128 0.0514989 0.00782056 0.02700112 0.03268693 8.8997E-05
Water, salt, ocean l 0.0179389 0.00049111 0.00793517 0.0012228 0.00338003 0.00490521 4.5991E-06
Water, salt, sole l 0.00067517 5.2565E-05 0.00031873 2.6587E-05 0.00017362 0.00010329 3.7662E-07
Water, turbine use, unspecified natural origin l 167.473593 4.04361763 59.8918253 8.96839596 54.9997433 39.496674 0.07333645
Water, unspecified natural origin/m3 l 0.32674005 0.07093967 0.24135366 0.00029238 0.01293331 0.00115122 6.9802E-05
Water, well, in ground l 0.02716898 0.00075406 0.0119402 0.00182694 0.00595586 0.00665286 3.9066E-05
Total (excluding cooling and turbine use) l 0.49554587 0.07560159 0.31317252 0.01120486 0.04977682 0.04557053 0.00021956
VF report 6/2014: Environmental Assessment of Dry Photovoltaic Etching Page 59 of 60

Appendix Table 17 Water consumption inventory results, both direct and indirect, for the dry texturing of one 4.5 W wafer (total does not include: water, cooling, unspecified natural origin/m3, or water, turbine use unspecified origin/m3)
Dry Texturing - 4.5 W per wafer
Substance Unit Total HF waste disposal F2 N2 CDA Electricity Waste water
Water, cooling, unspecified natural origin/m3 cm3 603.457166 16.7195862 259.267283 47.9042913 135.505915 143.851884 0.20820608
Water, lake mm3 592.422241 13.411873 130.772204 16.3135874 348.363263 66.0665556 17.4947585
Water, river cm3 123.923358 3.48017169 53.5053493 8.1798065 28.2569837 30.4078992 0.09314765
Water, salt, ocean cm3 18.1385445 0.50999455 8.24432817 1.27896977 3.53723786 4.56320055 0.00481361
Water, salt, sole mm3 691.722535 54.5862267 331.14934 27.8086455 181.694701 96.0894386 0.39418425
Water, turbine use, unspecified natural origin dm3 170.18226 4.19914138 62.2252731 9.38037175 57.5578709 36.7428467 0.07675655
Water, unspecified natural origin/m3 cm3 339.409854 73.6681207 250.757046 0.30580897 13.5348625 1.07095811 0.07305776
Water, well, in ground cm3 27.5620864 0.78305793 12.4054052 1.9108582 6.23287852 6.18899857 0.040888
Conditioned
Water, cooling, unspecified natural origin/m3 l 0.60345717 0.01671959 0.25926728 0.04790429 0.13550591 0.14385188 0.00020821
Water, lake l 0.00059242 1.3412E-05 0.00013077 1.6314E-05 0.00034836 6.6067E-05 1.7495E-05
Water, river l 0.12392336 0.00348017 0.05350535 0.00817981 0.02825698 0.0304079 9.3148E-05
Water, salt, ocean l 0.01813854 0.00050999 0.00824433 0.00127897 0.00353724 0.0045632 4.8136E-06
Water, salt, sole l 0.00069172 5.4586E-05 0.00033115 2.7809E-05 0.00018169 9.6089E-05 3.9418E-07
Water, turbine use, unspecified natural origin l 170.18226 4.19914138 62.2252731 9.38037175 57.5578709 36.7428467 0.07675655
Water, unspecified natural origin/m3 l 0.33940985 0.07366812 0.25075705 0.00030581 0.01353486 0.00107096 7.3058E-05
Water, well, in ground l 0.02756209 0.00078306 0.01240541 0.00191086 0.00623288 0.006189 4.0888E-05
Total (excluding cooling and turbine use) l 0.51031799 0.07850934 0.32537405 0.01171957 0.05209202 0.04239321 1|0.0002298
VF report 6/2014: Environmental Assessment of Dry Photovoltaic Etching Page 60 of 60