Cradle-to-gate life cycle assessment of the dry etching step in the manufacturing of photovoltaic...
14
Manuscript submitted to: Volume 2, Issue 4, 410-423. AIMS Energy DOI: 10.3934/energy.2014.4.410 Received date 25 August 2014, Accepted date 6 November 2014, Published date 12 November 2014 Research article Cradle-to-gate life cycle assessment of the dry etching step in the manufacturing of photovoltaic cells Otto Andersen 1, *, Geoffrey Gilpin 1 , and Anders S.G. Andrae 2 1 Western Norway Research Institute, P.O. Box 163, 6851 Sogndal, Norway 2 Huawei Technologies Sweden AB., P.O. Box 54., 16494, Kista, Sweden * Correspondence: Email: [email protected]; Tel: +47977 10 928; Fax: +47947 63 727. Abstract: A new photovoltaic silicon crystalline solar cell dry chemical etching process (DCEP) is developed. It is an alternative to the current State-of-the-Art (SoA) wet chemical etching process (WCEP), associated with relatively large environmental loadings in the form of high water consumption and emissions of greenhouse gases with high Global Warming Potential (GWP). In order to compare the environmental impacts of DCEP to the corresponding impacts from WCEP, a comparative attributional life cycle assessment (LCA) is conducted. From the LCA it can be concluded that the DCEP will lead to 86% reduction in water consumption compared to WCEP (acidic), and 89% reduction compared to WCEP (alkaline). The emissions of greenhouse gases, as expressed by the GWP100 indicator of the etching step, are also reduced with 63% and 20% respectively, when compared with current SoA acidic and alkaline WCEP. The toxicity impacts are also assessed to be lower for the DCEP compared to WCEP technologies, although the uncertainty is relatively high for the applied toxicity indicators. All in all, DCEP can reduce the CO 2 eq emissions of solar photovoltaic systems production by 5–10%. Keywords: dry etching; global warming potential; life cycle assessment; photovoltaic solar cells; toxicity; water consumption 1. Introduction Solar photovoltaic systems (PV systems, “Solar panels”) are widely admired for the way they silently, and seemingly without pollution, extract clean energy from the sun’s rays. For example, Dominguez-Ramos et al. showed in a long-term prospective study that PV systems are associated with at least 13 times lower emissions of CO 2 –equivalents (CO 2 eq) than the grid power, when
Transcript of Cradle-to-gate life cycle assessment of the dry etching step in the manufacturing of photovoltaic...
Manuscript submitted to: Volume 2, Issue 4, 410-423.
AIMS Energy DOI: 10.3934/energy.2014.4.410
Received date 25 August 2014, Accepted date 6 November 2014, Published date 12 November 2014
Research article
Cradle-to-gate life cycle assessment of the dry etching step in the
manufacturing of photovoltaic cells
Otto Andersen 1, *, Geoffrey Gilpin 1, and Anders S.G. Andrae 2
1 Western Norway Research Institute, P.O. Box 163, 6851 Sogndal, Norway 2 Huawei Technologies Sweden AB., P.O. Box 54., 16494, Kista, Sweden
* Correspondence: Email: [email protected]; Tel: +47977 10 928; Fax: +47947 63 727.
Abstract: A new photovoltaic silicon crystalline solar cell dry chemical etching process (DCEP) is developed. It is an alternative to the current State-of-the-Art (SoA) wet chemical etching process (WCEP), associated with relatively large environmental loadings in the form of high water consumption and emissions of greenhouse gases with high Global Warming Potential (GWP). In order to compare the environmental impacts of DCEP to the corresponding impacts from WCEP, a comparative attributional life cycle assessment (LCA) is conducted. From the LCA it can be concluded that the DCEP will lead to 86% reduction in water consumption compared to WCEP (acidic), and 89% reduction compared to WCEP (alkaline). The emissions of greenhouse gases, as expressed by the GWP100 indicator of the etching step, are also reduced with 63% and 20% respectively, when compared with current SoA acidic and alkaline WCEP. The toxicity impacts are also assessed to be lower for the DCEP compared to WCEP technologies, although the uncertainty is relatively high for the applied toxicity indicators. All in all, DCEP can reduce the CO2eq emissions of solar photovoltaic systems production by 5–10%.
Keywords: dry etching; global warming potential; life cycle assessment; photovoltaic solar cells; toxicity; water consumption
1. Introduction
Solar photovoltaic systems (PV systems, “Solar panels”) are widely admired for the way they silently, and seemingly without pollution, extract clean energy from the sun’s rays. For example, Dominguez-Ramos et al. showed in a long-term prospective study that PV systems are associated with at least 13 times lower emissions of CO2–equivalents (CO2eq) than the grid power, when

411
AIMS Energy Volume 2, Issue 4, 410-423.
supplying power to a photovoltaic solar electrochemical oxidation process [1]. PV systems generally consist of PV modules and balance of system (BOS) parts, whose
production contributes to specific environmental problems [2,3,4]. PV modules supply chain generally consists of silicon (or other materials) wafer production, PV cells production and PV modules assembly. BOS parts are typically support structures, module interconnections, junction boxes, wire and grounding devices, batteries, inverters, transformers, generators, etc. There exist serious environmental issues connected not only to the way PV systems are produced, but also to the way they are disposed of after the use phase [5]. This research focuses on PV cells production.
The production of PV cells is following these main steps: 1) Etching/texturing, 2) Anti-reflection coating, 3) Metallization and 4) Contact Firing.
A key problem with current PV cell production is the high water consumption in the etching (Step 1) of the crystalline silicon wafers. The wet chemical process (WCEP), which is State-of-the- Art (SoA) in PV cell production, involves the processing of wafers in a series of consecutive and different chemical baths. Between each chemical treatment, the wafers need to be rinsed free from chemicals, using substantial amounts of clean (de-ionized) water in the process. In 2011, a leading USA solar company, with manufacturing plants in Malaysia and the Philippines, stated that their WCEP required about 15,000 litres of high purity process water per minute for a 1.4 GW production facility for PV solar cells [6].
As such, major chemical waste treatment facilities have shown to be necessary, to cope with the large volumes of contaminated water from the PV solar cell production, when using the wet chemical process [7]. That is why alternative process types, using less water, are needed.
PV manufacturing industry is in addition one of the leading emitters of fluorinated compounds. This includes hexafluoroethane (C2F6), nitrogen trifluoride (NF3), and sulphur hexafluoride (SF6). These are all extremely strong greenhouse gases, with global warming potentials (GWPs) of 12,200, 17,200, and 22,800 times that of CO2 on a 100-year time horizon (GWP100) [8]. In Europe, the European Commission Regulation No 842/2006 on certain fluorinated greenhouse gases (F gases) aims at reducing the emissions of F gases such as HFCs, PFCs and SF6.
SF6 is commonly used to remove damages to the wafers; so-called saw damages, which have occurred during the slicing of the crystalline silicon ingots. The SF6 is also used during the oxide etching process step [9]. The use of these strong greenhouse gases implies that an effect of large-scale implementation of PV solar cells in the future might have a considerable impact on climate, from emissions during their manufacturing [10,11,12]. This is in addition to the fact that production of silicon for crystalline PV solar cells also contributes substantially to the emission of GHGs [13]. These aspects explain why electricity production with the use of PV solar cells is worse than many other comparable technologies, in terms of life cycle GHG emissions. Depending on the system boundaries and modeling approach for the life cycle assessment (LCA), rather detrimental life cycle performance have been reported, with emissions as high as 110 g CO2eq/kWh [13-19]. In the European Commission ExternE project, on external costs for energy, the life-cycle emissions from PV installations in Germany were presented to be as high as 180 g CO2eq/kWh [20,21]. In ExternE, the use of PV solar cells was ranked even worse than natural gas in terms of life cycle GHG emissions and air pollution [21].
The present new process, that has been developed in the European Commission project SOLNOWAT—Development of a competitive zero Global Warming Potential (GWP) dry process to reduce the dramatic water consumption in the ever expanding solar cell manufacturing industry, is
412
AIMS Energy Volume 2, Issue 4, 410-423.
an alternative to the current WCEP used in crystalline PV solar cell production. This new chemical process has basis in previous work on plasma-based processes [22,23]. It is
however taking place in atmospheric pressure and not in vacuum, as has been common in dry plasma etching. It moreover relies on the use of fluorine (F2) as the etching gas. However, due the high toxicity to F2, emissions have to be avoided. Therefore, regulatory emission control requirements, and exposure limits for F2, must also be taken into consideration, in order to implement the necessary precautionary actions in the development of the DCEP. F2 is central to this research and its production is included in the LCA.
2. Life Cycle Assessment (LCA)
Life cycle assessment (LCA) offers a way to do model based estimations of environmental impacts. In recent years the number of published LCA studies has mushroomed. LCA studies are usually categorized as combinations of micro, macro, attributional and consequential studies featuring more or less dynamic modeling.
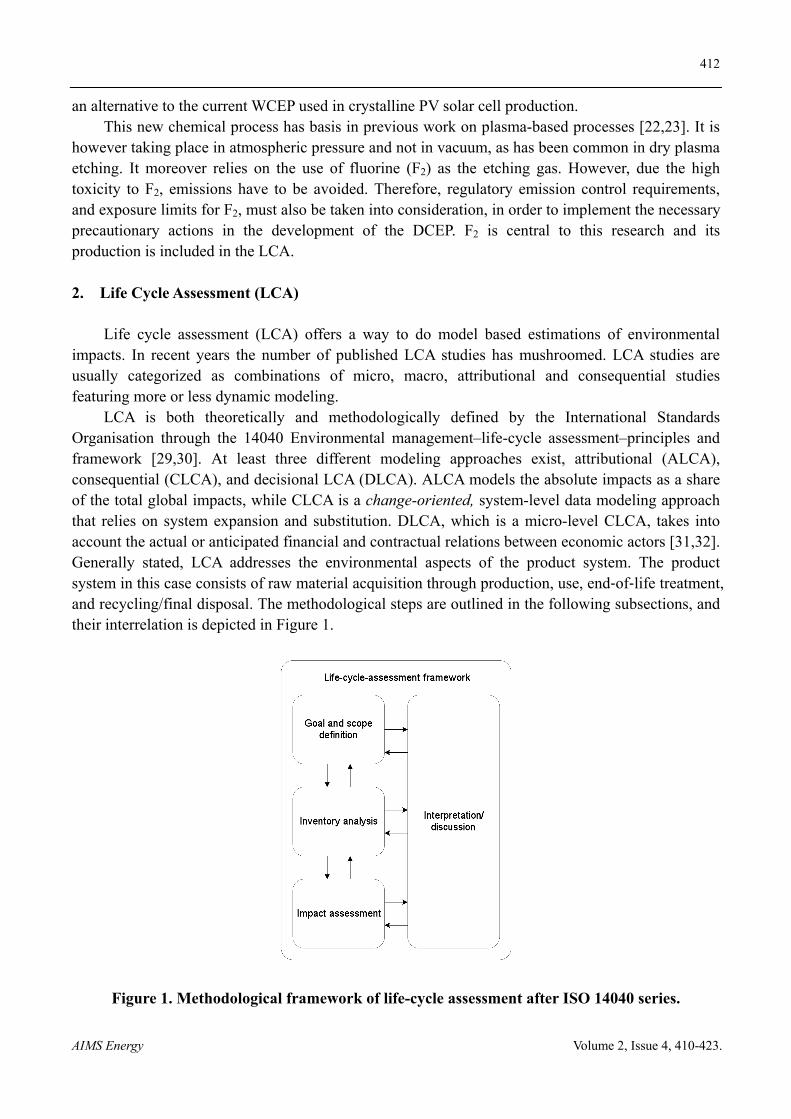
LCA is both theoretically and methodologically defined by the International Standards Organisation through the 14040 Environmental management–life-cycle assessment–principles and framework [29,30]. At least three different modeling approaches exist, attributional (ALCA), consequential (CLCA), and decisional LCA (DLCA). ALCA models the absolute impacts as a share of the total global impacts, while CLCA is a change-oriented, system-level data modeling approach that relies on system expansion and substitution. DLCA, which is a micro-level CLCA, takes into account the actual or anticipated financial and contractual relations between economic actors [31,32]. Generally stated, LCA addresses the environmental aspects of the product system. The product system in this case consists of raw material acquisition through production, use, end‐of‐life treatment, and recycling/final disposal. The methodological steps are outlined in the following subsections, and their interrelation is depicted in Figure 1.
Figure 1. Methodological framework of life-cycle assessment after ISO 14040 series.
413
AIMS Energy Volume 2, Issue 4, 410-423.
For ALCA and CLCA, detailed guidelines can be found in European Union’s ILCD Handbook [33].
The purpose of this study has been to perform a comparative ALCA exploring the eco-environmental impacts from the WCEP and DCEP (“SOLNOWAT”) PV etching processes. Through the comparison, it is possible to elucidate eco-environmental advantages and/or disadvantages associated with both etching processes. The present LCA study estimates eco-environmental impacts throughout the life cycle from raw material acquisition, production, use, end-of-life treatment (recycling and final disposal).
2.1. Goal and Scope Definition
The goal and scope definition, which is the first phase of the LCA, clarifies the aim of the study, the functional unit, the system alternatives considered, and the breadth and depth of the LCA in relation to this aim. In the first step of the goal and scope definition, the goal of the LCA study is stated and justified, explaining the aim of the study and specifying the intended use of the results. The goal of the present research is to compare the operation texturing phase eco-environmental impact between the DCEP and conventional WCEP PV solar wafer etching processes, with particular focus on greenhouse gas emissions and water consumption. The reason for doing this is to aid the development of a dry route alternative for the solar cell industry, which can reduce the high water consumption, and greenhouse gas emissions, of the current process. The intended use of the results is thus to support the development of the new DCEP.
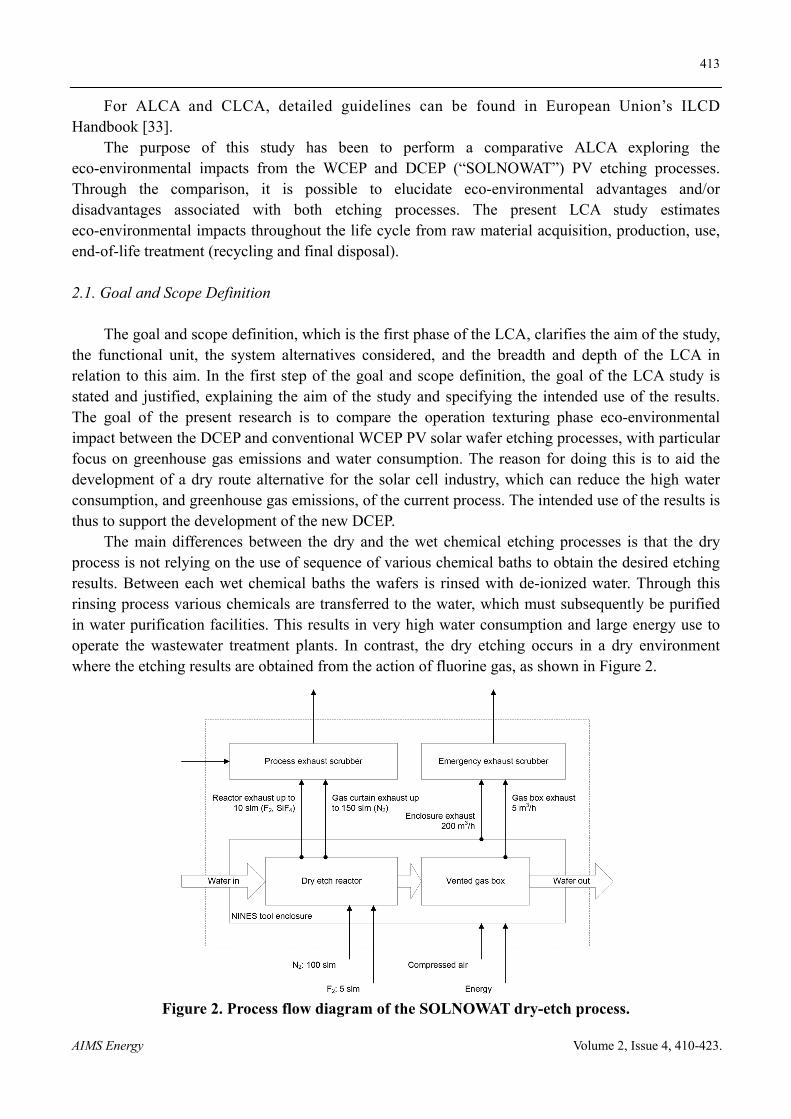
The main differences between the dry and the wet chemical etching processes is that the dry process is not relying on the use of sequence of various chemical baths to obtain the desired etching results. Between each wet chemical baths the wafers is rinsed with de-ionized water. Through this rinsing process various chemicals are transferred to the water, which must subsequently be purified in water purification facilities. This results in very high water consumption and large energy use to operate the wastewater treatment plants. In contrast, the dry etching occurs in a dry environment where the etching results are obtained from the action of fluorine gas, as shown in Figure 2.
Figure 2. Process flow diagram of the SOLNOWAT dry-etch process.

414
AIMS Energy Volume 2, Issue 4, 410-423.
The functional unit for the study is defined as one photovoltaic solar cell wafer. The system boundaries are shown in Figure 2. The flow rate of the various gas types depicted in the figure is in standard liter per minute (slm).
The Centrum voor Milieukunde Leiden (CML) 2 Baseline impact categories and impact assessment methods are used [34]. A limitation with the present eco-environmental assessment is that it only covers the texturing phase operations, and moreover it is only based on preliminary process data. Thus one should be careful to base claims solely on these results.
2.2. Inventory Analysis
The inventory analysis comprises of collecting data, for the unit processes within the system boundaries, for the studied product system, necessary to meet the defined goals. Also, the calculation procedures are established, resulting in an inventory of input/output data with respect to the system defined in the goal and scope definition phase. The data input to the process inventory is based on information from the SOLNOWAT project partners Fraunhofer Institute (J. Rentsch, pers. comm. 04.07.2013) and NINES Engineering (E. Duffy, pers. comm. 26.09.2013). Data are normalized to the functional unit, and detailed in the life-cycle inventories in the supporting information (available online)—Appendix I.
Figure 3. Life cycle impact assessment results. Results are calculated with CML 2 baseline mid-point impact assessment method, and subsequently normalized.
415
AIMS Energy Volume 2, Issue 4, 410-423.
2.3. Impact Assessment Results
The life cycle impact assessment (LCIA) results for two variants wet texturing process; WCEP (acidic) and WCEP (alkaline), and the corresponding DCEP of two different type of wafers; with 4.3 Watt and 4.5 Watt per wafer efficiency respectively, are included in the supporting information—Appendix II. The results are presented graphically in Figure 3. The results shown are obtained by applying CML 2 baseline mid-point impact assessment.
In Figure 3 is shown that the DCEP provide reductions for all impact categories with respect to their corresponding WCEP. However, as included in the supporting information—Appendix IV, it is shown that several impact category results, e.g. those for Photochemical oxidation and Human toxicity, are associated with relatively large uncertainties.
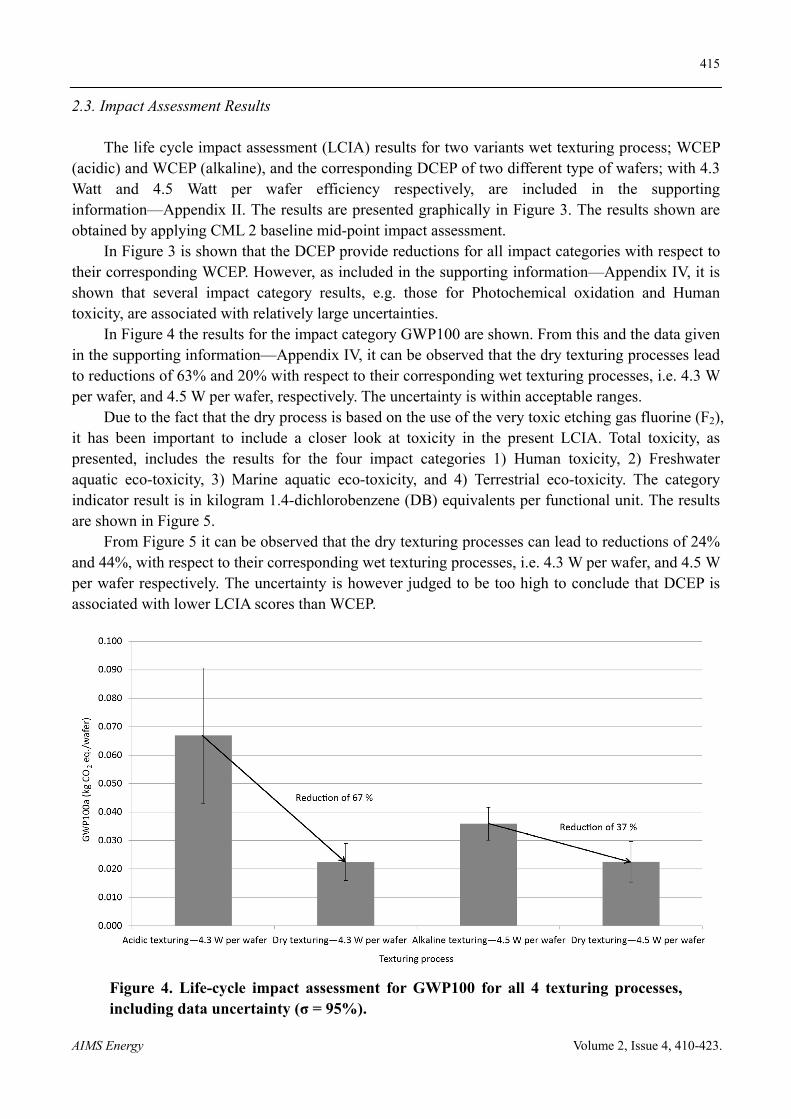
In Figure 4 the results for the impact category GWP100 are shown. From this and the data given in the supporting information—Appendix IV, it can be observed that the dry texturing processes lead to reductions of 63% and 20% with respect to their corresponding wet texturing processes, i.e. 4.3 W per wafer, and 4.5 W per wafer, respectively. The uncertainty is within acceptable ranges.
Due to the fact that the dry process is based on the use of the very toxic etching gas fluorine (F2), it has been important to include a closer look at toxicity in the present LCIA. Total toxicity, as presented, includes the results for the four impact categories 1) Human toxicity, 2) Freshwater aquatic eco-toxicity, 3) Marine aquatic eco-toxicity, and 4) Terrestrial eco-toxicity. The category indicator result is in kilogram 1.4-dichlorobenzene (DB) equivalents per functional unit. The results are shown in Figure 5.
From Figure 5 it can be observed that the dry texturing processes can lead to reductions of 24% and 44%, with respect to their corresponding wet texturing processes, i.e. 4.3 W per wafer, and 4.5 W per wafer respectively. The uncertainty is however judged to be too high to conclude that DCEP is associated with lower LCIA scores than WCEP.
Figure 4. Life-cycle impact assessment for GWP100 for all 4 texturing processes, including data uncertainty (σ = 95%).

416
AIMS Energy Volume 2, Issue 4, 410-423.
Figure 5. Life-cycle impact assessment for total toxicity: fresh water aquatic ecotoxicity, human toxicity, marine aquatic ecotoxicity, and terrestrial ecotoxicity, for all 4 texturing processes, including data uncertainty (σ = 95%).
2.4. Water consumption (direct and indirect)
Water consumption does not constitute an impact category in the CML 2 baseline mid-point impact assessment method. As such, total water consumption is determined by investigating the inventory results; including both the direct and indirect usage of water. Water for cooling and water passing through turbines for the generation of electricity are not included in the studied product system. The results for each of the four etching processes are shown in Figures 6–10. The source data can be found in the supporting information—Appendix V.
HF is usually manufactured by mixing sulfuric acid and calcium fluoride (CaF2). HF can then be used to produce aluminium trifluoride (AlF3). Dominguez-Ramos et al. [35] analyzed AlF3 manufacturing and proposed a recovery of fluoride wastewater for making synthetic CaF2 (77 kg per ton AlF3) to be used in HF manufacturing, then used in the AlF3 manufacturing. This HF manufacturing system differs from the presently used ecoinvent process (hydrogen fluoride, at plant/GLO) in that it used synthetic CaF2, reducing the need for primary CaF2.
The manufacturing of primary CaF2 contribute to around 10% of the GWP100 per kg for HF, albeit higher and lower in other CML mid-point categories. Therefore there are indications that synthetic CaF2 can help reduce the HF manufacturing impacts.
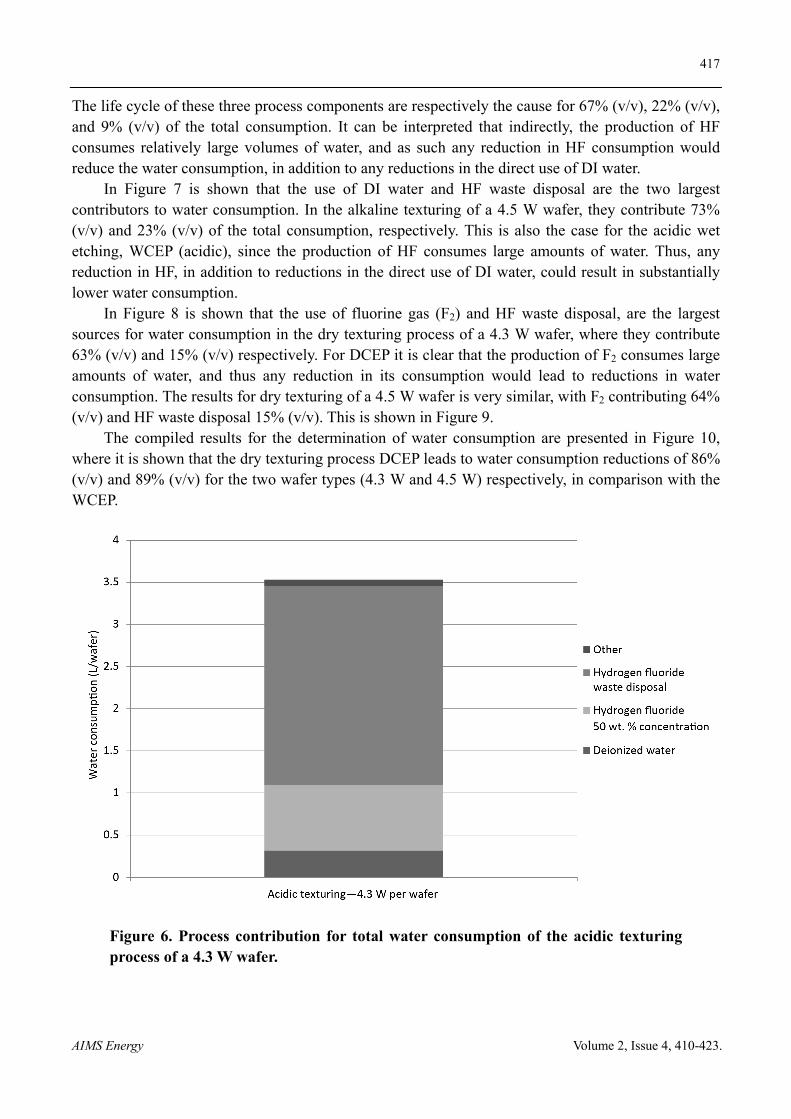
In Figure 6 we observe that the production and use of HF, as well as de-ionized water (DI) are the strongest contributors to water consumption in the acidic wet chemical etching of a 4.3 W wafer.
417
AIMS Energy Volume 2, Issue 4, 410-423.
The life cycle of these three process components are respectively the cause for 67% (v/v), 22% (v/v), and 9% (v/v) of the total consumption. It can be interpreted that indirectly, the production of HF consumes relatively large volumes of water, and as such any reduction in HF consumption would reduce the water consumption, in addition to any reductions in the direct use of DI water.
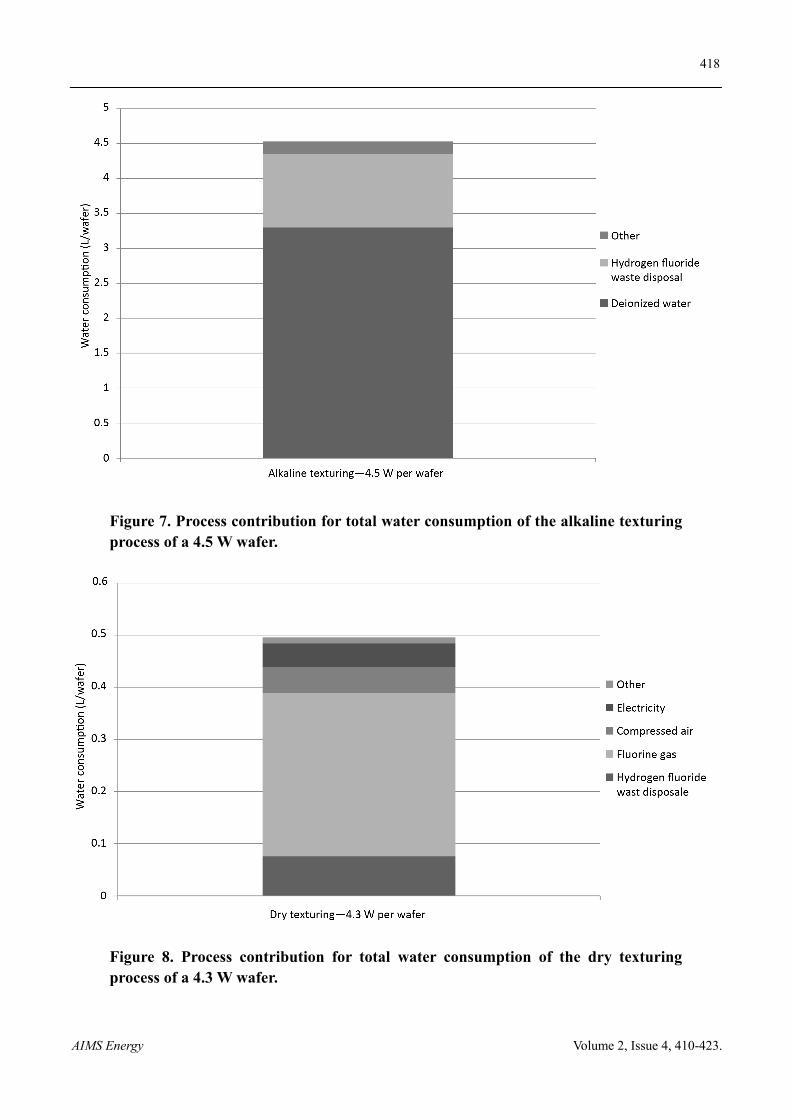
In Figure 7 is shown that the use of DI water and HF waste disposal are the two largest contributors to water consumption. In the alkaline texturing of a 4.5 W wafer, they contribute 73% (v/v) and 23% (v/v) of the total consumption, respectively. This is also the case for the acidic wet etching, WCEP (acidic), since the production of HF consumes large amounts of water. Thus, any reduction in HF, in addition to reductions in the direct use of DI water, could result in substantially lower water consumption.
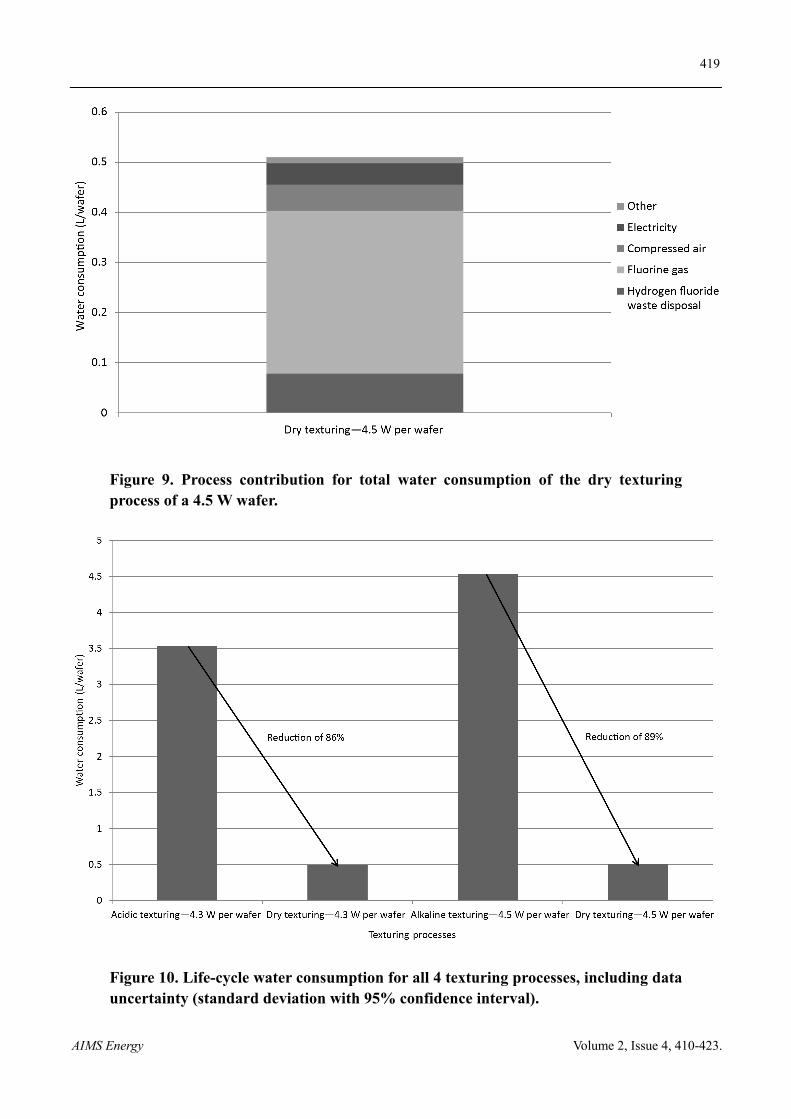
In Figure 8 is shown that the use of fluorine gas (F2) and HF waste disposal, are the largest sources for water consumption in the dry texturing process of a 4.3 W wafer, where they contribute 63% (v/v) and 15% (v/v) respectively. For DCEP it is clear that the production of F2 consumes large amounts of water, and thus any reduction in its consumption would lead to reductions in water consumption. The results for dry texturing of a 4.5 W wafer is very similar, with F2 contributing 64% (v/v) and HF waste disposal 15% (v/v). This is shown in Figure 9.
The compiled results for the determination of water consumption are presented in Figure 10, where it is shown that the dry texturing process DCEP leads to water consumption reductions of 86% (v/v) and 89% (v/v) for the two wafer types (4.3 W and 4.5 W) respectively, in comparison with the WCEP.
Figure 6. Process contribution for total water consumption of the acidic texturing process of a 4.3 W wafer.
418
AIMS Energy Volume 2, Issue 4, 410-423.
Figure 7. Process contribution for total water consumption of the alkaline texturing process of a 4.5 W wafer.
Figure 8. Process contribution for total water consumption of the dry texturing process of a 4.3 W wafer.
419
AIMS Energy Volume 2, Issue 4, 410-423.
Figure 9. Process contribution for total water consumption of the dry texturing process of a 4.5 W wafer.
Figure 10. Life-cycle water consumption for all 4 texturing processes, including data uncertainty (standard deviation with 95% confidence interval).

420
AIMS Energy Volume 2, Issue 4, 410-423.
3. Conclusion and Discussion
In the supporting information—Appendix III, it is shown through a contribution analysis the degree to which the processes contribute to the total LCA results. With this information it is possible to focus attention on these processes, and analyze if they are sufficiently representative and complete, as well as if there are important assumptions within these processes, which could alter the final conclusions. In this analysis a graphical representation of the process tree shows a vertical bar that indicates the relative contribution of the process. This facilitates the understanding of the role of each process in the life cycle. From these process trees, it can be concluded that the largest contributors to GWP100 indicator in the acidic texturing process, WCEP (acidic), are the production of nitric acid and HF. It can also be revealed that the provision of electricity contributes greatly to the GWP100 score for HF. As such, reductions in these two consumables, and careful selection of HF whose production uses electricity associated with lower eco-environmental effects, would lead to an overall reduction in GWP100 results. The largest contributors to GWP100 in the alkaline texturing process, WCEP (alkaline) are the production of hydrogen fluoride, Singulus MetaTEX200, potassium hydroxide, and the production of electricity (which is based on European production mix averages). Due to the uncertainty in the inventory of Singulus MetaTEX200, as described in supporting information—Appendix I, one should not base decisions on this particular result. It can though be interpreted that reductions in the remaining consumables are recommended, and again particularly the selection of HF based on electricity with lower GWP.
For the dry etching process (DCEP), the greatest contributors to GWP are the production of fluorine and the provision of compressed air and electricity based on European production mix averages. Considering that both fluorine production and compressed air consume large amounts of electricity, it can be interpreted that reductions in electricity consumption, and/or the use of electricity with lower environmental effect would lead to an overall reduction in determined GWP.
Data uncertainties (standard deviations with 95% confidence intervals) for each CML impact category are determined using Monte Carlo analysis with 1,000 runs for this study. The results are included in the supporting information—Appendix IV. Initial square geometric standard deviations for the consumption of materials and energy were determined using the pedigree matrix method [36], which is included in the Ecoinvent database (Simapro 7) LCA tool. SimaPro uses several LCI databases such as Ecoinvent in which the uncertainty of the LCI data has been quantified. The total logarithmically distributed square geometric standard deviation is 1.4 for all consumption flows, e.g. of HF and electricity. The only exception is Singulus MetaTEX200 consumption with a standard deviation of 1.68.
Taking this all into consideration, it is possible to conclude that the DCEP compared with WCEP has the potential to reduce the eco-environmental impacts in the form of lower water consumption and emission of greenhouse gases. As far as water consumption, the present LCA has shown that DCEP constitute a substantial improvement in the form of 85–89% reduction. The emissions of greenhouse gases are reduced with 63% and 20% in comparison with current SoA WCEP (acidic) and WCEP (alkaline), respectively. Finally, the life cycle toxicity impacts appear not to be increased by the new process DCEP, even though the etching is facilitated through the use of highly toxic F2 gas. However, the issue should be investigated further.
How much can DCEP reduce the GWP100 per produced solar photovoltaic system? From ecoinvent 2.2 process “Electricity 3kWp facade roof m-Si Lam/integrated U” it can be concluded
421
AIMS Energy Volume 2, Issue 4, 410-423.
that PV systems GWP100 score are distributed as BOS ≈ 10%, silicon (or other materials) wafer production ≈ 60%, PV cells production ≈ 20% and PV modules assembly ≈ 10% assembly. This means that DCEP, placed within PV cells production, can reduce the overall GWP100 score of PV systems to the degree it can reduce etching within PV cells production. Likely etching by WCEP is around 25–50% of PV cells production, i.e., DCEP can reduce the total GWP100 score of PV systems production by 5–10%.
Based on the results in this study, is can also be proposed that the environmental impact of solar cell production can be further reduced, by not only converting to the dry chemical process, but also develop and implement measures to reduce the consumption of fluorine gas in that process. This is based on the relatively high contribution of environmental impacts from the production of fluorine.
Acknowledgments
This work was financially supported by the European Commission through the project "Development of a competitive zero Global Warming Potential (GWP) dry process to reduce the dramatic water consumption in the ever expanding solar cell manufacturing industry—SOLNOWAT", grant agreement no. 286658.
Conflict of Interest
All authors declare no conflicts of interest in this paper.
References
1 Dominguez-Ramos A, Held M, Aldaco R, et al, (2010) Prospective CO2 emissions from energy supplying systems: Photovoltaic systems and conventional grid within Spanish frame conditions. Int J LCA 15(6): 557-566.
2 Andersen O (2013) Solar Cell Production. In: Unintended Consequences of Renewable Energy. Problems to be Solved. Springer London, London, 81-89.
3 Bianco C, Torrelli A, Squizzato V, et al.. Energy and carbon pay back times for renewable power supply systems for Italian RBS off-grid sites. Telecommunications Energy Conference (INTELEC), 2011 IEEE 33rd International; 2011 9-13 Oct.; Amsterdam, the Netherlands. IEEE. 1-6.
4 Andrae ASG, Dong H, Shudong L, et al.. Added value of life cycle assessment to a business case analysis of a photovoltaic/wind radio base site solution in South Africa. Telecommunications Energy Conference (INTELEC), 2012 IEEE 34th International; 2012 30 Sept.-4 Oct.; Scottsdale, AZ, USA. IEEE. 1-7.
5 Zehner O (2011) Unintended Consequences of Green Technologies. Green Technology. Sage, London, 427-432.
6 Duffy E (2012) SOLNOWAT—Development of a competitive zero Global Warming Potential (GWP) dry process to reduce the dramatic water consumption in the ever-expanding solar cell manufacturing industry. D7.3 Exploitation Plan (interim).
7 Agostinelli G, Dekkers HFW, De Wolf S, et al. (2004) Dry Etching and Texturing Processes for Crystalline Silicon Solar cells: Sustainability for Mass Production. Paris, 423-426.

422
AIMS Energy Volume 2, Issue 4, 410-423.
8 Forster P, Ramaswamy V, Artaxo P, et al. (2007) Changes in Atmospheric Constituents and in Radiative Forcing. In: Climate Change 2007: The Physical Science Basis. Contribution of Working Group I to the Fourth Assessment Report of the Intergovernmental Panel on Climate Change. Cambridge University Press, Cambridge, United Kingdom and New York, NY, USA.
9 Piechulla P, Seiffe J, Hoffman M, et al.. Increased Ion Energies for Texturing in a High-Throughput Plasma Tool. European Photovoltaic Solar Energy Conference and Exhibition (EU PVSEC); 2011 5-9 Sept.; Hamburg, Germany. Fraunhofer-Publica. 2024-2027.
10 Alsema E (2000) Energy pay-back time and CO2 emissions of PV systems. Prog Photovoltaics: Res Appl 8(1): 17-25.
11 Alsema E, de Wild-Scholten M. Environmental Impact of Crystalline Silicon Photovoltaic Module Production. 13th CIRP Intern. Conf. on Life Cycle Engineering; 2006 31 May-2 Jun.; Leuven, Belgium. G3.3.
12 Fthenakis VM, Kim HC, Alsema E (2008) Emissions from Photovoltaic Life Cycles. Environ Sci Technol 42:2168-2174.
13 Fthenakis VM, Kim HC (2010) Photovoltaics: Life-cycle analyses. Sol Energ 85:1609-1628. 14 Pehnt M (2006) Dynamic life cycle assessment (LCA) of renewable energy technologies. Renew
Energ 31:55-71. 15 Jungbluth N (2005) Life cycle assessment of crystalline photovoltaics in the Swiss ecoinvent
database. Prog Photovoltaics: Res Appl 13:429-446. 16 Fthenakis VM, Kim HC (2007) Greenhouse-gas emissions from solar electric- and nuclear power:
A life-cycle study. Energ Policy 35:2549-2557. 17 Bergesen J D, Heath GA, Gibon T, et al. (2014) Thin-film photovoltaic power generation offers
decreasing greenhouse gas emissions and increasing environmental co-benefits in the long term. Env Sci Tec 48(16): 834-9843.
18 Kim, H. C., Fthenakis, V., Choi, J., & Turney, D. E. (2012). Life cycle greenhouse gas emissions of thin-film photovoltaic electricity generation: Systematic review and harmonization. J Ind Ecol 16(SUPPL.1): S110-S121.
19 Fthenakis V, Kim HC, Alsema E (2008). Emissions from photovoltaic life cycles. Env Sci Tec 42(6): 2168-2174.
20 European Commission (2003) External Costs. Research results on socio-environmental damages due to electricity and transport. European Commission, Directorate-General for Research Information and Communication Unit, Brussels.
21 European Commission (1995) ExternE: Externalities of Energy. Prepared by ETSU and IER for DGXII: Science, Research & Development, Study EUR 16520-5 EN. Luxembourg.
22 Rentsch J, Jaus J, Roth K, Preu R. Economical and ecological aspects of plasma processing for industrial solar cell fabrication. Photovoltaic Specialists Conference, 2005. Conference Record of the Thirty-first IEEE; 2005 3-7 Jan.. IEEE, 931-934.
23 Agostinelli G, Choulat P, Dekkers HFW, et al.. Advanced dry processes for crystalline silicon solar cells. Photovoltaic Specialists Conference, 2005. Conference Record of the Thirty-first IEEE; 2005 3-7 Jan.. IEEE, 1149-1152.
24 Lopez E, Dani I, Hopfe V, et al.. Plasma enhanced chemical etching at atmospheric pressure for silicon wafer processing. European Photovoltaic Solar Energy Conference; 2006 4-8 Sept.; Dresden, Germany. Fraunhofer-Publica. 1161-1166.
25 Lopez E, Beese H, Mäder G, et al.. New developments in plasma enhanced chemical etching at

423
AIMS Energy Volume 2, Issue 4, 410-423.
atmospheric pressure for crystalline silicon wafer processing. The compiled state-of-the-art of PV solar technology and deployment. 22nd European Photovoltaic Solar Energy Conference, EU PVSEC 2007. Proceedings of the international conference; 2007 3-7 Sept.; Milan, Italy. Fraunhofer-Publica. 1484-1487.
26 Linaschke D, Leistner M, Mäder G, et al. Plasma Enhanced Chemical Etching at Atmospheric Pressure for Crystalline Silicon Wafer Processing and Process Control by In-Line FTIR Gas Spetroscopy. 21st European Photovoltaic Solar Energy Conference 2006. Proceedings; 2008 1-5 Sept.; Valencia, Spain. Fraunhofer-Publica.1907-1910.
27 Photovoltaics World, Champions of Photovoltaics: Cells and Modules. Photovoltaics World, 2011. Available from: http://www.renewableenergyworld.com/rea/news/article/2011/12/champions-of-photovoltaics-cells-and-modules.
28 Dresler B, Köhler D, Mäder G, et al. (2012) Novel Industrial single sided dry etching and texturing process for silicon solar cell improvement. 27th European Photovoltaic Solar Energy Conference and Exhibition 1825-1828.
29 International Standards Organisation (2006) Environmental management–life cycle assessment–principles and framework. International Organization for Standardization, Geneva, Switzerland.
30 International Standards Organisation (2006) Environmental management–life cycle assessment–Requirements and Guidelines. International Organization for Standardization, Geneva, Switzerland.
31 Andrae ASG (2009) Global life cycle impact assessments of material shifts: the example of a lead-free electronics industry. Springer.
32 Frischknecht R, Stucki M (2010) Scope-dependent modeling of electricity supply in life cycle assessments. Int J LCA 15:806-816.
33 European Commission Joint Research Centre Institute for Environment and Sustainability (2010) International Reference Life Cycle Data System (ILCD) Handbook—General guide for Life Cycle Assessment—Detailed guidance. First edition March 2010. EUR 24708 EN. Luxembourg. Publications Office of the European Union.
34 Institute of Environmental Sciences (CML) Faculty of Science, CML-IA Characterisation Factors. Leiden University Institute of Environmental Sciences (CML), 2013. Available from: http://cml.leiden.edu/software/data-cmlia.html.
35 Dominguez-Ramos A, Aldaco R, Irabien A (2007) Life cycle assessment as a tool for cleaner production: Application to aluminium trifluoride. Int J Chem Reactor Eng 5(1): 1542-6580.
36 Weidema B, Wesnaes M (1996) Data quality management for life cycle inventories—an example of using data quality indicators. J Cleaner Prod 4(3-4):167-174.
@2014, Otto Andersen, et al., licensee AIMS Press. This is an open access article distributed under the terms of the Creative Commons Attribution License (http://creativecommons.org/licenses/by/4.0)