Hornblende etching and quartz/feldspar ratios as weathering ...
10
Hornblende etching and quartz/feldspar ratios as weathering and soil development indicators in some Michigan soils Leslie R. Mikesell a , Randall J. Schaetzl b, * , Michael A. Velbel a a Department of Geological Sciences, Michigan State University, East Lansing, MI 48824 United States b Department of Geography, Michigan State University, East Lansing, MI 48824-1115, United States Received 1 April 2003 Available online 14 August 2004 Abstract Weathering can be used as a highly effective relative age indicator. One such application involves etching of hornblende grains in soils. Etching increases with time (duration) and decreases with depth in soils and surficial sediments. Other variables, related to intensity of weathering and soil formation, are generally held as constant as possible so as to only minimally influence the time–etching relationship. Our study focuses on one of the variables usually held constant—climate—by examining hornblende etching and quartz/feldspar ratios in soils of similar age but varying degrees of development due to climatic factors. We examined the assumption that the degree of etching varies as a function of soil development, even in soils of similar age. The Spodosols we studied form a climate-mediated development sequence on a 13,000-yr-old outwash plain in Michigan. Their pedogenic development was compared to weathering-related data from the same soils. In general, soils data paralleled weathering data. Hornblende etching was most pronounced in the A and E horizons, and decreased rapidly with depth. Quartz/feldspar ratios showed similar but more variable trends. In the two most weakly developed soils, the Q/F ratio was nearly constant with depth, implying that this ratio may not be as effective a measure as are etching data for minimally weathered soils. Our data indicate that hornblende etching should not be used as a stand-alone relative age indicator, especially in young soils and in contexts where the degree of pedogenic variability on the geomorphic surface is large. D 2004 University of Washington. All rights reserved. Keywords: Relative age dating; Soil development; Hornblende; Quartz/feldspar ratios; Surface exposure dating; Spodosols Introduction Hornblende is common in crystalline rocks (Blackburn and Dennen, 1988) and is the most abundant heavy mineral in many soils (Allen and Hajek, 1989; Blackburn and Dennen, 1988; Dreimanis et al., 1957; Dworkin et al., 1985; Hall and Martin, 1986). In soils, hornblende is most common in the sand and silt fractions (Allen and Hajek, 1989; Locke, 1979; Ruhe et al., 1966). Weathering corrodes/etches hornblende minerals in a crystallographically controlled manner (Berner and Schott, 1982; Berner et al., 1980; Velbel, 1987, 1989). Etch pits form on the grain surface and progress through a sequence of stages, enlarging and coalescing with time (Berner and Schott, 1982; Berner et al., 1980; Cremeens et al., 1992; L3ng, 2000). End-to-end coalescence results in the formation of longitudinal grooves or striations, whereas side-by-side coalescence forms denticulated or sawtooth margins (Fig. 1). Progressive weathering causes the etch features to systematically increase in amplitude and size (Berner and Schott, 1982; Locke, 1979, 1986; Velbel, 1993). Etching data has an advantage over other proxy data for weathering because it can be objectively obtained and is amenable to statistical analysis (Hall and Michaud, 0033-5894/$ - see front matter D 2004 University of Washington. All rights reserved. doi:10.1016/j.yqres.2004.06.006 * Corresponding author. Department of Geography, Michigan State University, 314 Natural Science Building, East Lansing, MI 48824-1115. Fax: +1 517 432 1671. E-mail address: [email protected] (R.J. Schaetzl). Quaternary Research 62 (2004) 162 – 171 www.elsevier.com/locate/yqres
-
Upload
khangminh22 -
Category
Documents
-
view
1 -
download
0
Transcript of Hornblende etching and quartz/feldspar ratios as weathering ...

www.elsevier.com/locate/yqres
Quaternary Research 6
Hornblende etching and quartz/feldspar ratios as weathering and soil
development indicators in some Michigan soils
Leslie R. Mikesella, Randall J. Schaetzlb,*, Michael A. Velbela
aDepartment of Geological Sciences, Michigan State University, East Lansing, MI 48824 United StatesbDepartment of Geography, Michigan State University, East Lansing, MI 48824-1115, United States
Received 1 April 2003
Available online 14 August 2004
Abstract
Weathering can be used as a highly effective relative age indicator. One such application involves etching of hornblende grains in soils.
Etching increases with time (duration) and decreases with depth in soils and surficial sediments. Other variables, related to intensity of
weathering and soil formation, are generally held as constant as possible so as to only minimally influence the time–etching relationship. Our
study focuses on one of the variables usually held constant—climate—by examining hornblende etching and quartz/feldspar ratios in soils of
similar age but varying degrees of development due to climatic factors. We examined the assumption that the degree of etching varies as a
function of soil development, even in soils of similar age. The Spodosols we studied form a climate-mediated development sequence on a
13,000-yr-old outwash plain in Michigan. Their pedogenic development was compared to weathering-related data from the same soils. In
general, soils data paralleled weathering data. Hornblende etching was most pronounced in the A and E horizons, and decreased rapidly with
depth. Quartz/feldspar ratios showed similar but more variable trends. In the two most weakly developed soils, the Q/F ratio was nearly
constant with depth, implying that this ratio may not be as effective a measure as are etching data for minimally weathered soils. Our data
indicate that hornblende etching should not be used as a stand-alone relative age indicator, especially in young soils and in contexts where the
degree of pedogenic variability on the geomorphic surface is large.
D 2004 University of Washington. All rights reserved.
Keywords: Relative age dating; Soil development; Hornblende; Quartz/feldspar ratios; Surface exposure dating; Spodosols
Introduction
Hornblende is common in crystalline rocks (Blackburn
and Dennen, 1988) and is the most abundant heavymineral in
many soils (Allen and Hajek, 1989; Blackburn and Dennen,
1988; Dreimanis et al., 1957; Dworkin et al., 1985; Hall and
Martin, 1986). In soils, hornblende is most common in the
sand and silt fractions (Allen and Hajek, 1989; Locke, 1979;
Ruhe et al., 1966).
0033-5894/$ - see front matter D 2004 University of Washington. All rights rese
doi:10.1016/j.yqres.2004.06.006
* Corresponding author. Department of Geography, Michigan State
University, 314 Natural Science Building, East Lansing, MI 48824-1115.
Fax: +1 517 432 1671.
E-mail address: [email protected] (R.J. Schaetzl).
Weathering corrodes/etches hornblende minerals in a
crystallographically controlled manner (Berner and Schott,
1982; Berner et al., 1980; Velbel, 1987, 1989). Etch pits
form on the grain surface and progress through a sequence
of stages, enlarging and coalescing with time (Berner and
Schott, 1982; Berner et al., 1980; Cremeens et al., 1992;
L3ng, 2000). End-to-end coalescence results in the
formation of longitudinal grooves or striations, whereas
side-by-side coalescence forms denticulated or sawtooth
margins (Fig. 1). Progressive weathering causes the etch
features to systematically increase in amplitude and size
(Berner and Schott, 1982; Locke, 1979, 1986; Velbel,
1993). Etching data has an advantage over other proxy
data for weathering because it can be objectively obtained
and is amenable to statistical analysis (Hall and Michaud,
2 (2004) 162–171
rved.

Figure 1. Examples of different degrees of etching in hornblende grains, illustrating some of the etching classes applied in this research.
L.R. Mikesell et al. / Quaternary Research 62 (2004) 162–171 163
1988). Like other weathering-related phenomena in soils,
hornblende etching also varies in different climatic regimes
(Hall and Horn, 1993).
Hornblende etching (HE) is greater in near-surface soil
horizons, and usually decreases logarithmically with
depth (Hall and Michaud, 1988; L3ng, 2000; Locke,
1979, 1986), paralleling hornblende depletion data (April
et al., 1986). Likewise, the depth of measurable etching
is greater in older soils (Locke 1979). For this reason,
HE has been applied as a relative age indicator in soils
in, e.g., the Rocky Mountains (Hall and Martin, 1986;
Hall and Michaud, 1988) and the Arctic (Locke, 1979,
1986). In these studies, the general approach involves
relating aspects of hornblende denticulation, or etching
amplitude, to surface age or exposure (Locke, 1979).
Once this relationship has been established for surfaces of
known age, it can, theoretically, be extrapolated to those
of unknown age. Other factors, such as climate or relief,
are usually held constant in these studies so that the
effect of time on etching can be established. HE has been
most commonly applied to soils and surfaces that are
younger than 150,000 yr (Hall and Horn, 1993; Locke,
1986), suggesting that it is a sensitive weathering
indicator on relatively young surfaces but on much older
surfaces it is less discriminating than are other surface
exposure dating methods. Locke’s (1979) study applied
HE to soils as old as 200,000 yr, but this was a
periglacial region where soil formation and weathering
are slow.
Another mineralogical indicator of weathering is the ratio
of a resistant mineral (or minerals) to one (or more) that is
more susceptible to weathering. The most common minerals
used in this regard are quartz (Q) and feldspar (F) (Bockheim
et al., 1996; Dorronsoro and Alonso, 1994; Muhs 1982;
Nesbitt and Markovics, 1997; Ruhe, 1956). Like data on
hornblende denticulation, Q/F ratios tend to decrease with
depth in soils. Because Q/F ratios involve total depletion of a
mineral rather than simple etching, it is perhaps slower to
change than are other indices of weathering. Thus, Q/F ratios
might be more applicable to soils and surfaces that are in
moderate to advanced stages of weathering (Bockheim et al.,
1996; Dorronsoro and Alonso, 1994; Muhs, 1982; Ruhe,
1956; Soller and Owens, 1991).
Because weathering processes are time-dependent, most
hornblende etching studies have been set up such that
duration of surface exposure is the primary factor influencing
denticulation amplitude; similar statements could bemade for
studies involving Q/F ratios, e.g., Ruhe (1956), Locke
(1979), and Hall and Michaud (1988). These studies have
generally assumed that (1) etch features enlarge, and
feldspars continue to be lost with time, and (2) the relation-
ship is strong enough that it overwhelms any statistical
bnoiseQ introduced by, e.g., pH, moisture or leaching regime,
water-holding capacity, organic matter content, or variations
in hornblende mineralogy (White and Brantley, 1995).
Because most of these studies have deliberately held climate
relatively constant across the study sites, there exists little
information about the effect of climate on these two weath-
ering indicators, vis a vis time.
HE research has great potential as a surface exposure
dating tool but is nonetheless still in its infancy, having been
applied in only a few settings and circumstances. The
literature associated with this tool has yet to determine the
effect of weathering duration vs. intensity (as proxied by soil
development and as mediated by climate) on etching. Our
research, therefore, was designed to examine the relationship
between mineral weathering in soils, as manifested in
hornblende etch features and Q/F ratios, and surficial
weathering intensity and duration, as proxied by soil
development. Traditionally, these mineralogical measures
have been applied to soils on surfaces of different age; time is
allowed to vary and the mineralogical data are correlated to it.
Our approach is somewhat different. We questioned the
degree to which mineral-based measures are responding to
duration vs. intensity of weathering (or soil development) and
suggest that both must be considered. Therefore, in our study,
we held time constant and allowed soil development/weath-
ering to vary by examining four soils similar in age but with
different profile morphologies—from very weakly to
strongly developed Spodosols. In sum, the purpose of our
study was to examine two mineralogical indicators of
weathering, both of which have been used as relative age
dating tools, on a surface of constant age but with varying
degrees of soil development, to determine the sensitivity of
these indicators to a factor other than time (or surface age),
i.e., climate.

L.R. Mikesell et al. / Quaternary Research 62 (2004) 162–171164
Study area
This study compiled data from four soils, all of which are
located on a geomorphic surface associated with the Port
Huron re-advance of the Laurentide ice sheet in northwest-
ern lower Michigan (Fig. 2; Blewett and Winters, 1995).
The Port Huron ice advanced to its farthest point in
Michigan ca. 13,000 yr ago, forming a large head of
outwash as it stagnated (Blewett, 1991; Blewett and
Winters, 1995; Blewett et al., 1993). All soils are located
on well-drained locations on this outwash apron in Kalkaska
County, MI, which enabled us to hold surface/sediment age,
drainage/wetness, and texture of the parent material
relatively constant (Table 1).
The soils in this region, by virtue of their coarse textures,
cool, snowy climate, and mixed coniferous–deciduous
vegetation, are influenced by podzolization (Barrett and
Schaetzl, 1992; Lundstrfm et al., 2000; Messenger et al.,
1972). In podzolization, infiltrating water containing dis-
solved organic acids drives translocation of Fe, Al, and
organic carbon from E to Bhs and Bs horizons. Podzoliza-
tion, which is especially strong in this region (Schaetzl and
Figure 2. Study area map, showing the locations of the four soil pits and nearby
minor landform subdivisions, based on Farrand and Bell (1982). The dark gray pol
by the thick, gray isolines of mean annual snowfall totals, after data in Eichenl
1—Grayling; 2—Weak Rubicon; 3—Strong Rubicon; 4—Kalkaska.
Isard, 1991), leads to the formation of soils that classify as
Spodosols, with some variant on O-A-E-Bhs-Bs-BC-C
horizonation. Any carbonates in the soil must be weathered
and leached from the system before podzolization can
proceed.
Within this region, even across short distances, there is a
great deal of variability in macroclimate due to its location
within the narrow but intense lake effect snowbelt of Lake
Michigan (Norton and Bolsenga, 1993). Among the four
study sites, the amount of snowfall is reasonably predict-
able: 4 N 3 N 2 N 1 (Fig. 2). Increased snowfall accentuates
soil development and podzolization. More water infiltrates
into the soil in snowbelt areas, facilitating weathering,
leaching, and translocation of Fe, Al, and organic matter
(Schaetzl and Isard, 1991, 1996). Additionally, soil under
deep snow cover is less likely to freeze and thus stays
permeable throughout the spring when podzolization is
potentially intense (Isard and Schaetzl, 1995; Schaetzl and
Isard, 1991).
Paralleling the snowfall gradient is a floristic trend, from
open, xeric, fire-prone jack pine (Pinus banksiana) stand at
site 1, to white (Pinus strobus) and red pine (Pinus
landforms in northern Michigan. The various thin lines on the map reflect
ygon is the outer Port Huron moraine. The lake effect snowbelt is indicated
aub et al. (1990). Site numbers refer to these site names used in the text:

Table 1
Physical, chemical, and morphological data for the four soils studied
Horizon Depth
(cm)
Munsell
color
(moist)
pH
(2:1 soil/water)
Coarse fragments
(N2-mm diameter)
(estimated volume
percent of whole
sample)
Sand
(%)
Silt
(%)
Clay
(%)
Texture
classaMean particle
size (Am)
Kalkaska (site 4 on Fig. 2) USPLS location: SE 1/4, NE 1/4, Sec. 5, T28N, R5W
Oi 0–3 – 0
A 3–16 7.5YR 2/0 4.7 0 88.3 11.6 0.0 S 345
E 16–24 5YR 4/3 4.2 0 87.5 12.4 0.0 S 359
Bhs 24–31 5YR 2.5/2 4.0 0 83.3 13.2 3.5 LS 340
Bs1 31–58 7.5YR 4/6 6.1 0 95.1 4.9 0.0 S 355
Bs2 58–85 5YR 5/8 6.6 4 97.4 2.5 0.0 S 413
Bw 85–128 10YR 4/6 6.7 4 98.2 1.8 0.0 S 343
2E/Bt 128–160+ 10YR 4/6 (E)
7.5YR 4/4 (Bt)
6.9 8 98.1 2.0 0.0 S 384
Strong Rubicon (site 3 on Fig. 2) USPLS location: SW 1/4, NE 1/4, Sec. 3, T28N, R5W
Oi 0–5 – 0
A 5–9 7.5YR 3/2 5.4 2 90.3 9.7 0.0 S 364
E 9–18 7.5YR 4/2 6.1 2 90.3 8.2 1.4 S 363
Bs1 18–28 5YR 4/6 5.7 6 90.5 8.8 0.7 S 374
Bs2 28–48 7.5YR 4/6 6.4 6 93.5 6.5 0.0 S 362
BC 48–79 10YR 5/6 7.1 8 98.1 2.0 0.0 S 422
C 79–170+ 10YR 6/4 7.2 8 98.6 1.4 0.0 S 391
Weak Rubicon (site 2 on Fig. 2) USPLS location: NW 1/4, SE 1/4, Sec. 36, T28N, R5W
Oi 0–4 – 0
A 4–9 N 2/0 4.0 0 96.8 3.3 0.0 S 421
E 9–20 7.5YR 4/2 6.1 0 95.1 3.7 1.2 S 401
Bs1 20–41 5YR 3/4 6.1 0 95.3 4.8 0.0 S 389
Bs2 41–62 10YR 4/6 6.9 0 98.8 0.1 1.0 S 378
BC 62–126 10YR 5/4 7.2 1 99.6 0.5 0.0 S 323
C 126–165+ 10YR 6/4 7.5 1 99.7 0.0 0.4 S 291
Grayling (site 1 on Fig. 2) USPLS location: NW 1/4, NW 1/4, Sec. 30, T27N, R4W
Oi 0–7 – 0
A 7–11 7.5YR 3/2 4.4 0 91.0 9.0 0.0 S 364
Bs 11–36 7.5YR 4/6 6.1 0 96.4 3.6 0.0 S 386
BC 36–62 10YR 5/6 6.9 0 99.4 0.7 0.0 S 409
C 62–116 10YR 5/4 7.2 2 99.6 0.4 0.0 S 406
2C 116–140 10YR 5/3 7.2 6 98.9 1.1 0.0 S 409
3C 140–165+ 10YR 5/3 7.3 0 99.4 0.6 0.0 S 369
a S: sand, LS: loamy sand. Textures according to the Soil Survey Division Staff (1993).
L.R. Mikesell et al. / Quaternary Research 62 (2004) 162–171 165
resinosa) stands at sites 2 and 3, to a northern hardwood
stand with sugar maple (Acer sachharum), white pine,
hemlock (Tsuga canadensis), and yellow birch (Betula
allegeniensis) at site 4. Thus, it is difficult to separate
vegetation and climate as independent variables, for they
interact so closely (Mokma and Vance, 1989; Schaetzl,
2002).
Methods
Study sites were chosen based on criteria intended to
constrain the state factors of relief/topography, parent
material, and time (Jenny, 1941). All are on the Port Huron
outwash surface, which dates to ca. 13,000 yr ago (Blewett
et al., 1993). Additionally, all are on nearly level, well-
drained locations, far from any escarpments or topographic
bedgesQ that might affect subsurface or surface water
movement. The remaining two factors (climate and organ-
isms) vary among the sites and are strongly correlated to
each other, even across short distances (Schaetzl, 2002).
Using these criteria, four sites that span the range of
pedogenic expression/development on the outwash surface,
but are representative of broad areas of the surface, were
chosen for sampling (Fig. 2). We emphasize that the soils at
these four sites span over 90% of this part of the Port Huron
outwash plain, and are therefore highly representative of
that geomorphic surface. The soil at site 4 classifies within
the Kalkaska series (Typic Haplorthods); it is the best
developed soil of the four. Sites 2 and 3 both are within the
intermediately developed Rubicon series (Entic Haplor-
thods), but the soil at site 3 was better developed (Table 1),

L.R. Mikesell et al. / Quaternary Research 62 (2004) 162–171166
and thus we named sites 2 and 3 bWeak RubiconQ and
bStrong Rubicon,Q respectively. The weakest soil develop-
ment in the region is an area mapped as a consociation of
Grayling (Typic Udipsamments) soils; this was our site 1.
Although the soil sampled here was morphologically similar
to other Grayling soils in the region, it (surprisingly) met all
the criteria for a weakly developed Spodosol (Entic
Haplorthod). For the sake of communication, however, we
will refer to this pedon as Grayling; it would undoubtedly be
remapped in the Grayling series by NRCS personnel.
At each site, a backhoe pit was opened and the soil
profile described according to standard procedures (Soil
Survey Division Staff, 1993). Samples of about 4 kg were
taken from the profile face, for each genetic horizon, and
air-dried. We also augered an additional meter below the
bottom of each pit, and sampled the unaltered C horizon
material from that depth; these samples have the prefix
bDeepQ in subsequent figures and tables. Coarse fragments
(N2-mm diameter) were removed by sieving. Two passes
through a sample splitter resulted in a well-mixed, 1-kg
sample, which was used for subsequent analyses. Soil pH
(2:1 soil/water) was measured with a model #720A Orion
pH meter. Particle size analysis was performed by pipette
(Soil Survey Laboratory Staff 1996). During the pipette
analysis, the fine sand fraction (125–250-Am diameter)
was captured and placed in a bath of 3% sodium
hypochlorite (NaOCl) to remove organic matter, followed
by a water rinse and oven drying. The heavy fraction of
the fine sand was separated using a sodium polytungstate
solution at a specific gravity of 2.95 g cm3. Because
hornblende has a specific gravity of 2.9–3.3 (Blackburn
and Dennen, 1988), it sank to the bottom of the separatory
funnel and was extracted. Three hundred hornblende
grains from each horizon were measured and the ampli-
tude of the denticulated, teeth-like margins for each grain
were determined under a petrographic microscope at
200�; we choose a sample size of 300 because it provides
adequate confidence limits (Mikesell, 2002; Van der Plas
and Tobi, 1965). To ascertain the degree of HE precisely,
we directly measured denticulation amplitudes at the
margins of the grains with a graded ocular. The maximum
denticulation amplitude of each grain was used to assigned
it to a class based on the scheme of Locke (1979). Classes
ranged from 0 to 8 with class breaks every 4 Am; grains
that showed no apparent etching were assigned to Class 0
and the most severely denticulated grains were in Class 8
(Fig. 1).
A second index of weathering, the quartz/feldspar (Q/F)
ratio, was calculated for the fine sand fraction of each
horizon. Grain samples were placed in a container and
impregnated with epoxy resin. Thin sections were then cut,
acid-etched, and stained with Alizarin red to help distin-
guish plagioclase from quartz. Exactly 300 grains per
horizon were then counted under a petrographic microscope.
Plagioclase and K-feldspar counts were summed to arrive at
a count of all feldspars.
Because podzolization is expressed chemically as illuvial
coatings on grains, we wanted to know the types and
amounts of Fe and Al compounds in our soil samples
(McKeague, 1967; McKeague and Day, 1966; Parfitt and
Childs, 1988). Thus, A, E, and B horizon samples were
exposed to three extractants: sodium citrate–dithionite (CD),
acidified ammonium-oxalate (AAO), and sodium pyrophos-
phate (PP) (Loeppert and Inskeep, 1996; Ross and Wang,
1993). CD primarily extracts bfreeQ Fe and Al, denoted by
Fed and Ald, from pedogenic oxide minerals (Jackson et al.,
1986). AAO extracts bactiveQ Fe and Al (Feo and Alo) from
noncrystalline hydrous oxides. The term bactiveQ is given to
oxides that are small in size, have a high surface area, and a
high degree of reactivity (Loeppert and Inskeep, 1996). PP
extracts Fe and Al (Fep and Alp) from organically bound
complexes and, to a lesser degree, noncrystalline hydrous
oxides. The supernatants were analyzed on the flame
apparatus of a Perkin-Elmer 5100 PC AAS (Soil Survey
Laboratory Staff, 1996).
Results and discussion
The four soils, all of which classified as Spodosols,
have formed in nearly uniform sands, with all but one
horizon in the bsandQ texture class (Soil Survey Division
Staff, 1993; Table 1). Medium sand dominated the five
sand fractions. Mean particle size data for the soils were
typically in the 320–420-Am range, in the medium sand
(250–500 Am) fraction (Table 1). No horizon had more
than 3.5% clay and the majority had no measurable clay.
Thus, we assumed that variation in degree of pedogenesis
and weathering among the soils is probably due to factors
other than variation in parent material. For example, the
soils had minimal silt contents at depth, in the parent
material. However, they all also had a significant silt peak,
ranging from 3.6 to N10%, in their upper sola, which we
interpreted as reflecting either a slight eolian influx or
additions due to weathering (Table 1).
Pedogenic development vs. weathering indicators
To evaluate the effects of time vs. weathering/soil
development, we first had to evaluate the varying degrees
of soil development that exist on this outwash surface, as
exemplified by the four soils. Table 2 illustrates and ranks
various pedogenic development data for the soils, and
shows that:
KalkaskaNStrong RubiconNWeak RubiconNGrayling
Soil development on the Port Huron outwash surface
parallels snowfall patterns (Fig. 2). The best developed soil
(Kalkaska) is located nearest the heart of the snowbelt while
the weakest soil (Grayling) is farthest inland, away from the
snowbelt; this is the typical macroclimate–pedogenic
relationship for the northern Great Lakes region (Schaetzl,

Table 2
Pedogenesis and weathering indicators, ranked for the four soils studied
Criterion of comparisona Grayling
(site 1)
Weak Rubicon
(site 2)
Strong Rubicon
(site 3)
Kalkaska
(site 4)
Pedogenesis indicators
Solum thickness (cm) 62 (2) 62 (2) 48 (4) 128 (1)
E horizon thickness (cm) 0 (4) 11 (1) 9 (2) 8 (3)
B horizon thickness (cm) 25 (4) 42 (2) 30 (3) 61 (1)
POD Indexb 0 (3) 2 (1) 0 (3) 1.5 (2)
A or E horizon pH
(lowest of the two)
4.4 (3) 4.0 (1) 5.4 (4) 4.2 (2)
B horizon pH
(lowest of any subhorizon)
6.1 (3) 6.1 (3) 5.7 (2) 4.0 (1)
Hue of reddest B horizon 7.5YR (4) 5YR (1) 5YR (1) 5YR (1)
Color value of darkest B horizon 4 (3) 3 (2) 4 (3) 2.5 (1)
Citrate-dithionite-extractable
Fe in Bs and Bhs horizons (%),
weighted (multiplied) by
B horizon thickness (cm)
2.75 (4) 7.14 (3) 13.60 (1) 10.92 (2)
Pyrophosphate-extractable
Fe in Bs and Bhs horizons (%),
weighted (multiplied) by B
horizon thickness (cm)
1.75 (3) 1.68 (4) 4.20 (1) 3.89 (2)
Oxalate-extractable Fe in Bs and
Bhs horizons (%),
weighted (multiplied)
by B horizon thickness (cm)
0.75 (4) 1.47 (3) 3.30 (1) 2.88 (2)
Citrate-dithionite-extractable Al in Bs
and Bhs horizons (%), weighted
(multiplied) by B horizon thickness (cm)
2.75 (4) 5.04 (3) 6.20 (2) 7.53 (1)
Oxalate-extractable Al
in Bs and Bhs horizons
(%), weighted
(multiplied) by
B horizon thickness (cm)
4.76 (4) 7.77 (3) 8.60 (2) 9.62 (1)
Overall mean rank
for pedogenesis
3.4 2.2 2.2 1.9
Overall median rank for pedogenesis 4 2 2 1
Weathering indicators
Hornblende denticulationc
(categories 0–8, with 0 being lowest),
weighted profile mean
1.19 (4) 1.38 (3) 1.66 (2) 2.59 (1)
Hornblende denticulation,
profile maximum (category)
3.24 (4) 5.79 (3) 7.16 (2) 8.21 (1)
Hornblende denticulation,
profile minimum (category)
0.39 (4) 0.57 (3) 1.15 (2) 1.31 (1)
Hornblende denticulation at
50-cm depth (mean of categories)
1.75 (4) 2.04 (2) 1.77 (3) 2.79 (1)
Q/F ratio, weighted profile mean 8.49 (2) 5.66 (4) 9.49 (1) 8.37 (3)
Q/F ratio, profile maximum 10.5 (3) 7.8 (4) 24.0 (1) 16.7 (2)
Q/F ratio, profile minimum 5.3 (3) 4.6 (4) 6.1 (2) 6.3 (1)
Silt content in A horizon (%) 9.0 (3) 3.3 (4) 9.7 (2) 11.6 (1)
Silt content: maximum in any
near-surface horizon (%)
9.0 (3) 4.8 (4) 9.7 (2) 13.2 (1)
Overall mean rank for weathering 3.3 3.4 1.9 1.3
Overall median rank for weathering 3 4 2 1
a Numbers in parentheses represent the rank for the variable in question, with 1 being maximum and 4 being minimum.b The POD Index (Schaetzl and Mokma, 1988) is a field-based index of podzolization; higher values indicate increased soil development.c Denticulation categories are defined in the text. They range from 0 to 8, with 0 being lowest; see Figure 1.
L.R. Mikesell et al. / Quaternary Research 62 (2004) 162–171 167
2002; Schaetzl and Isard, 1996). The two Rubicon soils
were comparable in development, both having a mean rank
of 2.2 and a median rank of 2 (Table 2). In the field,
however, it was clear that the one Rubicon pedon—bStrong
RubiconQ—was better developed, with a more chemically
and morphologically contrasting E–B sequum, along with
an increased amount of ortstein (Bsm material). The Strong
Rubicon site was closer to the core of the snowbelt than was
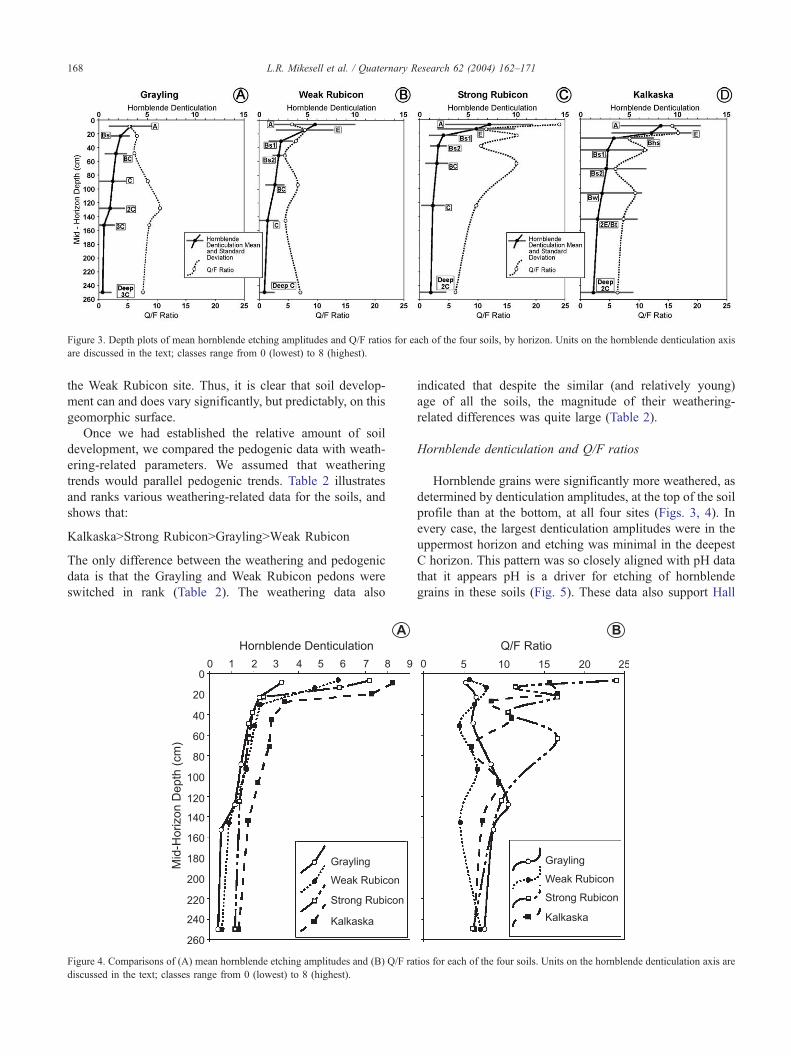
Figure 3. Depth plots of mean hornblende etching amplitudes and Q/F ratios for each of the four soils, by horizon. Units on the hornblende denticulation axis
are discussed in the text; classes range from 0 (lowest) to 8 (highest).
L.R. Mikesell et al. / Quaternary Research 62 (2004) 162–171168
the Weak Rubicon site. Thus, it is clear that soil develop-
ment can and does vary significantly, but predictably, on this
geomorphic surface.
Once we had established the relative amount of soil
development, we compared the pedogenic data with weath-
ering-related parameters. We assumed that weathering
trends would parallel pedogenic trends. Table 2 illustrates
and ranks various weathering-related data for the soils, and
shows that:
KalkaskaNStrong RubiconNGraylingNWeak Rubicon
The only difference between the weathering and pedogenic
data is that the Grayling and Weak Rubicon pedons were
switched in rank (Table 2). The weathering data also
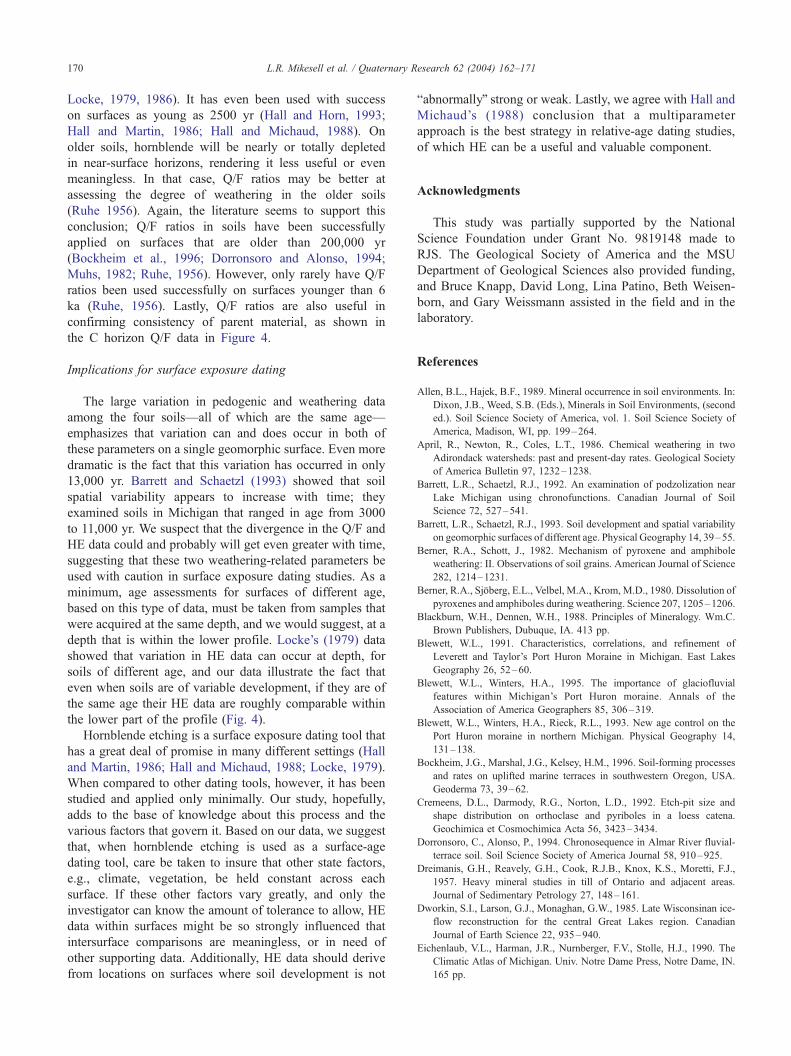
Figure 4. Comparisons of (A) mean hornblende etching amplitudes and (B) Q/F ra
discussed in the text; classes range from 0 (lowest) to 8 (highest).
indicated that despite the similar (and relatively young)
age of all the soils, the magnitude of their weathering-
related differences was quite large (Table 2).
Hornblende denticulation and Q/F ratios
Hornblende grains were significantly more weathered, as
determined by denticulation amplitudes, at the top of the soil
profile than at the bottom, at all four sites (Figs. 3, 4). In
every case, the largest denticulation amplitudes were in the
uppermost horizon and etching was minimal in the deepest
C horizon. This pattern was so closely aligned with pH data
that it appears pH is a driver for etching of hornblende
grains in these soils (Fig. 5). These data also support Hall
tios for each of the four soils. Units on the hornblende denticulation axis are

Figure 5. Depth plots of mean hornblende etching amplitudes and pH for each of the four soils, by horizon. Units on the hornblende denticulation axis are
discussed in the text; classes range from 0 (lowest) to 8 (highest).
L.R. Mikesell et al. / Quaternary Research 62 (2004) 162–171 169
and Horn’s (1993) conclusion that etching, particularly at
shallow depths, is rapid within the first 10,000–15,000 yr of
soil formation. They also mirror data from Hall and Martin
(1986), for soils in the Tobacco Root Range of Montana.
The current climate in this alpine area is only slightly wetter
than at our Michigan sites; soils at lower elevations are also
slightly warmer. Nonetheless, Hall and Martin’s data for the
soils show, as do our data, logarithmically decreasing
etching values with depth; the shape of their curves is
remarkably similar to those shown in Figure 3. The main
exception is that our Michigan soils, perhaps due to their
lower pH values in the upper profile, exhibit stronger
etching in the topmost horizons.
Standard deviations of the HE data are largest in the A
horizon and get progressively smaller with depth (Fig. 3).
We suggest that our denticulation data are excellent
surrogates for weathering because, despite the wide degree
of difference among the four soils in their upper sola, all
soils have roughly similar values in their C horizons (Fig.
4). In soils where age is markedly different, HE data can be
widely disparate, even at depth (Locke 1979). Our C
horizon denticulation data also attest to the uniformity of
parent materials among the sites.
Etching was generally much larger in A and E horizons
than in horizons below, giving the depth trends for
denticulation amplitude a distinct bbreak in slopeQ betweenthe eluvial (A and E) and illuvial (B) parts of the profile
(Fig. 4). This depth trend is different than the steady,
logarithmically decreasing weathering intensity that has
been reported elsewhere (Hall and Horn, 1993; Locke,
1979). We suggest that our etching data reflect the two-
compartment pedogenic model reported by Ugolini et al.
(1977). They monitored podzolization by sampling soil
solutions in situ and documented the existence of an upper,
biopedological compartment (the O, A, E, and upper B
horizons) in which ionic movement is governed by soluble
organic acids that depress the bicarbonate concentration.
Most of these acids get captured and neutralized in the upper
B horizon, leading to a rise in pH. In the lower, geochemical
compartment, higher pH values lead to a weathering
environment dominated by the dissociation of carbonic
acid, increasing the importance of the bicarbonate ion in this
part of the soil. Our HE data (Fig. 4) support the notion of
two separate compartments of not only pedogenesis, but
also weathering, in these young soils.
Hornblende etching (HE) data generally paralleled soil
development data. The largest denticulation amplitudes
occurred in the Kalkaska soil (pit 4) while the smallest
amount of etching was observed in the weakly developed
Grayling soil (Table 2). This pattern parallels that of
snowfall and infiltration (Fig. 2), which supports the
contention that, after the effect of age, soil moisture and
depth of wetting are the most important factors in
determining etching rates (Hall and Horn, 1993; L3ng,2000; Locke, 1979, 1986).
Q/F data were more variable than HE data, but
suggested that the two best-developed soils (Kalkaska
and Strong Rubicon) were more weathered than the Weak
Rubicon and Grayling soils (Table 2). That is, instead of
a clear, four-part sequence, as observed with the
denticulation data, the soils broke out into two groups
based on Q/F data (Fig. 4; Table 2). In the two more
weakly developed soils, Q/F ratios were nearly constant
with depth, implying that this method may not be as
effective as HE for young and/or minimally weathered
soils (Fig. 4). That is, if weathering intensity decreases
steadily with depth, then this characteristic appears to be
captured more precisely (in these young soils) by etching
of hornblende than by loss of feldspar grains. Applica-
tions of HE in the literature seem to support this
contention; most studies have applied HE to surfaces that
are less than 150,000 yr old (Hall and Horn, 1993;
L.R. Mikesell et al. / Quaternary Research 62 (2004) 162–171170
Locke, 1979, 1986). It has even been used with success
on surfaces as young as 2500 yr (Hall and Horn, 1993;
Hall and Martin, 1986; Hall and Michaud, 1988). On
older soils, hornblende will be nearly or totally depleted
in near-surface horizons, rendering it less useful or even
meaningless. In that case, Q/F ratios may be better at
assessing the degree of weathering in the older soils
(Ruhe 1956). Again, the literature seems to support this
conclusion; Q/F ratios in soils have been successfully
applied on surfaces that are older than 200,000 yr
(Bockheim et al., 1996; Dorronsoro and Alonso, 1994;
Muhs, 1982; Ruhe, 1956). However, only rarely have Q/F
ratios been used successfully on surfaces younger than 6
ka (Ruhe, 1956). Lastly, Q/F ratios are also useful in
confirming consistency of parent material, as shown in
the C horizon Q/F data in Figure 4.
Implications for surface exposure dating
The large variation in pedogenic and weathering data
among the four soils—all of which are the same age—
emphasizes that variation can and does occur in both of
these parameters on a single geomorphic surface. Even more
dramatic is the fact that this variation has occurred in only
13,000 yr. Barrett and Schaetzl (1993) showed that soil
spatial variability appears to increase with time; they
examined soils in Michigan that ranged in age from 3000
to 11,000 yr. We suspect that the divergence in the Q/F and
HE data could and probably will get even greater with time,
suggesting that these two weathering-related parameters be
used with caution in surface exposure dating studies. As a
minimum, age assessments for surfaces of different age,
based on this type of data, must be taken from samples that
were acquired at the same depth, and we would suggest, at a
depth that is within the lower profile. Locke’s (1979) data
showed that variation in HE data can occur at depth, for
soils of different age, and our data illustrate the fact that
even when soils are of variable development, if they are of
the same age their HE data are roughly comparable within
the lower part of the profile (Fig. 4).
Hornblende etching is a surface exposure dating tool that
has a great deal of promise in many different settings (Hall
and Martin, 1986; Hall and Michaud, 1988; Locke, 1979).
When compared to other dating tools, however, it has been
studied and applied only minimally. Our study, hopefully,
adds to the base of knowledge about this process and the
various factors that govern it. Based on our data, we suggest
that, when hornblende etching is used as a surface-age
dating tool, care be taken to insure that other state factors,
e.g., climate, vegetation, be held constant across each
surface. If these other factors vary greatly, and only the
investigator can know the amount of tolerance to allow, HE
data within surfaces might be so strongly influenced that
intersurface comparisons are meaningless, or in need of
other supporting data. Additionally, HE data should derive
from locations on surfaces where soil development is not
babnormallyQ strong or weak. Lastly, we agree with Hall and
Michaud’s (1988) conclusion that a multiparameter
approach is the best strategy in relative-age dating studies,
of which HE can be a useful and valuable component.
Acknowledgments
This study was partially supported by the National
Science Foundation under Grant No. 9819148 made to
RJS. The Geological Society of America and the MSU
Department of Geological Sciences also provided funding,
and Bruce Knapp, David Long, Lina Patino, Beth Weisen-
born, and Gary Weissmann assisted in the field and in the
laboratory.
References
Allen, B.L., Hajek, B.F., 1989. Mineral occurrence in soil environments. In:
Dixon, J.B., Weed, S.B. (Eds.), Minerals in Soil Environments, (second
ed.). Soil Science Society of America, vol. 1. Soil Science Society of
America, Madison, WI, pp. 199–264.
April, R., Newton, R., Coles, L.T., 1986. Chemical weathering in two
Adirondack watersheds: past and present-day rates. Geological Society
of America Bulletin 97, 1232–1238.
Barrett, L.R., Schaetzl, R.J., 1992. An examination of podzolization near
Lake Michigan using chronofunctions. Canadian Journal of Soil
Science 72, 527–541.
Barrett, L.R., Schaetzl, R.J., 1993. Soil development and spatial variability
on geomorphic surfaces of different age. Physical Geography 14, 39–55.
Berner, R.A., Schott, J., 1982. Mechanism of pyroxene and amphibole
weathering: II. Observations of soil grains. American Journal of Science
282, 1214–1231.
Berner, R.A., Sjfberg, E.L., Velbel, M.A., Krom, M.D., 1980. Dissolution of
pyroxenes and amphiboles during weathering. Science 207, 1205–1206.
Blackburn, W.H., Dennen, W.H., 1988. Principles of Mineralogy. Wm.C.
Brown Publishers, Dubuque, IA. 413 pp.
Blewett, W.L., 1991. Characteristics, correlations, and refinement of
Leverett and Taylor’s Port Huron Moraine in Michigan. East Lakes
Geography 26, 52–60.
Blewett, W.L., Winters, H.A., 1995. The importance of glaciofluvial
features within Michigan’s Port Huron moraine. Annals of the
Association of America Geographers 85, 306–319.
Blewett, W.L., Winters, H.A., Rieck, R.L., 1993. New age control on the
Port Huron moraine in northern Michigan. Physical Geography 14,
131–138.
Bockheim, J.G., Marshal, J.G., Kelsey, H.M., 1996. Soil-forming processes
and rates on uplifted marine terraces in southwestern Oregon, USA.
Geoderma 73, 39–62.
Cremeens, D.L., Darmody, R.G., Norton, L.D., 1992. Etch-pit size and
shape distribution on orthoclase and pyriboles in a loess catena.
Geochimica et Cosmochimica Acta 56, 3423–3434.
Dorronsoro, C., Alonso, P., 1994. Chronosequence in Almar River fluvial-
terrace soil. Soil Science Society of America Journal 58, 910–925.
Dreimanis, G.H., Reavely, G.H., Cook, R.J.B., Knox, K.S., Moretti, F.J.,
1957. Heavy mineral studies in till of Ontario and adjacent areas.
Journal of Sedimentary Petrology 27, 148–161.
Dworkin, S.I., Larson, G.J., Monaghan, G.W., 1985. Late Wisconsinan ice-
flow reconstruction for the central Great Lakes region. Canadian
Journal of Earth Science 22, 935–940.
Eichenlaub, V.L., Harman, J.R., Nurnberger, F.V., Stolle, H.J., 1990. The
Climatic Atlas of Michigan. Univ. Notre Dame Press, Notre Dame, IN.
165 pp.
L.R. Mikesell et al. / Quaternary Research 62 (2004) 162–171 171
Farrand, W.R., Bell, D.L., 1982. Quaternary Geology (map) of Southern
Michigan with surface water drainage divides. 1:500,000 scale.
Department of Natural Resources, Geol. Survey Division, Lansing,
MI.
Hall, R.D., Horn, L.L., 1993. Rates of hornblende etching in soils in glacial
deposits of the northern Rocky Mountains (Wyoming–Montana,
U.S.A.): influence of climate and characteristics of the parent material.
Chemical Geology 105, 17–29.
Hall, R.D., Martin, R.E., 1986. The etching of hornblende grains in the
matrix of alpine tills and periglacial deposits. In: Colman, S.M., Dethier,
D.P. (Eds.), Rates of Chemical Weathering of Rocks and Minerals.
Academic Press, Inc., Orlando, FL, pp. 101–128.
Hall, R.D., Michaud, D., 1988. The use of hornblende etching, clast
weathering, and soils to date alpine glacial and periglacial deposits: a
study from southwestern Montana. Geological Society of America
Bulletin 100, 458–467.
Isard, S.A., Schaetzl, R.J., 1995. Estimating soil temperatures and frost in
the lake effect snowbelt region, Michigan, USA. Cold Regions Science
Techology 23, 317–332.
Jackson, M.L., Lim, C.H., Zelazny, L.W., 1986. Oxides, hydroxides, and
aluminosilicates. In: Klute, A. (Ed.), Methods of Soil Analysis: Part 1.
Physical and Mineralogical Methods, SSSA Book Series, vol. 9(1).
SSSA and ASA, Madison, WI, pp. 101–150.
Jenny, H., 1941. Factors of Soil Formation. McGraw-Hill, New York, NY.
281 pp.
L3ng, L.-O., 2000. Heavy mineral weathering under acidic soil conditions.
Applied Geochemistry 15, 415–423.
Locke III, W.W., 1979. Etching of hornblende grains in Arctic soils: an
indicator of relative age and paleoclimate. Quaternary Research 11,
197–212.
Locke III, W.W., 1986. Rates of hornblende etching in soils on glacial
deposits, Baffin Island, Canada. In: Colman, S.M., Dethier, D.P. (Eds.),
Rates of Chemical Weathering of Rocks and Minerals. Academic Press,
Orlando, FL, pp. 129–145.
Loeppert, R.H., Inskeep, W.P., 1996. Iron. In: Bartels, J.M. (Ed.), Methods
of Soil Analysis. Part 3. Chemical Methods, SSSA Book Series,
vol. 5(3). SSSA and ASA, Madison, WI, pp. 639–663.
Lundstrfm, U.S., van Breemen, N., Bain, N., 2000. The podzolization
process: a review. Geoderma 94, 91–107.
McKeague, J.A., 1967. An evaluation of 0.1 M pyrophosphate and
pyrophosphate–dithionite in comparison with oxalate as extractants of
the accumulation products in podzols and some other soils. Canadian
Journal of Soil Science 47, 95–99.
McKeague, J.A., Day, J.H., 1966. Dithionite- and oxalate-extractable Fe
and Al as aids in differentiating various classes of soils. Canadian
Journal of Soil Science 46, 13–22.
Messenger, A.S., Whiteside, E.P., Wolcott, A.R., 1972. Climate, time, and
organisms in relation to Podzol development in Michigan sands: I. Site
descriptions and microbiological observations. Soil Science Society of
America Proceedings 36, 633–638.
Mikesell, L.R., 2002. Hornblende etching as an indicator of soil develop-
ment and relative weathering among Spodosols. MS thesis, Michigan
State University.
Mokma, D.L., Vance, G.F., 1989. Forest vegetation and origin of some
spodic horizons, Michigan. Geoderma 43, 311–324.
Muhs, D.R., 1982. A soil chronosequence on Quaternary marine terraces,
San Clemente Island, California. Geoderma 28, 257–283.
Nebsitt, H.W., Markovics, G., 1997. Weathering of granodioritic crust,
long-term storage of elements in weathering profiles, and petrogenesis
of siliciclastic sediments. Geochimica et Cosmochimica Acta 61,
1653–1670.
Norton, D.C., Bolsenga, S.J., 1993. Spatiotemporal trends in lake effect and
continental snowfall in the Laurentian Great Lakes, 1951–1980. Journal
of Climate 6, 1943–1956.
Parfitt, R.L., Childs, C.W., 1988. Estimation of forms of Fe and Al: a
review, and analysis of contrasting soils by dissolution and
Moessbauer methods. Australian Journal of Soil Research 26,
121–144.
Ross, G.J., Wang, C., 1993. Extractable Al, Fe, Mn, and Si. In: Carter, M.R.
(Ed.), Soil Sampling and Methods of Analysis. Canadian Society of Soil
Science, Boca Raton, FL, pp. 239–246.
Ruhe, R.V., 1956. Geomorphic surfaces and the nature of soils. Soil Science
82, 441–455.
Ruhe, R.V., Daniels, R.B., Cady, J.G., 1966. Landscape evolution and soil
formation in southwestern Iowa. Technical Bulletin-United States
Department of Agriculture 1349. 242 pp.
Schaetzl, R.J., 2002. A Spodosol–Entisol transition in northern Michigan:
climate or vegetation? Soil Science Society of America Journal 66,
1272–1284.
Schaetzl, R.J., Isard, S.A., 1991. The distribution of spodosol soils in
southern Michigan: a climatic interpretation. Annals of the Association
of American Geographers 81, 425–442.
Schaetzl, R.J., Isard, S.A., 1996. Regional-scale relationships between
climate and strength of podzolization in the Great Lakes region, North
America. Catena 28, 47–69.
Schaetzl, R.J., Mokma, D.L., 1988. A numerical index of podzol and
podzolic soil development. Physical Geography 9, 232–246.
Soil Survey Division Staff, 1993. Soil Survey Manual. USDA Handbook,
vol. 18. US Government Printing Office, Washington, DC. 437 pp.
Soil Survey Laboratory Staff, 1996. Soil survey laboratory methods
manual. USDA-SCS, National Soil Survey Center. Soil Survey
Investigations Report. 42, Version 3.0. National Soil Survey Center,
Lincoln, NE.
Soller, D.R., Owens, J.P., 1991. The use of mineralogic techniques as
relative age indicators for weathering profiles on the Atlantic Coastal
Plain, USA. Geoderma 51, 111–131.
Ugolini, F.C., Minden, R., Dawson, H., Zachara, J., 1977. An example of
soil processes in the Abies amabilis zone of central Cascades,
Washington. Soil Science 124, 291–302.
Van der Plas, L., Tobi, A.C., 1965. A chart for judging the reliability of
point counting results. American Journal of Science 263, 87–90.
Velbel, M.A., 1987. Rate-controlling factors in the weathering of some
ferromagnesian silicate minerals. Transactions, 13th Congress of the
International Society of Soil Science, Hamburg, Germany, vol. 6.
pp. 1107–1118.
Velbel, M.A., 1989. Weathering of hornblende to ferruginous products by a
dissolution–reprecipitation mechanism: Petrography and stoichiometry.
Clays and Clay Minerals 37, 515–524.
Velbel, M.A., 1993. Formation of protective surface layers during silicate–
mineral weathering under well-leached, oxidizing conditions. American
Mineralogist 78, 405–414.
White, A.F., Brantley, S.L. (Eds.), Reviews in Mineralogy, Chemical
Weathering Rates of Silicate Minerals, vol. 31. Mineralogical Society of
America, Washington, DC. 583 pp.