prediction of photovoltaic systems production using weather ...
14
PREDICTION OF PHOTOVOLTAIC SYSTEMS PRODUCTION USING WEATHER FORECASTS Jure Vetršek* 1 and prof. Sašo Medved 1 1University of Ljubljana, Faculty of Mechanical Engineering, Laboratory for Sustainable Technologies in Buildings, Aškerčeva 6, 1000 Ljubljana, Slovenia * Corresponding Author, [email protected] Abstract In this paper weather prediction production data model of photovoltaic (PV) systems is presented and compared with experimental data. The predicted PV system daily energy production and peak power output is becoming more important due to increasing technology penetration, the trading with electricity, and to establish the necessary back up capacities. Two forms of weather forecast were utilized. Forecast with 5-day horizon and day time step including data for cloudiness and temperatures, and 3-day horizon forecast with hourly time step prediction of solar radiation. Homer simulation tool was used for determination of hourly PV system production based on forecasted solar radiation. Simulation results were compared to the measured data for 14 kW p grid connected system and 1,5 kW p off-grid system. 1. Introduction Distributed electricity production is rapidly inclining worldwide. Utilization of solar enegy with PV technology is among the frontrunners, but has some disadvantages such as time variability of production due to solar radiation variability. In order to manage electrical systems optimally, combine different production facilities in penetrating smart networks and above all trading with electricity, the forecasting of electricity production of PV systems is needed. This can be done regarding to needs such as desired time horizon. Various authors [1,2] utilize neural networks for forecasting short and also long term production. Even though neural networks utilization in PV production forecasts have high accuracy, they have important down side, which is that measurements are needed in very diverse conditions for learning the network for individual facility due to largely stochastic local meteorological conditions. Therefore we examine the possibility of utilizing available weather forecast for PV production prediction. Some authors even predict the daily global radiation based on air temperature variation and rainfall [3]. Even though these methods show higher accuracy in prediction of air temperatures, we concluded that they are not relevant for prediction of solar radiation in our application therefore we do not utilize them. Forecasts usually, beside temperatures and phenomena, predict sky cloud cover or solar radiation. Without radiation prediction, like in the example of 5 day forecast utilized in this work, it has to be calculated from available parameters. We utilized the commonly used Kasten&Czeplak model.
-
Upload
khangminh22 -
Category
Documents
-
view
3 -
download
0
Transcript of prediction of photovoltaic systems production using weather ...

PREDICTION OF PHOTOVOLTAIC SYSTEMS PRODUCTION USING WEATHER FORECASTS
Jure Vetršek*1 and prof. Sašo Medved
1 1University of Ljubljana, Faculty of Mechanical Engineering, Laboratory for Sustainable Technologies in
Buildings, Aškerčeva 6, 1000 Ljubljana, Slovenia
* Corresponding Author, [email protected]
Abstract
In this paper weather prediction production data model of photovoltaic (PV) systems is presented
and compared with experimental data. The predicted PV system daily energy production and peak
power output is becoming more important due to increasing technology penetration, the trading
with electricity, and to establish the necessary back up capacities. Two forms of weather forecast
were utilized. Forecast with 5-day horizon and day time step including data for cloudiness and
temperatures, and 3-day horizon forecast with hourly time step prediction of solar radiation. Homer
simulation tool was used for determination of hourly PV system production based on forecasted
solar radiation. Simulation results were compared to the measured data for 14 kWp grid connected
system and 1,5 kWp off-grid system.
1. Introduction
Distributed electricity production is rapidly inclining worldwide. Utilization of solar enegy with PV
technology is among the frontrunners, but has some disadvantages such as time variability of
production due to solar radiation variability. In order to manage electrical systems optimally, combine
different production facilities in penetrating smart networks and above all trading with electricity, the
forecasting of electricity production of PV systems is needed. This can be done regarding to needs
such as desired time horizon. Various authors [1,2] utilize neural networks for forecasting short and
also long term production. Even though neural networks utilization in PV production forecasts have
high accuracy, they have important down side, which is that measurements are needed in very diverse
conditions for learning the network for individual facility due to largely stochastic local meteorological
conditions. Therefore we examine the possibility of utilizing available weather forecast for PV
production prediction.
Some authors even predict the daily global radiation based on air temperature variation and rainfall [3].
Even though these methods show higher accuracy in prediction of air temperatures, we concluded that
they are not relevant for prediction of solar radiation in our application therefore we do not utilize
them. Forecasts usually, beside temperatures and phenomena, predict sky cloud cover or solar
radiation. Without radiation prediction, like in the example of 5 day forecast utilized in this work, it
has to be calculated from available parameters. We utilized the commonly used Kasten&Czeplak
model.

2. Availability and content of weather forecasts
Base for all forecasts are results generated by the numerical model ALADIN which is widely applied.
Weather forecast is available ( in Slovenia forecasts are published by National Environmental Agency
ARSO) for 3 days with hurly frequency and 5 days in advance with daily frequency. The data for 5 day
forecast is presented in figurative form, and can be accessed automatically via XML/RSS/HTML
services.
Fig. 1. Example of 5 days forecast for central Slovenia from forecasters [4]
Crucial values for prediction of solar radiation are share of the sky covered with clouds called oktas.
Additional parameters can be included as well such as fog, thunderstorm with hail with; with its
intensity and minimal and maximal temperature.
Table 1. Example of processed automated weather forecast for 5 days
Time of
issuing
Forecast for day
of the week
Consecutive
day
Forecast
for the date
Cloud
coverage Phenomena
Phenomena
intensity
Min.
T
Max.
T
12.9.2011
8:00 Monday CEST 1
12.9.2011
12:00 6 4 1 17 28
12.9.2011
8:00 Tuesday CEST 2
13.9.2011
12:00 2 0 0 15 29
12.9.2011
8:00
Wednesday
CEST 3
14.9.2011
12:00 4 4 1 16 28
12.9.2011
8:00 Thursday CEST 4
15.9.2011
12:00 4 0 0 15 29
12.9.2011
8:00 Friday CEST 5
16.9.2011
12:00 4 0 0 13 25
Parameters in the Table 1 were obtained automatically with developed script. A phenomenon 4 in the
table above stands for partly cloudy.
2.1. Prediction of solar radiation from cloud cover forecast
Because solar radiation is considered as the main influential parameter for PV system production , we
are focusing on its forecast only. We are not taking in to account the losses of productivity due to the
rise of temperature modules because analyses of PV systems done by International Energy Agency
showed [5], that freestanding and flat roof systems, such as ones used for verification in this work,
have the yearly temperature losses of energy yield between 1,7 and 5 % which is below the weather
forecast accuracy of prediction.

The cloudiness, as a main indicator for solar radiation, is given with 8 levels in classical
meteorological form. Where 0/8 means clear sky and 8/8 is sky full covered with clouds. Additional
parameters forecasted are also the prediction of phenomena, from fog to thunderstorm with hail with
its intensity, minimal and maximal temperature. The correlation between cloudiness and solar radiation
is considered to be high according to various studies found in literature review [6,7].
This is used for the case of 5 day weather forecast utilization due to the fact, that solar radiation is not
forecasted and needs to be calculated with model. In the case of 3 day forecast this is not necessary,
because solar radiation is forecasted directly.
Determination of solar radiation from cloud cover is done by algorithm based on Kasten&Czeplak
model [6]. This simplified weather forecast was compared to hourly forecast in order to evaluate its
usability for PV production forecasting. In this case solar radiation on horizontal surface is predicted
for every hour for next 3 days. Additional parameters in this forecast are the air temperature, relative
humidity, velocity and direction of the wind and cloudiness.
Fig. 2. Example of average hourly solar radiation prediction from cloud cover by Kasten&Czeplak model
Radiation estimation based on cloud cover was based on work of Kasten&Czeplak according to
following algorithm [6]. For every hour of analyzed period the azimuth and height of the sun was
calculated in order to get real sun paths over the year..
IGC= 910 sinα – 30 Eq. 1
IG= IGC (1 – 0,75 (N/8)3,4
) Eq. 2
ID= IG (0,3 + 0,7 (N/8)2) Eq. 3
Where IGC is clear sky global solar radiation on horizontal surface, α is solar altitude, IG represents
global horizontal irradiance, N is cloud cover in oktas and ID represents diffuse pat of horizontal
irradiance.
The model is relatively simple, and has some limitations. It underestimates maximal radiation in some
cases.
2. 2. Three day time horizon forecast with hourly frequency Five days horizon daily forecast was compared to the three days hour-by-hour forecasts.
We obtained them from ARSO generated by the ALADIN model with spatial resolution of 10 by 10
kilometres and time resolution of one hour. The height of the point in the model was approximately
300 meters above the terrain.

Table 2. Example of part of 3 day hourly model forecast for Zagorje ob Savi
Forecast
for date
Hour
(UTC)
Temperature
in °C
Rainfall
in mm
Short wave
radiation in
J/m2
Relative
humidity
in %
Wind
velocity
in m/s
Direction
of wind
in °
Overcast
in %
20120402 0 -3,6 0 0 76,2 1,3 250 0
20120402 100 -3,7 0 0 75,7 1,6 245 0
20120402 200 -3,8 0 0 74,9 1,6 240 0
20120402 300 -3,9 0 0 74,3 1,5 230 0
20120402 400 -4 0 0 74,1 1,7 220 0
20120402 500 -3,9 0 3 74,1 2 220 0
20120402 600 -2,7 0 80 72,2 2 220 10
20120402 700 0,3 0 233 66,8 1,8 225 10
20120402 800 3,2 0 400 63,8 1,9 235 10
20120402 900 5,2 0 548 62,1 2,5 240 10
20120402 1000 6,8 0 657 60,6 3,4 245 10
20120402 0 -3,6 -99 -99 76,2 1,3 250 0
The forecast in the Table 2 was obtained from ARSO data
2.3. Forecast validation
Forecasts accuracy was verified by showing its variation for same target interval but different time
horizons. This inaccuracy is shown in Figure 3 where cloud coverage forecasts issued on different days
is presented. We observed how forecasts are in some cases corrected every day, because more data is
obtained for prediction of target time horizon.
Fig. 3. Example of the differences between 5 day daily forecasts concerning the day of issuing
Fig. 3 shows the variation of forecasted cloud coverage index, used for determination solar radiation
by utilizing Kasten&Czeplak model. Three - day time horizon hourly forecast issued on 2 consecutive
days are shown in Figure 4.

Fig. 4. . Example of the differences between 3 day hourly forecasts concerning the day of issuing
One can observe the variation in forecasted radiation for the same target time but different time
horizons. This demonstrates the forecast uncertainty even on shorter time horizon such as one or two
days. From this we can conclude, that forecast of PV system operation will be at least this inaccurate,
because of we base our prediction on weather forecast. We cannot say how accurate the weather
forecast is precise because this validation is substantial task and out of the domain of this research. The
uncertainty will be imbedded in our forecasts.
3. PV system output modelling
PV modules are installed having certain orientation and declination. Solar radiation is forecasted for
horizontal surface and hast to be converted to fit the analyzed PV system properties.
PV systems hourly output is modelled with Homer simulation tool [8]. Meteorological data obtained
from weather forecast is integrated in to software input files. Hourly simulations of PV system
operation based on weather forecasts are run for the periods of 3 and 5 days for various weather
conditions that occur during the year.
Simulated data is compared with the field measurements from two PV systems, and adequacy of each
weather forecast is analyzed based on daily electricity production, daily peak power and the time of
daily peak occurrence.
4. Validation of prediction
4.1. Grid connected 14 kWp PV system
This grid connected facility sell all produced power to public utility grid and is located in central Slovenia on a cultural centre in Zagorje ob Savi. It was build in the frame of FP6 Remining-lowex project. Its operation is monitored via SCADA based community utility monitoring and management system, therefore all historical high resolution production data is available.
It consist of 60 modules with total area of 98,2 m2, azimuth 0° and slope 30°. Its maximal DC power is
14,3 kW and AC 13,5 kW and maximal DC voltage of 900 V. PV modules are silica polycrystal Perlight Solar PLM- P230 with silica nitride coating. Inverter is Power One type Aurora PVI – 12,5.

Fig. 5. Site (left) and modules of grid connected facility (right)
4.2. Off grid 1,5 kWp system
Island facility in installed on OLEA research demo unit in Zagorje ob Savi. OLEA is self sufficient mobile facility for presentation of new concepts of low exergy technologies based on renewable sources and low energy construction. PV system consist of 6 silica mono crystal modules Sinodeu ZD245 – 20m with total area of 9,2 m
2, azimuth 0° and slope 70°. Total peak power is 1,47 kW.
OLEA is equipped with SMA Sunny Boy 1700 inverter 5ith 1550 W and peak DC power of 1850 W and voltage of 400 V. as a backup source a EFOY COMFORT E80 methanol fuel cell is installed. Produced and used electricity is managed by Sunny Island 2012 and stored in TAB lead batteries with nominal capacity of 1200 Ah at 12 V. system is monitored via SMA web box, and crucial parameters are measured by SMA sensor box equipment. Also its all key operational parameters are publicly accessible via SMA sunny portal
Fig. 6. OLEA off grid system (left) and its radiation sensor (right)
5. Verification of the model
Measurement form both systems were compared with two forecasts with different spatial and time
resolution (3 and 5 days daily and hourly) for different weather conditions. In order to measure the
prediction accuracy, various statistical parameters can be used. In this work we followed most
commonly used method for accuracy measurement [9], which is root mean square error (RMSE).
Eq. 2.

Where n is the number of pairs of measurement and calculation/model evaluated, and the variable x
represent the measured (index true) and forecasted (index i). The accuracy measure of RMSE is
calculated for hourly values. Only hours with daylight are considered for the calculation of RMSE. We
present results in relative values of error measures (rRMSE).
Three day time horizon local hourly forecast of low overcast and measurement for off grid
system We compare forecasted and measured average hourly power, daily peak power size and time. Peak
power should occur at solar noon, on the clear days, but may vary when overcastted.
Because measurements take place on off grid facility one cannot compare electricity production,
because if is a function of battery state of charge. Once the battery is full, there is no more electricity
produced, even if radiation is available. Therefore we compare measured and predicted radiation on
surface of PV system which is the main influential parameter for electricity production.
Fig. 7. Prediction and measurement of hourly values of solar radiation on horizontal surface for 3 day hourly low
overcast forecast.
Fig. 7 shows the predicted and measured solar radiation. The daytime rRMSE of hourly horizontal
solar radiation for the whole 3 days period is 157,7 % (total measured radiation energy in the period
was 15,5 kWh/m2 and predicted 18,3 kWh/m2).
Table 3. Example of measured and predicted total daily solar radiation energy in kWh/m2
Time horizon in days 1 2 3
Predicted 6,02 6,51 5,76
Measured 5,51 5,4 4,55
When comparing predicted and measured daily peak we calculate the rRMSE values on the range from
13 to 30 %, depending on time horizon. Measured peak for the first day was 1064 W, and predicted
746 W.
Calculated errors for: rRMSE
[%]
Hourly data 1st day 178,1
2nd 186,3
3rd 90,6
All days 157,7
Daily energy 1st day 9,4
2nd 20,4
3rd 26,7
All days 23,4
Peak 1st day 29,9
2nd 24,1
3rd 13,3

Three day time horizon local hourly forecast of mid overcast and measurement for off grid
system For mid overcast we consider variable forecast of sky cloud coverage, which was from 0,8 to 7,2 oktas
in the analyzed period.
Fig. 8. Prediction and measurement of hourly values of solar radiation on horizontal for 3 day hourly mid
overcast forecast.
Prediction of daily radiation energy for first day is very precise (2,6 %) but rRMSE for hourly values is
105 %. Reason is, as we can observe from the Figure 8, that higher peak is compensated with
forecasted solar radiation variation in late afternoon that did not occur.
rRMSE of hourly horizontal solar radiation for the whole 3 days period is significant, 334,8 %.This
shows high inaccuracy in hourly radiation predictions – for 2nd
day rRMSE is 540,9%, but daily energy
forecast missed for 35,2 %.
Peaks forecasts are accurate in the range from 20 to 30 %.
Table 4. Example of measured and predicted total daily solar radiation energy in kWh/m
2
Time horizon in days 1 2 3
Measured 4,99 4,43 4,78
Predicted 4,86 4,88 6,46
Calculated errors for: rRMSE
[%]
Hourly data 1st day 105,0
2nd 540,9
3rd 180,8
All days 334,8
Daily energy 1st day 2,6
2nd 10,2
3rd 35,2
All days 26,2
Peak 1st day 29,7
2nd 27,9
3rd 20,0

Three day time horizon local hourly forecast of high overcast and measurement for off grid
system In this analysis we focused on the period where forecasted sky cloud coverage was above 4 oktas most
of the analyzed period.
Fig. 9. Prediction and measurement of hourly values of solar radiation on horizontal surface for 3 day hourly high
overcast forecast issued on 2 consecutive days.
Table 5: Comparison of accuracy prediction indicators for two consecutive days
Inaccuracy in high cloud cover period is significant, especially rRMSE for hourly predictions. Peak
prediction is more successful in very cloudy conditions, because we know how it is limited. From the
Table 5 we can observe increase of accuracy (lower rRMSE) for most of the values on shorter time
horizon. The this is not valid only for 2 (3) day peak forecast, which is problematic in all conditions.
Table 6. Example of measured and predicted time of daily peak occurrence
Time horizon in days 1 2 3
Predicted 13:00 15:00 12:00
Measured 12:00 13:00 15:00
When predicting time of daily peak power occurrence, the precisions cannot be higher than 1 hour,
because this is the time step of forecast and simulations. In low overcast period, the peak time can be
determined accurately based only geometrical correlations between receiver surface and the sun as the
function of time of the year. But for cloud covered sky this cannot be achieved with reasonable
accuracy.
Issued on 15 4 (left) Issued on 16 4 (right)
Calculated errors for: rRMSE
[%]
rRMSE
[%]
Hourly data 1st day 276,4
2nd 525,0 Hourly data 1st day 437,6
3rd 213,6 2nd 165,5
All days 364,1 3rd 638,9
Daily energy 1st day 72,1 All days 457,2
2nd 232,1 Daily energy 1st day 208,3
3rd 27,3 2nd 16,8
All days 51,2 3rd 71,9
Peak 1st day 24,7 All days 39,5
2nd 84,9 Peak 1st day 62,7
3rd 5,3 2nd 11,1
3rd 25,0

Five day time horizon regional daily forecast of low overcast for grid connected system
Solar radiation on horizontal plane for 5 day time horizon regional forecast is calculated by
Kasten&Czeplak model from predicted overcast. Output of grid connected PV power plant is modelled
with HOMER on hourly basis. System is model in detail and meteo input files are prepared for each
period. Simulation of operation are run and presented here. They are compared with measurement of
electricity production from grid connected facility.
Fig. 10. Prediction and measurement of hourly values of electricity production for 5 day daily low overcast
forecast.
Forecasted cloud cover for the whole period was 1 okta. We can observe from the Figure 10, peaks are
predicted to low. rRMSE of hourly power production for the whole 5 days period is 25,9 %. Total
measured produced electricity was 353 kWh and we predicted 322 kWh in the 5 day period.
Mean precision of daily energy production prediction in low overcast weather forecast is 14,5 %.
The reason in underestimated peak may lie in the PV modelling in Homer simulation tool, but even
though, the precision is in the range of 16 %.
Five day time horizon regional daily forecast of mid overcast for grid connected system
Due to daily time step, all daily profiles are flat, because we use only one value for sky cloud cover
from the prediction. Forecasted cloud coverage was 6, 2, 4, 4, 4 oktas.
Fig. 11. Prediction and measurement of hourly values of electricity production for
5 day daily mid overcast forecast.
Calculated errors for: rRMSE
[%]
Hourly data 1st day 15,9
2nd 30,4
3rd 31,4
4th 30,0
5th 17,1
All days 25,9
Daily energy 1st day 17,6
2nd 12,9
3rd 15,5
4th 12,8
5th 13,8
All days 14,6
Peak 1st day 16,3
2nd 16,4
3rd 16,6
4th 16,2
5th 16,9
Calculated errors for: rRMSE
[%]
Hourly data 1st day 87,4
2nd 90,6
3rd 36,0
4th 100,7
5th 32,4
All days 77,5
Daily energy 1st day 14,1
2nd 13,4
3rd 23,5
4th 4,8
5th 23,2
All days 17,3
Peak 1st day 44,5
2nd 20,4
3rd 27,8
4th 28,1
5th 28,4

Fig. 12. Measurements of electricity production with 2 min sampling rate from PV plant Delavski dom
monitoring system for same period as Figure 9.
In this mid overcast period rRMSE of hourly power production for the whole 5 days period is 77,5 %.
Total measured produced electricity was 305 kWh and we predicted 255 kWh in the whole 5 day
period. Total daily energy production precision is up to 23,5 %
Peaks are underestimated in the prediction.
We can observe, that even though the forecasted cloudiness is significantly higher for the region than
in previous case, the measured production profile is very similar. The reason is, that the predicted
cloudiness does not reflect real condition of PV system site accurately enough.
Five day time horizon regional daily forecast of high overcast for grid connected system
In this scenario we analyzed the period with following forecasted cloudiness: 7,7,7,7 and 6 oktas for
the 5th day.
Fig. 13. Prediction and measurement of hourly values of electricity production for 5 day daily high overcast
forecast.
In high overcast period rRMSE of hourly power production for the whole 5 days period is 87,9%
where total electricity production in the 5 day period was 59 kWh and predicted 77,6 kWh. Daily peak
prediction precision is up or 32 %, except for the 4th day when it was 110 %.
Calculated errors for: rRMSE
[%]
Hourly data 1st day 41,7
2nd 42,3
3rd 42,0
4th 43,7
5th 177,3
All days 87,9
Daily energy 1st day 16,4
2nd 24,0
3rd 6,9
4th 370,6
5th 134,0
All days 176,7
Peak 1st day 32,0
2nd 31,3
3rd 4,0
4th 110,0
5th 21,5
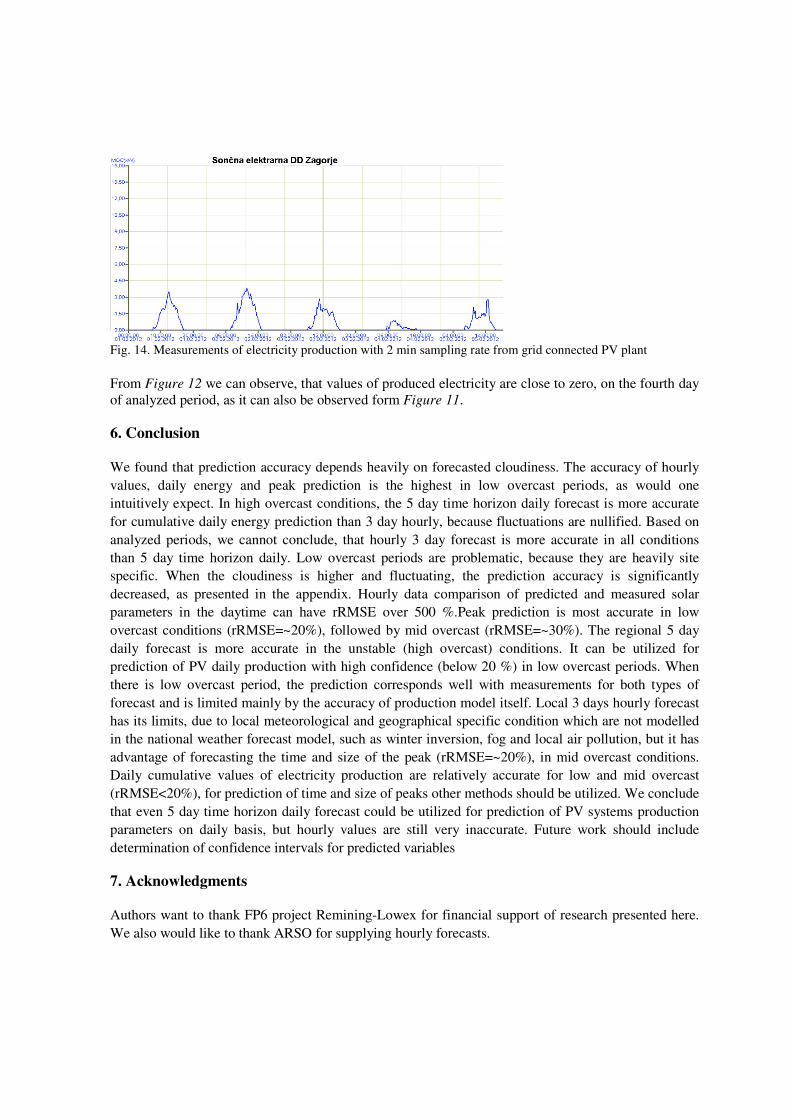
Fig. 14. Measurements of electricity production with 2 min sampling rate from grid connected PV plant
From Figure 12 we can observe, that values of produced electricity are close to zero, on the fourth day
of analyzed period, as it can also be observed form Figure 11.
6. Conclusion
We found that prediction accuracy depends heavily on forecasted cloudiness. The accuracy of hourly
values, daily energy and peak prediction is the highest in low overcast periods, as would one
intuitively expect. In high overcast conditions, the 5 day time horizon daily forecast is more accurate
for cumulative daily energy prediction than 3 day hourly, because fluctuations are nullified. Based on
analyzed periods, we cannot conclude, that hourly 3 day forecast is more accurate in all conditions
than 5 day time horizon daily. Low overcast periods are problematic, because they are heavily site
specific. When the cloudiness is higher and fluctuating, the prediction accuracy is significantly
decreased, as presented in the appendix. Hourly data comparison of predicted and measured solar
parameters in the daytime can have rRMSE over 500 %.Peak prediction is most accurate in low
overcast conditions (rRMSE=~20%), followed by mid overcast (rRMSE=~30%). The regional 5 day
daily forecast is more accurate in the unstable (high overcast) conditions. It can be utilized for
prediction of PV daily production with high confidence (below 20 %) in low overcast periods. When
there is low overcast period, the prediction corresponds well with measurements for both types of
forecast and is limited mainly by the accuracy of production model itself. Local 3 days hourly forecast
has its limits, due to local meteorological and geographical specific condition which are not modelled
in the national weather forecast model, such as winter inversion, fog and local air pollution, but it has
advantage of forecasting the time and size of the peak (rRMSE=~20%), in mid overcast conditions.
Daily cumulative values of electricity production are relatively accurate for low and mid overcast
(rRMSE<20%), for prediction of time and size of peaks other methods should be utilized. We conclude
that even 5 day time horizon daily forecast could be utilized for prediction of PV systems production
parameters on daily basis, but hourly values are still very inaccurate. Future work should include
determination of confidence intervals for predicted variables
7. Acknowledgments
Authors want to thank FP6 project Remining-Lowex for financial support of research presented here.
We also would like to thank ARSO for supplying hourly forecasts.
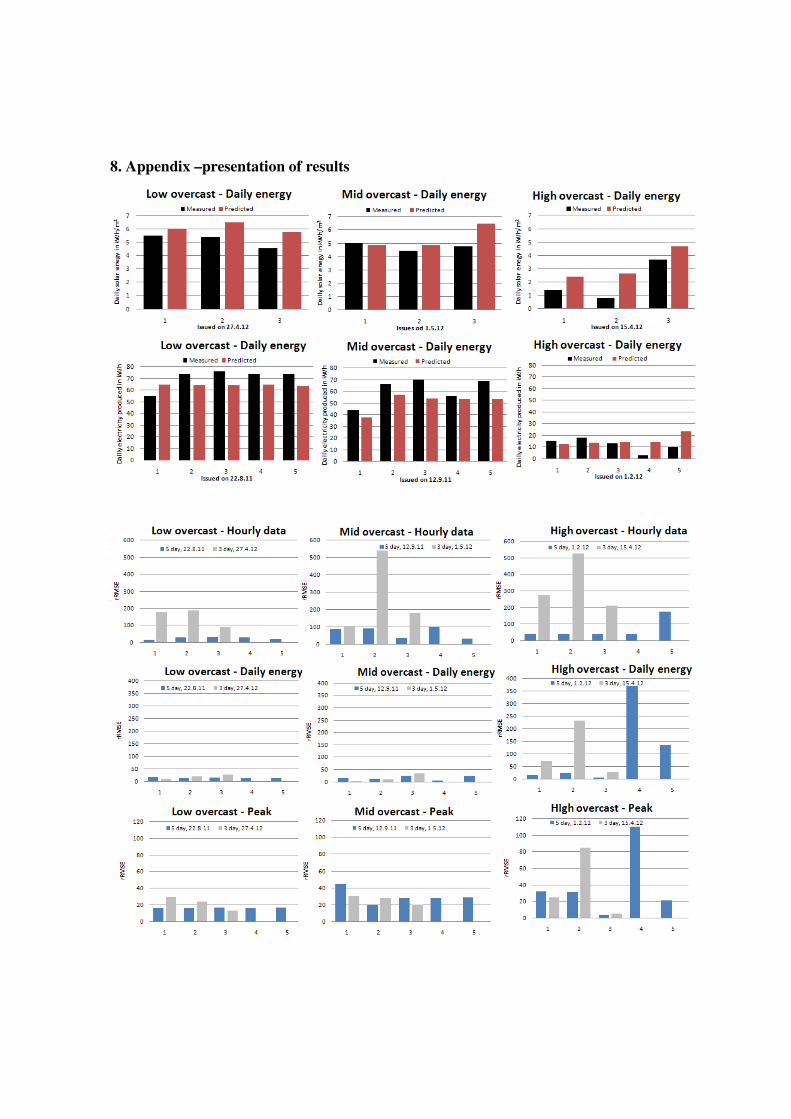
8. Appendix –presentation of results

9. References
[1] Mellit A.,Massi Pavan A.: A 24-h forecast of solar irradiance using artificial neuralnetwork: Application for
performance prediction of a grid-connected PV plant at Trieste, Italy, , Department of Electronics, Faculty of
Sciences and Technology, Jijel University, Algeria, Department of Materials and Natural Resources,
University of Trieste, Trieste, Italy,2009
[2] Izgi E., et al. Short–mid-term solar power prediction by using artificial neural networks, Yıldız Technical
University, Electrical Engineering Department, Yıldız, I_stanbul, Turkey, Solar Energy 86 (2012) 725–733
[3] Bindi F. Miglietta, Estimating daily global radiation from air temperature and rainfall measurements, IATA-
CNR. Institute of Environmental Analysis and Remote Sensing for Agriculture, P.le delle Cascine 18,I-50144
Florence, Italy, CLIMATE RESEARCH, l: Vol. 1:117-124. 1991
[4] ARSO. Forecast 5 day. 2011 7. 6. 2011]; Available from:
http://meteo.arso.gov.si/uploads/probase/www/fproduct/text/sl/fcast_SLOVENIA_latest.html.
[5] Nordmann, T, Clavadetscher L. Understanding temperature effects on PV system performance, TNC
Consulting AG, Seestrasse 141, CH-8703 Erlenbach, Switzerland, 3rd
World Conference on Pholovoltaic
Energv Conversion May 11-18. 2003 Osaka, Japan
[6] S. Younes, T Muneer: Improvements in solar radiation models based on cloud data, School of engineering;
Napier University; Edinburgh; 2006
[7] Kodama, G.W.a.Y., On the relationship between global radiation and cloudiness in southern Alaska. Solar
Energy, 1985. 36(5): p. 431-435.
[8] Lilienthal, T.L.P.G.a.P., MicropowerSystemModelingWithHOMER.
[9] Lorenz E., et al. : Irradiance Forecasting for the Power Prediction of Grid-Connected Photovoltaic Systems,
IEEE journal of selected topics in applied earth observations and remote sensing, VOL. 2, NO. 1, march 2009