Review of the use of Numerical Weather Prediction (NWP) Models for wind energy assessment
11
Renewable and Sustainable Energy Reviews 15 (2011) 1545–1555 Contents lists available at ScienceDirect Renewable and Sustainable Energy Reviews journal homepage: www.elsevier.com/locate/rser Evaluation of NWP performance for wind energy resource assessment in Oman Yassine Charabi a,∗ , Sultan Al-Yahyai b , Adel Gastli b a Department of Geography, College of Arts and Social Sciences, Sultan Qaboos University, P.O. 42, Al-Khodh, Muscat-123, Oman b Department of Electrical & Computer Engineering, College of Engineering, Sultan Qaboos University, P.O. 33, Al-Khodh, Muscat-123, Oman article info Article history: Received 1 June 2010 Accepted 24 November 2010 Available online 12 January 2011 Keywords: Assessment NWP Oman Satellite data Wind energy abstract Few studies have been conducted to evaluate the wind energy potential in Oman. All of the published studies were based on ground measurements from weather stations, which provide wind data at 10 m above the ground. The spatial and temporal coverage of the actual meteorological network in Oman presents some inadequacy with the need of the wind power industry in term of data sets. Currently, these assessments are done on a site-by-site basis, using existing station data and limited on-site monitoring data. A primary task under this research is to supplement existing wind-power potential assessments and develop an enhanced (spatially explicit) inventory of the wind resource across Oman. With the current available computational power, it is possible to use of high resolution numerical weather prediction (NWP) models to provide wind data usable for wind energy resource assessment. This paper evaluates the performance of NWP model data for wind energy application for Oman with a comparison to satellite data. Two models namely HRM and COSMO were used in this study. Suitable model resolution was first selected by evaluating the ability of the models to simulate weak local wind circulation (i.e. sea breeze), then one year of data was generated and compared to satellite data and ground measurements. The NWP data showed better accuracy over satellite data with comparison to the ground measurements. Wind power output was also calculated for selected sites with high potential. © 2010 Elsevier Ltd. All rights reserved. Contents 1. Introduction ........................................................................................................................................ 1545 2. Data and methodology ............................................................................................................................. 1547 3. Synopsis of the case study on the 1st of August 2009 ............................................................................................. 1549 4. Case study results .................................................................................................................................. 1550 5. Wind energy assessment based on measurements, satellite, and NWP model data ............................................................. 1552 6. Conclusion ......................................................................................................................................... 1554 Acknowledgments ................................................................................................................................. 1555 References ......................................................................................................................................... 1555 1. Introduction The threat from the Global warming and the continuously decline of the fossil fuel resources are driving the greatest shift in energy supply in the history of human civilization. As a result, renewable resources such as solar and wind energy are making con- stantly greater contributions to electricity production worldwide. The Sultanate of Oman is blessed with substantial solar energy resources due to its latitude and vast bare land [1–3]. However, the exploitation of this huge solar energy potential, should overcome a lot of challenges and barriers related to the climate, technolo- ∗ Corresponding author. E-mail addresses: [email protected] (Y. Charabi), [email protected] (S. Al-Yahyai), [email protected] (A. Gastli). gies and investments. The wind regime in Oman coupled with an extensive coastline and vast unpopulated areas have the poten- tial to contribute significantly to the future electricity supply of the country. However, wind energy is not quite as simple to implement as some other energy sources. Unlike a diesel power station, for example, where power only stops being produced when the diesel fuel runs out, or there is maintenance, wind energy from farm stops if the wind is too strong, not strong enough or there is an abrupt changes in wind direction. The wind variability and the non-storable character of wind energy constitute the major constraints for power system operation – how to prevent fluctuations in the power production of a wind farm from affecting the continuity of electricity supply to the consumer is a major challenge [4]. 1364-0321/$ – see front matter © 2010 Elsevier Ltd. All rights reserved. doi:10.1016/j.rser.2010.11.055
Transcript of Review of the use of Numerical Weather Prediction (NWP) Models for wind energy assessment
E
Ya
b
a
ARAA
KANOSW
C
Trea
(
1d
Renewable and Sustainable Energy Reviews 15 (2011) 1545–1555
Contents lists available at ScienceDirect
Renewable and Sustainable Energy Reviews
journa l homepage: www.e lsev ier .com/ locate / rser
valuation of NWP performance for wind energy resource assessment in Oman
assine Charabia,∗, Sultan Al-Yahyaib, Adel Gastli b
Department of Geography, College of Arts and Social Sciences, Sultan Qaboos University, P.O. 42, Al-Khodh, Muscat-123, OmanDepartment of Electrical & Computer Engineering, College of Engineering, Sultan Qaboos University, P.O. 33, Al-Khodh, Muscat-123, Oman
r t i c l e i n f o
rticle history:eceived 1 June 2010ccepted 24 November 2010vailable online 12 January 2011
eywords:ssessmentWPman
a b s t r a c t
Few studies have been conducted to evaluate the wind energy potential in Oman. All of the publishedstudies were based on ground measurements from weather stations, which provide wind data at 10 mabove the ground. The spatial and temporal coverage of the actual meteorological network in Omanpresents some inadequacy with the need of the wind power industry in term of data sets. Currently, theseassessments are done on a site-by-site basis, using existing station data and limited on-site monitoringdata. A primary task under this research is to supplement existing wind-power potential assessments anddevelop an enhanced (spatially explicit) inventory of the wind resource across Oman. With the currentavailable computational power, it is possible to use of high resolution numerical weather prediction
atellite dataind energy
(NWP) models to provide wind data usable for wind energy resource assessment.This paper evaluates the performance of NWP model data for wind energy application for Oman with
a comparison to satellite data. Two models namely HRM and COSMO were used in this study. Suitablemodel resolution was first selected by evaluating the ability of the models to simulate weak local windcirculation (i.e. sea breeze), then one year of data was generated and compared to satellite data andground measurements. The NWP data showed better accuracy over satellite data with comparison to the
ground measurements. Wind power output was also calculated for selected sites with high potential.© 2010 Elsevier Ltd. All rights reserved.
ontents
1. Introduction . . . . . . . . . . . . . . . . . . . . . . . . . . . . . . . . . . . . . . . . . . . . . . . . . . . . . . . . . . . . . . . . . . . . . . . . . . . . . . . . . . . . . . . . . . . . . . . . . . . . . . . . . . . . . . . . . . . . . . . . . . . . . . . . . . . . . . . . 15452. Data and methodology . . . . . . . . . . . . . . . . . . . . . . . . . . . . . . . . . . . . . . . . . . . . . . . . . . . . . . . . . . . . . . . . . . . . . . . . . . . . . . . . . . . . . . . . . . . . . . . . . . . . . . . . . . . . . . . . . . . . . . . . . . . . . 15473. Synopsis of the case study on the 1st of August 2009 . . . . . . . . . . . . . . . . . . . . . . . . . . . . . . . . . . . . . . . . . . . . . . . . . . . . . . . . . . . . . . . . . . . . . . . . . . . . . . . . . . . . . . . . . . . . . 1549
4. Case study results . . . . . . . . . . . . . . . . . . . . . . . . . . . . . . . . . . . . . . . . . . . . . . . . . . . . . . . . . . . . . . . . . . . . . . . . . . . . . . . . . . . . . . . . . . . . . . . . . . . . . . . . . . . . . . . . . . . . . . . . . . . . . . . . . . 1550model data . . . . . . . . . . . . . . . . . . . . . . . . . . . . . . . . . . . . . . . . . . . . . . . . . . . . . . . . . . . . . 1552. . . . . . . . . . . . . . . . . . . . . . . . . . . . . . . . . . . . . . . . . . . . . . . . . . . . . . . . . . . . . . . . . . . . . . . . . . . 1554. . .. . . .
he Sultanate of Oman is blessed with substantial solar energyesources due to its latitude and vast bare land [1–3]. However, thexploitation of this huge solar energy potential, should overcomelot of challenges and barriers related to the climate, technolo-
∗ Corresponding author.E-mail addresses: [email protected] (Y. Charabi), [email protected]
S. Al-Yahyai), [email protected] (A. Gastli).
364-0321/$ – see front matter © 2010 Elsevier Ltd. All rights reserved.oi:10.1016/j.rser.2010.11.055
. . . . . . . . . . . . . . . . . . . . . . . . . . . . . . . . . . . . . . . . . . . . . . . . . . . . . . . . . . . . . . . . . . . . . . . . 1555. . . . . . . . . . . . . . . . . . . . . . . . . . . . . . . . . . . . . . . . . . . . . . . . . . . . . . . . . . . . . . . . . . . . . . . 1555
gies and investments. The wind regime in Oman coupled with anextensive coastline and vast unpopulated areas have the poten-tial to contribute significantly to the future electricity supply of thecountry. However, wind energy is not quite as simple to implementas some other energy sources.
Unlike a diesel power station, for example, where power onlystops being produced when the diesel fuel runs out, or there ismaintenance, wind energy from farm stops if the wind is too strong,not strong enough or there is an abrupt changes in wind direction.The wind variability and the non-storable character of wind energy
5. Wind energy assessment based on measurements, satellite, and NWP6. Conclusion . . . . . . . . . . . . . . . . . . . . . . . . . . . . . . . . . . . . . . . . . . . . . . . . . . . . . . . . . . . . . .
Acknowledgments . . . . . . . . . . . . . . . . . . . . . . . . . . . . . . . . . . . . . . . . . . . . . . . . . . . . . .References . . . . . . . . . . . . . . . . . . . . . . . . . . . . . . . . . . . . . . . . . . . . . . . . . . . . . . . . . . . . . .
1. Introduction
The threat from the Global warming and the continuouslydecline of the fossil fuel resources are driving the greatest shiftin energy supply in the history of human civilization. As a result,renewable resources such as solar and wind energy are making con-stantly greater contributions to electricity production worldwide.
constitute the major constraints for power system operation – howto prevent fluctuations in the power production of a wind farm fromaffecting the continuity of electricity supply to the consumer is amajor challenge [4].
1546 Y. Charabi et al. / Renewable and Sustainable Energy Reviews 15 (2011) 1545–1555
am of
Fatenfpp
adpsttictiaOispb
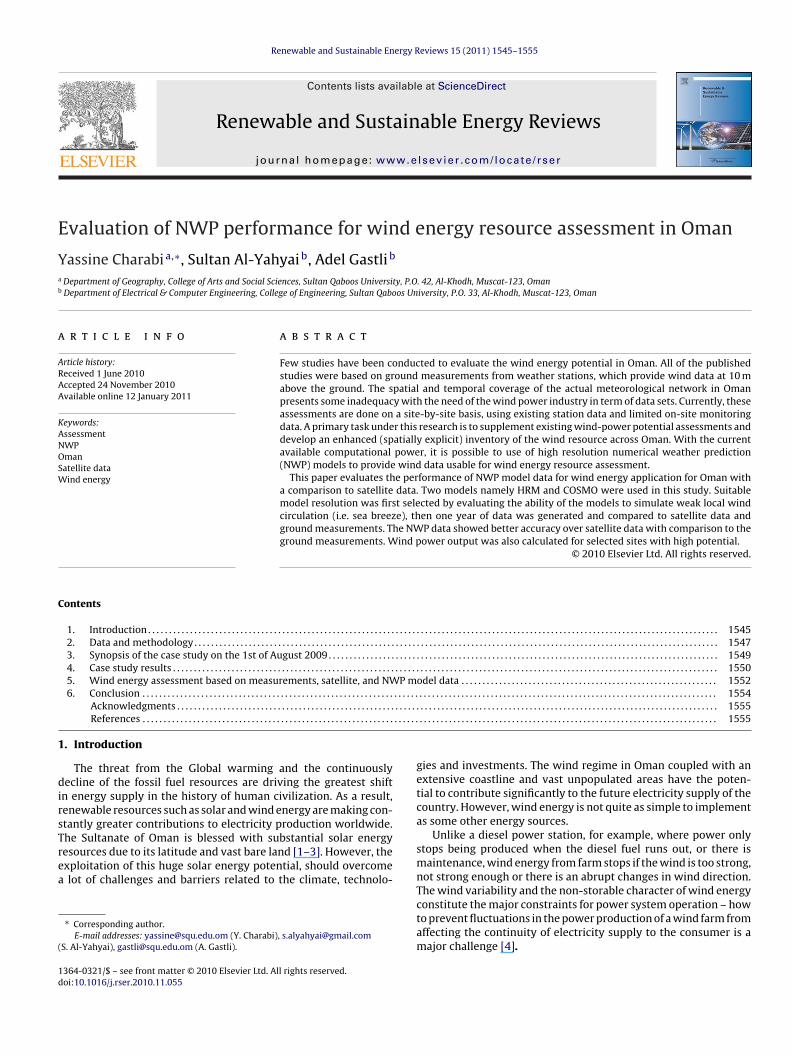
Fig. 1. Data flow diagr
Climate variability and energy consumption are strongly linked.or wind power applications, variations in weather and climate playfundamental role in determining both short-term power produc-
ion from a wind plant and accurate site assessments for long-termlectricity generation. Thus, the robustness and the representative-ess of existing climate data sets for identifying past, current, and
uture trends, and variability in the potential wind resource arerimordial to the ability of any country to realize their target ofroducing electricity from wind power [5].
Recent work reviewed published work about wind resourcesssessment in Oman [6]. This work involved a comparison betweenifferent studies using different data sets. It point out how the tem-oral resolution (hourly, daily and monthly) of the climate dataets affects resource assessment and power production estima-ion in Oman. The national meteorological network is probablyhe most relevant sources of long-term data base in Oman, butts spatial coverage and terrain representativeness is dedicated byivilian requirements; hence, most stations are located in accessibleerrain. Additionally, the distribution of the available meteorolog-cal stations has very coarse resolution. As a result, the spatialnd temporal coverage of the actual meteorological network in
man presents some inadequacy with the need of the wind powerndustry in term of data sets. Much of these data are ground mea-urements (i.e. at 10 m for wind data), and they are not directlyertinent to determining the wind energy resources at typical tur-ine hub heights.
the applied approach.
Precise approximations of the local wind resource and effectsupon turbine performance are dependent upon atmospheric andland-surface forcings across a wide range of temporal and spatialscales – from the synoptic (thousands of km2), through the meso-scale (tens to hundreds of km2), down to local (km2 or less). Thus, acomprehensive understanding of how this energy flow has an effecton resource assessment and estimated wind power production iscrucial. In this regard, numerical weather predictions (NWP) mod-els constitute key resources in such investigations. Such modelsare essential components of efforts to consistently simulate windand energy resources at different spatial and temporal scales (Pryoret al. [7]).
Research undertaken to date implies regional climate simu-lations of wind regimes, which are strongly dependent on thegeneral circulation models (GCM) used to provide lateral boundaryconditions for regional climate model (RCM) [8]. But such com-prehensive studies have not been conducted for Oman. This paperinvestigates the ability of NWP models to simulate local windcirculations over Oman in order to facilitate modeling for windresource assessment purposes. Fig. 1 summarizes the approachof the study. Two different NWP models namely high resolu-
tion model (HRM) and the consortium for small-scale modeling(COSMO) model were used with 28 and 7 km resolution. Germanglobal model (GME) was used to provide the initial and lateralboundary conditions. To increase confidence in NWP wind resourceestimation, the NWP outputs are compared with NASA satellite data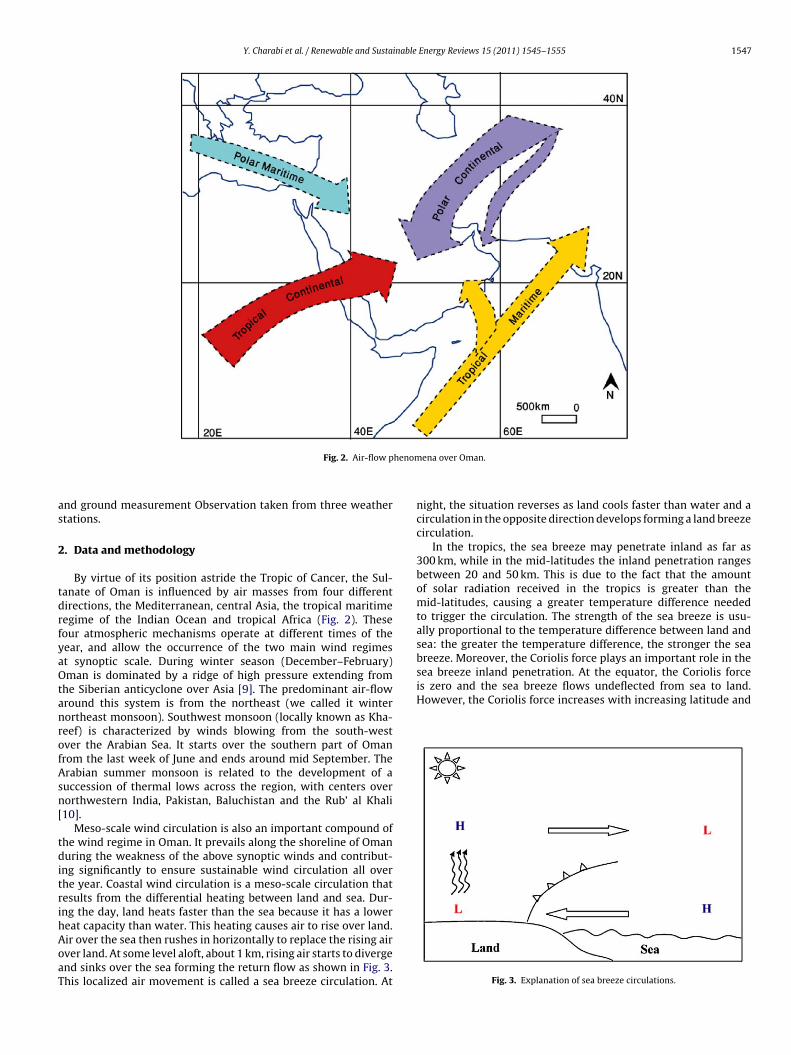
Y. Charabi et al. / Renewable and Sustainable Energy Reviews 15 (2011) 1545–1555 1547
henom
as
2
tdrfyaOtanrofAsn[
tditrihAoaT
breeze. Moreover, the Coriolis force plays an important role in thesea breeze inland penetration. At the equator, the Coriolis forceis zero and the sea breeze flows undeflected from sea to land.However, the Coriolis force increases with increasing latitude and
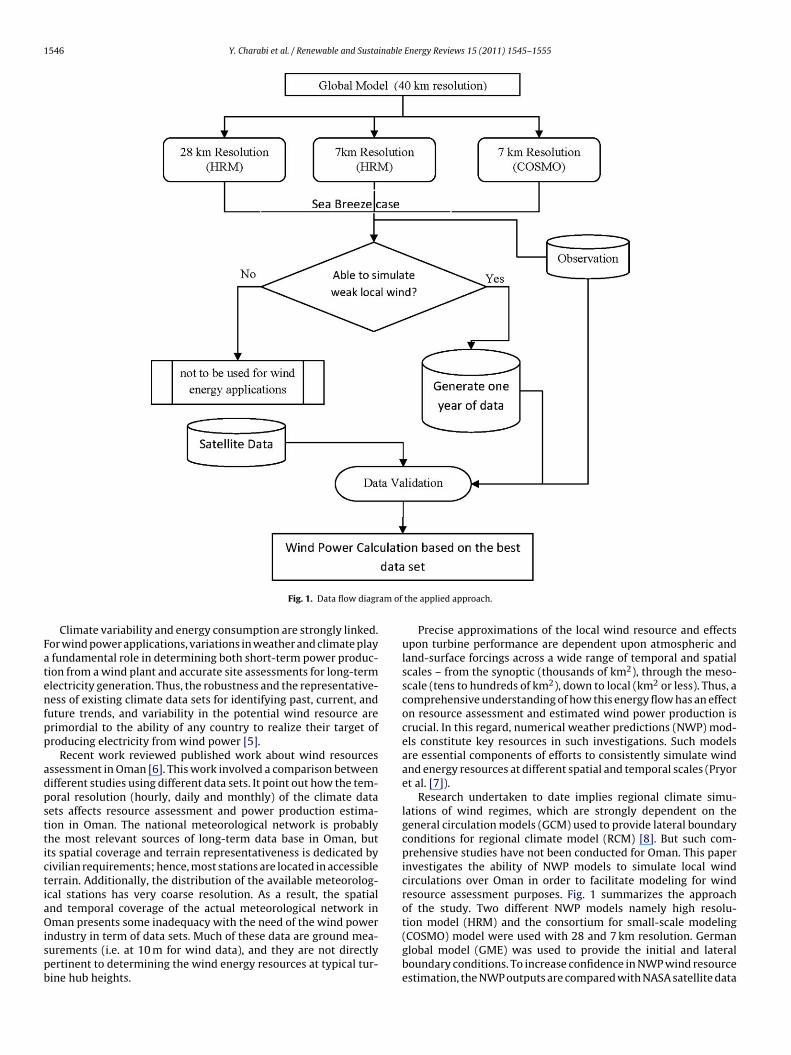
Fig. 2. Air-flow p
nd ground measurement Observation taken from three weathertations.
. Data and methodology
By virtue of its position astride the Tropic of Cancer, the Sul-anate of Oman is influenced by air masses from four differentirections, the Mediterranean, central Asia, the tropical maritimeegime of the Indian Ocean and tropical Africa (Fig. 2). Theseour atmospheric mechanisms operate at different times of theear, and allow the occurrence of the two main wind regimest synoptic scale. During winter season (December–February)man is dominated by a ridge of high pressure extending from
he Siberian anticyclone over Asia [9]. The predominant air-flowround this system is from the northeast (we called it winterortheast monsoon). Southwest monsoon (locally known as Kha-eef) is characterized by winds blowing from the south-westver the Arabian Sea. It starts over the southern part of Omanrom the last week of June and ends around mid September. Therabian summer monsoon is related to the development of auccession of thermal lows across the region, with centers overorthwestern India, Pakistan, Baluchistan and the Rub’ al Khali10].
Meso-scale wind circulation is also an important compound ofhe wind regime in Oman. It prevails along the shoreline of Omanuring the weakness of the above synoptic winds and contribut-
ng significantly to ensure sustainable wind circulation all overhe year. Coastal wind circulation is a meso-scale circulation thatesults from the differential heating between land and sea. Dur-ng the day, land heats faster than the sea because it has a lower
eat capacity than water. This heating causes air to rise over land.ir over the sea then rushes in horizontally to replace the rising airver land. At some level aloft, about 1 km, rising air starts to divergend sinks over the sea forming the return flow as shown in Fig. 3.his localized air movement is called a sea breeze circulation. Atena over Oman.
night, the situation reverses as land cools faster than water and acirculation in the opposite direction develops forming a land breezecirculation.
In the tropics, the sea breeze may penetrate inland as far as300 km, while in the mid-latitudes the inland penetration rangesbetween 20 and 50 km. This is due to the fact that the amountof solar radiation received in the tropics is greater than themid-latitudes, causing a greater temperature difference neededto trigger the circulation. The strength of the sea breeze is usu-ally proportional to the temperature difference between land andsea: the greater the temperature difference, the stronger the sea
Fig. 3. Explanation of sea breeze circulations.
1548 Y. Charabi et al. / Renewable and Sustainable Energy Reviews 15 (2011) 1545–1555
tp
aFtaet
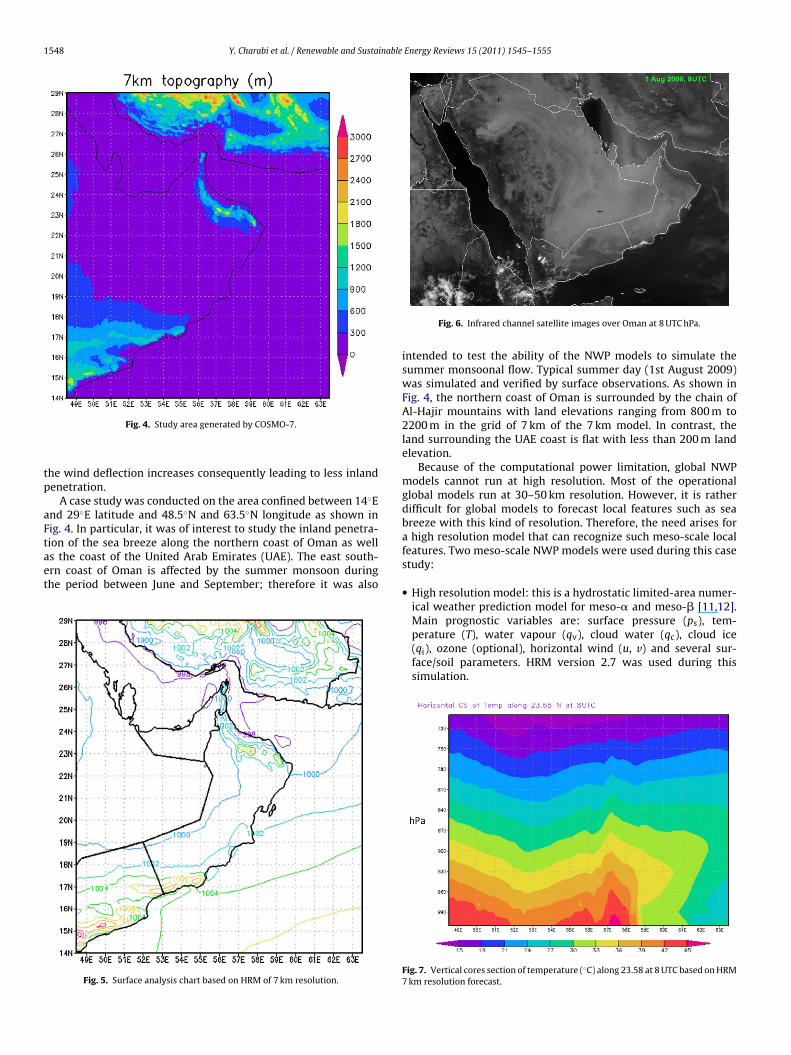
Fig. 4. Study area generated by COSMO-7.
he wind deflection increases consequently leading to less inlandenetration.
A case study was conducted on the area confined between 14◦End 29◦E latitude and 48.5◦N and 63.5◦N longitude as shown inig. 4. In particular, it was of interest to study the inland penetra-
ion of the sea breeze along the northern coast of Oman as wells the coast of the United Arab Emirates (UAE). The east south-rn coast of Oman is affected by the summer monsoon duringhe period between June and September; therefore it was alsoFig. 5. Surface analysis chart based on HRM of 7 km resolution.
Fig. 6. Infrared channel satellite images over Oman at 8 UTC hPa.
intended to test the ability of the NWP models to simulate thesummer monsoonal flow. Typical summer day (1st August 2009)was simulated and verified by surface observations. As shown inFig. 4, the northern coast of Oman is surrounded by the chain ofAl-Hajir mountains with land elevations ranging from 800 m to2200 m in the grid of 7 km of the 7 km model. In contrast, theland surrounding the UAE coast is flat with less than 200 m landelevation.
Because of the computational power limitation, global NWPmodels cannot run at high resolution. Most of the operationalglobal models run at 30–50 km resolution. However, it is ratherdifficult for global models to forecast local features such as seabreeze with this kind of resolution. Therefore, the need arises fora high resolution model that can recognize such meso-scale localfeatures. Two meso-scale NWP models were used during this casestudy:
• High resolution model: this is a hydrostatic limited-area numer-ical weather prediction model for meso-� and meso-� [11,12].
Main prognostic variables are: surface pressure (ps), tem-perature (T), water vapour (qv), cloud water (qc), cloud ice(qi), ozone (optional), horizontal wind (u, v) and several sur-face/soil parameters. HRM version 2.7 was used during thissimulation.Fig. 7. Vertical cores section of temperature (◦C) along 23.58 at 8 UTC based on HRM7 km resolution forecast.
Y. Charabi et al. / Renewable and Sustainable Energy Reviews 15 (2011) 1545–1555 1549
ed thr
•
va
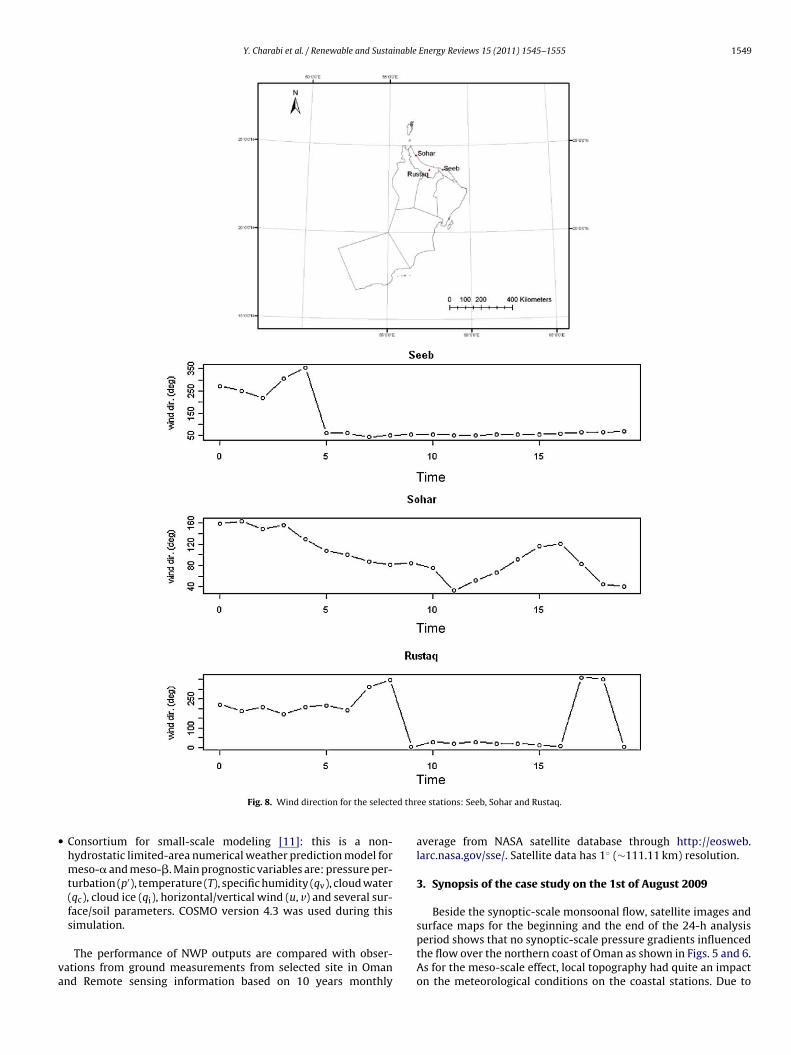
Fig. 8. Wind direction for the select
Consortium for small-scale modeling [11]: this is a non-hydrostatic limited-area numerical weather prediction model formeso-� and meso-�. Main prognostic variables are: pressure per-turbation (p′), temperature (T), specific humidity (qv), cloud water(qc), cloud ice (qi), horizontal/vertical wind (u, v) and several sur-face/soil parameters. COSMO version 4.3 was used during this
simulation.The performance of NWP outputs are compared with obser-ations from ground measurements from selected site in Omannd Remote sensing information based on 10 years monthly
ee stations: Seeb, Sohar and Rustaq.
average from NASA satellite database through http://eosweb.larc.nasa.gov/sse/. Satellite data has 1◦ (∼111.11 km) resolution.
3. Synopsis of the case study on the 1st of August 2009
Beside the synoptic-scale monsoonal flow, satellite images and
surface maps for the beginning and the end of the 24-h analysisperiod shows that no synoptic-scale pressure gradients influencedthe flow over the northern coast of Oman as shown in Figs. 5 and 6.As for the meso-scale effect, local topography had quite an impacton the meteorological conditions on the coastal stations. Due to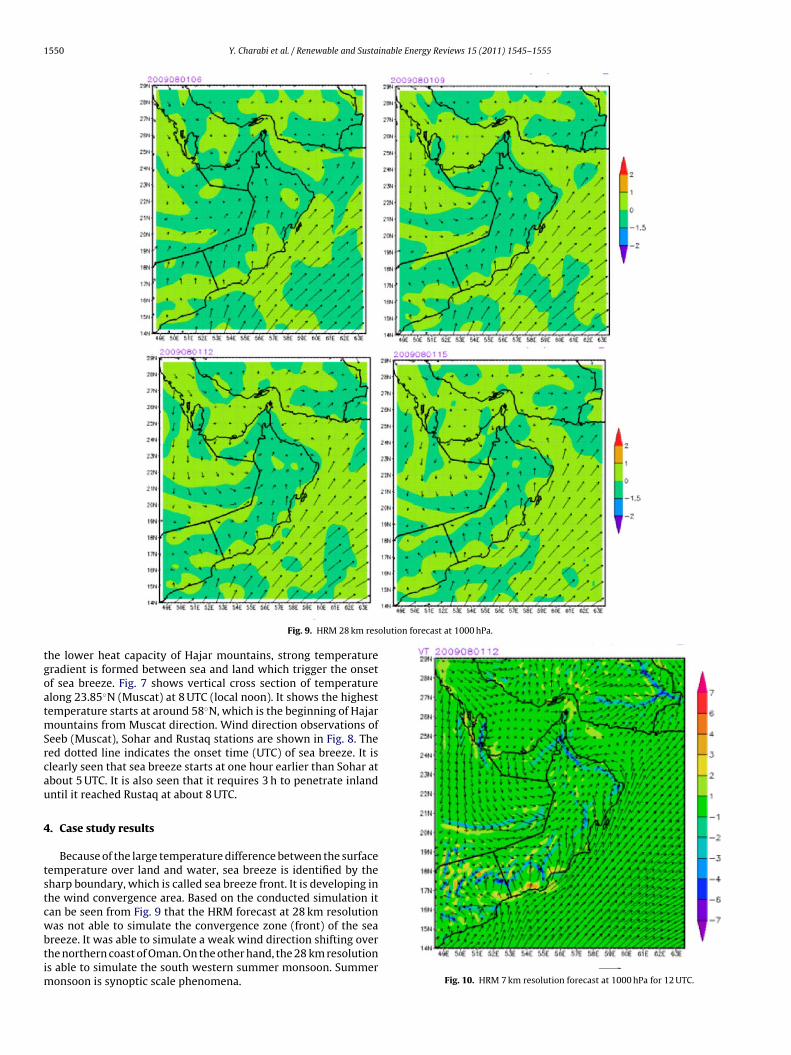
1550 Y. Charabi et al. / Renewable and Sustainable Energy Reviews 15 (2011) 1545–1555
olution forecast at 1000 hPa.
tgoatmSrcau
4
tstcwbtim
Fig. 9. HRM 28 km res
he lower heat capacity of Hajar mountains, strong temperatureradient is formed between sea and land which trigger the onsetf sea breeze. Fig. 7 shows vertical cross section of temperaturelong 23.85◦N (Muscat) at 8 UTC (local noon). It shows the highestemperature starts at around 58◦N, which is the beginning of Hajar
ountains from Muscat direction. Wind direction observations ofeeb (Muscat), Sohar and Rustaq stations are shown in Fig. 8. Theed dotted line indicates the onset time (UTC) of sea breeze. It islearly seen that sea breeze starts at one hour earlier than Sohar atbout 5 UTC. It is also seen that it requires 3 h to penetrate inlandntil it reached Rustaq at about 8 UTC.
. Case study results
Because of the large temperature difference between the surfaceemperature over land and water, sea breeze is identified by theharp boundary, which is called sea breeze front. It is developing inhe wind convergence area. Based on the conducted simulation itan be seen from Fig. 9 that the HRM forecast at 28 km resolution
as not able to simulate the convergence zone (front) of the seareeze. It was able to simulate a weak wind direction shifting overhe northern coast of Oman. On the other hand, the 28 km resolutions able to simulate the south western summer monsoon. Summer
onsoon is synoptic scale phenomena. Fig. 10. HRM 7 km resolution forecast at 1000 hPa for 12 UTC.
Y. Charabi et al. / Renewable and Sustainable Energy Reviews 15 (2011) 1545–1555 1551
RM 7 km forecast at 1000 hPa.
sasst7wfcbdbibt1tfl
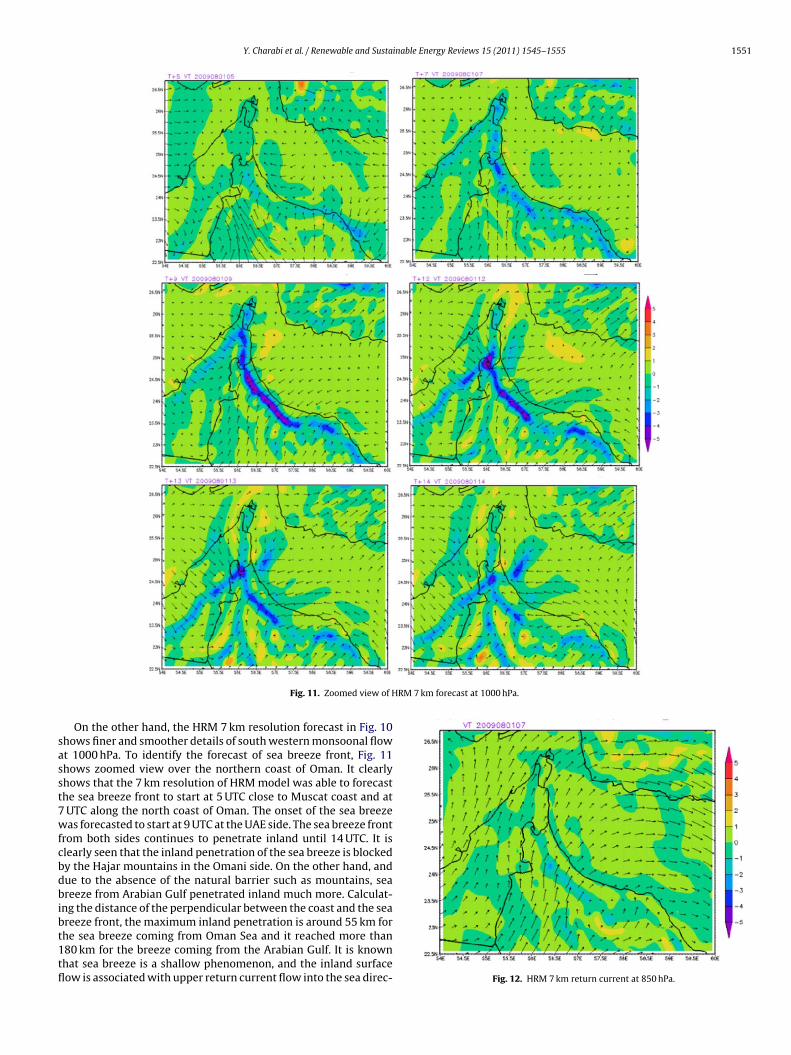
Fig. 11. Zoomed view of H
On the other hand, the HRM 7 km resolution forecast in Fig. 10hows finer and smoother details of south western monsoonal flowt 1000 hPa. To identify the forecast of sea breeze front, Fig. 11hows zoomed view over the northern coast of Oman. It clearlyhows that the 7 km resolution of HRM model was able to forecasthe sea breeze front to start at 5 UTC close to Muscat coast and atUTC along the north coast of Oman. The onset of the sea breezeas forecasted to start at 9 UTC at the UAE side. The sea breeze front
rom both sides continues to penetrate inland until 14 UTC. It islearly seen that the inland penetration of the sea breeze is blockedy the Hajar mountains in the Omani side. On the other hand, andue to the absence of the natural barrier such as mountains, seareeze from Arabian Gulf penetrated inland much more. Calculat-
ng the distance of the perpendicular between the coast and the sea
reeze front, the maximum inland penetration is around 55 km forhe sea breeze coming from Oman Sea and it reached more than80 km for the breeze coming from the Arabian Gulf. It is knownhat sea breeze is a shallow phenomenon, and the inland surfaceow is associated with upper return current flow into the sea direc- Fig. 12. HRM 7 km return current at 850 hPa.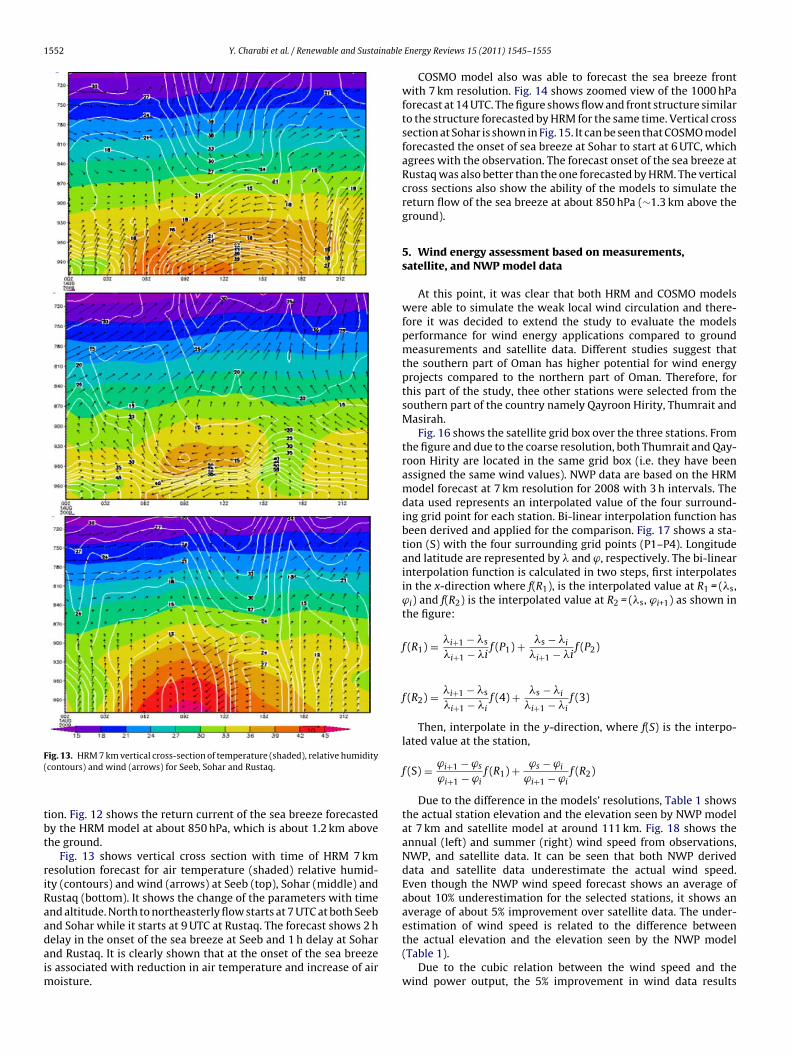
1552 Y. Charabi et al. / Renewable and Sustainable
F(
tbt
riRaadaim
ig. 13. HRM 7 km vertical cross-section of temperature (shaded), relative humiditycontours) and wind (arrows) for Seeb, Sohar and Rustaq.
ion. Fig. 12 shows the return current of the sea breeze forecastedy the HRM model at about 850 hPa, which is about 1.2 km abovehe ground.
Fig. 13 shows vertical cross section with time of HRM 7 kmesolution forecast for air temperature (shaded) relative humid-ty (contours) and wind (arrows) at Seeb (top), Sohar (middle) andustaq (bottom). It shows the change of the parameters with timend altitude. North to northeasterly flow starts at 7 UTC at both Seeb
nd Sohar while it starts at 9 UTC at Rustaq. The forecast shows 2 helay in the onset of the sea breeze at Seeb and 1 h delay at Soharnd Rustaq. It is clearly shown that at the onset of the sea breezes associated with reduction in air temperature and increase of airoisture.
Energy Reviews 15 (2011) 1545–1555
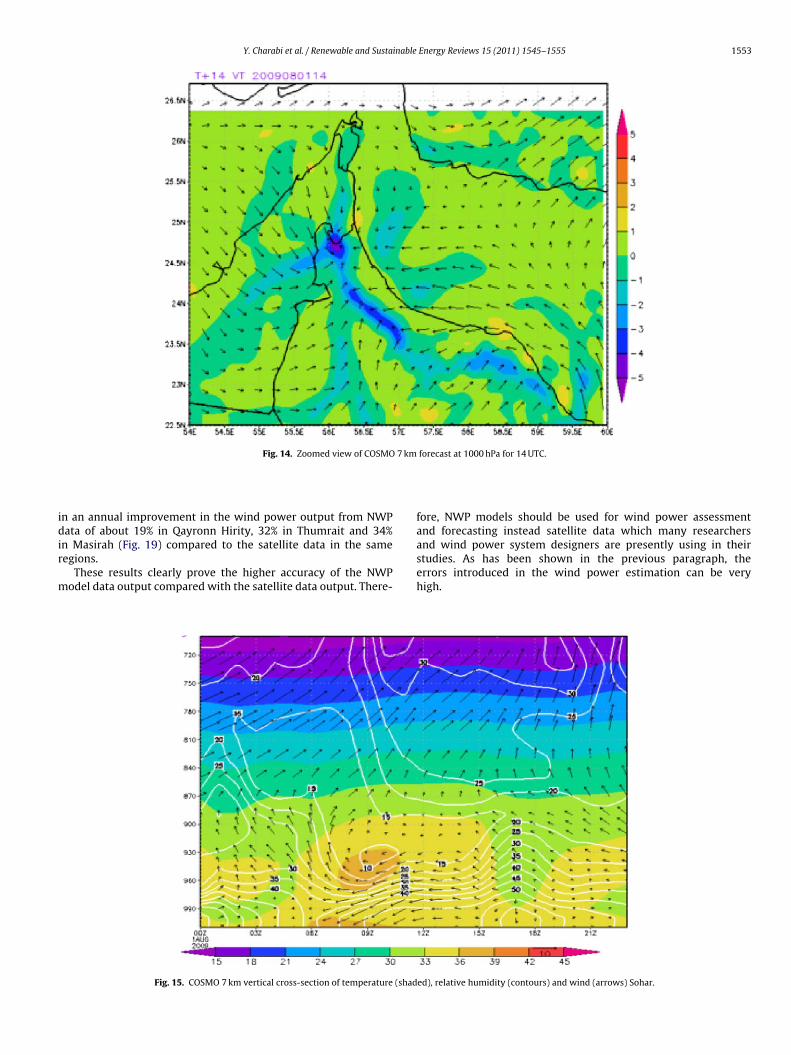
COSMO model also was able to forecast the sea breeze frontwith 7 km resolution. Fig. 14 shows zoomed view of the 1000 hPaforecast at 14 UTC. The figure shows flow and front structure similarto the structure forecasted by HRM for the same time. Vertical crosssection at Sohar is shown in Fig. 15. It can be seen that COSMO modelforecasted the onset of sea breeze at Sohar to start at 6 UTC, whichagrees with the observation. The forecast onset of the sea breeze atRustaq was also better than the one forecasted by HRM. The verticalcross sections also show the ability of the models to simulate thereturn flow of the sea breeze at about 850 hPa (∼1.3 km above theground).
5. Wind energy assessment based on measurements,satellite, and NWP model data
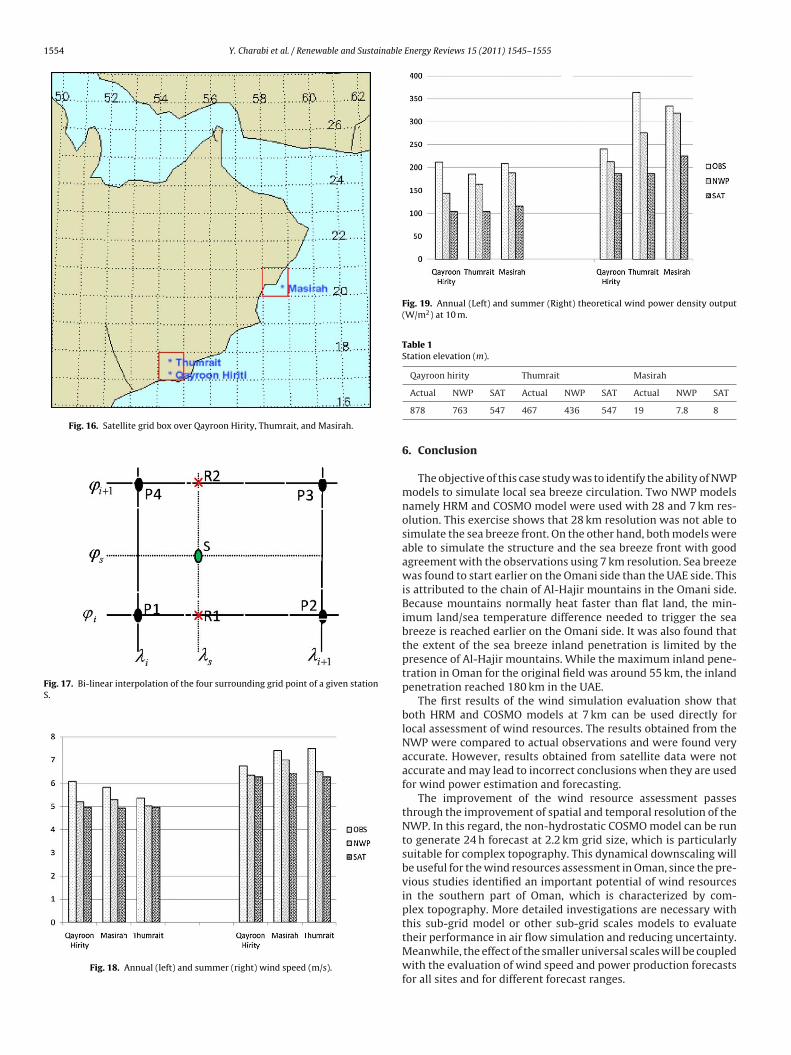
At this point, it was clear that both HRM and COSMO modelswere able to simulate the weak local wind circulation and there-fore it was decided to extend the study to evaluate the modelsperformance for wind energy applications compared to groundmeasurements and satellite data. Different studies suggest thatthe southern part of Oman has higher potential for wind energyprojects compared to the northern part of Oman. Therefore, forthis part of the study, thee other stations were selected from thesouthern part of the country namely Qayroon Hirity, Thumrait andMasirah.
Fig. 16 shows the satellite grid box over the three stations. Fromthe figure and due to the coarse resolution, both Thumrait and Qay-roon Hirity are located in the same grid box (i.e. they have beenassigned the same wind values). NWP data are based on the HRMmodel forecast at 7 km resolution for 2008 with 3 h intervals. Thedata used represents an interpolated value of the four surround-ing grid point for each station. Bi-linear interpolation function hasbeen derived and applied for the comparison. Fig. 17 shows a sta-tion (S) with the four surrounding grid points (P1–P4). Longitudeand latitude are represented by � and ϕ, respectively. The bi-linearinterpolation function is calculated in two steps, first interpolatesin the x-direction where f(R1), is the interpolated value at R1 = (�s,ϕi) and f(R2) is the interpolated value at R2 = (�s, ϕi+1) as shown inthe figure:
f (R1) = �i+1 − �s
�i+1 − �if (P1) + �s − �i
�i+1 − �if (P2)
f (R2) = �i+1 − �s
�i+1 − �if (4) + �s − �i
�i+1 − �if (3)
Then, interpolate in the y-direction, where f(S) is the interpo-lated value at the station,
f (S) = ϕi+1 − ϕs
ϕi+1 − ϕif (R1) + ϕs − ϕi
ϕi+1 − ϕif (R2)
Due to the difference in the models’ resolutions, Table 1 showsthe actual station elevation and the elevation seen by NWP modelat 7 km and satellite model at around 111 km. Fig. 18 shows theannual (left) and summer (right) wind speed from observations,NWP, and satellite data. It can be seen that both NWP deriveddata and satellite data underestimate the actual wind speed.Even though the NWP wind speed forecast shows an average ofabout 10% underestimation for the selected stations, it shows anaverage of about 5% improvement over satellite data. The under-
estimation of wind speed is related to the difference betweenthe actual elevation and the elevation seen by the NWP model(Table 1).Due to the cubic relation between the wind speed and thewind power output, the 5% improvement in wind data results
Y. Charabi et al. / Renewable and Sustainable Energy Reviews 15 (2011) 1545–1555 1553
7 km
idir
m
Fig. 14. Zoomed view of COSMO
n an annual improvement in the wind power output from NWP
ata of about 19% in Qayronn Hirity, 32% in Thumrait and 34%n Masirah (Fig. 19) compared to the satellite data in the sameegions.
These results clearly prove the higher accuracy of the NWPodel data output compared with the satellite data output. There-
Fig. 15. COSMO 7 km vertical cross-section of temperature (shad
forecast at 1000 hPa for 14 UTC.
fore, NWP models should be used for wind power assessment
and forecasting instead satellite data which many researchersand wind power system designers are presently using in theirstudies. As has been shown in the previous paragraph, theerrors introduced in the wind power estimation can be veryhigh.ed), relative humidity (contours) and wind (arrows) Sohar.
1554 Y. Charabi et al. / Renewable and Sustainable Energy Reviews 15 (2011) 1545–1555
Fig. 16. Satellite grid box over Qayroon Hirity, Thumrait, and Masirah.
Fig. 17. Bi-linear interpolation of the four surrounding grid point of a given stationS.
Fig. 18. Annual (left) and summer (right) wind speed (m/s).
Fig. 19. Annual (Left) and summer (Right) theoretical wind power density output(W/m2) at 10 m.
Table 1Station elevation (m).
Qayroon hirity Thumrait Masirah
Actual NWP SAT Actual NWP SAT Actual NWP SAT
878 763 547 467 436 547 19 7.8 8
6. Conclusion
The objective of this case study was to identify the ability of NWPmodels to simulate local sea breeze circulation. Two NWP modelsnamely HRM and COSMO model were used with 28 and 7 km res-olution. This exercise shows that 28 km resolution was not able tosimulate the sea breeze front. On the other hand, both models wereable to simulate the structure and the sea breeze front with goodagreement with the observations using 7 km resolution. Sea breezewas found to start earlier on the Omani side than the UAE side. Thisis attributed to the chain of Al-Hajir mountains in the Omani side.Because mountains normally heat faster than flat land, the min-imum land/sea temperature difference needed to trigger the seabreeze is reached earlier on the Omani side. It was also found thatthe extent of the sea breeze inland penetration is limited by thepresence of Al-Hajir mountains. While the maximum inland pene-tration in Oman for the original field was around 55 km, the inlandpenetration reached 180 km in the UAE.
The first results of the wind simulation evaluation show thatboth HRM and COSMO models at 7 km can be used directly forlocal assessment of wind resources. The results obtained from theNWP were compared to actual observations and were found veryaccurate. However, results obtained from satellite data were notaccurate and may lead to incorrect conclusions when they are usedfor wind power estimation and forecasting.
The improvement of the wind resource assessment passesthrough the improvement of spatial and temporal resolution of theNWP. In this regard, the non-hydrostatic COSMO model can be runto generate 24 h forecast at 2.2 km grid size, which is particularlysuitable for complex topography. This dynamical downscaling willbe useful for the wind resources assessment in Oman, since the pre-vious studies identified an important potential of wind resourcesin the southern part of Oman, which is characterized by com-plex topography. More detailed investigations are necessary withthis sub-grid model or other sub-grid scales models to evaluate
their performance in air flow simulation and reducing uncertainty.Meanwhile, the effect of the smaller universal scales will be coupledwith the evaluation of wind speed and power production forecastsfor all sites and for different forecast ranges.
inable
A
oMah
R
[
[11] Doms G., and Schattler U. A description of the Nonhydrostatic RegionalModel LM. Part I: Dynamics and Numerics. Deutscher Wetterdienst(DWD), Offenbach. November 2002 [available from http://www.cosmo-model.org/content/model/documentation/core/cosmoDyncsNumcs.pdf].
Y. Charabi et al. / Renewable and Susta
cknowledgments
This research was funded by The Research Council (Sultanatef Oman). The authors are grateful to the Directorate General ofeteorology and Air Navigation, Sultanate of Oman for providing
ccess to its PC Cluster to run the NWP models and providing windourly data for this research.
eferences
[1] Gastli A, Charabi Y. Solar electricity prospects in Oman using GIS-based solarradiation maps. Renewable & Sustainable Energy Reviews 2010;14(February(2)):790–7, doi:10.1016/j.rser.2009.08.018.
[2] Charabi Y, Gastli A. GIS assessment of large CSP plant in Duqum-Oman.Renewable & Sustainable Energy Reviews 2010;14(February (2)):835–41,doi:10.1016/j.rser.2009.08.019.
[3] Gastli A, Charabi Y, Zekri S. GIS-based assessment of combined CSP
electric power & seawater desalinisation plant for Duqum-Oman.Renewable & Sustainable Energy Reviews 2010;14(February (2)):821–7,doi:10.1016/j.rser.2009.08.020.[4] Merlinde JK, Nicholas C, Adam M, Lain M, Hugh O. Emerging challenges in windenergy forecasting for Australia. Australian Meteorological and OceanographicJournal 2009;58:99–106.
[
Energy Reviews 15 (2011) 1545–1555 1555
[5] U.S. Department of Energy Workshop Report: Research needs for wind resourcecharacterization. Technical report. NREL/TP-500-43521; June 2008.
[6] Al-Yahyai S, Charabi Y, Gastli A, Al-Alawi S. Assessment of wind energy potentiallocations in Oman using data from existing weather stations. Renewable &Sustainable Energy Reviews 2010, doi:10.1016/j.rser.2010.01.008.
[7] Pryor SC, Barthelmie RJ, Schoof JT. Inter-annual variability of wind indicesacross Europe. Wind Energy 2006;9:27–38.
[8] Pryor SC, Barthelmie RJ, Kjellström E. Analyses of the potential climate changeimpact on wind energy resources in northern Europe using output from aRegional Climate Model. Climate Dynamics 2005;25:815–35.
[9] Charabi Y, Hatrushi S. Synoptic aspects of winter rainfall vari-ability in Oman. Atmospheric Research 2010;95(4):470–86,doi:10.1016/j.atmosres.2009.11.009.
10] Charabi Y. Arabian summer monsoon variability: teleconex-ion to ENSO and IOD. Atmospheric Research 2009;91:105–17,doi:10.1016/j.atmosres.2008.07.006.
12] The Consortium for Small-scale Modeling (COSMO) (online) at www.cosmo-model.org.