
Economic assessment of solar electricity production from organic-based photovoltaic modules in a...
13
Economic assessment of solar electricity production from organic-based photovoltaic modules in a domestic environment Brian Azzopardi, * a Christopher J. M. Emmott, b Antonio Urbina, bc Frederik C. Krebs, d Joseph Mutale a and Jenny Nelson b Received 18th May 2011, Accepted 5th July 2011 DOI: 10.1039/c1ee01766g The primary driver for development of organic photovoltaic (OPV) technologies is the prospect of very low cost module manufacture leading to affordable solar electricity. This paper presents an economic assessment of OPV based on an existing pre-industrial manufacturing process and the associated detailed material inventory. Using life cycle costing techniques, the life cycle investment cost for a 1kW p , grid-connected OPV system is calculated, taking into account the materials, direct process energy, labour, balance of system components, design and maintenance costs. Assuming values for the performance ratio of the PV system, insolation level, inflation and interest rates, the levelised electricity cost (LEC) is calculated. Under an average solar irradiance of 1700 kWh/m 2 /year, typical of southern Europe, a LEC of between 0.19 V/kWh and 0.50 V/kWh was calculated for a 1kW p system, based on modules containing 7% efficient cells and assuming a 5 year module lifetime. The OPV module is found to make up the majority of the system cost while the material costs constitute the largest contribution to the cost of the OPV module. The influence of OPV module lifetime is studied using sensitivity. This paper demonstrates that competitive solar electricity from OPV is within reach if efficiencies of ca. 7% already demonstrated in lab scale devices can be achieved in large area modules and if lifetimes of at least 5 years can be achieved. 1.0 Introduction Thin film photovoltaic modules based on solution processable organic semiconductors are attracting intense interest as a possible alternative to conventional thin film photovoltaic approaches. 1 The attraction of the organic photovoltaic (OPV) approach lies in the potential for very low-cost module manu- facture, in comparison with both wafer-based silicon and inor- ganic thin films, achieved by adapting high throughput printing and coating techniques, and in the potentially disruptive effect of the new technology on the PV market. Inorganic thin film technologies already offer potential for cost reductions in comparison with wafer based silicon through lower energy and material consumption during manufacture. 2 Analysis suggests that in the near future, production costs of 0.95 V/W p should be achievable for a-Si modules with efficiencies of 10%, 1.0 V/W p for CdTe modules of 12% efficiency, and 1.2 V/W p for CIGS modules of 14% efficiency. 3 Relative to these inorganic thin film a Electrical Energy and Power Systems Group, School of Electrical and Electronic Engineering, University of Manchester, Ferranti Building, Sackville Street, Manchester, M13 9PL, United Kingdom. E-mail: brian. [email protected]; Tel: + 44 (0) 161 306 8721 b Department of Physics and Grantham Institute for Climate Change, Imperial College London, London, SW7 2AZ, United Kingdom c Department of Electronics, Technical University of Cartagena, Plza. Hospital 1, 30202 Cartagena, Spain d Risø National Laboratory for Sustainable Energy, Technical University of Denmark, Frederiksborgvej 399, DK-4000 Roskilde, Denmark Broader context Organic Photovoltaics (OPV) are often cited as the answer to low-cost and sustainable solar electricity. However, until now there has been little research on the economic assessment of OPV and so this claim has not had the evidence to corroborate it. This paper presents an economic assessment of OPV based on an existing pre-industrial manufacturing process which has previously been analysed from an environmental life cycle perspective. Together these studies provide evidence to support the argument that OPV can provide affordable solar power through low-energy and low-cost manufacture. The ability to compare the cost profile of OPV with conventional PV systems is essential in realising the potential of this technology, and even in the capacity of the PV market as a whole. This journal is ª The Royal Society of Chemistry 2011 Energy Environ. Sci., 2011, 4, 3741–3753 | 3741 Dynamic Article Links C < Energy & Environmental Science Cite this: Energy Environ. Sci., 2011, 4, 3741 www.rsc.org/ees ANALYSIS
Transcript of Economic assessment of solar electricity production from organic-based photovoltaic modules in a...

Dynamic Article LinksC<Energy &Environmental Science
Cite this: Energy Environ. Sci., 2011, 4, 3741
www.rsc.org/ees ANALYSIS
Economic assessment of solar electricity production from organic-basedphotovoltaic modules in a domestic environment
Brian Azzopardi,*a Christopher J. M. Emmott,b Antonio Urbina,bc Frederik C. Krebs,d Joseph Mutalea
and Jenny Nelsonb
Received 18th May 2011, Accepted 5th July 2011
DOI: 10.1039/c1ee01766g
The primary driver for development of organic photovoltaic (OPV) technologies is the prospect of very
low cost module manufacture leading to affordable solar electricity. This paper presents an economic
assessment of OPV based on an existing pre-industrial manufacturing process and the associated
detailed material inventory. Using life cycle costing techniques, the life cycle investment cost for
a 1kWp, grid-connected OPV system is calculated, taking into account the materials, direct process
energy, labour, balance of system components, design and maintenance costs. Assuming values for the
performance ratio of the PV system, insolation level, inflation and interest rates, the levelised electricity
cost (LEC) is calculated. Under an average solar irradiance of 1700 kWh/m2/year, typical of southern
Europe, a LEC of between 0.19 V/kWh and 0.50 V/kWh was calculated for a 1kWp system, based on
modules containing 7% efficient cells and assuming a 5 year module lifetime. The OPVmodule is found
to make up the majority of the system cost while the material costs constitute the largest contribution to
the cost of the OPV module. The influence of OPV module lifetime is studied using sensitivity. This
paper demonstrates that competitive solar electricity from OPV is within reach if efficiencies of ca. 7%
already demonstrated in lab scale devices can be achieved in large area modules and if lifetimes of at
least 5 years can be achieved.
1.0 Introduction
Thin film photovoltaic modules based on solution processable
organic semiconductors are attracting intense interest as
aElectrical Energy and Power Systems Group, School of Electrical andElectronic Engineering, University of Manchester, Ferranti Building,Sackville Street, Manchester, M13 9PL, United Kingdom. E-mail: [email protected]; Tel: + 44 (0) 161 306 8721bDepartment of Physics and Grantham Institute for Climate Change,Imperial College London, London, SW7 2AZ, United KingdomcDepartment of Electronics, Technical University of Cartagena, Plza.Hospital 1, 30202 Cartagena, SpaindRisø National Laboratory for Sustainable Energy, Technical University ofDenmark, Frederiksborgvej 399, DK-4000 Roskilde, Denmark
Broader context
Organic Photovoltaics (OPV) are often cited as the answer to low-co
been little research on the economic assessment of OPV and so thi
presents an economic assessment of OPV based on an existing pr
analysed from an environmental life cycle perspective. Together the
can provide affordable solar power through low-energy and low-co
with conventional PV systems is essential in realising the potential o
a whole.
This journal is ª The Royal Society of Chemistry 2011
a possible alternative to conventional thin film photovoltaic
approaches.1 The attraction of the organic photovoltaic (OPV)
approach lies in the potential for very low-cost module manu-
facture, in comparison with both wafer-based silicon and inor-
ganic thin films, achieved by adapting high throughput printing
and coating techniques, and in the potentially disruptive effect of
the new technology on the PV market. Inorganic thin film
technologies already offer potential for cost reductions in
comparison with wafer based silicon through lower energy and
material consumption during manufacture.2 Analysis suggests
that in the near future, production costs of 0.95 V/Wp should be
achievable for a-Si modules with efficiencies of 10%, 1.0 V/Wp
for CdTe modules of 12% efficiency, and 1.2 V/Wp for CIGS
modules of 14% efficiency.3 Relative to these inorganic thin film
st and sustainable solar electricity. However, until now there has
s claim has not had the evidence to corroborate it. This paper
e-industrial manufacturing process which has previously been
se studies provide evidence to support the argument that OPV
st manufacture. The ability to compare the cost profile of OPV
f this technology, and even in the capacity of the PV market as
Energy Environ. Sci., 2011, 4, 3741–3753 | 3741

technologies OPV enjoys a relative abundance of the raw mate-
rials and the potential for even lower material and energy
consumption along with high-speed, roll to roll (R2R)
processing.
Although the efficiency and lifetime of OPV modules are still
inferior to other PV technologies, both have made rapid
improvements in recent years4,5 and it is expected that inferior
module performance could be tolerated if the system cost is very
much lower. OPV offers the additional advantage of low capital
investment for manufacture, making the technology financially
accessible and feasible even for small scale production. This
factor could accelerate the rate of deployment of PV technology
in sparsely populated or poor regions.
While cost projections have been worked out for a variety of
wafer based silicon3,6,7 and thin film8–10 PV technologies, until
now only a few studies have addressed the cost of OPV and then
with only rough estimates of the material and process costs
involved. Such studies indicate a diverse range of module costs,
from 36V/Wp to 0.7V/Wp,11–16 the lowest estimate was shown to
result in an electricity cost of around 0.34 V/kWh under
1700 kWh/m2 annual insolation.12,17 These estimates compare
unfavourably with the 2010 average solar module retail price
index of 3.31 V/Wp in the European Union (EU), resulting in
electricity prices of between 0.11 V/kWh and 0.21 V/kWh,18 and
with projected thin film PV costs of around 1.0 V/Wp.3
The lack of detailed cost projections for OPV until now results
from very limited production experience. However, a recently
demonstrated pre-industrial scale R2R manufacturing process,
ProcessOne,19 now provides useful information on procedures,
facilities, manpower, energy and materials usage, that allow
a thorough assessment of module production cost. ProcessOne
utilises sequential deposition of four, solution processable layers:
a ZnO electron transport layer; a P3HT:PCBM active layer;
a PEDOT:PSS hole transport layer; and a silver ink back elec-
trode, which are deposited onto an ITO coated substrate (Fig. 1).
This process has recently been analysed in terms of energy
consumption using a Life Cycle Analysis (LCA) calculation for
the OPV itself and for product integrated OPV.15,20–22 The results
are promising and compare well with other thin film technolo-
gies: for a typical module containing cells of 3% efficiency, and an
active area of 67% of module surface, the direct process energy is
77 MJ/m2 and the energy embedded in the materials is 303 MJ/
m2.22 The energy pay-back time (EPBT) of such modules was
found to be 1.3 years assuming a system performance ratio of 0.8
and an irradiance level of 1700 kWh/m2/year. Importantly, the
analysis thus showed that even with pre-industrial production,
the EPBT of OPV is competitive with other, more mature thin
film PV technologies. The existence of the LCA model of this
process allows a direct comparison of energy and financial costs
of each stage of production, and enables the projection of a likely
cost evolution in the future given various projections of material
and energy costs, although this was beyond the scope of the
present study.
An area of uncertainty in the costs of OPV systems is the cost
of the balance of systems (BoS), which has already been shown to
significantly increase the EPBT.21 As module cost decreases, BoS
costs soon become the limiting factor making the cost of the
module less relevant. Yet OPV offers flexibility, adaptability and
the possibility of implementation in a variety of contexts such as
3742 | Energy Environ. Sci., 2011, 4, 3741–3753
the integration into building components and textiles, dual
function appliances, replaceable modules as well as lower weight
that may reduce the BoS cost. However, the BoS costs for OPV
still need to be analysed.
In this paper we use a methodology based on Life Cycle Cost
(LCC) techniques to estimate the Levelised Electricity Cost
(LEC) of grid-connected OPV systems, considering a 1kWp
system with module manufacture based on the ProcessOne
manufacturing process. In the LCC technique, the Life Cycle
Investment Cost (LCIC) is discounted to a reference starting
year, following which a LEC can be calculated for given module
efficiency and insolation levels. Our method encompasses the
effects of module degradation and future technological
improvements leading to improved efficiency. We use sensitivity
analysis to identify the main factors that influence the resulting
LEC.
This paper is structured as follows. In section 2, the economic
assessment model is illustrated and calculation figures as well as
tables are provided within this model. Key findings are discussed
throughout. Then, in section 3, sensitivity analysis provides an
insight on the variables in the model. Later, in section 4, the
potential of organic-based PV is discussed along with possible
future developments of the technology and limitations of the
model. Finally, in section 5, the main conclusions are presented.
2.0 Economic assessment model
The economic assessment model involves the material, produc-
tion and process costs of the PV module, the cost of the BoS
components and the operation of the PV system as shown in
Fig. 1. In order to establish a PV area related cost we first
determine the material costs using material usage data from an
existing LCA study22 and manufacturers’ price data, and then
calculate the production and process costs using the LCA model
and known electricity costs. Based on the discovered cost esti-
mates per square metre, the module cost is calculated in V/Wp
under standard test conditions (STC) at 1000W/m2 for an
assumed efficiency. This is a comparable metric between PV
technologies. However, in order to identify the market viability,
a LEC in V/kWh is calculated. The LEC is dependent on
a number of parameters and variables including lifetime, effi-
ciency degradation, active area, insolation level and mode of
financing. The LEC is the conversion from a turn-key system
price, in V/kWp installed capacity, to PV electricity cost, in
V/kWh over the whole system lifetime. The cost of CO2 saved is
omitted from the calculation because of uncertainties in the
Carbon Market.
2.1 The OPV module costs
2.1.1 Material costs. Market prices of each of the materials
used in the six stages of ProcessOne were obtained from up to three
different sources. The minimum and maximum prices were deter-
mined for each material and are presented in Table 1. Since these
costs are related to manufacturing resources for any business
venture, VAT was not included. In some cases delivery was
included in the quoted price, however, this was deemed to be
negligible and so prices which do not include delivery were not
adjusted. In addition, where information was available, the price
This journal is ª The Royal Society of Chemistry 2011

Fig. 1 Economic assessment model of OPV grid-connected system.
reduction of buying in bulk has been taken into account. The costs
were based on the quantities obtained for 1 m2 of OPV module
with a PV active area of 67% in the previous LCA study.22
This journal is ª The Royal Society of Chemistry 2011
ProcessOne uses a flexible substrate coated with a transparent
conducting oxide, in this case indium tin oxide (ITO). The device
structure has a cathode on the transparent substrate and an
Energy Environ. Sci., 2011, 4, 3741–3753 | 3743

Table 1 OPV module material costs
ProcessOneMaterial Inventory
1m2 ModuleUnit
Cost of material (V per unit)Cost per 1m2
module (V/m2)
67% active area 1 2 3 15 Min Max
S1 ITO ELECTRODE PATTERNINGITO on PET substrate 10000 cm2 0.0124 0.0125 0.0026 14.64 65.50PMMA 3.28 g 0.1827 4.1128 — 0.57 13.47CuCl2 0.25 g 0.0327 0.0929 0.0030 0.00 0.02Water 0.52 l 0.0031 0.0032 — 0.00 0.00NaOH 1.66 g 0.0133 0.0129 0.0034 0.00 0.02Demineralised Water 0.21 l 1.1031a 0.5031b 0.5332 0.10 0.23PET ITO 48.53 15.32 79.24S2 ELECTRON TRANSPORT COATINGZn(OAc)2 1.38c g 0.1127 0.2528 0.0329 0.04 0.35KOH 0.69c g 0.0133 0.0229 0.0035 0.00 0.01MeOH 1.66 ml 0.0127 0.0129 0.0036 0.00 0.01Acetone 3.32 ml 0.0127 0.0229 0.0037 0.00 0.06Isopropanol 25.77 g 0.0027 0.0037 0.0229 0.02 0.51MEA 0.04 g — 0.1228 — 0.01 0.01ZnO 1.08 0.07 1.08S3 ACTIVE LAYER DEPOSITIONP3HT 0.10 g — 266.4938 52.2626 5.14 26.21PCBM 0.08 g 100.0039 194.2340 189.2538 7.87 15.28chlorobenzene 6.56 ml 0.0127 0.0928 0.0229 0.08 0.56P3HT:PCBM 8.36 8.36 42.06S4 PEDOT:PSS DEPOSITIONisopropanol 40.52 g 0.0027 0.0037 0.0229 0.03 0.80PEDOT:PSSd 29.51 g 0.3641 0.4028 — 10.62 11.77PEDOT:PSS 4.30 4.30 12.57S5 ELECTRODE DEPOSITIONSilver ink (PV 410) 19.67 g — — — 0.39 7.67 7.67Silver 7.67 7.67S6 LAMINATION3M 467 MPF 50.60 g 0.07 3.57 3.57PET 72.75 g 0.12 8.52 8.52Encapsulation 10.0042e 5.0042f — 5.00 12.08TOTAL MATERIAL COSTS 40.71 154.70
a Estimated from max price in Europe of electricity used in demineralisation plus average price of UK tap water. b Estimated from min price in Europeof electricity used in demineralisation plus average price of UK tap water. c Note that reference (Espinosa, 2010)22 contains typographical errors in thesedata points which have been corrected here. d 1.3 wt% aqueous solution. e Encapsulation giving over 10 year lifetime. f Encapsulation giving up to 5 yearlifetime.
anode on top, a structure which is currently preferred for R2R
processing as it avoids evaporated metals. ProcessOne employs
a zinc oxide (ZnO) nanoparticle interlayer which acts as an
electron collector, whilst poly(3,4-ethylenedioxythiophene) poly
(styrenesulfonate) (PEDOT:PSS) is used as a hole collector. In
April 2010, a dispute was resolved between HC Stark and Agfa-
Gevaert N.V. over intellectual property concerning PEDOT:
PSS, suggesting that costs for this material are likely to fall in the
future.23 The active layer used in ProcessOne is a blend of poly(3-
hexylthiphene) (P3HT), a polythiophene, with phenyl-C61-
butyric acid methyl ester (PCBM) using chlorobenzene as
solvent. The module is encapsulated in a laminate, a target price
for which was provided by Amcor who are yet to commercialise
their OPV encapsulation product. The minimum price for the
encapsulation material costs was taken as a planned Amcor
product which aims to provide a 5 year lifetime, which is in line
with the assumed module lifetime used in this model. Exchange
rates of 1 USD equals 0.75V and 1 GBP equals 1.17V were used
when prices were provided in these currencies.
Hence the total material costs for OPV manufactured by Proc-
essOne range between V40.71/m2 and V154.70/m2. Most of the
3744 | Energy Environ. Sci., 2011, 4, 3741–3753
material cost is attributed to the ITO coated PET followed by the
active layer and silver electrode, PEDOT:PSS and encapsulation as
shown in Fig. 2. It should be noted that future developments in
performance, materials development or availability, and innova-
tions in device design will influence the impact of different mate-
rials. For example, organic transparent conductors such as high
conductivity PEDOT:PSS could be used in place of the ITO elec-
trode, and reduce the large impact of ITO on the cost profile.2
2.1.2 Production and process costs. As for the material costs,
the production and process costs are determined for the six stages
of the ProcessOne manufacturing procedure. Production costs
comprise the following: electricity used during processing;
investment costs for the equipment and infrastructure; labour
costs; and overheads. The cost of electricity consumed by the
machines in the process is calculated using the amounts of energy
consumed found by the recent ProcessOne LCA study,22 multi-
plied by the minimum, industry electricity prices, or maximum,
household electricity prices, as published by the EU commis-
sion43 to give minimum and maximum costs of the direct process
energy consumption. The results of this are shown in Table 2.
This journal is ª The Royal Society of Chemistry 2011

Fig. 2 Absolute (top) and fractional (bottom) costs of materials used in
the manufacture of a 1m2 OPV module.
The estimated investment cost of equipment and infrastructure
for OPV manufacturing is much lower than for mature PV
technologies. In fact, an OPV module manufacturing plant costs
around 0.5 MV for 20,000 m2 production capacity per year
having a 95% module yield.15 Assuming a 5% module efficiency
this is around 0.5 MV per megawatt peak annual capacity while
mature thin film PV technologies manufacturing investment
range from around 0.328 MV to 3.28 MV per megawatt peak
annual capacity.44 To estimate the levelised capital investment
costs per square metre of module over the lifetime of the
manufacturing facility, we take into account the Capital
Recovery Factor (CRF) using eqn (1):
Cinvestment ¼ Total Capital Cost� CRF þ Maintenance
Yearly Output Rate � Plant Lifetime(1)
where CRF is defined in eqn (2). Cinvestment represents the total
capital cost for an investment spread evenly over its useful
lifetime.
CRF ¼ rð1þ rÞnð1þ rÞn � 1
(2)
Using a CRF for a 10 year plant lifetime, a 20,000 m2 annual
production and a 7% real interest rate (r), and assuming that
maintenance amounts to 4% of the levelised capital cost we find
a capital investment cost of V3.93/m2. Table 3 shows the
breakdown of the investment costs for an OPV manufacturing
facility.
To estimate the labour cost of OPV module manufacture we
used the labour time values and cost per unit time given for the
production of small OPV modules and scaled this up to represent
manufacture of a 1m2 module.15 The resulting labour cost
This journal is ª The Royal Society of Chemistry 2011
estimate is V5.32/m2 as shown in Table 4. This value may be an
overestimate since the value per unit time of labour (taken asV80
per hour) covers personnel related overhead costs in a Danish
environment. Table 4 shows that the largest contribution to
labour costs is the preparation and deposition of the PEDOT:
PSS layer.
The overhead costs of OPV manufacture, shown in Table 5,
are based on a simple cost model for OPV which includes facility
rental, miscellaneous and customer warranty costs.12 The
miscellaneous costs and warranty were taken at 5% each of the
total manufacturing costs, that is, 5% of the sum of the direct
process energy costs, investment costs, labour costs and facility
rental. This high rate in miscellaneous costs represents research
and development costs that are aimed at technical developments
intended to reduce market prices as technology matures.
2.1.3 Balance of module costs. Table 6 presents a summary of
the costs of a one metre squared module, which includes mate-
rial, production, investment, labour and overhead costs. The
model also includes a percentage overhead margin, estimated at
10%, which reflects any freight and profit margins for the OPV
modules to the customer. The OPV module or Balance of
Module (BOM) costs range between V191.89/m2 and V63.16/m2,
when the 10% overhead margin is included. Assuming a cell
efficiency of 7%, chosen in line with efficiencies being demon-
strated in lab scale devices,45 and a module active area (area
covered by cells) of 67%, this results in a module cost of between
V4.09/Wp and V1.35/Wp.
The total costs associated with manufacturing a square meter
of OPVmodule given in Table 6, can subsequently be used to find
the contribution of the modules to the total cost of the PV
system. From the efficiency of the modules, the required area of
modules for a certain power rating can be determined, which
multiplied by the cost per square meter, gives the value CBOM.
As illustrated in Fig. 3, it is clear that the material costs
constitute the largest contribution to the total cost of an OPV
module. This may be influenced by the low demand for certain
materials, or low availability of some others, such as indium.
Increases in the scale of OPV manufacture will ultimately reduce
material prices while new low-cost materials may also be avail-
able to replace the components that currently limit the cost of
OPV modules. In addition, the equity at end of lifetime of the
manufacturing plant is not considered, which would act to
further reduce module costs.
2.2 Balance of system costs
Additional costs must be included to account for components of
a PV system beyond the modules themselves, as well as the costs
of installing a system. These BoS costs are strongly dependent
on, among other factors, the type of system (e.g. roof-top,
building-integrated, ground-based), the efficiency of the modules
used, and the country where it is sited. This makes it difficult to
formulate general targets. Indicative targets for the BoS costs for
roof-top systems are: 0.9 to 1.1V/Wp in 2013, 0.75 to 0.9V/Wp in
2020, and under 0.5 V/Wp in 2030.46 The ranges in BoS cost
targets mainly correspond to the range in targeted module effi-
ciencies, reflecting the fact that part of the BoS cost is system
area-related. In this section the BoS costs are based on a 1kWp,
Energy Environ. Sci., 2011, 4, 3741–3753 | 3745

Table 2 OPV module direct process energy costs
ProcessOne DirectProcess Energy
Primary EnergyElectricity Cost
Wel/m2
V/m2
67%active area Min Max
S1 ITO ELECTRODE PATTERNINGUV curable etch resist screen printing 993.54 0.07 0.15Curing 248.09 0.02 0.04Etching 496.77 0.03 0.07PET ITO 1738.70 0.12 0.26S2 ELECTRON TRANSPORT COATINGInk preparation 10.39a 0.00 0.00Slot die coating 109.29 0.01 0.02Layer drying 327.87 0.02 0.05ZnO 447.55 0.03 0.07S3 ACTIVE LAYER DEPOSITIONInk preparation 6.56 0.00 0.00Slot die coating 68.31 0.00 0.01Layer drying 327.87 0.02 0.05P3HT:PCBM 402.73 0.03 0.06S4 PEDOT:PSS DEPOSITIONInk preparation 1.48 0.00 0.00Slot die coating 455.37 0.03 0.07Layer drying 2185.79 0.15 0.32PEDOT:PSS 2642.64 0.18 0.39S5 ELECTRODE DEPOSITIONScreen printing 2087.43 0.14 0.31Silver 2087.43 0.14 0.31S6 ENCAPSULATIONR2R lamination 4.10b 0.00 0.00PET with 3M Adhesive 4.10 0.00 0.00TOTALS 7321.10 0.49 1.08
a Note that reference (Espinosa, 2010)22 contains a typographical error in this data point which have been corrected here. b Note that this is an updatedvalue from (Espinosa, 2010).22
Table 3 OPV manufacturing equipment investment costs
EquipmentMachine Infrastructure Total(V) (V) (V)
R2R Screen printer (Alraun) a 126,400 35,800 162,200R2R Slot-die Coater (SCM) b 152,000 18,500 170,500R2R Etching machine (Klemm) 42,500 9,500 52,000R2R Laminator (GM) 35,800 0 35,800R2R Characterizer (RisøDTU) c 72,850 0 72,850R2R Sheeter (GM) 28,900 0 28,900Contactor (Prym) 8,000 0 8,000Total Capital Cost 466,450 63,800 530,250
Manufacturing equipment investment cost estimates per m2
Machine/Infrastructure lifetime 10 yearsCapital Recovery Factor (CRF) 0.14Levelised Capital Cost 75,495.67 V/yearMaintenance costs per year 3,019.83 V/year 4% of levelised capital cost12
Levelised investment costs 78,515.50 V/yearRate of output of machinery (m2/year) 20,000.00 m2/year 15
Levelised Investment cost per m2 3.93 V/m2
a Includes both hot air dryer and UV-curing oven. b Includes edge guiding system, humidity sensors and corona treater. c Includes solar simulator(KHS1200), source-meter (Keithley2400), power meter, control electronics and pneumatic control.
3746 | Energy Environ. Sci., 2011, 4, 3741–3753 This journal is ª The Royal Society of Chemistry 2011

Table 4 OPV module labour costs
Step Production Description
3050 cm2 1m2 Module
Time (s) Cost (V) Time (s) Cost (V)
1 Barrier 0.64 0.01 1.93 0.042 Adhesive 0.64 0.01 1.93 0.044 PET-ITO 9.00 0.20 27.00 0.605 ZnO 9.64 0.21 28.92 0.646 P3HT:PCBM 8.43 0.19 25.29 0.537 PEDOT:PSS 45.00 1.00 135.00 3.008 Silver 4.50 0.10 13.50 0.309 PET overlamination 0.64 0.01 1.93 0.0410 Adhesive 0.64 0.01 1.93 0.0411 Barrier 0.64 0.01 1.93 0.04TOTALS 79.78 1.77 239.34 5.32
Table 5 OPV module overhead costs
Description
V/m2
Min Max
Facilities (e.g. rent) 5.45 7.63Miscellaneous (5% oftotal manufacturing costs)
0.76 0.90
Customer Warranty (5%of total manufacturing costs)
0.76 0.90
TOTALS 6.97 9.43
grid-connected, roof-mounted system, with a system lifetime of
25 years to allow comparison with conventional PV systems.
For a grid-connected PV system the associated electronics
comprise an inverter, metering and switchgear related equip-
ment. The lifetime of this equipment was taken into account
assuming a 10 year inverter lifetime and 20 year lifetime of all
other associated electronics. Installation costs considered the
initial installation costs that include the design, project
management, insurance, scaffolding and other related costs such
as wiring and mounting, as well as the associated installation
costs when replacing modules. OPV technology is deemed to be
easily mounted due to its flexibility and future replacement
procedures. The labour costs were based on estimates for glass
modules, however, here we consider lightweight, flexible OPV.
Hence the subsequently reduced mounting and installation costs
are considered to equate, when combined, to the initial labour
costs of installing glass modules. Labour costs for replacing
modules were estimated at half of the initial installation labour
due to the fact that wiring and associated electronics would all be
Table 6 Summary of OPV balance of module costs
V/m2
Min Max
Material Costs 40.71 154.70Direct Process Energy Costs 0.49 1.08Manufacturing Equipment Investment Costs 3.93 3.93Labour Costs 5.32 5.32Overhead Costs 6.97 9.43Total Module Costs 57.42 174.45Overhead Margin (10%) 5.74 17.44Balance of Module Costs 63.16 191.89
This journal is ª The Royal Society of Chemistry 2011
already in place, thus less labour would be required at this point.
The initial BOS costs for a 1kWp system are summarised in Table
7. In addition a non-discounted 2% maintenance cost per year is
added to the initial BOS and module costs.
2.3 Cost of electricity from an OPV system
In order to calculate the cost of the electricity produced by the
OPV system, the Life Cycle Investment Cost (LCIC), that is the
total cost of the system, is divided by the total electricity yield of
the system over its lifetime. This thus gives a monetary value for
each kilowatt hour produced by the system.
2.3.1 Life cycle costs. Life Cycle Costing (LCC) is a tech-
nique to determine the total cost of ownership by constructing an
expenditure profile for the system over its anticipated life-span.
To facilitate comparison of electricity cost with other PV tech-
nologies, costs are worked out over a period of time comparable
with the lifetime of conventional PV systems. We use 25 years in
accordance with other studies.13,50 Because the lifetime of OPV
modules is uncertain and expected to be shorter than the
conventional system lifetime, the model allows for replacement
of the OPV modules at the end of their lifetime, as well as for the
replacement of BoS components, where appropriate. Thus the
cost of the system comprises the sum of the following:
i. Initial investment cost for PV modules, CBOM,
ii. Initial investment cost for system components including
inverters, metering, switchgear, mounting structures and instal-
lation labour cost, collectively known as BoS, CBOS,
iii. Investment cost for additional PV modules after successive
intervals of the module lifetime,
iv. Labour cost of replacing the modules, and
v. Investment cost for additional inverters or other BoS
components.
From this sum any discounted value remaining in components
with residual life at the end of the assessment period are deduc-
ted, known as the cost adjustment.
In the case of both module and BoS, the total LCIC is the sum
of initial outlay (i or ii) plus the cost of future investment (iii + iv
or v) discounted to the present day assuming some discount rate
r, minus the value of unused modules or system components. For
the module,
Energy Environ. Sci., 2011, 4, 3741–3753 | 3747

Fig. 3 Absolute (top) and fractional (bottom) BOM costs of a 1m2 OPV
module.
Table 7 Summary of BOS Costsa
BOS ComponentsV/kWp V/kWp
Min Max
Associated Electronics CostsInverter47 348.46 850.93Metering and Switchgear48 30.00 49.30Installation CostsLabour48 198.50 397.00Design, Project Management, Insurance, etc.48 119.10 238.20Scaffolding48 200.00 300.00Other CostsMounting — —Wiring49 50.00 50.00Maintenance Costs at 2% of BOM + Initial BOS 36.50 100.83BOS Costs associated with replacement of OPV modulesLabour 99.25 198.50Scaffolding 200.00 300.00
a All values are not discounted and are based at year zero.
Fig. 4 Absolute (top) and fractional (bottom) system costs for a 1kWp
OPV system with 5 year module lifetime and 25 year system lifetime.
LCICBOM ¼Xi¼intðT=LmÞ
i¼0
CBOM
ð1þ rÞiLm� CBOM
adj (3)
where CBOM is the present day cost of the module given by, Lm
the module lifetime, T the timeframe being considered (i.e. the
system lifetime), int() indicating that i takes integer values only,
and CBOMadj the module adjustment cost given by
CBOMadj ¼ CBOM
ð1þ rÞT � fraction of energy remaining (4)
The real discount/interest rate can be related to the inflation rate,
i, and nominal discount/interest rate, n, via (1 + r)¼ (1 + n)/(1 + i).
Similar equations are used to estimate the LCIC of the BoS
(see appendix).
3748 | Energy Environ. Sci., 2011, 4, 3741–3753
For this study, we consider an OPV system of 1 kWp capacity.
The area of modules required to give this system capacity, Am,
which, multiplied by the cost per m2 of the module, gives CBOM,
is determined from the cell efficiency, hPV, and the percentage of
the module that is active cell area, a, according to
Am ¼ 1
hPV :am2 (5)
The parameters controlling the final system cost are r, hPV, a and
Lm. For our calculations, we fix r at 7%, which is consistent with
a nominal discount rate of 10.2% and inflation rate of 3%, a at
67% and vary hPV in the range 3% to 10% (which corresponds to
module efficiencies between 2% and 6.7%) and Lm in the range 1
to 25 years.
As illustrated in Fig. 4, it is clear that for a cell efficiency of 7%
and module lifetime of five years the module costs constitute the
largest part of the total OPV system costs. This fraction could be
reduced through efficiency improvement or through increased
active area within a module, both of which would reduce the area
of module needed, and thus tackle this bottleneck for low-cost
PV modules.
2.3.2 Energy output. A generalised energy output calculation
during the lifetime of the PV system is defined in eqn (6),
considering module replacements, averaged linear degradation
to a defined limit, davg, at which point the module is considered as
at the end of its useful life, and performance ratio, PR, for the
system:
EPV ¼XT�1
t¼0
Hyr$hPV$davg$PR$ðAm$aÞ (6)
This journal is ª The Royal Society of Chemistry 2011

where Hyr is the annual radiation; hPV is the efficiency of the PV
active area; PR is the performance ratio of the system, considered
at 85%, which accounts for system losses and soiling effects;Am is
the area of module required; T is the PV system lifetime, chosen
as 25 years; t is the year and davg is the average linear degradation
given by
davg ¼ 1� ð1� dÞ
�ðtmodLmÞ þ 0:5
Lm
�!(7)
where Lm is the module lifetime assumed to be 5 years and d is the
PV efficiency degradation limit.
Here we fixHyr at 1700 kWh/m2 per year, representative of the
Southern European solar resource and d at 80%. In Fig. 5, the
yearly energy output is plotted for two scenarios. In one case hPVis 7% and remains constant over the lifetime of the system, which
results in a total yield, over 25 years, of 32,513 kWh. The system
output was also considered for the case where advances in OPV
technology lead to replacement modules being increasingly effi-
cient. For this scenario, an initial cell efficiency of 3% was used,
corresponding to the efficiency of present day R2R manufac-
tured cells51 and developments were considered according to the
IEA PV roadmap 2010,46 which stipulates a linear development
in cell efficiency of 1.065 annually over the next 25 years. This
gives a total system output of 71,114 kWh over the 25 year
system lifetime.
The annual output of a crystalline silicon based 1kWp PV
system is also included in Fig. 5 for comparison. The output of
this system accounts for a linear degradation in the module
efficiency to a limit of 80%, according to most mature PV tech-
nology manufacturers’ warranty. For simplicity when consid-
ering efficiency development, the area of OPV modules remains
constant while the efficiency increases. Hence any efficiency
increase results in an increase in electricity production which will
ultimately lower the LEC. On the other hand if one considers
lowering the PV active area such that the system remains at
1kWp, resulting in lowering the module costs, a similar LEC
would be found.
Fig. 5 Electrical Energy Production considering average linear
degradation.
This journal is ª The Royal Society of Chemistry 2011
The comparison of the static efficiency and evolving efficiency
scenarios in Fig. 5 demonstrates the potential impact of
continual technical innovation on the projection of electricity
costs, and correspondingly, EPBT. OPV efficiency developments
and relatively short module lifetimes could instigate a competi-
tive edge towards low solar electricity costs due to the increase in
annual energy production per unit area, or lower module costs
required for a 1kWp system, realised over the course of the
system lifetime.
2.3.3 Energy cost. The LEC for a 1 kWp system could be
calculated from the LCIC divided by the total PV energy output.
Considering the reference parameters of a 5 year module lifetime,
an active area efficiency of 7%, average annual radiation of 1700
kWh/m2, the LEC estimates for OPV range from 0.19 V/kWh to
0.50 V/kWh, when technical development is neglected. If tech-
nical development over the lifetime of the system is included, and
starting with 3% efficient cells, as described earlier, costs of the
LEC range between 0.16 V/kWh and 0.47 V/kWh.
Fig. 6 shows the LEC in comparison with the published cost
ranges of electricity from other clean sources. The resulting OPV
electricity costs are not favourable against current centralised
power stations and wind energy. However, when considering
technical developments in OPV efficiency, the LEC of OPV
power is competitive with mature PV and Solar thermal
technologies.
3.0 Sensitivity analysis
Since future developments in technology and scale-up of manu-
facture are likely to affect the parameters controlling LEC, the
sensitivity of the LEC to these parameters, was analysed. The
minimum costs, giving a LEC of 0.19 V/kWh, were taken as the
baseline for this sensitivity analysis, assuming a PR of 0.85, 7%
active area efficiency, 5 year lifetime modules, 67% PV active area
coverage and 1700 kWh/m2 yearly insolation. The sensitivity
analysis was performed by adjusting the variables from �80% to
80% from the baseline.
Fig. 6 The electricity generation costs of power plants. Lower and upper
limits to the levelised electricity costs are based on results in this paper for
OPV and on data in52 for other technologies. OPV efficiencies shown are
for the active area within the module.
Energy Environ. Sci., 2011, 4, 3741–3753 | 3749
The factors which have the most significant impacts on the
LEC are: system performance ratio; module lifetime; module
active area coverage; insolation; and PV efficiency, as shown in
Fig. 7. The relationship of the LEC with most of these factors is
reciprocal which means that improvements in the parameters
have a smaller effect than deterioration in the parameters relative
to the baseline.
Both BOM and BOS costs have a linear effect on the LEC
(Fig. 7). Since the BOM cost has the major share of the system
cost, it has a larger effect on the LEC than the BOS costs. Of the
BOS costs, the cost of associated electronics is the most signifi-
cant component. However, total BOS costs may have only
a maximum effect of 0.07 V/kWh on the LEC. As experience
develops in this field, a more sophisticated sensitivity analysis
could be done, for example, employing statistical methods.53
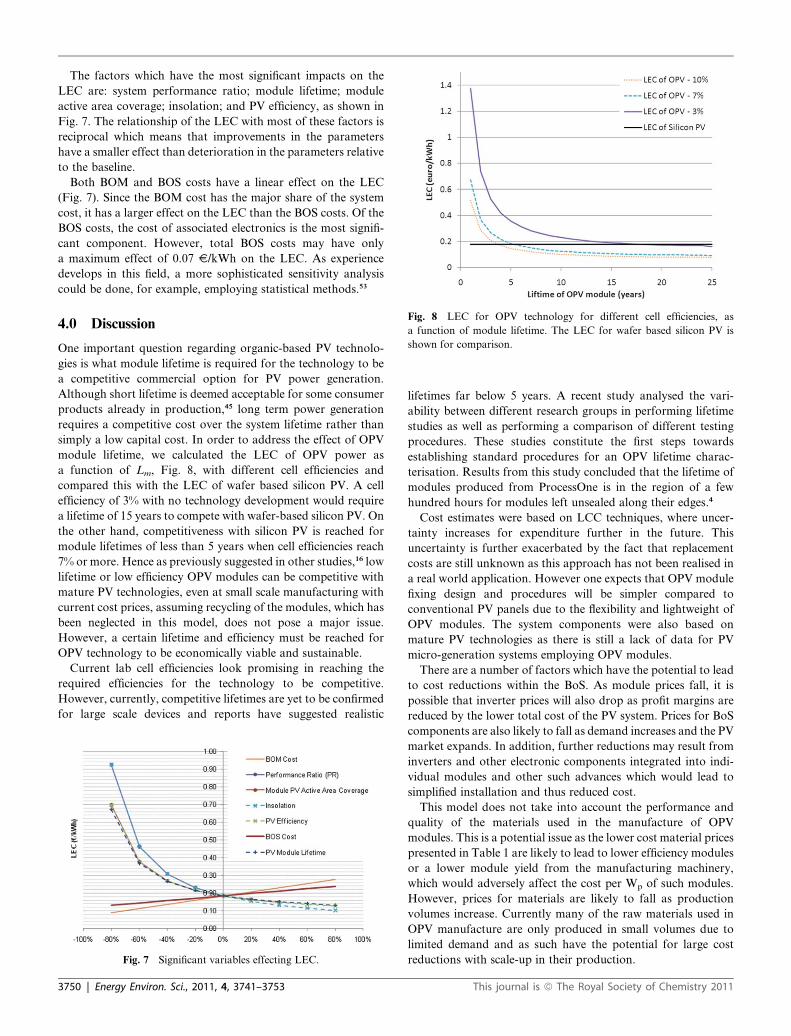
Fig. 8 LEC for OPV technology for different cell efficiencies, as
a function of module lifetime. The LEC for wafer based silicon PV is
shown for comparison.
4.0 Discussion
One important question regarding organic-based PV technolo-
gies is what module lifetime is required for the technology to be
a competitive commercial option for PV power generation.
Although short lifetime is deemed acceptable for some consumer
products already in production,45 long term power generation
requires a competitive cost over the system lifetime rather than
simply a low capital cost. In order to address the effect of OPV
module lifetime, we calculated the LEC of OPV power as
a function of Lm, Fig. 8, with different cell efficiencies and
compared this with the LEC of wafer based silicon PV. A cell
efficiency of 3% with no technology development would require
a lifetime of 15 years to compete with wafer-based silicon PV. On
the other hand, competitiveness with silicon PV is reached for
module lifetimes of less than 5 years when cell efficiencies reach
7% or more. Hence as previously suggested in other studies,16 low
lifetime or low efficiency OPV modules can be competitive with
mature PV technologies, even at small scale manufacturing with
current cost prices, assuming recycling of the modules, which has
been neglected in this model, does not pose a major issue.
However, a certain lifetime and efficiency must be reached for
OPV technology to be economically viable and sustainable.
Current lab cell efficiencies look promising in reaching the
required efficiencies for the technology to be competitive.
However, currently, competitive lifetimes are yet to be confirmed
for large scale devices and reports have suggested realistic
Fig. 7 Significant variables effecting LEC.
3750 | Energy Environ. Sci., 2011, 4, 3741–3753
lifetimes far below 5 years. A recent study analysed the vari-
ability between different research groups in performing lifetime
studies as well as performing a comparison of different testing
procedures. These studies constitute the first steps towards
establishing standard procedures for an OPV lifetime charac-
terisation. Results from this study concluded that the lifetime of
modules produced from ProcessOne is in the region of a few
hundred hours for modules left unsealed along their edges.4
Cost estimates were based on LCC techniques, where uncer-
tainty increases for expenditure further in the future. This
uncertainty is further exacerbated by the fact that replacement
costs are still unknown as this approach has not been realised in
a real world application. However one expects that OPV module
fixing design and procedures will be simpler compared to
conventional PV panels due to the flexibility and lightweight of
OPV modules. The system components were also based on
mature PV technologies as there is still a lack of data for PV
micro-generation systems employing OPV modules.
There are a number of factors which have the potential to lead
to cost reductions within the BoS. As module prices fall, it is
possible that inverter prices will also drop as profit margins are
reduced by the lower total cost of the PV system. Prices for BoS
components are also likely to fall as demand increases and the PV
market expands. In addition, further reductions may result from
inverters and other electronic components integrated into indi-
vidual modules and other such advances which would lead to
simplified installation and thus reduced cost.
This model does not take into account the performance and
quality of the materials used in the manufacture of OPV
modules. This is a potential issue as the lower cost material prices
presented in Table 1 are likely to lead to lower efficiency modules
or a lower module yield from the manufacturing machinery,
which would adversely affect the cost per Wp of such modules.
However, prices for materials are likely to fall as production
volumes increase. Currently many of the raw materials used in
OPV manufacture are only produced in small volumes due to
limited demand and as such have the potential for large cost
reductions with scale-up in their production.
This journal is ª The Royal Society of Chemistry 2011

Scale up in the production of OPV modules would be expected
to lead to further reductions in the LEC through development in
the efficiency and lifetime of the technology as well scale-up in
manufacturing in the same way as expected cost reductions in the
raw materials. Thus a steep learning curve is anticipated for OPV
technology in the near future and has already been observed to
date.15,54 Innovation both at the material and module integration
level can help in addressing possible future materials concerns
and cost reductions in delivering organic photovoltaic technol-
ogies. These developments may have a decisive role in defining
the future relative cost level and market penetration for emerging
organic-based photovoltaics.
The issue of recycling modules is of much greater importance
with organic photovoltaics compared to other PV technologies
due to the short lifetime of OPV modules. Thus far there is no
experience of end of life treatment of OPV and thus costs asso-
ciated with this were neglected in this model. However, there is
speculation that recycling of OPV could be a relatively simple
process due to the nature of materials involved. For example, the
dominant material in OPV, by mass, is the flexible substrate. In
the case of ProcessOne this is PET which can potentially be easily
recycled. However, there are of course a number of uncertainties
and the issue of recycling OPV modules is the subject of ongoing
research.
Despite these issues associated with short lifetime modules,
there are also some advantages. The cost profile of an OPV based
system highlights another potential advantage for this tech-
nology. Through low lifetime modules the total cost of the
system is spread over a number of years making it increasingly
affordable to consumers unable to pay for the large capital cost
of conventional PV. This is particularly relevant in the devel-
oping world, where solar photovoltaics have a huge potential for
improving rural livelihoods.55
In addition, the low capital outlay of manufacturing facilities
allows decentralised, small scale manufacture which opens up the
possibility for very different business models in OPV manufac-
ture compared with silicon based photovoltaics. Decentralised,
R2R manufacture also allows for production on a massive scale
and shows that R2R processed photovoltaics are the only tech-
nology capable of producing a gigawatt a day.
5.0 Conclusion
This paper has illustrated cost assessment on a practical R2R
coating procedure used for small-scale manufacturing flexible
polymer solar cell modules, also known as ProcessOne, and has
assessed the economics behind a complete 1kWp, grid connected,
micro-generation system. The analysis showed that the total cost
of an OPV module ranges from V63.16/m2 to V191.89/m2, cor-
responding to between 1.26 V/Wp and 3.84 V/Wp for a 5% effi-
cient module. This is based on present day technology and
material costs, and thus can be seen as an upper limit for module
costs. Extending the analysis to a 1kWp system operating for 25
years and utilising modules containing 7% efficient cells and a 5
year lifetime, gave a total system discounted cost of between
V6,019 and V16,270. Under an average solar irradiance of
1700 kWh/m2/year, typical of southern Europe, an LEC of
between 0.19V/kWh and 0.50V/kWh could be realised with such
a system.
This journal is ª The Royal Society of Chemistry 2011
This analysis showed that potential bottlenecks to low cost
OPV production lie largely in the cost of raw materials and not in
the processing costs. This shows that there is limited opportunity
for cost reductions through improved processing methods in the
case of a R2R manufacturing process such as ProcessOne,
although improvements in processing could lead to more efficient
use of materials. In particular the ITO transparent conducting
layer was shown to dominate the cost of a module as has been
previously observed,15 as well as dominating the embedded
energy in a module.22 This finding highlights the need for alter-
native transparent conductors, a number of examples of which
are being explored such as carbon nanotube films, high-
conductivity PEDOT and metal nanowires. In addition, the large
contribution of PEDOT:PSS and silver ink to the cost of the
module further motivates a search for lower cost electrode
materials.
The LEC does not only depend on the manufacturing cost but
also on module performance, location and BoS costs. The BoS
costs may contribute up to 36% of the system costs in organic-
based PV systems, however, as module costs fall this percentage
would be expected to increase. Minimising BoS costs by inno-
vative system design and building integration is aided by the
flexible, lightweight and potentially transparent nature of OPV,
which could be a significant advantage for this emerging tech-
nology. Although the potential for such cost reductions in the
BoS compared to conventional silicon based modules is
unknown, the nature of OPV technology is also likely to open up
new markets and applications for photovoltaics. In addition, as
the cost of modules decrease, prices for inverters and the asso-
ciated electronics are likely to fall as consumer demand forces the
inverter cost to remain comparable to the module costs for
a system, similar to past trends in battery costs for consumer
electronics.
This model shows that currently achievable cell efficiencies of
7%, if reproducible in large area modules, could already be
competitive with conventional silicon technology if 5 year OPV
module lifetimes could be achieved. Even more encouraging is
the LEC found when the development in the efficiency of OPV
technology is accounted for, as shown in Fig. 5. This shows the
potential for a competitive cost even if the initial modules
installed contain cells of only 3% efficiency and without factoring
in expected future reductions in the cost of modules (Fig. 6). In
the case of a small scale, grid-connected system, lifetimes of
around five years, or up to fifteen years for very low efficiency
modules, need to be achieved if OPV is to become competitive
with conventional photovoltaic technologies in the domestic
micro-generation market. However, the numerous advantages of
OPV in their potential for unique architectural and product
integrated design, R2R processing methods, and low initial
capital costs (both for systems and manufacturing facilities),
mean that markets will still exist for this technology despite
inferior performance compared to conventional photovoltaics.
Appendix
The module cost for 67% PV active area is calculated as in (8):
CWpBOM ¼ Cm2
BOM
0:67� hPV �HSTC
(8)
Energy Environ. Sci., 2011, 4, 3741–3753 | 3751

where HSTC is the irradiance at standard test conditions (STC)
i.e. 1000W/m2
The LCIC for BOS is calculated in (9):
LCICBOS ¼
CinitialþPT�1
t¼0
2664sinverter$CinverterþsM &S$CM &SþsPV$CL&SþCmain
3775ð1þ rÞ�t�
Cadjinverter�
CadjM &S
9>>>>>>>>=>>>>>>>>;
(9)
where
s ¼ 1 if replacement of the component is needed,
otherwise s ¼ 0;
Initial costs are not discounted and include the installation,
design, management, mountings and wiring.
M&S is metering and switchgear costs
L&S is labour and scaffolding costs
Main is maintenance costs
The adjusted cost values are based on the lifetime of the
components as in (10):
Cadjx ¼
hð1þ rÞ�T$Cx
i��1� T �NLx
Lx
�(10)
where N is the number of replacement during systems’ lifetime,
calculated in (11):
N ¼�T
Lx
�(11)
where Lx is the lifetime of the component and T is the PV system
lifetime.
Acknowledgements
The authors wish to thank EPSRC Pathway to Impact under
Grant EP/I50105 and the Danish Strategic Research Council
(2104-07-0022) and EUDP (j. nr. 64009-0050) as well as
MICINN-Spain (HOPE CSD2007-00007; MAT2010-21267-
C02) and CARM-Murcia (D429-2008). Partial financial support
was also received from the European Commission as part of the
Framework 7 ICT 2009 collaborative project HIFLEX (Grant
No. 248678), from the EU-Indian framework of the ‘‘Largecells’’
project that received funding from the European Commission’s
Seventh Framework Programme (FP7/2007–2013, Grant No.
261936) and from PV-ERA-NET (project acronym POLY-
STAR). Jenny Nelson acknowledges the support of the Royal
Society through an Industrial Fellowship.
Notes and references
1 B. Kippelen and J.-L. Bredas, Energy Environ. Sci., 2009, 2, 251–261.2 C. Candelise, B. Azzopardi, J. Nelson, J. Mutale, M. Winskel andR. Gross, Emerging and mature thin film: synergies that effect costdevelopments in photovoltaic technologies, Valencia, 2010.
3 A strategic research agenda for photovoltaic solar energy technology,Office for Official Publications of the European Communities,Luxemburg, 2007.
4 S. A. Gevorgyan, A. J. Medford, E. Bundgaard, S. B. Sapkota,H.-F. Schleiermacher, B. Zimmermann, U. W€urfel, A. Chafiq,M. Lira-Cantu, T. Swonke, M. Wagner, C. J. Brabec, O. Haillant,E. Voroshazi, T. Aernouts, R. Steim, J. A. Hauch, A. Elschner,M. Pannone, M. Xiao, A. Langzette, D. Laird, M. T. Lloyd,
3752 | Energy Environ. Sci., 2011, 4, 3741–3753
T. Rath, E. Maier, G. Trimmel, M. Hermenau, T. Menke, K. Leo,R. R€osch, M. Seeland, H. Hoppe, T. J. Nagle, K. B. Burke,C. J. Fell, D. Vak, T. B. Singh, S. E. Watkins, Y. Galagan,A. Manor, E. A. Katz, T. Kim, K. Kim, P. M. Sommeling,W. J. H. Verhees, S. C. Veenstra, M. Riedex, M. G. Christoforo,T. Currier, V. Shrotriyay, G. Schwartz and F. C. Krebs, Sol.Energy Mater. Sol. Cells, 2011, 95, 1398–1416.
5 Y. Liang, Z. Xu, J. Xia, S.-T. Tsai, Y. Wu, G. Li, C. Ray and L. Yu,Adv. Mater., 2010, 22, E135–E138.
6 A. Luque, Progr. Photovolt.: Res. Appl., 2001, 9, 303–312.7 W. G. H. M. van-Sark, E. A. Alsema, H. M. Junginger, H. H. C. de-Moor and G. J. Schaeffer, Progr. Photovolt.: Res. Appl., 2008, 16,441–453.
8 E. A. Alsema, Progr. Photovolt.: Res. Appl., 2000, 8, 17–25.9 M. Raugei, S. Bargigli and S. Ulgiati, Energy, 2007, 32, 1310–1318.
10 K. Kato, T. Hibino, K. Komoto, S. Ihara, S. Yamamoto andH. Fujihara, Sol. Energy Mater. Sol. Cells, 2001, 67, 279–287.
11 A. J. Medford, M. R. Lilliedal, M. Jørgensen, D. Aarø, H. Pakalski,J. Fyenbo and F. C. Krebs, Opt. Express, 2010, 18, A272–A285.
12 J. Kalowekamo and E. Baker, Sol. Energy, 2009, 83, 1224–1231.13 G. Dennler and C. J. Brabec, in Organic Photovoltaics: Materials,
Device Physics and Manufacturing Technologies, ed. C. J. Brabec, V.Dyakonov and U. Scherf, Wiley-VCH Verlag GmbH & Co.,Weinheim, 2008, ch. 20, pp. 531–567.
14 A. L. Roes, E. A. Alsema, K. Blok andM. K. Patel, Progr. Photovolt.:Res. Appl., 2009, 17, 372–393.
15 F. C. Krebs, T. Tromholt andM. Jorgensen, Nanoscale, 2010, 2, 873–886.
16 G. Dennler, M. C. Scharber and C. J. Brabec, Adv. Mater., 2009, 21,1323–1338.
17 C. Powell, T. Bender and Y. Lawryshyn, Sol. Energy, 2009, 83, 1977–1984.
18 solarbuzz, www.solarbuzz.com, 2011.19 F. C. Krebs, S. A. Gevorgyan and J. Alstrup, J. Mater. Chem., 2009,
19, 5442–5451.20 F. C. Krebs, J. Fyenbo and M. Jørgensen, J. Mater. Chem., 2010, 20,
8994–9001.21 N. Espinosa, R. Garc�ıa-Valverde and F. C. Krebs, Energy Environ.
Sci., 2011, 4, 1547–1557.22 N. Espinosa, R. Garc�ıa-Valverde, A. Urbina and F. C. Krebs, Solar
Energy Mater. Solar Cells, 2010, 95, 1293–1302.23 J. Bayley, H. C. Starck Clevios GmbH Patent Cross-Licensing
Agreement with Agfa-Gevaert N.V, http://www.clevios.com/index.php?news_id¼20100412104055979764000000&bereich_id¼13582010.
24 A. Kennedy, personal communication.25 M. Vernon, personal communication.26 Qian, personal communication.27 Fisher Scientific Catalogue, www.fisher.co.uk, Accessed Dec. 16,
2010.28 Sigma-Aldrich Catalogue, www.sigma-aldrich.com, Accessed Dec.
15, 2010.29 GFS Chemicals Catalogue, www.gfschemicals.com, Accessed Dec.
18, 2010.30 Hebei Kingway Import And Export Trading Co. Ltd. Catalogue,
kingway.en.alibaba.com, Accessed Jan. 10, 2011.31 Water UK - Average price of tap water in the UK, www.water.org.uk,
Accessed Dec. 17, 2010.32 Fairfax Water - Average price of tap water in the USA, www.fcwa.
org, Accessed Dec. 17, 2010.33 LP Chemicals Catalogue, www.lpchemicals.com, Accessed Dec. 19,
2010.34 Tianjin Yangmingshun Chemicals Co. Ltd. Catalogue,
tjyangmingshun.en.alibaba.com, Accessed Jan. 10, 2011.35 Shenyang Bovvsheng Chemicals Co. Ltd. Catalogue, sybys.en.
alibaba.com, Accessed Feb. 28, 2011.36 Kam Lung Trading Ltd. Catalogue, kamlung.en.alibaba.com,
Accessed Feb. 28, 2011.37 Average market price in China, jimzheng.4mg.com, Accessed Jan. 10,
2011.38 B. Nguyen, personal communication.39 Solenne B.V. Catalogue, www.solennebv.com, Accessed Dec. 10,
2010.40 SES Research Calatogue, sesres.com, Accessed Dec. 10, 2010.41 J. Bayley, personal communication.
This journal is ª The Royal Society of Chemistry 2011

42 B. Jannon, personal communication.43 Eurostat, Half-yearly electricity and gas prices, http://epp.eurostat.ec.
europa.eu/statistics_explained/images/6/64/Energy_prices_2011.xls,2011.
44 K. Zweibel, Sol. Energy Mater. Sol. Cells, 1999, 59, 1–18.45 konarka, www.konarka.com, 2011.46 IEA, Technology roadmap: Solar photovoltaic energy, International
Energy Agency, Paris, 2010.47 V. Huber, personal communication.48 D. Davies, personal communication.49 T. Ferenczi, personal communication.
This journal is ª The Royal Society of Chemistry 2011
50 B. Azzopardi, J. Mutale and D. Kirschen, Cost boundaries for futurePV systems, Singapore, 2008.
51 Solarmer Energy Inc, www.solarmer.com, 2011.52 EIA, Annual Energy Outlook 2011, Energy Information
Administration, 2010.53 S. B. Darling, F. You, T. Veselka and A. Velosa, Energy Environ. Sci.,
2011, DOI: 10.1039/C0EE00698J.54 T. D. Nielsen, C. Cruickshank, S. Foged, J. Thorsen and F. C. Krebs,
Sol. Energy Mater. Sol. Cells, 2010, 94, 1553–1571.55 F. C. Krebs, T. D. Nielsen, J. Fyenbo, M. Wadstrom and
M. S. Pedersen, Energy Environ. Sci., 2010, 3, 512–525.
Energy Environ. Sci., 2011, 4, 3741–3753 | 3753