Residual Flexural Capacity of Corroded Prestressed ... - MDPI
Upload
khangminh22Category
view
0download
0
D
elft
Univ
ers
ity o
f Tech
nolo
gy
Master’s Thesis
FATIGUE MODEL FOR PRESTRESSED
CONCRETE DECKS
Tudor Mihai Brata

FATIGUE MODEL FOR PRESTRESSED CONCRETE DECKS
2
Master’s Thesis – Tudor Mihai Brata

FATIGUE MODEL FOR PRESTRESSED CONCRETE DECKS
3
Master’s Thesis – Tudor Mihai Brata
Copyright © 2016 Delft University of Technology and Tudor Mihai Brata
This document is property of Delft University of Technology and Tudor Mihai Brata. It
may not be used for any other purpose than for which is supplied. This document may not be
wholly or partly copied, duplicated or in any way made use of without prior written approval
of Delft University of Technology and Tudor Mihai Brata. All rights reserved.

FATIGUE MODEL FOR PRESTRESSED CONCRETE DECKS
4
Master’s Thesis – Tudor Mihai Brata

FATIGUE MODEL FOR PRESTRESSED CONCRETE DECKS
5
Master’s Thesis – Tudor Mihai Brata
Master’s Thesis
Fatigue model for prestressed concrete decks
By
Tudor Mihai Brata 4418646
In partial fulfilment of the requirements for the degree of
Master of Science in Civil Engineering
at Delft University of Technology
December 2016
Assessment Committee:
Thesis Chair: Prof. Dr. Ir. D. A. Hordijk Thesis Supervisor: Dr. Ir. C. van der Veen
Thesis Committee Member: Prof. Dr. Ir. M. A. N. Hendriks
Graduation Coordinator: Ir. L. J. M. Houben

FATIGUE MODEL FOR PRESTRESSED CONCRETE DECKS
6
Master’s Thesis – Tudor Mihai Brata

FATIGUE MODEL FOR PRESTRESSED CONCRETE DECKS
7
Master’s Thesis – Tudor Mihai Brata
Acknowledgements
The present Master’s Thesis report marks the completion of both an academic and a life
cycle which would have not been possible without the help and support of a certain number of
people that contributed to my personal development, both professionally and as a human being.
I would like to express my gratitude to the members of my committee: Dr. van der Veen,
Prof. Hendriks and Prof. Hordijk, for their valuable advices, guidance, patience and time spent
so that I could have a clear and better understanding of this topic that represents a drop in the
sea that is our profession, Civil Engineering.
I want to thank my close family: my mother Dora, my father Valentin and my aunt Lia
for their unconditional and always present support and love, for never stopping to believe in me
and for being always by my side.
To my friends from Romania, that will never fully understand how much their presence
helped me go forward, especially during the dawn of this adventure of mine that started more
than two years back, thank you.
I want also to thank all the wonderful people and friends I met during my studies here.
They showed me that kindness and friendship can be sought and found in all the corners of this
round world.
Last but not least, I want to thank Delft University of Technology and the beautiful city
of Delft for the environment that I discovered here, this gateway not only to education and
Dutch culture, but also to cultures from all around the world. It has been an extraordinary
experience.
Sincerely,
Tudor Mihai Brata

FATIGUE MODEL FOR PRESTRESSED CONCRETE DECKS
8
Master’s Thesis – Tudor Mihai Brata

FATIGUE MODEL FOR PRESTRESSED CONCRETE DECKS
9
Master’s Thesis – Tudor Mihai Brata
Summary A high number of concrete bridges that were built in the Netherlands around half a
century ago and which had a transversely prestressed thin deck, nowadays raise a series of
questions regarding their structural integrity. This is because their service life has been affected
over time by a substantial rise in the number of vehicles that transit them and the considerable
increase in the loads applied by these vehicles upon the structure. The concern amplifies when
it is highlighted that these structures were designed according to old codes that were valid
during that period, codes that have been substantially modified in the course of time. Having
all this that needs to be taken into account, it is of high interest to determine how safe these
structures are today.
One phenomenon that in time would have left its mark on the structural integrity of these
bridges is fatigue. This can be defined as the deterioration in time due to a repetitive loading.
A large array of studies were dedicated to the topic of fatigue of concrete, aiming at a better
understanding of its behaviour, impact and consequences upon a structure. However,
throughout this extensive research that also analysed failed structures, fatigue was never found
to be the primary mechanism that led to failure, but its contribution was acknowledged and, as
a consequence, investigations on this topic are still of current interest. Of great importance is
also the phenomenon of compressive membrane action (CMA) that is characteristic to concrete
slabs and has a beneficial influence on the structure, leading to an increase in the capacity, being
highly influenced by the degree of restraint
At Delft University of Technology, a couple of research programs that were performed
recently tried to shed some light on both of the previously described topics. The study done on
fatigue gave promising results, with its outcome being found to fit together with other
researches performed worldwide. A follow-up study based solely on fatigue will start in the
near future, this having as objective the impact of the loading sequence. In anticipation of this
new study, in order to see to what extent the previous results can be replicated numerically and
future ones forecasted, a FEA model for fatigue assessment and prediction was created and its
accuracy was evaluated, this being the scope of the Master’s Thesis.
For the development of the finite element model, departure points had to be set for each
main phase. For the construction and calibration phase, the point of departure meant the use of
a two-dimensional model for describing the behaviour of the real life structure, namely the
evolution of stresses, deterioration and failure mode. For the second phase, the one related to
replicating and assessing the fatigue damage, the departure point meant assuming a uniform
alteration in the material properties due to the cyclic loading, modification considered at a
structural level.
The FEA model was designed to be a simple 2D plane stress model, realizing that such a
choice implied certain behavioural limitations. By using a two-dimensional model it was clear
that this could not fully describe a three-dimensional stress state. For its development, the actual
structure was used as reference, describing the full cross section for the model’s geometry,
FATIGUE MODEL FOR PRESTRESSED CONCRETE DECKS
10
Master’s Thesis – Tudor Mihai Brata
together with the reinforcing and prestressing bars. In order to obtain a realistic behaviour under
loading, multiple material models were considered for the components of the FEA model, with
the concrete’s compressive and tensile ones being of utmost importance. Other prime
constituents of the model were represented by the acting loads, support conditions and the
characteristics of the performed analyses, such as the iterative or incremental procedures or the
convergence criteria. For the construction of the model, the guidelines from Rijkswaterstaat on
non-linear FE analysis of concrete structures were applied.
Its calibration was based on the previous performed tests and it was determined that the
behaviour is influenced by a series of parameters, the most important being the considered
effective width of the model. Having assumed an adequate value for it, the initial stiffness of
the model was very similar to the ones obtained in the previous research programs. Other
parameters that were highly influential on the capacity of the model were the considered
degrees of freedom at the supports, amount of reinforcement considered - directly proportional
to the width, the tensile and compressive material models for the concrete, the choice of bond
for the prestressing bar or the arc-length control incremental procedure.
In the end it was decided to use two models for the fatigue assessment: one that presented
the best behaviour, entitled the “best behaviour model” (BBM) and a second one, named the
“realistic model” (RM). The difference between them was represented by the considered bond
between the prestressing bar and the concrete element. In reality there was no bond between
them, but in the case of the FEA model it was observed that if the bond is considered, the
capacity is considerably increased, resulting in a behaviour more similar to the ones from the
previous researches. Having decided on the models, it was studied how they behave during the
analyses and the way of failure.
The next stage comprised the simulation of the fatigue tests. In order for the model to
take into account the fatigue damage, the material parameters of the concrete had to be altered,
with the main parameter being the compressive strength. A uniform reduction of the material
properties was assumed, reduction that was considered at a structural level. For this, a formula
that predicted the maximum allowed compressive stress following the cyclic loading was used,
this being a function of the number of cycles and the stress or load ratio from an applied range.
Subsequently, reductions for the tensile strength and both fracture energies were performed.
A series of analyses that involved a single loading range were carried out, with the results
showing an offset from the confidence interval given by the prediction formula from TU Delft.
The resulting force from the FEA model was larger than the one estimated by the said formula.
It is thought that, apart from the model itself, this behaviour is influenced by the way the
reduction in the compressive stress is performed, being too simplistic to consider only the ratio
of the loads and not taking into account their values. The same simplicity in interpreting the
fatigue behaviour can be assigned also to the formula that predicts the fatigue force based only
on the number of cycles and the static force.
For the multiple loading ranges, two different approaches, phased and separate, were used
for the analyses, but it is thought that the behaviour of the real tests was not described accurately

FATIGUE MODEL FOR PRESTRESSED CONCRETE DECKS
11
Master’s Thesis – Tudor Mihai Brata
and it presented limitations. Regarding the impact of the loading sequence, the results showed
no difference in behaviour between a low-to-high and a high-to-low analysis but a conclusive
answer cannot be given in this matter. These outcomes might be due to the limitations of the
model itself, since it is a simplistic one, but also due to the limited experience of the DIANA
user with such type of analyses.
The current research program on fatigue that is being performed at TU Delft began in
early December 2016 and has as a stated objective the clarification of the impact that the loading
sequence might have on the tested specimen. The structural system for these tests was built
during the summer of 2016 and it is already in the testing stage.

FATIGUE MODEL FOR PRESTRESSED CONCRETE DECKS
12
Master’s Thesis – Tudor Mihai Brata

FATIGUE MODEL FOR PRESTRESSED CONCRETE DECKS
13
Master’s Thesis – Tudor Mihai Brata
Table of Contents
Acknowledgements ................................................................................................................... 7
Summary ................................................................................................................................... 9
Table of Contents ................................................................................................................... 13
Chapter 1: Introduction .................................................................................................. 18
1.1 Background of the Master’s Thesis topic .................................................................. 19
1.2 Aim of the Master’s Thesis ....................................................................................... 21
1.3 Procedure for the development of the FEA model for fatigue .................................. 21
1.4 Contents of the thesis ................................................................................................. 23
Chapter 2: Literature Survey ......................................................................................... 24
2.1 Introduction ............................................................................................................... 25
2.2 Fatigue of concrete .................................................................................................... 25
2.2.1 Fatigue in plain concrete .................................................................................... 26
2.2.1.1 Plain concrete in compression .................................................................... 27
2.2.1.2 Plain concrete in tension ............................................................................. 28
2.2.1.3 Plain concrete in compression-tension ........................................................ 29
2.2.1.4 Additional aspects concerning plain concrete ............................................. 30
2.2.2 Fatigue of reinforcing and prestressing steel ...................................................... 32
2.2.2.1 Reinforcing steel ......................................................................................... 32
2.2.2.2 Prestressing steel ......................................................................................... 33
2.2.3 Behaviour of reinforced concrete elements ........................................................ 34
2.2.3.1 Bending failure ............................................................................................ 35
2.2.3.2 Shear failure ................................................................................................ 35
2.2.3.3 Bond failure ................................................................................................ 36
2.2.4 Fatigue in bridge deck slabs – recent studies ..................................................... 36
2.3 Compressive membrane action in concrete slabs ...................................................... 43
2.3.1 General ............................................................................................................... 43
2.3.2 Earlier research ................................................................................................... 44
2.3.3 Theoretical developments .................................................................................. 45
2.3.4 Design provisions ............................................................................................... 46
2.3.5 Recent studies on CMA ...................................................................................... 47
Chapter 3: Assessment of TU Delft fatigue research program .................................... 53
3.1 Introduction ............................................................................................................... 54
3.2 Experimental program at TU Delft ............................................................................ 54
3.2.1 Structural system and test setup ......................................................................... 54
3.2.2 Initial static and fatigue loading tests ................................................................. 55
3.2.3 Fatigue and static tests from additional research program ................................. 58
3.2.4 Results ................................................................................................................ 62
3.2.5 Conclusions ........................................................................................................ 64

FATIGUE MODEL FOR PRESTRESSED CONCRETE DECKS
14
Master’s Thesis – Tudor Mihai Brata
3.3 Studies outside the Netherlands ................................................................................. 65
3.3.1 Introduction ........................................................................................................ 65
3.3.2 Research programs and characteristics .............................................................. 65
3.4 Assessment of TU Delft testing program .................................................................. 73
3.4.1 General remarks ................................................................................................. 73
3.4.2 Comparison of experimental results ................................................................... 75
3.4.3 Conclusions ........................................................................................................ 79
Chapter 4: Finite Element Analysis - Stage I ................................................................ 81
4.1 Introduction ............................................................................................................... 82
4.2 Development of the FEA model ................................................................................ 83
4.2.1 Plane Stress model ............................................................................................. 83
4.2.2 Geometry and support conditions of the model ................................................. 83
4.2.3 Reinforcing and prestressing steel ...................................................................... 85
4.2.4 Element types of the model ................................................................................ 86
4.2.4.1 Plane stress elements ................................................................................... 86
4.2.4.2 Interface elements ....................................................................................... 87
4.2.4.3 Reinforcement elements .............................................................................. 87
4.2.5 Constitutive (material) models ........................................................................... 88
4.2.5.1 Concrete ...................................................................................................... 88
4.2.5.2 Reinforcing steel ......................................................................................... 92
4.2.5.3 Prestressing steel ......................................................................................... 93
4.2.5.4 Steel for plates ............................................................................................. 94
4.2.5.5 Interface ...................................................................................................... 94
4.2.6 Loads acting on the model ................................................................................. 95
4.2.7 Mesh properties .................................................................................................. 95
4.2.8 Features of the performed analyses .................................................................... 96
4.3 Calibration of the FEA model ................................................................................... 98
4.3.1 Initial model based on the width from the experimental programs .................... 99
4.3.1.1 Behaviour of the initial model .................................................................. 100
4.3.1.2 Conclusions regarding the initial model ................................................... 103
4.3.2 Impact of the considered effective width ......................................................... 104
4.3.3 Impact of the degrees of freedom at the supports ............................................ 105
4.3.4 Impact of the prestressing bar’s bond .............................................................. 105
4.3.5 Impact of the Arc-Length Control (ALC) method ........................................... 107
4.3.6 Impact of the rotation at the supports ............................................................... 107
4.3.7 Impact of the compressive behaviour of concrete ............................................ 107
4.3.8 Impact of the tensile behaviour of concrete ..................................................... 108
4.3.9 Chosen FEA models ......................................................................................... 108
4.4 Final models and their behaviour ............................................................................ 109
4.4.1 Linear analysis checks ...................................................................................... 109
4.4.2 Capacity of the models ..................................................................................... 109
4.4.3 Failure modes ................................................................................................... 110

FATIGUE MODEL FOR PRESTRESSED CONCRETE DECKS
15
Master’s Thesis – Tudor Mihai Brata
4.4.3.1 Best behaviour model (BBM) ................................................................... 110
4.4.3.1.1 Stresses and strains in the reinforcing steel .......................................... 111
4.4.3.1.2 Stresses and strains in the concrete ....................................................... 112
4.4.3.1.3 Crack width ........................................................................................... 113
4.4.3.1.4 Deflection at mid-span .......................................................................... 114
4.4.3.1.5 Compressive membrane action (CMA) ................................................ 114
4.4.3.2 Realistic model (RM) ................................................................................ 115
4.4.3.2.1 Stresses and strains in the reinforcing steel .......................................... 115
4.4.3.2.2 Stresses and strains in the concrete ....................................................... 116
4.4.3.2.3 Crack width ........................................................................................... 116
4.4.3.2.4 Deflection at mid-span .......................................................................... 117
4.4.3.2.5 Compressive membrane action (CMA) ................................................ 117
4.5 Conclusions of FEA – Stage I ................................................................................. 118
Chapter 5: Finite Element Analysis - Stage II ............................................................. 119
5.1 Introduction ............................................................................................................. 120
5.2 Changes in material properties ................................................................................ 120
5.2.1 Compressive strength and compressive fracture energy of concrete ............... 121
5.2.2 Modulus of elasticity of concrete ..................................................................... 122
5.2.3 Tensile strength and tensile fracture energy of concrete .................................. 123
5.3 Single cyclic loading range analyses ....................................................................... 124
5.3.1 Test BB23_200 ................................................................................................. 125
5.3.2 Test BB24_150 ................................................................................................. 127
5.3.3 Test BB26_165 ................................................................................................. 130
5.3.4 Accuracy of the results ..................................................................................... 132
5.4 Multiple cyclic loading ranges analyses .................................................................. 133
5.4.1 Performed tests ................................................................................................. 133
5.4.1.1 Phased analysis approach .......................................................................... 134
5.4.1.2 Separate analyses approach ....................................................................... 135
5.4.2 Sequence effect ................................................................................................ 137
5.4.2.1 Palmgren-Miner rule ................................................................................. 137
5.4.2.2 Phased analysis approach .......................................................................... 138
5.4.2.3 Separate analysis approach ....................................................................... 139
5.5 Conclusions of the FEA – Stage II .......................................................................... 139
Chapter 6: Future research program ........................................................................... 142
Chapter 7: General conclusions .................................................................................... 147
Chapter 8: Recommendations ....................................................................................... 152
Annex 1 .................................................................................................................................. 154
Annex 2 .................................................................................................................................. 159
List of Figures ....................................................................................................................... 164
List of Graphs ....................................................................................................................... 169
List of Tables ......................................................................................................................... 170

FATIGUE MODEL FOR PRESTRESSED CONCRETE DECKS
16
Master’s Thesis – Tudor Mihai Brata
List of Equations ................................................................................................................... 170
References ............................................................................................................................. 171

FATIGUE MODEL FOR PRESTRESSED CONCRETE DECKS
17
Master’s Thesis – Tudor Mihai Brata

FATIGUE MODEL FOR PRESTRESSED CONCRETE DECKS
18
Master’s Thesis – Tudor Mihai Brata
Chapter 1: Introduction
FATIGUE MODEL FOR PRESTRESSED CONCRETE DECKS
19
Master’s Thesis – Tudor Mihai Brata
1.1 Background of the Master’s Thesis topic
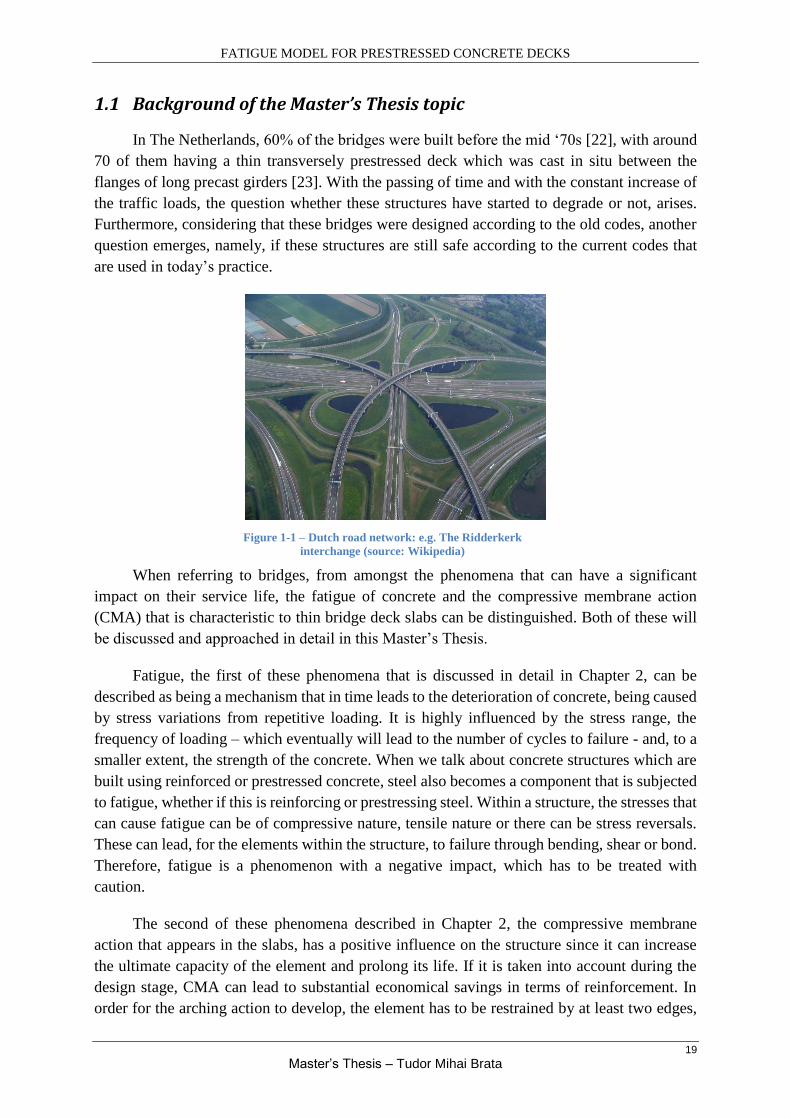
In The Netherlands, 60% of the bridges were built before the mid ‘70s [22], with around
70 of them having a thin transversely prestressed deck which was cast in situ between the
flanges of long precast girders [23]. With the passing of time and with the constant increase of
the traffic loads, the question whether these structures have started to degrade or not, arises.
Furthermore, considering that these bridges were designed according to the old codes, another
question emerges, namely, if these structures are still safe according to the current codes that
are used in today’s practice.
When referring to bridges, from amongst the phenomena that can have a significant
impact on their service life, the fatigue of concrete and the compressive membrane action
(CMA) that is characteristic to thin bridge deck slabs can be distinguished. Both of these will
be discussed and approached in detail in this Master’s Thesis.
Fatigue, the first of these phenomena that is discussed in detail in Chapter 2, can be
described as being a mechanism that in time leads to the deterioration of concrete, being caused
by stress variations from repetitive loading. It is highly influenced by the stress range, the
frequency of loading – which eventually will lead to the number of cycles to failure - and, to a
smaller extent, the strength of the concrete. When we talk about concrete structures which are
built using reinforced or prestressed concrete, steel also becomes a component that is subjected
to fatigue, whether if this is reinforcing or prestressing steel. Within a structure, the stresses that
can cause fatigue can be of compressive nature, tensile nature or there can be stress reversals.
These can lead, for the elements within the structure, to failure through bending, shear or bond.
Therefore, fatigue is a phenomenon with a negative impact, which has to be treated with
caution.
The second of these phenomena described in Chapter 2, the compressive membrane
action that appears in the slabs, has a positive influence on the structure since it can increase
the ultimate capacity of the element and prolong its life. If it is taken into account during the
design stage, CMA can lead to substantial economical savings in terms of reinforcement. In
order for the arching action to develop, the element has to be restrained by at least two edges,
Figure 1-1 – Dutch road network: e.g. The Ridderkerk
interchange (source: Wikipedia)

FATIGUE MODEL FOR PRESTRESSED CONCRETE DECKS
20
Master’s Thesis – Tudor Mihai Brata
with the degree of lateral restraint stiffness giving the magnitude of the arching action. Other
factors that influence the CMA are the percentage of reinforcement (a high percentage
decreases relatively the arching action) and the concrete strength (a higher strength has a
positive influence, increasing the CMA). Additionally, if a transverse prestressing of the bridge
deck slab is performed, this will result in a positive effect on the CMA and also will lead to a
thinner deck.
In the recent past, Delft University of Technology together with Rijkswaterstaat (Dutch
Ministry of Infrastructure and Environment) conducted a research program on the compressive
membrane action in prestressed concrete deck slabs, with the focus on the behaviour of this
structural system under static loading [14]. A small number of fatigue tests were also performed
within the said study [15], but a proper investigation on this was not done. The fatigue tests
were of compressive nature only and had a constant amplitude (Figure 1-2). Subsequently, the
need for studying also the effect of cyclic loading arose and a plan for a research program
conducted by the same two organizations had been approved.
Besides the general fatigue problem, an additional consideration for these fatigue tests
came from the following circumstances: the bridges/viaducts are designed to sustain a certain
Figure 1-3 - Variable amplitude fatigue loading (I)
Figure 1-4 - Variable amplitude fatigue loading (II)
Figure 1-2 - Constant amplitude fatigue loading

FATIGUE MODEL FOR PRESTRESSED CONCRETE DECKS
21
Master’s Thesis – Tudor Mihai Brata
maximum load throughout their service life; nevertheless, a few times each year this maximum
load is exceeded, fact that can have serious consequences on the structural integrity of the
system. Therefore it would also be of interest to study the impact of such a loading situation on
the fatigue resistance, especially the loading’s sequence effect and assess which case has a more
detrimental impact (Figure 1-3 and Figure 1-4).
1.2 Aim of the Master’s Thesis
The main goal of the Master’s Thesis is to create a simplified FEA (Finite Element
Analysis) model that can simulate the tests from the experimental program performed at Delft
University of Technology and can be used for the prediction of the fatigue damage due to a
constant amplitude loading range. It will also be tried to assess the behaviour under multiple
loading ranges and also the impact of the loading sequence.
The model will be created in such a way that it will reflect as accurate as possible the
experimental programs performed in the recent past at TU Delft and their outcomes, although
limitations due to the model’s simplified nature must be thought of. For its calibration, the
results from the static tests will be used. A series of parameters within the model will be studied
and varied in order to understand better their influence and the model’s behaviour.
A literature survey on the topics of fatigue and compressive membrane action will be
performed and presented with the scope of a better understanding of these phenomena and their
interaction with the structural system.
Additionally, the author of this report will take part in the construction of the new structural
system (bridge at a 1:2 scale) that is being built for the future experimental program that will
be performed at TU Delft’s Faculty of Civil Engineering and will focus on the fatigue loading
of bridge deck slabs, more specifically, on the loading sequence effect.
1.3 Procedure for the development of the FEA model for fatigue
The point of departure for the development of the finite element model is the choice of
using a two-dimensional (2D) model in order to replicate the behaviour of a real structure,
behaviour that is normally described by a three-dimensional stress state (3D). This is a major
assumption and simplification that has a large impact on the structural behaviour, influencing
how the stresses develop within the model, how deterioration manifests itself and how the
model will eventually fail.
A high number of parameters must be considered when developing the model, these being
related to aspects such as the geometry, support conditions, material models, applied loads or
characteristics of the performed analyses. All of them influence the FEA model’s behaviour to
a higher or a lower extent, this being assessed and highlighted within the thesis. Based on these

FATIGUE MODEL FOR PRESTRESSED CONCRETE DECKS
22
Master’s Thesis – Tudor Mihai Brata
parameters, a calibration must be performed in order for the model to depict a behaviour that is
very similar to the ones from the experimental program and FE analysis of S. Amir [14]. The
performed analyses must be of nonlinear nature as these allow the subsequent modification of
the model’s parameters, specifically the ones related to the materials.
Once an acceptable calibration is reached and the static capacity of the model is
determined, the next stage consists of the simulation on the FEA model of the fatigue loading
cycles and their subsequent damage upon the real structure. The point of departure for this stage
is represented by the assumption that the damage caused by fatigue is taken into account at a
structural level, by considering a uniform decrease in the material properties of the concrete.
The reduction of these properties is directly dependent on the number of cycles and on the ratio
between the minimum and maximum stresses/loads within the loading range.
The assumption of having a uniform general reduction in the material properties at a
structural level is a simplification of the actual behaviour of the real structure. In the case of the
latter, the alteration of the material properties as a consequence of the cyclic loading does not
result in the same effect on the whole structure but in a non-uniform variation of the properties,
having a different reduction depending on the point or location within the structure. In fact, the
real structure is loaded in bending which results in a linear stress distribution over the thickness
of the concrete deck. However, it is assumed that the fatigue behaviour of the concrete deck is
similar to that of a centrically loaded cylinder under compression, in which all the concrete
fibres area loaded uniformly.
Therefore, it is of interest to assess to what extent the FEA model predicts correctly the
structural failure load, as all of the assumptions related to the damage caused by fatigue are
implemented at the level of the model’s material parameters by reducing their values. The
assumptions for this reduction consider a structural behaviour (Figure 1-5) that is similar to a
cyclic type of loading in compression (Figure 1-6). They also consider a softening reduction
correlated with the same compressive behaviour and they also take into account a reduction of
the compressive and tensile fracture energies. All these parameters are connected to each other.
Figure 1-5 – Structural behaviour
Figure 1-6 – Behaviour due to cyclic loading in
compression [29]

FATIGUE MODEL FOR PRESTRESSED CONCRETE DECKS
23
Master’s Thesis – Tudor Mihai Brata
Having made these assumptions, the behaviour of the FEA model under the cyclic loading
can be assessed using nonlinear analyses, evaluating the outcome of single or multiple loading
ranges, with the impact of the loading sequence also being studied.
1.4 Contents of the thesis
The current section will briefly describe the contents of the following chapters of the
Master’s Thesis.
Chapter 2 will present the literature survey that was performed on the topics of fatigue of
concrete and compressive membrane action (CMA) in bridge deck slabs.
Chapter 3 presents the assessment of the fatigue research that was previously performed at
Delft University of Technology.
In Chapters 4 and 5, the stages of the numerical analysis are presented. The finite element
analysis from stage I deals with the development and calibration of the FEA model. In stage II,
the analyses that try to assess the fatigue damage are presented.
The structural system for the following fatigue research experimental program and its
construction stages are presented in Chapter 6.
Chapters 7 and 8 present the general conclusions and the recommendations that follow
from the used procedure and the results obtained.
In the annexes, additional information will be presented concerning certain parts of the
thesis that require clarification or some extra amount of data.

FATIGUE MODEL FOR PRESTRESSED CONCRETE DECKS
24
Master’s Thesis – Tudor Mihai Brata
Chapter 2: Literature Survey

FATIGUE MODEL FOR PRESTRESSED CONCRETE DECKS
25
Master’s Thesis – Tudor Mihai Brata
2.1 Introduction
The second chapter of the Master’s Thesis work presents the literature survey on which the
topic of the thesis is based. The choice for this topic was made by assessing its degree of
relevance, the academic significance and possibility of accomplishment. It was decided to do a
study and research on the fatigue loading of concrete focusing on bridge deck slabs and also on
the effect of compressive membrane action that is characteristic to these concrete slabs. The
topic of the thesis is a combination of the previously mentioned subjects.
In the following sections, both subjects will be presented, trying to describe in an accurate
manner their characteristics, behaviour and influence in the civil engineering field. Reports,
bulletins and articles will be used as source of documentation and information.
2.2 Fatigue of concrete
Fatigue can be defined as a deterioration mechanism that acts in time - resulting in the
continuous growth of cracks - that is due to stress variations caused by repetitive/cyclic loading,
which can eventually cause failure of the element or of the structure [1]. The main parameters
that influence fatigue are the magnitude of the stress range, a sufficiently high number of
loading cycles, the presence of a stress concentration [1, 2].
When discussing about the topic of fatigue in civil engineering, generally this is related to
steel elements or structures. These are more prone to such actions and eventual failures, being
mandatory to take fatigue into account since the design stage and perform adequate
maintenance and checks throughout the service life, since as early as the second half of the 19th
century it was known that metals fracture under frequently repeated stresses that were lower
than their ultimate static strength. Wohler came to the conclusion that fatigue strength depends
on the range of fluctuating stress and that reversed stresses can cause fracture [2, 3].
In case of concrete structures, fatigue has not proven to be the main reason for structural
failure, but in combination with other factors and actions, such as corrosion and fretting fatigue,
it can have a major impact on the service life of said structures, even to the extent to which it
could lead to its end. Fatigue cracks in concrete are hard to identify since they do not have an
easily recognisable surface topography like the ones in steel, therefore increased attention has
to be paid during maintenance and inspection. Fatigue can occur in a concrete element when
excessive cracking and deflection develops under repeated service loads. Under laboratory
conditions, it was proved that concrete elements can fail under fatigue induced deterioration
and, additionally, a series of real structural cases were documented by CEB-Comité européen
du beton (now, FIB - Fédération internationale du béton) in their 1988 Bulletin No. 188 [3].
For assessing the fatigue part of this literature survey, the core of this documentation is
comprised of the CEB Bulletin No. 188 ([3]) and Mallett’s state of the art review on fatigue of
reinforced concrete ([2]). These documents contain major data on the fatigue phenomenon that
describe its behaviour and the important aspects that characterize and influence the outcome of
fatigue loading on concrete structures.
FATIGUE MODEL FOR PRESTRESSED CONCRETE DECKS
26
Master’s Thesis – Tudor Mihai Brata
In the first half of the 20th century, fatigue was not considered a problem for concrete
structures. The question whether this had a detrimental effect emerged starting with the 1960’s,
when different types of steel started being used within the concrete and also the stresses that
were acting on the structures gradually increased [2]. In the CEB Bulletin No. 188 a series of
cases were presented in which a wide range of deteriorations of concrete structures was
assessed, with probable or possible contribution of fatigue. Following this examination, a series
of recommendations and conclusions were drawn with respect to the behaviour of the
structures, with fatigue being deemed as not having a sole contribution to the deterioration, but
most likely only having a contributory part [3, 2].
Two approaches can be used for assessing the fatigue life: fracture mechanics, which takes
into account the energy of the loading cycles for crack propagation, or the estimation of
cumulative damage, S-N/Palmgren-Miner method, which gives an acceptable probability that
failure due to fatigue will not occur before a certain number of loading cycles ( ∑ 𝑛/𝑁 ≤ 1 ).
The second approach is considered to be the classical, more common approach. Fatigue
characteristics can be presented using S-N curves and Goodman diagrams [2].
There are two types of fatigue loading cycles that can be distinguished: low-cycle fatigue
and high-cycle fatigue. During low-cycle (amplitude) fatigue, the stress levels of the applied
load are high and the number of cycles is low (e.g. earthquake). For high-cycle fatigue the
stresses are lower and the number of cycles is higher, this situation being more common in
practice [3, 4].
In terms of nature of the loading that can cause fatigue, this can be one or a combination
of the following: wind and wave loads, loads for highway and railway bridges, loads for crane
runways, freezing temperatures, thermal gradients. It must be mentioned that in a high number
of cases the load that causes fatigue is considerably influenced by the dynamic response of the
system [3].
2.2.1 Fatigue in plain concrete
Concrete is a non-homogeneous material. When talking about fatigue in concrete, this is a
process within which the structure of the material continuously changes, with the possibility of
appearance of micro-cracks which will propagate and eventually form macro-cracks. These
cracks have a direct impact on the remaining fatigue life since they are synonyms with cross-
sectional reduction and concentration of stresses. The important features of the fatigue process
are the stress/strain changes under cyclic loading and the mechanics of crack growth [2, 3].
There are different methods to compare the development of fatigue damage under cyclic
loading as it can be seen in the below graph made by Holmen (’79). The distinguishable
methods are: ultrasonic pulse velocity, acoustic emissions, strain development [2, 3].

FATIGUE MODEL FOR PRESTRESSED CONCRETE DECKS
27
Master’s Thesis – Tudor Mihai Brata
2.2.1.1 Plain concrete in compression
The fatigue strength of concrete is defined as a fraction of the static strength that can be
sustained repeatedly for a certain number of loading cycles. It can be represented by S-
N/Wohler curves (stress-fatigue life curves). In common practice, these curves are plotted for
a given constant minimum stress or for a constant ratio between the minimum and maximum
stresses [2, 3].
Figure 2-3 - Example of a Goodman diagram [3]
With the use of Goodman diagrams (Figure 2-3) the effect of the fatigue strength depending
both on the maximum and minimum stresses in the loading cycle can be assessed. It was
observed that the fatigue strength for a given number of cycles increases with the increase of
the minimum stress. Unlike steel, there is no fatigue limit for concrete, meaning that there is no
known stress below which the fatigue life is infinite and no damage will occur [3].
Studies on the longitudinal strain (the sum of elastic and inelastic strain) of compression
fatigue revealed that this has two components, one related to the endurance of the specimen and
Figure 2-2 - Example of a Wohler diagram (S-N curves)
[2, 3]
Figure 2-1 - Development of fatigue damage [2, 3]
FATIGUE MODEL FOR PRESTRESSED CONCRETE DECKS
28
Master’s Thesis – Tudor Mihai Brata
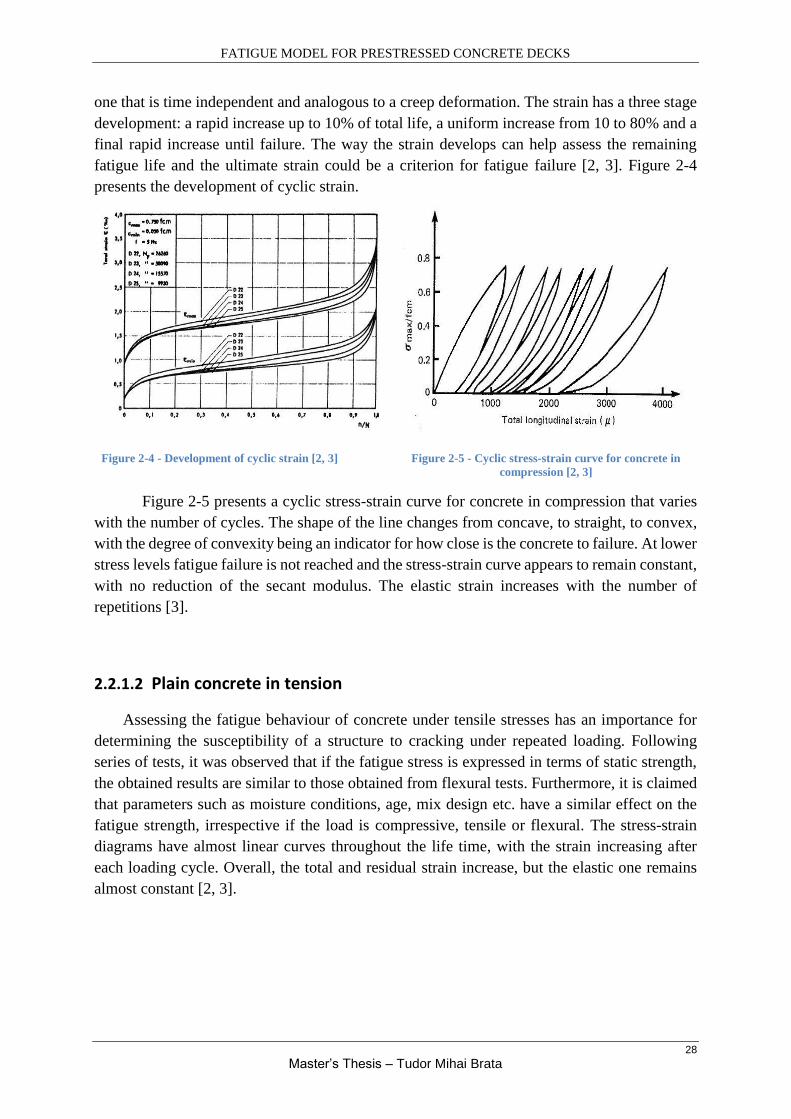
one that is time independent and analogous to a creep deformation. The strain has a three stage
development: a rapid increase up to 10% of total life, a uniform increase from 10 to 80% and a
final rapid increase until failure. The way the strain develops can help assess the remaining
fatigue life and the ultimate strain could be a criterion for fatigue failure [2, 3]. Figure 2-4
presents the development of cyclic strain.
Figure 2-4 - Development of cyclic strain [2, 3]
Figure 2-5 - Cyclic stress-strain curve for concrete in
compression [2, 3]
Figure 2-5 presents a cyclic stress-strain curve for concrete in compression that varies
with the number of cycles. The shape of the line changes from concave, to straight, to convex,
with the degree of convexity being an indicator for how close is the concrete to failure. At lower
stress levels fatigue failure is not reached and the stress-strain curve appears to remain constant,
with no reduction of the secant modulus. The elastic strain increases with the number of
repetitions [3].
2.2.1.2 Plain concrete in tension
Assessing the fatigue behaviour of concrete under tensile stresses has an importance for
determining the susceptibility of a structure to cracking under repeated loading. Following
series of tests, it was observed that if the fatigue stress is expressed in terms of static strength,
the obtained results are similar to those obtained from flexural tests. Furthermore, it is claimed
that parameters such as moisture conditions, age, mix design etc. have a similar effect on the
fatigue strength, irrespective if the load is compressive, tensile or flexural. The stress-strain
diagrams have almost linear curves throughout the life time, with the strain increasing after
each loading cycle. Overall, the total and residual strain increase, but the elastic one remains
almost constant [2, 3].

FATIGUE MODEL FOR PRESTRESSED CONCRETE DECKS
29
Master’s Thesis – Tudor Mihai Brata
Figure 2-6 – Cyclic stress-strain curve for concrete in
tension [3]
Figure 2-7 – Development of the tensile strain
components [3]
2.2.1.3 Plain concrete in compression-tension
The tensile fatigue strength of concrete seems to be affected by stress reversals, with the
minimum compressive stress levels reducing the number of cycles to failure considerably. The
outcome of a stress reversals with a low minimum stress level – high compressive stress – is
that compressive failure is generated. When alternating compressive and tensile stresses, the
compressive one has a higher negative effect on the fatigue life than the tensile one [2, 3].
Figure 2-8 - Cyclic stress-strain for reversals
[2, 3]
Figure 2-9 – Detrimental effect of stress reversals [2, 3]
During stress reversals, in the early cycles a compressive strain is produced, this
remaining almost constant, whilst the tensile strain increases leading to hysteresis and failure
(Figure 2-9) [2, 3].
FATIGUE MODEL FOR PRESTRESSED CONCRETE DECKS
30
Master’s Thesis – Tudor Mihai Brata
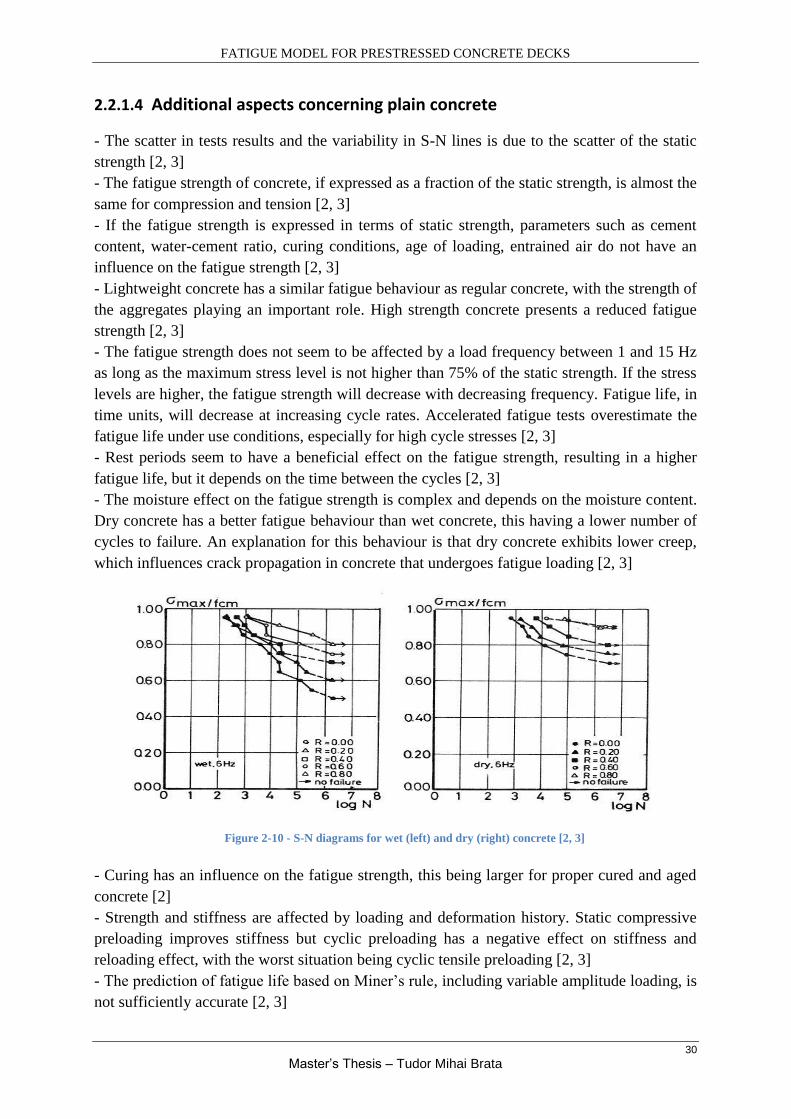
2.2.1.4 Additional aspects concerning plain concrete
- The scatter in tests results and the variability in S-N lines is due to the scatter of the static
strength [2, 3]
- The fatigue strength of concrete, if expressed as a fraction of the static strength, is almost the
same for compression and tension [2, 3]
- If the fatigue strength is expressed in terms of static strength, parameters such as cement
content, water-cement ratio, curing conditions, age of loading, entrained air do not have an
influence on the fatigue strength [2, 3]
- Lightweight concrete has a similar fatigue behaviour as regular concrete, with the strength of
the aggregates playing an important role. High strength concrete presents a reduced fatigue
strength [2, 3]
- The fatigue strength does not seem to be affected by a load frequency between 1 and 15 Hz
as long as the maximum stress level is not higher than 75% of the static strength. If the stress
levels are higher, the fatigue strength will decrease with decreasing frequency. Fatigue life, in
time units, will decrease at increasing cycle rates. Accelerated fatigue tests overestimate the
fatigue life under use conditions, especially for high cycle stresses [2, 3]
- Rest periods seem to have a beneficial effect on the fatigue strength, resulting in a higher
fatigue life, but it depends on the time between the cycles [2, 3]
- The moisture effect on the fatigue strength is complex and depends on the moisture content.
Dry concrete has a better fatigue behaviour than wet concrete, this having a lower number of
cycles to failure. An explanation for this behaviour is that dry concrete exhibits lower creep,
which influences crack propagation in concrete that undergoes fatigue loading [2, 3]
- Curing has an influence on the fatigue strength, this being larger for proper cured and aged
concrete [2]
- Strength and stiffness are affected by loading and deformation history. Static compressive
preloading improves stiffness but cyclic preloading has a negative effect on stiffness and
reloading effect, with the worst situation being cyclic tensile preloading [2, 3]
- The prediction of fatigue life based on Miner’s rule, including variable amplitude loading, is
not sufficiently accurate [2, 3]
Figure 2-10 - S-N diagrams for wet (left) and dry (right) concrete [2, 3]

FATIGUE MODEL FOR PRESTRESSED CONCRETE DECKS
31
Master’s Thesis – Tudor Mihai Brata
- Reliable material models are needed for an accurate computation with the aid of computer
software, with respect to fatigue and deformations. In order to describe the relation between
stress and strain, the models use the development of cyclic strain and Young’s modulus as an
input. These give the behaviour for uncracked concrete. In order to describe the behaviour of
cracked concrete, the post-peak properties of the material are needed. Following tests, stress-
strain diagrams can be obtained for concrete undergoing compression or tension. These models
take into account the softening properties of the material which is caused by the formation of
micro-cracks [3].
Figure 2-11 - Stress-strain relation with post-peak
cycles for concrete in compression [3]
Figure 2-12 - Stress-strain relation with post-peak
cycles for concrete in tension [3] (from Reinhardt,
Cornelissesn and Hordijk, 1986)
- In his thesis, Hordijk [13] aimed for a better understanding of the causes and mechanisms of
the fatigue of concrete and the development of a model based on fracture mechanics. For
reaching his goal, he also did an extended research on the tensile behaviour of concrete, since
this property of the material was essential for a proper development of the model. Following
the tests, he proposed a model for the tension softening curve, this being used in both analytical
and finite element model calculations [13].
Figure 2-13 - Linear softening relations and an
experimentally determined relation [13]
Figure 2-14 - σ-w relations, and data points [13]

FATIGUE MODEL FOR PRESTRESSED CONCRETE DECKS
32
Master’s Thesis – Tudor Mihai Brata
2.2.2 Fatigue of reinforcing and prestressing steel
2.2.2.1 Reinforcing steel
There are different types of steel and steel reinforcing bars, each having their own
properties. The studied cases mentioned in Bulletin No. 188 that reported fatigue damages
undergone by concrete structures, exhibited cracking or spalling of the concrete, with no fatigue
damage of the reinforcing bars. Nevertheless, there are situation that require a proper
assessment of the fatigue performance of the bars, such as in the case of increased cyclic loading
or corrosion of steel due to deterioration of concrete. It can be difficult to assess if the
reinforcing bars have failed since there can be no obvious sign except for local cracking of
concrete. The fatigue strength of bars is expressed in terms of the stress range and S-N curves
[2, 3].
For testing continuous bars there are two methods at use, axial testing in air and bending
tests on concrete beams (considered more relevant for service conditions). The disadvantage of
the axial test lays in the gripping of the test specimen which can cause local stresses and early
failure, whilst the disadvantage for the bending tests consist of usage of low cyclic frequencies
in order to avoid heating problems. During axial tests, fatigue cracking is initiated at minor
surface defects, whilst for bending tests the fatigue is initiated in the vicinity of the ribs. On
average, axial tests exhibit a lower fatigue performance, around 20% lower than bending tests
[3].
The ribs on the reinforcement bars were designed to improve the bond with the concrete
and for a higher pull-out strength, but they can also cause stress concentrations. There are
several factors that can cause premature failure, including intersecting ribs, small radii of the
ribs, poorly designed identification markers, fabrication effects [2, 3].
It was found that the fatigue strength decreases with the increase in bar diameter, mainly
due to the higher probability of existing manufacturing flaws on the surface of the bars. A
similar effect was noticed on the static strength [2, 3].
Figure 2-15 - Size effect on bars [2]

FATIGUE MODEL FOR PRESTRESSED CONCRETE DECKS
33
Master’s Thesis – Tudor Mihai Brata
In the case of bent bars, it was shown that these have a lower fatigue strength than
straight bars. The reduction of strength increases as the bend diameter decreases with respect
to the bar diameter. The cause of this reduction is due to cold working and residual and bending
stresses [2, 3].
Three types of connections are used for reinforcing bars in concrete: overlapping,
mechanical and welded. The straight overlapped bars have a very similar fatigue strength to
continuous bars. Mechanical and welded connections reduce fatigue life [2, 3].
Corrosion also has a negative effect on the fatigue strength of reinforcing bars and
subsequently reduce the fatigue life of a structure. Local corrosion is more dangerous than
general corrosion since it results in deep pits and is harder to detect. This can lead to significant
reductions of the cross-section (even up to 50%) and stress concentrations [2, 3].
2.2.2.2 Prestressing steel
Fatigue behaviour of prestressing steel, from the bare steel point of view, is similar to
that of reinforcing steel. Concerning prestressing steel, initially it was thought that fatigue is
not an issue, since all the concrete members were fully prestressed and no cracking occurred.
Since subsequently partial prestressing became used more often and the stress ranges increased,
it was required for a better understanding of the fatigue behaviour of prestressing steel. With
respect to their type, they can be classified according to their strength, shape and manufacturing
process [2, 3].
The fatigue performance of steel is considered at a stress range - referred to also as the
endurance limit - of constant amplitude for two million cycles, given a maximum stress. The
parameters that influence the fatigue behaviour are the stress range, the mean stress (drop in
fatigue strength with increasing mean stress), length of the specimen (drop in fatigue strength
with increase of the specimen’s length) and frequency (lower frequencies lead to lower fatigue
strength) [2, 3].
Figure 2-16 - S-N curves for wires and bars [2, 3]

FATIGUE MODEL FOR PRESTRESSED CONCRETE DECKS
34
Master’s Thesis – Tudor Mihai Brata
Fretting corrosion has a negative effect on the fatigue strength since it can damage the
tendons. Fretting can occur between the wires of a strand, between tendon and the empty duct
or between wires and anchorages. Slip and mechanical transverse pressure are the main
parameters that influence fretting corrosion. The worst form of corrosion is pitting corrosion
and generally, prestressing steel is much more sensitive to corrosion than regular bars [2, 3].
Figure 2-17 - Influence of frequency [2, 3]
Figure 2-18 – Fretting at different frequencies [2, 3]
Redistribution of stresses can occur in a cracked section that contains both active and
passive reinforcement. This is caused by different bond behaviour of both types of
reinforcement and it leads to a decrease of stress in the prestressing steel if the regular
reinforcing bars have a better bond. On the other hand, the increase of stress in the reinforcing
bars can be up to 25% [3].
Additional characteristics that were revealed after considerable testing include:
- Smooth steel has a better behaviour than ribbed steel
- Curved cables in concrete beams have lower fatigue strength than bare cables.
- Steel ducts are worse when compared to plastic ducts
- Tendons in the beam have a considerably lower fatigue strength than tendons in the air,
between 40 and 70% lower
- Coupled beams have considerable lower fatigue life than uncoupled beams, due to earlier
cracking, fretting and local bending [2, 3].
2.2.3 Behaviour of reinforced concrete elements
A reinforced concrete structure is a composite structure and its fatigue properties are
given by the interaction and properties of the composing materials, concrete and steel. The
steel’s purpose is to carry tensile forces when the concrete cracks, with this happening when
the tensile strength is reached in the concrete. The concrete, whilst designed to undergo
compression stresses, in the tensile zones it will be subjected to different levels of tensile
stresses up to the moment of cracking, when, due to redistribution, the stresses will be taken by
the steel. Since fatigue depends on the stress level, the susceptibility of fatigue in the structure
will be varied. With the progressing of fatigue and propagation of cracks, there will be

FATIGUE MODEL FOR PRESTRESSED CONCRETE DECKS
35
Master’s Thesis – Tudor Mihai Brata
deformations and stress redistribution changes so that fatigue failure could be given by a
different mechanism than for static failure. When determining the stresses in the reinforced
concrete, simplified models are used. Additionally, taking into account the diversity of
materials and loads, it can be observed why there is such a large scatter in fatigue test results
[2, 3].
The fatigue properties of an under-reinforced member failing in bending are related to
the reinforcement. Heavy reinforced members undergoing bending failures or members where
shear or bond are governing have more complicated conditions [2, 3].
2.2.3.1 Bending failure
For this type of failure there can be two situations: failure of the concrete in compression
or failure of the tensile reinforcement. In the first situation, compression zone at bending, there
is a stress gradient which allows for stress redistribution as the zone with the highest stress
starts to deteriorate due to the cyclic loading. It was proved that it is safe to assess the
compression zone of beams using uniaxial compression fatigue data. With respect to the fatigue
of tensile reinforcement in bending, it was discovered that the relative fatigue strength has a
low value. High yield steel reinforcement has only a slightly better fatigue performance
compared to mild steel [2, 3].
2.2.3.2 Shear failure
In practice, shear failure is avoided being considered a brittle type of failure. The ductile
failure, which is desirable in the ultimate limit state, is about yielding of the reinforcement.
However, it was acknowledged that there were situations when similar specimens (beams)
failed in shear, when they were exposed to cyclic loading, and bending, when they were
exposed to static loading [2, 3].
Beams without shear reinforcement present some specific characteristic that were
outlined following series of tests. Their crack pattern is developed after the first few loading
cycles, with the critical shear crack appearing after limited crack elongations. The formation of
the critical crack, which intersected the bending cracks, lead to the failure of the element. In
some cases, the longitudinal moment reinforcement separated from the web concrete, without
having a direct impact on the failure of the specimen. At the beginning of the loading cycles,
the deflections and the strains increased substantially, but this behaviour got reduced with
cycling. After the formation of the critical shear crack, the number of cycles to failure is difficult
to predict. Concrete has a similar fatigue behaviour for shear and bending [2, 3].

FATIGUE MODEL FOR PRESTRESSED CONCRETE DECKS
36
Master’s Thesis – Tudor Mihai Brata
The fatigue properties of beams with shear reinforcement are dependent on the
properties of the reinforcement. Their behaviour is affected by the stress history of the stirrups,
the occurrence of failure at the lower bends of the stirrups and the fact that shear cracks cross
the stirrups at skew angles. Size and scale effects influence the fatigue resistance [2, 3]
2.2.3.3 Bond failure
There are several factors that influence the bond, such as the type of reinforcing bar, the
geometry of the surrounding concrete, the existence of confinement, load time history,
transverse pressure or tension, maximum load level (compared with the ultimate static load).
There can be distinguished three types of bond failure:
- failure due to excess of shear strength between the bar and the concrete
- if there is sufficient shear strength between the reinforcing bar and the concrete, the tensile
stress will lead to the cracking of the concrete, with the bond force being directed outwards,
such that the surrounding concrete may be split away by the pressure of the bar
- if the splitting resistance of the surrounding concrete is high enough, in the situation of a
deformed bar, the bond failure will also occur as a shear failure in the concrete along the
perimeter of the bar
The reduction of bond strength due to fatigue depends on how the previously mentioned
strengths are affected by the cyclic loading. Usually the bond stress is not uniformly distributed
along the bond length [2, 3].
2.2.4 Fatigue in bridge deck slabs – recent studies
After CEB’s Bulletin No. 188 publication in 1988, which had the purpose of presenting
the research previously done and setting guidelines with respect to the fatigue behaviour of
concrete and reinforced concrete structures, in the following decades more studies were
conducted on this topic since it still represents an important aspect in the field of civil
Figure 2-19 - Failure modes for beams without stirrups (left) and with stirrups (right) [2, 3]
FATIGUE MODEL FOR PRESTRESSED CONCRETE DECKS
37
Master’s Thesis – Tudor Mihai Brata
engineering, where fatigue of concrete can be a mechanism that has a significant impact in the
life of a structure.
In this section, a few articles that were based on researches done on fatigue in the past
years will be presented, including the description of the tests, parameters and their conclusions.
The outcome of these investigations should be rooted in the general knowledge of CEB’s no.
188 bulletin, providing a deeper insight of the topic, but also extending the knowledge with
better understanding of the phenomenon that is fatigue and the parameters that influence its
behaviour.
The first study presented was performed by Carvelli, Pisani & Poggi, 2010 [5] and
focused on the fatigue behaviour of concrete bridge deck slabs reinforced with GFRP (Glass
Fibre Reinforced Polymer) bars. This type of bars are an alternative to the traditional steel
reinforcing bars, mainly due to their extremely good behaviour in terms of corrosion resistance.
For the experimental part, four full scale bridge deck specimens were subjected to cyclic
loading and their fatigue behaviour was assessed [5].
The reasoning behind the use of GFRP bars, although they have lower mechanical
properties, was that the normal steel bars in bridge decks are affected by corrosion due to the
use of de-icing salts and temperature variation. Corrosion of the rebars will cause cracking and
spalling of the concrete deck, which in the end will affect the durability of the structure and will
raise additional costs [5].
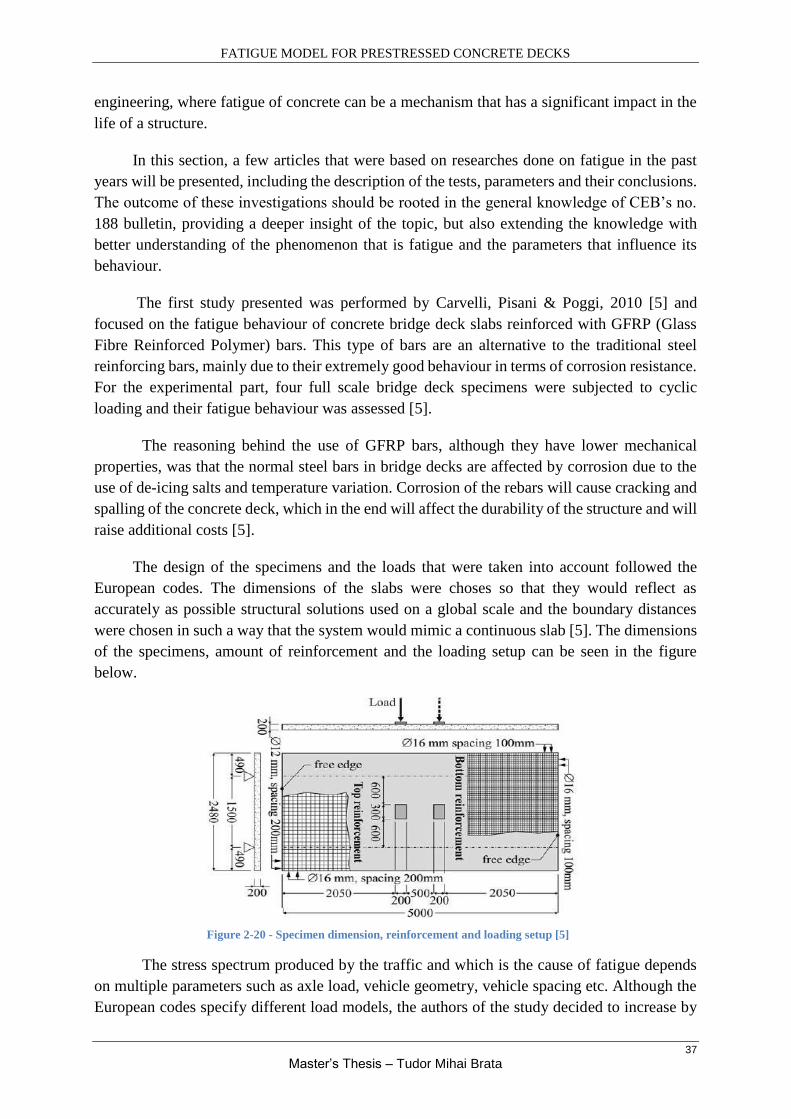
The design of the specimens and the loads that were taken into account followed the
European codes. The dimensions of the slabs were choses so that they would reflect as
accurately as possible structural solutions used on a global scale and the boundary distances
were chosen in such a way that the system would mimic a continuous slab [5]. The dimensions
of the specimens, amount of reinforcement and the loading setup can be seen in the figure
below.
The stress spectrum produced by the traffic and which is the cause of fatigue depends
on multiple parameters such as axle load, vehicle geometry, vehicle spacing etc. Although the
European codes specify different load models, the authors of the study decided to increase by
Figure 2-20 - Specimen dimension, reinforcement and loading setup [5]

FATIGUE MODEL FOR PRESTRESSED CONCRETE DECKS
38
Master’s Thesis – Tudor Mihai Brata
50% the maximum load from the codes and also reduce the wheel contact area. All this was
done in order to reduce the number of cycles to failure during the experimental tests [5].
The GFRP bars had a tensile strength 1.5 times higher than regular steel bars, but a
modulus of elasticity that was 5 times smaller, the latter being similar to the one from concrete,
making the GFRP bars useless in aiding the concrete under compression forces. Combined with
a weak resistance to shear stresses, they are not capable in taking punching also. Other aspects
concerning this type of rebar is the possible low fatigue endurance and bond under cyclic
loading [5].
According to the European codes, the strength verification for concrete under cyclic
loading is performed using the Palmgren-Miner rule. Following this procedure, a hypothetical
number for cycles to failure was determined. The design punching shear strength of the
specimen was also determined following the codes [5].
The setup tried to reproduce closely the actual working situation of a bridge. In order to
simulate a simple support boundary condition, the slabs were constrained by two longitudinal
beams on two of the sides. The loading was performed by using two hydraulic jacks, with a
frequency range varying between 0.2 and 1.25 Hz. The loading was applied in such a way that
it mimicked the real wheel load, always having one jack delivering the maximum load, whilst
the other one was at its minimum. Two of the slabs were subjected to cyclic plus static loading,
one slab only to cyclic loading and the last one only to static loading [5].
Figure 2-21 - Experimental setup [5]
Figure 2-22 - Shape of load variation [5]
The slabs that did not collapse following the cyclic loading (S1 and S2), were
subsequently loaded statically up to failure, with a single concentrated load. Tensile tests were
performed on the rebars and compressive tests were performed on concrete specimens, all these
to determine the properties of the materials. The slabs that underwent cyclic loading, each had
a different maximum load within the cycles. The variation of the frequency did not show any
influence on the behaviour of slab S1, which had the lowest maximum load. The cracks showed
a radial distribution from the contact zone of the load. After 1.5 million cycles the test was
stopped since the slab reached a stable response. Slab S3, which was the last specimen subjected

FATIGUE MODEL FOR PRESTRESSED CONCRETE DECKS
39
Master’s Thesis – Tudor Mihai Brata
to cyclic loading and had the highest load, failed after a very low number of cycles (≈400). S2
was somewhere in between and S4 was loaded only statically to failure [5].
Slab S1 proved to be stiff enough to resist the loading cycles without major damage and
had a very low displacement at the mid-span of the free edges. According to the codes, slab S1
should have failed long before the test was stopped, case similar for slab S2 also. The GFRP
rebars showed no signs of debonding even after collapse. The displacement of these slabs
increased during the first period of cycle loading, matching the predictions from literature: the
strain in the concrete increases until the stability curve is reached. The collapse mechanism in
all the static tests was punching, which is characteristic for reinforced concrete bridge decks.
The experimental punching shear strength for these specimens was only slightly higher than
the one given by the codes [5].
The study concludes that the experimental behaviour of the specimens, under both low
and high cyclic loading, is better than the one predicted by the codes. It is believed that GFRP
bars are a viable solution for severe environments [5].
In another study performed in Switzerland by M. Schlafli and E. Bruhwiler in 1998, the
fatigue of existing reinforced concrete bridge deck slabs was investigated [6]. In the second half
of the 20th century, most of the bridges that have been constructed in Switzerland were made
out of reinforced concrete. Since this is a material that degrades over time and the traffic loads
increase constantly, the necessity of evaluating the performance of these bridges emerged [6].
The bridge decks are the most loaded elements of a bridge, being prone to fatigue. This
subsequently may lead to the damage of concrete and the steel rebars. Fatigue damage has been
observed mainly during tests since it is hard to distinguish in a real structure, but there are cases
where it was determined that fatigue damage occurred. The assessment of fatigue is based
initially on codes and assumes a worst case scenario, this leading to a conservative approach,
which might be acceptable for new structures but costly for the already existing ones [6].
Examining a certain number of existing bridges, some conclusions were drawn.
Amongst these, it was found that normal stress reversals in the longitudinal direction leads to
cracking of the slab in the transverse direction; due to positioning of the load, fatigue safety
could be insufficient in section that met structural safety requirements and vice-versa; the
thickness of the pavement/deck has a big influence on load distribution and stresses [6].
The behaviour of concrete under fatigue loading is described, considering the main
relevant situations. Plain concrete under compressive or tensile fatigue loading exhibits a high
strain increase during the first cycles. This is followed by a steady, but slow increase of the
strain. During the last cycles before failure, again the strain increases rapidly. Throughout the
loading cycles, the modulus of elasticity decreases due to the formation of micro-cracks. In
both situations, uniaxial compression and tension, the fatigue loading is dominated by the
propagation of cracks, with the cement matrix or the interface suffering from micro-cracking.
In the case of stress reversals, the concrete is deteriorated rapidly since the micro-cracks have
different orientations, following from alternating compressive and tensile stresses [6].

FATIGUE MODEL FOR PRESTRESSED CONCRETE DECKS
40
Master’s Thesis – Tudor Mihai Brata
For assessing fatigue there are several models in use: S-N approach, fracture mechanics
and damage accumulation [6].
The S-N approach is based on stress S versus number on load cycles N curves. Tests
are performed to assess the resistance to fatigue and checks are made to see if the fatigue
resistance is larger than the fatigue loading. For steel reinforcement, the important parameter
are the stress range, number of load cycles and discontinuities. For concrete, fatigue is defined
by a maximum and a minimum stress and their effect over a number of cycles is represented by
a Goodman diagram. When stress reversals occur (e.g. due to a moving load), the resistance to
fatigue is significantly reduced. Other parameters relevant for fatigue behaviour are the concrete
strength and the size factor [6].
Fracture mechanics for steel rebars describe the crack growth as a function of material
parameters, crack size geometry and specimen geometry. A linear elastic approach is used in
case of steel structures. The development of fatigue is considered to have 3 stages: crack
initiation, propagation and unstable crack growth until failure. In the case of concrete, a
softening crack is introduce by the means of fracture mechanics, resulting in a decrease in the
stress transfer with the increase in crack opening [6].
The third model for evaluating fatigue, damage accumulation, allows the prediction of
damage by assessing the varying stresses. The Palmgren-Miner hypothesis is the most common.
This is a linear damage accumulation model and describes the sum of the damage from each
individual cycle, being based on S-N curves [6].
The research conducted by the authors focused on the remaining fatigue life of existing
bridges. Their testing program included beam specimens that resembled slabs, they had no shear
reinforcement. The loading on the beams was either static or cyclic (4.5 Hz, sinusoidal load).
Only after the maximum fatigue load was increased to more than 60% of the final static load,
fatigue damage was observed. The deflection and the strains increased significantly during the
first thousand cycles, followed by a period on slow but constant increase. Following the results
from the tests, based on which observations were made by the authors, a procedure was
proposed to examine existing bridges [6].
Figure 2-23 - Influence line for a moving load – stress reversal occurrence [6]

FATIGUE MODEL FOR PRESTRESSED CONCRETE DECKS
41
Master’s Thesis – Tudor Mihai Brata
A third article published by Hwang et al. [7] dealt with the punching and fatigue
behaviour of long-span prestressed concrete deck slabs. Such slabs are used in order to
minimize the weight of the deck and to make the structural system more economical.
Additionally, prestressing increases the flexural, punching and fatigue strengths but there are
questions whether the same formulas from reinforced concrete deck slabs can be applied to the
prestressing situation. Static and fatigue tests on long-span prestressed concrete decks were
carried out by the authors in order to obtain reliable design formulas for punching and fatigue
strength [7].
In order to have a wider and more reliable base for the design formulas of punching
shear and fatigue, the authors selected four formulas for punching and one for fatigue. The ones
for punching were chosen due to their use in official codes or mechanical considerations, whilst
the one for fatigue was chosen because it was the only one that took into account a moving
wheel load [7].
For the experimental program 10 one-way slab specimens were produced on a 1:3 scale
of a real bridge components, but with identical sectional detail. The level of prestressing was
classified into 5 sub-stages (from fully prestressed to none), with the tendons being disposed
eccentrically in order to maximize the efficiency of the section. The slabs are connected to the
supporting girders by shear connectors, in order to reproduce the real life situation [7].
Since the strength of the specimens decreases with the increasing number of cycles, the
accumulated fatigue damage had to be estimated by comparison with the static strength, this
being obtained following a static load test. For the fatigue tests, an equipment that simulated
the passing of a wheel was used, this being also able to perform static tests. A track made of
steel blocks that was placed on the specimens was used as a runway. Due to their setup, the
specimens were considered to have fixed and fully supported boundary conditions. During the
tests, the strains and the deflections were measured [7].
Figure 2-24 – Static test [7]
Figure 2-25 – Wheel load fatigue test [7]
For the static tests, the specimens that were subjected to punching exhibited different
behaviour depending on the concrete strength and level of prestressing. The failure mode was
punching shear or a combination with flexure. Prestressing increases the arching action and

FATIGUE MODEL FOR PRESTRESSED CONCRETE DECKS
42
Master’s Thesis – Tudor Mihai Brata
seems to influence the failure mode. For the specimen without prestressing, the cracks started
at the bottom of the slab, having a mixed failure mode. For the specimens that were prestressed,
the cracks had a radial pattern, a trademark for punching shear. In this situation, failure occurred
before yielding of the tendon and reinforcing bars in the longitudinal direction. In terms of
ultimate strength, all the prediction formulas used gave a lower strength than the one obtained
from the test, with an accuracy between 60 and 85%. The formula from the Eurocode is
considered to be reasonable for the estimation of punching strength. It appears that the punching
strength is proportional to the level of prestressing [7].
The cyclic wheel loading gives more conservative results than the fixed-point cyclic
loading. To shorten the testing period, large loads and load increments were chosen. Specimens
failed by sudden subsidence at the centre of the slab. The cracks at the bottom resembled the
punching cone from the static tests [7].
Figure 2-26 - Failure shape of fatigue test specimen, top
[7]
Figure 2-27 - Failure shape of fatigue test specimen,
bottom [7]
The specimens that were subjected to high wheel loading values (up to 50% of the
predicted static strength) failed after ≈35000 cycles. The short fatigue life is given by the
accelerated cyclic loading damage combined with the occurrence of cracks in both longitudinal
and transverse directions. The specimens that were fatigue loaded in two stages, underwent a
considerably higher number of cycles, especially in the first stage of loading. Cycles of 5x10⁵
and 8x10⁵ were performed without any significant damage to the specimens, having the
deflection of the slab and the strains of the bars monitored. The number of cycles which led to
failure during the second stage was very low, since the load was increased substantially. At the
bottom of the slabs, the transverse cracks progressed to form a grid shape, with a distribution
similar to that of the punching cone from the static tests [7].
It is generally accepted that minimum fatigue strength is thought of being achieved if
after two million loading cycles there is no observable damage to the specimen. This is done
since there are no clear specifications or guidelines for fatigue evaluation. If the prediction of
Miner’s rule is applied, this will give a much too conservative result. This was observed by
comparing the actual deflections of the slabs and strains of the transverse tensile bars, with the
theoretical prediction from Miner’s method. According to the latter, the specimens should have

FATIGUE MODEL FOR PRESTRESSED CONCRETE DECKS
43
Master’s Thesis – Tudor Mihai Brata
failed at a much lower number of cycles, but in reality the damage corresponding to that number
(or equivalent no. of cycles at a different load) was very small. A prediction formula is derived
by the author by combining Miner’s rule with the test result, but provides also conservative
results. According to it, the test specimens studied in this paper have sufficient fatigue strength
and durability [7].
2.3 Compressive membrane action in concrete slabs
2.3.1 General
The second subject that will be treated in the literature survey of the Master’s Thesis
refers to the compressive membrane action (CMA) in concrete slabs. A phenomenon that
initially was neglected and therefore not considered, CMA was subsequently researched to a
higher extent when it was understood the highly beneficial outcome from it.
The design of bridge deck slabs has been based throughout time on the concept of a
wheel load distributed over a certain effective width, with the methods that were behind this
approach being developed in the first half of the 20th century by Westergaard. This type of
design meant that only the bending effects were taken into account, assuming that the shear
capacity that would result is adequate. By doing so, the in-plane forces were neglected, although
it was known to a certain extent that they might have a significant effect on the behaviour of
the slab. The strength of the slab is enhanced if the in-plane forces are of compressive nature
[8].
The effect, in the concrete slabs, of in-plane compressive struts (forces), which provide
an arch or dome effect, is called “compressive membrane action” (referred to also as “arching
action”). This phenomenon is due to the restrained movements of the slab at the supports, with
the slab panels having the tendency to act as arches between the supports. This type of
behaviour can increase significantly the load capacity of the slab, so that bridge slabs that are
designed for bending, will normally fail in punching shear. The actual failure load can be
several times higher than the predicted flexural strength [1, 8, 9].
Figure 2-28 - Arching in concrete element [1]
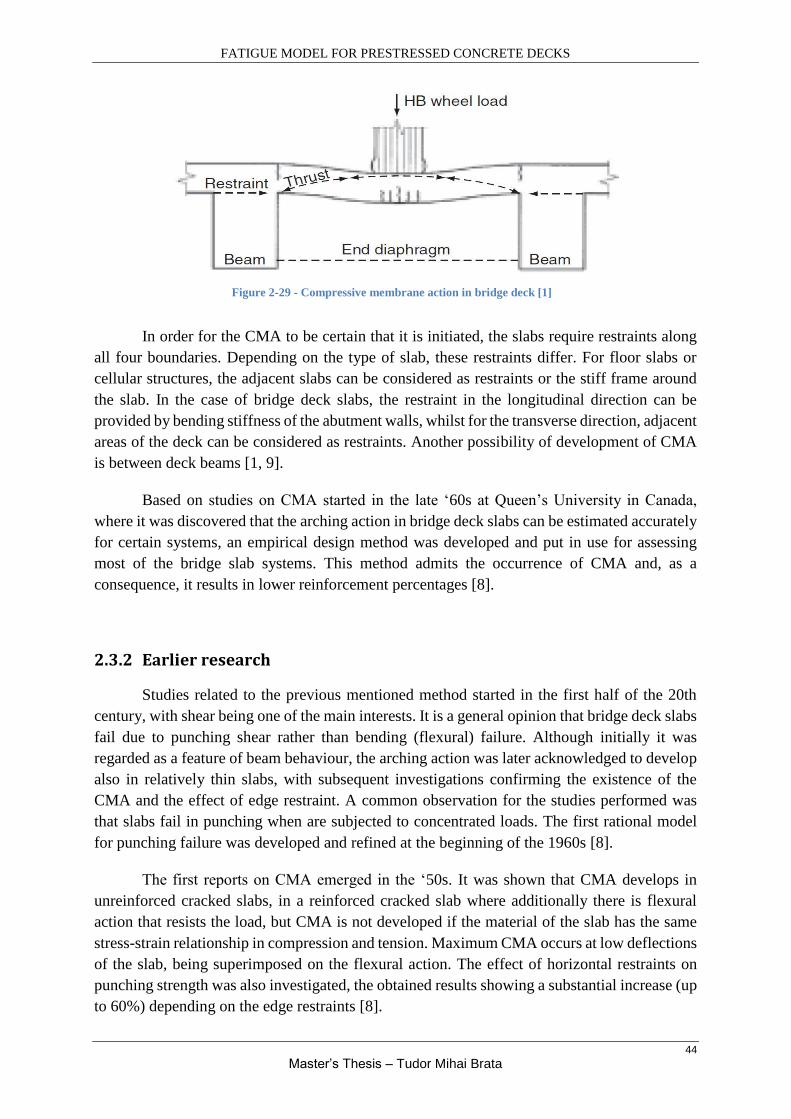
FATIGUE MODEL FOR PRESTRESSED CONCRETE DECKS
44
Master’s Thesis – Tudor Mihai Brata
In order for the CMA to be certain that it is initiated, the slabs require restraints along
all four boundaries. Depending on the type of slab, these restraints differ. For floor slabs or
cellular structures, the adjacent slabs can be considered as restraints or the stiff frame around
the slab. In the case of bridge deck slabs, the restraint in the longitudinal direction can be
provided by bending stiffness of the abutment walls, whilst for the transverse direction, adjacent
areas of the deck can be considered as restraints. Another possibility of development of CMA
is between deck beams [1, 9].
Based on studies on CMA started in the late ‘60s at Queen’s University in Canada,
where it was discovered that the arching action in bridge deck slabs can be estimated accurately
for certain systems, an empirical design method was developed and put in use for assessing
most of the bridge slab systems. This method admits the occurrence of CMA and, as a
consequence, it results in lower reinforcement percentages [8].
2.3.2 Earlier research
Studies related to the previous mentioned method started in the first half of the 20th
century, with shear being one of the main interests. It is a general opinion that bridge deck slabs
fail due to punching shear rather than bending (flexural) failure. Although initially it was
regarded as a feature of beam behaviour, the arching action was later acknowledged to develop
also in relatively thin slabs, with subsequent investigations confirming the existence of the
CMA and the effect of edge restraint. A common observation for the studies performed was
that slabs fail in punching when are subjected to concentrated loads. The first rational model
for punching failure was developed and refined at the beginning of the 1960s [8].
The first reports on CMA emerged in the ‘50s. It was shown that CMA develops in
unreinforced cracked slabs, in a reinforced cracked slab where additionally there is flexural
action that resists the load, but CMA is not developed if the material of the slab has the same
stress-strain relationship in compression and tension. Maximum CMA occurs at low deflections
of the slab, being superimposed on the flexural action. The effect of horizontal restraints on
punching strength was also investigated, the obtained results showing a substantial increase (up
to 60%) depending on the edge restraints [8].
Figure 2-29 - Compressive membrane action in bridge deck [1]

FATIGUE MODEL FOR PRESTRESSED CONCRETE DECKS
45
Master’s Thesis – Tudor Mihai Brata
The investigations on bridge deck slabs acknowledged that compressive membrane
action was a direct effect of the restraining against horizontal movements of the edges of the
slab panel and this leads to an increase in strength. Punching failure becomes predominant in
deck slabs subjected to concentrated loads. Due to the many variables that such a complex
problem poses, a universal design approach could not be reached, instead empirical methods
were used [8].
2.3.3 Theoretical developments
Investigations at Queen’s University in Ontario led to the conclusion that the traditional
methods for bridge deck slab design were highly non-economical. Subsequently, a modified
version of a previously proposed model was considered accurate enough to predict punching
shear strength for typical bridges deck slabs. The said model had incorporated edge restraints
due to bending and membrane forces [8].
Figure 2-31 - Punching failure model, boundary forces
[8]
Figure 2-32 - Punching failure model, forces on sector
element [8]
Figure 2-30 - Components of load deflection curve for a partially restrained slab [8]

FATIGUE MODEL FOR PRESTRESSED CONCRETE DECKS
46
Master’s Thesis – Tudor Mihai Brata
The effect on the punching load of the variation of boundary restraints was also studied,
having varied the values of the force and moment at the boundary. The model predicts an
increase in the punching strength with the increase in the boundary forces. With respect to the
model, it was concluded that the predicted results are very good [8].
Determining the values of the boundary restraining forces for all the situations was
impossible, therefore a restraining factor was introduced (η). The extremes would be 0 when
considering a simply supported slab and 1 for a fully restrained slab. With the aid of a computer
software and using data from previous tests, curves for punching load versus restraint factor
were developed [8].
This empirical method was applied and tested on a larger scale with good results, but
with additional requirements needed in order to be deemed efficient and safe. Its proper use
will lead to a more economical design, having considerable savings in terms of reinforcement,
without having the safety compromised [8].
2.3.4 Design provisions
The Design manual for roads and bridges [9] provides guidelines that must be considered
when designing bridge deck slabs and taking into account the compressive membrane action.
The manual defines general principles, the design approach with considerations for
serviceability and ultimate limit states, assessments of these analyses and a simplified method
for determining the local capacity of the bridge deck slabs.
For the simplified method it is assumed that the slab reinforcement makes no contribution
to the local load carrying capacity. This method was first formulated by Kirkpatrick et al. in
1984 when, after series of tests, it was discovered that the CMA provides significant additional
strength to such extent that the failure load is almost independent of the amount of transverse
reinforcement. The increase in the punching strength due to the CMA is considered by an
equivalent percentage reinforcement factor, with the actual reinforcement being neglected. This
method is also presented in the ICE Manual for bridge engineering [1], but there are some small
Figure 2-33 - Variation of punching load with boundary forces
[8]
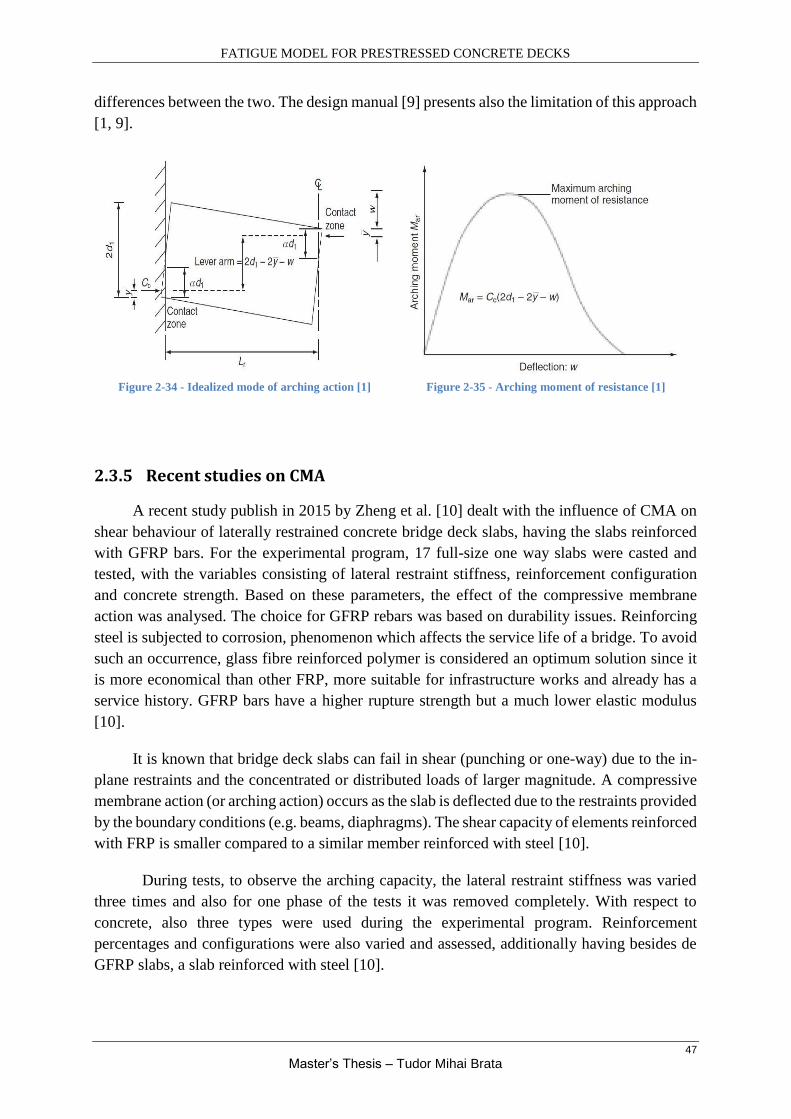
FATIGUE MODEL FOR PRESTRESSED CONCRETE DECKS
47
Master’s Thesis – Tudor Mihai Brata
differences between the two. The design manual [9] presents also the limitation of this approach
[1, 9].
Figure 2-34 - Idealized mode of arching action [1]
Figure 2-35 - Arching moment of resistance [1]
2.3.5 Recent studies on CMA
A recent study publish in 2015 by Zheng et al. [10] dealt with the influence of CMA on
shear behaviour of laterally restrained concrete bridge deck slabs, having the slabs reinforced
with GFRP bars. For the experimental program, 17 full-size one way slabs were casted and
tested, with the variables consisting of lateral restraint stiffness, reinforcement configuration
and concrete strength. Based on these parameters, the effect of the compressive membrane
action was analysed. The choice for GFRP rebars was based on durability issues. Reinforcing
steel is subjected to corrosion, phenomenon which affects the service life of a bridge. To avoid
such an occurrence, glass fibre reinforced polymer is considered an optimum solution since it
is more economical than other FRP, more suitable for infrastructure works and already has a
service history. GFRP bars have a higher rupture strength but a much lower elastic modulus
[10].
It is known that bridge deck slabs can fail in shear (punching or one-way) due to the in-
plane restraints and the concentrated or distributed loads of larger magnitude. A compressive
membrane action (or arching action) occurs as the slab is deflected due to the restraints provided
by the boundary conditions (e.g. beams, diaphragms). The shear capacity of elements reinforced
with FRP is smaller compared to a similar member reinforced with steel [10].
During tests, to observe the arching capacity, the lateral restraint stiffness was varied
three times and also for one phase of the tests it was removed completely. With respect to
concrete, also three types were used during the experimental program. Reinforcement
percentages and configurations were also varied and assessed, additionally having besides de
GFRP slabs, a slab reinforced with steel [10].

FATIGUE MODEL FOR PRESTRESSED CONCRETE DECKS
48
Master’s Thesis – Tudor Mihai Brata
To simulate the horizontal in-plane restraints from actual service life, a steel frame was
used. The lateral restraint stiffness is a combination of the axial stiffness of the steel bolt and
the bending stiffness of the steel frame. The specimens were tested under three point bending,
with a line load applied at mid-span. The specimens were equipped with strain gauges and
deflection transducers for data acquisition. Each specimen was incrementally loaded to failure,
during which time the deflection, the crack width development, the strains in concrete and bars
were measured [10].
Increasing the restraint stiffness resulted in smaller crack widths, effect which was similar
with increasing the percentage of reinforcement. The failure mode for the restrained slabs was
shear-compression failure, with the concrete being crushed due to the arching action. The slabs
that had no lateral restraints failed in bending. The amount of reinforcement and the degree of
restraint had a similar effect on controlling the main diagonal crack, which was formed at
around 50-60% of the ultimate load. Once the applied load exceeded the flexural crack load,
the horizontal deflections were enhanced, this being a sign for the development of the arching
action. Increasing the FRP rebar percentage reduces the contribution of the arching action, but
also reduces the strain of the bars. The shear strength is increased with the increase of external
restraint, meaning that the CMA is enhanced with the increase in restraint stiffness. The load
carrying capacity increases also with the increase of the concrete compressive strength [10]
There is a difference between the behaviour of elements reinforced with steel and FRP
and this makes it hard to predict their shear behaviour. As a consequence, a number of shear
strength prediction models were developed by different researchers, without including the
arching action. The authors of the article, [10], compared their test results with results given by
some of the prediction models but in most cases these turned out to be too conservative. Their
recommendation is that the effect of the arching action should be included in the shear strength
prediction methods. This can be done by assuming an increase in the reinforcement percentage,
as it was concluded from the experimental part. This approach has already been considered and
presented in papers such as [1, 9] and their references. By using this method, the authors obtain
accurate results, with a small conservative tendency [10].
Figure 2-36 - Test slab and lateral restraint configuration [10]

FATIGUE MODEL FOR PRESTRESSED CONCRETE DECKS
49
Master’s Thesis – Tudor Mihai Brata
Another recent study, part of a doctoral research program at TU Delft, was performed by
Amir, van der Veen and Walraven [11] and dealt with the bearing capacity of prestressed
concrete deck slabs, the influence of the compressive membrane action being a point of high
interest. The tests carried out examined parameters such as the transverse prestressing level,
type of loading, geometry of deck and their influence on the punching shear strength [11].
In the Netherlands, old bridges with prestressed decks no longer achieve safety
requirements if the shear capacity is determined using current design codes. Since these bridges
were designed using flexural theories, their safety poses a big concern, as in the past decades it
has been proved that bridge deck slabs are most likely to fail in punching shear. Compressive
membrane action is a phenomenon that comes to aid the structural behaviour of such elements
by enhancing their overall strength [11].
For the experimental program a scaled model (1:2) of a bridge was built, being designed
in such a way that failure would occur in the deck slab. A pallet of lower bound parameters
were considered in order to account for the least favourable effects, such as higher centre-to-
centre distance between transverse reinforcement or two transverse prestressing levels. The
whole system consisted of four precast concrete beams placed in the longitudinal direction, two
cast in-situ concrete beams placed in the transverse direction and a cast in situ deck slab, which
subsequently was transversely post-tensioned. The loading was of static type, with multiple
positions across the area of the deck slab, having either one point load or two point loads [11].
Figure 2-37 - Test setup, laboratory [11]
Figure 2-38 - Test setup, scheme [11]
Until the publication of the article, 16 tests have been carried out, most of them between
the prestressing ducts, therefore the results can be categorized as low boundary. Except the case
when the load was applied at mid-span (failure by flexural punching), for all the other tests the
failure mode was brittle punching shear. When the tests were performed above the ducts, an
increase in the transverse prestressing level is certain to give a higher bearing capacity, therefore
have a positive effect. The cracking pattern at the bottom of the slab, for the brittle punching
mode, is in the form of a punching cone, which is the already known pattern for punching shear
failure. For the flexural failure mode, although there was a significant increase in the
prestressing bars due to rotations at mid-span, failure occurred by punching of one of the loaded

FATIGUE MODEL FOR PRESTRESSED CONCRETE DECKS
50
Master’s Thesis – Tudor Mihai Brata
plates. Analysing the data, it was confirmed that a higher level of prestressing in the transverse
direction delayed the moment of cracking. Single loads or loads at mid-span presented lower
cracking when compared to loads applied close to the support/interface or double loads [11].
The punching capacity of the slabs was predicted using both the European EC2 code and
ACI 318 from the US. Both codes underestimate the punching shear capacity as they do not
take into account the compressive membrane action. Nevertheless, there are other methods or
codes that do take into account the CMA (e.g. UK BD81/02 or the method of Park et al. - 1980).
By using Park’s et al. method for determining the flexural capacity which considers CMA in
reinforced concrete structures, a higher estimate than the actual failure load is obtained, proving
that the punching shear is critical. Calculating the punching failure capacity following the UK
standard, a lower value is obtained than the ones from the test, most likely since the prestressing
effect is not accounted for, the method being developed for reinforced concrete only. In case of
the two point loads at mid-span, the flexural capacity is considered to be the sum of the arching
moment capacity and the bending moment capacity. A method developed by Taylor et al.
(2002) appears to give a good estimation [11].
Figure 2-39 - Punching failure load predictions: EC2,
ACI [11]
Figure 2-40 - Punching failure load calculated from UK
BD81/02 with CMA [11]
At the beginning of the years 2000s, Graddy et al. [12] conducted a research on the
punching shear behaviour of bridge decks under fatigue loading, taking also into account the
compressive membrane action. The study comprised an experimental and an analytical part.
For the experimental part, static and cyclic fatigue tests were performed on the specimens and
their behaviour was analysed [12].
It has been studied and confirmed that the arching action improves the overall capacity
of the slab, both bending and punching shear. This increase in flexural capacity will make the
punching shear to be governing and dictate the design of the bridge. Up to the moment of
cracking, the bridge deck will resist traffic loads through transverse flexure. Following the
occurrence of cracks, a compressive membrane action develops in the slab, its magnitude
depending on the degree of edge restraint. According to the AASHTO standard, the large
distance between the axles of a vehicle allows for the CMA to form. A problem emerges in the

FATIGUE MODEL FOR PRESTRESSED CONCRETE DECKS
51
Master’s Thesis – Tudor Mihai Brata
situation where there are multiple loads applied simultaneously at a close distance, this leading
to a decrease of the arching effect and posing the question whether the slab can sustain such
loading scenario. Having this combined with fatigue deterioration will lead to a great concern
in bridge design [12].
The specimens used during the testing procedure simulated the behaviour of parts from a
real bridge deck, being designed to fail in punching shear. Some of them were cast on place,
whilst others where made of precast and prestressed panels with a cast in-situ topping. The load
applied on the specimens was considered to be given by a two wheels tandem. Finite element
and analytical models were used for the development and verification of the capacities of the
specimens [12].
The punching shear capacities of the slabs were analytically determined using a similar
procedure from both AASHTO and ACI codes. For determining the flexural capacity of the
specimens in both directions, moment-curvature analyses were used. Based on these capacities
an overall flexural capacity was determined using yield-line analysis, but the CMA was not
accounted for. The arching effects were subsequently included following finite element analysis
but their contribution was small [12].
A steel frame was used for testing the specimens. The value of the minimum cyclic load
was around 10% of the cycle’s maximum load value. A high percentage of flexural
reinforcement was used to avoid flexural failure of the cast-in-place specimens. For the precast
specimens it was also made sure that they would not fail in bending. The deflections of the slabs
at various locations and the strains of the reinforcing bars were measured. For the pulsating
fatigue tests in case of the precast slabs, the dimensions of the footprint were reduced in order
to increase the punching shear stress without increasing the load, therefore avoiding bending
failure. The fatigue load was sinusoidal, having a frequency between 1 and 4.5 Hz [12].
For the cast-in-place specimens two static tests were performed which ended in punching
shear failure. The bending cracks started forming at low values of the force and propagated in
both directions. During the pulsating fatigue tests, the majority of flexural cracks formed during
Figure 2-41 - Scheme of reduced effectiveness of arching action due to multiple close loads
[12]

FATIGUE MODEL FOR PRESTRESSED CONCRETE DECKS
52
Master’s Thesis – Tudor Mihai Brata
the first loading cycle, propagating into the specimen and towards the supports. Fatigue
deterioration was observed as the numbers of cycles increased, presenting wide cracks and
considerable loss of material after more than 500000 cycles [12].
Figure 2-42 - Pattern of cracking on bottom surface of
cast-in-place specimens after punching shear fatigue
failure [12]
Figure 2-43 - Load-deflection behavior of cast-in-place
specimens under fatigue [12]
The precast slabs underwent two static tests, both failing in punching shear but at lower
load values than for the other type of slabs. There were also two fatigue tests. Bending cracks
formed during the first cycle, but new ones formed as the cycles progressed [12].
Figure 2-44 - Schematic plan view of combined failure
mode for precast specimens [12]
Figure 2-45 - Schematic section view of combined
failure mode for precast specimens [12]
Later is was discovered that the specimens that were tested under fatigue failed due to
the delamination at the neutral axis caused by high shear stresses. Since the precast specimens
failed at values much lower than expected, it was assumed that this is due to a combined failure
mode. The influence of the supports was analysed and it was found to be highly responsible for
the unusual combined failure mode. The obtained results were also compared to analytical
predictions, turning out to be significantly higher than the predictions from AASHTO and ACI
codes [12].

FATIGUE MODEL FOR PRESTRESSED CONCRETE DECKS
53
Master’s Thesis – Tudor Mihai Brata
Chapter 3: Assessment of TU Delft fatigue research program

FATIGUE MODEL FOR PRESTRESSED CONCRETE DECKS
54
Master’s Thesis – Tudor Mihai Brata
3.1 Introduction
As stated previously, the majority of bridges in The Netherlands were built before the mid-
1970s. Since then, the traffic has increased significantly and the loads also became larger as
time went by, leading to a possible degradation of these structures. Taking all of this into
account, it is of concern whether the safety requirements of these bridges are still fulfilled when
referred to the present day design codes. To arrive at an answer, a series of studies were or will
be performed, with their conclusions hoping to shed some light on this important aspect.
In the recent years, at Delft University of Technology a research study was conducted on
the compressive membrane action (CMA) in prestressed concrete deck slabs under static
loading, study that was organized together with Rijkwaterstaat, which is part of the Dutch
Ministry of Infrastructure and Environment (reference 14). Although the main point of interest
in terms of the nature of loading was the static type, a series of fatigue tests were also performed.
The outcome of these cyclic tests was presented in the report “Vermoeiingssterkte
voorgespannen tussenstort” - report number 25.5-14-06 from December 2014 (ref. 15). This
report will be a primary source of information for the third chapter of the Master’s Thesis and
will depict the way fatigue loading was treated during this study at TU Delft. In the following,
an overview of the tests will be presented together with the structural system, characteristics of
the loading cycles and results. For the second part of this chapter, other testing procedures from
different studies will be presented as a comparison and discussed. Based on all of these, an
assessment of the procedure utilized at TU Delft will be performed and comments related to its
suitability and reliability will be made.
3.2 Experimental program at TU Delft
3.2.1 Structural system and test setup
The structural system used (12 meters x 6.40 meters) for the experimental testing program
was a 1:2 scale model of a real life concrete bridge. This was composed of precast, prestressed
longitudinal T girders (12 meters in length, with 0.75 meters being the width of the top flange),
with a concrete deck cast in-situ between the flanges of the girders. The deck was transversely
post-tensioned using bars. Additionally, two transverse cross-beams were casted in-situ at both
ends of the structure in order to increase the stiffness of the structural system and deploy the
compressive membrane action, resulting in a higher bearing capacity. The cross-beams were
also post-tensioned after casting. All the elements of the structural system were properly cured
before prestressing. The bars used for prestressing of the deck slab and the cross-beams were
not bonded in order to allow for change in the transverse prestressing level. In order to avoid
non-uniform stresses, the prestressing followed a certain sequence in terms of prestressing force
and order of the bars. The cross-beams were initially prestressed to 1 MPa before the casting
and prestressing of the deck, subsequently having their level increased to that of the deck [14,
15].

FATIGUE MODEL FOR PRESTRESSED CONCRETE DECKS
55
Master’s Thesis – Tudor Mihai Brata
The tests were performed using an electro-hydraulic actuator system, which, by
introducing a concentrated load, simulated an actual wheel load applied to the concrete bridge
deck. The actuator was attached to a frame that was bolted to the floor, the whole setup having
the ability to be moved from one testing position to another once the test was complete. The
loads applied to the concrete bridge deck were either single loads or double loads, these being
transmitted from the actuator to the loading plates (steel and rubber, depending on the situation)
via an H-profile steel beam. In terms of measurements, a high range of parameters were
monitored such as: applied load, mid span and interface deflections, horizontal and vertical
displacements, support reactions and prestressing forces, crack pattern [14].
3.2.2 Initial static and fatigue loading tests
On the original structural system from S. Amir’s PhD research program (ref. 14), besides
the static tests, a couple of fatigue tests were also performed, these being linked to an acoustic
emission study, since in the case of the latter, the load was applied in an alternating manner.
Additional static loading tests were performed in order to have an order of magnitude for the
ultimate capacity of the slab for this extra study [15].
Figure 3-1 – T girders before casting of the deck and the
cross-beams [14]
Figure 3-2 – Structural system after casting of the deck
and the cross-beams [14]
Figure 3-3 – Loading setup scheme: single load and double load [14]

FATIGUE MODEL FOR PRESTRESSED CONCRETE DECKS
56
Master’s Thesis – Tudor Mihai Brata
In the case of the static tests, these were conducted by applying a single point load with a
load area of 200 mm x 200 mm and an increment of 50 kN. Failure occurred within 45 minutes
after the start of the tests, with a mean value for the failure load of 335 kN. This value was
higher than the one that resulted from conventional bearing capacity theories since those do not
consider the effect of the compressive membrane action [15].
For the two tests involving acoustic emissions, the same load step of 50 kN was applied,
similar to the static tests. When the desired load was reached, this was maintained for 10
minutes, with each loading step being repeated three times. Failure occurred after 5 (for test no.
1) and 8 (for test no. 2) hours and at an average load of 283 kN, which was reasonably lower
than the value from the static tests. Due to the alternating nature of the load which is similar to
a fatigue type of behavior, the strength was reduced by 16%, a value that cannot be neglected
[15].
As mentioned previously, two fatigue tests were also performed on the original prestressed
concrete deck, at a frequency of 1 Hz (1 cycle/sec). These tests were performed on the middle
section (strip) of the structural system. The thickness of the slab was 100 mm, having 30
transverse prestressing bars passing through Φ40 mm sheath tubes at a spacing distance of 400
mm, with a transverse prestressing level of 2.5 MPa (compressive stress in the concrete between
the girders). The load was transferred to the slab through a steel plate with a thickness of 20
mm and a rubber plate of 10 mm, both having the same in-plane dimensions of 200 x 200 mm2.
The tests simulated a single wheel loading situation, applying only compressive stresses, with
the lower limit of the load having a value of 10% of the maximum applied load. For each fatigue
test the maximum applied load was different: 200 kN in case of the first tests and 150 kN in
case of the second test. The load was applied between the prestressing bars and not directly
above one, in order to consider a least favorable situation [15].
Figure 3-4 – Loading scheme for static (blue line) and alternating loading [15]

FATIGUE MODEL FOR PRESTRESSED CONCRETE DECKS
57
Master’s Thesis – Tudor Mihai Brata
The 200 kN maximum load from the first test represented 60% of the average failure load
from the static tests. The number of cycles to failure had the low value of approximately 24800
cycles, with a maximum crack width of 0.4 mm after 1000 cycles. The radial cracking pattern
increased with the increasing number of cycles. The cracks due to shrinkage that were observed
before the tests were not considered to have a negative effect but, on the contrary, it was
assumed that this would represent even more the actual service life of such a structure.
Following the failure of the slab, large transverse cracks were observed along the tubes that
served as sheathing for the prestressing bars. A huge bending crack was also present in the
middle area, parallel to the girders [15].
For the second dynamic test, only the values for the maximum and minimum load had been
changed. It was chosen a maximum loading value of 150 kN which represented 45% of the
average static strength. The corresponding minimum value was 15 kN, representing 10% of the
maximum one. Since the specimen did not fail after 1.5 million cycles, it was decided to
continue the test by applying a static load, this eventually leading to failure at a value of 330
kN, a load that was extremely close to the average static strength of 335 kN. Following this
result, it seemed that the cyclic loading had almost no impact. In terms of cracking, at 150 kN
there was observed an opening of 0.25 mm, this increasing to 0.3 mm after 1000 cycles.
Figure 3-5 – Position of the fatigue tests [15]
Figure 3-6 – Position of the applied load [15]
Figure 3-7 – Loading during the first fatigue test [15] Figure 3-8 – Failure of specimen during the first
fatigue test [15]

FATIGUE MODEL FOR PRESTRESSED CONCRETE DECKS
58
Master’s Thesis – Tudor Mihai Brata
Between 1 and 1.5 million cycles the crack width increased to 0.6 mm. In the end, the crack
pattern at failure was similar to the ones from the tests that were of static nature only [15].
3.2.3 Fatigue and static tests from additional research program
Following the results from the initial fatigue tests, it was decided to continue the study
on this phenomenon with an additional research. In order to do this, the central strip of the
original bridge deck that got damaged during the previous tests was replaced, resulting in a
brand new structural system in the central area, with a length of 12 m and a width of 1,05 m.
The diameter of the casing pipes was changed to 30 mm from 40 mm in the previous tests. At
two locations along the slab (A, B, C and D, E, F) dummy tubes are installed with a center to
center distance of 300 mm. In these areas there are no prestressing bars but the average level of
compression in the concrete between the girders (2.5 MPa) is maintained by prestressing at a
higher level the other bars. For the casing tubes that have prestressing bars passing through,
their center to center distance remained 400 mm. In total, a number of 3 static tests and 5
dynamic tests (frequency of 1 Hz) were performed, with one test from each category being
performed at the locations that lacked prestressing bars [15].
Figure 3-9 – Crack pattern at failure, fatigue test no. 2
[15] Figure 3-10 – Crack pattern at 330 kN [15]
Figure 3-11 - New deck slab before casting [15]
Figure 3-12 – Position of static and dynamic tests [15]

FATIGUE MODEL FOR PRESTRESSED CONCRETE DECKS
59
Master’s Thesis – Tudor Mihai Brata
For all of the tests, the size of the steel plates that simulated a scaled wheel print was
115 x 150 mm2, with a thickness of 20 mm. In 6 out of the 8 tests, a rubber plate of 10 mm
thickness was used between the steel loading plate and the concrete slab. Each of the tests
performed had at least one parameter that was characteristic to that test alone, resulting in a
series of tests that were unique and which covered a wider range of variables [15].
The first static test was performed at one of the locations with dummy tubes (spaced at
300 mm) and had the single point load transferred to the slab by means of the steel plate only,
missing the rubber one. The load was applied in increments of 50 kN up to the failure load of
330 kN. The cracks started forming below the loading plate and increased rapidly as the failure
load was being reached, forming the characteristic cracking pattern that is known for punching
shear. Outside the area of the loading plate, the cracks were considerably smaller in width: 0.25
mm compared to 0.9 mm below the plate [15].
For the second static test, the steel plate and the rubber plate were positioned at mid
distance between two prestressing bars (c.t.c. = 400 mm). The load was applied in increments
of 50 kN up to the failure of the slab, this having a value of 364 kN. Regarding crack
development, same observations can be made as for the first test. A different aspect from the
previous test was that failure came gradually under controlled deformation [15].
In case of the third static test, again the plates were positioned at mid distance between
two casing pipes that had a center to center distance of 400 mm. Similar to both previous tests,
the load was applied in increments of 50 kN until failure, this load having a value of 331 kN.
The steel plate had in-plane dimensions of 115 x 150 mm2. Same observations can be made
with respect to the development of the cracks. These could be already measured at 100 kN and
had an opening of 0.2 mm. They increased gradually up to 200 kN, subsequently reaching in a
short period of time a width of 0.9 mm at failure. The cracking pattern again depicted a
punching shear type of failure [15].
The first fatigue test was performed at the other location where dummy tubes were
installed with a 300 mm spacing between them. There was no rubber between the loading plate
and the concrete. The applied load was of compressive nature only, with a maximum value of
165 kN and a minimum value of 16.5 kN (10% of the maximum). As stated previously, the
Figure 3-13 - Crack pattern at failure, static test no. 1
[15] Figure 3-14 - Crack pattern at failure, static test no. 2
[15]
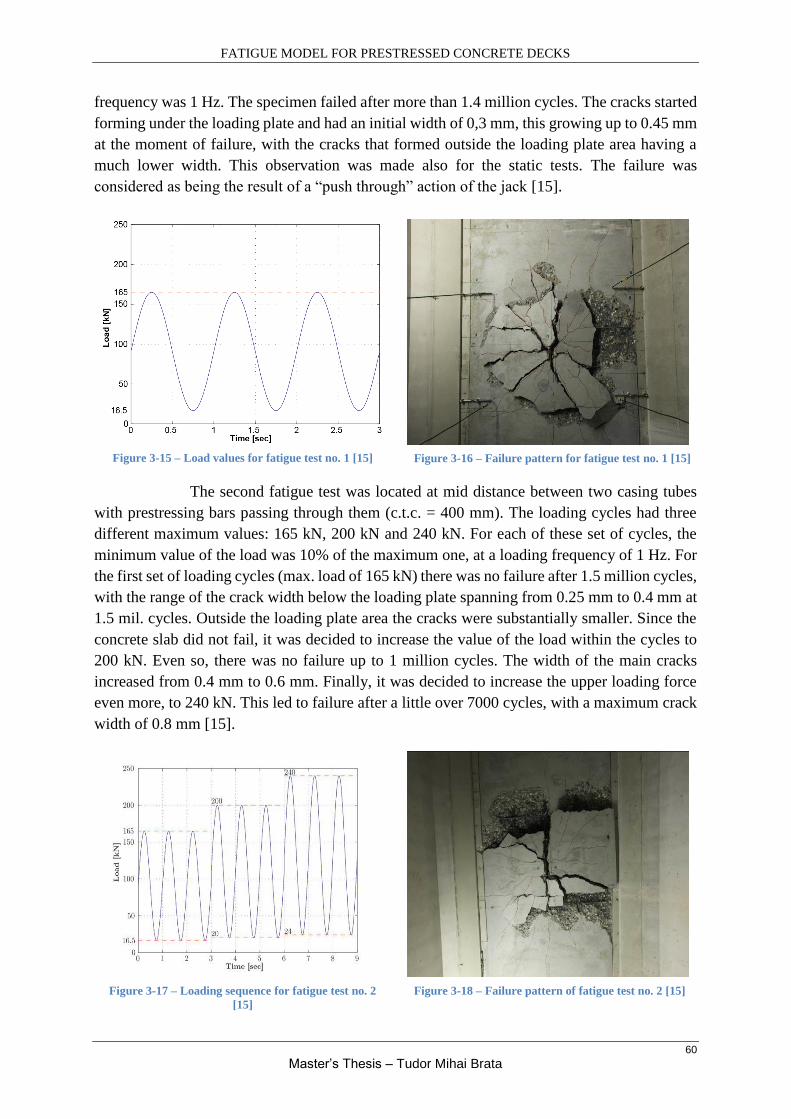
FATIGUE MODEL FOR PRESTRESSED CONCRETE DECKS
60
Master’s Thesis – Tudor Mihai Brata
frequency was 1 Hz. The specimen failed after more than 1.4 million cycles. The cracks started
forming under the loading plate and had an initial width of 0,3 mm, this growing up to 0.45 mm
at the moment of failure, with the cracks that formed outside the loading plate area having a
much lower width. This observation was made also for the static tests. The failure was
considered as being the result of a “push through” action of the jack [15].
The second fatigue test was located at mid distance between two casing tubes
with prestressing bars passing through them (c.t.c. = 400 mm). The loading cycles had three
different maximum values: 165 kN, 200 kN and 240 kN. For each of these set of cycles, the
minimum value of the load was 10% of the maximum one, at a loading frequency of 1 Hz. For
the first set of loading cycles (max. load of 165 kN) there was no failure after 1.5 million cycles,
with the range of the crack width below the loading plate spanning from 0.25 mm to 0.4 mm at
1.5 mil. cycles. Outside the loading plate area the cracks were substantially smaller. Since the
concrete slab did not fail, it was decided to increase the value of the load within the cycles to
200 kN. Even so, there was no failure up to 1 million cycles. The width of the main cracks
increased from 0.4 mm to 0.6 mm. Finally, it was decided to increase the upper loading force
even more, to 240 kN. This led to failure after a little over 7000 cycles, with a maximum crack
width of 0.8 mm [15].
Figure 3-15 – Load values for fatigue test no. 1 [15] Figure 3-16 – Failure pattern for fatigue test no. 1 [15]
Figure 3-17 – Loading sequence for fatigue test no. 2
[15] Figure 3-18 – Failure pattern of fatigue test no. 2 [15]

FATIGUE MODEL FOR PRESTRESSED CONCRETE DECKS
61
Master’s Thesis – Tudor Mihai Brata
The next dynamic test was located at a similar position as the previous one, at mid
distance between two prestressing bars. The loading cycles had two different maximum loads,
200 kN and 220 kN, with the minimum load being 10% of the max. With the maximum load
of 200 kN, the specimen did not fail after 1.5 million cycles (1 Hz). The crack width ranged
between 0.35 and 0.5 mm. Subsequently, the loads were increased to 220 kN (max) and 22 kN
(min), this leading to failure after approx. 265000 cycles. The crack width below the loading
plate remained at a constant value of 0.6 mm until failure [15].
The fourth fatigue test was the only test where a double point load was applied. The two
steel plates were positioned at 600 mm center to center distance from one another, having in-
plane dimension of 115 x 150 mm2 and a thickness of 20 mm. between the steel plates and the
concrete a rubber plate of 10 mm thickness was applied. The loading sequence was more
complex than in the previous tests, having five different maximum loading values: 280 kN, 240
kN, 280 kN, 320 kN and 360 kN. The minimum load was always 10% of the maximum one.
For the first loading sequence at a maximum load value of 280 kN, the crack width grew rapidly
from 0.35 to 0.7 mm in the first 100000 cycles (1 Hz). Fearing that the specimen would fail,
the maximum load was decreased to 240 kN, using this value to reach 1.5 million cycles and a
maximum crack width of 0.7 mm. Since no failure occurred, the load was increased again to
280 kN until 2.25 million cycles were reached and a maximum crack width of 1.5 mm. The
load was increased for the second time to 320 kN for 500000 cycles and for a final time to 360
kN. Failure eventually occurred after approx. 33000 cycles performed at the last loading value.
The maximum crack width had a value of 2 mm [15].
Figure 3-19 - – Loading sequence for fatigue test no. 3
[15] Figure 3-20 – Crack pattern at failure,
fatigue test no. 3 [15]
Figure 3-21 – Loading scheme of fatigue test no. 4

FATIGUE MODEL FOR PRESTRESSED CONCRETE DECKS
62
Master’s Thesis – Tudor Mihai Brata
The last fatigue test was located again between two prestressing bars and had a large
steel plate of 200 x 200 mm2 for transferring the load. The main difference from the other tests
performed previously is that for the present one the cycles that had a higher maximum value of
the load were applied before the ones with a lower load. In the first part of the test, a 240 kN
maximum load was applied, with a corresponding min. load of 24 kN. After 100000 cycles the
load was decreased to 200 kN since the crack width had a large value (0.7 mm). With the smaller
maximum load, failure occurred at approx. 283000 cycles. Following the test, it seems that by
applying the loads in this order (max. to min.) the fatigue life of the specimen is considerably
reduced [15].
3.2.4 Results
The structural system on which all the test were conducted tried to replicate as close as
possible a real life bridge, at a 1:2 scale. In order to predict the failure load at a certain number
of cycles, namely the upper limit for the second fatigue test performed during the initial set of
experiments, a whole range of results were considered, including the ones from four static tests
Figure 3-22 – Loading sequence for fatigue test no. 4
[15] Figure 3-23 – Failure pattern of fatigue test no. 4 [15]
Figure 3-24 - Loading sequence for fatigue test no. 5
[15] Figure 3-25 - Failure pattern of fatigue test no. 5 [15]
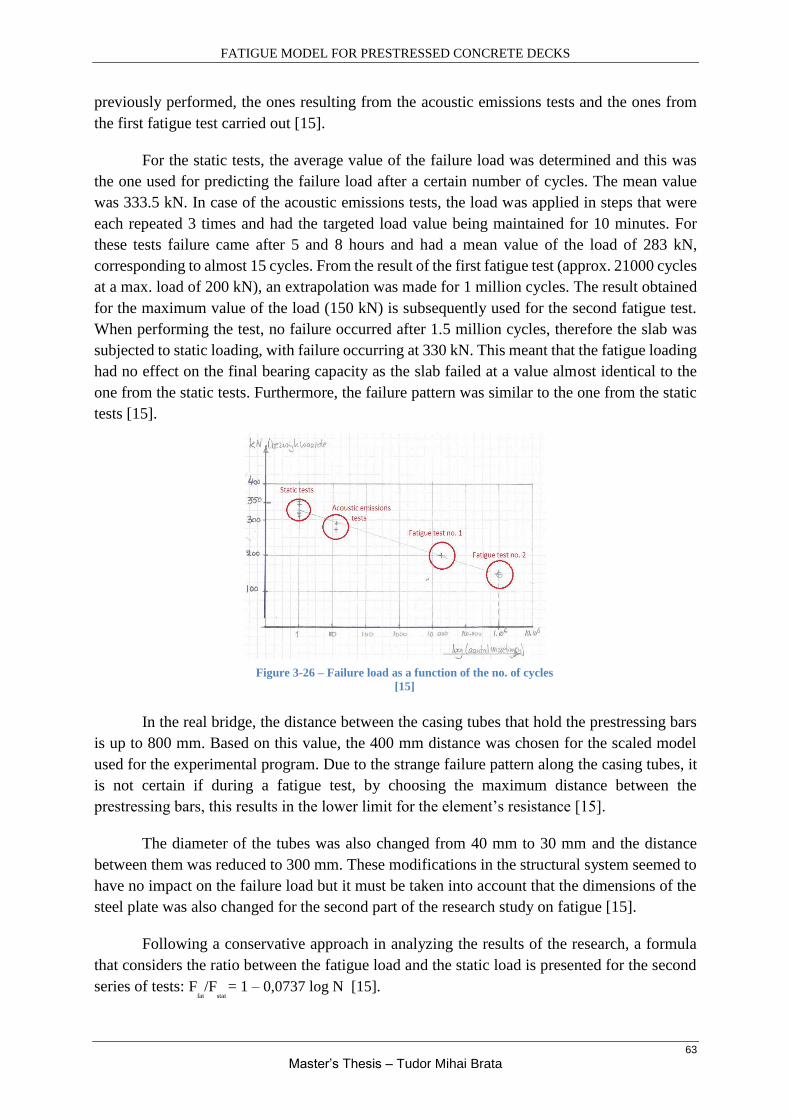
FATIGUE MODEL FOR PRESTRESSED CONCRETE DECKS
63
Master’s Thesis – Tudor Mihai Brata
previously performed, the ones resulting from the acoustic emissions tests and the ones from
the first fatigue test carried out [15].
For the static tests, the average value of the failure load was determined and this was
the one used for predicting the failure load after a certain number of cycles. The mean value
was 333.5 kN. In case of the acoustic emissions tests, the load was applied in steps that were
each repeated 3 times and had the targeted load value being maintained for 10 minutes. For
these tests failure came after 5 and 8 hours and had a mean value of the load of 283 kN,
corresponding to almost 15 cycles. From the result of the first fatigue test (approx. 21000 cycles
at a max. load of 200 kN), an extrapolation was made for 1 million cycles. The result obtained
for the maximum value of the load (150 kN) is subsequently used for the second fatigue test.
When performing the test, no failure occurred after 1.5 million cycles, therefore the slab was
subjected to static loading, with failure occurring at 330 kN. This meant that the fatigue loading
had no effect on the final bearing capacity as the slab failed at a value almost identical to the
one from the static tests. Furthermore, the failure pattern was similar to the one from the static
tests [15].
In the real bridge, the distance between the casing tubes that hold the prestressing bars
is up to 800 mm. Based on this value, the 400 mm distance was chosen for the scaled model
used for the experimental program. Due to the strange failure pattern along the casing tubes, it
is not certain if during a fatigue test, by choosing the maximum distance between the
prestressing bars, this results in the lower limit for the element’s resistance [15].
The diameter of the tubes was also changed from 40 mm to 30 mm and the distance
between them was reduced to 300 mm. These modifications in the structural system seemed to
have no impact on the failure load but it must be taken into account that the dimensions of the
steel plate was also changed for the second part of the research study on fatigue [15].
Following a conservative approach in analyzing the results of the research, a formula
that considers the ratio between the fatigue load and the static load is presented for the second
series of tests: Ffat/F
stat = 1 – 0,0737 log N [15].
Figure 3-26 – Failure load as a function of the no. of cycles
[15]

FATIGUE MODEL FOR PRESTRESSED CONCRETE DECKS
64
Master’s Thesis – Tudor Mihai Brata
The previous formula does not take into account the results from the original structural
system and the ones from the acoustic emissions tests. When these are also taken into account,
the formula becomes: Ffat/F
stat = 0.93 – 0.065 log N [15].
The expression given by the previous formula is presented in the upper graph on the
right (Figure 3-28) together with the 95% confidence value. It is approximated an average
relative fatigue value of 0.54 and 0.41 at 1 and 100 million cycles. At 1 million cycles it can be
seen that for the fatigue load a value of 54% of the static load is given. This is a conservative
assumption following from a limited number of observations [15].
An important observation regards the outcome from reversing the order of the
magnitude of the load during the loading cycles. If initially a higher maximum load is
considered for the first loading cycles, followed by loading cycles at a lower maximum load,
then the fatigue life seems to be reduced quite considerably [15].
3.2.5 Conclusions
For a single point (wheel) load, a relationship was found between the relative value of
the fatigue load and the logarithm of the number of cycles to failure. The relative fatigue load
value is given as a ratio between the fatigue load and the static load. The values at 1 million
and 100 million cycles are approximated to 0.54 and 0.41. In case of a double wheel load, the
same results apply for fatigue loading. In order to obtain the static failure value of the load in
this case (double point load), it is sufficient to multiply the static failure value of one single
point load by 1.4 [15].
There seems to be no influence due to the different diameter of the casing tube (30 and
40 mm), nor due to the center to center distance between these tubes (300 and 400 mm). In both
cases a similar failure load is obtained. This outcome might be the result of using different steel
loading plates, smaller in size [15].
Figure 3-27 - Relative load value Ffat/Fsta as a function of
the no. of loading cycles for the 2nd series of tests [15] Figure 3-28 - Relative load value Ffat/Fsta as a function of
the no. of loading cycles for all the tests [15]

FATIGUE MODEL FOR PRESTRESSED CONCRETE DECKS
65
Master’s Thesis – Tudor Mihai Brata
3.3 Studies outside the Netherlands
3.3.1 Introduction
In this section, a number of experimental programs from all around the world that dealt
with the fatigue of concrete deck slabs will be presented. Already, in the literature survey part
of the Master’s Thesis, certain scientific articles were detailed and an overview of those studies
was performed. Nevertheless, the main ideas that are needed for a comparison with the TU
Delft research program will be addressed here again, thus having a more condensed data
compendium, with this assuring a cursive flow for the said comparison. In general, for all the
studies presented in this chapter, it will be shown the way those studies were conducted,
characteristics of the structural systems or elements, the approach towards the testing of the
elements, procedures and results. All this will be accounted for in the following.
3.3.2 Research programs and characteristics
In reference no. 12, the study performed by Graddy et al. on the punching shear behavior
of bridge decks under fatigue loading was presented. The tested specimens were meant to
simulate a real bridge deck at the point of application of the wheel point load, being both precast
and prestressed (with a cast in-situ topping) or cast in-situ only [12].
For the analytical evaluation of the proposed specimens, the applied load was idealized
as a double point load, each footprint having an in-plane dimension of 0.30 (1 ft.) x 0.20 (8 in.)
m2 and a center to center distance of 0,405 m (1,33 ft.). The dimensions of the specimens were
≈1.80 m (6 ft.) x ≈2.10 m (7 ft.). Finite element and analytical models were used for the
development and verification of the capacities of the specimens. The calculation, using the
analytical model, of the transverse membrane forces of the full bridge and the transverse
membrane forces of the proposed test specimen proved to have very similar results, validating
the suitability of the proposed specimens for testing. The punching shear capacities were
determined from AASHTO and ACI codes, following a similar procedure and also from the
general punching shear model (Tsui, Burns, Klingner) [12].
Figure 3-29 – Tested specimens as component of a bridge [12] Figure 3-30 – Loading of specimen for
analytical studies [12]

FATIGUE MODEL FOR PRESTRESSED CONCRETE DECKS
66
Master’s Thesis – Tudor Mihai Brata
The testing of the specimens was performed using a steel frame, ensuring that the
bearing of the slabs on the frame was uniform. For the cyclic tests, a sinusoidal load was applied
whose minimum value was approximately 10% of the maximum one with a frequency between
1 and 4.5 Hz. The cast in-situ specimens were 1.83 m (6 ft.) by 2.13 (7 ft.) with a thickness of
191 mm and had a high amount of flexural reinforcement in order to prevent bending failure.
The precast and prestressed specimens were composed out of a precast prestressed panel and a
cast in-situ topping that had regular reinforcement. The dimensions of these specimens were
2.44 m (8 ft.) by 2.13 (7 ft.) with a thickness of approx. 185 mm [12].
The loading of the specimens was performed using a hydraulic ram. In case of the static
and cyclic tests for the cast in-situ specimens, each footprint from the pair of loading plates had
an area of 356 x 610 mm2. For the precast specimens this area was reduced to 445 x 254 mm2
in order to increase the punching shear stresses. During the fatigue tests, strains, loads and
deflections were recorded after the first cycle and, subsequently, after a predefined number of
cycles until failure occurred [12].
Two static tests were performed for the cast in-situ specimens, both ending in punching
shear failure. Bending cracks started forming at low values of the force and propagated in both
directions. During the pulsating fatigue tests, the majority of flexural cracks formed during the
first loading cycle, propagating into the specimen and towards the supports. Fatigue
deterioration was observed with the increase in the number of cycles, presenting wide cracks
and considerable loss of material after more than 500000 cycles. Two static tests were also
performed on the precast specimens, in both cases failure occurring due to punching shear, with
the failure load being smaller than the one for the cast in-situ specimens. The number of fatigue
tests was also two, with many flexural cracks forming during the first loading cycle [12].
The specimens that were subjected to static loading failed in punching shear whilst the
ones that were subjected to cyclic loading failed by delamination of the neutral axis. For the
precast specimens, the failure load was smaller than the one predicted, most likely due to a
combined failure mode. The support conditions used to increase the bending capacity had a
contribution to the mode of failure. The predicted punching shear capacities were modified to
take into account the failures of the precast specimens by including only the areas for which it
Figure 3-31 – Test setup [12] Figure 3-32 – Crack pattern at failure for precast
specimens [12]

FATIGUE MODEL FOR PRESTRESSED CONCRETE DECKS
67
Master’s Thesis – Tudor Mihai Brata
was certain that punching failure occurred. The nominal punching shear stresses at failure were
normalized and plotted against the no. of cycles to failure. The arching action appeared to only
slightly increase the capacity of simply supported slabs [12].
Reference number 5 detailed a research program that involved the fatigue behavior of
bridge deck slabs reinforced with GFRP bars. For the experimental part, the tested specimens
simulated an actual bridge deck slab, having real scale dimensions: 5000 x 2480 x 200 mm3.
The adopted wheel load had a 50% increase compared to the maximum one from the codes,
having a value of 140 kN, with the contact area of the wheel being reduced to 200 x 300 mm2.
These values were adopted in order to reduce the number of cycles to failure [5].
The concrete under cyclic compressive loading must have its strength verified by means
of the Palmgren-Miner rule, according to the European codes. Also the punching shear strength
is determined following the codes. For the experimental part, the slabs were considered simply
supported in the attempt to recreate as accurately as possible the real structural system. For this
purpose, the slabs were restrained on two sides by beams. Hydraulic jacks were used to apply
the load, with its frequency varying between 0.2 and 1.25 Hz. The loading was applied in such
a way that it mimicked the real wheel load, always having one jack delivering the maximum
Figure 3-33 – Predicted and observed results for
precast specimens [12] Figure 3-34 – S-N diagram for all specimens [12]
Figure 3-35 - Experimental setup [5] Figure 3-36 - Shape of load variation [5]

FATIGUE MODEL FOR PRESTRESSED CONCRETE DECKS
68
Master’s Thesis – Tudor Mihai Brata
load, whilst the other one was at its minimum. Two of the slabs were subjected to cyclic and
static loading, one slab only to cyclic loading and the last one only to static loading [5].
The slabs that underwent cyclic loading but did not fail (S1 and S2) were subsequently
statically loaded with a single concentrated load, up to failure. Slab S1, which had a maximum
load value of 140 kN, did not fail after 1.5 million cycles and had a mid-span displacement of
1,8 mm in the beginning of the test and 2,5 mm after the cyclic test. The second slab, S2, was
subjected to a maximum load of 290 kN and did not fail after 140000 cycles but the tests was
stopped due to the large displacement at the mid-span (≈12 mm). The last slab that was
subjected to a fatigue type of loading (S3) had a maximum value of the load of 440 kN and
failed after approx. 400 cycles. Slab S4 underwent only static loading and failed at a value of
592 kN. When compared to this value, the reduction of the maximum static load for slabs S1
and S2 was extremely small, being less than 3,5% [5].
Slabs S1 and S2 behaved much better than predicted, since, according to the codes, they
should have failed. The displacement of these slabs increased during the first period of cycle
loading, matching the predictions from literature, namely, that the strain in the concrete
increases until the stability curve is reached. The failure mechanism of the slabs was punching
shear [5].
The study performed by Hwang et al. which was denoted as reference 7, researched the
punching and fatigue behavior of long-span prestressed concrete deck slabs. Tests of both
nature, static and cyclic, were carried out on scaled models of an actual bridge deck in order to
come up with reliable formulas that would be used for assessing these two phenomena in such
a structural system. For having a wider range in assessing the punching shear and fatigue
performances, a number of current formulas were used, 4 for punching shear and one for fatigue
[7].
Within the experimental program, 10 one-way (for reducing the weight) slab specimens
were produced and tested. These models were scaled 1:3 out of a real bridge, having identical
sectional details. They had 5 different levels of prestressing, from fully prestressed to none. The
other variable was the concrete class. In terms of dimensions, the slabs had a total length of 4.3
Figure 3-38 – Cracks in slab S1 after the cyclic test [5] Figure 3-37 – Slab S1 at failure after static loading [5]

FATIGUE MODEL FOR PRESTRESSED CONCRETE DECKS
69
Master’s Thesis – Tudor Mihai Brata
m, with a span length of 2.7 m and two cantilevers of 0.8 m. The other in-plane dimension was
5 m, with the specimens being 115 mm thick. The slabs were connected to the supporting
girders by shear connectors [7].
Static load tests were performed in order to determine the static strength that served as
a comparative value in estimating the cumulative damage that followed from the cyclic loading,
where the strength of the specimen decreases with the increase in the number of cycles. An
equipment that had loading capacities of 500 kN (for fatigue, simulating the passing of a wheel)
and 1000 kN (for static) was used for the tests. The steel loading blocks were 192 x 77 mm2 in
dimension and were used as a runway during the fatigue tests. Due to their setup, the specimens
were considered to have fixed and fully supported boundary conditions. During the tests, the
strains and the deflections were measured [7].
Following the static tests, it was noted that the specimens subjected to punching
exhibited different behaviour depending on the concrete strength and the level of prestressing.
Their ultimate failure load ranged between 216 and 325 kN, with the mode of failure being
punching shear or a combination of this and flexure. Prestressing increases the arching action,
therefore influences the mode of failure. The deflection at failure appears to be inversely
proportional to the level of prestressing. In the case of the specimen without prestressing,
longitudinal cracks started at the bottom of the slab during the early stages of the loading,
propagating towards the edges of the specimens and having a diagonal orientation as the load
increased, this cracking pattern being associated with flexure. In the end, this slab had a
combined failure mode. For the specimens that were prestressed, the cracks had a radial pattern.
Failure occurred before yielding of the tendon and reinforcing bars in the longitudinal direction,
though the reinforcement in the transverse direction did yield. All the prediction formulas used
for the ultimate strength gave a lower value than the one obtained from the tests, with an
accuracy between 60 and 85%. The formula from the Eurocode is considered to be reasonable
for the estimation of punching strength since it is easy to use and has a good accuracy, although
the one developed by Graddy et al. gives the best prediction. The punching strength appears to
be proportional with the level of prestressing [7].
Figure 3-39 – Geometry and reinforcement layout of
the specimens [7] Figure 3-40 – Tests setup for (moving wheel) fatigue
test [7]

FATIGUE MODEL FOR PRESTRESSED CONCRETE DECKS
70
Master’s Thesis – Tudor Mihai Brata
Even though the cyclic wheel loading produces more conservative results compared to
a fixed point loading, still it was decided to perform the fatigue tests in this manner in order to
shorten the testing period by applying high loads and load increments. By making use of
Miner’s rule and the determined static strength, an estimation of the punching strength of the
fatigue specimens is performed [7].
For the first two specimens tested, the applied load was kept constant until failure. A
value of 168 kN of the load led to failure after 35000 cycles, whilst a value of 141 kN led to
failure after ≈32000 cycles. The values for de loads were chosen to represent a certain
percentage of the static strength. For the last two fatigue tests, the load was applied in steps.
For specimen no. 3, a first loading step of 29 kN resulted in 500000 cycles without failure,
followed by an increase of the load to 141 kN and failure after ≈22000 cycles. For the last
specimen, the first step had a 78 kN load which resulted in 800000 cycles without failure.
Subsequently the load was increased to 141 kN and failure occurred after 1000 cycles.
Specimens failed by sudden subsidence at the centre of the slab. At the bottom of the slabs, the
transverse cracks progressed to form a grid shape, with a distribution similar to that of the
punching cone from the static tests [7].
Without having clear guidelines for the evaluation of fatigue, it is generally accepted
that minimum fatigue strength is thought of being achieved if after two million loading cycles
there is no observable damage to the specimen. The predictions based on Miner’s rule are
considered to be too conservative, conclusion that is reached after comparing the results from
the tests with the ones given by this method. The author derives a formula for predicting the
fatigue life that is based on Miner’s rule, but this also proves to be too conservative [7]
The study performed by El-Ragaby et al. (ref. 16) focused on the fatigue analysis of
concrete bridge deck slabs reinforced with E-glass/vinyl ester FRP reinforcing bars. This type
of reinforcement was chosen since it has a very good behaviour in corrosive environments.
On the downside, the modulus of elasticity has a low value together with the transverse strength,
resulting in elements with a lower shear capacity when compared to ones reinforced with steel.
For the experimental program, a number of six bridge deck specimens were constructed (S0-
steel, S1..5-GFRP), these having the dimensions 2500 x 3000 x 200 mm3. Five of these slabs
Figure 3-41 – Failure of specimen after static tests [7] Figure 3-42 – Failure of specimen after fatigue test [7]

FATIGUE MODEL FOR PRESTRESSED CONCRETE DECKS
71
Master’s Thesis – Tudor Mihai Brata
were reinforced with GFRP bars having different reinforcement ratios and configurations,
whilst the last slab was reinforced with steel. The concrete used had a targeted value for its
compressive strength of 37 MPa at 28 days. After curing, the specimens were stored outdoors
for more than a year in order to undergo environmental conditions similar to the ones from the
service life of the structure. After this period, the properties of the concrete were concluded to
have been stabilized at 42 MPa for the compressive strength and 34 GPa for the modulus of
elasticity [16].
.
The specimens were tested by applying a single point load at mid-span through a steel
plate of 250 x 600 mm2 in area and with a 75 mm thickness. Between the steel plate and the
concrete it was positioned a 20 mm neoprene sheet used for avoiding stress concentrations. To
ensure a partial end restraint for the slabs, these were connected to two supporting steel beams.
For the fatigue loading, two different schemes were used: one with variable amplitude and one
with constant amplitude. The variable amplitude fatigue loading consisted of a sinusoidal
waveform of the applied load, between a minimum load level and a variable maximum level.
The minimum load level was set to 15 kN, whilst the different maximum loads were selected
based on the fatigue limit state given by the Canadian Highway Bridge Design Code [16].
Based on the regulations from CHBDC, the used maximum loads were 183.8, 245,
367.5, 450 and 490 kN. Each load step was applied for 105 cycles at a frequency of 2 Hz, the
test continuing until failure if this would not occur during the specified number of cycles at the
highest load. This loading scheme was applied to 4 slabs, namely S0, S1, S4 and S5. Slab S3
had a similar type of variable amplitude fatigue loading but with 3 additional load levels, all
below the ones mentioned previously. The constant amplitude loading was applied to slab S2
for 4 million cycles at a peak load value of 122.5 kN, with a frequency of 4 Hz. The
measurements performed on the specimens included strains of the reinforcing bars and
concrete, deflections at the load area and the support, crack width [16].
Figure 3-43 – Test setup [16]

FATIGUE MODEL FOR PRESTRESSED CONCRETE DECKS
72
Master’s Thesis – Tudor Mihai Brata
For a better understanding of the loading effects that vehicles have on the deck slabs of
bridges, the authors have performed a finite element analysis where the monotonic loading on
such a system and its ultimate capacity were investigated. In order to do so, they had to choose
a constitutive model for the concrete that would describe as accurately as possible its actual
behaviour. This model was based on a smeared cracking methodology, took into account the
non-linear properties of the material and the strain softening regime. The reinforcement is also
taken into account in the model. The finite element model was validated based on results from
previous experiments [16].
In order to estimate the fatigue damage, the magnitude of the residual deflection was
considered a proper measure for it. Following the finite element analysis that took into account
only the static loading, it appears that the slabs have a very similar ultimate capacity (≈750 kN)
despite the different top reinforcement ratios. The reduction in transverse reinforcement also
seems to have no impact. From the analysis of the load-deflection behaviour of slab S1, it is
shown that at the same load level, the deflection under cyclic loading is greater than the one
under static loading. For slab S2, even after 4 million cycles, which is twice the expected
lifetime of the structure, the deflection is below the allowable limit, this slab having the lowest
residual deflection. For the slab reinforced with steel, S0, the damage was higher due to the
Figure 3-44 – Variable amplitude fatigue loading
scheme [16] Figure 3-45 - Constant amplitude fatigue loading
scheme [16]
Figure 3-46 – Load-deflection behavior of slab S1
under static and cyclic loading [16] Figure 3-47 – Static response of the slabs after
different fatigue loading steps (Ff=367 kN) [16]
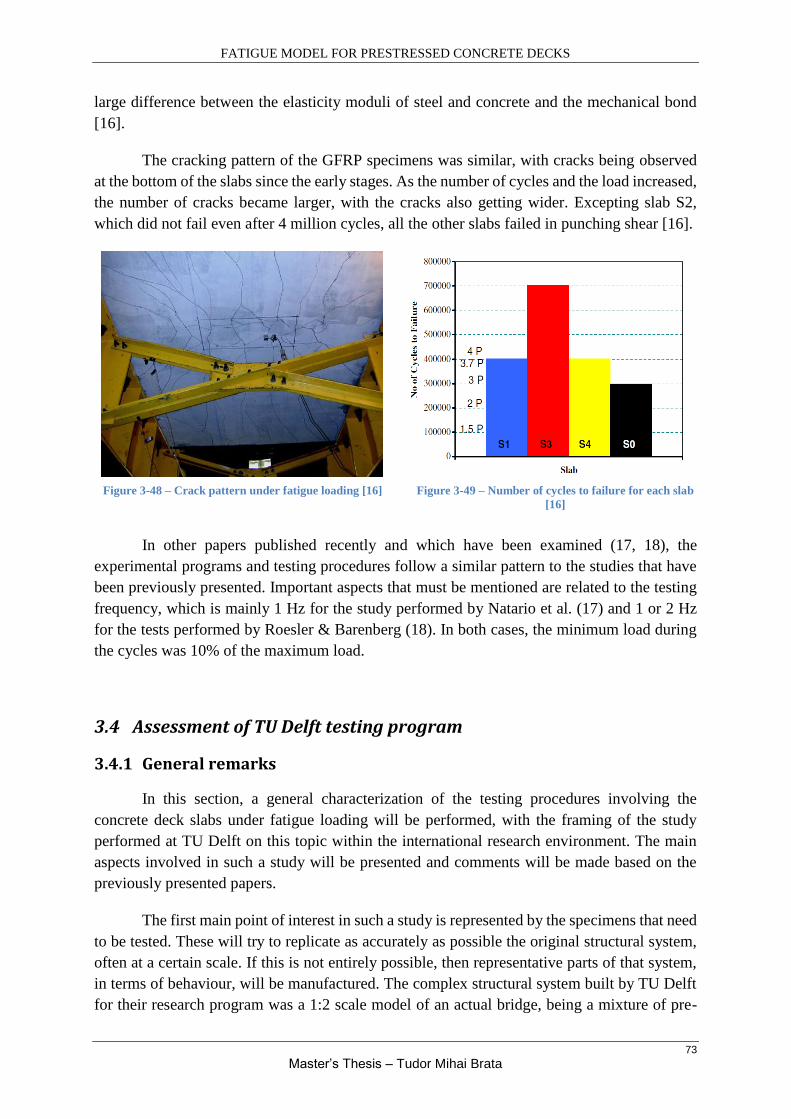
FATIGUE MODEL FOR PRESTRESSED CONCRETE DECKS
73
Master’s Thesis – Tudor Mihai Brata
large difference between the elasticity moduli of steel and concrete and the mechanical bond
[16].
The cracking pattern of the GFRP specimens was similar, with cracks being observed
at the bottom of the slabs since the early stages. As the number of cycles and the load increased,
the number of cracks became larger, with the cracks also getting wider. Excepting slab S2,
which did not fail even after 4 million cycles, all the other slabs failed in punching shear [16].
In other papers published recently and which have been examined (17, 18), the
experimental programs and testing procedures follow a similar pattern to the studies that have
been previously presented. Important aspects that must be mentioned are related to the testing
frequency, which is mainly 1 Hz for the study performed by Natario et al. (17) and 1 or 2 Hz
for the tests performed by Roesler & Barenberg (18). In both cases, the minimum load during
the cycles was 10% of the maximum load.
3.4 Assessment of TU Delft testing program
3.4.1 General remarks
In this section, a general characterization of the testing procedures involving the
concrete deck slabs under fatigue loading will be performed, with the framing of the study
performed at TU Delft on this topic within the international research environment. The main
aspects involved in such a study will be presented and comments will be made based on the
previously presented papers.
The first main point of interest in such a study is represented by the specimens that need
to be tested. These will try to replicate as accurately as possible the original structural system,
often at a certain scale. If this is not entirely possible, then representative parts of that system,
in terms of behaviour, will be manufactured. The complex structural system built by TU Delft
for their research program was a 1:2 scale model of an actual bridge, being a mixture of pre-
Figure 3-48 – Crack pattern under fatigue loading [16] Figure 3-49 – Number of cycles to failure for each slab
[16]

FATIGUE MODEL FOR PRESTRESSED CONCRETE DECKS
74
Master’s Thesis – Tudor Mihai Brata
cast and cast in-situ elements. It comprised precast prestressed longitudinal girders, post-
tensioned transverse beams and a transversely prestressed deck. By building an actual structure,
the researchers at TU Delft succeeded in creating a system that would behave almost identical
to the full sized one, this being essential in order to obtain precise data that could be accurately
extrapolated to real life situations.
For the other research programs that were studied, it must be noted that only scaled
specimens were manufactured. From this point of view, the approach from TU Delft is
considerably more beneficial. A certain degree of imperfection is another aspect that gives the
specimen authenticity with respect to the behaviour of a real structure. This means, for instance,
that the specimen can be subjected on purpose to an outdoor environment and its actions, like
it was in the case of a previous study (16), or that it can suffer some structural flaws, like
shrinkage cracks in the case of the TU Delft model. The scope in the end is to obtain a system
that behaves as realistic as possible, scope that was achieved by the research program at TU
Delft.
The testing setup, another point of interest, would usually involve a frame rigid enough
to withstand the loading process of the specimens, this being performed by means of a hydraulic
jack or an electro-hydraulic actuator. The applied load is normally a single point (wheel) load
or a double point load that would simulate the loading from an actual wheel system. Such a
frame was used for the loading process within the TU Delft research program. Depending on
the type of research, the frame could be more complex and also be used for ensuring the support
conditions of the specimens, providing the required degree of rigidity to its sides (12) and, for
instance, being able to activate the compressive membrane action (CMA) of a slab. In the case
of the TU Delft model, the structural system was conceived in such a way that it did not require
additional restraints. Through the nature of the system itself and by making use of the transverse
girders that would increase the rigidity, the arching action within the model was enabled.
Another aspect that is relevant for the test setup involves how the load is transferred to
the specimen. This is done through the means of a steel plate that has realistic in-plane
dimensions that are in accordance with the size of wheels given in the codes. If it is desired to
decrease the number of cycles to failure without increasing the load, then the size of the steel
plate can be reduced, resulting in a higher applied stress. In order to avoid or reduce as much
as possible the risk of stress concentrations on the perimeter of the loaded area, usually a rubber
sheet is applied between the steel plate and the concrete. This procedures were present in the
studies that were described in the previous sections, with the program at TU Delft having a
similar approach.
The instrumentation used for measuring the data within the tests is also part of the setup.
A wide range of variables can be measured during testing, such as: applied load, deflections at
the location of the load, deflections at the supports, strains of the reinforcing or prestressing
steel, strains of the concrete, crack widths and patterns. It is of importance in the case of fatigue
loading to assess what is happening to the specimen after one loading cycle, subsequently
studying the outcome at a predefined number of cycles.
FATIGUE MODEL FOR PRESTRESSED CONCRETE DECKS
75
Master’s Thesis – Tudor Mihai Brata
As mentioned earlier, the applied load would simulate the effect that an actual wheel
from an automobile has on the bridge. Usually, the load would have a fixed point of application,
resulting in a pulsating fatigue test, this being the case of the ones performed by TU Delft. In
this situation, the load would have a sinusoidal waveform, with a minimum and a maximum
value within each stress range, being applied for a certain number of cycles. Another type of
loading system that might be used would be one that simulates the actual passing of a wheel
over the specimen (7). Although it tries to be more realistic in terms of load application, it is
considered that the results provided are too conservative. Pardikaris et al. (1988) came to the
conclusion that one wheel load passage of such a system over the specimen is equivalent to 80-
600 load cycles of a stationary pulsating load that has the same amplitude (16).
For the experimental program at TU Delft the applied stress was only of compressive
nature, similar to the cases presented in Section 3, with the load consisting of a single or a
double point load. The maximum value of the load within a stress range would represent a
certain percentage out of the ultimate static strength, whilst the minimum value would represent
10% of the chosen maximum. This type of approach was adopted for the TU Delft tests but is
also a common choice for other experimental programs (12, 17, 18). An interesting observation
from the presented tests, including TU Delft, is that at a lower maximum value of the load, the
fatigue loading does not seem to affect the ultimate static strength of the specimen. Another
important aspect during fatigue loading is represented by the frequency of the load. The chosen
value for this was 1 Hz, again a very common choice for this type of tests (12, 5, 17, 18). CEB’s
Bulletin no. 188 (3) and Mallett (2) state that, for plain concrete, higher frequencies, between 1
and 15 Hz, do not affect the fatigue strength if the maximum stress level is not higher than 75%
of the static strength. A recent study performed by Medeiros et al. (19) confirms that fatigue
life is reduced at lower frequencies for plain concrete. It can be concluded that the choice made
by TU Delft with respect to the frequency is correct. In terms of load positioning, this would be
applied at the position that is more susceptible to failure or where it would have an impact on
the structural system (e.g. at the mid-span of the element).
Concerning the failure of the specimens, it is a general observation that for slabs where
the compressive membrane action (CMA) is deployed, punching shear will be the failure mode.
CMA increases the ultimate capacity of the slabs, with the flexural resistance becoming higher
than the shear one, making the punching shear to be governing. This was also the failure mode
for the tests performed by TU Delft and is in accordance with the other tests presented. In terms
of cracking pattern, this was the well-known one for such a failure mode: cracks would form
below the loading plate and would spread in a radial pattern, with their width being larger under
the area where the force was applied, whilst outside that area they would have considerable
smaller openings.
3.4.2 Comparison of experimental results
Following the experimental program performed by TU Delft and analysing the obtained
results, a series of conclusion and observations were made, with the main ideas being presented

FATIGUE MODEL FOR PRESTRESSED CONCRETE DECKS
76
Master’s Thesis – Tudor Mihai Brata
at the end of section 2 of this chapter. It was acknowledged that with the decrease of the fatigue
load value, the fatigue life of the specimen was enhanced, namely the number of loading cycles
to failure would increase. A descending trend is clearly visible in the graph that presents the
relative load value (Ffat/Fsta - the ratio between the fatigue load and the static load) versus the
number of cycles (Figure 3-50). Having a decrease in the fatigue life with the increase of the
load is logical since, as deterioration begins, the element will undergo continuous damage at a
certain rate, depending on the value of the cyclic load. Based on the formula that was derived
by the researchers at TU Delft, it was approximated that the average value for the fatigue load
at 1 million cycles is 54% of the static load, respectively 41% at 100 million cycles. These
results will be compared in the following with results from other researches, with the purpose
of assessing whether they fit within the general findings on this topic and additionally
evaluating their degree of accuracy/reliability.
The research presented as reference 12 focused on the fatigue testing of concrete deck
slabs that tried to replicate as accurately as possible a part of a real bridge deck. These
specimens were either cast in situ or a combination of prestressed and cast in situ concrete.
With the obtained results following from the fatigue and static tests, the S-N diagram presented
in Figure 3-51 was obtained. It can be observed immediately that also in this case the trend line
is descending, meaning that with the increase in value of the applied stress, the number of cycles
to failure is decreasing. This graph shows the normalized shear stress ratio plotted against the
number of cycles to failure. This normalized stress was used in order to take into account the
area of the specimen that failed in punching shear only.
Since this study (12) does not give a prediction formula nor an S-N graph that accounts
for the ratio between the fatigue and static loads like it was in the case of the TU Delft research,
an approximation was made in order to obtain an average value for the fatigue load at 1 million
cycles. The procedure on how this value was obtained is described in Annex 1 and is based on
the data presented in the scientific paper (12). As a result of the calculations, it was estimated
that at 1 million cycles the fatigue load would have a 51% value of the static load, result that is
very similar to the one from the TU Delft research (54%).
Figure 3-50 - Relative load value Ffat/Fsta as a
function of the no. of loading cycles for all the tests [15]
Figure 3-51 - S-N diagram for all specimens [12]
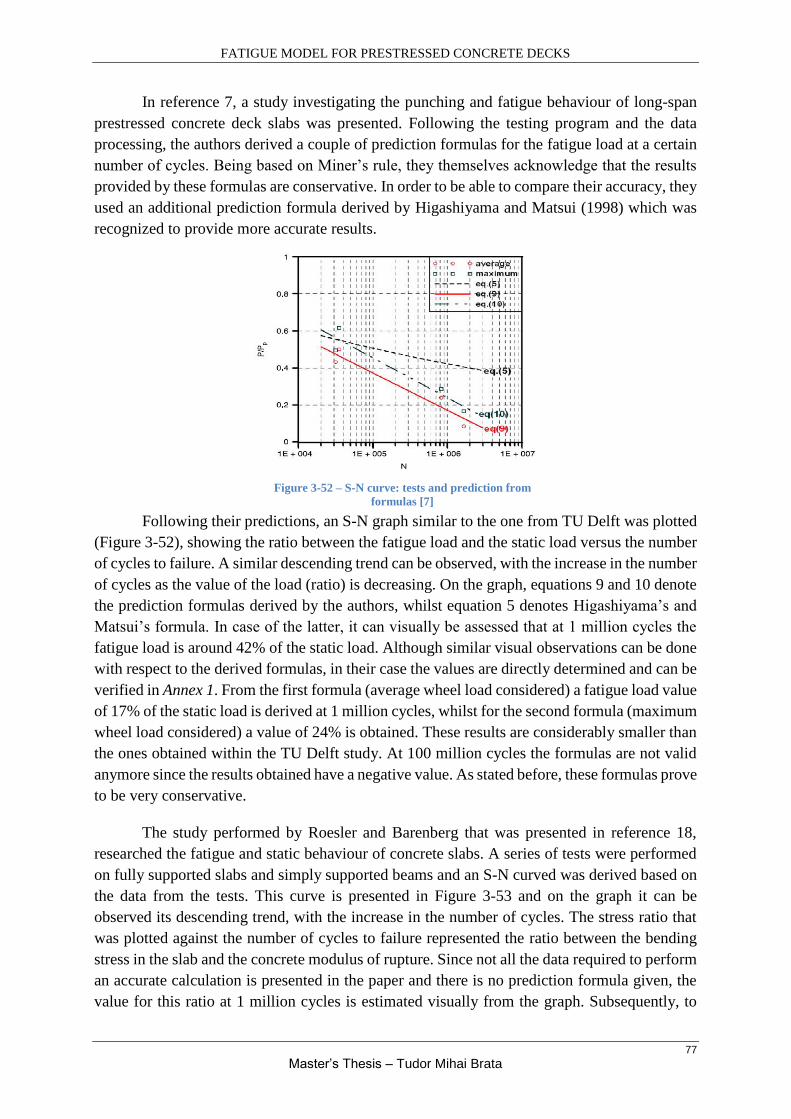
FATIGUE MODEL FOR PRESTRESSED CONCRETE DECKS
77
Master’s Thesis – Tudor Mihai Brata
In reference 7, a study investigating the punching and fatigue behaviour of long-span
prestressed concrete deck slabs was presented. Following the testing program and the data
processing, the authors derived a couple of prediction formulas for the fatigue load at a certain
number of cycles. Being based on Miner’s rule, they themselves acknowledge that the results
provided by these formulas are conservative. In order to be able to compare their accuracy, they
used an additional prediction formula derived by Higashiyama and Matsui (1998) which was
recognized to provide more accurate results.
Following their predictions, an S-N graph similar to the one from TU Delft was plotted
(Figure 3-52), showing the ratio between the fatigue load and the static load versus the number
of cycles to failure. A similar descending trend can be observed, with the increase in the number
of cycles as the value of the load (ratio) is decreasing. On the graph, equations 9 and 10 denote
the prediction formulas derived by the authors, whilst equation 5 denotes Higashiyama’s and
Matsui’s formula. In case of the latter, it can visually be assessed that at 1 million cycles the
fatigue load is around 42% of the static load. Although similar visual observations can be done
with respect to the derived formulas, in their case the values are directly determined and can be
verified in Annex 1. From the first formula (average wheel load considered) a fatigue load value
of 17% of the static load is derived at 1 million cycles, whilst for the second formula (maximum
wheel load considered) a value of 24% is obtained. These results are considerably smaller than
the ones obtained within the TU Delft study. At 100 million cycles the formulas are not valid
anymore since the results obtained have a negative value. As stated before, these formulas prove
to be very conservative.
The study performed by Roesler and Barenberg that was presented in reference 18,
researched the fatigue and static behaviour of concrete slabs. A series of tests were performed
on fully supported slabs and simply supported beams and an S-N curved was derived based on
the data from the tests. This curve is presented in Figure 3-53 and on the graph it can be
observed its descending trend, with the increase in the number of cycles. The stress ratio that
was plotted against the number of cycles to failure represented the ratio between the bending
stress in the slab and the concrete modulus of rupture. Since not all the data required to perform
an accurate calculation is presented in the paper and there is no prediction formula given, the
value for this ratio at 1 million cycles is estimated visually from the graph. Subsequently, to
Figure 3-52 – S-N curve: tests and prediction from
formulas [7]

FATIGUE MODEL FOR PRESTRESSED CONCRETE DECKS
78
Master’s Thesis – Tudor Mihai Brata
have a better estimation of the fatigue life, the modulus of rupture was replaced by the static
strength. Therefore it can be assumed that the bending stress is directly linked to the fatigue
load and therefore the ratio can be interpreted as being between a fatigue and a static load. At
1 million cycles this ratio is approximately 0.6, meaning that the fatigue load would have a
value of around 60% of the static load, result that is close to the ones from the TU Delft research.
Sonoda and Horikawa researched the fatigue strength of reinforced concrete bridge deck
slabs under moving loads, this study being labelled as reference 20. For their experimental
program they tested 20 slabs that were subjected to static loading, fixed point pulsating loading
and moving loads. These slabs had either isotropic or orthotropic bottom reinforcement and
were simply supported during the tests. Following the experimental program, prediction
formulas and S-N curves were determined, this being presented in Figure 3-54. The load level
“R” on the vertical axis represents the ratio between the applied (fatigue) load and the average
static collapse load, this load level being plotted against the number of cycles. The same
descending trend of the S-N curve can be observed. Of interest in this situation are the
prediction formulas that relate to the fixed point pulsating tests since the same type of tests were
performed during the research at TU Delft. Based on these prediction formulas, it is estimated
that at 1 million cycles, for isotropic slabs, the fatigue load is 56% of the static load, whilst for
orthotropic slabs the value is 58%. At 100 million cycles the values are 39% and 42%. These
results are very similar to the ones from the study by TU Delft and they can be verified in Annex
1.
Another research performed by El-Ragaby et al. is presented in reference 21 and deals
with the fatigue life of concrete bridge deck slabs reinforced with GFRP bars. A similar study
performed by the same author was presented in reference 16 and these studies are most likely
linked to one another. In the current paper, a series of deck slabs were tested under a fixed point
pulsating load and subsequently the results were processed in order to obtain a fatigue life
prediction formula based on which a S-N curve was plotted. Since the reinforcement consisted
of GFRP bars, this had to be considered for the prediction, as the behaviour of such bars differs
from the behaviour steel.
Figure 3-53 – S-N curve for fully supported slabs from
Roesler and Barenberg study [18] Figure 3-54 – S-N curve from the study performed by
Sonoda and Horikawa [20]

FATIGUE MODEL FOR PRESTRESSED CONCRETE DECKS
79
Master’s Thesis – Tudor Mihai Brata
Figure 3-55 presents the ratio between the fatigue and the static loads plotted against
the number of cycles using several prediction formulas, including the one proposed for elements
with GFRP bars. They all follow the same descending trend: as the ratio of the loads reduces,
the number of cycles to failure increases. Based on the prediction formula by El-Ragaby, the
fatigue load at 1 million cycles has a value of 48.5% of the static load. At 100 million cycles
the prediction results in a value of 34%. In the same paper, a formula derived by Matsui et al.
(2001) is also presented, this dealing with steel reinforcement. Following this formula, the
prediction at 1 million cycles is 51.5%, whilst at 100 million cycles is 36%. These calculations
can be verified in Annex 1. It can be stated that both the S-N curves and the results are similar
to the ones from the TU Delft research.
It is a general observation that the lower the applied fatigue load is, the higher is the
number of cycles required for failure of the specimen. Such descending trend was observed in
each research that was presented and the study performed by TU Delft had the same outcome.
Overall, it can be concluded that the results from TU Delft’s research are in good
correlation with other researches performed worldwide, this giving them a high degree of
reliability and credibility. Nevertheless, it must be kept in mind that fatigue testing is prone to
a large scatter in the results due to the non-uniform properties of the material (concrete) and
future usage of TU Delft’s prediction formula should be accompanied by further testing in order
to validate its accuracy.
3.4.3 Conclusions
The research program performed by TU Delft on the fatigue of concrete deck slabs was
complex, from the point of view of the structural system and from the point of view of the
variables within each test. A better understanding of the fatigue phenomenon was tried to be
achieved and also a way of predicting the fatigue life of old and new structures.
As an overall review of the tests from the experimental program conducted by TU Delft,
it can be acknowledged that these fit well within the general pattern of fatigue tests performed
Figure 3-55 – S-N curves based on different prediction
formulas [21]

FATIGUE MODEL FOR PRESTRESSED CONCRETE DECKS
80
Master’s Thesis – Tudor Mihai Brata
on a global scale. The main points of interest for such tests align themselves to the international
researches, as it was presented in the previous sections. There result also are in correlation with
similar outcomes from studies performed across the globe. In The Netherlands there is no
standardised procedure involving the fatigue testing of slabs, therefore an approach like the one
used, more empirical, is legitimate. Outside The Netherlands, such standardized procedures can
be found, like the one for “Determining the fatigue failure of compacted asphalt concrete -
ASTM D7460”. Nevertheless, the way this research was conducted can be appreciated as being
suitable for the topic and reliable.
A series of observations involving certain aspects of the testing procedure could be
made. Related to the tests, since each one had its own characteristics, it would be of interest to
confirm the result by performing a replication of this tests. This way any improbability or
concern could be removed. Another aspect that might have had an influence on the results,
although measures were taken in order to avoid a negative impact, was the fact that these test
were performed at locations close to each other and the structural system could have given a
slightly different response in case of test n+1, following test n. A final comment involves the
order of the applied stress ranges. It was observed during the tests performed at TU Delft that
an initial higher stress range might have a detrimental impact on the fatigue life, shortening it
considerably. In the presented literature, such a case was not encountered so no other
information can be given on this aspect. It is then one of the goals of this Master’s Thesis to try
and shed some light on this matter and see if there is indeed an impact caused by the loading
sequence.

FATIGUE MODEL FOR PRESTRESSED CONCRETE DECKS
81
Master’s Thesis – Tudor Mihai Brata
Chapter 4: Finite Element Analysis - Stage I

FATIGUE MODEL FOR PRESTRESSED CONCRETE DECKS
82
Master’s Thesis – Tudor Mihai Brata
4.1 Introduction
The finite element analysis (FEA) is a powerful tool that can be used in order to evaluate
in detail the behaviour of structures or elements within a structure, without having to perform
costly and time consuming experiments. In order to benefit from the full usage of such a tool,
it is required to understand how it works, how to operate it and how to interpret the results that
follow from this type of analysis.
As the main goal of the Master’s Thesis, it was set that a FEA model would be created
in order to try to predict the fatigue damage of transversely prestressed thin bridge deck slabs.
First, the model should be able to describe as accurate as possible the static capacity of the
structural system from the previous experimental program (S. Amir’s PhD Thesis, [14]).
Subsequently, the model should be used for the fatigue prediction of the experiments described
in TU Delft’s report number 25.5-14-06 ([15]).
It was decided that the model would be a simple one, two-dimensional (2D), thus not
having a high degree of complexity. By doing so, it must be understood that the model would
have its drawbacks and limitations, since it won’t be able to fully describe the real three-
dimensional stress state. A complex 3D model was created by S. Amir for her PhD thesis and
experimental program ([14]) and it is presented in Figure 4-1.
As part of the numerical analysis section of the Master’s Thesis, this first stage of FEA
presents the development of the model, with all the necessary steps required to reach a suitable
result, including its calibration.
The software used for this section was DIANA FEA (version 10.0). This is a multi-
purpose software package that is widely used in different branches of the civil engineering field
and it was developed in The Netherlands by DIANA FEA BV, company that has its origins at
the Computational Mechanics department of TNO Building and Construction Research
Institute in Delft.
Figure 4-1 – 3D solid finite element bridge model, S. Amir [14]
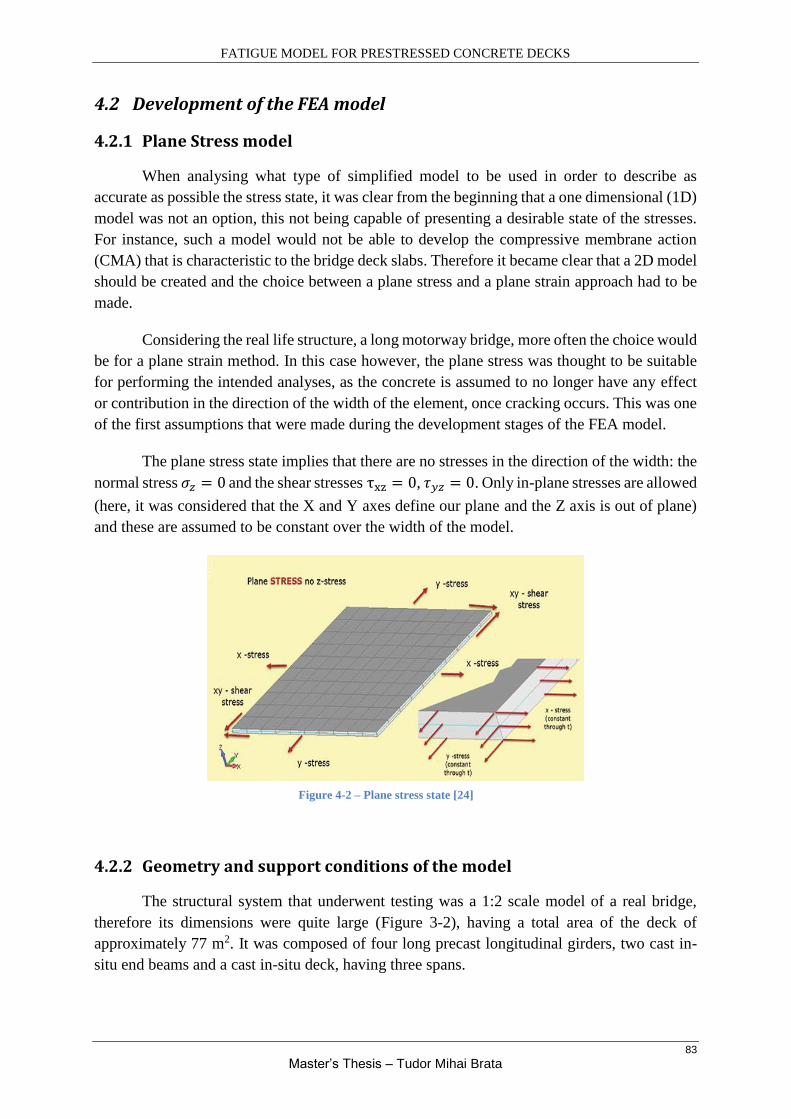
FATIGUE MODEL FOR PRESTRESSED CONCRETE DECKS
83
Master’s Thesis – Tudor Mihai Brata
4.2 Development of the FEA model
4.2.1 Plane Stress model
When analysing what type of simplified model to be used in order to describe as
accurate as possible the stress state, it was clear from the beginning that a one dimensional (1D)
model was not an option, this not being capable of presenting a desirable state of the stresses.
For instance, such a model would not be able to develop the compressive membrane action
(CMA) that is characteristic to the bridge deck slabs. Therefore it became clear that a 2D model
should be created and the choice between a plane stress and a plane strain approach had to be
made.
Considering the real life structure, a long motorway bridge, more often the choice would
be for a plane strain method. In this case however, the plane stress was thought to be suitable
for performing the intended analyses, as the concrete is assumed to no longer have any effect
or contribution in the direction of the width of the element, once cracking occurs. This was one
of the first assumptions that were made during the development stages of the FEA model.
The plane stress state implies that there are no stresses in the direction of the width: the
normal stress 𝜎𝑧 = 0 and the shear stresses τxz = 0, 𝜏𝑦𝑧 = 0. Only in-plane stresses are allowed
(here, it was considered that the X and Y axes define our plane and the Z axis is out of plane)
and these are assumed to be constant over the width of the model.
4.2.2 Geometry and support conditions of the model
The structural system that underwent testing was a 1:2 scale model of a real bridge,
therefore its dimensions were quite large (Figure 3-2), having a total area of the deck of
approximately 77 m2. It was composed of four long precast longitudinal girders, two cast in-
situ end beams and a cast in-situ deck, having three spans.
Figure 4-2 – Plane stress state [24]

FATIGUE MODEL FOR PRESTRESSED CONCRETE DECKS
84
Master’s Thesis – Tudor Mihai Brata
For reasons of simplification, only the deck was modelled (in the transverse direction),
considering the top midpoints of the precast longitudinal girders as the locations of the supports.
Since it had 3 spans, the first set of analyses tried to replicate only the middle span, this being
the one that was loaded by a point load. This was done in order to assess how the model behaves
and reacts having different support conditions: simply supported and one time statically
indeterminate. The anticipated increase of the initial stiffness and capacity and decrease of the
vertical deflection at the mid-span of the model were observable and can be seen in Graph 4-1
below. For reasons of comparison, the outcome of considering the full transverse cross section
is also presented, this being closer to a clamped situation.
Graph 4-1 - Influence of boundary conditions (following
from the linear analyses)
After the first series of analyses, it was understood that by modelling only the loaded
span of the actual bridge, the capacity of the model was extremely low. For the simply supported
conditions it had a value between 12 and 15 kN (following from the nonlinear analyses), a very
low value compared to the mean static capacity of the structural system (considered to be 335
kN, according to [15]). Therefore it was decided to define as geometry of the FEA model the
full transverse section of the bridge deck as a continuous element, assuming that the precast
girders and the cast in-situ deck had the same material properties.
Since the full transverse section was modelled, this was considered as a beam on
multiple supports, with the supports being positioned at the location of the longitudinal girders
in the real structure. A main reason for choosing this type of schematization was that, by doing
so, the ultimate capacity would increase substantially and the compressive membrane action
was able to develop and be assessed in the model. Its in-plane dimensions were 6.40 meters by
0.10 meters. Regarding the supports, all of them ended up having fixed translations on both X
and Y axes, but in-plane rotation was allowed.
At the supports and at the location of the applied force, steel plates were added to the
model in order to avoid stress concentrations, a phenomenon that occurred during the first
analyses performed. Similar plates were added to the sides of the model for the same reason,
since the prestressing load was applied as an external lateral load. All the steel plates were 200
mm in length, 20 mm in height and 200 mm in the out-of-plane direction. Between the steel
Figure 4-3 – First FEA model, simply supported

FATIGUE MODEL FOR PRESTRESSED CONCRETE DECKS
85
Master’s Thesis – Tudor Mihai Brata
plates and the concrete section, an interface was defined for the same purpose of avoiding the
stress concentrations.
Figure 4-4 - Lack of plate in the model (linear analysis)
Figure 4-5 – Effect of the loading plate on the stress
distribution (linear analysis)
Although the conducted analyses were of a 2D plane stress type, also a dimension for
the out-of-plane direction had to be considered – an effective width. The final model had a
width 1.95 meters and in the section of this chapter regarding the calibration, it will be presented
how this value was reached.
4.2.3 Reinforcing and prestressing steel
Following the design of the real structure presented in S. Amir’s thesis ([15]),
reinforcement was also added to the model. Having assumed a certain effective width (1.95
meters) which would theoretically be influenced by the load, the real area of reinforcement
distributed over that width was assigned to the model. The reinforcement was schematized as
horizontal embedded bars at the top and bottom of the FEA model, running across the full
transverse section. This was done although in the real structural system the bars which are of
interest were distributed in those parts of the deck that were cast in-situ. But because the precast
girders contained enough reinforcement in the top flange, the assumption of continuous
reinforcement in the model was made. The concrete cover was considered to be 10 mm. The
amount of reinforcement that was assigned at either sides of the model was 311 mm2, since the
reinforcement was Φ6/200: there were considered 11 bars for the effective width of 1.95 meters,
the first one being laid down at “0” meters. Shear reinforcement was not provided for the actual
deck therefore such a type of reinforcement was of no interest.
Although the prestressing force was applied as an external load, the number of
prestressing bars that had been spread over the assumed effective width were schematized in
the model as a bar placed at the centre of the section, having an equivalent area to that of the
actual bars. This was done in order to represent as accurate as possible the real life situation.
The area considered for the prestressing steel was 883 mm2: 5 bars of Φ15/400. In the section

FATIGUE MODEL FOR PRESTRESSED CONCRETE DECKS
86
Master’s Thesis – Tudor Mihai Brata
that deals with the calibration of the model it will be discussed about the impact of this bar,
taking into account whether it was bonded or not.
The following figure presents the final model used, having the previously specified
geometry (with the steel plates included), support conditions and steel (reinforcing or
prestressing):
4.2.4 Element types of the model
4.2.4.1 Plane stress elements
The main element of the constructed FEA model, used for both deck and plates, is
defined in DIANA with the indicative CQ16M. According to the software’s manual, reference
[25], this is an eight-node quadrilateral isoparametric plane stress element, which is based on
quadratic interpolation and Gauss integration. By default, DIANA applies 2 x 2 integration
points (deemed as optimal), but it can also use a 3 x 3 integration scheme.
Figure 4-7 – Plane stress element as defined by DIANA
[25]
Figure 4-8 – CQ16M element of DIANA [25]
As characteristics for a plane stress element it is stated that its nodes must be in a flat
plane, that its width must be smaller than the in-plane dimension(s) or that the loading must be
in the plane of the element. It was already mentioned that the stresses in the direction of the
Figure 4-6 – FEA model displaying the geometry and the reinforcing/prestressing bars

FATIGUE MODEL FOR PRESTRESSED CONCRETE DECKS
87
Master’s Thesis – Tudor Mihai Brata
width are assumed to be 0 (𝜎𝑧 = 0 ). The element cannot be used in the case of out-of-plane
bending [25].
For CQ16M, the determination of the displacement in both directions, ui (i = x, y),
makes use of following quadratic polynomial expression:
𝑢𝑖(𝜉, 𝜂) = 𝑎0 + a1𝜉 + 𝑎2𝜂 + 𝑎3𝜉𝜂 + 𝑎4𝜉2 + 𝑎5𝜂2 + 𝑎6𝜉2𝜂 + 𝑎7𝜉𝜂2 [25]
By using the above relationship, the strains can be determined. εxx varies linearly on X
and quadratically on Y, εyy varies linearly on Y and quadratically on X, whilst the shear strain
varies quadratically in both directions [25].
4.2.4.2 Interface elements
Generally, such interface elements describe the behaviour with respect to normal and
shear tractions and normal and shear displacements across the interface. The elements used in
the FEA model were of type CL12I as defined by DIANA and are used as interfaces between
two lines of adjacent elements in a 2D state, being based on quadratic interpolation and, by
default, a 3 point integration scheme [25].
Figure 4-10 – Connection of CL12I to
another element [25]
4.2.4.3 Reinforcement elements
The reinforcement bars were considered as being embedded into the mother element,
therefore not allowing any slip (perfect bond) and adding stiffness to the FEA model. DIANA
treats them as bars and assesses these elements as having the shape of a line, dividing them into
so called particles, performing for each particle a separate numerical integration. The output is
composed of stresses and strains which are oriented along the axis of the element. In order to
have a bar embedded in a plane stress element, DIANA requires for each plane stress element
the location points of each particle of the bar embedded into that element [25].
Figure 4-9 – CL12I interface element [25]

FATIGUE MODEL FOR PRESTRESSED CONCRETE DECKS
88
Master’s Thesis – Tudor Mihai Brata
Figure 4-11 – Reinforcement bar as considered by
DIANA [25]
4.2.5 Constitutive (material) models
In order to analyse a structure, one major part of this process is represented by how the
physical behaviour of the materials used in the said structure are modelled for the finite element
analysis, behaviour that is based on the knowledge about what kind of failure mechanisms can
occur in the material. DIANA offers an extensive library of material models that can be used in
order to describe as realistic as possible the way a certain material behaves, considering
different loading hypotheses and types of structures.
To be sure that a right constitutive model is used for the FEA, the Guidelines for
Nonlinear Finite Element Analysis of Concrete Structures released by Rijkswaterstaat [26], the
DIANA manual [25] and S. Amir PhD thesis [14] were examined.
4.2.5.1 Concrete
Being the main material used for the structure tested during the experimental programs
related to static [14] and fatigue [15] loading, concrete is known for having a very complex
behaviour, being influenced by the stresses that it must bear and by the fact that it is not a
homogeneous material. Concrete can be labelled as a composite material, made up of different
components, each with specific properties that influence in the end the characteristics of the
final product. The structures that are constructed out of reinforced concrete have their behaviour
influenced by that of the main constitutive materials: concrete, with its proneness to cracking
(tensile behaviour) or crushing (compressive behaviour) and steel, with its proneness to
yielding.
In order to obtain results that were in accordance with the previously performed
experimental programs and FEA analyses, certain material properties were borrowed from S.
Amir’s PhD thesis [14]. Among these properties, for concrete it is mentioned the mean
compressive strength, the mean tensile strength, the modulus of elasticity and the tensile
fracture energy, all of these being based on results from tests. The coefficient of lateral
Figure 4-12 - Bar particle in a plane stress element [25]

FATIGUE MODEL FOR PRESTRESSED CONCRETE DECKS
89
Master’s Thesis – Tudor Mihai Brata
contraction (Poisson’s coefficient) was taken from the guidelines for nonlinear analysis of
Rijkswaterstaat [26], although analyses performed with both values showed no difference in
behaviour. For the determination of the tensile fracture energy, according to [14], a mean value
was considered, between the results provided by Model Code 90 and Model Code 2010. The
guidelines for Rijkswaterstaat [26] use only the approach from MC2010:
𝐺𝐹 = 73 ∗ 𝑓𝑐𝑚0.18
All the considered properties for concrete will be presented in a table at the end of this
subsection.
For the cracking behaviour of concrete, a smeared cracking approach was adopted. Such
a concept allows for cracking to develop in the element once the cracking initiation conditions
are met, with the cracks being allowed to form freely in the model, anywhere and in any
direction. This is opposite to a discrete cracking procedure, where the location of a crack is
more or less imposed or known. Rots in his article [27] describes these two approaches and
presents the characteristic features of each.
When the principal tensile stresses exceed the tensile strength of the concrete, a crack
is initiated, with its direction being perpendicular to that of the principal tensile stresses [28].
For the smeared cracking procedure, the opening of the crack is smeared all across the
considered element, being represented by the strains of the crack. These strains are dependent
on the displacement of the crack surface and the band width of the crack (length over which the
displacement is distributed) [14]. Another important parameter that influences the smeared
crack propagation is the fracture energy, which is in close correlation with the tension softening
stress-strain diagram [28].
Figure 4-15 – Smeared crack model, tensile behaviour [14]
Figure 4-13 – Material properties of concrete and steel from S. Amir’s
PhD thesis [14]
Figure 4-14 – Smeared cracking approach [28]

FATIGUE MODEL FOR PRESTRESSED CONCRETE DECKS
90
Master’s Thesis – Tudor Mihai Brata
Within the smeared cracking concept, a total strain based crack model with rotating
cracks was adopted (cracks rotate with the axes of the principal strain), as recommended by the
guidelines from Rijkswaterstaat [26] and similar to S. Amir’s finite element analyses [14]. The
benefit of using such a model is represented by the avoidance of stress locking. The value for
the crack bandwidth was equal to the dimension of the discretized element, 10 mm.
For the tensile behaviour of the concrete (cracking), DIANA offers a wide range of
predefined tension softening functions. Rijkswaterstaat [26] recommends the use of an
exponential function since it will result in more localized cracks, avoiding scattered cracking.
In order to see how the FEA model behaves, analyses were conducted with a Hordijk, an
exponential and a linear type of softening. The behaviour turned out to be significantly
influenced by the choice of the softening function, the linear type of softening giving the best
results. This will be presented in the section that deals with the calibration of the model.
Figure 4-16 – Tension softening functions: Hordijk (left), Exponential (centre) and Linear (right) [25]
The tension-compression interaction, namely the reduction of the compressive strength
due to lateral cracking, is taken into account, as the guidelines [26] suggest, by using the
reduction model of Vecchio and Collins from 1993, with a value of 0.4 as the lower bound of
the reduction curve. For the Poisson’s ratio reduction due to cracking, a damaged based
reduction model was chosen, meaning a decrease of the ratio with increasing damage due to
cracking.
Figure 4-17 – Vecchio and Collins reduction factor due to lateral cracking [25]

FATIGUE MODEL FOR PRESTRESSED CONCRETE DECKS
91
Master’s Thesis – Tudor Mihai Brata
The compressive behaviour of concrete (crushing) can also be modelled in a high variety
of ways, as DIANA offers again a wide range of predefined functions to account for this type
of material behaviour. According to Rijkswaterstaat’s guidelines [26], a parabolic stress-strain
diagram with a softening branch should be used in order to limit the maximum compressive
stress. In order to assess their impact, both a parabolic and an ideal (constant) curve were used,
the outcome showing a considerably better behaviour in case of the parabolic function. This
will be presented in the subsection regarding the calibration of the model. The increase in
compressive strength due to the lateral confinement is taken into account by using the model
proposed by Selby and Vecchio. For the parabolic curve it was necessary to determine the
compressive fracture energy which was done by consulting the guidelines [26]:
𝐺𝐶 = 250 ∗ 𝐺𝐹 [26]
The characteristics of the constitutive model for concrete are summed up in Table 4-1:
Table 4-1 – Properties of the constitutive model for concrete
Element class Regular plane stress
Material class Concrete and Masonry
Model for concrete Total strain based crack model with rotating cracks
Elasticity modulus 39 GPa
Poisson’s ratio 0.15 or 0.20
Mass density 2500 kg/m3
Tensile curve Hordijk, Exponential or Linear - crack energy
Tensile strength 5.41 MPa
Tensile fracture energy (GF) 0.15 N/mm
Reduction due to lateral
cracking
Vecchio & Collins ‘93 model; lower bound factor: 0.4
Poisson’s ratio reduction Damage based reduction model
Compression curve Parabolic or Ideal (Constant)
Compressive strength 65 MPa
Compressive fracture energy 37.5 N/mm (250 x GF)
Stress confinement Selby & Vecchio model
Figure 4-18 – Parabolic compression curve [25] Figure 4-19 – Ideal (constant) compression curve [25]

FATIGUE MODEL FOR PRESTRESSED CONCRETE DECKS
92
Master’s Thesis – Tudor Mihai Brata
4.2.5.2 Reinforcing steel
For the reinforcing steel, the recommendation from Rijkswaterstaat [26] states that an
elasto-plastic material with hardening should be used, where the elastic limit is represented by
the steel’s yield strength.
In S. Amir’s thesis, tests were conducted in order to determine the properties of the
reinforcing steel, properties such as the mean yield and ultimate tensile strengths and the
modulus of elasticity. Although no hardening was considered for the FEA model from the PhD
thesis [14], based on the determined properties, a hardening branch was considered for the
material model of this thesis. As it was done for concrete, also in the case of the steel the same
material properties would be used in order to obtain results close to the experimental ones and
to the ones from the PhD’s FEA.
The plastic behaviour of the reinforcing steel, which in DIANA was modelled as an
embedded bar, was defined using the Von Mises plasticity model for the yielding of the
reinforcement, having a total strain - yield stress criterion. Within the model, the hardening
branch was specified based on the previously determined material properties. In the analyses,
two values for the ultimate strain were considered, 5.5% (minimum value from the tests) and
7% (considered average value of the tests) but no influence was observed on the behaviour of
the model. In order to be sure that there will be no problems related to the iterative process
during the finite element analysis, an abrupt descending branch was provided to the stress-strain
diagram of the steel.
Figure 4-21 – Strain curves of steel from the
experimental program [14]
Figure 4-22 – Stress-strain diagram used for the FEA
model of the Master’s Thesis
In DIANA also a hypothesis for hardening must be considered, therefore a strain
hardening hypothesis was chosen. For the hardening type an isotropic hardening was
considered.
Figure 4-20 – Reinforcing steel properties from S. Amir’s PhD thesis [14]

FATIGUE MODEL FOR PRESTRESSED CONCRETE DECKS
93
Master’s Thesis – Tudor Mihai Brata
The properties of the reinforcing steel used for the FEA model are summed up in the
following table:
Table 4-2 – Properties of the constitutive model for reinforcing steel
Class Reinforcement and pile foundation
Material model Von Mises plasticity
Elasticity modulus 200 GPa
Plastic hardening Total strain – Yield stress
Yield stress 525 MPa
Ultimate stress 580 MPa
Strain at yield stress 2.625 x 10⁻³
Strain at ultimate stress 7% (0.07) or 5.5% (0.055)
Hardening hypothesis Strain hardening
Hardening type Isotropic hardening
4.2.5.3 Prestressing steel
Since the prestressing load was applied on the FEA model as an external lateral load,
the modelling of the prestressing bar was done just to be in accordance with the real structure.
As a consequence, the bar was modelled as a reinforcing bar, having however different
properties than the reinforcing steel. For this bar, a higher yield strength (equal to the 0.1%
proof stress for Y1100H type of steel used in the structure) and a higher modulus of elasticity
were considered. Although the Von Mises plasticity was taken into account, no hardening was
considered.
The properties of the “prestressing” steel used for the FEA model are presented in the
following table:
Table 4-3 – Properties of the constitutive model for prestressing steel
Class Reinforcement and pile foundation
Material model Von Mises plasticity
Elasticity modulus 205 GPa
Plastic hardening Total strain – Yield stress
Yield stress 900 MPa
In the real structure the prestressing bars were not bonded to the concrete since they had
a plastic tube through which they passed, with the tube remaining not grouted after the bars
were installed and subsequently tensioned. Nevertheless, analyses were performed considering
this bar both bonded and not bonded and the results will be presented and discussed in the
section that deals with the calibration of the FEA model.

FATIGUE MODEL FOR PRESTRESSED CONCRETE DECKS
94
Master’s Thesis – Tudor Mihai Brata
4.2.5.4 Steel for plates
Like it was previously mentioned, the steel plates used at the loading positions and at
the supports were added to the model in order to avoid stress concentrations and a premature
failure, assuring a proper force transfer to the concrete element. The behaviour of these plates
was not a part of the object of the study, consequently the material for them was considered to
have only a linear elastic behaviour.
The properties of the steel plate material are presented below:
Table 4-4 – Properties of the constitutive model for the steel plates
Element class Regular plane stress
Material class Steel
Material model Linear elastic isotropic
Elasticity modulus 200 GPa
Poisson’s ratio 0.3
Mass density 7850 kg/m3
4.2.5.5 Interface
The interface was used between the steel plates and the concrete element for the same
reason of ensuring that there will be no stress concentrations at the points where the loads were
applied. For the interface material to be able to do this, a very high stiffness modulus in the
normal direction was assumed, combined with a very low shear stiffness modulus. The width
of the interface (on Z direction) was assumed to be equal to the one of the steel plates (200
mm). For the determination of the two stiffness’s the following formulas were used:
𝐾𝑛 =𝐸𝑠
ℎ∗ 1000 – Normal stiffness modulus
𝐾𝑠 =𝐸𝑠
ℎ∗1000 – Shear stiffness modulus
Es is the modulus of elasticity of steel and h is the dimension of the discretized element.
The properties of the interface material are presented in the following table:
Interface type Connected
Element class Structural interfaces
Material class Interface elements
Material model Linear elasticity
Type 2D line interface
Normal stiffness modulus 2E07 N/mm3
Shear stiffness modulus 20 N/mm3

FATIGUE MODEL FOR PRESTRESSED CONCRETE DECKS
95
Master’s Thesis – Tudor Mihai Brata
4.2.6 Loads acting on the model
The applied loads that act on the model are described in this section.
Self-weight of the concrete (γc = 25 kN/m3)
Prestressing load: the requirement during the experimental programs [14] and [15] was
that a constant compressive stress of 2.5 MPa (maximum level of transverse
prestressing considered) should be in the deck, thus implying that a force of 100 kN
would be applied in each prestressing bar, since the bars were positioned at a distance
of 400 mm from each other and the deck was 100 mm in height. In the case of the FEA
model from this thesis, the applied lateral load was dependent on the assumed effective
width of the model and the prestressing bars that were distributed over that width. As
a consequence of this, the value of the applied lateral load varied with the value of the
considered effective width. For a width of 1.95 meters, a lateral load of 487.5 kN was
applied (on both sides of the model).
Point or distributed load / Imposed displacement: The applied point load (or distributed
load if it was applied over the whole length of the loading plate) had a value of 335 kN
since this was the mean force at which the deck failed during the static tests (according
to research on fatigue [15]). For the imposed displacement analyses, a vertical
displacement of 5 mm was considered to be sufficient, this value being in accordance
with the results from the PhD thesis of S. Amir [14].
4.2.7 Mesh properties
The size of the used mesh was in accordance with the guidelines on nonlinear analysis
from Rijkswaterstaat [26]. In order to have a smooth stress field, a minimum of 6 elements over
the height should be used. In the case of the FEA model, a number of 10 elements over the
height were used. Each meshing element had an in-plane dimension of 10 x 10 mm2, with the
same mesh size being used for all the components of the model. The use of a slightly coarser
mesh that would still comply with the guidelines was tried, but the outcome showed no
difference.
According to the guidelines, the maximum element size can be determined as follows:
Maximum element size = min (𝑙
50,
ℎ
6) = min (
1800
50,
100
6) = min(36, 16.7) = 16.7𝑚𝑚
l = 1800 mm (span of model), h = 100 mm (height of model)
Since the maximum allowed size of the element was 16.7 mm and requiring at least 6
element over the height, the choice of having 10 element of 10 mm over the height of the FEA
model complies with the requirements. There is no requirement for a minimum size of the
element.
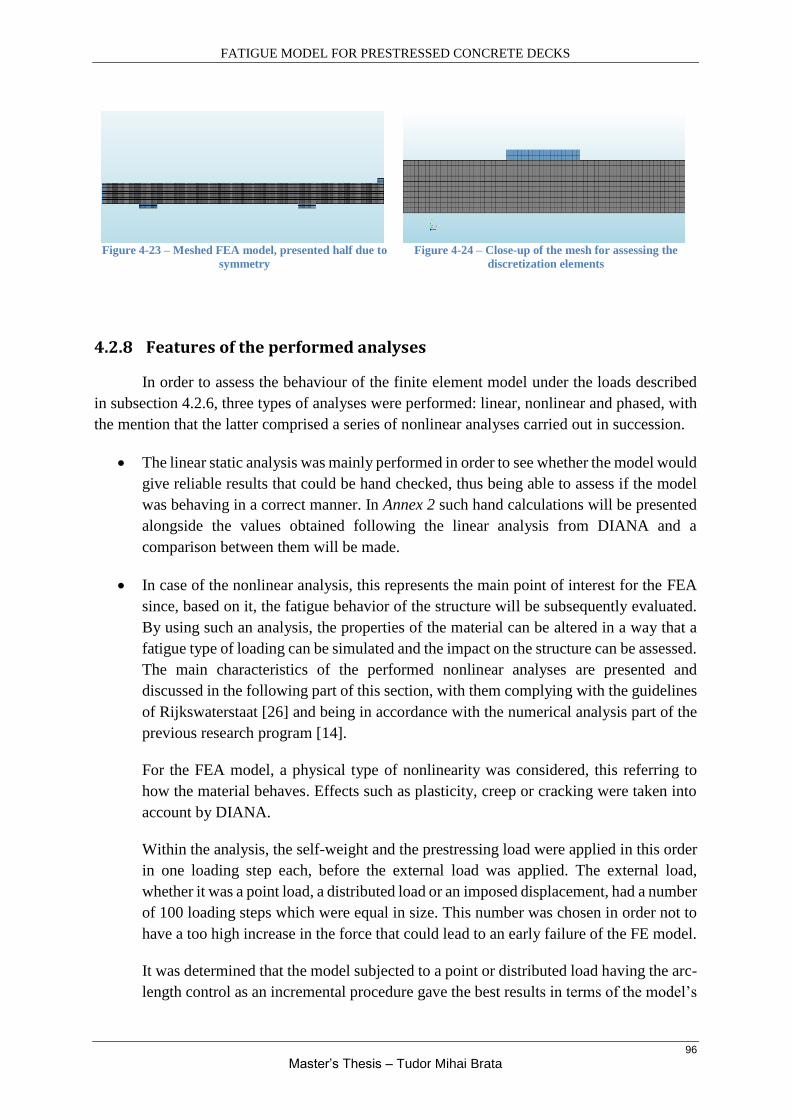
FATIGUE MODEL FOR PRESTRESSED CONCRETE DECKS
96
Master’s Thesis – Tudor Mihai Brata
Figure 4-23 – Meshed FEA model, presented half due to
symmetry
Figure 4-24 – Close-up of the mesh for assessing the
discretization elements
4.2.8 Features of the performed analyses
In order to assess the behaviour of the finite element model under the loads described
in subsection 4.2.6, three types of analyses were performed: linear, nonlinear and phased, with
the mention that the latter comprised a series of nonlinear analyses carried out in succession.
The linear static analysis was mainly performed in order to see whether the model would
give reliable results that could be hand checked, thus being able to assess if the model
was behaving in a correct manner. In Annex 2 such hand calculations will be presented
alongside the values obtained following the linear analysis from DIANA and a
comparison between them will be made.
In case of the nonlinear analysis, this represents the main point of interest for the FEA
since, based on it, the fatigue behavior of the structure will be subsequently evaluated.
By using such an analysis, the properties of the material can be altered in a way that a
fatigue type of loading can be simulated and the impact on the structure can be assessed.
The main characteristics of the performed nonlinear analyses are presented and
discussed in the following part of this section, with them complying with the guidelines
of Rijkswaterstaat [26] and being in accordance with the numerical analysis part of the
previous research program [14].
For the FEA model, a physical type of nonlinearity was considered, this referring to
how the material behaves. Effects such as plasticity, creep or cracking were taken into
account by DIANA.
Within the analysis, the self-weight and the prestressing load were applied in this order
in one loading step each, before the external load was applied. The external load,
whether it was a point load, a distributed load or an imposed displacement, had a number
of 100 loading steps which were equal in size. This number was chosen in order not to
have a too high increase in the force that could lead to an early failure of the FE model.
It was determined that the model subjected to a point or distributed load having the arc-
length control as an incremental procedure gave the best results in terms of the model’s

FATIGUE MODEL FOR PRESTRESSED CONCRETE DECKS
97
Master’s Thesis – Tudor Mihai Brata
capacity. This aspect will be emphasized more in the calibration related section of this
chapter.
The arc-length method, that can adapt its step size depending on the results in the current
step, is used to overcome too large displacement predictions that emerge when a load
increment is prescribed. By using this method, behaviours such as snap-through and
snap-back, that otherwise would lead to divergence, can be analysed. The size of the
increment is adapted automatically within the iteration process and no longer depends
on the one imposed at the beginning of the increment [25].
Figure 4-25 – Snap-through [25]
Figure 4-26 – Snap-back [25]
For the iterative method, the modified Newton-Raphson was used, considering a
maximum of 50 iterations per loading step. This method, although it may require a
higher number of iterations, is faster than the regular Newton-Raphson and can
converge in situations where the latter is not able to do that, evaluating the stiffness at
the start of the increment and not for every iteration [25].
The convergence norms for an applied load were displacement and energy based, whilst
for an imposed displacement they were force and energy based. With respect to the
tolerances, their values were taken from the guidelines [26]: 0.001 for an energy norm
and 0.01 for an unbalanced force.
Figure 4-27 – Modified Newton-Raphson method [25]

FATIGUE MODEL FOR PRESTRESSED CONCRETE DECKS
98
Master’s Thesis – Tudor Mihai Brata
The phased analysis was used in two situation. First, when an imposed displacement
was acting on the model and there was a need for adding an extra support at the location
of the displacement in order to apply this deformation. Second, when a series of
nonlinear analyses had to be performed successively, with the materials (concrete)
within the model having their properties changed. This was done in order to simulate
the effect of fatigue. Basically, a phased analysis was used when either geometrical or
material changes had to be done to the model within the same extended analysis, with
the results from the previous phases being used as initial values for the next phase.
4.3 Calibration of the FEA model
In order to calibrate the FEA model as accurate as possible, the results from the previous
experimental programs, [14] and [15], were needed for comparison. To achieve this, the first
step was to obtain from the PhD thesis of S. Amir [14] the data required to plot the force –
deflection behaviour of the structural system during the experiments and from the FEA analysis.
Since this data was not directly available, use was made of one of the graphs (from an image)
from the thesis, this containing the previously mentioned information that was of interest. A
software named ENGAUGE DIGITIZER was used to recover the data points from the said
graph that was in the image file. Based on those points, a new graph was created and the plotted
curves (reference) served as the basis for comparing the results obtained from the FEA model.
The graph taken from the PhD thesis [14] was created for a transverse prestressing level (TPL)
of 2.5 MPa and an applied single point load at the mid-span of the deck slab, the same
characteristics being valid for the FEA model of this thesis.
Figure 4-28 – Load-deflection behaviour for a single
point load at mid-span and a TPL of 2.5 MPa [14]
(image used to obtain Graph 4-2)
Graph 4-2 – Load-deflection behaviour following from
the experimental program and the FEA of S. Amir
Having managed to obtain the behaviour of the structure during both the experiment
and FEA 3D model (the reference curves), the following step was to perform a static calibration
of this thesis’s FEA model, before moving to the assessment and prediction of the fatigue
damage. The goal was to create a model that would behave similar to the cases already

FATIGUE MODEL FOR PRESTRESSED CONCRETE DECKS
99
Master’s Thesis – Tudor Mihai Brata
mentioned and depicted in Graph 4-2. During this process, it was noticed that a number of
parameters had an impact on the model’s behaviour and they will be individually discussed in
the following. It must be noted that the influence of some of these parameters was assessed
before reaching the model that was considered to have the best behaviour, therefore the
variables within these transition models might have had different values than the final ones, but
is important to understand that here the sensitivity of the model was assessed with respect to
these parameters.
It must be mentioned that for all the graphs that will be presented in this Master’s Thesis
and are related to the force-deflection behaviour of the model, only the external applied force
was considered for this plots. The contribution to this behaviour of the self-weight or
prestressing load was disregarded, due to its small impact and because it would have had the
same effect on a model with the same width but a variation in other parameters.
4.3.1 Initial model based on the width from the experimental programs
This subsection presents the model that ensued by following the results and the data
from both experimental programs, [14] and [15]. Although it was labelled as the initial model,
this was because it was the first complex model that included all the parameters from the
research, the previous models being very simplistic when related to this aspect.
Having established how the in-plane geometry of the FEA model would be defined - its
shape, steel plates and position of bars - a realistic value for the considered effective width was
necessary for the plane stress model. After studying S. Amir’s thesis [14] and the report on the
fatigue tests [15], a width (in Z direction) of 1.40 meters was considered to be in good
correlation with the real experiments. This choice was based on assessing the observed cracking
pattern and punching cone in the previously mentioned sources, but it must be noted that those
were real life experiments having a three dimensional stress state.
Figure 4-29 – Cracking pattern due
to static loading [15] Figure 4-31 – Punching cone
contour and crack pattern due to
fatigue loading [15]
Figure 4-30 – Failure due to fatigue
loading [15]

FATIGUE MODEL FOR PRESTRESSED CONCRETE DECKS
100
Master’s Thesis – Tudor Mihai Brata
As a consequence of the chosen effective width, other parameters such as the area of
reinforcement or the lateral prestressing load had to be adjusted accordingly. For instance, in
order to have a 2.5 MPa stress level in the concrete, the lateral load had to be increased to 350
kN. As reinforcement, 8Φ6 bars were considered at each side (top and bottom) and 4Φ15 for
the area of prestressing steel. Regarding the supports, the left one had fixed translations on both
X and Y axes, whilst the other supports had a fixed translation only on the Y axis, trying to
replicate the conditions from S. Amir’s thesis [14]. It must be mentioned that whilst in the case
of S. Amir’s research the supports were considered at the bottom side of the longitudinal girders
ends, in the FEA model of this thesis they are considered at the level of the deck since only this
element was modeled. The external force had a value of 335 kN as it was described in section
4.2.6. If this was distributed over the length of the plate, its value would be 1675 N/mm.
Graph 4-3 – Force-deflection behaviour of the initial
model for different loading situations
Graph 4-4 – Different force-deflection behaviours of the
initial model compared to the reference curves
In the above graphs, the force-deflection behaviour of the initial model is presented. A
series of analyses were conducted within which the external load was applied in different
manners: as a point load acting on the loading plate in the middle of the span, as a uniformly
distributed load acting over the length of the steel plate or as an imposed displacement. Another
important parameter studied was the bond of the prestressing steel and its impact.
4.3.1.1 Behaviour of the initial model
Following the analyses, it was very clear that the behaviour of the initial model was far
from the experimental and the 3D FEA results, especially in terms of initial stiffness and
capacity. However, a series of observations were made which allowed for the continuous
development of the model.
It was observed that an applied point load, in an analysis with arc-length control, gives
better results in terms of capacity than an applied uniformly distributed load (UDL). At the
opposite end, an imposed displacement gives by far the lowest estimation of the model’s
capacity.
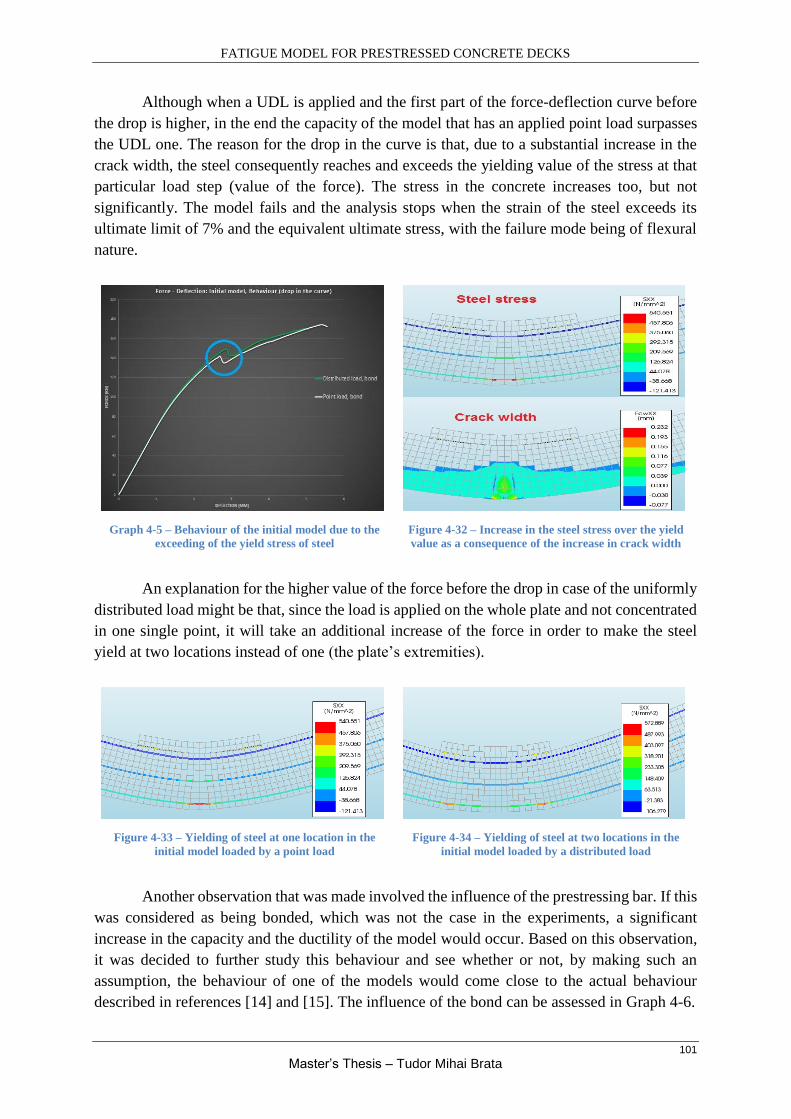
FATIGUE MODEL FOR PRESTRESSED CONCRETE DECKS
101
Master’s Thesis – Tudor Mihai Brata
Although when a UDL is applied and the first part of the force-deflection curve before
the drop is higher, in the end the capacity of the model that has an applied point load surpasses
the UDL one. The reason for the drop in the curve is that, due to a substantial increase in the
crack width, the steel consequently reaches and exceeds the yielding value of the stress at that
particular load step (value of the force). The stress in the concrete increases too, but not
significantly. The model fails and the analysis stops when the strain of the steel exceeds its
ultimate limit of 7% and the equivalent ultimate stress, with the failure mode being of flexural
nature.
Graph 4-5 – Behaviour of the initial model due to the
exceeding of the yield stress of steel
Figure 4-32 – Increase in the steel stress over the yield
value as a consequence of the increase in crack width
An explanation for the higher value of the force before the drop in case of the uniformly
distributed load might be that, since the load is applied on the whole plate and not concentrated
in one single point, it will take an additional increase of the force in order to make the steel
yield at two locations instead of one (the plate’s extremities).
Figure 4-33 – Yielding of steel at one location in the
initial model loaded by a point load
Figure 4-34 – Yielding of steel at two locations in the
initial model loaded by a distributed load
Another observation that was made involved the influence of the prestressing bar. If this
was considered as being bonded, which was not the case in the experiments, a significant
increase in the capacity and the ductility of the model would occur. Based on this observation,
it was decided to further study this behaviour and see whether or not, by making such an
assumption, the behaviour of one of the models would come close to the actual behaviour
described in references [14] and [15]. The influence of the bond can be assessed in Graph 4-6.

FATIGUE MODEL FOR PRESTRESSED CONCRETE DECKS
102
Master’s Thesis – Tudor Mihai Brata
Another parameter that was varied was the ultimate strain of the reinforcing steel. Its
increase from a value of 5.5% to a value of 7% had as effect an extremely small increase in the
ductility of the model. Overall it can be concluded that the variation of the ultimate steel strain
has no major impact on the behaviour of the model. This can also be seen in Graph 4-7, with
both of the curves overlapping each other.
Graph 4-6 - Influence of the prestressing bar’s bond on
the behaviour of the initial model
Graph 4-7 – Influence of the ultimate steel strain on the
behaviour of the initial model
One important observation concerns the sensitivity of the model to the value of the
applied force and number of loading steps, seeming that these influence substantially the force-
deflection behaviour. Although a high number of equal loading steps (100) was considered
especially to avoid higher load increments that could lead to early failure, it appears that for the
parameter combination within the model, there is a range of applied force values for which this
early failure manifests itself. This can be assessed in Graph 4-8.
Graph 4-8 – Influence of the value of the applied force
Graph 4-9 – Influence of the arc-length control method
Having an applied external force, it was necessary to use the arc-length method for the
nonlinear finite element analysis in order to have convergence for as many load increments as

FATIGUE MODEL FOR PRESTRESSED CONCRETE DECKS
103
Master’s Thesis – Tudor Mihai Brata
possible and avoid or delay the occurrence of divergence. The lack of the arc-length method
from the analysis setup will lead to early failure. Its influence is presented in Graph 4-9.
Another important remark refers to the development of the compressive membrane
action within the model. As it was thought, this phenomenon occurs in the deck slab and is a
result of slab’s supporting conditions and restraints. The CMA can be observed in the figure
below:
4.3.1.2 Conclusions regarding the initial model
This subsection presents briefly the main conclusions that followed from the series of
analyses performed on the initial complex model, all of these representing the main basis for
improvement and further development of the FEA model, with the goal of creating one that
depicts a behaviour similar to the reference curves.
The failure of the model is of flexural nature
The phenomenon of compressive membrane action develops within the FEA model
The initial stiffness and overall capacity of the model must be considerably improved
in order to obtain a behaviour similar to the reference curves
Applying a point load (concentrated force) gives the best results in terms of capacity
and ductility
The use of the arc-length method is mandatory to avoid premature failure when a point
load is applied to the model
Considering the prestressing bar as being bonded, assumption that does not reflect the
situation within the real structure, increases substantially the behaviour of the model
Most of the parameters assessed in subsection 4.3.1 will also be analysed with respect
to the final FEA models and it will be shown that they influence the model’s behaviour a manner
similar to what was described previously.
Figure 4-35 – Development of the compressive membrane action (CMA) within the initial FEA model

FATIGUE MODEL FOR PRESTRESSED CONCRETE DECKS
104
Master’s Thesis – Tudor Mihai Brata
4.3.2 Impact of the considered effective width
Following the analyses performed on the initial complex model, it was concluded that
a substantial increase in the model’s initial stiffness is required. To achieve this, the effective
width of the FEA model, which emerged as a fundamental parameter, was increased step-wise,
assessing its impact for each individual value. Together with the increase of the width, also an
increase in the areas of reinforcing and prestressing steel and the prestressing load was
performed, since they were tightly correlated to each another. The areas of steel because of the
number of bars distributed over the considered width and the prestressing load due to the fact
that a uniform compressive stress of 2.5 MPa had to be achieved in the deck slab.
Such a realistic value, in terms of its magnitude, for the effective width was considered
in order to have a behaviour for the FEA model that would be as close as possible to the ones
determined in the previous research [14]. Taking into account that the used model already had
a series of major assumptions that influenced its behaviour, it was though that a simplification
in terms of width size (effective width) would lead to certain drawbacks. The FEA model tried
to replicate on a 1:1 scale the real structural system so that a similar behaviour would be
obtained. Using a two-dimensional model to reproduce a three-dimensional stress state proved
already its limitations, therefore it was tried to avoid the potential disadvantages and
insufficiencies that might have occurred by using a scaled down value for the width. In essence,
it was thought that by reproducing the life-sized structure, the stress state and the behaviour
would be more accurate.
By successively varying the value of the width it was determined that the plane stress
model in DIANA has a size limitation of 2 meters with respect to this. According to the manual,
the plane stress model is dependent on the geometry, not allowing the width to be too large
compared to the in-plane dimensions, as stated in subsection 4.2.4.1. In the end, the final width
of the FEA model, as previously mentioned in subsection 4.2.2, had a value of 1.95 meters, this
giving the best behaviour with respect to the reference curves. The equivalent steel areas are
the ones presented in subsection 4.2.3 and the prestressing load in subsection 4.2.6.
Graph 4-10 – Impact of the effective width on the FEA
model’s behaviour
Graph 4-11 – Best behaviour obtained for a width of
1.95 meters
The previous graphs present the impact of the considered width on the behaviour of the
FEA model, with the substantial increase of the initial stiffness being extremely clear.

FATIGUE MODEL FOR PRESTRESSED CONCRETE DECKS
105
Master’s Thesis – Tudor Mihai Brata
4.3.3 Impact of the degrees of freedom at the supports
After studying the behaviour of the initial model, modifications to the supports were
performed since it was obvious that the results were very far from those obtained by S. Amir
[14]. It must be mentioned that in the actual experiment (S. Amir), as part of the structural
system, two end cross-beams were present at each end of the concrete deck, these completely
restraining its horizontal movement. As a consequence, the translations on both directions (X
and Y) for all supports were blocked, this action resulting in a substantial increase in the initial
stiffness of the FEA model and a more realistic behaviour that was similar to the actual
structure. As it was outlined in subsection 4.3.1, in the real structure the supports were
considered at the bottom side of the longitudinal girder’s ends, whilst the deck was overall
monolithically connected (the flanges of these girders with the concrete cast in-situ between
them). This gave a higher degree of restraint to the deck, considering that only rotations were
allowed at the location of the girders. Since in the FEA model the supports were part of the
deck, the assumption of translations blocked on both directions seems sound, allowing only
rotations. The influence on the model of the previously mentioned rotations will also be
analysed later in this section.
The downside of fixing both translations meant that the required compressive stress of
2.5 MPa within the concrete slab was no longer achievable since the supports restricted the
transfer of the prestressing load across the slab. Nevertheless, a compressive stress of 1.7 MPa
on average was obtained due to the bending moment resulted at the supports from the action of
the laterally applied prestressing load. The small loss in the compressive stress was deemed to
be acceptable, considering the substantially improved behaviour of the FEA model.
Graph 4-12 – Impact of the translation restraint at the
supports
4.3.4 Impact of the prestressing bar’s bond
As it was observed for the initial model, whether the prestressing bar is considered
bonded or not has a large influence on the model’s behaviour. In reality the bar was not bonded,
as it was described in subsection 4.2.5.3, but seeing that it can increase the model’s capacity
Figure 4-36 - Compressive stress in the deck slab after
blocking both translations at the supports

FATIGUE MODEL FOR PRESTRESSED CONCRETE DECKS
106
Master’s Thesis – Tudor Mihai Brata
quite substantially and give a behaviour that is similar to the reference curves, it was decided
to create also a model where the prestressing bar is bonded. The outcome was in accordance to
what was previously mentioned, obtaining results that were closer to the experimental
capacities of the structural system. This is presented below:
Graph 4-13 – Influence of the prestressing bar’s bond
on the capacity of the model: no bond considered
Graph 4-14 - Influence of the prestressing bar’s bond
on the capacity of the model: bond considered
Another aspect that was also studied was the relevance of modelling the prestressing
bar in the situation that this was not bonded to the mother element. Since the prestressing load
was applied to the model as an external lateral load and also because there would be no
contribution in terms of stiffness or capacity when the bar would be modelled without bond, it
seemed that the absence of the prestressing bar element from the FEA model would be justified.
The performed analyses showed indeed that the behaviour of a model that does not contain the
prestressing bar is similar to that of a model that contains the bar, but this is not bonded.
In the following graph, the behaviour of the FEA model with different widths and
having the prestressing bar modelled with no bond or not modelled at all, can be observed. It is
clear that for the same width, the force-deflection curves are identical and overlap each other
for both previously mentioned situations.
Graph 4-15 – Behaviour of the FEA model without the
prestressing bar and with the bar not being bonded

FATIGUE MODEL FOR PRESTRESSED CONCRETE DECKS
107
Master’s Thesis – Tudor Mihai Brata
4.3.5 Impact of the Arc-Length Control (ALC) method
The arc-length control method, assessed also for the initial model in subsection 4.3.1.1,
was used within the nonlinear FEA in order to avoid early divergence during the iterative
process. Its impact was clear following the analyses, this method assuring the convergence of
a higher number of incremental steps. As a direct outcome from the usage of ALC it can be
mentioned the higher capacity of the FEA model that resulted from the analyses. For the final
width of 1.95 meters such a study was performed and the result is presented in Graph 4-16.
Graph 4-16 - Influence of the Arc-Length Control
method; final effective width (1.95 m) considered
Graph 4-17 - Influence of the rotation at the supports
on the behaviour of the FEA model
4.3.6 Impact of the rotation at the supports
Due to the simplifications, in terms of modelling of the structure, that were already
mentioned in this section, at the location of the supports in the FEA model the translations were
blocked on both directions, whilst the rotations were permitted. This was done in order to
replicate more accurately the real life situation.
Because an increase in capacity and stiffness were the goals throughout the calibration
stage of the FEA model, a number of analyses were also performed by assuming that the model
is fully clamped: all translations and rotations were blocked. However, the outcome was
identical to the situation where rotations were permitted, not existing any difference in the
behaviour of the model. In Graph 4-17 the impact of the rotation can be assessed for an applied
force of 335 kN (mean static strength from the experiments) and different configurations of the
model, with the graphs overlapping each other (2 pairs).
4.3.7 Impact of the compressive behaviour of concrete
In order to assess the compressive behaviour of concrete, two models were tested, as it
was mentioned in subsection 4.2.5.1. The guidelines from Rijkswaterstaat [26] recommend that
a parabolic function with a softening branch should be used. Apart from this model, a constant

FATIGUE MODEL FOR PRESTRESSED CONCRETE DECKS
108
Master’s Thesis – Tudor Mihai Brata
one (ideal: elastic-perfectly plastic) with no softening branch was also tested since such a
function was used by S. Amir in her thesis [14]. Following the performed analyses it was
concluded that a parabolic model would give a better behaviour for this FEA model. This is
presented in Graph 4-18.
Graph 4-18 - Influence of the compressive model of the
concrete on the FEA model’s behaviour
Graph 4-19 - Influence of the tensile model of concrete
on the FEA model’s behaviour
4.3.8 Impact of the tensile behaviour of concrete
For the tensile behaviour of concrete a series of tension softening functions were
considered, as described in subsection 4.2.5.1: exponential softening - which is recommended
by Rijkswaterstaat [26], Hordijk softening – used by S. Amir [14] and linear softening.
Following a series of analyses performed using each of these functions, the results showed that
a linear softening model gives a better behaviour. This can be assessed in Graph 4-19.
4.3.9 Chosen FEA models
After performing an extensive number of analyses and studying the impact of a series
of parameters that influenced the behaviour of the FEA model, two final variations of this model
were chosen for the fatigue prediction analyses.
The first of these models gave the best behaviour when compared to the reference
curves, but, in its case, the assumption of having the prestressing bar bonded to the mother
element was made in order to increase the capacity. It was discussed previously that this was
not the case with the real structure, but for the purpose of calibrating the model as accurately
as possible this assumption was adopted. All the other parameters were in accordance with the
real structure. This was deemed as the “best behaviour model” (BBM). The second FEA model
used was very similar to the first one, the only exception being that the prestressing bar was not
bonded. Since in this case all the parameters, including areas of steel and prestressing load,
were in line with the tested structure, this was deemed as the “realistic model” (RM).

FATIGUE MODEL FOR PRESTRESSED CONCRETE DECKS
109
Master’s Thesis – Tudor Mihai Brata
The majority of the properties or parameters of these models were presented in section
4.2. Following the calibration process, the other important parameters were obtained and are
described in the current section, 4.3. One major parameter that must be mentioned due to its
contribution to the stiffness of the model and its overall behaviour is the considered effective
width, this having a value of 1.95 meters. The two final models, based on this width, are
presented in the graph below:
4.4 Final models and their behaviour
4.4.1 Linear analysis checks
In order to be sure that the general FEA model behaves as intended and it is reliable, a
series of hand calculations were performed and their results were compared with the outcomes
from the linear analysis performed on the model. For assessing the linear behaviour, the
following were checked: vertical deflection, stresses at top and bottom side of the section and
the moment of cracking. The results showed a good correlation between the hand-checked
calculations and the data obtained from DIANA, this being presented in Annex 2.
4.4.2 Capacity of the models
Following the performed nonlinear analyses for the calibration process, it was
concluded that the two FEA models selected for the fatigue prediction stage proved to have a
lower overall capacity than the reference curves based on the experimental programs [14] and
[15]. This was to be expected since the plane stress model refers to a bi-dimensional (2D) stress
state, whilst in the real life structure a three-dimensional stress state defines the behaviour. As
a consequence, there are limitations to the 2D FEA model and a completely accurate description
of the real behaviour is hard to achieve.
Graph 4-20 - Final FEA models

FATIGUE MODEL FOR PRESTRESSED CONCRETE DECKS
110
Master’s Thesis – Tudor Mihai Brata
Although the externally applied point load had a value of 335 kN, as it was described
in subsection 4.2.6, none of the two models was able to reach it. The one that exhibited the best
behaviour (BBM) had a final static capacity of approximately 245 kN, this representing 73%
of the value from the tests. The second model (RM), having the prestressing bar not bonded,
had its capacity equal to approximately 203 kN, meaning 60% of the mean static capacity from
the tests [15].
In case of the first model (BBM), divergence occurred during the nonlinear analysis and
the iterative process together with the analysis was halted. For the second model, all the load
increments converged, but after reaching a peak value, the force started a continuous decrease.
This was the moment when the steel exceeded its ultimate stress value, but with the strain
remaining below the ultimate limit according to DIANA. This will be presented in the
subsection related to the realistic model (RM). For defining this model’s behaviour, only the
first part of the curve was considered, the second branch being truncated. This is presented in
the graph below. The failure modes of both models are assessed in the next subsection.
4.4.3 Failure modes
The real structural system, from [14] and [15], failed exclusively through punching
shear during all the tests that were performed on it, this being a three-dimensional mode of
failure. In case of the FEA model, since this was of a two-dimensional plane stress type, for all
the analyses performed, the failure mode was of flexural nature. In the following, the behaviour
of both chosen models (BBM and RM) will be presented.
4.4.3.1 Best behaviour model (BBM)
The FEA model that presented the best behaviour (BBM) failed as the stress in the
reinforcing steel exceeded the yield limit and almost reached the ultimate value of 580 MPa,
Graph 4-21 – Behaviour of the “realistic model’ (RM)

FATIGUE MODEL FOR PRESTRESSED CONCRETE DECKS
111
Master’s Thesis – Tudor Mihai Brata
this happening at an applied force of ≈245 kN. The value of the strain increased substantially
at failure, to 1.3%, but was still well below the ultimate value of 7%. This large difference
might be due to how DIANA considers the strains, calculating an average over the length of
one discretized element, with the outcome being a smaller value.
The concrete compressive stress was smaller than its compressive strength, whilst the
tensile stress was higher than the tensile strength, with cracking occurring in the initial loading
stages at ≈90 kN of the applied force (or 27%). It can be stated that once the concrete has
cracked, the steel starts to take over most of the load, with a redistribution of stresses also taking
place.
In the case of this FEA model, it was also studied what impact would the choice of
presenting the results in the nodes of the plane stress elements or in the integration points have.
It was observed that the results that are given in nodes are higher than the ones from the
integrations points. This occurs due to the extrapolation that is performed from the integration
points to the nodes. When the results are determined in the integration points, DIANA still
presents them as being in the nodes. What happens here is that the software takes the results
from the integration points and attributes them to the nodes without any extrapolation, therefore
having lower values.
The following subsections present the results from the analysis, showing the stresses
and strains of steel and concrete, crack widths, deflections, occurrence of CMA.
4.4.3.1.1 Stresses and strains in the reinforcing steel
The following figures present the stress in the steel at the moment of failure, with the
values exceeding the yield stress. The difference between the results in the nodes (left figure)
and the ones in the integration points (right figure) is clearly visible, having higher values in
the nodes of the plane stress element. The reason behind this matter was explained in the
previous paragraph.
Figure 4-37 – Stresses in the steel at failure (presented
in the nodes)
Figure 4-38 - Stresses in the steel at failure (presented in
the integration points)
The values of the strains are presented below, in the nodes and in the integration points,
with the observations made earlier being valid also in this case. A possible explanation for the
low value of the strain at such a high stress was given at the beginning of subsection 4.4.3.1.

FATIGUE MODEL FOR PRESTRESSED CONCRETE DECKS
112
Master’s Thesis – Tudor Mihai Brata
Figure 4-39 – Strains in the steel at failure (presented in
the nodes)
Figure 4-40 - Strains in the steel at failure (presented in
the integration points)
The variation of the stress in the steel with the increase in the force was also studied and
is presented in the following graph. It can be observed that after a long period of slow and
gradual increase, there is an abrupt rise in the value of the stress, up to failure.
4.4.3.1.2 Stresses and strains in the concrete
The stresses in the concrete clearly show that high values were reached at the moment
of failure, with the increase in the compressive stress being higher than the increase of the
tensile one, when compared to the second to last loading step. The compressive strength of the
concrete (65 MPa) is not reached but the tensile strength (5.41 MPa) is exceeded by 40% at the
moment of failure, with cracking occurring in the early loading stages at an applied load of ≈90
kN. It must be mentioned that in the case of the results given in the integration points, once the
concrete cracks, the value of the tensile stress does not change, only the height of the tensile
zone. In the following figures only the most relevant part of the deck is presented, which is at
the location of the applied load. The loading plate is not included in the plots.
Graph 4-22 – Steel stress variation in the best
behaviour model

FATIGUE MODEL FOR PRESTRESSED CONCRETE DECKS
113
Master’s Thesis – Tudor Mihai Brata
Figure 4-41 – Stress in the concrete at failure (presented
in the nodes)
Figure 4-42 - Stress in the concrete at failure (presented
in the integration points)
The strains of the concrete are presented below and they clearly show the locations
where the cracks were formed. Again, the values presented in the nodes are higher that the
results obtained in the integration points. An observation can be made regarding the values in
the nodes. Since these are determined via extrapolation, the unrealistic situation when to the
strains in a crack a negative value is attributed, can occur. Here the loading plate is included in
the plot since in this case it does not have an impact on the results.
Figure 4-43 - Strain of the concrete at failure (presented
in the nodes)
Figure 4-44 - Strain of the concrete at failure (presented
in the integration points)
4.4.3.1.3 Crack width
The location of the cracks is in correlation with the strains showed earlier, as anticipated.
The way DIANA determines the crack widths is by multiplying the strains with the crack
bandwidth (hcr). For a two-dimensional element, the crack bandwidth is equal to the square root
of the element’s area. Since in this case the element was defined as having a 10 x 10 mm2 area
(subsection 4.2.7), the value for hcr was 10 mm. The resulting crack width can be easily checked
by multiplying the values of the strains with 10.
In order to check whether the obtained results have a realistic fundament, reference is
made to the tests performed within the research [15]. According to the obtained results in test
number BB25, at a loading between 200 and 250, the crack width ranged between 0.35 and 0.5
mm. Subsequently the specimen failed at 330 kN and a crack width of 0.9 mm. For test BB31
similar values are obtained, having a crack width of 0.5 mm at a load that varied between 200
and 250. However, test BB27 displayed much lower crack widths, between 0.05 and 0.15 mm
for the same loading range.

FATIGUE MODEL FOR PRESTRESSED CONCRETE DECKS
114
Master’s Thesis – Tudor Mihai Brata
For the BBM, it was observed that at the moment of failure there was a substantial
increase in the crack width. The crack widths are presented in the figures below and it can be
observed that they have the same order of magnitude with the previous presented results.
Figure 4-45 – Crack width at failure (presented in the
nodes)
Figure 4-46 - Crack width at failure (presented in the
integration points)
4.4.3.1.4 Deflection at mid-span
In order to verify if the value for the obtained deflection at mid-span was realistic, a
comparison was made with the deflections obtained in S. Amir’s thesis [14], both experimental
and FEA. It must be kept in mind that the values from the experimental tests are the outcome
of an average applied force of 335 kN and the value from the FEA is obtained under a load of
≈300 kN. Since the static capacity of the BBM is ≈245 kN, the obtained lower value for the
deflection is thought to be justified and to have the same order of magnitude.
Figure 4-47 – Deflection values from the experimental
tests [14]
It was observed that the deflection was identical for both types of outputs, in the nodes
or in the integration points. As a consequence only one plot will be presented.
Figure 4-49 – Deflection of the best behaviour FEA model
4.4.3.1.5 Compressive membrane action (CMA)
As expected, the FEA model was able to develop the compressive membrane action, by
doing so the moment of failure being delayed. This can be assessed in the following figure. In
Figure 4-48 - Deflection values from the FEA [14]

FATIGUE MODEL FOR PRESTRESSED CONCRETE DECKS
115
Master’s Thesis – Tudor Mihai Brata
order for it to be more clearly visible, the value of the maximum and minimum stresses were
chosen accordingly.
Figure 4-50 – Development of the Compressive Membrane Action in the BBM FEA model
4.4.3.2 Realistic model (RM)
The FEA model that was deemed as the realistic model (RM) due to the fact that its
parameters were in accordance with the real structural system, failed as the stress in the
reinforcing steel exceeded the ultimate limit of 580 MPa, this happening after a force of ≈203
kN was applied. Nevertheless, the value of the strain remained extremely low, occurrence
which is thought that it should not have happened. This aspect is presented in the following
subsection.
It was already mentioned and presented in subsection 4.4.2 that after reaching the peak
value, the force started a continuous decrease and the analysis did not stop. It is thought that
this happened due to the inaccurate value of the strain computed by DIANA. Nevertheless, this
part of the curve was not considered for the model’s behaviour, as it can be seen in Graph 4-21.
The compressive stress in the concrete was well below the compressive strength, whilst
the tensile stress was higher than the concrete’s tensile strength. Cracking started at a value of
the force of ≈90 kN. At the moment when the stress in the steel exceeded its ultimate limit,
considered to be the failure moment of the model, the compressive stress had a small increase
of ≈1.5 MPa, whilst the tensile stress had a very small decrease of ≈0.3 MPa. At this stage the
crack widths grew substantially.
Like in the case of the BBM, also for the realistic model the following subsections
present the results from the analysis, showing the stresses and strains of steel and concrete,
crack widths, deflections, occurrence of CMA.
4.4.3.2.1 Stresses and strains in the reinforcing steel
As it was mentioned earlier, after the applied load of 203 kN, the stresses in the steel
exceeded the ultimate value. As a consequence, the strain should have had also a value
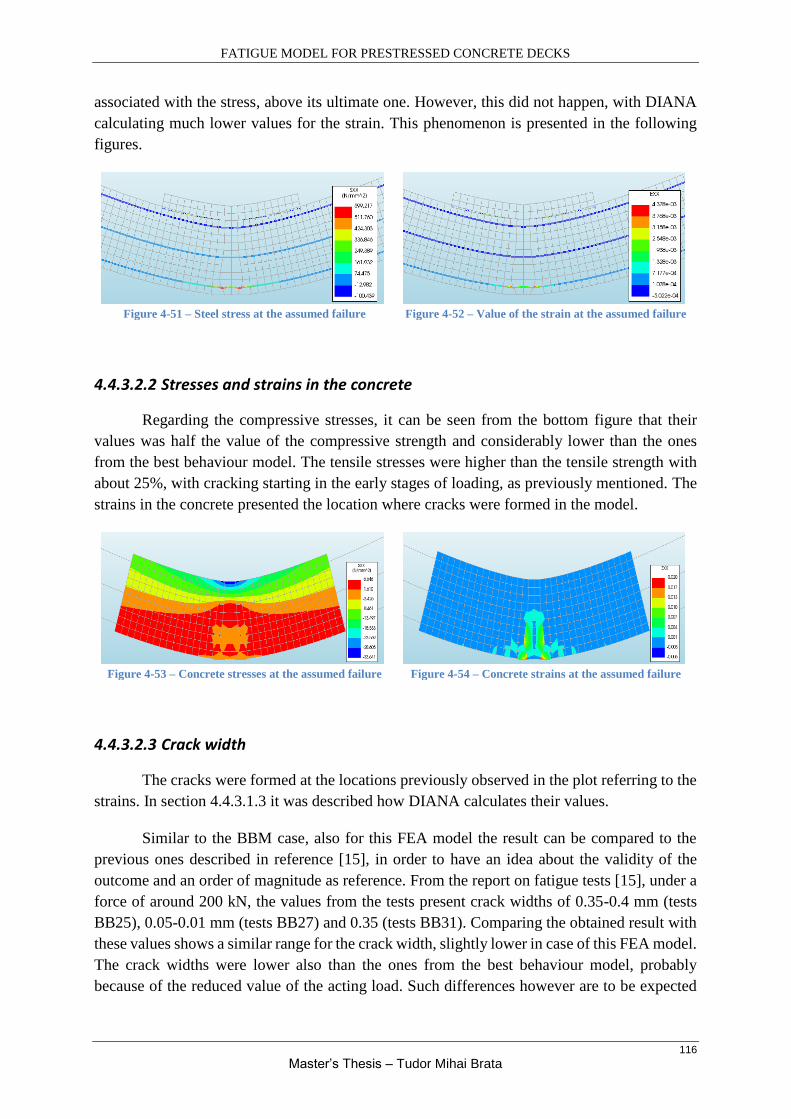
FATIGUE MODEL FOR PRESTRESSED CONCRETE DECKS
116
Master’s Thesis – Tudor Mihai Brata
associated with the stress, above its ultimate one. However, this did not happen, with DIANA
calculating much lower values for the strain. This phenomenon is presented in the following
figures.
Figure 4-51 – Steel stress at the assumed failure
Figure 4-52 – Value of the strain at the assumed failure
4.4.3.2.2 Stresses and strains in the concrete
Regarding the compressive stresses, it can be seen from the bottom figure that their
values was half the value of the compressive strength and considerably lower than the ones
from the best behaviour model. The tensile stresses were higher than the tensile strength with
about 25%, with cracking starting in the early stages of loading, as previously mentioned. The
strains in the concrete presented the location where cracks were formed in the model.
Figure 4-53 – Concrete stresses at the assumed failure
Figure 4-54 – Concrete strains at the assumed failure
4.4.3.2.3 Crack width
The cracks were formed at the locations previously observed in the plot referring to the
strains. In section 4.4.3.1.3 it was described how DIANA calculates their values.
Similar to the BBM case, also for this FEA model the result can be compared to the
previous ones described in reference [15], in order to have an idea about the validity of the
outcome and an order of magnitude as reference. From the report on fatigue tests [15], under a
force of around 200 kN, the values from the tests present crack widths of 0.35-0.4 mm (tests
BB25), 0.05-0.01 mm (tests BB27) and 0.35 (tests BB31). Comparing the obtained result with
these values shows a similar range for the crack width, slightly lower in case of this FEA model.
The crack widths were lower also than the ones from the best behaviour model, probably
because of the reduced value of the acting load. Such differences however are to be expected
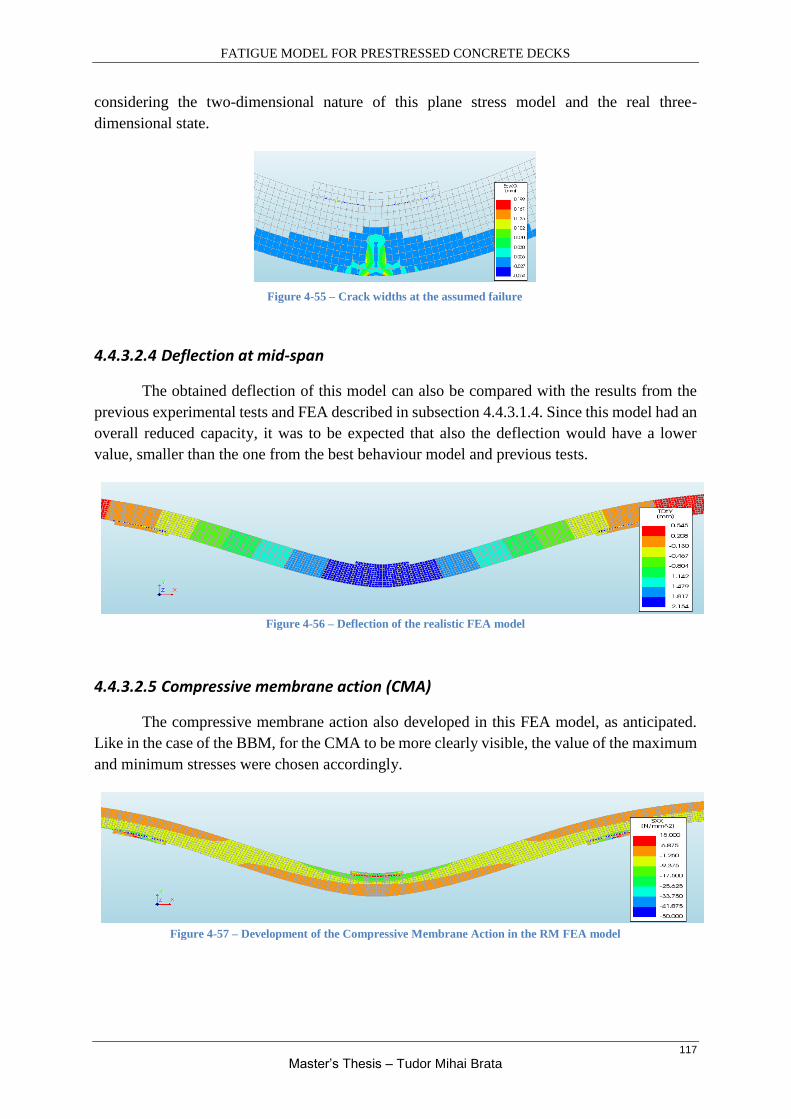
FATIGUE MODEL FOR PRESTRESSED CONCRETE DECKS
117
Master’s Thesis – Tudor Mihai Brata
considering the two-dimensional nature of this plane stress model and the real three-
dimensional state.
4.4.3.2.4 Deflection at mid-span
The obtained deflection of this model can also be compared with the results from the
previous experimental tests and FEA described in subsection 4.4.3.1.4. Since this model had an
overall reduced capacity, it was to be expected that also the deflection would have a lower
value, smaller than the one from the best behaviour model and previous tests.
Figure 4-56 – Deflection of the realistic FEA model
4.4.3.2.5 Compressive membrane action (CMA)
The compressive membrane action also developed in this FEA model, as anticipated.
Like in the case of the BBM, for the CMA to be more clearly visible, the value of the maximum
and minimum stresses were chosen accordingly.
Figure 4-57 – Development of the Compressive Membrane Action in the RM FEA model
Figure 4-55 – Crack widths at the assumed failure

FATIGUE MODEL FOR PRESTRESSED CONCRETE DECKS
118
Master’s Thesis – Tudor Mihai Brata
4.5 Conclusions of FEA – Stage I
For the first stage of the finite element analysis, the construction of a model that would
replicate as accurately as possible the results obtained by TU Delft’s experimental programs
[14] and [15] was performed. The behaviour of a transversely prestressed concrete deck slab
had to be modelled using the software package DIANA FEA and calibrated accordingly.
The departure point for this phase was the choice of using a two-dimensional model in
order to describe and assess the behaviour of the real structure, this being a three-dimensional
situation. The simplified approach involving a 2D plane stress model was chosen,
acknowledging the limitations that would come with the use of such a model. Although
simplistic from a geometrical point of view, the FEA model had a high number of parameters
that influenced its behaviour during the analyses and the obtained results. Among these
parameters, the ones that had a large impact on the outcome were the support conditions, the
material properties, the considered effective width of the model, the bond of the prestressing
bar, the incremental method, the way the external force was applied and the accuracy in
reproducing the real structure that was tested. Nonlinear analyses were performed in order to
reflect more realistically the behaviour and also for the ability to subsequently modify the
properties of the materials for the second stage of the FE analysis, the one related to fatigue.
The material models had a decisive role in describing as realistic as possible the
behaviour of the FEA model. For this, different functions were considered for simulating the
compressive and tensile behaviour of the concrete, choosing in the end the ones that gave the
best results. Another parameter that proved to be decisive was the considered width of the plane
stress model. Its value was essential for obtaining an initial stiffness similar to the ones from
the experimental program. The degrees of freedom of the supports also had a significant impact.
Whether the prestressing bar was considered bonded or not had a large influence on the capacity
of the model.
Overall, the influence of many parameters was studied and in the end the choice was
made to use two models for the second FEA stage. One of these models presented the best
behaviour (BBM) when compared to the results of previous experiments [14] and [15].
Nevertheless, in order to achieve such results the assumption of a bonded prestressing bar was
made, this being contrary to the real structure. The other model was in accordance with the
parameters from the structure and therefore was deemed as the realistic model (RM), its
behaviour however not being as good as for the other model.
The capacity of both FEA models was found to be lower than the previous experimental
and FEA results, but this was to be expected considering that a plane stress model was used.
The failure modes were analysed, studying the steel and concrete stresses and strains, the crack
widths, deflections and the development of the compressive membrane action, which occurred
as expected. Whilst in reality the structure experienced a punching shear type of failure given
the three-dimensional stress state, in the case of the FEA plane stress model the failure was of
flexural nature.

FATIGUE MODEL FOR PRESTRESSED CONCRETE DECKS
119
Master’s Thesis – Tudor Mihai Brata
Chapter 5: Finite Element Analysis - Stage II

FATIGUE MODEL FOR PRESTRESSED CONCRETE DECKS
120
Master’s Thesis – Tudor Mihai Brata
5.1 Introduction
The stated main goal of this Master’s Thesis was to create a FEA model that could
predict the fatigue behaviour of transversely prestressed concrete deck slabs. During the first
stage of the finite element analysis, two very similar models were created in order to replicate
this behaviour, both being calibrated according to the previous researches performed at TU
Delft, [14] and [15]. One of these experimental programs [15] studied the effect of fatigue on
such a structural system described earlier and represents the benchmark of this chapter.
This chapter describes how the created FEA models tried to replicate the previously
obtained test results and also assesses the accuracy of their prediction of the fatigue behaviour,
when this is compared with the outcome of the prediction formula derived at TU Delft for the
experiments described in reference [15]. Changes in material properties, namely concrete, were
performed in order to simulate the damage due to fatigue. The changes were directly linked to
the number of loading cycles and the loading range that acted on the structure.
The tests performed during the experimental program [15] were of compressive nature
only and had either one or multiple loading ranges. Apart from assessing the behaviour of the
structure under a single range, it was also of importance to analyse whether the loading
sequence in case of more than one range had any impact. For this however, only a single test
was performed, therefore there is no much data on such a behaviour. The effect of the loading
sequence is the object of the next research on fatigue at TU Delft, the experimental program
starting in the near future. This will be presented in the next chapter of the thesis.
Since an actual fatigue analysis cannot be performed in DIANA, the ones performed for
this chapter were still static analyses, where the reduction of material properties was taken into
account in the FEA models to simulate the fatigue behaviour. For all the analyses performed
for this part of the thesis, the value of the load that was applied to the FEA models was
represented by the static capacity of each model, since the loading range from the tests was
taken into account within the modified material parameters.
5.2 Changes in material properties
As concrete is subjected to cyclic loading, micro cracks and, subsequently, cracks start
to develop slowly in the concrete. By doing so, the material’s properties are getting altered
continuously, with the initial characteristics being reduced over time.
In the case of the deck slabs, with the load acting repeatedly on the structure, the
reduction of material properties starts with the assumption that the concrete’s compressive
strength is the main parameter that influences the behaviour. In the following it will be
presented to what extent the main properties of concrete influence the assumed fatigue
behaviour and it will be shown how these are correlated with each other.

FATIGUE MODEL FOR PRESTRESSED CONCRETE DECKS
121
Master’s Thesis – Tudor Mihai Brata
5.2.1 Compressive strength and compressive fracture energy of concrete
As a direct consequence of the repeated loading, the cracked concrete reduces its
bearing capacity, with the compressive strength being directly influenced by this phenomenon.
The reduction in the compressive stress that the structure can withstand is dependent on the
number of loading cycles and the loading range. A simplified approach used in order to
determine the maximum compressive stress in a structure after the action of a cyclic type of
loading is given by the formula:
Equation 5-1 – Determination of the maximum compressive stress
𝜎𝑐.𝑚𝑎𝑥
𝑓𝑐= 1 − 𝛽 ∗ (1 − 𝑅) ∗ 𝑙𝑜𝑔𝑁 [29], where
- 𝛽 is a coefficient: 0.064 < 𝛽 < 0.080 , here it was considered that 𝛽 =1
14
- 𝑅 =𝜎𝑚𝑖𝑛
𝜎𝑚𝑎𝑥 is the ratio between the minimum and maximum stresses (loads) in the cycle
- N represents the number of cycles within a loading range
- fc is the compressive strength of the concrete (assumed to be the mean one for the analyses)
During the performed tests, it was decided that for all of them the minimum load value
within a loading range would be 10% of the maximum one. As a consequence, in the above
formula, the ratio “R” between the minimum and maximum stresses (or loads) always had a
value of 0.1. Inserting into the formula the number of cycles along with the ratio of the stresses
(or loads) and the value for the initial compressive strength of the concrete, the result would
give a reduced compressive stress that, in theory, would be the maximum value that the concrete
could bear after the fatigue loading cycles.
This obtained value was used in the FEA model as the new and modified compressive
strength, representing the main parameter for assessing the fatigue behaviour. When
considering the crushing behaviour of concrete, apart from its strength, also the compressive
fracture energy plays a role and this was one of the parameters that served as an input for the
FEA model. Since these two are linked to each other, it was assumed that the same reduction
that was obtained for the compressive strength was also valid for the fracture energy.
Figure 5-1 – Compressive fracture energy dependence
on the compressive strength [25]
Graph 5-1 – Impact of the modified compressive
strength and fracture energy on the FEA model

FATIGUE MODEL FOR PRESTRESSED CONCRETE DECKS
122
Master’s Thesis – Tudor Mihai Brata
In Figure 5-1 the influence of the compressive strength on the compressive fracture
energy is presented for the parabolic function used in order to describe the compressive
behaviour of the concrete within the FEA model.
Following a series of analyses, it was observed that by modifying only the compressive
strength and the compressive fracture energy, the FEA model would not behave realistically.
This modifications led only to a decrease in the final capacity of the model, with no
deterioration of the stiffness, as it can be seen in Graph 5-1. A decrease in the stiffness should
have occurred since the concrete starts developing more and more cracks.
As the outcome from changing only the before mentioned parameters was considered
not to be satisfactory from a realistic point of view, the change of other parameters within the
FEA model was subsequently considered and performed.
5.2.2 Modulus of elasticity of concrete
As a consequence of the repeated loading, the concrete will crack and its stiffness will
be reduced. However, it was observed that during the initial finite element analyses related to
fatigue, the stiffness suffered no modifications after the parameters described in subsection
5.2.1 were altered. Therefore it was thought to study the impact of a modified modulus of
elasticity, this having a direct impact on the stiffness. The amount of reduction was thought to
have the same percentage as for the previous parameters. The outcome of modifying also the
value for the modulus of elasticity within in the FEA model can be observed in the following
graph.
Again, after a series of analyses that had the same outcome outlined by Graph 5-2, it
was clear that also by modifying the elasticity modulus of concrete, the end result would not
properly describe the real situation. In this case, the stiffness is completely different than the
ones obtained during the previous research programs right from the beginning of the analysis.
Since this is far from a real description of the behaviour, other parameters were modified.
Graph 5-2 – Impact of the elasticity modulus on the
fatigue behaviour

FATIGUE MODEL FOR PRESTRESSED CONCRETE DECKS
123
Master’s Thesis – Tudor Mihai Brata
5.2.3 Tensile strength and tensile fracture energy of concrete
With the previous modified material parameters not being able to describe a behaviour
that could have been considered realistic when related to the fatigue loading, thought was given
in altering also the tensile strength and the tensile fracture energy of the concrete, with the latter
being dependent on the former.
In order to come up with the best possible result, a series of combinations in terms of
considered parameters were taken into account and also several approaches in determining the
degree of reduction for the tensile strength and fracture energy.
Graph 5-3 – Behaviour of FEA model depending on the
parameters considered for modification
Graph 5-4 – Impact of different approaches in
determining the tensile strength and fracture energy
In Graph 5-3 the combination that would lead to a more realistic behaviour of the FEA
model can be observed, with the parameters that were taken into account being both strengths
of the concrete and their associate fracture energies. The modulus of elasticity was assumed not
to have its value modified, with the tensile strength determining the loss in stiffness once the
concrete starts to crack.
Graph 5-4 presents the outcome of different approaches that involved the way the
reduction of the tensile strength and fracture energy were considered. These two parameters are
also linked to the compressive strength, therefore were highly influenced by it. These
approaches were thought of in this form so that a behaviour closer to a real situation would be
simulated.
Table 5-1 – Approaches for determining the reduced tensile strength and tensile fracture energy
Outcome Parameters
High tensile
strength 𝑓𝑐𝑘𝑓𝑎𝑡𝑖𝑔𝑢𝑒
= 𝜎𝑐.𝑚𝑎𝑥 𝑓𝑐𝑡𝑚
𝑓𝑎𝑡𝑖𝑔𝑢𝑒
= 0.3𝑓𝑐𝑘𝑓𝑎𝑡𝑖𝑔𝑢𝑒
23
𝐺𝑓𝑡 =
𝐺𝑓𝑐
250
Lower tensile
strength 𝑓𝑐𝑚
𝑓𝑎𝑡𝑖𝑔𝑢𝑒= 𝜎𝑐.𝑚𝑎𝑥
𝑓𝑐𝑘𝑓𝑎𝑡𝑖𝑔𝑢𝑒
= 𝑓𝑐𝑚𝑓𝑎𝑡𝑖𝑔𝑢𝑒
− 8𝑀𝑃𝑎
𝑓𝑐𝑡𝑚𝑓𝑎𝑡𝑖𝑔𝑢𝑒
= 0.3𝑓𝑐𝑘𝑓𝑎𝑡𝑖𝑔𝑢𝑒
23
𝐺𝑓𝑡 =
𝐺𝑓𝑐
250
Lowest tensile
strength
𝑓𝑐𝑚𝑓𝑎𝑡𝑖𝑔𝑢𝑒
= 𝜎𝑐.𝑚𝑎𝑥
𝑓𝑐𝑘𝑓𝑎𝑡𝑖𝑔𝑢𝑒
= 𝑓𝑐𝑚𝑓𝑎𝑡𝑖𝑔𝑢𝑒
− 8𝑀𝑃𝑎
𝑓𝑐𝑡𝑚𝑓𝑎𝑡𝑖𝑔𝑢𝑒
= 0.3𝑓𝑐𝑘𝑓𝑎𝑡𝑖𝑔𝑢𝑒
23
𝑓𝑐𝑡𝑘.𝑚𝑖𝑛𝑓𝑎𝑡𝑖𝑔𝑢𝑒
= 0.7𝑓𝑐𝑡𝑚𝑓𝑎𝑡𝑖𝑔𝑢𝑒
𝐺𝑓𝑡
= 73𝑓𝑐𝑡𝑚𝑓𝑎𝑡𝑖𝑔𝑢𝑒0.18

FATIGUE MODEL FOR PRESTRESSED CONCRETE DECKS
124
Master’s Thesis – Tudor Mihai Brata
For the formulas in Table 5-1, the guidelines from Rijkswaterstaat [26 - table on page
11] were used, but not necessarily in the order presented there. The calculation process was
started by knowing the amount of reduction for the compressive stress and compressive fracture
energy. As a result, the tensile compressive energy was determined based on the compressive
tensile energy (for the first two methods) and not on the tensile strength, as would have been
done in [26]. By following the above mentioned approaches, it was observed that a too high
tensile strength might not lead to a failure associated with fatigue, the model behaving similar
to the static tests. On the other hand, a too low tensile strength could make the model fail sooner
than desired. It was also observed that the value of the tensile strength affects the ductility of
the model and not its capacity. As a consequence of all these observation, the second approach
was chosen in the end, this being the one that would result in a lower tensile strength (second
line of the table), between the two extremes.
Having determined what parameters influence the behaviour of the FEA model related
to the fatigue prediction analyses, the next step consisted of replicating the results from the
research on fatigue [15] and also determining the degree of accuracy of the FEA model with
respect to the prediction formula derived from the experimental tests described in reference
[15]. All of these are presented in the next subsections of the thesis.
5.3 Single cyclic loading range analyses
Within the experimental program related to fatigue [15], a series of single point load
tests were conducted by applying only a single load range on the structure. Like mentioned
previously, all the tests were of compressive nature, with the minimum load value being 10%
of the maximum one, the latter having always smaller value than the static strength of the
structure. Based on the results from these tests, but also from the ones with multiple stress
ranges, double point load or acoustic emissions, all described in reference [15], a prediction
formula was derived by the researchers from TU Delft, formula with which the theoretical
maximum force that could act on a structure after a certain number of cycles would be
determined.
Equation 5-2 – Force prediction formula
𝐹𝑓𝑎𝑡
𝐹𝑠𝑡𝑎= 0.93 − 0.065 ∗ 𝑙𝑜𝑔𝑁 [15], where
- Ffat is the force predicted after N loading cycles to be resisted by the element/structure
- Fsta is the static capacity of the element/structure
- N represents the number of loading cycles
Based on this formula, a value for the force after a certain number of cycles is obtained,
this being subsequently compared with the one resulting from the fatigue analysis performed in
DIANA, analysis that implies the modification of material properties. Furthermore, the results
from the FEA will be plotted against the ones from the tests and their accuracy will be assessed.

FATIGUE MODEL FOR PRESTRESSED CONCRETE DECKS
125
Master’s Thesis – Tudor Mihai Brata
5.3.1 Test BB23_200
Being the first fatigue test with a single load range and applied point load, this had a
maximum force value of 200 kN and a minimum one of 20 kN, as presented in Figure 5-2. The
number of cycles to failure was 24800. The prediction according to the previous formula was
done based on the static capacity of the two FEA models: the one with the best behaviour
(BBM) and the realistic one (RM). For both models a nonlinear analysis was performed using
DIANA.
Figure 5-2 - Cyclic loading range for test BB23_200 [15]
Graph 5-5 – Fatigue FEA of test BB23_200
It can be observed from Graph 5-5 that the capacity and ductility of the models are
considerably reduced following the fatigue FE analyses. Nevertheless, the resulting forces are
higher than the ones predicted by Equation 5-2 and can be assessed in the following table:
Table 5-2 – Test BB23_200 FEA results and prediction
FEA model Static capacity (Fsta) [kN] Predicted force (Ffat) [kN] FEA result [kN]
BBM 244.86 157.78 178.25
RM 203.38 131.05 156.31
In case of the BBM all loading steps converged (applied 73% of load), with the steel
stress being just slightly below the yield limit and the steel strain having a very small value at
the end of the analysis. The compressive stress in the concrete was considerably low compared
to the compressive strength, whilst the tensile stress was larger than the tensile strength as
cracking occurred in the early loading stages. The strain in the tensioned zone had a large value.
Figure 5-3 – Steel stress at the end of the analysis,
BB23_200 - BBM
Figure 5-4 – Steel strain at the end of the analysis,
BB23_200 - BBM

FATIGUE MODEL FOR PRESTRESSED CONCRETE DECKS
126
Master’s Thesis – Tudor Mihai Brata
Figure 5-5 – Concrete stresses at the end of the analysis,
BB23_200 - BBM
Figure 5-6 –Concrete strains at the end of the analysis,
BB23_200 - BBM
The drop in the force - deflection curve, followed by a rise, is the result of a very large
and instant increase in the steel stress (by more than 50%), caused by an increase of the crack
width. It was observed that once the curve in the graph starts to rise again, the stress in the
concrete varies only to a small extent, whilst the stress in the steel continues to constantly
increase its value until the end of the analysis. The output in terms of crack width from DIANA
(≈0.2 mm), seen in Figure 5-7, showed a similar magnitude to the crack width measured in the
test (0.4 mm). It was also clear that the CMA had developed within the model as presented in
Figure 5-8.
In case of the realistic model (RM) the analysis diverged towards the end. The failure
was of flexural nature, most likely due to the concrete failing in tension, this being combined
with the effect of the steel stresses, although the latter did not exceed its yield values. The steel
stress had a value far from the yielding one, but at failure the stress increased by more than
40%. Nevertheless, the steel strain remained at a low value.
Figure 5-9 – Steel stress at failure, BB23_200 - RM
Figure 5-10 – Steel strain at failure, BB23_200 - RM
Like for the BBM, the compressive stress in the concrete was considerably lower than
the compressive strength, with the tensile stresses being larger than the tensile strength. At
failure, the increase in their value was extremely small but the crack width increased
Figure 5-7 – Crack width, BB23_200 - BBM Figure 5-8 – Development of CMA, BB23_200 - BBM

FATIGUE MODEL FOR PRESTRESSED CONCRETE DECKS
127
Master’s Thesis – Tudor Mihai Brata
significantly, almost doubling its value. The strain had a high value in the tensioned zone. The
compressive membrane action had developed within the model also during this analysis.
Figure 5-11 – Concrete stress at failure, BB23_200 - RM
Figure 5-12 – Concrete strain at failure, BB23_200 -RM
Figure 5-13 – Crack width, BB23_200 - RM
5.3.2 Test BB24_150
This was the second test that had a single load range, with the loading being applied at
one location. The maximum value of the load was 150 kN and the minimum one was 15 kN.
After 1.5 million cycles the concrete deck slab still did not fail and subsequently was statically
loaded to failure, this occurring at 330 kN. Only the fatigue loading was analysed in DIANA.
Figure 5-15 - Cyclic load range for test BB24_150 [15]
Graph 5-6 - Fatigue FEA of test BB24_150
The outcome of the analyses for both FEA models was similar to the first test. It can be
observed that the capacity and the ductility are reduced when compared with the ones from the
static loading. Another similarity was that the resulting forces from the FE analyses had larger
values than the ones predicted by Equation 5-2, this being presented in Table 5-3.
Figure 5-14 – Development of CMA, BB23_200 - RM

FATIGUE MODEL FOR PRESTRESSED CONCRETE DECKS
128
Master’s Thesis – Tudor Mihai Brata
Table 5-3 - Test BB24_150 FEA results and prediction
FEA model Static capacity (Fsta) [kN] Predicted force (Ffat) [kN] FEA result [kN]
BBM 244.86 129.42 174.89
RM 203.38 107.50 146.49
In the case of the BBM all the loading steps converged, with the analysis ending at about
71% of the applied load. At the end of the analysis the stress in the steel had a value close to
the yield one, with the strain being relatively low.
Figure 5-16 - Steel stress at the end of the analysis,
BB24_150 - BBM
Figure 5-17 - Steel strain at the end of the analysis,
BB24_150 - BBM
The concrete tensile stress exceeded the tensile strength, with the height of the tensile
zone being more than 70% of the section’s height. The compressive stress was lower than the
strength. The strain of the concrete had quite a large value in the tension zone. Since the model
did not fail by the end of the analysis, the cracks continued to grow. The development of the
compressive membrane action was clearly visible in the model. Like in the case of the first
test, the decrease and subsequent rise in the force - deflection curve is due to a sudden opening
of the cracks and increase in the steel stress, increase that was not as high as the one from
BB23_200. At the same time a small decrease in the tensile stress of the concrete is noticeable.
Figure 5-18 - Concrete stresses at the end of the
analysis, BB24_150 - BBM
Figure 5-19 - Concrete strains at the end of the analysis,
BB24_150 - BBM
Figure 5-20 - Crack width, BB24_150 - BBM
Figure 5-21 – Development of CMA, BB24_150 - BBM

FATIGUE MODEL FOR PRESTRESSED CONCRETE DECKS
129
Master’s Thesis – Tudor Mihai Brata
For the realistic model (RM), the behaviour was almost identical to its equivalent from
test BB23_200. The analysis stopped before finishing all load increments, with the model
experiencing flexural failure. The steel stress increased by more than 35% when the model
failed, but still it had a low value, around half of its yield one. A high growth in the crack
opening is believed to be the cause of the behaviour of the steel. The steel strain had a low
value.
Figure 5-22 - Steel stress at failure, BB24_150 - RM
Figure 5-23 - Steel strain at failure, BB24_150 - RM
The compressive stress in the concrete did not exceed the compressive strength but the
tensile one did. At failure, the tensile stress increased by more than 25% but the concrete was
already cracked since the early loading stages.
Figure 5-24 - Concrete stress at failure, BB24_150 - RM
Figure 5-25 - Concrete strain at failure, BB24_150 - RM
The crack width that resulted from the analysis had a noticeably smaller value (0.07
mm) compared to the one that was measured in the test (0.6 mm). The strain in the area under
tension was higher than 0.7%. Regarding the compressive membrane action, once again this
was observed to develop in the FEA model.
Figure 5-26 – Crack width, BB24_150 - RM
Figure 5-27 – Development of CMA, BB24_150 - RM

FATIGUE MODEL FOR PRESTRESSED CONCRETE DECKS
130
Master’s Thesis – Tudor Mihai Brata
5.3.3 Test BB26_165
Being the last of the tests involving a single load range, this had a maximum load value
of 165 kN and a minimum of 16.5 kN, with failure occurring after a little over 1.4 million
cycles.
Figure 5-28 – Cyclic load range for test BB26_165
Graph 5-7 - Fatigue FEA of test BB26_165
The overall behaviour of this test was also very similar to the previous two tests. The
same decrease in capacity and ductility of the models can be seen. Regarding the prediction of
the force after the number of loading cycles (using Equation 5-2), again the value resulted from
the FE analyses proved to be higher. It must be mentioned that the values obtained from the
FEA were almost identical to the ones from tests BB24_150, although the material parameters
were modified in accordance with the procedure described in subsection 5.2.
Table 5-4 - Test BB26_165 FEA results and prediction
FEA model Static capacity (Fsta) [kN] Predicted force (Ffat) [kN] FEA result [kN]
BBM 244.86 129.87 174.94
RM 203.38 107.87 146.44
For the best behaviour model all the loading steps converged and the analysis ended at
around 71% of the applied load. Again, the steel stress proved to be very high but still it did not
reach the yielding value. Its strain was also below the yield value.
Figure 5-29 - Steel stress at the end of the analysis,
BB26_165 - BBM
Figure 5-30 - Steel strain at the end of the analysis,
BB26_165 - BBM
As in the previous tests, the compressive stress in the concrete was below the
compressive strength and the tensile one was above the tensile strength, with the tensile zone

FATIGUE MODEL FOR PRESTRESSED CONCRETE DECKS
131
Master’s Thesis – Tudor Mihai Brata
spreading over more than 70% of the section’s height. The strain had a large value in the tensile
area. Like before, the decrease and subsequent rise in the force - deflection curve is due to a
sudden opening of the cracks and increase in the steel stress. After the curve started to go up
again, the stresses in the concrete had a very small variation. The cracks continued to grow until
the analysis was finished. The compressive membrane action was again present in the model.
Figure 5-31 - Concrete stresses at the end of the
analysis, BB26_165 - BBM
Figure 5-32 - Concrete strains at the end of the analysis,
BB26_165 - BBM
Figure 5-33 Crack width, BB26_165 - BBM
The realistic model had a behaviour that was similar to the ones from the previous tests.
It failed before all the loading steps were applied, with the type of failure being flexural. At
failure, the stress in the steel increased by almost 55%, but still had a lower value compared to
the yield stress. This behaviour is thought to have happened due to large increase in the crack
width, which got enlarged by more than 50%. The value of the strain was quite low, obviously
not reaching the yield limit.
Figure 5-35 - Steel stress at failure, BB26_165 - RM
Figure 5-36 - Steel strain at failure, BB26_165 - RM
The tensile stress of the concrete exceeded the tensile strength, but this happened in the
early stages of loading when cracking occurred. At failure only a small increase was observed.
The compressive stress was lower than the equivalent strength. The strain of the concrete had
a value of ≈1% in the area under tension. The cracked width increase substantially at failure,
more than doubling its value. The compressive membrane action was observed also for this
FEA model.
Figure 5-34 – Development of CMA, BB26_165 - BBM

FATIGUE MODEL FOR PRESTRESSED CONCRETE DECKS
132
Master’s Thesis – Tudor Mihai Brata
Figure 5-37 - Concrete stress at failure, BB26_165 - RM
Figure 5-38 - Concrete strain at failure, BB26_165 - RM
Figure 5-39 – Crack width, BB26_165 - RM
5.3.4 Accuracy of the results
Having performed the analyses that involved the single load range fatigue tests, it was
of interest to see where they fit compared with the previous results and how accurate can the
FEA models be considered. In order to do this, use was made of Figure 3-28, originating from
the report on the fatigue tests [15]. This contained all the previous results, the prediction given
by Equation 5-2 and the 95% confidence interval. The data points from the image were retrieved
by using again the software ENGAUGE DIGITIZER. These were plotted together with the
results from the FEA tests for both models and their theoretical predictions. Of interest for the
plot was the ratio between the fatigue force from the FEA tests or the one predicted and the
static capacity of the models, together with the number of cycles for each loading range.
Figure 5-40 – Development of CMA, BB26_165 - RM
Graph 5-8 – Fatigue tests: Results and accuracy; Ffat/Fsta vs. logN

FATIGUE MODEL FOR PRESTRESSED CONCRETE DECKS
133
Master’s Thesis – Tudor Mihai Brata
It can be observed in the graph that the results from the FE analyses are at some distance
from the confidence interval, with only one test, BB23_200 – BBM, being exactly on the upper
boundary of the interval. Two of the tests, BB24_150 and BB26_165 had almost an identical
outcome, mostly due to a very close number of loading cycles. The predictions for the tests that
follow from the formula derived at TU Delft, Equation 5-2, are located as expected on or near
the prediction trend line.
Based on the plotted results, it appears that the model is not yet accurate enough to
predict in a satisfactorily manner the fatigue damage suffered by a concrete deck slab, with a
number of reasons being considered to influence this outcome. This will be discussed in
subsection 5.5, where the conclusion of the second stage of the FEA are presented.
5.4 Multiple cyclic loading ranges analyses
Apart from the single load range tests that were performed during the research on fatigue
[15], also tests that included multiple load ranges were conducted. In order to try and simulate
these tests using the finite element method, a phased analyses was considered as a primary
option. Such an analysis is meant to execute all the loading ranges one after the other, with the
influence of the previous phase being taken into account in the next one. Since in subsection
5.3 it was observed that the realistic model (RM) always failed for an applied single loading
range, for this subsection only the best behaviour model (BBM) will be considered for the FEA
analyses. For each phase of an analysis, a progressive reduction of the material properties was
considered, the reduction being performed as it was described in subsection 5.2.
Besides the phased analysis, another approach was tried in order to see how the outcome
would differ and what additional observations could be made. This approach implied running
each loading range within a test as a separate analysis, but having the material properties
modified for each subsequent load range. Like stated before, a progressive reduction was
thought to be more accurate. For the sake of comparison between the approaches, the BBM was
also used for this one.
Apart from the performed FE analyses regarding multiple loading ranges, the question
related to the impact of the sequencing effect still remained. In order to try and see whether
some clarifications could be obtained related to this topic, a series of analyses were performed
especially for this. The outcome will also be presented in the following.
5.4.1 Performed tests
For assessing the behaviour of the models under multiple loading ranges, two
experimental tests from the fatigue research [15] were considered: BB28 and BB29.

FATIGUE MODEL FOR PRESTRESSED CONCRETE DECKS
134
Master’s Thesis – Tudor Mihai Brata
5.4.1.1 Phased analysis approach
Test BB28 was composed of three different loading ranges. The maximum values in
each range were 165, 200 and 240 kN, in this order, with the minimum values being 10% of
the maximum ones, similar to the single load range tests. The first cyclic range did not fail after
1.5 million cycles, with the second one not failing also after 1 million cycles. Eventually the
specimen failed after 7144 cycles during the last loading range.
Figure 5-41- Loading ranges for test BB28 [15]
Graph 5-9 - FE analyses of test BB28
For each phase of the analysis, the material parameters were changed in order to reflect
the theoretical damage caused by the cyclic loading. For the second phase the reduction was
based on the values of the compressive strength and fracture energy from the first phase, whilst
for the third one the reduction was based on the values of the same parameters of the second
phase. The other modified parameters were the tensile strength and the tensile fracture energy.
Graph 5-9 presents the outcome of a series of analyses, including one on the RM model.
This was performed just to confirm that for this FEA model, failure occurs during the first
phase. The other two curves are the result of two analyses performed on the BBM, both failing
during the second phase. The difference in behaviour was given by the assumed reduction in
the material. A progressive reduction, as it was described in the previous paragraph, resulted in
a better behaviour (blue curve). The earlier failure in the second stage (orange curve) was
caused by assuming the same compressive strength for the reduction of each phase. For the
BBM it is clear that the analysis was terminated due to divergence before starting its third phase.
The small decrease and subsequent increase of the curve in the first phase of the analysis
was caused by a widening of the cracks and subsequent increase in the steel stress, behaviour
similar to the single loading range models. The big drop in the curve marks the transition
between the first and second phases of the analysis. It is thought that this behaviour might be
caused by the decrease in the properties of the FEA model as a consequence of the assumed
fatigue damage. It is essential to mention that as soon as the second phase started, the steel
stress had exceeded the yield value and the concrete stress had exceeded the compressive
strength, but did not exceed its ultimate strain. This was eventually exceeded, strangely, quite
some load steps before failure. Until the analysis stopped, the stresses continued to grow, but

FATIGUE MODEL FOR PRESTRESSED CONCRETE DECKS
135
Master’s Thesis – Tudor Mihai Brata
the steel stress did not reach its ultimate value. It is not understood why, based on the values
from the second phase, the analysis did not stop much earlier, even at the beginning of this
phase. It can be concluded that the FEA model presented a strange behaviour that can be
deemed as unreliable and unrealistic.
Figure 5-42 – Steel stress at the beginning of the second
phase, BB28
Figure 5-43 - Concrete stress at the beginning of the
second phase, BB28
Test BB29 was composed of two load ranges, having maximum values of 200 and 220
kN. For the first range a number of 1.5 million cycles were performed whilst for the second,
just under 265 thousands.
Figure 5-44 – Loading ranges for BB29 [15]
Graph 5-10 - FE analysis of test BB29
As it can be seen from Graph 5-10, the result of the FE analysis does not describe
correctly the behaviour of the test BB29. The first phase of the analysis and the transition
between phases followed the same trend as the one described by test BB28. When it came to
the second phase however, the FEA model presented a decrease in both force and deflection.
Such an occurrence cannot happen and it is unclear why the model behaved in such a manner.
All the steps performed for the previous analyses regarding tests BB28 were followed also for
this test, however the behaviour was very different. This might be due to the sensitivity of the
model to certain parameters. Multiple analyses were performed in order to find what might be
causing this behaviour but the same outcome was obtained every time.
5.4.1.2 Separate analyses approach
For this approach, all the loading ranges were analysed individually and subsequently
plotted in order to assess the behaviour of the model, namely, its deterioration caused by each

FATIGUE MODEL FOR PRESTRESSED CONCRETE DECKS
136
Master’s Thesis – Tudor Mihai Brata
loading range. The downside of this approach was that every analysis started with the same
initial stiffness, the original one, whilst in the actual tests the stiffness had decreased constantly
with the increase in the number of loading cycles and modification of the range. Such a change
in stiffness was not performed for the second or third load ranges since it was not known how
this would have been affected by the loading. The modification in the stiffness throughout the
analysis was accounted for only by the tensile properties of the concrete. Nevertheless, the
results can give an idea about how the fatigue damage, which was reproduced through the
properties of the material, affected the capacity and the ductility of the structure.
For tests BB28 and BB29, three, respectively two separate analyses were performed
accounting for the different cyclic ranges within each test. The outcome can be observed in the
following graphs:
Graph 5-11 - Individual FEA for each loading range of
test BB28
Graph 5-12 - Individual FEA for each loading range of
test BB29
It can immediately be seen that there is a reduction in capacity with the increase in the
loading range. This outcome is deemed as correct, since it was expected that, with the increase
in the loading range, the model would not be able to bear higher loads due to the changes in the
material’s properties that accounted for the actual fatigue loading.
The curve for the first range had a small drop and rise due to the growth of crack widths
and, simultaneously, increase in the steel stress. Such a behaviour was assessed previously in
subsection 5.3. The curves for the other ranges were smoother, with the concrete and steel
stresses having lower values than for the first range. Taken individually, the force resulted from
the analysis of each range was higher than the predicted force given by Equation 5-2. This was
also mentioned in subsection 5.3.
The first method tried to present the combined effect of the loading ranges by attempting
to reach the static capacity of the model, this being considered as failure for the FE analysis. In
case of the separate range approach, this tried to show the impact of the cyclic ranges on the
model, presenting the progressive deterioration of the FEA model.
Since the best behaviour model was used (BBM) as it was mentioned earlier, all the
loading steps converged, meaning that the model did not technically fail. Nevertheless, its
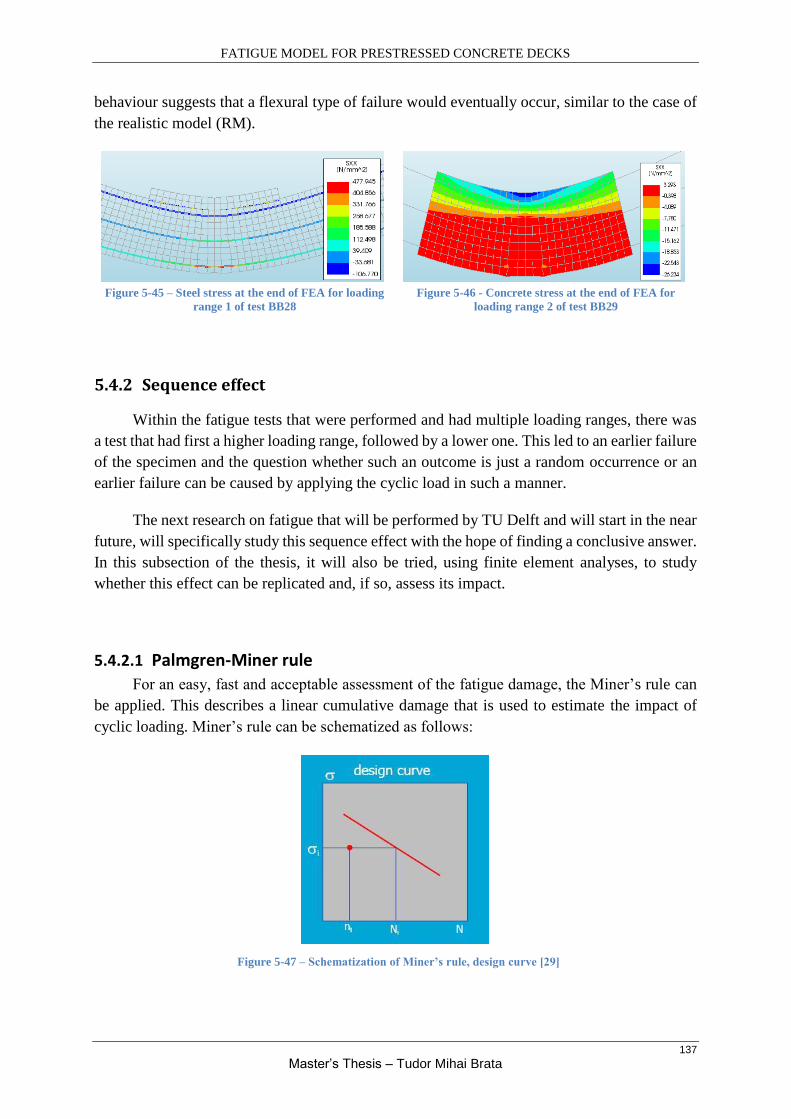
FATIGUE MODEL FOR PRESTRESSED CONCRETE DECKS
137
Master’s Thesis – Tudor Mihai Brata
behaviour suggests that a flexural type of failure would eventually occur, similar to the case of
the realistic model (RM).
Figure 5-45 – Steel stress at the end of FEA for loading
range 1 of test BB28
Figure 5-46 - Concrete stress at the end of FEA for
loading range 2 of test BB29
5.4.2 Sequence effect
Within the fatigue tests that were performed and had multiple loading ranges, there was
a test that had first a higher loading range, followed by a lower one. This led to an earlier failure
of the specimen and the question whether such an outcome is just a random occurrence or an
earlier failure can be caused by applying the cyclic load in such a manner.
The next research on fatigue that will be performed by TU Delft and will start in the near
future, will specifically study this sequence effect with the hope of finding a conclusive answer.
In this subsection of the thesis, it will also be tried, using finite element analyses, to study
whether this effect can be replicated and, if so, assess its impact.
5.4.2.1 Palmgren-Miner rule
For an easy, fast and acceptable assessment of the fatigue damage, the Miner’s rule can
be applied. This describes a linear cumulative damage that is used to estimate the impact of
cyclic loading. Miner’s rule can be schematized as follows:
Figure 5-47 – Schematization of Miner’s rule, design curve [29]

FATIGUE MODEL FOR PRESTRESSED CONCRETE DECKS
138
Master’s Thesis – Tudor Mihai Brata
The general formulation for Miner’s rule is given as:
Equation 5-3 – Formulation for Miner’s rule
∑𝑛𝑖
𝑁𝑖= 1
𝑘
𝑖=1 [29] , where:
- ni represents the number of applied cycles within a certain stress/load range
-Ni represents the number of cycles to failure for a certain stress/load range
One major limitation of this method is that it does not take into account the sequence
effect, more specifically, the order of loading is of no importance. This does not correspond
with results from tests, where an impact of the sequence was observed. Another limitation of
Miner’s rule refers to the accumulation of damage, which is considered to be independent of
the stress level. Again, this is a too simplistic assumption. [29]
Since the Miner’s rule cannot provide a proper assessment of the sequence effect, in the
following a numerical approach will be used for this purpose.
5.4.2.2 Phased analysis approach
For this approach, two loading ranges were assumed, one with a maximum value of 150
kN and 1.5 million cycles and a second range with a maximum value of 200 kN and 1 million
cycles. Such a high number of cycles was chosen since it was observed that a proper reduction
in the material’s parameters occurred only at high values. The minimum load value within each
range was 10% of its maximum, as before. The reduction in material properties was done for
each loading range as it was described in subsection 5.4.1.1.
Two analyses were performed on the best behaviour model (BBM), one where the first
loading range had a smaller maximum value than the second range (low to high) and a second
analysis that had first a higher range, followed by a smaller one (high to low).
Figure 5-48 – Loading sequence, type I
Figure 5-49 – Loading sequence, type II

FATIGUE MODEL FOR PRESTRESSED CONCRETE DECKS
139
Master’s Thesis – Tudor Mihai Brata
Following the analyses, a similar behaviour to the one described in subsection 5.4.1.1
was observed, with the outcome being almost identical for both of the FEA models. Based on
this observation, it seemed that there was no impact of the load sequence, at least not for this
model. Graph 5-13 presents the results of the phased analyses.
5.4.2.3 Separate analysis approach
For the separate approach the same stress ranges as for the phased analysis were
considered. In this case, two sets of analyses were performed, one for each type of sequence,
low to high and high to low. Within each set, individual analyses were performed for each
loading range using the best behaviour model. The stiffness was considered to be the original
one in all the analyses, as it was explained in subsection 5.4.1.2.
As it can be seen in Graph 5-14, also for this approach the FEA model does not seem to
be sensitive to the loading sequence. The resulting curves describe almost the same behaviour,
with two of them, the ones at the bottom, overlapping each other. The curves at the top represent
the outcome of the first loading range within each set of analyses, whilst the curves at the bottom
are the result of the second loading ranges.
5.5 Conclusions of the FEA – Stage II
Having created and calibrated the FEA model in Chapter 4, the first part of this chapter
tried to replicate the single load range fatigue tests that were described in reference [15]. In
order to do that, changes in the material’s parameters of the FEA model had to be made for
simulating its deterioration as a consequence of the cyclic loading. The effect of fatigue meant
a decrease in the capacity and ductility of the model.
The main point of departure for this stage was the consideration of a uniform reduction
in the material properties with an impact at the structural level. It was assumed that the
Graph 5-14 – Sequence effect, separate analysis Graph 5-13 – Sequence effect, phased analysis

FATIGUE MODEL FOR PRESTRESSED CONCRETE DECKS
140
Master’s Thesis – Tudor Mihai Brata
compressive strength of the concrete was the main material parameter and the rest were
dependent on its variation. The decrease in this strength, which was based on Equation 5-1, led
to an overall diminishment in the behaviour of the FEA models. Directly affected were the
tensile strength and both fracture energies. For the tensile strength, different approaches were
considered for its reduction, choosing the one that seemed more fitting. This had no influence
on capacity of the model, only on its ductility.
In the case of the BBM, this had that extra capacity and increase in the curve probably
due to the bond of the prestressing bar, with the CMA being also more easily noticeable. The
RM had a not so common mode of failure, with the stresses still being well below their ultimate
value, except the tensile one in the concrete. It is thought that the strain capacity of the concrete
was exceeded due to a sudden increase of the crack width, in combination with a similar
increase in the steel stress, this being the main reason for failure.
Following the FE analyses, all the tests presented a significant reduction in terms of
capacity and ductility of the model when compared to the static tests, reduction that was
expected to occur with the simulation of the fatigue loading. Nevertheless, when the results
were plotted against the ones from the experimental tests, the outcome presented quite a
discrepancy from what was presumed to be obtained. These were out of the confidence interval,
with a single exception, and also the reduction in material properties seemed insufficient. By
assessing Graph 5-8, it could be estimated that the model would present a higher accuracy for
lower numbers of loading cycles. As a general remark, both FEA models present a higher value
for the fatigue force than the one given by the prediction formula (Equation 5-2).
A major reason for this behaviour is thought to be the reduction in the compressive
strength of the concrete. According to Equation 5-1, this reduction depends on the number of
cycles, on the ratio of the minimum and maximum values of the applied stress (force) and on
the compressive strength of the concrete. Whilst the former and latter have values that,
righteously, can be considered as constants (fixed values) for a single analysis, assuming that
the influence of the loading range can be expressed only through its force ratio seems not
realistic in terms of the actual impact of the loading on the structural system. Based on the
ratio, no matter how high or low the applied maximum force within a stress range is, it will lead
to the same impact. Maybe it is assumed that the applied value of the load can be reflected in
the number of cycles to failure (the higher the value, the lower the number of cycles), but this
would also be a partially wrong assumption, since it is known about the large scatter in the
results of fatigue tests.
An eloquent example can be seen in Graph 5-8 for the tests BB24_150 and BB26_165,
which displayed an almost identical behaviour. This happened although there was a difference
in the number of cycles of ≈100000, but also a difference in the value of the load.
Coming back to the formula for determining the maximum compressive stress
(Equation 5-1), this might be deemed as being not accurate enough for properly describing the
reduction of the compressive strength due to a cyclic loading. The value of the load should have
a higher impact on the reduction by taking into account the stress range in a more realistic

FATIGUE MODEL FOR PRESTRESSED CONCRETE DECKS
141
Master’s Thesis – Tudor Mihai Brata
manner. If such a correlation would be possible, then a more accurate reduction in the material’s
parameters would lead to a highly realistic scenario of assessing fatigue, this being of utmost
importance.
The prediction formula for the fatigue force, Equation 5-2, might also have an impact
on the range of the results. This takes into account only the number of cycles and based on this
it predicts the ratio between the fatigue and static forces. Not taking into account at all the
loading range might seem too simplistic and not sufficiently accurate. It might be that an altered
formula that takes into account the values of the load would give results closer to the FEA
analysis.
The second part of this chapter dealt with tests that had multiple loading ranges and also
with the impact of the load sequence on the behaviour of the model. In order to simulate a test
with multiple ranges, two different approaches were used: one dealt with phased analyses whilst
the other used separate analyses for each range. A phased analysis meant that the loading ranges
were analysed one after the other, having a continuity of the stress state.
For replicating the behaviour of the structural system as close as possible to the one
damaged by fatigue, each loading range from an analysis had its material properties modified.
Both strengths, together with the fracture energies, ended up being altered, with the
compressive strength being considered the main parameter in simulating the damage due to the
cyclic loading. It was observed that a high number of cycles was required in order to witness a
proper reduction.
Following the multiple range analyses, it was observed that both of the approaches
used, phased and separate, had difficulties in describing accurately the behaviour from the
experimental tests. The outcome presented strange results that could be attributed to the FEA
model itself, but also to the user of DIANA, due to a lack of experience and expertise with this
type of analyses. Like stated previously, the phased analysis tried to present the combined effect
of the loading ranges. This was done by attempting to reach the static capacity of the FEA
model, since this was considered to be the failure criterion of the FE analysis. As for the separate
range approach, this analyses tried to show the impact of the cyclic ranges on the model,
presenting its progressive deterioration, with this type of behaviour being observed following
the analyses.
In order to assess the impact of the loading sequence, use was made again of the
previously mentioned approaches. Following the obtained results, it might seem that the
sequence of loading does not have any impact on the behaviour of the model. Nevertheless, a
conclusive answer cannot be given, since the behaviour of the model is influenced by a high
range of parameters, with the model also presenting a series of limitations, as it was stated from
the beginning. The reduction in the properties of the material plays also a significant role,
together with the number of assumed cycles to failure. Also the user component has to be taken
into account, as it was stated before.

FATIGUE MODEL FOR PRESTRESSED CONCRETE DECKS
142
Master’s Thesis – Tudor Mihai Brata
Chapter 6: Future research program
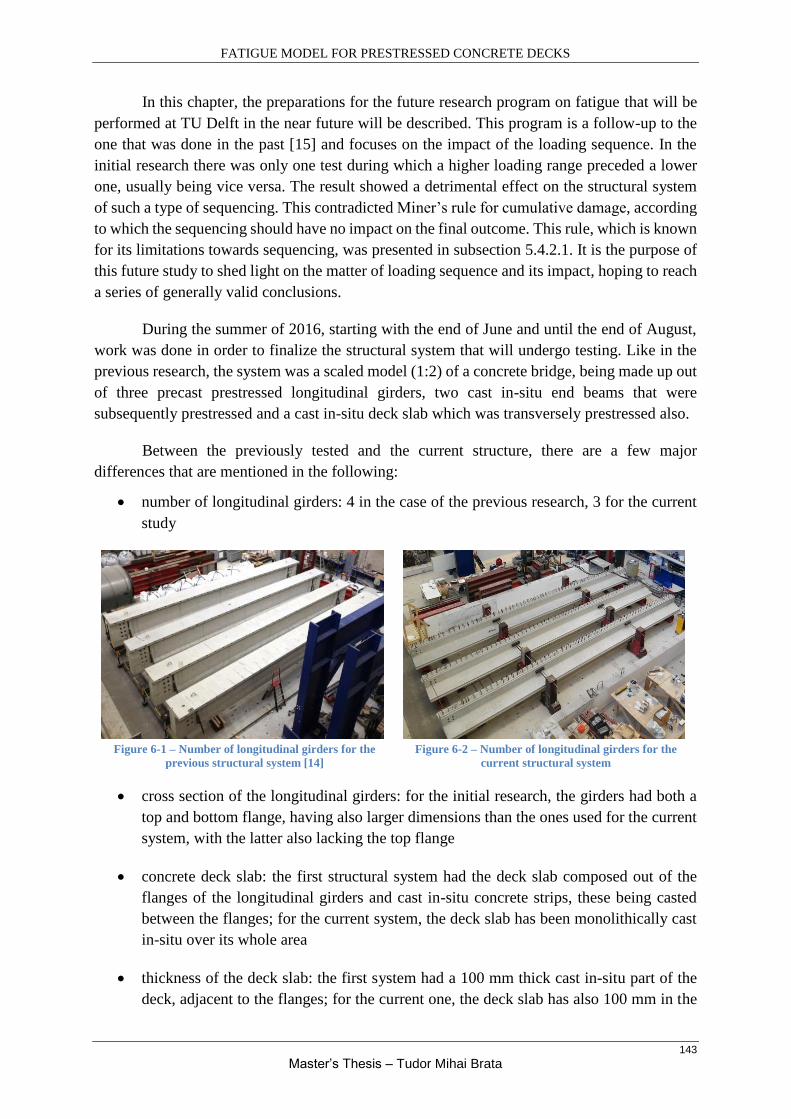
FATIGUE MODEL FOR PRESTRESSED CONCRETE DECKS
143
Master’s Thesis – Tudor Mihai Brata
In this chapter, the preparations for the future research program on fatigue that will be
performed at TU Delft in the near future will be described. This program is a follow-up to the
one that was done in the past [15] and focuses on the impact of the loading sequence. In the
initial research there was only one test during which a higher loading range preceded a lower
one, usually being vice versa. The result showed a detrimental effect on the structural system
of such a type of sequencing. This contradicted Miner’s rule for cumulative damage, according
to which the sequencing should have no impact on the final outcome. This rule, which is known
for its limitations towards sequencing, was presented in subsection 5.4.2.1. It is the purpose of
this future study to shed light on the matter of loading sequence and its impact, hoping to reach
a series of generally valid conclusions.
During the summer of 2016, starting with the end of June and until the end of August,
work was done in order to finalize the structural system that will undergo testing. Like in the
previous research, the system was a scaled model (1:2) of a concrete bridge, being made up out
of three precast prestressed longitudinal girders, two cast in-situ end beams that were
subsequently prestressed and a cast in-situ deck slab which was transversely prestressed also.
Between the previously tested and the current structure, there are a few major
differences that are mentioned in the following:
number of longitudinal girders: 4 in the case of the previous research, 3 for the current
study
Figure 6-1 – Number of longitudinal girders for the
previous structural system [14]
Figure 6-2 – Number of longitudinal girders for the
current structural system
cross section of the longitudinal girders: for the initial research, the girders had both a
top and bottom flange, having also larger dimensions than the ones used for the current
system, with the latter also lacking the top flange
concrete deck slab: the first structural system had the deck slab composed out of the
flanges of the longitudinal girders and cast in-situ concrete strips, these being casted
between the flanges; for the current system, the deck slab has been monolithically cast
in-situ over its whole area
thickness of the deck slab: the first system had a 100 mm thick cast in-situ part of the
deck, adjacent to the flanges; for the current one, the deck slab has also 100 mm in the
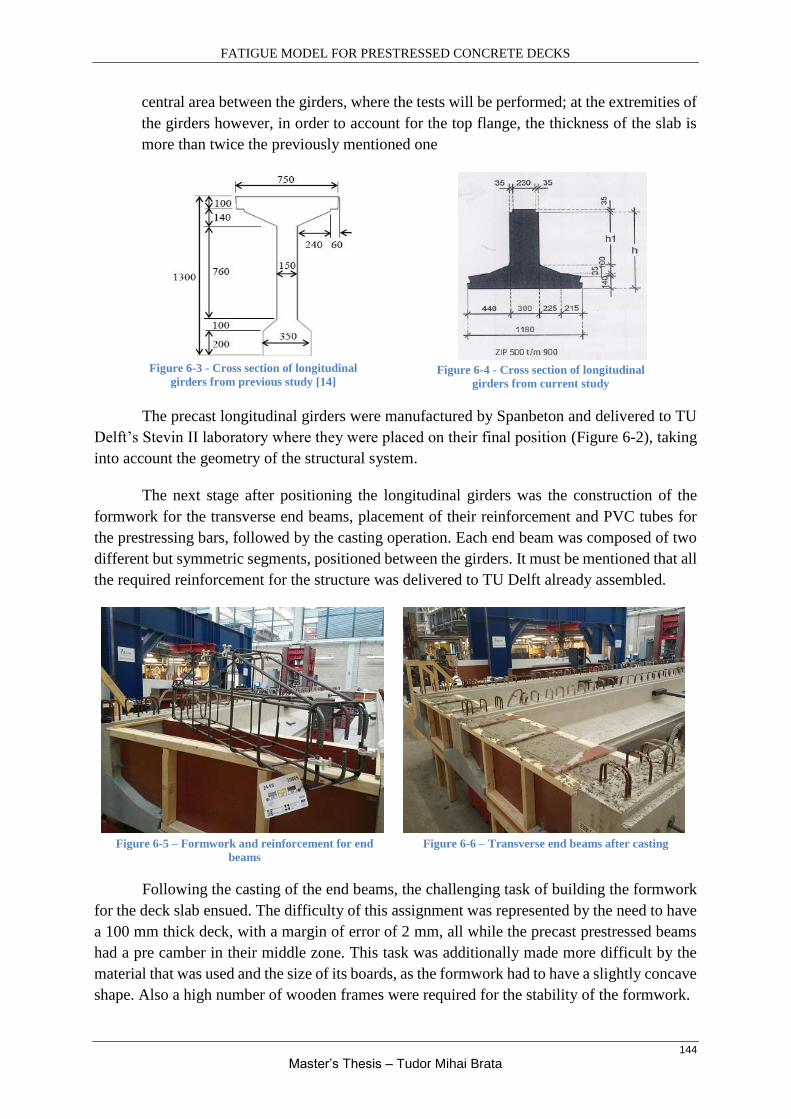
FATIGUE MODEL FOR PRESTRESSED CONCRETE DECKS
144
Master’s Thesis – Tudor Mihai Brata
central area between the girders, where the tests will be performed; at the extremities of
the girders however, in order to account for the top flange, the thickness of the slab is
more than twice the previously mentioned one
The precast longitudinal girders were manufactured by Spanbeton and delivered to TU
Delft’s Stevin II laboratory where they were placed on their final position (Figure 6-2), taking
into account the geometry of the structural system.
The next stage after positioning the longitudinal girders was the construction of the
formwork for the transverse end beams, placement of their reinforcement and PVC tubes for
the prestressing bars, followed by the casting operation. Each end beam was composed of two
different but symmetric segments, positioned between the girders. It must be mentioned that all
the required reinforcement for the structure was delivered to TU Delft already assembled.
Figure 6-5 – Formwork and reinforcement for end
beams
Figure 6-6 – Transverse end beams after casting
Following the casting of the end beams, the challenging task of building the formwork
for the deck slab ensued. The difficulty of this assignment was represented by the need to have
a 100 mm thick deck, with a margin of error of 2 mm, all while the precast prestressed beams
had a pre camber in their middle zone. This task was additionally made more difficult by the
material that was used and the size of its boards, as the formwork had to have a slightly concave
shape. Also a high number of wooden frames were required for the stability of the formwork.
Figure 6-3 - Cross section of longitudinal
girders from previous study [14] Figure 6-4 - Cross section of longitudinal
girders from current study

FATIGUE MODEL FOR PRESTRESSED CONCRETE DECKS
145
Master’s Thesis – Tudor Mihai Brata
Figure 6-7 – Wooden frames for supporting the
formwork
Figure 6-8 – Completed formwork for the deck slab
After finishing with the erection of the formwork, the next stage in the construction of
the structural system was represented by the placement of the reinforcement inside the
formwork. The bars had already been assembled and delivered in a cage type of format. With
the aid of a moving crane, all the parts were placed at their required positions. Following the
placement of the reinforcement, the PVC tubes for the prestressing bars within the deck were
mounted.
Figure 6-9 – Structure after positioning of the
reinforcement ant PVC tubes
Figure 6-10 – Close-up with the reinforcement and the
plastic tubes
Once the structural system had the reinforcement and the plastic tubes for the
prestressing bars installed at the required locations, the casting of the concrete followed. This
was a continuous operation that was performed in one go, starting with the casting at one side
of the deck slab and finishing at the other end. Used was made again of the moving crane, this
moving the concrete bucket from which the concrete was poured inside the formwork.
Throughout the casting procedure, the concrete was vibrated in order to obtain a better
compaction and remove the air pockets.
After the casting was finalized, the surface of the concrete was smoothened using a long
aluminium beam and subsequently it was covered with a plastic foil in order to prevent the
water from evaporating, therefore assuring a proper hydration process.

FATIGUE MODEL FOR PRESTRESSED CONCRETE DECKS
146
Master’s Thesis – Tudor Mihai Brata
Figure 6-11 – Casting and smoothing the surface of the
concrete
Figure 6-12 – Concrete covered with a plastic foil to
prevent water evaporation
A week after the casting, the transverse prestressing bars were installed at their position
and at the beginning of October, after it was considered that the concrete had developed the
required strength, they were also tensioned. After tensioning the bars, the preparation for the
testing setup began. A large metal frame was moved in position and a loading device was
eventually attached to it. The full setup consists of a high number of sensors and measuring
devices for forces and deflections, all connected to a system for data acquisition.
In the following months, both static and fatigue tests will be performed on the structural
system, with the stated goal of clarifying whether there is an effect of the loading sequence
within the fatigue tests.
Figure 6-13 – Tensioning of the prestressing bars
Figure 6-14 – Structural system prepared for tests

FATIGUE MODEL FOR PRESTRESSED CONCRETE DECKS
147
Master’s Thesis – Tudor Mihai Brata
Chapter 7: General conclusions

FATIGUE MODEL FOR PRESTRESSED CONCRETE DECKS
148
Master’s Thesis – Tudor Mihai Brata
This chapter will present in a more fluid and concise manner the conclusions that
accompanied the previously discussed segments of this Master’s Thesis. Each previous chapter
introduced a specific part that was required to properly describe the theme that was addressed
in this thesis. In the following, the essential ideas, observations, viewpoints and conclusions
will be outlined so that a full image of the accomplished work will be portrayed.
The thesis started with the idea of creating a simplified FEA model that would describe
the effect of fatigue on a structure, more specifically on a concrete bridge deck slab that was
transversely prestressed. Before tackling this numerical approach, insight into the topics of
fatigue and compressive membrane action (CMA) had to be gained. These are two phenomena
that affect the service life of a bridge, fatigue in a negative manner, whilst the CMA has a
positive effect.
As the main topic around which this thesis was constructed, fatigue was described as a
complex phenomenon, being presented how it affects and damages the individual materials,
concrete and steel, but also the reinforced concrete structures. In case of the materials, the
emphasis was put on the behaviour of concrete under different stress situations such as
compression, tension and alternating stresses, presenting the material’s response under the
cyclic loading. In terms of structures, the impact of fatigue on concrete deck slabs was mainly
discussed. As a general conclusion related to the impact of fatigue, it is stated that, although it
did not cause a direct failure of a structure, its contribution cannot be ignored during the service
life of structures that are prone to this phenomenon. For the other approached topic, CMA, it is
found that this forms in concrete slabs and increases the capacity of the structure, being
dependent on the degree of restraint.
The previous research program on fatigue of concrete deck slabs performed at TU Delft
was assessed from the point of view of the results, the structural system and the variables within
each test and was considered to fit well with the other studies performed on this topic on a
worldwide scale. The obtained results are in correlation with similar outcomes from studies
performed across the globe, this giving a high degree of trust to the research. This study
represented one of the primary sources for the development of the FEA model, with the other
major source being the research on CMA of prestressed concrete deck slabs performed around
the same time also at TU Delft.
The method used for the development of the FEA model comprised a series of steps and
suppositions that were followed in order to obtain an outcome that was as accurate as possible.
During this process, a couple of fundamental points of departure had to be considered. The first
one implied the use of a two-dimensional model for describing the stress state, whilst the other
made use of the assumption of a uniform reduction in the material properties on a structural
level. Both of these had a decisive contribution to the behaviour of the model and the results.
The scope of the FEA model, developed using DIANA FEA, was to replicate as
accurately as possible the results from the previously mentioned experimental programs. For
its development, a two-dimensional plane stress model was chosen, acknowledging the
limitations of such a model when describing a three-dimensional stress state. In terms of

FATIGUE MODEL FOR PRESTRESSED CONCRETE DECKS
149
Master’s Thesis – Tudor Mihai Brata
geometry, it was decided to define the whole cross section of the structure since it was observed
that, by doing so, the behaviour was more realistic. For the supports, the fixed translation on
both directions combined with an allowed rotation presented the best outcome by having a
substantial contribution to the increase in the initial stiffness of the model. The chosen effective
width of the model proved to be essential in obtaining an initial stiffness that was similar to the
one from the previous studies. Based on this width, the directly proportional quantity of
reinforcement was assigned to the model and also the equivalent prestressing load. These last
two parameters had a vital contribution to the capacity of the model. A high contribution to the
overall behaviour was also obtained by considering that the prestressing bar was bonded.
The chosen material models were in accordance with the guidelines from
Rijkswaterstaat and proved to have a considerable impact on the model’s behaviour as well.
For the concrete, a total strain based crack model with rotating cracks and smeared cracking
was used. Its compressive behaviour was defined using a parabolic model, whilst for the tensile
behaviour a linear softening model was used, this giving a better behaviour than the exponential
one recommended by the guidelines. For the reinforcing steel, a model based on Von Mises
plasticity was used, with a user defined stress-strain diagram that included a hardening branch
and a downward branch considered for the iterative process.
Applying the external force as a point load was found to give better results than a
distributed load or a prescribed displacement. In order to avoid early divergence of the iterative
procedure, the arc-length control method was used. Linear analyses were performed only to
check the reliability of the model. Nonlinear analyses were performed in order to reflect more
realistically the behaviour of the model and also for the possibility to subsequently modify the
parameters of the materials for the second stage of the FE analysis, the one related to fatigue.
The mesh size used was in accordance with the guidelines also.
After considering and assessing the influence of a wide range of parameters, it was
decided to use two models for the fatigue related stage of the FE analysis. The first model gave
the closest results to the ones from the previous studies and it was named the “best behaviour
model” (BBM). In its case it was used the assumption that the prestressing bar is bonded. The
second model did not consider the bond of the prestressing bar, being in accordance with the
real structure. This was named the “realistic model” (RM) and had a lower capacity than the
previous one. Overall, the capacity of both FEA models was found to be lower than the
capacities obtained in the previous studies, but this was expected considering that the FEA
model was built using a simplified approach. It was observed that within the models, the CMA
had developed. The failure mode was of flexural nature, this being the result of the two-
dimensional plane stress model used.
For simulating the deterioration of the structure due to fatigue, modifications of the
material parameters of concrete in the FEA model were performed, with the effect of fatigue
being a reduction in capacity and ductility. This reduction was considered to be uniform and at
a structural level. The main material parameter that was modified was the compressive strength
of the concrete and, based on it, the tensile strength and the fracture energies were modified
also. For the determination of the maximum compressive stress allowed after the cyclic loading,

FATIGUE MODEL FOR PRESTRESSED CONCRETE DECKS
150
Master’s Thesis – Tudor Mihai Brata
a reduction formula was used, this being dependent on the number of cycles and the ratio
between the minimum and maximum values of the stresses/loads within a loading range.
Following the FE analyses, the expected reduction in capacity and ductility was
witnessed, with the BBM having a better behaviour than the RM. When the results were plotted
against the previous ones from the experiments, it was observed that they had an offset from
the confidence interval given by a prediction formula developed at TU Delft, with one single
exception. As a general observation, both FEA models present a higher value for the fatigue
force than the one given by the prediction formula, with the RM giving the highest ratios
between the fatigue force and the static force. It was observed that in order to obtain a proper
reduction in the material properties a high number of cycles was required.
A main cause for this behaviour, apart from the limitations of the FEA model itself, is
thought to be an insufficient reduction in the previously mentioned material properties, the main
considered parameter being the compressive strength. Its reduction, which is based on the
number of cycles and the ratio of the stresses/loads, seems to be too simplistic, with the actual
impact of the loading being disregarded. By considering only the ratio, no matter how high or
low the applied maximum force within a stress range is, it will lead to the same effect. If it is
assumed that the magnitude of the applied load is reflected in the number of cycles, this would
also be a partially wrong assumption, since it is known about the large scatter in the results of
fatigue tests. The opinion is that the reduction formula for the compressive stress is not accurate
enough and does not describe properly the full effect of the fatigue loading. On a similar note,
the prediction formula for the fatigue force might also be too simplistic since it disregards the
loading effect altogether and considers only the influence of the number of cycles and the static
strength.
For the tests involving multiple loading ranges two different approaches for the analyses
were used, phased and separate. The phased analysis tried to present the combined effect of the
loading ranges, whilst the separate analysis tried to show the impact of the cyclic ranges on the
model, presenting its progressive deterioration. Like in the case of single loading ranges, also
here a reduction in the material parameters was performed for each individual range, the same
properties as the ones mentioned before being modified. Having performed the analyses, it was
acknowledged that both of the approaches used had difficulties in describing accurately the
behaviour from the experimental tests. It is thought that the results could be attributed to the
FEA model itself, but also to the DIANA user, due to a lack of experience and expertise with
this type of analyses.
The last attended matter was represented by the impact of the loading sequence. The
same two approaches, phased and separate, were used in order to describe the behaviour of low-
to-high or high-to-low loading cycles. Based on the results it seems that the sequence has no
impact on the behaviour of the model, but it is thought that a conclusive answer cannot be given.
This is due to the limitations of the model and the assumptions taken for its development, the
high number of parameters that interact with each other and influence its behaviour. The way
the reduction in the properties of the material is performed or the user component must also be
considered.

FATIGUE MODEL FOR PRESTRESSED CONCRETE DECKS
151
Master’s Thesis – Tudor Mihai Brata
The FEA model that was developed to serve as topic for this Master’s Thesis proved its
limitations when compared to the results obtained from the previous research programs. This
was not something unexpected, considering that a simplified approach was taken for its
development. It was shown that its behaviour is influenced by a high number of parameters,
being sensitive to their variation, but also proved to be flexible in response.

FATIGUE MODEL FOR PRESTRESSED CONCRETE DECKS
152
Master’s Thesis – Tudor Mihai Brata
Chapter 8: Recommendations

FATIGUE MODEL FOR PRESTRESSED CONCRETE DECKS
153
Master’s Thesis – Tudor Mihai Brata
The 8th and final chapter of this Master’s Thesis presents a series of recommendations
that aim at improving the approach towards the studied topic and its desired outcome. The
improvements can be done on different levels as it will be outlined below.
For the actual FEA model, considering other material models for the behaviour of
concrete under compression and tension might lead to a change in the results and possibly a
better outcome. For this thesis, a number of such constitutive models were considered, taking
also into account the guidelines on nonlinear analysis of concrete structures from
Rijkswaterstaat, but DIANA offers a higher number of predefined material functions. It might
be that by using other material models the behaviour of the FEA model will be noticeably
improved.
If a two-dimensional model would still be desirable, then a plane strain one could be
used. The choice of the plane stress model for this thesis was deemed to be accurate enough
and its choice was explained. Nevertheless, a plane strain model might present an improvement
of the stress state and of the general behaviour, being closer to the real structure.
For a complex and realistic assessment of the structure, a three-dimensional model could
be created. This would present as close as possible the actual behaviour of the structural system,
being defined by a high complexity and the lack of simplifications or assumptions required for
a two-dimensional model. However, the high fidelity of its behaviour has a series of downsides,
such as the time required to actually develop the model, the duration of the performed analyses,
this increasing exponentially compared to the simple 2D model, or the amount of computational
power required to perform such complex analyses.
Upgrades to the formula that determines the maximum compressive stress bearable by
the structure after cyclic loading should be performed. It was discussed that it appears to be too
simplistic to consider only the ratio of the stresses/loads within a range, this leading to an effect
of the fatigue that is thought not to be correctly described. As a consequence, a higher
contribution of the loading range must be considered.
Modifications could be done also to the prediction formula for the fatigue force so that
this would take into account the force values of a loading range, not only the number of cycles
and the static capacity of the structure. It is believed that, by doing so, a more accurate force
prediction will be obtained.
Further fatigue tests should also be performed in order to gain additional knowledge
related to this phenomenon and assess better the impact of the loading sequence and its
minimum and maximum values.

FATIGUE MODEL FOR PRESTRESSED CONCRETE DECKS
154
Master’s Thesis – Tudor Mihai Brata
Annex 1

FATIGUE MODEL FOR PRESTRESSED CONCRETE DECKS
155
Master’s Thesis – Tudor Mihai Brata
Estimation of the fatigue load value
1) Reference no. 12 - study by Graddy et al.
In the article, besides the S-N line, the essential data used to obtain the graph is
presented for each specimen (Table 4). In order to estimate a value at 1 million cycles, a series
of assumptions are made, these being presented in the following.
For the prediction, a number of 3 tests is considered since they were identical and the
scatter in the results, in terms of numbers of cycles to failure, is small compared to other tests,
having the same range for the magnitude. The codes of the specimens were S1P110, S2P110
and S3P110.
The tests taken into account had only cast in situ specimens but the estimation for the
fatigue load will also be extrapolated to the prestressed + cast in situ specimens since the S-
N graph takes them into account also.
From the graph, it is approximated that the value for the normalized stress range at 1
million cycles is 3.25.
The value for the static load will be the average of the ones obtained following the
static tests.
The value for the concrete compressive strength will be the average value of the
strengths of the specimens.
The Imperial unit system will be used, as it is used throughout in the scientific paper.
The formulas used for the nominal punching shear and for the normalized stress are
the ones presented and used in the article.
- Nominal punching shear stress
- normalized stress
- Average value for the
concrete compressive
strength
- Effective area
- approximated normalized stress at 1 million cycles
P
b0 deff
P
fc
fc.average5490psi 5710psi 5870psi
35.69 10
3 psi
b0 deff 395in2
b0 deff Aeff 395in2
assumption
fc.average
3.25assumption
fc.average
assumption 3.25 psi fc.average 245.154 psi

FATIGUE MODEL FOR PRESTRESSED CONCRETE DECKS
156
Master’s Thesis – Tudor Mihai Brata
- Estimated value of the fatigue load
at 1 million cycles
- The ratio between the estimated fatigue load at 1 million cycles
and the static load
2) Reference no. 7 - study by Hwang et al.
Prediction from formula no. 1, based on the average wheel load:
- Prediction for 1 million cycles
P is the fatigue load and Pp is the static load.
Prediction from formula no. 2, based on the maximum wheel load:
- Prediction for 1 million cycles
At 100 million cycles the result is negative, the formulas not being able to predict the fatigue
load:
- First formula
- Second formula
Pfatigue Aeff assumption 9.684 104
lbf
Pstatic173kip 205kip
21.89 10
5 lbf
Pfatigue
Pstatic
51.236 %
P
Pp
0.2019 log Nc 1.384P
Pp
Nc1 106
P
Pp
0.2019 log 106 1.384 0.173
P
Pp
P
Pp
0.2157 log Nc 1.535P
Pp
Nc2 106
P
Pp
0.2157 log 106 1.535 0.241
P
Pp
P
Pp
0.2019 log 108 1.384 0.231
P
Pp
P
Pp
0.2157 log 108 1.535 0.191
P
Pp
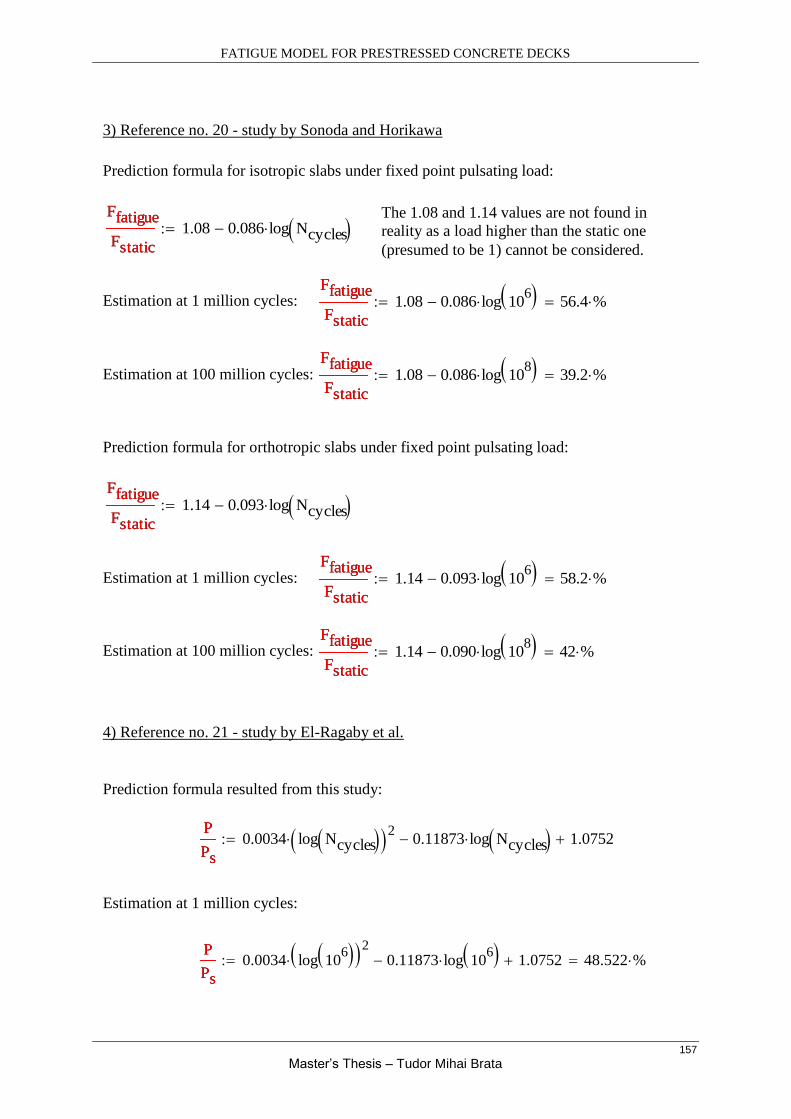
FATIGUE MODEL FOR PRESTRESSED CONCRETE DECKS
157
Master’s Thesis – Tudor Mihai Brata
3) Reference no. 20 - study by Sonoda and Horikawa
Prediction formula for isotropic slabs under fixed point pulsating load:
Estimation at 1 million cycles:
Estimation at 100 million cycles:
Prediction formula for orthotropic slabs under fixed point pulsating load:
Estimation at 1 million cycles:
Estimation at 100 million cycles:
4) Reference no. 21 - study by El-Ragaby et al.
Prediction formula resulted from this study:
Estimation at 1 million cycles:
Ffatigue
Fstatic
1.08 0.086 log Ncycles Ffatigue
Fstatic
Ffatigue
Fstatic
1.08 0.086 log 106 56.4 %
Ffatigue
Fstatic
Ffatigue
Fstatic
1.08 0.086 log 108 39.2 %
Ffatigue
Fstatic
Ffatigue
Fstatic
1.14 0.093 log Ncycles Ffatigue
Fstatic
Ffatigue
Fstatic
1.14 0.093 log 106 58.2 %
Ffatigue
Fstatic
Ffatigue
Fstatic
1.14 0.090 log 108 42 %
Ffatigue
Fstatic
P
Ps
0.0034 log Ncycles 2
0.11873 log Ncycles 1.0752P
Ps
P
Ps
0.0034 log 106 2 0.11873 log 10
6 1.0752 48.522 %P
Ps
The 1.08 and 1.14 values are not found in
reality as a load higher than the static one
(presumed to be 1) cannot be considered.

FATIGUE MODEL FOR PRESTRESSED CONCRETE DECKS
158
Master’s Thesis – Tudor Mihai Brata
Estimation at 100 million cycles:
The prediction formula derived by Matsui et al. (2001) that deals with reinforcing steel:
Estimation at 1 million cycles:
Estimation at 100 million cycles:
P
Ps
0.0034 log 108 2 0.11873 log 10
8 1.0752 34.296 %P
Ps
logP
Ps
0.07835 log Ncycles log 1.52( )P
Ps
P
Ps
100.07835 log 10
6 log 1.52( ) 51.492 %
P
Ps
P
Ps
100.07835 log 10
8 log 1.52( ) 35.896 %
P
Ps

FATIGUE MODEL FOR PRESTRESSED CONCRETE DECKS
159
Master’s Thesis – Tudor Mihai Brata
Annex 2

FATIGUE MODEL FOR PRESTRESSED CONCRETE DECKS
160
Master’s Thesis – Tudor Mihai Brata
Linear and nonlinear analysis checks
For these checks, the steel plates were not considered in the hand calculations or the FEA
analysis since their behaviour could influence the results.
1) Deflection at mid-span due to self-weight (linear):
The part of the deck is schematized as a beam clamped at both ends.
- length of the span
- height of the deck
- considered thickness of the model
- specific weight of concrete
The load per linear meter is equal to:
- modulus of elasticity of concrete
- moment of inertia of the deck
The deflection at mid-span due to the self-weight is equal to:
Figure 1 - Deflection of the FEA model due to self-weight
It can be seen that the calculated value of the displacement is similar to the value determined
by DIANA following the linear analysis.
lspan 1.80m
h 0.10m
b 1.95m
c 25kN
m3
q c h b 4.875kN
m
Ec 39000MPa
Ib h
3
121.625 10
4 m
4
G
q lspan4
384 Ec I0.021 mm

FATIGUE MODEL FOR PRESTRESSED CONCRETE DECKS
161
Master’s Thesis – Tudor Mihai Brata
2) Stresses at the outer fibers due to self-weight (linear):
- moment due to self-weight
- section modulus
The stress at the outer fibres due to self-weight is:
Figure 2 - Stresses at the outer fibers due to self-weight in the FEA model
It can be seen that the calculated value of the stresses at the outer fibres is similar to
the values determined by DIANA following the linear analysis.
3) Force at cracking (nonlinear):
- tensile strength of the concrete
- cracking moment of the section
considering also the effect of the
prestressing
General formulation for the cracking moment:
- cracking force determined analytically
MG
q lspan2
246.581 10
5 N mm
Wsectionb h
2
63.25 10
6 mm
3
G
MG
Wsection
0.203 MPa
fct 5.41MPa
Mcr fct 2.5MPa Wsection 25.708 kN m
Mcr
q lspan2
24
Fcr lspan
8
Fcr
8 Mcrq lspan
2
3
lspan
111.331 kN

FATIGUE MODEL FOR PRESTRESSED CONCRETE DECKS
162
Master’s Thesis – Tudor Mihai Brata
In the FEA model the cracking occurs at a value of approximately 90 kN, a lower value than
the one calculated previously. This difference is thought to be the result of how DIANA uses,
within the nonlinear analysis, the material models considered for the concrete in combination
with a smeared cracking approach.
4) Deflection due to the point load (linear):
- external point load applied to the deck
The deflection at mid-span due to the point load is equal to:
Figure 3 - Deflection due to the external force of the FEA model
In case of the deflection due to the external force, the value resulted from the FEA linear
analysis is slightly larger than the computed one.
5) Stresses at the outer fibers due to the point load (linear):
- moment due to the point load
- stress in the outer fibres
The stresses obtained from the FEA are very close to tha calculated value. In the plot below,
the stress at the top should have a similar value with the one at the bottom, but this differs
since the point load is applied in this case directly on the concrete element, therefore having
a stress concentration in that area.
Fpl 335kN
F
Fpl lspan3
192 Ec I1.606 mm
MF
Fpl lspan
875.375 kN m
F
MF
Wsection
23.192 MPa

FATIGUE MODEL FOR PRESTRESSED CONCRETE DECKS
163
Master’s Thesis – Tudor Mihai Brata
Figure 4 - Stresses at the outer fiber due to the point load in the FEA model

FATIGUE MODEL FOR PRESTRESSED CONCRETE DECKS
164
Master’s Thesis – Tudor Mihai Brata
List of Figures
Figure 1-1 – Dutch road network: e.g. The Ridderkerk interchange (source: Wikipedia) ...... 19 Figure 1-2 - Constant amplitude fatigue loading...................................................................... 20 Figure 1-3 - Variable amplitude fatigue loading (I) ................................................................. 20 Figure 1-4 - Variable amplitude fatigue loading (II) ................................................................ 20
Figure 1-5 – Structural behaviour ............................................................................................ 22 Figure 1-6 – Behaviour due to cyclic loading in compression [29] ......................................... 22 Figure 2-1 - Development of fatigue damage [2, 3] ................................................................. 27
Figure 2-2 - Example of a Wohler diagram (S-N curves) [2, 3] .............................................. 27 Figure 2-3 - Example of a Goodman diagram [3] .................................................................... 27 Figure 2-4 - Development of cyclic strain [2, 3] ...................................................................... 28 Figure 2-5 - Cyclic stress-strain curve for concrete in compression [2, 3] .............................. 28 Figure 2-6 – Cyclic stress-strain curve for concrete in tension [3] .......................................... 29
Figure 2-7 – Development of the tensile strain components [3] .............................................. 29 Figure 2-8 - Cyclic stress-strain for reversals .......................................................................... 29 Figure 2-9 – Detrimental effect of stress reversals [2, 3] ........................................................ 29 Figure 2-10 - S-N diagrams for wet (left) and dry (right) concrete [2, 3] ................................ 30
Figure 2-11 - Stress-strain relation with post-peak cycles for concrete in compression [3] .... 31 Figure 2-12 - Stress-strain relation with post-peak cycles for concrete in tension [3] (from
Reinhardt, Cornelissesn and Hordijk, 1986) ............................................................................ 31 Figure 2-13 - Linear softening relations and an experimentally determined relation [13] ...... 31
Figure 2-14 - σ-w relations, and data points [13] ..................................................................... 31 Figure 2-15 - Size effect on bars [2]......................................................................................... 32 Figure 2-16 - S-N curves for wires and bars [2, 3] .................................................................. 33
Figure 2-17 - Influence of frequency [2, 3] .............................................................................. 34 Figure 2-18 – Fretting at different frequencies [2, 3] ............................................................... 34
Figure 2-19 - Failure modes for beams without stirrups (left) and with stirrups (right) [2, 3] 36 Figure 2-20 - Specimen dimension, reinforcement and loading setup [5] ............................... 37 Figure 2-21 - Experimental setup [5] ....................................................................................... 38 Figure 2-22 - Shape of load variation [5] ................................................................................. 38
Figure 2-23 - Influence line for a moving load – stress reversal occurrence [6] ..................... 40 Figure 2-24 – Static test [7] ...................................................................................................... 41
Figure 2-25 – Wheel load fatigue test [7] ................................................................................ 41 Figure 2-26 - Failure shape of fatigue test specimen, top [7]................................................... 42 Figure 2-27 - Failure shape of fatigue test specimen, bottom [7] ............................................ 42 Figure 2-28 - Arching in concrete element [1] ......................................................................... 43 Figure 2-29 - Compressive membrane action in bridge deck [1] ............................................. 44
Figure 2-30 - Components of load deflection curve for a partially restrained slab [8] ............ 45 Figure 2-31 - Punching failure model, boundary forces [8] ..................................................... 45 Figure 2-32 - Punching failure model, forces on sector element [8] ........................................ 45 Figure 2-33 - Variation of punching load with boundary forces [8] ........................................ 46
Figure 2-34 - Idealized mode of arching action [1] ................................................................. 47 Figure 2-35 - Arching moment of resistance [1] ...................................................................... 47 Figure 2-36 - Test slab and lateral restraint configuration [10] ............................................... 48
Figure 2-37 - Test setup, laboratory [11] ................................................................................. 49 Figure 2-38 - Test setup, scheme [11] ...................................................................................... 49 Figure 2-39 - Punching failure load predictions: EC2, ACI [11] ............................................. 50

FATIGUE MODEL FOR PRESTRESSED CONCRETE DECKS
165
Master’s Thesis – Tudor Mihai Brata
Figure 2-40 - Punching failure load calculated from UK BD81/02 with CMA [11] ............... 50 Figure 2-41 - Scheme of reduced effectiveness of arching action due to multiple close loads
[12] ........................................................................................................................................... 51 Figure 2-42 - Pattern of cracking on bottom surface of cast-in-place specimens after punching
shear fatigue failure [12] .......................................................................................................... 52 Figure 2-43 - Load-deflection behavior of cast-in-place specimens under fatigue [12] .......... 52 Figure 2-44 - Schematic plan view of combined failure mode for precast specimens [12] ..... 52 Figure 2-45 - Schematic section view of combined failure mode for precast specimens [12] 52 Figure 3-1 – T girders before casting of the deck and the cross-beams [14] ........................... 55
Figure 3-2 – Structural system after casting of the deck and the cross-beams [14] ................. 55 Figure 3-3 – Loading setup scheme: single load and double load [14] .................................... 55
Figure 3-4 – Loading scheme for static (blue line) and alternating loading [15] ..................... 56 Figure 3-5 – Position of the fatigue tests [15] .......................................................................... 57 Figure 3-6 – Position of the applied load [15] ......................................................................... 57 Figure 3-7 – Loading during the first fatigue test [15] ............................................................. 57 Figure 3-8 – Failure of specimen during the first fatigue test [15] .......................................... 57
Figure 3-9 – Crack pattern at failure, fatigue test no. 2 [15] .................................................... 58 Figure 3-10 – Crack pattern at 330 kN [15] ............................................................................. 58 Figure 3-11 - New deck slab before casting [15] ..................................................................... 58 Figure 3-12 – Position of static and dynamic tests [15] ........................................................... 58
Figure 3-13 - Crack pattern at failure, static test no. 1 [15] ..................................................... 59 Figure 3-14 - Crack pattern at failure, static test no. 2 [15] ..................................................... 59
Figure 3-15 – Load values for fatigue test no. 1 [15] ............................................................... 60 Figure 3-16 – Failure pattern for fatigue test no. 1 [15] ........................................................... 60
Figure 3-17 – Loading sequence for fatigue test no. 2 [15] ..................................................... 60 Figure 3-18 – Failure pattern of fatigue test no. 2 [15] ............................................................ 60 Figure 3-19 - – Loading sequence for fatigue test no. 3 [15] ................................................... 61
Figure 3-20 – Crack pattern at failure, fatigue test no. 3 [15] .................................................. 61 Figure 3-21 – Loading scheme of fatigue test no. 4 ................................................................. 61
Figure 3-22 – Loading sequence for fatigue test no. 4 [15] ..................................................... 62 Figure 3-23 – Failure pattern of fatigue test no. 4 [15] ............................................................ 62 Figure 3-24 - Loading sequence for fatigue test no. 5 [15] ...................................................... 62
Figure 3-25 - Failure pattern of fatigue test no. 5 [15] ............................................................. 62 Figure 3-26 – Failure load as a function of the no. of cycles [15] ........................................... 63
Figure 3-27 - Relative load value Ffat/Fsta as a function of the no. of loading cycles for the 2nd
series of tests [15] ..................................................................................................................... 64
Figure 3-28 - Relative load value Ffat/Fsta as a function of the no. of loading cycles for all the
tests [15] ................................................................................................................................... 64 Figure 3-29 – Tested specimens as component of a bridge [12] .............................................. 65 Figure 3-30 – Loading of specimen for analytical studies [12] ............................................... 65 Figure 3-31 – Test setup [12] ................................................................................................... 66
Figure 3-32 – Crack pattern at failure for precast specimens [12] ........................................... 66 Figure 3-33 – Predicted and observed results for precast specimens [12] ............................... 67 Figure 3-34 – S-N diagram for all specimens [12] ................................................................... 67 Figure 3-35 - Experimental setup [5] ....................................................................................... 67
Figure 3-36 - Shape of load variation [5] ................................................................................. 67 Figure 3-37 – Slab S1 at failure after static loading [5] ........................................................... 68
Figure 3-38 – Cracks in slab S1 after the cyclic test [5] .......................................................... 68 Figure 3-39 – Geometry and reinforcement layout of the specimens [7] ................................ 69 Figure 3-40 – Tests setup for (moving wheel) fatigue test [7] ................................................. 69

FATIGUE MODEL FOR PRESTRESSED CONCRETE DECKS
166
Master’s Thesis – Tudor Mihai Brata
Figure 3-41 – Failure of specimen after static tests [7] ............................................................ 70 Figure 3-42 – Failure of specimen after fatigue test [7] ........................................................... 70 Figure 3-43 – Test setup [16] ................................................................................................... 71 Figure 3-44 – Variable amplitude fatigue loading scheme [16] ............................................... 72
Figure 3-45 - Constant amplitude fatigue loading scheme [16] ............................................... 72 Figure 3-46 – Load-deflection behavior of slab S1 under static and cyclic loading [16] ........ 72 Figure 3-47 – Static response of the slabs after different fatigue loading steps (Ff=367 kN)
[16] ........................................................................................................................................... 72 Figure 3-48 – Crack pattern under fatigue loading [16] ........................................................... 73
Figure 3-49 – Number of cycles to failure for each slab [16] .................................................. 73 Figure 3-50 - Relative load value Ffat/Fsta as a function of the no. of loading cycles for all the
tests [15] ................................................................................................................................... 76 Figure 3-51 - S-N diagram for all specimens [12] ................................................................... 76 Figure 3-52 – S-N curve: tests and prediction from formulas [7] ............................................ 77 Figure 3-53 – S-N curve for fully supported slabs from Roesler and Barenberg study [18] ... 78 Figure 3-54 – S-N curve from the study performed by Sonoda and Horikawa [20] ................ 78
Figure 3-55 – S-N curves based on different prediction formulas [21] ................................... 79 Figure 4-1 – 3D solid finite element bridge model, S. Amir [14] ............................................ 82 Figure 4-2 – Plane stress state [24] .......................................................................................... 83 Figure 4-3 – First FEA model, simply supported ..................................................................... 84
Figure 4-4 - Lack of plate in the model (linear analysis) ......................................................... 85 Figure 4-5 – Effect of the loading plate on the stress distribution (linear analysis) ................ 85
Figure 4-6 – FEA model displaying the geometry and the reinforcing/prestressing bars ........ 86 Figure 4-7 – Plane stress element as defined by DIANA [25] ................................................. 86
Figure 4-8 – CQ16M element of DIANA [25] ........................................................................ 86 Figure 4-9 – CL12I interface element [25] .............................................................................. 87 Figure 4-10 – Connection of CL12I to another element [25] .................................................. 87
Figure 4-11 – Reinforcement bar as considered by DIANA [25] ............................................ 88 Figure 4-12 - Bar particle in a plane stress element [25] ......................................................... 88
Figure 4-13 – Material properties of concrete and steel from S. Amir’s PhD thesis [14] ....... 89 Figure 4-14 – Smeared cracking approach [28] ....................................................................... 89 Figure 4-15 – Smeared crack model, tensile behaviour [14] ................................................... 89
Figure 4-16 – Tension softening functions: Hordijk (left), Exponential (centre) and Linear
(right) [25] ................................................................................................................................ 90
Figure 4-17 – Vecchio and Collins reduction factor due to lateral cracking [25] .................... 90 Figure 4-18 – Parabolic compression curve [25] ..................................................................... 91
Figure 4-19 – Ideal (constant) compression curve [25] ........................................................... 91 Figure 4-20 – Reinforcing steel properties from S. Amir’s PhD thesis [14] ........................... 92 Figure 4-21 – Strain curves of steel from the experimental program [14] ............................... 92 Figure 4-22 – Stress-strain diagram used for the FEA model of the Master’s Thesis ............. 92 Figure 4-23 – Meshed FEA model, presented half due to symmetry ...................................... 96
Figure 4-24 – Close-up of the mesh for assessing the discretization elements ........................ 96 Figure 4-25 – Snap-through [25] .............................................................................................. 97 Figure 4-26 – Snap-back [25] ................................................................................................... 97 Figure 4-27 – Modified Newton-Raphson method [25] ........................................................... 97
Figure 4-28 – Load-deflection behaviour for a single point load at mid-span and a TPL of 2.5
MPa [14] (image used to obtain Graph 4-2) ............................................................................ 98
Figure 4-29 – Cracking pattern due to static loading [15] ....................................................... 99 Figure 4-30 – Failure due to fatigue loading [15] .................................................................... 99 Figure 4-31 – Punching cone contour and crack pattern due to fatigue loading [15] .............. 99

FATIGUE MODEL FOR PRESTRESSED CONCRETE DECKS
167
Master’s Thesis – Tudor Mihai Brata
Figure 4-32 – Increase in the steel stress over the yield value as a consequence of the increase
in crack width ......................................................................................................................... 101 Figure 4-33 – Yielding of steel at one location in the initial model loaded by a point load .. 101 Figure 4-34 – Yielding of steel at two locations in the initial model loaded by a distributed
load ......................................................................................................................................... 101 Figure 4-35 – Development of the compressive membrane action (CMA) within the initial
FEA model ............................................................................................................................. 103 Figure 4-36 - Compressive stress in the deck slab after blocking both translations at the
supports .................................................................................................................................. 105
Figure 4-37 – Stresses in the steel at failure (presented in the nodes) ................................... 111 Figure 4-38 - Stresses in the steel at failure (presented in the integration points) ................. 111
Figure 4-39 – Strains in the steel at failure (presented in the nodes) ..................................... 112 Figure 4-40 - Strains in the steel at failure (presented in the integration points) ................... 112 Figure 4-41 – Stress in the concrete at failure (presented in the nodes) ................................ 113 Figure 4-42 - Stress in the concrete at failure (presented in the integration points) .............. 113 Figure 4-43 - Strain of the concrete at failure (presented in the nodes) ................................. 113
Figure 4-44 - Strain of the concrete at failure (presented in the integration points) .............. 113 Figure 4-45 – Crack width at failure (presented in the nodes) ............................................... 114 Figure 4-46 - Crack width at failure (presented in the integration points) ............................. 114 Figure 4-47 – Deflection values from the experimental tests [14] ......................................... 114
Figure 4-48 - Deflection values from the FEA [14] ............................................................... 114 Figure 4-49 – Deflection of the best behaviour FEA model ................................................. 114
Figure 4-50 – Development of the Compressive Membrane Action in the BBM FEA model
................................................................................................................................................ 115
Figure 4-51 – Steel stress at the assumed failure ................................................................... 116 Figure 4-52 – Value of the strain at the assumed failure........................................................ 116 Figure 4-53 – Concrete stresses at the assumed failure ......................................................... 116
Figure 4-54 – Concrete strains at the assumed failure ........................................................... 116 Figure 4-55 – Crack widths at the assumed failure ................................................................ 117
Figure 4-56 – Deflection of the realistic FEA model ............................................................. 117 Figure 4-57 – Development of the Compressive Membrane Action in the RM FEA model 117 Figure 5-1 – Compressive fracture energy dependence on the compressive strength [25] .... 121
Figure 5-2 - Cyclic loading range for test BB23_200 [15] .................................................... 125 Figure 5-3 – Steel stress at the end of the analysis, BB23_200 - BBM ................................. 125
Figure 5-4 – Steel strain at the end of the analysis, BB23_200 - BBM ................................. 125 Figure 5-5 – Concrete stresses at the end of the analysis, BB23_200 - BBM ....................... 126
Figure 5-6 –Concrete strains at the end of the analysis, BB23_200 - BBM .......................... 126 Figure 5-7 – Crack width, BB23_200 - BBM ........................................................................ 126 Figure 5-8 – Development of CMA, BB23_200 - BBM ........................................................ 126 Figure 5-9 – Steel stress at failure, BB23_200 - RM ............................................................. 126 Figure 5-10 – Steel strain at failure, BB23_200 - RM ........................................................... 126
Figure 5-11 – Concrete stress at failure, BB23_200 - RM ..................................................... 127 Figure 5-12 – Concrete strain at failure, BB23_200 -RM ...................................................... 127 Figure 5-13 – Crack width, BB23_200 - RM ......................................................................... 127 Figure 5-14 – Development of CMA, BB23_200 - RM ........................................................ 127
Figure 5-15 - Cyclic load range for test BB24_150 [15] ....................................................... 127 Figure 5-16 - Steel stress at the end of the analysis, BB24_150 - BBM ................................ 128
Figure 5-17 - Steel strain at the end of the analysis, BB24_150 - BBM ................................ 128 Figure 5-18 - Concrete stresses at the end of the analysis, BB24_150 - BBM ...................... 128 Figure 5-19 - Concrete strains at the end of the analysis, BB24_150 - BBM ........................ 128

FATIGUE MODEL FOR PRESTRESSED CONCRETE DECKS
168
Master’s Thesis – Tudor Mihai Brata
Figure 5-20 - Crack width, BB24_150 - BBM ....................................................................... 128 Figure 5-21 – Development of CMA, BB24_150 - BBM ...................................................... 128 Figure 5-22 - Steel stress at failure, BB24_150 - RM ............................................................ 129 Figure 5-23 - Steel strain at failure, BB24_150 - RM ............................................................ 129
Figure 5-24 - Concrete stress at failure, BB24_150 - RM ..................................................... 129 Figure 5-25 - Concrete strain at failure, BB24_150 - RM ..................................................... 129 Figure 5-26 – Crack width, BB24_150 - RM ......................................................................... 129 Figure 5-27 – Development of CMA, BB24_150 - RM ........................................................ 129 Figure 5-28 – Cyclic load range for test BB26_165 .............................................................. 130
Figure 5-29 - Steel stress at the end of the analysis, BB26_165 - BBM ................................ 130 Figure 5-30 - Steel strain at the end of the analysis, BB26_165 - BBM ................................ 130
Figure 5-31 - Concrete stresses at the end of the analysis, BB26_165 - BBM ...................... 131 Figure 5-32 - Concrete strains at the end of the analysis, BB26_165 - BBM ........................ 131 Figure 5-33 Crack width, BB26_165 - BBM ......................................................................... 131 Figure 5-34 – Development of CMA, BB26_165 - BBM ...................................................... 131 Figure 5-35 - Steel stress at failure, BB26_165 - RM ............................................................ 131
Figure 5-36 - Steel strain at failure, BB26_165 - RM ............................................................ 131 Figure 5-37 - Concrete stress at failure, BB26_165 - RM ..................................................... 132 Figure 5-38 - Concrete strain at failure, BB26_165 - RM ..................................................... 132 Figure 5-39 – Crack width, BB26_165 - RM ......................................................................... 132
Figure 5-40 – Development of CMA, BB26_165 - RM ........................................................ 132 Figure 5-41- Loading ranges for test BB28 [15] .................................................................... 134
Figure 5-42 – Steel stress at the beginning of the second phase, BB28 ................................. 135 Figure 5-43 - Concrete stress at the beginning of the second phase, BB28 ........................... 135
Figure 5-44 – Loading ranges for BB29 [15] ......................................................................... 135 Figure 5-45 – Steel stress at the end of FEA for loading range 1 of test BB28 ..................... 137 Figure 5-46 - Concrete stress at the end of FEA for loading range 2 of test BB29 ............... 137
Figure 5-47 – Schematization of Miner’s rule, design curve [29] ......................................... 137 Figure 5-48 – Loading sequence, type I ................................................................................. 138
Figure 5-49 – Loading sequence, type II ................................................................................ 138 Figure 6-1 – Number of longitudinal girders for the previous structural system [14] ........... 143 Figure 6-2 – Number of longitudinal girders for the current structural system ..................... 143
Figure 6-3 - Cross section of longitudinal girders from previous study [14] ......................... 144 Figure 6-4 - Cross section of longitudinal girders from current study ................................... 144
Figure 6-5 – Formwork and reinforcement for end beams .................................................... 144 Figure 6-6 – Transverse end beams after casting ................................................................... 144
Figure 6-7 – Wooden frames for supporting the formwork ................................................... 145 Figure 6-8 – Completed formwork for the deck slab ............................................................. 145 Figure 6-9 – Structure after positioning of the reinforcement ant PVC tubes ....................... 145 Figure 6-10 – Close-up with the reinforcement and the plastic tubes .................................... 145 Figure 6-11 – Casting and smoothing the surface of the concrete ......................................... 146
Figure 6-12 – Concrete covered with a plastic foil to prevent water evaporation ................. 146 Figure 6-13 – Tensioning of the prestressing bars ................................................................. 146 Figure 6-14 – Structural system prepared for tests ................................................................ 146

FATIGUE MODEL FOR PRESTRESSED CONCRETE DECKS
169
Master’s Thesis – Tudor Mihai Brata
List of Graphs
Graph 4-1 - Influence of boundary conditions (following from the linear analyses) .............. 84 Graph 4-2 – Load-deflection behaviour following from the experimental program and the
FEA of S. Amir ........................................................................................................................ 98 Graph 4-3 – Force-deflection behaviour of the initial model for different loading situations100
Graph 4-4 – Different force-deflection behaviours of the initial model compared to the
reference curves ...................................................................................................................... 100 Graph 4-5 – Behaviour of the initial model due to the exceeding of the yield stress of steel 101
Graph 4-6 - Influence of the prestressing bar’s bond on the behaviour of the initial model . 102 Graph 4-7 – Influence of the ultimate steel strain on the behaviour of the initial model....... 102 Graph 4-8 – Influence of the value of the applied force ........................................................ 102 Graph 4-9 – Influence of the arc-length control method ........................................................ 102 Graph 4-10 – Impact of the effective width on the FEA model’s behaviour ......................... 104
Graph 4-11 – Best behaviour obtained for a width of 1.95 meters ........................................ 104 Graph 4-12 – Impact of the translation restraint at the supports ............................................ 105 Graph 4-13 – Influence of the prestressing bar’s bond on the capacity of the model: no bond
considered ............................................................................................................................... 106
Graph 4-14 - Influence of the prestressing bar’s bond on the capacity of the model: bond
considered ............................................................................................................................... 106
Graph 4-15 – Behaviour of the FEA model without the prestressing bar and with the bar not
being bonded .......................................................................................................................... 106
Graph 4-16 - Influence of the Arc-Length Control method; final effective width (1.95 m)
considered ............................................................................................................................... 107 Graph 4-17 - Influence of the rotation at the supports on the behaviour of the FEA model.. 107
Graph 4-18 - Influence of the compressive model of the concrete on the FEA model’s
behaviour ................................................................................................................................ 108
Graph 4-19 - Influence of the tensile model of concrete on the FEA model’s behaviour ..... 108 Graph 4-20 - Final FEA models ............................................................................................. 109 Graph 4-21 – Behaviour of the “realistic model’ (RM) ......................................................... 110 Graph 4-22 – Steel stress variation in the best behaviour model ........................................... 112
Graph 5-1 – Impact of the modified compressive strength and fracture energy on the FEA
model ...................................................................................................................................... 121
Graph 5-2 – Impact of the elasticity modulus on the fatigue behaviour ................................ 122 Graph 5-3 – Behaviour of FEA model depending on the parameters considered for
modification ........................................................................................................................... 123 Graph 5-4 – Impact of different approaches in determining the tensile strength and fracture
energy ..................................................................................................................................... 123
Graph 5-5 – Fatigue FEA of test BB23_200 .......................................................................... 125 Graph 5-6 - Fatigue FEA of test BB24_150 .......................................................................... 127 Graph 5-7 - Fatigue FEA of test BB26_165 .......................................................................... 130 Graph 5-8 – Fatigue tests: Results and accuracy; Ffat/Fsta vs. logN ........................................ 132
Graph 5-9 - FE analyses of test BB28 .................................................................................... 134 Graph 5-10 - FE analysis of test BB29 .................................................................................. 135 Graph 5-11 - Individual FEA for each loading range of test BB28 ....................................... 136
Graph 5-12 - Individual FEA for each loading range of test BB29 ....................................... 136 Graph 5-13 – Sequence effect, phased analysis ..................................................................... 139 Graph 5-14 – Sequence effect, separate analysis ................................................................... 139

FATIGUE MODEL FOR PRESTRESSED CONCRETE DECKS
170
Master’s Thesis – Tudor Mihai Brata
List of Tables
Table 4-1 – Properties of the constitutive model for concrete ................................................. 91 Table 4-2 – Properties of the constitutive model for reinforcing steel ..................................... 93
Table 4-3 – Properties of the constitutive model for prestressing steel ................................... 93 Table 4-4 – Properties of the constitutive model for the steel plates ....................................... 94 Table 5-1 – Approaches for determining the reduced tensile strength and tensile fracture
energy ..................................................................................................................................... 123 Table 5-2 – Test BB23_200 FEA results and prediction ....................................................... 125
Table 5-3 - Test BB24_150 FEA results and prediction ........................................................ 128 Table 5-4 - Test BB26_165 FEA results and prediction ........................................................ 130
List of Equations
Equation 5-1 – Determination of the maximum compressive stress ...................................... 121
Equation 5-2 – Force prediction formula ............................................................................... 124 Equation 5-3 – Formulation for Miner’s rule ......................................................................... 138

FATIGUE MODEL FOR PRESTRESSED CONCRETE DECKS
171
Master’s Thesis – Tudor Mihai Brata
References
[1] ICE Manual for bridge engineering, Institution of Civil Engineers, 2008
[2] G. P. Mallett, Fatigue of reinforced concrete, HMSO, Transport and road research
laboratory, 1991
[3] Comité européen du beton, Bulletin No. 188, 1988
[4] Ahsan R., Fatigue in concrete structures, BSRM Seminar on fatigue properties of
construction steel
[5] V. Carvelli, M. A. Pisani, C. Poggi, Fatigue behaviour of concrete bridge deck slabs
reinforced with GFRP bars, Composites: Part B Engineering 41(7):560-567 · October 2010
[6] M. Schlafli, E. Bruhwiler, Fatigue of existing reinforced concrete bridge deck slabs,
Engineering Structures, Vol. 20, No. 11, pp. 991–998, 1998
[7] H. Hwang, H. Yoon, C. Joh, B-S. Kim, Punching and fatigue behavior of long-span
prestressed concrete deck slabs, Engineering Structures 32 (2010) 2861-2872
[8] B. deV. Batchelor, Membrane Enhancement in Top Slabs of Concrete, Concrete Bridge
Engineering: Performance and advances, CRC Press 1987
[9] The Highways Agency, Use of compressive membrane action in bridge decks - Summary of
correction – BD 81/02 Volume 3, Section 4, Part 20, Design manual for roads and bridges,
2007
[10] Y. Zheng, C.H. Li, J.B. Yang, C. Sun, Influence of arching action on shear behaviour of
laterally restrained concrete slabs reinforced with GFRP bars, Composite Structures 132
(2015) 20–34
[11] S. Amir, C. van der Veen, J.C. Walraven, A. de Boer, Bearing capacity of prestressed
concrete decks slabs. In CR Alimchandani (Ed.), Proceedings of the 4th international FIB
congress (pp. 1-10). Himayatnagar: Universities Press. (TUD), 2014
[12] J. C. Graddy, J. Kim, J. H. Whitt, N. H. Burns, R. E. Klingner, Punching-Shear Behavior
of Bridge Decks under Fatigue Loading, ACI Structural Journal 99(3):257-266, Title no. 99-
S27 · May 2002
[13] D. A. Hordijk, Local approach to fatigue of concrete, Technische Universiteit Delft, 1991
FATIGUE MODEL FOR PRESTRESSED CONCRETE DECKS
172
Master’s Thesis – Tudor Mihai Brata
[14] S. Amir, Compressive Membrane Action in Prestressed Concrete Deck Slabs, PhD
thesis, TU Delft, 2014 – from TU Delft repository
[15] C. van der Veen, A. Bosman, Vermoeiingssterkte voorgespannen tussenstort” - report
number 25.5-14-06, TU Delft, December 2014
[16] A. El-Ragaby, E. El-Salakawy, B. Benmokrane, Fatigue analysis of concrete bridge deck
slabs reinforced with E-glass/vinyl ester FRP reinforcing bars, Composites Part B:
Engineering, 38 (2007) 703–711
[17] F. Natário, M. F. Ruiz, A. Muttoni, Experimental investigation on fatigue of concrete
cantilever bridge deck slabs subjected to concentrated loads, Engineering Structures 89 (2015)
191–203, 2015
[18] J. R. Roesler, E. J. Barenberg, Fatigue and Static Testing of Concrete Slabs,
Transportation Research Record, No. 1684, Pag. 71-80, Nov. 1999
[19] A. Medeiros, X. Zhang, G. Ruiz, R. C. Yu, M. de Souza Lima Velasco, Effect of the loading
frequency on the compressive fatigue behaviour of plain and fiber reinforced concrete,
International Journal of Fatigue 70 (2015) 342–350, 2015
[20] K. Sonoda, T. Horikawa, Fatigue strength of reinforced concrete slabs under moving
loads, IABSE reports, 37 (1982)
[21] A. El-Ragaby, E. El-Salakawy, B. Benmokrane, Fatigue Life Evaluation of Concrete
Bridge Deck Slabs Reinforced with Glass FRP Composite Bars, Journal of Composites for
Construction © ASCE / May/June 2007, J. Compos. Constr., 2007, 11(3): 258-268
[22] E. Lantsoght, C. van der Veen, A. de Boer, J. Walraven, Recommendations for the Shear
Assessment of Reinforced Concrete Solid Slab Bridges, PowerPoint presentation at IABMAS
2014, 7th International Conference on Bridge Maintenance, Safety and Management, 7th-11th
of July, Shanghai, China
[23] S. Amir, Compressive Membrane Action in Concrete Decks, Proc. of the 9th fib
International PhD Symposium in Civil Engineering July 22 to 25, 2012, Karlsruhe Institute of
Technology (KIT), Germany – from TU Delft repository
[24] Digital Engineering, Online engineering platform and magazine
http://www.digitaleng.news/de/simplifying-fea-models-plane-stress-and-plane-strain/
[25] DIANA 10.0 Manual, Website of DIANA FEA,
http://dianafea.com/manuals/d100/Diana.html
FATIGUE MODEL FOR PRESTRESSED CONCRETE DECKS
173
Master’s Thesis – Tudor Mihai Brata
[26] Guidelines for Nonlinear Finite Element Analysis of Concrete Structures,
Rijkswaterstaat Technical Document (RTD), Doc. nr. : RTD 1016-1:2016, Version: 2.0,
Status: Final, Date: 24 June 2016
[27] J. G. Rots, J. Blaauwendraad, Crack models for concrete: Discrete or Smeared? Fixed,
multi-directional or rotating? , Heron, Vol. 34, 1989, No. 1
[28] Computational Modelling of Structures Course (CIE5148), Faculty of Civil Engineering
and Geosciences, Technical University of Delft, 2015/2016
[29] Fatigue Course (CIE5126), Faculty of Civil Engineering and Geosciences, Technical
University of Delft, 2015/2016
Copyright © 2022 FDOKUMEN