Masaryk University MASTER'S THESIS - IS MUNI
68
Masaryk University Faculty of Economics and Administration MASTER’S THESIS Brno, 2019 Madhuparna DATTA
-
Upload
khangminh22 -
Category
Documents
-
view
0 -
download
0
Transcript of Masaryk University MASTER'S THESIS - IS MUNI

Masaryk University
Faculty of Economics and Administration
MASTER’S THESIS
Brno, 2019 Madhuparna DATTA

Masaryk University
Faculty of Economics and Administration
Field of study: Public Economics and Administration
PUBLIC SECTOR ENTERPRISES IN INDIAN ECONOMY:
CHALLENGES FACED AND MAJOR REASONS FOR FAILURE
Master’s Thesis
Thesis Supervisor: Author:
Mgr. Martin GUZI, Ph.D Madhuparna DATTA, BA (Hons)
Brno, 2019

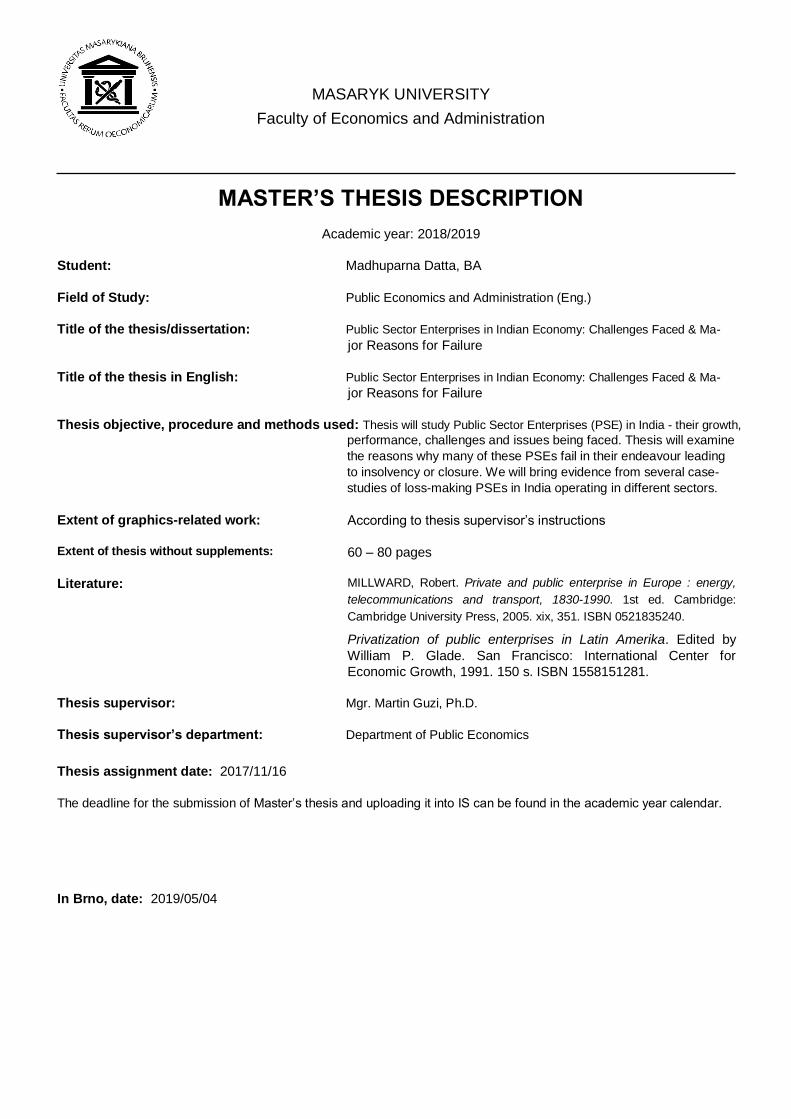
MASARYK UNIVERSITY
Faculty of Economics and Administration
MASTER’S THESIS DESCRIPTION
Academic year: 2018/2019
Student: Madhuparna Datta, BA
Field of Study: Public Economics and Administration (Eng.)
Title of the thesis/dissertation: Public Sector Enterprises in Indian Economy: Challenges Faced & Ma-
jor Reasons for Failure
Title of the thesis in English: Public Sector Enterprises in Indian Economy: Challenges Faced & Ma-
jor Reasons for Failure
Thesis objective, procedure and methods used: Thesis will study Public Sector Enterprises (PSE) in India - their growth,
performance, challenges and issues being faced. Thesis will examine the reasons why many of these PSEs fail in their endeavour leading to insolvency or closure. We will bring evidence from several case- studies of loss-making PSEs in India operating in different sectors.
Extent of graphics-related work:
Extent of thesis without supplements:
Literature:
According to thesis supervisor’s instructions
60 – 80 pages
MILLWARD, Robert. Private and public enterprise in Europe : energy,
telecommunications and transport, 1830-1990. 1st ed. Cambridge:
Cambridge University Press, 2005. xix, 351. ISBN 0521835240. Privatization of public enterprises in Latin Amerika. Edited by
William P. Glade. San Francisco: International Center for
Economic Growth, 1991. 150 s. ISBN 1558151281.
Thesis supervisor: Mgr. Martin Guzi, Ph.D.
Thesis supervisor’s department: Department of Public Economics
Thesis assignment date: 2017/11/16
The deadline for the submission of Master’s thesis and uploading it into IS can be found in the academic year calendar. In Brno, date: 2019/05/04
Name and sur name o f t he author : Madhuparna DATTA
Master’s t hes is t it le: Public Sector Enterprises in Indian Economy: Challenges
Faced and Major Reasons for Failure
Depar tment : Department of Public Economics
Master’s t hes is super viso r : Mgr. Martin Guzi, Ph.D.
Master’s t hes is dat e: 2019

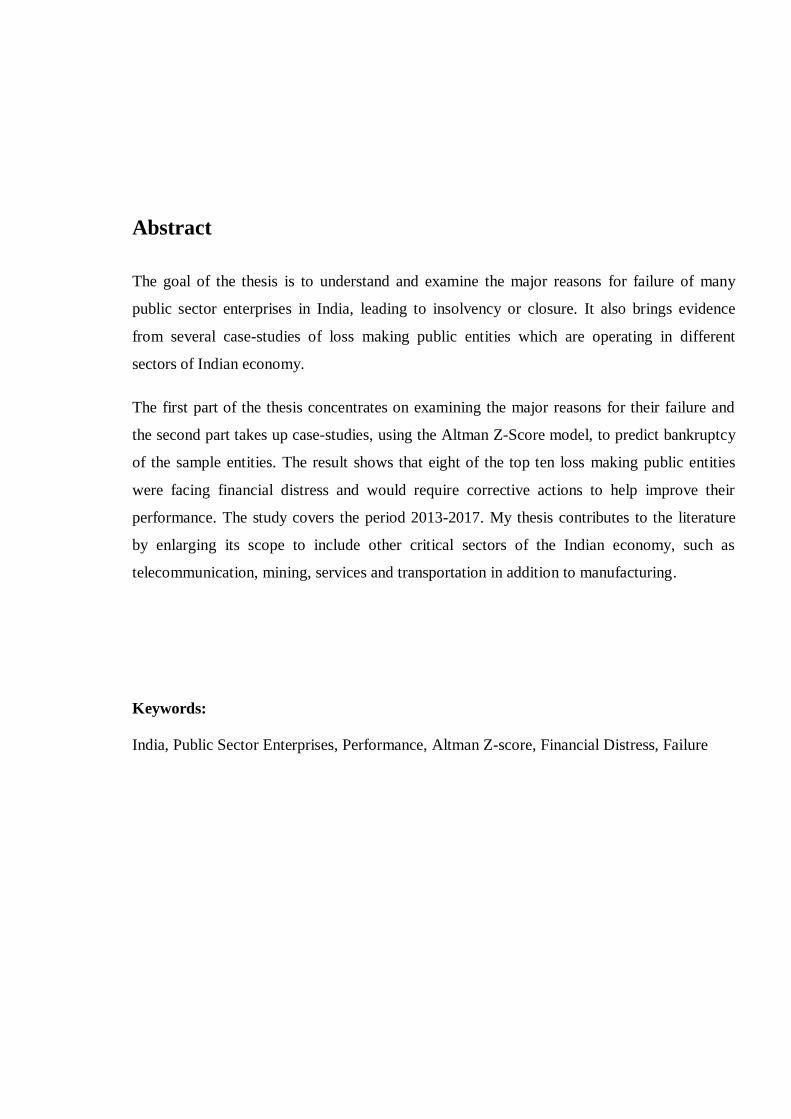
Abstract
The goal of the thesis is to understand and examine the major reasons for failure of many
public sector enterprises in India, leading to insolvency or closure. It also brings evidence
from several case-studies of loss making public entities which are operating in different
sectors of Indian economy.
The first part of the thesis concentrates on examining the major reasons for their failure and
the second part takes up case-studies, using the Altman Z-Score model, to predict bankruptcy
of the sample entities. The result shows that eight of the top ten loss making public entities
were facing financial distress and would require corrective actions to help improve their
performance. The study covers the period 2013-2017. My thesis contributes to the literature
by enlarging its scope to include other critical sectors of the Indian economy, such as
telecommunication, mining, services and transportation in addition to manufacturing.
Keywords:
India, Public Sector Enterprises, Performance, Altman Z-score, Financial Distress, Failure
Declaration
I certify that I have written the Master’s Thesis “Public Sector Enterprises in Indian
Economy: Challenges Faced and Major Reasons for Failure” by myself under the supervision
of Mgr. Martin Guzi, Ph.D. and I have listed all the literature and other specialist sources in
accordance with legal regulations, Masaryk University internal regulations, and the internal
procedural deeds of Masaryk University and the Faculty of Economics and Administration.
In Brno .......................................... ...................................................
Madhuparna Datta, BA (Hons)
Acknowledgement
I would like to acknowledge the time and effort dedicated by my thesis supervisor
Martin Guzi from Masaryk University. I would like to thank him for his valuable guidance
and support. I would also like to thank my family for their constant encouragement and
support.
TABLE OF CONTENTS
INTRODUCTION ........................................................................................................ 7
1. THEORIES OF THE STATE-OWNED FIRM.......................................................... 9
1.1 Property Rights Approach ................................................................................ 11
1.2 Transaction Cost Theory ................................................................................... 11
1.3 Agency Theory ................................................................................................. 12
1.4 Resource-based View ....................................................................................... 12
1.5 Summary .......................................................................................................... 13
2. PUBLIC SECTOR ENTERPRISES IN INDIA ....................................................... 14
2.1 Evolution and Characteristics of PSEs in India ................................................. 14
2.2 Performance Indictors of PSEs in India............................................................. 17
2.3 Summary .......................................................................................................... 19
3. THE FAILURE OF PUBLIC SECTOR ENTERPRISES ........................................ 20
3.1 Reasons for Failures ......................................................................................... 20
Soft Budget Constraint ........................................................................................... 20
Corporate Governance Challenges......................................................................... 21
Competition ............................................................................................................ 22
Capacity Under-Utilization .................................................................................... 23
Political Interference and Lack of Autonomy .......................................................... 23
3.2 Summary .......................................................................................................... 25
4. SCREENING FOR BANKRUPTCY RISK............................................................. 26
4.1 Altman Z-Score Model ..................................................................................... 26
4.2 Empirical Studies on Financial Distress of PSEs in India .................................. 27
4.3 Summary .......................................................................................................... 28
5. RESEARCH METHODOLOGY ............................................................................ 29
5.1 Profiles of Top 8 Loss Making PSEs in Study Sample ...................................... 29
5.2 Data Collection ................................................................................................. 31
5.3 Model Specification.......................................................................................... 31
6. PRESENTATION AND DISCUSSION OF RESULTS .......................................... 34
7. REFORMS FOR RESTRUCTURING PUBLIC SECTOR ...................................... 41
7.1 Strategies to Reform the Underperforming PSEs .............................................. 41
7.2 Government Policy for Revival of Sick PSEs ................................................... 41
CONCLUSION .......................................................................................................... 44
LIST OF LITERATURE ............................................................................................ 46
LIST OF TABLES ...................................................................................................... 55
LIST OF FIGURES .................................................................................................... 56
LIST OF ABBREVIATIONS ..................................................................................... 57
LIST OF APPENDICES ............................................................................................. 58

7
INTRODUCTION
The International Monetary Fund defines public sector enterprises as firms that are
owned and/or controlled by the government/state which implies that organisations that are
minority owned by the government can also be referred to as public sector enterprises
(Lienert, 2009). According to Bajo, Zuber, and Primorac (2018), public sector enterprises can
be in the form of joint stock companies or limited liability companies. Typically, state-owned
firms are large and operate in key sectors of the economy. Mallya (1971) describes public
sector enterprises in India as autonomous or semi-autonomous entities that are owned and
managed by the government. These entities participate in industrial and commercial activities.
The role of the public sector enterprises is critical to the economy. These entities
operate in areas that require long gestation periods and huge investments. They contribute
substantially to the total output. Thus, the financial wellbeing of these firms incessantly
affects the overall performance of the economy. Public Sector Enterprises (PSEs) were
formed in India, like in most other countries, to accelerate economic and social development.
The other major reasons for their formation include social welfare, employment generation,
income generation, import substitution, and regional development (Delhi Univ., Study
Material).
Over the years, governments across the globe have introduced reforms in the
management and operations of public sector enterprises. Some authors found that the
government run entities are less efficient and often a drain to public resources as they lacked
profit motive. In the late 1970s and throughout the 1980s there was a growing concern in
India about the performance of PSEs (Bhoothalingam, 1993; Marathe, 1989; Mujamdar,
1998). In the early 1990s, the Indian government introduced the Public Enterprises Reform
Process based on different policies. These policies include the New Industrial Policy,
Empowerment of Enterprises Policy, and Privatization (Khanna, 2012). The reforms entailed
liberalisation, disinvestment, measures for improving performance, downsizing, restructuring
and revival, autonomy to large enterprises, professionalism, and shutting-down of loss-
making PSEs (Chittedi and Singh, 2012).
The Indian government premised that these reforms would result in the public sector
enterprises becoming more efficient and productive. However, despite the reforms introduced
by the government, the firms are still facing challenges which affect their financial wellbeing
8
and sustainability (Deloitte, 2011). Given the importance of the PSEs in India, it is necessary
to determine the financial health and solvency of these entities. The consequences of failure
are not only felt by the government but also by the other stakeholders such as suppliers,
employees, and customers. Therefore, being able to accurately predict the bankruptcy of a
firm is important. The aim of the thesis is to understand the challenges and major reasons for
failure of PSEs in India. Additionally, the thesis will use a methodology to predict financial-
distress/insolvency of selected PSEs.
The thesis is divided in to eight chapters including introduction. The introduction
highlights the research problem and the significance of this thesis. Chapter one presents a
summary of the theory of state-owned firms and provides rationale for the formation and
importance of PSEs. Chapter two summarises background information on PSEs in India. This
includes the evolution, growth and performance of PSEs over the years. Chapter three
discusses the challenges faced by PSEs and examines the major reasons for their failure.
Chapter four highlights the financial distress and use of the Altman Z-score for
predicting bankruptcy of PSEs. Chapter five presents the research methodology to help
evaluate the financial health of selected PSEs in India. Chapter six summarizes the findings
and results of the thesis along with analysis. Chapter seven discusses the government policies
and reform measures for under-performing PSEs, and thereafter it ends with the conclusion.
9
1. THEORIES OF THE STATE-OWNED FIRM
This chapter highlights the theory that provides the basis for the formation and the
continued operations of PSEs. It also provides the argument for PSEs to be evaluated in a
similar manner as used for private entities.
In many countries, especially developing countries like India, the public sector firms
are formed for strategic purposes such as providing support to sectors that are important for
the development of the nation or for the control of the country’s natural resources (Shleifer,
1998). There are several differences between public sector firms and private firms. Grout and
Stevens (2003) identified the main difference between the two categories of firms as being
their objectives. The primary objective of private enterprises is to maximise profits of the
shareholder, whereas the main objective of public enterprises is to balance the interests of the
stakeholders and enhance social welfare.
Jakob (2017) further states that the state-owned firms differ from private enterprises in
terms of financing, liquidation management and compensation. In public enterprises, the state
provides the capital and most of the financial needs of the firm. Private enterprises typically
raise their capital from the shareholders. The government provides stability to public firms
and also subsidies in situations where their sources of income are not adequate to cover their
costs. In liquidation, private sector firms have to be declared bankrupt or acquired when
insolvent. Whereas, in case of insolvency of PSEs, the government first examines the strategic
importance of the enterprise to national economy and seeks ways to bail it out by providing
public funds (Peng, Bruton, Stan and Huang, 2016). The management of private companies is
strictly left to the managers who typically determine the strategies and policies for survival
and growth. Whereas in the case of the state-owned firms, the strategy and policy decisions
are taken by the government and those responsible to the parliament. Here the managers are
responsible for daily operations. The Table 1.1 below summarises the characteristics of
private firms versus the public sector enterprises.
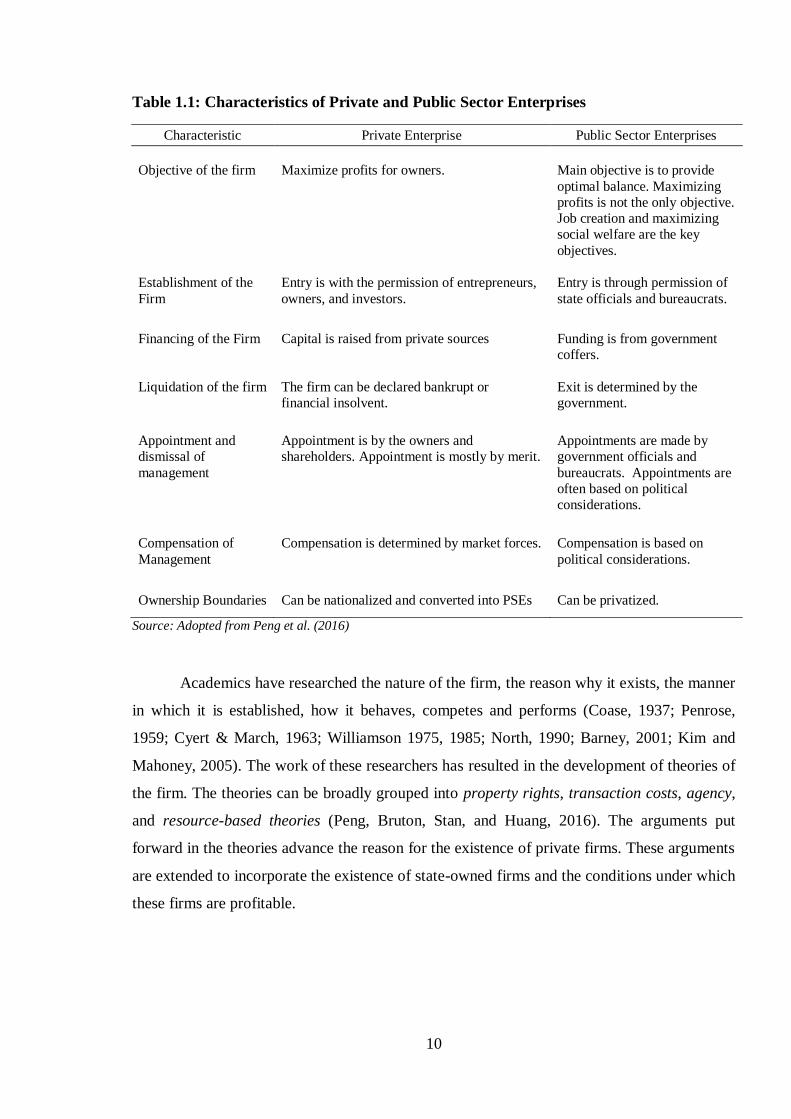
10
Table 1.1: Characteristics of Private and Public Sector Enterprises
Characteristic Private Enterprise Public Sector Enterprises
Objective of the firm
Maximize profits for owners.
Main objective is to provide
optimal balance. Maximizing
profits is not the only objective.
Job creation and maximizing
social welfare are the key
objectives.
Establishment of the
Firm
Entry is with the permission of entrepreneurs,
owners, and investors.
Entry is through permission of
state officials and bureaucrats.
Financing of the Firm
Capital is raised from private sources
Funding is from government
coffers.
Liquidation of the firm
The firm can be declared bankrupt or
financial insolvent.
Exit is determined by the
government.
Appointment and
dismissal of
management
Appointment is by the owners and
shareholders. Appointment is mostly by merit.
Appointments are made by
government officials and
bureaucrats. Appointments are
often based on political
considerations.
Compensation of
Management
Compensation is determined by market forces. Compensation is based on
political considerations.
Ownership Boundaries
Can be nationalized and converted into PSEs
Can be privatized.
Source: Adopted from Peng et al. (2016)
Academics have researched the nature of the firm, the reason why it exists, the manner
in which it is established, how it behaves, competes and performs (Coase, 1937; Penrose,
1959; Cyert & March, 1963; Williamson 1975, 1985; North, 1990; Barney, 2001; Kim and
Mahoney, 2005). The work of these researchers has resulted in the development of theories of
the firm. The theories can be broadly grouped into property rights, transaction costs, agency,
and resource-based theories (Peng, Bruton, Stan, and Huang, 2016). The arguments put
forward in the theories advance the reason for the existence of private firms. These arguments
are extended to incorporate the existence of state-owned firms and the conditions under which
these firms are profitable.
11
1.1 Property Rights Approach
Karl Marx expressed that private ownership is a sin as capitalism contributed to the
greed of private owners who exploit their employees to maximize their profits (Peng et al.,
2016). According to Marx, the solution is to convert private property into public entities. In
this way the PSEs would create a new set of property rights (Monteiro and Zylbersztajn,
2012). There are three types of property rights:
(i) The right to generate income from the property. The owners of the firm are the citizens
and the income generated is given to them. For example the National Copper Corporation of
Chile which is the biggest firm in Chile generates approximately $ 7 billion per year. All
excess profits are paid to the state (Codelco, 2018). Similarly, in India, the Oil and Natural
Gas Corporation generates approximately $2.8 billion per annum with a significant amount of
the profits remitted to the exchequer (Republic of India, 2018).
(ii) The right to control and use the property. This dimension entails the fact that bureaucracy
determines how the organisation will be financed, appoint the managers, and also set their
compensation level.
(iii) The right to transfer or sale of property. The PSEs are owned and managed by the
government of India. The rights to control and use property and the right to transfer property
are maintained by the central government of India. This right is seen in divestment scheme
where the government has sold its stake in PSEs like, Bharat Aluminium Company,
Hindustan Zinc, and Indian Petrochemicals Corporation Limited.
1.2 Transaction Cost Theory
A key question of the transaction cost theory is to examine the purpose that the firms
serve. Therefore, by extension, the question becomes why do PSEs exist? The transaction cost
theory stipulates that the firm exists to economise on transaction costs efficiently. Extending
this logic it can be argued that PSEs, despite their challenges, exist to economize on
transaction costs in an effective manner in the market place (Peng et al., 2016). Williamson
(1975) indicates that in most countries around the world, it is market failure that results in the
formation of public firms. In countries that have severe market failure, the only viable firms
are the public firms (Rajan, 2010). Despite their numerous challenges one of the main benefits
of PSEs is to reduce transaction costs in economies that are suffering from severe market
12
failures. The textile industry is an example of a scenario in which the public sector enterprises
act as cost minimisers. Over the last few decades, the government of India has streamlined the
operations of textile PSEs resulting in firms exhibiting high levels of efficiency (Sen and
Kayal, 2017).
1.3 Agency Theory
The government is the defacto owner and the employees are the agents. This gives
rise to the conflict of interests between principals and agents that is at the heart of the agency
theory put forward by Jensen and Meckling (1976). There is a new nexus of contracts that
have replaced the previous nexus of contracts between principals and agents of private firms
and between owners and agents in the public sector (Wright et al., 2005). In private
companies the primary objective of the firm is to maximise financial performance.
Consequently, the focus is on aligning the interest of the management and those of the
owners. In public entities there is no diversification in ownership but there is diversification in
management. This makes the process of monitoring, control, and accountability beyond the
normal corporate governance template (World Bank, 2016). Additionally, the agency problem
in PSEs is more pronounced due to the fact that the PSEs are managed by several government
entities including the administrative ministry, the ministry of finance, the department of
enterprises, and the parliament. Approval for various projects undertaken by the PSEs needs
to be submitted by the cabinet committee. All these layers of management complicate the
governance structure and create complex agency relationships.
1.4 Resource based View
The Resource Based theory maintains that firms have to be competitive as they have
to develop the rare, valuable, and hard to imitate resources and abilities (Barney, 2001). A key
assumption of this theory is that firms operate in competitive markets. In a bid to extend the
resource based theory of the firm, numerous scholars have pointed out that the PSEs have a
stream of non-market based resources and capabilities that arise out of the political and
bureaucratic association of these firms (Oliver and Holzinger, 2008; Lux, Crook, and Woehr,
2011; Li, Peng, and Macaulay, 2013). The scholars argue that the political influences are
resources and capabilities that contribute significantly to the performance of the PSEs. Li, He,
Lan, and Yu (2012) maintain that all firms, regardless of their ownership, value political
connections and influence.
13
When competing with foreign and private entities, PSEs can leverage their political
resources. The political ties are thought to be rare, valuable, and hard to imitate (Xia. Ma, Lu,
and Yi, 2014). Subramanian (2016) established that state-owned firms in India have greater
advantages than private entities as the government creates conditions suitable for monopoly
rather than competitive markets. Additionally, the firms have access to unrestricted flow of
capital generated from the taxpayers.
1.5 Summary
Liberalisation, globalisation, and economic structural changes across the globe have
resulted in the expansion of the private sector and decline of the public sector. However, the
PSEs play an important role in the development of countries. Their contribution to the
nation’s wellbeing has resulted in reviewing the role of these entities. It has become clear that
PSEs need to be managed efficiently and effectively. Various theories have been adopted so
that they can be applied to the public sector.
14
2. PUBLIC SECTOR ENTERPRISES IN INDIA
This chapter aims to highlight the evolution and growth of PSEs in India, the role they
play in the economy and their performance over the last decade.
2.1 Evolution and Characteristics of PSEs in India
At independence (1947), India was a backward and an underdeveloped country. It had
a weak industrial base, low level of savings and investment and high unemployment rate. The
economy needed a big push which could not come from the private sector, as they lacked
funds and did not have the ability to take risks for large and long gestation investments
(Gupta, 1975). So, the government took initiative through public sector to become self-reliant
and overcome economic and social backwardness.
The PSEs in India emerged from the government’s efforts to transform the country
into an industrial based economy. The industrialization was meant to ensure that the country
was able to produce goods and services for mass consumption and raw materials needed in the
manufacturing sector (Mallay, 1971). Thus, the PSEs played an important role in the
development of the Indian industry. As laid down by the government, the characteristics and
objectives of the PSEs in India are mentioned below:
Characteristics of PSEs
- Owned, managed and controlled by the Government
- Welfare oriented
- Funded by the Government
- Meant for public utility services
- Responsible to the Parliament (DPE Report, 2010)
Objectives of PSEs
As stated in the Industrial Policy Resolution of 1956, the PSEs need to achieve the following
objectives:
- To achieve economic development by creating and expanding infrastructure
- To generate financial resources for development
- To promote redistribution of income and wealth
- To create employment opportunities
- To promote balanced regional growth
15
- To accelerate the expansion of small-scale/ancillary industries
- To encourage export promotion and import substitution
(Delhi Univ., Study Material)
In India, PSEs are owned by either the union government of India or the state
government or both. The law requires that the majority-owner (with 51% stake or higher)
should be a government entity. The PSEs are required to produce goods and services for the
government and/or citizens. The PSEs in India are present in the major sectors such as -
Petroleum, Mining, Metals & Steel, Heavy Engineering, Transportation, Banking, Insurance,
Power generation and transmission, Nuclear energy, Fertilizers & Chemicals, Aviation
industry, Warehouse and Public distribution, Shipping and Trading, Telecommunication, and
Consultancy services.
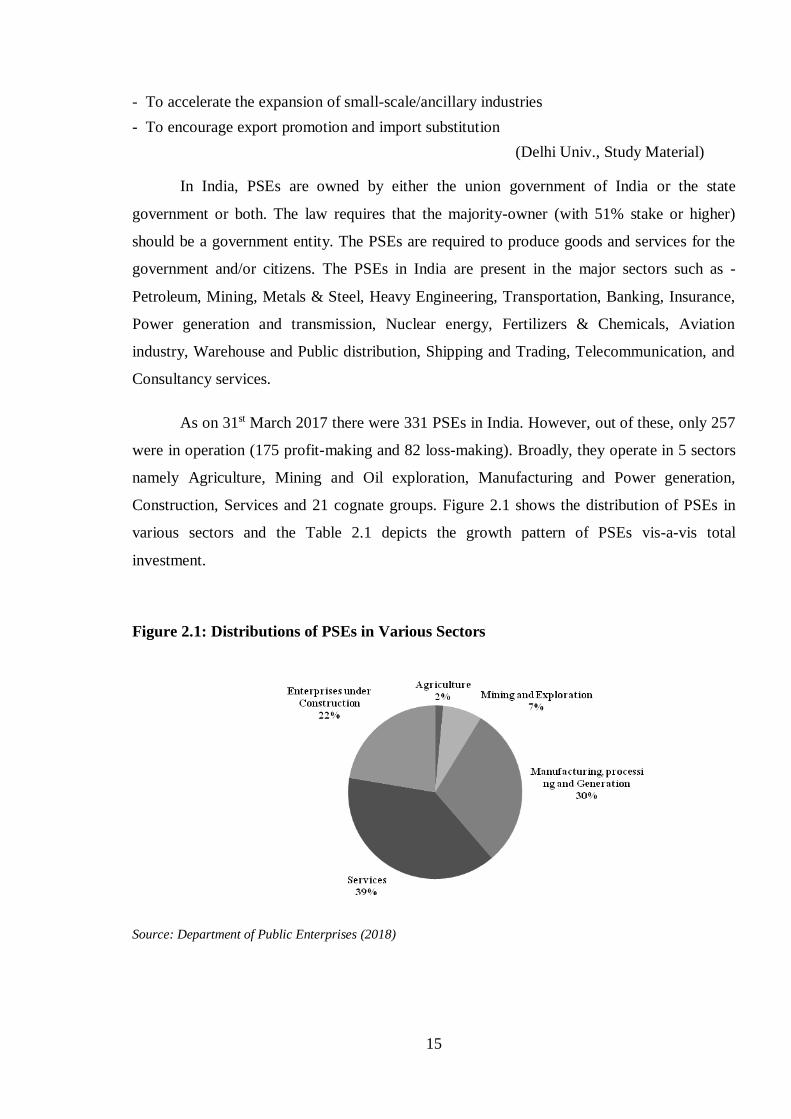
As on 31st March 2017 there were 331 PSEs in India. However, out of these, only 257
were in operation (175 profit-making and 82 loss-making). Broadly, they operate in 5 sectors
namely Agriculture, Mining and Oil exploration, Manufacturing and Power generation,
Construction, Services and 21 cognate groups. Figure 2.1 shows the distribution of PSEs in
various sectors and the Table 2.1 depicts the growth pattern of PSEs vis-a-vis total
investment.
Figure 2.1: Distributions of PSEs in Various Sectors
Source: Department of Public Enterprises (2018)
16
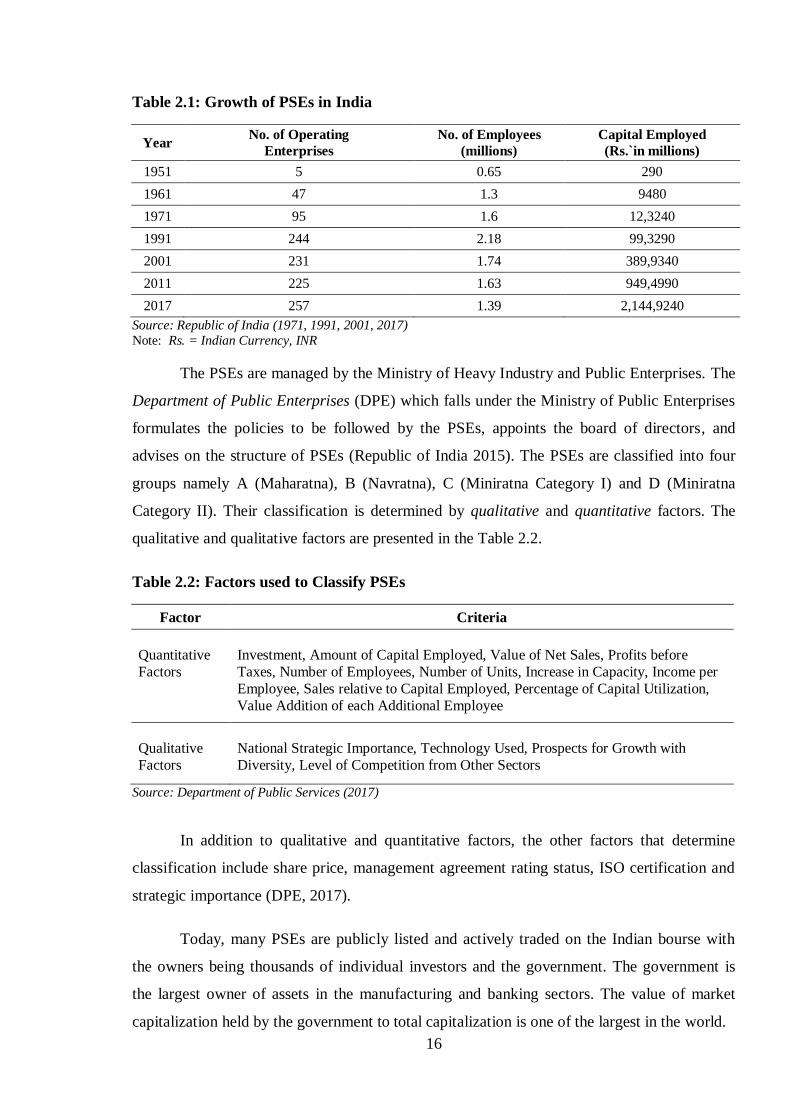
Table 2.1: Growth of PSEs in India
Year No. of Operating
Enterprises
No. of Employees
(millions)
Capital Employed
(Rs.`in millions)
1951 5 0.65 290
1961 47 1.3 9480
1971 95 1.6 12,3240
1991 244 2.18 99,3290
2001 231 1.74 389,9340
2011 225 1.63 949,4990
2017 257 1.39 2,144,9240
Source: Republic of India (1971, 1991, 2001, 2017)
Note: Rs. = Indian Currency, INR
The PSEs are managed by the Ministry of Heavy Industry and Public Enterprises. The
Department of Public Enterprises (DPE) which falls under the Ministry of Public Enterprises
formulates the policies to be followed by the PSEs, appoints the board of directors, and
advises on the structure of PSEs (Republic of India 2015). The PSEs are classified into four
groups namely A (Maharatna), B (Navratna), C (Miniratna Category I) and D (Miniratna
Category II). Their classification is determined by qualitative and quantitative factors. The
qualitative and qualitative factors are presented in the Table 2.2.
Table 2.2: Factors used to Classify PSEs
Factor Criteria
Quantitative
Factors
Investment, Amount of Capital Employed, Value of Net Sales, Profits before
Taxes, Number of Employees, Number of Units, Increase in Capacity, Income per
Employee, Sales relative to Capital Employed, Percentage of Capital Utilization,
Value Addition of each Additional Employee
Qualitative
Factors
National Strategic Importance, Technology Used, Prospects for Growth with
Diversity, Level of Competition from Other Sectors
Source: Department of Public Services (2017)
In addition to qualitative and quantitative factors, the other factors that determine
classification include share price, management agreement rating status, ISO certification and
strategic importance (DPE, 2017).
Today, many PSEs are publicly listed and actively traded on the Indian bourse with
the owners being thousands of individual investors and the government. The government is
the largest owner of assets in the manufacturing and banking sectors. The value of market
capitalization held by the government to total capitalization is one of the largest in the world.
17
2.2 Performance Indictors of PSEs in India
The performance of PSEs is important as it involves huge investment and public
money is used in it. Several measures have been developed to assess the performance of this
sector (Backhaus, 1994).
Bajo, Zuber, and Primorac (2018) points out that the performance of public sector
enterprise can be indicated with regard to public responsibilities as well as market approach.
The elements of public responsibility arise from the fact that decision making in PSE is
determined by the government. The performance indicated by profit or loss appear in the
government budget. The PSE’s are accountable to the taxpayers through the parliament. The
market elements are seen in the fact that these organisations are expected to ensure proper
financial performance like private enterprises. Bajo and Primorac (2016) mentioned that
financial measures can be used to indicate the performance of PSEs. These indicators include
dividend paid, profits/ losses, and return on assets. In India, DPE measures the performance of
PSEs using net profit/loss, dividend declared, cash flows, level of investments, participation
in equity, short term borrowing, net turnover, foreign exchange earnings, number of
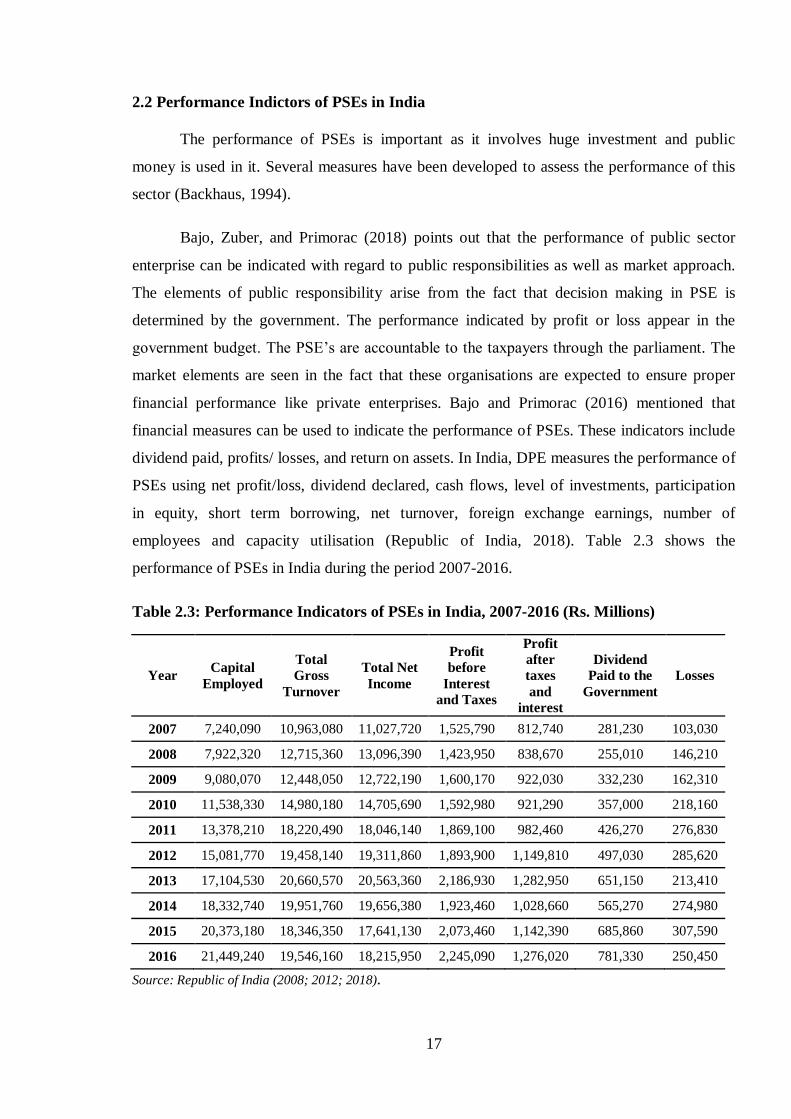
employees and capacity utilisation (Republic of India, 2018). Table 2.3 shows the
performance of PSEs in India during the period 2007-2016.
Table 2.3: Performance Indicators of PSEs in India, 2007-2016 (Rs. Millions)
Year Capital
Employed
Total
Gross
Turnover
Total Net
Income
Profit
before
Interest
and Taxes
Profit
after
taxes
and
interest
Dividend
Paid to the
Government
Losses
2007 7,240,090 10,963,080 11,027,720 1,525,790 812,740 281,230 103,030
2008 7,922,320 12,715,360 13,096,390 1,423,950 838,670 255,010 146,210
2009 9,080,070 12,448,050 12,722,190 1,600,170 922,030 332,230 162,310
2010 11,538,330 14,980,180 14,705,690 1,592,980 921,290 357,000 218,160
2011 13,378,210 18,220,490 18,046,140 1,869,100 982,460 426,270 276,830
2012 15,081,770 19,458,140 19,311,860 1,893,900 1,149,810 497,030 285,620
2013 17,104,530 20,660,570 20,563,360 2,186,930 1,282,950 651,150 213,410
2014 18,332,740 19,951,760 19,656,380 1,923,460 1,028,660 565,270 274,980
2015 20,373,180 18,346,350 17,641,130 2,073,460 1,142,390 685,860 307,590
2016 21,449,240 19,546,160 18,215,950 2,245,090 1,276,020 781,330 250,450
Source: Republic of India (2008; 2012; 2018).
18
The total capital employed during the fiscal year 2007-08 was Rs. 7,240,090 million
which increased steadily and was Rs. 21,449,240 million in 2016-17. This represents a growth
of 196.26 % over the last ten years. The largest share of capital employed by firms was in the
Service sector 47.4%, followed by Power 28.7%, Mining sector 14.7% and Agriculture 9.2%
(Republic of India, 2018). The total net income in 2007 was Rs. 11,027,720 million. The
amount has been increasing steadily and reached Rs. 18,215,950 million in 2016, representing
a growth of 65.18 % under the review period. Similarly, the amount of dividend paid out has
been growing steadily from Rs. 281,230 million in 2007 to Rs. 781,330 million in 2016,
representing a growth of 177.83%.
Cumulatively, the data in Table 2.3 shows that the PSEs have been profitable.
However, there are some public firms which realised significant losses. The loss realised from
the loss making PSEs was Rs. 250,450 million in the fiscal year 2016, which was a decline of
18.58% from that realised in 2015. Although the amount of loss decreased, the number of
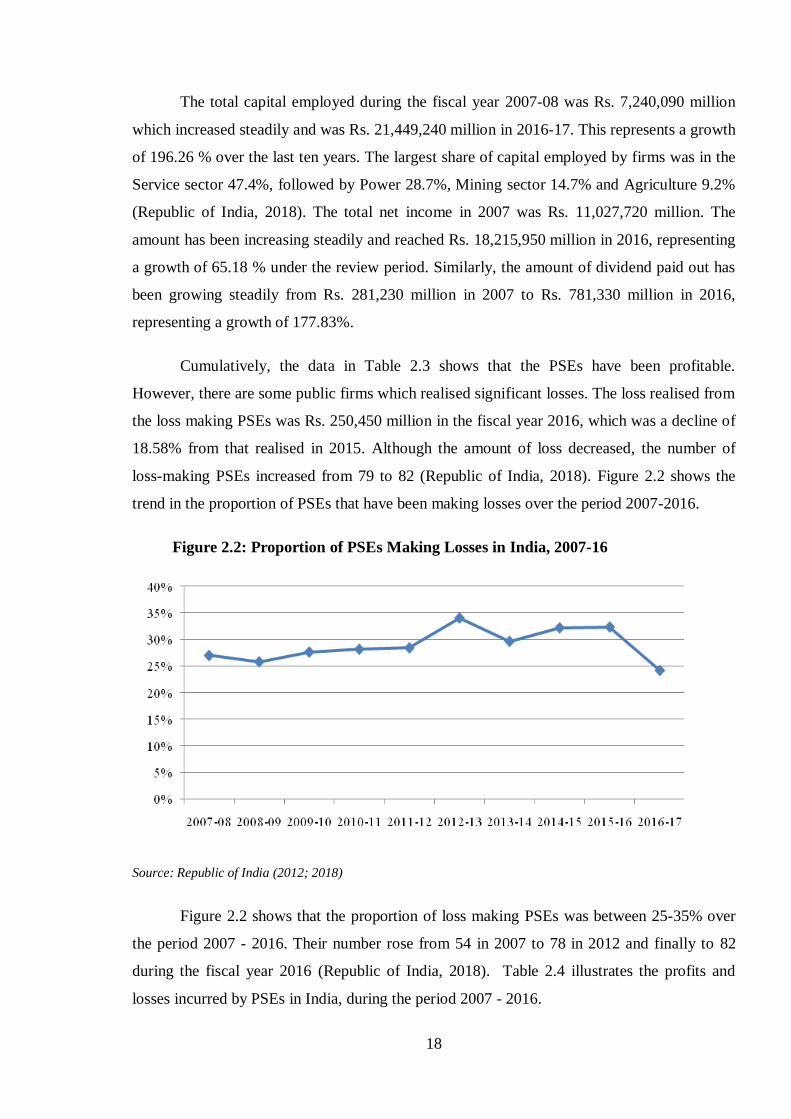
loss-making PSEs increased from 79 to 82 (Republic of India, 2018). Figure 2.2 shows the
trend in the proportion of PSEs that have been making losses over the period 2007-2016.
Figure 2.2: Proportion of PSEs Making Losses in India, 2007-16
Source: Republic of India (2012; 2018)
Figure 2.2 shows that the proportion of loss making PSEs was between 25-35% over
the period 2007 - 2016. Their number rose from 54 in 2007 to 78 in 2012 and finally to 82
during the fiscal year 2016 (Republic of India, 2018). Table 2.4 illustrates the profits and
losses incurred by PSEs in India, during the period 2007 - 2016.
19
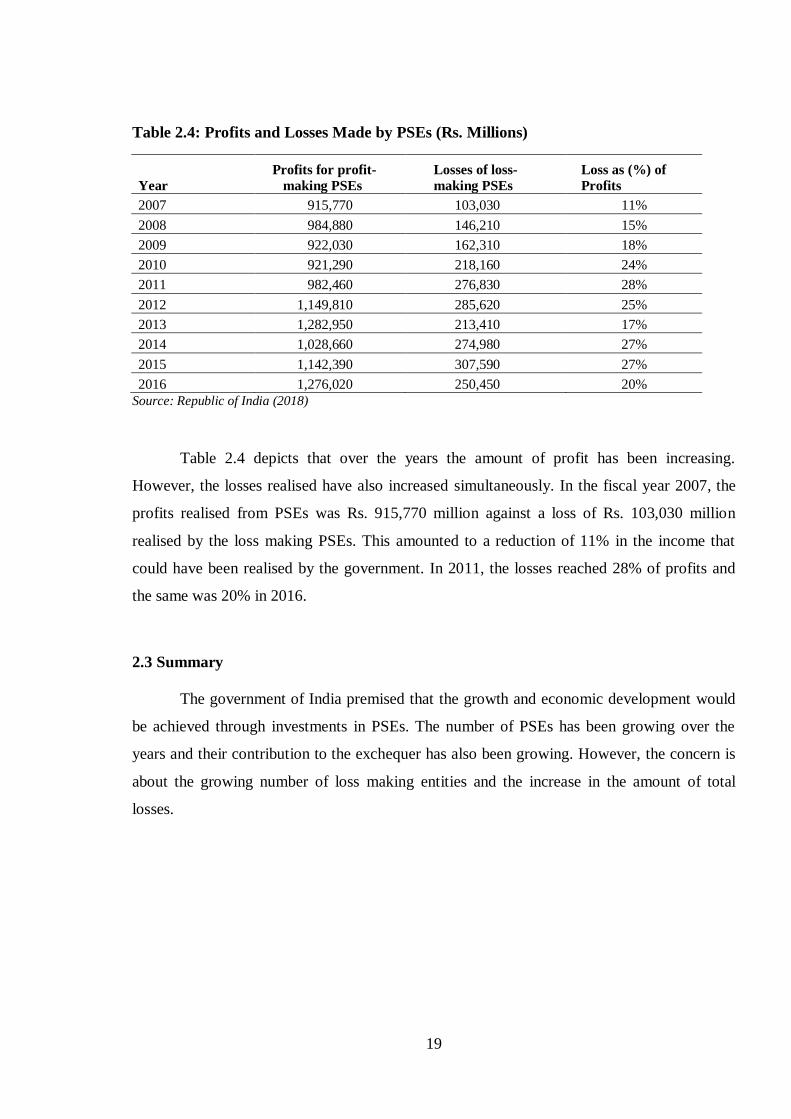
Table 2.4: Profits and Losses Made by PSEs (Rs. Millions)
Year
Profits for profit-
making PSEs
Losses of loss-
making PSEs
Loss as (%) of
Profits
2007 915,770 103,030 11%
2008 984,880 146,210 15%
2009 922,030 162,310 18%
2010 921,290 218,160 24%
2011 982,460 276,830 28%
2012 1,149,810 285,620 25%
2013 1,282,950 213,410 17%
2014 1,028,660 274,980 27%
2015 1,142,390 307,590 27%
2016 1,276,020 250,450 20%
Source: Republic of India (2018)
Table 2.4 depicts that over the years the amount of profit has been increasing.
However, the losses realised have also increased simultaneously. In the fiscal year 2007, the
profits realised from PSEs was Rs. 915,770 million against a loss of Rs. 103,030 million
realised by the loss making PSEs. This amounted to a reduction of 11% in the income that
could have been realised by the government. In 2011, the losses reached 28% of profits and
the same was 20% in 2016.
2.3 Summary
The government of India premised that the growth and economic development would
be achieved through investments in PSEs. The number of PSEs has been growing over the
years and their contribution to the exchequer has also been growing. However, the concern is
about the growing number of loss making entities and the increase in the amount of total
losses.
20
3. THE FAILURE OF PUBLIC SECTOR ENTERPRISES
This chapter focuses on the challenges faced by public sector enterprises in India and
the major reasons for their failure which lead to insolvency or closure.
3.1 Reasons for Failures
In most countries, PSEs are formed to stimulate economic and social development
(Ogohi, 2014). However, increasing evidence suggests that a number of these enterprises
either do not achieve the economic and social development targets set for them or do not
perform their functions and/or often require continued taxpayers’ support in order to continue
operation (World Bank, 2016). This has led the academics to question the viability of state-
owned corporations, probing the reasons why so many of these firms fail to sustain and
deliver services for which they were formed (Shleifer, 1998; Linert, 2009; Mayar-Abuja,
2011; Jakob, 2017). The annual published reports of the Department of Public Sector
Enterprises (DPE) shows that a significant number of PSEs in India have been making losses
over the years. The loss making PSEs which have received government bail outs are Air
India, State Bank of India, Dena Bank, Allahabad Bank (Tripathy, 2018). Additionally, the
review indicates that the number of loss making PSEs have been increasing over the years
(Republic of India 2008; 2012; 2018). According to Mukher (2019) the failures can be
attributed to various issues/challenges. Some of the major reasons are discussed in the
following sections.
Soft Budget Constraint
Goldeng, Grunfeld, and Benito (2008) expressed that many state owned firms suffer
from soft-budget constraint. Soft-budget constraint occurs because the government can give
various forms of financial and non-financial support to the PSEs. This results in the distortion
of the incentive structure, as the PSEs have other sources of support besides profit. The long-
term existence of the PSEs is not determined by the level of profits. Mukher (2019) identified
the lack of importance of profit motive as one of the main reasons of failure of key PSEs, such
as Solar Energy Corporation of India, Gujarati State Financial Corporation, and Water
Infrastructure Limited. Bhardwaj (2013) argues that the PSEs are not driven by profit motive
alone, but are formed to enhance the welfare of the citizens. The PSEs such as Water
21
Infrastructure Limited and Solar Energy Corporation provide essential services to the citizens
and facilitate manufacturing. Additionally, the Gujarati State Financial Corporation was
providing loans to firms which the mainstream financial sector had considered too risky to
finance (Bhardwaj, 2013). The soft budget constraint also alters the risk taking behaviour of
PSEs. Chattopadhyay (2011) observed that PSEs in India are prone to positive risk aversion.
Corporate Governance Challenges
Mukher (2019) also identified the lack of proper and professional management. The
management was found not to have the necessary educational and technical competencies
necessary to conduct their job function. Mukher (2019) attributed the lack of competencies of
the management to the way in which appointments were made. In private entities,
appointment of directors and management of the firm is based on educational attainment,
technical qualification, and individual performance at their previous jobs. However, Mukher
(2019) indicated that the appointment of directors and senior officers in PSEs was based on
political affiliation and cronyism which meant that the management, officials, and board of
directors did not have sufficient competencies to run the enterprises successfully. The PSEs
also face governance challenges arising from multiple principals, low levels of transparency
and accountability, and weak protection of minority shareholders (World Bank, 2014).
In 1948, the Indian Telephone Industry (ITL) was established as a Central PSE that
manufactured telecommunication equipments. By 2009, ITL had been privatised following a
number of years of continuous loss making. Subramania (2010) highlighted that the failure of
ITL was attributed to the high fixed costs that led to piling up of losses. The main fixed cost
was associated with overstaffing. The management of the firm was unable to take remedial
actions to mitigate the losses due to government policies. Government policy was to create
jobs. Therefore, reducing the labour force would have gone against government’s objectives.
Subramania (2010) concluded that government policies, although well intentioned and well
thought out, had sometimes constrained and weakened the performance of PSEs in India.
Mishra (2017) identified the incompetence of the board of directors of the PSEs, such
as Scooters India Ltd, Bharat Dynamics Ltd, Garden Reach Shipbuilders and Engineers Ltd,
Mazagon Dock Shipbuilders Ltd, Mishra Dhatu Nigam Ltd, Indian Railway Catering and
Tourism Corporation Ltd, RITES Ltd. The board of directors lacked professionalism and
efficiency needed for effectively managing these entities.
22
The corporate remuneration structure is designed to reward the efforts of the
management. Private sector employees’ income is determined by the level of profits and
growth dynamics of the firm. This rule does not apply to PSEs, where the pay structure is
designed based on the objective of ensuring social equality. Thus, the pay does not always
reward for good performance. As pay and performance are not always related, there is often
no structure in the corporate governance for monitoring of the enterprise’s performance.
Competition
Mayer-Ahuja (2011), found that PSEs in India were not geared up for changes in the
business environment. Citing the case of ITL, Maye-Ahuja (2011) argued that such PSEs
were formed at independence (1947) when these entities had a monopoly. Post 1991, with
economic liberalization in India, the new industrial policy 1991 adopted ‘de-reservation’ that
allowed the entry of private sector in the activities reserved for public sector. Thus, the PSEs
had to face competition from both, domestic private companies and the large multi-national
corporations. The burden of bureaucratic imperatives and inability to compete has led to the
collapse of several PSEs over the past few decades (DPE Reports, 2010 and 2017).
During the period 2000 - 2010, the revenue of some PSEs declined significantly (like
ONGC, ITI Ltd., MSTC Ltd., Mazgaon Dock Ltd., etc.) and some PSEs suffered heavy
financial losses (like BSNL, MTNL, Air India, Hindustan Photo Films, HMT, and IDPL)
leading to their insolvency/failure (Cromptroller and Auditor General of India, 2013). This
compelled the government to re-examine their case and take actions like winding up of non-
core and continuously loss making enterprises. This led to either their closure or privatisation.
In coming fiscal years, 2019-20 and 2020-21, Air India is projected to post losses of
approximately $1.5 – $2 billion (Center for Asia Pacific Aviation, 2018). This loss will be
funded by the taxpayers, in addition to bail-outs of $ 4 billion which have been provided to
the national carrier since 2012 (The Economic Times, 2018). The losses have been attributed
to the fact that the airline has lost its market share over the years to local and international
airline companies (The Economic Times, 2018).

23
Capacity Under-Utilization
Singh (2012) asserts that capacity under-utilisation is a serious problem that the PSEs
face in India. The firms were found to lack definable production targets, proper planning and
control and measures to identify future needs. This meant that the firms were unable to make
use of their fixed assets. This made them non-viable. Thus, leading to their
insolvency/collapse. Further, Singh (2012) indicated that the pricing policy was also
responsible for the failure of public firms. The government had not specified the rate of return
to be obtained from different undertakings. This was partly attributed to the entities being
expected to fulfil socio-economic objectives as well as poor planning.
Political Interference and Lack of Autonomy
Singh (2016b) found that political interference adversely affected the performance,
viability, and growth of public firms in India. Politicians particularly those from the ruling
party influenced the location, employment, and production of the firms. The politicians did
not take into consideration the feasibility, viability, and costs of their proposals. This led to
wastage of resources and improper actualisation of state firms. Additionally, Singh (2016b)
found that projects carried out by PSEs were often completed late. The delay in completion of
projects led to cost over-run which resulted in loss of money by the respective firms.
Chari and Gupta (2008), Ghosh (2009), and Jain (2016) observed that political factors
were the key factors in delaying the disinvestment from loss making PSEs. The political
factors were also responsible for the failure of PSEs to introduce reforms and reinvention. Jain
(2016) further argued that the challenges faced by the PSEs can also be attributed to the
ideologies of the political parties in power.
Research by Tiwari (2016) confirms the arguments of Jain (2016). Tiwari (2016)
showed that during the period 1999-2004 when the National Democratic Alliance (NDA), a
right-leaning political party was in power, more than 15 PSEs including Videsh Sanchar
Nigam Ltd, Bharat Aluminium Company Ltd, CMC Ltd and Hindustan Zinc were reformed
and privatised. When the United Progressive Alliance (UPA) came into power, the policy
took a back seat and only minority stake sales were undertaken. Again, since 2014, with NDA
in power the focus is on reforms and disinvestment of loss making PSEs.
24
Bloated Work Force and Corruption
The employment rate in the PSEs has been growing significantly over the years.
Between the 1970s and 1980s, the level of employment grew from 0.7 million to 2.24 million
constituting a 220% growth rate. The large labour force and over-staffing created a wage bill
that was not sustainable. Thus, the government introduced voluntary retirement schemes to
reduce the number of employees. The PSEs Survey in 2016-17 indicated that there are 1.13
million employees. However, Kapur (2019) indicates that although the number of employees
has decreased significantly, the relative wages and emoluments under the PSEs has more than
doubled. This has continued to constrain the performance of the PSEs. Further, Kapur (2019)
indicates that employment was based on cronyism and political influence that resulted in
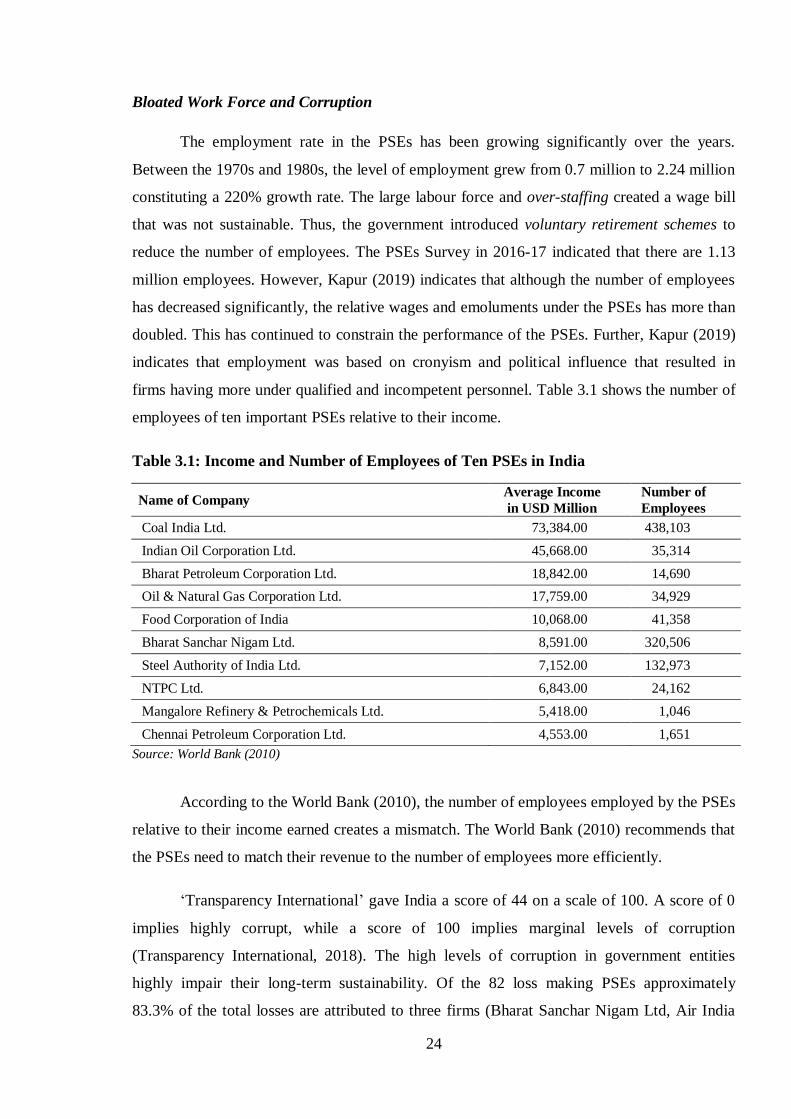
firms having more under qualified and incompetent personnel. Table 3.1 shows the number of
employees of ten important PSEs relative to their income.
Table 3.1: Income and Number of Employees of Ten PSEs in India
Name of Company Average Income
in USD Million
Number of
Employees
Coal India Ltd. 73,384.00 438,103
Indian Oil Corporation Ltd. 45,668.00 35,314
Bharat Petroleum Corporation Ltd. 18,842.00 14,690
Oil & Natural Gas Corporation Ltd. 17,759.00 34,929
Food Corporation of India 10,068.00 41,358
Bharat Sanchar Nigam Ltd. 8,591.00 320,506
Steel Authority of India Ltd. 7,152.00 132,973
NTPC Ltd. 6,843.00 24,162
Mangalore Refinery & Petrochemicals Ltd. 5,418.00 1,046
Chennai Petroleum Corporation Ltd. 4,553.00 1,651
Source: World Bank (2010)
According to the World Bank (2010), the number of employees employed by the PSEs
relative to their income earned creates a mismatch. The World Bank (2010) recommends that
the PSEs need to match their revenue to the number of employees more efficiently.
‘Transparency International’ gave India a score of 44 on a scale of 100. A score of 0
implies highly corrupt, while a score of 100 implies marginal levels of corruption
(Transparency International, 2018). The high levels of corruption in government entities
highly impair their long-term sustainability. Of the 82 loss making PSEs approximately
83.3% of the total losses are attributed to three firms (Bharat Sanchar Nigam Ltd, Air India
25
Ltd, and Mahanagar Telephone Nigam Ltd). The firms had been slated for divestment and/or
closure but remain open due to political interference and corruption in the government.
3.2 Summary
Unlike private entities which pursue profit motive, PSEs have both profit and social
welfare motives. The facts provided in this chapter show that capacity under-utilization,
competition, corporate governance challenges, political interference, and man-management
are the major challenges and reasons for their failure.

26
4. SCREENING FOR BANKRUPTCY RISK
Financial distress refers to the condition in which a firm is unable to meet its financial
obligations. This chapter highlights the method for evaluating financial distress of an entity.
4.1 Altman Z-Score Model
Outecheva (2007) indicates that financial distress of firms is characterised by four
stages: deterioration of performance, failure, insolvency and default. Firm decline and
deterioration affect the income and profitability of the firm, while insolvency and default
affect the liquidity position of the firm. Outecheva (2007) indicates a firm can be in financial
distress without defaulting on payments to creditors. However, default and eventual
bankruptcy cannot occur without the firm first experiencing financial distress.
The idea that financial ratios could be used to predict financial distress was first
postulated by Beaver (1966). He calculated financial ratios of firms that had failed and those
which were still in operation to prove his hypothesis. Beaver (1966), concluded that the ratio
of cash flow to total debt was the single most significant predictor of financial distress prior to
five years of the firm going bankruptcy. The model developed by Beaver (1966) was
univariate. Thus, the combined effect of all the financial ratios or variables could not be
identified in the estimation process. This was a significant shortcoming that affected the
results. These errors were corrected by the use of a multivariate model.
Altman (1968) developed the discriminant function referred to as the Z-score model,
using information from public entities that had been classified according to industry and size.
The model was designed to give predictive power, two years before bankruptcy. The model is
based on the multivariate discriminant analysis. This process uses data from multivariate
independent variables such as ratios and combines them into one score. This is then applied to
the classification of observation into either a-priori groups or mutually exclusive groups
(Altman, 1968). The Altman Z-score model consists of a linear equation consisting of four to
five commonly used financial ratios and weighted coefficients. The aim of the Altman Z-
score model is to assess the financial health of a company and to predict the probability that
the company will collapse within a period of two years.
27
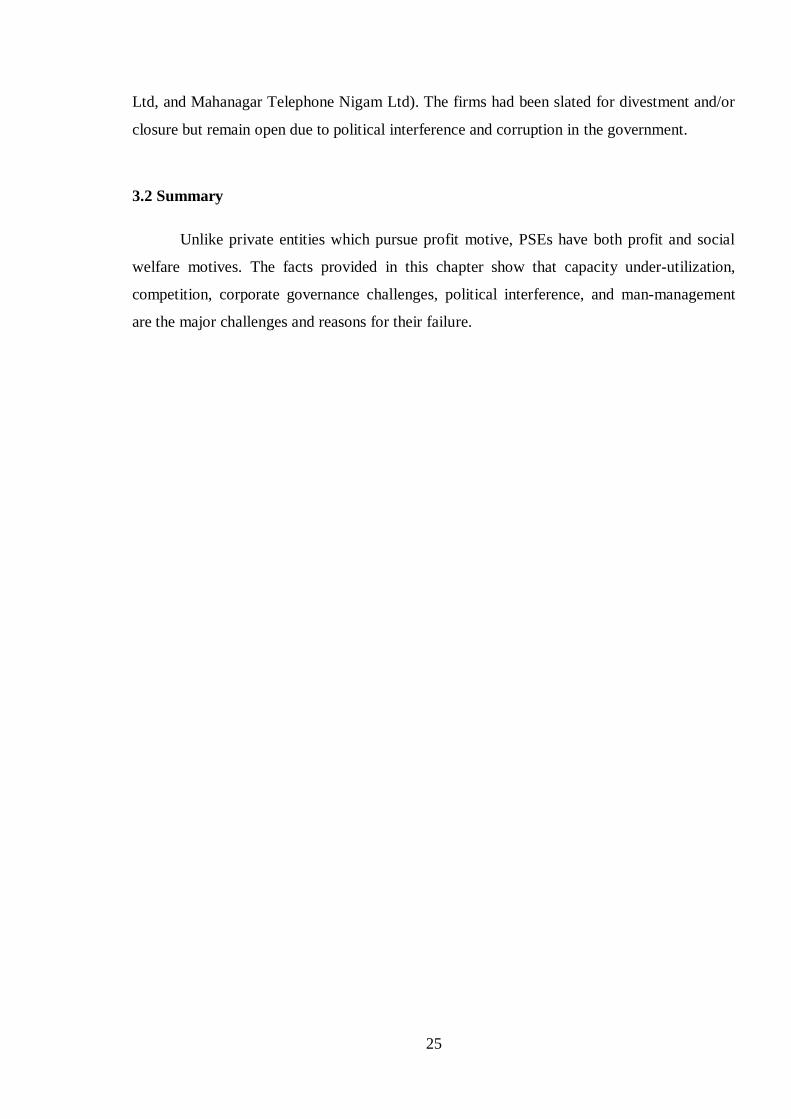
Using Multiple Discriminant Analysis, Edward Altman combined a set of 5 financial
ratios to come up with the Altman Z-Score Formula, as given below:
Where denotes working capital to total assets, retained earnings to total assets,
earnings before interest and taxes to total assets, market value of equity to total
liabilities and sales to total assets (Altman, 2000). The zones of discrimination are set as
follows:
Z >= 3.0 - Safe zone
1.81 < Z < 3.0 - Grey zone
Z <= 1.81 - Distress zone
A study conducted by Heine (2000) covering various sample periods, over a period of
thirty years and based on 120 firms established that the Altman Z-score model retained its
reported high accuracy and was a robust estimator.
4.2 Empirical Studies on Financial Distress of PSEs in India
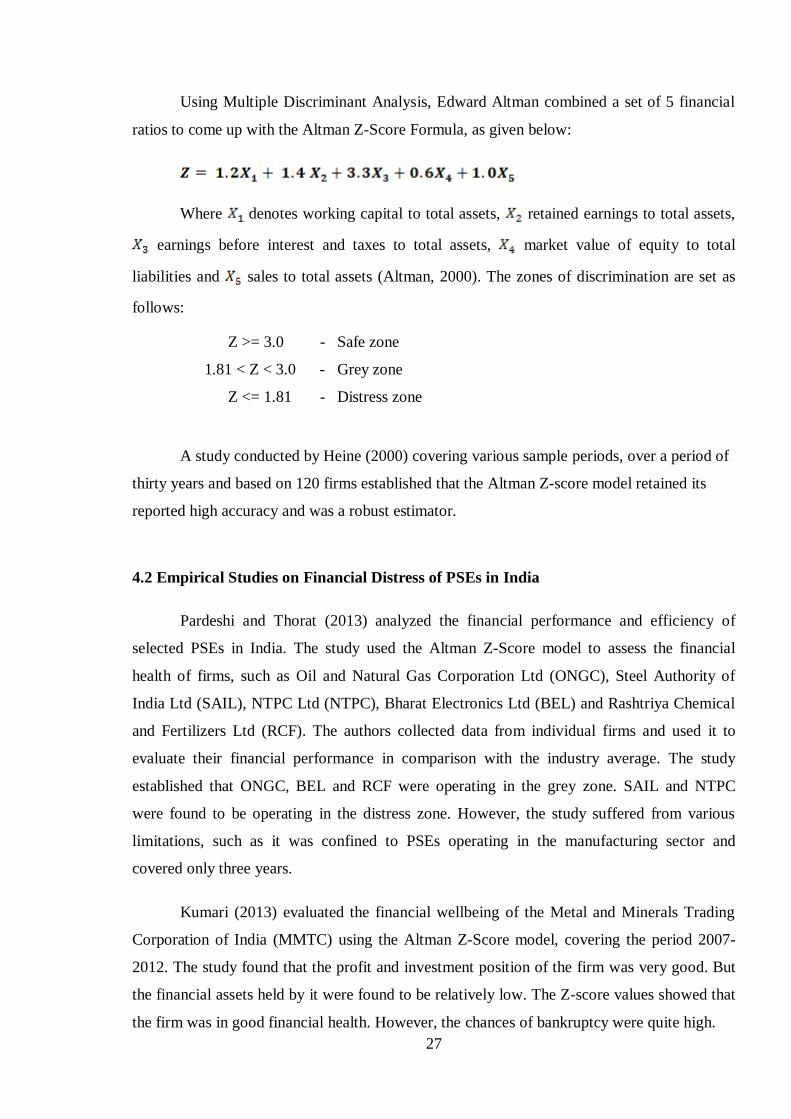
Pardeshi and Thorat (2013) analyzed the financial performance and efficiency of
selected PSEs in India. The study used the Altman Z-Score model to assess the financial
health of firms, such as Oil and Natural Gas Corporation Ltd (ONGC), Steel Authority of
India Ltd (SAIL), NTPC Ltd (NTPC), Bharat Electronics Ltd (BEL) and Rashtriya Chemical
and Fertilizers Ltd (RCF). The authors collected data from individual firms and used it to
evaluate their financial performance in comparison with the industry average. The study
established that ONGC, BEL and RCF were operating in the grey zone. SAIL and NTPC
were found to be operating in the distress zone. However, the study suffered from various
limitations, such as it was confined to PSEs operating in the manufacturing sector and
covered only three years.
Kumari (2013) evaluated the financial wellbeing of the Metal and Minerals Trading
Corporation of India (MMTC) using the Altman Z-Score model, covering the period 2007-
2012. The study found that the profit and investment position of the firm was very good. But
the financial assets held by it were found to be relatively low. The Z-score values showed that
the firm was in good financial health. However, the chances of bankruptcy were quite high.
28
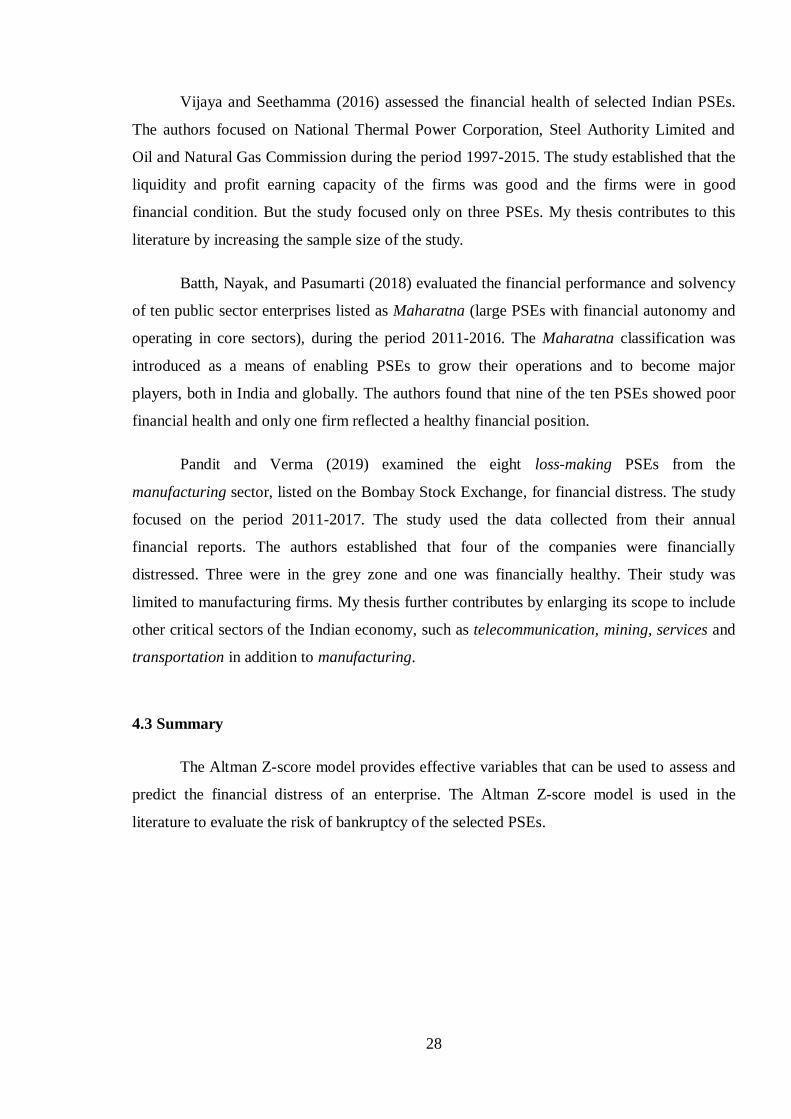
Vijaya and Seethamma (2016) assessed the financial health of selected Indian PSEs.
The authors focused on National Thermal Power Corporation, Steel Authority Limited and
Oil and Natural Gas Commission during the period 1997-2015. The study established that the
liquidity and profit earning capacity of the firms was good and the firms were in good
financial condition. But the study focused only on three PSEs. My thesis contributes to this
literature by increasing the sample size of the study.
Batth, Nayak, and Pasumarti (2018) evaluated the financial performance and solvency
of ten public sector enterprises listed as Maharatna (large PSEs with financial autonomy and
operating in core sectors), during the period 2011-2016. The Maharatna classification was
introduced as a means of enabling PSEs to grow their operations and to become major
players, both in India and globally. The authors found that nine of the ten PSEs showed poor
financial health and only one firm reflected a healthy financial position.
Pandit and Verma (2019) examined the eight loss-making PSEs from the
manufacturing sector, listed on the Bombay Stock Exchange, for financial distress. The study
focused on the period 2011-2017. The study used the data collected from their annual
financial reports. The authors established that four of the companies were financially
distressed. Three were in the grey zone and one was financially healthy. Their study was
limited to manufacturing firms. My thesis further contributes by enlarging its scope to include
other critical sectors of the Indian economy, such as telecommunication, mining, services and
transportation in addition to manufacturing.
4.3 Summary
The Altman Z-score model provides effective variables that can be used to assess and
predict the financial distress of an enterprise. The Altman Z-score model is used in the
literature to evaluate the risk of bankruptcy of the selected PSEs.
29
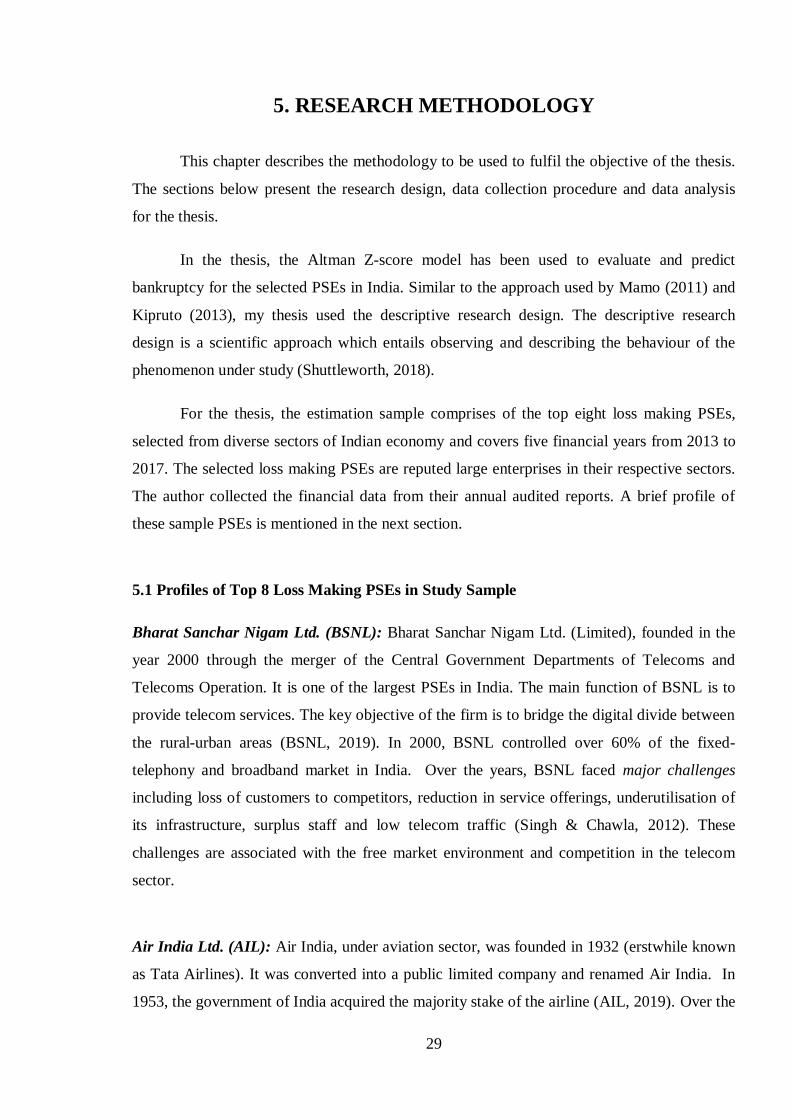
5. RESEARCH METHODOLOGY
This chapter describes the methodology to be used to fulfil the objective of the thesis.
The sections below present the research design, data collection procedure and data analysis
for the thesis.
In the thesis, the Altman Z-score model has been used to evaluate and predict
bankruptcy for the selected PSEs in India. Similar to the approach used by Mamo (2011) and
Kipruto (2013), my thesis used the descriptive research design. The descriptive research
design is a scientific approach which entails observing and describing the behaviour of the
phenomenon under study (Shuttleworth, 2018).
For the thesis, the estimation sample comprises of the top eight loss making PSEs,
selected from diverse sectors of Indian economy and covers five financial years from 2013 to
2017. The selected loss making PSEs are reputed large enterprises in their respective sectors.
The author collected the financial data from their annual audited reports. A brief profile of
these sample PSEs is mentioned in the next section.
5.1 Profiles of Top 8 Loss Making PSEs in Study Sample
Bharat Sanchar Nigam Ltd. (BSNL): Bharat Sanchar Nigam Ltd. (Limited), founded in the
year 2000 through the merger of the Central Government Departments of Telecoms and
Telecoms Operation. It is one of the largest PSEs in India. The main function of BSNL is to
provide telecom services. The key objective of the firm is to bridge the digital divide between
the rural-urban areas (BSNL, 2019). In 2000, BSNL controlled over 60% of the fixed-
telephony and broadband market in India. Over the years, BSNL faced major challenges
including loss of customers to competitors, reduction in service offerings, underutilisation of
its infrastructure, surplus staff and low telecom traffic (Singh & Chawla, 2012). These
challenges are associated with the free market environment and competition in the telecom
sector.
Air India Ltd. (AIL): Air India, under aviation sector, was founded in 1932 (erstwhile known
as Tata Airlines). It was converted into a public limited company and renamed Air India. In
1953, the government of India acquired the majority stake of the airline (AIL, 2019). Over the
30
years, the firm has accumulated a debt of Rs. 460,000 million (Karnik, 2017). The funds were
used for expansion projects as well as to sustain its operations. In addition to debt, the firm
faces challenges of high oil prices and competition from private airline companies, both
domestic and international. Over the years, the market share of AIL has been falling.
Currently, the firm only controls 14% of the Indian market.
Mahanagar Telephone Nigam Ltd. (MTNL): The Company provides telecommunications
services in the metro cities of Mumbai and New Delhi in India (MTNL, 2018). Until 1992,
MTNL was the only telecommunications provider in Mumbai and New Delhi. Following the
liberalisation programme which was introduced by the government (1991), the firm has faced
increased competition. The firm’s shares are currently listed on the Bombay Stock Exchange,
the London Stock Exchange and the New York Stock Exchange (MTNL, 2018). In 2009, the
firm reported that it controlled 71% and 60% of the fixed telecommunication market in
Mumbai and New Delhi respectively and 17% of the mobile telephone market in both the
cities. By 2017, MTNL controlled less than 1% of the fixed and mobile phone markets in both
the cities (Khanna, 2017). According to Khanna (2017), the firm is unable to perform well as
it has a huge debt portfolio, is over staffed, has obsolete technology and has underutilized
capacity.
Brahmaputra Crackers & Polymer Ltd. (BCPL): The PSE was formed in 1985 with an aim
of bringing socioeconomic development in the North-East region of India. This PSE is a
dominant player in the production of petrochemicals. Over the past few years, the firm has
been posting poor performance due to a decline in the demand for its products. The decline
in demand has resulted in the under utilization of the firm’s capacity/facilities (Karmakar,
2018).
Steel Authority of India Ltd. (SAIL): The company was incorporated in 1973 and is a major
player in the steel sector. Currently, the firm produces 14.38 million metric tons of steel. This
makes it one of the largest steel producers in the world (SAIL, 2018). The company hopes to
increase its production capacity to 50 million tonnes by the year 2025 (SAIL, 2018). In 2017,
the firm announced that it was facing challenges, including decreased demand for steel and
market competition in the steel sector. This resulted in the firm being unable to optimise the
use of its assets and constrained its ability to be profitable (Singh, 2017).
Rashtriya Ispat Nigam Ltd. (RINL): Rashtriya Ispat Nigam Ltd is a steel producer. The firm
produces 7.3 million tonnes of steel in a year (RINL, 2012). The firm started its operation in
31
the 1980s. During the initial periods, the company suffered huge losses. The government took
over the firm in 2010 due to the huge losses it was accruing. However, in 2011 it registered an
impressive profit. The firm was able to grow its profits by 200% in the year 2014 (RINL,
2015). The firm posted losses of Rs. 12,360 million in 2016-17 and Rs. 13,690 million in
2017-18 (RINL, 2018). In a bid to improve performance, the firm has undertaken capacity
expansion program and modernization projects (RINL, 2018).
Western Coalfields Ltd. (WCL): Western Coalfields Ltd came into operations in 1956. It is a
subsidiary of Coal India Limited. The firm is engaged in the mining and production of coal
(WCL, 2019). The firm’s output increased over the years but the high cost of operations
diminished the margins (Arya, 2017). The firm also had to deal with corruption within the
organisation. The officers of the firm have been convicted of stealing money from the firm,
supplying adulterated coal and overcharging clients (The Economic Times, 2014).
State Trading Corporation of India Ltd. (STCL): The main business of the STCL is the
export of various products such as tea, rice, sugar, coffee, extractions, textiles, construction
materials, processed foods, castor oil, pharmaceuticals, consumer goods, leather ware,
engineering goods, chemicals, jewellery and clothing. The firm also imports goods such as
precious metals, edible oils, minerals, petrochemicals, fertilisers and metal ores (Bloomberg,
2019). In 2018, the firm reported revenue of Rs. 16,226 million compared to a loss of Rs. 22,
368 million. The losses were attributed to high operating costs (Bloomberg, 2019).
5.2 Data Collection
The estimation sample comprises the selected eight loss making PSEs and covers five
financial years, spanning over 2013-2017. I collected the financial data from their annual
audited reports.
5.3 Model Specification
Data analysis involves the systematic processing of the collected data, using statistical
methods, through the evaluation, transformation, and modelling of data in order to obtain
useful and meaningful information for decision making. The data was analysed using
Microsoft Excel and applying the Altman Z-Score Formula introduced in chapter 4.
32
Where denotes working capital to total assets ratio, retained earnings to total
assets ratio, earnings before interest and taxes (EBIT) to total assets ratio, market value
of equity to total liabilities ratio, and sales to total assets ratio (Altman, 1968). The
financial ratios have been explained below.
- Working Capital to Total Assets Ratio is used to indicate the net liquid assets of the firm
relative to the total capitalization. The liquid assets are the difference between the current
assets and the current liabilities. A firm that has continuous operating losses will have
reducing current assets relative to its total assets (Brown, 2019).
- Retained Earnings to Total Assets Ratio is used to measure the percentage of the total
assets owned by the firm that are financed by the retained earnings. This ratio indicates the
degree to which the firm is retaining its profits and using this retained funds to finance the
acquisition of assets instead of paying dividends (Brown, 2019). There is no right level of
the retained earnings to total assets ratio. Comparison can be made using the industry
average.
- Earnings before Interest and Tax (EBIT) to Total Assets Ratio indicates the degree to
which the firm’s profitability is generated using the firm’s assets. It shows how effectively
the firm is using its assets to generate income. EBIT is used instead of the net profits to
keep the focus on the operating income without the effect of tax and financing obligations.
This allows for comparison with similar firms (Brown, 2019).
- Book Value of Equity to Total Liabilities Ratio shows the extent to which the firm’s asset
reduce in value before the liabilities exceed the assets and the firm is declared insolvent
(Altman, 1968).
- Sales to Total Assets Ratio shows the sales generating capability of the assets held by the
firm. The ratio indicates the measures put in place by management to handle competitive
conditions. According to Heine (2000), this indicator is the most important as it is the least
33
significant ratio individually. Among all the ratios, this is often ranked second due to its
contribution to the overall discriminating ability of the model.
5.4 Summary
In my thesis, the Altman Z-score model has been used to evaluate and predict
bankruptcy in selected PSEs in India. The estimation sample comprises of the top 8 loss
making PSEs selected from diverse sectors of Indian economy and covers five financial years
from 2013 to 2017.
34
6. PRESENTATION AND DISCUSSION OF RESULTS
This chapter summarizes the test results and findings using the Altman Z-score,
calculated separately for each of the eight firms introduced in chapter 5. The sections below
present the test result and its analysis for each firm.
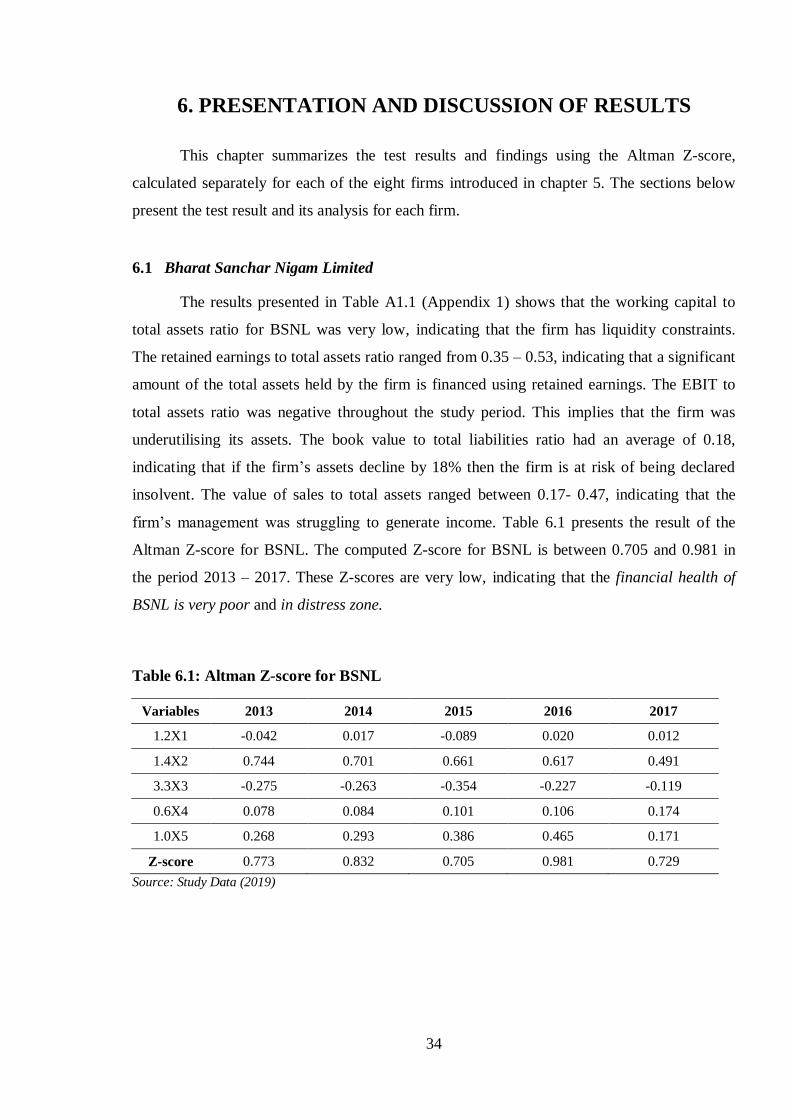
6.1 Bharat Sanchar Nigam Limited
The results presented in Table A1.1 (Appendix 1) shows that the working capital to
total assets ratio for BSNL was very low, indicating that the firm has liquidity constraints.
The retained earnings to total assets ratio ranged from 0.35 – 0.53, indicating that a significant
amount of the total assets held by the firm is financed using retained earnings. The EBIT to
total assets ratio was negative throughout the study period. This implies that the firm was
underutilising its assets. The book value to total liabilities ratio had an average of 0.18,
indicating that if the firm’s assets decline by 18% then the firm is at risk of being declared
insolvent. The value of sales to total assets ranged between 0.17- 0.47, indicating that the
firm’s management was struggling to generate income. Table 6.1 presents the result of the
Altman Z-score for BSNL. The computed Z-score for BSNL is between 0.705 and 0.981 in
the period 2013 – 2017. These Z-scores are very low, indicating that the financial health of
BSNL is very poor and in distress zone.
Table 6.1: Altman Z-score for BSNL
Variables 2013 2014 2015 2016 2017
1.2X1 -0.042 0.017 -0.089 0.020 0.012
1.4X2 0.744 0.701 0.661 0.617 0.491
3.3X3 -0.275 -0.263 -0.354 -0.227 -0.119
0.6X4 0.078 0.084 0.101 0.106 0.174
1.0X5 0.268 0.293 0.386 0.465 0.171
Z-score 0.773 0.832 0.705 0.981 0.729
Source: Study Data (2019)
35
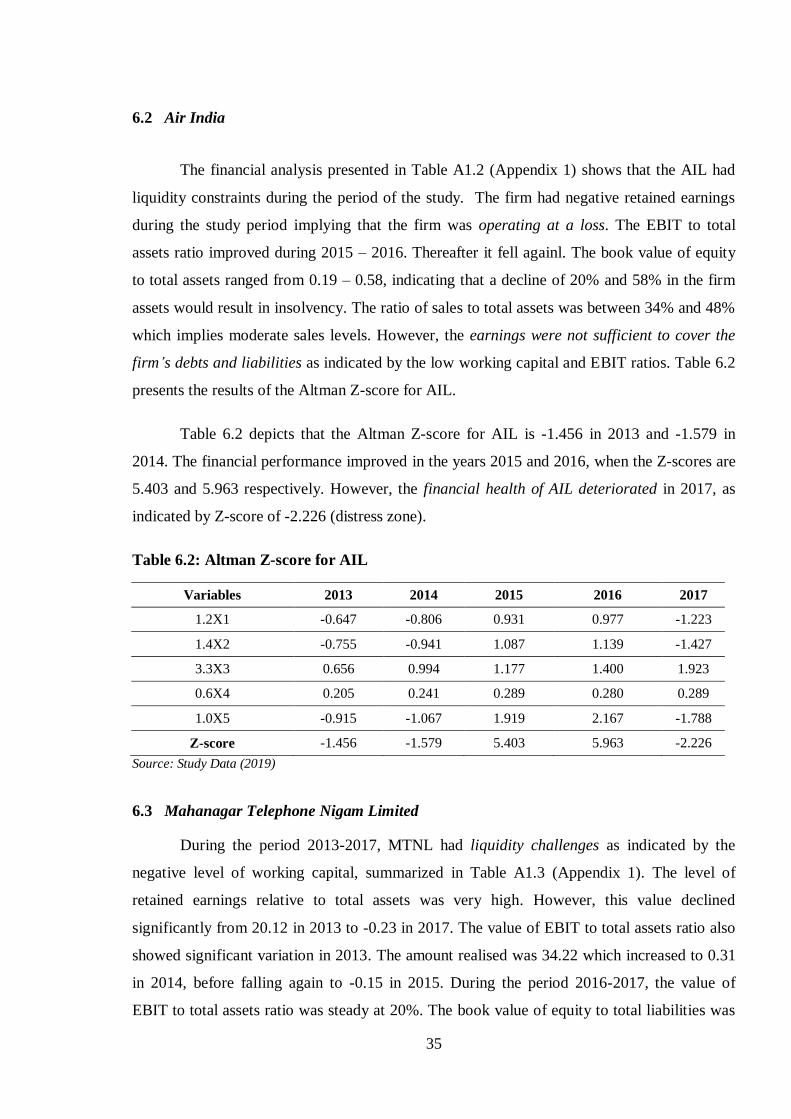
6.2 Air India
The financial analysis presented in Table A1.2 (Appendix 1) shows that the AIL had
liquidity constraints during the period of the study. The firm had negative retained earnings
during the study period implying that the firm was operating at a loss. The EBIT to total
assets ratio improved during 2015 – 2016. Thereafter it fell againl. The book value of equity
to total assets ranged from 0.19 – 0.58, indicating that a decline of 20% and 58% in the firm
assets would result in insolvency. The ratio of sales to total assets was between 34% and 48%
which implies moderate sales levels. However, the earnings were not sufficient to cover the
firm’s debts and liabilities as indicated by the low working capital and EBIT ratios. Table 6.2
presents the results of the Altman Z-score for AIL.
Table 6.2 depicts that the Altman Z-score for AIL is -1.456 in 2013 and -1.579 in
2014. The financial performance improved in the years 2015 and 2016, when the Z-scores are
5.403 and 5.963 respectively. However, the financial health of AIL deteriorated in 2017, as
indicated by Z-score of -2.226 (distress zone).
Table 6.2: Altman Z-score for AIL
Variables 2013 2014 2015 2016 2017
1.2X1 -0.647 -0.806 0.931 0.977 -1.223
1.4X2 -0.755 -0.941 1.087 1.139 -1.427
3.3X3 0.656 0.994 1.177 1.400 1.923
0.6X4 0.205 0.241 0.289 0.280 0.289
1.0X5 -0.915 -1.067 1.919 2.167 -1.788
Z-score -1.456 -1.579 5.403 5.963 -2.226
Source: Study Data (2019)
6.3 Mahanagar Telephone Nigam Limited
During the period 2013-2017, MTNL had liquidity challenges as indicated by the
negative level of working capital, summarized in Table A1.3 (Appendix 1). The level of
retained earnings relative to total assets was very high. However, this value declined
significantly from 20.12 in 2013 to -0.23 in 2017. The value of EBIT to total assets ratio also
showed significant variation in 2013. The amount realised was 34.22 which increased to 0.31
in 2014, before falling again to -0.15 in 2015. During the period 2016-2017, the value of
EBIT to total assets ratio was steady at 20%. The book value of equity to total liabilities was
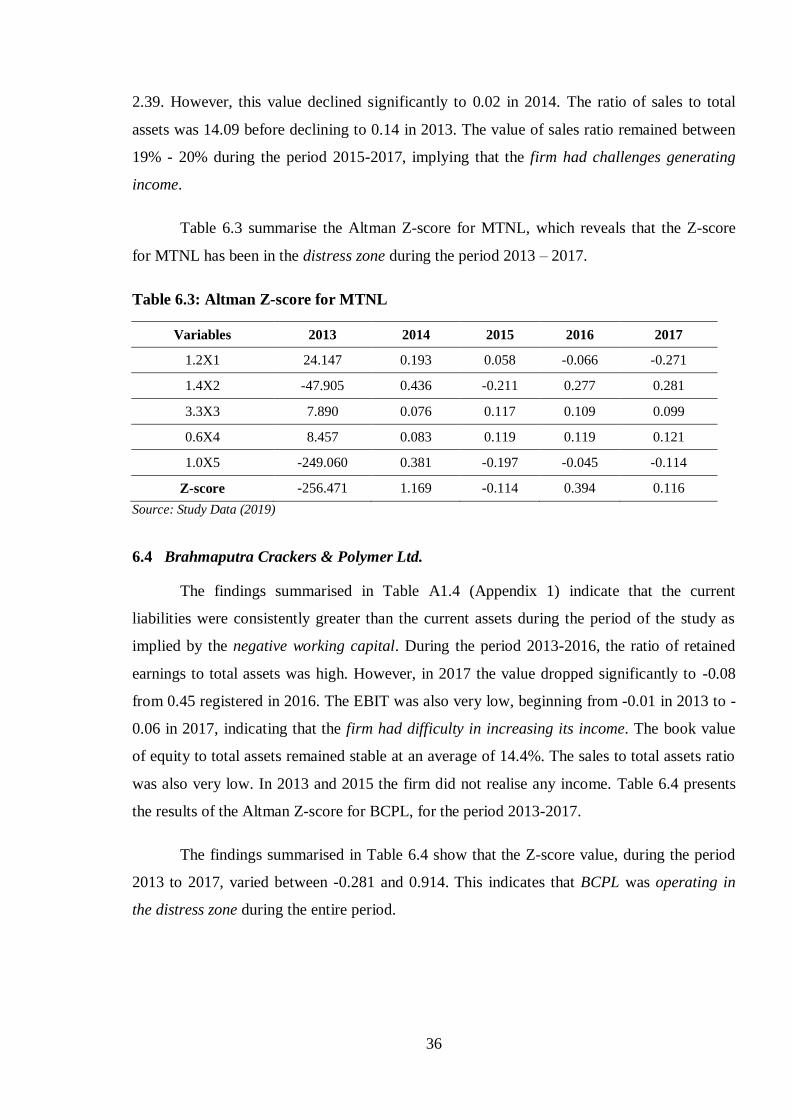
36
2.39. However, this value declined significantly to 0.02 in 2014. The ratio of sales to total
assets was 14.09 before declining to 0.14 in 2013. The value of sales ratio remained between
19% - 20% during the period 2015-2017, implying that the firm had challenges generating
income.
Table 6.3 summarise the Altman Z-score for MTNL, which reveals that the Z-score
for MTNL has been in the distress zone during the period 2013 – 2017.
Table 6.3: Altman Z-score for MTNL
Variables 2013 2014 2015 2016 2017
1.2X1 24.147 0.193 0.058 -0.066 -0.271
1.4X2 -47.905 0.436 -0.211 0.277 0.281
3.3X3 7.890 0.076 0.117 0.109 0.099
0.6X4 8.457 0.083 0.119 0.119 0.121
1.0X5 -249.060 0.381 -0.197 -0.045 -0.114
Z-score -256.471 1.169 -0.114 0.394 0.116
Source: Study Data (2019)
6.4 Brahmaputra Crackers & Polymer Ltd.
The findings summarised in Table A1.4 (Appendix 1) indicate that the current
liabilities were consistently greater than the current assets during the period of the study as
implied by the negative working capital. During the period 2013-2016, the ratio of retained
earnings to total assets was high. However, in 2017 the value dropped significantly to -0.08
from 0.45 registered in 2016. The EBIT was also very low, beginning from -0.01 in 2013 to -
0.06 in 2017, indicating that the firm had difficulty in increasing its income. The book value
of equity to total assets remained stable at an average of 14.4%. The sales to total assets ratio
was also very low. In 2013 and 2015 the firm did not realise any income. Table 6.4 presents
the results of the Altman Z-score for BCPL, for the period 2013-2017.
The findings summarised in Table 6.4 show that the Z-score value, during the period
2013 to 2017, varied between -0.281 and 0.914. This indicates that BCPL was operating in
the distress zone during the entire period.
37
Table 6.4: Altman Z-score for BCPL
Variables 2013 2014 2015 2016 2017
1.2X1 -0.033 -0.018 -0.062 -0.093 -0.137
1.4X2 0.746 0.844 0.751 0.634 -0.121
3.3X3 -0.009 0.001 -0.001 -0.089 -0.213
0.6X4 0.092 0.087 0.081 0.073 0.088
1.0X5 0 0 0 0.005 0.102
Z-score 0.796 0.914 0.769 0.530 -0.281
Source: Study Data (2019)
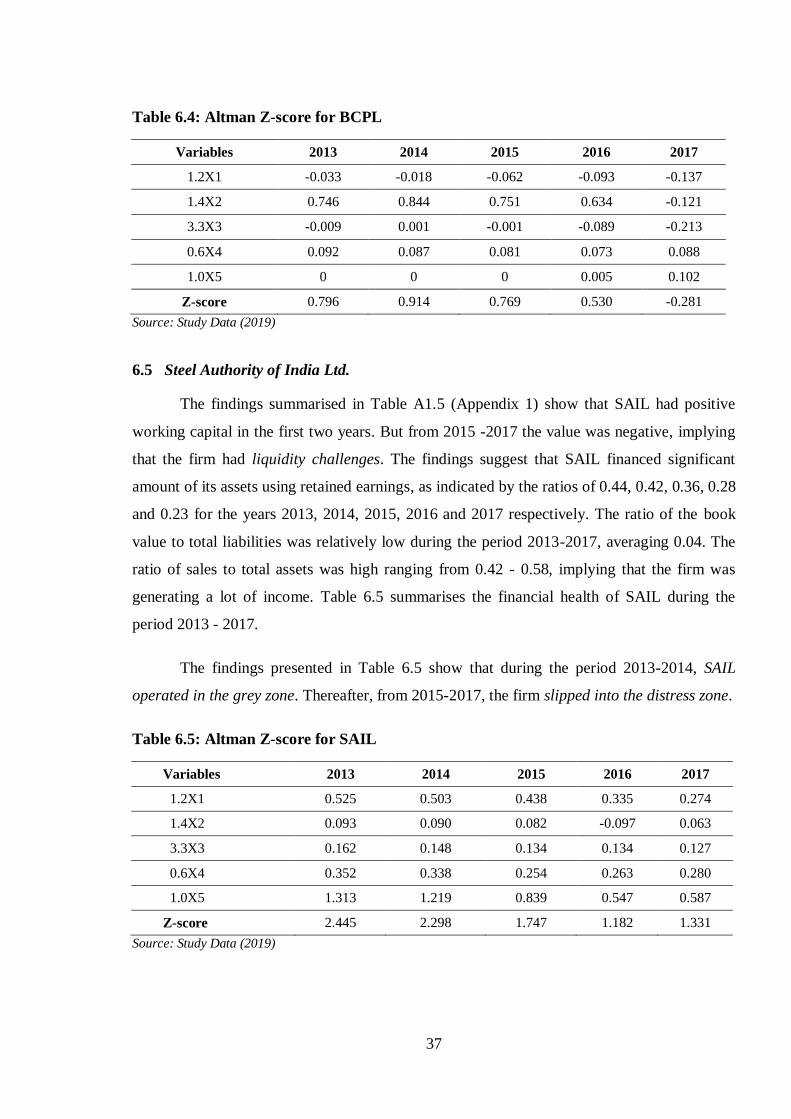
6.5 Steel Authority of India Ltd.
The findings summarised in Table A1.5 (Appendix 1) show that SAIL had positive
working capital in the first two years. But from 2015 -2017 the value was negative, implying
that the firm had liquidity challenges. The findings suggest that SAIL financed significant
amount of its assets using retained earnings, as indicated by the ratios of 0.44, 0.42, 0.36, 0.28
and 0.23 for the years 2013, 2014, 2015, 2016 and 2017 respectively. The ratio of the book
value to total liabilities was relatively low during the period 2013-2017, averaging 0.04. The
ratio of sales to total assets was high ranging from 0.42 - 0.58, implying that the firm was
generating a lot of income. Table 6.5 summarises the financial health of SAIL during the
period 2013 - 2017.
The findings presented in Table 6.5 show that during the period 2013-2014, SAIL
operated in the grey zone. Thereafter, from 2015-2017, the firm slipped into the distress zone.
Table 6.5: Altman Z-score for SAIL
Variables 2013 2014 2015 2016 2017
1.2X1 0.525 0.503 0.438 0.335 0.274
1.4X2 0.093 0.090 0.082 -0.097 0.063
3.3X3 0.162 0.148 0.134 0.134 0.127
0.6X4 0.352 0.338 0.254 0.263 0.280
1.0X5 1.313 1.219 0.839 0.547 0.587
Z-score 2.445 2.298 1.747 1.182 1.331
Source: Study Data (2019)
38
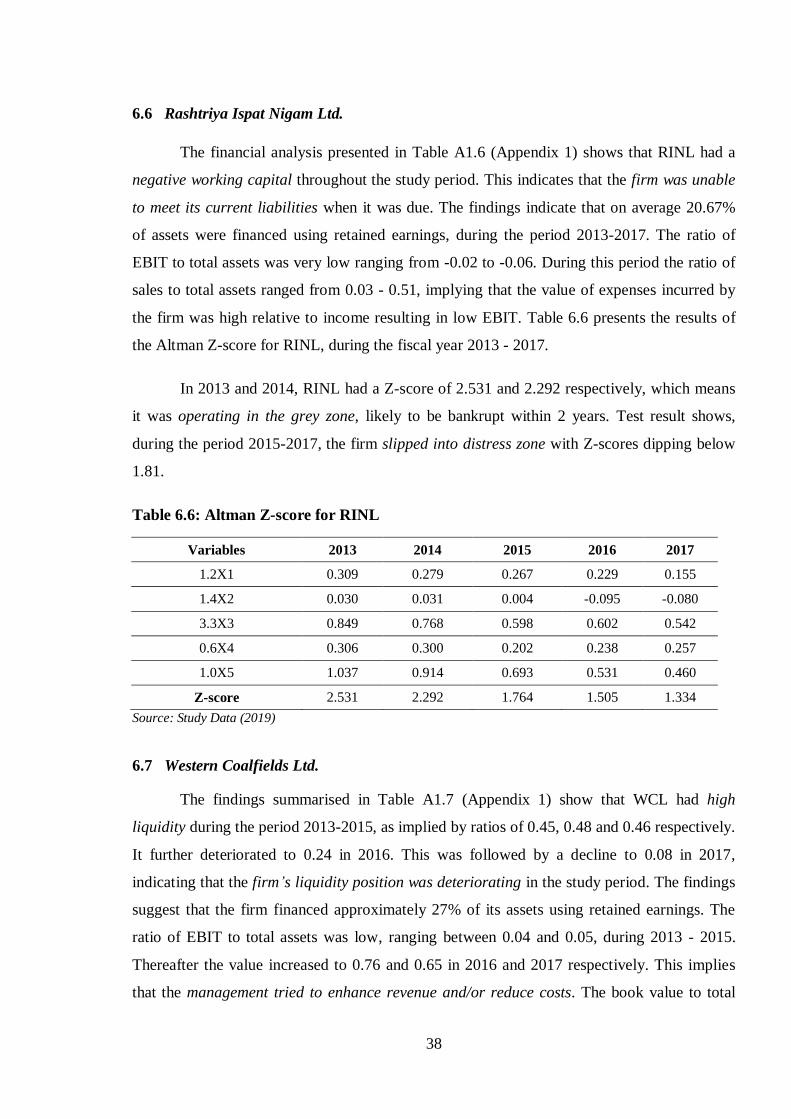
6.6 Rashtriya Ispat Nigam Ltd.
The financial analysis presented in Table A1.6 (Appendix 1) shows that RINL had a
negative working capital throughout the study period. This indicates that the firm was unable
to meet its current liabilities when it was due. The findings indicate that on average 20.67%
of assets were financed using retained earnings, during the period 2013-2017. The ratio of
EBIT to total assets was very low ranging from -0.02 to -0.06. During this period the ratio of
sales to total assets ranged from 0.03 - 0.51, implying that the value of expenses incurred by
the firm was high relative to income resulting in low EBIT. Table 6.6 presents the results of
the Altman Z-score for RINL, during the fiscal year 2013 - 2017.
In 2013 and 2014, RINL had a Z-score of 2.531 and 2.292 respectively, which means
it was operating in the grey zone, likely to be bankrupt within 2 years. Test result shows,
during the period 2015-2017, the firm slipped into distress zone with Z-scores dipping below
1.81.
Table 6.6: Altman Z-score for RINL
Variables 2013 2014 2015 2016 2017
1.2X1 0.309 0.279 0.267 0.229 0.155
1.4X2 0.030 0.031 0.004 -0.095 -0.080
3.3X3 0.849 0.768 0.598 0.602 0.542
0.6X4 0.306 0.300 0.202 0.238 0.257
1.0X5 1.037 0.914 0.693 0.531 0.460
Z-score 2.531 2.292 1.764 1.505 1.334
Source: Study Data (2019)
6.7 Western Coalfields Ltd.
The findings summarised in Table A1.7 (Appendix 1) show that WCL had high
liquidity during the period 2013-2015, as implied by ratios of 0.45, 0.48 and 0.46 respectively.
It further deteriorated to 0.24 in 2016. This was followed by a decline to 0.08 in 2017,
indicating that the firm’s liquidity position was deteriorating in the study period. The findings
suggest that the firm financed approximately 27% of its assets using retained earnings. The
ratio of EBIT to total assets was low, ranging between 0.04 and 0.05, during 2013 - 2015.
Thereafter the value increased to 0.76 and 0.65 in 2016 and 2017 respectively. This implies
that the management tried to enhance revenue and/or reduce costs. The book value to total

39
liabilities was stable at approximately 0.03 during the study period. The ratio of sales to total
assets ranged between was 0.65 and 0.76, during 2013 – 2017.
The results presented in Table 6.7 show that WCL was in grey zone during the period
2013-2015 as implied by Z-score values being above 1.81. Thereafter, during 2016 – 2017,
with Z-score value being above 3.0, indicating the firm was in safe zone.
Table 6.7: Altman Z-score for WCL
Variables 2013 2014 2015 2016 2017
1.2X1 0.546 0.581 0.558 0.288 0.099
1.4X2 0.446 0.454 0.425 0.371 0.263
3.3X3 0.146 0.107 0.167 2.527 2.138
0.6X4 0.018 0.018 0.016 0.016 0.015
1.0X5 0.747 0.664 0.681 0.766 0.648
Z-score 1.903 1.824 1.847 3.968 3.163
Source: Study Data (2019)
6.8 State Trading Corporation of India Ltd.
The financial analysis presented in Table A1.8 (Appendix 1) shows that STCL had
liquidity challenges as implied by negative working capital. The firm also had negative
retained earnings. The negative EBIT to total assets ratio suggests that the firm had negative
income during the period 2013-2016. During the same period the level of sales relative to
total assets was high, ranging between 1.88 and 4.73. These findings imply that the expenses
were significantly higher than the income, resulting in poor liquidity and retained earnings.
Table 6.8 summarises the findings of the Altman Z-score test conducted on the
financial results of STCL. It shows that STCL with Z-score value of 2.484 in 2013 was in the
grey zone. But during 2014-2016, the Z-score indicates financial distress.
Table 6.8: Altman Z-score for STCL
Variables 2013 2014 2015 2016 2017
1.2X1 -0.604 -1.008 -0.786 -0.968 -1.260
1.4X2 -0.682 -1.419 -0.789 -0.948 -1.405
3.3X3 -0.546 -0.914 -0.888 -1.026 20.533
0.6X4 0.005 0.006 0.005 0.004 0.005
1.0X5 4.311 4.726 3.152 2.235 1.885
Z-score 2.484 1.391 0.694 -0.703 19.758
Source: Study Data (2019)

40
6.9 Summary:
The Altman Z-score model is useful to help assess and predict bankruptcy in advance
for a company, so that it can take corrective measures in time for improvement. Applying
Altman Z-score model for the selected 8 loss making PSEs, the test results established that
during the period 2013 – 2017 these PSEs were either in the grey zone or in the financial
distress zone.
41
7. REFORMS FOR RESTRUCTURING PUBLIC SECTOR
In India, the growing number of PSEs facing financial distress is a major concern as it
affects the economy. It is a concern to both, the government and the public. This chapter
highlights the government policies and major reform measures taken for under-performing
and ailing PSEs.
7.1 Strategies to Reform the Underperforming PSEs
In India, the public sector is considered as one of the key instruments of government
intervention in economic activity and for the development of the nation. It is an effective tool
for managing the pace and the composition of the economic activities in the mixed economy.
In order to bring regional development and equitable distribution of wealth, it was necessary
for the government to take action and remedial measures to revive the ailing PSEs.
Broadly, the strategies for restructuring / revival of PSEs, including ailing PSEs, on
long-term basis include – (i) Revival through the process of a Constitutional Board, (ii)
Financial restructuring, (iii) Joint ventures by inducting partners capable of providing
technical, financial and marketing inputs, (iv) Organizational restructuring and manpower
rationalization (DPE Report, 2010). For this, the government has taken policy decisions and
launched various reforms measures, which are mentioned below.
7.2 Government Policy for Revival of Sick PSEs
The Industrial Policy of 1991 and the subsequent Government Policy of 1999
contained several reform measures for PSEs in India. Some of these are selling of loss making
entities to the private sector (Privatization), inviting private participation in PSEs (PPP
Model) and also strategic Sale of ailing PSSEs (Business Line, 2016). Privatization was
launched primarily to enhance efficiency and focus on PSEs in core-sectors (Indian Economy,
2016). Until 2015, there was no initiative by the government to help revive the ailing PSEs
through the PPP Model (public-private partnership). But recently it is seriously considering to
involve private players through PPP model to revive some of the sick pharmaceutical
enterprises and restart their production, namely for IDPL (Indian Drugs & Pharmaceutical
Ltd.) and HAL (Hindustan Antibiotics Ltd) (Business Standard, 2016). In India, the PPP
42
Model is mostly being adopted for new projects in key sectors like - Roads, Railways, Ports
and Airports.
After 1991, major reform measures for public sector were initiated by the government
with an aim to increase efficiency, accountability, professionalism, and market-driven
approach for these enterprises (Delhi Univ., Study Material). Some of the important reform
measures introduced through the policy are mentioned below.
(i) Transparency in Operations of PSEs
In 2005, ‘Corporate Governance Code’ was formulated by the government to bring in greater
public accountability and transparency amongst PSEs, due to competition in the market. In
addition, the PSEs were also covered under the Right to Information Act.
(ii) Revival and Restructuring of Sick PSEs
The Government took initiative to restructure PSEs in order to help improve their
performance and also to revive the ailing enterprises. But those chronically ailing and beyond
revival need to be closed or sold. Those having potential for revival were taken up by the
private sector to make them operational (Delhi Univ., Study Material). For this purpose, in
2004, Board for Reconstruction of PSEs (BRPSE) was created by the government to review
the ailing PSEs and consider those having potential for restructuring and revival. So far, total
60 cases of ailing PSEs were referred to BRPSE and with their intervention 18 PSEs were
revived. Tthe latest revival entities being Konkan Railways and Hindustan Copper Ltd. which
are making profits continuously for the past 2-3 years.
(iii) Disinvestment and Privatization
In India, disinvestment primarily aims to improve performance, bring competition and
accountability in the decision making process for PSEs. It involves transfer of government
holding/shares in PSEs to private companies. Most of the entities privatised during 1999-2004
could turn-around and some became profitable companies in India (Business Line, 2016).
(iv) Allowing PSEs to Enter Capital Market
After 1991, the government started reducing the budgetary support and allowed PSEs to raise
equity from the capital market. This in turn put market pressure on PSEs to improve their
performance. In 2007, total 44 PSEs were found listed on the stock exchange (Delhi Univ.,
Study Material).

43
(v) Other Measures
Implicit Subsidies: These are subsidies given in excess of the already existing subsidies given
to PSEs through direct or indirect government investment. These subsidies are most
frequently given to PSEs on providing electricity and water (OECD, 2011). These subsides
are given in situations where the PSEs are unable to earn a market rate of return. Research
shows that the Government of India spends about 3.5% of its GDP on such subsidies (OECD,
2011).
Enhanced Competitiveness: Certain measures were taken by the government to ensure that
the PSEs become competitive and market oriented. Some of these strategies include, hiring
experts and paying them salary equivalent to those earned in the private sector. Further, the
government modernised and upgraded the technology.
Financial Restructuring: The government had put in place comprehensive financial
restructuring plans that consist of various methods of financing the affected entities. These
plans include limited private investment, leveraging and/or institutional support.
Manpower Rationalization: PSEs have been suffering from over-staffing for a long period
which had incurred high recurring cost. To reduce this burden, the government introduced
Voluntary Retirement Schemes in a number of PSEs to shed the surplus manpower. These
schemes target 58 of the 82 loss making PSEs (The Economic Times, 2014).
The Government of India, through its policies and reform measures, has made
sustained efforts to modernize and restructure PSEs to improve their operational and financial
performance. However, the concern still remains as many of these are under-performing.
44
CONCLUSION
In this thesis, I have described and examined the major reasons why many of these
PSEs fail in their endeavour, leading to insolvency or closure. In its empirical part, the thesis
brings evidence from several case-studies of loss making PSEs which are operating in diverse
sectors of the Indian economy.
The findings revealed that the major challenges and reasons for failure of these PSEs
are - soft budget constraints, over-staffing, competition, capacity under-utilization, corporate
governance challenges, political interference and lack of autonomy, lack of accountability and
corruption. The case-studies taken up, using Altman Z-score model, established that eight of
the top ten loss making PSEs were facing financial distress and would require corrective
actions/measures to help improve their performance and sustain their operations.
My thesis contributes to the literature by studying the financial distress of eight loss
making PSEs which operate in important and different sectors of the Indian economy, such as
telecommunication, mining, services and transportation in addition to manufacturing.
The limitations of the thesis are: First, the data was collected from the published
annual audited reports of the selected PSEs. The reliability of the findings depends on the
accuracy of the financial data published in their annual reports. Second, the sample includes
eight of the eighty-two loss making PSEs. A higher sample size from the loss making PSEs
would have allowed for more accurate generalisation. Third, the thesis uses Altman Z-score
model to assess the financial distress of the PSEs and no other methods have been applied.
These limitations may be addressed in the future research.

45
46
LIST OF LITERATURE
Aasen, M. R. (2011). Applying Altman’s Z-score to the financial Crisis. An empirical study of
financial Distress on Oslo Stock Exchange. (Unpublished Master’s Thesis).Norwegian
School of Economics, Norway.
Abubakar, J. (2011, January 6). Nigeria: How privatised companies are collapsing. Daily
Trust. Retrieved from https://allafrica.com/stories/201101060386.html
Air India Limited. (2019) History. Retrieved from http://www.airindia.in/timeline.htm
Altman, E.(1968). Financial ratios, discriminant analysis and the prediction of corporate
bankruptcy. Journal of Finance, 23(4), 189–209.
Altman, E. (2000). Predicting financial distress of companies. Retrieved from Stern.nyu.edu Arellano-Gault, D., Demortain, D., Rouillard, C., & Thoenig, J.-C. (2013). Bringing public
organization and organizing back in. Organization Studies, 34(2), 1023–1033.
Arend, R. J., & Levesque, M. (2010). Is the resource-based view a practical organizational
theory? Organization Science, 21(2), 913–930.
Arya, S. (2017, March 15). Western coalfield limited sees prospects in selling sand. The
Economic Times. Retrieved from:
https://energy.economictimes.indiatimes.com/news/coal/western-coalfields-limited-
sees- prospects-in-selling-sand/57642541
Babalola, S. S. (2009). Perception of Financial Distress and Customers Attitude towards
Banking. International Journal of Business and Management, 4(10), 81-88.
Backhaus, J. (1994). Assessing the performance of public enterprises: A public-choice
approach. European Jouranl of Law and Economics, 1(4), 275-287.
Baldev R. (2001). Globalization and nationalism: The changing balance of India's economic
policy, 1950–2000. New Delhi: Sage.
Bajo A. and Primorac, M. (2016). Financial performance of major public enterprises in
Croatia from 2006 to 2014. Economia Pubblica, (3), 117-148.
Bajo, A., Zuber, L., & Primorac, M. (2018). Financial performance of state-owned
enterprises. Institute of Public Finance. Retrieved from
www.researchgate.net/publication/323005758_Financial_performance_of_state-
owned_enterprises
Barney, J. B. (2001). Resource-based theories of competitive advantage: A ten-year
retrospective on the resource-based view. Journal of Management, 27, 643–650.
Baruah, P., & Gogoi, K. (2016).Performance assessment of PSEs through memorandum of
understanding. Journal of Research, Extension, & Development, 4(11), 1-14.
47
Batth, C., Nayak, B., & Pasumarti, S. (2018). The study of financial performance of India
public sector undertaking. Global Journal of Finance and Management, 10 (1), 21-43.
Beaver, W. (1966). Financial ratios as predictors of failure; Empirical research in accounting,
selected studies. Journal of Accounting Research, (5), 71-111.
Bhardwaj, R. (2013). Vigilance administration: Public enterprises. Kaleidoscope, 47-49.
Bhoothalingam, S. (1993). Reflections on an era: Memoirs of a civil servant. Madras:
Affiliated East-West Publishers.
Bharat Sanchar Nigam Limited. About BSNL. Retrieved from:
http://www.bsnl.co.in/opencms/bsnl/BSNL/about_us/company/about_bsnl.htm
Bloomberg. (2019). Company overview of the State Trading Corporation of India Limited.
Retrieved from
https://www.bloomberg.com/research/stocks/private/snapshot.asp?privcapId=8910895
Bombay Stock Exchange. (2017). Divestment: A historical perspective. Retrieved from
http://www.bsepsu.com/historical-disinvestment.asp
Brown, M. (2019). Working capital to total assets: definition and explanation. Financial
Analysis Hub. Retrieved from: http://financialanalysishub.com/working-capital-to-
total-assets/
Brownbridge, M. (1998, March). Financial Distress in Local Banks in Kenya. Nigeria,
Uganda and Zambia: Causes and Implications for Regulatory Policy.(Working
Paper No 132) Retrieved from uncad.org/en/docs/dp_132.en.pdf
Bruton, G. D., Filatotchev, I., Chahine, S., & Wright, M. (2010). Governance, ownership
structure, and performance of IPO firms: The impact of different types of private
equity investors and institutional environments. Strategic Management Journal, 31,
491–509.
Bruton, G. D., Peng, M. W., Ahlstrom, D., Stan, C. V., & Xu, K. (2015). State-owned
enterprises around the world as hybrid organizations. Academy of Management
Perspectives, 29(1), 92–114.
Business Line (2016, Oct 03). Divestment should be used to restructure the public sector, not
just raise revenue. Retrieved from
www.thehindubusinessline.com/opinion/editorial/strategic-shift/article9180869.ece
Carney, R.W., & Child, T. B. (2013). Changes to the ownership and control of East Asian
corporations between 1996 and 2008: The primacy of politics. Journal of Financial
Economics, 107, 494–513.
Chattapadhyay, C. (2011). Corporate governance and public sector units in India: A
review.IPEDR, 20, 167-172.
48
Chari, A., & Gupta, N. (2008). Incumbents and protectionism: The political economy of
foreign entry liberalization. Journal of Financial Economics, 88(3):633{656.
Cheung, S. (1983). The contractual nature of the firm. Journal of Law and Economics, 26, 1–
21.
Chittedi, K., & Singh, J. (2012). Performance of public sector enterprises in India: A Macro-
Level analysis. The IUP Journal of Managerial Economics, IX(3), 7-25.
Coase, R. H. (1937). The nature of the firm. Economica, 4, 386–405
Codelco. (2018). About us. Retrieved from https://www.codelco.com/
Coste, A., & Tudor, A. 92013). Serive performance-between measurement and information in
the public sector. Procedia Social and Behavioural Sciences, 92, 215-219.
Cyert, R., & March, S. (1963). A behavioral theory of the firm. Englewood Cliffs, NJ:
Prentice Hall.
Deloitte. (2011). Public sector enterprises in india, pursuing the triple bottom line. Deloitte
and Indian Chamber of Commerce. Retrieved from www. deloitte.com/in
Dewenter, K. L., & Malatesta, P. H. (2001). State-owned and privately owned firms: An
empirical analysis of profitability, leverage, and labor intensity. American Economic
Review, 91, 320–334.
Filatotchev, I., Buck, T., & Zhukov, V. (2000). Downsizing in privatized firms in Russia,
Ukraine, and Belarus. Academy of Management Journal, 43, 286–304.
Ghosh, S. (2009). Do productivity and ownership really matter for growth? Firm-level
evidence. Economic Modeling, 26(6),1403-1413.
Grossman, S. J., & Hart, O. D. (1986). The costs and benefits of ownership: A theory of
vertical and lateral integration. Journal of Political Economy, 94, 691–719.
Grout, P., & Stevens, M. (2003). The assessment: Financing and managing public services.
Oxford Review of Economic Policy, 19, 215-234.
Gupta, K. (1975). Issues in Public Enterprises. New Delhi. S.Chand and Co. Ltd.
Jain, R. (2016). Do political factors influence performance of public sector enterprises? The
Indian disinvestment experience.
Jakob, B. (2017). Performance in strategic sectors: A comparison of profitability and
efficiency of state-owned enterprises and private corporations. The Park Place
Economist, 25(1), 9- 19
Jensen, M. C., & Meckling, W. H. (1976). Theory of the firm: Managerial behavior, agency
costs, and ownership structure. Journal of Financial Economics, 3, 305–360.
49
Jones, G. R., & Hill, C. W. L. (1988). Transaction cost analysis of strategy-structure choice.
Strategic Management Journal, 9, 159–172.
Kapur, D. (2019, Februrary 7). India’s public sector enterprises: Where do we go from here?
The Print. Retrieved from: https://theprint.in/opinion/indias-public-sector-enterprises-
where-do-we-go-from-here/149208/
Karmakar, S. (2018, February 02). BCPL posts Rs 800 Cr loss. The Telegraph.
https://www.telegraphindia.com/states/north-east/bcpl-posts-rs-800cr-
loss/cid/1441301
Karnik, M. (2017). A mountain of debt has been slowly killing Air India. Quartz. Retrieved
from https://qz.com/india/983534/a-mountain-of-debt-has-been-slowly-killing-air-
india/
Khanna, S. (2012). State-owned enterprises in India: Restructuring and growth. The
Copenhagen Journal of Asian Studies, 30(2), 5-28.
Khanna, S. (2017, December 13). MTNL woes show PSUs need a long-term game plan. Live
Mint. Retrieved from
https://www.livemint.com/Opinion/oDx9YBWLaQHHXVjBp24utK/MTNLs-woes-
show-PSUs-need-a-longterm-game-plan.html
Kim, J., & Mahoney, J. T. (2005). Property rights theory, transaction costs theory, and agency
theory: An organizational economics approach to strategic management. Managerial
and Decision Economics, 26, 223–242.
Kim, J., & Mahoney, J. T. (2010). A strategic theory of the firm as a nexus of incomplete
contracts: A property rights approach. Journal of Management, 36, 806–826.
Kipruto, K. (2013). The validity of Altaman’s failure prediction model in predicting corporate
financial distress in Uchumi supermarket in Kenya (unpublished master’s thesis).
University of Nairobi, Kenya.
Kumari, N. (2013). Evaluation of financial health of MMTC of India: A Z score model.
European Journal of Accounting Auditing and Finance Research, 1(1), 36-43.
Lance, P., & Hattori, A. (2016). Sampling and evaluation: A guide to sampling for program
impact evaluation. Retrieved from
www.measureevaluation.org/resources/publications/ms-16-112
Le, T. V., & O’Brien, J. P. (2010). Can two wrongs make a right? State ownership and debt in
a transition economy. Journal of Management Studies, 47, 1297–1316.
Li, W., He, A., Lan, H., & Yiu, D. (2012). Political connections and corporate diversification
in emerging economies: Evidence from China. Asia Pacific Journal of Management,
29(3), 799–818.
Li, Y., Peng, M. W., & Macaulay, C. 2013. Market-political ambidexterity during institutional
transitions. Strategic Organization, 11, 205–213.
50
Lienert, I. (2009). Where does the public sector end and the private sector begin. International
Monetary Fund, Working Paper 09/122.
Lux, S., Crook, T. R., & Woehr, D. J. (2011). Mixing business with politics: A meta-analysis
of the antecedents and outcomes of corporate political activity. Journal of
Management, 37, 223–247.
Mahangar Telephone Nigam Ltd. (2018). About us. Retrieved from http://mtnl.in/about-
us.html.
Mallya, N. (1971). Public enterprises in India: Their control and accountability. Delhi:
National Publishers.
Mambo, A. (2011). Applicability of Altman 1968 model in predicting financial distress of
commercial banks in Kenya (unpublished master’s thesis). University of Nairobi,
Kenya.
Marathe, S.S. (1989). Regulation and development. New Delhi: Sage.
Mathur, B.L. and Mathur, R. (2010).Ed. “Accountability and Autonomy relationship in
central public sector enterprises (PSEs) in India through Memorandum of
Understanding.” Proceedings of International Conference on Applied
Economics, pp 495-503.
Mayer-Ahuja, N. (2011). Review: decline of public sector enterprise. Economic and Political
Weekly, 46(3), 27-30.
Megginson, W. L., & Netter, J. M. (2001). From state to market: A survey of empirical
studies on privatization. Journal of Economic Literature, 39, 321–389.
Mishra, A. (2017, May 10). Government seeks to sell scooters India state, invites interest for
advisers. Live Mint. Retrieved from:
https://www.livemint.com/Companies/W95Gbz086r8PHbHXuOyF4I/Government-
seeks-to-sell-Scooters-India-stake-invites-inter.html
MILLWARD, Robert. Private and public enterprise in Europe : energy, telecommunications
and transport, 1830-1990. 1st ed. Cambridge: Cambridge University Press, 2005. xix,
351. ISBN 0521835240.
Monteiro, G., & Zylbersztajn, D. (2012). A property rights approach to strategy. Strategic
Organization, 10, 366–383.
Mukher, S.(n.d.). Top 9 causes of poor performance of public enterprises in India. Retrieved
from http://www.economicsdiscussion.net/india/public-enterprises/top-9-causes-of-
poor-performance-of-public-enterprises-in-india/11019
North, D. (1990). Institutions, institutional change, and economic performance. New York:
Norton.
Ogohi, D. (2014). Analysis of the performance of public enterprises in Nigeria. European
Journal of Business and Management, 6(25), 24-32.
51
Oliver, C., & Holzinger, I. (2008). The effectiveness of strategic political management: A
dynamic capabilities framework. Academy of Management Review, 33, 496–520.
Organisation for Economic Cooperation and Development. (2011). OECD economic surveys:
India. Retrieved from
https://books.google.co.ke/books?id=KOt_3y2BjpUC&pg=PA78&lpg=PA78&dq=im
plicit+subsidies+PSEs+India&source=bl&ots=FdoH51BZ8b&sig=ACfU3U2IGZsBJ
Nt27xwG1IFbgP7qHkOReA&hl=en&sa=X&ved=2ahUKEwi94KGe59PhAhVnxYU
KHS_ZDh8Q6AEwCXoECAkQAQ#v=onepage&q=implicit%20subsidies%20PSEs%
20India&f=false
Outecheva, N. (2007). Corporate Financial Distress: An Empirical Analysis of Distress
Risk. (Unpublished doctoral dissertation),University of St Gullen,Switzerland
Pandit, J., & Verma, A. (2019). Measuring financial distress of public sector enterprises using
Z-score model. Pramana Research Journal, 9(2), 186-196.
Pardeshi, B., & Thorat, H. (2013). Evaluating the financial health of central public sector
enterprises in India through Z score model. Retrieved from: www.aims-
international.org/aims12/12A-CD/PDF/K753-final.pdf
Penrose, E. T. (1959). A theory of the growth of the firm. New York: Wiley.
Rai, S. (2016, June 11). Central vigilance commission to rate public sector firms on integrity,
honesty. India Today. Retrieved from: www.indiatoday.in/mail-today/story/central-
vigilance-commission-to-rate-public-sector-firms-on-integrity-13564-2016-06-11
Rajan, R. G. (2010). Fault lines. Princeton, NJ: Princeton University Press.
Rashtriya Isapat Nigam. (2012). Annual report 2011. Retrieved from
http://www.vizagsteel.com/insiderinl/financialperformance.asp
Rashtriya Isapat Nigam. (2015). Annual report 2014. Retrieved from
http://www.vizagsteel.com/insiderinl/financialperformance.asp
Rashtriya Isapat Nigam. (2018). Annual report 2017. Retrieved from
http://www.vizagsteel.com/insiderinl/financialperformance.asp
Republic of India. (1956). Industrial policy handbook. Retrieved from:
web.archive.org/web/20150528135133/http://eaindustry.nic.in/handbk/chap001.pdf
Republic of India. (2018). Public enterprises survey 2016-2017. Retrieved from
https://dpe.gov.in/public-enterprises-survey-2016-17
Sankar, T.L., Mishra, R.K., & Lateef S, A. (1994). Divestments in public enterprises: The
Indian experience. International Journal of Public Sector Management, 7 (2), 69–88.
52
Sen, K., & Kayal, S. (2017). A study on performance evaluation of public sector enterprise
textile companies using Shannon DEA approach. Bhatter College Journal of
Multidiscpliary Studies, VII (2), 17-26.
Shleifer, A. (1998). State versus private ownership. Journal of Economic Perspectives, 12(4),
133-150.
Singh, M. (2016, September 27). Govt to shut down 15 loss making PSUs. The Times of
India. Retrieved from: https://timesofindia.indiatimes.com/business/india-
business/Govt-to-shut-down-15-loss-making-PSUs/articleshow/54531782.cms
Singh, S. (2012). What are the problems of public enterprises? Retrieved fromm
http://www.preservearticles.com/2012022823832/what-are-the-problems-of-public-
enterprises.html
Singh, T. (2016b). Public sector and its problems in India. International Journal of Research
in Management & Business Studies, 3(4), 25-27.
Singh, L., & Chawla, A. (2012). Customer retention in BSNL: A challenge ahead.
International Journal of Management and Business Studies, 2(1), 71-75.
Singh, P. (2017, February 05). Business environment is becoming a challenge for the steel
sector. The Economic Times. Retrieved from;
https://economictimes.indiatimes.com/industry/indl-goods/svs/steel/business-
environment-is-becoming-a-challenge-for-the-steel-sector-
sail/articleshow/56983087.cms
Subramanian, D. (2010) Telecommunications Industry in India: State, Business and Labour in
a Global Economy. New Delhi: Social Science Press.
Subramanian, S. (2016). A comparison of corporate governance practices in state-owned
enterprises and the their private sector peers in India. IIM Kozhikode Society &
Management Review, 5(2), 25-36.
Shuttleworth, M. (2018). Descriptive research design. Retrieved from:
https://explorable.com/descriptive-research-design
Teece, D. J., Pisano, G., & Shuen, A. (1997). Dynamic capabilities and strategic management.
Strategic Management Journal, 18, 509–533.
Tiwari, D. (2016, Feb 23). Strategic sale will not be confined to loss making PSU: Secretary
Neeraj Kumar Gupta. The Economic Times. Retrieved from
https://economictimes.indiatimes.com/news/economy/policy/strategic-sale-will-not-
be-confined-to-loss-making-psu-secretary-neeraj-kumar-
gupta/articleshow/51109360.cms
Tripathy, D.(2018, May 25). India state bank’s bailout stumbles as losses mount. Reuters.
Retrieved from https://in.reuters.com/article/india-banks/india-state-banks-bailout-
stumbles-as-losses-mount-idINKCN1IP3T1
53
The Economic Times. (2014a). Government to revive 5 PSUs: plans VRS for employees of
six units. Retrieved from:
https://economictimes.indiatimes.com/news/economy/policy/government-to-revive-5-
psus-plans-vrs-for-employees-of-six-units/articleshow/43441016.cms
The Economic Times. (2014b). High court orders coal companies to respond on poor quality ,
less. Retrieved from: https://economictimes.indiatimes.com/industry/indl-
goods/svs/metals-mining/high-court-orders-coal-companies-to-respond-on-poor-
quality-less-quantity/articleshow/33906682.cms
The Economic Times. (2015, June 05). Eight reasons why the government cannot afford to
delay Air India sale. Retrieved from:
https://economictimes.indiatimes.com/industry/transportation/airlines-/-aviation/eight-
reasons-why-the-government-cannot-afford-to-delay-air-india-
sale/articleshow/64462356.cms
Transparency International. (2018). India. Retrieved from:
https://www.transparency.org/country/IND
Vickers, J., & Yarrow, G. (1991). Economic perspectives on privatization. Journal of
Economic Perspectives, 5,111–132.
Vijaya, S., & Seethamma, K. (2016). A study of the financial health pertaining to select
Indian PSEs- with special reference to SAIL, NTPC, and ONGC (1997 To 2015).
International Journal of Research in Commerce, Economics, & Management, 6 (06),
11-17.
Western Coalfields Limited. (2019). About us. Retrieved from http://www.westerncoal.in/
Whittington, R. (2012). Big strategy/small strategy. Strategic Organization, 10, 263–268.
Wilkinson, J. (2013). Z score model. The Strategic CFO. Retrieved from:
https://strategiccfo.com/z-score-model/
Williamson, O. E. (1975). Markets and hierarchies. New York: Free Press.
Williamson, O. E. (1985). The economic institutions of capitalism. New York: Free Press.
World Bank. (2014). Republic of India: Corporate governance of central public sector
enterprises. Retrieved from
Wright, M., Filatotchev, I., Hoskisson, R. E., & Peng, M. W. (2005). Strategy research in
emerging economies: Challenging the conventional wisdom. Journal of Management
Studies, 42, 1–33.
Xia, J., Ma, X., Lu, J.W., & Yiu, D.W. (2014). Outward foreign direct investment by
emerging market firms: A resource dependence logic. Strategic Management Journal,
35, 1343–1363.
54
Young, M. N., Tsai, T., Wang, X., Liu, S., & Ahlstrom, D. (2014). Strategy in emerging
economies and the theory of the firm. Asia Pacific Journal of Management, 31(1),
331–354.
Other Sources:
Delhi University, SOL, Study Material -Economics. Public Sector Enterprises in India.
[ONLINE] Available at:
https://sol.du.ac.in/mod/book/view.php?id=1267&chapterid=946
Department of Public Enterprises (DPE) Website. Reports. Available at:
https://www.india.gov.in/website-department-public-enterprises-dpe
Department of Public Enterprises (DPE) Publication. PE Survey Reports 2010, 2017.
Available at: https://dpe.gov.in/guidelines/dpe-guidelines
Cromptroller and Auditor General of India (CAG) Report, March 2013 Available at:
https://www.scribd.com/document/334569715/CAG-PSU-2-of-2014
55
LIST OF TABLES
Table 1.1: Characteristics of Private and Public Sector Enterprises ........................................... 10
Table 2.1: Factors used to Classify PSEs .................................................................................. 16
Table 2.2: Growth of PSEs in India .......................................................................................... 10
Table 2.3: Performance Indicators of PSEs in India, 2007-2016 ............................................... 17
Table 2.4: Profits and Losses Made by PSEs (Rs. Millions) ...................................................... 19
Table 3.1: Income and Number of Employees of Ten PSEs in India ......................................... 24
Table 6.1: Altman Z score Results for BSNL ............................................................................ 34
Table 6.2: Results of Altman Z Score for AIL .......................................................................... 35
Table 6.3: Results of the Altman Z Score for MTNL ................................................................ 36
Table 6.4: Results of Altman Z Score for BCPL ....................................................................... 37
Table 6.5: Results of the Altman Z Score for SAIL................................................................... 37
Table 6.6: Results of the Altman Z Score Test for RINL .......................................................... 38
Table 6.7: Results of the Altman Z Score for WCL................................................................... 39
Table 6.8: Results of Altman Z Score for STCL ....................................................................... 39

56
LIST OF FIGURES
Figure 2.1: Distributions of PSEs in Various Sectors ................................................................ 15
Figure 2.2: Proportion of PSEs Making Losses in India, 2007-16 ............................................. 18
57
LIST OF ABBREVIATIONS
AIL Air India Limited
BSNL Bharat Sanchar Nigam Limited
BCPL Brahmaputra Crackers & Polymer Limited
BEL Bharat Electronics Limited
DPE Department of Public Enterprises
EBIT Earnings Before Interest and Tax
HMT Hindustan Machine Tools Limited
ITL Indian Telephone Industry Limited
Ltd. Limited
MMTC Metal and Minerals Trading Corporation of India
MTNL Mahanagar Telephone Nigam Limited
NDA National Democratic Alliance
NTPC National Thermal Power Corporation
OECD Organisation for Economic Co-operation and Development
ONGC Oil and Natural Gas Corporation Limited
PSE Public Sector Enterprise
RINL Rashtriya Ispat Nigam Limited
SAIL Steel Authority of India Limited
STCL State Trading Corporation of India Limited
Univ. University
UPA United Progressive Alliance
WCL Western Coalfields Limited
58
LIST OF APPENDICES
Appendix 1: Analysis of the Financial Performance of Selected PSEs in India
Table A1.1: Financial Performance of BSNL
Table A1.2: Financial Performance of AIL
Table A1.3: Financial Performance of MTNL
Table A1.4: Financial Performance of BCPL
Table A1.5: Financial Performance of SAIL
Table A1.6: Financial Performance of RINL
Table A1.7: Financial Performance of WCL
Table A1.8: Financial Performance of STCL
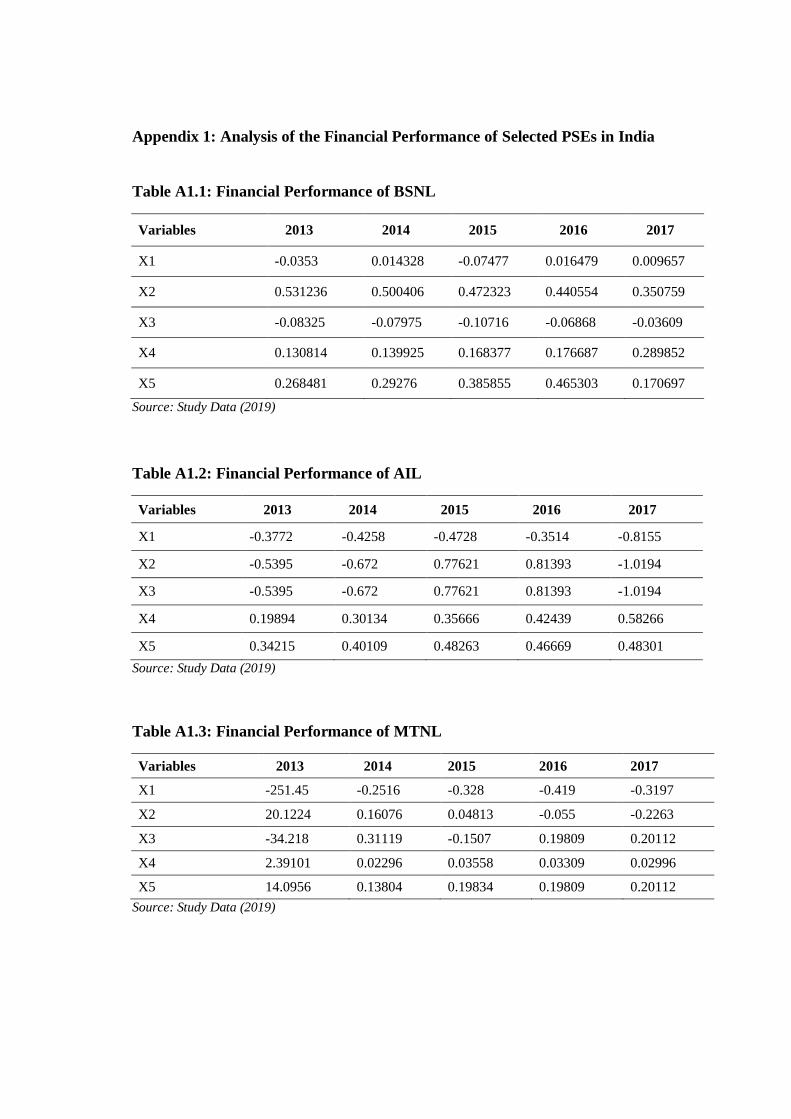
59
Appendix 1: Analysis of the Financial Performance of Selected PSEs in India
Table A1.1: Financial Performance of BSNL
Variables 2013 2014 2015 2016 2017
X1 -0.0353 0.014328 -0.07477 0.016479 0.009657
X2 0.531236 0.500406 0.472323 0.440554 0.350759
X3 -0.08325 -0.07975 -0.10716 -0.06868 -0.03609
X4 0.130814 0.139925 0.168377 0.176687 0.289852
X5 0.268481 0.29276 0.385855 0.465303 0.170697
Source: Study Data (2019)
Table A1.2: Financial Performance of AIL
Variables 2013 2014 2015 2016 2017
X1 -0.3772 -0.4258 -0.4728 -0.3514 -0.8155
X2 -0.5395 -0.672 0.77621 0.81393 -1.0194
X3 -0.5395 -0.672 0.77621 0.81393 -1.0194
X4 0.19894 0.30134 0.35666 0.42439 0.58266
X5 0.34215 0.40109 0.48263 0.46669 0.48301
Source: Study Data (2019)
Table A1.3: Financial Performance of MTNL
Variables 2013 2014 2015 2016 2017
X1 -251.45 -0.2516 -0.328 -0.419 -0.3197
X2 20.1224 0.16076 0.04813 -0.055 -0.2263
X3 -34.218 0.31119 -0.1507 0.19809 0.20112
X4 2.39101 0.02296 0.03558 0.03309 0.02996
X5 14.0956 0.13804 0.19834 0.19809 0.20112
Source: Study Data (2019)
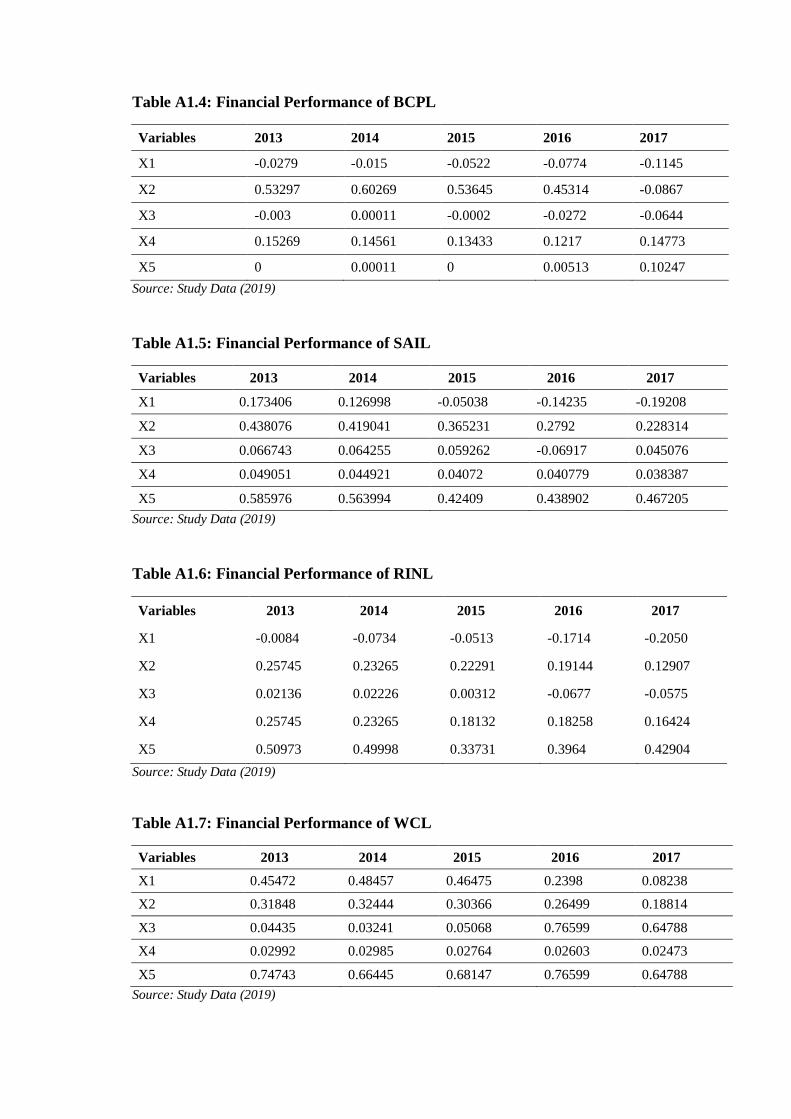
60
Table A1.4: Financial Performance of BCPL
Variables 2013 2014 2015 2016 2017
X1 -0.0279 -0.015 -0.0522 -0.0774 -0.1145
X2 0.53297 0.60269 0.53645 0.45314 -0.0867
X3 -0.003 0.00011 -0.0002 -0.0272 -0.0644
X4 0.15269 0.14561 0.13433 0.1217 0.14773
X5 0 0.00011 0 0.00513 0.10247
Source: Study Data (2019)
Table A1.5: Financial Performance of SAIL
Variables 2013 2014 2015 2016 2017
X1 0.173406 0.126998 -0.05038 -0.14235 -0.19208
X2 0.438076 0.419041 0.365231 0.2792 0.228314
X3 0.066743 0.064255 0.059262 -0.06917 0.045076
X4 0.049051 0.044921 0.04072 0.040779 0.038387
X5 0.585976 0.563994 0.42409 0.438902 0.467205
Source: Study Data (2019)
Table A1.6: Financial Performance of RINL
Variables 2013 2014 2015 2016 2017
X1 -0.0084 -0.0734 -0.0513 -0.1714 -0.2050
X2 0.25745 0.23265 0.22291 0.19144 0.12907
X3 0.02136 0.02226 0.00312 -0.0677 -0.0575
X4 0.25745 0.23265 0.18132 0.18258 0.16424
X5 0.50973 0.49998 0.33731 0.3964 0.42904
Source: Study Data (2019)
Table A1.7: Financial Performance of WCL
Variables 2013 2014 2015 2016 2017
X1 0.45472 0.48457 0.46475 0.2398 0.08238
X2 0.31848 0.32444 0.30366 0.26499 0.18814
X3 0.04435 0.03241 0.05068 0.76599 0.64788
X4 0.02992 0.02985 0.02764 0.02603 0.02473
X5 0.74743 0.66445 0.68147 0.76599 0.64788
Source: Study Data (2019)

61
Table A1.8: Financial Performance of STCL
Variables 2013 2014 2015 2016 2017
X1 -0.4195 -0.7003 -0.5457 -0.6725 -0.8751
X2 -0.348 -0.7239 -0.4027 -0.4836 -0.717
X3 -0.0502 -0.0839 -0.0815 -0.0942 1.88545
X4 0.01333 0.01801 0.01283 0.01235 0.01399
X5 4.31066 4.72621 3.15184 2.23528 1.88545
Source: Study Data (2019)