Large-scale inflation of Tungurahua volcano (Ecuador) revealed by Persistent Scatterers SAR...
24
Large-scale inflation of Tungurahua volcano (Ecuador) revealed by Persistent Scatterers SAR interferometry J. Champenois, 1,2 V. Pinel, 2 S. Baize, 1 L. Audin, 2 H. Jomard, 1 , A. Hooper, 3 A. Alvarado, 4 and H. Yepes 2,4 Corresponding author: J. Champenois, Institut de Radioprotection et de Sˆ uret´ e Nucl´ eaire, BP 17, Fontenay-aux-Roses Cedex 2, France. ([email protected]) 1 Institut de Radioprotection et de Sˆ uret´ e Nucl´ eaire, 92262 Fontenay-aux-Roses BP 17, France. 2 Institut des Sciences de la Terre, UMR 5275, F-38041 Grenoble, France. 3 COMET+, School of Earth and Environment, University of Leeds, Leeds LS2 9JT, UK. 4 Instituto Geof´ ısico, Escuela Polit´ ecnica Nacional, Quito, Ecuador. This article has been accepted for publication and undergone full peer review but has not been through the copyediting, typesetting, pagination and proofreading process, which may lead to differences between this version and the Version of Record. Please cite this article as doi: 10.1002/2014GL060956 c 2014 American Geophysical Union. All Rights Reserved.
Transcript of Large-scale inflation of Tungurahua volcano (Ecuador) revealed by Persistent Scatterers SAR...
Large-scale inflation of Tungurahua volcano
(Ecuador) revealed by Persistent Scatterers SAR
interferometryJ. Champenois,
1,2V. Pinel,
2S. Baize,
1L. Audin,
2H. Jomard,
1, A. Hooper,
3
A. Alvarado,4
and H. Yepes2,4
Corresponding author: J. Champenois, Institut de Radioprotection et de Surete Nucleaire, BP
17, Fontenay-aux-Roses Cedex 2, France. ([email protected])
1Institut de Radioprotection et de Surete
Nucleaire, 92262 Fontenay-aux-Roses BP
17, France.
2Institut des Sciences de la Terre, UMR
5275, F-38041 Grenoble, France.
3COMET+, School of Earth and
Environment, University of Leeds, Leeds
LS2 9JT, UK.
4Instituto Geofısico, Escuela Politecnica
Nacional, Quito, Ecuador.
This article has been accepted for publication and undergone full peer review but has not been throughthe copyediting, typesetting, pagination and proofreading process, which may lead to differencesbetween this version and the Version of Record. Please cite this article as doi: 10.1002/2014GL060956
c©2014 American Geophysical Union. All Rights Reserved.

The Tungurahua volcano, in Ecuador, has been experiencing a substan-
tial activity period since 1999, with several eruptions, including those of 2006
and 2008. We use a persistent scatterers approach to analyze a time series
of ENVISAT SAR data over the period 2003–2009, to investigate surface de-
formation in the region of the volcano. We measure a continuous large scale
uplift with a maximum line-of-sight displacement rate of about 8 mm/yr,
which is the first evidence of a sustained inflation in the Andes for an ac-
tive volcano encompassing several eruptions. We model this signal as magma
emplacement in a permanent storage zone at 11.5 km below sea level, with
a net inflow rate of 7 million m3/yr. The paroxysmal eruptions in 2006 and
2008, did not seem to disrupt this long-term signal. However, we observe sig-
nificant deformation during the 2006 eruption consistent with an additional
intrusion of 4.5 million m3 of magma.
c©2014 American Geophysical Union. All Rights Reserved.
1. Introduction
Synthetic Aperture Radar Interferometry (InSAR) can provide maps of surface displace-
ments over large areas with an accuracy reaching a few mm/year over tens of kilometers.
As a remote technique, it does not require any specific field instrumentations and has early
been identified as a valuable method to detect and follow surface deformations around
volcanoes [Dzurisin, 2003; Hooper et al., 2012a]. The main limitations of this technique
are due to spatio-temporal decorrelation and atmospheric perturbations to interferometric
phase [Zebker and Villasenor , 1992], which makes the application of InSAR to andesitic
stratocones challenging [Pinel et al., 2011]. However, the signal-to-noise ratio can be
significantly increased by Multi-Temporal InSAR (MT-InSAR) techniques based on the
processing of multiple SAR acquisitions in time [Hooper et al., 2012b].
Allowing for regional studies, InSAR has been widely applied to the Andes volcanic
arc. Pritchard and Simons [2002] first focused on the Central Andes and detected two
uplifting areas around currently inactive volcanoes: Uturuncu (22.27oS,67.22oW) and
Lazufre (25.25oS, 68.49oW), where inflation has later been shown to last for more than
10 years [Froger et al., 2007; Sparks et al., 2008; Fournier et al., 2010; Fialko and Pearse,
2012; Henderson and Pritchard , 2013; Walter and Motagh, 2014]. At Uturuncu volcano,
an uplift of around 1-2 cm/yr over 70 km was recorded from 1992 to 2011, which has
been interpreted as being due to magma emplacement at 17 to 24 km depth at a rate of
10–29 million m3/yr [Sparks et al., 2008; Henderson and Pritchard , 2013]. Based on the
observation of a ring of subsidence around the uplifting area, Fialko and Pearse [2012]
propose that this signal of deformation could be produced by a diapir of magma rising
c©2014 American Geophysical Union. All Rights Reserved.
from the Altiplano-Puna Magma Body, a large mid-crustal melt zone. At Lazufre (also
known as Lastarria-Cordon del Azufre volcanic complex) the uplift recorded since 1996 is
around 2–3.5 cm/yr over 40 km and corresponds to a slightly shallower source (7–15 km)
with a rate of magma emplacement of 14–17 million m3/yr [Froger et al., 2007; Henderson
and Pritchard , 2013]. Such long-term inflating zones, which imply large storage of magma
within the crust, have significant consequences in terms of risk assessment, with the linked
question of the future evolution of these storage zones and the potential risk of a large
silicic eruption [Sparks et al., 2008]. Using L-band data, Fournier et al. [2010] and Feigl
et al. [2014] extended the application of InSAR to the Southern Andes and Northern
Andes detecting uplift at several non currently active volcanoes, including Cordon Caulle
and Laguna del Maule. Inflation was also observed, for at least six years, before the 2011
eruption of Cerro Hudson [Delgado et al., 2014]. Co-eruptive subsidence was measured
using L-band data at Galeras, Colombia [Parks et al., 2011]. Other deformation signals
inferred at Andean volcanoes have been based on a few ground measurements (tiltmeters,
leveling, GPS) [Ordonez and Rey , 1997; Mothes et al., 2010].
In the Northern Andes, Ecuador encompasses one of the most active volcanic areas.
With presently nine active volcanoes including three currently erupting (Reventador, Tun-
gurahua, and Sangay), volcanic hazard assessment is a crucial issue in this country and
the enhancement of volcano monitoring requires dense ground measurements. For the last
5 years, GPS networks have been deployed over the main hazardous volcanoes in Ecuador,
but these point-wise measurements cannot provide spatially dense maps of ground defor-
mation.
c©2014 American Geophysical Union. All Rights Reserved.
In this study, we use InSAR to dramatically increase the density of measurements
around Tungurahua volcano, which is currently the most active volcano in Ecuador. Over
the period 1992-2002, the ERS data available were sparse in time and affected by strong
decorrelation over the Tungurahua [Stevens and Wadge, 2004]. Previous studies [Biggs
et al., 2010; Fournier et al., 2010] based on PALSAR images provided by the ALOS
satellite (L-band) showed a rapid uplift of Tungurahua during the 2008 eruption and
inferred a sill-like magmatic source located at shallow depth within the volcanic edifice.
Their estimated volume for the sill of 1.2 million m3 was almost equivalent to the volume
of magma erupted in February 2008. We present results from ASAR data provided by
the ENVISAT satellite (C-band with a 5.6 cm wavelength) acquired between 2003 and
2009, covering the two major phases of the ongoing Tungurahua activity in 2006 and
2008. Moreover, we applied the Persistent Scatterers InSAR (PSI) technique in order to
perform a proper time series analysis of ground deformation induced by magma intrusion
during eruptive cycle. We then modeled the resulting signal using an analytical solution
for a point pressure source [Mogi , 1958] and a numerical model.
2. Tungurahua recent eruptive activity
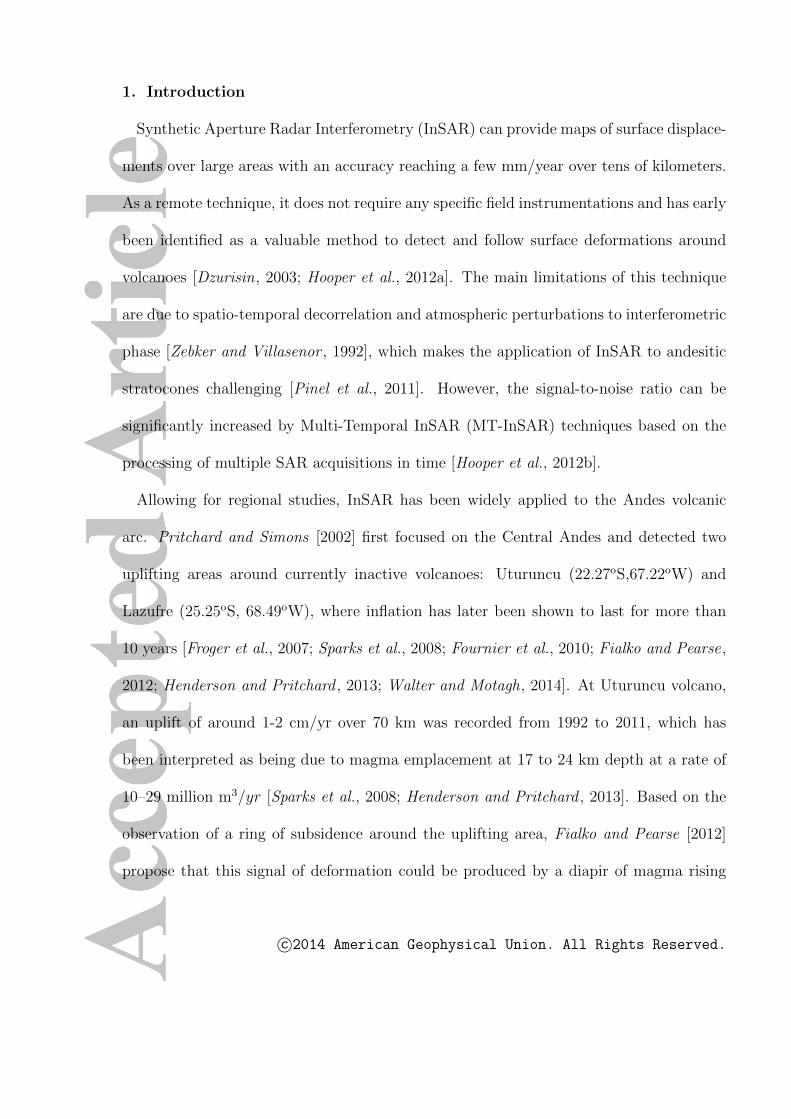
Tungurahua volcano (reaching 5023 m above sea level) is an andesitic stratovolcano
located in the Eastern Cordillera of Ecuador. This steep-sided edifice (12 km in diameter)
is surrounded by two other potentially active volcanoes (Chimborazo and Punalica) and
numerous inactive volcanic edifices (Figure 1). Based on geologic studies, Tungurahua’s
eruptive rate has been estimated to be around 1.5 million m3/yr dense rock equivalent
(DRE) of magma over the last 2300 years [Hall et al., 1999]. Tungurahua has had five
c©2014 American Geophysical Union. All Rights Reserved.

main eruptive periods during historical time: 1640–1641, 1773–1777, 1886–1888, 1916–
1918 and 1999–present [Hall et al., 1999; Ruiz et al., 2006; Le Pennec et al., 2008]. After
more than 80 years of repose, on October 5th 1999, Tungurahua began the current eruptive
cycle, characterized by intermittent strombolian eruptions and punctuated by significant
vulcanian to subplinian eruptions [Ruiz et al., 2006; Samaniego et al., 2011].
The volcanic edifice is monitored by a national seismic network, which has been op-
erated by the Instituto Geofısico, Escuela Politecnica Nacional of Ecuador since 1993.
Volcano-tectonic earthquakes recorded by this network have been used to produce a to-
mographic study of the upper 5 km of crust beneath the volcano, showing a shallow
and vertical magma body which feeds the system [Molina et al., 2005]. In early April
2006, the Tungurahua Volcanological Observatory observed deep long-lasting seismic ac-
tivity (5–15 km below the summit). The seismic activity dramatically increased until the
beginning of July 2006 and peaked during the July 14th and August 16–17th eruptions
(apps.igepn.edu.ec/cnd). The 2006 eruptions were characterized by highly explosive events
associated with pyroclastic flows, affecting the western flank of the volcano [Samaniego
et al., 2011], which caused about 5–6 fatalities and destroyed villages. The July 14 erup-
tion was a moderate-size event, Volcanic Explosive Index (VEI) 2, with the emission of
about 1 million m3 DRE, whereas the August 16–17th eruption reached VEI 3 with an
eruptive column height around 16 km above the vent [Eychenne et al., 2012]. During this
eruptive event, 30 Pyroclastic density currents with an estimated volume of 18.7 million
m3 DRE [Hall et al., 2013] were emplaced together with a DRE volume of juvenile tephra
of 7.7 million m3 [Eychenne et al., 2013]. The explosive phase was followed by lava flow
c©2014 American Geophysical Union. All Rights Reserved.
with an estimated volume of 7 million m3 [Arellano et al., 2008; Hall et al., 2013]. The
total volume of magma emitted during the August 2006 eruption is thus estimated to be
30 million m3 DRE. From October 2006 to the next paroxysmal eruptive phase in early
2008, the Tungurahua activity returned to an eruptive cycle similar to the 1999–2005
period. This last 2008 paroxysmal phase was characterised by the emission of a much
lower quantity of magma of about 1.5 million m3 [Biggs et al., 2010] in comparison to the
major 2006 event.
3. InSAR Persistent Scatterers Measurements
3.1. Method and Data
The Stanford Method for Persistent Scatterers (StaMPS) developed by Hooper et al.
[2007] was applied to 22 ENVISAT images acquired over the Tungurahua volcano between
July 2003 and June 2009 (File S1 for processing parameters). This PS approach uses both
information of amplitude dispersion [Ferretti et al., 2001] and phase stability with time
to select PS pixels. During the phase analysis, the probability for a pixel to be a PS
is estimated and refined through a series of iterations. Starting from SAR raw data, 21
interferograms were calculated with the 14 of April 2006 as the common master image
using ROI PAC [Rosen et al., 2004] and Doris software. Interferograms were flattened and
georeferenced using the 90 meter resolution Shuttle Radar Topography Mission (SRTM)
digital elevation model (DEM) [Farr et al., 2007]. At the end of the StaMPS processing,
a map of mean velocity along the radar line of sight (LOS velocity) is produced together
with the displacement time series at each acquisition date for selected pixels.
c©2014 American Geophysical Union. All Rights Reserved.

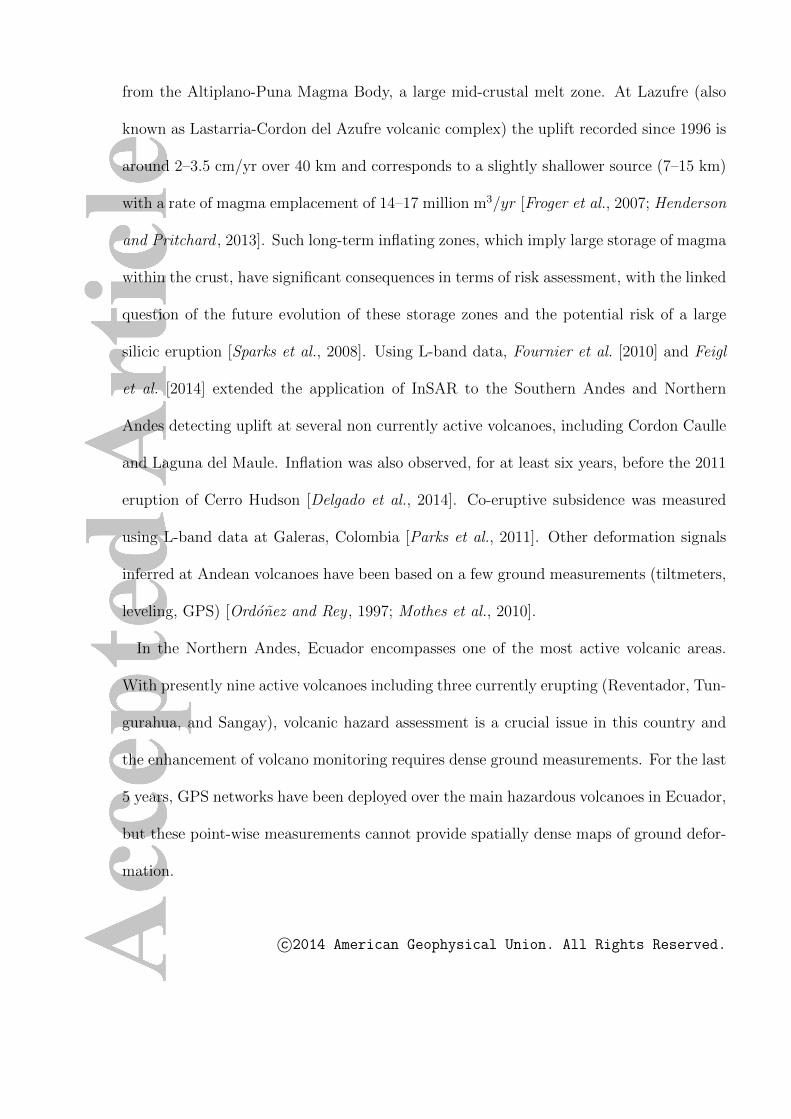
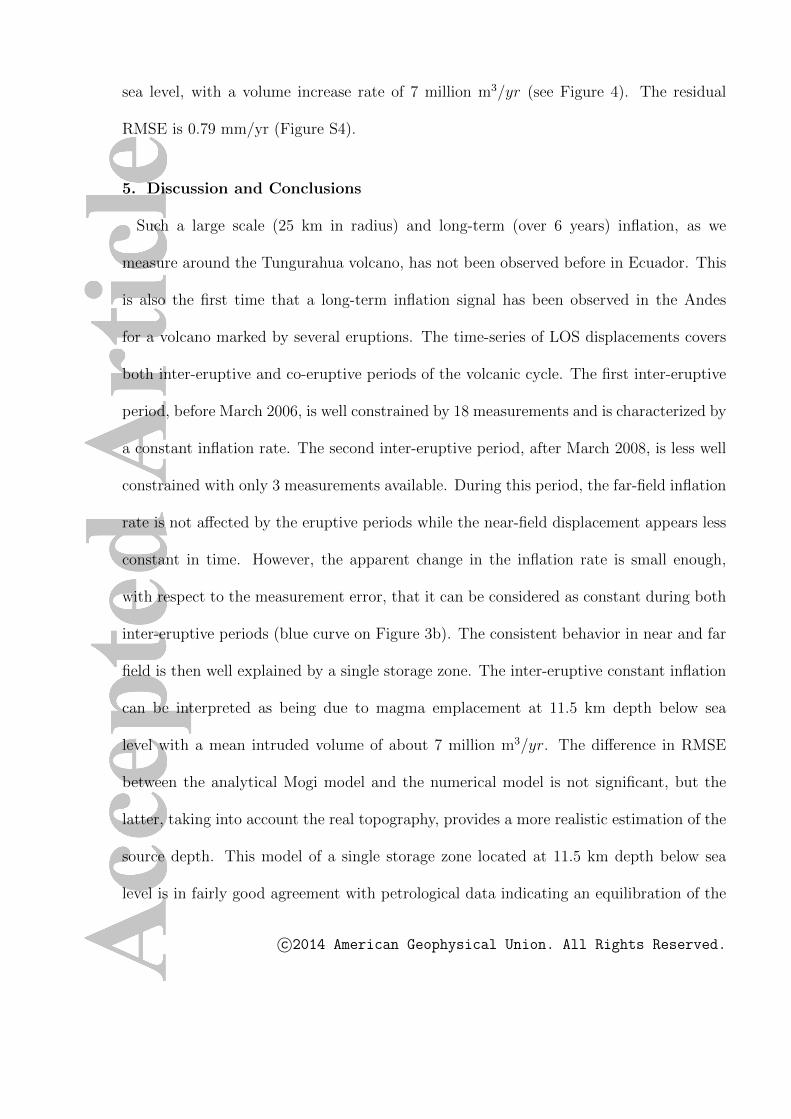
3.2. Results
The mean LOS velocity map (Figure 2) for the period 2003–2009 was calculated for
more than 190,000 PS pixels with a spatial density superior to 25 PS per km2. LOS
velocities are given with respect to the reference area which is located in the city of
Ambato (see Figure 1 for location). The PS distribution is not homogeneous across
the obtained map, with two main distinct areas: (i) the eastern cordillera with a low PS
density (∼ 10 PS per km2) due to tropical vegetation that leads to radar phase instability,
and (ii) the remaining area with an impressive PS density (∼ 42 PS per km2) due to the
presence of man-made structures and large rock outcrops. Uncertainties in the mean LOS
velocities are estimated by the percentile bootstrap method [Efron and Tibshirani , 1986]
and range from 0.3 mm/yr to 1.5 mm/yr (about 1.2 mm/yr in the area of the volcano,
Figure S2). The very low standard deviations correspond to PS close to the reference area
(Ambato city) and values increase with distance away from the reference due to increasing
differences in the path delay through the atmosphere. Concerning the phase unwrapping,
visible inspection of the wrapped phase (minus DEM error and master atmosphere) shows
no jump in the unwrapped result, but we cannot categorically state that there is not a
phase discontinuity surrounding the pixels on the eastern side.
The ground displacements clearly highlight a large circular pattern in the LOS velocity
centered on the Tungurahua active volcanic complex. This pattern also includes surround-
ing areas, for instance the eastern flank of the Igualata volcano and the city of Banos.
The total affected area covers a zone of 25 km radius around the Tungurahua volcano.
In contrast, the rest of the studied area displays much lower rates of deformation, with
c©2014 American Geophysical Union. All Rights Reserved.

LOS velocities ranging between -2 mm/yr and 2 mm/yr. The two PS profiles across the
Tungurahua volcano (Figure 2) show a highly symmetrical pattern of deformation, with a
maximum LOS velocity of about 8.2 mm/yr, near the summit of the volcano. Incidentally,
few PS are located on the active volcanic edifice (∼ 450 pixels) mostly due to the ash
deposits and lava flows of the 2006 July 14th and August 16–17th eruptions, as mapped
by Samaniego et al. [2011].
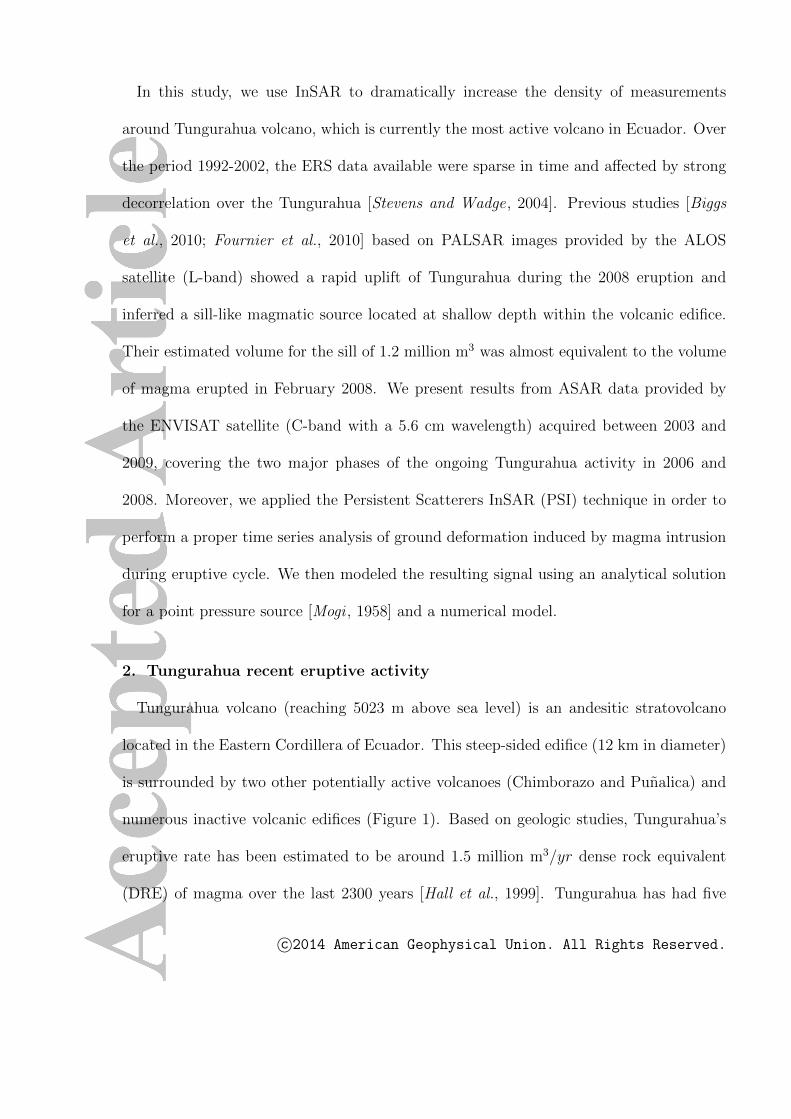
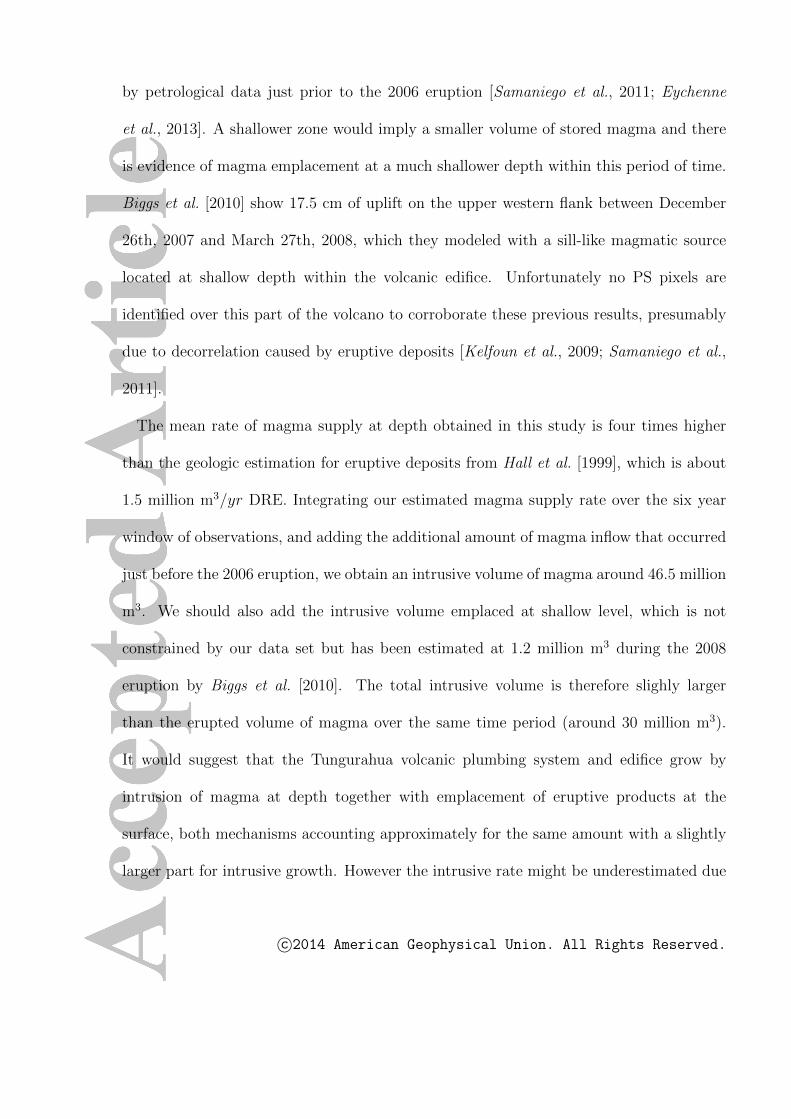
The time series of LOS displacement between July 2003 and June 2009 calculated
from the PS phases is presented in Figure 3a. Even though uplift of Tungurahua is
approximately constant with time, the time series of LOS displacement for selected pixels
located on the eastern summit of Tungurahua and western flank of Igualata (respectively
P1 and P2 on Figure 3b) indicates that deformation can be divided into three periods:
(i) A steady uplift between July 4th, 2003 and March 10th, 2006, (ii) an increased uplift
detected between March 10th and April 14th, 2006 (35 days), and (iii) a new steady period
of uplift from March 2008 to June 2009, which appears to be similar or slightly larger than
that experienced before the 2006 eruption. However, the latter is not well constrained,
with only 3 measurements. Regarding P2, which is about 16 km to the west of the summit
(far-field deformation), it is clear that the uplift rate is constant during the inter-eruptive
periods (before March 2006 and after March 2008). On the other hand, the uplift rate of
P1 after March 2008 is more questionable and two scenarios are possible: (i) the uplift
rate is the same as before March 2006 and an additional uplift (+4.3 mm) occurs between
April 2006 and March 2008 (blue curve on figure 3b), and (ii) the uplift rate increases
c©2014 American Geophysical Union. All Rights Reserved.
from 5.5 mm/yr to 7.5 mm/yr after the 2006 eruption (grey curve on figure 3b). Note
that these two scenarios fit equally well with the three last measurements available.
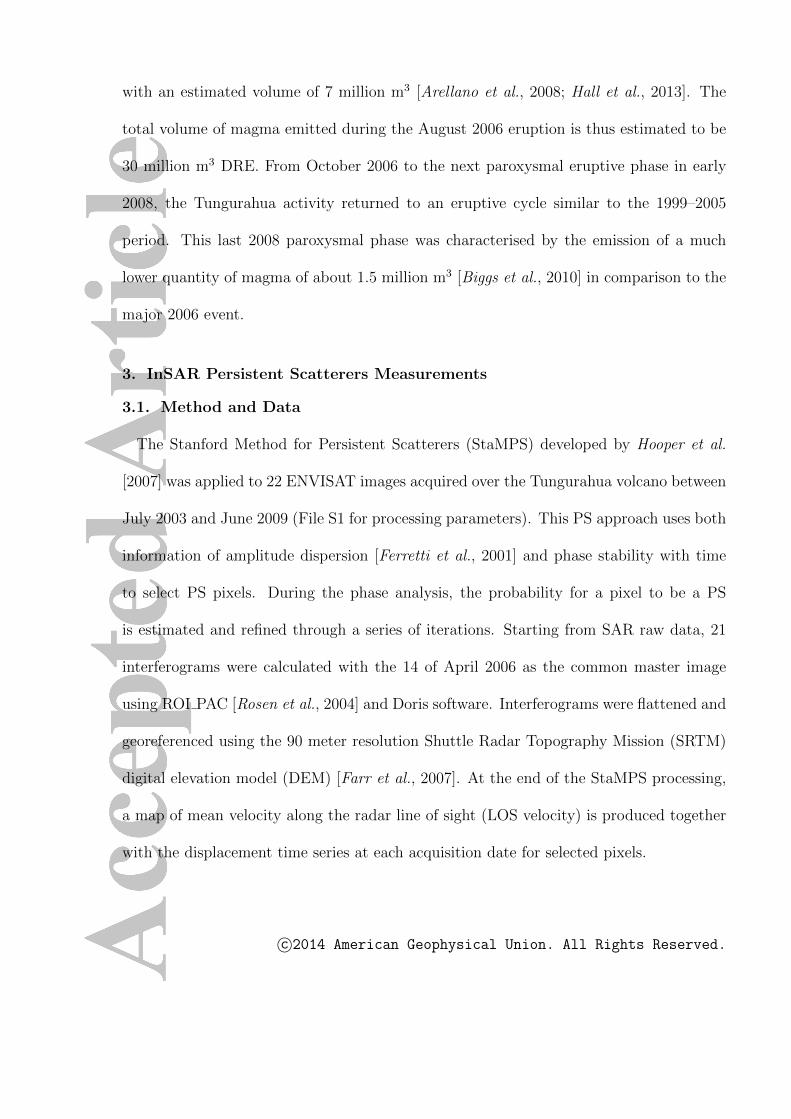
4. Deformation Source Modeling
To a first approximation, we considered the inter-eruptive inflation rate as constant, and
modeled it using the classical analytical model derived by Mogi [1958] for a pressure point
source in an elastic half-space. The best-fitting model was obtained for a source at 1.47oS,
78.465oW located 14.5 km beneath the free surface, and characterized by a volume increase
rate of 6.7 million m3/yr. The residual root mean square error (RMSE) is 0.80 mm/yr
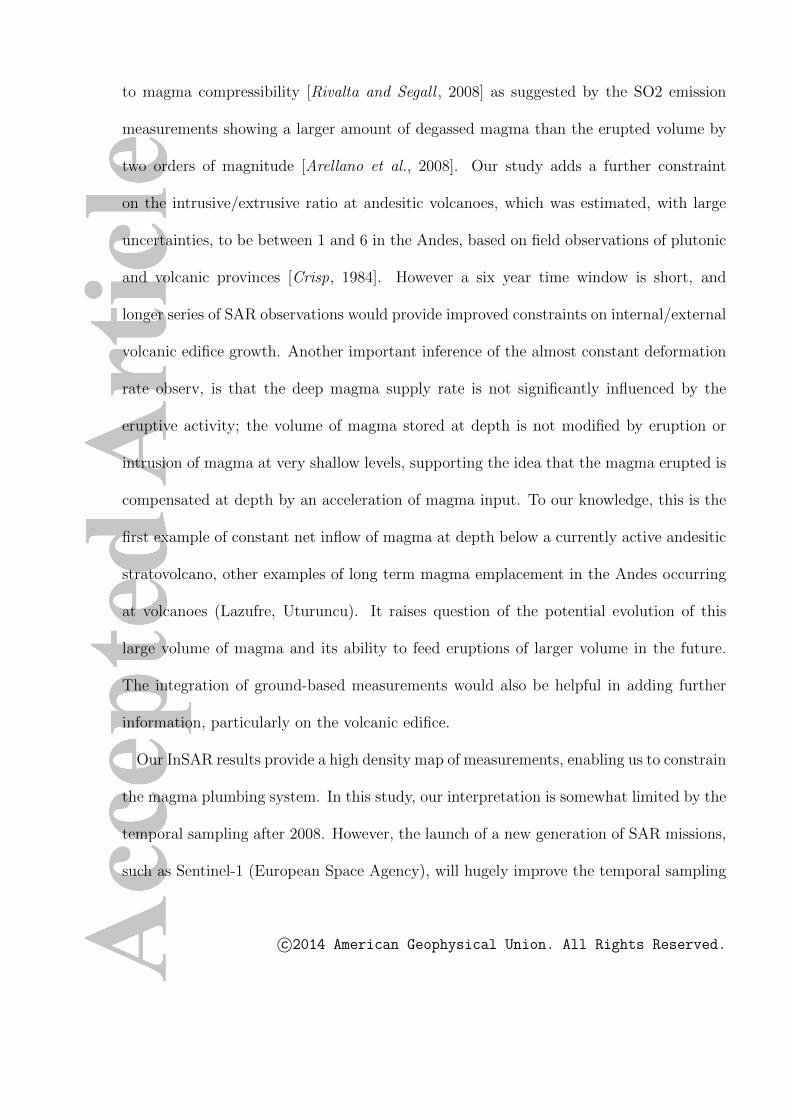
(Figure S3). In order to account for the topography around the volcano, we also performed
an inversion using a numerical model with the SRTM DEM as an input for the surface
elevation. The surface displacements induced by a spherical source have been calculated
using the 3D finite-element commercial Software COMSOL. We used a 100*100*50 km box
containing 100,000 elements with a refined mesh at the surface and around the spherical
magma reservoir. A “roller” condition (no displacement perpendicular to the surface)
was applied on the lateral side and bottom frontiers (using infinite elements in order to
artificially increase the numerical box size). The upper boundary (i.e. the volcano flank)
was considered as a free limit. A uniform surface displacement corresponding to a given
volume increase was applied to the boundary of a spherical magma reservoir characterized
by its location (latitude, longitude) and depth below sea level. Surface displacements were
calculated for 4,429 points, projected into the line of sight direction and then compared
with PS measurements. The best fitting model was obtained for a source located slightly
eastward in comparison to the Mogi solution (1.475oS, 78.44oW) and at 11.5 km below
c©2014 American Geophysical Union. All Rights Reserved.
sea level, with a volume increase rate of 7 million m3/yr (see Figure 4). The residual
RMSE is 0.79 mm/yr (Figure S4).
5. Discussion and Conclusions
Such a large scale (25 km in radius) and long-term (over 6 years) inflation, as we
measure around the Tungurahua volcano, has not been observed before in Ecuador. This
is also the first time that a long-term inflation signal has been observed in the Andes
for a volcano marked by several eruptions. The time-series of LOS displacements covers
both inter-eruptive and co-eruptive periods of the volcanic cycle. The first inter-eruptive
period, before March 2006, is well constrained by 18 measurements and is characterized by
a constant inflation rate. The second inter-eruptive period, after March 2008, is less well
constrained with only 3 measurements available. During this period, the far-field inflation
rate is not affected by the eruptive periods while the near-field displacement appears less
constant in time. However, the apparent change in the inflation rate is small enough,
with respect to the measurement error, that it can be considered as constant during both
inter-eruptive periods (blue curve on Figure 3b). The consistent behavior in near and far
field is then well explained by a single storage zone. The inter-eruptive constant inflation
can be interpreted as being due to magma emplacement at 11.5 km depth below sea
level with a mean intruded volume of about 7 million m3/yr. The difference in RMSE
between the analytical Mogi model and the numerical model is not significant, but the
latter, taking into account the real topography, provides a more realistic estimation of the
source depth. This model of a single storage zone located at 11.5 km depth below sea
level is in fairly good agreement with petrological data indicating an equilibration of the
c©2014 American Geophysical Union. All Rights Reserved.

andesitic magma at 200 to 250 MPa corresponding to a depth of 7.5 to 9.5 km below the
mean elevation of the area [Samaniego et al., 2011]. However, if the inflation rate after
2008 in the near field is effectively slightly larger than before 2006 (grey curve on Figure
3b), the storage zone located at 11.5 km depth still explains most of the observed uplift
but an additional storage zone is required at shallower level in order to explain a different
temporal evolution in the near field and the far field. The presence of a shallow magma
reservoir (around 5 km depth) and located on the same vertical path as a deeper mid-
crustal magma reservoir appears to be a common feature as it has been inferred at several
other locations, including Montserrat, Fernandina and Grimsvotn [Elsworth et al., 2008;
Foroozan et al., 2010; Bagnardi and Amelung , 2012; Reverso et al., 2014]. A withdrawal of
the shallower reservoir by summit eruptions could induce an increase in its replenishment
rate after these events and explain the inflation rate increase after the large 2006 eruption.
In addition to the long-term inflation rate, the time-series of LOS displacement is marked
by at least one significant offset in inflation, which occurred at the time of increased
eruptive activity. This offset observed in both the far-field and near-field between March
2006 and April 2006 coincided with the deep long-period seismic activity monitored by
the Tungurahua Volcanological Observatory. This offset in inflation together with the
seismicity recorded can be interpreted as a larger-than-usual volume of magma migrating
upwards and inducing seismicity around the inferred storage zone between 10 and 15 km
depth. Assuming a source depth similar to the one inferred for the inter-eruptive period,
the volume of magma intruded would be around 4.5 million m3. This sudden increase
of magma supply to the storage zone is consistent with the sudden magma input shown
c©2014 American Geophysical Union. All Rights Reserved.
by petrological data just prior to the 2006 eruption [Samaniego et al., 2011; Eychenne
et al., 2013]. A shallower zone would imply a smaller volume of stored magma and there
is evidence of magma emplacement at a much shallower depth within this period of time.
Biggs et al. [2010] show 17.5 cm of uplift on the upper western flank between December
26th, 2007 and March 27th, 2008, which they modeled with a sill-like magmatic source
located at shallow depth within the volcanic edifice. Unfortunately no PS pixels are
identified over this part of the volcano to corroborate these previous results, presumably
due to decorrelation caused by eruptive deposits [Kelfoun et al., 2009; Samaniego et al.,
2011].
The mean rate of magma supply at depth obtained in this study is four times higher
than the geologic estimation for eruptive deposits from Hall et al. [1999], which is about
1.5 million m3/yr DRE. Integrating our estimated magma supply rate over the six year
window of observations, and adding the additional amount of magma inflow that occurred
just before the 2006 eruption, we obtain an intrusive volume of magma around 46.5 million
m3. We should also add the intrusive volume emplaced at shallow level, which is not
constrained by our data set but has been estimated at 1.2 million m3 during the 2008
eruption by Biggs et al. [2010]. The total intrusive volume is therefore slighly larger
than the erupted volume of magma over the same time period (around 30 million m3).
It would suggest that the Tungurahua volcanic plumbing system and edifice grow by
intrusion of magma at depth together with emplacement of eruptive products at the
surface, both mechanisms accounting approximately for the same amount with a slightly
larger part for intrusive growth. However the intrusive rate might be underestimated due
c©2014 American Geophysical Union. All Rights Reserved.
to magma compressibility [Rivalta and Segall , 2008] as suggested by the SO2 emission
measurements showing a larger amount of degassed magma than the erupted volume by
two orders of magnitude [Arellano et al., 2008]. Our study adds a further constraint
on the intrusive/extrusive ratio at andesitic volcanoes, which was estimated, with large
uncertainties, to be between 1 and 6 in the Andes, based on field observations of plutonic
and volcanic provinces [Crisp, 1984]. However a six year time window is short, and
longer series of SAR observations would provide improved constraints on internal/external
volcanic edifice growth. Another important inference of the almost constant deformation
rate observ, is that the deep magma supply rate is not significantly influenced by the
eruptive activity; the volume of magma stored at depth is not modified by eruption or
intrusion of magma at very shallow levels, supporting the idea that the magma erupted is
compensated at depth by an acceleration of magma input. To our knowledge, this is the
first example of constant net inflow of magma at depth below a currently active andesitic
stratovolcano, other examples of long term magma emplacement in the Andes occurring
at volcanoes (Lazufre, Uturuncu). It raises question of the potential evolution of this
large volume of magma and its ability to feed eruptions of larger volume in the future.
The integration of ground-based measurements would also be helpful in adding further
information, particularly on the volcanic edifice.
Our InSAR results provide a high density map of measurements, enabling us to constrain
the magma plumbing system. In this study, our interpretation is somewhat limited by the
temporal sampling after 2008. However, the launch of a new generation of SAR missions,
such as Sentinel-1 (European Space Agency), will hugely improve the temporal sampling
c©2014 American Geophysical Union. All Rights Reserved.
of SAR images acquired over active volcanoes, leading to a better understanding of their
eruptive cycle.
Acknowledgments. The ENVISAT ASAR data were provided by European Space
Agency throught category-1 project 13248. This research was supported by french Cen-
tre National d’Etudes Spatiales (CNES). ISTerre is part of Labex OSUG@2020 (ANR10
LABX56). We thank two anonymous reviewers for their suggestions that significantly
improved our manuscript as well as J.-L. Le Pennec for fruitful discussions.
References
Arellano, S., M. Hall, P. Samaniego, J.-L. L. Pennec, A. Ruiz, I. Molina, and
H. Yepes (2008), Degassing patterns of Tungurahua volcano (Ecuador) during the
1999–2006 eruptive period, inferred from remote spectroscopic measurements of SO2
emissions, Journal of Volcanology and Geothermal Research, 176 (1), 151 – 162, doi:
http://dx.doi.org/10.1016/j.jvolgeores.2008.07.007.
Bagnardi, M., and F. Amelung (2012), Space-geodetic evidence for multiple magma reser-
voirs and subvolcanic lateral intrusions at Fernandina Volcano, Galapagos Islands, J.
Geophys. Res., 117, doi:10.1029/2012JB009465.
Biggs, J., P. Mothes, M. Ruiz, F. Amelung, T. H. Dixon, S. Baker, and S. H. Hong
(2010), Stratovolcano growth by co-eruptive intrusion: The 2008 eruption of Tungu-
rahua Ecuador, Geophysical Research Letters, 37 (21), L21,302.
Crisp, J. A. (1984), Rates of magma emplacement and volcanic output, Journal of Vol-
canology and Geothermal Research, 20 (3–4), 177–211.
c©2014 American Geophysical Union. All Rights Reserved.
Delgado, F., M. Pritchard, R. Lohman, and J. Naranjo (2014), The 2011 Hudson volcano
eruption (Southern Andes, Xhile): Pre-eruptive inflation and hotspots observed with
InSAR and thermal imagery, Bulletin of Volcanology, 76 (5), 1–19.
Dzurisin, D. (2003), A comprehensive approach to monitoring volcano deformation as a
window on the eruption cycle, Review of Geophysics, 41, 1–29.
Efron, B., and R. Tibshirani (1986), Bootstrap methods for standard errors, confidence
intervals, and other measures of statistical accuracy, (1), 54–75.
Elsworth, D., G. Mattioli, J. Taron, B. Voight, and R. Herd (2008), Implications of magma
transfer between multiple reservoirs on eruption cycling, Science, pp. 246–248.
Eychenne, J., J.-L. Pennec, L. Troncoso, M. Gouhier, and J.-M. Nedelec (2012), Causes
and consequences of bimodal grain-size distribution of tephra fall deposited during the
August 2006 Tungurahua eruption (Ecuador), Bulletin of Volcanology, 74 (1), 187–205.
Eychenne, J., J.-L. Le Pennec, P. Ramon, and H. Yepes (2013), Dynamics of explosive
paroxysms at open-vent andesitic systems: High-resolution mass distribution analyses
of the 2006 Tungurahua fall deposit (Ecuador), Earth and Planetary Science Letters,
361 (0), 343–355.
Farr, T. G., P. A. Rosen, E. Caro, R. Crippen, R. Duren, S. Hensley, M. Kobrick, M. Paller,
E. Rodriguez, L. Roth, D. Seal, S. Shaffer, J. Shimada, J. Umland, M. Werner, M. Oskin,
D. Burbank, and D. Alsdorf (2007), The Shuttle Radar Topography Mission, Reviews
of Geophysics, 45 (2), RG2004.
Feigl, K. L., H. Le Mevel, S. Tabrez Ali, L. Cordova, N. L. Andersen, C. DeMets, and B. S.
Singer (2014), Rapid uplift in Laguna del Maule volcanic field of the Andean Southern
c©2014 American Geophysical Union. All Rights Reserved.
Volcanic zone (Chile) 2007–2012, Geophysical Journal International, 196 (2), 885–901.
Ferretti, A., C. Prati, and F. Rocca (2001), Permanent scatterers in SAR interferometry,
Geoscience and Remote Sensing, IEEE Transactions on, 39 (1), 8–20.
Fialko, Y., and J. Pearse (2012), Sombrero uplift above the Altiplano-Puna magma
body: Evidence of a ballooning mid-crustal diapir, Science, 338 (6104), 250–252, doi:
10.1126/science.1226358.
Foroozan, R., D. Elsworth, B. Voight, and G. S. Mattioli (2010), Dual reservoir structure
at Soufriere Hills Volcano inferred from continuous GPS observations and heterogeneous
elastic modeling, Geophys. Res. Lett., 37, doi:10.1029/2010GL042511.
Fournier, T. J., M. E. Pritchard, and S. N. Riddick (2010), Duration, magnitude, and
frequency of subaerial volcano deformation events: New results from Latin Amer-
ica using InSAR and a global synthesis, Geochemistry, Geophysics, Geosystems, 11,
q01003,doi:10.1029/2009GC002558.
Froger, J. L., D. Remy, S. Bonvalot, and D. Legrand (2007), Two scales of inflation at
Lastarria-Cordon del Azufre volcanic complex, central Andes, revealed from ASAR-
ENVISAT interferometric data, Earth and Planetary Science Letters, 255 (1–2), 148–
163.
Hall, M. L., A. L. Steele, P. A. Mothes, and M. C. Ruiz (2013), Pyroclastic density currents
(PDC) of the 1617 August 2006 eruptions of Tungurahua volcano, Ecuador: Geophysical
registry and characteristics, Journal of Volcanology and Geothermal Research,265 (0),
78-93.
c©2014 American Geophysical Union. All Rights Reserved.
Hall, M. L., C. Robin, B. Beate, P. Mothes, and M. Monzier (1999), Tungurahua Vol-
cano, Ecuador: structure, eruptive history and hazards, Journal of Volcanology and
Geothermal Research, 91 (1), 1–21.
Henderson, S. T., and M. E. Pritchard (2013), Decadal volcanic deformation in the Cen-
tral Andes Volcanic Zone revealed by InSAR time series, Geochemistry, Geophysics,
Geosystems, 14 (5), 1358–1374, doi:10.1002/ggge.20074.
Hooper, A., P. Segall, and H. Zebker (2007), Persistent scatterer interferometric synthetic
aperture radar for crustal deformation analysis, with application to Volcan Alcedo,
galapagos, J. Geophys. Res., 112 (B7), B07,407.
Hooper, A., F. Prata, and F. Sigmundsson (2012a), Remote sensing of volcanic hazards
and their precursors, Proceedings of the IEEE, 100 (10), 2908–2930.
Hooper, A., D. Bekaert, K. Spaans, and M. Arikan (2012b), Recent advances in SAR
interferometry time series analysis for measuring crustal deformation, Tectonophysics,
514-517, 1–13.
Kelfoun, K., P. Samaniego, P. Palacios, and D. Barba (2009), Testing the suitability of fric-
tional behaviour for pyroclastic flow simulation by comparison with a well-constrained
eruption at Tungurahua volcano (Ecuador), Bulletin of Volcanology, 71 (9), 1057–1075.
Le Pennec, J. L., D. Jaya, P. Samaniego, P. Ramon, S. Moreno Yanez, J. Egred, and
J. van der Plicht (2008), The AD 1300–1700 eruptive periods at tungurahua volcano,
Ecuador, revealed by historical narratives, stratigraphy and radiocarbon dating, Journal
of Volcanology and Geothermal Research, 176 (1), 70–81.
c©2014 American Geophysical Union. All Rights Reserved.
Mogi, K. (1958), Relations between the eruptions of various volcanoes and the deforma-
tions of the ground surfaces around them, Bull. Earthq. Res. Inst., 36 (2), 99–134.
Molina, I., H. Kumagai, J.-L. Le Pennec, and M. Hall (2005), Three-dimensional p-
wave velocity structure of Tungurahua Volcano, Ecuador, Journal of Volcanology and
Geothermal Research, 147 (1–2), 144–156.
Mothes, P. A., M. Lisowski, M. C. Ruiz, A. Ruiz, and P. B. Palacios Palacios (2010), Bore-
hole Tiltmeter and CGPS Response to VLP Seismic Events under Cotopaxi Volcano,
Ecuador, AGU Fall Meeting Abstracts, p. C848.
Ordonez V, M. I., and C. A. Rey G (1997), Deformation associated with the extrusion of a
dome at Galeras volcano, Colombia, 1990–1991, Journal of Volcanology and Geothermal
Research, 77 (1–4), 115–120.
Parks, M. M., J. Biggs, T. A. Mather, D. M. Pyle, F. Amelung, M. L. Monsalve, and L. N.
Medina (2011), Co-eruptive subsidence at Galeras identified during an InSAR survey
of Colombian volcanoes (2006–2009), Journal of Volcanology and Geothermal Research,
202 (3–4), 228–240.
Pinel, V., A. Hooper, S. De la Cruz-Reyna, G. Reyes-Davila, M.-P. Doin, and P. Bascou
(2011), The challenging retrieval of the displacement field from InSAR data for andesitic
stratovolcanoes: Case study of Popocatepetl and Colima Volcano, Mexico, 200, 49–61,
doi:10.1016/j.jvolgeores.2010.12.002.
Pritchard, M. E., and M. Simons (2002), A satellite geodetic survey of large-scale defor-
mation of volcanic centres in the central Andes, Nature, 418, 167–171.
c©2014 American Geophysical Union. All Rights Reserved.
Reverso, T., J. Vandemeulebrouck, F. Jouanne, V. Pinel, T. Villemin, E. Sturkell, and
P. Bascou (2014), A two-magma chamber model as a source of deformation at Grımsvotn
Volcano, Iceland, Journal of Geophysical Research: Solid Earth, 2013JB010569.
Rivalta, E., and P. Segall (2008), Magma compressibility and the missing source for some
dike intrusions, Geophysical Research Letters, 35 (4), L04,306.
Rosen, P. A., S. Henley, G. Peltzer, and M. Simons (2004), Updated Repeat Orbit Inter-
ferometry Package Released, Eos Trans. AGU, p. p. 85.
Ruiz, M., J. Lees, and J. Johnson (2006), Source constraints of Tungurahua volcano
explosion events, Bulletin of Volcanology, 68 (5), 480–490.
Samaniego, P., J.-L. Le Pennec, C. Robin, and S. Hidalgo (2011), Petrological analysis of
the pre-eruptive magmatic process prior to the 2006 explosive eruptions at Tungurahua
volcano (Ecuador), Journal of Volcanology and Geothermal Research, 199 (1–2), 69–84.
Sparks, R. S. J., C. B. Folkes, M. C. Humphreys, D. N. Barfod, J. Clavero, M. C. Sunagua,
S. R. McNutt, and M. E. Pritchard (2008), Uturuncu volcano, Bolivia: Volcanic unrest
due to mid-crustal magma intrusion, American Journal of Science, 308 (6), 727–769.
Stevens, N. F., and G. Wadge (2004), Towards operational repeat-pass sar interferometry
at active volcanoes, Natural Hazards, 33 (1), 47–76.
Walter, T. R., and M. Motagh (2014), Deflation and inflation of a large magma body
beneath Uturuncu volcano, Bolivia? Insights from InSAR data, surface lineaments and
stress modelling, Geophysical Journal International.
Zebker, H., and J. Villasenor (1992), Decorrelation in Interferometric Radar
Echoes, citeSeerX - Scientific Literature Digital Library and Search Engine
[http://citeseerx.ist.psu.edu/oai2] (United States) ER.
c©2014 American Geophysical Union. All Rights Reserved.
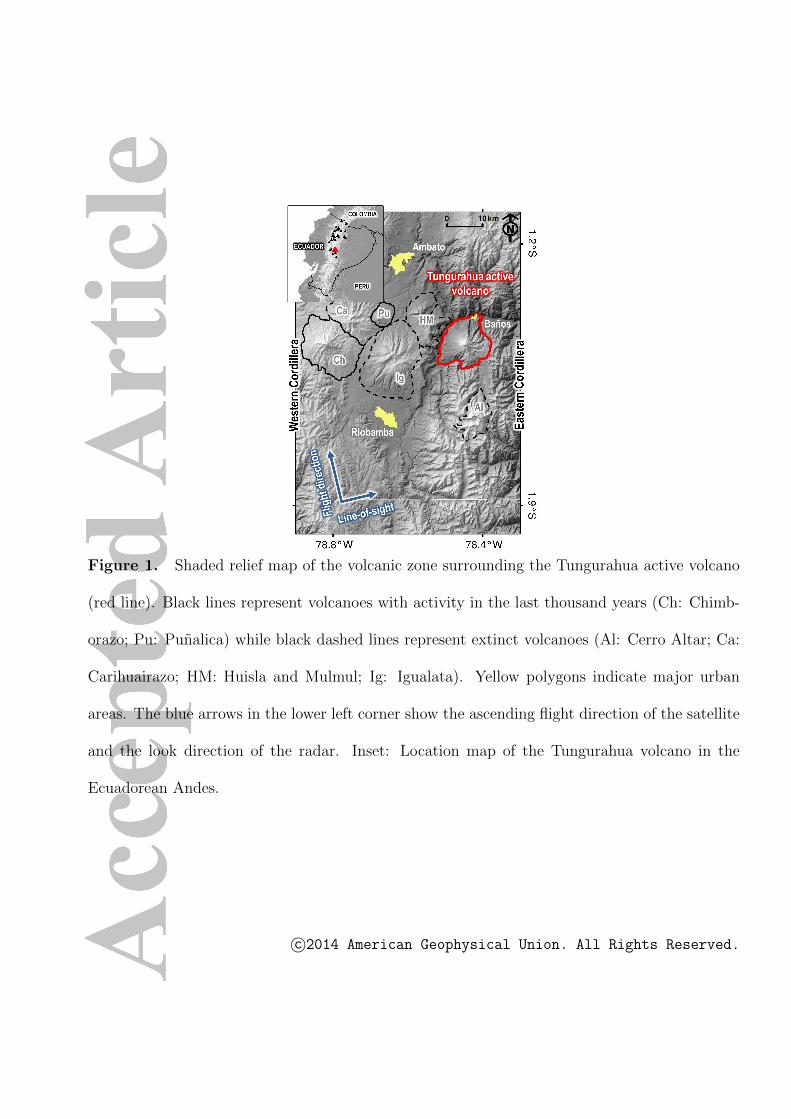
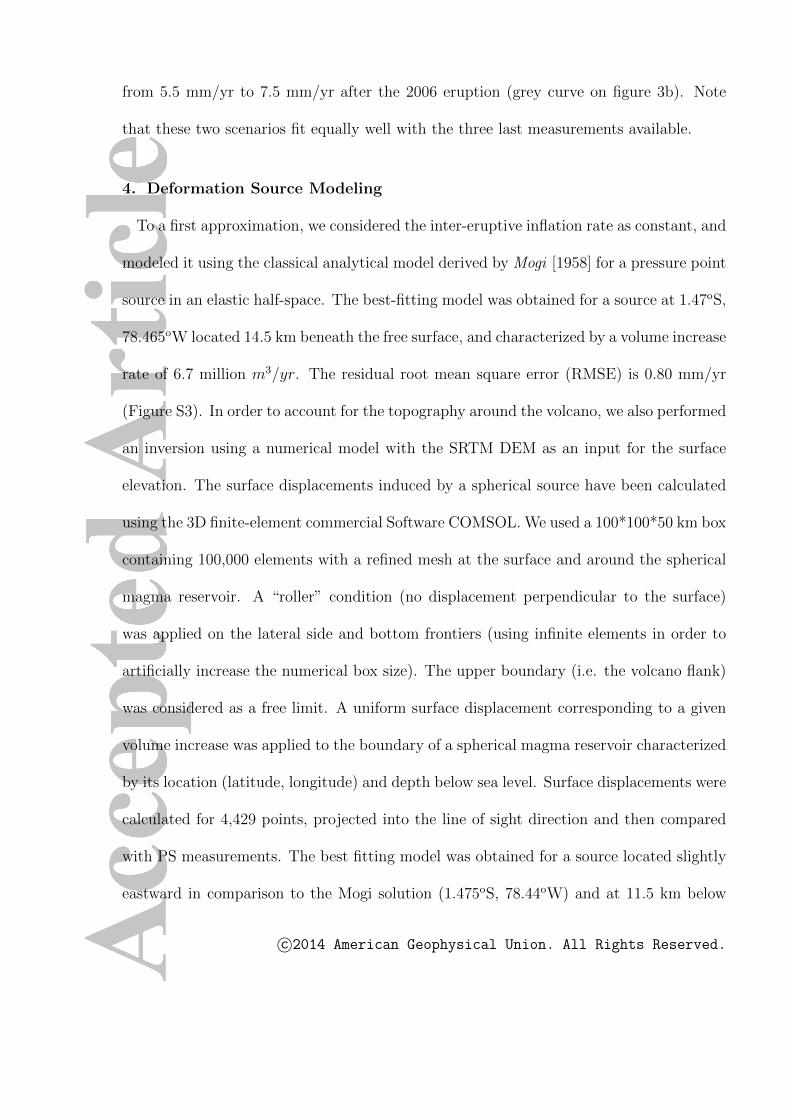
Figure 1. Shaded relief map of the volcanic zone surrounding the Tungurahua active volcano
(red line). Black lines represent volcanoes with activity in the last thousand years (Ch: Chimb-
orazo; Pu: Punalica) while black dashed lines represent extinct volcanoes (Al: Cerro Altar; Ca:
Carihuairazo; HM: Huisla and Mulmul; Ig: Igualata). Yellow polygons indicate major urban
areas. The blue arrows in the lower left corner show the ascending flight direction of the satellite
and the look direction of the radar. Inset: Location map of the Tungurahua volcano in the
Ecuadorean Andes.
c©2014 American Geophysical Union. All Rights Reserved.
Figure 2. PS mean velocity map of Tungurahua volcano between July 2003 and June 2009
derived from ENVISAT SAR images. The velocities are relative to the mean LOS velocity of
PS pixels of the reference area represented by the black star (Ambato city). The white line
corresponds to the Tungurahua active volcano while black dashed lines indicate the location of
the PS profiles. The black arrows in the lower left corner show the ascending flight direction
of the satellite and the look direction of the radar (with a 23o look angle). The black dashed
lines indicate the location of two PS profiles across the Tungurahua volcano superimposed on
topographic profiles from the 90 meter resolution SRTM digital elevation model where red lines
show the Tungurahua topographic footprint. The black arrow on the lower right profile shows
location of PS pixels used in Figure 3b.
c©2014 American Geophysical Union. All Rights Reserved.
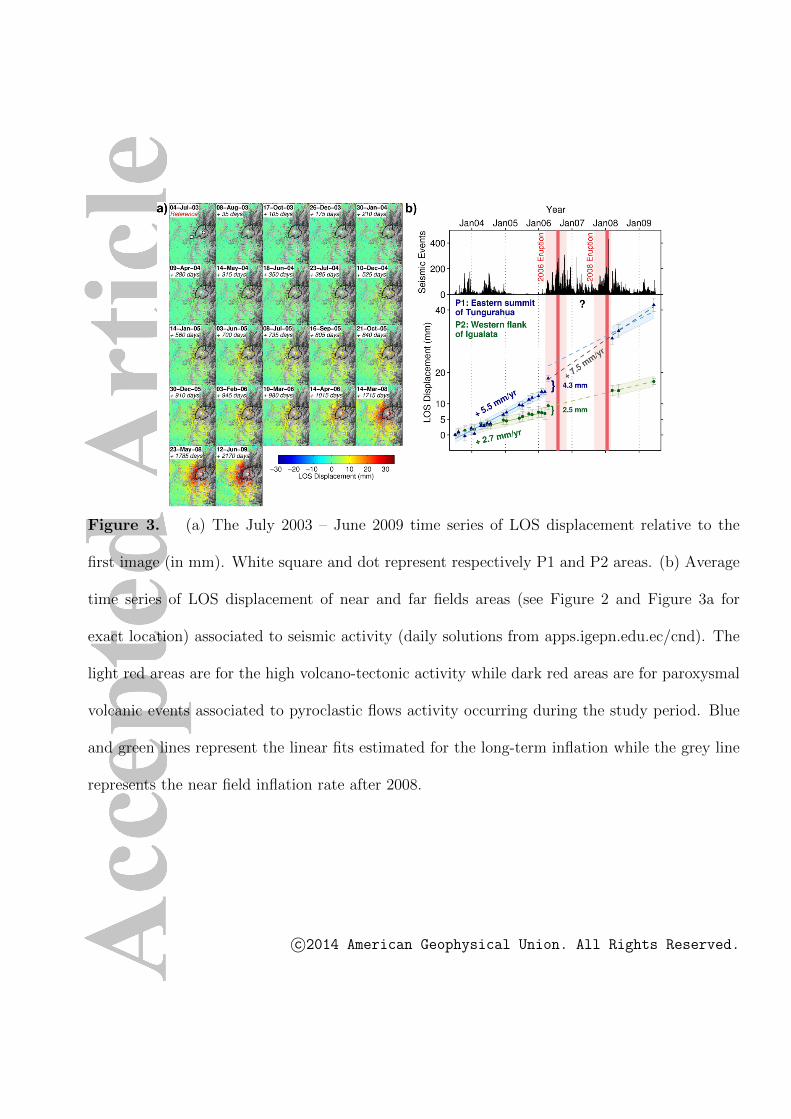
Figure 3. (a) The July 2003 – June 2009 time series of LOS displacement relative to the
first image (in mm). White square and dot represent respectively P1 and P2 areas. (b) Average
time series of LOS displacement of near and far fields areas (see Figure 2 and Figure 3a for
exact location) associated to seismic activity (daily solutions from apps.igepn.edu.ec/cnd). The
light red areas are for the high volcano-tectonic activity while dark red areas are for paroxysmal
volcanic events associated to pyroclastic flows activity occurring during the study period. Blue
and green lines represent the linear fits estimated for the long-term inflation while the grey line
represents the near field inflation rate after 2008.
c©2014 American Geophysical Union. All Rights Reserved.
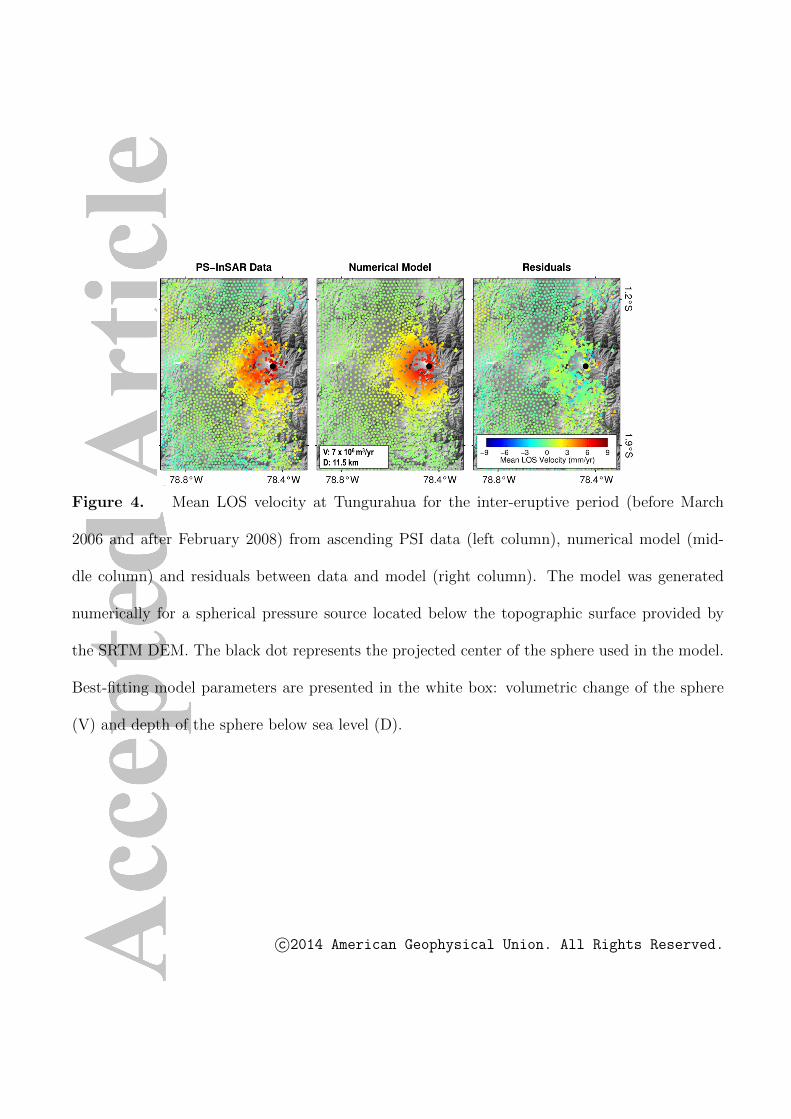
Figure 4. Mean LOS velocity at Tungurahua for the inter-eruptive period (before March
2006 and after February 2008) from ascending PSI data (left column), numerical model (mid-
dle column) and residuals between data and model (right column). The model was generated
numerically for a spherical pressure source located below the topographic surface provided by
the SRTM DEM. The black dot represents the projected center of the sphere used in the model.
Best-fitting model parameters are presented in the white box: volumetric change of the sphere
(V) and depth of the sphere below sea level (D).
c©2014 American Geophysical Union. All Rights Reserved.