Ku-BAND INTERFEROMETRY - DSpace@MIT
124
JMENT OFFICEEW1. T ROOM& -6-4 "I iARCH LABORATORY OF EECTROICS ;ACHUSETTS INSTITUTE OF TECmHOLOh I / Ku-BAND INTERFEROMETRY GEORGE D. PAPADOPOULOS C TECHNICAL REPORT 481 DECEMBER 31, 1970 MASSACHUSETTS INSTITUTE OF TECHNOLOGY RESEARCH LABORATORY OF ELECTRONICS CAMBRIDGE, MASSACHUSETTS 02139 LO AN __ LI-·· --- - U- r·-I
-
Upload
khangminh22 -
Category
Documents
-
view
1 -
download
0
Transcript of Ku-BAND INTERFEROMETRY - DSpace@MIT

JMENT OFFICEEW1. T ROOM& -6-4 "IiARCH LABORATORY OF EECTROICS;ACHUSETTS INSTITUTE OF TECmHOLOh I /
Ku-BAND INTERFEROMETRY
GEORGE D. PAPADOPOULOS
C
TECHNICAL REPORT 481
DECEMBER 31, 1970
MASSACHUSETTS INSTITUTE OF TECHNOLOGY
RESEARCH LABORATORY OF ELECTRONICSCAMBRIDGE, MASSACHUSETTS 02139
LO AN
__ LI-·· ---�-
U- r·-I

The Research Laboratory of Electronics is an interdepartmentallaboratory in which faculty members and graduate students fromnumerous academic departments conduct research.
The research reported in this document was made possible inpart by support extended the Massachusetts Institute of Tech-nology, Research Laboratory of Electronics, by the JOINT SER-VICES ELECTRONICS PROGRAMS (U.S. Army, U.S. Navy, andU.S. Air Force) under Contract No. DA 28-043-AMC-02536(E),the National Aeronautics and Space Administration (Grant NGL22-009-016), and the National Science Foundation (Grants GP-7046,GP-8415, GP-14854).
Requestors having DOD contracts or grants should apply forcopies of technical reports to the Defense Documentation Center,Cameron Station, Alexandria, Virginia 22314; all others shouldapply to the Clearinghouse for Federal Scientific and TechnicalInformation, Sills Building, 5285 Port Royal Road, Springfield,Virginia 22151.
THIS DOCUMENT HAS BEEN APPROVED FOR PUBLICRELEASE AND SALE; ITS DISTRIBUTION IS UNLIMITED.

MASSACHUSETTS INSTITUTE OF TECHNOLOGY
RESEARCH LABORATORY OF ELECTRONICS
Technical Report 481 December 31, 1970
Ku-BAND INTERFEROMETRY
George D. Papadopoulos
Submitted to the Department of ElectricalEngineering at the Massachusetts Instituteof Technology, February 23, 1970, in par-tial fulfillment of the requirements for thedegree of Doctor of Philosophy.
(Manuscript received September 30, 1970)
THIS DOCUMENT HAS BEEN APPROVED FOR PUBLIC
RELEASE AND SALE; ITS DISTRIBUTION IS UNLIMITED.
Abstract
The construction of a Ku-band radio interferometer and some preliminary obser-vations are reported. The interferometer was built for the purpose of mapping somediscrete ratio sources: the Crab Nebula, Cas A, and Cyg A. The system containstwo 8 ft parabolic antennas and receives radiation at 17. 128 GHz (1. 75 cm). Themaximum baseline length of 100 m corresponds to a resolution of 35 seconds of arc.A PDP-8 computer is incorporated in the system and used for pointing, tracking, delaycompensation, and real-time data analysis. The phase stability of the system wasfound to be better than 10° over a period of 2 hours. Consistent fringe componentswere obtained from the Crab Nebula with the baseline set at 8 m.
ii
TABLE OF CONTENTS
I. INTRODUCTION 1
II. INTERFEROMETER THEORY 2
2. 1 Source-Baseline Geometry 2
2. 1. 1 Spherical Triangle and Fringe Rate 2
2. 1. 2 Source Angular Coordinates and Projected BaselineComponents 4
2. 2 Incident Radiation 6
2. 3 Response of a Wideband Interferometer to an Extended Source 9
2. 4 Fringe Visibility Plane and Aperture Synthesis 14
2.4. 1 Locus of Fringe Visibility Points for a TrackingInterferometer 14
2. 4. 2 Accessible Part of the Locus 14
III. INTERFEROMETER OUTPUT AND DATA ANALYSIS 18
3. 1 Signal and Noise Levels 18
3. 2 Delay Compensation 19
3.2. 1 SSB Receiver 19
3.2.2 DSB Receiver 19
3.3 Data Processing 21
3.4 Signal-to-Noise Ratio Analysis 22
IV. Ku-BAND INTERFEROMETER SYSTEM 31
4. 1 Antennas 31
4.2 Radiometer 31
4. 3 Phase-Lock System 31
4.4 Back End 36
4. 4. 1 Compensation Boxes 36
4.4.2 Gain Calibration 38
4. 5 Analog Multiplier 40
4.5. 1 Theory and Circuit Description 40
4.5. 2 Tests and Evaluation 41
4.6 Computer-System Interface 43
4. 6. 1 A-D Converter (Fig. 23) 44
4. 6. 2 Level Converter, Gates and Compensation 45
4.6.3 Clock and Interrupts (Fig. 25) 50
4. 7 Antenna Control 52
V. PROGRAM 53
iii

CONTENTS
VI. OBSERVATIONS 71
6. 1 Observational Procedure 71
6. 2 Interference: Diagnostics and Possible Solutions 71
6. 3 Fringe Rates and Projected Baseline Lengths 74
6. 4 Interferometer Data 74
6. 5 Interpretation of the Data 83
6. 5. 1 Estimated Fringe Visibility for the Crab Nebula 83
6.5.2 Baseline Parameters 83
VII. CONCLUSION 87
Appendix A Circuits 88
Appendix B Computer Organization 91
Appendix C Program Language 93
Acknowledgment 106
References 107
iv
I. INTRODUCTION
The need for better angular resolution at wavelengths shorter than 3 cm in radio
astronomical observations has been apparent for quite some time. For instance, our
knowledge of the physical processes that give rise to the radiation from the Crab
Nebula 1 ' 2 and the planet Venus3 '4 could be greatly enhanced by observations at 2 cm
with angular resolution better than 30 seconds of arc. With this problem in mind, the
present work was undertaken. The objective was to show that a coherent interferometer
can be built at 1. 75 cm and used for aperture synthesis. We have built a phase-stable
interferometer, thereby accomplishing the first part of our objective. Although con-
sistent fringes have been obtained from the Crab Nebula, no aperture synthesis has been
done. As well as the phase stability, we have also demonstrated the use of a small
computer (4 k memory) in the control of such functions as antenna pointing and tracking,
delay compensation, and real-time data processing.
In Section II, the theory of the earth- rotation synthesis, otherwise called "tracking
interferometer," is presented. This technique was first used with the 178-MHz
interferometer of Cambridge University ' 6 and has been treated by Zisk7 and by
Swenson and Mathur. 8 A review of other existing and proposed instruments designed
for earth-rotation aperture synthesis has been given by Swenson. 9
In Section III the data-processing technique is explained. The technique that was used
is the least-square fit. A derivation is given of the interferometric signal-to-noise
ratio; in this derivation we have included the effects of the processing technique.
Section IV gives a concise but complete description of the system. We felt it was
necessary to give a thorough account of the equipment, since none of it existed at the
beginning of this project. Some parts of it, such as the analog multiplier and the over-
all interface concept, are novel. The phase-lock system idea was first used by
Alan E. E. Rogers in the OH interferometer between Haystack and Millstone at Lincoln
Laboratory, M.I.T. 1 0 The A-D conversion method, as well as some of the designs,
were suggested by Donald E. Troxel of the Cognitive Information Processing Group of
the Research Laboratory of Electronics. In general, this has been written with the
future users of the interferometer in mind, as well as any other reader who is inter-
ested in problems of interferometric design.
In section V we explain the software. We decided that a clear presentation of the
program is necessary because it is an important part of the system, and also because
such a presentation would facilitate the addition of improvements by future users.
In Section VI we tabulate and interpret some of the data that were obtained from
Cygnus A, Cassiopeia A and the Crab Nebula (N. G. C. 1952, 1 M).
Finally, in Section VII modifications are suggested that will enable us to make a
complete aperture synthesis.
1

II. INTERFEROMETER THEORY
We shall now develop the theory of an interferometric system. The basic assump-
tions germane to the system and to the nature of the source to be studied are the fol-
lowing.
1. The sources are discrete ratio sources; that is, «2S << B' where S is the width
of the source and QB is the beamwidth of the antennas.
2. The radiations from different points on the source are completely incoherent.
3. The antennas are continuously tracking the source.
Fig. 1. Simple interferometer.
A simple interferometer is shown in Fig. 1. The response of this interferom-
eter to a point monochromatic source is
v =A cos 2Tr d sin.0 X
(1)
The dependence of sin 0 on the source and baseline coordinates, as well as the
response of the interferometer to an extended polychromatic source, will be obtained.
2. 1 SOURCE-BASELINE GEOMETRY
2. 1. 1 Spherical Triangle and Fringe Rate
Figure 2 shows the half of the celestial sphere that lies above the local horizon.
P is the north celestial pole, R is the radio source that is being observed, and (L, L')
2

are the points at which the baseline intersects the celestial sphere. For this interferom-
eter the baseline lies on the horizon. In specifying the baseline we shall use the NW
intersection point, L, for which HL = 9. 75 h and DL = 42. 36°.
N
WL HORIZON
Fig. 2. Celestial sphere.
The angle formed by the line OR and the plane perpendicular to the baseline at 0 is
called 0. Since, in this case, the baseline lies on the horizon, is the angle formed
by OR and OZ. The source, R, is specified by its hour angle, h, and declination 6.
The angle p is called the position angle. It is measured counterclockwise from the
source hour circle PRT. The source-based orientation is such that North is toward
the top, West toward the right and East toward the left. Figure 3 shows this orienta-
tion, as well as the sense of p. According to this orientation the angle p shown in
RADIOSOURCE
PE
N
wFig. 3. Source-based orientation.
S
Fig. 2 is negative. As a matter of fact, it will be negative for a source in the western
hemisphere and positive for a source in the eastern hemisphere.
For the spherical triangle LPR we obtain
3
.rD A 'l ' C l Ii¢'
..

sin 8 = sin 6 sin DL + cos 6 cos DL cos 12 (HL-h). (2)
Equation 2 can be expressed in terms of the sidereal time, t, by setting h = t - a. If the
expression for sin 0 (2) is substituted in (1), the output of the interferometer becomes
v = A cos [2 r (sin6sinDL+cos6cosDL cos '2 (H+a-t) .
By expanding around to , where t = t + t', we get
v = A cos [2r dI sin6 sinDL+ cos 6cosDLcos - (H+a-to )
+ t' cos 6 cos DL sin 12 (H+a-t)]] (3)
By studying (3), we can define the quantity fringe rate, R(6, a, to):
Rr(, a, t ) = d cos D sin IT (Hoa sfringes
o)- = 8 6 4 0 C os s DL sin (H+a-to) sid. sec.' (4)
Therefore, over short intervals of time the output of the interferometer is a cosinus-
oidal function with a frequency given by Eq. 4. The fringe rate goes through zero when
HL= h.
2. 1.2 Source Angular Coordinates and Projected Baseline Components
Let us consider an extended source as shown in Fig. 4. We can define the source-
based angular coordinates x and y in terms of the source hour angle and declination
(in radians):
x (h-ho) cos 60
(5)
Y = 0 60
C'lX IDt- D
N
EQUATOR
S
OCAL HORIZON
W
Fig. 4. Definition of angular source coordinates.
4

According to the source-based orientation defined here, positive x is toward the
right (W), and positive y is toward the top (N).
Figure 5 shows the region of the sky around the source, R, the center (h o, 6o) of
which coincides with the center of the antenna beam. We also show the projection of the
baseline, (d/X) cos 0, on the source plane (x, y). The solid projection is used when our
ENNA PATTERN
= (h-ho) cos °
E
Fig. 5. Source-centered coordinates.
baseline is defined by the vector OL in Fig. 2, and the dotted projection is used when
the baseline is defined by the vector OL'. As mentioned previously, the vector OL will
be used for our baseline. Then the components of the projected baseline in the western
and northern directions are
EW u = -d/X cos 0 sin p
SN v = d/X cos 0 cos p. (6)
By applying the laws of sine and cosinel2 in the spherical triangle LPR of Fig. 2, we
obtain
u = d/X cos DL sin (HL-h)
v = d/X [sinDL cos - cos DL sin 6 cos (HL-h)]. (7)
These projected baseline components are the angular frequency coordinates to which
the angular coordinates x, y transform. It can be demonstrated very simply by consid-
ering the point sources C and Q in Fig. 5. From Eq. 1 the interferometer response to
j2Zrr sin - j21T dsin 0/% - O I z - -- x . . ......... J-- '--
t; is vC = A tRe e , and to Q it s vQ = iA e e . I we now expana sin
5
-1

around (ho , 6o) and make use of (5) we obtain
sin 0 = sin + cos 6 a sin
RecogniZing thatRecognizing that
1 /8 sin0u = - 6 ah
we have
d sin 0= d sin0 + ux+vyX si O°
+ .(s,,o8 6- _(ho0, 6 )
anda sin 0
0 0
(8)
Substituting (8) in the expression for VQ, we obtain
d OjZw ~si o j2i(ux+vy)
VQ = ARe e
We can now recognize the expressions for vC and VQ as Fourier transforms in the
u,v plane of impulse functions in the x,y plane, one at the origin and the other at (x, y).
2.2 INCIDENT RADIATION
Let us consider the source-receiver configuration shown in Fig. 6 which is actually
a different representation of the configuration on Fig. 4. The antenna is pointed in the
direction z which connects the origin of the receiving aperture with the center of the
source at (ho , 60). The electric field, , on the plane of the aperture, because of radi-
ation originating at a point Q on the source, will then be a function of the direction
cosines 8 ' 11 cos axI cos a y, cos a and time t; that is,cos ax, cosy, os a
2 C= J(csa ,Cosay, Cosaz t).
Since the dimension of the source is much
we may say that
smaller as compared with the distance R,
cos a = 1z
COs a = XQx Q
COS ay =
where xQ and yQ are in radians. With these approximations the electric field
has the more convenient form (x, y;t), where x and y are the angular coordi-
nates on the source.
6

N
E
W
S Q
z
az
RECEIVING APERTURE
Fig. 6. Source receiver configuration.
If we now define the temporal Fourier transform of the electric field
E(x, y;v) =-00
then, as has been shown,1 1the intensity of radiation (I(x,y;v) at the receiving site is
(10)
2The units of I(x, y;v) are W/Hz-m -ster. The
ness temperature distribution of the source by
2kTB(x, Y)I(x, y;v)= 2
X2
radiation intensity is related to the bright-
(11)
The output of the antenna expressed in units of power/Hz is 1 3 ' 14
7
(9)
E
(X, y; t) e -j 2 -rv dt,
I(X, Y; v) - L X, Y; V) Z

kTA = 2 I(x, y; v) A(x-x, yo-y) dxdy, (12)
where A is the effective area of the antenna and is related to the power of the
antenna by
G =4 A . (13)X2 o
In writing (12) we have not included the effects of the atmosphere. Calculations
show that at our signal frequency of 17 GHz the atmospheric attenuation on an average
day (PH o = 1 g/cm3 ) is 0. 06 dB and the emission temperature approximately 5K. These16
numbers change drastically on cloudy or rainy days. For observations taken on good
days the atmospheric attenuation will be negligible. The atmospheric emission received
by two spatially separated antennas is uncorrelated; therefore, it does not have to be
included in the interferometer equations.
By making use of basic assumption 1, we can simplify (12) to
kTA = 2 Ao I(x y; v) dxdy
(14)1
kTA 2 A oS (v)
where S(v) is the source flux defined by
S(v) = J I(x, y; v) dxdy. (15)
Equation 14 gives us the output of a total-power radiometer. In interferometry,
however, we are interested in the voltage output of the antenna. To get an expression
for the voltage output, we made use of the electric field spectrum given in (9) and the
antenna voltage gain given by
G = =- i- . (16)V p X o0
Then, by making use of assumption 1, we can get an expression for the voltage output
of the antenna
Va() = K G ,5 E(x, y; v) dxdy, (17)
where
/4 X (18)K=) %F4T (18
8
��

2. 3 RESPONSE OF A WIDEBAND INTERFEROMETER TO
AN EXTENDED SOURCE
In Fig. 7 the signals at the different points of the interferometer are defined.
(v)
(v )/Lt
Vb (V ')2
V (v')I1
vo(T)
Fig. 7. Interferometer signals.
From Eq. 17 we can write expressions for the voltages Val(V) and Va2 (v):
Va 1 (v) KGv S9 E 1 (x, y; v) dxdy
Va2 (V) = KGvSS E 2 (x, y; v) dxdy.
(19a)
(19b)
Since the incident field arrives at antenna 1 d sin 0 s later than it does at antenna 2,C
we can relate E (x, y; v) and E 2 (x, y; v) by
El(x,y;v) = E 2 (x,y;v) exp(-j2v dcsin0). (20)
Use of (20) will be made later.
9

After mixing, the signals become
b (V')1
Vb W2
al
a2
(v) e
(v) e
-JTVLt
-jrrvLt
where v' is the IF frequency v' = v - vL.
If the IF filter-amplifiers have identical frequency responses H(v'), then
Vcl(V' ) = Vbl(V') H(v')
Vc2 (V ) = Vb (v ) H(v').F l a2
Finally the output of the crosscorrelator, v (T), is
li m1 ~
T~~~~
T-imoo 2 5-T-00 Tv (t+ T) V (t)
1 2dt}
2rvli (t+T)] d i
Vc2 (t) c c2 (v) exp(-jZ2v t) dv 2.
If we now substitute Eqs. 24, 22, and 21 in Eq. 23, we obtain
o zT v KT-OO T j Tv0 dt dvl diVa (V1) Va (V2)2
(25a)X H(v1) H(v.) exp[-j2Trt(v{-v )] exp(j2rv
By using the fact that
lim TT-oo T
-j 2rrt (v -v )e
(25a) becomes
vo (T) = KGp Re {S (v) va (V)I H(vI) 2 ej z2Tr v ' T dv'.
If we now use Eqs. 19, 20, and assumption 2, we obtain
10
(21 a)
(21 b)
v0 (T) = Re
(22a)
(22b)
where
v(t+T) = Vc(v'1 ) exp[jS-
(23)
(24a)
(24b)
dt = 6(v'-v ,
(Z 5b)

v0 () = K2G Re {(dv' ISdxdy E(x, y;v)12 exp(-j2rv C.sinE) H(v') 2 ej2 VT(25
(25c)
From Eqs. 10, 13, and 18 we have
K2G E(xy;v)12 = 1 A I(x,y;v),
where the factor 1/2 accounts for the fact that
(25c) becomes
O(T) = A Re dv' SSdxdy I(x, y;v)0 Z 0 Yo
we receive only one polarization. Then
H(v') | 2 exp(-j2rrv d sin 0)
dThe geometrical delay dc sin 0 is next expanded around ho , 6 The
expansion is given by Eq. 8. By substituting (8) in (26), we get
(26)
result of this
(t) = A Re { dv' dxdy I(x, y;v) e - j 2(ux+vy)
X exp(-jz2wrv c sin0 0 ) IH(v') e }. (27)
Recognizing that I(x, y; v) e- j2 (ux+vy) is effectively constant over the passband, B,
of H(v'), (27) is simplified to
vo (T) = A Re {dv' H(v')12 ej2 v T exp(-j2rv d sin )0 2 0 c o
X YI(x,y;v) e - j 2 (ux+vy) dxdy} (28)
where v is the mean frequency at which the radiation is received.
By means of Eq. 11, we can rewrite (28) as
VO(T) = 2 A Re dv' I H(v')1 ejZ2 rv ' T0 Z 0 X 2
exp(-j2rv d sin o)c o
X TB(x,y) e- j 2 7r (ux+vy) dxdy}.
Equation 29 indicates that VO(T)
the source brightness temperature
coordinates of the transform plane
The normalized Fourier transform
defined by
is proportional to the
distribution TB(x, y). 17
are the parameters u
of TB(x, y) is called f
Fourier transform of
The angular frequency
and v defined in Eq. 7.
ringe visibility and is
11
(29)
j27TV'Te

V(u, V) =ff TB(x, y) e- j2r ( U +v y ) dxdy
ff TB(x, y) dxdy
By substituting (11), (15), and (30) in (29), the correlator output, Vo(T), becomes
v ( T) = A S Re0 2 o
V(u,v) IHi(v ) 2 ej2rv'T exp(-j2v d sin0 ) dv}.
We now proceed to solve the bandpass integral for the SSB and DSB cases.
(a) SSB Receiver
The bandpass characteristic for this case is illustrated by the following diagram.
Here, vL is the local-oscillator frequency, and vIF = V0 - vL is the center intermediate
frequency.
After making the appropriate substitutions and carrying out the integration,
bandpass integral becomes
the
ISSB = exp(-j2ZvL d sin o)v IF+B/2
VIF-B/2
exp[jZiTvT (T
sin TrB(T- d sin 0)
rB(T- sin o )co
exp[-j2rvL d.ij21r I( d s in 0)]d sin 0 +JZiv T - dcsi II.c JF\ coi
Substituting ISSB in Eq. 31, we obtain
1V(T) = 1 ASBT 0
sin rB (T - -sinO )Ic 0o IV(u, v)l Cosz T[v 0 d sin 0o-vFT+ ((u, v)],
1TBT - 2c sin 00)c 0
where we have written V(u, v) in terms of its amplitude and phase:
12
(30)
(31)
-d sin 0)c o
dv'
(32)

V(u, v) = I V(u, v)I e-j (u V) (33)
(b) DSB Receiver
The bandpass characteristic for this case is illustrated by the following diagram.
- /IF VIF I
before, v' = v - vL' and vIF = vo - VL' with v the mean frequency in the upper
For this configuration the bandpass integral, IDSB' from Eq. 31, can be
sin TB( T- sin 0)
IDSB = exp(-j2rvL c sin0) eXP-j2TrVF c
(_ )I [ ( dinTB (T- sinO
c o
sin n
+ exp[j21Tv(T - d sin )] BIF rB
Simplifying further, we obtain
sin B (T- d sin o)c 0
IDSB B cos 2ViF(T- sinO ) exp(-jZnvTIF c o) L
B(T - sin 0o)c o
Substituting IDSB in (31), we obtain
sin rTB(T- d sino )
v0 (T) = AoSB cos 21TvIF(T
rB(T - sin )c o
Ix V(u, v) cos 2 Tr c sino+(u, v)j.
13
Here, as
sideband.
written
d sin 0).
d sin 0)c 0o
(34)
1
t

Equations 32 and 34 will be discussed in more detail in section 3. 2.
2. 4 FRINGE VISIBILITY PLANE AND APERTURE SYNTHESIS
2. 4. 1 Locus of Fringe Visibility Points for a Tracking Interferometer
We have established that the output of the interferometer is proportional to the fringe
visibility V(u, v) which is the normalized Fourier transform of TB(x, y). Therefore, by
measuring V(u, v) at a sufficient number of points, the brightness temperature distribu-
tion TB(x, y) can be reconstructed. For a tracking interferometer the samples of V(u,v)
taken with a fixed baseline length lie on an ellipse in the u-v plane. This can be shown
by eliminating the variable parameter H-h in Eq. 7. Then the equation of the locus is
2 (V-V )2+ 1
2 2a b
This is indeed the equation of an ellipse, with
u semiaxis a = d/X cos DL
(35)v semiaxis b = d/k cos DL sin 6
and center (0, vo) = (0, d/X sinDL cos 6).
By changing the spacing of the antennas, we obtain several ellipses and thereby fill
up the u-v plane. According to the sampling theorem the samples of V(u, v) need not
be taken any closer than
1 1Au, AV < uv< 2X ' 2Y
c c
where X and Y are the maximum dimensions of the source.c c
A rough estimate of the number of points that are needed to reconstruct TB(X, y) isU V
given N= maxX max Since U V d/X, we havegve J Au A v max max
N = 4(d/X) XcY . (36)
Actually, half of these points are redundant because V(u, v) = V(-u, -v); this is a prop-
erty of the Fourier transforms of real functions like TB(x, y).
2. 4. 2 Accessible Part of the Locus
The section of the u-v plane ellipse that can be mapped is called "accessible." There
is a limitation because the source is above the horizon only part of the day. A good dis-
cussion of this problem has been given by Zisk.7 Our approach will be to determine the
accessible part of the locus by finding the (u, v) coordinates for three positions of the
14
__

source that are above the horizon. These positions are the rise, the set, and the Oh
positions. Figure 8 shows the source at the rise, R, and set, R', positions. To
z
N
W
Fig. 8. Spherical triangles for the rise and set positions of the source.
compute (u, v) at these positions we have to find h and h . These angles can be founds r
by solving spherical triangles ZPR and ZPR':
sin sin cos h = -
s, r cos cos 6(37)
If 6 > 0, then 90 < h < 180 ° and 180 < h < 270 ° . If 6 < 0, then 0 < h < 90 ° and
270 < h < 360 ° .rWe shall now find the accessible locus for two declinations: 6 = 22 ° , which is the
declination of the Crab Nebula, and 6 = -10 ° , which is close to the declination of some
interesting Southern Sky sources that are like the Orion Nebula.
To find the accessible locus we shall use Eqs. 7, 35, and 37. The values
of the baseline parameters are HL = 146 ° , DL = 42 ° , d = 2000 . The latitude, 4,is 42 °.
1. 6 = 220
h = 250 ° , h = 110 °r s
a = 1500, b = 500, v = 1240
(u, v)/0 h = (835, 1700)
(u, v)/h r =(-1435, 1390)
(u, v)/h s = (875, 788).
This locus is shown in Fig. 9a.
15

2. 6 = -10
h = 279° , h = 810r S
a = 1500, b = 256, v = 1320
(u, )/Oh = (835, 1107)(u, v)/h = (835, 1107)(u, )/hr =
(u, v)/h =
(-1180, 1145)
(1345, 1427).
This locus is shown in Fig. 9b.
In Fig. 9 we have drawn the lines joining the origin with the rise and set points.
The position angles ps and r are equal and negative to each other. To show this, we
R
(a)
1500
1000 1500
(b)
Fig. 9. u-v plane loci. (a) 6 = 22 ° . (b) 6 = -10.
16

solve triangles ZPR and ZPR' of Fig. 8. Then we obtain
sin +sin p r cos 6
sin sin Ps = (38)
5 Cos 5 38
17
III. INTERFEROMETER OUTPUT AND DATA ANALYSIS
The interferometer equations obtained in Section II will now be applied to the Ku-band
interferometer. The interferometer is composed of two 8-ft dishes with a possible sepa-
ration range of 10-100 m. The local-oscillator frequency is 17.128 GHz, corresponding to
a wavelength of 1.75 cm. The radiation is mixed down to a 60-MHz intermediate fre-
quency, by means of a double-sideband heterodyne receiver. The IF bandwidth is 20 MHz.
3. 1 SIGNAL AND NOISE LEVELS
The antenna temperature can be obtained from Eq. 14.
A S1 oTA- 2 k'
where Ao is the effective dish area corresponding to a dish efficiency of 35%; therefore,2
A = 1.9 m . The efficiency is lower than expected. This can be attributed mainly to
two factors: (a) there is some uncertainty about the focusing; and (b) the primary pat-
tern is such that there is an excessive amount of spillover.
The noise temperature, T R, of the receiver is approximately 1600°K. The rms
noise at the output of the second detector is given by
TAT (39)rms X ; '
where B is the IF bandwidth, and T is the integration time of the second detector. For
an integration time of 3 minutes, the rms noise is:
AT = 0.0250 K.rms
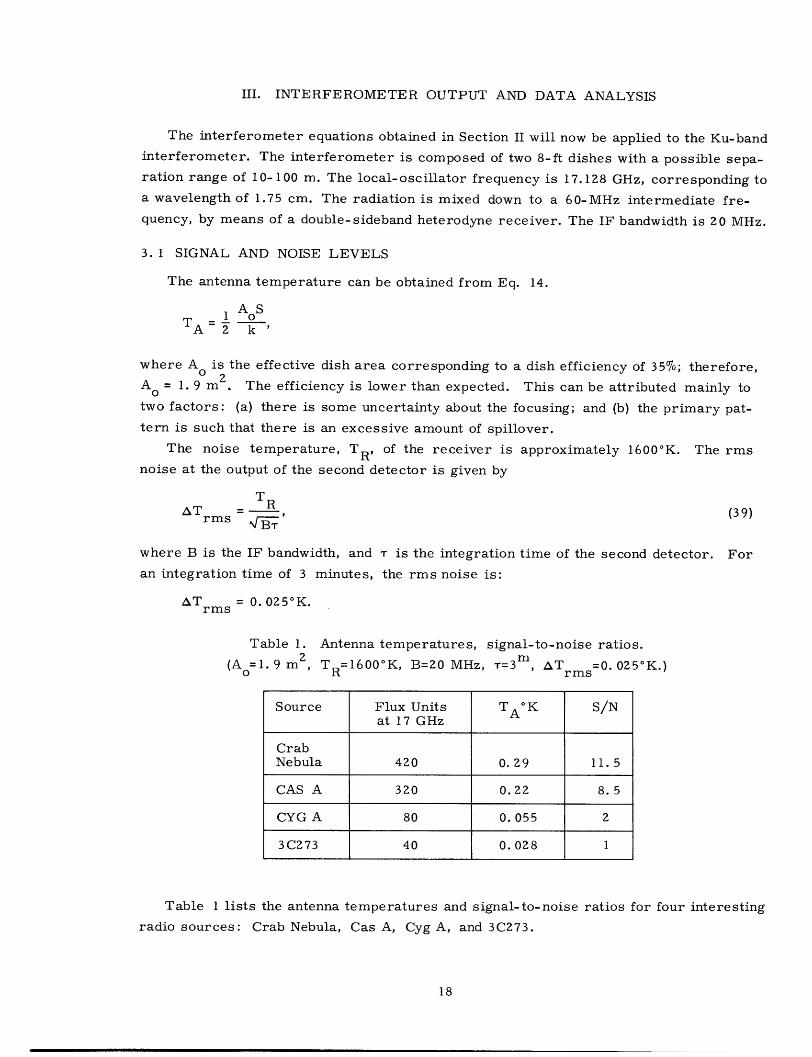
Table 1. Antenna temperatures, signal-to-noise ratios.
(A =1. 9 m, TR=1600°K, B=20 MHz, T=3 , AT =0. 025°K.)(Ao TR rms
Source Flux Units TAK S/Nat 17 GHz
CrabNebula 420 0.29 11.5
CAS A 320 0.22 8. 5
CYG A 80 0.055 2
3C273 40 0.028 1
Table 1 lists the antenna temperatures and signal-to-noise ratios for four interesting
radio sources: Crab Nebula, Cas A, Cyg A, and 3C273.
18

3.2 DELAY COMPENSATION
3.2. 1 SSB Receiver
Equation 32 gives us the output of the interferometer for an SSB system:
sin rB(T- -dsin )1
Vo(T ) 2 AoBS
TrB(T-- sin 8)
Bandpass Envelope
I V(u, v)j cos Zw Hsin0 vT+ (U, V)]
Fringe s
By studying Eq. 32, we can draw the following conclusions:
1. The bandpass envelope will wipe out the fringes unless we compensate in the IF
strip so that
TrB(T- d sin ) << 1. (40a)
2. Any phase changes in the IF will appear as a phase error in the fringes.
From (40a) we can compute the maximum change in the geometric delay, T, that can
be tolerated:
d 1AT = - COS AO << (40b)
c TrB'
For a bandwidth of 20 MHz, AT is 6 ns.
As long as condition (40a) is satisfied, the fringes are always under the peak of the
envelope. These fringes are called "white fringes."
The time intervals at which one should compensate can be found from the inequal-
ity (40b).
wB 24 36t cos 0 << 1,24 3600
where At is the time interval at which we should compensate.
For our baseline orientation we may assume that the maximum value of cos 0 is
equal to 1/2. Then
c 86400d 2fB
3. 2. 2 DSB System
The interferometer output for a DSB system is given by Eq. 34.
19

sin TrB(T - d sin 0)c
Vo(T) = A SB
rB T -- sin 0C O
X cos 2IF c sino) I V(u, v)j cos 2Tr L d sinO + (u, v).
Envelope Fringes
The conclusions that we draw from Eq. 34 are the following.
1. The amount of compensation and the rate at which we must compensate depends
on the center IF frequency, VIF, and not on the IF bandwidth as in the SSB case.
2. Phase changes in the IF strip cancel out and do not appear as phase errors in
the fringes.
In a way similar to that of the SSB system we can compute the maximum change in
the geometrical delay that can be tolerated and the time intervals at which we should
compensate. These are
1T<<rIF
and
c 86400At<d< 2 (42)
ZIT VIF
In Table 2 we give the compensation intervals for the case of the longest baseline
which is 100 m. The inequalities are converted to equalities by multiplying the right-
hand side of inequalities (41) and (42) by 1/5.
Table 2. Compensation intervals.
(X=1. 75 cm, d=100 m, B=20 MHz, vIF=60 MHz.)
Basic Compensation Minimum CompensationCase Delay, AT(ns) Intervals (min)
SSB 6 4
DSB 1 0.7
Although the compensation rates are smaller in an SSB system, we decided in favor
of a DSB for the following reasons: (i) simpler front end; (ii) signal-to-noise ratio bet-
ter by 3 dB for the broadband mixer that we are using; (iii) IF phase changes do not
produce an error in the phase of fringes; and (iv) the use of a small computer to control
the system makes it possible to compensate at high rates.
A basic amount of compensation delay of 1. 25 ns and a fixed compensation interval
20

of 1 min were chosen. The maximum compensation delay needed is equal to the sepa-
ration distance of the two antennas. For the maximum spacing of 100 m the required
compensation delay is 330 ns. This delay is generated digitally by using the 1. 25 ns
delay as the basic unit. Then the other delays are 2. 5, 5, 10, 20, 40, 80, and 160 ns.
We shall now describe the way in which the digital delay is computed and inserted.d
At the end of each 1-min compensation interval, the program computes - sin 0 and thenC
divides it by the basic delay of 1. 25 ns. The result is an 8-bit binary number; the high-
order bit controls the 160-ns delay, and so on. If sin 0 is positive, the delay is inserted
in the IF signal path of the northern antenna and vice versa. The reason for this is the
convention that was adopted (see Section II) according to which the baseline is specified
by its northwest intersection, L, with the celestial sphere.
The implementation of the delay compensation will be explained further in sec-
tions 4. 4 and 5. 26.
3.3 DATA PROCESSING
As we have mentioned, the interferometer output, over short intervals of time, is
a sinusoid the frequency of which is given by Eq. 4. This sinusoid is buried in the sys-
tem noise; its amplitude and phase are detected by a real-time least-squares fit pro-
cessing.
The output of the correlator is sampled every 0.2 s which is sufficiently smaller than
the minimum fringe period of 2 s; this period occurs at the longest baseline spacing.
The sample is then converted into a 10-bit digital number which is transferred into the
computer. The program knows the exact time at which the sample was accepted and
proceeds to the real-time processing. Let us call the sample taken at time t i , Yi. Then
the least-squares fit detection demands that
NE = 1 (Yi-al cos Yi-a 2 sin i) (43)
i= 1
be a minimum, where N is the number of samples taken in the integration interval
Yi = 2T d sin i, (44)
and al, a 2 are the in-phase and quadrature components related to the fringe amplitude
and phase by
al cos i + a2 sin i = A(u, v) cos 2T X sin i+ (u, v). (45)
Then
A(u, v) = a + a2 (46)
and
21

-1 a2~(u, v) = -tan 1
2 (47)a1
We can now solve for a and a 2 from Eq. 43 by setting
a- 0, a 0.aa1 aa2
Solving these two equations, we obtain
N N N N Z yi cos yi- s Yi sin Yi Z cos yi sin Y./ sin Yi
a 1 = (48)2
L cos y.
i=l 1
N N NN 2Y y. sin y - Z Yi cos yi Z cos Yi sin i Zi cos (
i=l
closer than
1 =Au 4 and v 1. (50)
2X 2Yc c
By means of inequality (50) we can calculate the maximum time interval over
which we are allowed to integrate without violating the sampling theorem. From
Eq. 7, after expanding in time, we have
(Au) d 2A (51)max X 86400 At (51)
where At is in sidereal seconds. Combining Eqs. 51 and 50, we obtain
(At) _< 1 X 86400 (52)max 2X d 2r.
c
In Table 3 we list the maximum integration times for different baseline lengths
and for X = 5 minutes of arc, which is typical of the width of the Crab Nebula
and Cas A.
3.4 SIGNAL-TO-NOISE RATIO ANALYSIS -
We shall obtain an expression of the signal-to-noise ratio for the fringe com-
ponents (al, a 2 ) and for the brightness temperature distribution TB(x, y). The
22

Table 3. Maximum integration times for different baseline lengths.
(X=1. 75 cm, X=5 minutes of arc.)
Baseline MaximumLength, d d/X Integration Time
(m) (min)
10 570 90
20 1140 45
30 1710 30
40 2280 25
50 2850 16
100 5700 8
steps involved are shown in
the output of the filter can be
Fig. 10. We
expressed as
have assumed that the multiplier is ideal;
1 kAtv (kAt) = -
(k- )At
x(t) y(t)
x(t) y(t) dt, (53)
where At is the sampling interval, and the index k
varies from 0 to N. N is the ratio of T/At when T
is the total integration time. The fringe components
a1 , a2 are given by Eqs. 48 and 49. These equations
can be simplified if we neglect the second-order
terms. Then al, a 2 have the form
a1
a2
NT vo(tk) cos Yk
-k= 1N 2Z cos k
k=l
NY vo(tk) sin Yk
- k= N
s in Ykk=l
(54)
(55)
The inputs x(t) and y(t) can be written as
sum of the coherent signal and the noise signal:
the
x(t) = s l ( t) + nl(t)
Fig. 10. Processing sequence. y(t) = s 2 (t) + n2 (t).
23
(56)

Both s(t) and n(t) are narrow-band Gaussian processes; any narrow-band Gaussian pro-
cess can be expressed in the forml8
f(t) = F(t) cos [wct+ (t) ] , (57)
where F(t) has a Rayleigh probability density, and (t) is uniformly distributed. With
these definitions in mind we can now write the general expressions for sl(t) and s2(t):
s l (t) = A l (t) cos [ct+a(t)]
(58)s 2 (t) = A2 (t) cos [ct+a(t)+4l ],
where d1 is the phase resulting from the RF delay.
Let us now consider the case in which the output of the filter is sampled every
At second and the total integration time is T.
If we now substitute in Eq. 53 the expressions for x(t) and y(t) as given in (56), we
obtain
vo(kAt) = Sk + N k +N 2k + N 3k (59)
where
1 kAt
Sk = At s (t) s (t) dt (6Oa)
(k-1)At
(k-1)At
1 CkAtN3k At kAt n l(t) n(t) dt. (60d)3 k At (k-l)At 1
Our objective is to compute the rms noise components al and 0ra These
noise terms are equal. Therefore it suffices to evaluate one of them only. By
means of Eqs. 59 and 60 we can write a 1 from (54) as
NZ (Sk+Nlk+N2k+N 3 k) cos Yk
k= 1a1 N 2
Y. cos Ykk= 1
N 2 1 Twhere N = T/At. Since Z cos k = a' we have
k=l
24

al =
NZ (Sk+N +N k+N3k) cos k
k= 11 T2 At
The exact expression for Sk, under the assumption of a DSB system, is given in
Eq. 34. For the case of white fringes we can write
(61)
Sk = AoSBI V(u, v)I cosZn Xd sink+ .
Then
N TSkcos Yk=1 T AoSBIVI cos .
k= 1
Substituting (63) in (61), we have
al = ASBIVI cos + N,
where N is the sum of the three noise terms:
N
N1
N2 =
N3
- Nlk cos kk= 1
1 T2 At
NZ N2 k cos Yk
k= 11 T2 At
NZ N3 k cos Yk
k= 11 T2 At
Then the variance of a l is
2 2 2 2a = No + -N +-Na1 , 1 2 N3
Since N1 and N2 have the same form 2N1
2 2 2=2o- +o-a 1 1 N3
By using (65a), we can write the expression for the variance of N1
25
(62)
(63)
(64)
(65a)
(65b)
(65c)
2= N2,2
(66)

2¢N 1
NZ E(NlkNlj) cos k cos j
k,j kj
/1 T 2
2 t)
N k E(N k) cos Yk
k= 1
(ZA
2Nlk
T2 t
Nlk is a zero-mean random variable and is given by Eq. 60b; it is the averaged
product of two Gaussian processes each with a rectangular spectrum of bandwidth B.
By means of the sampling theorem we can write
s 1 (t) =
n(t)
2AtB 1,i= 1 If2- -s i.i(t)
i=l 1 1(68)
2htB= n * i(t).
i=1 I 1 1
Then (60b) becomes
1 2 AtBNlk 2BAt i S i1ii=and the variance of N
and the variance of Nlk can be written
2aNlk
1
(2BAt)2
2n
(2BAt)
2n
2 B(t)2
2AtBi s iS E(n in)
2AtB 2]5 s.
i=l
At 2s (t) dt.•0
2The variance, nI, of the noise at the input of the multiplier is given by
we= k TR B,
where k is Boltzmann's constant.
The signal power is given by
(69)
26
(67)

s (t) dt = ASB.20
If we substitute (69) and (70) in the expression for
2'Nlk
2aNk we obtainNlk
kT BAoS4AR 4At
Substituting (71) in (67), we obtain
2
'N1
kT RBAoSR
2T
Since AoS = 2kTA - becomes
k2 2TRTAB
N 1 T
In a manner similar to that for the evaluation of
of N3 :
2
2 N3kN3 T
2 At
E AtkAt
(k-l)
2I
we can compute the variance
n2(t) n2 (t) d
n 1 (t) n (t) dt
1 T
() 2 tAt
iT2 At
2BAt2 Z E(n inljn2inj )
(2BAt) i, j
1 TZ At
1 ZBAtZ E(ni) E(n2i )(2BAt)z i=l
1 T2 At
27
I At
0T(70)
(71)
(72)
-

1 (kTRB)22 2BAt
N3 1 T2 At
(kTR) B
T (73)
Combining (66), (72), and (73), we obtain
2 =kTB (2TRTA+TR) (74)a 1 T R R
Usually we speak in terms of the fringe amplitude and phase that are defined by
Eqs. 46 and 47,
A =a + a2
-1 a2= -tan a
a1
The variance of A can be calculated easily if we make two reasonable assumptions:
(i) that the noise components of al and a 2 are Gaussian by the strength of the Central
Limit theorem , and (ii) that a-/al is sufficiently greater than 1, which is true for
the sources that we plan to observe. Using these two assumptions, we can showl8 that
the probability density of A is approximately Gaussian with the same variance as al and
a2 . Then the expression for the rms deviations in A is given by
A = k T (TR+ZTRTA). (75)
The signal component of A is AoSBI VI; therefore, by means of Eqs. 14 and 75, we
can get the signal-to-noise ratio for the fringe amplitude:
s\ BTN) = 2T Al I 2
TRT A + T '
Since TR>> TA, (N becomes
(S)A = 2TAV T (76)A R
The phase variations can be obtained by differentiating Eq. 47.
a Aa - aAa 1
af ~2 2a1 + a
Then the phase variance is
28
�_ �I

2
2 al
A + a2
1 TR
2 B-T T A V I
(77)
In Table 4 we list the computed signal-to-noise ratios and rms phase, with the fringe
visibility amplitude as a parameter, for 4 different sources. We have used the antenna
temperatures calculated in Table 1.
Table 4. Fringe amplitude signal-to-noise ratios and
(T R=1600°K, B=20 MHz, T=3 min.)R
rms phase.
Crab Nebula CAS A CYG A 3 C273
lvi (S/N)A - A, (S/N)A o-a, (S/N)A 0 /,A (S/N)A cYA(rad)
1 22 3° 17 40 4.5 15 ° 1.5 30 °
0.5 11 6° 8 8° 2.0 30 °
0.25 5. 5 12 ° 4 16 ° 1.0 60 °
3C273 is not resolved; therefore, IVI = 1 always.
The signal-to-noise ratio is improved when the fringe visibility is inverted to obtain
the source brightness distribution TB(x, y). To show this,
case of a one-dimensional temperature distribution TB(x).
TB(X) = b d/ [a l1(u)+ja 2 (u)] e j2 wu x du,
let us consider the simple
Then
(78)
where b is a normalization constant.
The variance of TB(x) is given by
T = E[TB(x)-TB(x)] 2
TB
Making use of (78) and subtracting the mean, TB(x), we obtain
0T_ = bZ S dudu' E[a, (u)a (u,+ a ua ejZ(u-u')xTB
= b2 d/-d/X
du {E[Aa1 (u) + E[Aa2 (u)]2 }
= 2b2 A d,AX'
0* 29
and
(79)
... . .. .A ...... __ _ ....................... _ _ .,_. _ .

where A is given by Eq. 75.
We can now express the signal-to-noise ratio for TB(x) as
TB(X)(S/N)T B(X) x
TB(X) ~TB
I J-d/k (80)1 yd/x [al(u)+ja2(u)] ei2Wux duNf: -d/A A
For a point source Eq. 80 becomes
(S/N)T = /7d; (S/N)A,B
where (S/N)A is the signal-to-noise ratio for the amplitude of each individual fringe
vector.
In the discrete case d/k corresponds to the number of points, N, in the u-v plane
for which fringe vectors were measured. Thus, after inversion, the signal-to-noise
ratio for a point source becomes
(S/N)T = XN (S/N)A. (81)
30
I - - - -

IV. Ku-BAND INTERFEROMETER SYSTEM
4. 1 ANTENNAS
The antennas are shown in Fig. 11. They are 8-ft dishes on equatorial mounts
driven by stepping motors. At the present time, we have no indication whether the
motor advances by a step each time a stepping pulse is sent by the computer. We know,
however, that had the motor missed 10-20 pulses in the course of an observation the
antennas would not return to their index position. The fact that they always do return
indicates that no pulses are missed. At the operating frequency of 17. 128 GHz the
beamwidth is 30 minutes of arc. The pointing of the dishes was determined by computer-
controlled sun scans; the pointing accuracy is within ±1 minute of arc. The efficiency
of the dishes was estimated to be approximately 35%.
4.2 RADIOMETER
A picture of the radiometer is shown in Fig. 12 and its schematic in Fig. 13. A
small amount of Dicke-switched noise, approximately 5K, is injected in series with
the signal. This noise signal is then detected by a synchronous detector and used as
a continuous monitor of the gain stability of the system. More will be said about this
concurrent calibration scheme.
The double-sideband noise figure, F, of the system was found to be 8 dB, and the
noise temperature, T R, is 1600°K.
The center intermediate frequency is 60 MHz and the IF bandwidth is 20 MHz. The
two sidebands of each radiometer were studied by connecting a Ku-band sweeper at the
input of the radiometer and observing the detected output of the IF amplifier. The
results are shown in Fig. 14 for radiometers No. 1 and No. 2.
4.3 PHASE-LOCK SYSTEM
The local oscillators of the two radiometers must be phase-locked to a common
stable frequency in order to preserve the coherence of the input RF signals. Figure 15
shows the complete phase-lock system for this interferometer. The two synchronizing
frequencies are 28 MHz and 300 MHz; the 28-MHz frequency is generated from a
1-MHz Selzar oscillator and the 300-MHz frequency from a 100-MHz crystal oscillator.
The schematic diagrams of the comb generators are shown in Appendix A.
The two synchronizing frequencies are then sent, as shown in Fig. 15, to the antenna
sites where they are demultiplexed. The 57 t h harmonic of the 300 MHz frequency is
mixed with the 17. 128 GHz local oscillator, thereby producing a difference frequency
of 28 MHz. The difference is then compared with the reference 28 MHz frequency by
means of the phase comparator; the output of the phase comparator is used to adjust
the klystron reflector voltage, which completes the feedback loop.
The stability of the local oscillator is determined by the stability of the 300 MHz
frequency which is one part in 5 X 10⁷. The exact local oscillator frequency was
31

it
£
aI11, W? g
a)-4a)C)E0pa)
a)
'Scd
-Q
bO
U
32
I

Fig. 12. Radiometer.
33
i
- -7~~~~~~~~~~~~~~~ha

Eo zo o
000 .0 0oO~
a)
0c+4
a)
0
Cd
b~.-j44
rlCI
a)
0·;-'.
4-.
0U)
Cd,.QoOaa)U)
34
-- ----- I I
I
I�
rr

UJ2
U2Ul
aC)0
C)
i
.W
35
�11� ______111___1_1________i__ll
J
Ir
II
Al
i-- _______
o
- *I --. I
I

measured by a counter and found to be 17, 127770; its stability was indeed between-7 -810 7 and 10 .
The over-all phase stability of the system was determined by feeding a 17, 188 MHz
signal to the inputs of the two radiometers and monitoring the output of the correlator.
0.
-90°
-180°
I I I I I I I I I I0 20 40 60 80 100
TIME ( min )
_~t~C -~ - - - ~
Fig. 16. Phase stability test for the Ku-band interferometer.
Figure 16 shows the output for a period of 2 hours; a 180 ° phase shift was introduced in
one of the IF strips after 1 hour of monitoring. Over this time interval the phase
stability of the system was better than 10 ° .
4.4 BACK END
The complete schematic of the back end is shown in Fig. 17. As can be seen from
Fig. 13, the 60-MHz IF signals are transmitted from the two antenna sites to the
control room where the appropriate compensation delay is inserted in the IF signal
paths; the units that introduce and control the delays are called compensation boxes.
The outputs of the compensation boxes are then amplified further in the postamplifiers.
The IF outputs of the postamplifiers are applied to the analog multiplier, the averaged
output of which is the interferometer output plus noise. The detected outputs of the
amplifiers are brought to a synchronous detector where the gain calibration noise is
detected.
The constituent blocks of the back end will now be explained individually.
.4. 4. 1 Compensation Boxes
The basic function of the compensation boxes was explained in section 3. 2. From
Fig. 17 we see that each box has 8 delay sections varying from 1. 25 ns to 160 ns. The
delays were constructed by using the appropriate length of RG-9 cable; the schematic
of the circuit that switches the delays in and out is shown in Fig. 18. When the delay
is out the signal goes through an attenuation pad that has the same attenuation as the
36

0tr
r) Z
Oz
0 a
JLIaI
4LL
IH
'o
0
I <Z((Jz-U,
U,
a)
U
$.4)a)
0)
a)
a)
-:
bfl4-(
37
*0
(nzwa-
0C)
-JLL
0
wo
z
LJ
I
0C)
0O
LL
� _I__I__IIXPCI__(__I____·�··LIII^I·XII I__111111II-��11II .I--·III�LIC·. -.I_._-·_·I---_�_L--. _I__-I 1·I^--- _ __� _

500
Fig. 18. Switching circuit for the compensation delays.
corresponding delay; thus, a constant total attenuation for the compensation box is
maintained independent of the delays that are switched in or out. The switching signals
are generated in the interface and are controlled by the program as is explained in sec-
tion 4. 6. 2 and Section 5. 26.
4. 4. 2 Gain Calibration
A schematic diagram of the gain calibration circuit is shown in Fig. 19. It is designed
to handle the gain calibration of a four-polarization radiometer (the interferometer in
its present form receives only the horizontal polarization). For instance, the four inputs
to the adder-and-filter circuit are the detected outputs DET. R 1 , DET. L 1, DET. R2 , and
DET. L2 of the IF amplifiers corresponding to the right circular polarization of antenna
No. 1, left circular of antenna No. 1, right circular of antenna No. 2, and left circular
of antenna No. 2, respectively. These four detected outputs are proportional to the
temperatures of the injected calibration signals TCAL1 TCAL2 TCAL3 and TCAL4.
Then the outputs OUT1, OUT2, OUT3, and OUT4 of the adder-and-filter circuit in
Fig. 19 are proportional to
OUTI (DET. R 1) + (DET. R 2)
OUT2 - (DET. R 1) + (DET. L 2 )
OUT3 - (DET. L 1) + (DET. R 2 )
OUT4 ~ (DET. L 1) + (DET. L 2 )
38

4
-J4
C-)
u
-,4
I-
I-40C-)+
C-)
4-)
uC-
t- C)Lra
- 0u r.
o-C-)ol O
ed
Cd
C)
00
ox
PL4
1, -- o:, uj a-
0 -- ~-- a.cr u z 3 TLu o01-4
39
__ _ _I �_ I _yll _ 1__4_1___ _1 I�� �IU1III·IY__II__I_____I_ III1I ��.(-�.·1�_....

These 4 outputs are next fed into 4 different synchronous detectors, the outputs of which
are the calibration voltages associated with the following interferometric output signals:
R 1 XR 2 , R 1 X L 2 , L1 X R 2 and L1 X L 2 . The calibration voltages go to the A-D con-
verter where they are sampled by the computer at the end of each integration cycle.
4.5 ANALOG MULTIPLIER
The analog multiplier shown in Fig. 17 gives the averaged product of the two IF sig-
nals. It has a dynamic range of 80 dB, and its frequency response is flat within 1 dB
in the IF bandpass 50-70 MHz.
4. 5. 1 Theory and Circuit Description
The multiplication is accomplished by means of a balanced FET bridge. The field-
effect transistors operate in their low-current region where their i-v characteristic is
similar to that of a variable resistance. Figure 20a shows the bridge with the driving
s
Fig. 20.
(a) FET multiplier equivalent circuit.
(b)
sources E and I, while Fig. 20b is a simple resistive model of the bridge; this model
is valid if the variable compensating capacitors shown in Fig. 20a are properly adjusted.
The 2N4417 field-effect transistors were chosen as a compromise between good
40
-- ·- - ---- -- I

high-frequency response and relatively small turn-on resistance (150 2). Actually, to
reduce the turn-on resistance further two 2N4417's were put in parallel. Because of
this low resistance, a current source is needed to drive the source terminals of the
bridge. The gate terminals are driven by a balanced voltage source; this gate voltage
determines the instantaneous resistance of each transistor as shown in Fig. 20b. If we
now expand according to a Taylor series, we obtain
R(E) =R +RE+RE +o 1 2
R(-E) = R RE+ R E + .... (82)
Then by making use of these expansions we can solve for the bridge output voltage
V0 R 1 E I. (83)
Equation 83 tells us that the output of the bridge is proportional to the product of the
two input signals, provided that (a) the FET's have been biased properly so that they all
have the same expansion (82); (b) the gate voltage drive, E, is small enough so that
third-order terms can be neglected, and (c) the compensating capacitors are properly
adjusted so that the output of the bridge attributable to the gate drive, E, is zero.
The complete schematic of the multiplier is shown in Fig. 21. Since geometric sym-
metry is very important at the frequency of operation, the source driver and the bridge
were built on the same printed circuit board; the source driver uses a complementary
pair of transistors (2N918 and 2N4958) to transform the voltage from input No. 1 into
a current drive. The voltage inputs to the source, as well as to the gates, are brought
to the printed circuit board by means of coaxial cables; these coaxial cables are also
used to transmit the bias voltages for the source driver transistors and the FET' s. The
output of the bridge goes to a lowpass amplifier that has a gain of approximately 5 X 10⁵;
the output of this amplifier is the interferometer output.
The bridge is balanced by means of the gate bias network and the compensating
capacitors. The gate bias network is adjusted so that the bridge output is zero, with
input No. 2 terminated and input No. 1 driven hard. The compensating capacitors are
adjusted for zero bridge output but with the input conditions reversed.
4. 5.2 Tests and Evaluation
The test setup used for the measurement of the dynamic range and frequency
response is shown in Fig. 22. Inputs No. 1 and No. 2 of the multiplier were obtained
from the same oscillator. When the attenuators in series with the input signals are set
at 45 dB the output of the multiplier is equal to the fluctuations caused by the flicker
noise of the high-gain lowpass amplifier. So, 45 dB defines the lower limit of the
dynamic range. The attenuation was then removed gradually by the same steps for both
attenuators and in each step the output voltage was recorded.
41
I1I1I^IIIIII C-� _-)---�I -1.·__1_�1� ·-�--1�1�_---·11111�-_1�^�··--�-·-� --- _11 1

*-I
1o
1I,I-
I
'i
42
41
G
YOto J
r

VARIABLE ATTENUATORS
Fig. 22. Test arrangement for determining the dynamic range of the multiplier.
If the output voltage is V i and Vi+1 for steps i and i + 1, then the linearity condi-
tion is
Vl 106/10V.
1
where 6 is the dB amount that was taken out from each of the attenuators. The linearity
condition was satisfied until both of the attenuators were down to 5 dB; thus, 5 dB sets
the upper limit for the dynamic range. Then the total dynamic range is 2 X (45-5) = 80 dB.
Table 5. Linearity data for the analog multiplier at three frequencies.
Attenuator Output Voltage (V)Settings
(dB) 50 MHz 60 MHz 70 MHz
30 0. 02 0.02 0.017
20 0.2 0.2 0. 17
15 0.63 0.63 0.55
12 1. 27 1.27 1. 1
9 2.55 2.55 2.2
6 5. 1 5. 1 4.4
4.5 7.5 7.3 6.4
Table 5 shows the linearity data taken at 3
attenuator settings ranged from 30 dB to 5 dB.
quencies indicate a frequency response that is
frequencies: 50, 60, and 70 MHz. The
The voltage outputs at these three fre-
flat within 1 dB in the range 50-70 MHz.
4.6 COMPUTER-SYSTEM INTERFACE
The general functions performed by the interface are the following.
1. Sampling the interferometer output once every 0. 2 s, converting the sample into
43

a 10-bit digital number and depositing it in the accumulator of the computer. This part
of the interface is presented in Fig. 23.
2. Controlling the compensation delays by translating the computer command into
the appropriate voltage levels and directing it to the appropriate delays. This part of
the interface is presented in Fig. 24.
3. Generating the system clock of 0. 2 s, as well as the other timing clocks of 1 s
and 10 s by dividing down a 1 MHz signal. This part of the interface is shown in Fig. 25.
4. Generating the tracking pulses for the two antennas. It does this by using as a
basic unit a 1-ms clock derived from the counter chain of Fig. 25. This part of the
interface is shown in Fig. 26.
The communication links between the computer and interface that make possible the
transfer of data and commands are the following.
1. The wires that transfer data numbers from the interface to the accumulator
directly. These wires are designated in Fig. 23 as AC2-AC11.
2. The wires that transfer numbers from the accumulator buffer to the interface;
these are designated as AC4-AC11 in Fig. 24.
3. The SKIP and INTERRUPT buses by means of which the interface can cause a
skip or an interrupt in the program.
4. The memory buffer wires designated as MB3-MB8 in Fig. 24; these wires carry
the device selection commands from the computer to the interface.
5. The buses for the input-output pulses IOP1, IOP2, and IOP4, designated as such
in Fig. 24. The code numbers for these pulses are 6XY1, 6XY2, and 6XY4. The
XY part of the code number is transmitted on the memory buffer wires MB3-MB8 and
designates the device to which the input-output pulses are directed; for instance, if the
device code is 64 then the memory buffer wires will transmit the binary number 110100.
We shall now proceed to explain briefly the four interface block diagrams.
4. 6. 1 A-D Converter (Fig. 23)
The analog-to-digital conversion process begins with IOT2(DS), which is the IOP2
pulse designated only for the sampling of the interferometer signals. This pulse reads
into the selection device boards the code of the device that is to be sampled. This code
is carried by inputs F1, F2, F3, F4; therefore, it is possible to sample 15 devices
sequentially. In addition to reading in the code, IOT2(DS) performs two more functions.
1. It sets the bit-conversion flip-flop Q1 to 1 and resets the others. This brings
the output of the D-A ladder right at the center of its range, 4 V. The output of the
ladder is 8 V when all the flip-flops (Q1-Q10) are 1 and 0 V when they are all 0.
2. It triggers the timing circuit; this generates 10 successive pulses (TP) of 100 ns
pulsewidth and separated by 0. 5 s. These pulses generate sequentially the conversion
bits.
Let us say that five TP pulses have already been generated; these first five pulses
will establish the final level of the first five flip-flops Q1-Q5. In addition, the fifth
44

pulse will set Q6 to 1. The other flip-flops, Q7-Q10, will be 0. The voltage level at
the output of the D-A ladder is determined by the new Q-levels. The comparator driver
serves as a buffer between the D-A ladder and the comparators; its voltage output ranges
between ±2 V. The output of the comparator is compared simultaneously with all of the
inputs (RR, RL, etc.); this produces 8 comparison levels (C1, C2, . .. C7, C8). Only the
comparison level that corresponds to the output that is currently being sampled, how-
ever, will affect the "SELECT" level coming out of the selection device board #2. This
new "SELECT" level will now set a gating condition for the next TP pulse (#6). For
instance, if the select level is 1, TP #6 will reset Q6 to 0; if it is 0, however, Q6 will
remain 1. In addition, TP #6 automatically sets Q7 to 1.
This process continues until all 10 Q-levels have been established. The last TP(#10)
generates a new pulse, STOPP, which reads the Q-levels into the level converters; the
outputs of the level converters are deposited straight into the accumulator of the com-
puter.
4. 6. 2 Level Converter, Gates, and Compensation (Figs. 24 and 26)
The level converter converts the memory buffer signals and the IOP pulses from
the computer levels to interface levels. The converted memory buffer levels are then
used in board #12 of Fig. 24 and boards #7 and #9 of Fig. 26 to produce gating condi-
tions for IOP1, IOP2, and IOP4. The correspondence between device and code number
is as follows.
1. 3, 4 are the code numbers of the teletype,
2. 31 is the code number of the "SKIP" device; this device is shown in Fig. 29 and
explained in Section 5. 10. The IOP pulses directed to this device are designated IOT1 (31)
and IOT2(31); in conjunction with the 0. 2 s clock they activate the "SKIP" mechanism
of the computer.
3. 35 is the code number that produces IOT1(35); this pulse controls the compen-
sation delays that are in series with IF # 1.
4. Gate #30 generates IOT1(30) which controls the compensation delays in series
with IF #2.
5. Gate #36 is used in the circuit that acknowledges the interrupts from the pulses
destined for the hour-angle axis of antenna No. 2; its output gated with IOP2 generates
IOT2(36) which is the stepping pulse.
6. Gate #37 serves the same function as gate #36 but for antenna No. 1.
7. Gate #41 generates IOTI(41) and IOT2(41) which check whether the stepping pulses
sent to the motors have been received.
8. Gate #43 generates IOT1(43) which is the stepping pulse for the declination motor
of antenna No. 2.
9. Gate #45 generates IOT1(45) which is the stepping pulse for the declination motor
of antenna No. 1.
As mentioned previously, IOT2(DS) starts the process of analog-to-digital conversion.
45

+05
,, t
BEGP
SKI
BOARD # 6
TIMINGC IRCUIT
04 sec.
LP __
STOPP
r--
OUIT LEVEL
2BOARD # 4 11
COMPAPATOR DRIVER 4 --6
14 1 19 22 6 8
I I _
-12 +12 I
' IOT2 (DS)FROM RACK 3-BOARD 7
SKIP FROM RACK # lb
F, FROM ACK # lb /
F2
FROM RAC I b* *
IOPI FROM RACK # I
F3
FROM RACK lb
F4
FROM RI_- _ _
DCII I.,
IOPI TO RACK # 2
-1*
3 7
4 9
5 1 D
BIT 15
CONVERSION
IS 2020
1- 3 7-
-4 9-
B OARD I
BIT ID
CONVERSION2
20
SELECT
f2f
LS
I IP |
O I1061
lop,(DS -F IOT2 DS)
_I I Fa
0304
SET 6
1
STOPP
T
09
I+12 15
+9 16-17
+
I+5V
OUT 2
5 22
7 21 F F8 BOARD # 2 F' F
91SELECTION 3 IOPI
DEVICE 2Ii 104TI 2 (S)
2
T
17 1 9
8 BOARD I19 II
20 12
21 133 14
SELECTION 4 IS
DEVICE 1 7£5
+5 -12
6 AC - PE2H 17/6
9 AC3BCARD 9 II 4- PE2 17/7
IA12 15 E2M 17/814
20L E E L
19 E 2 P 171LE/EL 191 PEZP 17/IC20
I6 CCS AC RA.2 ACA F 2 5 17/11
18 17 P2K 17/9
4
I I I
a o i I I I I i I
T I I I
B
BOARD 5
D-A LDDER
22
L 74
t 64 1 1 360 L;.
,,. I I IF 50
44 _
F'i F2
11
iI
'5 -12 C
4
7 PE2T 1I/12
BOARD IO II --- PE V 1,7/13
IS -c P I 2D 17/14
IEVEL 19 _ PF2 17/6
AO CONVERTFAR 22 I- PEAR 7/IA
i . . .INTERRPT
FRr,M RaCE 2
STOPP goRD 12
2021 I
20-21
1 _
[L____
+12 -6
18 I 11 22 '< RR17 21 F4 <RL
16 20 _ ERBOARD # 3 5S
S ID~e< LLCOMPARATOR8 IA C*- CAL LL
7 44 .CAL RR10 5t< CAL RL
3 6 CAL LR5
Fig. 23. A-D
46
converter.
TP
_l'- SP
J
! I It Ht- -- | C
_ 1 [ I
,1 = {f I I I I --1_ _- l
I
. .u-
uf J , .
_ I
I I I
T
-
I
c t
r
oi
~ 2I v
BOARD 7
Q5I
1- _-t ---
I
: I I ISTOPP
a
I
I
1�JM
I
F.
I I .1
_�-
iI
I I I I
I
2

TO DELAY COMPENSATION FOR ANT. 2
A, A, A2
A A A AA4
TO DELAY COMPENSATION FOR ANT. I
Al, A A2 A2
A)A A A4
21 19 17 IS 13 11 9 7 21 19171513 11 9 7+5 I +5
BOARD #18 BOARD # 142 BUFFER (30 2 BUFFER (35)
+6 4 +6 _ 422201816 1412 10 8 222018 16 14 12 10 8
9 1011 12 13 14 16 C4 9 10 11 12 13 14 15 16
+ 5 1 BOARD #17 +5 I1 ' BOARD # 132 COMPENS. (30). AC- 2 COMPENS. (35)
AC7 22 I II 4 5 3 6 7
1810 ME3M
18111 ME34P18/12 ME34S
18/13 ME34TFROM RACK #2 18/14 ME34V
18/15 MF34D
18/16 MF34E
18/17 MF34H
FROM RACK 3
AC4
ACS
AC6
AC7
I 1~~~IO - I -I U n
FROM RACK # : -BOARD 11
18 16 13
+5- I BOARD # IZ 2 IOT GATES 20
I0P2 3.4.31.35)310 345678
F I / I I I I 80AD 126
O 1 C 1 KS # 3283 55 'I 2 2 1792 J tTO RACKS# 2 8 3. r 3 I I I / I
8 E35M 5 7 9 2118/8 ME35S 1 20 19
18/7 ME35V 18 2 | i . _ |lop' M, F18/6 ME35E =, Fa / _
0 I IB/S ME35K " 14 o / 17 . N
18/3 MF35K 12 <>Z .j ,18/2 MF34M Tp1
18/1 MF34F 6 I 6 |t
+51 o 1 1
A A Z A2A
3A
3A
4A
4
2119171513 11 9 7
BOARD 16
BUFFER (35)+6 4
2220 18 16 14 12 1 8
9 10 12 13 14 15 16
+ 5 I
BOARD I i
2 COMPENS. (35) #2
4 5 3 6 7
f I<loT_=X
O I I
4 6 7
,2 .O.# 19.IOT (30) | COMPENS. (30) 2
9 10 11 12 13 14 15 16
2220 18 16 14 12 10 aI +5
BOARD #20
BUFFER (331
21 19 7 IS 13 11 9 7
AsAs A6 A A7A
8A
816/9 16/11 16/13 16/15
16/10 16/12 16/14 16/16
"._
TO DELAY COMPENSATIONFOR ANT 4 2
BI
I.I
Fig. 24. Level converters and compensation-computer interface.
47
I I I I I I I
U11 hV U41 Q
- --- I
. AC9- _- i ) * -- _- I t
ACII.- t-
TnTI rn) I t--�---�
_- J I
A8
7" I
Ar I^
rui . .
2
1LL
I,

+5
I H,
Io.c
RACK FROM RACK*lb # Ib
Fig. 25. Clock-computer interface.
48
IN
CLOC
rRACK
e 0.1 2-74 rc.
+12 +5
I

I m ec. PULSE
I+5 _ _
'i T I ir I 2 3 4 I 2
5~~~~.809 sec. .809 sec
6 6TRACKING TRACKING
9 PULSE PULSE
13 -~--1 3BOARD I 1 1 BOARD * 2
19 ~ 19( 3) (#4)
20 20
21 2122
IOP4
IOPI
T - FROM RACK #2
1 5 -5
'Y 1 2 1 2.807 sec. .807 sec.
6 6TRACKING TRACKING
PULSE 9 PULSE13 13
BOARD #3 = BOARD 191 ~~~~~ ~BOARD 4 I19 19~~1
(*I) 2 0 (,2)20 ~~20
21 2122
TRACKING PULSEFOR ANTENNA #2
(# 36)
TRACKING PULSE FOR ANT. #1 (37) I se.
-.--}-- I , sec.
6 4+5c- ~ I 2I
FROM
17 18
2 BOA)12 GATE
13.9 414
IOP2
FROM RACK #lb
INHIBIT #3,4,31FROM RACK #lb
IOT2 (DS) TO RACK #lo
BOARD #
RACK * lb P4 |8 FLAGS 36 8 37 198
3 a 7 6 II 9 12 Z Os7 'I.~~~~~~~19 20 21 225 INHIBIT 36 m m
RD 7 6RD#7 16 | INHIBIT # 37 | ||z DE 36,37.41 TO SKP r '
10 11
1 11 5 8 12 14
2 BOARD #6 22IOPI ,, STEP PULSS FOR
I I -- IOP2 I ' MOTORS #36,37 13
fL0' 5" sec I' RETURN PULSE STEP PULSE STEP PULSETO GATE 41 FOR HR #1 FOR HR #2
(37) (36)
_ i1 1 1
INTERRUPT OF. DEVICES 36,37
TO RACK 2
TO SKP BUSIN RACK 2
IOP4 (30)I I I15 7 22 21 FROM RACK #lb
2 BOARD*B F F F F F:L #2 HOUR ANGLE STEP
L #I PULSE GENERATOR t t t5 6 19 17
FROM TO HR OFHR#2 ANT. #2
FROM TO HR OFHR # ANT. #I
+S 1 3 4 6 7 8 22 45CCW2 BOARD 9 2
FROM I- PIOPI I 1,6 GATE # 30.43,45 20 45CW
RACK lb OP4 13 9.1214 10 19
_ f gI(30 TO RACK
+12 + I43
+12
12 4 15
+S_ I BOARD 102 DECLINATION STEP
IOPI PULSE GENERATOR5
16 IB
PULSE PULSE
FOR FOR
DECL * I DECL * 2
Fig. 26. Antenna-computer interface.
49
FROM DECFROM DEC
I ·
- ---
I
l
i
4 i[1 ...... i
i f
i i

Therefore IOP2 is converted to IOT2(DS) only when the interferometer outputs are to be
sampled. Since IOP2 is also used by the devices 3, 4, 31, 36, 37, 41, an INHIBIT gate is
used to prevent IOP2 meant for these devices from getting to the A-D converter. The
gate is implemented in board #12 of Fig. 24 and board #7 of Fig. 26. IOT2(DS) is
generated in the latter board.
In Section 5. 26, the part of the program that computes the compensation delays is
explained. For instance if delay is to be added in series with IF #1, the computer will
compute this delay in binary form and deposit it in the accumulator buffer from which
it is transmitted to the interface on the wires labeled as AC4-AC11 (see Fig. 24). It
then sends IOT1(35) which reads the information carried by the buffer wires into the
compensation (35) boards. The buffer boards are used to drive the delay switching cir-
cuits (see Fig. 18). Since the delay in series with IF #2 is zero, the program will
deposit zeros in the accumulator buffer; then, by means of IOT1(30), will read these
zeros into the compensation (30) boards which control the delay in series with IF #2. The
reverse will be true if delay is to be added in IF #2.
4. 6. 3 Clocks and Interrupts (Fig. 25)
The system clocks are produced by dividing down a 1-MHz signal generated from a
stable oscillator. The fifth counter of the divider is coupled with a control circuit which
can speed up or slow down the count. Out of the counter chain we get three clocks;
0. 2 s, 1 s, and 10 s. By means of the speed-up or slow-down control circuit, the
10-s clock can be made to occur exactly on the minute within 1/2 s; then, the 1-s clock
is aligned with the 1-s WWV timing signal within 5 ms. Once the clocks have been syn-
chronized, the observation can begin; the starting procedure is explained in Sec-
tion 5. 10 along with the associated program. Every time a 0. 2 s pulse is received by
L[0.2 s CLOCK
TERRUPT
P BUSP BUS
lOP1
Fig. 27. Clock interrupt circuit.
50
IL �_ _���_��� �___�____� _ _

a0
oo
o
33V831NI
VNN3iNV- 831ndi0dOD N08
51
J --.Jw,,. 3< t)
CXriq0
C)0
C-)
C)zas
0
bda.)
cO10i
r.
_· I I __

the computer the program increments the sidereal-time register by 0. 2 (1+0.0027) s.
The 0. 2 s pulse is acknowledged either by the "SKIP" or the "INTERRUPT" computer
mechanisms; the "SKIP" method is explained in Section 5. 10.
The interrupt mechanism serves 4 devices: Device #32 associated with the clock
interrupt; Device #33 associated with the time-check interrupt; and Devices #36 and #37
(explained in section 4. 6. 2).
When one of these devices causes an interrupt, the program will jump out of the cur-
rent location and enter a routine which checks which device caused the interrupts.
Figure 27 shows the implementation of the clock-interrupt method. When a 0. 2 s pulse
arrives, it will drive the interrupt bus to zero, thereby causing the program to enter
the routine that checks which device caused the interrupt; the checking is done by gating
the flag of each device with IOT1(36), IOT1(37), IOT1(32), and IOT1(33), respectively.
For instance, in the case under consideration, the interrupt was caused by the clock;
therefore; flag #32 in Fig. 27 is up. Thus, when IOT1(32) comes, it will drive the
"SKIP" bus to zero, then the program exits the "check" routine and goes to serve the
clock interrupt by adding 0. 2 (1+0. 0027) s to the sidereal-time register.
In addition to driving the "SKIP" bus to ground, IOT1(32) resets FLIP-FLOP A,
thereby removing the cause of the interrupt.
4.7 ANTENNA CONTROL
In Fig. 28, the antenna control schematic is depicted. Two kinds of control mech-
anisms are included in this diagram: computer/manual control, and direction control.
Both functions can be controlled either from the central room or from the antenna site.
52

V. PROGRAM
The program was written in machine language and all computations were done in
fixed point. It was designed to perform the following general functions.
1. Accept the necessary input parameters through the teletype.
2. Point the antennas to the source and track the source.
3. Keep a record of the sidereal time by means of a stable external clock.
4. Take data.
5. Do a least-squares fit on the data.
6. Insert the appropriate compensation delay in the IF strip.
7. Decide whether to track the source or the calibration source.
8. Repeat the data-taking cycle.
The different sections of the program will now be explained. The computer organi-
zation is presented in Appendix B and the complete program listing in Appendix C.
The main program will be explained from beginning to end. To facilitate this expla-
nation, the program is broken up into sections. These sections are identified by the
numbers of the first and last registers which they contain. The numbers are in octal and
vary from 0 to 7200.
5. 1 - 0-117
These locations are used to store the symbols that are more commonly used and
likely to be addressed from any page. The only exceptions are locations 0 and 1 which
are reserved for the interrupt, and locations 10-17 which are the "self-indexing
registers. "
5.2 - 6510-6524
The program starts at location 6510. It clears and initiates the timing and antenna
control devices in the interface and then transfers control to location 200.
5. 3 - 200-226
In this section the program accepts the input parameters through the teletype by
means of the SICONV subroutine supplied by DEC. These numbers are deposited
sequentially by means of the self-indexing register "10" into storage locations 6610-
6651. The format and function of the input parameters are given below in the order they
are typed.
Number of days since January 0 of the current year
Number of integrations on the source
Number of integrations on the calibration source
Greenwich civil time (G. C. T.) in hours, minutes, seconds, and fractional seconds
Calibration source right ascension (R. A.) in hours, minutes, seconds, and fractional
seconds
53
__I_�C_·l I_ --------·-Lllsi

Source right ascension (R. A.) in hours, minutes, seconds, and fractional seconds
Baseline hour angle in hours, minutes, seconds, and fractional seconds
Calibration source declination (Dec.) in degrees, minutes, seconds, and fractional
seconds
Source declination (Dec.) in degrees, minutes, seconds, and fractional seconds
Baseline declination in degrees, minutes, seconds, and fractional seconds
Baseline length in meters, centimeters, and millimeters.
5.4 - 227-273
The input parameters corresponding to G. C. T., calibration source R. A., source
R. A. and baseline hour angle have the same format and dimensions. Therefore, they
are operated upon sequentially and converted into numbers of a single unit which is the
unit "hours." After they have been converted they are deposited in triple precision
registers and their fixed point format is
I ~~~I
Integral Part Fractional Part
5. 5 - 274-426
The input parameters for the calibration source Dec., the source Dec. and the base-
line Dec. are operated upon sequentially and converted into the units of both radians and
degrees. The format for the degrees is
Integral Part Fractional Part
and for the radians
XXX XXX XXX XXX
l
5. 6 - 427-443
The baseline length input parameters are converted into a double precision number
in meter units.
54
- -- '-------------------- ---- --
I

5.7 - 444-640
The G. C. T. at which the program is to start is converted into the local sidereal
time (L. S. T.)
LST = GST - LONGITUDE
GST = GCT + SIDHRO + (UTHR) * C1
UTHR = (NDAYS) * (24) + GCT,
where GST is Greenwich sidereal time, SIDHRO is Greenwich sidereal time at 0 hours
of January 0 of the current year, NDAYS is the number of days that have elapsed since
January 0, and C1 = 9. 857/3600 is the conversion factor from solar time to sidereal
time.
5. 8 - 641-667
The index hour and declination of each antenna are converted into the appropriate
system of units by means of the subroutine TRANSF located at address 1721. This sub-
routine takes a coordinate number given in (hours, minutes, seconds) or (degrees,
minutes, seconds) and converts it into a triple precision number in units of hours or
degrees, respectively.
5. 9 - 670- 1022
As the antennas track the source a continuous record is kept of their current hour
angles in registers HR1 and HR2. This is done by incrementing the contents of these
registers by a fixed number each time a stepping pulse is sent to the motor drives.
These numbers, which are different for the two antennas because of the different gear
ratios, are computed in this section.
STEP NUMBER = (1. 8 degrees/gear ratio) X (1/15) hours,
where 1.8 ° is the amount by which the stepping motor advances when it receives a pulse.
Next, the ratio, d/X = baseline length/wavelength is computed and stored in register
BSLAMD in the format
XXX XXX XXX XXX XXX XXX XXX XXX
_ __ j fI
Integral Part Fractional Part
5. 10 - 1023- 1034
At this point the program halts and waits for the "START CLOCK" command. The
55
'-- - - IC-� I�·�·-sl�-L-·----·l�- ..�II_ __I__

waiting is accomplished by putting the program into a loop from which it exits when the
first clock pulse arrives. The instant at which the first 0. 2 s pulse arrives coincides
exactly with the starting time specified in our input parameters. This is accomplished
by synchronizing the 1-s and 10-s clocks derived from our stable oscillator with the
WWV timing signals. Figure 29 is a diagram explaining how the starting of the clock
is accomplished. The program section associated with Fig. 29 is
63116312JMP.- 1
Instruction 6311 generates the pulse IOTI(31) which clears the Flip- Flop B in
Fig. 29. The next two instructions form a loop that is only broken when the computer
"skip" bus is driven to zero; this will occur at the time when the first 0. 2 s clock
arrives and sets Flip-Flop B. This time is the observation starting time, and is
BUS
Fig. 29. Timing control diagram.
controlled by the "START CLOCK" switch which when closed allows the 10-s clock to
set the Latching Flip-Flop A. Our timing signals are synchronized with those of WWV;
thus the 10-s clock that sets Flip-Flop A arrives exactly on the minute specified by the
observer.
5. 11 - 1036-1052
In this section the program decides whether it should point to the calibration source
or to the source that has to be studied.
5. 12 - 1053- 1321
Once the source to be tracked has been chosen the program addresses the registers
where the declination and right ascension of the source are stored and computes the
following functions:
56
___ __

CONST9 = h + a
(d/X)sinDcos6, (d/X)sin6cosD, (d/X)cosD, (d/X)sin6sinD,
(d/X) cos 6cosD,
where H is the baseline hour angle, a the right ascension of the source, 6 the declina-
tion of the source, and D the declination of the baseline.
5. 13 - 1322- 1353
The antennas are moved on the declination axis and pointed to the declination of the
source. The parts of this section that are repeated many times in the course of theobservation (for example, going from one source to the other or going back to the index
position) are converted into subroutines. These subroutines and their locations are
the following.
DEC12 (2000-2045) - common to both antennas
DEC45 (5410-5430) - for antenna No. 1 only
DEC43 (6464-6504) - for antenna No. 2 only
PULSEP (543 1-5447) - common to both antennas.
5. 14 - DEC12
The function of this subroutine is presented as a flow chart in Fig. 30.
OBTAIN
DIFF. = (SOURCE DECL. ) -
(PRESENT DECL.)
NO/FF.
SET ANTENNA DIRECT- SET ANTENNA DIRECT-
|ION CONTROLS TO CW ION CONTRLS TO CCW
GO TO DEC45 IF ANTENNA #1 IS BEING
POINTED OR GO TO DEC43 IF ANTENNA
#2 IS BEING POINTED
Fig. 30. Pointing the declination axis.
57
-_1_ 1_ 11__ ~~~~~~~~~_ A .. .

5. 15 - DEC45 or DEC43, and PULSEP
The function of this subroutine is presented as a flow chart in Fig. 31.
rig. -I.
NOCOINT =0
YES
GO BACK TO MAIN
PROGRAM AND UPDATE
THE DECLINATION REGISTERS
5. 16 - 1400- 1525
The antennas are next pointed on the hour angle axis. They are pointed ahead of
the source by a fixed lead time at the end of which tracking begins. Four subroutines
are used in pointing the hour angle.
HR12 (2045-2161) - common to both antennas
HR37 (1526-1550)- for antenna No. 1 only
HR36 (1551-1573)--for antenna No. 2 only
PULSEP (5341-5447)- common to both antennas.
The functions performed in this section are presented in Fig. 32.
58
OBTAIN NUMBER OF PULSES NEEDED TO
POINT DECLINATION AXIS =
IDIFF.| GEAR RATIO/1.8
INITIALIZE REGISTERS
TO KEEP COUNT OF
THE NUMBER OF PULSES
1SEND
STEPPING PULSE TO APPROPRIATE
DISH
GO TO SUBROUTINE PULSEP:
INCREMENT COUNT AND INSERT A
TIME DELAY BETWEEN STEPPING PULSES
l l
n - - I I
1U��IIIIQ�IVII rVIIIL�LLIEj �UUIVU�ILL��3·
--

ESTABLISH A
LEAD TIME tL
OBTAIN TIME AT WHICH TRACKING
STARTS t = tpresen t tL
OBTAIN THE SOURCE HOUR ANGLE AT t
h = t - a
FORM
D = h - hhdish
Fig. 32.
Computation of initial hour angle.
GO TO
SUBROUTINE HR12
5. 17 - HR12
This subroutine is presented in Fig. 33.
Fig. 33. Determination of direction for pointing the hour angle.
59
-- -urrrr�----·rr�---rr�---------·-l---r�--
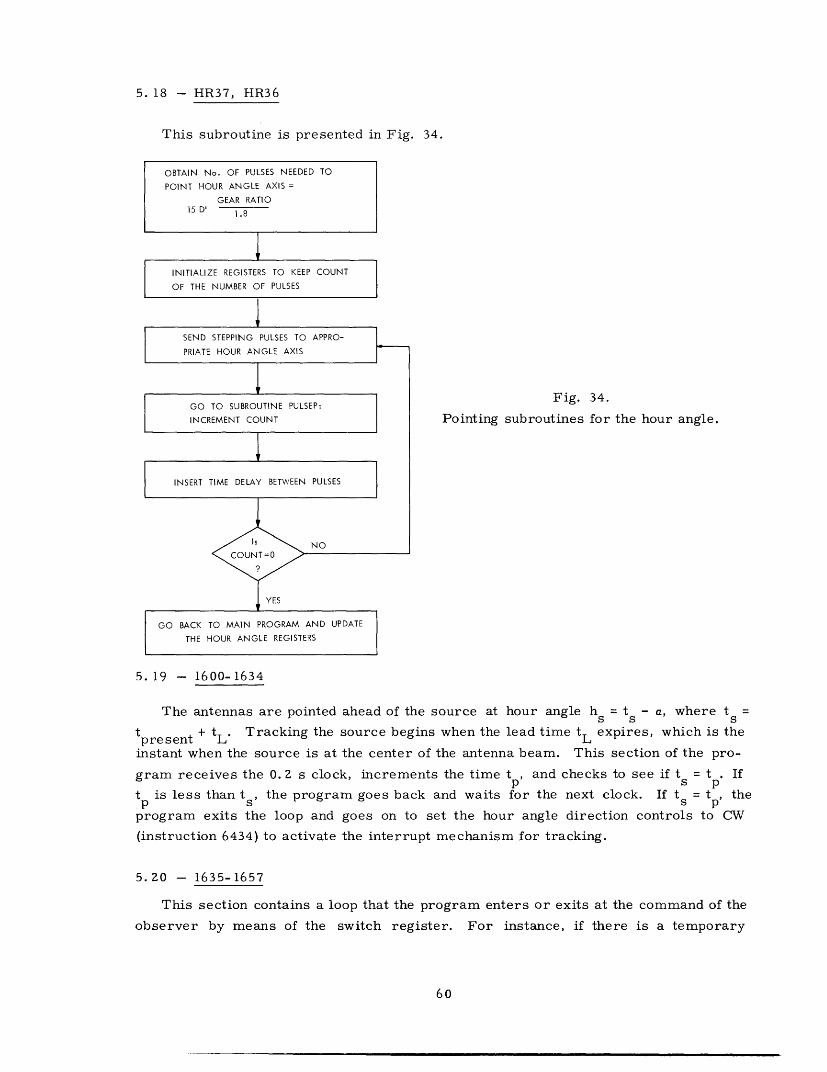
5. 18 - HR37, HR36
This subroutine is presented in Fig. 34.
SEND STEPPING PULSES TO APPRO-
PRIATE HOUR ANGLE AXIS
GO TO SUBROUTINE PULSEP:
INCREMENT COUNT
INSERT TIME DELAY BETWEEN PULSES
I \ NO(UUIN I
Fig. 34.
Pointing subroutines for the hour angle.
YES
GO BACK TO MAIN PROGRAM AND UPDATETHE HOUR ANGLE REGISTERS
5. 19 - 1600- 1634
The antennas are pointed ahead of the source at hour angle hs t a, where t
tpresent + t L . Tracking the source begins when the lead time tL expires, which is the
instant when the source is at the center of the antenna beam. This section of the pro-
gram receives the 0. 2 s clock, increments the time t , and checks to see if t = t . Ifp s p
tp is less than ts, the program goes back and waits for the next clock. If ts = tp, the
program exits the loop and goes on to set the hour angle direction controls to CW
(instruction 6434) to activate the interrupt mechanism for tracking.
5.20 - 1635- 1657
This section contains a loop that the program enters or exits at the command of the
observer by means of the switch register. For instance, if there is a temporary
60
OBTAIN No. OF PULSES NEEDED TOPOINT HOUR ANGLE AXIS=
GEAR RATIO15 D' 1.8
INITIALIZE REGISTERS TO KEEP COUNT
OF THE NUMBER OF PULSES
_ ,
[
C are '· IT-f\

READ SWITCH REGISTER
ISYES
IT 1000
NO
IS NO{ nT 1n A 1 n
YES
GO TO A LOOP AND WAIT FOR THE
" TIME CHECK" COMMAND
TYPE OUT LOCAL CIVIL TIME
Fig. 35. Functions of Section 5. 20.
malfunction in the system that would make the data meaningless, the observer orders the
program to wait until the malfunction has been corrected. Another function accomplished
in this section is the "time check"; that is, while the program is in this waiting loop the
operator may command it to type out the local civil time. The way in which these func-
tions are accomplished is demonstrated in the flow chart of Fig. 35.
5.21 - 1660-1720 and 2200-2442
The program goes through this section before it starts the integration cycle. It
enters a loop like that described in Section 5. 10 and waits for the 0. 2 s clock. Let us
call the time when the clock arrives tbegin. The program then proceeds to compute
cos [( 1/1Z)(H+a-tb)] and sin [( 1T/12)(H+a-tb)] by means of the cosine and sine subrou-
tines.
These two functions are then used to compute the transform plane components u, v
Tintegr
given by Eq. 7. These numbers are computed for a time= t = tbwherebegin 2 where
Tinteg r is the length of the integration cycle. The flow chart of Fig. 36 explains the
sequence of these computations.
61
GO TO LOCATION 1660 AND WAIT FOR
THE NEXT CLOCK PULSE WHICH WILL
INITIATE THE INTEGRATION CYCLE
�
- -- --s�- -`- II
v RI " X 1

DEACTIVATE THE CLOCK PULSE INTER-
RUPT(6334) AND TURN INTERRUPT ON
COMPUTE: H + -tbegin
H - BASELINE HOUR ANGLE
a - RIGHT ASCENSION
COMPUTE
cos [ (/12) ( H + a-tb) ]
sin [( 7/12) ( H+ a-tb)]
COMPUTE h = t - au (t), (t)
TINTEGRWHERE t =t b + 2
COMPENSATE FOR RF DELAY
Fig. 36. Sequence of computa-tions in Section 5.21.
al =
a2 =
Z Yi cos Yi -
.cos i sin yi
,. 2
5.22 - 2443-3154, 3155-3254
This section of the program accepts data
from the four inputs and does the least-squares
fit. The data inputs are being sampled sequen-
tially every 0.2 s during the integration cycle.
The total number of samples per input depends
on the integration time. For instance, for an
integration length of 6 min the number of sample
will be 1800. At the beginning of each 0. 2 s cycle
the program waits for the clock pulse. Once the
clock pulse arrives it exits the waiting loop and
scans by means of IOT instructions (6743, 6703,
6643, and 6603) the four inputs. While the pro-
gram is waiting for the clock pulse and during
scanning of the inputs the interrupt is off. At
the end of the scanning the data processing section
follows, during which the interrupt is turned on
so that the tracking pulses will be serviced.
The clock pulse cannot cause an interrupt
during this section because it has already
been serviced.
The objective in this section is to compute
the fringe components al, a 2 given by Eqs. 48
and 49.
Z Yi sin i
cos yi
. cos y. sin yi
Yi sin i - Z Yi cos Yi2Z cos i
Y sin ¥i
where yi is the data sample taken every 0.2 s, and yi = (Td/X)[sin6sinD +
cos cosD cos (( w/12)(H+a-ti))]. In each 0.2 s cycle the products yi cos i,2 2
Yi sin i' cos yi', and sin yi are being computed and added to their re-spective summing registers. The program first computes cos[( 1T/12)(H+a-ti)] and
62
TURN INTERRUPT OFF AND WAIT FOR
CLOCK PULSE CORRESPONDING TO tb
COMPUTE T
cos [ ( /12) (H+ a-tb - INEG )
INTEGRsin [ ( /12 ) ( H + a-t b 2 )
-
- ----

DISABLE CLOCK INTERRUPT
TURN INTERRUPT ON
COMPUTE
cos [ (/12) ( H+ a-t )
COMPUTE (d/X) in
1
1
Fig. 37. Least-squares fit processing.
63
INITALIZE REGISTERS THAT
CONTAIN THE INTEGRATION LENGTH
CLEAR SUMMING REGISTERS
r cos2
yi, sin2 r yI coS r;'
AND E y; sin Yj
TURN INTERRUPT OFF AND
WAIT FOR CLOCK
SAMPLE INPUTS SEQUENTIALLY
INCREMENT TIME REGISTER BY
0.2 (1 +0.0027)
'O B
OBTAIN FRACTIONAL PART OF
(d/X) sin 9 AND COMPUTE
yj = 2n ( FRACTIONAL PART )
COMPUTE
cos yi AND sin yi
--
l

then it calculates (d/X)sinOi= (d/k)(sin6sinD+cos6cosDcos[( Tr/12)(H+a-ti)]. This num-
ber has the following format:
Integral Part Fractional Part
The fractional part is then separated out with the appropriate sign attached to it and
multiplied by 2rr. The number that we obtain is y.. The program then proceeds to
compute cos 'i and sin i, as well as cos 2 ¥i and sin Yi' These functions are subse-
quently used in the least-squares fit.
The program was written to sample 4 input devices. The outputs are the circular
polarization products (R 1R 2 ), (L 1 L2), (R 1 L2 ), and ( R2 L). The least-squares fit
routine is then applied sequentially to the data samples from these four inputs.
The sequence of operations in this section is exhibited by means of the flow chart
of Fig. 37.
5.23 - 3264-3305
This section contains the "NEGATE" subroutine that gives the 2's complement of a
triple precision number.
5.24 - 3306-3362
The
ment of
limits.
subroutine "CHKARG" contained in this section checks to see whether the argu-
the cosine and sine functions that must be computed is within the appropriate
The flow chart for this subroutine is shown in Fig. 38.
Fig. 38. Subroutine that checks the argument of the cosine and sine functions.
64

5.25 - 5200-5407
The fringe components a, a 2 computed in Section 5. 22 are punched on paper tape in
binary format and printed out in decimal format. Other quantities that are punched and
printed out are the source hour angle, the Fourier plane variables (u, v), as well as the
system gain calibration voltages. The DEC subroutine "BPUN" is used for the punching,
and the subroutines "DECPRT" and "SSPRNT" are used for the printing. The binary
format of the numbers to be output is the following.
U, V:
al a2 and
calibrationnumbers:
xxx xxx xxx xxx xxx xxx xxx xxx
xxx xxx xxx xxx xxx xxx xxx xxx
xxx xxx xxx xxx xxx xxx xxx xxx
tIn the decimal print-out, consideration has to be given to the sign and the location
of the binary point. Since the set of the (a1 , a2 ) components, as well as the calibration
numbers, have the same format, a single print-out routine is used for all of
them.
The different functions of this section are presented in the flow chart of Fig. 39.
5.26 - 5447- 5560
The "COMPEN" subroutine listed in this section generates the digital numbers that
control the compensation delays whenever called for by the main program. This is
accomplished by computing the difference in the signal RF paths (d/c) sin 0 and then
converting this difference into a digital number. For instance, if the signal arrives
earlier at Antenna No. 1, the program will insert the right amount of delay in device
No. 35, which is in series with the IF signal from Antenna No. 1. If Antenna No. 2
receives the radiation earlier, then delay will be inserted in device No. 30, which is
in series with, the signal from Antenna No. 2. The different delay values are synthe-
sized digitally by means of 8 basic delay units: 1.25 ns, 2.5 ns, 5 ns, 10 ns, 20 ns,
40 ns, 80 ns, and 160 ns.
The flow chart of the compensation routine is presented in Fig. 40.
65
-----�------1---1111l_.l__���_��_.�_ ��-�

GIVE CODE INDICATING PUNCH OUT END
GET THE HOUR ANGLE
PRINT THE INTEGRAL PART
PRINT A POINT (.)
PRINT FRACTIONAL PART
PRINT CARRIAGE RETURN AND LINE FEED
INCREMENT K
NO / IS
YES
THE NEXT
YES YES
GO TO LOCATION 1036;YI EREINITALIZED AND POINT G TO LOCATION 1053;THE DISHES TO CALIBRA- THE DISHES TOTION SOURCE
YES~~~~~~~~~~~~~~~~~~~~~
SET INDEX K TO- 12 FOR THE EIGHT
VISIBILITY COMPONENTS AND FOUR
CALIBRATION NUMBERS
A GET NUMBER CORRESPONDING TO INDEX K
PRINT OUT ITS SIGNED INTEGRAL PART
PRINT OUT A POINT (.)
PRINT OUT ITS FRACTIONAL PART
PRINT CARRIAGE RETURN AND LINE FEED
Fig. 39. Punch and print sequence.
66
GIVE CODE INDICATING THE
BEGINNING OF THE PUNCH-OUT
USE THE BPUN SUBROUTINE TO PUNCH
OUT THE FOLLOWING NUMBERS:
h,u,v
a1 'a2 for device No. 1
01 '02 for device No. 2
a1' 2 for device No. 3
1 ,a2 for device No. 4
Calibration for device No. 1
Calibration for device No. 2
Calibrotion for device No. 3
Calibration for device No. 4

Fig. 40. Delay compensation subroutine.
67
i _ Il --- UII __Lmlll_·III____YI__IIII__X__I·-ll_�
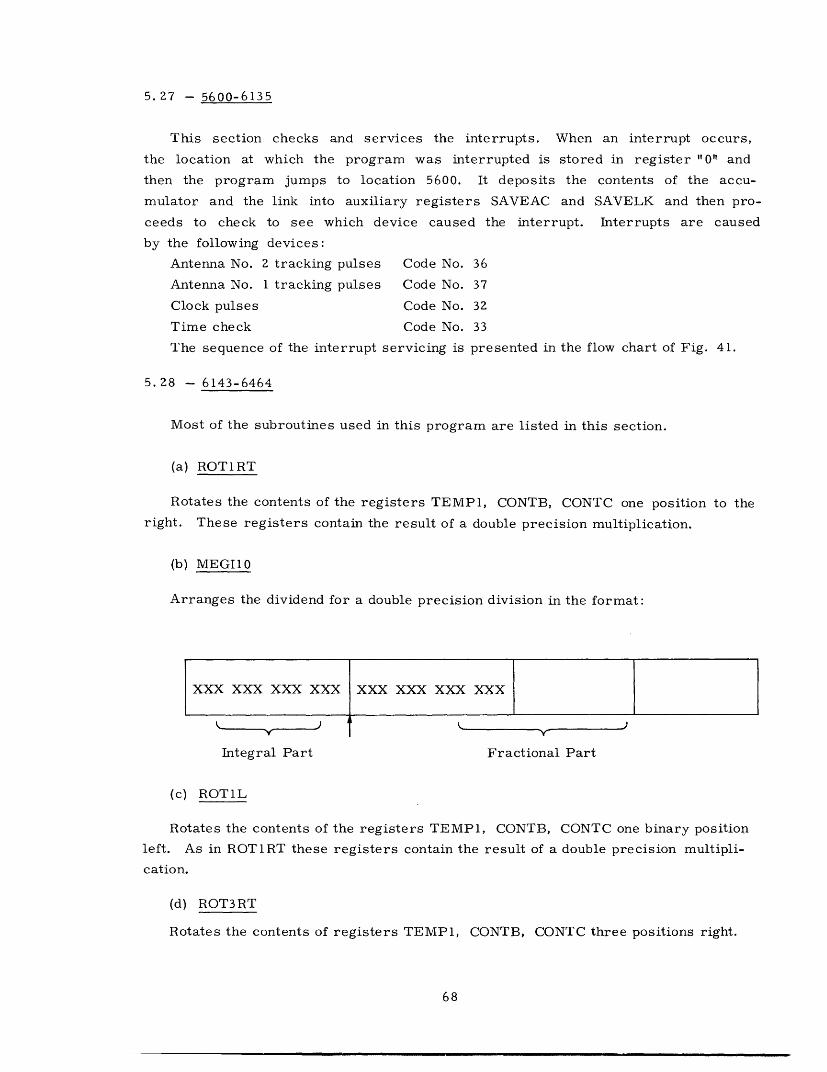
5.27 - 5600-6135
This section checks and services the interrupts. When an interrupt occurs,
the location at which the program was interrupted is stored in register "0" and
then the program jumps to location 5600. It deposits the contents of the accu-
mulator and the link into auxiliary registers SAVEAC and SAVELK and then pro-
ceeds to check to see which device caused the interrupt. Interrupts are caused
by the following devices:
Antenna No. 2 tracking pulses Code No. 36
Antenna No. 1 tracking pulses Code No. 37
Clock pulses Code No. 32
Time check Code No. 33
The sequence of the interrupt servicing is presented in the flow chart of Fig. 41.
5.28 - 6143-6464
Most of the subroutines used in this program are listed in this section.
(a) ROT1RT
Rotates the contents of the registers TEMP1, CONTB, CONTC one position to the
right. These registers contain the result of a double precision multiplication.
(b) MEGI10
Arranges the dividend for a double precision division in the format:
Integral Part Fractional Part
(c) ROT1L
Rotates the contents of the registers TEMP1, CONTB, CONTC one binary position
left. As in ROT1RT these registers contain the result of a double precision multipli-
cation.
(d) ROT3RT
Rotates the contents of registers TEMP1, CONTB, CONTC three positions right.
68
I-- I - - -- I �__I�
I

SAVE CONTENTS OF
ACCUMULATOR AND LINK
IS YESFLAGO YES
DEVICE No.36UP
NO tYES SEND A STEPPING PULSE TO HOUR
D \EVICE OF ANTENNA #1 AND INCREMENTTHE HOUR ANGLE OF ANTENNA #1BY THE PROPER AMOUNT
A B
NOOBSERVATION
OVER
YES
YESFLAG O YESDEVICE No.32
UP
NO
ISFLA O YES |PRINT OUT THE LOCAL CIVIL
VICE No.33 UP TIME
NO
RETURN TO LOCATION WHERE
THE INTERRUPT OCCURREDJ~~~~~~~~~~~~~~~~~~~~~RETURN TO LOCATION 1635
FOR NEW INTEGRATION CYCLE
Fig. 41. Sequence of interrupt servicing.
69
SEND A STEPPING PULSE TO HOUROF ANTENNA# 2 AND INCREMENTTHE HOUR ANGLE OF ANTENNA #2BY THE PROPER AMOUNT
BRING DISHES BACK TO INDEX
POSITION AND HALT THE
PROGRAM
INCREMENT THE CONTENT OF THE
TIME REGISTER BY THE CLOCK
PERIOD
l
"hIy
iIIJ
� ------- ICI---------�-- -- ---- II -------- -- ---U-II...-�-P-�.P-.· I-_�--_----.L_

(e) ROT3LF
Rotates the contents of registers TEMP1, CONTB, CONTC three locations left.
(f) TMINCR
Increments the present time by the clock period of 0. 2(1 + 0. 0027)/3600 hours.
(g) ROT6LF
Rotates a triple precision number stored in registers TEMP1, TEMP2, TEMP3 six
positions left.
(h) ROTZLF
Rotates the contents of registers TEMP1, CONTB, CONTC two locations left.
(i) PARA
Checks the sign of a number before rotating right.
(j) CRLF
Types carriage return and line feed.
(k) TYPEPT
Types a point (.).
(1) TYPE
Types any character when called.
5.29 - 6400-6463
The source hour angle and the u, v parameters are computed at a time cor-
responding to the center of the integration interval. This section calculates the func-
tions necessary for the computation of h, u, and v. These are: T/2, cos [( r/12Z)(T/2)]
and sin [( rr/lZ)(T/Z)], where T is the integration time.
5.30 - 6510-6524
The program begins at location 6510; then it proceeds to clear interrupt flags and
reset the timing circuits. After this has been done it jumps back to location 200.
70
--- _ _ _

VI. OBSERVATIONS
The interferometer has been operational since the beginning of October 1969. The
preliminary observations were made with a baseline spacing of 8 m. The eventual max-
imum spacing between the two antennas will be 100 m. At this time no other spacing
has been tried, primarily because of the persistent problem of interference. The nature
of this interference and the difficulties that it causes are discussed in section 6.2. The
data are presented in section 6. 4 and an interpretation is given in 6. 5.
The system in general worked quite well. We achieved most of the engineering goals
that we set out to reach. In view of the good phase stability, which was shown in Fig. 16,
we may say that this Ku-band interferometer is a successful prototype for interferomet-
ric observations at wavelengths less than 2 cm.
With the 8-m baseline length we observed and measured fringes from the Crab
Nebula, Cas A, and Cyg A. We did not detect 3C273 because interference limited the
integration time.
6. 1 OBSERVATIONAL PROCEDURE
The use of the PDP-8 computer made it possible to design the system so that its
operation was automatic. The input parameters for starting the observation of a source
have been explained in Section 5. 3. At the beginning of the observation they are typed
in the order listed there. Then the observer starts the clock at the prespecified minute
as explained in Section 5. 10. At this point the computer assumes control of the system
and the observation: It points the antennas, tracks the source, inserts the right com-
pensation delay, performs a least-squares fit on the interferometer output, and at the
end of the integration cycle punches out in binary form and prints out in decimal form
the source hour angle, the u, v components, the fringe components (a1 , a 2 ) and the gain
calibration constants. At the completion of the punch-out and print-out of data, the
program checks whether to continue integrating on the source or switch over to a cali-
bration source. The observer decides whether the calibration source is to be an off-
source position or a point source like 3C273 which can be used for flux calibrations.
While the program is cycling the observer cannot interfere with its operation except
when he wants to make a time-check. To do that he inserts a number into the switch
register of the computer and the program responds by printing out the local civil time
at which the command to do so is given. At the end of the observation the antennas are
brought back to the index position automatically.
6.2' INTERFERENCE: DIAGNOSTICS AND POSSIBLE SOLUTIONS
Since interference proved to be a very serious impediment, we feel that it is neces-
sary to explain its nature and suggest possible remedies. Its nature is such that it
appears only at the output of the correlator (see Fig. 17) and not at the detected IF out-
puts. The gain of the system is adjusted so that the peak-peak noise fluctuations at the
71
_ I_ _I �IF· III IIIII_-^L�III^I_-.· ill�--�� �tll�_------_i��

output of the correlator are less than ±4 V; the DC average, of course, should be zero.
Because of interference, this DC level varied from ±1 V at best to approximately ±15 V
at worst. At the fringe rates of approximately 0. 01-0. 02 Hz, which we get for the
present baseline separation (see Table 6), these DC level variations will destroy the
signal coherence for a weak source like 3C273 or upset the phase consistence for the
stronger sources.
The diagnostics of the interference may be summarized as follows.
1. It can be picked up in the IF strip; this implies that it is in the IF bandpass range
of 50-70 MHz. As a matter of fact, by means of a receiver we picked up 4 frequencies
in this range, two of which are television stations.
2. It is present when the klystrons are off, but is much stronger when they
are on. It is independent of the reflector voltage setting when the klystrons
are in lock, and is still there when the klystrons are out of lock. These diag-
nostics imply that this is not Ku-band interference and that it is getting in either
through the crystals or by amplitude modulation of the local oscillator or both.
To modulate the local oscillator it must be picked up by the L. 0O. power cables.
Filters were inserted at the end of these cables just before they go into the
klystron. By doing this, we corrected part of the problem but not all of it;
that is, before insertion of the filters the correlator DC level was dependent
on the setting of the reflector voltage when the klystrons were in lock. That
is not so any more.
3. The correlator DC level changes as much as 10 V when the antennas move with
respect to each other; during tracking the variations are more reasonable. This is to
be expected if the interference is IF and it is picked up by cables moving with respect
to each other.
From these diagnostics we may say that the interference enters the system through
the klystron cables or through a ground loop or both. In the first case it amplitude-
modulates the L. O., and in the second case it gets into the crystals or into the input of
the IF preamplifier.
Our study of the interference problem suggests both short-term and long-
term solutions to the problem. The short-term solutions that we propose are
as follows:
(a) Thorough checking of the system for ground loops.
(b) Rebuild all klystron cables so that they are completely shielded.
(c) Use fringe rotation technique; this can be accomplished by off-setting one of the
23 MHz reference signals (see Fig. 15), for instance, by 1 Hz.
The long term solutions that we propose are as follows:
(a) Move the antennas away from the interference.
(b) Improve the signal-to-noise ratio by using larger antennas and/or low-noise
front ends.
Because of time limitations, none of these proposals has been implemented.
72
_I _ � _ _ __

C)) C) c
Cd Cd 0
-"4l O O O
O 03. E X O
II 1 10 0
u0 0-~ 0a)c) 0 N o o
.0 LO CO OaH N Go o
',- C
C5do N N o N-
mC u C 0 NQ~ 1n-) -)C.
,,Dr-'.0
Lr.
06Go
N~
o0a'
.
'0't
C)
Cdc4-0
a)-4
S(1)0
z
-4
5-40a1)z
OU)oC)
-
a)(3)
UlCd
pq
a)
a)
opk
N
C1)-4
Cda)
b)
,-
Sq
cr
cli
0
V9
-V
(nr-
O~(1
0
C)
C)L)
.QCd
u
r-Cf,
rC
¢-
.QCd5-q)
~- 4 a)I-i
;O bu
0o
'.0
-0
Co
`0N-
N-
LO)
t
Nt
o
't
o
.)
o
C0oo
oC)C)
'
ao
to
r.
N
C)
0
N
N
Nu
C
o
C)
of.O)
o
C)
O
N.
r:
co
o00
06
OC)
N-
N,
t-oOr
N
oC)C)
00
co
co
C5
co
oo
rcn
LO
oocN
LC)
t
r
O
GoOOCC)
o0oo
oC)
o
NoC)
C)
N
Co
Go
r-co
o00,(1)
'0N
Go
(o
00O
'D
NaNC
C)
`0
C
oC;C)C)
C)od
N
oo
,)'0cn
o0
dq
o
C;
Co
o
N
C)
cNNNC)
C)
73
r -- - --
>I
-- -- .
-- -- -- --
,=-
___ _ �_�� �_I_ �����_� ���_

6.3 FRINGE RATES AND PROJECTED BASELINE LENGTHS
In Table 6 the fringe rates, projected baseline lengths, and resolutions for four
sources are listed. The hour angles at which these quantities are computed vary from
23 hours to 4 hours. This hour-angle range is most appropriate for observations with
the present baseline orientation, since the fringe rates are largest in this interval; the
faster the fringes, the less the effect of interference.
By studying Table 6 we notice that (a) The fringe rates are maximum at 4 h West
when the sources are near setting, and (b) Resolutions change very little over an obser-
vation period of 4 h; for instance, for the Crab Nebula they change less than 5%.
The best arrangement would be one in which the fringe rates are largest around
transit, since the pointing of the antennas is known best there. This arrangement can
be achieved with an E-W baseline. Our baseline is almost N-S, which we had to use
because of the shape and orientation of the building on which the antennas were placed.
The E -W baseline is actually the optimum orientation because with it a larger portion
of the u-v plane can be mapped than with an N-S baseline7; for instance, for the
Crab Nebula, with an E-W baseline, the projected baseline vector would change by at
least a factor of 2 in an observation interval of 4 h. Therefore it is clear why an E -W
baseline is strongly recommended in a future rearrangement of the interferometer.
6.4 INTERFEROMETER DATA
We shall present some of the interferometric data that we took on Cyg A, Cas A, and
the Crab Nebula. The data are listed in Tables 7-21. The quantity A is the fringe
amplitude in millivolts, and is the fringe phase in degrees. They were calculated
from the measured fringe components a (in-phase) and a 2 (quadrature). The fringe
amplitude is I/a 1 + a 2 , and the fringe phase is -tan- 1 a 2 /a 1.
The data were taken by integrating 12 min on the source and then 12 min off the
source. Interference was there all of the time; its presence is evident from the large
fringe components that we obtained on the off-source position. Because of the corrup-
tion of the data by interference, no information could be obtained about fringe visibility
variations with hour angle, and no accurate estimation of the baseline parameters could
be made.
In Figs. 42-49 we show vectorially the data listed in Tables 7-21. The amplitudes
of the vectors in each observation were normalized with respect to the maximum sig-
nal vector of that particular observation. In each figure we have drawn the signal and
noise vectors from two successive observations on the same source. This vector rep-
resentation makes it easy to discuss the behavior of the fringe amplitude and phase
during the course of a single observation and also to compare the phase variations for
two successive observations. No comparison, however, should be made of the ampli-
tudes obtained in the two successive observations, because of the way in which they were
normalized.
74
I _

90
"I
NN"1-NIY
I
SIGNAL VECTORS FROM TABLE 7
NOISE VECTORS FROM TABLE 7
SIGNAL VECTORS FROM TABLE 8
NOISE VECTORS FROM TABLE 8
Fig. 42. Vector representation of data in Tables 7 and 8.
Table 7. CYG A -October 12, 1969.
HorON OFF
Angle A (mV) (deg) A (mV) (deg)
23. 57 91 -150
0. 03 39 114
0. 2 13 5 157
o. 64 50 -6
0. 7 9 152 150
1.25 86 -105
1. 4Z 151 -153
i. 86 68 -90
Table 8. CYG A--October 16, 1969.
HorON OFF
Angle A (mV) (P(deg) A (mV) ~ (deg)
1 . 56 48 -355
0. 95 18 119
1. 07 83 0
1.46 16 -35
___
I -, ---- - -------- ·*- -- -----------·---------------------------- -----·-
\1- - _-- - - --
i
75

90
-v
00
ABLE 9
ABLE 10
BLE 10
Fig. 43. Vector representation of data in Tables 9 and 10.
Table 9. CAS A - October 21, 1969.
Table 10. CAS A -October 26, 1969.
Hour ON OFFHourAngle A (mV) c (deg) A (mV) 1 (deg)
3.37 52 23
3.80 20 -3
3.90 69 -2
4.34 31 -167
4.44 38 -32
4.86 20 70
76
ONHourAngle A (mV) $ (deg)
2.38 89 140
Z.70 82 50
---------�II

,9 /, / /
/
I 900
-w7/,
///
SIGNAL VECTORS FROM TABLE 11
-------- NOISE VECTORS FROM TABLE 11
SIGNAL VECTORS FROM TABLE 12
-.- *- NOISE VECTORS FROM TABLE 12
Fig. 44. Vector representation of data in Tables 11 and 12.
Table 11. CAS A-October 30, 1969.
Hour ON OFFAngle A (mV) P (deg) A (mV) ' (deg)
3.29 56 128
3.72 15 109
3.79 50 46
4.22 28 10
4.29 50 111
4. 71 16 120
Table 12. CAS A-November 19, 1969.
Hour ON OFFAngle A (mV) 1 (deg) A (mV) q (deg)
1.01 61 -122
1.55 27 38
1.69 116 -152
2. 16 29 90
2.3 124 44
2.79 49 -157
77
_ oO
111 "-�'"��1-�"1-�'�1-�I�-I`^ - 1�11----�-

90o
-
00
SIGNAL VECTORS FROM TABLE 13
------ NOISE VECTORS FROM TABLE 13
SIGNAL VECTORS FROM TABLE 14
NOISE VECTORS FROM TABLE 14
Fig. 45. Vector representation of data in Tables 13 and 14.
Table 13. CAS A- December 3, 1969.
Hour ON OFF
Angle A (mV) 1 (deg) A (mV) ' (deg)
1.17 22 166
1.60 6 100
1.70 36 147
2.14 7 -51
Table 14. CAS A--December 5, 1969.
Hour ON OFF
Angle A (mV) 4 (deg) A (mV) c (deg)
1.28 64 170
1.73 40 126
1.83 53 168
2. 27 4 -45
78
i

900
I A//l//'An' dv
X~~~ _ ..,1/10/
-qI I
SIGNAL VECTORS FROM TABLE 15
-------- NOISE VECTORS FROM TABLE 15
SIGNAL VECTORS FROM TABLE 16
NOISE VECTORS FROM TABLE 16
Fig. 46. Vector representation of data in Tables 15 and 16.
Table 15. CRAB NEBULA - October 24, 1969.
ON OFFHourAngle A (mV) 4) (deg) A (mV) 4 (deg)
0. 8 93 86
1.23 10 -79
1.31 111 144
1.75 6 -90
Table 16. CRAB NEBULA- October 24, 1969.
ON OFFHourAngle A (mV) 4 (deg) A (mV) 4 (deg)
1.91 107 30
2.36 10 -6
2.43 158 +93
2. 88 34 -126
2.96 100 32
3.4 10 -122
79
le.
Lm
-· -- ·---·------ ---- -� -�-·-L-�--�ll- -1_-11--_1� �11�-111�_�·�
1�IIIIIIIIIIIII

900
SIGNAL VECTORS FROM TABLE 17
NOISE VECTORS FROM TABLE 17
SIGNAL VECTORS FROM TABLE 18
- NOISE VECTORS FROM TABLE 18
Fig. 47. Vector representation of data in Tables 17 and 18.
CRAB NEBULA -October 28, 1969.
Table 18. CRAB NEBULA-October 30, 1969.
A(mV)
ON
150
21
OFFHourAngle A (mV)
701. 52
1.96
2.05
2.49
2. 57
3.00
91
85
-156
174
42
25
1 57
136
90
.,
Table 17.
ON OFFHourAngle
0.9
1. 34
1.41
1.86
1.93
2. 38
2.45
2. 90
A (mV)
75
106
109
60
4 (deg)
180
-124
-46
93
A (mV)
57
28
28
26
s (deg)
-75
-51
140
101
80
.
~ (deg) Q (deg)
----- . . .
----- ------ �------ -----
-- __
1

x,
N
////
//
900
SIGNAL VECTORS FROM TABLE 19
.------- NOISE VECTORS FROM TABLE 19
SIGNAL VECTORS FROM TABLE 20
NOISE VECTORS FROM TABLE 20
· - _
I
Fig. 48. Vector representation of data in Tables 19 and 20.
Table 19. CRAB NEBULA-December 9, 1969.
Hour ON OFF
Angle A (mV) 4 (deg) A (mV) 4 (deg)
1.6 138 -17
2.01 42 -50
2. 16 141 16
2.6 39 -6
Table 20. CRAB NEBULA -January 9, 1970.
81
Hour ON OFF
Angle A (mV) 4 (deg) A(mV) 4 (deg)
1.00 111 -87
1.05 42 -139
1.6 131 -51
2. 01 33 180
2. 12 109 8
2. 57 26 173
2. 67 138 140
3. 13 23 45
3.78 66 -124
4. 22 20 53
_ - 0· _ l In·__ _
-- ~~~^- II-----~~~~-~~ 1 1~~~~~^"-~~~1"~~" 11.~~1"----`~~~~ lll~~-(~~YI1-· --1 ---
i

90°
ABLE 21
BLE 21
Fig. 49. Vector representation of data in Table 21.
Table 21. CRAB NEBULA -January 11, 1970.
82
ON OFFHour
Angle A (mV) 4 (deg) A (mV) . ) (deg)
0.74 109 58
1.2 7 -8
1.84 57 -171
2.3 5 -11
2.4 81 -147
2.85 26 43
2.95 54 -162
3.4 18 90
3.5 84 -85
3.96 21 -17
4. 01 60 -162
4.5 22 -80

From examination of Figs. 42-49 we may make the following remarks:
(a) The signal vectors are consistently larger than the noise vectors.
(b) The amplitude of the signal vectors rarely varies more that 50% in the course
of an observation.
(c) The phase of the signal vectors does not vary more than 45 ° for most of the
observations.
6.5 INTERPRETATION OF THE DATA
The presence of interference makes it impossible to extract much information from
our data. We shall give a short discussion of the methods that can be used to estimate
the fringe visibility amplitudes and the uncertainties in the baseline parameters.
6. 5. 1 Estimated Fringe Visibility for the Crab Nebula
Of the sources observed, the Crab Nebula gave us the most consistent fringes. The
fringe amplitude variations were within 20-30% in most cases. To obtain the fringe vis-
ibility amplitude experimentally, we would have to measure A, the fringe amplitude of
a point source such as 3C273, with the same system gain as in the measurement of
the Crab Nebula fringe amplitude, ACrab. Then the fringe visibility, IV , would be
|VIlCb = Crab/ 3C273
SCrab/S3 C273
where S is the flux.
We did not measure any fringes from 3C273; therefore, experimental calculation of
the fringe visibility amplitude for the Crab Nebula was impossible. We could, however,
obtain an estimate of the fringe visibility amplitude and phase over the useful hour-angle
range. We shall do that for a one-dimensional source of uniform brightness temper-
ature with a width of 4 minutes of arc. We make use of Eq. 30, and after simplifi-
cation and integration we obtain
sin TruXV uX (84)iTUX
c
For Xc = 4 minutes of arc and the values of u given in Table 6 we find that V = 0.6 over
the 4-h observation interval. The phase is zero because we assumed a uniform bright-
ness temperature distribution. In reality, the distribution is not uniform; therefore,
the fringe visibility amplitude is not 0. 6, and the phase is not zero. Yet both remain
constant over the observation interval, because of the small changes in u.
6. 5. 2 Baseline Parameters
To estimate the baseline parameters one should measure the phase of a point
source for an interval of 2 h. Actually, for our present baseline length and orientation,
83

the Crab Nebula can be used for estimating the baseline parameters, since its intrinsic
phase remains essentially constant over an interval of 2 h. Interference, however, cor-
rupted the consistency of the fringe phase that we measured; thus, the Crab Nebula can-
not be used, at this time, for the estimation of the baseline parameters.
The baseline parameters used in our observations were obtained from geometrical
measurements. The accuracy of these measurements cannot be depended upon for inter-
ferometric work; therefore, we can safely say that part of the phase inconsistency in
our data is due to baseline errors. This is suggested in one set of our data; specifically,
examination of the data in Table 20 reveals that the fringe vector seems to be changing
phase in almost consistent fashion. We shall assume that these changes are due
entirely to errors in the baseline parameters and proceed to demonstrate the technique
by means of which these parameters can be obtained exactly.
The phase error, A, attributable to errors Ad, ADL, and AH L in the baseline
length, declination, and hour angle, respectively, is given by
at ap apa d Ad + AD + H AH, (85)
L L
where
= 2Tr (sin 6 sin DL + cos 6 cos D L cos 2 (HL-h),
and hs is the source hour angle.
Then
A = 2rrd (sin 6 sin DL + cos 6 cos DL cos (H -h)-d
+ 2r d (sin 6 cos DL -cos 6 sin DL cos 2 (HL-h)) 57
- 2rrd (cos 6 cos DL sin 12 (HL-hs)) 12 H (86)
where ADL is in degrees, and AH L is in hours.
If we now separate the constant and time-variant terms, we obtain
AD \is = 2r d sin 6 sin D d + sin 6 cos D L)(cos Ld L 7
+ 2 os 6 cos DA cos sin D AD CosX ( 6 L d L 57 cos / 2 (HL-h )
- 2 X (cos 6 cos DL 12 AHL) sin 12 (HL-hs). (87)X L 12 L~~~~~~~~~~~~~~~~8) T
84

Equation 87 can be written
A = A(Ad, ADL) + B(Ad, ADL) cos T2 (HL-h) - C(AHL) sin 12 (HL-hs).
Thus, by measuring the phase over 2 h, we can compute the coefficients A, B and C;
then we can solve for Ad, ADL, and AHL.
Another method that is not sensitive to the instrumental phase and to the intrinsic
phase of the source is to differentiate A4 with respect to h . The derivative is called
6(Af) and corresponds to the difference between 2 successive phase measurements,
provided the hour angle change is reasonably small.
If we differentiate Eq. 86 with respect to h s , we obtain
(A) = 2w cos 6 cos DL sin 12 (HL-hs)( Ahs) d
-i (L d. cs s ihs)(·- - ADL- 2w cos 6 sin DL sin (HL-h)( 12 Ah 57
[ d wz L s1 w )]ADL
2w cos 6 cos DL cos 12 (HL-h)( ]-Ahs) AH LX L 12 L s 12 sj12 L'(88)
To compute Ad, D L, and AHL, we must form a system of 3 equations by meas-
uring 3 successive phase changes; each measurement is separated from the next by a
reasonable hour interval. From the data in Table 20 we can form Table 22, which shows
the hour angles at which the measurements were taken, the hour angle intervals, and
the phase changes.
Table 22. Parameters used to solve forobtained from Table 21.
If we use Eq. 88 and the values given in Table
of equations:
Ad, ADL, and AHL,
22, we obtain the following system
85
Source Hour Hour Angle PhaseAngle Change Change
(h) (h) (deg)
h Ah 6((A)S S
1.3 0.6 36.5
1.86 0. 52 58. 5
2.4 1 0.55 132I _ _ -

30. 9Ad-3. 88ADL -47. 2AH L = 0. 68L
29. 4Ad - 3.69ADL - 3 2 . 4AHL = 1. 02
33. 15Ad - 4. 17AD L -24. 9AH L = 2. 30
The solution of this system yields
Ad = 1101 m, ADL = 8045 ° , AH L = 0. 056 h.
These values are not realistic. We then proceed to solve the first two equations of the
system by setting Ad = 0. This assumption is reasonable because the baseline length
was measured rather accurately. Then the solution of the new system gives
ADL = -0. 55 ° = -33 minutes of arc.
HL = 0. 03 h = 27 minutes of arc.
These uncertainties in the baseline declination and hour angle are quite possible.
86
__ �

VII. CONCLUSION
When work began on the Ku-band interferometer three years ago, there was not much
to it except two antennas, an available roof, and our determination and enthusiasm.
Today, we have a working prototype for interferometric work at a wavelength of 1.75 cm.
With some more work, especially on the problem of interference, and with the improve-
ment of the signal-to-noise ratio, we believe that this interferometer will add to our
knowledge of some discrete radio sources like the Crab Nebula, Venus, Cas A, Cyg A,
and possibly some HII regions.
Possible solutions for the interference problem have been discussed in section 6.3.
The signal-to-noise ratio can be improved by using larger antennas or low-noise front
ends as parametric amplifiers, or both. As we have pointed out, in any future rear-
rangement of the interferometer an E-W baseline is strongly recommended.
With the discovery of strong H20 sources, use of the interferometer for H20 line
work becomes possible. For instance, at the maximum baseline spacing of 100 m the
interferometer will be able to resolve features separated by 10 S of arc. As well as rel-
ative position measurements, we can study the atmospheric phase effects at different
baseline spacings by monitoring H20 sources. The conversion of the continuum Ku-band
interferometer to an H 2 0 spectral-line interferometer would be simple, since we already
have two phase-locked front ends. For the back end we recommend 30 channels each
with a 20-kHz bandwidth. This would give us a total bandwidth of 600 kHz. Each channel
would consist of a FET multiplier. The H20 line sources have features that spread over
a bandwidth of 10 MHz. Thus, a synthesizer would have to be used as a second local
oscillator. Real-time data processing for all 30 channels will be feasible if we add an
arithmetic element to the PDP-8 computer.
87

APPENDIX A
Circuits
We shall now show the circuits that were used to generate the 28-MHz and 300-MHz
local-oscillator synchronizing signals of the Ku-band interferometer. The 28-MHz
signal is generated from the 1-MHz standard in two steps: 1-7 and 7-28. Step-recovery
diodes were used to generate the harmonics (see Figs. A-1, A-2 and A-3). The 300-MHz
signal is generated from a 100-MHz crystal oscillator (see Fig. A-4). Figure A-5
shows the circuit of the 300-MHz Class B power amplifier.
OUT
Fig. A-1. Harmonic multiplier (1-7 MHz).
88
INPUT
__ __

41 I
$-I
N
0)t Z S-c 0,,o -
.1- - QP: ·H
14~ (1).H '
,A .1
0z
-T
I-F-_ (
I -
rl-
89
NI
D
0
I'
0o
T0
N
cocqt-
0)
-i
4-
1-4
rz-,
OIcI
Z -
m
I
I

* )
I
oO
c~ ~
E
U)
N I0. -
rTCd
. ()
bb .,.qr-. -
U a_ >
I"'
90
0-
w
< OD _
Z-Z (D
\ \N _
v,
I
LL1
8o
m
8->

APPENDIX B
Computer Organization
The PDP-8 4K memory is divided into 32 pages. Each page consists of 128 regis-
ters. The registers of page "0' can be addressed from any other page directly; indirect
instructions must be used when addressing a register of a certain page from a register
of another page.
The most important instructions are presented and explained as follows.
INSTRUCTION
AND
TAD
ISZ
DCA
JMS
JMP
IOT
NOP
CLA
CLL
CMA
CML
RAR
RAL
RTR
RTL
IAC
SMA
SZA
SPA
SNA
SNL
SKP
OSR
HLT
CIA
LAS
STL
ION
IOF
CODE FUNCTION
0000
1000
2000
3000
4000
5000
6000
7000
7200
7100
7040
7020
7010
7004
7012
7006
7001
7500
7440
7510
7450
7420
7410
7404
7402
7041
7604
7120
6001
6002
logical and
2's complement add
increment and skip if zero
deposit and clear Accumulator
jump to subroutine
jump
in/out transfer
no operation
clear AC
clear link
complement AC
complement link
rotate AC and link one location to the right
rotate AC and link one location to the left
rotate AC and link two locations to the right
rotate AC and link two locations to the left
increment AC
skip on minus AC
skip on zero AC
skip on plus AC
skip on non-zero AC
skip on zero link
skip
inclusive OR, switch register with AC
halt program
complement and increment AC
load AC with switch register
set link to 1
interrupt on
interrupt off
91
.I , ._

The DEC subroutines used in conjunction with the main program are the following.
SICONV single precision decimal-to-binary conversion andinput ASR-33; signed or unsigned
DMUL double precision multiplication
DUBDIV double precision division
DSIN double precision sine
DCOS double precision cosine
BPUN binary punch
DECPRT unsigned decimal print, single precision
SSPRNT signed decimal print, single precision
92

AP PE ND IX C
Program Language
The program was written in machine language and is listed in the following pages.
On the first page the user' s symbols are defined. The program uses up 29 out of the 32
computer pages that were defined in Appendix B. Although efficiency was one of our
concerns, it was not the primary one. In a new edition of the program use of the
Marco-8 machine language is recommended instead of the PAL-III machine language
that we used.
93
I I-

SYMBOLS
ADOES 0160ALFLG 0A20ALPNS 0033ARCHI 16.354H 3742ARHI 166qARXI 61700 4141HASL 0613HASLD 6647RINP 4451BP'JN 4490SPUNCH 5365RSLAMD 1157C 4142CHKARG 3306C0ARG 8023CRS 4476CLARCD 5267CHINTG 0140CM3303 0L25CNANO 5555CNTDEV 0144CNTIN 0370CNTM2 0022CNTM3 0024CNTM6 010CNTN 0121COMPE 0124COMPEN 5447CONPNT 5406CONSTO 1357CONSTI 0105CONST2 1355CONST3 1361CONST4 017CONSTS 1363COrST9 0112CONSIO 2165CONTB 0055CONTC 0056CONTD 857CONV R 0570COSDDE 1166COSDIF 2360COSGAM 2770COSIMI 0132COSMDT 6460COSTI 8126CRLF 6344CRIFP 0166CTRI 4503CYCL36 1562CYCL37 1537CYCL43 6473CYCL4s 5417C200 4504D 4143DATA 2467DATAC 3167DAYS 6610DAYX24 5761DAY24 8537DCOS 5060DCOSP 0076DCPRNT 0170DC43 1370DC45 1367DDIVP 08847DECAL 6663DEC8 6643DECL 6633DECLB 6667DECPNT 1366DECPRT 50880DECS 6637DECI 6727DECIZ 6711DEC12 200DECI2P 5756DEC2 6732DEC2Z 6715DEC43 6464DEC43P 5768DEC4s 54leDEC4SP 5757DEGR 8564DEGRS 8274DELTS 6665DIVND4 4335DIXE 0157DMEGA 3255DMINS 0277DIMUL 4080DMULTP 8854DSECS 8317DSIN 3400DSINP 0877DU0DIV 4208DIR8 5561EN 1161ENTER 8366EX 3166FA 4501FEREI 0572FERE2 0573FINADR 0164FLGCHK 560088FLGCK 0171FRNL 5334FREU 0766GETI 0757GET2 1523GET3 57516ET4 5752
*443. '331n
r'334.1 735*^SI - J
44C 451
4333I 1?4'I437p 771
347 4733LIll I 7 I
6347 3324
6.43744 57 1Hq34 673
-L 63343.07 613
I 7i a
3l>4 33 317t''1 1,.
IcO I T17 !34LF 2364
atLI P 1nF Ga 434s2"'GI 337"IF IR 'I SL,3773453GavT 1 H
Il)l 774oL3 17233NS 3333PI ,T 1R^?
XS713 945397773 5247U13U73 3465
2 ? 237333? 453
4 1137_ 6311
54 4477
N l:F Il41
PFGaTF 1?
5l03N 5367
5317 3756
637P 3173
4334 0574
713? 17
744332 30137
4P46 1 257
pn6r3 337
pAGr 4 '772
pllo? S l73
PLOT 4440PNTI 6456POINTP 1053POSARG 3334POSD 114PROSOI 0051PROSO2 0052PROS03 0053PT256 6362PULSE 0122PUJLSEP 5431PUN 4471PUNCT 0167PJNL 4417PUTI 2372P'T IP 1162PUT2 3373PUT2P 1163PUT, 0374PUT3P 1164PtJT4 0760PUT'P 1365RACAL 0030RACL 6617RAS 6623REDIVD 3137RESET 1036RESETP 5407ROTP 5355ROTIL 0060ROTILF 6200ROTIR 08146ROTIRT 6143ROTL 0147ROT2LF 6314ROT3L 0102ROT3LF 6231ROT3R 0078ROT3RT 6212ROT6L 0116ROT6Lr 6275SAVEAC 5736SAVERL 2572SECS 0240SICON 0371SICONV 4600SIDHR0 0071S IFTL 3350SILLY 6136SILY 1717SINDDE 0103SINDIF 2362SINGM 2772SINI5 I 0134S INMDT 6462SINTI 0130SL6 4507SL7 4506SPRNT 53665R32 5704SR33 5706SR6 5623SR37 5640SSADDR 4554SSBOX 4561SSCNT 4562SSCNTR 4560SSCON 4564SSMNS 4557SSOUT 4545SSPLUS 4556SSPRNT 4510SSTWO 4555SSVAL 4563SSXYZ 4526STDECL 6654STDECS 6657STEPI 0764STEPIP 5747STEP2 0762STEP2P 5742STIME 1515STORE 0142STPNT 2133SUMPEL 6743SIJI 0150SUN2 0153TEMPO 0003TEMPI 0005TEMP2 0006TEMP3 8007TEPI 4505TIME 0825TMINC 0115TMINCR 6250TOPOS 0156TRANPR 5725TRANSF 1721TRANSX 0067TRIA 08162TS 1713T'JOPI 3364TYPE 6363TYPEPT 6355TYPO R16SVEL 0770VI 6741WAIT 1643WAITST 1604WLONG 6675YU 6737DUBD IV.420DD1VN44335DMUL 4000
=141C =4142O *4143SICONV4600DECPRT 5000DS IN=3400DC0005 5060ARG-3742
94
__
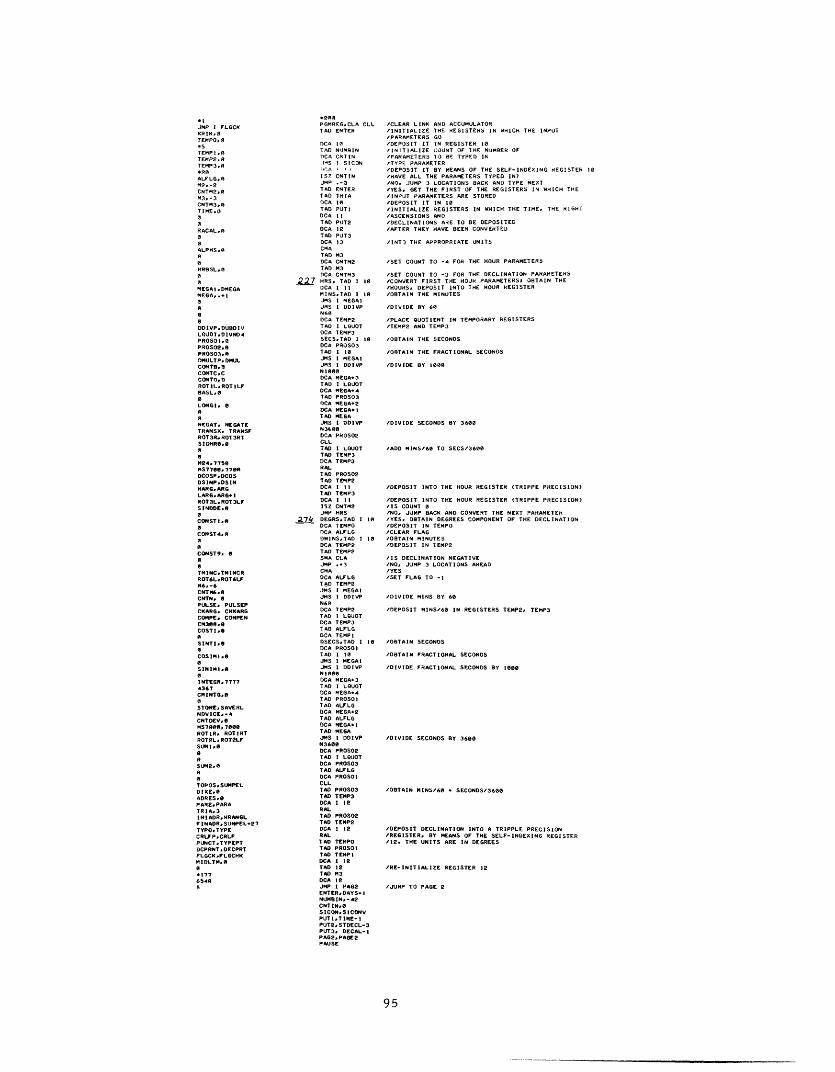
PGtREGCLA CLLTAD ENTER
OC 10ITAD NUN1INOCA CNTIN.IS I SICON
IS7 CNTINJMP .-3TAD ENTERTAD TRIADCA INTAD PUTtDCA 11TAD PUT2DCA 12TAD PUT3DCA 13CHATAD M3DCA CNTM2TAD M3DCA CNTH3
227 RS, TAD I 1BDCAI 11MINS.TAD I I1.JMS I MEGAIJNS I DDIVP
DCA TEMP2TAD I LUOTDCA TEMP3SECSTAD I 1DCA PROSO3TAD ItoJMS I EGAlJMS I DDIVPN IBDCA NEGA-3TAD I LOUOTDCA MEGA-4TAD PROSO3DCA EGA*2DCA MEGA TAD MEGA.MS I DDIVPN36G~DCA PROS02CLLTAD I LOUOTTAD TEMP3DCA TEMP3RALTAD PROS02TAD TEMP2DCA I1TA) TEMP3DCA I III5Z CNTM2
JMP HRS74 DEGRS.TAD I A
DCA TEMPO'CA ALrLGDMINS,TAD I 10DCA TEMP2TAD TEMP?SNA CLAJnP .*3CMADCA ALFLGTAD TEMP2JMS I EGAIJnS I DDIVPN6DCA TEMP2TAD I LQUOTDCA TEMP3TAD ALFLGDCA TEMPIDSECS.TAD I 10DCA PROSOTAD I 10JMS I EGAJMS I DDIVP
DCA MEGA+3TAD I LUOTDCA MEGA-ATAD PROSOITAD ALFLGDCA MEGA.2TAD ALFLGDCA MEGA.ITAD EGAJMS I DDIVP
DCA PROSO2TAD I LUOTDCA PROS03TAD ALFLGDCA PROSOICLLTAD PROSO3TAD TEMPSDCA I ISRALTAD PROS02TAD TEMP2DCA I 12RALTAD TEMPOTAD PROSOITAD TEMPIDCAI 12TAD 12TAD N3DCA 12JMP I PAG2ENTERDAYS-INUNMIN,-42CNTIN,.SICON. SICONVPUTI.TIME-IPUT. STDECL-3PUT3. DECAL-IPAG2, PAE2PAUSE
(CLEAR LINK AND ACCUMULATOR(INITIALIZE THE REGISTERS IN HICH THE INPUT(PARAMETERS GO(DEPOSIT IT IN REGISTER IO(INITIALIZE COUNT OF HE NUMBER OF(PARAMETERS 1 aBE TYPED IN'TYPE PARAMETER'DEPOSIT IT BY MEANS OF THE SELF-INDEXING REGISTER 10/HAVE ALL THE PARAMETERS TYPED IN?(NO, JUMP 3 LOCATIONS SACK AND TYPE NEXT/YES. GET THE FIRST OF THE REGISTERS IN WHICH THE(INPUT PARAMETERS ARE STORED(DEPOSIT IT IN IA/INITIALIZE REGISTERS IN HICH THE TIME, THE RIGHT/ASCENSIONS AND/DECLINATIONS ARE TO BE DEPOSITED/AFTER THEY HAVE BEEN CONVERTED
(INTO THE APPROPRIATE UNITS
/SET COUNT TO -4 FOR THE HOUR PARAMETERS
/SET COUNT TO -3 FOR THE DECLINATION PARAMETERS(CONVERT FIRST THE HOUR PARAMETERSI OBTAIN THE(HOURS, DEPOSIT INTO THE HOUR REGISTER(OBTAIN THE MINUTES
(DIVIDE BY 6A
(PLACE UOTIENT IN TEMPORARY REGISTERS/TEMP2 AND TEMP3
(OBTAIN THE SECONDS
(OBTAIN THE FRACTIONAL SECONDS
(DIVIDE BY 100
(DIVIDE SECONDS Y 36OS
(ADD NlINS60 TO SECS(3600
/DEPOSIT INTO THE HOUR REGISTER (TRIPPE PRECISION)
/DEPOSIT INTO THE HOUR REGISTER TRIPPE PRECISION)/IS COUNT /NO, JUMP BACK AND CONVERT THE NEXT PARAMETER(YES, OBTAIN DEGREES COMPONENT OF THE DECLINATION/DEPOSIT IN TEMPO/CLEAR FLAG/OBTAIN MINUTES(DEPOSIT IN TEMP2
/IS DECLINATION NEGATIVE(NO. JUMP 3 LOCATIONS AHEAD/YES(SET FLAG TO -1I
/DIVIDE MINS BY 60
/DEPOSIT MINS60 IN REGISTERS TEMP2. TEMP3
(OBTAIN SECONDS
/OBTAIN FRACTIONAL SECONDS
(DIVIDE FRACTIONAL SECONDS BY 1I00
/DIVIDE SECONDS BY 3600
(OBTAIN MINS608 * SECONDSO3600
(DEPOSIT DECLINATION INTO A TRIPPLE PRECISION(REGISTER. BY MEANS OF THE SELF-INDEXING REGISTER/12. THE UNITS ARE IN DEGREES
/RE-INITIALIZE REGISTER 12
/JUMP TO PAGE 2
95
elJMP I FLGCKKRI.0TEMPO, .5TEMP I.TEMP. 0TEMP3 *20ALFLG.M2. -2CNTMH. AM3, -3CNTM3.TIME.O
RACAL,.B
ALPHSB
A
HRBSL ,N
MEGAI DMEGAMEGA,. I
DDIVP.DUBDIVLOUOT.DIVNODPROSO I.0PROSO2, PROSO3.OMULTP, D"ULCONTBS,CONTC,CCONTO.DROT IL ROTILFBASL.
LONGI, 0
NGAT. NEGATETRANSX. TRANSFROT3R ROT3RTSIDHR.0
eJa,2775AnS77e. A770DCOSPDCOSDSINP.DSINRAN GARC LARG ARG
ROT3L.ROT3LFSINDDEs0
CONST I, ACOHSTA, 0
CONST9,
TMINC.TMINCRROT L,ROT6LFM6.-6CNTM6 .CNTN. NPULSE, PULSEPCKARG, CMKARGCOMPE, COMPEN
COSTIA
SINTI.9
COSIl .e
SINIMI.
INTEGR.77774367CMINTG.e
STORESAVERLNDVICE.-4CNTDEV,.MST e~,?$e7ROTIR. ROTIRTROT2LROT2LFSUMI.S
ASUNS. N
TOPOS.SUNPELDIXE.ADR ES.PARE. PARATRIA,3INIADRHRRANLFINADRSUNPEL+27TYPO,TYPECRL PCRLFPUNCT.TYPEPTDCPRNT.DECPRTFLGCK .FLGCHKMI DLTN,.
a177654a
--- ------ - ------1 1·__ _

PAGE2.OCA MEGAATAD 1 I2DCA MEGA*3TAD I 12DCA MGCA2
DCA MEGA-ITAD MEGAJMS I DDIVP /DIVIDE DECLINATION (IN DEGREES) BY I80DIR~nCA TEMPITAD I LOQOTDCA TEMP2JMS I DMULTP /ULTIPLY UOTIENT BY P (if)TEMPIPAlDCA TEMPIJmS I ROTILDCA I 13 /DEPOSIT DOUBLE-PRECISION DECLINATION (IN RADIANS)TAD I CONTB 'BY MEANS OF THE SELF INDEXING REGISTER IJOCA I 13IS? CNTM3 /HAVE ALL THt DECLINATION COORDINATES BEING CONVERTEOJMP I DEGR /NO, JUMP BACK AND CONVERT THE NEXT
7 TAO I 10 /YES. OBTAIN THE METER COMPONENT OF THE BASELINEDCA BASLTAD I /OBTAIN THE CENTIMETER COMPONENT OF THE BASELINEJMS I EGAlJMS I DDIVP 'DIVIDE 100lNIT'DCA TEMPITAD I I /OBTAIN THE MILLIMETER CONPONENTJMS I MEGAIJMS I DDIVP /uIVIDE BY 1B00NIRBMTAD TEMPIOCA BASL I
_4' TAD FEREI 'OBTAIN THE GREENWICH SIDEREAL TIME AT JANUARY OCA 1JMS I TRANSX /CONVERT IT INTO HOUR UNITS AND DEPOSIT ITTAD PROS03 /IN THE TRIPPLE PRECISION REGISTER SIDHR0DCA SIDMRo*2RALTAD TEMPOTAD PROSO2DCA S.IDHR0IRALTAD PHOSOIDCA S IDHRJMS DAY24 GO TO SUBROUTINE DAY24TAD TIME /OBTAIN GREEWICH CIVIL TIME (GCT) AND MULTIPLY IT BYDCA MEGA-2 'THE CONVERSION FATOR C9.57/3600TAD TIME+IDCA MEGA-3TAD TIME2DCA MEGA+4OCA MEGA*ITAD MEGAJMS I DDIVP IDEVIDE BY 36M0N7R20DCA PROSOITAD I LOUOTDCA PROSO2JMS I DM.JLTP /MULTIPLY BY 9.857CON VERPROSOI /PRODUCT REGISTERS B AND C CONTAIN GCTRCICLLTAD TEMP3 /ADD GCT+(DAYS)*24*CITAD TIME+2DCA TEMP3RALTAD TEMP2TAD TIME+IDCA TEMP2PALTAD TEMPITAD TIMEDCA TEMPI 'REGISTERS TEMPI. TEMP2. TEMP3 CONTAIN THE AOVE SUMCLLJMP I TO7215STO7215. 7215*522TAD FERE2 /OBTAIN THE LONGITUDE COMPONENTSDCA IAJMS I TRANSX /CONVERT THEM INTO A SINGLE UNIT (HOURS) NUMBERTAD PROSO3 /CONTAINED IN REGISTER LONGI.1. *2DCA LONGI+2RALTAD TEMPOTAD PROSO2DCA LONGI*IRALTAD PROSO IDCA LONGIJMP I PAG3 /JUMP TO PAGE 3DAY24.0 /MULTIPLY THE NUMBER OF DAYS THAT HAVE ELLAPSEDTAD I NDAYS 'SINCF JAN. 0 BY 249.857/36009.857/150DCA MEGA2DCA MEGA+3DCA MEGA4DCA MEGA-I /PUT THE NUMBER OF DAYS IN THE DIVIDENDTAD MEGAJMS I DOlVP 'DIVIDE BY 150N226DCA TEMPITAD I LQUOTOCA TEMP2JMS I DMULTP OMULTIPLY OUOTIENT BY 9.857TEMPICONVERDCA TEMPI /DEPOSIT CONTENTS IN REGISTERS TEMPI. TEMP2TAD I CONTAB AND TEMP3DCA TEMP2TAD I CONTCDCA TEMP3JMP I DAY24DEGR.DEGRSNDAYS.DAYSN7020-00702NTA00A
CONVER, 11666416FEREI .HRJAN- IFERE2. WLONG-IN226 .002260PAG3. PAGE3PAUSE
*600PAGE3.CLLTAD LONGI.2 /NEGATE LONGITUDECIADCA PROS03RALnCA KRIKTAD LONGI-ICMATAD KRIKDCA PROS02RALOCA KRIKTAD LONGICMATAD KRIKDCA PROSOICLLTAD PROS03 /OBTAIN (GST-LONGITUDE) AND DEPOSIT ITTAD TEMP3 /IN THE TRIPPLE PRECISION REGISTER TIME. *1. -2DCA TIME-2RALTAD PROS02TAD TEMP2DCA TIME-IRALTAD PROSOITAD TEMPIDCA TIMETAD TIMETAD M24 /OBTAIN THE DIFFERENCE (TIME-24)SPA /IS DIFFERENCE POSITIVE?JMP.*2 /NO, JUMP 2 LOCATIONS AHEADDCA TIME /YES, DEPOSIT DIFFERENCE IN THE REGISTER TIME
64/ CLA CLL /CONVEKT THE ANTENNA COORDINATESTAD GETI /OBTAIN THE INDEX POSITIONS OF THE HOUR AND DECLINA1IONOCA In /AXES OF THE DISHES BY MEANS OF THE SELF INDEXINGTAD PUJT4 REGISTER 10. INITIALIZE LOCATIONS AT WHICH THEDCA II /INDEX POSITIONS ARE TO E DEPOSITED AFTER THEYCA tARE CONVERTEDTAD M3DCA CNTM2 /SET COUNT TO -4HRDEC.JMS I TRANSI/THE HOUR INDEX POSITIONS ARE IN UNITS OF HOURS.TAD PROSO3 IMINS. SECS AND THE DECLINATION ONES IN DEGREES. MINS.DCA PROSDJ /SECS! THE THANSX SUBROUTINE CONVEVlS THEM IN70 SINGLERAL /UNIT NUMBERSI HOURS FOY THE HOUR ANGLES AND DEGREESTAD PROS02 /FOR THE DECLINATIONSTAD TEMPODCA PRO502TAD PROSOI /DEPOSIT CONVERTED INDEX COORDINATES BY MEANS OFDCA I II THE SELF-INDEXING REGISTER IITAD PROS02DCA I IITAD PROD03DCA I IfISZ CNTM2 /HAVE ALL THE INDEX POSITIONS BEEN CONVERTED?JnP HRDEC /NOD JUMP BACK TO HRDEC
670 TAO N22P /YES. COMPUTE HOUR ANGLE STEPPING INTERVALSDCA MEGA2 tEACH STEPPING PULSE INCREMENTS THE HOUR ANGLEDCA MEGA+I /OF ANT. 2 BY STEP2-(1.8/537.I)l/ SDCA MEGA3DCA MEGA-4TAD MEGAJMS I DDIVP /OBTAIN 1.8/537.1N5371OCA MEGA-2TAD I LJOTDCA MEGA+3OCA MEGAIDCA MEGA+4TAD MEGAJMS I DDIVP /DIVIDE UOTIENT BY ISN17DCA STEP2TAD I LOUOTDC STEP* ITAD N22PDCA MEGA*2 tSTEPI-( I.Bt533.R*)I/I5DCA MEGAI
DCA MEGA-3
TAD MEGAJMS I DDIVP /OBTAIN (1.8/533.8)N53R
OCA MEGAY*TAD I I.OUOTnCA MEGA-3DCA MEGA.IDCA MEGA+4TAD MEGAJMS I DDIVP DIVIDE BY ISN17DCA STEPITAD I LOUOTDCA STEPI+IJMS I MIDL /GO TO SUBROUTINE MIDLTAD VEL /ORTAIN VELOCITY OF LIGHTDCA TEMPI /DEPOSIT IT IN REGISTERS TEMPI. TEMP2DCA TEMPOCLLiMS I DMULTP /FORM PRODUCT OF FYE.)*(.ASELINE)= dRASLFREQUOCA MEGA.I /DEPOSIT PRODUCT IN DIVIDENDTAD I CONTRDCA MEGA+2TAD I CONTCDCa MEGA3TAD I CONTDDCA MEGA+4NOPJiP I PAGH JUMP TO PAGE HGETI. HRIZ-IPUT. HR I -INO2P. YYXXSTP.
STEPI .O
FUEJ.2533146VEL.S0MIDL,. MIDLPAG. PAGE4PAUSE
96

PAGE4. CLLNOP /THESE OP INSTRUCTIONS WERE INSERTEDNOP WAFTER A CORRECTION WAS INTRODUCEDNOP /IN THIS SECTION OF THE PROGRAMNOPNOPNOPNOPNOPNOPNOPNOPTAD MEGAJMS I DDIVP /OBTAIN ( el/CTEMPICA BSLAND /DEPOSIT OUOTIENT (dl/) IN THE DOUBLE-PRECISION
TAD I LGUOT /REGISTER SLANDOCA BSLAMDOI /START CLOKTLSHLT /PROGRAM HALTS
023 6311 /RESET SKIP FLIP-FLOP6312 /HAS CLOCK ARRIVED YES. SKIPJMP.-I /NO. JUMP ONE LOCATION ACK6321 /CLEA CLOCK INTERRUPT6331 /CLEAR TIME-CHECK INTERRUPT6324 /ACTIVATE CLOCK INTERRUPT6361 /CLEAR TRACKING PULSE (12) INTERRUPT6371 /CLEAR TRACKING PULSE ('I) INTERRUPT6374 /DEACTIVE TRACKING INTERRUPTSION /TURN INTERRUPT ON
/036 RESET. 6374CLACMA /GET REGISTER THAT CONTAINS THE NUMBER OFTAD EN /INTGRATION CYCLES ON THE CALIBRATION SOURCEDCA /DEPOSIT IT IN THE SELF-INDEXING REGISTER 12TAD PUTIP /INITIALIZE REGISTERS CONTAINING THE RIGHT ASCENSIONSDCA 13 /OF THE TWO SOURCESI DEPOSIT INITIAL REGISTER IN 13TAD PUT3P /INITIALIZE REGISTERS CONTAINING THE DECLINATIONSDCA 14 'OF THE TWO SOURCES IN RAUIANS) DEPOSIT IN 14TAD PJT2P 'INITIALIZE REGISTERS CONTAINING THE DECLINATIONS OFDCA IS /THE TWO SOURCES IN DEGREESI DEPOSIT IN ISTAD M2 /SET SOURCE IDENTIFICATION INDEX TO -2i -2 CORRESPONDSDCA 16 /TO THE CALIBRATION SOURCE AND -I TO THE REGULAR
/053 POINTP. 6374 /SIJRCETAD I 12 GET THE NUNMER 3F INTEGRATION CYCLES FOH THE SOURCEDCA CNTN /UNDER EXAMINATION DEPOSIT IT IN REGISTER CNTNTAD I 13 /GET THE RIGHT ASCENSIUNDCA T.MPI DEPOSITT I IN REGISTERS TEMPI. TEHP2. TEMP3TOO 1 13DC4 TPMP2T~O I 13nCA TFnP'.:LITAD TEHP3 IOBTAIN HK.Ir(HOUR ANGLE OF BASELINE)+(R. ASCENSION OFTAD HRESL2 ISOURCE)nCA CONST9+2> ALTA TEMP?TRD HRRSLInCA CONST9H1
TAD TEMPITAD HRBSLDCA CONST9 /REGISTER CONST, *1. +2 CONTAINS (Ha)TAD LCTP /INITIALIZE REGISTERS FOR SCRAP CALCULATIONSDCA 10 /DEPOSIT INITIAL REGISTER LCT INTO eTAD I 14 /OBTAIN HIGH ORDER DECLINATION IN RADIANSDCA I IX /DEPOSIT IT INTO LCTTAD I 14 /OBTAIN LOW-ORDER DECLINATION IN RADIANSDCA I 1R /DEPOSIT IT INTO LCT.IJMS I DCOSP /OBTAIN COSINE OF THE BASELINE DECLINATION (COS D)DECLBTAD I HARGDCA I 10 /DEPOSIT HIGH ORDER COSINE IN LCT+2TAD I LARGOCA I 1K /DEPOSIT LOW ORDER COSINE IN LCT-3JRS I DSINP /OBTAIN COSINE OF THE BASELINE DECLINATION (SIN D)DECLBTAD I HARG IDEPOSIT IN LCT-4nA 1 I ITAD I LARGDCA IN /DEPOSIT IN LCTS JMS I DCOSP /OBTAIN COSINE OF THE SOURCE DECLINATION (CUS)LCTTAD I HARGDCA I 10 /DEPOSIT INTO LCT+6TAD I LARGOCA I 10 /DEPOSIT INTO LCT-7 pJMS I SSINP /OBTAIN SINE OF THE SOURCE DECLINATION (SIN)t CTTAD I HARGDCA I IR IDEPOSIT INTO LCT-8TAD I LARGDCA I 1o /DEPOSIT INTO LCT-9JMS I DMULTP /ULTIPLY COS&COSDLCT+2LCT+6DCA TEMPIJMS I ROTIL /ROTATE CONTENTS OF TEMPI, CONTB. CONTC BY ONE LEFTOCA COSDDE /REGISTERS COSDDE, *I CONTAIN COS
1COSD
TAD I CONTBOCA COSDDEsIJMS I DMULTP /MULTIPLY SINSINOLCT+4LCT+ROCA TEMP IJMS I ROTILDCA SINODE /REGISTERS SINDDE. *I CONTAIN SINESINDTAD I CONTIOCA SINDODEIJMP I PGS IJUP TO PAGE BSLAND, 0
EN. NPUTIP. RACAL-IPUT2P. STDECL-3PUT3P, DECAL-ILCTP. LCT-ICOSDDE.e
PAGS. PAGESPAUSE
PAGES. JMS I DULTP IULTIPLY COSSIND
LCT*6LCT4DCA TEMPIJMS I ROTILDCA CONSTI /REGISTERS CONSTI, I COTAD I CONTBDCA CONSTI-IJMS I DMULTP /MULTIPLY COSDINFLCT+LCTH+DCA TEMPIJMS I ROTILDCA CONST2 IREGISTER CONST2. 1 CONTAD I CONTROCA CONSTIJMS I DMULTP /OBTAIN §1COSTSINDRSLAMDCONSTIDCA TEMPIJMS I ROTILDCA CONSTI /CONSTI. +I CONTAIN CTAD I CONTB2CA CONSTI-IJMS I DMULTP /OBTAIN 4d/COSDbSINASLAMDCONST2DCA TEMPIJMS I ROT ILDCA CONST2 /REGISTERS CONST2. *I COTAD I CONTROCA CONST2I JS I DMULTP /FORM PRODUCT 2%PAIHSLANDOCA MEGA-I /PJT PRODUCT INTO DIVIDETAD I CONTGOCA MEGA-2TAD I CONTCDCA MEGA3TAD I CONTODCA IEGAH4TAD EGAJMS I DDIVP /DIVIDE BY 86.400NR64ROCA CONSTATAD I LQUOT ICONSTB. I CONTAIN (21I)CA CONSTO-IJMS I ,MULTP /MULTIPLY (CONST)INCObECONST0COSDODEDCA TEMPIJMS I ROTILDCA CONSTA /REGISTERS CONSTB. * CTAD I CONTBOCA CONSTRHI
JMS IOTAIN (d/.)COSDRSLANDLCT-2OCA TEMPIJMS I ROTILDCA CONST3 IREGISTERS CONST3. *1 CTAD I CONTBDCA CONST3I rJMS I DULTP /OBTAIN (SINSINiSINDRSLAMDSINDDEDCA TEMPIJMS I ROTILDCA CONST4 /REGISTERS CONST4, I1.TAD I CONTBDCA CONST4+ITAD I.CONTCDCA CONST42
JMS I DMULTP /MULTIPLY (l/))*COSCOSISLAMD
COSDDEDCA TEMPIJDS I ROTILDCA CONSTS IPRODUCT IS DEPOSITED IhTAD I CONTBDCA CONSTS-I /POINT DECLINATION
1322 TAD PUT4P /INITIALIZE THE REGISTEIDCA II /AT WHICH THE DISHES ARITAD I 15 /REGISTER IN II1. GET DECDCa PROS03TAD I ISOCA PROSO02TAD I 15DCA PROSOI /REGISTERS PROSOI. 2. 3JMS I DECPNT /GO TO SUBROUTINE DEC12JNS I DC45 /GO TO SURROUTINE DEC45,JMS I DECPNT /GO TO SUBROUTINE DEC12JMS I DC43 /GO TO SUBROUTINE DEC43TAD PUT4P IRE-INITIALIZE THE REGI/DCA ItI AT WHICH THE DISHES ARETAD PROSOI /DEPOSIT THE NEW DECLIN,DCA I II 'BY MEANS OF THE SELF-11TAD PROSO 'INTO REGISTERS DECI. I1DCA I 11 IFOR DISHES 11 AND #2 RITAD PROS03DOCR IITAO PROSOIDCA I IITAD PROSO02DCA I IITAD PROSO3
1353 DCA I IIJMP I PAG6 /JUMP TO PAGE 6CONST2,00CONSTO. 0
CONST3.0
CONSTS.0
PUT4P.DECI-IDECPNT.DEC 12DC45. DEC45DC43 DEC43PAG6,PAGE6PAUSE
NTAIN COSSIND
TAIN COSDSINS
OSISIND
NTAIN ,/ COSDSIN3
ND
s/64a0*(d/,)
,DE
ONTAIN 1(2/864000)a(d/)*COoSCOSD
ONTAIN ()*COSD
+2 CONTAIN (d/)SIN[SIND
I REGISTERS CONSTS. +1
IS CONTAINING THE DECLINATIONE POINTINGI DEPOSIT INITIAL
:LINATION OF THE SOURCE
CONTAIN THE SOURCE DECLINATION
I POINT DECL. OF ANT. I
* POINT DECL. AXIS OF ANT. 12STERS CONTAINING THE DECLINATIONE POINTINGTION POSITION OF DISHESNDEXING REGISTERIII, +2ISPECTIVELY
97
--------- _ __ 1_ 11_· ~ 1I-- ~ _ 1 1·-

61466PAGEr6 TAD TRIATAD TRIATAD TRIAIACJS I MEGAIJMS I DDIVPN60DCA TEMP2TAD I LUOTDCA TEMP3CLLTAD TIME.2TAD TEMP3DCA STIME.2RALTAD TIME ITAD TEMP 2OCA STIMEAIRALTAD TIMEJMP I 1576TAD 13TAD M3DCA 13TAD I 13DCA TEMPITAD I 13DCA TEMP2TAD I 13DCA TEMP3JMS I NEGATTAD TEMPIDCA MALPHTAD TEMP2DCA MALPH+ITAD TEMP3DCA ALPMH2CLLTAD TEMP3TAD STIME-*.DCA PROS03RALTAO TEMP2TAD STIMEHIDCA PROS02RALTAD TEMPITAD STIMEDCA PROSOITAD PROSOISMA CLAJMP -5TAD4 M24CIATAD PROSOIDCA PROSOITAD GET2DCA IIJMS I HRPNTJMS HR37JMS I HRPNT_IS HR36TAD GET2DCA I1TAD PROSO)DC AI IITAD PHOS2DCA 1 I11TAD PROS03DCA I IITAD PROSOI
TAD PROS)
TAD PROS03DCA I lIJMP I PAG7STIIE.,
MALPH,4
GET2,HR-IHRPNTHR1e
/5s5 PAG7WRAITSTHR37,0JMS I DOMILTPTEMPIN5338DCA TEMPITAD I CONTBDCA TEMP2DCA TEMP3JMS I NEGATCYCL37.CLA641163726412JMP.-IJMS I PULSETAD TEMPISPA CLAJMP CYCL37JMP I HR37HR36,.JMS I DMULTPTEMP IN5371DCA TEMPITAD I CONTRDCA TEMP2DCA TEMP3JMS I NEGATCYCL36.CLA641163626412JMP._-IJIS I PULSETAD TEMPISPA CLAJMP CYCL36JMP I HR36
61 5166550PAUSE
/POINT HR ANGLE
/ESTABLISH A 10 MIN. LEAD TIME
/DIVIDE IT BY 60
/ADD 10/60 TO PRESENT TIME
/REGISTERS STIME, 1, *2 CONTAIN THE 1IME
/AT WHICH TRACKING IS TO START
/JUMP TO A ROUTINE TO CHECK IF STIME<24/REINITIALIZE THE REGISTERS CONTAINING THE RIGHT/ASCENSION AT WHICH THE DISHES ARE TO BE POINTED
/DEPOSIT THE RIGHT ASCENSION IN REGISTERS/TEMPI, TEMP2, TEMP3
/NEGATE RIGHT ASCENSION
/REGISTERS MALPH, *1. *2 CONTAIN(- ()
/FORM (STIME -) THIS DIFFERENCE/IS THE HOUR ANGLE AT WHICH THE DISHES MUST/POINTI THIS HOUR ANGLE IS STORED IN/REGISTEHS PROSOI., PROSO2, AND PROS03
/OBTAIN INTEGRAL PART OF THIS HOUR ANGLE/IS IT NEGATIVE/NO, JUMP FIVE POSITIONS AHEAD/YES. ADD TO IT 24
/FORM POSOI * 24/DEPOSIT IT IN PROSOI/INITIALIZE AGAIN THE REGISTERS THAT CONTAIN THE/HOUR ANGLEAT WHICH THE DISHES ARE TO E POINTED/JUMP TO SUBROUTINE HR12/JUMP TO SUBROUTINE HR37. POINT HOUR AXIS OF ANT. I/JUMP TO SUBROUTINE HR12/JUMP TO SUBROUTINE HR36. POINT HOUh AXIS OF ANT12/REINITIALIZE HOUR ANGLE REGISTERS
/OBTAIN THE NEW HOUR ANGLE POSITION OF DISH Il/DEPOSIT IT IN HOURI (TRIPPLE PRECISION)
/OBTIN 1HE NEW HOUR ANGLE OF DISH T/DEPOSIT IT IN HOUR2 (TRIPPLE PRECISION)
/JUMP TO PAGE 7
/SUBROUTINE FOR POINTING ANT. II/MULTIPLY (SOURCE HOUR - DISH HOUH)5ISB(533./1.81
/TEMPI, TEMP2, TEMP3 NOW CONTAIN THE NUMBER OF PULSES/NEEDED TO POINT THE HOUR OF ANT. 1
/INITIALIZE PULSE COUNT (NEGATIVE NUMBER)
/SEND STEPPING PULSE TO ANT.#I/WAIT FOR RETURN PULSE
/GO TO SUBROUTINE WHICH INCREMENTS COUNT OF PULSES/GET THE PULSE COUNT/IS IT LESS THAN ZERO?/YES. SEND NEXT STEPPING PULSE/NO, JUMP OUT OF THE SUAROUTINE/SUBROUTINE FOR POINTING HOUR OF ANT. 12, SIMILAR/TO HR37 EXCEPT FOR GEAR RATIO
*1606WA ITST. 633463116312JMP . IJMS I TMINC6321JMS 1 1776324JMS I NEGATCLLTAD TEMP3TAD I TS.2DCA TEMP3RALTAD TEMP2TAD I TSIDCA TEMP2RALTAD TEMPITAD TSDCA TEMPITAD TEMPISMA CLAJMP WAITST6361637163.46434
/634 6364ARCHICLALASTAD MS7000SNAJMP WAITJMP ARHIWAITCLADCA TEMPO157 TEMPOJMP.-_ICLALASTAD MS7000SNAJMP WAITAND MS400SNAJMP ARHIJMP I SILY
/ 60 ARHI.IOF
6312JMP.-IJMS I TMHIN6334IONTAD TIMEDCA TEMPITAD TIMELIDCA TEMP2TAD TIME-2DCA TEMP3JMS I NEGATCLLTAD TEMP3TAD CONST9+2DCA TEMP3RALTAD TEMP2TAD CONST9-IDCA TEMP2RALTAD TEMPtTAD CONST9OCA TEMPIJMP I PAG9TS,STIMESTIME.ISTIMEH2MS40, 40SILY. S ILLY
/720 PAG9,PAGE9TRAN SF TAD I 1DCA PROSOITAD I 10JM5 I MEGAlJMS I DDIVPN60DCA PRO502TAD I LOUOTDCA PROS03TAD I 10DCA MEGA-2DCA MEGA-ITAD I 10DCA MEGAH3DCA MEGA-4TAD MEGAJMS I DDIVPN3666DCA TEMPOCLLTAD I LOTJMP I TRANSFN22 .2200
N5442,00544200NS416.05416e,0I 6poN17.0017
N5338,012J32v0N537 1,e123
PAUSE
/DEACTIVATE CLOCK INTERRUPT/CLEAR SKIP FLIP-FLOP/HAS CLOCK ARRIVED?/NO, JUMP ONE BACK/YES, INCREMENT TIME/CLEAR CLOCK INTERRUPT FLAG/DEPOSIT PRESENT TIME IN REGISTERS TEMPI, TEMP2,&TEMP3/ACTIVATE CLOCK INTERRUPT/NEGATE TIME
/FORM DIFF.(STARTING TIME )-PRESENT TIME)
/THE DIFFERENCE IS DEPOSITED IN TEMPITEMP2,.TEMP3
/GET THE INTEGRAL PART OF DIFFERENCE/IS IT NEGATIVE?/NO, JUMP TO WAITST/YES, CLEAR TRACKING INTERRUPTS 136 & 037
/CLEAR COUNTERS GENERATING TRACKING PULSES/SET DIRECTION TO Cw/ACTIVATE TRACKING PULSE INTERRUPT
/DEPOSIT SWITCH REGISTER IN AC/ADD 7000/IS AC ZERO?/YES, JUMP TO WAIT/NO, JUMP TO ARHI/THIS IS A WAITING LOOP IN CASE THERE IS A BREAKDOWN
/IN THE SYSTEMJ ENTER IT BY MAKING THE/SWITCH REGISTER 100/CLEAR AC/READ SWITCH REGISTER AGAIN/ADD 7006/IS THE AC NON-ZERO/NO, JUMP BACK TO WAIT/YES, MASK AC WITH 400/IS AC NON-ZERO/NO, JUMP TO ARHI/YES, DO TIME-CHECK/TURN INTERRUPT OFF
/WAIT FOR CLOCK
/INCREMENT TIME/DEACTIVATE CLOCK INTERRUPT/TURN INTERRUPT ON/DEPOSIT THE PRESENT TIME IN REGISTERS/TEMPI, TEMP2, 1TEMP3
/NEGATE THE TIME
/COMPUTE H-il DEPOSIT IT IN TEMPI, TEMP2, &TEMP3
/JUMP TO PAGE 9
/THIS SUBROUTINE CONVERTS HOUR ANGLES GIVEN/IN HOURS, MINS., SECS., &FRACTIONAL SECS./AND DECLINATIONS GIVEN IN DEG.,MINS.,SECS.,.FR. bECS/INTO SINGLE UNIT TRIPPLE PRECISION NUMBERS
98
I ---

/DECLINATION POINTING SUBROUTINE/GET PRESENT DECLINATION POSITION OF THE DISHIDEPOSIT IN TEMPI.2.3
(NEGATE DISH DECLINATION POSITION
/OBTAIN DIFF.-(SOURCE DECLINATION)-(ANT. DECLINATION)
(DEPOSIT DIFF. INTO DIVIDEND REGISTERS
/DIVIDE DIFFERENCE BY I.8 DEGREES
/DEPOSIT QUOTIENT IN TEMPI.2
/GET TEMPI/IS IT POSITIVE?/NO. JUMP 4 POSITIONS AHEAD/YES, SET DIRECTION CONTROLS TO CW/NEGATE TEMPI.2/JUMP 3 POSITIONS AHEAD/CLEAH AC(SET DIRECTION TO CCW/JUMP OUT OF THE SUBROUTIE/HOUR ANGLE POINTING SUBROUTINE'GET PRESENT HOUR ANGLE/DEPOSIT IT IN TEMPI. TEMP2. TEMP3
/NEGATE TEMPI, TEMP. TEMP3
/OBTAIN DIFF.-(SOURCE HOUR- (ANT. HOUR ANGLE)
/REGISTERS TEMPI.2.3 CONTAIN DIFFERENCE G/GET THE INTEGRAL PART OF D/IS IT NEGATIVE? CLEAR AC/NO, JUMP TO POSD/YES, OBTAIN ITS ABSOLUTE VALUE D
(FORM DI--12/IS AC POSITIVE? CLEAR AC(NO, JUMP 8 LOCATIONS AHEAD(SET DIRECTION TO Cw/NEGATE TEMPI,2.3
(OBTAIN 24-II(DEPOSIT IT IN TEMPI/JUMP TO STPNT
/SET DIRECTION TO CCW(JUMP TO STPNT
/OBTAIN D-12/IS AC NEGATIVE? CLEAR AC/NO. JUMP 3 LOCATIONS AHEAD(YES. SET DIRECTION TO CCW(JUMP TO STPNT
(SET DIRECTION TO CCW(NEGATE TEMPI.2.3
(OBTAIN 24-D(DEPOSIT IT IN TEMPI
/DIVIDE ADJUSTED DIFFERENCE Y 1.8 DEGREES
/MULTIPLY THE UOTIENT BY IS DEG./HOUR
/TEMPI. TEMP2 CONTAIN (ADJUSTED DIFFERENCE)I(IR/I;8)/THIS NUMBER IS NEGATIVE
/JUMP OUT OF THE SUBROUTINE
PAGE9.TAD TEMPI /GET INTEGRAL PART OF H--tTAD M24 (ADD -24SPA /IS THE DIFFERENCE POSITIVE?SKP /NO. SKIPDCA TEMPI /YES, DEPOSIT THE DIFFERENCE IN TEMPICLAJMS I ROT6L IROTATE CONTENTS UF TEPI.2.3 6 POSITIONS LEFTJMS I DMULTP (FORM THE PRODUCT (/12)*(H+A-t)TEMPI
DCA TEMPI (DEPOSIT HIGH ORDER TERM OF THE PRODUCT IN TEMPIJMS I ROT2L /ROTATE PRJDJCT BY 2 BINARY POSITIONS LEFTTAD I CONTBDCA TEMP2 /ARGJMENT IS CONAINED IN TEMPI.2JMS I CKARG (CHECK IF -ARGC
/f
JMS I DCOSP /OBTAIN COS(R.*(HN--))TEMP ITAD I HRGDCA COSTI /REGISTERS COSTI.+I CONTAIN COS((r/I12)r*(Hi-.))TAD I LARGOCA COSTI+ JMS I DSINP /ORTAIN SINI((IfI2)(HI+K-t))
TEMPITAD I HARGOCA SINTI IREGISTERS COSTI*.I CONTAIN SIN((IF12/)*(.R-t))TAD I LARGDCA SINTI+IJMS I DMULTP /MULTIPLY (COSTI)ICOS((T/12)-(T/2))C)STICOSIDT /WHERE T IS INTEGRATION LENGTHDCa TEMPIJMS I ROTILOCA COSU IrITn) I CONTA)CA COSDIF IJMS I DMULTP /ULTIPLY (SINTI)*SIN((I/12)*(T2))SINTISINMDTDCA TE'D'MS I ROTIL
DCA TEMPICLLTAD I CONTB /FORM SUM OF THE TWO PRODUCTSTAD COSDIF. IDCA COSDIF-I /DEPOSIT THE SUM IN COSDIF.+IPALTAD TEMPITAD COSD IrDCA COSDIF /COSDIF.+I CONTAIN COS((I(2)(HA-t-T/2))JMS I DMULTP /MULTIPLY (SINTl)*COS((I12)*(T/2))SINTICOSMDTDCA TEMPIJMS I ROTILDCA PROSOITAD I CONTBDCA PROSO2JMS I DMULTP /MULTIPLY (COSTI)-SIN((/12)R(T2E))COSTIS INMDTDCA TEMPI /DEPOSIT THE LAST PRDUCT IN TEMPI.2,3JMS I ROTILDCA TEMPITAD I CONTBDCA TEMP2DCA TEMP3JMS I NEGAT /NEGATE CONTAINS OF TEMPI,2,3CLLTAD TEMP2 /OBTAIN (SINTII)CODS (IIW/2)I*(H--t-T/2))- (COSTI).TAD PROSO2 /SIN((/l1I2)(T/2))DCA SINDIF*I /DEPOSIT DIFFERENCE IN SINDIF.+IRALTAD TEMPITAD PROSOIDCA SINDIF /SINOIF..I CONTAIN SIN(('12)*(H+d-t-T2))JMS I COMPE / DO DELAY COMPENSATIONCLACMA (INITIALIZE REGISTERS IN WHICH THE PARAMETERSTAD H6 /SOURCE HOJR ANGLE, UDV ARE TO HE DEPOSITEDTAD TOPOSDCA 17 (DEPOSIT INITIAL REGISTER IN 17CLLTAD TIME-2 (OBTAIN SUM-(PRESENT TIME)-(INTEGRATION TIME)/2TAU MIDLTM+IDCA TEMP3RALTAD TIME-ITAD MIDLTMOCA TEMP2RALTAD TIMEDCA TEMPI / TEMPI.2,3 CONTAIN THE ABOVE SUMCLLTAD TEMP3 /OBTAIN SOURCE HOUR ANGLE AT CENTER OFTAD I MALF+2 (INTEGRATION INTERVAL=f.T/2 -0(DCA TEMP3RALTAD TEMP2TAD I MALF .+DCA TEMP2RALTAD TEMPITAD I MALFDCA TEMPI /DEPOSIT HOUR ANGLE IN TEMPI.2.3TAD TEMPI /GET INTEGRAL PART OF HOUR ANGLE (TEMPI)SMA CLA /IS IT NEGATIVE?JMP.-5 (NO, JUMP 5 LOCATIONS AHEADTAD NM24 YES. ADD 24 TO TEMPICIATAD TEMPIDCA TEMPI (DEPOSIT SUM BACK IN TEMPIJMP I PAGR /JUMP TO PAGE 10COSDIF.0
SINDIF*.
MALF, MALPHMALPH IMALPH.2PAGIOPAGE 10PAUSE
99
.*2o0DEC12,rTAD I IDCA TEIMPTAD I IIDCA TEMP2TAD I IIDCA TEMP3JMS I NEGATCLLTAD PROS03TAD TEMP3DCA MEGA,3RALTAD PROS02TAD TEMP2DCA MEGA.2PALTAD PROSOITAD TEMPIDCA MEGA.IDCA MEGA+4TAD MEGAJMS I DDIVPN22DCA TEMPITAD I LQUOTDCA TEMP2DCA TEMP3TAD TEMPISPA CLAJMP.-46434JMS I NEGATJMP..3CLA6454JMP I DEC12HRI, ATAD I IIDCA TEMPITAD I IIDCA TEMP21AD I ICA TEMP3
.IMS I NEGATCLLTAD TEMP3TAD PROSO3DCA TEMP3RALTAD TSMP2T4D PROSO2DCA TEMP2RALTAD TEMPITAD PRCSOIDCA TEMPITAD TEMPISMA CLAJMP POSDJMS I NEGATTAD M6TAD M6TAD TEMPISPA CLAJMP.1I6434JMS I NEGATTAD M24CIATAD TEMPIDCA TEMPIJMP STPNTCLA6454JMP STPNTPOSD,CLATAD M6TAD M6TAD TEMPISMA CLAJMP.+36434JMP STPNTCLA6454JMS I NEGATTAD M24CIATAD TEMPIDCA TEMPISTPNT,CLA CLLTAD TEMPIDCA MEGAITAD TEMP2DCA MEGA+2TAD TEMP3DCA MEGA-3DCA MEGA+4TAD MEGAJMS I DDIVPN22DCA TEMPITAD I LQUOTDCA TEIMPJMS I DMULTPTEMPINI7TAD I CONTHDCA TEMPITAD I CONTCDCA TEMP2JMP I HR12PAI,31I3755P112.2602510
5363PAUSE
______lllllylllUI���L -P·l^-_I- _

PAGEIA.JMS I ROT6L /ROTATE CONTENTS OF TEMPI,2, 6 ITS LEFTT9O TENPI IGET THE ROTATED HOUR ANGLE ANDDCA I 17 ISTORE IT BY MEANS OF THE SELF-INDEXINGTAD TEMP2 'REGISTER 17DCA I I?JMS I MULTP 'MULTIPLY (/)MCOS SIN(It/I2)M(H.--t-T/2))
CONST3SINDIFDCA TEMPI ITHIS PRODUCT IS THE PARAMETER UJMS I ROTILDCA I 17TAD I CONTSB STORE UDCA I 17
JMS I DMULTP IMULTIPLY (/S)COSDeSINIMCOSHA/12)A(H+ L-i-TI))CONST2COSDIFDCA TEMPIJMS I ROTILDCA TEMPI IDEPOSIT IT IN TEPI,2.3TAD I CONTBDCA TEMP2DCA TEMP3JMS I NEGAT /NEGATE CONTENTSCLLTAD TEMP l/ADD (dl/)*COSiSSIND TO TEMPI.2,3TAD CONSTItIDCA TEMP2RALTAD TEMPITAD CONSTIDCA TEMPI /THE SUM IS THE PARAMETER VTAD TEMPIOCA 17 I STORE VTAD TEMP2DCA I 17
443 TAD INTEGR /GET INTEGRATION TIME EXPRESSED IN NUMBER OF CLOCKDCA CMINTG /PULSES;INITIALIZE INTEGRATION INTERVAL COUNTTAD INTEGR-I /CONTAINED IN REGISTERS CINTG & CMINTG-IOCA CMINTIG-DCA SUMI CLEAR REGISTERS THAT STORE COSrDCA SIIMI+IDCA SUM1-2DCA SlM2 ICLEAR REGISTERS THAT STOREZSIN'r.DCA SUN21IDCA SIIM22TAD M24DCA TEMPO /DEPOSIT -24 IN TEMPO TO KEEP COUNT
CA / THME 24 REGISTERS THAT STORE ZECOS3 & SINj'TAD TOPOS FO THE FOUR DATA CHANNELS ARE LOCAIED BETWEENDCA l /ISUMPEL AND SUMPEL+27DCA I IS /CLEAR THESE REGISTERS SEQUENTIALLY BYISZ TEMPO /INCREMENTING TEMPOJMP.-2DATA, IOF /INTEGRATION CYCLE BEGINS HERECMA /INITIALIZE REGISTERS THAT WILL STORE THETAD STORE IINPUTS FROM THE A-D CONVERTERDCA IA DEPOSIT INITIAL REGISTER IN is63116312 /WAIT FOR THE CLOCK THAT WILL INITIATE THE DATA
JMP.-I ITAKING CYCLECLA6743 /SCAN INPUT DEVICE 74NOPNOPNOPHOPNOPDCA I IA /DEPOSIT BY MEANS OF SELF-INDEXING REGISTER 106703 /SCAN INPUT DEVICE 70NOPNOPNOPNOPNOPDCA I IDEPOSIT663 / SCAN INPUT DEVICE 64NOPNOPHOPNOPNOPDCA I /IDEPOSIT6603 /SCAN INPUT DEVICE 60MOPNOPNOPNOPMOPDCA I 10 IDEPOSIT6334 /REACTIVATE CLOCK INTERRUPTION ITURN INTERRUPT ONJMS I TMINC IINCREMENT TIME REGISTER bY .2(10.*027)/3600 HOURSTAD COSTi+I /GET COt((T/1Tn)*(H- tl))DCA COSI I-I /DEPOSIT IT IN SCRAP REGISTERTAD COSTIDCA COSIMITAD SINTI+I IGET SIN((/l2)e(H
+I--i,))
DCA SINIMINI /DEPOSIT IT IN SCRAP REGISTERTAD SINTIDCA SINI"IJMS I DMULTP /MULTIPLY SIN((l/I~)
*( H.- t -
) ) * 2P
/ 86 4 0A
)A
SININI /.2( 1-0.*027)CON SIDCA TEMPICLLTAD COSIMI-I 'ADD TO THE ABOVE PRODUCT COS((1/'t).(H+---)ITAD I CONTBDCA COSTI1IRALTAD TEMPITAD COSIMIDCA COSTI ICOSTI.,I CONTAIN COSI((I2)*(H--t))JMS I DMULTP OMULTIPLY COS( I/I1)e(HRt-,- ))(2/864Il )ICOSIMI /0.2(1.0.027)CONSIADCA TEMPITAD I CONTBDCA TEMP2DCA TEIP3JMS I NEGAT /NEGATE THE ABOVE PRODUCTCLLJMP I PAGII /JUMP TO PAGE IISAVERL,A /THESE ARE THE FOUR REGISTERS IN0 PI/HICH THE DATA ARE STOREDA /AS SOON AS THEY ARE RECEIVED
PAGI I.PAGEIIPAUSE
PAGEII,TAD TEMPT /FORP SIN((H/IS)*(HN-t;-)-I/86400)*TAD SINIMI+I /8o.2COS (I/2*(H+a-t-))DCA SINTII /DEPOSIT IT IN SINTIIIRALTAD TEMPITAD SINIMIDCA SINTI /SINTI,NI NOW CONTAIN SIN((/12)I*H+-iJMS I DMULTP /MULTIPLY d/)I*COSSMC-U*COSTICONSTSCOSTIDCA TEMPI
JMS I ROTILDCA TEMPICLLTAD CONST+2 /ADD TO THE ABOVE PRODUCT (dJ})*SINDSITAD I CONTCDCA PROSO3RALTAD CONSTA-ITAD I CONTROCA PROSO(AL
TAD TEMPITAD CONST4TCA PROSOI /EGISTERS PROSO,2.3 NOW CONTAINTAD PROSOI /GET PROSOISMA CLA /IS AC NEGATIVE? CLEAR ACJMP..2 /NOJUNP 2 LOCATIONS AHEADTAD NS7000 /YES, SET FLAG TO 7800rEA ALFLG /SET FLAG TO 0
TAD MS7lA /GET 7000CMA /COMPLEMENT ITAND PROS02 /MASK THE FRACTIONAL PART OF (d/,)SINLSZA /IS THE HIGH ORDER FRACTIONAL PART 0?JMP.-3 /NO JUMP 3 LOCATIONS AHEADTAD PROS03 /YES, GET THE LOW ORDER FRACTIONAL PAR'SZA CLA /SKIP ON ZENO AC. CLEAR ACTAD ALFLG /ADD FLAG AND DEPOSIT AC IN PROS02DCA PROSO2 IPHOOSO23 NOW CONTAIN THE SIGNED FACTIJMS I D.ULTP IOF I/)*SIN6;) MULTIPLY PROS02,3 BY
PAIPROSOPDCA TEMPIJMS I ROT3L IROTATE 3 LOCATIONS LEFTTAD I CONTBDCA TEMP2 ITEMPI.2 CONTAIN ARGUMENTJMS I CKARG /CHECK IF -<ARGUMENT I
JMS I DCOSP IOBTAIN COS2DT S1NO)
TEMPITAD I HARG DCA OSGM I/COSGAM.,+I CONTIN CONTAIN COS(21d IN)TAD I LARGDCA COSGAM+IJMS I DSINP IOMTAIN Sf 2.d/,SI1Ni)TEMPITAD I HARGDCA SINGAM / SINGAM.NI CONTAIN SIN(2nId )SIN A)
TAD I LARGDCA SINGAMI JMS I DMULTP /OBTAIN (COSGAM)COSGAMCOSGAMDCA TEMPICLLJMS I ROTIR /ROTATE ONE RIGHT
CLL 1TAD SUMI-2 /ADD (COSGAM) TO THE CONTENTS OFTAD I CONTB /SUMMING REGISTERS SUMI*+1,2ICA SMNI.2RALTAD SUMIITAD TEMPIDCA S1 I IRALTAD SUIDCA SUMIJMS I DNIJLTP /OBTAIN (SINGAM)S INGAMSINGAMDCA TEMPICI.I_JMS I ROT1R /ROTATE ONE RIGHTCLLTAD SUM2.2 lADD (SINGAM) TO THE CONTENTS OFTAD I CONTB ISUMMING REGISTERS SUM2,+1,+2DCA SUM2.2RALTAD SVUM2ITAD TEMPIDCA SU12*IRALTAD SUM2DCA SUNT-TAD NDVICE IGET INPUT DEVICE INDEX (-4)DCA CNTDEV /DEPOSIT -A INTO THE COUNT REGISTENTAD STONE /GET THE GROUP OF REGISTENS CONIAININGDCA ADHES ISAMPLESJ DEPOSIT IN ADRES THE FIRST TAD I ADES /GET INPUT SAMPLETAD MS7080 ISUBTKACT 2DCA I ADRES IDEPOSIT DEFFERENCE HACK IN THE SAMEISZ ADRES /INITIALIZE FOR NEXT SAMPLE
IZ CNTUEV /IS DEHICE INDEX ZERO?JMP .-S INO. JUMP RACK S LOCATIONSTAD STORE /YES, TE SECTION FROM THIS LOCATION TIAC / THIS PAGE OBTAINS FOS. THE DATA CURHElaC /TO THE CROSS-POLARIZATIUON EUNRHELAT10TCA AOPES /(RLI) H IRNL. THF THIHU ANU F JTHTAD ADRES ISTUKFS PA _ME-YSI THIS IS DONE BY TAN
IAC IFIRST THE SUM AND THEN THE DIFFERENCEDCA DIXE ITWO PRODUCTSTAD I ADRESTAD I DIXEDCA TEMPITAD I DIXECIATAD I ADRESDCA I DIXETAD TEMPIDCA I ADRESJNP I AG12 IJUP TO PAGE 12COSGANM,
SINGAM,0
PAG I12,PAGEI2PAIUSE
i )
INS
|NSINA,
H,
IONAL PART277
: THE DATA'F THEM
eEGISTEN
TO THE END OFEbPNUINGi FUNIIONS
:IN TO- THESE
100
__ ___ �

*3000PAGE12 TAD NDVICE /OBTAIN INPUT DEVICE INDEX (-4)DCA CNTDEV /DEPOSIT -4 INTO THE COUNT REGISTERCMA /INITIALIZE DATA STORAGE EGISTERSTAD STORE /GET SAVERL-IDCA 10 IEPOSIT IT IN 0TAD TOPOS IGET SUMPEL (FIRST OF SUMMING EGISTERS)OCA DIXE /DEPOSIT IT IN DIXELSOFIT,TAD I IA /GET DATA SAMPLE OF DEVICE I ()DCA PROSOI /DEPOSIT IT IN PROSOIOCA PROS02PRO 1SMIJLTP /MULTIPLY .COSJ
PROSOICOSGAM
CA TEMPI /DEPOSIT HIGH ODER TERM OF PRODUCT IN TEMPIJMS I PARE /CHECK FOR SIGN, SET LINK IF NEGATIVEJMS I OTIR /ROTATE ONE RIGHTCLLTAD DIXE / GET CONTENT OF DIXE (SUPEL)IACIACDCA ADRES /DEPOSIT SUMPEL-2 IN ADRESTAD I ADRES /ADD CONTENT OF SUMPEL2 TO CONTD WHICH
TAD I CONTA /CONTAINS THE LOW ORDER TERM OF qCOS'DCA I ADRES /DEPOSIT SUM IN SUMPEL-OTAD DIE / GET SUMPELIACDCA ADRES IDEPOSIT SUMPEL-I IN ADRESHALTAD I ADRES 'GET CONTENT OF SUMPELAITAD TEMPI /ADD TEMPIDCA I ADRES /DEPOSIT SUM IN SUMPELI.HAL IROTATE LINK LEFT TAD I DIXE / ADD SUMPEL (HIGH ORDER yCOS )TAD TEMPO bADD PROPER SIGN OF 9iCOSj.CA I DIXE /DEPOSIT SUM IN SUMPEL
JMS I DMULTP /MULTI PLY SINt.P HO So
SINGAMDCA TEMPI ITEMP CONTAINS HIGH ORDER TERM OF SIN.JMS I PAREJMS I ROTIR
CLLTAD DIX / GET SUMPELTAD TRIA bADD 3IACI ACDCA ADRES IDEPOSIT SUMPEL+S IN ADRESTAD I ADRES /GET CONTENT OF SUMPEL5+STAD I CONTO / ADDTO IT LOW ORDER TERM OF ISIN,
DCA I ADRES /DEPOSIT IN SUMPEL+5TAD DIXETAD TRIAIACDCA ADRES /DEPOSIT IN ADRES SUMPELX4
ALTAD I ADRES /GET CONTENT OF SUMPEL-4TAD TEMPI bADD TEMPIDCA I ADRES / DEPOSIT IN SUMPEL4TAD DIETAD TRIADCA ADRES IDEPOSIT IN ADRES SUMPEL-3RAL /ROTATE LINK LEFT TAD I ADRES 'ADD SUPEL. (HIGH ORDER TER, OF LSINJ,)TAD TEMPO /ADD SIGN OF ,JSINJ iDCA I ADRES /DEPOSIT SUM IN SUMPEL6TAD DIXE /GET SUMPELTAD EXI 'ADD SIXDCA DIXE IDEPOSIT SUMPEL-6 IN DIXEISZ CNTDEV /INCREMENT DEVICE INDEX REGISTER
JMP LSOFIT / JUMP TO LSFIT IF INDEX 0IS CM300 ICHECK FOR COMPENSATIONSKP ISKIPJMS I COMPE /COMPESATECLA CLLTAD CMINTG+I /INCREMENT INDEX REGISTER THAT KEEPSIAC ITRACK OF THE NUMBER OF CLOCK PULSESDCA CINTG-I /RECEIVED IN THE PRESENT INTEGRATION CYCLERALTAD CMINTGDCA CMINTGTAD CMINTG-ISZA CLAJMP I DATACTAD CMINTG$ZA CLA / IS THE INTEGRATION CYCLE OVER?JMP I DATAC / NO. JUMP TO DATA6321 IYES. CLEAR CLOCK INTERRUPT FLAG6324 /ACTIVATE CLOCK INTERRUPTCMATAD TOPOS /GET SUMPEL-1OCA I1 /DEPOSIT IT IN eTAD 0 / GET SUMPEL- IDCA 11 /DEPOSIT IT IN IITAD NOVICE GET DEVICE INDEX (-4)DCA CNTDEV /DEPOSIT IN CNTDEVREDIVD.JMS I MEGI JMS I DoIVP /DIVIDE t;COS; /COSiSUM!DCA I I /DEPOSIT HIGH ORDER UOTIENT IN SUMPELTAD I LUOTDCA I II /DEPOSIT LOW ORDER QUOTIENT IN SUMPEL+3JMG S MEG
JM IDDIVP /DIVIDE y.SINr, /ICSINSUM2DCA I I /DEPOSIT HIGH ORDER GUOTIENT IN SUMPEL+2TAG I LQUOTDCA I I /DEPOSIT LOW ORDER QUOTIENT IN SUMPEL-3ISZ CNTDEV /INCREMENT DEVICE INDEXJMP REDIVD /JUMP TO REDIVD IF INDEX 4
?,155 TADD M? lADS IS AT (IE E£IERO rO RI¢£/Pt r/fE AM415MT/O#
ri)TAD TOPOS 'ADD SUMPELDCA 17 DEPOSIT SUMPELIS IN 17IOF63116312 /WAIT FOR CLOCKJMP -IJMS I TMINCJMP I PAG13 /JUMP TO PAGE 13EXI6DATAC2465NI7P. 17MEGI. MEGI IePAG 13,PAGE 13PAUSE
*3200I',bE13,CLA6343
MOPNOPNOPNOP
OPTAD MS7100HAL CLLDCA 17'CA I I
6443NONOPNOPNOPNOPHOPTAD MS7!00RAL CLLDCA I 17DCA I 7IT6503NOPNOPNOPNOPNOPTAD MS7000RAL CLL
DCA I 17DCA 1 17DC' I IT6543NOPNOPNOPNOP
NOPTADO Ms700RAL CLL!CA I 17DCA I 176321ION
JMP I PG213 PA 2 .PAGE2
OMEGA, 0CA MEGA+I
DCA MEGA2DCA MEGA3
DCA MEGA'4TAD MEGAJMP I OMEGA
3Z64 NEGATE.NCLA CLLTAD TEMP3CIADCA TEMP3HALDCA KR IK
TAD TEMP2CMA
TAD KRIKCA TEMP2
MALDCA KRIK
TAD TEMPtCMATAD KRIKDCA TEMP IJMP I NEGATE
3306 CHKARG. aTAD TENPI
SMA CLAJMP POSARG
CA TEMP3JMS I NEGATTAD TEMPITAD MP IOTSMA CLAJMP .-3JMS I NEGATJMP SIFTLJMS I NEGATCLL
TAD TEMP2TAD TWOPIIDCA TEMP2
RALTAD TEMPITAD TWOPI
CA TEMPIJMP SIFTLPOSARG. CLATAD TEMPITAD PIOTSMA CLAJMP.O
JMP SIFTLCLA CLLTAD TEMP2TAD MTWOPI.IDCA TEMP2HALTAD TEMP ITAD MTWOPI
CA TEMPISIFTLCLL
TAD TEMP2HAL
CA TEMPOTAD TEMP I
RALDCA TEMPI
JMP I CHKARGMPOT63336012TWOPI.31 13755MTWOPI 4667
PAUSE
/SAMPLE CALIBRATION DEVICE
/SUBTACT
/DEPOSIT IT IN SUMPELeI6
/SAMPLE CALIHRAION DEVICE 2
/SUBTRACT
/DEPOSIT IT IN SUMPEL-I18
/SAMPLE CALIBRATION DEVICE #3
/SUBTRACT 2
/DEPOSIT IN SUMPELX20
/SAMPLE CALIBRATION DEVICE I4
/SUBTRACT 2
/DEPOSIT IT IN SUMPEL-22
/CLEAR CLOCK INTERRUPT FLAG/TURN INTERRUPT ON/JUMP TO PAGE 21
/SUBROUTINE THAT IS USED PRIOR TO/THE DIVIDE SUBROUTINE TO SET UP THE/DIVIDEND IN THE PROPER FORMAT
/THIS SUBROUTINE GIVES THE 2S/COPLEMENT OF A TRIPPLE PECISION NUMBER
ICHECKS THE SIGN OF THE ARGUMENT OF A SINE OR COSIt/GET HIGH ORDER ARGUMENT/IS ACCUMULATOR NEGATIVE?INO, JUMP TO POSARGbYES,
/NEGATE CONTENTS OF TEMPI.2,3(1 l1)GET AGAIN HGH ORDER TERM OF |IFORM I-T
IS IT NEGATIVE?/NO, JUMP 3 LOCATIONS AHEADIYES, NEGATE
/JUMP TO SIFTL/NEGATE
IOBTAIN 2B- IAI
'JUMP TO SIFTL
GET HIGH ORDER TERM OF OIFORM HA-T/15 IT NEGATIVE?INO, JUMP 2 LOCATIONS AHEAD/YES. JUMP TO SIFTL
'FORM -0
/TEMPI AND TEMP2 CONTAIN THE ARGUMENTIADJUSTED TO E -ZARGO?/THEN TEMPI,2 ARE ROTATED ONE POSITIONILEFT SO THAT THE BINARY POINT IS IN THE/PROPER PLACE
IJUMP OUT OF THE SUBROUTINE
101
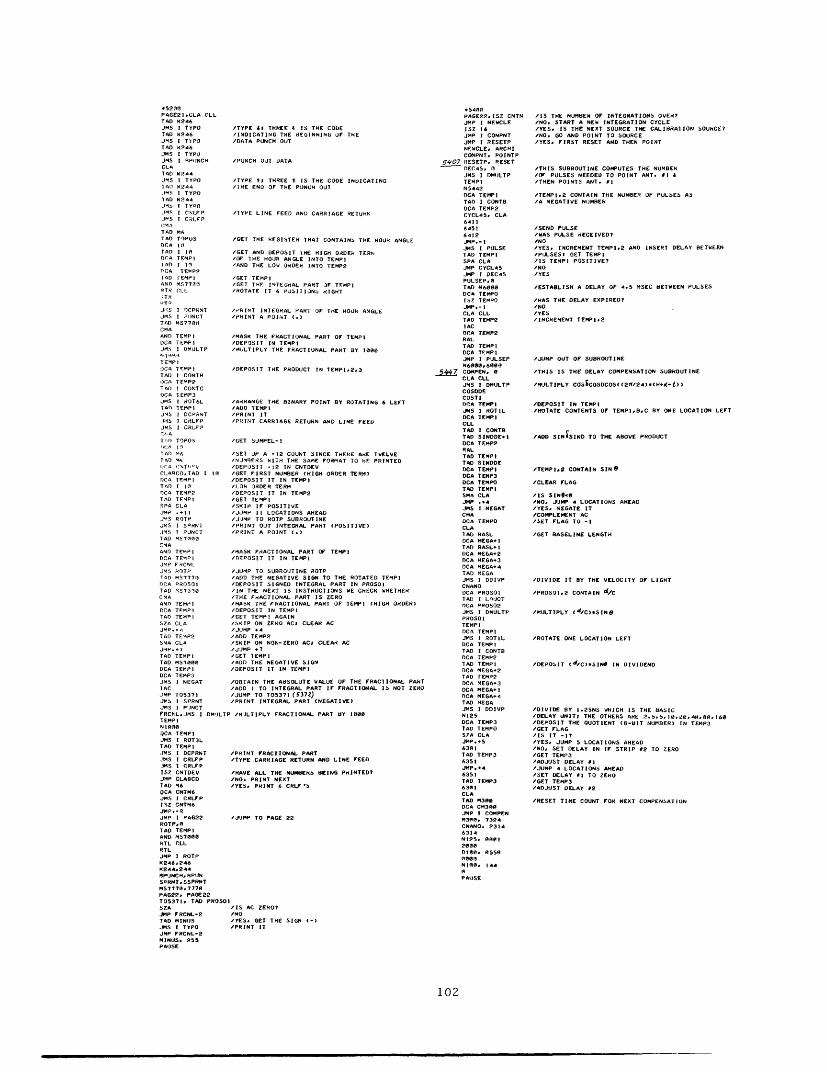
/TYPE RI THREE IS THE CODE/INDICATING THE EGINNING OF THE/DATA PUNCH OUT
/PUNCH OUT DATA
/TYPE I THREE IS THE CODE INDICATING/IHE END OF THE PUNCH OUT
/lYPE LINE FEED AND CARRIAGE RETURN
/GET THE REGISTER THAT CONTAINS THE HOUR ANGLE
/GET AND DEPOSIT THE HIGH ORDER TERM/OF THE HOUR ANGLE INTO TEMPI/AND THE LOW ORDER INTO TEMP2
'GET TEMPI/GET THE INTEGRAL PART JF TEMPIIROTATE IT 6 POSITIOND RIGHT
1/RINT INTEGRAL PART UF THE HOUR ANGLE/PRINT A POINT (.)
/MASK THE FRACTIONAL PART OF TEMPI/DEPOSIT IN TEMPI'MULTIPLY THE FRACTIONAL PART aY 1000
/DEPOSIT THE PRODUCT IN TENPI,2.3
/RRANGE THE BINARY POINT BY ROTATING 6 LEFTIADD TEMPI'PRINT IT'PRINT CARRIAGE RETURN AND LINE FEED
/GET SUMPEL-I
/SET UP A -12 COUNT SINCE THERE AE TWELVE/NJRERS WITH THE SAME FORMAT TO HE PRINTED/DEPOSIT -12 IN CNTDEV/GET FIRST NUMBER (HIGH ORDER TERM)IDEPOSIT IT IN TEMPIILOW ORDER TERM/DEPOSIT IT IN TEMP2/GET TEMPI/SKIP IF POSITIVEIJJMP II LOCATIONS AHEAD/JJMP TO ROTP SUBROUTINE/PRINT OUT INTEGRAL PART (POSITIVE)/PRINT A POINT ()
IMASK FRACTIONAL PART OF TEMPI/nEPOSIT IT IN TEMPI
/JUMP TO SUBROUTINE ROTPIADD THE NEGATIVE SIGN TO THE ROTATED TEMPI/DEPO5IT SIGNED INTEGRAL PART IN PROSOI/IN THE NEXT 15 INSTRUCTIONS WE CHECK WHETHER/THE FACTIONAL PART IS ZERO/MASK THE FRACTIONAL PART OF TEMPI (HIGH ORDER)/DEPOSIT IN TEMPI/GET TEMPI AGAIN'SKIP ON ZERO ACJ CLEAR AC/JUMP *4/ADD TEMP2/SIP ON NON-ZERO ACI CLEAR AC/J'JMP *7IGET 1TEMPI/ADD THE NEGATIVE SIGN/DEPOSIT IT IN TENPI
/OBTAIN THE ABSOLUTE VALUE OF THE FRACTIONAL PART/ADD I TO INTEGRAL PART IF FRACTIONAL IS NOT ZERO'JUMP TO T05371 (5372)/PRINT INTEGRAL PART (NEGATIVE)
IMULTIPLY FRACTIONAL PART Y 1000
IPRINT FRACTIONAL PART/TYPE CARRIAGE RETURN AND LINE FEED
/HAVE ALL THE NUMBERS BEING PRINTED?INO. PRINT NEXT/YES. PRINT 6 CRLF'
'JlMP TO PAGE 22
/IS AC ZERO?1/NIYES. GET THE SIGN (-)/PRINT IT
s540PAGE2. ISZ CNTNJMP I NEWCLEISZ 16IMP I CONPNTJMP I RESETPNEWCLEr ARCHICONPNT, POINTP
5407 RESETP. RESETDEC45. AJNS I DMIJLTPTEMPIN 5442DCA TEMPITAD I CONTSOCA TEMP2CYCL45. CLA
6R1 I645 1
JMP.-IJMS I PULSETAD TEMPISPA CLAJMP CYCL45JMP I DEC45PULSEPSTAD N6000DCR TEMPOISZ TEMPOJMP.-ICLA CLLTAD TEMP2IACDCA TEMNPRALTAD TEMPIDCA TEMPIJNP I PULSEPN60BB060B0
544 COPEN, 0CLA CDLJMS I DFMULTPCOSODOECOSTInCA TECPIJOS I ROTILDCA TEMPICLLTAD I CONTBTAD SINDDE-IDCA TEMP2RALTAD TEMPITAD SINDDEDCA TEMPIDCA TEMP3DCA TEMPOTAD TEMPISMA CLAJMP .4JMS I NEGATCMRDCA TEMPOCLA1AD BASLDCA MEGA-cITAD BASL+IDCA MEGA+2DCA HEGA*3DCA MEGA-4TAD MEGAJMS I DDIVPCNANODCA PROSOITAD I LOUOTnCA PROSO2JMS I DMULTPPROSOITEMPIDCA TEMPIJMS I ROTILDCA TEMPITAD I CONTBOCA TEMP2TAD TEMPIDCA MEGA+2TAD TEMP2DCA MEGA+3DCA MEGA-IncR MEGAW4TAD MEGAJMS I DDIVPNIDSDCA TEMP3TAD TEMPOS7A CLAJ.HP..S6301TAD TEMP36351JMP.*46351TAD TEMP363 1CLATAD MS30DCA CHM30JMP I COOPENM3O0. 7324CNANO. 23146314
2DO
NIRS. 5144DOeR
PAUSE
/IS THE NUMBER OF INTEGRATIONS OVER?/NO, START A NEW INTEGRATION CYCLEbYES. IS THE NEXT SOURCE THE CALIBRATION SOURCE?/NO. GO AND POINT TO SOURCE/YES. FIRST RESET AND THEN POINT
/THIS SUBROUTINE COMPUTES THE NUMBER/O- PULSES NEEDED TO POINT ANT. SI t/THEN POINTS ANT. l
ITEMPI,2 CONTAIN THE NUMBER OF PULSES ASIA NEGATIVE NUMBEk
/SEND PULSE/WAS PULSE RECEIVED?INO/YES, INCREMENT TEMPI.2 AND INSERT DELAY BETWEENIPULSESI GET TEMPI/IS TEMPI POSITIVE?/NOIYES
/ESTABLISH A DELAY OF 4.5 SEC BETWEEN PULSES
/HAS THE DELAY EXPIRED?/NO/YES/INCkEMENT TEMPI.2
/JUMP OUT OF SUBROUTINE
/THIS IS THE DELAY COMPENSATION SUBROUTINE
/MULTIPLY COSSCOSDCOS((2D/24)e(CH+r-t)
/DEPOSIT IN TEMPI/ROTATE CONTENTS OF TEMPIB.C BY ONE LOCATION LEFT
/ADO SINrSIND TO THE ABOVE PRODUCT
/TEMPI.A CONTAIN SINO
/CLEAR FLAG
'IS SIN60.INO. JJMP 4 LOCATIONS AHEAD/YES. NEGATE IT/COMPLEMENT AC/SET FLAG TO -I
/GEl BASELINE LENGTH
IDIVIDE IT BY THE VELOCITY OF LIGHT
IPROSOl., CONTAIN d/C
/MULTIPLY (d/C).SING
'ROTATE ONE LOCATION LEFT
/DEPOSIT (d/C),SIN IN DIVIDEND
'DIVIDE BY 1.25NS WHICH IS THE BASIC'DELAY UNITI THE OTHERS ARE 2..5510.-0.4,.B0. I16/DEPOSIT THE GUOTIENT (-BIT NUMBER) IN TEMP3/GET FLAGlIS IT -?IYES. JUMP 5 LOCATIONS AHEAD/NO. SET DELAY IN IF STRIP 2 TO ZERO/GET TEMP3/ADJUST DELAY 1
JUMP 4 LOCATIONS AHEADISET DELAY lI TO ZERO/GET TEMP3/4DJUST DELAY S2
/RESET TIME COUNT FOR NEXT COMPENSATION
102
PAGE21.CLA CLLTAD K246JMS I TYPOTAD D46JMS I TPOTAD R46JMS I TYPOJMS 1 aRPNCHCL.TA4D K44JIS I TYPOlAD K244.INS I TYPOTAD RT44JD I TYPO.IMS I CRLFPJ.S I CRLFPCIATAD MWTAO40 TOPUSnCr I,,TAD I I1OCR TEMPIT4D I InPcA TE"P?
TAD -EMPI
ANn MS577RRTR CLL-TR'T7J''S I CPRNTJMS I JINCTTAD MS770CMAAND TEMPIDCA TEMPIJMR I DMULTP
TE'PIL)CA TrMPITAD I CONTHI)CR TEMPPT41) I CONTCDCA TEMP3JMS I ROT6LTA l TEItPIJRS I DCPRNT.I'S I CRLFPJMS I CRLF?C4T,.I) TOPOS,(: 1'
TAD TAD RH
CLA4RCDTAD I ISDCA TErPITAD I 10OCA TEMP2TAD TFYPISPA CLAJMP .+IIJ5 ROTPJMS I SPRNTJRS I PUNCTTAD MS 7a0CMAAND TEMPIDCA TEMPJMP F RCNLJMS ROTPT4D MS777)DC PROSOITAD 57330CMA4ANn TEMIIDCA TEMPITAO TEMPISZA CLA
TAD TEP2SNA CLAJMP.+7TAD TEMPITAD MS70ADCA TEMPIDCA TEMP3JMS I NEGATIACJMP TO537IJMS I SPRNTJMS I PIlNCTFRCNL,JMS I DMULTPTEMP I
QCA TEMPIJS I ROT3LTAD TEMPI
RJMS I DCPRNTJMS I CRLFPJMS I CRLPISZ CNTDEVJMP CLASCDTAD M6OCA CNTM6JMS I CRLFPISZ CNTM6JMP.-2JMP I PAG22ROTP. eTAD TEMPIAND MS7O0RTL CLLRTLJMP I ROTPK246,246244. 244
RPJNCH. RPUNSPRNTSSPRNTMS777. 7770PAG2. PAGE22TO537 1T TAD PROSOISZAJMP FRCNL-2TAD MINIUSJMS I TYPOJMP FRCNL-2MINUS. 255PAUOSE

*5600FLGCHK, JMP TO576s5 JUMP TO 57656361 'IS FLAG OF DEVICSKP /NO. SKIPJMP SR36 'YES, GO TO SERVE6371 IIS FLAG OF DEVICSKP /NO, SKIPJMP SR37 /YES. GO TO SERVE6321 lIS FLAG OF DEVICSKP /NO, SKIPJMP SH32 .YES, GO TO SERVE6331 / IS FLAG OF DEVI CSYP /NO, SKIPJMP SR33 IYES. GO TO SERVEION ITURN INTERRUPT J.P T05772 /JlMP TO 5772JMp I IJUMP TO LOCATIONSR36, 64116362 /SEND STEPPING PU6412 IWAS PULSE RECEIVJMP- I /NOCLA CLL /YEST4D I STEP2P-I /ADD HE STEP TOT4A) I HRP.P,CA I HR2P+2RALTAD I STEP2PTAD I HR2PPIDCA I nRP. IRALTAD I HR2P.IMP I 5764 /GO TO CHECK IF HJMP FLGCH+*SR37 611S37 /ISEND STEPPING PUI
WAS PULSE RECEIVJMP.- I /NOCLA CLL /YESTAD I STEPIP-I /ADD THE STEP TOTAD I HRIP.2DCA I HRIP.+RALTAD I STEPIPTAD I HRIP+IDCA I HRIPRIR ALTAD I HRIPJ`P I 5763 /GO TO CHECK IF HiLAS /READ SWITCH REGI:AND TRIA /MASK IT WITH 3SNA CLA /IS AC NON-ZEROJMP FLGCHK7 INO7AD GET3 /YESDCA 13 /GET INDEX COORDITAD GET4)CA IIJMS TRANPR IRETURN DISHES TOJM. I HRISPJS I HR37PJMS TRANPRJMS I RIPJMS I HR36PJMS TRANPRJMS I DECIPIJMS I DFCOSpJMS TAN, RJMS I DECIOPJMS I DEC43PHLT IHALT PROGRAMSR53, JMS I TINC /INCRAEEN1 TIME JMP FLGCHK-12SR33, ION ITHIS SERVES THE CLL CLA /INTERRUPT ONTAD TIME- IORTAIN GST.LST-L(TAD LONGI-2DCA PROS03KALTAI) TIME+ITAD LONGIAIDCA PROS0RALTAD TIMETAD LONG!DCA PROSOt IPHOSOI,2,3 CONTAIJM I DAYX24 /COMPUTE (#DAYS)*2JMP I PAG24 /TEMPI.2.31 JUMP TTRANP, 0JMS I TRANSXTAD PRO503)P P6I5O5RALTAD PHOSO2TAD TEMPOOCA PRS502JMP I TR4NPRSAVEAC, .RP, HR2HRSI
STEP2P, STEP2STEP2IHRIP, nH.
~l+2STEPIP, STEPISTEP* IGETS, HRIZ-IGETs, RI- IHRI2P. HR12HR17P, H37NR36P, H6DECIPP, DEC12DEC4VPM OEC45OEC43P, DEC43DAYX24. DAY24PAG24, PAGE24*57636557656T05765, DCA SAVEAC SAVE AC CONTENTRAL6CA SAVELK /SAVE LINK CONIENTJ*P T056.1SAVELK, RTOI772, CLA CLLTAO SAVELK tREHIEVE LINK CON
TAD SAVEAC /RETRIEVE A COilTEIJp I
CE 36 UP?
DEVICE 36CE 37 UP?
E DEVICE 37E :1P U?
E DEVICE 32E 33 UP?
DEVICE 33
ULSE TO ANT. *2ED?
THE HR2 REGISTEt.
HR224
LSE TO ANT. IED?
THE HRI REGISTER
RI 24STER
IATES OF DISHES
INDEX POSITION
RGISTER
rIME CHECK INTERRUPTI TURN
ONGITUDE
N GST64*(9.857/3600) DEPOSI INO PAGE 24
PAGFPA, ):LLAD lEMP3
TAD SIDHRO+2DCA TEMP3RALTAD TEMPSTAD SIDHR.IDCA TEMP2RAL1AD TEMPITAD SIDHR0DCA TEMPIJMS I NEGATCLLTAD TEMP3TAD PROS03DCA PROS03RALTAD TEMP2TAD PROS02nCA PROSOPRALTAD TEMPITAD PROSO!DCA PROSOITan PROSI1DCA EGA-2TAD PROS02DCA VEGA+3TAD PROS03DCA MEGA.4OCA MEGAITAD VEGAJMS I DDIVPN7~e
DCA TEMPITAD I LOOTOCR TEMP2JMS I DMULTPTEMPICONVERDCA TEMPITAD I CONTBDCA TEMP2TAD I CONTCDCA TEMP3JMS I NEGATCLLTAD TEWP3TAD PROS03DCA TEMP3RALIAD TEMP2TAD PROS02DCA TEMP2RALTAD TEMPITAD PROSOIDCA TEMPIJMS I DMULTPTEMP2NGHDCA TEMP2TAD I CONTBDCA PROSOITAD I CONTCDCA PROS02JMS I DMULTPPROSOIN60DCA TEMP3TAD I CONTBDCA PROSOITAD I CONTCDCA PROS02JMS I DMULTPPROSOINRl00DCA TEMPOJMS I CRLFPTAD TEMP IJMS I DCPRNTJMS I CRLPTAD TEMP2JMS I DCPRNTJMS CRLFPTAD TEMP3JMS I DCPRNTJMS CRLFPTAD TEMPOJMS I DCPRNTJMS I CRLFPCLA
6135 JMP I ARXISILLY, CLADCA TEMPOISZ TEMPOJP.- IJMP SILLY
6143 ROT T, ATAD TEMPIRARDCA TEMPITAD I CONTBRARVIA I CONTSTAD I CONTCRARDCA I CONTCJMP I ROTIRTMEGII, 0TAD I 10UCA MEGA-ITAD I ADCA MEGA-2TAD I 10DCA MEGA3DCA MEGA4TAD MEGAJMP I MEGIIARXI, ARHIPA'JSE
/ADD TEMPI,2,3 TO UT AT JANUARY /CONTAINED IN SIDHRA,.*+12
/DEPOSIT SUM IN TEMPI,23/NEGATE THE SUM
/OBL1AIN GST-UTHRO- ( DAYS)*24A(9.857/J6d)
/PROSO1,2,3 CONTAIN DIFFERENCE
/NOW WE MULTIPLY (PROSOI,2,3)-II-9.85K/3600)=GCl/DEPOSIT PROS01,2,3 I DIVIDEND
/DIVIDE BY 3600
IOEPOSIT IN TEMPI,.
I/ULTIPLY TEMPI19.857
IDEPOSIT PRODUCT IN TEMPI,2.3
INEGATE TEMP1.2,3
/FORM (PROSO1,7.3)-(TEMPI,2.3)=GCT
ITEMPI,2,3 CONTAIN GCT IN HOURS/MULTIPLY FRACTIONAL PART OF GCT BY 60
'DEPOSIT INTEGRAL PART OF PRODUCT IN TEMP2 (MINUTES)
'DEPOSIT FRACTIONAL PART IN PROSO1,2.3
IMULTIPLY FRACTIONAL MINUTES BY 60
/TEMP3 CONTAINS THE SECONDS
/TYPE CARRIAGE RETURN
ITYPE THE HOURS
/TYPE THE MINUTES
ITYPE THE SECONDS
/JUMP TO LOCATION 1660/THIS'A WAITING LOOP USED WHILE E ARE/GETTING SET FOR THE TIME CHECK
/THIS SUBROUTINE OTlAIE THE CONTENTS'OF TEMPI, 9 AND C BY ONE LOCATION/RIGHT
/SETS UP THE DIVIDEND Y iEANS OF/THE SELF-INDEXING REGISTE 1I
T EN1
NT
103
1 �1�11_��_11__1_ _1_ _

/ROTATE CONTENTS OF TEMPI,I,Cf/Y ONE LOCATION LEFT B.C AROE THE LOW ORDER
/REGISTES IN WHICH THE PRODUCT I STHREL/1HE HIGH ORDER IS IN THE ACCUMULATO0/tRICH IN THIS CASE WAS DEPOSITED) IN TEMPI
/OTrATES CONTENTS 3F TEMPIB.C THREE/LOCA I NS I GHT
/ROTATES THE CONTENTS OF TEMPI.B.C THREE/LOCATIONS LEFT
/INCREMENTS THE TIME REGISTER BY1 .2*( I+0. 027)/3600 HOURS
/ROTATES CONTENTS OF TEMPI,2,3/SIX LOCATIONS LEFT
/ROTATES CONTENTS OF TEMPI.B.C/TWO LOCATIONS LEFT
/CHECKS THE SIGN OF A NUMREH rEFORE/THE NUMdER IS ROTATED IGHT/GET HIGH oRDER TEHM OF NUMf'E/IS IT NEGATIVE?/NO. JUMP 3 AHEAD/YES. SET LINK TO I/COMPLEMENT AC/DEPOSIT -I IN TEMPO
/GIVES A CARRIAGE RETURN AND A LINE FEED
/TYPES (.)
iTYPES ANY CHARACTER
MID lL,CLAT AD INTFGRDCA TEMPITAD INTEGH IDCA TEMP2DCA TF9P3,IS I NEGATJMS I DJLTPTFMPIPNTIDCA TEMPITAD I CONTRDCA TEMPTTAD TEMPIDCR MEG4A1Tan TEMP2DCA MEGA+2OCA MEGA3DCA MEGA 4TAn MEGAJIS I DDIVPN3ROA
DCA MIDLTMTAD I LOIOTDCA MIDLTMHIJMP I T06433T0433 7245064~7TAD I CONT.DCA TEMP2JnS I oCOSPTEMPITAD I HARGDCA COSMDTTAD I LARGDCA COSMDTHIInS I DSINP
TEMPITAD I HARGDCA SINMDTTAO I LARGDCA SINMDT*IJIP I MIDDLPNTI. 1463 _1462COSMDT. 0
SINID)T, 0
DEC 3.0JMS I DULTPTEPPINS416DCA TEMPITAD I CONTHDCA TEMP2CYCLA, CLA641164316412JMP.-IJMS I PULSETAD TEMPISPA CLAJMP CYCL43JMP I DEC43
6434IOF
63346321
633163746371637t63616361JMP I PROGMPROGM.209CHK24 .etAD I OPERATTAD 0974SPASKPDCA I OPERATCLAJMP I CK24OP RATA H6540PATCH. 102730071I26
1025305JMP I PATCH*6550OCA I TEMPSTTAD TEMPSTDCA OPERAT·IMS CHK24JMP I TO1425T014AS. 1425TEMPST.1515.*657OCA I HRIPTAD HRIPOCA OPERATJRS CH24,IMP I T05657HRIP.671T05657 ,5657*6566DC I HRPTAD HR2PDCA OPERATJMS CMH24JMP I TO5637R2P. 6724T05637 5637
/THIS 5JH.)UIINE COMPUTES THE INTEGRATION TIME, T,/IN HOUJRS AND THEN CALCULATES COS(T/2) AND 1SN(T/2/.
/THE LAST TWO FUNCTIONS ARE USED FOR rHE/CALCULAIION OF U AND V.
/rIILTM.H I CONTAIN 1/2 IN HOURS
/I.UMP TO 7245 TO COPUTE (120)*(2IT/
/COSMDT·,I CONTAIN CO0(¢2ft2f)(TO2)1
/SINMDT,+I CNTAIN SIN((2r24)(112)
/THIS SLBH.OUTINE IS UbED IN THE POINTING/OF DECLINATION e2
/PROGRAM STARTS HERE
/DEACTIVATE CLOCK INTERRUPT/CLEAR FLAG 32/CLEAR FLAG 33/DEACTIVATE TRACKING INTERRUPT/CLEAR FlAG 37
/CLEAR FLAG 36
'CHECKS AHETHER A/NUMBER IS GREATER THAN 24
/CORRECTION PATCH
/CHECKS WHETHER STIME IS/GREATER THAN 24
ICRECKS WHETHER HRI-24
/CHECKS WHETHER HR2-24
104
.62 0ROT ILF, TAD I CONTCRAL CLLDCA I CONTCTAD I CONTRRALDCA I CONT8TAD TEMP IRAL,JMP I ROTII F
OT3RT.0TAD M3DCA CNTM3TAD TEMP IRAR CLLDCA TEMPITAD I CONTRRAHnCA I CONT9TAD I CONTCRARDCA I CONTCISZ CNTM3JMP ROT3RT-3JMP I ROT3RTROT3LF ,1AD M3DCA CNM3TAD I CONTCHAL CLLDCA I CONTCTAD I CONTH
ALDCA I CONT9TAD TEMPI
ALDCA TFMPIISZ CNTM3JMP ROT3LF 3JMP I ROT3LFTMINCR.0CLL CLATAD TIME-2TAD INCHIDCA TIME-2RALTAD TIME.ITAD INCHRDCA TIMEHIRALTAD TIMEDCA TIMETAD TIMETAD M24SPASKPDCA TIMECLAJMP I TMINCRINCHR. 0001646ROT6LF,HTAD M6DCA CNTM6TAD TEMP3RAL CLLDCA TEMP3TAD TEMP2
DCA TERP2TAD TEMPIRALDCA TEMPIISZ CNTM6JMP ROT6LF+3JMP I ROT6LFROT2LF TAD M2DCA CNTM2TAD I CONTCRAL CLLDCA I CONTCTAD I CONTBRALDCA I CONTBTAD TEMPIRA.DCA TEMPIIS7 CNTMOJMP KOT2LF-3JYP I ROT2LFPARA.0CLA CLLTAD TEMPISMA CLAJMP..3STLCMADCA TEMPOJMP I PARACRLF, CLATAD KCRJS I TYPOTAD RLFJMS I TYPOJMP I CRLFKCR,21 59LE .212
TYPEPTIfCLATAD PT956JMS I TYPOJIP I TYPEPTPT256, 256TYPE.0TLSTSrJMP.- ITCFCLAJMP I TYPEPAUSE
I -

/NIIMBER OF DAYS SINCE JANUARY 0/NUMBER OF INTEGRATIONS ON THE CALIBRATION OUHCE/NUMBER OF INTEGRATIONS ON THE SOURCE
IDECLINATION OF CALIBRATION SOURCE IN DEGREES
/DECLINATION OF SOURCE IN DEGREES
*7215TPD TEMP3TAD I CONTCDCA TEMP3RALTAD TEMP2TAD I CONTADCA TEMP2RALTAD TEMPIDCA TEMPCLLTAD TEMP3TAD SIDHR0-2DCA TEMP3RALTAD TEMP2TAD SIDHR0I-DCA TEMP2RALTAD TEMPITAD SIDHRDCa TEMPIJMP I T0522T0522,522.7-P5TAD MIDLTMDCA MIDTMPTAD MIDLTM.IDCA MIDTMP-ITAD M3PCA CNTM3ROTRCLLTAD MIDTAPRARDCA MI DTMPTAO MIDTMP-IRAROCA MIDTMP IIS? CNTM3JMP ROTRJMS I DMiJLTPP ITP
I)CA TEMPIJMP I TOMPGTOMPG, 6437MIDTMP,. I
/CORRECTION REFERRED TO LOCATION 519
/CORRECTION REFERRED TO LOCATION 6433
/DECLINATION OF CALIBRATION SOURCE IN RADIANS
/DECLINATION OF SOURCE IN RADIANS
/DECLINATION OF BASELINE IN RADIANS
/UNIVERSAL TIME AT HR. AT JANUARY 0 OF 1969
/INDEX HOUR OF ANTENNA A1
tINDEX HOUR OF ANTENNA 2
,INDEX DECLINATION OF ANTENNA il
/INDEX DECLINATION OF ANTENNA M2
/PRESENT HOUR ANGLE OF ANTENNA Il
/PRESENT HOUR ANGLE OF ANTENNA 12
/PRESENT DECLINATION OF ANIENNA 1
/PRESENT DECLINATION OF ANTENNA 2
/STOES THE HOUR ANGLE THAT IS TYPED OUT
/STORES U
/STORES V
/STORES =J COSI FOP DEVICE #1
/STORES ?FSIN FOR DEVICE il
/STORES ZyCOSJ FOH DEVICE A2
/STORES Y, SIN1 FOR DEVICE P2
/STORES 7
COS6 FOR DEVICE A3
/STORES , SINS FOR UEVICE D3
/STORES , CTOS FOPk EVICE i4
/STORES SINJ FDo DEVICE A
105
.6611 3NAP, 9T74
NIOT, 1750
N36L, 0in07TDN64R. 2506
000TDS.
LCT O0LC,
R4CL.T0
RAS,
0HOUR, a
00DECL, 0n00DECS. A0
DECBS. A
RASLD.
00
STDECL A
STDECS,
DECAL, .
DELTS. P0OECL8. f
45675656WLONG. 454257412HRIZ, 2772340HR2Z.
45
DECIZ, 5266526DEC2Z, 5252556HRI. A
0H.
DECI, 0
DECT,
PRANGL, 00
SUMPEL. A
0
0
0
0
0
00
PAUSE0
000
PAUSE
_��__·__I__ _�

Acknowledgment
My deep appreciation and gratitude go to Professor
Bernard F. Burke for his support, guidance, and encour-
agement during all of the phases of my thesis research.
I would like to thank Professor Donald E. Troxel, Profes-
sor Robert P. Rafuse, Professor Donald H. Steinbrecher,
and Dr. Alan E. E. Rogers for their suggestions in equip-
ment design, and Professor David H. Staelin for his advice
in the system trouble shooting. Special mention should be
made of D. Cosmo Papa who designed the antenna mounts
and took care of the mechanical problems that came up. I
would also like to thank my colleagues Martin S. Ewing,
Richard Lewis, and John W. Barrett.
106

References
1. R. J. Allen, Ph. D. Thesis, Massachusetts Institute of Technology, 1967 (unpub-lished).
2. L. Sartori and P. M. Morrison, Astrophys. J. 150, 385 (1967).
3. A. H. Barret and D. H. Staelin, Space Sci. Revs. 3, 109 (1964).
4. D. Morrison, Science 63, 815 (1969).
5. M. Ryle and A. C. Neville, Mon. Not. Roy. Astron. Soc. 125, 39 (1962).
6. S. Kenderdine, M. Ryle, and G. G. Pooley, Mon. Not. Roy. Astron. Soc. 134, 189(1966).
7. S. H. Zisk, Ph.D. Thesis, Stanford Electronics Laboratories, 1965 (unpublished).
8. G. W. Swenson, Jr., and N. C. Mathur, Proc. IEEE 56, 2114 (1968).
9. G. W. Swenson, Jr., Ann. Rev. Astron. Astrophys. 7, 353 (1969).
10. A. E. E. Rogers, "The Haystack-Millstone Interferometer System," TechnicalReport 457, Research Laboratory of Electronics, Massachusetts Institute of Tech-nology, Cambridge, Mass., March 15, 1967.
11. D. H. Staelin, Class Notes, Course 6.624, Massachusetts Institute of Technology,1968.
12. W. M. Smart, Spherical Astronomy (Cambridge University Press, London, 1965).
13. A. H. Barret, Class Notes, Course 6.625, Massachusetts Institute of Technology,1969.
14. J. D. Kraus, Radio Astronomy (McGraw-Hill Book Company, New York, 1966).
15. J. W. Waters, Private communication, 1969.
16. G. G. Haroules and W. E. Brown III, J. Geophys. Res. 74, 4453 (1969).
17. R. N. Bracewell, Proc. IRE 46, 97 (1958).
18. W. B. Davenport and W. L. Root, An Introduction to the Theory of Random Signalsand Noise (McGraw-Hill Book Company, New York, 1958) .
107
I-- -- · 7·C_ ---- - ____ _

JOINT SERVICES ELECTRONICS PROGRAM
REPORTS DISTRIBUTION LIST
Department of Defense
Assistant Director (Research)Office of Director of Defense, Research
& EngineeringThe Pentagon, Rm 3C128Washington, D.C. 20301
Technical LibraryDDR&ERoom 3C-122, The PentagonWashington, D.C. 20301
Director For Materials SciencesAdvanced Research Projects Agency1400 Wilson BoulevardArlington, Virginia 22209
Chief, R&D Division (340)Defense Communications AgencyWashington, D.C. 20305
Defense Documentation CenterAttn: DDC-TCACameron StationAlexandria, Virginia 22314
Dr. Alvin D. SchnitzlerInstitute For Defense AnalysesScience and Technology Division400 Army-Navy DriveArlington, Virginia 22202
LTC Norman D. JorstadWeapons Systems Evaluation Group400 Army-Navy DriveArlington, Virginia 22202
Central Intelligence AgencyAttn: CRS/ADD/PUBLICATIONSWashington, D.C. 20505
Department of the Air Force
Hq USAF (AF/RDPE)Washington, D.C. 20330
Hq USAF/RDPSWashington, D.C. 20330
Hq 1JSAF (RDSD)The PentagonWashington, D.C. 20330
Colonel E. P. Gaines, Jr.ESD (MCD)L. G. Hanscom FieldBedford, Massachusetts 01730
Dr L. A. Wood, DirectorElectronic and Solid State SciencesAir Force Office of Scientific Research1400 Wilson BoulevardArlington, Virginia 22209
Dr Harvey E. Savely, DirectorLife SciencesAir Force Office of Scientific Research1400 Wilson BoulevardArlington, Virginia 22209
Mr I. R. MirmanHq AFSC (SGGP)Andrews Air Force Base,Washington, D.C. 20331
Rome Air Development CenterAttn: Documents Library (TDLD)Griffiss Air Force Base, New York 13440
Mr H. E. Webb, Jr. (ISCP)Rome Air Development CenterGriffiss Air Force Base, New York 13440
Dr L. M. HollingsworthAFCRL (CA)L. G. Hanscom FieldBedford, Massachusetts 01730
Hq ESD (TRI)L. G. Hanscom FieldBedford, Massachusetts 01730
Professor R. E. Fontana, HeadDept of Electrical EngineeringAir Force Institute of TechnologyWright-Patterson Air Force Base,Ohio 45433
__

JOINT SERVICES REPORTS DISTRIBUTION LIST (continued)
Dr H. V. Noble, AFAL/TEChief, Electronics Technology DivisionAir Force Avionics LaboratoryWright-Patterson Air Force Base,Ohio 45433
DirectorAir Force Avionics LaboratoryWright-Patterson Air Force Base,Ohio 45433
AFAL/TEA (Mr R. D. Larson)Wright-Patterson Air Force Base,Ohio 45433
Director of Faculty ResearchDepartment of the Air ForceU.S. Air Force AcademyColorado 80840
Mr Jules I. WittebortChief, Electronics BranchManufacturing Technology DivisionAFAL/LTEWright-Patterson Air Force Base,Ohio 45433
Academy Library (DFSLB)USAF Academy, Colorado 80840
Director of Aerospace Mechanics SciencesFrank J. Seiler Research
Laboratory (OAR)USAF Academy, Colorado 80840
Major Richard J. GowenTenure Associate ProfessorDept of Electrical EngineeringUSAF Academy, Colorado 80840
Director, USAF PROJECT RANDVia: Air Force Liaison OfficeThe RAND CorporationAttn: Library D1700 Main StreetSanta Monica, California 90406
AUL3T-9663Maxwell Air Force Base, Alabama 36112
AFETR Technical Library(MU-135)Patrick Air Force Base, Florida 32925
ADTC (SSLT)Eglin Air Force Base, Florida 32542
Hq AMD (RDR/Lt Col Godden)Brooks Air Force Base, Texas 78235
USAFSAM (RAT)Brooks Air Force Base, Texas 78235
Commanding GeneralAttn: STEWS-AD-L, Technical LibraryWhite Sands Missile Range,New Mexico 88002
European Office of Aerospace ResearchTechnical Information OfficeBox 14, FPO New York 09510
VELA Seismological Center312 Montgomery StreetAlexandria, Virginia 22314
Capt C. E. BaumAFWL (SRE)Kirtland Air Force Base,New Mexico 87117
Biomedical Engineering Branch (SCB)USAF School of Aerospace Medicine (AFSC)Department of the Air ForceBrooks Air Force Base, Texas 78235
Department of the Army
DirectorPhysical & Engineering Sciences Division3045 Columbia PikeArlington, Virginia 22204
Commanding GeneralU.S. Army Security AgencyAttn: IARD-TArlington Hall StationArlington, Virginia 22212
Commanding GeneralU.S. Army Materiel CommandAttn: AMCRD-TP (Dr Zarwyn)Washington, D.C. 20315
DirectorU.S. Army Advanced Materiel
Concepts Agency2461 Eisenhower AvenueAlexandria, Virginia 22314
_I__ Ill_·___llllylllslll·^C-YI� 1-�--·--·--�-_I__�

JOINT SERVICES REPORTS DISTRIBUTION LIST (continued)
Commanding GeneralUSACDC Institute of Land CombatAttn: Technical Library, Rm 6362461 Eisenhower AvenueAlexandria, Virginia 22314
Mr H. T. Darracott (AMXAM-FT)U. S. Army Advanced Materiel
Concepts Agency2461 Eisenhower AvenueAlexandria, Virginia 22314
Commanding OfficerHarry Diamond LaboratoriesAttn: Dr Berthold Altman (AMXDO-TI)Connecticut Avenue and
Van Ness Street N. W.Washington, D.C. 20438
Commanding Officer (AMXRD-BAD)U. S. Army Ballistic Research LaboratoryAberdeen Proving GroundAberdeen, Maryland 21005
U. S. Army Munitions CommandAttn: Science & Technology Information
Branch, Bldg 59Picatinny Arsenal, SMUPA-RT-SDover, New Jersey 07801
Dr Herman RoblDeputy Chief ScientistU. S. Army Research Office (Durham)Box CM, Duke StationDurham, North Carolina 27706
Richard O. Ulsh (CRDARD-IP)U. S. Army Research Office (Durham)Box CM, Duke StationDurham, North Carolina 27706
Technical Director (SMUFA-A2000-107-1)Frankford ArsenalPhiladelphia, Pennsylvania 19137
Redstone Scientific Information CenterAttn: Chief, Document SectionU.S. Army Missile CommandRedstone Arsenal, Alabama 35809
Commanding GeneralU.S. Army Missile CommandAttn: AMSMI-RRRedstone Arsenal, Alabama 35809
Commanding GeneralU.S. Army Strategic Communications
CommandAttn: SCC-ATS (Mr Peter B. Pichetto)Fort Huachuca, Arizona 85613
Dr Homer F. PriestChief, Materials Sciences Division,
Bldg 292Army Materials & Mechanics Research
CenterWatertown, Massachusetts 02172
C ommandantU.S. Army Air Defense SchoolAttn: Missile Science Division, C&S DeptP. O. Box 9390Fort Bliss, Texas 79916
CommandantU.S. Army Command and General
Staff CollegeAttn: Acquisitions, Lib DivFort Leavenworth, Kansas 66027
Dr Hans K. ZieglerArmy Member TAC/JSEP (AMSEL-XL-D)U. S. Army Electronics CommandFort Monmouth, New Jersey 07703
Mr I. A. Balton, AMSEL-XL-DExecutive Secretary, TAC/JSEPU.S. Army Electronics CommandFort Monmouth, New Jersey 07703
Director (NV-D)Night Vision Laboratory, USAECOMFort Belvoir, Virginia 22060
Commanding OfficerAtmospheric Sciences LaboratoryU.S. Army Electronics CommandWhite Sands Missile Range,New Mexico 88002
Atmospheric Sciences LaboratoryU.S. Army Electronics CommandAttn: AMSEL-BL-DD (Mr Marvin Diamond)White Sands Missile Range,New Mexico 88002
__

JOINT SERVICES REPORTS DISTRIBUTION LIST (continued)
ChiefMissile Electronic Warfare Tech
Area (AMSEL-WL-M)Electronic Warfare Laboratory,
USAECOMWhite Sands Missile Range,New Mexico 88002
Project Manager NAVCONAttn: AMCPM-NC, Bldg 439
(H. H. Bahr)Fort Monmouth, New Jersey 07703
Mr A. D. Bedrosian, Rm 26-131U. S. Army Scientific Liaison OfficeMassachusetts Institute of Technology77 Massachusetts AvenueCambridge, Massachusetts 02139
Commanding GeneralU. S. Army Electronics CommandFort Monmouth, New Jersey 07703Attn: AMSEL-RD-O (Dr W. S. McAfee)
GG-DDXL-DXL-DTXL-G (Dr S. Kronenberg)XL-H (Dr R. G. Buser)BL-FM-PCT-DCT-RCT-SCT-LCT-OCT-ICT-ANL-D (Dr H. Bennett)NL-ANL-CNL-PNL-P-2NL-RNL-SKL-DKL-IKL-EKL-SKL-SMKL-TVL-DVL-FWL-DRD-PB (Miss F. Morris)
Department of the Navy
Director, Electronics ProgramsAttn: Code 427Office of Naval Research800 North Quincy StreetArlington, Virginia 22217
Mr Gordon D. Goldstein, Code 437Information Systems ProgramOffice of Naval Research800 North Quincy StreetArlington, Virginia 22217
CommanderNaval Security Group CommandNaval Security Group HeadquartersAttn: Technical Library (G43)3801 Nebraska Avenue, N. W.Washington, D.C. 20390
DirectorNaval Research LaboratoryWashington, D.C. 20390Attn: Code 5200
Mr A. Brodzinsky, Supt,Electronics Div
DirectorNaval Research LaboratoryAttn: Dr H. Rabin, Code 7000Washington, D.C. 20390
Code 8050Maury Center LibraryNaval Research LaboratoryWashington, D.C. 20390
Dr G. M. R. WinklerDirector, Time Service DivisionU. S. Naval ObservatoryWashington, D.C. 20390
Naval Air Systems CommandAIR 310 - Research AdministratorRoom 424 JP-1Washington, D.C. 20360
Dr A. L. SlafkoskyScientific AdvisorCommandant of the Marine Corps (Code AX)Washington, D. C. 20380
Naval Ship Systems CommandShip 035Washington, D.C. 20360
U. S. Naval Weapons LaboratoryDahlgren, Virginia 22448
��_�I I*I L--�l-�-·--�^P�-pl ·----�1I�^^1I_·- ·IU·IIIPI--Y·�LXIIII�^ I··_-1I1 IP

JOINT SERVICES REPORTS DISTRIBUTION LIST (continued)
Naval Electronic Systems CommandAttn: Code 0311, Rm 7W12, NC #1Department of the NavyWashington, D.C. 20360
C ommande rU.S. Naval Ordnance LaboratoryAttn: LibrarianWhite Oak, Maryland 20910
DirectorOffice of Naval ResearchBoston Branch495 Summer StreetBoston, Massachusetts 02210
Commander (ADL)Naval Air Development CenterAttn: NADC LibraryJohnsville, Warminster,Pennsylvania, 18974
Commanding OfficerNaval Missile CenterAttn: 5632.2, Technical LibraryPoint Mugu, California 93042
W. A. Eberspacher, Associate HeadSystems Integration Division, Code 5340AU.S. Naval Missile CenterPoint Mugu, California 93041
CommanderNaval Electronics Laboratory CenterAttn: Lib rarySan Diego, California 92152
Deputy Director and Chief ScientistOffice of Naval Research Branch Office1031 East Green StreetPasadena, California 91101
Library (Code 2124)Naval Postgraduate SchoolMonterey, California93940
Glen A. Myers (Code 52Mv)Assoc Professor of Electrical EngineeringNaval Postgraduate SchoolMonterey, California 93940
Officer in Charge, New London Lab.Naval Underwater Systems CenterAttn: Technical LibraryNew London, Connecticut 06320
Commanding OfficerNaval Avionics FacilityAttn:- D/035 Technical LibraryIndianapolis, Indiana 46241
DirectorNaval Research LaboratoryAttn: Library, Code 2039 (ONRL)Washington, D.C. 20390
Commanding OfficerNaval Training Device CenterAttn: Technical LibraryOrlando, Florida 32813
U. S. Naval Oceanographic OfficeAttn: M. Rogofsky, Librarian (Code 1640)Washington, D.C. 20390
Other Government Agencies
Dr H. HarrisonAEC/NASA Space Nuclear Systems
OfficeAEC Headquarters (F-309)Washington, D.C. 20545
NASA Lewis Research CenterAttn: Library21000 Brookpark RoadCleveland, Ohio 44135
Los Alamos Scientific LaboratoryAttn: Reports LibraryP. O. Box 1663Los Alamos, New Mexico 87544
Mr M. Zane ThorntonDeputy DirectorCenter for Computer Sciences and
TechnologyNational Bureau of StandardsU.S. Department of CommerceWashington D.C. 20234
U.S. Postal ServiceLibrary - Room 601212th & Pennsylvania Ave., N. W.Washington, D.C. 20260
---- -- I I I

JOINT SERVICES REPORTS DISTRIBUTION LIST (continued)
Non-Government Agencies
DirectorResearch Laboratory of ElectronicsMassachusetts Institute of TechnologyCambridge, Massachusetts 02139
Mr Jerome Fox, Research CoordinatorPolytechnic Institute of Brooklyn333 Jay StreetBrooklyn, New York 11201
DirectorColumbia Radiation LaboratoryColumbia University538 West 120th StreetNew York, New York 10027
DirectorCoordinate Science LaboratoryUniversity of IllinoisUrbana, Illinois 61801
DirectorStanford Electronics LaboratoryStanford UniversityStanford, California 94305
DirectorMicrowave LaboratoryStanford UniversityStanford, California 94305
DirectorElectronics Research LaboratoryUniversity of CaliforniaBerkeley, California 94720
DirectorElectronics Sciences LaboratoryUniversity of Southern CaliforniaLos Angeles, California 90007
DirectorElectronics Research CenterThe University of Texas at AustinEngineering-Science Bldg 110Austin, Texas 78712
Division of Engineering andApplied Physics
210 Pierce HallHarvard UniversityCambridge, Massachusetts 02138
Dr G. J. MurphyThe Technological InstituteNorthwestern UniversityEvanston, Illinois 60201
Dr John C. Hancock, HeadSchool of Electrical EngineeringPurdue UniversityLafayette, Indiana 47907
Dept of Electrical EngineeringTexas Technological UniversityLubbock, Texas 79409
Aerospace CorporationP. O. Box 95085Attn: Library Acquisitions GroupLos Angeles, California 90045
Airborne Instruments LaboratoryDeerpark, New York 11729
The University of ArizonaDepartment of Electrical EngineeringTucson, Arizona 85721
Chairman, Electrical EngineeringArizona State UniversityTempe, Arizona 85281
Engineering and MathematicalSciences Library
University of California at Los Angeles405 Hilgred AvenueLos Angeles, California 90024
Sciences-Engineering LibraryUniversity of CaliforniaSanta Barbara, California 93106
Professor Nicholas GeorgeCalifornia Institute of TechnologyPasadena, California 91109
Aeronautics LibraryGraduate Aeronautical LaboratoriesCalifornia Institute of Technology1201 E. California BoulevardPasadena, California 91109
Hunt LibraryCarnegie-Mellon UniversitySchenley ParkPittsburgh, Pennsylvania 15213
1 ____11_1^__11___·111I _ 1I_----·I1III��I11IIIly Y ---�--�LI

JOINT SERVICES REPORTS DISTRIBUTION LIST (continued)
Dr A. G. JordanHead of Dept of Electrical EngineeringCarnegie-Mellon UniversityPittsburg, Pennsylvania 15213
Case Western Reserve UniversityEngineering DivisionUniversity CircleCleveland, Ohio 44106
Hollander AssociatesAttn: LibrarianP. O. Box 2276Fullerton, California 92633
Dr Sheldon J. WellesElectronic Properties Information CenterMail Station E-175Hughes Aircraft CompanyCulver City, California 90230
Illinois Institute of TechnologyDepartment of Electrical EngineeringChicago, Illinois 60616
Government Documents DepartmentUniversity of Iowa LibrariesIowa City, Iowa 52240
The Johns Hopkins UniversityApplied Physics LaboratoryAttn: Document Librarian8621 Georgia AvenueSilver Spring, Maryland 20910
Lehigh UniversityDepartment of Electrical EngineeringBethlehem, Pennsylvania 18015
Mr E. K. PetersonLenkurt Electric Co. Inc.1105 Country RoadSan Carlos, California 94070
MIT Lincoln LaboratoryAttn: Library A-082P. O. Box 73Lexington, Massachusetts 02173
Miss R. Joyce HarmanProject MAC, Room 810545 Main StreetCambridge, Massachusetts 02139
Professor R. H. RedikerElectrical Engineering, ProfessorMassachusetts Institute of TechnologyBuilding 13-3050Cambridge, Massachusetts 02139
Professor Joseph E. RoweChairman, Dept of Electrical EngineeringThe University of MichiganAnn Arbor, Michigan 48104
New York UniversityEngineering LibraryBronx, New York 10453
Professor James A. CadzowDepartment of Electrical EngineeringState University of New York at BuffaloBuffalo, New York 14214
Department of Electrical EngineeringClippinger LaboratoryOhio UniversityAthens, Ohio 45701
Raytheon CompanyResearch Division Library28 Seyon StreetWaltham, Massachusetts 02154
Rice UniversityDepartment of Electrical EngineeringHouston, Texas 77001
Dr Leo Young, Program ManagerStanford Research InstituteMenlo Park, California 94025
GTE Waltham Research Lab LibraryAttn: Documents Librarian
Esther McLaughlin40 Sylvan RoadWaltham, Massachusetts 02154
Dr W. R. LePage, ChairmanDepartment of Electrical EngineeringSyracuse UniversitySyracuse, New York 13210
Dr F. R. CharvatUnion Carbide CorporationMaterials Systems DivisionCrystal Products Department8888 Balboa AvenueP. O. Box 23017San Diego, California 92123

JOINT SERVICES REPORTS DISTRIBUTION LIST (continued)
Utah State UniversityDepartment of Electrical EngineeringLogan, Utah 84321
Research Laboratories for theEngineering Sciences
School of Engineering and Applied ScienceUniversity of VirginiaCharlottesville, Virginia 22903
Yale UniversityEngineering and Applied Science Library15 Prospect StreetNew Haven, Connecticut 06520
��_11_______1_1___�___I___I__�__LIIX·I_ 1 __�--.I -_1_-.__^-_ · _----111 ·- �1


UNCLASSIFIEDSecurity Classification
DOCUMENT CONTROL DATA - R & D(Security classification of title, body of abstract and indexing annotation must be entered when the overall report is classified)
. ORIGINATING ACTIVITY (Corporate author) 2a. REPORT SECURITY CLASSIFICATION
Research Laboratory of Electronics UnclassifiedMassachusetts Institute of Technology 2b. GROUP
Cambridge, Massachusetts 02139 None3. REPORT TITLE
Ku-band Interferometry
4. DESCRIPTIVE NOTES (Type of report and inclusive dates)
Technical report5. AU THOR(S) (First name, middle initial, last name)
George D. Papadopoulos
6. REPORT DATE 7. TOTAL NO. OF PAGES 7b. NO. OF REFS
December 31, 1970 122 188a. CONTRACT OR GRANT NO. 9a. ORIGINATOR'S REPORT NUMBER(S)
DA 28-043-AMC-02536(E) Technical Report 481b. PROJECT NO. 20061102B31F
NASA Grant NGL 22-009-016c. Gb. OTHER REPORT NO(S) (Any other numbers that may be assigned
this report)NSF Grant GP-14854~~~d. ~Noned.
10. DISTRIBUTION STATEMENT
THIS DOCUMENT HAS BEEN APPROVED FOR PUBLIC RELEASE AND SALE;ITS DISTRIBUTION IS UNLIMITED. °
I1. SUPPLEMENTARY NOTES 12. SPONSORING MILITARY ACTIVITY
Joint Services Electronics ProgramThrough U. S. Army Electronics Commane
1.. A.STRAC13. ABSTRACT
The construction of a Ku-band radio interferometer and some preliminary obser-vations are reported. The interferometer was built for the purpose of mapping somediscrete radio sources: the Crab Nebula, Cas A, and Cyg A. The system containstwo 8 ft parabolic antennas and receives radiation at 17. 128 GHz (1. 75 cm). Themaximum baseline length of 100 m corresponds to a resolution of 35 seconds of arc.A PDP-8 computer is incorporated in the system and used for pointing, tracking,delay compensation, and real-time data analysis. The phase stability of the systemwas found to be better than 10 ° over a period of 2 hours. Consistent fringe compo-nents were obtained from the Crab Nebula with the baseline set at 8 m.
DD D NOV 1473 (PAGE 1 ) UNCLASSIFIED
Security Classification
_IIIIL-LI-. -I I-llsll I _ _

UNCLASSIFIEDSecurity Classification
14.KEY WORDS
.,,~~~~~~~~~~~~~~~~~~~~
Aperture Synthesis
Ku-band Radiometer
PDP-8 Computer, Application to InterferometricSystem
Radio Astronomy
Radio Interferometry
Real-Time Data Processing
DD I NOV .1473 (BACK)
(PAGE 2)
LINK A
ROLE WT
LINK
ROLE WT
UNCLASSIFIEDSecurity Classification
LINK C
ROLE WT
I - -