Korean OFDI - CEPAL
56
Korean OFDI: investment strategies and corporate motivations for investing abroad Jae Sung Kwak Division of Production, Productivity and Management Santiago, Chile, december 2007 182 desarrollo productivo S E R I E
-
Upload
khangminh22 -
Category
Documents
-
view
0 -
download
0
Transcript of Korean OFDI - CEPAL

K orean OFDI: investment strategies and corporate motivations for investing abroad Jae Sung Kwak
Division of Production, Productivity and Management
Santiago, Chile, december 2007
182
desarrollo productivo
S E R I E

This document was prepared by Dr. Jae Sung Kwak profesor from Hyung Hee University, consultant of the Division of Production, Productivity and Management.
The views expressed in this document, which has been reproduced without formal editing, are those of the authors and do not necessarily reflect the views of the Organization. United Nations Publication ISSN printed version 1020-5179 ISSN online version 1680-8754 ISBN: 978-92-1-121656-1 LC/L.2804-P Sales No.: E.07.II.G.137 Copyright © United Nations, December 2007. All rights reserved Printed in United Nations, Santiago, Chile Applications for the right to reproduce this work are welcomed and should be sent to the Secretary of the Publications Board, United Nations Headquarters, New York, N.Y. 10017, U.S.A. Member States and their governmental institutions may reproduce this work without prior authorization, but are requested to mention the source and inform the United Nations of such reproduction.

CEPAL - Serie Desarrollo productivo No 182 Korean OFDI: Investment strategies and corporate motivations ….
3
Contents
Introduction ........................................................................................5 I. Evolution of Korean OFDI..........................................................9 1.1. Korean OFDI by destination ................................................13 1.2. Korean OFDI by industry.....................................................14 1.3. Korean OFDI by size of company........................................15 II. Characteristics of korean OFDI ...............................................19 2.1. Head office control over foreign subsidiaries......................19 2.2. R&D and technology transfer...............................................21 2.3. Home country impact on OFDI ............................................23 III. Motivations and corporate strategies of Korean OFDI .........31 3.1. Determinants of Korean OFDI .............................................31 3.2. Deepening of localization.....................................................33 3.3. Looking back, looking forward ............................................33
IV. Conclusion: the need for more coherent Korean OFDI Policy ......................................................................................31 Bibliography .......................................................................................37 Annexes ...............................................................................................39 Annex 1 Statistical annex ....................................................................41 Annex 2 Korean FDI flows by region..................................................53
Serie de desarrollo productivo: issues published............................65

CEPAL - Serie Desarrollo productivo No 182 Korean OFDI: Investment strategies and corporate motivations ….
4
Tables Table 1 KOREA: NET OFDI, TO 2004..............................................................................................7 Table 2 KOREAN OFDI...............................................................................................................10 Table 3 KOREA’S AUTHORIZED AND REALIZED OFDI................................................................11 Table 4 TOP 10 KOREAN COMPANIES, 1995-2000, AND 2005........................................................16 Table 5 SAMSUNG ELECTRONICS: TWO YEARS OF INVESTMENTS (APRIL 1993-FEB 1995)..........20 Table 6 OFDI AND TIME LAG BY TOP THREE ELECTRONICS FIRMS (COLOR TV).........................20 Table 7 OPERATION OF R&D CENTER/DEPARTMENT BY ESTABLISHMENT PERIOD...................21 Table 8 TECHNOLOGY TRANSFER OF KOREAN OFDI.................................................................22 Table 9 OFDI AND DOMESTIC PRODUCTION BY PERIOD............................................................24 Table 10 MAJOR INVESTMENT BEHAVIOR BY MOTIVES..............................................................24 Table 11 IMPACT OF FOREIGN SUBSIDIARY OPERATION IN EMPLOYMENT OF PARENT
COMPANY ...................................................................................................................25 Table 12 EMPLOYMENT EFFECT ON DIFFERENT ECONOMIC SECTORS........................................26 Table 13 TRADE EFFECT.............................................................................................................28 Table 14 IMPORT EFFECT............................................................................................................29 Table 15 DETERMINANTS OF FOREIGN INVESTMENT BY INDUSTRY...........................................32
Boxes Box 1 RELIABILITY OF KOREAN OFDI STATISTICS....................................................................6 Box 2 RELATIONS BETWEEN PARENT COMPANIES AND SUBSIDIARIES..................................21 Box 3 CATCHING-UP STRATEGY, TAKEOVER OF ZENITH BY LG..............................................23
Figures Figure 1 KOREA: OFDI BY DESTINATION, 1968-2006....................................................................14 Figure 2 KOREA: OFDI BY INDUSTRY, 1968-2006.........................................................................15 Figure 3 KOREAN OFDI BY SIZE..................................................................................................17

CEPAL - Serie Desarrollo productivo No 182 Korean OFDI: Investment strategies and corporate motivations ….
5
Introduction
International flows of capital in the form of foreign direct investment have become an important means of promoting economic development in many countries. The spread of globalization and the activity of transnational corporations have been driving forces behind these flows have already been adequately analyzed. An important new phenomenon of recent decades is the rapid increase in the outward foreign direct investment (OFDI) flows from developing countries.
Much less attention has been paid to outward investment by developing countries, mainly because it was negligible until recently. OFDI from emerging economies is playing an increasingly important role in enhancing the competitiveness of their companies and their integration into the global economy. It helps strengthen national firms' competitiveness by providing access to strategic assets, technology, skills, natural resources and markets, and in improving their efficiency. The internationalization provides greater opportunities for international cooperation, especially South-South, as the bulk of the investment goes to other developing countries.
Therefore, the governments of many emerging market countries are now paying closer attention to addressing their enterprise competitiveness through OFDI. In this regard, there is a need to further analyze the trends and features of OFDI to help emerging markets' governments design and implement an appropriate framework to benefit from this phenomenon.

CEPAL - Serie Desarrollo productivo No 182 Korean OFDI: Investment strategies and corporate motivations ….
6
The main purpose of this paper is to survey the trends and motivations of Korean overseas foreign direct investments. It consists of three sections: first, it outlines the evolution of Korean OFDI in terms of investment destinations, industry and company size. Secondly, central characteristics of Korean OFDI are analyzed, paying special attention to the relations between parent companies and subsidiaries, investment patterns and R&D activities. Lastly, the motivations as to why Korean companies go abroad and make overseas foreign direct investment are analyzed.
It should to emphasized at the outset that official statistics of the Korean Export Import Bank track the evolution of Korean OFDI; however, they are subject to certain shortcomings with regards to their reliability and interpretation (Box 1).
Box 1 RELIABILITY OF KOREAN OFDI STATISTICS
Korea Eximbank is the only authoritative source of statistics for Korean OFDI. However, as it is based on company reporting some of the qualitative as well as quantitative aspects of this investment are very difficult to trace. First, it only concerns the initial destination of the investment and no subsequent follow-up is made with regard to the final destination. Therefore, offshore financed projects are not adequately captured by this reporting system. This means that even though a company may relocate overseas assets from one host country to another there is no adjustment made to the official statistics of Korea. There are numerous examples of such. One, LG Electronics invested in Netherlands in 2001 with capital withdrawn from China and Indonesia. Two, in 2004, Korean investment to Latin America increased by 87% compared to the previous year and this was mainly a result of Hyundai Motor Co. and NHN, the largest Internet portal company in Korea, investing large amounts of capital, 85 million dollars and 82 million dollars respectively, in a tax haven, Cayman Island. HMC subsequently transferred these resources to China for the purpose of acquiring a local subsidiary. NHN established a holding company for further investment in Internet game industry (Suh, 2004). Some investments of Samsung and LG Electronics in Mexico are financed from their US subsidiaries, so they are not counted as Korean OFDI in Latin America from the statistical viewpoint of the Korean Eximbank. Interestingly, Mexico is considered part of North America by most of the big Korean TNCs.
Second, another challenge for Korean OFDI statistics is that there are not many reliable sources for the sectoral distribution of such investment. Although there are numerous associations covering the major industries, such as textiles, electronics, automotive, and construction, not many of them maintain data of overseas investment. Above all else, Korea lacks a nationwide industrial standard for investment data collection. In contrast to foreign investment statistics, trade statistics provide sectoral and other information because there is a specialized institution (KITA - Korea International Trade Association) for that purposed.
Third, one new characteristic of late 1990s and early 2000s was the sharp increase in OFDI withdrawals. The total amount of OFDI withdrawn during 1998-2002 reached 8 billion dollars, which was no less than 64.5% of the total OFDI withdrawn during the whole period from 1968 to the end of 2005. In a country in which OFDI is relatively small, it is necessary to give a special attention to the withdrawn amount. If it is reinvested, it is counted as a new investment in the official statistics. This means that the magnitude of Korea’s OFDI might really be smaller than the total amount indicated. That demonstrates why the net amount of investment is a useful figure. For instance, the fact that LG electronics launched a massive investment in Netherlands with the resources withdrawn from Asia partly explains the huge gap between total investment and net investment in 2001.
Fourth, there’s a huge gap in terms of FDI amount between home (sender) and host (recipient) statistics. For instance, Korea’s investment to China in 2004 was 23 billion dollars according to the Chinese Ministry of Industry and Commerce, whereas Korean Exim bank statistics suggested only 9.2 billion dollars. Two reasons can be proposed for now: one, offshore financing as explained above; two, increasing importance of incremental investment of existing operations. In Korea, there seems to be no mechanism or data collection mechanism to trace the third party financing of this kind.
Source: Suh (2004), Ha (2004), Yang (2004).
CEPAL - Serie Desarrollo productivo No 182 Korean OFDI: Investment strategies and corporate motivations ….
7
Table 1
KOREA: NET OFDI, TO 2004 (Billions of Dollars)
Year Invested Amount Withdrawn Amount Net Amount
Up to 1992 5.2 0.8 4.4
1993 1.2 0.2 1
1994 2.3 0.3 2
1995 3.1 0.3 2.8
1996 4.5 0.7 3.8
1997 3.7 0.3 3.4
1998 4.8 1.1 3.7
1999 3.3 1.1 2.3
2000 5.1 1.5 3.6
2001 5.1 3.3 1.8
2002 3.7 1.1 2.6
2003 4.0 0.7 3.3
2004 5.9 0.8 5.2
Source: Ha (2004)

CEPAL - Serie Desarrollo productivo No 182 Korean OFDI: Investment strategies and corporate motivations ….
9
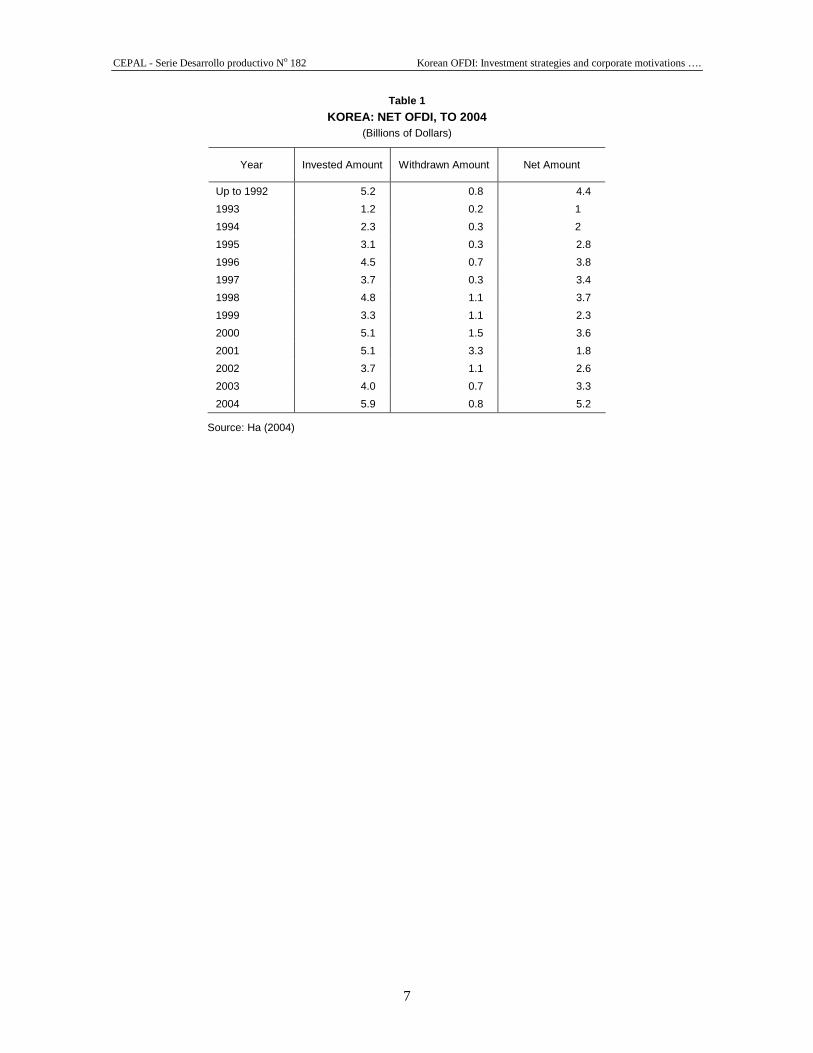
I. Evolution of Korean OFDI
Before the 1980s, Korean development was constrained by serious balance of payments problems, such that, except for OFDI needed to access natural resources, open export markets or support special activities (i.e. foreign currency-generating construction projects in the Middle East), it was generally prohibited by the Korean government. For that reason, up to 1980, only 400 cases involving OFDI in the order of 274 million dollars were requested and only 352 cases representing OFDI worth 145 million dollars were registered.
Korean OFDI emerged in greater quantity as of the late 1980s prompted by the changes in legal and economic circumstances. The total value of the stock of OFDI rose from 0.77 billion dollars in 1987 to 3.1 billion dollars in 1993 and 13.8 billion dollars in 2001. The annual average cases and amount of OFDI were only 37 and 39 million dollars, respectively, during 1968-1987. There were huge jump in both cases and amount during following years. Annual average of Korean OFDI recorded 3,024 million dollars during 1994 - 2001, and 4,528 during 2002-2005. However, recent trend is that, although total number and amount of investment are increasing, the average amount per case has been dropping from 2.3 million dollars in 1994-2001, to 1.8 million dollars in 2002-2005. (Table 2).

CEPAL - Serie Desarrollo productivo No 182 Korean OFDI: Investment strategies and corporate motivations ….
10
Table 2
KOREAN OFDI (Number of cases and amounts in millions of US dollars )
1968-1987 1988-1993 1994-2001 2002-2005
Cases (yearly average) 734
37
2,405
400
10,671
1,334
10,254
2,563
Amount (yearly average,US$) 774
39
5,750
958
24,192
3,024
18,113
4,528
Amount per case 1.1 2.4 2.3 1.8
Source: Korea Exim Bank
Note: based on total invested amounts
During the period of state-led development, the dominant paradigm was formed by an ideological dichotomy in which capital inflows, exports and national ownership was favored over overseas foreign investment, imports and foreign ownership. The former was regarded as the absolute good, while the latter was largely discouraged. Therefore, in a country that had suffered from chronic current account deficits and had fundamentally lacked capital, technology and management capability, it was not strange that the government had long taken the restrictive stance towards OFDI by imposing strict foreign exchange controls.
In this environment, OFDI was at most regarded as a tool to access natural resources, to create new export market, or to support foreign currency-generating projects like constructions in the Middle East. Until the mid-1980s, therefore, the first wave of the Korean OFDI was undertaken in the primary industry for developing and importing raw materials in the form of natural resource seeking. Following the outward oriented development strategy, the government first allowed local firms to invest overseas in 1968. As a legal framework, a chapter on OFDI was introduced in 1968 in foreign exchange control regulations. Yet OFDI levels remained insignificant until the mid-1980s. The value and cases of total stock of OFDI during first 13 years were only 145 million dollars and 352 cases, respectively. (Korea Exim Bank)
The second phase of Korean OFDI was triggered by the changing domestic and international environment in the late 1980s. An especially important turning point came in 1986 when Korea recorded a remarkable export growth and a sizable current account surplus. This provoked new trade barriers and restrictions in several major markets. Hence, there was a growing need for new paradigm in international economic policy. At the same time, rapid domestic wage increases eroded the cost competitive advantages of domestic production. These examples suggest that global pull and domestic push factors created a growing need for the internationalization of Korean firms. During the first OFDI takeoff period of the late 1980s, various initiatives were introduced in order to regain competitiveness, from relocating production in low-wage countries to relaxing somewhat regulations and restrictions on inward foreign direct investment.

CEPAL - Serie Desarrollo productivo No 182 Korean OFDI: Investment strategies and corporate motivations ….
11
Table 3
KOREA’S AUTHORIZED AND REALIZED OFDI (Number of cases and Investments in thousands US dollars)
Authorizations Requested Realized Investments Year
Number of Cases Amount of
Authorization Number of Cases Amount Transferred
Until 1980 400 273 534 352 145 201
1981 64 293 761 49 28 211
1982 54 818 470 49 100 841
1983 67 82 969 56 108 910
1984 49 195 324 46 50 188
1985 42 219 191 38 112 775
1986 73 363 788 49 182 651
1987 109 367 361 91 409 710
1988 248 1 636 305 171 215 834
1989 369 973 844 269 570 795
1990 514 2 274 414 341 963 117
1991 526 1 797 677 444 1 109 702
1992 630 2 026 810 497 1 216 651
1993 1 052 1 996 762 689 1 264 179
1994 1 946 3 630 621 1 487 2 303 822
1995 1 572 5 222 266 1 332 3 101 518
1996 1 818 7 015 579 1 472 4 458 348
1997 1 608 6 104 602 1 330 3 709 912
1998 719 5 830 176 617 4 812 422
1999 1 268 5 101 674 1 095 3 329 344
2000 2 286 6 075 997 2 082 5 068 531
2001 2 327 6 361 881 2 153 5 163 667
2002 2 747 6 251 861 2 490 3 697 107
2003 3 079 5 579 183 2 809 4 061 534
2004 3 924 7 899 726 3 764 5 988 587
2005 4 555 9 029 993 4 389 6 557 190
2006 5 250 18 459 723 5 185 10 731 047
Total 37 296 105 883 492 33 346 69 461 794
Source: Korea Exim Bank
Third, the globalization strategy of Korean firms in the 1990s accelerated the outflow of OFDI. In line with government's globalization policy, the top national conglomerates (chaebols)embarked on ambitious globalization strategies aimed to increase their overseas share of production and sales, in order to complement the limited national market in an effort to catch up with global leaders1. In some cases, however, premature and bold internationalization strategies without building up strong enough competitive advantages proved not to be sustainable, as is exemplified by bankruptcy of Daewoo and the efforts made to save Kia. They realized that the 40 million dollar domestic market was too small to fuel top chaebols' continued growth. At the same time chaebols as latecomers in the global level tried to catch up global leaders through access to
1 A million-seller book, It's a Big World and There's Lots to be Done, written by Chairman Kim of Daewoo group well represented
the chaebols' globalization strategy at that time.

CEPAL - Serie Desarrollo productivo No 182 Korean OFDI: Investment strategies and corporate motivations ….
12
high technology frontier abroad and by establishing extensive international production systems. As a result, for instance, UNCTAD listed Daewoo Corporation as second largest TNCs from developing economies ranked by foreign assets in 1998 and 6th in 1999 (UNCTAD, 2000 and 2001). Another example can be found in Samsung Electronics’ investment in California. The company established a semiconductor laboratory in the Silicon Valley as part of its catching-up strategy, so that it could develop a series of DRAMs, 64K(1983-4), 256K(1984-6), 1M(1985-7). Thanks to the investment of the 1980s, Samsung has now surged as not only the global market leader in DRAMs with 32% of share but also the technology pioneer.
However, premature and bold internationalization strategies without building up strong enough advantage were not always sustainable. Korean transnationals have pushed to set up international production systems too rapidly during this period although they had relatively weak competitive advantages. As seen in the case of Daewoo group's bankruptcy and the failure of Hyundai's first foreign car plant in Canada2, rapid expansion of foreign production without enough advantage and profitability could not survive in the long run.
The fourth phase came after 1997-8 financial crisis when Korean OFDI has fallen dramatically. Korean firms went through extensive post-crisis restructuring process, which included such measures as closing down foreign subsidies and canceling or delaying investment plans amid liquidity problems. The psychological effect of the financial crisis also played a role as the failure of foreign asset management of financial institutions has been widely condemned for provoking crisis.
A fifth stage is apparent since 2003, when the economy emerged from that crisis, Korean OFDI began to recover. In 2006, authorized Korean OFDI reached 18 billion dollars showing a dramatic increase of more than 100% from the previous year. Although Korean OFDI has increased since the 1990s, the fact that 54% of overseas subsidiaries/firms have established since 2000 means they are still in the early stage of operation. Especially, in many aspects of company management Korean firms are far behind of global competitors: they are under strong influence of parent company in Korea; most investments are concentrated in Asia, mainly in China. Nevertheless, overseas operations are increasingly regarded as independent entities as they pursuing localization process, for instance in recruiting local labor forces, and possibly generating more profits.3
Recently, pressure for the further evaluation of ever strong won has become a burden for Korean economy, mainly on its export performance. Therefore, the need for more outward foreign investment, both direct and portfolio, has been emphasized in the light of the situation that Korean OFDI is relatively small given the size of the economy. Total amount of Korea’s OFDI per GDP was only 1.8% in 2005, far insignificant than neighboring economies like Japan (5.7%) and Singapore (21.8%).
Furthermore, Korea has by far the lowest gross foreign asset holdings in comparison to Japan, Taiwan and China, Despite the large current account surpluses that Korea has run since the Crisis of 1997-98, Korea’s foreign asset holdings are only 46% of GDP, compared with 185% in Taiwan and 100% in Japan. Of this amount, the share of the foreign assets held by the private sector is as low as that of China, which is extraordinarily low mainly because most of the accumulation of foreign assets since 1978 has been carried out by the public sector in the form of
2 Meanwhile, rapid export successes on the US market led Hyundai to invest early on a large manufacturing facility in Canada in
1989 anticipating projectionist reactions from the US. The problem was that the Canadian plant assembled Sonata, a mid-sized car, although Hyundai's competitive products both in quality and the price were subcompacts like Pony and Excel. Finally, the factory closed down in 1993 due to failure of the timing of investment and model choice.
3 Authorized overseas direct investment rose 104.4 percent to US$18.5 billion in 2006 from a year earlier. Main reasons are: that local companies have increasingly been pushing to dig out overseas resources, such as oil and gas, as the country is heavily dependent on energy imports; that manufacturing plant construction by leading businesses such as Hyundai Motor Co. and Kia Motors Co. also contributed to the surge.

CEPAL - Serie Desarrollo productivo No 182 Korean OFDI: Investment strategies and corporate motivations ….
13
accumulation of official foreign reserves. Given that Korea is a member of the OECD, its low private sector holdings at only 19% of GDP, is remarkable. One could say that Korea’s private sector has exhibited extreme ‘home bias’ in its collective investment portfolio. Morgan Stanley presented an opinion that this may very well be less a result of voluntary choice by the private sector than an outcome of strict capital controls (Jen, 2007).
In this regard, it is worthwhile to examine the recent changes in the institutional framework to promote OFDI from Korea. First came the establishment of Korea Investment Corporation (KIC) which was officially launched on July 1, 2005. KIC’s aim is manage foreign exchange reserves, initially 20 billion dollars, to achieve sustainable return on foreign-currency assets and make asset management business lead Korea's financial industry to a global standard. Second was the Korean government’s announcement in January of 2007 that capital outflows will be further liberalized. The boosting measures particularly target strategic areas: 1) resources and energy development projects, 2) overseas infrastructure projects, and 3) financial industry. Along with this, deregulatory measures will be made for risk sharing and more financial support (MOFE). Thirdly, government and public enterprises are in the process of selecting a financial company that will manage funds to be used for overseas oil development. The idea of investing in an oil field has long been unrealistic for SMEs and individuals. However, now oil field development is open to individual investors, that will naturally lead more OFDI in this area (Maeil Business Newspaper 2006; Seoul Economy, 2006).
1. Korean OFDI by destination
In the early stages of Korean OFDI, it was viewed primarily as a tool for facilitating export or securing a stable supply of natural resources. Therefore, typical destinations were Korea’s trading partners, North America and Asia, or oil producing countries in the Middle East. By the end of 1980s, OFDI in those regions accounted for 72.2 percent of total overseas investment stock. Projects also included investments in Indonesia to access timber supplies and in Saudi Arabia to support construction activities. Nowadays, Korean investment is far more diversified. During the period between 1968- 2006, Korean OFDI in Asian countries was 32 billion dollars (46% of total OFDI). North America ranked second (18 billion dollars, 26%), followed by Europe (10 billion dollars 15%) and Latin America (4.7 billion dollars, 7%). (see Figure 1)
In terms of individual destination countries, China absorbs 30.8% of Korea’s total OFDI (3.3 billion dollars), followed by the US (1.7 billion dollars, 16.3%) and Hong Kong (0.7 billion dollars, 6.8%). Southeast Asian countries have become destinations as well: Vietnam (5.5%) attracted significant Korean OFDI in 2006, and Singapore (2.8%) and Indonesia (1.3%) continue to be preferred host countries. Geographical proximity and low wage levels are main pull factors of Southeast Asia. Noticeable new destinations are Eastern European countries such as Slovak Republic (2.7%), Poland (2.1%) and Czech Republic (1%). (Korea Exim Bank)
From 2001 onwards, 75% of total new OFDI in manufacturing sector have invested in China alone. Among the investments in China, textile and apparel industries comprise the largest proportion, accounting for 20.8%, in terms of number of projects. In terms of investment volume, the metal component sector at 31.3% represents the largest element. The main fields of investment by Korean firms in China in recent years are mainly information technology (IT), petroleum, chemical, steel, and auto industries. The focus of investment by Korean firms is currently being shifted from manufacturing to service sector and from the coastal areas to the inland. (Zhan 2004, 7) Average amount per investment is only 1.5 million dollars. The figure is highest in Latin America reaching 11 million dollars while investment to Asian countries reaches average of 1.2 million dollars. This suggests that most investments in Asian countries are undertaken by small scale investors and SMEs (Suh 2005, 3).

CEPAL - Serie Desarrollo productivo No 182 Korean OFDI: Investment strategies and corporate motivations ….
14
Africa, 1,159,240, 2%
Oceania, 1,459,868, 2%Europe,
10,270,051, 15%
Latin America, 4,740,437, 7%
North America ex. Mexico,
17,879,857, 26%Middle East,
1,390,316, 2%
Asia, 32,562,025, 46%
Figure 1
KOREA: OFDI BY DESTINATION, 1968-2006 (Number of cases and Investments in US dollars)
Source: Korea Exim Bank
1.2. Korean OFDI by industry As mentioned above, early OFDI was export-facilitating and resource-seeking in such areas as mining and forestry. In the late 1980s, primary industry accounted for 50.6% of the total amount of investment while manufacturing and trading industries did 14.4% and 14.7%, respectively Between 1968 and 2006, manufacturing sector occupied the largest portion of Korean OFDI with 37 billion dollars (53%), followed by retail and wholesale (14 billion dollars, 20%) and mining (5 billion dollars, 7%). A high degree of investment in the manufacturing sector confirms that Korea’s international competitiveness lies not in service industry but in manufacturing. (Figure 2)
The breakdown of Korea’s investment in manufacturing in 2006 indicates that electronics and telecommunication equipment sector reached 1.5 billion dollars (29.1% of the total manufacturing sector). Second place was taken by motors and equipments with 1 billion dollars (20.6% share). Another important sector is the petrochemical industry with a 13.6 share.

CEPAL - Serie Desarrollo productivo No 182 Korean OFDI: Investment strategies and corporate motivations ….
15
Other Services, 4,493,468 , 6%
Agriculture and Fishery, 562,025 ,
1%
Telecommunications, 1,815,290 , 3%
Banking and Insurance,
1,397,361 , 2%
Real Estate, 1,750,147 , 3%Hotels and
Restaurants, 1,664,196 , 2%
Retail and Wholesale,
13,693,492 , 20%
Construction, 1,703,575 , 2%
Others, 3,023 , 0%
Mining, 5,081,756 , 7%
Manufacturing, 36,666,807 , 53%
Figure 2
KOREA: OFDI BY INDUSTRY, 1968-2006 (US$, percentage)
Source: Korea Exim Bank
1.3 Korean OFDI by size of company Most of the Korean OFDI has been undertaken by large conglomerates. One of the most impressive results was the change introduced into the chaebols themselves.(Table 3) The corporate reform say some of the main conglomerates decline (Samsung co. and Hyundai) or disappear as independent entities (Daewoo, Kia) and many of their competitive core elements (Samsung Electronics, Hyundai Motor Company) became more independent or were sold to competitors (Kia Motor, Hynix). A number of relative newcomers arrived to the top 10 (Kookmin Bank, SK Networks, S-Oil).
One novel feature of the current rise in OFDI is that not only are large enterprises engaging in OFDI, but also small and medium ones do so. (Figure 4) Currently there are more than 20,000 Korean firms operating in overseas territories. The number is relatively small given the size of the Korean economy. Every year, however, around 3,000 Korean FDI firms are setting up overseas operations. This suggests that many new investments are undertaken by small and medium sized companies.4
4 It is well known that large enterprises played a crucial role in the rise of Korean economy. But now chances for SMEs to grow as a
conglomerates seem to be minimum. The Chosun Daily suggested that since 1993 only 0.01% of SMEs have grown to large enterprises. Among them, only 5 companies have achieved annual sales of 3 billion dollars. So far, at least, the majority of Korean companies are SMEs. (Chosun Daily, 2006)

CEPAL - Serie Desarrollo productivo No 182 Korean OFDI: Investment strategies and corporate motivations ….
16
Table 4
TOP 10 KOREAN COMPANIES, 1995, 2000 AND 2005 (Millions of korean Won)
1995 2000 2005
Company Total sales Company Total sales Company Total sales
Samsung Corp. 19,253,806 Hyundai Corp. 40,752,502 Samsung Electronics
57,457,669
Hyundai Corp. 16,742,345 Samsung Corp. 40,641,602 Hyundai Motor 27,383,738
Samsung Electronics
16,189,838 Samsung Electronics 34,283,752 Korea Electronic Power Corp.
25,112,331
Daewoo 15,024,667 LG Int'l corp. 19,839,220 LG Electronics 23,774 152,
LG Int'l Corp. 10,447,828 Korea Electronic Power Corp.
18,252,800 Sk 21,914,583
Hyundai Motor 10,339,185 Hyundai Motor 18,230,960 Posco 21,695,044
Korea Electronic Power Corp.
10,014,563 LG Electronics 14,835,674 Kookmin Bank 17,855,258
Posco 8,218,742 Sk 14,021,615 Kia Motor 15,999,356
Sk 6,593,341 Sk Global 14,020,670 Sk Networks 14,879,511
LG Electronics 6,591,709 Posco 11,692,000 S-Oil 12,232,327
Source: korean Exchange Data (www.kse.or.kr)
In 2006, investment by large enterprises reached 6.3 billion dollars while SMEs accounted for 3.4 billion dollars. The share of OFDI by SMEs has constantly increased till 2005, but dropped in 2006. Average investment per company dropped from 7.7 million dollars to 1.4 million dollars. The investment pattern of SMEs is different from that of large conglomerates. Whereas big companies like Samsung Electronics, LG Electronics and Hyundai Motors have traditionally invested overseas primarily to secure local markets, SMEs tend to go abroad for cheap and abundant labor. (Lee 2006) Although not classified as SMEs’ investments, OFDI by individual emigrants has increased a lot as well. Over 1,440 cases of individual investment were reported during the first half of 2006 which is 23.5% increase compared to the same period of last year. Total amount of OFDI by individuals reached 480 million dollars between January and June, 2006.
With regard to the target industry, large companies and SMEs show a similar pattern as 558 cases out of 1,443 total individual investments were manufacturers (38.7%). Wholesale and retail trade occupied second place (22.1%). Hence, like other Korean companies, these two areas were preferred activities (60.8%) for individual OFDI. (Naeil Daily 2006) Although China is the most preferred destination with 648 cases, followed by the US (483 cases and 33.5%), investments in emerging market such as India, Vietnam, Indonesia seem to be ever increasing. Another characteristic is that individual investment in overseas real estate market is getting more popular. The US is the largest provider of overseas real estate market for Koreans, but China is catching up in that respect.

CEPAL - Serie Desarrollo productivo No 182 Korean OFDI: Investment strategies and corporate motivations ….
17
Figure 3
KOREAN OFDI BY SIZE
Source: Korea Eximbank (2005)
Large Enterprises
Small and Medium
Enterprises
Others
0%
10%
20%
30%
40%
50%
60%
70%
80%
90%
100%
2000 2001 2002 2003 2004 2005 2006


CEPAL - Serie Desarrollo productivo No 182 Korean OFDI: Investment strategies and corporate motivations ….
19
II. Characteristics of Korean OFDI
2.1. Head office control over foreign subsidiaries
The level of management control over foreign subsidiaries is a relevant detail. Wholly (100%) owned foreign subsidiaries account for 68.3% (3.9 billion dollars), and subsidiaries with 50% to 100% share holding were 10.2%. The sum of these two, in other words, investments more than 50% of equity control, is 78.5%. According to Lee (2006), there could be more majority shareholding investments from larger enterprises than SMEs. Also, it could be interpreted to mean that large Korean firms have their own significant competitive advantage in foreign markets, and therefore prefer carrying out business by themselves. Meanwhile, SMEs seem to pursue a cooperative strategy with local partners to a greater degree than large firms in foreign markets. (Lee 2006)
Korean TNCs show a clear preference for majority ownership, and it is particularly the case in mature markets like EU and the US where 84 percent and 70 percent of Korean investments are securing majority holdings, respectively. (Perrin, 2001). Some Korean firms have resorted to acquisitions or outright control when they wanted to source technology abroad and diversify into high-tech business while Japanese firms have resorted to joint ventures (Miotti and Sachwald, 2001) Cases can be found in Samsung Electronics’ purchase of AST and LG’s Zenith. Table 3 shows how intensively Samsung conducted overseas investments in the mid-1990s.

CEPAL - Serie Desarrollo productivo No 182 Korean OFDI: Investment strategies and corporate motivations ….
20
Table 5 SAMSUNG ELECTRONICS: TWO YEARS OF INVESTMENTS (APRI L 1993-FEBRUARY 1995)
Name of firm Date Scope and content
Array Microsystems (US) Apr. 1993 SEC acquired 20% of Array and established cooperative arrangement in digital process chip technology used in multimedia products.
Harris Microwave Semiconductor (US)
May. 1993 HMS specializes in gallium arsenide chips and is one of the world’s leading makers of optical semiconductors
LUX (Japan) May 1994 Acquisition(51%) of Japanese hi-fi audio maker
LUX: development and sales
SEC: manufacturing and sales
Control Automation Inc. Jun. 1994 Acquisition (51%) of the CAD/CAM software technology company
ENTEL (Chile) Sep. 1994 Investment (15.1%) in the largest operator of telecommunication system
Integrated Telecom Technology (US)
Jan. 1995 Acquisition(100%) of ITT that specialized in ATM technology
Integral Peripherals (US) Jan. 1995 Investment(4%) in shares of US based firm specializing in HDD technology joint development of HDD products
AST Research (US) Feb. 1995 Investment(40.25%, later 100%) in shares if US based computer company, broad range of commercial relationships including supply and pricing of critical components, joint product development, cross OEM-arrangements and cross-licensing of patent.
Source: Kim (1997) p.18
Interestingly, the strong rivalry among Korean chaebols in domestic and foreign market and 'follow-the-pioneer' behavior resulted in geographical concentration of Korean OFDI. Indeed, the national characteristics that induce a first Korean firm to invest in a specific country might also be suited to the goal of a second firm. Twinned investments are frequently seen in the electronics industry in such examples as the presence of Samsung and LG in the US-Mexico border cities and Manaus in Brazil. (Table 5)
Table 6
OFDI AND TIME LAG BY TOP THREE ELECTRONICS FIRMS (C OLOR TV) Sam-Sung Electronics LG Electronics Daewoo Electronics
U.S.A 1984 1981
U.K. 1987 1988
Continental Europe Portugal (1982) Germany (1997) France (1992)
Mexico 1988 1988 1990
Thailand 1988 1988
Indonesia 1991 1990
Vietnam 1995 1995 1994
Brazil 1995 1996
Poland 1996 1993
China 1994 1995
India 1995 1997
Source: Eun (2002, 10)

CEPAL - Serie Desarrollo productivo No 182 Korean OFDI: Investment strategies and corporate motivations ….
21
Box 2 RELATIONS BETWEEN PARENT COMPANIES AND SUBSIDIARIES
With regard to parent-subsidiary relations, most of the key decisions are made by parent companies in Korea and the local decision making process seems to be minimal. Parent companies are in charge of new investments decisions and executive level personnel affairs for their foreign subsidiaries. On the contrary, local subsidiary determines salary level and personnel affairs of local employees. For instance, as far as human resource management is concerned, executives for overseas subsidiaries are directly appointed by parent companies (81.0%), but hiring/firing employees in lower ranks is the commitment of foreign subsidiaries (78.4%).
The usage of foreign subsidiary's revenue and decision on infrastructure investment were almost entirely at the parent companies’ discretion. In revenue management, 23.3% of local subsidiaries make decision on the independent use of revenue, compared to 73.0% of companies that follow the decision of parent companies. Furthermore, 77.8% of companies pointed out that parent companies make on the key investment issues of overseas subsidiaries.
On the other hand, overseas subsidiaries seem to have high degree of independency in terms of division of labor with parent companies. Only 23.1% of local subsidiaries performed simple processing/assembling operations or produced parts or half finished products for their parent companies. Most of the foreign subsidiaries have developed a separated one-stop local production system in sectors different from those of parent companies (50.3%) On the other hand, 24.5% of them are engaged in identical sectors to parent companies’. In sum, 74.8% of the foreign subsidiaries show independence in production from the parent company. (Ha 2004, 57-61)
It may be difficult to definitely say what degree of firm control by the parent company is best. However, a case reported seems to reveal the necessity of certain control. In 1995 an IT company invested 15 million dollars in the US for the purpose of parts supply facilitation, R&D and access to advanced venture capital. To achieve this goal the parent company decided to operate the subsidiary with only local staff. However, after three years of operation it had to shut down the subsidiary. Main reasons revealed were the resistance of local employees to the decision of parent company and frequent communication problems that naturally lead the delay of decision making.
Source: (MOFE, http://www.mofe.go.kr/ODI).
2.2. R&D and technology transfer
Few of the Korean offshore subsidiaries performed R&D related operations; 11.4% had R&D department, 1% R&D center, and 1% both department and center for local R&D. The majority of them (86.5%) did not have any R&D function. This suggests that most of the parent companies regard their subsidiary as a base for production or sales, and not for R&D. Although recently established subsidiaries tend to have more local R&D centers, the weight is minimum (2%).
Table 7
OPERATION OF R&D CENTER/DEPARTMENT BY ESTABLISHMENT PERIOD With R&D
Department With R&D
Center With both Department and
Center Without any R&D
function
Founded in 80s 12.5 0 3.1 84.4
Founded in 90-94 17.7 0.7 0.7 81.1
Founded in 95-99 12.2 0.8 1.1 86.0
Founded in 2000 or later
9.5 1.3 1.0 88.2
Source: Ha (2004, 62)
The major objectives of companies with R&D facilities were modification and reform of the existing products (69.0%), development of new products (51.4%), and the creation of new processing method (29.6%). Modification/reform and development of new products seem to have ranked top as parent companies want to customize products for the local market, as a part of their localization strategy.

CEPAL - Serie Desarrollo productivo No 182 Korean OFDI: Investment strategies and corporate motivations ….
22
A big portion of companies with subsidiaries abroad are transferring technologies, with 24.6% of them transferring key technology contents and 44.6% of non-key technology. However, as the definition of “key-technology” is vague and subjective, this result shouldn’t be regarded as transferal of “key-technology” of Korean Economy as a whole.
In comparison to the average technology level of Korean companies, the transferred technology are higher (7.6%) or in similar level (29.0%) to the average. Some companies (5.3%) have transferred technology beyond the Korean average. Industries such as textile and apparel, footwear and leather, fabricated metal, food and beverage, and electronics and telecommunications transferred technology higher than domestic average level. Textile and apparel (6.2%), footwear and leather (6.1%), and fabricated metal (8.3%) transferred their technology to foreign subsidiary in order to concentrate their production capability in international factories, replacing the less competitive domestic production facilities. Electronics and telecommunications industry made active technology transfer especially in home appliances which is less competitive than before. (Table 8)
In general, the lower the competitiveness of domestic production in the industry, the higher the probability of technology transfer is likely to happen in that industry.
Table 8
TECHNOLOGY TRANSFER OF KOREAN OFDI Compared to the Korean average
technology level, the level of transferred technology is
Compared to the Korean average technology level, the company's technology level is
Lower Similar Higher Lower level
Similar level
Higher level
No transfer
Total 63.4 29.0 7.6 44.0 20.2 5.3 30.5
Food & Beverage 64.3 25.0 10.7 39.1 15.2 6.5 39.1
Textile and Apparel 62.5 26.7 10.8 35.9 15.3 6.2 42.6
Footwear and Leather
75.6 14.6 9.8 47.0 9.1 6.1 37.9
Paper and Printing 40.0 60.0 0.0 16.7 25.0 0.0 58.3
Petrochemicals 76.5 18.4 5.1 61.5 14.8 4.1 19.7
Non-metallic Minerals
73.9 26.1 0.0 47.2 16.7 0.0 36.1
Basic Metal 52.2 39.1 8.7 36.4 27.3 6.1 30.3
Fabricated Metal 61.3 29.0 9.7 52.8 25.0 8.3 13.9
Machine equipment 61.6 34.2 4.1 45.0 25.0 3.0 27.0
Electronics and Tele-
communications
60.2 30.7 9.1 44.4 22.6 6.7 26.4
Transportation machinery
62.3 34.4 3.3 51.4 28.4 2.7 17.6
Other manufacturing 46.7 44.4 8.9 30.4 29.0 5.8 34.8
Source: Ha (2004, 64)
CEPAL - Serie Desarrollo productivo No 182 Korean OFDI: Investment strategies and corporate motivations ….
23
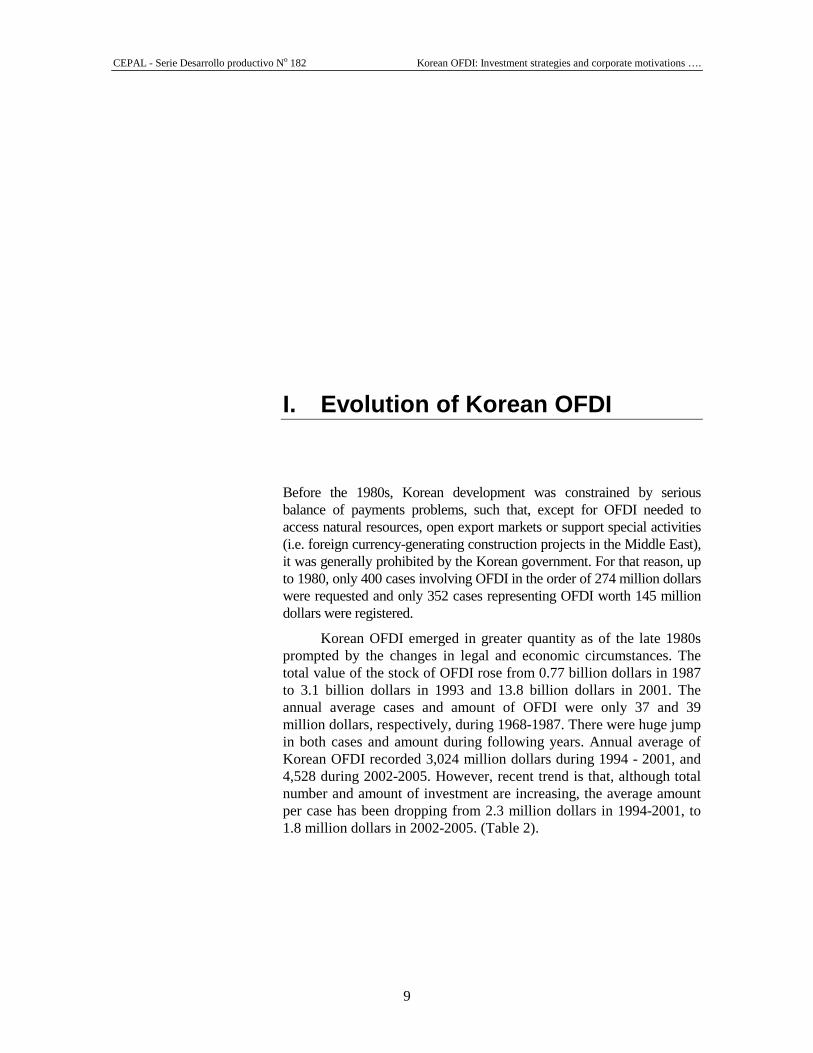
Box 3
CATCHING-UP STRATEGY, TAKEOVER OF ZENITH BY LG
Since the 1990s, the chaebols' strategies have been grounded on the conviction that they had to nurture more creative assets in order to gain technology autonomy, and thus international competitiveness. Chaebols have partially used foreign investment as part of their catching-up strategy. They have resorted to acquisitions, minority shareholdings and joint ventures in the US to access sophisticated R&D resources. The examples of acquiring Zenith by LG Electronics shows catching-up strategy of chaebols through OFDI.
The acquisition aimed at getting an instant injection of high technology and brand name. However, not long after purchasing a 57% stake in perennial U.S. money loser, LG has been forced to send Zenith to Chapter 11 bankruptcy proceedings in 1999. Furthermore, LG lost creative assets because of the conflict relationships with local management that resulted in a number of resignations. Initially the LG’s investment seemed to be a failure and misplaced.
However, after five years of steady restructuring efforts and extra investment of 60 million dollars, LG managed to secure 100% share of Zenith. During this period fundamental change was undertaken by abandoning all production lines of Zenith but maintaining the R&D function. That paved the road for success. Before LG’s takeover, Zenith had invested in new technology, such as Internet television boxes, cable modems, and high definition TV systems, and it upgraded color picture tube production capabilities. Especially, such original technologies as VSB(Vestigial Side Band) of Zenith became an industrial standard for digital TV that quickly replaced analogue TV. Currently VSB is licensed to over 100 digital TV manufacturers and generating more than 100 million dollars a year for LG. This one-time ‘ugly duckling’ became a ‘goose that laid golden eggs’.
Source: Park(1998, 43-4)
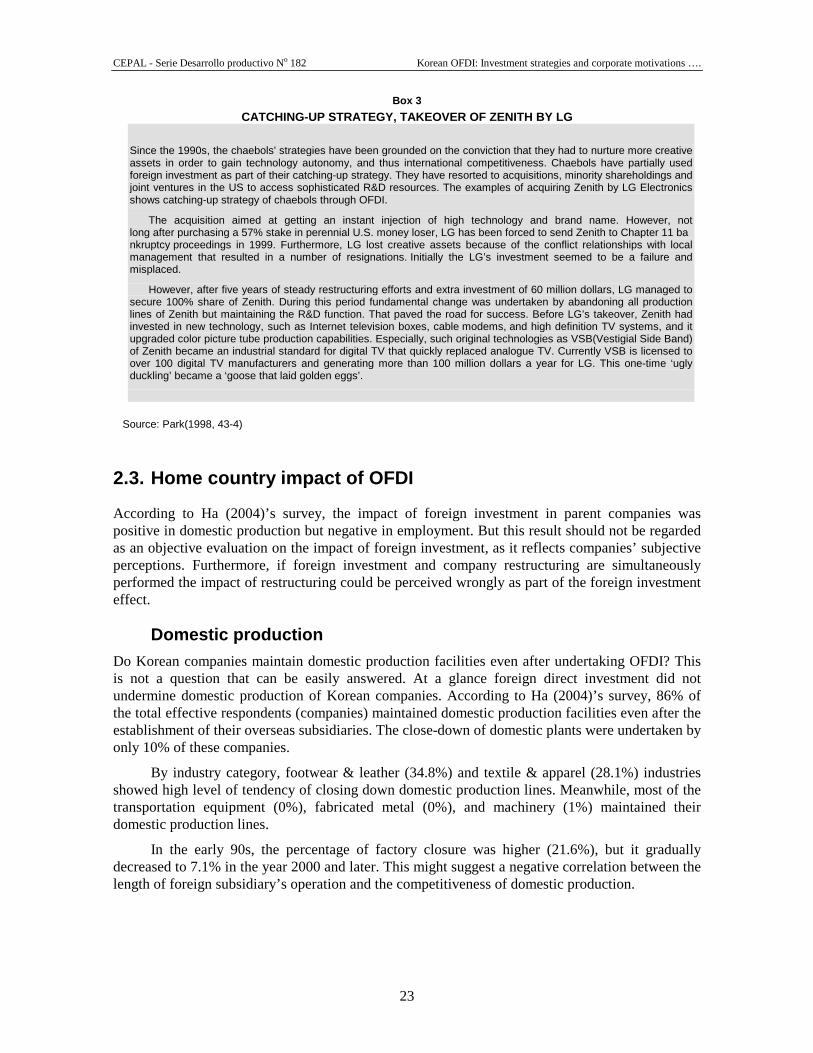
2.3. Home country impact of OFDI
According to Ha (2004)’s survey, the impact of foreign investment in parent companies was positive in domestic production but negative in employment. But this result should not be regarded as an objective evaluation on the impact of foreign investment, as it reflects companies’ subjective perceptions. Furthermore, if foreign investment and company restructuring are simultaneously performed the impact of restructuring could be perceived wrongly as part of the foreign investment effect.
Domestic production Do Korean companies maintain domestic production facilities even after undertaking OFDI? This is not a question that can be easily answered. At a glance foreign direct investment did not undermine domestic production of Korean companies. According to Ha (2004)’s survey, 86% of the total effective respondents (companies) maintained domestic production facilities even after the establishment of their overseas subsidiaries. The close-down of domestic plants were undertaken by only 10% of these companies.
By industry category, footwear & leather (34.8%) and textile & apparel (28.1%) industries showed high level of tendency of closing down domestic production lines. Meanwhile, most of the transportation equipment (0%), fabricated metal (0%), and machinery (1%) maintained their domestic production lines.
In the early 90s, the percentage of factory closure was higher (21.6%), but it gradually decreased to 7.1% in the year 2000 and later. This might suggest a negative correlation between the length of foreign subsidiary’s operation and the competitiveness of domestic production.

CEPAL - Serie Desarrollo productivo No 182 Korean OFDI: Investment strategies and corporate motivations ….
24
Table 9
OFDI AND DOMESTIC PRODUCTION BY PERIOD (Unit: %)
Closure of Domestic factory
Downsizing of Domestic Factory
Maintenance of Domestic Factory
Others
Established in 80s 6.3 25.0 65.6 3.1
Established in 90-94 21.6 19.6 54.3 4.6
Established in 95-99 10.3 19.0 65.0 5.7
Established after 2000
7.1 15.1 75.6 2.2
Source: Ha (2004. 58)
Companies tend to maintain domestic production capacity when they launch market seeking investment or when they move abroad with their partner companies. On the other hand, when the main purpose of the investment is cost reduction, companies are more likely to reduce the size of domestic production facility or to simply shut them down.
Fully 92.3% of companies investing overseas as a part of their market seeking activities kept their domestic production facilities. Only 6.3% of them chose for downsizing procedures and 1.4% for complete closure of their domestic production facilities. This result is comparable to 19.7% of factory closure rate in companies seeking for cost efficiency. These companies also showed higher proportion in preference for domestic production reduction (28.7%).
Companies investing abroad because their partner companies have reincorporated abroad showed a similar result with those seeking market entrance effect, and presented 1% proportion in factory closure and 10.6% in size reduction. Moreover, investment towards large emerging economies got along with general characteristics of cost reduction. The only difference is that the former shows lower level of closure (10.0%) and downsizing (18.0%) of domestic factories than the latter.
Table 10
MAJOR INVESTMENT BEHAVIOUR BY MOTIVES Closure of Domestic
Production Facility Downsizing of Domestic
Production Facility Maintenance of Domestic
Production Facility
Market seeking investment 1.4 6.3 92.3
Cost efficiency seeking investment
19.7 28.7 51.6
Overseas relocation of business partner
1.0 10.6 88.5
Entry to Emerging Markets 10.0 18.0 72.0
Source: Ha (2004. 59)
Employment Unlike production, as mentioned above, OFDI seems to have generally negative impact on national employment. Since 2000, the proportion of companies that experienced reduction in employment (23.3%) is slightly higher than companies that had an increase in their employment (20.6%). For instance, domestic employment is estimated to decrease by 7.7% by the year 2003 compared to the base year 2000, due to enlarged foreign operations. By the end of the year 2003, 119,522 employees were working in 311 parent companies, which means that 9,945 jobs were lost since 2000. Including the 2.5% of companies that stopped hiring employees from the domestic labor

CEPAL - Serie Desarrollo productivo No 182 Korean OFDI: Investment strategies and corporate motivations ….
25
market, foreign investment has played some role in company restructuring, replacing domestic labor to foreign labor. One of the evidence of such restructuring process through foreign investment is the fact that 31.4% of textile & apparel and footwear industries downsized the number of their workers.
Most of the industries reported that foreign subsidiary operations resulted in the reduction of the parent company’s employment, except in basic metals, and footwear & leather industries. But this result can't be regarded entirely as the effect of foreign investment, as in many cases foreign investment were undertaken along with internal restructuring process. For example, companies in footwear and leather industry estimated 1.9% increase in employment. This is most likely due to the fact that they already have completed their restructuring process in the mid 90s. In other words, it is more proper to take this result just as an index showing the decreased capability of employment in the manufacturing industry, and as the possible function of overseas subsidiary operation as a way to reform the structure of the company
Table 11
IMPACT OF FOREIGN SUBSIDIARY OPERATION IN EMPLOYMEN T OF PARENT COMPANY No of companies 2000 (A) 2003 (B) Variation (B-A) Variation rate
Total 311 129,467 119,522 -9,945 -7.7
Manufacturing 305 129,420 116,777 -9,643 -7.6
Food & Beverage 5 723 646 -77 -10.7
Textile and Apparel 66 20,825 19,456 -1,369 -6.6
Footwear and Leather 20 24,626 25,101 475 1.9
Lumber and Furniture 3 79 55 -24 -30.4
Paper and Printing 3 466 488 22 4.7
Petrochemicals 30 25,380 20,698 -4,682 -18.4
Non-metallic Minerals 11 2,818 1,986 -832 -29.5
Basic Metal 10 5,733 6,143 410 7.2
Fabricated Metal 13 9,966 9,349 -617 -6.2
Machinery & equipment 32 7,082 5,474 -1,608 -22.7
Electronics and Telecommunications
76 18,026 17,219 -807 -4.5
Transportation machinery 15 4,181 4,057 -124 -3.0
Other manufacturing 21 6,514 6,105 -409 -6.3
Non manufacturing 6 3,047 2,745 -302 -9.9
Source: Ha (2004, 67)
*Categorized by Industry based on the industry the parent company in the year 2003.
As seen in the table, 71,477 new jobs were created in manufacturing industry, and for all industries in general, 88,326 new jobs by 2003. This means an increase of 2.49% in manufacturing industry and 0.83% in whole industry compared to the base year 2000.
In effects, job creation effect of exportation of parts and half-finished products amounts to 156,193, being the sector with highest beneficiary of the effect. From which 11,395 jobs were in manufacturing sector, and the remaining 45,798 from non-manufacturing sector. On the contrary, the reduction of employment due to re-importation and import substitution was 45,181 for manufacturing and 27,194 for non-manufacturing industry.

CEPAL - Serie Desarrollo productivo No 182 Korean OFDI: Investment strategies and corporate motivations ….
26
By industry, the major creation effect of employment was found in the industry with the largest trade surplus, the electronics and telecommunication industry. (30,324 jobs). The others in the top-tier list were machinery & equipment (13,352), and textile and leather (7,095).
Table 12
EMPLOYMENT EFFECT ON DIFFERENT ECONOMIC SECTORS Export Promotion (A)
Parts and semi-
assembled products
Capital goods
Re-importation
Export substitution
Sum of variation in employment
Manufacturing in General
110,395 3,324 -23,165 -19,077 71,477
Food & Beverage 1,177 40 -379 -83 755
Textile and Leather 10,533 989 -3,020 -1,407 7,095
Wood and Paper 2,237 50 -875 -240 1,172
Paper products and Publishing
989 28 -486 -176 355
Petroleum and Coas 151 7 -77 -24 57
Chemical products 7,050 527 -2,980 -1,160 3,438
Non-metallic Minerals 2,551 56 -1,216 -488 903
Basic Metal 5,653 123 -1,418 -786 3,572
Fabricated Metal 3,475 179 -1,447 -511 1,696
Machinery & equipment 19,688 364 -4,308 -2,391 13,352
Electronics and Telecommunications
46,633 443 -6,245 -10,507 30,324
Medical Instruments 1,233 61 -366 -90 838
Transportation machinery 8,138 412 -177 -1,123 7,250
Other manufacturing 886 44 -171 -91 669
Non manufacturing 45,798 1,184 -22,016 -8,117 16,849
Total 156,193 4,508 -45,181 -27,194 88,326
Source: Ha (2004, 94)
Trade Korea's trade surplus with overseas subsidiaries reached to 6.8 billion dollars. According to the survey of Ha(2004), parts and half-finished products made 12.21 billion dollars from exports and the re-importation reached an amount of 5.66 billion dollars. By the year 2003, exports and imports in this particular pattern of trade reached 6.3% (193.82 billion dollars) and 3.2% (178,883 billion dollars), respectively.
Categorizing by effects, the export of parts and half-finished products, and capital goods increased to 3.2 billion dollars and 0.8 billion dollar, respectively. On the contrary, the reduction of revenue was due to re-importation (7.9 billion dollars), and export substitution (5.7 billion dollars).
By industry, electronics and telecommunications industry reported 2.8 billion dollars of trade surplus exporting parts and half-finished products worthy of 7.3 billion dollars. The industry not only showed the biggest effect on improving the trade balance, but also on production increase. Transportation machinery industry also had a surplus of 1.18 billion dollars.
Some industries experienced loss in trade, such as food and beverage (410 million dollars), non-metallic metal (170 million dollars), and medical instruments (170 million dollars).However,

CEPAL - Serie Desarrollo productivo No 182 Korean OFDI: Investment strategies and corporate motivations ….
27
textile and leather industries achieved a 0.12 billion dollars surplus from exportation of parts and half-finished products. (Ha 2004, 90-3)
It is noteworthy to observe the strategy of the investment of automobile industry in emerging economies. Korean carmakers launched OFDI if the sales growth potential was high or the protectionism measures were expected. In this case, ODI generally inclines to crowd out export. However what happened was that foreign productions have opened new trade routes for exports for Korean carmakers. For instance, Daewoo’s or Hyundai’s foreign manufacturing operations have started with large scale assembling of imported kits. In this case, foreign investment pulls exports of parts and kits to new markets.
Table 13
TRADE EFFECT Export promotion (A)
Part and Semi-
assembled products
Capital goods
Re-importation
(B)
Export Substitution
(C)
Trade Balance (A-
B-C)
Trade Balance (A-B)
Manufacturing in General
12,214,228 304,491 5,660,574 2,216,302 4,641,843 6,858,154
Food & Beverage 160,446 4,696 202,305 4,511 -41,674 -37,163
F Textile and Leather 591,934 58,548 535,194 77,630 37,658 115,288
Lumber and Paper 99,056 1,191 54,066 2,541 43,640 46,181
Printing and Publication
416 22 100 50 288 338
Petroleum and Coal 0 0 0 0 0 0
Chemical products 249,513 55,094 138,836 30,687 135,084 165,771
Non-metallic Minerals 33,398 2,176 198,588 4,098 -167,112 -163,014
Basic Metal 718,289 12,820 99,970 88,700 542,439 631,139
Fabricated Metal 39,358 8,587 17,627 2,087 28,231 30,318
Machine equipment 1,740,021 30,058 1,336,536 163,357 270,186 433,543
Electronics and Telecommunications industry
7,339,708 66,819 2,928,316 1,681,176 2,797,035 4,478,211
Medical Instruments 53,465 3,546 68,048 868 -11,905 -11,037
Transportation machinery
1,152,641 59,009 32,669 158,518 1,020,463 1,178,981
Other manufacturing 35,983 1,925 48,319 2,079 -12,490 -10,411
Source: Ha (2004, 91)
As for import creation effect, manufacturing industry in general estimates a net revenue of 1.2 billion dollars and 1.36 billion dollars for the entire industry. The export of parts and half-finished product triggered import revenue of 3.32 billion dollars and capital good sum up to 0.6 billion dollars of import revenue. Re-importation and export substitution seem to have produced each 1.46 billion dollars and 0.66 billion dollars loss.
Major beneficiary of the effect was electronics & telecommunication industry with 0,77 billion dollars in trade surplus. Basic metals gained 0.14 billion dollars and machinery & equipment 0.12 billion dollars. These industries have relatively high level of import coefficient (total import/Intermediate input), meaning that these industries present relatively higher amount of import promotion to its level of trade surplus.

CEPAL - Serie Desarrollo productivo No 182 Korean OFDI: Investment strategies and corporate motivations ….
28
Table 14
IMPORT EFFECT (10 million US dollars)
Export promotion
Part and semi-assembled products
Capital goods
Reimportation
Export Substitution
Sum of variation in Imports
Sum of trade balance effect
Manufacturing in General 3,137,404 55,429 -1,369,565 -624,950 1,198,318 3,443,525
Food & Beverage 16,656 1,238 -17,233 -1,526 -865 -40,810
Textile and Leather 64,978 5,734 -53,824 -8,818 8,070 29,589
Wood and Paper 21,688 374 -12,788 -1,478 7,796 35,844
Paper products and Publishing
3,239 54 -1,620 -626 1,047 -759
Petroleum and Coal 19,252 2,913 -11,343 -2,399 8,423 -8,423
Chemical products 234,188 10,123 -108,836 -46,367 89,108 45,976
Non-metallic Minerals 35,557 490 -18,328 -7,865 9,854 -176,966
Basic Metal 240,103 4,836 -73,162 -35,084 136,693 405,746
Fabricated Metal 20,657 590 -8,391 -2,762 10,094 18,137
Machinery & equipment 349,859 6,096 -186,209 -51,923 117,823 152,362
Electronics and Telecommunications
2,070,450 20,015 -863,817 -460,934 765,716 2,031,321
Medical Instruments 20,412 886 -10,928 -4,834 5,535 -17,440
Transportation machinery 38,433 1,954 -1,388 -131 38,868 981,595
Other manufacturing 1,932 125 -1,697 -203 158 -12,647
Non manufacturing 185,309 4,272 -90,870 -32,093 66,618 -66,618
Total 3,322,712 59,702 -1,460,435 -657,043 1,264,936 3,376,907
Source: Ha (2004, 95)
Korean OFDI contributed in the balance of payments by inducing more trades as local subsidiaries are heavily dependent on parent companies in Korea for not only parts and intermediaries, but also capital goods. This fact naturally resulted in the rise of domestic production and employment by 2.7% and 2.5%, respectively. However, the other side of the coin shows the negative impact of foreign investment in domestic employment, as OFDI has been generally accompanied with company restructuring process.

CEPAL - Serie Desarrollo productivo No 182 Korean OFDI: Investment strategies and corporate motivations ….
29
III. Motivations and corporate strategies of Korean OFDI
This analysis of Korean OFDI indicates that it has been reactivated since the resolution of the financial crisis. It began mainly as natural resource-seeking OFDI in Asia and market seeking OFDI in the major markets (North America, Europe and Asia), however, efficiency-seeking OFDI is growing fast, especially in china and other Asian countries. The Korean OFDI is primarily in manufacturing activities where the Korean economy possesses its principal competitive advantages. Both Korean TNCs and SMEs have participated in the OFDI, nevertheless, it is the global strategies of the TNCs that are putting their imprint on the evolution and nature of such outflows. Although the official statistics capture little OFDI that seeks strategic assets, it will become evident that this is more a failure of the information gathering system than an absence of those kinds of activities since part of the catching-up strategies what are today TNCs were based on it .
3.1. Determinants of Korean OFDI
According to Ha’s survey (2004), it seems that investment decisions were primarily made by cost reduction motives, considering that 40.2% of the surveyed companies indicated labor and other cost reduction as their major investment motivation.

CEPAL - Serie Desarrollo productivo No 182 Korean OFDI: Investment strategies and corporate motivations ….
30
It was followed by market seeking concerns (34.5%), the overseas relocation of partner companies (9.9%), and opening up third markets (4.9%).
With regard to Chinese market in particular, labor and other cost reduction was of fundamental importance for Korean companies, representing 42.6% of the total respondents. This exceeds the average of the total respondents regardless of region they are investing in. The second important reason seems to be opening up new markets (33%). As for the size of the companies, larger enterprises are more prompted by market-seeking motivation while small and medium sized enterprises appear to make more emphasis in labor and other cost reduction (43.4%). (Ha 2004, 55-7)
Classified by industry types, most of the labor intensive industries (textile and apparel, footwear and leather, non metallic minerals, etc.) chose cost-efficiency as their major motivation for OFDI, unlike technology oriented industries such as transportation equipment, petrochemical, machinery and primary metal, in which the market seeking motivation was the dominant one. (Table 15)
Table 15
DETERMINANTS OF FOREIGN INVESTMENT BY INDUSTRY Category Industry Type 1st motive 2nd motive 3rd motive
Heavy Chemical Industry
Electronics and Telecommunications
Market-seeking (48.0)
Cost Reduction (36.4)
Overseas Relocation of business partners (20.2)
Machinery & equipment
Market-seeking (48.0)
Cost Reduction (25.0)
Overseas Relocation of Partner Companies (12.0)
Petrochemicals Market-seeking (55.6)
Cost Reduction (23.4)
Overseas Relocation of Partner Companies /Entrance to Third World Market (6.5)
Transportation equipment
Market-seeking (48.6)
Overseas Relocation of Partner Companies (27.0)
Cost Reduction (13.5)
Fabricated Metal Cost Reduction (47.2)
Market-seeking (33.3)
Entrance to Third World Market (11.1)
Basic Metal Market-seeking (45.4)
Cost Reduction (36.4)
Overseas Relocation of Partner Companies (12.1)
Light Industry Textile and apparel Cost Reduction (66.2)
Market-seeking (15.7)
Entrance to Third World Market (5.2)
Food & Beverages Market-seeking (54.3)
Local natural resources (13.0)
Cost Reduction (10.9)
Footwear and Leather
Cost Reduction (65.2)
Market-seeking (16.2)
Shortage of national labor force (6.1)
Non-metallic Minerals
Cost Reduction (36.1)
Market-seeking (18.2)
Local natural resources (13.9)
Paper and Printing* Cost Reduction (50.0)
Market-seeking (25.0)
Overseas Relocation of Partner Companies /Entrance to Third World Market/Shortage of National labor force (8.3)
Source: Ha (2004, 57)
Note* Paper and Printing 8.3% reflects the answer of 1 company only.

CEPAL - Serie Desarrollo productivo No 182 Korean OFDI: Investment strategies and corporate motivations ….
31
3.2. Deepening of localization
Diversified production pattern Strategies to pursue cost reduction and possibly market seeking motives have diversified considerably, especially in Korean investments in emerging economies like China and Vietnam. Now many companies are in the process of transforming their investment pattern from simple production based on cost effectiveness to more vertically integrated form of operation by using more local parts, establishing retail networks and starting R&D activities.
Especially in a big country like China region-oriented approach tends to be adopted to solve logistics problems. In the past, typical investment pattern used to be setting-up a massive production line near metropolitan areas, mainly in Beijing and Shanghai, but increasingly small and medium sized factories are getting established to facilitate quick access to local market. These days a Kumho tire sold in Tienjin is more likely produced locally rather than manufactured in and transported from Beijing.
Such region-oriented approach is also needed for marketing purpose as each region has different buying power and consumption pattern. A company may want use differentiated marketing strategy in Shanghai from Shimyang. So factories to produce premium brands are in Shanghai, while those in Northeast region are focusing on mass production of popular brands. (Yang 2004,9)
Increased importance of incremental investment A notable trend is the increase of incremental investments, in other words, reinvestment of net profits by capital increase or setting up another subsidiary. Especially in China while the government is still regulating overseas remittance of net profits tax benefits are granted if a company reinvests net profits: in this case, 40 percent of paid corporate tax is refunded.
For instance, one Korean company invested 450,000 dollars in China in late 1980s to produce parts for audio speakers. in China since the late 1980s was. After eight times of repeated capital increase total capital of Chinese subsidiary of the company now reaches nearly 5 million dollars. Among this amount, 1 million dollars can be classified as incremental investment. (Yang 2004, 24-5) Given the growing importance of incremental investment of Korean firms’ OFDI, as noted in Box 1, a comprehensive study should be undertaken in this area.
3.3. Looking back, looking forward
As is the case for other emerging markets, the Korean experience suggests that overseas investment is determined by various factors, both domestic and global. Rising domestic wages, interest rates, exchanges rates, an appreciating national currency, a limited domestic market and considerable regulation are relevant domestic push factors. The need for natural resources, export markets, technology and improved efficiency are important global pull factors.
Looking toward the future, some trends can be perceived. First, while huge investments of large conglomerates will continue, micro investments (each under 1 million dollars) will increase as Korean suppliers and individual investors move offshore. Second, China will continue to be the most favored destination of Korean OFDI. However, due to wage rise and increasing competition there, some companies will contemplate alternative destinations like Vietnam or India. Thirdly, while companies are pursuing investment with traditional motivation of efficient-seeking or market-seeking OFDI, increasingly they will integrate their separate motivations into a global
CEPAL - Serie Desarrollo productivo No 182 Korean OFDI: Investment strategies and corporate motivations ….
32
strategy to improve their international competitiveness in which the continuous relocation of investments to acquire more appropriate host country conditions will become a central aspect of their activities. Fourthly, large scale investment in natural resource development will continue to grow. Due to an increase in oil prices, local companies have increasingly been pushing to dig out overseas resources, such as oil and gas, as the country is heavily dependent on energy imports. Not only the energy sector, but also the mining-related industries rose whose investment four-fold to 3.8 billion dollars in 2006.

CEPAL - Serie Desarrollo productivo No 182 Korean OFDI: Investment strategies and corporate motivations…
33
IV. Conclusion: the need for more coherent Korean OFDI policy
The growth of Korean OFDI suggests that there exists a coordinated OFDI policy which promotes it; however, this is not necessarily the case. It is evident that a number of policy changes have taken place since the first rather restrictive law of December of 1968 and especially since liberalization began in July of 1981. The principal features of the changes dealt with four basic aspects (Moon, 2005). With regard to finance, the main aspects concerned access to loans from the Export-Import Bank of Korea and the Economic Development Co-operation Fund, negotiating investment protection agreements with host governments (62) and establishing foreign exchange management rules. In terms of taxation, negotiating double taxation agreements with host countries (57) and specific measures for resource industries were the most relevant. A third aspect had to do with access to the overseas investment insurance offered by the Korean Export Insurance Company. Finally, distinct kinds of administrative and information support were offered by the Korea Overseas Company Assistance Center, the FDI Information Network, the Korea Overseas Information System of the Ministry of Finance and Economy, the Export-Import Bank of Korea and the Korean Institute for Industrial Economics and Trade. Since February 1994, the liberalization of Korean OFDI policy included notable advances with regards to setting up a one-stop service by transaction banks, allowing OFDI from all sectors, raising the individual investor limit, and encouraging strategic alliances with foreign firms. As of December 2003, more active assistance was offered and the in-depth study of the problems of Korean TNCs with OFDI commenced.

CEPAL - Serie Desarrollo productivo No 182 Korean OFDI: Investment strategies and corporate motivations…
34
All these changes in the existing rules and regulations and activities by distinct Korean institutions do not necessarily add up to a coherent and coordinated OFDI policy. What is missing is an overarching policy framework which relates OFDI to Korean national development goals. In this regard it should be point out that liberalization of capital outflow and OFDI promotion plan of January 2007 announced by MOFE was prompted for monetary purposes; to ease the fast appreciation of Won.
Instead, one would expect such an outlook to involve coordinated and coherent actions on the part of the Ministry of Finance and Economy, the Ministry of Commerce, Industry and Energy, the Korean Trade-Investment Promotion Agency and the Korean Exim Bank. This explains why -- in the context of the strengthening Korean Won which is undermining the international competitiveness of Korean products -- there is currently a flurry of activity to put together a comprehensive package of measures aimed at promoting overseas investment and further reduce existing restrictions (Korean Times, 2006). Perhaps this will transform the many elements dealing with Korean OFDI into a coherent and coordinated OFDI policy.5
5 The Ministry of Finance and Economy (MOFE) announced on January 15, 2007 the "Measures to Boost Corporate Expansion
Overseas and Encourage Overseas Direct Investment." The government is trying to expand financial support tools, streamline the regulations and establishing a risk management system to revitalize corporate expansion overseas. According to the MOFE, the boosting measures particularly target strategic areas: 1) Resources and energy development projects, 2) Overseas infrastructure projects, and 3) financial industry. (MOFE)

CEPAL - Serie Desarrollo productivo No 182 Korean OFDI: Investment strategies and corporate motivations…
35
Bibliography
Ha, Byung-Ki, et.al (1994), An Assessment on the Crisis of Korean Manufacturing Industry and Overseas Foreign Direct Investment, Ministry of Commerce, Industry and Energy.
Jen, Stephen (2007), “KRW: No Instant Satisfaction from Liberalization of Outflows”, Morgan Stanley – Global Economic Forum, January 19, 2007. http://www.morganstanley.com.
Kim, Youngsoo (1997), “Technological Capabilities and Samsung Electronics’ International Production Network in Asia”, Berkeley Roundtable on the International Economy, BRIE working paper, University of California, Berkely.
Lee, Jae-Min (2006), “Chang of the Korean OFDI structure”, Digital Times, 13 Dec, 2006.
Lee, Seong-Bong (2006), “New Trends of Korean Outward FDI and its Global Competitiveness”, KIEP.
MOFE, “Cases of Korean OFDI: success and failure stories”, http://www.mofe.go.kr/ODI.
Park, Young-Ho (1998), Currency Crisis and Difficulties for Overseas Affiliates: A Case Study on the Restructuring of Korean Affiliates in the U.S.A, Working Papers 98-09, KIEP.
“SMEs won’t become comglomerates”, Chosun Daily, 26 Dec, 2006. “S.Korea’s overseas direct investment doubles in 2006”, YonHap News, 28
Jan, 2007. Suh, Hee-Jung (2005), “Trend of Korean OFDI in 2004”, Exim Overseas
Economic Reviews, The Export-Import Bank of Korea, pp.1-18. The Export-Import Bank of Korea (2005, 2006), Overseas Direct investment
Statistics Yearbook. Yang, Hyung-sup (2004), A Case Study of Changing Strategy of Korean
Companies in China, Trade Research Institute of KITA. Zhang, Xiaohong (2004), “Analysis of South Korea’s Direct Investment in
China”, Journal of International Logistics and Trade, Vol.2, No.2, December 2004.

CEPAL - Serie Desarrollo productivo No 182 Korean OFDI: Investment strategies and corporate motivations…
37
Annexes


CEPAL - Serie Desarrollo productivo No 182 Korean OFDI: Investment strategies and corporate motivations…
39
Annex 1
STATISTICAL ANNEX Korean OFDI flows by sector
Unit: Projects, US$1,000
Total Invested Amount Liquidation, etc Net Invested Amount Year Sector
Project Amount Project
Amount Project Amount
Agriculture & Fishing
41 35,347 11 3,930 30 31,417
Mining 3 1,454 -- -- 3 1,454
Manufacturing 35 33,226 6 9,025 29 24,201
Construction 34 25,717 11 1,719 23 23,998
Trade & Retail 211 31,871 37 3,123 174 28,748
Transport & Warehousing
13 2,545 2 252 11 2,293
Hotels & Restaurants
4 2,156 2 32 2 2,124
Services 9 2,144 4 116 5 2,028
1968-
1980
Real estate 2 10,741 -- -- 2 10,741
Agriculture & Fishing
6 10,596 2 668 4 9,928
Mining 1 114 -- -- 1 114
Manufacturing 7 4,571 1 410 6 4,161
Construction 6 4,214 4 4,659 2 -445
Trade & Retail 25 8,036 6 550 19 7,486
Transport &Warehousing
2 137 -- -- 2 137
Hotels & Restaurants
1 397 -- -- 1 397
Services 1 146 - -- 1 146
1981
Real estate -- -- -- -- -- --
Agriculture & Fishing
5 8,480 1 150 4 8,330
Mining 4 65,289 -- -- 4 65,289
Manufacturing 6 6,124 -- - 6 6,124
Construction 6 5,930 - - 6 5,930
Trade & Retail 20 12,821 14 1,291 6 11,530
Transport &Warehousing
2 234 - - 2 234
Hotels & Restaurants
-- 700 - - -- 700
Services 6 1,263 2 1,819 4 -556
1982
Real estate -- -- - - - --
Agriculture & Fishing
6 19,455 2 3,202 4 16,253
Mining 1 43,963 - - 1 43,963
Manufacturing 16 26,724 - 658 16 26,066
Construction 9 2,641 1 1,205 8 1,436
1983
Trade & Retail 16 12,679 7 387 9 12,292
(Continued)

CEPAL - Serie Desarrollo productivo No 182 Korean OFDI: Investment strategies and corporate motivations…
40
Transport &Warehousing
4 620 1 800 3 -180
Finance & Insurance
1 125 - - 1 125
Hotels & Restaurants
- 2,300 - - - 2,300
Services 3 407 1 74 2 333
Real estate - - - - - -
Agriculture & Fishing
2 5,584 2 816 - 4,768
Mining 1 14,517 - - 1 14,517
Manufacturing 10 13,047 - 144 10 12,903
Construction 7 4,479 1 100 6 4,379
Trade & Retail 17 10,007 6 292 11 9,715
Transport &Warehousing
2 100 2 130 - -30
Finance & Insurance
1 459 - - 1 459
Hotels & Restaurants
- - 2 521 -2 -521
Services 6 1,995 - - 6 1,995
1984
Real estate - - - - - -
Agriculture & Fishing
3 5,931 5 6,178 -2 -247
Mining 2 70,980 - 31,360 2 39,620
Manufacturing 11 20,646 2 612 9 20,034
Construction 2 1,590 3 1,809 -1 -219
Trade & Retail 17 11,665 16 1,089 1 10,576
Transport &Warehousing
1 8 1 87 - -79
Finance & Insurance
- 125 - - - 125
Hotels & Restaurants
- - - - - -
Services 2 1,830 2 388 - 1,442
1985
Real estate - - - 7,500 - -7,500
Agriculture & Fishing
3 4,300 3 5,957 - -1,657
Mining - 83,091 1 11,919 -1 71,172
Manufacturing 20 76,643 3 1,645 17 74,998
Construction 1 1,910 1 2,976 - -1,066
Trade & Retail 22 15,687 11 1,765 11 13,922
Transport &Warehousing
1 74 1 100 - -26
Finance & Insurance
- 125 - - - 125
Hotels & Restaurants
- - - - - -
Services 2 821 - - 2 821
1986
Real estate - - - - - -
Agriculture & Fishing
5 5,635 3 3,286 2 2,349 1987
Mining 4 219,088 2 63,916 2 155,172
(continued)

CEPAL - Serie Desarrollo productivo No 182 Korean OFDI: Investment strategies and corporate motivations…
41
Manufacturing 30 156,065 8 3,859 22 152,206
Construction 4 2,758 2 6,342 2 -3,584
Trade & Retail 38 23,151 13 10,951 25 12,200
Transport &Warehousing
4 1,110 3 758 1 352
Finance & Insurance
- - - - - -
Hotels & Restaurants
1 1,260 - - 1 1,260
Services 4 411 1 500 3 -89
Real estate 1 232 - - 1 232
Agriculture & Fishing
8 15,074 7 3,248 1 11,826
Mining 2 64,993 2 51,230 - 13,763
Manufacturing 69 84,976 7 2,464 62 82,512
Construction 8 5,165 2 255 6 4,910
Trade & Retail 66 39,441 12 2,420 54 37,021
Transport &Warehousing
6 516 - - 6 516
Finance & Insurance
1 1,000 - - 1 1,000
Hotels & Restaurants
3 660 - - 3 660
Services 7 2,809 2 50 5 2,759
1988
Real estate 1 1,200 - - 1 1,200
Agriculture & Fishing
11 74,393 3 13,171 8 61,222
Mining 1 75,963 - 78,999 1 -3,036
Manufacturing 148 280,469 10 80,084 138 200,385
Construction 3 12,914 - - 3 12,914
Trade & Retail 77 61,158 8 4,587 69 56,571
Transport &Warehousing
6 2,014 3 200 3 1,814
Finance & Insurance
- 83 - - - 83
Hotels & Restaurants
12 50,108 - - 12 50,108
Services 5 4,406 3 163 2 4,243
1989
Real estate 6 9,287 - - 6 9,287
Agriculture & Fishing
19 41,338 4 6,468 15 34,870
Mining 6 151,922 - 112,033 6 39,889
Manufacturing 197 487,270 9 22,282 188 464,988
Construction 7 4,931 3 3,336 4 1,595
Trade & Retail 78 228,615 7 2,033 71 226,582
Transport &Warehousing
8 1,718 - - 8 1,718
Finance & Insurance
- 29 - - - 29
Hotels & Restaurants
13 24,355 1 50 12 24,305
Services 8 14,089 1 20 7 14,069
1990
Real estate 5 6,518 - - 5 6,518
(Continued)

CEPAL - Serie Desarrollo productivo No 182 Korean OFDI: Investment strategies and corporate motivations…
42
Agriculture & Fishing
24 16,944 2 3,701 22 13,243
Mining 3 122,948 - 59,754 3 63,194
Manufacturing 279 607,559 12 12,341 267 595,218
Construction 4 12,662 1 1,400 3 11,262
Trade & Retail 93 228,995 10 5,595 83 223,400
Transport &Warehousing
8 9,792 2 730 6 9,062
Telecommunications 2 383 - - 2 383
Finance & Insurance
- 30 - - - 30
Hotels & Restaurants
11 66,144 1 4,950 10 61,194
Services 16 37,184 - 47 16 37,137
1991
Real estate 5 15,578 - - 5 15,578
Agriculture & Fishing
32 24,307 4 3,871 28 20,436
Mining 7 149,982 1 79,047 6 70,935
Manufacturing 345 657,343 13 35,126 332 622,217
Construction 4 666 7 2,482 -3 -1,816
Trade & Retail 86 304,650 8 5,784 78 298,866
Transport &Warehousing
5 10,560 4 1,041 1 9,519
Telecommunications 2 3,398 - - 2 3,398
Finance & Insurance
- - - - - -
Hotels & Restaurants
3 47,951 - 100 3 47,851
Services 13 17,234 3 923 10 16,311
1992
Real estate - 4,115 - 3,245 - 870
Agriculture & Fishing
18 13,168 2 10,359 16 2,809
Mining 8 146,030 1 89,799 7 56,231
Manufacturing 520 559,605 27 60,887 493 498,718
Construction 17 20,451 2 811 15 19,640
Trade & Retail 93 445,513 29 75,276 64 370,237
Transport &Warehousing
7 6,092 1 226 6 5,866
Telecommunications 1 1,000 - - 1 1,000
Finance & Insurance
- - - - - -
Hotels & Restaurants
9 65,215 1 3,050 8 62,165
Services 14 5,963 7 4,818 7 1,145
1993
Real estate 1 1,800 - - 1 1,800
Agriculture & Fishing
30 14,440 7 27,724 23 -13,284
Mining 17 115,264 1 69,823 16 45,441
Manufacturing 1,099 1,490,412 25 84,263 1,074 1,406,149
Construction 31 31,295 8 5,986 23 25,309
1994
Trade & Retail 168 553,063 27 62,555 141 490,508
(Continued)

CEPAL - Serie Desarrollo productivo No 182 Korean OFDI: Investment strategies and corporate motivations…
43
Transport &Warehousing
29 13,755 1 215 28 13,540
Telecommunications 3 7,675 - - 3 7,675
Finance & Insurance
- - - - - -
Hotels & Restaurants
53 44,169 2 4,000 51 40,169
Services 49 22,065 9 2,053 40 20,012
Real estate 9 12,318 1 16,412 8 -4,094
Agriculture & Fishing
23 23,240 12 31,213 11 -7,973
Mining 5 77,305 3 48,369 2 28,936
Manufacturing 954 2,047,525 43 137,065 911 1,910,460
Construction 41 80,160 3 2,254 38 77,906
Trade & Retail 157 327,344 29 63,465 128 263,879
Transport &Warehousing
22 43,448 3 457 19 42,991
Telecommunications 20 296,012 - 6,196 20 289,816
Finance & Insurance
1 5 - - 1 5
Hotels & Restaurants
43 56,080 - - 43 56,080
Services 49 94,836 5 22,489 44 72,347
1995
Real estate 17 94,318 1 1,950 16 92,368
Agriculture & Fishing
39 20,534 3 4,245 36 16,289
Mining 17 250,499 1 17,116 16 233,383
Manufacturing 1,036 2,836,229 62 510,482 974 2,325,747
Construction 34 87,475 4 1,589 30 85,886
Trade & Retail 168 619,279 20 102,135 148 517,144
Transport &Warehousing
33 29,911 4 1,208 29 28,703
Telecommunications 22 199,441 - 5,654 22 193,787
Finance & Insurance
- - - - - -
Hotels & Restaurants
49 109,462 2 350 47 109,112
Services 61 239,126 6 9,133 55 229,993
1996
Real estate 11 49,674 1 600 10 49,074
Agriculture & Fishing
23 16,916 6 2,220 17 14,696
Mining 13 216,362 1 13,690 12 202,672
Manufacturing 884 1,845,382 53 186,615 831 1,658,767
Construction 28 83,979 8 2,026 20 81,953
Trade & Retail 158 503,173 26 20,535 132 482,638
Transport &Warehousing
29 28,612 4 2,309 25 26,303
Telecommunications 29 423,996 1 11,500 28 412,496
Finance & Insurance
- - - - - -
Hotels & Restaurants
71 195,824 4 21,707 67 174,117
1997
Services 79 139,590 5 3,672 74 135,918
(Continued)

CEPAL - Serie Desarrollo productivo No 182 Korean OFDI: Investment strategies and corporate motivations…
44
Real estate 13 205,453 1 2,808 12 202,645
Others 1 120 - - 1 120
Agriculture & Fishing
9 17,137 2 1,956 7 15,181
Mining 8 111,498 1 27,219 7 84,279
Manufacturing 376 2,351,595 47 687,044 329 1,664,551
Construction 14 93,990 5 4,834 9 89,156
Trade & Retail 106 1,862,419 21 188,144 85 1,674,275
Transport &Warehousing
22 10,374 2 4,545 20 5,829
Telecommunications 14 117,216 3 124,708 11 -7,492
Finance & Insurance
- - - - - -
Hotels & Restaurants
18 13,674 2 260 16 13,414
Services 40 103,231 8 11,143 32 92,088
Real estate 6 104,350 1 7,264 5 97,086
1998
Others - 260 - - - 260
Agriculture & Fishing
15 8,015 3 807 12 7,208
Mining 10 210,148 4 52,839 6 157,309
Manufacturing 689 1,669,438 51 528,847 638 1,140,591
Construction 21 60,472 4 17,726 17 42,746
Trade & Retail 106 1,064,949 24 297,510 82 767,439
Transport &Warehousing
70 53,315 6 816 64 52,499
Telecommunications 12 34,231 3 61,500 9 -27,269
Finance & Insurance
1 100 - - 1 100
Hotels & Restaurants
49 61,261 2 4,882 47 56,379
Services 117 112,979 6 79,440 111 33,539
Real estate 4 50,395 2 11,758 2 38,637
1999
Others - 40 - - - 40
Agriculture & Fishing
19 18,139 6 5,981 13 12,158
Mining 11 88,943 2 53,799 9 35,144
Manufacturing 1,070 1,525,996 52 567,240 1,018 958,756
Construction 23 97,193 3 49,084 20 48,109
Trade & Retail 262 808,740 16 342,221 246 466,519
Transport & Warehousing
24 35,501 7 47,038 17 -11,537
Telecommunications 26 171,461 5 69,084 21 102,377
Finance & Insurance
11 9,110 - - 11 9,110
Hotels & Restaurants
87 248,971 4 220,908 83 28,063
Services 534 1,932,965 11 31,131 523 1,901,834
Real estate 4 97,593 3 37,600 1 59,993
2000
Others 3 1,577 - - 3 1,577
2001 Agriculture & Fishing
14 8,453 4 4,486 10 3,967
(Continued)

CEPAL - Serie Desarrollo productivo No 182 Korean OFDI: Investment strategies and corporate motivations…
45
Mining 9 56,749 1 7,505 8 49,244
Manufacturing 1,264 3,814,710 63 2,341,913 1,201 1,472,797
Construction 16 43,594 7 42,392 9 1,202
Trade & Retail 298 880,062 19 656,055 279 224,007
Transport &Warehousing
27 9,150 4 27,575 23 -18,425
Telecommunications 11 45,945 11 163,931 - -117,986
Finance & Insurance
5 1,580 - - 5 1,580
Hotels & Restaurants
123 27,289 3 5,084 120 22,205
Services 368 203,442 23 32,587 345 170,855
Real estate 11 38,206 3 11,657 8 26,549
Others 1 150 - - 1 150
Agriculture & Fishing
32 19,347 3 35,540 29 -16,193
Mining 10 162,887 2 18,549 8 144,338
Manufacturing 1,588 1,733,859 66 451,717 1,522 1,282,142
Construction 21 60,595 1 49,506 20 11,089
Trade & Retail 327 1,187,552 27 383,365 300 804,187
Transport &Warehousing
32 15,216 3 1,517 29 13,699
Telecommunications 13 37,838 7 16,329 6 21,509
Finance & Insurance
5 3,365 1 - 4 3,365
Hotels & Restaurants
111 38,332 11 69,732 100 -31,400
Services 323 302,059 31 45,571 292 256,488
Real estate 18 83,921 3 18,079 15 65,842
2002
Others 1 121 - - 1 121
Agriculture & Fishing
43 26,445 4 5,271 39 21,174
Mining 17 273,470 1 17,741 16 255,729
Manufacturing 1,788 2,145,218 81 467,623 1,707 1,677,595
Construction 30 47,351 1 6,287 29 41,064
Trade & Retail 360 945,255 34 104,590 326 840,665
Transport &Warehousing
19 15,347 7 7,489 12 7,858
Telecommunications 15 63,427 3 7,242 12 56,185
Finance & Insurance
3 1,925 1 218 2 1,707
Hotels & Restaurants
170 77,962 20 17,830 150 60,132
Services 327 267,063 30 15,389 297 251,674
Real estate 30 100,910 4 36,158 26 64,752
2003
Others 1 100 - - 1 100
Agriculture & Fishing
52 34,438 2 7,108 50 27,330
Mining 28 302,506 1 7,782 27 294,724
Manufacturing 2,225 3,359,965 121 395,890 2,104 2,964,075
Construction 48 77,526 6 12,278 42 65,248
2004
Trade & Retail 471 1,113,910 44 148,171 427 965,739
(Continued)

CEPAL - Serie Desarrollo productivo No 182 Korean OFDI: Investment strategies and corporate motivations…
46
(Concluded) Transport &Warehousing
35 20,801 7 4,926 28 15,875
Telecommunications 12 80,885 5 5,564 7 75,321
Finance & Insurance
- 360 - 125 - 235
Hotels & Restaurants
316 108,892 14 73,924 302 34,968
Services 552 597,445 41 89,067 511 508,378
Real estate 28 192,192 2 11,396 26 180,796
Others 1 655 - - 1 655
Agriculture & Fishing
34 17,241 1 1,395 33 15,846
Mining 8 135,167 1 647 7 134,520
Manufacturing 996 1,495,064 37 81,304 959 1,413,760
Construction 55 64,270 7 1,765 48 62,505
Trade & Retail 381 569,412 19 14,875 362 554,537
Transport &Warehousing
40 67,668 2 3,453 38 64,215
Telecommunications 7 87,531 1 6,972 6 80,559
Finance & Insurance
1 300 2 1,139 -1 -839
Hotels & Restaurants
179 75,998 2 481 177 75,517
Services 296 264,567 16 63,799 280 200,768
Real estate 22 52,869 1 4,519 21 48,350
2005
Others - - - - - -
Total 25,758 54,640,766 1,940 12,096,445 23,818 42,544,321
Source: Own elaboration.

CEPAL - Serie Desarrollo productivo No 182 Korean OFDI: Investment strategies and corporate motivations…
47
Annex 2
Korean OFDI flows by region
Unit: Projects, US$1,000
Total Invested Amount Liquidation, etc Net Invested Amount Year Region
Project Amount Project Amount Project Amount
Asia 88 49,533 14 12,168 74 37,365
Middle East 30 22,608 4 1,540 26 21,068
North America excl. Mexico
118 32,727 24 1,683 94 31,044
Latin America 20 4,879 9 468 11 4,411
Europe 51 5,213 2 319 49 4,894
Africa 20 25,266 5 1,277 15 23,989
Oceania 25 4,975 15 742 10 4,233
1968-1980
Total 352 145,201 73 18,197 279 127,004
Asia 17 5,489 1 750 16 4,739
Middle East 6 3,408 3 4,559 3 -1,151
North America excl. Mexico
13 4,667 4 485 9 4,182
Latin America 3 978 1 410 2 568
Europe 1 1,503 2 65 -1 1,438
Africa 4 919 2 18 2 901
Oceania 5 11,247 - - 5 11,247
1981
Total 49 28,211 13 6,287 36 21,924
Asia 11 6,614 2 194 9 6,420
Middle East 5 6,610 2 506 3 6,104
North America excl. Mexico
16 42,188 5 350 11 41,838
Latin America 5 1,061 - - 5 1,061
Europe 5 2,153 7 710 -2 1,443
Africa 3 593 1 1,500 2 -907
Oceania 4 41,622 - - 4 41,622
1982
Total 49 100,841 17 3,260 32 97,581
Asia 18 28,466 - 3,768 18 24,698
Middle East 5 2,624 3 2,079 2 545
North America excl. Mexico
23 48,686 5 354 18 48,332
Latin America 5 312 - - 5 312
Europe 2 12,614 3 57 -1 12,557
Africa 2 416 - - 2 416
Oceania 1 15,796 1 68 - 15,728
1983
Total 56 108,914 12 6,326 44 102,588
Asia 7 10,285 3 333 4 9,952 1984
Middle East 4 6,690 - - 4 6,690
(Continued)

CEPAL - Serie Desarrollo productivo No 182 Korean OFDI: Investment strategies and corporate motivations…
48
North America excl. Mexico
25 19,018 3 180 22 18,838
Latin America 3 739 - - 3 739
Europe 1 1,016 2 73 -1 943
Africa 3 581 3 35 - 546
Oceania 3 11,859 2 1,382 1 10,477
Total 46 50,188 13 2,003 33 48,185
Asia 14 17,671 5 848 9 16,823
Middle East 1 10,298 3 4,008 -2 6,290
North America excl. Mexico
12 26,813 14 22,713 -2 4,100
Latin America 3 2,858 1 59 2 2,799
Europe 3 38,813 4 169 -1 38,644
Africa 1 231 1 5,000 - -4769
Oceania 4 16,091 1 16,226 3 -135
1985
Total 38 112,775 29 49,023 9 63,752
Asia 12 4,064 4 5,658 8 -1594
Middle East 2 80,247 2 4,867 - 75,380
North America excl. Mexico
26 80,640 7 3,329 19 77,311
Latin America 3 2,720 2 75 1 2,645
Europe 3 5,582 1 130 2 5,452
Africa - - 2 279 -2 -279
Oceania 3 9,398 2 10,024 1 -626
1986
Total 49 182,651 20 24,362 29 158,289
Asia 18 132,359 11 3,546 7 128,813
Middle East 1 70,908 2 2,537 -1 68,371
North America excl. Mexico
41 188,603 10 23,776 31 164,827
Latin America 14 4,225 2 549 12 3,676
Europe 10 6,844 3 49,049 7 -42205
Africa 2 622 1 8,937 1 -8315
Oceania 5 6,149 3 1,218 2 4,931
1987
Total 91 409,710 32 89,612 59 320,098
Asia 65 44,464 9 4,595 56 39,869
Middle East 1 41,213 2 48,776 -1 -7563
North America excl. Mexico
57 95,829 13 5,352 44 90,477
Latin America 15 14,209 2 193 13 14,016
Europe 16 15,443 3 243 13 15,200
Africa 3 1,460 2 308 1 1,152
Oceania 14 3,216 1 200 13 3,016
1988
Total 171 215,834 32 59,667 139 156,167
Asia 125 127,995 6 1,800 119 126,195
Middle East 1 31,648 - 78,888 1 -47240 1989 North America excl. Mexico
73 283,417 8 81,055 65 202,362
(Continued)

CEPAL - Serie Desarrollo productivo No 182 Korean OFDI: Investment strategies and corporate motivations…
49
Latin America 28 55,429 3 81 25 55,348
Europe 16 19,137 4 774 12 18,363
Africa 5 8,341 2 118 3 8,223
Oceania 21 44,828 4 14,488 17 30,340
Total 269 570,795 27 177,204 242 393,591
Asia 186 292,405 8 4,068 178 288,337
Middle East - 40,276 1 112,686 -1 -72410
North America excl. Mexico
86 438,253 10 21,450 76 416,803
Latin America 26 66,813 2 357 24 66,456
Europe 21 64,099 3 4,752 18 59,347
Africa 2 26,518 1 2,376 1 24,142
Oceania 20 32,421 - 533 20 31,888
1990
Total 341 960,785 25 146,222 316 814,563
Asia 270 427,040 6 5,244 264 421,796
Middle East - 58,572 1 57,013 -1 1,559
North America excl. Mexico
83 460,819 13 16,054 70 444,765
Latin America 36 41,596 4 1,838 32 39,758
Europe 35 89,423 - 1,330 35 88,093
Africa 5 18,004 2 2,076 3 15,928
Oceania 16 22,765 2 4,963 14 17,802
1991
Total 445 1,118,219 28 88,518 417 1,029,701
Asia 360 519,682 18 17,665 342 502,017
Middle East 2 75,250 3 63,012 -1 12,238
North America excl. Mexico
61 393,023 10 26,054 51 366,969
Latin America 28 36,504 1 6,483 27 30,021
Europe 33 143,127 5 11,263 28 131,864
Africa 4 29,065 2 1,399 2 27,666
Oceania 9 23,555 1 5,743 8 17,812
1992
Total 497 1,220,206 40 131,619 457 1,088,587
Asia 553 503,349 20 34,052 533 469,297
Middle East 4 85,694 2 66,517 2 19,177
North America excl. Mexico
58 392,126 31 111,986 27 280,140
Latin America 29 43,201 5 17,242 24 25,959
Europe 32 175,047 9 8,911 23 166,136
Africa 6 30,681 1 2,023 5 28,658
Oceania 6 34,739 2 4,495 4 30,244
1993
Total 688 1,264,837 70 245,226 618 1,019,611
Asia 1,214 1,153,594 32 83,760 1,182 1,069,834
Middle East 4 38,273 3 53,900 1 -15627
North America excl. Mexico
135 567,016 30 58,132 105 508,884
Latin America 37 49,899 7 28,942 30 20,957
1994
Europe 55 357,215 5 39,098 50 318,117
(Continued)

CEPAL - Serie Desarrollo productivo No 182 Korean OFDI: Investment strategies and corporate motivations…
50
Africa 8 113,517 1 3,357 7 110,160
Oceania 35 24,942 3 5,842 32 19,100
Total 1,488 2,304,456 81 273,031 1,407 2,031,425
Asia 1,045 1,741,283 43 135,884 1,002 1,605,399
Middle East 1 31,624 1 2,323 - 29,301
North America excl. Mexico
139 549,864 33 95,119 106 454,745
Latin America 31 122,441 13 54,588 18 67,853
Europe 71 613,825 7 15,900 64 597,925
Africa 7 41,733 - 3,332 7 38,401
Oceania 38 39,503 2 6,312 36 33,191
1995
Total 1,332 3,140,273 99 313,458 1,233 2,826,815
Asia 1,079 1,850,627 62 130,700 1,017 1,719,927
Middle East 5 26,484 2 2,395 3 24,089
North America excl. Mexico
198 1,599,500 25 394,747 173 1,204,753
Latin America 40 272,567 2 24,387 38 248,180
Europe 71 604,146 8 97,004 63 507,142
Africa 8 17,145 1 181 7 16,964
Oceania 69 71,161 3 3,098 66 68,063
1996
Total 1,470 4,441,630 103 652,512 1,367 3,789,118
Asia 914 1,731,241 65 137,678 849 1,593,563
Middle East 2 68,717 2 644 - 68,073
North America excl. Mexico
229 896,624 15 57,230 214 839,394
Latin America 35 280,028 7 14,745 28 265,283
Europe 72 432,858 14 26,762 58 406,096
Africa 17 113,387 1 21,281 16 92,106
Oceania 59 136,552 5 8,742 54 127,810
1997
Total 1,328 3,659,407 109 267,082 1,219 3,392,325
Asia 398 2,067,814 47 549,163 351 1,518,651
Middle East 1 18,710 - 12,510 1 6,200
North America excl. Mexico
135 989,341 30 251,839 105 737,502
Latin America 14 243,265 7 19,242 7 224,023
Europe 38 1,229,911 5 184,574 33 1,045,337
Africa 9 106,730 1 11,548 8 95,182
Oceania 18 129,973 2 28,241 16 101,732
1998
Total 613 4,785,744 92 1,057,117 521 3,728,627
Asia 671 1,281,729 52 361,474 619 920,255
Middle East 2 863 - - 2 863
North America excl. Mexico
323 1,417,759 30 478,665 293 939,094
Latin America 24 227,723 4 7,910 20 219,813
Europe 41 302,401 11 169,773 30 132,628
Africa 10 25,415 1 5,320 9 20,095
1999
Oceania 23 69,453 7 32,983 16 36,470
(Continued)

CEPAL - Serie Desarrollo productivo No 182 Korean OFDI: Investment strategies and corporate motivations…
51
Total 1,094 3,325,343 105 1,056,125 989 2,269,218
Asia 1,186 1,564,898 43 713,140 1,143 851,758
Middle East 4 26,678 - - 4 26,678
North America excl. Mexico
709 1,405,221 41 157,354 668 1,247,867
Latin America 49 1,504,743 9 72,271 40 1,432,472
Europe 67 288,978 9 296,515 58 -7537
Africa 7 155,954 1 132,170 6 23,784
Oceania 52 89,717 6 52,636 46 37,081
2000
Total 2,074 5,036,189 109 1,424,086 1,965 3,612,103
Asia 1,428 1,373,323 71 1,924,438 1,357 -551115
Middle East 2 19,267 - - 2 19,267
North America excl. Mexico
529 1,474,172 45 1,182,221 484 291,951
Latin America 25 98,050 6 33,792 19 64,258
Europe 69 2,128,820 9 146,846 60 1,981,974
Africa 7 15,113 - 242 7 14,871
Oceania 87 20,585 7 5,646 80 14,939
2001
Total 2,147 5,129,330 138 3,293,185 2,009 1,836,145
Asia 1,818 1,721,860 70 408,857 1,748 1,313,003
Middle East 11 30,766 - 272 11 30,494
North America excl. Mexico
468 598,086 55 108,040 413 490,046
Latin America 30 247,066 6 59,728 24 187,338
Europe 70 955,457 14 423,606 56 531,851
Africa 9 13,376 3 33,493 6 -20117
Oceania 75 78,481 7 55,909 68 22,572
2002
Total 2,481 3,645,092 155 1,089,905 2,326 2,555,187
Asia 2,085 2,371,297 88 241,815 1,997 2,129,482
Middle East 5 10,625 2 70 3 10,555
North America excl. Mexico
551 1,063,176 73 309,980 478 753,196
Latin America 31 182,611 5 11,873 26 170,738
Europe 68 220,753 7 114,141 61 106,612
Africa 5 23,591 1 - 4 23,591
Oceania 58 92,420 10 7,959 48 84,461
2003
Total 2,803 3,964,473 186 685,838 2,617 3,278,635
Asia 2,705 3,328,595 122 473,754 2,583 2,854,841
Middle East 9 24,090 2 862 7 23,228
North America excl. Mexico
860 1,384,578 76 168,732 784 1,215,846
Latin America 30 341,489 6 15,204 24 326,285
Europe 99 683,975 21 80,374 78 603,601
Africa 13 50,667 6 3,307 7 47,360
Oceania 52 76,181 10 13,998 42 62,183
2004
Total 3,768 5,889,575 243 756,231 3,525 5,133,344
2005 Asia 1,392 1,686,177 51 92,637 1,341 1,593,540
(Continued)
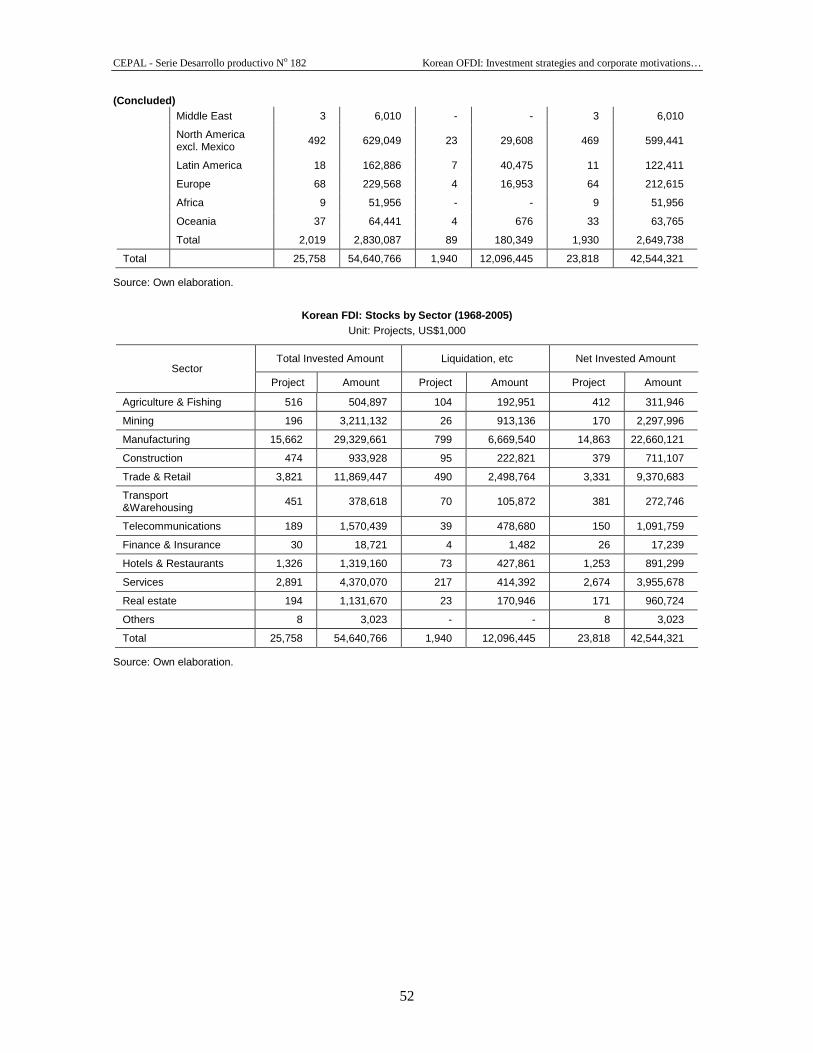
CEPAL - Serie Desarrollo productivo No 182 Korean OFDI: Investment strategies and corporate motivations…
52
(Concluded) Middle East 3 6,010 - - 3 6,010
North America excl. Mexico
492 629,049 23 29,608 469 599,441
Latin America 18 162,886 7 40,475 11 122,411
Europe 68 229,568 4 16,953 64 212,615
Africa 9 51,956 - - 9 51,956
Oceania 37 64,441 4 676 33 63,765
Total 2,019 2,830,087 89 180,349 1,930 2,649,738
Total 25,758 54,640,766 1,940 12,096,445 23,818 42,544,321
Source: Own elaboration.
Korean FDI: Stocks by Sector (1968-2005)
Unit: Projects, US$1,000
Total Invested Amount Liquidation, etc Net Invested Amount Sector
Project Amount Project Amount Project Amount
Agriculture & Fishing 516 504,897 104 192,951 412 311,946
Mining 196 3,211,132 26 913,136 170 2,297,996
Manufacturing 15,662 29,329,661 799 6,669,540 14,863 22,660,121
Construction 474 933,928 95 222,821 379 711,107
Trade & Retail 3,821 11,869,447 490 2,498,764 3,331 9,370,683
Transport &Warehousing
451 378,618 70 105,872 381 272,746
Telecommunications 189 1,570,439 39 478,680 150 1,091,759
Finance & Insurance 30 18,721 4 1,482 26 17,239
Hotels & Restaurants 1,326 1,319,160 73 427,861 1,253 891,299
Services 2,891 4,370,070 217 414,392 2,674 3,955,678
Real estate 194 1,131,670 23 170,946 171 960,724
Others 8 3,023 - - 8 3,023
Total 25,758 54,640,766 1,940 12,096,445 23,818 42,544,321
Source: Own elaboration.
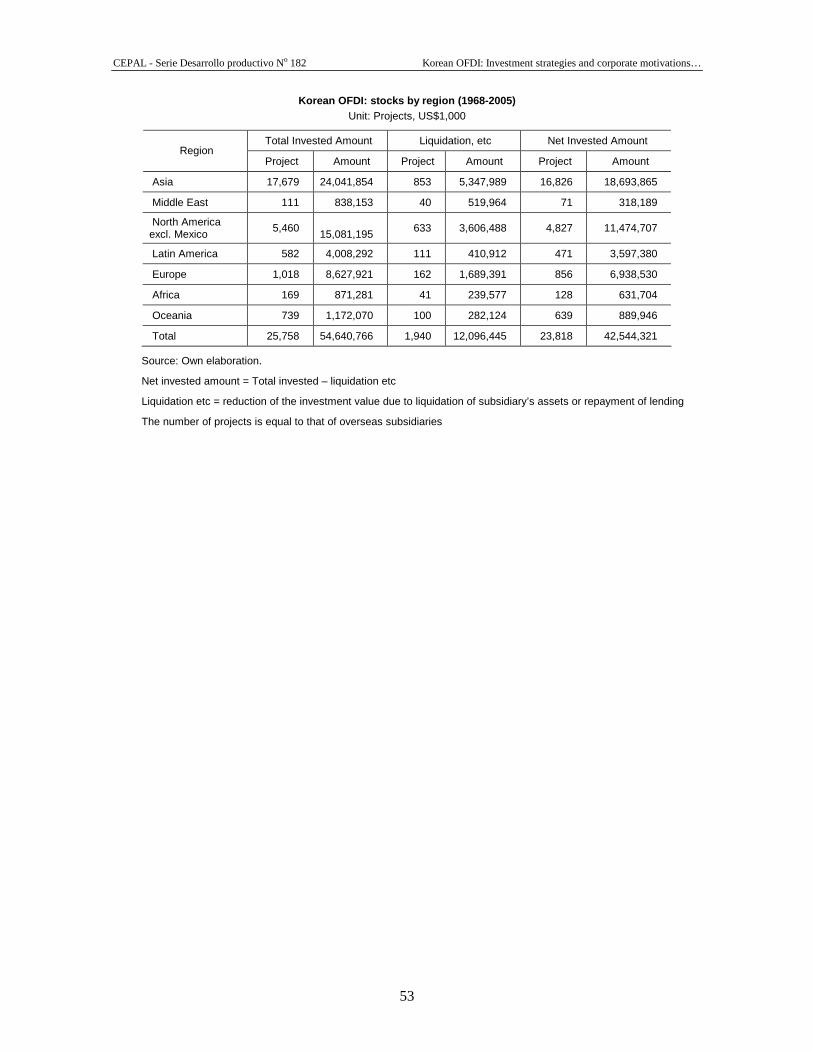
CEPAL - Serie Desarrollo productivo No 182 Korean OFDI: Investment strategies and corporate motivations…
53
Korean OFDI: stocks by region (1968-2005) Unit: Projects, US$1,000
Total Invested Amount Liquidation, etc Net Invested Amount Region
Project Amount Project Amount Project Amount
Asia 17,679 24,041,854 853 5,347,989 16,826 18,693,865
Middle East 111 838,153 40 519,964 71 318,189
North America excl. Mexico
5,460 15,081,195
633 3,606,488 4,827 11,474,707
Latin America 582 4,008,292 111 410,912 471 3,597,380
Europe 1,018 8,627,921 162 1,689,391 856 6,938,530
Africa 169 871,281 41 239,577 128 631,704
Oceania 739 1,172,070 100 282,124 639 889,946
Total 25,758 54,640,766 1,940 12,096,445 23,818 42,544,321
Source: Own elaboration.
Net invested amount = Total invested – liquidation etc
Liquidation etc = reduction of the investment value due to liquidation of subsidiary’s assets or repayment of lending
The number of projects is equal to that of overseas subsidiaries


CEPAL - Serie Desarrollo productivo No 182 Korean OFDI: Investment strategies and corporate motivations…
55
Números publicados
El listado completo de esta colección, así como las versiones electrónicas en pdf están disponibles en nuestro sitio web: www.cepal.o rg/publicaciones
182 Korean OFDI: investment strategies and corporate motivations for investing abroad, Jae Sung kwak (LC/L. 2804-
P), Nº de venta S.07.II.G.137 (US$10.00), 2007. 181 Producción de Biomasa para combustibles líquidos: el potencial de América Latina y el Caribe, Carlos Razo, Carlos
Ludeña, Alberto Saucedo, Sofía Astete-Miller, Josefina Hepp y Alejandra Vildósola (LC/L. 2803-P), Nº de venta S.07.II.G.136 (US$10.00), 2007.
180 Pymes y articulación productiva. Resultados y lecciones a partir de experiencias en América Latina, Marco Dini, Carlo Ferraro y Carolina Gasaly (LC/L.2788-P), Nº de venta S.07.II.G.138 (US$10.00), 2007.
179 El monitoreo de los resultados de políticas agrícolas rurales: deficiencias de las estadísticas tradicionales, nuevas herramientas y su aplicación en el Municipio de Carapeguá, Paraguay, retirada.
178 Biocombustibles y su impacto potencial en la estructura agraria, precios y empleo en América Latina, Carlos Razo, Sofía Astete-Miller, Alberto Saucedo, Carlos Ludeña (LC/L.2768-P), Nº de venta S.07.II.G.104 (US$10.00), 2007.
177 Capital de riesgo y mecanismos financieros de apoyo a la innovación en Brasil y Chile, Luis Felipe Jiménez (LC/L.2763-P), Nº de venta S.07.II.G.99 (US$10.00), 2007.
176 Cinco piezas de política de desarrollo productivo, Mario Cimoli, Martine Dirven, Carlo Ferraro, João Carlos Ferraz, Nicolo Gligo, Martin Hilbert, Wilson Peres, Annalisa Primi y Giovanni Stumpo (LC/L.2704), Nº de venta S.07.II.G.53 (US$10.00), 2007.
175 Políticas activas para atraer inversión extranjera directa en América Latina y el Caribe, Nicolo Gligo S. (LC/L.2667-P), Nº de venta S.07.II.G.18 (US$10.00), 2007.
174 Características del empleo rural no agrícola en América Latina con énfasis en los servicios, Claus Köbrich y Martine Dirven, (LC/L. 2659-P), N° de venta: S.07.II.G.10 (US$ 10), 2007.
173 Capital de riesgo para la innovación: lecciones de países desarrollados, Luis Felipe Jimenez (LC/L.2617-P), Nº de venta S.06.II.G.159 (US$10.00), 2006.
172 Investimento brasileiro no exterior: panorama e considedraçoes. Marcia Tavares (LC/L.2624-P), Nº de venta P.06.II.G.148 (US$10.00), 2006.
171 Los efectos potenciales del tratado de libre comercio entre Ecuador y Estados Unidos en las mujeres rurales ecuatorianas, César Morales y Soledad Parada, Red de desarrollo agropecuario, (LC/L.2496-P), Nº de venta S.06.II.G.28 (US$10.00), 2006.
170 Disposiciones agroalimentarias en los Tratados de Libre Comercio con Estados Unidos: avances y limitaciones para futuras negociaciones con socios latinoamericanos, Mônica Rodrigues, Red de desarrollo agropecuario (LC/L.2483-P), Nº de venta S.06.II.G.11 (US$10.00), 2006.
169 Organización industrial y competencia en las telecomunicaciones en América Latina: estrategias empresariales, Judith Mariscal, Eugenio Rivera, Red de reestructuración y competitividad (LC/L.2423-P) Nº de venta S.05.II.G.170 (US$10.00), 2005.
168 Crédito bancário no Brasil: participação das pequenas empresas e condições de acesso, José Mauro de Morais, Red de Restructuración y Competitividad (LC/L.2422-P), Nº de venta P.05.II.G.169 (US$10.00), 2005.
167 Impactos diferenciados de la liberalización comercial sobre la estructura agrícola en América Latina, Mônica Rodrigues, Red de desarrollo agropecuario (LC/L.2421-P), Nº de venta S.05.II.G.168 (US$10.00), 2005.
166 El (lento) retorno de las políticas industriales en América Latina y el Caribe, Wilson Peres, Red de reestructuración y competitividad (LC/L.2419-P), Nº de venta S.05.II.G.166 (US$10.00), 2005.
165 Science and Technology Policies in Open Economies: The Case of Latin America and the Caribbean, Mario Cimoli, João Carlos Ferraz y Analiza Primi, (LC/L.2404-P), sales Nº E.05.II.G.151 (US$10.00), 2005.
164 La importancia de la tecnología de la información y la comunicación para las industrias de recursos naturales, Graciela Moguillansky, Red de inversiones y estrategias empresariales (LC/L.2401-P), Nº de venta S.05.II.G.148 (US$10.00), 2005.
Serie
desarrollo productivo

CEPAL - Serie Desarrollo productivo No 182 Korean OFDI: Investment strategies and corporate motivations…
56
163 El precio de mercado de la tierra desde la perspectiva económica, Raimundo Soto, Red de desarrollo agropecuario (LC/L.2355-P), Nº de venta S.05.II.G.97 (US$10.00), 2005.
162 Informe sobre la industria automotriz mexicana, Michael Mortimore, Faustino Barron, Red de inversiones y estrategias empresariales (LC/L.2304-P), Nº de venta S.05.II.G.52 (US$10.00), 2005.
161 Macroeconomic policies, sector performance and firm response: the case of Chile’s textile goods market, Beverly Carlson, Restructuring and Competitiveness Network (LC/L.2255-P), Sales No. E.05.II.G.12 (US$10.00), 2005.
160 Liberalización comercial agrícola con costos de transporte y transacción elevados: evidencia para América Latina, Mónica Kjöllerstrom, Red de Desarrollo Agropecuario (LC/L.2232-P), Nº de venta S.04.II.G.152 (US$10.00), 2004.
159 Innovación participativa: experiencias con pequeños productores agrícolas en seis países de América Latina, Marcela Cordoba, Maria Verónica Gottreet, Tito Lopez y Asociados, Alvaro Montes, Liudmila Ortega, y Santiago Perry, Red de Desarrollo Agropecuario (LC/L. 2203-P), Nº de venta S.04.II.G.128 (US$ 10.00), 2004.
158 Acuerdos bilaterales de inversión y demandas ante Tribunales Internacionales: la experiencia argentina reciente, Leonardo E. Stanley, Red Inversiones y Estrategias Empresariales (LC/L.2181-P), Nº de venta S.04.II.G.108 (US$10.00), 2004.
157 Áreas económicas locales y mercado de trabajo en Argentina: estudio de tres casos, Ximena Mazorra, Agustín Filippo y Diego Schleser, Red de reestructuración y competitividad (LC/L. 2151-P), Nº de venta S.04.II.G.79 (US$ 10.00), 2004.
156 A Chilean wine cluster? Governance and upgrading in the phase of internationalization Evert-Jan Visser, Red de reestructuración y competitividad (LC/L.2138-P), sales Nº E.04.II.G.67 (US$10.00), 2004.
155 Competitividad del sector agrícola y pobreza rural: el papel del gasto público en América Latina, Mónica Kjöllerström, Red de desarrollo agropecuario, (LC/L.2137-P), Nº de venta S.04.II.G.66 (US$10.00), 2004.
154 Créditos a pyme en Argentina: racionamiento crediticio en un contexto de oferta ilimitada de dinero, Agustín Filippo, Daniel Kostzer y Diego Schleser, (LC/L.2136 -P), Nº de venta S.04.II.G65 (US$10.00), 2004.
153 Salud y seguridad en el trabajo y el papel de la formación en México (con referencia a la industria azucarera), Leonard Mertens y Mónica Falcón, (LC/L.2130-P), Nº de venta S.04.II.G.58 (US$10.00), 2004.
152 Políticas públicas y la agricultura latinoamericana en la década del 2000, Pedro Tejo, (LC/L.2121-P) Nº de venta S.04.II.G.50 (US$10.00), 2004.
151 La inversión extranjera directa en República Dominicana y su impacto sobre la competitividad de sus exportaciones, Sebastián Vergara, Red de reestructuración y competitividad (LC/L.2120-P) Nº de venta S.04.II.G.47 (US$10.00), 2004.
150 El microcrédito como componente de una política de desarrollo local: el caso del Centro de Apoyo a la Microempresa (CAM), en la Ciudad de Buenos Aires, Néstor Bercovich, (LC/L.2103-P), Nº de venta S.04.II.G.41 (US$10.00), 2004.
159 Capacitación laboral para las pyme: una mirada a los programas de formación para jóvenes en Chile, Roberto Poblete Melis (LC/L.2076-P), N° de venta S.04.G.19 (US$10.00), 2004.
148 Observatorio de empleo y dinámica empresarial en Argentina, Victoria Castillo, Sofía Rojo Brizuela, Elisabet Ferlan, Diego Schleser, Agustín Filippo, Giovanni Stumpo, Ximena Mazorra y Gabriel Yoguel, (LC/L.2072-P), Nº de venta S.04.II.G.15 (US$10.00), 2004.
147 Tratados de libre comercio y desafíos competitivos para Chile: la extensión de la ISO 9000, Alicia Gariazzo, Red de reestructuración y competitividad (LC/L.2068-P) N° de venta S.04.II.G.11 (US$10.00), 2004.
146 Alcanzando las metas del milenio: una mirada hacia la pobreza rural y agrícola, Martine Dirven, Red de desarrollo agropecuario (LC/L.2062-P), Nº de venta S.04.II.G.6 (US$10.00), 2004.
145 Formación y desarrollo de un cluster globalizado: el caso de la industria del salmón en Chile, Cecilia Montero, Red de reestructuración y competitividad (LC/L.2061-P), Nº de venta S.04.II.G.5 (US$10.00), 2004.
144 Pobreza rural y agrícola: entre los activos, las oportunidades y las políticas —una mirada hacia Chile—, Claus Köbrich, Liliana Villanueva y Martine Dirven, Red de desarrollo agropecuario (LC/L.2060-P), Nº de venta S.04.II.G.4 (US$10.00), 2004.
• El lector interesado en adquirir números anteriores de esta serie puede solicitarlos dirigiendo su correspondencia a la Unidad de Distribución, CEPAL, Casilla 179-D, Santiago, Chile, Fax (562) 210 2069, correo electrónico: [email protected].
Name: ............................................................................................................................................
Activity: .........................................................................................................................................
Address:.........................................................................................................................................
Postal code, city, country:..............................................................................................................
Tel.:...................................Fax: ..................................... E.mail: ...................................................