RVI73_en.pdf - Repositorio CEPAL
183
CEPAL Review is prepared by the Secretariat of the Economic Commission for Latin America and the Caribbean. The views expressed in the signed articles, including the contributions of Secretariat staff members, however, represent the personal opinion of the authors and do not necessarily reflect the views of the Organization. The designations employed and the presentation of material in this publication do not imply the expression of any opinion whatsoever on the part of the Secretariat concerning the legal status of any country, territory, city or area or its authorities, or concerning the delimitation of its frontiers or boundaries. CEPAL Review is published in Spanish and English versions three times a year. Annual subscription costs for 2000 are US$ 30 for the Spanish version and US$ 35 for the English version. The price of single issues is US$ 15 in both cases. The cost of a two-year subscription (2000-2001) is US$ 50 for the Spanish-language version and US$ 60 for English. A subscription application form may be found just before the section “Recent ECLAC Publications”. Applications for the right to reproduce this work or parts thereof are welcomed and should be sent to the Secretary of the Publications Board, United Nations Headquarters, New York, N.Y. 10017, U.S.A. Member States and their governmental institutions may reproduce this work without application, but are requested to mention the source and inform the United Nations of such reproduction. Copyright © United Nations 2001 All rights reserved Printed in Chile LC/G.2130-P — April 2001 United Nations Publications ISSN 0251 - 2920 / ISBN 92-1-121334-7
-
Upload
khangminh22 -
Category
Documents
-
view
1 -
download
0
Transcript of RVI73_en.pdf - Repositorio CEPAL

CEPAL Review is prepared by the Secretariat of the Economic Commission for Latin America and theCaribbean. The views expressed in the signed articles, including the contributions of Secretariat staff members, however, represent the personal opinion of the authors and do not necessarily reflect the views of theOrganization. The designations employed and the presentation of material in this publication do not implythe expression of any opinion whatsoever on the part of the Secretariat concerning the legal status of anycountry, territory, city or area or its authorities, or concerning the delimitation of its frontiers or boundaries.
CEPAL Review is published in Spanish and English versions three times a year.Annual subscription costs for 2000 are US$ 30 for the Spanish version and US$ 35 for the English version.The price of single issues is US$ 15 in both cases.The cost of a two-year subscription (2000-2001) is US$ 50 for the Spanish-language version and US$ 60 forEnglish.A subscription application form may be found just before the section “Recent ECLAC Publications”.
Applications for the right to reproduce this work or parts thereof are welcomed and should be sent to theSecretary of the Publications Board, United Nations Headquarters, New York, N.Y. 10017, U.S.A. MemberStates and their governmental institutions may reproduce this work without application, but are requestedto mention the source and inform the United Nations of such reproduction.
Copyright © United Nations 2001All rights reserved
Printed in Chile
LC/G.2130-P — April 2001
United Nations Publications
ISSN 0251 - 2920 / ISBN 92-1-121334-7

C E P A L R E V I E W 7 3
United Nations
� � � � ��������������������
��� ���� ���� � ��
����� ���� �
JOSE ANTONIO OCAMPOJOSE ANTONIO OCAMPOJOSE ANTONIO OCAMPOJOSE ANTONIO OCAMPOJOSE ANTONIO OCAMPOExecutive Secretary
REYNALDO BAJRAJREYNALDO BAJRAJREYNALDO BAJRAJREYNALDO BAJRAJREYNALDO BAJRAJDeputy Executive Secretary

C E P A L R E V I E W 7 3
� � � � �RRRRR E V I E WE V I E WE V I E WE V I E WE V I E W
��������
�� ������
�������������
OSCAR ALOSCAR ALOSCAR ALOSCAR ALOSCAR ALTIMIRTIMIRTIMIRTIMIRTIMIRDirector of the Review
UNITED NATIONS

Notes and explanation of symbolsThe following symbols are used in tables in the Review:
(…) Three dots indicate that data are not available or are not separately reported.
(—) A dash indicates that the amount is nil or negligible.
A blank space in a table means that the item in question is not applicable.
(–) A minus sign indicates a deficit or decrease, unless otherwise specified.
(.) A point is used to indicate decimals.
(/) A slash indicates a crop year or fiscal year, e.g., 1998/1999.
(-) Use of a hyphen between years, e.g., 1998-1999, indicates reference to the complete number ofcalendar years involved, including the beginning and end years.
References to “tons” mean metric tons, and to “dollars”, United States dollars, unless otherwise stated.Unless otherwise stated, references to annual rates of growth or variation signify compound annual rates.Individual figures and percentages in tables do not necessarily add up to the corresponding totals, becauseof rounding.
Guidelines for contributorsto CEPAL Review
The editorial board of the Review are always interested in encouraging the publication of articleswhich analyse the economic and social development of Latin America and the Caribbean. With this inmind, and in order to facilitate the presentation, consideration and publication of papers, they haveprepared the following information and suggestions to serve as a guide to future contributors.—The submission of an article assumes an undertaking by the author not to submit it simultaneouslyto other periodical publications.—Papers should be submitted in Spanish, English, French or Portuguese. They will be translated intothe appropriate language by ECLAC.—Every article must be accompanied by a short summary (of about 300 words) giving a brief descrip-tion of its subject matter and main conclusions. This summary will also be published on the ECLACHome Page on the Internet.—Papers should not be longer than 10 000 words, including the summary, notes and bibliography, ifapplicable, but shorter articles will also be considered.—One copy of the original text should be submitted, accompanied by a copy on diskette (Word forWindows 95 format), to CEPAL Review, casilla 179-D, Santiago, Chile. In the absence of the copy ondiskette, two printed or typed copies should be provided. Texts may also be sent by e-mail to:[email protected].—All contributions should be accompanied by a note clearly indicating the title of the paper, the name ofthe author, the institution he belongs to, his nationality, his fax and telephone numbers, and his e-mailaddress.—Footnotes should be kept to the minimum, as should the number of tables and figures, whichshould not duplicate information given in the text.—Special attention should be paid to the bibliography, which should not be excessively long. All thenecessary information must be correctly stated in each case (name of the author or authors, completetitle (including any subtitle), publisher, city, month and year of publication and, in the case of a series,the title and corresponding volume number or part, etc.).—The editorial board of the Review reserve the right to make any necessary revision or editorialchanges in the articles, including their titles.—Authors will receive a one-year courtesy subscription to the Review, plus 30 offprints of theirarticle, both in Spanish and in English, at the time of publication in each language.

C E P A L R E V I E W 7 3
A P R I L 2 0 0 1
C O N T E N T S
Why is there so much economic insecurity in Latin America? 7Dani Rodrik
Strengthening regional financial cooperation 31Manuel R. Agosin
The Latin American social agenda in the year 2000 51Rolando Franco and Pedro Sáinz
Education and development in Brazil, 1995-2000 65Paulo Renato Souza
Educational reform in Chile 81José Pablo Arellano Marín
Social protection for the poor in Latin America 93Norman Hicks and Quentin Wodon
Old and new forms of citizenship 115Martín Hopenhayn
Industrial policy, comparative advantages and growth 127Jaime Ros
Brazil in the 1990s: an economy in transition 147Renato Baumann
Job-seeking strategies in Trinidad and Tobago 171Kathleen Valtonen
CEPAL Review Referees 1999-2000
Recent ECLAC publications
184
187

7C E P A L R E V I E W 7 3 • A P R I L 2 0 0 1
WHY IS THERE SO MUCH ECONOMIC INSECURITY IN LATIN AMERICA? • DANI RODRIK
C E P A L R E V I E W 7 3
APRIL 2001
Why is there so mucheconomic insecurity
in Latin America?
Dani Rodrik
Harvard [email protected]
The view that pervasive economic insecurity threatens po-litical support for the ongoing market-oriented reforms hasbecome one of the most common refrains in current discus-sions on Latin American affairs. Dealing with economic in-security would thus appear to be a key part of the unfin-ished agenda of Latin America’s reforms. The author arguesthat economic insecurity in Latin America is multifacetedand has many sources that feed on each other. Some of theinsecurity arises from the decline in employment protectionand increased volatility of household outcomes. Some of itis the result of erratic capital flows and the systemic insta-bility generated by a divorce between the instruments ofstabilization and the real economy. Finally, an importantcomponent is the weakness of the institutions of voice andrepresentation. Programmes aimed at social protection perse can be of partial help only. They will have to be comple-mented by applying macroeconomic policies, especially withregard to capital flows and the exchange rate, that are moreconducive to the stability of the real economy and by loos-ening the control of financial markets over the instrumentsof macroeconomic policy. They will also require access torepresentative institutions –trade unions, political parties,and legislatures– with greater responsiveness and legitimacythan those that exist at present. But perhaps what LatinAmerica needs most is a vision of how social cohesion canbe maintained in the face of large inequalities and volatileoutcomes, both of which are being aggravated by the growingreliance on market forces. The region will have to develop avision that finds a way to ease the tension between marketforces and the yearning for economic security.

C E P A L R E V I E W 7 3 • A P R I L 2 0 0 18
WHY IS THERE SO MUCH ECONOMIC INSECURITY IN LATIN AMERICA? • DANI RODRIK
IIntroduction
Latin American countries recently found that 61% ofthe respondents thought their parents had lived betterthan they do. Moreover, less than half of the respon-dents (46%) thought that their children would end uphaving better lives than themselves, with that percent-age varying from as little as 30% in Mexico to 61% inChile (see table 1).
The same survey identified a strong demand forsocial insurance in the region. Almost three-quartersof the respondents favoured increased spending onunemployment insurance, and more than 80% ex-pressed a desire for more spending on pensions. More-over, these demands cut across social groups. The pref-erence for greater spending on pensions andunemployment insurance varied very little with therespondents’ level of income, education and type of
During the 1990s per capita income in Latin Americaand the Caribbean grew at an annual average rate ofaround 2%, after having fallen at a rate of almost 1%during the 1980s. The performance of the 1990s remainsbelow the pace of economic expansion to which theregion was accustomed prior to the debt crisis of 1982.But it does give hope that the continent might be leavingthe “lost decade” of the 1980s firmly behind. Nonethe-less, the region remains in the grip of a disconcertinglevel of economic insecurity. The view that pervasiveeconomic insecurity threatens political support for theongoing market-oriented reforms has become one ofthe most common refrains in current discussions onLatin American affairs.
The problem is evident in recent surveys under-taken in the region. A large cross-national survey of 14
TABLE 1Latin America (14 countries): Answers to a survey onexpected changes in standard of living, 1999(In percentages, unless otherwise indicated)
Total Countries
Number % Argen- Boli- Bra- Colom- Costa Chile Ecua- Guate- Mexi- Pana- Para- Peru Uru- Vene-tina via zil bia Rica dor mala co ma guay guay zuela
14 839 100 1 200 794 1 000 1 200 1 000 1 200 1 200 1 000 1 200 1 000 600 1 045 1 200 1 200
Taking everything into consideration, would you say that your parents lived better, the same or worse than you live today?
Better 9 081 61.2 63 51 64 78 56 45 67 57 43 52 75 80 59 70The same 3 261 22 22 31 9 14 26 32 20 31 35 24 14 12 18 19Worse 2 139 14.4 12 16 25 8 14 22 10 11 20 21 6 6 20 10No answer 358 2.4 3 3 2 1 5 1 2 1 3 3 5 2 3 2
With regard to your children, do you think they will live better, the same or worse than you live today?
Better 6 843 46.1 43 56 58 36 52 61 34 51 30 48 48 37 46 53The same 3 071 20.7 22 20 12 21 25 22 21 23 23 20 26 19 22 17Worse 3 261 2 20 13 21 38 11 11 29 17 41 21 13 26 19 19No answer 1 664 11.2 16 11 9 6 12 7 16 8 6 12 13 19 13 12
Source: Mirror on the Americas Poll (1999), Wall Street Journal Interactive Edition.
This paper was originally prepared for and funded by the WorldBank. I am grateful to Guillermo Perry for asking me to do thispaper, and to Jorge Domínguez, Nora Lustig, Norman Hicks, BillMaloney, Guillermo Perry, Martín Rama, Guilherme Sedlacek, LuisServen and Mariano Tommasi for very useful comments on an ear-
lier draft. Vladimir Kliouev provided expert research assistance.None of these individuals, however, and least of all the World Bank,should be considered as having any responsibility for the viewsexpressed herein.

9C E P A L R E V I E W 7 3 • A P R I L 2 0 0 1
WHY IS THERE SO MUCH ECONOMIC INSECURITY IN LATIN AMERICA? • DANI RODRIK
employment (table 2). Predictably, the demand for socialinsurance tends to be larger in countries where greaterpessimism prevails regarding the future. But there areinteresting exceptions. In Mexico, demands for greaterspending on social insurance are muted despite a highlevel of pessimism about the next generation’s pros-pects. In Chile, meanwhile, where expectations are rea-sonably upbeat, the percentage of respondents whofavour greater spending reaches 85% in the case of un-employment insurance and 93% in the case of pensions.
Do these numbers mean anything? One indicationthat they do comes from the responses to the other ques-tions in the survey. For example, when the same indi-viduals were asked about national defence and thearmed forces, less than a third replied that they wouldlike to see an increase in spending on them (table 2).This shows that the respondents made a clear distinc-tion between economic security and national security,and ranked the former significantly above the latter.Another indication comes from comparing results ofsimilar surveys in other settings. When surveys of this
kind are undertaken in the advanced industrial coun-tries, the proportions of respondents that favour in-creased spending on pensions and unemployment ben-efits tend to be significantly lower than the numbersreported above. Moreover, the proportions vary signifi-cantly according to income levels.1 A poignant examplefrom Brazil was recently highlighted in the New YorkTimes, which reported that as many as one millionpeople (one out of every 160 Brazilians) were compet-ing in August 1999 for 10,000 desk jobs at the Bancodo Brasil, a government-run institution that “pays sala-ries on time and in full” and provides comprehensivehealth insurance and pension benefits. “I need stabilityin my life”, a 23-year old job applicant was quoted assaying when asked why she applied for a job that actu-ally pays less than her present salary (Romero, 1999).Dealing with economic insecurity would appear to bea key part of the unfinished agenda of Latin America’sreforms.
1 For some comparative evidence, see Taylor-Gooby (1989).
TABLE 2
Latin America (14 countries): Answers to a survey on aspectsconnected with social security, by socioeconomic categorya
(In percentages, unless otherwise indicated)
Total sample Age Employment Education Income
No. % 18- 30- 50+ Self- Gov- Priv- Unem- Reti- House- No Prim- Secon- Univ- Low Middle High29 49 em- ern- ate ployed red wife schooling ary dary ersity
ployed ment sector
Unemploymentinsurance
No answer 551 3.7 3 4 4 4 5 3 3 4 4 3 4 3 4 4 4 3Spend more 10 088 73.4 74 73 73 74 69 74 80 74 73 74 74 75 71 72 73 74Spend less 2 543 17.1 18 18 16 17 19 17 13 16 17 19 16 16 19 19 17 17Don’t know 857 5.8 5 5 7 5 7 6 3 6 7 5 7 5 6 4 6 6
PensionsNo answer 172 1.2 1 1 1 1 2 1 1 1 1 1 1 1 1 2 1 1Spend more 12 426 83.7 83 83 86 83 84 84 88 88 84 82 83 85 83 83 85 83Spend less 1 861 12.5 13 13 10 13 12 13 9 9 12 15 13 12 14 14 11 13Don’t know 380 2.6 3 3 3 3 2 2 1 2 3 2 3 2 2 2 2 3
Defence andarmed forces
No answer 623 4.2 4 5 5 4 6 3 3 5 4 3 4 4 5 5 5 3Spend more 4 810 32.4 33 31 34 34 28 29 36 33 35 32 37 33 27 32 31 34Spend less 8 359 56.3 58 57 53 56 59 60 56 54 52 60 50 57 62 58 56 57Don’t know 1 047 7.1 5 7 9 6 7 7 5 8 9 5 8 7 7 6 8 7
Source: Mirror on the Americas Poll (1999), Wall Street Journal Interactive Edition.
a The text of the question was: “Do you believe that in your country it would be better to spend more or less on each of the followingitems?”.
C E P A L R E V I E W 7 3 • A P R I L 2 0 0 110
WHY IS THERE SO MUCH ECONOMIC INSECURITY IN LATIN AMERICA? • DANI RODRIK
How can policy-makers progress in this? A firststep is to understand the root causes of economic inse-curity. In this paper I highlight the role of three sets ofcritical contributory factors. First, we must begin withthe trauma of the 1980s. The deep recession that mostof the countries of the region experienced in the after-math of the debt crisis is reminiscent in some ways ofthe Great Depression in the United States during the1930s. While the Great Depression resulted in a steeperfall in incomes, the recovery was more rapid as well.In the United States, the hardships caused by the De-pression, and especially the losses suffered by themiddle classes, stimulated a set of governmentprogrammes –collectively known as the New Deal–which greatly expanded the role of the government,established social safety nets, and provided social in-surance. In Latin America, the upshot of the debt crisiswas a series of reforms that actually served to weakensocial insurance institutions. Employment generallybecame less secure, and publicly provided safety netswere weakened.
Second, as Latin America entered the 1990s itfound itself in a world of high macroeconomic volatil-ity, which was driven in large part by erratic capitalflows, or at least magnified by them. The spread of in-ternational financial markets and the region’s enthusi-astic embrace of them left macroeconomic policy de-pendent on (and often hostage to) the fancies ofshort-term investors. Key instruments such as fiscalpolicy and the exchange rate became overwhelmed bythe need to manage capital flows and could no longerbe targeted at domestic stability. Macroeconomic policybecame increasingly divorced from the real economy.This has exacerbated the volatility of economic out-comes both over time and across households.
Third, a key shortcoming in Latin America is thatsocial and political institutions have not been adequatelyresponsive so far to the clamour for greater economicsecurity. As mentioned above, States have retrenchedrather than taken on the added responsibilities thatmanaging risk in market-oriented societies requires. Butthe problem goes beyond governments. Political sys-
tems as a whole have failed to create viable mecha-nisms of voice: national legislatures have been frag-mented and unrepresentative, and political parties weak.Trade unions have been unable to develop an adequateand encompassing strategy for dealing with job inse-curity and have lost members. And the monopolizationof policy discussions around a narrow, WashingtonConsensus-based view of development policy, sharplyconstrained by the “requirements” of global economicintegration, has prevented the emergence of an alter-native (or at least complementary) vision of economicreform driven by local concerns and national aspira-tions.
I will discuss these issues and their policy impli-cations in the rest of the paper. But a key caveat needsto be mentioned at the outset. The focus in this paper isnot on the poor and most vulnerable per se. I do notdeal with anti-poverty policy, nor do I discuss how toreduce the vulnerability of the poor to volatility andshocks.2 The Latin American poor have always beenexcluded and vulnerable. What seems to be new is thatthe fear of downward mobility now affects a large partof the middle classes as well. The survey mentionedearlier reveals that in some of the largest countries ofLatin America –Argentina, Brazil, Mexico and Venezuelain particular– the middle-income groups are morepessimistic about their children’s future than the lowest-income groups. Indeed, that is what gives the demandfor “social protection” its political salience in the region.My focus will be on this broader notion of economicinsecurity and its consequences.
Finally, I should emphasize that the purpose of thispaper is to stimulate discussion, suggest hypotheses andlay out an agenda for further research, just as much asit is to present specific arguments with supportingevidence. Many of my arguments below remain specu-lative. The empirical “tests” that I do present are sug-gestive rather than definitive. But if the paper helps opennew lines of inquiry it will have achieved its objective.
2 For a good set of essays on these issues, see Lustig (ed.), 1995.

11C E P A L R E V I E W 7 3 • A P R I L 2 0 0 1
WHY IS THERE SO MUCH ECONOMIC INSECURITY IN LATIN AMERICA? • DANI RODRIK
IIThe trauma of the 1980s
The debt crisis of 1982 engulfed Latin America in adeep and prolonged recession. Figure 1 shows an indexof per capita income in the leading countries of theregion, comparing their experience with that of theUnited States during the Great Depression. In the UnitedStates, incomes declined on average by 35% between1929 and 1933, and unemployment peaked at 25 % (in1933). As figure 1 shows, the decline in real incomes(and rise in unemployment) was not as steep in LatinAmerica after 1981: it was of the order of 20% inArgentina, Chile, Mexico and Venezuela, and 10% inBrazil. Among the major countries, only Peru (thanksto President García’s disastrous policies) experiencedan income collapse of the same magnitude as thatsuffered by the United States in the Great Depression.However, with the notable exception of Chile, therecovery in Latin America was also more gradual. Ittook 10 years in the United States for per capita in-come to recover to its pre-crisis level. In Argentina andBrazil, it took 12 and 13 years respectively, and inMexico, Peru and Venezuela per capita incomes were
still below 1981 levels in 1997 (the latest year for whichnational income estimates were available (World Bank,1999). Moreover, the United States economy, boostedin part by the Second World War, experienced a muchfaster rate of expansion in the 1940s than it had duringthe 1920s. Latin America’s growth rate during the1990s, however, has failed to match the record of the1960s and 1970s.
The United States responded to the Great Depres-sion with a series of major institutional innovations thatgreatly expanded the role of the government in theeconomy and for the most part represented a sharp breakwith the past. Many of these innovations took the formof social insurance (Bordo, Goldin and White (eds.),1998, page 6): social security, unemployment compen-sation, public works, public ownership, deposit insur-ance and legislation favouring unions were among thenew mechanisms created to deal with the perceivedshortcomings of the private marketplace. As Jacoby(1998) notes, prior to the Great Depression the middleclasses were generally able to self-insure or buy insur-
FIGURE 1
Comparison between Latin America after 1981 and the United Statesin the Great Depression: Decline in real per capita income
40
60
80
100
120
140
160
180
200
-3 -2 -1 0 1 2 3 4 5 6 7 8 9 10 11 12 13 14 15year in relation to onset of crisis (1929 or 1981 = 100)
Argentina Brazil Chile Colombia Mexico Peru Uruguay Venezuela United States
Number of years before or after the beginning of the crisis (1929 or 1981 = 100)

C E P A L R E V I E W 7 3 • A P R I L 2 0 0 112
WHY IS THERE SO MUCH ECONOMIC INSECURITY IN LATIN AMERICA? • DANI RODRIK
ance from private intermediaries. As these private formsof insurance collapsed, the middle classes threw theirconsiderable political weight behind the extension ofsocial insurance and the creation of what would laterbe called the Welfare State.
The Great Depression had two effects: first, it un-dermined middle-class trust in the private system forhandling labour market risks; the collapse of “welfarecapitalism”, combined with mass layoffs and bank failures,created a crisis of confidence that caused middle-classAmericans to mobilize in search of alternatives. Second,it caused the middle class to perceive its social statusas precarious; actual or threatened downward mobilitynarrowed the social distance between the middle classand those below, making cross-class alliances morelikely and weakening resistance to redistributiveprogrammes that could benefit the downwardly mo-bile. In short, the experiences of the 1930s and 1940sinclined the American middle classes to favour socialsolidarity over rugged individualism: a shift that pro-moted the Welfare State, public education, and otherforms of government expenditure (Jacoby, 1998,pp. 29-31).
Note the parallels with the Latin American experi-ence in the aftermath of the debt crisis. As in the caseof the United States, the crisis of the 1980s placed greatstrains on private insurance arrangements in LatinAmerica. For example, Glewwe and Hall (1998) findin their analysis of Peru that inter-household transfernetworks collapsed almost in their entirety during thesecond half of the 1980s. Since transfer-making house-holds suffer during major crises too, private systems ofincome support tend not to be very resilient to macroshocks. And one implication of the generalized crisiswas that, as noted in the introduction, social insurancehas become a middle-class preoccupation in LatinAmerica as well.
But there was also an ideological underpinning forthe growth of government programmes in the UnitedStates. Rockoff (1998) has argued that the change inattitudes towards the role of the government was facili-tated in the United States by an ideological shift amongeconomists from laissez-faire to interventionismdating at least from a decade prior to the Great Depres-sion. While macroeconomists tended to be conserva-tive, microeconomists “championed a long list ofreforms such as minimum wages, employment exchanges,old-age pensions, publicly owned regional powerutilities, and so on” (Rockoff, 1998, p. 134). Henceideology and interests coincided in spurring the adoptionof social insurance programmes.
In terms of the role of government, Latin Americaentered the 1980s from a very different vantage pointfrom that of the United States at the beginning of the1930s. Most of the countries of the region had indus-trialized behind the protection of government-imposedtrade restrictions, public enterprises had become com-monplace, and fiscal deficits and macroeconomic mis-management were the proximate causes of the debtcrisis. Governments were seen as part of the problemrather than as the solution. And just as in the case ofthe United States, academic opinion had been largelytransformed during the 1970s, but this time in thedirection of favouring markets over government inter-vention.
The reforms that Latin America adopted in the1980s and thereafter were correspondingly aimed atenhancing the scope of the market and reining in thatof government. Privatization, deregulation, trade liber-alization and financial liberalization were key items inthe Washington Consensus. Public opinion surveys, likethose cited earlier, generally show that a majority ofLatin Americans prefer markets and the private enter-prise system to government control. However, what isimportant from our perspective is the complete absencefrom the Washington Consensus agenda of prescrip-tions aimed at combatting economic insecurity.
This is especially striking in view of the fact thatmany of the market-oriented reforms had the predict-able effect of increasing risk for workers and house-holds. Privatization, deregulation and trade liberaliza-tion all entailed restructuring of the economy andgreater risk of job loss, at least in the short run. Theretrenchment of the public sector meant reduced op-portunities for relatively safe public employment.Financial liberalization could be counted upon to gen-erate volatility in the economic environment. Greatercapital mobility implied the shifting of idiosyncraticcountry risk from mobile capital to immobile labour. Itis only recently that the importance of such effects hascome to be recognized.
We can therefore presume that the economicinsecurity generated by the prolonged debt crisis wasonly amplified by the market-oriented reforms that allthe countries of the region eventually adopted withoutinstituting complementary programmes of socialinsurance. Whereas the response to the Great Depres-sion in the United States was a significant strengthen-ing of social protection, the response to the debtcrisis in Latin America was a weakening of socialinsurance in the face of increased labour-marketrisks.

13C E P A L R E V I E W 7 3 • A P R I L 2 0 0 1
WHY IS THERE SO MUCH ECONOMIC INSECURITY IN LATIN AMERICA? • DANI RODRIK
IIIThe decline of job security
While many of the reforms undertaken in Latin Americacould have been expected to raise job insecurity, at leastin the short run, direct evidence on this is not easy tocome by. Measures of involuntary job displacement arenot widely available, and in any case are contaminatedby the behavioral responses that economic insecuritygenerates: workers who feel less secure are more likelyto accept wage reductions or make other concessionsto avoid losing their jobs. Furthermore, there has notbeen much change in formal legislation on employ-ment protection, despite much talk about the need torender labour markets more “flexible” (Márquez andPages, 1998). Nonetheless, the available evidence doessuggest that the proportion of workers with “secure”jobs has declined practically in all of the countries ofthe region for which relevant data exist.
One indication of this is the sharp reduction in tradeunion density since the 1980s, in all countries exceptChile. This is significant, since bargaining for greaterjob security on behalf of their members is a key func-tion of trade unions. Table 3 presents statistics fromthe International Labour Organisation (ILO) on tradeunion membership and trade union density for ten LatinAmerican countries. Wherever a comparison betweenthe 1980s and 1990s is possible, the numbers typicallyreveal a sharp decline. In Argentina, for example, thepercentage of the non-agricultural labour force repre-sented by unions has fallen from 49% in 1986 to 25%in 1995. In Mexico, the corresponding percentage wentdown (if the statistics are to be believed) from 54% to31% in the span of two years (1989 to 1991). Chile,where the demise of Pinochet’s rule and the transitionto democracy resulted in an initial jump in trade unionmembership and density, is the sole exception to therule. However, even in Chile more recent figures showthat union membership ratios have declined since theearly 1990s, and are currently back at pre-democracylevels.3
Table 3 also shows another indicator of job inse-curity: the proportion of workers who are not “pro-tected” by formal written contracts or inclusion in social
benefit programmes. The definition of unprotectedemployment, taken from ILO (1999), is somewhat slip-pery, and refers to different things in different coun-tries. For example, the Argentine figures relate to pri-vate employees without written contract as a share oftotal private employment in Greater Buenos Aires. InBolivia, the numbers are for those not covered by labourand social legislation, as a share of total salaried em-ployment. The Brazilian figures (taken from Ferreiraand Paes de Barros, 1999) are for employees withoutcarteira as a fraction of all wage employees and self-employed workers.
In all seven countries where a comparison betweentwo points in time is possible, the numbers reveal anupward jump in “unprotected” employment: from 22%to 34% in Argentina, from 64% to 69% in Brazil, from44% to 50% in Mexico. This time Chile is no excep-tion to the trend (with an increase from 17% to 22%).Note that these proportions cannot be compared acrosscountries, since the samples covered vary greatly, andthe absolute shares in themselves are not very mean-ingful (unlike the changes therein). Since the denomi-nators typically cover more privileged workers (in ur-ban areas or those that are salaried), the absolutenumbers represent in most cases an underestimation ofthe proportion of unprotected workers. The oft-repeatedstatement that the informal economy accounts for 80%of the new jobs created in Latin America over the lasttwo decades (see for example ILO, 1999) provides acomplementary perspective to these findings.4 ,5
Since the legislation itself has not changed much,these trends have to be interpreted as the endogenousresponses of the economy to the joint shocks of thedebt crisis and structural reform. In Chile, for example,
3 Chilean Ministry of Labour figures, as reported in The Econo-mist Intelligence Unit (1998).
4 The extent to which the decline in the share of formal sector em-ployment is the outcome of restrictive employment legislation–such as minimum wages and mandatory benefits– remainsdebatable. Amadeo and Camargo (1997) argue in the Braziliancontext that such legislation is only a small part of the story. Pessino(1997) provides an alternative perspective on Argentina.5 Note that informal sector employment, despite generally lowerlevels of employment security, need not imply worse outcomes forworkers. In many cases, workers may prefer informality so as toavoid paying income and other taxes.

C E P A L R E V I E W 7 3 • A P R I L 2 0 0 114
WHY IS THERE SO MUCH ECONOMIC INSECURITY IN LATIN AMERICA? • DANI RODRIK
the period since the debt crisis has witnessed histori-cally high levels of labour turnover. Moreover, tradeliberalization has resulted in the expansion of activi-ties (forestry and agriculture in particular) where long-term contract employment is less common and self-employment more so than in traditional activities (suchas copper mining and manufacturing). The expansionof exports has also been associated with greater sub-contracting, which generally shifts risk to small enter-prises and the self-employed. In forestry, an impres-sive export performance has been “accompanied by atype of work organization characterized by a high shareof subcontracting activities and employment instabil-ity” (ILO, 1998). In Brazil, labour turnover remains quitehigh by European or even U.S. standards, a situationthat Amadeo and Camargo (1997) characterize as a caseof “excessive” employment flexibility.
Has the evident decline in job protection been com-pensated by lower rates of unemployment overall? The
empirical literature on the relationship between termi-nation costs and unemployment rates does not yieldstrong conclusions. The cross-national evidence gen-erally suggests that the first-order effects of employ-ment protection are distributional: the beneficiaries tendto be older, male workers, while younger, female work-ers lose out. But the relaxation of job protection legis-lation appears to have weak effects on overall levels ofemployment. The limited evidence from Latin Americais consistent with such findings (Márquez and Pages,1998).
Table 4 displays unemployment rates for 16 LatinAmerican countries for three sub-periods since 1981(1981-1988, 1989-1993, and 1994-1998). For mostcountries, unemployment exhibits a U-shaped pattern.The early years following the debt crisis were gener-ally a period of high unemployment. Unemploymentfell during the late 1980s, but has subsequently risensince the mid-1990s. Brazil, Mexico, Uruguay and
TABLE 3
Latin America (10 countries): Indicators of employment security
Trade union membership Trade union coverage “Unprotected” employment(thousands) (as % of non-agricultural (as a percentage
workers) of number of workers)
Argentina 1986 3 262 1986 48.7 1990 21.71995 3 200 1995 25.4 1996 34
Bolivia 1994 276 1994 16.4 1991 281997 34.8
Brazil 1991 15 205 1991 32.1 1985 63.61996 68.5
Chile 1985 361 1985 11.6 1990 171993 684 1993 15.9 1996 22.3
Colombia 1985 877 1985 11.21995 840 1995 7.0
El Salvador 1985 79 1985 7.9 1994 59.11995 103 1995 7.2 1997 61.3
Mexico 1989 9 500 1989 54.1 1990 43.41991 7 000 1991 31.0 1997 49.6
Peru 1991 442 1991 7.5 1990 25.21996 34.1
Uruguay 1990 222 1990 19.91993 151 1993 11.6
Venezuela 1988 1 700 1988 25.91995 1 153 1995 14.9
Source: ILO, 1997, tables 1.1 and 1.2; ILO, 1999, table 7; Ferreira and Paes de Barros, 1999, table 1.
a The term “unprotected” employment refers to the proportion of private sector or urban workers without a contract or social securitybenefits in each country. See ILO, 1999, table 7 for the original sources and more details.

15C E P A L R E V I E W 7 3 • A P R I L 2 0 0 1
WHY IS THERE SO MUCH ECONOMIC INSECURITY IN LATIN AMERICA? • DANI RODRIK
Venezuela all exhibit this distinctive pattern. But thereare also exceptions. In Chile, unemployment has re-mained well below the levels of the early to mid-1980s.In Argentina, unemployment has increased more or lesssteadily since the early 1980s for workers at all skilllevels (Pessino, 1997). It is striking that half of thecountries in the table (eight out of sixteen) had higherunemployment rates in 1994-1998 than they did during1981-1988 (Argentina, Brazil, Ecuador, Mexico, Nica-ragua, Peru, Paraguay and Venezuela).
Therefore the decline in job protection has beenaccompanied by rising unemployment levels during the1990s in most countries of the region. While it is pos-sible that unemployment would have risen to greaterheights had unions not lost membership and other formsof job protection not weakened, the international evi-dence suggests that this is not a very likely scenario.The risks of job loss followed by a period of unem-ployment seem to have clearly increased.
IVMacroeconomic volatility and its relation tohousehold incomes: a decomposition
TABLE 4
Latin America (16 countries): Rates of unemployment(Percentages)
1981-1988 1989-1993 1994-1998
Argentina 5.4 7.6 15.3Bolivia 7.6 6.9 3.6Brazil 5.6 4.7 5.7Chile 14.9 7.2 7.6Colombia 11.6 9.9 10.4Costa Rica 6.2 4.4 5.4Ecuador 8.2 8.1 8.8El Salvador 9.4 8.5 7.2Guatemala 9.1 4.1 4.0Honduras 10.3 7.1 5.6Mexico 4.0 2.9 4.8Nicaragua 13.0 14.7 16.5Paraguay 5.6 5.6 6.0Peru 6.9 8.3 7.8Uruguay 11.3 8.8 10.8Venezuela 10.4 8.4 10.5
Source: Inter-American Development Bank (IDB, undated).
While the fear of drastic reduction in income associatedwith job loss and unemployment is an importantcomponent of economic insecurity, another is sheervolatility of the household income stream. As Gavinand Hausmann (1996) have emphasized in their work,Latin America is a volatile region, where the standarddeviation of GNP growth rates tends to be on averagearound twice the level observed in industrial econo-mies. For individual households, what matters is thevolatility of their own income streams. While, by defi-nition, not all households can successfully shield them-selves from the average volatility of the economy (ascaptured in movements of aggregate GNP), the distribu-tion of uncertainty across households does depend onthe degree to which household risks vary with nationaloutput.6
We can express the relationship between house-hold and national income volatility using a simple de-composition based on the identity:
6 For the purposes of this discussion, I shall treat national incomeand GNP interchangeably.
d ln yit ===== d ln yt + (d ln yit – d ln yt)
where yit and yt are household and national incomes attime t, and d ln yit and d ln yt are the growth rates of theith household’s income and of GNP, respectively. Let usdefine the household and national growth rates as:
d ln yit ===== δit
d ln yt ===== δt
Furthermore, let the household’s income growth raterelative to the national average be given by:
(d ln yit – d ln yt) = ρit
Now we can decompose the volatility of the ithhousehold’s income growth into three separate terms.
),(cov2222titii
δρσσσ ρδδ ++= .
The first term represents the volatility of the nationaleconomy ( 2
δσ ). This term captures the macro shocks
≡

C E P A L R E V I E W 7 3 • A P R I L 2 0 0 116
WHY IS THERE SO MUCH ECONOMIC INSECURITY IN LATIN AMERICA? • DANI RODRIK
that affect the economy and is the volatility on whichthe work by Gavin and Hausmann (1996) focuses. Thesecond term is the volatility of relative household in-comes ( )2
iρσ . This captures the purely idiosyncraticshocks that hit a given household. Finally, the third termis the covariance between the growth rates of GNP and ahousehold’s relative incomes ( ),(cov tit δρ ). This termwill be positive whenever a household’s relative incomeis pro-cyclical: i.e., when the household’s income growsfaster than the average in good times for the nationaleconomy and slower than the average in bad times.Obviously, the third term cannot have the same signfor all households in the economy. Lustig (1999) citesstudies showing that for every one percentage pointdecline in growth, poverty rises by 2 %. If the poor aremore vulnerable to economic downturns, as these stud-ies indicate, the third term will be positive for house-holds at the bottom of the income distribution and nega-tive for households at the top.
The decomposition is useful in that it helps or-ganize our thinking on how uncertainty at the house-hold level can best be tackled. It highlights threesources of uncertainty with three different kinds ofimplications for policy. If most of the uncertainty isat the macro level, improving the quality of macro-economic policymaking would be the most direct andeffective way of reducing household risk. If most ofit is instead idiosyncratic, specific to individualhouseholds, what is needed is insurance pure andsimple (whether provided privately or through thegovernment). If a considerable amount of it origi-nates from the excessive susceptibility of particularhouseholds to macroeconomic downswings, then theappropriate response consists of identifying thosehouseholds and making sure that transfer mecha-nisms are (a) appropriately targeted and (b) resilientto macro shocks.7
Carrying out this decomposition requires repeatedhousehold panels, which do not exist for many coun-tries. Peru’s Living Standards Measurement Surveysdo provide data in panel form. They have been used byGlewwe and Hall (1998) for the purpose of identifyingthe households that are more vulnerable to shocks.
In order to show how the decomposition can beput to work, I will now undertake a very rough exer-cise based on easily obtainable data on average real
wages. The exercise consists of making illustrativecalculations for an “average” worker household. Weconsider a household whose sole source of income iswages, and which earns the average wage in theeconomy and cannot vary the hours worked. Then therelevant volatility decomposition for this household canbe written as follows:
),(cov2222 δρσσσ ρδ ++=w ,
where 2wσ stands for the volatility of real wage
growth, 2ρσ for the volatility of real wages relative
to GNP, and the other terms have the obvious interpreta-tions. As before, the equation decomposes the volatil-ity of the average worker’s earnings into three components:a macro term, an idiosyncratic term, and a covarianceterm.
Note an important caveat here: Basing the calcu-lations on an economy-wide average wage defeats thepurpose of the decomposition methodology in that itclouds the distinction between idiosyncratic and macrorisks. The incidence of risk among workers is ignored.The only source of idiosyncratic risk that this particu-lar calculation can capture is that which affects aver-age (formal-sector) labour income relative to othersources of income. For that reason, the exercise cannotbe interpreted as giving an accurate guide to the mag-nitude of idiosyncratic versus macro risks. It is only anillustrative guide to the experience of an “average”worker.
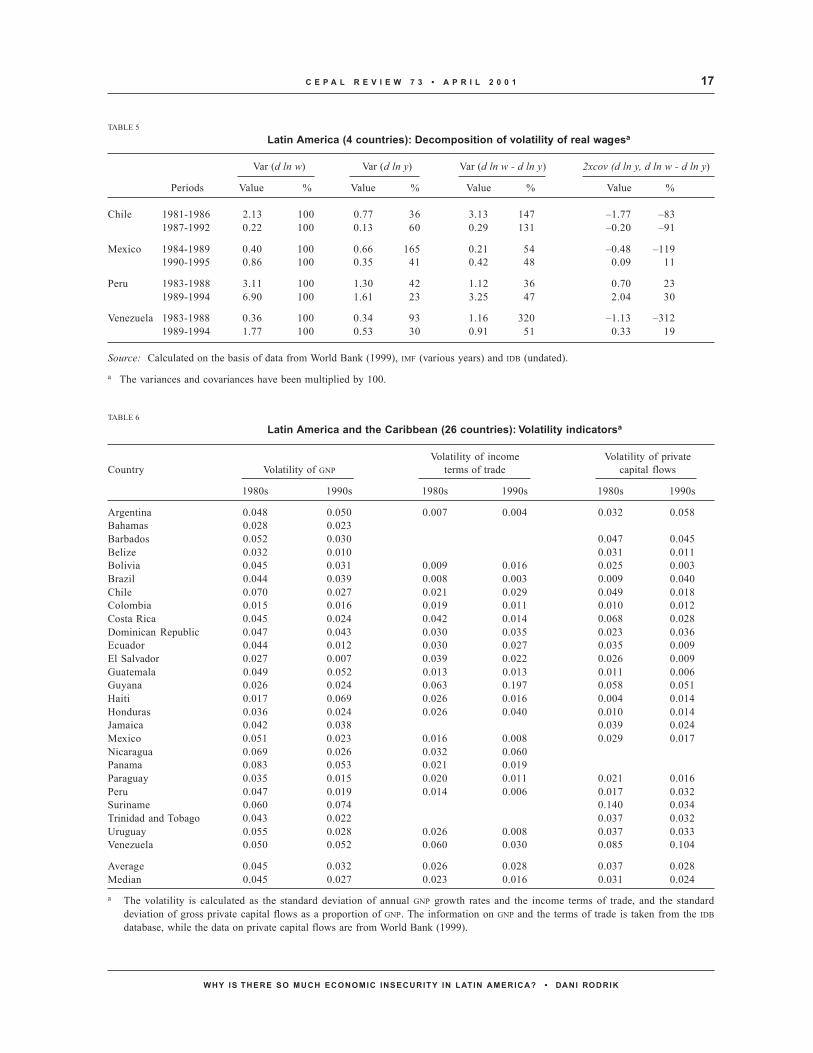
Table 5 shows the calculations for four countries(Chile, Mexico, Peru and Venezuela), selected accord-ing to the availability of real wage data. For each country,the calculations are shown for two sub-periods sincethe early 1980s. The main result that comes across intable 5 is the difference between Chile and the othercountries in the sample. First, the volatility of real wageshas increased greatly in the 1990s in all countries butChile. In Chile’s case wage growth has been consider-ably more stable in the period since the 1980s collapse.Second, the growth of wages relative to national in-come is either pro-cyclical (Peru) or has become so inthe 1990s (Mexico and Venezuela) in all countries butChile. In other words, macroeconomic volatility istransmitted on to wages in these countries in a magni-fied manner. Third, for the average worker, the “idio-syncratic” component of wage volatility accounts foraround half or less of total wage volatility in the threecountries other than Chile. Hence, macro shocks andtheir interaction with wage movements are a major –ifnot the major– part of wage uncertainty in Mexico, Peru
7 See Lustig (1999), especially on the design of poverty-sensitiveresponses to adverse shocks. Lustig calls for the institution ofcounter-cyclical safety nets to protect the poor from excessive vul-nerability to economic downswings.
17C E P A L R E V I E W 7 3 • A P R I L 2 0 0 1
WHY IS THERE SO MUCH ECONOMIC INSECURITY IN LATIN AMERICA? • DANI RODRIK
TABLE 5
Latin America (4 countries): Decomposition of volatility of real wagesa
Var (d ln w) Var (d ln y) Var (d ln w - d ln y) 2xcov (d ln y, d ln w - d ln y)
Periods Value % Value % Value % Value %
Chile 1981-1986 2.13 100 0.77 36 3.13 147 –1.77 –831987-1992 0.22 100 0.13 60 0.29 131 –0.20 –91
Mexico 1984-1989 0.40 100 0.66 165 0.21 54 –0.48 –1191990-1995 0.86 100 0.35 41 0.42 48 0.09 11
Peru 1983-1988 3.11 100 1.30 42 1.12 36 0.70 231989-1994 6.90 100 1.61 23 3.25 47 2.04 30
Venezuela 1983-1988 0.36 100 0.34 93 1.16 320 –1.13 –3121989-1994 1.77 100 0.53 30 0.91 51 0.33 19
Source: Calculated on the basis of data from World Bank (1999), IMF (various years) and IDB (undated).
a The variances and covariances have been multiplied by 100.
TABLE 6Latin America and the Caribbean (26 countries): Volatility indicatorsa
Volatility of income Volatility of privateCountry Volatility of GNP terms of trade capital flows
1980s 1990s 1980s 1990s 1980s 1990s
Argentina 0.048 0.050 0.007 0.004 0.032 0.058Bahamas 0.028 0.023Barbados 0.052 0.030 0.047 0.045Belize 0.032 0.010 0.031 0.011Bolivia 0.045 0.031 0.009 0.016 0.025 0.003Brazil 0.044 0.039 0.008 0.003 0.009 0.040Chile 0.070 0.027 0.021 0.029 0.049 0.018Colombia 0.015 0.016 0.019 0.011 0.010 0.012Costa Rica 0.045 0.024 0.042 0.014 0.068 0.028Dominican Republic 0.047 0.043 0.030 0.035 0.023 0.036Ecuador 0.044 0.012 0.030 0.027 0.035 0.009El Salvador 0.027 0.007 0.039 0.022 0.026 0.009Guatemala 0.049 0.052 0.013 0.013 0.011 0.006Guyana 0.026 0.024 0.063 0.197 0.058 0.051Haiti 0.017 0.069 0.026 0.016 0.004 0.014Honduras 0.036 0.024 0.026 0.040 0.010 0.014Jamaica 0.042 0.038 0.039 0.024Mexico 0.051 0.023 0.016 0.008 0.029 0.017Nicaragua 0.069 0.026 0.032 0.060Panama 0.083 0.053 0.021 0.019Paraguay 0.035 0.015 0.020 0.011 0.021 0.016Peru 0.047 0.019 0.014 0.006 0.017 0.032Suriname 0.060 0.074 0.140 0.034Trinidad and Tobago 0.043 0.022 0.037 0.032Uruguay 0.055 0.028 0.026 0.008 0.037 0.033Venezuela 0.050 0.052 0.060 0.030 0.085 0.104
Average 0.045 0.032 0.026 0.028 0.037 0.028Median 0.045 0.027 0.023 0.016 0.031 0.024
a The volatility is calculated as the standard deviation of annual GNP growth rates and the income terms of trade, and the standarddeviation of gross private capital flows as a proportion of GNP. The information on GNP and the terms of trade is taken from the IDB
database, while the data on private capital flows are from World Bank (1999).

C E P A L R E V I E W 7 3 • A P R I L 2 0 0 118
WHY IS THERE SO MUCH ECONOMIC INSECURITY IN LATIN AMERICA? • DANI RODRIK
and Venezuela. In Chile, it is the idiosyncratic componentof wage movements that exerts the dominant influence.
These calculations and conclusions are necessar-ily tentative, especially since one would like to carryout the decompositions with household-level datainstead of average wages. Nonetheless, they are indica-tive of the significant and growing role played bymacroeconomic instability –in addition to idiosyncraticshocks– in driving income uncertainty for workers inthe region. The implication would be that increasingthe stability of the macroeconomic environment shouldmake a substantial contribution –perhaps in some casesmore than social insurance programmes per se– to theeconomic security of workers.
Latin America is indeed a region with a very highlevel of aggregate macroeconomic volatility. Whilevolatility has decreased somewhat since the debt-crisisyears, it still remains high in comparative terms. Table6 shows volatility figures for the countries of the re-gion for the 1980s and 1990s. In unweighted terms,average GNP growth volatility has come down from 4.5percentage points during the 1980s to 3.2 points in the1990s. Even so, this is still twice the level of volatilityexperienced in an industrial economy such as the UnitedStates. Moreover, in a number of significant cases vola-tility has increased: Argentina and Venezuela are twocountries with above-average volatility levels where the1990s have been even more volatile than the 1980s.
A longer-term comparison with the 1960s and1970s is undertaken in table 7 for the larger countriesof the region. Rather than presenting raw standard de-viations, I have chosen to present the numbers in asomewhat different form. The figures in this table an-swer the following question: what is the probability inany given year that per capita income will fall by 5%or more? Since economic insecurity is often based onthe fear of a sharp drop in income, this would seem tobe a better measure than volatility per se. I have basedmy calculations on the decadal averages of growth ratesand their standard deviation, assuming that annualgrowth rates are identically and normally distributed.For a given growth rate, the probability of a 5% de-cline in income increases with volatility. On the other
TABLE 7
Latin America (8 countries): Economic insecurityin a long-term perspective(Percentage probability that per capitaincome will fall by 5% in a year)
1960s 1970s 1980s 1990s
Argentina 7.9 5.4 36.5 3.3Brazil 2.3 0.2 12.4 14.4Chile 0.4 25.5 17.5 0.0Colombia 0.0 0.0 0.5 0.0Mexico 0.0 0.0 17.1 19.0Peru 3.5 3.6 36.5 17.8Uruguay 4.3 0.3 28.7 0.4Venezuela 5.4 1.5 37.3 9.0
Average 3.0 4.6 23.3 8.0Median 2.9 0.9 23.1 6.1
Source: Calculations by the author, based on decadal averages ofgrowth rates of per capita income and their standard deviation,assuming that growth rates are distributed identically and normallyover a decade.
hand, for a given level of volatility (expressed as thestandard deviation of growth), the same probability isdeclining in the average growth rate. Hence, the prob-abilities shown in table 7 combine information fromboth the growth rate of income and its volatility.
The table reveals that the 1990s were a vast im-provement over the 1980s. But it also makes clear that,for most of the countries shown, aggregate income in-security was substantially higher in the 1990s than itwas during the 1960s and 1970s. In Brazil, Mexico,Peru and Venezuela, the likelihood that averageincomes will fall by 5% or more in any given year is inthe range of 10-20%, which is substantially above thelevels experienced prior to the 1980s. Only Argentinaand Chile can be said to have experienced clear im-provements in income security by this measure. Takingthe sample of countries as a whole, the average prob-ability of a sharp contraction in income (of 5% or more)during the 1990s was around twice the levels observedduring the 1960s and 1970s (8.0% versus 3.0% and4.6%, respectively).

19C E P A L R E V I E W 7 3 • A P R I L 2 0 0 1
WHY IS THERE SO MUCH ECONOMIC INSECURITY IN LATIN AMERICA? • DANI RODRIK
VThe sources of macroeconomic volatility:the importance of capital flows
The causes of macroeconomic volatility in LatinAmerica have been investigated by Hausmann andGavin (1996). As these authors emphasize, volatility isdriven both by external shocks and by domestic policyfailures. On the external front, instability in the termsof trade and in capital flows are the key contributors.Some data on these external determinants are shown intable 6. On the policy front, the collapse of pegged ex-change rate regimes and erratic monetary policies havegenerally played a large role. Hence in general exog-enous shocks and domestic institutions and policies allmatter.
For the 1990s, the evidence suggests that the in-stability in private capital flows has been perhaps themost important single determinant of macroeconomicvolatility. This is the central message that comes out ofthe regressions shown in table 8.
That table shows the results of regressing averagesof GNP growth volatility for each of the two decades(1980s and 1990s) on a number of determinants: thevolatility of the income terms of trade, volatility of grossprivate capital flows, volatility of monetary conditions,financial depth, per capita income, and a dummy forthe 1990s.8 The first column, which pools the averagesfor the two decades (and contains up to two observa-tions per country), shows that the volatility of capitalflows is a highly significant correlate of GNP volatility.The estimated coefficient of terms-of-trade volatilityis positive but insignificant. Financial depth (proxiedby M2/GDP) seems not to matter. Volatility of domesticmonetary conditions is statistically significant, but onlyat the 90% confidence level. The dummy for the 1990sis negative and significant, with an estimated coeffi-cient that is roughly equal to the decline in average GNP
volatility between the two decades. Finally, there is anegative and significant association between per capitaincome and volatility. The second column in table 8drops the insignificant variables (terms-of-trade vola-tility and financial depth) to gain a few additional ob-
servations. The results remain unchanged. In particu-lar, the volatility of gross private capital flows enterswith a highly significant coefficient.
The last two columns of table 8 show the resultswhen the regressions are run decade by decade. Wefind that the association between GNP volatility and thevolatility of private capital flows is particularly strongin the 1990s. In fact, together with per capita income,capital-flow volatility accounts for close to half of thecross-national variation in GNP volatility within LatinAmerica during the 1990s (compared with less than20% during the 1980s). The coefficient estimate indi-cates that a one point increase in the standard deviationof gross private capital flows (as a percentage of GNP)is associated with an increase in the standard deviationof GNP growth rates of more than half a percentage point.The exceptionally strong relationship during the 1990sbetween the volatility of capital flows and GNP volatil-ity in the region is also shown in figure 2. As thatfigure shows, some of the smaller countries of theregion with little access to private capital flows (Bo-livia and Guatemala) have experienced the lowest levelsof macroeconomic volatility. Argentina and Venezuelaare at the other extreme, with very high levels of expo-sure to volatility of private capital flows and correspond-ingly high levels of macro volatility. Countries like
8 See Easterly, Islam and Stiglitz (1999) for a cross-national analy-sis of a similar nature.
FIGURE 2Relation between GNP volatility and volatilityof gross private capital flows during the 1990s(taking account of per capita income andmonetary volatility)
e(
vo
lgn
p |
X,v
olp
cap
) +
b*v
olp
ca
p
- .01 25 78
.05 3075
volpcap.00 2965 .10 4241
Haiti
Mexico
Belice Chile
HondurasEl Salvador
ColombiaParaguay
EcuadorBoliviaGuatemala
ArgentinaBarbados
Dominica
PeruUruguay
TrinidadBrazil
Costa RicaJamaica
Venezuela
Guyana

C E P A L R E V I E W 7 3 • A P R I L 2 0 0 120
WHY IS THERE SO MUCH ECONOMIC INSECURITY IN LATIN AMERICA? • DANI RODRIK
Brazil, Chile and Colombia, which have managed theirprivate capital flows, are somewhere in between.
It is also possible to interpret these results in a dif-ferent manner, emphasizing the causality in the oppo-site direction. Perhaps capital flows simply respond tounderlying volatility in the economic environment, andare not a determinant of it. This would be the appropri-ate interpretation under the assumption that private capi-tal flows follow fundamentals and there are no multipleequilibria, with the result that capital flows are not anindependent source of disturbances. Even under this
scenario, however, our results indicate that capital flows,by being very sensitive to other shocks, are a potentialsource of magnification of such shocks. In this sense,countries that are very open to private capital flows maysuffer from additional volatility generated by reversalsin flows even if capital flows respond only to funda-mentals. This point is picked up in greater detail in thefollowing section, which shows how capital mobilityaggravates risk for the domestic economy even whencapital responds only to exogenous “productivity”shocks.
TABLE 8
Latin America and the Caribbean: Determinants ofGNP volatility for the 1980s and 1990sa
Dependent variable: standard deviation of GNP growth rates
(1) (2) (3) (4)
Constant 0.087* 0.067* 0.044 0.079*(0.029) (0.019) (0.031) (0.024)
Log per capita income –0.009** –0.006** –0.003 –0.009**(0.004) (0.003) (0.005) (0.003)
Volatility of monetary policy 0.011*** 0.010*** 0.012 0.003(standard deviation of M1 growth) (0.006) (0.005) (0.007) (0.009)
Volatility of income terms of trade –0.049(0.112)
Volatility of gross private capital flows 0.505* 0.454* 0.419** 0.509*(0.130) (0.099) (0.177) (0.127)
Financial depth (M2/GNP) 0.0000(0.0003)
Dummy variable for the 1990s –0.010** –0.010**(0.005) (0.004)
Period covered 1980s 1980s Only 1980s Only 1990s1990s 1990s
N 36 44 22 22Adjusted R2 0.39 0.41 0.16 0.46
a The regressions use up to two observations per country: one for the 1980s and one for the 1990s. The standard errors are shown inparentheses. The asterisks indicate the level of significance: * = 99%, ** = 95% and *** = 90%. The samples used in these regressionsexcluded four small countries with very volatile private capital flows: Suriname, Panama, Bahamas and Nicaragua.

21C E P A L R E V I E W 7 3 • A P R I L 2 0 0 1
WHY IS THERE SO MUCH ECONOMIC INSECURITY IN LATIN AMERICA? • DANI RODRIK
VICapital mobility and the incidence of macro risk
The finding that erratic capital flows are a strong cor-relate of macroeconomic volatility has an importantimplication which has to do with the distribution ofmacroeconomic risk across domestic households. Asthe decomposition in a previous section highlighted,households whose relative income streams co-vary withthe national average bear greater income risk than thosewhose relative incomes are counter-cyclical. In particu-lar, as my illustrative empirical application highlighted,workers whose real wages are pro-cyclical–rising morethan national income in good times, and falling morein bad times– suffer disproportionately from macro-economic volatility.
One implication of capital mobility is precisely thatmore of the macro risk gets shifted on to domestic fac-tors of production –such as labour– that are not inter-nationally mobile. Since capital can move in and out inresponse to, say, domestic productivity shocks, it canevade the risk posed by the stochastic nature of thedomestic economic environment. But capital flowsthereby impose an externality on internationally im-mobile groups because the latter now have to bear agreater share of the domestically undiversifiable risk.
A simple model, adapted from Rodrik (1997,chap. 4), illustrates how this works. Let us assume asmall open economy that produces (and exports) asingle good, whose price is determined in world markets.This good is produced under constant returns to scale,using labour and capital. Unlike labour, capital canmove across borders, but at a cost. The magnitude ofthis cost will be the parameter capturing the degree ofcapital mobility in the economy. Labour, whosewelfare is the focus of the analysis, consumes only theimportable. The only source of uncertainty in the modelis the productivity level in the exportable sector, whichis assumed to be stochastic. Labour income consists ofwage income plus the proceeds of a tax on domesticcapital.
Let the production function of the exportable sec-tor be written as pf(k, l), with the usual regularity con-ditions: fk > 0, fl > 0, fkk < 0, fll < 0, and fkl > 0. Thestochastic productivity parameter is given by p. (Wecould equivalently think of p as the terms of trade.) Wenormalize the economy’s fixed labour endowment to
unity, so the production function can also be expressedas pf(k). The domestically-owned capital stock is ex-ogenously fixed at k0. Note that k, the capital used athome, can differ from k0 as capital moves in and out ofthe country. A key assumption is that an increasing costis incurred by capitalists as capital moves across bor-ders. We can think of this as the cost of setting up busi-ness in a less familiar environment, the cost incurred intransporting the final goods back to the home economy,the cost of communicating with subsidiaries in a dif-ferent country, etc. Increased capital mobility will becaptured in the model by reductions in the parameter λ.
The model can be described in three equations:
r = pfk(k) – τ [1]
r = r* – λ(k0 – k) [2]
w = pft(k) [3]
The domestic return to capital (r) is given by the mar-ginal value product of capital net of the domestic tax.International trade in capital services requires that thisreturn be equal to the international return (r*) minus amargin that is related to the cost of moving capitalabroad. Hence a capital outflow which reduces the capi-tal stock at home to k1 would depress the rate of returnearned by domestic capitalists to r* - λ(k0 - k1). Equa-tion [2] expresses this arbitrage condition. Finally, equa-tion [3] states that the domestic wage (w) equals themarginal value product of labour. These three equa-tions determine the three endogenous variables in thesystem, w, r, and k.
Figure 3 presents a graphical view of the way themodel works. The downward sloping schedule showsthe negative relationship between r and k expressed inequation [1]. As domestic productivity (p) movesaround, so does this schedule. Intuitively, for any givenamount of capital invested at home, the return to capi-tal fluctuates in tandem with the productivity in theexportable sector. The upward sloping schedule, for itspart, represents the relationship expressed in equation[2]. Two versions of this schedule are shown, one forhigh λ (low capital mobility) and one for low λ (high

CEPAL REVIE W 73 • APRIL 200122
WHY IS THERE SO MUCH ECONOMIC INSECURITY IN LATIN AMERICA? • DANI RODRIK
capital mobility). The lower is λ, the flatter this sched-ule. At the limit, with capital fully mobile at zero cost,the schedule would be horizontal and it would fix thedomestic rate of return at r*.Let us denote by k(p,τ,λ) the equilibrium level of
capital employed at home. Consider an initial equilib-rium where the combination of parameters is such thatk(p,τ, λ) = k0. In this equilibrium, denoted by A infigure 3, r = r*. Changes in λ would have no effect onw or k (or r) starting from this initial equilibrium, since
dk k – k0= ,dλ p f kk – λ
dw k – k0= p f kldλ p fkk – λ
and both expressions equal zero when k = k0. Intuitively,we fix the initial equilibrium such that capital has noincentive to move in or out of the domestic economy,and consequently changes in the cost of mobility areof no consequence (holding p constant).Now let us consider what happens as p fluctuates.
A reduction in p drives down the domestic return tocapital and results in a capital outflow, the magnitudeof which is inversely proportional to λ. As the figuredemonstrates, the greater the mobility of capital, thewider the fluctuations in the domestic capital stock inresponse to changes in the world price. Formally,
dk f k= > 0,dp λ – pfkk
which is decreasing with respect to λ. The consequencesfor labour can be easily deduced. Since the domesticwage (in terms of the importable) is determined by thevalue marginal product of labour in the exportable(equation [3]), capital mobility accentuates the fluc-tuation in the consumption wage. The lower is λ, thewider the amplitude of fluctuations in w:
dw p f kl f k= fl + > 0,dp λ – p fkk
which is decreasing in λ.
In fact, things are even worse for labour, insofar aspart of workers’ income comes from the tax on capital.Denoting workers’ total (real) income by I,
I = w + τk
Fluctuations in I therefore result not only from fluc-tuations in wages, but also from fluctuations in the taxbase (k) as capital moves back and forth in search ofhigher returns.Hence, by rendering capital more responsive to
changes in domestic productivity, capital mobility mag-nifies the amplitude of fluctuations in workers’ incomesat home. The effect arises because workers’ incomesdepend not only on domestic productivity, but also on(a) the domestic capital stock, which fluctuates in re-sponse to productivity shocks; and (b) the economy’stax base, which also fluctuates to a greater extent as aresult of capital mobility. The effect of capital mobilityis increased exposure of labour to macro risk. This canbe appropriately viewed as a negative externality thatcapital imposes on labour. Moreover, when capitalmobility is sufficiently high, it becomes impossible tocompensate labour through suitable adjustments in thetax on capital: capital mobility allows capitalists toevade the tax, which leaves workers even worse off.The model thus captures in schematic fashion a policydilemma faced all around the world, but especiallystrongly in Latin America, where the volatility of capi-tal flows is particularly significant.
[ [
FIGURE 3
Functioning of the model
high λ
r = r*-low (k0 - k)
low λ
high p
r = pfk (k) - t
low p
r
r*
k0
A

23C E P A L R E V I E W 7 3 • A P R I L 2 0 0 1
WHY IS THERE SO MUCH ECONOMIC INSECURITY IN LATIN AMERICA? • DANI RODRIK
VIIExchange rates, capital mobilityand macroeconomic volatility
The association between exchange-rate policy andmacroeconomic volatility has already been noted: thecollapse of unsustainable currency pegs has historicallybeen an important source of instability for Latin Ameri-can countries. One of the findings of Hausmann andGavin (1996) is that countries with flexible exchangerates have typically experienced lower GDP volatilitythan countries with fixed rates. One reason has to dowith the avoidance of currency crises. The other is thatflexible exchange rates provide greater insulationagainst real shocks: a decline in productivity intradeables sectors or the terms of trade can be met byimmediate currency depreciation, short-cutting an ad-justment process that under fixed rates would have tobe effected through domestic price changes and wouldtake much longer.
Capital mobility in the 1990s has undercut the abil-ity of flexible exchange rates to perform that stabiliz-ing function. Where they are not fixed, currency val-ues have been driven less by shocks to competitivenessor changes in the trade balance and more by consider-ations of maintaining short-term capital flows and in-vestor confidence. Michael Gavin summarizes the re-sponse in the region to the shocks since the Asian crisisas follows:
“The first stylized fact is that despite the magni-tude of the external shocks, most countries usedtheir exchange rate flexibility very sparingly… InPeru —a formally floating rate country that wasseverely hit by both El Niño and the collapse inthe terms of trade— the cumulative devaluationbarely kept pace with inflation. Chile also allowedminimal movements in its exchange rate in spiteof a major collapse in the price of copper and inthe Asian demand for its exports” (Gavin, 1999,p. 3; italicized in the original).
Gavin goes on to discuss how the policy response ofchoice was instead the interest rate, which was usedaggressively to defend the exchange rate. In otherwords, rather than letting the nominal exchange ratedepreciate sufficiently to give the real economy a boost,Latin American governments chose to tighten monetary
conditions to prevent depreciation. Exchange-ratepolicy was de-linked from the needs of the realeconomy.
Table 9 provides a more systematic look at this byanalyzing the correlation between real exchange ratechanges and balance-of-payments flows of differentkinds. The exercise is inspired by a similar one reportedin ILO (1999, table 3), which however covers only asingle Latin American country. It consists of calculat-ing the correlation coefficients between the quarterlymovements in the real exchange rate and flows of twokinds: “real” flows and “financial” flows. The first cat-egory of flows is defined as the sum of the current ac-count and inward foreign direct investment (FDI). Thesecond category covers all capital account movementsexcept FDI and reserve changes, and includes errors and
TABLE 9
Latin America (6 countries): Correlations betweenthe real exchange rate and balance ofpayments flowsa
Coefficient of correlation between thereal exchange rate and:
Current account Financial Periodb
+ FDI inflows
Argentina 0.19 –0.52* 89Q2-98Q4Brazil 0.40*** –0.23 93Q1-97Q4Chile –0.24 –˜0.03 89Q1-98Q4Mexico 0.68* –0.69* 89Q1-98Q4Peru 0.40 0.21 94Q1-97Q4Venezuela 0.24 –0.06 94Q1-98Q4
Source: Calculated on the basis of data from IMF (various years).
a The exchange rates are defined in terms of units of nationalcurrency per unit of foreign currency, so that an increaserepresents a depreciation in real terms. Financial inflows cor-respond to all capital account movements other than FDI
inflows and variations in reserves, including errors and omissions.The periods were selected according to the availability of quar-terly data. The levels of statistical significance were as follows:* = 99%, ** = 95%, *** = 90%.
b Q = quarter.

C E P A L R E V I E W 7 3 • A P R I L 2 0 0 124
WHY IS THERE SO MUCH ECONOMIC INSECURITY IN LATIN AMERICA? • DANI RODRIK
omissions.9 The exercise is carried out for all of themajor Latin American countries for which the IMF’sInternational Financial Statistics report the relevantquarterly data for some time during the 1990s. Thereare six countries in all.
The results tell a consistent story. The correlationbetween financial flows and real exchange rate move-ments is negative in all but one case (Peru is the soleexception). This indicates that there is a general ten-dency for the real exchange rate to appreciate in responseto financial inflows. The correlation between the realexchange rate and real flows, on the other hand, is posi-tive in five out of six cases (Chile is the sole exceptionin this case). In other words, in all countries exceptChile, deteriorations in the current account (and the FDI
balance) are associated with an appreciation of the realexchange rate.
What these results seem to reflect is an increas-ingly common pattern where financial flows are in thedriving seat for the real exchange rate. As far as stabi-
lizing demand for domestic output is concerned, theexchange rate tends to move in the “correct” directionin the case of financial flows –a reduction in inflowsdepreciates the real exchange rate– but in the “wrong”direction in the case of trade flows: a deterioration inthe current account is accompanied by appreciation ofthe real exchange rate. This pattern is clearest in thecase of Mexico, where increasing financial inflows andcurrent account deterioration between 1988 and 1994were matched with an ongoing real appreciation of thecurrency. This is picked up in table 9 in the form ofvery strong correlations between these flows and thereal exchange rate. Of course, it is possible to interpretMexico’s experience as an equilibrium appreciation ofthe currency in anticipation of future productivity gains,notwithstanding the eventual peso crisis. It is nonethe-less the case that the real exchange rate was governedby short-term investors’ expectations rather than by thestate of domestic demand or the large and growing cur-rent account deficit.
VIIIExchange rate flexibility as social insurance
The operation of exchange rate policy during the 1990shas contributed to greater economic insecurity in theregion in a more subtle fashion as well. An exchangerate that is targeted on the real economy not only servesa stabilization function; it also serves a social insur-ance function. The reason is that when the exchangerate follows the behaviour of the current account, shocksto the competitiveness of individual industries are dis-sipated throughout the entire economy via changes inthe value of the currency. On the other hand, when theexchange rate is fixed or is responsive mainly to finan-cial flows, the affected industries have to bear the fullbrunt of the shock. Since this point is not widely rec-ognized, I will develop it using a simple model.
Let us consider a small open economy that pro-duces two tradeable goods (denoted by 1 and 2) and asingle non-tradeable good (denoted by n). We will as-
sume for simplicity’s sake that neither of the two trade-able goods is consumed at home, and that the total do-mestic output of these goods is exported. Householdsconsume the non-tradeable good as well as an importedgood that is not produced at home. We fix the (exog-enous) world prices of the tradeable goods at unity. Lete stand for the nominal exchange rate in units of homecurrency per foreign currency unit. The domestic priceof all three tradeable goods (the two exportables andthe importable) is then given by e. Let the price of thenon-tradeable be p.
We will simplify the structure of the economy fur-ther by assuming that labour is the only factor of pro-duction, and that each of three productive sectors athome uses labour specific to that particular activity.There is no intersectoral mobility of labour. Let theinelastically supplied labour of each type be given by,l1, l2 and ln, with associated wages w1, w2, and wn, whilelabour productivity in the three sectors is given by a1,a2, and 1, respectively.
To allow nominal exchange-rate policy to have realeffects, we shall assume that w1 and w2 are rigid down-
9 Note that since changes in reserves are excluded from the calcu-lations, the two sets of correlations need not produce symmetricalresults (identical in absolute value and opposite in sign).
25C E P A L R E V I E W 7 3 • A P R I L 2 0 0 1
WHY IS THERE SO MUCH ECONOMIC INSECURITY IN LATIN AMERICA? • DANI RODRIK
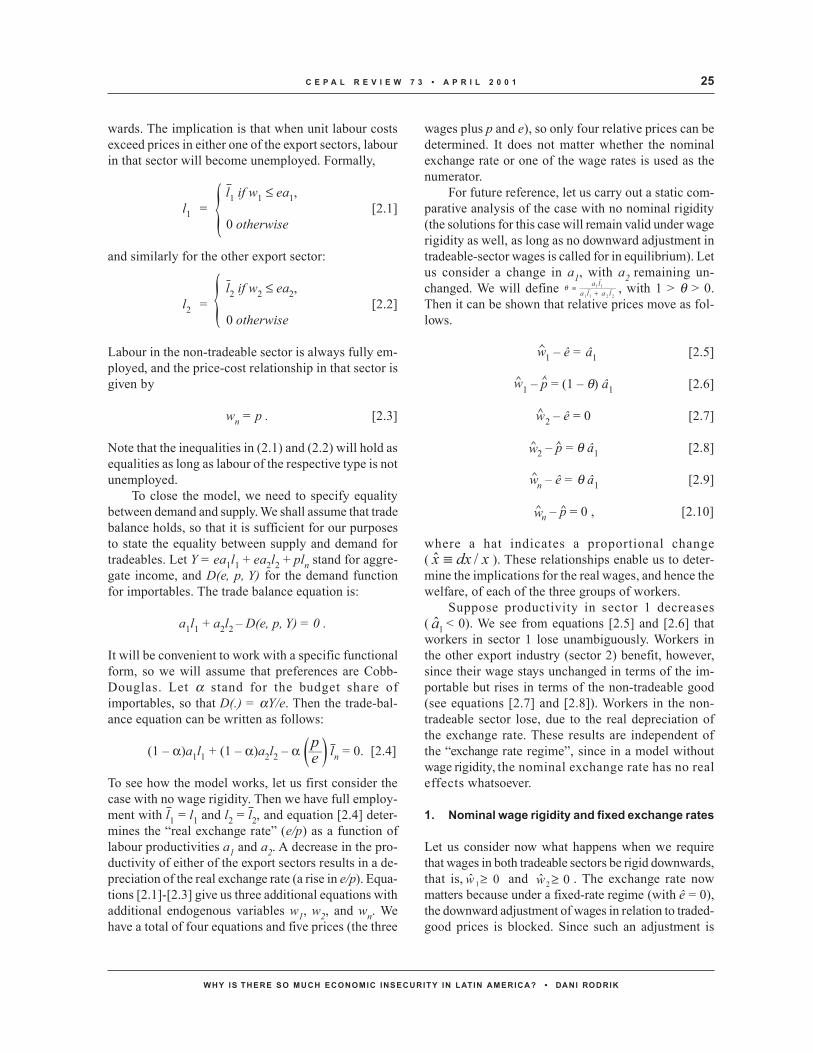
wards. The implication is that when unit labour costsexceed prices in either one of the export sectors, labourin that sector will become unemployed. Formally,
l1 if w1 ≤ ea1,l1 = [2.1]
0 otherwise
and similarly for the other export sector:
l2 if w2 ≤ ea2,l2 = [2.2]
0 otherwise
Labour in the non-tradeable sector is always fully em-ployed, and the price-cost relationship in that sector isgiven by
wn = p . [2.3]
Note that the inequalities in (2.1) and (2.2) will hold asequalities as long as labour of the respective type is notunemployed.
To close the model, we need to specify equalitybetween demand and supply. We shall assume that tradebalance holds, so that it is sufficient for our purposesto state the equality between supply and demand fortradeables. Let Y = ea1l1 + ea2l2 + pln stand for aggre-gate income, and D(e, p, Y) for the demand functionfor importables. The trade balance equation is:
a1l1 + a2l2 – D(e, p, Y) = 0 .
It will be convenient to work with a specific functionalform, so we will assume that preferences are Cobb-Douglas. Let α stand for the budget share ofimportables, so that D(.) = αY/e. Then the trade-bal-ance equation can be written as follows:
(1 – α)a1l1 + (1 – α)a2l2 – α (—) ln = 0. [2.4]
To see how the model works, let us first consider thecase with no wage rigidity. Then we have full employ-ment with l1 = l1 and l2 = l2, and equation [2.4] deter-mines the “real exchange rate” (e/p) as a function oflabour productivities a1 and a2. A decrease in the pro-ductivity of either of the export sectors results in a de-preciation of the real exchange rate (a rise in e/p). Equa-tions [2.1]-[2.3] give us three additional equations withadditional endogenous variables w1, w2, and wn. Wehave a total of four equations and five prices (the three
wages plus p and e), so only four relative prices can bedetermined. It does not matter whether the nominalexchange rate or one of the wage rates is used as thenumerator.
For future reference, let us carry out a static com-parative analysis of the case with no nominal rigidity(the solutions for this case will remain valid under wagerigidity as well, as long as no downward adjustment intradeable-sector wages is called for in equilibrium). Letus consider a change in a1, with a2 remaining un-changed. We will define
2211
11
lalala
+≡θ , with 1 > θ > 0.
Then it can be shown that relative prices move as fol-lows.
1 – ê = â1 [2.5]
1 – p = (1 – θ) â1 [2.6]
2 – ê = 0 [2.7]
2 – p = θ â1 [2.8]
n – ê = θ â1 [2.9]
n – p = 0 , [2.10]
where a hat indicates a proportional change( xdxx /ˆ ≡ ). These relationships enable us to deter-mine the implications for the real wages, and hence thewelfare, of each of the three groups of workers.
Suppose productivity in sector 1 decreases( 1a < 0). We see from equations [2.5] and [2.6] thatworkers in sector 1 lose unambiguously. Workers inthe other export industry (sector 2) benefit, however,since their wage stays unchanged in terms of the im-portable but rises in terms of the non-tradeable good(see equations [2.7] and [2.8]). Workers in the non-tradeable sector lose, due to the real depreciation ofthe exchange rate. These results are independent ofthe “exchange rate regime”, since in a model withoutwage rigidity, the nominal exchange rate has no realeffects whatsoever.
1. Nominal wage rigidity and fixed exchange rates
Let us consider now what happens when we requirethat wages in both tradeable sectors be rigid downwards,that is, 0ˆ 1≥w and 0ˆ 2 ≥w . The exchange rate nowmatters because under a fixed-rate regime (with ê = 0),the downward adjustment of wages in relation to traded-good prices is blocked. Since such an adjustment is
{{
pe
w
w
w
w
w
w

C E P A L R E V I E W 7 3 • A P R I L 2 0 0 126
WHY IS THERE SO MUCH ECONOMIC INSECURITY IN LATIN AMERICA? • DANI RODRIK
required in order to maintain full employment whenan industry receives a negative productivity shock, theoutcome will be unemployment.
Comparative static analysis of this case, with â1 < 0as before, yields the following results under fixed ex-change rates:
dl1 = – l1 [2.11]
w 2 – ê = 0
w2 – p = θâ1 + θ [2.8’]
wn – ê = θâ1 – θ [2.9’]
wn – p = 0 .
We note three changes. First, all workers in industry 1lose their jobs (equation 2.11). Second, workers in in-dustry 2 now experience an even larger gain in realwages (compare equations 2.8 and 2.8’, rememberingthat â1 < 0 ). Third, workers in the non-tradeable sectorexperience a bigger drop in real wages (compare 2.9and 2.9’). The last two results are due to a sharperchange in the real exchange rate when wage rigiditycombined with fixed exchange rates results in unem-ployment. The intuition is as follows: when export indus-try 1 collapses as a result of becoming uncompetitive,the incipient trade deficit is much larger, and the requi-site relative-price correction is commensurately bigger.
The important result from our perspective is thatthe distributional implications of the productivity shockare accentuated. Wage rigidity combined with fixedexchange rates results not only in inefficient outcomes
(captured here by unemployment), but also in greaterdispersion of the distributional outcomes.
2. Nominal wage rigidity and flexible exchangerates
When the exchange rate is not fixed and can be tar-geted on the trade balance, these effects can be offsetby a depreciation of the nominal exchange rate that islarge enough to restore unit labour costs in industry 1to their original level (i.e., ê = –â1). Flexibility in eallows the wage in sector 1 to be reduced in terms oftraded-goods prices, eliminating unemployment. There-fore, equations [2.5] to [2.10] continue to describe thebehaviour of the economy, despite downward rigidityin w1. The distributional outcomes are the same as inthe absence of wage rigidity.
The results with productivity shocks to sector 2are analogous, and need not be discussed in detail. Table10 summarizes the distributional impacts for the threesectors, under both positive and negative shocks. Notethat under positive productivity shocks, the distribu-tional impacts do not depend on whether the exchangerate is fixed or targeted on the trade balance. This isbecause of the (plausible) assumption that wages arerigid downward but not upward. Consequently, non-classical results obtain under fixed exchange rates onlywhen one of the sectors is hit with a negative shock.When that happens, the distributional effects areaggravated under fixed rates through the two channelsmentioned above: first, incomes collapse in the ad-versely affected sector because of unemployment, andsecond, there is a larger relative price change to thebenefit of the other tradeable sector and the detrimentof the non-tradeable sector.
TABLE 10Distributional implications of productivity shocksunder different exchange-rate regimes
Shock to export sector 1 Shock to export sector 2
Positive shock (â1> 0) Negative shock (â1 > 0) Positive shock (â2 > 0) Negative shock (â2 > 0)Implication for sector: Implication for sector: Implication for sector: Implication for sector:
Exchange rate regime 1 2 n 1 2 n 1 2 n 1 2 n
Fixed exchange rates + – + --- ++ –– --- + + ++ --- ---
Flexible exchange rates + – + – + – – + + + – –
a The model assumes that nominal wages are rigid downwards in sectors 1 and 2. See text for description of model and discussion.

27C E P A L R E V I E W 7 3 • A P R I L 2 0 0 1
WHY IS THERE SO MUCH ECONOMIC INSECURITY IN LATIN AMERICA? • DANI RODRIK
IXInstitutions of voice
The demise of military rule and the transition to de-mocracy have been the most encouraging developmentsto take place in Latin America during the last two de-cades. Cross-national evidence suggests strongly thatsocieties with greater political openness and participa-tion are better at adjusting to external shocks, experi-ence lower economic volatility, and generate lower in-flation (Rodrik, 1998). Hence, the institutionalizationof democracy should eventually produce more stableeconomic outcomes and alleviate economic insecurityin the region.
The international evidence on the relationship be-tween type of political regime and economic stabilityis shown in figures 4 and 5. These scatter plots displaythe (partial) association between a measure of non-elitepolitical participation and two indicators of macroeco-nomic volatility over the span of two decades (1970sand 1980s). The volatility measures are the standarddeviation of real GDP growth rates (figure 4) and theaverage inflation rate (figure 5). The measure of par-ticipation (parcomp) is an index taken from the PolityIII data set of Jaggers and Gurr (1995), and is definedas the “extent to which non-elites are able to accessinstitutional structures for political expression”. Thelatter is highly correlated with usual measures of de-mocracy (such as the commonly used Freedom Houseindex), but I have found that it is a better predictor ofmacroeconomic volatility than others. The regressionson which the scatter plots are based contain the follow-ing additional controls: per capita income, populationsize, terms-of-trade volatility, and regional dummiesfor Latin America, Africa, and East Asia. The scatterplots show the association between political participa-tion and volatility, controlling for these other variables.
Political participation turns out to be strongly, andnegatively, correlated with both GDP volatility and in-flation levels. While correlation does not prove causa-tion, other econometric work and a range of case stud-ies suggest that the degree to which a political systemis open to participation from below does affect the qual-ity of macroeconomic management for the better (seeRodrik, 1999, and references therein). Participationhelps in a number of different ways. First, democracyallows a smooth transfer of power from failed policiesand politicians to a new group of government leaders.
Second, participation enables mechanisms of consul-tation and bargaining, allowing policy makers to fash-ion the consensus needed to undertake the necessarypolicy adjustments in a decisive manner. Third, insti-tutionalized mechanisms of “voice” obviate the needfor riots, protests, and other kinds of disruptive actionsby affected groups, as well as lowering the support forsuch behaviour by other groups in society.
Participatory institutions in Latin America still havea number of important weaknesses, however, despite
coef = -.00302049, se = .00093256, t = -3.24
e(
sdrg
dp
ch
| X
)
e( pa rcom p | X )-2.40685 3.69141
-.025365
.030401
FIGURE 4Relationship between GDP volatility and politicalparticipation, 1975-90 (96 countries)
FIGURE 5
coe f = -.024 64 03 3, se = .01 042 947 , t = -2 .3 6
e(
inf7
59
0 |
X)
e ( p arco m p | X )-2 .0 034 5 3.62 95 6
-.13 998 1
.3 94 17 7
FIGURE 5Relationship between inflation and politicalparticipation, 1970-90 (96 countries)

C E P A L R E V I E W 7 3 • A P R I L 2 0 0 128
WHY IS THERE SO MUCH ECONOMIC INSECURITY IN LATIN AMERICA? • DANI RODRIK
the region’s transition to democracy. These weaknesseshave to be seen as one of the elements aggravating eco-nomic insecurity: when large segments of the popula-tion lack an effective mechanism of voice in mattersthat affect them, they naturally feel less in control oftheir fate.
As already noted, trade unions, which are an im-portant institution of collective voice, have lost mem-bership in all countries for which data are available,except Chile. Unions are important to workers not onlybecause they act as pressure groups in the politicalsphere, but also because they enable participation indecision making in the workplace. On both accounts,unions provide their members with a greater sense ofcontrol over their working environment. As Pencavel(1997, p. 58) puts it in his discussion of Latin America:
“It is important… that workers not feel alienatedfrom the economic and social system and [that they]believe they have a stake in it. Process matters: evenif outcomes are identical, employees value thefact that they or their agents help to shape theirworking environment. The labour union has beenthe primary vehicle for accomplishing this situa-tion”.
The old style of trade union activity in Latin America,consisting of lobbying for legally mandated forms ofjob protection and wage advantages, is arguably notwell suited to the requirements of economies with com-petitive markets and smaller production units. In thepast, unions have been too often associated with popu-list and protectionist policies. As Márquez and Pages(1998) argue, neither trade union leaders nor policymakers have yet been able to fashion an environmentin which unions are seen as sufficiently responsive tothe needs of workers as a group.
The broader political system in Latin America isfaced with what Domínguez (1997) calls a “crisis ofrepresentation”. As he puts it, “long-standing forms ofrepresentation –populist parties and so-called corporatistarrangements– have weakened precisely at the momentwhen public support must be found to help guaranteethe stability of economic reforms and constitutionalgovernment ….. Government officials in Latin Americaare perceived as corrupt, political parties as a collec-tion of factions, legislatures as ineffective, and presi-dents as either saviors or rascals to be impeached. Whilemilitary coups have all but disappeared, new forms ofthreats to constitutionalism have emerged: rule by Presi-dential decree, mutinies led by disgruntled middle-rank-ing military officers, and Presidential “coups” against
the legislature, courts and all vehicles that help civilsociety seek advocacy and representation for its inter-ests” (Domínguez, 1997, pp. 109-112). Mutinies fromwithin the military have taken place in Argentina, Ec-uador, Guatemala, Panama and Venezuela, while presi-dential coups have been attempted in Guatemala, Peruand Venezuela.
Colonel Hugo Chávez, a Venezuelan paratrooper,typifies all these trends: in 1992 he unsuccessfully triedto topple the democratically elected government ofVenezuela. Even though he failed, his attempt was suf-ficiently popular to carry him to a clear majority in thepresidential elections of 1998. In late 1999, Chávez stillmaintained high popularity ratings despite his decisionto effectively disband the legislature and replace it witha constitutional assembly elected to draft a new consti-tution. This is indicative of the frustration that LatinAmericans evidently feel regarding their political sys-tems.
As in so many other instances, Chile stands out asan exception to many of these trends. The transition todemocracy in Chile in 1990 was accompanied by theinitiation of a social dialogue between labour, businessand the government and a series of annual tripartiteagreements. The democratically-elected government ofPatricio Aylwin sought to gain social legitimacy for itseconomic policies by increasing spending on socialprogrammes and by drawing on the labour movement.The Aylwin government’s first significant piece of leg-islation was a tax increase earmarked for greater socialspending (Domínguez, 1998). The tripartite agreementsallowed the unions to participate in national decisionmaking over such matters as the raising of the mini-mum wage and the reform of labour laws. In the wordsof Cortázar (1997), the centre-left coalitions that haverun Chile since 1990 have looked on labour unions asan “opportunity for, rather than a threat to, develop-ment”. Employers, for their part, have found it conve-nient in the post-Pinochet period to have a social part-ner across the negotiating table in order to avoid socialstrife. The result has been a comparatively harmonioussystem of labour relations10 and a political system thathas perhaps a surprising amount of popular legitimacydespite its failure to come to grips with Pinochet’slegacy.
10 A 1997 survey, carried out among 300 private-sector companiesin Santiago, found that an astonishing 83.7% of employers con-sider labour unions to help labour relations, and only 6 % believethat they make them more difficult. Among trade union leaders,65.3 % said that most of the time employers facilitate the work oftrade unions. (Reported in The Economist Intelligence Unit, 1998).

29C E P A L R E V I E W 7 3 • A P R I L 2 0 0 1
WHY IS THERE SO MUCH ECONOMIC INSECURITY IN LATIN AMERICA? • DANI RODRIK
XConcluding remarks
I have argued in this paper that economic insecurity inLatin America is multifaceted and has many sourcesthat feed on each other. Some of the insecurity arisesfrom the decline in employment protection andincreased volatility of household outcomes. Some of itis the result of erratic capital flows and the systemicinstability generated by a divorce between the instru-ments of stabilization and the real economy. Finally,an important component is the weakness of the institu-tions of voice and representation.
An important implication of this is thatprogrammes aimed at social protection per se can beof partial help only. Well-functioning safety nets–unemployment compensation, old-age and medicalbenefits, targeted social funds– may help cope withsome of the idiosyncratic risks that households face.But they will have to be complemented by macroeco-nomic policies (with regard to capital flows and theexchange rate in particular) that are more conducive tothe stability of the real economy and by loosening thecontrol of financial markets over the instruments ofmacroeconomic policy. They will also require accessto representative institutions —trade unions, political
parties, and legislatures— with greater responsivenessand legitimacy than those that exist at present.
Perhaps what Latin America needs most, however,is a vision of how social cohesion can be maintained inthe face of large inequalities and volatile outcomes, bothof which are being aggravated by the growing relianceon market forces. In today’s advanced industrialcountries, the expansion of the market’s role has his-torically gone hand in hand with the strengthening ofthe institutions of social insurance. Since the New Dealin the United States, and even more so since World WarII in Europe, that has meant the growth of the publicsector and the erection of a welfare state. If LatinAmerica is to carve a different path for itself, the regionwill have to develop an alternative vision that articu-lates how the tension between market forces and theyearning for economic security can be eased.
The good news is that this question is at least beingaddressed. The bad news is that no-one, least of alleconomists, has a very useful answer to offer so far.
(Original: English)
Bibliography
Amadeo, E. J. and J. M. Camargo (1997): Brazil: regulationand flexibility in the labor market, in S. Edwards andN. Lustig (eds.), Labor Markets in Latin America,Washington, D.C., Brookings Institution.
Bordo, M. D., C. Goldin and E. N. White (eds.) (1998): TheDefining Moment: The Great Depression and theAmerican Economy in the Twentieth Century, Chicago,Illinois, University of Chicago Press.
Cortázar, R. (1997): Chile: The evolution and reform of thelabor market, in S. Edwards and N. Lustig (eds.),Labor Markets in Latin America, Washington, D.C.,Brookings Institution.
Domínguez, J. (1997): Latin America’s crisis of representa-tion, Foreign Affairs, vol. 76, No. 1, New York, Councilon Foreign Affairs, Inc.
(1998): Free politics and free markets in LatinAmerica, Journal of Democracy, vol. 9, No. 1, NewYork, Council of Foreign Relations, October.
Easterly, W., R. Islam and J. E. Stiglitz (1999): Shaken andStirred: Volatility and Macroeconomic Paradigms forRich and Poor Countries, Michael Bruno Memorial
Lecture, XII World Congress of the IEA, Buenos Aires,International Association for the Evaluation of Educa-tional Achievement (IEA), 27 August.
Ferreira, F. H. and R. Paes de Barros (1999): The SlipperySlope: Explaining the Increase in Extreme Poverty inUrban Brazil, 1976-1996, Texto para discussão, No.404, Rio de Janeiro, Catholic University of Rio deJaneiro.
Gavin, M. (1999): Latin American central banks: Reticentto react, Latin American Economic Policies, vol. 7,Washington, D.C., Inter-American Development Bank(IDB), Office of the Chief Economist.
Gavin, M. and R. Hausmann (1996): Sources of Macroeco-nomic Volatility in Developing Economies, Washington,D.C., IDB.
Glewwe, P. and G. Hall (1998): Are some groups morevulnerable to macroeconomic shocks than others?Hypothesis tests based on panel data from Peru, Journalof Development Economics, vol. 56, No. 1, Amsterdam,The Netherlands, Elsevier Science Publishers, B.V.
Hausmann, R. and M. Gavin (1996): Securing Stability and

C E P A L R E V I E W 7 3 • A P R I L 2 0 0 130
WHY IS THERE SO MUCH ECONOMIC INSECURITY IN LATIN AMERICA? • DANI RODRIK
Growth in a Shock Prone Region: The Policy Challengefor Latin America, Washington, D.C., IDB.
IDB (Inter-American Development Bank) (undated): Eco-nomic and Social Data Base (http://database.iadb.org/esdbweb/scripts/esdbweb.exe).
ILO (International Labour Organisation) (1997): WorldLabour Report 1997-1998, Geneva.
(1998): Studies on the Social Dimensions of Glo-balization, Geneva.
(1999): Progress Report on the Country Studies onthe Social Impact of Globalization, Geneva, 24 March.
IMF (International Monetary Fund) (various years): Interna-tional Financial Statistics, Washington, D.C.
Jacoby, S. M. (1998): Risk and the Labor Market: SocietalPast as Economic Prologue, Los Angeles, California,University of California, Institute of Industrial Relations.
Jaggers, K. and T.R. Gurr (1995): Tracking democracy’s thirdwave with Polity III data, Journal of Peace Research,vol. 32, Oslo, International Peace Research InstituteOslo (PRIO).
Lustig, N. (ed.) (1995): Coping with Austerity: Poverty andInequality in Latin America , Washington, D.C.,Brookings Institution.
Lustig, N. (1999): Crises and the Poor: Socially ResponsibleMacroeconomics, Washington, D.C., IDB, September.
Márquez, G. and C. Pages (1998): Ties That Bind: Employ-ment Protection and Labor Market Outcomes in LatinAmerica, Washington, D.C., IDB, February.
Mirror on the Americas Poll 1999 (1999): New York, WallStreet Journal Interactive Edition.
Pencavel, J. (1997): The legal framework for collectivebargaining in developing economies, in S. Edwards and
N. Lustig (eds.), Labor Markets in Latin America, Wash-ington, D.C., Brookings Institution.
Pessino, C. (1997): Argentina: The labor market during theeconomic transition, in S. Edwards and N. Lustig (eds.),Labor Markets in Latin America, Washington, D.C.,Brookings Institution.
Rockoff, H. (1998): By way of analogy: The expansion ofthe federal government in the 1930s, in M. D. Bordoand others (eds.), The Defining Moment: The GreatDepression and the American Economy in the TwentiethCentury, Chicago, Illinois, University of Chicago Press.
Rodrik, D. (1997): Has Globalization Gone Too Far?,Washington, D.C., Institute for International Economics(IIE).
(1998): Where has all the growth gone? Externalshocks, social conflict, and growth collapses, Journalof Economic Growth, No. 4, Boston, Kluwer AcademicPublishers.
(1999): The New Global Economy and DevelopingCountries: Making Openness Work, Washington, D.C.,Overseas Development Council (ODC).
Romero, S. (1999): Brazilians eagerly seek a big bank’sentry-level jobs, The New York Times, New York, 26August.
Taylor-Gooby, P. (1989): The role of the State, in R. Jowelland others, British Social Attitudes: Special Interna-tional Report, vol. 6, Aldershot, U.K., Gower Publish-ing.
The Economist Intelligence Unit (1998): Country Report forChile, London, 17 August.
World Bank (1999): World Development Indicators 1999,CD-ROM.

31C E P A L R E V I E W 7 3 • A P R I L 2 0 0 1
STRENGTHENING REGIONAL F INANCIAL COOPERATION • MANUEL R. AGOSIN
C E P A L R E V I E W 7 3
APRIL 2001
Strengtheningregional financial
cooperation
The severe international financial crises which rocked the
Latin American economies in the 1980s and 1990s suggest
that the international financial system suffers from serious
defects. This article looks at one of the reforms which has
been mooted in recent years: strengthening regional finan-
cial cooperation. It concludes that a Latin American fund
made up of a modest portion of the reserves of the countries
of the region, possibly backed up with contingency credits
from the international banking system, could be an effec-
tive line of defense against financial crises caused by capi-
tal flight and could help to prevent the spread of crises within
the region. A fund of this nature could also have other func-
tions, such as providing finance to cope with balance of
payments problems associated with temporary slumps in the
terms of trade. It would also promote harmonization of the
macroeconomic policies of its members, which is an essen-
tial condition for achieving more stable bilateral exchange
rates and effective regional integration. Such a regional fund
would not be a substitute for the International Monetary
Fund, but would be complementary to it.
Manuel R. Agosin
Regional Economic Adviser,Inter-American DevelopmentBank (IDB), and Professorin the Department ofEconomics of the Universityof [email protected]

C E P A L R E V I E W 7 3 • A P R I L 2 0 0 132
STRENGTHENING REGIONAL F INANCIAL COOPERATION • MANUEL R. AGOSIN
IIntroduction
iii) protecting intra-regional trade and investments attimes of global financial crisis;
iv) providing a forum to help in the coordination ofmacroeconomic policies, thus leading to less vul-nerability to external crises and greater stability ofbilateral exchange rates; and
v) promoting the exchange of information on mat-ters vital for international financial stability, suchas prudential regulation of the financial sector andcapital flows.
After it is posited in the introduction to this article thatthe nature of financial crises within the context ofglobalized finance makes it advisable to have strongerregional institutions in this field, section II deals withthe last-generation financial crises and their effects onrecipient economies. Section III sets out the argumentsin favour of the strengthening of regional financialmechanisms. Section IV deals with the role suchmechanisms could play in promoting regionalintegration. Section V then describes two of theinternational financial cooperation institutions whichalready exist in the region: the Latin American ReserveFund (FLAR) and the Mutual Payments and CreditsAgreement (CPCR) of the Latin American IntegrationAssociation (ALADI), after which section VI presentssome options for strengthening the regional financialinstitutions to face the challenges of financialglobalization and Latin American integration. SectionVII analyses the feasibility of a strengthened regionalfund and the size it should have in order to be consideredcapable of coping with the challenges of globalization.Finally, section VIII presents some conclusions.
The recurrent international financial crises which haverocked the “emerging” economies have given rise to avigorous debate on possible reforms in the internationalfinancial architecture. Many reform proposals havebeen put forward, and some of them include thecreation of regional monetary bodies (see Ocampo,1999, pp. 68-70; Mistry, 1999; FLAR, 2000). This articleanalyses the importance of the role that could be playedby measures to strengthen the capability of regionalbodies to tackle financial “contagion” and promoteintra-regional trade and investment.
The Latin American countries have been particu-larly active in efforts to establish subregional financialinstitutions to come to the aid of countries with bal-ance of payments problems. There are also regionaland subregional mutual payments mechanisms in LatinAmerica which are designed to reduce the need to re-sort to foreign exchange to finance payments amongtheir members. Although these institutions have playedan important role in the last two or three decades, theyneed to be strengthened in order to face up to the chal-lenges of globalization and become the regional linkcurrently absent from the international financial archi-tecture.
Strengthening the regional financial institutionswould have the following objectives:
i) helping member countries to cope with balance ofpayments crises due to reasons unconnected withthe quality of their macroeconomic policies;
ii) promoting regional integration by furtheringgreater stability of the bilateral exchange rates be-tween the countries of the region;
The author wishes to express his thanks for the comments madeon a previous version of this study by an anonymous referee andby Reinaldo Bajraj, Javier Camboni, Roberto Guarnieri, FelipeJiménez, Edgard Moncayo, Humberto Mora, José Antonio Ocampoand Rogério Studart. The preparation of the study was greatly fa-
cilitated by the excellent research assistance of Ricardo Mayer andVíctor Zuñiga. This study was financed by an ECLAC project whichreceived resources from the Latin American Reserve Fund (FLAR)and the Andean Development Corporation (CAF).

33C E P A L R E V I E W 7 3 • A P R I L 2 0 0 1
STRENGTHENING REGIONAL F INANCIAL COOPERATION • MANUEL R. AGOSIN
IIThe latest generation of financial crises
The international financial crisis set off by the depre-ciation of the Thai baht in July 1997 had worldrepercussions and severely affected the developingcountries which had managed to gain access to theinternational capital markets. In this context, the LatinAmerican countries were not able to isolate theireconomies from the vicissitudes of international capi-tal. As from 1998, the region’s growth rate markedlydeteriorated, and in 1999 they turned in their worsteconomic performance since the debt crisis.
In the paragraphs below we will define moreprecisely what the word “contagion” means in thiscontext. Suffice it to say at this point that we considercontagion to mean a pure external shock which hasnothing to do with the virtues or shortcomings of thedomestic economic policy of the countries affected byit. Generally speaking, the term contagion has been usedwith reference to the financial field: a financial crisisacts as a signal, and this signal sets off forms of herdbehaviour in the capital markets. Although this is oneof the most important forms of contagion in a finan-cially globalized world economy, it is by no means theonly form, however. There are countries in LatinAmerica which participate only marginally in theglobal financial markets but have nevertheless been se-verely affected by the indirect effects that events in thosemarkets have on their terms of trade or export volumes.For these reasons, we use the term contagion in abroader sense which also naturally covers capital flightcaused by international financial problems in othercountries or by interest rate rises in the industrializedcountries.
The contagion mechanisms suffered by the regionduring the most recent world financial crisis were ofvarious types:
i) there was trade contagion through the impact onthe terms of trade caused by the recession in theAsian economies (which were the hardest hit bythe financial crisis): the prices of various raw ma-terials exported by the Latin American countriesto international markets went down sharply.Although it is true that the fall in the prices ofexport products was offset to some extent in somecases by lower prices of some imported products
(especially oil and manufactures), there was nev-ertheless a deterioration in the terms of trade ofmost of the countries;1
ii) trade contagion also occurred through a contrac-tion in the volumes of exports to Asia, withparticularly severe effects on the countries forwhich the Asian economies are important markets,but it also took the form of a disproportionatecontraction in intra-regional exports, which areconcentrated on manufactures;
iii) financial contagion was serious for most of thecountries of the region, and it had particularly ad-verse effects. As a result of the run on capital byall the emerging countries, the banks and compa-nies of many countries of the region had difficultyin renewing their lines of credit. The spreads atwhich they could sell new corporate bondsincreased dramatically. In some cases, even first-linecompanies in the region simply could not sell bondsat any price, while foreign portfolio investorsliquidated their holdings;
iv) financial contagion also had a purely domesticaspect. The sudden increase in exchange riskcaused domestic agents to shift their investmentsfrom national-currency securities to others denomi-nated in dollars, thus aggravating the trend towardsdepreciation of the local currency. Companies withforeign-exchange liabilities, accumulated duringthe long period of easy availability of foreign capi-tal, hastened to cover themselves, thus further ag-gravating the crisis caused by the flight of foreigncapital and the non-renewal of loans by the inter-national banking system;
v) all the countries (except those with fixed exchangerates) registered excessive degrees of exchange-rate depreciation in nominal and even in some casesreal terms, although some of these have now beenreversed.
Most of the countries of the region suffered both tradeand financial contagion, which was why the crisis hadsuch severe effects. The consequences of both types of
1 This study was completed before the oil price rises in the secondhalf of 2000.

C E P A L R E V I E W 7 3 • A P R I L 2 0 0 134
STRENGTHENING REGIONAL F INANCIAL COOPERATION • MANUEL R. AGOSIN
contagion can be relieved through the provision ofsuitable finance. In the case of trade contagion, if it isexpected that the deterioration in the terms of trade and/or the drop in export volumes are temporary and re-versible, the best policy is to obtain compensatory fi-nance to tide over the period of such problems. This isthe reason for the existence of the IMF CompensatoryFinancing Facility.
Financial contagion is also of a temporary nature.As the Mexican and Asian crises of the 1990s showed,inflows and outflows of capital follow each other in acyclical manner (a matter which will be dealt withbelow in greater detail). If balance of payments problemsare due to financial contagion, there would be groundsfor the provision of advance lines of credit to supple-ment the international reserves of the countries affected,thus saving their authorities from having to apply over-restrictive policies to reduce the external deficit.
In view of the globalization of finance, the growingparticipation of the countries of the region in the inter-national capital markets and the behaviour of both do-mestic and international financial agents make it verylikely that financial crises will be increasingly frequentand increasingly due to contagion from outside. Thereforms proposed in the international financial archi-tecture are designed to reduce the likelihood that suchcrises will occur and protect the developing countriesfrom the worst effects of those that do take place.2
This means that the balance of payments crises nowbeing suffered by many countries may have little to dowith erroneous macroeconomic policies. The typicalbalance of payments crises to which we were accus-tomed in the region in the past were due to currentaccount deficits which it became impossible to finance.The macroeconomic policies associated with thesecrises included heavy fiscal deficits (even in cyclicboom periods), which had to be monetarized in someway, and over-expansionary monetary policies or in-sistence on the maintenance of an overvalued exchangerate (perhaps because domestic inflation had beenhigher than international levels for a substantial lengthof time). Imprudent macroeconomic policies led to ul-timately unsustainable current account deficits and toloss of reserves by the Central Bank. It is this kind ofsituations that the IMF is prepared to tackle by grantingits conditional loans.
The region is not of course entirely free as yet ofthese “first generation crises” (whose formal expres-sion as a model may be found in Krugman, 1979). Whatdistinguishes the present crises from those crises is thatthey now occur in several countries in sequence, oftenwithout any evident causes attributable to the macro-economic management of the countries concerned. Thisis what we call “financial contagion”. As we shall seebelow, this sequential nature was very evident in theAsian financial crisis.
An empirically verifiable constant is that countrieswhich become victims of this new generation of crisesassociated with globalization first of all receive a heavyinflow of capital. This is what happened in Mexico inthe period before 1994, and it also happened in all thecountries most severely rocked by the recent financialcrisis: Thailand, Malaysia, Indonesia, the Philippines,South Korea, Russia, Brazil and Argentina. Thus, to someextent financial crises are gestated during periods ofexcessive capital inflows, especially of short-termcapital (Rodrik and Velasco, 1999). The massive inflowof resources into certain countries is due to a combina-tion of factors, including the favourable perceptions offoreign financial investors or simply expectations thatthe currency in question will appreciate.3 Since interestrates are normally higher in emerging markets than inthose of the developed countries, expectations ofexchange-rate appreciation can spark off heavy capitalinflows.
Those inflows are often by no means marginal foran individual recipient. In emerging economies, theymay amount to over 10% of the gross domestic prod-uct (GDP). Furthermore, as the financial markets of thoseeconomies are very shallow, capital movements oftenform a very high proportion of the national finances.As may be seen from table 1, whereas in the developedcountries international capital movements hardly everexceed 5% of the (M2) money supply, in emergingeconomies they may amount to as much as 25%.
Consequently, waves of capital inflows can causeserious negative externalities in the developing countries,for they can generate current account deficits, lead toexchange rate appreciation, give rise to asset pricebubbles, and increase the national financial system’s
3 This is a rather sui generis international version of Keynes’s“beauty queen contests” (Eatwell, 1997, p. 243). Thus, some agentsare more sensitive to what other agents plan to do than to the in-trinsic value of assets. When these agents predominate over the“fundamentalists”, financial markets can become extremely vola-tile.
2 There is extensive literature on this subject, and many reformproposals have been put forward. See for example Ocampo (1999),Eichengreen (1999), Agosin (1999) and Ahluwalia (2000).

35C E P A L R E V I E W 7 3 • A P R I L 2 0 0 1
STRENGTHENING REGIONAL F INANCIAL COOPERATION • MANUEL R. AGOSIN
vulnerability to a run on short-term credits or failure torenew them. Moreover, they often raise the ratio ofshort-term debt to the international reserves. Likewise,the short-term nature of capital flows means thatinvestors can easily leave the country in masses andcreditors may refuse to renew their loans as soon asthey sense some problem.
When there is a change in the fundamentaleconomic variables, at some point the perceptions ofvulnerability begin to grow and the inflow of capitalshrinks and may even turn into a net outflow, withmassive flight of resources. When a country has lost acertain volume of its reserves, foreign and domesticfinancial investors perceive the existence of exchangerisk, and when fears of devaluation begin to gatherforce, everyone begins to liquidate their nationalcurrency holdings or try to cover their foreign-exchangeliabilities, thus speeding up the loss of reserves andprecipitating an acute crisis.
As the banks were major recipients of foreigncredits during the boom period, outflows of capital areassociated with the non-renewal of credits and causeserious banking crises. Because of this, the last-generation crises are usually “twin crises” affecting thebalance of payments and the banking systemsimultaneously (Kaminsky and Reinhart, 1996;Kaminsky, Lizondo and Reinhart, 1998).
It should be stressed that in the present context bothinflows and outflows of capital are subject to contagion.In the case of inflows, portfolio investors and bankcreditors tend to underestimate the risks involved ininvesting or lending money to agents in the recipienteconomy. Inflows of capital into an emerging economyare usually accompanied by inflows into other countrieswith similar characteristics. In contrast, at times ofabrupt outflows there is a tendency to overestimate therisks involved in staying in them (Ocampo, 1999, p.21). The vast majority of the Latin American economiesreceived enormous amounts of portfolio investmentsand international bank loans in the 1990s. Among theseeconomies, some had already carried out profoundeconomic reforms, while others were just embarkingon that process (Calvo, Leiderman and Reinhart, 1993;Devlin, Ffrench-Davis and Griffith-Jones, 1995;Ocampo and Steiner, 1994). Consequently, althoughmany countries had made great progress in theirmacroeconomic management, many were veryvulnerable to contagion from financial stampedes likethose that occurred after the Asian crisis, the Russiancrisis (July 1998) and the two Brazilian crises (August-September 1998 and January 1999).
When there are capital inflows which are verylarge in comparison with the size of the financialmarkets of the recipient economies, macroeconomicmanagement becomes a very complicated business inthe latter. Although it is possible to counteract theexpansionary effect of the inflows to some extent withrestrictive fiscal and monetary policies, no LatinAmerican country has been completely successful inthis, even in the case of those like Chile and Colombiawhich made this an explicit objective of their economicpolicy. Experience shows that the wisest course foremerging economies is to adopt prudential regulationson capital flows.
Although there is evidence that some forms offinancial contagion are simultaneous (simultaneousincreases in the spreads that debtors in emergingeconomies must pay, for example), the experience ofthe last few years indicates that international financialcrises tend to occur sequentially. After one economybegins to suffer from capital outflows, internationalinvestors and creditors begin to have doubts about thecreditworthiness of debtors in other countries whichmight display similar symptoms. In some cases, thecontagion is due to the effects of the initial crisis: theexchange-rate depreciation caused by the first crisismakes the exports of other economies with similarexport profiles less competitive.
TABLE 1
Developed and emergent economies (14 countries):Net capital flowsa as a percentage of M2b
Country 1990-1998 1990-1994 1995-1998
Japan 1.7 1.8 1.7Canada 3.1 4.2 1.7United States 3.1 2.1 4.2Switzerland 5.7 5.3 6.0South Korea 5.7 4.7 7.0Brazil 7.2 3.3 10.4Indonesia 9.1 8.9 8.4Malaysia 11.2 13.2 6.3Venezuela 14.5 18.5 11.4Chile 18.6 18.9 19.2Colombia 18.5 11.8 26.0Mexico 18.9 23.8 12.9Ecuador 19.6 16.4 19.3Argentina 22.0 25.5 18.2
Source: IMF (2000).
a Net inflows or outflows (outflows in the case of Switzerlandand Japan, inflows in all the other countries).
b Currency outside banks, demand deposits, term deposits andsavings deposits.

C E P A L R E V I E W 7 3 • A P R I L 2 0 0 136
STRENGTHENING REGIONAL F INANCIAL COOPERATION • MANUEL R. AGOSIN
IIIThe role of regional funds incoping with financial crises
As already noted at the beginning of this article, thephenomena described here have given rise to theperception that the international financial architectureneeds major modifications and have set off a veryinteresting international debate on the elements thatshould make up this new structure. One conclusionreached is that much greater importance should beattached to the regional monetary institutions as an extraline of defense against financial crises and contagion.
This objective of strengthening the regionalfinancial institutions does not mean making them takethe place of the IMF, which is a key institution in theinternational monetary system. No regional fund wouldhave either the volume of resources of the IMF or thepolitical capacity to mobilize large-scale financialrescue operations when necessary. Moreover, manyinternational financial problems go beyond the regionalambit and require global solutions.
Regional funds could however be an important linkbetween individual countries and a strengthened andreformed IMF, thus giving the system greater capacityto promote international financial stability.Furthermore, if international-level reforms were notcarried out, this would be all the more reason for theLatin American countries to strengthen their lines ofdefense against financial crises by strengtheningregional cooperation.
There are a variety of reasons for strengtheningregional funds. All the Latin American countries arecontinually exposed to temporary external shocks dueto fluctuations in their terms of trade, higher interestrates on international financial markets, or financialshocks like those described earlier. These shocks canbe tackled in various different ways. One way is self-insurance, which consists of maintaining higher levelsof international reserves than those currently prevailingor arranging contingency credit lines with theinternational banking system. This solution involvestwo problems: the opportunity cost of the reserves ishigh, and the contingency credits that each countrycould expect to receive from the international bankingsystem are costly and quite modest in size. A secondoption would be to resort directly to the IMF. The Latin
American countries will undoubtedly continue to dothis when they run into severe financial difficulties, butthe Fund usually imposes conditions which are notalways the right ones for dealing with the problem, andits decisions are usually too slow to cope with problemsthat call for quick responses. Finally, the Latin Americancountries have very little influence on the IMF’s decisionsand criteria.
For all these reasons, making use of a regional bodycould be an attractive option. A regional monetary bodycould respond effectively to essentially regionalproblems. The desirability of having adequate reservesto deal with common problems is thus a powerfulargument in favour of establishing what would in effectbe an international credit union in the region. If at thesame time financial crises have an element of regionalcontagion, the arguments in favour of forming regionalfunds to deal with them become all the stronger,especially if avoiding a balance of payments crisis inone country of the region would mean avoiding similarcrises in other countries of the same region. In otherwords, a regional financial body would have substantialexternalities.
Regional contagion was clearly visible in themost recent financial crisis, which had two phases,both of them with strong regional implications. Thefirst phase was markedly Asian: it began in July 1997in Thailand and in the second half of the year itgradually spread in turn to almost all the emergentmarkets of Asia: Indonesia, the Philippines,Malaysia, Hong Kong, Taiwan, Singapore and finally,in November of that year, South Korea. The crisiswas no respecter of persons, affecting not onlycountries with high levels of short-term indebtednessin proportion to their reserves (Thailand, Indonesia,Malaysia and South Korea) but also countries with avery sound reserve situation, such as Hong Kong andSingapore, and not only countries with high currentaccount deficits as a proportion of their GDP (Thailandand Malaysia) but also countries with only moderatedeficits (South Korea and Indonesia) and eveneconomies with significant surpluses (Singapore andHong Kong).

37C E P A L R E V I E W 7 3 • A P R I L 2 0 0 1
STRENGTHENING REGIONAL F INANCIAL COOPERATION • MANUEL R. AGOSIN
In 1998, after the Russian crisis, the Brazilian realhad to withstand a first speculative onslaught in Augustand September. This worsened the crisis in LatinAmerica, which was already experiencing substantialbut still manageable trade and financial difficulties. Bythe middle of 1998, with the mass exit of portfolioinvestors from the emergent economies and the negativerevision of Latin American debtors by internationalcreditors, the countries of the region had already begunto experience serious balance of payments problemswhich called for severe adjustment policies. It was thesecond –and this time successful– attack against thereal in January 1999, however, which sparked off themost acute phase of the crisis in the other countries ofthe region.
If the financial crises were not of a sequentialnature, a regional fund would be unlikely to havesufficient resources to deal with cases of capital flightfrom several countries simultaneously. As crises of thisnature can indeed occur (the debt crisis in the 1980swas an outstanding example of this), regional funds
cannot play the role of an institution like the IMF insolving such crises.
If crises gradually spread from one economy toanother, a regional fund capable of stemming the capitalflight from the first country in the region affected wouldsignificant reduce the danger for the other countries ofthe region, assuming of course that the initial crisis wasnot due to bad macroeconomic management. A regionalbody designed to control cases of contagion would notbe suitable for dealing with the latter situation, whichcould only be dealt with by the international provisionof liquidity on suitable conditions.
Regional funds are also justified on other grounds.The countries of a region will have a much greater sayin the policy of a regional fund than in that of anorganization like the IMF, and a regional fund wouldtherefore meet the needs of its member countries muchmore completely. This can be very important when tryingto coordinate monetary and economic policies in orderto attain a more advanced stage in regional integration:a matter which will be addressed in the next section.
IVThe role of regional fundsin furthering integration
The need to strengthen regional financial cooperationgoes beyond the pursuit of a common line of defenseagainst possible contagion. Regional integration is amajor objective of the development policy of all theLatin American countries. In recent years there havebeen substantial advances in the trade-related aspectsof integration, both within the framework of themultilateral integration agreements already operatingin Latin America –MERCOSUR, the Andean Community,the Central American Common Market (CACM) and theCaribbean Community (CARICOM)– and betweenindividual countries. Likewise, since the beginning ofthe 1990s a number of quite comprehensive bilateraltrade agreements have been signed. Both themultilateral and the bilateral agreements have helpedto increase intra-regional trade significantly, and indeedit has grown faster than inter-regional trade.
However, the lack of harmonization ofmacroeconomic policies and the sharp fluctuationswhich have taken place in bilateral exchange rates have
militated against faster progress towards tradeintegration and mutual investments among thecountries of the region. In the Andean Community, thestrong growth of mutual trade registered in recent yearscame to an abrupt stop in 1998 because of the financialcrisis.
So far, governments have acted on the implicitassumption that progress towards trade integration canbe achieved by concentrating on tariff reduction andthe removal of non-tariff barriers to trade, while leavingexchange and financial matters for a later stage. Perhapsnow is the time to reverse these priorities. Experiencehas shown time and again that exchange rate volatilityand financial crises seriously upset trade flows and endup in practice by dismantling the formal arrangementsof the trade agreements. An international financial crisiscan suddenly cause the exchange rate of a country vis-a-vis its regional partners to vary by a much largerpercentage than its most-favoured-nation tariff. Thisshows that exchange-rate stability can be more

C E P A L R E V I E W 7 3 • A P R I L 2 0 0 138
STRENGTHENING REGIONAL F INANCIAL COOPERATION • MANUEL R. AGOSIN
important than tariff reductions for promoting regionaland subregional trade flows.
MERCOSUR itself –the most ambitious subregionalintegration process of recent time– has come underconsiderable pressures precisely because of theinstability of the exchange rate prevailing between itstwo biggest members, caused by the impact on theeconomies in question of changes in direction of capitalflows and the lack of macroeconomic and exchangerate coordination between countries.
There are various reasons why financial crises areso harmful to mutual trade. When a country begins tosuffer from balance of payments problems, twophenomena occur in particular: its exchange rate isdepreciated vis-a-vis the currencies of its neighbours,and there is a fall in aggregate demand. This latter effectcan be further amplified by the adoption of restrictivepolicies aimed at tackling the balance of paymentscrisis. The trade-related effects of these phenomena hitneighbouring countries particularly hard, since they findit harder to sell their own products on the market of thecountry suffering the crisis, while at the same time theyhave to face stronger competition from the exports ofthat country.
Latin America’s regional trade is stronglyconcentrated on manufactures, the demand for whichis highly sensitive to fluctuations in the exchange ratesand aggregate demand of other members. This is notso in the case of commodities, which are mainlyexported to the industrialized countries.
Instability in the financial flows to Latin Americancountries gives rise to great volatility of bilateralexchange rates within the region and depresseseconomic activity in all the countries of the region.These two factors are highly prejudicial to theachievement of closer economic integration.
Generalized financial crises are particularlyharmful to integration. When a country begins to sufferfrom contagion from other crises in the region, itscurrency is devalued and its producers recover thecompetitiveness they lost during the capital inflowboom that preceded the crisis. The positive effects ofthis currency devaluation are obtained at the expenseof its regional partners, however. Furthermore, it cannottake full advantage of the situation because its regionalpartners are suffering recessions on account of the crisis.The abrupt changes in the competitiveness of Brazilianproducers compared with those of Argentina during therecent financial crisis are a copybook example of this.
There can be no doubt, then, that in order to achievegreater integration of trade and investments, greater
exchange stability is needed among the countriesseeking to integrate. Without this, it is unlikely thatmuch more progress can be made in the region towardsgreater integration. This does not mean that we shouldhasten to adopt a common currency. Integrationprocesses take place gradually, and in Latin Americathey are still at an early stage. It is essential, however,to take the first steps towards financial integration, forwhich bilateral exchange rates must be much morestable than they have been so far.
We need only recall the experience of Europe. Thewhole of the first stage of European integration tookplace within the framework of the exchange ratestability provided by the system of fixed (but adjustable)exchange rates adopted at Bretton Woods. When thatsystem broke down in 1971-1973, much of the workfor establishing a customs union had already been done.Nevertheless, the members of the European EconomicCommunity quickly succeeded in giving their bilateralexchange rates a degree of stability that would havebeen impossible if they had decided to use the systemthat began to prevail as from 1973 for convertiblecurrencies: flexible exchange rates with a dirty float.The European countries, however, decided first thattheir currencies would float together within what theycalled the “snake”, which limited the fluctuations inbilateral exchange rates. They the went on to adopt theEuropean Monetary System (EMS), with an exchangerate mechanism which fixed a central exchange ratefor each currency with respect to the European CurrencyUnit (ECU), with narrow ranges of permissible floatsaround that central parity. The final stage in this processwas reached early in 1999, with the establishment ofthe Euro.
The stormy moments that the exchange ratemechanism had to weather during the financial crisesof 1992-1993 did not prevent final progress towardsthe irrevocable fixing of exchange rates and theadoption of the Euro by 11 European countries. Therecan be no doubt that the exchange rate stability whichexists among the European countries, to which theyare politically committed, has been a powerful impulsein favour of trade integration and real investment flowsin Europe.
The existence of Community monetary institutionsand concerted intervention in exchange markets havehelped the European countries to attain the high degreeof exchange rate stability they have enjoyed since thecollapse of the Bretton Woods system.
One of the crucial differences between the mem-ber countries of the European Union and the Latin

39C E P A L R E V I E W 7 3 • A P R I L 2 0 0 1
STRENGTHENING REGIONAL F INANCIAL COOPERATION • MANUEL R. AGOSIN
American nations is that the European countries haveconvertible currencies and can carry out interventionsin the exchange markets in their own currency. Fur-thermore, their central banks (and now likewise theEuropean Central Bank) have lines of credit from theUnited States Federal Reserve and the Bank of Japanfor intervening in exchange markets.
The Latin American countries are at a seriousdisadvantage in this respect, because as the currencyfor intervention is the U.S. dollar, they must use theirreserves for this; furthermore, the possibility ofcoordinated intervention by their central banks toprevent sharp fluctuations and misalignments inbilateral exchange rates is much weaker, and they donot enjoy lines of credit from the Federal Reserve. Onlyat times of crisis, and even then only in the case of thebiggest countries, can they have a chance of obtainingemergency financial resources from that source.Moreover, this only occurs when a crisis has alreadybroken out, and only under an adjustment programmeagreed with the IMF.
All this suggests that monetary and exchange sup-port for integration will only be available from a muchfuller system of regional financial institutions than thatwhich currently exists. In order for Latin America toachieve greater trade integration, it is important to attaingreater exchange rate stability among the countries of theregion, which would also promote the growth of mutualinvestments. This process, which has already begun, isessential for achieving fuller economic integration.
The objectives of ensuring financial resources forlimiting contagion phenomena at the regional and sub-regional levels and securing greater bilateral exchangerate stability are of course interrelated. Financial criseshave an almost immediate effect on exchange rates, soif a regional financial institution fulfils the objective ofpreventing financial crises among its member countriesit will likewise contribute to greater exchange stabilityamong them.
Exchange rates are also sensitive to economicpolicy mismatches. Consequently, by promoting greatermacroeconomic policy convergence, the existence of aregional financial institution would check exchange ratevolatility among its member countries.
As already noted, financial crises are gestatedduring booms in foreign capital inflows. In order toavoid such crises, it is essential that countries shouldtake measures to moderate capital inflows when thesethreaten to become excessive and to cause adeterioration in their macroeconomic balances. One ofthe missions of a regional financial institution wouldbe to facilitate the exchange of information and thuspromote common standards for bank regulation andprudential regulation of capital flows.4 As destabilizingcapital inflows also include flows which do not passthrough the banks (such as direct loans to localcompanies and inflows of portfolio investments),these prudential regulations are not only limited toadequate bank supervision, although of course thisis essential.
VA brief review of some existing regionalexternal payments support institutions
Latin America already has financial and monetary in-stitutions which carry out to some extent some of thefunctions that we consider a regional fund should have.They are the Latin American Reserve Fund (FLAR), theMutual Payments and Credit Agreement (CPCR) of theLatin American Integration Association (ALADI), theCentral American Clearing House of the Central Ameri-can Common Market (CACM), the Latin American Mon-etary Stabilization Fund of the CACM, and the Carib-bean Multilateral Clearing Facility of CARICOM.5 Ananalysis of their activities and the amounts of finance
these bodies provide would therefore be a good start-ing point for our study. We will concentrate our atten-tion in particular on two of these institutions: FLAR andCPCR.
4 The recent experience of Chile and Colombia in this field hasbeen analysed in Agosin and Ffrench-Davis (1997), Le Fort andLehmann (2000), Barrera and Cárdenas (1997) and Ocampo andTovar (1999).5 For a description of other financial cooperation mechanisms inthe region, see ECLAC (1990).

C E P A L R E V I E W 7 3 • A P R I L 2 0 0 140
STRENGTHENING REGIONAL F INANCIAL COOPERATION • MANUEL R. AGOSIN
1. The Latin American Reserve Fund (FLAR)
FLAR was originally set up in 1978 by the Andean Com-munity as the Andean Reserve Fund. In 1991 its thenmembers (Bolivia, Colombia, Ecuador, Peru and Ven-ezuela) decided to throw it open to participation by otherLatin American countries, so that it became in effect aregional financial institution. At the end of June 1998,FLAR had assets of some US$ 1,032 million, made upof the quotas of its member countries and its capital-ized net profits (FLAR, 1998). With the incorporation ofCosta Rica in mid-2000, FLAR began a process of ex-pansion to bring in Latin American countries whichare not members of the Andean Community, in orderto increase the Fund’s scope (FLAR, 2000).
The stated objectives of FLAR are:
– To provide member countries with support whenthey suffer from balance of payments problems.
– To help in the harmonization of macroeconomicand exchange policies in order to give countriessupport in complying with the commitments en-tered into under the Cartagena Agreement, whichset up the Andean Community, and the Treaty ofMontevideo, which set up ALADI.
– To improve the conditions for investment of mem-ber countries’ international reserves.
FLAR is financed primarily from the quotas paid by thecentral banks of its member countries. Another way ofsecuring funds is to accept time deposits by centralbanks and other authorized bodies. During the 1997/1998 financial year (1 July 1997 to 30 June 1998)central banks and the Andean Parliament made depositsamounting to US$ 1,837 million, with the balance at30 June 1998 standing at US$ 237 million (FLAR, 1998).
FLAR’s main activity is the provision of supportservices for its members’ balances of payments. Thus,FLAR is a form of credit union along the lines of the IMF.The central banks of member countries can draw loansup to 2½ times their paid-up contribution of capital, inthe case of Colombia, Peru and Venezuela, and up to 3times that amount in the case of Bolivia and Ecuador.
FLAR provides the following services for the centralbanks of its member countries:
– Balance of payments support credits: these aregranted for up to four years, including one year’sgrace, subject to macroeconomic performancecommitments.
– Credits for restructuring the external public debt:these are granted under co-financing with other
multilateral bodies, with a term of up to four years,including one year’s grace.
– Liquidity credits: these are designed to help coun-tries to cover transitory liquidity needs throughcredits with a term of up to one year.
– Contingency Financing Facility: this facility, setup in 1998, is designed to help member countriesto finance temporary balance of payments imbal-ances of external origin not due to fundamentalinconsistencies in the balance of payments equi-librium conditions. This finance is for a term ofsix months, non-renewable. Loans granted by thisfacility must be guaranteed by the debtors withsecurities acceptable to FLAR.
– “Andean Peso”: this was created in order to facili-tate payments between central banks and other au-thorized holders. It has not been used much so far.
Thus, FLAR covers almost the whole range of activitiesthat a strengthened regional fund should have. But howimportant, in quantitative terms, is the finance providedto the central banks of member countries in order toprevent or relieve balance of payments crises, particu-larly those due to exogenous causes, and how muchdoes it contribute to the stability of bilateral exchangerates?
FLAR’s importance as a supplier of finance dependson its quotas, which are its only stable source of fi-nance. As may be seen from table 2, the quotas FLAR
receives from its member countries (except in the caseof Venezuela) are significant with respect to their IMF
quotas. Furthermore, access to FLAR resources multi-plies the value of those quotas by a factor of up to 3.5for the less developed members (Bolivia and Ecuador)and 2.5 in the case of the other three members. Thismeans that Bolivia and Ecuador have access to FLAR
loans worth US$ 437.5 million, which is considerablymore than they could obtain from the IMF, which rarelygrants loans larger than the borrower’s quota, and whenit does, grants them in tranches which are disbursedonly slowly, and against proof that the borrower is com-plying with the conditions laid down in the Letter ofIntent. The FLAR loans are not devoid of conditions, butthese tend to be less strict. Disbursements are usuallyquite rapid, with only a meeting of the Board of Direc-tors being needed to examine requests for loans greaterthan the respective quota, which, if approved, are dis-bursed forthwith.
For the smaller member countries, FLAR credits rep-resent a substantial addition to their reserves and to theircapacity to cope with an international financial crisis.

41C E P A L R E V I E W 7 3 • A P R I L 2 0 0 1
STRENGTHENING REGIONAL F INANCIAL COOPERATION • MANUEL R. AGOSIN
This is not so in the case of the three largest members,since their international reserves are a high multiple oftheir quotas in FLAR.
The ratio between a country’s short-term debt andits international reserves may be considered as a reli-able indicator of that country’s vulnerability to a runon its currency. Table 2 gives two different calculationsof this ratio: between the short-term debt and the re-serves as at the end of 1997, and between that debt andthe reserves plus the maximum credit available fromFLAR. As may be seen from the table, access to FLAR’sresources significantly reduces the external vulnerabil-ity of Bolivia and Ecuador, but not that of the threebiggest members.
Thus, in spite of its modest resources, FLAR is al-ready playing an important role in the international fi-nances of the Andean Community members. If FLAR ora successor with expanded capacity is to become aninstitution capable of providing the finance needed byits member countries, however, it will need consider-ably larger resources. Various ways of securing theseare put forward in section VI below.
2. The ALADI Mutual Payments and CreditsAgreement (CPCR)
CPCR began to operate in 1969, its aim being to minimizethe use of the ALADI member countries’ internationalreserves in the settlement of external trade transactionsamong them. The system has two components: aclearing house, with the Central Reserve Bank of Peruacting as banking agent, and mutual lines of credit withterms of four months. The banking agent carries out
settlements between creditors and debtors every fourmonths. The central banks have given each otherbilateral lines of credit in dollars which must likewisebe settled every four months. The system has been asuccess, because a high and growing percentage ofintra-regional trade has been covered by its operations(ECLAC, 1990). In 1990, the coverage of operationshandled by the Agreement compared with the total valueof intra-regional trade was almost 100%. At the sametime, the foreign exchange transferred by the bankingagent amounted to less than 20% of the total value ofthe transactions. The existence of the CPCR has thusmeant a substantial saving of foreign exchange by thecentral banks of the ALADI member countries.
The system was put to the test during the 1980scrisis. Because of that crisis, some central banks haddifficulty in covering their debit balances and had toleave the system temporarily, negotiating bilateral termsof payment with the creditor central banks. As thefinancial crisis eased, however, the central banksreturned to the system, which had recovered all its mem-bers by 1988.
The 1981 Santo Domingo Agreement establishedarrangements for granting credit to central banks whichwere unable to settle their debit balances within thefour-month term. These arrangements provide creditfor an additional four months, renewable for up to oneyear. The Agreement established a special creditprogramme for countries with general balance ofpayments deficits and those suffering from naturaldisasters. In the first case, the term of the credit is fortwo years, renewable for a further year, while in thesecond case the term is for two years, renewable on a
TABLE 2
Latin American Reserve Fund (FLAR):Relative size of quotas at end of 1997(Amounts in millions of dollars; ratios in percentages)
Bolivia Colombia Ecuador Peru Venezuela
FLAR quotas 125 250 125 250 250IMF quotas 170 757 296 628 2 633International reserves 1 359 9 611 2 213 11 306 17 704Short-term debt 374 5 759 2 069 6 832 4 395Debt/reservesa 27.5 59.9 93.5 60.4 24.8Debt/reserves asaugmented by FLARb 20.8 56.3 78.1 57.3 24.0
Source: IMF (1998); World Bank (1999); FLAR (1998).
a Ratio of short-term debt to reserves.b Ratio of short-term debt to reserves as augmented by maximum indebtedness with FLAR.

C E P A L R E V I E W 7 3 • A P R I L 2 0 0 142
STRENGTHENING REGIONAL F INANCIAL COOPERATION • MANUEL R. AGOSIN
bilateral basis with the creditor central banks for fiveyears.
Unlike the FLAR, the CPCR does not have resourcesof its own, but simply brings into effect the lines ofcredit that the central banks agreed to previously. When
the crisis spread over the whole region, however, thosebanks were not in a position to make the contributionsthey had promised. This is why it is essential that sucha system of payments should operate in conjunctionwith a larger regional institution with greater resources.
VIOptions for strengthening theregional payments bodies
FLAR is undoubtedly an excellent starting point for mea-sures to strengthen the regional financial institutions:it already operates on a significant scale, and the func-tions its member countries have assigned it are exactlythose that a regional financial mechanism should have.In this section we will deal with various aspects thatmust be taken into account in considering a possibleagreement by the countries of the region to set up aLatin American financial institution.6
1. Membership
The regional fund would be open to all the countries ofLatin America and the Caribbean. Participation in aregional fund along the lines of FLAR could be anattractive proposition. The reserves deposited in it aremultiplied at times of crisis, and moreover the fundcould gain access to resources not available to theindividual countries.
2. Resources
The resources available to a regional fund must be com-mensurate with its responsibilities. There are variousoptions in this respect:
a) Increases in the paid-up capital of the fund
The fund’s resources would increase with the entry ofnew members. Consideration could also be given to an
increase in the level of the quotas, which currently rep-resent between 9% and 1.5% of the FLAR member coun-tries’ reserves.
b) Contingency credit commitments
The central banks of the member countries couldprovide the fund with lines of credit that would only beactivated in the event of financial emergencies of apredetermined nature. This solution would be similarto the General Arrangements to Borrow (GAB) and NewArrangements to Borrow (NAB) between theInternational Monetary Fund and the central banks ofthe Group of Ten and Switzerland. The IMF also has aparallel agreement with Saudi Arabia. Under the GAB,11 industrialized countries or their central banks haveagreed to lend the Fund certain volumes of resourcesat market interest rates in situations of financial crisiswhich cannot be tackled with the IMF’s regularresources. The NAB, which were approved in November1994 as a result of the Mexican crisis, are similar to theGAB, except that they involve 25 countries. Theresources available to the IMF under both arrangementscan be loaned to both participating and non-participating countries. A mechanism of this type wouldprovide the Latin American fund with resources thatare much greater than its capital, for coping withfinancial emergencies in its member countries.
c) Indebtedness on international capital markets
The IMF is not authorized to assume indebtedness inorder to finance its rescue operations for countries suf-fering from financial crises. There is no impediment toa Latin American institution doing this, however. ALatin American fund could imitate the World Bank andhave two classes of capital: one would consist of thequotas of the central banks, while the other would serve
6 We are not necessarily suggesting that FLAR should become thestrengthened regional monetary body referred to in this article. Theexact way in which the region should progress from the presentinstitutions to one with greater resources and capacity for action isa political question which goes beyond the scope of this article.The aim of this section is simply to outline the features that a fu-ture continental-scale financial body should have.

43C E P A L R E V I E W 7 3 • A P R I L 2 0 0 1
STRENGTHENING REGIONAL F INANCIAL COOPERATION • MANUEL R. AGOSIN
as a guarantee for the fund to take out debt directly onthe market. This option would still be conservative, aseven under this system the gearing ratio of the fundwould still be less than 1.
Would the international financial markets bewilling to accept long-term bonds from a LatinAmerican fund, and would the spread for the fund’ssecurities be less than for those of its member countries?The answer to both questions is probably affirmative:the joint guarantee of all the fund members wouldnecessarily be better than in the case of each of themindividually, since the financial capacity of a group ofcountries acting together is greater than that of thecountries individually.7
By increasing the availability of financialresources, this option would endow the fund with greatcapacity to help member countries with financialproblems.
d) Contingency credits with the private bankingsystem
The fund could negotiate lines of credit with theinternational private banking system, to be activated inthe event of financial crises threatening membercountries. The central banks of Argentina and Mexicohave already done this on an individual basis. Theintervention of a regional body could undoubtedly helpto obtain larger amounts of resources on better terms,however, as it would be backed up by all the centralbanks or governments of its member countries. Thisoption, together with that discussed in the previous sub-section, could make the fund attractive even for bigcountries needing finance at times of crisis on a scalethat could exceed the fund’s capacity.
e) Creation of “Latin American Special DrawingRights”
FLAR already has an instrument of this nature: the“Andean Peso”, but a Latin American peso that couldbe used in payments among the central banks of theregion would undoubtedly have more uses. A unit ofaccount of this nature could strengthen the CPCR andhelp to minimize the use of international reserves.
As in the IMF, the member countries of the fundand the CPCR would receive allocations of LatinAmerican pesos, which could be used in paymentsamong central banks to settle their debts in the CPCR.Countries which registered a net absorption of LatinAmerican pesos would undertake to pay off their netdebit balances when their balance of payments situationimproved or within maximum terms to be determinedby the Board of Directors of FLAR. This option wouldobviously call for close relations between CPCR and thefund. CPCR could even become a direct dependency ofthe fund.
f) Access to IMF resources
If the regional institutions were strengthened within thecontext of a reform of the international financial archi-tecture providing for the establishment of a network ofregional funds to complement the IMF in the event of acrisis affecting a number of countries of the region, theLatin American fund, like other funds, could serve asan intermediary for the availability of resources betweenthe IMF and the countries in question (Ocampo, 1999,p. 70). Likewise, the Latin American fund could bedesignated as a recipient of special drawing rights(SDRs), to which it could resort at times of crisis.8
3. Possible facilities of the fund and theirconditions
It would be necessary to lay down quite clearly theoccasions on which a country with balance of paymentsproblems could seek assistance from the fund. Thus,four types of balance of payments problems should bedistinguished: (a) temporary shortage of internationalliquidity; b) balance of payments crises due tofundamental imbalances in the member country’seconomic policy; c) balance of payments crises bycontagion, and d) balance of payments problems dueto a transitory deterioration in the terms of trade.
a) Liquidity credits facility
FLAR already has a facility for tackling transitoryliquidity problems, under which countries can makeuse of a certain proportion of their quotas (75% in the
7 It could be argued that the spread payable by the fund would be aweighted average of the spreads for the sovereign debt of itsmembers. We are assuming that the fund would enjoy substantialsynergies because it is an institution with the simultaneous guaran-tees of a group of countries. In this sense, the existence of the fundcould be seen as the solution to a problem of collective action.
8 In another study (Agosin, 1999) the present author argued that inorder to tackle acute crises in the international financial systemthe IMF could resort to extraordinary issues of SDRs, which wouldbe annulled when the system returned to normal. The mere exist-ence of such a possibility would make systemic crises less likely.

C E P A L R E V I E W 7 3 • A P R I L 2 0 0 144
STRENGTHENING REGIONAL F INANCIAL COOPERATION • MANUEL R. AGOSIN
case of the two less developed member countries and50% in the case of the other three) for a period of up toone year. A Latin American monetary institution couldincorporate this facility without much alteration.
b) Balance of payments support facility
This facility would be available to countries sufferingfrom balance of payments problems due to fundamen-tal imbalances in their exchange, monetary or fiscalpolicies. Such credits should be granted subject to strictconditions, along the lines of the IMF. The regional fundcould even conceivably act in a concerted manner withthe IMF in these cases.
c) Contingency credit facility
This facility would have two objectives: to discouragepotential speculators and to persuade membercountries to coordinate their economic policies moreeffectively.
If well designed, this facility would be used onlyinfrequently. It would be activated when a countrysuffered from a balance of payments crisis associatedwith capital flight that had nothing to do withfundamental macroeconomic imbalances. FLAR alreadyhas a contingency credit facility, approved quiterecently. However, the term it allows for repaying theloans (six months) is too short, and the resources it hasavailable for this purpose are too scanty.
In order to avoid moral hazard problems, membercountries would have to satisfy some minimum priorrequirements in order to have access to this facility.These could include progress in bank regulation,especially with regard to potential currency mismatchesbetween assets and liabilities; financial fragilityindicators (ratios between short-term debt and reservesand between reserves and M2), and current accountdeficit targets.
It is important not to add too many dimensions tothese prior requisites. The mere fact of a country losingaccess to the facility could set off capital flight.Therefore, although it is impossible to do without somedegree of prior conditionality, the fund should be freeto manage this flexibly and constructively.
In order for the facility to be of use in halting herdeffects on international markets, its disbursementsshould be quick and timely. If the interest rates chargedwere higher than for other operations of the fund, thiswould encourage user countries to repay the resourcesloaned as quickly as possible.
d) Compensatory financing facility
This facility would be activated when a country wasfacing balance of payments problems due to a transitoryand reversible deterioration in its terms of trade.Consequently, as soon as those terms improved,countries would be under the obligation to repay thebalance owed and/or loan resources to the fund, whichcould maintain a special account for this purpose.Debtor countries would pay interest, while creditorswould receive it. A further option would be to includein this facility, as in the case of the IMF, the possibilityof granting credits to cover needs connected withinternational interest rate rises.
As almost all Latin American countries sufferpronounced fluctuations in their terms of trade, eitherbecause the prices of their exports are volatile orbecause this is true of the prices of some specific imports(especially oil and grains). Terms-of-trade cycles arenot synchronized between countries. Indeed, themovements of some key prices (such as those of oil,for example) simultaneously improve the terms of tradeof some countries but depress those of others.9
It is therefore both possible and desirable that thereshould be a regional fund to help countries to cope withbalance of payments problems due to this structuralcondition of their economies. As there is a trade-offbetween the countries whose terms of trade deteriorateand those whose terms improve, a regional fund couldmake much better use of foreign exchange than thestabilization funds that some countries maintain for thispurpose. Countries which already have such fundscould contribute part of the resources deposited in themto the regional fund. As already mentioned, thesecontributions would be suitably remunerated.
There is generally no correlation betweenmovements in the terms of trade of the countries of theregion, so that it would be financially viable for aregional body to operate a scheme like that suggestedhere. For the period from 1981 to 1999, 55 coefficientsof correlation between the annual variations in the termsof trade of the pairs of countries were studied, but of
9 This is not only because some countries are exporters of oil whileothers are net importers. There is also an indirect effect on theprices of other industrial inputs. When oil prices rise, exports ofother commodities such as copper, iron ore or wood may go downif the oil price rises generate expectations that the economic activityof the industrialized countries will be adversely affected.

45C E P A L R E V I E W 7 3 • A P R I L 2 0 0 1
STRENGTHENING REGIONAL F INANCIAL COOPERATION • MANUEL R. AGOSIN
these only 18 were significantly different from zero.10
Four of the 18 coefficients were negative; all of theminvolved a gas or oil exporting and an importing country(Bolivia-Brazil, Brazil-Ecuador, Brazil-Venezuela andCosta Rica-Venezuela). Three of the coefficients ofcorrelation which were positive and significantlydifferent from zero were between gas or oil exporters(Bolivia-Venezuela, Ecuador-Venezuela and Bolivia-Ecuador), and one of them was between copperexporters (Chile-Peru). The results are shown in table3, with the coefficients which are significantly differentfrom zero in bold type.
A regional compensatory financing facility couldcoordinate its activities with the corresponding facilityof the IMF. If this were possible, the regional fund couldmobilize more resources and help the countries of theregion to make more use of the IMF facility.
4. Coordination of economic policy and banksupervision
A regional monetary institution could become a suitableand probably very effective forum for coordination of
the economic policies of the countries of the region inorder to encourage member countries to maintain thefundamental macroeconomic balances and thusminimize the possibility of financial crises.Coordination of policies, including those on capitalflows, is easier and more acceptable among peers thanwhen it is imposed by a far-off institution which maybe seen as hostile. A strengthened Latin Americanfinancial system would therefore strengthen themacroeconomic balances of its members and hencemake them less vulnerable to contagion.
Greater convergence of economic policies, togetherwith the existence of a regional financial fund with accessto substantial resources, would favour regional exchangestability and make it possible to advance towards greaterintegration of the Latin American economies.
The weakness of domestic banking supervision hasbeen one of the causes (although certainly not the onlyone) of national financial crises. Among othershortcomings, regulatory bodies have omitted –or beenunable– to prevent local banks from taking outexcessive debts in foreign currency and then lendingthose resources to bodies which do not have foreigncurrency incomes. A regional financial body could helpto substantially raise the standards of prudentialsupervision of its members. As already noted, havingsuitable standards (and ensuring that they are respected)
10 At 10% significance. The stadigraph z = , which has a
distribution t with n–2 degrees of freedom, was used. ρ is the esti-mated value of the coefficient of correlation.
ρ√n – 2√ 1 – ρ 2
TABLE 3
Latin America (10 countries): Coefficients of correlationbetween variations in terms of trade, 1981-1999a
Argentina Bolivia Brazil Chile Colombia
Bolivia 0.62Brazil –0.14 –0.55Chile 0.01 –0.21 0.46Colombia 0.44 0.40 0.05 –0.01Costa Rica –0.22 –0.39 0.51 0.17 0.46Ecuador 0.70 0.89 –0.67 –0.21 0.31Paraguay 0.22 0.05 0.72 0.26 0.17Peru 0.15 –0.22 0.47 0.82 –0.21Uruguay 0.10 –0.10 0.16 0.70 –0.25Venezuela 0.61 0.84 –0.60 –0.10 0.08
Costa Rica Ecuador Paraguay Peru Uruguay
Ecuador –0.44Paraguay 0.10 –0.28Peru –0.02 –0.15 0.25Uruguay –0.13 0.17 0.16 0.53Venezuela –0.67 0.91 –0.20 0.02 0.04
Source: ECLAC, 1999.
a Coefficients significantly different from zero are shown in bold type.

C E P A L R E V I E W 7 3 • A P R I L 2 0 0 146
STRENGTHENING REGIONAL F INANCIAL COOPERATION • MANUEL R. AGOSIN
could be made one of the prior conditions for havingaccess to the contingency credit facility. The regionalbody could also institute periodic appraisals of nationalbanking supervision and establish standards that couldbe adopted by all its members.
The existence of a regional fund would also makepossible a fluid exchange of information about the
various countries’ experience regarding policies for theprudential regulation of capital movements. This wouldfacilitate progress towards regionally concertedpolicies on this important and delicate subject, whichwould help to ease the financial crises which, as alreadynoted, tend to result from excessive inflows of foreigncapital.
VIIThe feasibility and size of anexpanded regional fund
Is it feasible to expand regional financial cooperationin the way we have been suggesting in this study?Whether this is so or not will depend on the magnitudeof national crises and the degree of co-variance betweenthem. If all the countries of the region suffer balance ofpayments crises simultaneously through financialcontagion (or through deterioration of the terms oftrade), a regional fund could be non-viable from thefinancial point of view.
In order to answer the queries about the co-varianceof national crises, an analysis was made, for pairs ofcountries, of the correlation between changes in capitalflows (less foreign direct investment and official flows) inthe period from 1978 to 1998 (table 4). The period wasdivided into two sub-periods, 1978-1987 and 1988-1998,in order to see how far co-variance has increased betweencapital flows to different countries. In table 4, the bilateralcorrelation coefficients which are significantly differentfrom zero at 10% significance are shown in bold type.
This analysis showed that there is indeedconsiderable co-variance between capital flows todifferent Latin American countries, but this is not largeenough to make a regional fund financially inviable. In1988-1998, only 22 out of 55 coefficients of correlationwere positive and significantly different from zero.Another conclusion which could back up the need fora regional fund is the increase over time in the numberof high bilateral correlations: thus, positive correlationssignificantly different from zero increased from 11 to22 between 1978-1987 and 1988-1998, whereas thenumber of negative and significant correlationsremained unchanged at two.
In order to determine how big a regional fundshould be, an analysis was also made of the annual
changes in private capital flows (excluding foreigndirect investment) to the six largest countries of theregion, except Mexico, over the period from 1991 to1998. If there are annual outflows from all the countriessimultaneously, it is unlikely that a regional fund wouldbe able to cope with them. Table 5 shows that there is atendency for both increases and decreases in foreignprivate capital to be correlated among the countries,but there is sufficient divergence among the individualsituations to make a regional fund viable. Thus, forexample, whereas in 1994 Argentina had a great needof finance due to the “tequila crisis”, Brazil registeredheavy inflows of capital. Exactly the opposite occurredin 1997-1998. The maximum amount of resourcesneeded may be estimated as the sum of the negativefigures in table 5. In those crisis years, that amountwas between US$ 25 and 30 billion, which a regionalfund could certainly handle.
It is important to bear in mind that the existence ofa regional fund with the capacity to deal with crisescould result in a change of climate: stopping a crisis inone country could considerably reduce the probabilitythat it would spread to other countries. In other words,the existence of the fund would reduce the co-varianceof capital flows to the countries of the region.
If it is true that crises are sequential and that theexistence of a big enough fund would reduce theprobability of contagion for other countries of theregion, then the fund should have sufficient resourcesto ensure that a vulnerable member country capable ofgiving rise to contagion should be able to cope withthe non-renewal of its short-term debt. A fund that had,say, 15% of the reserves of the 11 countries shown intable 6 (some US$ 20 billion in 1997, which was the

47C E P A L R E V I E W 7 3 • A P R I L 2 0 0 1
STRENGTHENING REGIONAL F INANCIAL COOPERATION • MANUEL R. AGOSIN
TABLE 4Latin America (10 countries): Coefficients ofcorrelation between net inflows of capital, 1978-1998ab
1978-1998
Argentina Bolivia Brazil Chile Colombia
Bolivia 0.02Brazil 0.30 –0.20Chile 0.22 –0.49 0.41Colombia 0.50 –0.07 0.61 0.29Costa Rica 0.54 –0.07 0.38 0.17 0.13Ecuador 0.27 –0.19 0.66 0.38 0.09Paraguay 0.58 –0.01 0.51 0.34 0.37Peru 0.58 –0.43 0.62 0.61 0.40Uruguay 0.29 0.05 0.26 0.45 0.03Venezuela 0.04 0.13 –0.09 0.16 –0.39
Costa Rica Ecuador Paraguay Peru Uruguay
Ecuador 0.66Paraguay 0.47 0.45Peru 0.52 0.42 0.76Uruguay 0.27 0.32 0.38 0.30Venezuela 0.15 0.37 0.25 0.00 0.08
1978-1987
Argentina Bolivia Brazil Chile Colombia
Bolivia –0.20Brazil 0.27 –0.23Chile 0.41 –0.57 0.39Colombia –0.19 –0.29 0.42 0.46Costa Rica 0.67 0.26 0.42 0.11 –0.11Ecuador 0.65 –0.05 0.75 0.35 0.07Paraguay 0.36 0.00 0.42 0.58 0.19Peru 0.32 –0.76 0.55 0.75 0.43Uruguay 0.38 0.06 0.11 0.45 –0.37Venezuela 0.71 0.29 0.13 0.17 –0.38
Costa Rica Ecuador Paraguay Peru Uruguay
Ecuador 0.83Paraguay 0.30 0.44Peru 0.05 0.33 0.56Uruguay 0.13 0.30 0.36 0.04Venezuela 0.88 0.62 0.22 –0.08 0.43
1988-1998
Argentina Bolivia Brazil Chile Colombia
Bolivia 0.51Brazil 0.36 0.33Chile 0.33 0.47 0.44Colombia 0.60 0.18 0.88 0.33Costa Rica 0.65 0.06 0.13 –0.01 0.33Ecuador 0.36 0.07 0.33 0.27 0.39Paraguay 0.62 0.82 0.57 0.15 0.51Peru 0.71 0.80 0.63 0.52 0.52Uruguay 0.60 0.55 0.73 0.33 0.60Venezuela –0.10 0.38 –0.43 0.14 –0.41
Costa Rica Ecuador Paraguay Peru Uruguay
Ecuador –0.24Paraguay 0.13 0.30Peru 0.51 0.12 0.76Uruguay 0.57 0.17 0.67 0.92Venezuela –0.56 –0.06 0.10 –0.22 –0.56
Source: IMF, 1999.a Excluding flows of foreign direct investment and official flows.b Bilateral coefficients of correlation significantly different from zero at 10% are shown in bold type.
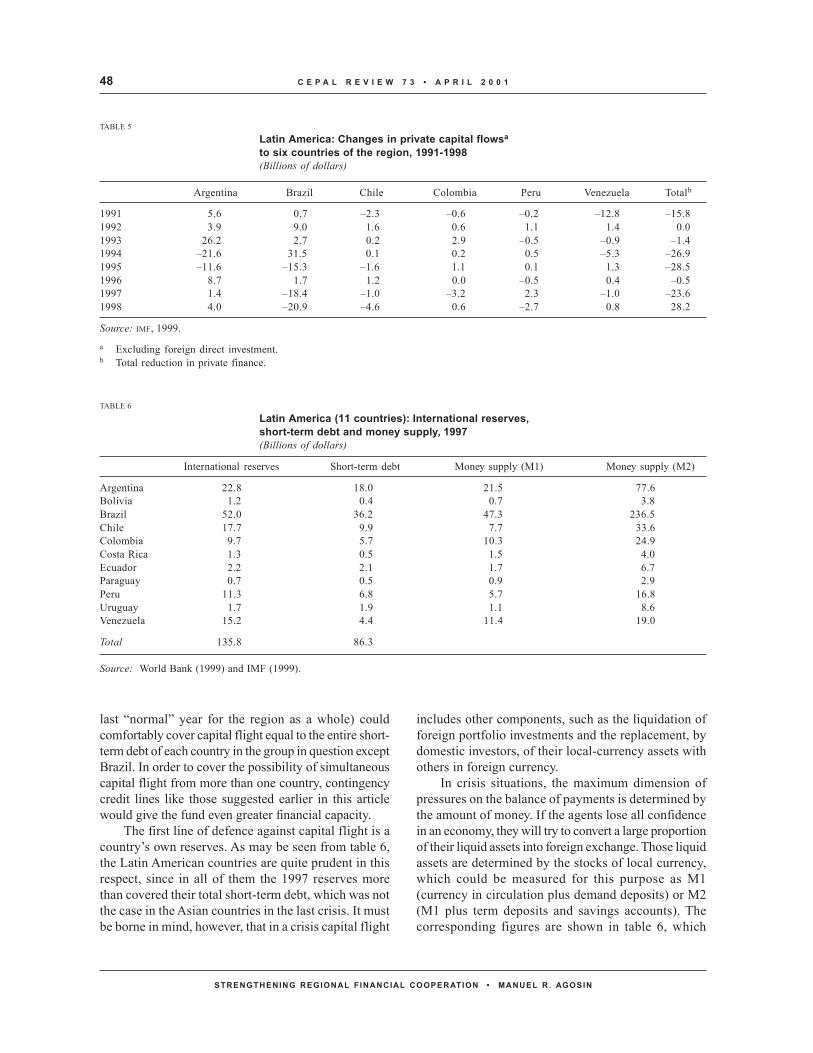
C E P A L R E V I E W 7 3 • A P R I L 2 0 0 148
STRENGTHENING REGIONAL F INANCIAL COOPERATION • MANUEL R. AGOSIN
last “normal” year for the region as a whole) couldcomfortably cover capital flight equal to the entire short-term debt of each country in the group in question exceptBrazil. In order to cover the possibility of simultaneouscapital flight from more than one country, contingencycredit lines like those suggested earlier in this articlewould give the fund even greater financial capacity.
The first line of defence against capital flight is acountry’s own reserves. As may be seen from table 6,the Latin American countries are quite prudent in thisrespect, since in all of them the 1997 reserves morethan covered their total short-term debt, which was notthe case in the Asian countries in the last crisis. It mustbe borne in mind, however, that in a crisis capital flight
includes other components, such as the liquidation offoreign portfolio investments and the replacement, bydomestic investors, of their local-currency assets withothers in foreign currency.
In crisis situations, the maximum dimension ofpressures on the balance of payments is determined bythe amount of money. If the agents lose all confidencein an economy, they will try to convert a large proportionof their liquid assets into foreign exchange. Those liquidassets are determined by the stocks of local currency,which could be measured for this purpose as M1(currency in circulation plus demand deposits) or M2(M1 plus term deposits and savings accounts). Thecorresponding figures are shown in table 6, which
TABLE 6
Latin America (11 countries): International reserves,short-term debt and money supply, 1997(Billions of dollars)
International reserves Short-term debt Money supply (M1) Money supply (M2)
Argentina 22.8 18.0 21.5 77.6Bolivia 1.2 0.4 0.7 3.8Brazil 52.0 36.2 47.3 236.5Chile 17.7 9.9 7.7 33.6Colombia 9.7 5.7 10.3 24.9Costa Rica 1.3 0.5 1.5 4.0Ecuador 2.2 2.1 1.7 6.7Paraguay 0.7 0.5 0.9 2.9Peru 11.3 6.8 5.7 16.8Uruguay 1.7 1.9 1.1 8.6Venezuela 15.2 4.4 11.4 19.0
Total 135.8 86.3
Source: World Bank (1999) and IMF (1999).
TABLE 5
Latin America: Changes in private capital flowsa
to six countries of the region, 1991-1998(Billions of dollars)
Argentina Brazil Chile Colombia Peru Venezuela Totalb
1991 5.6 0.7 –2.3 –0.6 –0.2 –12.8 –15.81992 3.9 9.0 1.6 0.6 1.1 1.4 0.01993 26.2 2.7 0.2 2.9 –0.5 –0.9 –1.41994 –21.6 31.5 0.1 0.2 0.5 –5.3 –26.91995 –11.6 –15.3 –1.6 1.1 0.1 1.3 –28.51996 8.7 1.7 1.2 0.0 –0.5 0.4 –0.51997 1.4 –18.4 –1.0 –3.2 2.3 –1.0 –23.61998 4.0 –20.9 –4.6 0.6 –2.7 0.8 28.2
Source: IMF, 1999.
a Excluding foreign direct investment.b Total reduction in private finance.

49C E P A L R E V I E W 7 3 • A P R I L 2 0 0 1
STRENGTHENING REGIONAL F INANCIAL COOPERATION • MANUEL R. AGOSIN
indicates that 15% of the reserves of the 11 countriesin question would come to US$ 20.4 billion. This meansthat all those countries, except Brazil and Argentina,could cope with capital flight equal to the whole oftheir M2 by using their own reserves (85% of the figuresshown in table 6 under “international reserves” plusthose of a fund set up with 15% of the reserves of thecountries as a whole. Argentina, for its part, could
finance capital outflows equal to the whole of its M1or over half of its M2. In other words, a fund with 15%of the reserves represents an important potential fordiscouraging speculative attacks against the currenciesof the region. If, in addition, it could have other sourcesof finance like those suggested earlier, the proposedfund could play an important role in promoting thestability of the Latin American economies.
VIIIConclusions
This article has argued in favour of the establishmentof a regional fund which would help to fill a gap in theinternational financial architecture. Such a fund wouldbe extremely useful for the countries of the region asan additional line of defense against internationalfinancial crises, which have become increasinglyexogenous to national policies and will probablycontinue to affect the region even though its countriescontinue to improve the quality of their macroeconomicpolicies.
A regional fund is no substitute for macroeconomicprudence, of course. Its existence would rather be ameans of helping the countries of the region to continueimproving the quality of their macroeconomic policies.A fund with substantial resources for lending tocountries that apply good policies would be a powerfulincentive in that direction.
A regional fund could be conceived either as partof a thorough-going reform of the present financialstructure or as a body that would fit into a system thatwould not undergo fundamental changes. Although thefirst scenario is the most favourable from the point ofview of the new body’s efficiency in protecting thecountries of the region from the adverse effects ofinternational financial disturbances, such a fund wouldin fact be even more necessary in the second scenario.In any case, as we have argued in the preceding section,a regional fund of the type described is not outside thefinancial capabilities of the Latin American countriesin the present circumstances.
A regional fund like that proposed would have theadditional mission -of great importance for the futuredevelopment of the region- of helping to integrate the
regional economy through the promotion of exchangestability and the coordination of macroeconomicpolicies. In their policies to promote regionalintegration, so far the countries have given priority toprogress in the harmonization of trade policies. Thetrade barriers between them have tended to go downsignificantly in the last decade, and the setbacksobserved have almost always been related with financialdisturbances. In some cases, governments have had toresort to trade protection in order to defend themselvesfrom the effects of capital inflows which causeexchange rate appreciation and threaten internationallytradeable domestic activities. In others, capital flighthas caused balance of payments crises which leave noalternative but to restrict trade flows. The biggestmenace to the progress of regional integration isundoubtedly international financial instability, whichhas significantly increased exchange rate volatility anddomestic instability in the countries of the region.
The institutional mechanism proposed here couldsoften the adverse effects of international financialinstability on the national economies and also help thecountries to progress towards economic integration.With each financial crisis that periodically hits thecountries of the region, the advances in integrationwhich have been obtained with so much effort areusually succeeded by partial setbacks. Greater stabilityof exchange rates and of the domestic economies wouldallow the Latin American countries to converge towardsthe long-desired trade integration: a dream that beganfour decades ago but has still not been realized.
(Original: Spanish)
C E P A L R E V I E W 7 3 • A P R I L 2 0 0 150
STRENGTHENING REGIONAL F INANCIAL COOPERATION • MANUEL R. AGOSIN
Bibliography
Agosin, M. R. (1999): Towards a New Architecture for theInternational Financial System: Lessons from the Fi-nancial Crisis, Documento de trabajo No. 1, Santiago,Chile, University of Chile, Department of Economics,Center for International Economics and Development(CENDES).
Agosin, M. R. and R. Ffrench-Davis (1997): Managing capi-tal inflows in Chile, Estudios de economía, vol. 24,No. 2 , Santiago, Chile, University of Chile, Depart-ment of Economics.
Ahluwalia, M. S. (2000): Reforming the Global FinancialArchitecture, London, Commonwealth Secretariat,April.
Barrera, R. and M. Cárdenas (1997): On the effectiveness ofcapital controls: The experience of Colombia during the1990s, Journal of Development Economics, vol. 54,No. 1, Amsterdam, The Netherlands, Elsevier SciencePublishers, B.V.
Calvo, G., L. Leiderman and C. Reinhart (1993): Capitalinflows and real exchange rate appreciation in LatinAmerica: The role of external factors, IMF Staff Papers,vol. 40, No. 1, Washington, D.C., International Mon-etary Fund (IMF).
Devlin, R., R. Ffrench-Davis and S. Griffith-Jones (1995):Surges in capital flows and development: An overviewof policy issues, in R. Ffrench-Davis and S. Griffith-Jones (eds.), Coping with Capital Surges. The Returnof Finance to Latin America, Boulder, Colorado, LynneRienner Publishers, Inc.
Eatwell, J. (1997): International capital liberalization: Theimpact on world development, Estudios de Economía,vol. 24, No. 2, Santiago, Chile, University of Chile,Department of Economics.
ECLAC (Economic Commission for Latin America and theCaribbean) (1990): La cooperación regional en los cam-pos financiero y monetario, “Financiamiento deldesarrollo” series, No. 5, Santiago, Chile.
(1999): Preliminary Overview of the Economies ofLatin America and the Caribbean, 1999, LC/G.2088-P,Santiago, Chile.
Eichengreen, B. (1999): Toward a New International Finan-cial Architecture, Washington, D.C., Institute for Inter-national Economics (IIE).
FLAR (Latin American Reserve Fund) (1998): Annual Re-port 1997-1998, Santafé de Bogotá.
(2000): Propuesta para la transformación del Fondo
Latinoamericano de Reservas en un fondo monetariolatinoamericano, Santafé de Bogotá, March, mimeo.
IMF (International Monetary Fund) (1998): InternationalFinancial Statistics. Yearbook 1998, Washington, D.C.
(1999): International Financial Statistics. Yearbook1999, Washington, D.C.
(2000): International Financial Statistics. Yearbook2000, Washington, D.C.
Kaminsky, G. and C. M. Reinhart (1996): The Twin Crises:The Causes of Banking and Balance-of-Payments Prob-lems, International finance discussion paper, No. 544,Washington, D.C., Board of Governors of the FederalReserve System, March.
Kaminsky, G., S. Lizondo and C. M. Reinhart (1998): Lead-ing indicators of currency crises, IMF Staff Papers,vol. 45, No. 1, Washington, D.C., IMF.
Krugman, P. (1979): A model of balance of payments crises,Journal of Money, Credit and Banking, vol. 11, No. 3,Columbus, Ohio, Ohio State University.
Le Fort, G. and S. Lehmann (2000): El encaje, los flujos decapitales y el gasto: una evaluación empírica ,Documento de trabajo, No. 64, Santiago, Chile, Cen-tral Bank of Chile, February.
Mistry, P. S. (1999): Coping with financial crises: Are re-gional arrangements the missing link?, in UNCTAD(United Nations Conference on Trade and Develop-ment), International Monetary and Financial Issues forthe 1990s, vol. 10, Geneva.
Ocampo, J. A. (1999): La reforma del sistema financierointernacional: un debate en marcha, Santiago, Chile,Fondo de Cultura Económica (FCE).
Ocampo, J. A. and R. Steiner (1994): Foreign capital in LatinAmerica: An overview, in J. A. Ocampo (ed.), ForeignCapital in Latin America, Santafé de Bogotá, Founda-tion for Higher Education and Development(FEDESARROLLO)/Inter-American Development Bank(IDB).
Ocampo, J. A. and C. Tovar (1999): Price-Based CapitalAccount Regulations: The Colombian Experience,“Financiamiento del desarrollo” series, No. 87, Santiago,Chile, ECLAC.
Rodrik, D. and A. Velasco (1999): Short-term capital flows,ABCDE Conference, Washington, D.C., World Bank,mimeo.
World Bank (1999): Global Development Finance. CountryTables, 1999, Washington, D.C.
51C E P A L R E V I E W 7 3 • A P R I L 2 0 0 1
THE LATIN AMERICAN SOCIAL AGENDA IN THE YEAR 2000 • ROLANDO FRANCO AND PEDRO SAINZ
C E P A L R E V I E W 7 3
APRIL 2001
The Latin Americansocial agenda
in the year 2000
Rolando Franco
Director of the ECLAC
Social Development [email protected] SáinzDirector of the ECLAC
Statistics and EconomicProjections [email protected]
Now that the 1990s have ended and a new millennium isdawning, the low rate of economic growth, the region’svulnerability to international financial instability and thelimited progress made in terms of equity oblige us to reflecton the social agenda for the future. An important role in thatagenda will continue to be played by the efforts to overcomepoverty and indigence, conditioned to a large extent by theregion’s capacity for economic change and its dynamism increating large numbers of jobs of higher quality in terms ofproductivity and income. At the same time, in view of theheavy burden of unfulfilled social needs that still persists, itis essential that social programmes should use their resourcesefficiently and –in order to be prepared for possible crises–safety nets should be established to cope with periods ofrecession. Those programmes must attach great importanceto the creation of human capital, taking care to improve thepresent unsatisfactory distribution of education between thesocial strata, which is one of the symbols of Latin America’ssocial shortcomings. Education alone, however, is notenough to overcome the lack of equity, improve incomedistribution and generate a situation of social mobility whichwill give sons and daughters better opportunities for materialwell-being and social status than their parents had. Economicchange should take advantage of the better levels ofeducation achieved by creating more jobs of higherproductivity, for which purpose it will be necessary toincrease the present investment coefficients and theprocurement and dissemination of technical progress. Abetter mix of labour, capital and technical progress will laythe foundations for more inclusive and equalitarian societies.
C E P A L R E V I E W 7 3 • A P R I L 2 0 0 152
THE LATIN AMERICAN SOCIAL AGENDA IN THE YEAR 2000 • ROLANDO FRANCO AND PEDRO SAINZ
IIntroduction
The vulnerability of most of the countries of the regionto international financial instability, the low rates ofeconomic growth, the limited progress made in termsof equity, and the dissatisfaction observable in publicopinion have modified the coordinates of the economicand social debate under way in the region, bringinginto question some of the principles on which the pre-vailing development models are based.
On the one hand, it has been proposed that changesshould be made in the international financialarchitecture (ECLAC, 1998) in order to favour sustainablestability and facilitate the taking of timely decisions toforestall or handle crises (ECLAC, 1999a).
In the international debate, great concern has alsobeen expressed for equity,1 although it is also stressedthat macroeconomic discipline should be maintained(Camdessus, 1996). It has been asserted thatdevelopment is something more than adjustment, andthat so far we have concentrated too much on economicaspects, without taking due account of the social,political, environmental and cultural aspects of society.We should therefore go beyond financial stabilizationand address the problem of long-term growth withequity, which is the basis for human prosperity andprogress (Wolfenson, 1998).
At the same time, in Europe a debate has arisenabout the degree of inequality which is “tolerable” inthose societies and the viable alternatives for developing(or maintaining) protection of the most vulnerablesectors (Giddens, 1998). In that connection, the idea ofpursuing these objectives through a “Third Way” more
or less midway between the traditional options hasgained considerable currency, at least in the media.2
In Latin America, for its part, the optimism of theearly 1990s has been lost. The successive crises led toan economic growth rate below that of other eras. Itmay be recalled that in the early 1970s the regionalproduct was growing at around 6% per year, but towardsthe end of that decade the growth rate had gone downto 1.5%, and it fell to zero with the crisis of the 1980s.In the first half of the 1990s there was an encouragingrecovery, with growth reaching 3% and attaining a peakof 5.3% in 1997, only to fall back in 1998 to 2.5%. In1999 growth was negative in most of South America,and it recovered only feebly in 2000. Another point ofconcern in the region is that this slow growth is notgenerating sufficient good-quality jobs to giveemployment to those entering the labour force,especially young people and women. This has beenreflected in signs of dissatisfaction among the public,loss of interest for political activity in some cases, andcriticisms of the way the political parties andgovernments operate.
In view of such a legacy of the 1990s, it is worthreflecting about the issues that form part of the socialagenda in Latin America and will mark the first yearsof the new century.
1 Good social policies are called for, because without themglobalization and democracy would lose legitimacy. It isrecommended that social safety nets should be established, thatagrarian reform should be carried forward, that equality ofopportunities should be promoted, and that extreme inequalitiesof income distribution should be reduced through fair transfers ofincome from the richest sectors to the neediest, from the healthy tothe sick, and from those who have jobs to those who have not(Camdessus, 1996, p. 35).
2 Various different approaches have been proposed. A broad groupof world political leaders seem to coincide with the supporters ofthe “Third Way”, who seek to combine the social-democraticcontributions of the period dubbed “the glorious thirties” with therecognized advantages of the market. There are social democratswho are reluctant to support these changes, however, while someanalysts, who consider that “social-democratic ideas do not makesense [at present], because they correspond to the return to powerof trade unionism, which is at present on the retreat all over theworld” but at the same time feel that the new “social liberalism”represents a centre-right alliance between the State and economicforces, propose instead a “2½” alternative in which the State givesgreater weight to social pressures (Touraine, 1998). Other sectorsalso seem disposed to adopt renewed perspectives, as in the UnitedStates, with the idea of “compassionate conservatism” (Olasky,2000), which was adopted by one of the presidential candidates(one of whom wrote the foreword to the book in question), and inthe region itself, with the efforts to construct a “reformist centre”.Mention should also be made of some points of coincidence whichgo beyond political traditions (Blair and Aznar, 2000).

53C E P A L R E V I E W 7 3 • A P R I L 2 0 0 1
THE LATIN AMERICAN SOCIAL AGENDA IN THE YEAR 2000 • ROLANDO FRANCO AND PEDRO SAINZ
IIThe present social situation
1. Poverty and indigence
According to measurements made by ECLAC, theincidence of poverty in Latin America went down from41% to 36% between 1990 and 1997, thus returning toa level similar to that prevailing before the debt crisis.Indigence evolved in a similar manner, going downfrom 18% to 15% over the same period (ECLAC, 1999b).The 1998-1999 crisis increased the proportion of poorpeople in some countries and caused a slackening inthe favourable tendency previously observed in someothers, so that the decade closed with nearly 38% ofhouseholds under the poverty line and 16% in a stateof indigence (ECLAC, 2000).
As a result, whereas the reduction in poverty inthe first part of the 1990s made it possible to stabilizethe number of poor persons, the impact of thesubsequent crisis caused the number of poor to rise tonearly 220 million and the number of indigent personsto increase from 93.4 million to nearly 100 million(ECLAC, 2000).
Two conclusions may be drawn from whathappened in the region in these years. Economicgrowth can be said to have had a positive impact onthe reduction of poverty, although the degree ofreduction depends on the particular growth profile,while the regressive impact of the episodes ofrecession on poverty reduction is also clear: one yearof recession caused the loss of between 50 and 100%of the advances made in this respect in four or fiveyears of growth.
2. Employment and unemployment
Towards the end of the 1990s, not only did growthslacken but there were also increases in openunemployment and in the percentage of non-permanentwage earners and the number of workers withoutemployment contracts and without social security(ECLAC, 2000, pp. 49-53 and 95-102).
In 1999 the average rate of open unemploymentin the region (8.7%) was the highest in the decade,even though the rate of participation in the labour forcehad gone down from 58.5% to 57.9%. Two differentsituations should be distinguished in this respect,
however: while Mexico and some Central Americanand Caribbean countries registered appreciableeconomic buoyancy and a decline in unemployment,the latter indicator increased in the South Americancountries, which had problems of economicstagnation. The phenomenon was particularly notablein Chile, where the unemployment rate rose from 6.4%in 1996 to 9.8% in 1999 (ECLAC, 2000, p. 95) andcontinued to rise in the year 2000, reaching 10.6%. Asimilar trend was observed in Argentina, although itwas not so marked, since although the product wentdown by 3% unemployment only increased from12.9% to 14.3%.
There were also significant changes in theorganization of work, which was marked by an increasein precarious employment. Labour deregulation wasfurther increased through the reduction of labour costs,more short-term hiring (temporary, seasonal or part-time work), the broadening of grounds for thetermination of contracts, the reduction of severancepayments, and the restriction of the right to strike, allwith the aim of maintaining or increasing economiccompetitiveness at the international level.
There has thus been an increase in non-permanentemployment, although to very varied levels ranging in1997 from 9.5% in Costa Rica to 45.1% in Ecuador,with extreme rates of increase in Colombia, where itrose from 6.6% in 1980 to 20.0% in 1997. This type oftemporary employment is most common in micro-enterprises and among persons under 30, women andpeople of low educational level (Martínez and Tokman,cited in ECLAC, 2000, p. 99).
There was also an increase in the number andproportion of those with jobs but without anyemployment contract. In 1996 the proportion of wage-earners in this situation ranged from 65% to 22%,depending on the country. Such precarious employmentwas naturally linked with lower wages and greatervulnerability and poverty.
A substantial proportion of workers did not havesocial security or health protection. There are notabledifferences between countries in this respect: over 60%of workers lack such protection in Bolivia and Paraguay,whereas almost all workers are covered in Uruguay(ECLAC, 2000, p. 101).

C E P A L R E V I E W 7 3 • A P R I L 2 0 0 154
THE LATIN AMERICAN SOCIAL AGENDA IN THE YEAR 2000 • ROLANDO FRANCO AND PEDRO SAINZ
3. Income distribution
During the 1980s, governments centered their attentionon economic growth and the relief of poverty, assumingthat for this purpose it was sufficient to recover themacroeconomic balances, end inflation, do away withthe presence of the State in certain areas and expandthe spaces open for the private sector. Many of thosewho advocated these policies thought that in the longterm the trickle-down effect would put an end topoverty. Improvement of income distribution was notan objective in itself because it was believed thatmeasures to promote this could affect both economicgrowth and the possibility of reducing poverty throughsuch growth.
Today, income distribution has gained politicalimportance once more, both because economic growthdoes not generally seem to have led to better distributionand because the economic debate has taken up thequestion of income distribution once again, relating itwith three important issues.
A first line of analysis has taken up once again thetheory that more equalitarian income distributionpromotes economic growth, in contrast with theargument that –at least in the first phases of thedevelopment process– income should be concentratedin certain groups that have the capacity to save andinvest. Doubts have also been expressed as to whetherthe higher-income groups in the region have thiscapacity, in view of the propensity to consume that theyusually show (ILPES, 1999, pp. 15-19).
A relation has also been traced between incomedistribution and poverty. The argument in this respect,which is of a mechanical nature, holds that there is now“unnecessary” poverty in Latin America (Berry, 1997),because if the income distribution of the early 1980shad been maintained, the increase in poverty as a resultof the crisis would have been 50% smaller (Londoñoand Szekely, 1997).
Finally, it is held that the reduction of inequalitiesincreases the stability of democratic political systems,whereas concentration gives rise to greater risks, dueto the reaction of losing groups seeking to improve theirinferior position.
Income distribution in Latin America in the 1990smay be analysed through the following indicators:
i) the percentage of households with an income belowthe average for the society in question rose from67% to 75% between 1970 and 1990 and remainedat that level throughout the 1990s. This indicatesthat the evolution of average income does not
adequately reflect what is happening in three-quarters of the Latin American population;
ii) the Gini coefficient indicates that between 1990and 1997 inequality increased in seven countriesand went down in only four (ECLAC, 1999b). It maybe recalled that Latin America is the region withthe worst income distribution in the world, althoughit should be noted that it is a heterogeneous set ofnations which are very different from each otherin this respect, with Brazil and Uruguay at the twoextremes (ECLAC, 1998, pp. 216-217, table 23);
iii) the ratio between the income of the richest 10% ofthe population and the poorest 40% increasedbetween 1990 and 1997 in seven countries and wentdown in only four (ECLAC, 1999b, pp. 64 and 66).
It may be concluded, then, that even in the best of casesthe form of economic growth that has prevailed in theregion in recent years has done nothing to reduce theinequalities that have traditionally been characteristicof the area. However, “these problems are not a resultof the present development model, since they were alsotypical of the preceding and even earlier models. Theythus reflect fundamental problems of the economic andsocial structure which we should not try to conceal”(Ocampo, 2000, p. 125).
This tendency towards inequality does not seemto be peculiar to Latin America. It is also found even inthe developed world, albeit with other levels ofconcentration. In the United States, for example, severalanalysts have noted that information technologiesincrease the employment and income opportunities for“symbolic analysts”, which is the term used to denotehighly-qualified workers engaged in the production ofnon-material knowledge-intensive goods (Reich, 1993).In contrast, assembly-line workers are affected by theincreasing requirement that they should havequalifications in informatics and the fact that companiesare transferring their routine production processes toother countries (Thurow, 1992). Likewise, in theEuropean Community notable differences have beenobserved between the incomes of the better-off sectorsof the population, which are increasing significantly,and the employment possibilities, type of employmentand wages of the bottom 40% of the population(Dahrendorf, 1996, p. 44).
These characteristics of the world economicsystem, which are due in part to the incorporation ofnew technologies, are compounded in Latin Americaby specific factors which explain the concentration of

55C E P A L R E V I E W 7 3 • A P R I L 2 0 0 1
THE LATIN AMERICAN SOCIAL AGENDA IN THE YEAR 2000 • ROLANDO FRANCO AND PEDRO SAINZ
income distribution and make it less easy to modify inthe short term.
ECLAC (1998) identifies four factors which areparticularly important in this connection:
i) Wealth: The distribution of wealth in Latin Americais even more concentrated than that of total income.On average, income from wealth stands atpercentile 85 (ECLAC, 1998, figure 4), which meansthat 85% of the Latin American population haveless access to wealth than the average level forsociety as a whole.
ii) Demography: Lower-income households havemore members (five or more persons on average)than households in the upper income levels.
iii) Employment: Employment density –that is to say,the number of employed persons in relation to thetotal number of persons in the household– isparticularly important for explaining what ishappening with regard to income distribution. Insome countries, the upper strata register values ofthis indicator which are twice those of the lowerstrata. In view of the importance of labour incomein total household income, this disparity explainsmuch of the high degree of income concentration.The distance between those in the first incomedistribution decile and those in the bottom 40% isalso increased by the growing disparity betweenthe wages paid in modern occupations and thosepaid in low-productivity jobs.
iv) Education: Income distr ibution is alsoconditioned by education. Although the amountof schooling has increased over the last 25 or 30years, so that the new generations have an averageof three more years’ schooling than their parents,there is still a high degree of concentration ofeducational capital.
4. Social expenditure: a neglected “window ofopportunities”?
After the reduction in public social expenditure whichtook place in most of the countries in the 1980s, therewas a significant increase in this expenditure duringthe 1990s. Thus, between 1990-1991 and 1996-1997 itgrew by 38% for the region as a whole: twice as fast asthe per capita product, and exceeding the historical peaklevels in three-quarters of the countries. This tendencyappears to have continued up to the end of the decade,although we will have to wait for the publication of theECLAC Social Panorama of Latin America 2000-2001for the official figures.
However, full advantage has not been taken of this“window of opportunities”, which accompanies the“demographic bonus”3 enjoyed by the region. It isworth stressing that spending a lot does not necessarilymean spending well, so that one of the pending tasks isto increase the efficiency, efficacy and impact4 of suchresources: a particularly important consideration in aregion where the percentages of GDP devoted to publicexpenditure are markedly lower than those of thedeveloped countries.
It should also be noted that the margin thatgovernments have for continuing to expand their publicsocial expenditure faster than their economic growthrates is increasingly small. Keeping up the present levelsof public resources for social programmes is a currentchallenge.
5. Public dissatisfaction
In the early 1990s, Latin Americans were mainlyconcerned about the inflationary processes that wereeroding their income, and governments that weresuccessful in stabilizing the economy received supportat the polls (Mora and Araujo, 1992). Only a few sectors(especially public-sector employees) reacted negativelyto their relative losses of income and benefits (ECLAC,1995). The rest of the population wagered on the futurein the hope that they would eventually receive theirshare of the fruits of growth.
Today, however, uncertainty prevails. Theeconomic and social situation already described hashelped to dilute hopes and in many cases has broughtto the surface the population’s weariness with theongoing adjustment. Opinion surveys carried out in 16countries reveal that approximately 67% of those
3 The expression “demographic bonus” seeks to express the ad-vantage that the Latin American region is enjoying because itspopulation growth rates have slowed and there has therefore beenan increase in the proportion of adults within the total population,which should in theory reduce the dependency rate (ECLAC/CELADE,1996).4 Efficiency measures the relation between the cost of a projectand the products (goods or services) delivered by it. The objectiveof efficiency analysis is to find the alternative that minimizes thecost per unit of product. Efficacy reflects the extent to which theproduction targets of the project have been attained over a givenperiod of time, independently of the costs incurred. The impact,for its part, expresses the size of the benefits received by the targetpopulation in line with the objectives of the project: for example,the percentage reduction of grade 1 and 2 malnutrition achieved inthe target group by a project having this objective (see Cohen andFranco, 1992).

C E P A L R E V I E W 7 3 • A P R I L 2 0 0 156
THE LATIN AMERICAN SOCIAL AGENDA IN THE YEAR 2000 • ROLANDO FRANCO AND PEDRO SAINZ
interviewed consider that the current distribution ofwealth is unjust, and 61% consider that their country isnot developing (ECLAC, 1998).
Obviously, those opinions are strongly based onthe personal experience of those expressing them. Thosewho form part of the rising sectors or are emergingfrom a state of poverty do not feel the same as themembers of currently impoverished middle-classsectors, who compare their present standard of livingwith that which they had in the past.
There are also generational differences. The presentgeneration feel that they have fewer opportunities thanthe generation which preceded them or that which willfollow them (Latinobarómetro, 2000, p. 11).
It is very common for young people to expressdissatisfaction at the difficulties they face in finding ajob in line with their aspirations. It may be noted thatthis perception does seem to have a strong basis in fact,especially as regards the evolution of the labour marketand the difficulties micro-enterprises and smallenterprises experience in operating properly.
There is a notable similarity between thepercentage of dissatisfied young people (between 49%and 63%, according to surveys made in seven countries)and the percentage of persons who have not receivedan education which ensures them some degree of socialmobility through proper integration into the labourmarket5 (between one-third and half). It could be saidthat these young people with insufficient educationalcapital become aware at an early age of howpredetermined and limited the sequence of opportunitiesfor greater well-being will be for them in the course oftheir working life (Gerstenfeld, 1998).
In Chile –where the economic reforms havematured more than in other places and high growth rateshave been attained– there is growing concern overinequality, which has tended in this respect to take theplace of the view of poverty as a lack of resources.
“This change means that the population is payingparticular attention to the different rates at which thebenefits of economic progress reach different sectorsof our society” (Manzi and Catalán, 1998, p. 555).Those interviewed in the lower and middle sectorsconsider that the current levels of poverty and inequalityare not in keeping with the growth achieved. They feelthat this inconsistency is due to the dynamics of thesystem itself and to the policies of the social actors withdecision-making power, whom they criticise for theirlack of sensitivity. They also call for a more active roleon the part of the State (ibid., p. 532).
The perception of inequality and lack ofopportunities causes citizens to gradually loseconfidence in politicians and institutions and to abandonthe political parties (Manzi and Catalán, 1998). Theydraw away from political activity, which they no longersee as a means for defending their group interests andhelping to create a society where social distances arekept down to a reasonable level. They do, however,support democracy as the best system of government,although they do not feel a similar degree of satisfactionwith the way it works, because of the high expectationsthat they had in the capacity of democracy to solve theirproblems. In fact, only 37% of Latin Americans aresatisfied with the performance of democracy(Latinobarómetro, 2000, p. 6).
It must be acknowledged, however, that anyprocess of development means sparking off variousdemands. Even when there is economic growth andsocial progress in the satisfaction of basic needs(drinking water, electricity, rural roads), opinion pollswill not necessarily reflect satisfaction. Maslow’s theorythat the satisfaction of some primary necessities meansthe immediate appearance of other strongly felt needs(Maslow, 1954) may go some way towards explainingthe discontent felt on account of the appearance of newexpectations and aspirations.
5 That is to say, an education longer than that of their parents (mak-ing allowance for “educational devaluation”) which enables them
to cross the minimum threshold for proper incorporation into thelabour market.

57C E P A L R E V I E W 7 3 • A P R I L 2 0 0 1
THE LATIN AMERICAN SOCIAL AGENDA IN THE YEAR 2000 • ROLANDO FRANCO AND PEDRO SAINZ
IIIEmerging social issues
In a situation like that described above, a fundamentalelement on the Latin American agenda in the comingdecade will be the building of more equalitarian soci-eties, which means incorporating large percentages ofthe population into the consumer society and creatingchannels that promote social mobility.
1. Integration into the consumer society
In Latin America, most households do not havesufficient income to reach a minimum level of massconsumption. This is a dimension not only of materialwell-being, but also of status and integration, whichare increasingly prized by society. Even so, there arecircles which keep on denouncing what they call“consumerism”, which they see as a departure fromcertain cultural patterns, due to the demonstration effectof adopting fashions felt to belong to other social strataand other countries.
In general, only two or three out of every ten urbanhouseholds currently have a level of per capita incomesufficiently high to bring them into the consumer societyby Latin American standards.6 In rural areas thesituation is even more unfavourable. In Uruguay, abouthalf the households qualify for the consumer society,but in the other countries only a third are in this position.According to an optimistic hypothesis, only Argentinaand Chile could join the group of Latin Americancountries with over half their households integrated intothe consumer society between now and 2005(Gerstenfeld, 1998).
It is probably the members of these urbanhouseholds which are not poor but do not have sufficientincome to enter the consumer society fully who aremost responsible for the feeling of frustration recordedin surveys (Gerstenfeld, 1998).
Sustained economic growth is undoubtedly themeans by which the broad masses could be integratedinto consumer society.
2. Social mobility
A modern, open society with a concern for equityshould be marked by smooth and easy social mobility.One way of ensuring that the social roles operate cor-rectly is that there should be possibilities and incen-tives for rising to positions which are better paid or areof higher status. In traditional societies, in contrast, rolesare assigned basically through principles of entitlementwhereby these positions are reserved by birth.
In the first phases of development there is a kindof “structural” mobility under which new higher-levelpositions are rapidly created and filled by anyone whohas the necessary training for carrying out thesefunctions. In more advanced phases, mobility becomesa “circular” process: not so many new positions aregenerated, and change must take place through rotation:that is to say, through the departure of some of theoccupants of higher positions (by retirement, death ortermination) and their replacement by persons withsuitable qualifications for the job (Pastore and Silva,2000, p. 5).
Studies show that only two out of every four urbanyoung people and only one out of every four rural youngpersons have had educational mobility. It may thereforebe concluded that the probability of social mobility hasremained practically unchanged since 1980 (ECLAC,1998). The possibility of changing this pattern is closelylinked with the educational system.
It should be noted here that a society based on merit–a “meritocracy”–, in which positions are occupied bythose who have certain capabilities, may doom thosewho do not have those capabilities to exclusion andpoverty. This justifies the argument that it is necessaryto incorporate an element of solidarity to make up forthis lack.
3. Towards more equalitarian societies
Great stress is usually laid on the economic aspects ofinequality. Latin American experience shows that evenin those countries which have managed to comply with
6 In order to be integrated into consumer society, a household percapita income greater than three poverty lines is needed. At thispoint, the distribution displays a clear upward jump in the level ofexpenditure. It may be recalled that one poverty line naturallyrepresents a situation of poverty, while having an income of up totwo poverty lines represents a situation of vulnerability and a riskof suffering poverty at some stage in life.

C E P A L R E V I E W 7 3 • A P R I L 2 0 0 158
THE LATIN AMERICAN SOCIAL AGENDA IN THE YEAR 2000 • ROLANDO FRANCO AND PEDRO SAINZ
the recommendation to keep up growth rates of 6% peryear, there is no improvement in income distribution,nor are there any differences with regard to the degreeof public satisfaction over what is happening. There istherefore a clear “need to give special attention toeconomic and social policies which have a directincidence on aspects of a distributive nature, especiallyin those areas where there is the greatest sensitivity overinequality (education, housing and health)” (Manzi andCatalán, 1998, p. 555). Likewise, the new intellectualconcern with income distribution already referred tohas identified relations which appear to show thatgreater equality in this respect is even preferable forsecuring higher growth.
While this aspect is very important, it should alsobe noted that the concern to build more equal societiesgoes beyond economic matters and material well-being.Other forms of equality, without which a good societycannot exist, are also important.
Such advances in the satisfaction of basic needsentail monetary costs which must be met by thebeneficiaries, and this is difficult when there has notbeen an increase in the productivity of the backwardsectors in question and there are no new employmentoptions to support the advances made.
An equalitarian society goes beyond consensus onthe most crucial economic elements, however. Firstly,equality is a prior requisite for the proper functioningof the market itself. This is so, for example, in the caseof equality before the law, which, although enshrined inthe Constitutions of Latin America, is far from prevailingin practice. The reforms being made in systems of justicerepresent an acknowledgement of the shortcomingswhich exist in the region in this respect. Another essentialrequisite is equality of opportunity, understood as theelimination of the disadvantages faced by some personsdue to the existence of certain barriers or restrictions orthe impossibility of gaining access to certain media.Equality of opportunity means doing away with theconnections which exist between the possibilities ofwell-being and some personal characteristics which itis impossible or extremely difficult to change (sex orrace, for example) or which derive from the fact ofhaving been born into a family with certain attributes(socioeconomic level, caste, etc.).
In the final analysis, even when freedom is the mainpriority it is necessary to ensure that there is equalityof freedom, that is to say, to display equal concern, atall levels, for all the persons involved (Sen, 1999, p. 7).
It is also necessary to promote equality of freedomof expression. In any country there are undoubtedly
many differing views on how to organize society, andall persons, communities and groups must beguaranteed the right to express their preferences andorganize themselves to promote them within thedemocratic debate.
Many of these principles are of fundamentalimportance for the proper functioning of democracy.The principle of “one man, one vote” must be respectedif democracy is to work. There must be equality ofcitizenship. Although we talk about the “politicalmarketplace” we cannot permit the (economic) marketto determine political decisions. We must ensure that“although people may have different weight andimportance in the market as a function of what theyown, they must all have the same weight and importancewhen it is time for them to exercise, as citizens, theircivic and political, social and occupational, value-linkedand ideological rights” (Hardy, 2000).
Equality of rights as citizens means that differencesin personal status do not lead to privileges for some butexclusion for others.
In the field of society and culture, it is alsonecessary that there should be equality in diversity: thatis to say, that individuals, communities and groups ofdifferent types should have the possibility of developingtheir own views of the different dimensions of humanbehaviour and thus be able to live their differential waysof life, resulting in cultural pluralism.
Growth also depends, however, on social policiesinsofar as these form the human capital which will bemobilized to permit the proper functioning of the postsneeded in order to make the economic system work.Social policies also help to create the political conditionsneeded in order to give rise to the stability required forinvestment and the execution of productive projects.
4. Responsibility of public policies
Public policies will undoubtedly be one of the keyinstruments for tackling the social agenda of the end ofthe century. A good economic policy also has positivesocial effects. It creates suitable conditions for thegeneration of employment and good wages, and evenwhen the jobs created are of low productivity andwages, as has mainly been the case in recent years, thisallows a larger number of members of poor householdsto find employment, thus increasing the occupationaldensity of households and hence also their per capitaincome. Economic growth also facilitates increasedpublic spending, with its potential for improving equityand reducing poverty in the short and long term.

59C E P A L R E V I E W 7 3 • A P R I L 2 0 0 1
THE LATIN AMERICAN SOCIAL AGENDA IN THE YEAR 2000 • ROLANDO FRANCO AND PEDRO SAINZ
It should be borne in mind, however, that “thesensitivity of the region’s growth to internationalfinancial cycles continues to be as marked as ever,despite the growing sophistication of macroeconomicmanagement” (Ocampo, 2000, p. 122). This makes itessential to try to reduce the impact of such cycles onthe population in general and its less protected sectorsin particular. Moreover, the growing segmentation ofthe labour market calls for policies designed to preventrelative prices from affecting the hiring of labour; toensure ongoing training of labour and prepare workersto use new technologies, and to improve labourlegislation and establish unemployment insuranceschemes which provide workers with protection inperiods of recession and of readaptation of production.Since the low-productivity sectors are made up of smalland micro-enterprises, which provide employment forover half of all Latin American workers, efforts shouldbe made to promote the introduction of new technologyin them, by ensuring that they have access to credit andmarkets, and to provide them with support in the areasof information, product development, marketingchannels and business management.
Policies in the fields of low-cost housing andcommunity facilities are also vital for improving theliving conditions of the people, raising the quality ofhealth services and creating a suitable environment forschoolchildren to gain the fullest benefit fromeducation, as well as helping to improve the distributionof wealth. Where the proportion of rural dwellers inthe total population is still substantial, it is necessaryto facilitate the market access of producers in distantregions by carrying out infrastructural programmes andimproving access to land and water.
With regard to social policies, they obviouslycannot be responsible for pursuing the objective ofequity unaided. Social development is not entirely theirexclusive responsibility: this task is shared witheconomic policy. Social policies have a direct andindirect influence on the reduction of poverty andimprovement of living conditions through their threebasic functions: investment in human capital, socialcompensation, and social integration or cohesion.
a) Investment in human capital: education
When the main production factor is knowledge, thereare concrete reasons justifying the pursuit of greaterequity, and it is no longer necessary to use onlyarguments of an ethical, philanthropic or solidarity-oriented nature. Countries cannot be competitive if they
do not have a properly trained and educated labour forcecapable of gaining access to technical progress andincorporating it in their everyday work. Competitivenessand equity may therefore be seen as objectives whichcan be pursued simultaneously and which mutuallyfoster each other. Thus, from the aggregate point ofview, social policy oriented towards investment inhuman capital becomes an essential prerequisite foreconomic growth. The same is true of the need to trainthe population in matters of health, so that they cancarry out their productive functions properly.
Education is also of key importance for individuals.At the same time, however, it must be acknowledgedthat this is an inherited asset, especially in the case ofhigh-quality education. Opportunities for well-being aretransmitted from one generation to another (ECLAC,1998), so that there is a link between the household oforigin and the number of years of schooling, type ofoccupation and level of well-being that its new memberswill be able to attain in the course of their lives.
To begin with, the household of origin has afundamental role to play in the advantage taken ofschooling. There are various features of the householdwhich are of influence in this respect: i) itssocioeconomic level; ii) the educational climateprevailing in it, defined as the number of years ofschooling possessed by its adult members; iii) thehousing conditions (whether there is overcrowding ornot), and iv) the form of organization of the family(single-parent or with both parents present; the type ofunion between the parents is also important).
The future of the new generations is thus definedat an early stage, establishing a big difference betweenthe excluded (those whose education is insufficient togive them a chance of occupying well-paid jobs thatwill free them from poverty) and the integrated. Thosewho are in the excluded sectors will not attain adequatelevels of living, and they will not be in a position tomake a contribution to competitiveness either, becausethey will lack the knowledge and flexibility needed toincorporate technical progress into their forms ofproduction.
In another link of the chain, educational capital isof key importance in terms of the occupationalopportunities young people will have when they entereconomically active life, because of two closelyinterlinked phenomena which must be taken intoaccount in policy design: educational devaluation andthe minimum educational threshold level.
Educational devaluation is the loss of importancesuffered by certain educational levels as more and more

C E P A L R E V I E W 7 3 • A P R I L 2 0 0 160
THE LATIN AMERICAN SOCIAL AGENDA IN THE YEAR 2000 • ROLANDO FRANCO AND PEDRO SAINZ
people reach them; it reflects the need to complete moreand more years of formal education in order to gainaccess to a given occupation or obtain a similar levelof wages to that enjoyed by the preceding generation.7Experience shows that the lower the educational level,the greater the degree of devaluation.
The educational threshold, for its part, is theminimum number of years of education that must becompleted at a given time in order to obtain a job whichgives a high probability (90%) of being able to avoidpoverty throughout the rest of one’s life. In LatinAmerica, this threshold stands in many cases at the levelof 12 years’ formal schooling (ECLAC, 1999b) and isonly reached by a third of young people in urban areasand one-tenth in rural areas.
Finally, the occupation obtained links up with theopportunities of future well-being, as noted in the SocialPanorama of Latin America. Those with less than eightyears’ schooling will only be able to obtain jobs thatprovide them with an income around two and a halfpoverty lines, which is not enough for a minimum levelof well-being. At the other extreme, those with 12 ormore years’ education will be able to work astechnicians, managers or owners of businesses, and inthese occupations they will obtain incomes over fourpoverty lines. Those who are in an intermediate position(9-11 years’ schooling) will work as salesmen or similartypes of work and will receive incomes which at certainstages in their life cycle –when they have formed afamily and their children are reaching adolescence–maynot be sufficient to give them an adequate level of well-being (ECLAC, 1998).
From the point of view of society, the cost ofuntrained human resources which are not efficientenough for competitive production systems may bedefined as: “the growth potential of the human capitalendowment which is not realized because of theeducational deficits which exist” (Cohen, 1996, p. 4).
Therefore, although educational reform policieswhich seek to reduce repetition of grades and droppingout and improve the quality of education are veryimportant, they are not of themselves sufficient toovercome lack of equity. It is also necessary to takeinto account the out-of-school factors that affecteducational performance and to make up for differencesconnected with the household of origin of students, if
it is desired to prevent the educational system fromfunctioning as a mechanism that reproduces existingdifferences.
It should be emphasized that the improvement ofeducation is not of itself enough to bring about changesin income distribution in the next ten years. As therotation of workers in the labour force takes place atthe rate of 2% or 3% per year, the occupational profileof 80% of those currently working will continue toapply to the labour market until the end of the nextdecade. No advantage will therefore be gained fromthe improvements being made in the educationalsystem, which are designed to affect those who havenot yet entered the labour market.
The distribution of access to health is alsoinequitable, although it must be acknowledged thatprogress has been made in reducing infant mortality,increasing life expectancy, etc. Nevertheless, there arenow new demands which will make it necessary tobroaden policies in this field and provide more modernand diversified services, not only in preventiveactivities. The reform processes carried out so far, inwhich the private sector plays a significantly greaterrole than in the past, have given rise to a large-scaledebate on the best way of improving efficiency andmeeting ever-increasing demands.
b) Social compensation: safety nets
The struggle to overcome poverty and indigence willcontinue to be a central issue, and growing importanceis being assumed by social safety nets: that is to say,the sets of compensatory measures which increaseincome and other assets through targeted transfers andare specifically designed to maintain or increase thewell-being of poor or vulnerable groups at times ofeconomic transition (Graham, 1994). It is even believedthat such measures can increase popular support forthe economic transition process, provided there isadequate communication and the participation of thoseaffected is promoted by strengthening their capacityfor organization.
Safety nets must be stable, must form part ofpermanent institutional systems, have specialized staff,suitable mechanisms for determining eligibility,portfolios of projects and established practices for theirevaluation, etc. If not, they will be unable to respond ina timely manner to the needs for protection at times ofcrisis (Cornia, 1999).
Since the 1980s, the protection of the poor at timesof crisis has been based on emergency employment
7 This question was analysed in depth some years ago by Aldo E.Solari and is dealt with in various ECLAC studies. It has recentlybeen taken up again in the press: see La Tercera (2000).

61C E P A L R E V I E W 7 3 • A P R I L 2 0 0 1
THE LATIN AMERICAN SOCIAL AGENDA IN THE YEAR 2000 • ROLANDO FRANCO AND PEDRO SAINZ
programmes, anti-poverty programmes and socialemergency funds or social investment funds, throughwhich it has been sought to complement the traditionalsocial assistance programmes. It would also bedesirable, however, to take measures which keep upemployment, such as bringing forward plannedinvestments in infrastructure or promoting public worksin communities which have suffered natural disastersor unfavourable economic situations (Iglesias,forthcoming). The basic criterion for such programmesshould be to carry them out in a counter-cyclicalmanner, expanding their coverage and benefits inperiods of recession. It would therefore be necessaryto identify those branches which should not suffer cutsor should actually be expanded in times of crisis.
c) Social cohesion
An integrated society is one in which the populationbehaves in accordance with socially accepted patternsand there is an equilibrium between cultural goals, thestructure of opportunities for attaining them, and theformation of individual capabilities for takingadvantage of such opportunities. There are of coursealways types of behaviour which are not in keepingwith these patterns and can give rise to increases insocial cohesion or, on the contrary, processes ofdisintegration usually linked with phenomena ofexclusion: that is to say, circumstances in which societydoes not make available to individuals the proper means(opportunities) for attaining the goals imposed by theculture in question (ECLAC, 1997, chapter III, p. 73).
Concern for cohesion does not mean the pursuitof homogenization, since a modern society must respectpeople’s right to their own cultural identity and must
value diversity, together with the contributions madeby the creativity of each cultural group. Thus, whileglobal objectives and rules are shared, there is still roomfor a wide range of other goals, both of individuals andof groups. This is particularly important in multiracialor multicultural societies.
The traditional problems of low levels ofintegration displayed by the region (poverty and otherproblems already referred to, racial discrimination,social segmentation, residential segregation) are nowcompounded by such new phenomena as various formsof violence, citizen insecurity, drug trafficking andcorruption.
This set of situations weakens or destroys the linksof shared belongingness, the acceptance of sharedpatterns of behaviour and the exercise of effectivecitizenship, while at the same time strengtheningexclusive forms of particularism and generating lackof confidence in the public order.
The improvement of social integration is thus alsolinked to the recomposition of channels of socialmobility in keeping with the changes under way, theapplication of a form of development whose benefitsreach all levels of society, a public environment whichrecognizes and values diversity and promotes thestrengthening of the actors of civil society, and apolitical system in which the demands and interests ofall the actors are represented and negotiated.
The incorporation of those who are excludedthrough various types of discrimination (ethnic, sex-based, etc.) is a task that is still to be completed, inwhich affirmative action or positive discrimination arefundamental ways of progressing in the struggle toovercome different types of inequality due to familyorigin, race or sex.8
IVConclusions
On the social level, the situation in Latin America atthe end of the twentieth century is not satisfactory.Although economic growth has been restored to someextent, it is not fast enough to improve the levels ofliving of the whole population. At the same time, whilesocial policies have received very considerableresources, it will not be easy to keep up this socialexpenditure unless there is sustained economic growth,
and in any case there will have to be notableimprovements in the efficiency of the way such policies
8 For example, by using positive discrimination or affirmative actionto reduce differences and inequalities, although this solution iscurrently being questioned in some circles. Thus, PresidentFernando Henrique Cardoso has highlighted the resistance thatexists in Brazil to a quota system for facilitating the access ofnegroes to education (see Cardoso, 1998, p. 328).
C E P A L R E V I E W 7 3 • A P R I L 2 0 0 162
THE LATIN AMERICAN SOCIAL AGENDA IN THE YEAR 2000 • ROLANDO FRANCO AND PEDRO SAINZ
are applied, in their efficacy in reaching their objectives,and in the impact of the programmes on the beneficiarypopulation.
The future agenda of the region will include theaspiration to build more inclusive and equalitariansocieties, with increasing incorporation of hithertoexcluded strata of the population into the consumersociety and social mobility.
Emphasis must be placed on the importance ofdemocracy and the quality thereof. This is a basicingredient for a good society. Democracies of theilliterate are not true democracies and very easily openthe way to clientism and populism. Societies with largenumbers of excluded persons also provide fertile groundfor violence and citizen insecurity and end up byaffecting the functioning of democracy itself. They leadto a deterioration in the living conditions not only ofthe poor but also of the integrated sectors, who tend to
live in fortified bunkers and to feel insecure whenmoving around in their own cities, and they encouragethe development of the private security industry.
One of the debates which is going on in Europe atpresent deals with the “two-thirds” society: that is tosay, a society in which only two out of every threepersons are integrated. In Latin America, however,“one-third” societies currently predominate. Thechallenge, then, is to create societies in which, as thetitle of a recent book says, “Everybody’s in” (Busteloand Minujin, 1998). This is the challenge facing theregion, which will only be authentically competitive ifit simultaneously achieves human development.
As Dahrendorf (1996) says, “Simultaneouslyachieving growth, cohesion and liberty may be difficult;it may even mean ‘squaring the circle’, which is ofcourse impossible to achieve in a completely perfectmanner, but we can nevertheless come closer to it”.
Bibliography
Berry, A. (1997): The income distribution threat in LatinAmerica, Latin American Research Review, vol. 32, No. 2,Albuquerque, New Mexico, University of New Mexico.
Blair, T. and J. M. Aznar (2000): El crecimiento es el objetivoesencial para Europa, El País, Madrid, 18 June.
Bustelo, E. and A. Minujin (1998): Todos entran, BuenosAires, United Nations Children’s Fund (UNICEF)/Editorial Losada,.
Camdessus, M. (1996): Los nuevos pilares para una nuevasolidaridad, Círculo de Montevideo: “Los nuevoscaminos de América Latina”, Primera Reunión Plenaria,Montevideo, 5-6 September.
Cardoso, F.H. (1998): El Presidente segundo o sociólogo.Entrevista de Fernando Henrique Cardoso a RobertoPompeu de Toledo, São Paulo, Companhia das Letras.
Cohen, E. (1996): Presentación, Educación, eficiencia yequidad, Santiago, Chile, Economic Commission forLatin America and the Caribbean (ECLAC)/OAS(Organization of American States)/Ediciones SUR.
Cohen, E. and R. Franco (1992): Evaluación de proyectossociales, Mexico City, Siglo XXI Editores.
Cornia, A. (1999): Liberalization, Globalization and IncomeDistribution, Working paper No. 157, Helsinki, WorldInstitute for Development Economics Research,(WIDER).
Dahrendorf, R. (1996): La cuadratura del círculo. Bienestareconómico, cohesión social y libertad política, MexicoCity, Fondo de Cultura Económica (FCE).
ECLAC/CELADE (Latin American Demographic Centre) (1996):Impacto de las tendencias demográficas sobre lossectores sociales en América Latina: contribución aldiseño de políticas y programas, Serie E-CELADE, No. 45,Santiago, Chile.
ECLAC (1995): Social Panorama of Latin America, 1995,LC/G.1886-P, Santiago, Chile.
(1997): The Equity Gap. Latin America, the Carib-bean and the Social Summit, LC/G.1954/Rev.1-P,Santiago, Chile.
(1998): Social Panorama of Latin America, 1997,LC/ G.1892-P, Santiago, Chile.
(1999a): The International Financial Crisis: AnECLAC Perspective, LC/G.2040, Santiago, Chile.
(1999b): Social Panorama of Latin America, 1998,LC/G.2050-P, Santiago, Chile.
(2000): Social Panorama of Latin America, 1999-2000, LC/G.2068-P, Santiago, Chile.
Gerstenfeld, P. (1998): Oportunidades de bienestar ymovilidad social en América Latina. Percepciones yrealidades, Revista paraguaya de sociología, Año 35,Nº101, Asunción, Centro Paraguayo de EstudiosSociológicos (CPES).
Giddens, A. (1998): El centro derecha sigue en la confusiónneoliberal, El país, No. 933, Madrid, 22 November.
Graham, C. (1994): Safety Nets, Politics and the Poor,Washington, D.C., The Brookings Institution.
Hardy, C. (2000): Repensar la agenda progresista, RevistaRocinante, Santiago, Chile, October.
Iglesias, E. V. (forthcoming): La crisis, el desempleo y lasredes de protección social. Explorando nuevas fronteras,in R. Franco (ed.), Sociología del desarrollo, políticassociales y democracia, Buenos Aires, Fondo de CulturaEconómica (FCE).
ILPES (Latin American and Caribbean Institute for Economicand Social Planning) (1999): Reflexiones sobre eldesarrollo y la responsabilidad del Estado, Santiago, Chile.
La Tercera (2000): Santiago, Chile, 24 September.Latinobarómetro (2000): Informe de prensa, 1999-2000,
Santiago, Chile, Corporación Latinobarómetro.Londoño, J.L. and M. Szekely (1997): Persistent Poverty and
Excess Inequality: Latin America, 1970-1995, Working

63C E P A L R E V I E W 7 3 • A P R I L 2 0 0 1
THE LATIN AMERICAN SOCIAL AGENDA IN THE YEAR 2000 • ROLANDO FRANCO AND PEDRO SAINZ
paper series, No. 357, Washington, D.C., Inter-AmericanDevelopment Bank (IDB).
Manzi, J. and C. Catalán (1998): Los cambios en la opiniónpública, in C. Toloza and E. Lahera (eds.), Chile en losnoventa, Santiago, Chile, Office of the President of theRepublic /Dolmen Ediciones..
Maslow, H.H. (1954): Motivation and Personality, New York,Harper.
Mora, M. and M. Araujo (1992): Ensayo y error, BuenosAires, Editorial Sudamericana.
Morley, S. (1998): La pobreza en tiempos de recuperacióneconómica y reforma en América Latina: 1985-1995,in E. Ganuza, L. Tayor and S. Morley (eds.), Políticamacroeconómica y pobreza en América Latina y elCaribe , Madrid, United Nations DevelopmentProgramme (UNDP)/Mundiprensa.
Ocampo, J. A. (2000): Nuestra agenda, La CEPAL en sus 50años. Notas de un seminario conmemorativo, Librosde la CEPAL, No. 54, Santiago, Chile, ECLAC.
Ocampo, J.A. (coord.) (2000): Equity, Development andCitizenship, LC/G.2071, Santiago, Chile, ECLAC.
Olasky, M. (2000): Compassionate conservatism, New York,The Free Press.
Pastore, J. and N. do Valle Silva (2000): Mobilidade socialno Brasil, São Paulo, Makron Books.
Reich, R. (1993): El trabajo de las naciones. Hacia elcapitalismo del siglo XXI, Buenos Aires, Vergara.
Sen, A. K. (1999): Nuevo examen de la desigualdad, Madrid,Alianza Editorial.
Thurow, L. (1992): La guerra del siglo XXI, Buenos Aires,Javier Vergara Editor.
Touraine, A. (1998): 3 y 2 ½, El país, No. 911, Madrid, 31October.
Wolfenson, J. D. (1998): La otra crisis, address before theBoard of Governors of the Federal Reserve System,Washington, D.C., 6 October.

C E P A L R E V I E W 7 3 • A P R I L 2 0 0 164
THE LATIN AMERICAN SOCIAL AGENDA IN THE YEAR 2000 • ROLANDO FRANCO AND PEDRO SAINZ

65C E P A L R E V I E W 7 3 • A P R I L 2 0 0 1
EDUCATION AND DEVELOPMENT IN BRAZIL , 1995-2000 • PAULO RENATO SOUZA
C E P A L R E V I E W 7 3
APRIL 2001
Education and developmentin Brazil, 1995-2000
This article analyses the education policies applied in Brazil
in the six-year period from 1995 through 2000. After noting
the need to prepare citizens and the country to face the
twenty-first century, it addresses the long-standing lag in
Brazilian education and the general characteristics of the
educational system of that country. It then describes the
educational policy options adopted in the period in question,
which were aimed primarily at the expanding the system
while improving its quality, and analyses the special features
of the programmes in the field of basic education (understood
as the education given from the earliest stages up to the end
of secondary education); compensatory programmes aimed
at keeping students in school; special education; literacy
training plans, and the education of young people and adults.
Next, it looks at the training of teachers, secondary and
techno-professional training, and higher education, as well
as matters connected with the transparency of information
on the educational system and the possibilities of evaluating
the system, the financing of education, and the
implementation of the corresponding constitutional rules.
The article ends with an analysis of the challenges and
prospects of education in Brazil, noting that the main
challenge is the pursuit of increasingly high levels of quality
at all levels of education: an objective which is intimately
linked with the upgrading of teachers and the financing of
the system.
Paulo Renato Souza
Minister of Education of theFederative Republic of [email protected]

C E P A L R E V I E W 7 3 • A P R I L 2 0 0 166
EDUCATION AND DEVELOPMENT IN BRAZIL , 1995-2000 • PAULO RENATO SOUZA
IPreparing citizens and the countryfor the twenty-first century
With a population of 165 million, Brazil is the fifthmost populous country in the world, surpassed in thisrespect only by China, India, Russia and the UnitedStates. It is the fourth biggest in terms of area, and isamong the ten largest economies in the world.
Its society and economy are diversified andcomplex, with enormous potential but also with seriousproblems inherited from the past. There is now a clearawareness in the country that investment in educationis the most important way of tackling those problemsand making the great hopes that its people have in thefuture come true.
Since it is aware of the strategic importance ofeducation for incorporating the country in a globaleconomy which is increasingly based on knowledgeand innovation, Brazil has come to view education as anational priority. As well as taking measures to ensurethe financing of this sector, over the last six years it hasconsistently applied a coherent set of policies at alllevels of education.
These policies have as their background theawareness that the world is going through a greatprocess of structural change in terms of its economichistory, with all the social and political consequencesthat that implies. The form of production in Brazil hastaken a great leap forward, which has had an enormouseffect on consumption, employment, wages and, inparticular, the productivity of labour.
The appearance of informatics revolutionizedindustrial production technology, making old
specialized skills obsolete and requiring a new type ofworker, more versatile and better-equippedintellectually. The great leap forward incommunications, furthered by the development of spacetechnology, literally pulverized national barriers:countries could no longer keep themselves isolated ina world with instant access to information, andautochthonous national development processes were nolonger viable.
In this world which is globalized andinterdependent to a degree never before seen inuniversal history, the objectives of overcoming povertyand building firm foundations for democracynecessarily depend on the capacity for the appropriationand generation of scientific and technologicalknowledge, which is the rootstock and driving force ofpresent-day capitalism, and on the consolidation of abody of citizens endowed with the necessary meansfor understanding, criticizing and influencing decisionsaffecting the course of those changes.
For education, there is a dual challenge: to trainindividuals and to prepare the country both forunderstanding a new world founded on completelyreorganized bases, and for participating in that world.Making up for lost time, overcoming fundamental andessential shortcomings inherited from the past, and atthe same time implementing the educational reformsdemanded by the new society is a giant task whichmeans that governments and societies must give clearpriority to education.
IIThe long-standing lags in Brazilian education
In spite of all the shortcomings and inequalities in itselitist and concentrative development model, Brazilnevertheless occupied second place among thecountries with the greatest economic growth in theworld between 1890 and 1980. It was the last countryto abolish slavery, however (in 1889), and the Brazilian
agrarian model kept the great peasant masses –mostlydescendants of slaves and indigenous peoples who hadlost their own cultural characteristics– in a state ofexclusion and ignorance.
The industrialization process –between 1930 and1980– was marked by import substitution without much

67C E P A L R E V I E W 7 3 • A P R I L 2 0 0 1
EDUCATION AND DEVELOPMENT IN BRAZIL , 1995-2000 • PAULO RENATO SOUZA
attention to competitiveness or innovation. Exportscame only from the sectors making intensive use ofnatural resources and cheap labour, and a high degreeof income concentration existed side by side withincreasing social exclusion.
Up to 1950, almost 70% of the population still livedin rural areas. In 1960, only 60% of children between7 and 14 years of age went to school, and the rate ofilliteracy was 40%. By 1997, however, 80% of allBrazilians were living in cities. This frenzied processof urbanization was accompanied up to the end of the1980s by high rates of population growth, and the bigcities, in particular, with their already deficient systemsof urban infrastructure and services, had to receive amassive inflow of young people of rural origin whowere almost completely devoid of the skills needed forproduction activities in the industrial economy.
By the mid-1990s, 89% of all children wereattending school, and the rate of illiteracy had fallen to16%. This was a considerable advance, although it wasstill insufficient to meet the demands of the newknowledge-based society, especially considering thatonly 50% of the children beginning the first grade ofprimary schooling completed the full eight grades andtook an average of twelve years to do this, because ofthe very high rates of repetition and dropping out.
This dismal educational situation -even today thecountry still has a legacy of 15 million illiterates overthe age of 14- was coherent with and even “functional”to the development model prevailing up to then, whichwas designed to serve a policy of protectionism andwas capable of maintaining domestic balances thanksto protection from international competition. For thisform of industrial development favoured by the elites,it was sufficient to have a segment of good-qualityeducation covering all the levels (primary, secondaryand university), without bothering to expand itscoverage, since ensuring that the whole populationreceived education was not a priority.
Within these limits, the country pursued thiseducational model with a certain degree of efficiency,since under it -especially between the 1960s and 1980s-the best post-graduate specialized study facilities of anyof the developing countries developed and flourished.
Especially from the 1990s on, however, there wasincreasing pressure to provide better educationalconditions for the population as a whole. This pressurecame not only from young people and families seekingupward economic and social mobility but also from theeconomy itself, which was increasingly urbanized andcomplex and increasingly exposed to outsidecompetition.
IIIFeatures of the Brazilian educational system
A special feature of the Brazilian educational systemis that it is extremely diversified and decentralized.Brazil is a federal republic, made up of 26 federativestates and the Federal District. In turn, the federatedstates are subdivided into municipalities, of which thereare currently some 6,000.
Except at the higher level, the educational systemis predominantly public. There are currently 54.7million students enrolled in the different levels ofeducation. This figure represents nearly a third of theentire population and is practically equal to thecombined total populations of Argentina, Chile andUruguay. The public sector schools provide freeeducation to 89% of the 52 million students in the basiceducational segment (kindergarten, primary andsecondary), which is equivalent to the total populationof Venezuela and Peru together.
The new Law on the Guidelines and Bases forNational Education, which was officially published inDecember 1996, redefined the roles and responsibilitiesof each of the educational systems (federal, state andmunicipal). By giving greater independence to theindividual schools, making curricula more flexible, andpromoting the improvement of teachers’ qualifications–it lays down that by 2007 all the teachers in basiceducation must have university-level training– the newlaw provided a suitable environment for theimplementation of significant changes in the country’seducational system.
Compulsory primary education (grades 1 through8), as well as day nurseries (0-3 years of age), preschooleducation (4-6 years of age) and secondary educationhave always been the responsibility of the states andmunicipalities. At these levels, the central government

C E P A L R E V I E W 7 3 • A P R I L 2 0 0 168
EDUCATION AND DEVELOPMENT IN BRAZIL , 1995-2000 • PAULO RENATO SOUZA
plays a normative role, laying down the main lines ofthe system of redistribution and subsidiarity andproviding assistance and subsidies in order to reducesocial and regional inequalities. Only the institutionsof higher education and the middle-level techno-professional schools are maintained directly by theUnion.
The adoption of the Law on the Guidelines andBases for National Education set in motion an extensiveprocess of municipalization of primary education andstate-level responsibility for secondary education. In1997 there were 18 million students in state schoolsand 12 million in municipal ones, but in 1999 themunicipal and state-level systems drew level, with 16
million students each. Secondary education, whichexpanded at an average rate of 14% between 1996 and1999, has been increasingly concentrated in the state-level systems. Preliminary data from the 2000 schoolcensus show that the 5.4% increase in enrollment wasaccounted for mainly by the state system, which grewby 7.9%, whereas all the other systems decreased:-10.2% in the case of federal-level education, -4.9% atthe municipal level, and -4.2% in the case of privateeducation.
This evolution is in keeping with the Law on theGuidelines and Bases for National Education, whichenvisages the provision of secondary education by thestates.
IVThe main options of the federal government’snew educational policy
The whole of the federal government’s efforts arecurrently concentrated on expanding educationalopportunities while at the same time promoting higherquality, from the most basic areas of the educationalsystem to its highest levels; these efforts are directed inparticular towards the school-age population, but theyalso seek to provide opportunities for entry to thosewho did not have access to education at thecorresponding age, in view of the right of all Braziliansto enjoy full citizenship and to have access to thedevelopment model necessary for the full exercise ofthat right.
In primary education, the most important objectivewas to enroll children between 7 and 14 and keep themin school thereafter, guaranteeing them high-qualityeducation. The second objective of the government,after universal access, was to ensure the success of theschooling provided, as represented by the progress ofstudents up to the completion of the last grade withinthe scheduled time: an objective which necessarilyincluded improvement of the quality of education.
Mention should also be made, however, in additionto the priority given to the universal coverage of primaryeducation, of the measures for the reform anddiversification of secondary and techno-professionaleducation, the training and upgrading of teachers, andthe expansion and evaluation of higher education.
The quantitative and qualitative aspects of thesepolicies were subjected to continuous control throughreliable information and educational appraisalmechanisms, so that, after starting from scratch five yearsago, Brazil now has an educational system comparablewith those of the most highly developed countries.
In addition, complementary programmes of acompensatory nature –some of them among the mostcomprehensive in the world– have been prepared inorder to overcome the past history of inequality inBrazilian society. Among these programmes are theprovision of free school lunches and textbooks inprimary education, the supplementation of the incomesof the poorest families with children in school, andeducational loans for young people who reach the levelof higher education. In addition, the programmes ofaccelerated learning, literacy training and education foryoung people and adults and of support for theeducational systems of the Northern and Northeasternregions are also designed to make up for regional andincome-related inequalities and to contribute to the greateffort to promote social inclusion currently under wayin Brazil.
The educational programme of the government,based on the pursuit of equality of opportunities,includes not only the principles of universal coverage,high quality and decentralization, but also community

69C E P A L R E V I E W 7 3 • A P R I L 2 0 0 1
EDUCATION AND DEVELOPMENT IN BRAZIL , 1995-2000 • PAULO RENATO SOUZA
participation in the running of schools and greater socialcontrol over public expenditure and its results. To thisend, the traditional allocation of federal resources tothe federated elements of the country through negotiatedagreements has gradually been replaced by systems ofautomatic transfers based on transparent and universalcriteria, while the bureaucratic follow-up and evaluationarrangements have been replaced by communityparticipation in collegiate supervision and accountingcontrol bodies.
1. Primary (“fundamental”) education
In five years there has been a big expansion in accessto primary education. The proportion of childrenbetween 7 and 14 enrolled in school rose from 89% in1994 to 96% in 1999, representing the incorporationof four million students into the system. Regionalinequalities are also being reduced. Thus, in theNortheast region enrollment grew by almost 27%,compared with 13% for the country as a whole.
Contrary to what is usually assumed, it wouldappear that the public schools offering basic educationhave enough vacancies (naturally with adaptations tosuit a different student profile) to absorb the entirepopulation of children between 7 and 14 (correspondingto compulsory primary education) and 15 and 17(corresponding to secondary education). According tothe 1999 school census, Brazil had 44 million studentsenrolled in the public basic educational system, whereasthe population aged between 7 and 17 was only 37million. The difference is accounted for by repetition,which reaches very high levels in the earliest grades,and late entry into the system.
Although the age/grade distortion is still high–46.6% of all students could be in higher grades– Brazilis improving its performance in primary education.
Between 1994 and 1999, the number of studentsgraduating from primary education soared from1,588,000 to 2,383,000 - an increase of 50.1%. Overthe same period, the number of students graduatingfrom secondary education grew by 67.8%, from915,000 to 1,535,000.
The promotion rate, which measures the numberof students progressing from one grade to the next, rosefrom 65% in 1995 to 74% in 1998; the expectation ofcompleting first grade increased to 63%, and theaverage time needed to complete all eight grades wentdown from 12 to 10 years. In 2000, enrollment in theprimary cycle began to go down for the first time, butmainly in the first four grades, as it continues to grow
in the case of the fifth to eighth grades. More studentsare completing primary education than are entering it,which means that the age/grade distortion and theindexes of repetition are going down. This greaterefficiency lightens the educational burden on themunicipalities and increases the challenge to the states,which are responsible for ensuring the expansion ofsecondary education.
An important element in the improvement in theage/grade distortion is the accelerated learningprogramme. Through it, the federal governmentfinances special classes for students having a seriouslag in this respect, in order to help them to progressrapidly to the grade corresponding to their age. Between1998 and 2000 over 3.5 million students took part inthis programme, and most of them succeeded inadvancing in their studies.
It should be repeated that the main problem inprimary education is not quantitative but qualitative.In this respect, in addition to the formulation anddiffusion of national parameters and curricularguidelines for all levels and forms of basic education(pre-school, primary and secondary education, togetherwith special programmes for young people and adultsand indigenous groups) and programmes such as “TVEscola” or “Proinfo”, which will be dealt with later,there are also the efforts made to improve and extendother programmes, such as those for the issue of schoolbooks and school libraries, in order to meet thechallenge of raising the quality of primary education.
Primary school teachers were provided with morethan 1.4 million copies of the curricular parameters andguidelines. In 1998, schools were issued with 20,000sets of the “teacher’s library”, consisting of referenceworks on the historical, social and political formationof Brazil, and in 1999 a further 35,000 libraries ofchildren’s and young people’s literature were deliveredfor use by primary school students.
Programmes of a compensatory nature, designedto correct the effects of the big social and income-related disparities affecting a large proportion ofBrazilian families, also helped to create suitableconditions for the successful education of students fromlow-income families.
2. Compensatory programmes
The National School Nutrition Programme (PNAE),commonly known as the “school lunch programme”,provides during the 200 days of the school year at leastone meal per day to the 36 million children in the

C E P A L R E V I E W 7 3 • A P R I L 2 0 0 170
EDUCATION AND DEVELOPMENT IN BRAZIL , 1995-2000 • PAULO RENATO SOUZA
primary and pre-school levels of the public system andin private philanthropic educational establishments. Thepopulation thus served exceeds the total population ofCanada and is equal to the combined population ofAustralia, Greece, New Zealand and Singapore. Thecoverage of the programme is practically universal: in1999 it operated in 96.7% of all urban public schoolsand in 98.1% of the rural schools. Many schoolheadmasters (75% of those in rural schools and 61% inurban schools) believe that the “school lunch” is themain meal of the day for most of their students.
The programme has been improved, expanded andcompletely decentralized. The present government hasalmost doubled the expenditure on these meals: between1995 and the end of 1999 the country invested 3.6billion reales in feeding primary school students. In1999 alone the investment came to 903 million reales,representing 33% of the total budget authorized for theNational Educational Development Fund (FNDE). Theresources are sent directly to over 5,000 municipalities,where the community and the schools freely decide onthe menu in line with local and regional eating habitsand are responsible for controlling the quality of thefood. Since 1999, the formation of a municipal schoollunch council has been made an essential condition forthe transfer of the resources to the municipalities.
The existing National School Book Programme(PNLD), through which the federal government acquiresand distributes primary school textbooks, has beenimproved and expanded since 1995. The old programmeleft much to be desired, as it was limited to the firstfour grades, suffered from chronic problems ofunpunctuality in the distribution of the books, andlacked arrangements for the evaluation of the contentsof the books and the methodologies followed inaccordance with appropriate national curricularguidelines.
As from 1996, the PNLD began to serve all first toeighth grade primary school students. Between 1994and 2000, the FNDE (directly) or the states of São Pauloand Minas Gerais (autonomously) acquired 597 millionschool books, selected by the teachers from a catalogueof books evaluated by an independent commission ofteachers. In 1999, 502 different works from 27publishers were distributed to 170,000 schools all overBrazil.
A joint company formed by the Ministry ofEducation and the Brazilian Postal and TelegraphCompany ensures that 100% of the books are deliveredto the schools before classes begin, even in the mostremote municipalities. The programme is designed on
the assumption that the books can be re-used for threeyears, to which end the publishers were required toimprove the quality of the paper and binding, and aneducational campaign was carried out among studentsand their families to encourage them to take care ofthis study material; the rate of return has beensurprisingly high. According to an independent survey,93.5% of school headmasters considered that theirstudents “were happy to use the books” and approvedof the choice of texts.
The most important and effective initiative forensuring that children from low-income families stayin school is undoubtedly the National GuaranteedMinimum Income Programme (PGRM), better known asthe “Every child in school” programme. Within theworldwide tendency towards the decentralization ofresources and the targeting of attention, the programmeprovides monthly financial aid to deprived families(with a family income of less than half a minimum wageper member) with school-age children.
The PGRM is implemented by municipalities wherethe average family income is less than the average forthe state in question, and those municipalities whichare not in a position to cover the total cost of theprogramme may receive financial aid from the Union.In 2002 the aim is to cover the entire universe of over3,000 municipalities eligible for participating in thescheme. At the end of 1999 the programme had alreadybenefited over 500,000 families, representing almost amillion children between 7 and 14, in over a thousandmunicipalities. The programme also helps in eradicatingchild labour and reducing the exodus of families to thebig cities.
The Northeast Project was established in the lightof the extremely unfavourable situation of educationin that region of the country, which registers indicatorsfar below the Brazilian averages. In addition toproviding substantial resources for municipal and stateeducation programmes, this project supports researchto help formulate effective strategies to overcomeeducational shortcomings.
Between 1993 and 1998, the Northeast Projectinvested national and external resources (the latter camefrom a World Bank loan) amounting to nearly US$ 500million. It was reformulated in 1998 under the newname of Educational Strengthening Fund (Fundescola)and was also extended to the North and Centre-Westregions.
The educational indicators in the Northeast andNorthern regions have grown faster than the nationalaverage in both quantitative and qualitative terms. This

71C E P A L R E V I E W 7 3 • A P R I L 2 0 0 1
EDUCATION AND DEVELOPMENT IN BRAZIL , 1995-2000 • PAULO RENATO SOUZA
favourable evolution, which has become even moremarked in recent years, shows that regional differencesare rapidly being reduced. In those regions, primaryeducation has grown by 27.2% since 1994, comparedwith 13% in the country as a whole, while enrollmentin the fifth to eighth grades has grown by 49%,compared with a nationwide 27%. Over half of thestudents attending accelerated learning classes (50.6%)are in the Northeast region. In secondary education,while nationwide enrollment grew by 5.4% between1999 and 2000 it increased by 11% in the Northeastand by 8.3% in the Northern region.
3. Infant education (0-6 years of age) and specialeducation
Two advances are worthy of note in infant education:adoption of the concept that educational attention forchildren between 0 and 6 years of age is a first stage inbasic education, and the expansion of enrollment at thislevel. The inclusion of day nurseries (0-3 years of age)in educational systems and the definition of the respon-sibility of municipalities for infant education completethe institutional changes made in this field. Pre-schoolenrollment (providing attention for children between 4and 6 years of age) grew from 35.4% of that age groupin 1990 to 50.4% in 1998. Another positive aspect isthat although the indicators of coverage of pre-schooleducation are still unsatisfactory, regional disparitiesare much smaller than at the other levels of educationand the distribution of enrollments between rural andurban areas is better.
Improving the records of infant educationalestablishments (especially those that have day nurseries)is a difficult task, as many such establishments operateinformally in connection with churches, associationsand non-governmental organizations. In order toinclude this informal system of establishments in thestatistics of the Ministry of Education, as from October2000 the National Institute for Educational Studies andResearch (INEP) carried out the first census of infanteducation, the data from which will be of vitalimportance for defining educational policies for thesector. The school census published each year by theINEP currently collects data on both day nurseries andpre-school establishments. A survey exclusively oninfant education is planed, in order to expand thecoverage of the information collected.
In the field of special education, analysis of theprogress made in the 1990s shows that there has been amarked increase in the access to education of those with
special needs. This is the result of the efforts made toovercome both the idea and the practical application ofsegregation and to progress towards an “inclusive” formof education within the regular educational system, withrespect for the diversity of students being the guidingprinciple in education. Between 1988 and 1998 therewas an increase of 102.8% in the enrollment of studentswith special needs.
4. Literacy training, and education for youngadults
The constant growth in the rate of school attendancethroughout the country has been reducing illiteracy,raising the level of education of the population, andgradually reducing the marked regional disparities. Thepercentage of children between 7 and 14 who do notgo to school, which stood at 16.2% in 1989, went downfrom 9.8% to 4.3% between 1995 and 1999.
In the 10-14 age group, in which children areexpected to be at least able to read and write, the rateof illiteracy went down from 14.8% in 1989 to 9.9% in1995 and 5.5% in 1999. The heavy inherited burden ofilliteracy and low average educational level of thepopulation, however, which was the result of pastquantitative and qualitative shortcomings in primaryeducation, makes it necessary to continue to tackle theseserious deficiencies with specific programmes.
According to the Constitution, it is the duty of theState to further the free provision of education for all,including those who did not have access to it at thecorresponding age. Various initiatives have thereforebeen implemented to provide literacy training for adultsand secure the reincorporation into regular primaryeducation of young people who had dropped out ofschool.
There is an increasing conviction, however, thatthe education of young people and adults (EYA) callsfor special policies as well as curricula and methodsspecially adapted to the needs of young people and adultworkers. Since 1994, the federal government has begunto invest in solutions of this type, with programmes forthe production of suitable teaching material and thetraining of specialized teachers. Special importance hasbeen attached to initiatives in the field of associationand other successful efforts made by employers, byvarious civil organizations, by universities, and by thestate and municipal departments of education.
As a result of these policies, already in 1998 theschool census registered 2.8 million persons enrolledin courses for young people and adults, the great

C E P A L R E V I E W 7 3 • A P R I L 2 0 0 172
EDUCATION AND DEVELOPMENT IN BRAZIL , 1995-2000 • PAULO RENATO SOUZA
majority of whom were completing their primaryeducation.
In 2000, enrollment in all levels of EYA specialeducation for young people and adults totalled 3.1million. Following the same trends as in regulareducation, there was a small increase in the literacytraining groups (3.7%) and in first to fourth gradeeducation (2.3%), but a considerably larger expansionin fifth through eighth grade classes (9.9%). There wasa particularly marked increase in secondary education,which grew by 33.3% compared with the previous year,involving 807,600 students. Compared with the 1995census, the increase was 169.6%.
In order to tackle illiteracy in the 12-18 age group–a problem which is concentrated in the poorestmunicipalities of the country– an initiative called“Supportive Literacy Training”, which was a newproject of the “Supportive Community” programme ofthe Office of the President of the Republic, was putinto effect. This project, which was set up in January1997 and operates in association with universities andprivate initiatives, had some 300,000 students in 866municipalities as at December 1999, mostly in theNorthern and Northeast regions.
5. Teacher training and the quality of education
Improving the quality of education is the main battlethat the Ministry has begun to fight on various differentfronts. Extensive reform of school curricula at all levelsis under way. For the first time in the history of Brazilianeducation, the federal government has establishednational parameters for the curricula of all eight gradesof primary education, as well as guidelines for infanteducation, and it has reformulated the whole system ofteacher training. Parameters have also been laid downfor the education of young people, adults, andindigenous groups. The latter is one of the mostinteresting aspects of the policies of the presentgovernment, since it seeks to make a clear effort topreserve and enhance the culture of indigenous groups.
One of the most innovative features of theparameters laid down for school curricula is their broadcoverage, which goes far beyond the subjects makingup the traditional curricula, since it includes subjectsconnected with the formation of citizens and deals withquestions of ethics, citizenship and cultural diversity,as well as education in the fields of the environment,health, and sex.
For distance education, new programmes have beencreated, such as school television (“TV Escola”), in
order to provide sixty thousand schools all over thecountry with backup educational programmes,assistance for the work of the teachers, and ongoingteacher training. This school television, which istransmitted on a dedicated channel by satellite, providesthree hours of high-quality programmes per day,repeated four times a day.
The National Educational Informatics Programme(PROINFO) has proved to be another important initiative.Under it, over 20,000 teachers have so far been trainedin the use of computers in education. To date, thegovernment has installed 30,000 computers andperipherals in over 2,000 schools in the 26 states andthe Federal District, directly benefiting nearly 200,000students. The programme aims to install 100,000computers in 6,000 schools by 2001, thus reaching 7.5million students. In 2000, through the establishment ofthe Universal Telecommunications Services Fund(FUST), the federal government will spend 300 millionreales on connecting public schools to the Internet.
In order to raise the quality of primary educationanother great challenge must also be faced: that oftraining teachers. This means raising the status ofteachers and improving their working conditions andsalaries. The Fund for the Maintenance andDevelopment of Primary Education and theImprovement of the Status of Teachers (FUNDEF) hasbegun to correct the salary problem by devoting amandatory 60% of its resources to upgrading thequalifications and salaries of teachers. After a year ofoperation of this Fund, the nationwide average salaryof teachers has increased by 13%, but in the case ofteachers in the municipal education systems of theNortheast, where salaries were lower, the increase hasamounted to 50%.
In addition to the increase in the number of teachersover the last five years –10% in primary education and36% in secondary education– the school census revealsthat they are now better qualified, since their level oftraining has improved considerably. Between 1994 and1999, the proportion of teachers without full training–the so-called lay teachers– went down to 41% inprimary education, the number of teachers with fullsecondary education increased by 8%, and the numberwith full higher education grew by 24%.
The Law on the Guidelines and Bases for NationalEducation provides that by 2007 all teachers in basiceducation must have higher education. There arecurrently 600,000 teachers without such training in thecountry, of whom 95,000 do not even have theminimum qualifications required at present

73C E P A L R E V I E W 7 3 • A P R I L 2 0 0 1
EDUCATION AND DEVELOPMENT IN BRAZIL , 1995-2000 • PAULO RENATO SOUZA
(intermediate-level teachers’ training). Almost 80% ofthe teachers in the first four grades of primary educationwill have to upgrade their qualifications, as will almost25% of the teachers in the last four grades.
This will call for a major joint effort by all threelevels of government in the coming years, as the task isenormous and the time available only short. Big changesare being made in the organization of the teachertraining system. The idea of higher institutes ofeducation and a career system for graduates of suchinstitutes, the definition of special teachers’ trainingprogrammes and the formulation of new guidelines forthe curricula of teachers’ training courses anduniversity-level degrees in general are measures thatare bound to have a strong impact in the short term.
At the same time, there is general agreement amongspecialists in education that no initial training, even ofthe best quality and at the highest level, is sufficient ofitself for professional development. This means that itis essential to establish a system of ongoing permanenttraining for all teachers.
The government is investing more and moreresources in distance training courses in order to makeit possible to upgrade the qualifications of workingteachers. Some states, with the support of universities,are also carrying out effective in-service trainingprogrammes for thousands of teachers in theirrespective school systems.
The “TV Escola” school television programme,which is transmitted on a dedicated channel by satellite,promotes the upgrading of teachers by providingsystematic support for their classroom activities. Whenit installed the programme, the government trained200,000 teachers in its use, and there are now 56,506schools equipped to receive three hours of theprogramme each day. The programme has been on theair for three years now and serves nearly a millionteachers and 28 million students.
6. Secondary and techno-professional education
The growth rate of the number of enrollments insecondary education has soared by 11.5% in 1999 and57% between 1994 and 1999. In the Northeast regionthe growth has been even faster: 62%.
The impressive expansion of enrollments insecondary education is due to three main factors: thereare more students completing their primary education;more students are now completing it at an earlier ageand are therefore in a position to continue with theirstudies, and there has been an increase in the demand
from young people for better schooling to meet thedemands of an increasingly competitive labour market.Supplementary secondary education (education ofyoung people and adults over 18) grew by 169%between 1995 and 2000.
Secondary and techno-professional education isundergoing profound reforms. Previously, secondaryeducation had no identity of its own and was divorcedfrom the requirements of the modern world, so that itwas not fulfilling the functions demanded of it. Whatwas required was that it should teach students to learnon their own, provide them with guidance on practicaleveryday matters and their future working careers, andprepare them for the exercise of citizenship anddemocracy. It should also be able to train young peoplein the use of new technologies and ways of producinggoods, services and knowledge.
The first step in the reform of secondary educationwas of a structural nature: secondary education wasseparated from techno-professional training. Theseareas of education now operate independently, and thelatter is now complementary to the former. This willfacilitate the achievement of another of thegovernment’s great goals in education: the attainmentof universal coverage of secondary education too.
In addition to these structural changes in secondaryeducation, the Ministry has also made changes in theareas of teaching itself and the curricula. At the teachinglevel, the new form of secondary education willassociate knowledge with the practical life of students,providing them with guidance on their future and notmerely being a preparatory stage for future entry intohigher education.
The national curricular guidelines laid down forsecondary education are compulsory for all the schoolsin the country. After their definition, the Ministryprepared the corresponding curricular parameters anda set of guidelines and recommendations for supportingthe work of teachers under this new concept ofsecondary education.
The curricula have been made more flexible: 75%of their content is in line with a common national base,while the remaining 25% is defined by the schoolsthemselves in the light of local economic and socialcharacteristics or the interests of the school community.Through this innovation, students now have greaterfreedom to design their own curricula.
In addition to these changes in secondaryeducation, the Ministry has also embarked on the reformof techno-professional education, as provided for in theLaw on the Guidelines and Bases for National

C E P A L R E V I E W 7 3 • A P R I L 2 0 0 174
EDUCATION AND DEVELOPMENT IN BRAZIL , 1995-2000 • PAULO RENATO SOUZA
Education. That area of education is now divided intothree independent levels: basic (independent of whateverprevious schooling the students have), technical(simultaneous with or subsequent to secondaryeducation), and technological (of a higher level,subsequent to secondary education). The secondary-level, post-secondary and higher courses in this areawere previously given in full-time schools with rigidcurricular structures linked with very clearly-definedoccupations and aimed primarily at young people.
Today, however, as well as being separate from thesecondary cycle, techno-professional education offerscourses that meet the needs of local and regional labourmarkets. The authorities are promoting thediversification of post-secondary techno-professionaleducation, both technical and higher-level, to give broadflexibility to the curricula and freedom for young peopleand adults to enter and leave the educational systemseveral times. The organization of the curricula inmodules allows students to take various short coursesat different times in their lives and allows for flexiblecontents which take account of the students’preferences. With this restructuring, techno-professional education will be able to effectively trainstudents to work in various different occupations.Furthermore, it will only attract young people whoreally do want to work as middle-level professionals.
Through the Brazilian Support Service for Micro-and Small-scale Enterprises (SEBRAE), 10,000 technicaleducation teachers are being trained to give theirstudents a basic knowledge of business management,thus preparing students to work on their own account,if they so desire, or open a small enterprise aftercompleting their training.
The Techno-Professional Expansion Programme(PROEP), which is financed by the Ministries of Educationand Labour with support from the Inter-AmericanDevelopment Bank (IDB), is spending US$ 500 millionon the re-equipment of public technical schools andthe establishment of a network of community techno-professional schools in association with municipalities,trade unions and civil organizations.
7. Higher education
Although the Brazilian higher education system is quitesmall for the size of the country and displays enormousdifferences in quality, it has never been a serious im-pediment to Brazilian development.
The percentage of the population with completedhigher education among adults over 25 is similar to the
levels for countries such as Austria, Chile, Italy andUruguay and is higher than in China, India, Indonesiaand Turkey.
In 1997, 7% of the population between 25 and 34years of age had higher education. In the 35-44 agegroup the percentage rose to 9%, while in the 45-54and 55-64 age groups the percentages went down to8% and 5% respectively. The indicators for Italy foreach of these age groups are similar to these figures:8% (25-34), 11% (35-44), 8% (45-54) and 5% (55-64).
In higher educational policy the challenge to befaced –ensuring the expansion and diversification ofthe system while maintaining or improving its quality–was very clear in view of the big increase in the ratesof completion of secondary education and the demandsof an increasingly sophisticated and segmented labourmarket.
Expansion of this area of education recovered inquantitative terms from 1994 on, after a long period inwhich the number of students remained unchanged. Inthe four years from 1994 the enrollment in highereducation grew more in absolute terms than in theprevious 14 years, with 424,000 new enrollments.
Thus, in 1998 there were 2.1 million students inhigher education: 28% more than in 1994. The totalnumber of graduates now represents 9% of thepopulation aged 21 or over (7% in the case of men and11% in that of women).
With regard to diversification, the curricula of thehigher courses are being reformed in two aspects: theirstructure is more flexible, thus permitting partialcertification of short courses, and the establishment ofminimum curricula for each course has been abandonedand replaced with curricular guidelines for each areaof study.
As far as quality is concerned, up to 1995 theexpansion of the system was only subject to ex antebureaucratic controls, without there being any systemof evaluation that enabled the accreditation ofinstitutions to be linked to judgements on theirperformance and quality.
The legislation on the accreditation of courses andinstitutions has been substantially modified, andevaluation of performance as the main mechanism foraccreditation and re-accreditation has beeninstitutionalized. An innovative system of finalexaminations, which must be taken by all students inorder to graduate, has been established as an indirectmeans of evaluating the performance of the courses inquestion. The results of these examinations, togetherwith the evaluation of the operating conditions carried

75C E P A L R E V I E W 7 3 • A P R I L 2 0 0 1
EDUCATION AND DEVELOPMENT IN BRAZIL , 1995-2000 • PAULO RENATO SOUZA
out by specialist commissions appointed by theMinistry, enable society to know which institutions andcourses have the best performance. As well as makingthis information more democratically available,favouring social supervision and control andhighlighting shortcomings, these results serve as thebasis on which the Ministry decides whether or not torenew the accreditation of institutions and courses.
Since the creation of this integral system ofevaluation, there has been greater freedom for theprivate sector to expand its activities in the field ofhigher education, subject to the fulfillment ofestablished patterns of quality under the supervisionand systematic evaluation of the Ministry of Education.Significant expansion of higher educational activitiestowards the interior of the country and correction ofregional imbalances have been observed. Thus, almostone-third of the increase in the number of vacancies inprivate-sector institutions has been in the Northern,Northeast and Centre-West regions.
Since much of the expansion in the supply of highereducation is taking place and will continue to take placein the private sector, the government has concerneditself with improving the support mechanisms to helpstudents from low-income families to have access tohigher education.
The new Student Finance Programme (FIES), whichwas set up in 1999, provided loans to more than 80,000students enrolled in institutions all over the country inits first six months of operation. This is 173% more thanthe last selection process made in 1997 by the formereducational credit system, and in 1999 the resources usedfor this purpose exceeded 150 million reales.
In public higher education, which is free of charge,measures were taken to increase the productivity of thesystem, which had one of the lowest student/professorratios in the world. Under the present government, theresources devoted to higher education by the federalpublic system have increased by 28%, and efforts havebeen made to use them in the most transparent andefficient manner. Federal resources are now distributedto the public universities according to the number ofstudents and graduates, and a system of remunerationof the professors linked to their academic performancehas been introduced.
Consequently, the expansion of higher educationnow includes an important new feature: the publicsystem has recovered its dynamism. The number ofundergraduate students grew by 17% between 1994 and1999, while the number of postgraduate students alsoincreased significantly: between 1995 and 1998 the
number of students studying for masters’ degrees rosefrom 43,000 to 51,000, and those studying fordoctorates increased from 16,000 to 27,000. This meansthat Brazil is training 13,000 graduates with masters’degrees and 4,000 with doctorates each year.
Investment is being made both in human resourcesand in physical equipment and installations. Theaverage level of qualifications of the faculty membershas improved, since the proportion with doctorates rosefrom 22% to 29%. Priority has been given toundergraduate education, and over 100 million realeshas been spent on libraries, computers and informationinfrastructure. International tenders were invited for thesupply of US$ 300 million of laboratory equipment forundergraduate education and university hospitals, andthis equipment is already being delivered to publichigher educational institutions.
8. Information and evaluation
Under the present government, there has been a veri-table revolution in terms of educational information andevaluation. The high quality of the studies carried outhas made them an indispensable instrument for the plan-ning and execution of the public policies of the Minis-try of Education. Thanks to them, the government isnot only spending more on education but is using theseresources more effectively.
The starting point for this was the conversion ofthe National Institute for Educational Studies andResearch (INEP) into an autonomous body with its ownresources. In this capacity, the INEP has taken overresponsibility for the entire system for the collection,evaluation and storage of information on all aspects ofeducation in the country.
The System for the Evaluation of Basic Education(SAEB), which studies the performance of primary andsecondary school students, is recognized as one of themost sophisticated in the world in matters of theevaluation of school performance.
The National Secondary Education Examination(ENEM), which was held for the third time in 2000, isbecoming firmly established as an important instrumentfor evaluating the performance of students and schools.In that year, 350,000 students took the examination,which is already accepted by 130 institutions as validproof of eligibility to enter higher education, eitheralone or in conjunction with the traditional entranceexamination.
As from 2001, enrollment for this examination willbe free of charge for all students of public schools. The

C E P A L R E V I E W 7 3 • A P R I L 2 0 0 176
EDUCATION AND DEVELOPMENT IN BRAZIL , 1995-2000 • PAULO RENATO SOUZA
aim is to pressure the federal universities to accept theexamination: at present, out of over 50 federaluniversities in Brazil, only 7 accept it as one of theforms of entry. It is expected that out of a total of 1.8million students graduating from secondary educationin 2001, some 900,000 will be enrolled for the ENEM.
In higher education, the National Degree CourseExamination (“Provão”) has also been gainingacceptance after four years of application; it now covers18 higher education courses and serves to evaluate2,889 course modules through an examination takenby 214,000 students in the country (70% of the totalnumber of undergraduate students). This nationalexamination, which is essential for evaluating the
quality of undergraduate courses in higher education,is playing a notable part in improving the level of highereducational institutions.
The quality of the work done by INEP over the lastfive years has won international respect. Thanks to theadvances made in systems of evaluation andinformation, Brazil now takes part in internationalcomparative studies such as the World EducationalIndicators (WEI), prepared by UNESCO in conjunctionwith the OECD, and the PISA 2000 study of theOrganization for Economic Cooperation andDevelopment (OECD), which make possible a precisediagnostic study of the situation of Brazil comparedwith the other countries.
VPublic resources for education
Brazilian legislation provides for a regular flow ofpublic resources to education. Brazil’s publicexpenditure on education, as a proportion of GDP, is oneof the highest among the countries participating in theWEI project and is equal to the average of the OECD
countries.In 1997, public expenditure on education came to
37 billion reales. This was equivalent to 4.8% of thecountry’s GDP: more than in Argentina (3.7%), Chile(3.2%), Philippines (3.0%), Mexico (4.6%), Malaysia(4.4%), Thailand (4.3%) and Uruguay (2.6%), andcomparable to that of Spain (4.8%) and the average ofthe OECD countries (4.9%).
Total expenditure in that year was 43.3 billionreales, made up of 8.6 billion from the Union (19.8%),21 billion from the states (49.8%) and 13.1 billion fromthe municipalities (30.4%). The federal governmentprovides 62% of the resources invested in highereducation and plays an important supporting role inprimary and secondary education.
In that same year, expenditure on staff costsabsorbed 57.6% of the direct resources provided bythe three levels of government. This proportion istending to increase because of the policies for thetraining and upgrading of the teaching staff. Between1994 and 1999 there was an increase of 45.3% in thenumber of teachers with full higher-level training anda reduction of 65.8% in the number of lay teachers (i.e.,without secondary-level qualifications).
The 1988 Constitution lays down that the statesand municipalities must devote at least 25% of theirtax revenue to education, and of that amount at least60% must be spent on primary education. At the levelof the Union, the corresponding minimum is 18% oftax revenue.
Primary education also receives supplementaryresources from the “education wage”, a socialcontribution equal to 2.5% of their payroll thatenterprises must make for this purpose. One-third ofthese resources goes to a federal fund, the FNDE, whichprepares support programmes devoted exclusively tothe state and municipal primary educational systems,while two-thirds goes directly to the states where thetax is collected. In 1998, the resources allocated by thethree levels of government exclusively to primaryeducation amounted to 18.3 billion reales.
If it had not been for the faulty distribution of theexisting resources, plus their faulty application, theavailable resources would have been enough to maintainan educational system of much better quality and coveragethan that which actually existed in the country up to 1995.
The faulty distribution was due to the bigdifferences in revenue collection capacity between thericher and poorer states and municipalities. The formerdid not devote the mandatory 25% of their revenue tocompulsory primary education or infant education: theyinvested a considerable part of those resources insecondary education, and even in some cases in higher

77C E P A L R E V I E W 7 3 • A P R I L 2 0 0 1
EDUCATION AND DEVELOPMENT IN BRAZIL , 1995-2000 • PAULO RENATO SOUZA
education. In the poorer municipalities, for their part,especially in the Northeast, the resources available werenot sufficient to provide good-quality education. Inmany such localities the average expenditure per studentper year was less than 100 reales, and teachers’ wagesdid not even amount to the official minimum wage.There was therefore no relation between the resourcesavailable and the number of students served by thedifferent educational systems.
The forms of faulty application of resources rangedfrom the use of resources that were supposed to be forprimary education for other levels of education, andeven the straightforward diversion of resources to other
uses, so that they were lost in the nooks and cranniesof bureaucracy before they ever arrived at the schools,both because of the lack of a clear definition of“expenditure on education” and because of the lack ofaccounting and administrative controls.
It was in order to correct such distortions andensure the implementation of the objectives of the newLaw on the Guidelines and Bases for NationalEducation that in 1996 the present governmentproposed and approved Constitutional Amendment No.14 which set up a Fund for the Maintenance andDevelopment of Primary Education and theImprovement of the Status of Teachers (FUNDEF).
VIThe Fund for the Maintenance and Developmentof Primary Education and the Improvementof the Status of Teachers (FUNDEF)
Constitutional Amendment No. 14, which set up FUNDEF,laid down that for ten years from the date of itspromulgation states and municipalities must assign toprimary education no less than 60% of the resourcesalready earmarked for education under the 1988Constitution. Although FUNDEF does not cover all thetaxes collected by states and municipalities, thiscommitment applies to all the revenues making up thebudgets of those levels of government.
The resources previously earmarked for educationin general –without there being any clear definition ofwhat should be considered as expenditure on education–were not necessarily allocated in line with the realpriorities defined for the country: primary education,an increase in the number of students, better pay forteachers, and a level of resources which would improvethe quality of the schools in the poorest regions.
FUNDEF, which was set up in 1998 in all the units ofthe federation for a period of ten years, is anadministrative fund (that is to say, it does not generatenew resources but simply distributes the existingresources differently) extending to all the main sourcesof state and municipal revenue.
Before this fund was set up, the way tax incomewas distributed between states and municipalities boreno relation to the division of educational burdens
between the state and municipal educational systems.This further exaggerated the inequalities between therichest and poorest municipalities in each state and didnothing to combat the traditional regional imbalancesin the country.
With the creation of FUNDEF, the redistributionbetween each state and its component municipalitiesof the resources making up the fund takes placeautomatically, according to the number of studentsenrolled in the respective primary education systems.
With the new definition –now endowed with theforce of law– of what can be included in expenditureon education, the amounts redistributed by the fund aredeposited in a special bank account, thus notablyimproving public control over their use.
The resources received by state or municipaleducational systems in the account in question must beallocated in line with the following requirements:
i) a minimum of 60% must be used for the paymentof teachers actually working in primary education,although part of those resources may be used forthe upgrading of lay teachers up to 2001;
ii) the remaining 40% must be used for actions definedby the law as corresponding to the upkeep anddevelopment of education: construction,

C E P A L R E V I E W 7 3 • A P R I L 2 0 0 178
EDUCATION AND DEVELOPMENT IN BRAZIL , 1995-2000 • PAULO RENATO SOUZA
expansion, completion or remodelling of schools,acquisition of teaching material and equipment,miscellaneous services, and payment of pensions.
The federal government undertakes to make up theamounts provided when the resources distributed bythe fund in a state do not reach a certain minimum levelper student which is determined annually and iscurrently 333 reales per student/year in the first fourgrades of primary education and 349.65 reales in thelast four grades.
In 1998, which was the first year of operation ofthe fund, almost 13.3 billion reales was distributed tothe compulsory primary education system. In 2000, theprojected income of the fund was 17 billion reales, tobe distributed as follows: Southern region, 2.5 billionreales; Southeast, 8 billion; Centre-West, 1.1 billion;Northeast, 4 billion, and Northern region, 1.4 billion.The poorest states, which did not reach the minimumexpenditure per student, were to receive supplementaryamounts: 511.6 million reales for the Northeast and122.6 million for the Northern region. In the otherregions the states exceed the minimum expenditure perstudent.
The constitutional amendment under which thefund was set up also provided for the establishment of
councils made up of members of civil society at thevarious levels of government in order to keep a checkon the expenditure made.
In the light of recent complaints of irregularitiesin the allocation of FUNDEF’s resources (failure toallocate 60% of the resources to primary education;financing of activities not considered to correspond tothe upkeep and development of education) in some5.5% of the municipalities, the government decided topermanently do away with the banking secrecy of theaccounts of all the prefectures and state governmentsin which educational resources are deposited. It alsobrought legal actions in the official auditing bodies andpublic prosecutors’ offices of the states whereirregularities were reported, which has already led tothe dismissal of five prefects and more than 100 officialinvestigations in 20 states.
In addition to the members of the above-mentionedsupervisory councils, local members of parliament,mayors, and members of the public prosecutor’s officeand of the official auditing bodies now have free accessto the statements of accounts of the fund. FUNDEF is thusan innovative example of a transparent social policywhich links together the three levels of government andpromotes the participation of civil society in supervisingthe way the funds are used.
VIIOther sources of finance
1. International resources
Foreign loans can be important means for carrying outspecial projects, provided the regular financing of thesystem is not dependent on such resources. In this re-spect, international cooperation has been very impor-tant for Brazil, in the form of technical assistance andthe financing of studies and projects. The Inter-Ameri-can Development Bank (IDB) and the World Bank areboth important sources for the financing of projectsfundamentally designed to improve the quality of edu-cation and the equity of the educational system.
The main project supported with resources fromthe World Bank is the Northeast Project, aimed at thepoorest areas of the country, which has now beenreformulated and expanded under the name ofFUNDESCOLA to cover also the Northern and Centre-West
regions of the country. The IDB, for its part, is providingsupport for the important Techno-ProfessionalExpansion Programme (PROEP) which will cost US$ 500million, including resources from the Ministries ofEducation and Labour; it is also contributing toprogrammes such as the International Virtual EducationNetwork (RIVED), which brings together specialists fromBrazil, Venezuela and Colombia to promote thedevelopment of computer programmes to support theteaching of mathematics and science in public schools.
In conjunction with domestic resources, includingresources from the states, the IDB will also finance halfof the US$ 500 million to be spent on the innovativePROMED-Escola Jovem project, the aim of which is toprovide schools with the necessary conditions for thefull application of the reforms in secondary schoolcurricula. PROMED is aimed above all at the creation of

79C E P A L R E V I E W 7 3 • A P R I L 2 0 0 1
EDUCATION AND DEVELOPMENT IN BRAZIL , 1995-2000 • PAULO RENATO SOUZA
school spaces intended specifically for young people,through the construction, expansion and improvementof physical facilities and the installation of libraries,science laboratories and information processingequipment. The programme will also stimulate activeparticipation by young people, providing for theincorporation of projects to be developed by the studentsthemselves in any area -science, arts, sport, communityinitiatives- of the regular activities of schools.
2. Association with the community
The main objective of the extensive programme of as-sociation with the community being developed by theMinistry of Education –Acorda, Brasil! Está na horada Escola!– is to foster within the country a climate ofcommitment to education, and especially primary edu-cation. For example, a housewife who turns her houseinto an enrollment centre; a student’s father who paintsor repairs his child’s school; a renowned artist who takespart free of charge in school promotion campaigns, ora retired teacher who gives classes, likewise free ofcharge, to students who need to make up for lost time:there are thousands of actions whose value cannot bemeasured in monetary terms.
As well as encouraging spontaneous collaborationbetween the state and the community in order to solveeducational problems, however, the programme alsoseeks to build formal associations with the social agents.
Up to September 1998 it had organized 121 suchassociations, involving investments of almost 25 millionreales and benefitting some 20 million students in publicschools all over Brazil, for the purpose of carrying outeducational projects, donating teaching material andequipment, contributing advertising space and trainingteachers.
As the community gradually adopts a more pro-active approach to schooling, there is an increasingnumber of enterprises, organs of communication,foundations and non-governmental organizations, stateand municipal governments, business associations andfinancial institutions which collaborate with education,even though they may not be formal “partners” of thegovernment. Thus, for example, one financial institutionitself maintains 36 schools in 23 states offering pre-school, primary, secondary, complementary and techno-professional education to nearly 95,000 students, withan investment of 80 million reales per year.
Donations of computer equipment, television sets,educational videos, encyclopedias, contests and prizes,out-of-school sporting and artistic activities,participation in parents’ associations and schoolcouncils, and supervision of programmes and of theallocation of public funds are all forms of participationwhich are on the increase and are helping to create thesocial capital which is both a prerequisite for and aconsequence of the silent revolution that Brazil iscarrying out in education.
VIIIChallenges and future prospects
The current great challenge for Brazilian education isno longer the achievement of universal primaryeducation or the elimination of illiteracy, but rather thequest for ever-improving indices of quality at all levels:an objective which is intimately associated with theupgrading of the teaching staff.
Between 1991 and 1998 there was a reduction in thenumber of illiterates in absolute terms, from 19.2 millionto 15.2 million, and there was a particularly rapid reductionin the rates of illiteracy among the younger groupsbenefitted by the increased coverage of the school system.Brazil has succeeded in providing universal access toprimary education, expanding the coverage of secondaryand higher education, and raising teachers’ qualifications.
Much more is needed, however: it is necessary toapply the reforms in curricula to the full, increase thenumber of teachers with higher education, expandenrollments in secondary education while improving itsquality, and increase the average number of years ofschooling of the population. It is no longer enough toensure universal coverage of eight-year primary education:in order to be able to exercise full citizenship and live aproductive life it is essential to have at least twelve years’schooling.
The speed at which Brazil has managed to expandthe coverage of secondary education is probablyunparalleled in any other country. However, the netenrollment ratio (33.4% of the population between 15

C E P A L R E V I E W 7 3 • A P R I L 2 0 0 180
EDUCATION AND DEVELOPMENT IN BRAZIL , 1995-2000 • PAULO RENATO SOUZA
and 17) is still considered to be low, even though itgrew by 57% between 1994 and 1999.
The challenge of training and upgrading teachersfor the new stage of expansion of secondary and techno-professional education is enormous. It will be necessaryto make use of new technologies, with a growingcombination of in-school and distance education, andto develop computer programmes, televisionprogrammes, interactive learning modules by Internet,and new technologies in which the teacher acts in theclassroom as a kind of versatile monitor who uses theresources of distance education while at the same timelearning and upgrading his skills himself.
The universities are preparing to take the lead inthis process by organizing themselves into virtualeducation networks. The “Uni-Rede” is a consortiumset up in January 2000, made up of 65 public, federaland state universities which cover the entire countryby Internet and cable television in order to meet thedemand for public higher education throughout thecountry. Each institution will produce programmes inthe areas in which it is most competent, and theseprogrammes will be transmitted and shared. The firstprogramme will offer undergraduate degrees in areasdefined according to national, regional and local needs.The training of working teachers to meet the highertraining requirements laid down in the Law on theGuidelines and Bases for National Education is one ofthe priority objectives of the Uni-Rede, which aims to serve100,000 students per year, bringing educational contentand teaching resources prepared by the best universitiesof Brazil to the furthest-flung corners of the country.
The tendency to combine distance education withtraditional in-school education is increasingly markednot only in the field of undergraduate studies but alsoin higher education as a whole. The universities will beable to have access to compact versions of courses from
the best world centres: courses prepared, for example,by a Nobel prizewinner in macroeconomics or the bestworld specialist in a particular type of surgery, and,within their own faculties, by professors trained to workwith these methods and pass them on to their students.This is nothing like the old model of distance education,in which students downloaded material from theInternet at night and then did their homework at home.That is not much of a system: the important thing inthe future will be the combination of in-school studywith the new resources of technology.
Financing education is of course a big problem allover the world. Brazil’s public expenditure oneducation, as a proportion of GDP, is one of the highestof all the countries participating in the UNESCO/OECD
project and is similar to the average for the OECD
countries as a whole. The government’s efforts toachieve fiscal balance have not had a significant effecton its investments in education. Great progress has beenmade in improving productivity within the system, butthe increases being achieved are now only marginal.
Brazil will have to continue to resort tointernational finance to ensure the expansion andimprovement of the physical system of educationalestablishments on the one hand and the intensive useof the most advanced in-school and distance educationaltechnologies on the other. It would be highly desirable,not only for Brazil but also for all borrower countries,that these loans should not be counted within the limitson indebtedness that form part of the objectives of fiscaladjustment programmes.
The prospects for the national educational systemare very promising. Great progress has been made, andthe country is much better than it was, but there is stilla long way to go.
(Original: Portuguese)

81C E P A L R E V I E W 7 3 • A P R I L 2 0 0 1
EDUCATIONAL REFORM IN CHILE • JOSE PABLO ARELLANO MARIN
C E P A L R E V I E W 7 3
APRIL 2001
Educational reformin Chile
José Pablo Arellano Marín
Consultant,Office of the ExecutiveSecretary, ECLAC
Minister of Education of Chilefrom September 1996to March [email protected]
This article analyses the reforms put into effect in the mid-1990s with the aim of setting in motion a process of profoundchanges in pre-school, basic and secondary education inChile, the main changes made, and some of the achievementsand difficulties of this process as seen at the present day. Itbegins by describing the initial context of the reforms, inwhich, as the objectives of full coverage of the educationalsystem had been largely achieved, the new objectiveaddressed was to improve the quality of education withequity. It also makes reference to the institutional changeswhich had taken place in the organization of education: theconsolidation of the system of subsidies and the transfer ofeducational establishments to the municipalities in the 1980s,and the change in teachers’ working conditions in the 1990s.It then summarizes the main initiatives taken to improveeducation in the 1990s. The central part of the article dealswith the four main pillars of the educational reform process:programmes to improve and modernize teaching methods;the professional development of teachers and the incentivesoffered for this; the reform of educational curricula, and theintroduction of full-day rather than half-day classes. Itconcludes with an appraisal of the achievements made andthe difficulties encountered; among the first are the highpriority given to education within the increased allocationof public and private resources, the emphasis on equity inthe measures taken to improve education, and the continuityof the policies followed throughout the 1990s; among thesecond are the relatively poor results still obtained by mostpupils and the learning gap that those results imply.

C E P A L R E V I E W 7 3 • A P R I L 2 0 0 182
EDUCATIONAL REFORM IN CHILE • JOSE PABLO ARELLANO MARIN
IThe initial context
In the mid-1960s, the main aim of the reforms was toexpand the coverage of basic education (which was alsolengthened from 6 to 8 years) in order to make ituniversal, and to increase the coverage of 4-yearsecondary education.
In Chile, the proposed objectives in terms ofcoverage were largely achieved. It can be seen fromtable 1 that not only was basic education made universalbut also secondary education now covers the greatmajority of young people between 15 and 18. Thepresent objectives are therefore to improve the qualityand equity of education by ensuring that the opportunityof having a good education is extended in particular tochildren from lower-income families.
However, improving the quality of education hastwo dimensions: on the one hand it is necessary to makegood the deficits revealed when expanding thecoverage, and on the other it is necessary to take on thenew challenges raised by the information society, withall its changes and new demands on the educationsystem. The inherited deficits in the system are due tothe fact that part of the expansion of coverage wascarried out without having sufficient resources, and thiswas compounded by the sharp cuts made in theresources provided for public expenditure on Chileaneducation during the 1980s.
Secondary education –which has grown mostrapidly– is also the area where there has been the
TABLE 1
Chile: Increase in the coverage of education, 1960-1990(Percentages)
Year Illiteracy Pre-school Basic Secondary Higher Number of(among those education education education education students
over 10) (20-24 years) (thousands)
1960 17.6 2 80 14 4 2 2571970 10.2 4 93 50 9 2 2541982 8.3 12 95 65 11 3 162a1990 5.4 18 95 78 20 3 269
Source: National Institute of Statistics (INE), population censuses.
a Data for 1980.
most serious shortage of resources. At the beginningof the 1960s, the amount invested per student wasequivalent to 15% of the per capita product, but 30years later this proportion had gone down to 10%.Table 2 shows the expenditure on education in the1980s and reveals that even during the economicrecovery in the second half of that decade publicexpenditure on education continued to go down. Allthis redounded in inferior working conditions forteachers and insufficient resources to provide good-quality education. As a result of the reduction inpublic resources, the purchasing power of teachers’pay shrank so much that there was a decline in thenumber of young people interested in university-levelteachers’ training courses, there was a deteriorationin the school infrastructure, and there was a shortageof schoolbooks and materials.
TABLE 2
Chile: Expenditure by the Ministry of Education (MINEDUC),1980-1990(In pesos of the year 2000)
Year Expenditure by Subsidized Monthly subsidyMINEDUC enrollment per student
(billions of pesos) (thousands of (pesos)students)
1982 736.1 2 331.4 13 1881983 682.6 2 391.9 11 3341984 664.6 2 458.6 10 6471985 663.9 2 497.5 10 0011986 603.8 2 529.0 11 1891987 555.3 2 740.2 10 5041988 574.6 2 746.9 10 6211989 560.8 2 709.5 10 6391990 534.7 2 692.1 10 103
Source: Ministry of Education (1999).

83C E P A L R E V I E W 7 3 • A P R I L 2 0 0 1
EDUCATIONAL REFORM IN CHILE • JOSE PABLO ARELLANO MARIN
IIInstitutional changes
In the institutional field, two very important changes inthe organization of the educational system had occurredin the early 1980s and remain in effect today. On the onehand, a system of educational subsidies for financingprivate education was improved and consolidated, and onthe other, all the educational establishments belonging tothe central government were transferred to themunicipalities. A decentralized system for the managementof education was thus established in which the Ministryof Education (MINEDUC) pays a monthly subsidy for everystudent who attends classes in a municipal or private schoolchosen by his parents.
This system of subsidies, which shares someelements with what is known as the voucher system inother contexts, has a long-standing tradition behind itin Chile. Ever since the nineteenth century privateschools providing education free of charge havereceived assistance from the government. As from 1951,when Bernardo Leighton was Minister of Education, itwas laid down that the amount of the subsidy for suchschools would be equal to half the amount paid by theState in respect of each pupil in public schools. Thus,subsidized free private schools received a certainamount of money per pupil from the State, obtainingthe rest of the resources they needed from other sources.In reality, however, the size of the subsidy for privateschools varied considerably over the next three decadesand was rarely enough to cover a significant proportionof their costs. As from 1980, the amount of money paidper pupil attending classes was set at a uniform level,regardless of whether the beneficiary establishmentswere municipal schools or subsidized private schools.
The improvement in the size of the subsidy andthe regularity with which it was paid were reflected ina big increase in the number of private schools duringthe 1980s. In terms of the number of students enrolled,subsidized private education expanded from 402,000students in 1980 to 960,000 in 1990, while enrollmentin municipal schools went down from 2,260,000 to1,700,000 over the same period. During the 1990s thelevel of enrollment in municipal schools has stabilizedand registered a slight increase in the number ofstudents, but enrollment in private schools continuesto display the most dynamic growth.
The main institutional change in the 1990sconcerned the working conditions of teachers. In 1991the Statute on Educational Professionals, better knownas the Teachers’ Statute, was adopted and it removedteachers from the provisions of the general labour codecovering private-sector workers and brought them undera set of special rules in keeping with their employmentconditions, including a better pay scale, bonuses andallowances, and greater employment stability.
It was not easy to arrive at this set of rules, andindeed the 1991 regulations were modified in 1995 tomake them more flexible. Teachers’ needs andaspirations in terms of increased pay had to bereconciled with the fiscal resources available, and theincrease in pay was therefore gradual. It was alsonecessary to reconcile and harmonize the administrativedecentralization arrangements and subsidies (theamount paid per student attending classes) with the newrules on staff costs, which were independent of the sizeof the student body.
IIIMeasures to improve education
Since 1990, when democracy was restored, thegovernments of the Democratic Coalition havegradually been putting into practice a set ofmeasures designed to reverse the crisis situationof the educational system, to promote innovation
in education, and to create a new climate inschools and colleges, thus preparing the groundfor the reform process begun a few years later.Some of the most outstanding measures are describedbelow:
C E P A L R E V I E W 7 3 • A P R I L 2 0 0 184
EDUCATIONAL REFORM IN CHILE • JOSE PABLO ARELLANO MARIN
1. The programme to improve the quality of basicschools in poor areas (the P-900 programme)
This programme is designed to give support to the 10%of schools with the worst performance and the greatestneeds, so that first-cycle pupils (up to fourth grade)will obtain a mastery of the basic cultural skills: reading,writing and elementary mathematics.
Using the principle of positive discrimination, theP-900 programme (which began in 1990 and is still inoperation) has given rise to actions to create the mostsuitable context for the work of both teachers andstudents, by improving the teaching and learningprocesses as well as school management. Under thisprogramme, teaching material is supplied and technicalassistance in the form of workshops for teachers andsupport for students by young monitors is provided.Two years ago the programme was expanded to coverthe whole of basic education. The Ministry of Educationhas signed three-year agreements with each school forthe design of a strategy to enable them to overcometheir problems. After that period, an evaluation of theirmanagement must be made. So far, the P-900programme has involved 2,361 establishments withover half a million students, almost 20,000 teachers and15,000 young monitors, at an annual cost per studentof around US$ 20.
2. Programme for Improving the Quality and Equityof Basic Education (the basic MECE programme)
The basic MECE programme, aimed at pre-school andbasic education, was begun in the early 1990s. Underit, the supply of school books in basic education wassubstantially expanded, the distribution of classroomlibraries (under which each classroom receives some70 books to stimulate the habit of reading) was begun,and funds were earmarked for increasing the coverageof pre-school education and introducing non-traditionalforms of education in that area.
This programme was carried out between 1992 and1997 with the support of a US$ 170 million World Bankloan, and since then it has been maintained –and evenexpanded– with national resources and has been madepart of the regular activities of the Ministry. The basicMECE programme represented an increase in theinvestment in infrastructure and teaching materials, aswell as innovations in education. In a similar manner,the Weblinks programme and the EducationalImprovement Projects (PME) were also begun, as weshall see below.
3. The Weblinks programme
This was originally a pilot project for an inter-schoolcomputer network involving the installation of leading-edge information technology in marginal rural andurban schools. Subsequently, it was extended to allestablishments.
Today, all high schools have a computer laboratory.Half of them –accounting for nearly 90% of the totalenrollment– have been connected to the network sincethe year 2000. Between three and eleven computers,with the respective software, have been installed in eachschool, together with between one and three printers(depending on the size of the school).
Since 1999, under an agreement with theTelefónica CTC Chile telephone company, some 5,200schools enjoy free access to and use of the Internet forten years. At the same time, 55,000 teachers (54% ofthe total number in the country) have received specialtraining. Indeed, the Weblinks programme has devotedthe equivalent of 20% of its investment in equipment(which comes to US$ 80 million) to the training ofteachers in this field.
4. Educational Improvement Projects (PME)
A fund was set up at the beginning of the 1990s forthese projects, which are aimed not only at further im-proving basic and secondary education but also atstrengthening the autonomy of basic and secondaryschools in teaching matters. This novel initiative hasbecome an important challenge for teachers and schoolmanagers. Each educational community defines its ownproject on the basis of its own particular diagnosis. Theteaching team designs the most appropriate actions forits students and lays down objectives, deadlines andevaluation strategies, all this being aimed at dealingwith problem situations and promoting innovations inteaching or management.
In order to obtain finance, the PMEs compete witheach other in provincial-level contests which evaluatetheir technical quality, their impact on learning, andthe level of socio-educational risk of the establishment.When selected, the schools receive the correspondingfunds and an educational aid package which providesthem with the tools, equipment and basic inputs(television set, VCR, image projector, etc.) to enable themto carry out their programmes, which usually lastbetween two and three years. The amount allocated foreach project ranges from US$ 4,000 to US$ 28,000,depending on the number of students enrolled andwhether the school is of primary or secondary level.

85C E P A L R E V I E W 7 3 • A P R I L 2 0 0 1
EDUCATIONAL REFORM IN CHILE • JOSE PABLO ARELLANO MARIN
Teaching material has also been allocated, to the valueof nearly US$ 1,900 per school.
This initiative has become a valuable experimentin the decentralization of teaching. In support of it, theMinistry has given schools and colleges the possibilityof managing the funds they receive directly. Thanks tothis possibility, the management teams feel moreresponsible for the project; they obtain the materialsand resources promptly; they are publicly accountablefor them to their teachers, students, parents andauthorities, and in many cases they manage to obtainother contributions from the community, thusoptimizing the direct financing received from theMinistry of Education.
Interesting and frequent examples of PMEs areschool radio stations, newspapers and even televisionnews programmes developed by teachers in conjunctionwith their students in order to strengthen their languageand communicational capacity. One rural school inCentral Chile installed a meteorological station tosupport the teaching of mathematics: this helped theteacher to train his students in the use of decimals, whichthey were finding it hard to learn. Another schoolorganized beekeeping, while others have developedhydroponic cultivation, among many other initiatives.
5. Programme for Improving the Quality and Equityof Basic Rural Education (the rural MECE programme)
A special programme called the rural MECE programmehas also been developed and is aimed at over 3,000small, isolated and scholastically incomplete schoolsteaching children up to sixth grade in combined classes.These multi-grade schools, which have one, two or upto three teachers, required special teaching arrange-ments enabling them to work simultaneously with chil-dren of different grades and to incorporate educationalelements peculiar to a rural setting, as urban practiceswere not applicable in many respects.
This programme has provided students withtextbooks and material which are specially designedfor their specific situation and also make possibledifferential progress, according to the learning capacityof each pupil, in a combined group or class. Micro-coordination centres have been set up so that teachersfrom nearby localities can meet periodically to analysethe innovations made in each establishment and follow
up these initiatives. In this way, the rural MECE programmeseeks to overcome the professional isolation of ruralschoolteachers and adapt the supply of courses to theneeds of multi-grade rural schools and their respectiverural environments. These micro-centres are a foretasteof the type of school that the educational reform processis trying to promote all over the country: a non-bureaucratic, self-managed school which is flexible andopen to its environment. They anticipate the learningcommunity into which each teaching team in thecountry should develop, that is to say, a creative groupwhich, in that capacity, evaluates and discusses the bestteaching strategies for its students.
Rural schools are a natural meeting point forfamilies. The rural MECE programme envisages variousstrategies for bringing parents, and especially mothers,into closer contact with the education of their children.In recent years, in areas where there is no formal pre-school education, the programme “Know Your Child”has been introduced: a project in the hands of themothers themselves. Its aim, as well as providingattention for children between 4 and 6, is to link upfamilies with the educational project of the local school,to generate an alliance in this way for the benefit of allthe children, and to keep this alliance in being all thetime that the children are in school.
All these programmes (P-900, Weblinks, the basic,secondary and rural MECE programmes and the PMEs),which were begun in the early 1990s, are still inoperation and have gradually been improved andenriched during the second half of the decade on thebasis of the experience gained. The P-900 programmehas expanded its coverage in terms of the grades andsubjects it supports; textbooks have increased in bothquality and quantity, and teachers are now even giventhe chance to choose which of them to use; classroomlibraries now extend up to eighth grade, and the materialin them is now being renovated; the “second generation”PMEs are pursuing more demanding teaching objectives,and so forth.
Taken together, these initiatives have improved theconditions of subsidized education, have furthered therenovation of teaching practices, have provided anincentive for collective work by teachers, and havemade possible the decentralization of education, betterschool management, and more and better refreshertraining for teachers.

C E P A L R E V I E W 7 3 • A P R I L 2 0 0 186
EDUCATIONAL REFORM IN CHILE • JOSE PABLO ARELLANO MARIN
IVThe four pillars of the educational reform process
In the midst of all these initiatives and advances in theeducational system, in 1994, at the beginning of histerm of office, President Frei set up the NationalCommission for the Modernization of Education, madeup of 18 distinguished professionals and academicsfrom various fields of activity and politicalbackgrounds. Its mission was to make a diagnosticstudy of the educational system –including itsshortcomings and limitations–, identify the challengesthat Chile must face in the coming years, and putforward suitable proposals for meeting them. The reportof the Commission thus became an important point ofreference for the changes to be made later.
In May 1996, President Frei called into being aneducational reform process which, while reasserting theinitiatives and programmes under way, added others tomake up an integrated set of changes.
1. Programmes for educational improvementand innovation
This set of programmes includes all the programmeswhich have been adopted over time in order to provideschools with teaching material and promote innovation,such as the supply of textbooks and other material andthe various measures taken under the MECE programmesalready referred to. In addition, it includes theMontegrande Project, which is to set up a network oftop-level high schools to lead the way in the reformof education, which will later spread all over thecountry.
2. Professional development of teachers
No educational reform can be successful unless itprovides for energetic support for teachers. The presentreform provides for the improvement of teachers’working conditions and training, both in the case ofteachers who are already working and those who arestill on their initial training courses.
In Chile, 95% of all teachers have completedspecialized studies: 78% are graduates of universitiesor university-level professional training institutes, while17% come from the teachers’ training system. Theiraverage age is 43: 12% are under 30, while 11% areover 55. The great majority (70%) are women.
The improvement in teachers’ pay has been gradualbut systematic and substantial, as may be seen fromtable 3. Innovative forms of incentives for obtainingbetter results have been introduced, such as:
a) Improvement of working conditions
i) Special allowances for outstanding performance.These are quarterly bonuses for teachers in the schools(one-quarter of the total) which obtained better results,in recognition of the work of the teaching teams whichmade the schools work well and helped their studentsto learn better.
In order to determine which establishments deservethese bonuses, the National System for Evaluating thePerformance of Subsidized Educational Establishments(SNED) was set up and evaluates every two years thewhole of the subsidized schools and colleges. In orderfor the process to be fair, the comparisons are madebetween schools of similar types. First, the schools aredivided into homogeneous groups on the basis of thesocio-economic vulnerability of their students, the leveland form of education given in the schools, their size,and whether or not they are in rural areas. The schoolsin each group are then compared with each other: i.e.,
TABLE 3
Chile: Teachers’ pay for a 44 hour week(monthly average over a year)(In 1999 average pesos)
Year Municipal sector Subsidized private sector
Average Minimum Minimum
1990 243 138 134 251 69 0471991 260 398 162 097 150 6671992 304 402 180 105 173 3541993 342 277 190 617 176 9581994 389 270 221 192 197 8331995 428 380 244 095 239 0391996 459 854 268 310 267 1511997 502 544 294 345 293 0741998 528 488 320 789 320 7891999a 547 794 338 408 338 4082000a 566 503 356 717 356 717
Source: Ministry of Education, Planning and Budget Division.
a Estimate.

87C E P A L R E V I E W 7 3 • A P R I L 2 0 0 1
EDUCATIONAL REFORM IN CHILE • JOSE PABLO ARELLANO MARIN
the comparison is only between establishments withsimilar characteristics. Finally, six indicators aredetermined for them: effectiveness, effort to improve,initiative, improvement of teachers’ working conditions,equality of opportunities, and integration of teachersand parents. This process takes into account not onlythe level attained in comparison with the rest of thegroup, but also, and especially, the progress made inall the indicators.
This system of measurement has gradually beenperfected to make it more objective and thus rewardthe most important results pursued in the establishmentsin question. The size of the bonuses awarded foroutstanding performance has also gradually beenincreased.
ii) Special allowances for work in difficultconditions. These allowances aim to compensateteachers who work in places considered as difficultbecause of their geographical location (difficult access,particularly bad climate, etc.), marginality, extremepoverty, urban insecurity or the like. They consist of avariable percentage of the national basic salary, with amaximum of 30%. In each region, the size of the bonuscorresponding to each establishment is determinedevery two years. The regions have a limited amount ofresources to distribute among their schools in respectof these allowances, and determine with specialattention which of them need this incentive most.
iii) Awards for excellence in teaching. As anothermeans of recognizing the importance of teachers’ work,in 1997 all the schools in the country were invited forthe first time to elect from among their teaching staffthe teacher most worthy of distinction for the excellenceof his or her educational work. The idea was not thatthe Ministry of Education, the government or themunicipalities should make this selection: instead, eachestablishment should do so. This is a significant awardwhich, in addition to the honour it represents, alsoinvolves a substantial economic reward: over 10 monthsof the 1999 average salary.
b) Refresher courses for teachers
In this respect, the reform process includes a wide andvaried range of initiatives such as the following:
i) Fundamental upgrading courses. The introductionof the new programmes of studies was preceded by whatwere known as fundamental upgrading courses. Theobjective is that all teachers should prepare themselvesfor the implementation of the new curricula.Introductory and upgrading courses were offered in
various matters specially required by teachers, withspecial courses for head teachers.
In collaboration with universities and other accreditedacademic institutions, the Ministry of Education hasoffered these upgrading courses totally free of charge. Therespective classes are held during the summer months andare complemented with various actions that teachers mustcarry out in their own schools in the course of the year.
ii) Internships and diploma courses. Trainingscholarships are offered in connection with practicallyall the initiatives in the reform process, but the mostnovel measure has probably been the possibility ofattending courses abroad. This programme, whichstarted in 1996, includes internships and diplomacourses (according to whether they last two or fivemonths), and has helped to give our teachers and oureducational system the possibility of familiarizationwith international advances.
iii) Weblinks. Suitable training for teachers is offundamental importance for the use of informationtechnology as a teaching tool. For this purpose, theMinistry set up the Technical Assistance Network, madeup of 30 university institutions which offer training to20 teachers from each school entering the Weblinksproject. This training is given in the teachers’ ownschools and comprises two yearly stages involving atotal of 92 hours of attendance. In the last four years,over 55,000 teachers have completed this training.
iv) Programme to Strengthen Initial TeacherTraining. In order to achieve higher quality in the upper-level studies of future teachers, a special programmeof scholarships was set up for talented young peopletraining to be teachers, together with a fund offeringresources to be awarded by competition to universitiesand institutes for financing projects to improve four-year teachers’ training courses. Working networks havebeen established among the institutions, and new linkshave been forged with the educational system and itscomponent schools; in addition, improvements havebeen made in the infrastructure of faculties of educationand their libraries, and greater use is being made ofmultimedia facilities.
In the last three years, an increase has beenobserved in the number of applicants for teachers’training courses, who also have better academicqualifications than in previous years. This is clear proofthat the set of reform initiatives, including the higherpriority given to education on the public agenda, hassucceeded in reversing the negative trends of previousyears. Increasing numbers of young people are nowdeciding that they want to be teachers.

C E P A L R E V I E W 7 3 • A P R I L 2 0 0 188
EDUCATIONAL REFORM IN CHILE • JOSE PABLO ARELLANO MARIN
3. Reform of curricula
This reform has three main objectives. First, to updatethe aims and content of basic and secondary education,in view of the fact that the existing study plans andprogrammes had been prepared in the early 1980s.Second, to promote high-quality educationincorporating the most recent advances in teaching.Third, to comply with the provisions of theConstitutional Organic Law on Education, which, inaddition to formally expressing the general goals andgraduation profiles for the two cycles, laid down newprocedures for establishing school curricula, based ondecentralization. This means that schools have asubstantial degree of freedom to define their own studyplans and programmes.
The reform of curricula involves two stages.Initially it was necessary to agree on a global frameworkand then to prepare the study programmes. The generalframework must incorporate certain basic objectivesin respect of ethical training, personal growth and self-assertion, the person and his environment, and thedevelopment of the ability to think.
The general curricular framework for basiceducation was approved early in 1996, after which thestudy programmes for the first and second stages ofbasic education were prepared and came into effect thefollowing year. The new curricular framework forsecondary education was also approved and began tobe applied as from 1999. In the year 2002, all levels ofeducation will be subject to the new study programmes.As already noted, the implementation of these changesin curricula calls for the corresponding training ofteachers and the renewal of school books.
New bases for pre-school education are also beingprepared, and in 2002 a new curriculum will come intoeffect which will replace that used for over threedecades.
Special mention should be made of the participativeyet highly professional way in which the new curriculahave been prepared. This is one of the key functions ofthe Ministry of Education, which now guides, leads andregulates the educational system, without directresponsibility for running the schools, as in the past.For this purpose, it set up the Curricula and EvaluationUnit, to be responsible for the preparation, updatingand evaluation of curricula, which prepared a first draftcurricular framework for submission to a group ofoutside experts. A national consultation was then heldamong all teachers and even secondary school students.After that, a panel of specially invited foreign experts
was organized to analyse the draft and compare it withthe standards of the countries with the best schoolresults. Finally , the proposed framework was submittedto the Supreme Council for Education for its finalapproval.
The actual study programmes can be prepared bythe schools themselves, although the great majority ofthem –as was expected– have initially used the curriculaprepared by Curricula Unit of the Ministry of Education.
4. Full-day classes
This was the most important initiative in the programmeannounced by President Frei in May 1996. Accordingto the prior diagnostic studies, it was obvious that high-quality education called for more hours of study thanthose being fulfilled by schoolchildren in Chile. Thegreat majority of them attended classes for only halfthe day, because in order to expand enrollment theschool facilities were being used in two shifts.
The concern to increase the time spent in schoolhad already been reflected in several measures takenin previous years, under which the school year had beenincreased from 37 to 40 weeks. In 1995 an educationalsupport subsidy was established to enable pupils whoso required to receive extra hours of teaching duringthe last months of the year.
This initiative to introduce full-day classes meansthat in basic education the weekly number of hours ofclasses goes up from 30 to 38, while in secondaryeducation it rises to 42 hours. In other words, taken
TABLE 4Chile: Monthly subsidy per student, according to type ofeducation(In February 2000 pesos)
Half-day Full-dayclasses classes
Basic education, grades 1 - 6 17 899 24 076
Basic education, grades 7 and 8 19 438 24 175
Special basic education 59 027 73 154
Secondary agricultural techno-professional training, grades 1 - 4 32 213 39 261
Secondary industrial techno-professional training, grades 1 - 4 25 098 30 581
Secondary commercial techno-professional training, grades 1 - 4 22 498 28 854
Source: Ministry of Education, Planning and Budget Division.

89C E P A L R E V I E W 7 3 • A P R I L 2 0 0 1
EDUCATIONAL REFORM IN CHILE • JOSE PABLO ARELLANO MARIN
over the whole 12 years of schooling, the larger numberof hours per week are equivalent to over two more yearsof schooling compared with the half-day system.
International studies soundly endorse the positiveeffect of more hours of schooling on the quality ofeducation. Indeed, in the preparation of the reformspecial attention was paid (among other sources) to theinfluential study Prisoners of Time made in the UnitedStates by the National Education Commission on Timeand Learning and a review of 130 studies on this subjectmade by The Brookings Institution, which concludesthat 97% of the studies in question bear out the assertionthat there is a highly robust link between longer timein school and the achievement of better results.
The expansion of full-day classes not only meansincreasing the number of hours for which teachers arehired, for which purpose it is necessary to increase themonthly subsidy, but also expanding the school facilitiesin the great majority of the country’s schools, whichinvolves heavy investments for at least five years. Table4 shows the increases in the subsidies paid, which havebeen increased by approximately a third because of theextension of the school day.
So far, over half the schools (although only asmaller proportion of students) are already giving full-day classes. The remainder are building facilities orpreparing projects for their incorporation into thissystem in the coming years.
VAchievements and difficulties
A process of profound changes like the educationalreform programme described here is a complex processwhose effects can only be appreciated after some time.This is particularly true when the reforms are still incourse of application and will only be fully in effectaround the year 2005. Nevertheless, some elementsalready stand out and offer valuable experience for otherprocesses of change.
Clearly, one of the achievements of these years hasbeen the higher priority given to education in the publicagenda and in the allocation of public and privateresources, and the continuity of the policies appliedthroughout the 1990s.
The considerable increase in resources may be seenfrom table 5. Between 1990 and 1999, publicexpenditure on education increased by 150% in realterms. The priority given to the educational reformprocess in the allocation of public resources was clearlyshown when, in spite of the fiscal restrictions in 1998-2000 associated with the effects of the Asian crisis,public expenditure in this area continued to increaseand the investments originally scheduled for the reformprocess were not affected.
In the 1990s, the subsidies given and theexpenditure per student more than doubled: thesubsidies went up from 10,143 pesos in 1990 to 24,000pesos in 2000 (in pesos of the latter year). Such asubstantial increase in the subsidy per student forprimary and secondary education was possible because
not only was overall public expenditure on educationincreased, but also this expenditure was concentratedon basic and secondary education, with only a smallincrease in expenditure on university education.Furthermore, within basic and secondary educationthere was a proportionally larger increase in theresources aimed at students from lower-incomefamilies.
It may be seen from table 5 that the privatecontribution to education grew even more than that ofthe public sector, registering an increase of 170% inreal terms during the decade and representing nearly3% of the gross domestic product. This significantincrease was due to the contributions made by familiesto the cost of higher education and a growingcontribution to subsidized education through the co-financing system. This was naturally made possible bythe rapid growth of the economy during these years.
Most of the larger resources went to improve theworking conditions of teachers (see table 3 above).
This increased private contribution to the financingof education helped the State to concentrate itsresources on less well-off families. In practically allprogrammes priority was given to the neediest families,in keeping with the greater equity pursued by thereforms.
The strategy of greater equity in the educationalimprovement initiatives of the early 1990s and thereforms announced in 1996 always sought to give

C E P A L R E V I E W 7 3 • A P R I L 2 0 0 190
EDUCATIONAL REFORM IN CHILE • JOSE PABLO ARELLANO MARIN
priority to the students with the greatest needs. It beganwith the 900-P programme, which gave priority to the10% of schools with the lowest performance, and wenton to increase the school subsidies to give specialsupport to rural education, students in special schools,pupils requiring support classes to avoid repetition andpossible dropping out from the system, and students inboarding schools. Moreover, almost without exceptionnew programmes were begun in the poorest schools:this was so, for example, in the case of the provision ofcomputer training and the introduction of full-dayclasses, where the first schools to extend the schoolday were precisely those serving the poorest children.Likewise, the programmes to increase school mealcoverage, school health programmes, the provision oftextbooks and materials and the expansion of pre-schoolenrollment were all aimed at securing greater equity.Similarly, in the programmes operating on a competitivebasis, such as applications for PMEs, for theMontegrande Project for secondary education, or forrefresher courses for teachers, one of the selectioncriteria has always been the level of poverty and needsof the schools in question.
When families have been required to help pay forthe education of their children, systems of scholarshipsand (in the case of higher education) loans have beenestablished in order to prevent this requirement frombecoming a factor of exclusion.
Apart from the importance of the bigger resourcesmade available for achieving the advances made in thereform process, another basic factor has been thecontinuity of the policies applied during these years.This has been aided by the continued existence of theCoalition government, the building of consensuses inrespect of the reform proposals, and the continuity ofthe high-level staff of the Ministry of Education. This
continuity is worth stressing, because in Latin Americathere is generally a high degree of policy instability,with frequent changes of ministers. This is particularlyundesirable in an activity such as education, which byits very nature is a long-term project.
As regards the achievements in terms of learning,two aspects are worthy of note. Firstly, repetition anddropping out have been reduced, so that a growingproportion of young people are completing theirsecondary education. Within secondary education, therate of repetition has been reduced from over 12% in1990 to 8% at the end of the decade and the dropoutrate has been brought down from 7.5% to 5%. The sameevolution is to be seen in basic education, with the ratesdropping from 7.8% to 3.5% and from 2.3% to 1.5%,respectively. These rates had remained practicallyunchanged during the 1980s. This success in keepingchildren in school and increasing the proportion ofstudents who pass on to the next grade is undoubtedlyan important achievement.
With regard to scholastic achievement proper, Chilehas the great advantage of having the System forMeasuring the Quality of Education (SIMCE), which hasbeen carrying out periodical nationwide tests since thelate 1980s. According to the results of these tests, theaverage improvement in results is still insufficient.There has, however, been significant progress in thecase of the poorest schools.
Notwithstanding the positive impact representedby this progress, however, the poor results obtained bythe vast majority of students in comparison withinternational standards are worthy of note. Over 60%of the pupils in Chilean schools fail to reach the levelsconsidered desirable for the eighth grade. Likewise, theresults in the international mathematics and science testsheld in 1998 under the Third International Mathematics
TABLE 5
Chile: Total expenditure on education, as a percentage of GDPa
Public expenditure on education/centralgovernment expenditure
Public expenditure on education/GDPPrivate expenditure on education/GDPTotal expenditure on education/GDP
Source: Ministry of Education, Planning and Budget Division.
a Gross domestic product.b The figures for 1997 and 1998 are provisional. Public expenditure on education comprises central government expenditure on this item,plus municipal contributions to education.
1990 1991 1992 1993 1994 1995 1996 1997b 1998b
11,9 12,0 12,8 13,0 13,5 14,3 14,9 15,5 16,12,6 2,7 2,9 3,0 3,1 3,1 3,4 3,5 3,91,8 1,9 2,0 2,2 2,5 2,5 2,8 2,9 3,14,4 4,6 4.9 5,3 5,6 5,6 6,2 6,4 7,0

91C E P A L R E V I E W 7 3 • A P R I L 2 0 0 1
EDUCATIONAL REFORM IN CHILE • JOSE PABLO ARELLANO MARIN
and Science Study (TIMSS) reflect a poor showing bythe eighth grade students of Chile, whose results wereamong the lowest of the 38 participating countries.Thus, 95% of the Chilean schoolchildren turned in aperformance below the average registered by childrenof the countries with the best results, such as SouthKorea and Singapore.
All this confirms the importance of the effortswhich have been made as part of the educational reformprocess and at the same time highlights the need toheighten them in order to narrow the learning gap thusrevealed, although this will necessarily take severalyears.
There are various aspects of the reform processwhich must be strengthened in order to ensureimprovements in quality, which are by definition harderto attain than increases in coverage (see the proposalsin Arellano, 2000).
At this point, I should like to emphasize an aspectwhich seems to me to be specially important when theobjective is higher quality and there is decentralization.This is emphasis on the results and on the need forongoing evaluation. In practice, very great differencesare to be observed between the results of differentschools attended by children of similar social andcultural backgrounds. The figure shows this dispersionin the results of the establishments attended by childrenfrom the poorest 40% of the population. In spite of theirunfulfilled needs, 13% of those children obtained resultswhich were better than the national average.
Greater emphasis needs to be placed on the resultsand on the adaptation of teaching practices and thelearning environment in order to bring them closer tothose of the schools which, despite their lack ofresources, managed to enable their pupils to learn and
develop their capabilities, as indispensable means forovercoming the shortcomings of the school system.
Above all, it is necessary to persevere with theefforts made in these years. Improvements in the qualityof education are not achieved in a short period of time,and this is proved by the results of the last internationalTIMSS tests: of the countries which repeated themathematics and science examinations after four years,practically none of them display any substantial changein the average performance of their students. A sustainedeffort lasting ten to fifteen years is needed in order toattain the levels of quality that our educational systemneeds in order to prepare our children better to meet thedemanding challenges of the knowledge society.
(Original: Spanish)
Bibliography
Arellano, J. P. (2000): Reforma educacional: prioridad quese consolida, Santiago, Chile, Editorial Los Andes(www.jparellanom.terra.cl).
Delannoy, F. (2000): Education Reforms in Chile, 1980-98:A Lesson of Pragmatism, Washington, D.C., WorldBank, June.
García-Huidobro, J. E. (ed.) (1999): La reforma educacionalchilena, Santiago, Chile, Editorial Popular.
Ministry of Education (MINEDUC) (1999): Reforma enmarcha: buena educacion para todos, Santiago, Chile.
0
50
100
150
200
250
300
(310
o m
ás)
(295
- 30
9,9)
(280
- 29
4,9)
(265
- 27
9,9)
(250
- 26
4,9)
(235
- 24
9,9)
(220
- 23
4,9)
(205
- 21
9,9)
(190
- 20
4,9)
(190
om
enos
)
FIGURE
Establishments in the fourth and fifth quintiles of thesocio-economic scale, in order of SIMCE ranking insecond half of 1998
Num
ber o
f est
ablis
hmen
ts
Range of points
- - - - Language – – – Mathematics
(310
or m
ore)
(190
or l
ess)
Source: Estimates by the author on the basis of Ministry ofEducation, results of the System for Measuring the Quality ofEducation (SIMCE).

C E P A L R E V I E W 7 3 • A P R I L 2 0 0 192
EDUCATIONAL REFORM IN CHILE • JOSE PABLO ARELLANO MARIN

93C E P A L R E V I E W 7 3 • A P R I L 2 0 0 1
SOCIAL PROTECTION FOR THE POOR IN LATIN AMERICA • NORMAN HICKS AND QUENTIN WODON
C E P A L R E V I E W 7 3
APRIL 2001
Social protectionfor the poor in
Latin America
Norman Hicks
Quentin Wodon
[email protected] Bank
Confronted with recurrent macroeconomic shocks, govern-
ments in Latin America and the Caribbean have increasingly
been concerned about establishing or strengthening systems
of social protection and safety net programmes. The goal of
these programmes is to help mitigate the impact of shocks
on the poor before they occur, and to help the poor cope
with the shocks once they have occurred. In this paper, we
focus on publicly funded or mandated safety nets function-
ing as risk-coping mechanisms. The paper reviews the char-
acteristics of a good safety net, in comparison with the main
types of safety nets currently in place, and finds in general
that no single programme meets all of the criteria in terms
of efficiency and effectiveness, although some are better than
others. Finally, what has been the actual record in terms of
protecting the poor through targeted public spending dur-
ing crises? The paper finds that because of fiscal constraints
during a crisis, social spending is often pro-cyclical when
ideally it should be counter-cyclical. Ironically enough, so-
cial protection spending itself does not appear to be pro-
tected.

C E P A L R E V I E W 7 3 • A P R I L 2 0 0 194
SOCIAL PROTECTION FOR THE POOR IN LATIN AMERICA • NORMAN HICKS AND Q UENTIN WODON
IThe context: persistent poverty and vulnerability
to macroeconomic shocks
The Latin American and Caribbean region has beenplagued by macroeconomic shocks over the last twentyyears, with serious consequences for the poor (seeGlewwe and Hall, 1998; Lustig (ed.), 1995; Lustig,1999; Ganuza, Taylor and Morley, 1998). Such shocksare so-called “covariant” shocks (Holzmann andJorgensen, 1999) which affect the real incomes of alarge share of the population, typically through areduction in both real hourly wages (via inflation) andthe number of hours worked (via unemployment orunderemployment). Beyond these income effects,which may vanish once growth resumes,macroeconomic shocks may also have longer-termconsequences. For example, the reduction in thequantity and quality of public health care due tobudgetary cuts during a crisis may induce irreparabledamage. Also, when coping with a crisis, parents maysend their children to work in order to compensate fortheir own loss of income. If there is substitution betweenchild labour and schooling, and if the children do notreturn to school at a later stage, they will incur long-term wage losses due to their lower endowment withhuman capital (Wodon and Siaens, 2000). All this mayhelp explain why De Janvry and Sadoulet (1999) findevidence that the increase in poverty that follows amacroeconomic shock may be larger than thesubsequent reduction in poverty with growth.
There are signs that the reforms enacted in manycountries of the region in the 1990s have been bearingat least some fruits. Wodon (2000a) estimates that in1996, slightly more than one-third of the population ofthe region (36.7%) was poor (i.e., not able to cover
their basic food and non-food needs), and one out ofevery six persons (16.1%) was extremely poor (i.e., notable to cover even their basic food needs). Thisrepresents some progress compared with 1992, whenthe incidences of poverty and extreme poverty wereboth higher. However, the absolute number of the poorhas not been reduced to the same extent, due topopulation growth. Moreover, if the comparison is madewith 1986 instead of 1992, the numbers of the poorand extreme poor in 1996 have risen considerably (seeLustig and Arias (forthcoming) for a survey of povertyestimates). Projections of further poverty reductionbetween 1996 and 1998 using elasticities of povertyreduction to growth and actual levels of growthobserved in the region suggest only limited gains inpercentage terms, with the numbers of the poor andextremely poor remaining constant.1
In addition to high levels of poverty, LatinAmerican households are affected by instability ofincome and employment. While the level of instabilityis often thought to be linked with the current trendstowards globalization, De Ferranti, Perry and others(2000) show that instability has not grown over time,and it is no worse in Latin America than in otherdeveloping regions. Still, there is much more instabilityin Latin America than in the OECD countries, andopenness may have resulted in a widening of wagedifferentials between more and less skilled workers.2Moreover, while the current changes in labour marketsshould ultimately bring net positive aggregate gains,they may induce idiosyncratic (i.e., household-specific)shocks for individuals who lose their jobs at a time whenthe region has not yet fully developed systems of socialprotection.
This paper was prepared for the XII Seminario Regional dePolítica Fiscal held in Chile in January 2000. It is based in part onthe last chapter of a regional study on poverty and policy (Wodon,2000a) completed with funding from the Regional Office for LatinAmerica and the Caribbean of the World Bank (Chief Economist,Guillermo Perry). The authors are grateful to Ana-María Arriagada,Judy Baker, Charles Griffin, Margaret Grosh, Kathy Lindert andWilliam Maloney for the valuable discussions held with them. Theviews expressed in this paper are those of the authors, and do notnecessarily represent those of the World Bank, its Executive Di-rectors, or the countries they represent.
1 The region has performed better in terms of non-monetaryindicators of well-being, with improvements for adult illiteracy,infant mortality, life expectancy, gross secondary school enrollment,and access to safe water.2 There is no convincing body of empirical evidence on many ofthese issues. Lustig and Arias (forthcoming) argue for example thatthere have been widening returns to skills, but Gill (1999) suggeststhat the empirical evidence is still very much mixed. See forexample Fajnzylber and Maloney (1999).

95C E P A L R E V I E W 7 3 • A P R I L 2 0 0 1
SOCIAL PROTECTION FOR THE POOR IN LATIN AMERICA • NORMAN HICKS AND QUENTIN WODON
In these circumstances, it should not be surprisingthat there is some degree of malaise in the region. Whileaverage levels of real per capita income have risen inthe majority of Latin American and Caribbean countriesin the 1990s, this may not yet have been translated intoimprovements in subjective perceptions of welfare.Table 2 presents the results of a 1999 opinion surveyconducted by the Wall Street Journal in fourteen LatinAmerican and Caribbean countries. Almost two-thirdsof the respondents believe that their parents had a betterlife than they do, and less than half believe that theirchildren will have a better life than themselves. Thispessimism probably reflects both a feeling of economicinsecurity and the relative Latin American and Caribbeanlack of progress in reducing poverty observed over thelast two decades and documented above.
There are no easy answers to the difficulties anduncertainties faced by poor households in Latin Americaand the Caribbean. Macroeconomic policies promotingstable and broad-based economic growth certainly helpin reducing poverty, but they are not enough.Governments in the region have increasingly beenconcerned about establishing or strengthening systemsof social protection and safety net programmes that helpmitigate the potential impact of economic shocks beforethey occur and help the poor to cope with these shocksafter they have occurred. In this paper, we focus onpublicly funded or mandated safety nets functioning
as risk-coping mechanisms. What are the characteristicsof good public safety nets? What are the main types ofsafety nets currently in place in the countries of theregion? Which programmes should be protected orexpanded during economic crises? Finally, what hasbeen the actual record in terms of protecting the poorthrough targeted public spending during crises? Thispaper provides tentative answers to these questions.Section II below introduces the reader to the mainconcepts used in the literature on social protection andsafety nets within the context of the various ways inwhich households are affected by, and respond toshocks. Section III presents the main types ofprogrammes currently in place, with their respectivestrengths and limitations. Section IV uses data on sevenLatin American countries to assess the actual record inprotecting the poor through safety nets during crises.Finally, section V contains a brief conclusion.3
TABLE 1Latin America and the Caribbean: Number of poorand extremely poor, 1986-1998
Year Population Percentage of population Number of poor Percentage of population Number of extremely poor(millions) in a state of poverty (millions) in a state of extreme poverty (millions)
1986 407.38 33.75 137.49 13.32 54.261989 430.98 38.26 164.89 17.59 75.811992 454.65 39.65 180.27 18.65 84.791995 478.21 36.92 176.56 15.94 76.231996 486.06 36.74 178.58 16.10 78.261998 501.87 35.83 179.84 15.55 78.05
Source: Wodon (2000a). Poverty numbers for 1998 are based on projections, not surveys.
TABLE 2
Latin America and the Caribbean: Subjective perceptionsof changes in living standards(Percentages)
Better Same Worse No reply
Taking everything into consideration, would you say that your parents lived better,the same, or worse than how you live today? 61.2 22.0 14.4 2.4And regarding your children, do you believe that they will live better, the same,or worse than how you live today? 46.1 20.7 22.0 11.2
Source: 1999 poll by the Wall Street Journal, quoted by Rodrick (1999).
3 Several authors have recently reviewed the literature on socialprotection, safety nets, and crises. They include Klugman (1999)for safety nets, Dar and Tzannatos (1999) on active labour marketprogrammes, Karni (1999) on unemployment insurance, andEzemenari and Subbarao (1999) on social assistance. The Inter-American Development Bank (in February 1999) and the WorldBank (in June 1999) have held conferences on these topics. For adiscussion of social protection within the context of globalization,see also De Ferranti, Perry and others (2000).

C E P A L R E V I E W 7 3 • A P R I L 2 0 0 196
SOCIAL PROTECTION FOR THE POOR IN LATIN AMERICA • NORMAN HICKS AND Q UENTIN WODON
IIThe goal: designing good safety netsand social protection systems
A recent World Bank paper on social protection strategy(World Bank, 1999; see also Holzmann and Jorgensen,1999) places social protection in the context of socialrisk management. It divides social risk managementstrategies into three types: risk reduction, risk mitigationand risk coping. Risk reduction covers macroeconomicmanagement, regulations, and institutional developmentpolicies that help prevent crises from occurring. Whilethese prevention policies are important, they are toogeneral to be part of the social protection system, whichconsists mainly of mitigation and coping strategies. Riskmitigation strategies are put in place before a shock, toreduce its impact once it occurs. They include forexample income diversification and insurancemechanisms, both formal and informal. Risk copingstrategies, for their part, are implemented after a shockto deal with the impacts of the shock not covered byrisk mitigation policies. Table 3, taken from Gill (1999),provides an overview of some of the main governmentand private sector policies.
In this paper, we focus on publicly provided ormandated instruments for assisting private individualsin coping with shocks (the bottom cell in the middlecolumn of table 3). This does not mean that we do nottake into account private coping strategies4. There areof course linkages between private and public copingstrategies (see for example Ezemenari, 1997, for
transfers). As mentioned in the introduction, someprivate short-term strategies may have permanenteffects that make it difficult to reduce poverty in thelonger term. This is the case when the nutrition ofcertain family members suffers. It is also the case ifchildren are removed from school and are put to work5.In more general terms, publicly funded or mandatedsocial protection programmes and safety nets representan attempt to protect the poor against the risks that arisefrom shocks, whether the shocks are foreign ordomestically induced, and whether they are covariantor idiosyncratic. As already mentioned, an economiccrisis produces a covariant shock, whereby many peopleare affected at the same time. But even in normal times,households can be affected by idiosyncratic shocks suchas death, illness or loss of employment. One shoulddifferentiate between the social safety nets which shouldbe in place at all times to deal with idiosyncratic shocks,and the programmes which are specifically designedto help large numbers of poor people suffering fromtemporary adverse covariant shocks (World Bank,1999).
There are usually more mechanisms available forcoping with idiosyncratic than for covariant shocks, andthe fiscal implications of the two types of shocks areclearly different. However, even among the programmes
5 Although the substitution effects between work and schoolingare likely to be partial due to the possibility for the parents to reducethe time devoted by the children to leisure (Ravallion and Wodon,2000a), it has been estimated that on average, for six Latin Americancountries, the reduction in the probability of going to school whena child is performing paid work varies from 21% to 67% dependingon the sample (Wodon and Siaens, 2000; the estimates includecontrols for a wide range of other variables affecting the decisionto go to school and/or to work, so that they are net marginal effects).This substitution between work and schooling reduces the humancapital endowment of working children to the extent that workingchildren may expect on average a loss of about 7% of theirdiscounted lifetime earnings when they are put to work, even aftertaking into account their positive earnings when working as childrenand the higher level of experience accumulated because of work atan early age. Clearly, the magnitude of the long-term losses due tochild labour calls for the design of programmes that help parentskeep their children in school, especially during economic crises.
4 To cope with the income losses induced by shocks, the poor adopta wide variety of strategies. These may include moving from formalto informal sector employment; working longer hours and/orworking at a second job; promoting the labour force participationof additional family members such as spouses and children; selling(or consuming in the case of farmers) productive and other assets,including stocks; migrating temporarily or permanently in orderto search for employment opportunities; reducing consumptionpatterns, including restricting the food intake of family members,taking children out of school to reduce education expenditures, orpostponing health care expenditures; relocating and/or restructuringhouseholds, for example by having several families living underone roof; and drawing on outside help both in kind and in cash,including support from local communities, friends and relatives,and private institutions such as NGOs (this in turn highlights therole of social capital). An interesting paper about the genderdimension of these strategies is Cunningham (1998).

97C E P A L R E V I E W 7 3 • A P R I L 2 0 0 1
SOCIAL PROTECTION FOR THE POOR IN LATIN AMERICA • NORMAN HICKS AND QUENTIN WODON
designed to deal with covariant shocks, one can identifya number of alternatives. These include:
– Emergency employment programmes involvingpublic works, often using labour-intensive meth-ods, commonly called “workfare”;
– Social funds which establish special programmes,usually in rural areas, for financing small-scale pub-lic works identified by local community groups;
– Nutrition and food interventions, particularly thosetargeted at vulnerable groups such as children andpregnant women. These may take many forms,including food distribution, food stamps, and foodserved in schools or community kitchens;
– Systems of direct cash grants targeted at the poor-est, which may be conditioned on favourablebehaviour (such as school attendance and/or visitsto health centres);
– Other instruments, such as pensions and unemploy-ment insurance, including systems of mandatoryseverance payments upon termination.
Another way of organizing the discussion is to look atthe programmes in terms of the age groups they serve,in view of the fact that the different age groups havedifferent needs.6 People in the youngest age groups aregenerally at greater nutritional risk than other groups,
while for adults, the principal problem may be one ofemployment. For the elderly, the critical problems aremaintaining sufficient income to meet basic needs, andadequate health care access.
Within Latin America and the Caribbean, almostall the countries currently have some mix of the aboveprogrammes in varying degrees. However, very few ifany of the programmes completely fulfill the criteriaof an ideal safety net, which should have the followingcharacteristics:7
– It should be based on a sound analysis of who islikely to be affected the most by crises, and whatkinds of coping mechanisms are normally used bythose affected;
– It should provide sufficient coverage of the popu-lation to be reached, particularly the most vulner-able and excluded groups;
– It should be well targeted on the poor, with cleareligibility and termination rules, so that access issimple and predictable;
– It should be supervised by well-functioning insti-tutions already in place;
– It should be counter-cyclical (i.e., it should receivemore funding when there is an economic crisis), andin some cases it should be implemented automati-cally according to pre-agreed triggers, such as a riseabove a given level of unemployment or poverty;
TABLE 3
Latin America and the Caribbean: Classification ofgovernment and private risk management measures
Nature of measure Government Private sector
Mainly prevention Macroeconomic policies Infrastructure investments(risk-reducing) Financial regulations Human capital investments
Regulatory Infrastructure investments Portfolio diversificationTaxpayer-funded Labour-related regulationsUniversal Human capital investments
Mainly insurance Unemployment insurance Individual savings(risk-mitigating) Severance funds Sale of assets (e.g. land)
Inter-temporal transfers Job protection statutes Labour force participationPremium-funded Public works guaranteesNon-poor and poor
Mainly assistance Public works programmes Inter-household transfers(risk-coping) Means-tested cash transfers Community solidarity
Within-period transfers Conditional cash transfers Support from NGOsTaxpayer-funded Commodity transfers Public-private partnershipsTargeted: focus on poor
Source: Gill (1999).
6 This idea was suggested by Ana María Arriagada. See Appendixfor details. 7 For a fuller discussion of the criteria see Grosh (1995).

C E P A L R E V I E W 7 3 • A P R I L 2 0 0 198
SOCIAL PROTECTION FOR THE POOR IN LATIN AMERICA • NORMAN HICKS AND Q UENTIN WODON
– It should be fiscally sustainable;– It should be able to provide benefits quickly, with
as large as possible a share of the costs being spenton net increases in incomes;
– It should complement, not substitute for, privatesafety net programmes and other social protectionmechanisms;
– It should be scaled back when the crisis is over.
IIIThe tools: types of safety netsand social protection programmes
1. “Workfare” programmes
These programmes provide employment throughspecifically designed public works projects. The classicexample is “Trabajar” in Argentina. In this programme,projects are identified by local governments, NGOs andcommunity groups, and can provide employment forno more than 100 days per participant. Project proposalsare reviewed by a regional committee, and projects withhigher poverty and employment impacts are speciallyfavoured8. Workers hired by the project are paid by thegovernment, specifically the Ministry of Labour. Theother costs are financed by local authorities. Examplesof eligible projects include the construction or repairof schools, health facilities, basic sanitation facilities,small roads and bridges, community kitchens andcentres, and small dams and canals9
The projects financed by “Trabajar” are limited topoor areas as identified by a poverty map. Moreover,wages are set to be no higher than 90% of the prevailingmarket wage, so that the workers have an incentive toreturn to private sector jobs when these are available.Thus, the programme involves self-targeting as well asgeographic targeting. Overall, targeting of the poorunder “Trabajar II” (the second round of the project)has been reported to be quite good, with 75% of thefunds reaching the bottom 20% of the incomedistribution, and 40% reaching the bottom 5%.However, the supply of jobs in the programme dependson budgetary allocations as well as the ability of localcommunities to identify viable projects. As good as itis, “Trabajar” has provided employment to no more than1% or 2% of the labour force, at a time whenunemployment has ranged from 13% to 18% of thatforce.
Large “workfare” programmes were alsoimplemented by the government of Chile during theperiod 1975-1988. The objective of these programmeswas to absorb workers displaced from the public sector,and to reduce unemployment during the adjustmentperiod. As in the case of “Trabajar”, these programmesprovided employment in emergency public works,including maintenance and repairs to roads and schools,construction of parks, forestry projects, etc. Theprogrammes were administered by municipalities, andwere gradually built up to a peak in 1983, when theyemployed about 13% of the total work force (over500,000 workers), while the unemployment rate stood
8 In a recent reform of the “Trabajar” programme, several stepswere taken to improve its performance. The focus of the reformwas placed on increasing community participation and funding inthe choice of the projects to be financed. “Trabajar” now works incollaboration with local community groups, NGOs andmunicipalities which present projects for selection. Projects mustfirst be approved for technical feasibility. Next, they are selectedon a points basis. More points are awarded to projects which arelocated in poorer areas, yield larger public benefits, are sponsoredby well-regarded community groups or NGOs, and reduce labourcosts below the minimum wage. These new features have improvedtargeting both at the geographic and individual levels. Theinvolvement of local groups has also improved the quality ofmonitoring and feedback for the projects.9 These activities are fairly similar to those financed by social funds(see below). One of the differences between a social fund projectand a workfare project is that the workfare project is likely to besupervised by local authorities, rather than by independent agencies,and execution is typically not contracted to the private sector, butis carried out by the sponsoring agency, which can include localand provincial governments, private groups, and national
organizations. Another difference is that workfare programmes havethe generation of employment and income as their priority, whilesocial funds focus more on the quality of the infrastructureproduced.

99C E P A L R E V I E W 7 3 • A P R I L 2 0 0 1
SOCIAL PROTECTION FOR THE POOR IN LATIN AMERICA • NORMAN HICKS AND QUENTIN WODON
at 17%. The programmes were gradually reduced asprivate sector employment increased, and finally phasedout completely in 1988. The two largest programmesoffered manual labour at very low wages, to ensure self-targeting. Most of the workers were unskilled, and theyreceived one-fourth of the then current minimum wage(about one-half of the market wage). A quarter of theparticipants were women. However, while theprogramme was considered successful in terms ofreducing poverty and the social impact ofunemployment, the quality of the public worksproduced was notably low, particularly as theprogramme expanded in size. In addition, it is not clearthat all the workers in the programme would have beenunemployed without the programme. An evaluationfound that 32% of the participants had no workexperience prior to participating in the programme, and46% had retired voluntarily before joining theprogramme. Many of those with no experience werewomen who went to work for the first time (Universityof Chile, 1992).
The advantages of workfare programmes includetheir ability to expand quickly during a crisis, once thebasic mechanisms have been established, and to reachthe poor through area targeting and, within poor areas,through self-targeting thanks to the low wages. But aproblem with these programmes is that the cost ofgenerating one dollar in additional income for the poorthrough public works is typically large, in the range ofthree dollars or more. To understand why, the measureof cost effectiveness and its decomposition proposedin Box 1 are useful.
The measure of cost effectiveness used is the shareof total programme costs which reaches the poorthrough net increases in earnings. Modifying slightlythe formula provided in Ravallion (1999), as indicatedin Box 1, this share can be seen as a function of fourkey parameters: the proportionate wage gain, thetargeting performance, the wage share, and the budgetleverage. A reasonable value for the proportionate wagegain may be 0.5, because workfare wages are low andthe poor typically find some other way to generateresources, for example through part-time informalemployment, when they do not have access to theprogrammes. Because of the self-selection involved andthe priorities given to poor areas, targeting performancemay be good, at about 0.8. The wage share can oftenbe obtained from administrative records by multiplyingthe number of work days created by the programme bythe wage rate, and dividing this amount by the totalcost of the programme. In many cases, the wage share
will not exceed 0.7. Finally, when the programme isalmost entirely financed by the central government(even though project selection may be done at the locallevel), the budget leverage is equal to one (in the caseof “Trabajar” there is budget leverage, but while thissaves money for the central government, it still has tobe paid by local governments). The measure of costeffectiveness is obtained by multiplying the variousparameters10. It thus typically costs three or more dollarsto the national or federal government to transfer onedollar to the poor in additional wages.
The notion that it costs three or more dollars totransfer one dollar of income to the poor throughworkfare could be challenged, in that the benefits couldbe higher for two reasons11:
First, the method presented in Box 1 does not takeinto account the benefits of the public worksthemselves, which can be substantial if the workers areput to good use. The problem, however, is that thesebenefits will be enjoyed during the whole life of theinfrastructure built, while what the poor need in timesof crisis is immediate income support. If the poor havehigh discount rates (which they do in general, butespecially in times of crisis when their resources donot provide for basic subsistence), the discounted valueof the benefits generated by the public works may bequite low. Moreover, since the emphasis is on jobcreation rather than investments, there may be a biastowards “make work” or prestige projects which maynot be very valuable. This may be particularly true in acrisis, when a rapid expansion of the programmeexhausts the backlog of viable projects.
Second, the method presented in Box 1 assumesthat only the net proportionate wage gain must be takeninto account for measuring the programme’s impact.But in periods of high unemployment, it could be arguedthat at least part of the difference between the publicworks wage and what the programme participant wouldhave earned by himself without the programme will beavailable as earnings for another worker who does notparticipate in the programme and who is also
10 In our illustrative examples, this measure would be equal to0.5*0.8*0.7=0.28, in which case the total cost of generating onedollar in net additional wage earnings for programme participantsis 1/0.28=3.6 dollars. For an example of the econometric methodsthat can be used to measure with some precision the net wage benefitof workfare programmes using household surveys (i.e. the parameterNWB/W), see Jalan and Ravallion (1998).11 For a fuller discussion of these points, see Wodon (2000b) andMaloney (2000).

C E P A L R E V I E W 7 3 • A P R I L 2 0 0 1100
SOCIAL PROTECTION FOR THE POOR IN LATIN AMERICA • NORMAN HICKS AND Q UENTIN WODON
underemployed. At the extreme, the whole wage ratecould be taken into account in the cost-benefit analysis,which would greatly enhance the cost-effectiveness ofsuch programmes.
On the other hand, arguments could also be putforward to argue that the net transfers to the poor arelower than predicted by the decomposition in Box 1.For example:
First, since workers are paid by local authorities,the opportunities for corruption and political bias aremore pronounced. With “Trabajar”, there remains someevidence of political influences in the choice ofparticipants and gender discrimination (few women areselected in some areas).
Second, the poorest communities may not alwaysbe well positioned to submit proposals for projects and/or to contribute to non-wage costs. In this case, thetargeting performance of the programme may suffer,because the contribution of geographic targeting tooverall targeting performance will be reduced.
Apart from Argentina and Chile, the experience ofMexico is also valuable for the assessment of thestrengths and limitations of workfare programmes. In
Mexico’s rural areas the Programa de Empleo Temporal(PET) provides off-season temporary employment belowthe minimum wage through public works. Employmentis for up to 88 working days at 90% of the minimumwage. In 1999, 93 million work days and one millionjobs were to be created. PET is an example of aprogramme which functions in normal times rather thanonly during crises, although it is restricted to certainperiods of the year only. As expected, the projects arelabour-intensive. Examples include irrigating land,paving roads, clearing land, improving housing, andinstalling water and sewerage systems. The data suggestgood targeting, with the participants being poor andneeding the temporary jobs more than non-participantsbecause they do not benefit from occupations that keepthem employed all year long. Yet, the programme doesnot reach the smallest (and probably poorest) ruralcommunities. On average, PET communities are almosttwice as large as non-PET communities. PET communitieshave better access than non-PET communities toelectricity (74% versus 60%), public phones (33%versus 19%), pre-school education (81% versus 67%),primary schools (89% versus 82%), and tele-secondary
Box 1MEASURING THE COST-EFFECTIVENESS OF PUBLIC WORKS
In the spirit of Ravallion (1999), let us assume that without public works, an individual has a probability F* offinding employment at market wage W*. Expected earnings are F*W*. With public works, the individual earnsthe public works wage W. If the individual can continue to search for private or self-employment while partici-pating in public works, with probability F of finding such employment, the expected wage with public works isFW*+(1-F)W. The net wage benefit from the programme for the worker is NWB = (1-F)W - (F* - F)W*. If theworker gets unemployment benefits or a subsistence allowance S, the wage benefit is reduced to NWB = (1-F)W- (F* - F)W* - (1-F*)S. If the programme costs G to the government per worker employed, a measure of cost-effectiveness is the share of public expenditures transferred to workers as wage gain NWB/G. This measure canbe decomposed as follows:
NWB =
C (W+L) W NWB
G G C (W+L) W
budget wage leverage share targeting proportionateperformance wage gain
The determinants of cost-effectiveness are a) the leverage ratio C/G, where C is the total cost per worker includ-ing community funding; b) the wage share (W+L)/C, where W stands for wages paid to the poor and L stands forleakage due to wages paid to the non-poor; c) the targeting performance W/(W+L) which is the percentage ofwages reaching the poor; and d) the proportionate wage gain NWB/W. This model can be extended to take intoaccount the benefits of the infrastructure built by public works, but these benefits are not as immediate (seeWodon, 2000b, for a model and a discussion).

101C E P A L R E V I E W 7 3 • A P R I L 2 0 0 1
SOCIAL PROTECTION FOR THE POOR IN LATIN AMERICA • NORMAN HICKS AND QUENTIN WODON
schools (distance education) (22% versus 11%). Partof the problem may be due to the higher (e.g.,administrative) cost of reaching very small ruralcommunities.
One might also consider job training programmesas a safety net, particularly if they can be modifiedduring times of crisis. In Mexico, the Probecatprogramme was implemented in 1986 as a response tothe growth in unemployment that followed the 1982debt crisis and the subsequent structural adjustmentpolicies. Today, the programme provides training forclose to 500,000 beneficiaries per year in urban areas.A new evaluation of the programme suggests, however,that it does not have a statistically significant impacton employment and wages (Wodon and Minowa, 1999;see Revenga, Riboud and Tan, 1994, and STPS, 1998,for previous evaluations). These disappointing resultsare not very surprising, because most retrainingprogrammes in OECD countries have been found to havelimited impacts. One reason for this may be that thetraining is provided for too short a period of time (afew months) to provide skills valuable in the long run.Some job training programmes may in fact function assafety nets by providing temporary relief for theunemployed with a self-targeting mechanism not unlikethat of public works programmes, since participantstypically receive only the minimum wage. It is probablybetter to choose one goal or the other (training versussocial protection), rather than trying to meet both goalswith a single programme.
2. Social investment funds
Social investment funds (SIFs) were the original WorldBank response to the social aspects of adjustmentprogrammes, and some of the earliest funds (e.g.,Bolivia’s Emergency Social Fund created in 1991) weredesigned primarily to provide employment (Jorgensen,Grosh and Schacter, 1992). In fact, SIFs were started inpart to avoid the problems associated with emergencypublic works (workfare) programmes. Yet almost allSIFs now have evolved into programmes designed toprovide small-scale social infrastructure, particularlyin rural and poor areas, using projects generated andexecuted at the local level. Therefore, social funds arenot safety nets per se. Note that unlike workfareprogrammes, some social funds also financeprogrammes that do not involve construction or main-tenance, such as nutrition programmes, technical as-sistance and micro-credit. When construction work isinvolved, it is not rare to see social funds using skilled
manpower paid at market wages. This is because thequality of the infrastructure built is considered to bemore important than the provision of employment forthe poor. This is the case with the Honduras social fund,which originated from the transformation of an em-ployment generation programme in the early 1990s butdoes not consider the objective of employment creationas its main priority nowadays. On the other hand, mostsocial funds are usually targeted to poor areas throughthe use of a poverty map (or, in some cases, throughthe use of a map of unmet basic needs).
While both workfare and social fund programmesbuild projects in the public sector, there are importantdifferences. The social fund finances the material andlabour costs of a project, although some local labourmay be donated as a community contribution. Thisvaries across SIFs and countries. A workfare programmegenerally finances the labour cost of a project at thenational or federal level, and asks that localgovernments or agencies provide for the material costs.Thus, there is a clear incentive in workfare programmesfor the local agency to find labour-intensive methodsof construction and choose labour-intensive projects.Since SIF projects are bid out to the private sector, oftenthe most modern and capital-intensive constructionmethods are used, although in some cases social fundsspecify minimum employment levels to be attained intheir operations.
Most social funds are agencies which areindependent of the ministries -often attached to theOffice of the country’s President- which review andfund projects submitted by NGOs, local governments andother sponsoring agents. Their strong points includelocal community involvement and the ability to respondto local perceptions of needs, especially in rural areaswhere normal government expenditures often do notreach the poor. Social funds also have a better abilityto avoid corruption and “make-work” projects. But theyare not very good at providing safety nets, and they donot normally expand during a crisis to provide moreemployment. In fact, the amount of employment andincome generation provided by social funds hashistorically been low. For instance, a review of socialfunds found that 10 major social funds providedemployment on average equal to only 4% of the labourforce (Goodman, Morley and others, 1997). Likewise,the monetary contribution in terms of wages was judgedto be small, as well as the poverty reduction impactcoming from the projects themselves. Social funds arebetter at improving the supply of health, education, andbasic infrastructure services, with in some cases impacts

C E P A L R E V I E W 7 3 • A P R I L 2 0 0 1102
SOCIAL PROTECTION FOR THE POOR IN LATIN AMERICA • NORMAN HICKS AND Q UENTIN WODON
on outcomes such as school enrollment rates, age-for-grade, or the incidence of illnesses (recent evaluationsusing household-level data include Pradhan, Rawlingsand Ridder, 1998, for Bolivia, and ESA Consultores,1999, for Honduras).
Still, one of the clear advantages of social funds isthat they have strong organizations with relatively goodsystems for project management and monitoring. Theseorganizations can be used in times of crisis for thedelivery of social safety nets. The existing social fundin Honduras, for instance, has proven highly valuablein directing emergency assistance to local villages afterHurricane Mitch. One possibility therefore is to workwith social investment funds to modify their operationsduring a crisis, as for example by putting more emphasison labour- intensive projects and by having the fundinvolved in new, hard-hit areas. It is thus a good idea toidentify labour- intensive projects in advance of apotential crisis, so that they will be ready for fundingshould a crisis come about.
3. Nutrition and food programmes
Nutrition and food programmes take a variety of forms.Subbarao, Bonnerjee and others (1997) have identifiedabout thirty countries using food policies with redis-tributive aims. In these countries, price subsidies areused as often as feeding programmes and “food-for-work” requirements, and much more often than foodquantity rationing and food stamps. In fact, manyworkfare programmes now providing wages in cashinitially started as food-for-work programmes. As fordirect feeding programmes, these provide food to needyrecipients, through direct delivery of unprepared foodsfrom a programme warehouse, delivery of preparedfood from a community kitchen, or the provision of alunch or breakfast for children in school12. Evaluationsof nutrition programmes generally indicate that thereis only a small, marginal improvement in nutrition com-pared to the case where the family receives an equiva-lent cash grant. This is because families may substitutefree food for their own purchases, and largely use thesavings for other purposes. However, even if a foodprogramme is roughly equivalent in effect to a cashgrant, there are fewer possibilities of diversion of funds,since food is less likely to be misappropriated than cash.
In addition, food is more likely to go to women, and beused to improve the welfare of the family, while cash ismore likely to be used by men for lower-priority ac-tivities. An intermediate alternative between cash andfood is the issue of food stamps. Food stamps have theadded benefit of not requiring a complicated system ofstorage and transport of food, while making use of thealready existing private food distribution network. InHonduras, the food stamp programme used to also covermedicines and school books. In Jamaica, the food stampprogramme was introduced in place of general foodsubsidies, and has proven effective in raising the in-comes of the poor (Grosh, 1992).
A common way of targeting food programmes isby linking distribution to a health programme,particularly maternal and child health care. In this way,the food serves as an incentive to attend the programme,and nutrition education can help improve the use ofthe food given out. As already mentioned, giving foodto women also lessens the possibilities of it beingdiverted for sale in the market. Food programmes canalso be designed to be self- targeted, if the food productsgiven out are those consumed by the poor and not bythe middle class. Alternatively, food distribution cantake place at centres located in poor neighbourhoods.Such approaches can reduce the administrative burdenof targeting programmes, but they increase thepossibility of leakage to the non-poor. School lunchand breakfast programmes are also difficult to target atthe individual level if it is desired to avoid stigmatizingsome students within the school as being “poor.” Inmany countries, schools from poor areas are targeted,but completely untargeted national programmes are alsocommon. One benefit of these programmes is theincentive given to keep the children in school in orderto have them fed, and the fact that they improve theirlearning abilities while in school (see Wodon andSiaens, 1999a, for an evaluation of the Mexican schoolbreakfast programme). From a nutritional point of view,however, the prime beneficiaries of the programmesmay be other members of the family, if the children arenot fed at home because the parents know that theywill receive a school lunch.
Food subsidies are another way to help the poorby reducing the cost of their consumption bundle(Besley and Kanbur, 1988). Means-tested foodsubsidies tend to be more effective than other subsidiesin reducing inequality and improving welfare. ForMexico, for example, Wodon and Siaens (1999b)suggest that universal subsidies do not perform wellfor the reduction of inequality and the improvement of
12 School feeding programmes are especially popular in LatinAmerica. See for example Phillips, Sáenz and others (1995) onHonduras, Dall’Acqua (1991) on Brazil, and Jacoby, Cueto andPolitt (1996) on Peru.

103C E P A L R E V I E W 7 3 • A P R I L 2 0 0 1
SOCIAL PROTECTION FOR THE POOR IN LATIN AMERICA • NORMAN HICKS AND QUENTIN WODON
welfare. They compare three programmes: the nowdefunct universal subsidy for tortillas, a programmeproviding one kilogramme of free tortillas forhouseholds with income below two minimum wages,and a subsidized milk programme, also means-tested.Their main findings were as follows:
– Food subsidies are better than non-food subsidies.Subsidies for basic consumption goods such astortillas reduced inequality, especially in urbanareas, and more so than subsidies for utilities suchas water and electricity. However, food subsidiesgenerate price distortions and they are costly.Furthermore, a universal subsidy for tortillas is lesseffective than would be a similar generalizedsubsidy for the ingredients needed for makingtortillas, such as corn flour.
– Within food subsidies, means-tested subsidies arebetter than universal subsidies. The marginalimpact on inequality and welfare achieved with theuniversal tortilla subsidies does not come close tothe welfare gains achieved with the means-testedsubsidies.
Still, food subsidies may not represent a sound and cost-effective investment for poverty reduction. Food sub-sidies and distribution systems can have negative in-centive effects on the supply of labour (Sahn andAlderman, 1995). They can be badly targeted, with highleakage to the non-poor (Grosh, 1994; Cornia andStewart, 1995). And, while self-targeting can beachieved to some extent by subsidizing goods con-sumed in larger quantities by the poor than by the non-poor, this is no panacea (Tuck and Lindert, 1996). Therehas therefore been a tendency to reduce funding forfood subsidies in favour of other programmes, for ex-ample in Mexico (Levy and Dávila, 1998).
4. Conditional cash transfers
Since food is fungible with money, one could arguethat cash grants are the simplest and most direct wayof providing safety net assistance. The use of cash grantsalso avoids the utility losses associated with in-kindsupport. In developed countries, and some advancedLatin American countries, cash payments to selectedhouseholds are slowly becoming more common.Unconditional cash payments and similar forms ofsocial assistance are usually targeted to women withdependent children, the disabled, the aged, and thoseunable to work. However, the problems of targetingand controlling cash payments make this approach
difficult in poorer countries that lack goodadministrative arrangements. For instance, in Boliviathe Bonosol programme gave adult citizens an annualcash grant equal to four weeks’ pay at the minimumwage. The attractiveness of the grant and the lack ofscreening or identification mechanisms resulted inwidespread abuses, however, including doublepayments and payments to non-Bolivians.
An attractive alternative is to link cash grants toschool attendance or other desirable behaviour. Thissystem has been introduced in various degrees in suchcountries as Brazil (Bolsa Escola), Argentina (BecaSecundaria), Mexico (Progresa), and Honduras (PRAF),among others13. These programmes are not safety netsproperly speaking, or at least they were not originallydesigned to function as compensatory safety nets duringcrises. Yet the programmes do provide valuable benefitswhich households can rely upon during crises, and thesebenefits can be increased during a recession if need be.In other words, as was the case with job trainingprogrammes and social investment funds, existingprogrammes providing conditional cash transfers canbe expanded and modified to serve as safety nets duringa crisis. In general, however, school-related grants willoffer only a partial response to crisis situations, if onlybecause the programmes are targeted at families withchildren already in school, so that some of the poorestwho cannot afford to send their children to school areexcluded from the programmes’ coverage.
School-based conditional cash transferprogrammes reduce the opportunity cost for poorparents of keeping their children in school. Thisopportunity cost is essentially the loss of child wagesor of the value for the parents of the domestic workdone by the children, which cannot be enjoyed whenthe children go to school. In many cases, thisopportunity cost of schooling is difficult to estimate,and it is by no means obvious that the grants mustnecessarily be equal to the opportunity cost in order topersuade parents to send their children to school(Ravallion and Wodon, 2000a). Indeed, it is reasonableto think that the parents have an intrinsic interest inhaving their children go to school, either for altruistic
13 A rigorous evaluation of Mexico’s Progresa scheme is beingprepared by the Progresa staff with support from the InternationalFood Policy Research Institute. Preliminary results are availablein Progresa (1999). The International Food Policy Research Instituteis also going to help in the evaluation of Honduras’s FamilyAllowance Programme (PRAF), with a design combining demand-and supply-side interventions.

C E P A L R E V I E W 7 3 • A P R I L 2 0 0 1104
SOCIAL PROTECTION FOR THE POOR IN LATIN AMERICA • NORMAN HICKS AND Q UENTIN WODON
motives, or for the future benefits that intergenerationaltransfers provide once the children reach adulthood. Insome countries, however, the level of conditional grantsappears to be high. In the case of Progresa in Mexico,for example, in order to justify the relatively high levelof the Progresa grants it has been argued that apart fromproviding incentives to accumulate human capital, theyalso improve the families’ overall quality of life. Yetthere may be more cost-effective ways of improvingthe quality of life of the programme’s beneficiaries. Onthe other hand, as shown by Wodon, González, andSiaens (2000), when the value of the grants is low,demand-side schooling interventions may exclude thepoorest. More work is needed to measure the manytrade-offs involved.
At what level of schooling should the grants beprovided? This will depend on the characteristics ofthe country. In Brazil and Argentina, the programmesfocus on secondary school students, since these are thechildren who are more likely to be pulled out of schoolduring a crisis. In Honduras, the programme focuseson the first four years of primary school. In Mexico,the programme covers the end of primary schoolingand the lower secondary school cycle. In Venezuela,the programme covers primary school children. In somecases, these programmes are tied not only to attendancebut also to school performance, including passing onto the next grade. While this may provide valuableincentives, one has to make sure that such conditionsdo not exclude the poorest children, who may havemore difficulties in succeeding at school.
How should the grants be targeted? The experienceof Progresa is interesting (Skoufias, Davis andBehrman, 2000). The programme uses a three-stagetargeting mechanism. First, poor rural localities areselected for participation. Next, poor families areselected within participating communities, using amultivariate discriminant analysis. Third, localcommunities may review Progresa’s selection andreclassify poor families as non-poor and vice versa. Thistargeting mechanism is basically sound, and the resultsappear to be good. One concern is that the level ofcommunity involvement remains marginal. Thetargeting process is centralized in part due to the desireto avoid political interference in the choice ofbeneficiaries. Nevertheless, more efforts could be madeto promote the role of communities in targeting.Another related question relates to the need for targetingwithin poor communities. The higher the proportionof the poor in a community, the less the need to targetwithin that community, especially if targeting is costly
not so much administratively but rather in terms ofsocial cohesion (those who do not get into theprogramme may envy those who benefit from it). InHonduras, where the PRAF programme is being modifiedin part on the basis of Progresa’s experience, it has beendecided to provide support to all the families residingin the poor communities that participate14.
Conditional cash transfer programmes can also beused to promote good health practices, including theconsultation of local health providers. This is again thecase with Mexico’s Progresa scheme, where eligiblefamilies receive a transfer (both in cash and in kindthrough a nutritional supplement) for health purposesapart from the transfers related to schooling. In otherwords, Progresa aims at providing coordinatedintervention for education, health and nutrition, in thehope that the impact of the whole programme will belarger than that of its individual parts. Of course, withProgresa as with the other programmes, in maximizingthe impact of the school- and/or health-basedinterventions it is important to take care of supply-sideissues. For example, Progresa has been successful inraising school enrollment and attendance at health carecentres, but this has led to tensions on the supply side.Steps have been taken to coordinate Progresa’s actionwith that of other ministries, such as those of educationand health, but more may be needed to optimizedemand- and supply-side interventions.
5. Unemployment insurance and otherprogrammes
Unemployment insurance is common in Europe andNorth America, but relatively rare in Latin America,partly because of its high cost. On the other hand, thecurrent labour legislation in many Latin American andCaribbean countries mandates a severance payment ontermination which is a function of the number of yearsworked. Normally, this is about one month’s salary forevery year of service, up to some maximum. This maybe supplemented by an unemployment insurancescheme (as in Argentina and Brazil for formal-sectorworkers) in which monthly contributions from payrollsand/or the employer entitle workers to a monthly pay-ment over a limited time horizon, with the payment setlow enough to reduce disincentive effects. But sincethe formal sector in many countries is less than half of
14 It is important, when feasible, to use distributional weights inthe evaluation of the targeting of social programmes and otherinterventions. For such an analysis, see for example Ravallion andWodon (2000b), and Wodon and Yitzhaki (2000).

105C E P A L R E V I E W 7 3 • A P R I L 2 0 0 1
SOCIAL PROTECTION FOR THE POOR IN LATIN AMERICA • NORMAN HICKS AND QUENTIN WODON
the total work force, the coverage of unemploymentinsurance/severance payments is far from complete, andthe exclusion of the informal and rural sectors meansthat these mechanisms miss those areas which containmany of the poor. Moving from a severance pay sys-tem to an unemployment insurance system could bebeneficial if it reduces labour costs. However, unem-ployment insurance can also create moral hazard prob-lems by subsidizing unemployment (as compared toworkfare programmes, which subsidize employment).One important element here is to ensure that unem-ployment benefits are not so generous as to discouragethe search for work. For this, both the level of the pay-ments and the length of time workers can receive ben-efits must be monitored (for a review of OECD experi-ence with labour market rigidities and unemploymentinsurance, see Nickell, 1997).
An alternative frequently mentioned is a systemof Unemployment Insurance Savings Accounts (UISAs),under which workers would receive no “reward” uponlosing their jobs, and they would suffer no “penalty”for finding a new job quickly. Each employed workerwould make a fixed mandatory minimum contributionto his/her UISA each month, and additional voluntarycontributions above the mandatory minimum levelswould be permitted. Upon becoming unemployed, anindividual worker would be entitled to withdraw a fixedmaximum amount per month from his or her UISA
(smaller withdrawals would also be permitted). Whenthe individual’s UISA balance falls to zero, or is seriouslydepleted, he/she would be entitled to unemploymentassistance. The unemployment assistance would befinanced through a tax levied on all wage earners. When
workers retire with a positive balance in their UISA, theywould be able to use that balance to top-up theirpensions. Overall, the workers themselves would playa much larger role in financing their own support duringperiods of unemployment. The main advantage of UISAsis that they tend to set the incentives right, withoutcreating distortions in the behaviour of employers andfirms, since the funds taken out by an unemployedindividual from his/her UISA directly reduce theindividual’s personal wealth by an equal amount, sothat individuals fully internalize the cost ofunemployment compensation. UISA systems are notwithout risks, and special interventions are likely to beneeded to protect those workers who are younger,poorer and less well educated. For Chile, Castro-Fernández and Wodon (2000) suggest that although theredistributive impact per dollar spent on unemploymentbenefits of a UISA-based system would probably besmaller than the redistributive impact of Chile’s currentunemployment assistance system, the complementaryunemployment assistance component of the systemwould still be highly redistributive, and it wouldprobably have a much better coverage because the valueof the benefits would be higher.
Finally, it is worth mentioning that there are severalother types of social protection programmes that exist,including pensions for the elderly. Because many ofthe poor belong to the informal sector, they do not haveaccess to the pensions provided by social securitysystems (likewise, those in the informal sector oftenlack access to other State-organized benefits such aslow-income housing). For a discussion of pension issuesfor the poor, see Holzmann and Packard (1999).

C E P A L R E V I E W 7 3 • A P R I L 2 0 0 1106
SOCIAL PROTECTION FOR THE POOR IN LATIN AMERICA • NORMAN HICKS AND Q UENTIN WODON
IVThe constraints: fiscal spaceand administrative capacity
1. Are social protection programmescounter-cyclical?
Good social protection programmes should expandduring an economic crisis as unemployment grows andincome levels decline. In other words, the programmesshould be counter-cyclical: i.e., rising when theeconomy falls. In some countries, the system of safetynets is supported by automatic entitlements that forcethe public sector to spend more on those who need it.For instance, unemployment causes an increase in thenumbers eligible for unemployment benefits, anddeclining incomes can increase the number ofhouseholds eligible to receive cash or food assistance.But in most Latin American countries, there are no suchautomatic triggers. This is partly because the need tohave counter-cyclical social protection programmes canconflict with the need to impose fiscal austerity duringa recession. An economic crisis, whether domesticallyor externally induced, leads to a drop in output andconsequently a fall in government revenues. But duringa crisis, governments are reluctant to raise taxes, somaintaining high expenditure levels can lead to largebudget deficits.
Let us consider the data presented in table 4. BothArgentina and Mexico suffered adverse shocks in 1995(Mexico was first, Argentina followed). Per capita GDP
in Argentina decreased by 5.32% between 1994 and1995, while it went down by 4.93% in Mexico between1994 and 1996. The share of GDP devoted to targetedsocial spending decreased a little in both countries,while the poverty rate increased, leading to an increasein the total number of poor people. The targetedspending per poor person decreased much more thanper capita GDP, yielding an elasticity to growth (in thiscase to a recession) of targeted spending per poor personof about five in the two countries. During this recession,spending for the poor was thus highly pro-cyclical,whereas ideally it should have been counter-cyclical inorder to protect the poor from the adversemacroeconomic shock.
The data in table 4 are based on one period in twocountries only and on a number of assumptions for boththe estimation of poverty and the categorization ofsocial spending. It may be misleading to conclude thatsocial protection declines in all countries during a crisis.Unfortunately, beyond point estimates of the elasticitiesof targeted spending to growth such as those presented
TABLE 4
Argentina and Mexico: Targeted public spendingper poor person, 1994-1996
Real per capita GDP Share of targeted social Poverty rate Number of poor Targeted spending(1994 = 100) spending in GDP (%) (%) people (million) per poor person
(1994 = 100)
Argentina1994 100 1.24 21.6 7.5 1001995 94.68 1.21 27.2 9.6 63.12% change -5.32% -27.88%
Mexico1994 100 1.36 46.95 42.04 1001996 95.07 1.23 60.93 56.51 67.30% change -4.93% -23.70%
Source: Wodon, Hicks and others (1999). The data for the two countries are not strictly comparable. Hence it should not be inferred thatsocial protection spending is more pro-cyclical in one country than in the other. Note also that the Government of Mexico has made asubstantial effort to increase targeted funding for the poor in recent years, for example by providing funding for Progresa. This is notreflected in the table.

107C E P A L R E V I E W 7 3 • A P R I L 2 0 0 1
SOCIAL PROTECTION FOR THE POOR IN LATIN AMERICA • NORMAN HICKS AND QUENTIN WODON
in table 4, the extent to which Latin American andCaribbean countries have provided counter-cyclicalsocial protection is a question which has receivedsurprisingly little attention. One problem is that the dataon budget expenditures do not typically identify socialprotection or safety nets as a separate activity. Socialprotection programmes are scattered over varioussectors such as health, education, social security, andwelfare. However, data are available in some countries.
Wodon, Hicks and others (1999) use data for sevencountries (Argentina, Bolivia, Chile, Costa Rica,Dominican Republic, Mexico and Panama) to test forthe business cycle properties of targeted and socialspending in Latin America. They first propose atheoretical model to analyse how targeted publicspending for the poor may be affected by booms andbusts. A government is said to be “pro-poor” if it givesreasonable weight to the poor in its social welfarefunction, if it considers a minimum level of basic needsthat must be satisfied for the poor, if over time it raisesthis level of basic needs faster than GDP during a periodof growth, and if it does not reduce the level ofminimum basic needs during a temporary recession. Ifa government is pro-poor according to the abovedefinition, the elasticity of targeted public spending togrowth will be positive and larger than one duringbooms, and smaller than one during recessions. If thegovernment is not pro-poor, the model predicts that theelasticity of targeted spending will always be smallerthan or equal to one. The existence of an asymmetrybetween booms and busts in the elasticity to growth oftargeted public spending for the poor when thegovernment is pro-poor is then tested with the paneldata on public expenditures. The results in table 5suggest that governments are to some extent pro-poorand pro-social, because targeted and social expendituresare rising faster than GDP and total government spendingduring booms. While this is encouraging, the factremains that during recessions, targeted spending is notprotected. It decreases slightly faster than GDP (althoughthe elasticities are not statistically different from onein table 5 in the case of a recession). Thus, even thoughgovernments can be considered as being pro-poor,targeted and social spending remain highly pro-cyclical.The evidence suggests that social protectionprogrammes, instead of expanding quickly during acrisis, are actually contracting, in many cases as rapidlyas other types of public spending15.
TABLE 5
Latin America (seven countries): Estimated elasticitiesof expenditures with respect to changes in GDP
Growtha Recession
Total government spending 0.971 1.003Social sectors spending 1.475* 1.128Social protection spending 1.999* 1.391
Source: Adapted from Wodon, Hicks and others (1999). Sample of7 countries, with 97 observations.
a * denotes an elasticity statistically different from one at the 5%level.
The impact of a recession on targeted spending onthe poor is even more negative than table 5 suggests. Itcan be shown that in Latin America, a one percentagepoint decrease in per capita GDP leads to at least a twopercentage point decrease in targeted public spendingper poor person. Half of this impact is due to thereduction in per capita GDP itself, which reducesspending even when the share of targeted spending withrespect to GDP remains constant (the fact that the shareremains constant is evidenced by the unit elasticity intable 5). The other half of the impact comes from theincrease in poverty due to the crisis: i.e., the availabletargeted public spending must be shared among a largernumber of poor people.
The fact that targeted programmes for the poor arenot well protected may be surprising, given that theseprogrammes represent only a small proportion of GDP(typically 2% or less) and a small proportion of totalspending as well. One reason for the lack of protectionfor targeted spending may be related to the lack ofbargaining power of the poor. Another reason whyexpenditure protection may be difficult during aneconomic and fiscal crisis is that the country musthonour its debt service and a number of mandatoryentitlement programmes, with consequently low levelsof discretionary resources. In other words, if 30% ofthe budget is protected because of its safety net andpoverty aspects, and 50% is for debt service and otherprogrammes that cannot be cut, a 10% reduction inoverall spending would produce a 50% cut in theremaining sectors. Given that the remaining sectorsmight include such sensitive areas as defence, justiceand administration, this may not be a feasible solution,thereby forcing the government to abandon the idea ofprotecting funding for key social protectionprogrammes. One message from this discussion is thatprevention before a crisis is crucial, because during thecrisis, it will always be difficult to protect the poor.
15 Ravallion (2000) finds somewhat similar evidence with data forArgentina.

C E P A L R E V I E W 7 3 • A P R I L 2 0 0 1108
SOCIAL PROTECTION FOR THE POOR IN LATIN AMERICA • NORMAN HICKS AND Q UENTIN WODON
2. How can one select the programmes to beprotected or expanded during a crisis?
The objective during a crisis should be first to agree thatkey programmes that benefit the poor will not be cut backeven though total government expenditures may be reduced.Next comes the difficult question of which specificprogrammes should be protected or even expanded. It istempting to put on the list almost all programmes in basichealth, education and nutrition. But not all programmes inthe social sectors are equally effective in reducing poverty,and some programmes producing long-term benefits forthe poor may be deferrable. In deciding which programmesto keep and expand during a crisis, an important criterionshould be the cost-effectiveness of the programme inquickly channeling income or its equivalent in kind to thepoor. As suggested in the case of workfare programmes,the cost-effectiveness of programmes depends on a numberof parameters. Knowing these parameters beforehandhelps in making a selection. Comparison of the cost-effectiveness of alternative safety nets in smoothingconsumption patterns for the poor via income generation,in-kind commodity distribution or commodity subsidiesis one area where additional analytical work should clearlybe done.
One element of a viable strategy -actually, one ofthe key parameters of the cost-effectiveness of safetynets- is the protection of programmes that have goodtargeting mechanisms for reaching the poor. Untargetedor universal welfare programmes are often fiscallyimpossible to sustain, particularly during a crisis. It istrue that targeting beneficiaries by complicated meanstesting (i.e., intensive questioning over income andwealth) can be costly and not very reliable. This is whymany World Bank-funded programmes have relied ongeographic targeting, even though this can lead tosubstantial leakage. An alternative approach is the proxymeans test, whereby likely recipients are interviewedand respond to questions concerning their livingconditions, such as the type of housing in which theylive, the availability of drinking water, the types ofappliances possessed by the household, etc. Wodon(1997) has shown that these indicators are powerfulmeans for avoiding the two types of errors that can becommitted in targeting, namely identifying as poor anon-poor household, and as non-poor a poor household.For any given budget, good targeting also helps toimprove coverage among the poor (i.e., what percentageof the poor actually receive programme benefits), whichis an important advantage in Latin America, wherecoverage has often been low.
Variants of means-testing systems have been used,among others, for the CAS (Social Action Committee)cards in Chile, SISBEN (Beneficiary IdentificationSystem) in Colombia, SISFAM (Beneficiary FamilyIdentification System) in Argentina, and Progresa inMexico. In practice, people who apply for assistanceare interviewed, and their score on the questionnairedetermines their eligibility. The weights for the vari-ous indicators included in the questionnaire are basedon estimated econometric relationships between thepoverty status of a representative sample of householdsand their indicators. Grosh (1994) has estimated thatthe cost of targeting through proxy means testing orgeographic targeting (definition of poor areas) need notbe much higher than the cost of universal distribution(a reasonable mark-up would be 3% to 8%), while pro-ducing substantial benefits. In a sample of untargetedprogrammes, only 33% of the benefits accrued to thelowest 40% of the population, whereas in targetedprogrammes 72% of their benefits reached that popu-lation.
Beyond the need to protect the consumption of thepoor during a crisis, it is also clear that some existinghealth and education programmes not necessarily tar-geted to the poor should be preserved. It is possiblethat the demand for these programmes might go up if,for example, the losses in income due to unemploy-ment or underemployment cause people to shift fromprivate providers and private health insurance to pub-lic programmes. Likewise in the field of health, someprogrammes not targeted on the poor should be main-tained because there are large externalities involved.This would be so, for example, in the cases of diseasesurveillance, immunization campaigns, malaria control,AIDS prevention, etc. Preserving access to basic (pri-mary and lower secondary) education is not a short-term safety net issue but, as discussed earlier, it doesreduce the costs of a crisis over the longer term by avoid-ing cuts in education spending for the poor that even-tually lead to a reduction in human capital, and therebylead to lower productivity and income.
In order to be able to protect all the aboveprogrammes, it will be necessary to identify someprogrammes that can be reduced, put on hold, oreliminated. For example, some of the worse cases ofmisspent social spending in Latin America have beenlarge subsidized housing programmes for the middleclass, which are often mandated through earmarkedtaxes. While it may be impossible for a government tochange these programmes quickly without majorlegislative or even constitutional authority, in some

109C E P A L R E V I E W 7 3 • A P R I L 2 0 0 1
SOCIAL PROTECTION FOR THE POOR IN LATIN AMERICA • NORMAN HICKS AND QUENTIN WODON
cases the need to reallocate spending due to anemergency or a crisis may facilitate fundamentalchanges. Other candidates for expenditure reductionmay include subsidies, such as below-cost pricing fornon-poor groups, for such services as electricity, wateror urban transport. Better cost recovery for highereducation (e.g., at the university level) and for somehealth care services may also help. Table 6 (the ideafor which came from a discussion with K. Lindert) givesa generic ranking based on common practice andobservation, although the priorities may changedepending on the country.
3. Additional implementation issues
There are several additional issues which must be con-sidered when implementing safety nets. First, estab-lishing new institutions that work effectively at the na-tional level is difficult. Most social funds, for instance,take 2 to 3 years to get up and running at a level thatreaches a substantial number of poor people. Underthe pressure of time, it is much easier to work withexisting institutions by providing them with supportthat enables them to expand their operations during acrisis. It is also often possible to expand safety netprogrammes that have already started on a pilot basisand that have been evaluated and proven effective. Asa corollary, it might be useful to experiment with newprogrammes every now and then on a pilot basis, inorder to evaluate their strengths and weaknesses andtheir ability to be expanded in case of need. Also, asindicated earlier, it may be possible to use existing in-
stitutions running programmes for job training, socialfunds, or transfers for the distribution of emergencyassistance when needed.
Second, not all governments possess the samecapacity to administer programmes. In some countries,a simple programme that is not well targeted might bea better choice than a more complicated programme.Safety net programmes need to strike a balance betweenadministrative capacity, fiscal sustainability, politicalacceptability, the scope of the intervention, and targetingefficiency. An additional problem is the relationshipbetween the federal and provincial-level governments.The staff of multilateral development banks havetraditionally established a dialogue with federalauthorities, but a large part of social spending takesplace at the provincial level. It may be necessary toagree to additional support from the federal budget forstate, provincial or municipal budgets during a crisis ifsafety net programmes are operated locally. However,while decentralization has a number of advantages, itis not necessarily pro-poor, so that serious monitoringof sub-national authorities is needed.
Third, one problem encountered in many countriesis the proliferation of small programmes throughoutvarious parts of the government. Nutrition programmes,for instance, are found in the ministries of health,education, social development and agriculture, as wellas in autonomous agencies belonging to the Office ofthe President. Training programmes are run by theministries of education, labour and economicdevelopment. It is important to seek some sort of inter-ministerial coordination in order to avoid overlaps and
TABLE 6
Priorities in protecting programmes duringcrises: a possible hierarchy
Health Education Social protection/others
High priority Immunizations Means-tested stipends Workfare programmesDisease control School breakfasts in poor areas Means-tested pensions for the elderlyAIDS prevention Special programmes for Means-tested nutrition supplementsPregnancy care and indigenous populationsearly child development
Moderate priority Primary health care Basic education Unemployment insuranceposts and centres (primary and lower secondary) Social securityBasic care in hospitals Scholarships for poor Social funds
students at universities Job trainingFood subsidies
Low priority Advanced curative care Free/low-cost university Subsidized housingin hospitals education for non-poor Subsidies for
Research budgets infrastructure services

C E P A L R E V I E W 7 3 • A P R I L 2 0 0 1110
SOCIAL PROTECTION FOR THE POOR IN LATIN AMERICA • NORMAN HICKS AND Q UENTIN WODON
duplication. In the longer term, it may be possible tocombine or consolidate programmes, and to eliminatethe programmes that are least effective. As mentionedearlier, a crisis can help in reorienting social budgets.
Fourth, in monitoring expenditure levels it ispreferable in principle to use actual expenditures, ratherthan the amounts budgeted. However, actualexpenditure levels are difficult to monitor in manycountries because of the long lag involved in receiving
the information. By the time it is known that actualexpenditures have fallen, or that the available creditshave not been used, it may be too late. To avoid non-intentional budget cuts due to lags in spending, it isimportant, after budget allocations have been made, totry to ensure that the budgets are set operationally andmaintained at adequate levels, with continuousmonitoring of the outlays in order to confirm that theplans are effectively being carried out.
VConclusions
Economic shocks may lead to a decline in real incomecaused by loss of employment, a situation ofunderemployment, or a shift to less lucrative employment.Real wages may also be reduced by high levels of inflation.Changes in relative prices may have negative effects. Thepoor may also lose their access to essential public servicesfor health, nutrition and education as a result of reducedgovernment real spending. They may lose the value oftheir financial assets (however meagre) if these are notprotected from bankruptcy by the financial system or bythe public social security system. Or they may simply haveto sell their assets. In all these potential effects and in manyothers, the poor are more vulnerable than the non-poorbecause their income may fall far more quickly belowbare subsistence levels.
It is common practice to recommend thatgovernments should protect key social protectionprogrammes during a crisis and expand the social safetynet. However, with fiscal resources shrinking at a timewhen the number of poor are increasing, it may beextremely difficult to do this. Still, one would hope atleast that high-priority programmes will be less subjectto cuts than other programmes. This is feasible becausesocial safety nets represent only a small part of existingbudgets. Yet this does not appear to be the case atpresent. Rather than being counter-cyclical, safety netsare as pro-cyclical as other types of public expenditures,and in some cases may actually be more pro-cyclical.Ironically, social protection expenditures are notthemselves protected.
Assuming that there is an agreement to protect thepoor from budget cuts during a crisis, the questionbecomes: which programmes should be protected?There are no easy answers to this question, and the
answer is bound to be country-specific. Still, oneimportant criterion for the selection of the programmesto protect or expand is their ability to quickly provideincome support or its equivalent in kind for the poor.Workfare schemes may help, but policy-makers shouldbe aware that it typically costs more than three dollarsto generate one additional dollar in net earnings for thepoor through these programmes. Some nutrition andfood programmes may also be effective, provided theyare well targeted, which is not always the case. Goodtargeting is one of the key parameters of the cost-effectiveness of safety nets. Also, existing socialprogrammes which are not safety nets proper (e.g., jobtraining programmes, social funds, and conditionalstipends for school attendance in poor areas) can proveto be valuable delivery mechanisms for emergencyassistance when there is limited administrative capacityin the country. Apart from compensating the poor forthe likely loss of market-based income which occursduring a crisis, it is also necessary for the governmentto protect some universal programmes. These wouldinclude primary health care and education, as well ashealth programmes with large externalities. But themost difficult task of all is to identify those programmesthat can be reduced, put on hold, or eliminated.Candidates in this respect may include subsidizedhousing, other subsidies for commodities not consumedmainly by the poor, some social security programmes,and spending on higher education and advancedcurative care. While it is often difficult politically toreform these programmes, the need to act during a crisismay facilitate the necessary fundamental changes.
(Original: English)

111C E P A L R E V I E W 7 3 • A P R I L 2 0 0 1
SOCIAL PROTECTION FOR THE POOR IN LATIN AMERICA • NORMAN HICKS AND QUENTIN WODON
APPENDIX
Main risks by age group, and role ofsocial protection in addressing those risks
Age group Main risks Roles of other sectors Role of social Role of socialprotection: insurance protection: assistance
0-4 – Stunted child development – Primary health care services — – Early child development– Pre-school centres
5-14 – Low education quality – Quality education — – Scholarships and schooling– Late entry to school – Earlier entry incentives– Late age by grade – Reduced repetition —
15-24 – Low secondary school – Access to/quality of — – Scholarships and schooling completion rates secondary education incentives
– Teen pregnancy – Remedial education– Venereal diseases – Reproductive health —
25-64 – Low income – Labour-intensive growth – Unemployment – “Workfare” projects(unemployment/ (with emphasis on SMEs) insurance – Cash transfersunderemployment) – Labour market reforms – Job training
– Job search assistance
65+ – Low income – Social security (no pension, no assets) (contributory pensions) – Income transfer
(non-contributory pensions)
All groups – Low access to and – Better provision of – Health insurance – Housing subsidies quality of health care health services – Relocation to safe areas
– Low housing quality – Affordable housing– Low access to basic – Investments in basic
infrastructure infrastructure– Insecure tenancy – Titling programmes– Risk of flooding
Source: Adapted from Arriagada (1999).

C E P A L R E V I E W 7 3 • A P R I L 2 0 0 1112
SOCIAL PROTECTION FOR THE POOR IN LATIN AMERICA • NORMAN HICKS AND Q UENTIN WODON
Bibliography
Arriagada, A.M. (1999): Managing social risk in Argentina,Washington, D.C., World Bank, mimeo.
Basu, K. and P. H. Van (1998): The economics of child la-bor, The American Economic Review, vol. 88, No. 3,Nashville, Tennessee, American Economic Association.
Besley, T. and R. Kanbur (1988): Food subsidies and pov-erty alleviation, The Economic Journal, vol. 98, No.392, Oxford, U.K., Basil Blackwell.
(1993): The principles of targeting, in M. Liptonand J. Van der Gaag (eds.), Including the Poor, Wash-ington, D.C., World Bank.
Castro-Fernández, R. and Q. Wodon (2000): Protecting theunemployed in Chile: From State assistance to indi-vidual insurance, Washington, D.C., World Bank,mimeo.
Cornia, G. A. and F. Stewart (1995): Two errors of targeting,in D. Van de Walle and K. Nead (eds.), Public Spendingand the Poor: Theory and Evidence, Baltimore, Mary-land, Johns Hopkins University Press.
Cunningham, W. (1998): Breadwinner versus care giver:Labor force participation and sectoral choice over theMexican business cycle, Washington, D.C., World Bank,mimeo.
Dall’Acqua, F. (1991): Economic adjustment and nutritionpolicies: Evaluation of a school-lunch programme inBrazil, Food and Nutrition Bulletin, vol. 13.
Dar, A. and Z. Tzannatos (1999): Active labor market pro-grams: A review of the evidence from evaluations, So-cial Protection Discussion Paper No. 9901, Washing-ton, D.C., World Bank.
De Ferranti, D., G. E. Perry, I. S. Gill and L. Serven (2000):Securing our Future in a Global Economy, Washing-ton, D.C., World Bank.
De Janvry, A. and E. Sadoulet (1999): Growth, poverty, andinequality in Latin America: A causal analysis 1970-1994, Washington, D.C., Inter-American DevelopmentBank (IDB), mimeo.
ESA Consultores (1999): Evaluación ex-post del FondoHondureño de Inversión Social, Tegucigalpa.
Ezemenari, K. (1997): The link between public and privateinterhousehold transfers: Implications for the design ofsafety net programs in developing countries, AmericanJournal of Agricultural Economics, vol. 79, Ames, Iowa,Latin American and Caribbean Association of Agricul-tural Economists.
Ezemenari, K. and K. Subbarao (1999): Social Assistanceand Poverty-Targeted Programs: A Toolkit for LatinAmerica and the Caribbean, Washington, D.C., WorldBank.
Fajnzylber, P. and W. Maloney (1999): Labor demand andtrade reform in Latin America, Washington, D.C., WorldBank, mimeo.
Ganuza, E., L. Taylor and S. Morley (1998): Políticamacroeconómica y pobreza en América Latina y el Car-ibe, Madrid, Ediciones Mundi-Prensa.
Gill, I. (1999): Managing socioeconomic risks in LatinAmerica and the Caribbean, Washington, D.C., WorldBank, mimeo.
Glewwe, P. and G. Hall (1998): Are some groups more vul-nerable to macroeconomic shocks than others? Hypoth-esis tests based on panel data from Peru, Journal ofDevelopment Economics, vol. 56, No. 1, Amsterdam,The Netherlands, Elsevier Science Publishers, B.V.
Goodman, M., S. Morley, G. Siri and E. Zuckerman (1997):Social Funds in Latin America: Past Performance andFuture Role, Washington, D.C., IDB.
Grosh, M. E. (1992): The Jamaican food stamps programme,Food Policy, vol. 17, Stoneham, Massachusetts,Butterworth-Heinemann, Ltd.
(1994): Administering Targeted Social Programs inLatin America: From Platitudes to Practice, Washing-ton, D.C., World Bank.
(1995): Five criteria for choosing among povertyprograms, in N. Lustig (ed.), Coping with Austerity:Poverty and Inequality in Latin America, Washington,D.C., The Brookings Institution.
Hicks, N. (1991): Expenditures reductions in developing coun-tries revisited, Journal of International Development, vol.3, No. 1, West Sussex, U.K., John Wiley & Sons, Ltd.
Holzmann, R. and S. Jorgensen (1999): Social protection associal risk management: conceptual underpinnings forthe social protection sector strategy paper, Social Pro-tection Discussion Paper No. 9904, Washington, D.C.,World Bank.
Holzmann, R. and T. Packard (1999): Extending coverage inmulti-pillar pension systems: Constraints and hypoth-eses. Preliminary evidence and future research agenda,Washington, D.C., World Bank, mimeo.
Jacoby, E., S. Cueto and E. Politt (1996): Benefits of a schoolbreakfast programme among Andean children in Huaraz,Peru, Food and Nutrition Bulletin, vol. 17.
Jalan, J. and M. Ravallion (1998): Income gains fromworkfare and their distribution: Estimates fromArgentina’s Trabajar program, Washington, D.C., WorldBank, mimeo.
Jorgensen, S., M. Grosh and M. Schacter (1992): Bolivia’sAnswer to Poverty, Economic Crisis and Adjustment:The Emerging Social Fund, Washington, D.C., WorldBank.
Karni, E. (1999): Optimal unemployment insurance: A guideto the literature, Social Protection Discussion Paper No.9906, Washington, D.C., World Bank.
Klugman, J. (1999): Social safety nets and crises, Washing-ton, D.C., World Bank, mimeo.
Levy, S. and E. R. Dávila (1998): Subsidios y política so-cial, Examen, vol. 110.
Lustig, N. (ed.) (1995): Coping with Austerity: Poverty andInequality in Latin America, Washington, D.C., TheBrookings Institution.
(1999): Crisis and the Poor: Socially ResponsibleMacroeconomics, Presidential address to LACEA 1999,Washington, D.C., The Brookings Institution.
Lustig, N. and O. Arias (forthcoming): Poverty and inequal-ity in Latin America: economic crises and widening re-turns to skills, Finance and Development, Washington,D.C., International Monetary Fund (IMF).
113C E P A L R E V I E W 7 3 • A P R I L 2 0 0 1
SOCIAL PROTECTION FOR THE POOR IN LATIN AMERICA • NORMAN HICKS AND QUENTIN WODON
Maloney, W (2000): The evaluation of workfare and condi-tional transfer programs as emergency measures, anda modification to Trabajar, Washington, D.C., WorldBank, mimeo.
Nickell, S. (1997): Unemployment and labor market rigidi-ties: Europe versus North America, The Journal of Eco-nomic Perspectives, vol. 11, No. 3, Nashville, Tennes-see, American Economic Association.
Phillips, M., G. Sáenz, J. Fielder, B. Rogers, P. Tatian, T.Sanghvi and J. Behrman (1995): The Costs and Cost-Effectiveness of School Feeding and School Bonos Pro-grams in Honduras, Report No. LAC-0657-C-00-0051,Washington, D.C., United States Agency for Interna-tional Development (USAID).
Pradhan, M., L. Rawlings and G. Ridder (1998): The Boliv-ian social investment fund: An analysis of baseline datafor impact evaluation, The World Bank Economic Re-view, vol. 12, No. 3, Washington, D.C., World Bank.
Progresa (Education, Health and Nutrition Program) (1999):Más oportunidades para las familias pobres, Mexico City.
Ravallion, M. (1999): Appraising workfare, The World BankResearch Observer, vol. 14, Washington, D.C., WorldBank.
(2000): On protecting the poor from fiscal contrac-tions, Washington, D.C., World Bank, mimeo.
Ravallion, M. and Q. Wodon (2000a): Does child labor dis-place schooling? Evidence on behavioral responses toan enrollment subsidy, The Economic Journal, vol. 110,Oxford, U.K., Basil Blackwell, March.
(2000b): Banking on the poor? Branch placementand nonfarm rural development in Bangladesh, Reviewof Development Economics, No. 4.
Revenga, A., M. Riboud and H. Tan (1994): The impact ofMexico’s retraining program on employment and wages,The World Bank Economic Review, vol. 8, No. 2, Wash-ington, D.C., World Bank.
Rodrik, D. (1999): Why is there so much insecurity in LatinAmerica?, Boston, Harvard University, mimeo, andCEPAL Review, No. 73.
Sahn, D. and H. Alderman (1995): Incentive effects on laborsupply of Sri Lanka’s rice subsidy, in D. Van de Walleand K. Nead (eds.), Public Spending and the Poor:Theory and Evidence, Baltimore, Maryland, JohnsHopkins University Press.
Skoufias, E., B. Davis and J. Behrman (2000): Evaluacióndel sistema de selección de familias beneficiarias, inPROGRESA (Programa de Educación, Salud yAlimentación), Progresa, más oportunidades para lasfamilias pobres, Mexico City.
STPS (Secretaría de Trabajo y Previsión Social) (1998):Evaluación del programa de becas de capacitación paradesempleados, Mexico City
Subbarao K., A. Bonnerjee, J. Braithwaite, S. Carvalho, K.Ezemenari, C. Graham and A. Thompson (1997): SafetyNet Programs and Poverty Reduction: Lessons fromCross-Country Experience, Washington, D.C., WorldBank.
Tuck, L. and K. Lindert (1996): From universal food subsi-dies to a self-targeted program: A case study in Tuni-sian reform, World Bank discussion paper No. 351,Washington, D.C., World Bank.
University of Chile (1992): Estudio sobre los programasespeciales de empleo, Santiago, Chile, Department ofEconomics.
Wodon, Q. (1997): Targeting the poor using ROC curves,World Development, vol. 25, No. 12, Washington. D.C.,The American University.
(2000a): Poverty and policy in Latin America andthe Caribbean, World Bank technical paper No. 467,Washington, D.C., World Bank.
(2000b): Public works employment and workfareprograms: Optimizing the timing of benefits for povertyreduction, Washington, D.C., World Bank, mimeo.
Wodon, Q., G. González and C. Siaens (2000): Do condi-tionalities in social programs exclude the poorest? De-mand-side schooling interventions in Latin America,Washington, D.C., World Bank, mimeo.
Wodon, Q., N. Hicks, B. Ryan and G. González (1999): Aregovernments pro-poor? A test based on targeted andsocial spending during booms and busts, Washington,D.C., World Bank, mimeo.
Wodon, Q. and M. Minowa (1999): Training the urban un-employed: A reevaluation of Mexico’s Probecat, Wash-ington, D.C., World Bank, mimeo.
Wodon, Q. and C. Siaens (1999a): Child labor and govern-ment programs in Mexico, Washington, D.C., WorldBank, mimeo.
(1999b): Food subsidies and consumption inequal-ity in Mexico, Washington, D.C., World Bank, mimeo.
(2000): Estimating the cost of child labor, Wash-ington, D.C., World Bank, mimeo.
Wodon, Q. and S. Yitzhaki (2000): Targeted social programs,allocation among beneficiaries, and income inequality,Washington, D.C., World Bank, mimeo.
World Bank (1999): Social protection sector strategy paper,Washington, D.C., mimeo.

C E P A L R E V I E W 7 3 • A P R I L 2 0 0 1114
SOCIAL PROTECTION FOR THE POOR IN LATIN AMERICA • NORMAN HICKS AND Q UENTIN WODON

115C E P A L R E V I E W 7 3 • A P R I L 2 0 0 1
OLD AND NEW FORMS OF CIT IZENSHIP • MARTIN HOPENHAYN
C E P A L R E V I E W 7 3
APRIL 2001
Old and new formsof citizenship
Martín Hopenhayn
Social DevelopmentDivision, ECLAC
This article holds that ensuring the full sway of economic,
social and cultural rights makes it possible to advance
towards greater equality of opportunities, both for attaining
well-being and for asserting differences in the field of
identity. This development of the effective use of rights must
be complemented with new forms of citizenship connected
with the possibility of interaction with the media and greater
participation in the knowledge-based society. Only in this
way does it seem feasible to give an ethical foundation to
social and development policies which have been deprived
of ideological bases. In this state of affairs it is necessary to
build a political culture which transcends the merely formal
nature of procedures and translates political action into forms
of communication between different actors. The cultural
construct of democratic citizenship necessarily involves such
a pact or contract, which must provide space for the voices
of a broad range of social actors and must have a real
capability to prescribe forms of reciprocity and recognition
in such diverse areas as access to justice, to social services,
to informed political debate, and to the expression of
opinions in the communication media.

C E P A L R E V I E W 7 3 • A P R I L 2 0 0 1116
OLD AND NEW FORMS OF CIT IZENSHIP • MARTIN HOPENHAYN
ICitizenship in these new times
Citizenship is a concept and practice which is constantlychanging. In the course of the twentieth century, itscontent has been linked to liberal-democratic, social-democratic and republican conceptions. In the first case,citizenship is linked to first and second generationrights: first civil and then political. Civil rights refer tothe freedoms inherent in a State of Law (freedom ofopinion, expression and association) and seek to protectindividual independence against possible coercion bythe State or one of its institutions. Political rightsconcern the right of every citizen to vote and berepresented in the political system by the executive andlegislative powers or to participate directly in thatsystem.
In the social-democratic conception, rights alsoextend to those of the third generation: economic, socialand cultural rights. Basically, these include the right towork, to health, to education, to a decent income, to asuitable dwelling, and to respect for citizens’ culturalidentity. Finally, in the republican conception,citizenship is associated with mechanisms and feelingsof belongingness of the individual to a community ornation and the participation of citizens in public affairsand in the definition of societal projects.
Now that the old century is ending and a new oneis beginning, many people feel that citizenship is beingrethought, rewritten and reinscribed in new spaces,without giving up its historical content. The rights thathave been won (first civil and political, then economic,social and cultural) have not lost their importance norare taken for granted. Indeed, the enjoyment of theserights is not complete: the current world order has beenaccompanied by greater enjoyment of civil rights butmany problems for making effective use of economicand social rights. Nevertheless, the impact ofpostmodernism in the cultural field, of globalization inthe political field, and of the information revolution inthe field of technology together make up a new settingfor citizenship.1
The impact of globalization on citizenship takesplace at at least two very different levels. The first is of
a political and cultural nature, and is reflected in theincreasing worldwide spread of a certain sensitivity todemocratic values and respect for human rights,sometimes associated with what are termed “politicallycorrect” attitudes. This new global climate is governedby respect for the rules of a State of Law and tolerancefor cultural and ethnic differences. Its values spreadamong the citizens within countries and are alsoreflected in agreements signed by the bulk of theinternational community. Citizens’ civil, cultural andpolitical rights are seen as being protected not only bythe State but also by a kind of “global supervision”under which violations of those rights are reported,denounced and censured.
At the level of trade and financial globalization,the disappearance of frontiers and the growingvulnerability of national economies to externalmovements ride roughshod over the idea of thesovereignty of the Nation-State, with adverseconsequences for the exercise of citizenship and, inparticular, social and economic rights. A crisis inSoutheast Asia, a devaluation in Russia or a rise ininterest rates in the United States can affect the levelsof investment and the money supply of the LatinAmerican economies, adversely affecting the jobs andstandard of living of many citizens of distant countries,without the Nation-State being able to do much to offsetthese effects. Who can a citizen turn to in order to seekredress because his social rights have suddenly beenaffected by a “financial event” which took place veryfar from his country, which is not at all clear to him,and which neither he nor his country can do anythingto influence? In order to try to defend themselvesagainst the effects of globalization, citizens mustassociate at the global level with organizations whichmobilize mass support, hit the headlines, and make animpact on global public opinion. A recent example wasthe campaign of “global” non-governmentalorganizations (NGOs) against the Seattle meeting of theWorld Trade Organization.
In the post-modern era, the new form of citizenshipis marked by decentralization and the differential self-assertion of issues, partly in response to the inherenttendencies of globalization itself, such as the weakeningof Nation-States and the greater social differentiation
1 This distinction, like the views expressed below in this respect, isbased on Hopenhayn (2000).
117C E P A L R E V I E W 7 3 • A P R I L 2 0 0 1
OLD AND NEW FORMS OF CIT IZENSHIP • MARTIN HOPENHAYN
that is tending to take place worldwide as a result ofthe new model of production. With regard todecentralization, citizens’ actions do not converge on asingle focal point (the State, the political system, orthe nation, as its territorial expression) but are scatteredover a multitude of fields of action, spaces for thenegotiation of conflicts, territorial areas andinterlocutors. The citizen ceases to be a mere depositaryof rights promoted by the State of Law or the State as asociety and instead becomes an individual who, insofaras his rights permit, seeks participation in areas ofempowerment which are defined according to hiscapacity for action and also his instrumental appraisalof which area is most favourable for the demand he istrying to make. And in proportion as the role ofindividual consumption (both material and symbolic)grows in importance in the life of society, the sense ofbelonging shifts from the Nation-State to a wide varietyof fields in the production of such a sense and theinteraction of individuals. The republican idea ofcitizenship reappears, but not so much in the field ofpolitical participation as in a great variety of forms ofassociation or communication at the citizen’s sociallevel which do not necessarily converge on the publicor State spheres.
The second level –the differentiation ofindividuals– means that citizenship increasinglyinvolves the issue of the assertion of differences andthe promotion of diversity. Because of this, many fieldsof cultural self-assertion which were previously coveredexclusively in private negotiations and were consideredto concern the inner feelings of the individuals inquestion are now matters for society as a whole, arethe subject of outward-looking discussion, and formpart of the political and public treatment of associateddemands. Thus, for example, matters which were oncedeemed by people in general to be outside the sphereof work and territorial concerns and were seen asbelonging rather to a subjective sphere, now form partof politics and are part of the fight for rights andcommitments: differences of sex, race, sexual practices,drug consumption, religious minorities, ancient andpostmodern tribal cultures, etc. All these have gonebeyond their core area of belonging and have spreadinto a public dialogue which seeks to change publicopinion, reverse the stigma affecting some groups, andincrease tolerance.
The impact of the information revolution istransforming Fordist societies into information-basedsocieties, production societies into societies based onknowledge and information and the world of work into
a world of communication: in short, transformingdiscipline-based logics into network-based approaches.All this spreads unevenly among and within countries.However, we are living our different historical periodsin a more and more synchronous manner, so that inLatin America too the exercise and concept ofcitizenship are affected by the “information society”.In a world which is more and more decentralized andbased on networks, in which demands depend less onthe political system processing them and more on theacts of communication flowing through multiplenetworks, the exercise of citizenship is spreading toeveryday practices which are half political and halfcultural, relating to communication with distantinterlocutors, the use of information to gain personalor group benefits, the redefinition of the consumer (ofgoods and of symbols) as an agent giving voice to hisrights and preferences, and the use of the media tobecome an actor interacting with other actors.2
Here too, the greater dispersion of the citizens’ actsand demands in the new information age leads to greaterdifferentiation of their demands. It is no longerindispensable to seek a political party to channeldemands which, according to traditional political logic,should be grouped together under great commondenominators. It is possible to voice demands and waveflags in micro-groups connected with a world audienceby Internet, telephone, e-mail or any other mediumtravelling from the local to the global level at the speedof light and free from censure. Information enables usto know where in the world there are opposite numberswho can join together with their peers in our countriesand unite forces in the concert of global voices. Thisalso makes it possible to seek those who can fill ourdemands and locate spaces where our demands can beheard with the desired effect. In no time it is possibleto project a local rite into a political reflection on whata multiracial State or nation means.
All these processes suffer from conflicts andunevenness. Postmodernism, globalization and theinformation revolution are neither aseptic nor even-minded. The promise held out by long-distanceinteraction and unlimited information are in contrastwith the social exclusion, loss of cohesion andinequality that exist in our national societies, which arephenomena that the new production patterns not onlydo not reduce but may even increase. Social and
2 Although networks can be either “disciplinary” or “emancipatory”,depending on whether they operate in a hierarchical or horizontalmanner.

C E P A L R E V I E W 7 3 • A P R I L 2 0 0 1118
OLD AND NEW FORMS OF CIT IZENSHIP • MARTIN HOPENHAYN
economic rights are more difficult to translate into realcommitments between the State and society, especiallyin view of the threatened breakdown of the Welfare Statein Europe (and its partial replicas in Latin America),the social costs of the fiscal adjustment, and anunprecedented labour crisis (higher unemployment and/or bigger wage gaps).
At the same time, globalization brings with it agreater awareness of the differences between culturalidentities, either because those differences are aired inthe communication media, incorporated in the newpolitical climate spread by transnational NGOs andreflected in growing waves of immigration or becausethere are cultures which react violently to the spread of“world culture” and give rise to new types of regionalconflicts which flood the television screens of the wholeworld. Thus, the political visibility of cultural assertionand the right to be different is increased, while thedemands for the fuller exercise of social and economicrights come up against limited labour markets, morecompetitive economies and less mutually supportivesocieties.
In society at large, old cultural problems becomematters of citizenship: matters for discussion, for theprocessing of differences, for claiming rights and,ultimately, for demanding the attention of the centralauthorities. Because of the new social movements, orbecause the cultural industry now amplifies voices thatwere previously not represented in the spheres ofdecision-making, change now takes place through thepolitical or public actions of actors who are notpresenting the traditional demands for higher wages orbigger social benefits but are instead expressing theirconcerns in fields which are symbolic rather thanmaterial. This is the case, for example, of the entry ontothe political and public scene of such issues as gender,race, sexuality, consumption, etc. These are issueswhere the demand for equal rights is accompanied bystrong claims for the recognition of differences; wherethe typical demands of the social actors in the politicalsystem (non-discrimination in wages, the right to land,health protection, recognition of the rights and libertiesof the consumer) are accompanied by other demands,harder to translate into social distribution policies,connected with the new roles of women in society andthe family, the self-assertion of culture through theinstitutionalized use of native languages, greatersensitivity to the feelings of the gay community, andthe relations between identity and consumption.
Furthermore, the increasingly important role of thecommunication media means that politics must
primarily develop its media-related component, so thatthe image of politicians is now defined to a much greaterextent by the way they appear in the media and bybetter-informed use of popular culture on the basis ofsurveys. There is thus a change in the form of appraisalof political competence, which is measured less andless by the production of projects and is increasinglydetermined by the circulation of images andinformation. Citizens are leaving the streets andmeeting-points and concentrating on the individualprocessing of information in front of their televisionsets or computer monitors. Identification with greatnational projects is being replaced by opinions on morespecific and varied matters. People are now moreinterested in the integrity of politicians than in theirprojects for society and are more interested in what thenewspapers say than in identifying with political parties.
All this means that reflections on citizenship mustnow extend both to the relations between culture andpolitics and to the links between local and globalconcerns.3 With regard to the first of these matters,political cultures are changing in that they are adaptingto the logic of the mass media, to a “post-ideological”situation and to the exhaustion of utopias. Culturalconflicts are becoming more political because they arebecoming more ruthless and violent and thus makenecessary the intervention of (local or global) powers,but cultural demands are also taking on a more politicaltone, because the political system -due to its difficultyin meeting traditional social demands and committingitself to great projects for change- finds that themarketplace for cultural demands is a promising placefor staying in the contest. Thus, for example, it is noweasier to propose bilingual education for the Aymara-speaking population in Bolivia than to try to revitalizeagrarian reform, and promoting a television channelfor women is easier than trying to redistribute wealthto benefit households headed by women.
As regards the links between local and globalissues, there are authors (Mato, 1999; Lins Ribeiro,1999) who consider that we are witnessing new formsof cultural citizenship. Globalization, they say, istransnationalizing the production of socialrepresentations, so that local and global actors areinteracting and thus bringing about a change in themeaning of cultural expressions such as “identity” and“civil society” on which the political order andcitizenship have traditionally been founded. According
3 This point has been dealt with in another article (Hopenhayn,forthcoming).

119C E P A L R E V I E W 7 3 • A P R I L 2 0 0 1
OLD AND NEW FORMS OF CIT IZENSHIP • MARTIN HOPENHAYN
to Mato, this reconfiguration of concepts is leading inturn to a reorientation of the practices of some actorswhich strengthens the positions of the global actors andcreates bilateral networks with local actors, promotingtheir participation in events and production networks.More specifically, according to Mato the formulationof new representations of race, environment andsustainable development in new global networks hastaken place on the basis of the creation of transnationalcodes and linguistic categories such as the biosphere,biodiversity, civil society, etc. According to that author,these aim to establish a form of discourse and atransnational sense which guide the actions of thealternative global and local actors and form the basisfor a sort of alliance of interests among them aimed atestablishing an alternative transnational programme ofaction to stand up against the most exclusive andpredatory aspects of economic globalization.
Mato’s diagnosis points to the interestingpossibility of bringing about a kind of “globalizationfrom below” in response to the globalization from aboveled by the main transnational groups. This would make
it possible to move towards “representations of culturalparticularity” expressed in different civic organizationswith their own projects. Lins Ribeiro, for his part,considers that in defining the relation between nationalidentity (national cultures) and political practices it isessential to take into account the state of“transnationality”. This state involves a new level ofintegration and representation of belonging andtherefore completely changes the traditional settingsfor action. The interaction between culture and politicsis reflected in the challenges of transforming theconditions of citizenship and regulating and orderingthe new setting arising from transnationalization. Inview of this, Lins Ribeiro’s proposal basically involvesthe creation and strengthening of a “global civil society”which, he considers, is currently represented by “animagined/virtual transnational community whosematerial dynamic ….. is a symbol of the newtechnologies of communication, especially the Internet”and whose main characteristics are its “remotetestimony” and its “remote political activism” (LinsRibeiro, 1999, p. 4).
IICitizenship: betweenequality and diversity
The field of citizenship is enriched to the extent that thepermeability of the cultural industry and globalcommunications make it possible to claim and promotecultural rights. The banner of democratic communicationflies high as a promise combining technology, politicsand subjectivity, and many dream of a new utopia inwhich the old value of equality is replaced by the newvalue of diversity. Instead of social classes there wouldbe cultural actors and identities whose potential foremancipation could not be universal but would reside inthe democratic interplay of differences. The universalelement would be the rules of the game which wouldgive such differences visibility and guarantee relativeequality of conditions for the exercise of citizenship,especially as regards cultural rights.
In this context, I should like to highlight a contrastwhich is typical of the present democracies.4 On the one
4 This idea is based on the last chapter of Ocampo (coord., 2000).
hand, it is sought to restore or revitalize equality,understood above all as the inclusion of those who arecurrently excluded, without this leading to culturalsameness, greater concentration of political power, oruniformity of tastes and lifestyles. On the other, it is soughtto support and promote differentiation, understood ascultural diversity, pluralism of values and greater autonomyof the subjects, yet without turning this into a justificationfor inequality or for the non-inclusion of the excluded.Integration without subordination would involve bothsocial and cultural rights: better distribution of materialassets goes hand in hand with more equal access tosymbolic assets (information, communication andknowledge), together with a more equitable presence ofthe multiplicity of socio-cultural actors in publicdecision-making and the incorporation of culturalpluralism in rules and institutions.
It might be asked at this point how the free self-determination of subjects and the differences in culture

C E P A L R E V I E W 7 3 • A P R I L 2 0 0 1120
OLD AND NEW FORMS OF CIT IZENSHIP • MARTIN HOPENHAYN
and values pursued in this defence of autonomy can bereconciled with economic and social policies thatimplement the “third generation” rights by reducingthe differences in income, wealth, employment, humansecurity and access to knowledge. It is a question ofpromoting equality at the intersection between the fairdistribution of potential for asserting diversity andautonomy and the fair distribution of goods and servicesto make possible the satisfaction of basic needs and theexercise of social rights. At the same time, culturalsegmentation also makes it difficult to achieve socialagreement on the solidarity and sacrifices (taxes)demanded by social distribution. In other words,without cultural unity the viability of a consensualproject for the progressive redistribution of assets insociety is more and more difficult.
In order to achieve universal enjoyment ofeconomic, social and cultural rights, non-discriminationin the cultural field must be combined with a sociallyacceptable form of distribution to correct inequalities.This will include policies of affirmative action withrespect to ethnic minorities and other groups definedby their socio-economic level, cultural characteristics,age or gender which are also in more vulnerablesituations. Policies against discrimination on thegrounds of difference (which serve to promote people’scivil, political and cultural rights) must becomplemented with social policies targeted on thegroups which are, objectively, victims of discrimination,that is to say, which are in the most unfavourableposition for asserting their special characteristics,satisfying their basic needs, and developing capabilitiesfor making more positive use of their liberties.
Such affirmative action must extend rights inparticular to those who lack them most: not only socialrights such as the rights to education, employment,social assistance and housing, but also the rights toparticipate in public life, to enjoy respect for culturalpractices which are not in the majority, and to be heardin the public dialogue. In short, the objective should bea concept of complex equality in keeping with the newideals of a democratic, multicultural society in whichall citizens have the right to be different, without thisbeing used to justify conditions which produce andreproduce socio-economic exclusion.
Traditionally, the question of equality hasovershadowed that of the right to be different in thepolitical debate, in negotiations between actors, inconsensus-building, and in the State’s responses todemands. The demand for a socially acceptable formof distribution through wages, contracts, benefits and
services has been at the core of the relationship betweenpolitics and society under the principle of equality, butwhat happens when it is desired to reformulate thatrelationship so that the right to be different is equallyimportant in the linkages between political and socialmatters? Once again, this brings us back to the questionof culture, cultural demands, and the redefinition ofsocial actors qua cultural actors, but with the difficultythat our political systems and our social State (or whatremains of it, if it ever existed) are fluent in pro-equalitylanguage but not in the more complex language of theright to be different.
This problem is strongly felt in education. We knowthat the knowledge society strongly discriminatesbetween those who have or have not had access totimely good-quality education, so that it is necessaryto improve universal access to educational opportunitiesin order to give greater future opportunities for well-being to the entire population, so as to incorporatesociety as a whole into the new patterns of productionand communication. We also know, however, thatstandardized education has traditionally tended to bringabout cultural homogenization and is currently elicitingthe most bitter criticisms from those who defend ethnicplurality and the right to be different.
This tension is now reflected in education policies.A clear example is the abandonment of “systemicsimultaneity”: i.e., the idea that once formal educationis universal it should be the same for all, both for reasonsof economy of scale and of equality.5 Such simultaneityassumed that all those being educated were essentiallyequal, had the same possibilities of learning, and foundthe same subjects equally useful, so that standardizededucation would promote greater equality ofopportunity.
Today, however, many analysts have abandonedthis idea of systemic simultaneity in order to try toensure that the subjects learnt and the forms of learningwill be more appropriate to the socio-cultural situationof which they form a part (Gvirtz and Narodowski,1998). The application of critical theories to education,at least two decades ago, showed that homogeneouseducation did not mean greater equity or greaterdemocratization in the transmission of knowledge, butcould on the contrary lead to a type of “systemicrationalization” in which the identities and cultural rootsof different groups were sacrificed. Furthermore, it was
5 This idea was developed at length in Hopenhayn and Ottone(2000).

121C E P A L R E V I E W 7 3 • A P R I L 2 0 0 1
OLD AND NEW FORMS OF CIT IZENSHIP • MARTIN HOPENHAYN
seen that a homogeneous supply of education vis-a-visheterogeneous demand could prolong and heighteninitial inequalities during a person’s schooling, so thatdifferences of social class or ethnic origin could growworse rather than being reduced under the “systemicsimultaneity” model.
We are faced here with a situation in which it isnecessary to balance equality against diversity.Education must not only transmit the values of equalityand respect for diversity, but must also incorporate thatbalance in its own curricular flexibility. Equity througheducation gives rise to a new approach in which thepursuit of equality exists side by side with respect fordifferences. For the first of these objectives it isnecessary to ensure progressive universal coverage ofthe school cycle, from basic to secondary education,and to reduce disparities in the quality of educationlinked with socio-economic origin. For the second, itis necessary to adapt study programmes to specificgroups (including bilingual education in areas whereSpanish is not the mother tongue), to try to ensure thatcurricula are adapted to the territorial characteristicsof the area where the school operates, and to allocatespecial financial resources in areas of greater socialvulnerability and more precarious economic conditions.As Gvirtz and Narodowski (1998, p. 54) note: “what isinvolved in the need to get away from systemicsimultaneity is the possibility of respecting diversity… instead of being seen as a civilizing agent whichdoes away with ignorance and barbarity, the schoolbecomes the means whereby different culturalexpressions can exist side by side”.
A question which remains unanswered, however,with regard to equality of opportunity and the crucialrole played in it by education, is that of the realconditions for the progress of students in an educationalcontext which prizes diversity rather than uniformity.Within the framework of globalized economies whichcompete more effectively in proportion as they advancein the third industrial revolution, the labour market ofthe future obliges today’s children to acquire skills thatwill enable them to obtain jobs in the future, especiallyif they seek upward social mobility from one generationto the next. On the other hand, education also pursuesthe objective of respecting and promoting the culturalidentity of its students. The options between these twoobjectives can be complementary, but they can also bedivergent.
This also involves taking risks in the educationalprocess itself, for a school which promotes amulticultural society is also a school teaching
communication, which radically alters the teacher-pupilrelationship, sees knowledge as something to be builtin the classroom with the students, and respects thestudents in their own conflicts of identity. In the wordsof Alain Touraine, “we cannot talk about the school asa place for learning subjects without defending theschool as a place for communication, and that is wherethe greatest resistance is encountered …. every timethis subject is raised it is rejected both by parents andby teachers, who fear that it will lead to uncontrollabledisorder in affective relationships and will do away withwhat they consider to be the main mission of the school,namely, to teach subjects and prepare students forexaminations which will open the door to employmentfor them” (Touraine, 1997, pp. 336-337).
While the school as a place for communication mayseem to threaten order and discipline, however, on theother hand it is an indispensable means for tackling thechallenge of multiculturalism and tolerance andpreparing citizens for the new democracies based oncommunication and knowledge, without getting lost ina mass of atomized information: “Globalization hasstripped society of its role as a creator of norms. Inorder to avoid the risk of cultural fragmentation it isproposed precisely to adopt the principle of interculturalcommunication … to educate students to respectdiversity, recognize the qualities and rights of others,and practice solidarity, as conditions for broadeningand enriching one’s own identity” (Cubides, 1998, p.45). And as the school is a basic nucleus forsocialization, its own practices in terms of learning anddiscipline must incorporate those values.
Another area of tension between the values ofequality and diversity is in the frequent conflicts thatarise between formal education on the one hand and,on the other, the exposure of students to thecommunications media and, increasingly, computers.Today we talk about multiple forms of literacy anddifferent ways of “reading the world”. These differentways involve the interaction of the school, television,the new interactive media, and the recomposition ofthe city as a radically heterogeneous space. Thispolymorphism undermines the position of forms ofculture based preferentially on the written word, andgives rise to areas of both agreement and disagreementnot only within a subject but also between differentsubjects.
In this sense, Guillermo Orozco invites us to getaway from the two antithetical positions adopted byeducation with regard to the communications media:defence of the audience against the media, or uncritical

C E P A L R E V I E W 7 3 • A P R I L 2 0 0 1122
OLD AND NEW FORMS OF CIT IZENSHIP • MARTIN HOPENHAYN
acceptance of the latter as means of educationalmodernization. Instead of this, he proposes a form ofteaching involving constructive criticism of the materialpresented, which opens up a debate in the classroomon how the material supplied by the communicationsmedia should be received, assumes that the school isone institution competing with a number of others forleadership in the field of knowledge, imparts skillswhich will enable students to express themselves in amultimedia environment, and sees literacy as anongoing process dealing with the different alphabetsof a post-modern world: a process which is media-
based, multicultural and serves to speed up change(Huergo, 1998; Orozco, 1996). Giving students anattitude of critical analysis of the messages they receive,which will enable them to process the stimuli theyreceive from the different media so omnipresent ineveryday life, is equivalent to training them incitizenship, by making all those exposed to informationand audiovisual images capable of using those elementsto recreate their own subjectivity and communicate withothers, without being limited to the passive receipt ofimages which are no more than fetishes or the productof unilateral information.
IIIThe cultural industry and citizenship:symbolic capital and “voice”
As already noted, we are witnessing changes in theexercise of citizenship in which this is not only definedby entitlement to rights but also by mechanisms ofbelonging, by the capacity for taking part in the publicdialogue, and, increasingly, by practices of symbolicconsumption (of information, knowledge andcommunication). In the words of García Canclini(1995): “It is not so much the social revolutions whichhave taken place …. as the dizzy pace of the growth ofaudiovisual communications technologies which havemade it so clear how public activities and the exerciseof citizenship have been changing since the last century.But these changes …. have been shifting the exerciseof citizenship towards activities of consumption …many questions of the citizens are answered throughthe private consumption of goods and of the mass mediarather than … in public spaces”. Thus, the circulationof symbolic goods is increasingly becoming anextension of the exercise of citizenship. This is why itis so important to open up the communications mediato new voices.
The relation between the cultural industry andcitizenship does not only concern symbolicconsumption. Today, the cultural industry is the mostimportant means of access to public spaces for broadsectors which have traditionally had no means ofexpressing themselves in them. Television, video andinformation and telecommunications networks are tools
whose relative cost is going down day by day, so thatthose previous excluded now have unprecedentedpossibilities for taking part in cultural exchanges, notonly as consumers but also as producers of messages,because the cost of using “transmission” technologiessuch as fax, Internet, e-mail or community radio is goingdown all the time and very little training is needed touse them, so that more and more actors can now enterthe long-distance dialogue as interlocutors andspokesmen. All this is possible insofar as the marketdoes not subject the cultural industry to the system ofexclusion that the national economies are currentlysuffering.
These promises of symbolic participation as a newfield for the exercise of citizenship exist, however, in acontext in which material access to the fruits of progressis not following the same expansive trend.6 Let us lookat Latin America: while social and material integrationis threatened by the employment crisis and thepersistence of income disparities, symbolic integrationis being boosted all the time by the cultural industry,political democracy and new social movements. On theone hand, the consumption of communication mediaand school enrollment continue to expand. Education
6 This contrast between access to symbolic capital and access tomaterial well-being has been referred to in previous articles.

123C E P A L R E V I E W 7 3 • A P R I L 2 0 0 1
OLD AND NEW FORMS OF CIT IZENSHIP • MARTIN HOPENHAYN
now displays problems of quality rather than ofcoverage, which has increased so much that otherchallenges in education are beginning to come to thefore. In the case of the communication media, in mostof the Latin American countries the great majority ofthe population now have more information7 and moreaccess to the output of culture and the political debate.Never before has the region had democratically electedgovernments in almost all the countries; today, there isgreater awareness and effective existence of civil andpolitical rights, political and cultural pluralism is valuedmore highly, and the question of citizenship and socialand cultural rights has renewed currency.
On the other hand, however, there are now morepoor people in Latin America than at the beginning ofthe 1980s; income distribution has not improved, andhas even markedly deteriorated in some countries; theinformal sector, based on low incomes and little capital,is growing and is the sector that absorbs most of thegreat contingents of workers who are left on thesidelines of the production modernization process orthe poorly-trained young people entering the labourmarket; the traditional rural sector is being increasinglymarginalized from the other sectors, and societies arebecoming increasingly fragmented through the buildupof these phenomena, with disquieting effects in termsof a feeling of insecurity among the population, politicalapathy and increasing violence.
Let us look at some data in this respect. Accordingto ECLAC statistics, between 1980 and 1990 per capitaprivate consumption in Latin America went down by1.7% (ECLAC, 2000). Over the same period, however,the number of television sets per 1,000 inhabitants inLatin America and the Caribbean increased from 98 to162 (UNESCO, 1998), furthermore, the effects of theeducational achievements in previous decades beganto make themselves felt, considerably raising theaverage educational level of the young population. Inother words, while access to knowledge, images andsymbols sharply increased, consumption of “real”goods went down. In the period in question, the mediaindustry8 and educational coverage and achievementsgrew strongly in Mexico, Venezuela and Brazil, whereaspoverty reduction or improvement of the quality of lifeevolved at a very different rate.
If we take the period from 1970 to 1997, we seethat the number of television sets per 1,000 inhabitantsrose from 57 to 205 in the region (UNESCO, 1998), thenumber of hours of television programmes (and theaverage number of hours of television consumed bythe population) increased geometrically from one five-year period to the next, and the average educationallevel of the young population rose by at least four yearsof formal education. Yet the index of poverty of theregion is today still at the same level as in the early1980s, while the real income of the urban populationhas increased slightly in some countries and gone downin others (such as Venezuela). Thus, access toknowledge, information and publicity has grown at arate which is totally different from that of access tohigher incomes, greater well-being and moreconsumption.
This situation raises other questions about thechanges taking place in the links between politics andculture. Firstly, the greater distribution of symbolic goodsthan of material goods may transfer the distributionstruggle, at least in part, to cultural goods such as timelyaccess to knowledge, information and education. Thisdoes not mean that classic matters such as employment,wages and social services will disappear as subjects ofpolitical negotiation, but it does mean that there will bechanges in political agendas, political publicity, the natureof competition for votes, and matters which are thesubject of great consensuses in society.
Secondly, this gap between symbolic and materialgoods may give rise to growing social conflict and maythus affect the political treatment of the gap. As theconsumption of publicity expands but the purchasingpower for responding to what that publicity toutsremains unchanged, society begins to “heat up”, andthis affects the distribution struggle and ultimatelygovernance. This problem (the expectations gap) is notnew, but it may gather speed: on the one hand the youngpopulation of Latin America now has more educationand knowledge and greater expectations of consumptionbecause of its exposure to the cultural industry; on theother, unemployment among young people is doublethat of the rest of the population, in a region with theworst income distribution in the world. Young peoplehave more information and greater mastery ofinteractive information media than their parents, whichmakes them more capable of exercising activecitizenship today, but their demands for social rightsassociated with well-being and the quality of life runup against the brick wall of the market, unemploymentand exclusion.
7 Although it is not clear how far this greater access to informationis reflected in greater knowledge and action resources.8 See, for example, the cases of huge enterprises like Televisa inMexico and O Globo in Brazil.

C E P A L R E V I E W 7 3 • A P R I L 2 0 0 1124
OLD AND NEW FORMS OF CIT IZENSHIP • MARTIN HOPENHAYN
Thirdly, the use of long-distance communicationis tending to be increasingly important for exertinginfluence politically, gaining public visibility andbecoming a valid interlocutor in the dialogue betweenactors. There are some striking examples of this, suchas the use of the Internet by the Zapatistas. This presentsus with a new problem or dilemma: if some problemsin the cultural field begin to be politicized, that is tosay, if certain matters that were previously only dealtwith -or repressed- “internally” are now airedpolitically, how can we avoid disparities in power dueto the fact that some cultural actors take advantage ofcommunications technology to make themselves heardbut others do not? How can we promote the mostsuitable technical media, and knowledge of how to usethem, to secure “democratic subject-oriented policies”?How can we prevent the new gap between theinformatically literate and illiterate from leading to agap between symbolic representations that circulateover the Internet and can make news, affect decisionsand check abuses of power, and other representationswhich, because they are “electronically invisible”,subsequently become politically invisible too and,hence, defenceless?
In the face of this latter threat, we must promotethe use of the new communications technologies inorder to give the silenced or inaudible sectors a voice.Teleconference systems, informatics-based networksand integrated connections (between the telephone, faxmachine, computer and photocopier) can be used topass the microphone to those who have not had a chanceto make themselves heard in public spaces. Indeed,these new systems, integrated in turn with the massmedia, have great potential for expanding the publicspaces for communication. A great mass of socialdemands coming from scattered or subordinated actorscould begin to have a place in the public circulation ofmessages.
The tendency towards the “de-centering” of thetransmission of messages in the cultural industry couldhelp to democratize the societies of the region. Whilewe have already achieved political democracy in thevast majority of our countries, the further deepening ofdemocracy, based on the participation of different socialactors, could be favoured by the spread of the new formsof the cultural and communications industry. There are
now highly illustrative cases in a number of countriesof the region where the use of new resources of thecultural and communications industry has made itpossible to connect up various groups suffering fromsocio-cultural segregation. These cases could form thebasis for new initiatives in this field, including theconstruction of networks to incorporate demands fromhighly dispersed sectors, greater linkages of indigenousethnic groups in and between countries of the region,and the production of programmes for the diffusion ofautochthonous cultures run by the indigenous groupsthemselves.
In Guatemala, indigenous peasants fax messagesabout violations of human rights to international non-governmental organizations, without knowing how touse a typewriter. In Brazilian Amazonia, illiterateIndians exchange videocassettes in order to spread theirancient customs. In Mexico, neighbourhoodorganizations have multiplied their pressures in publicspaces for attention to their demands with the aid ofcomputers, their own databases and inter-neighbourhood information networks. Also in Mexico,peasant federations have established a database of theirown to keep track of rural credit programmes, and inVeracruz local ecological groups have successfullyopposed the proposed installation of a nuclear powerplant because they obtained timely information fromUnited States ecologists and publicized the risks in thepress. In Chiapas, associations of small coffee producersmake contact with similar groups in Central Americaand the Caribbean to share information on transport,markets, international prices, production technologyand international trade negotiations.
In this context, cultural policies take onconsiderable importance: in other words, culturebecomes politicized insofar as it becomes a battlegroundfor reversing exclusion through the participation of alarger range of voices in political transactions. Thereare serious obstacles standing in the way of the self-assertion of the subordinated or excluded identities,however: on the economic side there is the privatizationof communications, together with the concentration ofmedia power in great transnational mergers, and on thepolitical side there is the lack of commitment of theState to cultural policies which seek greater democracyin communication.

125C E P A L R E V I E W 7 3 • A P R I L 2 0 0 1
OLD AND NEW FORMS OF CIT IZENSHIP • MARTIN HOPENHAYN
IVBy way of conclusion
A thesis which is now in vogue, and with which weconcur in this article, is that the recognition asinalienable rights not only of those in the civil andpolitical fields, but also of economic, social and culturalrights, could help to further greater equality ofopportunities both for attaining well-being and forasserting diversity. Thus, the clamour for “morecitizenship” not only seeks the revitalization ofcitizenship for a media-dominated world and a societybased on knowledge but also brings up again the ideaof the citizen as the possessor of inalienable rights. Onlyin this way does it seem feasible to give an ethical basisto social and development policies which have beenstripped of their ideological foundations.
In order both to promote the political participationof sectors which have been socially and culturallyexcluded from the debate on the public agenda and tofacilitate communication with them, innovations areneeded in the forms of access to negotiation spaces. Itis necessary to promote mechanisms capable ofexpressing the demands of dispersed groups andgrassroots socio-cultural movements, and to foster thedirect presence of such groups in the intermediate levelsof politics (such as trade unions, municipalities, etc.).It is not just a question, within the bounds of moderndemocracy, of returning once again to the question ofthe redistribution of material resources, but rather ofbringing up the question of the distribution of symbolicresources, such as participation, access to information,and presence in the exchange of messages(communication). Closer links must be promotedamong the organizations that express the demands ofthe groups which are least integrated into the benefitsof modernization. This requires that the political systemabove all, and after it the State social sector, shouldpromote actions to strengthen the network of socialmovements which have the capacity to discern boththe immediate and the longer-term demands of thosegroups and to help exert pressure in favour of those
demands on the relevant decision-making bodies, withina framework of political viability and the furtherconsolidation of democracy.
In order to promote linkages among organizationsrepresenting marginalized groups it may be useful todo the following: spread information andcommunication technology to the grassroots level;redefine cultural policies in line with the organizationalculture of that level; strengthen State initiatives aimedat mobilizing the social and cultural capital of themasses in order to optimize the effect of social aid ondifferent types of programmes; and support the linkingrole of the “external agents”, whether these be NGOs,municipalities or social programmes, in order to linkup the rationales of the socio-cultural movements withthe tendencies of society as a whole, thus reducing thedegrees of segregation and fragmentation.
Against this background, it is necessary to build aform of political culture which goes beyond the purelyformal nature of procedures and turns political actioninto communication activities which socially internalizenorms of reciprocity and mutual recognition betweendifferent actors. Building the cultural aspects ofdemocratic citizenship involves rethinking the contentof that pact or contract to make room for the voices ofa broad range of social actors and to give it a realcapacity to prescribe forms of reciprocity and mutualrecognition. Those prescriptions can involve suchdiverse areas as access to justice, to social services andto informed political debate and the ability to expressopinions in the communications media. Such a pactshould serve as a dual fulcrum: first, as a mechanismfor linking a new political culture with the differentsocio-cultural actors, with their demands andexpectations, and second, as a mechanism forstrengthening a new political culture of reciprocitywhich extends to the whole of society.
(Original: Spanish)

C E P A L R E V I E W 7 3 • A P R I L 2 0 0 1126
OLD AND NEW FORMS OF CIT IZENSHIP • MARTIN HOPENHAYN
Bibliography
Cubides, H. (1998): El problema de la ciudadanía: unaaproximación desde el campo de la comunicación-educación, Revista nómadas, No. 9, Santafé de Bogotá,Fundación Universidad Central, Departamento deInvestigaciones, September.
ECLAC (Economic Commission for Latin America and theCaribbean) (2000): Statistical Yearbook for LatinAmerica and the Caribbean, 1999, Santiago, Chile.
García Canclini, N. (1995): Consumidores y ciudadanos:conflictos multiculturales de la globalización, MexicoCity, Editorial Grijalbo.
Gvirtz, S. and M. Narodowski (1998): Acerca del fin de laescuela moderna. La cuestión de la simultaneidad enlas nuevas reformas educativas de América Latina,Revista RELEA, No. 5, Caracas, Central University ofVenezuela, May-August.
Hopenhayn, M. (2000): Nuevas formas de ser ciudadano:¿la diferencia hace la diferencia?, Revista RELEA,Caracas, Central University of Venezuela.
(forthcoming): ¿Integrarse o subordinarse? Nuevoscruces entre política y cultura, Buenos Aires, LatinAmerican Social Sciences Council (CLACSO).
Hopenhayn, M. and E. Ottone (2000): El gran eslabón:educación y desarrollo en el siglo XXI, Buenos Aires,Fondo de Cultura Económica (FCE).
Huergo, J. (1998): Las alfabetizaciones posmodernas, laspugnas culturales y los nuevos significados de la
ciudadanía, Revista nómadas, No. 9, Santafé de Bogotá,Fundación Universidad Central, Departamento deInvestigaciones, September.
Lins Ribeiro, G. (1999): Do transnacionalismo ao pós-imperialismo: para pensar a relação cultura e política,paper presented at the Grupo de Trabajo de CLACSO,Cultura y transformaciones sociales en tiempos deglobalización, Caracas, Latin American Social SciencesCouncil (CLACSO), November, mimeo.
Mato, D. (1999): Cultura y transformaciones sociales entiempos de globalización, paper presented at the Grupode Trabajo de CLACSO, Cultura y transformacionessociales en tiempos de globalización, Caracas, LatinAmerican Social Sciences Council, November, mimeo.
Ocampo, J.A. (coord.) (2000): Equity, Development and Citi-zenship, LC/G.2071-P, Santiago, Chile, ECLAC.
Orozco, G. (1996): Educación, medios de difusión ygeneración de conocimiento: hacia una pedagogía críticade la representación, Revista nómadas, No. 6, Santaféde Bogotá, Fundación Universidad Central,Departamento de Investigaciones, September.
Touraine, A. (1997): ¿Podremos vivir juntos? Iguales ydiferentes, Buenos Aires, FCE.
UNESCO (United Nations Educational, Scientific and CuturalOrganization) (1998): web page: http://unestat.unesco.org/statsen/sta…book/tables/cult and com.

127C E P A L R E V I E W 7 3 • A P R I L 2 0 0 1
INDUSTRIAL POLICY, COMPARATIVE ADVANTAGES AND GROWTH • JAIME ROS
C E P A L R E V I E W 7 3
APRIL 2001
Industrial policy,comparative advantages
and growth
Jaime Ros
Research Fellow,Helen Kellogg Institutefor International Studies,Notre Dame University,Indiana, [email protected]
This article analyses the relations between the international
specialization pattern and growth. For this purpose, it adopts
as its analytical framework the recent literature emphasizing
the importance of initial conditions and public policies, and
not only factor endowment. It also analyses the empirical
and economic policy implications of this approach. After
an introduction (section I), section II presents the analytical
framework: a model with two internationally tradeable goods
sectors and a non-tradeable inputs sector, with increasing
returns to scale and dynamic pecuniary externalities. Section
III draws the implications of the analysis in terms of the
effects that industrial policies can have on the specialization
pattern and the growth rate, while section IV does the same
with respect to the initial conditions and real and monetary
shocks. Section V examines the empirical information on
the relations between the specialization pattern, the capital
accumulation rate and growth, and finally section VI sums
up the main conclusions of the study with regard to the scope
and limitations of industrial policy.

C E P A L R E V I E W 7 3 • A P R I L 2 0 0 1128
INDUSTRIAL POLICY, COMPARATIVE ADVANTAGES AND GROWTH • JAIME ROS
IIntroduction
In the literature (both old and new) on internationaltrade, there are a number of contributions which analysethe way in which the international trade specializationpattern can affect growth: the “infant industry”argument, Prebisch’s and Singer’s theories on the termsof trade of primary commodities, or the multisectoralmodels with different rates of learning in the newinternational trade theory. A common feature of thesecontributions is that the specialization pattern of aneconomy, as determined by its comparative advantages,may not be the same as the specialization patterngiving the greatest economic benefits in the long term.This may be because the static comparative advantagesof the economy do not coincide with its dynamiccomparative advantages, because of technologicalexternalities associated with learning processes, orbecause the evolution of the terms of trade is suchthat the economy would do better to abandon thespecialization pattern associated with staticcomparative advantages. In this case, an industrialpolicy which reallocates resources to the sectors withdynamic advantages, through subsidies or customstariffs, is justified if there are flaws in the factormarkets (especially the lack of a perfect capitalmarket).
There is another way of approaching the subjectof the way in which the specialization pattern can affectthe long-term growth rate, that is, when a given factor
endowment does not mean that there is only onepossible specialization pattern and the differentspecialization patterns consistent with the same factorendowment have different dynamic effects. This maybe due to the existence of dynamic pecuniaryexternalities associated with different linkages withsectors of goods which are not tradeable, or onlyimperfectly tradeable, on the international market. Inthis case, there is not a conflict between static anddynamic comparative advantages which could, intheory, be satisfactorily solved if the capital market wereperfect. There is rather a difference between a very highcapital yield on a set of coordinated investments andthe yield that could be obtained by an individual investorand which is very low or insufficient to shift capital tothe sectors with high growth potential. When theeconomy specializes in a less dynamic pattern, theproblem is thus due to a lack of coordination. Recentmodels based on this approach may be found in Rodrik(1995), Rodríguez-Clare (1996), Ciccone andMatsuyama (1996), Skott and Ros (1997) and Ros(2000, chapter 9). It hardly seems necessary to notethat the subject is closely linked with the debates onthe role played by industrial policy in the examples ofrapid growth after the war and the recent empiricalliterature on the effects of the international tradespecialization pattern on the growth rate (Matsuyama,1992; Sachs and Warner, 1997; Sala-i-Martin, 1997).
IIThe analytical framework
In neoclassical theory, the pattern of specialization isunequivocally determined by the factor endowment ofthe economy (along with technology and the terms oftrade) because, regardless of the initial conditions, theeconomy is assumed to converge towards a pattern ofspecialization which can be explained by the factorendowment. At the other extreme of the theoreticalscale, some models in the new international trade theoryconsider productivity growth to be the result of learning
processes and leave out factor endowment as adeterminant of comparative advantages (see, forexample, Krugman, 1987). In this case, thespecialization pattern cannot be determinedindependently of the initial conditions and past history.Accidents –that is to say, disturbances in the real sphere,such as a temporary boom in natural resources, ormonetary disturbances such as temporary exchange rateovervaluation– are of decisive importance in

129C E P A L R E V I E W 7 3 • A P R I L 2 0 0 1
INDUSTRIAL POLICY, COMPARATIVE ADVANTAGES AND GROWTH • JAIME ROS
determining the pattern of specialization. Industrialpolicy also becomes of crucial importance in theacquisition of new comparative advantages. The modelpresented in this section may be seen as an extensionof a neoclassical model which admits the existence ofincreasing returns to scale in the production of non-tradeable inputs, or as a model based on the newinternational trade theory –like that of Krugman (1987)on the “competitive consequences of Mrs. Thatcher”–which discards the assumption of Ricardian-typetechnology and introduces non-tradeable goods. As weshall see, in these conditions the factor endowment, theinitial conditions and the policies adopted all play arole in determining the specialization pattern.
1. The basic model
Let us consider an economy with three sectors. Sector1 produces a tradeable good using capital and labour,on competitive conditions and with constant returns toscale. Sector 2 also produces a tradeable good, usingcapital and non-tradeable inputs (we are leaving outthe labour factor for the purpose of simplicity and inorder to emphasize that what this sector is producing,on competitive conditions and with constant returns toscale, is a good which makes intensive use of capital).In both sectors, the technology used is of the Cobb-Douglas type. Sector 3 produces the non-tradeableinputs used in sector 2. These inputs are produced usinglabour and with increasing returns to scale. Theseintermediate goods can represent a set of manufacturedinputs and production services (such as banking andinsurance services), as in the model used in Rodríguez-Clare (1996), or they can be a set of infrastructuralgoods and services (energy, transport andcommunications), as in Skott and Ros (1997). Formally,input I of the set of intermediate goods Ii may berepresented as:
Ι = (Σ (1/n) Iiσ)1/σ 0 < σ < 1,
where n is the number of intermediate goods, assumedto be a given value.
Alternatively, sector 3 may be considered as anindustry assembling a set of components Ii producedunder conditions of increasing returns:1
I = na (Σ (1/n) Iiσ)1/σ a > 1 0 < σ < 1,
where I is the output of sector 3 and n is the number(not fixed) of components produced. In this case, we
interpret each of these components as a link in theproduction process. An increase in the number ofcomponents means a finer division of labour. Becauseof the existence of economies of specialization, thisgreater division of labour makes it more productive,by increasing differentiation and generating newprocesses and auxiliary industries (see Kaldor, 1967,p. 14). There are two differences between thisspecification of sector 3 and the previous one. Firstly,the economies (of specialization) taken into accounthere are external to the enterprise, unlike the economiesof scale, internal to the plant, described in the firstspecification. This is what the second specificationimplies: as the parameter a is greater than one, anincrease of x% in the number of components, keeping(n Ii) constant, generates more units of I than an increaseof x% in each component, keeping n constant. Secondly,in the present specification the number of intermediategoods, instead of being given, is endogenous and isdetermined by the size of the market for sector 3.
In the following sections, the presentation will bebased on the first specification, characterized by thepresence of internal economies of scale, althoughqualitatively similar results can be obtained using thesecond specification. At all events, the key differencebetween sectors 1 and 2 is that whereas sector 2 has abackward linkage with the sector producing inputs,there are no linkages in the case of sector 1. Theintegrated sector 2 and 3 may be seen as a “productioncomplex” characterized, as we shall see, by effectswhich are external to each one of the two sectors thatmake it up.
a) Multiple equilibria and pecuniary externalities
In an economy like that considered here, under certainconditions there can be multiple market equilibria. Aformal analysis of the existence of multiple equilibriais given in the appendix. Here, we will limit ourselvesto describing the basic assumption. In order tounderstand why there are multiple equilibria, we maybegin by noting that an equilibrium in which sectors 1and 2 exist side by side is an unstable equilibrium. Thus,let us imagine an economy in which the two tradeablegoods sectors exist side by side and both have the samelevels of profitability. In this situation, the reallocationof a small amount of capital to sector 2 has the effect ofincreasing its relative profitability, for the expansionof the market for sector 3 (associated with thereallocation of capital to sector 2) tends to reduce thecost of producing the intermediate goods in question,
1 This is what is known as Dixit-Stiglitz and Ethier’s specification(see Ethier, 1982).

C E P A L R E V I E W 7 3 • A P R I L 2 0 0 1130
INDUSTRIAL POLICY, COMPARATIVE ADVANTAGES AND GROWTH • JAIME ROS
with a favourable effect on the rate of profitability ofsector 2. This increase in the relative profitability ofsector 2 causes capital to flow to it and hence furtherincreases its rate of profitability. In contrast, reallocationof capital to sector 1 has the opposite effect of reducingthe relative profitability of sector 2, by reducing thesize of the market for sector 3 and raising the cost ofproducing intermediate goods. The capital thereforetends to flow to sector 1, further increasing its relativeprofitability. In both cases the process continues up tothe point of the complete disappearance of one of thetwo tradeable goods sectors and total specialization ofthe economy in the other sector.
The second thing to be noted is that an equilibriumwith specialization in sector 1 always exists in theeconomy in question, regardless of whether there aremultiple equilibria or not. When the levels of capitalinvested in sector 2 are low, the profitability of the sectortends towards zero, because of the high cost ofproducing the necessary intermediate goods, but itcontinues to be positive in sector 1, whatever the levelof the stock of capital. There are therefore someallocations of capital, if the levels of capital invested insector 2 are sufficiently low, in which sector 1 is moreprofitable than sector 2. As we shall see below, the factthat there is always an equilibrium with specializationin sector 1 is due to the assumption that that sector doesnot use inputs produced by sector 3.
As there is always an equilibrium withspecialization in sector 1, it follows that the existenceof an equilibrium with specialization in sector 2 ensuresthe existence of multiple equilibria. There is anequilibrium with specialization in sector 2 if theprofitability of that sector, when all the capital isinvested in it, is greater than that of sector 1 (takingaccount of the market equilibrium wage when the entirelabour force is employed in sector 3). As demonstratedin the appendix, the existence of such an equilibriumdepends on the capital and labour endowments of theeconomy and the terms of trade between sectors 1 and2. In particular, in order for there to be an equilibriumwith specialization in sector 2, the total stock of capitalmust be large enough to ensure that, when it is entirelyinvested in sector 2, the prices of the intermediate goodsmust be low enough and the wages high enough to makesector 2, which makes intensive use of capital andinputs, more profitable than sector 1, which makesintensive use of labour. The higher the relative price ofthe goods produced by sector 1 (with respect to thoseof sector 2), the greater the size of the stock of capitalneeded for there to be multiple equilibria, since that
higher price increases the relative profitability of sector1. The size of the stock of capital needed also increaseswith the number of enterprises n in the intermediategoods sector, which adversely affects the productivityof sector 3 and the profitability of sector 2.2
The existence of multiple equilibria is associatedwith the presence of pecuniary externalities (althoughthe presence of such externalities is not of itself asufficient condition, since there may be a singleequilibrium with specialization in sector 1). Thus, theexistence of increasing returns to scale in theintermediate goods sector means that productiondecisions in sector 3 and investment decisions in sector2 have significant external effects. An increase in theproduction of one of the intermediate goods adverselyaffects demand for other inputs, but it lowers the priceof the overall set of intermediate goods and increasesboth the total input of intermediate goods and the rateof profitability of sector 2. In addition to these staticeffects, there is also a dynamic externality: higherprofitability of sector 2 encourages capital accumulationin that sector and leads to an increase in future demandfor intermediate goods. On the investment side, theatomized producers in sector 2 take all prices as givenand do not take into account the external effects thatthe greater stock of capital has on future demand forintermediate goods or the tendency for the prices ofthose goods to go down as the production costs of sector3 are reduced.
As a result of these dynamic pecuniaryexternalities, an economy specializing in sector 1 willbe trapped in that specialization pattern if all theenterprises follow a line of behaviour which is rationalfor each of them. As all the capital is invested in sector1, the demand for intermediate goods is non-existentand the production costs of those goods are extremelyhigh. Consequently, the profitability of sector 2 is solow that the capital is invested in sector 1. This keepsthe production costs of sector 3 high and lowers theprofitability of sector 2.
b) The two patterns of specialization compared
Why does it matter if the economy is trapped in a tradepattern specializing in sector 1? The reason is that thetwo specialization patterns are not equivalent in termsof economic well-being (nor, as we shall see below, in
2 This conclusion does not apply to the model with the secondspecification of sector 3, in which the number of enterprises isendogenous and positively affects the productivity of the sector.

131C E P A L R E V I E W 7 3 • A P R I L 2 0 0 1
INDUSTRIAL POLICY, COMPARATIVE ADVANTAGES AND GROWTH • JAIME ROS
terms of growth potential). As demonstrated in the ap-pendix, the existence of multiple equilibria ensures thatthe rate of profitability is higher in the equilibrium spe-cializing in sector 2, provided that that sector makesmore intensive use of capital than sector 1. It may beassumed that the high level of the stock of capitalneeded for there to be multiple equilibria will generaterelatively high wages, and this will tend to depress therate of profitability of sector 1, which makes intensiveuse of labour. On the other hand, at sufficiently highlevels of capital stock, real wages are also higher in theequilibrium specializing in sector 2, for at sufficientlyhigh levels of capital stock the greater scale of sector 3will have made this sector more productive and reducedthe relative price of the intermediate goods produced.As a result, as the stock of capital increases the capital/intermediate inputs ratio in the output of sector 2 tendsto go down, and the expansion of sector 2 at the ex-pense of sector 1 generates an excess of demand forlabour, with a positive impact on real wages.
2. Extensions
a) The model involving the use of inputs in sector 1
In the previous model, the technology available in sector1 does not use intermediate goods. Let us now assume,however, that sector 1 does use intermediate goods,although less intensively than sector 2.3 The demandfor intermediate goods no longer comes exclusivelyfrom sector 2 and therefore does not depend on theamount of capital invested in it. The capital invested insector 1 now also affects the demand for intermediategoods and, ultimately, the relative price of those goodswith respect to those produced by sector 2.Consequently, the profitability of sector 2 will nowdepend not only on the capital invested and the wagesin that sector, but also on the capital invested in sector1 and, hence, the total stock of capital. This means thatthere will be a sufficiently high value of the stock ofcapital which, when the whole of that stock is investedin sector 1, will make the relative price of theintermediate goods sufficiently low and wagessufficiently high to cause the rate of profitability ofsector 2 to be higher than that of sector 1, both ratesbeing calculated at the market equilibrium values for
wages and intermediate goods. When the total stock ofcapital reaches that value, the equilibrium withspecialization in sector 1 disappears, since sector 2 ismore profitable than sector 1 even when the whole ofthe capital is invested in the latter. Unlike the previousmodel, it is no longer true that there is always anequilibrium with specialization in sector 1, whateverthe size of the total stock of capital.
We now have three configurations. First, for a rangeof low values of the capital stock there is a singleequilibrium. In this equilibrium, the economyspecializes in the production of tradeable goods insector 1, and a small sector 3 exists side by side withsector 1. The trade specialization must be in sector 1,not sector 2, because sector 1 is the sector which usesintermediate goods least intensively and is thereforethe only one capable of surviving with the highproduction costs prevailing in the intermediate goodssector.
In a range of intermediate values of the capitalstock, there are two stable equilibria, with specializationin sector 1 and sector 2 respectively. The total stock ofcapital is sufficiently large to generate a productiveintermediate goods sector and make sector 2 viable,but only if the capital is invested in sector 2. If the capitalis invested in sector 1, the intermediate goods marketwill not be sufficient to make investing in sector 2profitable. In the equilibrium with specialization insector 2, however, the rate of profitability is greater andthe real wage is at least as high as in the equilibriumwith specialization in sector 1. The equilibrium withspecialization in sector 2 is therefore superior in termsof Pareto’s cr iterion to the equilibrium withspecialization in sector 1, not just for a certain minimumvalue of the capital stock but for the whole range ofvalues of the capital stock where there are multipleequilibria.
Finally, for large values of the capital stock we havea single equilibrium once more. The capital stock issufficiently large not only to make sector 2 viable butalso to cause the equilibrium with specialization insector 1 to disappear. The low prices of intermediategoods and high wages make it profitable for individualinvestors to shift from sector 1 to sector 2, even whenall the capital is initially invested in sector 1. Whenthis is done, the prices of intermediate goods and wagesmove in such a way as to strengthen the relativeprofitability of sector 2, and eventually the whole ofthe capital shifts to that sector. Sector 1 becomes non-viable because of the high wages associated with therelatively high capital/labour ratio of the economy.
3 This is the case analysed by Rodríguez-Clare (1996), in a modelsimilar to that presented in the appendix. As well as providing forthe use of intermediate inputs in sector 1, Rodríguez-Clare’s modeladopts Dixit-Stiglitz and Ethier’s specification for sector 3 insteadof the specification with a fixed number of intermediate inputs.

C E P A L R E V I E W 7 3 • A P R I L 2 0 0 1132
INDUSTRIAL POLICY, COMPARATIVE ADVANTAGES AND GROWTH • JAIME ROS
b) The model with skilled labour in the intermediategoods sector
Let us now assume that the technology employed insector 3 uses skilled labour (whereas sector 1 usesunskilled labour).4 Together with the size of the capitalstock, the level of skills of the labour force thus becomesa further factor influencing the existence of multipleequilibria, for a higher level of skills may make up forthe high costs resulting from a small market forintermediate goods produced under conditions ofincreasing returns and thus tends to reduce the size of
the capital stock required for there to be an equilibriumwith specialization in sector 2. Similar conclusions maybe reached if it is sector 2, rather than sector 3, whichmakes intensive use of skilled labour: whereas the highprice of intermediate goods tends to depress the relativeprofitability of sector 2, an abundance of skilled labourtends to increase it, so that sector 2 can be viabledepending on the allocation of the capital stock. At allevents, the existence of multiple equilibria can be theresult of different mixes of levels of skills and capitalstocks, rather than simply a range of intermediate valuesof the capital stock.
IIIIndustrial policy and growth
Many developing countries have adopted industrialpolicies in an attempt to speed up the rate ofindustrialization and the economic growth rate. Theresults have been mixed, judging from the variety ofdifferent results obtained using similar policies. Thisexplains why the efficacy of these policies is a matterof controversy and why there are different opinions asto whether these policies have made a difference and,if so, whether their effects have been positive ornegative. This is so even though both observers andpolicy-makers have amply documented the role ofindustrial policy in achieving the rapid industrializationof East Asia (see Amsden, 1989; Wade, 1990). Thissituation goes a long way towards explaining why thereis no consensus on the key question of how, and in whatconditions, industrial policy can significantly alter therates of capital accumulation and growth. The analyticalframework set forth earlier in this article sheds somelight on this question, as we shall see below.
Let us begin by noting that in neoclassicalinternational trade theory factor endowment,technology and the terms of trade are considered tounequivocally determine the pattern of comparativeadvantages and specialization of an economy. In theanalytical framework presented in the previous section,
in contrast, the existence of multiple market equilibriaassociated with different patterns of specialization butwith the same factor endowment, technology and termsof trade makes the very notion of comparativeadvantage ambiguous. More exactly, when a singleequilibrium exists, regardless of whether it is withspecialization in sector 1 or 2, it makes sense to saythat the economy displays a comparative advantage inthe corresponding sector, and the market incentives willinduce the economy to specialize in the sector whichhas a comparative advantage. When there are multipleequilibria, however, there is longer a clear answer tothe question of where the comparative advantage intrade lies. It could be said (using a phrase which wouldmake no sense in the context of neoclassical theory)that the economy is in a state of transition between apattern of comparative advantages which hasdisappeared and another which has not yet emerged.
The different specialization patterns associatedwith the same factor endowment have different growthimplications. Let us consider, for example, the modelwith intermediate inputs in the two tradeable goodssectors and assume that the conditions for the existenceof multiple equilibria are fulfilled. We will comparetwo economies which are identical in all aspects (factorendowment, rate of saving, size of the labour force)except their pattern of specialization, since one isspecialized in sector 1 and the other in sector 2. As wehave seen earlier, real wages and the rate of profitabilityare higher in the second economy. Consequently, thiseconomy will also have a higher per capita income, so
4 A similar case is analysed by Rodrik (1995). In the presentanalysis, the existence of multiple equilibria is associated with arelatively high level of skills of the labour force, together with arelatively small stock of capital.
133C E P A L R E V I E W 7 3 • A P R I L 2 0 0 1
INDUSTRIAL POLICY, COMPARATIVE ADVANTAGES AND GROWTH • JAIME ROS
that for the same rate of saving and investment it willhave higher rates of capital accumulation and growth.The superiority of the growth rate of the economyspecializing in sector 2 will be even greater if there isinternational capital mobility, since this capital will tendto flow to the economy offering the highest return oncapital and that economy’s rate of investment willtherefore tend to be higher.
This means that if an economy is specialized insector 1, an industrial policy which reallocates resourcesto sectors 2 and 3, leading to a specialization patternbased on those sectors, will raise the growth rate of theeconomy. Moreover, in the absence of an industrialpolicy an economy specializing in sector 1 will notmove spontaneously towards the high-growthequilibrium. With the prices and wages prevailing inthe equilibrium with specialization in sector 1, the rateof profitability of sector 2 will be below that of sector1, and no individual investor will find it profitable toinvest in sector 2. Individual incentives, as measuredby the market, will keep the economy on the low growthpath associated with specialization in sector 1, as longas that equilibrium persists. Only when a sufficientlylarge mass of investors shift simultaneously to sectors2 and 3 will the profitability of sector 2 be moreattractive than that offered by sector 1. However, thisrequires policy interventions in order to provide thenecessary coordination among producers.
It is quite true that eventually the economyspecializing in sector 1 will obtain a comparativeadvantage in sector 2 through the capital accumulationprocess itself. When that happens, the profitability ofsector 2 will be greater than that of sector 1 and themarket incentives will lead the economy to specializein sector 2, since the equilibrium with specialization insector 1 will have disappeared. During the transition tothe stock of capital needed for this to happen, however,an economy which specialized in sector 2 from the startwill have a higher growth rate. The high and sustainedgrowth rate of the East Asian economies may beunderstood as the result of a succession of policyinterventions which speeded up the transitions betweendifferent patterns of production and international tradespecialization. It is hard to imagine how a developmentmodel driven primarily by the market forces, such asthe developing countries are currently beingrecommended to adopt, can pass through thesetransitions so successfully. This is not because thereare no examples of successes based on the market (thisis open to debate), but because theory suggests exactlythe opposite: that the market incentives can hardly solve
efficaciously (or at least efficiently) the problems ofcoordination that arise in the transition.
Successful policy interventions aimed at speedingup the transition form the basis for Rodrik’sinterpretation of how Korea and Taiwan became rich(Rodrik, 1995; see also Amsden, 1989, and Wade,1990). The argument is that, rather than their exportorientation, the distinctive feature of these examplesof growth was the sharp and sustained increase in theirinvestment rates in the early 1960s. Through a varietyof policy interventions, subsidizing and coordinatinginvestment projects, government policy succeeded inreallocating resources to modern industries makingintensive use of capital and skilled labour. With growingreturns in these activities, such reallocation raised theprofitability of capital and propelled the economytowards a high growth path. Outward orientation was aconsequence of this, because the higher rates ofinvestment increased the demand for imported capitalgoods. The relatively high level of skills of the labourforce in both countries was a necessary condition forthe success of the industrial policy adopted.
At the same time, the analysis made shows thelimitations of industrial policy when the conditionsneeded for its success (the existence of multipleequilibria) are absent. Let us assume that there is a singleequilibrium in the economy, with specialization insector 1. In this case, industrial policy cannot improvethe results of the market forces. Let us consider, forexample, a policy which seeks to reallocate resourcesto sectors 2 and 3. Let us assume that this policy issuccessful in reallocating new investments to sector 2.Precisely because there is no equilibrium withspecialization in sector 2, wages in this economy willfall compared with their value for equilibrium withspecialization in sector 1. Profitability will also tend tofall, because the stock of capital is small and the costsof the intermediate goods produced are therefore high.With a rate of profitability in sector 2 which is lessthan that of sector 1 (at market prices and wages), thechanges in relative prices which must be induced inorder to make sector 2 viable would mean an evengreater fall in real wages. On the other hand, whenthere is a single equilibrium with specialization insector 2 an industrial policy is not needed. Theeconomy has a clear comparative advantage in sector2, and the market incentives will of themselves leadthe economy to adopt the specialization pattern withthe highest growth path.
This means that the existence of externalities isnot sufficient to justify an industrial policy. When

C E P A L R E V I E W 7 3 • A P R I L 2 0 0 1134
INDUSTRIAL POLICY, COMPARATIVE ADVANTAGES AND GROWTH • JAIME ROS
industrial policy cannot do anything to improve themarket results (when there is only an equilibrium withspecialization in sector 1) or is actually unnecessary(when there is only an equilibrium with specializationin sector 2) this is due ultimately to the fact that, as wesaw earlier in this article, the presence of static anddynamic externalities is not sufficient to ensure theexistence of multiple equilibria.
This analysis has other interesting connotations.In the literature on the effects of industrial policy, thevariety of results obtained has tended to be associatedwith the variety of policies adopted (see for exampleAmsden, 1989). Thus, for example, the success of theindustrial policies applied in East Asia compared withthe less successful results obtained in Latin Americahas been associated with the fact that in the first casethe incentives for firms or sectors were granted inexchange for the attainment of clearly defined goals,and the time horizon for the operation of the policieswas clearly delimited. These differences undoubtedlymust have contributed to the success of the Asian model,but our analysis also suggests that the success of an
industrial policy depends very much on the existenceof the necessary conditions for its application. A singlegiven industrial policy may be effective or not,depending on this. In this context, it is easy tounderstand the importance that the initial level of skillsof the labour force in the East Asian countries had fortheir emergence as industrialized countries in the early1960s. This relatively high level of skills had existedfor a long time before, but it only became crucial lateron, when it gave viability to an industrial policy whichreallocated resources to modern sectors makingintensive use of physical and human capital. Ouranalysis also makes it possible to understand the roleplayed by the particular design of industrial policies inEast Asia. By limiting the time horizon and theincentives offered, these policies incorporated self-correction mechanisms. If the conditions needed forthe industrial policy to be effective were lacking, itslack of viability was clearly evident as soon as it beganto be applied. This made it possible to turn back andthus minimize the loss of resources that persistence witha non-viable policy would have involved.
IVThe terms of trade and the “Dutch Disease”
The size of the capital stock and the level of skills ofthe labour force are not the only factors affecting theexistence of multiple specialization patterns. As alreadymentioned, the existence of multiple equilibria alsodepends on the terms of trade between the goodsproduced by sectors 1 and 2. In order to illustrate therole of these terms, let us consider an economyspecializing in the labour-intensive sector (sector 1),and let us assume that with the passage of time the entryonto the international market of new producers withlow wage costs tends to reduce the relative prices oflabour-intensive goods. This has the effect of generatingan equilibrium with specialization in sector 2, withoutthis necessarily causing the economy to shift to thathigher-growth equilibrium. In a way, the economy islosing its competitiveness in sector 1, without howeveracquiring a comparative advantage in sector 2. Thissituation corresponds to that of a number of semi-industrialized countries which on the one hand arefacing strong competition from new low-wageproducers of labour-intensive goods, while on the other
they are not as yet capable of competing with the moreefficient producers of capital-intensive goods in theindustrialized countries. If we interpret sector 1 as asector producing primary commodities, this transitiondescribes the balance of payments problems and theeventual beginning of industrialization of countries withabundant natural resources which are facing adeterioration in the terms of trade of their exports ofprimary commodities.
Whichever of these interpretations is adopted, thetransitional economy whose terms of trade have becomeunfavourable will continue to specialize in the goodsproduced by sector 1 (primary commodities or labour-intensive goods) until it may reach the high levels ofcapital which make sector 2 profitable from the pointof view of individual investors (unless right from thestart the drop in the prices of the goods produced bysector 1 is so great that it eliminates the equilibriumwith specialization in sector 1). This is so simplybecause the equilibrium with specialization in sector 1is a locally stable equilibrium: no individual investor

135C E P A L R E V I E W 7 3 • A P R I L 2 0 0 1
INDUSTRIAL POLICY, COMPARATIVE ADVANTAGES AND GROWTH • JAIME ROS
alone will find the investment opportunities in sector 2more attractive than those in sector 1. In the transitionalperiod, the economy will suffer a reduction in its growthrate as a result of the decline in the relative price ofsector 1’s goods. As equations [7] and [14] in theappendix show, the rate of profitability in that economyis an inverse function of the relative price of the goodsproduced in sector 2. Insofar as the rate of accumulationdepends on this profitability, the reduction in the relativeprice of the goods produced by sector 1 will adverselyaffect capital accumulation and growth. In turn, thelower rate of accumulation will prolong the transitionto the level of capital stock needed to make theproduction of goods in sector 2 spontaneouslyprofitable. When there is such a “slow growth trap”,economic policy intervention may make a substantialdifference in the medium-term growth rate.
Another implication of the analysis confirms thefears expressed in the literature on the “Dutch Disease”(for a review of this literature, see Corden, 1984). Letus assume that sector 1 is natural resource-intensive
and the economy is specialized in sector 2. With theinitial terms of trade and capital stock there are multipleequilibria. Starting from this situation, the relative priceof sector 1’s goods subsequently rises to such a pointthat sector 1 is more profitable than sector 2, so thatthe equilibrium with specialization in sector 2disappears. This shifts resources from sectors 2 and 3to sector 1 and the economy becomes specialized insector 1. Later on, the relative price of sector 1’s goodsreturns to its initial level, causing the reappearance ofthe equilibrium with specialization in sector 2, but thereis not a corresponding shift in resources to sectors 2and 3. The economy continues to be specialized insector 1 because, as we assumed, with the initial termsof trade there are multiple equilibria and the profitabilityof sector 1 is therefore greater than that which anindividual investor can obtain in sector 2 when theeconomy is specialized in sector 1. The boom in naturalresources, although only temporary, has had permanenteffects on the specialization pattern of the economy andthe long-term growth rate.
VEmpirical evidence5
1. Trade specialization and growth
The main conclusion to be drawn from the foregoinganalysis is that the specialization pattern is adetermining factor in the economic growth rate. Thereare two channels by which this influence is exerted.Firstly (controlling for other factors), the capital yield,and hence the investment rate, tend to be higher in thespecialization pattern based on industries withincreasing returns. Secondly, for the same level ofincome per worker, specialization in industries withincreasing returns is associated with a higher product/capital ratio. This means that, even if the rates ofinvestment are the same, the rates of capitalaccumulation and growth will be higher when theeconomy is specialized in industries with growingreturns. Let us now look at the empirical validity ofthese relations.
It is worth noting, first of all, that the reallocationof resources to modern industries making intensive useof capital and skilled labour was accompanied in SouthKorea and Taiwan, as predicted in our analyticalframework, with an increase in capital yields (and alsoin the rate of investment). In South Korea, profit ratesin manufacturing rose from 16% in 1954-1956 to 28%in 1957-1962 and 35% in 1963-1970 (Hong, 1993, citedby Rodrik, 1995). In Taiwan, profitability increasedafter the late 1950s in the majority of manufacturingsectors except traditional industries such as textiles andwood products (Lin, 1973, cited by Rodrik, 1995).
Let us now look at the relation betweenspecialization and growth through a cross-countryanalysis. The first question that arises is how to measurethe pattern of specialization. As the level of income ofa country rises, its trade pattern changes. Typically, theeconomy changes from being a net importer ofmanufactures to being a net exporter, and manufacturesincreasingly dominate its foreign trade. As the level ofincome affects the growth rate in ways which areindependent of the pattern of specialization, it would
5 This section is based in part on Ros (2000), chapter 9, sections 3and 4.

C E P A L R E V I E W 7 3 • A P R I L 2 0 0 1136
INDUSTRIAL POLICY, COMPARATIVE ADVANTAGES AND GROWTH • JAIME ROS
be useful to have an indicator of trade specializationwhich isolates the effects of resource endowment fromthose of the policies applied and excludes the influenceof the level of income on the trade pattern.
Such an indicator may be found in Chenery andSyrquin (1986). It consists of their index of tradeorientation, which can be used to measure the biastowards manufactures in the composition of exports ofgoods, after adjustment for the income level and sizeof each country.6 The index measures, then, the degreeto which an economy specializes in manufactures as aresult of factors other than size and income (resourceendowment and policies). This index is available for1975, for 34 countries (including Hong Kong andTaiwan)7 , many of which were semi-industrialized inthe 1970s.
We will also consider a smaller sample of 22countries for which both the trade orientation index andthe Leamer index of intra-industry trade and otherfeatures of foreign trade are available. These 22countries were grouped according to their tradeorientation index as follows:
i) countries with a positive bias towards exports ofmanufactures, mostly from East Asia and South-ern Europe: Egypt, Greece, Hong Kong, Israel,Japan, Morocco, Portugal, Singapore, Spain andYugoslavia;
ii) countries with a moderate bias towards exports ofprimary goods, mostly including Latin Americanand East Asian countries: Colombia, Costa Rica,Malaysia, Philippines, Thailand and Turkey; and
iii) countries with a strong bias towards exports ofprimary goods, mostly consisting of Latin Ameri-can countries: Argentina, Brazil, Dominican Re-public, Ecuador, Ivory Coast and Peru.
Table 1 summarizes the information available for thissmaller sample of 22 countries: for the sample in
question it reveals a positive relation between the biastowards exports of manufactures and the investmentrate. Table 2 presents cross-country correlations for thesample.
Table 3 gives correlations for the larger sample (34countries); the correlation coefficient between the biastowards manufactures and the investment rate is 0.35.This is exactly what was implied by the models insection II, which suggest that specialization in industrieswith increasing returns (a bias towards manufactures)should have a positive effect on the investment rate.
As already noted, another implication of thesemodels concerns the effect of the specialization patternon the rate of capital accumulation, for a giveninvestment rate. As table 2 shows, the correlationbetween the trade orientation index (which measuresthe degree to which an economy specializes in theexport of manufactures) and growth is very high (0.73):higher than the correlation between the trade orientationindex and the investment rate. Also noteworthy is thevery significant coefficient of the trade orientation indexin a regression of the growth rate with this index, theinvestment rate, and the initial level of GDP per worker:
g = 2.02 + 0.09 I/Y + 1.47 OC - 0.0002 Y/L60 R2 = 0.75
(3.73) (4.02) (4.39) (-4.42)
where g is the growth rate of the GDP per worker (1960-1990); I/Y is the real investment rate (1970-1980); OCis the trade orientation index of Chenery and Syrquin,1975, and Y/L60 is the real GDP per worker in 1960. Thet statistics are given in parentheses.
This equation indicates that, for the same initialincome and investment rate, countries which specializedin the export of manufactures grew faster during the1960-1990 period than primary commodity exporters.If we interpret sector 1 of the model in the first sectionas a sector which makes intensive use of naturalresources and has few linkages with activities havingincreasing returns, the equation illustrates the basicimplications of the model in terms of the effects ofinvestment allocation on growth. The initial level ofGDP per worker also has a very significant (negative)coefficient in the regression. This suggests that in thisgroup of 34 semi-industrialized countries there is atendency towards convergence: other conditions beingequal, the countries with a lower level of income tendedto grow faster. As the models examined previouslyindicate, however, this convergence was conditionedby the specialization pattern: the economies specializingin the export of manufactures converged towards highlevels of income faster than those specializing in
6 This means measuring, for a given country, the deviation betweenthe observed bias towards manufactures and the bias predicted fora typical country of similar income level and size. The tradeorientation index of Chenery and Syrquin (1986) actually measuresthe bias towards primary exports. What we have done is to use thisindex by multiplying it by -1, which gives us the bias towardsmanufactures.7 Algeria, Argentina, Brazil, Chile, Colombia, Costa Rica,Dominican Republic, Ecuador, Egypt, Greece, Guatemala, HongKong, Iran, Iraq, Israel, Ivory Coast, Japan, Malaysia, Mexico,Morocco, Peru, Philippines, Portugal, Singapore, South Korea,Spain, Syria, Taiwan, Thailand, Tunisia, Turkey, Uruguay,Venezuela and Yugoslavia.

137C E P A L R E V I E W 7 3 • A P R I L 2 0 0 1
INDUSTRIAL POLICY, COMPARATIVE ADVANTAGES AND GROWTH • JAIME ROS
commodity exports. In reality, they were convergingtowards a higher equilibrium level of income, as theanalysis made in section II suggests.
It may be noted that the results presented here tendto confirm the findings of recent studies (Sachs andWarner, 1997; Sala-i-Martin, 1997), which show that,after controlling for other variables, economies
specializing in the production and export of goodsmaking intensive use of natural resources tend to growmore slowly than those specializing in the export ofmanufactures. According to Sachs and Warner,abundance of natural resources, as measured by thepercentage of GDP accounted for by exports makingintensive use of natural resources, has a negative effect
TABLE 1
22 countries: Trade orientation, investment and growtha
(Averages per group of countries)
Bias towards Bias towardsexport of manufactures export of commodities
Moderate Strong
Trade orientation index 1975 0.45 –0.10 –0.45Rate of investment 24.8 19.1 19.5Growth rate 4.1 2.8 1.5Foreign trade share 84.8 48.5 39.2Trade intensity (Leamer 1) 0.08 0.04 –0.05Index of intra-industry trade 0.56 0.30 0.17Number of countries 10 6 6
a For definitions and sources, see text of article and notes to table 3.
TABLE 2
22 countries: Cross-country correlationsa
Trade orientation Intra- Trade Foreign tradeindex 1975 industry trade intensity share
Trade orientation index 1975 1.00 0.69 0.42 0.35Intra-industry trade 1.00 0.73 0.71Trade intensity 1.00 0.85Foreign trade share 1.00
a For definitions and sources, see text of article and notes to table 3.
TABLE 3
34 countries: Cross-country correlations
TO1975a I/Y70-80 Foreign trade Growthc
shareb
TO1975 1.00 0.35 0.33 0.73
I/Y70-80d 1.00 0.30 0.54
Foreign trade share 1.00 0.39
Growth 1.00
a TO1975 : Trade orientation 1975 (Chenery and Syrquin, 1986).b (Exports + Imports) / nominal GDP. Average for 1970-1980 period (Penn World Tables, Mark 5.6).c Growth : growth rate of real GDP per worker 1960-1990 (Penn World Tables, Mark 5.6).
Intra-industry trade: index of intra-industry trade 1982 (Leamer, 1988).Trade intensity: adjusted index of trade intensity 1982, Leamer 1 (Leamer, 1988).
d I/Y70-80 : Share of investment in GDP. Average for 1970-1980 period ((Penn World Tables, Mark 5.6).
C E P A L R E V I E W 7 3 • A P R I L 2 0 0 1138
INDUSTRIAL POLICY, COMPARATIVE ADVANTAGES AND GROWTH • JAIME ROS
on growth: an influence that the authors attribute to“Dutch Disease”-type effects. These authors experimentwith other measures of abundance of natural resources(such as the share of commodity exports in total exports,or the amount of land per capita), with results thatconfirm this negative relation. According to Sala-i-Martin, exports of primary commodities as a proportionof total exports is one of the few economic variableswhich is systematically (negatively) correlated withgrowth.
2. Trade openness, investment and growth
In their “sensitivity analysis” of cross-country growthregressions, Levine and Renelt (1992) examined therobustness of the empirical relations between long-termgrowth and a variety of economic, political andinstitutional indicators. Their findings were pessimistic.Although there are many econometric specificationsin which various indicators are significantly correlatedwith per capita growth rates, almost all thesespecifications are fragile in the sense that smallalterations in the “other” explanatory variables changethe results previously obtained. Only two relations passthis test. One is the positive correlation between growthand the investment rate (investment as a percentage ofGDP). The other is the positive correlation between theshare of foreign trade in GDP and the investment rate.Table 3 presents results that support these conclusionsfor the large sample of 34 countries: the positivecorrelation between growth and the investment rate(0.54) and that between the share of foreign trade andthe investment rate (0.30).
The first result is reassuring because it coincideswith economic theory. The second is a puzzle, however.Firstly, it is important to note that the robust relationfound by Levine and Renelt is not between theinvestment rate and trade barriers, but between theinvestment rate and the share of foreign trade. Therelations between the investment rate (or the growthrate) and various indicators of trade barriers ordistortions in foreign trade policy are not robust8 , sothe robust relation does not seem to reflect the effects
of trade policy. Secondly, when controlled for theinvestment rate, there is no robust relation between theshare of foreign trade and growth (provided of coursethat the indicator used is the share of exports and/orimports). The fact that the robust relation is betweentrade and the investment rate suggests that if tradeaffects growth it does not do so through the conventionalchannels involving resource allocation but through lessconventional channels involving positive effects on theinvestment rate.
What these channels can be is not clear from theexisting literature. Romer (1990 a and b) suggests thattrade openness has a positive effect on research anddevelopment expenditure and, by thus increasing therate of technological change, influences the investmentand growth rates. Other points of view stress the positiveeffects of trade openness on technology transfer.9Whatever the merits of these views, they hardlyrepresent a convincing explanation of Levine andRenelt’s findings. One reason is that the trade opennessconsidered in these models does not refer to the shareof trade in GDP and therefore any attempt to provide anexplanation of the statistical relation between the shareof trade and the investment rate runs up against an oldobjection recently restated by De Long and Summers(1991). The share of trade is influenced by the size of acountry and its proximity to its trading partners. IfBelgium and the Netherlands were to merge, it wouldbe difficult to imagine how much the combined rate oftechnical progress should go down (or increase) becausethis new entity would be less “open” than each of thetwo countries separately.10
Even if the objection against measuring tradeopenness by the share of foreign trade were not decisive,however, the following question remains: Why is therobust correlation only between investment and trade
8 These indicators include “real exchange rate distortion” (Dollar,1992), the average premium on the currency black market, andChenery and Syrquin’s trade openness index. In a more recentreview of the literature on trade policy and growth (after thepublication of Levine and Renelt’s article), Rodríguez and Rodrik(1999) conclude that trade policy indicators lack statisticalsignificance in well-specified cross-country growth regressions.
9 At the same time, it can be argued that the effects of trade opennessdepend on the specialization pattern induced by the greateropenness (as in the model in section II). In some North-Southmodels, such as that of Young (1991), trade openness can evenresult in a slower rate of technological change in the South.Moreover, foreign direct investment is a major vehicle fortechnology transfer but there is no clear relation between tradeopenness and openness to foreign direct investment.10 It should be noted that De Long and Summers’ observation isnot an objection against models in which trade openness -in thesense of the absence of trade barriers- has a positive effect oninvestment. It is rather an objection against the use of the share offoreign trade in GDP as a measure of trade openness. The implication,however, is that we must not interpret the correlation betweeninvestment and the share of foreign trade as evidence in support ofmodels in which openness stimulates investment.

139C E P A L R E V I E W 7 3 • A P R I L 2 0 0 1
INDUSTRIAL POLICY, COMPARATIVE ADVANTAGES AND GROWTH • JAIME ROS
share and not between investment and other (moreappropriate) measures of trade openness? The analysismade in this and earlier sections suggests varioushypotheses which can provide a convincing explanationof the positive relation between trade share and theinvestment rate.11 Our line of argument will be that thelink between trade and investment involves thespecialization pattern as determined by policies andfactor endowment, including natural resources. Thestudies on differences in growth rates between countrieshave ignored these links because, with a few recentexceptions, they have ignored the influence these twofactors (industrial policy and resource endowment)exert through their effects on trade orientation.12
The nub of the argument is that the positivecorrelation between trade share and the investment rateis measured by the trade orientation; in other words,the explanation of the positive relation is that the tradeshare and investment rate are both positively affectedby a bias towards manufactures in trade orientation.We have already analysed and illustrated the effects oftrade orientation on the investment rate. We will nowlook at the effects of trade orientation on trade share.Table 1 shows a positive relation between these twovariables, while tables 2 and 3 show positive coefficientsof correlation of 0.35 and 0.33.
Why should a specialization pattern based on theexport of manufactures have a positive effect on tradeshare? One reason is the positive effect that
specialization in activities with increasing returns canhave on trade creation. The increasing returns favourthe expansion of intra-industry trade -two-way tradeflows of similar products with economies ofspecialization. Countries with a bigger bias towardsmanufactures in their exports usually have higherindexes of intra-industry trade. The correlationcoefficient between the two indexes, as shown intable 2, is 0.69.
A second reason may be the presence of “DutchDisease”-type effects of exports of primary commodi-ties. What the “Dutch Disease” models imply is thatcommodity-exporting countries tend to be less open(other things being equal), because in the long-termequilibrium they have bigger non-tradeable goods sec-tors (see Ros, 2000, chapter 8). It may be noted in thisrespect that trade orientation towards manufactures hasa positive relation with Leamer’s trade openness in-dex. This is an adjusted trade intensity index whichrepresents the difference between the observed levelof trade (not the trade pattern) and the level predictedby a Heckscher-Ohlin model, which includes factorendowment and distance to markets. The positive rela-tion with trade orientation indicates that the more bi-ased the trade orientation is towards commodity ex-ports, the lower the index of trade intensity tends to be,probably because of the existence of larger non-trade-able goods sectors and lower levels of intra-industrytrade.
VIConclusions
This study offers an analytical framework for analysingthe relations between the specialization pattern andgrowth, together with empirical evidence which doesindeed suggest that the specialization pattern is an im-
portant determinant in the growth process. The analy-sis showed the scope and limitations of industrial policy.On the one hand, it showed how an industrial policywhich reallocates resources towards sectors with po-tential to exploit economies of scale and specializationcan raise the growth rate of an economy by increasingthe capital yield and capital accumulation rate. On theother hand, it clearly revealed that the efficacy of in-dustrial policy depends on the presence of certain con-ditions –especially physical and human capital endow-ment and a sufficiently broad market for sectors witheconomies of scale and specialization– which do in-deed allow the reallocation of resources to raise theprofit rate in the new spearhead sectors.
11 We have already mentioned the argument put forward by Rodrik(1995) whereby a higher investment rate can lead to a higher tradeshare as a result of an increase in imports of capital goods ineconomies which are in the process of industrialization. In thisargument, the causality is from investment to trade and not in theopposite direction. In the following paragraphs of this article ourideas will follow a different direction which is complementary tothe foregoing.12 As already mentioned, the exceptions include Sachs and Warner(1997) and Sala-i-Martin (1997).

C E P A L R E V I E W 7 3 • A P R I L 2 0 0 1140
INDUSTRIAL POLICY, COMPARATIVE ADVANTAGES AND GROWTH • JAIME ROS
The empirical analysis tended to confirm thateconomies oriented towards the export of manufacturestend to grow faster than those oriented towardscommodity exports. Among the semi-industrializedcountries, there are no examples of super-growth basedon the export of goods making intensive use of naturalresources.13 This does not mean that countries with anabundance of such resources must change theirspecialization pattern in order to grow faster. Efforts inthis direction would probably be a failure in many ofthem, precisely because the efficacy of industrial policyis conditioned by factor endowment. Nor does it meanthat these countries with an abundance of naturalresources are doomed to grow more slowly thancountries with a bias towards exports of manufactures,
since they can speed up their growth process by tryingto influence other determinants of that process.
Finally, it should be noted that in this article theeconomic policy implications are limited by the typeof externalities considered. The external effects of apecuniary and dynamic nature which take placebetween producers of capital-intensive goods andproducers of intermediate goods operating in conditionsof increasing returns give rise to flaws in coordinationwhose solution calls for public intervention. However,the study did not deal with other types of externalitiesand market flaws (especially in factor markets) whichjustify interventions generally included under theheading of industrial policy.
(Original: Spanish)
Appendix: The formal model14
There are two sectors producing tradeable goods in theeconomy (denoted by 1 and 2). The technology used in bothsectors is of the Cobb-Douglas type:
Q1 = K1bL1
1–b Q2 = K2aI1–a
where K is the capital input and L is the labour input. Let usassume that a > b, that is to say, sector 2 is more capital-intensive than sector 1. I represents the input consisting of aset of intermediate goods:
I = (Σ (1/n)Iiσ)1/s 0 < σ < 1,
where n is the number of intermediate goods, assumed to begiven. The sector producing these intermediate goods (sector 3)does so using labour in conditions of increasing returns to scale:
Ii = Li1+µ µ >0 [1]
where Li is the labour input.The enterprises in the three sectors maximize their benefits,
taking the prices of the inputs as given. The enterprises in sectors1 and 2 also take the prices of the goods produced as given. Inboth sectors the capital stock is predetermined. The levels ofuse of the factors variable in the short term are derived from thefirst-order conditions for the maximization of benefits:
L1 = [(1–b)p1 / w]1/b K1 [2]
I = (1–a)1/a (p3 / p2)–1/a K [3]
where w is wages, p1 and p2 are the prices of goods 1 and 2,and p3 is the (minimum) cost of a basket of intermediategoods such that I = 1.
In sector 3, the producers operate in conditions ofmonopolistic competition and face downward-slopingdemand curves:
Iid = D pi
–η η > 1 [4]
where D reflects the position on the demand curve and η isthe price elasticity of demand faced by individual producers.This elasticity is a function of σ, a and n, and for large valuesof n is given approximately by 1/(1-σ). The inequality in [4]is due to the parametric restrictions 0 < a < 1 and 0 < σ < 1.
Based on the demand function in [4] and productionfunction [1], the optimal price decision of an individualproducer of intermediate goods is a profit margin (π) overthe marginal cost (ω):
pi = (1 + π) ω [5]
where:
1 + π = [η / (η–1)] ω = w/(1+µ) Ii µ / (1+µ)
Equations [4] and [5] are combined with the input demandof sector 2 (equation [3]) to find a solution for I, p3 and D.Using [1] and the solution for I, we obtain the level ofemployment in sector 3:
L3 = [(1 / n)1–f G K2a p2 / w]1/f [6]
G = (1–a) (1 + µ) (η – 1) /η
f = a – µ (1 – a)
13 Although Botswana can hardly be described as a semi-industrialized economy, it comes closest to being an exception tothis. The sustained progress of this economy seems to have beenthe result of a series of mining booms (diamond mining) withinthe context of a stable macroeconomic policy.14 This appendix is based on Ros (2000), chapters 5 (sections 2 and3), 8 (section 3) and 9 (section 1).

141C E P A L R E V I E W 7 3 • A P R I L 2 0 0 1
INDUSTRIAL POLICY, COMPARATIVE ADVANTAGES AND GROWTH • JAIME ROS
Equilibrium in the labour market
Equilibrium in the labour market means a uniform rate ofwages in sectors 1 and 3, with full employment of the labourforce (L): L = L1 + L3. Let us consider what happens withthe equilibrium wage when capital is reallocated from sector1 to sector 2. At the initial level of wages, the reduction inthe stock of capital in sector 1 causes a decline in the demandfor labour in that sector. Using the labour demand equationfor L1 and keeping wages constant, the reduction inemployment in sector 1 is given by:
–dL3 = [(1-b) p1 / w]1/b (–dK1)
The greater stock of capital in sector 2 causes an increasein the demand for labour in sector 3. Using the demandfunction for L3, the increase in employment in sector 3 at theinitial wage level is:
dL3 = [(1/n)1–f G p2 / w]1/f (a/f) K2 (a/f)–1 dK2
with -dK1 = dK2, on the assumption that the reallocationdoes not affect the total stock of capital. Whether the changegives rise to an excess supply or demand for labour dependson the size of (-dL1) compared with (dL3). Obviously, theanswer depends on the level of K2. When K2 is small, sector3 is also small and produces at very high costs, in view ofthe existence of economies of scale in this sector. As therelative price of intermediate inputs (p3/p2) is very high, thecapital intensity (K/I) in sector 2 is also very high, eventhough the absolute value of K2 is small. With a high valueof the ratio (K/I), the increase in the stock of capital in sector2 has only small indirect effects on employment in sector 3.The reduction in the demand for labour in sector 1 is thengreater than the increase in the demand for labour in sector3. A reallocation of capital from sector 1 to sector 2 thustends to create an excess supply of labour, and this requiresa reduction in wages in order to clear the labour market.
In contrast, when the level of K2 is high, the indirecteffects of the expansion of sector 2 on employment mayoutweigh the reduction in the demand for labour in sector 1.The greater scale of sector 3 has made it more productiveand reduced the relative price of intermediate goods. With alower level of capital intensity (K/I), the expansion of sector2 at the expense of sector 1 may then have the effect of givingrise to excess demand for labour and increasing theequilibrium wage.
We can formally verify that a reallocation of capital tosector 2 should first of all have the effect of lowering theequilibrium wage but later on have the effect of raising it.Substituting the labour demand functions in the fullemployment condition, we can derive an equilibrium locusfor the labour market which shows the equilibrium wage for
different compositions of the capital stock. Keeping Kconstant, the slope of this locus in the space (logw, logK2) is:
dlogw / dlogK2 = [a / f –(K2 / K1)(L1 / L3)] / [1 / f + (1 / b)(L1 / L3)]
where L1/L3, using the labour demand functions, is givenby:
L1 / L3 = (B K1 / A K2a/f) w1/f–1/b
B = [(1–b) p1]1/b A = [(1/n)1–f Gp2]
1/f
As we can see, the slope of this locus is negative, tendingtowards zero at low levels of K2 but becoming positive andtending towards “a” at high levels of K2 (on condition thatsuch high values exist because of the size of the total capitalstock). Consequently, the equilibrium value of wages firstgoes down as K2 increases and subsequently rises, becominga growing function of K2 (see figure 1).
Equilibrium in the capital market
Using the definition of the profit rate and the first-orderconditions for maximizing benefits in sectors 1 and 2, therates of profitability in these sectors may be expressed asinverse functions of the wage rate:
r1 = b (p1 / p2) [(1–b) p1 / w](1–b) / b [7]
r2 = a K2µ (1/a)/f [(1/n) G / (w/p2)] (1–f) / f [8]
Capital is assumed to be mobile between sectors 1 and2. Equilibrium in the capital market requires full use of thetotal stock of capital (K) and equal rates of profitability inthe two sectors using capital (insofar as these two sectorsexist side by side):
K = K1 + K2 r1 = r2
By replacing the expressions for the profit rate in thecondition of equality between the two rates, we can derivethe equation for an equilibrium locus in the capital market.In the space (w, K2), this locus shows the value of K2 foreach given value of wages and the corresponding compositionof the capital stock which gives the same rate of profitabilityin sectors 1 and 2. So, if there is an increase in wages, howmust the composition of the capital stock change in order tomaintain equilibrium in the capital market? Intuitively, theanswer to this question depends on which of the two sectorsmakes the most intensive use of labour. Higher wages willnaturally tend to cause a bigger reduction in the profitabilityof the sector which makes the most intensive use of labour.The reallocation required would therefore depend on the

C E P A L R E V I E W 7 3 • A P R I L 2 0 0 1142
INDUSTRIAL POLICY, COMPARATIVE ADVANTAGES AND GROWTH • JAIME ROS
effects of K2 on the relative rates of profitability.15 Theproblem is that in this model it is not clear which of the twosectors makes the most intensive direct and indirect use oflabour. Although the use of capital in sector 2 is moreintensive than in sector 1 (in the sense that a > b), theparameter of increasing returns (µ) may be sufficiently greatto cause the “indirect” share of labour in sector 2 to be greaterthan the share in sector 1. This is because of the presence ofreturns to scale in sector 3, which causes the sum of the sharesof capital and labour in the “integrated” sectors 2 and 3 to begreater than unity.
Formally, the slope of the locus for capital marketequilibrium in the space (logw, logK2) is given by:
dlogw / dlogK2 = [µ (1–a) / f] / [(1–a)(1+µ) / f–(1–b)/b]
We have, in fact, two different cases, depending on thetechnology parameters for the three sectors. Section A of figure1 shows the case where b > f. This means that (1-a)(1+µ) >(1-b), that is to say, that the “indirect” share of labour in sector2 is greater than the share of labour in sector 1. In this case, an
increase in wages (K2 being given) reduces the rate ofprofitability in sector 2 more than in sector 1. An increase inK2 (which has a positive effect on r2) is therefore required inorder to restore equality of profit rates. This means that theslope of the locus is positive.
In the second case (section B of figure 1), we have b < f.This means that (1-a) (1+µ) < (1-b): in other words, the“indirect” share of labour in sector 2 is less than in sector 1.In this case, an increase in wages (K2 being given) will reducethe profitability of sector 1 more than that of sector 2. Thisrequires a reduction in K2 (which reduces r2) in order torestore equality of rates of profitability. The slope of the locusis then negative.
In the two configurations shown in figure 1, the areato the right of the locus r1 = r2 is such that sector 2 ismore profitable than sector 1. This is because it is an areain which K2 is relatively large for each given level ofwages, and K2 has a positive effect on the relativeprofitability of sector 2. Thus, on the right of the locuscapital will flow to sector 2 and the ratio K2/K1 will tendto increase. To the left of the locus r1 = r2, in contrast, theprofitability of sector 2 is less than that of sector 1 andcapital will flow to sector 1. It follows from this that inboth cases the composit ion of the capital stockcorresponding to the intersection of the two loci is anunstable equilibrium. As the figure shows, allocation ofthe capital stock with a level of K2 which is higher than atthe intersection generates a profit rate in sector 2 which ishigher than that of sector 1. Capital thus moves to sector2 and further depresses the relative profitability of sector1. Similar mechanisms, in the opposite direction, operate
logK2
FIGURE 1
Specialization pattern for increasing returns to scale
logw
r1 = r2
r2 < r1r2 > r1
logK2
logwr1 = r2
r2 < r1
r2 > r1
A B
ww
15 If there is no effect –that is to say, if K2 does not appear in theequation for the rate of profitability of sector 2– there will be noreallocation capable of restoring the equality of the rates ofprofitability. In this case, the locus would be a horizontal straightline corresponding to the single value of wages consistent withequality of the rates of profitability. As may be seen, this is thecase if µ = 0: that is to say, if the technology of the integratedsector 2/3 has constant returns to scale.

143C E P A L R E V I E W 7 3 • A P R I L 2 0 0 1
INDUSTRIAL POLICY, COMPARATIVE ADVANTAGES AND GROWTH • JAIME ROS
for capital allocations in which K2 is lower than at theintersection.16
Multiple equilibria
We can also verify that when the two curves intersect, thisintersection is unique.17 Consequently, if an intersectionexists there will be two stable equilibria in which the wholeof the capital stock is invested in one of the two sectors. Inone equilibrium, the economy is completely specialized insector 1. As in this case there is no sector 3, not only thewhole of the capital stock but also the whole of the labourforce is employed in sector 1. In the other equilibrium, theeconomy is specialized in the production and export of thegoods produced in sector 2, and as there is no sector 1 thewhole of the labour force is employed in sector 3.
In our economy, there is always an equilibrium withspecialization in sector 1, regardless of whether or not thereare multiple equilibria. As already noted in the article, this isbecause of the assumption that sector 1 does not useintermediate inputs produced under conditions of increasingreturns. At low levels of K2, the profitability rate of sector 2will tend towards zero, while it will remain positive in sector1 however large the capital stock is. There are therefore capitalallocations at sufficiently low levels of K2 for which sector 1is more profitable than sector 2.
As there is always an equilibrium with specialization insector 1, it follows that the existence of an equilibrium withspecialization in sector 2 ensures the existence of anintersection and hence also ensures the existence of multipleequilibria. Likewise, an equilibrium with specialization insector 2 exists if the profitability of sector 2, when the wholeof the capital stock is invested in that sector, is greater thanthat of sector 1 (valued at the market equilibrium wagecorresponding to L = L3). Let us first of all consider the wagewith specialization in sector 2 (w2*). Using [6] and theconditions L3 = L and K2 = K, and solving the equation forthe wage, we have:
w2* = G (1/n)1–f p2 Ka/Lf [ 9]
Substituting [9] in [8], and making w2 * equal to w2 andK2 equal to K, we obtain the profitability rate for theequilibrium with specialization in sector 2 (r2*):
r2* = a (L/n)1–f / K1–a [10]
The profitability rate in sector 1, valued at wage w2*, isobtained by substituting [9] in [7]:
r21 = b (p1 / p2)
1/b [(1–b) n1–f Lf / G Ka](1–b)/b [11]
It should be noted that the profitability rate of sector 1,r2
1, valued at wage w2*, is an increasing function of thenumber of producers of intermediate goods (n). A largernumber of producers increases the unit cost of each of theintermediate goods and reduces the demand for labour insector 3. This has a negative effect on w2* and thereby tendsto increase the rate of profitability in sector 1, which doesnot use intermediate goods. This negative effect on wages isoffset in the case of the profitability rate of sector 2, since alarger number of producers implies higher costs in sector 2:r2* is a decreasing function of the number of producers (n).
Using [10] and [11], the condition for r* > r21 and,
hence, for the existence of multiple equilibria, is:
Ka-b > K* a-b = (b/a)b (p1/p2) [(1–b) /G]1–b n1–f Lf–b [12]
The existence of multiple equilibria depends on theendowment of capital and labour and the relative prices. Inparticular, the total stock of capital must be sufficiently largeto ensure that, when the whole of that stock is invested insector 2, the price of intermediate goods is sufficiently lowto make that sector viable. The critical value (K*) of the totalstock of capital increases with the relative price (p1/p2), whichincreases the profitability of sector 1. That profitability alsoincreases with the number of enterprises (n) in sector 3, whichadversely affects the profitability of sector 2. The effect ofthe size of the labour force on the critical value of the capitalstock depends on the sign of (f-b), that is to say, on the“indirect” share of labour in sector 2 compared with sector 1.
Let us assume that the conditions for the existence ofmultiple equilibria are fulfilled, and let us then compare thewages and profitability rates in the two equilibria. In theequilibrium with specialization in sector 2, the rates of wagesand profitability are given by equations [9] and [10]. In theequilibrium with specialization in sector 1, we have K1 = Kand L1 = L. Using equations [2] and [7], the wages and ratesof profitability in the equilibrium with specialization in sector1 are:
16 The instability of the capital allocation corresponding to theintersection is due to the existence of increasing returns to scale inthe integrated sector 2/3. At constant returns to scale, the labourmarket equilibrium locus has a negative slope (if the integratedsector 2/3 is the capital-intensive sector), while the capital marketequilibrium locus is a horizontal straight line (see footnote 15). Asthe reader can see, in this case the equilibrium corresponding tothe intersection is stable.17 In case A, this is because the capital market equilibrium locushas a more pronounced slope than the labour market equilibriumlocus at high levels of K2. The necessary and sufficient conditionsfor this are that a > b and f > 0. In case B, the intersection isunique because the capital market locus has a steeper slope, at lowlevels of K2, than the labour market locus.

C E P A L R E V I E W 7 3 • A P R I L 2 0 0 1144
INDUSTRIAL POLICY, COMPARATIVE ADVANTAGES AND GROWTH • JAIME ROS
w1* = (1–b) p1 (K / L)b [13]
r1* = b (p1 / p2) (L / K)1–b [14]
Comparison of [10] and [14] shows that r2* is greaterthan r1* if:
Ka–b > K**a–b = (b/a) (p1/p2) n1–f Lf–b [15]
Comparing [12] and [15] we can establish that K* >K**. The assumption that a > b and the second-ordercondition for a maximum of producers of intermediate goodsguarantee this inequality.18 Consequently, when anequilibrium with specialization in sector 2 exists (K > K*),the rate of profitability in this equilibrium is greater than in
the equilibrium with specialization in sector 1 (since K isthen greater than K**).
Examination of [9] and [13] shows that for w2* to begreater than w1* the total stock of capital must be such that:
Ka–b > K***a–b = (1–b) (p1 / p2) n1–f L f–b / G [16]
From [12] and [16] we can establish that K*** > K*.19
The existence of an equilibrium with specialization in sector2 does not ensure that the wages in that equilibrium are higherthan in the equilibrium with specialization in sector 1. Forthis to take place, the capital stock must be greater than K***.In that case, with K > K*** and hence with K greater thanK* and K**, there is an equilibrium with specialization insector 2 which has both profitability rates and wages higherthan in the equilibrium with specialization in sector 1.
18 K* > K** if the following condition is fulfilled:
(1–b)/b > [(1–a)/a] (1+µ) (1–1/η)
a > b means that (1-b)/b > (1-a)/a. In order for the second-ordercondition for the maximization of benefits among producers ofintermediate goods to be fulfilled, it is necessary that (1+µ)(1-1/η)< 1. Together, these inequalities ensure the fulfillment of the abovecondition.
19 This requires, as in the previous case:
(1–b)/b > [(1–a)/a] (1+µ) (1–1/η)
This inequality is guaranteed by the conditions mentioned earlier(a > b and the second-order condition for the maximization ofbenefits among the producers of intermediate goods).

145C E P A L R E V I E W 7 3 • A P R I L 2 0 0 1
INDUSTRIAL POLICY, COMPARATIVE ADVANTAGES AND GROWTH • JAIME ROS
Bibliography
Amsden, A. (1989): Asia’s Next Giant. South Korea and LateIndustrialization, New York, Oxford University Press.
Chenery, H.B. and M. Syrquin (1975): Patterns ofDevelopment, 1950-1970, London, Oxford UniversityPress.
(1986): The semi-industrial countries, in H.B.Chenery, S. Robinson and M. Syrquin, Industrializationand Growth. A Comparative Study, Washington, D.C.,World Bank.
Ciccone, A. and K. Matsuyama (1996): Start-up costs andpecuniary externalities as barriers to economicdevelopment, Journal of Development Economics, vol.49, No. 1, Amsterdam, The Netherlands, ElsevierScience Publishers, B.V.
Corden, W. M. (1984): Booming sector and Dutch diseaseeconomics: Survey and consolidation, Oxford EconomicPapers, vol. 36, No. 3, London, Oxford University Press.
De Long, J.B. and L. Summers (1991): Equipment investmentand economic growth, Quarterly Journal of Economics,vol. 106, No. 2, Cambridge, Massachusetts, The MITPress.
Dollar, D. (1992): Outward-oriented developing economiesreally do grow more rapidly: Evidence from 95 LDCs1976-1985, Economic Development and CulturalChange, vol. 40, No. 3, Chicago, Illinois, The Universityof Chicago.
Ethier, W. J. (1982): National and international returns toscale in the modern theory of international trade,American Economic Review, vol. 72, No. 3, Nashville,Tennessee, American Economic Association.
Hong, W. (1993): Trade and development: The experienceof Korea and Taiwan, in G. Hasson (ed.), InternationalTrade and Development, London, Routledge.
Kaldor, N. (1967): Strategic Factors in EconomicDevelopment, The Frank W. Pierce Memorial Lecturesat Cornell University, October 1966, Ithaca, New York,Cornell University.
Krugman, P. (1987): The narrow moving band, the Dutchdisease, and the competitive consequences of Mrs.Thatcher: Notes on trade in the presence of dynamicscale economies, Journal of Development Economics,vol. 27, Nos. 1-2, Amsterdam, The Netherlands, ElsevierScience Publishers, B.V.
Leamer, E. (1988): Measures of openness, in R. Baldwin(ed.), Trade Policy Issues and Empirical Analysis, NBERConference Report Series, Chicago, Illinois, Universityof Chicago Press.
Levine R. and D. Renelt (1992): A sensitivity analysis ofcross-country growth regressions, American EconomicReview, vol. 82, No. 4, Washington, D.C., AmericanEconomic Association.
Lin, C. (1973): Industrialization in Taiwan, 1946-72: Tradeand Import Substitution Policies in DevelopingCountries, New York, Praeger.
Matsuyama, K. (1992): Agricultural productivity,comparative advantage and economic growth, Journalof Economic Theory, No. 58, New York, Academic Press.
Rodríguez-Clare, A. (1996): The division of labor andeconomic development, Journal of DevelopmentEconomics, vol. 49, No. 1, Amsterdam, The Netherlands,Elsevier Science Publishers, B.V.
Rodríguez, F. and D. Rodrik (1999): Trade Policy andEconomic Growth: A Skeptic’s Guide to the Cross-National Evidence, NBER working paper, No. 7081,Cambridge, Massachusetts, National Bureau ofEconomic Research (NBER)
Rodrik, D. (1995): Getting interventions right: How SouthKorea and Taiwan grew rich, Economic Policy, No. 20,London, Centre for Economic Research, April.
Romer, P. (1990a): Capital, Labor and Productivity ,Brookings Papers on Economic Activity, special issue,Washington D.C, The Brookings Institution.
(1990b): Endogenous technical change, Journal ofPolitical Economy, vol. 98, No. 5, Chicago, Illinois, TheUniversity of Chicago Press.
Ros, J. (2000): Development Theory and the Economics ofGrowth, Michigan, University of Michigan Press.
Sachs, J.D. and A.M. Warner (1997): Natural ResourceAbundance and Economic Growth , Cambridge,Massachusetts, Harvard Institute for InternationalDevelopment
Sala-i-Martin, X. (1997): I just ran two million regressions,American Economic Review, vol. 87, No. 1, Washington,D.C., American Economic Association, May.
Skott, P. and J. Ros (1997): The ‘big push’ in an openeconomy with non-tradable inputs, Journal of PostKeynesian Economics, vol. 20, Armonk, New York, M.E.Sharpe Inc., Fall (p. 5).
Young, A. (1991): Learning by doing and the dynamic effectsof international trade, Quarterly Journal of Economics,vol. 106, No. 2, Cambridge, Massachusetts, MIT Press.
Wade, R. (1990): Governing the Market: Economic Theoryand the Role of Government in East AsianIndustrialization, Princeton, New Jersey, PrincetonUniversity Press.

C E P A L R E V I E W 7 3 • A P R I L 2 0 0 1146
INDUSTRIAL POLICY, COMPARATIVE ADVANTAGES AND GROWTH • JAIME ROS
147C E P A L R E V I E W 7 3 • A P R I L 2 0 0 1
BRAZIL IN THE 1990s : AN ECONOMY IN TRANSIT ION • RENATO BAUMANN
C E P A L R E V I E W 7 3
APRIL 2001
Brazil in the1990s:
an economyin transition
The 1990s have been termed “the reform decade” in Brazil,
because of the significant number of changes which took
place in various aspects of that country’s economic and
administrative policy. This article aims to systematically set
forth the main features of those changes and analyse them
in the light of the literature on reforms. It represents an
attempt to sum up various studies made on the case of Brazil
as part of a regional-level study coordinated by ECLAC. The
article finds that in various aspects the results have been in
line with those proposed by the literature in question, but
not everything has turned out as planned or desired. It
considers that this disparity of results can be explained by
factors ranging from the way the reform process was
designed, in some cases, to the different perceptions by the
economic agents of the market signals associated with those
changes.
Renato Baumann
ECLAC Brasilia [email protected]

C E P A L R E V I E W 7 3 • A P R I L 2 0 0 1148
BRAZIL IN THE 1990s: AN ECONOMY IN TRANSIT ION • RENATO BAUMANN
IIntroduction
Analysis of the Brazilian economy during the 1990srepresents much more than something which coincideswith the calendar. This period, which is an extremelyfertile area of study, displays a number of aspects whichwill continue to be analysed for a long time to come.
The international scene at the beginning of thedecade was marked by an increasingly intensive flowof capital and technological changes, although thedifficulties associated with an unstable domesticmacroeconomic environment did not allow the Brazilianeconomy to participate to the full in these newmovements. Furthermore, the economic policy-makerswere constantly being reminded of the success of theemerging economies in other regions, and the path forattaining such success seemed to be clearly marked,according to the various analysts.
At the domestic level, the growing inflation wasgiving rise to various anti-inflationary attempts, whilea new Constitution (promulgated in 1988) added furtherfiscal and social problems to an already unsettledeconomic environment.
In the second half of the decade, the context wasmarkedly different. The stabilization of prices achieved,accompanied by relative openness to foreign trade, has
no precedent in the economic history of the country.At the macroeconomic level, various important changeswere made which facilitated access to internationalcapital markets and led to a new growth pattern.
The purpose of the present article is to analyse thesefeatures in the light of the adjustment process whichtook place in the 1990s. Some aspects evolved in linewith the prescriptions of the specialized literature onreforms in developing countries. Not everything turnedout as planned or desired, however. We consider thatthe reasons for this lie in factors ranging from policydesign to the economic agents’ perceptions of themarket signals.1
This article has five sections. The following section(section II) gives a brief overview of the literature onthe reforms, and more specifically the suggestions asto the time and sequence for their application. SectionIII then gives a detailed account of the basiccharacteristics of the reforms applied in Brazil duringthe 1990s. Section IV analyses some results which donot fully correspond with the expectations, and anattempt is made to identify the reasons for this. Finally,section V relates some lessons that may be derived fromthe recent Brazilian experience.
IIThe need for reform,and the basic recipes
In general, Latin American policy-makers were exposedto a variety of pressures during the 1970s and 1980s.The economic and social distortions and shortcomingswhich existed, together with external constraints madeworse by the intensive movements in international com-modity markets and the prevailing financial difficul-
ties, further increased the need to promote substantialreforms.
The countries of the region adopted differentapproaches in the course of the period studied,2
The views expressed here are exclusively those of the authorand do not necessarily correspond with those of ECLAC or the Uni-versity of Brasilia. This text is an updated and edited version ofthe chapter published in Baumann (coord.), 2000.
1 This article is based on the 1988-1998 period. Even so, we con-sider that its findings hold good for the rest of the decade, becausealthough the economic contraction and changes in relative pricesin 1999 and the recovery in activity in the year 2000 changed someaspects, most of the basic tendencies analysed here continue tohold good.2 As may be seen, for example, from the processes of greater openness

149C E P A L R E V I E W 7 3 • A P R I L 2 0 0 1
BRAZIL IN THE 1990s : AN ECONOMY IN TRANSIT ION • RENATO BAUMANN
although in general the design of the reforms was highlyinfluenced by the orthodox reading of the results ofthe successful experiences of the emerging economiesof Southeast Asia. According to this view, reform wasan urgent task, because the sooner the adjustmentprocess was begun, the lower the costs involved wouldbe. In the words of a high World Bank official, “a delayedadjustment is more painful” (Stern, 1991, p. 3).
Market-oriented policy reforms were recommended,on the basis of four main arguments (Rodrik, 1993a, p. 7):a) economic liberalization reduces the static inefficienciesgenerated by faulty distribution and waste of resources;b) it stimulates the learning process; c) outward-orientedeconomies manage to cope with adverse external shocksbetter, and d) market-based economic systems are less proneto rent-seeking activities which lead to waste of resources.
Thus, a reform programme should include fiscaldiscipline and measures to guarantee free trade, as wellas reducing existing market price distortions to theminimum. Economies in the process of restructuringshould receive financial assistance during the transitionalperiod, as a way of reducing the costs associated withthe reforms at the microeconomic level: the adjustmentincludes reforms of both policies and institutions, becauseit is believed that such changes can improve resourceallocation, increase economic efficiency, expand thegrowth potential and heighten resistance to future shocks(Thomas, Chibber and De Melo, eds., 1991, p. 12).
The finance agencies and various academics agreedthat the measures which it was indispensable to take atthe start of the process3 included those now known asthe Washington Consensus: fiscal discipline;reorientation of public expenditure priorities towardsthe areas of health, education and infrastructure; fiscalreform (broadening of the tax base and reduction ofmarginal tax rates); establishment of competitiveexchange rates; guarantees for property; deregulation;trade liberalization; privatization; elimination of barriersto foreign investment, and financial liberalization.
This ideal roadmap for a system free of distortionssheds little light on how to cope with some crucialaspects, however (Conley and Maloney, 1995), suchas: how to minimize the costs of the adjustment; howto cope with the implications of different rates ofadjustment between sectors; the right macro-policy toapply during the reforms (specifically, how to manage
the exchange rate), and how to minimize theconsequences for social welfare of leaving one sectorcontrolled while others are freed of State intervention.
In an ideal world, anyone who had to reform –forexample– trade policies would not need to bother withthese intermediate stages, as the optimum policy wouldbe an immediate leap to free trade, unless there werespecific market distortions (Mussa, 1986).
In practice, however, proper design of the reformprocess is essential, and not only for the benefit ofacademic appraisals or in order to ensure politicalsupport for the reforms. Credibility is an essential aspectwhich must be taken into account (Calvo, 1989). Lackof confidence in the durability of a reform brings indistortions which can end up by destroying it: the reformprocess can be reversed simply because people believeit is only going to have a short life.4
The need to recommend a particular path to followin the reform process has given rise to a literaturefocussing on the proper moment and sequence of thereforms which also emphasizes the importance ofeliminating all uncertainty about the government’sintentions.
The major part of the debate has been on whethertrade liberalization should precede or followliberalization of the capital account.5 Experience hasshown that a macroeconomic imbalance at thebeginning of a period of reforms can affect the finalresults. There is therefore an additional and morespecific debate on the sequence that should be followedin an initial economic environment of high inflation,with special attention to synchronization between theprice stabilization process and the reforms proper.6
Another aspect connected with the analysis of thereforms7 is the relation between reform of the domestic
in Argentina, Chile and Uruguay in the late 1970s and early 1980s, ascompared with the later trade reforms in Bolivia, Brazil and Mexico.3 According to Williamson (1990).
4 A simple example is that of a trade reform which is only perceivedas being temporary. The economic agents may perceive thatimported goods will only temporarily be cheaper: in thosecircumstances, they will assume bigger debts than they normallywould, simply by bringing forward their consumption. If they canobtain finance (in the belief that they will have higher permanentincomes) through an open capital account, present consumptionwill increase (Conley and Maloney, 1995). The current accountimbalance resulting from such actions can lead to the restorationof trade barriers and consequent reversal of the original trend.5 The literature does not express any clear conclusions on the pointin time at which the reforms should also include other markets,such as the labour market (an inevitable step if trade opennesscontinues).6 This was a matter of great interest for Brazil in the early 1990s.7 Strongly influenced by the Chilean experience in the early 1980s.

C E P A L R E V I E W 7 3 • A P R I L 2 0 0 1150
BRAZIL IN THE 1990s: AN ECONOMY IN TRANSIT ION • RENATO BAUMANN
financial sector and liberalization of the balance ofpayments capital account. Especially in countries withhigh rates of inflation, the fiscal deficit and interventionsin the financial market often result in artificially lowdomestic interest rates. When opening of the capitalaccount takes place in a context in which domesticinterest rates are being kept below their equilibriumlevel, the result will be the draining-away of resources.If the fiscal deficit is under control, however, thereformed domestic financial market will operate atequilibrium interest rates.
There would thus appear to be little to discussregarding the sequence between reform of the domesticfinancial market and liberalization of capitalmovements: the barriers to international capitalmovements should not be eased before the domesticfinancial sector is liberalized.8
A number of authors have also argued thatliberalization of the capital account should only takeplace after trade and other distortions have beeneliminated (McKinnon, 1982). By giving rise to inflowsof capital, the easing of controls on capital leads to anincrease in the level of aggregate expenditure, both ontradeables and on non-tradeables, which will in turnpromote a real revaluation of the currency, hinderingor even frustrating foreign trade liberalization.9
Although the opening of the capital account usuallyleads to a real revaluation of the currency, it is knownboth theoretically and empirically (Choksi andPapageorgiou, eds., 1986),10 in respect of a number ofcases of trade policy reform, that successful tradeliberalization generally requires real devaluation of thecurrency.
Thus, in principle trade reform should be adoptedbefore eliminating controls on foreign capital flows.This conclusion gives rise to two other dilemmas,however.
Firstly, it is not clear from this debate whether agradual reform is preferable to one that takes place moreabruptly. As Edwards (1990) explains, a gradualapproach can have characteristics which either increase
or compromise the credibility of the reforms, dependingon the real conditions in each country: if it reducesunemployment or makes possible fiscal balance, agradual reform will tend to generate greater credibility,but at the same time, a slower reform process couldallow the groups affected by the new policies toorganize themselves in order to act against them.
Another aspect is the relation between the reformsand price stability. Economic theory offers fewguidelines in this area. Even so, experience suggests(Corbo and Fischer, 1992) that in economies with acutemacroeconomic problems reforms should only bebegun after suitable reduction of the imbalances inquestion: instability limits the benefits of reforms aimedat improving resource allocation through changes inrelative prices.
With regard to trade liberalization –the first stagein the proposed reform scheme– there are threearguments in favour of delaying it until inflation is undercontrol (Rodrik, 1993b). First, the already mentionedvariability of relative prices, which affects the way theadvantages of the greater efficiency are passed on.Second, trade liberalization could affect fiscal incomeif the reduction or elimination of duties on trade exceedsthe fiscal income deriving from the increase in tradeactivity. Third, liberalization requires a compensatorydevaluation of the exchange rate in order to protect thecurrent account, and this would affect domestic pricestabilization, through the cheaper imports favoured bya revalued currency.
The exchange rate argument calls for somedetailed considerations. From the theoretical point ofview, this is the aspect which imposes the most seriousrestrictions on trade liberalization.11 As far as thisarticle is concerned, this matter is directly related withproper understanding of the Brazilian experience since1994.
The debate on the application of reforms in acontext of stabilization policies has been concentratedon whether the reforms can effectively facilitate theprocess of reducing inflation, since trade liberalizationshould make possible price stabilization by forcingconvergence between the rates of variation of thedomestic and external prices of tradeable goods.Whereas trade liberalization requires compensatoryexchange rate devaluation (because of wage rigidities),however, price stabilization requires, on the contrary,avoidance of such devaluation, so that the exchange
8 Edwards and Edwards (1987) and Edwards (1990). As we shallsee below, the question of regulation of the liberalized financialsector is also of fundamental importance.9 Another way of presenting this argument is based on the rate ofadjustment of the goods and financial markets: since the former isslower to adjust than the latter, a homogeneous reform will requirethe liberalization of the goods markets before the financial mar-kets.10 It is considered that real devaluation of the currency is a neces-sary condition for successful trade liberalization. 11 See the analysis in Rodrik (1993b).

151C E P A L R E V I E W 7 3 • A P R I L 2 0 0 1
BRAZIL IN THE 1990s : AN ECONOMY IN TRANSIT ION • RENATO BAUMANN
rate can be used either as a means of attaining a realgoal (in which case it forms part of the process of fixingprices and wages) or as a nominal anchor for domesticprice levels (in which case it leads this process).
Furthermore, when accompanied by financialliberalization,12 real exchange rate revaluationtends to compromise the credibi l i ty of theliberalization process, or else, once the initial excessof capital inflows is over, the expectations of realdevaluation may lead to higher real interest rates,precisely at a time when the productive sector isgoing through the difficult period of adjustmentfollowing the easing of trade restrictions (Edwards andEdwards, 1987).
However, this dilemma over the exchange rate maybe illusory, if over-valuation of the exchange rate isviewed as the price that must be paid for ensuring thecredibility of the process. If, on the one hand, inflationhas a strong inertial component linked to indexing orthe accommodation of key nominal variables13 todelayed variations in price levels, then on the otherhand, in order to be credible a policy must not onlyfight inflation but must also eliminate the nominalrigidities which make it necessary to use devaluationto ensure competitiveness.
From this point of view, exchange rate overvaluationmay be considered as an appropriate approach, althoughnot devoid of risks. For a public which has alreadywitnessed the failure of many anti-inflation plans due tothe lack of political will, an ambitious package whichattacks all the sources of inflation may be taken toindicate the presence of a government with cleardecisions and well-defined policies, so that a reversal ofpolicy in the event of temporary problems will be lesslikely. Thus (Rodrik, 1993b), the use of the exchangerate as a nominal anchor may not necessarily conflictwith trade liberalization, since if that anchor works,nominal wage rigidity will finally disappear andsustainable competitiveness will be more likely.
The last two observations regarding the reformsare connected with the fact that: a) open market policiesgenerate their own group of interested parties (Rodrik,1992) –as new opportunities for gain appear, thebusiness community benefitted by the post-inflationsituation will tend to fight against any attempt to reversethat state of affairs; and b) a reformed system does notnecessarily mean the elimination of rent-seekingactivities –as long as governments are responsible forapplying policies, individuals will always try to obtainbenefits for themselves (Rodrik, 1993a).
IIIThe reforms and the economy inthe 1990s
The 1990s are considered as the “reform decade” inBrazil. Although some initial actions were taken in thelate 1980s –such as foreign trade liberalization and thefirst privatization operations, for example– the mostsignificant stages only began to be fulfilled from 1990on.
This decade represented a turning-point in thecountry’s economic history. After having been for theprevious four decades a closed economy with a strongpresence of the State as a producer of goods and
services, and after a long period of high inflation withindexing, at the end of the 1990s Brazil became aneconomy with a marked degree of openness tomerchandise trade and capital14 and a simultaneousreduction in the function of the State as a directproducer.
In addition, the economy attained anunprecedented degree of price stability which hasalready lasted for over six years: the consumer priceindex rose to a record level of 2,489% in 1993 but
12 The elimination of inflation-related gains as a result of a suc-cessful stabilization process could lead the financial sector to seekother sources of finance.13 Wages, the monetary aggregates and the exchange rate.
14 According to estimates by Mesquita (1999), the imported com-ponent of industrial production rose from 4.3% in 1989 to 20.3%in 1998.

C E P A L R E V I E W 7 3 • A P R I L 2 0 0 1152
BRAZIL IN THE 1990s: AN ECONOMY IN TRANSIT ION • RENATO BAUMANN
gradually went down to single-digit values by 1996,standing at 5.3% in the year 2000.15
In order to understand the reforms and their effects,it is necessary to take into account the extremelysignificant impact of a price stabilization process likethat which took place in this period: a) it generated a“wealth effect” which affected both consumers andproducers; b) the stable macroeconomic situationcreated a political environment favourable to thereforms; c) it inspired confidence among Brazilian andforeign investors, and d) at the same time it eliminatedthe substantial gains obtained by the government andthe banking sector from inflation, with importantconsequences for monetary and fiscal policy as well asfor the design of the new regulations for the financialsector as a whole.
The specialized literature on policy reforms usuallytakes a taxonomic approach in which various levels ofmeasures are identified. According to this view, Brazilhas almost completed its first-generation reforms, whichbegan with trade openness and the privatization of Stateenterprises in the late 1980s and has been furtherintensified since the early 1990s. The country has alsotaken a number of steps towards second-generationreforms such as those in social security, publicadministration and fiscal policy.
There were also other policy changes in the sameperiod which had important consequences for theeconomy. Social programmes were thoroughlyredesigned in order to incorporate the new universalrights guaranteed by the 1988 Constitution and toovercome fiscal difficulties and spread the burden ofproviding services among the federal government, thestates and the municipalities.
On the social level, as well as in other areas suchas science and technology, there was growing (althoughstill insufficient) private sector participation in thefinancing of various activities. The recent fiscal resultsand the forecasts for coming years suggest that this is afeature which could be further accentuated in the future.
This does not mean that the reforms havenecessarily been in the right direction, that they havebeen properly applied, and much less that they are nowcomplete. There can be no doubt, however, that theyhave substantially changed the production environmentin recent years.
It might be wondered why such a concentration ofreforms took place in this particular period of time. Theanswer has to do with the increasing perception of thedomestic economic actors –government authorities,employers and analysts from the academic field– thatchanges were very necessary. The conjuncture of thefinal stages of the multilateral trade negotiations, therenewed access of other Latin American countries tofinance, and the fiscal policies applied in othereconomies16 acted as a stimulus for the reformers.
The reforms –especially privatization and theredesign of social security– called for major changesin the Constitution. Political will and power weretherefore needed, and these could only be attained onthe basis of consensus among the economic agents.
Figure 1 shows the sequence in which the mainreforms took place. The process began with the reformof trade policy and, early in the 1990s, some sporadictentative moves towards the privatization of publicassets, followed by the opening of the balance ofpayments capital account. The second generation ofreforms only began in the second half of the decade,with reforms in public administration and socialsecurity, accompanied by a series of changes in varioussocial programmes covering education, health and thereduction of poverty.
1. Trade reform
Trade reform began in 1987, with the first change inthe nominal tariff structure in 30 years and a progres-sive reduction in tariff rates which gained pace from1990 on.17 The simple (unweighted) tariff rates wereas follows:
1988-1990: 33.4%1991-1993: 17.8%1994-1996: 12.9%1997-1998: 13.9%
There were two points at which the tariff reductionprocess speeded up: in 1990, and again in late 1994. Inboth cases one of the main arguments for carrying outthe process was the need to provoke a competitivenessshock among Brazilian producers, breaking up
15 As we shall see below, in spite of the marked exchange rate de-valuation in 1999, the consumer price index only rose by 8.4% inthat year.
16 The tax and interest rate differentials were an important stimu-lus for arbitrage-related international financial movements.17 A full examination of the changes in trade policy in the 1990sshould also take into account the fact that, for the first time in itshistory, Brazil formed part of a regional integration process, whichbrought in some important additional considerations.

153C E P A L R E V I E W 7 3 • A P R I L 2 0 0 1
BRAZIL IN THE 1990s : AN ECONOMY IN TRANSIT ION • RENATO BAUMANN
monopoly situations and using trade policy as acomplement to the price stabilization process.18 The1990 trade reform was broadened to include theelimination of non-tariff barriers and various exportincentives, as well as a significant reform of theinstitutional structure responsible for foreign tradepolicy. The 1994 reform led to partial advanceapplication19 of the MERCOSUR common external tariff,which would otherwise only have come into effect inJanuary 1995.
Consequently, analysis of the impact of tradereforms on the balance of payments is not direct,because: a) due to the special features of the very largedomestic market which had been closed for so manyyears, some time passed before imports reached asignificant level; b) the growth of exports was the resultof two simultaneous processes: multilateral tariffreduction and the regional preferences in force inMERCOSUR; c) the price stabilization after 1994 causeda “wealth effect” which affected domestic demand forimported goods, and d) exchange rate policy kept thecurrency markedly overvalued up to 1999, and thisaffected foreign trade.
Taking account of these preliminary observations,it may simply be noted that the trade surpluses whichaveraged US$ 13 billion between 1992 and 1994 turnedinto trade deficits of US$ 6 billion in the 1995-1998period.20 The import coefficient21 rose from 5.5% in1990-1993 to 7.2% in 1995-1997 (see figure 2). Theimported goods in greatest demand were raw materialsand intermediate products, capital goods and motorvehicles. The importance of this import structure forthe domestic investment cycle and some productionsectors will be analysed later on in this article.
The trade reforms were substantial and reallyserved to: i) increase the imported component indomestic production,22 which ii) raised theproductivity of labour23 and iii) increased theconsumer surplus (total imports of consumer goods
FIGURE 1
Brazil: A decade of reformsa
1988 1989 1990 1991 1992 1993 1994 1995 1996 1997 1998 1999 2000or earlier
Trade reform * * * * * * * * * * *Opening up to external * * * *
financial capitalPrivatization * * * * * * *Regulation of financial
sector * * * * * *Reform of social security * * * * *Administrative reform * *Reform of social
programmes:Education * * * * * *Health * * * * * *
Source: Prepared by the author.
a The asterisks indicate the approximate date of the main measures designed to regulate each of the reform processes rather than the date ofthe greatest intensity of change. It is important to bear this in mind, for example, in the case of the privatization process, which was muchmore intense in 1998, in terms of the real value of the transactions carried out, than in any previous period.
18 There is still some criticism of the way these changes were car-ried out. For a detailed description of the 1994-1996 tariff reforms,see Baumann, Rivero and Zavattiero (1997).19 In September 1994.
20 In spite of the sustained expansion of exports, which registeredan average annual growth rate of 6% between 1994 and 1998, andthe improvement of almost 20% in the terms of trade between 1991and 1995.21 Total imports/GDP (percentage).22 Data from the IBGE show that in 1990 only 11% of gross fixedcapital formation in machinery and equipment corresponded toimported goods, but by 1997 this percentage had risen to 41% (Saínzand Calcagno, 1999).23 Bonelli (1998) estimates that labour productivity in the manu-facturing sector rose at the rate of 8.7% between 1991 and 1997,compared with an average rate of 0.3% between 1981 and 1989and a rate of 5.6% in the early 1970s.

C E P A L R E V I E W 7 3 • A P R I L 2 0 0 1154
BRAZIL IN THE 1990s: AN ECONOMY IN TRANSIT ION • RENATO BAUMANN
increased from US$ 2.6 billion in 1990 to US$ 11billion in 1998), but their impact on exports was offsetby overvaluation of the exchange rate24 and the increasein wages25 (especially in industry).
2. Opening-up to financial capital
There was also concern in the early 1990s to establishconditions which would enable the Brazilian economyto take advantage of the growing facilities for access tointernational capital markets which existed at that time.
Ever since the 1950s, Brazil has stood out amongthe developing countries because of the large share offoreign capital in its production structure.26 Up to theend of the 1970s, it was one of the countries whichreceived most foreign investment. The situationchanged during the crisis of the 1980s, and quite awidespread perception grew up that the economy was
missing out on the opportunities created by financialglobalization, which were more plentiful in that decadethan in any other period.27
This led to the adoption, beginning in 1991, ofvarious specific policy measures aimed at creatingfavourable conditions for attracting portfolioinvestments. As a result, flows of such investments,which amounted to less than US$ 800 million up to1992, already rose to nearly US$ 7 billion in 1993. Thesystematic deficits registered on the balance ofpayments capital account between 1985 and 199128
turned into a surplus of US$ 25 billion in 1992.It may be noted that this was a period of somewhat
limited economic activity: the GDP growth rates in 1991and 1992 were 1% and -0.3%, respectively, rising to4.5% in 1993. The inflow of resources was thereforemainly due to the changes made in domesticlegislation29 and the relatively low levels of the equitycapital of Brazilian companies after several years ofinflation and low growth rates.
The recovery of domestic economic activity,30
together with the opportunities created by theprivatization process, subsequently caused foreigndirect investment to exceed the flows of portfolioinvestments, FDI flows (in billions of dollars) beingapproximately 0.9 in the 1990-1993 period, 2.2 in 1994and 3.3 in 1995, but then rising to unprecedented levelsof 9.6 in 1996, 17 in 1997, 26 in 1998, and 30 in 1999.
3. Privatization
The new favourable conditions offered to foreigninvestors, together with a favourable internationalenvironment, gave rise to the first expectations of majorforeign participation in the privatization of Stateenterprises. In reality, this was one of the main obstaclesencountered by the programme in its initial stages,although the actual results would have shown that suchfears were exaggerated, since the share of foreigninvestors in the national privatization programme31
represented less than 1% of total income.
FIGURE 2
Brazil: Trade balance, 1980-1999
Bill
ions
of d
olla
rs
Exports Imports
Source: Central Bank of Brazil.
24 Exchange policy during the 1990s was quite varied. Starting witha situation where the market was allowed to determine theequilibrium exchange rate (as a new means for breaking a long-standing and generalized indexing process), the government foundit necessary to adopt a system of currency bands, which underwentsome modifications in the course of time. In January 1999, externalpressures which had built up as a result of the accumulatedovervaluation led to a new free-floating system.25 A bilateral dollar-real index, deflated by the wholesale priceindexes prevailing in mid-1994, would show that the real wasovervalued from July 1994 to March 1996, with a peak of 17 pointsin February 1995. Bonelli and Fonseca (1998a) give some detailsin this respect: while the competitiveness of labour increased by62% between 1990 and 1996, the average wage in dollars rose by84%, so that the gains in terms of productivity were more thanoffset by the increase in labour costs. In other words, the reductionin competitiveness was not due solely or even mainly toovervaluation of the exchange rate: wages in industry, deflated bythe wholesale price index, increased by 76% over the period,compared with a 5% revaluation of the real vis-a-vis the dollar.26 It is calculated (Chudnovsky and López, 1997) that, in 1995,92% of total sales in the motor industry, 59% in the pharmaceuticalindustry, 56% of sales of domestic appliances and 44% of the salesof the beverages and tobacco industry in Brazil were linked withforeign companies.
27 Brazil’s share in total world foreign direct investment was asfollows: 1970-1975, 5.1%; 1976-1980, 6.3%; 1981-1985, 4.4%;1986-1990, 1.2%; 1991-1995, 1.3%, and 1996, 2.7%, accordingto United Nations Conference on Trade and Development (UNCTAD)(various issues).28 Due to amortization payments on the external debt.29 And also to international liquidity.30 After a rate of -0.3% in 1992, GDP growth averaged 4.5% in thefollowing four years.31 According to Pinheiro and Giambiagi (1998).
020406080
1980
1982
1984
1986
1988
1990
1992
1994
1996
1998

155C E P A L R E V I E W 7 3 • A P R I L 2 0 0 1
BRAZIL IN THE 1990s : AN ECONOMY IN TRANSIT ION • RENATO BAUMANN
The privatization efforts began in the early 1980s,32
but it was only in the mid-1990s that the process reallygot under way. In the period from 1991 to 2000, thetotal income from the privatization programmeamounted to US$ 58 billion (in respect of enterprisesbelonging to the federal government), plus US$ 33billion in respect of enterprises owned by the federalstates. All this came to a total of US$ 74 billion forsales of assets, plus US$ 18 billion in respect of debttransfers (see table 1).
Between 1991 and 1994, only quite a small numberof enterprises were privatized, for a total income of US$8.6 billion. It was in this phase that the privatization ofthe industrial sector was completed, however, with thesale of all the most important State enterprises: thosein the iron and steel, petrochemicals and fertilizerssectors accounted for over 90% of the State’s industrialactivities. A curious aspect of this stage was that a thirdof the total income corresponded to federal bonds.33
The total amount of resources involved –more thanUS$ 92 billion over a period of 8 years–34 makes thisone of the biggest privatization processes in the world,and it will certainly have a powerful impact on theproduction sector. The process had a dual rationale: theenterprises were sold in order to improve generalefficiency, but in a number of cases there were strongfiscal motives.35
4. Fiscal accounts
The successful plan to combat inflation and privatizeState enterprises did not have the positive effects onthe fiscal accounts obtained in other countries, how-ever. On the one hand, fiscal income was indexed be-fore the stabilization process.36 Moreover, some items
of expenditure increased after stabilization, such aspublic sector wages37 and expenditure on social secu-rity, reform of the health sector, and adjustment of thefinancial sector.
As a result, there was a deterioration in the fiscalresults from a surplus of 1.4% of GDP in 1994 to a deficitof approximately 8% of GDP in 1998. The nominalinterest rates needed to finance this deficit38 were keptat very high levels,39 often exceeding 3% per month,while monthly inflation rates were around 0.3% (andwere even negative in some months in 1997 and 1998).
5. Financial restructuring
The elimination of transfers to the banking sector(generated by inflation)40 after price stabilization
32 In 1979 the government set up a special ministry for the controlof State enterprises, charged with limiting the number of enter-prises belonging to the State. It was only in 1981 that the firstspecial commission on privatization was set up (Pinheiro andGiambiagi (1998)).33 For a detailed account of the whole process of privatization inBrazil, see Pinheiro (1996).34 With a significant number of enterprises still for sale in the en-ergy and telecommunications sectors.35 For example, in the case of the states privatization was impor-tant because of its stronger fiscal impact: whereas the enterprisesbelonging to the central government obtained a fiscal surplus equalto 0.1% of GDP on average during the 1995-1998 period, those be-longing to the states had a deficit of 0.5% of GDP over the sameperiod. See Pinheiro and Giambiagi, 1998.36 The “Olivera-Tanzi effect” associated with the end of inflation-ary processes was only small: in the years with high rates of infla-
TABLE 1
Brazil: Privatization programme, 1991-2000(Millions of dollars)
Sector Number of Assets Debt Totalenterprises sold transferred
Iron and steel 8 5 562 2 625 8 187Petrochemicals 27 2 698 1 003 3 701Electricity 3 3 907 1 670 5 577Railways 6 1 697 — 1 697Mining 2 3 305 3 559 6 864Telecommunications 21 26 978 2 125 29 103Others 14 2 583 344 2 927Federal enterprises 81 46 730 11 326 58 056Enterprisesbelonging to the states 26 26 866 6 750 33 616
Total 107 73 596a 18 076 91 672a
Source: Pinheiro and Giambiagi (1998) and Banco Nacional deDesenvolvimento Econômico e Social (n/d).
a Including sales of minority holdings.
tion this effect was in reality positive, since the indexed incomeassociated with arrears of payment generated fresh gains for thegovernment.37 It is calculated that the public sector wage policy applied in 1995(whereby wage adjustments were on the basis of past inflation)increased the wage bill by 15% to 20%. Furthermore, the significantincrease in the minimum wage in that year also affected socialsecurity expenditure.38 And to neutralize the monetary impact on the flow of externalresources.39 And rose even higher in response to the external shocks in 1995,1997 and 1998.40 These transfers were generated by the decline in the real valueof deposits. It is calculated that they amounted to 4% of GDP in1990-1993, but disappeared as from 1995.

C E P A L R E V I E W 7 3 • A P R I L 2 0 0 1156
BRAZIL IN THE 1990s: AN ECONOMY IN TRANSIT ION • RENATO BAUMANN
caused the monetary authorities to create newmechanisms for avoiding systematic crises in thefinancial sector. The rapid drop in inflation rates gaverise to a bigger demand for money, so that in 1998 thebroadest monetary concept (M4) was double that of1994 in real terms, while credit to the private sectorincreased fourfold in those four years.
However, this expansion of credit includes bothnormal finance and a significant number of resourcesused to restructure the banking sector. The eliminationof the gains generated by inflation, together with thebig rise in interest rates (see figure 3) as from March1995,41 gave rise to enormous difficulties for a numberof private and public banks, so that restructuring of thebanking sector was a very necessary measure.42
The monetary authorities were obliged to intervenea number of institutions and had to create variousinstruments for dealing with the problems encountered.The most important of the mechanisms used were creditprogrammes to finance institutions in difficulties, atboth the federal and state levels, together with theredesign of the sector as a whole through mergers orthe sale of private and public banks with liquidityproblems.43 This led to the elimination of most of theinstitutions owned by the state governments. As a resultof this process, the banking system managed to copewith the 1997-1998 external shocks with a total loan/assets coefficient of 35% and a capital/reserves ratio of13%.44
6. Financing social expenditure
The macroeconomic adjustment also had effects in thearea of social expenditure. In the early 1990s, socialpolicies were usually financed through monetary trans-fers. The enormous number of potential clients was atvariance, however, with a system which depended to alarge extent on contributions45 and had a large numberof administrative bodies and service networks, togetherwith strong concentration of resources (two-thirds) in
the federal government, which led to faulty targetingof social programmes. Furthermore, the considerablenumber of social funds and the fact that they were linkedto specific expenditure items meant that resources forsocial expenditure were highly sensitive to the eco-nomic cycle (Draibe, 2000).
The 1988 Constitution reduced the links betweencontributions and the financing of the system,46 madeaccess to social services a universal right, andestablished minimum levels of social benefits. The mostradical change was in the area of health, with thecreation of the single health system, covering bothhealth and social security services.
The paradoxical feature of all this is that in theearly 1990s there was feverish legislative activity toregulate the new constitutional provisions, yet at thesame time there was a drastic reduction in socialexpenditure47 and in the institutional facilities forproviding social services. In the middle of the decade anew social development strategy was adopted whichtook into account the universal right of access to basicsocial services and included employment and incomeprogrammes to generate new opportunities, withpriority for universal programmes.48
Since 1994, in spite of the fiscal difficulties facingthe states and municipalities, both have been taking on
41 Average nominal monthly rates for inter-bank transactions rosefrom 3.2% in February to 4.4% in March 1995.42 The proportion of operations where recovery of the funds wasdoubtful rose from less than 9% of the total number of loans tonearly 14% by the end of 1995 (Baumann and Mussi, 1999).43 Between July 1994 and December 1997, 42 banks out of a totalof 271 were affected by such problems.44 That is to say, higher than the 8% ratio recommended by theBasle Committee.45 Fixed percentages of wages and profits, together with other semi-fiscal sources of income.
46 Although financing continued to be heavily dependent (58% in1996) on such contributions.47 Government social expenditure went down from 11.4% of GDP
in 1990 to 9.7% in 1992 (a period of recession). Each of the areaswas affected differently: whereas federal expenditure in 1993 onhealth, nutrition and drinking water supply and sanitation was only50-60% of its 1989 level, expenditure on social security doubledover the same period (Draibe, 2000).48 Social expenditure as a proportion of GDP increased by approxi-mately 4% between 1990-1991 and 1996-1997, reaching almost20%. In the same period, the share of social expenditure in totalpublic expenditure remained practically unchanged (59%) (ECLAC,1999).
FIGURE 3
Brazil: Nominal monthly interest ratesand inflation, 1995-1999
Per c
ent
Jan
95
July
95
Jan
96
July
96
Jan
97
July
97
Jan
98
July
98
Jan
99
July
99
Interest rate Inflation
Source: Central Bank of Brazil.
6420
-2

157C E P A L R E V I E W 7 3 • A P R I L 2 0 0 1
BRAZIL IN THE 1990s : AN ECONOMY IN TRANSIT ION • RENATO BAUMANN
more and more responsibility for the financing of socialprogrammes, thus reducing the amount of resourcesprovided by the central government.49
According to Draibe (2000), in 1995 the federalgovernment was still responsible for the major part ofexpenditure, in 8 out of a total of 14 social programmes.In 1995, the joint social expenditure of the federal, stateand municipal governments was equivalent to 21% ofGDP, and 85% of that amount was devoted to education,health, social assistance and benefits of public officials.
Price stabilization and political will were the factorswhich made possible better targeting and greaterselectivity of programmes, new expenditure procedures,and more clearly defined technical criteria for theallocation of resources. Social programmes concentrateon two lines of action: investment in human resourcesand social assistance, and programmes for combatingpoverty.
7. Reform of the pension system
The need to reform the social security sector becameevident in the late 1980s, due to a number of factors:up to then, the system had been incorporating membersfaster than the rate of increase of the number ofbeneficiaries, and even at a faster rate than the growthof the labour force, but there was a significant changein the demographic pattern of the population, and the1988 Constitution brought rural workers into thesystem.50 The number of new pensioners between 1991and 1995 was almost two million, while the averagepension almost doubled in value over that period and athird of the rural population of pensionable age receivedpensions (Dias and Amaral, 2000).
Furthermore, there is the fact that the lifeexpectancy of the population has been increasing inrecent decades. As the system allowed members to retire
on the basis of their number of years of service, in 1995two-thirds of the new pensioners were only 54 yearsold, with a remaining life expectancy of over 22 years.In 1998, social security expenditure absorbed almost10% of GDP,51 and there were almost 19 million realbeneficiaries. In that year, the social security deficitamounted to some 3% of GDP, due mainly (75%) to thebenefits paid to public employees.
The reform of the social security system thereforeinvolved the establishment of a maximum value forpensions as well as a minimum age for retirement.Moreover, military personnel were obliged to begin topay contributions.
8. Investment and productivity
As was to be expected, price stabilization and tradeopenness promoted economic activity and investment,both through increased domestic demand for consumergoods and through easier access to cheaper capitalgoods.52
In the early 1990s (especially between 1990 and1992), most manufacturing enterprises went through aprocess of rationalization of their production, as one ofthe ways of facing up to the competition from importedproducts. With the disappearance of inflation, the returnson investment became relatively high, because of thelower cost of equipment and parts, the fact that mostenterprises had already gone through a rationalizationprocess, and progress made in overcoming thetechnological backwardness of the sector thanks to thenew equipment installed. All this helped to increase factorproductivity in industry, although it also made the sectormore capital-intensive.53
Investment in the industrial sector was concentratedmainly on modernization, with only a limited increasein production capacity in some specific sectors.54
Classifying sectors by capital formation reveals adifferent picture from that observed in previousinvestment cycles, such as the 1970s. Table 2 showsthe basic information in this respect.
49 This has been possible thanks to the bigger transfers of resourcesfrom the federal government to the states and municipalities andthe improvement in the latter’s fiscal income: in 1980 the statesreceived 25% and the municipalities 9.6% of total income, but in1991 the corresponding shares were 27% and 16% (Draibe, 2000).50 The amount of the retirement pension is calculated on the basisof the last 36 months of contributions to the system, up to amaximum of approximately US$ 1,000. Public employees, however,can retire with a pension equivalent to their last salary. Ruralworkers are guaranteed retirement pensions, but do not makecontributions. It is considered that the transfer of resources resultingfrom the inclusion of rural workers in the social security systemhas helped considerably in reducing the percentage of families underthe poverty line from 41% in 1990 to 20% in 1996, according toECLAC estimates (ECLAC, 1999).
51 Taking account of both public and private pension schemes.52 This effect was further amplified by the overvaluation of theexchange rate during most of the second half of the decade.53 According to estimates by Bonelli and Fonseca (1998b), theannual increase in total factor productivity rose from an average of1% in the 1980s to 2.1% in the 1990-1997 period. According toNeri and Camargo (1999), industrial production increased by 10%between 1991 and 1995, while employment in the industrial sectorwent down by 22% over the same period, resulting in a 40% increasein labour productivity.

C E P A L R E V I E W 7 3 • A P R I L 2 0 0 1158
BRAZIL IN THE 1990s: AN ECONOMY IN TRANSIT ION • RENATO BAUMANN
The sectors which had led the way in investmentin the 1970s –industry, mining and petroleum– had asmaller share of gross capital formation in the 1990s.Investment in infrastructure (electric power,telecommunications, transport and drinking watersupply and sanitation) went down in the 1990-1994period to between a half and a third of the valuesregistered in the 1970s. If the first and second halvesof the 1990s are compared, it will be noted that therewas a decline in absolute terms in investment in electricpower, a more or less stable pattern in the transportand drinking water supply and sanitation sectors, and amarked increase in telecommunications.
In the industrial sector, consumer goods registeredthe fastest increase (the most dynamic segments werethose of consumer durables, led by the transnationalcorporations), thanks to the marked “wealth effect”resulting from price stabilization.55 In the case ofintermediate and capital goods, the results wereunfavourable.
The three new elements affecting investments inthe second half of the 1990s were the incentives offeredby states and municipalities,56 the environment whichexisted after privatization, and the imported componentin investment and production processes. Another
important feature of investment from the mid-1990son is the fact that much of it is associated with theexploitation of the country’s comparative (static)advantages in natural resources.57
This raises the question of how far the industrialgrowth model in recent years has been based on theresource endowment, and hence how far it depends onthe international commodity market.58 A specializationpattern centered on production segments with sluggishdemand raises doubts about its long-term sustainabilityand its vulnerability to fluctuations in outside markets.An important aspect is therefore the real capability ofthe economy to support an alternative model favouringmore technology-intensive products.
9. Production development policies
Up to the late 1980s, Brazil’s science and technologypolicy was concentrated on the construction ofinfrastructure for research and development, along two
TABLE 2
Brazil: Gross fixed capital formation, 1970-1997(As a percentage of GDP, at constant 1980 prices)
1970-1980 1981-1989 1990-1994 1995-1997
Manufacturing 4.5 3.2 2.0 3.3Mining 0.2 0.2 0.1 0.1Petroleum 0.9 1.0 0.4 0.4Infrastructure 5.4 3.7 2.3 2.2Electricity 2.1 1.6 0.9 0.6Telecommunications 0.8 0.4 0.5 0.7Transport 2.1 1.5 0.8 0.8Drinking water supplyand sanitation 0.5 0.2 0.2 0.1Others 12.5 9.7 10.1 11.1
Total gross fixedcapital formation 23.5 17.8 14.9 17.1
Source: Bielschowsky (coord.), 1998.
54 In some sectors, such as the motor industry, there was indeedmore completely new investment, encouraged by the fiscal incen-tives provided. In most sectors, however, investment projects wereaimed above all at modernization.55 The only exception was that of textiles.56 These were of decisive importance in the unprecedented geo-graphical relocation of factories within the country in recent years.
57 According to Bielschowsky (coord., 1998), total fixed investmentin the manufacturing sector, at constant 1980 prices, averaged 3.3%of GDP between 1995 and 1997. The group of “dynamic” sectors,made up of manufacturers of steel products, transport equipment,processed foodstuffs, electrical and electronic equipment,pharmaceutical products, plastics and textiles, invested an averageof approximately 2.1% of GDP, while the manufacturers of chemicalproducts, machinery, non-metallic products, pulp and paper, andrubber products invested only 0.77% of GDP during the same period.58 In contrast, for example, with the strategies adopted by otheremerging economies and indeed by Brazil itself in previous de-cades, such as incentives for (producers and) exporters to enternew and more dynamic markets.
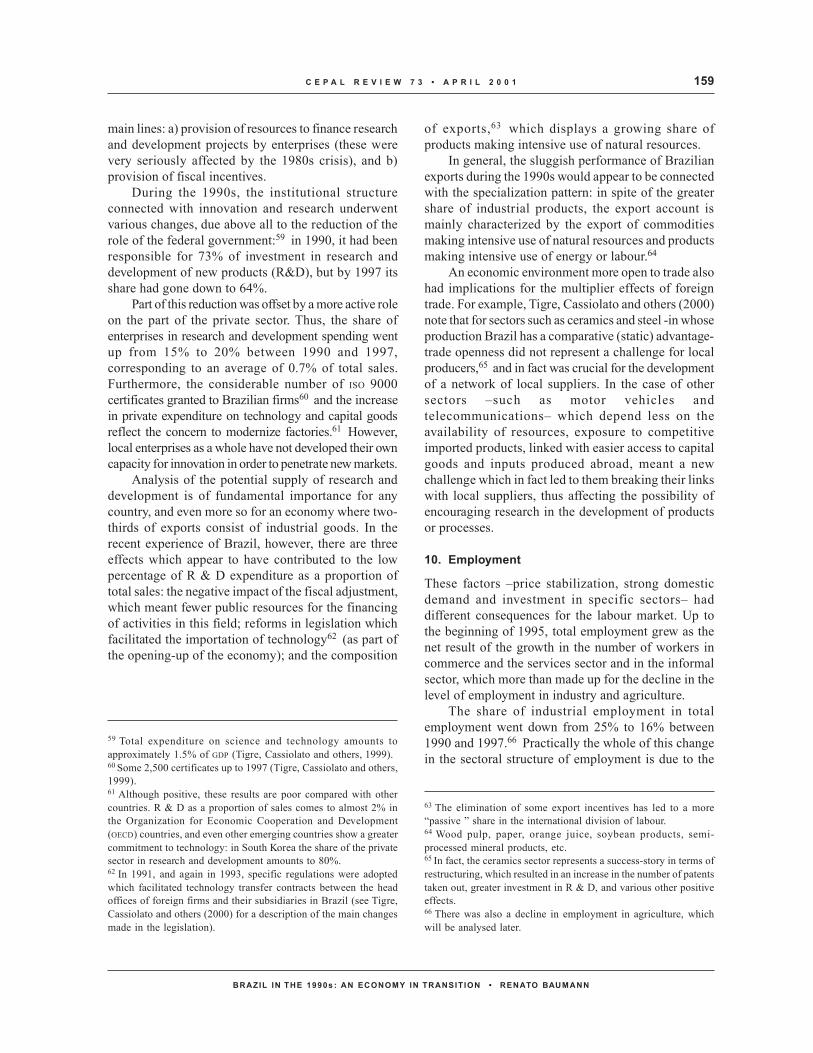
159C E P A L R E V I E W 7 3 • A P R I L 2 0 0 1
BRAZIL IN THE 1990s : AN ECONOMY IN TRANSIT ION • RENATO BAUMANN
main lines: a) provision of resources to finance researchand development projects by enterprises (these werevery seriously affected by the 1980s crisis), and b)provision of fiscal incentives.
During the 1990s, the institutional structureconnected with innovation and research underwentvarious changes, due above all to the reduction of therole of the federal government:59 in 1990, it had beenresponsible for 73% of investment in research anddevelopment of new products (R&D), but by 1997 itsshare had gone down to 64%.
Part of this reduction was offset by a more active roleon the part of the private sector. Thus, the share ofenterprises in research and development spending wentup from 15% to 20% between 1990 and 1997,corresponding to an average of 0.7% of total sales.Furthermore, the considerable number of ISO 9000certificates granted to Brazilian firms60 and the increasein private expenditure on technology and capital goodsreflect the concern to modernize factories.61 However,local enterprises as a whole have not developed their owncapacity for innovation in order to penetrate new markets.
Analysis of the potential supply of research anddevelopment is of fundamental importance for anycountry, and even more so for an economy where two-thirds of exports consist of industrial goods. In therecent experience of Brazil, however, there are threeeffects which appear to have contributed to the lowpercentage of R & D expenditure as a proportion oftotal sales: the negative impact of the fiscal adjustment,which meant fewer public resources for the financingof activities in this field; reforms in legislation whichfacilitated the importation of technology62 (as part ofthe opening-up of the economy); and the composition
of exports,63 which displays a growing share ofproducts making intensive use of natural resources.
In general, the sluggish performance of Brazilianexports during the 1990s would appear to be connectedwith the specialization pattern: in spite of the greatershare of industrial products, the export account ismainly characterized by the export of commoditiesmaking intensive use of natural resources and productsmaking intensive use of energy or labour.64
An economic environment more open to trade alsohad implications for the multiplier effects of foreigntrade. For example, Tigre, Cassiolato and others (2000)note that for sectors such as ceramics and steel -in whoseproduction Brazil has a comparative (static) advantage-trade openness did not represent a challenge for localproducers,65 and in fact was crucial for the developmentof a network of local suppliers. In the case of othersectors –such as motor vehicles andtelecommunications– which depend less on theavailability of resources, exposure to competitiveimported products, linked with easier access to capitalgoods and inputs produced abroad, meant a newchallenge which in fact led to them breaking their linkswith local suppliers, thus affecting the possibility ofencouraging research in the development of productsor processes.
10. Employment
These factors –price stabilization, strong domesticdemand and investment in specific sectors– haddifferent consequences for the labour market. Up tothe beginning of 1995, total employment grew as thenet result of the growth in the number of workers incommerce and the services sector and in the informalsector, which more than made up for the decline in thelevel of employment in industry and agriculture.
The share of industrial employment in totalemployment went down from 25% to 16% between1990 and 1997.66 Practically the whole of this changein the sectoral structure of employment is due to the
59 Total expenditure on science and technology amounts toapproximately 1.5% of GDP (Tigre, Cassiolato and others, 1999).60 Some 2,500 certificates up to 1997 (Tigre, Cassiolato and others,1999).61 Although positive, these results are poor compared with othercountries. R & D as a proportion of sales comes to almost 2% inthe Organization for Economic Cooperation and Development(OECD) countries, and even other emerging countries show a greatercommitment to technology: in South Korea the share of the privatesector in research and development amounts to 80%.62 In 1991, and again in 1993, specific regulations were adoptedwhich facilitated technology transfer contracts between the headoffices of foreign firms and their subsidiaries in Brazil (see Tigre,Cassiolato and others (2000) for a description of the main changesmade in the legislation).
63 The elimination of some export incentives has led to a more“passive ” share in the international division of labour.64 Wood pulp, paper, orange juice, soybean products, semi-processed mineral products, etc.65 In fact, the ceramics sector represents a success-story in terms ofrestructuring, which resulted in an increase in the number of patentstaken out, greater investment in R & D, and various other positiveeffects.66 There was also a decline in employment in agriculture, whichwill be analysed later.

C E P A L R E V I E W 7 3 • A P R I L 2 0 0 1160
BRAZIL IN THE 1990s: AN ECONOMY IN TRANSIT ION • RENATO BAUMANN
migration of workers from the manufacturing sector tocommerce and the services sector,67 largely becauseof the new technologies and the (low) cost of labour.68
Table 3 shows the urban occupational structure, bysectors.
It can be seen from table 3 that the reduction inemployment in the manufacturing sector was offset byan increase in the absorption of labour in the housing,commerce and services sectors.69
Employment in the industrial sector has beendeclining since 1995 in spite of the increase inproduction,70 whereas employment in commerce andthe services sector grew up to late 1996 butsubsequently stagnated. In other words, at the beginningof the price stabilization process the increase in thenumber of workers in the services sector more thanmade up for the decline in the number of workers inindustry, but this phenomenon only lasted up to 1997.As a result, at the end of the decade there was increasedand growing open unemployment: according to theBrazilian Geographical and Statistical Institute (IBGE),open unemployment rose from 4.3% in 1990 to 7.6%in 1998 (see figure 4).
In general, there was a clear productivity shock inboth the industrial and services sectors of the Brazilianeconomy, but it was more severe in the case of theformer.71 The references already made earlier to theincreases in productivity reflected in the labour/outputratios are confirmed by other indicators, such as theevolution of the initial wage of newly-hired workers72
and the number of years of formal schooling ofindustrial workers.73
The real income of urban workers did not go downduring the whole period, because: a) the stabilizationand trade openness processes tended rather to favourthe prices of non-tradeable goods; b) as long as thesefavourable factors lasted, the real incomes of workersin the services sector increased; c) when: i) employmentin the industrial and services sectors began to flag; ii)open unemployment began to increase, and iii) relativeprices ceased to favour the products of those sectors,so that the real income of workers in the services sectorbegan to go down steadily. In the industrial sector,however, while employment went down the real incomeof the workers continued to increase up to 1998, thusraising the real cost of labour in that sector (seefigure 5).74
67 This migration was also facilitated by another structuralcharacteristic of the Brazilian labour market: an average of between2.5% and 3% of all workers in industry change their jobs everymonth, while approximately 40% of the workers in industry onlyoccupy the same job for less than two months, because of thelegislation governing severance payments (see Amadeo andGonzaga, 1997, and Amadeo and Neri, 1997, for more details).68 The increase in the cost of labour in the industrial sector between1994 and 1997 (55%) was greater than in the case of the servicessector (15%) (Camargo, 1998).69 The figures on the agricultural sector in table 3 appear to reflecta significant increase in the number of own-account workers: theshare of rural wage-earners went down from 44% of the total numberof persons employed in the sector in 1990 to 34% in 1996, whilethe proportion of own-account workers increased from 53% to 64%over the same period (ECLAC, 1999).70 There has been an incipient recovery, however, since late 1999.71 In the future this could lead to growing wage disparities betweenthese two sectors (Camargo, Neri and Reis, 2000).72 Considered as an indicator of the marginal productivity of thelabour force, this suggests that between 1995 and 1997 the increasesin productivity were 45% in the industrial sector and 33% in theservices sector (Camargo, Neri and Reis, 2000).
TABLE 3
Brazil: Urban occupational structure,by sectors, 1990-1996(Percentages)
1990 1996
Agriculture and mining 6.8 8.7Manufacturing 25.2 16.0Housing 1.0 7.5Transport and communications 4.8 4.6Commerce and services 62.2 63.2
Total 100.0 100.0
Source: ECLAC, 1999.
FIGURE 4Brazil: Open unemployment rate in metropolitanareas, 1982-1999(Percentages)
Per c
ent
Source: Brazilian Geographical and Statistical Institute (IBGE).
73 The percentage of workers with less than four years’ schoolingwent down from 38% in 1989 to 31% in 1996, while the percentageof workers with more than eight years’ schooling rose from 42% to49% of the labour force (Camargo, Neri and Reis, 2000).74 There was an increase of 30% between 1994 and 1997 (Camargo,Neri and Reis, 2000).
02468
1982
1984
1986
1988
1990
1992
1994
1996
1998

161C E P A L R E V I E W 7 3 • A P R I L 2 0 0 1
BRAZIL IN THE 1990s : AN ECONOMY IN TRANSIT ION • RENATO BAUMANN
The adjustment of the labour market to an openeconomic environment with stable prices thus involvedthe transfer of workers from the tradeable goods sectorto the non-tradeable sector. This is consistent with theforegoing considerations on the growing capital-intensity of the production process following tradeopenness.
11. The agricultural sector
In the previous sections we have been dealing with theurban sectors. Up to the mid-1980s, the agriculturalsector went through a period of constant governmentintervention which was of fundamental importance forthe growth process, since it made possible the supplyof food at low prices. Since that time, however,agriculture has lost its main compensation mechanism-official programmes providing heavily subsidizedcredit- as part of the fiscal adjustment process.
In the new (post-1990) environment, in which theagricultural sector is exposed to internationalcompetition and the loss of official credit, the mainfactor behind the growth of production was the strongsystematic increase in productivity: the loss of easycredit made producers try to reduce their average coststhrough increases in productivity based on a moderatereduction in the area cultivated and a marked cut in thenumber of employees.
In the case of the main products, productivity inthe 1996-1998 period was substantially higher than in1990-1992.75 All the productivity indicators for theagricultural sector registered systematic increasesbetween 1987 and 1998, the annual rise in theseindicators being close to 1.8%.76
This recovery in productivity was favoured by: a)the poor transport infrastructure, which led to moreintensive use of the land, especially in areas close tourban centres; the growing use of new technologiesdeveloped in the country;77 c) the growingprofessionalism of the labour force, due among otherfactors to migration from the southern states to thewestern and northern regions of the country, and d) tradeopenness, which reduced the cost of inputs (Dias andAmaral, 2000).
One of the most important elements in the sustainedgrowth of agricultural production was the improvementof the terms of trade of the sector. Between 1987 and1994 (the peak year), the terms of trade of agricultureincreased by 46%, while the profitability of the sectorincreased by 59% between 1987 and 1998, reflecting arise of 22% in productivity and 31% in the terms oftrade of the agricultural sector (Dias and Amaral, 2000).This advantage in respect of productivity and the termsof trade enabled producers using new technologies tofind substitutes for traditional rural credit.
The general picture emerging from these figuresis that the agricultural sector managed to adjust throughhigher productivity, together with an increase in thecapital/product ratio and greater selectivity ofproducers. Together, these factors placed a still greaterburden on the urban labour market.
12. Reforms still pending
The above indicators suggest that Brazil is on the wayto completing the set of so-called “first generation”reforms. The further continuation of this process willinvolve the adoption of more measures, such as thereform of social security policies. Experience hasalready shown that in its present form this system isbound to register considerable deficits in the years tocome. If the system is to keep in balance over time, itwill be necessary to take various additional measures.
It has already been shown that the labour market issubject to a number of restrictions imposed by thelegislation which, in some aspects, goes back to the 1930s.Trade union representation, its financing and the incentivesto move between different activities are all part of the samegroup of issues which must be tackled in the short term.
Other reforms that will be needed have to do withthe functioning of the system of justice, which is slowand costly, and the system of political representation75 The increases in productivity were 26% in the case of cotton,
29% in soya beans, 27% in coffee, 30% in millet, and 21% in beans(Dias and Amaral, 2000).76 The growth rate in the stock-raising subsector was similar: closeto 1.9% per year (Dias and Amaral, 2000).
77 Mainly developed by the Brazilian Agricultural ResearchCorporation (EMBRAPA) of the Ministry of Agriculture.
FIGURE 5
Brazil: Employment and average real wagesin the manufacturing sector, 1990-1999
1994
=100
Employment Average real wage
Source: Brazilian Geographical and Statistical Institute (IBGE).
0
50100
150
1990 1991 1992 1993 1994 1995 1996 1997 1998 1999

C E P A L R E V I E W 7 3 • A P R I L 2 0 0 1162
BRAZIL IN THE 1990s: AN ECONOMY IN TRANSIT ION • RENATO BAUMANN
and decision-making itself, through the creation (forwhich there are no precedents in past history) ofmechanisms that will allow citizens to feel that they
are truly represented and actively participating. For thispurpose, profound changes need to be made in thepolitical and party structure and in electoral legislation.
IVWhat is it that didn’t work?Do we really know why?
Brazil has quite a lot of experience in making reforms.Retrospectively, these reforms followed a well-definedsequence, were varied, and mostly coincided with astabilization programme. Various indicators show thatnot all of them achieved the expected results, however.
Firstly, the two episodes of intensification of theimport tariff reduction process, in 1990 and 1994, werebasically part of price stabilization programmes. Thelowering of tariffs was therefore neither aninstantaneous process nor one that followed a linearcourse over time. On the contrary, various sectors hadto face a series of increases and reductions in tariff ratesover relatively short periods of time.78 Theseambiguous signals placed an extra burden on investorsand consumers of imported goods.
One of the most frequent criticisms of thestabilization policy adopted in 1994 is that, whenanalysed five years after its application, it is noted thatit continued to be basically just a stabilizationprogramme. There was a lack of a medium- and long-term strategy, and economic policy continued to besubordinated to that main objective, which naturallyhad its costs.
The exchange rate was kept below the equilibriumlevels on the grounds that: i) the economic“fundamentals” had been changed through pricestabilization (so that the parity criterion must bereconsidered, on new bases; ii) exchange ratedevaluation would have caused pressures on costs (thusadversely affecting the stabilization process), and iii)
the more stable macroeconomic environment wouldensure that the economy was attractive to foreigninvestors. As may be seen from figure 6, there was adecline in competitiveness (measured in parity termson the basis of the wholesale price index) up to mid-1996.
The overvaluation of the exchange rate wasreduced when the government began to emphasize theneed to modify the exchange rate in the light ofdomestic inflation (from 1997 on), but externalpressures made necessary a bigger change in 1999.
It was expected that the positive effects of the tradereforms on competitiveness would stimulate exports.It is not yet clear to what extent the easier access toimported goods stimulated export growth, but at allevents the high domestic interest rates affected theproduction of export goods, while the wage increasesassociated with the overvaluation of the exchange ratehad a negative impact on the foreign trade agents. Atthe same time, there was an explosive increase in thedemand for imports, and this gave rise to big tradedeficits.
The literature consulted for section II would seemto suggest that this procedure may have been part ofthe government’s strategy designed to win credibility
78 Baumann, Rivero and Zavattiero (1997) showed that in the caseof various products there were as many as eight changes in nominaltariff rates within a period of 26 months: from July 1994 toSeptember 1996. In some cases, the nominal tariff rates fluctuatedbetween 0% and 19% (and between 19% and 73% in some otherproducts), and these changes took place repeatedly in bothdirections, i.e., there was a series of rises and falls.
FIGURE 6
Brazil: Real exchange rate, 1994-1999
1994
ave
rage
rate
= 1
00
Source: Central Bank of Brazil.
0
50100
150
200
I1994
III I1995
III I1996
III I1997
III I1998
III I1999
III

163CEPAL REVIE W 73 • APRIL 2001
BRAZIL IN THE 1990s: AN ECONOMY IN TRANSITION • RENATO BAUMANN
for its reform programme, but it is not clear how muchtime was required by the credibility argument: basically,exchange policy was kept substantially unchanged forfour and a half years.In the monetary field, the domestic debt was
financed during the first half of the 1990s through fixed-interest bonds. As from the adoption of the Plano Real,however, the price stabilization associated with theinflow of external capital caused the authorities tomodify their finance structure, above all in favour offlexible interest rate bonds (70%) and dollar-indexedbonds (21%). The continuity of monetary policy andthe restrictions on the exchange rate were offundamental importance for maintaining price stability,although the maintenance of high interest rates calledfor by this combination of policies helped to increasepublic indebtedness, without the government being ableto make the necessary policy changes.This does not mean that efforts were not made to
increase revenue collection: fiscal income increasedfrom 25% of GDP in 1993 to 30% in 1998, and the“primary” fiscal results79 were positive throughout thesecond half of the decade. The problem lay in the areaof expenditure,80 especially as a result of the variationin domestic interest rates: in 1998 interest paymentson the domestic public debt were equivalent to 44% oftotal fiscal income.The overvalued exchange rate stimulated the
demand for foreign exchange by importers. Thechanges in legislation, price stabilization and renewedaccess to international capital markets generatedsubstantial inflows of foreign capital, first in the formof loans and portfolio investments and subsequently asforeign direct investment.The result was a vicious circle of inflows of foreign
currency which were monetized and had to beneutralized through higher interest rates. The latter, inturn, placed pressure on the fiscal accounts, giving riseto the expansion of indebtedness, the need for newloans, and hence also for still higher interest rates. Table4 shows the various components of the fiscal deficit.There are two aspects which are worthy of note in
table 4. First, interest payments on the domestic andexternal debts explain most of the deficit in the late1990s. Second, the monetization at the beginning ofthe stabilization process was replaced by the sale of
domestic and foreign bonds as a source of publicfinance.The dependence on external saving proved to be a
two-edged weapon. It helped to finance the public debt,but on the other hand the increase in the rate of externalsaving after 1994 (from 0.9% to 4.4% of GDP in 1998(see figure 7)) mainly went to finance consumption.The investment rate rose from 15% to 18%81 over thesefour years,82 although these investments were aboveall in modernization projects and not in the expansionof production capacity.83 Between 1993 and 1996,private consumption accounted for 72% of the increase
79 I.e., excluding monetary correction and interest payments.80 At the end of the decade another debate arose about the type of
revenue collected, which was based more and more on levies (fixed
percentages of wages and profits) than on taxes.
TABLE 4
Brazil: Main components of the fiscal deficit
(As percentages of GDP)
1994 1998
“Operational” fiscal deficit -1.4 7.5
Uses
“Primary” deficit -5.3 -0.0Interest on domestic debt 3.2 7.2
Interest on external debt 0.7 0.3
SourcesDomestic finance -2.6 4.5
External finance -3.0 2.2
Monetary expansion 4.3 0.8
Source: Central Bank of Brazil, 1999.
81 At constant 1980 prices.82 Mainly by the private sector, for public investment on machineryand equipment went down from 0.7% in 1994 to only 0.4% in
1998, while the corresponding rates for investment in construction
were 2.9% and 1.8%, according to the IBGE.83 The dependence on external finance also raised the total external
debt by 47% over the same period: from US$ 151 billion in 1994
to US$ 222 billion in 1998.
FIGURE 7
Brazil: Investment and saving, 1981-1997(As a percentage of GDP)
Per cent
-5
0
5
10
15
20
25
30
Investment/GDP Domestic saving/GDP External saving/GDP
Source: Brazilian Geographical and Statistical Institute (IBGE).
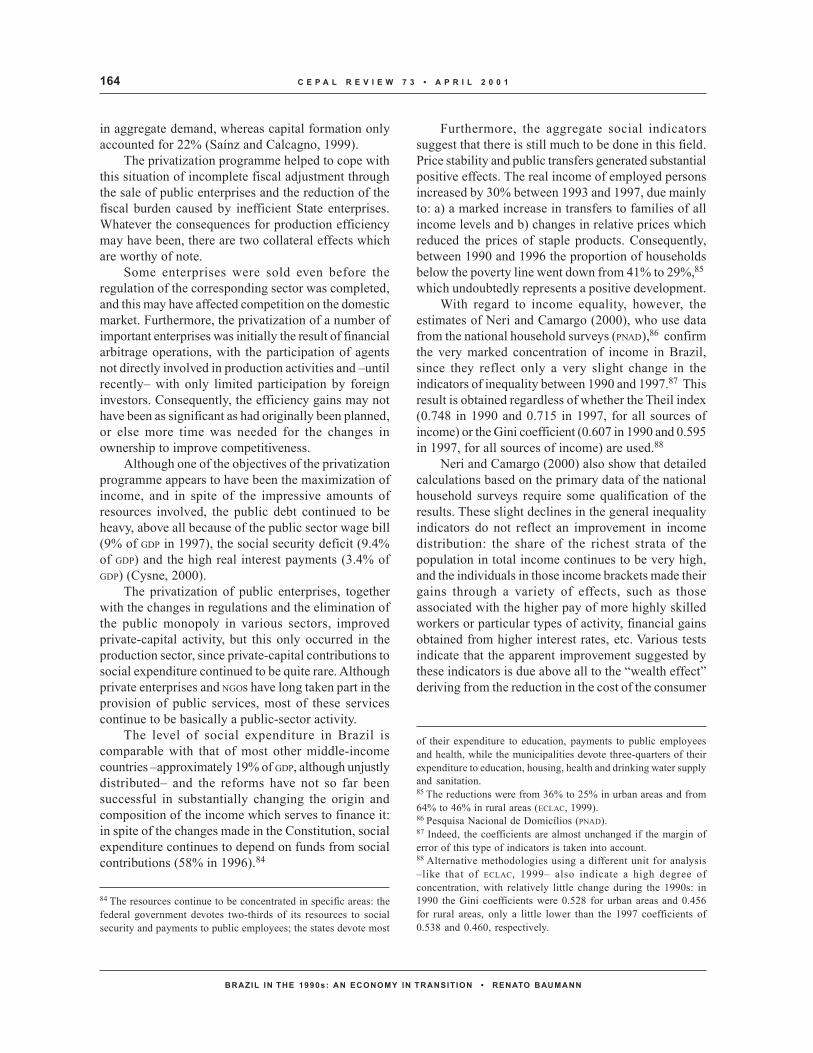
C E P A L R E V I E W 7 3 • A P R I L 2 0 0 1164
BRAZIL IN THE 1990s: AN ECONOMY IN TRANSIT ION • RENATO BAUMANN
in aggregate demand, whereas capital formation onlyaccounted for 22% (Saínz and Calcagno, 1999).
The privatization programme helped to cope withthis situation of incomplete fiscal adjustment throughthe sale of public enterprises and the reduction of thefiscal burden caused by inefficient State enterprises.Whatever the consequences for production efficiencymay have been, there are two collateral effects whichare worthy of note.
Some enterprises were sold even before theregulation of the corresponding sector was completed,and this may have affected competition on the domesticmarket. Furthermore, the privatization of a number ofimportant enterprises was initially the result of financialarbitrage operations, with the participation of agentsnot directly involved in production activities and –untilrecently– with only limited participation by foreigninvestors. Consequently, the efficiency gains may nothave been as significant as had originally been planned,or else more time was needed for the changes inownership to improve competitiveness.
Although one of the objectives of the privatizationprogramme appears to have been the maximization ofincome, and in spite of the impressive amounts ofresources involved, the public debt continued to beheavy, above all because of the public sector wage bill(9% of GDP in 1997), the social security deficit (9.4%of GDP) and the high real interest payments (3.4% ofGDP) (Cysne, 2000).
The privatization of public enterprises, togetherwith the changes in regulations and the elimination ofthe public monopoly in various sectors, improvedprivate-capital activity, but this only occurred in theproduction sector, since private-capital contributions tosocial expenditure continued to be quite rare. Althoughprivate enterprises and NGOs have long taken part in theprovision of public services, most of these servicescontinue to be basically a public-sector activity.
The level of social expenditure in Brazil iscomparable with that of most other middle-incomecountries –approximately 19% of GDP, although unjustlydistributed– and the reforms have not so far beensuccessful in substantially changing the origin andcomposition of the income which serves to finance it:in spite of the changes made in the Constitution, socialexpenditure continues to depend on funds from socialcontributions (58% in 1996).84
Furthermore, the aggregate social indicatorssuggest that there is still much to be done in this field.Price stability and public transfers generated substantialpositive effects. The real income of employed personsincreased by 30% between 1993 and 1997, due mainlyto: a) a marked increase in transfers to families of allincome levels and b) changes in relative prices whichreduced the prices of staple products. Consequently,between 1990 and 1996 the proportion of householdsbelow the poverty line went down from 41% to 29%,85
which undoubtedly represents a positive development.With regard to income equality, however, the
estimates of Neri and Camargo (2000), who use datafrom the national household surveys (PNAD),86 confirmthe very marked concentration of income in Brazil,since they reflect only a very slight change in theindicators of inequality between 1990 and 1997.87 Thisresult is obtained regardless of whether the Theil index(0.748 in 1990 and 0.715 in 1997, for all sources ofincome) or the Gini coefficient (0.607 in 1990 and 0.595in 1997, for all sources of income) are used.88
Neri and Camargo (2000) also show that detailedcalculations based on the primary data of the nationalhousehold surveys require some qualification of theresults. These slight declines in the general inequalityindicators do not reflect an improvement in incomedistribution: the share of the richest strata of thepopulation in total income continues to be very high,and the individuals in those income brackets made theirgains through a variety of effects, such as thoseassociated with the higher pay of more highly skilledworkers or particular types of activity, financial gainsobtained from higher interest rates, etc. Various testsindicate that the apparent improvement suggested bythese indicators is due above all to the “wealth effect”deriving from the reduction in the cost of the consumer
84 The resources continue to be concentrated in specific areas: thefederal government devotes two-thirds of its resources to socialsecurity and payments to public employees; the states devote most
of their expenditure to education, payments to public employeesand health, while the municipalities devote three-quarters of theirexpenditure to education, housing, health and drinking water supplyand sanitation.85 The reductions were from 36% to 25% in urban areas and from64% to 46% in rural areas (ECLAC, 1999).86 Pesquisa Nacional de Domicílios (PNAD).87 Indeed, the coefficients are almost unchanged if the margin oferror of this type of indicators is taken into account.88 Alternative methodologies using a different unit for analysis–like that of ECLAC, 1999– also indicate a high degree ofconcentration, with relatively little change during the 1990s: in1990 the Gini coefficients were 0.528 for urban areas and 0.456for rural areas, only a little lower than the 1997 coefficients of0.538 and 0.460, respectively.

165C E P A L R E V I E W 7 3 • A P R I L 2 0 0 1
BRAZIL IN THE 1990s : AN ECONOMY IN TRANSIT ION • RENATO BAUMANN
shopping basket and the lower volatility of workers’income after price stabilization. There was practicallyno significant structural change in the incomedistribution profile in this period.
At all events, the considerable number ofhouseholds which rose above the poverty line had aconsiderable impact on domestic aggregate demand.Consequently, imports shot up and aggregate investmentrates rose, largely to satisfy domestic demand.
In most industries there was a significant expansionin investment in 1995-1997, as compared with 1990-1994. Except in the telecommunications sector,however, the level of this investment was lower than inthe 1970s and 1980s. In the 1990s there was clearly anew investment model which was perhaps moreefficient from the microeconomic point of view, butnot from the standpoints of production capacity andeconomic growth.89
Outside the industrial field, levels of investmentwere varied. In the mining sector, investment was quitescarce because of the relatively limited knowledge ofthe available resources and the poor market prospectsfor those minerals whose reserves were known; thesame was true in the petroleum sector.
Production and distribution bottlenecks are sowidespread that they have come to be known as the“Brazilian cost”, to denote general inefficiency costsdue to specific cases of inadequacy. Investment ininfrastructure, too, is a mixture of successes andfailures: modernization of the ports has been under waysince their privatization, but there is relatively littleinvestment in railways and equipment, and therecontinues to be a lack of integration of the railwaysystem with other means of transport.90
The most outstanding performance is that of thetelecommunications sector, where there is a significantamount of investment connected with privatization. Theelectric power sector has turned in only a mediocreperformance, however, and this is leading to aninsufficient supply of electricity and even to the risk ofpower cuts.
Thus, from the point of view of industrial policythe reforms were only partially successful in terms ofimproving the infrastructure. As already shown, outputgrowth could recover for a time, but there are increasingdoubts about the resulting structure and the long-termprospects with regard to the economy’s place in theinternational division of labour.91
Generally speaking, enterprises have tried to adjustto competition from imported goods through defensivespecialization strategies which have often adverselyaffected local production of components and productswith the highest content of technology. The adjustmentprocess of the industrial sector has increased thecompetitiveness of sectors producing on a large scalewith intensive use of labour. At the same time, the easierimportation of capital goods has stimulated themodernization of technologically sluggish sectors.
In the period from 1991 to 1993, various measureshelped to facilitate the importation of technology, butthe use of foreign technology has not usually beenaccompanied by a corresponding domestictechnological effort, other than the adaptation of thosetechnologies to local conditions.92 Only a fewenterprises maintain research and developmentactivities, and the external technological links ofBrazilian enterprises are quite limited, not only withother enterprises but also with universities andresearch institutes. The establishment of technicalrelations among enterprises is made more difficult bythe fact that the industrial sector is excessivelyheterogeneous.
The spread of production processes which are morecapital-intensive and involve more importedcomponents has also helped to increase a structuralcomponent of open unemployment: even if theeconomy begins to produce more once again, thereduction in open unemployment will be slower thanon previous occasions. Thus, the average length of time
89 Furthermore, investment was stronger in those sectors whichmaintained to some extent their protection against foreign compe-tition, which had higher levels of productivity (consumer durables,for example), and where there was a greater presence oftransnational corporations.90 Private investment is beginning to improve conditions on vari-ous highways, but only a limited number of Brazilian expresswaysare candidates for privatization, in view of the private sector’s ex-pectations as regards profitability.
91 There is also concern about the real participation of producers inexport activity: out of a total of over a million registered enter-prises, only 14,000 systematically operate on the external market.92 The balance of payments data show an increase in the importa-tion of technology during the 1990s and a significant change in itscomposition: the share of “specialized technical services” in totalimports went down from 67% in 1990 to 32% in 1996, while at thesame time there was a pronounced increase in payments for “useof patents” and “supply of industrial technology” (in the case ofnon-patented technologies). This reflects an increase in the impor-tation and transfer of foreign technology, without a correspondingincrease in investment in research and development by local firms(see Tigre, Cassiolato and others, 2000).

C E P A L R E V I E W 7 3 • A P R I L 2 0 0 1166
BRAZIL IN THE 1990s: AN ECONOMY IN TRANSIT ION • RENATO BAUMANN
a worker remains unemployed rose from 3.5 months in1991 to 6 months in 1998 (Camargo, Neri and Reis,2000). This situation is further aggravated by the labourlegislation.93 An average of 3% of the workers in theindustrial sector change jobs every month, whichreduces the incentives to provide training and heightensthe difficulties already mentioned regarding localtechnological efforts.
The effects of the adjustment were also perceivedin rural areas. The reduction in credit, tradeliberalization and an overvalued exchange rate causedsignificant changes in the relative prices of agriculturalproducts.
The agricultural sector adjusted by experimentingwith different forms of domestic capitalization, mostlyassociated with a notable increase in productivity and
reductions in costs and assets. As a result, there was ahigh level of unemployment.94
The increase in the demand for food whichoccurred after the stabilization process95 was coveredby the domestic supply of food, which was stimulatedby the significant reduction in the cost of importedinputs. This fact, together with the marked reductionin official credit, discriminated against small producers,who use more traditional technologies. The eliminationof producers with below-average levels of productivityalso helped to increase the rate of open unemployment.
The problems resulting from this situation and thedissatisfaction with the results obtained are due to thefact that the reforms were incomplete, wronglyimplemented, or sent wrong signals to the economicagents.
VLessons from the Brazilian experience
The reforms applied in Brazil since the late 1980s arequite enlightening in various aspects. First, they haveat least two features which have not been taken intoaccount in the literature on reforms: a) they were appliedin parallel with a regional integration process(MERCOSUR) which involved significant commitments,at least in terms of external trade policies, and b) Brazilhas a federal structure, and this has major implicationsfor the results of many reforms such as those in thesocial security system and the financial sector.
As suggested in figure 1 (see section III above),the sequence of the reforms seems to have correspondedto the recommendations made in the literature: tradereform preceded all the others. There were neverthelesstwo clearly identifiable stages –up to mid-1994, andafter that time– with the turning-point being representedby the adoption of an energetic price stabilizationprogramme.
In other words, the trade reform process began ata time when the economy was still suffering from
serious macroeconomic imbalances –so that it was notpossible to maximize the benefits transmitted throughrelative prices– and then speeded up in parallel withthe price stabilization programme.
Simultaneous trade openness and deflation is morefully covered in the literature on reforms.
The indicators show that in reality the tradeopenness process aided stabilization and increased thesurpluses of both producers and consumers, throughaccess to imported goods. The simultaneous presenceof exchange rate overvaluation, which was needed forthe purpose of stabilization, affected both the tradebalance and the relative prices of tradeable and non-tradeable goods. As a result, there was a trade deficit,and the movement of factors towards the production ofnon-tradeable goods was stimulated.96
93 When the economy is growing and there is low unemployment,there is an implicit incentive for workers to provoke their owndismissal, as in this case they receive a month’s wages, plus 40%of a fund (FGTS) built up by the enterprise they work in, at the rateof one month’s wages per year of service in the enterprise (Amadeoand Gonzaga, 1997).
94 It is calculated that the number of workers in the agriculturalsector went down by 23% (5.5 million jobs) between 1985 and1996, but the sector’s output increased by 30% over the same period.95 The purchasing power of urban workers has increased in relationto the cost of food and clothing by over 60% since 1990, as theincrease in the wages of unskilled workers exceeded the increasein food prices.96 This was very similar to what an absorption-type balance ofpayments model would have predicted: a shift of the productionfrontier, in which relative prices favour the production of non-tradeable goods.

167C E P A L R E V I E W 7 3 • A P R I L 2 0 0 1
BRAZIL IN THE 1990s : AN ECONOMY IN TRANSIT ION • RENATO BAUMANN
It is generally accepted that during stabilizationprogrammes the maintenance of an overvaluedexchange rate is a cost that has to be paid, if it formspart of the government’s strategy designed to show itsfirm commitment to the reform process. The social costof the alternative -losing credibility with regard to thereforms- could turn out to be infinitely greater. Thequestion raised by the Brazilian experience, however,is why this policy lasted so long: much longer thanwould be considered necessary to generate credibility.
This therefore gave rise to growing concern aboutlong-term growth. The signals sent to the economicagents were mainly aimed at promoting stabilization.Not much was done in terms of creating suitableconditions for the recovery of growth, except for theincreases in efficiency expected from privatization andtrade openness. Consequently, there was an increase ininvestment as a whole, and it was more efficient inmicroeconomic terms, but the amount invested has notbeen large enough from the point of view of the long-term growth strategy (there was only a limited increasein production capacity), and it does not hold out muchhope as regards export performance.
It was also noted earlier that the literature onreforms states that the financial sector should bereformed before controls on foreign capital areeliminated. Here, too, the Brazilian experience wasrather special. Incentives for foreign investment wereadopted in 1990-1991, but the real financial sectorreform only took place in 1995, after it was seen thatadjustments needed to be made because of the loss ofthe profits previously derived from inflation, which hadbeen channeled to the banking sector. This reform didnot bring about a reduction in interest rates, as mighthave been expected. Instead, there was a vicious circleof capital flows linked with the fiscal deficit, this led toeven higher rates which in turn attracted fresh inflowsof capital, and this process was repeated successively.
According to the models analysed in section II,whenever lack of confidence in the permanence of thereforms is linked with access to external finance, the privatesector ends up contracting debts to finance the expectedconsumption. The Brazilian experience is different,however. This same effect -increasing externalindebtedness primarily in order to finance domesticconsumption- took place in a context of relatively lowlevels of investment, but strong domestic demand, althoughthere were few doubts about the government’s intentions(as the series of political victories won by it shows).
The basic recommendations regarding structuraladjustment likewise indicate that public expenditure
should be concentrated on health, education andinfrastructure, leaving all the other activities in the handsof private enterprise.
This is probably the aspect in which the federalstructure of Brazilian society is most clearly seen as adeterminant of the results. Sections III and IV showedthat various characteristics altered the structure ofpublic finance. The evidence also shows that: a) privatesector commitment to the financing of these areas isslow and limited, and b) there are structural restrictionswhich condition the extent to which it is possible totransfer federal government expenditure to the statesand municipalities. If it is desired to insist on thesereforms, this will call for a new design of the fiscalstructure.
This latter aspect, together with the signs ofrigidities in the labour market due to the legislation,and the increasingly evident cost of the manner ofoperation of the judiciary and legislature, mean thatthere is no room for partial reforms. If the aim is tomaintain the reform process, then once that process hasbeen initiated it must be constantly deepened andwidened.
In short, there are at least seven lessons which canbe learned from the experience of Brazil in the 1990s.
1. There are clear advantages in ending inflation,but the results obtained will depend on the way thestabilization process is kept up.
Brazil did not adopt either i) a repressive schemelike that adopted in Chile in the 1980s or that followedin Argentina (with Bonex and reductions in nominalwages) or ii) a negotiated process like those adopted inMexico and Israel. Instead, since the mid-1990s Brazilhas combined: a) a nominal exchange rate anchor; b)high positive real interest rates; c) repression of realwages in the public sector, and d) quantitativeadjustments in the labour market, with the result thatthis set of measures has created obstacles tocompetitiveness and medium- and long-term growth.
2. As economic theory predicts, trade opennessincreased both producer and consumer surpluses, butthe way the openness process was carried out seemsto have imposed excessively high costs on somesectors.
3. Fiscal adjustment is essential if it is desired toavoid excessively high interest rates and resume actionin the public sector. Such adjustment must be planned,however, so that it does not adversely affect productionefficiency or impose excessive social costs: privatefinancing of social expenditure is neither immediatenor sure.

C E P A L R E V I E W 7 3 • A P R I L 2 0 0 1168
BRAZIL IN THE 1990s: AN ECONOMY IN TRANSIT ION • RENATO BAUMANN
4. Restructuring of the financial sector is offundamental importance in a world of intensive capitalmovements: in this respect, the Brazilian process wasless costly in terms of GDP than similar processes inother countries, and it seems to have been of crucialimportance for avoiding the multiplier effects of recentexternal crises.
5. Although it is important, price stabilizationshould not be made the sole objective of economicpolicy. Experience has shown that it takes some timefor expectations of inflation to disappear.97 It is just asimportant, however, to transmit the right signals to theeconomic agents about the recovery of production inorder to ensure that suitable conditions for the reformsare sustainable over time.
6. Once begun, the reform process willdetermine its own continuity, progressing in eachstage if there is a firm intention to avoid a relapse.Consequently, economic contexts of low inflationand open economic relations with the rest of theworld demand fiscal consistency and changes inlabour legislation, as well as in administrative andinstitutional procedures.
7. Relying on external saving to resume aninvestment cycle is a risky approach, since the decisionsof foreign investors are based not only on what happenswith regard to the internal variables but also on eventsin other parts of the world.
The reforms made in Brazil in the 1990s were sointensive and numerous that it may still be prematureto try to evaluate them in full. Various policy changes -such as the privatization of public enterprises andreform of the social security system- are only likely tobe reflected in dynamic advantages after a certain lengthof time. However, ten years have passed since the firstsignificant changes, and there can be no doubt that somelessons can already be derived from them which willhelp us to understand adjustment processes indeveloping countries.
The experience of Brazil is an example of a casewhere the reforms did not follow the recommendedideal sequence, and sometimes the wrong signals weresent to the economic agents, but it is also a case wherethe advantages already obtained could easily be lost ifthe changes made so far came to be reversed.
(Original: Spanish)
Bibliography
Amadeo, E. and G. Gonzaga (1997): Brasil: salario,productividad y cambio. Análisis del costo unitario enla industria, ILO (International Labour Office), Costoslaborales y competitividad industrial en America Latina,Geneva.
Amadeo, E. and M. Neri (1997): Houve precarização do setorde serviços? Qualidades dos trabalhadores e dosempregos no Brasil entre 1989 e 1997, Rio de Janeiro,mimeo.
Banco Central do Brasil (1999): Boletim do Banco Centraldo Brasil, vol. 35, No. 5, Rio de Janeiro, May.
Banco Nacional de Desenvolvimento Econômico e Social(n/d): www.bndes.gov.br.
Baumann, R. (coord.) (2000): Brasil. Uma década emtransição, Rio de Janeiro, Economic Commission forLatin America and the Caribbean (ECLAC)/Editora Cam-pus.
Baumann, R. and C. Mussi (1999): Algunas característicasde la economía brasileña desde la adopción del PlanReal, “Temas de coyuntura económica” series, No. 5,Santiago, Chile, ECLAC.
Baumann, R., J. Rivero and Y. Zavattiero (1997): As tarifasde importação no plano real, Pesquisa e planejamentoeconômico, vol. 27, No. 3, Rio de Janeiro, Institute ofApplied Economic Research (IPEA).
Bielschowsky, R. (coord.) (1998): Investimentos na transiçãobrasileira dos anos 90, Rio de Janeiro, IPEA/ECLAC Of-fice in Brazil.
Bielschowsky, R., M. Abicalil and others (2000): Formaçãode capital no ambiente das reformas econômicasbrasileiras dos anos 1990: uma abordagem setorial, inR. Baumann (coord.), Brasil. Uma década em transição,Rio de Janeiro, ECLAC/Editora Campus.
Bonelli, R. (1998): A note on Foreign Direct Investment (FDI)and industrial competitiveness in Brazil, Texto paradiscussão, No. 584, Rio de Janeiro, IPEA.
Bonelli, R. and R. Fonseca (1998a): Ganhos de produtividadee de eficiência: novos resultados para a economiabrasileira, Pesquisa e planejamento econômico, vol. 28,No. 2, Rio de Janeiro, IPEA.
(1998b): Competitividade da indústria brasileira nos anosnoventa, Notas sobre o mercado de trabalho, No. 7,Brasilia, Ministry of Labour.
Bruno, M. (1991): High Inflation and the Nominal Anchorsof an Open Economy, Essays in international finance,No. 183, Princeton, New Jersey, Princeton University,Department of Economics.
Calvo, G. (1989): Incredible reforms, in G. Calvo and others(eds.), Debt, Stabilization and Development: Essays in
97 See, for example, the studies of the stabilization processes inArgentina, Chile, Mexico and Peru published by IPEA/ECLAC Officein Brazil (1997): over four years can elapse after stabilization beforethe economic agents lose their memories of inflation and adjusttheir behaviour. Indeed, the long Brazilian experience of widespreadinflation could require an even longer period of adaptation.

169C E P A L R E V I E W 7 3 • A P R I L 2 0 0 1
BRAZIL IN THE 1990s : AN ECONOMY IN TRANSIT ION • RENATO BAUMANN
Honor of Carlos Díaz-Alejandro, New York, BasilBlackwell.
Camargo, J. M. (1998): O mercado de trabalho brasileirono periodo pós-estabilização, Rio de Janeiro, mimeo.
Camargo, J. M., M. Neri and M. C. Reis (2000): Emprego eprodutividade no Brasil na década de 1990, in R.Baumann (coord.), Brasil. Uma década em transição,Rio de Janeiro, ECLAC/Editora Campus.
Choksi, A. M. and D. Papageorgiou (eds.) (1986): EconomicLiberalization in Developing Countries, Oxford, U.K.,Basil Blackwell.
Chudnovsky, D. and A. López (1997): Las estrategias de lasempresas transnacionales en la Argentina y Brasil: ¿quéhay de nuevo en los años noventa?, Documento detrabajo, No. 23, Buenos Aires, Centro de Investigacionespara la Transformación (CENIT).
Conley, J. P. and W. F. Maloney (1995): Optimal sequencingof credible reforms with uncertain outcomes, Journalof Development Economics, vol. 48, No. 1, Amsterdam,Netherlands, Elsevier Science Publishers, B.V.
Corbo, V. and S. Fischer (1992): Adjustment programs andbank support: Rationale and main results, in V. Corbo,S. Fischer and S. B. Webb (eds.), Adjustment LendingRevisited: Policies to Restore Growth, Washington, D.C.,World Bank.
Cysne, R. (2000): Aspectos macro e microeconômicos dasreformas, in R. Baumann (coord.), Brasil. Uma décadaem transição, Rio de Janeiro, ECLAC/Editora Campus.
Da Silva Dias, G. L. and C. Amaral (2000): Mudançasestruturais na agricultura brasileira: 1980-1998, in R.Baumann (coord.), Brasil. Uma década em transição,Rio de Janeiro, ECLAC/Editora Campus.
Draibe, S. (1998): Brasil anos 90: as políticas sociais nomarco das reformas estruturais, Rio de Janeiro, ECLAC.
(2000): As políticas sociais nos anos 1990, in R.Baumann (coord.), Brasil. Uma década em transição,Rio de Janeiro, ECLAC/Editora Campus.
ECLAC (1999): Social Panorama of Latin America and theCaribbean, 1998, LC/G.2050-P, Santiago, Chile.
Edwards, S. (1990): The sequencing of economic reform:Analytical issues and lessons from Latin American ex-periences, The World Economy, vol. 13, No. 1, Oxford,U.K., Blackwell Publishers, March.
Edwards, S. and A. C. Edwards (1987): Monetarism andLiberalization: The Chilean Experience, Cambridge,Massachusetts, Ballinger Publishing Company.
IPEA/ECLAC Office in Brazil (1997): O plano real e outrasexperiências internacionais de estabilização, Brasilia.
McKinnon, R. (1982): The order of economic liberalization:Lessons from Chile, in K. Brunner and A. H. Metzler(eds.), Economic Policy in a World of Change,Amsterdam, Netherlands, North-Holland.
Mesquita, M. (1999): A indústria brasileira nos anos 90: Oque já se pode dizer?, in F. Giambiagi and M. Mesquita(coords.), A economia brasileira nos anos 90, Rio deJaneiro, Banco Nacional de DesenvolvimentoEconômico e Social.
Mussa, M. (1986): The adjustment process and the timingof trade liberalization, in A. M. Choksi and D.Papageorgiou (eds.), Economic Liberalization in De-veloping Countries, Oxford, U.K., Basil Blackwell.
Neri, M. and J. M. Camargo (1999): Structural Reforms,Macroeconomic Fluctuations and Income Distributionin Brazil, “Reformas económicas” series, No. 39, Riode Janeiro, ECLAC.
(2000): Efeitos distributivos das reformasestruturais no Brasil, in R. Baumann (coord.), Brasil.Uma década em transição, Rio de Janeiro, ECLAC/Editora Campus.
Pinheiro, A. Castelar (1996): Privatização no Brasil, Rio deJaneiro.
Pinheiro, A. Castelar and F. Giambiagi (1998): The macro-economic background and the institutional frameworkof Brazilian privatization, Rio de Janeiro, BancoNacional de Desenvolvimento Econômico e Social.
Rodrik, D. (1992): The rush to free trade in the developingworld: why so late? why now? will it last?, NBER work-ing paper, No. 3947, Cambridge, Massachusetts, Na-tional Bureau of Economic Research (NBER).
(1993a): Trade and industrial policy reform in de-veloping countries: a review of recent theory and evi-dence, NBER working paper, No. 4417, Cambridge,Massachusetts, NBER.
(1993b): Trade liberalization in disinflation, NBERworking paper, No. 4419, Cambridge, Massachusetts,NBER.
(1996): Understanding economic policy reform,Journal of Economic Literature, vol. 34, No. 1, Nash-ville, Tennessee, American Economic Association,March.
Sáinz, P. and A. Calcagno (1999): La economía brasileñaante el Plan Real y su crisis, “Temas de coyuntura” se-ries, No. 4, Santiago, Chile, ECLAC.
Stern, E. (1991): Evolution and lessons of adjustment lend-ing, in V. Thomas, A. Chibber and J. de Melo (eds.),Restructuring Economies in Distress, Oxford, U.K.,Oxford University Press.
Thomas, V., A. Chibber and J. de Melo (eds.) (1991): Re-structuring Economies in Distress, Oxford, U.K., Ox-ford University Press.
Tigre, P., J. E. Cassiolato and others (1999): Câmbioestrutural e sistemas nacionais de inovação: o casobrasileiro, Rio de Janeiro, ECLAC.
(2000): Mudanças institucionais e tecnologia:impactos da liberalização sobre o sistema nacional deinovações, in R. Baumann (coord.), Brasil. Uma décadaem transição, Rio de Janeiro, ECLAC/Editora Campus.
UNCTAD (United Nations Conference on Trade and Develop-ment) (various issues): World Investment Report,Geneva.
Williamson, J. (1990): Latin American Adjustment: HowMuch has Happened?, Washington, D.C., Institute forInternational Economics (IIE).

C E P A L R E V I E W 7 3 • A P R I L 2 0 0 1170
BRAZIL IN THE 1990s: AN ECONOMY IN TRANSIT ION • RENATO BAUMANN

171C E P A L R E V I E W 7 3 • A P R I L 2 0 0 1
JOB-SEEKING STRATEGIES IN TRINIDAD AND TOBAGO • KATHLEEN VALTONEN
C E P A L R E V I E W 7 3
APRIL 2001
Job-seekingstrategies
in Trinidad and Tobago
Kathleen Valtonen
Department of Government,Sociology and Social Work,The University of theWest Indies, [email protected]
National levels of unemployment in Trinidad and Tobagohave remained consistently high since the 1980s, becauseof the economic recession, subsequent structural adjustmentarrangements and the diminution of traditional labour-intensive activities such as estate agriculture. Groups whichhad been dependent upon casual employment that wasavailable in pre-recession times have been experiencingchronic unemployment. Combining extremely irregularcasual employment with activity in the informal sector, theyoccupy a marginal and precarious position in the labourmarket. This study examines the way in which thecharacteristics and strategies of job-seekers differ inmainstream and in peripheral areas of the labour market. Inanalysis of the qualitative data, based on 45 in-depthinterviews, Ragin’s qualitative comparative procedures wereused. This method of analysing qualitative data permittedscrutiny of different individuals’ combinations ofcharacteristics, and identification of those job search strategycomponents that led either to finding employment or tosuffering long-term unemployment. The chronicallyunemployed showed a consistent lack of up-to-dateknowledge of the labour market, whereas those who weresuccessful in finding employment did have this type ofinformation, through ‘weak ties’ based on family andpreviously established labour market links. The success infinding employment by individuals who lacked advancedsecondary schooling and vocational training could beassociated with their ‘ties of merit’ acquired fromemployment experience and a work record in the formalsector. The data suggest that while affiliation with the formaleconomy could strengthen an individual’s position in thelabour market, association with the informal sector did notseem to give any later advantages in finding employment.

C E P A L R E V I E W 7 3 • A P R I L 2 0 0 1172
JOB-SEEKING STRATEGIES IN TRINIDAD AND TOBAGO • KATHLEEN VALTONEN
IIntroduction
Work is inextricably woven into the fabric of societies,and indeed it is of vital importance in societies wherethe social security system is not extensive, for in suchcases income depends on participation in the labourmarket, and households rely on the earnings of theireconomically active members. Although traditionallythe Government of Trinidad and Tobago has shown astrong commitment to the provision of a basic safetynet to cover the old, the disabled and female-headedhouseholds, ‘able-bodied’ citizens must rely on theirlinks to the labour market, since they are not eligiblefor the traditional forms of welfare assistance and arenot covered against the risk of unemployment. Nationalunemployment levels have remained consistently highsince the 1980s, because of the recession, subsequentstructural adjustment arrangements, and the diminu-tion of traditional labour-intensive activities such asestate agriculture. In a harsh economic climate, casualemployment opportunities that were once abundant (in,for example, public and private sector construction)became scarce, and that part of the labour force whichwas dependent upon such periodic employment wasleft without a livelihood and has to seek out earningopportunities in the informal sector.
This qualitative study is an examination of thecharacteristics and job search strategies of unemployedgroups in Trinidad. The in-depth interviews used in itproduced rich data whose scrutiny reveals informationon features of the job search which are highly relevantin this particular research context. A matrix based onthese relevant features is used to organize or ‘code’ the
data about each individual’s combination ofcharacteristics and job search strategy components thathave led either to success in finding employment or toa condition of long-term unemployment. Booleanalgebra is used to facilitate identification andcomparison of the different combinations ofcharacteristics and strategies associated with successfulor unsuccessful job search outcomes. The study wasconducted in the lower-middle and lowersocioeconomic levels of job-seekers. Among the latter,in particular, the educational background is weak.
The data collection targeted individuals indifferent positions vis-à-vis the labour market. Thefirst group were those who were seeking work in themore dynamic areas of the labour market and werevery near to finding employment. The second groupconsisted of individuals who had been unemployedfor long periods and occupied a marginal position inthe labour market. The research thus looks at the wayin which the characteristics and strategies (henceforthalso referred to as ‘attributes’) of job-seekers differin the mainstream and in the peripheral areas of thelabour market in Trinidad. The typology that emergesfrom this exercise can benefit policy and interventionplanning for similar target groups which are in dangerof marginalization from the labour force. A holisticperspective is sought with regard to the range of salientattributes and their interlinking processes. In the caseof marginalized groups, problems often need to beaddressed on several fronts in order to be dealt witheffectively.
IIThe labour market: the ‘centre’ and the ‘periphery’
Trinidad and Tobago (population 1.4 million) is an islandState in the Caribbean with a colonial past and a morerecent era of independence beginning in the early 1960s.The history of settlement and development has given eachof the Caribbean islands it own individual character, butTrinidad is distinctive because of its resources of oil and
natural gas. Oil exports are only a small fraction of thetotal world production, but they are the main source ofnational revenue, and the economy is heavily dependenton the production and export of petroleum and gas. Thiscapital-intensive sector is very sensitive to fluctuations inworld market prices (Rogozinski, 1994, pp. 275-279).

173C E P A L R E V I E W 7 3 • A P R I L 2 0 0 1
JOB-SEEKING STRATEGIES IN TRINIDAD AND TOBAGO • KATHLEEN VALTONEN
Oil ‘windfalls’ in the period between 1973 and1982 made possible rises in income, expansion of jobsin the public sector and investments in infrastructure,and improvements in living conditions.1 With the fallin international oil prices during the 1980s, there was asharp contraction of the economy, so that high levelsof government expenditure could not be maintained.Meanwhile only a small number of the jobs createdwere in the more long-term goods producing sectors,and even at the height of the oil boom theunemployment rate did not fall much below 10%.During the recession, and with the stringent measuresrequired by structural adjustment, employment has beenretrenched in the public sector. The public worksinfrastructure programmes on which many had cometo rely as a periodic source of income were also cutback. In the construction industry, the decline in theprivate and public sectors meant a drop from the peakin 1980, when the sector employed 18% of the labourforce, to a situation in which half of the labour force inthe sector was unemployed by the late 1980s (UnitedNations, 1995; Ramsaran, 1992). The decreased incomeopportunities for the unskilled in both public worksprojects and in the construction sector have broughteconomic hardship to households which had relied onthis type of work, and this situation is reflected in theliving conditions of the less-educated unemployed inthe target group.
The unemployment rate fluctuated between 16%and 22% in the 1990s. In the third quarter of 1995,according to Central Statistical Office data, the rate was16.3%, the lowest since 1985. Unemployment is higheramong women and young people. In Trinidad andTobago, unemployment is very closely linked witheconomic and social inequality. Thus, Henry andMelville (1989) found the correlation betweenunemployment and poverty to be 0.88 in the late 1980s.
Over 75% of all workers are employed in theformal sector: 42% in the private formal sector and 33%in the public sector. The remainder of the labour forceis located in the informal sector, and a significantproportion are own-account workers (self-employed).The agricultural sector accounts for less than 5% ofthe labour force. Occupations are not significantlydifferent in rural and urban areas.
Certain growing areas of unskilled work, such asthe domestic and security sectors (maids and securityguards), have high levels of underemployment. Theinformal sector2 is the area of the labour market towhich individuals must invariably resort in search ofan opportunity to earn income. There are two views onthe informal economy: that it ultimately reinforcessocial inequality, or alternatively, that it serves toalleviate or dilute unequal conditions (see McKeever1998)3 . Informal sector employment involves personalservices, artisan and craft production, and smallbusinesses, including micro-enterprises. Wages in theinformal sector are on average half of those of manualand non-manual workers in modern enterprises (ECLAC,1997, p. 16).
The data collected show that informal socialnetworks based on strong reciprocity, combined withintermittent income often from the informal sector, formthe commonest subsistence mechanisms in circleslacking regular income. Households routinely have tostruggle to meet even basic expenses, such as the cost offood, medicines, clothes, or transport fares for school-age children. Economic subsistence in informal networkshas developed into a long-standing survival mechanismfor the long-term unemployed and underemployed.Mutual assistance networks constitute the only ongoing‘safety net’, occasionally supplemented by targetedwelfare programmes such as that whereby the long-termunemployed in this target group were contacted for thisstudy. Many unemployed individuals seek work in somecapacity or other in the informal economy: peddling foodand small articles, for example, or, among the rural-based,selling home-grown produce, are some of the ways togenerate income.
1 Public spending and production subsidies increased, especiallyin the public administration and in transfers to alleviate thecontinued high rates of unemployment attributed to the capital-intensive nature of the oil sector (World Bank, 1995, pp. 11-32).
2 In keeping with the mostly widely held usage of the term, the‘informal economy’ refers to otherwise legal forms of incomegeneration that are not regulated by the legal and political institutionsof society (Portes and Castells, 1989, p. 12). For example, workersmay not pay taxes, workplaces may not comply with governmentregulations, or business owners may operate without requiredlicences. This type of economic activity takes place, however, withinthe context of a dominant formal economy, rather than independentlyof that economy. Moreover there are generally links between thetwo: for example, materials, labour and finished products movebetween them (McKeever, 1998, p. 1211).3 More recent studies present the argument that the informaleconomy comprises a wide range of jobs, offering opportunities tomany who could not find them in the formal sector, yet at the sametime exploiting the labour of others. In McKeever’s (1998) analysisof national-level survey data from South Africa, it was found thatsuccess, in terms of occupational status and income attainment,follows patterns of stratification in the informal economy that areconsistent with those in the formal economy.

C E P A L R E V I E W 7 3 • A P R I L 2 0 0 1174
JOB-SEEKING STRATEGIES IN TRINIDAD AND TOBAGO • KATHLEEN VALTONEN
IIIPrevious studies
The economic and structural dynamics of social in-equality in the Caribbean have been dealt with in sev-eral studies, e.g., Ramsaran (1992) and Gafar (1998).Sociopolitical and race-related aspects of inequalityhave been researched by Ryan and Stewart (eds.)(1995). The characteristics of deprived groups withina framework of poverty and deprivation have been fo-cused upon by Ryan, Mc Cree and St. Bernard (eds.)(1997), who used quantitative surveys and interview
data. These issues have also featured in Valtonen’s(1996) study of immigrant integration in Trinidad andin Neil’s (1987) in-depth study of one particular localcommunity in urban Trinidad.
Research has not been carried out in the Caribbeanregion on employment strategies and the job searchstage of labour market participation. This study looksat a preliminary but crucial stage on the threshold ofthe labour market, where individuals negotiate entryor re-entry into employment.
IVData collection and the target group
This study is based on qualitative data from in-depthinterviews conducted in Trinidad4 during 1995-1997.Each interview lasted between one and one and a halfhours. The interviews were semi-structured around is-sues that were approached through direct questions, aswell as by the use of probes. Individuals were willingto participate in the study because the topic was a sub-ject of concern, both for them and for others in the samesituation.
The number of persons interviewed amounted to45, aged between 17 and 45 years. Of the total, 22 wereurban-based in Port of Spain and its environs, and 23were rural-based, while 24 subjects had only primary-level education. Of the 21 subjects who had somesecondary education, 10 had completed it to the O-level(ordinary-level) grade and two of them had gone on tocomplete their schooling to the A (advanced)-level, thuscompleting their high school education5 . There was a
spread of educational attainment in the group, but thelevel of most of the 45 subjects was low (primary orlower secondary levels).
Following the procedure in the qualitative method,sampling was purposeful in order to reach individualswho would provide the best information on the researchtopic. The target group was drawn from two areas ofthe labour market, comprising individuals who werelooking for work in the mainstream or dynamic part ofthe labour market and were close to findingemployment, and individuals who had beenunemployed for long periods and were without anyimmediate prospects of locating work. This samplingprocedure allowed for differentiation of the target groupby strategy outcome, and facilitated the comparison ofattribute configurations.
Those subjects who were on the point of findingwork were contacted through the State Labour Office6 .
4 The majority of the country’s population live in Trinidad, wherethe ‘modern’ industrial sector is also located. The study wasconducted in Trinidad, to which the data mentioned in the courseof the article refer. Only 3.3% of the population live in Tobago,where agriculture is the main occupation, with some diversificationinto tourism.5 Grades 1-5 (age groups 5-11 years) correspond to primary-levelschooling. The secondary level is made up of Forms 1-5 (age groups12-16 years), culminating in the O-level exams in the Fifth Form.
The Lower and Upper Sixth Forms (age group 17-18) lead tomatriculation (the A-level exams). It should be noted that 55% ofthe economically active population in Trinidad and Tobago havenot gone beyond the initial years of secondary schooling.6 The State does not maintain comprehensive labour exchangeservices, but conducts recruitment for specified areas ofemployment in the public sector and, less frequently, the privatesector.

175C E P A L R E V I E W 7 3 • A P R I L 2 0 0 1
JOB-SEEKING STRATEGIES IN TRINIDAD AND TOBAGO • KATHLEEN VALTONEN
Some were at a pre-selection stage (shortlisted) forclerical work in the public sector and were likely to becalled to fill vacancies at some point, if not immediately.Others were registering for employment in fruitharvesting in Canada, which is a seasonal recruitmentactivity organized by the labour authorities.
The individuals with more remote prospects ofemployment were contacted through an NGO
Supplementary Feeding Programme that functionsunder State auspices. Eligibility for the programme isbased on inability to afford the ‘minimum foodbasket’.7 Food assistance is provided to eligiblehouseholds for a period of three months. As participantsof this highly targeted and residual-level social welfare
programme, these households had been experiencingeconomic difficulties and unemployment over aconsiderable number of years. The data were thusobtained from two groups in the job-seeking spectrum:one deploying an effective employment strategy, andthe other a non-effective strategy.
The interview protocol was structured into thefollowing sections: personal information (age, civilstatus, family and household type); education level(schooling and vocational education); employmenthistory (types of activity, employers, length ofemployment periods, job search, channels, contacts);and own outlook on the future, plans, and suggestionsfor official interventions.
VConceptual framework
The theoretical and conceptual framework underwentsome changes in the course of data collection andanalysis, as is common in the qualitative method8 . Thedeveloped theoretical frame is discussed in this section,together with the range of attributes and job-searchstrategies that emerged from the data as having animpact on the job seeking process in this target group.
Bourdieu’s thesis on the effect of culturaltransmission on later occupational success in thesucceeding generation has relevance to this study.Bourdieu and Passeron (1977) argue that educationreproduces the system of social stratification, sinceparents’ economic capital can be turned into thechildren’s ‘cultural capital’, which in turn determinesthe second generation’s economic position andoccupational success. According to Bourdieu, each classpossesses its own set of meanings, or culturalframework, which is initially internalized through
socialization within the family. This habitus mouldsperception, thought, taste, appreciation and action. Itis at the same time a framework of meanings which thedominant class is in a position to impose on others (andon the education system) as the only legitimate culture.Thus, children of upper-class families are equipped with‘cultural capital’ that fuels their academic achievementand eventual occupational success. This culturaltransmission process, that underlies achievement-oriented activity, is generally assumed to be absent inthe lower levels of the social structure, whose membersare thus assumed to be disadvantaged vis-à-vis their‘upper-class’ counterparts.
Although the target group was not from the levelsgenerally associated with Bourdieu’s culturaltransmission processes, the data showed that themajority of subjects were nonetheless very aware ofthe value and utility of education. Their school careerhad often, however, been cut short prematurely becausetheir families of origin had been too poor to meet thecost of books, transportation, uniforms, etc., whichschooling entailed9 . This was a prevalent feature amongthose who had started secondary schooling but haddropped out before the O-level exams. Their weakeducational background was not so much due to being
7 It is estimated that 11% of the households in Trinidad and Tobagoare ‘extremely poor’, i.e., unable to afford the minimum food basket(United Nations, 1995).8 Ragin (1994, p. 82) states that ‘qualitative research often involvesa process of reciprocal clarification of the researcher’s image ofthe research subject, on the one hand, and the concepts that framethe investigation, on the other. Images are built up from cases,sometimes by looking for similarities among several examples ofthe phenomenon that seem to be in the same general category. Theseimages, in turn, can be related to concepts’.
9 Book and uniform grants that were formerly targeted at poorfamilies were discontinued during the economic recession.

C E P A L R E V I E W 7 3 • A P R I L 2 0 0 1176
JOB-SEEKING STRATEGIES IN TRINIDAD AND TOBAGO • KATHLEEN VALTONEN
outside of circles where the cultural transmission issupposed to take place, but rather to materialcircumstances that inhibited the course of schooling.This finding corroborates that of Halsey, Heath andRidge (1980), who found in their study of pupils at aselective secondary school that material circumstanceswere a factor determining the length of school career.
Looking at the links between education and labourmarket status from a family perspective is useful in thisgroup. Those subjects at the higher end of theeducational scale who had actually completed theirsecondary schooling came from families in which atleast one adult was in steady employment in the formalsector. Among those subjects whose education had beeninterrupted, family labour market links tended to bemuch more tenuous. Sustained educational achievementin this group seems to be linked overall with relativelystronger socioeconomic status. The culturaltransmission theory may also have implications in thelower-middle and lower socioeconomic levels. Whereasin the upper levels of the social structure familybackground or ‘cultural capital’ and higher academicachievement leading to occupational success arepresumably linked, the very attainment of basiceducation in the lower levels may correspondingly bethe path out of economic dependence or subsistenceconditions.
‘Social resources’ is a concept implying a range oftangible and intangible components. It is possible toselect appropriate aspects that apply to this target groupin which the educational and family backgroundresources are at the weaker end of the scale. Socialresources have been defined as the wealth, status, powerand social ties of those persons who are directly orindirectly linked to the individual being studied. Lin,Ensel and Vaughn (1981) proposed that access to anduse of social resources through one’s network providean essential transition between family background andeducation, on the one hand, and socioeconomicachievement on the other. Their study was focused onone aspect of personal contacts: the occupational statusof the contact used in job-seeking. Taking into accountthe methodological constraints arising from the use ofa single aspect of social resources, the data suggestedthat an individual possesses a substantial advantage inthe occupational attainment process if he has access toand uses greater social resources (Lin, Ensel andVaughn, 1981, p. 1176). Social resources are seen asintermediary attributes, mediating between personalresources and occupational status attainment. Themodel of Lin, Ensel and Vaughn (1981) proposes,
specifically, that (socioeconomic) characteristics ofpersonal contacts affect variations in the level ofoccupational status eventually attained.
The present analysis is concerned with two aspectsof social resources which the data indicate as beingimportant for the job search process and its outcome.Two categories of social ties were identified: ‘weak ties’(Granovetter, 1973) and ‘ties of merit’.
Granovetter (1973) states that most network modelsdeal with strong ties10 , confining their applicability tosmall, well-defined groups, as a result of which all theimportant issues involving their content are ignored.Instead, he lays emphasis on ‘weak ties’ that functionas outward bridging mechanisms, especially betweengroups. These are channels through which ideas,influences or information socially distant from theindividual may reach him. The fewer indirect contactsa person has, the more encapsulated he will be in termsof knowledge of the world beyond his own friendshipcircle. The degree of overlap of two individuals’friendship networks also varies directly with thestrength of dyadic ties (Granovetter, 1973, pp. 1370-1371).
In this study, ‘weak ties’ are understood as thosethat lack the characteristics of ‘strong ties’, but specialemphasis is placed on their function as avenues of freshinformation to which the individual job seeker wouldnot normally have access through the ‘strong ties’ ofhis immediate, but generally limited, network ofinteraction. ‘Weak ties’ can include also ties ‘onceremoved’ that can be mediated through others, as wellas loosely maintained direct ties, in which interactionis not intensively sustained.
Examination of the data brought out a categoryof social resources termed ‘ties of merit’, which referto labour market ties that have been establishedthrough the individual’s own efforts. Merit refers alsoto the value assigned by others. ‘Ties of merit’ are
10 Granovetter (1973) states that ‘the strength of a tie is a (probablylinear) combination of the amount of time, the emotional intensity,the intimacy (mutual confiding), and the reciprocal services whichcharacterize the tie’. Anthropologists associate with strong ties thequality of ‘multiplexity’ or multiple contents in a relationship (seeKapferer, 1969, p. 213). Marsden and Campbell (1984) found in astudy of best-friend ties that the best indicators of an unobservedtie strength concept were measures of closeness or intensity in thesense that they were not contaminated by other measures. Durationtended to overstate the strength of kinship links, and frequencyexaggerated the strength of ties to co-workers and neighbours.Frequency was quite weakly associated with both closeness andduration.

177C E P A L R E V I E W 7 3 • A P R I L 2 0 0 1
JOB-SEEKING STRATEGIES IN TRINIDAD AND TOBAGO • KATHLEEN VALTONEN
based on the individual’s previous achievement orperformance in some field. They reflect therecognition, reputation or merit engendered by suchactivity, and enjoy legitimacy in wider circles of thelabour market. They have the quality of ‘symboliccapital’, which, according to Bourdieu (1986), is anysocial asset, tangible or intangible, that is regarded aslegitimate in society. This category of labour marketties belongs to the ‘constructed’ type, i.e., links builtby the individual with friends, co-workers, employers,etc. in the course of working life and other activity, asopposed to prescribed consanguineous and affinitivekinship ties (see Lin, Ensel and Vaughn, 1981). Sincea large part of the research conducted on the linkbetween personal resources (family background andeducation) and occupational status attainment islocated in strata where it can be assumed that personalresources are strong, ‘ties of merit’, as an alternativeform of personal resources, are especially relevant in
the context of the less advantaged socio-economicstrata under study here.
Areas of human interaction are seldom discretecategories. ‘Ties of merit’ can also be information-generating and thus function as ‘weak ties’. The latterare seen essentially as generating information -e.g., oncurrent conditions in the labour market- which wouldnot otherwise be socially available to the job seeker,while the former are understood as an asset enjoyinglegitimacy and symbolic value in society. ‘Ties of merit’are understood here to be based on, for example, anindividual’s employment record with a reputableenterprise, or a history of steady work relationships,especially in the formal sector, that generate a feelingof ‘trust’ and confidence in potential employers. ‘Tiesof merit’ could also be synonymous with, or signify, adesirable skill level that is maintained, or even possiblyacquired and developed, in favourable workingenvironments.
VICharacteristics and employment strategiesobserved in the target group
adult/s in the family is/are without any steadyemployment.
– Secondary education (abbreviated to ‘secondary’):the presence of ‘secondary’ indicates that theindividual has reached the secondary schoolinglevel and obtained O-level qualifications. Absencemeans that the individual has had only primarylevel education and possibly the first years ofsecondary schooling.
– Vocational education (abbreviated to ‘vocational’):the presence of ‘vocational’ indicates that theindividual has had vocational training, therebyacquiring a skill that increases his employability12 .Absence means that the individual has not receivedsuch training
– Skill: the presence of ‘skill’ indicates that theindividual has acquired some level of skill, throughvocational education or other channels, that would
Specific characteristics and employment strategies wereinitially selected from the data because they wereconsidered to be most important for the outcome of thejob search. These were transformed to nominal-scalemeasures to comply with Boolean algebra, which usesbinary data. There are two conditions or states: true (orpresent) and false (or absent), which are representedas: 1, indicating presence, and 0, indicating absence ofthe following attributes:
– Family background (abbreviated to ‘family’): thepresence of ‘family’ indicates that one adult in thesubject’s family or extended family11 is in steadyemployment, so that there is some regular sourceof income and possibly also contacts or ‘socialcapital’ in the workplace. Absence means that the
11 Although the nuclear family is the predominant form inhouseholds in Trinidad and Tobago (40%), extended familiesnevertheless account for 21.4% of households and single parentfamilies 13.9%.
12 The masculine gender is used for pronouns in order to increasetext readability.

C E P A L R E V I E W 7 3 • A P R I L 2 0 0 1178
JOB-SEEKING STRATEGIES IN TRINIDAD AND TOBAGO • KATHLEEN VALTONEN
improve his chances on the labour market. Absenceof skill means that the individual is basicallycompeting for unskilled work in the employmentmarket.
– ‘Ties of merit’ (abbreviated to ‘merit’): the presenceof ‘merit’ indicates that the individual hasestablished ‘ties of merit’ linking him with at leastone socially recognized institution or employer.The link is a resilient one, based on an adequateperiod of participation or a good work record. ‘Tiesof merit’ can also be a sign of employability,signifying that the individual has acquired someskill on the job, and function as a social guaranteeof competence or worth. Their absence means thatthe individual lacks the social guarantee that backsup his job search initiatives at any level. The datasuggested that ‘ties of merit’ were establishedchiefly through participation in the formal sector.Work activity in the informal sector did not seemto enjoy this type of value.
– ‘Weak ties’ (abbreviated to ‘weak’): the presenceof ‘weak’ indicates that the individual hasinformation on at least two possible areas ofemployment opportunities through networkingcontacts (in this group these were generally onceremoved). The individual is thus abreast of currentdevelopments in the wider labour market and ofpossible opportunity areas, especially at the levelappropriate to his capacity and potential. Their
absence means that the individual’s job seekingactivity was somewhat unfocused, diffuse andprobably unproductive.
– Urban: the presence of ‘urban’ indicates that thesubject is living in an urban concentration, whereproblems of distance and transport costs in the jobsearch stage do not generally arise. In the case ofrural-based subjects, the job search was oftenhindered by lack of resources to cover transportcosts.
– Plan: the presence of ‘plan’ indicates that theindividual has the objective of acquiring some typeof training to enhance his/her employability. Itsabsence means that the individual is notconsidering alternatives to improve his capacitybase.
– Active job search (abbreviated to ‘active’): thepresence of ‘active’ indicates that the individualengages in the job search very actively, has a highfrequency of enquiry, and initiates direct contacts.Its absence means that job search activity is not ofa high level, possibly due also to financial problemswith transport.
One characteristic initially expected to besignificant was found to be common to all the subjects.Thus, all stated that they were willing to accept anytype of work. This attribute is therefore not included inthe matrix.
VIIProcedures and findings
Scrutiny of the combinations of characteristics andstrategies was carried out using the qualitativecomparative analysis method and the related Booleanalgebra procedures developed by Ragin (1987 and1994). The main features of the procedures are brieflydescribed below, condensed from Ragin’s text.
Boolean analysis is combinatorial by design. Thisfeature of combinatorial logic is consistent with the ideathat cases –and especially their causally relevantfeatures– should be viewed holistically. Thus, inBoolean-based qualitative comparison, causes are notviewed in isolation but always within the context ofthe presence or absence of other causally relevantconditions.
By identifying patterns of similarities anddifferences it is possible to identify causal links: i.e.,how different configurations of causes produce differentoutcomes across the range of cases. The Booleanapproach has several features that lend themselves tothe analysis made in this study. It has the ability toaddress complex causal conjunctures, and it allows theresearcher to investigate cases both as wholes and asparts. Organizing the findings in the form ofconfigurations which can be juxtaposed makes itpossible to present and ‘evaluate’ competingexplanations.
A raw data matrix or ‘truth table’ was constructedfor data on the whole target group. The truth table is

179C E P A L R E V I E W 7 3 • A P R I L 2 0 0 1
JOB-SEEKING STRATEGIES IN TRINIDAD AND TOBAGO • KATHLEEN VALTONEN
not presented here in full, as it is possible to summarizethe configurations that exist in the raw data matrix,indicating the number of instances in which eachoccurred. Table 1 gives a summary of configurations.Each row in table 1 represents one configuration type,and the number of instances of occurrence in the targetgroup is given in the last column.
In Boolean analysis, the number of instances ofeach combination of causal conditions does not enterdirectly into any computations. Frequency criteria arenot as important as they are in statistical analysis.Instead, the focus is on types of situations (that is, rowsof the truth table) as the basic unit of analysis.
For clarity, the configurations can be translated intoupper case letters to represent presence of the condition,and lower case letters to represent absence of the samecondition. Thus ‘SECONDARY’ indicates presence ofthis condition, while ‘secondary’ indicates its absence.
Table 2 shows all the identified configurations (thoseshown in table 1), translated into uppercase and lowercase names. A multiplication sign (.) is used to indicatea combination of conditions.
At this stage, the first simple minimization stepcan be carried out. This involves combining rows whenthey differ on only one causal condition if theyotherwise have the same output values. This stepproduces configurations which Ragin (1987) called‘prime implicants’. This simplification strategy followsthe logic of an experiment. Only one condition at atime is allowed to vary (the “experimental condition”).If varying this condition has no discernible impact onthe outcome, it can be eliminated as a factor (Ragin,1994, pp. 124-125).
In rows 1 and 2, which both lead to success infinding employment, all features except one (secondaryeducation) are the same. Individuals can seek work
TABLE 1
Summary of configurations
Row Family Secondary Merit Weak Urban Plan Active Skill Vocat- Employ- Instan-No. ional ment ces
outcome
1 1 1 0 1 1 1 1 0 0 1 72 1 0 0 1 1 1 1 0 0 1 23 0 1 0 1 1 1 1 0 0 1 24 1 1 0 1 1 1 1 1 1 1 15 0 0 1 1 0 0 1 1 0 1 5
6 0 1 0 0 1 1 1 0 0 0 27 0 0 0 0 1 0 1 0 0 0 48 0 0 0 0 0 1 0 0 0 0 189 0 0 0 0 0 0 0 0 0 0 4
TABLE 2The configurationsa and their outcomes
Outcome: access to employment
1. FAMILY.SECONDARY. merit.WEAK.URBAN.PLAN.ACTIVE.skill.vocational2. FAMILY.secondary.merit.WEAK.URBAN.PLAN.ACTIVE.skill.vocational3. family.SECONDARY.merit.WEAK.URBAN.PLAN.ACTIVE.skill.vocational.4. FAMILY.SECONDARY.merit.WEAK.URBAN.PLAN.ACTIVE.SKILL.VOCATIONAL5. family.secondary.MERIT.WEAK.urban.plan.ACTIVE.SKILL.vocational
Outcome: lack of access to employment
6. family.SECONDARY.merit.weak.URBAN.PLAN.ACTIVE.skill.vocational7. family.secondary.merit.weak.URBAN.plan.ACTIVE.skill.vocational8. family.secondary.merit.weak.urban.PLAN.active.skill.vocational9. family.secondary.merit.weak.urban.plan.active.skill.vocational
a As explained earlier, upper case means presence of the condition and lower case its absence.

C E P A L R E V I E W 7 3 • A P R I L 2 0 0 1180
JOB-SEEKING STRATEGIES IN TRINIDAD AND TOBAGO • KATHLEEN VALTONEN
effectively, even in the absence of advanced secondarylevel education. Nonetheless it should be noted that thesuccessful combination with the absence of secondaryeducation is not common in the target group, and isalmost an exception. Nevertheless, rows 1 and 2 can bepaired, and if we omit the ‘secondary’ variable that doesnot affect the outcome, the minimized row reads:
FAMILY. merit.WEAK.URBAN.PLAN.ACTIVE.skill.vocational
It is not possible to do further minimization amongthe successful combinations in this list, since there areno further pair combinations which differ only in onefeature. Four configurations remain for describing thediversity of characteristics and strategies among the 17individuals effectively looking for work.
In table 2, in the list showing negative results(failure to find work), rows 8 and 9 only differ in thepresence or absence of Plan. The two rows can be pairedand minimized by omitting the Plan variable, whichdoes not influence the result. The minimized row willthus be:
family.secondary.merit.weak.urban.active.skill.vocational
The prime implicants present succinct ‘productterms’ or configurations of attributes. The primeimplicant combinations established from the data maybe seen as configurations of causal conditions or simplyas combinations of features which form the basis of anempirical typology. Since the main interest in this studywas to describe diversity succinctly by determining theprime implicants, further minimization or computationprocedures were not necessary. The final phase ofBoolean minimization, the ‘prime implicant chart’,
which seeks maximum logical parsimony, was not theobjective here and was thus not carried out.
The brevity of the minimization stage is not adisadvantage in this study, as the necessary clarity andeconomy of description are achieved by organizationof the data according to Boolean procedures, whichfacilitates the identification of distinct combinations.
Boolean algebra is useful for the analysis of groupsin which lack of resources may be just as influential indetermining the outcome, because the components areconsidered in their presence as well as their absence aspart of the statements of prime implicants. The methodpermits extrapolation of holistic interrelationshipswithin the configurations. The use of rich data fromwhich to select salient phenomena is an initialdimension of the ‘holistic’ treatment. Tracking thepresence or absence of features and their interplay, andbeing able to look at configurations in juxtaposition,are procedures that add rigour to the analysis ofqualitative data.
Table 3 shows the final four configurations(numbered 10, 11, 12 and 13) for successful jobseeking, and the final three configurations (numbered14, 15 and 16) for unsuccessful job seeking. Thesecomprise an empirical typology of attributeconfigurations in the target group.
The successful strategy and characteristic profileswill now be discussed, after which they will becompared with the unsuccessful ones.
Row 10 describes the pattern of individuals forwhom the presence or absence of secondary educationdid not affect the outcome. These individuals have theasset of ‘weak ties’: i.e. up-to-date labour marketinformation and information on opportunities. They areurban based, able to sustain an active job search, andhave plans to take up training of some kind in order
TABLE 3
An empirical typology of job seekers’ attribute configurations
Configurations with successful outcome: employment access
10. FAMILY. merit.WEAK.URBAN.PLAN.ACTIVE.skill.vocational11. family.SECONDARY.merit.WEAK.URBAN.PLAN.ACTIVE.skill.vocational12. FAMILY.SECONDARY.merit.WEAK.URBAN.PLAN.ACTIVE.SKILL.VOCATIONAL13. family.secondary.MERIT.WEAK.urban.plan.ACTIVE.SKILL.vocational
Configurations with unsuccessful outcome: lack of employment access
14. family.SECONDARY.merit.weak.URBAN.PLAN.ACTIVE.skill.vocational15. family.secondary.merit.weak.URBAN.plan.ACTIVE.skill.vocational16. family.secondary.merit.weak.urban.active.skill.vocational

181C E P A L R E V I E W 7 3 • A P R I L 2 0 0 1
JOB-SEEKING STRATEGIES IN TRINIDAD AND TOBAGO • KATHLEEN VALTONEN
thereby to increase marketable skills and employability.As these individuals do not have vocational educationor specialized skills, they lack ‘ties of merit’: a solidrecord or reputation that would otherwise serveindependently to support job seeking efforts. They comefrom families with stronger ties to the labour market,since at least one adult has regular employment andincome.
Row 11 shows a configuration similar to row 10 inmost attributes. However, links of the family orhousehold to the labour market are weak, as no adultsare employed. The job seeker nonetheless has secondaryeducation to O-level. Studies have shown that educationbegins, at the secondary level, to show an effect onemployment (World Bank, 1990). This finding suggeststhat the presence of basic educational qualifications isdecisive for individuals from families without strongties to the labour market.
Row 12 is a configuration of those with goodresources in this target group. Individuals have not, orpossibly not yet, entered the labour market andestablished ‘ties of merit’, but they have a range of otherresources: strong family background vis-à-vis thelabour market, secondary education, vocationaleducation and skill of some kind. They are urban based,have an information base (‘weak ties’), seekemployment actively, and have plans for furthertraining. Their prospects look good.
Row 13 is the configuration that does not conformto the main features of the majority of successfulconfigurations described above. This opens up aninteresting perspective. Row 13 represents a type ofjob seekers who have strengthened their labour marketposition from what was originally a less advantageousstarting point for the job search. They resemble theprevious type in that they possess ‘weak ties’ or effectiveinformation channels, and their job seeking activity ishigh: a combination occurring across all successfulpatterns. These may also be mutually reinforcingattributes. Otherwise, however, there is a markedabsence of other assets. This type has entered the labourmarket without having secondary school qualifications,and in the absence of other family connections withthe labour market, their ‘weak ties’ were probably basedon existing labour market relations. These individualsdid not have any plans for further training, and theywere also rural based.
The difference is that they now have ‘ties of merit’,i.e., they have established a record in the labour market,based on steady work relations. The type of connectionmade with the labour market has been decisive. It has
most likely given rise to their skill resource, since theyhave not had vocational training. Row 13 demonstratesthat an adequate level of marketable skills can beacquired through productive employment relations evenwhen the individual has not previously had theopportunity to obtain formal schooling and training. Awell established labour market relation can carryenough weight independently to overcome the absenceof formal qualifications and of the social capitalrepresented by family relations. A combination of weakties and a high level of job seeking activity iscomplemented by skill and established ‘ties of merit’with the labour market: decisive attributes for labourmarket mobility and for avoiding long-termunemployment in this configuration.
From a practical perspective, row 13 would seemto offer a formula that could be copied by job seekersstarting with fewer resources. However, the alternativeapproach would be to look at the range of successfulconfigurations in juxtaposition with the unsuccessfuland discover if it would be possible to respond with awide range of interventions designed to address multiple‘absences’ of resources. The patterns presented hererepresent different configurations of attributes that giverise to a variety of interlinking processes. In the case ofpatterns with a more generous range of resources, theinterrelationships and interaction processes are likelyto be mutually reinforcing and empowering. In moreweakly resourced patterns, the multiple absence ofresources and assets may jeopardize the effectivenessof singly occurring resources.
Scrutinizing the patterns of those who arechronically unemployed, we see that row 14 resemblesrow 11, except that, in contrast with that row, there isan absence of ‘weak ties’. This suggests that withoutweak ties, the individual’s planning and job searchdiligence could be unfocused and ultimatelyunproductive. This finding is significant in that itillustrates how the absence of one attribute (‘weak ties’)can cancel out, as it were, the effectiveness of a resourcewhich is actually present (ACTIVE). In groups wheresocial and personal resources are lower in an absolutesense, the particular configuration patterns, as well asthe relationships between components, may have adecisive influence on the eventual outcome of the jobsearch.
The presence of the urban-based factor seems tobe consistently associated with the presence of highjob search activity. The individuals in row 14 and row15 are urban based and, as in the case of successfulurban-based individuals in rows 10, 11 and 12, this

C E P A L R E V I E W 7 3 • A P R I L 2 0 0 1182
JOB-SEEKING STRATEGIES IN TRINIDAD AND TOBAGO • KATHLEEN VALTONEN
attribute seems to facilitate very active job seeking. Inurban locations where residential and workplaceconcentration is higher, transport and transport costsdo not constitute an obstacle to job seeking, as theymight in rural locations. It can likewise be assumedthat information networks are also denser in urbanconcentrations, giving the urban based a possibleadvantage over the rural based. Nonetheless, this findingsuggests that the information generated by density ofcontact in urban locations may not be of the samequality as that generated by ‘weak ties’. The
configurations with unsuccessful outcomes on rows 14and 15 show a presence of urban location and high levelof job search activity, but combined with an absence of‘weak’ information-generating ties. This points to theimportance of accurate employment and labour marketinformation over the whole range: such information wasconsistently absent among the chronically unemployedwho lacked ‘weak ties’. The role of officially sponsored,more comprehensive labour exchange facilities to fillat least part of this gap would be important forindividuals who do not have such contacts.
VIIIConclusion
The four effective and three ineffective configurationsdiscussed here constitute an empirical typology of jobseeking in two areas of the Trinidadian labour market.From a policy and planning perspective, researchexercises such as this can indicate where the weaknesseslie in resource configurations. The resources or resourcedeficiencies of individuals should be considered not inisolation but in the context of other impacting attributeswhich together, in concert, shape the job searchoutcome. Study findings illuminate several importantaspects of the job seeking process. Being urban basedis associated with having plans for further education ortraining. Such individuals were generally disposedtowards acquiring marketable skills, possibly becauseof the proximity of facilities and denser informationcircuits. Being urban based is also associated with ahigh level of job search activity. In this target groupthat is not strongly resourced, a high level of job searchactivity may yield many indirect benefits, such asincreasing the individual’s awareness of labour marketdynamics, its structure, or its unwritten rules. However,this activity has proven to be largely unproductiveamong those job seekers who lacked a source of moreaccurate information on current and developingopportunity areas on which to focus their search. ‘Weak’information-generating ties occupy a pivotal role in anyconfiguration of attributes. Among job seekers who lackinitial resources such as vocational education, basiceducational qualifications and ‘social capital’, acquired‘ties of merit’ built incrementally on employmentperformance in the formal economy can be a
compensating asset guaranteeing a degree of acquiredcompetence or skill.
Those attribute configurations featuring multipleabsence of resources and labour market marginalizationpoint to a situation in which the individuals concernedare in a subsistence pattern, depending heavily oninformal networks and irregular income from theinformal economy. In this target group, the outcomedifference is marked between those who managed toestablish links with the formal labour market and thosewho sustain activities at subsistence level withoutgaining entry into the formal sectors. It is possible toextrapolate from the data that association with theformal employment sector is more productive ofresources -and not only financial resources- thatpromote social and economic mobility. Association withand activity in the informal sector, on the other hand,produces economic benefits that hover around thesubsistence or safety net level but do not lead either toupward or lateral socioeconomic mobility.Configurations with vocational education and skillswere markedly absent from this target group (with oneexception). Those possessing such configurationswould probably not linger long on the threshold of thelabour market. Some measures to address the conditionsin peripheral groups are obvious. Innovative approachescall for the identification of key attributes and theinterrelations between these, in order to maximizeprogramme effectiveness.
(Original: English)

183C E P A L R E V I E W 7 3 • A P R I L 2 0 0 1
JOB-SEEKING STRATEGIES IN TRINIDAD AND TOBAGO • KATHLEEN VALTONEN
Bibliography
Bourdieu, P. (1986): The forms of capital, in J.G. Richardson(ed.), Handbook of Theory and Research for the Soci-ology of Education, New York, Greenwood.
Bourdieu, P. and J.-C. Passeron (1977): Reproduction: InEducation, Society, and Culture, Beverly Hills, Cali-fornia, Sage Publications.
ECLAC (Economic Commission for Latin America and theCaribbean) (1997): The Equity Gap: Latin America, theCaribbean and the Social Summit, LC/G.1954/Rev.1-P, Santiago, Chile. United Nations publication, SalesNo. E.97.II.G.11.
Gafar, J. (1998): Growth, inequality and poverty in selectedCaribbean and Latin American countries, with empha-sis on Guyana, Journal of Latin American Studies, Vol.30, No. 3, pp. 591-617. London, Cambridge UniversityPress.
Granovetter, M. S. (1973): The strength of weak ties, Ameri-can Journal of Sociology, Vol. 78, No. 6, pp. 1360-1381.Chicago, University of Chicago Press.
Granovetter, M. and C. Tilly (1988): Inequality and laborprocesses, in N. J. Smelser (ed.), Handbook of Sociol-ogy, San Francisco, California, Sage Publications.
Halsey, A.H., A. F. Heath and J.M. Ridge (1980): Originsand Destinations, Oxford, U.K., Clarendon Press.
Henry, R. and J. Melville (1989): Poverty revisited. Paperpresented at the Regional Conference on New Direc-tions in Caribbean Social Policy, The University of theWest Indies, St. Augustine, Trinidad and Tobago.
Kapferer, B. (1969): Norms and the manipulation of rela-tionships in a work context, in J. C. Mitchell (ed.) So-cial Networks in Urban Situations, Manchester, U.K.,Manchester University Press.
Lin, N., Ensel, W. M. and J.C. Vaughn (1981): Social re-sources and strength of ties: structural factors in occu-pational status attainment, American Sociological Re-view, Vol. 46, No. 4, pp. 393-405. Washington, D.C.,American Sociological Association.
Lin, N., J. C. Vaughn and W.M. Ensel (1981): Social re-sources and occupational status attainment, SocialForces, Vol. 59, No. 4, pp. 1163-1181. Chapel Hill,North Carolina, University of North Carolina.
Marsden, P.V. and K.E. Campbell (1984): Measuring tiestrength, Social Forces, Vol. 63, No. 2, pp. 482-501.Chapel Hill, North Carolina, University of North Caro-lina.
McKeever, M. (1998): Reproduced inequality: Participationand success in the South African informal economy,
Social Forces, Vol. 76, No. 4, pp. 1209-1241. ChapelHill, North Carolina, University of North Carolina.
Neil, A. (1987): Voices from the hill: The steelband and itseffects on poverty, stigma and violence in a community(mimeo).
Portes, A. and M. Castells (1989): World underneath: Theorigins, dynamics and effects of the informal economy,in A. Portes, M. Castells and L. Benton (eds.), The In-formal Economy: Studies in Advanced and Less Devel-oped Countries, Baltimore, Maryland, The JohnsHopkins University Press.
Ragin, C. C. (1987): The Comparative Method: Moving be-yond Qualitative and Quantitative Strategies, Berke-ley, California, The University of California Press.
(1994): Constructing Social Research, ThousandOaks, California, Pine Forge Press.
Ramsaran, R. (1992): Growth, employment and the standardof living in selected Commonwealth Caribbean coun-tries, Caribbean Studies, Vol. 25, Nos. 1-2, pp. 103-122. Río Piedras, Puerto Rico, University of PuertoRico, Institute of Caribbean Studies.
Rogozinski, J. (1994): A Brief History of the Caribbean: Fromthe Arawak and the Carib to the Present, New York,Meridian.
Ryan, S. and T. Stewart (eds.) (1995): The Black Power Revo-lution 1970: A Retrospective, St. Augustine, Trinidadand Tobago, University of the West Indies, Institute ofSocial and Economic Research.
Ryan, S., R. McCree and G. St. Bernard (eds.) (1997): Be-hind the Bridge: Poverty, Politics and Patronage inLaventille, Trinidad, St. Augustine, Trinidad and To-bago, University of the West Indies, Institute of Socialand Economic Research.
United Nations (1995): Report of the World Summit for So-cial Development, Preliminary Report, Copenhagen,World Summit for Social Development, March 6-12,1995.
Valtonen, K. (1996): Bread and tea: A study of the integra-tion of low-income immigrants from other Caribbeanterritories into Trinidad, International Migration Review,Vol. 30, No. 4, pp. 995-109. New York, Center for Mi-grant Studies of New York, Inc.
World Bank (1990): World Development Report 1990, Wash-ing, D.C.
(1995): Trinidad and Tobago. Poverty and unem-ployment in an oil-based economy, Report No.14382-TR, Washington, D.C., 27 October.

C E P A L R E V I E W 7 3 • A P R I L 2 0 0 1184
JOB-SEEKING STRATEGIES IN TRINIDAD AND TOBAGO • KATHLEEN VALTONEN
CEPAL Review Referees1999-2000
The following scholars and researchers have served as referees for the CEPAL Reviewduring this period:
Manuel Agosin Daniel Heymann Michael MortimoreIrma Arriagada Norman Hicks Hugo NochteffAlicia Bárcena Felipe Jiménez Nelson NoyaLuis Beccaria Andrei Jourvralev Marcelo OrtúzarMarta Bekerman Liselott Kana Ernesto OttoneCristián Bellei Jorge Katz Juan José PereiraAlbert Berry Emilio Klein Esteban PérezSebastián Bernstein Bernardo Kosacoff Juan Carlos RamírezAndrés Bianchi Mikio Kuwayama Joseph RamosRicardo Bielschowsky Guillermo Labarca Alfredo RehrenJorge Bravo Osvaldo Larrañaga Marcelo RepettoRudolf Buitelaar Norbert Lechner Nieves RicoAlfredo Calcagno Terence Lee Gert RosenthalMario Damill Arturo León Alejandro SchejtmanOscar Dancourt Juan Carlos Lerda Daniel SchydlowskyBeatriz David Eduardo Lora Miguel SolanesCarlos De Mattos Carla Macario Juan Carlos TedescoLilia Domínguez Scott Mainwaring Daniel TitelmanJohn Durston Jorge Máttar Andras UthoffRicardo Ffrench-Davis Patricio Meller Alejandro VargasCarlos Filgueira Isidora Mena Vivianne VenturaAlicia Frohmann Carmelo Mesa-Lago Jurgen WellerAlexander Galetovic Alberto Minujin Roberto ZahlerNorberto García Graciela MoguillanskyFrancisco Gatto Alfredo Monza
The CEPAL Review is grateful for their valuable contributions.
CEPAL REVIEW REFEREES 1999-2000