Foreign investment - Repositorio CEPAL
162
Foreign investment in Latin America and the Caribbean 2002
-
Upload
khangminh22 -
Category
Documents
-
view
0 -
download
0
Transcript of Foreign investment - Repositorio CEPAL
Foreign investment in Latin America and the Caribbean, 2001 3
Foreigninvestment
��������������
����� ��������
2002
2 ECLAC
Notes and explanation of symbols
The following symbols have been used in the tables in this study:
Three dots (...) indicate that data are not available or are not separately reported.A minus sign (-) indicates a deficit or decrease, unless otherwise indicated.A full stop (.) is used to indicate decimals.Use of a hyphen (-) between years, e.g., 1960-1970, signifies an annual average for the calendar years involved, including thebeginning and the end years.The word “dollars” refers to United States dollars, unless otherwise specified.
Figures and percentages in tables may not neccessarily add up to the corresponding totals, because of rounding.
Foreign Investment in Latin America and the Caribbean, 2002 Report is the latest edition of a series publishedannually by the ECLAC Unit on Investment and Corporate Strategies. It was prepared by Alvaro Calderón, GracielaMoguillansky, Nicole Moussa, Michael Mortimore and Rogerio Studart, with assistance from Sebastián Vergara anda special contribution from Fernando J. Cardim de Carvalho (consultant) in chapter III. The statistical data werecompiled and processed by Francisca Opitz, Patricio Valenzuela and Pablo Carvallo.
The Information Centre of the Unit on Investment and Corporate Strategies served as the primary source ofquantitative data. The development of this Information Centre has provided the Unit with ready access to statisticalinformation and other types of data from a number of international organizations, including the International MonetaryFund, the Statistical Office of the European Communities and the United Nations Conference on Trade and Development,as well as a host of national institutions such as central banks and investment promotion agencies for Latin Americaand the Caribbean.
Any comments or suggestions regarding this publication should be directed to Michael Mortimore (e-mail:[email protected] ).
4 ECLAC
Copyright © United Nations 2003All rights reserved
Printed in Chile
Applications for the right to reproduce this work are welcomed and should be sent to the Secretary of the Publication Board, UnitedNations Headquarters, New York. N.Y. 10017, U.S.A. Member States and their governmental institutions may reproduce this work
without prior authorization, but are requested to mention the source and inform the United Nations of such reproduction.
UNITED NATIONS PUBLICATIONS
Sales No: E.03.II.G.11
ISSN printed version 1680-8649ISSN online version 1681-0287
ISBN 92-1-121382-7
LC/G.2198-P
April 2003
Foreign investment in Latin America and the Caribbean, 2001 5
CONTENTS
Page
ABSTRACT ..................................................................................................................................... 9
SUMMARY AND CONCLUSIONS .............................................................................................................. 11
I. REGIONAL OVERVIEW ............................................................................................................... 19
A. RECENT TRENDS IN FOREIGN DIRECT INVESTMENT INLATIN AMERICA AND THE CARIBBEAN ....................................................................... 191. Foreign direct investment worldwide ......................................................................... 202. Foreign direct investment in Latin America and the Caribbean: recent
inflows and trends ....................................................................................................... 23
B. FDI STRATEGIES, AGENTS AND MODALITIES .............................................................. 351. TNC strategies in Latin America ................................................................................. 352. Foreign investment modalities in Latin America and the Caribbean ........................ 443. Conclusion .................................................................................................................. 45
Annex ..................................................................................................................................... 47Appendix ..................................................................................................................................... 55
II. THE ANDEAN COMMUNITY: FOREIGN DIRECT INVESTMENT AND CORPORATESTRATEGIES................................................................................................................................. 57
A. FOREIGN CAPITAL IN THE ANDEAN COMMUNITY ..................................................... 581. The treatment of foreign capital in the member countries of the Andean
Community ................................................................................................................. 582. Recent trends in FDI in the Andean Community ....................................................... 62
B. STRATEGIES USED BY TRANSNATIONAL CORPORATIONSIN THE ANDEAN COMMUNITY ....................................................................................... 671. Seeking natural resources for export .......................................................................... 672. Access to local services and infrastructure markets ................................................... 78
C. CONCLUSIONS ................................................................................................................... 89Annex ..................................................................................................................................... 91
III. INTERNATIONAL BANKS IN LATIN AMERICA: CORPORATESTRATEGIES AND REGIONAL IMPACT .................................................................................... 103
INTRODUCTION ........................................................................................................................... 103
A. THE LATIN AMERICAN BANKING SECTOR: STRUCTURAL PROBLEMS,CRISES AND RESTRUCTURING ....................................................................................... 1041. Structural characteristics and problems of banking systems prior to
the 1990s ..................................................................................................................... 105
B. UNIVERSALIZATION AND GLOBALIZATION: DETERMINANTS OFTHE STRUGGLE FOR NEW MARKETS ........................................................................... 1101. New trends in the international banking market ........................................................ 1102. The development of new financial instruments ......................................................... 1123. The banks' strategies for responding to change ......................................................... 114
6 ECLAC
Page
C. CORPORATE STRATEGIES IN LATIN AMERICA ........................................................... 1201. Strategy for penetrating the Latin American market .................................................. 1222. Corporate strategies, market share and profitability .................................................. 1233. Costs and benefits of expansion in Latin America ..................................................... 129
D. FOREIGN BANKS: MICROECONOMIC EFFICIENCY VERSUSMACROECONOMIC EFFECTIVENESS ............................................................................ 1311. Microeconomic efficiency .......................................................................................... 1312. Macroeconomic impact ............................................................................................... 137
E. CONCLUSIONS ................................................................................................................... 143Annex ..................................................................................................................................... 145
BIBLIOGRAPHY ..................................................................................................................................... 153
TABLES, FIGURES AND BOXES
Table I.1 Regional distribution of net inward foreign direct investment, 1996-2002 ............ 20Table I.2 Mexico, Central America and the Caribbean: net inward foreign direct
investment by country, 1990-2002 ............................................................................ 25Table I.3 South America: net inward foreign direct investment, 1990-2002 ........................... 29Table I.4 Brazil: sectoral distribution of foreign direct investment, 1996-2002 ..................... 30Table I.5 Argentina: foreign public utility firms that declared suspensions of
payments in 2002 ....................................................................................................... 33Table 1.6 Income sent abroad by foreign firms in Argentina, by sector, 1992-2001 ................ 33Table I.7 Latin America: main brewery groups ......................................................................... 40Table I.8 Latin America: main acquisitions in the brewery sector ........................................... 41Table I.9 Latin America and the Caribbean: privatizations by sector and amount, 2002 ....... 44Table II.1 FDI flows to the Andean Community countries, by destination, 1990-2002 ........... 62Table II.2 Member countries of the Andean Community: cumulative FDI flows, by
economic sector, 1992-2001 ...................................................................................... 64Table II.3 Andean Community: cumulative FDI, by country of origin, 1992-2001 ................. 66Table II.4 Andean Community: telecommunications indicators, 1995-2001 .......................... 81Table II.5 Andean Community: main mobile telephony operators, december 2001 ................ 82Table II.6 Santander Central Hispano (SCH) and Banco Bilbao Vizcaya Argentaria (BBVA):
presence in the banking market of the Andean Community countries, 2001 ........... 88Table III.1 Latin America: first-generation reforms of the financial system ............................... 105Table III.2 Foreign bank share of Latin American banking assets, 1990-2001 .......................... 108Table III.3 Indicators of concentration in the banking sector, 1994-2000 ................................. 109Table III.4 Money supply (M2) as a percentage of gross domestic product .............................. 109Table III.5 Outstanding stocks of debt securities issued on domestic markets .......................... 110Table III.6 United States: financial market instruments, 1997-2001 .......................................... 113Table III.7 European Union: comparative share of banking and non-banking activities,
1990-1997 .................................................................................................................. 113Table III.8 Bank concentration: share of the five largest banks in each country's total
assets, 1990-1999 ....................................................................................................... 114Table III.9 Latin America: market shares of the three largest international banks
in 2001 ....................................................................................................................... 123
Foreign investment in Latin America and the Caribbean, 2001 7
Page
Table III.10 The importance of BANAMEX to CITIGROUP ....................................................... 125Table III.11 Composition of foreign bank assets, 2001 ............................................................... 129Table III.12 Profitability in Latin America vs. profitability worldwide, 1999-2001 .................. 130Table III.13 Latin America: indicators of the profitability of local and foreign banks,
1997-2001 ................................................................................................................. 132Table III.14 Latin America: indicators of the efficiency of local and foreign banks,
1997-2001 ................................................................................................................. 134Table III.15 Liquidity indicator: effective availability of loanable funds in relation to total
deposits, 1997-2001 .................................................................................................. 135Table III.16 Latin America (selected countries): variation in lending to the private sector in
constant 1998 values, and real interest rates, 1997-2001 ........................................ 138Table III.17 Latin America (15 countries): bank intermediation spreads, 1997-2002 ................ 141Table III.18 Latin America: ratio between provisions for doubtful loans and non-performing
loans, 1997-2001 ...................................................................................................... 141
Figure I.1 United States: indicators of stock market trends, 1991-2002 .................................. 22Figure I.2 Latin America and the Caribbean: net inward foreign direct investment
by subregion, 1990-2002 .......................................................................................... 24Figure I.3 Mexico: importance of the manufacturing and financial services sectors as
destinations for foreign direct investment ................................................................ 26Figure I.4 Mexico: exports and employment in maquila export industries, 2000-2002 ......... 27Figure I.5 Mexico: reduction in the number of establishments and workers employed in
maquila export activities, January 2001-October 2002 ........................................... 36
Figure II.1 Share of the Andean Community in total FDI flows to Latin America and theCaribbean, 1990-2001 ............................................................................................... 62
Figure II.2 FDI flows to the Latin American integration association and the AndeanCommunity, by destination, 1990-2001 ................................................................... 63
Figure II.3 Colombia: investment in oil exploration, 1978-2000 .............................................. 69Figure II.4 Colombia, Peru and Venezuela: share of foreign banks in total assets of local
banking systems, 1990-2001 ..................................................................................... 88Figure III.1 CITIGROUP: performance over the last 10 years, 1991-2001 .................................. 119Figure III.2 Largest banks in Latin America by share of regional lending, 2001 ........................ 120Figure III.3 International banks: assets in Latin America vs. worldwide assets ........................... 121Figure III.4 Latin America: foreign bank share of total lending by the local banking system,
1998-2001 .................................................................................................................. 122Figure III.5 Banco Santander and Banco Bilbao Vizcaya Argentaria (BBVA) share prices on
the New York stock exchange, 1990-2002 ................................................................ 127Figure III.6 Return on assets: trends by country ........................................................................... 133Figure III.7 Trend of liquidity index in each country by type of bank, 1997-2001 ................... 136Figure III.8 Latin America (selected countries): ratio of credit to GDP, 1991-2001 .................... 137Figure III.9 Assets and loans in the Mexican banking system, 1997-2001 ................................. 139Figure III.10 Net income of the Mexican banking system, 1997-2001 ......................................... 140
Box I.1 Brazil: local banks lead the way in bank consolidation ........................................... 31Box I.2 Latin America and the Caribbean: strategies of transnational
corporations in the 1990s .......................................................................................... 35Box II.1 Bolivia: the capitalization plan ................................................................................. 60Box II.2 Interconexión Eléctrica S.A. (ISA): a Multi-Andean firm ......................................... 85
8 ECLAC
Page
Box III.1 First- and second-generation financial reforms in Latin America over the pasttwo decades ................................................................................................................. 106
Box III.2 Financial reforms in industrialized countries ............................................................. 112Box III.3 CITIGROUP: one of the world's largest universal banks ............................................ 117Box III.4 Spanish banks in Latin America .................................................................................. 124Box III.5 Foreign bank participation in pension fund management ......................................... 126Box III.6 Foreign banks dominate the Mexican banking system, but credit fails
to recover ..................................................................................................................... 139
ANNEXES
Table I-A.1 Latin America and the Caribbean: acquisitions of private firms by foreigninvestors for over US$ 100 million, 2002 .................................................................. 49
Table I-A.2 Latin America and the Caribbean: largest multinational firms by sales, 2000-2001 50Table I-A.3 Latin America and the Caribbean: concessions with foreign investor participation,
by sector, 2002 ............................................................................................................ 51Table I-A.4 Latin America: top 100 subsidiaries of transnational corporations by net sales,
2001 ............................................................................................................................ 53Table II-A.1 Andean Community: main privatizations with participation by foreign firms,
1991-2002 .................................................................................................................. 93Table II-A.2 Andean Community: main mergers and acquisitions with participation by
foreign firms, 1992-2002 ............................................................................................ 94Table II-A.3 Andean Community: largest firms with foreign ownership, by sales, 2001 ............. 96Table II-A.4 Andean Community: international competitiveness in the context of world
imports, 1985-2000 .................................................................................................... 97Table II-A.5 Andean Community: structure of exports and main export products, by
country, 1985-2000 .................................................................................................... 98Figure II-A.1 Andean Community: distribution pf oil reserves by member country, 1970-2001 . 99Figure II-A.2 Andean Community: distribution of oil production by member country,
1970-2001 .................................................................................................................. 101Figure II-A.3 Andean Community: distribution of natural gas reserves by member country,
1970-2001 .................................................................................................................. 101Figure II-A.4 Andean Community: distribution of natural gas production by member country,
1970-2001 .................................................................................................................. 102Table III-A.1 The 50 largest banks in Latin America, ranked by assets .......................................... 147Table III-A.2 Foreign bank share of the leading Latin American financial markets, 2001 ............ 148Table III-A.3 Main acquisitions in the Latin American financial sector ........................................ 149Table III-A.4 Banco Bilbao Vizcaya Argentaria (BBVA): main related firms in Latin America,2001 150Table III-A.5 Banco Santander Central Hispano (SCH): main related firms in Latin America, 2001 151Table III-A.6 Ranking of the world’s largest banks ......................................................................... 152
Foreign investment in Latin America and the Caribbean, 2001 9
ABSTRACT
The decline in flows of foreign direct investment (FDI) to Latin America and the Caribbean which began in2000 grew even sharper in 2002. This trend reflects a major change in the world and regional economies.At the regional level, it is associated with greater instability, slow economic growth and the approachingcompletion of the privatization process. National crises such as those experienced by Argentina, Uruguayand Venezuela made investors become more risk-averse. Sluggish growth in demand in the United Stateseconomy hurt investment in Mexico, Central America and the Caribbean, where the transnationalcorporations that employ efficiency-seeking strategies are concentrated. The global and regional situationshad a less adverse effect on FDI in the countries of the Andean Community, where the primary sectorpredominates, but instability in the Mercosur countries diminished their attractiveness for transnationalcorporations implementing market-seeking investment strategies.
This publication is composed of three chapters. The first provides a broad review of FDI trends in LatinAmerica and the Caribbean. The second offers the reader a comprehensive discussion of investment flowsto the Andean Community countries. The third analyses flows from transnational banks to the bankingsector in the region and assesses what types of effects their strategies are having on the region.

10 ECLAC
Foreign investment in Latin America and the Caribbean, 2002 11
SUMMARY AND CONCLUSIONS
The annual publication Foreign Investment in Latin America and the Caribbean, 2002
Report consists of three chapters. The first chapter examines global and regional FDI
trends in terms of their geographical and sectoral distribution and looks at the various
modalities of such flows, as well as the major foreign companies operating in Latin
America and the Caribbean. The principal corporate strategies driving FDI in the region
are also analysed. The second chapter focuses on the experience of the Andean
Community, a subregion which has, for the most part, maintained existing levels of
FDI inflows, while most others have not. The final chapter deals with financial services,
interpreting the new situation in the region in the context of changes in the international
market, national policy initiatives and the new corporate strategies of the principal
transnational banks operating there.
The regional outlook
The worldwide downturn in FDI flows continued in2002 (-27%). Many factors were involved in this result.Among the more prominent were the sharp decline inthe share prices of many transnational corporations(TNCs), mainly those associated with the new economy,the steep drop in privatizations and acquisitions ofinternational assets and the downward spiral in theamount of financing generally available to TNCs. Allthese factors combined to curb the internationalexpansion of these firms. Their impact on the United
States market and on United States TNCs wasparticularly detrimental to Latin America.
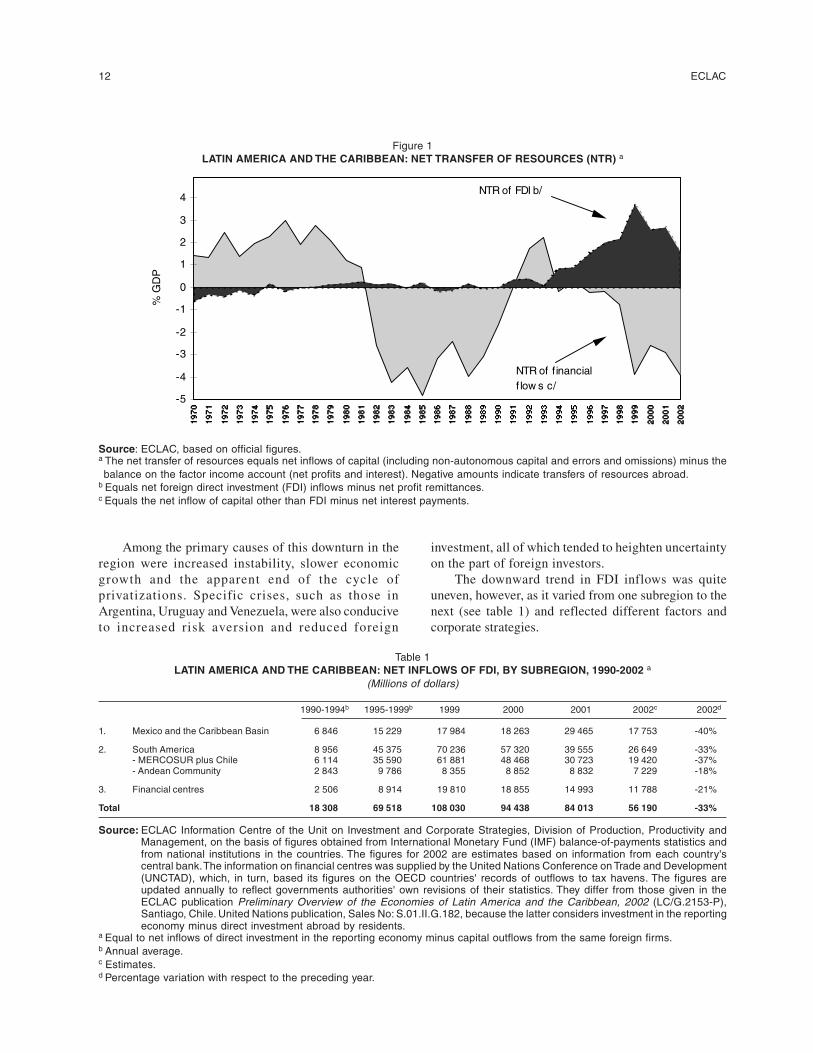
This time, unlike the situation in 2001, FDI flows toLatin America and the Caribbean slid more sharply thanthose to other areas (-33%). Moreover, contrary to the patternobserved in 1998-2001, as of 2002 the net transfer of FDIresources would no longer compensate for the negative nettransfer of financial resources, as it had since the Asian andRussian crises of 1997-1998. And indeed, the net outwardtransfer of financial resources swelled to the equivalent ofmore than 4% of Latin America's GDP in 2002, while thenet inward transfer of FDI resources fell to less than 2%.
12 ECLAC
Figure 1LATIN AMERICA AND THE CARIBBEAN: NET TRANSFER OF RESOURCES (NTR) a
-5
-4
-3
-2
-1
0
1
2
3
4
% G
DP
NTR of FDI b/
NTR of financial f low s c/
Source: ECLAC, based on official figures.a The net transfer of resources equals net inflows of capital (including non-autonomous capital and errors and omissions) minus thebalance on the factor income account (net profits and interest). Negative amounts indicate transfers of resources abroad.
b Equals net foreign direct investment (FDI) inflows minus net profit remittances.c Equals the net inflow of capital other than FDI minus net interest payments.
Among the primary causes of this downturn in theregion were increased instability, slower economicgrowth and the apparent end of the cycle ofprivatizations. Specific crises, such as those inArgentina, Uruguay and Venezuela, were also conduciveto increased risk aversion and reduced foreign
investment, all of which tended to heighten uncertaintyon the part of foreign investors.
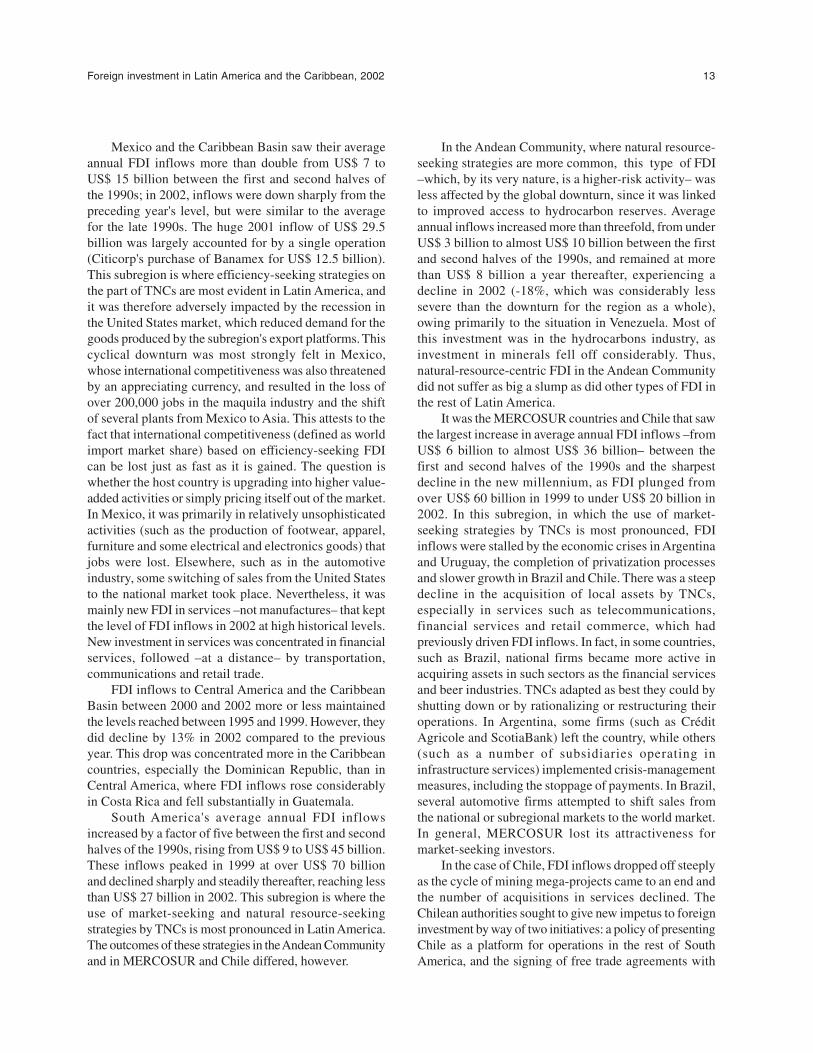
The downward trend in FDI inflows was quiteuneven, however, as it varied from one subregion to thenext (see table 1) and reflected different factors andcorporate strategies.
Table 1LATIN AMERICA AND THE CARIBBEAN: NET INFLOWS OF FDI, BY SUBREGION, 1990-2002 a
(Millions of dollars)
1990-1994b 1995-1999b 1999 2000 2001 2002c 2002d
1. Mexico and the Caribbean Basin 6 846 15 229 17 984 18 263 29 465 17 753 -40%
2. South America 8 956 45 375 70 236 57 320 39 555 26 649 -33%- MERCOSUR plus Chile 6 114 35 590 61 881 48 468 30 723 19 420 -37%- Andean Community 2 843 9 786 8 355 8 852 8 832 7 229 -18%
3. Financial centres 2 506 8 914 19 810 18 855 14 993 11 788 -21%
Total 18 308 69 518 108 030 94 438 84 013 56 190 -33%
Source: ECLAC Information Centre of the Unit on Investment and Corporate Strategies, Division of Production, Productivity andManagement, on the basis of figures obtained from International Monetary Fund (IMF) balance-of-payments statistics andfrom national institutions in the countries. The figures for 2002 are estimates based on information from each country'scentral bank. The information on financial centres was supplied by the United Nations Conference on Trade and Development(UNCTAD), which, in turn, based its figures on the OECD countries' records of outflows to tax havens. The figures areupdated annually to reflect governments authorities' own revisions of their statistics. They differ from those given in theECLAC publication Preliminary Overview of the Economies of Latin America and the Caribbean, 2002 (LC/G.2153-P),Santiago, Chile. United Nations publication, Sales No: S.01.II.G.182, because the latter considers investment in the reportingeconomy minus direct investment abroad by residents.
a Equal to net inflows of direct investment in the reporting economy minus capital outflows from the same foreign firms.b Annual average.c Estimates.d Percentage variation with respect to the preceding year.
Foreign investment in Latin America and the Caribbean, 2002 13
Mexico and the Caribbean Basin saw their averageannual FDI inflows more than double from US$ 7 toUS$ 15 billion between the first and second halves ofthe 1990s; in 2002, inflows were down sharply from thepreceding year's level, but were similar to the averagefor the late 1990s. The huge 2001 inflow of US$ 29.5billion was largely accounted for by a single operation(Citicorp's purchase of Banamex for US$ 12.5 billion).This subregion is where efficiency-seeking strategies onthe part of TNCs are most evident in Latin America, andit was therefore adversely impacted by the recession inthe United States market, which reduced demand for thegoods produced by the subregion's export platforms. Thiscyclical downturn was most strongly felt in Mexico,whose international competitiveness was also threatenedby an appreciating currency, and resulted in the loss ofover 200,000 jobs in the maquila industry and the shiftof several plants from Mexico to Asia. This attests to thefact that international competitiveness (defined as worldimport market share) based on efficiency-seeking FDIcan be lost just as fast as it is gained. The question iswhether the host country is upgrading into higher value-added activities or simply pricing itself out of the market.In Mexico, it was primarily in relatively unsophisticatedactivities (such as the production of footwear, apparel,furniture and some electrical and electronics goods) thatjobs were lost. Elsewhere, such as in the automotiveindustry, some switching of sales from the United Statesto the national market took place. Nevertheless, it wasmainly new FDI in services –not manufactures– that keptthe level of FDI inflows in 2002 at high historical levels.New investment in services was concentrated in financialservices, followed –at a distance– by transportation,communications and retail trade.
FDI inflows to Central America and the CaribbeanBasin between 2000 and 2002 more or less maintainedthe levels reached between 1995 and 1999. However, theydid decline by 13% in 2002 compared to the previousyear. This drop was concentrated more in the Caribbeancountries, especially the Dominican Republic, than inCentral America, where FDI inflows rose considerablyin Costa Rica and fell substantially in Guatemala.
South America's average annual FDI inflowsincreased by a factor of five between the first and secondhalves of the 1990s, rising from US$ 9 to US$ 45 billion.These inflows peaked in 1999 at over US$ 70 billionand declined sharply and steadily thereafter, reaching lessthan US$ 27 billion in 2002. This subregion is where theuse of market-seeking and natural resource-seekingstrategies by TNCs is most pronounced in Latin America.The outcomes of these strategies in the Andean Communityand in MERCOSUR and Chile differed, however.
In the Andean Community, where natural resource-seeking strategies are more common, this type of FDI–which, by its very nature, is a higher-risk activity– wasless affected by the global downturn, since it was linkedto improved access to hydrocarbon reserves. Averageannual inflows increased more than threefold, from underUS$ 3 billion to almost US$ 10 billion between the firstand second halves of the 1990s, and remained at morethan US$ 8 billion a year thereafter, experiencing adecline in 2002 (-18%, which was considerably lesssevere than the downturn for the region as a whole),owing primarily to the situation in Venezuela. Most ofthis investment was in the hydrocarbons industry, asinvestment in minerals fell off considerably. Thus,natural-resource-centric FDI in the Andean Communitydid not suffer as big a slump as did other types of FDI inthe rest of Latin America.
It was the MERCOSUR countries and Chile that sawthe largest increase in average annual FDI inflows –fromUS$ 6 billion to almost US$ 36 billion– between thefirst and second halves of the 1990s and the sharpestdecline in the new millennium, as FDI plunged fromover US$ 60 billion in 1999 to under US$ 20 billion in2002. In this subregion, in which the use of market-seeking strategies by TNCs is most pronounced, FDIinflows were stalled by the economic crises in Argentinaand Uruguay, the completion of privatization processesand slower growth in Brazil and Chile. There was a steepdecline in the acquisition of local assets by TNCs,especially in services such as telecommunications,financial services and retail commerce, which hadpreviously driven FDI inflows. In fact, in some countries,such as Brazil, national firms became more active inacquiring assets in such sectors as the financial servicesand beer industries. TNCs adapted as best they could byshutting down or by rationalizing or restructuring theiroperations. In Argentina, some firms (such as CréditAgricole and ScotiaBank) left the country, while others(such as a number of subsidiaries operating ininfrastructure services) implemented crisis-managementmeasures, including the stoppage of payments. In Brazil,several automotive firms attempted to shift sales fromthe national or subregional markets to the world market.In general, MERCOSUR lost its attractiveness formarket-seeking investors.
In the case of Chile, FDI inflows dropped off steeplyas the cycle of mining mega-projects came to an end andthe number of acquisitions in services declined. TheChilean authorities sought to give new impetus to foreigninvestment by way of two initiatives: a policy of presentingChile as a platform for operations in the rest of SouthAmerica, and the signing of free trade agreements with
14 ECLAC
important trading partners such as the European Union,the United States and the Republic of Korea.
Finally, the situation in the region's financial centreswas also one of growing uncertainty. As has generallybeen the case, little is known about the exact significanceand final destination of these financial flows. An initiativeby the Organisation for Economic Co-operation andDevelopment (OECD) to limit the use of these financialcentres for purposes of tax evasion could severely reduceFDI inflows in the near future.
The above considerations suggest that both cyclicaland structural factors were involved in the decline in FDIflows to Latin America and the Caribbean. The efficiency-seeking FDI that has normally been channelled intoexport platforms in Mexico, Central America and theCaribbean was hard hit by cyclical factors, such as therecession in the United States market and, in the case ofMexico, the revaluation of the peso. This led to thepostponement of investments, plant closures and massivelay-offs. Some of the more simple assembly activitieswere relocated to lower-cost sites, especially China andother Asian host countries. This kind of shift does notappear to have occurred in more sophisticated activities,such as the automotive and electronics sectors, thatemploy more highly skilled labour, however. This morestructural aspect suggests that the requisite policyresponse is not simply to wait for the United States marketto recover, but rather to promote a continual upgradingof local assembly and manufacturing processes in orderto improve their international competitiveness and thusset the stage for an upward trend in wages. Thisrepresents the "high road" in terms of the developmentstrategies of countries hosting components ofinternationally integrated production systems. The "lowroad" is to attempt to resist change by way of wagerepression, reduced social security benefits, competitivedevaluations and over-dimensioned incentives.
Another example is the case of the MERCOSURcountries. Clearly, the outlook for the domestic marketsof Brazil, Uruguay and Paraguay deteriorated in line withthe deepening of the Argentine crisis. This cyclicaldownturn has scared off new foreign investments, whileexisting FDI –both in sectors governed by specialarrangements, such as the countertrade provisionsestablished for the automotive industry, and in othermanufacturing activities– has tended to shift to exportmarkets beyond MERCOSUR. The sources of existingFDI in services do not usually have that option, and thetypical response is either to implement severe costreduction measures until better times come along or tolook for a way out. The second option has become morecommon in Argentina's financial services sector.
Finally, the natural resource-seeking FDI mostcommonly found in the Andean Community typicallytakes the form of long-term higher-risk projects whichdo not react as fast to cyclical factors once they havebeen launched. This has been true of a number ofhydrocarbons projects in the Andean Community, suchas those dealing with gas pipelines in Bolivia, petroleumpipelines in Ecuador, the Camisea gas fields in Peru, etc.
Thus, both cyclical and structural elements helpexplain the downturn in FDI, with the weight of each ofthese factors varying according to the corporate strategiesthat drive the FDI flows in question.
FDI in the Andean Community
One of the defining ideas of the Andean integrationscheme in the early 1970s was a common foreigninvestment code, known as Decision 24. This codeembodied a restrictive FDI policy which included anapproval process contingent on developmentalconsiderations, sectoral restrictions (especially in certainnatural resources and most services), a fade-out mechanismfor foreign owners of manufacturing firms, technologicalprovisions favouring national companies in theirnegotiations with TNCs, limits on payments (profitremittances, interest payments and royalties) and theprohibition of access to local financial markets. This policyeventually evolved into one of the divisive elements in theintegration scheme, and in the late 1980s it was set asideby an Andean Community decision that authorized moreopen and autonomous national policies. The Andeancountries are now endeavouring to take a unified stance intheir negotiations on the investment chapter of the FreeTrade Area of the Americas (FTAA) initiative. It remainsto be seen what this will mean in practice, however.
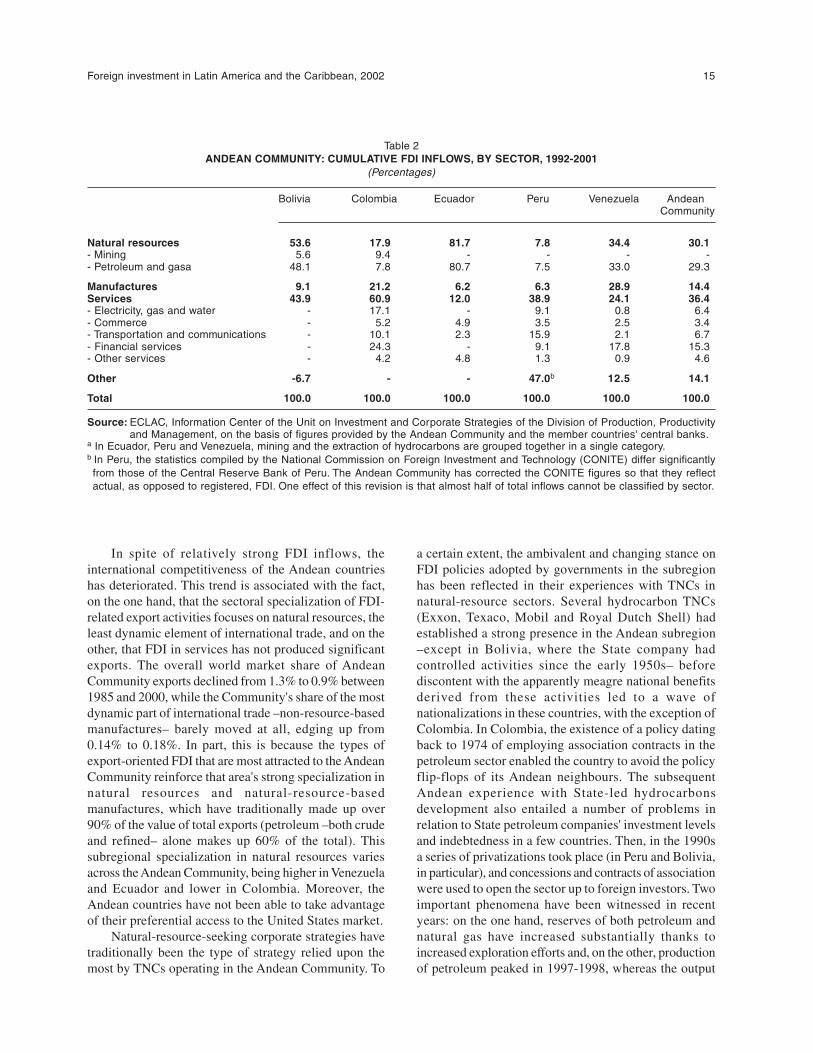
The Andean countries have been relatively successfulin attracting FDI more recently, accounting for 13% ofthe FDI that entered Latin America between 1990 and2001. Annual inflows stabilized at around US$ 9 billionduring 1998-2002. Those inflows have gone primarily tonatural resources (especially hydrocarbons) and services(particularly financial services, telecommunications andtransportation) (see table 2). Most of the FDI comes fromthe United States and Spain, and most of the exportsgenerated by such FDI go to the United States market.The principal owners of the biggest foreign companies,by sales, are Telefónica de España, BellSouth andTelecom Italia in telecommunications, AES Corporationand Endesa-España in electricity, ExxonMobil andChevronTexaco in petroleum, Grupo Minero México andNewmont Mining Corporation in mining, GeneralMotors, Ford and Toyota in the automotive sector, andCoca-Cola and Danone in food products.
Foreign investment in Latin America and the Caribbean, 2002 15
Table 2ANDEAN COMMUNITY: CUMULATIVE FDI INFLOWS, BY SECTOR, 1992-2001
(Percentages)
Bolivia Colombia Ecuador Peru Venezuela Andean Community
Natural resources 53.6 17.9 81.7 7.8 34.4 30.1- Mining 5.6 9.4 - - - -- Petroleum and gasa 48.1 7.8 80.7 7.5 33.0 29.3
Manufactures 9.1 21.2 6.2 6.3 28.9 14.4Services 43.9 60.9 12.0 38.9 24.1 36.4- Electricity, gas and water - 17.1 - 9.1 0.8 6.4- Commerce - 5.2 4.9 3.5 2.5 3.4- Transportation and communications - 10.1 2.3 15.9 2.1 6.7- Financial services - 24.3 - 9.1 17.8 15.3- Other services - 4.2 4.8 1.3 0.9 4.6
Other -6.7 - - 47.0b 12.5 14.1
Total 100.0 100.0 100.0 100.0 100.0 100.0
Source: ECLAC, Information Center of the Unit on Investment and Corporate Strategies of the Division of Production, Productivityand Management, on the basis of figures provided by the Andean Community and the member countries' central banks.
a In Ecuador, Peru and Venezuela, mining and the extraction of hydrocarbons are grouped together in a single category.b In Peru, the statistics compiled by the National Commission on Foreign Investment and Technology (CONITE) differ significantlyfrom those of the Central Reserve Bank of Peru. The Andean Community has corrected the CONITE figures so that they reflectactual, as opposed to registered, FDI. One effect of this revision is that almost half of total inflows cannot be classified by sector.
In spite of relatively strong FDI inflows, theinternational competitiveness of the Andean countrieshas deteriorated. This trend is associated with the fact,on the one hand, that the sectoral specialization of FDI-related export activities focuses on natural resources, theleast dynamic element of international trade, and on theother, that FDI in services has not produced significantexports. The overall world market share of AndeanCommunity exports declined from 1.3% to 0.9% between1985 and 2000, while the Community's share of the mostdynamic part of international trade –non-resource-basedmanufactures– barely moved at all, edging up from0.14% to 0.18%. In part, this is because the types ofexport-oriented FDI that are most attracted to the AndeanCommunity reinforce that area's strong specialization innatural resources and natural-resource-basedmanufactures, which have traditionally made up over90% of the value of total exports (petroleum –both crudeand refined– alone makes up 60% of the total). Thissubregional specialization in natural resources variesacross the Andean Community, being higher in Venezuelaand Ecuador and lower in Colombia. Moreover, theAndean countries have not been able to take advantageof their preferential access to the United States market.
Natural-resource-seeking corporate strategies havetraditionally been the type of strategy relied upon themost by TNCs operating in the Andean Community. To
a certain extent, the ambivalent and changing stance onFDI policies adopted by governments in the subregionhas been reflected in their experiences with TNCs innatural-resource sectors. Several hydrocarbon TNCs(Exxon, Texaco, Mobil and Royal Dutch Shell) hadestablished a strong presence in the Andean subregion–except in Bolivia, where the State company hadcontrolled activities since the early 1950s– beforediscontent with the apparently meagre national benefitsderived from these activities led to a wave ofnationalizations in these countries, with the exception ofColombia. In Colombia, the existence of a policy datingback to 1974 of employing association contracts in thepetroleum sector enabled the country to avoid the policyflip-flops of its Andean neighbours. The subsequentAndean experience with State-led hydrocarbonsdevelopment also entailed a number of problems inrelation to State petroleum companies' investment levelsand indebtedness in a few countries. Then, in the 1990sa series of privatizations took place (in Peru and Bolivia,in particular), and concessions and contracts of associationwere used to open the sector up to foreign investors. Twoimportant phenomena have been witnessed in recentyears: on the one hand, reserves of both petroleum andnatural gas have increased substantially thanks toincreased exploration efforts and, on the other, productionof petroleum peaked in 1997-1998, whereas the output
16 ECLAC
of natural gas continues to rise. Both TNCs and Statecompanies have played an important role in hydrocarbonsexploration, production and exports in the AndeanCommunity. While the role of TNCs has increased inrecent years, State companies continue to be the principalagents in most of these countries, which may explainwhy subregional projects have not been major recipientsof FDI in this sector.
FDI in services grew significantly in the 1990s.While most of the FDI has gone to the same sectors–financial services, telecommunications, transportationand electricity– national experiences in the AndeanCommunity have been varied. The privatization of Stateassets has produced some of the biggest foreigncompanies in the subregion, such as CANTV ofVenezuela (Verizon and Telefónica de España), Telcelof Venezuela (BellSouth), Telefónica de Perú (Telefónicade España), Electricidad de Caracas of Venezuela (AESCorporation) and EMGESA of Colombia (Endesa-España). The acquisition of local banks by foreigninvestors has also been a factor in FDI inflows. In veryfew of these services has the establishment of asubregional strategy been a significant element in thisrespect, however.
This leads to the surprising conclusion that theintegration of the Andean market itself has not proved tobe a major inducement for FDI in natural resources,services or, in fact, manufactures. The original integrationscheme was based on the idea of restricting FDI toactivities not undertaken by local companies. These firmswere intended to be the principal beneficiaries of theAndean Pact, and this rationale was what gave contentto the Pact's restrictive FDI code. The outcome of thesubsequent volte-face of FDI policy was not a single,more liberal regime for the promotion of FDI from asubregional market perspective, but rather five distinctFDI policies which failed to take the widened marketexplicitly into account. In fact, to this day, the principalattraction of the Andean Community member countriescontinues to be the oldest corporate strategy in the region,the one that seeks natural resources. FDI in services hasa number of diverse determinants. This explains, to agreat degree, why FDI has not played a significant rolein the industrialization of the subregion or in theimprovement of the region's internationalcompetitiveness.
FDI in financial services
The 1990s witnessed a strong increase in thepresence of foreign banks in financial services in LatinAmerica, which expanded from an average of less than
10% of total assets in 1990 to over 50% in 2001. This isattributable to the interaction of three groups of factors:increased competition in the international market forfinancial services, national policies that have facilitatedthe entry of foreign banks and new corporate strategies.The transnational banks that spearheaded the effort toachieve this stronger presence were seeking to improvethe competitive position of their universal services (and,hence, their long-term profitability) by means of aninternational expansion to and throughout the region.Governments of the region, for their part, were seekingto deepen and modernize the financial services availablein their economies by improving microeconomicefficiency (profitability, efficiency and liquidity) andmacroeconomic efficacy (availability and cost of credit,and systemic stability). In the end, both transnational banksand governments were disappointed to a certain degree.The experience provides some important lessons, however.
The international market factors involved in thisexpansion included a host of elements, ranging from theinitiatives taken to open up and liberalize financialservices in the United States and European markets–coupled with the World Trade Organization's FifthProtocol to the General Agreement on Trade in Services–to the new regulations and norms for supervisionpromoted by the Bank for International Settlements,technological change and new instruments (securitizationand derivatives). This combination of factors spurredglobal competition among transnational banks.
National policies in Latin America reflected thesetrends, albeit with some lag. The first generation ofreforms in the region was aimed at reducing the roleplayed by State banks in credit allocation, deregulatinginterest rates, reserve requirements and other creditallocation instruments, and opening up the sector toforeign banks. The second generation of reforms focusedmore on the new regulatory and supervisoryrequirements, institutional development and systemicstability.
These tendencies in the international market and inLatin America led transnational banks to adopt changesin their corporate strategies. The heightened competitionprompted them to search for scale advantages throughthe provision of universal services (all market segments)and greater global coverage (a broader geographicalpresence). This played out in a huge wave of acquisitionsin the industry and, within that context, Latin Americalooked very attractive to a number of such investors.
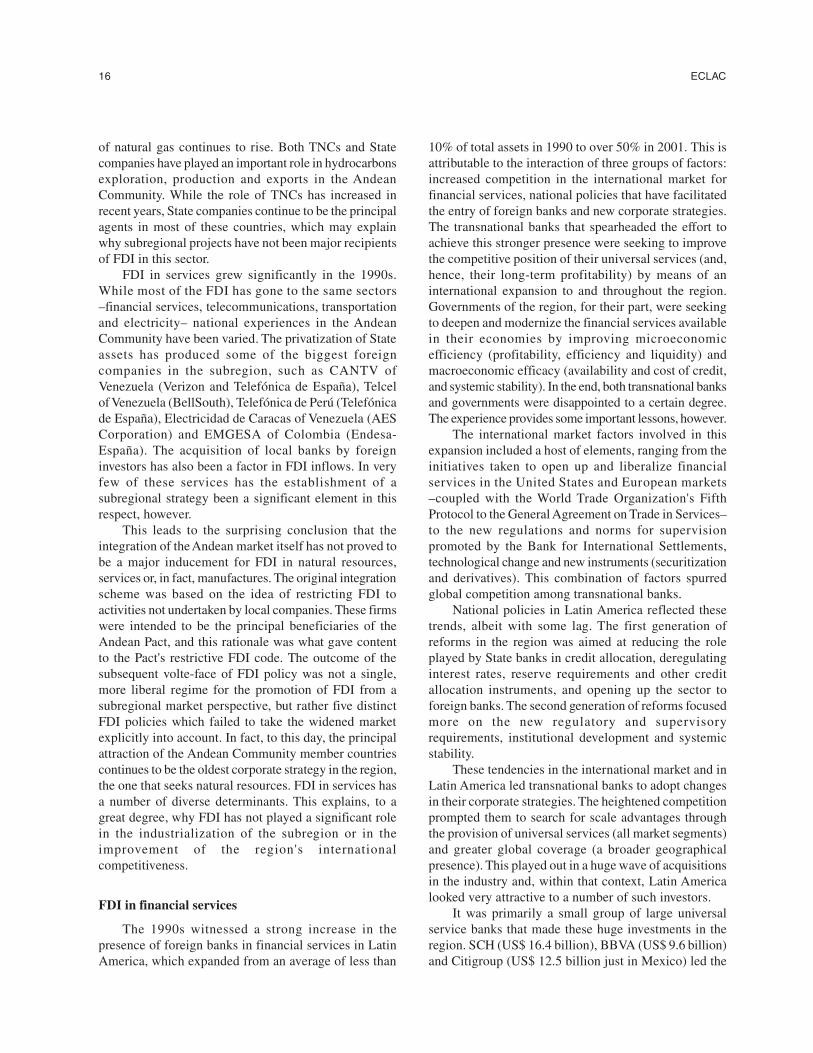
It was primarily a small group of large universalservice banks that made these huge investments in theregion. SCH (US$ 16.4 billion), BBVA (US$ 9.6 billion)and Citigroup (US$ 12.5 billion just in Mexico) led the
Foreign investment in Latin America and the Caribbean, 2002 17
way, mainly by purchasing local banking networks (seefigure 2). Others used strategies that called for theestablishment of a broad geographical presence solely
in the corporate segment (FleetBoston and Scotiabank)or that restricted their presence to the major markets(HSBC and ABN AMRO).
Figure 2MAJOR FOREIGN BANKS IN LATIN AMERICA, BY SHARE
OF TOTAL LENDING, 2001(Percentages)
0123456789
10
Citiban
kSCH
BBVA
FleetB
osto
n
HSBC
Sudameris
ABN Am
ro
Scotia
Bank
BNL
Lloyd
s
Source: Salomon Smith Barney, Foreign Financial Institutions in Latin America, 2001; Equity Research, LatinAmerica, and annex table A.III.2.
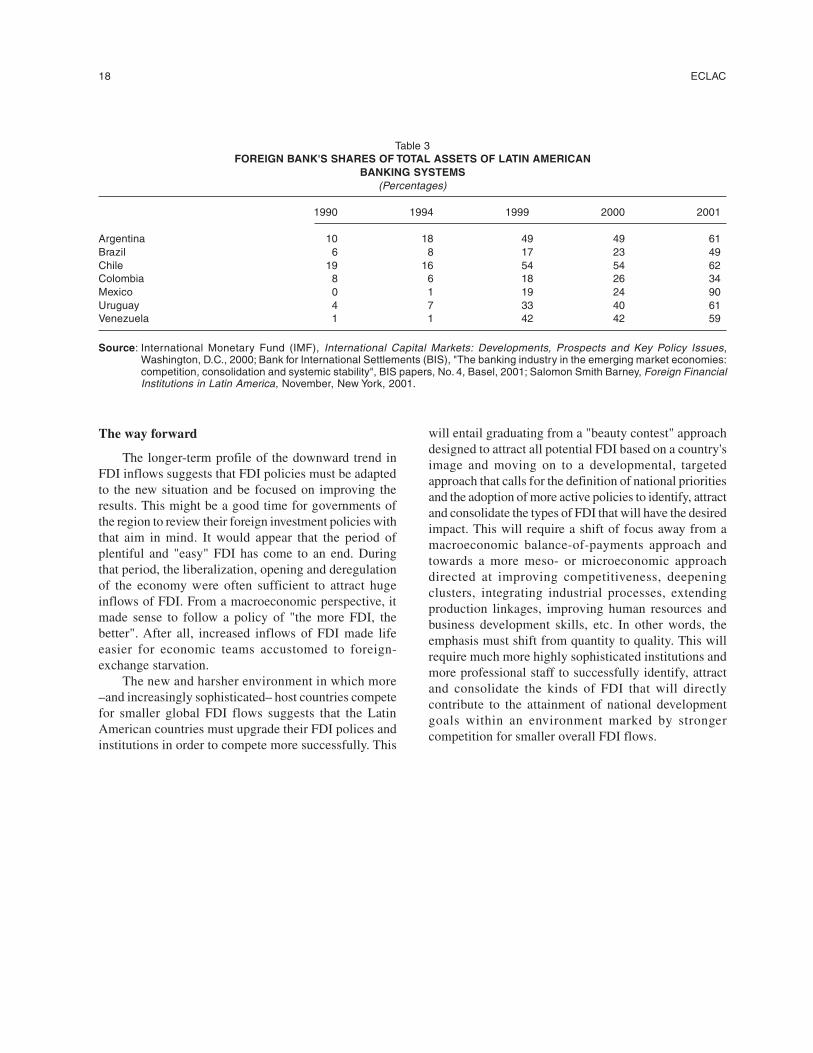
In terms of results, these foreign banks' entry intofinancial services in Latin America substantiallyincreased their participation in most countries andallowed them to become the dominant force in severalnations (see table 3). In most instances, this contributedsignificantly to the deepening and modernization offinancial services. Nevertheless, these transnationalbanks were disappointed by the returns on theirinvestments, since the positioning phase was soonfollowed by a significant downturn in themacroeconomic performance of most of the countriesthey were operating in. The ultimate impact of thisincreased foreign participation in the financial servicessector is as yet unclear. No doubt this new competitionhas had a favourable impact on the efficiency of local
banks' operations, since -as local banks were obligedto rise to the standard of efficiency set by the foreignentrants- no statistical differences are to be foundbetween the two in terms of performance. Nevertheless,this greater efficiency and the increased presence offoreign banks have not translated into a reduction inthe cost of financial services. Worse still, the presenceof foreign banks has not resulted in the availability ofmore credit or increased stability in these nationalfinancial systems. It is still too early to draw definitiveconclusions in this regard, but the fact remains that theentry of transnational banks into financial services inLatin America has yet to produce the hoped-for effects–in the quantities desired– for either the transnationalbank investors or the host governments.
18 ECLAC
Table 3FOREIGN BANK'S SHARES OF TOTAL ASSETS OF LATIN AMERICAN
BANKING SYSTEMS(Percentages)
1990 1994 1999 2000 2001
Argentina 10 18 49 49 61Brazil 6 8 17 23 49Chile 19 16 54 54 62Colombia 8 6 18 26 34Mexico 0 1 19 24 90Uruguay 4 7 33 40 61Venezuela 1 1 42 42 59
Source: International Monetary Fund (IMF), International Capital Markets: Developments, Prospects and Key Policy Issues,Washington, D.C., 2000; Bank for International Settlements (BIS), "The banking industry in the emerging market economies:competition, consolidation and systemic stability", BIS papers, No. 4, Basel, 2001; Salomon Smith Barney, Foreign FinancialInstitutions in Latin America, November, New York, 2001.
The way forward
The longer-term profile of the downward trend inFDI inflows suggests that FDI policies must be adaptedto the new situation and be focused on improving theresults. This might be a good time for governments ofthe region to review their foreign investment policies withthat aim in mind. It would appear that the period ofplentiful and "easy" FDI has come to an end. Duringthat period, the liberalization, opening and deregulationof the economy were often sufficient to attract hugeinflows of FDI. From a macroeconomic perspective, itmade sense to follow a policy of "the more FDI, thebetter". After all, increased inflows of FDI made lifeeasier for economic teams accustomed to foreign-exchange starvation.
The new and harsher environment in which more–and increasingly sophisticated– host countries competefor smaller global FDI flows suggests that the LatinAmerican countries must upgrade their FDI polices andinstitutions in order to compete more successfully. This
will entail graduating from a "beauty contest" approachdesigned to attract all potential FDI based on a country'simage and moving on to a developmental, targetedapproach that calls for the definition of national prioritiesand the adoption of more active policies to identify, attractand consolidate the types of FDI that will have the desiredimpact. This will require a shift of focus away from amacroeconomic balance-of-payments approach andtowards a more meso- or microeconomic approachdirected at improving competitiveness, deepeningclusters, integrating industrial processes, extendingproduction linkages, improving human resources andbusiness development skills, etc. In other words, theemphasis must shift from quantity to quality. This willrequire much more highly sophisticated institutions andmore professional staff to successfully identify, attractand consolidate the kinds of FDI that will directlycontribute to the attainment of national developmentgoals within an environment marked by strongercompetition for smaller overall FDI flows.
Foreign investment in Latin America and the Caribbean, 2002 19
I. REGIONAL OVERVIEW
A. RECENT TRENDS IN FOREIGN DIRECT INVESTMENTIN LATIN AMERICA AND THE CARIBBEAN
Global flows of foreign direct investment (FDI) retreatedfor the second year running in 2002 as a direct result ofthree main factors: steep falls on world stock markets,which reduced the value of merger and acquisitionoperations; a drop in the number of cross-bordertransactions, which had been a major component of FDIduring the boom years of the 1990s; and restricted accessto enterprise financing. These factors, in turn, are relatedto the conclusion of an expansionary phase in variousactivities, especially those with ties to the information andcommunications technology industries, which had beenthe powerhouse of worldwide economic growth in recentyears. In these new circumstances, many firms maderadical changes to their global strategy, slimming downtheir investment plans and no longer focusing on size andmarket share instead, they have adopted a strategy basedon the strict control of expenditure and investments.
Although these global trends contributed to thereduction in FDI flows to Latin America and theCaribbean (which diminished for the third straight yearin 2002), this decline was also compounded by nationaland regional factors that influenced the investmentdecisions taken by transnational corporations (TNCs).
When foreign firms were investing in Latin Americain the 1990s, international and regional conditions werevery different from those which began to emerge around2000: the world economy was growing, and an intensive
process of international mergers and acquisitions wasunfolding; at the regional level, monetary variables weremore stable and growth was reviving. Since then thesituation has changed radically: growth in theinternational economy is currently weak, and the regionhas slipped into recession. Notwithstanding this generalpicture, the mix of external and domestic factors has hadheterogeneous effects on the strategies of foreign firmsand on FDI flows in different parts of the region.
In Mexico, despite an overvalued currency whichinflates costs for TNCs operating in that country, FDI heldsteady at about US$ 14 billion (similar to the average forthe second half of the 1990s), as funds channelled into thefinancial sector compensated for faltering investment inthe maquila export industry. TNCs also curtailed theirmaquila investments in Central America and the Caribbeanpending an economic recovery in the United States.
The reasons for dwindling levels of FDI in SouthAmerica include recession and greater economic and/orpolitical instability. Such factors made themselves felt tovarying degrees in the different South American countries.The privatization of public-sector assets in the subregion,which attracted large volumes of FDI in the 1990s, hasnow run its course, and the few attempts made to privatizeState assets in 2002 have encountered fierce politicalresistance and have been either cancelled or postponed.Against this background of recession and instability,
20 ECLAC
investors grew more cautious about their enterprises inSouth America, especially in the case of foreign firms thathad invested to gain access to national or subregionalmarkets. This contrasted with investments in naturalresource exploitation, primarily in the Andean Communitycountries, which stayed more or less at their 2001 levelexcept in Venezuela, where they fell considerably.
The following two sections offer an assessment ofthe trend of global and regional FDI flows in 2002. Thisis followed by an analysis of the various strategiesdeployed during the year by TNCs with investments inLatin America and the Caribbean, to provide a completepicture of FDI behaviour in the region.
1. Foreign direct investment worldwide
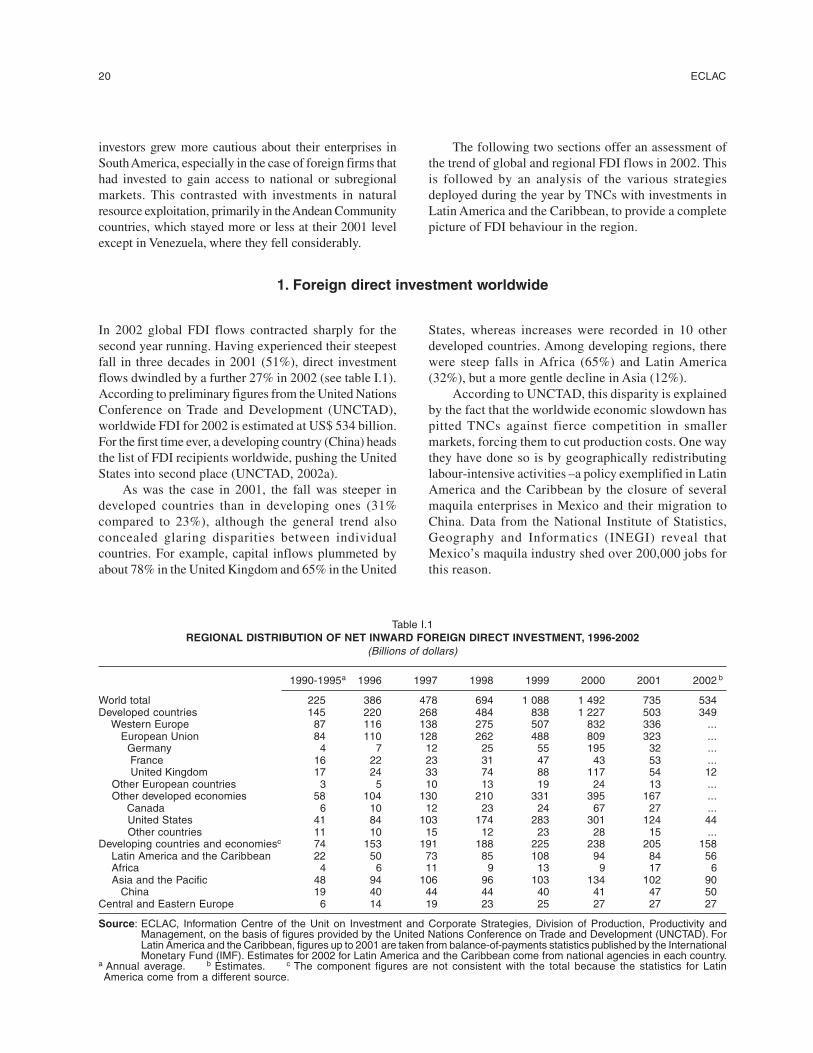
In 2002 global FDI flows contracted sharply for thesecond year running. Having experienced their steepestfall in three decades in 2001 (51%), direct investmentflows dwindled by a further 27% in 2002 (see table I.1).According to preliminary figures from the United NationsConference on Trade and Development (UNCTAD),worldwide FDI for 2002 is estimated at US$ 534 billion.For the first time ever, a developing country (China) headsthe list of FDI recipients worldwide, pushing the UnitedStates into second place (UNCTAD, 2002a).
As was the case in 2001, the fall was steeper indeveloped countries than in developing ones (31%compared to 23%), although the general trend alsoconcealed glaring disparities between individualcountries. For example, capital inflows plummeted byabout 78% in the United Kingdom and 65% in the United
States, whereas increases were recorded in 10 otherdeveloped countries. Among developing regions, therewere steep falls in Africa (65%) and Latin America(32%), but a more gentle decline in Asia (12%).
According to UNCTAD, this disparity is explainedby the fact that the worldwide economic slowdown haspitted TNCs against fierce competition in smallermarkets, forcing them to cut production costs. One waythey have done so is by geographically redistributinglabour-intensive activities –a policy exemplified in LatinAmerica and the Caribbean by the closure of severalmaquila enterprises in Mexico and their migration toChina. Data from the National Institute of Statistics,Geography and Informatics (INEGI) reveal thatMexico’s maquila industry shed over 200,000 jobs forthis reason.
Table I.1REGIONAL DISTRIBUTION OF NET INWARD FOREIGN DIRECT INVESTMENT, 1996-2002
(Billions of dollars)
1990-1995a 1996 1997 1998 1999 2000 2001 2002 b
World total 225 386 478 694 1 088 1 492 735 534Developed countries 145 220 268 484 838 1 227 503 349 Western Europe 87 116 138 275 507 832 336 ... European Union 84 110 128 262 488 809 323 ... Germany 4 7 12 25 55 195 32 ... France 16 22 23 31 47 43 53 ... United Kingdom 17 24 33 74 88 117 54 12 Other European countries 3 5 10 13 19 24 13 ... Other developed economies 58 104 130 210 331 395 167 ... Canada 6 10 12 23 24 67 27 ... United States 41 84 103 174 283 301 124 44 Other countries 11 10 15 12 23 28 15 ...Developing countries and economiesc 74 153 191 188 225 238 205 158 Latin America and the Caribbean 22 50 73 85 108 94 84 56 Africa 4 6 11 9 13 9 17 6 Asia and the Pacific 48 94 106 96 103 134 102 90 China 19 40 44 44 40 41 47 50Central and Eastern Europe 6 14 19 23 25 27 27 27
Source: ECLAC, Information Centre of the Unit on Investment and Corporate Strategies, Division of Production, Productivity andManagement, on the basis of figures provided by the United Nations Conference on Trade and Development (UNCTAD). ForLatin America and the Caribbean, figures up to 2001 are taken from balance-of-payments statistics published by the InternationalMonetary Fund (IMF). Estimates for 2002 for Latin America and the Caribbean come from national agencies in each country.
a Annual average. b Estimates. c The component figures are not consistent with the total because the statistics for LatinAmerica come from a different source.
Foreign investment in Latin America and the Caribbean, 2002 21
As stated in ECLAC (2002), the shrinking of globalFDI flows in recent years reflects the economic slowdownacross the globe, particularly in the United States, whichwas accompanied by less vigorous investment and a dropin corporate profits. This gave rise to widespread andsustained falls in share prices on financial marketsworldwide (a trend that had begun in 2000 but quicklygathered momentum in 2002), together with a substantialreduction in cross-border mergers and acquisitions. It alsorestricted firms’ access to financing –a situation that waslater aggravated by bankruptcies and accounting scandalsin a number of TNCs that had been leading absorbers offinancial resources in the 1990s.
Today, major uncertainties have arisen as to thefuture course of the United States economy and its abilityto continue acting as the powerhouse of worldwideeconomic growth, as it did throughout the 1990s. As thebehaviour of that economy strongly influences futureinvestment decisions, it warrants careful analysis in orderto understand it better.
In the 1990s, macroeconomic performance in theUnited States shattered the paradigms existing up untilthat time: robust economic growth was shown to becompatible with low levels of inflation andunemployment. Some specialists saw this asfundamentally due to microeconomic factors, reflectingthe impact of the latest technological revolution oncorporate productivity, which made it possible tomaintain profit margins without raising prices. Accordingto this thesis, a twin technological-liberal revolution hadgiven rise to profound industrial change, raising theUnited States economy’s growth potential and givingbirth to a “new economy”.1
The conclusions of that analysis were consistent withthe presence of another element believed to have made amajor contribution to the vigour of the United Stateseconomy, namely a sharp rise in the investment rate. This
was fuelled not only by domestic capital, but also by thelarge volumes of FDI that TNCs channelled into theUnited States in order to ride the wave of rapid growthin the world’s most powerful economy. In the 1990s theUnited States was the world’s leading FDI recipient. Inaddition, thanks to major technological advances, theinformation technology and telecommunications sectorsbecame a major focus of investment, absorption of state-of-the-art technologies and job creation, generatingpowerful forces that stimulated and intensified theongoing globalization process. Nonetheless, estimatesshow that productivity increases failed to keep pace withthe volume of capital being invested, which led tocumulative over-investment during the period.2
Equity and bond markets played a crucial role infinancing this investment boom in the United States,which was boosted by the liberalization of capital flowsin the 1990s. The amount of capital raised by firmsthrough share issues, whether quoted on stock marketsor not, is estimated at approximately US$ 270 billion in2000 in the United States alone –in other words, seventimes the amount raised in the late 1980s. A large portionof these funds was channelled into “new economy”sectors. In addition, the share of bonds in firms’ liabilitiesincreased at the expense of bank credit.3
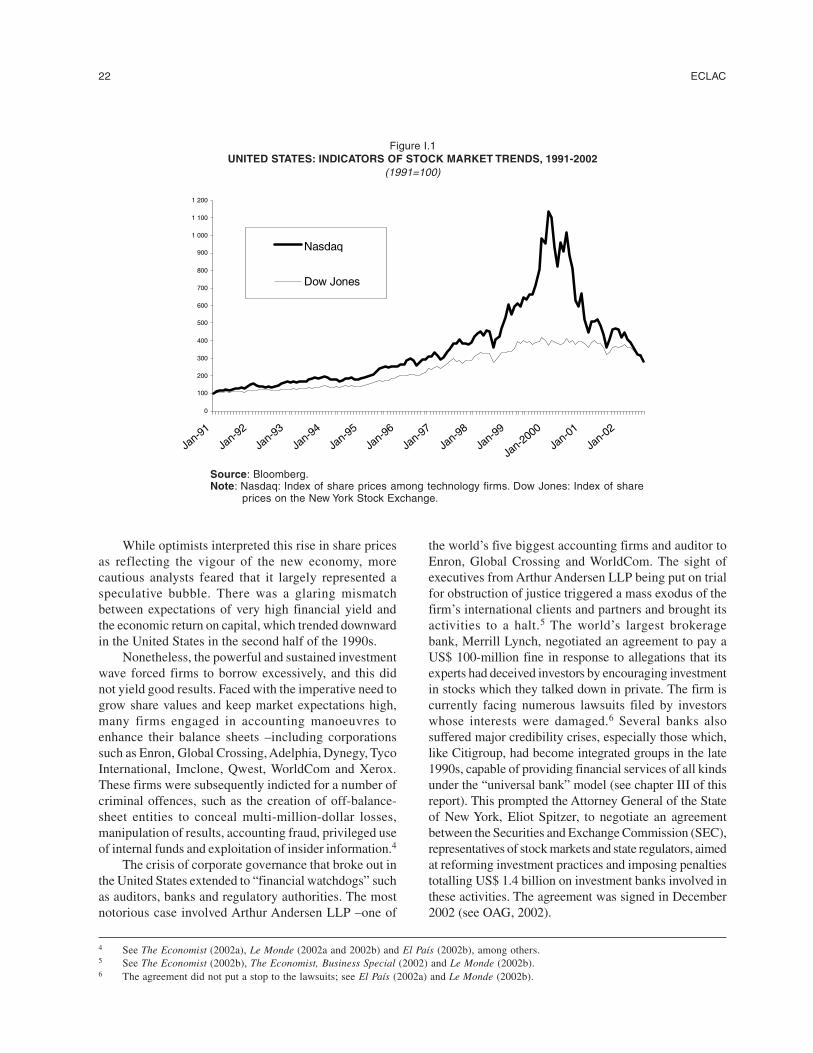
Given that over half of all families in the UnitedStates owned shares quoted on the stock market and thatsuch shares accounted for a large proportion of pensionfund asset portfolios, burgeoning share indices generatedwealth effects, fuelling a consumption boom thatoutpaced the growth of real wages. Expanding demandencouraged firms to undertake further investment,thereby creating a spiral of rising asset values andfinancial liquidity that drove up share prices, especiallyin “new economy” sectors (see figure I.1). Against thisbackdrop, business modernization and consolidation alsocontinued apace, further boosting FDI flows worldwide.
1 Fierce controversy continues to rage over this point; see Gordon (2000), Oliner and Sichel (2000) and Jorgenson (2001).2 As Brender and Pisani (1999 and 2001) point out, the structure of these investments revealed an increase in the share of information
technology and telecommunications products in firms’ capital expenditure. As the prices of such products fell in relation to those of othercapital goods, this component probably increased even more substantially in volume terms.
3 Between the early 1980s and the late 1990s, the share of bonds in corporate liabilities grew from 26% to 32%, while bank credit shrankfrom 27% to 23% (Brender and Pisani, 2001).
22 ECLAC
Figure I.1UNITED STATES: INDICATORS OF STOCK MARKET TRENDS, 1991-2002
(1991=100)
4 See The Economist (2002a), Le Monde (2002a and 2002b) and El País (2002b), among others.5 See The Economist (2002b), The Economist, Business Special (2002) and Le Monde (2002b).6 The agreement did not put a stop to the lawsuits; see El País (2002a) and Le Monde (2002b).
0
100
200
300
400
500
600
700
800
900
1 000
1 100
1 200
Jan-91
Jan-92
Jan-93
Jan-94
Jan-95
Jan-96
Jan-97
Jan-98
Jan-99
Jan-2000
Jan-01
Jan-02
Nasdaq
Dow Jones
Source: Bloomberg.Note: Nasdaq: Index of share prices among technology firms. Dow Jones: Index of share
prices on the New York Stock Exchange.
While optimists interpreted this rise in share pricesas reflecting the vigour of the new economy, morecautious analysts feared that it largely represented aspeculative bubble. There was a glaring mismatchbetween expectations of very high financial yield andthe economic return on capital, which trended downwardin the United States in the second half of the 1990s.
Nonetheless, the powerful and sustained investmentwave forced firms to borrow excessively, and this didnot yield good results. Faced with the imperative need togrow share values and keep market expectations high,many firms engaged in accounting manoeuvres toenhance their balance sheets –including corporationssuch as Enron, Global Crossing, Adelphia, Dynegy, TycoInternational, Imclone, Qwest, WorldCom and Xerox.These firms were subsequently indicted for a number ofcriminal offences, such as the creation of off-balance-sheet entities to conceal multi-million-dollar losses,manipulation of results, accounting fraud, privileged useof internal funds and exploitation of insider information.4
The crisis of corporate governance that broke out inthe United States extended to “financial watchdogs” suchas auditors, banks and regulatory authorities. The mostnotorious case involved Arthur Andersen LLP –one of
the world’s five biggest accounting firms and auditor toEnron, Global Crossing and WorldCom. The sight ofexecutives from Arthur Andersen LLP being put on trialfor obstruction of justice triggered a mass exodus of thefirm’s international clients and partners and brought itsactivities to a halt.5 The world’s largest brokeragebank, Merrill Lynch, negotiated an agreement to pay aUS$ 100-million fine in response to allegations that itsexperts had deceived investors by encouraging investmentin stocks which they talked down in private. The firm iscurrently facing numerous lawsuits filed by investorswhose interests were damaged.6 Several banks alsosuffered major credibility crises, especially those which,like Citigroup, had become integrated groups in the late1990s, capable of providing financial services of all kindsunder the “universal bank” model (see chapter III of thisreport). This prompted the Attorney General of the Stateof New York, Eliot Spitzer, to negotiate an agreementbetween the Securities and Exchange Commission (SEC),representatives of stock markets and state regulators, aimedat reforming investment practices and imposing penaltiestotalling US$ 1.4 billion on investment banks involved inthese activities. The agreement was signed in December2002 (see OAG, 2002).
Foreign investment in Latin America and the Caribbean, 2002 23
These events seriously undermined confidence in thesystem as a whole. Having originally been confined toinformation technology and telecommunications stocks,the fall on the stock market began to spread to othersectors in 2002. Share price indices in many developedcountries retreated to their levels of four, five or even sixyears earlier. For example, by September 2002, the DowJones industrial index had dropped to August 1998 levels;the Nasdaq, to its level of August 1996; London’s FTSEInternational index (the “Footsie”), to early-1996 levels;the CAC 40 in France, to its mid-1997 level; andGermany’s Dax, to where it had been in late 1996.
As their share prices plummeted on the stock market,firms also saw their profits and investment capacitywither. It became harder for them to obtain financing ina climate of strong risk aversion among investors andgrowing mistrust of the veracity of corporate balancesheets and the forecasts made by financial analysts.Banks, which were also affected by the crisis, tightenedrestrictions on their loans; investors, alarmed by majorbankruptcies and the collapse of the telecommunicationssector, demanded increasingly tough conditions onlending to firms.
Until 2000 the main selection criteria used for equityor bond purchases related to the general situationprevailing in the sector and the size or profitability ofthe firms in question. Today, however, investors are moreconcerned about a firm’s debt status. Previouslypermissive risk-rating agencies have become very strict.While the most prestigious large corporate groups, with
assured yield and high liquidity, have no great problemin obtaining financing, the situation is much moredifficult for other firms, especially those in thecommunications and information technology industry.
Restricted access to financing, compounded by theglobal economic slowdown, has radically altered firms’policy: as mentioned above, they have stopped competingon the basis of size and market share and have adopted apolicy of strict control over expenditure and investment.One sign of this is the steep decline in FDI flowsworldwide, a phenomenon that is largely due to thedrying up of mergers and acquisitions (mainly cross-border operations), which were the largest componentof FDI in the 1990s. The total value of mergers andacquisitions announced between January and September2002 was US$ 902.848 billion –down by 33% from thefigure for the same period of the preceding year (seeAmérica Economía, 2002b).
In short, FDI was affected both by short-term factors–mainly the economic slowdown in the United States andother leading industrialized economies– and by structuralfactors, such as the cyclical downturn in the informationtechnology and communications industry. In addition, theinstitutional crisis of corporate governance in certain largeTNCs undermined confidence among many investors(individual and institutional alike), who are now verycautious about using their savings to fuel a renewedexpansion of large corporations. This distrust, combinedwith the reduced availability of global financing, hasfurther dampened of FDI flows to the region.
2. Foreign direct investment in Latin America and the Caribbean:recent inflows and trends
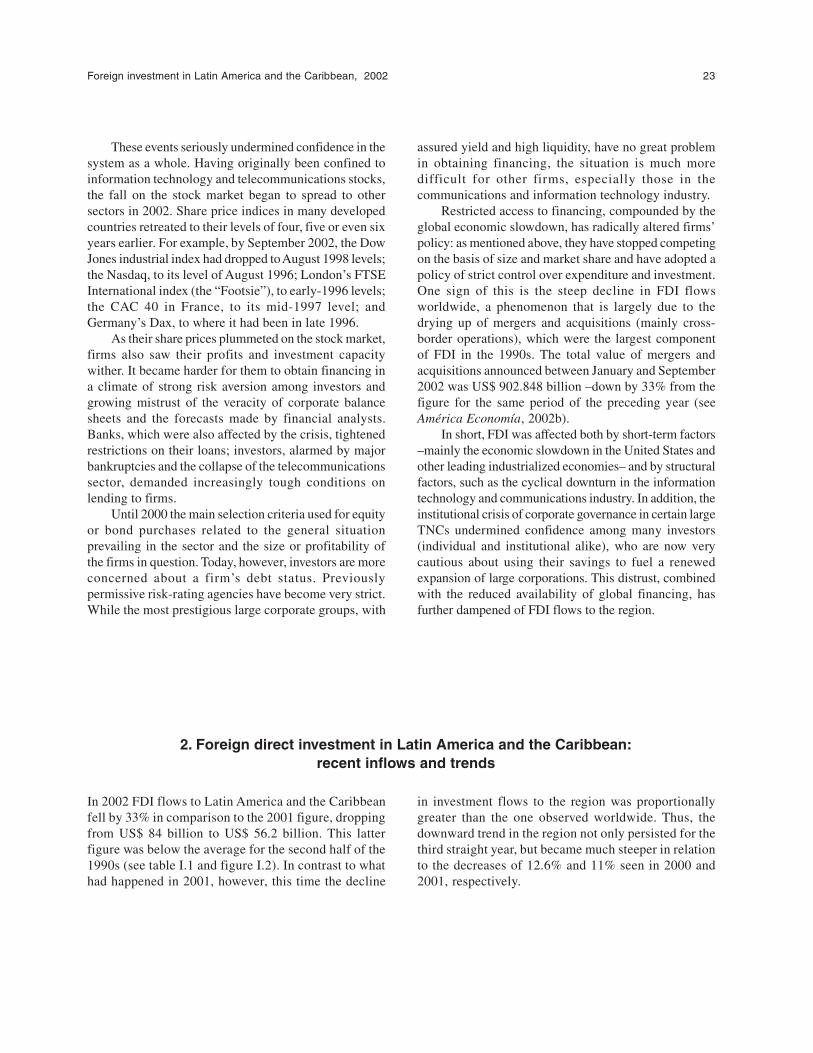
In 2002 FDI flows to Latin America and the Caribbeanfell by 33% in comparison to the 2001 figure, droppingfrom US$ 84 billion to US$ 56.2 billion. This latterfigure was below the average for the second half of the1990s (see table I.1 and figure I.2). In contrast to whathad happened in 2001, however, this time the decline
in investment flows to the region was proportionallygreater than the one observed worldwide. Thus, thedownward trend in the region not only persisted for thethird straight year, but became much steeper in relationto the decreases of 12.6% and 11% seen in 2000 and2001, respectively.
24 ECLAC
Figure I.2LATIN AMERICA AND THE CARIBBEAN: NET INWARD FOREIGN DIRECT INVESTMENT
BY SUBREGION, 1990-2002 a
(Billions of dollars)
Source: ECLAC, Information Centre of the Unit on Investment and Corporate Strategies, Division of Production,Productivity and Management, on the basis of figures from balance-of-payments statistics publishedby the International Monetary Fund (IMF) and national agencies in each country. The figures for2002 are estimates based on information from the countries’ central banks. The information onfinancial centres was provided by the United Nations Conference on Trade and Development(UNCTAD), on the basis of outflows to tax havens reported by members of the Organisation forEconomic Co-operation and Development (OECD). For those countries, figures for 2002 are estimatesmade by the Unit on Investment and Corporate Strategies. The figures presented are updatedannually according to government authorities’ revisions of their statistics. They differ from the figuresgiven in the Preliminary overview of the economies of Latin America and the Caribbean, 2002,published by ECLAC, since in the latter net FDI inflows are taken to be investment in the reportingeconomy minus direct investment abroad by its residents.
a Net inflows of direct investment in the reporting economy minus capital taken out of the country by thesame foreign firms.
b Annual average.c Estimates.
The context in which FDI flows take place in the worldeconomy continued to have repercussions throughout theregion, but with differential effects between countrieswhere TNCs have pursued efficiency-seeking strategies(such as Mexico, Central America and the Caribbean) andthose where they have focused on raw materials and marketexpansion (South America). This is discussed below.
(a) FDI in Mexico, Central America and theCaribbean
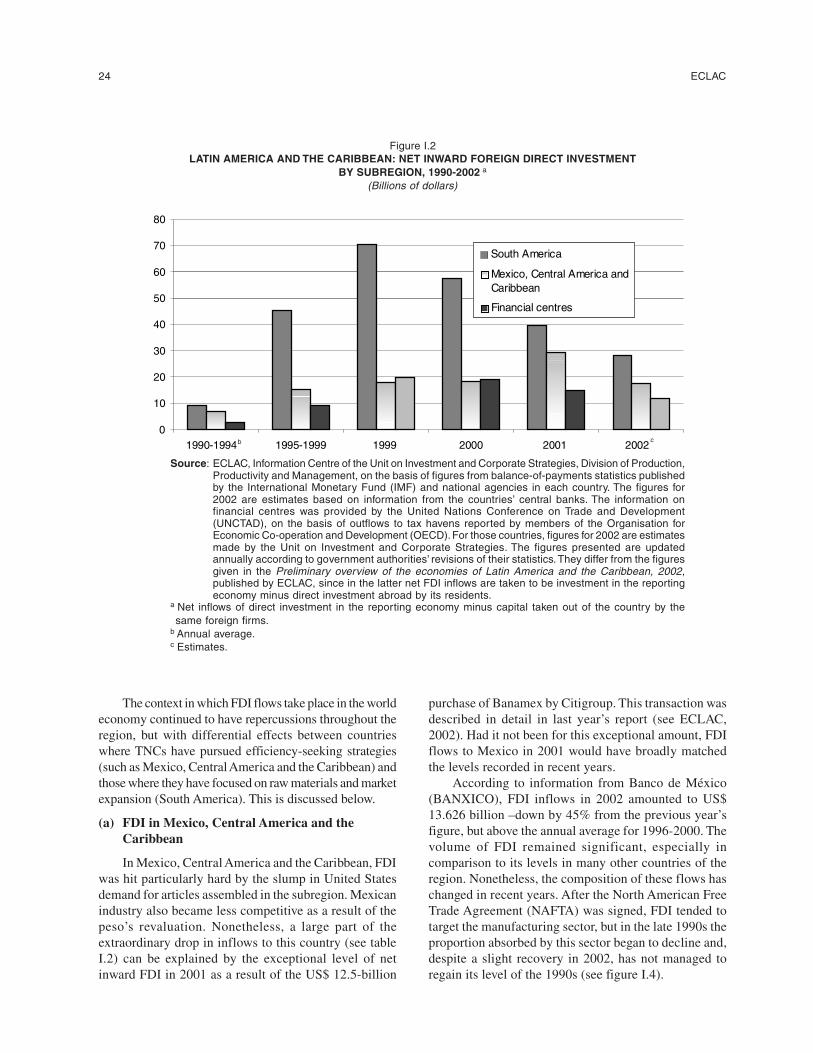
In Mexico, Central America and the Caribbean, FDIwas hit particularly hard by the slump in United Statesdemand for articles assembled in the subregion. Mexicanindustry also became less competitive as a result of thepeso’s revaluation. Nonetheless, a large part of theextraordinary drop in inflows to this country (see tableI.2) can be explained by the exceptional level of netinward FDI in 2001 as a result of the US$ 12.5-billion
purchase of Banamex by Citigroup. This transaction wasdescribed in detail in last year’s report (see ECLAC,2002). Had it not been for this exceptional amount, FDIflows to Mexico in 2001 would have broadly matchedthe levels recorded in recent years.
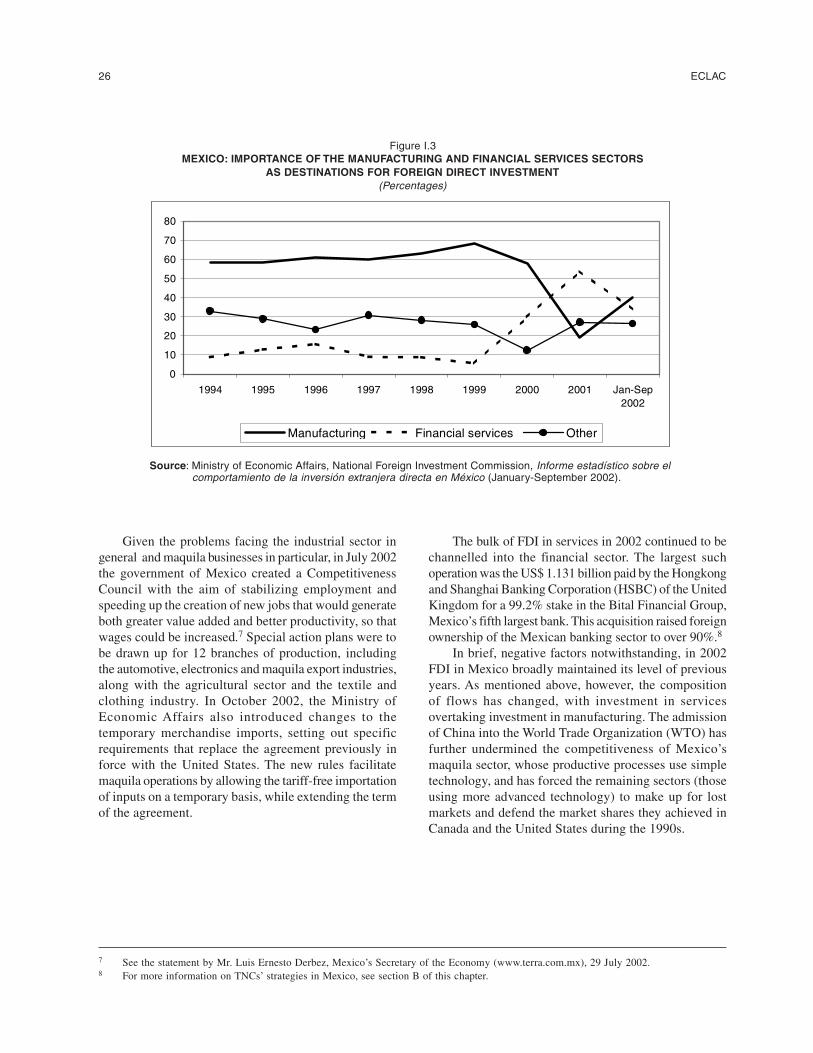
According to information from Banco de México(BANXICO), FDI inflows in 2002 amounted to US$13.626 billion –down by 45% from the previous year’sfigure, but above the annual average for 1996-2000. Thevolume of FDI remained significant, especially incomparison to its levels in many other countries of theregion. Nonetheless, the composition of these flows haschanged in recent years. After the North American FreeTrade Agreement (NAFTA) was signed, FDI tended totarget the manufacturing sector, but in the late 1990s theproportion absorbed by this sector began to decline and,despite a slight recovery in 2002, has not managed toregain its level of the 1990s (see figure I.4).
0
10
20
30
40
50
60
70
80
1990-1994 b 1995-1999 1999 2000 2001 2002 c
South America
Mexico, Central Americaand CaribbeanFinancial centres
Mexico, Central America andCaribbean
Financial centres
South America
b c
Foreign investment in Latin America and the Caribbean, 2002 25
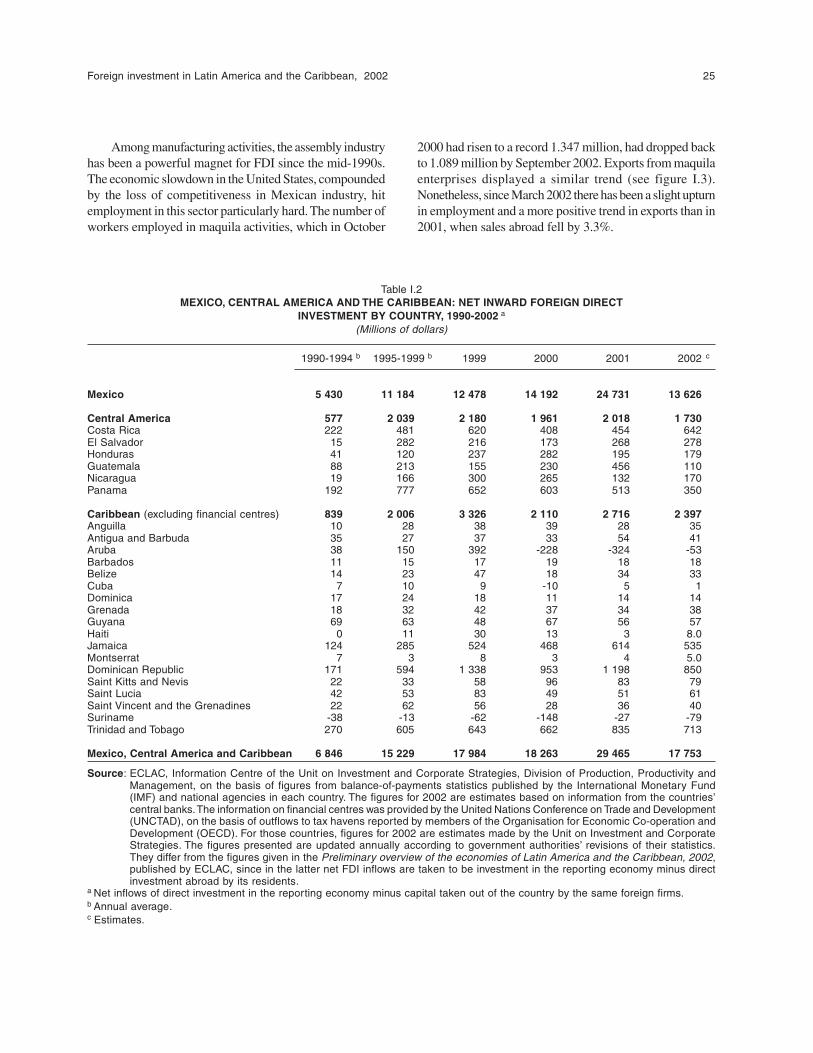
Among manufacturing activities, the assembly industryhas been a powerful magnet for FDI since the mid-1990s.The economic slowdown in the United States, compoundedby the loss of competitiveness in Mexican industry, hitemployment in this sector particularly hard. The number ofworkers employed in maquila activities, which in October
2000 had risen to a record 1.347 million, had dropped backto 1.089 million by September 2002. Exports from maquilaenterprises displayed a similar trend (see figure I.3).Nonetheless, since March 2002 there has been a slight upturnin employment and a more positive trend in exports than in2001, when sales abroad fell by 3.3%.
Table I.2MEXICO, CENTRAL AMERICA AND THE CARIBBEAN: NET INWARD FOREIGN DIRECT
INVESTMENT BY COUNTRY, 1990-2002 a
(Millions of dollars)
1990-1994 b 1995-1999 b 1999 2000 2001 2002 c
Mexico 5 430 11 184 12 478 14 192 24 731 13 626
Central America 577 2 039 2 180 1 961 2 018 1 730Costa Rica 222 481 620 408 454 642El Salvador 15 282 216 173 268 278Honduras 41 120 237 282 195 179Guatemala 88 213 155 230 456 110Nicaragua 19 166 300 265 132 170Panama 192 777 652 603 513 350
Caribbean (excluding financial centres) 839 2 006 3 326 2 110 2 716 2 397Anguilla 10 28 38 39 28 35Antigua and Barbuda 35 27 37 33 54 41Aruba 38 150 392 -228 -324 -53Barbados 11 15 17 19 18 18Belize 14 23 47 18 34 33Cuba 7 10 9 -10 5 1Dominica 17 24 18 11 14 14Grenada 18 32 42 37 34 38Guyana 69 63 48 67 56 57Haiti 0 11 30 13 3 8.0Jamaica 124 285 524 468 614 535Montserrat 7 3 8 3 4 5.0Dominican Republic 171 594 1 338 953 1 198 850Saint Kitts and Nevis 22 33 58 96 83 79Saint Lucia 42 53 83 49 51 61Saint Vincent and the Grenadines 22 62 56 28 36 40Suriname -38 -13 -62 -148 -27 -79Trinidad and Tobago 270 605 643 662 835 713
Mexico, Central America and Caribbean 6 846 15 229 17 984 18 263 29 465 17 753
Source: ECLAC, Information Centre of the Unit on Investment and Corporate Strategies, Division of Production, Productivity andManagement, on the basis of figures from balance-of-payments statistics published by the International Monetary Fund(IMF) and national agencies in each country. The figures for 2002 are estimates based on information from the countries’central banks. The information on financial centres was provided by the United Nations Conference on Trade and Development(UNCTAD), on the basis of outflows to tax havens reported by members of the Organisation for Economic Co-operation andDevelopment (OECD). For those countries, figures for 2002 are estimates made by the Unit on Investment and CorporateStrategies. The figures presented are updated annually according to government authorities’ revisions of their statistics.They differ from the figures given in the Preliminary overview of the economies of Latin America and the Caribbean, 2002,published by ECLAC, since in the latter net FDI inflows are taken to be investment in the reporting economy minus directinvestment abroad by its residents.
a Net inflows of direct investment in the reporting economy minus capital taken out of the country by the same foreign firms.b Annual average.c Estimates.
26 ECLAC
Figure I.3MEXICO: IMPORTANCE OF THE MANUFACTURING AND FINANCIAL SERVICES SECTORS
AS DESTINATIONS FOR FOREIGN DIRECT INVESTMENT(Percentages)
Source: Ministry of Economic Affairs, National Foreign Investment Commission, Informe estadístico sobre elcomportamiento de la inversión extranjera directa en México (January-September 2002).
7 See the statement by Mr. Luis Ernesto Derbez, Mexico’s Secretary of the Economy (www.terra.com.mx), 29 July 2002.8 For more information on TNCs’ strategies in Mexico, see section B of this chapter.
0
10
20
30
40
50
60
70
80
1994 1995 1996 1997 1998 1999 2000 2001 Jan-Sep2002
Manufacturing Financial services Other
Given the problems facing the industrial sector ingeneral and maquila businesses in particular, in July 2002the government of Mexico created a CompetitivenessCouncil with the aim of stabilizing employment andspeeding up the creation of new jobs that would generateboth greater value added and better productivity, so thatwages could be increased.7 Special action plans were tobe drawn up for 12 branches of production, includingthe automotive, electronics and maquila export industries,along with the agricultural sector and the textile andclothing industry. In October 2002, the Ministry ofEconomic Affairs also introduced changes to thetemporary merchandise imports, setting out specificrequirements that replace the agreement previously inforce with the United States. The new rules facilitatemaquila operations by allowing the tariff-free importationof inputs on a temporary basis, while extending the termof the agreement.
The bulk of FDI in services in 2002 continued to bechannelled into the financial sector. The largest suchoperation was the US$ 1.131 billion paid by the Hongkongand Shanghai Banking Corporation (HSBC) of the UnitedKingdom for a 99.2% stake in the Bital Financial Group,Mexico’s fifth largest bank. This acquisition raised foreignownership of the Mexican banking sector to over 90%.8
In brief, negative factors notwithstanding, in 2002FDI in Mexico broadly maintained its level of previousyears. As mentioned above, however, the compositionof flows has changed, with investment in servicesovertaking investment in manufacturing. The admissionof China into the World Trade Organization (WTO) hasfurther undermined the competitiveness of Mexico’smaquila sector, whose productive processes use simpletechnology, and has forced the remaining sectors (thoseusing more advanced technology) to make up for lostmarkets and defend the market shares they achieved inCanada and the United States during the 1990s.
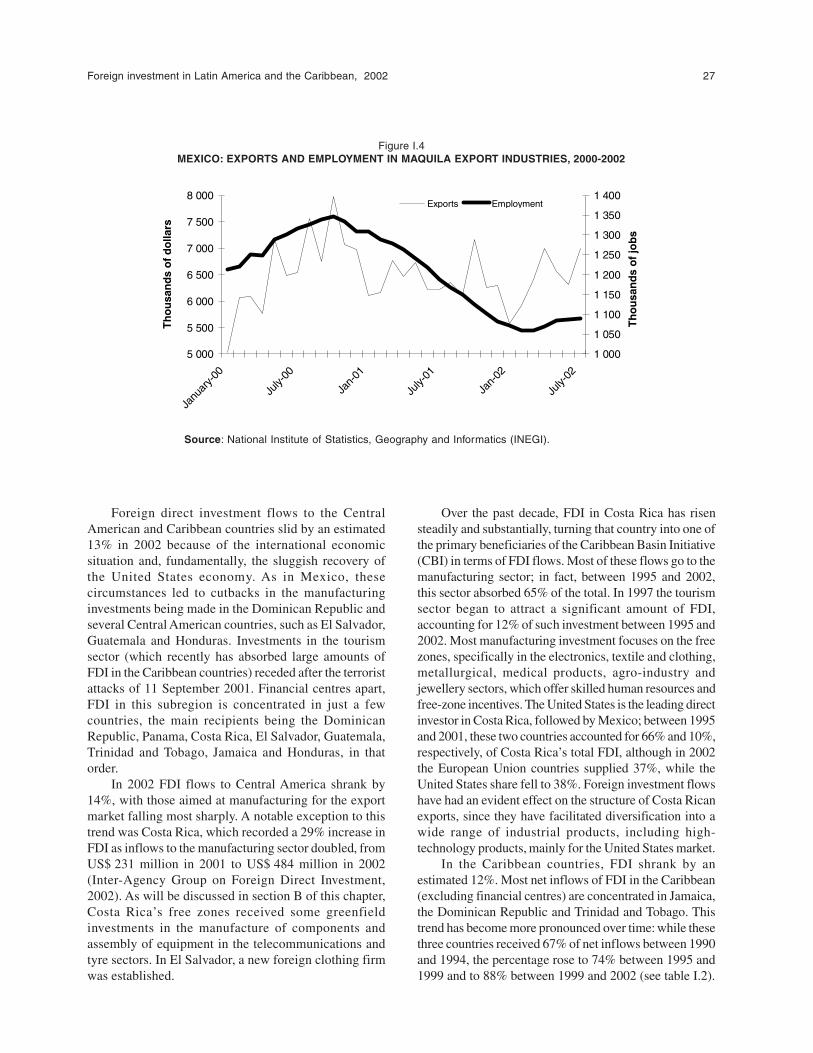
Foreign investment in Latin America and the Caribbean, 2002 27
Figure I.4MEXICO: EXPORTS AND EMPLOYMENT IN MAQUILA EXPORT INDUSTRIES, 2000-2002
5 000
5 500
6 000
6 500
7 000
7 500
8 000
Janu
ary-
00
July-
00
Jan-
01
July-
01
Jan-
02
July-
02
Th
ou
san
ds
of
do
llars
1 000
1 050
1 100
1 150
1 200
1 250
1 300
1 350
1 400
Th
ou
san
ds
of
job
s
Exports Employment
Source: National Institute of Statistics, Geography and Informatics (INEGI).
Foreign direct investment flows to the CentralAmerican and Caribbean countries slid by an estimated13% in 2002 because of the international economicsituation and, fundamentally, the sluggish recovery ofthe United States economy. As in Mexico, thesecircumstances led to cutbacks in the manufacturinginvestments being made in the Dominican Republic andseveral Central American countries, such as El Salvador,Guatemala and Honduras. Investments in the tourismsector (which recently has absorbed large amounts ofFDI in the Caribbean countries) receded after the terroristattacks of 11 September 2001. Financial centres apart,FDI in this subregion is concentrated in just a fewcountries, the main recipients being the DominicanRepublic, Panama, Costa Rica, El Salvador, Guatemala,Trinidad and Tobago, Jamaica and Honduras, in thatorder.
In 2002 FDI flows to Central America shrank by14%, with those aimed at manufacturing for the exportmarket falling most sharply. A notable exception to thistrend was Costa Rica, which recorded a 29% increase inFDI as inflows to the manufacturing sector doubled, fromUS$ 231 million in 2001 to US$ 484 million in 2002(Inter-Agency Group on Foreign Direct Investment,2002). As will be discussed in section B of this chapter,Costa Rica’s free zones received some greenfieldinvestments in the manufacture of components andassembly of equipment in the telecommunications andtyre sectors. In El Salvador, a new foreign clothing firmwas established.
Over the past decade, FDI in Costa Rica has risensteadily and substantially, turning that country into one ofthe primary beneficiaries of the Caribbean Basin Initiative(CBI) in terms of FDI flows. Most of these flows go to themanufacturing sector; in fact, between 1995 and 2002,this sector absorbed 65% of the total. In 1997 the tourismsector began to attract a significant amount of FDI,accounting for 12% of such investment between 1995 and2002. Most manufacturing investment focuses on the freezones, specifically in the electronics, textile and clothing,metallurgical, medical products, agro-industry andjewellery sectors, which offer skilled human resources andfree-zone incentives. The United States is the leading directinvestor in Costa Rica, followed by Mexico; between 1995and 2001, these two countries accounted for 66% and 10%,respectively, of Costa Rica’s total FDI, although in 2002the European Union countries supplied 37%, while theUnited States share fell to 38%. Foreign investment flowshave had an evident effect on the structure of Costa Ricanexports, since they have facilitated diversification into awide range of industrial products, including high-technology products, mainly for the United States market.
In the Caribbean countries, FDI shrank by anestimated 12%. Most net inflows of FDI in the Caribbean(excluding financial centres) are concentrated in Jamaica,the Dominican Republic and Trinidad and Tobago. Thistrend has become more pronounced over time: while thesethree countries received 67% of net inflows between 1990and 1994, the percentage rose to 74% between 1995 and1999 and to 88% between 1999 and 2002 (see table I.2).
28 ECLAC
FDI in the Dominican Republic has been channelledprimarily into the industrial free zones, in response totax incentives and low-cost labour; the electricity sector,especially since the privatization, in 1999, of a numberof generators and distributors; tourism; andtelecommunications. In the industrial free zones, theleading sector is clothing; among the Caribbean andCentral American countries, the Dominican Republicranks first in terms of the volume of clothing exports tothe United States market.
In Trinidad and Tobago, the hydrocarbon sector hasbeen the major focus of FDI ever since the authoritiesdecided to provide incentives for natural gas explorationand production by private companies. The latter startedmaking sizeable investments in the mid-1990s anddiscovered large natural gas reserves, which spurredinvestments in related activities (gas liquefaction plants,petrochemicals, thermoelectric power plants, etc.) (seeECLAC, 2002).
Jamaica has received copious amounts of FDI in theservice sector. The 2001 privatization of the electricityand energy firm Jamaica Public Service Company(JPSCo), purchased by Mirant Corporation of the UnitedStates, increased the flow of FDI to the electricity sector.The liberalization of telecommunications, whichculminated in March 2003 with the abolition of themonopoly previously held by the United Kingdom firmCable & Wireless in the long-distance segment, hasopened up new opportunities in this sector which haverecently attracted a number of foreign firms interestedin the mobile telephone market. Other foreign companieshave positioned themselves as Internet service providersand have installed call centres. In addition, therestructuring of the financial system beginning in 1997led to the purchase, in 2001, of Union Bank9 by RTTBInternational –Trinidad and Tobago’s largest bank– andto the privatization, in March 2002, of NationalCommercial Bank Jamaica Limited, which waspurchased by Advantage Investment Counsel Limited(AIC), a Canadian investment firm.10 The tourism sector,which had traditionally been run by local businesses, hasbecome one of Jamaica’s biggest absorbers of FDI inrecent years, largely as a result of generous governmentincentives. Considerable incentives have also beenapplied in other areas, such as textiles, agriculture andmining (bauxite and aluminium), and have attracted moreFDI in these sectors.
Investment in Caribbean financial centres was alsosharply down in 2002 (to US$ 11 billion, compared toUS$ 15 billion in 2001). Noteworthy in this connection isthe initiative launched by the Organisation for EconomicCo-operation and Development (OECD),11 urging thecountries where these financial centres are located tointensify cooperation on tax matters, restrict distortionarypractices and make the tax treatment of capital flows moretransparent, thereby enhancing competition in the globalfinancial market. To date, the vast majority of financialcentres, both in the Caribbean and elsewhere in the world,have been actively implementing this initiative to eliminateharmful tax practices –as explicitly defined in theinitiative– by April 2003.
Some Central American and Caribbeangovernments are taking special steps to counter thereduction in FDI flows. Guatemala, for example, isimplementing a wide-ranging privatization policy, whileCosta Rica is trying to boost FDI by developing high-technology and infrastructure industries. El Salvadoris attempting to position itself better in sectors such asagriculture, call centres, electronics and apparel. To thisend, for the past two years a new agency, the InvestmentPromotion Office (PROESA), has been promoting thedevelopment of new areas of investment, which hasresulted in the installation of 58 new firms, creating20,000 direct jobs. Puerto Rico, meanwhile, isimplementing a strategy with similar objectives,involving an investment programme that includes taxconcessions.
To summarize, the Central American and Caribbeancountries (except Costa Rica) saw FDI flows slacken,especially in the clothing manufacture and tourismsectors. A number of governments have adopted specialmeasures to reverse this trend (including policies onprivatization, infrastructure development and newindustries), while others have sought to better positionthemselves in the integrated international systems ofTNCs.
(b) FDI in South America
Although the unfavourable international situationaggravated the recessionary climate that had prevailedin South America since the Asian crisis, it was the politicaland economic upheaval in Argentina that most stronglyinfluenced FDI in this subregion. The deterioratingsituation in that country in 2002 had major repercussions
9 Union Bank was the result of a merger among five commercial banks, four merchant banks and four finance companies under the restructuringprocess in the banking system.
10 AIC paid US$ 134 million for the State’s 75% stake; the remaining 25% is owned by small-scale shareholders (Bloomberg).11 See OECD (1998).
Foreign investment in Latin America and the Caribbean, 2002 29
on the other members and associate members of theSouthern Common Market (MERCOSUR). To varyingdegrees, these countries suffered from sharp contractionsin the volume of trade (particularly Brazil, Uruguay andChile), exchange-rate volatility, heightened country riskand a sharp reduction in migrant remittances (whichstrongly affected Bolivia and Paraguay).
The recessionary climate, compounded by monetaryand exchange-rate instability, made investors morecautious. This was felt especially among foreign firmsthat had invested to gain access to national or subregionalmarkets –the hardest hit being those with little or nochance of refocusing their activities on extraregionalexports.
At the same time, the international economicsituation was further disrupted by the protectionistpolicies emerging in the United States, which led to theimposition of new import restrictions in 2002.12 On theother hand, the South American countries negotiated new
trade agreements aimed at opening up alternative outletsfor their exports. In 2002 Chile signed a free tradeagreement with the European Union,13 and in Decembersigned a similar accord with the United States. Brazilalso negotiated a separate agreement with the UnitedStates on trade in textiles, and signed an agreement withMexico covering the automotive sector.
Privatizations, which fuelled much of the FDI flowto South America throughout the 1990s, are now facingincreasingly hardened and sometimes violent politicalresistance. This has made it difficult to divest the fewassets still owned by the State (in Bolivia, Ecuador,Paraguay, Peru and Uruguay).
In sharp contrast to this generally negative FDI growthpanorama, investment flows to the Andean Communitycountries were relatively stable except in Venezuela (seetable I.3), largely reflecting the keen interest shown in theiroil and gas reserves by the corresponding TNCs, as detailedin chapter II of this report.
Table I.3SOUTH AMERICA: NET INWARD FOREIGN DIRECT INVESTMENT, 1990-2002 a
(Millions of dollars and percentages)
1990-1994 b 1995-1999 b 1999 2000 2001 2002 c Variation 2002/2001 (%)
Argentina 3 027 10 599 23 988 11 657 3 214 1 003 -69Bolivia 85 711 1 010 725 662 612 -7Brazil 1 703 19 240 28 576 32 779 22 636 16 566 -27Chile 1 207 5 402 8 988 3 639 4 476 1 603 -64Colombia 818 2 788 1 468 2 280 2 328 1 950 -16Ecuador 303 639 648 720 1 330 1 335 0Paraguay 99 185 94 119 79 80 1Peru 801 2 350 1 939 662 1 064 1 943 83Uruguay 78 164 235 274 318 168 -47Venezuela 836 3 298 3 290 4 465 3 448 1 389 -59Total 8 956 45 375 70 236 57 320 39 555 26 649 -33
Source: ECLAC, Information Centre of the Unit on Investment and Corporate Strategies, Division of Production, Productivity andManagement, on the basis of figures from balance-of-payments statistics published by the International Monetary Fund(IMF) and national agencies in each country. The figures for 2002 are estimates based on information from the countries’central banks. The figures presented are updated annually according to government authorities’ revisions of their statistics.They differ from the figures given in the Preliminary overview of the economies of Latin America and the Caribbean, 2002,published by ECLAC, since in the latter net FDI inflows are taken to be investment in the reporting economy minus directinvestment abroad by its residents.
a Net inflows of direct investment in the reporting economy minus capital taken out of the country by the same foreign firms.b Annual average.c Estimates.
12 These include an increase in United States agricultural subsidies, higher tariffs on imported steel and threats of non-renewal of tradeagreements with countries of the region involved in disputes with United States TNCs (see the description of Ecuador’s case in chapter II),among other measures.
13 This agreement has not yet been ratified by the respective legislatures of the 15 countries members of the European Union.
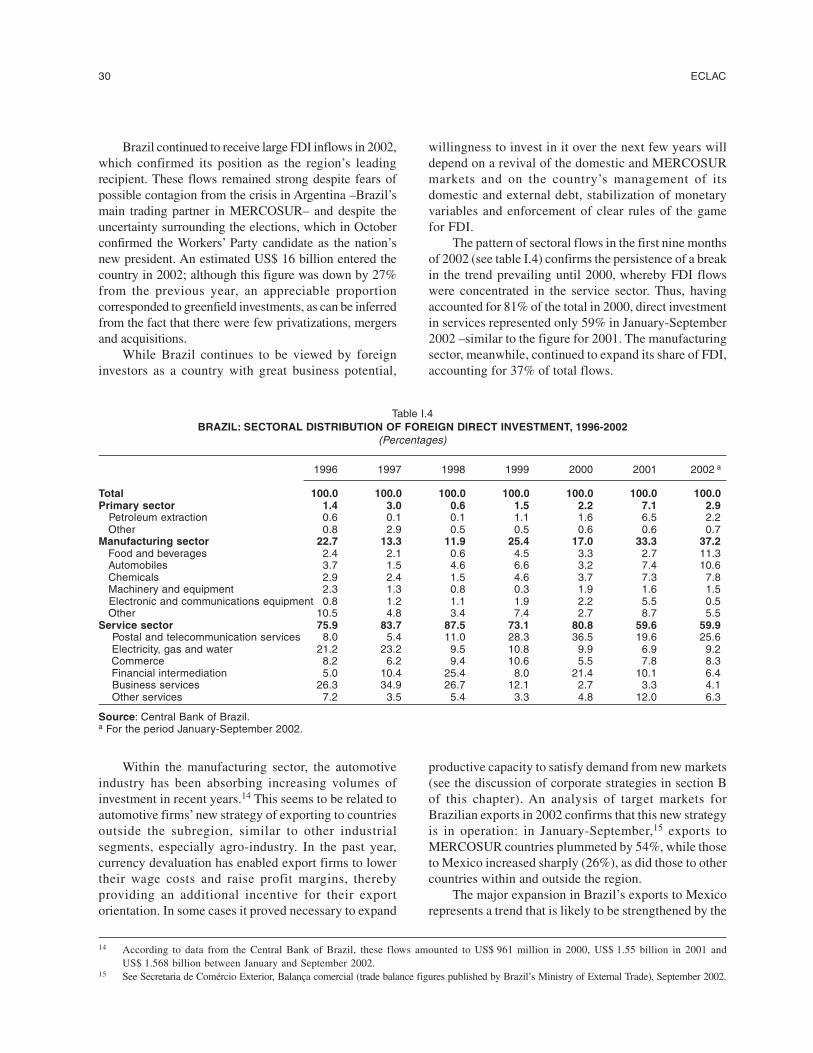
30 ECLAC
Brazil continued to receive large FDI inflows in 2002,which confirmed its position as the region’s leadingrecipient. These flows remained strong despite fears ofpossible contagion from the crisis in Argentina –Brazil’smain trading partner in MERCOSUR– and despite theuncertainty surrounding the elections, which in Octoberconfirmed the Workers’ Party candidate as the nation’snew president. An estimated US$ 16 billion entered thecountry in 2002; although this figure was down by 27%from the previous year, an appreciable proportioncorresponded to greenfield investments, as can be inferredfrom the fact that there were few privatizations, mergersand acquisitions.
While Brazil continues to be viewed by foreigninvestors as a country with great business potential,
willingness to invest in it over the next few years willdepend on a revival of the domestic and MERCOSURmarkets and on the country’s management of itsdomestic and external debt, stabilization of monetaryvariables and enforcement of clear rules of the gamefor FDI.
The pattern of sectoral flows in the first nine monthsof 2002 (see table I.4) confirms the persistence of a breakin the trend prevailing until 2000, whereby FDI flowswere concentrated in the service sector. Thus, havingaccounted for 81% of the total in 2000, direct investmentin services represented only 59% in January-September2002 –similar to the figure for 2001. The manufacturingsector, meanwhile, continued to expand its share of FDI,accounting for 37% of total flows.
Table I.4BRAZIL: SECTORAL DISTRIBUTION OF FOREIGN DIRECT INVESTMENT, 1996-2002
(Percentages)
1996 1997 1998 1999 2000 2001 2002 a
Total 100.0 100.0 100.0 100.0 100.0 100.0 100.0Primary sector 1.4 3.0 0.6 1.5 2.2 7.1 2.9 Petroleum extraction 0.6 0.1 0.1 1.1 1.6 6.5 2.2 Other 0.8 2.9 0.5 0.5 0.6 0.6 0.7Manufacturing sector 22.7 13.3 11.9 25.4 17.0 33.3 37.2 Food and beverages 2.4 2.1 0.6 4.5 3.3 2.7 11.3 Automobiles 3.7 1.5 4.6 6.6 3.2 7.4 10.6 Chemicals 2.9 2.4 1.5 4.6 3.7 7.3 7.8 Machinery and equipment 2.3 1.3 0.8 0.3 1.9 1.6 1.5 Electronic and communications equipment 0.8 1.2 1.1 1.9 2.2 5.5 0.5 Other 10.5 4.8 3.4 7.4 2.7 8.7 5.5Service sector 75.9 83.7 87.5 73.1 80.8 59.6 59.9 Postal and telecommunication services 8.0 5.4 11.0 28.3 36.5 19.6 25.6 Electricity, gas and water 21.2 23.2 9.5 10.8 9.9 6.9 9.2 Commerce 8.2 6.2 9.4 10.6 5.5 7.8 8.3 Financial intermediation 5.0 10.4 25.4 8.0 21.4 10.1 6.4 Business services 26.3 34.9 26.7 12.1 2.7 3.3 4.1 Other services 7.2 3.5 5.4 3.3 4.8 12.0 6.3
Source: Central Bank of Brazil.a For the period January-September 2002.
14 According to data from the Central Bank of Brazil, these flows amounted to US$ 961 million in 2000, US$ 1.55 billion in 2001 andUS$ 1.568 billion between January and September 2002.
15 See Secretaria de Comércio Exterior, Balança comercial (trade balance figures published by Brazil’s Ministry of External Trade), September 2002.
Within the manufacturing sector, the automotiveindustry has been absorbing increasing volumes ofinvestment in recent years.14 This seems to be related toautomotive firms’ new strategy of exporting to countriesoutside the subregion, similar to other industrialsegments, especially agro-industry. In the past year,currency devaluation has enabled export firms to lowertheir wage costs and raise profit margins, therebyproviding an additional incentive for their exportorientation. In some cases it proved necessary to expand
productive capacity to satisfy demand from new markets(see the discussion of corporate strategies in section Bof this chapter). An analysis of target markets forBrazilian exports in 2002 confirms that this new strategyis in operation: in January-September,15 exports toMERCOSUR countries plummeted by 54%, while thoseto Mexico increased sharply (26%), as did those to othercountries within and outside the region.
The major expansion in Brazil’s exports to Mexicorepresents a trend that is likely to be strengthened by the
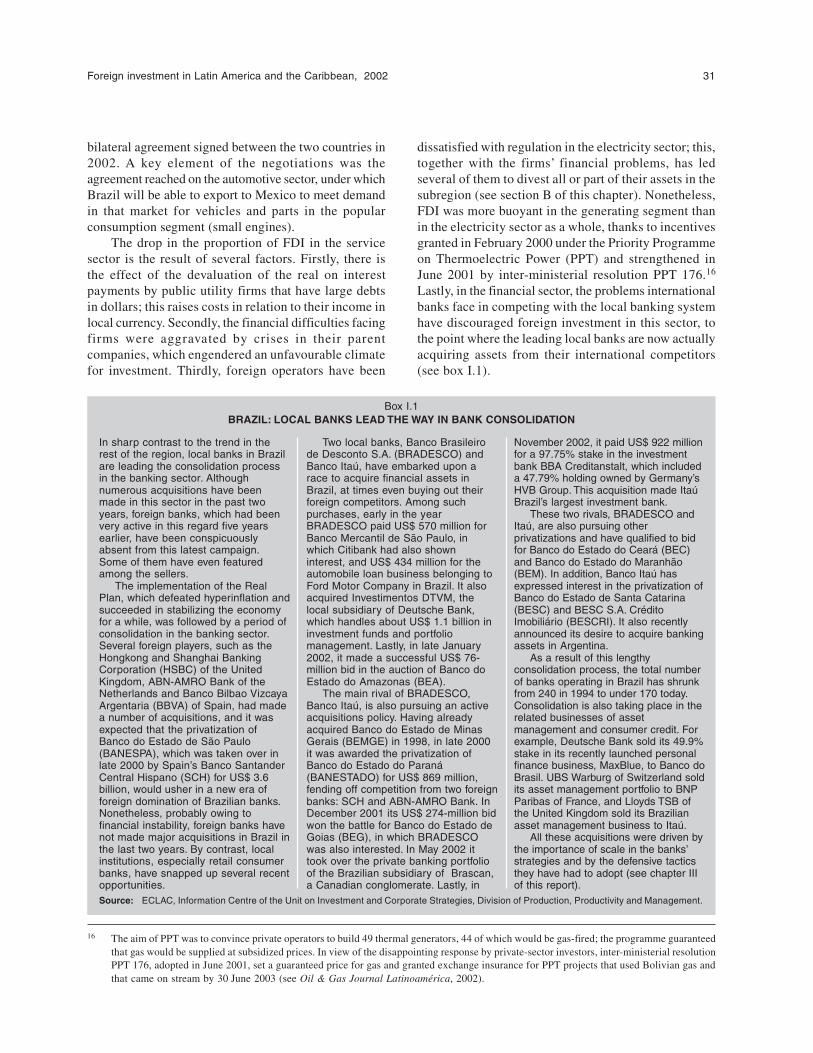
Foreign investment in Latin America and the Caribbean, 2002 31
bilateral agreement signed between the two countries in2002. A key element of the negotiations was theagreement reached on the automotive sector, under whichBrazil will be able to export to Mexico to meet demandin that market for vehicles and parts in the popularconsumption segment (small engines).
The drop in the proportion of FDI in the servicesector is the result of several factors. Firstly, there isthe effect of the devaluation of the real on interestpayments by public utility firms that have large debtsin dollars; this raises costs in relation to their income inlocal currency. Secondly, the financial difficulties facingfirms were aggravated by crises in their parentcompanies, which engendered an unfavourable climatefor investment. Thirdly, foreign operators have been
16 The aim of PPT was to convince private operators to build 49 thermal generators, 44 of which would be gas-fired; the programme guaranteedthat gas would be supplied at subsidized prices. In view of the disappointing response by private-sector investors, inter-ministerial resolutionPPT 176, adopted in June 2001, set a guaranteed price for gas and granted exchange insurance for PPT projects that used Bolivian gas andthat came on stream by 30 June 2003 (see Oil & Gas Journal Latinoamérica, 2002).
dissatisfied with regulation in the electricity sector; this,together with the firms’ financial problems, has ledseveral of them to divest all or part of their assets in thesubregion (see section B of this chapter). Nonetheless,FDI was more buoyant in the generating segment thanin the electricity sector as a whole, thanks to incentivesgranted in February 2000 under the Priority Programmeon Thermoelectric Power (PPT) and strengthened inJune 2001 by inter-ministerial resolution PPT 176.16
Lastly, in the financial sector, the problems internationalbanks face in competing with the local banking systemhave discouraged foreign investment in this sector, tothe point where the leading local banks are now actuallyacquiring assets from their international competitors(see box I.1).
Box I.1BRAZIL: LOCAL BANKS LEAD THE WAY IN BANK CONSOLIDATION
In sharp contrast to the trend in therest of the region, local banks in Brazilare leading the consolidation processin the banking sector. Althoughnumerous acquisitions have beenmade in this sector in the past twoyears, foreign banks, which had beenvery active in this regard five yearsearlier, have been conspicuouslyabsent from this latest campaign.Some of them have even featuredamong the sellers.
The implementation of the RealPlan, which defeated hyperinflation andsucceeded in stabilizing the economyfor a while, was followed by a period ofconsolidation in the banking sector.Several foreign players, such as theHongkong and Shanghai BankingCorporation (HSBC) of the UnitedKingdom, ABN-AMRO Bank of theNetherlands and Banco Bilbao VizcayaArgentaria (BBVA) of Spain, had madea number of acquisitions, and it wasexpected that the privatization ofBanco do Estado de São Paulo(BANESPA), which was taken over inlate 2000 by Spain’s Banco SantanderCentral Hispano (SCH) for US$ 3.6billion, would usher in a new era offoreign domination of Brazilian banks.Nonetheless, probably owing tofinancial instability, foreign banks havenot made major acquisitions in Brazil inthe last two years. By contrast, localinstitutions, especially retail consumerbanks, have snapped up several recentopportunities.
Two local banks, Banco Brasileirode Desconto S.A. (BRADESCO) andBanco Itaú, have embarked upon arace to acquire financial assets inBrazil, at times even buying out theirforeign competitors. Among suchpurchases, early in the yearBRADESCO paid US$ 570 million forBanco Mercantil de São Paulo, inwhich Citibank had also showninterest, and US$ 434 million for theautomobile loan business belonging toFord Motor Company in Brazil. It alsoacquired Investimentos DTVM, thelocal subsidiary of Deutsche Bank,which handles about US$ 1.1 billion ininvestment funds and portfoliomanagement. Lastly, in late January2002, it made a successful US$ 76-million bid in the auction of Banco doEstado do Amazonas (BEA).
The main rival of BRADESCO,Banco Itaú, is also pursuing an activeacquisitions policy. Having alreadyacquired Banco do Estado de MinasGerais (BEMGE) in 1998, in late 2000it was awarded the privatization ofBanco do Estado do Paraná(BANESTADO) for US$ 869 million,fending off competition from two foreignbanks: SCH and ABN-AMRO Bank. InDecember 2001 its US$ 274-million bidwon the battle for Banco do Estado deGoias (BEG), in which BRADESCOwas also interested. In May 2002 ittook over the private banking portfolioof the Brazilian subsidiary of Brascan,a Canadian conglomerate. Lastly, in
November 2002, it paid US$ 922 millionfor a 97.75% stake in the investmentbank BBA Creditanstalt, which includeda 47.79% holding owned by Germany’sHVB Group. This acquisition made ItaúBrazil’s largest investment bank.
These two rivals, BRADESCO andItaú, are also pursuing otherprivatizations and have qualified to bidfor Banco do Estado do Ceará (BEC)and Banco do Estado do Maranhão(BEM). In addition, Banco Itaú hasexpressed interest in the privatization ofBanco do Estado de Santa Catarina(BESC) and BESC S.A. CréditoImobiliário (BESCRI). It also recentlyannounced its desire to acquire bankingassets in Argentina.
As a result of this lengthyconsolidation process, the total numberof banks operating in Brazil has shrunkfrom 240 in 1994 to under 170 today.Consolidation is also taking place in therelated businesses of assetmanagement and consumer credit. Forexample, Deutsche Bank sold its 49.9%stake in its recently launched personalfinance business, MaxBlue, to Banco doBrasil. UBS Warburg of Switzerland soldits asset management portfolio to BNPParibas of France, and Lloyds TSB ofthe United Kingdom sold its Brazilianasset management business to Itaú.
All these acquisitions were driven bythe importance of scale in the banks’strategies and by the defensive tacticsthey have had to adopt (see chapter IIIof this report).
Source: ECLAC, Information Centre of the Unit on Investment and Corporate Strategies, Division of Production, Productivity and Management.
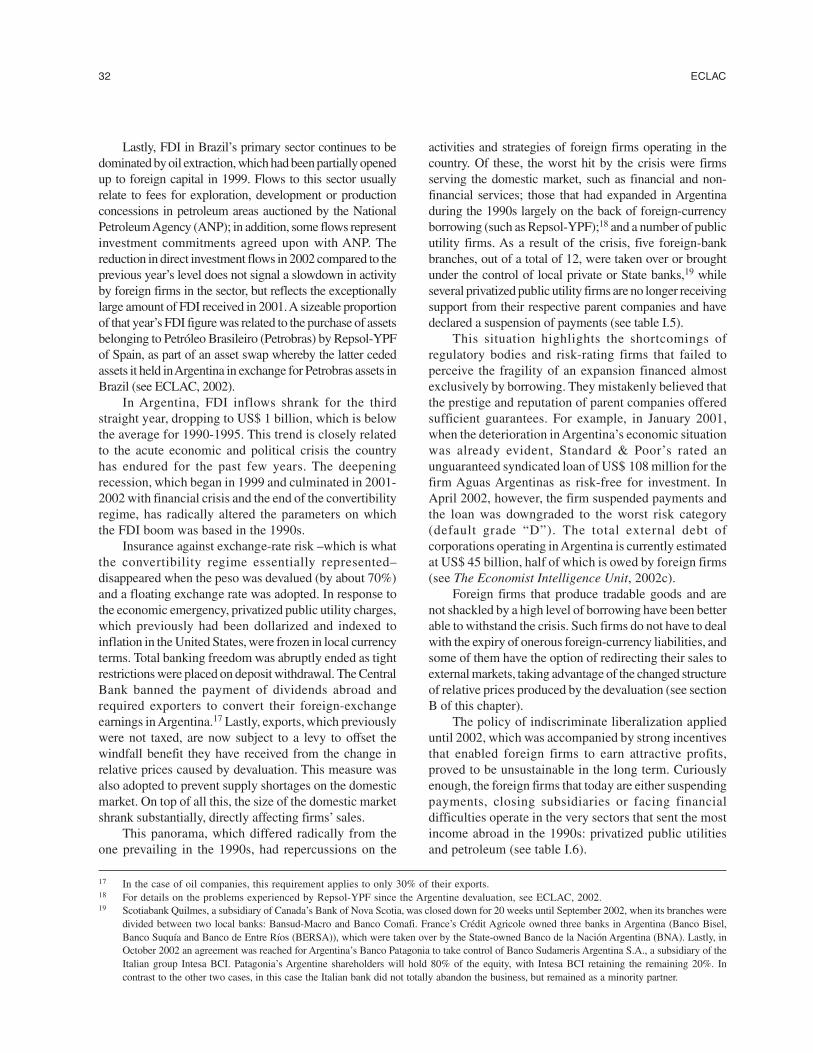
32 ECLAC
Lastly, FDI in Brazil’s primary sector continues to bedominated by oil extraction, which had been partially openedup to foreign capital in 1999. Flows to this sector usuallyrelate to fees for exploration, development or productionconcessions in petroleum areas auctioned by the NationalPetroleum Agency (ANP); in addition, some flows representinvestment commitments agreed upon with ANP. Thereduction in direct investment flows in 2002 compared to theprevious year’s level does not signal a slowdown in activityby foreign firms in the sector, but reflects the exceptionallylarge amount of FDI received in 2001. A sizeable proportionof that year’s FDI figure was related to the purchase of assetsbelonging to Petróleo Brasileiro (Petrobras) by Repsol-YPFof Spain, as part of an asset swap whereby the latter cededassets it held in Argentina in exchange for Petrobras assets inBrazil (see ECLAC, 2002).
In Argentina, FDI inflows shrank for the thirdstraight year, dropping to US$ 1 billion, which is belowthe average for 1990-1995. This trend is closely relatedto the acute economic and political crisis the countryhas endured for the past few years. The deepeningrecession, which began in 1999 and culminated in 2001-2002 with financial crisis and the end of the convertibilityregime, has radically altered the parameters on whichthe FDI boom was based in the 1990s.
Insurance against exchange-rate risk –which is whatthe convertibility regime essentially represented–disappeared when the peso was devalued (by about 70%)and a floating exchange rate was adopted. In response tothe economic emergency, privatized public utility charges,which previously had been dollarized and indexed toinflation in the United States, were frozen in local currencyterms. Total banking freedom was abruptly ended as tightrestrictions were placed on deposit withdrawal. The CentralBank banned the payment of dividends abroad andrequired exporters to convert their foreign-exchangeearnings in Argentina.17 Lastly, exports, which previouslywere not taxed, are now subject to a levy to offset thewindfall benefit they have received from the change inrelative prices caused by devaluation. This measure wasalso adopted to prevent supply shortages on the domesticmarket. On top of all this, the size of the domestic marketshrank substantially, directly affecting firms’ sales.
This panorama, which differed radically from theone prevailing in the 1990s, had repercussions on the
activities and strategies of foreign firms operating in thecountry. Of these, the worst hit by the crisis were firmsserving the domestic market, such as financial and non-financial services; those that had expanded in Argentinaduring the 1990s largely on the back of foreign-currencyborrowing (such as Repsol-YPF);18 and a number of publicutility firms. As a result of the crisis, five foreign-bankbranches, out of a total of 12, were taken over or broughtunder the control of local private or State banks,19 whileseveral privatized public utility firms are no longer receivingsupport from their respective parent companies and havedeclared a suspension of payments (see table I.5).
This situation highlights the shortcomings ofregulatory bodies and risk-rating firms that failed toperceive the fragility of an expansion financed almostexclusively by borrowing. They mistakenly believed thatthe prestige and reputation of parent companies offeredsufficient guarantees. For example, in January 2001,when the deterioration in Argentina’s economic situationwas already evident, Standard & Poor’s rated anunguaranteed syndicated loan of US$ 108 million for thefirm Aguas Argentinas as risk-free for investment. InApril 2002, however, the firm suspended payments andthe loan was downgraded to the worst risk category(default grade “D”). The total external debt ofcorporations operating in Argentina is currently estimatedat US$ 45 billion, half of which is owed by foreign firms(see The Economist Intelligence Unit, 2002c).
Foreign firms that produce tradable goods and arenot shackled by a high level of borrowing have been betterable to withstand the crisis. Such firms do not have to dealwith the expiry of onerous foreign-currency liabilities, andsome of them have the option of redirecting their sales toexternal markets, taking advantage of the changed structureof relative prices produced by the devaluation (see sectionB of this chapter).
The policy of indiscriminate liberalization applieduntil 2002, which was accompanied by strong incentivesthat enabled foreign firms to earn attractive profits,proved to be unsustainable in the long term. Curiouslyenough, the foreign firms that today are either suspendingpayments, closing subsidiaries or facing financialdifficulties operate in the very sectors that sent the mostincome abroad in the 1990s: privatized public utilitiesand petroleum (see table I.6).
17 In the case of oil companies, this requirement applies to only 30% of their exports.18 For details on the problems experienced by Repsol-YPF since the Argentine devaluation, see ECLAC, 2002.19 Scotiabank Quilmes, a subsidiary of Canada’s Bank of Nova Scotia, was closed down for 20 weeks until September 2002, when its branches were
divided between two local banks: Bansud-Macro and Banco Comafi. France’s Crédit Agricole owned three banks in Argentina (Banco Bisel,Banco Suquía and Banco de Entre Ríos (BERSA)), which were taken over by the State-owned Banco de la Nación Argentina (BNA). Lastly, inOctober 2002 an agreement was reached for Argentina’s Banco Patagonia to take control of Banco Sudameris Argentina S.A., a subsidiary of theItalian group Intesa BCI. Patagonia’s Argentine shareholders will hold 80% of the equity, with Intesa BCI retaining the remaining 20%. Incontrast to the other two cases, in this case the Italian bank did not totally abandon the business, but remained as a minority partner.
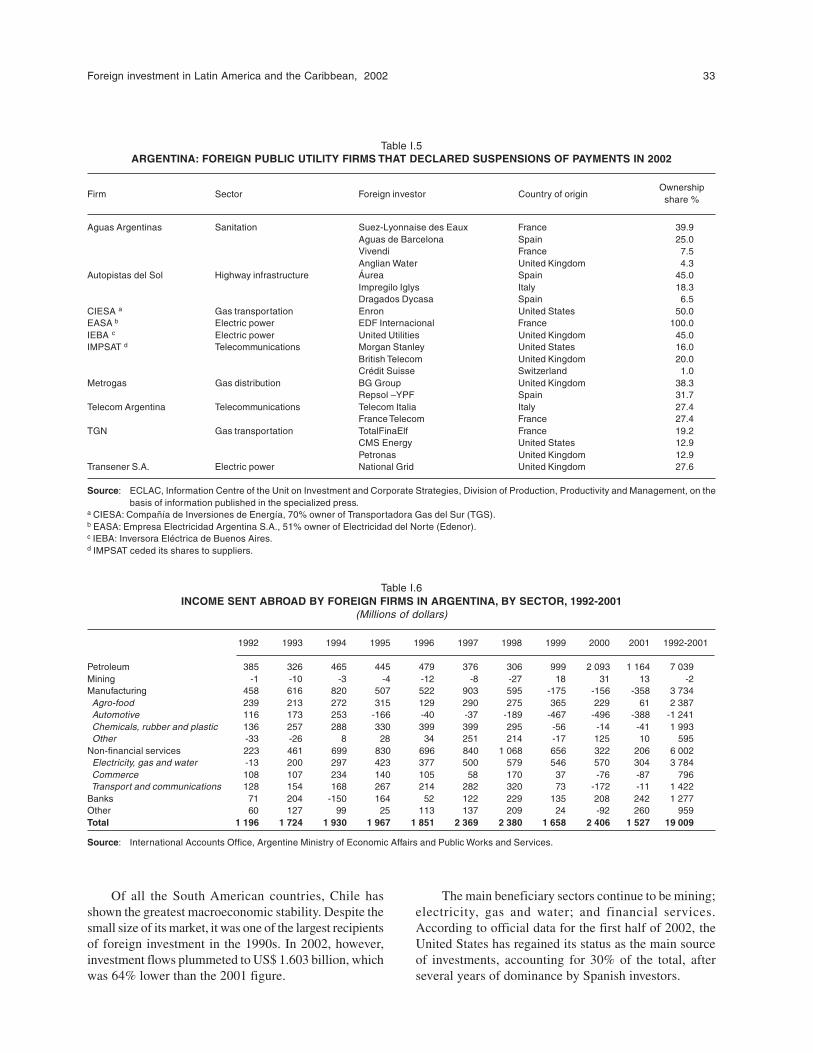
Foreign investment in Latin America and the Caribbean, 2002 33
Table I.6INCOME SENT ABROAD BY FOREIGN FIRMS IN ARGENTINA, BY SECTOR, 1992-2001
(Millions of dollars)
1992 1993 1994 1995 1996 1997 1998 1999 2000 2001 1992-2001
Petroleum 385 326 465 445 479 376 306 999 2 093 1 164 7 039Mining -1 -10 -3 -4 -12 -8 -27 18 31 13 -2Manufacturing 458 616 820 507 522 903 595 -175 -156 -358 3 734 Agro-food 239 213 272 315 129 290 275 365 229 61 2 387 Automotive 116 173 253 -166 -40 -37 -189 -467 -496 -388 -1 241 Chemicals, rubber and plastic 136 257 288 330 399 399 295 -56 -14 -41 1 993 Other -33 -26 8 28 34 251 214 -17 125 10 595Non-financial services 223 461 699 830 696 840 1 068 656 322 206 6 002 Electricity, gas and water -13 200 297 423 377 500 579 546 570 304 3 784 Commerce 108 107 234 140 105 58 170 37 -76 -87 796 Transport and communications 128 154 168 267 214 282 320 73 -172 -11 1 422Banks 71 204 -150 164 52 122 229 135 208 242 1 277Other 60 127 99 25 113 137 209 24 -92 260 959Total 1 196 1 724 1 930 1 967 1 851 2 369 2 380 1 658 2 406 1 527 19 009
Source: International Accounts Office, Argentine Ministry of Economic Affairs and Public Works and Services.
Table I.5ARGENTINA: FOREIGN PUBLIC UTILITY FIRMS THAT DECLARED SUSPENSIONS OF PAYMENTS IN 2002
Firm Sector Foreign investor Country of originOwnershipshare %
Aguas Argentinas Sanitation Suez-Lyonnaise des Eaux France 39.9Aguas de Barcelona Spain 25.0Vivendi France 7.5Anglian Water United Kingdom 4.3
Autopistas del Sol Highway infrastructure Áurea Spain 45.0Impregilo Iglys Italy 18.3Dragados Dycasa Spain 6.5
CIESA a Gas transportation Enron United States 50.0EASA b Electric power EDF Internacional France 100.0IEBA c Electric power United Utilities United Kingdom 45.0IMPSAT d Telecommunications Morgan Stanley United States 16.0
British Telecom United Kingdom 20.0Crédit Suisse Switzerland 1.0
Metrogas Gas distribution BG Group United Kingdom 38.3Repsol –YPF Spain 31.7
Telecom Argentina Telecommunications Telecom Italia Italy 27.4France Telecom France 27.4
TGN Gas transportation TotalFinaElf France 19.2CMS Energy United States 12.9Petronas United Kingdom 12.9
Transener S.A. Electric power National Grid United Kingdom 27.6
Source: ECLAC, Information Centre of the Unit on Investment and Corporate Strategies, Division of Production, Productivity and Management, on thebasis of information published in the specialized press.
a CIESA: Compañía de Inversiones de Energía, 70% owner of Transportadora Gas del Sur (TGS).b EASA: Empresa Electricidad Argentina S.A., 51% owner of Electricidad del Norte (Edenor).c IEBA: Inversora Eléctrica de Buenos Aires.d IMPSAT ceded its shares to suppliers.
Of all the South American countries, Chile hasshown the greatest macroeconomic stability. Despite thesmall size of its market, it was one of the largest recipientsof foreign investment in the 1990s. In 2002, however,investment flows plummeted to US$ 1.603 billion, whichwas 64% lower than the 2001 figure.
The main beneficiary sectors continue to be mining;electricity, gas and water; and financial services.According to official data for the first half of 2002, theUnited States has regained its status as the main sourceof investments, accounting for 30% of the total, afterseveral years of dominance by Spanish investors.
34 ECLAC
In one of the few acquisitions carried out in 2002, BancoSantander Central Hispano (SCH) paid US$ 680 million tothe Central Bank for a 35.4% holding in Banco Santiago.With this acquisition, SCH increased its total stake to 80%and began the process of merging the two banks. Thismerger, which exemplifies the Spanish banks’ aggressivepolicy of penetration in Latin America, created the biggestfinancial institution in Chile (see chapter III of this report).
Another major operation was the takeover ofCompañía Minera Disputada de Las Condes S.A., ownedby ExxonMobil of the United States. This mining companywas acquired by Anglo American of South Africa for aboutUS$ 1.3 billion,20 in a move that significantly increasedthe scale of Anglo American’s operations in Chile –italready owned the Mantos Blancos and Moly-Cop Chilemines, and had a 44% interest in María Inés de Collahuasi.
This operation revived a perennial debate in Chileconcerning the role of TNCs and the relevant regulatoryframeworks in the non-renewable natural resource sector.This was because ExxonMobil, in all the years it wasrunning the mine, never declared an accounting profitand thus did not pay the corresponding taxes. Under theChilean tax system, mining companies, like firms in othereconomic sectors, only pay tax on their accountingprofits. This enables them to extract mineral resourcesand pay dividends abroad without any tax liability untilthey fully amortize all the capital invested (seeMoguillansky, 1999, and Moussa, 2001).
Given the general slackness of FDI flows, theauthorities have attempted to distance Chile’s image fromthat of its crisis-stricken neighbours and to shore up thecountry’s ability to attract foreign capital. The measuresdeployed to achieve this include a programme to attracthigh-technology investments (see ECLAC, 2002, chapterI), progress in the promulgation of laws on public shareofferings, the removal of obstacles to capital entry andthe promotion of Chile abroad.
The authorities hope that these policies, inconjunction with the free trade agreements signed in 2002with the United States (after more than 10 years ofnegotiations), the European Union and the Republic ofKorea, along with other bilateral agreements already inforce, will give significant impetus to the materializationof greenfield investment in Chile. In January 2003 thegovernment launched a campaign headed by the ForeignInvestment Committee and the Production DevelopmentCorporation (CORFO) to promote a programme known
as “Chile: A platform for new markets”, aimed atencouraging TNCs to choose Chile as the hub for theiroperations in the region. For this purpose, it suggeststhat TNCs could share services, call centres, technicaland administrative support facilities and softwaredevelopment, among other activities. Under this samepolicy, in November 2002 the Chamber of Deputiespassed a tax bill granting exemption from income tax toforeign-owned firms that invest from Chile in othercountries. Among other aims, the new tax regulationsare intended to eliminate double taxation on TNCs thatchoose Chile as a platform for regional investment.
In contrast to the pattern prevailing in the rest of theregion, FDI in the Andean Community countries either fellmuch more slightly, remained stable or even grew,21 exceptin Venezuela, where FDI flows plummeted by 59% between2001 and 2002. In Colombia, investments dropped by 16%compared to the previous year’s level (which was half theaverage decline in South America); inflows slipped by 7%in Bolivia, held steady in Ecuador and jumped by 83% inPeru. This performance is mainly attributable to large-scaleprojects undertaken in the hydrocarbon sector, reflectingthe interest shown by transnational oil companies in thosecountries’ extensive hydrocarbon reserves. In the case ofPeru, the sharp increase in FDI flows also reflects thepurchase of the Backus brewery by Bavaria of Colombiaand the Cisneros group of Venezuela (see annex table A.I.1and chapter II).
To summarize, considering the region as a whole, in2002 FDI continued on the downward trend it had begunin 1999, only this time the decline was steeper. Investmentlevels fell particularly sharply in Mexico, Central Americaand the Caribbean. In Mexico, the extent of the fall largelyreflects an exceptionally high inflow in 2001 related tothe BANAMEX takeover by Citigroup. The slump inmanufacturing investment as a result of the cyclicaldownturn in maquila production was offset by newacquisitions in the financial sector. Meanwhile, financialcentres continued to receive flows of transitory investment,albeit in smaller amounts, in line with the depressed levelof transactions in the region. In South America, investmentflows dwindled in response to the Argentine crisis and itsrepercussions throughout MERCOSUR, but this was partlyoffset by investments in the hydrocarbons industry(especially in Andean Community countries), since thebehaviour of this sector tends to be independent of thespecific situation in Latin America at any given time.
20 Since this was a transaction between foreign shareholders, it does not affect net FDI inflows.21 See chapter II of this report.
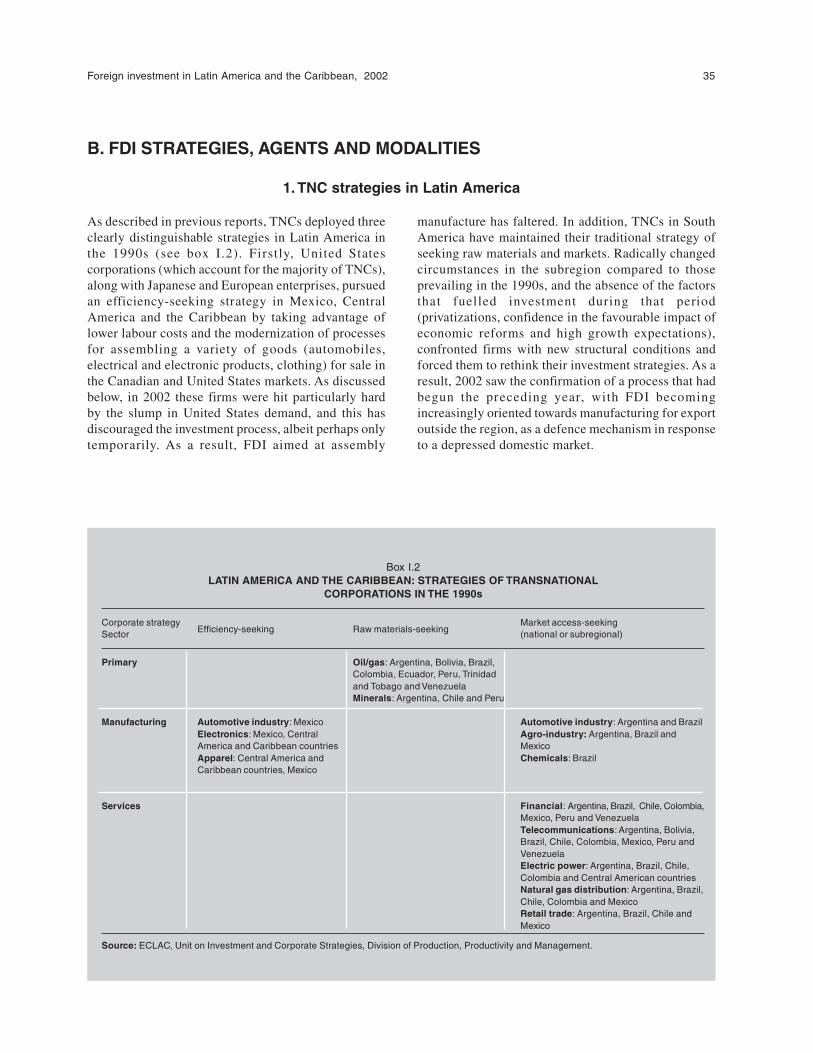
Foreign investment in Latin America and the Caribbean, 2002 35
B. FDI STRATEGIES, AGENTS AND MODALITIES
1. TNC strategies in Latin America
As described in previous reports, TNCs deployed threeclearly distinguishable strategies in Latin America inthe 1990s (see box I.2). Firstly, United Statescorporations (which account for the majority of TNCs),along with Japanese and European enterprises, pursuedan efficiency-seeking strategy in Mexico, CentralAmerica and the Caribbean by taking advantage oflower labour costs and the modernization of processesfor assembling a variety of goods (automobiles,electrical and electronic products, clothing) for sale inthe Canadian and United States markets. As discussedbelow, in 2002 these firms were hit particularly hardby the slump in United States demand, and this hasdiscouraged the investment process, albeit perhaps onlytemporarily. As a result, FDI aimed at assembly
manufacture has faltered. In addition, TNCs in SouthAmerica have maintained their traditional strategy ofseeking raw materials and markets. Radically changedcircumstances in the subregion compared to thoseprevailing in the 1990s, and the absence of the factorsthat fuelled investment during that period(privatizations, confidence in the favourable impact ofeconomic reforms and high growth expectations),confronted firms with new structural conditions andforced them to rethink their investment strategies. As aresult, 2002 saw the confirmation of a process that hadbegun the preceding year, with FDI becomingincreasingly oriented towards manufacturing for exportoutside the region, as a defence mechanism in responseto a depressed domestic market.
Box I.2LATIN AMERICA AND THE CARIBBEAN: STRATEGIES OF TRANSNATIONAL
CORPORATIONS IN THE 1990s
Corporate strategyEfficiency-seeking Raw materials-seeking
Market access-seekingSector (national or subregional)
Primary Oil/gas: Argentina, Bolivia, Brazil,Colombia, Ecuador, Peru, Trinidadand Tobago and VenezuelaMinerals: Argentina, Chile and Peru
Manufacturing Automotive industry: Mexico Automotive industry: Argentina and BrazilElectronics: Mexico, Central Agro-industry: Argentina, Brazil andAmerica and Caribbean countries MexicoApparel: Central America and Chemicals: BrazilCaribbean countries, Mexico
Services Financial: Argentina, Brazil, Chile, Colombia,Mexico, Peru and VenezuelaTelecommunications: Argentina, Bolivia,Brazil, Chile, Colombia, Mexico, Peru andVenezuelaElectric power: Argentina, Brazil, Chile,Colombia and Central American countriesNatural gas distribution: Argentina, Brazil,Chile, Colombia and MexicoRetail trade: Argentina, Brazil, Chile andMexico
Source: ECLAC, Unit on Investment and Corporate Strategies, Division of Production, Productivity and Management.
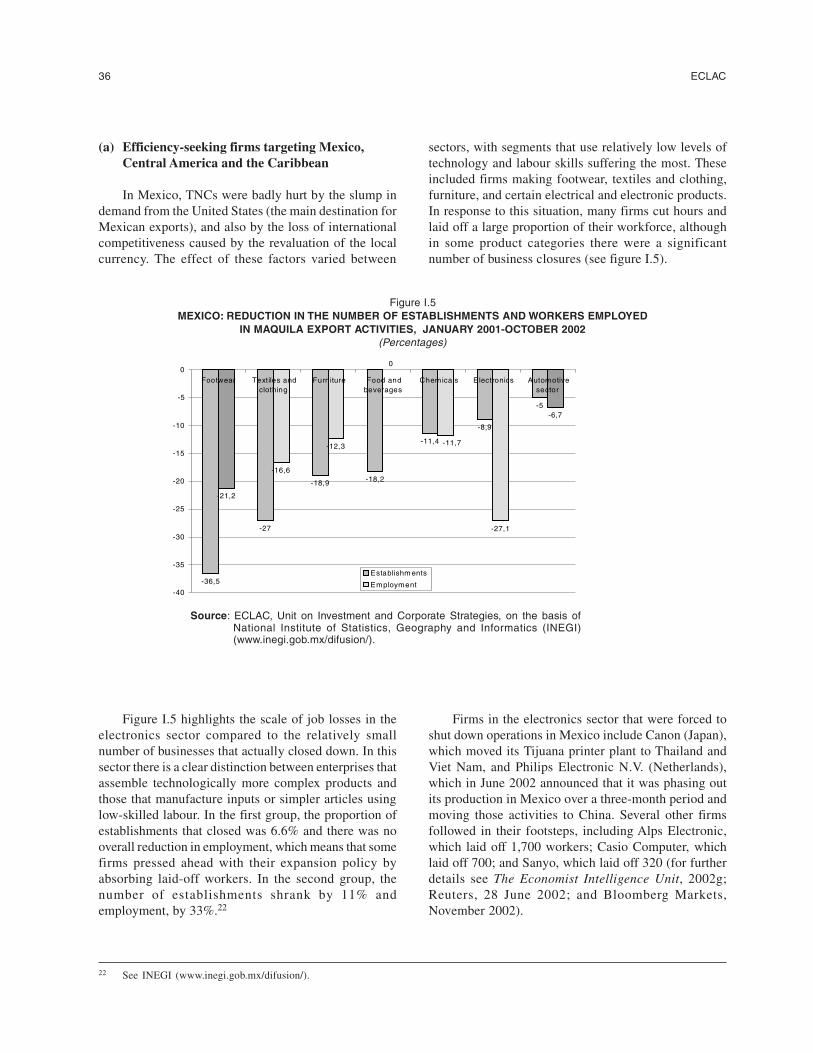
36 ECLAC
(a) Efficiency-seeking firms targeting Mexico,Central America and the Caribbean
In Mexico, TNCs were badly hurt by the slump indemand from the United States (the main destination forMexican exports), and also by the loss of internationalcompetitiveness caused by the revaluation of the localcurrency. The effect of these factors varied between
sectors, with segments that use relatively low levels oftechnology and labour skills suffering the most. Theseincluded firms making footwear, textiles and clothing,furniture, and certain electrical and electronic products.In response to this situation, many firms cut hours andlaid off a large proportion of their workforce, althoughin some product categories there were a significantnumber of business closures (see figure I.5).
Figure I.5MEXICO: REDUCTION IN THE NUMBER OF ESTABLISHMENTS AND WORKERS EMPLOYED
IN MAQUILA EXPORT ACTIVITIES, JANUARY 2001-OCTOBER 2002(Percentages)
22 See INEGI (www.inegi.gob.mx/difusion/).
Source: ECLAC, Unit on Investment and Corporate Strategies, on the basis ofNational Institute of Statistics, Geography and Informatics (INEGI)(www.inegi.gob.mx/difusion/).
Figure I.5 highlights the scale of job losses in theelectronics sector compared to the relatively smallnumber of businesses that actually closed down. In thissector there is a clear distinction between enterprises thatassemble technologically more complex products andthose that manufacture inputs or simpler articles usinglow-skilled labour. In the first group, the proportion ofestablishments that closed was 6.6% and there was nooverall reduction in employment, which means that somefirms pressed ahead with their expansion policy byabsorbing laid-off workers. In the second group, thenumber of establishments shrank by 11% andemployment, by 33%.22
Firms in the electronics sector that were forced toshut down operations in Mexico include Canon (Japan),which moved its Tijuana printer plant to Thailand andViet Nam, and Philips Electronic N.V. (Netherlands),which in June 2002 announced that it was phasing outits production in Mexico over a three-month period andmoving those activities to China. Several other firmsfollowed in their footsteps, including Alps Electronic,which laid off 1,700 workers; Casio Computer, whichlaid off 700; and Sanyo, which laid off 320 (for furtherdetails see The Economist Intelligence Unit, 2002g;Reuters, 28 June 2002; and Bloomberg Markets,November 2002).
-36,5
-27
-18,9 -18,2
-11,4
-8,9
-5
-21,2
-16,6
-12,3
0
-27,1
-6,7
-11,7
-40
-35
-30
-25
-20
-15
-10
-5
0Footwear Textiles and
clothing Furniture Food and
beverages Chemicals E lectronics Automotive
sector
Establishm ents
Employment
Foreign investment in Latin America and the Caribbean, 2002 37
Nonetheless, the comparative advantage of strategicproximity to the United States market continues to enticeTNCs that make mid-level- and high-technology finalproducts. Some of these firms adopted the tactic of cuttingback production while they waited for the United Stateseconomy to recover –examples include Ford Motor,Scientific-Atlanta and Hewlett Packard (see TheEconomist Intelligence Unit, 2002f and 2002g). In theautomotive segment, several firms announced newinvestment projects, including DaimlerChrysler andToyota (automobiles) and Michelin and Firestone(tyres).23 Even Ford Motor, which had announced a 17%cut in its production in Mexico in 2002,24 is planninginvestments of US$ 1.8 billion to expand operations atits pressing and assembly plant located in the State ofSonora (El Universal, 2002d).
The automotive industry in Mexico staged a recoveryin 2002, as growing domestic demand took up the slackfrom weaker exports. Between January and October, theproduction of automobiles for the domestic market grewby a cumulative 11% compared to the same period of2001, while production for export fell by 5.3%. Thisresulted in a 0.4% variation in output overall (AMIA,2002).
If this trend is confirmed, it will represent a changein the structure of Mexican exports, with labour-intensiveproduct lines declining and those that make moreintensive use of technology and human capital increasing.
The Central American countries likewiseexperienced a downturn in flows to the exportmanufacturing sector, but there were also greenfieldinvestments in some sectors, including the opening of asubsidiary of the United States-based MerrimacIndustries in Costa Rica. This firm designs andmanufactures components and assemblies for third-generation wireless telecommunications, which are usedin the aerospace and defence industries and forcommercial applications. In El Salvador, a newtransnational clothing manufacturer, Trims International,is about to set up operations in the Santa Tecla Free Zone,
with the aim of making clothing under the full-packagemodality.25
(b) Raw materials-seeking TNCs
As mentioned earlier, in contrast to the downwardtrend in investment flows globally, FDI aimed specificallyat raw materials extraction in the region stayed at aboutthe same level recorded the preceding year. This primarilyreflected investments in the hydrocarbon sector (oil andnatural gas), especially in the Andean Communitycountries. There were no major investments in the miningsector, in contrast to what had happened in 2001, whendevelopment of the Antamina mega-project had beencompleted. This copper and zinc mine in Peru involveda total disbursement of US$ 2.25 billion, making it thebiggest mining investment worldwide between 1998 and2001.
FDI in extractive activities is usually aimed atextraregional exports. Natural gas is an exception,however, since its particular transport conditions allowfor investments aimed at a local market (see ECLAC,2002). Investments in extractive activities are capital-intensive and, except in the natural gas segment, havefew linkages with local economies. Accordingly,domestic conditions in the host country tend to have littleeffect on investment decisions.
Moreover, given the strategic nature ofhydrocarbons, TNCs tend to invest even incircumstances that would normally be consideredhostile to FDI. In Latin America and the Caribbean,such factors include the dominant position held by theincumbent State firm, the requirement to act inpartnership with the public sector, the fact that FDI canonly enter marginal fields or exploration zones and theexistence of political instability or armed conflict.Lastly, the current geopolitical situation in the PersianGulf, which is heightening the uncertainty of supplyand pushing up the price of oil, has strengthened TNCs’interest in investing in other parts of the world with oilpotential.
23 In early 2002 DaimlerChrysler decided to shift production of its PT Cruiser model from Austria to Mexico and to invest some US$ 300million in the course of the year to expand its plant in Toluca in central Mexico (Gestión, 2002a). Toyota, meanwhile, announced inSeptember 2002 that it would invest US$ 140 million to install a new assembly line in its Tijuana plant, which would turn out 20,000Tacoma pick-up trucks a year starting in 2005 (El Universal, 2002c). In April 2002 Michelin announced that it would open a tyre productionplant in central Mexico, which would manufacture some 6,000 tyres a day for the domestic and external markets, with an investment ofUS$ 50 million (Gestión, 2002b). Firestone planned to invest US$ 10 million in new technologies and the expansion of its two Mexicanplants in 2002 (América Economía, 2002a).
24 This is equivalent to about 40,000 cars a year.25 This means that the manufacturer provides the full range of services, from the purchase of inputs to the manufacturing process to the timely
delivery of the finished merchandise.
38 ECLAC
FDI in the natural gas sector has remained buoyant,even though the sector’s closer linkages with localeconomies could have represented a liability in thisregard, given the economic difficulties being experiencedby several countries in the region. This is because firmsare eager to cash in on the large reserves discovered inrecent years, mainly in Bolivia, in which they havealready invested considerable sums. Two other favourableinfluences should also be noted: firstly, the potential fordeveloping new markets for natural gas, given that thishydrocarbon still represents only a small fraction of theenergy mix in the region’s countries, except in Argentina;and secondly, the equally interesting potential of projectsaimed at exporting liquefied natural gas (LNG) to marketsoutside the region.
In 2002 several major investments were undertakenin the hydrocarbon sector in Andean Communitycountries,26 including: (i) projects linked to the exportof Bolivian natural gas to Brazil; Bolivia is also about toreceive a major capital injection for a project to exportLNG to the United States and Mexico (see ECLAC,2002); (ii) development of the Camisea natural gasproject in Peru;27 (iii) investments in oilfield exploration,development and exploitation in Ecuador, and inconstruction of the heavy crude oil pipeline; (iv)investments in oilfield exploitation in Colombia, whereproduction from the Guando field (which was discoveredin 2000 by a consortium led by Petrobras, and isconsidered the largest find in Colombia since the Cusianaand Cupiagua fields)28 came on stream in July 2002; and(v) investments in oil and gas in Venezuela, where anagreement to develop the Mariscal Sucre project,29
requiring an outlay of US$ 2.7 billion, was signed inNovember 2002. The agreement involves Petróleos deVenezuela S.A. (PDVSA), which is expected to put up60% of the capital, together with Shell Venezuela S.A.(10%), Mitsubishi Venezolana C.A. (8%) and severallocally-owned firms (2%).
In addition to projects in the hydrocarbon sector thatare currently under study or being developed in AndeanCommunity countries, in Mexico transnational oilcompanies are jockeying for position in the only segmentthat is open to private capital, namely downstreamactivities in natural gas. One of the leading investors is
Gas Natural México, a subsidiary of Gas Natural S.D.G.Other firms have also shown interest in investing in LNGregasification projects, under which they plan to transportliquefied gas to terminals along the coast of BajaCalifornia, south of the border with the United States.Interested firms include Shell Gas & Power, whichintends to build a US$ 500-million regasification plantin Baja California, and Phillips Petroleum Company,which is planning a joint venture with El PasoCorporation of the United States to transport LNG to thecity of Rosarito from gas deposits located under the TimorSea. In addition, Marathon Oil Company, in partnershipwith the Indonesian State oil company Pertamina, hasannounced a plan to build an LNG complex close toTijuana. Lastly, CMS Energy Inc. and Sempra EnergyInternational have plans to transport LNG from LatinAmerica to a terminal to be located on the outskirts ofEnsenada. In August 2002 Sempra announced itsintention to invest a total of US$ 10 billion in Mexicoover the next five years. In addition to the regasificationterminal, its projects include the construction of gaspipelines and electric power plants (El Economista,2002c).
Mexico’s Energy Regulatory Commission iscurrently reviewing 18 different LNG proposals. Projectsin this field generally require large-scale investments,since they entail building port facilities, gas pipelinesand regasification plants to deliver the product in gasform to consumers (The Wall Street Journal Americas,2002a).
In Argentina, the crisis has caused major problemsfor oil companies that have a large proportion of theirassets in that country and that also have to service thelarge foreign-currency debts they used to fund their rapidexpansion in the region in the 1990s. This is true ofSpain’s Repsol-YPF and a number of Argentineenterprises, including Pérez Companc (PeCom Energía).Given the serious financial difficulties PeCom Energíawas facing in 2001, an imminent change of ownershipwas forecast in last year’s report (ECLAC, 2002). In 2002the firm was duly taken over by Brazil’s State-ownedPetrobras, making the latter the second-largest oilcompany in Argentina. Petrobras is apparently alsointerested in acquiring Argentine assets owned by Repsol-
26 See chapter II of this report.27 The total cost of this project, up until it comes on stream commercially in mid-2004, is estimated at US$ 1.6 billion; subsequent costs are
expected to add another US$ 1 billion to this amount.28 The Cusiana and Cupiagua fields, which contain large reserves of high-quality crude, were discovered in the early 1990s by a consortium
led by British Petroleum.29 This is a natural gas production project that includes: (i) development of offshore gas fields located north of the Paria Peninsula; (ii)
processing of the gas in a liquefaction plant to be built onshore; and (iii) export of liquefied gas to Brazil, the eastern seaboard of theUnited States and Mexico.
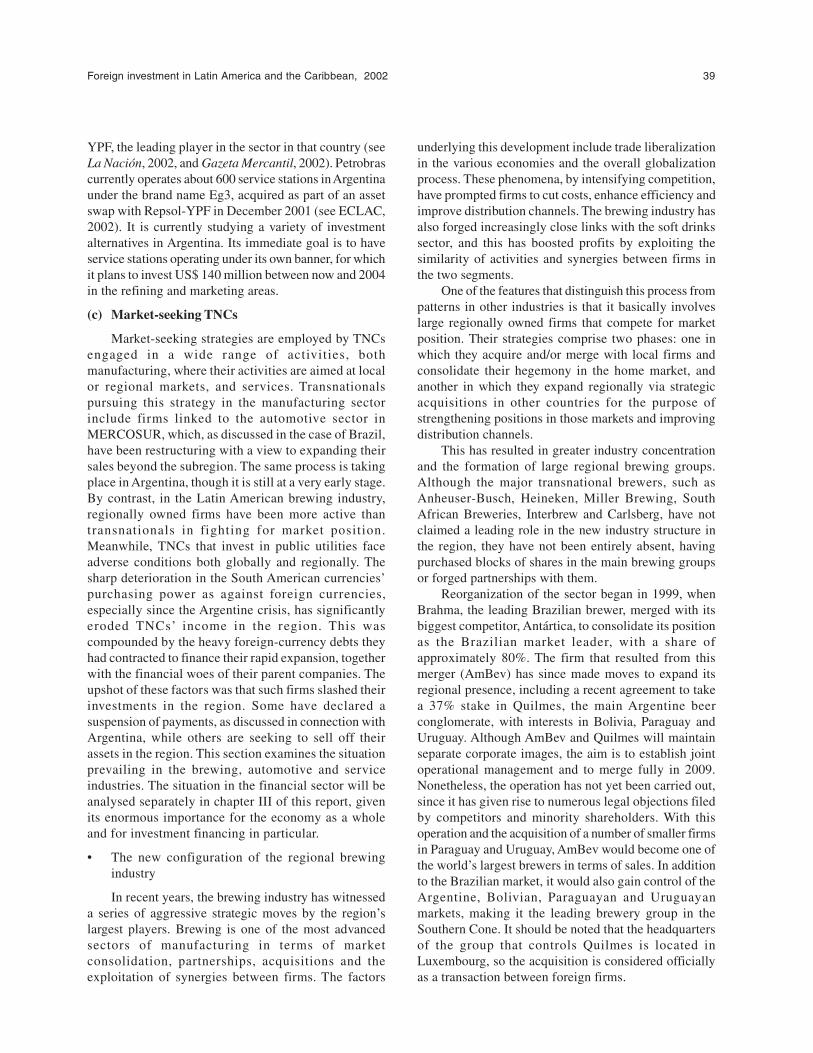
Foreign investment in Latin America and the Caribbean, 2002 39
YPF, the leading player in the sector in that country (seeLa Nación, 2002, and Gazeta Mercantil, 2002). Petrobrascurrently operates about 600 service stations in Argentinaunder the brand name Eg3, acquired as part of an assetswap with Repsol-YPF in December 2001 (see ECLAC,2002). It is currently studying a variety of investmentalternatives in Argentina. Its immediate goal is to haveservice stations operating under its own banner, for whichit plans to invest US$ 140 million between now and 2004in the refining and marketing areas.
(c) Market-seeking TNCs
Market-seeking strategies are employed by TNCsengaged in a wide range of activities, bothmanufacturing, where their activities are aimed at localor regional markets, and services. Transnationalspursuing this strategy in the manufacturing sectorinclude firms linked to the automotive sector inMERCOSUR, which, as discussed in the case of Brazil,have been restructuring with a view to expanding theirsales beyond the subregion. The same process is takingplace in Argentina, though it is still at a very early stage.By contrast, in the Latin American brewing industry,regionally owned firms have been more active thantransnationals in fighting for market position.Meanwhile, TNCs that invest in public utilities faceadverse conditions both globally and regionally. Thesharp deterioration in the South American currencies’purchasing power as against foreign currencies,especially since the Argentine crisis, has significantlyeroded TNCs’ income in the region. This wascompounded by the heavy foreign-currency debts theyhad contracted to finance their rapid expansion, togetherwith the financial woes of their parent companies. Theupshot of these factors was that such firms slashed theirinvestments in the region. Some have declared asuspension of payments, as discussed in connection withArgentina, while others are seeking to sell off theirassets in the region. This section examines the situationprevailing in the brewing, automotive and serviceindustries. The situation in the financial sector will beanalysed separately in chapter III of this report, givenits enormous importance for the economy as a wholeand for investment financing in particular.
• The new configuration of the regional brewingindustry
In recent years, the brewing industry has witnesseda series of aggressive strategic moves by the region’slargest players. Brewing is one of the most advancedsectors of manufacturing in terms of marketconsolidation, partnerships, acquisitions and theexploitation of synergies between firms. The factors
underlying this development include trade liberalizationin the various economies and the overall globalizationprocess. These phenomena, by intensifying competition,have prompted firms to cut costs, enhance efficiency andimprove distribution channels. The brewing industry hasalso forged increasingly close links with the soft drinkssector, and this has boosted profits by exploiting thesimilarity of activities and synergies between firms inthe two segments.
One of the features that distinguish this process frompatterns in other industries is that it basically involveslarge regionally owned firms that compete for marketposition. Their strategies comprise two phases: one inwhich they acquire and/or merge with local firms andconsolidate their hegemony in the home market, andanother in which they expand regionally via strategicacquisitions in other countries for the purpose ofstrengthening positions in those markets and improvingdistribution channels.
This has resulted in greater industry concentrationand the formation of large regional brewing groups.Although the major transnational brewers, such asAnheuser-Busch, Heineken, Miller Brewing, SouthAfrican Breweries, Interbrew and Carlsberg, have notclaimed a leading role in the new industry structure inthe region, they have not been entirely absent, havingpurchased blocks of shares in the main brewing groupsor forged partnerships with them.
Reorganization of the sector began in 1999, whenBrahma, the leading Brazilian brewer, merged with itsbiggest competitor, Antártica, to consolidate its positionas the Brazilian market leader, with a share ofapproximately 80%. The firm that resulted from thismerger (AmBev) has since made moves to expand itsregional presence, including a recent agreement to takea 37% stake in Quilmes, the main Argentine beerconglomerate, with interests in Bolivia, Paraguay andUruguay. Although AmBev and Quilmes will maintainseparate corporate images, the aim is to establish jointoperational management and to merge fully in 2009.Nonetheless, the operation has not yet been carried out,since it has given rise to numerous legal objections filedby competitors and minority shareholders. With thisoperation and the acquisition of a number of smaller firmsin Paraguay and Uruguay, AmBev would become one ofthe world’s largest brewers in terms of sales. In additionto the Brazilian market, it would also gain control of theArgentine, Bolivian, Paraguayan and Uruguayanmarkets, making it the leading brewery group in theSouthern Cone. It should be noted that the headquartersof the group that controls Quilmes is located inLuxembourg, so the acquisition is considered officiallyas a transaction between foreign firms.
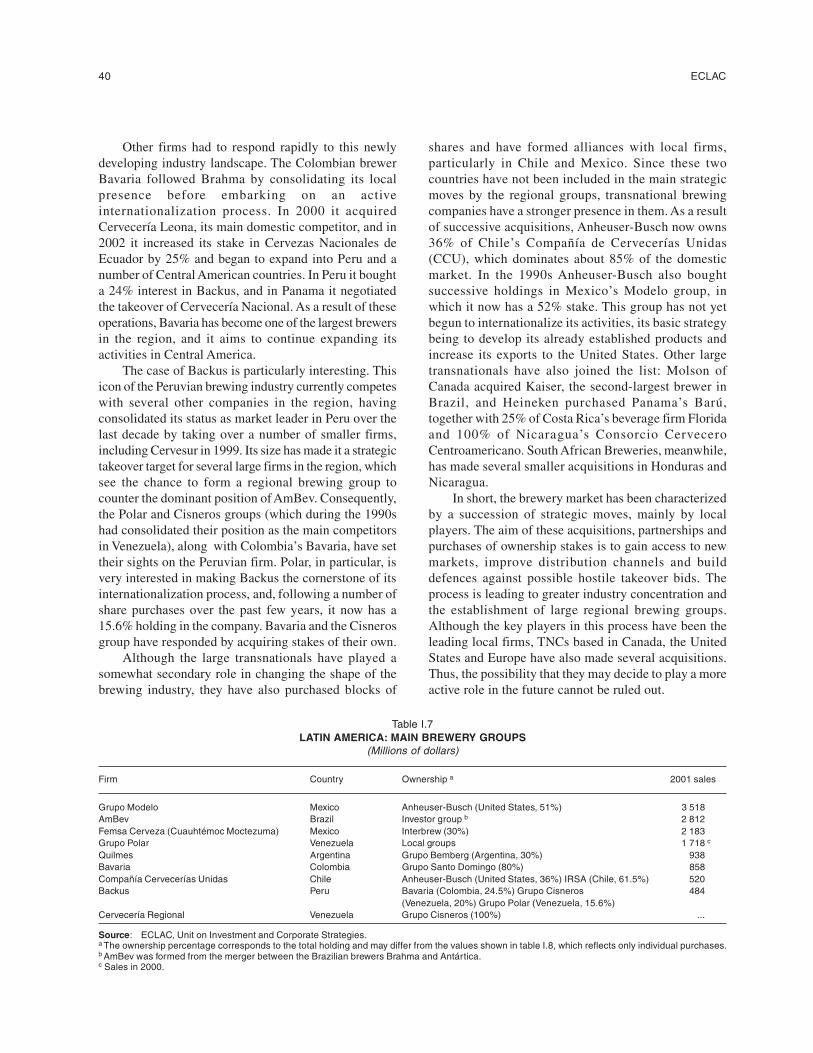
40 ECLAC
Other firms had to respond rapidly to this newlydeveloping industry landscape. The Colombian brewerBavaria followed Brahma by consolidating its localpresence before embarking on an activeinternationalization process. In 2000 it acquiredCervecería Leona, its main domestic competitor, and in2002 it increased its stake in Cervezas Nacionales deEcuador by 25% and began to expand into Peru and anumber of Central American countries. In Peru it boughta 24% interest in Backus, and in Panama it negotiatedthe takeover of Cervecería Nacional. As a result of theseoperations, Bavaria has become one of the largest brewersin the region, and it aims to continue expanding itsactivities in Central America.
The case of Backus is particularly interesting. Thisicon of the Peruvian brewing industry currently competeswith several other companies in the region, havingconsolidated its status as market leader in Peru over thelast decade by taking over a number of smaller firms,including Cervesur in 1999. Its size has made it a strategictakeover target for several large firms in the region, whichsee the chance to form a regional brewing group tocounter the dominant position of AmBev. Consequently,the Polar and Cisneros groups (which during the 1990shad consolidated their position as the main competitorsin Venezuela), along with Colombia’s Bavaria, have settheir sights on the Peruvian firm. Polar, in particular, isvery interested in making Backus the cornerstone of itsinternationalization process, and, following a number ofshare purchases over the past few years, it now has a15.6% holding in the company. Bavaria and the Cisnerosgroup have responded by acquiring stakes of their own.
Although the large transnationals have played asomewhat secondary role in changing the shape of thebrewing industry, they have also purchased blocks of
shares and have formed alliances with local firms,particularly in Chile and Mexico. Since these twocountries have not been included in the main strategicmoves by the regional groups, transnational brewingcompanies have a stronger presence in them. As a resultof successive acquisitions, Anheuser-Busch now owns36% of Chile’s Compañía de Cervecerías Unidas(CCU), which dominates about 85% of the domesticmarket. In the 1990s Anheuser-Busch also boughtsuccessive holdings in Mexico’s Modelo group, inwhich it now has a 52% stake. This group has not yetbegun to internationalize its activities, its basic strategybeing to develop its already established products andincrease its exports to the United States. Other largetransnationals have also joined the list: Molson ofCanada acquired Kaiser, the second-largest brewer inBrazil, and Heineken purchased Panama’s Barú,together with 25% of Costa Rica’s beverage firm Floridaand 100% of Nicaragua’s Consorcio CerveceroCentroamericano. South African Breweries, meanwhile,has made several smaller acquisitions in Honduras andNicaragua.
In short, the brewery market has been characterizedby a succession of strategic moves, mainly by localplayers. The aim of these acquisitions, partnerships andpurchases of ownership stakes is to gain access to newmarkets, improve distribution channels and builddefences against possible hostile takeover bids. Theprocess is leading to greater industry concentration andthe establishment of large regional brewing groups.Although the key players in this process have been theleading local firms, TNCs based in Canada, the UnitedStates and Europe have also made several acquisitions.Thus, the possibility that they may decide to play a moreactive role in the future cannot be ruled out.
Table I.7LATIN AMERICA: MAIN BREWERY GROUPS
(Millions of dollars)
Firm Country Ownership a 2001 sales
Grupo Modelo Mexico Anheuser-Busch (United States, 51%) 3 518AmBev Brazil Investor group b 2 812Femsa Cerveza (Cuauhtémoc Moctezuma) Mexico Interbrew (30%) 2 183Grupo Polar Venezuela Local groups 1 718 c
Quilmes Argentina Grupo Bemberg (Argentina, 30%) 938Bavaria Colombia Grupo Santo Domingo (80%) 858Compañía Cervecerías Unidas Chile Anheuser-Busch (United States, 36%) IRSA (Chile, 61.5%) 520Backus Peru Bavaria (Colombia, 24.5%) Grupo Cisneros 484
(Venezuela, 20%) Grupo Polar (Venezuela, 15.6%)Cervecería Regional Venezuela Grupo Cisneros (100%) ...
Source: ECLAC, Unit on Investment and Corporate Strategies.a The ownership percentage corresponds to the total holding and may differ from the values shown in table I.8, which reflects only individual purchases.b AmBev was formed from the merger between the Brazilian brewers Brahma and Antártica.c Sales in 2000.
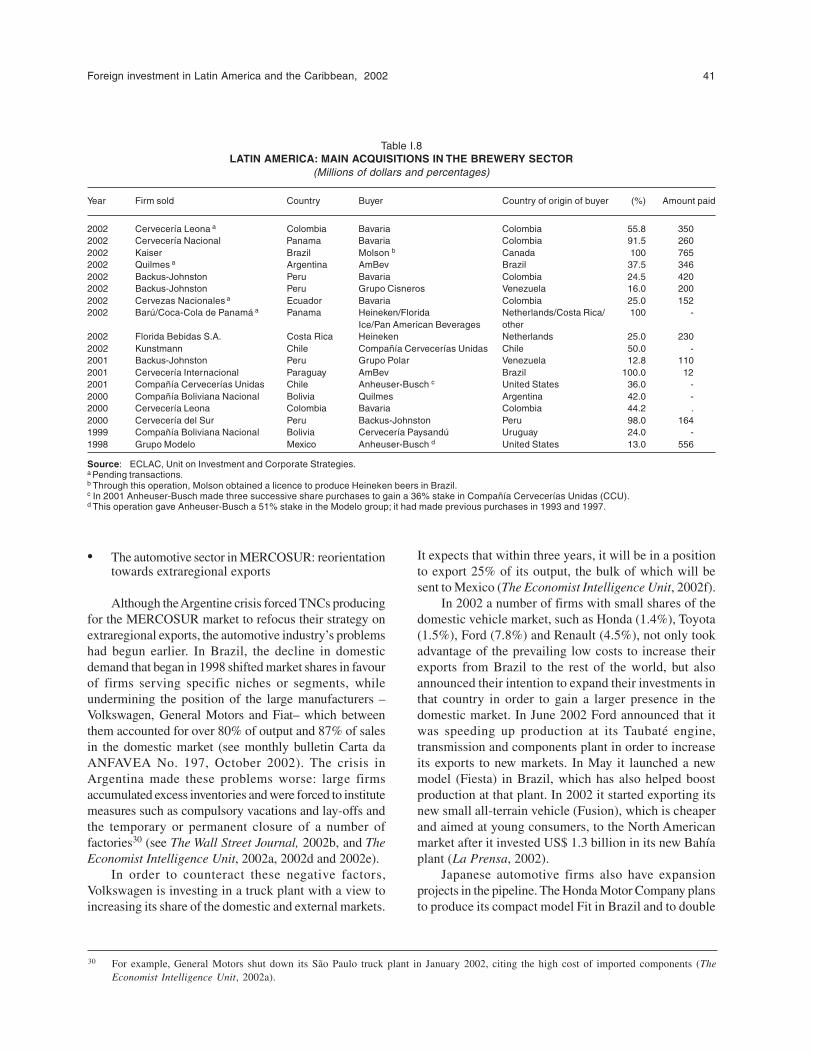
Foreign investment in Latin America and the Caribbean, 2002 41
Table I.8LATIN AMERICA: MAIN ACQUISITIONS IN THE BREWERY SECTOR
(Millions of dollars and percentages)
Year Firm sold Country Buyer Country of origin of buyer (%) Amount paid
2002 Cervecería Leona a Colombia Bavaria Colombia 55.8 3502002 Cervecería Nacional Panama Bavaria Colombia 91.5 2602002 Kaiser Brazil Molson b Canada 100 7652002 Quilmes a Argentina AmBev Brazil 37.5 3462002 Backus-Johnston Peru Bavaria Colombia 24.5 4202002 Backus-Johnston Peru Grupo Cisneros Venezuela 16.0 2002002 Cervezas Nacionales a Ecuador Bavaria Colombia 25.0 1522002 Barú/Coca-Cola de Panamá a Panama Heineken/Florida Netherlands/Costa Rica/ 100 -
Ice/Pan American Beverages other2002 Florida Bebidas S.A. Costa Rica Heineken Netherlands 25.0 2302002 Kunstmann Chile Compañía Cervecerías Unidas Chile 50.0 -2001 Backus-Johnston Peru Grupo Polar Venezuela 12.8 1102001 Cervecería Internacional Paraguay AmBev Brazil 100.0 122001 Compañía Cervecerías Unidas Chile Anheuser-Busch c United States 36.0 -2000 Compañía Boliviana Nacional Bolivia Quilmes Argentina 42.0 -2000 Cervecería Leona Colombia Bavaria Colombia 44.2 .2000 Cervecería del Sur Peru Backus-Johnston Peru 98.0 1641999 Compañía Boliviana Nacional Bolivia Cervecería Paysandú Uruguay 24.0 -1998 Grupo Modelo Mexico Anheuser-Busch d United States 13.0 556
Source: ECLAC, Unit on Investment and Corporate Strategies.a Pending transactions.b Through this operation, Molson obtained a licence to produce Heineken beers in Brazil.c In 2001 Anheuser-Busch made three successive share purchases to gain a 36% stake in Compañía Cervecerías Unidas (CCU).d This operation gave Anheuser-Busch a 51% stake in the Modelo group; it had made previous purchases in 1993 and 1997.
• The automotive sector in MERCOSUR: reorientationtowards extraregional exports
Although the Argentine crisis forced TNCs producingfor the MERCOSUR market to refocus their strategy onextraregional exports, the automotive industry’s problemshad begun earlier. In Brazil, the decline in domesticdemand that began in 1998 shifted market shares in favourof firms serving specific niches or segments, whileundermining the position of the large manufacturers –Volkswagen, General Motors and Fiat– which betweenthem accounted for over 80% of output and 87% of salesin the domestic market (see monthly bulletin Carta daANFAVEA No. 197, October 2002). The crisis inArgentina made these problems worse: large firmsaccumulated excess inventories and were forced to institutemeasures such as compulsory vacations and lay-offs andthe temporary or permanent closure of a number offactories30 (see The Wall Street Journal, 2002b, and TheEconomist Intelligence Unit, 2002a, 2002d and 2002e).
In order to counteract these negative factors,Volkswagen is investing in a truck plant with a view toincreasing its share of the domestic and external markets.
It expects that within three years, it will be in a positionto export 25% of its output, the bulk of which will besent to Mexico (The Economist Intelligence Unit, 2002f).
In 2002 a number of firms with small shares of thedomestic vehicle market, such as Honda (1.4%), Toyota(1.5%), Ford (7.8%) and Renault (4.5%), not only tookadvantage of the prevailing low costs to increase theirexports from Brazil to the rest of the world, but alsoannounced their intention to expand their investments inthat country in order to gain a larger presence in thedomestic market. In June 2002 Ford announced that itwas speeding up production at its Taubaté engine,transmission and components plant in order to increaseits exports to new markets. In May it launched a newmodel (Fiesta) in Brazil, which has also helped boostproduction at that plant. In 2002 it started exporting itsnew small all-terrain vehicle (Fusion), which is cheaperand aimed at young consumers, to the North Americanmarket after it invested US$ 1.3 billion in its new Bahíaplant (La Prensa, 2002).
Japanese automotive firms also have expansionprojects in the pipeline. The Honda Motor Company plansto produce its compact model Fit in Brazil and to double
30 For example, General Motors shut down its São Paulo truck plant in January 2002, citing the high cost of imported components (TheEconomist Intelligence Unit, 2002a).
42 ECLAC
its vehicle sales in that country in 2003. Meanwhile,Toyota, following a US$ 300-million expansion of itsfactory in the State of São Paulo, announced a policy tostop the import of its Corolla model from Japan and turnBrazil into an export base for selling the model in otherLatin American and Caribbean countries (El Economista,2002b).
Lastly, Renault has set up three plants in Brazil overthe past five years (one making automobiles, anotherengines and another pick-up trucks and vans). Havingseen its local market share grow from 2.9% in 1999 to4.5% in 2001, it then suffered a slump in profits as aresult of the steep devaluation of the real, which pushedup costs, given the high proportion of importedcomponents in its production. The firm’s executivesdecided that the only way to make the business viable inthis situation was to gradually increase production fromtoday’s 70,000 units per year to 200,000 by 2005, ofwhich 40% would have to be exported. This strategyrequires the local subsidiary to draw up a new scheduleof investments in Brazil and to design a new model ofcar to be built on a large scale for sale in the externalmarket.
In Argentina –Brazil’s main trading partner inMERCOSUR– signs of price and exchange-ratestabilization began to emerge in 2002, along with anupturn in the level of activity and spending. This ledseveral automotive firms to reconsider earlier decisionsto close down some of their plants. An example is FiatIveco, which was planning to transfer its truck plant inCórdoba to Brazil. In April, however, it put those planson hold and decided to resume its activities, takingadvantage of the new cost structure resulting fromdevaluation. Volkswagen Argentina, which had aireddoubts about the future of its Pacheco plant in BuenosAires, now views this factory as viable, although it is notyet planning any new investments.
Nonetheless, perhaps the most importantdevelopment in the Argentine automotive sector concernsToyota. In October 2002 the Japanese firm unveiled plansto invest US$ 200 million over the next two years toexpand its facilities in the country –the largest amountof FDI for greenfield investment announced since theJanuary 2002 devaluation. Toyota plans to triple itsproduction of light utility vehicles in Argentina, to attainan output level of 60,000 units, of which 75% will beexported to other Latin American countries. These newinvestments in Argentina are part of a global plan beingput in place by Toyota to concentrate its production in
South Africa and in certain Asian and Latin Americancountries. As mentioned above, it is also expanding itsactivities in Brazil and Mexico.
• TNCs seeking access to services
The last few years have witnessed large inflows ofexternal capital into sectors such as finance,telecommunications, electric power, computer servicesand retail trade. FDI in the electric power andtelecommunications sectors has recently been much lessactive than in the 1990s. This is largely explained by thedifficulties being experienced by the relevant operatorsin the international arena, compounded by the problemsfacing them at the regional level. Here again, there aredifferences between Mexico and the South Americancountries.
Whereas in Mexico many public utility assets arestill in State hands or under national ownership, and arecoveted by a number of TNCs, in South America theprivatization process has virtually run its course.Moreover, in view of the worsening economic situation,some TNCs are curtailing their expansion plans, freezingtheir investments or attempting to leave the subregion–even declaring a suspension of payments in certaincases. As seen in Argentina, parent companies havestopped propping up their subsidiaries, and several firmshave suspended payments. This also happened inColombia in the case of the local subsidiary of the UnitedStates electric power utility AES Gener.31
In Brazil several foreign-owned electric power utilitiesare apparently attempting to divest their local assetsbecause of the drop in profits resulting from the steepdepreciation of the real, in some cases compounded byfinancial problems in the respective parent company. Suchfirms include Enron, AES Corporation, Électricité deFrance (EDF) and Pennsylvania Power and Light (PP&L).It is interesting to note that the potential buyers that haveemerged are not TNCs, but locally owned financial groups,along with the State-owned Petrobras, which is specificallyinterested in acquiring Enron’s gas assets.
Nonetheless, FDI in the Brazilian electric power-generating segment has shown some buoyancy inresponse to the incentives mentioned earlier. The UnitedStates firm El Paso Energy opened two thermoelectricpower plants this year and is scheduled to open a third inmid-2003. It also has a project in the pipeline for a newplant in Rio de Janeiro, which is currently on holdpending better market conditions. In January 2002 theelectric power group Enersis, controlled by Endesa
31 Also in Colombia, six transnational telecommunications firms are demanding a total of US$ 1.5 billion in compensation from the State-owned Telecom Colombia because their income fell short of the levels projected in joint operation contracts signed in 1993.
Foreign investment in Latin America and the Caribbean, 2002 43
España and its subsidiary Endesa Internacional,announced a US$ 207-million investment to build athermoelectric power plant in the State of Ceará.Meanwhile, Eletricidade de Portugal (EDP) is planningan investment of US$ 450 million to construct athermoelectric power plant in Araraquara (São Paulo).
In the Brazilian telecommunications sector, severalsubsidiaries of foreign firms that had borrowed heavily indollar terms in the 1990s have encountered major financialdifficulties because of the crisis in the sector worldwide,compounded by the steep devaluation of the real and localfinancial instability. As a consequence, several operatorshave tried to divest assets or find new strategic partners.Not all of them have been successful, however, becauseof the sudden slowdown in the expansion plans of firmsin the sector, not only in Brazil but also internationally.
Firms interested in purchasing telecommunicationsassets in Brazil and expanding their activities include thelocally owned Brasil Telecom (BrT)32 and the Mexicanfirm América Móvil. The former is negotiating to purchasethree firms currently under foreign control: MetroRed, anInternet service provider controlled by FidelityInvestments; Globenet, a fibre-optic cable operator; andIntelig, a long-distance telephone service operatorcontrolled by Sprint, France Telecom and National Grid.If these negotiations are successful, BrT will grow from asecond-tier firm in the Brazilian market into one of thecountry’s leading long-distance operators and one of thebiggest providers of Internet services to large firms.
For its part, América Móvil gained four mobiletelephone businesses in Brazil by purchasing shares inTelecom Américas from its partner Bell CanadáInternacional. Once this acquisition is complete, AméricaMóvil is expected to exercise an option to acquire the11.1% still held by its other partner, Southwestern BellCommunications (SBC) of the United States. In addition,in November 2002 it announced it was studying thepossibility of purchasing shares held by BellSouth in twomobile telephone firms:33 BCP Telecomunicações andBSE S.A. BellSouth was very keen to sell its holdingsin these two firms, following the non-payment of aUS$ 375-million debt by BCP.
Among the foreign firms operating in the Braziliantelecommunications sector, Portugal Telecom andTelefónica de España have both made a number ofinvestments in the country. The former decided to reducethe debt of its Telesp Celular Participações (TCP)
subsidiary, Brazil’s largest cellular telephone firm, byissuing new shares. It purchased 80.5% of these itself,thereby increasing its stake in TCP from 45.2% to 83.9%.The operation enabled TCP to raise just over US$ 750million. Then, in October 2002, Portugal Telecom sold14.7% of TCP to Telefónica Móviles España, a subsidiaryof Telefónica de España, as part of an agreement betweenthe two firms to merge all their mobile telephonebusinesses in Brazil. For this purpose, a holding companywill be set up, with each party having a 50% stake. Theresulting corporation will be the largest in the sector inBrazil, with a client base of 13 million.
Spain’s Telefónica is also strengthening its position inthe mobile telephone segment in Mexico. According tostatements made in May 2002 by company president CésarAlierta, the company plans to invest US$ 500 million in2002 and a further US$ 2.5 billion over the next three years.Telefónica paid US$ 87 million for the mobile telephoneoperator Pegaso PCS in 2002, taking on a US$ 1.23-billiondebt in the process. This will make it the second-largestmobile telephone operator in Mexico, with about 2 millioncustomers and a target level of 6 to 7 million subscribers bythe end of 2005 (El Economista, 2002a).
In the Mexican electricity sector, private generatingplants today account for about 10% of electricity outputnationwide. The National Congress is currently studyinga reform of the sector to enable private generators to selldirectly to large consumers without having to go throughthe Federal Electricity Commission (CFE).34 The reformwill divide the electricity market into two segments: oneconsisting of households and small businesses thatconsume less than 2,500 MW per year, which will becustomers of CFE, and the other comprising large private-sector firms, which will be supplied directly from privategenerating plants (The Economist Intelligence Unit,2002h). Nonetheless, foreign firms do not seem to bewaiting for the reform to be implemented beforeexpanding their investments in the sector. Spain’sIberdrola, for example, is already undertaking majorinvestments and has several projects in the pipeline.
In 2002 Iberdrola acquired 13% of Gas NaturalMéxico (GNM), the country’s leading natural gasdistributor. Through this operation, Iberdrola aims toguarantee natural gas supplies to all its electric powergenerators –not only the existing ones, but also the onesit is building or planning to build. According to its 2002-2006 strategic plan, the firm intends to invest a total of
32 Brasil Telecom (BrT) is owned in part (65.5%) by Grupo Brasil Telecom Participações. Since August 2002 the latter has been controlled byOpportunity, a local financial group, which increased its share in the firm by acquiring the stake held by Telecom Italia.
33 BellSouth holds a 45% stake in each of these firms.34 The sector was partially opened up in 1992 to allow private investment in the generating segment, but only for purposes of self-supply or
under 25-year contracts to sell exclusively to CFE.
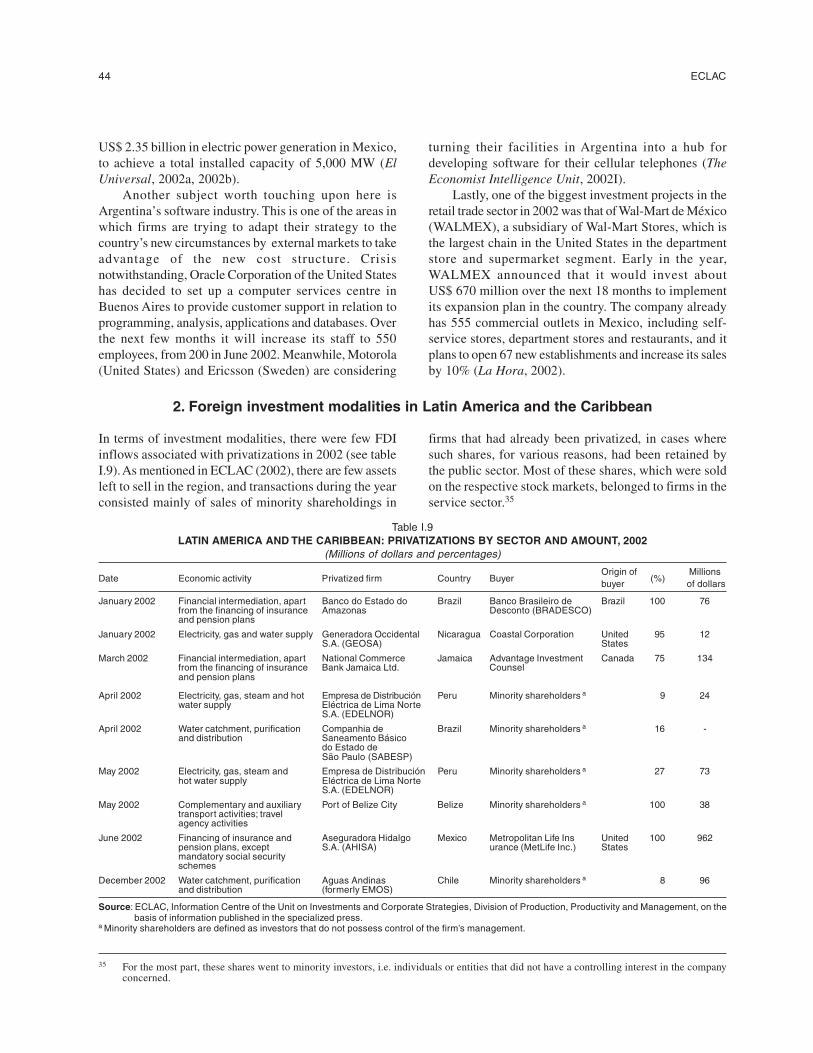
44 ECLAC
US$ 2.35 billion in electric power generation in Mexico,to achieve a total installed capacity of 5,000 MW (ElUniversal, 2002a, 2002b).
Another subject worth touching upon here isArgentina’s software industry. This is one of the areas inwhich firms are trying to adapt their strategy to thecountry’s new circumstances by external markets to takeadvantage of the new cost structure. Crisisnotwithstanding, Oracle Corporation of the United Stateshas decided to set up a computer services centre inBuenos Aires to provide customer support in relation toprogramming, analysis, applications and databases. Overthe next few months it will increase its staff to 550employees, from 200 in June 2002. Meanwhile, Motorola(United States) and Ericsson (Sweden) are considering
35 For the most part, these shares went to minority investors, i.e. individuals or entities that did not have a controlling interest in the companyconcerned.
turning their facilities in Argentina into a hub fordeveloping software for their cellular telephones (TheEconomist Intelligence Unit, 2002I).
Lastly, one of the biggest investment projects in theretail trade sector in 2002 was that of Wal-Mart de México(WALMEX), a subsidiary of Wal-Mart Stores, which isthe largest chain in the United States in the departmentstore and supermarket segment. Early in the year,WALMEX announced that it would invest aboutUS$ 670 million over the next 18 months to implementits expansion plan in the country. The company alreadyhas 555 commercial outlets in Mexico, including self-service stores, department stores and restaurants, and itplans to open 67 new establishments and increase its salesby 10% (La Hora, 2002).
2. Foreign investment modalities in Latin America and the Caribbean
In terms of investment modalities, there were few FDIinflows associated with privatizations in 2002 (see tableI.9). As mentioned in ECLAC (2002), there are few assetsleft to sell in the region, and transactions during the yearconsisted mainly of sales of minority shareholdings in
firms that had already been privatized, in cases wheresuch shares, for various reasons, had been retained bythe public sector. Most of these shares, which were soldon the respective stock markets, belonged to firms in theservice sector.35
Table I.9LATIN AMERICA AND THE CARIBBEAN: PRIVATIZATIONS BY SECTOR AND AMOUNT, 2002
(Millions of dollars and percentages)
Date Economic activity Privatized firm Country BuyerOrigin of
(%)Millions
buyer of dollars
January 2002 Financial intermediation, apart Banco do Estado do Brazil Banco Brasileiro de Brazil 100 76from the financing of insurance Amazonas Desconto (BRADESCO)and pension plans
January 2002 Electricity, gas and water supply Generadora Occidental Nicaragua Coastal Corporation United 95 12S.A. (GEOSA) States
March 2002 Financial intermediation, apart National Commerce Jamaica Advantage Investment Canada 75 134from the financing of insurance Bank Jamaica Ltd. Counseland pension plans
April 2002 Electricity, gas, steam and hot Empresa de Distribución Peru Minority shareholders a 9 24water supply Eléctrica de Lima Norte
S.A. (EDELNOR)
April 2002 Water catchment, purification Companhia de Brazil Minority shareholders a 16 -and distribution Saneamento Básico
do Estado deSão Paulo (SABESP)
May 2002 Electricity, gas, steam and Empresa de Distribución Peru Minority shareholders a 27 73hot water supply Eléctrica de Lima Norte
S.A. (EDELNOR)
May 2002 Complementary and auxiliary Port of Belize City Belize Minority shareholders a 100 38transport activities; travelagency activities
June 2002 Financing of insurance and Aseguradora Hidalgo Mexico Metropolitan Life Ins United 100 962pension plans, except S.A. (AHISA) urance (MetLife Inc.) Statesmandatory social securityschemes
December 2002 Water catchment, purification Aguas Andinas Chile Minority shareholders a 8 96and distribution (formerly EMOS)
Source: ECLAC, Information Centre of the Unit on Investments and Corporate Strategies, Division of Production, Productivity and Management, on thebasis of information published in the specialized press.
a Minority shareholders are defined as investors that do not possess control of the firm’s management.
Foreign investment in Latin America and the Caribbean, 2002 45
Among acquisitions in excess of US$ 100 million,the amounts paid were significantly lower than in 2001.The biggest purchases at this level involved businessesin the financial sector, which accounted for 42% of alloperations, thereby confirming the sector’s growingimportance as a target for FDI. The manufacturing sectortook second place in terms of the amounts paid (29%),in particular reflecting acquisitions by United StatesTNCs in Mexico, along with those made by LatinAmerican and a number of foreign firms in the brewerysector (see table I.A-1).
The largest acquisition in Mexico was the takeoverof Grupo Financiero Bital by the United Kingdom-basedholding company HSBC for US$ 1.74 billion.36 Bital isthe country’s fifth-largest financial institution, with 1,400branches, 6 million customers and 15,400 employees.This operation dashed the hopes of Spain’s BancoSantander Central Hispano (SCH), which had also beeninterested in gaining control of the Bital group, asrevealed a few months earlier when it had accumulated a26.6% stake through a succession of purchases –the mostrecent being a 13.3% holding bought in April. Thetakeover, which has yet to be approved by the Mexicanfinancial authorities, means that foreign bank penetrationin Mexico, which began in the mid-1990s, is nowpractically complete. As much as 92% of the assets ofthe country’s financial institutions will now be in foreignhands, and there will be only one bank left in the countrythat is still 100% Mexican-owned –Banorte, based in thenorthern city of Monterrey.
36 See Expansión Directo (www.expansiondirecto.com), 22 August 2002.37 Petrobras also took on the external debt of PeCom, estimated at US$ 2 billion.38 Both Santa Fe and Quilmes are foreign-owned: Santa Fe Energy belongs to Devon Energy (United States), while Quilmes, owned by the
Bemberg family, has its headquarters in Luxembourg.
Another major operation in the Mexican financialsector was the US$ 962-million purchase of AseguradoraHidalgo S.A. (AHISA) by Metropolitan Life Insurance(MetLife Inc.) of the United States. In addition, theMexican State sold a 3% interest in Grupo FinancieroBanco Bilbao Vizcaya Argentaria Bancomer (BBVABancomer) to Banco Bilbao Vizcaya Argentaria (BBVA)of Spain for US$ 216 million. Another large transactionin this area (which, however, took place between twoforeign parties) was Citigroup’s US$ 1.24-billionpurchase of the 48% stake held by Aegon N.V. of theNetherlands in the pension fund manager AforeBanamex.
In Argentina, although the opportunities opened upby lower asset values have thus far failed to attract largeinvestment flows, a number of substantial acquisitions havenonetheless taken place. The largest ones have been carriedout by two Brazilian firms. Firstly, the State oil companyPetrobras paid US$ 1.124 billion for a 58.6% holding inArgentina’s Pérez Companc (PeCom Energía)37 andUS$ 89.5 million for outright ownership of Santa Fe, aUnited States oil firm. Secondly, Companhia de Bebidasdas Américas (AmBev) agreed to pay US$ 346 millionfor a 37.5% stake in the brewer Cervecería y MalteríaQuilmes (Quinsa).38 This operation has not yet taken placebecause competitors of Quilmes have filed legal objectionswhich are delaying approval of the deal by the antitrustauthorities. Domestic investors have also taken theopportunity to acquire firms which had been divested byforeign owners, mainly in the financial sector.
3. Conclusion
The analysis in this section shows that TNCs havegenerally reacted in two different ways to the changesthat have occurred in the regional context. The firstreaction, of a short-term nature, has been displayedparticularly by corporations that were seeking efficiencygains in the 1990s. It represents a response, first, to theslump in United States demand for products assembledin Mexico, Central America and the Caribbean; andsecond, to the decline in competitiveness caused bycurrency revaluation in Mexico. These firms’ strategyhas included reducing output, temporarily shutting downassembly plants and increasing productivity, primarilyon the basis of considerable reductions in their workforce,while awaiting a recovery in the United States economy,
which is the main market for these products. This hasoccurred mainly in production sectors that use lowtechnology (footwear, clothing, furniture, electricalappliances), but it has also been observed in a number ofmid-level- and high-technology product lines that employmore highly skilled labour (electronics).
The second reaction, of a structural nature, has anumber of different components. Some TNCs havechosen to relocate their plants within their integratedinternational production systems (see UNCTAD, 2002b).This is happening in activities that involve less complexproductive processes and employ lower-skilled labour.As a result, plants are being transferred to countries wherewages are lower, with output aimed at markets showing
46 ECLAC
the greatest growth potential. For these and other reasons,the chosen country has been China, which has alsobenefited from its admission to WTO. As a result, Mexicois losing its share of these activities, and now faces thechallenge of maintaining already established positionsor even gaining ground in activities that involve morecomplex processes and require more highly skilledlabour. In this regard, the country’s proximity to theUnited States continues to represent an advantage.
The Argentine crisis had profound repercussions forcorporations that had directed their sales towardsMERCOSUR. This subregion does not offer goodprospects for market growth at the present time,especially in comparison to the expectations thatprevailed in the 1990s. This has led firms in a number ofsectors to downsize their projects and divert their productsto countries outside the subregion. This reorientation isstructural and has given rise to a new trend in thegeographical distribution of activities and investments.This does not mean that the subregion will suffer amassive outflow of FDI, however. Brazil seems to be thecountry that foreign investors are bound to favour,because the depreciation of the real will enable them tocut costs significantly. Nonetheless, for the time beinginvestors are waiting to see what policies will be adopted
by the new government. As regards Argentina, TNCs havebeen cautious, again waiting for clear indications of thecourse the economy is likely to take. In some cases,however, there is evidence of an incipient strategy ofredirecting exports to countries outside the region.
The one strategy that has not altered is that of TNCsthat extract raw materials, especially hydrocarbons.Countries possessing such resources have benefited frommajor gas discoveries, along with new investments ingas pipelines in Bolivia, an oil pipeline in Ecuador andthe Camisea gas deposits in Peru. These investments makeintensive use of capital. Except in the case of naturalgas, they normally have few linkages with the localeconomy, so domestic conditions in the host country tendto have less influence on investment decisions (seeECLAC, 2002, chapter IV). In 2002 the relatively highprice of oil gave an additional boost to these projects,which permanently benefit from the strategic nature ofthe product. This has led TNCs in the sector to invest incircumstances that would otherwise be consideredprohibitive for FDI. The current geopolitical context,involving heightened uncertainty about oil supplies fromthe Persian Gulf countries, is encouraging transnationalsto consider investing in other parts of the world with oilpotential.

Foreign investment in Latin America and the Caribbean, 2002 47
ANNEX

48 ECLAC
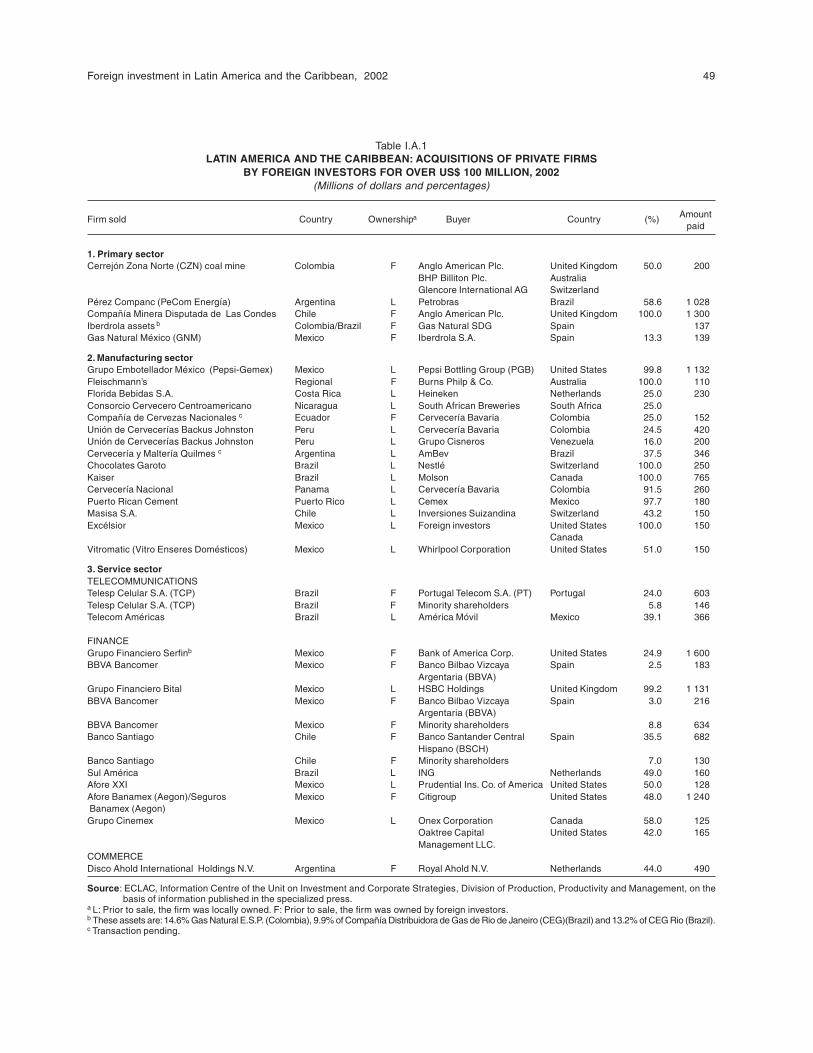
Foreign investment in Latin America and the Caribbean, 2002 49
Table I.A.1LATIN AMERICA AND THE CARIBBEAN: ACQUISITIONS OF PRIVATE FIRMS
BY FOREIGN INVESTORS FOR OVER US$ 100 MILLION, 2002(Millions of dollars and percentages)
AmountFirm sold Country Ownershipa Buyer Country (%)paid
1. Primary sectorCerrejón Zona Norte (CZN) coal mine Colombia F Anglo American Plc. United Kingdom 50.0 200
BHP Billiton Plc. AustraliaGlencore International AG Switzerland
Pérez Companc (PeCom Energía) Argentina L Petrobras Brazil 58.6 1 028Compañía Minera Disputada de Las Condes Chile F Anglo American Plc. United Kingdom 100.0 1 300Iberdrola assets b Colombia/Brazil F Gas Natural SDG Spain 137Gas Natural México (GNM) Mexico F Iberdrola S.A. Spain 13.3 139
2. Manufacturing sectorGrupo Embotellador México (Pepsi-Gemex) Mexico L Pepsi Bottling Group (PGB) United States 99.8 1 132Fleischmann’s Regional F Burns Philp & Co. Australia 100.0 110Florida Bebidas S.A. Costa Rica L Heineken Netherlands 25.0 230Consorcio Cervecero Centroamericano Nicaragua L South African Breweries South Africa 25.0Compañía de Cervezas Nacionales c Ecuador F Cervecería Bavaria Colombia 25.0 152Unión de Cervecerías Backus Johnston Peru L Cervecería Bavaria Colombia 24.5 420Unión de Cervecerías Backus Johnston Peru L Grupo Cisneros Venezuela 16.0 200Cervecería y Maltería Quilmes c Argentina L AmBev Brazil 37.5 346Chocolates Garoto Brazil L Nestlé Switzerland 100.0 250Kaiser Brazil L Molson Canada 100.0 765Cervecería Nacional Panama L Cervecería Bavaria Colombia 91.5 260Puerto Rican Cement Puerto Rico L Cemex Mexico 97.7 180Masisa S.A. Chile L Inversiones Suizandina Switzerland 43.2 150Excélsior Mexico L Foreign investors United States 100.0 150
CanadaVitromatic (Vitro Enseres Domésticos) Mexico L Whirlpool Corporation United States 51.0 150
3. Service sectorTELECOMMUNICATIONSTelesp Celular S.A. (TCP) Brazil F Portugal Telecom S.A. (PT) Portugal 24.0 603Telesp Celular S.A. (TCP) Brazil F Minority shareholders 5.8 146Telecom Américas Brazil L América Móvil Mexico 39.1 366
FINANCEGrupo Financiero Serfinb Mexico F Bank of America Corp. United States 24.9 1 600BBVA Bancomer Mexico F Banco Bilbao Vizcaya Spain 2.5 183
Argentaria (BBVA)Grupo Financiero Bital Mexico L HSBC Holdings United Kingdom 99.2 1 131BBVA Bancomer Mexico F Banco Bilbao Vizcaya Spain 3.0 216
Argentaria (BBVA)BBVA Bancomer Mexico F Minority shareholders 8.8 634Banco Santiago Chile F Banco Santander Central Spain 35.5 682
Hispano (BSCH)Banco Santiago Chile F Minority shareholders 7.0 130Sul América Brazil L ING Netherlands 49.0 160Afore XXI Mexico L Prudential Ins. Co. of America United States 50.0 128Afore Banamex (Aegon)/Seguros Mexico F Citigroup United States 48.0 1 240 Banamex (Aegon)Grupo Cinemex Mexico L Onex Corporation Canada 58.0 125
Oaktree Capital United States 42.0 165Management LLC.
COMMERCEDisco Ahold International Holdings N.V. Argentina F Royal Ahold N.V. Netherlands 44.0 490
Source: ECLAC, Information Centre of the Unit on Investment and Corporate Strategies, Division of Production, Productivity and Management, on thebasis of information published in the specialized press.
a L: Prior to sale, the firm was locally owned. F: Prior to sale, the firm was owned by foreign investors.b These assets are: 14.6% Gas Natural E.S.P. (Colombia), 9.9% of Compañía Distribuidora de Gas de Rio de Janeiro (CEG)(Brazil) and 13.2% of CEG Rio (Brazil).c Transaction pending.
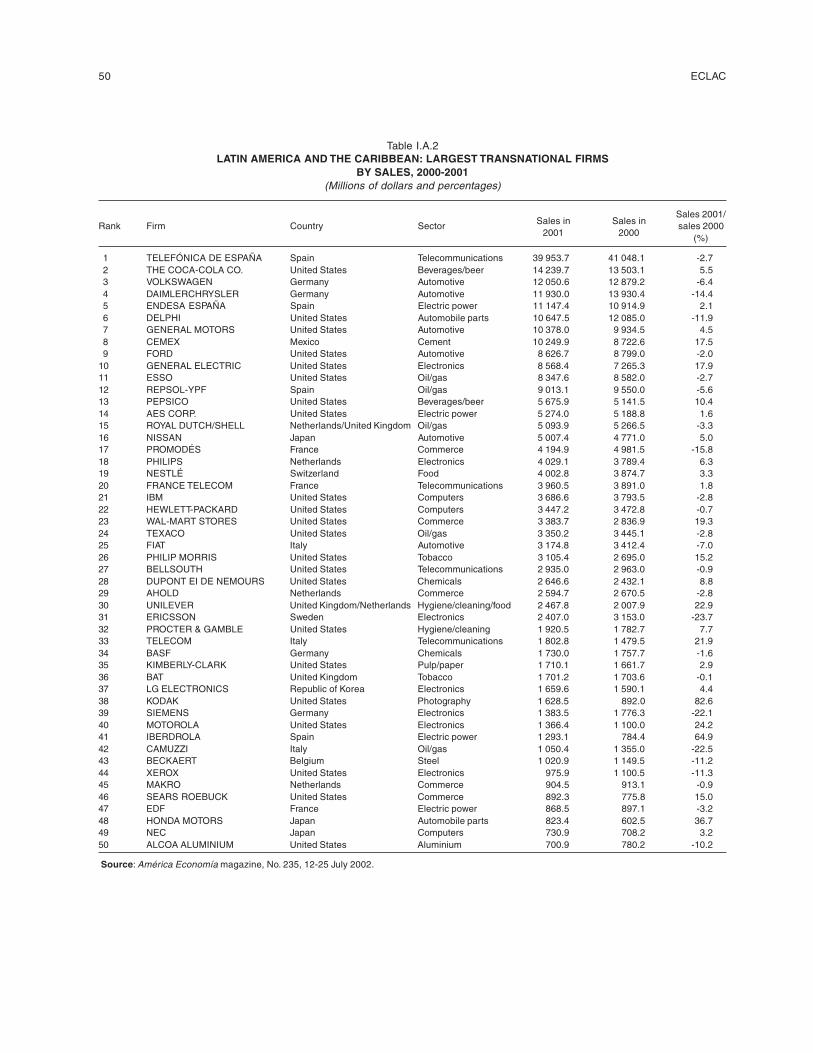
50 ECLAC
Table I.A.2LATIN AMERICA AND THE CARIBBEAN: LARGEST TRANSNATIONAL FIRMS
BY SALES, 2000-2001(Millions of dollars and percentages)
Sales in Sales inSales 2001/
Rank Firm Country Sector2001 2000
sales 2000(%)
1 TELEFÓNICA DE ESPAÑA Spain Telecommunications 39 953.7 41 048.1 -2.72 THE COCA-COLA CO. United States Beverages/beer 14 239.7 13 503.1 5.53 VOLKSWAGEN Germany Automotive 12 050.6 12 879.2 -6.44 DAIMLERCHRYSLER Germany Automotive 11 930.0 13 930.4 -14.45 ENDESA ESPAÑA Spain Electric power 11 147.4 10 914.9 2.16 DELPHI United States Automobile parts 10 647.5 12 085.0 -11.97 GENERAL MOTORS United States Automotive 10 378.0 9 934.5 4.58 CEMEX Mexico Cement 10 249.9 8 722.6 17.59 FORD United States Automotive 8 626.7 8 799.0 -2.0
10 GENERAL ELECTRIC United States Electronics 8 568.4 7 265.3 17.911 ESSO United States Oil/gas 8 347.6 8 582.0 -2.712 REPSOL-YPF Spain Oil/gas 9 013.1 9 550.0 -5.613 PEPSICO United States Beverages/beer 5 675.9 5 141.5 10.414 AES CORP. United States Electric power 5 274.0 5 188.8 1.615 ROYAL DUTCH/SHELL Netherlands/United Kingdom Oil/gas 5 093.9 5 266.5 -3.316 NISSAN Japan Automotive 5 007.4 4 771.0 5.017 PROMODÉS France Commerce 4 194.9 4 981.5 -15.818 PHILIPS Netherlands Electronics 4 029.1 3 789.4 6.319 NESTLÉ Switzerland Food 4 002.8 3 874.7 3.320 FRANCE TELECOM France Telecommunications 3 960.5 3 891.0 1.821 IBM United States Computers 3 686.6 3 793.5 -2.822 HEWLETT-PACKARD United States Computers 3 447.2 3 472.8 -0.723 WAL-MART STORES United States Commerce 3 383.7 2 836.9 19.324 TEXACO United States Oil/gas 3 350.2 3 445.1 -2.825 FIAT Italy Automotive 3 174.8 3 412.4 -7.026 PHILIP MORRIS United States Tobacco 3 105.4 2 695.0 15.227 BELLSOUTH United States Telecommunications 2 935.0 2 963.0 -0.928 DUPONT EI DE NEMOURS United States Chemicals 2 646.6 2 432.1 8.829 AHOLD Netherlands Commerce 2 594.7 2 670.5 -2.830 UNILEVER United Kingdom/Netherlands Hygiene/cleaning/food 2 467.8 2 007.9 22.931 ERICSSON Sweden Electronics 2 407.0 3 153.0 -23.732 PROCTER & GAMBLE United States Hygiene/cleaning 1 920.5 1 782.7 7.733 TELECOM Italy Telecommunications 1 802.8 1 479.5 21.934 BASF Germany Chemicals 1 730.0 1 757.7 -1.635 KIMBERLY-CLARK United States Pulp/paper 1 710.1 1 661.7 2.936 BAT United Kingdom Tobacco 1 701.2 1 703.6 -0.137 LG ELECTRONICS Republic of Korea Electronics 1 659.6 1 590.1 4.438 KODAK United States Photography 1 628.5 892.0 82.639 SIEMENS Germany Electronics 1 383.5 1 776.3 -22.140 MOTOROLA United States Electronics 1 366.4 1 100.0 24.241 IBERDROLA Spain Electric power 1 293.1 784.4 64.942 CAMUZZI Italy Oil/gas 1 050.4 1 355.0 -22.543 BECKAERT Belgium Steel 1 020.9 1 149.5 -11.244 XEROX United States Electronics 975.9 1 100.5 -11.345 MAKRO Netherlands Commerce 904.5 913.1 -0.946 SEARS ROEBUCK United States Commerce 892.3 775.8 15.047 EDF France Electric power 868.5 897.1 -3.248 HONDA MOTORS Japan Automobile parts 823.4 602.5 36.749 NEC Japan Computers 730.9 708.2 3.250 ALCOA ALUMINIUM United States Aluminium 700.9 780.2 -10.2
Source: América Economía magazine, No. 235, 12-25 July 2002.
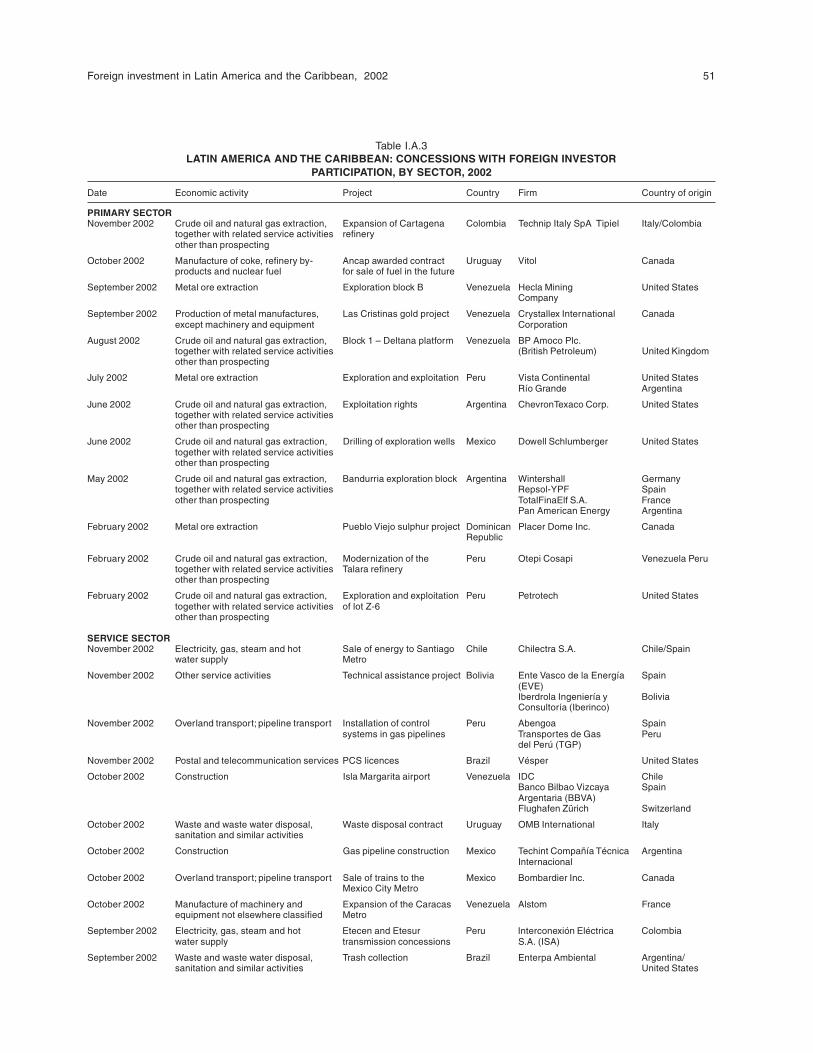
Foreign investment in Latin America and the Caribbean, 2002 51
Table I.A.3LATIN AMERICA AND THE CARIBBEAN: CONCESSIONS WITH FOREIGN INVESTOR
PARTICIPATION, BY SECTOR, 2002
Date Economic activity Project Country Firm Country of origin
PRIMARY SECTORNovember 2002 Crude oil and natural gas extraction, Expansion of Cartagena Colombia Technip Italy SpA Tipiel Italy/Colombia
together with related service activities refineryother than prospecting
October 2002 Manufacture of coke, refinery by- Ancap awarded contract Uruguay Vitol Canadaproducts and nuclear fuel for sale of fuel in the future
September 2002 Metal ore extraction Exploration block B Venezuela Hecla Mining United StatesCompany
September 2002 Production of metal manufactures, Las Cristinas gold project Venezuela Crystallex International Canadaexcept machinery and equipment Corporation
August 2002 Crude oil and natural gas extraction, Block 1 – Deltana platform Venezuela BP Amoco Plc.together with related service activities (British Petroleum) United Kingdomother than prospecting
July 2002 Metal ore extraction Exploration and exploitation Peru Vista Continental United States Río Grande Argentina
June 2002 Crude oil and natural gas extraction, Exploitation rights Argentina ChevronTexaco Corp. United Statestogether with related service activitiesother than prospecting
June 2002 Crude oil and natural gas extraction, Drilling of exploration wells Mexico Dowell Schlumberger United Statestogether with related service activitiesother than prospecting
May 2002 Crude oil and natural gas extraction, Bandurria exploration block Argentina Wintershall Germanytogether with related service activities Repsol-YPF Spainother than prospecting TotalFinaElf S.A. France
Pan American Energy Argentina
February 2002 Metal ore extraction Pueblo Viejo sulphur project Dominican Placer Dome Inc. CanadaRepublic
February 2002 Crude oil and natural gas extraction, Modernization of the Peru Otepi Cosapi Venezuela Perutogether with related service activities Talara refineryother than prospecting
February 2002 Crude oil and natural gas extraction, Exploration and exploitation Peru Petrotech United Statestogether with related service activities of lot Z-6other than prospecting
SERVICE SECTORNovember 2002 Electricity, gas, steam and hot Sale of energy to Santiago Chile Chilectra S.A. Chile/Spain
water supply Metro
November 2002 Other service activities Technical assistance project Bolivia Ente Vasco de la Energía Spain(EVE)Iberdrola Ingeniería y BoliviaConsultoría (Iberinco)
November 2002 Overland transport; pipeline transport Installation of control Peru Abengoa Spainsystems in gas pipelines Transportes de Gas Peru
del Perú (TGP)
November 2002 Postal and telecommunication services PCS licences Brazil Vésper United States
October 2002 Construction Isla Margarita airport Venezuela IDC ChileBanco Bilbao Vizcaya SpainArgentaria (BBVA)Flughafen Zürich Switzerland
October 2002 Waste and waste water disposal, Waste disposal contract Uruguay OMB International Italysanitation and similar activities
October 2002 Construction Gas pipeline construction Mexico Techint Compañía Técnica ArgentinaInternacional
October 2002 Overland transport; pipeline transport Sale of trains to the Mexico Bombardier Inc. CanadaMexico City Metro
October 2002 Manufacture of machinery and Expansion of the Caracas Venezuela Alstom Franceequipment not elsewhere classified Metro
September 2002 Electricity, gas, steam and hot Etecen and Etesur Peru Interconexión Eléctrica Colombiawater supply transmission concessions S.A. (ISA)
September 2002 Waste and waste water disposal, Trash collection Brazil Enterpa Ambiental Argentina/sanitation and similar activities United States
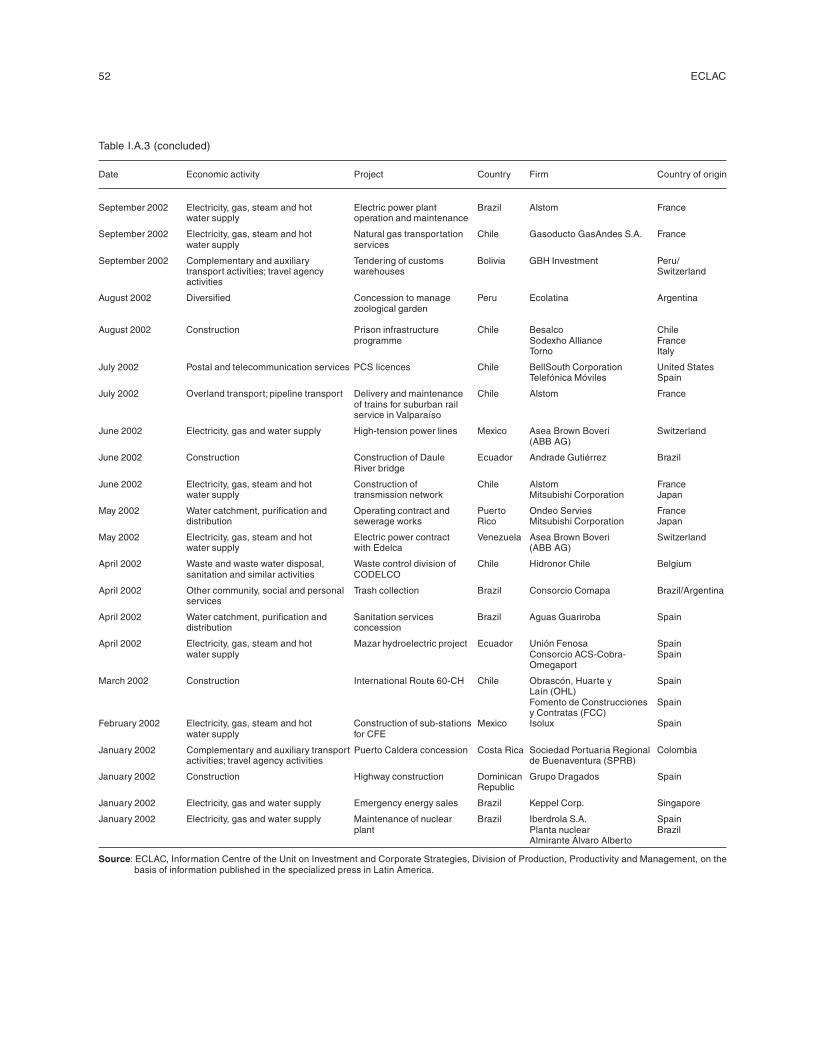
52 ECLAC
Table I.A.3 (concluded)
Date Economic activity Project Country Firm Country of origin
September 2002 Electricity, gas, steam and hot Electric power plant Brazil Alstom Francewater supply operation and maintenance
September 2002 Electricity, gas, steam and hot Natural gas transportation Chile Gasoducto GasAndes S.A. Francewater supply services
September 2002 Complementary and auxiliary Tendering of customs Bolivia GBH Investment Peru/transport activities; travel agency warehouses Switzerlandactivities
August 2002 Diversified Concession to manage Peru Ecolatina Argentinazoological garden
August 2002 Construction Prison infrastructure Chile Besalco Chileprogramme Sodexho Alliance France
Torno Italy
July 2002 Postal and telecommunication services PCS licences Chile BellSouth Corporation United States Telefónica Móviles Spain
July 2002 Overland transport; pipeline transport Delivery and maintenance Chile Alstom Franceof trains for suburban railservice in Valparaíso
June 2002 Electricity, gas and water supply High-tension power lines Mexico Asea Brown Boveri Switzerland(ABB AG)
June 2002 Construction Construction of Daule Ecuador Andrade Gutiérrez BrazilRiver bridge
June 2002 Electricity, gas, steam and hot Construction of Chile Alstom Francewater supply transmission network Mitsubishi Corporation Japan
May 2002 Water catchment, purification and Operating contract and Puerto Ondeo Servies Francedistribution sewerage works Rico Mitsubishi Corporation Japan
May 2002 Electricity, gas, steam and hot Electric power contract Venezuela Asea Brown Boveri Switzerlandwater supply with Edelca (ABB AG)
April 2002 Waste and waste water disposal, Waste control division of Chile Hidronor Chile Belgiumsanitation and similar activities CODELCO
April 2002 Other community, social and personal Trash collection Brazil Consorcio Comapa Brazil/Argentinaservices
April 2002 Water catchment, purification and Sanitation services Brazil Aguas Guariroba Spaindistribution concession
April 2002 Electricity, gas, steam and hot Mazar hydroelectric project Ecuador Unión Fenosa Spainwater supply Consorcio ACS-Cobra- Spain
Omegaport
March 2002 Construction International Route 60-CH Chile Obrascón, Huarte y SpainLaín (OHL)Fomento de Construcciones Spainy Contratas (FCC)
February 2002 Electricity, gas, steam and hot Construction of sub-stations Mexico Isolux Spainwater supply for CFE
January 2002 Complementary and auxiliary transport Puerto Caldera concession Costa Rica Sociedad Portuaria Regional Colombiaactivities; travel agency activities de Buenaventura (SPRB)
January 2002 Construction Highway construction Dominican Grupo Dragados SpainRepublic
January 2002 Electricity, gas and water supply Emergency energy sales Brazil Keppel Corp. Singapore
January 2002 Electricity, gas and water supply Maintenance of nuclear Brazil Iberdrola S.A. Spainplant Planta nuclear Brazil
Almirante Álvaro Alberto
Source: ECLAC, Information Centre of the Unit on Investment and Corporate Strategies, Division of Production, Productivity and Management, on thebasis of information published in the specialized press in Latin America.
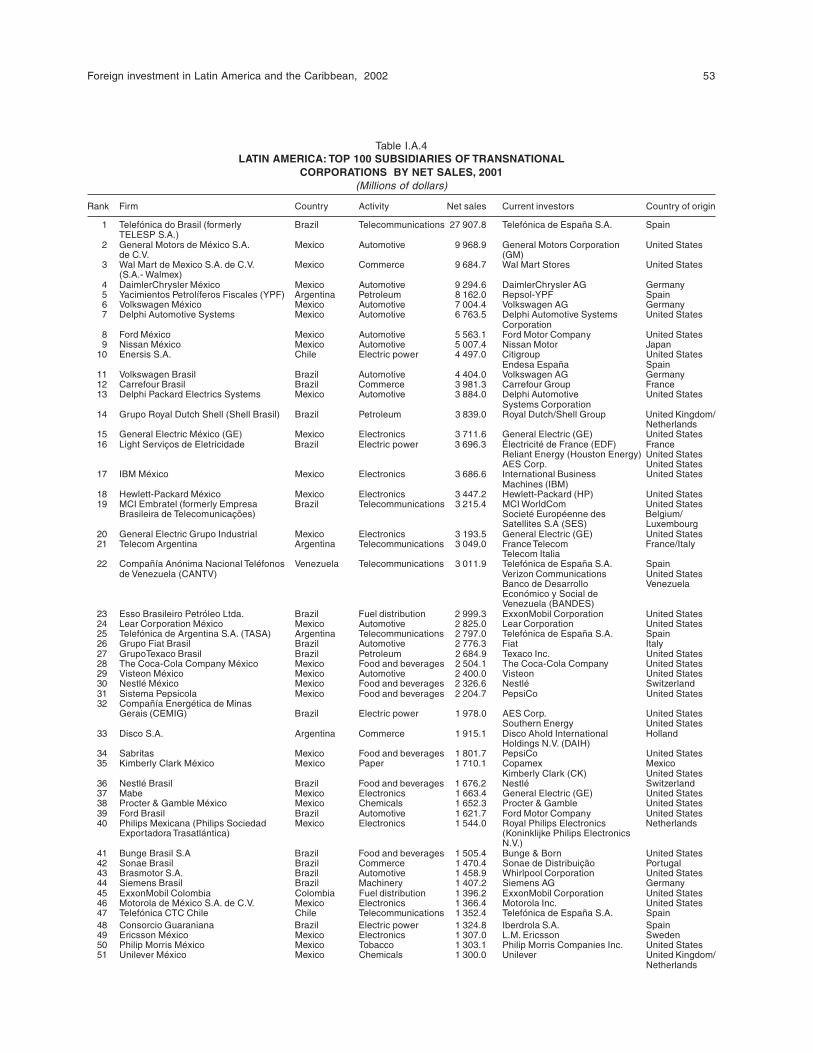
Foreign investment in Latin America and the Caribbean, 2002 53
Table I.A.4LATIN AMERICA: TOP 100 SUBSIDIARIES OF TRANSNATIONAL
CORPORATIONS BY NET SALES, 2001(Millions of dollars)
Rank Firm Country Activity Net sales Current investors Country of origin
1 Telefónica do Brasil (formerly Brazil Telecommunications 27 907.8 Telefónica de España S.A. SpainTELESP S.A.)
2 General Motors de México S.A. Mexico Automotive 9 968.9 General Motors Corporation United Statesde C.V. (GM)
3 Wal Mart de Mexico S.A. de C.V. Mexico Commerce 9 684.7 Wal Mart Stores United States(S.A.- Walmex)
4 DaimlerChrysler México Mexico Automotive 9 294.6 DaimlerChrysler AG Germany5 Yacimientos Petrolíferos Fiscales (YPF) Argentina Petroleum 8 162.0 Repsol-YPF Spain6 Volkswagen México Mexico Automotive 7 004.4 Volkswagen AG Germany7 Delphi Automotive Systems Mexico Automotive 6 763.5 Delphi Automotive Systems United States
Corporation8 Ford México Mexico Automotive 5 563.1 Ford Motor Company United States9 Nissan México Mexico Automotive 5 007.4 Nissan Motor Japan
10 Enersis S.A. Chile Electric power 4 497.0 Citigroup United StatesEndesa España Spain
11 Volkswagen Brasil Brazil Automotive 4 404.0 Volkswagen AG Germany12 Carrefour Brasil Brazil Commerce 3 981.3 Carrefour Group France13 Delphi Packard Electrics Systems Mexico Automotive 3 884.0 Delphi Automotive United States
Systems Corporation14 Grupo Royal Dutch Shell (Shell Brasil) Brazil Petroleum 3 839.0 Royal Dutch/Shell Group United Kingdom/
Netherlands15 General Electric México (GE) Mexico Electronics 3 711.6 General Electric (GE) United States16 Light Serviços de Eletricidade Brazil Electric power 3 696.3 Électricité de France (EDF) France
Reliant Energy (Houston Energy) United StatesAES Corp. United States
17 IBM México Mexico Electronics 3 686.6 International Business United StatesMachines (IBM)
18 Hewlett-Packard México Mexico Electronics 3 447.2 Hewlett-Packard (HP) United States19 MCI Embratel (formerly Empresa Brazil Telecommunications 3 215.4 MCI WorldCom United States
Brasileira de Telecomunicações) Societé Européenne des Belgium/Satellites S.A (SES) Luxembourg
20 General Electric Grupo Industrial Mexico Electronics 3 193.5 General Electric (GE) United States21 Telecom Argentina Argentina Telecommunications 3 049.0 France Telecom France/Italy
Telecom Italia22 Compañía Anónima Nacional Teléfonos Venezuela Telecommunications 3 011.9 Telefónica de España S.A. Spain
de Venezuela (CANTV) Verizon Communications United StatesBanco de Desarrollo VenezuelaEconómico y Social deVenezuela (BANDES)
23 Esso Brasileiro Petróleo Ltda. Brazil Fuel distribution 2 999.3 ExxonMobil Corporation United States24 Lear Corporation México Mexico Automotive 2 825.0 Lear Corporation United States25 Telefónica de Argentina S.A. (TASA) Argentina Telecommunications 2 797.0 Telefónica de España S.A. Spain26 Grupo Fiat Brasil Brazil Automotive 2 776.3 Fiat Italy27 GrupoTexaco Brasil Brazil Petroleum 2 684.9 Texaco Inc. United States28 The Coca-Cola Company México Mexico Food and beverages 2 504.1 The Coca-Cola Company United States29 Visteon México Mexico Automotive 2 400.0 Visteon United States30 Nestlé México Mexico Food and beverages 2 326.6 Nestlé Switzerland31 Sistema Pepsicola Mexico Food and beverages 2 204.7 PepsiCo United States32 Compañía Energética de Minas
Gerais (CEMIG) Brazil Electric power 1 978.0 AES Corp. United StatesSouthern Energy United States
33 Disco S.A. Argentina Commerce 1 915.1 Disco Ahold International HollandHoldings N.V. (DAIH)
34 Sabritas Mexico Food and beverages 1 801.7 PepsiCo United States35 Kimberly Clark México Mexico Paper 1 710.1 Copamex Mexico
Kimberly Clark (CK) United States36 Nestlé Brasil Brazil Food and beverages 1 676.2 Nestlé Switzerland37 Mabe Mexico Electronics 1 663.4 General Electric (GE) United States38 Procter & Gamble México Mexico Chemicals 1 652.3 Procter & Gamble United States39 Ford Brasil Brazil Automotive 1 621.7 Ford Motor Company United States40 Philips Mexicana (Philips Sociedad Mexico Electronics 1 544.0 Royal Philips Electronics Netherlands
Exportadora Trasatlántica) (Koninklijke Philips ElectronicsN.V.)
41 Bunge Brasil S.A Brazil Food and beverages 1 505.4 Bunge & Born United States42 Sonae Brasil Brazil Commerce 1 470.4 Sonae de Distribuição Portugal43 Brasmotor S.A. Brazil Automotive 1 458.9 Whirlpool Corporation United States44 Siemens Brasil Brazil Machinery 1 407.2 Siemens AG Germany45 ExxonMobil Colombia Colombia Fuel distribution 1 396.2 ExxonMobil Corporation United States46 Motorola de México S.A. de C.V. Mexico Electronics 1 366.4 Motorola Inc. United States47 Telefónica CTC Chile Chile Telecommunications 1 352.4 Telefónica de España S.A. Spain48 Consorcio Guaraniana Brazil Electric power 1 324.8 Iberdrola S.A. Spain49 Ericsson México Mexico Electronics 1 307.0 L.M. Ericsson Sweden50 Philip Morris México Mexico Tobacco 1 303.1 Philip Morris Companies Inc. United States51 Unilever México Mexico Chemicals 1 300.0 Unilever United Kingdom/
Netherlands
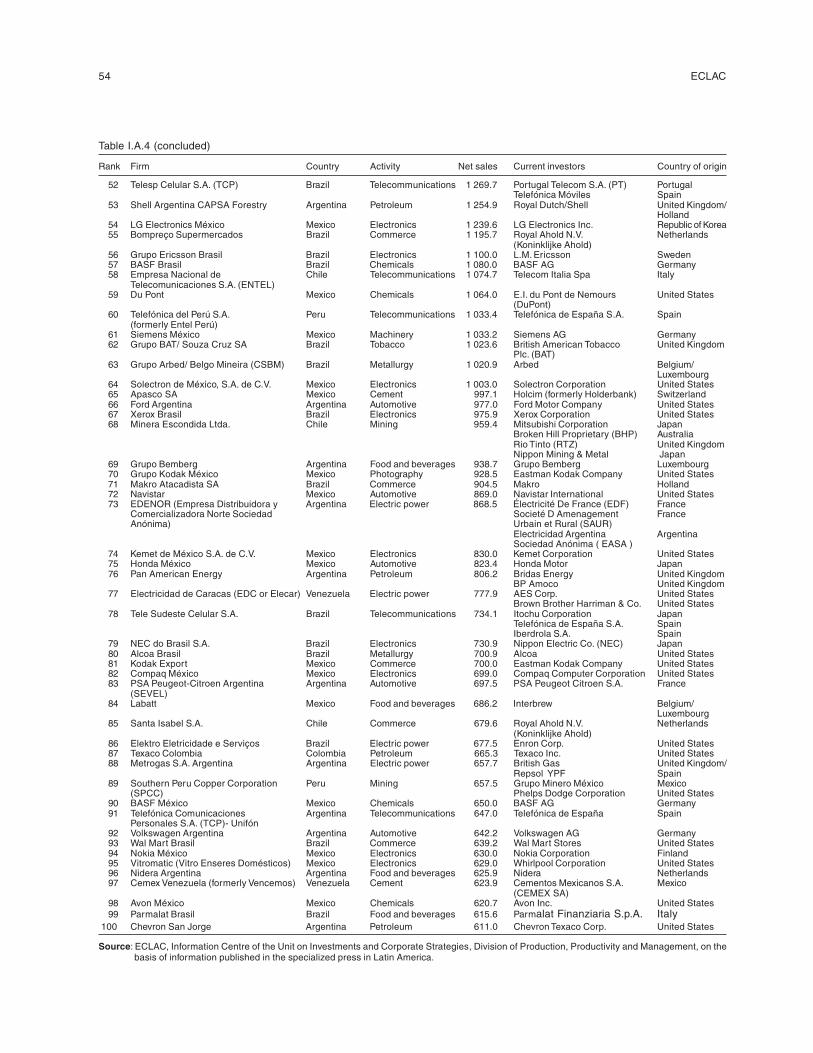
54 ECLAC
Table I.A.4 (concluded)
Rank Firm Country Activity Net sales Current investors Country of origin
52 Telesp Celular S.A. (TCP) Brazil Telecommunications 1 269.7 Portugal Telecom S.A. (PT) PortugalTelefónica Móviles Spain
53 Shell Argentina CAPSA Forestry Argentina Petroleum 1 254.9 Royal Dutch/Shell United Kingdom/Holland
54 LG Electronics México Mexico Electronics 1 239.6 LG Electronics Inc. Republic of Korea55 Bompreço Supermercados Brazil Commerce 1 195.7 Royal Ahold N.V. Netherlands
(Koninklijke Ahold)56 Grupo Ericsson Brasil Brazil Electronics 1 100.0 L.M. Ericsson Sweden57 BASF Brasil Brazil Chemicals 1 080.0 BASF AG Germany58 Empresa Nacional de Chile Telecommunications 1 074.7 Telecom Italia Spa Italy
Telecomunicaciones S.A. (ENTEL)59 Du Pont Mexico Chemicals 1 064.0 E.I. du Pont de Nemours United States
(DuPont)60 Telefónica del Perú S.A. Peru Telecommunications 1 033.4 Telefónica de España S.A. Spain
(formerly Entel Perú)61 Siemens México Mexico Machinery 1 033.2 Siemens AG Germany62 Grupo BAT/ Souza Cruz SA Brazil Tobacco 1 023.6 British American Tobacco United Kingdom
Plc. (BAT)63 Grupo Arbed/ Belgo Mineira (CSBM) Brazil Metallurgy 1 020.9 Arbed Belgium/
Luxembourg64 Solectron de México, S.A. de C.V. Mexico Electronics 1 003.0 Solectron Corporation United States65 Apasco SA Mexico Cement 997.1 Holcim (formerly Holderbank) Switzerland66 Ford Argentina Argentina Automotive 977.0 Ford Motor Company United States67 Xerox Brasil Brazil Electronics 975.9 Xerox Corporation United States68 Minera Escondida Ltda. Chile Mining 959.4 Mitsubishi Corporation Japan
Broken Hill Proprietary (BHP) AustraliaRio Tinto (RTZ) United KingdomNippon Mining & Metal Japan
69 Grupo Bemberg Argentina Food and beverages 938.7 Grupo Bemberg Luxembourg70 Grupo Kodak México Mexico Photography 928.5 Eastman Kodak Company United States71 Makro Atacadista SA Brazil Commerce 904.5 Makro Holland72 Navistar Mexico Automotive 869.0 Navistar International United States73 EDENOR (Empresa Distribuidora y Argentina Electric power 868.5 Électricité De France (EDF) France
Comercializadora Norte Sociedad Societé D Amenagement FranceAnónima) Urbain et Rural (SAUR)
Electricidad Argentina ArgentinaSociedad Anónima ( EASA )
74 Kemet de México S.A. de C.V. Mexico Electronics 830.0 Kemet Corporation United States75 Honda México Mexico Automotive 823.4 Honda Motor Japan76 Pan American Energy Argentina Petroleum 806.2 Bridas Energy United Kingdom
BP Amoco United Kingdom77 Electricidad de Caracas (EDC or Elecar) Venezuela Electric power 777.9 AES Corp. United States
Brown Brother Harriman & Co. United States78 Tele Sudeste Celular S.A. Brazil Telecommunications 734.1 Itochu Corporation Japan
Telefónica de España S.A. SpainIberdrola S.A. Spain
79 NEC do Brasil S.A. Brazil Electronics 730.9 Nippon Electric Co. (NEC) Japan80 Alcoa Brasil Brazil Metallurgy 700.9 Alcoa United States81 Kodak Export Mexico Commerce 700.0 Eastman Kodak Company United States 82 Compaq México Mexico Electronics 699.0 Compaq Computer Corporation United States83 PSA Peugeot-Citroen Argentina Argentina Automotive 697.5 PSA Peugeot Citroen S.A. France
(SEVEL)84 Labatt Mexico Food and beverages 686.2 Interbrew Belgium/
Luxembourg 85 Santa Isabel S.A. Chile Commerce 679.6 Royal Ahold N.V. Netherlands
(Koninklijke Ahold)86 Elektro Eletricidade e Serviços Brazil Electric power 677.5 Enron Corp. United States87 Texaco Colombia Colombia Petroleum 665.3 Texaco Inc. United States88 Metrogas S.A. Argentina Argentina Electric power 657.7 British Gas United Kingdom/
Repsol YPF Spain89 Southern Peru Copper Corporation Peru Mining 657.5 Grupo Minero México Mexico
(SPCC) Phelps Dodge Corporation United States90 BASF México Mexico Chemicals 650.0 BASF AG Germany91 Telefónica Comunicaciones Argentina Telecommunications 647.0 Telefónica de España Spain
Personales S.A. (TCP)- Unifón92 Volkswagen Argentina Argentina Automotive 642.2 Volkswagen AG Germany93 Wal Mart Brasil Brazil Commerce 639.2 Wal Mart Stores United States94 Nokia México Mexico Electronics 630.0 Nokia Corporation Finland95 Vitromatic (Vitro Enseres Domésticos) Mexico Electronics 629.0 Whirlpool Corporation United States96 Nidera Argentina Argentina Food and beverages 625.9 Nidera Netherlands97 Cemex Venezuela (formerly Vencemos) Venezuela Cement 623.9 Cementos Mexicanos S.A. Mexico
(CEMEX SA)98 Avon México Mexico Chemicals 620.7 Avon Inc. United States99 Parmalat Brasil Brazil Food and beverages 615.6 Parmalat Finanziaria S.p.A. Italy
100 Chevron San Jorge Argentina Petroleum 611.0 Chevron Texaco Corp. United States
Source: ECLAC, Information Centre of the Unit on Investments and Corporate Strategies, Division of Production, Productivity and Management, on thebasis of information published in the specialized press in Latin America.
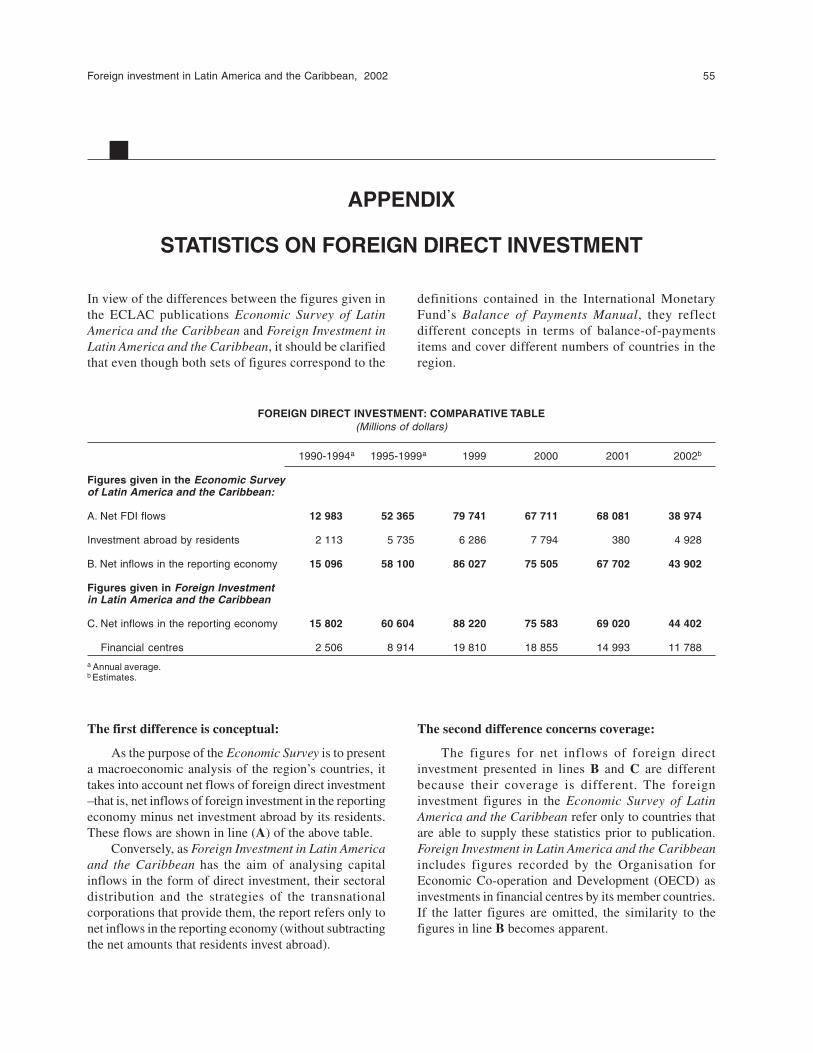
Foreign investment in Latin America and the Caribbean, 2002 55
APPENDIX
STATISTICS ON FOREIGN DIRECT INVESTMENT
In view of the differences between the figures given inthe ECLAC publications Economic Survey of LatinAmerica and the Caribbean and Foreign Investment inLatin America and the Caribbean, it should be clarifiedthat even though both sets of figures correspond to the
definitions contained in the International MonetaryFund’s Balance of Payments Manual, they reflectdifferent concepts in terms of balance-of-paymentsitems and cover different numbers of countries in theregion.
FOREIGN DIRECT INVESTMENT: COMPARATIVE TABLE(Millions of dollars)
1990-1994a 1995-1999a 1999 2000 2001 2002b
Figures given in the Economic Surveyof Latin America and the Caribbean:
A. Net FDI flows 12 983 52 365 79 741 67 711 68 081 38 974
Investment abroad by residents 2 113 5 735 6 286 7 794 380 4 928
B. Net inflows in the reporting economy 15 096 58 100 86 027 75 505 67 702 43 902
Figures given in Foreign Investmentin Latin America and the Caribbean
C. Net inflows in the reporting economy 15 802 60 604 88 220 75 583 69 020 44 402
Financial centres 2 506 8 914 19 810 18 855 14 993 11 788
a Annual average.b Estimates.
The first difference is conceptual:
As the purpose of the Economic Survey is to presenta macroeconomic analysis of the region’s countries, ittakes into account net flows of foreign direct investment–that is, net inflows of foreign investment in the reportingeconomy minus net investment abroad by its residents.These flows are shown in line (A) of the above table.
Conversely, as Foreign Investment in Latin Americaand the Caribbean has the aim of analysing capitalinflows in the form of direct investment, their sectoraldistribution and the strategies of the transnationalcorporations that provide them, the report refers only tonet inflows in the reporting economy (without subtractingthe net amounts that residents invest abroad).
The second difference concerns coverage:
The figures for net inflows of foreign directinvestment presented in lines B and C are differentbecause their coverage is different. The foreigninvestment figures in the Economic Survey of LatinAmerica and the Caribbean refer only to countries thatare able to supply these statistics prior to publication.Foreign Investment in Latin America and the Caribbeanincludes figures recorded by the Organisation forEconomic Co-operation and Development (OECD) asinvestments in financial centres by its member countries.If the latter figures are omitted, the similarity to thefigures in line B becomes apparent.

56 ECLAC
Foreign investment in Latin America and the Caribbean, 2002 57
II. THE ANDEAN COMMUNITY: FOREIGN DIRECTINVESTMENT AND CORPORATE STRATEGIES
This chapter reviews trends in foreign direct investmentin the Andean Community, which comprises Bolivia,Colombia, Ecuador, Peru and Venezuela. Ever since theCommunity was established in the early 1970s, thetreatment afforded to foreign capital has been one of themost significant –and controversial– issues to beaddressed by this subregional grouping. Initially, theCommunity’s policy decisions regarding foreigninvestment were binding in nature and took precedenceover any national rules, thereby superseding local foreigninvestment regulations. A multitude of restrictions wereplaced on foreign direct investment (FDI) and on theoperation of transnational corporations (TNCs). The aimof the restrictions was to ensure that these activities wouldplay a complementary role to local investment whichwould not constrain the industrialization of the Andeaneconomies.
In the late 1980s, the severe economic crisis thathad overtaken Latin America, together with pressuresbuilding up within the Andean Community, broughtabout a rapid shift in the thrust of economic policy andin the prevailing attitude towards foreign capital. Thesechanges in the subregional rules gave more discretion tothe individual countries. The process of phasing out therestrictions on foreign capital was also spurred by theappearance of new incentives. The main such incentiveswere associated with the privatization of State assets andwith the opening and liberalization of the great majority
of economic activities, in particular the resource-basedindustries (hydrocarbons and mining) which are theprincipal source of wealth for almost all the Andeancountries.
With the liberalization of these countries’ resource-based sectors, large volumes of foreign investment beganto flow into their economies. Most of these flows wereassociated with exploration and drilling in the petroleumand natural gas sectors. A number of utilities andinfrastructure activities also aroused some interest amongforeign investors, particularly those in the process ofbuilding up Latin American networks in such areas astelecommunications, electricity, financial services andretail commerce. This trend did not extend to other sectorsof the subregion’s economies, however. This was largelyattributable to the political and economic instabilityexhibited by the Andean countries, along with the limitedsize of their domestic markets and the impossibility ofcreating a genuine subregional market.
This chapter will look at the main features of FDIflows to the Andean Community countries, including themain factors of attraction, general and specificregulations, the sectoral pattern of allocation, the originof these capital flows and the most common corporatestrategies. Within this context, foreign investors aredivided into two clearly differentiated categories basedon whether their main strategy is to seek out raw materialsor to seek entry into national services markets.
58 ECLAC
A. FOREIGN CAPITAL IN THE ANDEAN COMMUNITY
1. The treatment of foreign capital in the member countries of the Andean Community
In the mid-twentieth century, the Andean countries werevery open to foreign capital, and most of them had nospecific legislation on the subject. In many of thesenations, the only regulations in this area were a fewexchange-rate provisions applying to activities involvingforeign capital. With the nationalization of many utilitiesand companies in the extractive industries (especially inthe hydrocarbons sector), however, the scope for foreigninvestment was sharply curtailed.
Foreign investment began to be considered as ameans of supplementing national saving, technologytransfer and industrialization in the context of adevelopment model that was based largely on domesticmarkets. Nonetheless, apprehensions about foreigninvestment’s impact on the balance of payments led thecountries to control and restrict FDI. Mechanisms forthe authorization, registration and control of FDI werecreated, and governments were empowered to channelflows according to national economic developmentpriorities. An effort was made to give preference to FDIthat would help to increase or diversify exports, priorassessments of its impact on the balance of paymentsand on employment were encouraged, and foreign capitalwas denied access to many activities, particularly thefinancial sector and public utilities. Requirements andlimitations were also established regarding therepatriation of earnings and capital.
This was the context in which the Andean integrationprocess was launched with the signing of the CartagenaAgreement in 1969. This was the agreement thatestablished the Andean Pact, which is now known as theAndean Community.1 The main purpose of this initiativewas to expand intraregional trade and stimulate economicgrowth in the member countries, first by creating a freetrade zone and later by means of a customs union (acommon external tariff). To this end, it propounded theharmonization of economic policies, particularly in theareas of foreign exchange, monetary and fiscal affairs,external trade and foreign investment. With regard toforeign investment, the integration scheme encouragedthe substitution of local and subregional investment forforeign capital, emphasizing the adverse effects of FDIon the generation of foreign exchange and balance-of-
payments equilibria. The idea was to prevent foreigncapital from monopolizing the benefits of the regionalintegration process and transferring them abroad.
June 1971 saw the introduction of a system calledthe Common Regime of Treatment of Foreign Capitaland Trademarks, Patents, Licenses and Royalties (morecommonly known as Decision 24), which later took onregulatory force in the countries of what was then theAndean Pact. The intent of this supranational rule was tolimit external financial influence and ensure that the localprivate sector would make a greater contribution tonational development. In addition, it provided for variousrestrictive practices, such as the gradual reduction offoreign stakes in local firms to a minority interest,2 theelimination of foreign capital in key sectors andlimitations on the right to remit earnings abroad. Otherdecisions relating to technology transfer, Andean firmsand sectoral industrial development programmes alsoinfluenced the treatment of foreign capital.
The severe deterioration seen in the terms of tradeduring the late 1970s and early 1980s had an adverseimpact on export earnings and the balance of payments.Economic growth slowed, and import substitution beganto show signs of having exhausted its potential. Externaldebt reached unprecedented levels, triggering a crisisthroughout Latin America and a steep downturn inexternal financing. This situation affected all the countriesof the subregion and brought the integration process to astandstill.
The crisis prompted the Andean countries toreconsider the role of FDI in development. As a result,after having been in force for 16 years and undergoing anumber of amendments, on 11 May 1987 Decision 24was superseded by Decision 220, which was publishedon 18 May of that same year. Decision 220 providedgreater flexibility in the treatment of foreign capital byeliminating some of the requirements concerning theregistration and authorization of investments and profitremittances, doing away with the classification of“reserved sectors” and allowing each member countryto formulate its own legislation on foreign investment.Under Decision 220, national regulations were changedsubstantially as the countries became increasingly more
1 The original signatories to the Cartagena Agreement were Bolivia, Chile, Colombia, Ecuador and Peru. Later, Chile withdrew and Venezuelajoined. Chile’s withdrawal from the Cartagena Agreement had a great deal to do with the restrictions that the arrangement placed on FDI,which clearly ran counter to the structural reforms that Chile began to implement in its economy in the second half of the 1970s.
2 Under the provisions of conversion contracts, new foreign firms were required to convert to mixed ownership within 15 years.
Foreign investment in Latin America and the Caribbean, 2002 59
open to foreign capital, streamlined their administrativeprocedures and introduced a more promotional regulatoryapproach. One of the strongest proponents of thesereforms was Colombia, which was planning to implementa series of projects in its mining and petroleum sectors(COINVERTIR, 1998).
On 29 March 1991, against a backdrop of sweepingeconomic reforms driven by the restructuring of nationalgovernments and by trade and financial liberalizationprogrammes, the signatories to the Cartagena Agreementonce again found it necessary to revise their commonlegislation. So it was that, in order to stimulate andpromote the flow of foreign capital and technology tothe Andean economies, the Common Regime wasmodified through the replacement of Decision 220 byDecision 291.
Decision 291 introduced a number of major changeswhich were aimed at removing obstacles to foreigninvestment and encouraging the flow of foreign capitaland technology to the Andean economies. All referencesto prior authorizations were eliminated, leaving only therequirement that investments be registered with therelevant national agency. Legislation on the subject alsoenshrined the principle of equal treatment for foreign,mixed and local firms, as well as the right to remit profitsand capital (without any upper limit being set on theamount of such remittances) and to have access to allapplicable tariff benefits within the Andean Communityframework.
In addition to increasing the flexibility of theirguidelines, the Andean Community countries made majorchanges in their economic policies. As a result, a numberof significant differences in focus of the countries’development strategies began to emerge.
• At one end of the spectrum was Peru, which hadembarked upon a far-reaching process of economicreform that included trade and financialliberalization, privatization of State assets and theimplementation of one of Latin America’s mostliberal foreign capital regimes. These changesstrained relations between the Peruvian authorities
and the institutions of the Andean integrationscheme. The dispute became so heated that threatswere made by both sides regarding Peru’s possibledeparture from the Andean Community. Both sideseventually softened their stances, however, and this,together with a gradual erosion of the power of theCommunity’s institutions, kept Peru within theintegration scheme, albeit under special rules,particularly in respect of the common external tariff.
• Bolivia, Colombia and Venezuela also launchedeconomic reform plans which, although less radicalthan the Peruvian programme, included theprivatization of some major public enterprises. TheBolivian authorities put in place an innovativeprogramme, known as the Capitalization Plan (seebox II.1), to transfer the country’s largest publicfirms to the private sector. This mechanism provideda number of Bolivia’s flagship enterprises with freshresources to finance ambitious investment andmodernization plans, while at the same time layingthe foundations for the development of a capitalmarket and a private pension fund administrationsystem. In Colombia, electricity firms, financialentities and mining companies were the main assetsto be transferred to the private sector. In Venezuela,the government privatized telecommunicationscompanies, air transport and a number ofmanufacturing firms, but retained control overPetróleos de Venezuela, S.A. (PDVSA), the largestfirm in the entire Andean region. Both Venezuelaand Bolivia have also pursued a policy ofestablishing closer relations with other subregionalgroupings, such as the Southern Common Market(Mercosur) of which Bolivia is actually an associatemember, while Colombia and Venezuela aremembers of the Group of Three, together withMexico.
• At the other end of the spectrum is Ecuador, where“pro-market” reforms were less ambitious andprivatization plans encountered staunch oppositionfrom both political circles and civil society.
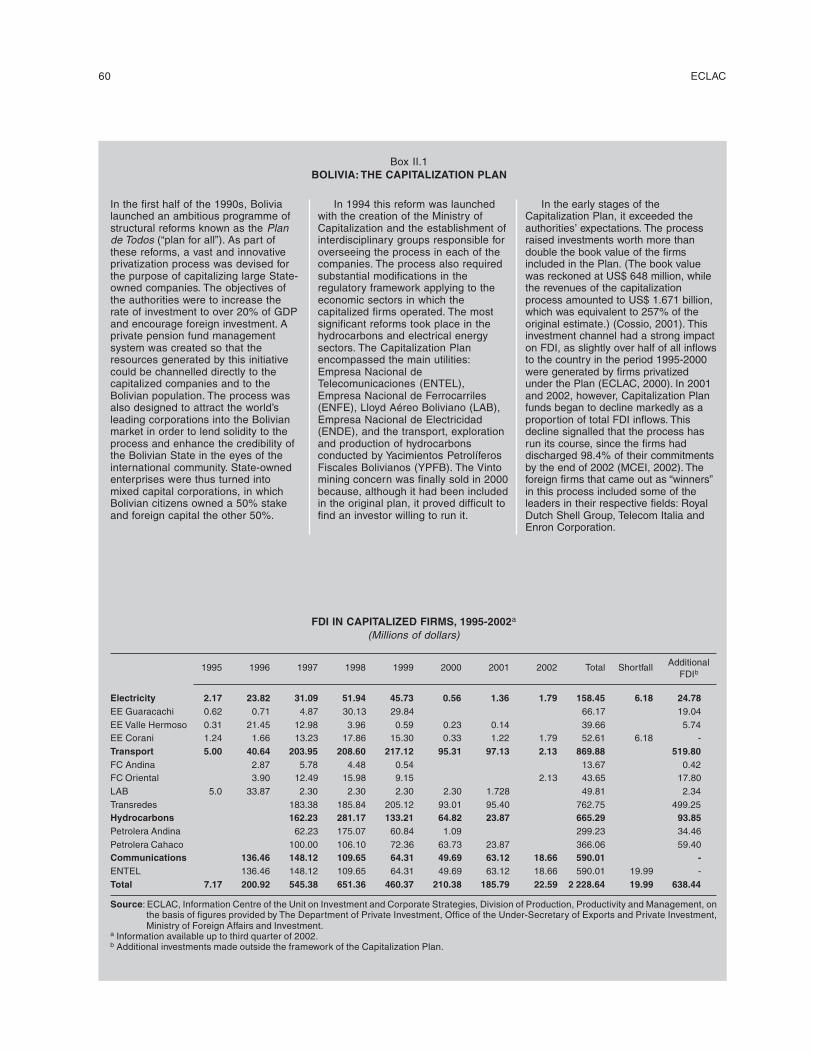
60 ECLAC
Box II.1BOLIVIA: THE CAPITALIZATION PLAN
In the first half of the 1990s, Bolivialaunched an ambitious programme ofstructural reforms known as the Plande Todos (“plan for all”). As part ofthese reforms, a vast and innovativeprivatization process was devised forthe purpose of capitalizing large State-owned companies. The objectives ofthe authorities were to increase therate of investment to over 20% of GDPand encourage foreign investment. Aprivate pension fund managementsystem was created so that theresources generated by this initiativecould be channelled directly to thecapitalized companies and to theBolivian population. The process wasalso designed to attract the world’sleading corporations into the Bolivianmarket in order to lend solidity to theprocess and enhance the credibility ofthe Bolivian State in the eyes of theinternational community. State-ownedenterprises were thus turned intomixed capital corporations, in whichBolivian citizens owned a 50% stakeand foreign capital the other 50%.
In 1994 this reform was launchedwith the creation of the Ministry ofCapitalization and the establishment ofinterdisciplinary groups responsible foroverseeing the process in each of thecompanies. The process also requiredsubstantial modifications in theregulatory framework applying to theeconomic sectors in which thecapitalized firms operated. The mostsignificant reforms took place in thehydrocarbons and electrical energysectors. The Capitalization Planencompassed the main utilities:Empresa Nacional deTelecomunicaciones (ENTEL),Empresa Nacional de Ferrocarriles(ENFE), Lloyd Aéreo Boliviano (LAB),Empresa Nacional de Electricidad(ENDE), and the transport, explorationand production of hydrocarbonsconducted by Yacimientos PetrolíferosFiscales Bolivianos (YPFB). The Vintomining concern was finally sold in 2000because, although it had been includedin the original plan, it proved difficult tofind an investor willing to run it.
In the early stages of theCapitalization Plan, it exceeded theauthorities’ expectations. The processraised investments worth more thandouble the book value of the firmsincluded in the Plan. (The book valuewas reckoned at US$ 648 million, whilethe revenues of the capitalizationprocess amounted to US$ 1.671 billion,which was equivalent to 257% of theoriginal estimate.) (Cossio, 2001). Thisinvestment channel had a strong impacton FDI, as slightly over half of all inflowsto the country in the period 1995-2000were generated by firms privatizedunder the Plan (ECLAC, 2000). In 2001and 2002, however, Capitalization Planfunds began to decline markedly as aproportion of total FDI inflows. Thisdecline signalled that the process hasrun its course, since the firms haddischarged 98.4% of their commitmentsby the end of 2002 (MCEI, 2002). Theforeign firms that came out as “winners”in this process included some of theleaders in their respective fields: RoyalDutch Shell Group, Telecom Italia andEnron Corporation.
FDI IN CAPITALIZED FIRMS, 1995-2002a
(Millions of dollars)
1995 1996 1997 1998 1999 2000 2001 2002 Total Shortfall AdditionalFDIb
Electricity 2.17 23.82 31.09 51.94 45.73 0.56 1.36 1.79 158.45 6.18 24.78EE Guaracachi 0.62 0.71 4.87 30.13 29.84 66.17 19.04EE Valle Hermoso 0.31 21.45 12.98 3.96 0.59 0.23 0.14 39.66 5.74EE Corani 1.24 1.66 13.23 17.86 15.30 0.33 1.22 1.79 52.61 6.18 -Transport 5.00 40.64 203.95 208.60 217.12 95.31 97.13 2.13 869.88 519.80FC Andina 2.87 5.78 4.48 0.54 13.67 0.42FC Oriental 3.90 12.49 15.98 9.15 2.13 43.65 17.80LAB 5.0 33.87 2.30 2.30 2.30 2.30 1.728 49.81 2.34Transredes 183.38 185.84 205.12 93.01 95.40 762.75 499.25Hydrocarbons 162.23 281.17 133.21 64.82 23.87 665.29 93.85Petrolera Andina 62.23 175.07 60.84 1.09 299.23 34.46Petrolera Cahaco 100.00 106.10 72.36 63.73 23.87 366.06 59.40Communications 136.46 148.12 109.65 64.31 49.69 63.12 18.66 590.01 -ENTEL 136.46 148.12 109.65 64.31 49.69 63.12 18.66 590.01 19.99 -Total 7.17 200.92 545.38 651.36 460.37 210.38 185.79 22.59 2 228.64 19.99 638.44
Source: ECLAC, Information Centre of the Unit on Investment and Corporate Strategies, Division of Production, Productivity and Management, onthe basis of figures provided by The Department of Private Investment, Office of the Under-Secretary of Exports and Private Investment,Ministry of Foreign Affairs and Investment.
a Information available up to third quarter of 2002.b Additional investments made outside the framework of the Capitalization Plan.
Foreign investment in Latin America and the Caribbean, 2002 61
The impact that the capitalizationprocess has had on fiscal revenuesthrough direct transfers and taxes hasbeen mixed. In the cases of ENTELand LAB, the impact appears to havebeen negative, but in ENFE, ENDE andparticularly YPFB, the results havebeen positive (Salinas, 2001).Investment commitments wereestablished when capitalizationcontracts were drawn up in order tosecure a capital contribution tomodernize the respective firms andenhance the efficiency and coverage oftheir services. With the exception ofENTEL and Empresa Eléctrica Corani,the privatized companies receivedinvestments far in excess of thecommitments made by the investors atthe time of purchase. Between 1995and mid-2002, total investments bycapital ized f irms amounted toUS$ 2.279 billion, which was US$ 642million more than the sum originallycommitted (MCEI, 2002). The mosttangible effects of the process havebeen seen in the sectors oftelecommunications, electrical energyand, especially, hydrocarbons.
• Before the capitalization of ENTEL,Bolivia had a telephone density offour lines per 100 inhabitants, had265,000 lines in service and 65% ofits network was digitalized. Giventhe lag in this subsector, the
capitalization strategy of ENTELconsisted of providing universalaccess to the telecommunicationsnetwork by supplying higher qualityservices and wider coverage. Fiveyears after its capitalization began,the landscape of the sector haschanged dramatically. Increases inthe penetration rates of local fixedtelephony and public telephoneservice have kept pace with aspectacular expansion in mobiletelephony, and the charges for thedifferent services have decreasedsubstantially. Between 1995 and2001, the number of main telephonelines per 100 inhabitants almostdoubled (from 3.33% to 6.22%), andthe number of subscribers to mobiletelephone services rose from10,000 to 744,000.
• The capitalization of ENDE has ledto a large increase in the generationcapacity of the NationalInterconnected System (SIN). In thelast five years, national coveragehas expanded from 31% to almost43% (Cossio, 2001). As in thetelecommunications subsector, theexpansion of the electric powersector has gone hand in hand witha reduction in real rates (Salinas,2001).
• Hydrocarbons have been the mostdynamic sector since thecapitalization of the State energy
firm, YPFB. In fact, investment inexploration and production hasexpanded sixfold since the time thesector was run by YPFB. This hassignificantly increased provenreserves of petroleum and naturalgas (Cossio, 2001). Between 1997and 2001, reserves of natural gasincreased by 5.7 trillion cubic feet(TCF) to 46.8 TCF, and reserves ofpetroleum from 201 million to 692million barrels. Bolivia thus becamethe second-ranking country in termsof natural gas reserves in SouthAmerica, after Venezuela (EIA,2002a). The Bolivian authorities seethe development of the natural gassector and the fiscal revenues it willprovide –through taxes androyalties– as a means of achievingrapid growth and reducing povertylevels.
In summary, as well as increasingFDI inflows, the Capitalization Plan hasgreatly improved the administration ofcompanies that were previouslyrunning deficits, and this has helped toreduce the pressure on public finances.As a result of this process, the BolivianState has also been able to achievemajor savings, especially with regard tolarge infrastructure projects –such asthe gas pipeline to Brazil– and theexploration and development of newdeposits of hydrocarbons.
Box II.1 (concluded)
Source: ECLAC, Unit on Investment and Corporate Strategies.
In summary, the supranational rules established bythe Andean Community have given member countriesincreasing degrees of freedom to define their own FDIpolicies. As a result, the countries have been moving awayfrom the original directives developed within theintegration scheme and have been adapting their legislation
to fit in with their own national interests. Today, althoughtheir umbrella legislation still exists, the Andean countrieseach have specific rules on the treatment of FDI. All ofthese nations’ bodies of legislation are liberal in spirit andare conducive to the establishment of a broad presence byforeign capital in their domestic economies.
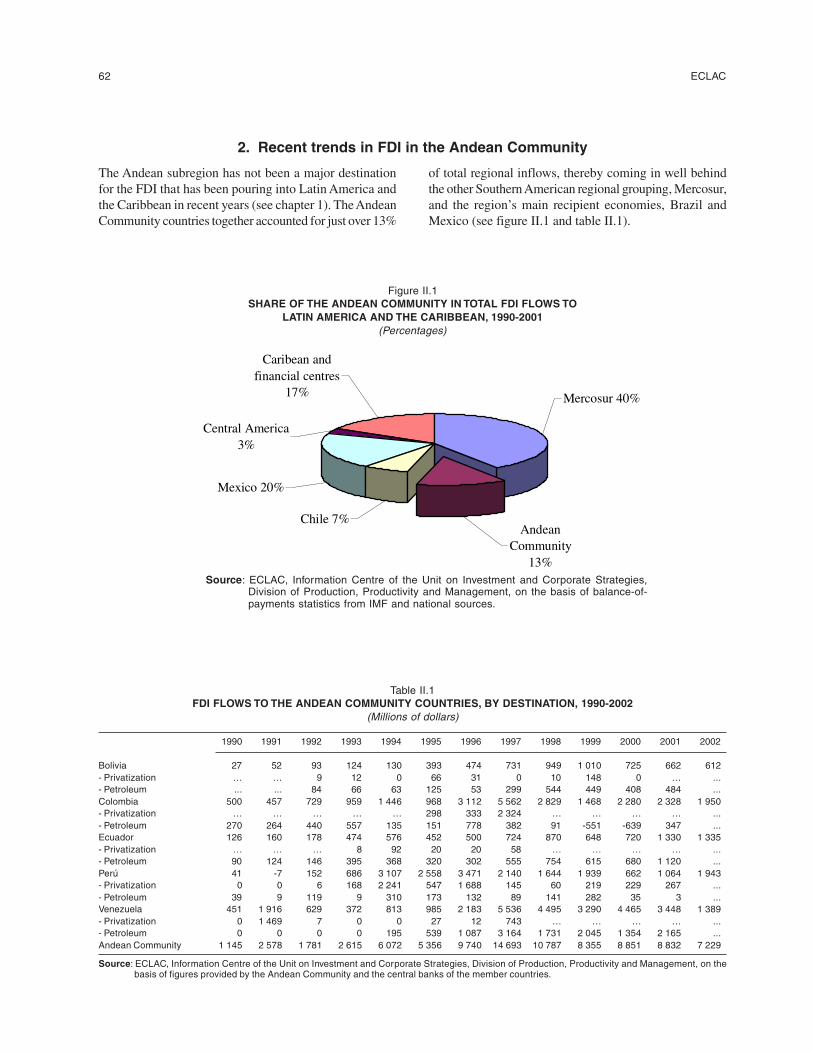
62 ECLAC
The Andean subregion has not been a major destinationfor the FDI that has been pouring into Latin America andthe Caribbean in recent years (see chapter 1). The AndeanCommunity countries together accounted for just over 13%
Mercosur 40%
Andean Community
13%
Chile 7%
Mexico 20%
Caribean and financial centres
17%
Central America 3%
Source: ECLAC, Information Centre of the Unit on Investment and Corporate Strategies,Division of Production, Productivity and Management, on the basis of balance-of-payments statistics from IMF and national sources.
Table II.1FDI FLOWS TO THE ANDEAN COMMUNITY COUNTRIES, BY DESTINATION, 1990-2002
(Millions of dollars)
1990 1991 1992 1993 1994 1995 1996 1997 1998 1999 2000 2001 2002
Bolivia 27 52 93 124 130 393 474 731 949 1 010 725 662 612- Privatization … … 9 12 0 66 31 0 10 148 0 … ...- Petroleum ... ... 84 66 63 125 53 299 544 449 408 484 ...Colombia 500 457 729 959 1 446 968 3 112 5 562 2 829 1 468 2 280 2 328 1 950- Privatization … … … … … 298 333 2 324 … … … … ...- Petroleum 270 264 440 557 135 151 778 382 91 -551 -639 347 ...Ecuador 126 160 178 474 576 452 500 724 870 648 720 1 330 1 335- Privatization … … … 8 92 20 20 58 … … … … ...- Petroleum 90 124 146 395 368 320 302 555 754 615 680 1 120 ...Perú 41 -7 152 686 3 107 2 558 3 471 2 140 1 644 1 939 662 1 064 1 943- Privatization 0 0 6 168 2 241 547 1 688 145 60 219 229 267 ...- Petroleum 39 9 119 9 310 173 132 89 141 282 35 3 ...Venezuela 451 1 916 629 372 813 985 2 183 5 536 4 495 3 290 4 465 3 448 1 389- Privatization 0 1 469 7 0 0 27 12 743 … … … … ...- Petroleum 0 0 0 0 195 539 1 087 3 164 1 731 2 045 1 354 2 165 ...Andean Community 1 145 2 578 1 781 2 615 6 072 5 356 9 740 14 693 10 787 8 355 8 851 8 832 7 229
Source: ECLAC, Information Centre of the Unit on Investment and Corporate Strategies, Division of Production, Productivity and Management, on thebasis of figures provided by the Andean Community and the central banks of the member countries.
2. Recent trends in FDI in the Andean Community
of total regional inflows, thereby coming in well behindthe other Southern American regional grouping, Mercosur,and the region’s main recipient economies, Brazil andMexico (see figure II.1 and table II.1).
Figure II.1SHARE OF THE ANDEAN COMMUNITY IN TOTAL FDI FLOWS TO
LATIN AMERICA AND THE CARIBBEAN, 1990-2001(Percentages)
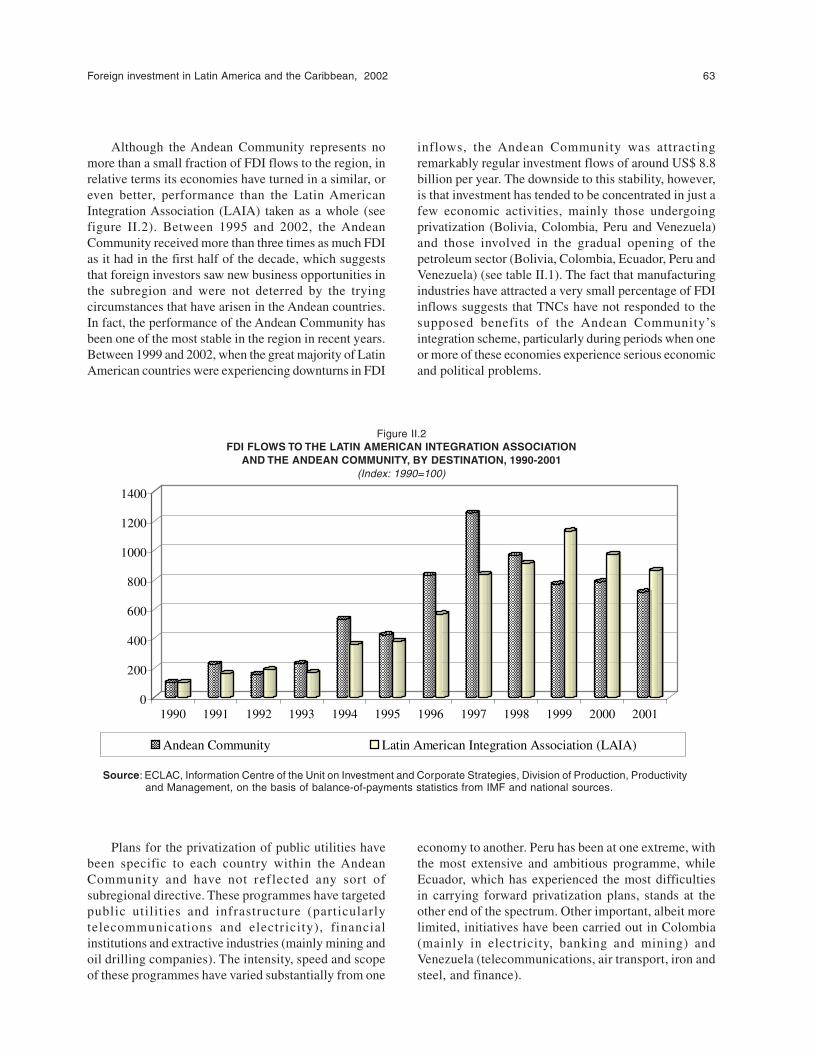
Foreign investment in Latin America and the Caribbean, 2002 63
Although the Andean Community represents nomore than a small fraction of FDI flows to the region, inrelative terms its economies have turned in a similar, oreven better, performance than the Latin AmericanIntegration Association (LAIA) taken as a whole (seefigure II.2). Between 1995 and 2002, the AndeanCommunity received more than three times as much FDIas it had in the first half of the decade, which suggeststhat foreign investors saw new business opportunities inthe subregion and were not deterred by the tryingcircumstances that have arisen in the Andean countries.In fact, the performance of the Andean Community hasbeen one of the most stable in the region in recent years.Between 1999 and 2002, when the great majority of LatinAmerican countries were experiencing downturns in FDI
inflows, the Andean Community was attractingremarkably regular investment flows of around US$ 8.8billion per year. The downside to this stability, however,is that investment has tended to be concentrated in just afew economic activities, mainly those undergoingprivatization (Bolivia, Colombia, Peru and Venezuela)and those involved in the gradual opening of thepetroleum sector (Bolivia, Colombia, Ecuador, Peru andVenezuela) (see table II.1). The fact that manufacturingindustries have attracted a very small percentage of FDIinflows suggests that TNCs have not responded to thesupposed benefits of the Andean Community’sintegration scheme, particularly during periods when oneor more of these economies experience serious economicand political problems.
Figure II.2FDI FLOWS TO THE LATIN AMERICAN INTEGRATION ASSOCIATION
AND THE ANDEAN COMMUNITY, BY DESTINATION, 1990-2001(Index: 1990=100)
0
200
400
600
800
1000
1200
1400
1990 1991 1992 1993 1994 1995 1996 1997 1998 1999 2000 2001
Andean Community Latin American Integration Association (LAIA)
Source: ECLAC, Information Centre of the Unit on Investment and Corporate Strategies, Division of Production, Productivityand Management, on the basis of balance-of-payments statistics from IMF and national sources.
Plans for the privatization of public utilities havebeen specific to each country within the AndeanCommunity and have not ref lected any sort ofsubregional directive. These programmes have targetedpublic utilities and infrastructure (particularlytelecommunications and electr icity), financialinstitutions and extractive industries (mainly mining andoil drilling companies). The intensity, speed and scopeof these programmes have varied substantially from one
economy to another. Peru has been at one extreme, withthe most extensive and ambitious programme, whileEcuador, which has experienced the most difficultiesin carrying forward privatization plans, stands at theother end of the spectrum. Other important, albeit morelimited, initiatives have been carried out in Colombia(mainly in electricity, banking and mining) andVenezuela (telecommunications, air transport, iron andsteel, and finance).
64 ECLAC
Privatizations had a particularly strong impact onFDI inflows in 1991 in Venezuela, with the sale of theCompañía Anónima Nacional de Teléfonos de Venezuela(CANTV); between 1994 and 1996 in Peru, with theprivatization of the Empresa Nacional deTelecomunicaciones (Entel) and some of the mainelectricity generation and distribution companies;between 1995 and 1998 in Colombia, with the sale ofelectricity companies; and since 1996 in Bolivia, withthe implementation of the Capitalization Plan (see tableII.A-1).
As in other Latin American economies, a number ofmergers and acquisitions involving firms that had beenprivatized in the 1990s took place in the AndeanCommunity countries. This process led to a concentrationof ownership among some of the subregion’s largest
firms, such as Telefónica del Perú, Electricidad deCaracas and several telecommunications companies,mainly in the mobile telephony segment. In addition,foreign investors bought some of the largest financialinstitutions in Bolivia, Colombia, Peru and Venezuela,as well as private local firms in the foods, beverages andnon-ferrous minerals (cement) sectors in Colombia, Peruand Venezuela (see table II.A-2). The purchase of existingassets thus became one of foreign investors’ preferredstrategies for gaining entry and positioning themselvesin Andean markets, particularly in the utilities,infrastructure and financial sectors. As a result, servicesaccounted for 36.4% of FDI flows into AndeanCommunity countries between 1992 and 2001, and asignificantly higher proportion in Colombia, Bolivia andPeru (see table II.2).
Table II.2MEMBER COUNTRIES OF THE ANDEAN COMMUNITY: CUMULATIVE FDI FLOWS,
BY ECONOMIC SECTOR, 1992-2001(Percentages)
AndeanBolivia Colombia Ecuador Peru Venezuela Community
Primary 53.6 17.9 81.7 7.8 34.4 30.1- Mines and quarries 5.6 9.4 - - - -- Petroleun and gasa 48.1 7.8 80.7 7.5 33.0 29.3Manufactures 9.1 21.2 6.2 6.3 28.9 19.4Services 43.9 60.9 12.0 38.9 24.1 36.4- Electricity, gas and water - 17.1 - 9.1 0.8 6.4- Commerce - 5.2 4.9 3.5 2.5 3.4- Transport and telecommunication - 10.1 2.3 15.9 2.1 6.7- Finance - 24.3 - 9.1 17.8 15.3- Other services - 4.2 4.8 1.3 0.9 4.6Other -6.7 - - 47.0 b 12.5 14.1Total 100.0 100.0 100.0 100.0 100.0 100.0
Source: ECLAC, Information Centre of the Unit on Investment and Corporate Strategies, Division of Production, Productivity andManagement, on the basis of figures provided by the Andean Community and the central banks of the member countries.
a In Ecuador, Peru and Venezuela, mining and petroleum activities are grouped under a single heading.b In Peru, the statistics prepared by the National Commission on Foreign Investment and Technology (CONITE) differ considerablyfrom the data supplied by the Central Reserve Bank of Peru. The Andean Community has corrected the CONITE figures on thebasis of the balance of payments so that the investment figures will correspond to actual flows rather than registered figures.Consequently, the sectoral destination of a large portion of these FDI flows cannot be determined.
In the hydrocarbons sector, rather than privatizingtheir public enterprises, the governments of Colombia,Ecuador and Venezuela decided to offer associationcontracts to foreign investors interested in exploring andexploiting deposits or secondary areas. This mechanismenabled the national authorities to tap resources thatotherwise would have been impossible to exploit, eitherbecause of a lack of funding or because of the difficultiesinvolved in obtaining and using the requisite technology.The gradual liberalization of activities in the petroleum
and natural gas sectors consequently translated intomassive inflows of FDI.
In Venezuela and Colombia, FDI was more highlyconcentrated in the manufacturing sector than it was inthe subregion as a whole owing to the size of thesecountries’ markets and their greater degree of industrialdevelopment (see table II.2). Liberalization and reformsmade the domestic market more attractive to investors,and this, together with their integration strategy,positioned both countries as potential export platforms,
Foreign investment in Latin America and the Caribbean, 2002 65
especially for sales to the rest of the Andean region(COINVERTIR, 1998). The continuation of operationsby United States and Japanese subsidiaries in theautomotive sector is an important factor in this respect.In addition, a number of manufacturing firms in the food,beverages and tobacco; hygiene and cleaning products,and chemicals and pharmaceuticals sectors cater to theAndean market. In fact, many large firms have chosen toset up manufacturing concerns in Venezuela andColombia so that they can take advantage of thesecountries’ membership in the Andean Community as atrampoline for exports to other member countries. Thishas been particularly significant in the automotiveindustry in Venezuela, where General Motors and FordMotors (both United States firms), DaimlerChrysler(Germany) and Toyota (Japan) have increased allocationsfor the production of exports, especially to Colombia andEcuador. In addition, thanks to the existing degree ofspecialization among the Andean subsidiaries of vehicleassembly firms, Colombia has also been able to exportto Venezuela.3
Extractive industries in the hydrocarbons sector–and, in some cases, metal mining– and access to servicesmarkets (mainly through the acquisition of existingassets) have thus accounted for much of the FDI that hasflowed into the subregion in the past decade (see tablesII.1 and II.2). In the larger economies, the manufacturingsector has received a relatively greater share thanks tothe presence of a number of production activities withpotential access to a broader subregional market.
With regard to the geographic origin of FDI inflows,the United States is the single largest investor in theAndean Community. Between 1992 and 2001, almost24% of total flows into the subregion came from UnitedStates firms (see table II.3). The next largest investor isthe European Union as a whole and, within it, Spain,which is the second most important single-countryinvestor. As in the rest of Latin America, within a quitebrief span of time Spanish firms have managed to increase
their presence in most of the Andean countries andespecially so in Colombia and Peru, where they havebeen key players in the privatization of State electricityand telecommunications firms. Other European countriesthat are high up on the list include Italy, thanks to TelecomItalia’s stake in The Bolivian Empresa Nacional deTelecomunicaciones (Entel), and the Netherlands and theUnited Kingdom, whose oil companies have investmentsin Bolivia, Colombia, Peru and Venezuela. As part of ageneral pattern seen throughout Latin America, Japaneseinvestment in the Andean Community is limited to a fewmining projects in Peru and Venezuela and a number ofvehicle assembly plants in Colombia and Venezuela.
Although the figures indicate that investments fromother Latin American countries are significant, thesestatistics need to be examined very carefully. First, thefigures are distorted by the fact that a substantial shareof the resources flowing into the Andean Communityeither has no clear origin –a problem attributable tonational registration authorities– or comes from financialcentres. These centres are used by foreign investors fortax purposes and conceal large amounts of funds, whichcome mainly from the industrialized countries. Second,these problems notwithstanding, it is quite clear that intra-subregional investments are very limited. This fact callsinto question some of the basic principles underlying theintegration process since its inception. Third, some ofthe largest Latin American investors have been replacedby capital from other sources as a result of the acquisitionof Latin American networks previously established bymajor Argentine and Chilean firms. Examples includethe Argentine petroleum firm Yacimientos PetrolíferosFiscales (YPF), which ran operations in a number ofAndean economies before being bought by Repsol ofSpain, and the strong presence established by Chileanenergy firms in Peru and Colombia before they cameunder the ownership of extraregional investors –Endesa-España and AES Corporation– following the purchaseof their parent companies (Enersis and Gener).
3 The automotive industry received a boost from a purpose-designed programme which Colombia, Ecuador and Venezuela signed in 1993and updated in 1999. The aim of the programme is to take greater advantage of the Andean market and lay the foundations for thecontinued development of the automotive sector in the Community. Based on this agreement, the countries have announced plans toexpand vehicle production in the subregion from 212,000 to 500,000 units in less than 10 years. The new agreement does away withsubregional content rules, in compliance with a provision of the World Trade Organization (WTO), and establishes a specific origin rule,as required by the Andean Community in order for locally assembled vehicles to gain access to the Andean market. This agreement enteredinto force in January 2000 and will remain in effect until 2010, when it may be extended. The new mechanism has fostered the developmentof producers of automotive parts and related services in Colombia, Venezuela and, to a lesser extent, Ecuador.
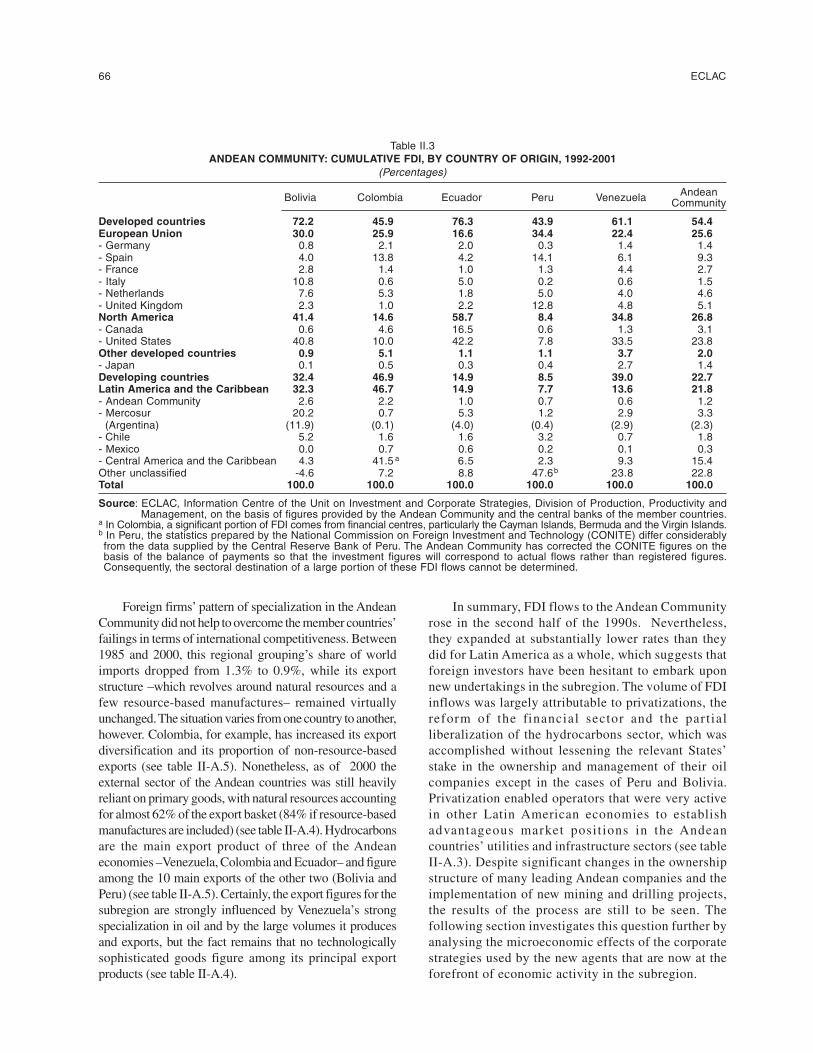
66 ECLAC
Table II.3ANDEAN COMMUNITY: CUMULATIVE FDI, BY COUNTRY OF ORIGIN, 1992-2001
(Percentages)
AndeanBolivia Colombia Ecuador Peru Venezuela Community
Developed countries 72.2 45.9 76.3 43.9 61.1 54.4European Union 30.0 25.9 16.6 34.4 22.4 25.6- Germany 0.8 2.1 2.0 0.3 1.4 1.4- Spain 4.0 13.8 4.2 14.1 6.1 9.3- France 2.8 1.4 1.0 1.3 4.4 2.7- Italy 10.8 0.6 5.0 0.2 0.6 1.5- Netherlands 7.6 5.3 1.8 5.0 4.0 4.6- United Kingdom 2.3 1.0 2.2 12.8 4.8 5.1North America 41.4 14.6 58.7 8.4 34.8 26.8- Canada 0.6 4.6 16.5 0.6 1.3 3.1- United States 40.8 10.0 42.2 7.8 33.5 23.8Other developed countries 0.9 5.1 1.1 1.1 3.7 2.0- Japan 0.1 0.5 0.3 0.4 2.7 1.4Developing countries 32.4 46.9 14.9 8.5 39.0 22.7Latin America and the Caribbean 32.3 46.7 14.9 7.7 13.6 21.8- Andean Community 2.6 2.2 1.0 0.7 0.6 1.2- Mercosur 20.2 0.7 5.3 1.2 2.9 3.3 (Argentina) (11.9) (0.1) (4.0) (0.4) (2.9) (2.3)- Chile 5.2 1.6 1.6 3.2 0.7 1.8- Mexico 0.0 0.7 0.6 0.2 0.1 0.3- Central America and the Caribbean 4.3 41.5 a 6.5 2.3 9.3 15.4Other unclassified -4.6 7.2 8.8 47.6b 23.8 22.8Total 100.0 100.0 100.0 100.0 100.0 100.0
Source: ECLAC, Information Centre of the Unit on Investment and Corporate Strategies, Division of Production, Productivity andManagement, on the basis of figures provided by the Andean Community and the central banks of the member countries.
a In Colombia, a significant portion of FDI comes from financial centres, particularly the Cayman Islands, Bermuda and the Virgin Islands.b In Peru, the statistics prepared by the National Commission on Foreign Investment and Technology (CONITE) differ considerablyfrom the data supplied by the Central Reserve Bank of Peru. The Andean Community has corrected the CONITE figures on thebasis of the balance of payments so that the investment figures will correspond to actual flows rather than registered figures.Consequently, the sectoral destination of a large portion of these FDI flows cannot be determined.
Foreign firms’ pattern of specialization in the AndeanCommunity did not help to overcome the member countries’failings in terms of international competitiveness. Between1985 and 2000, this regional grouping’s share of worldimports dropped from 1.3% to 0.9%, while its exportstructure –which revolves around natural resources and afew resource-based manufactures– remained virtuallyunchanged. The situation varies from one country to another,however. Colombia, for example, has increased its exportdiversification and its proportion of non-resource-basedexports (see table II-A.5). Nonetheless, as of 2000 theexternal sector of the Andean countries was still heavilyreliant on primary goods, with natural resources accountingfor almost 62% of the export basket (84% if resource-basedmanufactures are included) (see table II-A.4). Hydrocarbonsare the main export product of three of the Andeaneconomies –Venezuela, Colombia and Ecuador– and figureamong the 10 main exports of the other two (Bolivia andPeru) (see table II-A.5). Certainly, the export figures for thesubregion are strongly influenced by Venezuela’s strongspecialization in oil and by the large volumes it producesand exports, but the fact remains that no technologicallysophisticated goods figure among its principal exportproducts (see table II-A.4).
In summary, FDI flows to the Andean Communityrose in the second half of the 1990s. Nevertheless,they expanded at substantially lower rates than theydid for Latin America as a whole, which suggests thatforeign investors have been hesitant to embark uponnew undertakings in the subregion. The volume of FDIinflows was largely attributable to privatizations, thereform of the financial sector and the partialliberalization of the hydrocarbons sector, which wasaccomplished without lessening the relevant States’stake in the ownership and management of their oilcompanies except in the cases of Peru and Bolivia.Privatization enabled operators that were very activein other Latin American economies to establishadvantageous market positions in the Andeancountries’ utilities and infrastructure sectors (see tableII-A.3). Despite significant changes in the ownershipstructure of many leading Andean companies and theimplementation of new mining and drilling projects,the results of the process are still to be seen. Thefollowing section investigates this question further byanalysing the microeconomic effects of the corporatestrategies used by the new agents that are now at theforefront of economic activity in the subregion.
Foreign investment in Latin America and the Caribbean, 2002 67
B. STRATEGIES USED BY TRANSNATIONAL CORPORATIONSIN THE ANDEAN COMMUNITY
1. Seeking natural resources for export
4 In order to operate in Colombia, foreign oil companies have to negotiate an association contract with ECOPETROL. Contracts usually run fora fixed period of 28 years, which may be extended to 30 years if natural gas is found together with the oil. In the past 30 years, around 93% ofColombia’s oil output has been drilled under the terms of association contracts. An association contract is a strategic contractual alliance inwhich ECOPETROL becomes a partner of a foreign company (or consortium) to drill and develop hydrocarbon deposits and distribute theseproducts after the payment of the corresponding royalties. The partner company usually assumes 100% of the risk and the exploration costs,and ECOPETROL shares past and future expenses once the discovery is declared to be commercially viable (Barrios, 2001).
The Andean countries possess large reserves of petroleumand mining resources. Over the last 100 years, dominancein these activities has alternated between TNCs and theState. The 1990s saw a series of reforms that allowedprivate –especially foreign– capital into the differentsegments of these activities. Not all the AndeanCommunity countries opened up these areas of activityto the same degree, especially in the case of the oil sector.However, in those that did, some of the world’s largestTNCs entered the market to launch new projects.
(a) Hydrocarbons: the great wealth of the AndeancountriesThe Andean countries began to tap their first major
oil deposits in the late nineteenth century, and in the 1920sthey began to market these resources internationally. Thisprocess was largely conducted by foreign firms, whichwere drawn to the subregion by its national authorities’decision to launch an active policy of concessions. Someof the world’s largest oil companies –Exxon Corporation,Texaco, Inc., Mobil Oil Company and Royal Dutch Shell–became market leaders in Colombia, Ecuador andVenezuela. Later, as the Andean governments came torealize how much wealth was buried under their soil,they set up new legal mechanisms that would allow themto reap part of the earnings generated by this activity.
In the period following the Second World War,national governments began to taken on a larger role andto share operations in the oil sector with TNCs. TheEmpresa Colombiana de Petróleos (ECOPETROL) wasfounded in 1948 and began operations in 1951, whenthe Exxon Corporation’s De Mares contract came to anend and the concession reverted to the State. In 1953,Bolivia nationalized its hydrocarbons industry, whichthen began to be administered by YacimientosPetrolíferos Fiscales Bolivianos (YPFB). Venezuela setup its first public oil company, the CorporaciónVenezolana de Petróleo (CVP), in 1960. In October 1968,the Peruvian Government nationalized the assets of theInternational Petroleum Company (IPC) and createdPetróleos de Peru (Petroperú). Foreign capital was not
barred from participation, however, and Petroperúoperated alongside a number of transnational petroleumcompanies (Campodónico, 1999).
The shift towards greater State involvement in theoil industry in the Andean countries gathered momentumwhen international oil prices began to climb in 1973.This trend was particularly strong in Venezuela, whichpossesses Latin America’s largest oil reserves (see figureII-A.1). In 1971 new legislation was passed whichreserved for the State –through CVP– the right to operatenatural gas interests in Venezuela. In 1975, theVenezuelan Congress approved the Nationalization Act,under which the hydrocarbons industry and trade in theseproducts became the sole reserve of the State, concessionswere voided and petroleum resources were transferredto the State. Petróleos de Venezuela (PDVSA) was createdin 1976 to administer the national petroleum industry.
Ecuador also adopted a new, strongly nationalistpolicy on petroleum in the 1970s and went on to foundthe Compañía Estatal Petrolera Ecuatoriana (CEPE).Contracts with foreign firms were reviewed, and someolder concessions reverted to the State, giving it controlover 80% of the country’s oil industry. Ecuador began toexport hydrocarbons following the discovery of largereserves in the Amazonian region of Pañacocha.
Colombia was faced with a difficult situation duringthis period. For the first time in the country’s history,known oil reserves were being depleted faster than newreserves were being discovered. In response to thissituation, and in the light of the prevailing trend in theregion’s other oil-producing countries, the State redefinedits policy on petroleum. The largest foreign-ownedconcessions reverted to State ownership, and many ofthese firms’ assets were acquired by ECOPETROL. Atthe same time, the government entered into newassociation contracts4 in order to redefine accessconditions for foreign firms and give a boost toexploration. These activities led to the discovery of largehydrocarbons deposits in the first half of the 1980s inCaño Limón, Cusiana and Cupiagua, which substantiallyincreased the country’s reserves (see figure II-A.1).
68 ECLAC
(i) The gradual return of TNCs to thepetroleum industry5
In the late 1980s and early 1990s, the lack of publicfunds for investment in exploration and drillingoperations prompted the governments to find ways ofencouraging private investors to play a more active rolein the hydrocarbons subsector. This led to the eliminationof State monopolies in the various phases of theproduction process. Bolivia and Peru privatized theirState monopolies so that private investors could take partin the exploration, operation, marketing and distributionof petroleum and petroleum products. Ecuador andVenezuela introduced or extended mechanisms forestablishing partnerships or associations with foreigncompanies to implement new projects (Moguillansky andBielschowsky, 2001). Colombia maintained the schemeit had created in 1974.
In the early 1990s the liberalization of the petroleumsector gathered pace in Peru. The process of privatizingPETROPERU6 was begun, and a new Hydrocarbons Actwas passed that provided greater incentives for foreignfirms and put an end to the State-run company’smonopoly. The next phase of the privatization programmewas postponed several times because the necessaryagreements could not be reached. Finally, in late 1996, anew plan was introduced and some prized assets, suchas La Pampilla refinery, the Petrolube lubricants plantand some oilfields were sold to the private sector for morethan US$ 700 million plus investment commitmentsworth US$ 119 million (Paliza, 2000).
In 1996, production began to decline (see figureII-A.2), turning Peru into a net importer of oil, mainlyfrom Colombia, Ecuador and Venezuela. Today, fourcompanies account for 90% of its oil production:Occidental Petroleum and Petrotech of the United States
and Plupetrol and Pecom (formerly Pérez Companc) ofArgentina. There are extensive, largely unexploredregions in the north of Peru, thus the country hasenormous potential natural gas reserves. The presentAdministration hopes to encourage foreign investmentin hydrocarbons and is looking into new types ofincentives to make the industry more attractive.
In Bolivia, most of the assets of YPFB were soldunder the country’s Capitalization Plan (see box II.1). In1997, fields for exploration and production ofhydrocarbons began to be tendered on an annual basis.7
Colombia maintained its policy of pursuingexploration both directly and through associations,entering into joint ventures, compiling assay data onreserves and opening up new areas under tenderingschemes. As the financial situation of Ecopetrolimproved, its stake was gradually increased, althoughmost new investments in exploration have been made bypartner firms (see figure II.3). At the beginning of 2000,no new finds had followed the major discoveries at CañoLimón, Cusiana and Cupiagua, which translated into agradual decline in proven reserves, and in their usefullife (see figure II-A.2).
As a result of the sharp downturn in Colombianproduction in the last few years, which threatened to turnit into a hydrocarbon importer by 2004 (see figureII-A.2), Ecopetrol approved major changes in oil policyand in the terms of its association contracts. In September1999 it introduced attractive incentives to revive foreigncompanies’ interest in exploration and to counteract therisk aversion generated by guerrilla sabotage of oilindustry infrastructure.8 The main change was thereduction of the State company’s stake from 50% to 30%once an exploratory phase has proved to be successful;this allows the partner firm to increase its share of thereserves and recover its costs more quickly.
5 For further details see ECLAC (2002), chapter IV.6 The total assets of PETROPERU were not included in the first stage of privatization. The main assets at this stage were Compañía Peruana
de Gas (Solgas), 83 retail service stations and the shipping company which owned the tankers, Petrolera Transoceánica.7 In 1997, 16 blocks were tendered out, followed by six in 1998 and five in 1999. In 1999, Pluspetrol was the only bidder. In 2000 and 2001,
two and four blocks, respectively, were tendered out. In late 2002, YPFB offered concessions on nine blocks; two of these blocks were innon-traditional areas (Rio Beni and Puerto Linares) while the other seven were in traditional petroleum- and gas-producing areas (Cedro,Bato, Ipita, Inau, Irenda, Itaguazurenda and Buena Vista). No bids were entered, however, and the auction was declared void. A new roundwas scheduled for early 2003 (Alexander’s Gas and Oil Connections, vol. 7, No. 20, 15 October 2002).
8 Between mid-1986 and late 2001, the hydrocarbon transport system had sustained some 900 attacks in which explosives were used. TheCaño Limón-Puerto Coveñas pipeline, which services the Caño Limón field, was attacked 170 times during 2001 alone. The governmentputs the cost of the attacks perpetrated over the last 15 years at a total of US$ 1.5 billion (EIU, 2002a).
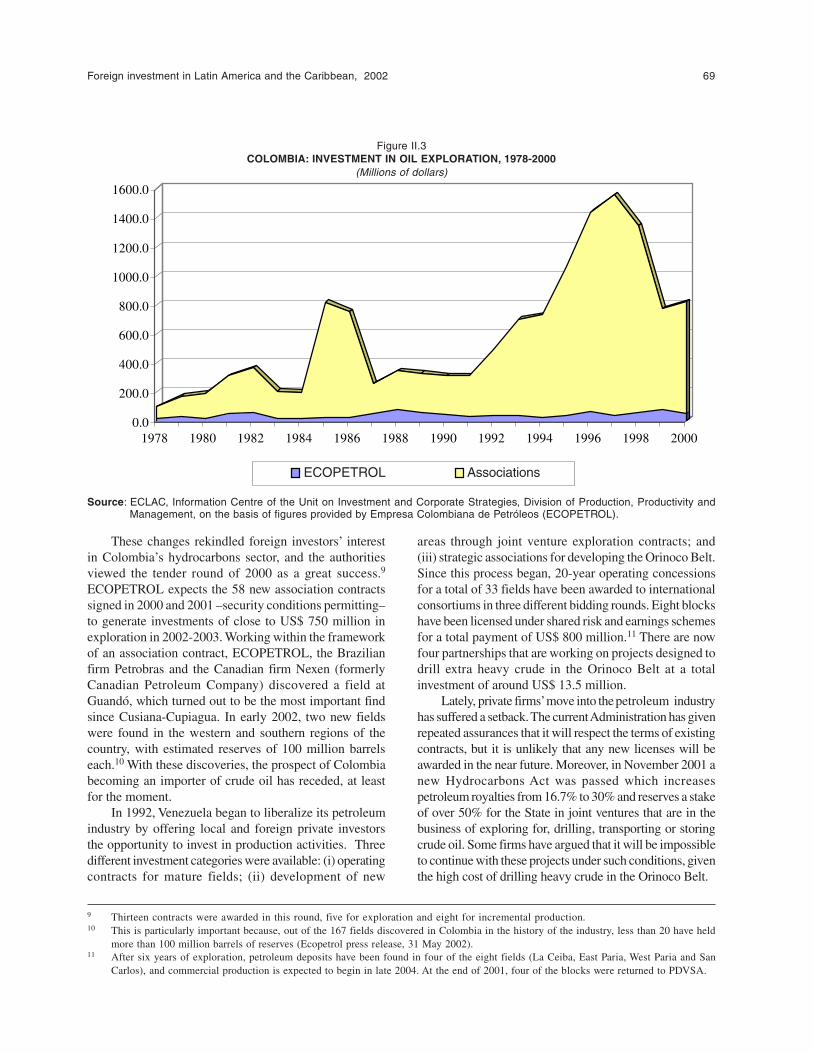
Foreign investment in Latin America and the Caribbean, 2002 69
Figure II.3COLOMBIA: INVESTMENT IN OIL EXPLORATION, 1978-2000
(Millions of dollars)
0.0
200.0
400.0
600.0
800.0
1000.0
1200.0
1400.0
1600.0
1978 1980 1982 1984 1986 1988 1990 1992 1994 1996 1998 2000
ECOPETROL AsociacionesAssociations
9 Thirteen contracts were awarded in this round, five for exploration and eight for incremental production.10 This is particularly important because, out of the 167 fields discovered in Colombia in the history of the industry, less than 20 have held
more than 100 million barrels of reserves (Ecopetrol press release, 31 May 2002).11 After six years of exploration, petroleum deposits have been found in four of the eight fields (La Ceiba, East Paria, West Paria and San
Carlos), and commercial production is expected to begin in late 2004. At the end of 2001, four of the blocks were returned to PDVSA.
Source: ECLAC, Information Centre of the Unit on Investment and Corporate Strategies, Division of Production, Productivity andManagement, on the basis of figures provided by Empresa Colombiana de Petróleos (ECOPETROL).
These changes rekindled foreign investors’ interestin Colombia’s hydrocarbons sector, and the authoritiesviewed the tender round of 2000 as a great success.9
ECOPETROL expects the 58 new association contractssigned in 2000 and 2001 –security conditions permitting–to generate investments of close to US$ 750 million inexploration in 2002-2003. Working within the frameworkof an association contract, ECOPETROL, the Brazilianfirm Petrobras and the Canadian firm Nexen (formerlyCanadian Petroleum Company) discovered a field atGuandó, which turned out to be the most important findsince Cusiana-Cupiagua. In early 2002, two new fieldswere found in the western and southern regions of thecountry, with estimated reserves of 100 million barrelseach.10 With these discoveries, the prospect of Colombiabecoming an importer of crude oil has receded, at leastfor the moment.
In 1992, Venezuela began to liberalize its petroleumindustry by offering local and foreign private investorsthe opportunity to invest in production activities. Threedifferent investment categories were available: (i) operatingcontracts for mature fields; (ii) development of new
areas through joint venture exploration contracts; and(iii) strategic associations for developing the Orinoco Belt.Since this process began, 20-year operating concessionsfor a total of 33 fields have been awarded to internationalconsortiums in three different bidding rounds. Eight blockshave been licensed under shared risk and earnings schemesfor a total payment of US$ 800 million.11 There are nowfour partnerships that are working on projects designed todrill extra heavy crude in the Orinoco Belt at a totalinvestment of around US$ 13.5 million.
Lately, private firms’ move into the petroleum industryhas suffered a setback. The current Administration has givenrepeated assurances that it will respect the terms of existingcontracts, but it is unlikely that any new licenses will beawarded in the near future. Moreover, in November 2001 anew Hydrocarbons Act was passed which increasespetroleum royalties from 16.7% to 30% and reserves a stakeof over 50% for the State in joint ventures that are in thebusiness of exploring for, drilling, transporting or storingcrude oil. Some firms have argued that it will be impossibleto continue with these projects under such conditions, giventhe high cost of drilling heavy crude in the Orinoco Belt.
ECOPETROL
70 ECLAC
The Ecuadorian Government set up a mechanism forthe issuance of petroleum concessions in the mid-1980s.In 1989, the Empresa Estatal de Petróleos del Ecuador(PETROECUADOR) was created out of the former(CEPE). The more active role played byPETROECUADOR and the involvement of private capitalled to a major increase in proven petroleum reserves (seefigure II-A.1). Underinvestment between 1994 and 2000led to a year-upon-year decline in the company’s output,however (EIU, 2001). In 2000, its share of total productiondropped to 60%, with the rest being accounted for bycontract arrangements with private firms.
A large number of new discoveries have been madein the past few years, and proven and probable reservesare now estimated at some 6.18 billion barrels. Thebiggest find has been in the Ishpingo TambocochaTiputini field in the Amazon region, on the border withPeru, with estimated reserves of 700 million barrels. TheState-owned company has sought to attract FDI to thecountry’s major deposits in order to raise its productionfrom about 230,000 barrels per day to 600,000 by 200512
(see figures II-A.1 and II-A.2). The firms that are activein Ecuador include Repsol-YPF of Spain, OccidentalPetroleum Corp (OXY) and Vintage Petroleum Inc. ofthe United States and Pérez Companc of Argentina.
The biggest constraint on the expansion of theEcuadorian oil industry is its pipeline network. This hasopened up an opportunity for foreign firms to join theconsortiums that are building pipelines. In June 2000,work was completed on the extension of the Trans-Ecuadorian Oil Pipeline System (SOTE), which increasedits capacity to 390,000 barrels per day. In June 2001,work began on the Heavy Crude Oil Pipeline (OCP),which is being constructed by a consortium formed byAlberta Energy of Canada (31.4%), Repsol-YPF of Spain(25.7%), OXY (12.3%) and Kerr McKee (4%) of theUnited States, Pérez Companc (15%) and Techint (4.1%)of Argentina and Agip of Italy (7.5%). With an investmentof US$ 1.1 billion to build 500 kilometres of pipeline,work is expected to be completed by the end of 2003.The pipeline will transport about 450,000 barrels per day,and OCP will operate it for 20 years. As well as doublingthe existing petroleum transport capacity, this project isexpected to boost GDP by 2.5%, create 52,000 jobsdirectly and indirectly, and generate US$ 800 million intax revenue (EIU, 2001).
(ii)A booming natural gas industry
After the United States, Venezuela possesses thelargest proven reserves of natural gas in the westernhemisphere, but it has not been very successful inlaunching large-scale private initiatives. The ChristopherColumbus Project is one example. The passage of theOrganic Law on Gaseous Hydrocarbons in September1999 made Venezuela an interesting prospect for someof the world’s largest energy companies. In June 2001,the first steps were taken to tender 11 blocks of non-associated natural gas; 6 of the 11 areas were awarded tosuch bidders as the French-Belgian group TotalFinalElf,Repsol-YPF of Spain and Pérez Companc and Pluspetrolof Argentina.
In November 2002, the government signed anagreement with seven foreign firms to develop fiveoffshore blocks of natural gas in the Deltana Platformto the east of Venezuela, which has proven reserves of100 trillion cubic feet. All ventures are to be conductedjointly with PDVSA, which holds a stake (60%) in each.Since most of the output will be exported, a liquefiednatural gas (LNG) plant will also be built13 (EIU,2002b).
Petroleum production has declined in Peru, but theCamisea deposits in that country are South America’slargest natural gas field. In 1984, the British-Netherlandsfirm Royal Dutch Shell located reserves of natural gasand condensates equivalent to 2.4 billion barrels of oil.This field holds a wealth of resources, but negotiationsconcerning its operation have run up against a series ofcomplications, such as those encountered by theconsortium formed by Shell and Mobil, which abandonedthe project in 1998, citing technical, commercial andpolitical problems. After many delays, contracts werefinally signed for the development of the Camisea fieldsin March 2001. The $2.6-billion Camisea project hasbeen split into a 40-year contract covering explorationand production, and a 33-year contract for transportationand distribution. In February 2000 the upstream(production) phase of Camisea was auctioned off to aconsortium formed by Pluspetrol of Argentina (40%),Hunt Oil of the United States (40%) and SK Corporationof the Republic of Korea (20%). The consortium isinvesting about US$ 1.6 billion in the exploration phase,
12 Although the Constitution absolutely prohibits the sale of State-owned petroleum assets, President Noboa’s Administration attempted toopen up the oil industry to foreign firms in the segments of transport (pipelines), investment in refineries and marketing.
13 In February 2002, PDVSA announced that the cost of exploring these fields and bringing them on stream, as well as building a majornatural gas processing complex, would amount to some US$ 4 billion by 2007 (EIU, 2002b). About 4,830 kilometres of gas pipelinesalready exist, but no pipelines suitable for export purposes are available.
Foreign investment in Latin America and the Caribbean, 2002 71
US$ 400m of which is to be provided by 2003 (EIU,2002c). The potential market for this project consists ofpower plants in Lima and the central-north area of thecountry, as well as large industrial customers. ExportingLNG to the west coast of the United States is also apossibility.
In October 2002 a second auction was held for thedownstream (transport and distribution) phase of theCamisea project. The successful (and only) bidder wasa consortium led by Argentina’s Techint14, which hasmade a total investment commitment of US$ 1.45 billion;US$ 401 million of this sum is to be used for a gaspipeline from Camisea to the coast, and US$ 91 millionfor a natural-gas distribution network in Lima and Callao.Techint has set itself a target of 36-44 months for bringnatural gas to the capital city.
In May 2002, the consortium responsible for thedevelopment and operation of the downstream phase ofthe project, Transportadora de Gas del Perú (TGP) selectedBelgium-based Tractebel as its strategic partner in theconcession for distributing Camisea’s natural gas to powerplants in Lima and the port of Callao. Once it comes onstream, Camisea is expected to generate between US$ 5billion and US$ 6 billion in royalties and tax revenues forPeru over the next 30 years. The project is progressing asplanned; pumping operations are expected to begin in thecourse of 2003 and natural gas should be reaching Limasome time in 2004 (http://www.camisea.com.pe/project.asp). President Toledo has also extended a proposalto the President of Bolivia –which possesses LatinAmerica’s second largest gas reserves– that the twocountries should join forces to increase the use of naturalgas in both. This comes at a time when Peru and Chile arecompeting to be chosen as the site for transportinfrastructure and a processing plant for Bolivian gas.
Bolivia has produced natural gas since the 1960sand began to export it, mainly to Brazil, in the late 1990s.More recently, an active exploration policy has led tomany large finds, including Block 20 (Tarija West), SanAntonio and San Alberto, El Dorado and Caipipendi.With these discoveries, the country’s proven gas reservesamount to five times the level of current domestic demandand projected exports for the next 20 years combined(EIU, 2002d).
Plans are in place to build a number of gas pipelinesin order to take Bolivian gas to the most lucrative markets.
Thanks to an investment of over US$ 2.1 billion involvingEnron Corp., Shell, Petrobras, the British Gas (BG)group, TotalFinalElf and El Paso, a pipeline connectingBolivia to the Brazilian city of Sao Paulo came on streamin 1999 (ECLAC, 2002). Although Brazilian demand forBolivian gas has declined lately, the consortium operatingthe Bolivian end of the export pipeline,GasTransBoliviano, has raised financing of US$ 90million to expand the pipeline and expected to completethis project in 2003.
Once the potential of the new finds had beenconfirmed, the government began to seek markets forBolivian natural gas. Plans to export LNG to NorthAmerica through a port on the Pacific coast, involvingan investment of over US$ 5 billion, are well advanced.15
In July 2001, the largest producers in Bolivia –Repsol-YPF (37.5%), British Gas (37.5%) and British Petroleum(25%)– formed a consortium called Pacific LiquefiedNatural Gas (Pacific LNG) to export LNG to NorthAmerica (mainly to the Californian and Mexican coasts).Pacific LNG has signed a memorandum of understandingwith the United States firm Sempra Energy for the supplyof LNG to the United States. The gas will be delivered toa reception terminal to be built jointly by Sempra Energyand CMS Energy Corp. in the Mexican state of BajaCalifornia. The project also involves the construction ofa pipeline to connect the Margarita field in southernBolivia to a port on the Pacific coast of either Chile orPeru. The Chilean option is preferred by the Pacific LNGconsortium, but there is strong opposition to it withincivil society in Bolivia. If the project comes to fruition,natural gas shipments to the United States should beginin 2006-2007. The initial delivery capacity would amountto about two thirds of the current volume of the pipelineto Brazil. TotalFinalElf –with one of the largest stakes inBolivia’s gas reserves– is therefore studying thepossibility of joining the Pacific LNG consortium in orderto circumvent the problems it has experienced inoperating the gas pipeline to Brazil (EIU, 2002d).
The discoveries at Cusiana and Volcanera in thesecond half of the 1990s positioned Colombia as the siteof Latin America’s fourth largest reserves of natural gas.Before 1990, discoveries of natural gas in Colombia wereviewed as a problem rather than an opportunity becausethe infrastructure needed to secure a market for it wasnot available (Barrios, 2001). Potential reserves in
14 The consortium Transportadora de Gas del Perú (TGP) comprises Techint and Pluspetrol of Argentina (30% and 19.2%, respectively),Hunt Oil of the United States (19.2%), Sonatrach of Algeria (10%), SK Corp. of the Republic of Korea (9.6%) and the Peruvian GroupGrana y Montero (12%).
15 Efforts are also being made to promote the consumption of natural gas in Bolivia’s domestic market. One of the authorities’ objectives isto build an urban gas distribution network to connect 250,000 consumers within five years. An effort will also be made to encourage theuse of natural gas as a fuel for motor vehicles.
72 ECLAC
offshore basins along the Caribbean coast are estimatedto contain enough gas to cover 150-200 years ofconsumption. Almost 100% of the natural gas now beingused is supplied by Chuchupa, an offshore field withreserves of close to 7 trillion cubic feet which is operatedby ChevronTexaco of the United States.
In 1997 an Ecopetrol subsidiary, Ecogas, was createdto distribute natural gas. The investment of some US$ 1billion made in Ecogas was used primarily to build a 5,632-kilometre network of gas pipelines. In 1998 a gas pipelinelinking the central and south-western portions of thecountry came on stream. This pipeline is being operatedunder a 20-year concession by a Canadian company.
Ecuador has enough refining capacity to processaround 20% of the natural gas produced in the Orienteoilfields and imports are necessary to meet about 50%of domestic demand (EIU, 2001). Energy DevelopmentCorporation (EDC), a subsidiary of Noble Energy of theUnited States, owns 100% of a gas-to-power energyventure. The project includes the Amistad field (9.8billion cubic metres), which lies in the Gulf of Guayaquiland is tapped from an off-shore platform. The gas fromAmistad will supply the Machala power plant. EDC hasso far invested about US$ 70 million in the gas projectand US$ 90 million in the electricity generation plant.
(iii) Strategies of the main transnational oilcompanies in the Andean region
The liberalization of the hydrocarbons subsector,together with a number of international mergers amongmajor oil companies, has brought about a repositioningof the TNCs most heavily involved in exploration andexploitation of petroleum and natural gas in the Andeancountries.
• TNCs that have been industry players for manydecades tend to have a smaller stake today. This isthe case of the world’s two largest oil companies,ExxonMobil and Royal Dutch Shell.16
• As a result of these international mergers andacquisitions, local firms been sought after ascomplementary assets, and this has boosted thesubregional presence of the newly merged firms.Examples are ChevronTexaco and BP Amoco Plc.
• Firms whose subregional presence has been a keypart of their strategy have –without abandoning theirAndean operations– started to expand their presencein other parts of the world. Occidental Petroleum isa prime example.
• New entrants –mostly European firms– have rapidlyexpanded their presence in the region. The mostnotable of these companies is TotalFinalElf.17
• Lastly, there are firms with a strong regional presencewhose international potential revolves around LatinAmerica. The Spanish firm Repsol-YPF is oneexample, mainly because of its operations inArgentina, while others include the Argentine firmsPérez Companc (PECOM), Pluspetrol –linked withRepsol-YPF– and Techint.18
The 2001 edition of this publication contained adetailed analysis of the corporate strategies of Repsol-YPF, TotalFinalElf, Royal Dutch Shell and PérezCompanc (ECLAC, 2002). In order to provide the readerwith new information, this section will therefore take amore detailed look at the activities of three firms whichhave played an important role in the development of thepetroleum and natural gas industries in the Andeansubregion: Occidental Petroleum, ChevronTexaco andBritish Petroleum.
(iv) Occidental Petroleum: the largesttransnational oil company in the Andeanregion
Today, the Occidental Petroleum Corporation (OXY)is one of the world’s largest so-called “independent” firmsengaged in exploring for and extracting petroleum andnatural gas (ECLAC, 2002, chapter IV). With operationsin the United States, the Middle East, Pakistan, Russiaand Latin America, OXY has concentrated on findingand developing new sources of petroleum and naturalgas (OXY, 2002b). The success of this strategy is reflectedin the fact that the firm has found five of the 50 largestoilfields discovered in the world in the last 50 years (OXY,2002a). A pivotal element of its corporate growth strategyhas been the acquisition of new assets in the regions ofthe world where its development is centred. Since 1998,OXY has invested some US$ 7.5 billion in buyingpetroleum and natural gas fields in the United States alone(OXY, 2002a). These acquisitions have resulted in a hugeincrease in the company’s reserves, output and profitability.
Occidental Petroleum is one of the leading oilcompanies in Latin America, with production operationsin Colombia and Ecuador and exploratory activities inPeru. In fact, since the discovery of over 700 millionbarrels of oil in the northern Peruvian jungle in 1971, ithas become the top transnational oil company in the entireAndean region.
16 See ECLAC (2002), chapter IV, for further details.17 See ECLAC (2002), chapter IV, for further details.18 See ECLAC (2002), chapter IV, for further details
Foreign investment in Latin America and the Caribbean, 2002 73
In 1983, OXY played a key role in Colombia’stransformation from an oil-importing to an oil-exportingcountry, thanks to the discovery of the Caño Limónoilfield in the Department of Arauca in the north-easternportion of the country. This was one of the largest oilstrikes in the western hemisphere in the last 25 years(OXY, 2002a). The project has been conducted throughan association contract with ECOPETROL, whichcontrols about 85%. Its production plant is sizeable andhas over 100 producing oil wells. This discovery andColombia itself became a key component of Occidental’sglobal operations; in fact, in the early 1990s Colombiaaccounted for around half of the company’s worldreserves and a similar proportion of its output andinvestments (Puyana and Dargay, 1996). Later, becauseof the firm’s swift international expansion, Colombia’simportance in its operations declined. To date, CañoLimón has produced 910 million barrels, out of estimatedreserves of 1.3 billion. The output of this oilfield hasdwindled to 100,000 barrels per day (from a peakproduction level of 208,000 barrels per day in 1990). Inaddition to the depletion of some of the wells, guerrillaattacks at Caño Limón have also affected productionlevels. Despite the decline, this deposit continues tosupply about a third of Colombia’s total oil exports (OXY,2002a). Occidental’s total investment in Caño Limónamounts to US$ 1.9 billion, including the constructionof a 777-kilometre pipeline to Coveñas on the Caribbeancoast, which the firm operates jointly with ECOPETROL.
In 1992, OXY signed a contract with the ColombianGovernment to explore a new oil-bearing area in Samoré.In 1997, seismological studies put potential reserves thereat an estimated 1.4 billion barrels of oil. Progress hasbeen slow, however, because of difficult relations withthe indigenous Uwa community. Occidental eventuallyabandoned 75% of its original exploration block andconcentrated on a drilling area of just two hectares. InSeptember 1999, the Colombian Government issuedOXY a new licence to drill the exploratory well GibraltarI, which is located outside the Uwa reserve.
Despite the success of its operations in Colombia,since 1964 OXY has had to deal with threats and violencefrom guerrilla groups. In fact, even though strict securitymeasures are in place, the Revolutionary Armed Forcesof Colombia (FARC) and the National Liberation Army(ELN) have attacked the Caño Limón pipeline more than700 times. Since the start of production at this oilfield,guerrilla attacks have caused the loss of over 2.1 millionbarrels of oil. What is more, between January 1987 andmid-August 2000, these attacks cost the ColombianGovernment almost US$ 13 million in losses, in additionto the cost of repairing the pipeline and the environmentaldamage that was done.
In 1985, Occidental Petroleum bought the drillingrights to 494,000 acres of Block 15 in the Amazonregion, in the north-eastern region of Ecuador. In theearly 1990s, OXY discovered six commercially viabledeposits in this area, which it brought on stream in 1993.It also built some 20 kilometres of pipeline to join upwith SOTE, which is owned by the State oil companyPETROECUADOR.
In 1995, OXY and the Ecuadorian Governmentsigned an agreement to explore the remaining portionof Block 15. This led to the discovery of the Eden-Yuturi field, with reserves of over 100 million barrels.The company’s exploratory work in these new fieldshas been quite successful, and it is therefore looking toraise its production level in Ecuador by 30,000 barrelsper day (OXY, 2002a). Eden-Yuturi’s start-up willcoincide with completion of the new transcontinentalHeavy Crude Oil Pipeline (OCP), which is scheduledfor 2003; OCP will have the capacity to transport450,000 barrels per day from the Oriente Valley to thePacific coast. The United States firm plans to spendabout US$ 965 million on the development of oilfieldsin Ecuador’s Amazonian region over the next five yearsin order to make the most of its stake in OCP. Inaddition, OXY has invested about US$ 334 million inthe Eden-Yuturi field, US$ 33 million in theLimoncocha field and US$ 76 million in Indillana (EIU,2001). Lastly, Occidental is continuing with itsexploratory work in Block 15 and hopes that, with thehelp of an aggressive use of 3-D seismic technology,its exploratory programme in Ecuador will continue tomeet with success (OXY, 2002a).
Three decades ago, Occidental discovered the largestoilfield to be found in Peruvian territory, Block 1-AB, inthe Amazon jungle, and began developing it. In early2000, it sold its stake in this block to Pluspetrol ofArgentina, but maintains a presence in Peru with interestsin two exploratory fields: Block Z-3 offshore and Block64, which lies to the south-east of 1-AB.
(v) ChevronTexaco Corporation: high stakesin Venezuela
On 9 October 2001, a merger was completed betweenthe United States oil companies Chevron Corporation andTexaco, Inc. The new firm –ChevronTexaco Corporation–thus became the second largest in the industry in the UnitedStates, after ExxonMobil, and the fourteenth largest in theworld (Fortune, 2002). Today, ChevronTexaco hasoperations in more than 180 countries focusing on energyactivities and the chemical industry (ChevronTexaco,2002a). In Latin America, ChevronTexaco maintains apresence in Argentina, Brazil, Colombia, Trinidad andTobago, and Venezuela.
74 ECLAC
In Venezuela, ChevronTexaco Corporation is theleading private foreign operator in terms of daily output(ChevronTexaco, 2002b). Texaco has been interested ininvesting in the country, particularly in the deposits ofheavy crude oil that lie in the Orinoco Belt (the largestreserves of crude oil in the world), ever since theliberalization of the oil sector began. This is howChevronTexaco came to have a share in Ameriven, oneof the four strategic projects authorized to develop theHamaca project in the eastern part of the country. Astrategic partnership among PDVSA (30%), PhillipsPetroleum (40%) and ChevronTexaco (30%) hasembarked on a venture to drill and transport 190,000barrels per day of extra-heavy 8.5 grade API crude andto upgrade it to 26-degree API crude, which brings ahigher price on international markets. The Hamacaproject became operational on 20 November 2001, afterinvesting almost US$ 900 million of the US$ 4 billionearmarked for the project over the next 35 years.
Also in Venezuela, ChevronTexaco operates theBoscan oilfield under an operating service agreement.So far it has drilled 32 wells which produce, on average,104,800 barrels per day (ChevronTexaco, 2002b). Thegroup also maintains a 27% ownership interest in theLL-652 field, located to the north-east of Lake Maracaibo(estimated reserves of 18 million barrels), which itoperates under a risk service agreement.
In Colombia, ChevronTexaco operates and holds aninterest in one productive field and three that are at theexploration stage through its subsidiary Texas PetroleumCompany (TEXPET). In the Guajira region, TEXPEToperates the Chuchupa field under a joint ventureagreement with ECOPETROL, with each companyholding a 50% stake. The area will revert to theColombian Government in December 2004, but TEXPETwill continue operating the fields until 2016. During2001, net production averaged 211 million cubic feet ofnatural gas and approximately 35,000 barrels of oil perday (ChevronTexaco, 2002b). In 2001, ECOPETROL,TexacoChevron and PDVSA signed a memorandum ofunderstanding to build a gas pipeline that will connectColombia’s Caribbean cast with western Venezuela.
(vi) British Petroleum Amoco (BPA): seekingnew reserves
On 31 December 1998, British Petroleum (BP)completed the purchase of Amoco, at a cost of US$ 55billion, thereby creating the largest oil company in Britainand the third largest in the world: BP Amoco Plc. BP hasbeen in the process of establishing an important presencein Colombia since 1987, following some modest earlierinvolvement in the country. The company discovered the
oilfields of Cusiana and Cupiagua in the Department ofCasanare, which it currently operates as part of aconsortium formed by ECOPETROL (50%), BP (19%),TotalFinalElf (19%) and Triton (12%). These fields’production level peaked at 815,000 barrels per day in1999, of which 516,000 went for export (EIU, 2002a). Italso has a 50% holding in a consortium with ECOPETROLthat was formed to develop the Piedmonte Block, to thenorth of Cusiana and Cupiagua. In addition, followingits merger with Amoco, BP also has the use of a numberof licenses that were formerly controlled by Amoco.
BP entered Venezuela for the first time in 1976 toprovide technical services to the then recentlynationalized oil industry. In the early 1990s, whenPDVSA embarked upon the liberalization of the oilindustry, BP became an active participant in the biddingprocess. With the Amoco merger and its acquisition ofARCO, the new company secured a stake in 11 oilfieldslocated throughout Venezuela. This portfolio has beenreorganized into six fields –two in the west and four inthe east– producing 550 million barrels of oil. BP is theoperator of DZO in Maracaibo and Boquerón in Maturínon behalf of PDVSA, partners TotalFinalElf, Chevron,Statoil and the local companies Polar and Inelectra. BPis now seeking to position itself as the leading gasolinesupplier in Venezuela with a network of 98 servicestations. In conjunction with Burmah Castrol, BP is infirst place in the lubricants market. In August 2002, theVenezuelan Government signed pre-selection agreementswith seven foreign firms to develop five offshore naturalgas blocks in the Deltana Platform to the east ofVenezuela, which has proven reserves of 100 trillioncubic feet. Block 1 was obtained by British Petroleum,Block 2 by British Gas jointly with ChevronTexaco,Block 3 by El Paso and the Norwegian firm Statoil, Block4 by the Franco-Belgian group TotalFinalElf and Block5 by ExxonMobil.
In Bolivia, BP owns 30% of Empresa PetroleraChaco in Santa Cruz, together with Bridas Corporation(20%) and the Bolivian pension funds (50%). This firm’sstrengths include its existing production levels, significantexploration acreage, mid- and downstream assets, andexperienced staff.
BP is also one of the largest private producers anddistributors of natural gas in Latin America and theCaribbean. It owns sizeable reserves and maintains apresence in several countries, including Argentina, Brazil,Bolivia, Colombia, Mexico, Trinidad and Tobago, andVenezuela, and has expanded into new natural gas-firedgeneration projects as well.
BP’s Chaco fields in Bolivia produce 15,000 barrelsof liquids and 110 million cubic feet of natural gas perday. In the natural gas mid- and downstream markets,
Foreign investment in Latin America and the Caribbean, 2002 75
Pan American Energy (PAE) and Chaco19 have gainedextensive development experience in such projects as the215-kilometre Cruz del Sur Gas Pipeline, which linksArgentina and Uruguay, the oil pipeline between Boliviaand Brazil and such power generation projects as the 800-megawatt Central Dock Sud plant near Buenos Aires,the 88 megawatt Bulo Bulo power plant and the RioGrande Compression Plant.
In summary, with the gradual opening of thehydrocarbons subsector, some of the leading transnationaloil companies have included the Andean region in theirglobal strategy for building up a diversified array ofreserves. In these countries, better access was thedetermining factor in attracting foreign firms, while factorssuch as macroeconomic stability, political violence andthe cost of factors of production have been less influential.The oil companies have tended to move into countrieswhen there is an acceptable degree of certainty thatresources can be found and exploited, and they haveinvested large sums to this end. This pattern has not beenuniform across the Andean countries, however. While Peruand Bolivia privatized their oil industries, Venezuela andEcuador have developed association arrangementsbetween the existing State company and foreign firms toexploit those reserves that have a lower value or higherproduction costs. The exception is Colombia, since it hasbeen developing its oil industry on a joint basis with foreignfirms since the mid-1960s.
(b) Metal mining
Most of the Andean countries have rich mineraldeposits. Mining has traditionally been the foremosteconomic activity in Peru and Bolivia, and it has beengrowing in importance in Colombia and Venezuela. Theendowment of mining resources, as well as the relative sizeof the industry, varies markedly from one Andean economyto another, however. Peru is the world’s seventh largestproducer of gold and copper (it possesses 15% of the world’scopper reserves) and the second largest producer of silver,as well as accounting for a substantial share of the world’szinc and lead production. Bolivia is the world’s largest
producer of tin (which was a major driver of its economyuntil the crisis of 1985) and has sizeable reserves of gold,silver, copper, zinc and lead. Colombia has the largest provenreserves of coal in Latin America and is the fourth largestcoal exporter in the world (after the United States, Australiaand South Africa).20 Venezuela has rich endowments ofmining resources, including some that are used as rawmaterials in industry (bauxite for producing aluminium andiron ore for producing steel), and of precious metals, mainlygold. Venezuela is also the third largest coal producer inLatin America, after Colombia and Brazil.
As in the case of hydrocarbons, mining activitieshave been dominated by foreign capital at some pointsin the region’s history while, at others, the State has beenthe primary (or sometimes only) agent. With theeconomic reforms of the early 1990s, a number ofimportant regulatory changes were made in the miningsector. National governments began to withdraw fromthe activity and to give private (mainly foreign) investorsexploration and mining rights. Concessions were madeeasier to obtain, legal stability was improved and moresubstantial guarantees and incentives were offered toinvestors.
In the 1990s, there was an increase in worldconsumption that stimulated supply (and, therefore, theinitiation of new projects). In the end, this brought aboutmajor technological changes in the industry –then ledby TNCs– which were clearly evidenced in the miningand refining of iron, copper and gold (Moguillansky andBielschowsky, 2001).
Of all the Andean countries, Peru made the fastestprogress in reforming its mining sector. The renewal ofthe regulatory framework and the sale of State assets inthe early 1990s gave a significant boost to this industry.The privatization of Minero Perú and Centrominoperating units and deposits yielded US$ 276 millionand US$ 291 million, respectively, and generatedUS$ 1.592 billion and US$ 2.829 billion in projects(Paliza, 2000). The Quellaveco and La Granja deposits andthe copper firm Cerro Verde, which belonged to MineroPerú,21 were also sold around this time, as were Metal
19 BP has two significant business ventures in the Southern Cone: PAE, which is owned 60% by BP and 40% by Bridas Corporation ofArgentina; and Chaco, which is owned 30% by BP, 20% by Bridas Corporation and 50% by the Bolivian pension funds (http://www.bpgas-latinamerica.com).
20 Colombian coal is of very high quality and 95% of its production is exported.21 At the end of 1992, the copper deposit of Quellaveco was bought by Mantos Blancos, a South African firm active in Chile, which paid
US$ 12 million and committed a further US$ 562 million in investment. In March 1994, La Granja was sold to the Canadian companyCambior, which agreed to invest US$ 475 million. In November 1993, Cyrpus Amax Minerals Co. of the United States bought the copperfirm Cerro Verde for US$ 35 million, with an investment commitment of US$ 485 million (Paliza, 2000).
76 ECLAC
Oroya and the Antamina mine, which were owned byCentromin.22 In the past few years, the mining subsectorhas grown rapidly, thanks to fresh investments and newprojects coming on stream. Mining –along withhydrocarbons– has thus become the most attractiveactivity for foreign investors.
The most recent engine of growth in the Peruvianmining sector has been the development of the Antaminamine (owned by the Canadian firms Noranda, Rio Algomand Teck Corporation), in which US$ 2.3 billion has beeninvested. Antamina is thought to hold the largest reservesof copper and zinc in the world (EIU, 2002c). The minebegan exporting copper concentrates in July 2001, andby the first semester of 2002, Antamina had surpassedSouthern Peru Copper Corporation (SPCC) 23 as thecountry’s largest copper exporter. Antamina was expectedto increase Peru’s copper exports by 50%, its zinc exportsby 30% and its GDP by two percentage points.Persistently low international copper prices have placeda number of large operations in difficulties, however. Anexample is the Tintaya mine,24 owned by the Anglo-Australian firm BHP Billiton, which shut downoperations at the end of 2001. According to informationsupplied by the company, Tintaya’s activities will remainat a standstill until at least mid-2003, although it willcontinue to produce copper cathodes at full installedcapacity (34,000 tons per year).
Gold mining is another major activity in Peru. In2001, Minera Yanacocha, owned by Newmont MiningCorporation25 of the United States, was Peru’s leadinggold exporter and the largest gold mine in Latin America.Newmont is planning to invest some US$ 1 billion inYanacocha in the next five years. The Yanacocha mine,which now produces 40% of Peru’s gold, has the largestreserves and has been the largest single gold exporter
since 1998. Another gold mining venture is Pierina,owned by Barrick of Canada, which recently discovereda vein containing an estimated 3.4 million ounces of goldin northern Peru. Opened in May 1999, Pierina has theworld’s lowest production costs (EIU, 2002c).
Peru is also a major producer of silver, zinc and lead,in which the main players are local firms (CompañíaMinera Buenaventura, Centromin and Compañía MineraVolcán). Other leading lead producers are CompañíaMinera Atacocha, which has Peruvian stakeholders, andthe metallurgical complex of La Oroya, which is operatedby The Doe Run Corporation of the United States.26 Thezinc industry includes Empresa Minera Iscaycruz, whichis owned by Glencore International AG of Switzerland,and Phelps Dodge Mining Company, which has a 40%share in the San Vicente zinc mine. One of the majorsilver mining companies is the Canadian firm PanAmerican Silver Corporation, which operates theQuiruvilca mine.
In Bolivia, the 1985 tin crisis triggered a far-reaching structural reorganization of the miningindustry. The operations of the State-owned companyCorporación Minera de Bolivia (COMIBOL) weregradually wound down and, in 2000, following theprivatization of the Vinto tin and antimony smelter,which was bought by the British firm Allied Deals,27
and the Huanuni and Colquiri mines, the State ceasedto be involved in the country’s mining activities.28
Mining production has also diversified towards gold andpolymetals (copper, silver, zinc and lead). Today thebulk of production is in the hands of private –mostlyforeign-owned– companies. These include one of SouthAmerica’s largest mining concerns, the Kori Kollo mine,88% of which is owned by Newmont MiningCorporation of the United States.
22 In July 1996, the firm Metal Oroya –owner of the metallurgical complex of La Oroya– was sold to The Doe Run Corporation of the UnitedStates for US$ 122 million, with an investment commitment of US$ 127 million. At the same time, rights to exploit the Antamina minewere awarded to Rio Algom Ltd. and Inmet Mining Corp. of Canada, at a price of US$ 20 million plus investment commitments ofUS$ 2.52 billion over five years (Paliza, 2000).
23 At the end of 2001, SPCC was considered to be one of the world’s top 10 copper producers. It is owned by Grupo México of Mexico(54.2%) and The Marmon Group (14.2%) and Phelps Dodge Corporation (14%), both of the United States.
24 In October 1994, the Tintaya deposit was auctioned off to the United States firm Magna Koper Corporation for US$ 277 million plus US$104 million in investment commitments. In January 1996, Tintaya was bought by the then Australian firm The Broken Hill Proprietary Co.Ltd. (BHP).
25 Newmont Mining operates Minera Yanacocha jointly with the Peruvian firm Compañía de Minas Buenaventura.26 The Doe Run Corporation bought the complex at La Oroya from Centromin in 1997.27 In early 2002, Allied Deals went into involuntary provisional liquidation amid accusations of financial mismanagement. Huanuni came
under temporary control of COMIBOL, while Vinto was sold to Empresa Minera Colquiri, a joint-venture subsidiary of Bolivia’s largestmining company Compañía Minera del Sur (COMSUR, 51%) and British investment fund CDC Capital Partners (49%). The majorityshareholder in COMSUR is Bolivia’s President, Gonzalo Sánchez de Lozada.
28 COMIBOL signed a 30-year shared-risk lease contract agreement with Allied Deals to operate the Huanuni mining centre, which wasphysically transferred on 16 March 2000. The investment commitment for the first two years of the contact is US$ 10.25 million. In April2000, the Colquiri mine was leased for 30 years to Compañía Minera del Sur (COMSUR), with an investment commitment of US$ 2million in the first two years.
Foreign investment in Latin America and the Caribbean, 2002 77
In Venezuela, the State controls all mining reserves,but the authorities have taken steps to attract privateinvestment to a number of large-scale projects. In 2000the regulatory framework that had been in place since1941 was reformed in order to streamline concessionprocedures and offer investors greater legal security.
With its rich endowment of iron ore and bauxitedeposits, Venezuela has been developing large iron andsteel and aluminium industries for some time now.Ferrominera del Orinoco, a subsidiary of CorporaciónVenezolana de Guyana (CVG), is the largest firm involvedin mining iron ore. An ambitious strategy to attract privateinvestment has yielded mixed results, however. In 2001, aUS$ 900 million joint venture of BHP Billiton andSiderúrgica Venezolana S.A. (SIVENSA)29 was suspendedwhen the Anglo-Australian firm pulled out. A secondproject, involving an investment of close to US$ 400million that is being financed mainly by Phang Steel ofKorea, was launched in June 2000. In 1997, CorporaciónAluminios de Venezuela (CAV) was set up with a view toprivatizing the activity, but that plan has not borne fruit.The Administration of President Chávez has not pursuedthe idea of privatization, but it has continued to seekstrategic partnerships. In 2001 an agreement was signedwith the French firm Pechiney to expand the productioncapacity of Bauxilum, a subsidiary of CVG.30 CVG alsoplans to develop two new large bauxite deposits (El Palmarand Pijiguaos), regarding which discussions havereportedly been held with BHP Billiton.
Venezuela possesses vast gold reserves. The Ministryof Energy and Mines has awarded some 350 explorationand mining concessions. In 2001, the largest producer wasLa Camorra, owned by the United States firm HeclaMining, followed by the State-run firm CVG Minerven.Other major projects now underway are Las Cristinas(US$ 575 million) and Brisas del Cuyuni (US$ 300 million).
In September 2002, the Canadian-owned CrystallexInternational Corporation was selected by CVG to operatethe Las Cristinas gold mine, which is considered to beone of the world’s largest undeveloped gold deposits31
(http://www.vannessaventures.com). Crystallex
announced it would invest about US$ 500 million todevelop the mine, which should have come on stream in2004-2005. This operation took Vannessa Venture Ltd.by surprise, however, after it had bought a controllingstake in the operation in late 2001 for a “token price” ofUS$ 50 million, from Placer Dome32 (both companiesare Canadian). After putting the project on hold in 1998because of low world gold prices, Placer Dome sold itsshare in Minera Las Cristinas (MINCA) over theobjections of CVG. The Venezuelan authorities refusedto recognize the transaction and argued that Placer Domehad violated the terms of the original concession contract,which specified that CVG had to be consulted regardingthe sale of stock by any of the partners. This situationhas given rise to a legal battle between MINCA and CVG.As a result of all this, the project has been set back bymore than five years. At the end of 2002, Vannessa wasstill asserting ownership rights over Las Cristinas, despitethe agreement between CVG and Crystallex.33
Colombia’s large coal deposits have aroused theinterest of both local and foreign firms. In mid-1999, atthe time of the creation of Empresa Nacional MineraLtda. (MINERCOL) from the merger of two existingfirms, Ecocarbón and Mineralco, the governmentestablished a policy regarding the country’s coalresources. A new regulatory framework, the MiningCode, was approved in June 2001 with a view to makingthe Colombian mining industry more competitive byproviding investors with better contractual stability andmore favourable conditions. All mining contracts withMinercol are 30-year concessions.
Almost 60% of Colombia’s coal output comes fromEl Cerrejón, one of the largest open-pit mines in theworld. In 2002 it was bought by Consorcio Cerrejón ZonaNorte (CZN), formed by Glencore of Switzerland andthe two British firms Anglo American and BHP Billiton.El Cerrejón had previously been operated by Interior, asubsidiary of Exxon Corporation of the United States,jointly with the State company Sociedad Carbones deColombia (CARBOCOL). In October 2000, the British-Swiss consortium paid CARBOCOL US$ 437 million
29 SIVENSA is also a shareholder in Siderúrgica del Orinoco (SIDOR). In 1998, the government sold a stake in SIDOR to the consortiumSierurgía Amazonia, formed by several Latin American firms including Techint, Hylsamex and Usiminas.
30 CVG operates four companies in the aluminium segment: two smelters, Venalum and Alcasa; a carbon anode plant, Carbonorca; and abauxite production plant, Bauxilum. Up to January 2002, those four firms has been vertically integrated in Corporación Aluminios deVenezuela (CAV), which had suffered from mismanagement and had run up substantial debts.
31 In 1997, Placer Dome estimated the gold reserves at Las Cristinas to be 11.8 million ounces (www.vannessavenures.com).32 In 1997, Placer Dome suspended construction of the mine because of low gold prices. Then, in June 2000, it made a new investment of
US$ 116 million.33 Vanessa Venture is still awaiting a final ruling on an appeal it lodged with Tribunal Supremo de Justicia (TSJ, the supreme court). It has
also said that it will seek international arbitration for redress under an investment protection agreement between Canada and Venezuela.Vannessa estimates that it has spent around US$ 170 million on exploration and preparatory work at the site (EIU, 2002b).
78 ECLAC
for its stake in El Cerrejón and, in early 2002, boughtExxon Corporation’s share for a sum of between US$550 and US$ 600 million, which will enable it to operatethe mine until 2033 (La Nota, 27 December 2002). Thesouthern and central zones (Cerrejón Zona Sur andCerrejón Zona Central) are controlled by the consortiumCarbones del Cerrejón (CDC), which is formed by AngloAmerican Plc., BHP Billiton and Glencore. In early 2002,CZN won the bidding to begin exploring the Patilla field,which has estimated reserves of 65 million tons. In mid-2002, CDC was absorbed by CZN, which moved it upfrom position 26 to position 17 in the ranking of thecountry’s largest firms by sales (US$ 825 million) (LaNota, 23 August 2002).
In 1995 the La Loma mine –a project managed by aUnited States company Drummond– came on stream.The mine yielded over 12 million tons in 2001, and itsoutput is expected to continue increasing over the nextfive years. The government predicts that recentdevelopments in the industry will allow coal exports todouble in 2005-2010 (EIU, 2002a).
Thanks to the discovery of the high-grade CerroMatoso deposit in 1956, Colombia also has large reservesof nickel and is currently among the top 10 nickelproducers in the world.34 Cerro Matoso was privatized
in 1996, when it was sold to Glencore for US$ 375million.
Ecuador opened its mining sector to foreigninvestment in the 1980s in an effort to find alternativesto petroleum, but development in the sector has been scantbecause of continuous regulatory changes anduncertainty over the enforcement of property andexploration rights. The 1991 Mining Act provides betterprotection to local and foreign investors than theypreviously enjoyed, and in 2000 further reforms wereenacted to increase the sector’s attractiveness.
In summary, regulatory changes and TNC strategieshave brought large flows of foreign investment into theAndean Community countries for the development ofnew mining ventures. The most active companies in thesubregion include Newmont Mining Corporation of theUnited States, which operates gold mines in Peru andBolivia; the Anglo-Australian corporation BHP Billiton,which mines copper in Peru and coal in Colombia;Noranda, Rio Algom and Teck Corporation of Canada,which are all in the copper industry in Peru; and Glencoreof Switzerland, which mines coal and nickel in Colombia.This overview gives an indication of the geographicaland product diversification of the modern TNCs operatingin the mining sector.
2. Access to local services and infrastructure markets
In the early 1990s, a series of reforms were implementedwhich permitted and, in many cases, encouraged foreigninvestors to move into basic services provision andinfrastructure activities. The mechanism that was mostcommonly used –although with widely varyingoutcomes– was the privatization of public assets. Thepioneers in this area were Peru and Venezuela, followedby Colombia and Bolivia. Ecuador, by contrast, has hada great deal of difficulty carrying forward some of itsinitiatives for downsizing the State’s role in the economy.
In Peru, at the start of the 1990s, the Administrationof President Alberto Fujimori embarked upon a plan toreduce the State’s involvement in the economy to aminimum. The government eliminated all the monopolyprivileges enjoyed by State enterprises, lifted allrestrictions and prohibitions on external trade, andestablished non-discriminatory treatment for foreigninvestment. The purpose of the privatization process wasto scale back State participation in economic activitiesor to eliminate it altogether.
This programme was launched in 1992 with the saleof the steel producer Hierroperú and continued with thedivestment of the airline Aeroperú and part of twotelephone companies. Subsequent privatizations in thetelecommunications, energy, banking, tourism andmanufacturing sectors were completed in 1998, but theprogramme then began to languish, particularly in theareas of electrical energy and road infrastructure.Between 1991 and 1998, more than 180 privatizationswere carried through, generating revenues of US$ 7.72billion and US$ 7.935 billion in investment projects(Paliza, 2000).
Today, President Alejandro Toledo’s Administrationhas made privatizations and concessions one of thecornerstones of its economic policy. In February 2002,Peru made a commitment to the International MonetaryFund (IMF) to take in US$ 700 million from sales andconcessions in 2002 and US$ 1 billion in 2003. Up toJune 2002, the government had raised around US$ 400million through privatizations, chiefly thanks to the sale
34 In 2001, Colombia was the eighth largest nickel producer in the world, after Russian, Australia, Canada, New Caledonia, Indonesia, Cubaand China (World Bureau of Metal Statistics, 2002).
Foreign investment in Latin America and the Caribbean, 2002 79
and concession of power generation and distributioncompanies. It has become very difficult to take theprivatization process further, however, because ofmounting public dissent. The greatest setback so far camein mid-2002, when the authorities capitulated to protestsagainst the sale of electricity assets in the south of thecountry.
Even though the government has altered its policy oncontroversial privatizations, it remains optimistic withregard to the sale of some of the State’s flagship enterprises.These firms include the Servicio de Abastecimiento deAgua Potable y Alcantarillado de Lima (SEDAPAL), theMantaro hydroelectric plant –which is worth an estimatedUS$ 1.5 billion– and some of the lesser assets of the Stateoil company, PETROPERU.
Venezuela began a privatization programme in 1991,but its implementation was hesitant and short-lived.Under this initiative, 45% of the State-owned airline andthe telephone company Compañía Anónima Nacional deTeléfonos de Venezuela (CANTV) were sold to foreigninvestors, but the process then ground the a halt.Venezuela remains an economy in which the State has amajor hand. A sharp turnaround in privatization policycame in December 1998, with the election of PresidentHugo Chávez. The new Administration made it clear thatstrategic economic assets such as oil production,electricity transmission and hydroelectric powergeneration would not be sold, but it did offer some shared-risk ventures in certain areas.
Colombia began its programme of privatizationsand concessions in 1994, which focused primarily onthe areas of electr ical energy, banking andtelecommunications. These initiatives stalled in 1999,but have picked up their pace somewhat in the last threeyears. The public sector continues to be a major supplierof electric power, is still the largest provider oftelecommunications services –though the EmpresaNacional de Telecomunicaciones (TELECOM) andother municipal firms– and maintains a monopoly inpetroleum and natural gas through ECOPETROL. TheColombian authorities have no plans to privatize eitherECOPETROL or TELECOM any time soon. A keyfactor for the future of the privatization process is theoutcome of the peace negotiations with guerrilla groups,which are staunchly opposed to the sale of State assetsto foreign investors.
During Bolivian President Gonzalo Sánchez deLozada’s first term in office, his Administration used aninnovative privatization programme involving five major
State-owned enterprises to further the economicliberalization process and downsize the State’s role inthe economy. Rather than paying the government forthese assets, investors received a 50% share in the firmsand signed an agreement which committed them tomaking certain investments over a set period of time.The remaining 50% went to a Collective CapitalizationFund (FCC), whose dividends were administered by twopension funds (see box II.1).
In Ecuador, the authorities have recently beenmoving away from the protectionist models based onheavy State involvement in the economy thatcharacterized a number of past Administrations. In 1998important amendments were made to the Constitutionwith a view to facilitating private-sector engagement inthe economy. Under the new provisions, the State isresponsible for supplying public services such as drinkingwater, electric power, telecommunications, road-building,and road and port maintenance. However, the authoritiesare empowered to delegate this responsibility to theprivate sector by means of concessions, capitalization orthe sale of shares in such assets. The Administration ofPresident Gustavo Noboa made a strong move in thisdirection, seeking to separate the political responsibilityof the government from the economic activities of theproduction sector by actively encouraging the sale ofState assets.35 In 2000, the government sponsored anumber of bills directed towards this objective, but failedto garner sufficient support for them in Congress. Themost significant change in this connection has been thepassage of the Economic Transformation Act, underwhich private investors may acquire up to 51% of theshares in electricity and telecommunications companies.
(a) Telecommunications: burgeoning growth inmobile telephony
In the early 1990s, telecommunicationsinfrastructure in the Andean countries suffered frommany shortcomings due to under-investment andtechnological lags. During that period, nationalauthorities introduced a number of reforms to attractprivate capital and, with it, investment and competition.In the first half of the 1990s, Venezuela and Peruprivatized their public telecommunications companiesand gave foreign operators a monopoly position in themarket for a fixed period of time. In 1995, Bolivia didsomething similar when it capitalized Empresa Nacionalde Telecomunicaciones (ENTEL). At the other end ofthe spectrum are Colombia and Ecuador, where fixed
35 At the end of 2002, the Ecuadorian State had a stake in about 190 concerns in the sectors of agriculture, telecommunications, energy,finances, industry, mining, storage, transport and tourism.
80 ECLAC
telephony continues to be controlled by the State. Ataround this same time, all the Andean countries openedup other segments of the telecommunications market tocompetition, particularly mobile telephony, in which asmall number of international operators have become themain players. Telecommunications has thus been one ofthe more dynamic subsectors of the Andean economies,attracting large investments and bringing aboutsubstantial improvements in infrastructure.
With the beginning of these privatizationprogrammes, the largest telecommunications operator inLatin America, Telefónica of Spain, became one the mostimportant actors in the Andean subregion. Telefónica hasbeen the winning bidder in two of the three privatizationsof fixed telephony utilities held in the subregion so far.In 1991, it formed part of a consortium led by GTECorporation –now Verizon Communications– whichgained control of Compañía Anónima Nacional deTeléfonos de Venezuela (CANTV) with an investmentof close to US$ 1.89 billion. Although the Spanish firmholds a minority interest, there has been speculation thatit has tried to increase its stake in CANTV. In fact, it isthought Telefónica may have been one of the leadingforces behind the recent public tender offer (PTO) forCANTV announced by Electricidad de Caracas, whichis controlled by AES Corporation.36 In early 1994,Telefónica bought 40% of the Peruvian companiesEmpresa Nacional de Telecomunicaciones (ENTEL), anational and international long distance monopoly, andCompañía Peruana de Teléfonos (CPT, or COPERTEL),Lima’s telephone company. Telefónica surprised its rivalbidders by offering close to US$ 2 billion and thenmerging the two firms to form Telefónica del Perú. In2000, as part of “Operation Veronica”, Telefónica paidUS$ 3.218 billion to gain outright control of its Peruviansubsidiary (ECLAC, 2001).
In Venezuela and Peru, the winning consortiumsmaintained a monopoly in the fixed telephony market,which placed them at a great advantage in dealing withthe new technological challenges arising in thetelecommunications sector.37 At that same time, two otherfirms –BellSouth of the United States and Telecom ItaliaMobile (TIM) of Italy– which were emerging as majorplayers in the mobile telephony market began to competewith Telefónica in the fixed telephony market. Then, in
mid-1999, BellSouth was awarded a concession toprovide fixed telephony services in Peru and later, in2001, won a similar contract in Venezuela. Telecom Italiahad also gained experience in this segment of thesubregional market, having bid successfully in thecapitalization of Bolivia’s State-run company, ENTEL.Under the terms of the privatization agreement, ENTELretained a monopoly over local, long distance andinternational service, with an investment of US$ 626million. TIM then began to invest heavily in the fixedtelephony market in Venezuela. Neither BellSouth norTIM has achieved a significant market share in Peru andVenezuela, however.
The Colombian and Ecuadorian authorities have notprivatized their basic telephony companies, which haslimited foreign investors’ access to these markets. InColombia, a number of joint ventures were undertakenwith foreign firms to expand local telephone service, andwhile public utilities continue to control the market,competition among them has increased sharply.38 In2000, the municipal authorities abandoned an attempt toprivatize 51% of Empresa de Telecomunicaciones deBogotá (ETB) –valued at US$ 710 million– because ofinvestor concerns about security in the country. InEcuador, since 1992 successive Administrations havetried to privatize the State telecommunications companiesAndinatel and Pacifictel. Following an unsuccessfulattempt to privatize 35% of these two firms in 1997 and1998, subsequent regulatory modifications enabled thegovernment to divest itself of a 51% share of bothAndinatel and Pacifictel. This privatization operation maybe completed in 2003, depending on the economic policystance adopted by the new Administration. In this regard,the government has asked the firms’ current managementto undertake competitive and transparent selectionprocesses –under the supervision of the competentinstitution– to find operators interested in administeringthem. In 2002 a second attempt to privatize theadministration of Pacifictel met with failure when novalid bids were received.39 The only bid was made bythe Swedish firm Telia, but it did not include the US$ 10million guarantee required under the conditions of thecall to tender (www.bsteam.telecomindice7.htm).
In general, the limited volume of foreign investmentbeing made, particularly in the less developed countries,
36 In the event of a successful takeover, AES proposed to sell the mobile telephony subsidiary (Movinet), and is believed to have entered intodiscussions with Telefónica in this connection.
37 Telefónica del Perú’s monopoly in fixed telephony expired in August 1998, and CANTV’s in November 2000.38 Empresas Colombiana de Telecomunicaciones (TELECOM), Empresa de Telecomunicaciones de Bogotá (ETB) and Empresas Públicas de
Medellín (EPM) controlled 79% of local telephone services.39 The tender offered a five-year concession to administer the company, which, to date, has 587,000 clients (44% of the country’s fixed lines).
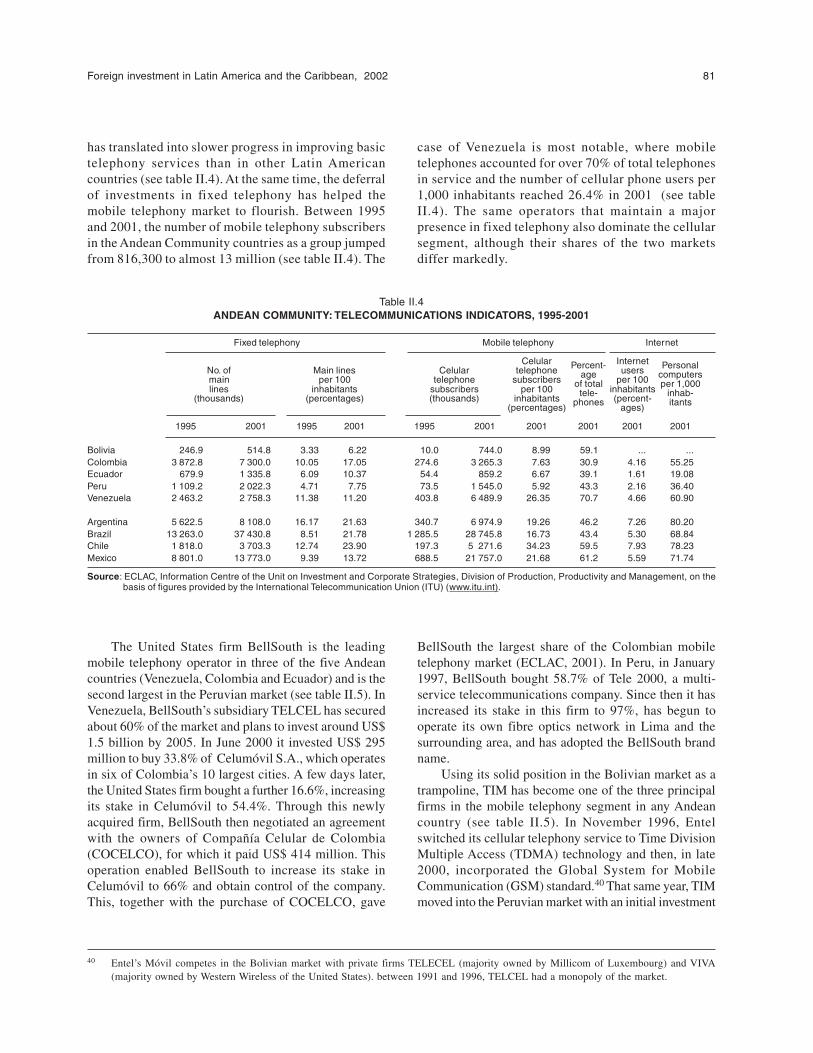
Foreign investment in Latin America and the Caribbean, 2002 81
has translated into slower progress in improving basictelephony services than in other Latin Americancountries (see table II.4). At the same time, the deferralof investments in fixed telephony has helped themobile telephony market to flourish. Between 1995and 2001, the number of mobile telephony subscribersin the Andean Community countries as a group jumpedfrom 816,300 to almost 13 million (see table II.4). The
case of Venezuela is most notable, where mobiletelephones accounted for over 70% of total telephonesin service and the number of cellular phone users per1,000 inhabitants reached 26.4% in 2001 (see tableII.4). The same operators that maintain a majorpresence in fixed telephony also dominate the cellularsegment, although their shares of the two marketsdiffer markedly.
Table II.4ANDEAN COMMUNITY: TELECOMMUNICATIONS INDICATORS, 1995-2001
Fixed telephony Mobile telephony Internet
Celular Percent- Internet PersonalNo. of Main lines Celular telephone age users computersmain per 100 telephone subscribers of total per 100 per 1,000lines inhabitants subscribers per 100 tele- inhabitants inhab-
(thousands) (percentages) (thousands) inhabitants phones (percent- itants(percentages) ages)
1995 2001 1995 2001 1995 2001 2001 2001 2001 2001
Bolivia 246.9 514.8 3.33 6.22 10.0 744.0 8.99 59.1 ... ...Colombia 3 872.8 7 300.0 10.05 17.05 274.6 3 265.3 7.63 30.9 4.16 55.25Ecuador 679.9 1 335.8 6.09 10.37 54.4 859.2 6.67 39.1 1.61 19.08Peru 1 109.2 2 022.3 4.71 7.75 73.5 1 545.0 5.92 43.3 2.16 36.40Venezuela 2 463.2 2 758.3 11.38 11.20 403.8 6 489.9 26.35 70.7 4.66 60.90
Argentina 5 622.5 8 108.0 16.17 21.63 340.7 6 974.9 19.26 46.2 7.26 80.20Brazil 13 263.0 37 430.8 8.51 21.78 1 285.5 28 745.8 16.73 43.4 5.30 68.84Chile 1 818.0 3 703.3 12.74 23.90 197.3 5 271.6 34.23 59.5 7.93 78.23Mexico 8 801.0 13 773.0 9.39 13.72 688.5 21 757.0 21.68 61.2 5.59 71.74
Source: ECLAC, Information Centre of the Unit on Investment and Corporate Strategies, Division of Production, Productivity and Management, on thebasis of figures provided by the International Telecommunication Union (ITU) (www.itu.int).
The United States firm BellSouth is the leadingmobile telephony operator in three of the five Andeancountries (Venezuela, Colombia and Ecuador) and is thesecond largest in the Peruvian market (see table II.5). InVenezuela, BellSouth’s subsidiary TELCEL has securedabout 60% of the market and plans to invest around US$1.5 billion by 2005. In June 2000 it invested US$ 295million to buy 33.8% of Celumóvil S.A., which operatesin six of Colombia’s 10 largest cities. A few days later,the United States firm bought a further 16.6%, increasingits stake in Celumóvil to 54.4%. Through this newlyacquired firm, BellSouth then negotiated an agreementwith the owners of Compañía Celular de Colombia(COCELCO), for which it paid US$ 414 million. Thisoperation enabled BellSouth to increase its stake inCelumóvil to 66% and obtain control of the company.This, together with the purchase of COCELCO, gave
40 Entel’s Móvil competes in the Bolivian market with private firms TELECEL (majority owned by Millicom of Luxembourg) and VIVA(majority owned by Western Wireless of the United States). between 1991 and 1996, TELCEL had a monopoly of the market.
BellSouth the largest share of the Colombian mobiletelephony market (ECLAC, 2001). In Peru, in January1997, BellSouth bought 58.7% of Tele 2000, a multi-service telecommunications company. Since then it hasincreased its stake in this firm to 97%, has begun tooperate its own fibre optics network in Lima and thesurrounding area, and has adopted the BellSouth brandname.
Using its solid position in the Bolivian market as atrampoline, TIM has become one of the three principalfirms in the mobile telephony segment in any Andeancountry (see table II.5). In November 1996, Entelswitched its cellular telephony service to Time DivisionMultiple Access (TDMA) technology and then, in late2000, incorporated the Global System for MobileCommunication (GSM) standard.40 That same year, TIMmoved into the Peruvian market with an initial investment
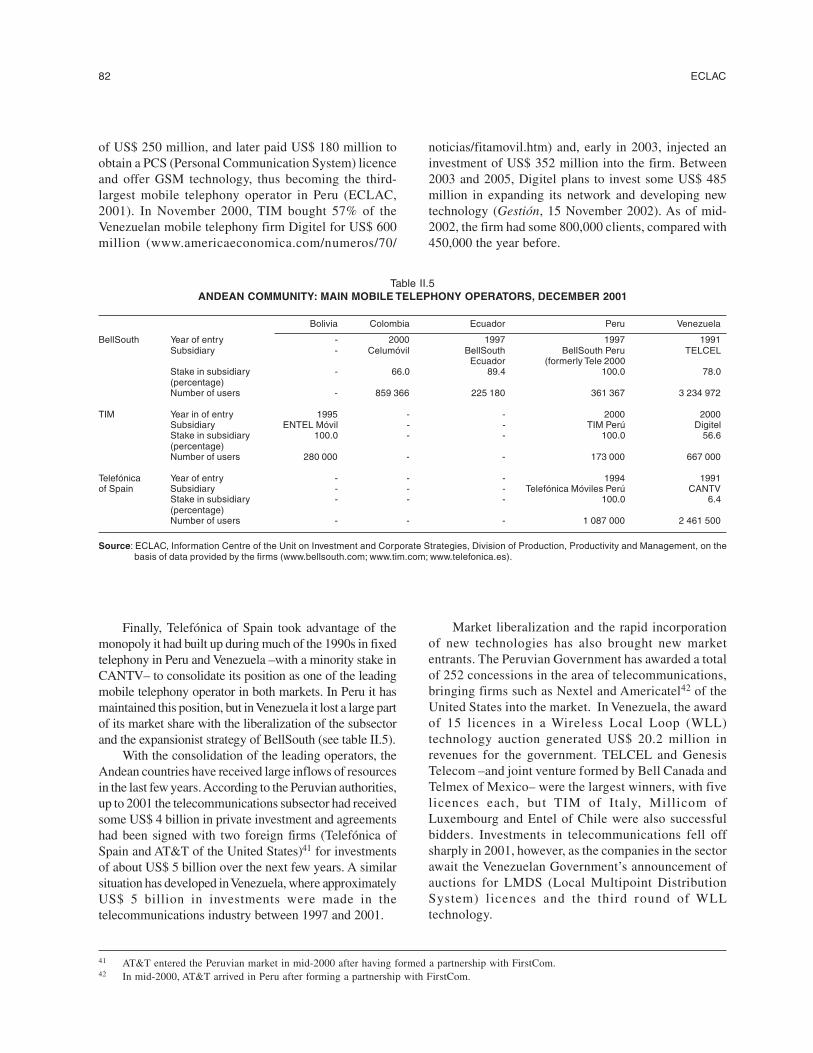
82 ECLAC
of US$ 250 million, and later paid US$ 180 million toobtain a PCS (Personal Communication System) licenceand offer GSM technology, thus becoming the third-largest mobile telephony operator in Peru (ECLAC,2001). In November 2000, TIM bought 57% of theVenezuelan mobile telephony firm Digitel for US$ 600million (www.americaeconomica.com/numeros/70/
noticias/fitamovil.htm) and, early in 2003, injected aninvestment of US$ 352 million into the firm. Between2003 and 2005, Digitel plans to invest some US$ 485million in expanding its network and developing newtechnology (Gestión, 15 November 2002). As of mid-2002, the firm had some 800,000 clients, compared with450,000 the year before.
Table II.5ANDEAN COMMUNITY: MAIN MOBILE TELEPHONY OPERATORS, DECEMBER 2001
Bolivia Colombia Ecuador Peru Venezuela
BellSouth Year of entry - 2000 1997 1997 1991Subsidiary - Celumóvil BellSouth BellSouth Peru TELCEL
Ecuador (formerly Tele 2000Stake in subsidiary - 66.0 89.4 100.0 78.0(percentage)Number of users - 859 366 225 180 361 367 3 234 972
TIM Year in of entry 1995 - - 2000 2000Subsidiary ENTEL Móvil - - TIM Perú DigitelStake in subsidiary 100.0 - - 100.0 56.6(percentage)Number of users 280 000 - - 173 000 667 000
Telefónica Year of entry - - - 1994 1991of Spain Subsidiary - - - Telefónica Móviles Perú CANTV
Stake in subsidiary - - - 100.0 6.4(percentage)Number of users - - - 1 087 000 2 461 500
Source: ECLAC, Information Centre of the Unit on Investment and Corporate Strategies, Division of Production, Productivity and Management, on thebasis of data provided by the firms (www.bellsouth.com; www.tim.com; www.telefonica.es).
Finally, Telefónica of Spain took advantage of themonopoly it had built up during much of the 1990s in fixedtelephony in Peru and Venezuela –with a minority stake inCANTV– to consolidate its position as one of the leadingmobile telephony operator in both markets. In Peru it hasmaintained this position, but in Venezuela it lost a large partof its market share with the liberalization of the subsectorand the expansionist strategy of BellSouth (see table II.5).
With the consolidation of the leading operators, theAndean countries have received large inflows of resourcesin the last few years. According to the Peruvian authorities,up to 2001 the telecommunications subsector had receivedsome US$ 4 billion in private investment and agreementshad been signed with two foreign firms (Telefónica ofSpain and AT&T of the United States)41 for investmentsof about US$ 5 billion over the next few years. A similarsituation has developed in Venezuela, where approximatelyUS$ 5 billion in investments were made in thetelecommunications industry between 1997 and 2001.
Market liberalization and the rapid incorporationof new technologies has also brought new marketentrants. The Peruvian Government has awarded a totalof 252 concessions in the area of telecommunications,bringing firms such as Nextel and Americatel42 of theUnited States into the market. In Venezuela, the awardof 15 licences in a Wireless Local Loop (WLL)technology auction generated US$ 20.2 million inrevenues for the government. TELCEL and GenesisTelecom –and joint venture formed by Bell Canada andTelmex of Mexico– were the largest winners, with fivelicences each, but TIM of Italy, Millicom ofLuxembourg and Entel of Chile were also successfulbidders. Investments in telecommunications fell offsharply in 2001, however, as the companies in the sectorawait the Venezuelan Government’s announcement ofauctions for LMDS (Local Multipoint DistributionSystem) licences and the third round of WLLtechnology.
41 AT&T entered the Peruvian market in mid-2000 after having formed a partnership with FirstCom.42 In mid-2000, AT&T arrived in Peru after forming a partnership with FirstCom.
Foreign investment in Latin America and the Caribbean, 2002 83
In Colombia and Ecuador, the situation hasdeveloped rather differently. In Colombia, the concessionof three new PCS licences was delayed by pressure fromthe firms already holding such licences (BellSouth andCOMCEL, a subsidiary of América Móvil of Mexico).Finally, in January 2003, Colombia Móvil –a consortiumof the Colombian firms Empresas Públicas de Medellín(EPM) and ETB– obtained the right to operate the threenew licenses. EPM is owned by the City of Medellínand is the leading public services provider in Colombia,while ETB is owned by the Colombian Government andis the country’s second-largest fixed telephony company.In late 2002, the Government of Ecuador announced itwould auction off a third mobile telephone license –licenses are currently held by BellSouth and Porta (asubsidiary of América Móvil), but the auction waspostponed at Porta’s request.43 This development is ofparticular interest, since it seems to indicate that AméricaMóvil is beginning to emerge as an important newoperator in the Andean subregion. This conglomerate,in which SBC Communications, Teléfonos de Méxicoand Bell Canada all have an interest, has obtained a shareof the market in Colombia, Ecuador and, recently,Venezuela. It also was involved in the unsuccessfulattempt to privatize Ecuador’s State-owned Pacifictel.
In summary, the telecommunications subsector hasbeen the recipient of sizeable amounts of foreigninvestment, particularly in those of the Andean countrieswhose markets have been opened up to competition.After the first few privatization operations, the majorinternational operators have concentrated their efforts onexpanding their shares in the mobile telephony market.In fact, cellular telephone penetration rates in the Andeancountries are quite high. Competition, the entry of newoperators and the ongoing introduction of state-of-the-art technology have brought about significantimprovements in service, coverage and prices which haveenabled leading firms such as BellSouth to meet thechallenge posed by new entrants despite the fact that theydo not have a subregional network of their own.
(b) Electric power: towards an Andean duopoly?
As in the telecommunications industry, most Andeancountries have encouraged private investment in the threesegments of the electric power subsector (generation,transmission and distribution) as a means of improvingand expanding available energy infrastructure. Outcomeshave varied widely, however.
Nearly all the countries have amended their sectoralregulations and devised mechanisms for transferring themain public enterprises to private ownership.Nonetheless, the ambitious privatization and concessionschemes put in place in Bolivia, Colombia and Peru facedopposition from civil society, and this tended to erodeinterest among potential foreign investors. In Ecuadorand Venezuela, several attempts at privatization have alsobeen abandoned, either as a result of political oppositionin Congress or as new authorities take office. In countrieswhere privatizations did take place, assets have tendedto gravitate into the hands of a few Spanish, United Statesand Chilean firms, such as Endesa-España and AESCorporation.
In Peru, a legal framework allowing the sale of allState firms in the subsector was established in 1992. Thisled to privatization of the restructured business divisionsof ELECTROLIMA,44 together with the distribution andgeneration units of ELECTROPERU.45 In the mid-1990s,the authorities in Bolivia carried out a far-reaching reformof the subsector, which allowed three of the maingenerating units of the State-owned Empresa Nacionalde Electricidad to be included in its Capitalization Plan.46
In 1996, the Colombian Government unblocked the saleof major electric power assets and embarked upon aprivatization policy that resulted in about half of thecountry’s generating and distribution capacity passinginto private ownership. The process attracted investmentsof about US$ 6 billion into the electric power subsector.
The initial enthusiasm engendered by privatizationsin Peru and Colombia faded rapidly, however. Thepopulation in Peru associated the sale of State assets with
43 In March 2000, the Mexican firm TELMEX acquired a 60% equity interest in Conecel S.A. as part of an investment programme aimed atstrengthening Porta’s coverage and modernizing its network.
44 To facilitate its privatization, ELECTROLIMA was split into five independent businesses: one generating firm – Empresa de GeneraciónEléctrica de Lima (EDEGEL), and four distributors – Luz del Sur, Empresa de Distribución Eléctrica de Lima Norte S.A. (EDELNOR),Ede-Chancay and Ede-Cañete.
45 The Government retained a 40% stake in these assets to be sold subsequently; 10% was reserved for employees.46 After making a contribution of US$ 140 million, 50% of the ownership and management of these companies was sold to United States
investors: Duke Energy (Empresa Eléctrica Conari S.A., US$ 59 million), Energy Initiatives (Empresa Eléctrica Guaracachi S.A., US$ 47million) and the Constellation Energy Group consortium (Empresa Eléctrica Valle Hermoso, US$ 34 million). In 1998, the country’s largestgenerator, Compañía Boliviana de Energía Eléctrica (COBEE), was acquired by NRG Energy Inc. also of the United States.
84 ECLAC
an increase in unemployment and utility-rate hikes, whichgenerated strong popular opposition. In June 2002, theGovernment cancelled the US$ 167 million sale of twoelectric power generators (EGASA and EGESUR) to theBelgian firm Tractebel in the wake of serious protests; itthen suspended the remainder of its privatizationprogramme indefinitely. In Colombia, plans to increaseprivate-sector participation were discontinued in viewof the scant interest shown by foreign investors inelectricity distribution firms that had been experiencingfinancial difficulties (in addition to being involved in legaldisputes), compounded by continuous guerrilla attacks.The sale of ISAGEN de Generación y Comercializaciónde Energía (valued at US$ 415 million) was postponedindefinitely, having failed to attract foreign investors.Privatization of Interconexión Eléctrica S.A. (ISA) hasalso been held back; in order to capitalize the firm, a24% stake was instead sold directly to the public betweenNovember and December 2000. This operation raised atotal of US$ 74 million. Despite terrorist attacks(numbering 194 in 2001), the ISA management hasstriven to double profits and project itself abroad throughprojects in Ecuador, Peru and Venezuela (see box II.2).
Although these programmes have been very short-lived, there has been one major winner: the Spanish firmEndesa – firstly, as a member of the consortia thatsubmitted the winning bids for some of the most attractiveassets, and then by acquiring a controlling interest in theChilean group Enersis, which was also an activeparticipant in Andean privatizations. Even before thisacquisition, Endesa and Enersis had been workingtogether to form consortia to bid on the different assetsbeing privatized. In Colombia, Endesa-España acquiredcontrol of Comercializadora y Distribuidora de EnergíaS.A. (CODENSA) and Empresa Generadora de EnergíaS.A. (EMGESA), both of Bogotá, and later added CentralHidroeléctrica de Betania, which had been acquired byan Enersis subsidiary. In Peru, the Spanish transnationalparticipated in the consortia that acquired Empresa deDistribución Eléctrica de Lima Norte S.A. (EDELNOR),Empresa de Generación Termoeléctrica de Ventanilla(ETEVENSA) and Empresa Eléctrica de Piura (EEPSA),in addition to several other assets acquired by Enersisand its subsidiaries.
With its acquisition of Enersis, Endesa-Españaconsolidated its position as the leading energy group inLatin America (Calderón, 2003); this also, however,created a number of problems for it with regulatoryauthorities, especially in Peru. In mid-1997, Endesa-España was already displaying a degree of horizontalconcentration in the generation market (ETEVENSA andEEPSA), but its acquisition of assets owned by Enersis–Empresa de Generación Eléctrica de Lima (EDEGEL)
and the distributor Edelnor– not only increased this, butalso gave the firm a high degree of vertical concentration(generation-distribution), which was expressly prohibitedunder Peruvian energy regulations. In November 1997,in an unprecedented decision, the Peruvian Congresspassed an anti-trust act for the electric power subsectorwhich, curiously enough, allowed vertical integration ofup to 5% and horizontal concentration of up to 15%, ifrequested in advance. Despite this, the National Institutefor the Defence of Competition and Protection ofIntellectual Property (INDECOPI) accepted the petitionfiled by ENDESA, which presented its 31%concentration in both cases as a fait accompli.
In Venezuela, the electric power subsector is madeup of both State-owned firms (which account for themajority of assets) and a number of private operators.The State infrastructure is substantially degraded, andan estimated US$ 12 billion in investment is required(EIU, 2002b). In September 1999, a new regulatoryframework was approved which allows privateinvestment in State firms and divides electric poweractivities into separate generation, distribution andtransmission segments in preparation for the opening ofthe subsector. To date, however, progress in this directionhas been very slow, and in 2001 the government departedstill further from these objectives by declaring that thelargest State firms –the generator Empresa deElectrificación del Caroní (EDELCA), and the distributorCompañía Anónima de Administración y FomentoEléctrico (CADAFE)– were strategic assets and wouldtherefore not be privatized. The authorities have also donean about-turn regarding the privatization of EnergíaEléctrica de Venezuela (ENELVEN); Energía Eléctricade la Costa Oriental (ENELCO); Energía Eléctrica deBarquisimeto (ENELBAR); and Sistema Eléctrico deMonagas y Delta Amacuro (SEMDA).
It was against this backdrop that one of the mostambitious strategies implemented in Latin America beganto unfold, as the United States firm AES Corporationemployed an aggressive acquisitions programme toposition itself among the leaders in the region’s electricpower subsector. One of the epicentres of this processwas the Andean Community, and particularly Venezuela.In June 2000, Venezuela’s regulatory system was put tothe test by a hostile takeover bid for the country’s largestprivate electric power firm, Electricidad de Caracas(EDC), for which AES Corporation offered US$ 1.6billion. The National Securities and ExchangeCommission (CNV) suspended the AES bid on twooccasions, arguing in support of the rights of minorityshareholders. Pressure from CNV forced the firm tobroaden its bid to include all EDC shares wishing toparticipate, thereby benefiting minority interests. In the
Foreign investment in Latin America and the Caribbean, 2002 85
end, the takeover was authorized, since this was seen asa means of sending out a positive signal to foreigninvestment. Once the acquisition was accomplished, AESsold off a number of unprofitable EDC assets in Colombiato the Spanish firm Unión Fenosa. Like Endesa-España,AES further expanded its presence in the Andeancountries in 2000 by acquiring the Chilean firm, Gener,which had assets in Peru and Colombia. It then alsoattempted to use a PTO to purchase thetelecommunications firm CANTV, but this operation wasultimately aborted.
In Ecuador the government’s privatization plan forthe electric power subsector has run into difficulties. In1999, the State-owned Instituto Ecuatoriano deElectrificación (INECEL) was divided into seven separateentities as a means of making it more attractive to
potential foreign buyers.47 The plan was to sell 51% ofthe equity in 17 distribution firms.48 In late 2001, threeinternational corporations were showing interest inparticipating in this privatization: Unión Fenosa of Spain,AES Corporation of the United States, and PérezCompanc of Argentina. The Ecuadorian authoritiessubsequently planned to sell off the transmission firmand six generators during 2002. In the case of Hidropaute,the country’s largest generator, 49% of its equity was tobe sold to the private sector. In early 2002, thegovernment was also intending to offer a concession forelectric power distribution in the City of Guayaquil,where 30% of all the country’s consumers reside.Nonetheless, in March and April of that year itsprivatization plans broke down because of the lowvaluation obtained by the 17 distribution firms (about
47 One transmission firm, Transelectric S.A., and six generators, Hidropaute S.A., Hidroagoyán S.A., Hidropucará S.A., TermoesmeraldasS.A., Termopichincha S.A. and Electroguayas S.A. In early 2001, Hidroagoyán took over Hidropucará.
48 Of the other 49% the workers would receive 10%, with the remainder going to the beneficiaries of popular capitalism.
Box II.2INTERCONEXIÓN ELÉCTRICA S.A. (ISA): A MULTI-ANDEAN FIRM
Interconexión Eléctrica (ISA) isColombia’s leading power transmissionfirm. Although its main activity is thetransportation of high-voltage power,the firm is noteworthy for its use inrecent years of a growth strategybased on two central pillars: (i)internationalization of its activities inAndean Community countries andexploitation of network synergies; and(ii) incipient diversification of activitiestowards the telecommunications sector.The ISA business group consists of itssubsidiaries Transelca and ISA-Perú inthe electric power sector, and Internexaand Flycom Comunicaciones intelecommunications. One of the keystrategic moves made by ISA inColombia was its 1998 acquisition of65% of Transelca, the country’ssecond-largest power transmitter. In2000, ISA became the leadingColombian mixed public-privateenterprise, although the Statecontinues to hold a majority interest.
As part of its regionalizationprocess and its diversification towardsthe telecommunications sector, in 2000ISA set up its Internexa subsidiary andbegan operations in fibre-opticnetworks. Internexa provides a carrier’scarrier service for power and
telecommunications firms. Recently itteamed up with the Ecuadorian firmTranselec to form Transnexa, which willoperate the fibre-optic network joiningthe two countries; it hopes to startoperations in Ecuador through thispartnership early in 2003. In addition,Internexa entered a joint venture withNew World Network to develop a land-based station for the use of thesubmarine cable that interconnectsColombia, the United States andseveral Central American andCaribbean countries. Meanwhile,Flycom Comunicaciones will operatethe local access licence in Colombia toprovide wireless broadband servicesregionwide with a view to supplying itsclients with network interconnectivityfor voice and data, high-speed Internetand other services.
In Peru, the regionalization ofelectric power activities began in 2001with the creation of the subsidiariesISA-Perú and Red de Energía del Perú.This step was made possible by theaward of several tenders to ISA,including a concession for the design,construction, exploitation and operationof a set of substations (Oroya,Carhuamayo and Vizcarra, amongothers), together with the electric
power interconnection systems of theGovernment of Peru (Etecen andEtesur) in 2002. This made ISA thelargest energy carrier in the country. Inrecent months, the firm has showninterest in deepening its position withinthe Andean Community andstrengthening the interconnections italready possesses with Venezuela andEcuador; specifically, it has declared itsintention to participate in new tendersfor energy transmission concessions inBolivia and Ecuador. ISA has set itselfthe objective of providing electricpower connectivity among Colombia,Ecuador, Peru and Venezuela in 2004;it is also evaluating the possibility ofjoining a future integrated market inCentral America.
ISA is thus a good example of alargely State-owned firm that has foundfertile ground for expansion in AndeanCommunity countries. Its success mayalso be associated with the relativestagnation of activities and operationsamong the large TNCs, presumablydue to financing difficulties. The firm’sexpansion has been based ondiversification of its activities towardstelecommunications and theimplementation of a common energystrategy in the subregion.
Source: ECLAC, Information Centre of the Unit on Investment and Corporate Strategies of the Division of Production, Productivityand Management, on the basis of information provided by Interconexión Eléctrica (ISA) (http://www.isa.com.co).
86 ECLAC
US$ 380 million), the municipal and provincialgovernments’ refusal to put their shares in the distributionfirms up for auction and widespread popular protest. InMay 2002, the concession of Empresa Eléctrica delEcuador (EMELEC), which supplies Guayaquil, also fellthrough, after Unión Fenosa and AES Corporation hadshown interest in taking over the company. As a result,100% of EMELEC passed into the hands of the DepositsGuarantee Agency (AGD), under the supervision of theNational Electricity Council, until such time as it can betransferred to a private investor.
The electric power subsector in Andean countries hasclearly undergone major changes in recent years. In mostcases –albeit with differing results– the national authoritieshave encouraged participation by private capital as a wayof upgrading and expanding their countries’ electricityinfrastructure, which has degraded over time due to a lackof public investment. These privatization programmesbegan with a great deal of optimism in Peru and Colombia,but social pressure and other difficulties steadilyundermined foreign firms’ interest. The Andean countrieswere no exception to the Latin American trend, however,and two of the largest TNCs in the subsector, Endesa-España and AES Corporation, managed to acquire severalof the most important assets. Furthermore, unlike the greatmajority of the other TNCs present in the subregion, thesetwo firms, together with ISA, are also notable for the factthat they have displayed what could be described as a pan-Andean vision.
(c) Other infrastructure sectors
The authorities in Andean countries see concessionprogrammes as a way of overcoming the infrastructuralshortcomings from which many of their economies suffer,and they have been using such mechanisms to transferthe construction, maintenance and administration ofhighways, ports and airports to private investors.
During the first half of the 1990s, the ColombianGovernment implemented a system of highwayconcessions aimed at encouraging participation by privateinvestors, both local and foreign, in the construction ofinfrastructure. The programme included contracts torehabilitate, build or maintain, as appropriate, differentsegments of various roadways. These contracts have beenawarded in three stages. The first lasted from 1994 to1997, the second from 1997 to 1999, and the third roundbegan in 2000. Between 1994 and 1999, the governmentgranted 13 highway concessions, for a total value ofUS$ 985 million, to rehabilitate 1,220 km of roads andbuild another 306 km. The largest of these have been theArmenia-Pereira-Manizales expressway, under
concession to Autopistas del Café S.A., and the TobiaGrande–Puerto Salgar expressway, which was awardedto Concesionaria del Magdalena Medio S.A. Constructionwork on the latter is currently suspended owing to a legaldispute between the government and the concession holder.The third phase of the concessions programme waslaunched in 2000 with the aim of strengthening exportpromotion policies by providing better links between theinterior of the country and its border areas. This phase,which is designed to cover 3,840 km of highways,encompasses eight projects spread across the countryhaving a total value of US$ 2.146 billion. These projectsinclude construction of the La Línea tunnel (US$ 222million), which forms part of the improvement plan forthe Bogotá-Buenaventura corridor (US$ 950 million);rehabilitation of the Atlántico–Bolívar–Córdoba–Sucrehighway system, involving an investment estimated atUS$ 220 million; and rehabilitation and expansion of theZipaquirá–Santa María highway, which is expected torequire an investment of around US$ 167 million(CONFIS, 2001; DNP, 2001). In addition, the authoritiesin Peru are implementing a concessions scheme to upgradeand operate 11 expressway extension projects, the first ofwhich was awarded in May 2002. Similar programmeshave been implemented in Ecuador, where 1,212 km ofhighways have been placed under concession to privateinvestors.
The remodelling and management of airports isanother activity that has kindled interest among foreigninvestors. In 2000 an international tender was held forthe concession of the Jorge Chávez Airport in the City ofLima; this contract was won by a consortium led by theGerman firm Flughafen Frankfurt Main, which runs theFrankfurt airport and another five airports in variouscountries. To obtain the 30-year concession, thesuccessful bidders made a US$ 1.2 billion investmentcommitment and agreed to pay 46.51% of their profitsto the State (EIU, 2002c). During the first year ofoperations, the concession-holder paid US$ 43 millionto the Peruvian Treasury. In 2001, a decree was signedempowering the municipalities of Quito and Guayaquilto award a concession to build new airports in those cities.In November 2002, the Mariscal Sucre InternationalAirport in Quito was transferred to a privately-ownedexport contracting agency, the Canadian CommercialCorporation (CCC). This consortium also signed aUS$ 300 million contract to build a new terminal.49 Inaddition, agreement was reached on a 35-year concessionfor the operation and maintenance of both the existingairport and the new one (Puembo) with a view to theireventual merger.
49 The Canadian firm will operate Mariscal Sucre until the new Quito airport is finished.
Foreign investment in Latin America and the Caribbean, 2002 87
Mention should also be made of the 30-yearconcession to operate and manage the water and seweragesystem in the City of Guayaquil, which was won byInternational Water Supply (IWS). This consortiumconsists of the British firm United Utilities (one of theleading public service providers in Europe), the UnitedStates firm Bechtel (one of the world’s largest engineeringand construction firms) and Edison SpA (Italy’s largestprivate energy supplier).
(d) The banking sector: the early bird gets the worm?
In the wake of the debt crisis of the 1980s, theAndean countries’ banking systems suffered fromproblems of insolvency and inadequate supervision. Inthe early 1990s, most Andean Community countriesbegan to introduce far-reaching reforms in their financialsystems. These reforms entailed such measures as theprivatization of State entities, the liberalization ofoperating rules, the elimination of most controls oninterest rates, the establishment of capital requirementsand expenditure limits, the reinforcement of prudentialsupervision measures and the lifting of restrictions onforeign participation in local financial institutions. Twoof the pioneers in this process were Peru and Colombia(the latter was in a particularly strong position thanks tothe banking supervision measures it implemented, whichwere second only to those of Chile among the LatinAmerica countries). Bolivia, Ecuador and Venezuelafollowed close behind, and banking activity grew stronglyagainst this backdrop while the presence of foreignplayers in local financial systems also expanded.50
Nonetheless, this new state of affairs did not lastlong; between 1994 and 1998, one by one, the Andeancountries’ banking systems began to run into difficulties.
• In 1994-1995, the Venezuelan financial system slippedinto a crisis that engulfed half of the country’s banksand cost the State around US$ 11 billion (EIU, 2002b).Today, although the situation has improved, thebanking sector in that country still suffers from seriousproblems of decapitalization and inefficiency.
• In Colombia, the situation worsened in 1998. Theeconomic recession, together with depreciating assetvalues and high interest rates, undermined the strengthof the banking system. Regulatory agencies had tointervene in the management of several institutions,and some of the smaller ones merged or closed theirdoors; a US$ 4.2 billion bailout package was puttogether, and those institutions that continued operatingdid so under strict oversight and supervision measures.
• In Peru, the effects of El Niño, compounded byexternal shocks and the devaluation of the localcurrency, created serious problems for the financialsystem in 1998. Although there was no risk ofoutright collapse, the government intervened with abailout package in order to restore the paymentschain. The banking sector avoided default, but it hasbeen faced with serious difficulties due to the highproportion of non-performing loans in its portfolio.As a result of this instability, about 70% of depositsin the Peruvian banking system are held in dollars.
• In Ecuador, the banking system was on the verge oftotal collapse in 1999, and the authorities had to issueUS$ 862 million in bonds to reimburse clients whohad held deposits in the State banks that closed down.In 1999, the authorities had to intervene in themanagement of Ecuador’s largest bank in terms ofassets, Filanbanco, and the bank was eventually forcedto close down following the July 2001 liquidity crisisand the government’s failure to find a buyer for thebank’s most attractive assets.51 Filanbanco’s collapsesent shockwaves throughout the financial system;between 1998 and 1999, the State took control of 16banks, four of which were merged into two units,while the remaining 12 were closed down.
During this turbulent period, the presence of foreigninstitutions in the Andean countries’ banking systemsgrew substantially (see figure II.4). Despite the riskassociated with these economies, international firms thatwere striving to consolidate and expand their presencein Latin America took advantage of the opportunitiesopened up by the banking crisis in the subregion. TheSpanish banks Banco Bilbao Vizcaya Argentaria (BBVA)and Santander Central Hispano (SCH) warrant specialmention in this connection.
These two Spanish banks are the largest foreigninstitutions currently operating in Andean financialmarkets. In the mid-1990s, SCH and BBVA engaged infierce competition to secure the best banking assetsthroughout Latin America, and the Andean Communitywas no exception (Calderón, 2002). SCH rapidlysucceeded in its bid to establish a strong andhomogeneous regional presence, first in the countries ofthe Southern Cone, then in the Andean economies, andfinally in the largest and most developed markets (Braziland Mexico) (see table II.6). Like its rival, BBVA firstconsolidated its presence in the medium-sized markets(including Colombia, Peru and Venezuela) before turningto the larger ones.
50 See chapter III of this report.51 Non-performing loans amounted to 62% of Filanbanco’s total portfolio (EIU, 2001).
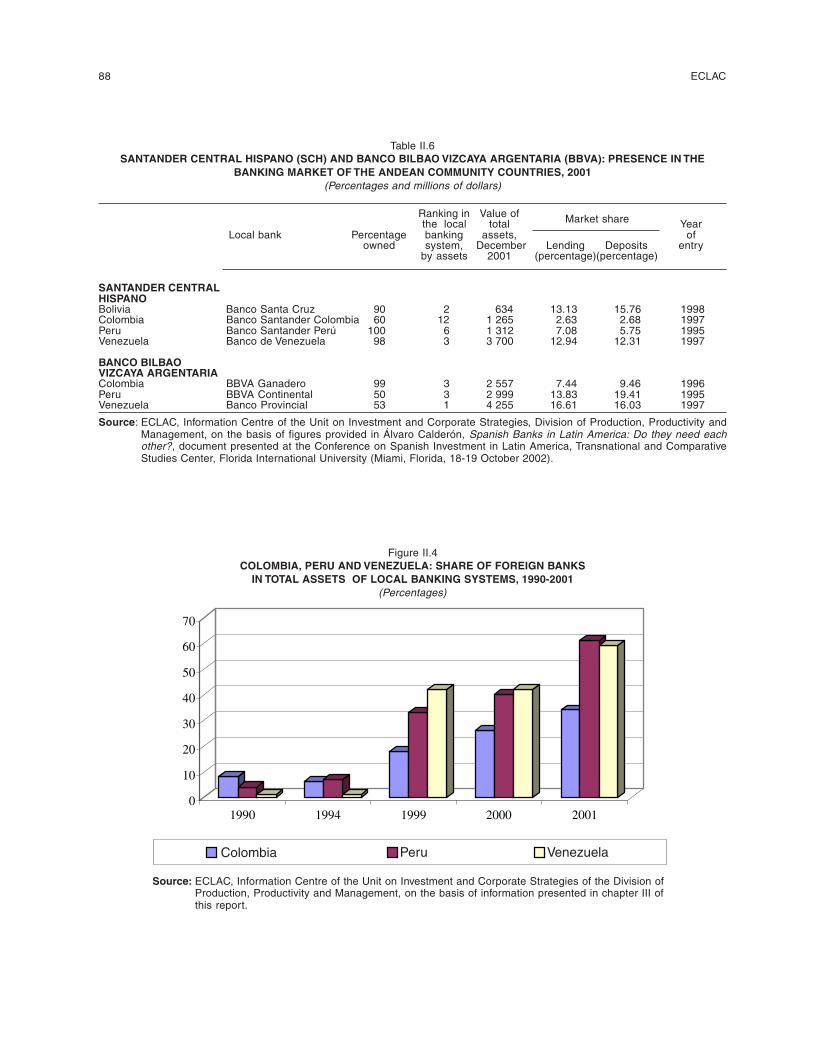
88 ECLAC
Figure II.4COLOMBIA, PERU AND VENEZUELA: SHARE OF FOREIGN BANKS
IN TOTAL ASSETS OF LOCAL BANKING SYSTEMS, 1990-2001(Percentages)
0
10
20
30
40
50
60
70
1990 1994 1999 2000 2001
Colombia Peru Venezuela
Source: ECLAC, Information Centre of the Unit on Investment and Corporate Strategies of the Division ofProduction, Productivity and Management, on the basis of information presented in chapter III ofthis report.
Table II.6SANTANDER CENTRAL HISPANO (SCH) AND BANCO BILBAO VIZCAYA ARGENTARIA (BBVA): PRESENCE IN THE
BANKING MARKET OF THE ANDEAN COMMUNITY COUNTRIES, 2001(Percentages and millions of dollars)
Ranking in Value ofthe local total Market share Year
Local bank Percentage banking assets, ofowned system, December Lending Deposits entry
by assets 2001 (percentage)(percentage)
SANTANDER CENTRALHISPANOBolivia Banco Santa Cruz 90 2 634 13.13 15.76 1998Colombia Banco Santander Colombia 60 12 1 265 2.63 2.68 1997Peru Banco Santander Perú 100 6 1 312 7.08 5.75 1995Venezuela Banco de Venezuela 98 3 3 700 12.94 12.31 1997
BANCO BILBAOVIZCAYA ARGENTARIAColombia BBVA Ganadero 99 3 2 557 7.44 9.46 1996Peru BBVA Continental 50 3 2 999 13.83 19.41 1995Venezuela Banco Provincial 53 1 4 255 16.61 16.03 1997
Source: ECLAC, Information Centre of the Unit on Investment and Corporate Strategies, Division of Production, Productivity andManagement, on the basis of figures provided in Álvaro Calderón, Spanish Banks in Latin America: Do they need eachother?, document presented at the Conference on Spanish Investment in Latin America, Transnational and ComparativeStudies Center, Florida International University (Miami, Florida, 18-19 October 2002).
Colombia Peru Venezuela
Foreign investment in Latin America and the Caribbean, 2002 89
The Spanish banks also viewed pension-fundmanagement as an attractive alternative for diversificationand expansion, given its strong growth potential in thedifferent regional environments. By late 1998, BBVA hadbecome the second-largest pension-fund manager in theregion, with an average weighted market share of 25%in the countries where it was present, and marketleadership in Bolivia, Colombia and Peru. In May 1999,BBVA consolidated its leadership in Latin America withthe indirect purchase of 40.7% of Provida, the largestpension-fund manager in Chile. Thus, having begun itsactivities in Ecuador, it then went on to strengthen itsposition in Colombia and Peru.
In general, the market strategies pursued byforeign-owned banks have focused on attracting savers’deposits, thereby introducing new patterns ofcompetition in the industry. Greater competition has notled to lower costs, however (see chapter III of thisreport).
(e) Retail trade
In Colombia, the supermarket business underwentprofound changes during the 1990s. The entry ofinternational retail chains fuelled competition, andsupermarkets increased their share of total retail sales.
The consumer boom of the early 1990s also stimulatedforeign investment: in 1996 the Dutch firm Makro enteredthe subregion, and this was followed in 1998 by the arrivalof the French chain Carrefour. In September 2001,Carrefour invested US$ 26 million to open four newhypermarkets in Bogotá. The French chain currentlyplans to open two new hypermarkets in Colombia everyyear (EIU, 2002a). Its operations in the country are partof a joint venture in which Carrefour has a 55% stake,Grupo Empresarial Bavaria has a 35% share and GrupoSigla holds a 10% interest.
In recent years, retail trade has burgeoned in Peru,both in the supermarket segment and among largedepartment stores (the Chilean firms Ripley and Saga-Falabella are examples). These retail establishments havespread rapidly both in Lima and in other cities in theinterior of the country. In 2001, Ripley was the country’slargest importer of consumer goods, with total importsexceeding US$ 36 million. Over the last three years, theSanta Isabel supermarket chain (a subsidiary of RoyalAhold of the Netherlands and Disco of Argentina) hasdoubled its number of outlets in Lima, in addition tooperating the Plaza Vea chain. Santa Isabel has 20 storesat the present time, and it was planning to add a furtherfive during 2002.
C. CONCLUSIONS
During the last 50 years, ownership of major productionassets in the Andean countries has undergone strikingchanges. In some periods the dominant players have beenTNCs, while at other times national governments haveexercised strong monopoly power. Since the mid-1980s,and especially since the early 1990s, the Andeaneconomies have been carrying forward sweepingeconomic reforms that have resulted in the withdrawalof the State from most production activities –with thepartial exception of the hydrocarbons sector– and thelifting of restrictions on foreign investment.
This new regulatory context attracted large FDIinflows into the Andean Community. Despite seriouseconomic and political difficulties in several countries, thesubregion took in nearly 13% of total FDI in the regionand maintained high and stable levels of foreign investmentthroughout 1998-2002. In fact, FDI flows have grownfaster in the Andean Community than in Latin Americaoverall. Nonetheless, investment has been heavilyconcentrated in a few activities which, by their very nature,have little to do with specific policies, the macroeconomicsituation, market conditions or other traditionally important
factors. In such cases, the relevant question has beenwhether or not transnational firms could participate in theactivities concerned. The pro-market reforms introducedin the early 1990s were decisive, and this was particularlytrue of the countries’ privatization programmes and thedecision to grant partial access for exploration andexploitation of hydrocarbons in association with State oilcompanies in Andean countries.
FDI has tended to target the exploration andproduction of natural resources –hydrocarbons and metalores– together with the basic services and infrastructuresectors. As a result of private investment in new miningand drilling projects, exports have increased considerablyand these sectors’ share of the world market has grown.The fact remains that, although the internationalcompetitiveness of the Andean subregion has improvedon the whole, this has not occurred in activities that aregaining ground in world trade flows. On the other hand,the arrival of foreign investors has brought majorimprovements in the coverage and quality of publicservices and infrastructure, and hence an increase in thesubregion’s systemic competitiveness.
90 ECLAC
The fact that Bolivia, Colombia, Ecuador, Peru andVenezuela are involved in a process of economicintegration does not seem to have had much impact ondecisions taken by TNCs. An analysis of the types ofactivities that are of greatest interest to foreign investorsmakes it quite clear that the potential of an expandedmarket is not one of the main determinants for them. Firmsseeking natural resources go where they have access tothem, while the new transnational service providers includeAndean Community countries within their strategies forLatin America as a whole, seeking to gain market accesswherever favourable conditions exist. Examples includethe strategies pursued by BellSouth and TIM intelecommunications; Endesa-España, AES Corporationand ISA in electric power; and BBVA and SCH in financialservices (banking and pension-fund management). Giventhe size of local markets, FDI in manufacturing is foundonly on a very minor scale and is concentrated in the largerand relatively more developed countries (Colombia andVenezuela). The possibility of exporting to other AndeanCommunity countries has been a major location factor onlyfor a few very specific types of manufacturing activities,
such as the automotive sector and the chemical-pharmaceutical industry in Colombia and Venezuela.
Undoubtedly, the improvement that has taken placein political and economic conditions in AndeanCommunity countries will be a decisive factor inmaintaining and, wherever possible, increasing theirattractiveness for foreign investors. In addition, thepossibility of deepening subregional integrationagreements, while extending and diffusing this processthroughout civil society and, in particular, the Andeanbusiness sector, could be an important additional factorin attracting FDI in the future. This could enhance thestrategic nature of the Andean Community’s geographiclocation for trade with the United States, Europe, Asia-Pacific and Latin America. Nonetheless, it is clear thatan effort also needs to be made to ensure that foreigninvestment effectively contributes to the productivedevelopment of the subregion. Given the characteristicsof FDI in the Andean Community economies, the lackof production linkages, weak demand for skilled humancapital and low levels of value-added are some of thekey challenges to be addressed in the years to come.
Foreign investment in Latin America and the Caribbean, 2002 91
ANNEX

92 ECLAC
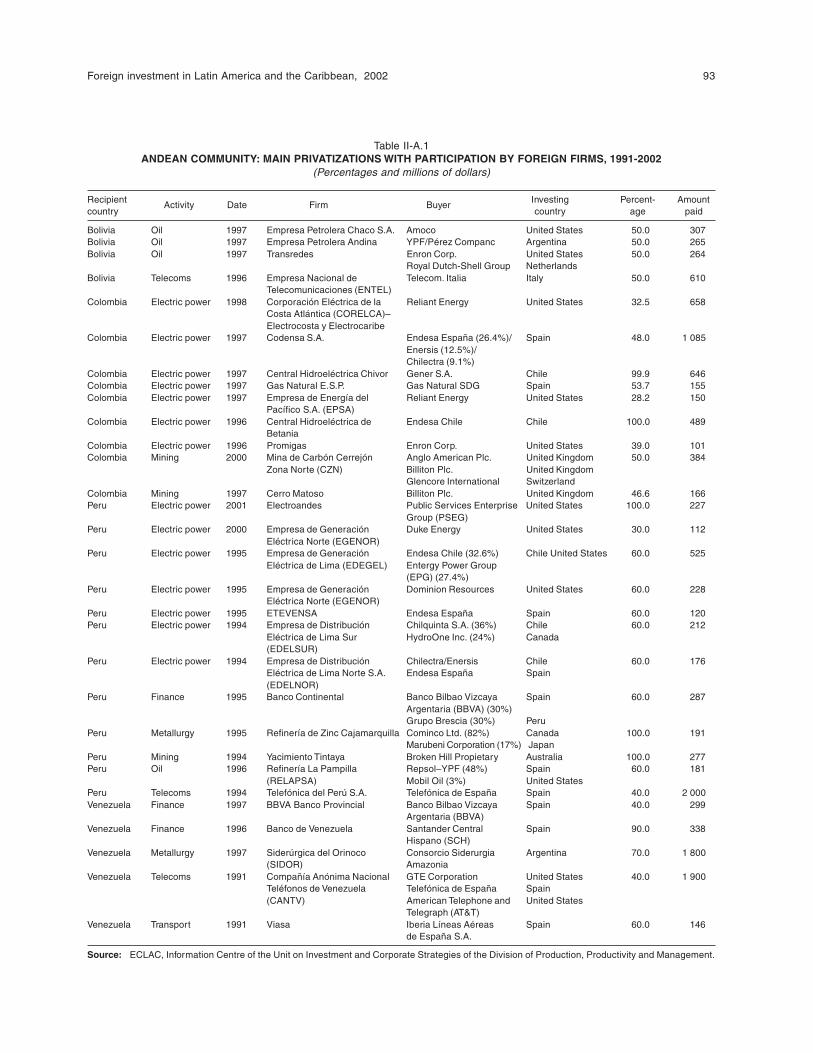
Foreign investment in Latin America and the Caribbean, 2002 93
Table II-A.1ANDEAN COMMUNITY: MAIN PRIVATIZATIONS WITH PARTICIPATION BY FOREIGN FIRMS, 1991-2002
(Percentages and millions of dollars)
Recipient Investing Percent- Amountcountry
Activity Date Firm Buyercountry age paid
Bolivia Oil 1997 Empresa Petrolera Chaco S.A. Amoco United States 50.0 307Bolivia Oil 1997 Empresa Petrolera Andina YPF/Pérez Companc Argentina 50.0 265Bolivia Oil 1997 Transredes Enron Corp. United States 50.0 264
Royal Dutch-Shell Group NetherlandsBolivia Telecoms 1996 Empresa Nacional de Telecom. Italia Italy 50.0 610
Telecomunicaciones (ENTEL)Colombia Electric power 1998 Corporación Eléctrica de la Reliant Energy United States 32.5 658
Costa Atlántica (CORELCA)–Electrocosta y Electrocaribe
Colombia Electric power 1997 Codensa S.A. Endesa España (26.4%)/ Spain 48.0 1 085Enersis (12.5%)/Chilectra (9.1%)
Colombia Electric power 1997 Central Hidroeléctrica Chivor Gener S.A. Chile 99.9 646Colombia Electric power 1997 Gas Natural E.S.P. Gas Natural SDG Spain 53.7 155Colombia Electric power 1997 Empresa de Energía del Reliant Energy United States 28.2 150
Pacífico S.A. (EPSA)Colombia Electric power 1996 Central Hidroeléctrica de Endesa Chile Chile 100.0 489
BetaniaColombia Electric power 1996 Promigas Enron Corp. United States 39.0 101Colombia Mining 2000 Mina de Carbón Cerrejón Anglo American Plc. United Kingdom 50.0 384
Zona Norte (CZN) Billiton Plc. United KingdomGlencore International Switzerland
Colombia Mining 1997 Cerro Matoso Billiton Plc. United Kingdom 46.6 166Peru Electric power 2001 Electroandes Public Services Enterprise United States 100.0 227
Group (PSEG)Peru Electric power 2000 Empresa de Generación Duke Energy United States 30.0 112
Eléctrica Norte (EGENOR)Peru Electric power 1995 Empresa de Generación Endesa Chile (32.6%) Chile United States 60.0 525
Eléctrica de Lima (EDEGEL) Entergy Power Group(EPG) (27.4%)
Peru Electric power 1995 Empresa de Generación Dominion Resources United States 60.0 228Eléctrica Norte (EGENOR)
Peru Electric power 1995 ETEVENSA Endesa España Spain 60.0 120Peru Electric power 1994 Empresa de Distribución Chilquinta S.A. (36%) Chile 60.0 212
Eléctrica de Lima Sur HydroOne Inc. (24%) Canada(EDELSUR)
Peru Electric power 1994 Empresa de Distribución Chilectra/Enersis Chile 60.0 176Eléctrica de Lima Norte S.A. Endesa España Spain(EDELNOR)
Peru Finance 1995 Banco Continental Banco Bilbao Vizcaya Spain 60.0 287Argentaria (BBVA) (30%)Grupo Brescia (30%) Peru
Peru Metallurgy 1995 Refinería de Zinc Cajamarquilla Cominco Ltd. (82%) Canada 100.0 191Marubeni Corporation (17%) Japan
Peru Mining 1994 Yacimiento Tintaya Broken Hill Propietary Australia 100.0 277Peru Oil 1996 Refinería La Pampilla Repsol–YPF (48%) Spain 60.0 181
(RELAPSA) Mobil Oil (3%) United StatesPeru Telecoms 1994 Telefónica del Perú S.A. Telefónica de España Spain 40.0 2 000Venezuela Finance 1997 BBVA Banco Provincial Banco Bilbao Vizcaya Spain 40.0 299
Argentaria (BBVA)Venezuela Finance 1996 Banco de Venezuela Santander Central Spain 90.0 338
Hispano (SCH)Venezuela Metallurgy 1997 Siderúrgica del Orinoco Consorcio Siderurgia Argentina 70.0 1 800
(SIDOR) AmazoniaVenezuela Telecoms 1991 Compañía Anónima Nacional GTE Corporation United States 40.0 1 900
Teléfonos de Venezuela Telefónica de España Spain(CANTV) American Telephone and United States
Telegraph (AT&T)Venezuela Transport 1991 Viasa Iberia Líneas Aéreas Spain 60.0 146
de España S.A.
Source: ECLAC, Information Centre of the Unit on Investment and Corporate Strategies of the Division of Production, Productivity and Management.
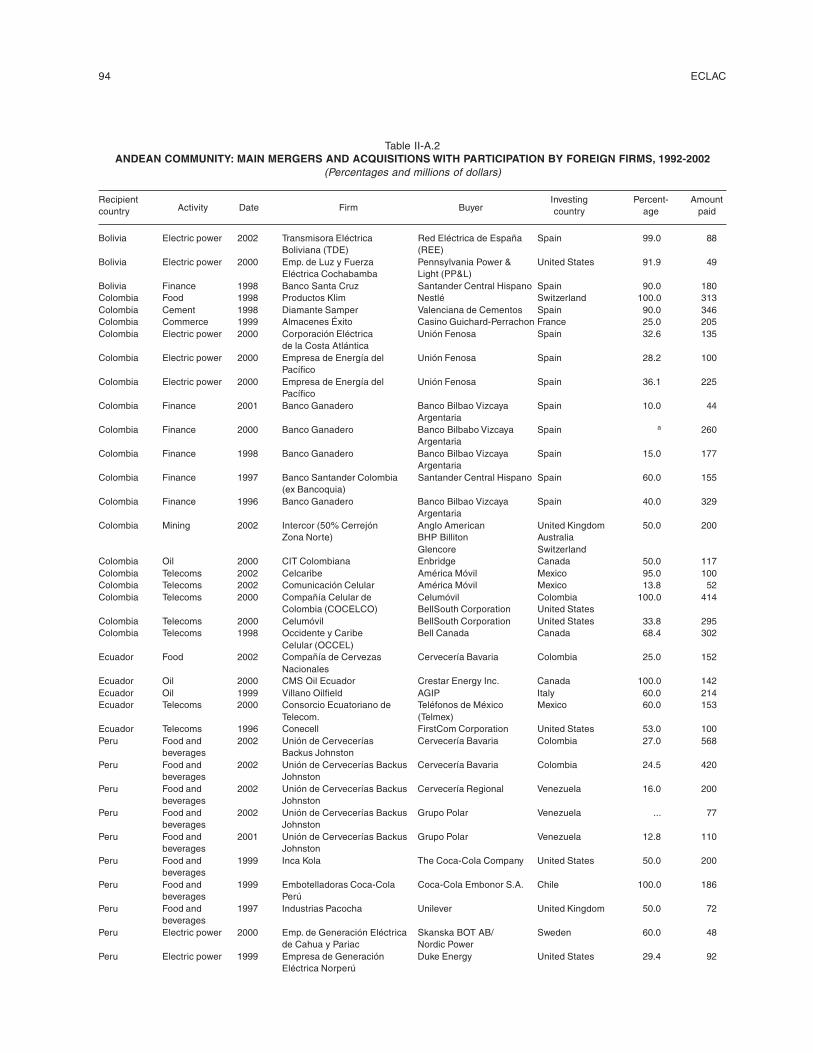
94 ECLAC
Table II-A.2ANDEAN COMMUNITY: MAIN MERGERS AND ACQUISITIONS WITH PARTICIPATION BY FOREIGN FIRMS, 1992-2002
(Percentages and millions of dollars)
Recipient Investing Percent- Amountcountry Activity Date Firm Buyer country age paid
Bolivia Electric power 2002 Transmisora Eléctrica Red Eléctrica de España Spain 99.0 88Boliviana (TDE) (REE)
Bolivia Electric power 2000 Emp. de Luz y Fuerza Pennsylvania Power & United States 91.9 49Eléctrica Cochabamba Light (PP&L)
Bolivia Finance 1998 Banco Santa Cruz Santander Central Hispano Spain 90.0 180Colombia Food 1998 Productos Klim Nestlé Switzerland 100.0 313Colombia Cement 1998 Diamante Samper Valenciana de Cementos Spain 90.0 346Colombia Commerce 1999 Almacenes Éxito Casino Guichard-Perrachon France 25.0 205Colombia Electric power 2000 Corporación Eléctrica Unión Fenosa Spain 32.6 135
de la Costa AtlánticaColombia Electric power 2000 Empresa de Energía del Unión Fenosa Spain 28.2 100
PacíficoColombia Electric power 2000 Empresa de Energía del Unión Fenosa Spain 36.1 225
PacíficoColombia Finance 2001 Banco Ganadero Banco Bilbao Vizcaya Spain 10.0 44
ArgentariaColombia Finance 2000 Banco Ganadero Banco Bilbabo Vizcaya Spain a 260
ArgentariaColombia Finance 1998 Banco Ganadero Banco Bilbao Vizcaya Spain 15.0 177
ArgentariaColombia Finance 1997 Banco Santander Colombia Santander Central Hispano Spain 60.0 155
(ex Bancoquia)Colombia Finance 1996 Banco Ganadero Banco Bilbao Vizcaya Spain 40.0 329
ArgentariaColombia Mining 2002 Intercor (50% Cerrejón Anglo American United Kingdom 50.0 200
Zona Norte) BHP Billiton AustraliaGlencore Switzerland
Colombia Oil 2000 CIT Colombiana Enbridge Canada 50.0 117Colombia Telecoms 2002 Celcaribe América Móvil Mexico 95.0 100Colombia Telecoms 2002 Comunicación Celular América Móvil Mexico 13.8 52Colombia Telecoms 2000 Compañía Celular de Celumóvil Colombia 100.0 414
Colombia (COCELCO) BellSouth Corporation United StatesColombia Telecoms 2000 Celumóvil BellSouth Corporation United States 33.8 295Colombia Telecoms 1998 Occidente y Caribe Bell Canada Canada 68.4 302
Celular (OCCEL)Ecuador Food 2002 Compañía de Cervezas Cervecería Bavaria Colombia 25.0 152
NacionalesEcuador Oil 2000 CMS Oil Ecuador Crestar Energy Inc. Canada 100.0 142Ecuador Oil 1999 Villano Oilfield AGIP Italy 60.0 214Ecuador Telecoms 2000 Consorcio Ecuatoriano de Teléfonos de México Mexico 60.0 153
Telecom. (Telmex)Ecuador Telecoms 1996 Conecell FirstCom Corporation United States 53.0 100Peru Food and 2002 Unión de Cervecerías Cervecería Bavaria Colombia 27.0 568
beverages Backus JohnstonPeru Food and 2002 Unión de Cervecerías Backus Cervecería Bavaria Colombia 24.5 420
beverages JohnstonPeru Food and 2002 Unión de Cervecerías Backus Cervecería Regional Venezuela 16.0 200
beverages JohnstonPeru Food and 2002 Unión de Cervecerías Backus Grupo Polar Venezuela ... 77
beverages JohnstonPeru Food and 2001 Unión de Cervecerías Backus Grupo Polar Venezuela 12.8 110
beverages JohnstonPeru Food and 1999 Inca Kola The Coca-Cola Company United States 50.0 200
beveragesPeru Food and 1999 Embotelladoras Coca-Cola Coca-Cola Embonor S.A. Chile 100.0 186
beverages PerúPeru Food and 1997 Industrias Pacocha Unilever United Kingdom 50.0 72
beveragesPeru Electric power 2000 Emp. de Generación Eléctrica Skanska BOT AB/ Sweden 60.0 48
de Cahua y Pariac Nordic PowerPeru Electric power 1999 Empresa de Generación Duke Energy United States 29.4 92
Eléctrica Norperú
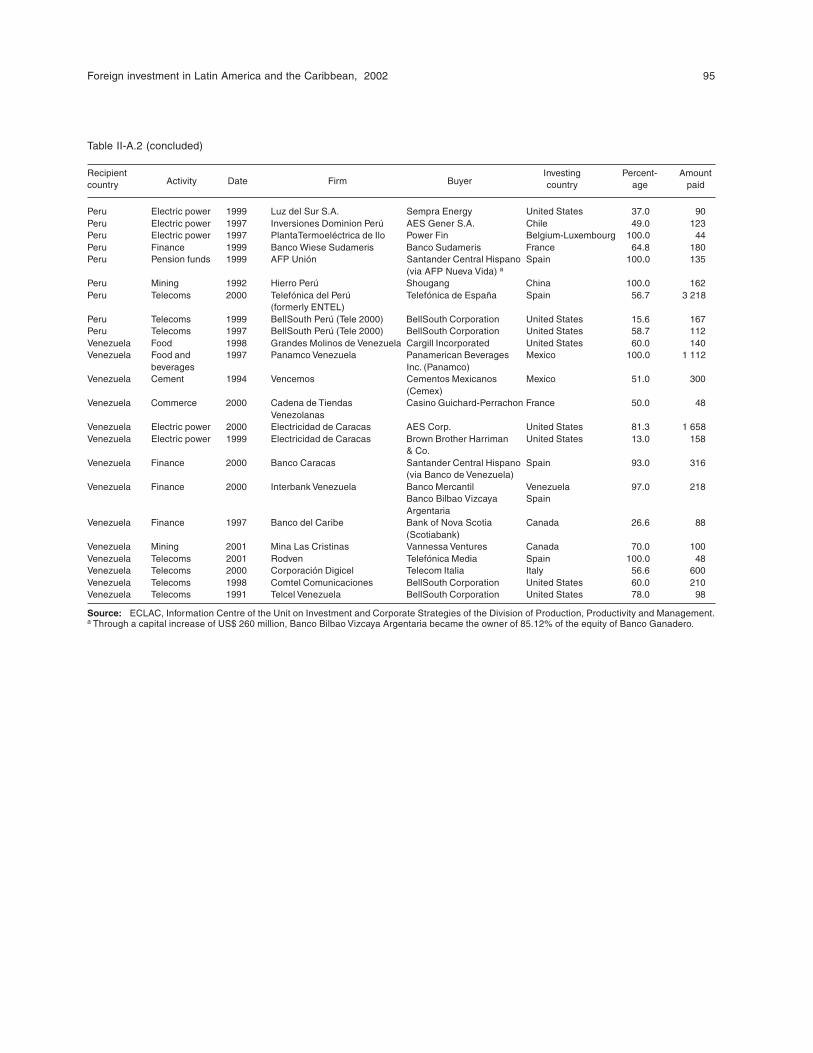
Foreign investment in Latin America and the Caribbean, 2002 95
Table II-A.2 (concluded)
Recipient Investing Percent- Amountcountry Activity Date Firm Buyer country age paid
Peru Electric power 1999 Luz del Sur S.A. Sempra Energy United States 37.0 90Peru Electric power 1997 Inversiones Dominion Perú AES Gener S.A. Chile 49.0 123Peru Electric power 1997 PlantaTermoeléctrica de Ilo Power Fin Belgium-Luxembourg 100.0 44Peru Finance 1999 Banco Wiese Sudameris Banco Sudameris France 64.8 180Peru Pension funds 1999 AFP Unión Santander Central Hispano Spain 100.0 135
(via AFP Nueva Vida) a
Peru Mining 1992 Hierro Perú Shougang China 100.0 162Peru Telecoms 2000 Telefónica del Perú Telefónica de España Spain 56.7 3 218
(formerly ENTEL)Peru Telecoms 1999 BellSouth Perú (Tele 2000) BellSouth Corporation United States 15.6 167Peru Telecoms 1997 BellSouth Perú (Tele 2000) BellSouth Corporation United States 58.7 112Venezuela Food 1998 Grandes Molinos de Venezuela Cargill Incorporated United States 60.0 140Venezuela Food and 1997 Panamco Venezuela Panamerican Beverages Mexico 100.0 1 112
beverages Inc. (Panamco)Venezuela Cement 1994 Vencemos Cementos Mexicanos Mexico 51.0 300
(Cemex)Venezuela Commerce 2000 Cadena de Tiendas Casino Guichard-Perrachon France 50.0 48
VenezolanasVenezuela Electric power 2000 Electricidad de Caracas AES Corp. United States 81.3 1 658Venezuela Electric power 1999 Electricidad de Caracas Brown Brother Harriman United States 13.0 158
& Co.Venezuela Finance 2000 Banco Caracas Santander Central Hispano Spain 93.0 316
(via Banco de Venezuela)Venezuela Finance 2000 Interbank Venezuela Banco Mercantil Venezuela 97.0 218
Banco Bilbao Vizcaya SpainArgentaria
Venezuela Finance 1997 Banco del Caribe Bank of Nova Scotia Canada 26.6 88(Scotiabank)
Venezuela Mining 2001 Mina Las Cristinas Vannessa Ventures Canada 70.0 100Venezuela Telecoms 2001 Rodven Telefónica Media Spain 100.0 48Venezuela Telecoms 2000 Corporación Digicel Telecom Italia Italy 56.6 600Venezuela Telecoms 1998 Comtel Comunicaciones BellSouth Corporation United States 60.0 210Venezuela Telecoms 1991 Telcel Venezuela BellSouth Corporation United States 78.0 98
Source: ECLAC, Information Centre of the Unit on Investment and Corporate Strategies of the Division of Production, Productivity and Management.a Through a capital increase of US$ 260 million, Banco Bilbao Vizcaya Argentaria became the owner of 85.12% of the equity of Banco Ganadero.
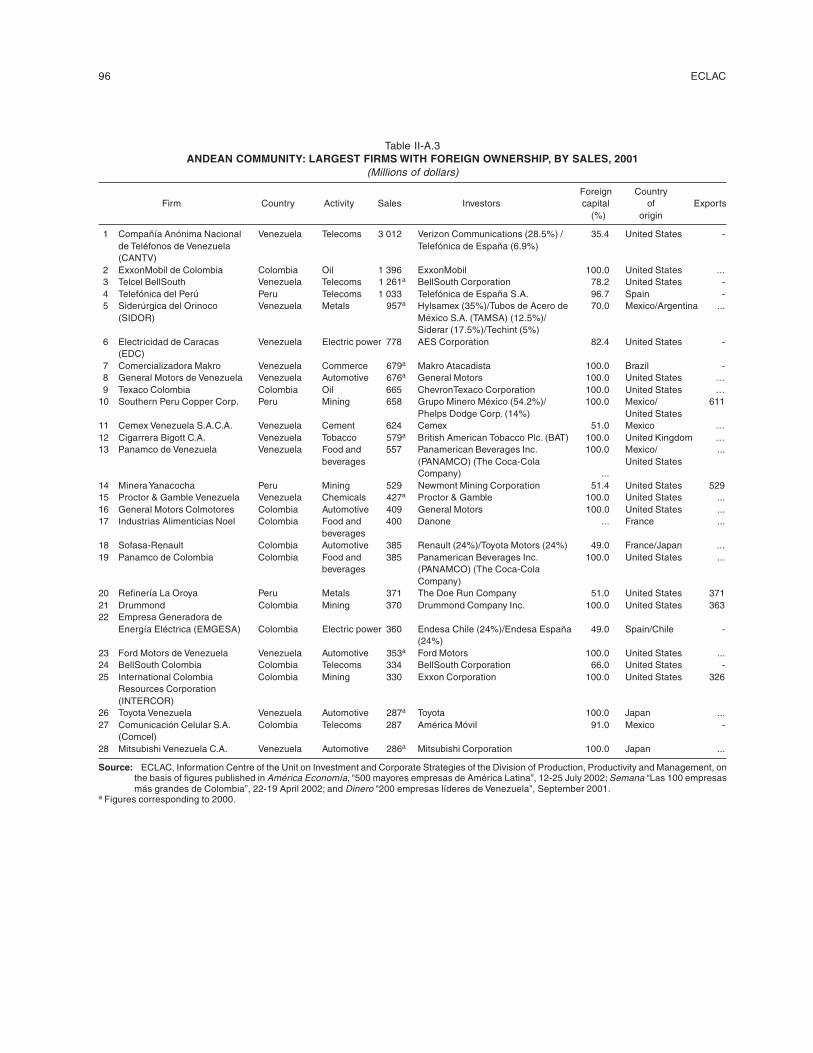
96 ECLAC
Table II-A.3ANDEAN COMMUNITY: LARGEST FIRMS WITH FOREIGN OWNERSHIP, BY SALES, 2001
(Millions of dollars)
Foreign CountryFirm Country Activity Sales Investors capital of Exports
(%) origin
1 Compañía Anónima Nacional Venezuela Telecoms 3 012 Verizon Communications (28.5%) / 35.4 United States -de Teléfonos de Venezuela Telefónica de España (6.9%)(CANTV)
2 ExxonMobil de Colombia Colombia Oil 1 396 ExxonMobil 100.0 United States ...3 Telcel BellSouth Venezuela Telecoms 1 261a BellSouth Corporation 78.2 United States -4 Telefónica del Perú Peru Telecoms 1 033 Telefónica de España S.A. 96.7 Spain -5 Siderúrgica del Orinoco Venezuela Metals 957a Hylsamex (35%)/Tubos de Acero de 70.0 Mexico/Argentina ...
(SIDOR) México S.A. (TAMSA) (12.5%)/Siderar (17.5%)/Techint (5%)
6 Electricidad de Caracas Venezuela Electric power 778 AES Corporation 82.4 United States -(EDC)
7 Comercializadora Makro Venezuela Commerce 679a Makro Atacadista 100.0 Brazil -8 General Motors de Venezuela Venezuela Automotive 676a General Motors 100.0 United States …9 Texaco Colombia Colombia Oil 665 ChevronTexaco Corporation 100.0 United States …
10 Southern Peru Copper Corp. Peru Mining 658 Grupo Minero México (54.2%)/ 100.0 Mexico/ 611Phelps Dodge Corp. (14%) United States
11 Cemex Venezuela S.A.C.A. Venezuela Cement 624 Cemex 51.0 Mexico …12 Cigarrera Bigott C.A. Venezuela Tobacco 579a British American Tobacco Plc. (BAT) 100.0 United Kingdom …13 Panamco de Venezuela Venezuela Food and 557 Panamerican Beverages Inc. 100.0 Mexico/ ...
beverages (PANAMCO) (The Coca-Cola United StatesCompany) ...
14 Minera Yanacocha Peru Mining 529 Newmont Mining Corporation 51.4 United States 52915 Proctor & Gamble Venezuela Venezuela Chemicals 427a Proctor & Gamble 100.0 United States ...16 General Motors Colmotores Colombia Automotive 409 General Motors 100.0 United States ...17 Industrias Alimenticias Noel Colombia Food and 400 Danone ... France ...
beverages18 Sofasa-Renault Colombia Automotive 385 Renault (24%)/Toyota Motors (24%) 49.0 France/Japan ...19 Panamco de Colombia Colombia Food and 385 Panamerican Beverages Inc. 100.0 United States ...
beverages (PANAMCO) (The Coca-ColaCompany)
20 Refinería La Oroya Peru Metals 371 The Doe Run Company 51.0 United States 37121 Drummond Colombia Mining 370 Drummond Company Inc. 100.0 United States 36322 Empresa Generadora de
Energía Eléctrica (EMGESA) Colombia Electric power 360 Endesa Chile (24%)/Endesa España 49.0 Spain/Chile -(24%)
23 Ford Motors de Venezuela Venezuela Automotive 353a Ford Motors 100.0 United States ...24 BellSouth Colombia Colombia Telecoms 334 BellSouth Corporation 66.0 United States -25 International Colombia Colombia Mining 330 Exxon Corporation 100.0 United States 326
Resources Corporation(INTERCOR)
26 Toyota Venezuela Venezuela Automotive 287a Toyota 100.0 Japan ...27 Comunicación Celular S.A. Colombia Telecoms 287 América Móvil 91.0 Mexico -
(Comcel)28 Mitsubishi Venezuela C.A. Venezuela Automotive 286a Mitsubishi Corporation 100.0 Japan ...
Source: ECLAC, Information Centre of the Unit on Investment and Corporate Strategies of the Division of Production, Productivity and Management, onthe basis of figures published in América Economía, “500 mayores empresas de América Latina”, 12-25 July 2002; Semana “Las 100 empresasmás grandes de Colombia”, 22-19 April 2002; and Dinero “200 empresas líderes de Venezuela”, September 2001.
a Figures corresponding to 2000.
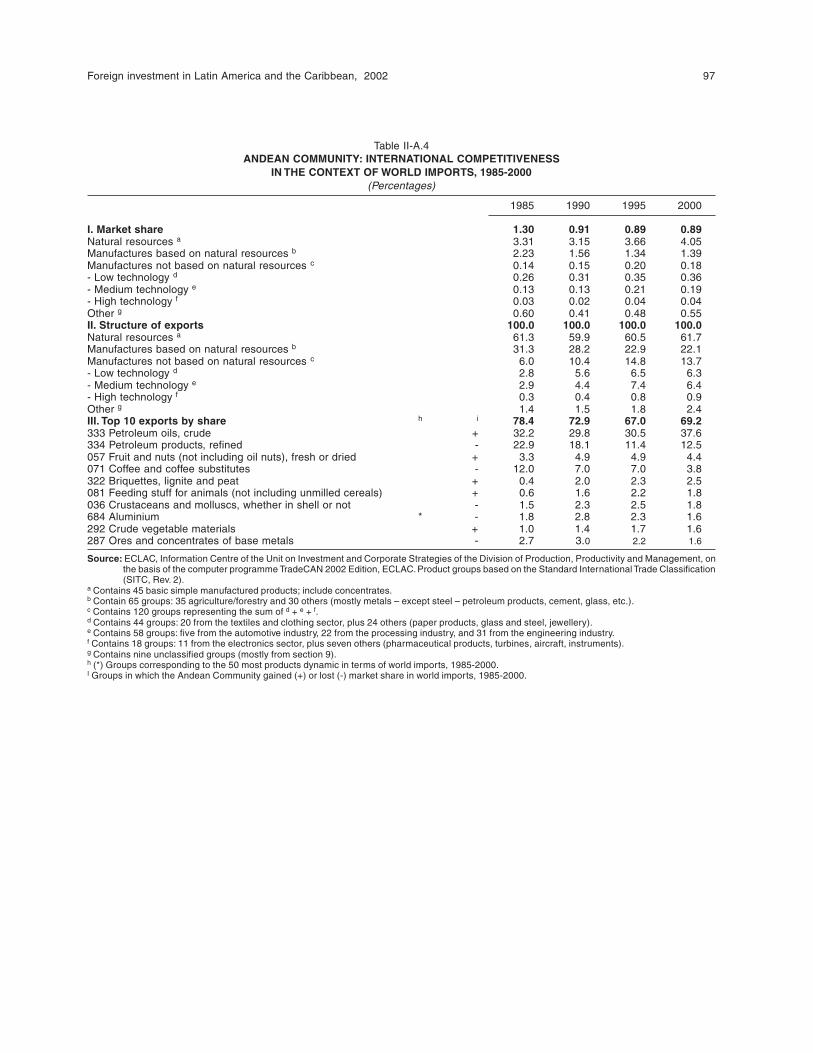
Foreign investment in Latin America and the Caribbean, 2002 97
Table II-A.4ANDEAN COMMUNITY: INTERNATIONAL COMPETITIVENESS
IN THE CONTEXT OF WORLD IMPORTS, 1985-2000(Percentages)
1985 1990 1995 2000
I. Market share 1.30 0.91 0.89 0.89Natural resources a 3.31 3.15 3.66 4.05Manufactures based on natural resources b 2.23 1.56 1.34 1.39Manufactures not based on natural resources c 0.14 0.15 0.20 0.18- Low technology d 0.26 0.31 0.35 0.36- Medium technology e 0.13 0.13 0.21 0.19- High technology f 0.03 0.02 0.04 0.04Other g 0.60 0.41 0.48 0.55II. Structure of exports 100.0 100.0 100.0 100.0Natural resources a 61.3 59.9 60.5 61.7Manufactures based on natural resources b 31.3 28.2 22.9 22.1Manufactures not based on natural resources c 6.0 10.4 14.8 13.7- Low technology d 2.8 5.6 6.5 6.3- Medium technology e 2.9 4.4 7.4 6.4- High technology f 0.3 0.4 0.8 0.9Other g 1.4 1.5 1.8 2.4III. Top 10 exports by share h i 78.4 72.9 67.0 69.2333 Petroleum oils, crude + 32.2 29.8 30.5 37.6334 Petroleum products, refined - 22.9 18.1 11.4 12.5057 Fruit and nuts (not including oil nuts), fresh or dried + 3.3 4.9 4.9 4.4071 Coffee and coffee substitutes - 12.0 7.0 7.0 3.8322 Briquettes, lignite and peat + 0.4 2.0 2.3 2.5081 Feeding stuff for animals (not including unmilled cereals) + 0.6 1.6 2.2 1.8036 Crustaceans and molluscs, whether in shell or not - 1.5 2.3 2.5 1.8684 Aluminium * - 1.8 2.8 2.3 1.6292 Crude vegetable materials + 1.0 1.4 1.7 1.6287 Ores and concentrates of base metals - 2.7 3.0 2.2 1.6
Source: ECLAC, Information Centre of the Unit on Investment and Corporate Strategies of the Division of Production, Productivity and Management, onthe basis of the computer programme TradeCAN 2002 Edition, ECLAC. Product groups based on the Standard International Trade Classification(SITC, Rev. 2).
a Contains 45 basic simple manufactured products; include concentrates.b Contain 65 groups: 35 agriculture/forestry and 30 others (mostly metals – except steel – petroleum products, cement, glass, etc.).c Contains 120 groups representing the sum of d + e + f.d Contains 44 groups: 20 from the textiles and clothing sector, plus 24 others (paper products, glass and steel, jewellery).e Contains 58 groups: five from the automotive industry, 22 from the processing industry, and 31 from the engineering industry.f Contains 18 groups: 11 from the electronics sector, plus seven others (pharmaceutical products, turbines, aircraft, instruments).g Contains nine unclassified groups (mostly from section 9).h (*) Groups corresponding to the 50 most products dynamic in terms of world imports, 1985-2000.I Groups in which the Andean Community gained (+) or lost (-) market share in world imports, 1985-2000.
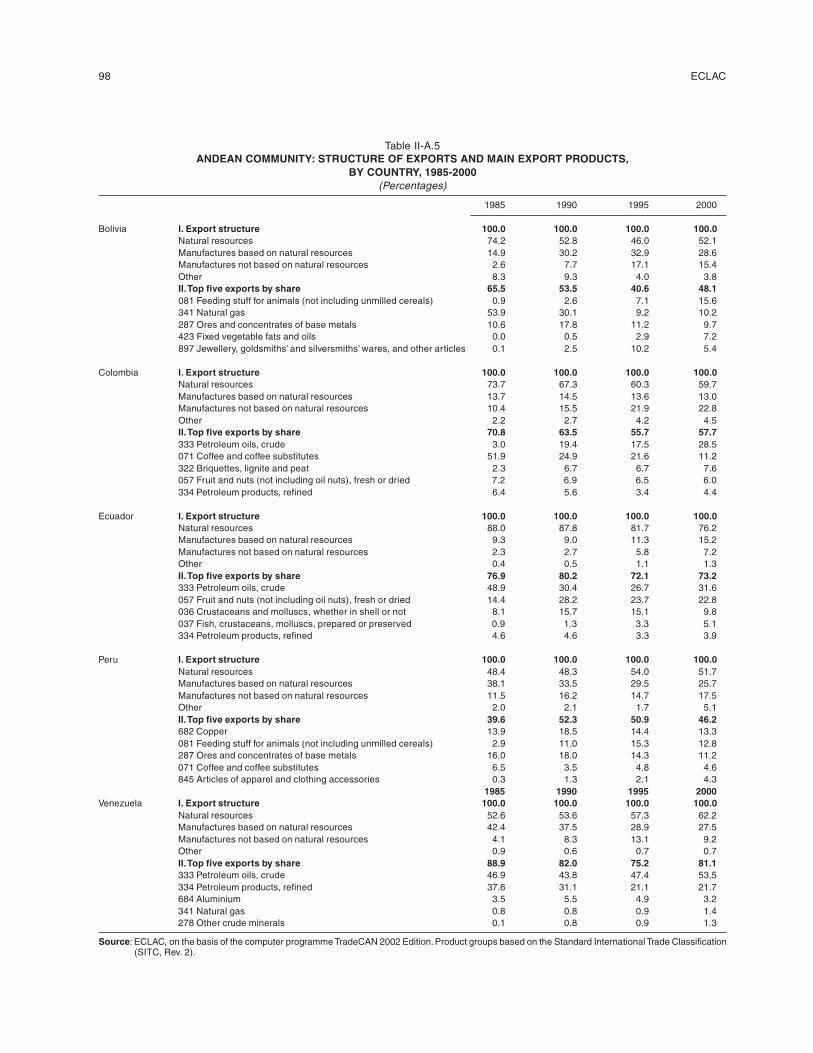
98 ECLAC
Table II-A.5ANDEAN COMMUNITY: STRUCTURE OF EXPORTS AND MAIN EXPORT PRODUCTS,
BY COUNTRY, 1985-2000(Percentages)
1985 1990 1995 2000
Bolivia I. Export structure 100.0 100.0 100.0 100.0Natural resources 74.2 52.8 46.0 52.1Manufactures based on natural resources 14.9 30.2 32.9 28.6Manufactures not based on natural resources 2.6 7.7 17.1 15.4Other 8.3 9.3 4.0 3.8II. Top five exports by share 65.5 53.5 40.6 48.1081 Feeding stuff for animals (not including unmilled cereals) 0.9 2.6 7.1 15.6341 Natural gas 53.9 30.1 9.2 10.2287 Ores and concentrates of base metals 10.6 17.8 11.2 9.7423 Fixed vegetable fats and oils 0.0 0.5 2.9 7.2897 Jewellery, goldsmiths’ and silversmiths’ wares, and other articles 0.1 2.5 10.2 5.4
Colombia I. Export structure 100.0 100.0 100.0 100.0Natural resources 73.7 67.3 60.3 59.7Manufactures based on natural resources 13.7 14.5 13.6 13.0Manufactures not based on natural resources 10.4 15.5 21.9 22.8Other 2.2 2.7 4.2 4.5II. Top five exports by share 70.8 63.5 55.7 57.7333 Petroleum oils, crude 3.0 19.4 17.5 28.5071 Coffee and coffee substitutes 51.9 24.9 21.6 11.2322 Briquettes, lignite and peat 2.3 6.7 6.7 7.6057 Fruit and nuts (not including oil nuts), fresh or dried 7.2 6.9 6.5 6.0334 Petroleum products, refined 6.4 5.6 3.4 4.4
Ecuador I. Export structure 100.0 100.0 100.0 100.0Natural resources 88.0 87.8 81.7 76.2Manufactures based on natural resources 9.3 9.0 11.3 15.2Manufactures not based on natural resources 2.3 2.7 5.8 7.2Other 0.4 0.5 1.1 1.3II. Top five exports by share 76.9 80.2 72.1 73.2333 Petroleum oils, crude 48.9 30.4 26.7 31.6057 Fruit and nuts (not including oil nuts), fresh or dried 14.4 28.2 23.7 22.8036 Crustaceans and molluscs, whether in shell or not 8.1 15.7 15.1 9.8037 Fish, crustaceans, molluscs, prepared or preserved 0.9 1.3 3.3 5.1334 Petroleum products, refined 4.6 4.6 3.3 3.9
Peru I. Export structure 100.0 100.0 100.0 100.0Natural resources 48.4 48.3 54.0 51.7Manufactures based on natural resources 38.1 33.5 29.5 25.7Manufactures not based on natural resources 11.5 16.2 14.7 17.5Other 2.0 2.1 1.7 5.1II. Top five exports by share 39.6 52.3 50.9 46.2682 Copper 13.9 18.5 14.4 13.3081 Feeding stuff for animals (not including unmilled cereals) 2.9 11.0 15.3 12.8287 Ores and concentrates of base metals 16.0 18.0 14.3 11.2071 Coffee and coffee substitutes 6.5 3.5 4.8 4.6845 Articles of apparel and clothing accessories 0.3 1.3 2.1 4.3
1985 1990 1995 2000Venezuela I. Export structure 100.0 100.0 100.0 100.0
Natural resources 52.6 53.6 57.3 62.2Manufactures based on natural resources 42.4 37.5 28.9 27.5Manufactures not based on natural resources 4.1 8.3 13.1 9.2Other 0.9 0.6 0.7 0.7II. Top five exports by share 88.9 82.0 75.2 81.1333 Petroleum oils, crude 46.9 43.8 47.4 53.5334 Petroleum products, refined 37.6 31.1 21.1 21.7684 Aluminium 3.5 5.5 4.9 3.2341 Natural gas 0.8 0.8 0.9 1.4278 Other crude minerals 0.1 0.8 0.9 1.3
Source: ECLAC, on the basis of the computer programme TradeCAN 2002 Edition. Product groups based on the Standard International Trade Classification(SITC, Rev. 2).
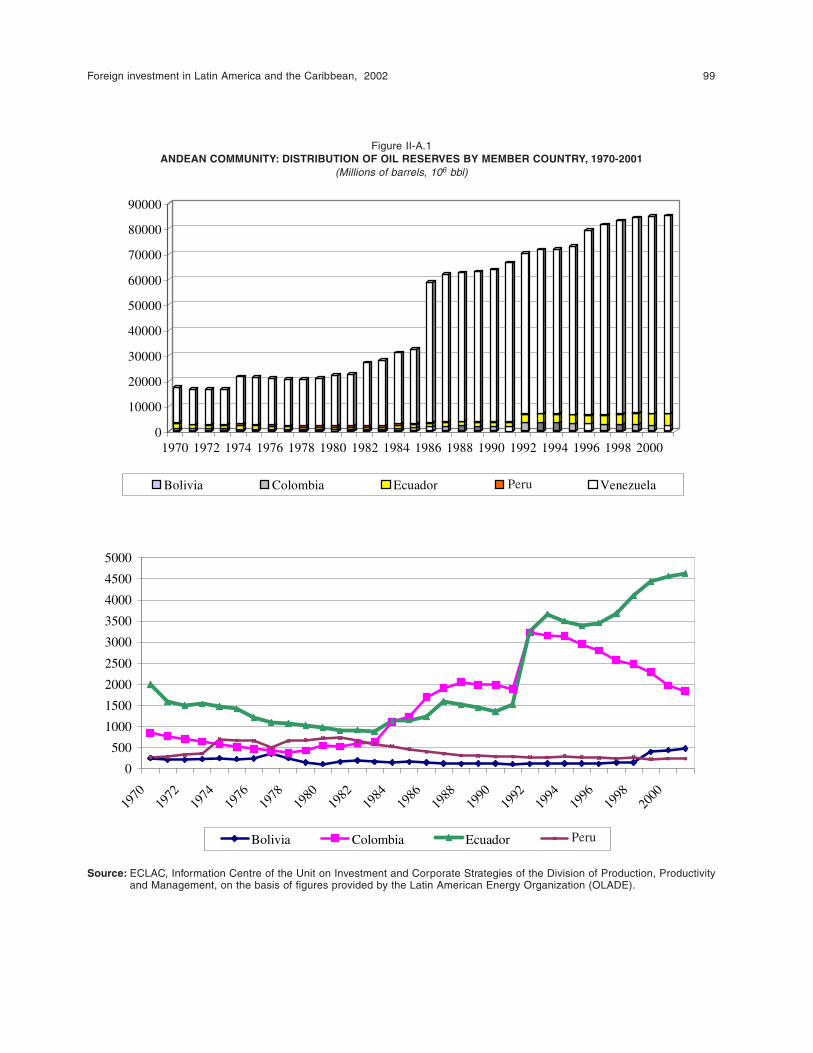
Foreign investment in Latin America and the Caribbean, 2002 99
Figure II-A.1ANDEAN COMMUNITY: DISTRIBUTION OF OIL RESERVES BY MEMBER COUNTRY, 1970-2001
(Millions of barrels, 106 bbl)
0
10000
20000
30000
40000
50000
60000
70000
80000
90000
1970 1972 1974 1976 1978 1980 1982 1984 1986 1988 1990 1992 1994 1996 1998 2000
Bolivia Colombia Ecuador Perú Venezuela
0
500
1000
1500
2000
2500
3000
3500
4000
4500
5000
1970
1972
1974
1976
1978
1980
1982
1984
1986
1988
1990
1992
1994
1996
1998
2000
Bolivia Colombia Ecuador Perú
Source: ECLAC, Information Centre of the Unit on Investment and Corporate Strategies of the Division of Production, Productivityand Management, on the basis of figures provided by the Latin American Energy Organization (OLADE).
Peru
Peru
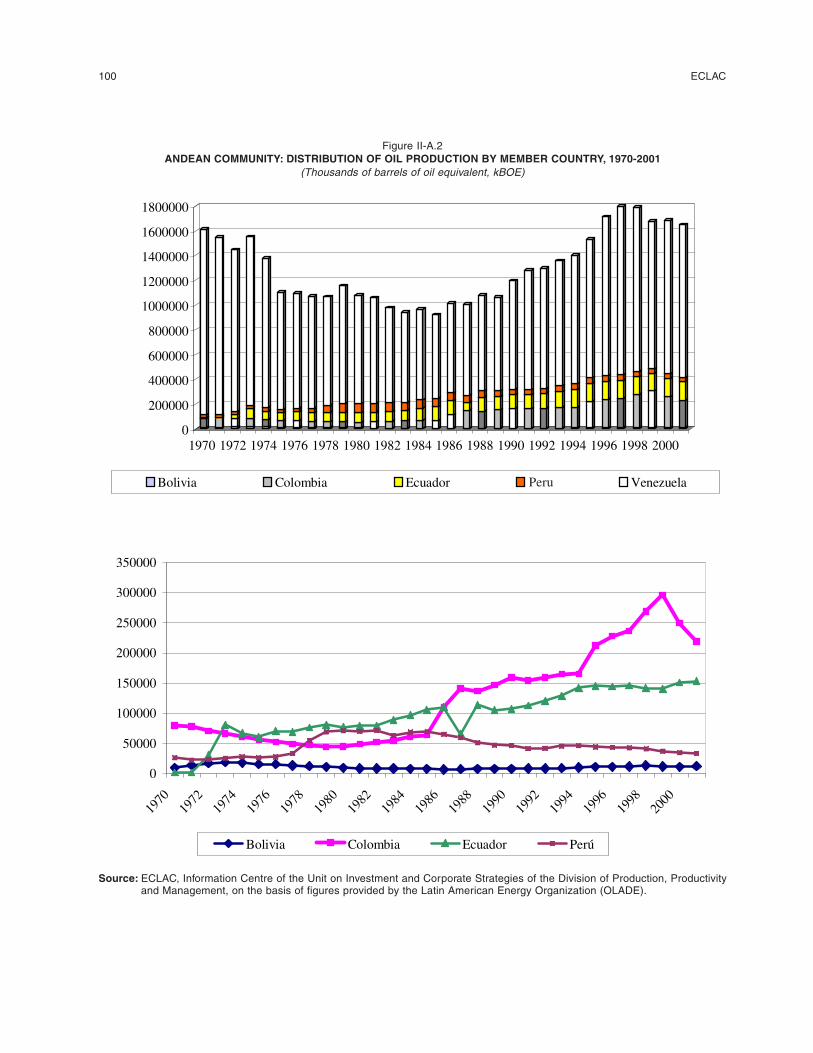
100 ECLAC
Figure II-A.2ANDEAN COMMUNITY: DISTRIBUTION OF OIL PRODUCTION BY MEMBER COUNTRY, 1970-2001
(Thousands of barrels of oil equivalent, kBOE)
0
200000
400000
600000
800000
1000000
1200000
1400000
1600000
1800000
1970 1972 1974 1976 1978 1980 1982 1984 1986 1988 1990 1992 1994 1996 1998 2000
Bolivia Colombia Ecuador Perú VenezuelaPeru
Peru
0
50000
100000
150000
200000
250000
300000
350000
1970
1972
1974
1976
1978
1980
1982
1984
1986
1988
1990
1992
1994
1996
1998
2000
Bolivia Colombia Ecuador Perú
Source: ECLAC, Information Centre of the Unit on Investment and Corporate Strategies of the Division of Production, Productivityand Management, on the basis of figures provided by the Latin American Energy Organization (OLADE).
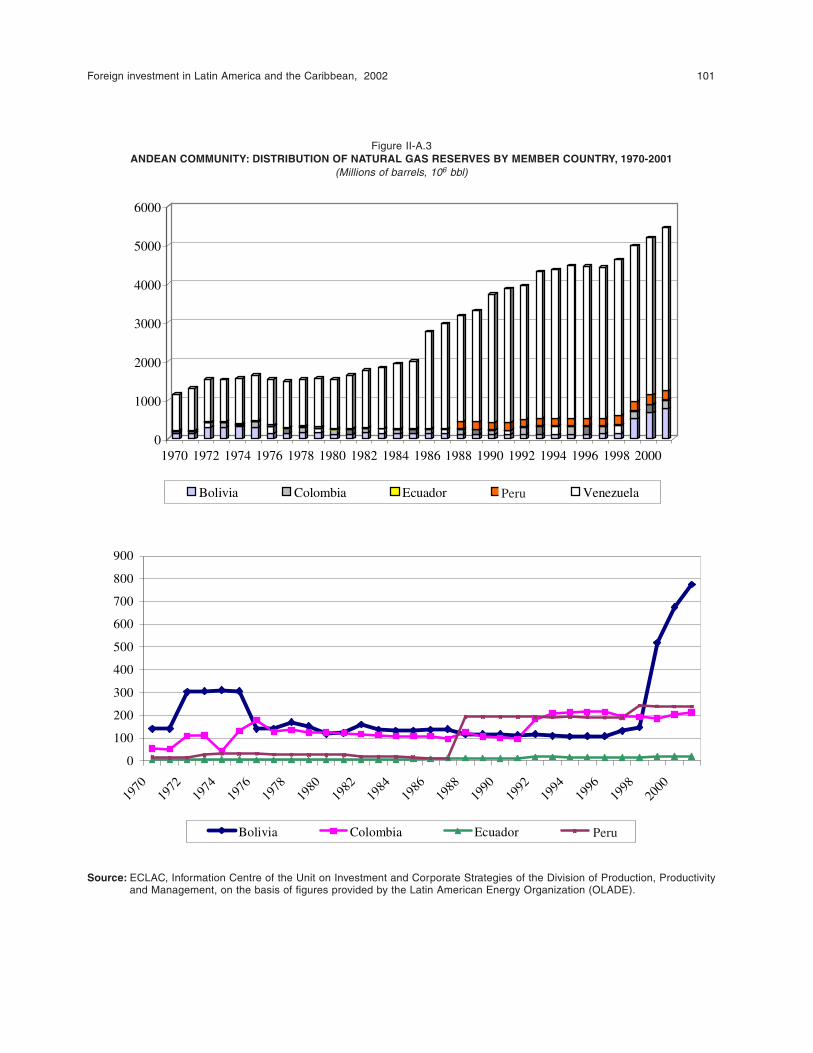
Foreign investment in Latin America and the Caribbean, 2002 101
Figure II-A.3ANDEAN COMMUNITY: DISTRIBUTION OF NATURAL GAS RESERVES BY MEMBER COUNTRY, 1970-2001
(Millions of barrels, 106 bbl)
0
1000
2000
3000
4000
5000
6000
1970 1972 1974 1976 1978 1980 1982 1984 1986 1988 1990 1992 1994 1996 1998 2000
Bolivia Colombia Ecuador Perú Venezuela
0
100
200
300
400
500
600
700
800
900
1970
1972
1974
1976
1978
1980
1982
1984
1986
1988
1990
1992
1994
1996
1998
2000
Bolivia Colombia Ecuador Perú
Peru
Peru
Source: ECLAC, Information Centre of the Unit on Investment and Corporate Strategies of the Division of Production, Productivityand Management, on the basis of figures provided by the Latin American Energy Organization (OLADE).
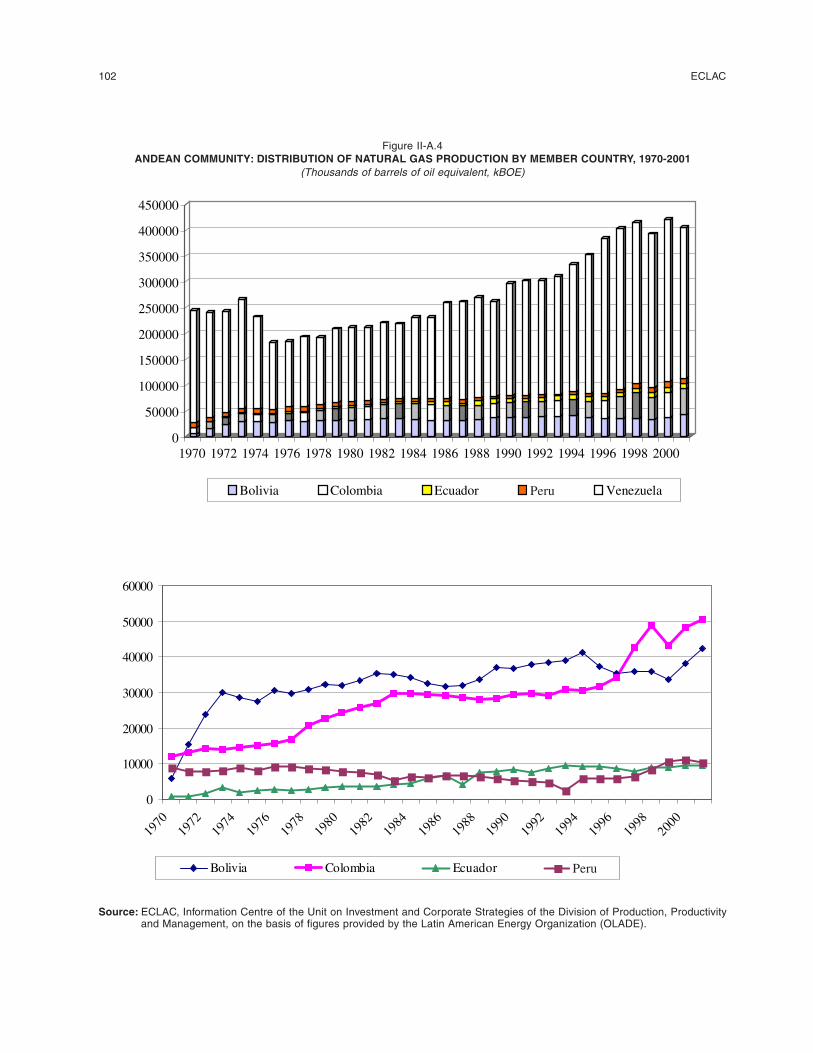
102 ECLAC
Figure II-A.4ANDEAN COMMUNITY: DISTRIBUTION OF NATURAL GAS PRODUCTION BY MEMBER COUNTRY, 1970-2001
(Thousands of barrels of oil equivalent, kBOE)
0
50000
100000
150000
200000
250000
300000
350000
400000
450000
1970 1972 1974 1976 1978 1980 1982 1984 1986 1988 1990 1992 1994 1996 1998 2000
Bolivia Colombia Ecuador Perú VenezuelaPeru
0
10000
20000
30000
40000
50000
60000
1970
1972
1974
1976
1978
1980
1982
1984
1986
1988
1990
1992
1994
1996
1998
2000
Bolivia Colombia Ecuador PerúPeru
Source: ECLAC, Information Centre of the Unit on Investment and Corporate Strategies of the Division of Production, Productivityand Management, on the basis of figures provided by the Latin American Energy Organization (OLADE).
Foreign investment in Latin America and the Caribbean, 2002 103
III. TRANSNATIONAL BANKS IN LATIN AMERICA:CORPORATE STRATEGIES AND REGIONALIMPACT
INTRODUCTION
1 This freedom of action attracted foreign banks to Latin America because it coincided with the way they operate in their own countries.Even though regulatory changes have a major impact on the decision to enter a country, they are made by the domestic authorities, andshould thus be classified among the "domestic or local determinants".
This chapter will examine the corporate strategies pursued by transnational banks and
the impact they have had on the region's financial system. The analysis does not include
offshore financial centres and banks, which have only indirect effects on the Latin
American countries' financial structures and on the macroeconomic impact of those
structures. The analysis therefore has a dual purpose: to review the factors that have
triggered changes in business strategies –factors impinging on the microeconomic
domain– and to evaluate the macroeconomic consequences of those changes.
The major presence that foreign banks had gained in LatinAmerica by the late 1990s was the outcome of bothdomestic and international forces. Domestically, financialcrises and subsequent bank restructuring processes,whichunfolded in an institutional setting favourable to the entryof foreign banks, undoubtedly played a key role.Regulatory changes allowed banks to operate not onlyin traditional commercial banking, but also in other
segments of the financial market.1 Another decisivefactor was the political climate, which was also morefavourable to the entry of other banks.
Governments in Latin American countries also hadhigh hopes that the entry of foreign players would helpsolve the structural problems that had long afflicteddomestic financial systems. These included asignificant credit squeeze, low levels of bank
104 ECLAC
penetration in the system, high borrowing costs andvery short maturities.
International determinants, on the other hand, includethe tendency of large banks in developed countries toexpand into other markets. This trend was driven bychanges in the world macroeconomic climate, innovationsin information and communication technologies, andliberalization and deregulation in developed-countryfinancial markets. Such changes promoted fiercecompetition to capture new market segments. At thesame time, the quest for economies of scale promptedbanks to increase both their size and the number oftheir customers, and thus to expand into emergingmarkets.
Not all transnational banks responded in the sameway to the incentives being generated in the region,however, nor did they all expand to the same extent or inthe same market segments. Accordingly, it is necessaryto analyse the specific features of corporate strategies.For example,the leading role currently being played bySpanish banks in Latin America –unforeseen a decadeago– reflects, among other important factors, theirresponse to competitive challenges in the European Unionand the cultural ties that exist between Spain and LatinAmerica. Maintaining a presence in Latin America entailscosts and benefits, which each bank evaluates differentlybefore adopting a specific strategy in each case.
Once the reasons why transnational banks enteredthe Latin American market have been considered, the nextstep is to ask what effects their presence has had on theperformance of the local banking system and on themacroeconomic situation in general. The microeconomicimpacts can be measured through indicators of the banks'
operational efficiency, lending and risk management. Themacroeconomic impact, on the other hand, can bemeasured in terms of effects on the supply and cost ofcredit and on the stability of the system. The analysiswill be incomplete, however, unless it first considers thesituation financial markets were in when foreign banksentered the host country, in addition to the institutionalframework in which they have operated and the way theyhave adapted to the new market. Given that foreign-bankpenetration in Latin America is a relatively recentphenomenon, the evaluation presented here is onlypreliminary, and the longer-term impact of thisdevelopment cannot yet be projected.
The chapter is therefore divided into four sections.The first begins by analysing the structural problems ofthe region's banking systems, together with the regulatorychanges and banking crises that have occurred, with aview to understanding how they engendered a morepropitious environment for the entry of foreign banksinto the region. The second section describes the factorsthat led transnational banks to seek new markets and theway these banks adapted to the new conditions in theinternational financial market. The third section analysesthe strategies deployed by transnational banks in LatinAmerica and the consequences of those strategies fortheir financial results, considering both costs andbenefits. The fourth section discusses various indicatorsthat measure the impact of foreign-bank participation inthe region, comparing their performance with that of thelocal banking system and assessing their macroeconomiceffects. The chapter ends by drawing together theconclusions of each section, and is followed by a numberof tables included as an annex.
A. THE LATIN AMERICAN BANKING SECTOR: STRUCTURAL PROBLEMS,CRISES AND RESTRUCTURING
The domestic banking crises of the 1990s and the bankrestructuring processes that ensued engendered afavourable attitude in Latin America towards foreignbanks' entering the region. The local economic authoritieshoped this would have positive effects on the long-standing structural problems persisting in the region'sfinancial systems. These included a significant creditsqueeze, low levels of bank penetration in the system,high borrowing costs and the predominance of shortmaturities.
Accordingly, this section starts by giving a briefdescription of the Latin American banking system in theearly 1990s, drawing attention to its main structuralproblems. It then analyses the financial liberalizationprocesses and subsequent banking crises that occurred,with a view to identifying the local factors thatencouraged a more receptive attitude towards foreignbanks, and the government expectations and regulatorychanges that facilitated their entry.
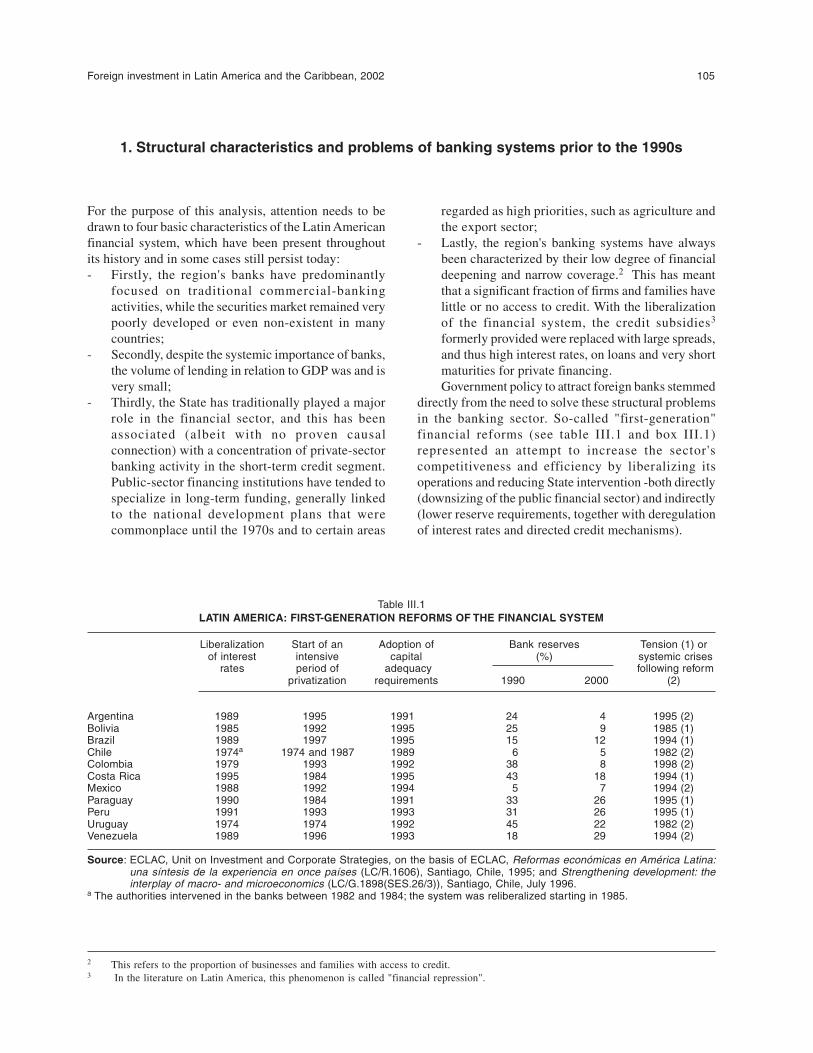
Foreign investment in Latin America and the Caribbean, 2002 105
2 This refers to the proportion of businesses and families with access to credit.3 In the literature on Latin America, this phenomenon is called "financial repression".
1. Structural characteristics and problems of banking systems prior to the 1990s
For the purpose of this analysis, attention needs to bedrawn to four basic characteristics of the Latin Americanfinancial system, which have been present throughoutits history and in some cases still persist today:- Firstly, the region's banks have predominantly
focused on traditional commercial-bankingactivities, while the securities market remained verypoorly developed or even non-existent in manycountries;
- Secondly, despite the systemic importance of banks,the volume of lending in relation to GDP was and isvery small;
- Thirdly, the State has traditionally played a majorrole in the financial sector, and this has beenassociated (albeit with no proven causalconnection) with a concentration of private-sectorbanking activity in the short-term credit segment.Public-sector financing institutions have tended tospecialize in long-term funding, generally linkedto the national development plans that werecommonplace until the 1970s and to certain areas
regarded as high priorities, such as agriculture andthe export sector;
- Lastly, the region's banking systems have alwaysbeen characterized by their low degree of financialdeepening and narrow coverage.2 This has meantthat a significant fraction of firms and families havelittle or no access to credit. With the liberalizationof the financial system, the credit subsidies3
formerly provided were replaced with large spreads,and thus high interest rates, on loans and very shortmaturities for private financing.Government policy to attract foreign banks stemmed
directly from the need to solve these structural problemsin the banking sector. So-called "first-generation"financial reforms (see table III.1 and box III.1)represented an attempt to increase the sector'scompetitiveness and efficiency by liberalizing itsoperations and reducing State intervention -both directly(downsizing of the public financial sector) and indirectly(lower reserve requirements, together with deregulationof interest rates and directed credit mechanisms).
Table III.1LATIN AMERICA: FIRST-GENERATION REFORMS OF THE FINANCIAL SYSTEM
Liberalization Start of an Adoption of Bank reserves Tension (1) orof interest intensive capital (%) systemic crises
rates period of adequacy following reformprivatization requirements 1990 2000 (2)
Argentina 1989 1995 1991 24 4 1995 (2)Bolivia 1985 1992 1995 25 9 1985 (1)Brazil 1989 1997 1995 15 12 1994 (1)Chile 1974a 1974 and 1987 1989 6 5 1982 (2)Colombia 1979 1993 1992 38 8 1998 (2)Costa Rica 1995 1984 1995 43 18 1994 (1)Mexico 1988 1992 1994 5 7 1994 (2)Paraguay 1990 1984 1991 33 26 1995 (1)Peru 1991 1993 1993 31 26 1995 (1)Uruguay 1974 1974 1992 45 22 1982 (2)Venezuela 1989 1996 1993 18 29 1994 (2)
Source: ECLAC, Unit on Investment and Corporate Strategies, on the basis of ECLAC, Reformas económicas en América Latina:una síntesis de la experiencia en once países (LC/R.1606), Santiago, Chile, 1995; and Strengthening development: theinterplay of macro- and microeconomics (LC/G.1898(SES.26/3)), Santiago, Chile, July 1996.
a The authorities intervened in the banks between 1982 and 1984; the system was reliberalized starting in 1985.
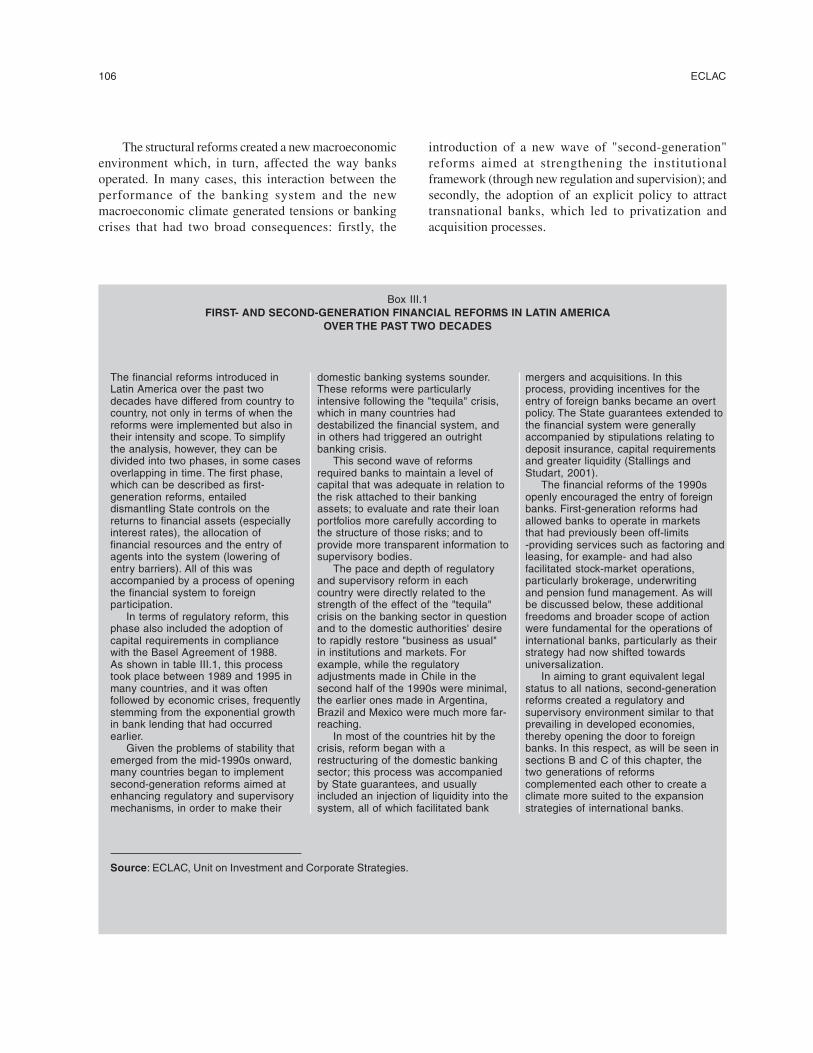
106 ECLAC
The structural reforms created a new macroeconomicenvironment which, in turn, affected the way banksoperated. In many cases, this interaction between theperformance of the banking system and the newmacroeconomic climate generated tensions or bankingcrises that had two broad consequences: firstly, the
introduction of a new wave of "second-generation"reforms aimed at strengthening the institutionalframework (through new regulation and supervision); andsecondly, the adoption of an explicit policy to attracttransnational banks, which led to privatization andacquisition processes.
Box III.1FIRST- AND SECOND-GENERATION FINANCIAL REFORMS IN LATIN AMERICA
OVER THE PAST TWO DECADES
The financial reforms introduced inLatin America over the past twodecades have differed from country tocountry, not only in terms of when thereforms were implemented but also intheir intensity and scope. To simplifythe analysis, however, they can bedivided into two phases, in some casesoverlapping in time. The first phase,which can be described as first-generation reforms, entaileddismantling State controls on thereturns to financial assets (especiallyinterest rates), the allocation offinancial resources and the entry ofagents into the system (lowering ofentry barriers). All of this wasaccompanied by a process of openingthe financial system to foreignparticipation.
In terms of regulatory reform, thisphase also included the adoption ofcapital requirements in compliancewith the Basel Agreement of 1988.As shown in table III.1, this processtook place between 1989 and 1995 inmany countries, and it was oftenfollowed by economic crises, frequentlystemming from the exponential growthin bank lending that had occurredearlier.
Given the problems of stability thatemerged from the mid-1990s onward,many countries began to implementsecond-generation reforms aimed atenhancing regulatory and supervisorymechanisms, in order to make their
domestic banking systems sounder.These reforms were particularlyintensive following the "tequila" crisis,which in many countries haddestabilized the financial system, andin others had triggered an outrightbanking crisis.
This second wave of reformsrequired banks to maintain a level ofcapital that was adequate in relation tothe risk attached to their bankingassets; to evaluate and rate their loanportfolios more carefully according tothe structure of those risks; and toprovide more transparent information tosupervisory bodies.
The pace and depth of regulatoryand supervisory reform in eachcountry were directly related to thestrength of the effect of the "tequila"crisis on the banking sector in questionand to the domestic authorities' desireto rapidly restore "business as usual"in institutions and markets. Forexample, while the regulatoryadjustments made in Chile in thesecond half of the 1990s were minimal,the earlier ones made in Argentina,Brazil and Mexico were much more far-reaching.
In most of the countries hit by thecrisis, reform began with arestructuring of the domestic bankingsector; this process was accompaniedby State guarantees, and usuallyincluded an injection of liquidity into thesystem, all of which facilitated bank
mergers and acquisitions. In thisprocess, providing incentives for theentry of foreign banks became an overtpolicy. The State guarantees extended tothe financial system were generallyaccompanied by stipulations relating todeposit insurance, capital requirementsand greater liquidity (Stallings andStudart, 2001).
The financial reforms of the 1990sopenly encouraged the entry of foreignbanks. First-generation reforms hadallowed banks to operate in marketsthat had previously been off-limits-providing services such as factoring andleasing, for example- and had alsofacilitated stock-market operations,particularly brokerage, underwritingand pension fund management. As willbe discussed below, these additionalfreedoms and broader scope of actionwere fundamental for the operations ofinternational banks, particularly as theirstrategy had now shifted towardsuniversalization.
In aiming to grant equivalent legalstatus to all nations, second-generationreforms created a regulatory andsupervisory environment similar to thatprevailing in developed economies,thereby opening the door to foreignbanks. In this respect, as will be seen insections B and C of this chapter, thetwo generations of reformscomplemented each other to create aclimate more suited to the expansionstrategies of international banks.
Source: ECLAC, Unit on Investment and Corporate Strategies.
Foreign investment in Latin America and the Caribbean, 2002 107
(a) Financial-market liberalization, crisis andrestructuring: from the "tequila" crisisto 1997
An essential bit of background for understandingthe current development of the Latin American bankingsystem is the financial liberalization that took placebetween the 1970s and the 1990s, both locally andinternationally. While only a few countries -among themArgentina, Chile, Colombia and Uruguay- introducedfinancial liberalization, to varying degrees, as early asthe 1970s, the processes triggered by liberalization,especially the financial crises of the early 1980s,4 werethe reason behind the subsequent push for tighter bankingregulation and supervision. The sequence ofliberalization, crisis and improved supervision andregulation was nonetheless repeated in countries that didnot begin the process until the 1990s.
Starting from a system in which State authoritiesset the interest rate, directed credit and required a highproportion of bank deposits to be held as reserverequirements, commercial banks were then givenfreedom to decide how much to lend to whom and atwhat price. More or less at the same time, capital-marketliberalization enabled local banks to borrow in foreigncurrency and allowed foreign banks to operate in the localmarket. Frequently, these changes were implementedwithout an adequate system of banking regulation andsupervision in place, which in several instances led toproblems in regional banks whose executives had littleor no experience in analysing local credit, let alone theinternational market.
The initial financial deregulation also affectedbusiness goals. Existing institutions could now engagein new activities and become "universal banks". Thisallowed them to operate in securities and insurancemarkets, provide asset-management services and holdequity positions in non-financial firms. The process to someextent mirrored what was happening in the industrializedcountries, but with the difference that the securitiesmarket in the region remained very underdeveloped.Accordingly, despite greater diversification, bankportfolios were restricted to short-term securities dealing,insurance products and real-estate activities.
Financial liberalization and deregulation did notyield the expected results, however. Instead, they gaverise in many cases to credit booms, mismatches betweencurrencies and maturities and, ultimately, banking crises.As had happened in Chile and Argentina during the
external debt crisis and then in Mexico in 1994, South-East Asia in 1998 and Argentina in 2001, mistakes madeby local actors were serious enough in themselves totrigger crises, but when they were compounded byexternal shocks, the situation became much worse (Heldand Jiménez, 2001).
In a reprise of the pattern already observed in theearly 1980s, banking crises and subsequent bailouts bygovernments had become commonplace in Latin Americaby the mid-1990s. Initially, these operations were limitedto non-recoverable portfolios, but this was later followedby bank recapitalization, then liquidation or mergers andacquisitions by foreign banks. Subsequently, in order toavert future crises, banking regulation and supervisionwere introduced, greater information and transparencywere required, and in some cases deposit insurance wasput in place, although some countries had already begunusing this instrument after the crisis of the early 1980s.
As a result of these crises, the initial expectationsraised by financial reform changed: financialliberalization was and still is a condition for long-termmarket development, but the latter cannot be achievedwithout stability in the system. This aim gave rise to adebate which clearly highlighted two specific needs:firstly, to regulate and supervise the sector, and secondly,to attract foreign banks.
(b) The macroeconomic environment
In contrast to what had happened in the precedingdecade, the macroeconomic climate of the 1990s (priorto the Asian crisis) was one of accelerating growth, whichfostered the rapid expansion of short-term lending toconsumers and firms. Capital-market liberalization, at atime of abundant liquidity in the international financialmarket, attracted foreign capital inflows, therebyremoving the traditional external constraint on theexpansion of demand and imports. This facilitated low-inflation growth, particularly in countries that hadadopted stabilization programmes based on an exchange-rate anchor. In this situation, the banks encountered strongdemand for short-term credit and were able to expandtheir operations merely by accommodating it.
Furthermore, international conditions allowed allbanks, local and foreign alike, to increase their externalfinancing. This phenomenon was related to more stableexchange rates and the development of the internationalderivatives market, which enabled financial investors topartially hedge exchange-rate risk and uncertainty.
4 See the now-classic article by Díaz-Alejandro (1985).
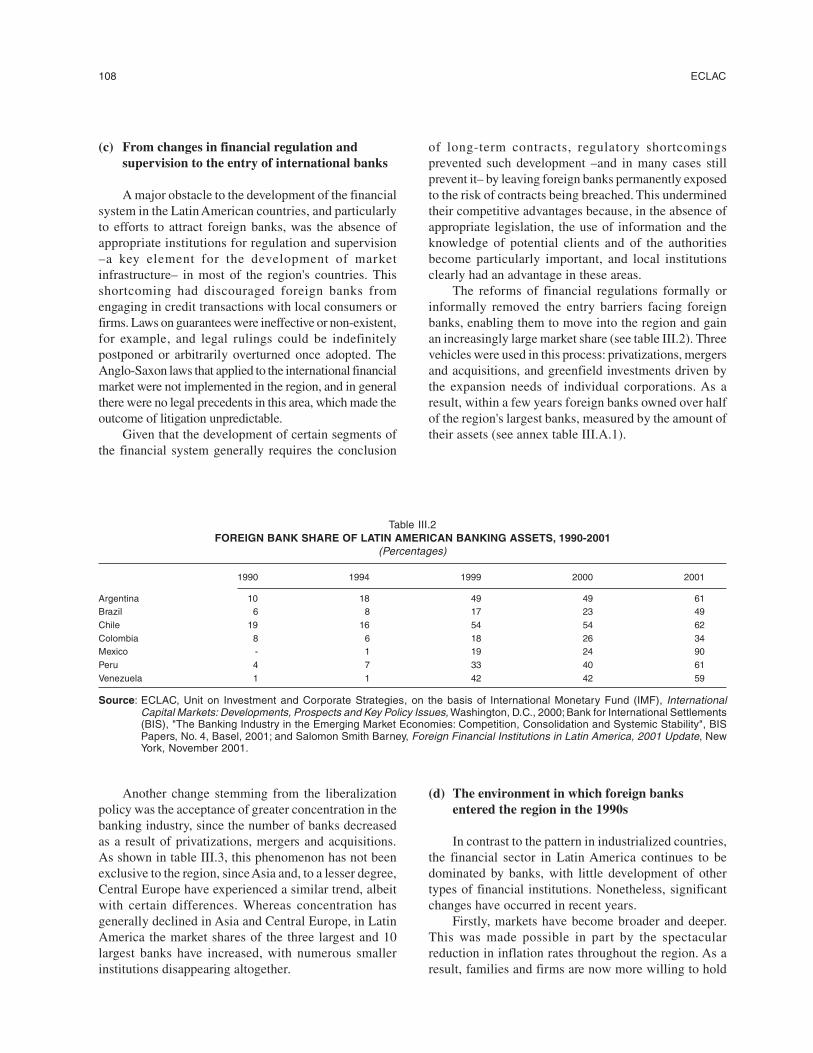
108 ECLAC
(c) From changes in financial regulation andsupervision to the entry of international banks
A major obstacle to the development of the financialsystem in the Latin American countries, and particularlyto efforts to attract foreign banks, was the absence ofappropriate institutions for regulation and supervision–a key element for the development of marketinfrastructure– in most of the region's countries. Thisshortcoming had discouraged foreign banks fromengaging in credit transactions with local consumers orfirms. Laws on guarantees were ineffective or non-existent,for example, and legal rulings could be indefinitelypostponed or arbitrarily overturned once adopted. TheAnglo-Saxon laws that applied to the international financialmarket were not implemented in the region, and in generalthere were no legal precedents in this area, which made theoutcome of litigation unpredictable.
Given that the development of certain segments ofthe financial system generally requires the conclusion
of long-term contracts, regulatory shortcomingsprevented such development –and in many cases stillprevent it– by leaving foreign banks permanently exposedto the risk of contracts being breached. This underminedtheir competitive advantages because, in the absence ofappropriate legislation, the use of information and theknowledge of potential clients and of the authoritiesbecome particularly important, and local institutionsclearly had an advantage in these areas.
The reforms of financial regulations formally orinformally removed the entry barriers facing foreignbanks, enabling them to move into the region and gainan increasingly large market share (see table III.2). Threevehicles were used in this process: privatizations, mergersand acquisitions, and greenfield investments driven bythe expansion needs of individual corporations. As aresult, within a few years foreign banks owned over halfof the region's largest banks, measured by the amount oftheir assets (see annex table III.A.1).
Table III.2FOREIGN BANK SHARE OF LATIN AMERICAN BANKING ASSETS, 1990-2001
(Percentages)
1990 1994 1999 2000 2001
Argentina 10 18 49 49 61Brazil 6 8 17 23 49Chile 19 16 54 54 62Colombia 8 6 18 26 34Mexico - 1 19 24 90Peru 4 7 33 40 61Venezuela 1 1 42 42 59
Source: ECLAC, Unit on Investment and Corporate Strategies, on the basis of International Monetary Fund (IMF), InternationalCapital Markets: Developments, Prospects and Key Policy Issues, Washington, D.C., 2000; Bank for International Settlements(BIS), "The Banking Industry in the Emerging Market Economies: Competition, Consolidation and Systemic Stability", BISPapers, No. 4, Basel, 2001; and Salomon Smith Barney, Foreign Financial Institutions in Latin America, 2001 Update, NewYork, November 2001.
Another change stemming from the liberalizationpolicy was the acceptance of greater concentration in thebanking industry, since the number of banks decreasedas a result of privatizations, mergers and acquisitions.As shown in table III.3, this phenomenon has not beenexclusive to the region, since Asia and, to a lesser degree,Central Europe have experienced a similar trend, albeitwith certain differences. Whereas concentration hasgenerally declined in Asia and Central Europe, in LatinAmerica the market shares of the three largest and 10largest banks have increased, with numerous smallerinstitutions disappearing altogether.
(d) The environment in which foreign banksentered the region in the 1990s
In contrast to the pattern in industrialized countries,the financial sector in Latin America continues to bedominated by banks, with little development of othertypes of financial institutions. Nonetheless, significantchanges have occurred in recent years.
Firstly, markets have become broader and deeper.This was made possible in part by the spectacularreduction in inflation rates throughout the region. As aresult, families and firms are now more willing to hold
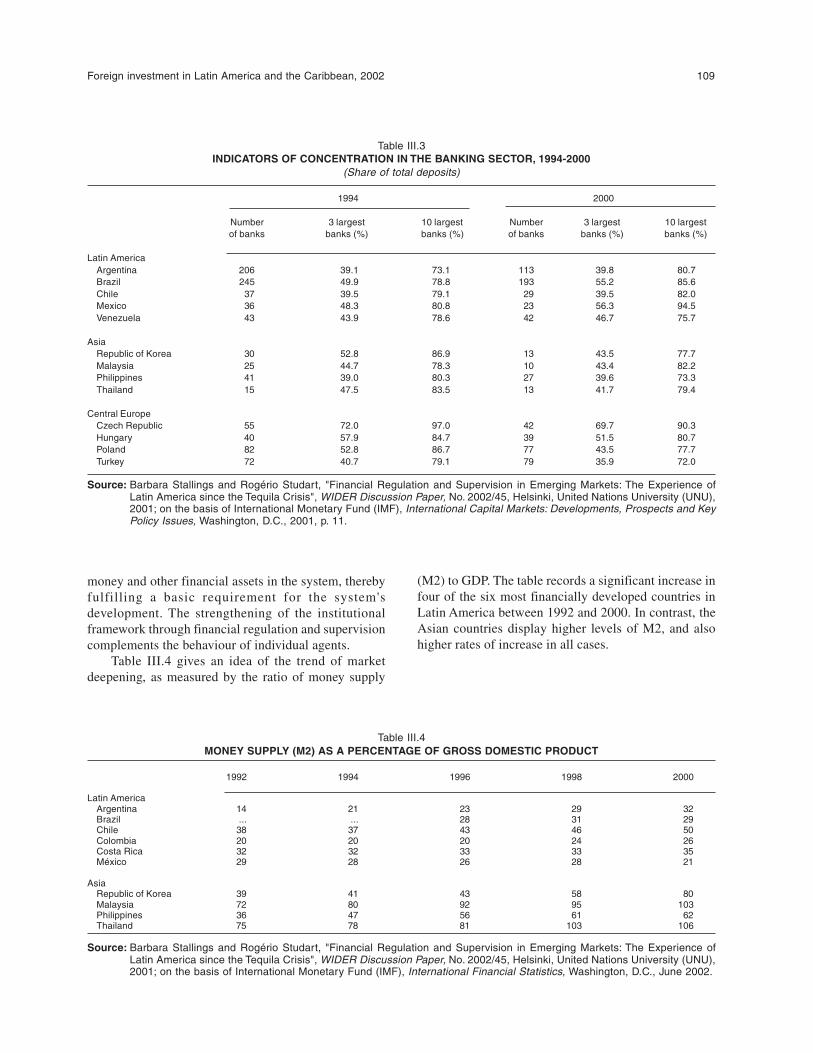
Foreign investment in Latin America and the Caribbean, 2002 109
Table III.3INDICATORS OF CONCENTRATION IN THE BANKING SECTOR, 1994-2000
(Share of total deposits)
1994 2000
Number 3 largest 10 largest Number 3 largest 10 largestof banks banks (%) banks (%) of banks banks (%) banks (%)
Latin AmericaArgentina 206 39.1 73.1 113 39.8 80.7Brazil 245 49.9 78.8 193 55.2 85.6Chile 37 39.5 79.1 29 39.5 82.0Mexico 36 48.3 80.8 23 56.3 94.5Venezuela 43 43.9 78.6 42 46.7 75.7
AsiaRepublic of Korea 30 52.8 86.9 13 43.5 77.7Malaysia 25 44.7 78.3 10 43.4 82.2Philippines 41 39.0 80.3 27 39.6 73.3Thailand 15 47.5 83.5 13 41.7 79.4
Central EuropeCzech Republic 55 72.0 97.0 42 69.7 90.3Hungary 40 57.9 84.7 39 51.5 80.7Poland 82 52.8 86.7 77 43.5 77.7Turkey 72 40.7 79.1 79 35.9 72.0
Source: Barbara Stallings and Rogério Studart, "Financial Regulation and Supervision in Emerging Markets: The Experience ofLatin America since the Tequila Crisis", WIDER Discussion Paper, No. 2002/45, Helsinki, United Nations University (UNU),2001; on the basis of International Monetary Fund (IMF), International Capital Markets: Developments, Prospects and KeyPolicy Issues, Washington, D.C., 2001, p. 11.
money and other financial assets in the system, therebyfulfilling a basic requirement for the system'sdevelopment. The strengthening of the institutionalframework through financial regulation and supervisioncomplements the behaviour of individual agents.
Table III.4 gives an idea of the trend of marketdeepening, as measured by the ratio of money supply
(M2) to GDP. The table records a significant increase infour of the six most financially developed countries inLatin America between 1992 and 2000. In contrast, theAsian countries display higher levels of M2, and alsohigher rates of increase in all cases.
Table III.4MONEY SUPPLY (M2) AS A PERCENTAGE OF GROSS DOMESTIC PRODUCT
1992 1994 1996 1998 2000
Latin AmericaArgentina 14 21 23 29 32Brazil ... ... 28 31 29Chile 38 37 43 46 50Colombia 20 20 20 24 26Costa Rica 32 32 33 33 35México 29 28 26 28 21
AsiaRepublic of Korea 39 41 43 58 80Malaysia 72 80 92 95 103Philippines 36 47 56 61 62Thailand 75 78 81 103 106
Source: Barbara Stallings and Rogério Studart, "Financial Regulation and Supervision in Emerging Markets: The Experience ofLatin America since the Tequila Crisis", WIDER Discussion Paper, No. 2002/45, Helsinki, United Nations University (UNU),2001; on the basis of International Monetary Fund (IMF), International Financial Statistics, Washington, D.C., June 2002.
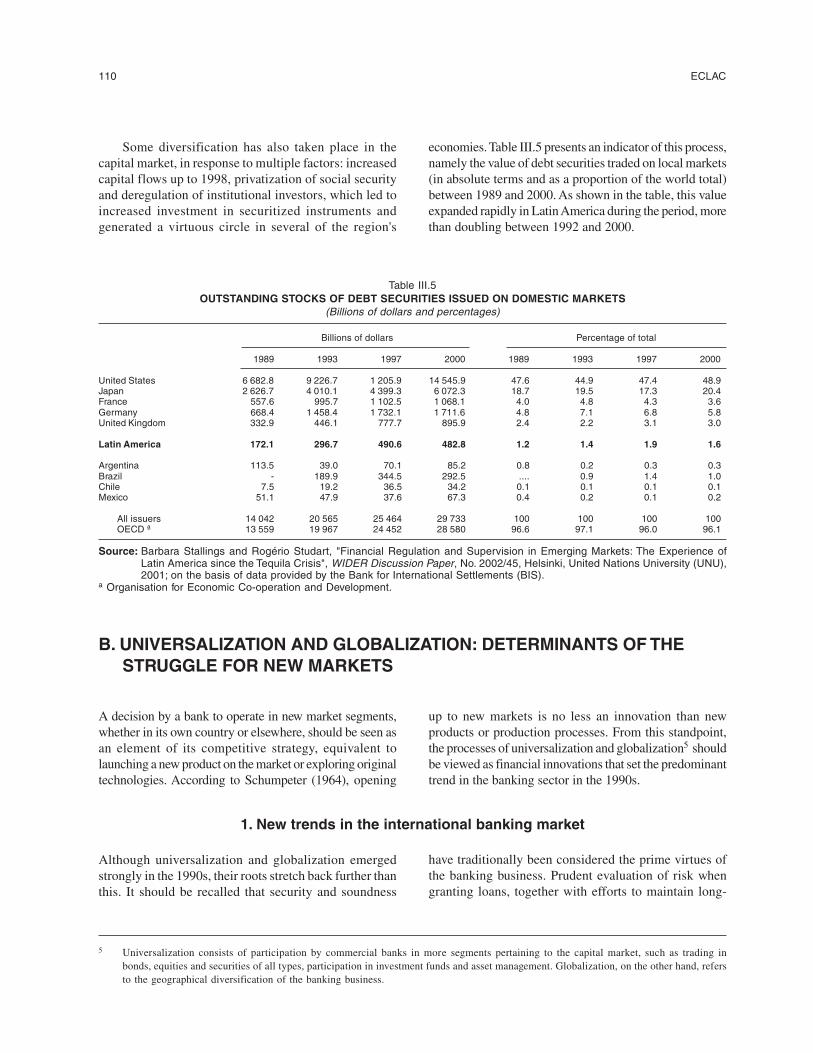
110 ECLAC
Some diversification has also taken place in thecapital market, in response to multiple factors: increasedcapital flows up to 1998, privatization of social securityand deregulation of institutional investors, which led toincreased investment in securitized instruments andgenerated a virtuous circle in several of the region's
economies. Table III.5 presents an indicator of this process,namely the value of debt securities traded on local markets(in absolute terms and as a proportion of the world total)between 1989 and 2000. As shown in the table, this valueexpanded rapidly in Latin America during the period, morethan doubling between 1992 and 2000.
Table III.5OUTSTANDING STOCKS OF DEBT SECURITIES ISSUED ON DOMESTIC MARKETS
(Billions of dollars and percentages)
Billions of dollars Percentage of total
1989 1993 1997 2000 1989 1993 1997 2000
United States 6 682.8 9 226.7 1 205.9 14 545.9 47.6 44.9 47.4 48.9Japan 2 626.7 4 010.1 4 399.3 6 072.3 18.7 19.5 17.3 20.4France 557.6 995.7 1 102.5 1 068.1 4.0 4.8 4.3 3.6Germany 668.4 1 458.4 1 732.1 1 711.6 4.8 7.1 6.8 5.8United Kingdom 332.9 446.1 777.7 895.9 2.4 2.2 3.1 3.0
Latin America 172.1 296.7 490.6 482.8 1.2 1.4 1.9 1.6
Argentina 113.5 39.0 70.1 85.2 0.8 0.2 0.3 0.3Brazil - 189.9 344.5 292.5 .... 0.9 1.4 1.0Chile 7.5 19.2 36.5 34.2 0.1 0.1 0.1 0.1Mexico 51.1 47.9 37.6 67.3 0.4 0.2 0.1 0.2
All issuers 14 042 20 565 25 464 29 733 100 100 100 100OECD ª 13 559 19 967 24 452 28 580 96.6 97.1 96.0 96.1
Source: Barbara Stallings and Rogério Studart, "Financial Regulation and Supervision in Emerging Markets: The Experience ofLatin America since the Tequila Crisis", WIDER Discussion Paper, No. 2002/45, Helsinki, United Nations University (UNU),2001; on the basis of data provided by the Bank for International Settlements (BIS).
a Organisation for Economic Co-operation and Development.
B. UNIVERSALIZATION AND GLOBALIZATION: DETERMINANTS OF THESTRUGGLE FOR NEW MARKETS
A decision by a bank to operate in new market segments,whether in its own country or elsewhere, should be seen asan element of its competitive strategy, equivalent tolaunching a new product on the market or exploring originaltechnologies. According to Schumpeter (1964), opening
up to new markets is no less an innovation than newproducts or production processes. From this standpoint,the processes of universalization and globalization5 shouldbe viewed as financial innovations that set the predominanttrend in the banking sector in the 1990s.
1. New trends in the international banking market
Although universalization and globalization emergedstrongly in the 1990s, their roots stretch back further thanthis. It should be recalled that security and soundness
have traditionally been considered the prime virtues ofthe banking business. Prudent evaluation of risk whengranting loans, together with efforts to maintain long-
5 Universalization consists of participation by commercial banks in more segments pertaining to the capital market, such as trading inbonds, equities and securities of all types, participation in investment funds and asset management. Globalization, on the other hand, refersto the geographical diversification of the banking business.
Foreign investment in Latin America and the Caribbean, 2002 111
6 An example of the traditional attitude taken by commercial banks until recently is provided by J.P. Morgan. As described in Euromoney(2000), the traditional Morgan strategy was to serve an elite group of clients. It was assumed that these clients would approach the bank toobtain its financial services, not that the bank would have to seek clients. In fact, one of the reasons for J.P. Morgan's merger with ChaseManhattan was precisely the fact that it had problems in expanding its client base.
7 The spread of automated teller machines (ATMs) reduced operating costs significantly, making it possible to multiply the volume ofbusiness. Direct funds transfer at point of sale (POS), access to the banking system from home, remote banking and smart cards paved theway for the virtual banking revolution. Nonetheless, these changes did not always gain immediate acceptance (see The Economist, 21November 1998).
8 The Agreement, though currently under review, is still in force. The text of the original Agreement and the most recent version released forcomment can be found on the web site of the Bank for International Settlements (BIS) (www.bis.org).
term relationships with clients, represented a bank's sealof quality.6 Nonetheless, a few decades ago, factorsemerged that helped to alter the relatively conservativeattitude that banks had historically shown towardsinnovation (Carvalho, 1997; BIS, 1996a; The Economist,1993a, 1993b, 1994a, 1997 and 2002). Three of theseare particularly important: heightened instability in theeconomic climate; technological progress; and greaterderegulation and liberalization of the financial and capitalmarkets.
(a) Heightened instability in the economic climate
The exceptionally unstable economic environmentthat prevailed in the world from the 1970s onward had adirect effect on the performance of the financial system.The main sources of that instability were rising inflationin the United States, the abandonment of the BrettonWoods rules, successive oil crises and themacroeconomic policies adopted by industrializedcountries. Together, these phenomena had a decisiveimpact on the strategy of the banking sector by generatingsharp volatility in the exchange rates of developed-country currencies and destabilizing interest rates. Thevolatility of these key prices not only rendered obsoletethe risk-management knowledge previously accumulatedby financial institutions, but also generated new risks thathad to be considered in banking activities. The virtualbankruptcy of Latin American debtors in the early 1980s,which hit the large United States banks and weakenedthem for a decade, illustrates the high cost of the creditrisk caused by interest-rate instability. The bankingsystem's response was to securitize its loan portfolio anddevelop derivative instruments, as discussed below.
(b) Progress in information and communicationtechnologies (ICT)
Advances in ICT have changed the financial sector'scompetitive functioning for producer and distributoralike, by generating incentives for greater efficiency. Thenew technologies have drastically and systematically
reduced transaction costs, provided wider access tofinancial services and enhanced the liquidity of the assetstraded in the system.7 As a result, markets in differentcountries and continents can now connect to each otherin real time, with consequences for the structure andcomplexity of contracts. This process has led to globalinterconnections between financial markets and clients.
In addition, the availability of more productiveinformation management tools has made it possible tomonitor the different services and products and focus onspecific clients. This has led to the development ofstrategies based on the marketing and mass distributionof standardized products, thereby giving retail consumersand small businesses access to such services. In thesemarket segments, electronic channels such as the Internethave multiplied the capacity to provide services withoutthe need for a physical presence, and banks have beeninvesting large sums in e-business to adapt their servicesto this medium.
(c) Liberalization and deregulation of financialand capital markets
The third force behind the banks' change of attitudewas the liberalization and deregulation of theinternational financial market, the main consequence ofwhich was to give banks greater freedom to pursue theirown strategies. The most important initiative in terms ofinternational banking regulation was the BaselAgreement, adopted in 1988.8
The Basel Committee on Banking Supervision, madeup of specialists from all the industrialized countries, wasformed to adopt an agreement among the signatorycountries on convergence towards a common regulatorysystem. The Committee pursued two objectives: to createcommon regulatory rules of the game for all banksoperating internationally, and to devise a new regulatorystrategy to replace the one prevailing up until that time,which had become obsolete.
Once these changes had been agreed upon, financialsupervision, instead of focusing on specific balance-sheetitems, concentrated more on the overall risk assumed by
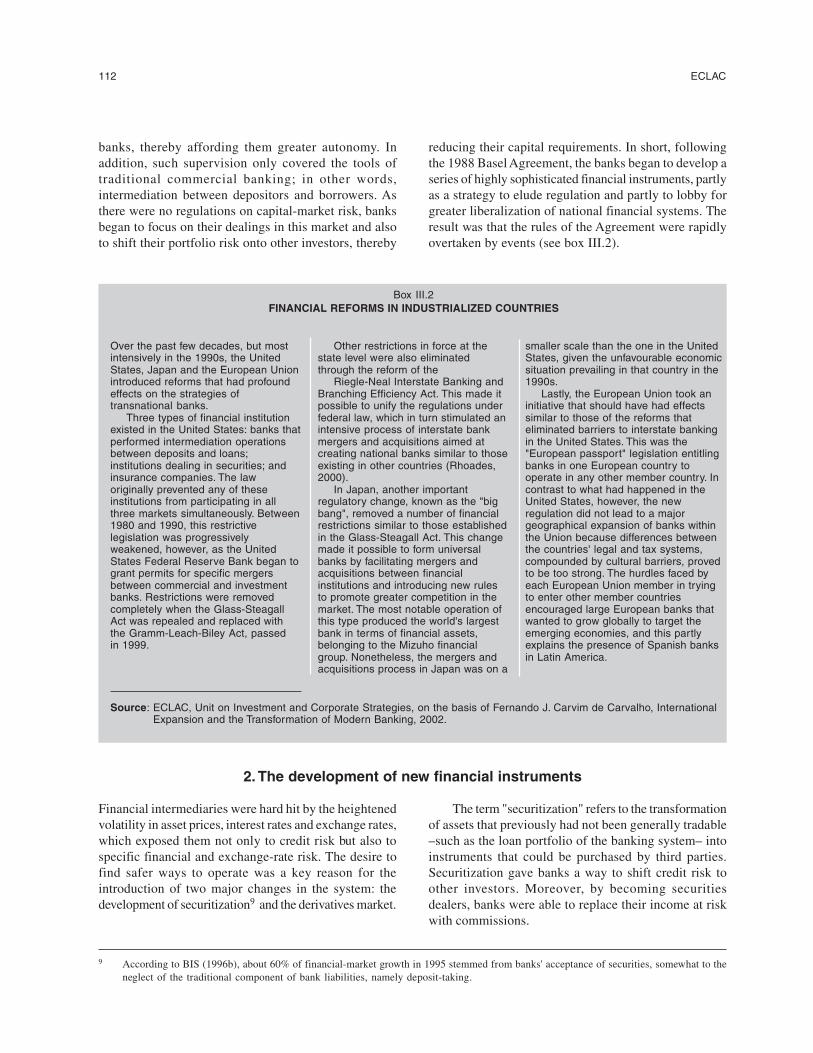
112 ECLAC
banks, thereby affording them greater autonomy. Inaddition, such supervision only covered the tools oftraditional commercial banking; in other words,intermediation between depositors and borrowers. Asthere were no regulations on capital-market risk, banksbegan to focus on their dealings in this market and alsoto shift their portfolio risk onto other investors, thereby
reducing their capital requirements. In short, followingthe 1988 Basel Agreement, the banks began to develop aseries of highly sophisticated financial instruments, partlyas a strategy to elude regulation and partly to lobby forgreater liberalization of national financial systems. Theresult was that the rules of the Agreement were rapidlyovertaken by events (see box III.2).
Box III.2FINANCIAL REFORMS IN INDUSTRIALIZED COUNTRIES
Over the past few decades, but mostintensively in the 1990s, the UnitedStates, Japan and the European Unionintroduced reforms that had profoundeffects on the strategies oftransnational banks.
Three types of financial institutionexisted in the United States: banks thatperformed intermediation operationsbetween deposits and loans;institutions dealing in securities; andinsurance companies. The laworiginally prevented any of theseinstitutions from participating in allthree markets simultaneously. Between1980 and 1990, this restrictivelegislation was progressivelyweakened, however, as the UnitedStates Federal Reserve Bank began togrant permits for specific mergersbetween commercial and investmentbanks. Restrictions were removedcompletely when the Glass-SteagallAct was repealed and replaced withthe Gramm-Leach-Biley Act, passedin 1999.
Other restrictions in force at thestate level were also eliminatedthrough the reform of the
Riegle-Neal Interstate Banking andBranching Efficiency Act. This made itpossible to unify the regulations underfederal law, which in turn stimulated anintensive process of interstate bankmergers and acquisitions aimed atcreating national banks similar to thoseexisting in other countries (Rhoades,2000).
In Japan, another importantregulatory change, known as the "bigbang", removed a number of financialrestrictions similar to those establishedin the Glass-Steagall Act. This changemade it possible to form universalbanks by facilitating mergers andacquisitions between financialinstitutions and introducing new rulesto promote greater competition in themarket. The most notable operation ofthis type produced the world's largestbank in terms of financial assets,belonging to the Mizuho financialgroup. Nonetheless, the mergers andacquisitions process in Japan was on a
smaller scale than the one in the UnitedStates, given the unfavourable economicsituation prevailing in that country in the1990s.
Lastly, the European Union took aninitiative that should have had effectssimilar to those of the reforms thateliminated barriers to interstate bankingin the United States. This was the"European passport" legislation entitlingbanks in one European country tooperate in any other member country. Incontrast to what had happened in theUnited States, however, the newregulation did not lead to a majorgeographical expansion of banks withinthe Union because differences betweenthe countries' legal and tax systems,compounded by cultural barriers, provedto be too strong. The hurdles faced byeach European Union member in tryingto enter other member countriesencouraged large European banks thatwanted to grow globally to target theemerging economies, and this partlyexplains the presence of Spanish banksin Latin America.
Source: ECLAC, Unit on Investment and Corporate Strategies, on the basis of Fernando J. Carvim de Carvalho, InternationalExpansion and the Transformation of Modern Banking, 2002.
2. The development of new financial instruments
Financial intermediaries were hard hit by the heightenedvolatility in asset prices, interest rates and exchange rates,which exposed them not only to credit risk but also tospecific financial and exchange-rate risk. The desire tofind safer ways to operate was a key reason for theintroduction of two major changes in the system: thedevelopment of securitization9 and the derivatives market.
The term "securitization" refers to the transformationof assets that previously had not been generally tradable–such as the loan portfolio of the banking system– intoinstruments that could be purchased by third parties.Securitization gave banks a way to shift credit risk toother investors. Moreover, by becoming securitiesdealers, banks were able to replace their income at riskwith commissions.
9 According to BIS (1996b), about 60% of financial-market growth in 1995 stemmed from banks' acceptance of securities, somewhat to theneglect of the traditional component of bank liabilities, namely deposit-taking.
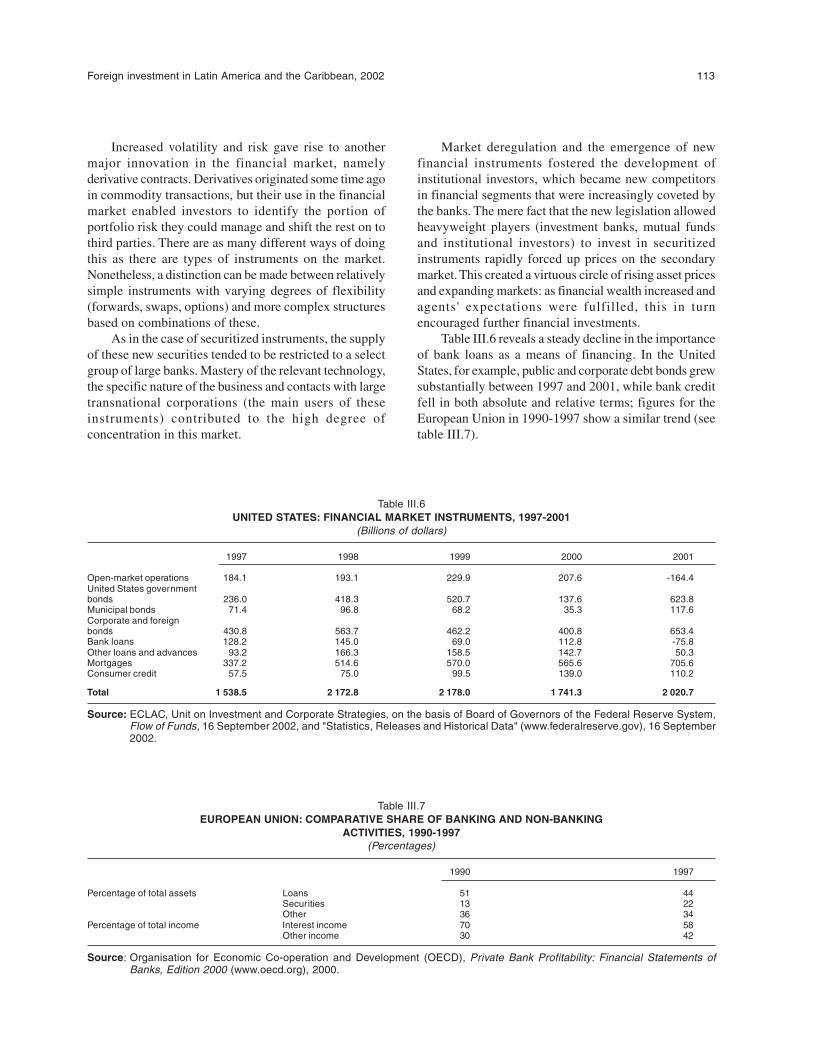
Foreign investment in Latin America and the Caribbean, 2002 113
Increased volatility and risk gave rise to anothermajor innovation in the financial market, namelyderivative contracts. Derivatives originated some time agoin commodity transactions, but their use in the financialmarket enabled investors to identify the portion ofportfolio risk they could manage and shift the rest on tothird parties. There are as many different ways of doingthis as there are types of instruments on the market.Nonetheless, a distinction can be made between relativelysimple instruments with varying degrees of flexibility(forwards, swaps, options) and more complex structuresbased on combinations of these.
As in the case of securitized instruments, the supplyof these new securities tended to be restricted to a selectgroup of large banks. Mastery of the relevant technology,the specific nature of the business and contacts with largetransnational corporations (the main users of theseinstruments) contributed to the high degree ofconcentration in this market.
Market deregulation and the emergence of newfinancial instruments fostered the development ofinstitutional investors, which became new competitorsin financial segments that were increasingly coveted bythe banks. The mere fact that the new legislation allowedheavyweight players (investment banks, mutual fundsand institutional investors) to invest in securitizedinstruments rapidly forced up prices on the secondarymarket. This created a virtuous circle of rising asset pricesand expanding markets: as financial wealth increased andagents' expectations were fulfilled, this in turnencouraged further financial investments.
Table III.6 reveals a steady decline in the importanceof bank loans as a means of financing. In the UnitedStates, for example, public and corporate debt bonds grewsubstantially between 1997 and 2001, while bank creditfell in both absolute and relative terms; figures for theEuropean Union in 1990-1997 show a similar trend (seetable III.7).
Table III.6UNITED STATES: FINANCIAL MARKET INSTRUMENTS, 1997-2001
(Billions of dollars)
1997 1998 1999 2000 2001
Open-market operations 184.1 193.1 229.9 207.6 -164.4United States governmentbonds 236.0 418.3 520.7 137.6 623.8Municipal bonds 71.4 96.8 68.2 35.3 117.6Corporate and foreignbonds 430.8 563.7 462.2 400.8 653.4Bank loans 128.2 145.0 69.0 112.8 -75.8Other loans and advances 93.2 166.3 158.5 142.7 50.3Mortgages 337.2 514.6 570.0 565.6 705.6Consumer credit 57.5 75.0 99.5 139.0 110.2
Total 1 538.5 2 172.8 2 178.0 1 741.3 2 020.7
Source: ECLAC, Unit on Investment and Corporate Strategies, on the basis of Board of Governors of the Federal Reserve System,Flow of Funds, 16 September 2002, and "Statistics, Releases and Historical Data" (www.federalreserve.gov), 16 September2002.
Table III.7EUROPEAN UNION: COMPARATIVE SHARE OF BANKING AND NON-BANKING
ACTIVITIES, 1990-1997(Percentages)
1990 1997
Percentage of total assets Loans 51 44Securities 13 22Other 36 34
Percentage of total income Interest income 70 58Other income 30 42
Source: Organisation for Economic Co-operation and Development (OECD), Private Bank Profitability: Financial Statements ofBanks, Edition 2000 (www.oecd.org), 2000.
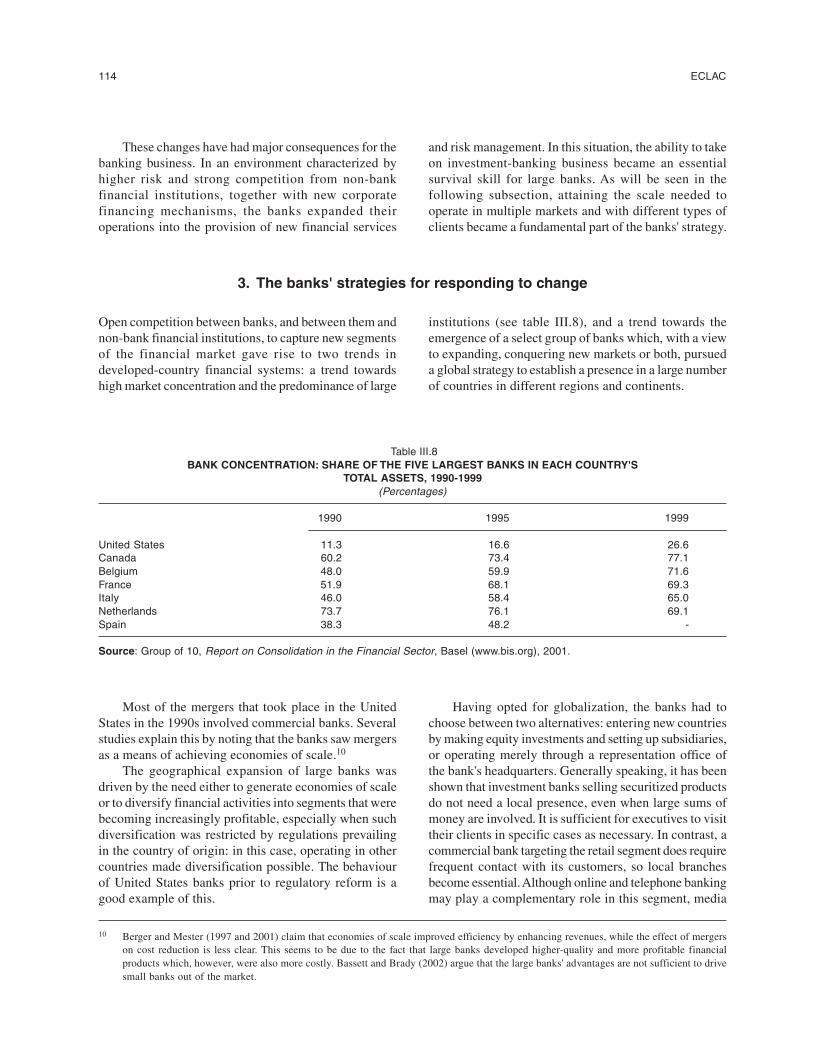
114 ECLAC
10 Berger and Mester (1997 and 2001) claim that economies of scale improved efficiency by enhancing revenues, while the effect of mergerson cost reduction is less clear. This seems to be due to the fact that large banks developed higher-quality and more profitable financialproducts which, however, were also more costly. Bassett and Brady (2002) argue that the large banks' advantages are not sufficient to drivesmall banks out of the market.
These changes have had major consequences for thebanking business. In an environment characterized byhigher risk and strong competition from non-bankfinancial institutions, together with new corporatefinancing mechanisms, the banks expanded theiroperations into the provision of new financial services
and risk management. In this situation, the ability to takeon investment-banking business became an essentialsurvival skill for large banks. As will be seen in thefollowing subsection, attaining the scale needed tooperate in multiple markets and with different types ofclients became a fundamental part of the banks' strategy.
3. The banks' strategies for responding to change
Open competition between banks, and between them andnon-bank financial institutions, to capture new segmentsof the financial market gave rise to two trends indeveloped-country financial systems: a trend towardshigh market concentration and the predominance of large
institutions (see table III.8), and a trend towards theemergence of a select group of banks which, with a viewto expanding, conquering new markets or both, pursueda global strategy to establish a presence in a large numberof countries in different regions and continents.
Table III.8BANK CONCENTRATION: SHARE OF THE FIVE LARGEST BANKS IN EACH COUNTRY'S
TOTAL ASSETS, 1990-1999(Percentages)
1990 1995 1999
United States 11.3 16.6 26.6Canada 60.2 73.4 77.1Belgium 48.0 59.9 71.6France 51.9 68.1 69.3Italy 46.0 58.4 65.0Netherlands 73.7 76.1 69.1Spain 38.3 48.2 -
Source: Group of 10, Report on Consolidation in the Financial Sector, Basel (www.bis.org), 2001.
Most of the mergers that took place in the UnitedStates in the 1990s involved commercial banks. Severalstudies explain this by noting that the banks saw mergersas a means of achieving economies of scale.10
The geographical expansion of large banks wasdriven by the need either to generate economies of scaleor to diversify financial activities into segments that werebecoming increasingly profitable, especially when suchdiversification was restricted by regulations prevailingin the country of origin: in this case, operating in othercountries made diversification possible. The behaviourof United States banks prior to regulatory reform is agood example of this.
Having opted for globalization, the banks had tochoose between two alternatives: entering new countriesby making equity investments and setting up subsidiaries,or operating merely through a representation office ofthe bank's headquarters. Generally speaking, it has beenshown that investment banks selling securitized productsdo not need a local presence, even when large sums ofmoney are involved. It is sufficient for executives to visittheir clients in specific cases as necessary. In contrast, acommercial bank targeting the retail segment does requirefrequent contact with its customers, so local branchesbecome essential. Although online and telephone bankingmay play a complementary role in this segment, media
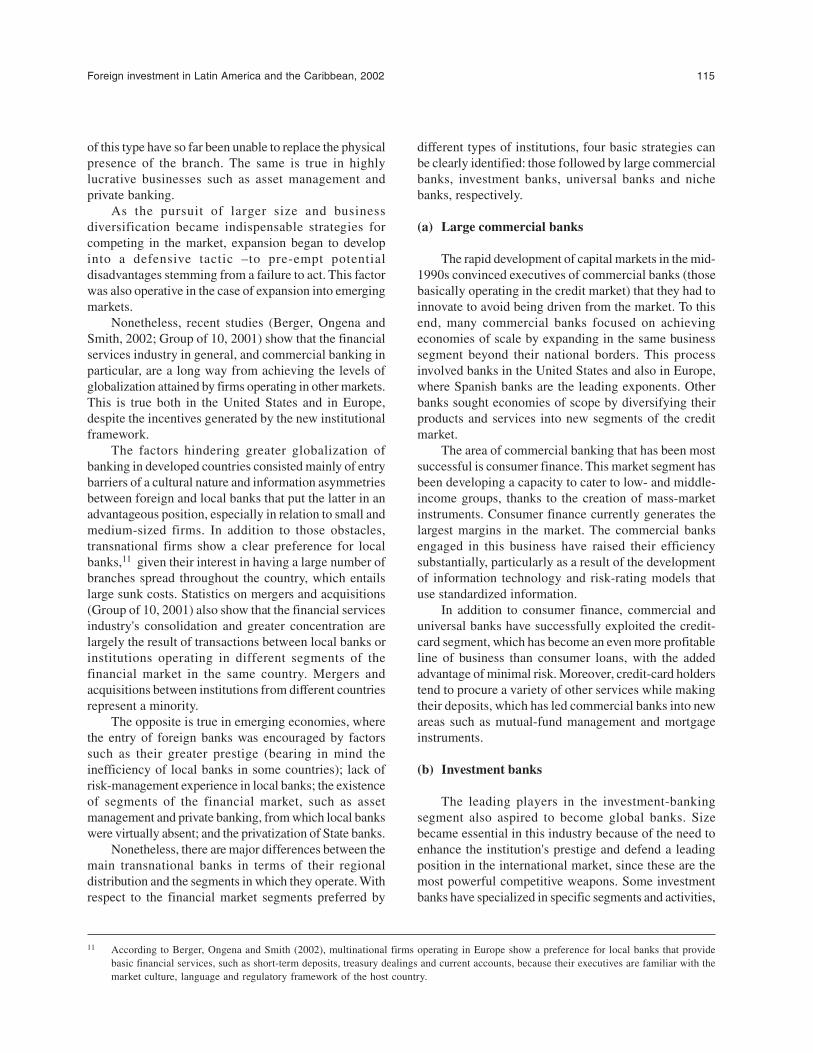
Foreign investment in Latin America and the Caribbean, 2002 115
11 According to Berger, Ongena and Smith (2002), multinational firms operating in Europe show a preference for local banks that providebasic financial services, such as short-term deposits, treasury dealings and current accounts, because their executives are familiar with themarket culture, language and regulatory framework of the host country.
of this type have so far been unable to replace the physicalpresence of the branch. The same is true in highlylucrative businesses such as asset management andprivate banking.
As the pursuit of larger size and businessdiversification became indispensable strategies forcompeting in the market, expansion began to developinto a defensive tactic –to pre-empt potentialdisadvantages stemming from a failure to act. This factorwas also operative in the case of expansion into emergingmarkets.
Nonetheless, recent studies (Berger, Ongena andSmith, 2002; Group of 10, 2001) show that the financialservices industry in general, and commercial banking inparticular, are a long way from achieving the levels ofglobalization attained by firms operating in other markets.This is true both in the United States and in Europe,despite the incentives generated by the new institutionalframework.
The factors hindering greater globalization ofbanking in developed countries consisted mainly of entrybarriers of a cultural nature and information asymmetriesbetween foreign and local banks that put the latter in anadvantageous position, especially in relation to small andmedium-sized firms. In addition to those obstacles,transnational firms show a clear preference for localbanks,11 given their interest in having a large number ofbranches spread throughout the country, which entailslarge sunk costs. Statistics on mergers and acquisitions(Group of 10, 2001) also show that the financial servicesindustry's consolidation and greater concentration arelargely the result of transactions between local banks orinstitutions operating in different segments of thefinancial market in the same country. Mergers andacquisitions between institutions from different countriesrepresent a minority.
The opposite is true in emerging economies, wherethe entry of foreign banks was encouraged by factorssuch as their greater prestige (bearing in mind theinefficiency of local banks in some countries); lack ofrisk-management experience in local banks; the existenceof segments of the financial market, such as assetmanagement and private banking, from which local bankswere virtually absent; and the privatization of State banks.
Nonetheless, there are major differences between themain transnational banks in terms of their regionaldistribution and the segments in which they operate. Withrespect to the financial market segments preferred by
different types of institutions, four basic strategies canbe clearly identified: those followed by large commercialbanks, investment banks, universal banks and nichebanks, respectively.
(a) Large commercial banks
The rapid development of capital markets in the mid-1990s convinced executives of commercial banks (thosebasically operating in the credit market) that they had toinnovate to avoid being driven from the market. To thisend, many commercial banks focused on achievingeconomies of scale by expanding in the same businesssegment beyond their national borders. This processinvolved banks in the United States and also in Europe,where Spanish banks are the leading exponents. Otherbanks sought economies of scope by diversifying theirproducts and services into new segments of the creditmarket.
The area of commercial banking that has been mostsuccessful is consumer finance. This market segment hasbeen developing a capacity to cater to low- and middle-income groups, thanks to the creation of mass-marketinstruments. Consumer finance currently generates thelargest margins in the market. The commercial banksengaged in this business have raised their efficiencysubstantially, particularly as a result of the developmentof information technology and risk-rating models thatuse standardized information.
In addition to consumer finance, commercial anduniversal banks have successfully exploited the credit-card segment, which has become an even more profitableline of business than consumer loans, with the addedadvantage of minimal risk. Moreover, credit-card holderstend to procure a variety of other services while makingtheir deposits, which has led commercial banks into newareas such as mutual-fund management and mortgageinstruments.
(b) Investment banks
The leading players in the investment-bankingsegment also aspired to become global banks. Sizebecame essential in this industry because of the need toenhance the institution's prestige and defend a leadingposition in the international market, since these are themost powerful competitive weapons. Some investmentbanks have specialized in specific segments and activities,
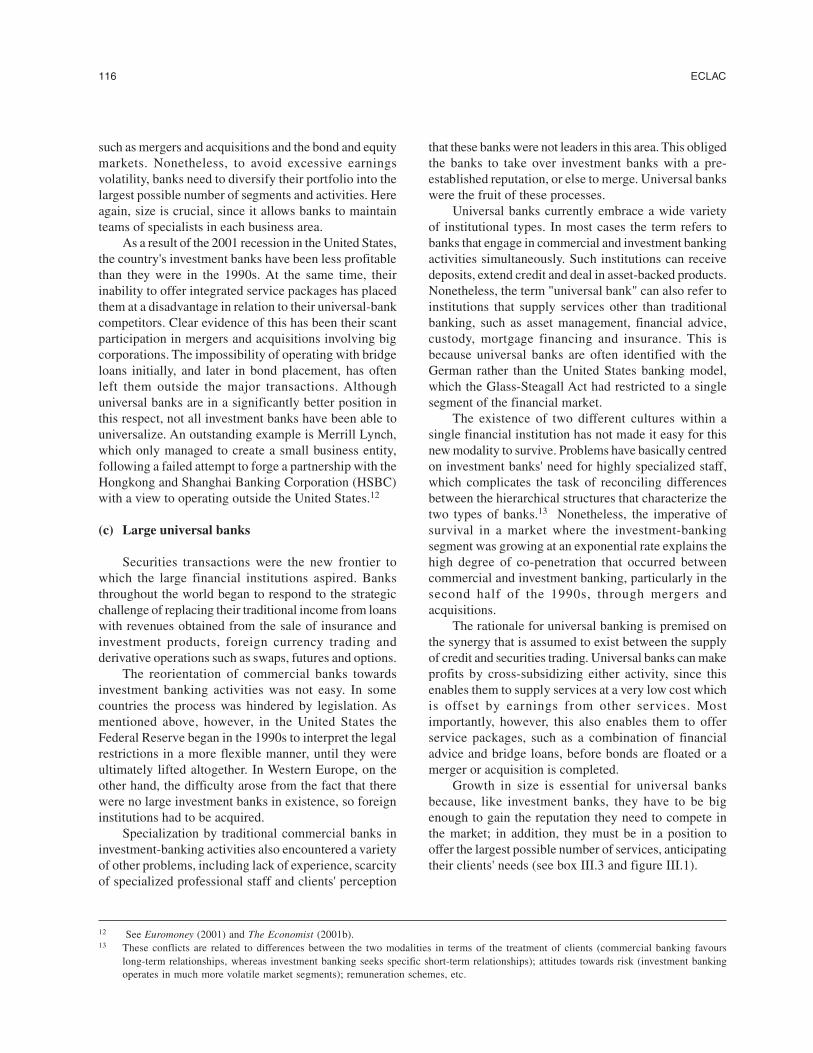
116 ECLAC
12 See Euromoney (2001) and The Economist (2001b).13 These conflicts are related to differences between the two modalities in terms of the treatment of clients (commercial banking favours
long-term relationships, whereas investment banking seeks specific short-term relationships); attitudes towards risk (investment bankingoperates in much more volatile market segments); remuneration schemes, etc.
such as mergers and acquisitions and the bond and equitymarkets. Nonetheless, to avoid excessive earningsvolatility, banks need to diversify their portfolio into thelargest possible number of segments and activities. Hereagain, size is crucial, since it allows banks to maintainteams of specialists in each business area.
As a result of the 2001 recession in the United States,the country's investment banks have been less profitablethan they were in the 1990s. At the same time, theirinability to offer integrated service packages has placedthem at a disadvantage in relation to their universal-bankcompetitors. Clear evidence of this has been their scantparticipation in mergers and acquisitions involving bigcorporations. The impossibility of operating with bridgeloans initially, and later in bond placement, has oftenleft them outside the major transactions. Althoughuniversal banks are in a significantly better position inthis respect, not all investment banks have been able touniversalize. An outstanding example is Merrill Lynch,which only managed to create a small business entity,following a failed attempt to forge a partnership with theHongkong and Shanghai Banking Corporation (HSBC)with a view to operating outside the United States.12
(c) Large universal banks
Securities transactions were the new frontier towhich the large financial institutions aspired. Banksthroughout the world began to respond to the strategicchallenge of replacing their traditional income from loanswith revenues obtained from the sale of insurance andinvestment products, foreign currency trading andderivative operations such as swaps, futures and options.
The reorientation of commercial banks towardsinvestment banking activities was not easy. In somecountries the process was hindered by legislation. Asmentioned above, however, in the United States theFederal Reserve began in the 1990s to interpret the legalrestrictions in a more flexible manner, until they wereultimately lifted altogether. In Western Europe, on theother hand, the difficulty arose from the fact that therewere no large investment banks in existence, so foreigninstitutions had to be acquired.
Specialization by traditional commercial banks ininvestment-banking activities also encountered a varietyof other problems, including lack of experience, scarcityof specialized professional staff and clients' perception
that these banks were not leaders in this area. This obligedthe banks to take over investment banks with a pre-established reputation, or else to merge. Universal bankswere the fruit of these processes.
Universal banks currently embrace a wide varietyof institutional types. In most cases the term refers tobanks that engage in commercial and investment bankingactivities simultaneously. Such institutions can receivedeposits, extend credit and deal in asset-backed products.Nonetheless, the term "universal bank" can also refer toinstitutions that supply services other than traditionalbanking, such as asset management, financial advice,custody, mortgage financing and insurance. This isbecause universal banks are often identified with theGerman rather than the United States banking model,which the Glass-Steagall Act had restricted to a singlesegment of the financial market.
The existence of two different cultures within asingle financial institution has not made it easy for thisnew modality to survive. Problems have basically centredon investment banks' need for highly specialized staff,which complicates the task of reconciling differencesbetween the hierarchical structures that characterize thetwo types of banks.13 Nonetheless, the imperative ofsurvival in a market where the investment-bankingsegment was growing at an exponential rate explains thehigh degree of co-penetration that occurred betweencommercial and investment banking, particularly in thesecond half of the 1990s, through mergers andacquisitions.
The rationale for universal banking is premised onthe synergy that is assumed to exist between the supplyof credit and securities trading. Universal banks can makeprofits by cross-subsidizing either activity, since thisenables them to supply services at a very low cost whichis offset by earnings from other services. Mostimportantly, however, this also enables them to offerservice packages, such as a combination of financialadvice and bridge loans, before bonds are floated or amerger or acquisition is completed.
Growth in size is essential for universal banksbecause, like investment banks, they have to be bigenough to gain the reputation they need to compete inthe market; in addition, they must be in a position tooffer the largest possible number of services, anticipatingtheir clients' needs (see box III.3 and figure III.1).
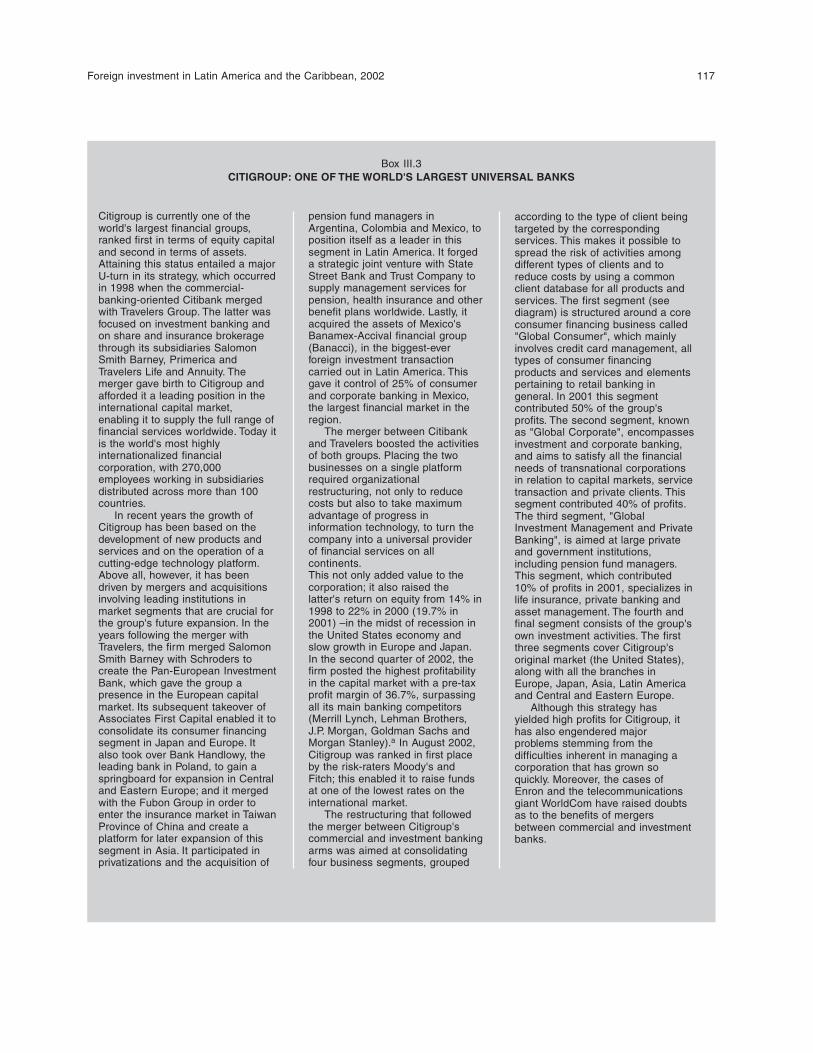
Foreign investment in Latin America and the Caribbean, 2002 117
Box III.3CITIGROUP: ONE OF THE WORLD'S LARGEST UNIVERSAL BANKS
Citigroup is currently one of theworld's largest financial groups,ranked first in terms of equity capitaland second in terms of assets.Attaining this status entailed a majorU-turn in its strategy, which occurredin 1998 when the commercial-banking-oriented Citibank mergedwith Travelers Group. The latter wasfocused on investment banking andon share and insurance brokeragethrough its subsidiaries SalomonSmith Barney, Primerica andTravelers Life and Annuity. Themerger gave birth to Citigroup andafforded it a leading position in theinternational capital market,enabling it to supply the full range offinancial services worldwide. Today itis the world's most highlyinternationalized financialcorporation, with 270,000employees working in subsidiariesdistributed across more than 100countries.
In recent years the growth ofCitigroup has been based on thedevelopment of new products andservices and on the operation of acutting-edge technology platform.Above all, however, it has beendriven by mergers and acquisitionsinvolving leading institutions inmarket segments that are crucial forthe group's future expansion. In theyears following the merger withTravelers, the firm merged SalomonSmith Barney with Schroders tocreate the Pan-European InvestmentBank, which gave the group apresence in the European capitalmarket. Its subsequent takeover ofAssociates First Capital enabled it toconsolidate its consumer financingsegment in Japan and Europe. Italso took over Bank Handlowy, theleading bank in Poland, to gain aspringboard for expansion in Centraland Eastern Europe; and it mergedwith the Fubon Group in order toenter the insurance market in TaiwanProvince of China and create aplatform for later expansion of thissegment in Asia. It participated inprivatizations and the acquisition of
pension fund managers inArgentina, Colombia and Mexico, toposition itself as a leader in thissegment in Latin America. It forgeda strategic joint venture with StateStreet Bank and Trust Company tosupply management services forpension, health insurance and otherbenefit plans worldwide. Lastly, itacquired the assets of Mexico'sBanamex-Accival financial group(Banacci), in the biggest-everforeign investment transactioncarried out in Latin America. Thisgave it control of 25% of consumerand corporate banking in Mexico,the largest financial market in theregion.
The merger between Citibankand Travelers boosted the activitiesof both groups. Placing the twobusinesses on a single platformrequired organizationalrestructuring, not only to reducecosts but also to take maximumadvantage of progress ininformation technology, to turn thecompany into a universal providerof financial services on allcontinents.This not only added value to thecorporation; it also raised thelatter's return on equity from 14% in1998 to 22% in 2000 (19.7% in2001) –in the midst of recession inthe United States economy andslow growth in Europe and Japan.In the second quarter of 2002, thefirm posted the highest profitabilityin the capital market with a pre-taxprofit margin of 36.7%, surpassingall its main banking competitors(Merrill Lynch, Lehman Brothers,J.P. Morgan, Goldman Sachs andMorgan Stanley).a In August 2002,Citigroup was ranked in first placeby the risk-raters Moody's andFitch; this enabled it to raise fundsat one of the lowest rates on theinternational market.
The restructuring that followedthe merger between Citigroup'scommercial and investment bankingarms was aimed at consolidatingfour business segments, grouped
according to the type of client beingtargeted by the correspondingservices. This makes it possible tospread the risk of activities amongdifferent types of clients and toreduce costs by using a commonclient database for all products andservices. The first segment (seediagram) is structured around a coreconsumer financing business called"Global Consumer", which mainlyinvolves credit card management, alltypes of consumer financingproducts and services and elementspertaining to retail banking ingeneral. In 2001 this segmentcontributed 50% of the group'sprofits. The second segment, knownas "Global Corporate", encompassesinvestment and corporate banking,and aims to satisfy all the financialneeds of transnational corporationsin relation to capital markets, servicetransaction and private clients. Thissegment contributed 40% of profits.The third segment, "GlobalInvestment Management and PrivateBanking", is aimed at large privateand government institutions,including pension fund managers.This segment, which contributed10% of profits in 2001, specializes inlife insurance, private banking andasset management. The fourth andfinal segment consists of the group'sown investment activities. The firstthree segments cover Citigroup'soriginal market (the United States),along with all the branches inEurope, Japan, Asia, Latin Americaand Central and Eastern Europe.
Although this strategy hasyielded high profits for Citigroup, ithas also engendered majorproblems stemming from thedifficulties inherent in managing acorporation that has grown soquickly. Moreover, the cases ofEnron and the telecommunicationsgiant WorldCom have raised doubtsas to the benefits of mergersbetween commercial and investmentbanks.
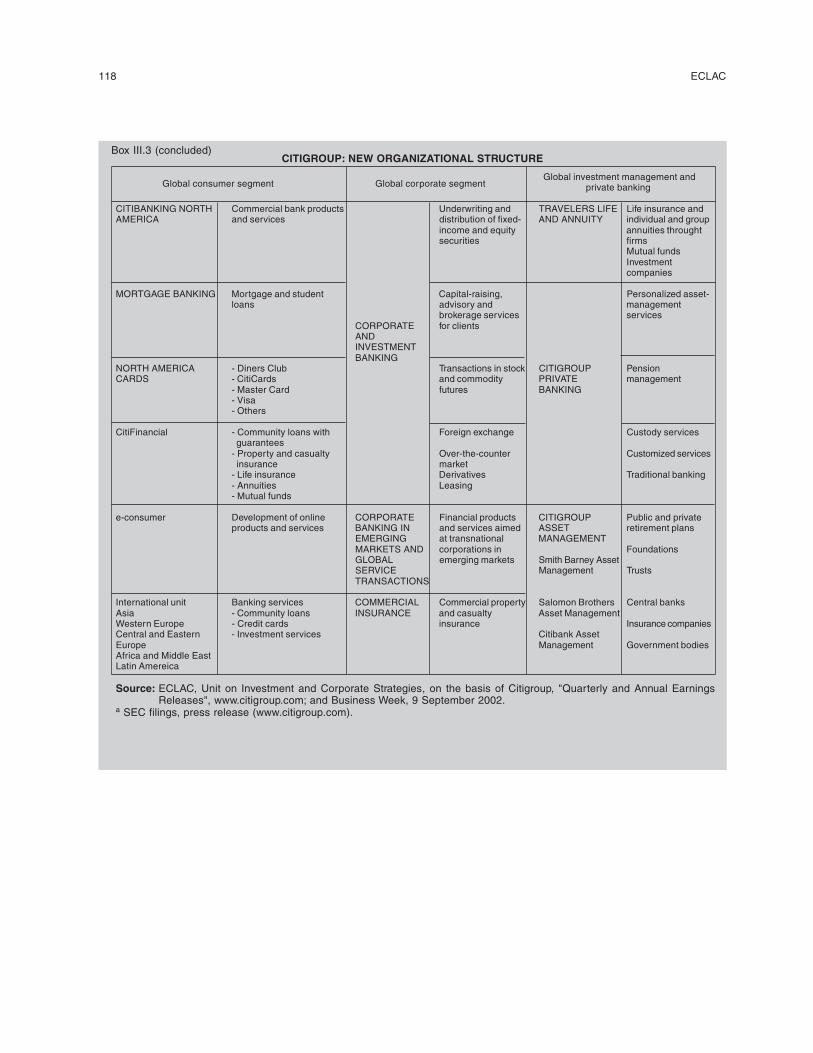
118 ECLAC
CITIGROUP: NEW ORGANIZATIONAL STRUCTURE
Global consumer segment Global corporate segment
Global investment management and private banking
CITIBANKING NORTH Commercial bank products Underwriting and TRAVELERS LIFE Life insurance andAMERICA and services distribution of fixed- AND ANNUITY individual and group
income and equity annuities throughtsecurities firms
Mutual fundsInvestmentcompanies
MORTGAGE BANKING Mortgage and student Capital-raising, Personalized asset-loans advisory and management
brokerage services servicesCORPORATE for clientsANDINVESTMENTBANKING
NORTH AMERICA - Diners Club Transactions in stock CITIGROUP PensionCARDS - CitiCards and commodity PRIVATE management
- Master Card futures BANKING- Visa- Others
CitiFinancial - Community loans with Foreign exchange Custody services guarantees- Property and casualty Over-the-counter Customized services insurance market- Life insurance Derivatives Traditional banking- Annuities Leasing- Mutual funds
e-consumer Development of online CORPORATE Financial products CITIGROUP Public and privateproducts and services BANKING IN and services aimed ASSET retirement plans
EMERGING at transnational MANAGEMENTMARKETS AND corporations in FoundationsGLOBAL emerging markets Smith Barney AssetSERVICE Management TrustsTRANSACTIONS
International unit Banking services COMMERCIAL Commercial property Salomon Brothers Central banksAsia - Community loans INSURANCE and casualty Asset ManagementWestern Europe - Credit cards insurance Insurance companiesCentral and Eastern - Investment services Citibank AssetEurope Management Government bodiesAfrica and Middle EastLatin Amereica
Source: ECLAC, Unit on Investment and Corporate Strategies, on the basis of Citigroup, "Quarterly and Annual EarningsReleases", www.citigroup.com; and Business Week, 9 September 2002.
a SEC filings, press release (www.citigroup.com).
Box III.3 (concluded)
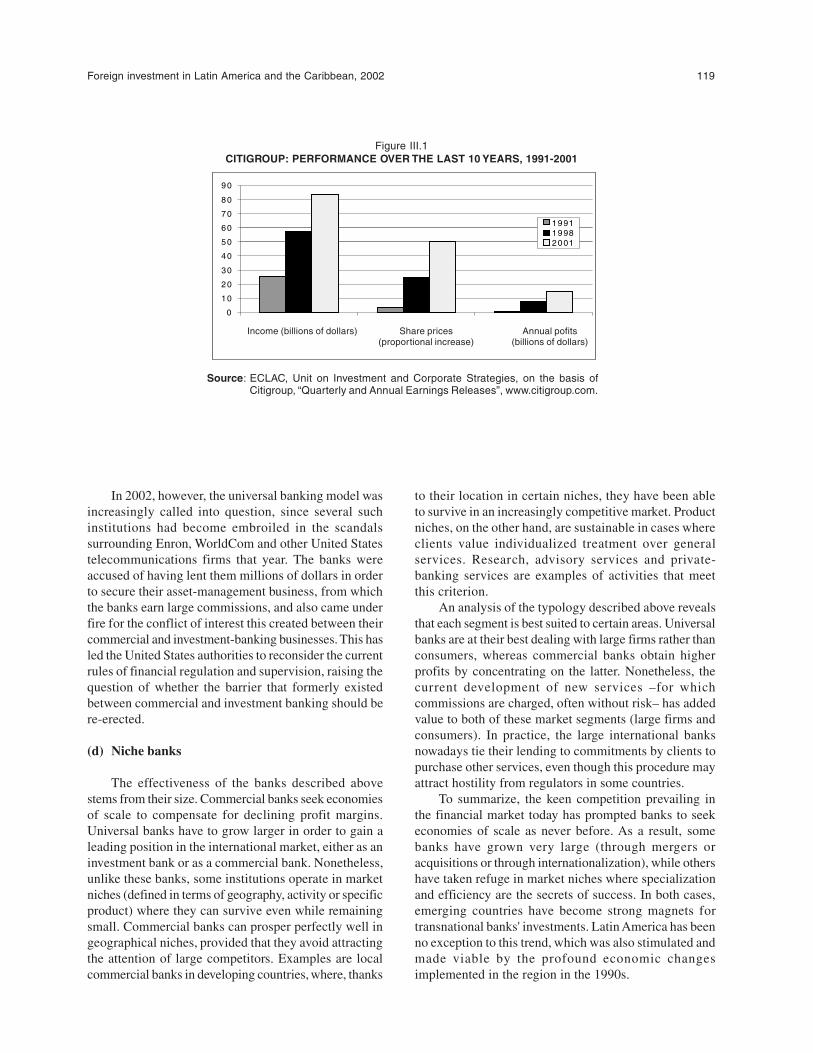
Foreign investment in Latin America and the Caribbean, 2002 119
In 2002, however, the universal banking model wasincreasingly called into question, since several suchinstitutions had become embroiled in the scandalssurrounding Enron, WorldCom and other United Statestelecommunications firms that year. The banks wereaccused of having lent them millions of dollars in orderto secure their asset-management business, from whichthe banks earn large commissions, and also came underfire for the conflict of interest this created between theircommercial and investment-banking businesses. This hasled the United States authorities to reconsider the currentrules of financial regulation and supervision, raising thequestion of whether the barrier that formerly existedbetween commercial and investment banking should bere-erected.
(d) Niche banks
The effectiveness of the banks described abovestems from their size. Commercial banks seek economiesof scale to compensate for declining profit margins.Universal banks have to grow larger in order to gain aleading position in the international market, either as aninvestment bank or as a commercial bank. Nonetheless,unlike these banks, some institutions operate in marketniches (defined in terms of geography, activity or specificproduct) where they can survive even while remainingsmall. Commercial banks can prosper perfectly well ingeographical niches, provided that they avoid attractingthe attention of large competitors. Examples are localcommercial banks in developing countries, where, thanks
0
10
20
30
40
50
60
70
80
90
Ing res os (m iles dem illones de dó la res)
P rec io de las acc iones(p ropo rc ión de aum en to )
Bene fic ios anua les(m iles de m illones de
dó la res)
199119982001
Figure III.1CITIGROUP: PERFORMANCE OVER THE LAST 10 YEARS, 1991-2001
Source: ECLAC, Unit on Investment and Corporate Strategies, on the basis ofCitigroup, “Quarterly and Annual Earnings Releases”, www.citigroup.com.
to their location in certain niches, they have been ableto survive in an increasingly competitive market. Productniches, on the other hand, are sustainable in cases whereclients value individualized treatment over generalservices. Research, advisory services and private-banking services are examples of activities that meetthis criterion.
An analysis of the typology described above revealsthat each segment is best suited to certain areas. Universalbanks are at their best dealing with large firms rather thanconsumers, whereas commercial banks obtain higherprofits by concentrating on the latter. Nonetheless, thecurrent development of new services –for whichcommissions are charged, often without risk– has addedvalue to both of these market segments (large firms andconsumers). In practice, the large international banksnowadays tie their lending to commitments by clients topurchase other services, even though this procedure mayattract hostility from regulators in some countries.
To summarize, the keen competition prevailing inthe financial market today has prompted banks to seekeconomies of scale as never before. As a result, somebanks have grown very large (through mergers oracquisitions or through internationalization), while othershave taken refuge in market niches where specializationand efficiency are the secrets of success. In both cases,emerging countries have become strong magnets fortransnational banks' investments. Latin America has beenno exception to this trend, which was also stimulated andmade viable by the profound economic changesimplemented in the region in the 1990s.
Income (billions of dollars) Share prices Annual pofits(proportional increase) (billions of dollars)
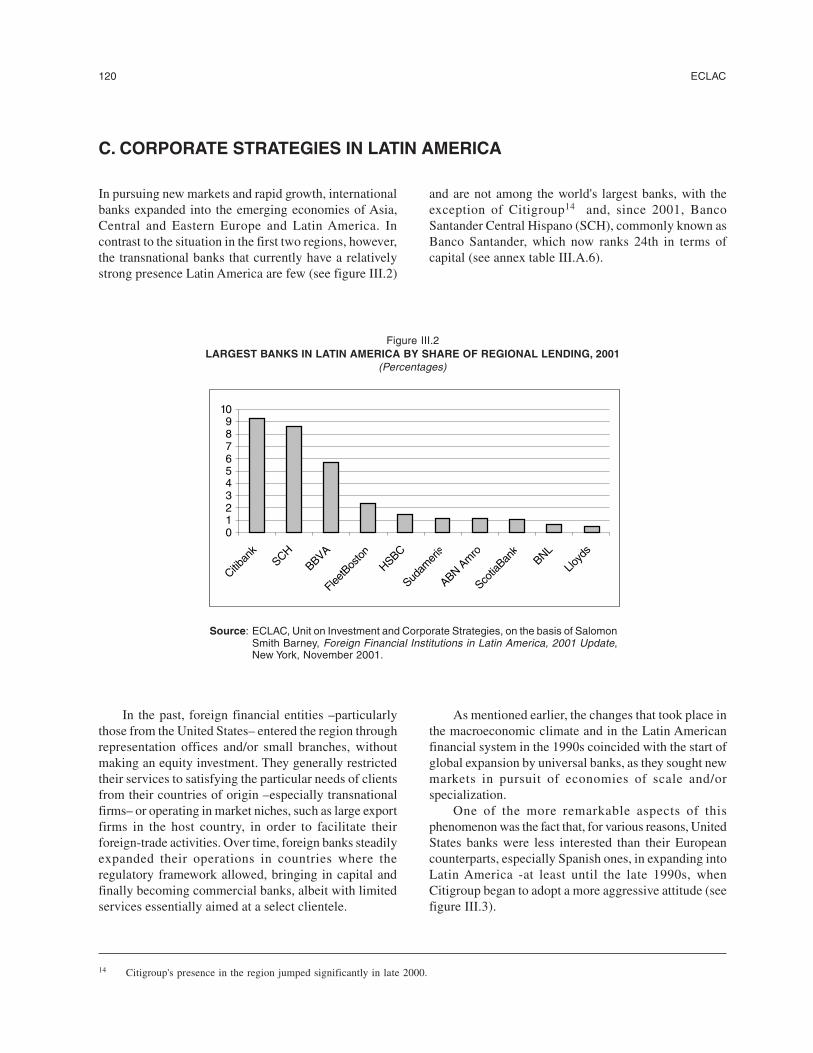
120 ECLAC
0123456789
10
Citiban
kSCH
BBVA
FleetB
oston
HSBC
Sudam
eris
ABN Am
ro
Scotia
Bank
BNL
Lloyd
s
C. CORPORATE STRATEGIES IN LATIN AMERICA
In pursuing new markets and rapid growth, internationalbanks expanded into the emerging economies of Asia,Central and Eastern Europe and Latin America. Incontrast to the situation in the first two regions, however,the transnational banks that currently have a relativelystrong presence Latin America are few (see figure III.2)
and are not among the world's largest banks, with theexception of Citigroup14 and, since 2001, BancoSantander Central Hispano (SCH), commonly known asBanco Santander, which now ranks 24th in terms ofcapital (see annex table III.A.6).
Figure III.2LARGEST BANKS IN LATIN AMERICA BY SHARE OF REGIONAL LENDING, 2001
(Percentages)
Source: ECLAC, Unit on Investment and Corporate Strategies, on the basis of SalomonSmith Barney, Foreign Financial Institutions in Latin America, 2001 Update,New York, November 2001.
In the past, foreign financial entities –particularlythose from the United States– entered the region throughrepresentation offices and/or small branches, withoutmaking an equity investment. They generally restrictedtheir services to satisfying the particular needs of clientsfrom their countries of origin –especially transnationalfirms– or operating in market niches, such as large exportfirms in the host country, in order to facilitate theirforeign-trade activities. Over time, foreign banks steadilyexpanded their operations in countries where theregulatory framework allowed, bringing in capital andfinally becoming commercial banks, albeit with limitedservices essentially aimed at a select clientele.
As mentioned earlier, the changes that took place inthe macroeconomic climate and in the Latin Americanfinancial system in the 1990s coincided with the start ofglobal expansion by universal banks, as they sought newmarkets in pursuit of economies of scale and/orspecialization.
One of the more remarkable aspects of thisphenomenon was the fact that, for various reasons, UnitedStates banks were less interested than their Europeancounterparts, especially Spanish ones, in expanding intoLatin America -at least until the late 1990s, whenCitigroup began to adopt a more aggressive attitude (seefigure III.3).
14 Citigroup's presence in the region jumped significantly in late 2000.
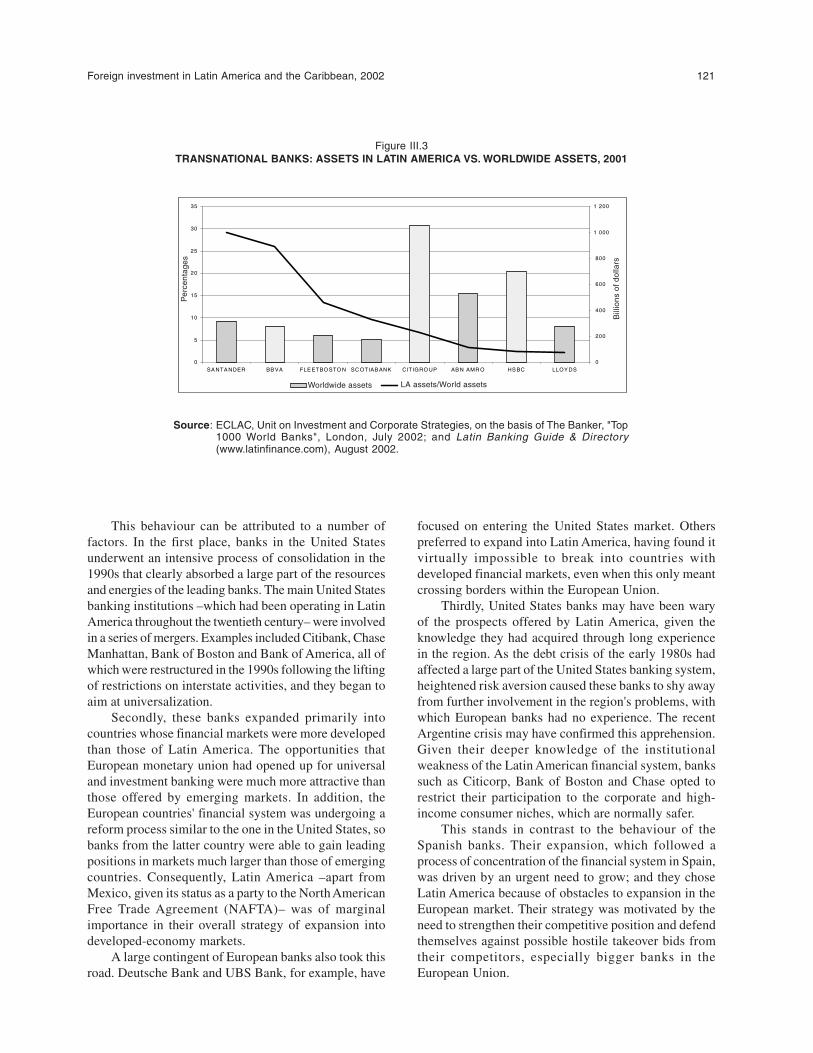
Foreign investment in Latin America and the Caribbean, 2002 121
Figure III.3TRANSNATIONAL BANKS: ASSETS IN LATIN AMERICA VS. WORLDWIDE ASSETS, 2001
0
5
10
15
20
25
30
35
SA NTA NDER BB VA FLE ETBO STO N SC OTIAB ANK CITIGRO UP AB N AMR O HS BC LLOY DS
Por
cent
ajes
0
200
400
600
800
1 000
1 200
Mile
s de
mill
ones
de
dóla
res
A ctiv os en e l m un do Activ os en A L/ Activos m u ndo
Source: ECLAC, Unit on Investment and Corporate Strategies, on the basis of The Banker, "Top1000 World Banks", London, July 2002; and Latin Banking Guide & Directory(www.latinfinance.com), August 2002.
Bill
ions
of d
olla
rs
Per
cent
ages
Worldwide assets LA assets/World assets
This behaviour can be attributed to a number offactors. In the first place, banks in the United Statesunderwent an intensive process of consolidation in the1990s that clearly absorbed a large part of the resourcesand energies of the leading banks. The main United Statesbanking institutions –which had been operating in LatinAmerica throughout the twentieth century– were involvedin a series of mergers. Examples included Citibank, ChaseManhattan, Bank of Boston and Bank of America, all ofwhich were restructured in the 1990s following the liftingof restrictions on interstate activities, and they began toaim at universalization.
Secondly, these banks expanded primarily intocountries whose financial markets were more developedthan those of Latin America. The opportunities thatEuropean monetary union had opened up for universaland investment banking were much more attractive thanthose offered by emerging markets. In addition, theEuropean countries' financial system was undergoing areform process similar to the one in the United States, sobanks from the latter country were able to gain leadingpositions in markets much larger than those of emergingcountries. Consequently, Latin America –apart fromMexico, given its status as a party to the North AmericanFree Trade Agreement (NAFTA)– was of marginalimportance in their overall strategy of expansion intodeveloped-economy markets.
A large contingent of European banks also took thisroad. Deutsche Bank and UBS Bank, for example, have
focused on entering the United States market. Otherspreferred to expand into Latin America, having found itvirtually impossible to break into countries withdeveloped financial markets, even when this only meantcrossing borders within the European Union.
Thirdly, United States banks may have been waryof the prospects offered by Latin America, given theknowledge they had acquired through long experiencein the region. As the debt crisis of the early 1980s hadaffected a large part of the United States banking system,heightened risk aversion caused these banks to shy awayfrom further involvement in the region's problems, withwhich European banks had no experience. The recentArgentine crisis may have confirmed this apprehension.Given their deeper knowledge of the institutionalweakness of the Latin American financial system, bankssuch as Citicorp, Bank of Boston and Chase opted torestrict their participation to the corporate and high-income consumer niches, which are normally safer.
This stands in contrast to the behaviour of theSpanish banks. Their expansion, which followed aprocess of concentration of the financial system in Spain,was driven by an urgent need to grow; and they choseLatin America because of obstacles to expansion in theEuropean market. Their strategy was motivated by theneed to strengthen their competitive position and defendthemselves against possible hostile takeover bids fromtheir competitors, especially bigger banks in theEuropean Union.
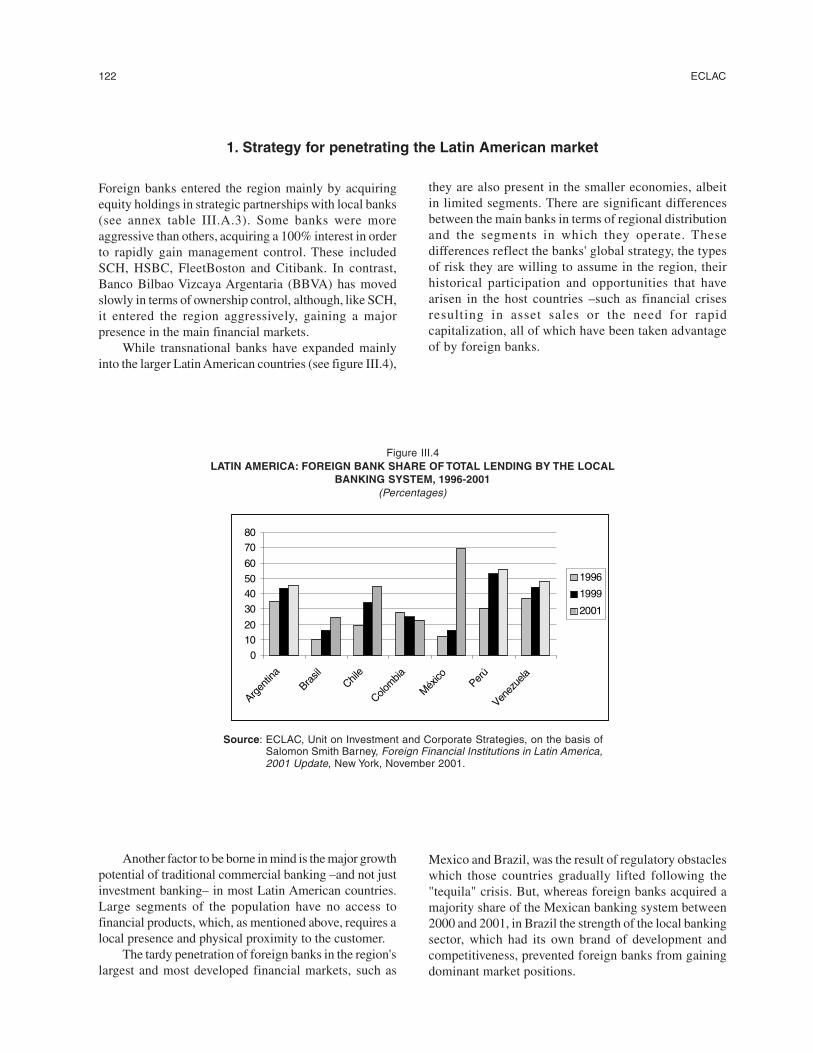
122 ECLAC
1. Strategy for penetrating the Latin American market
Foreign banks entered the region mainly by acquiringequity holdings in strategic partnerships with local banks(see annex table III.A.3). Some banks were moreaggressive than others, acquiring a 100% interest in orderto rapidly gain management control. These includedSCH, HSBC, FleetBoston and Citibank. In contrast,Banco Bilbao Vizcaya Argentaria (BBVA) has movedslowly in terms of ownership control, although, like SCH,it entered the region aggressively, gaining a majorpresence in the main financial markets.
While transnational banks have expanded mainlyinto the larger Latin American countries (see figure III.4),
they are also present in the smaller economies, albeitin limited segments. There are significant differencesbetween the main banks in terms of regional distributionand the segments in which they operate. Thesedifferences reflect the banks' global strategy, the typesof risk they are willing to assume in the region, theirhistorical participation and opportunities that havearisen in the host countries –such as financial crisesresulting in asset sales or the need for rapidcapitalization, all of which have been taken advantageof by foreign banks.
Figure III.4LATIN AMERICA: FOREIGN BANK SHARE OF TOTAL LENDING BY THE LOCAL
BANKING SYSTEM, 1996-2001(Percentages)
0
1020
30
4050
60
7080
Argen
tina
Brasil
Chile
Colombia
México Per
ú
Venez
uela
1996
1999
2001
Source: ECLAC, Unit on Investment and Corporate Strategies, on the basis ofSalomon Smith Barney, Foreign Financial Institutions in Latin America,2001 Update, New York, November 2001.
Another factor to be borne in mind is the major growthpotential of traditional commercial banking –and not justinvestment banking– in most Latin American countries.Large segments of the population have no access tofinancial products, which, as mentioned above, requires alocal presence and physical proximity to the customer.
The tardy penetration of foreign banks in the region'slargest and most developed financial markets, such as
Mexico and Brazil, was the result of regulatory obstacleswhich those countries gradually lifted following the"tequila" crisis. But, whereas foreign banks acquired amajority share of the Mexican banking system between2000 and 2001, in Brazil the strength of the local bankingsector, which had its own brand of development andcompetitiveness, prevented foreign banks from gainingdominant market positions.
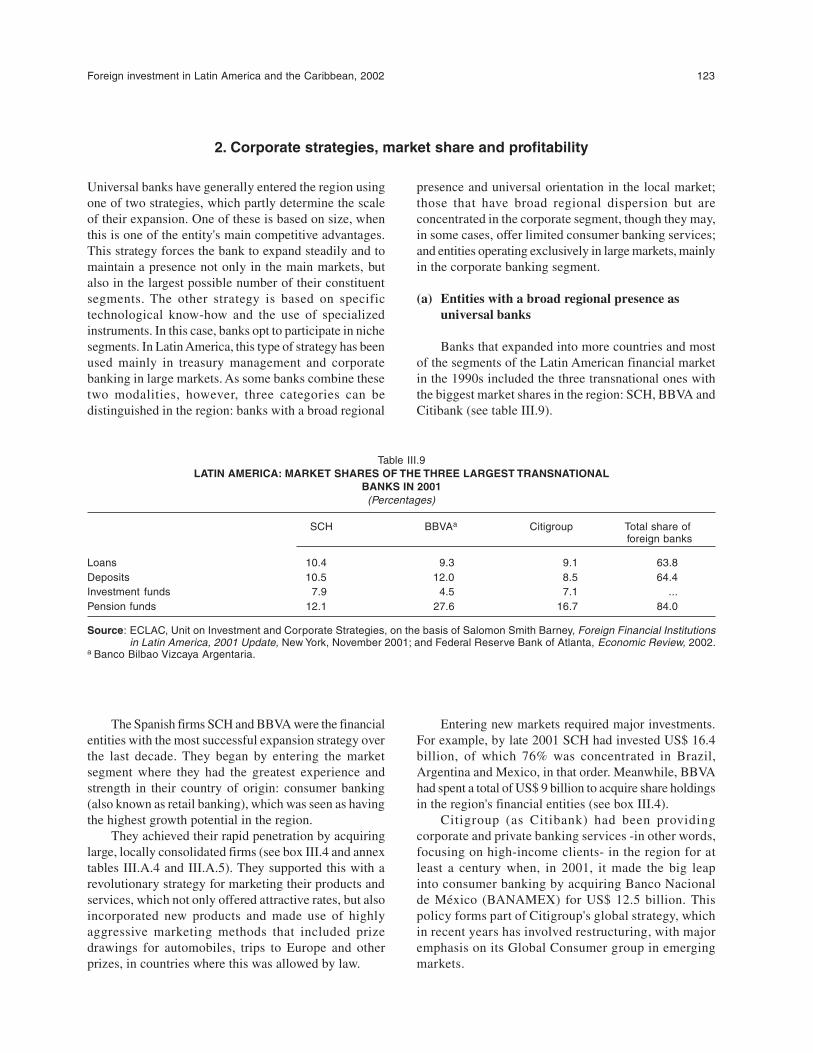
Foreign investment in Latin America and the Caribbean, 2002 123
2. Corporate strategies, market share and profitability
Universal banks have generally entered the region usingone of two strategies, which partly determine the scaleof their expansion. One of these is based on size, whenthis is one of the entity's main competitive advantages.This strategy forces the bank to expand steadily and tomaintain a presence not only in the main markets, butalso in the largest possible number of their constituentsegments. The other strategy is based on specifictechnological know-how and the use of specializedinstruments. In this case, banks opt to participate in nichesegments. In Latin America, this type of strategy has beenused mainly in treasury management and corporatebanking in large markets. As some banks combine thesetwo modalities, however, three categories can bedistinguished in the region: banks with a broad regional
presence and universal orientation in the local market;those that have broad regional dispersion but areconcentrated in the corporate segment, though they may,in some cases, offer limited consumer banking services;and entities operating exclusively in large markets, mainlyin the corporate banking segment.
(a) Entities with a broad regional presence asuniversal banks
Banks that expanded into more countries and mostof the segments of the Latin American financial marketin the 1990s included the three transnational ones withthe biggest market shares in the region: SCH, BBVA andCitibank (see table III.9).
Table III.9LATIN AMERICA: MARKET SHARES OF THE THREE LARGEST TRANSNATIONAL
BANKS IN 2001(Percentages)
SCH BBVAa Citigroup Total share of foreign banks
Loans 10.4 9.3 9.1 63.8Deposits 10.5 12.0 8.5 64.4Investment funds 7.9 4.5 7.1 ...Pension funds 12.1 27.6 16.7 84.0
Source: ECLAC, Unit on Investment and Corporate Strategies, on the basis of Salomon Smith Barney, Foreign Financial Institutionsin Latin America, 2001 Update, New York, November 2001; and Federal Reserve Bank of Atlanta, Economic Review, 2002.
a Banco Bilbao Vizcaya Argentaria.
The Spanish firms SCH and BBVA were the financialentities with the most successful expansion strategy overthe last decade. They began by entering the marketsegment where they had the greatest experience andstrength in their country of origin: consumer banking(also known as retail banking), which was seen as havingthe highest growth potential in the region.
They achieved their rapid penetration by acquiringlarge, locally consolidated firms (see box III.4 and annextables III.A.4 and III.A.5). They supported this with arevolutionary strategy for marketing their products andservices, which not only offered attractive rates, but alsoincorporated new products and made use of highlyaggressive marketing methods that included prizedrawings for automobiles, trips to Europe and otherprizes, in countries where this was allowed by law.
Entering new markets required major investments.For example, by late 2001 SCH had invested US$ 16.4billion, of which 76% was concentrated in Brazil,Argentina and Mexico, in that order. Meanwhile, BBVAhad spent a total of US$ 9 billion to acquire share holdingsin the region's financial entities (see box III.4).
Citigroup (as Citibank) had been providingcorporate and private banking services -in other words,focusing on high-income clients- in the region for atleast a century when, in 2001, it made the big leapinto consumer banking by acquiring Banco Nacionalde México (BANAMEX) for US$ 12.5 billion. Thispolicy forms part of Citigroup's global strategy, whichin recent years has involved restructuring, with majoremphasis on its Global Consumer group in emergingmarkets.
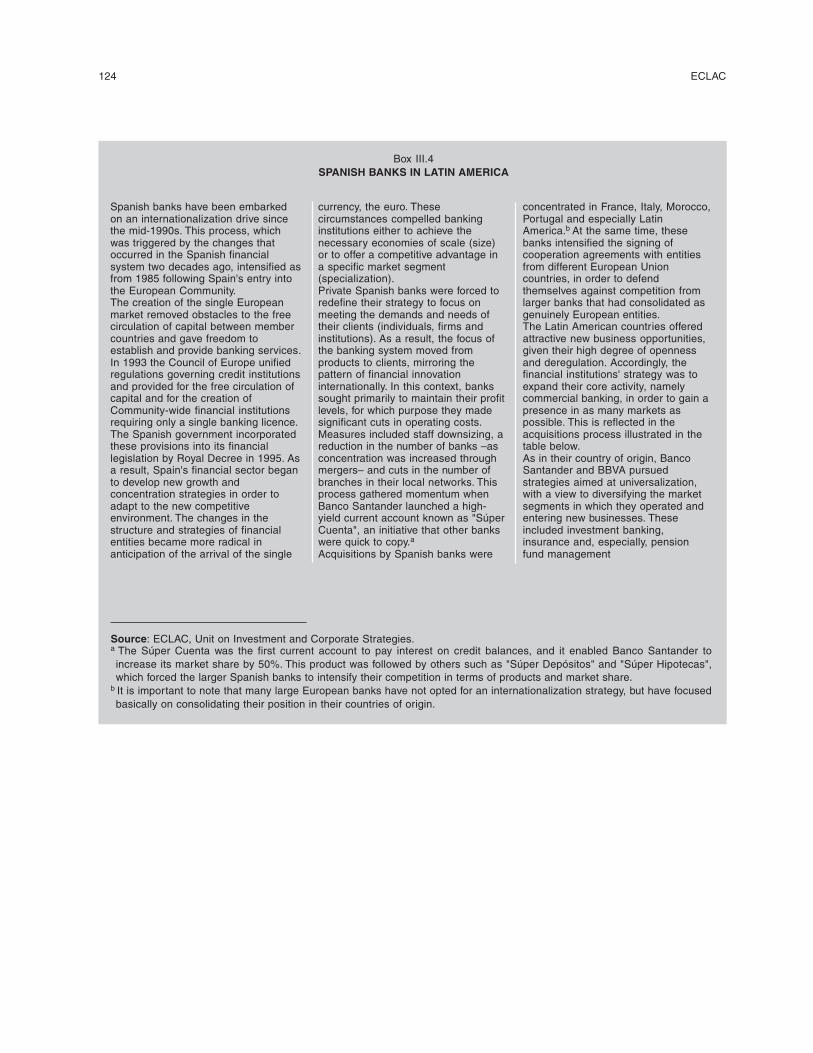
124 ECLAC
Box III.4SPANISH BANKS IN LATIN AMERICA
Spanish banks have been embarkedon an internationalization drive sincethe mid-1990s. This process, whichwas triggered by the changes thatoccurred in the Spanish financialsystem two decades ago, intensified asfrom 1985 following Spain's entry intothe European Community.The creation of the single Europeanmarket removed obstacles to the freecirculation of capital between membercountries and gave freedom toestablish and provide banking services.In 1993 the Council of Europe unifiedregulations governing credit institutionsand provided for the free circulation ofcapital and for the creation ofCommunity-wide financial institutionsrequiring only a single banking licence.The Spanish government incorporatedthese provisions into its financiallegislation by Royal Decree in 1995. Asa result, Spain's financial sector beganto develop new growth andconcentration strategies in order toadapt to the new competitiveenvironment. The changes in thestructure and strategies of financialentities became more radical inanticipation of the arrival of the single
currency, the euro. Thesecircumstances compelled bankinginstitutions either to achieve thenecessary economies of scale (size)or to offer a competitive advantage ina specific market segment(specialization).Private Spanish banks were forced toredefine their strategy to focus onmeeting the demands and needs oftheir clients (individuals, firms andinstitutions). As a result, the focus ofthe banking system moved fromproducts to clients, mirroring thepattern of financial innovationinternationally. In this context, bankssought primarily to maintain their profitlevels, for which purpose they madesignificant cuts in operating costs.Measures included staff downsizing, areduction in the number of banks –asconcentration was increased throughmergers– and cuts in the number ofbranches in their local networks. Thisprocess gathered momentum whenBanco Santander launched a high-yield current account known as "SúperCuenta", an initiative that other bankswere quick to copy.a
Acquisitions by Spanish banks were
concentrated in France, Italy, Morocco,Portugal and especially LatinAmerica.b At the same time, thesebanks intensified the signing ofcooperation agreements with entitiesfrom different European Unioncountries, in order to defendthemselves against competition fromlarger banks that had consolidated asgenuinely European entities.The Latin American countries offeredattractive new business opportunities,given their high degree of opennessand deregulation. Accordingly, thefinancial institutions' strategy was toexpand their core activity, namelycommercial banking, in order to gain apresence in as many markets aspossible. This is reflected in theacquisitions process illustrated in thetable below.As in their country of origin, BancoSantander and BBVA pursuedstrategies aimed at universalization,with a view to diversifying the marketsegments in which they operated andentering new businesses. Theseincluded investment banking,insurance and, especially, pensionfund management
Source: ECLAC, Unit on Investment and Corporate Strategies.a The Súper Cuenta was the first current account to pay interest on credit balances, and it enabled Banco Santander toincrease its market share by 50%. This product was followed by others such as "Súper Depósitos" and "Súper Hipotecas",which forced the larger Spanish banks to intensify their competition in terms of products and market share.
b It is important to note that many large European banks have not opted for an internationalization strategy, but have focusedbasically on consolidating their position in their countries of origin.
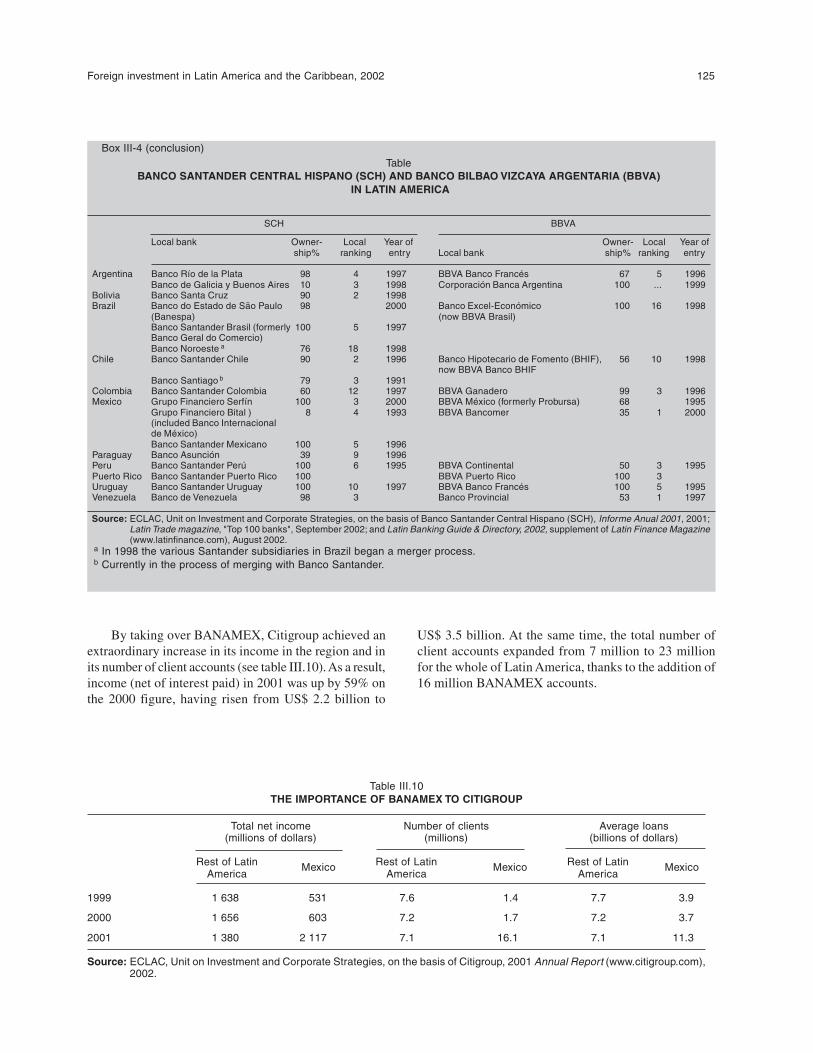
Foreign investment in Latin America and the Caribbean, 2002 125
TableBANCO SANTANDER CENTRAL HISPANO (SCH) AND BANCO BILBAO VIZCAYA ARGENTARIA (BBVA)
IN LATIN AMERICA
SCH BBVA
Local bank Owner- Local Year of Owner- Local Year ofship% ranking entry Local bank ship% ranking entry
Argentina Banco Río de la Plata 98 4 1997 BBVA Banco Francés 67 5 1996Banco de Galicia y Buenos Aires 10 3 1998 Corporación Banca Argentina 100 ... 1999
Bolivia Banco Santa Cruz 90 2 1998Brazil Banco do Estado de São Paulo 98 2000 Banco Excel-Económico 100 16 1998
(Banespa) (now BBVA Brasil)Banco Santander Brasil (formerly 100 5 1997Banco Geral do Comercio)Banco Noroeste a 76 18 1998
Chile Banco Santander Chile 90 2 1996 Banco Hipotecario de Fomento (BHIF), 56 10 1998now BBVA Banco BHIF
Banco Santiago b 79 3 1991Colombia Banco Santander Colombia 60 12 1997 BBVA Ganadero 99 3 1996Mexico Grupo Financiero Serfín 100 3 2000 BBVA México (formerly Probursa) 68 1995
Grupo Financiero Bital ) 8 4 1993 BBVA Bancomer 35 1 2000(included Banco Internacionalde México)Banco Santander Mexicano 100 5 1996
Paraguay Banco Asunción 39 9 1996Peru Banco Santander Perú 100 6 1995 BBVA Continental 50 3 1995Puerto Rico Banco Santander Puerto Rico 100 BBVA Puerto Rico 100 3Uruguay Banco Santander Uruguay 100 10 1997 BBVA Banco Francés 100 5 1995Venezuela Banco de Venezuela 98 3 Banco Provincial 53 1 1997
Source: ECLAC, Unit on Investment and Corporate Strategies, on the basis of Banco Santander Central Hispano (SCH), Informe Anual 2001, 2001;Latin Trade magazine, "Top 100 banks", September 2002; and Latin Banking Guide & Directory, 2002, supplement of Latin Finance Magazine(www.latinfinance.com), August 2002.
a In 1998 the various Santander subsidiaries in Brazil began a merger process. b Currently in the process of merging with Banco Santander.
Box III-4 (conclusion)
By taking over BANAMEX, Citigroup achieved anextraordinary increase in its income in the region and inits number of client accounts (see table III.10). As a result,income (net of interest paid) in 2001 was up by 59% onthe 2000 figure, having risen from US$ 2.2 billion to
US$ 3.5 billion. At the same time, the total number ofclient accounts expanded from 7 million to 23 millionfor the whole of Latin America, thanks to the addition of16 million BANAMEX accounts.
Table III.10THE IMPORTANCE OF BANAMEX TO CITIGROUP
Total net income Number of clients Average loans(millions of dollars) (millions) (billions of dollars)
Rest of Latin Rest of Latin Rest of LatinAmerica
MexicoAmerica
MexicoAmerica
Mexico
1999 1 638 531 7.6 1.4 7.7 3.9
2000 1 656 603 7.2 1.7 7.2 3.7
2001 1 380 2 117 7.1 16.1 7.1 11.3
Source: ECLAC, Unit on Investment and Corporate Strategies, on the basis of Citigroup, 2001 Annual Report (www.citigroup.com),2002.
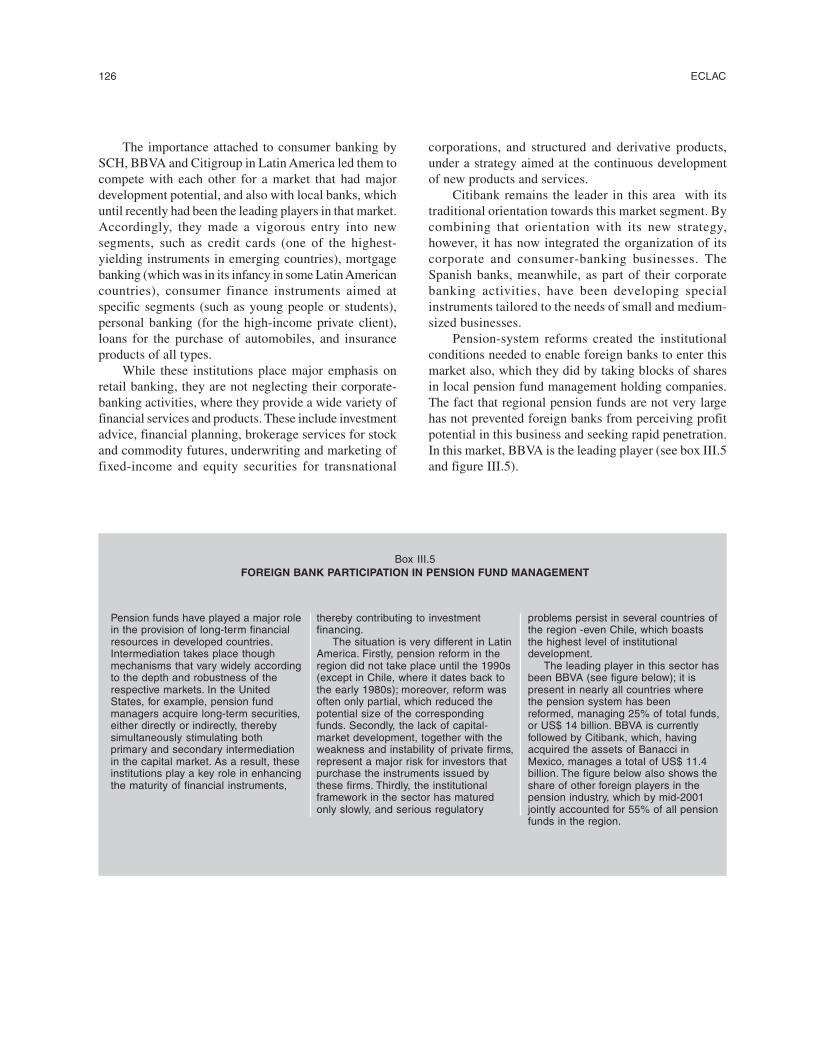
126 ECLAC
Box III.5FOREIGN BANK PARTICIPATION IN PENSION FUND MANAGEMENT
The importance attached to consumer banking bySCH, BBVA and Citigroup in Latin America led them tocompete with each other for a market that had majordevelopment potential, and also with local banks, whichuntil recently had been the leading players in that market.Accordingly, they made a vigorous entry into newsegments, such as credit cards (one of the highest-yielding instruments in emerging countries), mortgagebanking (which was in its infancy in some Latin Americancountries), consumer finance instruments aimed atspecific segments (such as young people or students),personal banking (for the high-income private client),loans for the purchase of automobiles, and insuranceproducts of all types.
While these institutions place major emphasis onretail banking, they are not neglecting their corporate-banking activities, where they provide a wide variety offinancial services and products. These include investmentadvice, financial planning, brokerage services for stockand commodity futures, underwriting and marketing offixed-income and equity securities for transnational
corporations, and structured and derivative products,under a strategy aimed at the continuous developmentof new products and services.
Citibank remains the leader in this area with itstraditional orientation towards this market segment. Bycombining that orientation with its new strategy,however, it has now integrated the organization of itscorporate and consumer-banking businesses. TheSpanish banks, meanwhile, as part of their corporatebanking activities, have been developing specialinstruments tailored to the needs of small and medium-sized businesses.
Pension-system reforms created the institutionalconditions needed to enable foreign banks to enter thismarket also, which they did by taking blocks of sharesin local pension fund management holding companies.The fact that regional pension funds are not very largehas not prevented foreign banks from perceiving profitpotential in this business and seeking rapid penetration.In this market, BBVA is the leading player (see box III.5and figure III.5).
Pension funds have played a major rolein the provision of long-term financialresources in developed countries.Intermediation takes place thoughmechanisms that vary widely accordingto the depth and robustness of therespective markets. In the UnitedStates, for example, pension fundmanagers acquire long-term securities,either directly or indirectly, therebysimultaneously stimulating bothprimary and secondary intermediationin the capital market. As a result, theseinstitutions play a key role in enhancingthe maturity of financial instruments,
thereby contributing to investmentfinancing.
The situation is very different in LatinAmerica. Firstly, pension reform in theregion did not take place until the 1990s(except in Chile, where it dates back tothe early 1980s); moreover, reform wasoften only partial, which reduced thepotential size of the correspondingfunds. Secondly, the lack of capital-market development, together with theweakness and instability of private firms,represent a major risk for investors thatpurchase the instruments issued bythese firms. Thirdly, the institutionalframework in the sector has maturedonly slowly, and serious regulatory
problems persist in several countries ofthe region -even Chile, which boaststhe highest level of institutionaldevelopment.
The leading player in this sector hasbeen BBVA (see figure below); it ispresent in nearly all countries wherethe pension system has beenreformed, managing 25% of total funds,or US$ 14 billion. BBVA is currentlyfollowed by Citibank, which, havingacquired the assets of Banacci inMexico, manages a total of US$ 11.4billion. The figure below also shows theshare of other foreign players in thepension industry, which by mid-2001jointly accounted for 55% of all pensionfunds in the region.
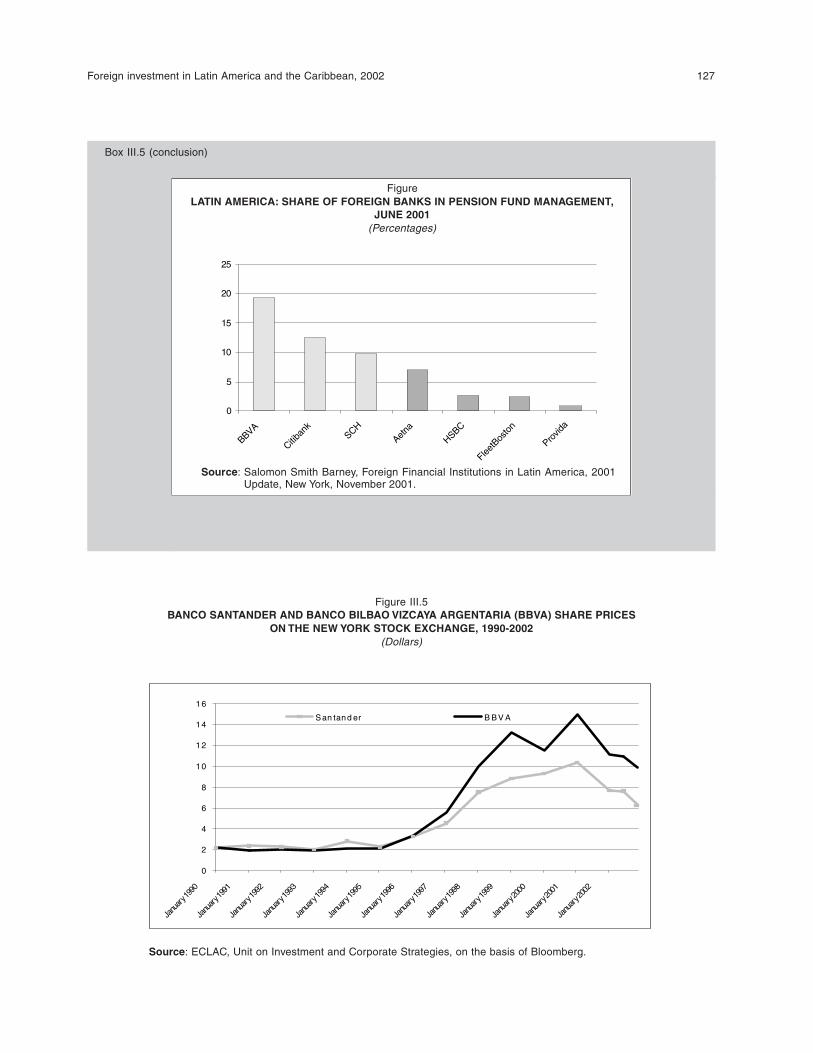
Foreign investment in Latin America and the Caribbean, 2002 127
0
5
10
15
20
25
BBVA
Citiban
kSCH
Aetna
HSBC
FleetB
osto
n
Provid
a
FigureLATIN AMERICA: SHARE OF FOREIGN BANKS IN PENSION FUND MANAGEMENT,
JUNE 2001(Percentages)
Source: Salomon Smith Barney, Foreign Financial Institutions in Latin America, 2001Update, New York, November 2001.
Figure III.5BANCO SANTANDER AND BANCO BILBAO VIZCAYA ARGENTARIA (BBVA) SHARE PRICES
ON THE NEW YORK STOCK EXCHANGE, 1990-2002(Dollars)
0
2
4
6
8
10
12
14
16
Janu
ary 1
990
Janu
ary 1
991
Janu
ary 1
992
Janu
ary 1
993
Janu
ary 1
994
Janu
ary 1
995
Janu
ary 1
996
Janu
ary 1
997
Janu
ary 1
998
Janu
ary 1
999
Janu
ary 2
000
Janu
ary 2
001
Janu
ary 2
002
S an tand er B B V A
Source: ECLAC, Unit on Investment and Corporate Strategies, on the basis of Bloomberg.
Box III.5 (conclusion)
128 ECLAC
(b) Entities that have broad regional dispersion butare concentrated in the corporate segment
Among the financial institutions that increased theirshare of the Latin American market in the 1990s, coveringa broad range of countries but concentrating theiractivities in limited market segments, the standouts areFleetBoston (outcome of the merger between FleetBostonand BankBoston in the United States) and the Canadian-owned Scotiabank.
FleetBoston was one of the first international banksto establish itself in Latin America, opening a BuenosAires office in 1917 to assist New England merchantsin administering their businesses. Today it maintains asignificant presence in the region, with operations inArgentina, Brazil, Chile, Colombia, Mexico, Panama,Peru and Uruguay. Overall, FleetBoston controls about2% of the loans and deposits of the region's mostimportant financial markets, and about 3% of totalassets.
The bank has aimed its products and services attransnationals, large domestic corporations and high-income individuals. Initially, most of its operationsinvolved banking, which today represents FleetBoston'score business in Latin America. More recently, however,it has gradually expanded into other high-growth areas,offering new financial services such as insurance,brokerage, leasing, factoring and pension fundmanagement.
Scotiabank, meanwhile, has been operating in theregion for over 100 years. Although initiallyconcentrated in the Caribbean, it began activities inSouth America 40 years ago. Its internationalizationstrategy focuses on the fastest-growing markets andeconomies with low bank penetration and favourabledemographic conditions. In 2000 it was planning todevelop a financial hub operated and managed jointlyin Chile and Argentina –countries in which it had beenbuilding up its assets. The crisis in Argentina, however,persuaded the bank to withdraw its capital from thatcountry, and it has since been intensifying its operationsin Mexico, for which purpose it took a controlling 55%interest in Inverlat in 2001. In 2002 it maintained arelatively significant presence in Chile, Costa Rica, ElSalvador, Mexico, Panama and Puerto Rico, throughsubsidiaries, representation offices and partnershipswith local banks. In 2001 it strengthened its activitiesin emerging markets, mainly in Latin America and insmall market niches in Asia. Like FleetBoston, itsexpansion strategy includes mutual fund management,insurance and electronic banking.
(c) Entities operating exclusively in large markets
The remaining foreign banks are concentrated in afew countries and operate mainly in the corporatesegment. Nonetheless, they too have followed the patternof integrating businesses that until recently wereindependent (investment funds, pension funds andinsurance companies).
The Hongkong and Shanghai Banking Corporation(HSBC) is one of the biggest financial institutions in theworld, with operations in over 80 countries. Althoughits activities in Latin America are on a small scale, sincethe mid-1990s HSBC has been strengthening its presencein the region. Initially, this strategic reorientation resultedin three acquisitions: 10% of Banco del Sur in Peru,19.9% of the Serfin financial group in Mexico and variousassets belonging to Banco Bemerindus do Brasil. Theseoperations were complemented by some smaller-scaleactivities in Argentina and Chile.
The firm's business areas are subdivided so as toprovide a full range of banking, financial and insuranceservices to different market segments. These areas includepersonal banking, commercial banking, private bankingand corporate banking (including investment banking).At the present time, HSBC operates mainly in five regionsor territories: Europe, Hong Kong SAR, the rest of Asia-Pacific (in addition to Africa and the Middle East), NorthAmerica and Latin America. The group's current strategyaims at cost-cutting, the development of new sources ofincome and commissions in developing countries, thedevelopment of a single corporate image, and alignmentof its corporate and investment banking arms.
In terms of assets, liabilities and profits, the mostimportant regions or territories for the firm's globalposition are Europe and Hong Kong SAR, in each ofwhich over 37% of the group's assets are concentrated.In contrast, Latin America accounts for only a minimalfraction of its global activities. It is interesting to notehow profits are distributed across regions and lines ofbusiness. In Europe, profits are sourced as follows:personal banking, 16%; commercial banking, 28%; andcorporate and investment banking, 37%. In Hong KongSAR and North America, the firm's main activity ispersonal banking, which accounts for 45% and 51% ofprofits in these markets, respectively. In Latin America,on the other hand, earnings are heavily concentrated incorporate and investment banking (52%), followed bycommercial banking (33%) and personal banking (11%).
The firm's main business in the region consists ofbanking and financial services for large firms (corporatebanking), with recent diversification into services for
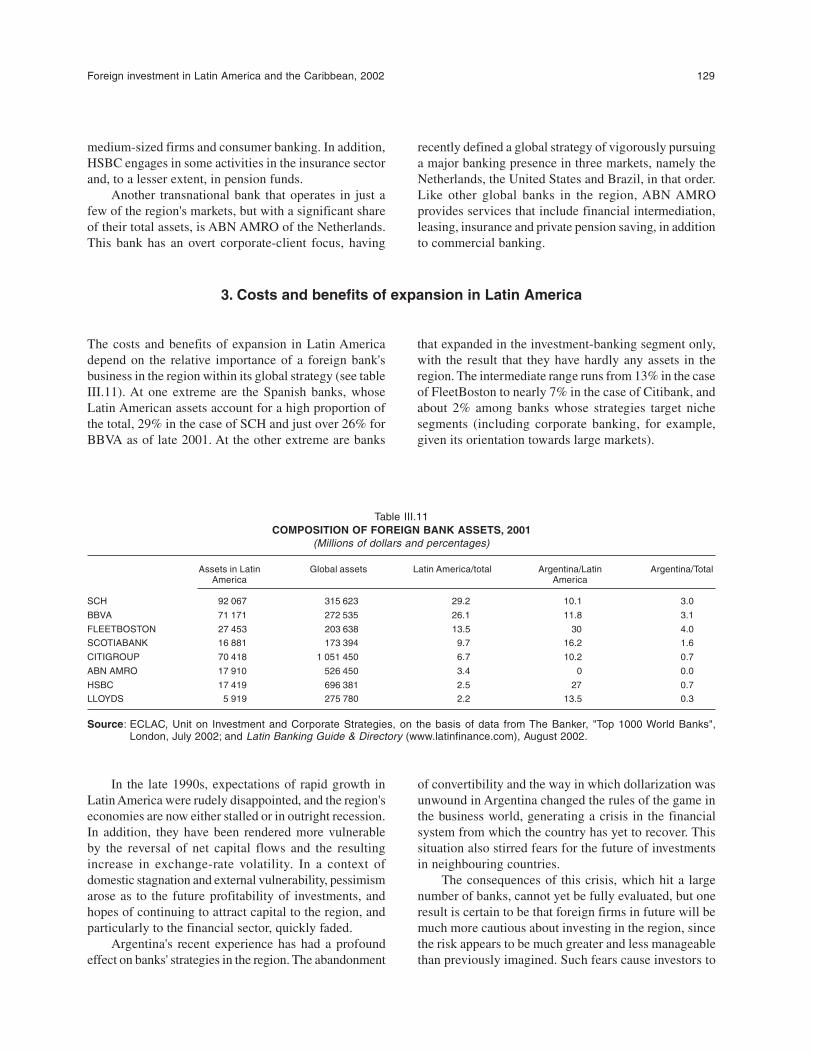
Foreign investment in Latin America and the Caribbean, 2002 129
medium-sized firms and consumer banking. In addition,HSBC engages in some activities in the insurance sectorand, to a lesser extent, in pension funds.
Another transnational bank that operates in just afew of the region's markets, but with a significant shareof their total assets, is ABN AMRO of the Netherlands.This bank has an overt corporate-client focus, having
recently defined a global strategy of vigorously pursuinga major banking presence in three markets, namely theNetherlands, the United States and Brazil, in that order.Like other global banks in the region, ABN AMROprovides services that include financial intermediation,leasing, insurance and private pension saving, in additionto commercial banking.
3. Costs and benefits of expansion in Latin America
The costs and benefits of expansion in Latin Americadepend on the relative importance of a foreign bank'sbusiness in the region within its global strategy (see tableIII.11). At one extreme are the Spanish banks, whoseLatin American assets account for a high proportion ofthe total, 29% in the case of SCH and just over 26% forBBVA as of late 2001. At the other extreme are banks
that expanded in the investment-banking segment only,with the result that they have hardly any assets in theregion. The intermediate range runs from 13% in the caseof FleetBoston to nearly 7% in the case of Citibank, andabout 2% among banks whose strategies target nichesegments (including corporate banking, for example,given its orientation towards large markets).
Table III.11COMPOSITION OF FOREIGN BANK ASSETS, 2001
(Millions of dollars and percentages)
Assets in Latin Global assets Latin America/total Argentina/Latin Argentina/TotalAmerica America
SCH 92 067 315 623 29.2 10.1 3.0
BBVA 71 171 272 535 26.1 11.8 3.1
FLEETBOSTON 27 453 203 638 13.5 30 4.0
SCOTIABANK 16 881 173 394 9.7 16.2 1.6
CITIGROUP 70 418 1 051 450 6.7 10.2 0.7
ABN AMRO 17 910 526 450 3.4 0 0.0
HSBC 17 419 696 381 2.5 27 0.7
LLOYDS 5 919 275 780 2.2 13.5 0.3
Source: ECLAC, Unit on Investment and Corporate Strategies, on the basis of data from The Banker, "Top 1000 World Banks",London, July 2002; and Latin Banking Guide & Directory (www.latinfinance.com), August 2002.
In the late 1990s, expectations of rapid growth inLatin America were rudely disappointed, and the region'seconomies are now either stalled or in outright recession.In addition, they have been rendered more vulnerableby the reversal of net capital flows and the resultingincrease in exchange-rate volatility. In a context ofdomestic stagnation and external vulnerability, pessimismarose as to the future profitability of investments, andhopes of continuing to attract capital to the region, andparticularly to the financial sector, quickly faded.
Argentina's recent experience has had a profoundeffect on banks' strategies in the region. The abandonment
of convertibility and the way in which dollarization wasunwound in Argentina changed the rules of the game inthe business world, generating a crisis in the financialsystem from which the country has yet to recover. Thissituation also stirred fears for the future of investmentsin neighbouring countries.
The consequences of this crisis, which hit a largenumber of banks, cannot yet be fully evaluated, but oneresult is certain to be that foreign firms in future will bemuch more cautious about investing in the region, sincethe risk appears to be much greater and less manageablethan previously imagined. Such fears cause investors to
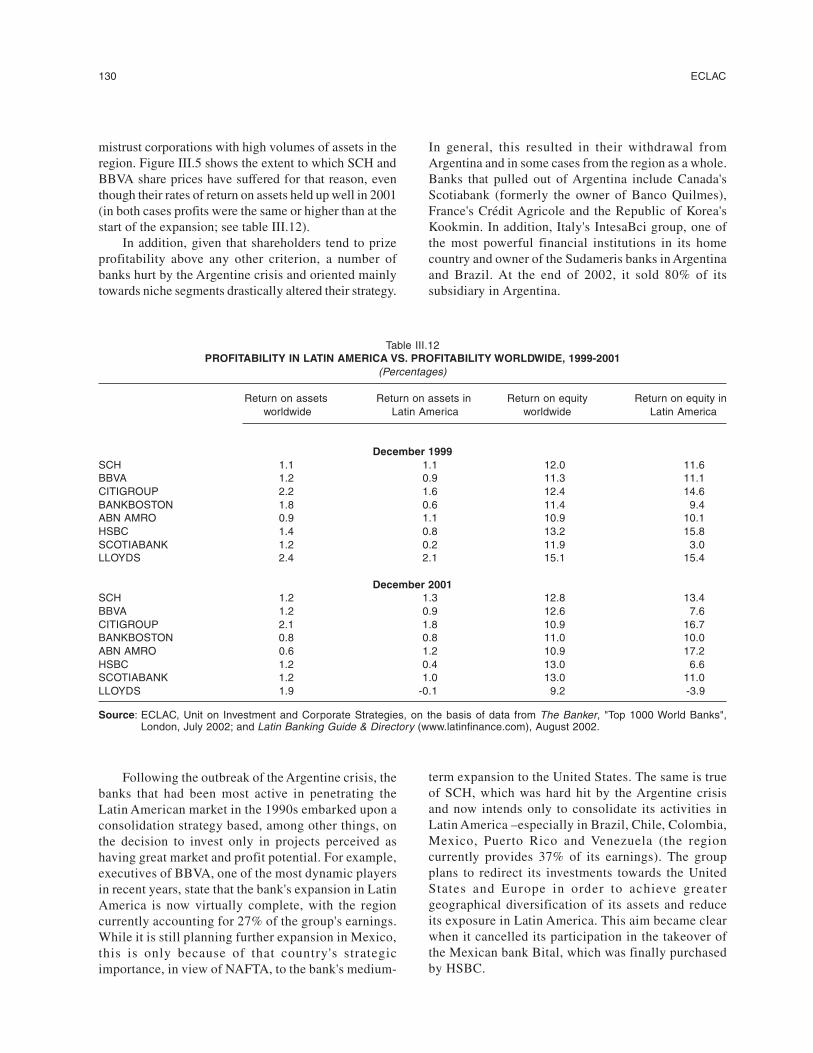
130 ECLAC
mistrust corporations with high volumes of assets in theregion. Figure III.5 shows the extent to which SCH andBBVA share prices have suffered for that reason, eventhough their rates of return on assets held up well in 2001(in both cases profits were the same or higher than at thestart of the expansion; see table III.12).
In addition, given that shareholders tend to prizeprofitability above any other criterion, a number ofbanks hurt by the Argentine crisis and oriented mainlytowards niche segments drastically altered their strategy.
In general, this resulted in their withdrawal fromArgentina and in some cases from the region as a whole.Banks that pulled out of Argentina include Canada'sScotiabank (formerly the owner of Banco Quilmes),France's Crédit Agricole and the Republic of Korea'sKookmin. In addition, Italy's IntesaBci group, one ofthe most powerful financial institutions in its homecountry and owner of the Sudameris banks in Argentinaand Brazil. At the end of 2002, it sold 80% of itssubsidiary in Argentina.
Table III.12PROFITABILITY IN LATIN AMERICA VS. PROFITABILITY WORLDWIDE, 1999-2001
(Percentages)
Return on assets Return on assets in Return on equity Return on equity in worldwide Latin America worldwide Latin America
December 1999SCH 1.1 1.1 12.0 11.6BBVA 1.2 0.9 11.3 11.1CITIGROUP 2.2 1.6 12.4 14.6BANKBOSTON 1.8 0.6 11.4 9.4ABN AMRO 0.9 1.1 10.9 10.1HSBC 1.4 0.8 13.2 15.8SCOTIABANK 1.2 0.2 11.9 3.0LLOYDS 2.4 2.1 15.1 15.4
December 2001SCH 1.2 1.3 12.8 13.4BBVA 1.2 0.9 12.6 7.6CITIGROUP 2.1 1.8 10.9 16.7BANKBOSTON 0.8 0.8 11.0 10.0ABN AMRO 0.6 1.2 10.9 17.2HSBC 1.2 0.4 13.0 6.6SCOTIABANK 1.2 1.0 13.0 11.0LLOYDS 1.9 -0.1 9.2 -3.9
Source: ECLAC, Unit on Investment and Corporate Strategies, on the basis of data from The Banker, "Top 1000 World Banks",London, July 2002; and Latin Banking Guide & Directory (www.latinfinance.com), August 2002.
Following the outbreak of the Argentine crisis, thebanks that had been most active in penetrating theLatin American market in the 1990s embarked upon aconsolidation strategy based, among other things, onthe decision to invest only in projects perceived ashaving great market and profit potential. For example,executives of BBVA, one of the most dynamic playersin recent years, state that the bank's expansion in LatinAmerica is now virtually complete, with the regioncurrently accounting for 27% of the group's earnings.While it is still planning further expansion in Mexico,this is only because of that country's strategicimportance, in view of NAFTA, to the bank's medium-
term expansion to the United States. The same is trueof SCH, which was hard hit by the Argentine crisisand now intends only to consolidate its activities inLatin America –especially in Brazil, Chile, Colombia,Mexico, Puerto Rico and Venezuela (the regioncurrently provides 37% of its earnings). The groupplans to redirect its investments towards the UnitedStates and Europe in order to achieve greatergeographical diversification of its assets and reduceits exposure in Latin America. This aim became clearwhen it cancelled its participation in the takeover ofthe Mexican bank Bital, which was finally purchasedby HSBC.
Foreign investment in Latin America and the Caribbean, 2002 131
Citigroup's problems with its global strategy in thesecond half of 2002 and its losses in Argentina, whichproduced a negative result at the regional level,15 haveled it to view the future with great caution, putting itsinvestments in Brazil on hold while it awaits greaterregional stability.
The biggest financial market in the region that hasbeen penetrated the least by foreign banks, even thoughit offers the greatest potential, is Brazil. Yet there aretwo major obstacles to any such initiatives in the shortrun: firstly, the line to be taken by the newly electedgovernment; and secondly, strong competition from thelarge local banks. The foreign banks that have enteredthe country in the past five years, such as HSBC, BBVA
and ABN AMRO, have found it hard to compete andcarve out an identity in the market. Nonetheless, analystsclaim that there are highly profitable niches available.16
The recent crisis involving large United Statescorporations has generated uncertainty as to the futureof universal banking in developed countries, but has notyet affected the strategy of such institutions in LatinAmerica. Nonetheless, the region's capital market cannotfulfil its development potential at present because theinternational financial market has yet to regain the levelof liquidity it enjoyed in the 1990s. This is likely to resultin a period of consolidation (concentration and possibleretrenchment) in the region's financial market, as well asa reorientation towards commercial banking.
D. FOREIGN BANKS: MICROECONOMIC EFFICIENCY VERSUSMACROECONOMIC EFFECTIVENESS
The foregoing sections analysed the forces that ledforeign banks to expand into the region and the effectsof their strategies on corporate performance. This sectionanalyses the impact that foreign banks have had at themicroeconomic and macroeconomic levels, particularlyin terms of solving the problems that have traditionallyafflicted the Latin American financial system. Thisobviously has implications for the financial constraintsfacing firms and the stability of the regional bankingsystem.
The microeconomic indicators presented here arenot very different from those used in other studies, sincethey compare the performance of foreign and local banksin terms of profitability, efficiency and liquidity. Tosimplify, this is referred to here as the microeconomicefficiency of the banking system. Despite their limitations,these indicators are often used to evaluate the way in
which banks are operating and their degree of riskexposure. The counterpart at the aggregate level wouldbe macroeconomic effectiveness. This aspect will bestudied by means of an analysis of access to credit bythe productive sector and families, together with thecorresponding interest rates and spreads, and the bankingsystem's contribution to stability.
As is true of most economic analyses, the step frommicro- to macroeconomic performance is not a directone. Nonetheless, some of the results presented belowsuggest that the microeconomic efficiency of the regionalbanking system increased during the 1990s, thanks partlyto the role played by foreign banks. In themacroeconomic domain, however, the cost andaccessibility of credit failed to improve, as didmacroeconomic stability. The analysis in this sectionattempts to explain this paradox.
1. Microeconomic efficiency
Three indicators in particular can be used to comparethe performance of banking institutions: profitability,efficiency and liquidity. Given that foreign banks did notgain a strong presence in Latin America until the late1990s, the analysis covers the period 1997-2001. Thedata refer to the 20 largest banks in terms of total assets
in the countries where the operations of transnationalbanks were concentrated: Argentina, Brazil, Chile,Colombia, Mexico, Peru and Venezuela. Overall, these20 banks encompass more than 80% of the system.
In evaluating microeconomic performance, it mustbe borne in mind that the local banking system has faced
15 For more information, see Citigroup (undated) and Business Week (2002).16 For further information, see Latin Finance (2000).
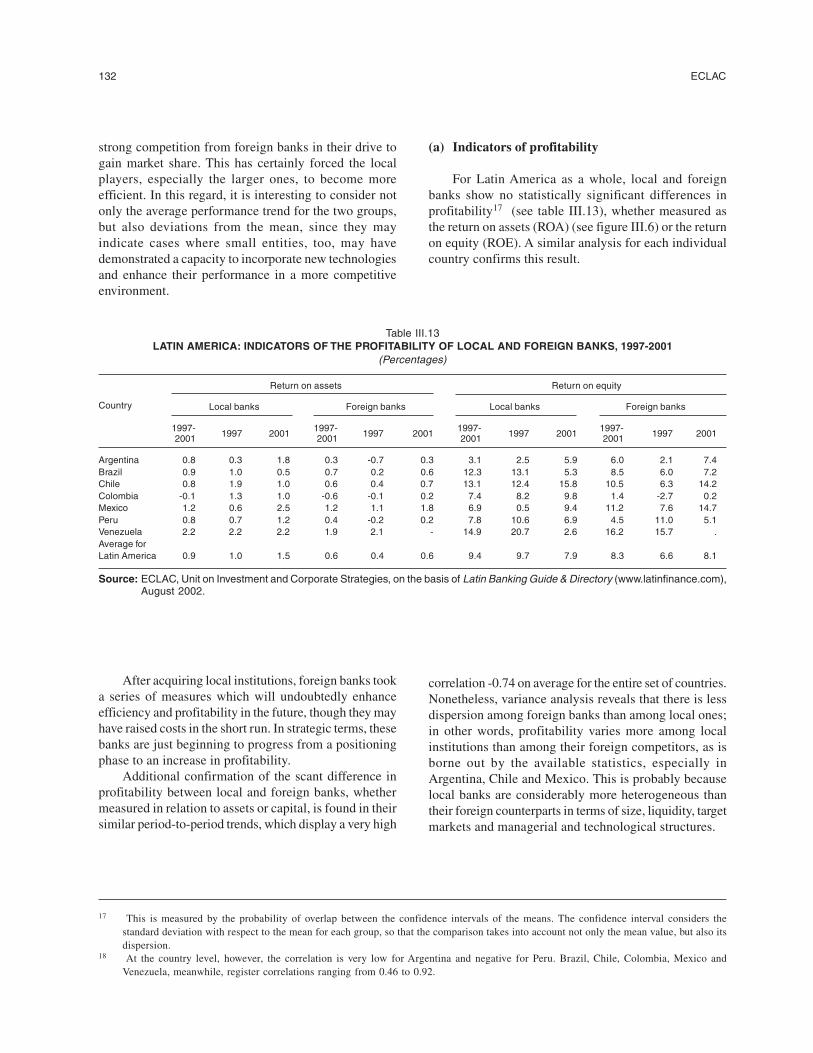
132 ECLAC
17 This is measured by the probability of overlap between the confidence intervals of the means. The confidence interval considers thestandard deviation with respect to the mean for each group, so that the comparison takes into account not only the mean value, but also itsdispersion.
18 At the country level, however, the correlation is very low for Argentina and negative for Peru. Brazil, Chile, Colombia, Mexico andVenezuela, meanwhile, register correlations ranging from 0.46 to 0.92.
strong competition from foreign banks in their drive togain market share. This has certainly forced the localplayers, especially the larger ones, to become moreefficient. In this regard, it is interesting to consider notonly the average performance trend for the two groups,but also deviations from the mean, since they mayindicate cases where small entities, too, may havedemonstrated a capacity to incorporate new technologiesand enhance their performance in a more competitiveenvironment.
(a) Indicators of profitability
For Latin America as a whole, local and foreignbanks show no statistically significant differences inprofitability17 (see table III.13), whether measured asthe return on assets (ROA) (see figure III.6) or the returnon equity (ROE). A similar analysis for each individualcountry confirms this result.
After acquiring local institutions, foreign banks tooka series of measures which will undoubtedly enhanceefficiency and profitability in the future, though they mayhave raised costs in the short run. In strategic terms, thesebanks are just beginning to progress from a positioningphase to an increase in profitability.
Additional confirmation of the scant difference inprofitability between local and foreign banks, whethermeasured in relation to assets or capital, is found in theirsimilar period-to-period trends, which display a very high
correlation -0.74 on average for the entire set of countries.Nonetheless, variance analysis reveals that there is lessdispersion among foreign banks than among local ones;in other words, profitability varies more among localinstitutions than among their foreign competitors, as isborne out by the available statistics, especially inArgentina, Chile and Mexico. This is probably becauselocal banks are considerably more heterogeneous thantheir foreign counterparts in terms of size, liquidity, targetmarkets and managerial and technological structures.
Table III.13LATIN AMERICA: INDICATORS OF THE PROFITABILITY OF LOCAL AND FOREIGN BANKS, 1997-2001
(Percentages)
Country
Return on assets Return on equity
Local banks Foreign banks Local banks Foreign banks
1997-1997 2001
1997-1997 2001
1997-1997 2001
1997-2001 2001 2001 2001 1997 2001
Argentina 0.8 0.3 1.8 0.3 -0.7 0.3 3.1 2.5 5.9 6.0 2.1 7.4Brazil 0.9 1.0 0.5 0.7 0.2 0.6 12.3 13.1 5.3 8.5 6.0 7.2Chile 0.8 1.9 1.0 0.6 0.4 0.7 13.1 12.4 15.8 10.5 6.3 14.2Colombia -0.1 1.3 1.0 -0.6 -0.1 0.2 7.4 8.2 9.8 1.4 -2.7 0.2Mexico 1.2 0.6 2.5 1.2 1.1 1.8 6.9 0.5 9.4 11.2 7.6 14.7Peru 0.8 0.7 1.2 0.4 -0.2 0.2 7.8 10.6 6.9 4.5 11.0 5.1Venezuela 2.2 2.2 2.2 1.9 2.1 - 14.9 20.7 2.6 16.2 15.7 .Average forLatin America 0.9 1.0 1.5 0.6 0.4 0.6 9.4 9.7 7.9 8.3 6.6 8.1
Source: ECLAC, Unit on Investment and Corporate Strategies, on the basis of Latin Banking Guide & Directory (www.latinfinance.com),August 2002.
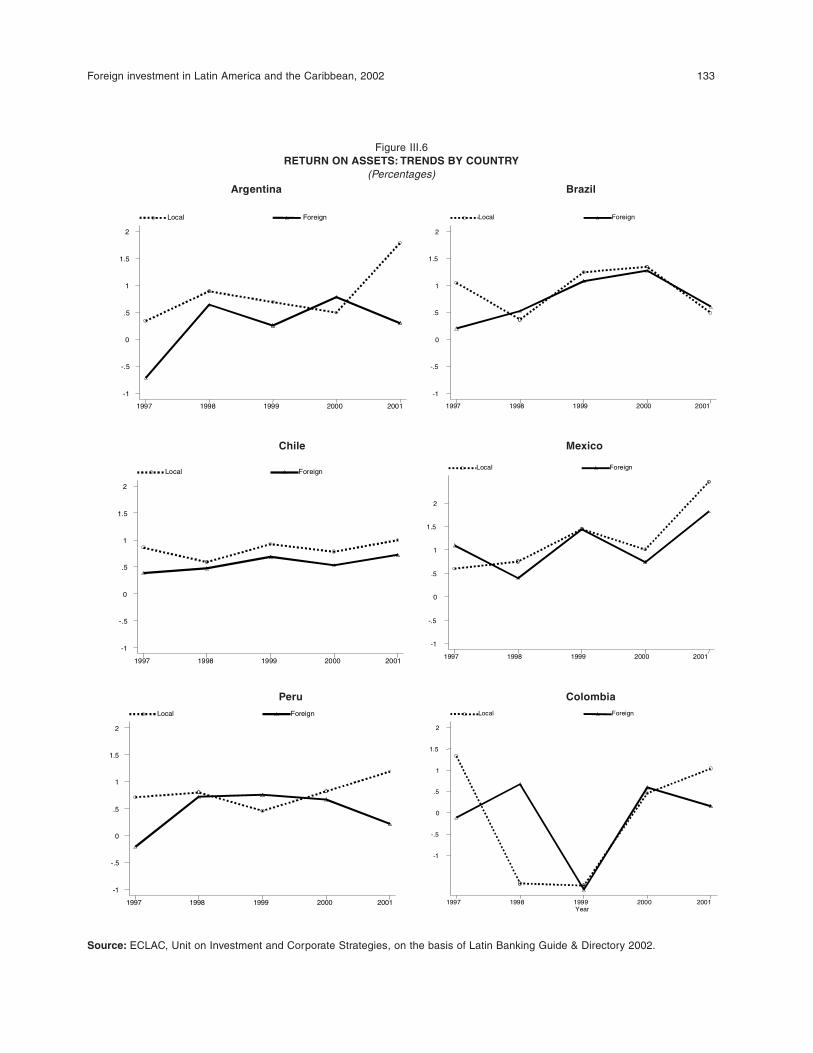
Foreign investment in Latin America and the Caribbean, 2002 133
Local Foreign
1997 1998 1999 2000 2001 -1
-.5
0
.5
1
1.5
2 Local Foreign
1997 1998 1999 2000 2001 -1
-.5
0
.5
1
1.5
2
Local Foreign
1997 1998 1999 2000 2001 -1
-.5
0
.5
1
1.5
2 Local Foreign
1997 1998 1999 2000 2001 -1
-.5
0
.5
1
1.5
2
Local Foreign
1997 1998 1999 2000 2001 -1
-.5
0
.5
1
1.5
2
Year
Local Foreign
1997 1998 1999 2000 2001
-1 -.5
0 .5 1
1.5 2
Figure III.6RETURN ON ASSETS: TRENDS BY COUNTRY
(Percentages)Argentina Brazil
Chile Mexico
Peru Colombia
Source: ECLAC, Unit on Investment and Corporate Strategies, on the basis of Latin Banking Guide & Directory 2002.
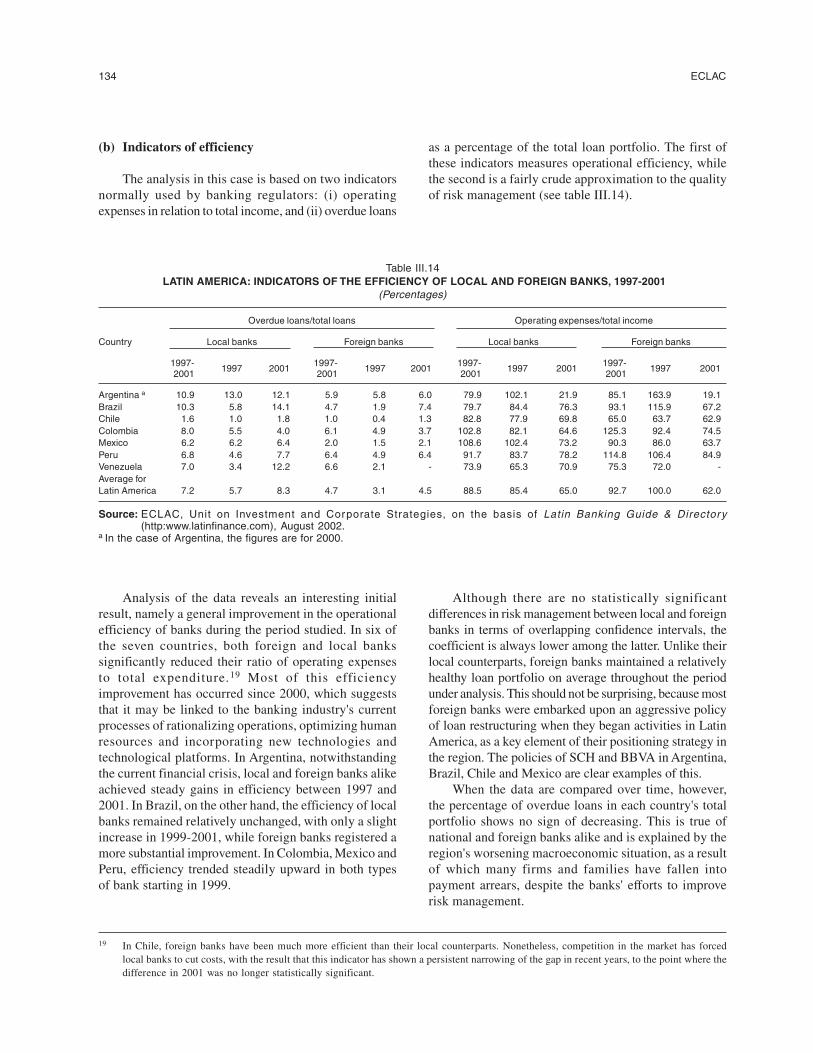
134 ECLAC
(b) Indicators of efficiency
The analysis in this case is based on two indicatorsnormally used by banking regulators: (i) operatingexpenses in relation to total income, and (ii) overdue loans
as a percentage of the total loan portfolio. The first ofthese indicators measures operational efficiency, whilethe second is a fairly crude approximation to the qualityof risk management (see table III.14).
Table III.14 LATIN AMERICA: INDICATORS OF THE EFFICIENCY OF LOCAL AND FOREIGN BANKS, 1997-2001
(Percentages)
Country
Overdue loans/total loans Operating expenses/total income
Local banks Foreign banks Local banks Foreign banks
1997-1997 2001
1997-1997 2001
1997-1997 2001
1997-2001 2001 2001 2001
1997 2001
Argentina a 10.9 13.0 12.1 5.9 5.8 6.0 79.9 102.1 21.9 85.1 163.9 19.1Brazil 10.3 5.8 14.1 4.7 1.9 7.4 79.7 84.4 76.3 93.1 115.9 67.2Chile 1.6 1.0 1.8 1.0 0.4 1.3 82.8 77.9 69.8 65.0 63.7 62.9Colombia 8.0 5.5 4.0 6.1 4.9 3.7 102.8 82.1 64.6 125.3 92.4 74.5Mexico 6.2 6.2 6.4 2.0 1.5 2.1 108.6 102.4 73.2 90.3 86.0 63.7Peru 6.8 4.6 7.7 6.4 4.9 6.4 91.7 83.7 78.2 114.8 106.4 84.9Venezuela 7.0 3.4 12.2 6.6 2.1 - 73.9 65.3 70.9 75.3 72.0 -Average forLatin America 7.2 5.7 8.3 4.7 3.1 4.5 88.5 85.4 65.0 92.7 100.0 62.0
Source: ECLAC, Unit on Investment and Corporate Strategies, on the basis of Latin Banking Guide & Directory(http:www.latinfinance.com), August 2002.
a In the case of Argentina, the figures are for 2000.
Analysis of the data reveals an interesting initialresult, namely a general improvement in the operationalefficiency of banks during the period studied. In six ofthe seven countries, both foreign and local bankssignificantly reduced their ratio of operating expensesto total expenditure.19 Most of this efficiencyimprovement has occurred since 2000, which suggeststhat it may be linked to the banking industry's currentprocesses of rationalizing operations, optimizing humanresources and incorporating new technologies andtechnological platforms. In Argentina, notwithstandingthe current financial crisis, local and foreign banks alikeachieved steady gains in efficiency between 1997 and2001. In Brazil, on the other hand, the efficiency of localbanks remained relatively unchanged, with only a slightincrease in 1999-2001, while foreign banks registered amore substantial improvement. In Colombia, Mexico andPeru, efficiency trended steadily upward in both typesof bank starting in 1999.
Although there are no statistically significantdifferences in risk management between local and foreignbanks in terms of overlapping confidence intervals, thecoefficient is always lower among the latter. Unlike theirlocal counterparts, foreign banks maintained a relativelyhealthy loan portfolio on average throughout the periodunder analysis. This should not be surprising, because mostforeign banks were embarked upon an aggressive policyof loan restructuring when they began activities in LatinAmerica, as a key element of their positioning strategy inthe region. The policies of SCH and BBVA in Argentina,Brazil, Chile and Mexico are clear examples of this.
When the data are compared over time, however,the percentage of overdue loans in each country's totalportfolio shows no sign of decreasing. This is true ofnational and foreign banks alike and is explained by theregion's worsening macroeconomic situation, as a resultof which many firms and families have fallen intopayment arrears, despite the banks' efforts to improverisk management.
19 In Chile, foreign banks have been much more efficient than their local counterparts. Nonetheless, competition in the market has forcedlocal banks to cut costs, with the result that this indicator has shown a persistent narrowing of the gap in recent years, to the point where thedifference in 2001 was no longer statistically significant.
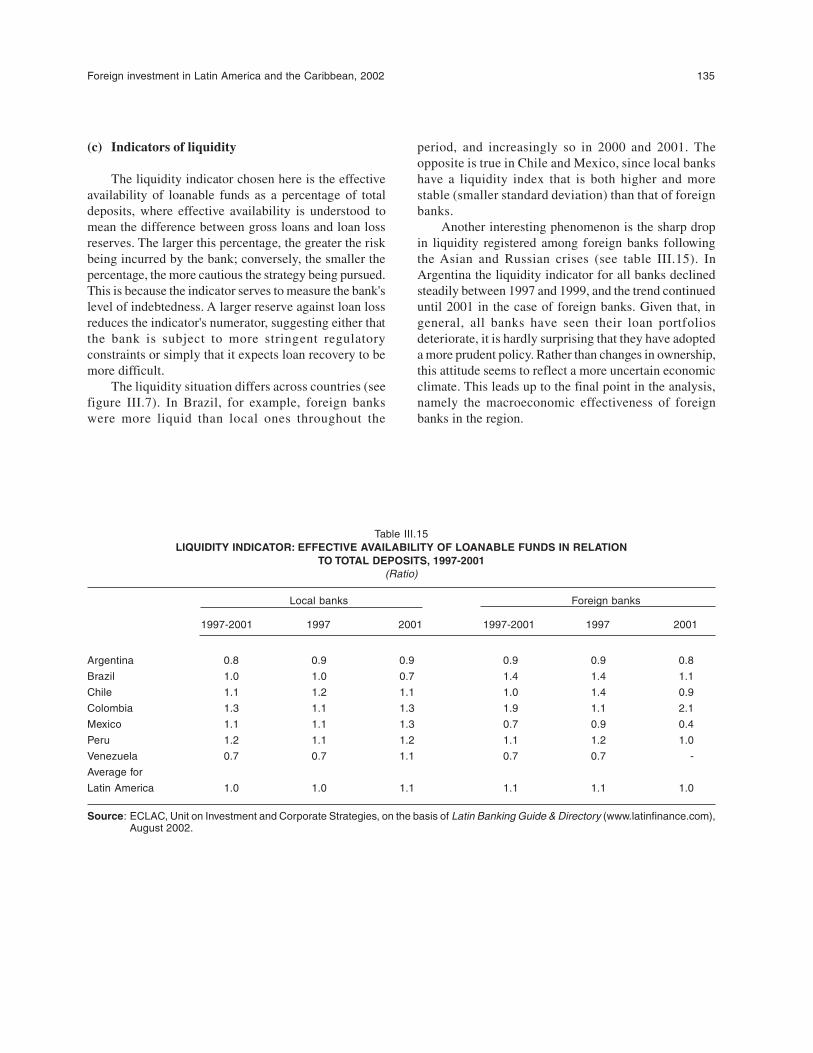
Foreign investment in Latin America and the Caribbean, 2002 135
(c) Indicators of liquidity
The liquidity indicator chosen here is the effectiveavailability of loanable funds as a percentage of totaldeposits, where effective availability is understood tomean the difference between gross loans and loan lossreserves. The larger this percentage, the greater the riskbeing incurred by the bank; conversely, the smaller thepercentage, the more cautious the strategy being pursued.This is because the indicator serves to measure the bank'slevel of indebtedness. A larger reserve against loan lossreduces the indicator's numerator, suggesting either thatthe bank is subject to more stringent regulatoryconstraints or simply that it expects loan recovery to bemore difficult.
The liquidity situation differs across countries (seefigure III.7). In Brazil, for example, foreign bankswere more liquid than local ones throughout the
period, and increasingly so in 2000 and 2001. Theopposite is true in Chile and Mexico, since local bankshave a liquidity index that is both higher and morestable (smaller standard deviation) than that of foreignbanks.
Another interesting phenomenon is the sharp dropin liquidity registered among foreign banks followingthe Asian and Russian crises (see table III.15). InArgentina the liquidity indicator for all banks declinedsteadily between 1997 and 1999, and the trend continueduntil 2001 in the case of foreign banks. Given that, ingeneral, all banks have seen their loan portfoliosdeteriorate, it is hardly surprising that they have adopteda more prudent policy. Rather than changes in ownership,this attitude seems to reflect a more uncertain economicclimate. This leads up to the final point in the analysis,namely the macroeconomic effectiveness of foreignbanks in the region.
Table III.15LIQUIDITY INDICATOR: EFFECTIVE AVAILABILITY OF LOANABLE FUNDS IN RELATION
TO TOTAL DEPOSITS, 1997-2001(Ratio)
Local banks Foreign banks
1997-2001 1997 2001 1997-2001 1997 2001
Argentina 0.8 0.9 0.9 0.9 0.9 0.8
Brazil 1.0 1.0 0.7 1.4 1.4 1.1
Chile 1.1 1.2 1.1 1.0 1.4 0.9
Colombia 1.3 1.1 1.3 1.9 1.1 2.1
Mexico 1.1 1.1 1.3 0.7 0.9 0.4
Peru 1.2 1.1 1.2 1.1 1.2 1.0
Venezuela 0.7 0.7 1.1 0.7 0.7 -
Average for
Latin America 1.0 1.0 1.1 1.1 1.1 1.0
Source: ECLAC, Unit on Investment and Corporate Strategies, on the basis of Latin Banking Guide & Directory (www.latinfinance.com),August 2002.
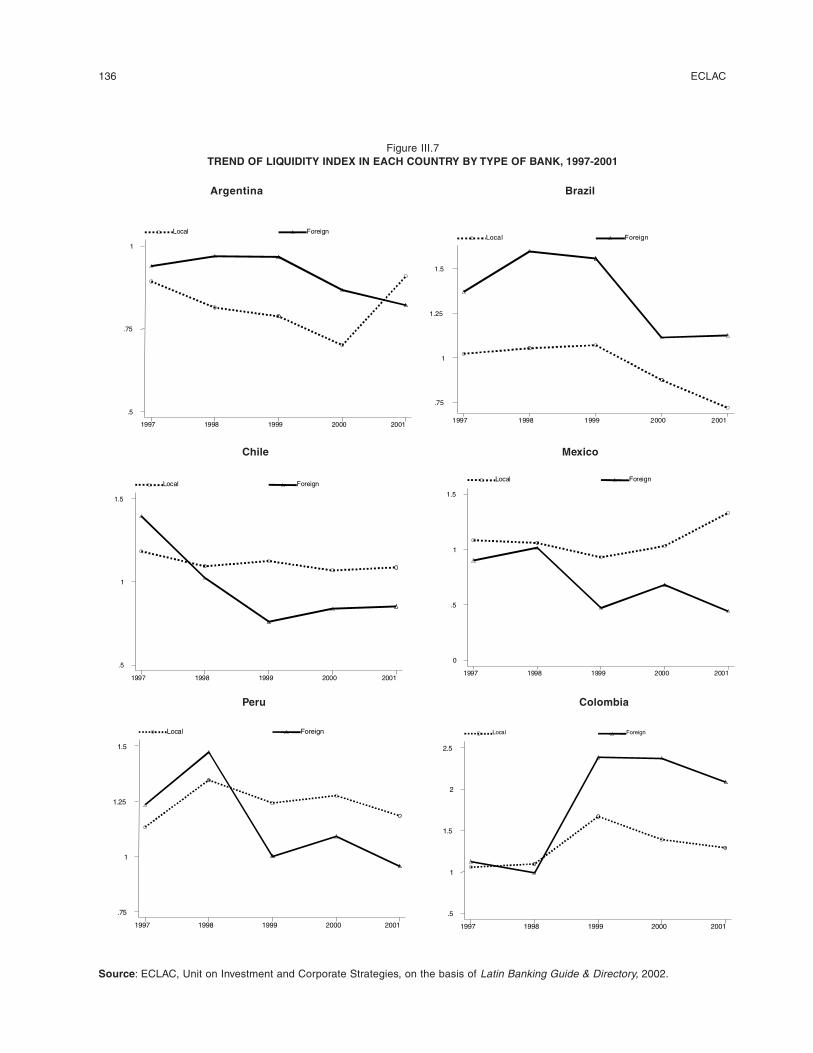
136 ECLAC
Local Foreign
1997 1998 1999 2000 2001
.5
.75
1 Local Foreign
1997 1998 1999 2000 2001
.75
1
1.25
1.5
Local Foreign
1997 1998 1999 2000 2001 .5
1
1.5 Local Foreign
1997 1998 1999 2000 2001 0
.5
1
1.5
Local Foreign
1997 1998 1999 2000 2001 .75
1
1.25
1.5 Local Foreign
1997 1998 1999 2000 2001 .5
1
1.5
2
2.5
Figure III.7TREND OF LIQUIDITY INDEX IN EACH COUNTRY BY TYPE OF BANK, 1997-2001
Argentina Brazil
Chile Mexico
Peru Colombia
Source: ECLAC, Unit on Investment and Corporate Strategies, on the basis of Latin Banking Guide & Directory, 2002.
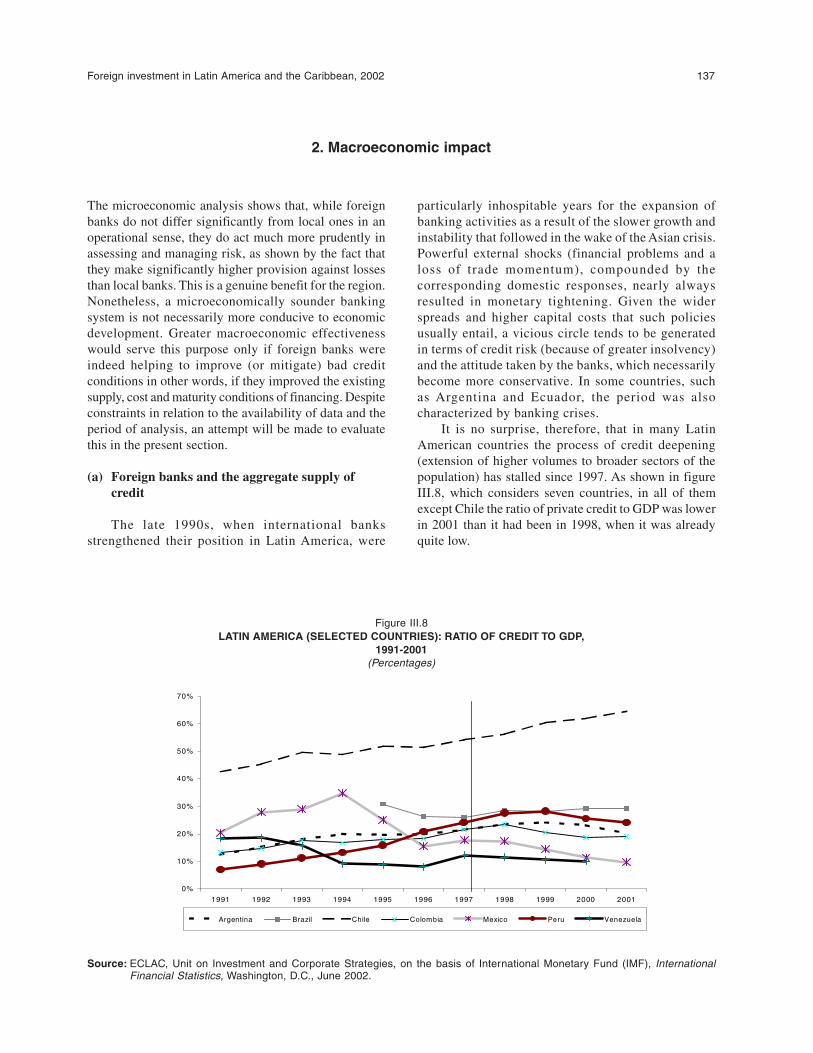
Foreign investment in Latin America and the Caribbean, 2002 137
2. Macroeconomic impact
The microeconomic analysis shows that, while foreignbanks do not differ significantly from local ones in anoperational sense, they do act much more prudently inassessing and managing risk, as shown by the fact thatthey make significantly higher provision against lossesthan local banks. This is a genuine benefit for the region.Nonetheless, a microeconomically sounder bankingsystem is not necessarily more conducive to economicdevelopment. Greater macroeconomic effectivenesswould serve this purpose only if foreign banks wereindeed helping to improve (or mitigate) bad creditconditions in other words, if they improved the existingsupply, cost and maturity conditions of financing. Despiteconstraints in relation to the availability of data and theperiod of analysis, an attempt will be made to evaluatethis in the present section.
(a) Foreign banks and the aggregate supply ofcredit
The late 1990s, when international banksstrengthened their position in Latin America, were
particularly inhospitable years for the expansion ofbanking activities as a result of the slower growth andinstability that followed in the wake of the Asian crisis.Powerful external shocks (financial problems and aloss of trade momentum), compounded by thecorresponding domestic responses, nearly alwaysresulted in monetary tightening. Given the widerspreads and higher capital costs that such policiesusually entail, a vicious circle tends to be generatedin terms of credit risk (because of greater insolvency)and the attitude taken by the banks, which necessarilybecome more conservative. In some countries, suchas Argentina and Ecuador, the period was alsocharacterized by banking crises.
It is no surprise, therefore, that in many LatinAmerican countries the process of credit deepening(extension of higher volumes to broader sectors of thepopulation) has stalled since 1997. As shown in figureIII.8, which considers seven countries, in all of themexcept Chile the ratio of private credit to GDP was lowerin 2001 than it had been in 1998, when it was alreadyquite low.
Figure III.8LATIN AMERICA (SELECTED COUNTRIES): RATIO OF CREDIT TO GDP,
1991-2001(Percentages)
Source: ECLAC, Unit on Investment and Corporate Strategies, on the basis of International Monetary Fund (IMF), InternationalFinancial Statistics, Washington, D.C., June 2002.
0%
10%
20%
30%
40%
50%
60%
70%
1991 1992 1993 1994 1995 1996 1997 1998 1999 2000 2001
Argentina Brazil Chile Colombia Mexico Peru Venezuela
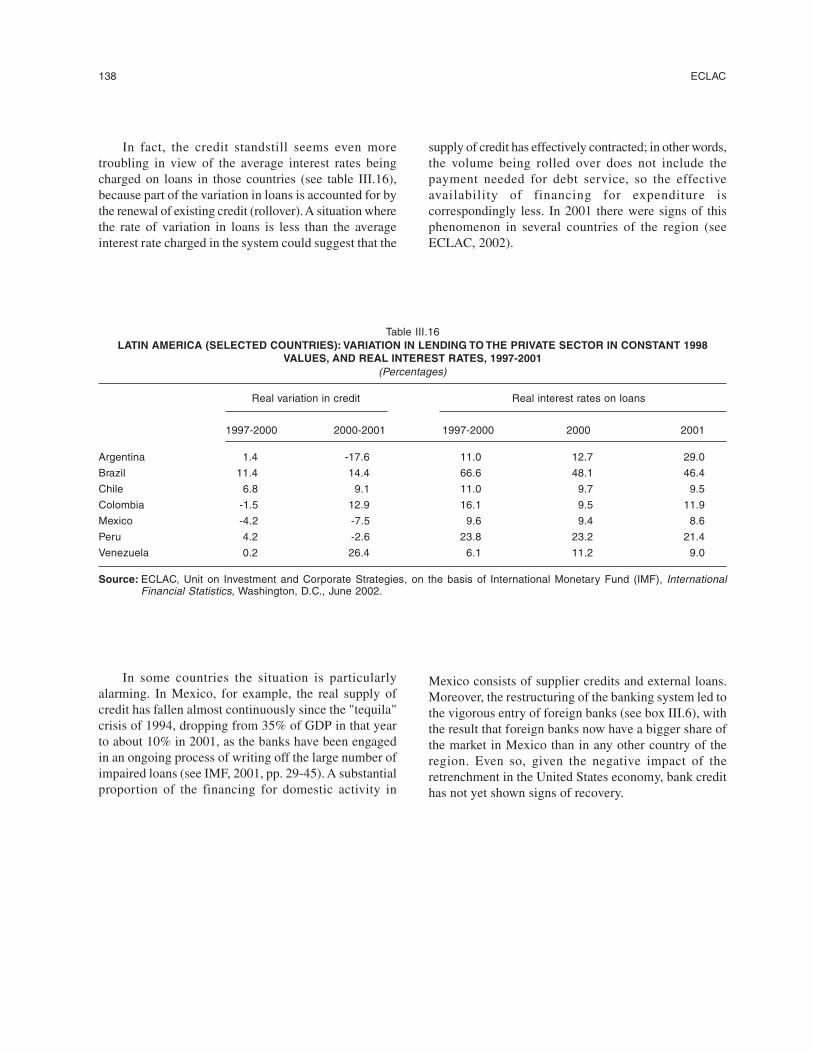
138 ECLAC
In fact, the credit standstill seems even moretroubling in view of the average interest rates beingcharged on loans in those countries (see table III.16),because part of the variation in loans is accounted for bythe renewal of existing credit (rollover). A situation wherethe rate of variation in loans is less than the averageinterest rate charged in the system could suggest that the
supply of credit has effectively contracted; in other words,the volume being rolled over does not include thepayment needed for debt service, so the effectiveavailability of financing for expenditure iscorrespondingly less. In 2001 there were signs of thisphenomenon in several countries of the region (seeECLAC, 2002).
Table III.16LATIN AMERICA (SELECTED COUNTRIES): VARIATION IN LENDING TO THE PRIVATE SECTOR IN CONSTANT 1998
VALUES, AND REAL INTEREST RATES, 1997-2001(Percentages)
Real variation in credit Real interest rates on loans
1997-2000 2000-2001 1997-2000 2000 2001
Argentina 1.4 -17.6 11.0 12.7 29.0
Brazil 11.4 14.4 66.6 48.1 46.4
Chile 6.8 9.1 11.0 9.7 9.5
Colombia -1.5 12.9 16.1 9.5 11.9
Mexico -4.2 -7.5 9.6 9.4 8.6
Peru 4.2 -2.6 23.8 23.2 21.4
Venezuela 0.2 26.4 6.1 11.2 9.0
Source: ECLAC, Unit on Investment and Corporate Strategies, on the basis of International Monetary Fund (IMF), InternationalFinancial Statistics, Washington, D.C., June 2002.
In some countries the situation is particularlyalarming. In Mexico, for example, the real supply ofcredit has fallen almost continuously since the "tequila"crisis of 1994, dropping from 35% of GDP in that yearto about 10% in 2001, as the banks have been engagedin an ongoing process of writing off the large number ofimpaired loans (see IMF, 2001, pp. 29-45). A substantialproportion of the financing for domestic activity in
Mexico consists of supplier credits and external loans.Moreover, the restructuring of the banking system led tothe vigorous entry of foreign banks (see box III.6), withthe result that foreign banks now have a bigger share ofthe market in Mexico than in any other country of theregion. Even so, given the negative impact of theretrenchment in the United States economy, bank credithas not yet shown signs of recovery.
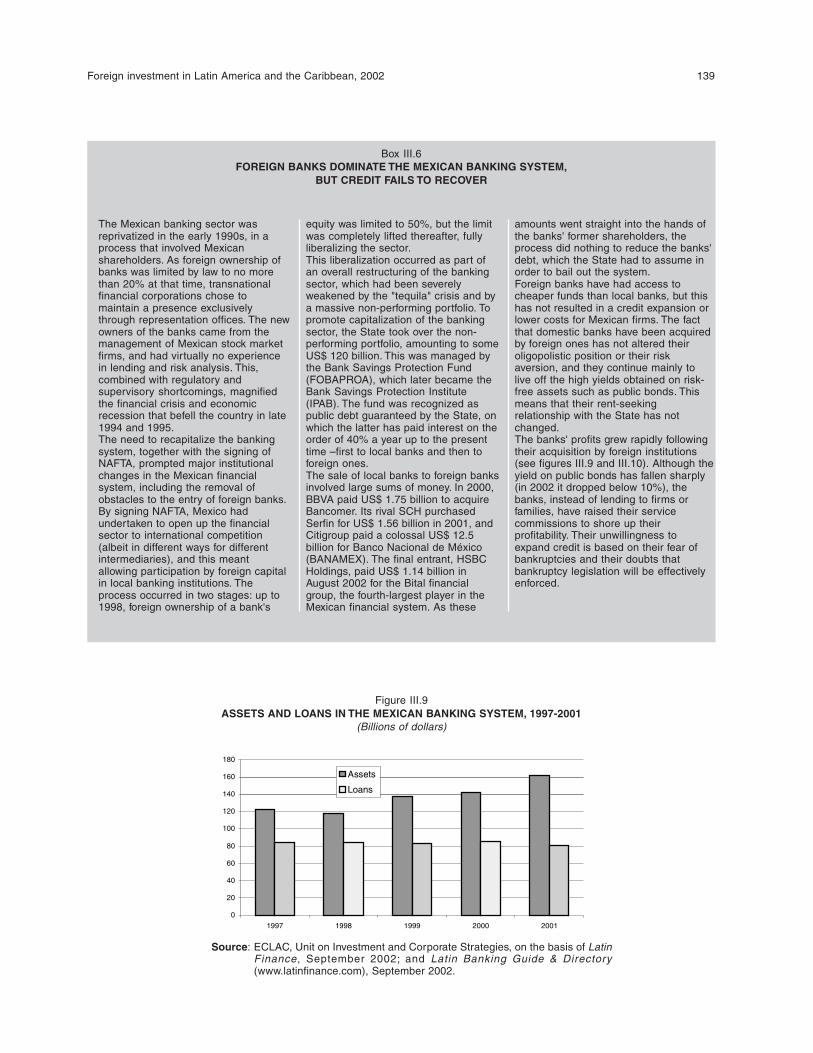
Foreign investment in Latin America and the Caribbean, 2002 139
The Mexican banking sector wasreprivatized in the early 1990s, in aprocess that involved Mexicanshareholders. As foreign ownership ofbanks was limited by law to no morethan 20% at that time, transnationalfinancial corporations chose tomaintain a presence exclusivelythrough representation offices. The newowners of the banks came from themanagement of Mexican stock marketfirms, and had virtually no experiencein lending and risk analysis. This,combined with regulatory andsupervisory shortcomings, magnifiedthe financial crisis and economicrecession that befell the country in late1994 and 1995.The need to recapitalize the bankingsystem, together with the signing ofNAFTA, prompted major institutionalchanges in the Mexican financialsystem, including the removal ofobstacles to the entry of foreign banks.By signing NAFTA, Mexico hadundertaken to open up the financialsector to international competition(albeit in different ways for differentintermediaries), and this meantallowing participation by foreign capitalin local banking institutions. Theprocess occurred in two stages: up to1998, foreign ownership of a bank's
Box III.6FOREIGN BANKS DOMINATE THE MEXICAN BANKING SYSTEM,
BUT CREDIT FAILS TO RECOVER
equity was limited to 50%, but the limitwas completely lifted thereafter, fullyliberalizing the sector.This liberalization occurred as part ofan overall restructuring of the bankingsector, which had been severelyweakened by the "tequila" crisis and bya massive non-performing portfolio. Topromote capitalization of the bankingsector, the State took over the non-performing portfolio, amounting to someUS$ 120 billion. This was managed bythe Bank Savings Protection Fund(FOBAPROA), which later became theBank Savings Protection Institute(IPAB). The fund was recognized aspublic debt guaranteed by the State, onwhich the latter has paid interest on theorder of 40% a year up to the presenttime –first to local banks and then toforeign ones.The sale of local banks to foreign banksinvolved large sums of money. In 2000,BBVA paid US$ 1.75 billion to acquireBancomer. Its rival SCH purchasedSerfin for US$ 1.56 billion in 2001, andCitigroup paid a colossal US$ 12.5billion for Banco Nacional de México(BANAMEX). The final entrant, HSBCHoldings, paid US$ 1.14 billion inAugust 2002 for the Bital financialgroup, the fourth-largest player in theMexican financial system. As these
amounts went straight into the hands ofthe banks' former shareholders, theprocess did nothing to reduce the banks'debt, which the State had to assume inorder to bail out the system.Foreign banks have had access tocheaper funds than local banks, but thishas not resulted in a credit expansion orlower costs for Mexican firms. The factthat domestic banks have been acquiredby foreign ones has not altered theiroligopolistic position or their riskaversion, and they continue mainly tolive off the high yields obtained on risk-free assets such as public bonds. Thismeans that their rent-seekingrelationship with the State has notchanged.The banks' profits grew rapidly followingtheir acquisition by foreign institutions(see figures III.9 and III.10). Although theyield on public bonds has fallen sharply(in 2002 it dropped below 10%), thebanks, instead of lending to firms orfamilies, have raised their servicecommissions to shore up theirprofitability. Their unwillingness toexpand credit is based on their fear ofbankruptcies and their doubts thatbankruptcy legislation will be effectivelyenforced.
0
20
40
60
80
100
120
140
160
180
1997 1998 1999 2000 2001
Assets
Loans
Figure III.9ASSETS AND LOANS IN THE MEXICAN BANKING SYSTEM, 1997-2001
(Billions of dollars)
Source: ECLAC, Unit on Investment and Corporate Strategies, on the basis of LatinFinance, September 2002; and Latin Banking Guide & Directory(www.latinfinance.com), September 2002.
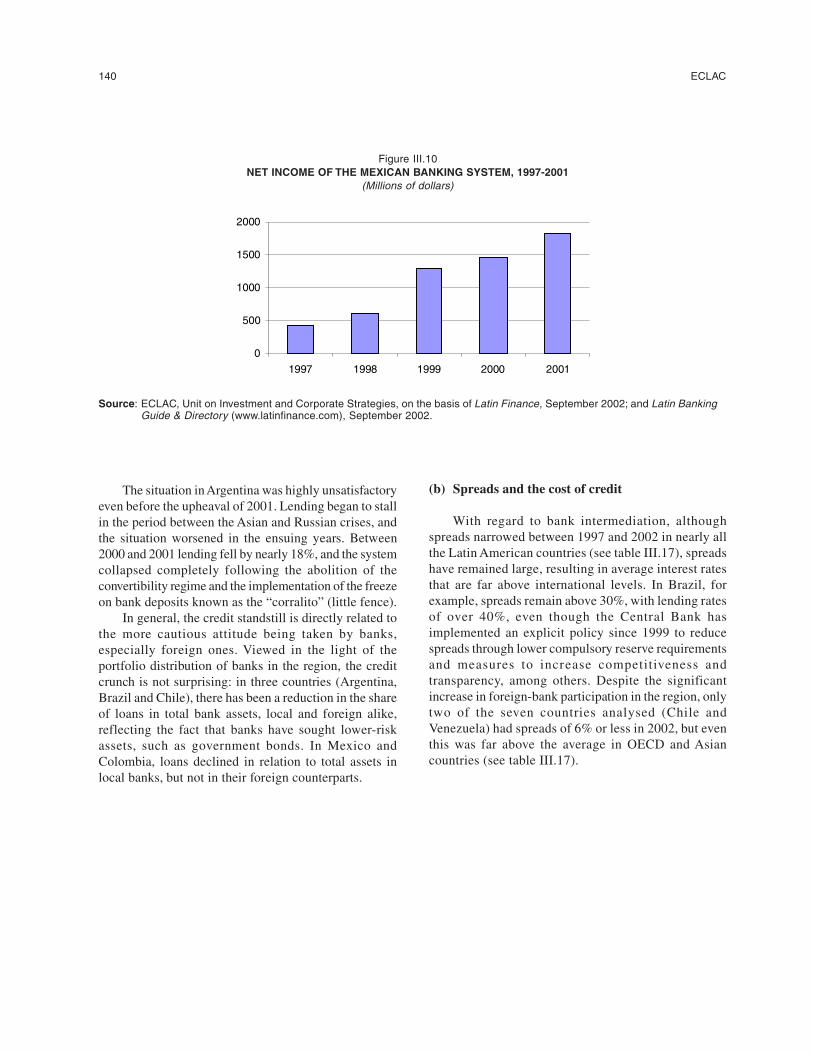
140 ECLAC
Figure III.10NET INCOME OF THE MEXICAN BANKING SYSTEM, 1997-2001
(Millions of dollars)
Source: ECLAC, Unit on Investment and Corporate Strategies, on the basis of Latin Finance, September 2002; and Latin BankingGuide & Directory (www.latinfinance.com), September 2002.
0
500
1000
1500
2000
1997 1998 1999 2000 2001
The situation in Argentina was highly unsatisfactoryeven before the upheaval of 2001. Lending began to stallin the period between the Asian and Russian crises, andthe situation worsened in the ensuing years. Between2000 and 2001 lending fell by nearly 18%, and the systemcollapsed completely following the abolition of theconvertibility regime and the implementation of the freezeon bank deposits known as the “corralito” (little fence).
In general, the credit standstill is directly related tothe more cautious attitude being taken by banks,especially foreign ones. Viewed in the light of theportfolio distribution of banks in the region, the creditcrunch is not surprising: in three countries (Argentina,Brazil and Chile), there has been a reduction in the shareof loans in total bank assets, local and foreign alike,reflecting the fact that banks have sought lower-riskassets, such as government bonds. In Mexico andColombia, loans declined in relation to total assets inlocal banks, but not in their foreign counterparts.
(b) Spreads and the cost of credit
With regard to bank intermediation, althoughspreads narrowed between 1997 and 2002 in nearly allthe Latin American countries (see table III.17), spreadshave remained large, resulting in average interest ratesthat are far above international levels. In Brazil, forexample, spreads remain above 30%, with lending ratesof over 40%, even though the Central Bank hasimplemented an explicit policy since 1999 to reducespreads through lower compulsory reserve requirementsand measures to increase competitiveness andtransparency, among others. Despite the significantincrease in foreign-bank participation in the region, onlytwo of the seven countries analysed (Chile andVenezuela) had spreads of 6% or less in 2002, but eventhis was far above the average in OECD and Asiancountries (see table III.17).
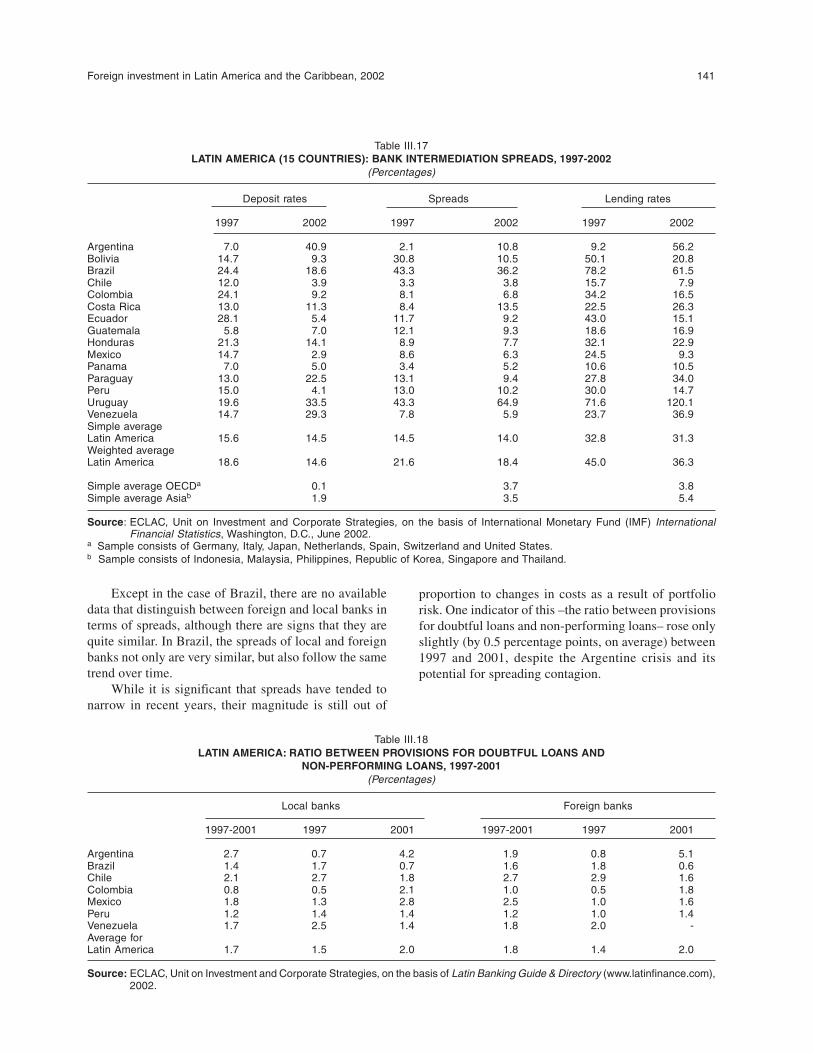
Foreign investment in Latin America and the Caribbean, 2002 141
Table III.17LATIN AMERICA (15 COUNTRIES): BANK INTERMEDIATION SPREADS, 1997-2002
(Percentages)
Deposit rates Spreads Lending rates
1997 2002 1997 2002 1997 2002
Argentina 7.0 40.9 2.1 10.8 9.2 56.2Bolivia 14.7 9.3 30.8 10.5 50.1 20.8Brazil 24.4 18.6 43.3 36.2 78.2 61.5Chile 12.0 3.9 3.3 3.8 15.7 7.9Colombia 24.1 9.2 8.1 6.8 34.2 16.5Costa Rica 13.0 11.3 8.4 13.5 22.5 26.3Ecuador 28.1 5.4 11.7 9.2 43.0 15.1Guatemala 5.8 7.0 12.1 9.3 18.6 16.9Honduras 21.3 14.1 8.9 7.7 32.1 22.9Mexico 14.7 2.9 8.6 6.3 24.5 9.3Panama 7.0 5.0 3.4 5.2 10.6 10.5Paraguay 13.0 22.5 13.1 9.4 27.8 34.0Peru 15.0 4.1 13.0 10.2 30.0 14.7Uruguay 19.6 33.5 43.3 64.9 71.6 120.1Venezuela 14.7 29.3 7.8 5.9 23.7 36.9Simple averageLatin America 15.6 14.5 14.5 14.0 32.8 31.3Weighted averageLatin America 18.6 14.6 21.6 18.4 45.0 36.3
Simple average OECDa 0.1 3.7 3.8Simple average Asiab 1.9 3.5 5.4
Source: ECLAC, Unit on Investment and Corporate Strategies, on the basis of International Monetary Fund (IMF) InternationalFinancial Statistics, Washington, D.C., June 2002.
a Sample consists of Germany, Italy, Japan, Netherlands, Spain, Switzerland and United States.b Sample consists of Indonesia, Malaysia, Philippines, Republic of Korea, Singapore and Thailand.
Except in the case of Brazil, there are no availabledata that distinguish between foreign and local banks interms of spreads, although there are signs that they arequite similar. In Brazil, the spreads of local and foreignbanks not only are very similar, but also follow the sametrend over time.
While it is significant that spreads have tended tonarrow in recent years, their magnitude is still out of
proportion to changes in costs as a result of portfoliorisk. One indicator of this –the ratio between provisionsfor doubtful loans and non-performing loans– rose onlyslightly (by 0.5 percentage points, on average) between1997 and 2001, despite the Argentine crisis and itspotential for spreading contagion.
Table III.18LATIN AMERICA: RATIO BETWEEN PROVISIONS FOR DOUBTFUL LOANS AND
NON-PERFORMING LOANS, 1997-2001(Percentages)
Local banks Foreign banks
1997-2001 1997 2001 1997-2001 1997 2001
Argentina 2.7 0.7 4.2 1.9 0.8 5.1Brazil 1.4 1.7 0.7 1.6 1.8 0.6Chile 2.1 2.7 1.8 2.7 2.9 1.6Colombia 0.8 0.5 2.1 1.0 0.5 1.8Mexico 1.8 1.3 2.8 2.5 1.0 1.6Peru 1.2 1.4 1.4 1.2 1.0 1.4Venezuela 1.7 2.5 1.4 1.8 2.0 -Average forLatin America 1.7 1.5 2.0 1.8 1.4 2.0
Source: ECLAC, Unit on Investment and Corporate Strategies, on the basis of Latin Banking Guide & Directory (www.latinfinance.com),2002.
142 ECLAC
To summarize, the entry of foreign banks has nothad a significant effect on the cost of capital, since, in allbanks, this cost responds more to the macroeconomicclimate than to differences in cost management. Foreignbanks seem to be adapting to regional circumstancesrather than imposing their own dynamic on thedetermination of capital costs.
(c) Stability of the banking sector
In evaluating the impact of foreign banks on themacroeconomic effectiveness of the region's bankingsystems, it is also useful to employ a different criterion,namely the variable represented by stability. Before thearrival of foreign banks, much was said about theirprobable benefits in terms of making the local financialsystem less fragile. At least three arguments weredeployed: (i) foreign banks would have moresophisticated risk-management systems as a result of themore rigorous supervision in force in their countries oforigin; (ii) they would be less vulnerable to domesticcycles in the region because their effective exposure tothem would be relatively small in relation to their broadglobal diversification; and (iii) local subsidiaries offoreign banks could always rely on their parentcompanies in the event of abrupt swings in liquidity.
Considering only indicators of risk management andprovision against losses, it is clear that the foreign bankshave helped to create a sounder banking system.Nonetheless, as Stallings and Studart (2001) argue, theviolent macroeconomic shocks of recent years renderedeven the most sophisticated monitoring and riskmanagement systems ineffective. In fact, in highlyunstable macroeconomic situations, such systems mayeven aggravate risk, given their well-known procyclicalproperties.20 Accordingly, it is not surprising that foreignbanks, which generally have more sophisticated (andmore conservative) risk evaluation systems than theirlocal counterparts, have reacted much more strongly thanthe latter to economic cycles.
As regards the argument that the globaldiversification of foreign banks has a positive effect onstability, the other side of the coin is that these banks aremuch more sensitive than local ones to expectationshocks originating in the advanced economies. For this
reason, to the extent that transnational banks haveincreased their exposure to the region's economies (BIS,2000), their local subsidiaries have adopted anincreasingly cautious stance.
Lastly, in response to the argument that foreign bankscan count on unconditional support from their parentcompanies at times of liquidity loss, two comments needto be made. Firstly, the parent company's capacity tosupport its subsidiaries is compromised by the fact thatit has to maintain, in its country of origin, a level of capitalcompatible with the weighted risk of its assets. This isbecause episodes of financial crisis in an emergingcountry are usually reflected in its "country-risk" rating,and any contribution from the parent company has torepresent an expansion of its global capital. As seenrecently in the Argentine crisis, this severely restricts theability of parent companies to supply funds at times ofmajor macroeconomic uncertainty and/or liquidity crisisin emerging economies.
Secondly, there are provisions in financial systemregulations that do not allow banks to support the liquidityof an ailing subsidiary under certain circumstances. Forexample, United States legislation, provides that a bankis not required to repay any deposit made in a foreignbranch of the bank if the branch cannot do so due to: (i)an act of war, insurrection or civil strife; or (ii) an actionby the government of the host country, unless the bankhas expressly agreed in writing to repay the deposit underthose circumstances. This law was added to existinglegislation in 1994, after Citibank was taken to court bydepositors in the Philippines and Vietnam and lost therespective cases.
In short, the banking system's macroeconomiceffectiveness has been profoundly impaired by the currentmacroeconomic climate, which is extremelyunfavourable for banking activity. This climate has givenrise to a more cautious attitude on the part of the banks,which, in turn, has led to a credit standstill, themaintenance of very large spreads and a shortening ofloan maturities. In order to avoid greater losses as a resultof macroeconomic instability in the region (especiallyin countries that have suffered currency crises similar tothat of Argentina), foreign banks have adopted a moreconservative stance, as shown by their maintenance ofhigh liquidity and, therefore, relatively low lending levels.
20 As Borio, Farfine and Lowe (2001) show, the banking system's procyclical nature stems from the fact that most risk evaluation systemswork with a time horizon that is too short to allow them to accurately determine default risks and correctly value the financial and realassets used as collateral. Accordingly, at times of economic retrenchment, risk indicators tend to rise very sharply, while the value of assetsposted in guarantee declines. As a result of these two movements, the banking system as a whole tends to behave more cautiously, givingrise to a contraction in credit or a slowdown in its growth, which, in turn, ultimately generates a vicious circle. As the macroeconomicsituation becomes more volatile, credit risk is evaluated more cautiously, so that the system's procyclical nature is intensified.
Foreign investment in Latin America and the Caribbean, 2002 143
E. CONCLUSIONS
The major presence of transnational banks in LatinAmerica in the 1990s was due partly to their strategy ofseeking markets throughout the world and partly tochanges in the region's economic climate and institutionalcontext. Regional penetration has produced costs andbenefits for both investor banks and the financial systemsconcerned.
The macroeconomic stability prevailing in the regionin the first half of the 1990s, together with low rates ofinflation and first-generation reforms, especially in thefinancial system and the capital market, attracted banksthat needed to generate economies of scale and grow ona global basis. In addition, the "tequila" crisis and itscontagion to several of the region's countries forcedgovernments to tighten regulation and supervision. Thisled to the establishment of regulatory frameworks thatwere similar to those existing in developed countries,thereby facilitating dialogue between the authorities andforeign banks.
Governments believed the entry of foreign bankswould afford an opportunity to capitalize the system and,at the same time, would act as a bulwark against systemicrisk. Foreign banks were thought to be better equippedthan local ones to face future crises or contagionprocesses because they had portfolios that werediversified across different regions and continents,together with strong capital support from the parentcompanies. They would also give greater security todepositors, who would flock to them in a "flight toquality" in times of crisis. Of course, technologicaladvances, both in management and in dealing with risk,were also considered important for enhancing theefficiency of the region's financial system.
This liberalization process coincided with theglobalization on which transnational banks were alreadyembarked, under either universalization or investment-banking strategies. Although the regional capital marketwas extremely underdeveloped, the reform andprivatization process of the 1990s lured transnationalfinancial firms, which created a demand for new products(such as securitized instruments and derivatives). Inaddition, pension-system reforms generated excellentprofit opportunities in fund management.
This new climate encouraged the entry of foreignbanks, which came to dominate the region's financialmarkets within the short span of five years. The globalinstitutions that expanded in the region were not thosethat had historical roots there, however. A notable featureof the process was the scant interest shown by United
States banks in entering the region –in contrast toEuropean banks, particularly Spanish ones. Severalfactors help explain this: firstly, the consolidation processin which the United States banking system was engaged;secondly, the emphasis placed on expansion strategiesin the European Union; and thirdly, the uncertaintycaused by the region's historical instability. Thiscontrasted with the Spanish banks' urgent need to expandin order to strengthen their competitive capacity, takeadvantage of economies of scale and defend themselvesagainst hostile attacks from rival banks. Entry barriersprevented them from achieving this in Europe, but LatinAmerica gave them the opportunity they needed.
Nonetheless, the aggressive entry of Spanish banksand the success of their incursions into new marketsegments that had not yet been explored by the localbanking system encouraged banks from the United States,especially Citigroup, to expand their participation in theregion. This process began in 2001 with the acquisitionof BANAMEX, one of Mexico's largest banks.
By early 2002, three large foreign players –SCH,BBVA and Citigroup– were operating in the medium-sized and large countries of the region, covering allsegments of the financial market by providing universalservices, and jointly accounting for 64% of foreign-bankactivity in Latin America. The remaining firms wereconcentrated solely in large markets, or else operatedexclusively in the corporate segment and the capitalmarket.
Regional expansion yielded numerous benefits forforeign banks, but it also entailed costs. In terms ofbenefits, up until 2001, when the Argentine crisis brokeout, foreign banks grew steadily and gained a significantshare of local banking systems, which ranged from 34%in Colombia to 90% in Mexico in 2001. A decade earlier,Chile had been the country with the greatest foreignparticipation, which, however, had accounted for less than20% of the market at that time. In addition, theprofitability of foreign banks' activities in the region,whether measured by the return on assets or the returnon equity, grew steadily and in some cases exceeded thebank's overall profitability. At the same time, foreignbanks expanded their participation in the capital market,especially in pension fund management, one of the mostattractive businesses for financial institutions.
Costs arose from various sources, including theregion's instability and its vulnerability to external shocksand currency crises. Moreover, in many cases, notablythat of Brazil, foreign banks underestimated the local
144 ECLAC
competition. The Argentine crisis clearly marked aturning point in foreign banks' expansion strategy,although the cost of this crisis for each bank dependedon the importance of Latin America, and particularlyArgentina, in its global business. At one extreme werethe Spanish banks, whose interests in the regionrepresented between 26% and 29% of their total assets;at the other were banks that only expanded in the treasurymanagement or corporate banking segments; and in themiddle was Citigroup, whose global diversificationprevented it from being seriously affected by thedeterioration in regional conditions, even though itsinterests in the region amounted to a not insignificant7% of its total assets.
Excluding losses in Argentina, which cannot beevaluated as yet, the deterioration in regional conditionshas had a series of consequences for foreign banks, whichcan be measured by a number of factors. In the first place,there was a drop in profitability, although it was onlysignificant in banks that had major investments inArgentina and little regional diversification. Secondly,future business prospects changed drastically; asexpectations of rapid growth faded and exchange ratesbecame more volatile, projections of future profitabilityslumped. This effect was compounded by politicalinstability in several countries of the region. Lastly,Argentina's difficulties led to a breakdown in the rulesof the game in that country and raised the spectre ofregional contagion, all of which served to heighteninvestment risk.
This prompted banks to exercise much more cautionin taking decisions or, in extreme cases -particularly thoseof banks without major investments in the region- to pullout of Latin America entirely. Nonetheless, the largeinvestors, especially SCH, BBVA and Citigroup, maintaina long-term vision whose prospects have persuaded themto defend the market positions they have gained thus farby rationalizing spending (for which purpose, inparticular, they have pressed ahead in implementingregional technological platforms) and awaiting theconsolidation and greater concentration of the regionalbanking system. All of this reflects their conviction thatexpansion in Latin America, crises notwithstanding, hasbeen positive for their global growth strategy.
The analysis also shows that, while foreign banksdo not differ significantly from local ones in terms ofoperational efficiency, they do act more cautiously inevaluating and managing risk. Nonetheless, the fact thatthere is no statistically significant efficiency gap betweenlocal and foreign banks does not mean that the latter havehad no positive impact in the region. Clearly, the
competition generated by the entry of foreign banks hasgalvanized efforts by local banks to cut costs and enhanceprofitability in order to protect themselves from beingdriven out of the market. In fact, despite the oligopolisticnature of the industry, competition nowadays betweenlarge local banks and foreign ones is very strong. Aninteresting feature of the financial sector is that allcompetitors have access to state-of-the-art technology.Because it is relatively cheap, it is not exclusive to foreignbanks, thanks to the progress made in information andcommunication technology, which the financial systemuses particularly intensively. Nonetheless, in all but a fewcountries –Chile, for example– the cost reductiongenerated by technological progress has not been passedon in the form of cheaper financial services for eitherfirms or individuals. Worse still, it has not given firmseasier access to credit.
Accordingly, the positive outcome for the region interms of microeconomic efficiency stands in contrast tothe macroeconomic impact –i.e., the effectiveness offoreign-bank participation in the system–, as measuredby the conditions under which credit is extended, theavailability of business financing and the stability of thesystem. From this analysis, it may be concluded thatforeign banks have not had a significant effect in thisregard: they are more cautious than their localcounterparts when extending credit, and their responseto crises is clearly procyclical, all of which intensifiesthe effects of monetary tightening. Despite these banks'managerial efficiency, interest-rate spreads narrowed inonly four of the seven countries analysed, and even inthose four they remained extremely high -far above thosein Asia and, of course, those in the OECD countries.Spreads have reacted more to the macroeconomicenvironment than to differences in cost management, andforeign banks seem to be adapting to regionalcircumstances in this regard, rather than imposing theirown dynamic on the processes that determine the cost ofcapital.
Lastly, in terms of reactions to systemic crises, theexperience of recent years has shown that the behaviourof transnational corporations towards their subsidiariesand branches depends on a number of factors: theinstitutional framework in the corporation's country oforigin, the institutional framework in the host countryand the steps taken by local authorities to deal with crises.In practice, the parent companies of foreign banks cannotbe considered lenders of last resort; their behaviour intimes of crisis has depended on the nature of the problemsfaced by banks in the host country and the type ofestablishment in question.

Foreign investment in Latin America and the Caribbean, 2002 145
ANNEX

146 ECLAC
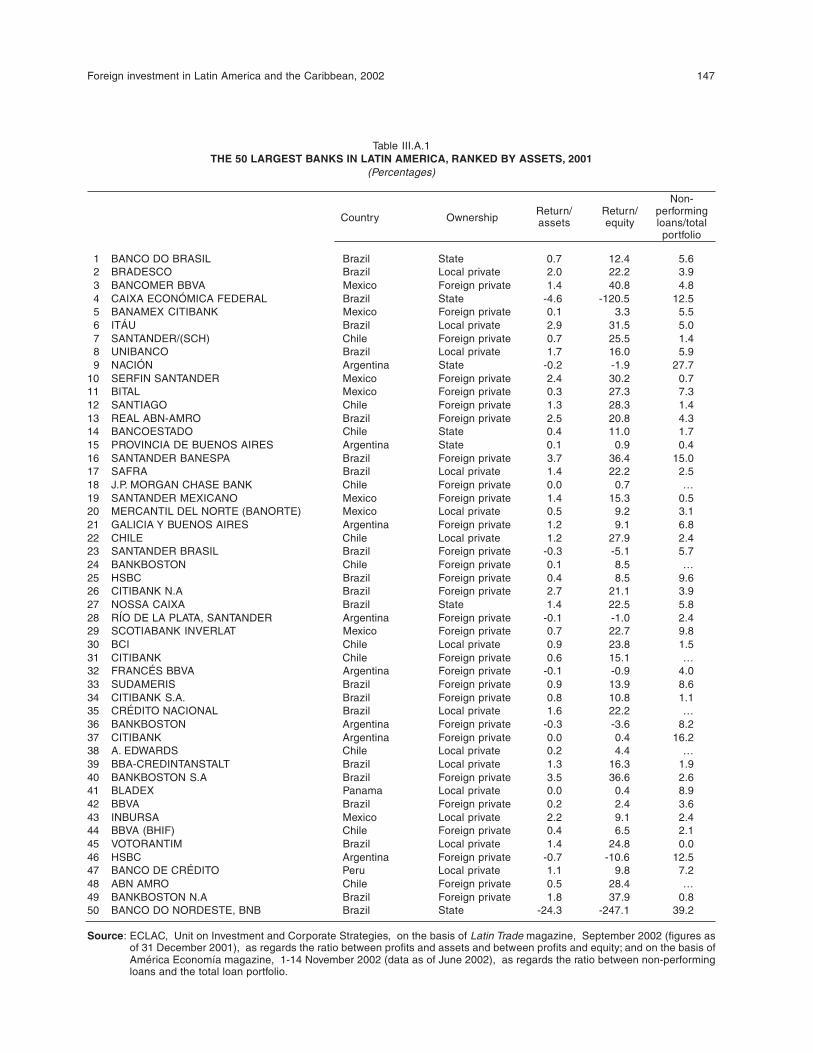
Foreign investment in Latin America and the Caribbean, 2002 147
Table III.A.1THE 50 LARGEST BANKS IN LATIN AMERICA, RANKED BY ASSETS, 2001
(Percentages)
Country OwnershipReturn/ Return/
Non-
assets equityperformingloans/totalportfolio
1 BANCO DO BRASIL Brazil State 0.7 12.4 5.6 2 BRADESCO Brazil Local private 2.0 22.2 3.9 3 BANCOMER BBVA Mexico Foreign private 1.4 40.8 4.8 4 CAIXA ECONÓMICA FEDERAL Brazil State -4.6 -120.5 12.5 5 BANAMEX CITIBANK Mexico Foreign private 0.1 3.3 5.5 6 ITÁU Brazil Local private 2.9 31.5 5.0 7 SANTANDER/(SCH) Chile Foreign private 0.7 25.5 1.4 8 UNIBANCO Brazil Local private 1.7 16.0 5.9 9 NACIÓN Argentina State -0.2 -1.9 27.710 SERFIN SANTANDER Mexico Foreign private 2.4 30.2 0.711 BITAL Mexico Foreign private 0.3 27.3 7.312 SANTIAGO Chile Foreign private 1.3 28.3 1.413 REAL ABN-AMRO Brazil Foreign private 2.5 20.8 4.314 BANCOESTADO Chile State 0.4 11.0 1.715 PROVINCIA DE BUENOS AIRES Argentina State 0.1 0.9 0.416 SANTANDER BANESPA Brazil Foreign private 3.7 36.4 15.017 SAFRA Brazil Local private 1.4 22.2 2.518 J.P. MORGAN CHASE BANK Chile Foreign private 0.0 0.7 …19 SANTANDER MEXICANO Mexico Foreign private 1.4 15.3 0.520 MERCANTIL DEL NORTE (BANORTE) Mexico Local private 0.5 9.2 3.121 GALICIA Y BUENOS AIRES Argentina Foreign private 1.2 9.1 6.822 CHILE Chile Local private 1.2 27.9 2.423 SANTANDER BRASIL Brazil Foreign private -0.3 -5.1 5.724 BANKBOSTON Chile Foreign private 0.1 8.5 …25 HSBC Brazil Foreign private 0.4 8.5 9.626 CITIBANK N.A Brazil Foreign private 2.7 21.1 3.927 NOSSA CAIXA Brazil State 1.4 22.5 5.828 RÍO DE LA PLATA, SANTANDER Argentina Foreign private -0.1 -1.0 2.429 SCOTIABANK INVERLAT Mexico Foreign private 0.7 22.7 9.830 BCI Chile Local private 0.9 23.8 1.531 CITIBANK Chile Foreign private 0.6 15.1 …32 FRANCÉS BBVA Argentina Foreign private -0.1 -0.9 4.033 SUDAMERIS Brazil Foreign private 0.9 13.9 8.634 CITIBANK S.A. Brazil Foreign private 0.8 10.8 1.135 CRÉDITO NACIONAL Brazil Local private 1.6 22.2 …36 BANKBOSTON Argentina Foreign private -0.3 -3.6 8.237 CITIBANK Argentina Foreign private 0.0 0.4 16.238 A. EDWARDS Chile Local private 0.2 4.4 …39 BBA-CREDINTANSTALT Brazil Local private 1.3 16.3 1.940 BANKBOSTON S.A Brazil Foreign private 3.5 36.6 2.641 BLADEX Panama Local private 0.0 0.4 8.942 BBVA Brazil Foreign private 0.2 2.4 3.643 INBURSA Mexico Local private 2.2 9.1 2.444 BBVA (BHIF) Chile Foreign private 0.4 6.5 2.145 VOTORANTIM Brazil Local private 1.4 24.8 0.046 HSBC Argentina Foreign private -0.7 -10.6 12.547 BANCO DE CRÉDITO Peru Local private 1.1 9.8 7.248 ABN AMRO Chile Foreign private 0.5 28.4 …49 BANKBOSTON N.A Brazil Foreign private 1.8 37.9 0.850 BANCO DO NORDESTE, BNB Brazil State -24.3 -247.1 39.2
Source: ECLAC, Unit on Investment and Corporate Strategies, on the basis of Latin Trade magazine, September 2002 (figures asof 31 December 2001), as regards the ratio between profits and assets and between profits and equity; and on the basis ofAmérica Economía magazine, 1-14 November 2002 (data as of June 2002), as regards the ratio between non-performingloans and the total loan portfolio.
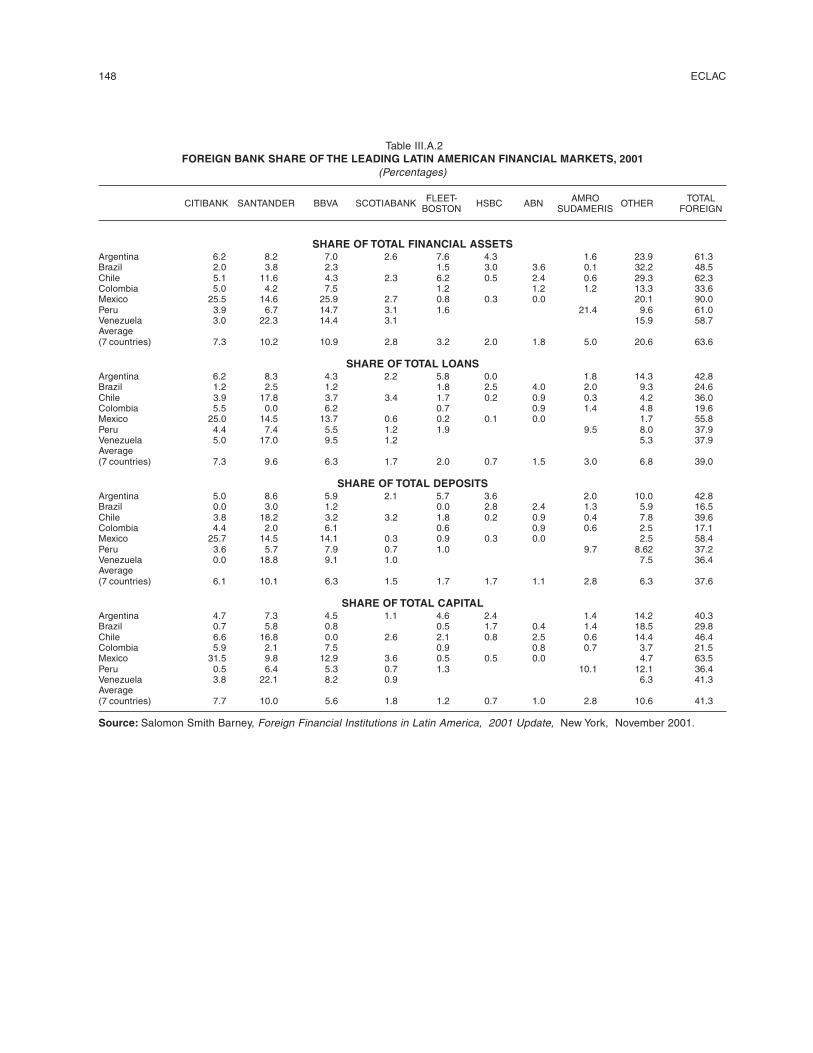
148 ECLAC
Table III.A.2FOREIGN BANK SHARE OF THE LEADING LATIN AMERICAN FINANCIAL MARKETS, 2001
(Percentages)
CITIBANK SANTANDER BBVA SCOTIABANK FLEET- HSBC ABN AMRO OTHER TOTALBOSTON SUDAMERIS FOREIGN
SHARE OF TOTAL FINANCIAL ASSETSArgentina 6.2 8.2 7.0 2.6 7.6 4.3 1.6 23.9 61.3Brazil 2.0 3.8 2.3 1.5 3.0 3.6 0.1 32.2 48.5Chile 5.1 11.6 4.3 2.3 6.2 0.5 2.4 0.6 29.3 62.3Colombia 5.0 4.2 7.5 1.2 1.2 1.2 13.3 33.6Mexico 25.5 14.6 25.9 2.7 0.8 0.3 0.0 20.1 90.0Peru 3.9 6.7 14.7 3.1 1.6 21.4 9.6 61.0Venezuela 3.0 22.3 14.4 3.1 15.9 58.7Average(7 countries) 7.3 10.2 10.9 2.8 3.2 2.0 1.8 5.0 20.6 63.6
SHARE OF TOTAL LOANSArgentina 6.2 8.3 4.3 2.2 5.8 0.0 1.8 14.3 42.8Brazil 1.2 2.5 1.2 1.8 2.5 4.0 2.0 9.3 24.6Chile 3.9 17.8 3.7 3.4 1.7 0.2 0.9 0.3 4.2 36.0Colombia 5.5 0.0 6.2 0.7 0.9 1.4 4.8 19.6Mexico 25.0 14.5 13.7 0.6 0.2 0.1 0.0 1.7 55.8Peru 4.4 7.4 5.5 1.2 1.9 9.5 8.0 37.9Venezuela 5.0 17.0 9.5 1.2 5.3 37.9Average(7 countries) 7.3 9.6 6.3 1.7 2.0 0.7 1.5 3.0 6.8 39.0
SHARE OF TOTAL DEPOSITSArgentina 5.0 8.6 5.9 2.1 5.7 3.6 2.0 10.0 42.8Brazil 0.0 3.0 1.2 0.0 2.8 2.4 1.3 5.9 16.5Chile 3.8 18.2 3.2 3.2 1.8 0.2 0.9 0.4 7.8 39.6Colombia 4.4 2.0 6.1 0.6 0.9 0.6 2.5 17.1Mexico 25.7 14.5 14.1 0.3 0.9 0.3 0.0 2.5 58.4Peru 3.6 5.7 7.9 0.7 1.0 9.7 8.62 37.2Venezuela 0.0 18.8 9.1 1.0 7.5 36.4Average(7 countries) 6.1 10.1 6.3 1.5 1.7 1.7 1.1 2.8 6.3 37.6
SHARE OF TOTAL CAPITALArgentina 4.7 7.3 4.5 1.1 4.6 2.4 1.4 14.2 40.3Brazil 0.7 5.8 0.8 0.5 1.7 0.4 1.4 18.5 29.8Chile 6.6 16.8 0.0 2.6 2.1 0.8 2.5 0.6 14.4 46.4Colombia 5.9 2.1 7.5 0.9 0.8 0.7 3.7 21.5Mexico 31.5 9.8 12.9 3.6 0.5 0.5 0.0 4.7 63.5Peru 0.5 6.4 5.3 0.7 1.3 10.1 12.1 36.4Venezuela 3.8 22.1 8.2 0.9 6.3 41.3Average(7 countries) 7.7 10.0 5.6 1.8 1.2 0.7 1.0 2.8 10.6 41.3
Source: Salomon Smith Barney, Foreign Financial Institutions in Latin America, 2001 Update, New York, November 2001.
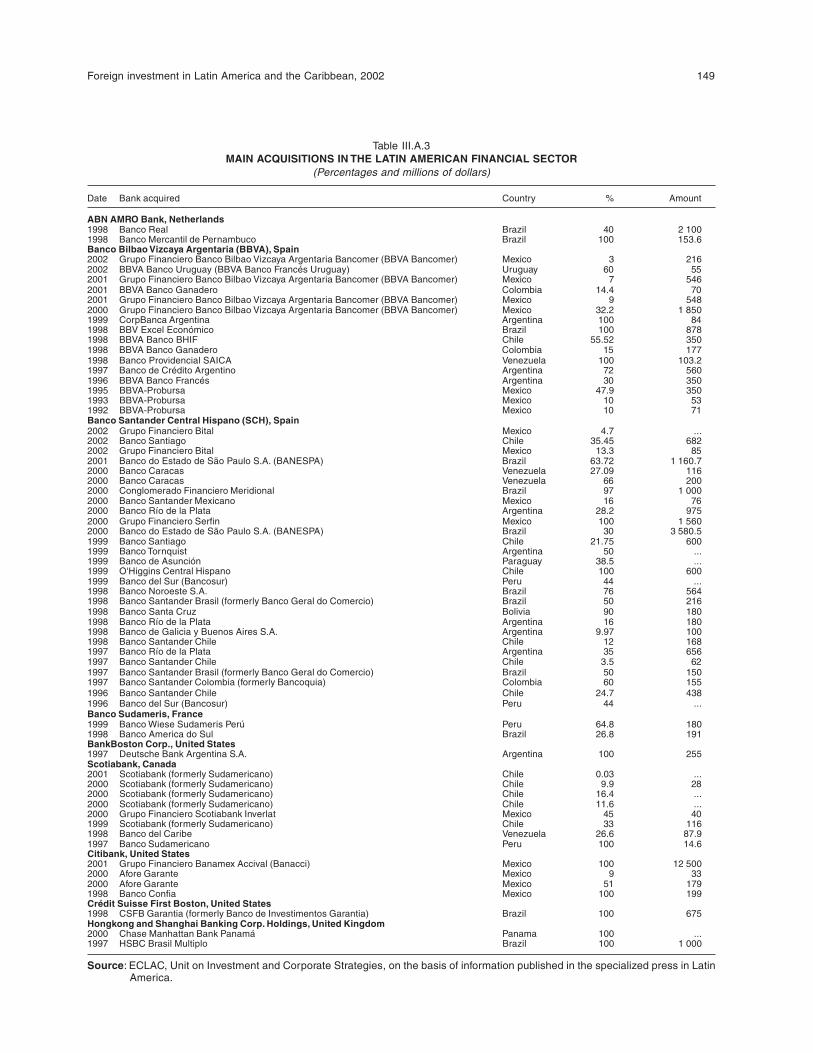
Foreign investment in Latin America and the Caribbean, 2002 149
Table III.A.3MAIN ACQUISITIONS IN THE LATIN AMERICAN FINANCIAL SECTOR
(Percentages and millions of dollars)
Date Bank acquired Country % Amount
ABN AMRO Bank, Netherlands1998 Banco Real Brazil 40 2 1001998 Banco Mercantil de Pernambuco Brazil 100 153.6Banco Bilbao Vizcaya Argentaria (BBVA), Spain2002 Grupo Financiero Banco Bilbao Vizcaya Argentaria Bancomer (BBVA Bancomer) Mexico 3 2162002 BBVA Banco Uruguay (BBVA Banco Francés Uruguay) Uruguay 60 552001 Grupo Financiero Banco Bilbao Vizcaya Argentaria Bancomer (BBVA Bancomer) Mexico 7 5462001 BBVA Banco Ganadero Colombia 14.4 702001 Grupo Financiero Banco Bilbao Vizcaya Argentaria Bancomer (BBVA Bancomer) Mexico 9 5482000 Grupo Financiero Banco Bilbao Vizcaya Argentaria Bancomer (BBVA Bancomer) Mexico 32.2 1 8501999 CorpBanca Argentina Argentina 100 841998 BBV Excel Económico Brazil 100 8781998 BBVA Banco BHIF Chile 55.52 3501998 BBVA Banco Ganadero Colombia 15 1771998 Banco Providencial SAICA Venezuela 100 103.21997 Banco de Crédito Argentino Argentina 72 5601996 BBVA Banco Francés Argentina 30 3501995 BBVA-Probursa Mexico 47.9 3501993 BBVA-Probursa Mexico 10 531992 BBVA-Probursa Mexico 10 71Banco Santander Central Hispano (SCH), Spain2002 Grupo Financiero Bital Mexico 4.7 ...2002 Banco Santiago Chile 35.45 6822002 Grupo Financiero Bital Mexico 13.3 852001 Banco do Estado de São Paulo S.A. (BANESPA) Brazil 63.72 1 160.72000 Banco Caracas Venezuela 27.09 1162000 Banco Caracas Venezuela 66 2002000 Conglomerado Financiero Meridional Brazil 97 1 0002000 Banco Santander Mexicano Mexico 16 762000 Banco Río de la Plata Argentina 28.2 9752000 Grupo Financiero Serfin Mexico 100 1 5602000 Banco do Estado de São Paulo S.A. (BANESPA) Brazil 30 3 580.51999 Banco Santiago Chile 21.75 6001999 Banco Tornquist Argentina 50 ...1999 Banco de Asunción Paraguay 38.5 ...1999 O'Higgins Central Hispano Chile 100 6001999 Banco del Sur (Bancosur) Peru 44 ...1998 Banco Noroeste S.A. Brazil 76 5641998 Banco Santander Brasil (formerly Banco Geral do Comercio) Brazil 50 2161998 Banco Santa Cruz Bolivia 90 1801998 Banco Río de la Plata Argentina 16 1801998 Banco de Galicia y Buenos Aires S.A. Argentina 9.97 1001998 Banco Santander Chile Chile 12 1681997 Banco Río de la Plata Argentina 35 6561997 Banco Santander Chile Chile 3.5 621997 Banco Santander Brasil (formerly Banco Geral do Comercio) Brazil 50 1501997 Banco Santander Colombia (formerly Bancoquia) Colombia 60 1551996 Banco Santander Chile Chile 24.7 4381996 Banco del Sur (Bancosur) Peru 44 ...Banco Sudameris, France1999 Banco Wiese Sudameris Perú Peru 64.8 1801998 Banco America do Sul Brazil 26.8 191BankBoston Corp., United States1997 Deutsche Bank Argentina S.A. Argentina 100 255Scotiabank, Canada2001 Scotiabank (formerly Sudamericano) Chile 0.03 ...2000 Scotiabank (formerly Sudamericano) Chile 9.9 282000 Scotiabank (formerly Sudamericano) Chile 16.4 ...2000 Scotiabank (formerly Sudamericano) Chile 11.6 ...2000 Grupo Financiero Scotiabank Inverlat Mexico 45 401999 Scotiabank (formerly Sudamericano) Chile 33 1161998 Banco del Caribe Venezuela 26.6 87.91997 Banco Sudamericano Peru 100 14.6Citibank, United States2001 Grupo Financiero Banamex Accival (Banacci) Mexico 100 12 5002000 Afore Garante Mexico 9 332000 Afore Garante Mexico 51 1791998 Banco Confia Mexico 100 199Crédit Suisse First Boston, United States1998 CSFB Garantia (formerly Banco de Investimentos Garantia) Brazil 100 675Hongkong and Shanghai Banking Corp. Holdings, United Kingdom2000 Chase Manhattan Bank Panamá Panama 100 ...1997 HSBC Brasil Multiplo Brazil 100 1 000
Source: ECLAC, Unit on Investment and Corporate Strategies, on the basis of information published in the specialized press in LatinAmerica.
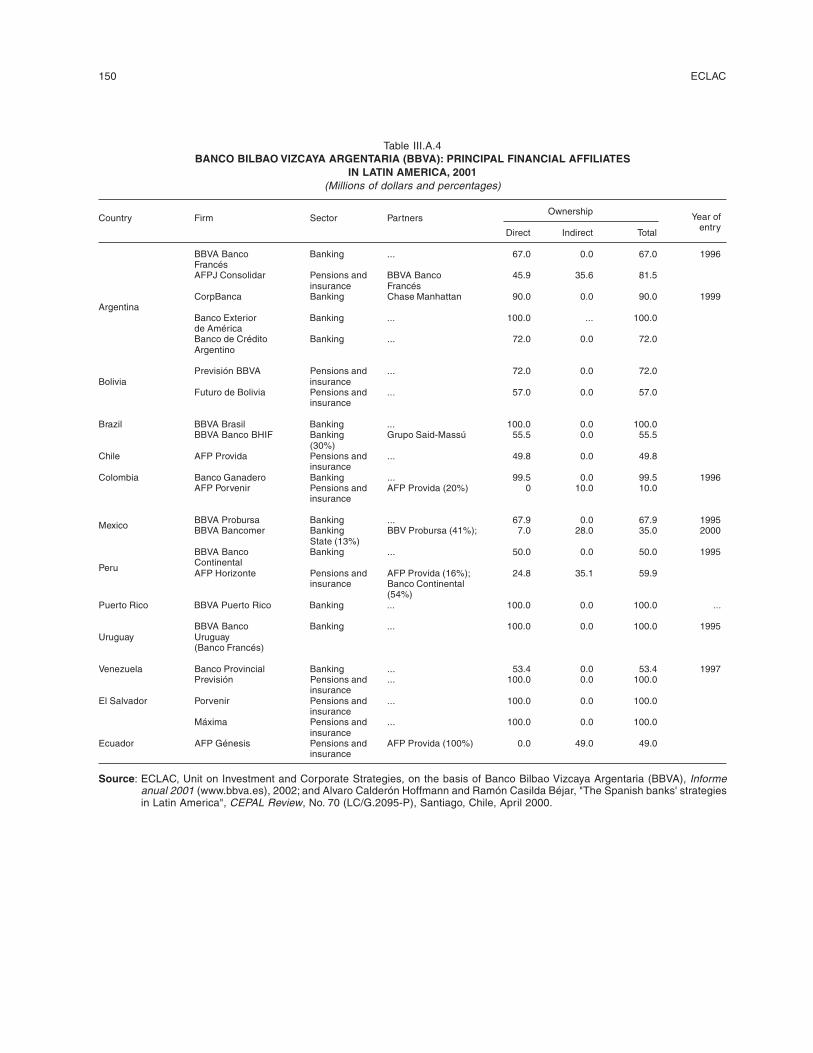
150 ECLAC
Table III.A.4BANCO BILBAO VIZCAYA ARGENTARIA (BBVA): PRINCIPAL FINANCIAL AFFILIATES
IN LATIN AMERICA, 2001(Millions of dollars and percentages)
Country Firm Sector PartnersOwnership
Year of
Direct Indirect Total entry
BBVA Banco Banking ... 67.0 0.0 67.0 1996FrancésAFPJ Consolidar Pensions and BBVA Banco 45.9 35.6 81.5
insurance FrancésCorpBanca Banking Chase Manhattan 90.0 0.0 90.0 1999
ArgentinaBanco Exterior Banking ... 100.0 ... 100.0de AméricaBanco de Crédito Banking ... 72.0 0.0 72.0Argentino
Previsión BBVA Pensions and ... 72.0 0.0 72.0Bolivia insurance
Futuro de Bolivia Pensions and ... 57.0 0.0 57.0insurance
Brazil BBVA Brasil Banking ... 100.0 0.0 100.0BBVA Banco BHIF Banking Grupo Said-Massú 55.5 0.0 55.5
(30%)Chile AFP Provida Pensions and ... 49.8 0.0 49.8
insuranceColombia Banco Ganadero Banking ... 99.5 0.0 99.5 1996
AFP Porvenir Pensions and AFP Provida (20%) 0 10.0 10.0insurance
MexicoBBVA Probursa Banking ... 67.9 0.0 67.9 1995BBVA Bancomer Banking BBV Probursa (41%); 7.0 28.0 35.0 2000
State (13%)BBVA Banco Banking ... 50.0 0.0 50.0 1995Continental
PeruAFP Horizonte Pensions and AFP Provida (16%); 24.8 35.1 59.9
insurance Banco Continental(54%)
Puerto Rico BBVA Puerto Rico Banking ... 100.0 0.0 100.0 ...
BBVA Banco Banking ... 100.0 0.0 100.0 1995Uruguay Uruguay
(Banco Francés)
Venezuela Banco Provincial Banking ... 53.4 0.0 53.4 1997Previsión Pensions and ... 100.0 0.0 100.0
insuranceEl Salvador Porvenir Pensions and ... 100.0 0.0 100.0
insuranceMáxima Pensions and ... 100.0 0.0 100.0
insuranceEcuador AFP Génesis Pensions and AFP Provida (100%) 0.0 49.0 49.0
insurance
Source: ECLAC, Unit on Investment and Corporate Strategies, on the basis of Banco Bilbao Vizcaya Argentaria (BBVA), Informeanual 2001 (www.bbva.es), 2002; and Alvaro Calderón Hoffmann and Ramón Casilda Béjar, "The Spanish banks' strategiesin Latin America", CEPAL Review, No. 70 (LC/G.2095-P), Santiago, Chile, April 2000.
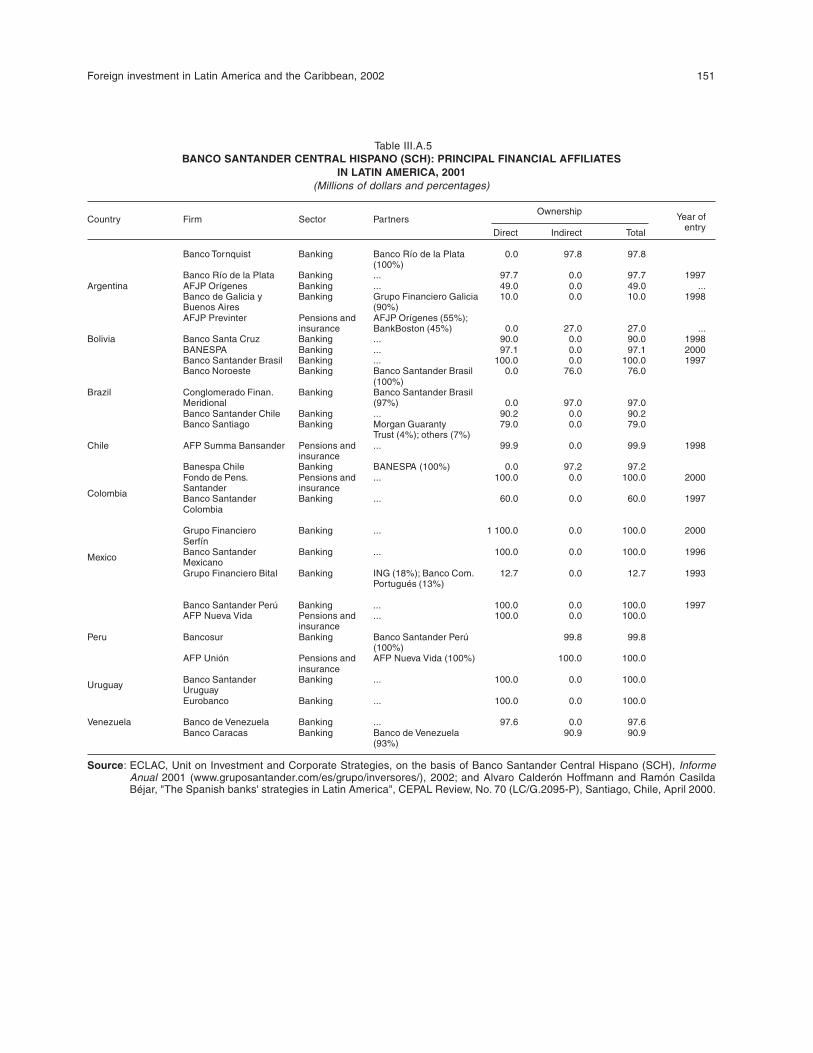
Foreign investment in Latin America and the Caribbean, 2002 151
Table III.A.5BANCO SANTANDER CENTRAL HISPANO (SCH): PRINCIPAL FINANCIAL AFFILIATES
IN LATIN AMERICA, 2001(Millions of dollars and percentages)
Country Firm Sector PartnersOwnership
Year of
Direct Indirect Totalentry
Banco Tornquist Banking Banco Río de la Plata 0.0 97.8 97.8(100%)
Banco Río de la Plata Banking ... 97.7 0.0 97.7 1997Argentina AFJP Orígenes Banking ... 49.0 0.0 49.0 ...
Banco de Galicia y Banking Grupo Financiero Galicia 10.0 0.0 10.0 1998Buenos Aires (90%)AFJP Previnter Pensions and AFJP Orígenes (55%);
insurance BankBoston (45%) 0.0 27.0 27.0 ...Bolivia Banco Santa Cruz Banking ... 90.0 0.0 90.0 1998
BANESPA Banking ... 97.1 0.0 97.1 2000Banco Santander Brasil Banking ... 100.0 0.0 100.0 1997Banco Noroeste Banking Banco Santander Brasil 0.0 76.0 76.0
(100%)Brazil Conglomerado Finan. Banking Banco Santander Brasil
Meridional (97%) 0.0 97.0 97.0Banco Santander Chile Banking ... 90.2 0.0 90.2Banco Santiago Banking Morgan Guaranty 79.0 0.0 79.0
Trust (4%); others (7%)Chile AFP Summa Bansander Pensions and ... 99.9 0.0 99.9 1998
insuranceBanespa Chile Banking BANESPA (100%) 0.0 97.2 97.2Fondo de Pens. Pensions and ... 100.0 0.0 100.0 2000Santander insurance
Colombia Banco Santander Banking ... 60.0 0.0 60.0 1997Colombia
Grupo Financiero Banking ... 1 100.0 0.0 100.0 2000Serfín
MexicoBanco Santander Banking ... 100.0 0.0 100.0 1996MexicanoGrupo Financiero Bital Banking ING (18%); Banco Com. 12.7 0.0 12.7 1993
Portugués (13%)
Banco Santander Perú Banking ... 100.0 0.0 100.0 1997AFP Nueva Vida Pensions and ... 100.0 0.0 100.0
insurancePeru Bancosur Banking Banco Santander Perú 99.8 99.8
(100%)AFP Unión Pensions and AFP Nueva Vida (100%) 100.0 100.0
insurance
UruguayBanco Santander Banking ... 100.0 0.0 100.0UruguayEurobanco Banking ... 100.0 0.0 100.0
Venezuela Banco de Venezuela Banking ... 97.6 0.0 97.6Banco Caracas Banking Banco de Venezuela 90.9 90.9
(93%)
Source: ECLAC, Unit on Investment and Corporate Strategies, on the basis of Banco Santander Central Hispano (SCH), InformeAnual 2001 (www.gruposantander.com/es/grupo/inversores/), 2002; and Alvaro Calderón Hoffmann and Ramón CasildaBéjar, "The Spanish banks' strategies in Latin America", CEPAL Review, No. 70 (LC/G.2095-P), Santiago, Chile, April 2000.
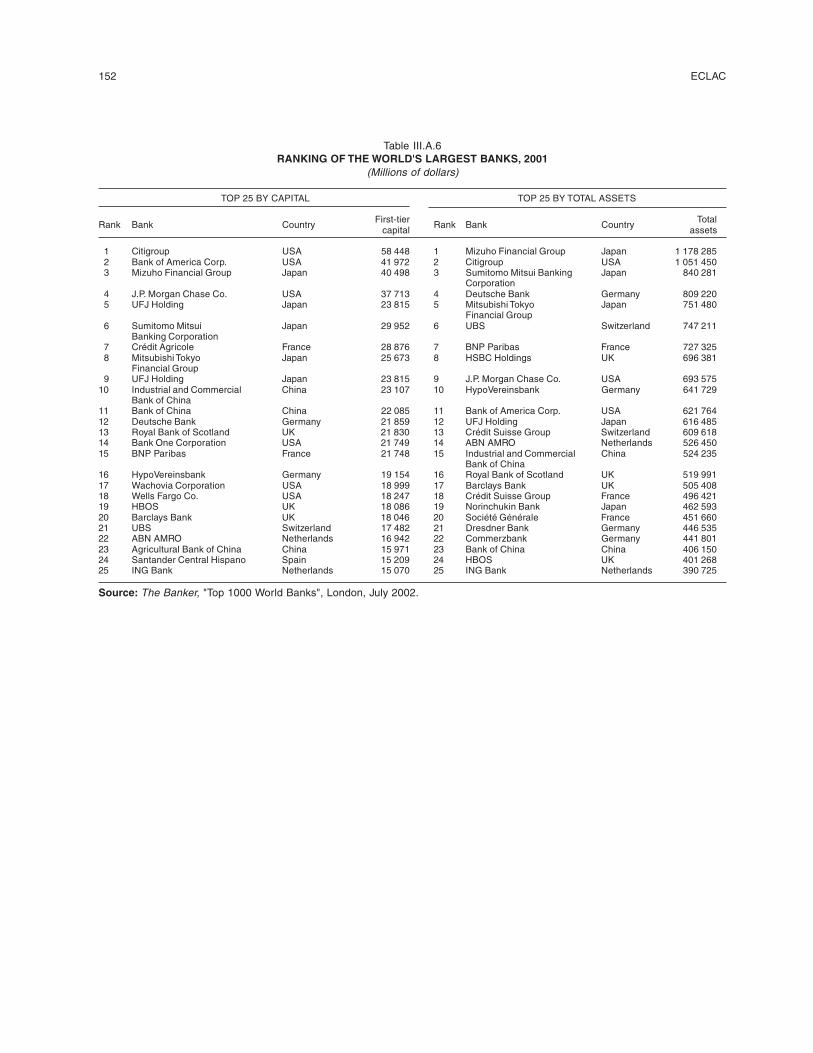
152 ECLAC
Table III.A.6RANKING OF THE WORLD'S LARGEST BANKS, 2001
(Millions of dollars)
TOP 25 BY CAPITAL TOP 25 BY TOTAL ASSETS
Rank Bank CountryFirst-tier
Rank Bank CountryTotal
capital assets
1 Citigroup USA 58 448 1 Mizuho Financial Group Japan 1 178 285 2 Bank of America Corp. USA 41 972 2 Citigroup USA 1 051 450 3 Mizuho Financial Group Japan 40 498 3 Sumitomo Mitsui Banking Japan 840 281
Corporation 4 J.P. Morgan Chase Co. USA 37 713 4 Deutsche Bank Germany 809 220 5 UFJ Holding Japan 23 815 5 Mitsubishi Tokyo Japan 751 480
Financial Group 6 Sumitomo Mitsui Japan 29 952 6 UBS Switzerland 747 211
Banking Corporation 7 Crédit Agricole France 28 876 7 BNP Paribas France 727 325 8 Mitsubishi Tokyo Japan 25 673 8 HSBC Holdings UK 696 381
Financial Group 9 UFJ Holding Japan 23 815 9 J.P. Morgan Chase Co. USA 693 57510 Industrial and Commercial China 23 107 10 HypoVereinsbank Germany 641 729
Bank of China11 Bank of China China 22 085 11 Bank of America Corp. USA 621 76412 Deutsche Bank Germany 21 859 12 UFJ Holding Japan 616 48513 Royal Bank of Scotland UK 21 830 13 Crédit Suisse Group Switzerland 609 61814 Bank One Corporation USA 21 749 14 ABN AMRO Netherlands 526 45015 BNP Paribas France 21 748 15 Industrial and Commercial China 524 235
Bank of China16 HypoVereinsbank Germany 19 154 16 Royal Bank of Scotland UK 519 99117 Wachovia Corporation USA 18 999 17 Barclays Bank UK 505 40818 Wells Fargo Co. USA 18 247 18 Crédit Suisse Group France 496 42119 HBOS UK 18 086 19 Norinchukin Bank Japan 462 59320 Barclays Bank UK 18 046 20 Société Générale France 451 66021 UBS Switzerland 17 482 21 Dresdner Bank Germany 446 53522 ABN AMRO Netherlands 16 942 22 Commerzbank Germany 441 80123 Agricultural Bank of China China 15 971 23 Bank of China China 406 15024 Santander Central Hispano Spain 15 209 24 HBOS UK 401 26825 ING Bank Netherlands 15 070 25 ING Bank Netherlands 390 725
Source: The Banker, "Top 1000 World Banks", London, July 2002.
Foreign investment in Latin America and the Caribbean, 2002 153
Bibliography
Aglietta, Michel (2002), "Derrière la débâcle boursière, une folle spirale", Le Monde, 1 October.Alcalde, Javier (1997), "La liberalización de la inversión extranjera directa en América Latina: un breve enfoque comparativo de
Brasil, Chile, Perú y el Grupo Andino", Apuntes, No. 41, Lima, University of the Pacific Research Centre.Alexander's Gas & Oil Connections (2002), vol. 7, No. 20 (http://www.gasandoil.com), 15 October.América Economía (2002a), "Firestone invierte US$ 10 millones en México", 10 June.____ (2002b), "Compras verde-amarelas", No. 246, 13 December 2002-16 January 2003.AMIA (Asociación Mexicana de la Industria Automotriz) (2002), Boletín, No. 443, México City, October.ANFAVEA (Associação Nacional dos Fabricantes de Veículos Automotores) (2002), "Carta de Anfavea", No. 197, São Paulo,
October.Banco Central Do Brasil (no date), "Balanço de pagamentos" (http://www.bcb.gov.br/).Barrios, Adriana (2001), "Evaluación histórica del contrato de asociación colombiano", Bogotá, D.C., unpublished.Bassett, William and Thomas Brady (2002), What Drives the Persistent Competitiveness of Small Banks?, Washington, D.C.,
United States Board of Governors of the Federal Reserve System, May.Berger, Allen and Loretta Mester (2001), "Explaining the Dramatic Changes in Performance of US Banks: Technological Change,
Deregulation, and Dynamic Changes in Competition", Federal Reserve Board of Philadelphia Working Paper, No. 01/6.____ (1997), "Inside the Black Box: What Explains Differences in the Efficiencies of Financial Institutions?", Wharton Financial
Institutions Center Working Paper, No. 97/04.Berger, Allen, Q. Dai, S. Ongena and D. Smith (2002), "To What Extent will the Banking Industry be Globalized? A Study of Bank
Nationality and Reach in 20 European Nations", International Finance Discussion Papers, No. 725, Washington, D.C., UnitedStates Board of Governors of the Federal Reserve System, May.
____ (2000), "Globalization of Financial Institutions: Evidence from Cross-border Banking Performance", Working Papers,Washington, D.C., United States Board of Governors of the Federal Reserve System.
BIS (Bank for International Settlements) (2002), International Banking and Financial Market Developments, March.____ (2001),"The Banking Industry in the Emerging Market Economies: Competition, Consolidation and Systemic Stability," BIS
Papers, No. 4, Basel.____ (2000), "Cycles and the financial system," Annual Report, Basel.____ (1996a), 66th Annual Report, Basel.____ (1996b), International Banking and Financial Market Developments, February.Board of Governors of the Federal Reserve System (2002), "Flow of Funds Accounts of the United States", Washington, D.C.
(www.federalreserve.gov/releases), 6 September.Borio, Claudio, Craig Furfine and Philip Lowe (2001), "Procyclicality of the Financial System and Financial Stability: Issues and
Policy Options", BIS Papers, No. 1, Basel.Boyd, John H. and Mark Gertler (1994), "Are banks dead? Or are the reports greatly exaggerated?", Federal Reserve Bank of
Minneapolis Quarterly Review, vol. 18, No. 3.Brender, Anton and Florence Pisani (2001), "Les marchés et la croissance", Economica, Paris.____ (1999), "Le nouvel âge de l'économie américaine", Economica, Paris.Burbach, Roger and Patricia Flynn (1980), Agribusiness in the Americas, New York, North American Congress on Latin America
(NACLA), January.Business Week (2002), 9 September.Calderón, Álvaro (2003), "Las inversiones españolas: ¿una apuesta arriesgada?", Vanguaria Dossier, No. 4, Barcelona, January-
March.
154 ECLAC
____ (2002), "Los bancos españoles y América Latina: ¿se necesitan mutuamente?", document presented at the Conference "SpanishInvestment in Latin America", organized by the Center for Transnational and Comparative Studies, Florida InternationalUniversity (FIU) (Miami, Florida, 18-19 October).
Campodónico Sánchez, Humberto (1999), "La inversión en el sector petrolero peruano en el período 1993-2000", Reformaseconómicas series, No. 23 (LC/L.1207), Santiago, Chile, Economic Commission for Latin America and the Caribbean (ECLAC),May.
Carrillo, Marianela (2000), "La inversión extranjera directa y los conflictos ambientales locales en Venezuela", Cuadernos delCENDES, year 17, No. 43, January-April.
Carvalho, Fernando J. Carvim de (2002a), "The recent expansion of foreign banks in Brazil: first results", Latin American BusinessReview.
____ (2002b), "International Expansion and the Transformation of Modern Banking", unpublished.____ (2000), "New competitive strategies of foreign banks in large emerging economies: the case of Brazil", Banca Nazionale del
Lavoro Quarterly Review, No. 213, June.____ (1997), "Financial innovation and the Post Keynesian approach to the 'process of capital formation", Journal of Post Keynesian
Economics, vol. 19, No. 3.Cemex (2002), Comunicado de Prensa, 12 June.CGFS (Committee on the Global Financial System) (1999), "A Review of Financial Market Events in Autumn 1998" (www.bis.org/
publ/cgfs12.htm).ChevronTexaco (2002a), 2001 Annual Report, San Francisco, California.____ (2002b), 2001 Supplement to the Annual Report, San Francisco, California.Citigroup (no date), "Quarterly and Annual Earning Releases" (www.citigroup.com).Claessens, Stijn, Asli Demirguc-Kunt and Harry Huizinga (2001), "How does foreign entry affect the domestic banking market",
Journal of Banking and Finance, No. 25.Clarke, George, Robert Cull and María Soledad Martínez Peria (2001), Does Foreign Penetration Reduce Access to Credit in
Developing Countries? Evidence from Asking Borrowers, Washington, D.C., Development Research Group, World Bank,September.
COINVERTIR (Corporación Invertir en Colombia) (2002), Colombia: Panorama y potencial de inversión, Bogotá, D.C., July.____ (2000), Obstáculos y oportunidades para la inversión extranjera en Colombia, Bogotá, D.C., February.____ (1998), Colombia, siete años de apertura a la inversión extranjera 1991-1997, Bogotá, D.C., September.Comisión Nacional de Inversiones Extranjeras (2002), Informe estadístico sobre el comportamiento de la inversión extranjera
directa en México, January-June.CONFIS (Consejo Superior de Política Fiscal) (2001), Privatizaciones y concesiones de la Nación, July.Conning, Jonathan and Michael Kevane (2002), Why Isn't There More Financial Intermediation in Developing Countries?",
Discussion Paper, No. 2002/28, World Institute for Development Economics Research (WIDER), February.Cossio Muñoz, Fernando (2001), Los impactos sociales de la capitalización en Bolivia, La Paz, International Institution on Economics
and Enterprise (IIDEE), December.Cubillos, Mircea and Verónica Navas (2000), "Inversión extranjera directa en Colombia: características y tendencias", Boletines de
divulgación económica, No. 4, Bogotá, D.C., Macroeconomic Analysis Unit, National Planning Department (DNP), June.DANE (Departamento Administrativo Nacional de Estadística) (1978), Inversión extranjera en la industria manufacturera
colombiana, Bogotá, D.C.De Young, Robert and Daniel Nolle (1995), Foreign-owned Banks in the US: Earning Market Share or Buying It?, Washington,
D.C., Office of the Comptroller of the Currency, April.Díaz-Alejandro, Carlos (1985), "Good bye financial repression, hello financial crash", Journal of Development Economics, vol.
19, No. 12, September-October.DNP (Departamento Nacional de Planeación) (2001), Participación privada en infraestructura, Bogotá, D.C., October.ECLAC (Economic Commission for Latin America and the Caribbean) (2002), Foreign investment in Latin America and the
Caribbean. 2001 Report (LC/G.2178-P), Santiago, Chile, May. United Nations publication, Sales No. E.02.II.G.47.____ (2001), Foreign Investment in Latin America and the Caribbean. 2000 Report (LC/G.2125-P), Santiago, Chile, April. United
Nations publication, Sales No. E.01.II.G.12.____ (2000), Foreign Investment in Latin America and the Caribbean.1999 Report (LC/G.2061-P), Santiago, Chile, January.
United Nations publication, Sales No. E. 00.II.G.4.____ (1996), Strengthening development: the interplay of macro and microeconomics (LC/G.1898), Santiago, Chile, July.____ (1995), Reformas económicas en América Latina: una síntesis de la experiencia en once países (LC/R.1606), Santiago, Chile.____ (1986), "Empresas transnacionales en el desarrollo colombiano", Estudios e Informes de la CEPAL series, No. 60 (LC/
G.1432), Santiago, Chile, September. United Nations publication, Sales No. 86.II.G.14.____ (1984), "La presencia de las empresas transnacionales en la economía ecuatoriana", Estudios e Informes de la CEPAL series,
No. 41 (LC/G.1331), Santiago, Chile, December. United Nations publication, Sales No. 84.II.G.16.
Foreign investment in Latin America and the Caribbean, 2002 155
Edwards, Franklin and Frederic Mishkin (1995), "The decline of traditional banking: implications for financial stability andregulatory policy", Economic Policy Review, vol. 1, No. 2, July.
EIA (Energy Information Administration) (2002a), "Bolivia Country Analisis Brief" (http://www.eia.doe.gov/emeu/cabs/bolivia.html).
____ (2002b), "Peru Country Analisis Brief" (http://www.eia.doe.gov/emeu/cabs/peru.html).EIU (The Economist Intelligence Unit) (2002a), "Automotive: Brazil", Business Latin America, 28 January.____ (2002b), "Automotive: Brazil", Business Latin America, 8 April.____ (2002c), "Argentina: fallen angels", Business Latin America, 6 May.____ (2002d), "Automotive: Brazil", Business Latin America, 20 May.____ (2002e), "Automotive: Brazil", Business Latin America, 17 June.____ (2002f), "Business outlook: Mexico", Business Latin America, 8 July.____ (2002g), "Mexico: the slow march", Business Latin America, 15 July.____ (2002h), "Mexico's economic challenge", Business Latin America, 26 August.____ (2002i), "Argentinean software: reprogrammed for growth", Business Latin America, 23 September.____ (2002j), Country Report Mexico, 4 October.____ (2002k), Country Profile 2002: Colombia, London.____ (2002l), Country Profile 2002: Venezuela, London.____ (2002m), Country Profile 2002: Peru, London.____ (2002n), Country Profile 2002: Bolivia, London.____ (2001), Country Commerce: Ecuador, New York, December.El Economista (2002a), "Telefónica invertirá en México US2,500 millones", Mexico City, 10 May.____ (2002b), "Toyota en Brasil aumentará exportaciones a Latinoamérica", Mexico City, 14 June.____ (2002c), "Invertirá $10,000 millones Sempra Energy International en México", Mexico City, 2 August.El País (2002a), "Multa de 100 millones a Merrill Lynch por engañar a los inversores", 22 May.____ (2002b), "La comisión de valores de EE UU descubre anomalías en las cuentas de Xerox", 28 June.____ (2002c), "Una avalancha de casos que ha puesto a prueba los mercados", 8 July.____ (2002d), "La farmacéutica Merck admite que contabilizó 12.400 millones de dólares que nunca ingresó", 9 July.____ (2002e), "Un nuevo escándalo en una de las mayores empresas de EE UU sacude las bolsas", 11 July.____ (2002f), "Dimite el 'número dos' de AOL tras conocerse que la empresa aumentó sus ingresos de forma poco convencional",
19 July.____ (2002g), "La telefónica WorldCom declara la mayor quiebra de la historia", 22 July.El Universal (2002a), "Invertirá Ibedrola en México más de 2 mdd en cinco años", Mexico City, 10 June.____ (2002b), "Construirá Ibedrola en México central de ciclo combinado", Mexico City, 1 August.____ (2002c), "Invertirá Toyota 140 mdd en Tijuana", Mexico City, 20 September.____ (2002d), "Invertirá Ford mil 800 mdd en Sonora", Mexico City, 12 November.Euromoney (2001), "Last days of pure investment banks", June.____ (2000), "Both sides' second choice", October.FDIC (Federal Deposit Insurance Corporation) (1997), "History of the Eighties" (www.fdic.gov/bank/historical/history/
contents.html).Focarelli, Dario and Alberto Pozzolo (2000), The Determinants of Cross-border Bank Shareholdings: An Analysis with Bank-level
Data from OECD Countries, Bank of Italy.Fortune (2002), "Fortune global 5 hundred", New York, 22 July.Fundação Instituto Brasileiro de Geografia e Estatística (IBGE) (2002), Indicadores IBGE, Pesquisa Industrial Mensal Produção
Física, Brasilia, August.Gazeta Mercantil (2002), "NEGÓCIOS: Presidente da Petrobras confirma interesse na compra da Repsol YPF", Brasilia, 8 July.Gestión (2002a), "Chrysler invertirá US$ 300 mlls. en México", Lima, 20 February.____ (2002b), "Michelin iniciará producción en México", Lima, 19 April.González Vigil, Fernando (1982), Capital extranjero y transnacionales en la industria peruana, Lima, Editorial Horizonte.Goodhart, Charles and others (1998), Financial Regulation. Why, How and Where Now?, London, Routledge.Gordon, Robert J. (2000), "Does the "New Economy" measure up to the great inventions of the past?", Journal of Economic
Perspectives, 1 May.Group of Ten (2001), "Report of Consolidation in the Financial Sector", Basel (http://www.bis.org).Grupo Institucional de Inversión Directa (2002), VII Informe sobre los flujos de inversión extranjera directa en Costa Rica 1997-
2002.Gual, Jordi (1999), "Deregulation, integration and market structure in European banking", European Investment Bank Papers, vol.
4, No. 2.Hamoir, Olivier and others (2002), "Europe's banks: verging on merging", The McKinsey Quarterly, No. 3.
156 ECLAC
Held, Günther and Luis Felipe Jiménez (2001), "Liberalización financiera, crisis y reforma del sistema bancario chileno: 1974-1999", Reformas, crecimiento y políticas sociales en Chile desde 1973, Ricardo Ffrench-Davis and Barbara Stallings (eds.),Santiago, Chile, Economic Commission for Latin America and the Caribbean (ECLAC)/LOM Ediciones.
Herring, Richard and Robert Litan (1995), Financial Regulation in the Global Economy, Washington, D.C., Brookings Institution.Honohan, Patrick and Joseph Stiglitz (2001), "Robust financial restraint", Financial Liberalization. How Far, How Fast?, Gerard
Caprio, Patrick Honohan and Joseph Stiglitz (eds.), Cambridge, Cambridge University Press.IMF (International Monetary Fund) (2001), International Capital Markets Developments, Prospects, and Key Policy Issues,
Washington, D.C.____ (2000), International Capital Markets. Developments, Prospects, and Key Policy Issues, Washington, D.C., September.Jeanneau, Serge and Marian Micu (2002), "Determinants of International Bank Lending to Emerging Countries", BIS Working
Papers, No. 112.Jorgenson, Dale (2001), "Information technology and the US economy", American Economic Review, vol. 91, No. 1, March.Kñakal, Jan (1981), "Transnational and mining development in Bolivia, Chile and Peru", CEPAL Review, No. 14, Santiago, Chile,
August. United Nations publication, Sales No. E.81.II.G.3.La Hora (2002), "Wal-Mart invertirá cerca 670 millones dólares en México", Caracas, 28 February.La Nación (2002), "Petrobras reconoce su interés por comprar YPF", Buenos Aires, 8 July.La Prensa (2002), "Ford venderá en EU un todoterreno fabricado en Brasil", Panama City, 5 February.Latin Finance (2000), "Brazil banking: sharks and minnows", Brazil: Financial Growth, March.Le Monde (2002a), "Quand critiquer Enron était politiquement incorrect", 20 May.____ (2002b), "Andersen a été jugé coupable d'obstruction à la justice", 17 June.____ (2002c), "La fin d'une histoire de 89 ans bâtie sur la rigueur", 17 June.____ (2002d), "Le discrédit touche toute la profession comptable", 17 June.____ (2002e), "WorldCom annoncée être en défaut sur une partie de sa dette", 1 July.____ (2002f), "Plus importante qu'annoncé, la fraude de WorldCom devient un scandale majeur", 3 July.____ (2002g), "WorldCom, la faillite de tous les excès", 22 July.____ (2002h), "Les irrégularités comptables de WorldCom atteignent 7,1 milliards de dollars", 9 August.Lora, Eduardo and Ugo Panizza (2002), "Structural Reforms in Latin America under Scrutiny", document prepared for the seminar
"Reforming reforms", Inter-American Development Bank (IDB) Annual Meeting (Fortaleza, Brazil, 11-13 March).Martínez Tapias, Sandra (1999), "La inversión extranjera en Colombia: arte y parte de la globalización", OIKOS, No. 12.MCEI (Ministerio de Comercio Exterior e Inversión) (2002), Bolivia: inversión extranjera directa, tercer trimestre de 2002, La
Paz, Investment Bureau, Vice Ministry of Investment and Privatization, December.Melcher, Dorotea (1998), "La globalización y la apertura petrolera en Venezuela", Revista Venezolana de Economía y Ciencias
Sociales, vol. 4, No. 1/1998, Caracas, Central University of Venezuela, January-March.Melo, Héctor (1975), La maniobra del oro en Colombia, Medellín, Ediciones La Pulga, June.Ministerio de Energía y Minas de Perú (no date) (http://www.mem.gob.pe/wmem/inversion/sm/cdrom/pagina_04.htm).Moguillansky, Graciela (1999), La Inversión en Chile: ¿el fin de un ciclo en expansión?, Santiago, Chile, Economic Commission
for Latin America and the Caribbean (ECLAC)/Fondo de Cultura Económica.Moguillansky, Graciela and Ricardo Bielschowsky (2001), Investment and Economic Reform in Latin America, Libros de la
CEPAL series, No. 63 (LC/G.2128-P), Santiago, Chile, Economic Commission for Latin America and the Caribbean (ECLAC).United Nations publication, Sales No. E.01.II.G.21.
Moussa, Nicole (2001), "Perfiles tributarios y rentabilidad de la inversión", Quinta Conferencia Interparlamentaria de Minería yEnergía en América Latina (CIME 2001), Seminarios y conferencias series, No. 13 (LC/L.1642-P), Ariela Ruiz Caro, Santiago,Chile, Economic Commission for Latin America and the Caribbean (ECLAC), November. United Nations publication, SalesNo. S.01.II.G.180.
OAG (Office of New York State Attorney General Eliot Spitzer) (2002), "Press Release" (http://www.oag.state.ny.us), 20 December.OECD (Organisation for Economic Co-operation and Development) (2000), "Private Bank Profitability: Financial Statements of
Banks, Edition 2000" (www.OECD.org).____ (1998), Harmful Tax Competition. An Emerging Global Issue, Paris.Oil & Gas Journal Latinoamerica (2002), "El negocio del gas natural, electricidad y la ley en Brasil", vol. 8, No. 4, July-August.Oliner, Stephen D. and Daniel E. Sichel (2000), "The Resurgence of Growth in the Late 1990s: Is the Information Technology the
Story?", Working Paper, Federal Reserve Noard, February.Ospina, Jorge and Fanny Kacew (1989), Evolución de la inversión extranjera en Colombia durante los años ochenta (LC/R.866),
Santiago, Chile, Economic Commission for Latin America and the Caribbean (ECLAC), December.OXI (2002a), "Occidental Petroleum Corporation Today" (http://www.oxy.com). (cap. 2)____ (2002b), "Occidental Petroleum Corporation 2001 Report" (http://www.oxy.com).Página 12 (2002), "Fraude en América Inc.", 30 June.
Foreign investment in Latin America and the Caribbean, 2002 157
Paliza, Rosendo (2000), Impacto de las privatizaciones en el Perú. Estudios económicos, Lima, Central Reserve Bank of Peru(BCRP), July.
Parra Luzardo, Gastón (1996), De la nacionalización a la apertura petrolera: derrumbe de una esperanza, 2da. Edición aumentaday actualizada, Maracaibo, Experimental Centre for Latin American Studies (CEELA), University of Zulia, June.
Puyana, Alicia and Joyce Dargay (1996), Competitividad del petróleo colombiano. Una revisión de factores externos, Bogotá,D.C., Regional Centre for Third World Studies (CRESET), Colombian Institute for the Development of Science and Technology.
Repsol-YPF (2002), Informe Anual 2001, Madrid, External Relations Corporative Department.Reuters (2002), "Philips cerrará planta mexicana y recortará 900 empleos", 28 June.Rhoades, Stephen (2000), "Bank Mergers and Banking Structure in the US, 1980-98", Staff Study, No. 174, Washington, D.C.,
United States Board of Governors of the Federal Reserve System, August.Rojas, Andrés (1997), "Venezuela: del rentismo petrolero al capitalismo petrolero, 1996", Comercio Exterior, vol. 47, No. 7,
Mexico City, July.Rojas, O.E. (1979), "Principales aspectos de la minería del oro en Colombia", Boletín de minas y energía, year 3, No. 7, December.Salinas, Luis (2001), Capitalización: su impacto en el flujo de ingresos fiscales del Estado y la evolución de los sectores, La Paz,
Master for Development, Bolivian Catholic University, September.Schumpeter, Joseph (1964), Business Cycles. A Theoretical, Historical and Statistical Analysis of the Capitalist Process, New
York, McGraw-Hill.Secretaría de Economía de México (2002), "Informe Estadístico Trimestral sobre el Comportamiento de la Inversión extranjera
Directa en México (enero-septiembre)", National Foreign Investment Commission (CNIE) (http://economia.gob.mx/?P=1175).Shatz, Howard (2001), "Expanding Foreign Direct Investment in the Andean Countries", CID Working Paper, No. 64, Center for
International Development (CID), Harvard University, March.Stallings, Barbara and Rogerio Studart (2001), "Financial Regulation and Supervision in Emerging Markets: The Experience of
Latin America since the Tequila Crisis", WIDER Discussion Paper, No. 2002/45, Helsinki, United Nations University (UNU).Steiner, Roberto and Natalia Salazar (2001), La inversión extranjera en Colombia: ¿cómo atraer más?, Proyecto Andino de
Competitividad, Bogotá, D.C., April.Stiroh, Kevin J. (1999), How Did Bank Holding Companies Prosper in the 1990s?, New York, Federal Reserve Board of New York, July.Terra (2002), "Crea gobierno consejo de competitividad" (www.terra.com.mx), 29 July.The Economist (2002a), "Corporate America's woes, continued", 28 November.____ (2002b), "Banks on trial", 25 july.____ (2002c), "Special supplement on international finance", 18 May.____ (2001a), "Mad for the mass affluent", 17 March.____ (2001b), "So long, banker", 27 October.____ (1997), "Special supplement on fund management", 25 October.____ (1994a), "Special supplement on international banking", 30 April.____ (1994b), "The big gamble", 27 August.____ (1993a), "Special supplement on international banking", 10 April.____ (1993b), "Special supplement on investment management", 11 November.The Economist, Business Special (2002), "American companies: trial and error", 20 June.The President's Working Group on Financial Markets (1999), "Hedge Funds, Leverage, and The Lessons of Long-Term Capital
Management" (www.ustreas.gov/press/releases/report3097.htm).The Wall Street Journal (2002a), "What's news", 1 April.____ (2002b), "What's news", 17 June.Torres, Victor and Fernando O'Phelan P. (1990), Inversión extranjera directa en Perú. Década del ochenta: balance y perspectivas,
Lima, International Relations Peruvian Institute (IPRI)/United Nations Development Programme (UNDP).Tschoegl, Adrian (2000), "Foreign Banks in the US since WWII: A Useful Fringe", Wharton Financial Institutions Center Working
Paper, No. 00-42.UNCTAD (United Nations Conference on Trade and Development) (2002a), "Unctad predicts 27% drop in FDI inflows this year",
Press Release (TAD/INF/PR/63), 24 October.____ (2002b), World Investment Report 2002: Transnational Corporations and Export Competitiveness (UNCTAD/WIR/2002),
Geneva, September. United Nations publication, Sales No. E.02.II.D.4.UPME (Unidad de Planeación Minero-Energética) (2001), "Balance del Gas Natural 2001-2010", Bogota, D.C., Ministry of
Mines and Energy (MME), July, unpublished.Valdivieso Trillo, Adán (1995), "Evolución de la inversión extranjera directa en el Perú", Ciencia económica, year 16, No. 36,
July-December.Vial, Joaquín (2002), "Foreign Investment in the Andean Countries", CID Working Paper, No. 85, Center for International
Development (CID), Harvard University, January.Viteri Díaz, Galo (1993), "Las empresas transnacionales que operan en el Ecuador", Revista Economía, No. 91, October.World Bureau of Metal Statistics (2002), World Metal Statistics, vol. 55, No. 12, December.
ECLACpublications
ECONOMIC COMMISSION FOR LATIN AMERICAAND THE CARIBBEAN
Casilla 179-D Santiago, Chile
Publications may be accessed at: www.eclac.cl/publicaciones
CEPAL ReviewCEPAL Review first appeared in 1976 as part of the PublicationsProgramme of the Economic Commission for Latin America and theCaribbean, its aim being to make a contribution to the study of theeconomic and social development problems of the region. The viewsexpressed in signed articles, including those by Secretariat staffmembers, are those of the authors and therefore do not necessarilyreflect the point of view of the Organization.CEPAL Review is published in Spanish and English versions threetimes a year.Annual subscription costs for 2002 are US$ 30 for the Spanishversion and US$ 35 for the English version. The price of single issuesis US$ 15 in both cases.The cost of a two-year subscription (2002-2003) is US$ 50 for Spanish-language version and US$ 60 for English.Revista de la CEPAL, número extraordinario: CEPAL CINCUENTA AÑOS,reflexiones sobre América Latina y el Caribe, 1998, 376 p. (out of stock)
Annual reportsIssues for previous years also available
• Panorama social de América Latina, 2001-2002, 272 p.Social Panorama of Latin America, 2001-2002, 272 p.
• Balance preliminar de las economías de América Latina y el Caribe,2002, 125 p.Preliminary Overview of the Economies of Latin America andthe Caribbean, 2002, forthcoming.
• Estudio económico de América Latina y el Caribe 2001-2002, 311 p.Economic Survey of Latin America and the Caribbean 2001-2002, forthcoming.
• Situación y perspectivas, estudio económico de América Latina y elCaribe 2001-2002, 48 p.Current conditions and outlook, Economic Survey of LatinAmerica and the Caribbean 2001-2002, 48 p.
• Anuario estadístico de América Latina y el Caribe /Statistical Yearbook for Latin America and the Caribbean(bilingual). 2001, 778 p.
• La inversión extranjera en América Latina y el Caribe, 2001, 190 p.Foreign investment of Latin America and the Caribbean, 2001,178 p.
• Panorama de la inserción internacional de América Latina y elCaribe, 2000-2001, 182 p.Latin America and the Caribbean in the World Economy,2000-2001, 174 p.
Libros de la CEPAL71 Capital social y reducción de la pobreza en América Latina y el
Caribe. En busca de un nuevo paradigma, 2003, Raúl Atria y MarceloSiles, Editors, CEPAL/Michigan State University, 590 p.
70 Meeting the Millenium Poverty Reduction Targets in LatinAmerica and the Caribbean, 2002, ECLAC/IPEA/UNDP, 70 p.
69 El capital social campesino en la gestión del desarrollo rural. Díadas,equipos, puentes y escaleras, 2002, John Durston, 156 p.
68 La sostenibilidad del desarrollo en América Latina y el Caribe:desafíos y oportunidades, 2002, 146 p.
68 The sustainability of development in Latin America and theCaribbean: challenges and opportunities, 2002, 140 p.
67 Growth with stability, financing for development in the newinternational context, 2002, Jürgen Weller, 196 p.
66 Economic reforms, growth and employment. Labour marketsin Latin America and the Caribbean, 2001, 205 p.
65 The income distribution problem in Latin America and theCaribbean, 2001, Samuel Morley, 169 p.
64 Structural reforms, productivity and technological change inLatin America, 2001, Jorge Katz, 143 p.
63 Investment and economic reforms in Latin America, 2001,Graciela Moguillansky y Ricardo Bielschowsky, 186 p.
62 Equity, development and citizenship (abridged edition)61 Apertura económica y (des)encadenamientos productivos-
Reflexiones sobre el complejo lácteo en América Latina, 2001,Martin Dirven (compiladora), 176 p.
60 El espacio regional. Hacia la consolidación de los asentamientoshumanos en América Latina (forthcoming)
59 Juventud, población y desarrollo en América Latina y el Caribe.Problemas, oportunidades y desafíos, 474 p.
58 La dimensión ambiental en el desarrollo de América Latina, Aperturay (des)encadenamientos–Reflexiones en torno a los lácteos, 2001,282 p.
57 Las mujeres chilenas en los noventa. Hablan las cifras, 2000, 214 p.56 Protagonismo juvenil en proyectos locales: lecciones del cono sur,
170 p.55 Financial globalization and the emerging economies, José
Antonio Ocampo, Stefano Zamagni, Ricardo Ffrench-Davis y CarloPietrobelli, 2000, 328 p.
54 La CEPAL en sus 50 años. Notas de un seminario conmemorativo,2000, 149 p.
53 Transformaciones recientes en el sector agropecuario brasileño, M.Beatriz de A. David, Philippe Waniez, Violette Brustlein, Enali M.
De Biaggi, Paula de Andrade Rollo y Monica dos Santos Rodrigues,1999, 127 p.
52 Un examen de la migración internacional en la Comunidad Andina,1999, 114 p.
51 Nuevas políticas comerciales en América Latina y Asia. Algunoscasos nacionales, 1999, 584 p.
50 Privatización portuaria: bases, alternativas y consecuencias, 1999,248 p.
49 Teorías y metáforas sobre el desarrollo territorial, Sergio Boisier,1999, 128 p.
48 Las dimensiones sociales de la integración regional enAmérica Latina, Rolando Franco y Armando Di Filippo, 1999,238 p.
47 El pacto fiscal. Fortalezas, debilidades, desafíos, 1998, 280 p.47 The fiscal covenant. Strenghts, weaknesses, challenges,
1998, 290 p.45 La grieta de las drogas. Desintegración social y políticas públicas
en América Latina, 1997, 218 p.46 Agroindustria y pequeña agricultura: vínculos, potencialidades y
oportunidades comerciales, 1998, 180 p.44 La brecha de la equidad. América Latina, el Caribe y la Cumbre
Social, 1997, 218 p.44 The equity Gap. Latin America, the Caribbean and the Social
Summit, 1997, 218 p.43 Quince años de desempeño económico. América Latina y el
Caribe, 1980-1995, 1996, 120 p.43 The economic experience of the last fifteen years. Latin
America and the Caribbean, 1980-1995, 1996, 206 p.42 Fortalecer el desarrollo. Interacciones entre macro y micro-
economía, 1996, 116 p.42 Strengthening development. The interplay of macro- and
microeconomics, 1996, 116 p.41 Las relaciones económicas entre América Latina y la Unión Europea:
el papel de los servicios exteriores, 1996, 395 p.40 América Latina y el Caribe: políticas para mejorar la inserción en
la economía mundial, 1995, 314 p. (out of stock)40 Latin America and the Caribbean: policies to improve
linkages with the global economy, 1995, 308 p.39 El regionalismo abierto en América Latina y el Caribe. La
integración económica en servicio de la transformacióntecnológica, 1994, 120 p.
39 Open regionalism in Latin America and the Caribbean.Economic integration as a contribution to changing productionspatterns with social equity, 1994, 103 p.
38 Imágenes sociales de la modernización y la transformacióntecnológica, 1995, 198 p.
37 Familia y futuro: un programa regional en América Latina y elCaribe, 1994, 137 p.
37 Family and future: a regional programme in Latin Americaand the Caribbean, 1994, 124 p.
36 Cambios en el perfil de las familias: la experiencia regional, 1993, 434 p.35 Población, equidad y transformación productiva, 1993, 2ª ed. 1993,
158 p.35 Population, social equity and changing production patterns,
1993, 154 p.34 Ensayos sobre coordinación de políticas macroeconómicas, 1992,
249 p.
33 Educación y conocimiento: eje de la transformación productiva conequidad, 1992, 269 p.
33 Education and knowledge: basic pillars of changingproduction patterns with social equity, 1992, 257 p.
32 Equidad y transformación productiva: un enfoque integrado, 1992,254 p.
32 Social equity and changing production patterns: social equityand the environment, 1991, 254 p.
31 El desarrollo sustentable: transformación productiva, equidad ymedio ambiente, 1991, 146 p.
31 Sustainable development: changing production patterns,social equity and the environment, 1991, 146 p.
30 Evaluaciones del impacto ambiental en América Latina y elCaribe, 1991, 232 p. (out of stock)
29 Inventarios y cuentas del patrimonio natural en América Latinay el Caribe, 1991, 335 p.
28 A collection of documents on economic relations between theUnited States and Central America, 1906-1956, 1991, 398 p.
27 Los grandes cambios y la crisis. Impacto sobre la mujer enAmérica Latina y el Caribe, 1991, 271 p.
27 Major changes and crisis. The impact on women in LatinAmerica and the Caribbean, 1992, 279 p.
26 América Latina y el Caribe: opciones para reducir el peso de ladeuda, 1990, 2a ed. 118 p.
26 Latin America and the Caribbean: options to reduce thedebt burden, 1990, 110 p.
25 Transformación productiva con equidad, 1990, 4ª ed. 1991, 185 p.25 Changing production patterns with social equity, 1990,
3rd ed. 1991, 177 p.24 The environmental dimension in development planning, 1991,
302 p.23 La crisis urbana en América Latina y el Caribe: reflexiones sobre
alternativas de solución, 1990, 197 p. (out of stock)
Recent co-publications
On occasion ECLAC concludes agreements for the co-publication oftexts that may be of special interest to other international organizationsor to publishing houses. In the latter case, the publishing houses haveexclusive sales and distribution rights.
Capital social rural. Experiencias de México y Centroamérica, MargaritaFlores y Fernando Rello, CEPAL/Plaza y Valdés, 2002.
Eqüidade, desenvolvimento e cidadania, José Antonio Ocampo,CEPAL/Editor Campus, 2002.
Crescimento, emprego e eqüidade; O Impacto das ReformasEconômicas na América Latina e Caribe, Barbara Stallings eWilson Peres, CEPAL/Editor Campus, 2002.
Crescer com Estabilidade, José Antonio Ocampo, CEPAL/EditoraCampus, 2002.
Pequeñas y medianas empresas industriales en América Latina yel Caribe, Wilson Peres y Giovanni Stumpo (coordinadores),CEPAL/Siglo XXI, México.
Aglomeraciones mineras y desarrollo local en América Latina, RudolfM. Buitelaar (compilador), CEPAL/Alfaomega, Colombia, 2002.
Panorama de la agricultura en América Latina y el Caribe 1990-2000 /Survey of Agriculture in Latin America and the Caribbean1990-2000, CEPAL/IICA, 2002.
Reformas, crecimiento y políticas sociales en Chile desde 1973, RicardoFfrench-Davis y Barbara Stallings (editores), CEPAL/LOMEdiciones, 2001.
Financial Crises in ‘Successful’ Emerging Economies, RicardoFfrench-Davis (editor), CEPAL/Brookings Institution Press, 2001.
Crecer con estabilidad. El financiamiento del desarrollo en unnuevo contexto internacional, José Antonio Ocampo (coordinador),CEPAL/Alfaomega, Colombia, 2001.
CLAROSCUROS, integración exitosa de las pequeñas y medianasempresas en México, Enrique Dussel Peters (coordinador),CEPAL/JUS, México, 2001.
Sociología del desarrollo, políticas sociales y democracia, Rolando Franco(coordinador), CEPAL/Siglo XXI, México, 2001.
Crisis financieras en países exitosos, Ricardo Ffrench-Davis(compilador), CEPAL/McGraw Hill, Santiago, 2001.
Una década de luces y sombras. América Latina y el Caribe en losnoventa, CEPAL/Alfaomega, Colombia, 2001.
Desarrollo Rural en América Latina y el Caribe, Beatriz David, CEPAL/Alfaomega, Colombia, 2001.
Equidad, desarrollo y ciudadanía, Tomos I, II y III, CEPAL/Alfaomega,Colombia, 2000.
La distribución del ingreso en América Latina y el Caribe, Samuel Morley,CEPAL/Fondo de Cultura Económica, Santiago, 2000.
Inversión y reformas económicas en América Latina, Graciela Moguillanskyy Ricardo Bielschowsky, CEPAL/Fondo de Cultura Económica,Santiago, 2000.
Reformas estructurales, productividad y conducta tecnológica enAmérica Latina, Jorge Katz, CEPAL/Fondo de CulturaEconómica, Santiago, 2000.
Reformas económicas, crecimiento y empleo. Los mercados de trabajoen América Latina y el Caribe, Jürgen Weller, CEPAL/Fondo deCultura Económica, Santiago, 2000.
Crecimiento, empleo y equidad. El impacto de las reformas económicasen América Latina y el Caribe, Barbara Stallings y Wilson Peres,CEPAL/Fondo de Cultura Económica, Santiago, 2000.
Growth, employment, and equity. The impact of the EconomicReforms in Latin America and the Caribbean, Barbara Stallingsand Wilson Peres, CEPAL/Brookings Institution Press,Washington, D.C., 2000.
Cinqüenta anos de pensamento na CEPAL, Tomos I y II, RicardoBielschowsky, CEPAL /RECORD/COFECOM, Brasil, 2000.
Integración regional, desarrollo y equidad, Armando Di Filippo y RolandoFranco, CEPAL/Siglo XXI, México, 2000.
Ensayo sobre el financiamiento de la seguridad social en salud, TomosI y II, Daniel Titelman y Andras Uthoff, CEPAL/Fondo de CulturaEconómica, Chile, 2000.
Brasil uma década em transição, Renato Baumann, CEPAL/CAMPUS, Brasil, 2000.
El gran eslabón: educación y desarrollo en el umbral del siglo XXI,Martín Hopenhayn y Ernesto Ottone, CEPAL/Fondo de CulturaEconómica, Argentina, 1999.
La modernidad problemática: cuatro ensayos sobre el desarrolloLatinoamericano, Ernesto Ottone, CEPAL/JUS, México, 2000.
La inversión en Chile ¿El fin de un ciclo de expansión?, Graciela
Mouguillansky, CEPAL/Fondo de Cultura Económica, Santiago,1999.
La reforma del sistema financiero internacional: un debate en marcha,José Antonio Ocampo, CEPAL/Fondo de Cultura Económica,Santiago, 1999.
Macroeconomía, comercio y finanzas para reformar las reformas enAmérica Latina, Ricardo Ffrench Davis, CEPAL/Mc Graw-Hill,Santiago, 1999.
Cincuenta años de pensamiento en la CEPAL: textos seleccionados,dos volúmenes, CEPAL/Fondo de Cultura Económica, Santiago,1998.
Grandes empresas y grupos industriales latinoamericanos, Wilson Peres(coordinador), CEPAL/Siglo XXI, Buenos Aires, 1998.
Flujos de Capital e Inversión Productiva. Lecciones para AméricaLatina, Ricardo Ffrench-Davis-Helmut Reisen (compiladores),CEPAL/Mc Graw Hill, Santiago, 1997.
Estrategias empresariales en tiempos de cambio, Bernardo Kosacoff(editor), CEPAL/Universidad Nacional de Quilmes, Argentina,1998.
La Igualdad de los Modernos: reflexiones acerca de la realización delos derechos económicos, sociales y culturales en América Latina,CEPAL/IIDH, Costa Rica, 1997.
La Economía Cubana. Reformas estructurales y desempeño en losnoventa, Comisión Económica para América Latina y el Caribe.CEPAL/Fondo de Cultura Económica, México, 1997.
Políticas para mejorar la inserción en la economía mundial. Américay El Caribe, CEPAL/Fondo de Cultura Económica, Santiago,1997.
América Latina y el Caribe quince años después. De la década perdidaa la transformación económica 1980-1995, CEPAL/Fondo deCultura Económica, Santiago, 1996.
Tendências econômicas e sociais na América Latina e noCaribe/ Economic and social trends in Latin America andthe Caribbean / Tendencias económicas y sociales en AméricaLatina y el Caribe, CEPAL/IBGE/CARECON RIO, Brasil, 1996.
Hacia un nuevo modelo de organización mundial. El sector manufactureroargentino en los años noventa, Jorge Katz, Roberto Bisang,Gustavo Burachick (editores), CEPAL/IDRC/Alianza Editorial,Buenos Aires, 1996.
Las nuevas corrientes financieras hacia América Latina: Fuentes,efectos y políticas, Ricardo Ffrench-Davis y Stephany Griffith-Jones (compiladores), México, CEPAL/Fondo de CulturaEconómica, primera edición, 1995.
Cuadernos de la CEPAL
86 Industria, medio ambiente en México y Centroamérica. Un reto desupervivencia, 2001, 182 p.
85 Centroamérica, México y República Dominicana: maquila ytransformación productiva, 1999, 190 p.
84 El régimen de contratación petrolera de América Latina enla década de los noventa, 1998, 134 p.
83 Temas y desafíos de las políticas de población en los años noventaen América Latina y el Caribe, 1998, 268 p.
82 A dinámica do Setor Saúde no Brasil, 1997, 220 p.
81 La apertura económica y el desarrollo agrícola en América Latina yel Caribe, 1997, 136 p.
80 Evolución del gasto público social en América Latina: 1980-1995,1998, 200 p.
79 Ciudadanía y derechos humanos desde la perspectiva de las políticaspúblicas, 1997, 124 p.
78 Centroamérica y el TLC: efectos inmediatos e implicacionesfuturas, 1996, 174 p.
77 La reforma laboral y la participación privada en los puertos delsector público, 1996, 168 p.
77 Labour reform and private participation in public-sectorports, 1996, 160 p.
76 Dinámica de la población y desarrollo económico, 1997, 116 p.75 Crecimiento de la población y desarrollo, 1995, 95 p.74 América Latina y el Caribe: dinámica de la población y desarrollo,
1995, 151 p.73 El gasto social en América Latina: un examen cuantitativo y
cualitativo, 1995, 167 p.72 Productividad de los pobres rurales y urbanos, 1995, 318 p.
(out of stock)71 Focalización y pobreza, 1995, 249 p. (out of stock)70 Canales, cadenas, corredores y competitividad: un enfoque
sistémico y su aplicación a seis productos latinoamericanos deexportación, 1993, 183 p.
69 Las finanzas públicas de América Latina en la década de 1980,1993, 100 p.
69 Public finances in Latin America in the 1980s, 1993, 96 p.68 La reestructuración de empresas públicas: el caso de los puertos
de América Latina y el Caribe, 1992, 148 p.68 The restructuring of public-sector enterprises: the case of
Latin America and Caribbean ports, 1992, 129 p.67 La transferencia de recursos externos de América Latina en la
posguerra, 1991, 92 p.67 Postwar transfer of resources abroad by Latin America, 1992, 90 p.66 The Caribbean: one and divisible, 1994, 207 p.65 Cambios estructurales en los puertos y la competitividad del
comercio exterior de América Latina y el Caribe, 1991, 141 p.65 Structural changes in ports and the competitiveness of Latin
America and Caribbean foreign trade, 1990, 126 p.64 La industria de transporte regular internacional y la competitividad
del comercio exterior de los países de América Latina y el Caribe,1989, 132 p.
64 The international common-carrier transportation industry andthe competitiveness of the foreign trade of the countries ofLatin America and the Caribbean, 1989, 116 p.
63 Elementos para el diseño de políticas industriales y tecnológicasen América Latina, 1990, 2ª ed. 1991, 172 p.
Cuadernos Estadísticos de la CEPAL28 Dirección del comercio exterior de América Latina, según la
clasificación central de productos provisionales de las NacionesUnidas, 2001, 532 p.
27 América Latina y el Caribe: series regionales y oficiales de cuentasnacionales 1950-1998, 2001, 136 p.
26 América Latina y el Caribe: series estadísticas sobre comercio deservicios 1980-1997, 1998, 124 p.
25 Clasificaciones estadísticas internacionales incorporadas en el Bancode Datos del Comercio Exterior de América Latina y el Caribe de laCEPAL, 1998, 287 p.
24 Chile: comercio exterior según grupos de la ClasificaciónUniforme para el Comercio Internacional, Rev. 3, y países dedestino y procedencia, 1990-1995, 1996, 480 p.
23 América Latina y el Caribe: series regionales y oficiales decuentas nacionales, 1950-1994, 1996, 136 p.
22 América Latina y el Caribe: dirección del comercio exterior delos principales productos alimenticios y agrícolas según paísesde destino y procedencia, 1970-1993, 1995, 224 p.
21 Estructura del gasto de consumo de los hogares en AméricaLatina, 1995, 274 p.
20 Dirección del comercio exterior de América Latina y el Caribesegún principales productos y grupos de productos, 1970-1992,1994, 483 p.
19 América Latina: comercio exterior según la clasificación IndustrialInternacional uniforme de todas las actividades económicas (CIIU)
Vol. I, Exportaciones, 1985-1991, 1993, 285 p. Vol. II, Importaciones, 1985-1991, 1993, 291 p.18 Clasificaciones estadísticas internacionales incorporadas en el
Banco de Datos del Comercio Exterior de América Latina y elCaribe de la CEPAL, 1993, 323 p.
17 Comercio intrazonal de los países de la Asociación de Integración,según capítulos de la Clasificación Uniforme para el ComercioInternacional (CUCI), Rev. 2, 1992, 299 p.
16 Origen y destino del comercio exterior de los países de laAsociación Latinoamericana de Integración, 1991, 190 p.
15 América Latina y el Caribe: series regionales de cuentasnacionales a precios constantes de 1980, 1991, 245 p.
Estudios e Informes de la CEPAL95 México: la industria maquiladora, 1996, 237 p.94 Innovación en tecnologías y sistemas de gestión ambientales en
empresas líderes latinoamericanas, 1995, 206 p. (out of stock)93 Comercio internacional y medio ambiente. La discusión actual,
1995, 112 p. (out of stock)92 Reestructuración y desarrollo productivo: desafío y potencial
para los años noventa, 1994, 108 p.91 Las empresas transnacionales de una economía en transición: la
experiencia argentina en los años ochenta, 1995, 193 p.90 El papel de las empresas transnacionales en la reestructuración
industrial de Colombia: una síntesis, 1993, 131 p.89 El impacto económico y social de las migraciones en
Centroamérica, 1993, 78 p.88 El comercio de manufacturas de América Latina. Evolución y
estructura 1962-1989, 1992, 150 p.87 Análisis de cadenas agroindustriales en Ecuador y Perú, 1993, 294 p.86 Inversión extranjera y empresas transnacionales en la economía de
Chile (1974-1989). El papel del capital extranjero y la estrategianacional de desarrollo, 1992, 163 p.
85 Inversión extranjera y empresas transnacionales en la economíade Chile (1974-1989). Proyectos de inversión y extrategias de lasempresas transnacionales, 1992, 257 p.
84 La transformación de la producción en Chile: cuatro ensayos deinterpretación, 1993, 372 p.
83 Reestructuración y desarrollo de la industria automotriz mexicanaen los años ochenta: evolución y perspectivas, 1992, 191 p.
82 América Latina y el Caribe: el manejo de la escasez de agua,1991, 148 p.
81 Magnitud de la pobreza en América Latina en los años ochenta,1991, 177 p.
80 Impacto ambiental de la contaminación hídrica producida por laRefinería Estatal Esmeraldas: análisis técnico-económico, 1991,190 p.
79 La industria de bienes de capital en América Latina y el Caribe: sudesarrollo en un marco de cooperación regional, 1991, 235 p.
78 La apertura financiera en Chile y el comportamiento de losbancos transnacionales, 1990, 132 p.
77 Los recursos hídricos de América Latina y del Caribe: planificación,desastres naturales y contaminación, 1990, 266 p.
77 The water resources of Latin America and the Caribbean–planning, hazards and pollution, 1990, 252 p.
Serie INFOPLAN: Temas Especialesdel Desarrollo13 Políticas sociales: resúmenes de documentos II, 1997, 80 p.12 Gestión de la información: reseñas de documentos, 1996, 152 p.11 Modernización del Estado: resúmenes de documentos, 1995, 75 p.10 Políticas sociales: resúmenes de documentos, 1995, 95 p. 9 MERCOSUR: resúmenes de documentos, 1993, 219 p. 8 Reseñas de documentos sobre desarrollo ambientalmente
sustentable, 1992, 217 p. (out of stock) 7 Documentos sobre privatización con énfasis en América Latina,
1991, 82 p.
Boletín demográfico/Demographic Bulletin(bilingual)Bilingual publication (Spanish and English) proving up–to–date estimatesand projections of the populations of the Latin American and Caribbeancountries. Also includes various demographic indicators of interest such
as fertility and mortality rates, life expectancy, measures of populationdistribution, etc.Published since 1968, the Bulletin appears twice a year in January andJuly.Annual Subscription: US$ 20.00 Per issue: US$ 15.00
Notas de poblaciónSpecialized journal which publishes articles and reports on recent studiesof demographic dynamics in the region, in Spanish with abstracts inSpanish and English. Also includes information on scientific and professionalactivities in the field of population.
Published since 1973, the journal appears twice a year in June andDecember.Annual Subscription: US$ 20.00 Per issue: US$ 12.00
Series de la CEPALComercio internacionalDesarrollo productivoEstudios estadísticos y prospectivosFinanciamiento del desarrolloGestión públicaInformación y desarrolloManualesMedio ambiente y desarrolloPoblación y desarrolloPolítica fiscalPolíticas socialesRecursos naturales e infraestructuraSeminarios y conferenciasTemas de coyunturaMacroeconomía del desarrolloEstudios y perspectivas regionalesInformes y estudios especiales
A complete listing is available at: www.eclac.cl/publicaciones
Las publicaciones de la Comisión Económica para América Latina y el Caribe (CEPAL)y las del Instituto Latinoamericano y del Caribe de Planificación Económica y Social(ILPES) se pueden adquirir a los distribuidores locales o directamente a través de:
Publicaciones de las Naciones Unidas Publicaciones de las Naciones UnidasSección de Ventas – DC-2-0853 Sección de Ventas, Fax (22)917-0027Fax (212)963-3489 Palais des NationsE-mail: [email protected] 1211 Ginebra 10, SuizaNueva York, NY, 10017Estados Unidos de América
Unidad de DistribuciónCEPAL – Casilla 179-D
Fax (562)208-1946E-mail: [email protected]
Santiago de Chile
Publications of the Economic Commission for Latin America and the Caribbean (ECLAC)and those of the Latin American and the Caribbean Institute for Economic and Social Planning(ILPES) can be ordered from your local distributor or directly through:
United Nations Publications United Nations PublicationsSales Sections, DC-2-0853 Sales Sections, Fax (22)917-0027Fax (212)963-3489 Palais des NationsE-mail: [email protected] 1211 Geneve 10, SwitzerlandNew York, NY, 10017USA
Distribution UnitCEPAL – Casilla 179-D
Fax (562)208-1946E-mail: [email protected]
Santiago, Chile