Foreign Investment 2004 - Repositorio CEPAL
159
-
Upload
khangminh22 -
Category
Documents
-
view
0 -
download
0
Transcript of Foreign Investment 2004 - Repositorio CEPAL
ForeignInvestment
in latin americain latin americain latin americain latin americain latin americaand the caribbeanand the caribbeanand the caribbeanand the caribbeanand the caribbean
2004
Notes and explanations of symbols
The following symbols have been used in this Study:
Three dots (…) indicate that data are not available or are not separately reported.A minus sign (-) indicates a deficit or decrease, unless otherwise indicated.A full stop (.) is used to indicate decimals.Use of a hyphen between years, e.g. 1971-1973, signifies an annual average for the calendar years involved, including thebeginning and the end years.The word "dollars" refers to United States dollars, unless otherwise specified.Figures and percentages in tables may not necessarily add up to the corresponding totals, because of rounding.
Foreign Investment in Latin America and the Caribbean, 2004 is the latest edition of a series published annually bythe Unit on Investment and Corporate Strategies of the ECLAC Division of Production, Productivity and Management.It was prepared by Álvaro Calderón, Pablo Carvallo, Michael Mortimore and Márcia Tavares, with contributions fromthe consultants Mónica Baer, Helder Queiroz Pinto Jr., Ángeles Sánchez Díez and Leonardo Stanley and assistancefrom Juan Eduardo Faúndez and Ole Våge. Chapter III was prepared jointly by the Commission’s Division of Production,Productivity and Management and its Natural Resources and Infrastructure Division. The contributions made by HugoAltomonte in this regard are gratefully acknowledged.
Improvements in the statistical information’s quality, coverage and currency have permitted the Unit on Investmentand Corporate Strategies to expand upon the more analytical aspects of the report and to benefit from the work of otherinstitutions concerned with quantitative data. The information used in this publication has been drawn from a numberof international agencies, including the International Monetary Fund, the United Nations Conference on Trade andDevelopment and the Organisation for Economic Co-operation and Development, as well as a host of national institutions,such as central banks and investment promotion agencies in Latin America and the Caribbean. The data on the operationsof leading firms in the region were taken from the specialized journal América economía. The use of this informationsource made it possible to standardize the criteria employed in this regard and to develop valuable inputs for thepreparation of this document.
Any comments or suggestions regarding this publication should be addressed to Michael Mortimore (e-mail:[email protected]).
United Nations publicationISBN: 92-1-121541-2ISSN printed version: 1680-8649 ISSN online version: 1681-0287LC/G.2269-PSales No: E.05.II.G.32Copyright © United Nations, March 2005. All rights reservedPrinted in Santiago, Chile - United Nations
Requests for authorization to reproduce this work in whole or in part should be sent to the Secretary of the Publications Board,United Nations Headquarters, New York, N.Y. 10017, United States of America. Member States and their governmental institutionsmay reproduce this work without prior authorization, but are requested to mention the source and to inform the United Nations ofsuch reproduction.
Contents
Page
Abstract.............................................................................................................................................................. 9
Summary and conclusions........................................................................................................................ 11
Chapter I: Regional overview of foreign direct investment in Latin America
and the Caribbean.......................................................................................................................................... 25
A. Introduction................................................................................................................................................. 25
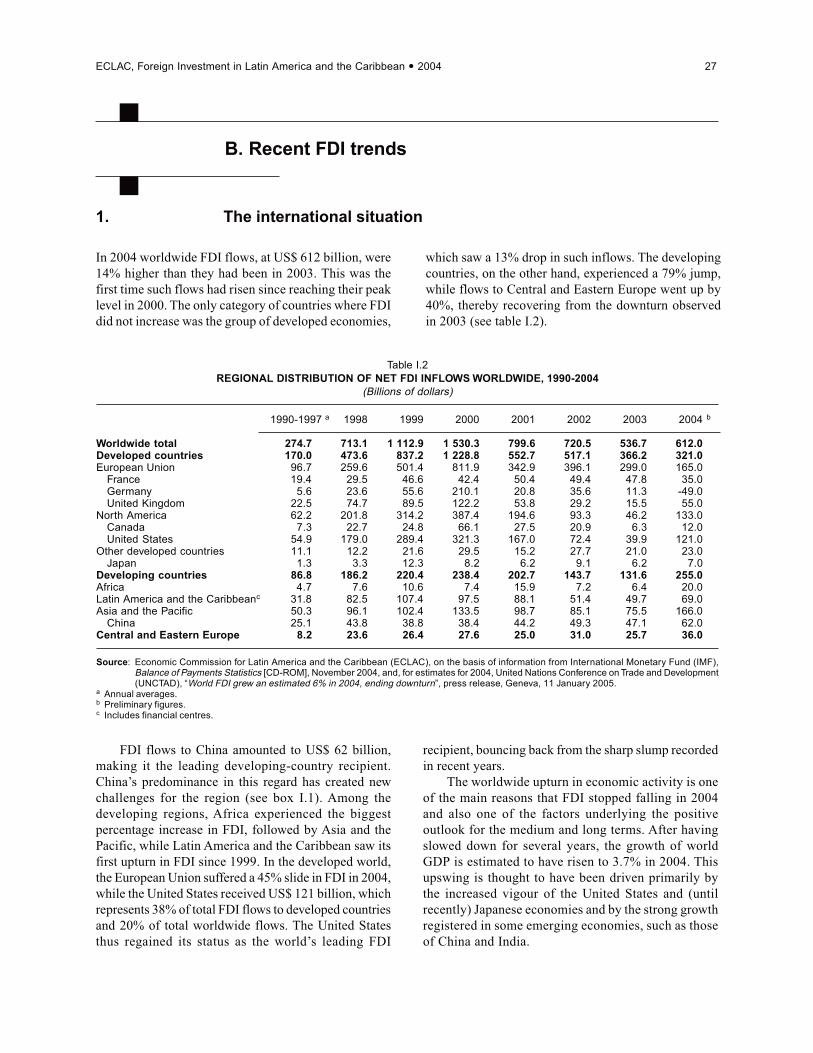
B. Recent FDI trends....................................................................................................................................... 261. The international situation........................................................................................................................ 262. The situation in Latin America and the Caribbean .................................................................................. 29
C. The presence of transnational corporations among the leading firms in
Latin America.............................................................................................................................................. 381. Transnational corporations....................................................................................................................... 392. Transnational banks.................................................................................................................................. 47
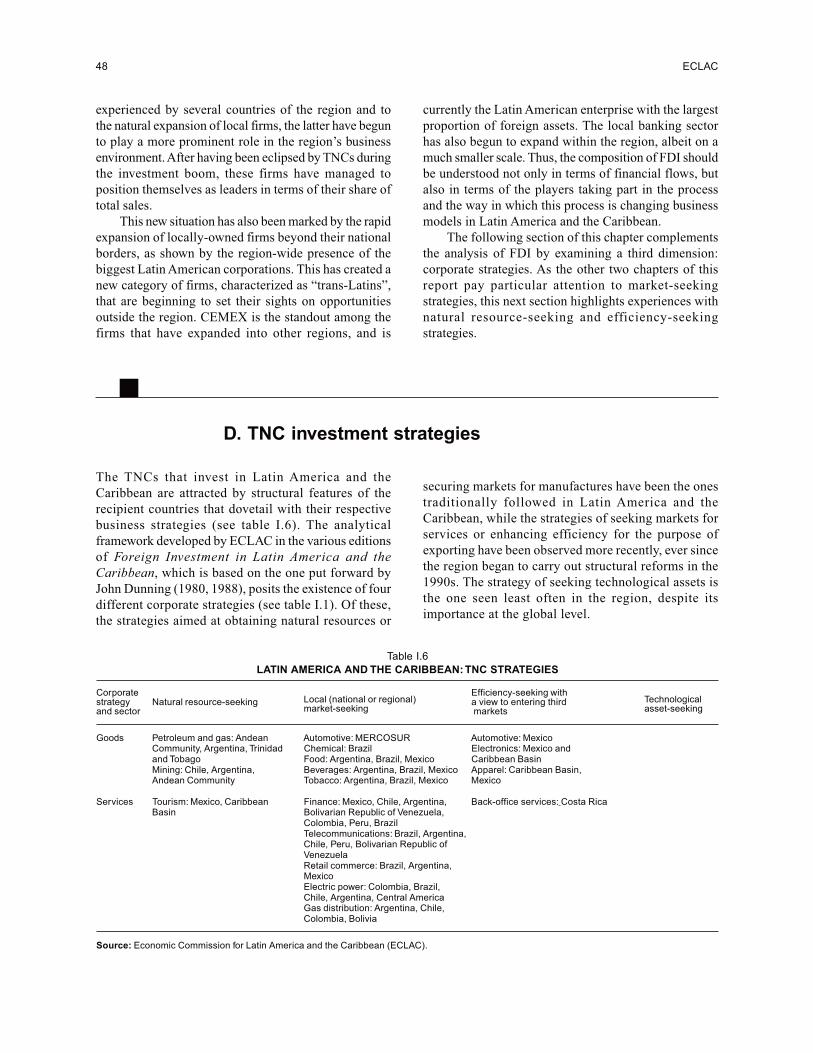
D. TNC investment stragegies....................................................................................................................... 481. Natural resource-seeking strategies.......................................................................................................... 502. Efficiency-seeking strategies: new services............................................................................................. 55
E. Conclusions................................................................................................................................................. 59
Chapter II: Brazil: foreign direct investment and corporate strategies................................. 69
A. Foreign capital in the economy................................................................................................................ 701. Determinants of FDI................................................................................................................................. 702. FDI flows in the post-privatization period............................................................................................... 74
B. Transnational corporations in Brazil: the predominance of market-seeking
strategies..................................................................................................................................................... 811. Market-seeking strategies focusing on access to local markets in services and infrastructure sectors .. 822. Market-seeking strategies focusing on access to local markets for manufactures.................................. 94
Page
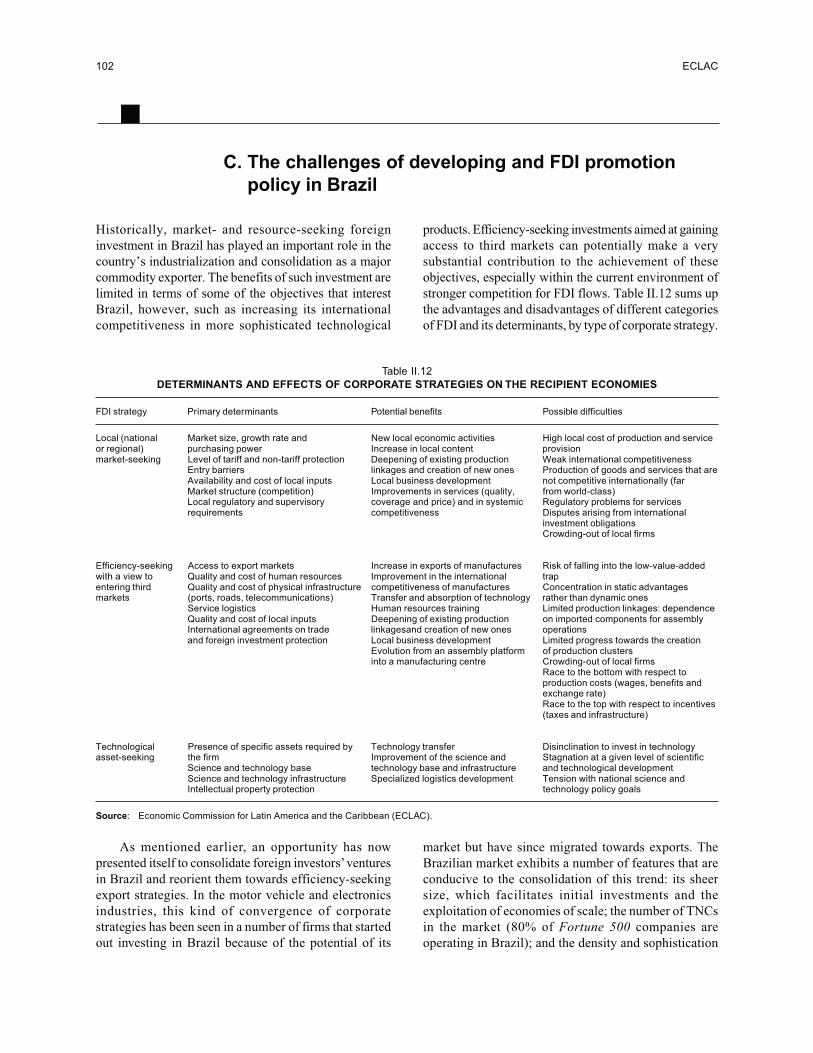
C. The challenges of developing and FDI promotion policy in Brazil....................................................... 1021. Reducing the “Brazil cost”....................................................................................................................... 1032. New investment-specific incentives......................................................................................................... 1053. An investment promotion agency............................................................................................................. 107
D. Conclusions................................................................................................................................................. 109
Chapter III: Electric power: foreign direct investment and corporate strategies in the
Southern Cone................................................................................................................................. 111
A. Introduction.................................................................................................................................. 111
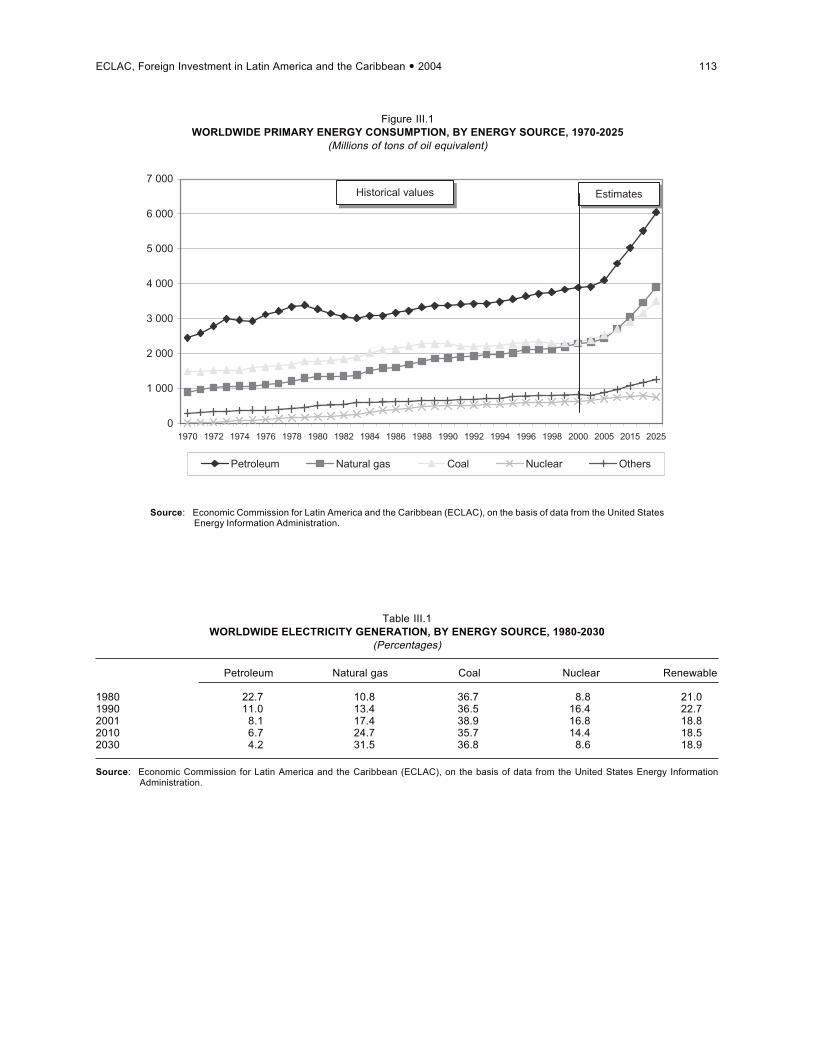
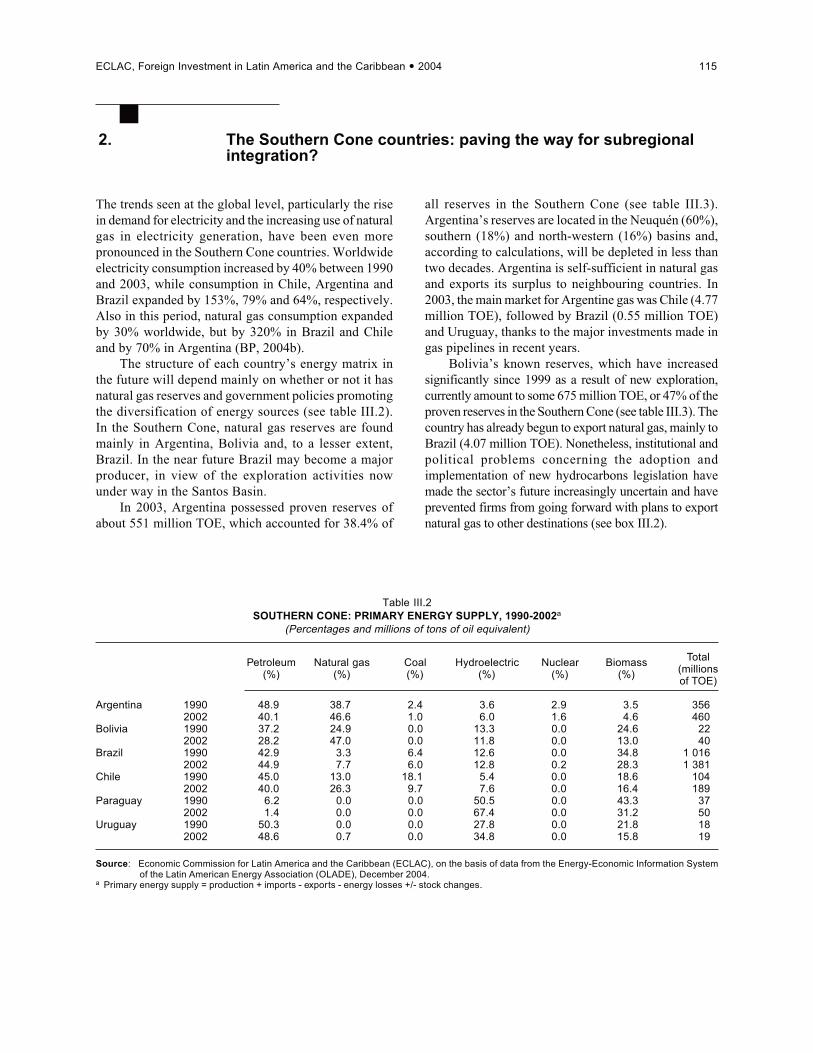
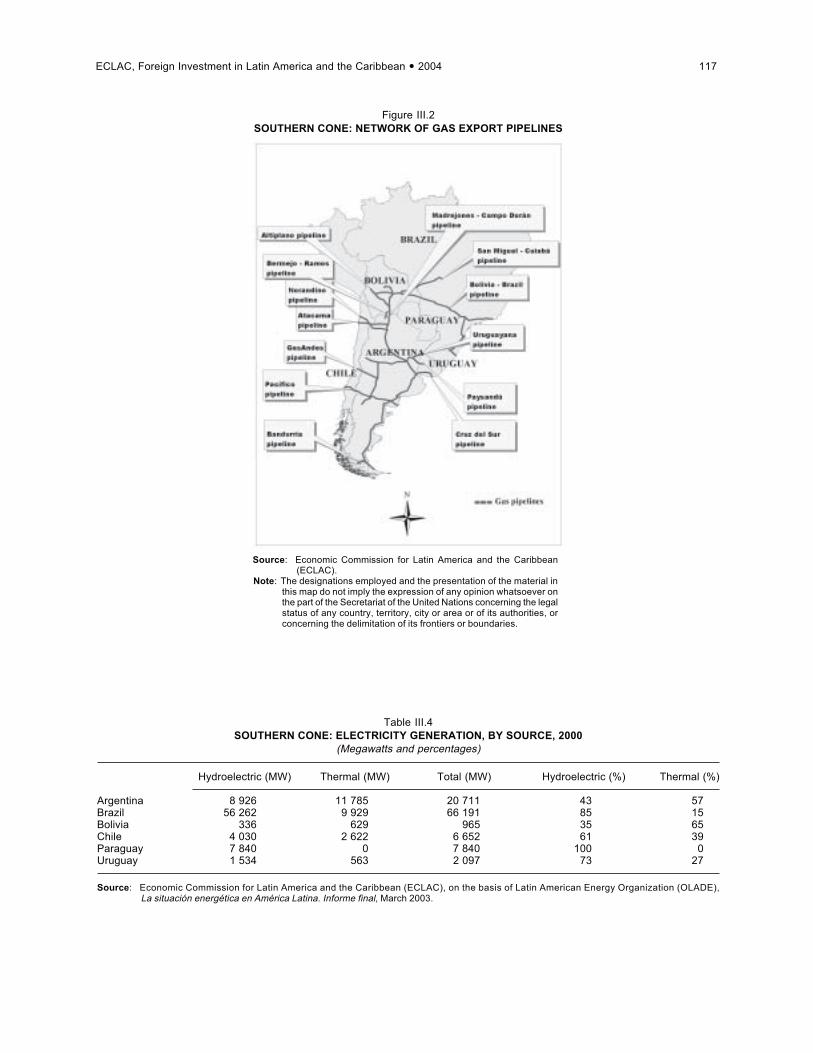
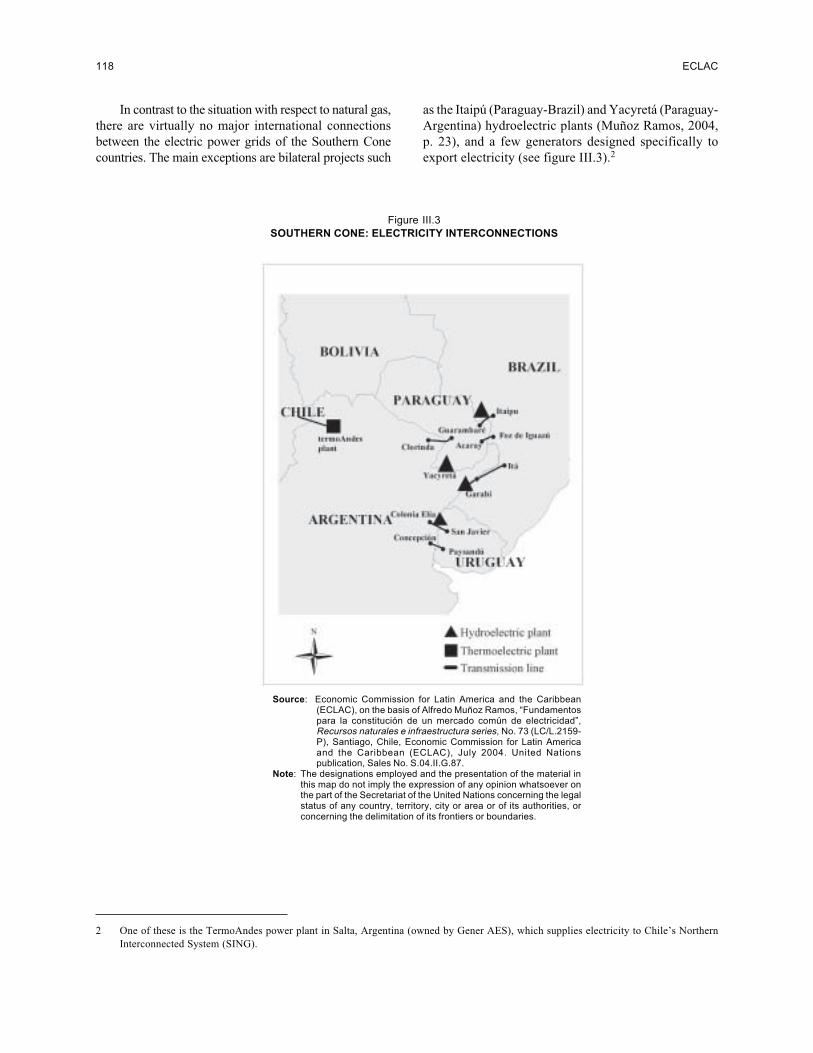
B. Overview of energy markets...................................................................................................................... 1121. The growing significance of natural gas in electricity generation...........................................................1122. The Southern Cone countries: paving the way for subregional integration?.......................................... 115
C. The energy crisis int he Southern Cone............................................................................................................. 1191. Energy markets in the Southern Cone before the crisis........................................................................... 1192. The roots of the crisis............................................................................................................................... 123
D. Strategies of transnational energy corporations in the Southern Cone.................................................. 1281. Strategies of electric power TNCs in the Southern Cone........................................................................ 1292. Transnational hydrocarbons firms with electricity interests in the Southern Cone ................................ 140
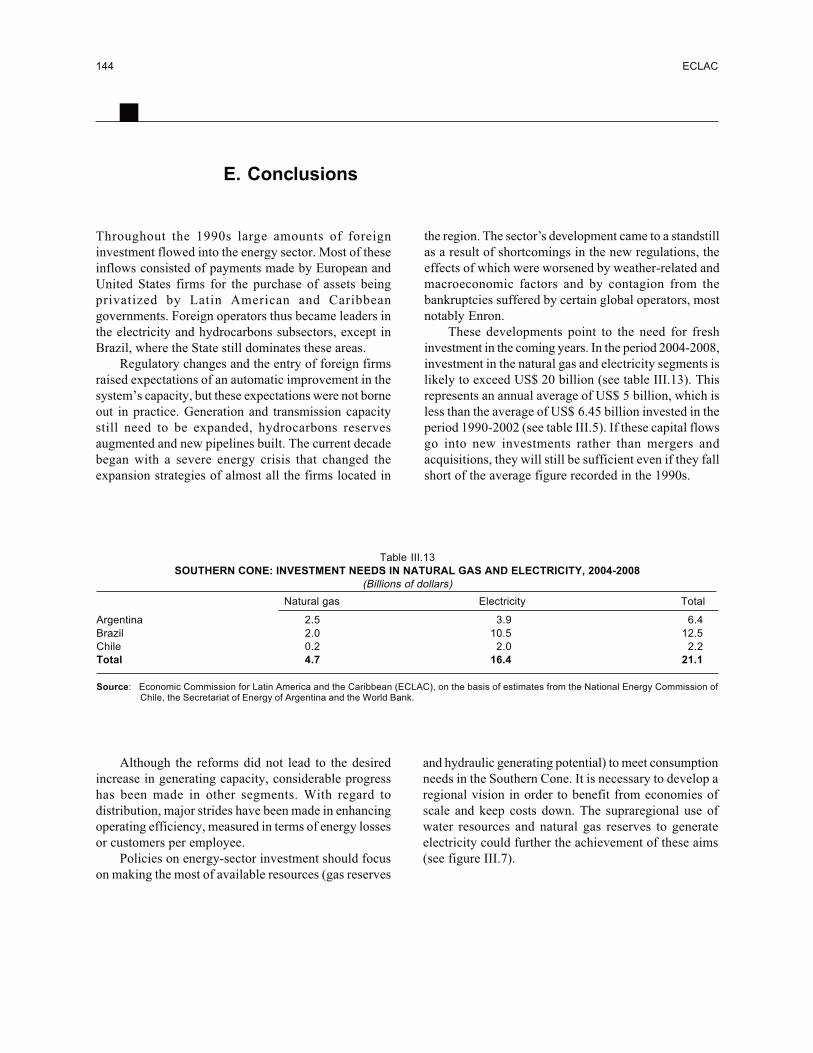
E. Conclusion................................................................................................................................................... 144
Bibliography..................................................................................................................................................... 153
Tables, figues and boxes
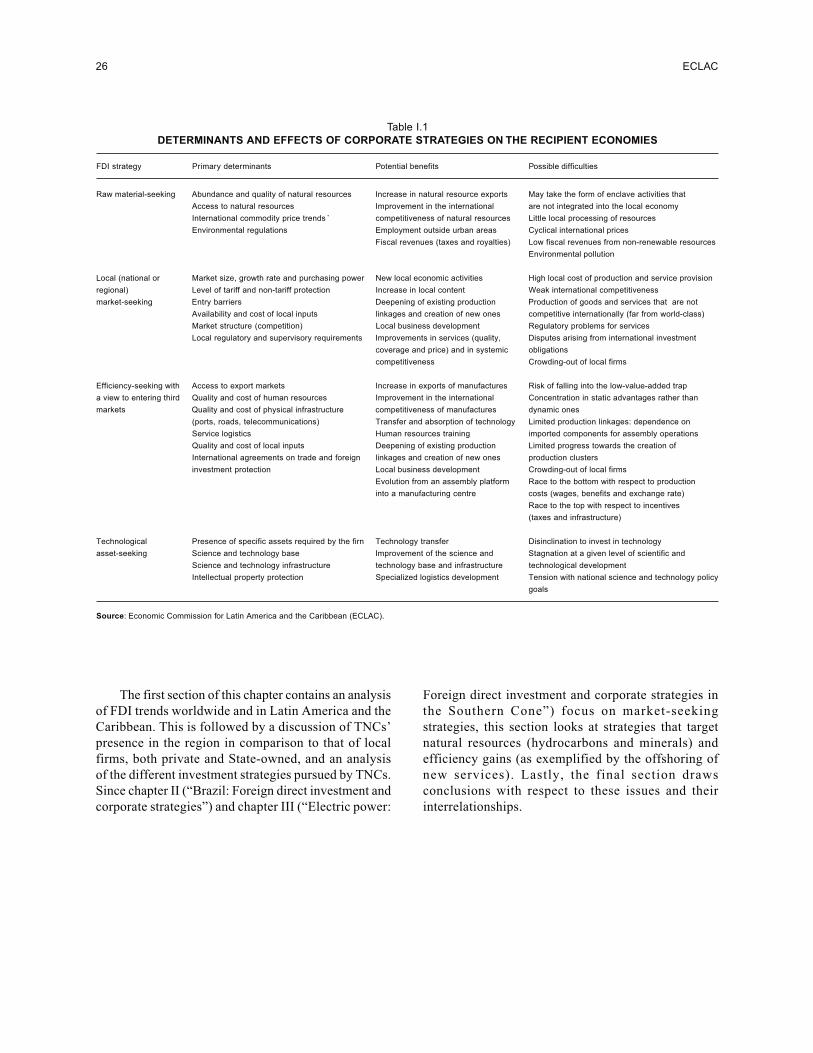
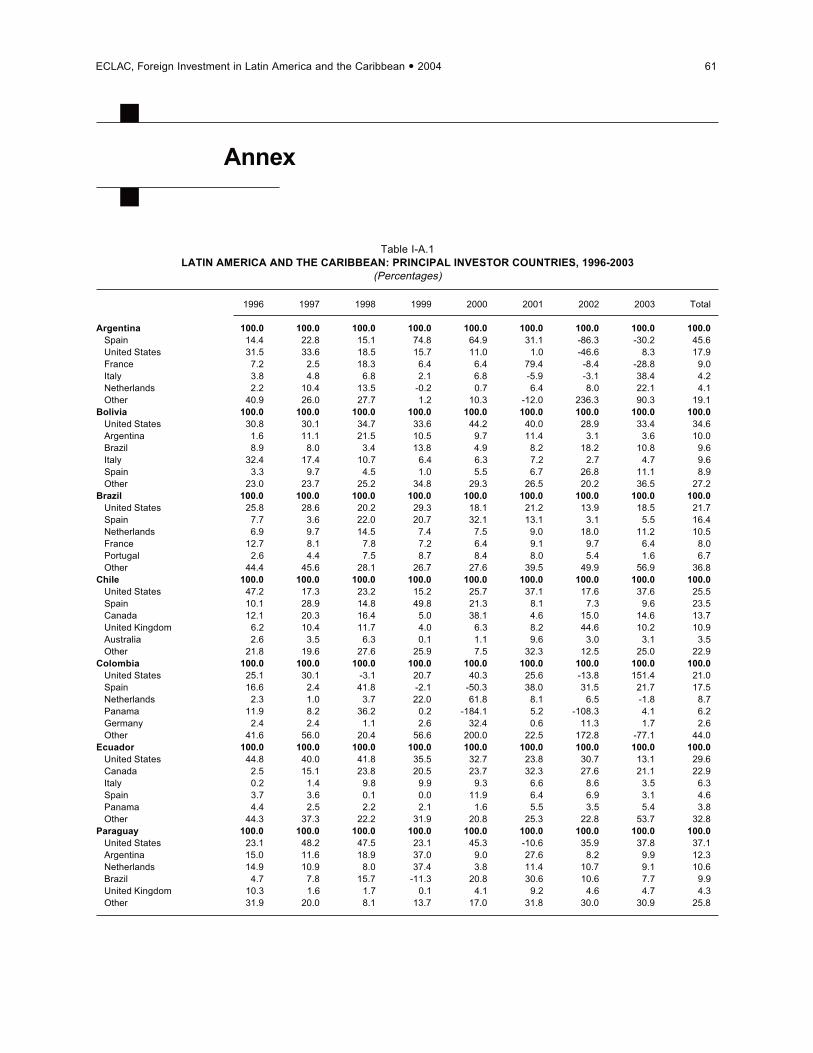
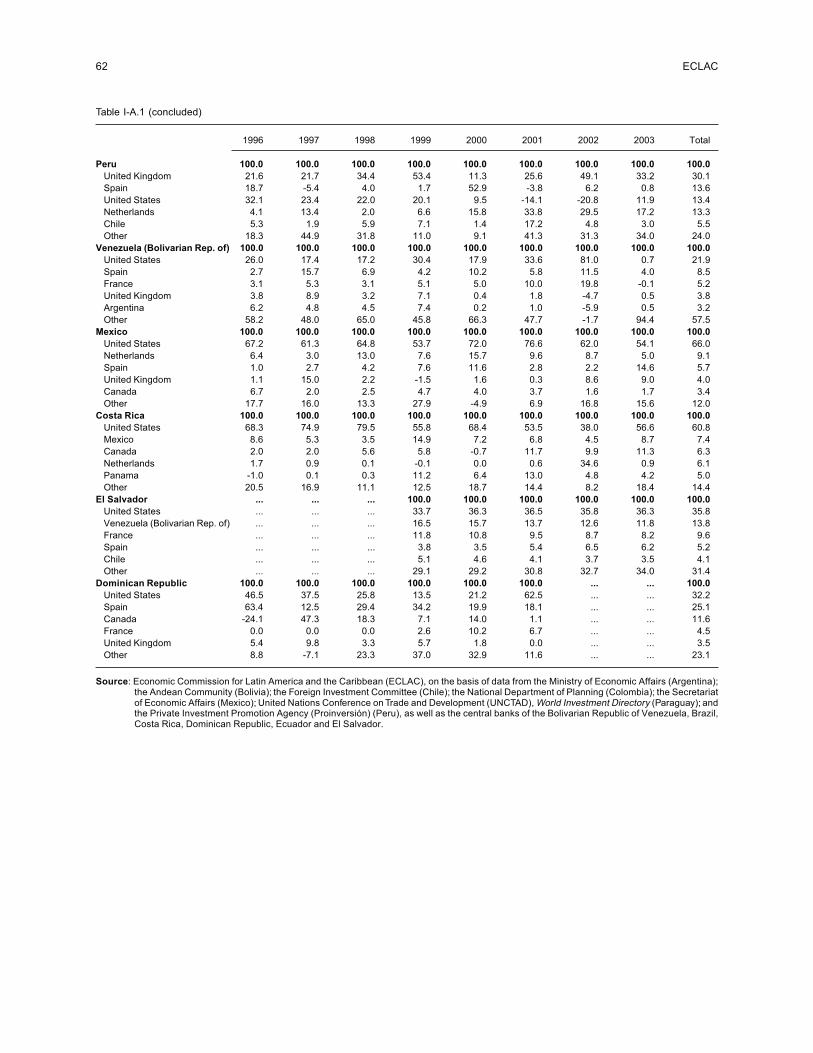
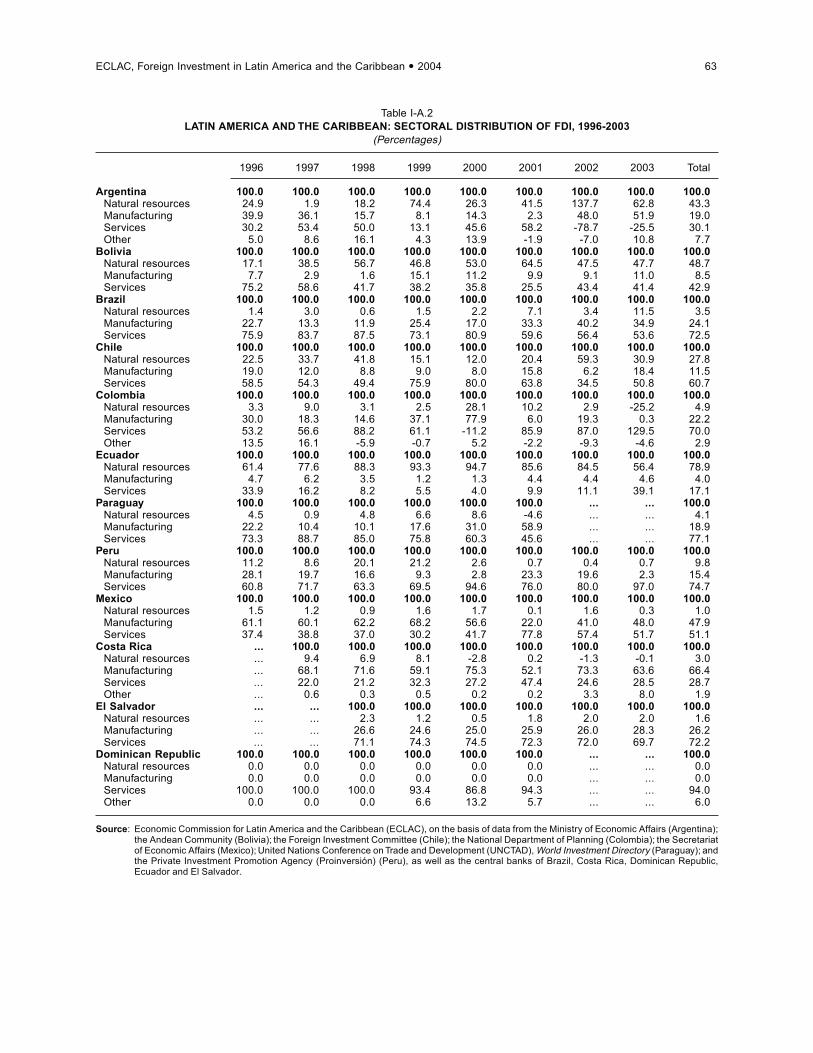
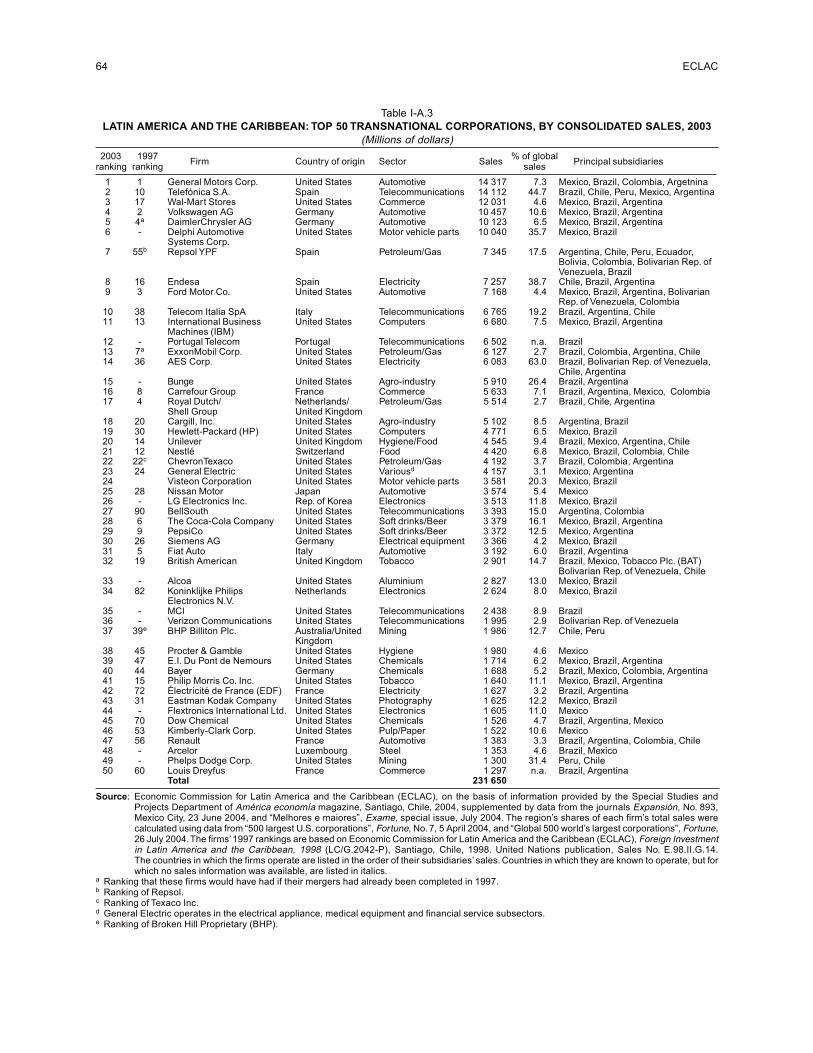
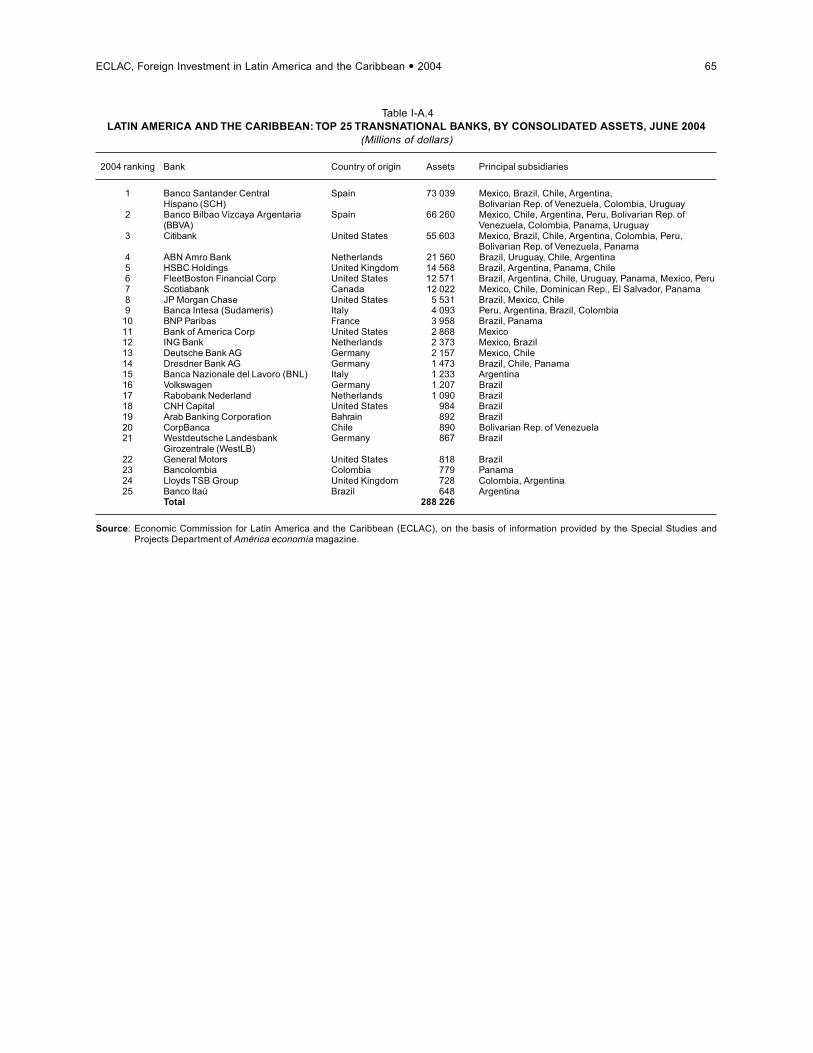
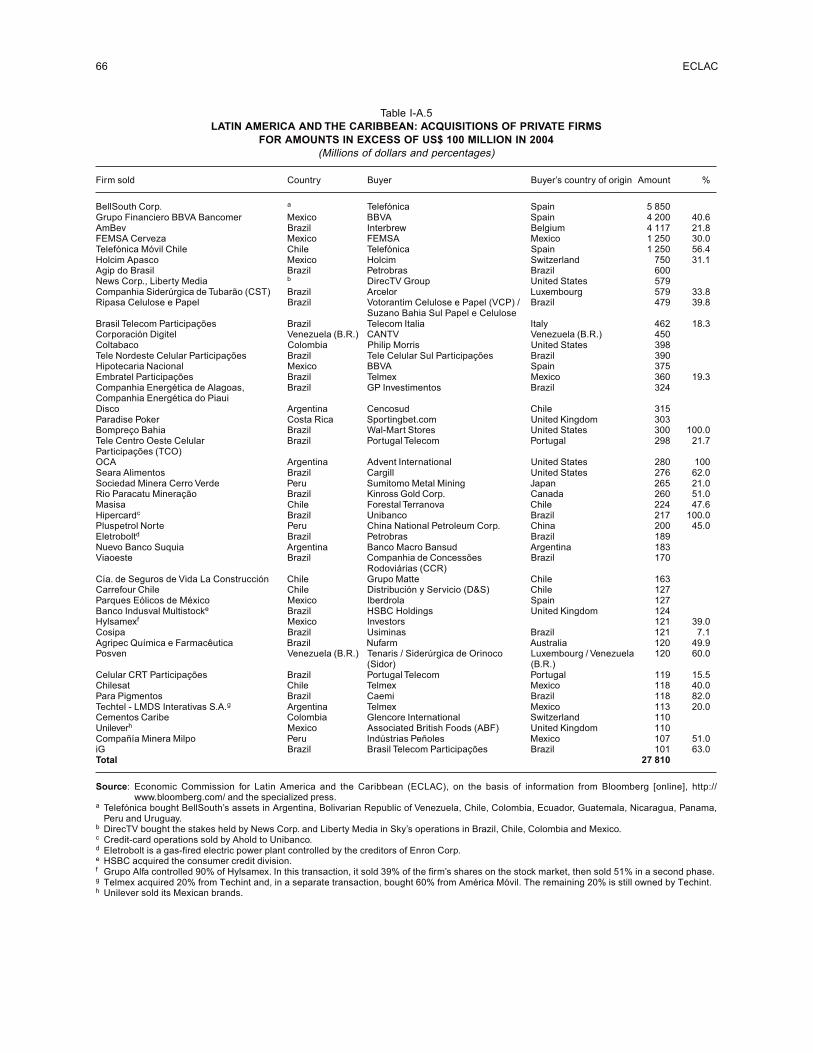
Table I.1 Determinants and effects of corporate strategies on the recipient economies............................... 26Table I.2 Regional distribution of net FDI inflows worldwide, 1990-2004.................................................. 27Table I.3 Mexico, Central America and the Caribbean: net FDI inflows, 1990-2004.................................. 33Table I.4 South America: net FDI inflows, 1990-2004 .................................................................................. 35Table I.5 Latin America and the Caribbean: top 25 “Trans-Latins”, by consolidated sales, 2003............... 43Table I.6 Latin America and the Caribbean: TNC strategies......................................................................... 48Table I.7 Offshoring and outsourcing of service provision........................................................................... 56Table I.8 Largest call-centre TNCs with operations in Latin America, by sales, 2003................................. 57Table I-A.1 Latin America and the Caribbean: principal investor countries, 1996-2003................................. 61Table I-A.2 Latin America and the Caribbean: sectoral distribution of FDI, 1996-2003................................. 63Table I-A.3 Latin America and the Caribbean: top 50 transnational corporations, by consolidated sales, 2003 .. 64Table I-A.4 Latin America and the Caribbean: top 25 transnational banks, by consolidated assets, June, 2004 .. 65Table I-A.5 Latin America and the Caribbean: acquisitions of private firms for amounts in excess of
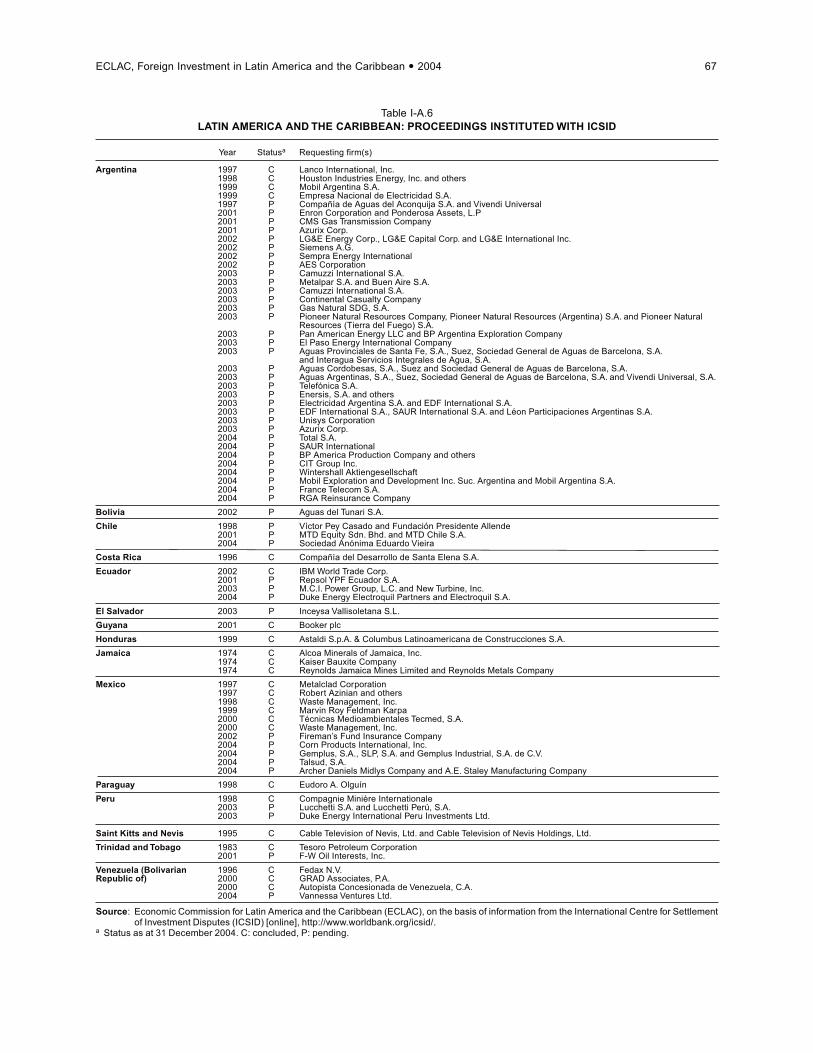
US$ 100 million in 2004................................................................................................................. 66Table I-A.6 Latin America and the Caribbean: proceedings instituted with ICSID.......................................... 67
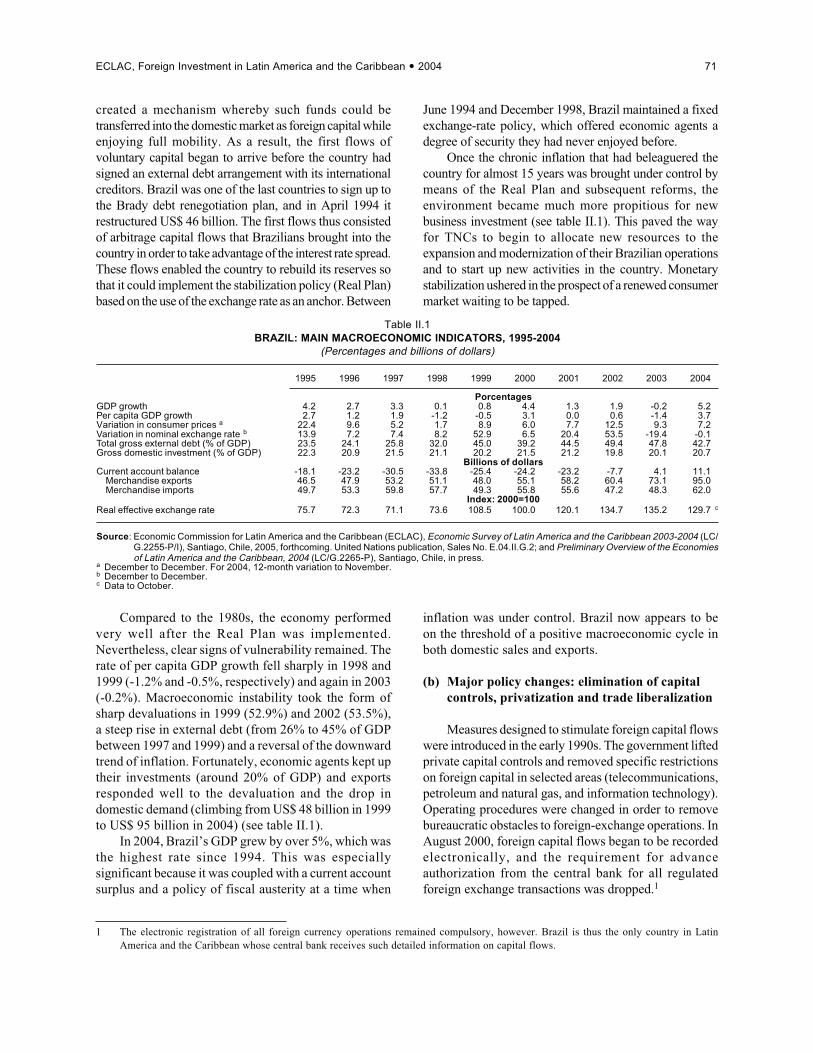
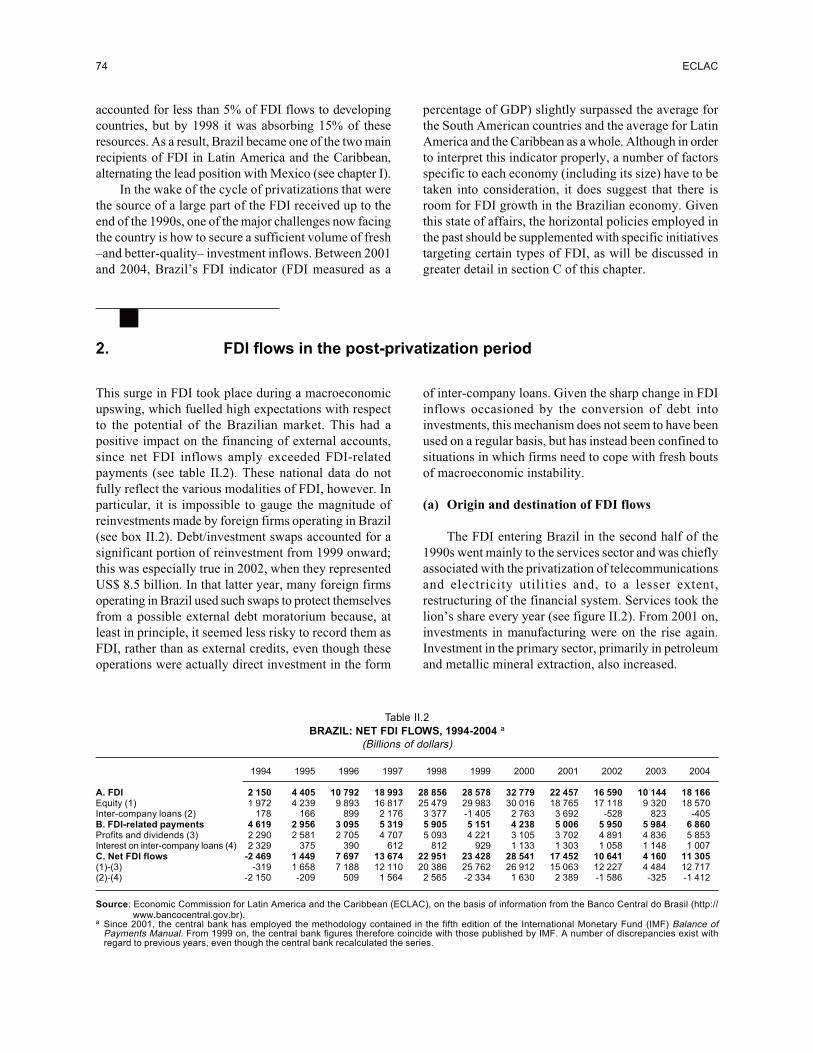
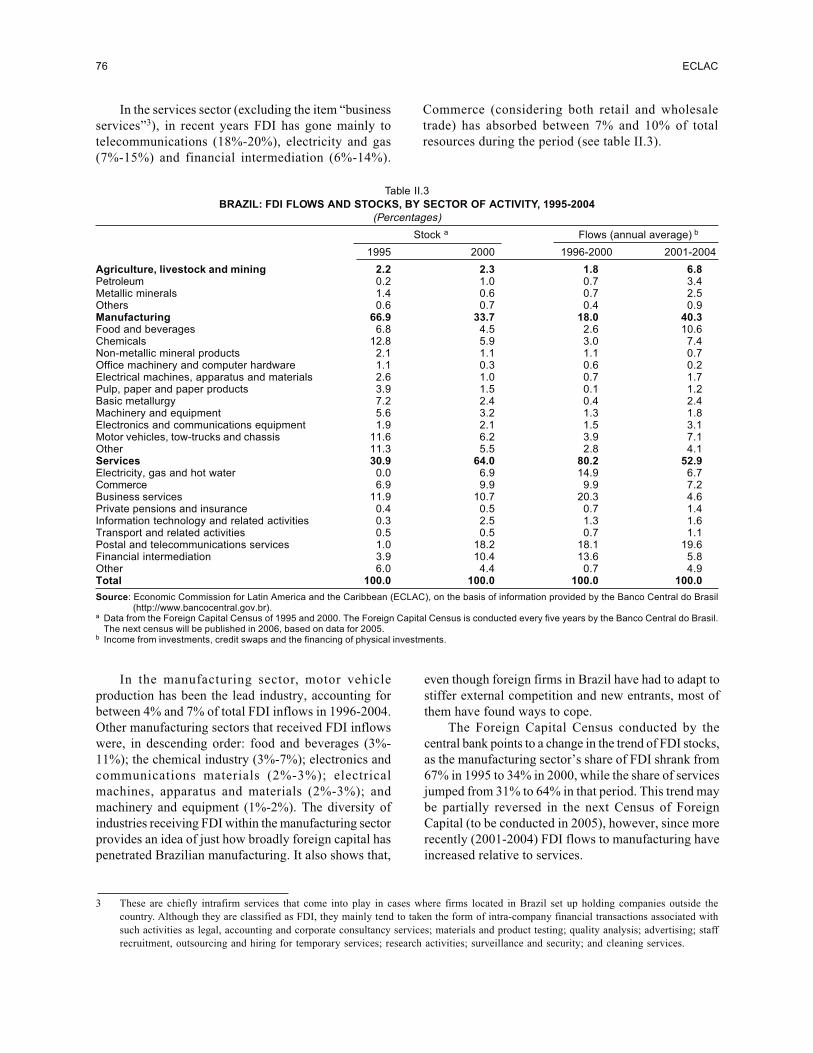
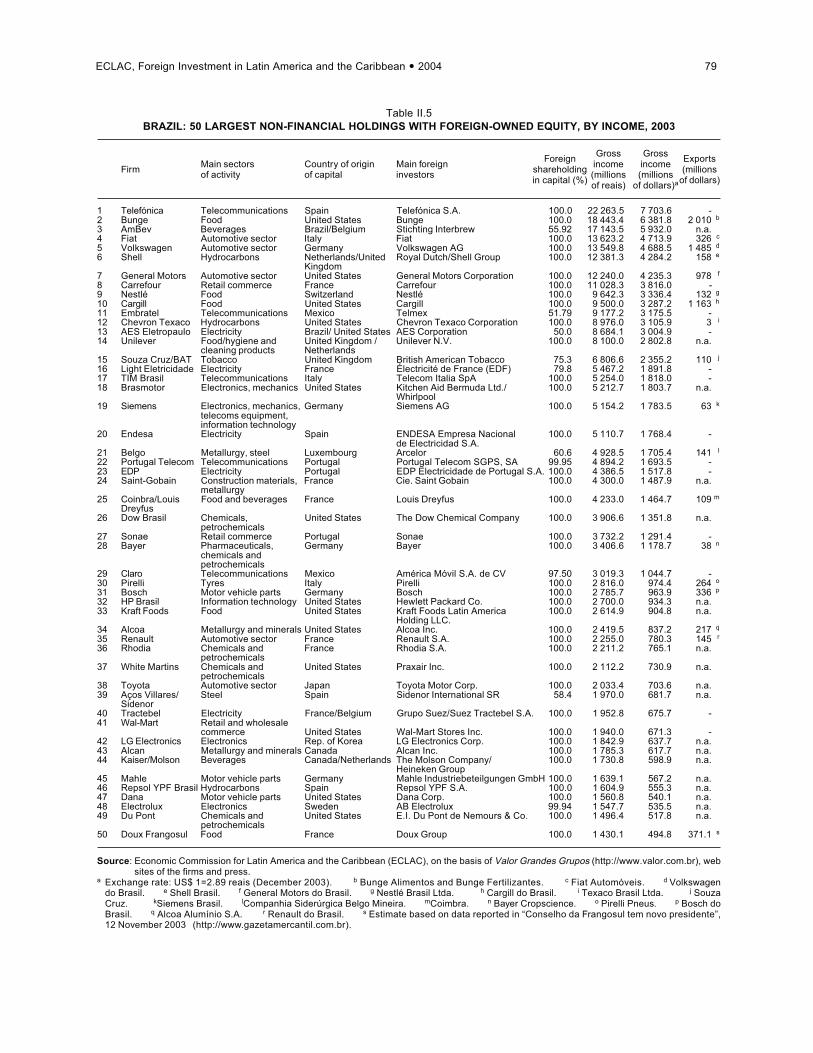
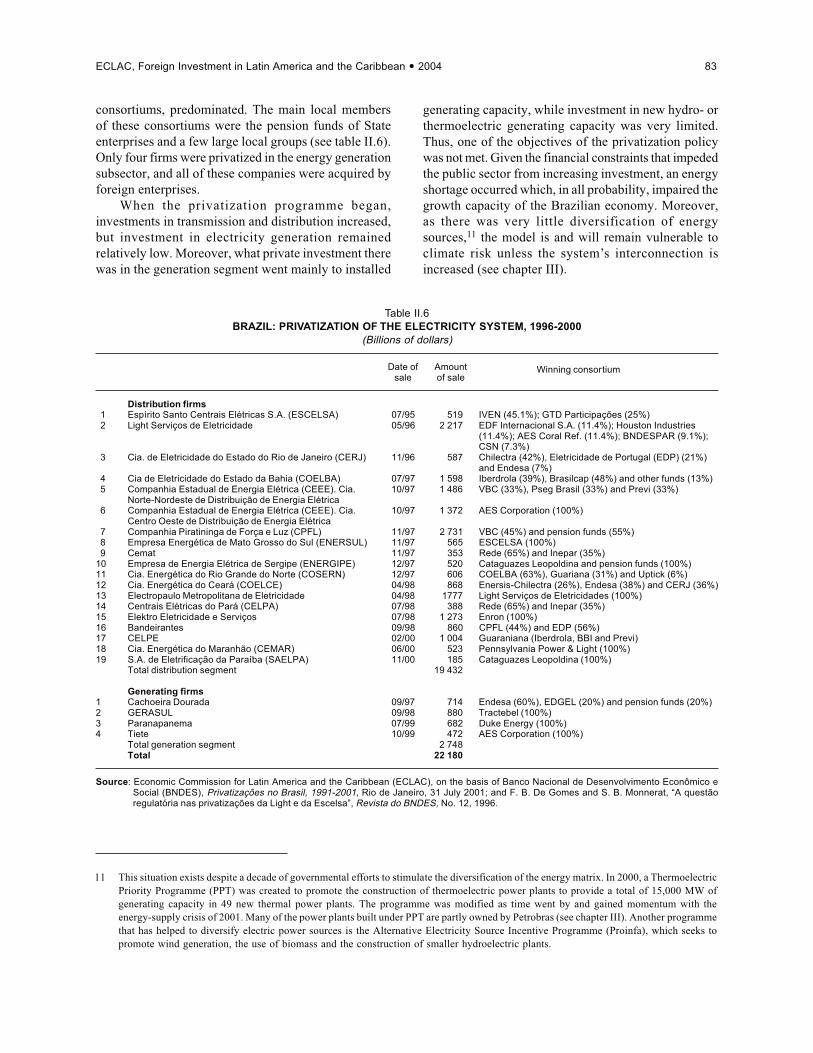
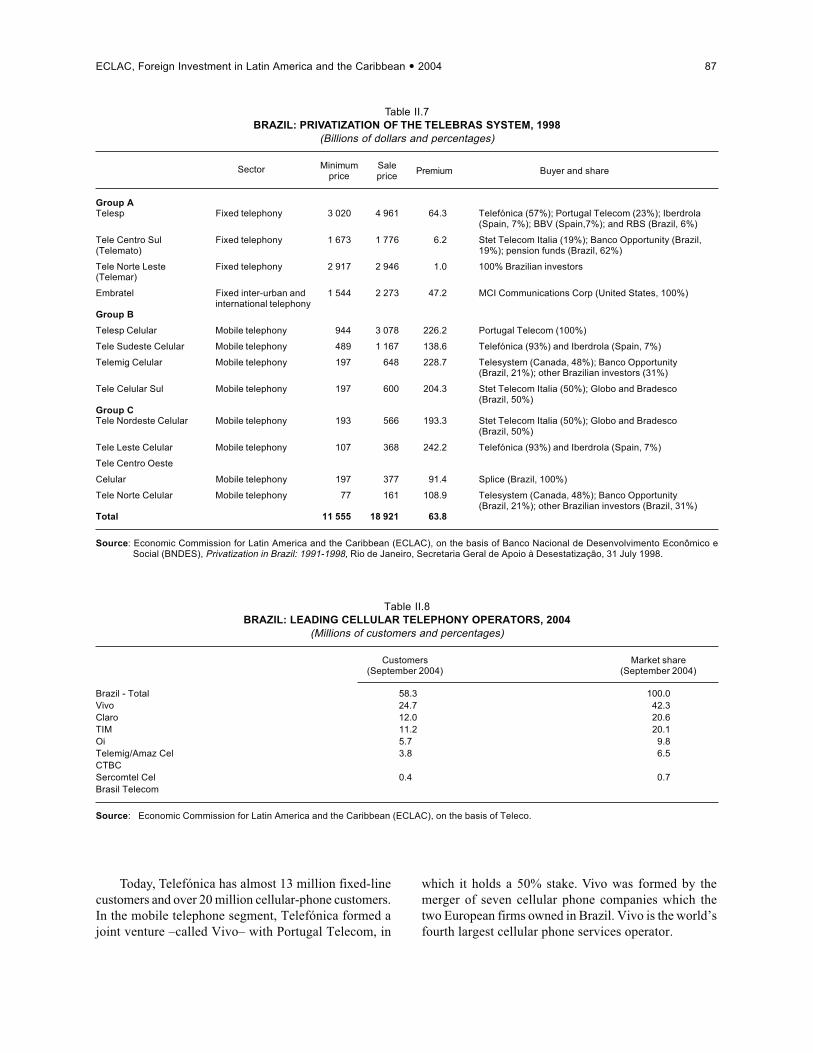
Table II.1 Brazil: main macroeconomic indicators, 1995-2004...................................................................... 71Table II.2 Brazil: net FDI flows, 1994-2004................................................................................................... 74Table II.3 Brazil: FDI flows and stocks, by sector of activity, 1995-2004..................................................... 76Table II.4 Brazil: FDI flows and stocks, by geographic origin, 1995-2004................................................... 77Table II.5 Brazil: 50 largest non-financial holdings with foreign-owned equity, by income, 2003 ............... 79Table II.6 Brazil: privatization of the electricity system, 1996-2000............................................................. 83Table II.7 Brazil: privatization of the Telebras system, 1998.......................................................................... 87Table II.8 Brazil: leading cellular telephony operators, 2004......................................................................... 87
Page
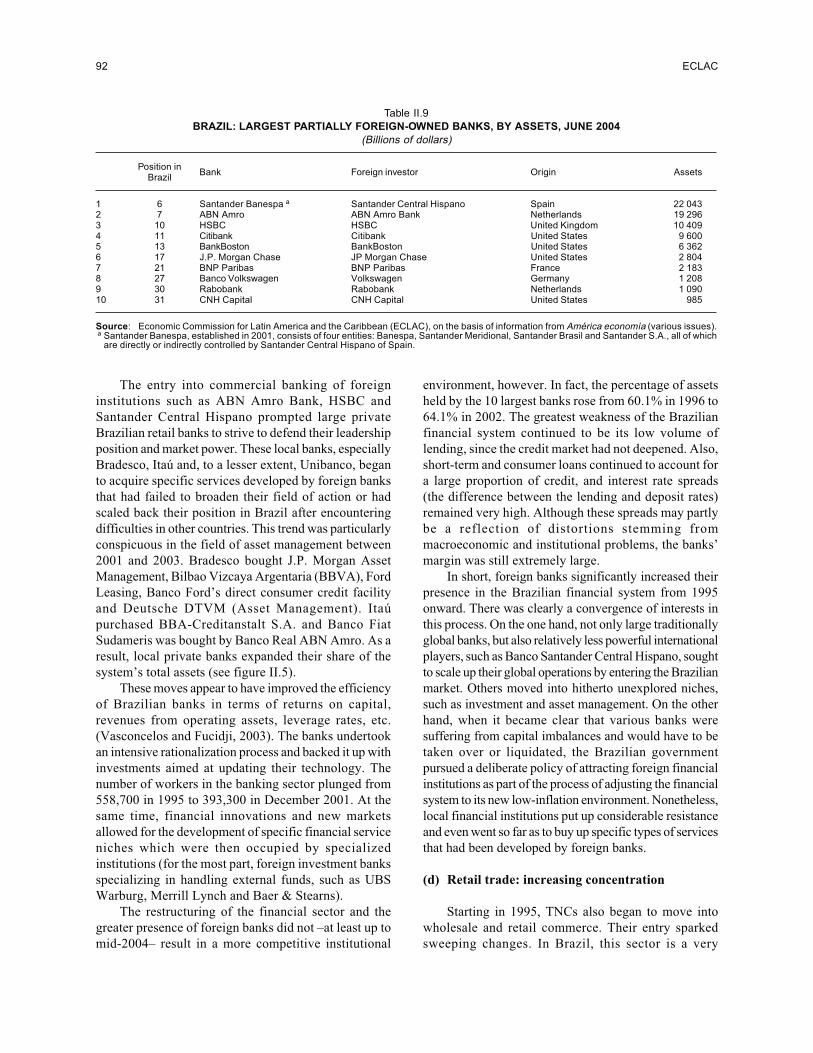
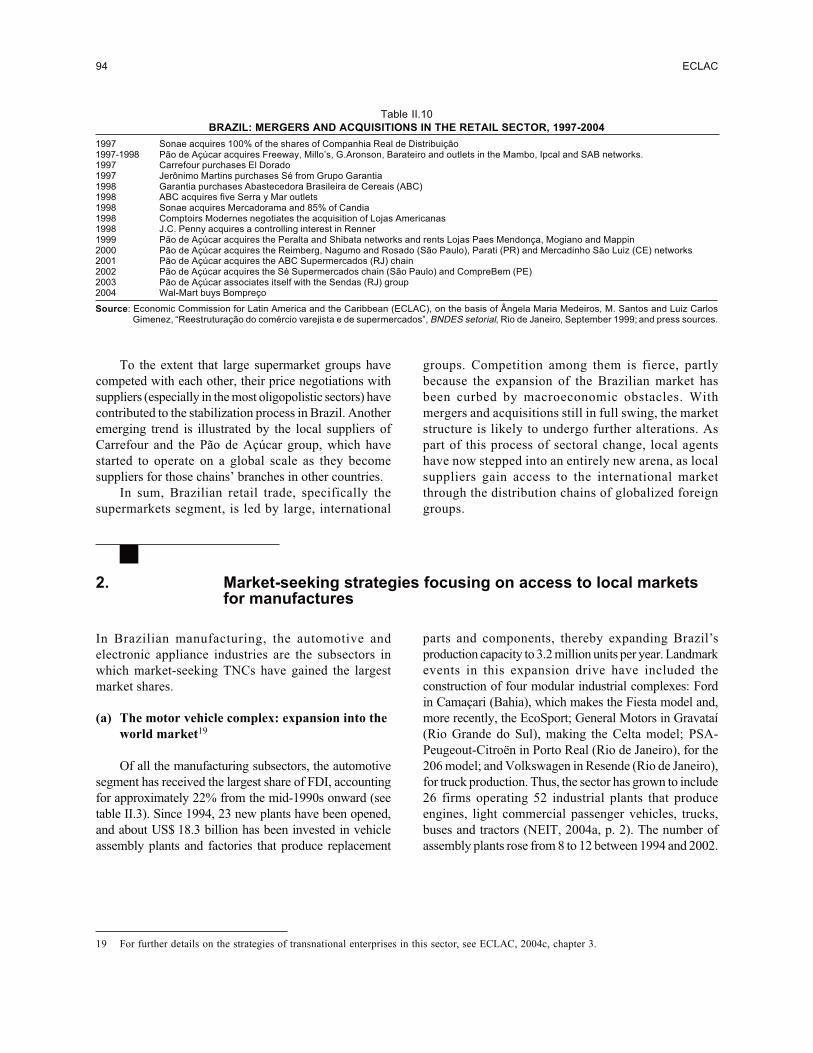
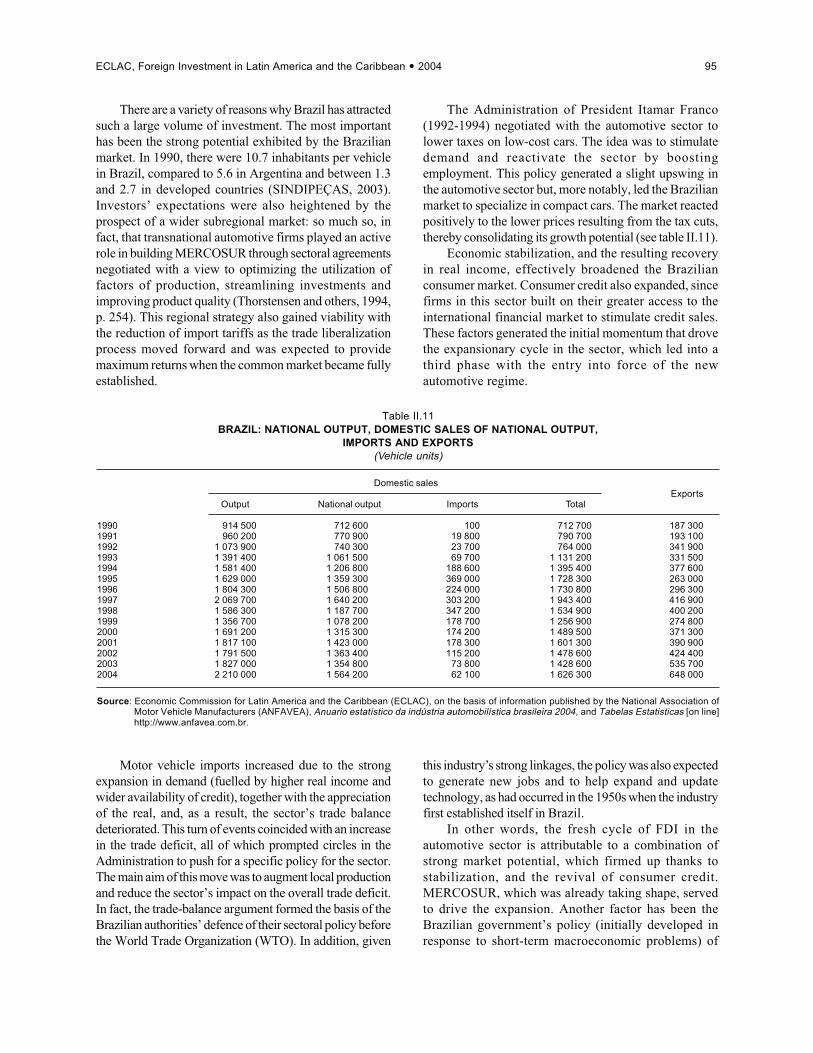
Table II.9 Brazil: largest partially foreign-owned banks, by assets, June 2004............................................. 92Table II.10 Brazil: mergers and acquisitions in the retail sector, 1997-2004................................................... 94Table II.11 Brazil: national output, domestic sales of national output, imports and exports........................... 95Table II.12 Determinants and effects of corporate strategies on the recipient economies............................... 102
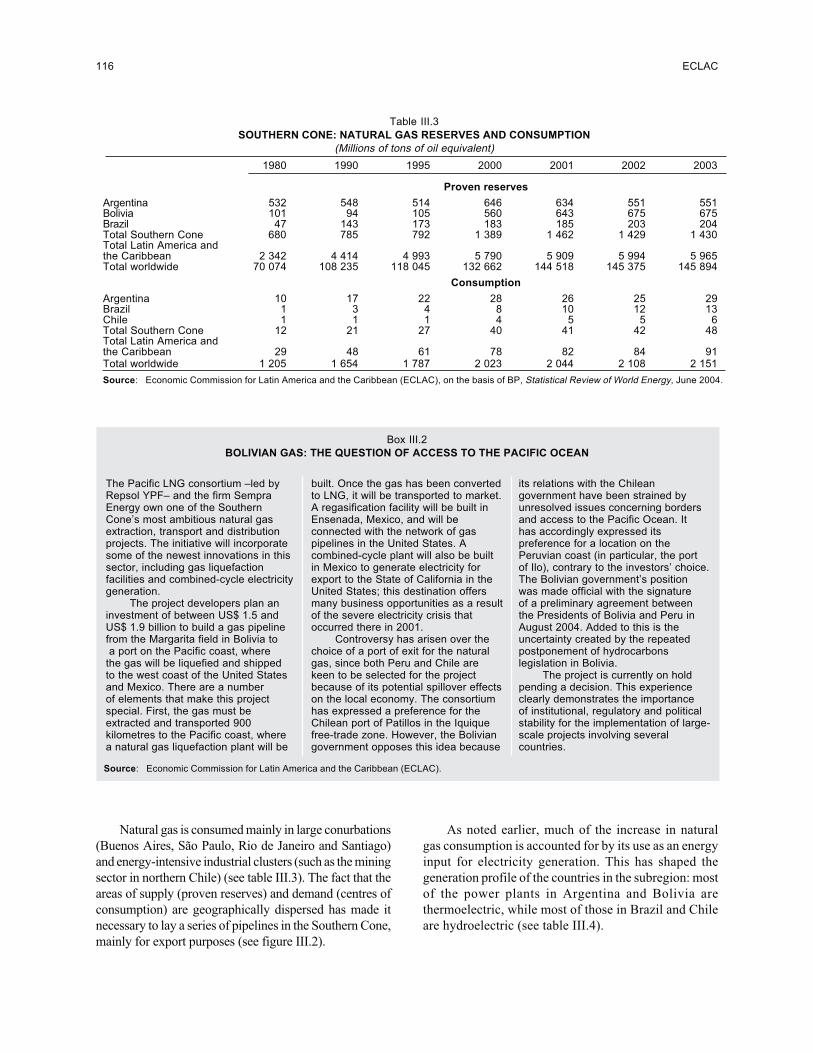
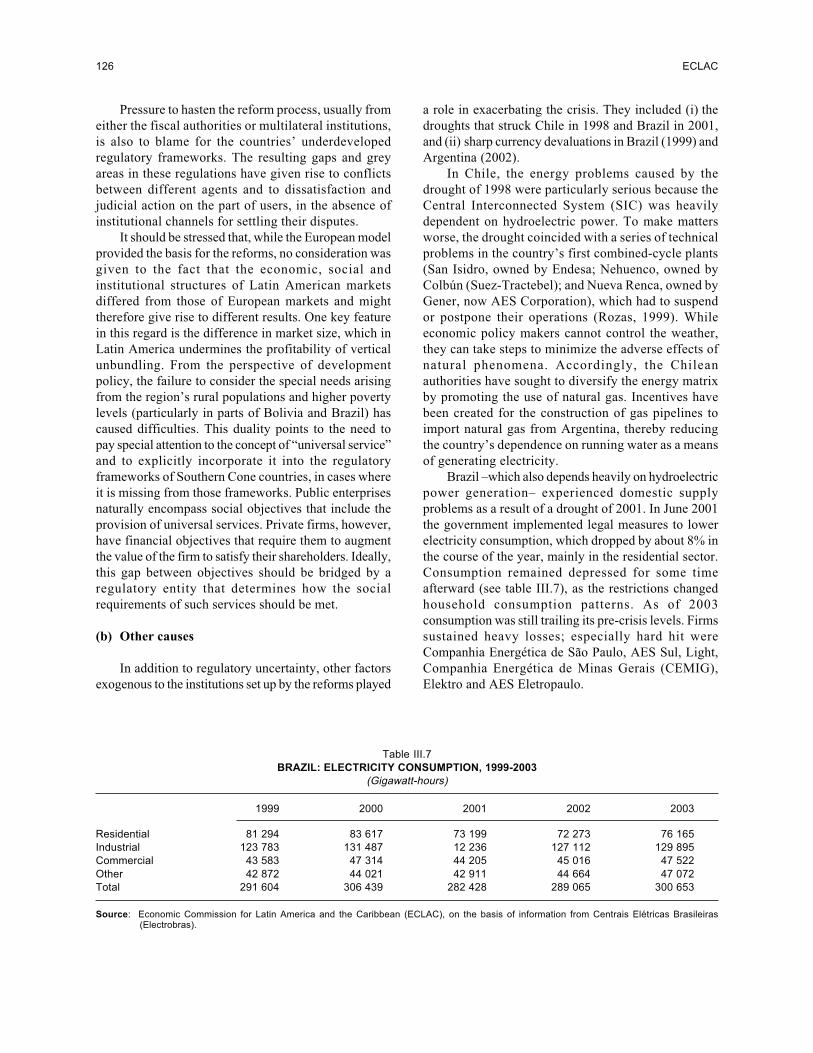
Table III.1 Worldwide electricity generation, by energy source, 1980-2030................................................... 113Table III.2 Southern Cone: primary energy supply, 1990-2002....................................................................... 115Table III.3 Southern Cone: natural gas reserves and consumption.................................................................. 116Table III.4 Southern Cone: electricity generation, by source, 2000 ................................................................. 117Table III.5 Southern Cone: private investment in gas and electricity, 1990-2002........................................... 120Table III.6 Southern Cone: causes and aggravating factors in the energy market crisis................................. 124Table III.7 Brazil: electricity consumption, 1999-2003................................................................................... 126Table III.8 Southern Cone: integration of electricity and gas operations, by company, 2004 ......................... 129Table III.9 Southern Cone: market shares of the main operators in the electricity sector, by installed
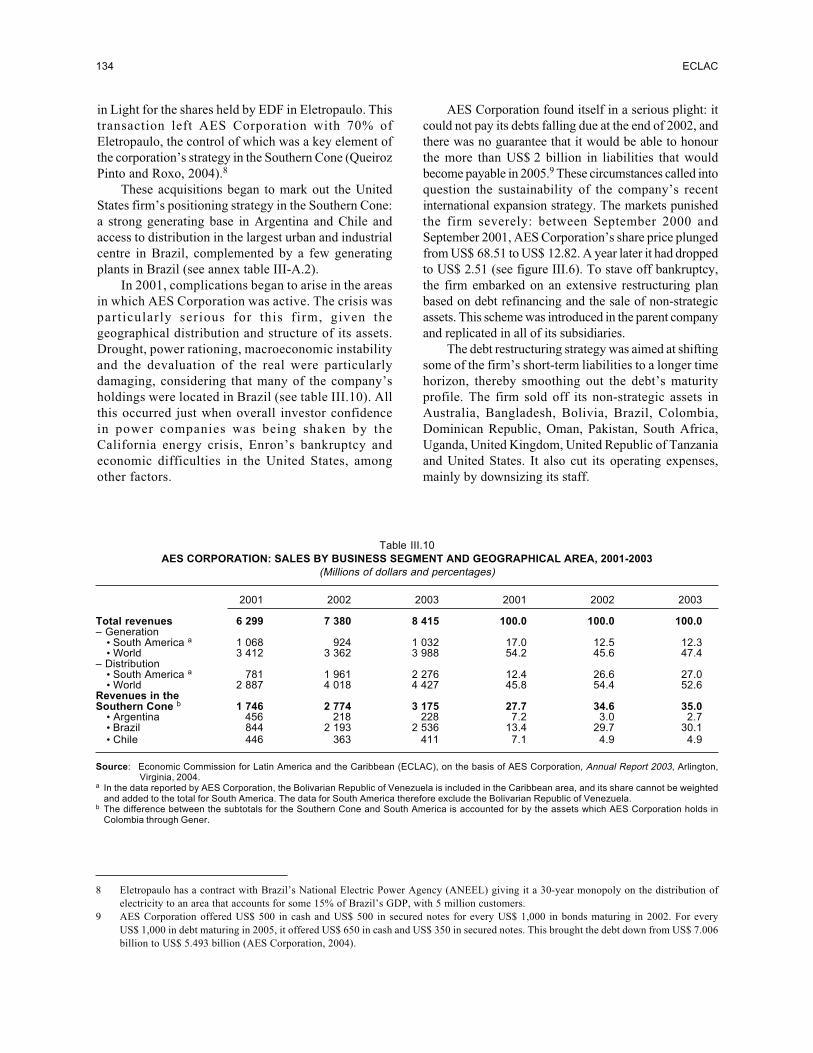
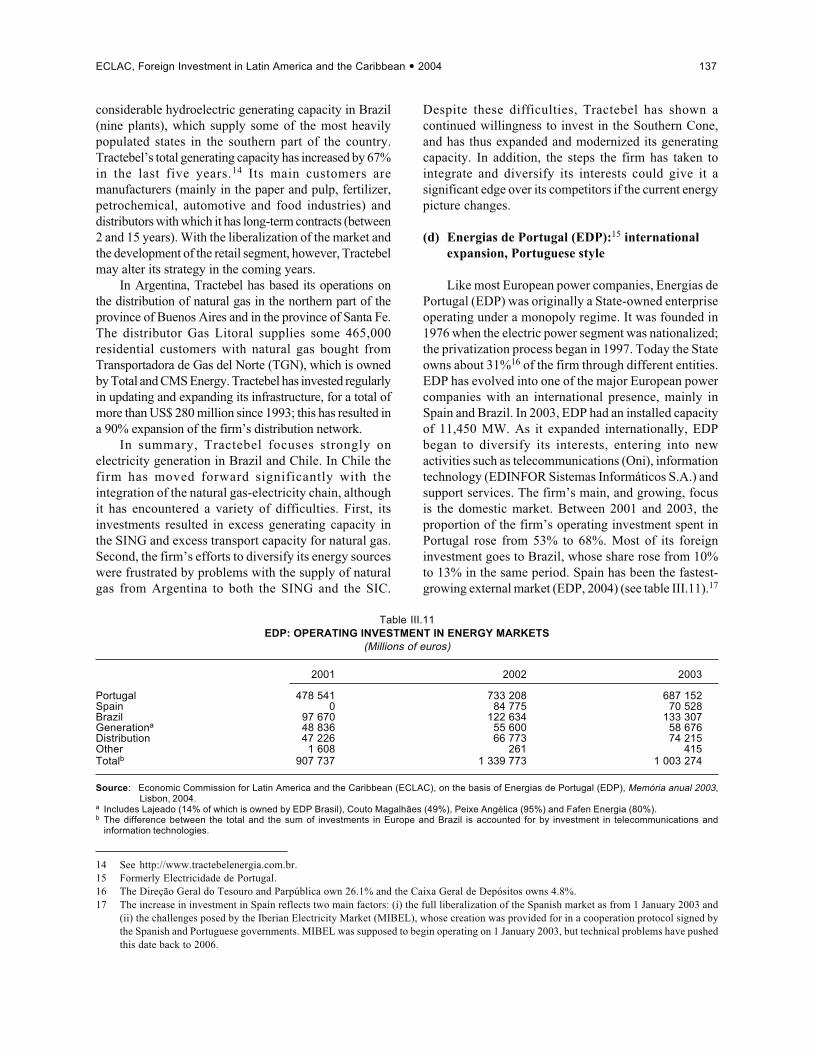
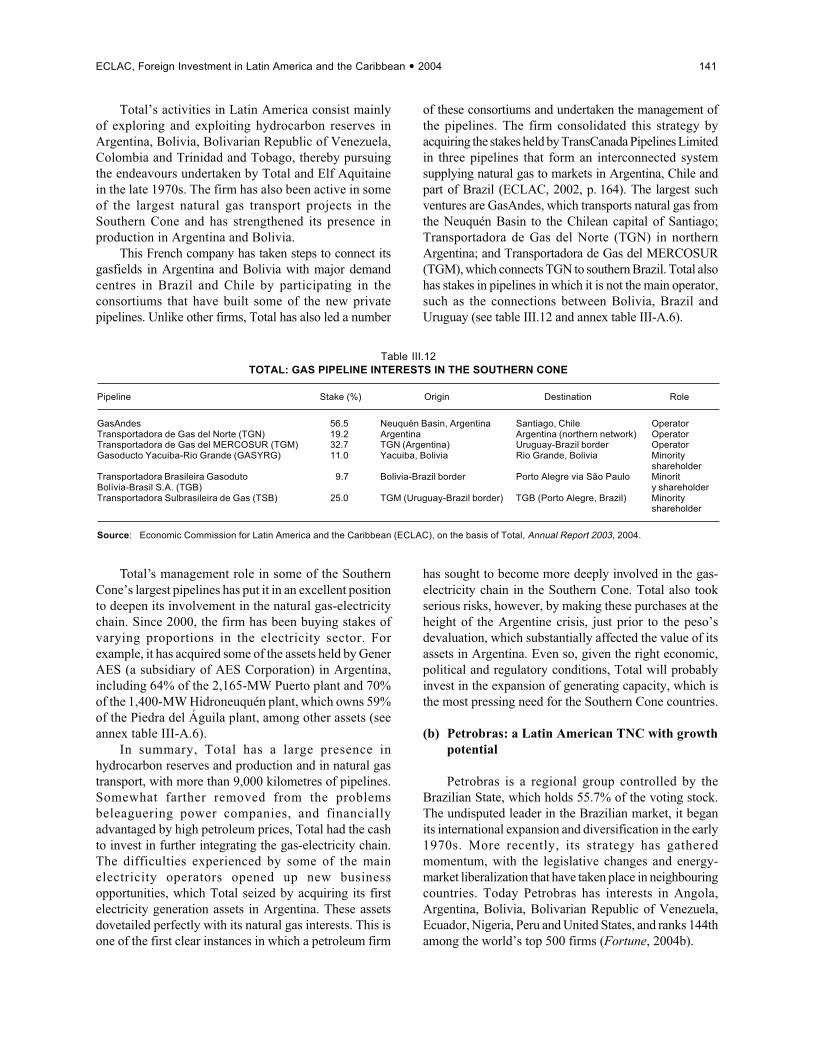
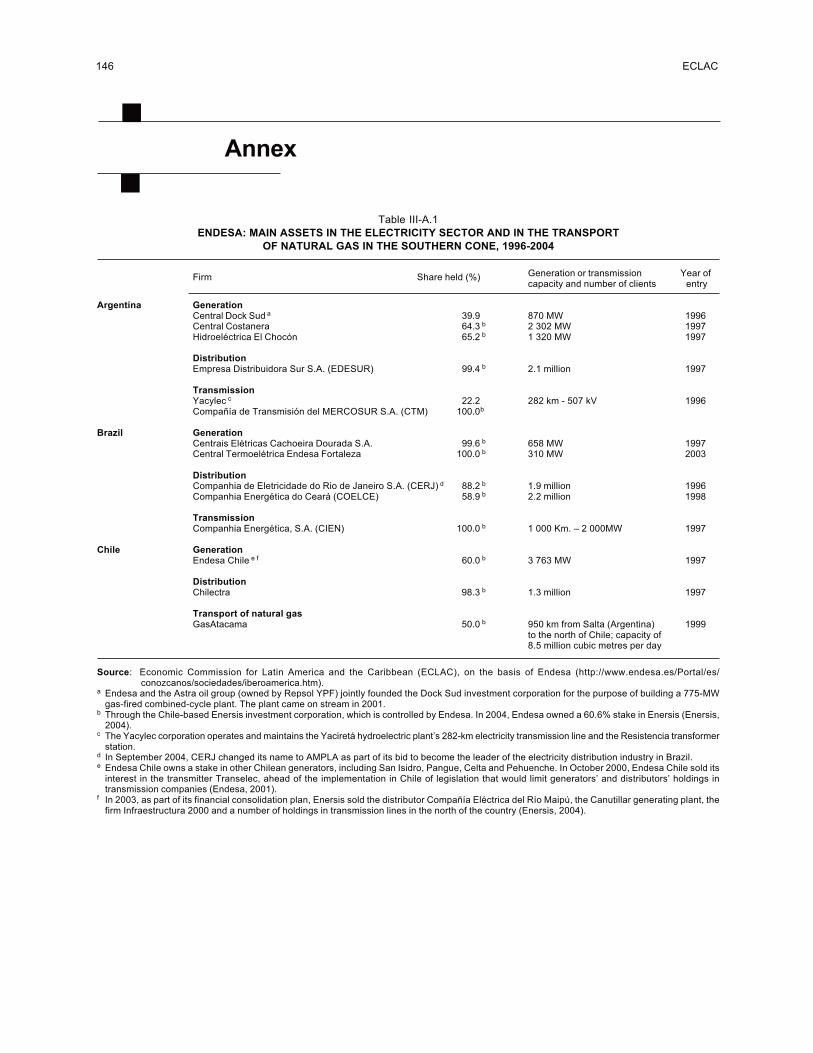
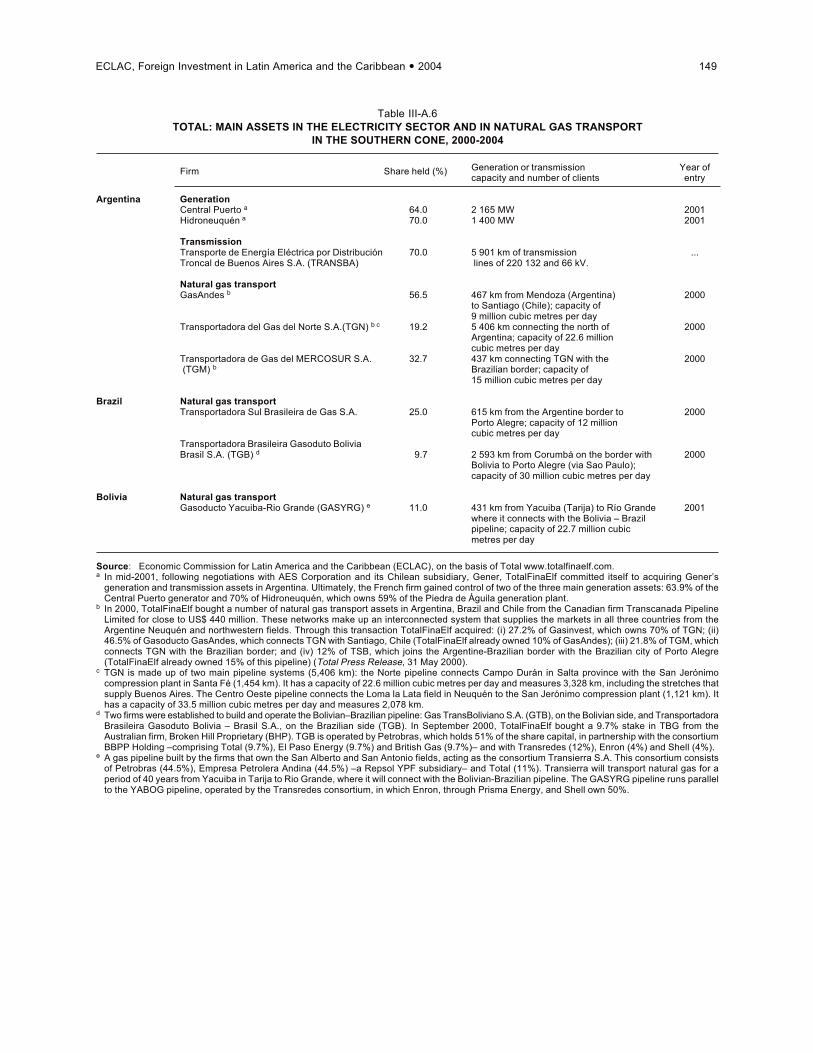
capacity, 2003.................................................................................................................................. 130Table III.10 AES Corporation: sales by business segment and geographical area, 2001-2003........................ 134Table III.11 EDP: operating investment in energy markets ................................................................................ 137Table III.12 Total: gas pipeline interests in the Southern Cone.......................................................................... 141Table III.13 Southern Cone: investment needs in natural gas and electricity, 2004-2008................................. 144Table III-A.1 Endesa: main assets in the electricity sector and in the transport of natural gas in the
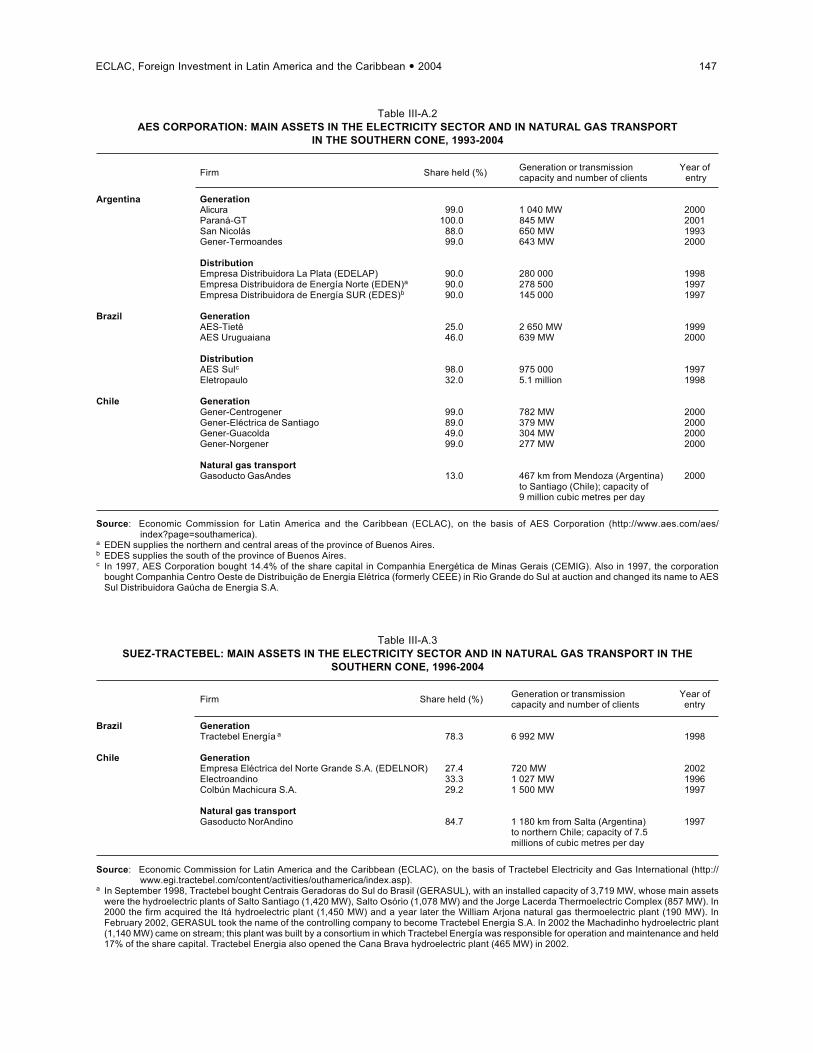
Southern Cone, 1996-2004............................................................................................................. 146Table III-A.2 AES Corporation: main assets in the electricity sector and in natural gas transport in the
Southern Cone, 1993-2004............................................................................................................. 147Table III-A.3 Suez-Tractebel: main assets in the electricity sector and in natural gas transport in the
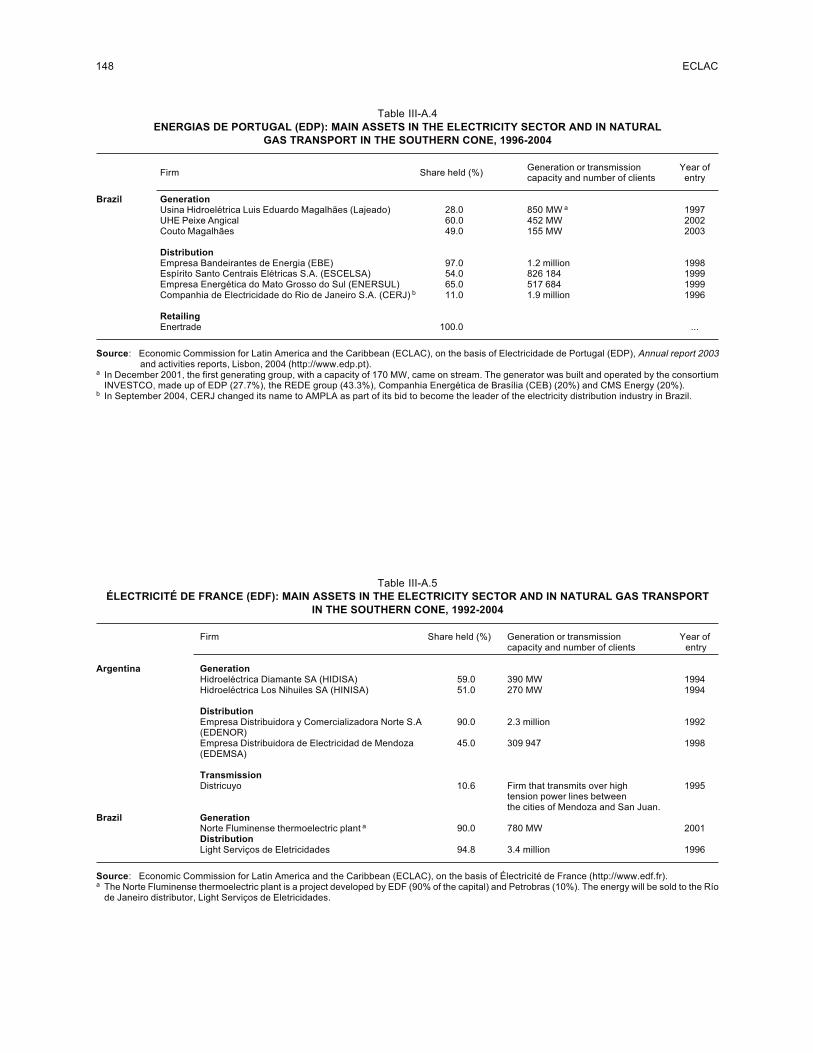
Southern Cone, 1996-2004............................................................................................................. 147Table III-A.4 Energias de Portugal (EDP): main assets in the electricity sector and in natural gas transport
in the Southern Cone, 1996-2004................................................................................................... 148Table III-A.5 Électricité de France (EDF): main assets in the electricity sector and in natural gas transport
in the Southern Cone, 1992-2004................................................................................................... 148Table III-A.6 Total: main assets in the electricity sector and in natural gas transport in the Southern Cone,
2000-2004........................................................................................................................................ 149Table III-A.7 Petrobras: main assets in the electricity sector and in natural gas transport in the Southern
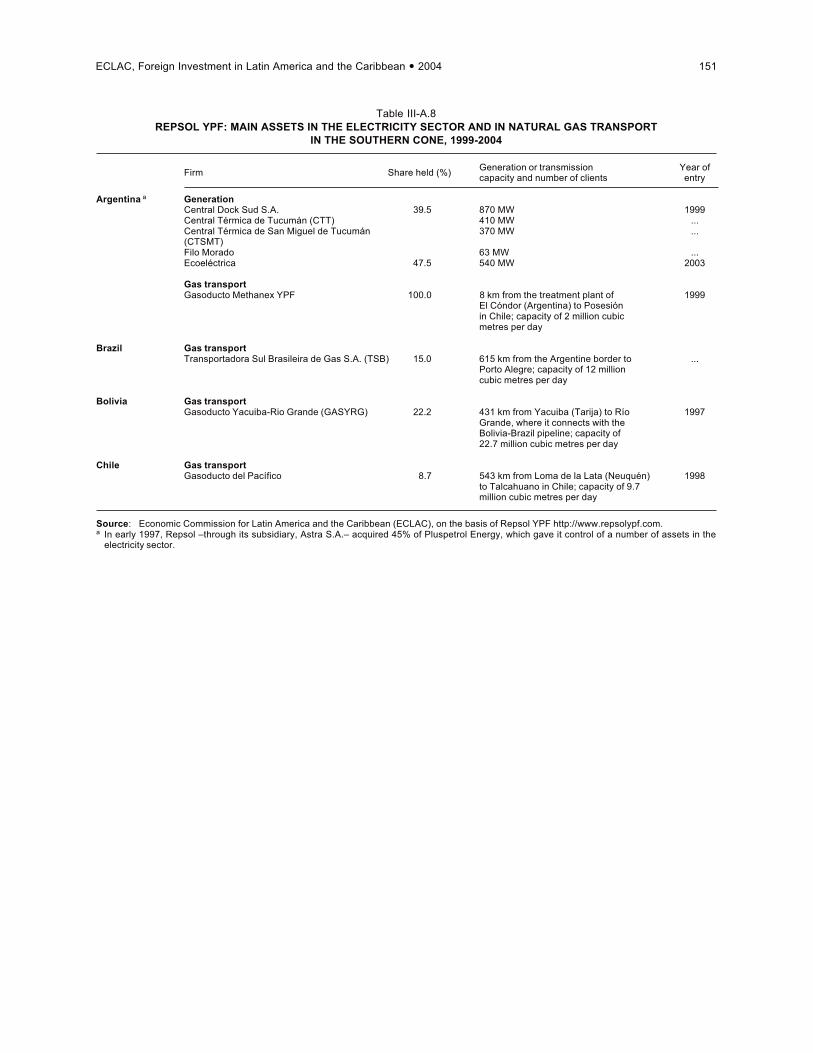
Cone, 1997-2004............................................................................................................................. 150Table III-A.8 Repsol YPF: main assets in the electricity sector and in natural gas transport in the Southern
Cone, 1999-2004............................................................................................................................. 151
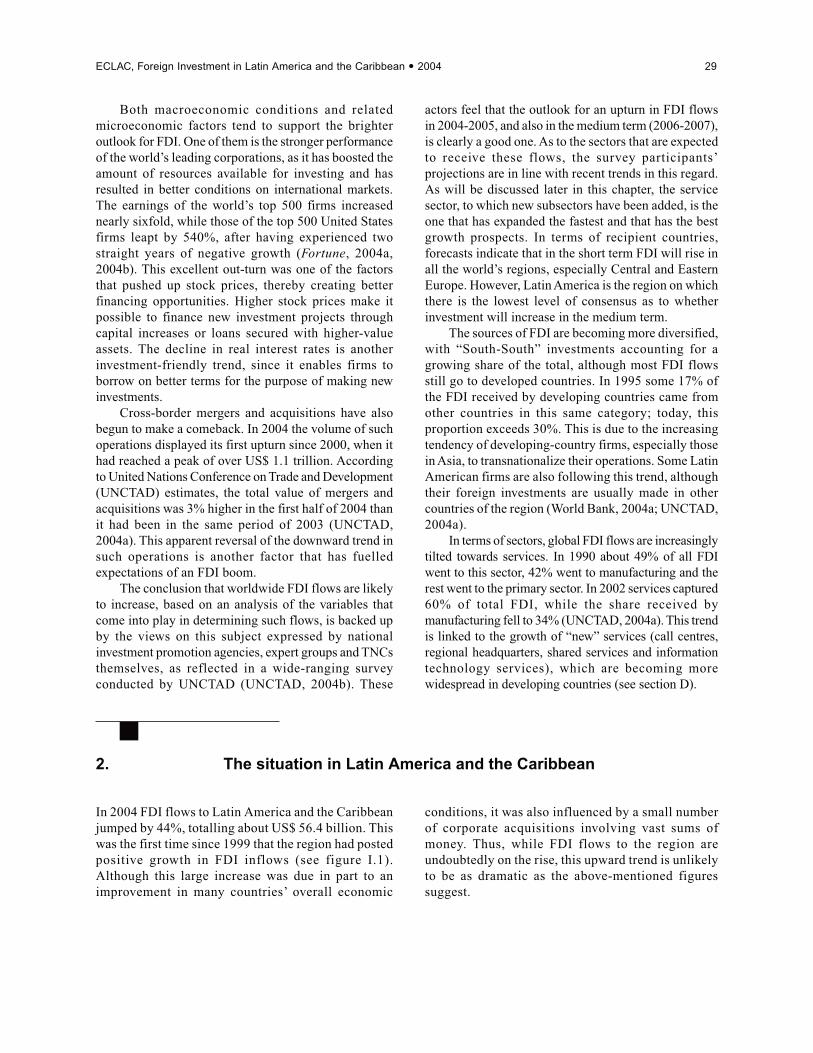
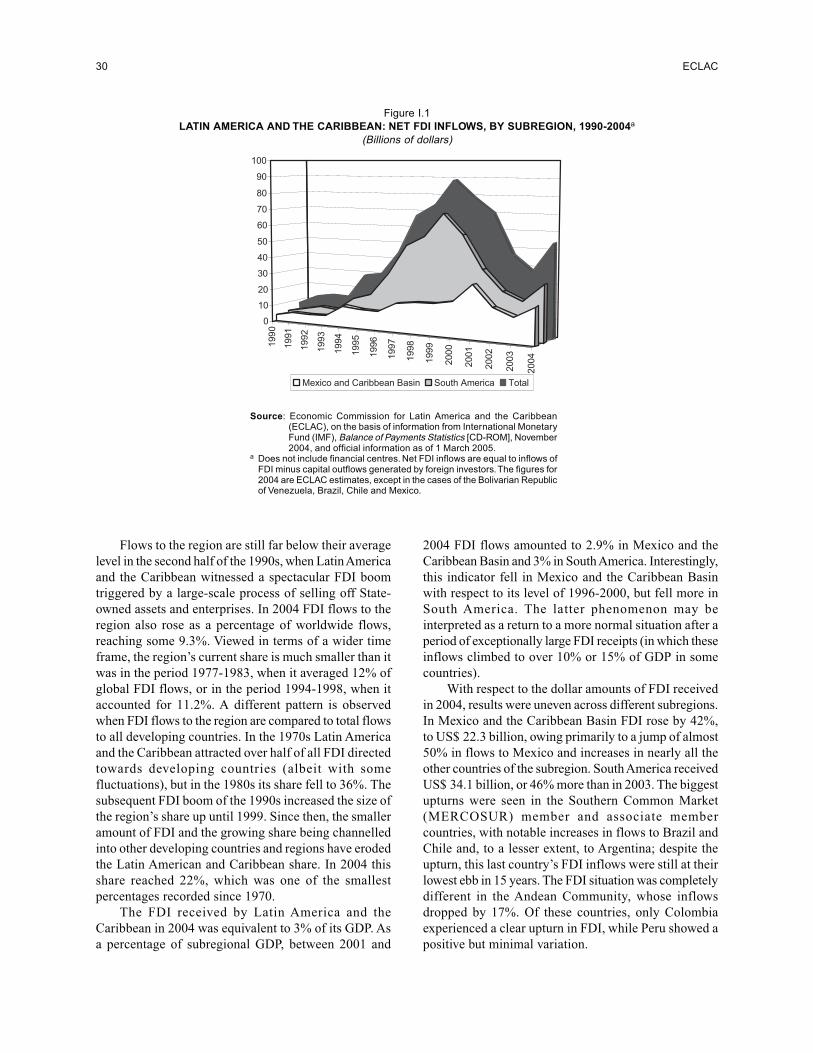
Figure I.1 Latin America and the Caribbean: net FDI inflows, by subregion, 1990-2004............................. 30Figure I.2 Latin America and the Caribbean: net FDI inflows and outflows of FDI-related payments,
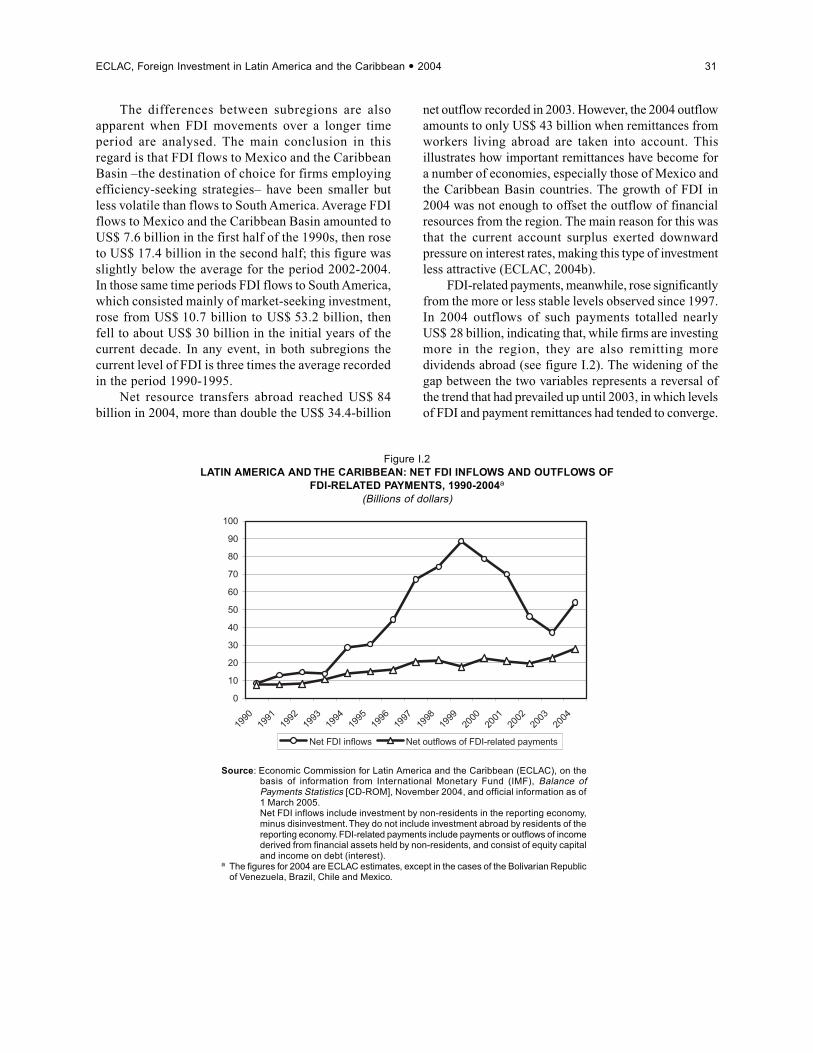
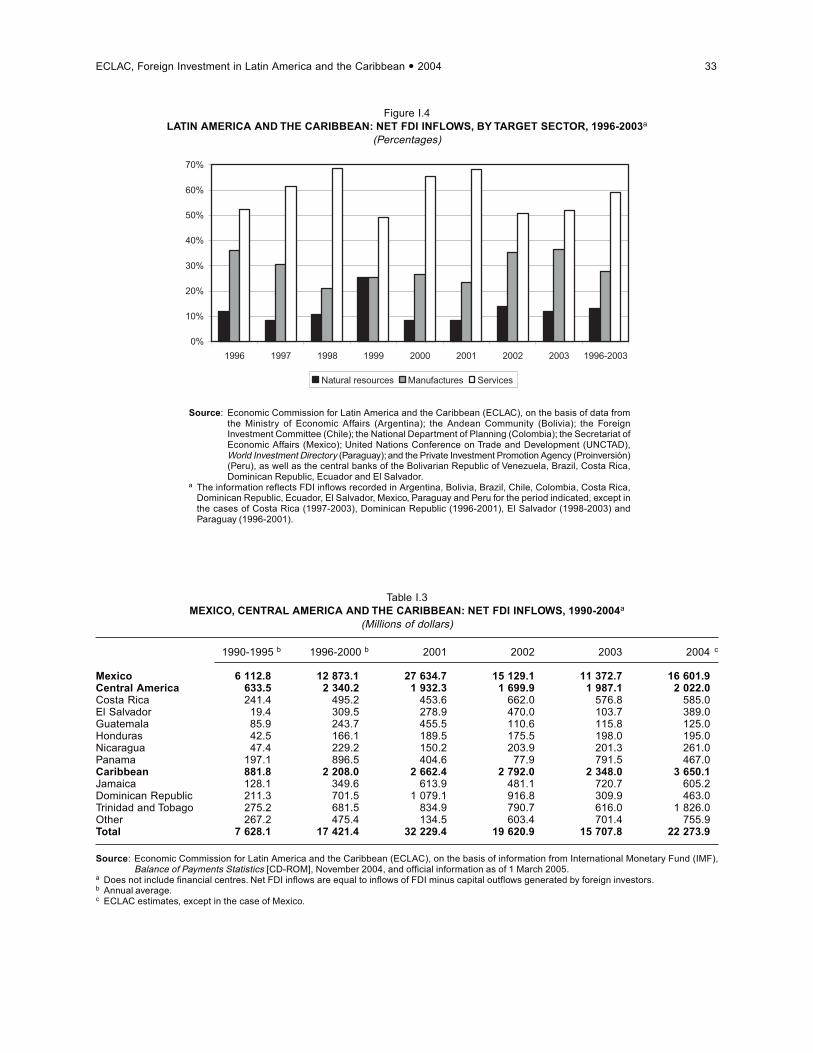
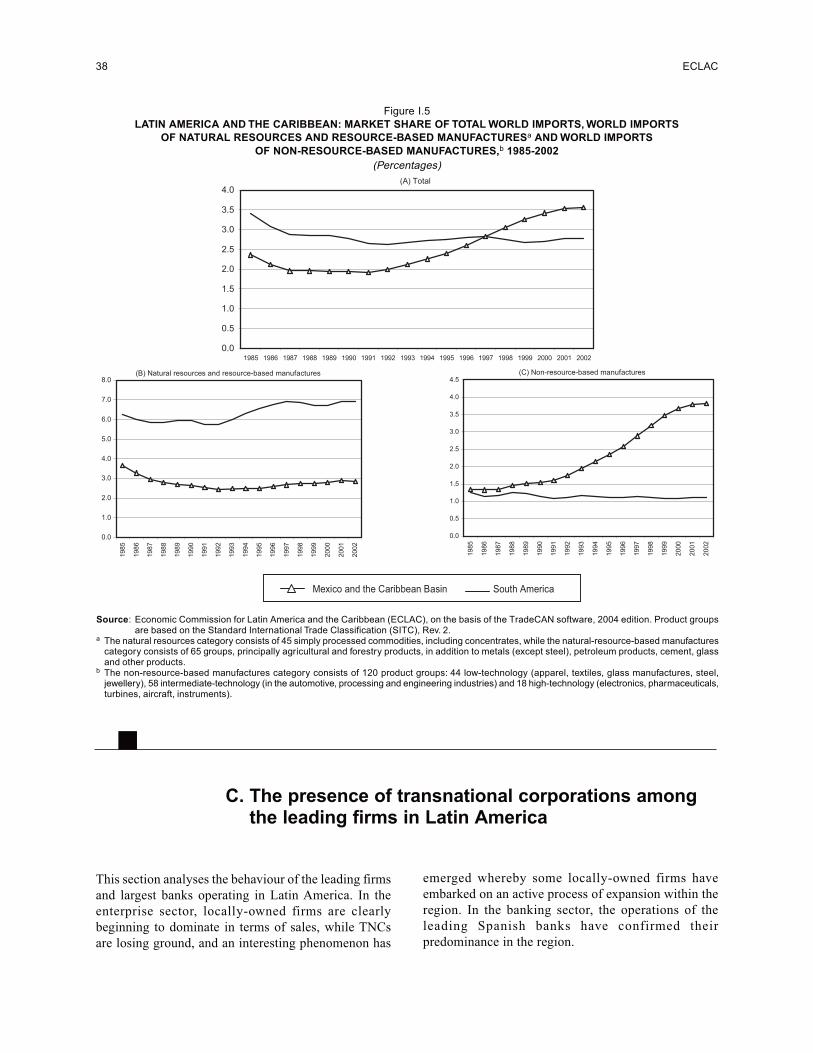
1990-2004........................................................................................................................................ 31Figure I.3 Latin America and the Caribbean: principal investor countries, 1996-2003................................. 32Figure I.4 Latin America and the Caribbean: net FDI inflows, by target sector,1996-2003.......................... 33Figure I.5 Latin America and the Caribbean: market share of total world imports, world imports
of natural resources and resource-based manufactures and world imports ofnon-resource-based manufactures, 1985-2002............................................................................... 38
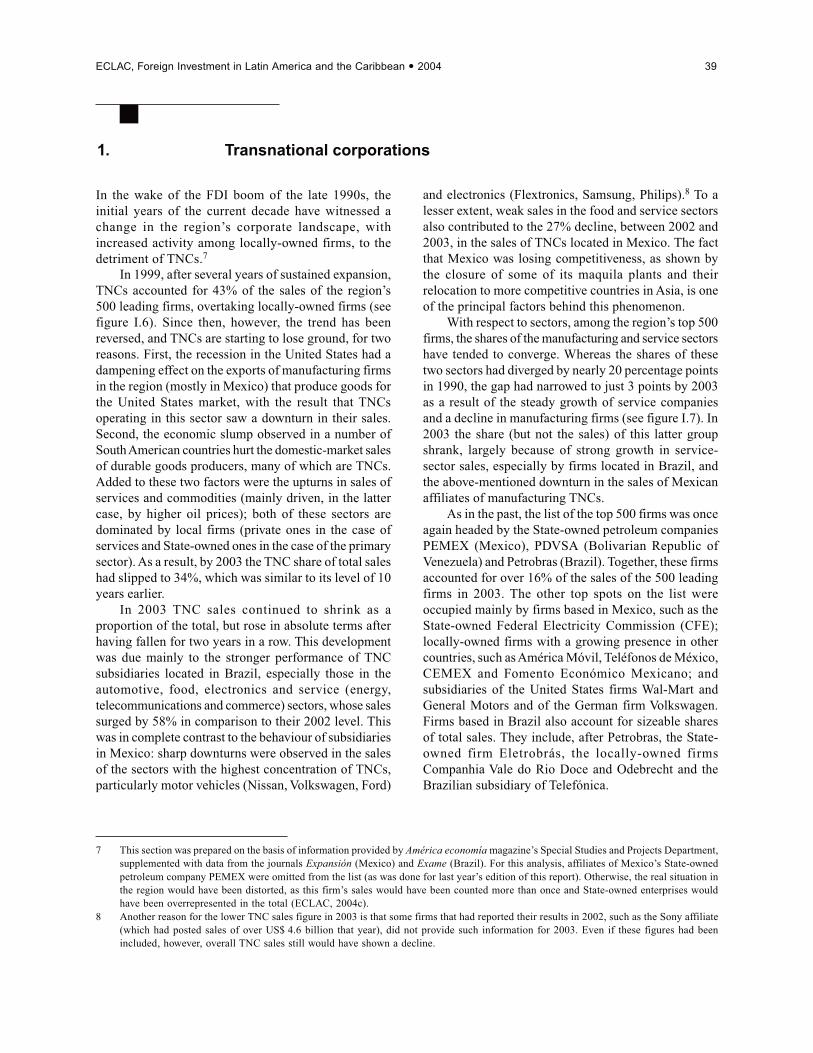
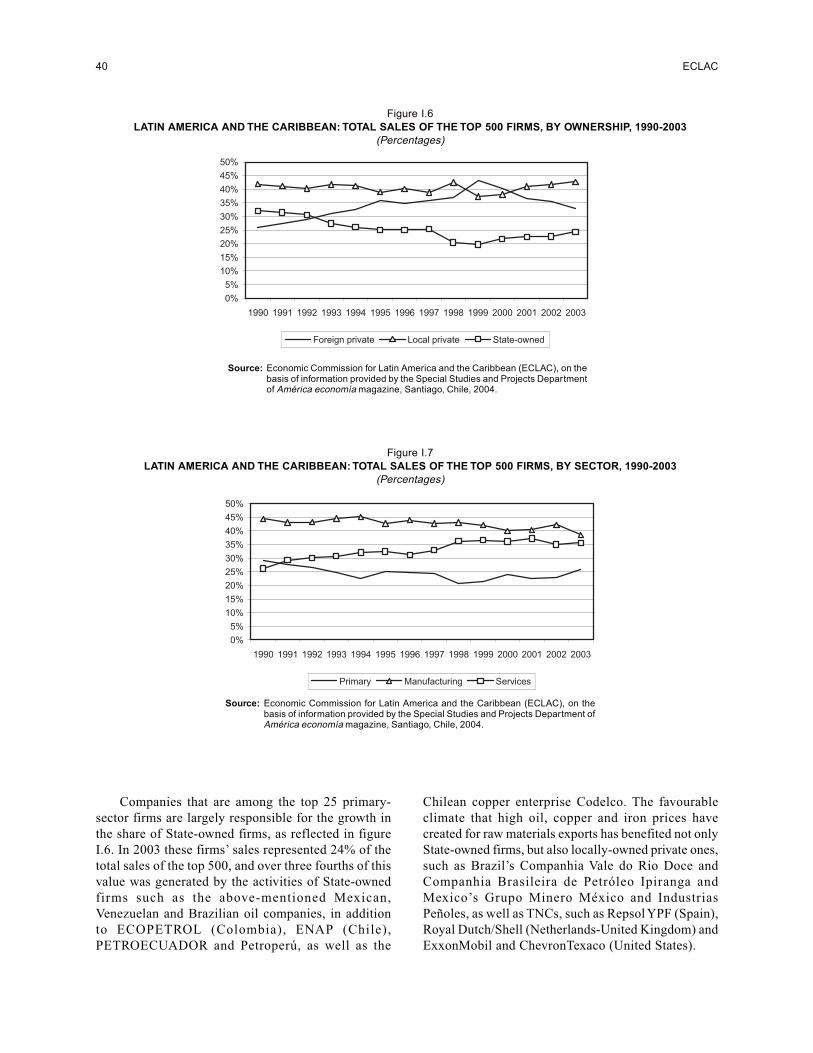
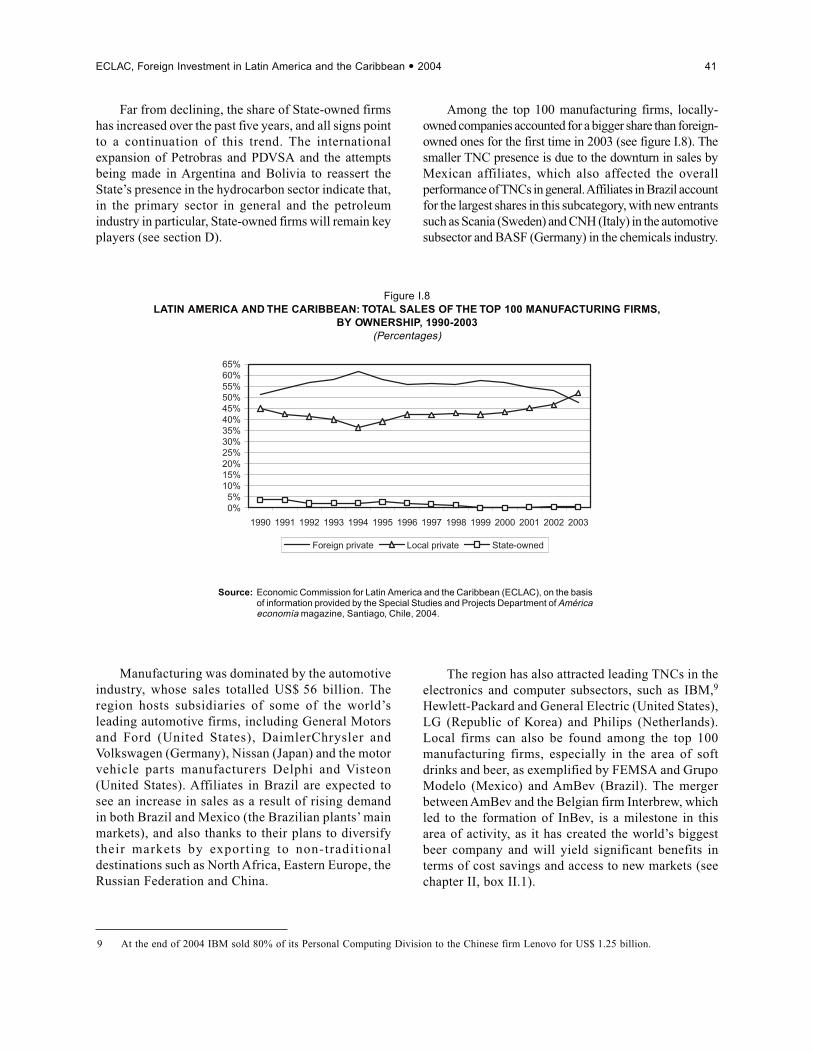
Figure I.6 Latin America and the Caribbean: total sales of the top 500 firms, by ownership, 1990-2003.... 40Figure I.7 Latin America and the Caribbean: total sales of the top 500 firms, by sector, 1990-2003............ 40Figure I.8 Latin America and the Caribbean: total sales of the top 100 manufacturing firms by
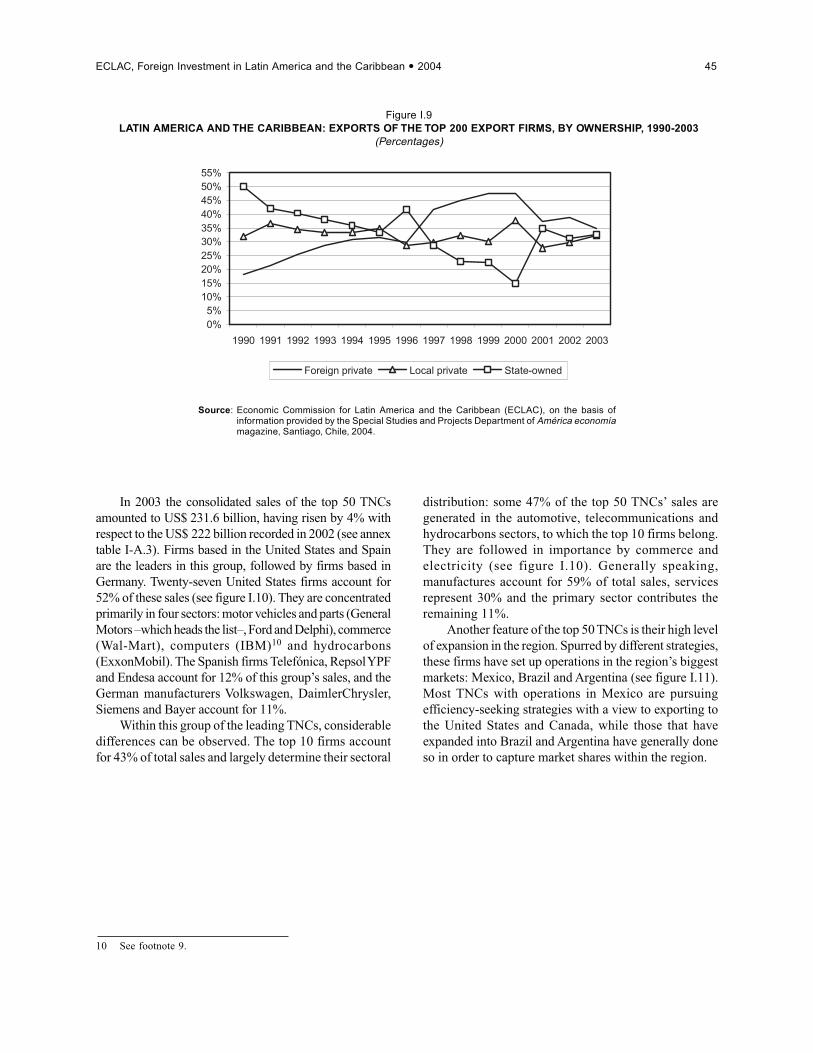
ownership, 1990-2003..................................................................................................................... 41Figure I.9 Latin America and the Caribbean: exports of the top 200 export firms, by ownership,
1990-2003........................................................................................................................................ 45
8 ECLAC
Page
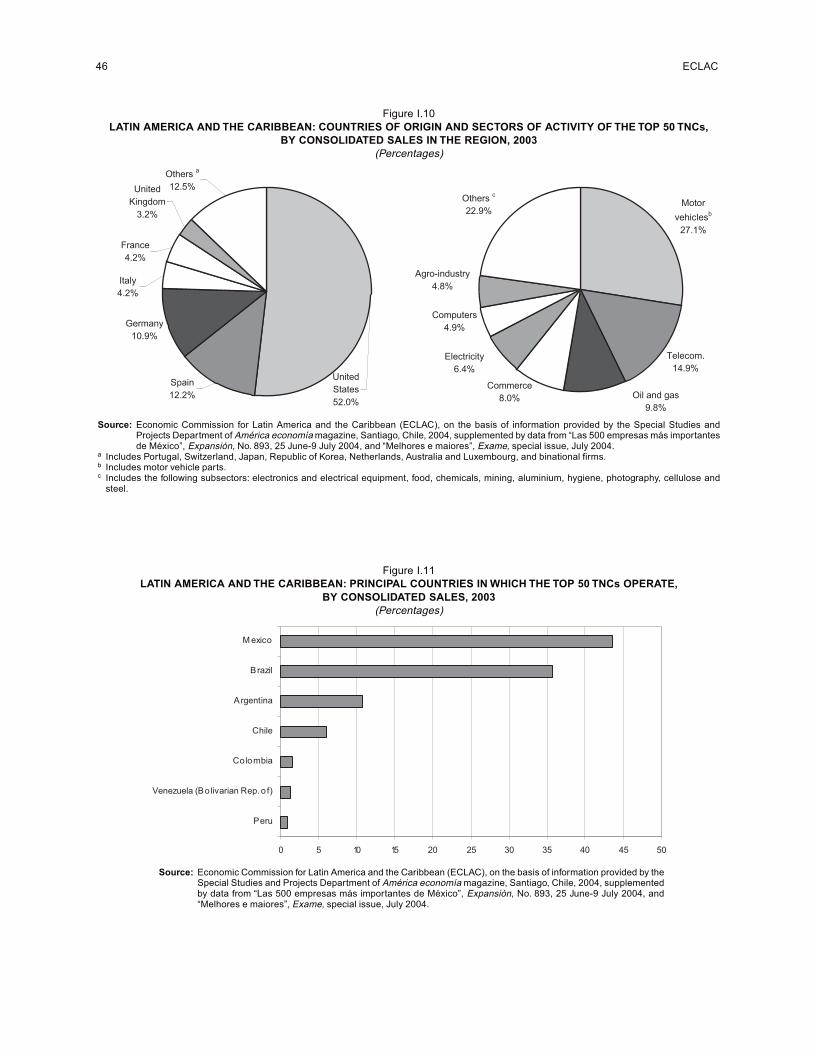
Figure I.10 Latin America and the Caribbean: countries of origin and sectors of activity of the top50 TNCs, by consolidated sales in the region, 2003 ........................................................................ 46
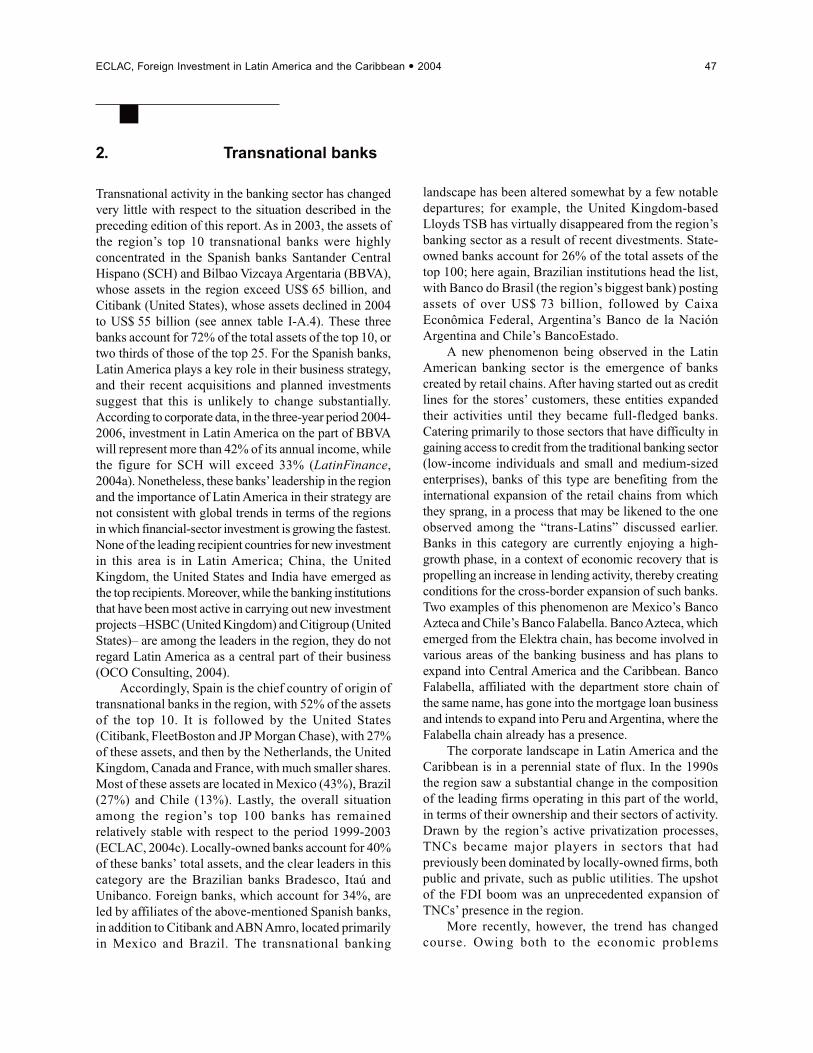
Figure I.11 Latin America and the Caribbean: principal countries in which the top 50 TNCs operate, byconsolidated sales, 2003 .................................................................................................................. 46
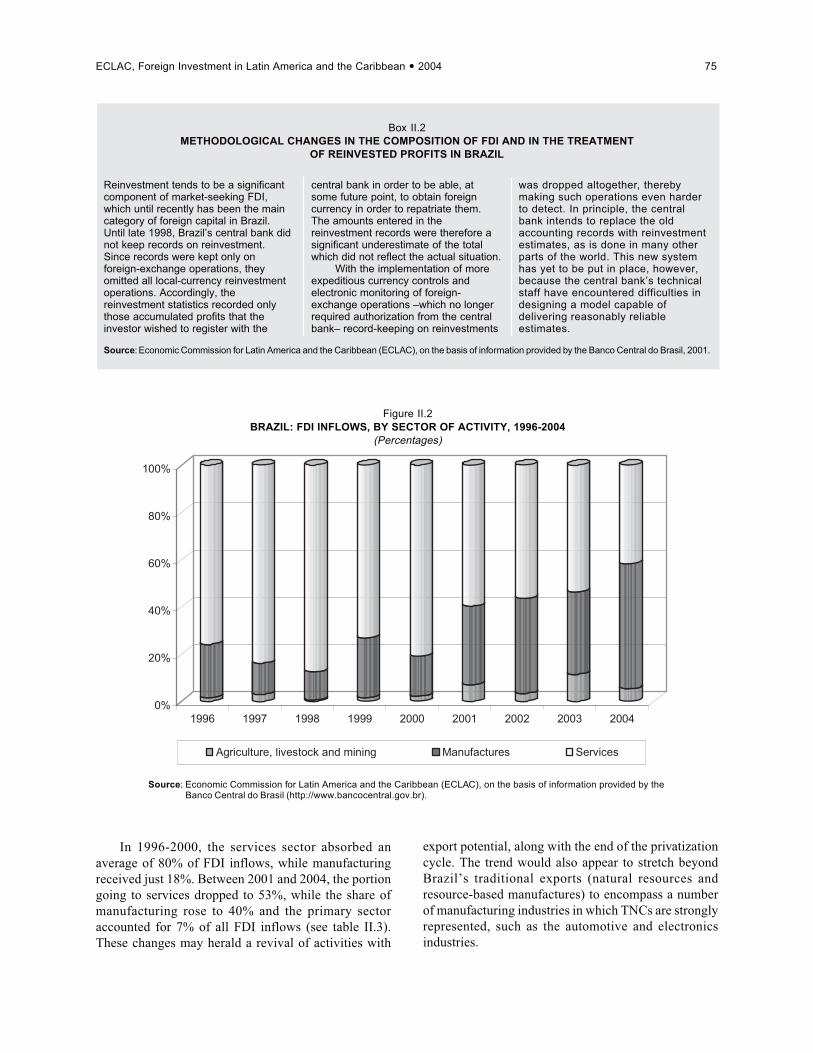
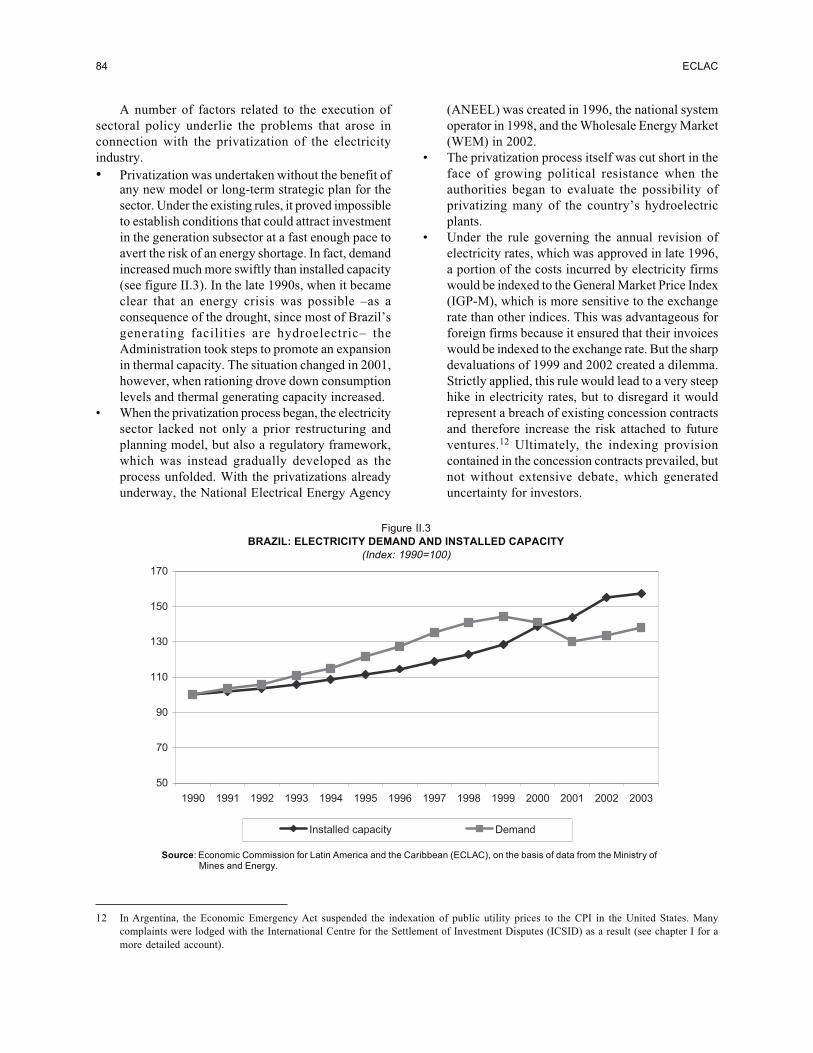
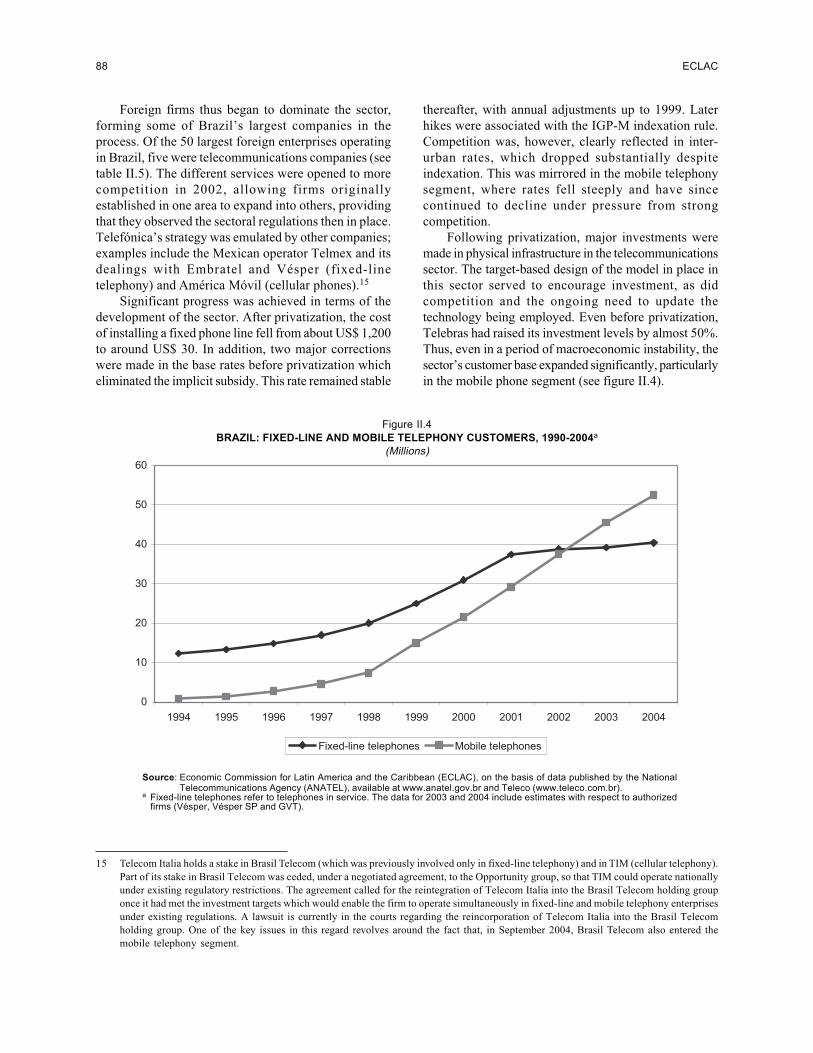
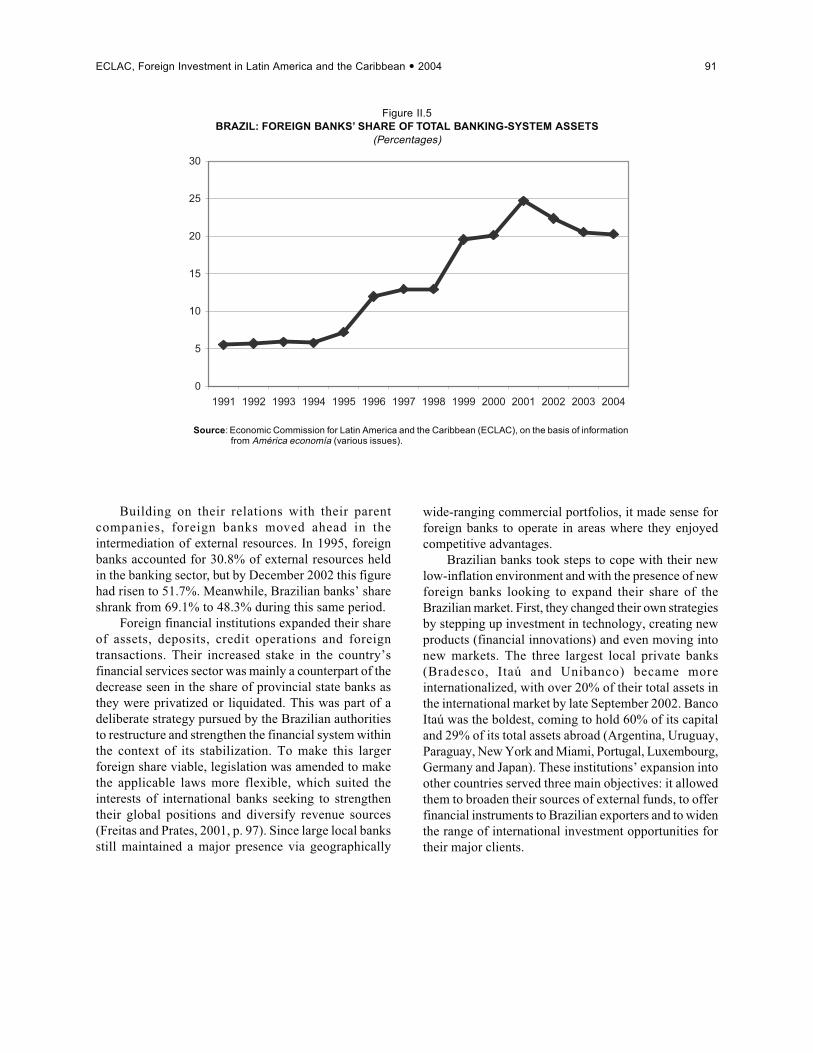
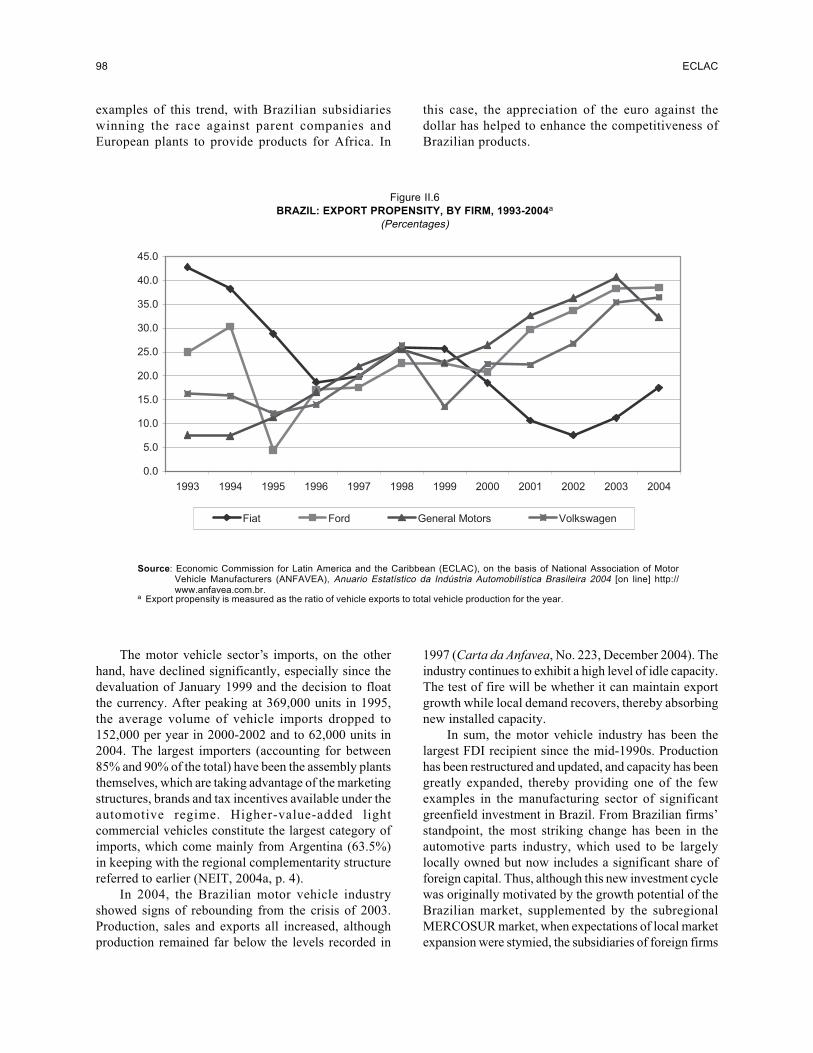
Figure II.1 Brazil: FDI inflows, 1980-2004...................................................................................................... 70Figure II.2 Brazil: FDI inflows, by sector of activity, 1996-2004.................................................................... 75Figure II.3 Brazil: electricity demand and installed capacity........................................................................... 84Figure II.4 Brazil: fixed-lines and mobile telephony customers, 1990-2004................................................... 88Figure II.5 Brazil: foreign banks’ share of total banking-system assets........................................................... 91Figure II.6 Brazil: export propensity, by firm, 1993-2004............................................................................... 98
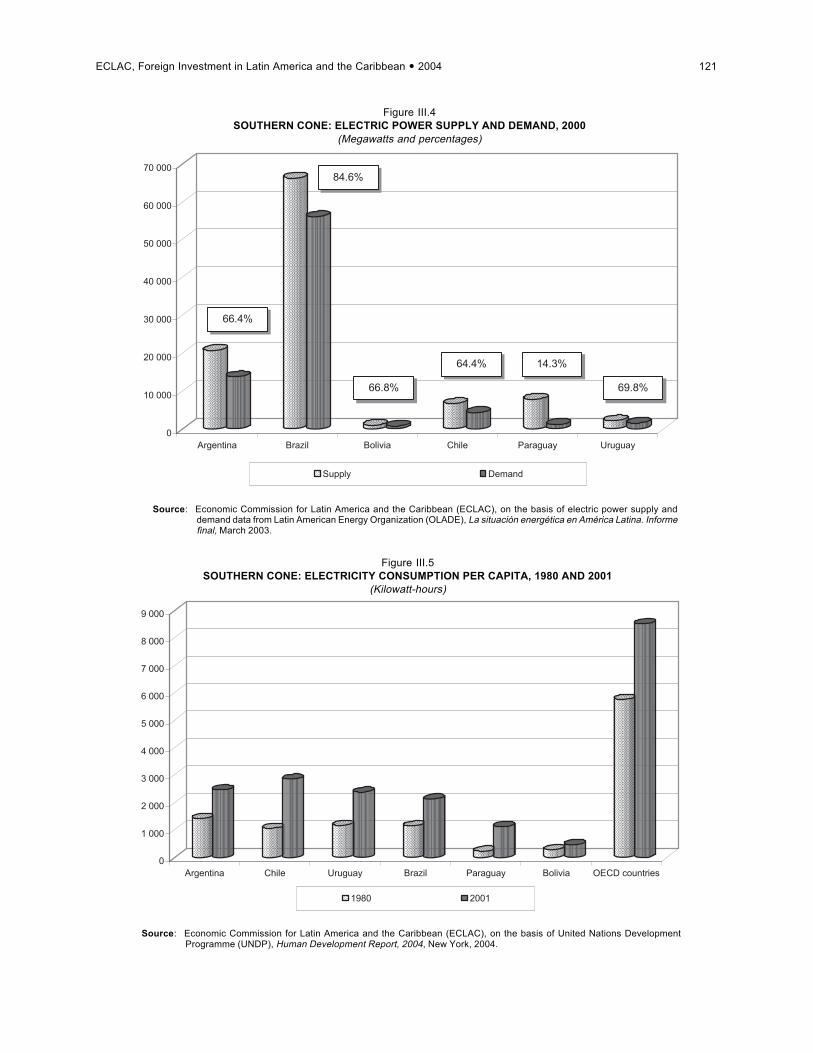
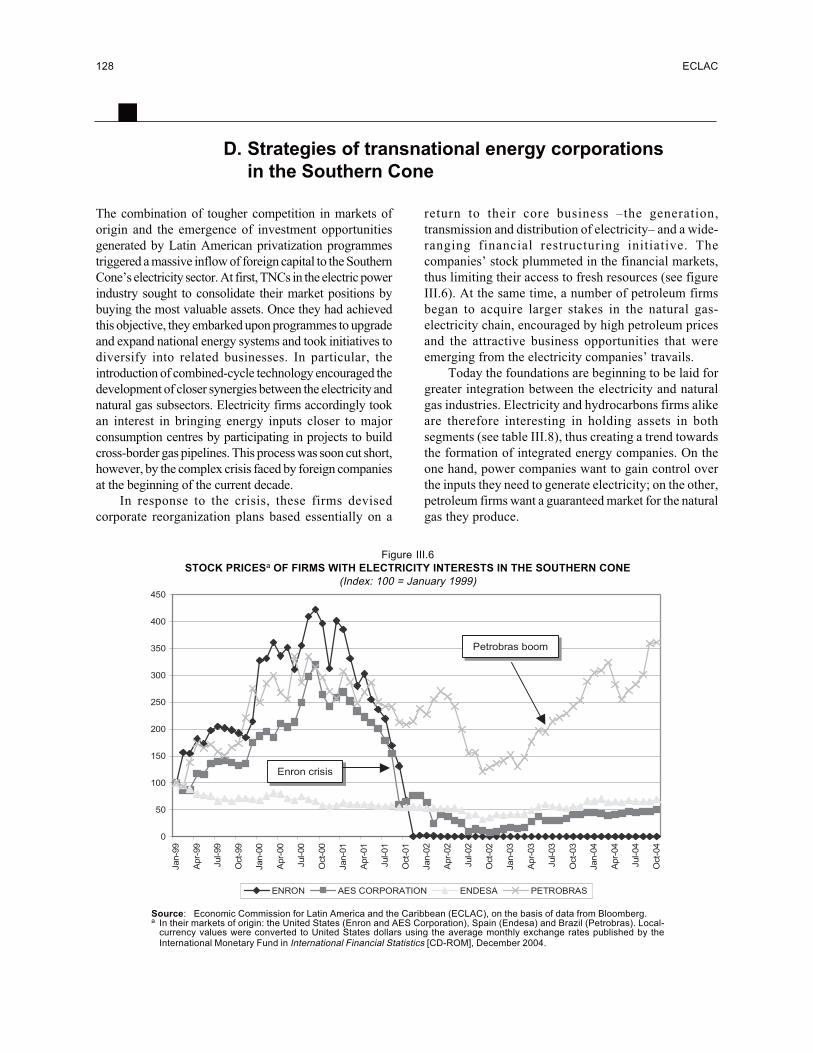
Figure III.1 Worldwide primary energy consumption, by energy source, 1970-2025...................................... 113Figure III.2 Southern Cone: network of gas export pipelines............................................................................ 117Figure III.3 Southern Cone: electricity interconnections................................................................................... 118Figure III.4 Southern Cone: electric power supply and demand, 2000............................................................. 121Figure III.5 Southern Cone: electricity consumption per capita, 1980 and 2001.............................................. 121Figure III.6 Stock prices of firms with electricity interests in the Southern Cone............................................ 128Figure III.7 Southern Cone: potential for electricity/gas integration................................................................. 145
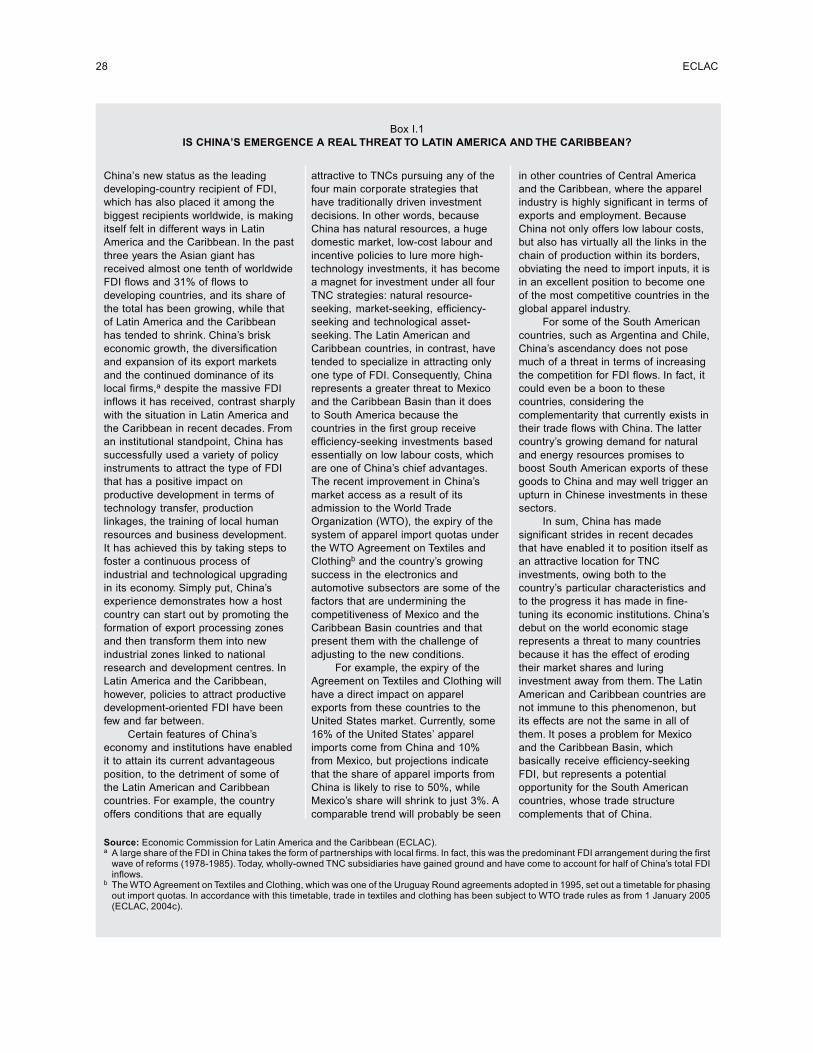
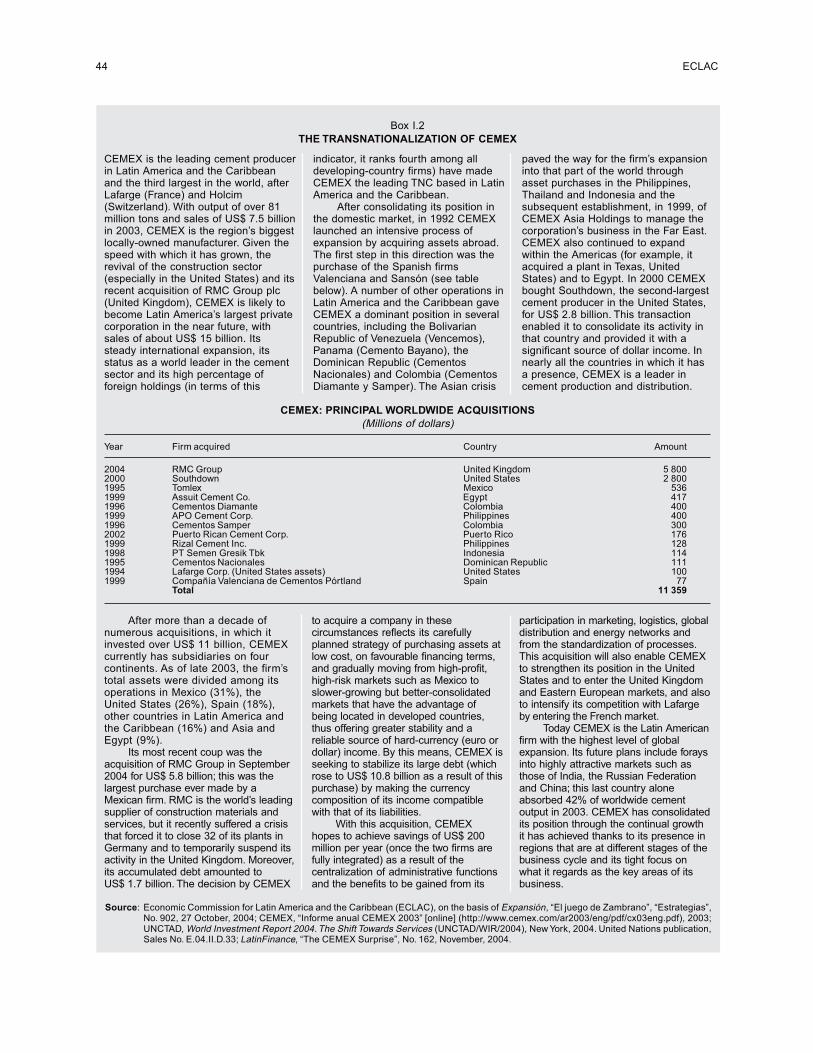
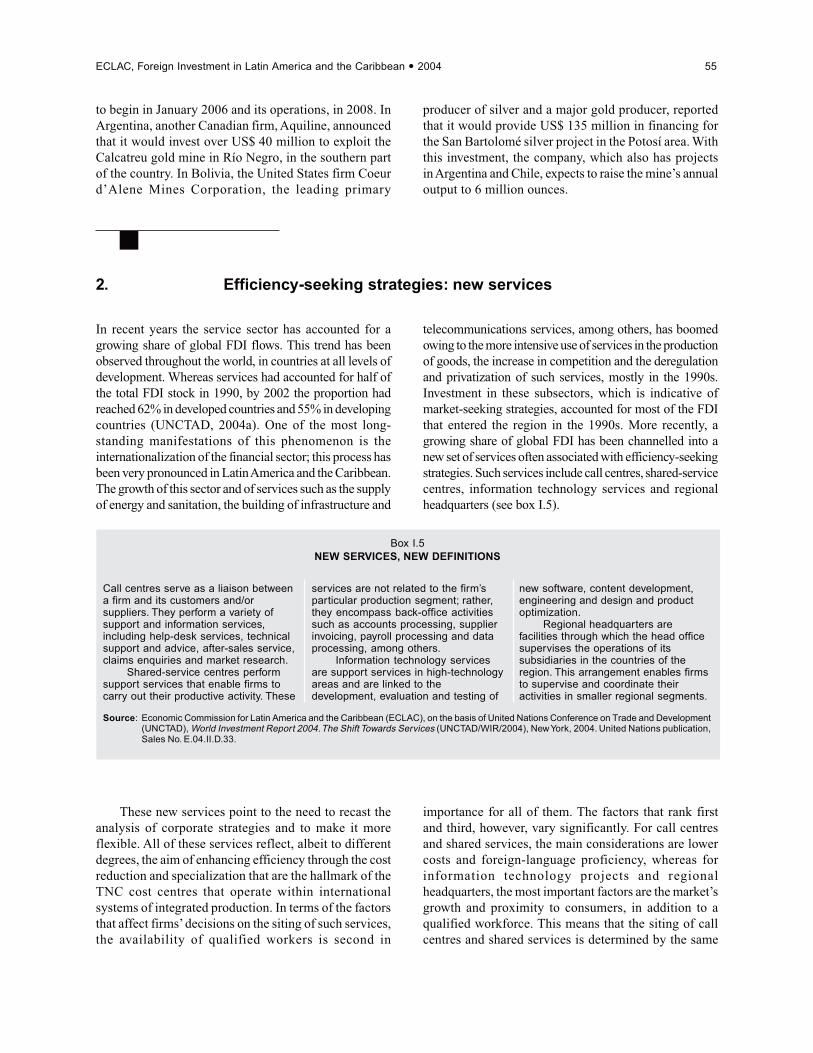
Box I.1 Is China’s emergence a real threat to Latin America and the Caribbean?..................................... 28Box I.2 The transnationalization of CEMEX.............................................................................................. 44Box I.3 Hydrocarbons: the State’s new leadership...................................................................................... 52Box I.4 The restructuring of Royal Dutch/Shell’s assets in Latin America................................................ 53Box I.5 New services, new definitions......................................................................................................... 55
Box II.1 Companhia de bebidas das Américas (AmBev): sale –or globalization?– of a Brazilian group ... 73Box II.2 Methodological changes in the composition of FDI and in the treatment of reinvested
profits in Brazil................................................................................................................................ 75Box II.3 Tax havens and an analysis of FDI by origin .................................................................................. 78Box II.4 Growth expectations for the electricity sector and the production of electrical materials and
equipment in Brazil........................................................................................................................ 85Box II.5 Impact of Telecoms sector expansion on the component and equipment manufacturing
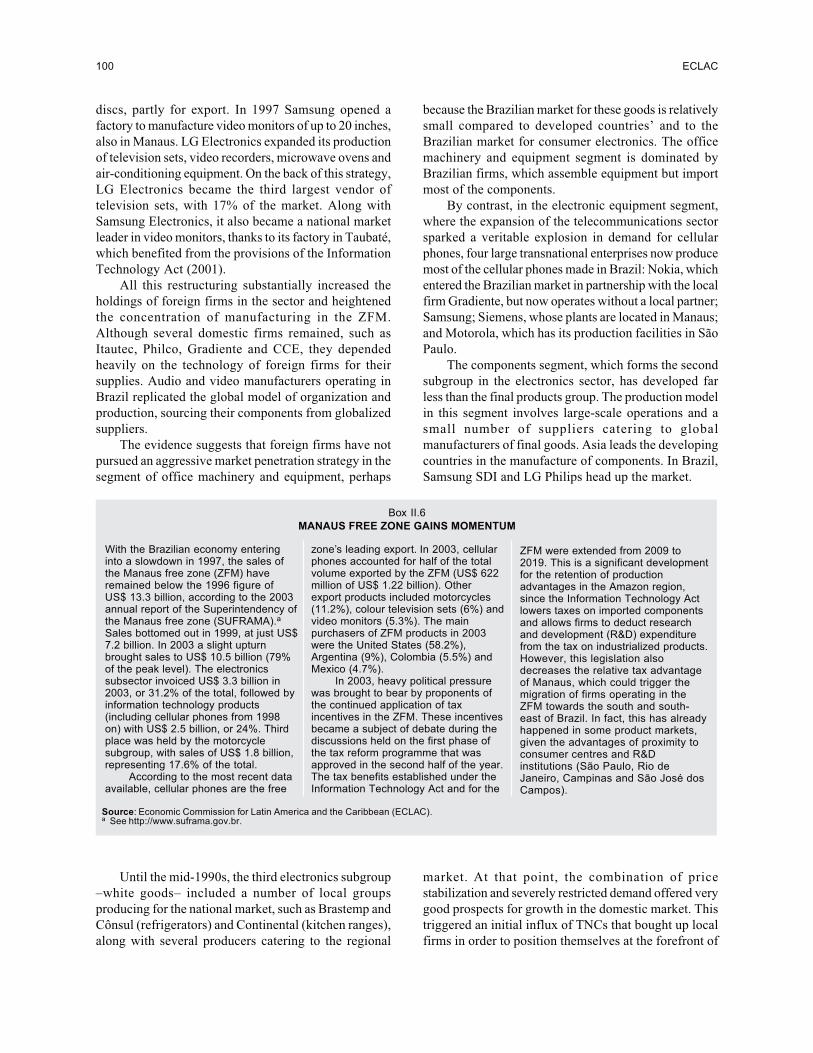
industry............................................................................................................................................ 89Box II.6 Manaus free zone gains momentum............................................................................................... 100Box II.7 A new industrial policy................................................................................................................... 107
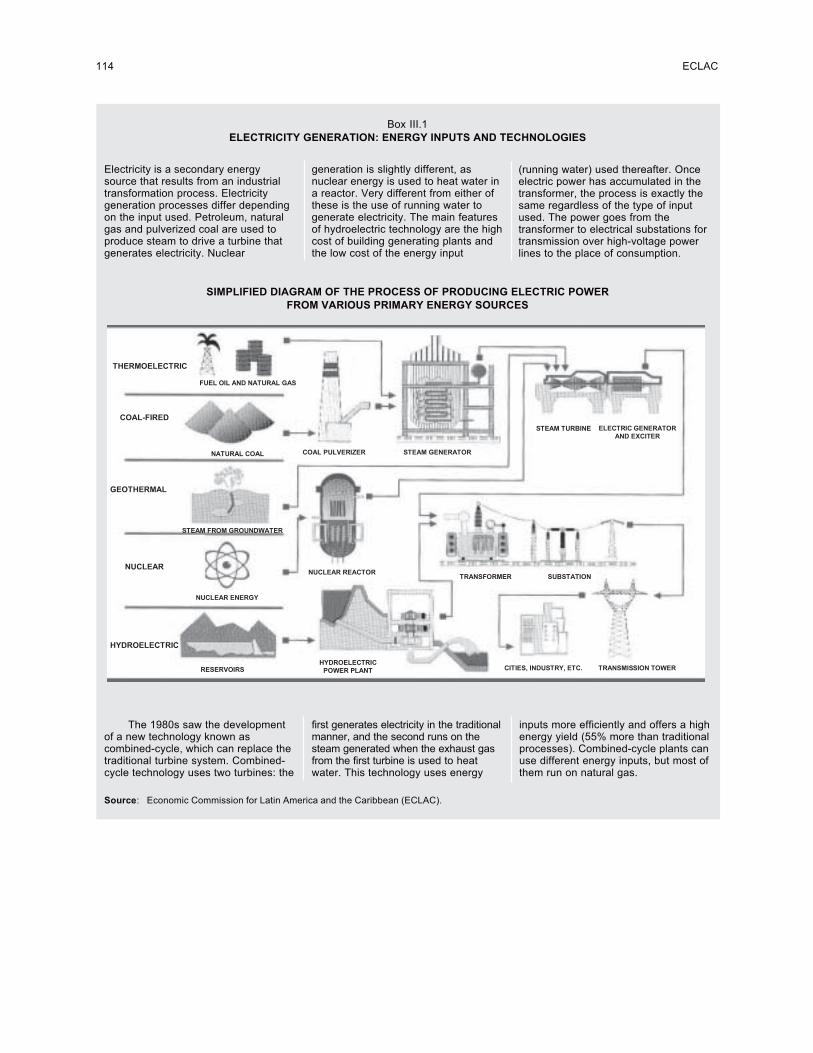
Box III.1 Electricity generation: energy inputs and technologies.................................................................. 114Box III.2 Bolivian gas: the question of access to the Pacific Ocean.............................................................. 116Box III.3 Enron: chronicle of a bankruptcy foretold...................................................................................... 122Box III.4 The United States and European Union regulatory models: implications for the
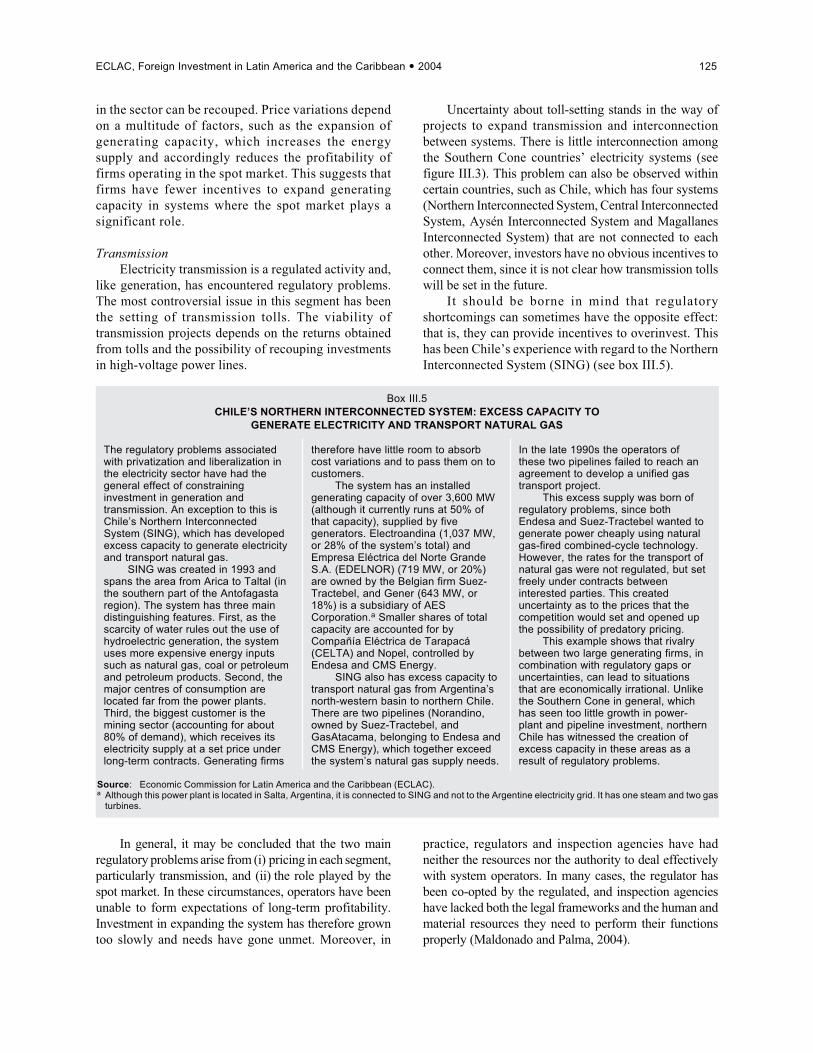
Southern Cone................................................................................................................................. 123Box III.5 Chile’s northern interconnected system: excess capacity to generate electricity and transport
natural gas........................................................................................................................................ 126Box III.6 Endesa in Latin America: the financial consolidation plan for Enersis......................................... 133Box III.7 Iberdrola: looking North-East......................................................................................................... 140
ECLAC, Foreign Investment in Latin America and the Caribbean 2004 9
Abstract
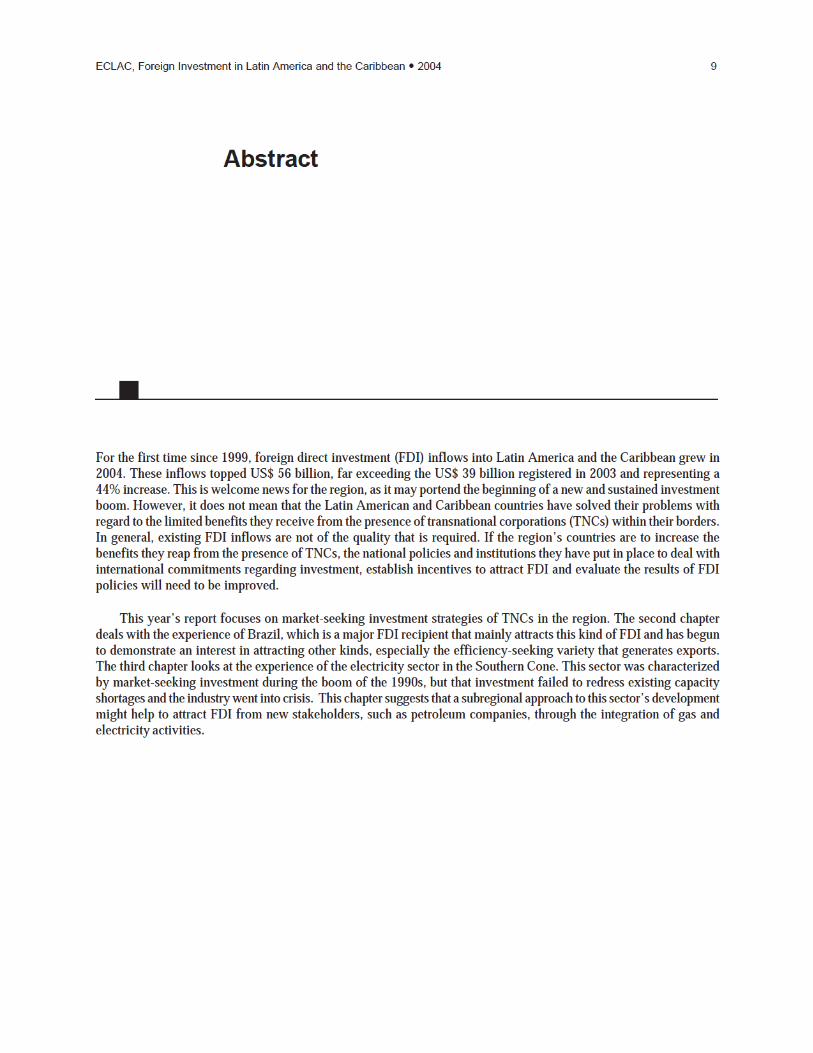
For the first time since 1999, foreign direct investment (FDI) inflows into Latin America and the Caribbean grew in2004. These inflows topped US$ 56 billion, far exceeding the US$ 39 billion registered in 2003 and representing a44% increase. This is welcome news for the region, as it may portend the beginning of a new and sustained investmentboom. However, it does not mean that the Latin American and Caribbean countries have solved their problems withregard to the limited benefits they receive from the presence of transnational corporations (TNCs) within their borders.In general, existing FDI inflows are not of the quality that is required. If the region’s countries are to increase thebenefits they reap from the presence of TNCs, the national policies and institutions they have put in place to deal withinternational commitments regarding investment, establish incentives to attract FDI and evaluate the results of FDIpolicies will need to be improved.
This year’s report focuses on market-seeking investment strategies of TNCs in the region. The second chapterdeals with the experience of Brazil, which is a major FDI recipient that mainly attracts this kind of FDI and has begunto demonstrate an interest in attracting other kinds, especially the efficiency-seeking variety that generates exports.The third chapter looks at the experience of the electricity sector in the Southern Cone. This sector was characterizedby market-seeking investment during the boom of the 1990s, but that investment failed to redress existing capacityshortages and the industry went into crisis. This chapter suggests that a subregional approach to this sector’s developmentmight help to attract FDI from new stakeholders, such as petroleum companies, through the integration of gas andelectricity activities.

ECLAC, Foreign Investment in Latin America and the Caribbean 2004 11
Summary and conclusions
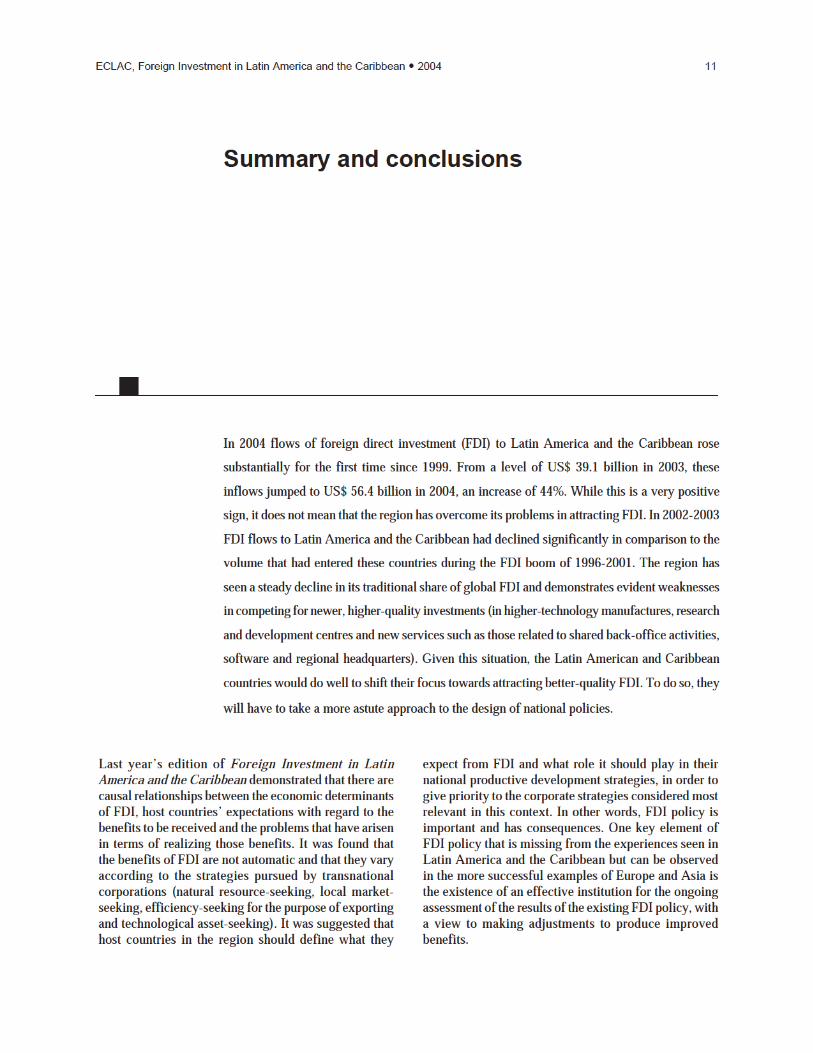
In 2004 flows of foreign direct investment (FDI) to Latin America and the Caribbean rose
substantially for the first time since 1999. From a level of US$ 39.1 billion in 2003, these
inflows jumped to US$ 56.4 billion in 2004, an increase of 44%. While this is a very positive
sign, it does not mean that the region has overcome its problems in attracting FDI. In 2002-2003
FDI flows to Latin America and the Caribbean had declined significantly in comparison to the
volume that had entered these countries during the FDI boom of 1996-2001. The region has
seen a steady decline in its traditional share of global FDI and demonstrates evident weaknesses
in competing for newer, higher-quality investments (in higher-technology manufactures, research
and development centres and new services such as those related to shared back-office activities,
software and regional headquarters). Given this situation, the Latin American and Caribbean
countries would do well to shift their focus towards attracting better-quality FDI. To do so, they
will have to take a more astute approach to the design of national policies.
Last year’s edition of Foreign Investment in LatinAmerica and the Caribbean demonstrated that there arecausal relationships between the economic determinantsof FDI, host countries’ expectations with regard to thebenefits to be received and the problems that have arisenin terms of realizing those benefits. It was found thatthe benefits of FDI are not automatic and that they varyaccording to the strategies pursued by transnationalcorporations (natural resource-seeking, local market-seeking, efficiency-seeking for the purpose of exportingand technological asset-seeking). It was suggested thathost countries in the region should define what they
expect from FDI and what role it should play in theirnational productive development strategies, in order togive priority to the corporate strategies considered mostrelevant in this context. In other words, FDI policy isimportant and has consequences. One key element ofFDI policy that is missing from the experiences seen inLatin America and the Caribbean but can be observedin the more successful examples of Europe and Asia isthe existence of an effective institution for the ongoingassessment of the results of the existing FDI policy, witha view to making adjustments to produce improvedbenefits.
12 ECLAC
A. Regional overview
The presence of transnational corporations (TNCs)in Latin America and the Caribbean is indicated bytwo different data sets. One consists of officialbalance-of-payments information on FDI inflows. The
other concerns the nature of the TNC presence, asmanifested in company-level information on salesoperations (both domestic and external).
1. FDI inflows
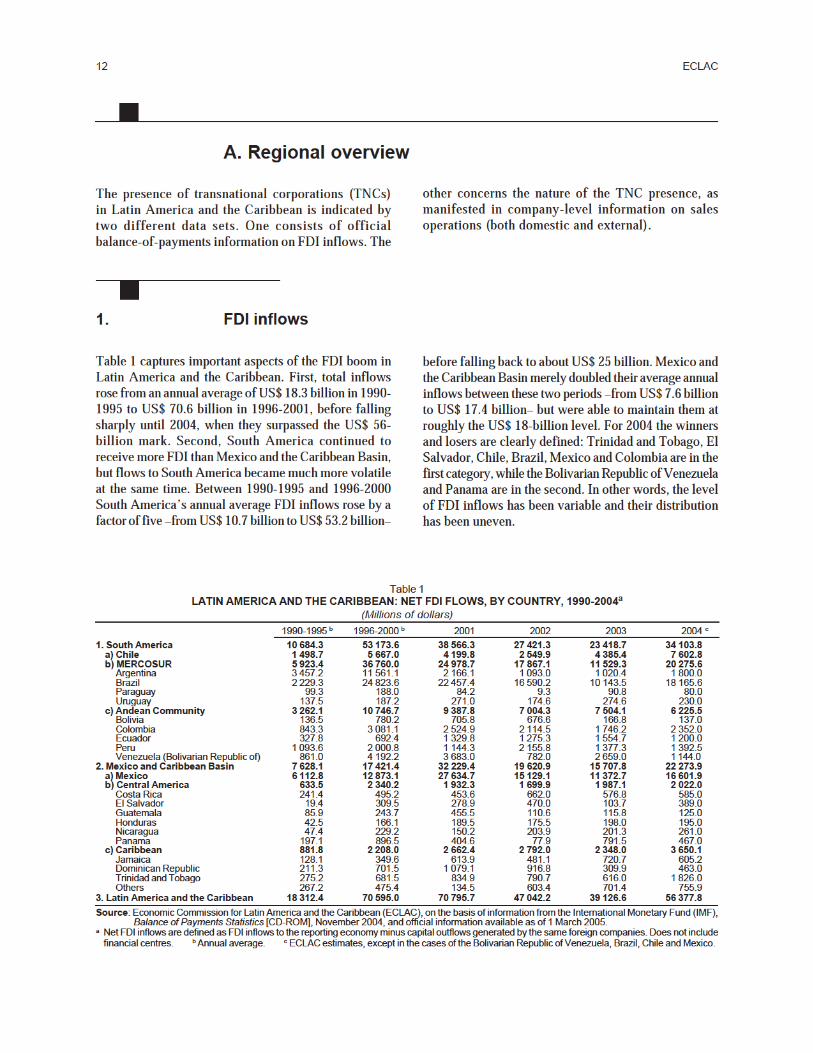
before falling back to about US$ 25 billion. Mexico andthe Caribbean Basin merely doubled their average annualinflows between these two periods –from US$ 7.6 billionto US$ 17.4 billion– but were able to maintain them atroughly the US$ 18-billion level. For 2004 the winnersand losers are clearly defined: Trinidad and Tobago, ElSalvador, Chile, Brazil, Mexico and Colombia are in thefirst category, while the Bolivarian Republic of Venezuelaand Panama are in the second. In other words, the levelof FDI inflows has been variable and their distributionhas been uneven.
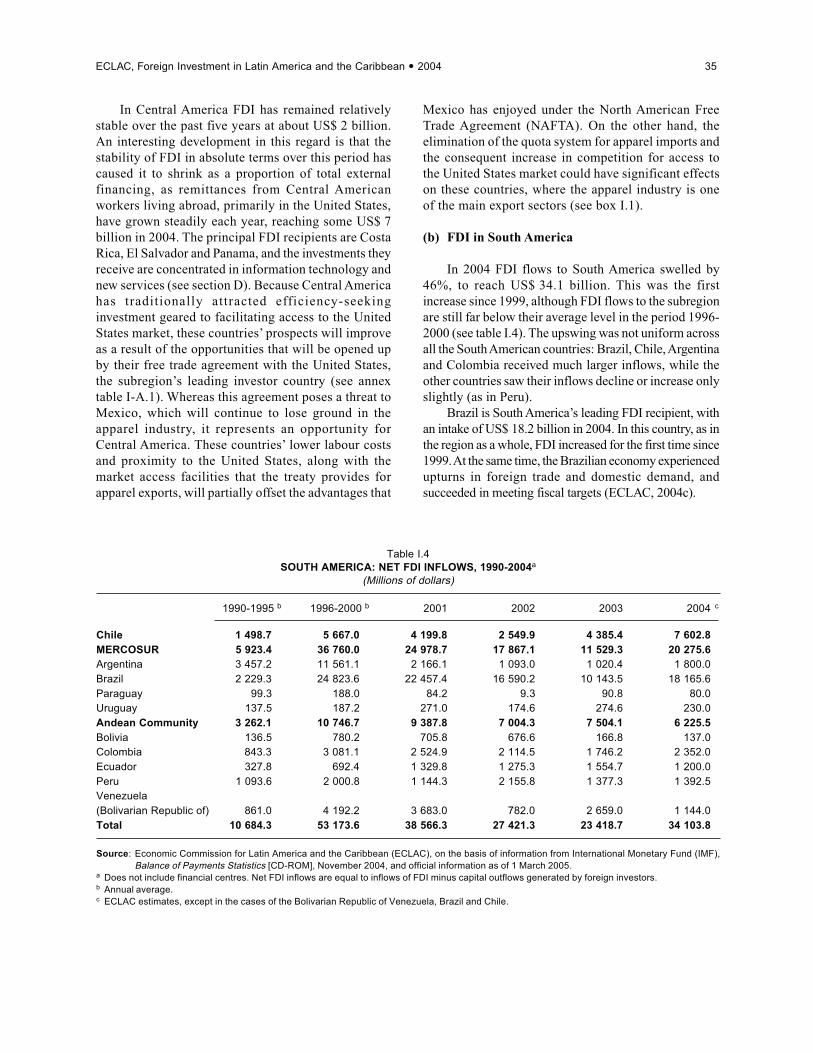
Table 1 captures important aspects of the FDI boom inLatin America and the Caribbean. First, total inflowsrose from an annual average of US$ 18.3 billion in 1990-1995 to US$ 70.6 billion in 1996-2001, before fallingsharply until 2004, when they surpassed the US$ 56-billion mark. Second, South America continued toreceive more FDI than Mexico and the Caribbean Basin,but flows to South America became much more volatileat the same time. Between 1990-1995 and 1996-2000South America’s annual average FDI inflows rose by afactor of five –from US$ 10.7 billion to US$ 53.2 billion–
Table 1LATIN AMERICA AND THE CARIBBEAN: NET FDI FLOWS, BY COUNTRY, 1990-2004a
(Millions of dollars)
1990-1995 b 1996-2000 b 2001 2002 2003 2004c
1. South America 10 684.3 53 173.6 38 566.3 27 421.3 23 418.7 34 103.8a) Chile 1 498.7 5 667.0 4 199.8 2 549.9 4 385.4 7 602.8b) MERCOSUR 5 923.4 36 760.0 24 978.7 17 867.1 11 529.3 20 275.6Argentina 3 457.2 11 561.1 2 166.1 1 093.0 1 020.4 1 800.0Brazil 2 229.3 24 823.6 22 457.4 16 590.2 10 143.5 18 165.6Paraguay 99.3 188.0 84.2 9.3 90.8 80.0Uruguay 137.5 187.2 271.0 174.6 274.6 230.0
c) Andean Community 3 262.1 10 746.7 9 387.8 7 004.3 7 504.1 6 225.5Bolivia 136.5 780.2 705.8 676.6 166.8 137.0Colombia 843.3 3 081.1 2 524.9 2 114.5 1 746.2 2 352.0Ecuador 327.8 692.4 1 329.8 1 275.3 1 554.7 1 200.0Peru 1 093.6 2 000.8 1 144.3 2 155.8 1 377.3 1 392.5Venezuela (Bolivarian Republic of) 861.0 4 192.2 3 683.0 782.0 2 659.0 1 144.0
2. Mexico and Caribbean Basin 7 628.1 17 421.4 32 229.4 19 620.9 15 707.8 22 273.9a) Mexico 6 112.8 12 873.1 27 634.7 15 129.1 11 372.7 16 601.9b) Central America 633.5 2 340.2 1 932.3 1 699.9 1 987.1 2 022.0Costa Rica 241.4 495.2 453.6 662.0 576.8 585.0El Salvador 19.4 309.5 278.9 470.0 103.7 389.0Guatemala 85.9 243.7 455.5 110.6 115.8 125.0Honduras 42.5 166.1 189.5 175.5 198.0 195.0Nicaragua 47.4 229.2 150.2 203.9 201.3 261.0Panama 197.1 896.5 404.6 77.9 791.5 467.0
c) Caribbean 881.8 2 208.0 2 662.4 2 792.0 2 348.0 3 650.1Jamaica 128.1 349.6 613.9 481.1 720.7 605.2Dominican Republic 211.3 701.5 1 079.1 916.8 309.9 463.0Trinidad and Tobago 275.2 681.5 834.9 790.7 616.0 1 826.0Others 267.2 475.4 134.5 603.4 701.4 755.9
3. Latin America and the Caribbean 18 312.4 70 595.0 70 795.7 47 042.2 39 126.6 56 377.8
Source: Economic Commission for Latin America and the Caribbean (ECLAC), on the basis of information from the International Monetary Fund (IMF),Balance of Payments Statistics [CD-ROM], November 2004, and official information available as of 1 March 2005.
aNet FDI inflows are defined as FDI inflows to the reporting economy minus capital outflows generated by the same foreign companies. Does not includefinancial centres. b Annual average. c ECLAC estimates, except in the cases of the Bolivarian Republic of Venezuela, Brazil, Chile and Mexico.
ECLAC, Foreign Investment in Latin America and the Caribbean 2004 13
With regard to some of the main features of FDIflows to Latin America and the Caribbean, inflows fromEuropean countries have been much more variable andhave declined significantly in recent years in comparisonto those from the United States. In terms of the sectoraldistribution of these flows, services still receive the lion’sshare of FDI (60%), although flows to manufacturing(30%) have bounced back to some extent in the last few
years. While privatization programmes now play a muchless important role in attracting FDI than they did in thepast, the acquisition of private assets is still verysignificant. It should be mentioned that the use of taxhavens as financial intermediaries limits the overallutility of statistical information from source countries,as does the use of different sectoral classifications indescribing the distribution of such resources.
2. The presence and operations of TNCs
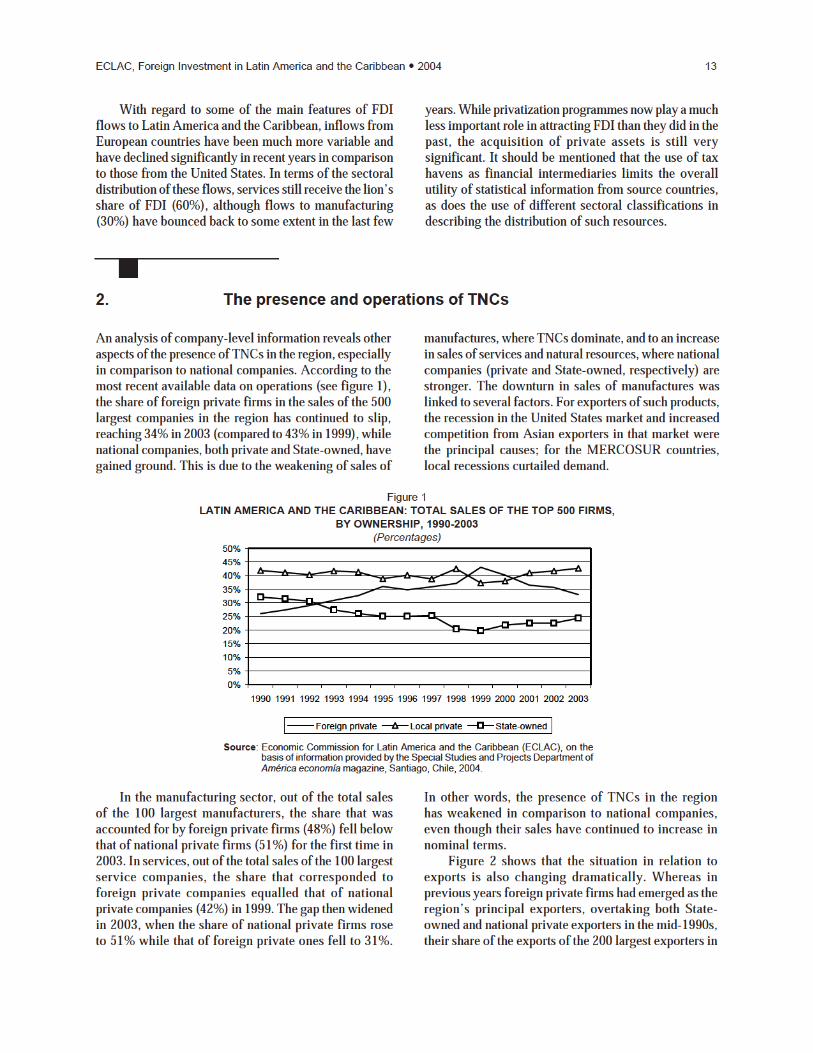
An analysis of company-level information reveals otheraspects of the presence of TNCs in the region, especiallyin comparison to national companies. According to themost recent available data on operations (see figure 1),the share of foreign private firms in the sales of the 500largest companies in the region has continued to slip,reaching 34% in 2003 (compared to 43% in 1999), whilenational companies, both private and State-owned, havegained ground. This is due to the weakening of sales of
manufactures, where TNCs dominate, and to an increasein sales of services and natural resources, where nationalcompanies (private and State-owned, respectively) arestronger. The downturn in sales of manufactures waslinked to several factors. For exporters of such products,the recession in the United States market and increasedcompetition from Asian exporters in that market werethe principal causes; for the MERCOSUR countries,local recessions curtailed demand.
Figure 1
LATIN AMERICA AND THE CARIBBEAN: TOTAL SALES OF THE TOP 500 FIRMS,BY OWNERSHIP, 1990-2003
(Percentages)
0%
5%
10%
15%
20%
25%
30%
35%
40%
45%
50%
1990 1991 1992 1993 1994 1995 1996 1997 1998 1999 2000 2001 2002 2003
Foreign private Local private State-owned
Source: Economic Commission for Latin America and the Caribbean (ECLAC), on thebasis of information provided by the Special Studies and Projects Department ofAmérica economía magazine, Santiago, Chile, 2004.
In the manufacturing sector, out of the total salesof the 100 largest manufacturers, the share that wasaccounted for by foreign private firms (48%) fell belowthat of national private firms (51%) for the first time in2003. In services, out of the total sales of the 100 largestservice companies, the share that corresponded toforeign private companies equalled that of nationalprivate companies (42%) in 1999. The gap then widenedin 2003, when the share of national private firms roseto 51% while that of foreign private ones fell to 31%.
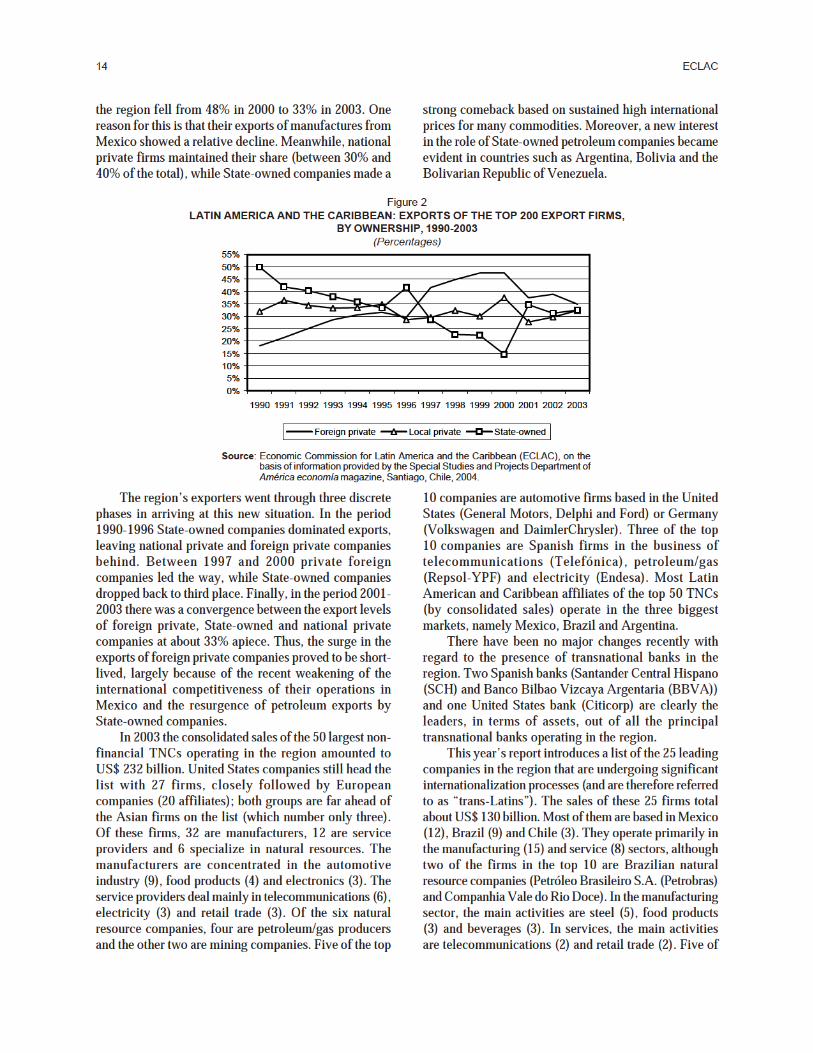
In other words, the presence of TNCs in the regionhas weakened in comparison to national companies,even though their sales have continued to increase innominal terms.Figure 2 shows that the situation in relation to
exports is also changing dramatically. Whereas inprevious years foreign private firms had emerged as theregion’s principal exporters, overtaking both State-owned and national private exporters in the mid-1990s,their share of the exports of the 200 largest exporters in
14 ECLAC
the region fell from 48% in 2000 to 33% in 2003. Onereason for this is that their exports of manufactures fromMexico showed a relative decline. Meanwhile, nationalprivate firms maintained their share (between 30% and40% of the total), while State-owned companies made a
strong comeback based on sustained high internationalprices for many commodities. Moreover, a new interestin the role of State-owned petroleum companies becameevident in countries such as Argentina, Bolivia and theBolivarian Republic of Venezuela.
The region’s exporters went through three discretephases in arriving at this new situation. In the period1990-1996 State-owned companies dominated exports,leaving national private and foreign private companiesbehind. Between 1997 and 2000 private foreigncompanies led the way, while State-owned companiesdropped back to third place. Finally, in the period 2001-2003 there was a convergence between the export levelsof foreign private, State-owned and national privatecompanies at about 33% apiece. Thus, the surge in theexports of foreign private companies proved to be short-lived, largely because of the recent weakening of theinternational competitiveness of their operations inMexico and the resurgence of petroleum exports byState-owned companies.In 2003 the consolidated sales of the 50 largest non-
financial TNCs operating in the region amounted toUS$ 232 billion. United States companies still head thelist with 27 firms, closely followed by Europeancompanies (20 affiliates); both groups are far ahead ofthe Asian firms on the list (which number only three).Of these firms, 32 are manufacturers, 12 are serviceproviders and 6 specialize in natural resources. Themanufacturers are concentrated in the automotiveindustry (9), food products (4) and electronics (3). Theservice providers deal mainly in telecommunications (6),electricity (3) and retail trade (3). Of the six naturalresource companies, four are petroleum/gas producersand the other two are mining companies. Five of the top
10 companies are automotive firms based in the UnitedStates (General Motors, Delphi and Ford) or Germany(Volkswagen and DaimlerChrysler). Three of the top10 companies are Spanish firms in the business oftelecommunications (Telefónica), petroleum/gas(Repsol-YPF) and electricity (Endesa). Most LatinAmerican and Caribbean affiliates of the top 50 TNCs(by consolidated sales) operate in the three biggestmarkets, namely Mexico, Brazil and Argentina.There have been no major changes recently with
regard to the presence of transnational banks in theregion. Two Spanish banks (Santander Central Hispano(SCH) and Banco Bilbao Vizcaya Argentaria (BBVA))and one United States bank (Citicorp) are clearly theleaders, in terms of assets, out of all the principaltransnational banks operating in the region.This year’s report introduces a list of the 25 leading
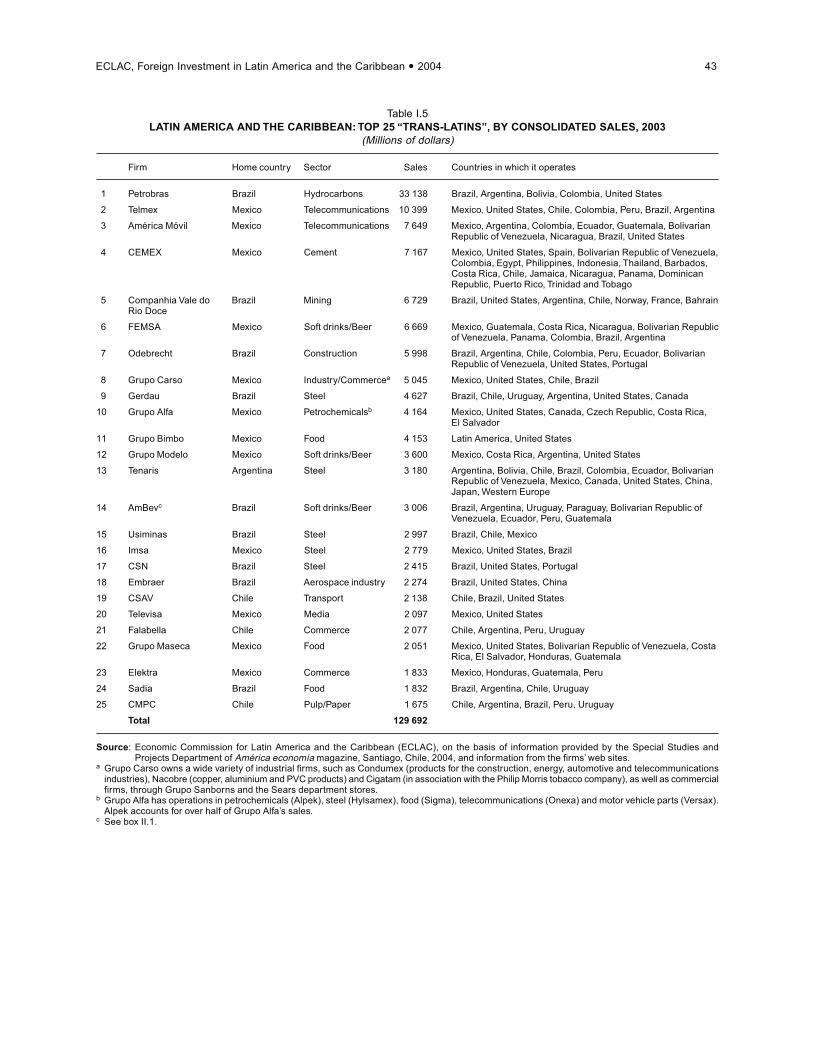
companies in the region that are undergoing significantinternationalization processes (and are therefore referredto as “trans-Latins”). The sales of these 25 firms totalabout US$ 130 billion. Most of them are based in Mexico(12), Brazil (9) and Chile (3). They operate primarily inthe manufacturing (15) and service (8) sectors, althoughtwo of the firms in the top 10 are Brazilian naturalresource companies (Petróleo Brasileiro S.A. (Petrobras)and Companhia Vale do Rio Doce). In the manufacturingsector, the main activities are steel (5), food products(3) and beverages (3). In services, the main activitiesare telecommunications (2) and retail trade (2). Five of
Figure 2
LATIN AMERICA AND THE CARIBBEAN: EXPORTS OF THE TOP 200 EXPORT FIRMS,BY OWNERSHIP, 1990-2003
(Percentages)
0%
5%
10%
15%
20%
25%
30%
35%
40%
45%
50%
55%
1990 1991 1992 1993 1994 1995 1996 1997 1998 1999 2000 2001 2002 2003
Foreign private Local private State-owned
Source: Economic Commission for Latin America and the Caribbean (ECLAC), on thebasis of information provided by the Special Studies and Projects Department ofAmérica economía magazine, Santiago, Chile, 2004.
ECLAC, Foreign Investment in Latin America and the Caribbean 2004 15
the top 10 internationalizers are Mexican, including bothservice providers (Telmex and América Móvil) andmanufacturers (CEMEX, Femsa, Grupo Alfa and GrupoCarso). CEMEX is already a transnational corporation,while others, such as Gerdau and Tenaris, are en route
to becoming TNCs. Thus, Latin America and theCaribbean appears to be sowing the seeds for thedevelopment of its own transnational corporations, eventhough most of these firms still operate exclusively inthe Americas.
3. Two different experiences in Latin America and the Caribbean
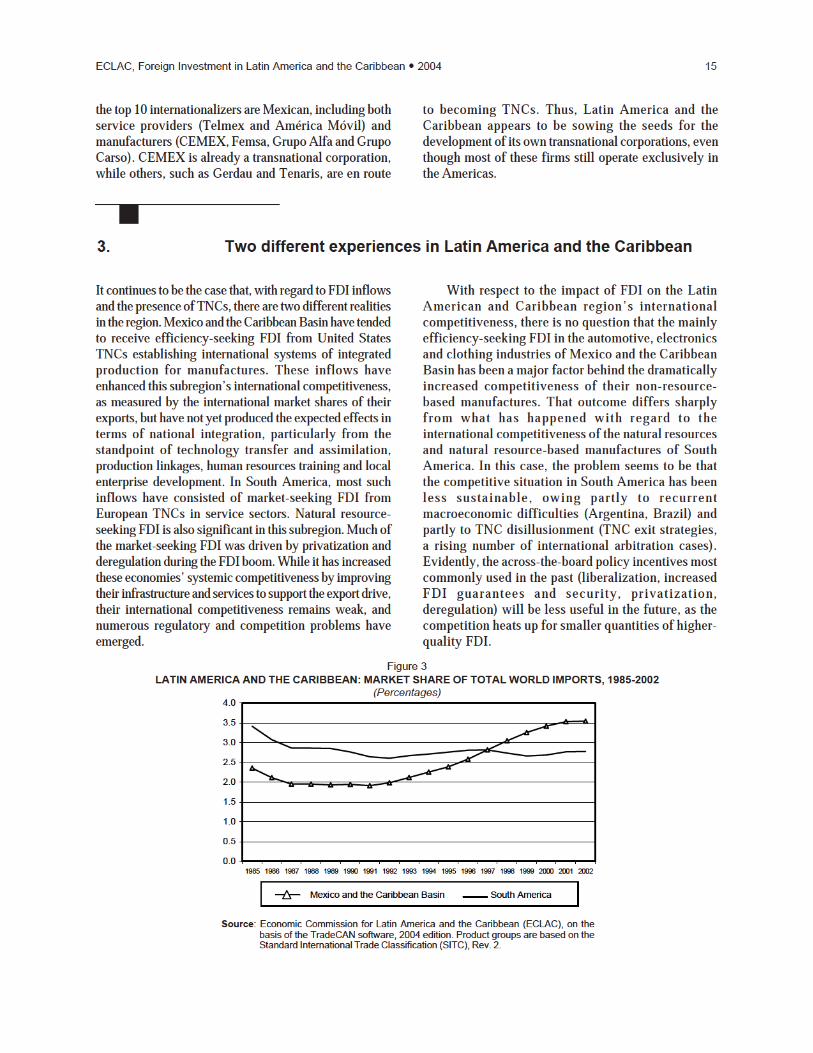
It continues to be the case that, with regard to FDI inflowsand the presence of TNCs, there are two different realitiesin the region. Mexico and the Caribbean Basin have tendedto receive efficiency-seeking FDI from United StatesTNCs establishing international systems of integratedproduction for manufactures. These inflows haveenhanced this subregion’s international competitiveness,as measured by the international market shares of theirexports, but have not yet produced the expected effects interms of national integration, particularly from thestandpoint of technology transfer and assimilation,production linkages, human resources training and localenterprise development. In South America, most suchinflows have consisted of market-seeking FDI fromEuropean TNCs in service sectors. Natural resource-seeking FDI is also significant in this subregion. Much ofthe market-seeking FDI was driven by privatization andderegulation during the FDI boom. While it has increasedthese economies’ systemic competitiveness by improvingtheir infrastructure and services to support the export drive,their international competitiveness remains weak, andnumerous regulatory and competition problems haveemerged.
With respect to the impact of FDI on the LatinAmerican and Caribbean region’s internationalcompetitiveness, there is no question that the mainlyefficiency-seeking FDI in the automotive, electronicsand clothing industries of Mexico and the CaribbeanBasin has been a major factor behind the dramaticallyincreased competitiveness of their non-resource-based manufactures. That outcome differs sharplyfrom what has happened with regard to theinternational competitiveness of the natural resourcesand natural resource-based manufactures of SouthAmerica. In this case, the problem seems to be thatthe competitive situation in South America has beenless sustainable, owing partly to recurrentmacroeconomic difficulties (Argentina, Brazil) andpartly to TNC disillusionment (TNC exit strategies,a rising number of international arbitration cases).Evidently, the across-the-board policy incentives mostcommonly used in the past (liberalization, increasedFDI guarantees and security, privatization,deregulation) will be less useful in the future, as thecompetition heats up for smaller quantities of higher-quality FDI.
Figure 3LATIN AMERICA AND THE CARIBBEAN: MARKET SHARE OF TOTAL WORLD IMPORTS, 1985-2002
(Percentages)
0.0
0.5
1.0
1.5
2.0
2.5
3.0
3.5
4.0
1985 1986 1987 1988 1989 1990 1991 1992 1993 1994 1995 1996 1997 1998 1999 2000 2001 2002
Mexico and the Caribbean Basin South America
Source: Economic Commission for Latin America and the Caribbean (ECLAC), on thebasis of the TradeCAN software, 2004 edition. Product groups are based on theStandard International Trade Classification (SITC), Rev. 2.
16 ECLAC
One particularly serious manifestation of TNCdisillusionment with the region is the growing frequencyof international investment disputes. In the world as awhole, the number of such disputes –involvinginvestment treaties at the bilateral, regional (e.g., NorthAmerican Free Trade Agreement (NAFTA)) orplurilateral (e.g., European Energy Charter) level– rosefrom 5 to 171 between 1994 and 2004; over half of themwere opened in the last three years. At the InternationalCentre for Settlement of Investment Disputes (ICSID),which is the principal forum, this number has jumped
from 3 to 106. Fifty governments have been parties toinvestment treaty arbitration, but the ones most ofteninvolved in such litigation are in the Americas: Argentina(37 cases), Mexico (14) and the United States (10). Whileit might be argued that Argentina is a special case, thefact of the matter is that TNCs are displaying a growingwillingness to make greater use of investor-State disputesettlement mechanisms, which facilitate internationalarbitration. This could entail considerable financial costsfor the host countries and further reduce the policy spaceavailable to national decision-makers.
4. Non-market-seeking corporate strategies
Chapter II (on Brazil) and chapter III (on the electricpower sector in the Southern Cone) of this report focusmainly on market-seeking investment strategies and theireffects. For that reason, this section will briefly refer tosome of the new developments taking place in the naturalresource-seeking and efficiency-seeking strategiesobserved in Latin America and the Caribbean. In thenatural resource sector, a significant number of large-scale projects continue to be implemented, especially inmining. The situation with regard to petroleum/gas,however, has changed in that the initiative seems to becoming more from national hydrocarbons companiesthan from TNCs.In mining, a number of major new projects are under
way. Examples include copper mines such as BHPBilliton’s Escondida project in Chile and Xstrata’s LasBambas project in Peru, and gold and silver mines suchas Barrick Gold’s Pascua-Lama project on the Argentine-Chilean border, Coeur d’Alene’s San Bartolomé projectin Bolivia and Aquiline’s Calcatreu project in Argentina.The discussion in Chile, or the application in Peru, ofnew royalties on non-renewable mineral resources donot seem to have had any major effect on the undertakingof new projects in those countries.The situation in the petroleum/gas sector is
different. Several major projects are still beingimplemented, such as the Camisea project being carriedout by Hunt Oil, Pluspetrol and SK Corporation in Peru,ChevronTexaco’s project on the maritime boundarybetween the Bolivarian Republic of Venezuela andTrinidad and Tobago and the Sincor project beingimplemented by the Bolivarian Republic of Venezuela’sState-owned petroleum company (Petróleos deVenezuela S.A., or PDVSA), together with Total and
Statoil. Nevertheless, the new activism and expansionof national petroleum companies, whether existing(Brazil’s Petrobras, Chile’s Empresa Nacional delPetróleo (ENAP)), new (Argentina’s Energía ArgentinaS.A. (ENARSA)) or restructured (Bolivia’s YacimientosPetrolíferos Fiscales de Bolivia (YPFB)), combinedwith the political uncertainty that prevailed in theBolivarian Republic of Venezuela in 2004, seem to havecooled the activities of some of the TNCs operating inthe region. One sign of this trend was the decision takenby Royal Dutch/Shell, the world’s third-biggestpetroleum company, to sell off assets in the region,including its network of service stations in Peru,Bolivarian Republic of Venezuela, Chile and Argentinaand a refinery in Argentina. The company is selling offa number of assets worldwide to concentrate more onits core activities, and Latin America and the Caribbeanno longer appears to be a priority.With regard to efficiency-seeking strategies, the
number of mega-projects seems to have declinedsignificantly and the competition from China and othercountries to host such investment projects has grown.One major new project was Ford’s US$ 1.2-billionundertaking in Hermosillo, Mexico, in 2004-2005 toconvert its existing plant into a modular one specializingin the production of the new Futura model for export toNorth America. The region continues to fare poorly inglobal rankings on FDI projects, as it attracts only about5% of the total.Of greater concern is the situation with regard to
new services, many of which are related to efficiency-seeking strategies. The Latin American and Caribbeancountries do not rank among the top locations for newservices such as shared-service centres, research and
ECLAC, Foreign Investment in Latin America and the Caribbean 2004 17
development centres, information technology centres,call centres and regional headquarters, the offshoring ofwhich has proved to be a dynamic source of mostlyhigher-quality FDI in the last few years. In relation toresearch and development centres, Latin America andthe Caribbean ranks last out of all the world’s regions interms of the percentage of research and developmentinvestment that companies have made in the last threeyears or expect to make in the next three years.Nevertheless, some important investments in other newservices have been registered. In information
technologies, companies such as Electronic DataSystems and Accenture have invested in Brazil, Mexico,Argentina, Bolivarian Republic of Venezuela, Colombiaand Chile. Regional headquarters have been establishedin Brazil by firms such as Delphi, Whirlpool, Bayer andSiemens, in Costa Rica by Procter & Gamble and inChile by Unilever. Numerous call centres have been setup in the region, although they tend to be of a low-technology nature. Again, the region’s countries willneed to make policy adjustments in order to attract andbenefit from better-quality FDI.
B. Brazil
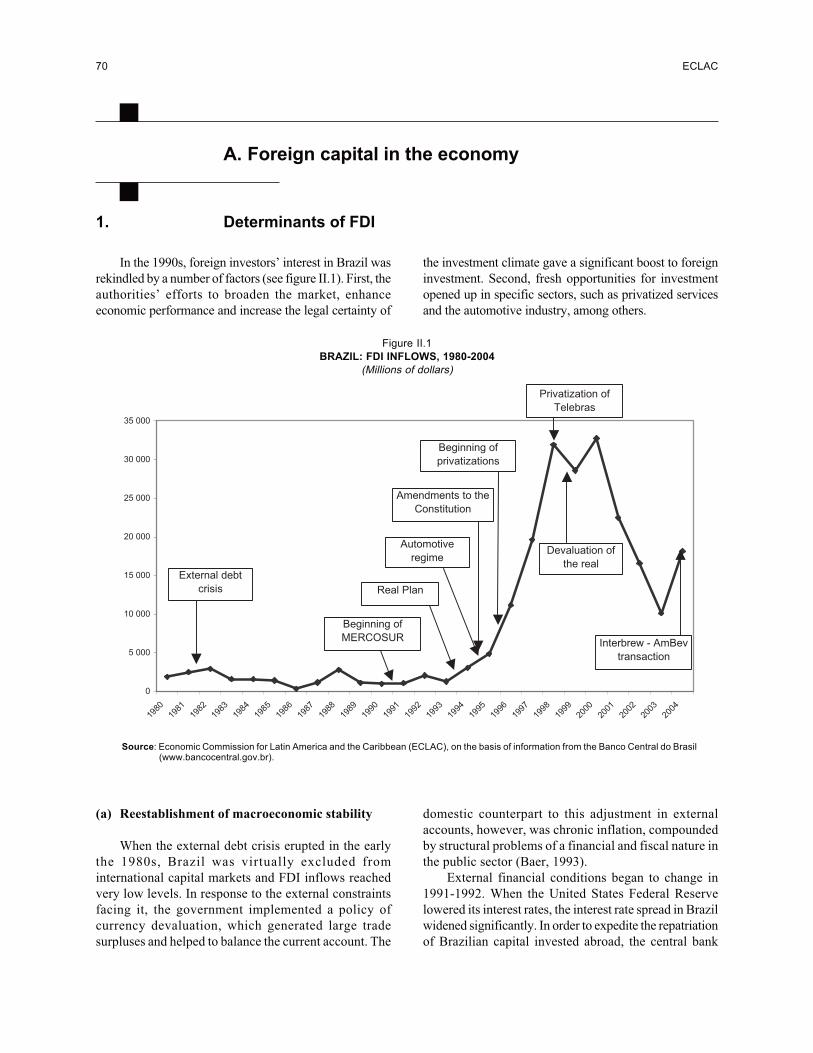
Brazil was one of the global focal points of market-seeking FDI in the manufacturing sector during theimport-substituting industrialization phase up until theinternational debt crisis of the 1980s. That crisis andits endemic macroeconomic imbalances dissuaded newforeign investors from entering Brazil and stifledinvestment by those already established there.Nevertheless, FDI flows returned in force in the 1990s,and some of the main reasons for Brazil’s resurgenceas a host country had to do with its improvedmacroeconomic stability (except during the volatileperiod of 1998-1999); the 1995 amendments to itsConstitution ending the State’s monopoly in thetelecommunications and petroleum/gas sectors andpaving the way for its massive privatizationprogramme; the launch of the Southern CommonMarket (MERCOSUR) integration schemeencompassing Argentina, Brazil, Paraguay andUruguay; and the 1995 automotive regime, amongother things. However, during the global FDI boomBrazil was unable to regain its previous share of overallglobal FDI flows to developing countries (which hadreached 20% to 25% in the 1970s), even though thestock of FDI in that country more than tripled between1995 and 2002 (from US$ 42 billion to US$ 142billion). By comparison, between 1996 and 2002China’s annual FDI inflows (US$ 44 billion) were twicethe amount of those received by Brazil. The FDI boomended abruptly in 1999-2000, although these flowsrecovered somewhat in 2004.The FDI boom of the 1990s was concentrated in market-
seeking FDI in services (mostly telecommunications,finance, commerce, and electricity and gas) rather thanmanufactures, in contrast to the pattern seen in the 1970s.
The share of services in the total FDI stock rose quickly,from 31% in 1995 to 64% in 2000. Brazil receives verylittle efficiency-seeking or technological asset-seekingFDI, and this largely explains its relatively poorperformance as a big-market FDI recipient in comparisonto other countries in that category, such as China.Manufacturing continued to be a significant target
sector for FDI, accounting for inflows of over US$ 33billion in the period 1995-2002, even though its shareof the FDI stock dropped precipitously, from 67% in1995 to 34% in 2000. The most dynamic industries fromthe perspective of FDI inflows tend to be capital- andtechnology-driven ones such as the automotive segment(which received 23% of FDI flows to manufacturing),chemicals (19%) and electronics (10%), although somenatural resource-intensive industries such as food andbeverages (16%) still receive considerable inflows.The privatization programme was the single most
important factor that revived FDI flows to Brazil startingin the mid-1990s. It was the largest privatizationprogramme in the world, as over US$ 100 billion inState-owned assets were sold off between 1991 and2002. Telecommunications and electricity services eachaccounted for 31% of these sales. One quarter of all FDIinflows between 1996 and 2000 resulted from such directsales. Most of this FDI came from TNCs based in theUnited States (32%) and Spain (29%). Post-privatizationFDI by the purchasing companies in those same servicesrepresented a significant share of overall FDI inflows.Transnational corporations have a solid presence in
Brazil, which hosts affiliates of about 400 of the top500 global TNCs, and they now account for about halfof the country’s total sales and business assets. In 2003the top 50 foreign groups –i.e., groups that are over 50%
18 ECLAC
foreign-owned– generated sales of about US$ 99 billion.With the exception of two Mexican groups (Telmex andAmérica Móvil) and two Asian groups (Toyota and LGElectronics), all these groups have their corporateheadquarters in Europe or the United States. Theiractivities are concentrated in six major sectors:telecommunications (Telefónica, Telmex, PortugalTelecom, Telecom Italia and América Móvil), motorvehicles (Fiat, Volkswagen, Ford, General Motors,Pirelli, Bosch, Renault, Mahle and Dana), electricity(AES Corporation, Endesa, Electricidade de Portugal(EDP), Électricité de France (EDF) and Tractebel), foodand beverages (AmBev, Bunge, Nestlé, Cargill, Unilever,Louis Dreyfus, Kraft Foods and Doux), petroleum(Royal Dutch/Shell, ChevronTexaco and Repsol-YPF)and retail commerce (Carrefour, Sonae and Wal-Mart).A large proportion of these activities are associated witheither market-seeking strategies in manufactures orservices or natural resource-seeking strategies. To date,very little evidence of efficiency-seeking strategies aimedat capturing third markets has been found among theprincipal affiliates operating in Brazil.Brazil has a small group of national companies that
are in the process of internationalizing their operations.
The predominant characteristic of these eight enterprisesis their focus on natural resources (Petrobras andCompanhia Vale do Rio Doce) or natural resource-basedmanufactures (steel producers Gerdau, Usiminas andCSN and food producer Sadia). In general, theinternational expansion processes of most of these firmsfocus on neighbouring countries rather than theinternational market. The construction firm Odebrechtand the aircraft maker Embraer are exceptions to theconcentration of these companies in natural resourcesectors.The impact of FDI and TNCs on Brazil’s growth
and development has been important, but less so thanexpected. Some very significant and positivemacroeconomic benefits have been registered, includingincreases in external financing (63% of total capitalinflows between 1991 and 2002) and capital formation(which reached 19.5% of GDP in 1996-2000). However,this must be contrasted with perceived shortcomings interms of creating employment and generating exports.In services, the impact has also been mixed, as theoutcome in the telecommunications sector has beenevaluated quite positively, whereas the one in theelectricity sector has not, and the situation in financial
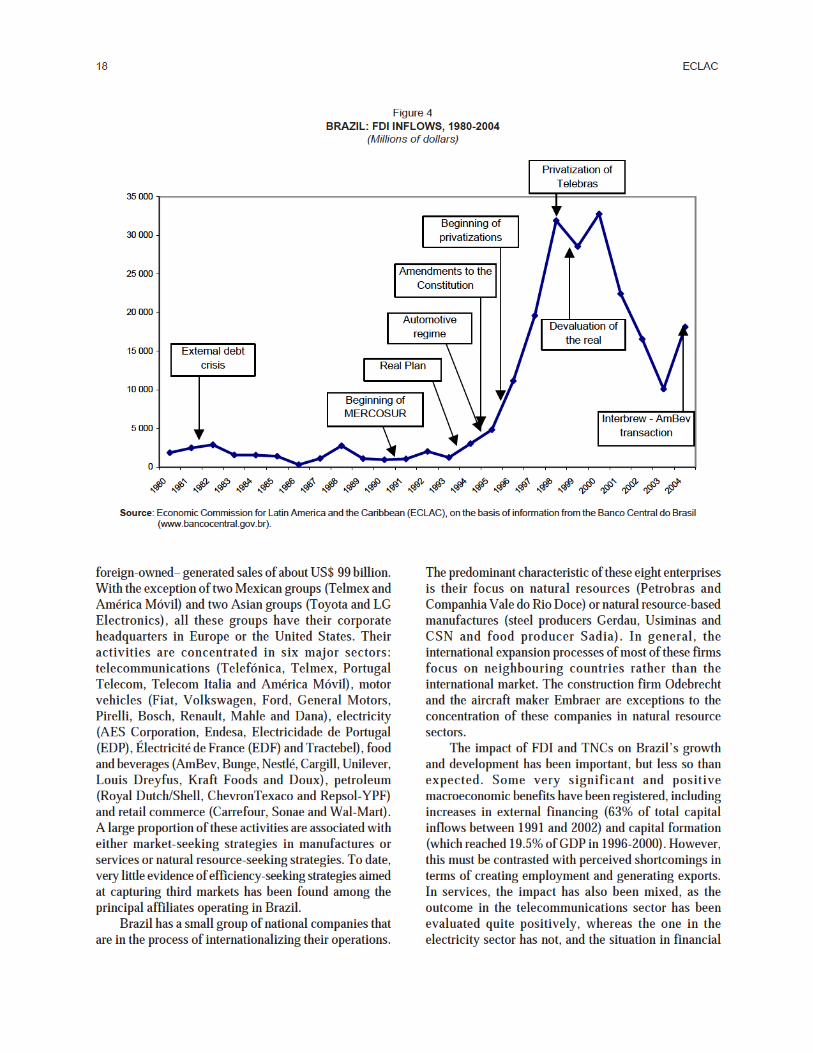
Figure 4BRAZIL: FDI INFLOWS, 1980-2004
(Millions of dollars)
Source: Economic Commission for Latin America and the Caribbean (ECLAC), on the basis of information from the Banco Central do Brasil(www.bancocentral.gov.br).
0
5 000
10 000
15 000
20 000
25 000
30 000
35 000
1980198119821983198419851986198719881989199019911992199319941995199619971998199920002001200220032004
External debt
crisis
Beginning of
MERCOSUR
Beginning of
privatizations
Privatization of
Telebras
Amendments to the
Constitution
Automotive
regime
Real Plan
Devaluation of
the real
Interbrew - AmBev
transaction
ECLAC, Foreign Investment in Latin America and the Caribbean 2004 19
services and retail commerce is less well defined. Theresults in the manufacturing sector have been the mostdisappointing in that the technological superiority ofmany of the TNCs present in Brazil did not have theeffect of upgrading the quality of employment orimproving international competitiveness, except, to someextent, in the automotive and telecommunicationsequipment industries. Firms with natural resource-seeking strategies generally accounted for the bulk ofthe exports generated by these leading affiliates. Anapparent shift from market-seeking to efficiency-seekingstrategies on the part of automobile assemblers wasobserved.The international market share of Brazil’s exports
suffered a significant decline between 1985 and 1995,falling from the equivalent of 1.38% of world importsto 1.01%, and did not begin to recover until 2003. Evenso, progress has been made in the sense that these exportshave shifted towards the more dynamic non-resource-based manufactures (from 35.8% to 44.5% of totalexports) and away from the less dynamic naturalresources (from 38.7% to 29.8%) and resource-basedmanufactures (from 24.5% to 23.4%). Moreover, amongnon-resource-based manufactures, there has been a shiftfrom low-technology to medium- and high-technologyproducts. Nonetheless, most of Brazil’s main exportproducts are still natural resources (iron ore, soybeanmeal, animal feed, coffee, etc.). While TNCs accountfor about half of Brazil’s merchandise exports, few ofthese exports are medium- or high-technologymanufactures. Among exports in the latter twocategories, only those of automobiles andtelecommunications equipment can be directlyassociated with FDI. Clearly, the existing TNCoperations in Brazil have not yet produced the hoped-for enhancement of Brazil’s internationalcompetitiveness through industrial and technologicalupgrading.It bears repeating that most of the FDI that enters
Brazil is of the market-seeking variety. While thisinvestment has made an important contribution toBrazil’s growth and development; the country shouldnot be limited to only this kind of FDI or TNC activity.New government priorities suggest that Brazil wants toattract other kinds of FDI, especially the efficiency-seeking investment needed to improve the productiveimpact of FDI and TNCs on the local economy. In thisregard, it would be prudent for Brazil to break out of itsexisting policy framework, which attracts mainly market-seeking FDI, in order to promote the efficiency-seekingtype of investment that could enhance its internationalcompetitiveness and generate more employment in high-technology industries.
Considering that competition among countries forforeign investment flows and limited public funds isexpected to become keener, the Brazilian governmentwill have to decide whether its investment policy shouldshift its focus from simply trying to attract biggervolumes of foreign investment to targeting higher-qualityinvestment with greater potential benefits for the country.As indicated earlier, within the right policy frameworkefficiency-seeking investments could help to boost thetechnological sophistication of Brazil’s exports, therebyimproving the country’s international competitivenessand reducing its vulnerability as a commodity exporter.Apart from the challenge of attracting efficiency-seekingFDI from new firms, Brazil has a window of opportunityto transform the strategies of a certain category of firmsfrom mostly market-seeking to efficiency-seeking. Thismay be taking place already with regard to the activitiesof some of the world’s leading TNCs operating in theautomotive and telecommunications equipmentindustries in Brazil.Attracting efficiency-seeking FDI will require
improvements in the investment environment, meaningthat the Brazil-specific costs and uncertainties knownas the “custo Brasil” must be reduced. Among the manycomponents of this concept are the promotion of stabilityand clarity in sectoral regulation, the reduction ofuncertainty about existing concession contracts and,specifically in the case of electricity, the promptconsolidation of a sound regulatory frameworkconducive to the elimination of existing bottlenecks, aswell as the deepening and expansion of the country’sscience and technology base. The government will alsohave to consider new ways of gaining access to majormarkets, whether by multilateral, plurilateral or bilateralmeans. This usually entails the implementation of acredible and efficient system for settling investment-related disputes, something that Brazil has not achievedat the national level and has been reluctant to engage ininternationally.It goes without saying that, with the exception of
certain across-the-board policy instruments, the policypackage used to attract market-seeking FDI will notnecessarily serve the purpose of attracting efficiency-seeking investment. Rather, a combination of policyinstruments and a more targeted approach will benecessary. Brazil’s new industrial and innovationpolicies may provide an interesting framework forsupporting specific investment incentives andenhancing its overall competitiveness as a hostcountry. In the right circumstances and with theappropriate policies, FDI can also become animportant instrument for achieving the goals of thenational industrial policy.
20 ECLAC
What is also needed in this connection is a well-organized and effective investment promotion agency withsufficient financial and human resources, credibility inthe business community and coordination capacity withinthe administration to actively identify investments to betargeted, negotiate with potential investors and orchestrategovernment action. Brazil recently dissolved its existinginvestment promotion agency, Investe Brasil, and set upa presidential commission to undertake this task. However,uncertainty has arisen regarding the solidity andpermanence of institutions and, therefore, of policies, andthis does not help to attract better-quality FDI.In other words, Brazil’s position as a major FDI
recipient has been based on market-seeking FDI, first inmanufacturing during the 1970s and more recently inservices and infrastructure. The incipient shift in thefocus of some of the manufacturing TNCs’ activitiesfrom the local market to exports suggests that Brazilhas an opportunity to consolidate this tendency among
TNCs already present in the country to make thetransition from market-seeking to efficiency-seekingFDI. Brazil could hasten this transition byimplementing a targeted policy to attract new entrantspursuing efficiency-seeking strategies. It could alsopromote efficiency-seeking FDI by consolidatingimprovements to its physical and service infrastructureto further facilitate exports. At the same time, it mustavoid the pitfalls and problems that have beenassociated with efficiency-seeking FDI in other partsof the region.This suggests that the Brazilian government must
carefully define its priorities, design and adopt policiesto promote those priorities, improve the nationalinstitutions that will implement them and continuallyevaluate the results of the new FDI policy. Furthermore,this might also be a good time to consider how theattraction of technological asset-seeking FDI might playa role in the new policy framework.
C. The electric power sector in the Southern Cone
Energy markets have undergone sweeping changes, andthe electricity sector is no exception. First, significantregulatory changes were introduced in developedcountries to liberalize the industry and privatize State-owned assets, and that initiative soon spread to developingcountries. Second, technological change impacted thesector in the form of natural gas-driven combined-cycleturbines that generated electricity more efficiently. Third,in the period of international expansion of TNCs in theelectricity and gas sector, some of the ones that hadexpanded most aggressively, such as Enron and AESCorporation, ran into debilitating financial problems andwere forced to sell off many of their newly acquired assets.All these factors played a role in the evolution of theelectric power sector in the Southern Cone.The European Union’s regulatory scheme
demonstrated a preference for segmenting markets intoseparate components –generation, transmission anddistribution– with the result that different companiestook on different functions. This pattern became thenorm in the Southern Cone even though it was notapplied in the context of a formal integration scheme,as in the case of the European Union. Economies of scalein Latin America and the Caribbean were limited by thesize of national markets. European energy TNCs tookthe initiative in the region because their opportunitiesfor intra-European mergers and acquisitions were limited
and because privatization and deregulation processes inthe region gave them a chance to expand into what wereexpected to be very dynamic markets in comparison totheir home bases. In these circumstances, the electricitysector in Latin America and the Caribbean offered energyTNCs many opportunities to achieve their strategicobjectives. Since Mexico continued to impose tightrestrictions on FDI in the energy sector, includingelectricity, the Southern Cone afforded TNCs the mostfertile ground for investment, in the form of hugeprivatization programmes in Brazil and Argentina andextensive deregulation, which included the infrastructurefor generating and distributing electricity.In other words, the electricity and gas sectors
developed a new and intimate interrelationship in theSouthern Cone, at a time when the direct role of theState in the electricity sector was declining andprivatization processes were opening up much moreroom for private capital, especially in the case ofelectricity TNCs. The aim of host governments in theSouthern Cone countries was to use private capital tomake their electricity sectors bigger, more efficient andmore modern. Most of these governments assumed thatthey could prevent supply shortfalls in their electricitysectors by opening them up to private investment toexpand capacity, something their public investmentbudgets were incapable of doing.
ECLAC, Foreign Investment in Latin America and the Caribbean 2004 21
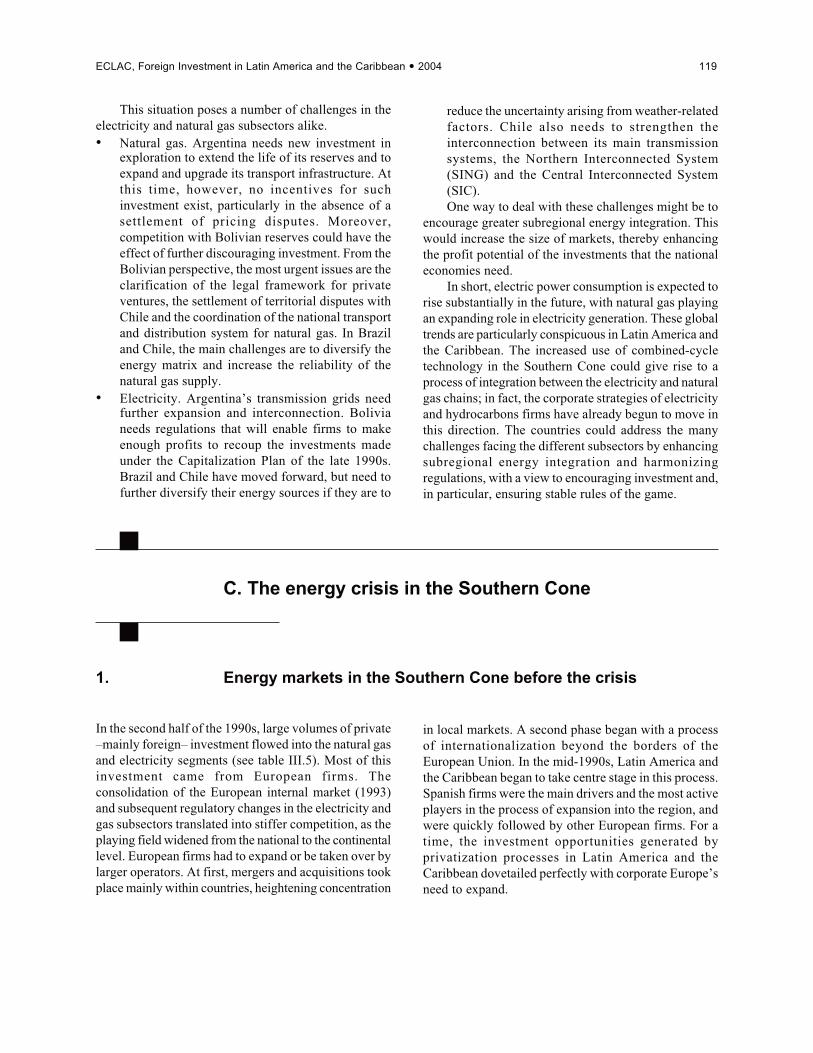
During the 1990s a huge amount of investment waschannelled into the electricity and gas sectors of theprincipal Southern Cone markets by TNCs trying toexpand their activities through national market-seekingstrategies. Over US$ 67 billion was invested in theelectricity sectors of these markets, mainly Brazil(US$ 43 billion), Argentina (US$ 16 billion) and Chile(US$ 8 billion). More than US$ 10 billion went intothe gas industry, primarily in Brazil (US$ 4.9 billion),Argentina (US$ 3.2 billion) and Chile (US$ 2.3billion). Three quarters of that investment was used toacquire existing assets, while only one quarter was usedto upgrade them or to make new (“greenfield”)investments.The electricity crisis in the Southern Cone stemmed
from a variety of causes, but one of the most criticalwas the shortage of investment in the expansion ofexisting infrastructure. This is quite ironic, consideringthat, for more than a decade, the governments concernedhad been implementing ambitious policies to open up,privatize and deregulate the electricity sector for the verypurpose of securing, from TNCs, the investment neededto expand and modernize the sector, thereby forestallingproblems of saturation in the face of burgeoning demand.Compounding the problem of the relative dearth of
new investment associated with the privatization of State-owned assets were a number of regulatory problems.Macroeconomic imbalances in Argentina and Brazil ledto sharp devaluations that made it hard for these countriesto set realistic utility rates. In some cases, thesemacroeconomic problems made it impossible forgovernments to respect established contractualcommitments (i.e., the currency and inflation adjustmentmechanisms to be used to define utility rates). Added tothese structural problems were weather-related factors(droughts in Chile and Brazil in 1998 and 2001) andsupply bottlenecks (Argentina’s inability in 2004 to fulfilits contractual obligations to provide Chile with gas forelectricity generation). These difficulties, coupled withthe excessive weight given to the spot market incomparison to longer-term contracts, led to lowprofitability for service providers. Most of them werepushed into serious financial problems that not onlymade the expansion of their electricity assets in theSouthern Cone out of the question, but even threatenedtheir very survival. Thus, the idea that the entry of TNCsin the electricity sector would automatically result inthe expansion of electricity infrastructure (for bothgeneration and distribution) did not pan out in practice.The above-mentioned factors were soon further
complicated by national problems that deepened thecrisis. In Argentina, the economic chaos that resultedfrom the drastic devaluation of January 2002 prompted
many electricity and gas providers to invoke the investor-State dispute settlement options available to them underbilateral investment agreements in order to seekinternational arbitration at ICSID. In Brazil, the nationaldevelopment bank had to offer bailout packages to someservice providers.TNCs responded in various ways, first to the
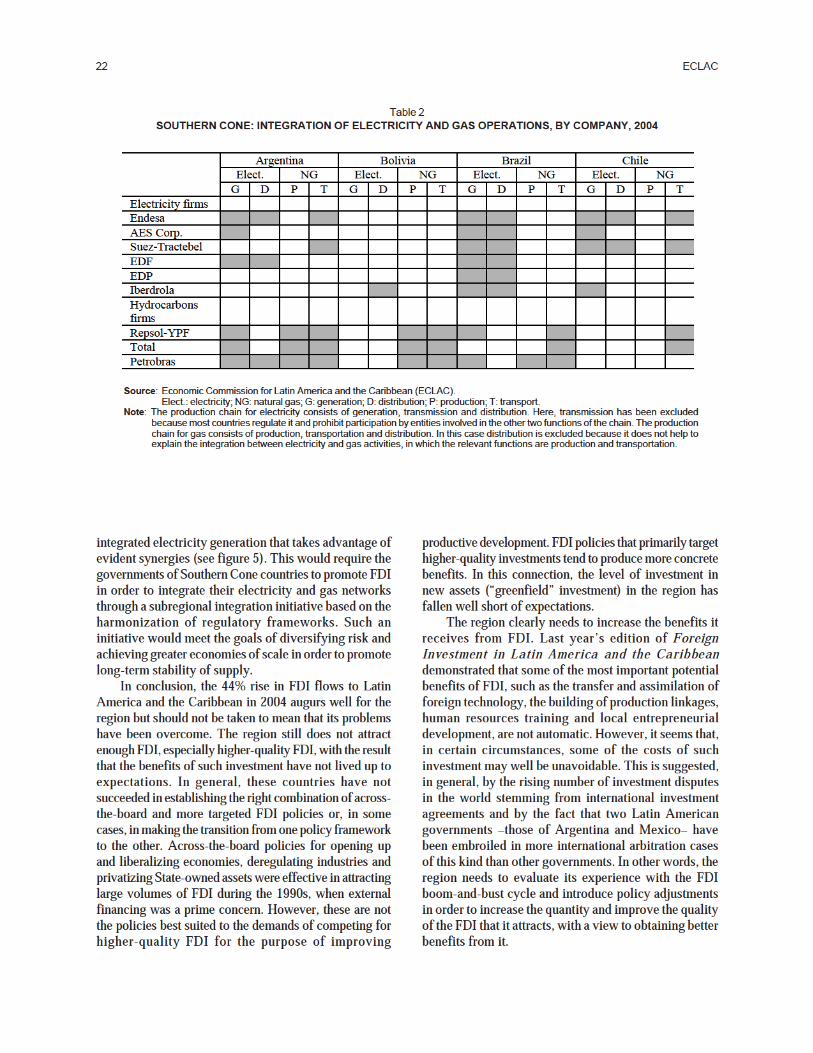
opportunities made available and later to the worseningelectricity crisis in the Southern Cone. The Europeanelectricity TNCs were forced to rethink their strategies.Some, such as Endesa and Tractebel, attempted toexpand their Southern Cone operations into the gassector to make them more efficient and integrated (seetable 2). EDP, which already has integrated gas/electricityoperations in Portugal and Spain, could develop similarones in Brazil. Others, such as EDF and Iberdrola, changedtheir priorities and started investing more in other marketsoutside the Southern Cone. The few non-European TNCsthat had established a significant presence in the SouthernCone became too enmeshed in the financial scandalsaffecting their firms in their home country to play a verypositive role in the sector’s development. Enron iscurrently in the process of selling its operations in theregion. AES opted to redefine its presence there. In otherwords, after the crisis hit, the European electricity TNCswere virtually the only major players left in the sector, atleast until a number of petroleum/gas companies saw anew opportunity there.Certain European petroleum/gas companies (Repsol-
YPF and Total) showed a new interest in extending theirgas activities into the electricity sector. The sustained highinternational price of petroleum strengthened thesecorporations’ financial position, enabling them to considerexpanding their presence in the sector. The aim of thesecompanies was to obtain secure access to major gasdeposits (in Argentina, Bolivia and, to a lesser extent,Brazil) and to build facilities for transporting their outputto the importing markets (Brazil and Chile). The idea ofgenerating electricity (in Argentina and Brazil) anddistributing it (in Argentina) became a distinct possibility.The Brazilian petroleum company Petrobras seems intenton becoming a central player in this initiative, incompetition with Repsol-YPF and Total.These newcomers to the subregion’s electricity
sector are petroleum companies that possess theresources needed to correct the problem of chronicunderinvestment that has plagued the sector. Thechallenge is to promote the needed investment to expandcapacity by way of an improved regulatory frameworkthat respects national priorities but also allowscorporations to attain their objectives. One element of apotential solution in this regard is the definition andimplementation of a Southern Cone strategy for
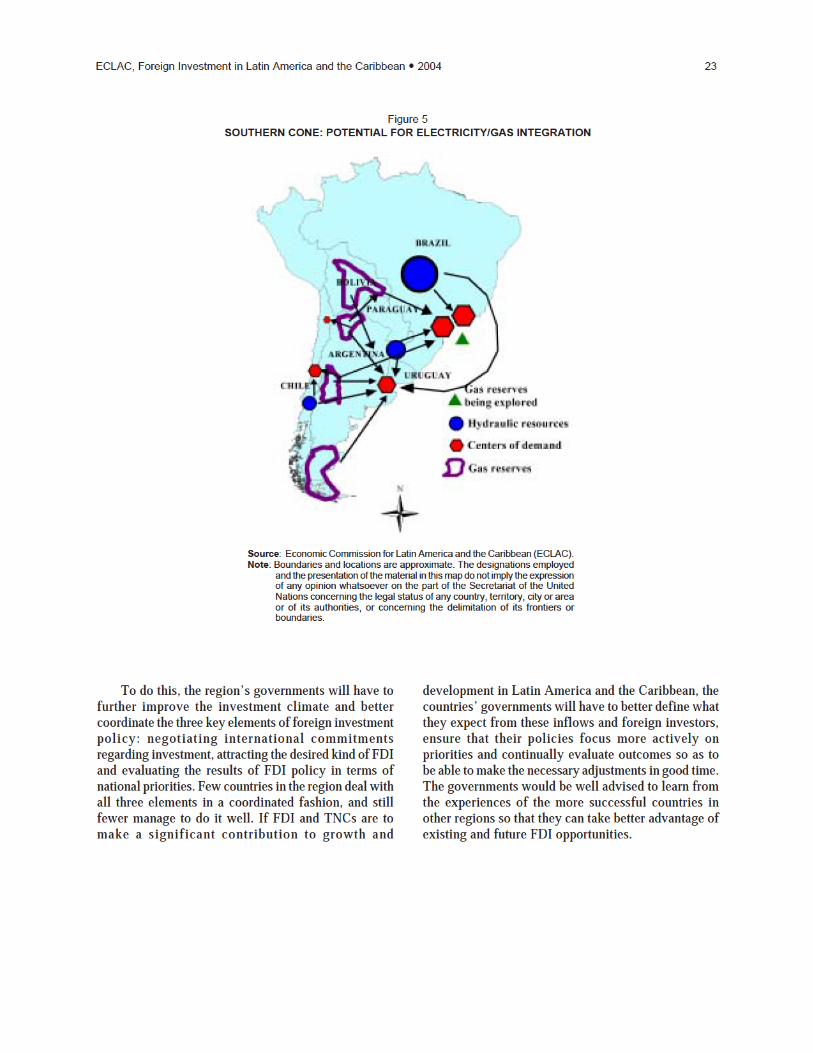
22 ECLAC
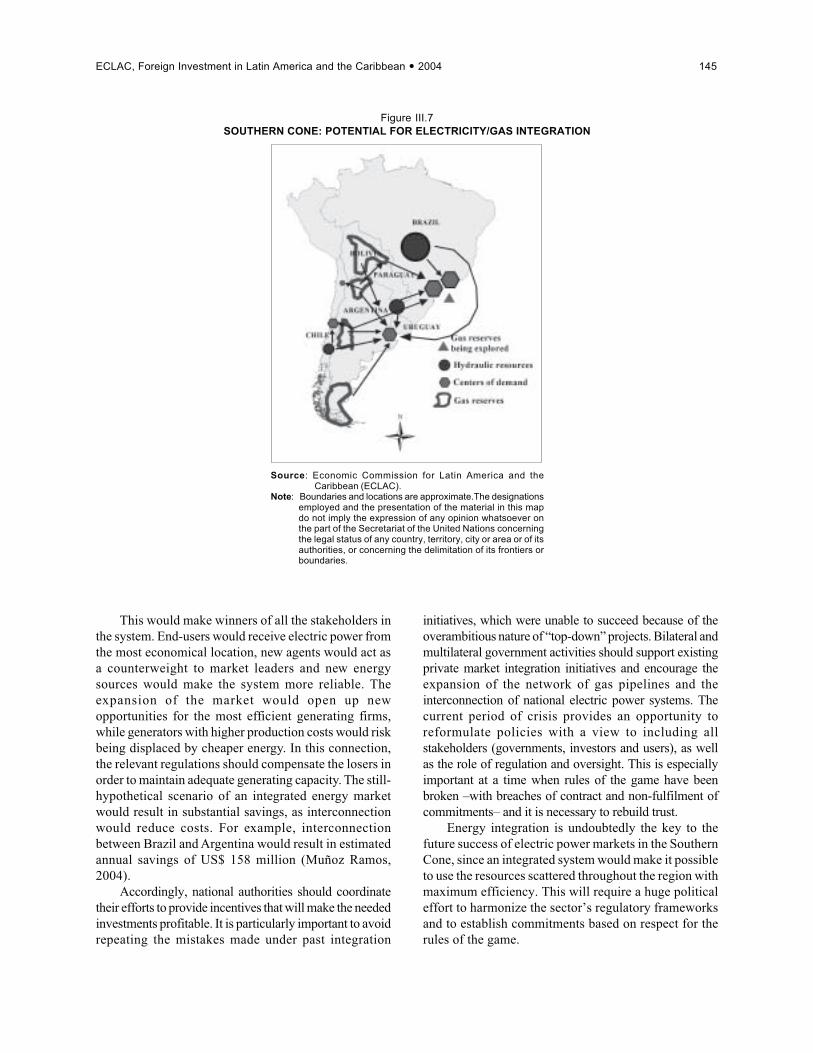
integrated electricity generation that takes advantage ofevident synergies (see figure 5). This would require thegovernments of Southern Cone countries to promote FDIin order to integrate their electricity and gas networksthrough a subregional integration initiative based on theharmonization of regulatory frameworks. Such aninitiative would meet the goals of diversifying risk andachieving greater economies of scale in order to promotelong-term stability of supply.In conclusion, the 44% rise in FDI flows to Latin
America and the Caribbean in 2004 augurs well for theregion but should not be taken to mean that its problemshave been overcome. The region still does not attractenough FDI, especially higher-quality FDI, with the resultthat the benefits of such investment have not lived up toexpectations. In general, these countries have notsucceeded in establishing the right combination of across-the-board and more targeted FDI policies or, in somecases, in making the transition from one policy frameworkto the other. Across-the-board policies for opening upand liberalizing economies, deregulating industries andprivatizing State-owned assets were effective in attractinglarge volumes of FDI during the 1990s, when externalfinancing was a prime concern. However, these are notthe policies best suited to the demands of competing forhigher-quality FDI for the purpose of improving
productive development. FDI policies that primarily targethigher-quality investments tend to produce more concretebenefits. In this connection, the level of investment innew assets (“greenfield” investment) in the region hasfallen well short of expectations.The region clearly needs to increase the benefits it
receives from FDI. Last year’s edition of ForeignInvestment in Latin America and the Caribbeandemonstrated that some of the most important potentialbenefits of FDI, such as the transfer and assimilation offoreign technology, the building of production linkages,human resources training and local entrepreneurialdevelopment, are not automatic. However, it seems that,in certain circumstances, some of the costs of suchinvestment may well be unavoidable. This is suggested,in general, by the rising number of investment disputesin the world stemming from international investmentagreements and by the fact that two Latin Americangovernments –those of Argentina and Mexico– havebeen embroiled in more international arbitration casesof this kind than other governments. In other words, theregion needs to evaluate its experience with the FDIboom-and-bust cycle and introduce policy adjustmentsin order to increase the quantity and improve the qualityof the FDI that it attracts, with a view to obtaining betterbenefits from it.
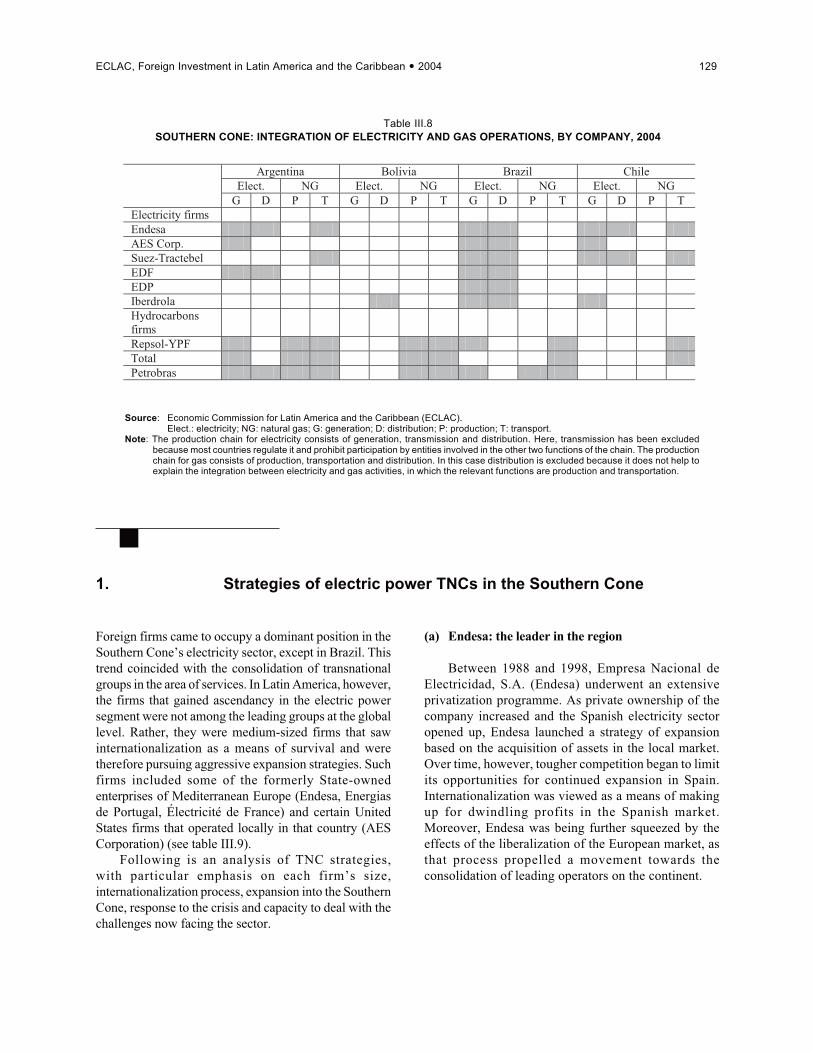
Table 2
SOUTHERN CONE: INTEGRATION OF ELECTRICITY AND GAS OPERATIONS, BY COMPANY, 2004
Source: Economic Commission for Latin America and the Caribbean (ECLAC).Elect.: electricity; NG: natural gas; G: generation; D: distribution; P: production; T: transport.
Note: The production chain for electricity consists of generation, transmission and distribution. Here, transmission has been excludedbecause most countries regulate it and prohibit participation by entities involved in the other two functions of the chain. The productionchain for gas consists of production, transportation and distribution. In this case distribution is excluded because it does not help toexplain the integration between electricity and gas activities, in which the relevant functions are production and transportation.
Argentina Bolivia Brazil Chile Elect. NG Elect. NG Elect. NG Elect. NG G D P T G D P T G D P T G D P T Electricity firms Endesa AES Corp. Suez-Tractebel EDF EDP Iberdrola Hydrocarbons firms
Repsol-YPF Total Petrobras
ECLAC, Foreign Investment in Latin America and the Caribbean 2004 23
To do this, the region’s governments will have tofurther improve the investment climate and bettercoordinate the three key elements of foreign investmentpolicy: negotiating international commitmentsregarding investment, attracting the desired kind of FDIand evaluating the results of FDI policy in terms ofnational priorities. Few countries in the region deal withall three elements in a coordinated fashion, and stillfewer manage to do it well. If FDI and TNCs are tomake a significant contribution to growth and
development in Latin America and the Caribbean, thecountries’ governments will have to better define whatthey expect from these inflows and foreign investors,ensure that their policies focus more actively onpriorities and continually evaluate outcomes so as tobe able to make the necessary adjustments in good time.The governments would be well advised to learn fromthe experiences of the more successful countries inother regions so that they can take better advantage ofexisting and future FDI opportunities.
Figure 5SOUTHERN CONE: POTENTIAL FOR ELECTRICITY/GAS INTEGRATION
Source: Economic Commission for Latin America and the Caribbean (ECLAC).Note: Boundaries and locations are approximate. The designations employed
and the presentation of the material in this map do not imply the expressionof any opinion whatsoever on the part of the Secretariat of the UnitedNations concerning the legal status of any country, territory, city or areaor of its authorities, or concerning the delimitation of its frontiers orboundaries.


ECLACpublications
ECONOMIC COMMISSION FOR LATIN AMERICAAND THE CARIBBEAN
Casilla 179-D Santiago, Chile
Publications may be accessed at: www.eclac.org
CEPAL ReviewCEPAL Review first appeared in 1976 as part of the Publications CEPALReview first appeared in 1976 as part of the Publications Programme ofthe Economic Commission for Latin America and the Caribbean, its aimbeing to make a contribution to the study of the economic and socialdevelopment problems of the region. The views expressed in signedarticles, including those by Secretariat staff members, are those of theauthors and therefore do not necessarily reflect the point of view of theOrganization.
CEPAL Review is published in Spanish and English versions threetimes a year.
Annual subscription costs for 2005 are US$ 30 for the Spanishversion and US$ 35 for the English version. The price of single issues isUS$ 15 in both cases.
The cost of a two-year subscription (2005-2006) is US$ 50 forSpanish-language version and US$ 60 for English.
Revista de la CEPAL, número extraordinario: CEPALCINCUENTA AÑOS, reflexiones sobre América Latina y el Caribe,1998, 376 p. (out of stock).
Annual reportsIssues for previous years also available
• Panorama social de América Latina, 2003-2004, in press.Social panorama of Latin America, 2003-2004, forthcoming.
• Balance preliminar de las economías de América Latina y el Cari-be, 2004, 174 p.Preliminary overview of the economies of Latin America andthe Caribbean, 2004, 172 p.
• Estudio económico de América Latina y el Caribe 2003-2004,358 p.Economic survey of Latin America and the Caribbean 2003-2004, 336 p.
• Anuario estadístico de América Latina y el Caribe / Statisticalyearbook for Latin America and the Caribbean (bilingüe). 2004,500 p., in press.
• La inversión extranjera en América Latina y el Caribe, 2004, inpress.Foreign investment of Latin America and the Caribbean, 2004,in press.
• Panorama de la inserción internacional de América Latina y elCaribe, 2002-2003, 240 p.Latin America and the Caribbean in the world economy, 2002-2003, 238 p.
Libros de la CEPAL80 Gobernabilidad e integración financiera: ámbito global y regional,
2004, José Antonio Ocampo and Andras Uthoff (compilers), 278 p.79 Etnicidad y ciudadanía en América Latina. La acción colectiva de
los pueblos indígenas, 2004, Álvaro Bello, 222 p.78 Los transgénicos en América Latina y el Caribe: un debate abierto,
2004, 416 p.77 Una década de desarrollo social en América Latina 1990–1999,
2004, 300 p.77 A decade of social development in Latin America 1990-1999,
2004, 308 p.77 Une décennie de développment social en Amérique latine 1990-
1999, 2004, 300 p.76 A decade of light and shadow. Latin America and the
Caribbean in the 1990s, 2003, 366 p.76 Une décennie d’ombres et de lumières. L’Amérique latine et
les Caraïbes dans les années 90, 2003, 401 p.75 Gestión urbana para el desarrollo sostenible en América Latina y el
Caribe, Ricardo Jordán and Daniela Simioni (compilers), 2003, 264 p.74 Mercados de tierras agrícolas en América Latina y el Caribe: una
realidad incompleta, Pedro Tejo (compiler), 2003, 416 p.73 Contaminación atmosférica y conciencia ciudadana, 2003. Daniela
Simioni (compilera), 260 p.72 Los caminos hacia una sociedad de la información en América
Latina y el Caribe, 2003, 139 p.72 Road maps towards an information society in Latin America
and the Caribbean, 2003, 130 p.71 Capital social y reducción de la pobreza en América Latina y el Caribe.
En busca de un nuevo paradigma, 2003, Raúl Atria and Marcelo Siles(compilers), CEPAL/Michigan State University, 590 p.
70 Hacia el objetivo del milenio de reducir la pobreza en AméricaLatina y el Caribe, 2002, 80 p.
70 Meeting the millennium poverty reduction targets in LatinAmerica and the Caribbean, 2002, ECLAC/IPEA/UNDP, 70 p.
70 L’objectif du millénaire de réduire la pauvreté en Amérique Latine etles Caraïbes, 2002, 85 p.
70 Rumo ao objetivo do milenio de reduzir a pobreza na AméricaLatina e o Caribe, 2002, 81 p.
69 El capital social campesino en la gestión del desarrollo rural. Díadas,equipos, puentes y escaleras, 2002, John Durston, 156 p.
68 La sostenibilidad del desarrollo en América Latina y el Caribe: desafíosy oportunidades, 2002, 251 p.
68 The sustainability of development in Latin America and theCaribbean: challenges and opportunities, 2002, 248 p.
67 Growth with stability, financing for development in the newinternational context, 2002, 248 p.
Recent co-publications
On occasion ECLAC concludes agreements for the co-publication oftexts that may be of special interest to other international organizations orto publishing houses. In the latter case, the publishing houses haveexclusive sales and distribution rights.
Pequeñas y medianas empresas y eficiencia colectiva. Estudios decaso en América Latina, Marco Dini and Giovanni Stumpo(coordinadores), CEPAL/Siglo XXI.
En búsqueda de efectividad, eficiencia y equidad: las políticas delmercado de trabajo y los instrumentos de su evaluación, JürgenWeller (compiler), CEPAL/ LOM.
América Latina en la era global, José Antonio Ocampo y Juan Martin(coordinadores), CEPAL/ Alfaomega.El desarrollo económico enlos albores del siglo XXI, José Antonio Ocampo (editor), CEPAL/Alfaomega.
Los recursos del desarrollo. Lecciones de seis aglomeracionesagroindustriales en América Latina, Carlos Guaipatín (compiler),CEPAL/Alfaomega.
Medir la economía de los países según el sistema de cuentas naciona-les, Michel Séruzier, CEPAL/Alfaomega, 2003.
Globalization and Development. A Latin American and CaribbeanPerspective, Edited by José Antonio Ocampo and Juan Martin,CEPAL/Alfaomega, 2003.
Globalización y desarrollo. Una reflexión desde América Latina y elCaribe, José Antonio Ocampo and Juan Martin (editors), CEPAL/Alfaomega, 2003.
Autonomía o ciudadanía incompleta. El Pueblo Mapuche en Chile yArgentina, Isabel Hernández, CEPAL/Pehuén, 2003.
Reformas económicas y formación. Guillermo Labarca (coordinador),CEPAL/GTZ/OIT-CINTERFOR, 2003.
El desarrollo de complejos forestales en América Latina, Néstor Bercovichy Jorge Katz (editors), CEPAL/Alfaomega, 2003.
Territorio y competitividad en la agroindustria en México. Condiciones ypropuestas de política para los clusters del limón mexicano enColima y la piña en Veracruz, Enrique Dussel Peters, CEPALPlazay Valdés, 2002.
Capital social rural. Experiencias de México y Centroamérica, MargaritaFlores y Fernando Rello, CEPAL/Plaza y Valdés, 2002.
Eqüidade, desenvolvimento e cidadania, José Antonio Ocampo,CEPAL/Campus, 2002.
Crescimento, emprego e eqüidade; O Impacto das ReformasEconômicas na América Latina e Caribe, Barbara Stallings andWilson Peres, CEPAL/Campus, 2002.
Crescer com Estabilidade, O financiamento do desenvolvimentono novo contexto internacional, José Antonio Ocampo, CEPAL/Campus, 2002.
Pequeñas y medianas empresas industriales en América Latina yel Caribe, Wilson Peres and Giovanni Stumpo (coordinators),CEPAL/Siglo XXI, México.
Aglomeraciones mineras y desarrollo local en América Latina, RudolfM. Buitelaar (compiler), CEPAL/Alfaomega, Colombia, 2002.
Panorama de la agricultura en América Latina y el Caribe 1990-2000 /Survey of Agriculture in Latin America and the Caribbean1990-2000, CEPAL/IICA, 2002.
Cuadernos de la CEPAL90 Los sistemas de pensiones en América Latina: un análisis de género,
2004, Flavia Marco (coordinadora), 270 p.89 Energía y desarrollo sustentable en América Latina y el Caribe.
Guía para la formulación de políticas energéticas, 2003, 240 p.88 La ciudad inclusiva, Marcello Balbo, Ricardo Jordán and Daniela
Simioni (compilers), CEPAL/Cooperazione Italiana, 2003, 322 p.87 Traffic congestion. The problem and how to deal with it, 2004
Alberto Bull (compiler), 198 p.87 Congestión de tránsito. El problema y cómo enfrentarlo, 2003,
Alberto Bull (compiler), 114 p.
Cuadernos Estadísticos de la CEPAL30 Clasificaciones estadísticas internacionales incorporadas en el
banco de datos del comercio exterior de América Latina y el Caribede la CEPAL, 2004, 308 p.
29 América Latina y el Caribe: series estadísticas sobre comercio deservicios 1980-2001, 2003, 150 p.
Estudios e Informes de la CEPAL95 México: la industria maquiladora, 1996, 237 p.94 Innovación en tecnologías y sistemas de gestión ambientales en
empresas líderes latinoamericanas, 1995, 206 p. (out of stock)93 Comercio internacional y medio ambiente. La discusión actual, 1995,
112 p. (out of stock)92 Reestructuración y desarrollo productivo: desafío y potencial para
los años noventa, 1994, 108 p.91 Las empresas transnacionales de una economía en transición: la
experiencia argentina en los años ochenta, 1995, 193 p.90 El papel de las empresas transnacionales en la reestructuración
industrial de Colombia: una síntesis, 1993, 131 p.
Serie INFOPLAN: Temas Especialesdel Desarrollo13 Políticas sociales: resúmenes de documentos II, 1997, 80 p.12 Gestión de la información: reseñas de documentos, 1996, 152 p.11 Modernización del Estado: resúmenes de documentos, 1995, 75 p.10 Políticas sociales: resúmenes de documentos, 1995, 95 p. 9 MERCOSUR: resúmenes de documentos, 1993, 219 p. 8 Reseñas de documentos sobre desarrollo ambientalmente
sustentable, 1992, 217 p. (out of stock) 7 Documentos sobre privatización con énfasis en América Latina,
1991, 82 p.
Boletín demográfico/DemographicBulletin (bilingual)Bilingual publication (Spanish and English) proving up–to–date estimatesand projections of the populations of the Latin American and Caribbeancountries. Also includes various demographic indicators of interest such
as fertility and mortality rates, life expectancy, measures of populationdistribution, etc.
Published since 1968, the Bulletin appears twice a year in January andJuly.
Annual Subscription: US$ 20.00 Per issue: US$ 15.00
Notas de poblaciónSpecialized journal which publishes articles and reports on recent studiesof demographic dynamics in the region, in Spanish with abstracts inSpanish and English. Also includes information on scientific and professionalactivities in the field of population.
Published since 1973, the journal appears twice a year in June andDecember.
Annual Subscription: US$ 20.00 Per issue: US$ 12.00
A complete listing is available at: www.eclac.cl/publicaciones
Series de la CEPALComercio internacionalDesarrollo productivoEstudios estadísticos y prospectivosEstudios y perspectivas:
— Bogotá— Buenos Aires— México
Financiamiento del desarrolloInformación y desarrolloInformes y estudios especialesMacroeconomía del desarrolloManualesMedio ambiente y desarrolloPoblación y desarrolloPolíticas socialesRecursos naturales e infraestructuraSeminarios y conferencias