S2100997_en.pdf - Repositorio CEPAL
210
2021 International Trade Outlook for Latin America and the Caribbean Pursuing a resilient and sustainable recovery
-
Upload
khangminh22 -
Category
Documents
-
view
0 -
download
0
Transcript of S2100997_en.pdf - Repositorio CEPAL
2021International Trade Outlook for Latin America and the Caribbean
Pursuing a resilient and sustainable recovery
ECLACPublications
Thank you for your interest in
this ECLAC publication
Please register if you would like to receive information on our editorial
products and activities. When you register, you may specify your particular
areas of interest and you will gain access to our products in other formats.
www.cepal.org/en/publications
Publicaciones www.cepal.org/apps

1SummaryInternational Trade Outlook for Latin America and the Caribbean • 2021
2021International Trade Outlook for Latin America and the Caribbean
Pursuing a resilient and sustainable recovery

2 Summary Economic Commission for Latin America and the Caribbean (ECLAC)
Alicia BárcenaExecutive Secretary
Mario CimoliDeputy Executive Secretary
Raúl García-BuchacaDeputy Executive Secretary for Management and Programme Analysis
Mario CastilloChief, Division of International Trade and Integration
Sally ShawOfficer in Charge, Documents and Publications Division
Explanatory notes:
- Three dots (...) indicate that data are not available or are not separately reported.- A dash (-) indicates that the amount is nil or negligible.- A full stop (.) is used to indicate decimals.- The word “dollars” refers to United States dollars, unless otherwise specified.- A slash (/) between years (e.g. 2013/2014) indicates a 12-month period falling between the two years.- Individual figures and percentages in tables may not always add up to the corresponding total because of rounding.
International Trade Outlook for Latin America and the Caribbean, 2021 is an annual report prepared by the Division of International Trade and Integration of the Economic Commission for Latin America and the Caribbean (ECLAC).
The production of the report was overseen by Mario Castillo, Chief of the Division of International Trade and Integration of ECLAC. Keiji Inoue, Senior Economic Affairs Officer with that Division, was responsible for its technical coordination. Assistance was provided in the preparation and drafting of the chapters by José Elías Durán, Sebastián Herreros, Jeannette Lardé, Jorge Lupano, Nanno Mulder, Ricardo Sánchez and Dayna Zaclicever, staff members of the same Division; Manuel Albaladejo, staff member in the United Nations Industrial Development Organization (UNIDO); and Eliana P. Barleta, Sergio Drucaroff, Ximena Olmos, Ira Ronzheimer, Inmaculada Ruiz, Mario Saeteros, and Silvana Sánchez di Doménico, consultants.
The authors are grateful for inputs provided by Raquel Artecona, Patricio Caniulao, Sebastián Castresana, Daniel Díaz, Alicia Frohmann, Nicolo Gligo, George Kerrigan, Javier Meneses, Paula Mirazo, Ixchel Mugica Jauregi, Daniel Perrotti, Gastón Rigollet, and Joseluis Samaniego. Thanks are also extended to the General Secretariat of the Andean Community, the Secretariat of the Southern Common Market (MERCOSUR), the Secretariat for Central American Economic Integration (SIECA), and the General Secretariat of the Latin American Integration Association (LAIA), which provided valuable statistical information. This document was also prepared with inputs from the Regional Facility for Development in Transition, funded by the European Commission.
This publication should be cited as: Economic Commission for Latin America and the Caribbean (ECLAC), International Trade Outlook for Latin America and the Caribbean, 2021. Summary (LC/PUB.2021/14-P/Rev.1), Santiago, 2021.
Applications for authorization to reproduce this work in whole or in part should be sent to the Economic Commission for Latin America and the Caribbean (ECLAC), Documents and Publications Division, [email protected]. Member States and their governmental institutions may reproduce this work without prior authorization, but are requested to mention the source and to inform ECLAC of such reproduction.
United Nations publication
ISBN: 978-92-1-122076-6 (print)
ISBN: 978-92-1-005568-0 (pdf)
ISBN: 978-92-1-358311-1 (ePub)
Sales No.: S.21.II.G.4
LC/PUB.2021/14-P/Rev.1
Distribution: G
Copyright © United Nations, 2021
All rights reserved
Printed at United Nations, Santiago
S.21-00997

3ContentsInternational Trade Outlook for Latin America and the Caribbean • 2021 CONTENTS
Introduction................................................................................................................................................................. 9Summary.................................................................................................................................................................... 13
Chapter I Global and regional trade are recovering amid heightened uncertainty ....................................................... 29
A. In 2021, world trade is expected to grow faster than it has in any year since 2010 ..................................... 31
B. The steady rise in freight charges threatens the recovery of global trade .................................................... 43
C. A hesitant recovery in world trade in services slowed by the slump in tourism .......................................... 48
D. Trade and value chains: a return to multilateralism or deepening regionalism? .......................................... 50
E. An uneven recovery in regional trade in 2021 ................................................................................................ 541. Goods trade recovered quickly, but services trade has yet to regain pre-pandemic levels ................... 542. The pandemic hit smaller export firms especially badly ......................................................................... 593. The recovery of goods exports in 2021 encompassed almost all sectors and countries, unlike in exports of services .................................................................................................................... 654. The pandemic accelerated the growth of e-commerce in the region, but this is not yet reflected in the international trade figures ............................................................................................................. 695. The prices of the region’s raw materials exports recovered strongly in 2021 ........................................ 726. Intraregional exports are recovering from the sharp drop posted in 2020 ............................................. 757. After a heavy fall in 2020, regional goods trade is expected to post a strong recovery in 2021 ........... 77
F. Concluding remarks......................................................................................................................................... 84
Bibliography ........................................................................................................................................................... 85
Annex I.A1 ............................................................................................................................................................. 89
Chapter II The challenge of regional productive self-sufficiency in the health-care industry ..................................... 91
Introduction ........................................................................................................................................................... 93
A. Brief characterization of the health-care industry .......................................................................................... 93
B. The global trade of the health-care industry has been highly dynamic ......................................................... 99
C. The region runs a large trade deficit in pharmaceutical products ............................................................... 106
D. The region’s pharmaceutical industry is poorly integrated ......................................................................... 116
E. The region’s trade in medical devices: some dynamic export hubs ............................................................. 122
F. The region’s production and technological capabilities in the medical devices sector .............................. 1271. The regional market in medical devices ................................................................................................ 1272. Medical device manufacturing and the profile of manufacturers ......................................................... 1293. Guidelines for identifying medical devices with export potential ........................................................ 131
G. The challenge of integrating trade and production in the health-care industry .......................................... 134Bibliography ......................................................................................................................................................... 137Annex II.A1 .......................................................................................................................................................... 140Annex II.A2 .......................................................................................................................................................... 143
Annex II.A3 .......................................................................................................................................................... 144
Chapter III How international trade contributes to a circular economy .......................................................................... 147
Introduction ......................................................................................................................................................... 149
A. International trade should be part of the transformation to the circular economy ..................................... 1501. The global material footprint multiplied in the last decades ................................................................ 1502. International trade can promote local circular economy processes ..................................................... 1543. Balancing safety and economic efficiency in transboundary waste regulation ................................... 158
B. The region’s share of trade in circular products ......................................................................................... 1601. The search for circular products and services in international trade .................................................... 1602. Agrifood products make up the majority of the region’s circular goods. .............................................. 1623. The United States is the region’s main trading partner in circular goods ............................................ 1664. The region exports waste to the European Union and imports used goods ......................................... 1695. The region’s trade in circular goods with China is less diversified and on a smaller scale ................. 1726. Recycling generates production linkages with other sectors ............................................................... 174
4 Contents Economic Commission for Latin America and the Caribbean (ECLAC)
C. Forestry-pulp-paper production chains have great circular potential .......................................................... 1771. Production with recycled inputs reduces deforestation ........................................................................ 1772. Recycled inputs play a major role in the paper value chain .................................................................. 1793. Circularity faces challenges in the paper value chain in the region ..................................................... 182
D. Integrating trade policies to enhance circular economy initiatives ............................................................. 1831. Developed countries are leaders in policies to advance the circular economy ................................... 1832. The countries of the region are also making progress in linking trade policy with the circular economy...................................................................................................................... 1853. Tariff and non-tariff barriers in the region may impede the transition to the circular economy .......... 188
E. Trade agreements can promote the circular economy ................................................................................. 1901. Market access instruments can promote circularity ............................................................................. 1912. Regulatory cooperation can promote the harmonization of circularity rules ........................................ 1923. Liberalization of trade in services contributes to circular economy strategies .................................... 1934. Trade agreements can target subsidies, government procurement and FDI towards circular economy objectives................................................................................................................... 193
F. Recommendations for increasing the contribution of trade to the circular economy .................................. 1951. Increased international cooperation ...................................................................................................... 1952. The promotion of more circular regional production chains ................................................................. 196
Bibliography ......................................................................................................................................................... 198
Annex III.A1 ......................................................................................................................................................... 201
ECLAC recent publications ...........................................................................................................................................205
Tables
Table I.1 Selected economies: year-on-year variation in the value of goods imports, by major economic sector, January–July 2020 and January–July 2021 ....................................... 35
Table I.2 Selected economies: 25 goods with the largest increases in import values, January–July 2021 relative to January–July 2020 ........................................................................ 39
Table I.3 Latin America and the world: year-on-year variation in seaborne container trade, measured in 20-foot equivalent units (TEU), January–August 2019, 2020 and 2021 ....................... 44
Table I.4 Latin America and the Caribbean: year-on-year variation in the value of goods and services exports by major sector, first half of 2018–first half of 2021 ........................................................ 58
Table I.5 Latin America and the Caribbean and selected groupings: annual variation in the value of goods and services exports, by major sector, 2020 ................................................................... 60
Table I.6 Latin America and the Caribbean: impacts of the COVID-19 pandemic on exports, export-related employment (including female) and MSME exporters ........................................... 62
Table I.7 Latin America and the Caribbean and selected groupings: year-on-year variation in goods and services exports by major sector, first half of 2021 ................................................. 65
Table I.8 Latin America and the Caribbean and selected groupings and countries: year-on-year variation in the value of exports and imports of goods, first half of 2020 and of 2021 ................ 68
Table I.9 Latin America and the Caribbean and selected groupings and countries: year-on-year variation in the value of services trade, January–July 2020 and January–July 2021 .................. 69
Table I.10 Latin America and the Caribbean: commodity price index, 2020, January–October 2020, January–October 2021 and projection for 2021 ............................................................................. 72
Table I.11 Latin America and the Caribbean: year-on-year variation in intraregional exports and exports within each grouping, January–June 2020 and January–June 2021 ............................................ 76
Table I.12 Latin America and the Caribbean: annual variation in the value of goods trade by main partner, 2020 and projection for 2021 .............................................................................. 78
Table I.13 Latin America and th Caribbean (selected subregions, groupings and countries): projected variation in goods trade by price, volume and value, 2021 ........................................... 79
Table I.14 The Caribbean (selected groupings and countries): projected variation in goods trade, by price, volume and value, 2021 ................................................................................................... 82
Table I.A1.1 Latin America and the Caribbean: value of goods exports and imports, 2019–2021 .................... 89Table I.A1.2 Latin America and the Caribbean (selected countries): projected variation in the value
of goods exports, by main destination, 2021 ................................................................................. 90Table I.A1.3 Latin America and the Caribbean (selected countries): projected variation in the value
of goods imports, by main origin, 2021 ........................................................................................................90
5ContentsInternational Trade Outlook for Latin America and the Caribbean • 2021
Table II.1 Latin America and the Caribbean, United States, Europe and the world: pharmaceutical sector gross domestic product (GDP) and shares of total, manufacturing, and chemical and pharmaceutical GDP, 2017 ...................................................................................................... 95
Table II.2 Global ranking of the top 20 pharmaceutical companies by average annual sales, 2017–2020 ...................................................................................................................................... 95
Table II.3 Pandemics of the late twentieth and early twenty-first centuries .............................................. 103Table II.4 Latin America: top 20 pharmaceutical companies by sales, 2017–2020 average ....................... 108Table II.5 Latin America and the Caribbean (selected countries): exports of pharmaceutical products
to the regional market, 2018–2020 average ................................................................................ 113Table II.6 Latin America and the Caribbean (selected countries): pharmaceutical imports
from the region, 2018–2020 average ........................................................................................... 113Table II.7 Latin America and the Caribbean: main products exported in the medical devices sector, 2019 ....... 126Table II.8 Latin America and the Caribbean (33 countries): exports and imports of medical devices
by technological intensity, 2018–2020 average ........................................................................... 126Table II.9 Latin America and the Caribbean (9 countries): employees and firms
in the medical devices sector, 2019 ............................................................................................. 129Table II.10 Important factors to be considered in evaluating medical device production capabilities ............. 134Table II.A1.1 Medicines included in the expanded health-care industry category ........................................... 140Table II.A1.2 Raw materials for the pharmaceutical industry included in the expanded
health-care industry category ....................................................................................................... 141Table II.A1.3 Pharmaceutical industry inputs and equipment and medical devices included
in the expanded health-care industry category ............................................................................ 142Table II.A2.1 Latin America and the Caribbean (33 countries): trade in health-care industry products,
2018–2020 average ...................................................................................................................... 143Table II.A3.1 Indicators used to calculate Ricardian, Schumpeterian and Keynesian efficiencies .................. 144Table II.A3.2 Scores assigned to the Keynesian efficiency scales .................................................................... 145Table III.1 Examples of circular and potentially circular products in international trade ............................. 161Table III.2 Environmental impacts of recycled paper relative to virgin paper ............................................... 178Table III.3 Latin America (selected countries): circular economy instruments and prioritized areas ............... 186Table III.4 Latin America (selected countries): trade and FDI-related actions in circular strategies ................ 187Table III.5 Latin America (selected countries): most-favoured-nation (MFN) tariffs
on circular economy product subheadings, 2020 ......................................................................... 188Table III.6 Latin America and the Caribbean: used car import regulations, 2017 ......................................... 189Table III.7 Types of incentive and levels of intervention of the circular economy-related provisions
in trade agreements ...................................................................................................................... 190Table III.8 Examples of modalities of regulatory cooperation to promote circularity in trade agreements ......... 192Table III.9 Examples of provisions included in trade and investment agreements to preserve
the host State’s regulatory power on environmental issues ....................................................... 195
FiguresFigure I.1 Year-on-year variation in the volume of world goods trade, January 2017–August 2021 ............ 31Figure I.2 Selected groupings and countries: fiscal measures adopted in response
to the COVID-19 pandemic ............................................................................................................. 31Figure I.3 Selected economies: variation in the volume of exports and imports of goods,
July 2021 relative to December 2019 ............................................................................................. 32Figure I.4 Selected countries: share of world trade in goods and annual variation in the value
of exports and imports of goods, 2020 ........................................................................................... 32Figure I.5 Annual variation in the volume of world goods trade, 1990-2022 ................................................. 33Figure I.6 Selected country groupings: share of population having received at least one dose
of a COVID-19 vaccine as of 1 November 2021 ............................................................................. 34Figure I.7 Selected economies: year-on-year variation in goods trade, by price, value and volume,
January–August 2021 relative to January–August 2020 .............................................................. 35Figure I.8 Selected economies (55 countries): year-on-year variation in the value of goods imports,
January 2018–July 2021................................................................................................................. 36
6 Contents Economic Commission for Latin America and the Caribbean (ECLAC)
Figure I.9 Selected economies (55 countries): variation in the value of goods imports, by economic sector, January–July 2020 and 2021 relative to the year-earlier period and January–July 2021 relative to the same period of 2019 ............................................................................................... 37
Figure I.10 China, European Union and United States: year-on-year variation in the value of goods imports, by origin, January 2018–September 2021 ..................................................................................... 40
Figure I.11 Selected economies: year-on-year variation in the value of goods imports, by major economic category, January 2018–September 2021 ....................................................... 41
Figure I.12 World and selected countries: year-on-year variation in the volume of seaborne exports of cereals, iron ore and coal, 2018-2021 ........................................................................................ 44
Figure I.13 Average freight costs worldwide for seaborne container transport, January 2019–September 2021..................................................................................................... 45
Figure I.14 Year-on-year variation in the volume of container trade in Latin America and maritime container freight costs on the Shanghai-South America route, January 2020–July 2021 ............................ 46
Figure I.15 Index of seaborne shipping freight charges for major commodities worldwide, January 2019–October 2021........................................................................................................... 46
Figure I.16 Market share of leading maritime shipping alliances, 2021 .......................................................... 47Figure I.17 Selected groupings and countries: year-on-year variation in the value of services exports,
first quarter of 2019 to second quarter of 2021 ............................................................................. 49Figure I.18 Selected countries: exports of parts and components, 2000–2020 ............................................... 52Figure I.19 Latin America and the Caribbean: year-on-year variation in goods and services trade,
January 2007–August 2021 ............................................................................................................ 55Figure I.20 Latin America and the Caribbean: monthly arrivals of international tourists,
January 2019–August 2021 ............................................................................................................ 56Figure I.21 Latin America and the Caribbean: year-on-year variation in goods trade, by value,
price and volume, January 2007–August 2021................................................................................ 59Figure I.22 Latin America and the Caribbean: share of local tourism in total tourism sector revenues,
2019 and 2020................................................................................................................................. 61Figure I.23 Colombia, Ecuador and Peru: number of exporting firms, January 2020–August 2021 ................ 63Figure I.24 Latin America and the Caribbean: services exports by major sector, first quarter
of 2010–second quarter of 2021..................................................................................................... 66Figure I.25 Latin America (6 countries): proportion of consumers buying online, 2020 ................................... 70Figure I.26 Latin America: local and cross-border business-to-consumer (B2C) e-commerce, 2019–2021 ............ 70Figure I.27 Latin America and the Caribbean and selected countries: share of cross-border e-commerce
in total e-commerce, 2019–2020 .................................................................................................... 71Figure I.28 Latin America and the Caribbean: year-on-year variation in indexes of main
commodity groupings, January 2017–October 2021 ...................................................................... 73Figure I.29 Latin America and the Caribbean: estimated variation in prices of manufactured products,
by sector, 2021 relative to 2020 ..................................................................................................... 75Figure I.30 Latin America and the Caribbean: year-on-year variation in the value of intraregional
goods exports, January 2007–September 2021 ............................................................................. 75Figure I.31 Latin America and the Caribbean: year-on-year variation in the value of intraregional
goods exports, January–June 2020 and January–June 2021 ....................................................... 76Figure I.32 Latin America and the Caribbean: annual variation in goods trade, 2000–2021 .......................... 77Figure I.33 Latin America and the Caribbean (selected subregions and countries): projected variation
in goods trade, 2021 ....................................................................................................................... 80Figure I.34 Latin America and the Caribbean (selected countries): year-on-year variation in the exports
of maquila and free zones, January–August 2021 ......................................................................... 81Figure I.35 Latin America and the Caribbean (selected subregions, groupings and countries):
projected variation in the terms of trade, 2021 .............................................................................. 83Figure I.36 Latin America and the Caribbean (selected subregions, groupings and countries):
goods trade balance, 2020 and projections for 2021 ..................................................................... 84Figure II.1 Structure of pharmaceutical sector gross domestic product (GDP) and value added
in the world, by origin, 2017 ........................................................................................................... 94Figure II.2 Distribution of the average total annual sales of the top 20 pharmaceutical multinationals
by country of headquarters and by concentration, 2017–2020 ...................................................... 96

7ContentsInternational Trade Outlook for Latin America and the Caribbean • 2021
Figure II.3 Structure of the total sales of the world’s top 20 pharmaceutical companies by product type and research and development (R&D) spending as a proportion of sales, 2017–2020 ............ 97
Figure II.4 Global health-care industry exports, 2007–2020 ......................................................................... 100Figure II.5 Global exports of medicines, grouped by growth rate and type of use, 2005–2020 ................... 102Figure II.6 The world’s top 10 exporters of medicines, 2009 and 2020 ........................................................ 103Figure II.7 The world’s top 10 exporters of active ingredients, 2009 and 2020 ............................................ 104Figure II.8 Distribution of world exports of medical devices by category, 2019 ........................................... 105Figure II.9 The world’s top 10 exporters of medical devices, 2009 and 2020 ............................................... 105Figure II.10 Latin America and the Caribbean: trade in pharmaceutical products, 2010–2020 ..................... 106Figure II.11 Latin America and the Caribbean: distribution of trade in pharmaceutical products,
2010–2012 and 2018–2020 .......................................................................................................... 107Figure II.12 Latin America and the Caribbean: trade balance by pharmaceutical industry component,
2010–2012 and 2018–2020 .......................................................................................................... 107Figure II.13 Latin America (6 countries): distribution of pharmaceutical product sales by nationality
of firms, 2017–2020 averages ...................................................................................................... 108Figure II.14 Latin America and the Caribbean: pharmaceutical patents granted, 1990–2019 ....................... 109Figure II.15 Latin America and the Caribbean: distribution of the trade in pharmaceutical products
by country, 2018–2020 average.................................................................................................... 110Figure II.16 Latin America and the Caribbean: distribution of pharmaceutical exports
by main destinations, 2010–2012 and 2018–2020 ...................................................................... 111Figure II.17 Latin America and the Caribbean and selected countries: distribution of pharmaceutical
exports by main destinations, 2010–2012 and 2018–2020 ......................................................... 111Figure II.18 Latin America and the Caribbean: distribution of pharmaceutical imports by main origins,
2010–2012 and 2018–2020 .......................................................................................................... 112Figure II.19 Latin America and the Caribbean and selected countries: distribution of pharmaceutical
imports by main origins, 2010–2012 and 2018–2020 .................................................................. 112Figure II.20 Latin America (5 countries) and developed countries (7 countries): origin of pharmaceutical
products, in total and by type of use, 2013–2017 ........................................................................ 116Figure II.21 Latin America (5 countries) and developed countries (4 countries): local pharmaceutical
sector production by origin of value added, 2012–2017 .............................................................. 117Figure II.22 Latin America (5 countries) and developed countries (4 countries): import content of local
pharmaceutical production by sector of origin, 2012–2017 ......................................................... 118Figure II.23 Latin America (5 countries): imports of basic chemical inputs and pharmaceutical inputs
by region of origin, 2007 and 2019 ............................................................................................... 118Figure II.24 Developed countries (4 countries): imports of basic chemical inputs and pharmaceutical
inputs by region of origin, 2007 and 2019 .................................................................................... 120Figure II.25 Latin America (4 countries): imports of basic chemical inputs and pharmaceutical
inputs by price category and region of origin, 2019 ..................................................................... 121Figure II.26 Latin America and the Caribbean: trade in medical devices, 2010–2020 ................................... 123Figure II.27 Latin America and the Caribbean: distribution of the trade in medical devices by country,
2018–2020 average ...................................................................................................................... 123Figure II.28 Latin America and the Caribbean: medical technology patents granted, 1990–2019 ................. 124Figure II.29 Latin America and the Caribbean: distribution of medical device exports
by main destinations, 2010 and 2020 ............................................................................................ 125Figure II.30 Latin America and the Caribbean: distribution of imports of medical devices
by main origins, 2010 and 2020 .................................................................................................... 125Figure II.31 Latin America and the Caribbean (10 countries): estimated size of medical devices markets
by value and cumulative shares of the total market, 2017–2019 ................................................ 128Figure II.32 Latin America and the Caribbean (8 countries): domestic production and imports
of medical devices, 2017–2019 averages .................................................................................... 128Figure III.1 Selected countries and regions: global and per capita material footprint, 1990–2017 .............. 151Figure III.2 Selected countries and regions: share of trade in the material footprint of production
and consumption, 1990, 2000 and 2017 ....................................................................................... 152Figure III.3 Selected countries and regions: per capita physical and raw-material-equivalent
trade balance, 1990, 2000 and 2015 ............................................................................................ 153

8 Contents Economic Commission for Latin America and the Caribbean (ECLAC)
Figure III.4 Global exports of products associated with the circular economy, annual averages, 2009–2012, 2013–2016 and 2017–2019 ...................................................................................... 162
Figure III.5 Selected countries and regions: exports and imports of products associated with the circular economy, 2002–2019 ........................................................................................ 164
Figure III.6 Latin America: composition of trade in products associated with the circular economy, by volume and category, average 2017–2019 .............................................................................. 166
Figure III.7 United States: trade with the world and with Latin America and the Caribbean in goods associated with the circular economy, 2002–2020 ...................................................................... 167
Figure III.8 United States: composition of trade in goods associated with the circular economy with Latin America, Mexico and the Caribbean, by category, average 2019–2020 .................... 168
Figure III.9 European Union (28 members): trade in products associated with the circular economy with Latin America and the rest of the world, by volume, 2009–2020 ........................................ 170
Figure III.10 European Union (28 members): trade in products associated with the circular economy with Latin America and the Caribbean, by category, average 2019–2020 .................................. 171
Figure III.11 European Union (28 members): trade in products associated with the circular economy with Latin America and the Caribbean, by main partner, average 2019–2020 ........................... 172
Figure III.12 China: trade with Latin America in goods associated with the circular economy, by value and volume, 2002–2020 ................................................................................................. 173
Figure III.13 China: trade in goods associated with the circular economy with Latin America and the Caribbean, by category, 2020 .......................................................................................... 174
Figure III.14 Chile and Colombia: backward and forward linkages in the materials recovery sector, by sector of origin ......................................................................................................................... 175
Figure III.15 Chile and Colombia: destination of the production of the materials recovery sector ................. 177Figure III.16 World and Latin America and the Caribbean: total exports of the forestry-pulp-paper chain
and circular goods within the chain, 2002–2019 ......................................................................... 179Figure III.17 World and Latin America and the Caribbean: composition of exports of recycled inputs
and final products of pulp-paper-paperboard, 2002–2019 .......................................................... 180Figure III.18 World and Latin America and the Caribbean: ratio of the unit value of recycled inputs
and recycled end-products to the unit value of virgin pulp-paperboard inputs and end-products, 2002–2019 ...................................................................................................... 182
Figure III.19 Latin America and the Caribbean: notifications to WTO on waste and recycling, 2009–2019 .................................................................................................................................... 189
BoxesBox I.1 The microchip shortage disrupts world commerce ........................................................................ 38Box I.2 The United States and the European Union: in search of autonomy in production
capacity in strategic industries ....................................................................................................... 53Box I.3 Impact of the COVID-19 pandemic on inbound tourism in Latin America and the Caribbean ............... 56Box II.1 The drug development and approval process and the regulatory challenges that arose
with the COVID-19 outbreak ........................................................................................................... 98Box II.2 The Anatomical Therapeutic Chemical (ATC) and Harmonized Commodity Description
and Coding System (HS) classifications: two different approaches to drug classification ............. 100Box II.3 Bioactives extracted from agricultural products .......................................................................... 114Box III.1 Three trends towards the circular economy in global value chains (GVCs) ................................. 156Box III.2 The contribution of the circular economy to social inclusion and gender equity ........................ 157Box III.3 Plastic traceability and accounting through the “attribute storage” system ............................... 159Box III.4 Changes to the Harmonized System (HS) in 2022 ........................................................................ 161
DiagramsDiagram II.1 Expanded categorization of the health-care industry ..................................................................... 94Diagram II.2 Methodology for identifying areas of opportunity in the local development of medical devices ......... 131Diagram II.3 Analysis of efficiencies in the medical devices sector ................................................................ 132Diagram II.4 Policy options as determined by the analysis of efficiencies in the medical devices sector .......... 133Diagram III.1 Contribution of trade to the transition to the circular economy in a value chain ........................ 154Diagram III.2 Production process of the forestry-pulp-paper chain ................................................................... 178

9SummaryInternational Trade Outlook for Latin America and the Caribbean • 2021
Introduction


11SummaryInternational Trade Outlook for Latin America and the Caribbean • 2021
This edition of International Trade Outlook for Latin America and the Caribbean covers 2021 and is divided into three chapters. Chapter I reviews the recent performance of global and regional trade following the crisis caused by the coronavirus disease (COVID-19) pandemic. Growth in world goods trade for 2021 is projected to be the strongest since 2010, driven by the gradual lifting of mobility restrictions, progress in vaccination efforts and economic stimulus programmes. Latin American and Caribbean goods trade has also recovered substantially in 2021 on the back of higher commodity prices for its main exports, stronger demand from its main trading partners and the pick-up in economic activity in the region. In contrast, exports of regional services have yet to bounce back from the pandemic-induced collapse in international tourism.
The pandemic triggered a significant loss of export capacity in the region, affecting micro, small and medium-sized enterprises in particular. This is largely due to the fall in intraregional trade observed since the beginning of 2019 and exacerbated by the COVID-19 crisis. This situation underscores the urgent need to deepen regional integration to bring about a sustainable and transformative recovery. In a global context in which the major economic powers are looking to enhance their strategic autonomy by advancing their own processes to regionalize trade and production, such integration is imperative. This reflects a number of factors in play that are redefining the organization of international trade, including the increasing digitization and automation of production processes, geopolitical tensions, the rising costs of maritime transport and the need to reduce the environmental footprint of production chains.
Chapter II analyses the region’s trade performance in the health industry. The COVID-19 pandemic has underscored the strategic nature of this industry, not only because of its direct link to public health, but also because it is an innovative sector with significant technological externalities. It has also highlighted how vulnerable the region is made by its heavy dependence on extraregional imports. The analysis focuses on two main sectors: the pharmaceutical industry and the medical devices industry. In the first, the region has registered a significant drop in exports over the last decade and a persistent trade deficit. The region’s export performance in the second sector has been much more robust, although shipments are concentrated almost exclusively in three countries. Another significant difference is the role of the regional market, which absorbs almost half of pharmaceutical exports from Latin America and the Caribbean but a mere 2% of medical device shipments. The chapter concludes with some recommendations for fostering productive self-sufficiency in the region by increasing coordination and integration in the areas of trade, production and health. It is essential to implement policies to promote greater integration of national markets in order to create a large, stable market that will allow for competitive scales of production. Cooperation between national regulatory authorities in the health sector is a prerequisite for the creation of a regional market.
Chapter III examines the contribution of international trade in the transition to a circular economy. Unlike in a linear economy, actors in circular production and consumption chains seek to: (i) reduce the use of material resources, (ii) extend the useful life of goods, and (iii) recover materials and nutrients at the end of the useful life of goods. When countries do not have the scale or technology required at national level for recycling, reuse or remanufacturing processes, trade enables the transfer of products to other countries in which these conditions do exist. Trade can also open up wider markets for developing new products and services based on circular strategies. The greatest potential for Latin America and the Caribbean lies in the valorization of agricultural waste, especially residues from vegetable oil extraction, which can be converted into inputs for new industrial
INTRODUCTION

12 Economic Commission for Latin America and the Caribbean (ECLAC)Introduction
processes in the food and pharmaceuticals industries and the production of bioplastics. The region also has an opportunity to improve circularity in production chains such as the pulp-paper-paperboard chain and other manufactures as well as in tourism. Leveraging this potential could be achieved by harmonizing trade and circular economy agendas in the region. By integrating the circular economy into trade agreements, the region would benefit from greater access to markets and enhanced cooperation between partners. At the same time, incorporating trade into circular economy agendas would promote the creation of global markets, foster international harmonization of standards and reduce unnecessary trade barriers.
13SummaryInternational Trade Outlook for Latin America and the Caribbean • 2021
Summary
A. Global and regional trade are recovering amid heightened uncertainty
B. The challenge of regional productive self-sufficiency in the health-care industry
C. How international trade contributes to the circular economy

15SummaryInternational Trade Outlook for Latin America and the Caribbean • 2021
A. Global and regional trade are recovering amid heightened uncertainty
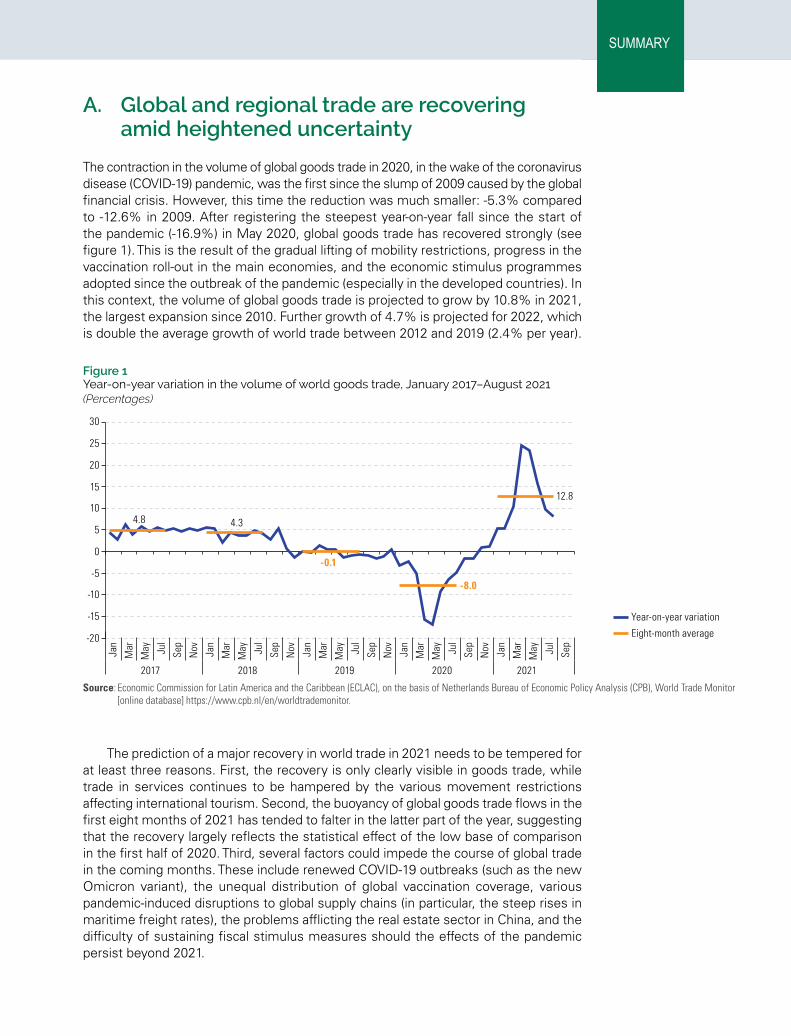
The contraction in the volume of global goods trade in 2020, in the wake of the coronavirus disease (COVID-19) pandemic, was the first since the slump of 2009 caused by the global financial crisis. However, this time the reduction was much smaller: -5.3% compared to -12.6% in 2009. After registering the steepest year-on-year fall since the start of the pandemic (-16.9%) in May 2020, global goods trade has recovered strongly (see figure 1). This is the result of the gradual lifting of mobility restrictions, progress in the vaccination roll-out in the main economies, and the economic stimulus programmes adopted since the outbreak of the pandemic (especially in the developed countries). In this context, the volume of global goods trade is projected to grow by 10.8% in 2021, the largest expansion since 2010. Further growth of 4.7% is projected for 2022, which is double the average growth of world trade between 2012 and 2019 (2.4% per year).
Figure 1 Year-on-year variation in the volume of world goods trade, January 2017–August 2021(Percentages)
Eight-month average
Year-on-year variation
4.8 4.3
-0.1
-8.0
12.8
-20
-15
-10
-5
0
5
10
15
20
25
30
Jan
Mar
May Ju
l
Sep
Nov Jan
Mar
May Ju
l
Sep
Nov Jan
Mar
May Ju
l
Sep
Nov Jan
Mar
May Ju
l
Sep
Nov Jan
Mar
May Ju
l
Sep
2017 2018 2019 2020 2021
Source: Economic Commission for Latin America and the Caribbean (ECLAC), on the basis of Netherlands Bureau of Economic Policy Analysis (CPB), World Trade Monitor [online database] https://www.cpb.nl/en/worldtrademonitor.
The prediction of a major recovery in world trade in 2021 needs to be tempered for at least three reasons. First, the recovery is only clearly visible in goods trade, while trade in services continues to be hampered by the various movement restrictions affecting international tourism. Second, the buoyancy of global goods trade flows in the first eight months of 2021 has tended to falter in the latter part of the year, suggesting that the recovery largely reflects the statistical effect of the low base of comparison in the first half of 2020. Third, several factors could impede the course of global trade in the coming months. These include renewed COVID-19 outbreaks (such as the new Omicron variant), the unequal distribution of global vaccination coverage, various pandemic-induced disruptions to global supply chains (in particular, the steep rises in maritime freight rates), the problems afflicting the real estate sector in China, and the difficulty of sustaining fiscal stimulus measures should the effects of the pandemic persist beyond 2021.
SUMMARY

16 Summary Economic Commission for Latin America and the Caribbean (ECLAC)
The strongest recovery in export volumes in the first eight months of 2021 occurred in China, followed by Japan and the emerging Asian economies (see table 1). While shipments from Latin America and the Caribbean expanded by less than the global average, the region’s import volumes grew by more than double that average, as economic activity recovered following the 6.8% slump in regional GDP in 2020.
Table 1 World and selected groupings and countries: variation in the volume of global goods trade, January–August 2021 relative to same period in 2020(Percentages)
Exports Imports
World 12 11Advanced economies 12 10 United States 10 14 Japan 18 5 Eurozone 12 10Emerging economies 14 15 China 27 12 Emerging economies of Asia (excluding China) 18 21 Eastern Europe and Commonwealth of Independent States 2 11 Latin America and the Caribbean 7 24 Africa and the Middle East -2 2
Source: Economic Commission for Latin America and the Caribbean (ECLAC), on the basis of Netherlands Bureau of Economic Policy Analysis (CPB), World Trade Monitor [online database] https://www.cpb.nl/en/worldtrademonitor.
The recovery of goods trade in Latin America and the Caribbean is being driven by three key factors: (i) higher prices for several of the region’s main export commodities (see figure 2); (ii) increased import demand in China, the European Union and the United States; and (iii) the recovery of economic activity in the region itself.
Figure 2 Selected products: price variation, January–October 2021 relative to the same period in 2020(Percentages)
-5-1
23
612
2630
35373840
4853
5764
686971
8496
119
-20 0 20 40 60 80 100 120 140
RiceBananas
CocoaGold
Crustaceans (frozen)Bovine meat
CoffeeRubberCottonNickelSugar
WheatAluminium
SoyaCopperMaize
IronSoybean oil
Crude oilTin
Natural gasCoal
Source: Economic Commission for Latin America and the Caribbean (ECLAC), on the basis of data from World Bank, Commodity Markets Outlook: Urbanization and Commodity Demand, October 2021, Washington, D.C.; International Monetary Fund (IMF); Economist Intelligence Unit; Bloomberg; Capital Economics; Energy Information Administration (EIA) and Central Bank of Chile.
The region’s service exports contracted much more sharply than its goods exports in 2020 (-36% and -10% in value terms, respectively). This mainly reflected the slump in tourism (-64%), which was hit hard by mobility restrictions. The recovery has not yet extended to service exports, the value of which was down by 9.9% year-on-year in the first half of 2021. Their performance in the coming months will depend on how the reopening of tourism progresses. As of August, international tourist arrivals were still well below their peak level in 2019.

17SummaryInternational Trade Outlook for Latin America and the Caribbean • 2021
For 2021 as a whole, the Economic Commission for Latin America and the Caribbean (ECLAC) projects a 25% increase in the value of regional goods exports, based on a 17% rise in prices and an 8% expansion in volume. The value of goods imports is expected to increase by 32%, as a result of a 20% increase in volume and a 12% rise in prices. South America is forecast to record the largest increase in export value in 2021 (34%), since its export specialization means that it will benefit especially from higher commodity prices. The Caribbean is in a similar situation and can expect to benefit from the high prices of oil, gas and bauxite exported by Guyana, Trinidad and Tobago and Jamaica, respectively. At the opposite extreme, Mexican exports (which consist mostly of manufactured goods) are expected to grow by 17% in value terms, driven mainly by increased volumes, with a similar situation prevailing in Central America. In the case of imports, values are expected to grow by more than 25% in all subregions and also in Mexico (see figure 3).
Figure 3 Latin America and the Caribbean (subregions and selected countries): projected variation in goods trade, 2021(Percentages)
A. Exports
28
2017
107
6
12
8
14
10
34
31
2524
17
0
5
10
15
20
25
30
35
40
0
5
10
15
20
25
30
35
40
South America The Caribbean Latin Americaand the Caribbean
Central America Mexico
Volume
Price
Value
B. Imports
Volume
Price
Value10 11 12
14 14
26 23 20 1512
3634
32
2926
0
5
10
15
20
25
30
35
40
0
5
10
15
20
25
30
35
40
South America Central America Latin Americaand the Caribbean
Mexico The Caribbean
Source: Economic Commission for Latin America and the Caribbean (ECLAC), on the basis of official information from central banks, customs services and statistical institutes of the countries of the region.

18 Summary Economic Commission for Latin America and the Caribbean (ECLAC)
Among the region’s main trading partners, the most dynamic flows in 2021 are projected to be those with Asia and those within the region itself (see figure 4). The projected 35% increase in the value of exports to China is consistent with the structure of shipments to that country. These consist almost exclusively of raw materials and processed natural resources, so their value is increasing because of the higher prices of these products. Intraregional trade has recovered in 2021 following the slide that began in February 2019 and accelerated abruptly during the pandemic. Several manufacturing sectors, such as metalworking (+83%), automotive industry (+66%) and textiles, apparel and footwear (+54%), posted high year-on-year increases in intraregional shipments during the first half of the year. Nonetheless, the regional market share in total goods exports is expected to be 13% in 2021, well down from its peak of 21% in 2008.
Figure 4 Latin America and the Caribbean: projected annual variation in goods trade value by main partner, 2021(Percentages)
35 33
31
25 23
19
33 33
31 3234
29
0
5
10
15
20
25
30
35
40
China Latin Americaand the Caribbean
Other Asiancountries
World European Union United States
ExportsImports
Source: Economic Commission for Latin America and the Caribbean (ECLAC), on the basis of on the basis of official information from central banks, customs services and statistical institutes of the respective countries.
In the South American countries, the faster rise in the prices of goods exports compared to those of imports signal an improvement in the terms of trade in 2021. This will mainly be the case in hydrocarbon exporting countries, whose terms of trade are projected to rise by 15%, followed by exporters of agroindustrial products (Argentina, Uruguay and Paraguay) and mining products (Chile and Peru) (see figure 5). Brazil is likely to benefit the most, as a result of higher prices for iron ore and other minerals, oil and various agribusiness products. In contrast to the outlook for South American countries, the terms of trade of subregions and countries that depend heavily on imports of fuels and other raw materials are projected to deteriorate. This is the case of Central America, most Caribbean countries and Mexico.

19SummaryInternational Trade Outlook for Latin America and the Caribbean • 2021
Figure 5 Latin America and the Caribbean (selected subregions, groupings and countries): projected variation in the terms of trade, 2021(Percentages)
19
15 13 13
5
-1
-5 -6-10
-5
0
5
10
15
20
25
Brazil Hydrocarbonexporters
Exporters ofagro-industrial
products
Mineralexporters
Latin Americaand the Caribbean
Central America The Caribbean(except Guyana,
Jamaica andTrinidad and Tobago)
Mexico
Source: Economic Commission for Latin America and the Caribbean (ECLAC), on the basis of official information from central banks, customs services and statistical institutes of the countries of the region.
The region as a whole is expected to report a US$ 24 billion surplus in its goods trade in 2021 (see figure 6). This is less than in 2020 owing mainly to the robust recovery of import volumes. The joint surplus of members of the Southern Common Market (MERCOSUR) is set to grow from US$ 55 billion in 2020 to US$ 82 billion in 2021. In contrast, the Central American and Caribbean countries will see their 2020 trade deficit widen.
Figure 6 Latin America and the Caribbean (selected subregions, groupings and countries): merchandise trade balance, 2020 and projections for 2021(Billions of dollars)
-23 -23
34
3
18
6455
-34-28
-6 -5
1524
82
-60
-40
-20
0
20
40
60
80
100
Central AmericanCommon Market
The Caribbean Mexico AndeanCommunity
Chile Latin America andthe Caribbean
SouthernCommon Market
(MERCOSUR)
20202021
Source: Economic Commission for Latin America and the Caribbean (ECLAC), on the basis of official information from the central banks, customs services and institutes of statistics of the countries of the region.

20 Summary Economic Commission for Latin America and the Caribbean (ECLAC)
The recovery of regional trade displays major similarities with the recent trend in world trade, and its short-term prospects are subject to similar risks. However, there are specific factors that determine the evolution of trade in the region, which stem from its export specialization pattern. In goods trade, the recovery of shipments in 2021 will be driven to a much greater extent by exogenous factors (the rise in commodity prices) than by the capacity to increase the volume exported. Although the prices of many commodities exported by the region are at high levels, there are no data to confirm the presence of a new super-cycle. In the case of trade in services, the region’s reliance on tourism far exceeds the world average; so the uncertainty surrounding the reopening of this sector is weighing on the prospects of several economies, especially in the Caribbean.
The pandemic caused a substantial erosion of the business fabric, particularly affecting micro, small and medium-sized enterprises (MSMEs) that export to the regional market. This is consistent with the shrinking of intraregional trade observed since early 2019, which worsened as a result of the pandemic. This situation should trigger reflection on the urgent need to deepen regional economic integration, especially in a global context in which the major economic powers are seeking to advance their own processes of regionalization in trade and production. Advancing towards an integrated regional market is essential, not only to generate efficient production scales and promote production and export diversification processes but also to achieve greater self-sufficiency in strategic sectors. This latter objective has become particularly important in the context of the disruptions to global supply chains caused by the pandemic.
B. The challenge of regional productive self-sufficiency in the health-care industry
The health-care industry encompasses production activities in which biology and technology are applied to improve health, such as biopharmaceuticals, medical technology, genomics, diagnostics and digital health. The COVID-19 pandemic has underscored the strategic nature of this industry, not only because of its direct link to public health, but also because it is an innovative sector with significant technological externalities. Global exports of health-care industry products totalled about US$ 1.1 trillion in 2020, equivalent to 6% of global trade in goods in that year. The pharmaceutical industry (drugs and their raw materials) contributed just over US$ 700 billion (66%), with the remainder (US$ 364 billion) being accounted for by medical devices (34%). While the value of global goods exports fell by 7.5% in 2020 as a result of the COVID-19 pandemic, the value of health industry shipments grew by 9%.
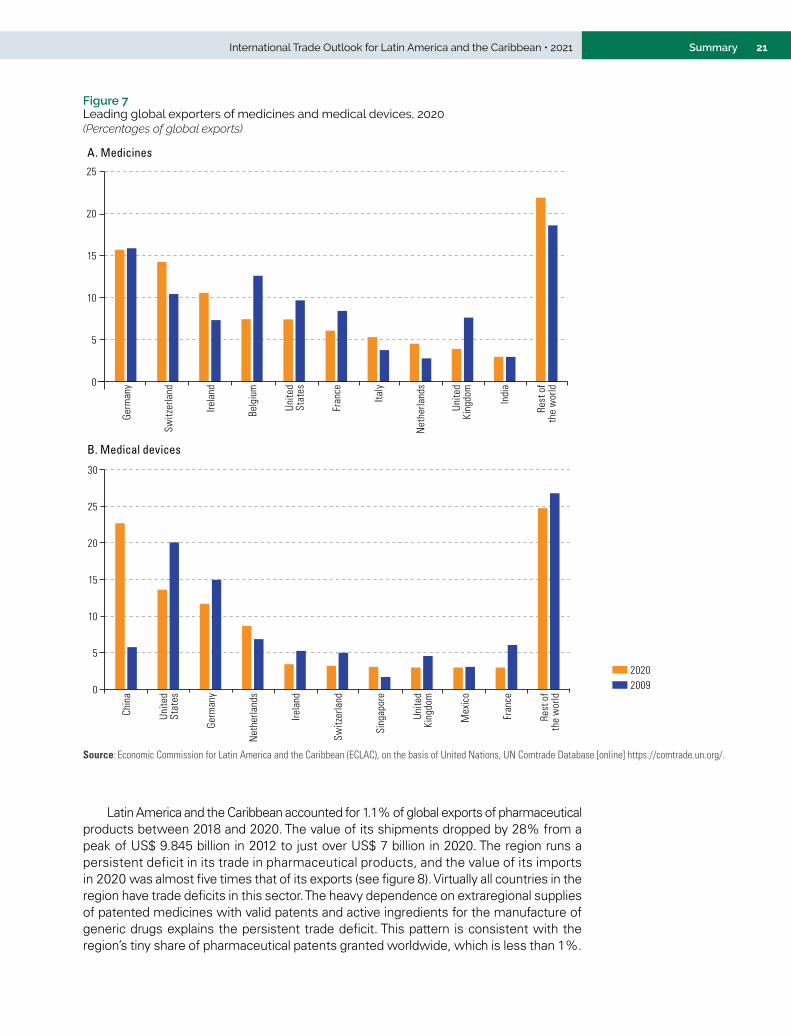
Health industry exports are concentrated in developed countries. The main exceptions are India in medicines and China in the case of medical devices (see figure 7). While India is the world’s leading exporter of generic drugs, China became the world’s leading exporter of medical devices in 2020. Mexico was the only Latin American or Caribbean country among the top 40 global exporters of medicines in 2020, ranked thirty-fourth, with a share of 0.15%. In the case of medical devices, Mexico ranked ninth (3%), followed by Costa Rica in eighteenth place (1.1%).
21SummaryInternational Trade Outlook for Latin America and the Caribbean • 2021
Figure 7 Leading global exporters of medicines and medical devices, 2020(Percentages of global exports)
0
5
10
15
20
25
Germ
any
Switz
erla
nd
Irela
nd
Belg
ium
Fran
ce
Italy
Net
herla
nds
Unite
dKi
ngdo
m
Indi
a
Unite
dSt
ates
Rest
of
the
wor
ld
A. Medicines
0
5
10
15
20
25
30
Chin
a
Germ
any
Net
herla
nds
Irela
nd
Switz
erla
nd
Sing
apor
e
Unite
dKi
ngdo
m
Mex
ico
Fran
ce
Rest
of
the
wor
ld
Unite
dSt
ates
20092020
B. Medical devices
Source: Economic Commission for Latin America and the Caribbean (ECLAC), on the basis of United Nations, UN Comtrade Database [online] https://comtrade.un.org/.
Latin America and the Caribbean accounted for 1.1% of global exports of pharmaceutical products between 2018 and 2020. The value of its shipments dropped by 28% from a peak of US$ 9.845 billion in 2012 to just over US$ 7 billion in 2020. The region runs a persistent deficit in its trade in pharmaceutical products, and the value of its imports in 2020 was almost five times that of its exports (see figure 8). Virtually all countries in the region have trade deficits in this sector. The heavy dependence on extraregional supplies of patented medicines with valid patents and active ingredients for the manufacture of generic drugs explains the persistent trade deficit. This pattern is consistent with the region’s tiny share of pharmaceutical patents granted worldwide, which is less than 1%.

22 Summary Economic Commission for Latin America and the Caribbean (ECLAC)
Figure 8 Latin America and the Caribbean: trade in the health industry, 2010–2020(Billions of dollars)
A. Exports
0
10
20
30
40
50
60
2010 2011 2012 2013 2014 2015 2016 2017 2018 2019 2020
Medical devicesPharmaceutical industry
B. Imports
Medical devicesPharmaceutical industry0
10
20
30
40
50
60
2010 2011 2012 2013 2014 2015 2016 2017 2018 2019 2020
Source: Economic Commission for Latin America and the Caribbean (ECLAC), on the basis of United Nations, UN Comtrade Database [online] https://comtrade.un.org/.
In contrast to the pharmaceutical sector, regional exports of medical devices grew by 86% in value terms between 2010 and 2019, to US$ 16.4 billion (twice the value of pharmaceutical exports in the same year). The region accounts for 5.5% of global exports of medical devices and even ran a trade surplus in this segment between 2016 and 2019.
Argentina, Brazil and Mexico account for 58% of the total value of the region’s exports of pharmaceutical products in 2018–2020 (see figure 9.A). Among the smaller economies, the Dominican Republic is the fifth largest regional exporter. In that period, the main destinations for regional exports were the region itself (46%) and the United States (25%). The main source of the region’s imports of pharmaceutical products is the European Union, which supplied 50% of the total on average between 2018 and 2020, followed by the United States (19%). Although imports from the region itself accounted for just 13% of the total, the intraregional share of purchases by the smaller economies is much higher. In Brazil and Mexico, the region’s two largest producers of pharmaceutical products, only 1%–2% of imported pharmaceutical inputs came from the region in 2019, which displays scant intraregional integration of production.

23SummaryInternational Trade Outlook for Latin America and the Caribbean • 2021
Figure 9 Latin America and the Caribbean: distribution of exports of pharmaceutical products and medical devices by origin and destination, average 2018–2020(Percentages)
By origin By destination
Mexico(22)Argentina
(10)
Chile(9)
El Salvador(2)
Uruguay(2)
Peru(2) Other countries
(5)
Dominican Rep.(7)
Colombia(6)
Costa Rica(5)
Guatemala(4) Brazil
(26)Latin America and
the Caribbean (46)
United States (25)
European Union(28 countries)
(22)
Rest of the world (7)
A. Pharmaceutical products
By origin By destination
Mexico(67)
Costa Rica(21)
Dominican Rep.(6)
Brazil(3)
Other countries (3)
United States (89)
European Union(28 countries)
(6)
Latin America andthe Caribbean
(2)
Rest of the world (3)
B. Medical devices
Source: Economic Commission for Latin America and the Caribbean (ECLAC), on the basis of United Nations, UN Comtrade Database [online] https://comtrade.un.org/.
The region’s export dynamism in the medical devices sector is almost entirely explained by the performance of Costa Rica, Mexico and, to a lesser extent, the Dominican Republic, which accounted for 94% of the total value of shipments between 2018 and 2020. Exports from these three countries are mainly by transnational United States and European firms that have set up manufacturing plants there and use large amounts of imported inputs. In 2020, 89% of regional exports of medical devices went to the United States, while just 2% stayed in the region itself (see figure 9.B). This shows that the presence in some countries of major production centres operated by transnational corporations is not necessarily a guarantee of regional productive autonomy, since decisions about the destination of this production are taken at these firms’ headquarters. In 2020, the main suppliers of medical devices in the region were the United States and China, accounting for 33% and 32%, respectively. During the pandemic, China’s share of the region’s purchases more than doubled in just one year, from 14% in 2019. Only 4% of regional imports in 2020 came from the region itself.
24 Summary Economic Commission for Latin America and the Caribbean (ECLAC)
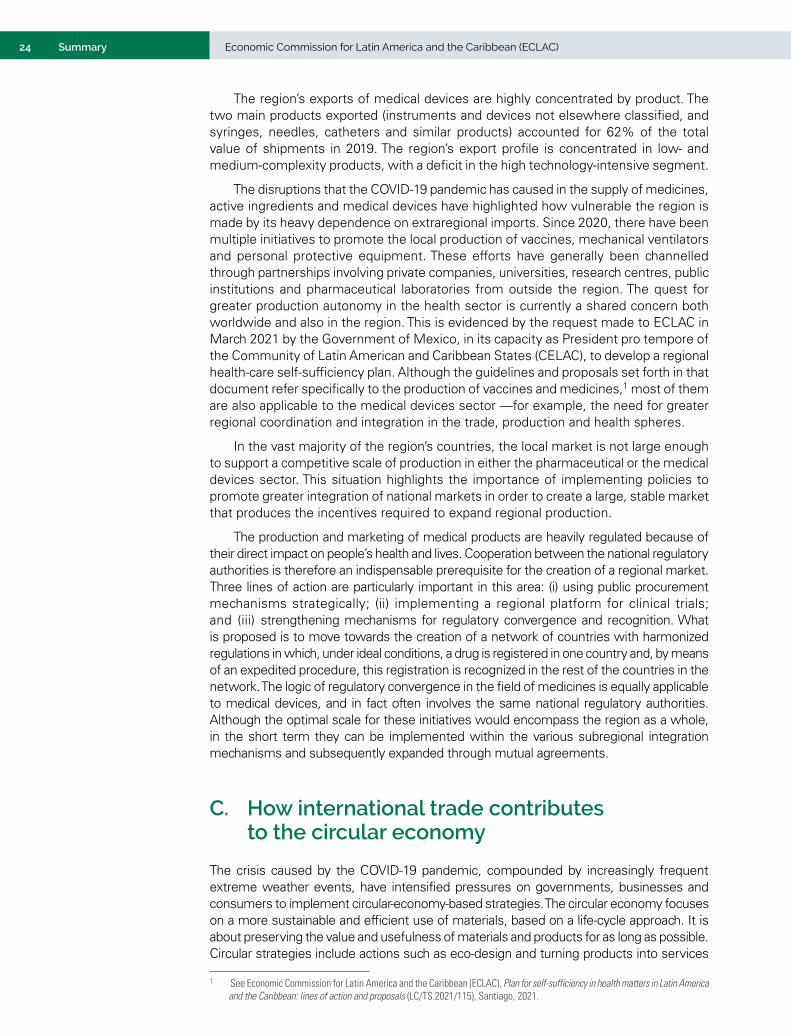
The region’s exports of medical devices are highly concentrated by product. The two main products exported (instruments and devices not elsewhere classified, and syringes, needles, catheters and similar products) accounted for 62% of the total value of shipments in 2019. The region’s export profile is concentrated in low- and medium-complexity products, with a deficit in the high technology-intensive segment.
The disruptions that the COVID-19 pandemic has caused in the supply of medicines, active ingredients and medical devices have highlighted how vulnerable the region is made by its heavy dependence on extraregional imports. Since 2020, there have been multiple initiatives to promote the local production of vaccines, mechanical ventilators and personal protective equipment. These efforts have generally been channelled through partnerships involving private companies, universities, research centres, public institutions and pharmaceutical laboratories from outside the region. The quest for greater production autonomy in the health sector is currently a shared concern both worldwide and also in the region. This is evidenced by the request made to ECLAC in March 2021 by the Government of Mexico, in its capacity as President pro tempore of the Community of Latin American and Caribbean States (CELAC), to develop a regional health-care self-sufficiency plan. Although the guidelines and proposals set forth in that document refer specifically to the production of vaccines and medicines,1 most of them are also applicable to the medical devices sector —for example, the need for greater regional coordination and integration in the trade, production and health spheres.
In the vast majority of the region’s countries, the local market is not large enough to support a competitive scale of production in either the pharmaceutical or the medical devices sector. This situation highlights the importance of implementing policies to promote greater integration of national markets in order to create a large, stable market that produces the incentives required to expand regional production.
The production and marketing of medical products are heavily regulated because of their direct impact on people’s health and lives. Cooperation between the national regulatory authorities is therefore an indispensable prerequisite for the creation of a regional market. Three lines of action are particularly important in this area: (i) using public procurement mechanisms strategically; (ii) implementing a regional platform for clinical trials; and (iii) strengthening mechanisms for regulatory convergence and recognition. What is proposed is to move towards the creation of a network of countries with harmonized regulations in which, under ideal conditions, a drug is registered in one country and, by means of an expedited procedure, this registration is recognized in the rest of the countries in the network. The logic of regulatory convergence in the field of medicines is equally applicable to medical devices, and in fact often involves the same national regulatory authorities. Although the optimal scale for these initiatives would encompass the region as a whole, in the short term they can be implemented within the various subregional integration mechanisms and subsequently expanded through mutual agreements.
C. How international trade contributes to the circular economy
The crisis caused by the COVID-19 pandemic, compounded by increasingly frequent extreme weather events, have intensified pressures on governments, businesses and consumers to implement circular-economy-based strategies. The circular economy focuses on a more sustainable and efficient use of materials, based on a life-cycle approach. It is about preserving the value and usefulness of materials and products for as long as possible. Circular strategies include actions such as eco-design and turning products into services
1 See Economic Commission for Latin America and the Caribbean (ECLAC), Plan for self-sufficiency in health matters in Latin America and the Caribbean: lines of action and proposals (LC/TS.2021/115), Santiago, 2021.
25SummaryInternational Trade Outlook for Latin America and the Caribbean • 2021
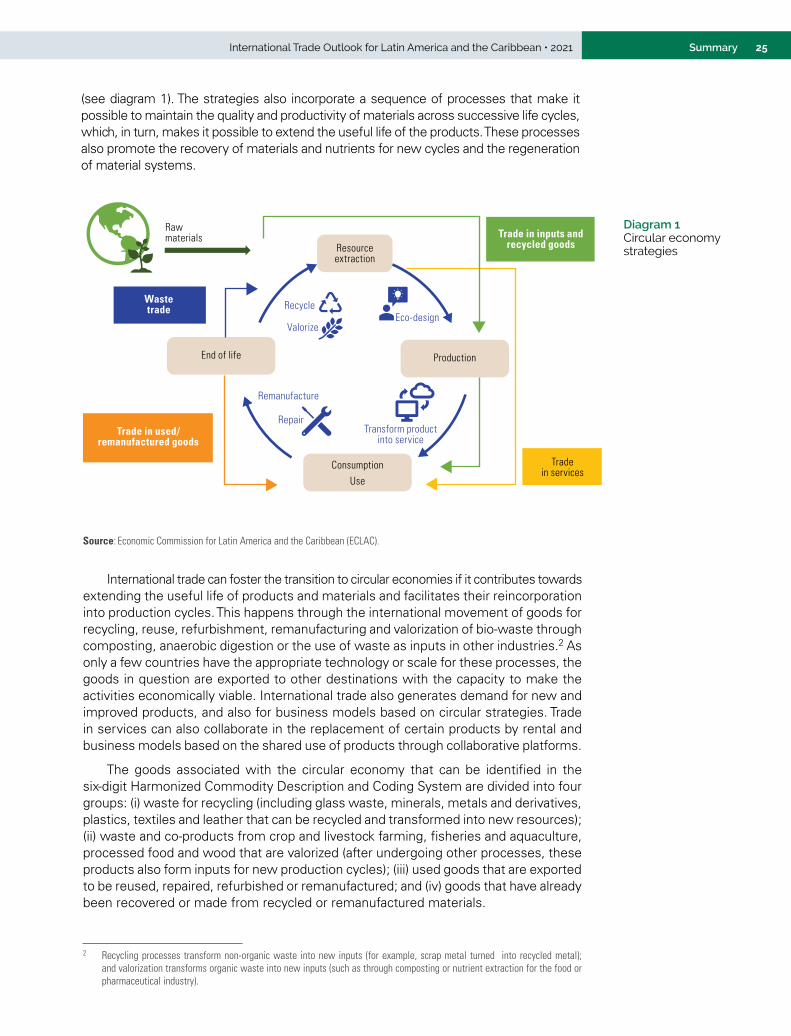
(see diagram 1). The strategies also incorporate a sequence of processes that make it possible to maintain the quality and productivity of materials across successive life cycles, which, in turn, makes it possible to extend the useful life of the products. These processes also promote the recovery of materials and nutrients for new cycles and the regeneration of material systems.
Diagram 1 Circular economy strategies
Eco-design
Remanufacture
Repair
Recycle
Valorize
Resourceextraction
End of life Production
ConsumptionUse
Wastetrade
Comercio de bienes usados/ remanufacturados
Trade in used/remanufactured goods
Tradein services
Transform productinto service
Rawmaterials Trade in inputs and
recycled goods
Source: Economic Commission for Latin America and the Caribbean (ECLAC).
International trade can foster the transition to circular economies if it contributes towards extending the useful life of products and materials and facilitates their reincorporation into production cycles. This happens through the international movement of goods for recycling, reuse, refurbishment, remanufacturing and valorization of bio-waste through composting, anaerobic digestion or the use of waste as inputs in other industries.2 As only a few countries have the appropriate technology or scale for these processes, the goods in question are exported to other destinations with the capacity to make the activities economically viable. International trade also generates demand for new and improved products, and also for business models based on circular strategies. Trade in services can also collaborate in the replacement of certain products by rental and business models based on the shared use of products through collaborative platforms.
The goods associated with the circular economy that can be identified in the six-digit Harmonized Commodity Description and Coding System are divided into four groups: (i) waste for recycling (including glass waste, minerals, metals and derivatives, plastics, textiles and leather that can be recycled and transformed into new resources); (ii) waste and co-products from crop and livestock farming, fisheries and aquaculture, processed food and wood that are valorized (after undergoing other processes, these products also form inputs for new production cycles); (iii) used goods that are exported to be reused, repaired, refurbished or remanufactured; and (iv) goods that have already been recovered or made from recycled or remanufactured materials.
2 Recycling processes transform non-organic waste into new inputs (for example, scrap metal turned into recycled metal); and valorization transforms organic waste into new inputs (such as through composting or nutrient extraction for the food or pharmaceutical industry).

26 Summary Economic Commission for Latin America and the Caribbean (ECLAC)
The exported volume of these goods has been increasing over the last decade, both globally and regionally (see figure 10). Worldwide, the main export category corresponds to products for recycling, especially waste and scrap metal. In Latin America and the Caribbean, the majority of exports correspond to products for valorization, in particular residues from soybean oil extraction. These products are mainly exported to Southeast Asian countries to be used to produce animal and fish feed.
Figure 10 World and Latin America and the Caribbean: exported volume of goods associated with the circular economy by category, averages 2009–2012, 2013–2016 and 2017–2019(Billions of tons)
0
50
100
150
200
250
300
350
400
450
500
2009-2012 2013-2016 2017-2019
UsedRecycledFor valorizationFor recycling
A. World
B. Latin America and the Caribbean
0
10
20
30
40
50
60
70
2009-2012 2013-2016 2017-2019
RecycledFor valorizationFor recycling
Source: Economic Commission for Latin America and the Caribbean (ECLAC), on the basis of Centre for International Prospective Studies and Information (CEPII), International Trade Analysis Database (BACI).
27SummaryInternational Trade Outlook for Latin America and the Caribbean • 2021
The forestry-pulp-paper industry in Latin America is an example of a regional value chain that is moving towards circularity. This industry has developed a circular product circuit based on the recycling of paper and paperboard, which serve as inputs for a special pulp that is used to produce recycled paper (testliners). The use of secondary raw materials contributes to export diversification and the reduction of deforestation in the region, since exports of recycled paper are increasing and can be used as an input for several other products. The promotion of the circular economy in the sector generates multiple savings in raw materials, energy and water, thereby making it a more efficient and environmentally friendly production alternative. The production of one ton of pulp from recycled secondary inputs is up to four times more efficient than production from virgin inputs.
Several countries in the region are defining standards and forming action plans for the circular economy, including several aspects related to international trade. In particular, they focus on certain strategic (export) sectors, the promotion of circular enterprises and products, access to markets and the search for foreign direct investment or international financing for circular economy ventures, especially for small and medium-sized enterprises (SMEs). Some countries are taking steps to establish registers of circular suppliers, which would make it possible to map supply in terms of export potential. In sustainable public procurement systems, the vast majority of countries are seeking to add circularity criteria, with a view to promoting new business models, especially among SMEs. Some countries are coordinating their national strategies around the circular economy, as exemplified by the initiative on the sustainable management of plastics launched by the Pacific Alliance in 2019.
Tariff and non-tariff barriers applied to potentially circular products can hinder their international trade. For example, in some countries of the region, food industry waste faces higher tariffs than metal waste. Non-tariff measures can also impede the transition to a circular economy. One example is import bans on used goods and waste in general. For example, several countries in Latin America and the Caribbean have banned imports of used cars; others restrict entry according to their age, giving preference to newer models; and a third group applies strict emission standards for the entry of this type of vehicle.
The more stringent production standards through which advanced countries are promoting the circular economy can provide opportunities for producers in Latin America and the Caribbean to add value to local production, gain access to demanding markets, and increase production efficiency through better management of waste and co-products. International trade can thus act as a vehicle for speeding up the transition to the circular economy; and the region’s countries should seek to capitalize on this opportunity as a way to hasten the sustainable economic development process.
Going forward, the contribution made by trade to the transition to a circular economy depends on how it interacts with national and international policies aimed at removing barriers and developing public policies (in partnership with the private sector) that promote the conservation of the value and utility of materials and products. There is a need to liberalize trade in goods and services that contribute to circularity at each stage of production and consumption, especially at the end of the life of the goods in question. These products need to be more precisely defined in both national and international trade classifications. Subregional integration mechanisms are an ideal vehicle for sharing experiences, harmonizing standards and promoting joint solutions. At the regional level, steps could be taken to design environmental regulations that transcend national borders. At the same time, the development of standards and certifications that endorse the circularity of processes could encourage firms to adopt sustainable practices.


29Chapter IInternational Trade Outlook for Latin America and the Caribbean • 2021
ICHAPTER
Global and regional trade are recovering amid heightened uncertainty
A. In 2021, world trade is expected to grow faster than it has in any year since 2010
B. The steady rise in freight charges threatens the recovery of global trade
C. A hesitant recovery in world trade in services slowed by the slump in tourism
D. Trade and value chains: a return to multilateralism or deepening regionalism?
E. An uneven recovery in regional trade in 2021
F. Concluding remarks
Bibliography
Annex I.A1


31Chapter IInternational Trade Outlook for Latin America and the Caribbean • 2021 IA. In 2021, world trade is expected to grow faster than it has in any year since 2010
When the volume of world trade in goods contracted in 2020 as a result of the coronavirus disease (COVID-19) pandemic, it was the first time that it had done so since the 2009 global financial crisis. This time, however, the downturn was much less drastic, as trade volumes shrank by 5.3% as opposed to 12.6% in 2009. After registering the steepest year-on-year drop since the start of the pandemic in May 2020 (−16.9%), global trade in goods has made a robust comeback (see figure I.1). Its mean year-on-year growth rate between January and August 2021 was 12.8%, in sharp contrast to its mean year-on-year decrease of 8% in the corresponding period of 2020. The recovery of world trade has been made possible by the gradual easing of restrictions on movement (both within countries and internationally), rising vaccination rates in the world’s major economies and the positive impact on demand of the economic stimulus programmes put in place since the pandemic began, which have been particularly ambitious in developed countries (see figure I.2).
Figure I.1 Year-on-year variation in the volume of world goods trade, January 2017–August 2021(Percentages)
Eight-month average
Year-on-year variation
4.8 4.3
-0.1
-8.0
12.8
-20
-15
-10
-5
0
5
10
15
20
25
30
Jan
Mar
May Ju
l
Sep
Nov Jan
Mar
May Ju
l
Sep
Nov Jan
Mar
May Ju
l
Sep
Nov Jan
Mar
May Ju
l
Sep
Nov Jan
Mar
May Ju
l
Sep
2017 2018 2019 2020 2021
Source: Economic Commission for Latin America and the Caribbean (ECLAC), on the basis of Netherlands Bureau of Economic Policy Analysis (CPB), World Trade Monitor [online database] https://www.cpb.nl/en/worldtrademonitor.
Figure I.2 Selected groupings and countries: fiscal measures adopted in response to the COVID-19 pandemica
(Percentages of 2020 GDP)
Capital, loans and guarantees
Additional expendituresand foregone earnings
5.7
3.2
15.3
25.5
16.7
4.8
11.4
4.2
0.9
27.8
2.4
28.3
1.3
0
5
10
15
20
25
30
Advancedeconomies
Emergingeconomies
Low-incomecountries
Germany United States Japan China
11.7
Source: Economic Commission for Latin America and the Caribbean (ECLAC), on the basis of International Monetary Fund (IMF), “Fiscal Monitor Database of Country Fiscal Measures in Response to the COVID-19 Pandemic”, October 2021 [online] https://www.imf.org/en/Topics/imf-and-covid19/Fiscal-Policies-Database-in-Response-to-COVID-19.
a Includes measures implemented between January 2020 and 27 September 2021 and measures announced before the latter date but implemented after it.
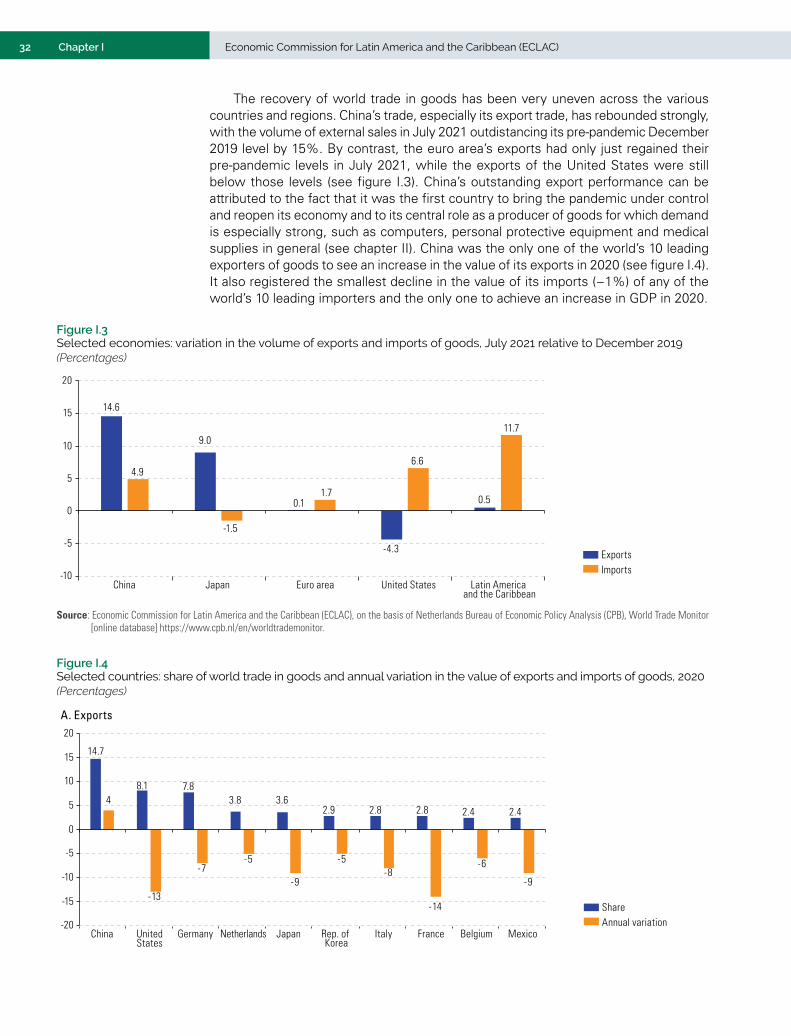
32 Economic Commission for Latin America and the Caribbean (ECLAC)Chapter I
The recovery of world trade in goods has been very uneven across the various countries and regions. China’s trade, especially its export trade, has rebounded strongly, with the volume of external sales in July 2021 outdistancing its pre-pandemic December 2019 level by 15%. By contrast, the euro area’s exports had only just regained their pre-pandemic levels in July 2021, while the exports of the United States were still below those levels (see figure I.3). China’s outstanding export performance can be attributed to the fact that it was the first country to bring the pandemic under control and reopen its economy and to its central role as a producer of goods for which demand is especially strong, such as computers, personal protective equipment and medical supplies in general (see chapter II). China was the only one of the world’s 10 leading exporters of goods to see an increase in the value of its exports in 2020 (see figure I.4). It also registered the smallest decline in the value of its imports (−1%) of any of the world’s 10 leading importers and the only one to achieve an increase in GDP in 2020.
Figure I.3 Selected economies: variation in the volume of exports and imports of goods, July 2021 relative to December 2019(Percentages)
ImportsExports
14.6
9.0
0.1
-4.3
0.5
4.9
-1.5
1.7
6.6
11.7
-10
-5
0
5
10
15
20
China Japan Euro area United States Latin America and the Caribbean
Source: Economic Commission for Latin America and the Caribbean (ECLAC), on the basis of Netherlands Bureau of Economic Policy Analysis (CPB), World Trade Monitor [online database] https://www.cpb.nl/en/worldtrademonitor.
Figure I.4 Selected countries: share of world trade in goods and annual variation in the value of exports and imports of goods, 2020(Percentages)
Annual variationShare
14.7
8.1 7.83.8 3.6
2.9 2.8 2.8 2.4 2.44
-13
-7-5
-9
-5-8
-14
-6
-9
-20
-15
-10
-5
0
5
10
15
20
China UnitedStates
Germany Netherlands Japan Rep. of Korea
Italy France Belgium Mexico
A. Exports

33Chapter IInternational Trade Outlook for Latin America and the Caribbean • 2021
Annual variationShare
B. Imports
13.511.5
6.6
3.6 3.6 3.4 3.3 2.6 2.4 2.3
-6
-1
-5
-9-12
-6
-11
-7
-11 -11
-15
-10
-5
0
5
10
15
United States
China Germany United Kingdom
Japan Netherlands France Rep. ofKorea
Italy Canada
Source: Economic Commission for Latin America and the Caribbean (ECLAC), on the basis of World Trade Organization (WTO), World Trade Statistical Review 2021, 2021, Geneva.
Figure I.4 (concluded)
After the global economy underwent the severest contraction (-3.5%) in 2020 to be recorded since the 1930s, it is expected to experience a burst of growth in 2021 and 2022 (of 5.3% and 3.6%, respectively) (UNCTAD, 2021b). In October 2021, the World Trade Organization (WTO) revised its growth projection for the volume of world trade in goods for that year upward from 8% to 10.8% (WTO, 2021b). If that projection turns out to be accurate, it will be the steepest increase since the 13.9% jump recorded in 2010 in the wake of the world financial crisis (see figure I.5). As was also true in that case, the rebound expected in 2021 will partially be the result of a statistical effect, given the low level of the 2020 reference rate. For 2022, the projected 4.7% growth rate is twice as high as the average growth rate of world trade for 2012–2019 (an annual rate of 2.4%).
Figure I.5 Annual variation in the volume of world goods trade, 1990-2022a
(Percentages)
Annual variationAverage variation
-15
-10
-5
0
5
10
15
20
1990
1991
1992
1993
1994
1995
1996
1997
1998
1999
2000
2001
2002
2003
2004
2005
2006
2007
2008
2009
2010
2011
2012
2013
2014
2015
2016
2017
2018
2019
2020
2021
2022
Source: Economic Commission for Latin America and the Caribbean (ECLAC), on the basis of World Trade Organization (WTO), “WTO Data” [online] https://data.wto.org/en#.a The figures for 2021 and 2022 are projections.

34 Economic Commission for Latin America and the Caribbean (ECLAC)Chapter I
The projections for 2021 and 2022 are subject to a considerable degree of uncertainty, since it cannot yet be determined what the future course of the pandemic will be, given the possible emergence of new variants of the virus and the extreme disparities in vaccination coverage across countries of differing income levels (see figure I.6). There are also doubts as to the ability, especially of lower-income countries, to sustain the fiscal effort deployed thus far if the pandemic lasts beyond 2021. Other risk factors include the disturbances in supply chains, such as the supply chain for semiconductors, generated by the sharp upswing in demand during the pandemic. The recovery of world trade in goods starting in the second half of 2020, in combination with the continued application of various pandemic-related restrictions, has resulted in congestion in maritime transport and seaports that has, in turn, driven up freight charges (see section B in this chapter).
Figure I.6 Selected country groupings: share of population having received at least one dose of a COVID-19 vaccine as of 1 November 2021(Percentages)
Upper-middle-incomecountriesa
Lower-middle-incomecountries
High-income countries
Low-income countries
71.6
3.7
38.1
66.3
0
10
20
30
40
50
60
70
80
1 Dec 2020
1 Jan 1 Feb 1 Mar 1 Apr 1 May 1 Jun 1 Jul 1 Aug 1 Sep 1 Oct 1 Nov 2021
Source: Economic Commission for Latin America and the Caribbean (ECLAC), on the basis of Our World in Data [online] https://ourworldindata.org.a The data for China are reported at irregular intervals.
In the first eight months of 2021, imports of goods by the United States, the European Union, China and Japan surged in terms of both value and volumes (see figure I.7), and this has driven an upswing in Latin American and Caribbean exports to those markets (which represented 52% of world imports in 2020, including trade among members of the European Union) and in the prices of the region’s main commodity exports (see section E).
Generally speaking, the strongest growth in imports in the world’s four leading economies has been seen in mining, energy and heavy manufactures (see table I.1). The growth in Chinese commodity imports has been particularly striking: the value of Chinese purchases of farm and livestock products climbed by 43% year-on-year in the first seven months of 2021, while purchases of metallic and non-metallic mineral products, petroleum and mining products jumped by over 50%.
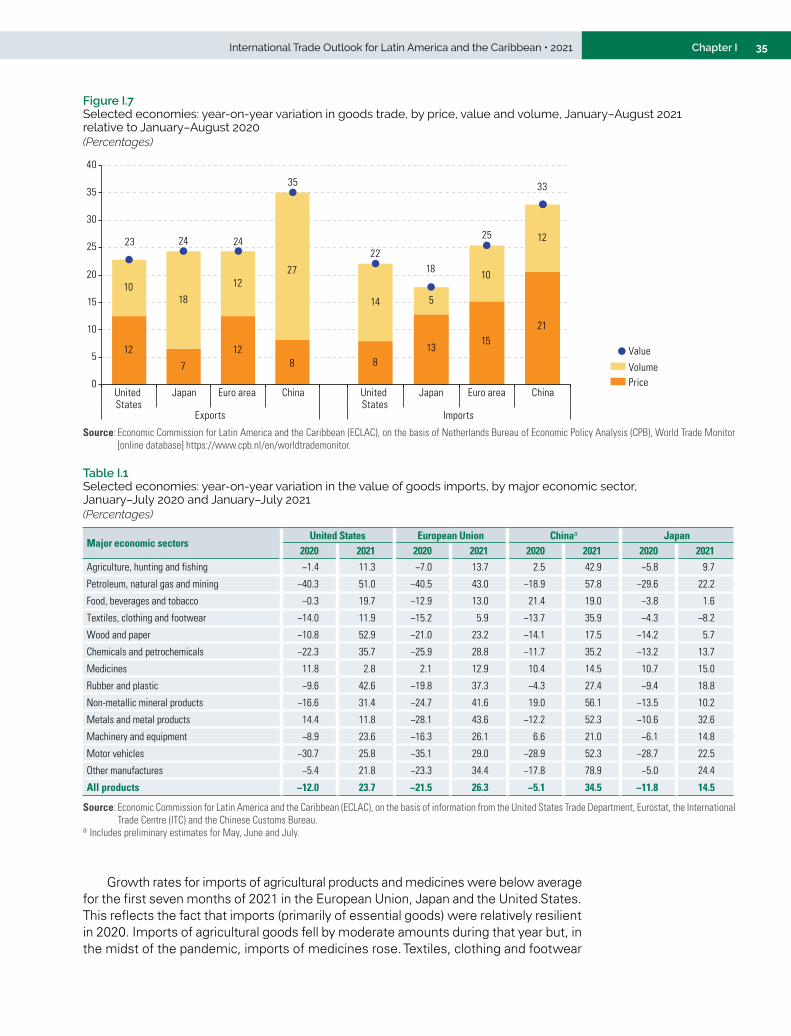
35Chapter IInternational Trade Outlook for Latin America and the Caribbean • 2021
Figure I.7 Selected economies: year-on-year variation in goods trade, by price, value and volume, January–August 2021 relative to January–August 2020(Percentages)
Volume
Value
Price
12
7
128 8
1315
21
1018
1227
14 5
10
1223 24 24
35
2218
25
33
0
5
10
15
20
25
30
35
40
United States
Japan Euro area Euro areaChina United States
Japan China
Exports Imports
Source: Economic Commission for Latin America and the Caribbean (ECLAC), on the basis of Netherlands Bureau of Economic Policy Analysis (CPB), World Trade Monitor [online database] https://www.cpb.nl/en/worldtrademonitor.
Table I.1 Selected economies: year-on-year variation in the value of goods imports, by major economic sector, January–July 2020 and January–July 2021(Percentages)
Major economic sectorsUnited States European Union Chinaa Japan
2020 2021 2020 2021 2020 2021 2020 2021Agriculture, hunting and fishing −1.4 11.3 −7.0 13.7 2.5 42.9 −5.8 9.7
Petroleum, natural gas and mining −40.3 51.0 −40.5 43.0 −18.9 57.8 −29.6 22.2
Food, beverages and tobacco −0.3 19.7 −12.9 13.0 21.4 19.0 −3.8 1.6
Textiles, clothing and footwear −14.0 11.9 −15.2 5.9 −13.7 35.9 −4.3 −8.2
Wood and paper −10.8 52.9 −21.0 23.2 −14.1 17.5 −14.2 5.7
Chemicals and petrochemicals −22.3 35.7 −25.9 28.8 −11.7 35.2 −13.2 13.7
Medicines 11.8 2.8 2.1 12.9 10.4 14.5 10.7 15.0
Rubber and plastic −9.6 42.6 −19.8 37.3 −4.3 27.4 −9.4 18.8
Non-metallic mineral products −16.6 31.4 −24.7 41.6 19.0 56.1 −13.5 10.2
Metals and metal products 14.4 11.8 −28.1 43.6 −12.2 52.3 −10.6 32.6
Machinery and equipment −8.9 23.6 −16.3 26.1 6.6 21.0 −6.1 14.8
Motor vehicles −30.7 25.8 −35.1 29.0 −28.9 52.3 −28.7 22.5
Other manufactures −5.4 21.8 −23.3 34.4 −17.8 78.9 −5.0 24.4
All products −12.0 23.7 −21.5 26.3 −5.1 34.5 −11.8 14.5
Source: Economic Commission for Latin America and the Caribbean (ECLAC), on the basis of information from the United States Trade Department, Eurostat, the International Trade Centre (ITC) and the Chinese Customs Bureau.
a Includes preliminary estimates for May, June and July.
Growth rates for imports of agricultural products and medicines were below average for the first seven months of 2021 in the European Union, Japan and the United States. This reflects the fact that imports (primarily of essential goods) were relatively resilient in 2020. Imports of agricultural goods fell by moderate amounts during that year but, in the midst of the pandemic, imports of medicines rose. Textiles, clothing and footwear
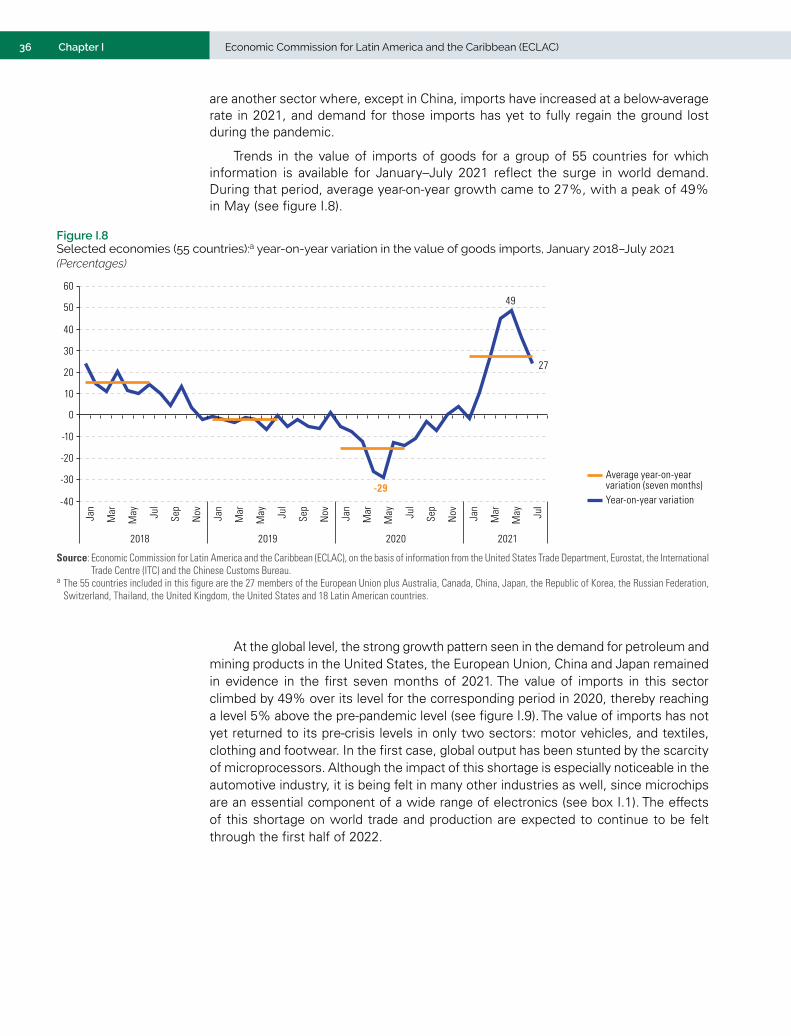
36 Economic Commission for Latin America and the Caribbean (ECLAC)Chapter I
are another sector where, except in China, imports have increased at a below-average rate in 2021, and demand for those imports has yet to fully regain the ground lost during the pandemic.
Trends in the value of imports of goods for a group of 55 countries for which information is available for January–July 2021 reflect the surge in world demand. During that period, average year-on-year growth came to 27%, with a peak of 49% in May (see figure I.8).
Figure I.8 Selected economies (55 countries):a year-on-year variation in the value of goods imports, January 2018–July 2021(Percentages)
Average year-on-yearvariation (seven months)Year-on-year variation
-29
49
27
-40
-30
-20
-10
0
10
20
30
40
50
60
Jan
Mar
May Ju
l
Sep
Nov Jan
Mar
May Ju
l
Sep
Nov Jan
Mar
May Ju
l
Sep
Nov Jan
Mar
May Ju
l2018 2019 2020 2021
Source: Economic Commission for Latin America and the Caribbean (ECLAC), on the basis of information from the United States Trade Department, Eurostat, the International Trade Centre (ITC) and the Chinese Customs Bureau.
a The 55 countries included in this figure are the 27 members of the European Union plus Australia, Canada, China, Japan, the Republic of Korea, the Russian Federation, Switzerland, Thailand, the United Kingdom, the United States and 18 Latin American countries.
At the global level, the strong growth pattern seen in the demand for petroleum and mining products in the United States, the European Union, China and Japan remained in evidence in the first seven months of 2021. The value of imports in this sector climbed by 49% over its level for the corresponding period in 2020, thereby reaching a level 5% above the pre-pandemic level (see figure I.9). The value of imports has not yet returned to its pre-crisis levels in only two sectors: motor vehicles, and textiles, clothing and footwear. In the first case, global output has been stunted by the scarcity of microprocessors. Although the impact of this shortage is especially noticeable in the automotive industry, it is being felt in many other industries as well, since microchips are an essential component of a wide range of electronics (see box I.1). The effects of this shortage on world trade and production are expected to continue to be felt through the first half of 2022.
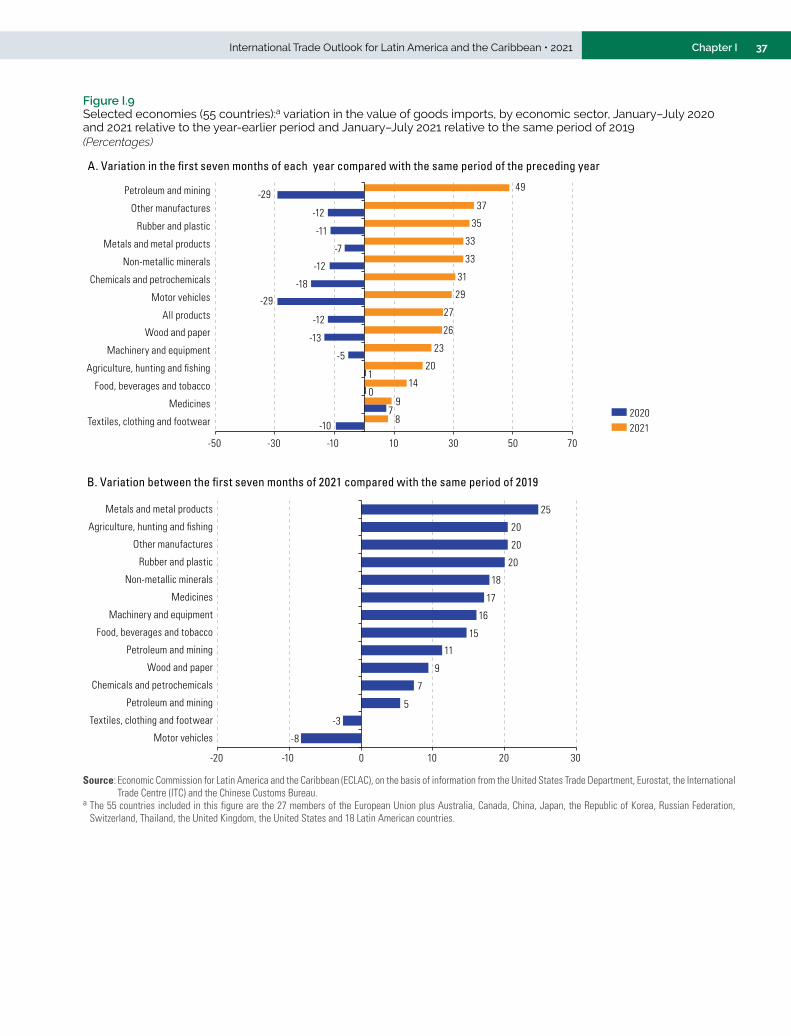
37Chapter IInternational Trade Outlook for Latin America and the Caribbean • 2021
Figure I.9 Selected economies (55 countries):a variation in the value of goods imports, by economic sector, January–July 2020 and 2021 relative to the year-earlier period and January–July 2021 relative to the same period of 2019(Percentages)
20202021-10
7
0
1
-5
-13
-12
-29
-18
-12
-7
-11
-12
-29
8
9
14
20
23
26
27
29
31
33
33
35
37
49
-50 -30 -10 10 30 50 70
Textiles, clothing and footwear
Medicines
Food, beverages and tobacco
Agriculture, hunting and fishing
Machinery and equipment
Wood and paper
All products
Motor vehicles
Chemicals and petrochemicals
Non-metallic minerals
Metals and metal products
Rubber and plastic
Other manufactures
Petroleum and mining
A. Variation in the first seven months of each year compared with the same period of the preceding year
B. Variation between the first seven months of 2021 compared with the same period of 2019
-8
-3
5
7
9
11
15
16
17
18
20
20
20
25
-20 -10 0 10 20 30
Motor vehicles
Textiles, clothing and footwear
Petroleum and mining
Chemicals and petrochemicals
Wood and paper
Petroleum and mining
Food, beverages and tobacco
Machinery and equipment
Medicines
Non-metallic minerals
Rubber and plastic
Other manufactures
Agriculture, hunting and fishing
Metals and metal products
Source: Economic Commission for Latin America and the Caribbean (ECLAC), on the basis of information from the United States Trade Department, Eurostat, the International Trade Centre (ITC) and the Chinese Customs Bureau.
a The 55 countries included in this figure are the 27 members of the European Union plus Australia, Canada, China, Japan, the Republic of Korea, Russian Federation, Switzerland, Thailand, the United Kingdom, the United States and 18 Latin American countries.

38 Economic Commission for Latin America and the Caribbean (ECLAC)Chapter I
Box I.1 The microchip shortage disrupts world commerce
The mobility restrictions imposed by various countries to help control the coronavirus disease (COVID-19) pandemic have generated disruptions in the electronics industry which have had a knock-on effect on a number of other industries worldwide, including the automotive industry. At the start of the pandemic, motor vehicle producers reduced their microchip orders in response to the decline in demand for automobiles and disruptions in the supply chain. Once the demand for vehicles rebounded, however, a bottleneck in the supply of microchips arose, partly because microchip producers had redirected their output to other products for which demand had increased during the pandemic, such as personal computers. As a result, even though the demand for automobiles has grown in 2021, many companies have nonetheless had to cut back their production. The dearth of microchips for use in the automotive sector is, in a sense, just the tip of the iceberg, as it reflects a much larger problem that affects other industries that use semiconductors in the production of a large array of items (computers, cellular telephones, medical equipment, home appliances and others).
There are a range of factors contributing to the current shortage: (i) the surge in demand for computers and other electronics generated by the widespread increase in telecommuting and distance education; (ii) the increased use of cryptocurrencies, whose technology and verification protocols require huge amounts of computational power; (iii) the proliferation of remote computing services, including cloud storage and the deployment of 5G networks; (iv) the scarcity of resins and semiconductors utilized as insulators in the production of microprocessors and integrated circuits; (v) the geographic concentration of the production of microchips, semiconductors and integrated circuits (the Republic of Korea and Taiwan Province of China, for example, produce 83% of the world’s computer chips); and (vi) the high levels of investment and long time frames involved in starting up new microchip and nanochip factories. On average, it takes between 2.5 and 4 years to bring new installed capacity on stream (López, 2021). These factors are compounded by new waves of the virus and lockdowns in the Asian countries where world production is concentrated.
The governments of a number of developed countries have taken steps to alleviate this crisis in view of the sector’s strategic importance. Both the European Union and the United States are both trying to promote the domestic production of semiconductors. To this end, they are looking to partner with the sector’s major companies, such as Taiwan Semiconductor Manufacturing Company Limited (TSMC) and Samsung, and are working to spur the reactivation of the installed capacity of others, such as Intel Corporation in the United States. Currently, the United States Congress is considering a bill that would provide US$ 52 billion in subsidies for the production of microprocessors. Despite all these efforts, it is thought that it will still take the sector a few years to make a complete recovery.
Source: Economic Commission for Latin America and the Caribbean (ECLAC), on the basis of L. Lee, “The chips are down: why there’s a semiconductor shortage”, Tech Xplore, 1 August 2021 [online] https://techxplore.com/news/2021-08-chips-semiconductor-shortage.html, and J. C. López, “La crisis de los semiconductores es la consecuencia de una tormenta perfecta: por qué no es tan fácil resolverla simplemente fabricando más chips”, 22 October 2021 [online] https://www.xataka.com/componentes/crisis-semiconductores-consecuencia-tormenta-perfecta-que-no-facil-resolverla-simplemente-fabricando-chips.
An analysis of 73% of world imports over the period from January to July 2021 shows that import values rose for 87% of these products, for an average increase of 31%, while import values for the other 13% of the products fell by an average of 17%. The list of the 25 products registering the biggest increases in value includes commodities such as iron ore and iron ore concentrates (100%), copper (58%), natural gas (56%) and petroleum (56%). Large upswings have also been seen in imports of strategic products such as diagnostic reagents (81%), machinery used to produce semiconductors (49%) and integrated circuits (32%), along with various intermediate products (motor vehicle parts and accessories, and parts and fittings for the electronics industry) and final products (automobiles, pick-up trucks and lorries). All in all, imports of those 25 products expanded by 44% and accounted for nearly 8% of the total increase in import values during the period under review (27%) (see table I.2).

39Chapter IInternational Trade Outlook for Latin America and the Caribbean • 2021
Table I.2 Selected economies: 25 goods with the largest increases in import values, January–July 2021 relative to January–July 2020a
(Percentages)
Harmonized Commodity Description and Coding System
DescriptionYear-on-year variation Share of total
imports (C)Contribution
(D=B*C)2020 (A) 2021 (B)
260111 Iron ores and concentrates 3,6 100,4 1,1 1,1382200 Composite diagnostic/lab reagents 18,8 81,4 0,2 0,2870340 Other vehicles with reciprocating piston engines 16,9 73,4 0,2 0,2870421 Transport vehicles not exceeding five tonnes −35,6 70,5 0,2 0,2260300 Copper ores and concentrates −8,2 57,8 0,5 0,3271121 Natural gas in gaseous state −39,2 56,4 0,6 0,3271012 Light petroleum oils and preparations −34,9 56,1 0,8 0,4740311 Refined copper cathodes 1,3 55,8 0,4 0,2848620 Machines for the manufacture of semiconductors 33,4 49,1 0,3 0,1711319 Jewellery and parts thereof −42,0 46,6 0,2 0,1870899 Tractor parts and accessories −27,5 41,9 0,4 0,2270900 Crude petroleum oils −35,7 39,9 4,7 1,9870829 Tractor body parts and accessories −27,5 39,5 0,4 0,1852872 Reception apparatus for colour television −7,8 39,1 0,2 0,1870840 Tractor and automobile gear boxes −29,8 38,6 0,4 0,1870323 Tourism automobiles (1.300–1.500 c.c.) −36,4 36,5 1,4 0,5870324 Tourism automobiles (over 3.000 c.c.) −33,5 34,8 0,4 0,1854430 Wiring sets for spark plugs −27,0 34,6 0,2 0,1950300 Tricycles, scooters and pedal cars −14,8 33,9 0,2 0,1271019 Medium-weight petroleum oils and preparations −37,1 33,1 1,2 0,4854239 Electronic integrated circuits 8,1 31,9 1,0 0,3120190 Soya bean, whether or not broken 7,5 31,5 0,5 0,2300215 Measured doses of immunological products 16,7 30,6 0,8 0,3850440 Electrical static converters 0,5 28,3 0,4 0,1847130 Automatic data processing machines 12,7 27,7 1,1 0,3
Total: 25 products −23,4 44,1 17,8 7,8
Source: Economic Commission for Latin America and the Caribbean (ECLAC), on the basis of information from the United States Trade Department, Eurostat, the International Trade Centre (ITC) and the Chinese Customs Bureau.
a The 52 countries included in this figure are the 27 members of the European Union plus Australia, Canada, China, Japan, the Republic of Korea, Russian Federation, Switzerland, Thailand, the United Kingdom, the United States and 15 Latin American countries.
Trends in trade flows among the world’s major economies reflect the robust performance of world trade up to this point in time. The value of imports by the United States and the European Union from China in 2021 has climbed steeply, with peak upswings of over 100% and 70%, respectively (see figure I.10). China’s imports from all markets, and especially from the United States, have also rebounded rapidly.
An examination of monthly trends in imports by type of product reveals a common pattern in the recoveries being made in the selected economies, with intermediate and consumer goods imports gaining more momentum than capital goods (see figure I.11). Trade between the European Union and China in motor vehicles, machinery and equipment, and agroindustrial products has rebounded; for all these product categories, European Union exports to China have regained their pre-crisis levels, as have European Union imports of Chinese-made intermediate and consumer goods.

40 Economic Commission for Latin America and the Caribbean (ECLAC)Chapter I
Figure I.10 China, European Union and United States: year-on-year variation in the value of goods imports, by origin, January 2018–September 2021(Percentages)
Latin America and the CaribbeanEuropean Union
Asia
A. China
77.7
20.2
-70
-50
-30
-10
10
30
50
70
90
110
Jan
Mar
May Ju
l
Sep
Nov Jan
Mar
May Ju
l
Sep
Nov Jan
Mar
May Ju
l
Sep
Nov Jan
Mar
May Ju
l
Sep
2018 2019 2020 2021
United States
World
Latin America and the Caribbean
WorldEuropean UnionChina
B. United States
105.9
-70
-50
-30
-10
10
30
50
70
90
110
Jan
Mar
May Ju
l
Sep
Nov Jan
Mar
May Ju
l
Sep
Nov Jan
Mar
May Ju
l
Sep
Nov Jan
Mar
May Ju
l
Sep
2018 2019 2020 2021
Japan
Latin America andthe CaribbeanUnited States
WorldEuropean UnionChina
Jan
Mar
May Ju
l
Sep
Nov Jan
Mar
May Ju
l
Sep
Nov Jan
Mar
May Ju
l
Sep
Nov Jan
Mar
May Ju
l
Sep
2018 2019 2020 2021
C. European Union
78.3
-70
-50
-30
-10
10
30
50
70
90
110

41Chapter IInternational Trade Outlook for Latin America and the Caribbean • 2021
Other Asian countries
China
European Union
D. China, European Union, United StatesJa
n
Mar
May Ju
l
Sep
Nov
Jan
Mar
May Ju
l
Sep
Nov
Jan
Mar
May Ju
l
Sep
Nov
Jan
Mar
May Ju
l
Sep
2018 2019 2020 2021
United States
World
-70
-50
-30
-10
10
30
50
70
90
110
Latin America andthe Caribbean
Source: Economic Commission for Latin America and the Caribbean (ECLAC), on the basis of information from the United States Trade Department, Eurostat, the International Trade Centre (ITC) and the Chinese Customs Bureau.
Figure I.11 Selected economies: year-on-year variation in the value of goods imports, by major economic category, January 2018–September 2021(Percentages)
ChinaEuropean Union
A. Intermediate goods
United States
-31
-60
-40
-20
0
20
40
60
80
Jan
Mar
May Ju
l
Sep
Nov Jan
Mar
May Ju
l
Sep
Nov Jan
Mar
May Ju
l
Sep
Nov Jan
Mar
May Ju
l
Sep
2018 2019 2020 2021
Japan
ChinaEuropean Union
B. Capital goods
United States
Jan
Mar
May Ju
l
Sep
Nov Jan
Mar
May Ju
l
Sep
Nov Jan
Mar
May Ju
l
Sep
Nov Jan
Mar
May Ju
l
Sep
2018 2019 2020 2021
Japan-60
-40
-20
0
20
40
60
80
Figure I.10 (concluded)

42 Economic Commission for Latin America and the Caribbean (ECLAC)Chapter I
ChinaEuropean Union
C. Consumer goods
United States
Jan
Mar
May Ju
l
Sep
Nov Jan
Mar
May Ju
l
Sep
Nov Jan
Mar
May Ju
l
Sep
Nov Jan
Mar
May Ju
l
Sep
2018 2019 2020 2021
Japan
65
-60
-40
-20
0
20
40
60
80
ChinaEuropean Union
D. All goods
United States
Jan
Mar
May Ju
l
Sep
Nov Jan
Mar
May Ju
l
Sep
Nov Jan
Mar
May Ju
l
Sep
Nov Jan
Mar
May Ju
l
Sep
2018 2019 2020 2021
Japan-60
-40
-20
0
20
40
60
80
Source: Economic Commission for Latin America and the Caribbean (ECLAC), on the basis of information from the United States Trade Department, Eurostat, the International Trade Centre (ITC) and the Chinese Customs Bureau
Figure I.11 (concluded)
The recovery of trade among the members of the European Union and of trade between the Union and Japan, on the other hand, is proving to be slower than the turnaround in trade between the European Union and China. This is a reflection of the relatively slacker pace of activity in those economies. Bilateral flows are still far from regaining their pre-crisis levels, especially in the cases of machinery and equipment and of motor vehicles. These two product categories represent between 40% and 70% the European Union’s exports to Japan and its imports from that country. By the same token, the automotive sector, which accounts for 13% of trade within the European Union, is still 13% below the level reached before the outbreak of the crisis.
For the first seven months of the year, United States imports of items produced by heavy industry (mainly machinery and equipment, vehicles, and metals and metal products) were still below their pre-crisis levels. These three product categories represent 56% of total United States imports from China. Meanwhile, China’s imports from the United States hit record levels, with their value jumping by over 50%. Trade in automotive products is not yet back up to its pre-crisis levels, however, owing to
43Chapter IInternational Trade Outlook for Latin America and the Caribbean • 2021
the shortage of semiconductors. Yet, even though Chinese imports from the United States have bounced back, as of late August 2021 they were still only slightly above their August 2017 level and were far below the level that China made a commitment to reach under the “Phase One” agreement signed in January 2020 (Bown, 2021).
Even though world trade in goods was quite robust during the first eight months of 2021, risks of a slowdown in the global economy persist. Risk factors include the continuing uncertainty about how the pandemic will play out and the inflationary pressures being fanned by rising oil prices, the labour shortage and continuing supply chain problems. International markets are also worried about the possible implications for China’s economic growth performance of the troubles being experienced by China’s Evergrande real estate conglomerate.
B. The steady rise in freight charges threatens the recovery of global trade
Ever since the outbreak of the pandemic, supply chains have been seriously disrupted by congestion at port terminals, shortages of containers for merchandise shipments and of hold space in ocean-going and river cargo vessels, and cut-offs of supplies from customary suppliers. All of this has led to the suspension of production at different points in time in various industries owing to the lack of inputs, part and accessories. The unprecedented spike in shipping charges is also an important factor. This situation is the outcome of a variety of causal factors, some of which are temporary while others are structural in nature.
The main non-structural factor behind the disturbances of global shipping logistics is the COVID-19 pandemic. To deal with this source of disruption, ports around the world have been conducting rigorous inspections and following very specific monitoring and quarantine procedures for arriving ships. These measures have, however, caused delays and, in some cases, the suspension of port activity, as in the case of the temporary closures of major port terminals in China. At the world level as well, lockdowns and fears about the further spread of the virus have led to a sharp downturn in consumption, especially in the services sector. Once COVID-19 health protocols had been established and vaccinations were being rolled out, economic activity bounced back. Because economic agents had cut their inventories of final products and inputs to a minimum when demand had slumped at the outset of the pandemic, the sudden resurgence of demand swiftly depleted those inventories (retail stock in the United States averaged 33 days of sales in June 21, versus 43 days in February 2020).
In the region, container trade registered a year-on-year decrease of 10.3% for January–August 2020, which was twice as steep a drop as was seen in world trade during that period (see table I.3). For 2020 as a whole, regional container trade slipped by 4% relative to its 2019 level (figures based on a sample of 88 ports and port areas). The eastern coast of South America saw a decline of 0.2% in commercial port activity from its 2019 level, whereas the western coast witnessed a 3.1% downturn. In the Caribbean, port trade was down by 4.9%. In Central America, the Caribbean coast registered a 5.7% decrease in container trade, but the Pacific coast actually recorded an increase (the only one to do so in all of the subregion) of 3.1% thanks to Asia’s more dynamic trade activity. In Mexico, the downswing amounted to 9.8% along the Gulf coast and to 8% on the Pacific coast. The steepest drops were in Panama: 15.1% on the Caribbean coast and 30.4% on the Pacific coast.

44 Economic Commission for Latin America and the Caribbean (ECLAC)Chapter I
Table I.3 Latin America and the world: year-on-year variation in seaborne container trade, measured in 20-foot equivalent units (TEU), January–August 2019, 2020 and 2021(Percentages)
January–August 2020 compared with January–August 2019
January–August 2021 compared with January–August 2020
January–August 2021 compared with January–August 2019
Latin America −10.3 13.0 1.4
World −5.0 10.2 4.7
Source: Economic Commission for Latin America and the Caribbean (ECLAC), on the basis of Container Trades Statistics (CTS) [online] https://www.containerstatistics.com/.
The contraction of ocean-borne trade in the region and around the world was brought about not only by the slump in the demand for goods but also by the restrictions placed on ports in an attempt to curb the spread of the virus. In the second half of 2020, a gradual recovery began to be made as restrictions were eased. As a result, the region’s container trade in the first eight months of 2021 outperformed the corresponding period of 2019 by 1.4%. Regional maritime trade in cereals also felt the impact of the COVID-19 crisis. For example, the volumes of cereal exports from Argentina, iron ore exports from Brazil and coal exports from Colombia were all lower in 2020 than they had been in 2019 (see figure I.12).
Figure I.12 World and selected countries: year-on-year variation in the volume of seaborne exports of cereals, iron ore and coal, 2018-2021a
(Percentages)
Variation in 2021compared with 2020ª
Variation in 2020compared with 2019
Variation in 2019 compared with 2018
45.3
10.4
-16.0-10.1
0.14.8
-1.4
8.3
0.8
-13.1
-7.7
1.7
-6.4
0.5
24.5
-2.3
4.20
3.2
-11.6-6.0
-22.1 -18.1
-9.4
-3.5-2.1
9.95.9
1.74.5 2.7 5.7 3.1
9.1 11.94.5
-25
-15
-5
5
15
25
35
45
Cere
als,
Arge
ntin
a
Cere
als,
Unite
d St
ates
Iron
ore,
Braz
il
Iron
ore,
Aust
ralia
Iron
ore,
Sout
h Af
rica
Iron
ore,
wor
ld to
tal
Cere
als
Braz
il
Coal
,In
done
sia
Coal
,Au
stra
lia
Coal
,Un
ited
Stat
es
Coal
,Co
lom
bia
Coal
,w
orld
tota
l
Source: Economic Commission for Latin America and the Caribbean (ECLAC), on the basis of Clarksons, Seaborne Trade Monitor, vol. 8, No. 1, 2021 (grains) and Dry Bulk Trade Outlook, vol. 27, No. 3, 2021 (iron ore and coal).
a The variations shown for 2021 relative to 2020 are projections.
The steep increase in United States demand for imports from Asia was the main cause of the bottlenecks that arose in the supply chain because, as a result of this trade imbalance, empty containers piled up at United States ports, since there were fewer shipments going in the other direction. This led to a sharp shift in scheduling and diversion of ships for what are known as blank sailings, with weekly services being dialled back to semi-monthly services in order to free up ships so that they could be redirected to other routes. This tactic also alters the amount of capacity available to exporters and importers, however. In the early days of the pandemic, businesses’ adjustment strategies were largely based on the cancellation of many different services in order to cut costs relative to their severely reduced revenues (in addition to implementing

45Chapter IInternational Trade Outlook for Latin America and the Caribbean • 2021
voluntary work stoppages and scrapping parts of their fleets). This all led to a severe reduction in capacity on some container trade routes. Since then, in the face of strong demand and weak supply, shipping companies have tried to acquire additional tonnage and to use forward contracts to reserve ships.
Freight charges began to climb in mid-2020, almost invariably exceeding 2019 fee schedules (see figure I.13). In February 2021, the average cost of shipping a 40-foot container was 240% higher than it had been in February 2020. By contrast, the volume of world trade in goods rose by 16% during that same period. And freight charges are continuing to outpace the rise in maritime trade volumes by a wide margin. In 2019, the average freight charge at the world level was US$ 1,457 per 40-foot equivalent units (FEU). In July 2020, freight charges averaged over US$ 2,000 per FEU, and in October 2021, they reached US$ 10,361 per FEU. This is 616% higher than the average for the same month of 2019 and 298% higher than it was in the same month of 2020. According to Drewry (2021b), freight charges for some routes come to nearly US$ 13,000 per FEU.
Figure I.13 Average freight costs worldwide for seaborne container transport, January 2019–September 2021(Dollars per 40-foot equivalent unit (FEU))
201920202021 0
2 000
4 000
6 000
8 000
10 000
12 000
Jan
Feb
Mar
Apr
May Jun
Jul
Aug
Sep
Oct
Nov De
c
2019
Jan
Feb
Mar
Apr
May Jun
Jul
Aug
Sep
Oct
Nov De
cJa
nFe
bM
arAp
rM
ay Jun
Jul
Aug
Sep
2020 2021
Source: Economic Commission for Latin America and the Caribbean (ECLAC), on the basis of data from Drewry.
During the first few months of 2020, freight charges for routes going between Asia and the eastern coast of South America fluctuated much more widely than they had in 2019. Between June and August 2020, the year-on-year variation was actually negative. Starting in September 2020, however, they began to climb sharply. In 2021, freight charges continued to rise and by June stood at 1,400% of what they had been in June 2020 (see figure I.14).
Freight charges for transport to the eastern coast of the United States, which is also the route used for reaching the main Caribbean ports, edged down slightly in the first two months of 2020 but then began to climb again relative to their 2019 levels.1 The year-on-year variation in the fee for that route is especially striking as of August 2020, when the amount charged for that route was 47.9% higher than it had been in August 2019. In October 2020, freight charges peaked at a level 95.5% higher than the year before. In July 2021, freight charges were 186% higher than they had been in July 2020.
1 Freight charges to the United States are used as a benchmark for imports from Asia and the Pacific to Central America.

46 Economic Commission for Latin America and the Caribbean (ECLAC)Chapter I
Figure I.14 Year-on-year variation in the volume of container trade in Latin America and maritime container freight costs on the Shanghai-South America route, January 2020–July 2021(Percentages)
-30
-20
-10
0
10
20
30
40
-100
100
300
500
700
900
1 100
1 300
Jan
2020
/ Jan
201
9
Mar
202
0/ M
ar 2
019
May
202
0/ M
ay 2
019
Jul 2
020/
Jul
201
9
Sep
2020
/ Sep
201
9
Nov
202
0/ N
ov 2
019
Jan
2021
/ Jan
202
0
Mar
202
1/ M
ar 2
020
May
202
1/ M
ay 2
020
Jul 2
021/
Jul
202
0
Container tradein Latin America (right axis)Maritime container freight costs, Shanghai-South America(Dollars per TEU)
Source: Economic Commission for Latin America and the Caribbean (ECLAC), on the basis of data from Container Trades Statistics (CTS) [online] https://www.containerstatistics.com/ (seaborne container trade) and Clarksons, Container Intelligence Monthly, vol. 23, No. 3, 2021 (freight).
The Baltic Dry Index (BDI) serves as a point of reference for shipping costs for various commodities on many of the main routes.2 In 2020, BDI levels indicated that average annual shipping charges were 21.2% lower than they had been in 2019. Starting in January 2021, however, freight charges began to climb quite steeply: by May, they were 506% higher than they had been in May 2020 and in October they were 311% above their October 2020 level (see figure I.15).
2 The Baltic Dry Index (BDI) was first published on 4 January 1985 and has used that date as its basis of comparison ever since.
Figure I.15 Index of seaborne shipping freight charges for major commodities worldwide, January 2019–October 2021
0
1 000
2 000
3 000
4 000
5 000
6 000
Jan
Mar
May Ju
l
Sep
Nov
2019 2020 2021
Jan
Mar
May Ju
l
Sep
Nov Jan
Mar
May Ju
l
Sep
Source: Economic Commission for Latin America and the Caribbean (ECLAC), on the basis of Baltic Exchange, Baltic Dry Index [online] https://www.balticexchange.com/en/data-services/market-information0/dry-services.html.
As for the relevant structural factors contributing to this situation, various sources indicate that between 50% and 75% of the containers used in international trade belong to shipping companies and that most of the rest are owned by leasing firms that may

47Chapter IInternational Trade Outlook for Latin America and the Caribbean • 2021
also be holding companies for the major carriers.3 The most decisive structural factor, however, is the concentration, as mentioned earlier, of the maritime shipping market as a whole, which is primarily a function of the economies of scale involved. Economic development is unequally distributed in geographic terms, and the expansion of trade is thus relatively concentrated. For example, the density of trade flows between Asia and North America or Europe makes it feasible to use very large container ships that afford significant unit cost savings compared to other ocean routes. This effect is heightened even further by the nature of the demand for transport services and logistical structures in general, since the profitability of these services is not so much determined by any individual pair of origin and destination points as it is by the string of ports located along that route. Thus, the denser that string is, the more profitable it is. This is known as the “network economies” of liner shipping, which offer important competitive advantages to the operators that manage to attain threshold densities in the ports of origin and destination that they serve.
Because of these economies of scale and network economies, business enterprises have a natural tendency towards concentration, especially in the case of international transport. This does not, however, automatically translate into market power in the sense of an oligopolistic position that shipping companies could capitalize upon in order to fix prices. Competition based on lower prices and better-quality service is still possible if these markets can be challenged, i.e. if new competitors are not blocked by market entry barriers (as shown by the experience of the air transport industry). Here is where the indivisibility of infrastructure comes into play as a significant obstacle: potential competitors can only gain access to port facilities by the same means as those to which current shipping enterprises already have guaranteed access. Furthermore, investments in port terminals have substantial hidden costs, as well as occasioning regular maintenance expenses.
These high freight charges translate into large profits for the shipping industry, in which three alliances currently account for 80% of the world container shipping market (see figure I.16). Soaring freight charges have allowed shippers to mark up record profits in 2021. The average value of the shares held by a group of 13 shipping companies studied by Drewry (2021b) had risen by 135% in the second quarter of 2021, and the average profits before tax and interest of that same group of 13 shippers jumped from 2.4% in the fourth quarter of 2019 to 44.4% in the second quarter of 2021.
3 See MundoMarítimo (2021).
Figure I.16 Market share of leading maritime shipping alliances, 2021(Percentages of total capacity in 20-foot equivalent units (TEUs))
THE alliance: Hapag-Lloyd, Yang Ming and Ocean
Network Express (ONE)(16.4)
Ocean alliance: CMA CGM/APL, COSCO Shipping
Ports and Evergreen Line(30.1)
2M alliance: Maersk and Mediterranean Shipping
Company (MSC)(33.8)
Other(19.8)
Source: Economic Commission for Latin America and the Caribbean (ECLAC), on the basis of data from Alphaliner.

48 Economic Commission for Latin America and the Caribbean (ECLAC)Chapter I
The information published on a regular basis by Drewry raises some concerns, given the considerations discussed above. For its statistical compilations, international shippers are defined as port agents that run major container terminals serving at least two world regions. These large enterprises handled 48.2% of global container transport traffic (measured in TEUs) in 2020, which was distributed over 21 different companies. Since, in 2010, the corresponding figures were 43.8% of that traffic distributed over 23 companies, the degree of market concentration has clearly increased over the last decade. A full 40% of total port terminal operations managed by international terminal operators is now controlled by those three global shipping partnerships as part of what constitutes a growing and dangerous vertical shipping and port operator integration process. In fact, the progressive transition of shipping companies into general logistics forwarders seems poised to trigger an increasing vertical integration of domestic market linkages encompassing railroads, truckers, strategic storage facilities and retailers.
In sum, the concentration of the container shipping sector appears to be an ongoing process, as does its upstream and downstream vertical integration. This does not bode well for the chances of any reversal of the uptrend in transport costs in the near future, especially when considered in conjunction with the continued operational delays caused by the pandemic and the fact that the effort to decarbonize maritime transport, which will probably add to initial costs, is just beginning. A continual increase in international transport costs has the same effects as a widespread increase in trade barriers, which are likely to include the break-up of cross-border production chains, more limited economies of scale and a setback in the effort to raise global production efficiency. The present study points to the conclusion that public policies and regulations aimed at promoting competition and restricting the vertical integration of shipping enterprises with port terminals would be of significant help in minimizing the damage.
C. A hesitant recovery in world trade in services slowed by the slump in tourism
The strong growth in world trade in goods seen since the second half of 2020 stands in contrast to the much slower recovery being made in services trade since it plummeted during the early months of the pandemic. For 2020 as a whole, the volume of global trade in services plunged by 14%, which was nearly three times as steep of a drop as the decrease in goods trade. A similar contraction was witnessed in the first quarter of 2021 (WTO, 2021c). The Services Trade Barometer reading for that same quarter of 2021 (102.5) points to a recovery in the course of the rest of the year, however.4
Tourism is the category of services that has sustained the sharpest decline during the pandemic, as it came to a virtual halt in March 2020. According to the World Tourism Organization (UNWTO, 2021), international tourist arrivals were down by 84% in March–December 2020 from the corresponding period of 2019, and the drop for 2020 as a whole amounted to −74%. Between January and July 2021, the decrease was of a similar magnitude (−80%) relative to the same period of 2019. As for the future outlook, 45% of a group of experts who were surveyed by UNWTO believe that international tourism will not regain its 2019 levels until 2024 or later, while 43% of the experts think that the recovery will be accomplished in 2023 (UNWTO, 2021).
4 The Services Trade Barometer provides an approximate measure of the volume of world trade in services that takes into account variations in prices and exchange rates.
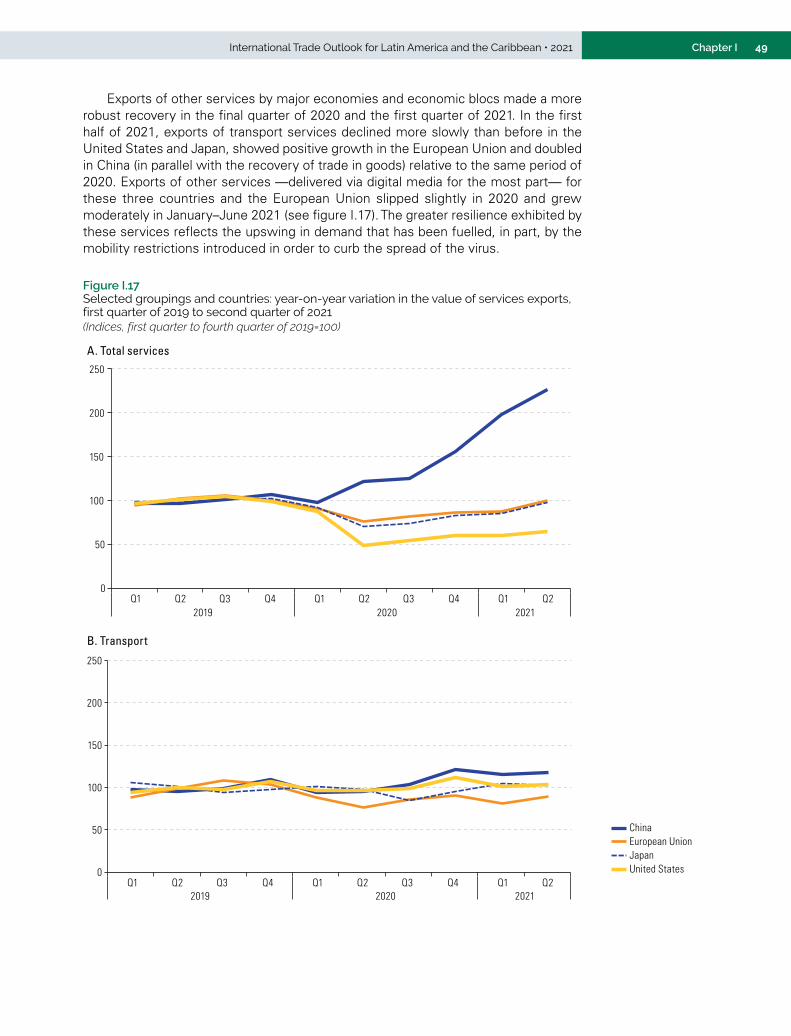
49Chapter IInternational Trade Outlook for Latin America and the Caribbean • 2021
Exports of other services by major economies and economic blocs made a more robust recovery in the final quarter of 2020 and the first quarter of 2021. In the first half of 2021, exports of transport services declined more slowly than before in the United States and Japan, showed positive growth in the European Union and doubled in China (in parallel with the recovery of trade in goods) relative to the same period of 2020. Exports of other services —delivered via digital media for the most part— for these three countries and the European Union slipped slightly in 2020 and grew moderately in January–June 2021 (see figure I.17). The greater resilience exhibited by these services reflects the upswing in demand that has been fuelled, in part, by the mobility restrictions introduced in order to curb the spread of the virus.
Figure I.17 Selected groupings and countries: year-on-year variation in the value of services exports, first quarter of 2019 to second quarter of 2021(Indices, first quarter to fourth quarter of 2019=100)
European UnionJapan
A. Total services
China
United States0
50
100
150
200
250
Q1 Q2 Q3 Q4 Q1 Q2 Q3 Q4 Q1 Q22019 2020 2021
European UnionJapan
B. Transport
China
United StatesQ1 Q2 Q3 Q4 Q1 Q2 Q3 Q4 Q1 Q2
2019 2020 2021
0
50
100
150
200
250
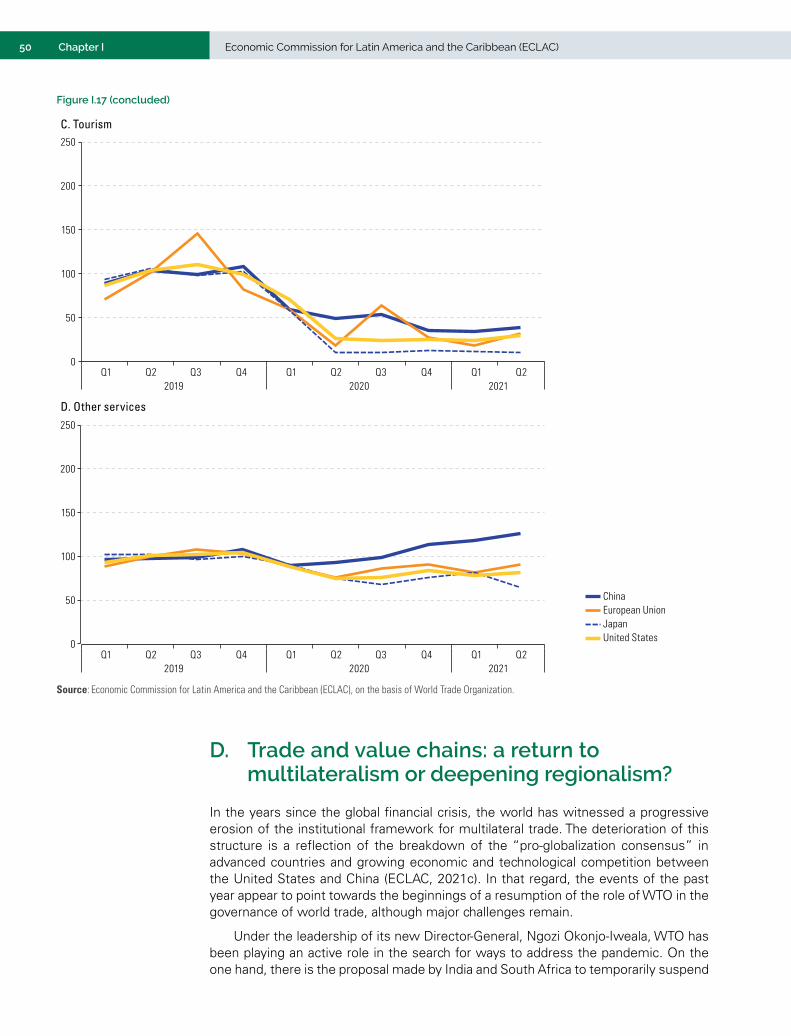
50 Economic Commission for Latin America and the Caribbean (ECLAC)Chapter I
European UnionJapan
C. Tourism
China
United States
Q1 Q2 Q3 Q4 Q1 Q2 Q3 Q4 Q1 Q22019 2020 2021
0
50
100
150
200
250
European UnionJapan
D. Other services
China
United States
Q1 Q2 Q3 Q4 Q1 Q2 Q3 Q4 Q1 Q22019 2020 2021
0
50
100
150
200
250
Source: Economic Commission for Latin America and the Caribbean (ECLAC), on the basis of World Trade Organization.
Figure I.17 (concluded)
D. Trade and value chains: a return to multilateralism or deepening regionalism?
In the years since the global financial crisis, the world has witnessed a progressive erosion of the institutional framework for multilateral trade. The deterioration of this structure is a reflection of the breakdown of the “pro-globalization consensus” in advanced countries and growing economic and technological competition between the United States and China (ECLAC, 2021c). In that regard, the events of the past year appear to point towards the beginnings of a resumption of the role of WTO in the governance of world trade, although major challenges remain.
Under the leadership of its new Director-General, Ngozi Okonjo-Iweala, WTO has been playing an active role in the search for ways to address the pandemic. On the one hand, there is the proposal made by India and South Africa to temporarily suspend

51Chapter IInternational Trade Outlook for Latin America and the Caribbean • 2021
patents and other intellectual property rights in order to speed the production of vaccines and their distribution to low-income countries. Talks on that proposal have not made much headway, however, owing to the opposition of various developed countries. On the other hand, WTO has been working to coordinate action with other organizations, such as the World Health Organization (WHO), the World Bank and the International Monetary Fund (IMF) (WTO, 2021a). Its Director-General has also sought to expedite negotiations on the elimination or reduction of subsidies that contribute to overfishing and illegal, unreported and unregulated fishing with a view to reaching an agreement at the Twelfth Ministerial Conference of WTO, which was to be held from 30 November to 3 December 2021. The objective of those negotiations corresponds to target 14.6 of the Sustainable Development Goals.
Yet while there are signs of a reactivation of WTO in some areas, its Appellate Body, whose work was brought to a halt in December 2019, remains paralysed, since the United States, which blocked new appointments to that body in 2017, has still not altered its position. Consequently, the ability of WTO to help resolve controversies among its members is minimal, and there are as yet no signs of a way forward in that connection. Nor has much headway been made in responding to the calls made in recent years for a thorough-going reform of the institution. Those calls for reform are motivated by various countries’ reservations about how WTO fulfils its functions as a forum for negotiating new rules, settling disputes and monitoring its members’ trade policies. Those reservations, particularly on the part of some developed countries, also extend to the institution’s governance structure. The most controversial issues include the rule that decisions must be made by consensus, the role of plurilateral accords and the special and differential treatment provisions applying to developing countries, especially with regard to the most advanced economies within that group (ECLAC, 2019).
The change of Administration in the United States has not eased trade tensions between that country and China. Most of the tariff hikes introduced by the two countries since 2018 remain in effect, as do the restrictions placed by the United States on sales of semiconductors and other components to Chinese technology companies. As was also true for its predecessor, one of the current Administration’s trade policy priorities is “addressing China’s coercive and unfair economic trade practices” (Office of the United States Trade Representative, 2021a). The main difference in the present Administration’s approach is that it has declared its intention to favour joint action with partners such as the European Union and Japan over unilateral measures (Tai, quoted in Office of the United States Trade Representative, 2021b). Tensions between the world’s two biggest economies underlie the crisis in WTO, as China puts up resistance to the attempts of the United States and other developed countries to bring in new multilateral rules on intellectual property, industrial subsidies and State-owned enterprises.
If the difficult situation in WTO remains unresolved, it is likely that in the next few years major world trading countries will turn their attention to the conclusion of what have come to be known as “mega-regional” agreements. The main agreements of this type already in existence are the Agreement between the United States of America, the United Mexican States and Canada (USMCA), which was established on 1 July 2020; the agreement signed in November 2020 by 15 countries of “Factory Asia” to form the Regional Comprehensive Economic Partnership (RCEP);5 the Comprehensive and Progressive Agreement for Trans-Pacific Partnership (CPTPP); and the African Continental Free Trade Area (AfCFTA) Agreement (Herreros, 2021).
5 RCEP is set to enter into force on 1 January 2022, now that the minimum number of ratifications necessary for its entry into effect has been reached. As of 2 November 2021, it had been ratified by Australia, Brunei Darussalam, Cambodia, China, Japan, the Lao People’s Democratic Republic, New Zealand, Singapore, Thailand and Viet Nam.
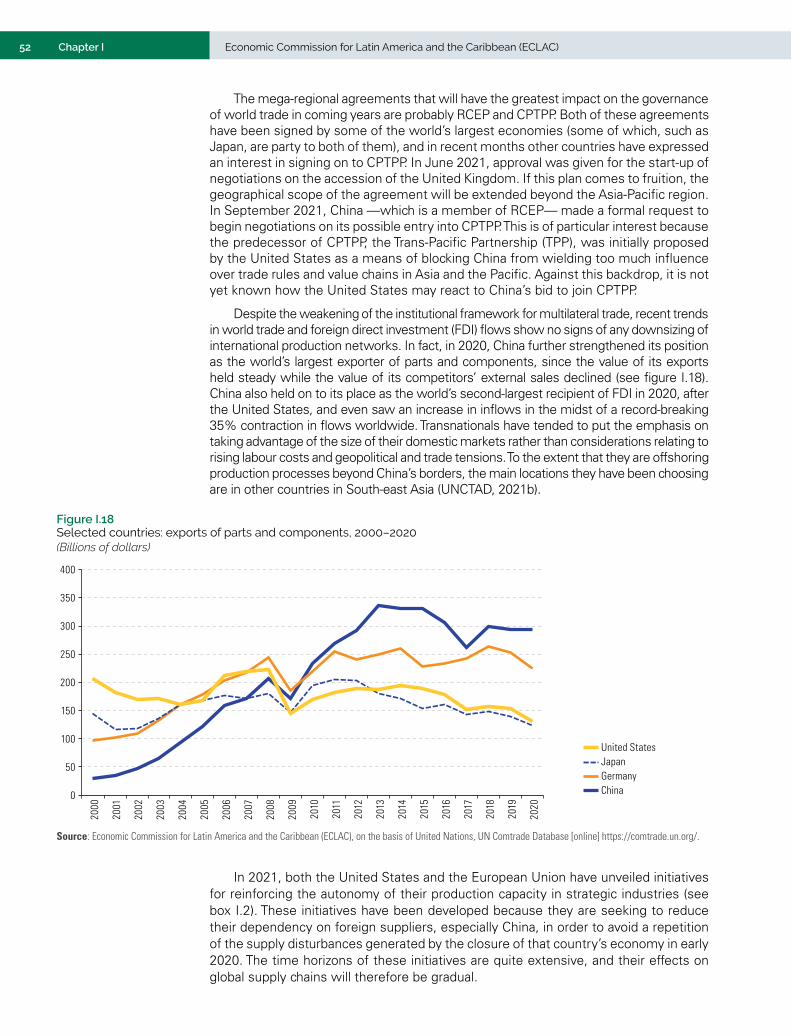
52 Economic Commission for Latin America and the Caribbean (ECLAC)Chapter I
The mega-regional agreements that will have the greatest impact on the governance of world trade in coming years are probably RCEP and CPTPP. Both of these agreements have been signed by some of the world’s largest economies (some of which, such as Japan, are party to both of them), and in recent months other countries have expressed an interest in signing on to CPTPP. In June 2021, approval was given for the start-up of negotiations on the accession of the United Kingdom. If this plan comes to fruition, the geographical scope of the agreement will be extended beyond the Asia-Pacific region. In September 2021, China —which is a member of RCEP— made a formal request to begin negotiations on its possible entry into CPTPP. This is of particular interest because the predecessor of CPTPP, the Trans-Pacific Partnership (TPP), was initially proposed by the United States as a means of blocking China from wielding too much influence over trade rules and value chains in Asia and the Pacific. Against this backdrop, it is not yet known how the United States may react to China’s bid to join CPTPP.
Despite the weakening of the institutional framework for multilateral trade, recent trends in world trade and foreign direct investment (FDI) flows show no signs of any downsizing of international production networks. In fact, in 2020, China further strengthened its position as the world’s largest exporter of parts and components, since the value of its exports held steady while the value of its competitors’ external sales declined (see figure I.18). China also held on to its place as the world’s second-largest recipient of FDI in 2020, after the United States, and even saw an increase in inflows in the midst of a record-breaking 35% contraction in flows worldwide. Transnationals have tended to put the emphasis on taking advantage of the size of their domestic markets rather than considerations relating to rising labour costs and geopolitical and trade tensions. To the extent that they are offshoring production processes beyond China’s borders, the main locations they have been choosing are in other countries in South-east Asia (UNCTAD, 2021b).
Figure I.18 Selected countries: exports of parts and components, 2000–2020(Billions of dollars)
GermanyJapan
China
United States
0
50
100
150
200
250
300
350
400
2000
2001
2002
2003
2004
2005
2006
2007
2008
2009
2010
2011
2012
2013
2014
2015
2016
2017
2018
2019
2020
Source: Economic Commission for Latin America and the Caribbean (ECLAC), on the basis of United Nations, UN Comtrade Database [online] https://comtrade.un.org/.
In 2021, both the United States and the European Union have unveiled initiatives for reinforcing the autonomy of their production capacity in strategic industries (see box I.2). These initiatives have been developed because they are seeking to reduce their dependency on foreign suppliers, especially China, in order to avoid a repetition of the supply disturbances generated by the closure of that country’s economy in early 2020. The time horizons of these initiatives are quite extensive, and their effects on global supply chains will therefore be gradual.

53Chapter IInternational Trade Outlook for Latin America and the Caribbean • 2021
Box I.2 The United States and the European Union: in search of autonomy in production capacity in strategic industries
United States
On 24 February 2021, only one month after taking office, President Joseph Biden issued Executive Order No. 14017 on the assessment of vulnerabilities and the strengthening of the resilience of supply chains of critical importance for the United States. On 8 June 2021, the government made public the findings of its assessment of four critical products (semiconductors, large-capacity batteries, critical minerals and materials, and active pharmaceutical ingredients) and announced the first corrective measures. Some of the most important announcements are discussed briefly here.
Under the Defense Production Act, a public-private consortium will be established for advanced manufacturing of essential medicines. The first step will be to select between 50 and 100 essential medicines that will be the initial focus of this effort. The Department of Energy will prepare a 10-year plan for the development of the domestic lithium battery production capacity that will be crucial in making the transition to electricity-powered vehicles and combating climate change. The Department of the Interior, with the support of the White House Office of Science and Technology Policy, will establish a working group to identify sites where critical minerals could be produced and processed in the United States while adhering to the highest environmental, labour and sustainability standards. The Department of Commerce has already supported nearly US$ 75 billion in direct investments from the private sector in domestic semiconductor manufacturing and in research and development in the country. An effort will also be made to work with partners such as Japan and the Republic of Korea in this area. In addition, a supply chain disruptions task force is to be established under the leadership of the Secretaries of Commerce, Transportation and Agriculture that will focus on areas where a mismatch between supply and demand has become evident.
European Union
On 5 May 2021, the European Commission announced that it was updating the European Industrial Strategy approved in March 2020 in order to move forward with its transition to a green and digital economy, make European Union industry more competitive and enhance Europe’s open strategic autonomy (European Commission, 2021). The purpose of the update is to incorporate the lessons learned from the COVID-19 pandemic. One of its components is aimed at addressing the European Union’s strategic dependencies. The first step was to identify the sectors which rely heavily on external supplies, such as raw materials, batteries, active pharmaceutical ingredients, hydrogen, semiconductors and cloud technologies. Based on the findings of this analysis, the Union announced that it would support new industrial alliances in strategic areas in which such alliances offer the best way to accelerate activities that would not develop otherwise. More specifically, the European Commission announced that it was preparing to launch an alliance on processors and semiconductor technologies and an alliance for industrial data, edge and cloud computing. It is also considering the creation of alliances on space launchers and on zero-emission aviation.
Source: Economic Commission for Latin America and the Caribbean (ECLAC), on the basis of “Fact Sheet: Biden-Harris Administration Announces Supply Chain Disruptions Task Force to Address Short-Term Supply Chain Discontinuities”, 8 June 2021 [online] https://www.whitehouse.gov/briefing-room/statements-releases/2021/06/08/fact-sheet-biden-harris-administration-announces-supply-chain-disruptions-task-force-to-address-short-term-supply-chain-discontinuities/; European Commission, “European industrial strategy” [online] https://ec.europa.eu/info/strategy/priorities-2019-2024/europe-fit-digital-age/european-industrial-strategy_en; and European Commission, “Updating the 2020 Industrial Strategy: towards a stronger Single Market for Europe’s recovery”, Press Release, 5 May 2021 [online] https://ec.europa.eu/commission/presscorner/detail/en/ip_21_1884.
No major signs have been seen so far that China might be considering relocating some of its manufacturing activities to the region. FDI inflows to the region in 2020 were down by 35%. This contraction was felt by the great majority of the countries in the region and was especially pronounced in the manufacturing sector (−38%). Furthermore, the value represented by new project announcements was lower than at any time in over 10 years, and the number of such announcements was the lowest since 2007 (ECLAC, 2021b).
Mexico is in a particularly advantageous position among the countries of the region to receive new manufacturing investments from countries in which companies are using nearshoring strategies as a way of shortening their supply chains while moving closer to the United States market. The changeover from the North American

54 Economic Commission for Latin America and the Caribbean (ECLAC)Chapter I
Free Trade Agreement (NAFTA) to USMCA is posing new challenges for Mexico as an export platform for the United States market, however. For example, under the USMCA rules of origin for the automotive industry, a higher percentage of the value of finished vehicles must originate in the United States than was required under NAFTA (Schott, 2021).6 In addition, article 32.10 of USMCA limits member countries’ ability to sign free trade agreements with countries that have “non-market economies”. This provision could hinder Chinese firms interested in setting up shop in Mexico in order to export to the United States while taking advantage of the benefits provided under USMCA.
An increasing move towards the regionalization of world trade governance structures appears to be likely in the light of the issues surrounding the role of WTO and the efforts being made by some of the world’s major economies to shorten their supply chains in strategic sectors. A scenario of this sort could lead to a fragmentation of world trade rules (Mattoo, Rocha and Ruta, 2021) that would be particularly problematical for Latin America and the Caribbean, which, unlike other world regions, have not managed to develop a sufficiently integrated regional market to reduce their exposure to changes in their main trading partners’ commercial and industrial policies.
E. An uneven recovery in regional trade in 2021
1. Goods trade recovered quickly, but services trade has yet to regain pre-pandemic levels
The pandemic had a smaller negative impact on the region’s goods trade in 2020 than had been projected at mid-year (ECLAC, 2021c), after the 15% drop in GDP in the second quarter and even larger contractions in May in volumes of goods exports and imports (down by 26% and 30%, respectively). The relatively rapid control of the pandemic in China, the strong fiscal stimulus in the United States, Europe and other economies, and the rise in certain commodity prices meant that, by year-end, export value was down by 10% (with variations of −4% in volume and −6% in price). The greatest impact was on goods imports, whose value fell by 15% (−4% by volume and −10% by price), amid a historical contraction of 6.8% of regional GDP.
The recovery of regional goods trade has continued during 2021, reflecting three main factors: (i) the rise in the prices of several commodities exported by the region (in particular, oil, gas, coal, copper, iron, soybeans and cereals); (ii) greater demand for imports in China, the United States and the European Union; and (iii) the recovery of economic activity in the region itself.
As in the rest of the world, since June 2021 the region has seen a slowdown in goods trade, reflecting a gradual return to trend rates. However, in September 2021, both regional exports and imports of goods continued to grow at high year-on-year rates: 21% and 30%, respectively (see figure I.19A). The possibility of a slowdown in growth in China, in the context of the difficulties faced by the real estate conglomerate Evergrande, has created uncertainty about the performance of regional exports in the final part of the year, mainly owing to the impact that such a slowdown would have on South America’s raw material exports.
6 In August 2021, Mexico requested consultations with the Government of the United States under the USMCA dispute settlement mechanism because, in its view, the United States has misinterpreted the rules of origin as they apply to that industry.

55Chapter IInternational Trade Outlook for Latin America and the Caribbean • 2021
Figure I.19 Latin America and the Caribbean: year-on-year variation in goods and services trade, January 2007–August 2021(Percentages)
Imports
A. Goods
Exports-60
-40
-20
0
20
40
60
80
Jan
Aug
Jan
Aug
Jan
Aug
Jan
Aug
Jan
Aug
Jan
Aug
Jan
Aug
Jan
Aug
Jan
Aug
Jan
Aug
Jan
Aug
Jan
Aug
Jan
Aug
Jan
Aug
Aug
Jan
2007 2008 2009 2010 2011 2012 2013 2014 2015 2016 2017 2018 2019 2020 2021
B. Services
-54-60
-40
-20
0
20
40
60
Q1 Q3 Q1 Q3 Q1 Q3 Q1 Q3 Q1 Q3 Q1 Q3 Q1 Q3 Q1 Q3 Q1 Q3 Q1 Q3 Q1 Q3 Q1 Q3 Q1 Q3 Q1 Q3 Q1 Q3
2007 2008 2009 2010 2011 2012 2013 2014 2015 2016 2017 2018 2019 2020 2021
ImportsExports
Source: Economic Commission for Latin America and the Caribbean (ECLAC), on the basis of official information from the central banks, customs services and institutes of statistics of the respective countries.
Services exports saw a much heavier contraction (−36%) in 2020 than exports of goods, mainly because of the slump in tourism (−64%), which was badly hit by lockdown measures and other restrictions on domestic and international mobility. In 2019, tourism accounted for 58% of regional services exports. Although services trade has come back up from the lows seen in the second quarter of 2020 (see figure I.19B), whether this recovery continues will much depend on how the reopening of tourism proceeds in the coming months. Up to August, tourist arrivals were still well below their 2019 peak (see figure I.20 and box I.3).

56 Economic Commission for Latin America and the Caribbean (ECLAC)Chapter I
Figure I.20 Latin America and the Caribbean: monthly arrivals of international tourists, January 2019–August 2021(Thousands of persons)
Peru (7)
A. South America
Uruguay (9)Colombia (6)
Argentina (2)Chile (5)
2019 2020 2021
0
200
400
600
800
1 000
1 200
1 400
1 600
1 800
2 000
Jan
Mar
May Ju
l
Sep
Nov Jan
Mar
May Ju
l
Sep
Nov Jan
Mar
May Ju
l
Aug
Costa Rica (10)
B. Rest of Latin America and the Caribbean
Cuba (8)The Caribbean (11)
Mexico (1)Dominican Rep. (3)
2019 2019 2019
0
200
400
600
800
1 000
1 200
1 400
1 600
1 800
2 000
Jan
Feb
Mar Ap
rM
ay Jun
Jul
Aug
Sep
Oct
Nov De
cJa
nFe
bM
ar Apr
May Jun
Jul
Aug
Sep
Oct
Nov De
cJa
nFe
bM
ar Apr
May Jun
Jul
Aug
Source: Economic Commission for Latin America and the Caribbean (ECLAC), on the basis of national data on inbound tourism.Note: The number shown beside each country indicates its position in the region as a tourist destination in 2019. Brazil, the fourth largest destination, is not included
because data after 2019 are not available.
Box I.3 Impact of the COVID-19 pandemic on inbound tourism in Latin America and the Caribbean
The coronavirus disease (COVID-19) pandemic has strongly affected the tourism sector. The partial or total closure of borders by most of the countries in the framework of the health emergency prompted a sharp drop in the number of international tourists globally. Although some destinations have begun to lift restrictions on the entry of foreign visitors and consumer confidence in travel has grown with the progress of vaccination, the outlook for the sector is for a slow recovery (UNWTO, 2021).
In 2020, as shown in the figure, the countries of Latin America and the Caribbean together saw a 69% reduction from 2019 in international tourist arrivals, compared to the drop of 73% in the world total and of 84% in Asia and the Pacific —the most heavily affected in this period. The largest decreases occurred in South and Central America (−74% and −72%,

57Chapter IInternational Trade Outlook for Latin America and the Caribbean • 2021
respectively). The data available for 2021 show some recovery in the flow of tourists entering the region between the first and second quarters of the year, reflected in a smaller drop with respect to the corresponding pre-pandemic levels. This result is attributable to the upturn in the performance of Mexico —the largest tourist destination in the region and one of the 10 largest in the world in 2019— and, to a lesser extent, of the Caribbean and Central America.
Selected regions, subregions, groupings and countries: variation in international tourist arrivals, 2020 and 2021 compared to the same period in 2019
(Percentages)
Q2 2021/Q2 2019Q1 2021/Q1 20192020/2019
-73 -69 -74 -72
-58-67
-76
-67
-84-87
-84
-95
-83
-61
-85 -84 -88
-96
-82
-67
-93
-73
-26
-66
-76-89
-95
-120
-100
-80
-60
-40
-20
0 Wor
ld
Latin
Am
eric
a an
d th
e Ca
ribbe
an
Sout
h Am
eric
aa
Cent
ral A
mer
ica
Mex
ico
The
Carib
bean
Unite
d St
ates
Euro
pean
Uni
on
Asia
and
th
e Pa
cific
Source: Economic Commission for Latin America and the Caribbean (ECLAC), on the basis of World Tourism Organization (UNWTO), UNWTO World Tourism Barometer, vol. 19, No. 5, September 2021, and official information.
a The figures for South America do not include the Bolivarian Republic of Venezuela.
Foreign tourist arrivals fell more sharply in the periods of tightest restrictions. As these were lifted, tourist arrivals have tended to recover. This occurred in Mexico in the second quarter of 2021, and also in Costa Rica and the Dominican Republic, although not in South America: Argentina and other countries, such as Chile and Uruguay, have maintained tough travel restrictions since the onset of the pandemic and have recorded a more persistent reduction in tourist arrivals compared to 2019.
The easing of international travel restrictions announced for the next few months by several Latin American countries, including Argentina, Chile and Uruguay, may be expected to lead to an upturn in tourist arrivals to these destinations. Likewise, the improvement seen in Mexico and some Caribbean and Central American countries could be consolidated by the lower restrictions on outbound tourism in the United States and Europe, the main origins for tourists to these countries. However, the lack of certainty regarding the evolution of the pandemic at the global and regional levels means that the outlook for the rest of the year remains subject to considerable uncertainty. Also contributing to uncertainty about the future of the tourism sector in the region amid greater regional economic instability is the fact that a significant proportion of tourists to the main South American destinations come from within the region itself.
Source: Economic Commission for Latin America and the Caribbean (ECLAC), on the basis of World Tourism Organization (UNWTO), UNWTO World Tourism Barometer, vol. 19, No. 5, September 2021.
The figures disaggregated by major category confirm the stronger growth of trade in goods than in services during the first half of 2021. Notable is the 52% year-on-year expansion in the value of exports of mining and energy products, as well as growth of over 20% in all the major categories of imported products (see table I.4) Conversely, in the case of services, the value of exports in the first half of 2021 was 10% below the year-earlier period, mainly owing to the 37% slump in the travel category (tourism).
Box I.3 (concluded)

58 Economic Commission for Latin America and the Caribbean (ECLAC)Chapter I
Unlike tourism, both exports and imports of transport services and the category of other services closed the first half of 2021 with positive figures. In the first case, this reflected the recovery of trade in goods, while in the second, it was the result of the boom in the trade of digitally delivered services during the pandemic. The upturn in transport services trade has been much greater in imports than in exports, mainly due to the recovery of domestic demand in all the countries of the region.
Table I.4 Latin America and the Caribbean:a year-on-year variation in the value of goods and services exports by major sector, first half of 2018–first half of 2021(Percentages)
Major groups January–June 2018
January–June 2019
January–June 2020
January–June 2021
Exports Goods and services 9.1 −0.8 −17.4 27.9
Goods 10.0 −1.1 −16.0 30.8
Agricultural and livestock products 1.2 3.6 4.7 11.0
Mining and oil 16.6 −7.1 −20.7 51.6
Manufactures 9.7 0.0 −18.0 27.2
Services 4.4 0.8 −28.7 −9.9
Transport 4.9 0.8 −18.4 1.8
Travel 5.2 3.1 −51.9 −36.9
Other services 3.1 −2.4 1.0 4.8
Imports Goods and services 11.9 −1.4 −19.2 24.9
Goods 12.5 −2.8 −17.4 31.0
Capital goods 14.9 −3.8 −16.1 20.7
Intermediate goods 9.3 −0.5 −12.5 31.4
Consumer goods 10.4 −5.9 −19.0 25.8
Combustibles 34.3 −6.9 −32.6 31.7
Services 7.6 5.6 −31.0 3.1
Transport 10.3 −4.6 −25.4 25.7
Travel 7.3 −9.7 −57.0 −40.3
Other services 5.9 25.2 −19.6 4.1
Source: Economic Commission for Latin America and the Caribbean (ECLAC), on the basis of official information from the central banks, customs services and institutes of statistics of the respective countries.
a The figures on goods trade include the 33 countries of the region. The figures on services trade do not include Antigua and Barbuda, Cuba, Dominica, Granada, Saint Kitts and Nevis, Saint Lucia or Saint Vincent and the Grenadines.
The recovery in the region’s goods trade up to August 2021 mainly reflects the higher prices of exported products, which rose year on year by 28% as a monthly average between April and August. On the import side, the biggest boost came from volume, which also posted annual monthly growth rates of 30% during the period. In both cases, the highest growth rates by value occurred between April and May, the months in which regional trade had contracted the most in 2020 (see figure I.21).
The high year-on-year growth rates of export values seen up to August 2021 —of over 50% in some months— had not occurred in the region for more than 15 years, during the commodity supercycle. However, this surge is largely explained by a statistical effect in the comparison with the historical fall of the first half of 2020. Accordingly, in the coming months regional export growth is expected to fall back closer to pre-pandemic levels.

59Chapter IInternational Trade Outlook for Latin America and the Caribbean • 2021
Figure I.21 Latin America and the Caribbean: year-on-year variation in goods trade, by value, price and volume, January 2007–August 2021(Percentages)
VolumePriceValue
2007 2008 2009 2010 2011 2012 2013 2014 2015 2016 2017 2018 2019 2020 2021
-80
-60
-40
-20
0
20
40
60
Jan
Aug
Jan
Aug
Jan
Aug
Jan
Aug
Jan
Aug
Jan
Aug
Jan
Aug
Jan
Aug
Jan
Aug
Jan
Aug
Jan
Aug
Jan
Aug
Jan
Aug
Jan
Aug
Jan
Aug
A. Exports
VolumePriceValue
2007 2008 2009 2010 2011 2012 2013 2014 2015 2016 2017 2018 2019 2020 2021
Jan
Aug
Jan
Aug
Jan
Aug
Jan
Aug
Jan
Aug
Jan
Aug
Jan
Aug
Jan
Aug
Jan
Aug
Jan
Aug
Jan
Aug
Jan
Aug
Jan
Aug
Jan
Aug
Jan
Aug
B. Imports
-60
-40
-20
0
20
40
60
80
Source: Economic Commission for Latin America and the Caribbean (ECLAC), on the basis of official information from the central banks, customs services and institutes of statistics of the respective countries.
2. The pandemic hit smaller export firms especially badly
In the area of goods trade, the largest drops in the regional export value in 2020 occurred in heavy manufacturing (automobiles and auto parts, non-electrical machinery and equipment, and chemicals and pharmaceuticals). The fall was less steep in the machinery and electrical appliances sector: 9% in for the region overall and 4% in Central America (see table I.5). Exports from the food, beverage and tobacco sector expanded by an average of 3%, given that, as they are mainly essential goods,
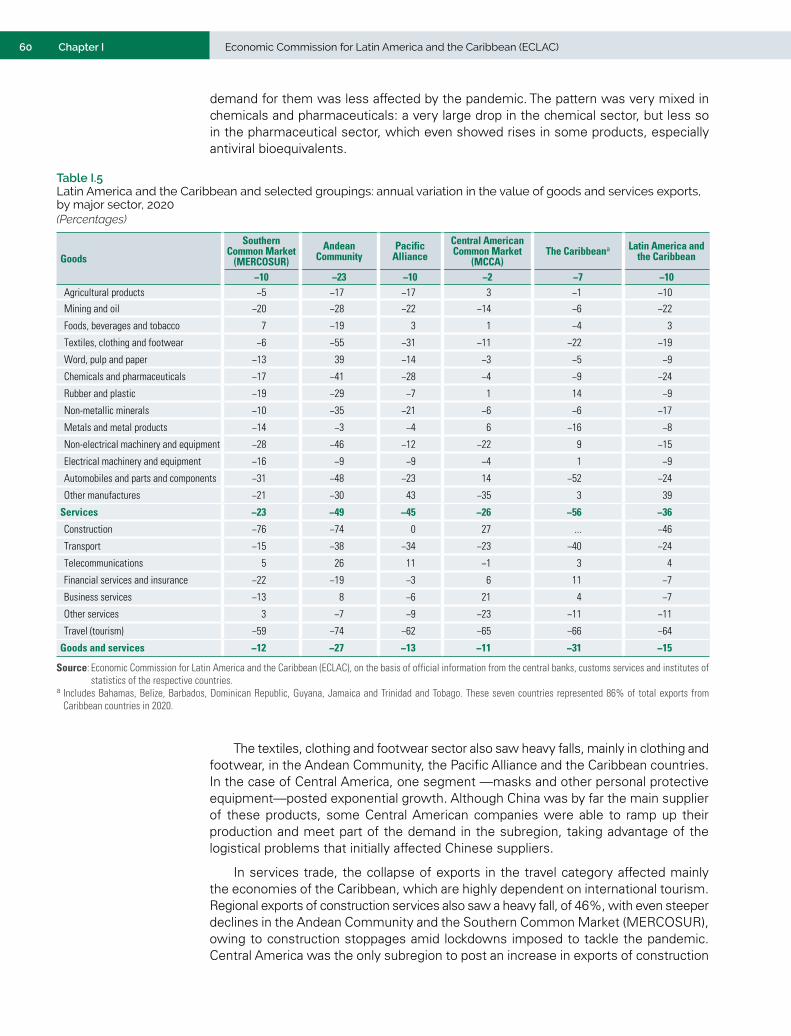
60 Economic Commission for Latin America and the Caribbean (ECLAC)Chapter I
demand for them was less affected by the pandemic. The pattern was very mixed in chemicals and pharmaceuticals: a very large drop in the chemical sector, but less so in the pharmaceutical sector, which even showed rises in some products, especially antiviral bioequivalents.
Table I.5 Latin America and the Caribbean and selected groupings: annual variation in the value of goods and services exports, by major sector, 2020(Percentages)
Goods
Southern Common Market
(MERCOSUR)Andean
CommunityPacific
AllianceCentral American Common Market
(MCCA)The Caribbeana Latin America and
the Caribbean
−10 −23 −10 −2 −7 −10Agricultural products −5 −17 −17 3 −1 −10
Mining and oil −20 −28 −22 −14 −6 −22
Foods, beverages and tobacco 7 −19 3 1 −4 3
Textiles, clothing and footwear −6 −55 −31 −11 −22 −19
Word, pulp and paper −13 39 −14 −3 −5 −9
Chemicals and pharmaceuticals −17 −41 −28 −4 −9 −24
Rubber and plastic −19 −29 −7 1 14 −9
Non-metallic minerals −10 −35 −21 −6 −6 −17
Metals and metal products −14 −3 −4 6 −16 −8
Non-electrical machinery and equipment −28 −46 −12 −22 9 −15
Electrical machinery and equipment −16 −9 −9 −4 1 −9
Automobiles and parts and components −31 −48 −23 14 −52 −24
Other manufactures −21 −30 43 −35 3 39
Services −23 −49 −45 −26 −56 −36
Construction −76 −74 0 27 ... −46
Transport −15 −38 −34 −23 −40 −24
Telecommunications 5 26 11 −1 3 4
Financial services and insurance −22 −19 −3 6 11 −7
Business services −13 8 −6 21 4 −7
Other services 3 −7 −9 −23 −11 −11
Travel (tourism) −59 −74 −62 −65 −66 −64
Goods and services −12 −27 −13 −11 −31 −15
Source: Economic Commission for Latin America and the Caribbean (ECLAC), on the basis of official information from the central banks, customs services and institutes of statistics of the respective countries.
a Includes Bahamas, Belize, Barbados, Dominican Republic, Guyana, Jamaica and Trinidad and Tobago. These seven countries represented 86% of total exports from Caribbean countries in 2020.
The textiles, clothing and footwear sector also saw heavy falls, mainly in clothing and footwear, in the Andean Community, the Pacific Alliance and the Caribbean countries. In the case of Central America, one segment —masks and other personal protective equipment—posted exponential growth. Although China was by far the main supplier of these products, some Central American companies were able to ramp up their production and meet part of the demand in the subregion, taking advantage of the logistical problems that initially affected Chinese suppliers.
In services trade, the collapse of exports in the travel category affected mainly the economies of the Caribbean, which are highly dependent on international tourism. Regional exports of construction services also saw a heavy fall, of 46%, with even steeper declines in the Andean Community and the Southern Common Market (MERCOSUR), owing to construction stoppages amid lockdowns imposed to tackle the pandemic. Central America was the only subregion to post an increase in exports of construction

61Chapter IInternational Trade Outlook for Latin America and the Caribbean • 2021
services. The third most affected sector was transport services (−24%), which recorded decreases across all the subregional groupings. The telecommunications, financial services and insurance, and business services sectors contracted to a lesser extent, or even experienced moderate increases, mainly in Central America and the Caribbean. This is attributable to increased demand for digital solutions owing to physical distancing measures.
As several temporary programmes were implemented to support tourism companies and their workers, the crisis impacted less on employment in this sector than on income. According to estimates by the World Travel and Tourism Council (WTTC, 2021), the GDP of the tourism and travel sectors fell by 41% in Latin America and 58% in the Caribbean in 2020. However, the impact on employment in these sectors was approximately half the impact on GDP: −23% and −25%, respectively. This drop has mainly affected women, who represent 60% of those employed in the tourism sector in Latin America and 62% in the Caribbean. In addition, more than half of the companies in the sector are headed by women (ECLAC, 2021c).
Local tourism grew in importance relative to international tourism in all the countries in 2020, being subject to less fewer restrictions. In 12 countries of the region, the share of local tourism in total sector revenues exceeded 70% in 2020 (see figure I.22). The Caribbean countries, however, are almost entirely dependent on international tourism. Although local tourism could be an engine for recovery, the daily spending of domestic tourists is lower than that of international travellers (World Travel and Tourism Council, 2021).
Figure I.22 Latin America and the Caribbean: share of local tourism in total tourism sector revenues, 2019 and 2020(Percentages)
0
10
20
30
40
50
60
70
80
90
100
Chile
Braz
il
Arge
ntin
aVe
nezu
ela
(Bol
. Rep
. of)
Guya
na
Hond
uras
Mex
ico
Peru
Trin
idad
and
Toba
go
Guat
emal
a
Urug
uay
Boliv
ia(P
lur.
Stat
e of
)Pa
ragu
ay
Cuba
Nic
arag
ua
El S
alva
dor
Colo
mbi
a
Surin
ame
Cost
a Ri
ca
Ecua
dor
Pana
ma
Baha
mas
Dom
inic
an R
ep.
Beliz
e
Jam
aica
Dom
inic
a
Sain
t Luc
ia
Angu
illa
Barb
ados
Sain
t Vin
cent
and
the
Gren
adin
esAn
tigua
and
Bar
buda
Sain
t Kitt
s and
Nev
is
Gren
ada
2020 2019
Source: Economic Commission for Latin America and the Caribbean (ECLAC), on the basis of World Travel and Tourism Council (WTTC), “Economic Impact Reports” [online] https://wttc.org/Research/Economic-Impact
Support will need to be provided for the recovery of tourism in the region, and to advance efforts to improve its resilience and sustainability. This requires linking tourism to strategies to manage the risks of natural and health disasters, especially those arising from climate change and pandemics (ECLAC, 2020). It is also important to drive the digital transformation of the tourism sector, particularly for small and medium-sized enterprises (SMEs), which are the furthest behind in this respect, but represent 99% of tourism providers.
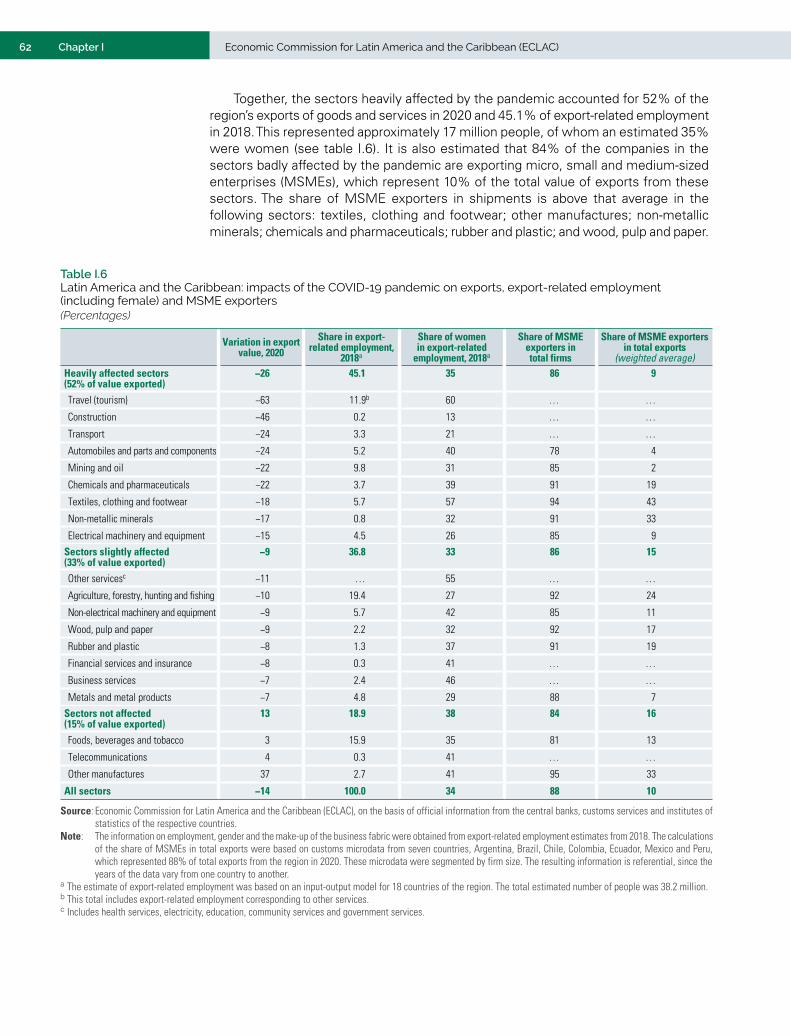
62 Economic Commission for Latin America and the Caribbean (ECLAC)Chapter I
Together, the sectors heavily affected by the pandemic accounted for 52% of the region’s exports of goods and services in 2020 and 45.1% of export-related employment in 2018. This represented approximately 17 million people, of whom an estimated 35% were women (see table I.6). It is also estimated that 84% of the companies in the sectors badly affected by the pandemic are exporting micro, small and medium-sized enterprises (MSMEs), which represent 10% of the total value of exports from these sectors. The share of MSME exporters in shipments is above that average in the following sectors: textiles, clothing and footwear; other manufactures; non-metallic minerals; chemicals and pharmaceuticals; rubber and plastic; and wood, pulp and paper.
Table I.6 Latin America and the Caribbean: impacts of the COVID-19 pandemic on exports, export-related employment (including female) and MSME exporters(Percentages)
Variation in export value, 2020
Share in export-related employment,
2018a
Share of women in export-related
employment, 2018a
Share of MSME exporters in total firms
Share of MSME exporters in total exports
(weighted average)Heavily affected sectors (52% of value exported)
−26 45.1 35 86 9
Travel (tourism) −63 11.9b 60 … …
Construction −46 0.2 13 … …
Transport −24 3.3 21 … …
Automobiles and parts and components −24 5.2 40 78 4
Mining and oil −22 9.8 31 85 2
Chemicals and pharmaceuticals −22 3.7 39 91 19
Textiles, clothing and footwear −18 5.7 57 94 43
Non-metallic minerals −17 0.8 32 91 33
Electrical machinery and equipment −15 4.5 26 85 9
Sectors slightly affected (33% of value exported)
−9 36.8 33 86 15
Other servicesc −11 … 55 … …
Agriculture, forestry, hunting and fishing −10 19.4 27 92 24
Non-electrical machinery and equipment −9 5.7 42 85 11
Wood, pulp and paper −9 2.2 32 92 17
Rubber and plastic −8 1.3 37 91 19
Financial services and insurance −8 0.3 41 … …
Business services −7 2.4 46 … …
Metals and metal products −7 4.8 29 88 7
Sectors not affected (15% of value exported)
13 18.9 38 84 16
Foods, beverages and tobacco 3 15.9 35 81 13
Telecommunications 4 0.3 41 … …
Other manufactures 37 2.7 41 95 33
All sectors −14 100.0 34 88 10
Source: Economic Commission for Latin America and the Caribbean (ECLAC), on the basis of official information from the central banks, customs services and institutes of statistics of the respective countries.
Note: The information on employment, gender and the make-up of the business fabric were obtained from export-related employment estimates from 2018. The calculations of the share of MSMEs in total exports were based on customs microdata from seven countries, Argentina, Brazil, Chile, Colombia, Ecuador, Mexico and Peru, which represented 88% of total exports from the region in 2020. These microdata were segmented by firm size. The resulting information is referential, since the years of the data vary from one country to another.
a The estimate of export-related employment was based on an input-output model for 18 countries of the region. The total estimated number of people was 38.2 million.b This total includes export-related employment corresponding to other services.c Includes health services, electricity, education, community services and government services.
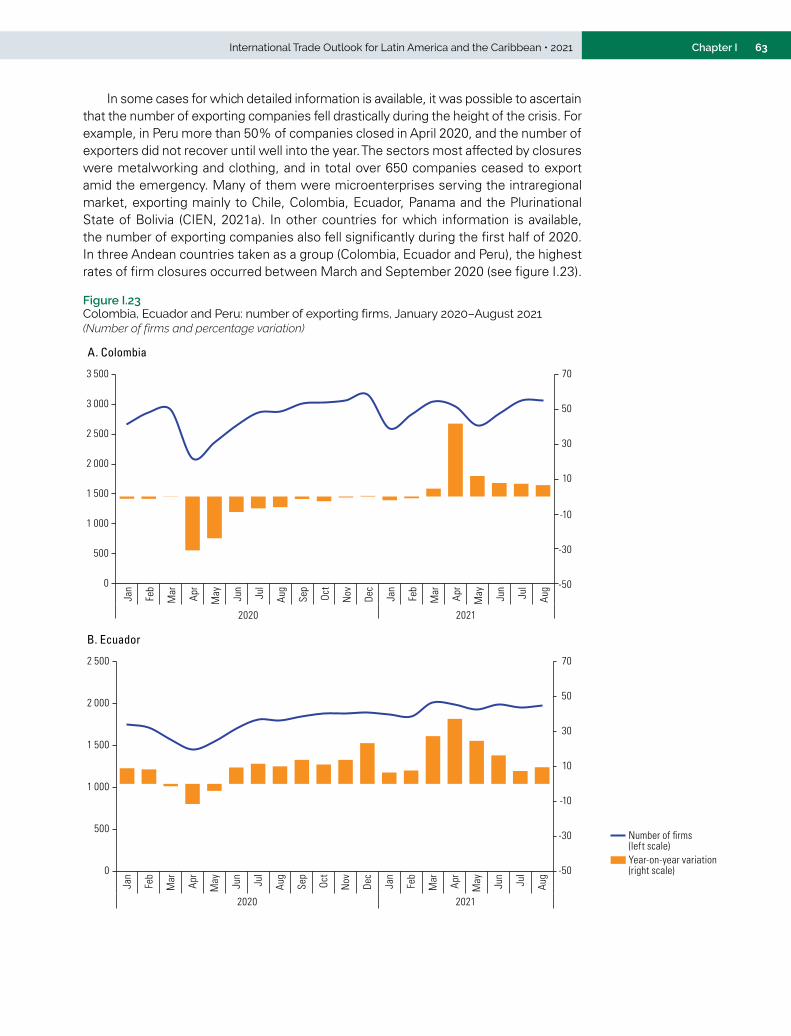
63Chapter IInternational Trade Outlook for Latin America and the Caribbean • 2021
In some cases for which detailed information is available, it was possible to ascertain that the number of exporting companies fell drastically during the height of the crisis. For example, in Peru more than 50% of companies closed in April 2020, and the number of exporters did not recover until well into the year. The sectors most affected by closures were metalworking and clothing, and in total over 650 companies ceased to export amid the emergency. Many of them were microenterprises serving the intraregional market, exporting mainly to Chile, Colombia, Ecuador, Panama and the Plurinational State of Bolivia (CIEN, 2021a). In other countries for which information is available, the number of exporting companies also fell significantly during the first half of 2020. In three Andean countries taken as a group (Colombia, Ecuador and Peru), the highest rates of firm closures occurred between March and September 2020 (see figure I.23).
Figure I.23 Colombia, Ecuador and Peru: number of exporting firms, January 2020–August 2021(Number of firms and percentage variation)
A. Colombia
-50
-30
-10
10
30
50
70
0
500
1 000
1 500
2 000
2 500
3 000
3 500
Jan
Feb
Mar Ap
r
May Jun
Jul
Aug
Sep
Oct
Nov De
c
Jan
Feb
Mar Ap
r
May Jun
Jul
Aug
2020 2021
Year-on-year variation(right scale)
Number of firms (left scale)
B. Ecuador
-50
-30
-10
10
30
50
70
0
500
1 000
1 500
2 000
2 500
Jan
Feb
Mar Ap
r
May Jun
Jul
Aug
Sep
Oct
Nov De
c
Jan
Feb
Mar Ap
r
May Jun
Jul
Aug
2020 2021
Year-on-year variation(right scale)
Number of firms (left scale)

64 Economic Commission for Latin America and the Caribbean (ECLAC)Chapter I
C. Peru
-1
6
-18
-52-37
-21-12 -8 -3
1 3
-1 -1 -1
25
117
67
3320 16
-80
-60
-40
-20
0
20
40
60
80
100
120
140
0
500
1 000
1 500
2 000
2 500
3 000
3 500
4 000
Jan
Feb
Mar Ap
r
May Jun
Jul
Aug
Sep
Oct
Nov De
c
Jan
Feb
Mar Ap
r
May Jun
Jul
Aug
2020 2021
Year-on-year variation(right scale)
Number of firms (left scale)
D. Colombia, Ecuador y Peru
-50
-30
-10
10
30
50
70
0
1 000
2 000
3 000
4 000
5 000
6 000
7 000
8 000
9 000
Jan
Feb
Mar Ap
r
May Jun
Jul
Aug
Sep
Oct
Nov De
c
Jan
Feb
Mar Ap
r
May Jun
Jul
Aug
2020 2021
Year-on-year variation(right scale)
Number of firms (left scale)
Source: Economic Commission for Latin America and the Caribbean (ECLAC), on the basis of official information from National Administrative Department of Statistics (DANE) of Colombia, the Centro de Investigación de Economía y Negocios Globales (CIEN) of Peru and the National Customs Service (SENAE) of Ecuador.
In Chile, the 6,939 exporting firms reported in the period January–August 2019 were reduced to around 6,500 in the same period of 2020, owing to the crisis, and to 6,292 by August 2021. Chile thus had 9% fewer exporters than before the pandemic (SUBREI, 2021). The sectors most affected by these closures include metal manufactures, grapes and wine.
In Ecuador, some of the main export sectors (food and beverages, base metals, metallic minerals, textiles and clothing) registered a decrease in sales as a result of the pandemic. SMEs were particularly affected, since their sales fell between 48% and 54% (Ministry of Production, Foreign Trade, Investment and Fisheries of Ecuador, 2020). In another example, the disruptions caused by the pandemic led to the paralysis and closure of Paraguayan MSMEs in the automotive and clothing value chains, both geared towards exports to the Brazilian market. The drop in demand in both areas forced many Paraguayan textile microenterprises and suppliers of cables, radios, water pumps and radiators, among other inputs for the automotive industry, to reduce production to a minimum. This meant the layoff of more than 90% of this sector’s workforce, made up mainly of women (Valenzuela and Reinecke, 2021).
Figure I.23 (concluded)

65Chapter IInternational Trade Outlook for Latin America and the Caribbean • 2021
3. The recovery of goods exports in 2021 encompassed almost all sectors and countries, unlike in exports of services
The value of regional goods exports recovered in the first half of 2021, compared to the prior-year period, in all major categories. Particularly high growth rates were seen in exports of metal products (59%), automobiles and autoparts (48%) and oil and mining (46%). The only exceptions were the Andean Community’s automotive exports, which declined, and agricultural exports from Central America and the Caribbean, whose growth was weak (see table I.7).
Table I.7 Latin America and the Caribbean and selected groupings: year-on-year variation in goods and services exports by major sector, first half of 2021(Percentages)
Southern Common Market
(MERCOSUR)Andean
CommunityPacific
AllianceCentral American Common Market
(CACM)
Caribbean Community(CARICOM)
Latin America and the Caribbean
Goods 34 50 32 22 36 33Agricultural products 12 28 14 6 5 12Mining and oil 34 51 53 30 60 46Foods, beverages and tobacco 30 29 17 16 31 26Textiles, clothing and footwear 39 88 44 50 44 42Wood, pulp and paper 14 7 12 24 15 13Chemicals and pharmaceuticals 22 24 14 17 52 21Rubber and plastic 25 53 33 37 41 32Non-metallic minerals 37 84 30 44 14 33Metals and metal products 73 114 50 65 27 59Non-electrical machinery and equipment 25 48 16 45 5 17Electrical machinery and devices 29 29 25 46 6 25Automobiles and parts and components 71 −12 45 19 188 48Other manufactures 60 54 44 42 29 43
Services −5 −16 −9 −8 −37 −10Construction −50 … 0 −33 ... −33Transport 18 −13 −7 −3 −29 2Telecommunications 16 19 17 10 −37 13Financial services and insurance 19 25 21 38 −34 18Business services 4 17 0 3 −48 0Other services 10 −17 −7 −5 −46 −1Travel (tourism) −65 −45 −23 −38 −35 −37
Goods and services 28 −27 29 12 9 28
Source: Economic Commission for Latin America and the Caribbean (ECLAC), on the basis of official information from the central banks, customs services and institutes of statistics of the respective countries.
The performance of regional services exports in the first half of 2021 contrasts with the positive performance of goods exports, with a year-on-year drop of 10% by value. This is because the tourism sector has not yet started to recover and saw a 37% drop in that period. The signs in economic activity in the countries with the highest tourism rates, mainly the Caribbean economies, suggest that the crisis will not subside in the short term. The recent new surges and the increase in the number of cases of COVID-19 in countries such as Jamaica, Cuba, Guyana and Suriname preclude any projection of a reversal of the deep decline that has occurred in the sector. Although exports of travel services grew at a year-on-year rate of 382% in the second quarter of 2021, tourism revenues have yet to exceed a third of the levels posted in the first quarter of 2019 (see figure I.24).

66 Economic Commission for Latin America and the Caribbean (ECLAC)Chapter I
Figure I.24 Latin America and the Caribbean: services exports by major sector, first quarter of 2010–second quarter of 2021(Percentages and millions of dollars)
A. Exports (rates of variation)
-200
-100
0
100
200
300
400
500
Q1 Q
2Q
3 Q4 Q1 Q2
Q3 Q4 Q1 Q2
Q3 Q4 Q1 Q2
Q3 Q4 Q1 Q2
Q3 Q4 Q1 Q2
Q3 Q4 Q1 Q2
Q3 Q4 Q1 Q2
Q3 Q4 Q1 Q2
Q3 Q4 Q1 Q2
Q3 Q4 Q1 Q2
2011 2012 2013 2014 2015 2016 2017 2018 2019 2020 2021
TransportTravel
Modern servicesOther services
B. Imports (rates of variation)
-200
-100
0
100
200
300
400
500
Q1 Q2
Q3 Q4 Q1 Q2
Q3 Q4 Q1 Q2
Q3 Q4 Q1 Q2
Q3 Q4 Q1 Q2
Q3 Q4 Q1 Q2
Q3 Q4 Q1 Q2
Q3 Q4 Q1 Q2
Q3 Q4 Q1 Q2
Q3 Q4 Q1 Q2
Q3 Q4 Q1 Q2
2011 2012 2013 2014 2015 2016 2017 2018 2019 2020 2021
65
203
14
TransportTravel
Modern servicesOther services
C. Exports (levels)
Trim
1Tr
im 2
Trim
3Tr
im 4
Trim
1Tr
im 2
Trim
3Tr
im 4
Trim
1Tr
im 2
Trim
3Tr
im 4
Trim
1Tr
im 2
Trim
3Tr
im 4
Trim
1Tr
im 2
Trim
3Tr
im 4
Trim
1Tr
im 2
Trim
3Tr
im 4
Trim
1Tr
im 2
Trim
3Tr
im 4
Trim
1Tr
im 2
Trim
3Tr
im 4
Trim
1Tr
im 2
Trim
3Tr
im 4
Trim
1Tr
im 2
Trim
3Tr
im 4
Trim
1Tr
im 2
Transport
TravelModern services
Other services
24 046
0
5 000
10 000
15 000
20 000
25 000
30 000
2010 2011 2012 2013 2014 2015 2016 2017 2018 2019 2020 2021
Trim
1Tr
im 2
Trim
3Tr
im 4

67Chapter IInternational Trade Outlook for Latin America and the Caribbean • 2021
D. Imports (levels)
Q1 Q2
Q3 Q4 Q1 Q2
Q3 Q4 Q1 Q2
Q3 Q4 Q1 Q2
Q3 Q4 Q1 Q2
Q3 Q4 Q1 Q2
Q3 Q4 Q1 Q2
Q3 Q4 Q1 Q2
Q3 Q4 Q1 Q2
Q3 Q4 Q1 Q2
Q3 Q4 Q1 Q20
5 000
10 000
15 000
20 000
25 000
30 000
2010 2011 2012 2013 2014 2015 2016 2017 2018 2019 2020 2021
Q1 Q2
Q3 Q4
Transport
TravelModern services
Other services
Source: Economic Commission for Latin America and the Caribbean (ECLAC), on the basis of official balance-of-payments data provided by the central banks and institutes of statistics of the respective countries of the region.
The largest increases in the value of goods exports during the first half of 2021 took place in the countries of the Caribbean Community (CARICOM) and the Andean Community (see table I.8). Within the first group, Guyana, the Bahamas and Trinidad and Tobago showed the fastest export growth, due to the expansion of the oil production frontier in the first two cases and the rise in gas prices in the third. The four member countries of the Andean Community are major exporters of those commodities whose prices rose in 2021 (oil, gas, coal, copper, tin and aluminum, among others).
The MERCOSUR countries as a group saw a year-on-year increase of 32.6% in the value of their exports in the first half of 2021, slightly above the regional average. The largest rise occurred in Brazil, thanks to the rise in the price of iron ore in the period. Conversely, exports from the Bolivarian Republic of Venezuela declined: although it benefited from the rise in international oil prices, export volumes fell significantly.7
With regard to Central America, the year-on-year increase in the value exported by Panama and El Salvador was above the subregional average. The best performing products in that period were copper ore in Panama and textile products and minerals and metals in El Salvador. Among the Caribbean countries, Cuba registered a drop in exports, mainly in the agricultural sector. These exports have been very depressed by lower volumes exported by the sector as a whole (with production down by 13%) and, in particular, by the sugar industry, whose production fell 38% (ONEI, 2021). Likewise, Antigua and Barbuda, Barbados and Suriname recorded a reduction in export values, mainly owing to the fall in the export volume of oil and fuels, fertilizers and vessels. By contrast, dynamism in mining exports, textiles, electronic equipment and pharmaceutical products drove growth of 28% in the value exported by the Dominican Republic.
7 During the first half of 2021, the volume of oil exported by Petróleos de Venezuela (PDVSA) registered a year-on-year drop of 14.3%. Only in July did volumes begin to recover, owing to the rebound in exports to China and other Asian countries (Petroguía, 2021).
Figure I.24 (concluded)
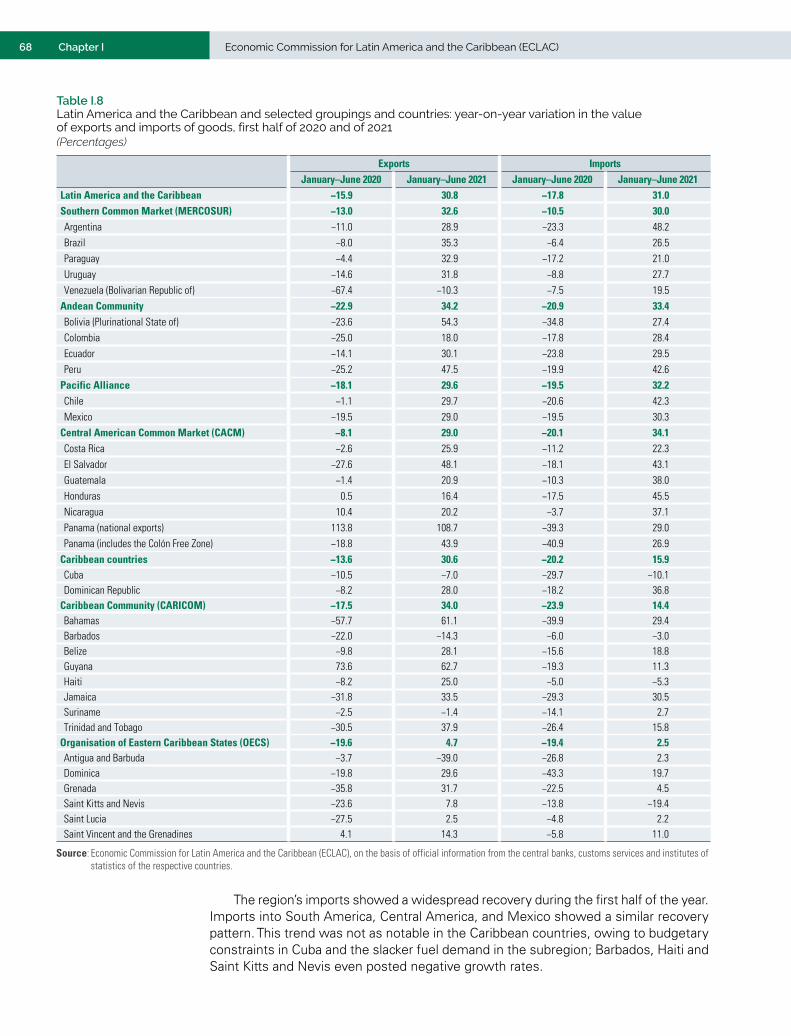
68 Economic Commission for Latin America and the Caribbean (ECLAC)Chapter I
Table I.8 Latin America and the Caribbean and selected groupings and countries: year-on-year variation in the value of exports and imports of goods, first half of 2020 and of 2021(Percentages)
Exports Imports
January–June 2020 January–June 2021 January–June 2020 January–June 2021Latin America and the Caribbean −15.9 30.8 −17.8 31.0Southern Common Market (MERCOSUR) −13.0 32.6 −10.5 30.0Argentina −11.0 28.9 −23.3 48.2Brazil −8.0 35.3 −6.4 26.5Paraguay −4.4 32.9 −17.2 21.0Uruguay −14.6 31.8 −8.8 27.7Venezuela (Bolivarian Republic of) −67.4 −10.3 −7.5 19.5
Andean Community −22.9 34.2 −20.9 33.4Bolivia (Plurinational State of) −23.6 54.3 −34.8 27.4Colombia −25.0 18.0 −17.8 28.4Ecuador −14.1 30.1 −23.8 29.5Peru −25.2 47.5 −19.9 42.6
Pacific Alliance −18.1 29.6 −19.5 32.2Chile −1.1 29.7 −20.6 42.3Mexico −19.5 29.0 −19.5 30.3
Central American Common Market (CACM) −8.1 29.0 −20.1 34.1Costa Rica −2.6 25.9 −11.2 22.3El Salvador −27.6 48.1 −18.1 43.1Guatemala −1.4 20.9 −10.3 38.0Honduras 0.5 16.4 −17.5 45.5Nicaragua 10.4 20.2 −3.7 37.1Panama (national exports) 113.8 108.7 −39.3 29.0Panama (includes the Colón Free Zone) −18.8 43.9 −40.9 26.9
Caribbean countries −13.6 30.6 −20.2 15.9Cuba −10.5 −7.0 −29.7 −10.1Dominican Republic −8.2 28.0 −18.2 36.8
Caribbean Community (CARICOM) −17.5 34.0 −23.9 14.4Bahamas −57.7 61.1 −39.9 29.4Barbados −22.0 −14.3 −6.0 −3.0Belize −9.8 28.1 −15.6 18.8Guyana 73.6 62.7 −19.3 11.3Haiti −8.2 25.0 −5.0 −5.3Jamaica −31.8 33.5 −29.3 30.5Suriname −2.5 −1.4 −14.1 2.7Trinidad and Tobago −30.5 37.9 −26.4 15.8
Organisation of Eastern Caribbean States (OECS) −19.6 4.7 −19.4 2.5Antigua and Barbuda −3.7 −39.0 −26.8 2.3Dominica −19.8 29.6 −43.3 19.7Grenada −35.8 31.7 −22.5 4.5Saint Kitts and Nevis −23.6 7.8 −13.8 −19.4Saint Lucia −27.5 2.5 −4.8 2.2Saint Vincent and the Grenadines 4.1 14.3 −5.8 11.0
Source: Economic Commission for Latin America and the Caribbean (ECLAC), on the basis of official information from the central banks, customs services and institutes of statistics of the respective countries.
The region’s imports showed a widespread recovery during the first half of the year. Imports into South America, Central America, and Mexico showed a similar recovery pattern. This trend was not as notable in the Caribbean countries, owing to budgetary constraints in Cuba and the slacker fuel demand in the subregion; Barbados, Haiti and Saint Kitts and Nevis even posted negative growth rates.

69Chapter IInternational Trade Outlook for Latin America and the Caribbean • 2021
Regional trade in services between January and July 2021 shows a year-on-year fall of 9.9% in the value of total exports. Brazil, El Salvador and Guatemala are the only countries to have posted increases (see table I.9). Regional imports of services were more dynamic, amid the upturn in economic activity. Most of the Andean and Central American countries, as well as the members of the Pacific Alliance, posted positive rates of variation in services imports.
Table I.9 Latin America and the Caribbean and selected groupings and countries: year-on-year variation in the value of services trade, January–July 2020 and January–July 2021(Percentages)
Exports Imports2020 2021 2020 2021
Latin America and the Caribbean −30.3 −9.9 −31.0 3.1Latin America −29.1 −9.3 −31.6 3.6South America −22.0 −8.4 −35.0 3.5Southern Common Market (MERCOSUR) −15.5 −5.0 −40.7 −1.9Argentina −22.4 −23.9 −36.4 −17.1Brazil −10.9 6.5 −44.4 7.5Paraguaya −22.9 −14.4 −25.9 −14.8Uruguay −23.4 −31.1 −21.9 −14.1Venezuela (Bolivarian Republic of)b −20.5 −19.2 −33.5 −22.0
Andean Community −36.9 −16.8 −22.5 12.4Bolivia (Plurinational State of) −43.1 −37.6 −31.2 −0.8Colombia −28.7 −11.6 −19.1 11.9Ecuadora −38.6 −20.3 −25.4 20.9Peru −45.4 −19.7 −23.4 13.4
Pacific Alliance −38.3 −9.4 −23.6 10.0Chile −24.9 −14.5 −20.4 14.1Mexico −43.1 −4.5 −26.3 6.8
Central American Common Market (CACM) −26.5 −6.2 −18.8 6.0Costa Rica −9.2 −14.2 5.5 5.0El Salvadora −36.4 44.0 −24.7 16.9Guatemalaa −29.7 4.7 −19.8 7.0Honduras −46.2 −54.5 −24.3 21.2Nicaraguaa −23.2 −8.9 −24.7 −6.8Panamaa −31.6 −4.0 −31.2 −3.7
The Caribbean −49.5 −37.0 −15.7 −15.0Dominican Republic −51.5 −55.7 −18.6 −33.8
Caribbean Community (CARICOM)c −47.7 −22.2 −14.3 −6.9
Source: Economic Commission for Latin America and the Caribbean (ECLAC), on the basis of quarterly balance-of-payments reports published by the central banks and institutes of statistics of the respective countries.
a Includes estimates for the second quarter of 2021.b Includes estimates for the whole period.c Does not include Antigua and Barbuda, Cuba, Dominica, Grenada, Saint Kitts and Nevis, Saint Lucia or Saint Vincent and the Grenadines.
Includes estimates for the second quarter in the cases of Bahamas, Belize, Guyana, Jamaica, Suriname and Trinidad and Tobago.
4. The pandemic accelerated the growth of e-commerce in the region, but this is not yet reflected in the international trade figures
The pandemic and the mobility restrictions imposed to prevent the spread of COVID-19 have accelerated the growth of business-to-consumer (B2C) e-commerce around the world, as both businesses and consumers turned to digital channels to offset the drop in sales in physical stores. As a result, the share of e-commerce in global retail increased from 14% in 2019 to 17% in 2020 (UNCTAD, 2021a). B2C e-commerce also expanded in Latin America and the Caribbean and in 2020 reached an estimated US$ 52 billion. This growth will likely continue in 2021, so that, in the first quarter of 2022, 63% of the population will be using e-commerce. Latin America and the Caribbean was the world’s second fastest-growing region in terms of e-commerce between 2014 and 2019, and could lead global growth in this area between 2020 and 2024. In a group of six countries in the region, the proportion of consumers who engaged in online operations increased during 2020 (see figure I.25).
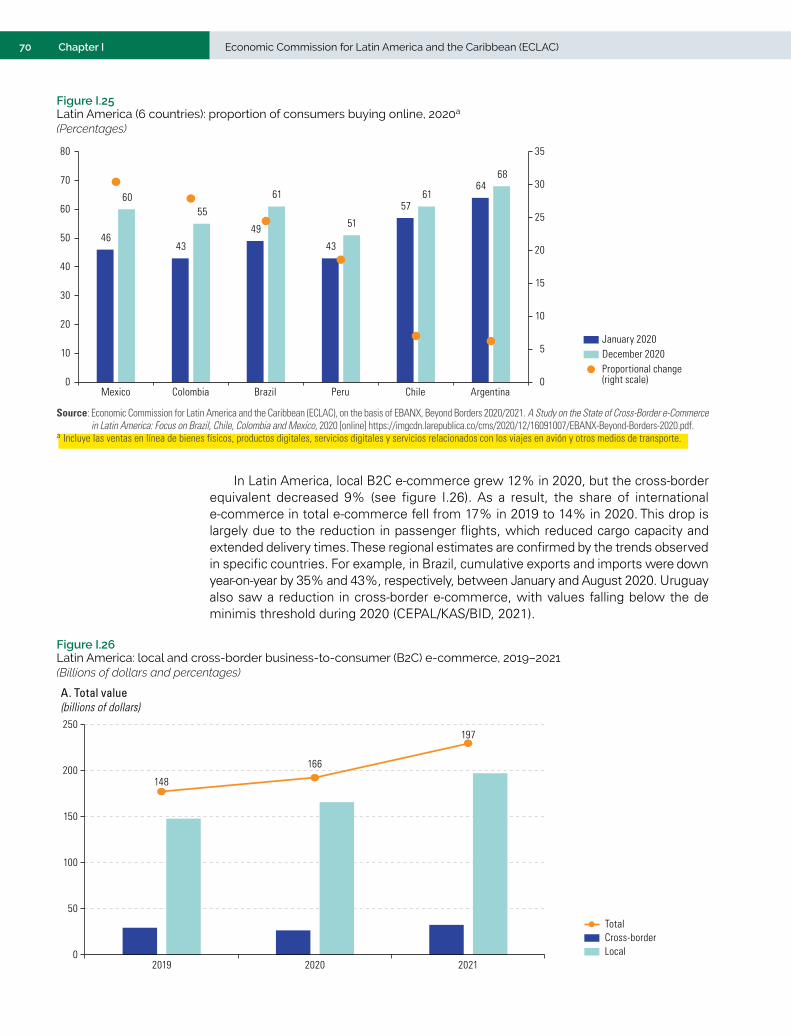
70 Economic Commission for Latin America and the Caribbean (ECLAC)Chapter I
Figure I.25 Latin America (6 countries): proportion of consumers buying online, 2020a
(Percentages)
January 2020December 2020Proportional change (right scale)
4643
49
43
57
6460
55
61
51
61
68
0
5
10
15
20
25
30
35
0
10
20
30
40
50
60
70
80
Mexico Colombia Brazil Peru Chile Argentina
Source: Economic Commission for Latin America and the Caribbean (ECLAC), on the basis of EBANX, Beyond Borders 2020/2021. A Study on the State of Cross-Border e-Commerce in Latin America: Focus on Brazil, Chile, Colombia and Mexico, 2020 [online] https://imgcdn.larepublica.co/cms/2020/12/16091007/EBANX-Beyond-Borders-2020.pdf.
a Incluye las ventas en línea de bienes físicos, productos digitales, servicios digitales y servicios relacionados con los viajes en avión y otros medios de transporte.
In Latin America, local B2C e-commerce grew 12% in 2020, but the cross-border equivalent decreased 9% (see figure I.26). As a result, the share of international e-commerce in total e-commerce fell from 17% in 2019 to 14% in 2020. This drop is largely due to the reduction in passenger flights, which reduced cargo capacity and extended delivery times. These regional estimates are confirmed by the trends observed in specific countries. For example, in Brazil, cumulative exports and imports were down year-on-year by 35% and 43%, respectively, between January and August 2020. Uruguay also saw a reduction in cross-border e-commerce, with values falling below the de minimis threshold during 2020 (CEPAL/KAS/BID, 2021).
Figure I.26 Latin America: local and cross-border business-to-consumer (B2C) e-commerce, 2019–2021(Billions of dollars and percentages)
A. Total value(billions of dollars)
0
50
100
150
200
250
2019 2020 2021
Cross-border Local
Total
148
166
197
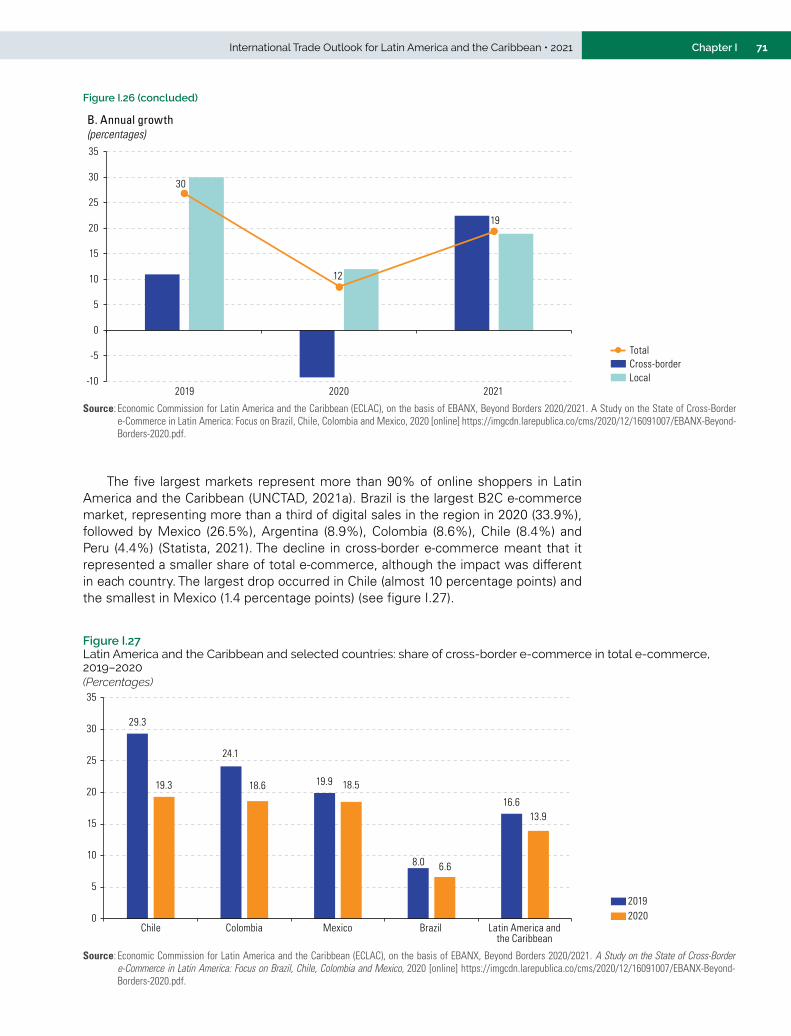
71Chapter IInternational Trade Outlook for Latin America and the Caribbean • 2021
B. Annual growth(percentages)
-10
-5
0
5
10
15
20
25
30
35
2019 2020 2021
30
12
19
Cross-border Local
Total
Source: Economic Commission for Latin America and the Caribbean (ECLAC), on the basis of EBANX, Beyond Borders 2020/2021. A Study on the State of Cross-Border e-Commerce in Latin America: Focus on Brazil, Chile, Colombia and Mexico, 2020 [online] https://imgcdn.larepublica.co/cms/2020/12/16091007/EBANX-Beyond-Borders-2020.pdf.
The five largest markets represent more than 90% of online shoppers in Latin America and the Caribbean (UNCTAD, 2021a). Brazil is the largest B2C e-commerce market, representing more than a third of digital sales in the region in 2020 (33.9%), followed by Mexico (26.5%), Argentina (8.9%), Colombia (8.6%), Chile (8.4%) and Peru (4.4%) (Statista, 2021). The decline in cross-border e-commerce meant that it represented a smaller share of total e-commerce, although the impact was different in each country. The largest drop occurred in Chile (almost 10 percentage points) and the smallest in Mexico (1.4 percentage points) (see figure I.27).
Figure I.27 Latin America and the Caribbean and selected countries: share of cross-border e-commerce in total e-commerce, 2019–2020(Percentages)
29.3
24.1
19.9
8.0
16.6
19.3 18.6 18.5
6.6
13.9
0
5
10
15
20
25
30
35
Chile Colombia Mexico Brazil Latin America andthe Caribbean
20192020
Source: Economic Commission for Latin America and the Caribbean (ECLAC), on the basis of EBANX, Beyond Borders 2020/2021. A Study on the State of Cross-Border e-Commerce in Latin America: Focus on Brazil, Chile, Colombia and Mexico, 2020 [online] https://imgcdn.larepublica.co/cms/2020/12/16091007/EBANX-Beyond-Borders-2020.pdf.
Figure I.26 (concluded)

72 Economic Commission for Latin America and the Caribbean (ECLAC)Chapter I
The pandemic and the changes it has driven in consumption patterns have increased the use of e-commerce in Latin America and the Caribbean and the great majority of governments in the region have taken measures to promote it during the pandemic. However, a recent study (ECLAC/KAS/IDB, 2021) found that only nine countries had a national strategy to this end, while the others were still developing one. Two main types of measures have been adopted to promote cross-border e-commerce: promoting the online presence of SMEs and facilitating trade. Examples of the first type are the development of online markets, such as “Costa Rica Fashion Week”, and of Internet sites with information on e-commerce opportunities for exporters (for example, those created by the Brazilian Trade and Investment Promotion Agency (Apex-Brasil) or by the General Directorate for Export Promotion (ProChile) of Chile). In terms of trade facilitation and logistics, few countries have adopted initiatives to facilitate delivery and logistics operations, and even fewer have taken action to develop new postal services or strengthen existing ones (ECLAC/KAS/IDB, 2021).
5. The prices of the region’s raw materials exports recovered strongly in 2021
A set of commodities that in 2020 represented 36% of the region’s total exports, showed a combined price increase over the prior-year period of 42% between January and October 2021. For the year overall, an increase of 41% is projected (see table I.10). The pattern of prices reflects the recovery of demand globally, and particularly in China in the case of metals and agricultural products. The price index trended upwards until July 2021, slowed in August and September, then resumed an upward path in October (see figure I.28). The prices of all commodities rose steadily until July, as world demand recovered from the supply restrictions and reduced mobility that led to the collapse of prices during the first four months of 2020.
Table I.10 Latin America and the Caribbean: commodity price index, 2020, January–October 2020, January–October 2021 and projection for 2021(Percentages)
Main commodities Share in exports in 2020 Variation in 2020 Variation between January–October 2020 and January–October 2021 Projection for 2021
Commodities 36 −9 42 41Energy 11 −32 69 78Oil 8 −33 71 73Oil products 2 −34 40 83Natural gas 1 −21 96 88Coal 1 −22 119 122Minerals and metals 7 10 42 33Iron 3 16 68 48Copper 2 3 57 51Gold 2 16 3 2Aluminium 0 −5 48 46Agricultural products 16 2 21 20Soybeans 3 10 53 43Bananas 3 0 5 3Beef 3 −2 12 14Maize 1 −1 64 56Coffee 1 9 26 28Shrimp and shellfish 1 −6 6 10Wheat 0 14 40 38Agro-industrial products 2 1 54 36Soybean oil 1 9 69 50Sugar 1 1 38 22
Source: Economic Commission for Latin America and the Caribbean (ECLAC), index constructed on the basis of a set of prices representative of the basic basket of the countries of Latin America and the Caribbean, on the basis of data from World Bank, Energy Information Administration (EIA), Chilean Copper Commission (COCHILCO), Agrarian Research and Policy Office (ODEPA), Bolsa de Comercio de Rosario and other sources.
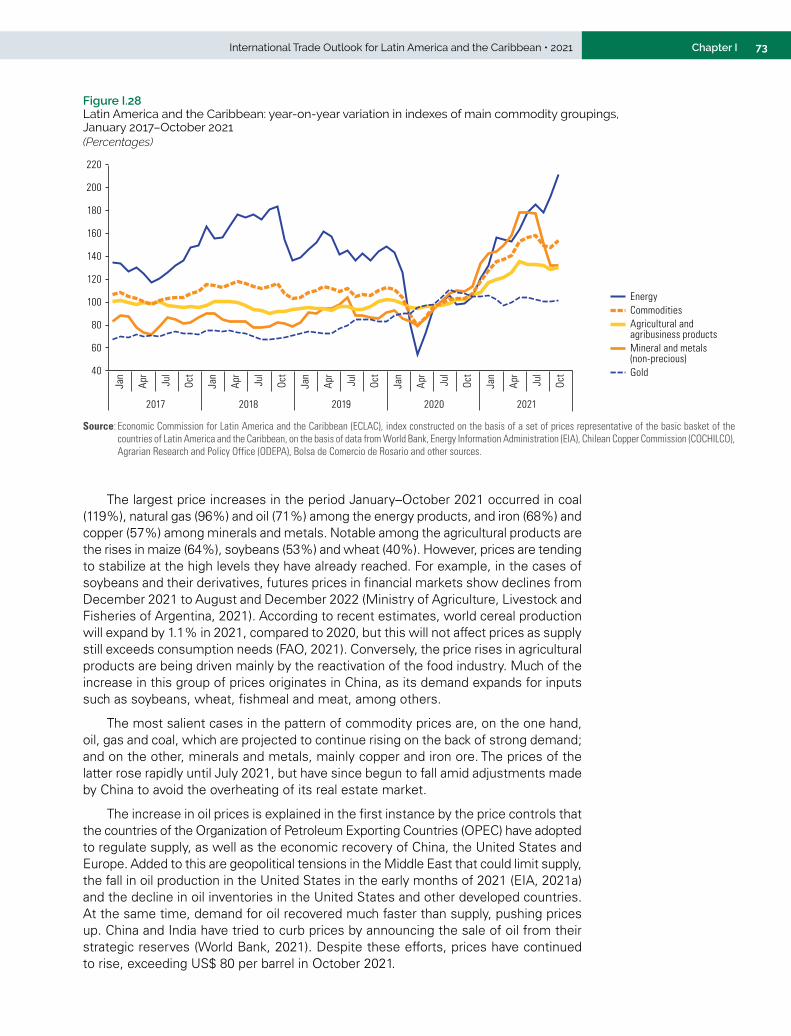
73Chapter IInternational Trade Outlook for Latin America and the Caribbean • 2021
Figure I.28 Latin America and the Caribbean: year-on-year variation in indexes of main commodity groupings, January 2017–October 2021(Percentages)
2017 2018 2019 2020 2021
40
60
80
100
120
140
160
180
200
220
Jan
Apr
Jul
Oct
Jan
Apr
Jul
Oct
Jan
Apr
Jul
Oct
Jan
Apr
Jul
Oct
Jan
Apr
Jul
Oct
Energy
Mineral and metals(non-precious)
Agricultural andagribusiness products
Commodities
Gold
Source: Economic Commission for Latin America and the Caribbean (ECLAC), index constructed on the basis of a set of prices representative of the basic basket of the countries of Latin America and the Caribbean, on the basis of data from World Bank, Energy Information Administration (EIA), Chilean Copper Commission (COCHILCO), Agrarian Research and Policy Office (ODEPA), Bolsa de Comercio de Rosario and other sources.
The largest price increases in the period January–October 2021 occurred in coal (119%), natural gas (96%) and oil (71%) among the energy products, and iron (68%) and copper (57%) among minerals and metals. Notable among the agricultural products are the rises in maize (64%), soybeans (53%) and wheat (40%). However, prices are tending to stabilize at the high levels they have already reached. For example, in the cases of soybeans and their derivatives, futures prices in financial markets show declines from December 2021 to August and December 2022 (Ministry of Agriculture, Livestock and Fisheries of Argentina, 2021). According to recent estimates, world cereal production will expand by 1.1% in 2021, compared to 2020, but this will not affect prices as supply still exceeds consumption needs (FAO, 2021). Conversely, the price rises in agricultural products are being driven mainly by the reactivation of the food industry. Much of the increase in this group of prices originates in China, as its demand expands for inputs such as soybeans, wheat, fishmeal and meat, among others.
The most salient cases in the pattern of commodity prices are, on the one hand, oil, gas and coal, which are projected to continue rising on the back of strong demand; and on the other, minerals and metals, mainly copper and iron ore. The prices of the latter rose rapidly until July 2021, but have since begun to fall amid adjustments made by China to avoid the overheating of its real estate market.
The increase in oil prices is explained in the first instance by the price controls that the countries of the Organization of Petroleum Exporting Countries (OPEC) have adopted to regulate supply, as well as the economic recovery of China, the United States and Europe. Added to this are geopolitical tensions in the Middle East that could limit supply, the fall in oil production in the United States in the early months of 2021 (EIA, 2021a) and the decline in oil inventories in the United States and other developed countries. At the same time, demand for oil recovered much faster than supply, pushing prices up. China and India have tried to curb prices by announcing the sale of oil from their strategic reserves (World Bank, 2021). Despite these efforts, prices have continued to rise, exceeding US$ 80 per barrel in October 2021.

74 Economic Commission for Latin America and the Caribbean (ECLAC)Chapter I
Gas prices have also climbed steadily, mainly because the demand for its different uses (residential and industrial consumption and electricity generation) has continued to increase, while supply is not expected to increase until 2025. This resulted in the price of gas posting new record highs in October. Hurricane Ida, which hit the United States and the Gulf of Mexico, caused large losses and unscheduled outages in gas production of up to 56%. The United States Energy Information Administration (EIA) raised its price projections to US$ 5.8 per million British thermal units (MMBtu) (EIA, 2021b), while forward contracts exceeded US$ 6.0 in the last week of October 2021.
The high prices of gas and oil have triggered rises in the price of coal, as an alternative source of energy for electricity generation and for industrial uses. Supply limitations due to floods in Indonesia and Australia and a mine closure in Colombia, in addition to China’s ban on the import of Australian coal, also contributed to the higher prices. The current high prices are expected to decline as the supply of natural gas expands and countries reduce their use of coal in the framework of their commitments in relation to climate change.
In the case of prices for mining products and metals, the main explanation for the recent rises is the rebound in construction and manufacturing production in China, which expanded rapidly in the first half of the year. These activities are the main sources of demand for a number of inputs exported by the region (copper, iron, aluminum, zinc, tin and lithium, among others). Recently, China announced measures to cool the expansion of the real estate sector, as well as to rationalize steel production in order to reduce pollution. As a result, the price of iron ore plummeted, dragging down the prices of copper and other metals with it.
It bears asking whether the uptrend in commodity prices could anticipate new all-time highs, or even a new price supercycle. However, several factors suggest that the probability of the latter scenario is rather low. The first is that the supercycle of the 2000s took place when the Chinese economy was growing at much higher rates than it is today. A second factor is that today’s high prices reflect a rebound from historically low prices so far this decade. The third concerns the medium-term exposure of financial markets, which have begun to invest in commodity derivatives, thereby increasing futures contracts and the prices of metals and other products. However, the appetite of financial funds for raw materials may well change if expectations of demand growth fall.
A final relevant point regarding the price pattern of the region’s export basket has to do with the slacker performance of manufacturing prices. The prices of a set of 16 manufactured products showed a combined year-on-year increase of just 0.5% in the period January–September 2021. The only products to show price increases were chemical products (1.8%), plastic articles (6.8%), wood pulp, paper and cardboard (0.6%), medical and scientific equipment (0.7%) and pharmaceutical products (0.3%). The rest showed zero growth or even a slight drop, in the case of electrical appliances and machinery.
Price projections for the region’s manufacturing products in 2021 show very few products with major increases (see figure I.29). Chemical products, metal manufactures and television receivers stand out, with price increases of 21%, 16% and 7%, respectively. The small price rises projected in the machinery and equipment, electronics, medical equipment and textiles and clothing industries, among others, suggest that expanding the region’s manufacturing exports will depend essentially on volumes.

75Chapter IInternational Trade Outlook for Latin America and the Caribbean • 2021
Figure I.29 Latin America and the Caribbean: estimated variation in prices of manufactured products, by sector, 2021 relative to 2020(Percentages)
21
16
73
3 2 2 2 2 1 1 1 1 1 00
5
10
15
20
25
30
Chem
ical
prod
ucts
(1.0
%)
Met
alm
anuf
actu
res (
0.7%
)
Tele
visio
n re
cept
ion
appa
ratu
s (1.
2%)
Sele
cted
man
ufac
ture
s (24
%)
Aut
opar
ts (3
.1%)
Med
ical
inst
rum
ents
(1.2
%)
Woo
dan
d pu
lp (1
.0%
)
Elec
trica
leq
uipm
ent (
1.2%
)
Pass
enge
rve
hicle
s (4.
1%)
Truc
ks a
nd sp
ecia
lve
hicle
s (2.
8%)
Text
iles a
ndclo
thin
g (1.
0%)
Tele
com
mun
icat
ions
equi
pmen
t(1.
5%)
Plas
ticar
ticle
s (0.
9%)
Parts
and
com
pone
nts (
1.1%
)
Elec
trica
lm
achi
nery
(1.2
%)
Source: Economic Commission for Latin America and the Caribbean (ECLAC), on the basis of United States Bureau of Labor Statistics (BLS), “Import/Export Price Indexes” [online] https://www.bls.gov/web/ximpim/harmimp.htm and estimates by the Division of International Trade and Integration, on the basis of historical price trends observed as of September 2021.
Note: The figure in brackets refers to the share of each group of products in the region’s exports.
6. Intraregional exports are recovering from the sharp drop posted in 2020
In 2021, intraregional trade has been recovering from a continuous decline that began in February 2019 and deepened sharply during the pandemic, with a year-on-year fall that reached 43% in value terms in May 2020, and lasted until November of that year (when the year-on-year decrease was 2.3%). In December 2020, intraregional trade growth turned positive again and rose to a high of 75% in May 2021 (see figure I.30). Until September 2021, the figures remain positive and comparatively high (with a year-on-year variation of 31%), although tending towards stabilization.
Figure I.30 Latin America and the Caribbean: year-on-year variation in the value of intraregional goods exports, January 2007–September 2021(Percentages)
75.4
-60
-40
-20
0
20
40
60
80
100
Jan
May Sep
Intraregional goods exports
-43.0
2007 2008 2009 2010 2011 2012 2013 2014 2015 2016 2017 2018 2019 2020 2021
Jan
May Sep
Jan
May Sep
Jan
May Sep
Jan
May Sep
Jan
May Sep
Jan
May Sep
Jan
May Sep
Jan
May Sep
Jan
May Sep
Jan
May Sep
Jan
May Sep
Jan
May Sep
Jan
May Sep
Jan
May Sep
Source: Economic Commission for Latin America and the Caribbean (ECLAC), on the basis of official information from the central banks, customs services and institutes of statistics of the respective countries.

76 Economic Commission for Latin America and the Caribbean (ECLAC)Chapter I
The information corresponding to the period January–June 2021 shows an upturn in intraregional trade across all economic sectors, with an average expansion of 34% in value terms. The strongest recoveries were in the metalworking, motor vehicle, non-metallic mineral products, textiles and clothing, and iron and steel sectors (see figure I.31).
Figure I.31 Latin America and the Caribbean: year-on-year variation in the value of intraregional goods exports, January–June 2020 and January–June 2021 (Percentages)
21.0 24.5
54.2
4.7
29.218.7
39.1
6.1
66.9
48.2
82.9
33.0
65.9
35.3 34.4
-60
-40
-20
0
20
40
60
80
100
Agric
ultu
ral
prod
ucts
Agro
-indu
stry
Text
iles,
clo
thin
g an
d fo
otw
ear
Pape
r and
car
dboa
rd
Fuel
s
Chem
ical
s
Rubb
er a
nd p
last
ic
Phar
mac
eutic
alpr
oduc
ts
Non
-met
allic
min
eral
s
Iron
and
stee
l
Met
al a
ndm
etal
pro
duct
s
Mac
hine
ryan
d eq
uipm
ent
Vehi
cles
Othe
r man
ufac
ture
s
Tota
l
First half 2020First half 2021
Source: Economic Commission for Latin America and the Caribbean (ECLAC), on the basis of official information from the central banks, customs services and institutes of statistics of the respective countries.
The MERCOSUR countries show the strongest recovery in intraregional trade, with a year-on-year growth rate of just over 40% (see table I.11). This trend was consolidated mainly by the growth of bilateral exports between Argentina and Brazil, which stood at 49% in the January–October period (INDEC, 2021). By contrast, trade growth within the Pacific Alliance was well below the regional average (11.5%).
Table I.11 Latin America and the Caribbean: year-on-year variation in intraregional exports and exports within each grouping, January–June 2020 and January–June 2021(Percentages)
Region or integration mechanism
Variation Coefficient of intraregional trade within each grouping
January–June 2020 January–June 2021 January–June 2020 January–June 2021Latin America and the Caribbean −21.5 34.4 11.9 13.0Southern Common Market (MERCOSUR)
−21.6 40.9 8.4 9.0
Andean Community −30.4 31.0 6.6 6.5Central American Common Market (CACM)
−9.2 29.5 27.8 28.7
Pacific Alliance −19.8 11.5 2.6 2.2Caribbean Community (CARICOM) −31.0 −13.4 8.9 8.4
Source: Economic Commission for Latin America and the Caribbean (ECLAC), on the basis of official information from the central banks, customs services and institutes of statistics of the respective countries.
Note: The information for CARICOM is based on official data from the Bahamas, Barbados, Belize, Guyana and Trinidad and Tobago, and on mirror statistics of those countries with the rest of the partners in the subregion.

77Chapter IInternational Trade Outlook for Latin America and the Caribbean • 2021
According to preliminary information on a group of CARICOM countries, the group saw a 13.4% drop in trade in the first half of 2021. This is partly explained by the 32% fall in fuel exports (mainly gas exports from Trinidad and Tobago to Barbados, which decreased by 35% in the first half of 2021) and the lower dependence on fuels imported by Guyana, which has begun to export crude oil, deepening the trade link with the United States. Suriname, which has experience in oil production for its own use, has also benefited from positive outcomes of exploration of new fields in its territory.
Albeit a vigorous recovery has been under way in intraregional trade, this has followed a decline over the whole of the past decade, mainly as a result of the very low economic growth the region has seen since 2014. In this context, in 2021 intraregional trade levels will still be well below their historical highs, in terms of both value and their share in the region’s total exports, which will likely reach 13% in 2021, a much lower percentage than the high of 21% reached in 1994 and again in 2008. This situation is worrying, given the importance of the regional market for manufacturing exports and, therefore, for the region’s productive and export diversification.
7. After a heavy fall in 2020, regional goods trade is expected to post a strong recovery in 2021
In the case of exports, a 25% increase in value is projected in 2021, driven by a rise of 17% in export prices and 8% in volume. The value of goods imports is set to increase by 32%, reflecting a 20% expansion in volume and 12% in prices (see figure I.32). Notably, the projected values of regional goods exports and imports in 2021 are 14% and 12%, respectively, above their 2019 levels—before the pandemic. In particular, the projected volume of imports for 2021 is 6% up on 2019, which indicates that the recovery is more than a mere statistical rebound.
Figure I.32 Latin America and the Caribbean: annual variation in goods trade, 2000–2021a
(Percentages)
A. Exports
17
8
25
-30
-20
-10
0
10
20
30
2000 2001 2002 2003 2004 2005 2006 2007 2008 2009 2010 2011 2012 2013 2014 2015 2016 2017 2018 2019 2020 2021
VolumePrice
Value

78 Economic Commission for Latin America and the Caribbean (ECLAC)Chapter I
B. Imports
-30
-20
-10
0
10
20
30
40
2000 2001 2002 2003 2004 2005 2006 2007 2008 2009 2010 2011 2012 2013 2014 2015 2016 2017 2018 2019 2020 2021
12
20
32
VolumePrice
Value
Source: Economic Commission for Latin America and the Caribbean (ECLAC), on the basis of official information from the central banks, customs services and institutes of statistics of the respective countries.
a The figures for 2021 are projections.
Among the region’s main trading partners, the largest projected increase in exports in 2021 is to China and the other Asian economies (see table I.12). In fact, in the first eight months of 2021 several countries8 registered notable increases in the value of exports to China, while the country’s National Bureau of Statistics reported that cumulative imports from the region to August 2021 were just over 33% up on the same period in 2020. Meanwhile, China’s GDP is expected to expand by 8.3% in 2021 (IMF, 2021) and, in that context, a 35% rise is projected in the value of the region’s exports to China.
8 Chile’s exports to China increased by 44% year-on-year in the period January–August 2021(SUBREI, 2021), while Argentina’s expanded by 18% (INDEC, 2021). In the case of Peru, the increase exceeded 90% (Ministry of Foreign Trade and Tourism of Peru, 2021). In the same period, exports from Mexico to China showed an increase of 45% (INEGI, 2021).
Table I.12 Latin America and the Caribbean: annual variation in the value of goods trade by main partner, 2020 and projection for 2021 (Percentages)
Exports Imports2020 2021 2020 2021
World −10 25 −16 32United States −11 19 −19 29European Union −11 23 −16 24Asia −3 34 −11 33 China 1 35 −9 33 Other Asian countries −8 31 −13 31Latin America and the Caribbean −20 33 −20 33
Source: Economic Commission for Latin America and the Caribbean (ECLAC), on the basis of official information from the central banks, customs services and institutes of statistics of the respective countries.
Another tailwind for regional exports is being provided by economic recovery in the United States, whose output is expected to expand by 7%. This momentum was already evident in the increase in imports by the United States during the first seven months of 2021, although this trend has begun to normalize since then.
At the level of individual countries and subregions, an increase in the value of exports is projected across the board, with few exceptions (see table I.13). The only countries for which declines are expected are Cuba and some Caribbean economies. In the Central American countries and in Mexico, export growth will be driven mainly by expansions of volume, unlike in the rest of the region. The main explanation for this difference is that these countries’ exports are intensive in manufactures, the branch that has been showing the greatest increase in export volumes, especially in the intraregional market.
Figure I.32 (concluded)
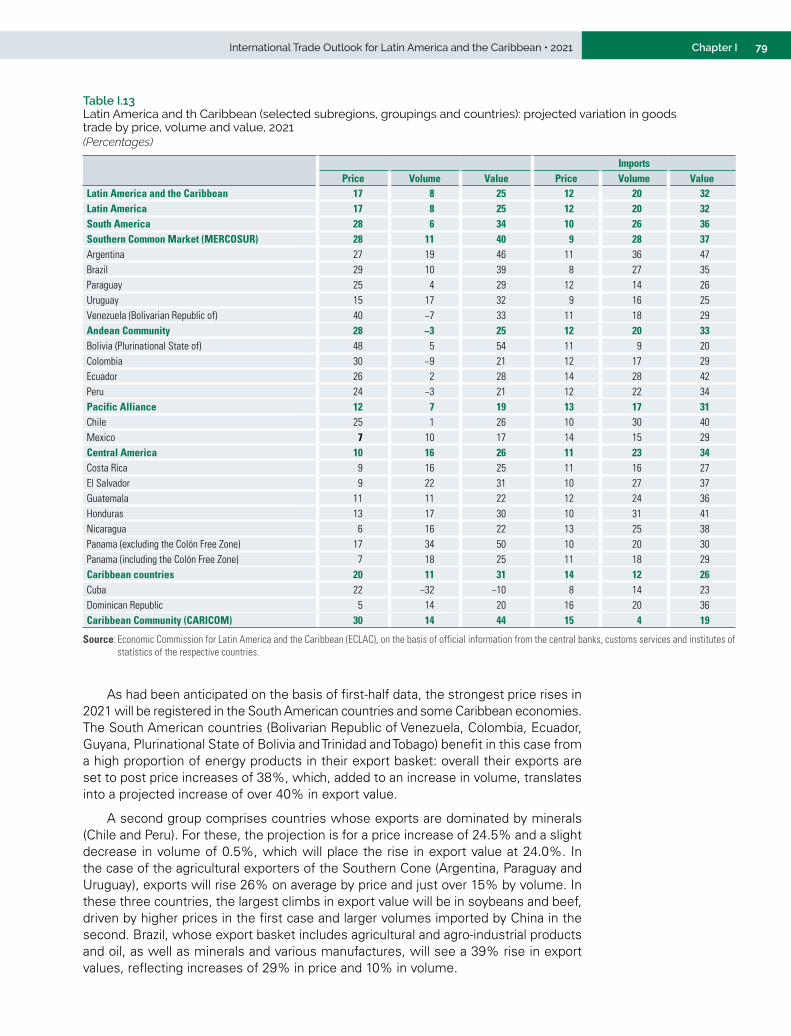
79Chapter IInternational Trade Outlook for Latin America and the Caribbean • 2021
Table I.13 Latin America and th Caribbean (selected subregions, groupings and countries): projected variation in goods trade by price, volume and value, 2021(Percentages)
ImportsPrice Volume Value Price Volume Value
Latin America and the Caribbean 17 8 25 12 20 32Latin America 17 8 25 12 20 32South America 28 6 34 10 26 36Southern Common Market (MERCOSUR) 28 11 40 9 28 37Argentina 27 19 46 11 36 47Brazil 29 10 39 8 27 35Paraguay 25 4 29 12 14 26Uruguay 15 17 32 9 16 25Venezuela (Bolivarian Republic of) 40 −7 33 11 18 29Andean Community 28 −3 25 12 20 33Bolivia (Plurinational State of) 48 5 54 11 9 20Colombia 30 −9 21 12 17 29Ecuador 26 2 28 14 28 42Peru 24 −3 21 12 22 34Pacific Alliance 12 7 19 13 17 31Chile 25 1 26 10 30 40Mexico 7 10 17 14 15 29Central America 10 16 26 11 23 34Costa Rica 9 16 25 11 16 27El Salvador 9 22 31 10 27 37Guatemala 11 11 22 12 24 36Honduras 13 17 30 10 31 41Nicaragua 6 16 22 13 25 38Panama (excluding the Colón Free Zone) 17 34 50 10 20 30Panama (including the Colón Free Zone) 7 18 25 11 18 29Caribbean countries 20 11 31 14 12 26Cuba 22 −32 −10 8 14 23Dominican Republic 5 14 20 16 20 36Caribbean Community (CARICOM) 30 14 44 15 4 19
Source: Economic Commission for Latin America and the Caribbean (ECLAC), on the basis of official information from the central banks, customs services and institutes of statistics of the respective countries.
As had been anticipated on the basis of first-half data, the strongest price rises in 2021 will be registered in the South American countries and some Caribbean economies. The South American countries (Bolivarian Republic of Venezuela, Colombia, Ecuador, Guyana, Plurinational State of Bolivia and Trinidad and Tobago) benefit in this case from a high proportion of energy products in their export basket: overall their exports are set to post price increases of 38%, which, added to an increase in volume, translates into a projected increase of over 40% in export value.
A second group comprises countries whose exports are dominated by minerals (Chile and Peru). For these, the projection is for a price increase of 24.5% and a slight decrease in volume of 0.5%, which will place the rise in export value at 24.0%. In the case of the agricultural exporters of the Southern Cone (Argentina, Paraguay and Uruguay), exports will rise 26% on average by price and just over 15% by volume. In these three countries, the largest climbs in export value will be in soybeans and beef, driven by higher prices in the first case and larger volumes imported by China in the second. Brazil, whose export basket includes agricultural and agro-industrial products and oil, as well as minerals and various manufactures, will see a 39% rise in export values, reflecting increases of 29% in price and 10% in volume.
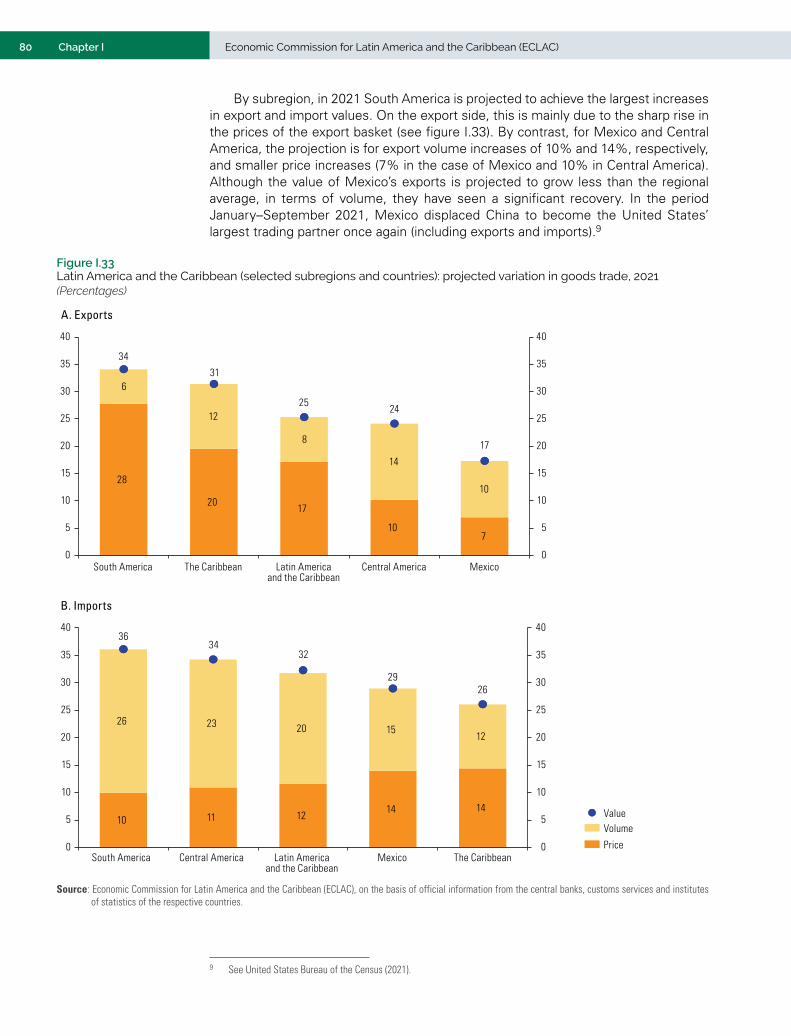
80 Economic Commission for Latin America and the Caribbean (ECLAC)Chapter I
By subregion, in 2021 South America is projected to achieve the largest increases in export and import values. On the export side, this is mainly due to the sharp rise in the prices of the export basket (see figure I.33). By contrast, for Mexico and Central America, the projection is for export volume increases of 10% and 14%, respectively, and smaller price increases (7% in the case of Mexico and 10% in Central America). Although the value of Mexico’s exports is projected to grow less than the regional average, in terms of volume, they have seen a significant recovery. In the period January–September 2021, Mexico displaced China to become the United States’ largest trading partner once again (including exports and imports).9
9 See United States Bureau of the Census (2021).
Figure I.33 Latin America and the Caribbean (selected subregions and countries): projected variation in goods trade, 2021(Percentages)
A. Exports
28
2017
107
6
12
8
14
10
34
31
2524
17
0
5
10
15
20
25
30
35
40
0
5
10
15
20
25
30
35
40
South America The Caribbean Latin Americaand the Caribbean
Central America Mexico
Volume
Price
Value
B. Imports
Volume
Price
Value10 11 12
14 14
26 23 20 1512
3634
32
2926
0
5
10
15
20
25
30
35
40
0
5
10
15
20
25
30
35
40
South America Central America Latin Americaand the Caribbean
Mexico The Caribbean
Source: Economic Commission for Latin America and the Caribbean (ECLAC), on the basis of official information from the central banks, customs services and institutes of statistics of the respective countries.

81Chapter IInternational Trade Outlook for Latin America and the Caribbean • 2021
In Costa Rica, the metalworking sector turned in a dynamic performance, with exports increasing by 65% during the first eight months of 2021. This was followed by the electrical and electronic sector, whose exports climbed 47%, and medical and precision equipment, which showed a 42% expansion. The value of exports rose in over 90% of Costa Rica’s export sectors in the period January–August 2021 (PROCOMER, 2021).
Another noteworthy point regarding exports from Central America and the Dominican Republic is the surge in exports from the maquila and free zone regimes, with significant increases in exports of clothing, electronic chips, medical equipment and tobacco products, among others. Preliminary information on the maquila industry in the free zones of several Central American countries, the Dominican Republic and Paraguay shows export values rising on average by 40% in January–August 2021, and by more in various sectors (see figure I.34).
Figure I.34 Latin America and the Caribbean (selected countries): year-on-year variation in the exports of maquila and free zones, January–August 2021a
(Percentages)
65 58
36
109
62
10
93
58
36
74
47
0
20
40
60
80
100
120
Knitt
ed g
arm
ents
Text
iles
Text
iles
and
clot
hing
Elec
trica
l wire
har
ness
es
Auto
part
s(w
ires
and
cabl
es)
Text
iles
and
clot
hing
Jew
els
Man
ufac
ture
sof
toba
cco
and
deriv
ativ
es
Text
iles
and
clot
hing
Elec
trica
lpr
oduc
ts
Med
ical
devi
ces
Text
iles
and
elec
trica
l wire
har
ness
es
El Salvador Nicaragua Paraguay Dominican Rep. Honduras
Source: Economic Commission for Latin America and the Caribbean (ECLAC), on the basis of official information from the central banks, customs services and institutes of statistics of the respective countries.
a In the case of Nicaragua the data refer to the period January–June 2021.
From a trade standpoint, the pandemic opened a range of opportunities for the region’s free zones, which have seen rising production and exports rise and new inflows of foreign direct investment (FDI). For example, Paraguay,10 Panama,11 the Dominican Republic12 and Uruguay13 have all reported FDI announcements and inflows. All these investments include the expansion of productive capacity in the recipient countries.
All the Central American countries posted increases in export volumes. The common denominator in the subregion was the higher growth rates in manufactured exports, mainly metal products, machinery and equipment and textiles, with jumps of over 40%. Panama
10 In the case of Paraguay, new investments of US$ 800 million and US$ 3.2 billion were announced for the production of biodiesel and for a pulp processing plant, respectively (IP, 2021a and 2021b).
11 Panama approved the establishment of five new free zones, which are expected to bring investment of US$ 21 million. This is expected to generate over 3,000 jobs directly, while two rum producers from Panama’s duty-free zone expanded their production line in a 15,000 m2 site in Panapark Free Zone.
12 The Government of the Dominican Republic launched a new free zone programme, which led to the establishment of 45 new firms and the direct creation of 6,000 new jobs up to early October 2021.
13 Google acquired a 30-hectare plot in the duty-free Parque de las Ciencias science park in Uruguay, with the aim of expanding its data business in Latin America.

82 Economic Commission for Latin America and the Caribbean (ECLAC)Chapter I
stands out, with export value expected to climb by 50% in 2021, boosted by the expansion of exports of copper ore and concentrates, which were up by 66% in the first half-year. Panama also began exporting new manufactures such as Portland cement and paints.
On the import side, after the heavy blow in 2020 amid the pandemic, projections in 2021 are for an expansion of 20% in volume and 12% in price, driven mainly by increases in fuels and food. By region of origin, the largest increases will occur in imports from China and from within the region itself.
The rise in import values has been widespread across the subregions and countries, mainly owing to the recovery of consumption and the need for capital goods and production inputs. Products showing higher-than-average growth rates include electronic equipment, trucks and cargo vehicles, communications equipment, and mining machinery, among others, which posted rises in imported value of between 80% and 100% in some countries of the region, especially in South America.
In the case of Mexico, the expansion was already evident in the first four months of the year, when there was a rise in imports, mainly of intermediate and capital goods, as well as consumer goods. A similar pattern was seen in the case of the Central American economies, although much more focused on subregion’s textile sector and Costa Rica’s manufacturing sector. Rising import values in Central America and the Caribbean are also explained by the increase in the energy bill and in consumer goods, mainly agro-industrial products. Common to the expansion of import volumes throughout the region has been the increase in imports of electrical and electronic equipment, medical devices and pharmaceutical products (mainly vaccines).
Among the Caribbean economies, Guyana and Trinidad and Tobago are projected to record the largest export expansions in 2021 (see table I.14). The Ministry of Finance of Guyana projects growth of 19.5%. Guyana’s GDP grew by 14.5% already in the first half-year, despite the restrictions imposed by the pandemic and the floods in May and June (Ministry of Finance of Guyana, 2021a and 2021b). Although agriculture saw a drop in volumes and its exports decreased, the oil sector continued to expand.
Table I.14 The Caribbean (selected groupings and countries): projected variation in goods trade, by price, volume and value, 2021(Percentages)
Exports Imports
Price Volume Value Price Volume ValueThe Caribbean 20 11 31 14 12 26Cuba 22 −32 −10 8 14 23Dominican Republic 5 14 20 16 20 36Caribbean Community (CARICOM) 30 14 44 15 4 19Bahamas 15 −8 8 17 0 17Barbados 18 −29 −11 13 −21 −8Belize 15 8 23 9 13 21Guyana 29 67 97 11 23 34Haiti 2 15 17 12 15 27Jamaica 28 21 49 20 −4 16Suriname 12 −5 6 12 −7 5Trinidad and Tobago 44 5 49 19 6 24Organisation of Eastern Caribbean States (OECS) 5 −4 1 12 2 13Antigua y Barbuda 9 −20 −12 4 17 21Dominica 5 32 37 38 −16 21Granada 5 10 15 6 2 8Saint Kitts and Nevis 8 5 13 14 −24 −10Saint Lucia 4 9 12 12 2 15Saint Vincent and the Grenadines 1 −36 −34 11 8 19
Source: Economic Commission for Latin America and the Caribbean (ECLAC), on the basis of official information from the central banks, customs services and institutes of statistics of the respective countries.
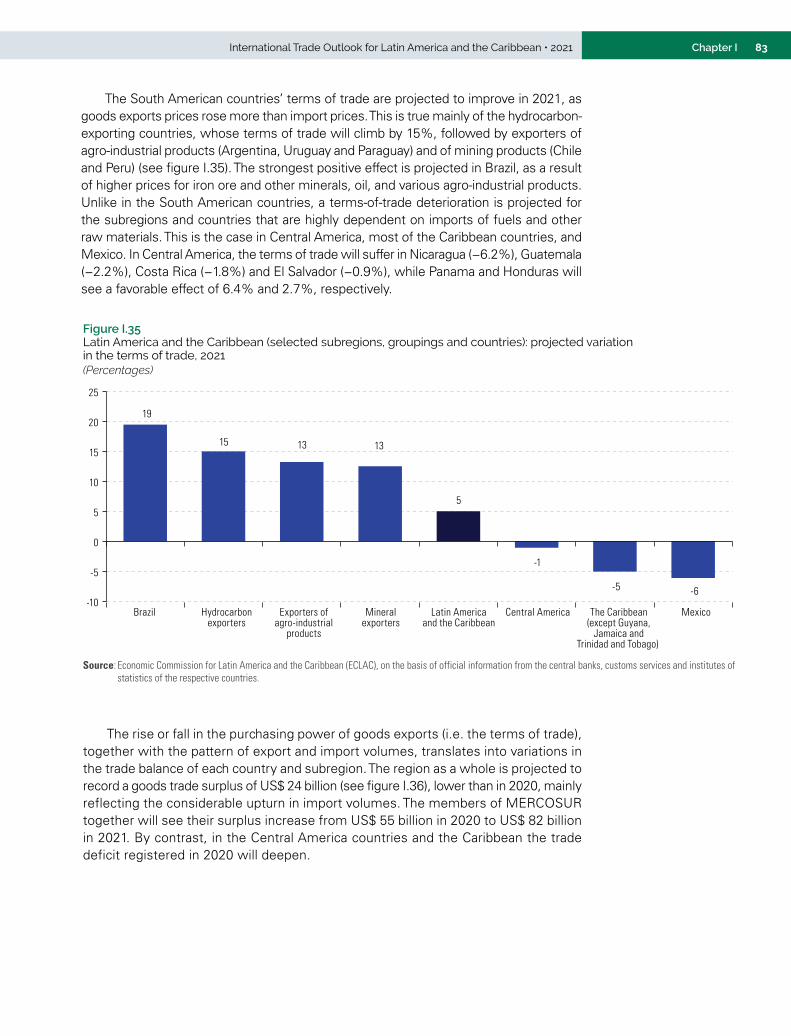
83Chapter IInternational Trade Outlook for Latin America and the Caribbean • 2021
The South American countries’ terms of trade are projected to improve in 2021, as goods exports prices rose more than import prices. This is true mainly of the hydrocarbon-exporting countries, whose terms of trade will climb by 15%, followed by exporters of agro-industrial products (Argentina, Uruguay and Paraguay) and of mining products (Chile and Peru) (see figure I.35). The strongest positive effect is projected in Brazil, as a result of higher prices for iron ore and other minerals, oil, and various agro-industrial products. Unlike in the South American countries, a terms-of-trade deterioration is projected for the subregions and countries that are highly dependent on imports of fuels and other raw materials. This is the case in Central America, most of the Caribbean countries, and Mexico. In Central America, the terms of trade will suffer in Nicaragua (−6.2%), Guatemala (−2.2%), Costa Rica (−1.8%) and El Salvador (−0.9%), while Panama and Honduras will see a favorable effect of 6.4% and 2.7%, respectively.
Figure I.35 Latin America and the Caribbean (selected subregions, groupings and countries): projected variation in the terms of trade, 2021(Percentages)
19
15 13 13
5
-1
-5 -6-10
-5
0
5
10
15
20
25
Brazil Hydrocarbonexporters
Exporters ofagro-industrial
products
Mineralexporters
Latin Americaand the Caribbean
Central America The Caribbean(except Guyana,
Jamaica andTrinidad and Tobago)
Mexico
Source: Economic Commission for Latin America and the Caribbean (ECLAC), on the basis of official information from the central banks, customs services and institutes of statistics of the respective countries.
The rise or fall in the purchasing power of goods exports (i.e. the terms of trade), together with the pattern of export and import volumes, translates into variations in the trade balance of each country and subregion. The region as a whole is projected to record a goods trade surplus of US$ 24 billion (see figure I.36), lower than in 2020, mainly reflecting the considerable upturn in import volumes. The members of MERCOSUR together will see their surplus increase from US$ 55 billion in 2020 to US$ 82 billion in 2021. By contrast, in the Central America countries and the Caribbean the trade deficit registered in 2020 will deepen.

84 Economic Commission for Latin America and the Caribbean (ECLAC)Chapter I
Figure I.36 Latin America and the Caribbean (selected subregions, groupings and countries): goods trade balance, 2020 and projections for 2021(Billions of dollars)
-23 -23
34
3
18
6455
-34-28
-6 -5
1524
82
-60
-40
-20
0
20
40
60
80
100
Central AmericanCommon Market
The Caribbean Mexico AndeanCommunity
Chile Latin America andthe Caribbean
Southern Common Market
(MERCOSUR)
20202021
Source: Economic Commission for Latin America and the Caribbean (ECLAC), on the basis of official information from the central banks, customs services and institutes of statistics of the respective countries.
F. Concluding remarks
As has been shown in the preceding sections, world trade will see a significant recovery in 2021. However, this assertion must be qualified, for at least three reasons. First, thus far a clear recovery is occurring only in goods trade, as trade in services continues to be affected by the various mobility restrictions on international tourism, as a result of the pandemic. Second, the strong growth in global goods trade flows during the first half of 2021 has tended to slow in the second half of the year, which shows that the recovery largely reflects the statistical effect of the low basis for comparison in the first half of 2020. Third, major risk factors remain that could skew the course of global trade in the coming months. These include the continual fresh outbreaks of COVID-19, the uneven distribution of global vaccination coverage, various pandemic-driven disruptions in global supply chains, the problems facing the real estate sector in China and the difficulty in maintaining fiscal stimuli if the effects of the pandemic persist beyond 2021.
The upturn in regional trade shows many similarities with the global trade situation described earlier, and its short-term prospects face similar risks. However, there are also specific factors shaping the pattern of the region’s trade, arising from its model of export specialization. The recovery in goods exports in 2021 will be driven more by exogenous factors (higher prices for raw materials) than by the ability to expand the volume exported. In fact, projections indicate that export volumes will increase less in 2021 than import volumes. As for services trade, the region is far more dependent on tourism than the world average, so the uncertainty regarding the reopening of the tourist sector darkens the outlook for several economies, especially in the Caribbean. In sum, the recovery in regional exports is based on their traditional sources of static comparative advantage (in particular, the abundance of raw materials) rather than on diversification towards new products and services with a higher knowledge content and a smaller environmental footprint.

85Chapter IInternational Trade Outlook for Latin America and the Caribbean • 2021
The information presented in this chapter testifies to a significant loss of business fabric in the region since the outbreak of the pandemic, which particularly affected MSME exporters, which depend crucially on the regional market. This is consistent with the downtrend in intraregional trade over the past decade, which steepened as a result of the pandemic. Amid this worrying state of affairs, it is all the more urgent to deepen regional economic integration, especially in a global context in which the main economic powers are seeking to advance their own processes of regionalization in trade and production. It is essential to move towards an integrated regional market through the progressive convergence of the different subregional groupings, not only to generate efficient production scales and promote production and export diversification, but also to achieve greater autonomy in strategic sectors. This latter objective has become particularly important in the context of the disruptions to global supply chains caused by the pandemic. One of the worst affected sectors has been the health-care industry, whose regional situation is discussed in the next chapter.
Bibliography
Bown, C. P. (2021), “Why Biden will try to enforce Trump’s phase one trade deal with China,” 5 October [online] https://www.piie.com/blogs/trade-and-investment-policy-watch/why-biden-will-try-enforce-trumps-phase-one-trade-deal-china.
Central Bank of Bahamas (2021), Quarterly Economic Review: June 2021, vol. 30, No. 2 [online] https://www.centralbankbahamas.com/viewPDF/documents/2021-09-22-14-07-53-Quarterly-Economic-Review-June-2021.pdf.
CIEN (Centro de Investigación de Economía y Negocios Globales) (2021a), “Reporte de empresas exportadoras: diciembre 2020” [online] https://www.cien.adexperu.org.pe/wp-content/uploads/2021/02/CIEN_REM_Diciembre_2020.pdf.(2021b), “Reporte de empresas exportadoras: julio 2021” [online] https://www.cien.adexperu.org.pe/wp-content/uploads/2021/09/CIEN_REM_Julio_2021.pdf.
Clarksons (2021a), Seaborne Trade Monitor, vol. 8, No. 1. (2021b), Dry Bulk Trade Outlook, vol. 27, No. 3.(2021c), Container Intelligence Monthly, vol. 23, No. 3.
CTS (Container Trades Statistics) (2021), [online] https://www.containerstatistics.com/.DANE (National Administrative Department of Statistics) (2021), “Exportaciones (EXPO):
agosto 2021”, Boletín Técnico, Bogotá, 1 October.Drewry (2021a), “World Container Index” [online] https://www.drewry.co.uk/supply-chain-advisors/
supply-chain-expertise/world-container-index-assessed-by-drewry.(2021b), “Drewry Maritime Financial Insight”, July.
EBANX (2020), Beyond Borders 2020/2021. A Study on the State of Cross-border e-Commerce in Latin America: Focus on Brazil, Chile, Colombia and Mexico [online] https://imgcdn.larepublica.co/cms/2020/12/16091007/EBANX-Beyond-Borders-2020.pdf.
ECLAC (Economic Commission for Latin America and the Caribbean) (2021a), “The recovery paradox in Latin America and the Caribbean. Growth amid persisting structural problems: inequality, poverty and low investment and productivity”, COVID-19 Special Report, No. 11, Santiago, July.(2021b), Foreign Direct Investment in Latin America and the Caribbean, 2021 (LC/PUB.2021/8-P), Santiago.(2021c), International Trade Outlook for Latin America and the Caribbean, 2020 (LC/PUB.2020/21-P), Santiago.(2020), “Evaluación de los efectos e impactos de la pandemia de COVID-19 sobre el turismo en América Latina y el Caribe: aplicación de la metodología para la evaluación de desastres (DaLA)”, Project Documents (LC/TS.2020/162), Santiago.(2019), International Trade Outlook for Latin America and the Caribbean, 2019 (LC/PUB.2019/20-P), Santiago.

86 Economic Commission for Latin America and the Caribbean (ECLAC)Chapter I
ECLAC/KAS/IDB (Economic Commission for Latin America and the Caribbean/Konrad-Adenauer-Stiftung/Inter-American Development Bank) (2021), Recuperación económica tras la pandemia COVID-19: empoderar a América Latina y el Caribe para un mejor aprovechamiento del comercio electrónico y digital, Panama City.
Economic and Commercial Office of the Embassy of Spain in Havana (2021), Informe económico y comercial: Cuba, April [online] https://www.icex.es/icex/es/navegacion-principal/todos-nuestros-servicios/informacion-de-mercados/paises/navegacion-principal/el-mercado/estudios-informes/inf-economico-comercial-cuba-doc2019815156.html?idPais=CU.
EIA (Energy Information Administration) (2021a), “Monthly crude oil and natural gas production”, 29 October [online] https://www.eia.gov/petroleum/production/.(2021b), “Short-Term Energy Outlook”, November [online] https://www.eia.gov/outlooks/steo/pdf/steo_full.pdf.
European Parliament (2021), Post Covid-19 value chains: options for reshoring production back to Europe in a globalised economy, March [online] https://www.europarl.europa.eu/RegData/etudes/STUD/2021/653626/EXPO_STU(2021)653626_EN.pdf.
FAO (Food and Agriculture Organization of the United Nations) (2021), “Nota informativa de la FAO sobre la oferta y la demanda de cereales”, 4 November [online] https://www.fao.org/worldfoodsituation/csdb/es/.
Gutiérrez, H. (2021), “La burbuja turística de República Dominicana”, El País, 27 June [online] https://elpais.com/economia/2021-06-28/la-burbuja-turistica-de-republica-dominicana.html.
Herreros, S. (2021), “La Zona de Libre Comercio Continental Africana: ¿un modelo para América Latina y el Caribe?”, International Trade series, No. 164 (LC/TS.2021/97), Santiago, Economic Commission for Latin America and the Caribbean (ECLAC).
IMF (International Monetary Fund) (2021), World Economic Outlook Update, July 2021: Fault Lines Widen in the Global Recovery, Washington, D.C., 27 July.
INDEC (National Institute of Statistics and Censuses) (2021), “Intercambio comercial argentino: cifras estimadas a octubre de 2021”, Comercio Exterior, vol. 5, No. 19 [online] https://www.indec.gob.ar/uploads/informesdeprensa/ica_11_2134E2C3A5C5.pdf.
INEGI (National Institute of Statistics and Geography) (2021), “Información oportuna sobre la balanza comercial de mercancías de México durante julio de 2021”, Comunicado de Prensa, No. 502/21 [online] https://www.inegi.org.mx/contenidos/saladeprensa/boletines/2021/balcom_o/balcom_o2021_08.pdf.
IP (Paraguayan Information Agency) (2021a), “Ejecutivo aprobó concesión de Zona Franca con millonaria inversión en Concepción”, 5 June [online] https://www.ip.gov.py/ip/ejecutivo-aprobo-concesion-de-zona-franca-con-millonaria-inversion-en-concepcion/.(2021b), “Paraguay proveerá biocombustible a multinacionales Shell y British Petroleum”, 27 January [online] https://www.ip.gov.py/ip/paraguay-proveera-biocombustible-a-las-multinacionales-shell-y-british-petroleum/.
Lee, K. (2021), “The chips are down: why there’s a semiconductor shortage”, Tech Xplore, 1 August [online] https://techxplore.com/news/2021-08-chips-semiconductor-shortage.html.
Loop News (2021), “Guyana records significant economic growth during first half of 2021”, 6 October [online] https://caribbean.loopnews.com/content/guyana-records-significant-economic-growth-during-first-half-2021.
López, J. C. (2021), “La crisis de los semiconductores es la consecuencia de una tormenta perfecta: por qué no es tan fácil resolverla simplemente fabricando más chips”, Xataca, 22 October [online] https://www.xataka.com/componentes/crisis-semiconductores-consecuencia-tormenta-perfecta-que-no-facil-resolverla-simplemente-fabricando-chips.
Mattoo, A., N. Rocha and M. Ruta (2021), “Why deep trade agreements may shape post-COVID-19 trade”, The Economics of Deep Trade Agreements, A. Fernandes, N. Rocha and M. Ruta (eds.), London, Centre for Economic Policy Research (CEPR) Press.
Mcloughlin, M. (2021), “La gran crisis de los semiconductores: qué se esconde tras la escasez mundial de chips”, El Confidencial, 17 February [online] https://www.elconfidencial.com/tecnologia/2021-02-13/semiconductores-crisis-provedoores-industria_2942859/.

87Chapter IInternational Trade Outlook for Latin America and the Caribbean • 2021
Ministry of Agriculture, Livestock and Fisheries of Argentina (2021), “Informe diario del Mercado de Granos” 25 November [online] https://www.magyp.gob.ar/sitio/areas/ss_mercados_agropecuarios/areas/granos/_archivos/000061_Informes/000003_Informe%20Diario%20del%20Mercado%20de%20Granos/000001_Informe%20Diario%20del%20Mercado%20de%20Granos-%20Actual.pdf.
Ministry of Finance of Guyana (2021a), Mid-Year Report 2021, 27 August [online] https://finance.gov.gy/wp-content/uploads/2021/10/Mid-Year%20Report%202021.pdf.(2021b), Guyana’s economy grew by 14.5 percent in first half of 2021, non-oil economy by 4.8 percent, despite COVID-19 and May/June floods” [online] https://finance.gov.gy/guyanas-economy-grew-by-14-5-percent-in-first-half-of-2021-non-oil-economy-by-4-8-percent-despite-covid-19-and-may-june-floods/.
Ministry of Foreign Affairs and Tourism of Perú (2021), “Reporte Mensual de Comercio Exterior – RMC”, September [online] https://www.gob.pe/institucion/mincetur/colecciones/543-reporte-mensual-de-comercio-exterior-rmc.
Ministry of Production, Foreign Trade, Investment and Fisheries of Ecuador (2020), COVID-19 en el Ecuador: Impacto Económico y Perspectivas [online] https://www.produccion.gob.ec/wp-content/uploads/2020/05/Boletin-Impacto-Covid-19.pdf.
Mulder, N. (coord.) (2020), “The impact of the COVID-19 pandemic on the tourism sector in Latin America and the Caribbean, and options for a sustainable and resilient recovery”, International Trade series, No. 157 (LC/TS.2020/147), Santiago, Economic Commission for Latin America and the Caribbean (ECLAC).
MundoMarítimo (2021), “¿Cómo opera la identificación de los propietarios de los contenedores a través de sus códigos?”, 26 June [online] https://www.mundomaritimo.cl/noticias/como-opera-la-identificacion-de-los-propietarios-de-los-contenedores-a-traves-de-sus-codigos.
Office of the United States Trade Representative (2021a), 2021 Trade Policy Agenda and 2020 Annual Report of the President of the United States on the Trade Agreements Program, Washington, D.C.(2021b), “Remarks as prepared for delivery of Ambassador Katherine Tai outlining the Biden-Harris Administration’s ‘new approach to the U.S.-China trade relationship’”, 4 October [online] https://ustr.gov/about-us/policy-offices/press-office/press-releases/2021/october/remarks-prepared-delivery-ambassador-katherine-tai-outlining-biden-harris-administrations-new.
ONEI (National Office of Statistics and Information of Cuba) (2021), Producto interno bruto trimestral: primer y segundo trimestres 2021, Havana, October [online] http://www.onei.gob.cu/sites/default/files/publicacion_i_y_ii_de_2021_0.pdf.
Petroguía (2021), “PDVSA acumula más de $ 2.000 millones adicionales en nueve meses de 2021 con respecto a 2020”, 22 October [online] http://www.petroguia.com/pet/noticias/petr%C3%B3leo/pdvsa-acumula-m%C3%A1s-de-2000-millones-adicionales-en-nueve-meses-de-2021-con-respecto.
PROCOMER (Costa Rican Foreign Trade Promoter) (2021), “Exportaciones de bienes de Costa Rica muestran crecimiento sostenido al incrementar un 27%”, 21 September [online] https://www.procomer.com/noticia/comprador-internacional-noticia/exportaciones-de-bienes-de-costa-rica-muestran-crecimiento-sostenido-al-incrementar-un-27/.
Schott, J. (2021), “Can Mexico help bring supply chains back to North America?”, Peterson Institute for International Economics, 21 September [online] https://www.piie.com/blogs/trade-and-investment-policy-watch/can-mexico-help-bring-supply-chains-back-north-america.
Statista (2021), “Digital Market Outlook” [online] https://www.statista.com/outlook/digital-markets. Subramanian, S. (2021), “Why are steel prices so high when iron ore prices have crashed?
Because: China”, 16 September [online] https://qz.com/2060156/chinas-cuts-have-made-steel-prices-soar-and-iron-ore-prices-crash/.
SUBREI (Undersecretariat for International Economic Relations of Chile) (2021), Informe Mensual: Comercio Exterior de Chile, August [online] https://www.subrei.gob.cl/estudios-y-documentos/minuta-mensual/detalle-minuta/2021/informe-mensual-de-comercio-exterior---agosto-de-2021.
The Economist Intelligence Unit (2021), Country Report: Cuba, London [online] http://country.eiu.com/FileHandler.ashx?issue_id=691381052&mode=pdf [accessed on 25 October 2021].

88 Economic Commission for Latin America and the Caribbean (ECLAC)Chapter I
UNCTAD (United Nations Conference on Trade and Development) (2021a), The UNCTAD B2C e-commerce index 2020: Spotlight on Latin America and the Caribbean, UNCTAD Technical Notes on ICT for Development, No. 17 [online] https://unctad.org/system/files/official-document/tn_unctad_ict4d17_en.pdf.(2021b), World Investment Report 2021: Investing in Sustainable Recovery, Geneva.
United States Bureau of the Census (2021), “Top trading partners - September 2021” [online] https://www.census.gov/foreign-trade/statistics/highlights/toppartners.html.
UNWTO (World Tourism Organization) (2021), “Vaccines and reopen borders driving tourism’s recovery”, 4 October [online] https://www.unwto.org/news/vaccines-and-reopen-borders-driving-tourism-s-recovery.(2020), “Tourism back to 1990 levels as arrivals fall by more than 70%”, News Release, Madrid, 17 December [online] https://webunwto.s3.eu-west-1.amazonaws.com/s3fs-public/2020-12/201217-barometer-en.pdf.
Valenzuela, M. E. and G. Reinecke (2021), “Panorama Laboral en tiempos de la COVID-19: impacto de la COVID-19 en cadenas mundiales de suministro en América Latina: Argentina, Brasil, Chile, Paraguay y Uruguay”, Nota Técnica, International Labour Organization (ILO), February [online] https://www.ilo.org/wcmsp5/groups/public/---americas/---ro-lima/documents/publication/wcms_771742.pdf.
World Bank (2021), Commodity Markets Outlook: Urbanization and Commodity Demand, Washington, D.C., October.
WTO (World Trade Organization) (2021a), “IMF, World Bank, WHO, WTO launch joint vaccine information website”, 30 July [online] https://www.wto.org/english/news_e/news21_e/igo_28jul21_e.htm. (2021b), “Global trade rebound beats expectations but marked by regional divergences”, Press Release, No. 889, 4 October [online] https://www.wto.org/english/news_e/pres21_e/pr889_e.htm. (2021c), “Global services trade recovering but below pre-pandemic levels, WTO barometer indicates”, 23 September [online] https://www.wto.org/english/news_e/news21_e/wtoi_23sep21_e.htm.(2020), “Trade set to plunge as COVID-19 pandemic upends global economy”, Press Release, No. 855, 8 April [online] https://www.wto.org/english/news_e/pres20_e/pr855_e.htm.
WTTC (World Travel and Tourism Council) (2021), “Travel and Tourism: Economic Impact 2021” [online] https://wttc.org/Portals/0/Documents/EIR/EIR2021%20Global%20Infographic.pdf?ver=2021-04-06-170951-897.

89Chapter IInternational Trade Outlook for Latin America and the Caribbean • 2021
Annex I.A1Table I.A1.1 Latin America and the Caribbean: value of goods exports and imports, 2019–2021a
(Millions of dollars)
Regions, groupings and countriesExports Imports
2019 2020 2021 2019 2020 2021Latin America and the Caribbean 1 059 370 959 023 1 206 072 1 057 796 894 778 1 181 941Latin America 1 040 179 942 304 1 183 256 1 017 629 861 832 1 142 328South America 526 862 474 350 633 799 467 026 397 987 541 413Southern Common Market (MERCOSUR) 337 628 298 200 414 342 278 598 243 220 332 128Argentina 65 156 54 945 79 946 46 928 40 315 59 379Brazil 225 800 210 707 291 829 199 253 178 337 241 622Paraguay 12 702 11 494 14 770 12 251 10 035 12 659Uruguay 11 743 9 885 12 999 8 663 7 837 9 825Venezuela (Bolivarian Republic of) 22 227 11 169 14 799 11 504 6 695 8 644
Andean Community 120 472 102 665 127 233 122 617 99 651 132 122Bolivia (Plurinational State of) 8 819 6 953 10 673 9 055 6 517 7 827Colombia 40 656 32 309 38 932 50 708 41 290 53 349Ecuador 22 774 20 461 25 884 21 749 17 131 24 275Peru 48 224 42 941 51 744 41 106 34 713 46 671
Pacific Alliance 618 581 565 887 668 882 613 396 514 291 669 559Chile 68 763 73 485 92 224 65 810 55 116 77 163Mexico 460 939 417 151 485 981 455 772 383 172 492 376
Central Americab 41 184 40 505 51 167 74 564 63 627 85 351Costa Rica 11 885 12 028 15 095 15 838 14 181 18 011El Salvador 4 748 4 158 5 426 10 458 9 363 12 805Guatemala 9 919 10 514 12 775 17 885 16 441 22 375Honduras 8 788 7 683 9 950 12 149 10 241 14 479Nicaragua 4 341 4 396 5 341 5 397 5 324 7 343Panama (excluding the Colón Free Zone) 1 504 1 726 2 580 12 836 8 077 10 338Panama (including the Colón Free Zone) 13 214 10 240 12 749 22 261 14 347 18 221
The Caribbean 30 384 27 016 35 124 60 434 49 992 62 801Cuba 2 062 2 462 2 216 10 680 10 710 13 141Dominican Republic 11 193 10 297 12 308 20 268 17 047 23 187
Caribbean Community (CARICOM) 17 130 14 257 20 601 29 487 22 236 26 472Bahamas 654 400 430 2 966 2 224 2 600Barbados 444 345 307 1 502 1 422 1 305Belize 462 287 352 969 731 888Guyana 1 567 2 587 5 087 4 040 2 073 2 775Haiti 1 201 886 1 040 4 198 3 473 4 423Jamaica 1 640 1 219 1 816 5 685 4 149 4 804Suriname 2 129 2 344 2 489 1 598 1 283 1 347Trinidad and Tobago 8 764 5 965 8 858 6 034 4 966 6 175
Organisation of Eastern Caribbean States (OECS) 268 224 222 2 496 1 915 2 154Antigua and Barbuda 55 36 32 622 385 466Dominica 18 15 21 281 188 228Grenada 46 28 33 413 348 376Saint Kitts and Nevis 29 26 29 358 269 241Saint Lucia 82 64 72 526 459 525Saint Vincent and the Grenadines 38 54 36 295 267 319
Source: Economic Commission for Latin America and the Caribbean (ECLAC), on the basis of official information from the central banks, customs services and institutes of statistics of the respective countries.
a The figures for 2021 are ECLAC projections. b Does not include trade flows of the Colón Free Zone.
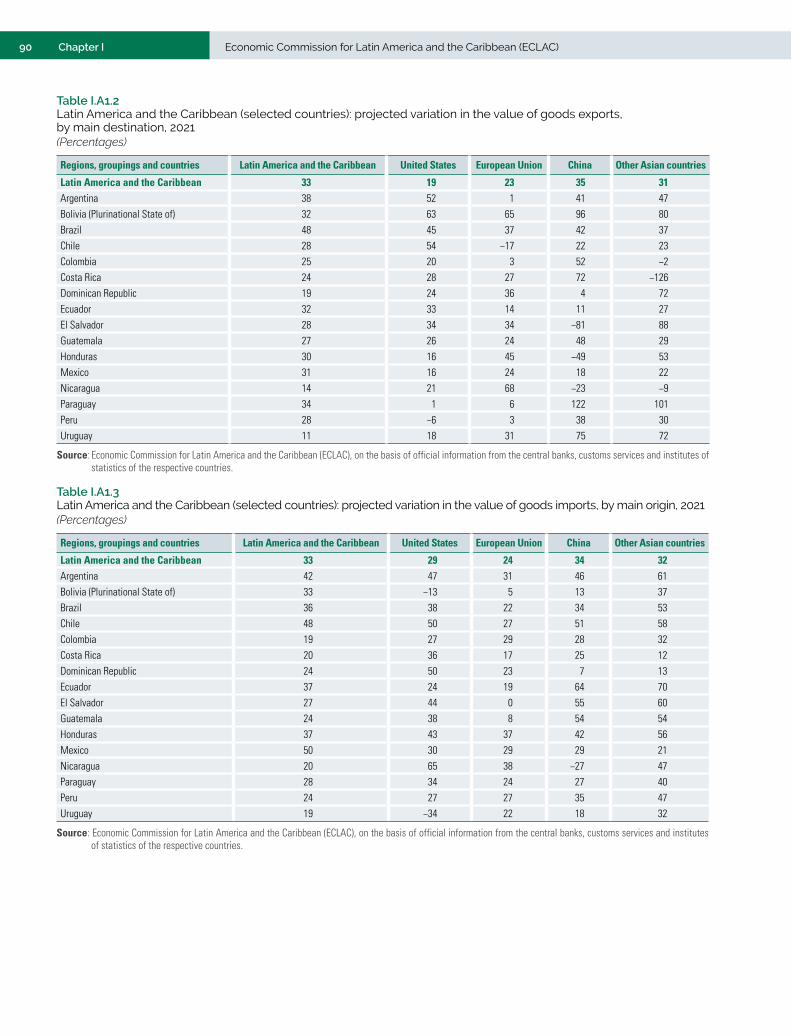
90 Economic Commission for Latin America and the Caribbean (ECLAC)Chapter I
Table I.A1.2 Latin America and the Caribbean (selected countries): projected variation in the value of goods exports, by main destination, 2021(Percentages)
Regions, groupings and countries Latin America and the Caribbean United States European Union China Other Asian countries
Latin America and the Caribbean 33 19 23 35 31Argentina 38 52 1 41 47Bolivia (Plurinational State of) 32 63 65 96 80Brazil 48 45 37 42 37Chile 28 54 −17 22 23Colombia 25 20 3 52 −2Costa Rica 24 28 27 72 −126Dominican Republic 19 24 36 4 72Ecuador 32 33 14 11 27El Salvador 28 34 34 −81 88Guatemala 27 26 24 48 29Honduras 30 16 45 −49 53Mexico 31 16 24 18 22Nicaragua 14 21 68 −23 −9Paraguay 34 1 6 122 101Peru 28 −6 3 38 30Uruguay 11 18 31 75 72
Source: Economic Commission for Latin America and the Caribbean (ECLAC), on the basis of official information from the central banks, customs services and institutes of statistics of the respective countries.
Table I.A1.3 Latin America and the Caribbean (selected countries): projected variation in the value of goods imports, by main origin, 2021(Percentages)
Regions, groupings and countries Latin America and the Caribbean United States European Union China Other Asian countries
Latin America and the Caribbean 33 29 24 34 32Argentina 42 47 31 46 61Bolivia (Plurinational State of) 33 −13 5 13 37Brazil 36 38 22 34 53Chile 48 50 27 51 58Colombia 19 27 29 28 32Costa Rica 20 36 17 25 12Dominican Republic 24 50 23 7 13Ecuador 37 24 19 64 70El Salvador 27 44 0 55 60Guatemala 24 38 8 54 54Honduras 37 43 37 42 56Mexico 50 30 29 29 21Nicaragua 20 65 38 −27 47Paraguay 28 34 24 27 40Peru 24 27 27 35 47Uruguay 19 −34 22 18 32
Source: Economic Commission for Latin America and the Caribbean (ECLAC), on the basis of official information from the central banks, customs services and institutes of statistics of the respective countries.

91Chapter IIInternational Trade Outlook for Latin America and the Caribbean • 2021
IICHAPTER
The challenge of regional productive self-sufficiency in the health-care industry
Introduction
A. Brief characterization of the health-care industry
B. The global trade of the health-care industry has been highly dynamic
C. The region runs a large trade deficit in pharmaceutical products
D. The region’s pharmaceutical industry is poorly integrated
E. The region’s trade in medical devices: some dynamic export hubs
F. The region’s production and technological capabilities in the medical devices sector
G. The challenge of integrating trade and production in the health-care industry
Bibliography
Annex II.A1
Annex II.A2
Annex II.A3


93Chapter IIInternational Trade Outlook for Latin America and the Caribbean • 2021 IIIntroduction
Throughout the world, the coronavirus disease (COVID-19) pandemic has highlighted the strategic character of the health-care industry, not only because of its direct relationship with public health, but because it is a highly innovative sector with major technological externalities. The pandemic has also revealed the extent of the region’s vulnerability in this sector, where it is highly dependent on imports from the rest of the world. Against this backdrop, the present chapter analyses the current situation of trade in health-related products in the world and the region and the prospects for moving towards greater regional productive self-sufficiency through increased coordination and integration in the areas of trade, production and health.
Following this introduction, section A characterizes the health-care industry in terms of the universe of products it comprises, its economic significance and its main actors. Section B then briefly examines global trade in the health-care industry. Section C analyses the region’s trade pattern in the pharmaceutical industry, while section D discusses its patterns of productive integration in that industry. Section E analyses the region’s trade pattern in the medical devices segment, and section F reviews current productive and technological capacities in that segment and presents some criteria for identifying products with export potential. Lastly, section G offers some policy recommendations that highlight the crucial role of the regional market.
A. Brief characterization of the health-care industry
For the purposes of the analysis presented below, the health-care industry is understood as encompassing production activities that apply biology and technology to improve health, such as biopharmaceuticals, medical technology, genomics, diagnostics and digital health (ECLAC, 2021). In this context, it is possible to identify two major segments: the pharmaceutical industry on the one hand, and the manufactures employed by that industry plus medical devices on the other. The first segment includes raw materials used to manufacture medicines plus the medicines themselves, while the second group includes equipment used to carry out research and development and to manufacture medicines plus medical devices used in medical centres (see diagram II.1).1
The health-care industry encompasses a very wide range of products which differ in a number of dimensions, such as their purpose, the risk involved in their ingestion or use, and their level of technological sophistication. However, products also have important commonalities, in particular: (i) they are applied or used in medical care, whether preventive or curative; (ii) they are produced and distributed on an industrial scale; (iii) their production entails the application of systematized research, development and innovation procedures relating to processes and products; and (iv) they are subject to strict regulatory standards, given their direct impact on human life and health (Álvarez and Herrera, 2021). Probably the most distinctive feature of the universe of products that make up the health-care industry is the crucial role played by research, development and innovation as a factor of competitiveness, especially in the pharmaceutical sector.
The analysis that will now be presented centres specifically on the pharmaceutical industry. This is because medical device and machinery production is destined not only for the health-care industry but for other economic sectors as well, such as the chemicals, petrochemicals, metallurgical and electronics sectors.
1 Annex II.A1 lists the products in each category covered by the analysis in this chapter. Digital health-related service activities such as telemedicine and mobile health applications are not included.
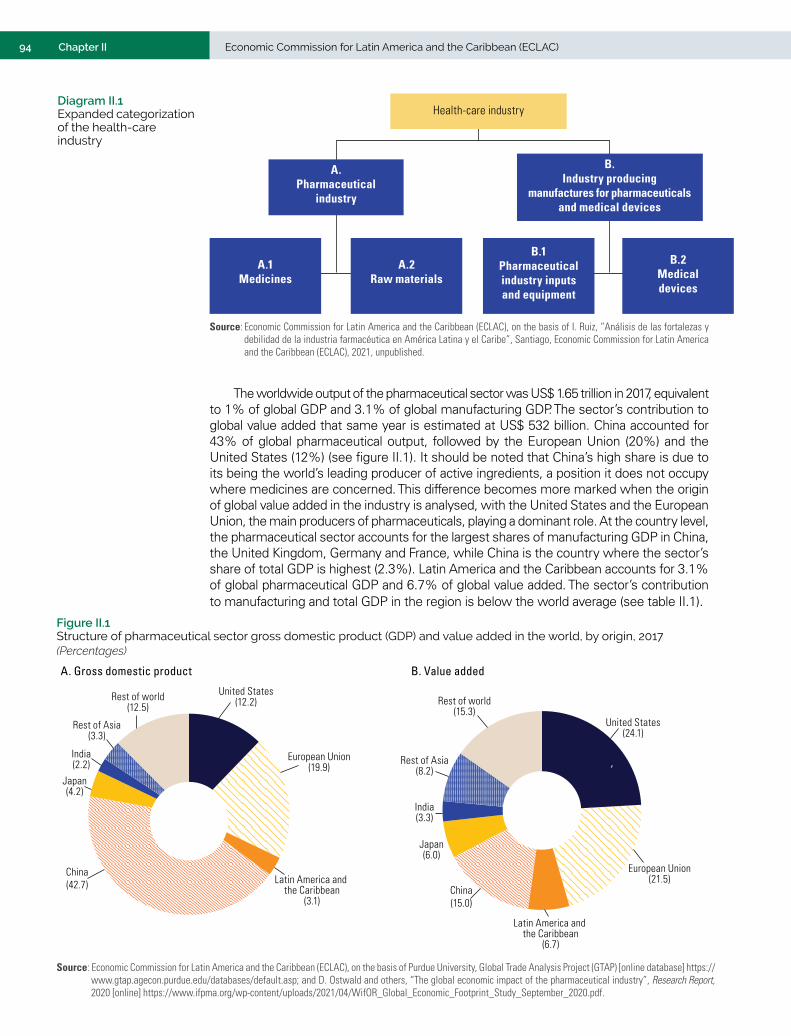
94 Economic Commission for Latin America and the Caribbean (ECLAC)Chapter II
Diagram II.1 Expanded categorization of the health-care industry
B. Industry producing
manufactures for pharmaceuticals and medical devices
Health-care industry
A. Pharmaceutical
industry
A.1Medicines
A.2Raw materials
B.1Pharmaceutical industry inputs and equipment
B.2Medical devices
Source: Economic Commission for Latin America and the Caribbean (ECLAC), on the basis of I. Ruiz, “Análisis de las fortalezas y debilidad de la industria farmacéutica en América Latina y el Caribe”, Santiago, Economic Commission for Latin America and the Caribbean (ECLAC), 2021, unpublished.
The worldwide output of the pharmaceutical sector was US$ 1.65 trillion in 2017, equivalent to 1% of global GDP and 3.1% of global manufacturing GDP. The sector’s contribution to global value added that same year is estimated at US$ 532 billion. China accounted for 43% of global pharmaceutical output, followed by the European Union (20%) and the United States (12%) (see figure II.1). It should be noted that China’s high share is due to its being the world’s leading producer of active ingredients, a position it does not occupy where medicines are concerned. This difference becomes more marked when the origin of global value added in the industry is analysed, with the United States and the European Union, the main producers of pharmaceuticals, playing a dominant role. At the country level, the pharmaceutical sector accounts for the largest shares of manufacturing GDP in China, the United Kingdom, Germany and France, while China is the country where the sector’s share of total GDP is highest (2.3%). Latin America and the Caribbean accounts for 3.1% of global pharmaceutical GDP and 6.7% of global value added. The sector’s contribution to manufacturing and total GDP in the region is below the world average (see table II.1).
Figure II.1 Structure of pharmaceutical sector gross domestic product (GDP) and value added in the world, by origin, 2017(Percentages)
,
China(42.7)
Japan(4.2)
Rest of world(12.5)
Rest of Asia(3.3)
India(2.2)
United States(12.2)
European Union(19.9)
Latin America and the Caribbean
(3.1)
United States(24.1)
Rest of world(15.3)
Rest of Asia(8.2)
India(3.3)
Japan(6.0)
China(15.0)
Latin America and the Caribbean
(6.7)
European Union(21.5)
A. Gross domestic product B. Value added
Source: Economic Commission for Latin America and the Caribbean (ECLAC), on the basis of Purdue University, Global Trade Analysis Project (GTAP) [online database] https://www.gtap.agecon.purdue.edu/databases/default.asp; and D. Ostwald and others, “The global economic impact of the pharmaceutical industry”, Research Report, 2020 [online] https://www.ifpma.org/wp-content/uploads/2021/04/WifOR_Global_Economic_Footprint_Study_September_2020.pdf.

95Chapter IIInternational Trade Outlook for Latin America and the Caribbean • 2021
Table II.1 Latin America and the Caribbean, United States, Europe and the world: pharmaceutical sector gross domestic product (GDP) and shares of total, manufacturing, and chemical and pharmaceutical GDP, 2017(Millions of dollars and percentages)
Pharmaceutical GDP
Share of world pharmaceutical GDP
Pharmaceutical sector share of total GDP in the region or country
Pharmaceutical sector share of
manufacturing GDP in the region or country
Pharmaceutical sector share of chemical and pharmaceutical GDP in
the region or countryLatin America and the Caribbean 50 664 3.06 0.5 1.6 15.6 South America 38 823 2.35 0.6 1.9 16.2 Argentina 3 838 0.23 0.4 1.5 16.2 Bolivia (Plurinational State of) 118 0.01 0.2 0.7 18.3 Brazil 24 156 1.46 0.7 2.0 16.4 Chile 2 898 0.18 0.6 2.4 31.3 Colombia 2 391 0.14 0.5 2.0 20.1 Ecuador 1 495 0.09 0.9 3.9 … Paraguay 163 0.01 0.2 0.8 25.8 Peru 1 853 0.11 0.4 1.0 5.8 Uruguay 562 0.03 0.6 2.7 36.7 Venezuela (Bolivarian Republic of) 1 350 0.08 0.3 1.2 11.8
Central America 4 182 0.25 0.9 3.2 32.6 Costa Rica 329 0.02 0.4 1.5 20.8 Dominican Republic 421 0.03 0.4 1.3 17.8 El Salvador 327 0.02 0.8 2.2 29.3 Honduras 204 0.01 0.4 1.2 16.2 Guatemala 744 0.04 0.6 1.8 19.4 Nicaragua 59 0.00 0.2 0.6 18.8 Mexico 5 646 0.34 0.3 0.7 9.1 Panama 2 518 0.15 2.3 9.3 53.5 Other Caribbean economies 1 592 0.10 0.5 2.4 19.0
United States 201 772 12.20 0.6 2.3 23.5Europe 472 496 28.56 1.3 4.4 36.3World 1 654 250 100.00 1.0 3.1 30.5
Source: Economic Commission for Latin America and the Caribbean (ECLAC), on the basis of Purdue University, Global Trade Analysis Project (GTAP) [online database] https://www.gtap.agecon.purdue.edu/databases/default.asp.
In the last four years, the global sales of the top 20 transnational pharmaceutical companies averaged US$ 662.591 billion, with medicines accounting for more than 70% of this. The sector’s sales are highly concentrated in a few countries, all of them developed. The leaders are companies based in the United States, a country that accounted for more than 50% of the sales of the top 20 pharmaceutical companies, followed by Switzerland, Germany and the United Kingdom (see table II.2 and figure II.2A).
Table II.2 Global ranking of the top 20 pharmaceutical companies by average annual sales, 2017–2020(Millions of dollars and percentages)
Rank Country Company Research and development spending
Global sales Latin American sales
Research and development spending as a proportion of global sales
1 United States Johnson & Johnson 11 211 80 669 2 079 13.92 Switzerland Roche 11 480 59 058 2 858 19.43 Switzerland Novartis 8 961 47 525 3 360 18.94 Germany Bayer 6 351 44 745 6 287 14.25 United States Merck & Co. 10 880 44 313 2 374 24.66 United Kingdom GlaxoSmithKline 5 830 41 693 865 14.07 United States Pfizer 8 273 40 666 3 194 20.38 France Sanofi 6 549 40 482 3 083 16.29 United States Abbvie 7 069 35 010 779 20.2
10 United States Abbott 2 349 31 120 1 360 7.511 United States Bristol Myers Squibb 7 526 26 834 472 28.012 United States Gilead Sciences 4 187 23 843 0 17.613 Japan Takeda 3 756 23 730 982 15.814 United States Eli Lilly & Co. 5 494 22 806 468 24.115 United States Amgen 3 906 22 693 83 17.216 United Kingdom AstraZeneca 5 935 22 664 798 26.217 Germany Boehringer Ingelheim 3 828 21 169 853 18.118 Denmark Novo Nordisk A/S 2 241 18 081 644 12.419 United States Bausch Health 424 8 433 500 5.020 United States Celgenea … 7 060 … …
Top 20 116 248 662 591 31 037 17.5
Source: Economic Commission for Latin America and the Caribbean (ECLAC), on the basis of the companies’ annual reports and specialized press.a This company was taken over by Bristol Myers in 2019, since when its sales have been included in the latter’s balance sheets.
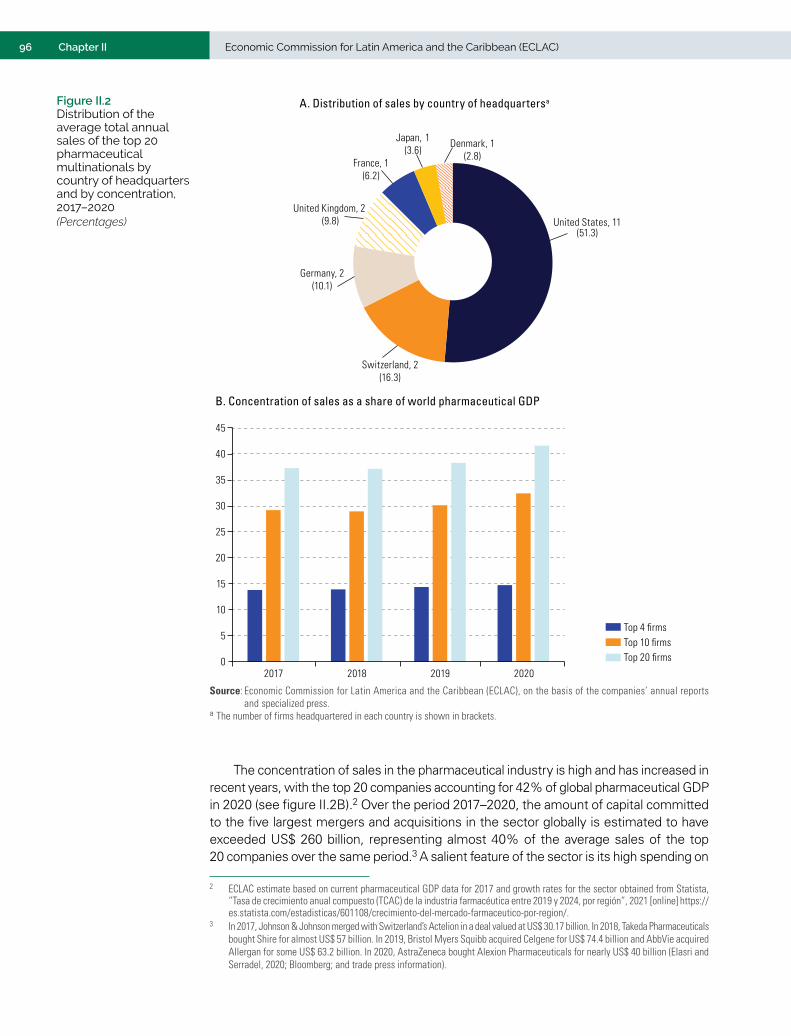
96 Economic Commission for Latin America and the Caribbean (ECLAC)Chapter II
Figure II.2 Distribution of the average total annual sales of the top 20 pharmaceutical multinationals by country of headquarters and by concentration, 2017–2020(Percentages)
A. Distribution of sales by country of headquartersa
United States, 11(51.3)
Switzerland, 2(16.3)
Germany, 2(10.1)
United Kingdom, 2 (9.8)
France, 1(6.2)
Denmark, 1(2.8)
Japan, 1(3.6)
B. Concentration of sales as a share of world pharmaceutical GDP
0
5
10
15
20
25
30
35
40
45
2017 2018 2019 2020
Top 20 firmsTop 10 firmsTop 4 firms
Source: Economic Commission for Latin America and the Caribbean (ECLAC), on the basis of the companies’ annual reports and specialized press.
a The number of firms headquartered in each country is shown in brackets.
The concentration of sales in the pharmaceutical industry is high and has increased in recent years, with the top 20 companies accounting for 42% of global pharmaceutical GDP in 2020 (see figure II.2B).2 Over the period 2017–2020, the amount of capital committed to the five largest mergers and acquisitions in the sector globally is estimated to have exceeded US$ 260 billion, representing almost 40% of the average sales of the top 20 companies over the same period.3 A salient feature of the sector is its high spending on
2 ECLAC estimate based on current pharmaceutical GDP data for 2017 and growth rates for the sector obtained from Statista, “Tasa de crecimiento anual compuesto (TCAC) de la industria farmacéutica entre 2019 y 2024, por región”, 2021 [online] https://es.statista.com/estadisticas/601108/crecimiento-del-mercado-farmaceutico-por-region/.
3 In 2017, Johnson & Johnson merged with Switzerland’s Actelion in a deal valued at US$ 30.17 billion. In 2018, Takeda Pharmaceuticals bought Shire for almost US$ 57 billion. In 2019, Bristol Myers Squibb acquired Celgene for US$ 74.4 billion and AbbVie acquired Allergan for some US$ 63.2 billion. In 2020, AstraZeneca bought Alexion Pharmaceuticals for nearly US$ 40 billion (Elasri and Serradel, 2020; Bloomberg; and trade press information).

97Chapter IIInternational Trade Outlook for Latin America and the Caribbean • 2021
research and development, averaging 17.5% of the total sales of the top 20 companies in the period mentioned (see figure II.3B). With the advent of the pandemic, merger and acquisition transactions declined and ventures aimed at the development of vaccines and medical treatments increased (Elasri and Serradel, 2020).
Figure II.3 Structure of the total sales of the world’s top 20 pharmaceutical companies by product type and research and development (R&D) spending as a proportion of sales, 2017–2020a
(Percentages)
A. Sales by product type
70 71 71 73
0
10
20
30
40
50
60
70
80
90
100
2017 2018 2019 2020Medicines
VaccinesHygiene and careOther products
5 5 5 510 10 9 9
16 14 14 13
B. R&D as a proportion of sales
R&D/medicine and vaccine sales
R&D/total sales
17 18 1719
23 2423
24
0
5
10
15
20
25
30
2017 2018 2019 2020
Source: Economic Commission for Latin America and the Caribbean (ECLAC), on the basis of the companies’ annual reports, Bloomberg and the Economist Intelligence Unit. a Annual average.
New drugs are complex to develop and can typically take between 8 and 15 years to bring to market. Many laboratories have accelerated vaccine development processes since the outbreak of the current pandemic, creating renewed challenges for the regulatory authorities that have to monitor their progress and provide authorization for vaccine use and marketing (see box II.1).

98 Economic Commission for Latin America and the Caribbean (ECLAC)Chapter II
The drug research, development, approval and registration process comprises five stages. The first three are the research and development carried out by the pharmaceutical company, and take between 8 and 15 years. The fourth stage is approval by the health authorities, which can take between 1 and 2 years. The fifth stage is pharmacovigilance, which is carried out jointly by the pharmaceutical company and the health authorities for as long as the medicine is on the market (see diagram). Each stage is carried out in successive phases, which are repeated as many times as necessary. It is a process of trial and error in which usually only 1 out of approximately every 10,000 products tested will reach the market.
Stages in the drug development process
Patent
20 years
2 to 5 years 1 to 3 years 5 to 7 years 1 to 2 years
10 000 products 250 products 5 products 1 product 1 product
Registration Vigilance
Generics
Research and development
Indefinite time
Continuous
Preclinical development
Clinical development
Approval by health
authorities
Pharmacovigilance oncethe drug has gone on sale
Discovery of theactive ingredient
Source: Economic Commission for Latin America and the Caribbean (ECLAC), on the basis of I. Ruiz, “Análisis de las fortalezas y debilidad de la industria farmacéutica en América Latina y el Caribe”, Santiago, Economic Commission for Latin America and the Caribbean (ECLAC), 2021, unpublished.
The first stage in the process is to discover the active ingredient for treating or preventing a given disease. This is
done by identifying the point of the disease to be targeted and looking for products that are likely to be active at that
level. Candidate products are selected and then discarded or improved in successive design phases. In the second stage
(preclinical development), some 250 products are tested on cell cultures, tissues and experimental animals to determine
their efficacy, short- and long-term side effects, standard doses, behaviour in the body, etc.
The clinical development stage begins with phase I, in which products are tested on a small group of healthy volunteers
(typically from 15 to 30) to study possible adverse effects and product behaviour in humans. The products with the best
tolerability move to phase II, in which groups of 80 to 100 patients are treated with the experimental drugs to test their
effectiveness against the disease to be treated. In phase III, hundreds or thousands of patients participate in different
centres around the world, always subject to informed consent and strict medical controls, in order to definitively establish
the efficacy and safety of the candidate drugs.
In the next stage, pharmaceutical companies must submit all product development documentation to the national
regulatory authorities of the country or region concerned for approval and registration. At the same time, a patent application
is filed to obtain the exclusive right to produce and market the product. If the patent is granted, it will protect the exclusivity
of the product for up to 20 years. Once this protection expires, other laboratories may produce the medicine in generic
versions or as a bioequivalent, using the same active ingredient. In both cases, the medicine must be registered before it
can be marketed, for which it is necessary to demonstrate to the national regulatory authority that it has the same properties
as the original. Once registration is authorized, the drug can be marketed for an indefinite period. The market prices of
bioequivalents are normally lower than those of the original medicines, since the released patents disclose the procedures
necessary to manufacture them and the laboratories producing them do not have to carry out R&D.
The pharmacovigilance phase (phase IV) consists of close monitoring of medicines in the market by national regulatory
authorities and pharmaceutical companies, mainly to detect possible adverse effects and, in some cases, therapeutic
applications other than the original one (repurposing). This phase is permanent and applies to both patent-protected and
generic medicines.
Box II.1 The drug development and approval process and the regulatory challenges that arose with the COVID-19 outbreak

99Chapter IIInternational Trade Outlook for Latin America and the Caribbean • 2021
The COVID-19 pandemic made it necessary to accelerate the approval process for drugs designed to treat this new virus. One of the measures taken was to provide authorization for a number of products which met basic safety requirements, and for which studies were already under way with a view to treating other known coronaviruses such as Middle East respiratory
syndrome (MERS), to move to phase III of clinical development. The preclinical and clinical trial processes were shortened
on average from 9 to 6 months at the same time, with the result that vaccines were approved in 18 months. This was the
procedure used to approve vaccines from Pfizer-BioNTech, AstraZeneca, Janssen, Moderna, Sinovac and Gamaleya, among
others, for emergency use. Another complementary strategy has been the repurposing of antiviral drugs such as remdesivir,
used for the Ebola virus, and immunomodulators such as tocilizumab, used for rheumatoid arthritis.
A recent review (Durán and others, 2021) finds that 13 of the 20 national regulatory authorities in the region directly
recognize or shorten the approval process for new medicines that have received approval from a regulatory body in another
jurisdiction, in particular the European Medicines Agency (EMA), the United States Food and Drug Administration (FDA) and
Health Canada. However, this review warns about the potential drawbacks of relying on the decisions of external authorities,
such as: evidence of questionable decisions by certain reputable national regulatory authorities, which have approved some
drug treatments without sufficient evidence of efficacy and safety; the fact that trusted national regulatory authorities already
use fast-track approval procedures in certain cases, which necessarily means that medicines are studied less rigorously;
and the loss of process transparency when trusted national regulatory authorities in turn place their trust in third parties.
Recent doubts about certain COVID-19 vaccines regarding side effects or loss of efficacy against new strains of the virus
necessitating new doses within a short time should alert national regulatory authorities in the region to the need to design
cooperation mechanisms with a view to optimizing best practices in the development and registration of drugs and vaccines
to deal with the pandemic. This cooperation should also extend to appropriate mechanisms to ensure equal access to all
necessary doses of the vaccines for the entire population.
Source: Economic Commission for Latin America and the Caribbean (ECLAC), on the basis of World Health Organization (WHO), “Good regulatory practices: guidelines for national regulatory authorities for medical products”, Working Document, No. QAS/16.686, Geneva, 2016; WHO Coronavirus (COVID-19) Dashboard [online database] https://covid19.who.int/; E. Olaya, “Caracterización del proceso productivo, logístico y regulatorio de los medicamentos”, Vitae, vol. 13, No. 2, Medellín, University of Antioquia, 2006; C. Durán and others, “Regulatory reliance to approve new medicinal products in Latin American and Caribbean countries”, Pan American Journal of Public Health, vol. 45, No. 10, Washington, D.C., Pan American Health Organization (PAHO), 2021; Elsevier, “Fases de desarrollo de un nuevo fármaco”, Berlin, 8 June 2020 [online] https://www.elsevier.com/es-es/connect/medicina/edu-fases-de-desarrollo-de-un-nuevo-farmaco; Public Health Institute of Chile (IPSCH), “Fases de desarrollo de las vacunas”, 2021 [online] https://www.ispch.cl/anamed/farmacovigilancia/vacunas/fases-de-desarrollo-de-las-vacunas/; I. Ruiz, “Análisis de las fortalezas y debilidad de la industria farmacéutica en América Latina y el Caribe”, Santiago, Economic Commission for Latin America and the Caribbean (ECLAC), 2021, unpublished.
B. The global trade of the health-care industry has been highly dynamic
Global exports of health-care industry products totalled about US$ 1.1 trillion in 2020, equivalent to 6% of world trade in goods that year.4 This is in addition to US$ 567 billion of manufactures directly linked to the pharmaceutical industry, bringing the total trade to US$ 1.6 trillion (see figure II.4). Of this amount, the pharmaceutical industry contributed just over US$ 700 billion (43%), with US$ 549 billion (34%) of this being accounted for by medicines and US$ 152 billion (9%) by raw materials used in the industry. The remaining US$ 364 billion was accounted for by medical devices, whose share has averaged around 21% over the last decade. While the value of global goods exports fell by 7.5% in 2020 as a result of the COVID-19 pandemic, the value of health-care industry shipments grew by 9%, with a much larger increase for medical devices (21%).
4 This figure incorporates information on 94 countries, including all the world’s leading exporters and importers.
Box II.1 (concluded)

100 Economic Commission for Latin America and the Caribbean (ECLAC)Chapter II
Figure II.4 Global health-care industry exports, 2007–2020(Trillions of dollars)
0
2.0
0.4
0.6
0.8
1.0
1.2
1.4
1.6
1.8
2007 2008 2009 2010 2011 2012 2013 2014 2015 2016 2017 2018 2019 2020
Manufactures for thepharmaceutical industry
Medical devices
MedicinesRaw materials
Source: Economic Commission for Latin America and the Caribbean (ECLAC), on the basis of United Nations, United Nations International Trade Statistics Database [online] https://comtrade.un.org/.
It should be noted that the figures presented for the global trade in medical products are an approximation, as this trade cannot be accurately quantified from the international statistics currently available. This is mainly because the Harmonized Commodity Description and Coding System (HS), developed by the World Customs Organization (WCO) and used by all countries in the world, only provides standardized codes at a fairly aggregate level (six digits). This means that items for medical and non-medical use can be grouped under the same code. While all countries calculate more disaggregated national statistics, both the level of disaggregation and the criteria used for it differ from country to country (WTO, 2021b). Moreover, in the case of medicines, the logic used to group them within the HS differs markedly from that underlying the Anatomical Therapeutic Chemical (ATC) classification used by the World Health Organization (see box II.2).
Box II.2 The Anatomical Therapeutic Chemical (ATC) and Harmonized Commodity Description and Coding System (HS) classifications: two different approaches to drug classification
The Anatomical Therapeutic Chemical (ATC) classification, first published in 1976, is a system in which the active ingredients of medicines are classified with reference to the organ or system on which they act and their therapeutic, pharmacological and chemical properties. In 1996, the World Health Organization (WHO) officially adopted the ATC classification. This system consists of five levels:
• First level: organ or system the drug acts on.
• Second level: therapeutic subgroup.
• Third level: therapeutic or pharmacological subgroup.
• Fourth level: therapeutic, pharmacological or chemical subgroup.
• Fifth level: name of the active substance.

101Chapter IIInternational Trade Outlook for Latin America and the Caribbean • 2021
Currently, 5,700 active substances are recognized under the ATC classification. As an example, the table below shows how the alphanumeric code is formed in the case of a medicine whose active ingredient is omeprazole and which is used for the treatment of peptic ulcer and gastro-oesophageal reflux disease. Some active substances, such as omeprazole itself, have only one code in the ATC classification, while others are assigned more than one code because they have more than one approved use.
ATC classification of the active substance omeprazole
Level Description Example Description
1 Anatomical group A Part of the body: alimentary tract and metabolism
2 Therapeutic subgroup A02 General function: treatment of acid-related disorders
3 Pharmacological subgroup A02B Specific function: treatment of peptic ulcer and gastro-oesophageal reflux disease
4 Chemical subgroup A02BC Chemical category: protein pump inhibitors
5 Active substance A02BC01 Chemical product: omeprazole
Source: I. Ruiz, “Análisis de las fortalezas y debilidad de la industria farmacéutica en América Latina y el Caribe”, Santiago, Economic Commission for Latin America and the Caribbean (ECLAC), 2021, unpublished.
By contrast with the ATC classification, the general criterion used to classify medicines in the Harmonized Commodity Description and Coding System (HS) is their chemical structure. Specifically, medicinal products are grouped under HS Chapter 30 (Pharmaceuticals) and part of Chapter 29 (Organic chemicals). The latter includes various active substances employed in retail medicines. This chapter also treats a number of raw materials that are required for the manufacture of medicinal products (sodium, sulphate, iodine, oxides and dioxides, among others) and that are included in other HS chapters (mainly 27 and 28) as forming part of the pharmaceutical sector.
The different logic of the ATC and HS classifications can lead to confusion, since the high level of aggregation of HS codes means that a single one can group together products which have very different uses (and thus different ATC codes). For example, code 300490 (“Medicaments consisting of mixed or unmixed products for therapeutic or prophylactic uses, put up in measured doses or in forms or packings for retail sale”) groups together medicines with such diverse uses as antibiotics, immunosuppressants, antineoplastics, analgesics, antipyretics and non-steroidal anti-inflammatory drugs, anticonvulsants, hypnotics and sedatives, antidepressants, anxiolytics, anaesthetics, antacids, diuretics and antihistamines, among others. The harmonized six-digit HS codes also do not distinguish between patent-protected medicines and their generic versions, nor between chemically synthesized and biologically based medicines. Similarly, all vaccines share the same six-digit code (300220), making it difficult to distinguish the trade in COVID-19 vaccines from that in vaccines used against other diseases.
Source: Economic Commission for Latin America and the Caribbean (ECLAC), on the basis of I. Ruiz, “Análisis de las fortalezas y debilidad de la industria farmacéutica en América Latina y el Caribe”, Santiago, Economic Commission for Latin America and the Caribbean (ECLAC), 2021, unpublished.
Analysis of the evolution of global demand for medicines, proxied by exports of medicines according to their use, reveals two distinct groups. The first group expanded steadily by an average of 4% per year, reflecting world population growth and improved access to health-care systems (see figure II.5A). This group accounts for 56% of total uses, and includes general-purpose medicines. The value of exports of a second group, comprising vaccines and medicines for haematological uses and the treatment of infectious diseases and cancer, grew more strongly from 2017. On average, exports of these four categories grew by 14% annually between 2005 and 2020, more than three times the rate of expansion of the first group (see figure II.5B).
Box II.2 (concluded)

102 Economic Commission for Latin America and the Caribbean (ECLAC)Chapter II
Figure II.5 Global exports of medicines, grouped by growth rate and type of use, 2005–2020(Index 2017 = 100)
10
30
50
70
90
110
130
150
2005 2006 2007 2008 2009 2010 2011 2012 2013 2014 2015 2016 2017 2018 2019 2020
Neuropsychiatric
Cardiovascular
Dermatological
Digestive
General
Hormonal
Respiratory
Antiparasitic
A. Average growth (4% a year)
B. High growth (14% a year)
10
30
50
70
90
110
130
150
2005 2006 2007 2008 2009 2010 2011 2012 2013 2014 2015 2016 2017 2018 2019 2020
Haematological
Infectious diseases
VaccinesCancer
Source: Economic Commission for Latin America and the Caribbean (ECLAC), on the basis of United Nations, United Nations International Trade Statistics Database [online] https://comtrade.un.org/.
The emergence of several viral pandemics in the twenty-first century and the persistence of acquired immunodeficiency syndrome (AIDS) since the twentieth century may partly explain why exports of medicines for infectious diseases have been the most dynamic since 2017 (see table II.3). This category includes antivirals, antibiotics and antifungals for diseases concomitant with viral infections, as well as disinfectants, antiseptics and diagnostic products. At the same time, pandemics and the increase in seasonal influenza and viruses have led to an expanded demand for vaccines. This may also be the cause of increased demand for haematological products such as blood and blood fractions, antihaemorrhagics, antithrombotics and anti-anaemics, all linked to side effects and complications of diseases from the end of the last century and the beginning of this one. Global trade in medicines can be expected to remain highly dynamic in 2021 and 2022, given the current context of pandemic and in particular the high demand for vaccines. Also to be considered are the long-term consequences of COVID (“long COVID”), since the disease produces multi-system effects that could increase the use of medicines of all kinds (López-León and others, 2021).

103Chapter IIInternational Trade Outlook for Latin America and the Caribbean • 2021
The list of the world’s top 10 exporters of medicines is dominated by developed countries, eight of which are European. This list has not changed much over the last decade, except for the entry of India at tenth place. The combined share of the top 10 exporters has held steady at around 80% (see figure II.6). The dominant position of developed countries reflects their high spending on research and development, which are crucial for the production of innovative patent-protected medicines. India, in contrast, has positioned itself as the world’s leading exporter of generic medicines.5 Because these are not patent-protected, they face greater competition in the market and therefore command lower prices than innovative medicines. The only country in the region to feature among the top 40 global exporters of medicines in 2020 is Mexico, which ranked thirty-fourth with a share of 0.15%.
5 See Statista, “Value of Indian pharmaceutical exports from financial year 2012 to 2021”, 2021 [online] https://www.statista.com/statistics/1038136/india-value-of-pharmaceutical-exports/.
Figure II.6 The world’s top 10 exporters of medicines, 2009 and 2020(Percentages of global exports)
0
5
10
15
20
25
Germ
any
Switz
erla
nd
Irela
nd
Belg
ium
Fran
ce
Italiy
Net
herla
nds
Unite
d Ki
ndom
Indi
a
20092020
Unite
dSt
ates
Rest
of w
orld
Source: Economic Commission for Latin America and the Caribbean (ECLAC), on the basis of United Nations, United Nations International Trade Statistics Database [online] https://comtrade.un.org/.
Table II.3 Pandemics of the late twentieth and early twenty-first centuries
Disease Acronym Virus Year of appearance
Approximate number of fatalities
Acquired immunodeficiency syndrome AIDS Human immunodeficiency virus (HIV) 1983 37 000 000Severe acute respiratory syndrome SARS SARS coronavirus 2002 100Bird influenza H5N1 virus 2003 500Swine influenza AH1N1 virus 2009 150 000Middle East respiratory syndrome MERS MERS coronavirus 2012 1 000Ebola Ebola virus 2013 15 000Zika Zika virus 2014 …SARS-CoV-2 coronavirus disease COVID-19 SARS-CoV-2 coronavirus 2019 4 600 000
Source: Economic Commission for Latin America and the Caribbean (ECLAC), on the basis of Mayo Clinic, “Diseases and conditions”, 2021 [online] https://www.mayoclinic.org/diseases-conditions; J. Martínez, “Pandemias y bioamenazas globales del siglo XXI”, Madrid, Elcano Royal Institute, 2016 [online] http://www.realinstitutoelcano.org/wps/portal/rielcano_es/contenido?WCM_GLOBAL_CONTEXT=/elcano/elcano_es/zonas_es/ari42-2016-martinezhernandez-pandemias-bioamenazas-globales-siglo-21; Joint United Nations Programme on HIV/AIDS (UNAIDS), “AIDS by the numbers”, 2021 [online] https://www.unaids.org/en; World Health Organization (WHO), WHO Coronavirus (COVID-19) Dashboard [online database] https://covid19.who.int/.
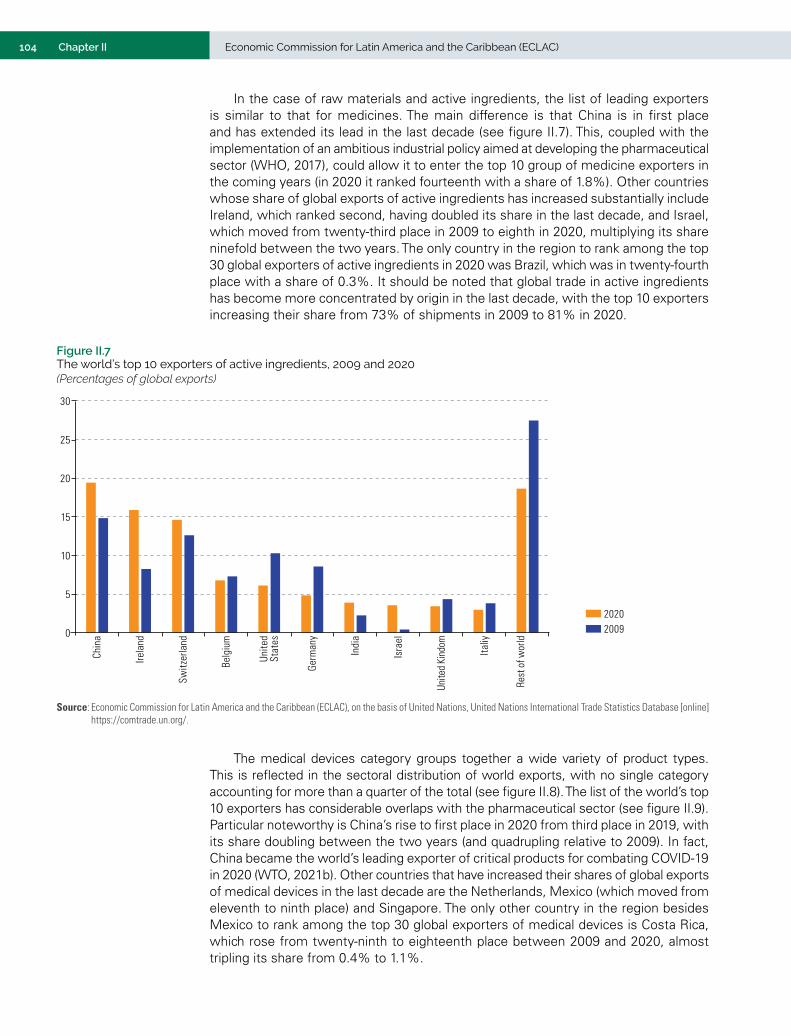
104 Economic Commission for Latin America and the Caribbean (ECLAC)Chapter II
In the case of raw materials and active ingredients, the list of leading exporters is similar to that for medicines. The main difference is that China is in first place and has extended its lead in the last decade (see figure II.7). This, coupled with the implementation of an ambitious industrial policy aimed at developing the pharmaceutical sector (WHO, 2017), could allow it to enter the top 10 group of medicine exporters in the coming years (in 2020 it ranked fourteenth with a share of 1.8%). Other countries whose share of global exports of active ingredients has increased substantially include Ireland, which ranked second, having doubled its share in the last decade, and Israel, which moved from twenty-third place in 2009 to eighth in 2020, multiplying its share ninefold between the two years. The only country in the region to rank among the top 30 global exporters of active ingredients in 2020 was Brazil, which was in twenty-fourth place with a share of 0.3%. It should be noted that global trade in active ingredients has become more concentrated by origin in the last decade, with the top 10 exporters increasing their share from 73% of shipments in 2009 to 81% in 2020.
Figure II.7 The world’s top 10 exporters of active ingredients, 2009 and 2020(Percentages of global exports)
0
5
10
15
20
25
30
Chin
a
Irela
nd
Switz
erla
nd
Belg
ium
Unite
dSt
ates
Germ
any
Indi
a
Isra
el
Unite
d Ki
ndom
Italiy
Rest
of w
orld
20092020
Source: Economic Commission for Latin America and the Caribbean (ECLAC), on the basis of United Nations, United Nations International Trade Statistics Database [online] https://comtrade.un.org/.
The medical devices category groups together a wide variety of product types. This is reflected in the sectoral distribution of world exports, with no single category accounting for more than a quarter of the total (see figure II.8). The list of the world’s top 10 exporters has considerable overlaps with the pharmaceutical sector (see figure II.9). Particular noteworthy is China’s rise to first place in 2020 from third place in 2019, with its share doubling between the two years (and quadrupling relative to 2009). In fact, China became the world’s leading exporter of critical products for combating COVID-19 in 2020 (WTO, 2021b). Other countries that have increased their shares of global exports of medical devices in the last decade are the Netherlands, Mexico (which moved from eleventh to ninth place) and Singapore. The only other country in the region besides Mexico to rank among the top 30 global exporters of medical devices is Costa Rica, which rose from twenty-ninth to eighteenth place between 2009 and 2020, almost tripling its share from 0.4% to 1.1%.

105Chapter IIInternational Trade Outlook for Latin America and the Caribbean • 2021
Figure II.8 Distribution of world exports of medical devices by category, 2019(Percentages)
Disposables(25)
Personal protective equipment
(5)Hospital furniture
(1)
Medical andsurgical instruments
(21)
Laboratory equipment(6)
Diagnostic and imaging equipment
(19)
Therapeutic devices(23)
Source: Economic Commission for Latin America and the Caribbean (ECLAC), on the basis of United Nations, United Nations International Trade Statistics Database [online] https://comtrade.un.org/.
Figure II.9 The world’s top 10 exporters of medical devices, 2009 and 2020(Percentages of global exports)
0
5
10
15
20
25
30
Chin
a
Germ
any
Net
herla
nds
Irela
nd
Switz
erla
nd
Sing
apor
e
Unite
d Ki
ndom
Mex
ico
Fran
ce
Unite
dSt
ates
20092020
Rest
of w
orld
B. Medical devices
Source: Economic Commission for Latin America and the Caribbean (ECLAC), on the basis of United Nations, United Nations International Trade Statistics Database [online] https://comtrade.un.org/.

106 Economic Commission for Latin America and the Caribbean (ECLAC)Chapter II
C. The region runs a large trade deficit in pharmaceutical products
Latin America and the Caribbean accounted for an average of 1.1% of global exports of pharmaceutical products between 2018 and 2020, well below its share of global exports of all goods (5.5%) over the same period. Its pharmaceutical exports have been on a downward trend since the beginning of the last decade, with their value declining from a peak of US$ 9.845 billion in 2012 to just over US$ 7 billion in 2020 (-28%).6 The region runs a persistent deficit in its trade in pharmaceutical products, and the value of its imports in 2020 was almost five times that of its exports (see figure II.10). Virtually all countries in the region have trade deficits in the pharmaceutical sector (see annex II.A2).
6 The regional trade figures presented in this section exclude Panama because its pharmaceutical exports are almost entirely re-exports from the Colón Free Zone of medicines originating elsewhere. See annex II.A2 for further details on each country’s data.
Figure II.10 Latin America and the Caribbean: trade in pharmaceutical products, 2010–2020a
(Billions of dollars)
-40
-30
-20
-10
0
10
20
30
40
2010 2011 2012 2013 2014 2015 2016 2017 2018 2019 2020BalanceImports
Exports
Source: Economic Commission for Latin America and the Caribbean (ECLAC), on the basis of United Nations, United Nations International Trade Statistics Database [online] https://comtrade.un.org/.
a Excludes Panama. The 2020 figures include mirror data for Chile, Costa Rica, the Dominican Republic, Ecuador, Honduras, Jamaica, Nicaragua, Paraguay, Peru, Saint Kitts and Nevis, Saint Lucia and Saint Vincent and the Grenadines. In the cases of the Bolivarian Republic of Venezuela, Cuba, Dominica and Haiti, mirror statistics were used for the whole period (2010–2020).
Raw materials and active ingredients account for a quarter of the region’s pharmaceutical exports and just over a fifth (22%) of its imports (see figure II.11). The bulk of the region’s trade deficit is in medicines. It exceeded US$ 20 billion in the period 2018–2020, which was almost four times as great as the deficit in raw materials (see figure II.12).

107Chapter IIInternational Trade Outlook for Latin America and the Caribbean • 2021
Figure II.11 Latin America and the Caribbean: distribution of trade in pharmaceutical products, 2010–2012 and 2018–2020a
(Percentages)
,
,
27
73
25
75
MedicinesRaw materials
23
77
22
78
A. Exports B. Imports
Source: Economic Commission for Latin America and the Caribbean (ECLAC), on the basis of United Nations, United Nations International Trade Statistics Database [online] https://comtrade.un.org/.
a The inner circle represents the period 2010–2012 and the outer circle the period 2018–2020.
Figure II.12 Latin America and the Caribbean: trade balance by pharmaceutical industry component, 2010–2012 and 2018–2020a
(Billions of dollars)
-25
-20
-15
-10
-5
0
2010–2012 2018–2020MedicinesRaw materials
Source: Economic Commission for Latin America and the Caribbean (ECLAC), on the basis of United Nations, United Nations International Trade Statistics Database [online] https://comtrade.un.org/.
a Excludes Panama.
The region’s trade pattern reflects the main characteristics of its pharmaceutical market and the role played by its pharmaceutical industry in this. Demand for innovative medicines, including biopharmaceuticals, is mainly met by extraregional imports supplied by transnational companies. In the period 2017–2020, 65% of total sales by pharmaceutical companies in six countries of the region (Argentina, Chile, Colombia, Ecuador, Mexico and Peru) were made by companies whose owners were based outside the region (see figure II.13). Similarly, 14 of the top 20 companies by sales are of extraregional origin, led by Bayer, Novartis and Pfizer (see table II.4).

108 Economic Commission for Latin America and the Caribbean (ECLAC)Chapter II
Figure II.13 Latin America (6 countries):a distribution of pharmaceutical product sales by nationality of firms, 2017–2020 averages(Percentages)
Brazil(15.0)
Germany(14.7)
Switzerland(13.4)
France(7.1)
Argentina(4.5)
Colombia(5.3)
United Kindom(4.1)
Chile(1.6)
Denmark(1.3)
Peru(4.7)
Other(0.8)
United States(24.3)
Mexico(3.3)
Source: Economic Commission for Latin America and the Caribbean (ECLAC), on the basis of the companies’ annual reports and specialized press.
a Argentina, Colombia, Chile, Ecuador, Peru and Mexico.
Table II.4 Latin America: top 20 pharmaceutical companies by sales, 2017–2020 average(Millions of dollars and percentages)
Rank Company Country of origin Sales Share of the top 20 companies’ sales
1 Bayer Germany 6 287 18.2
2 Novartis Switzerland 3 360 9.7
3 Pfizer United States 3 194 9.3
4 Sanofi France 3 083 8.9
5 Roche Switzerland 2 858 8.3
6 Merck & Co. United States 2 374 6.9
7 Johnson & Johnson United States 2 079 6.0
8 Abbott United States 1 360 3.9
9 Eurofarma Brazil 1 081 3.1
10 EMS Pharma Brazil 982 2.8
11 Takeda Japan 982 2.8
12 Hypera Pharma Brazil 936 2.7
13 GlaxoSmithKline United Kingdom 865 2.5
14 Boehringer Ingelheim Germany 853 2.5
15 Aché Brazil 831 2.4
16 AstraZeneca United Kingdom 798 2.3
17 Abbvie United States 779 2.3
18 Novo Nordisk A/S Denmark 644 1.9
19 Genomma Lab Mexico 639 1.9
20 Gador Argentina 541 1.6
Top 20 34 525 100.0
Source: Economic Commission for Latin America and the Caribbean (ECLAC), on the basis of the companies’ annual reports and specialized press.

109Chapter IIInternational Trade Outlook for Latin America and the Caribbean • 2021
In the region, as in the rest of the world, there is a trend towards concentration in the pharmaceutical sector. For example, there have been acquisitions of production rights, as when Hypera Pharma, Brazil’s third-largest pharmaceutical company, purchased rights from Japan’s Takeda and from Boehringer Ingelheim for an estimated US$ 825 million and US$ 320 million, respectively. Likewise, EMS Pharma, Brazil’s second-largest pharmaceutical company, bought Multilab, a smaller Brazilian company. Similar operations have taken place in Colombia and Uruguay.7 8 Some recent studies dealing with Colombia, Ecuador and Chile have highlighted the oligopolistic structure of the sector (SIC, 2020; National Economic Prosecutor’s Office, 2020; Sánchez and others, 2019).
Unlike innovative medicines, generic medicines are mostly produced by companies operating locally, but with an increasing use of imported active ingredients. In fact, there has been a trend away from the production of active ingredients in recent decades (Álvarez and Herrera, 2021). Heavy reliance on extraregional supplies of patent medicines and active ingredients, then, explains the persistent trade deficit. This pattern is consistent with the region’s tiny share of pharmaceutical patents granted worldwide, which is still less than 1% even though it has quadrupled since 1990 (see figure II.14). Indeed, the R&D activities of the local pharmaceutical industry tend to be limited to drug formulation, galenic research and small-scale clinical trials in order to obtain approval for its drugs in the local market (ECLAC, 2020c). R&D expenditure in the region was just 0.56% of GDP in 2019, well below the levels observed in the economies that are leaders in the pharmaceutical sector.9
7 Procaps, a Colombian manufacturer specializing in soft capsules, merged with Union Acquisition Corp. II. The merged company’s initial public offering was scheduled for 2021.
8 Between 2019 and 2020, the Canadian company Knight Therapeutics acquired the Uruguayan pharmaceutical group Biotoscana for about US$ 130 million.
9 See Ibero-American Network of Science and Technology Indicators (RICYT), “Expenditure on R&D as a percentage of GDP 2010–2019” [online] http://app.ricyt.org/ui/v3/comparative.html?indicator=GASTOxPBI&start_year=2010&end_year=2019.
Figure II.14 Latin America and the Caribbean: pharmaceutical patents granted, 1990–2019(Numbers and percentages of the world total)
0
0.1
0.2
0.3
0.4
0.5
0.6
0.7
0.8
0.9
0
50
100
150
200
250
300
350
1990
1992
1994
1996
1998
2000
2002
2004
2006
2008
2010
2012
2014
2016
2018
Percentage of world total(right scale)Number
Source: Economic Commission for Latin America and the Caribbean (ECLAC), on the basis of World Intellectual Property Organization (WIPO), WIPO IP Statistics Data Center [online database] https://www3.wipo.int/ipstats/.

110 Economic Commission for Latin America and the Caribbean (ECLAC)Chapter II
The development of the pharmaceutical industry in the region has also been influenced by the commitments that a number of countries have made in free trade agreements with developed-country partners. In particular, agreements with the United States contain a number of intellectual property provisions that go further than the World Trade Organization (WTO) Agreement on Trade-Related Aspects of Intellectual Property Rights (TRIPS). These provisions often have the effect of extending the period of exclusivity enjoyed by patented medicines beyond the 20 years stipulated in the TRIPS Agreement (ECLAC, 2021). This harms local industries producing generic versions of medicines by delaying the entry of their products into the market.
Brazil, Mexico and Argentina accounted for 58% of the total value of the region’s exports of pharmaceutical products in the period 2018–2020 (see figure II.15A). These countries are not only the largest economies in the region, but have the greatest production strengths in the pharmaceutical industry (see section C). Chile, which ranks fourth for exports, is mainly a supplier of inputs for the production of medicines. Among smaller economies, the Dominican Republic stands out as the region’s fifth-largest exporter. Its shipments are mainly made by companies operating under the free trade zone regime.10 The distribution of regional imports of pharmaceutical products, meanwhile, closely mirrors the size of the countries’ domestic markets, with Brazil, Mexico, Colombia and Argentina accounting for 70% of total imports in the period 2018–2020 (see figure III.15B).
10 The pharmaceutical sector is the main recipient of foreign direct investment (FDI) among companies located in the Dominican Republic’s free trade zones. As of December 2019, cumulative investment totalled US$ 1.346 billion, 26.5% of the total (CNZFE, 2020).
Figure II.15 Latin America and the Caribbean: distribution of the trade in pharmaceutical products by country, 2018–2020 average(Percentages)
A. Exports B. Imports
Mexico(22)
Argentina(10)
Chile(9)
El Salvador(2)
Uruguay(2)
Peru(2)
Other countries(5)
Brazil(34)
Mexico(18)
Colombia(9)
Argentina(9)
Chile(6)
Ecuador(4)
Peru(4)
Costa Rica(3)
Guatemala(2)
Dominican Rep.(2) Honduras
(2)
Dominican Rep.(7)
Colombia(6)
Costa Rica(5)
Guatemala(4) Brazil
(26)
Other countries(7)
Source: Economic Commission for Latin America and the Caribbean (ECLAC), on the basis of United Nations, United Nations International Trade Statistics Database [online] https://comtrade.un.org/.
The main destinations for Latin America and the Caribbean’s pharmaceutical exports are the region itself and the United States, which absorbed 46% and 25% of the total value of shipments in the period 2018–2020, respectively. However, shipments to both markets have performed unevenly over the past decade. Whereas exports to the region in the three-year period 2018–2020 were down by 19% compared with the average for the period 2010–2012, exports to the United States were up by 27%. This was mainly due to the reorientation of Mexican and Dominican exports towards that market (see figures II.16 and II.17).
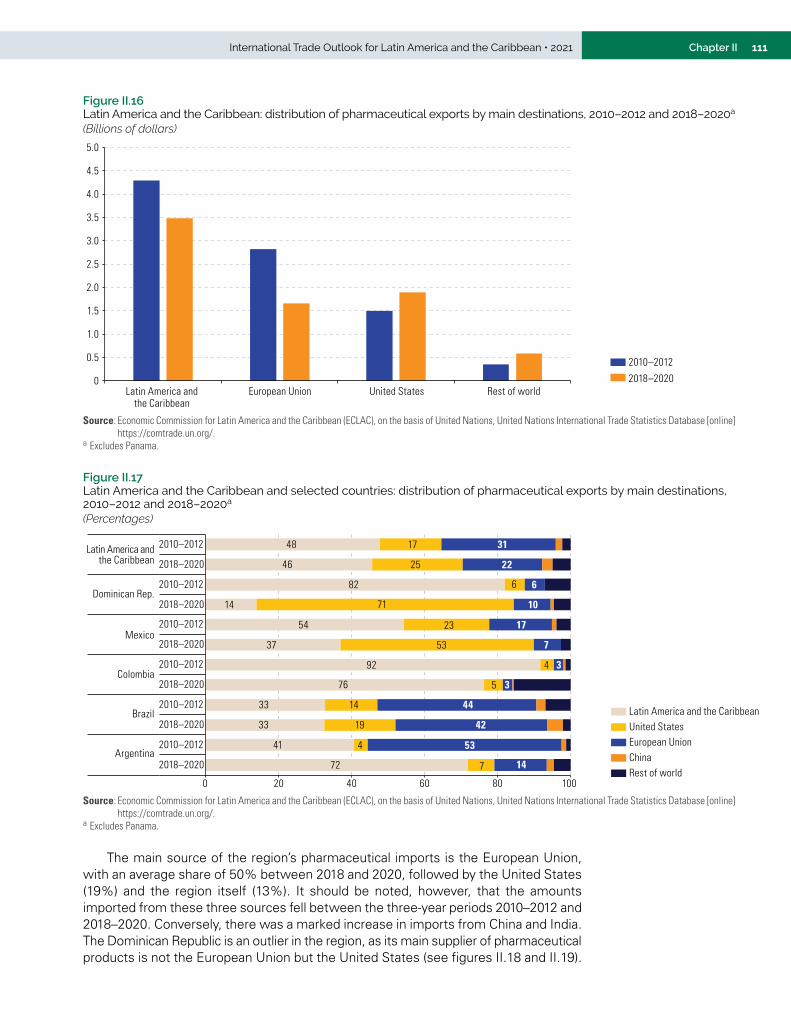
111Chapter IIInternational Trade Outlook for Latin America and the Caribbean • 2021
Figure II.16 Latin America and the Caribbean: distribution of pharmaceutical exports by main destinations, 2010–2012 and 2018–2020a
(Billions of dollars)
2018–2020
2010–2012
0
0.5
1.0
1.5
2.0
2.5
3.0
3.5
4.0
4.5
5.0
Latin America andthe Caribbean
European Union United States Rest of world
Source: Economic Commission for Latin America and the Caribbean (ECLAC), on the basis of United Nations, United Nations International Trade Statistics Database [online] https://comtrade.un.org/.
a Excludes Panama.
Figure II.17 Latin America and the Caribbean and selected countries: distribution of pharmaceutical exports by main destinations, 2010–2012 and 2018–2020a
(Percentages)
Rest of worldChinaEuropean UnionUnited StatesLatin America and the Caribbean
72
41
33
33
76
92
37
54
14
82
46
48
0 20 40 60 80 100
2018–2020
2010–2012
2018–2020
2010–2012
2018–2020
2010–2012
2018–2020
2010–2012
2018–2020
2010–2012
2018–2020
2010–2012
Argentina
Brazil
Colombia
Mexico
Dominican Rep.
Latin America and the Caribbean
17
25
6
71
23
53
4
5
14
19
4
7
31
22
6
10
17
7
3
3
44
42
53
14
Source: Economic Commission for Latin America and the Caribbean (ECLAC), on the basis of United Nations, United Nations International Trade Statistics Database [online] https://comtrade.un.org/.
a Excludes Panama.
The main source of the region’s pharmaceutical imports is the European Union, with an average share of 50% between 2018 and 2020, followed by the United States (19%) and the region itself (13%). It should be noted, however, that the amounts imported from these three sources fell between the three-year periods 2010–2012 and 2018–2020. Conversely, there was a marked increase in imports from China and India. The Dominican Republic is an outlier in the region, as its main supplier of pharmaceutical products is not the European Union but the United States (see figures II.18 and II.19).
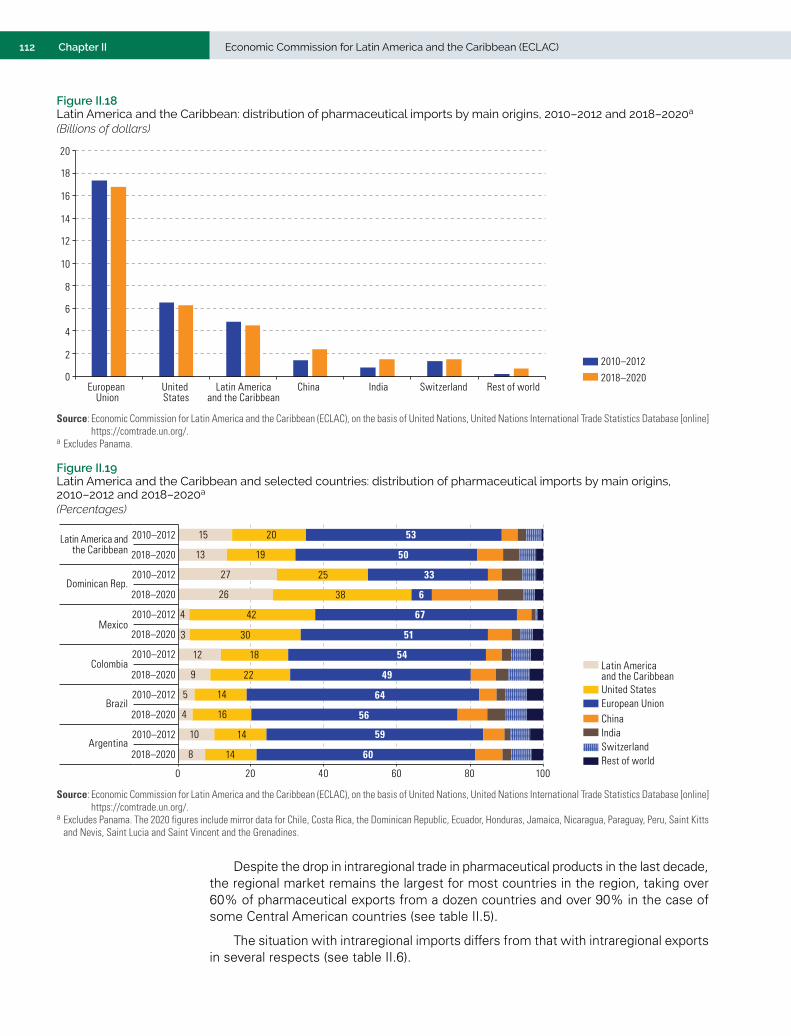
112 Economic Commission for Latin America and the Caribbean (ECLAC)Chapter II
Figure II.18 Latin America and the Caribbean: distribution of pharmaceutical imports by main origins, 2010–2012 and 2018–2020a
(Billions of dollars)
2018–2020
2010–20120
2
4
6
8
10
12
14
16
18
20
European Union
United States
Latin Americaand the Caribbean
China India Switzerland Rest of world
Source: Economic Commission for Latin America and the Caribbean (ECLAC), on the basis of United Nations, United Nations International Trade Statistics Database [online] https://comtrade.un.org/.
a Excludes Panama.
Figure II.19 Latin America and the Caribbean and selected countries: distribution of pharmaceutical imports by main origins, 2010–2012 and 2018–2020a
(Percentages)
Rest of worldSwitzerlandIndiaChinaEuropean UnionUnited States
Latin America and the Caribbean
8
10
4
5
9
12
3
4
26
27
13
15
0 20 40 60 80 100
2018–2020
2010–2012
2018–2020
2010–2012
2018–2020
2010–2012
2018–2020
2010–2012
2018–2020
2010–2012
2018–2020
2010–2012
Argentina
Brazil
Colombia
Mexico
Dominican Rep.
Latin America and the Caribbean
20
19
25
38
42
30
18
22
14
16
14
14
53
50
33
6
67
51
54
49
64
56
59
60
Source: Economic Commission for Latin America and the Caribbean (ECLAC), on the basis of United Nations, United Nations International Trade Statistics Database [online] https://comtrade.un.org/.
a Excludes Panama. The 2020 figures include mirror data for Chile, Costa Rica, the Dominican Republic, Ecuador, Honduras, Jamaica, Nicaragua, Paraguay, Peru, Saint Kitts and Nevis, Saint Lucia and Saint Vincent and the Grenadines.
Despite the drop in intraregional trade in pharmaceutical products in the last decade, the regional market remains the largest for most countries in the region, taking over 60% of pharmaceutical exports from a dozen countries and over 90% in the case of some Central American countries (see table II.5).
The situation with intraregional imports differs from that with intraregional exports in several respects (see table II.6).

113Chapter IIInternational Trade Outlook for Latin America and the Caribbean • 2021
Table II.5 Latin America and the Caribbean (selected countries): exports of pharmaceutical products to the regional market, 2018–2020 average
Country Exports to Latin America
and the Caribbean(millions of dollars)
Country’s share of total intraregional exports
(percentages)
Share of the country’s total pharmaceutical exports going to Latin America and the Caribbean
(percentages)Brazil 622 17.8 33Mexico 603 17.2 37Argentina 477 13.6 72Colombia 346 9.9 76Costa Rica 300 8.6 92Guatemala 272 7.8 93Chile 203 5.8 79El Salvador 169 4.9 95Uruguay 107 3.1 71Peru 99 2.8 74Dominican Republic 72 2.1 16Trinidad and Tobago 51 1.5 12Paraguay 41 1.2 14Ecuador 26 0.8 77Barbados 23 0.7 86Nicaragua 17 0.5 72Guyana 16 0.5 41Venezuela (Bolivarian Republic of) 13 0.4 16Cuba 13 0.4 71Honduras 11 0.3 15Bolivia (Plurinational State of) 6 0.2 37Other Caribbean countries 8 0.2 5Latin America and the Caribbean 3 495 100.0 46
Source: Economic Commission for Latin America and the Caribbean (ECLAC), on the basis of United Nations, United Nations International Trade Statistics Database [online] https://comtrade.un.org/.
Table II.6 Latin America and the Caribbean (selected countries): pharmaceutical imports from the region, 2018–2020 average
CountryImports from Latin America
and the Caribbean(millions of dollars)
Country’s share of total intraregional imports
(percentages)
Share of the country’s total pharmaceutical imports that come from Latin America and the Caribbean
(percentages)Ecuador 503 11.2 37Brazil 489 10.8 4Guatemala 481 10.7 58Peru 306 6.8 25Colombia 296 6.6 10Chile 292 6.5 15Costa Rica 264 5.9 31Mexico 258 5.7 4Honduras 251 5.6 48Argentina 241 5.3 8Dominican Republic 216 4.8 27Nicaragua 187 4.1 50El Salvador 186 4.1 41Paraguay 151 3.4 45Bolivia (Plurinational State of) 120 2.7 44Uruguay 95 2.1 31Venezuela (Bolivarian Republic of) 34 0.8 18Trinidad and Tobago 28 0.6 57Cuba 20 0.4 21Barbados 16 0.4 33Guyana 6 0.1 15Other Caribbean countries 71 1.6 11Latin America and the Caribbean 4 510 100.0 12
Source: Economic Commission for Latin America and the Caribbean (ECLAC), on the basis of United Nations, United Nations International Trade Statistics Database [online] https://comtrade.un.org/.

114 Economic Commission for Latin America and the Caribbean (ECLAC)Chapter II
The aspects in which intraregional imports differ from exports are as follows:
• First, intraregional imports are less concentrated: the share of the top 10 importers was 75% in the period 2018–2020, as against 93% for the top 10 exporters. This was to be expected, as export capacities in the pharmaceutical industry are much more concentrated than demand for the industry’s products.
• Second, the countries that top the ranking of the largest importers are different: four of the top five positions are held by Central American and Andean countries, including relatively small economies such as Guatemala and Ecuador.
• Third, the intraregional share of pharmaceutical imports differs greatly between larger and smaller economies. The three largest economies, which are also the three largest importers of pharmaceutical products in the region (Brazil, Mexico and Argentina, in that order), make only between 4% and 8% of their purchases from the region.
In sum, smaller economies whose pharmaceutical industries have a lower production capacity are the most dependent on supplies from the rest of the region, particularly neighbouring countries. For example, Ecuador’s main supplier is Colombia, while the main suppliers to Guatemala, Honduras, Nicaragua, El Salvador and Costa Rica are the other Central American countries. This situation suggests that, in a context of greater regional integration, the region’s pharmaceutical industries could increase their production and expand their supply to meet demand from national health systems, especially for the products in greatest demand (analgesics, anti-inflammatories, antibiotics, antivirals, antimalarials, antihypertensives, antiallergics, etc.).
At the same time, there is growing demand for pharmaceutical and parapharmaceutical products of natural origin, mainly plant extracts with medicinal or nutritional properties.11 The exceptional geographical characteristics of the region, with abrupt transitions between the Pacific coastal zone, the Andes mountain range, the Amazon rainforest and the Atlantic zone, together with the fact that many countries are located in the tropical and subtropical climate belt, have endowed it with the greatest biodiversity of species on the planet. Because of these geographical and climatic conditions, the variety and concentration of secondary plant metabolites such as alkaloids, flavonoids, tannins, terpenes and essential oils, the active ingredients that give plants their therapeutic properties, are unmatched anywhere else in the world. The more developed countries tend to value such products over chemically synthesized ones, which puts the region in a privileged position to develop new products with high added value from its natural resource base (see box II.3).
11 The parapharmaceutical category includes dermatological, cosmetic and homeopathic products, nutritional supplements and vitamins, among other things.
Box II.3 Bioactives extracted from agricultural products
The agricultural industry produces a large amount of residues and waste products, which are generally burned as waste or fuel (Chamorro and others, 2020). In recent years, the recycling of such organic waste has received increased attention because its potential for the pharmaceutical industry has been recognized. Generally, food waste is a rich source of valuable compounds (polyphenols) with high antioxidant activity that can be extracted by biotechnological methods for future industrial applications (Campos and others, 2020; Chamorro and others, 2020). The natural properties of these products allow them to be used as substitutes for synthetic substances that, as such, produce undesirable side effects. This is favourable for bioactive products.
Fruit processing generates large quantities of by-products such as peels, seeds, marc, bagasse, etc. Such by-products contain a large amount of bioactive compounds of chemical and nutritional value, mainly pectin, proteins, antioxidants and phenolic compounds, that have beneficial effects on human health (Campos and others, 2020). For example, several bioactives can act as antivirals by reducing the activity of infected cells and inhibiting the spread of pathogenic viruses. In the case of COVID-19, studies have been done on the potential of the bioactive hesperidin, found in citrus fruit peels, to prevent immune system overreaction. In addition, these by-products are rich sources of complex polysaccharides, carbohydrates, fibre and vitamins. It is important to recover them so that they can be supplied to industrial chains (commercialization).

115Chapter IIInternational Trade Outlook for Latin America and the Caribbean • 2021
The table below shows some examples of fruit residues and their bioactives that can be recycled and used in the pharmaceutical industry. Products that decompose easily can be recovered and used in a way that adds value. This is also the case with fruits whose peel or pips constitute a significant part of their mass. The rind, peel and seeds of fruits and vegetables contain particularly large amounts of phenolic compounds, whose antioxidant effects can play an important role in preventing and treating diseases. The large amounts of waste available mean there can be economies of scale in the extraction of bioactives and other important by-products.
Agricultural and agroindustrial products and their uses in the pharmaceutical industry
Bioactives and their uses in the pharmaceutical industry Medicinal fruits and plants Countries with potential
Polyphenols(Antioxidants, antibacterials, anticarcinogens and anti-inflammatories)
Açai (pulp), kiwi (peel, seeds, pulp), mango (peel, stone), avocado (peel), pineapple (peel, stem), tomato (peel, bagasse, seeds), grape (skin, bagasse), coconut (pulp), apple (pomace, leaves), banana (skin, bract), lemons, American cranberry (leaves), olive (peel, waste water)
Brazil, Chile, Costa Rica, Ecuador, Mexico, Dominican Republic
Citric acids(Antioxidants, antibacterials, antivirals, antifungals and anticoagulants)
Pineapple (peel, stem), banana (skin), lemons (peel) Argentina, Brazil, Ecuador, Costa Rica, Guatemala, El Salvador, Mexico
Carotenoids(Antioxidant and anticarcinogenic effects)
Kiwi (peel, seeds, pulp), melon (seeds, peel), tomato (peel, bagasse, seeds), avocado (stone, pulp)
Chile, Peru, Brazil, Guatemala
Vitamin A(Immune system boosters)
Melon (seeds, peel) Brazil, Guatemala, Mexico, Colombia
Vitamin C(Antioxidants)
Kiwi (peel, seeds, pulp), melon (seeds, peel), tomato (peel, bagasse, seeds)
Chile, Brazil, Guatemala, Mexico
Vitamin E(Antioxidants)
Kiwi (peel, seeds, pulp), melon (seeds, peel), tomato (peel, bagasse, seeds), coconut (pulp)
Chile, Mexico, Dominican Republic, Guyana
Potassium Kiwi (peel, seeds, pulp) Chile, Argentina, BrazilPectin(Antitumour effects)
Apple (peel, seeds), melon (seeds, peel) Argentina, Chile
Bromelain(Anti-oedematous, anti-inflammatory, anti-carcinogenic, anti-thrombotic and fibrinolytic effects, digestive system booster)(Antibiotic, anti-inflammatory and decongestant effects)
Pineapple (peel, stem) Ecuador, Costa Rica, Guatemala, Honduras, Mexico
Ginger, garlic, tea, eucalyptus, cinnamon, lemon verbena, laurel, matico
Brazil, Bolivia (Plurinational State of), Ecuador, Chile, Peru
Source: Economic Commission for Latin America and the Caribbean (ECLAC), on the basis of L. Ballesteros, “Compuestos bioactivos en coco (Cocos nucifera L.): efecto del cultivar y región de cultivo”, Biotecnia, vol. 23, No. 2, Sonora, University of Sonora, 2021; D. Campos and others, “Management of fruit industrial by-products: a case study on circular economy approach”, Molecules, vol. 25, No. 2, Basel, Multidisciplinary Digital Publishing Institute (MDPI), 2020; B. Cevallos-Casals and others, “Selecting new peach and plum genotypes rich in phenolic compounds and enhanced functional properties”, Food Chemistry, vol. 96, No. 2, Amsterdam, Elsevier, 2006; F. Chamorro and others, “Valorization of kiwi by-products for the recovery of bioactive compounds: circular economy model”, Proceedings, vol. 70, No. 1, Basel, Multidisciplinary Digital Publishing Institute (MDPI), 2020; M. Earling, T. Beadle and E. Niemeyer, “Açai berry (Euterpe oleracea) dietary supplements: variations in anthocyanin and flavonoid concentrations, phenolic contents, and antioxidant properties”, Plant Foods for Human Nutrition, vol. 74, No. 3, Berlin, Springer, 2019; H. Maurer, “Bromelain: biochemistry, pharmacology and medical use”, Cellular and Molecular Life Sciences CMLS, vol. 58, No. 9, Berlin, Springer, 2001; D. Morais and others, “Antioxidant activity, phenolics and UPLC–ESI(–)–MS of extracts from different tropical fruits parts and processed peels”, Food Research International, vol. 77, No. 3, Amsterdam, Elsevier, 2015; M. Nunes and others, “Olive pomace as a valuable source of bioactive compounds: a study regarding its lipid- and water-soluble components”, Science of the Total Environment, vol. 644, Amsterdam, Elsevier, 2018; Z. Raji and others, “Extraction optimization and physicochemical properties of pectin from melon peel”, International Journal of Biological Macromolecules, vol. 98, Amsterdam, Elsevier, 2017; S. Savatović and others, “Utilization of tomato waste as a source of polyphenolic antioxidants”, Acta Periodica Technologica, No. 41, Novi Sad, University of Novi Sad, 2010; N. Sagar and others, “Fruit and vegetable waste: bioactive compounds, their extraction, and possible utilization”, Comprehensive Reviews in Food Science and Food Safety, vol. 17, No. 3, Hoboken, Wiley, 2018; D. Tungmunnithum and others, “Flavonoids and other phenolic compounds from medicinal plants for pharmaceutical and medical aspects: an overview”, Medicines, vol. 5. No. 3, Basel, Multidisciplinary Digital Publishing Institute (MDPI), 2018; and R. Fernandez Coliñir, “Plantas medicinales de las mujeres mapuche de Paillako”, Ministry of Health [online] http://www.repositoriodigital.minsal.cl/handle/2015/1224?show=full [retrieved on 13 September 2021].
Another example of a product with strong potential for integration into the circular economy are oil cakes, produced when vegetable oil is extracted from sunflower seeds, olives and other plants. Oilcakes have numerous uses in industry. They are a source of bioactive compounds with health-promoting properties, such as proteins, dietary fibre and antioxidants, which can be used in the food, cosmetic, textile and pharmaceutical industries. They can also serve as substrates for the production of enzymes, antibiotics, biosurfactants and fungi.
Source: Economic Commission for Latin America and the Caribbean (ECLAC), on the basis of L. Osorio and others, “The potential of selected agri-food loss and waste to contribute to a circular economy: applications in the food, cosmetic and pharmaceutical industries”, Molecules, vol. 26, No. 2, Basel, Multidisciplinary Digital Publishing Institute (MDPI), 2021; D. Campos and others, “Management of fruit industrial by-products: a case study on circular economy approach”, Molecules, vol. 25, No. 2, Basel, Multidisciplinary Digital Publishing Institute (MDPI), 2020; N. Sagar and others, “Fruit and vegetable waste: bioactive compounds, their extraction, and possible utilization”, Comprehensive Reviews in Food Science and Food Safety, vol. 17, No. 3, Hoboken, Wiley, 2018; P. Ancuța and A. Sonia, “Oil press-cakes and meals valorization through circular economy approaches: a review”, Applied Sciences, vol. 10, No. 21, Basel, Multidisciplinary Digital Publishing Institute (MDPI), 2020; Z. Raji and others, “Extraction optimization and physicochemical properties of pectin from melon peel”, International Journal of Biological Macromolecules, vol. 98, Amsterdam, Elsevier, 2017; F. Chamorro and others, “Valorization of kiwi by-products for the recovery of bioactive compounds: circular economy model”, Proceedings, vol. 70, No. 1, Basel, Multidisciplinary Digital Publishing Institute (MDPI), 2020; and R. Rojas and others, “Valorisation of mango peels: extraction of pectin and antioxidant and antifungal polyphenols”, Waste and Biomass Valorization, vol. 11, No. 1, January 2020.
Box II.3 (concluded)

116 Economic Commission for Latin America and the Caribbean (ECLAC)Chapter II
Promoting the production of natural products would have several beneficial side effects for the region. First, since medicinal plants are often grown in small market gardens, it would boost development in indigenous communities. In addition, these crops tend to be completely organic, since fertilizers, herbicides and pesticides of plant or animal origin rather than chemical products are used to grow them, which reduces the environmental impact on these communities.
D. The region’s pharmaceutical industry is poorly integrated
The COVID-19 pandemic highlighted the productive and commercial interdependence between countries and the vulnerabilities associated with this. In the case of the pharmaceutical industry, the problems in the supply of critical products and inputs caused by disruptions in production or export restrictions imposed by some of the world’s main suppliers in a context of sharply increasing demand affected the ability of many countries to respond properly to the health emergency.
Global manufacturing of pharmaceutical products is heavily concentrated in industrialized countries and a small number of developing countries, mainly in Asia. The countries of Latin America and the Caribbean generally do not have sufficient production capabilities of their own, so that the supply of medicines, vaccines and active ingredients largely depends on imports from outside the region. The information available for five countries (Brazil, Chile, Colombia, Costa Rica and Mexico) shows a large share for imports in the supply of pharmaceutical products available locally for intermediate or final use (between 25% and 92%, depending on the country and product type) (see figure II.20A). Data from developed countries, including several of the world’s leading exporters of pharmaceutical products, also show imports providing a large proportion of supply, especially in the case of pharmaceutical intermediates (see figure II.20B).
Figure II.20 Latin America (5 countries) and developed countries (7 countries): origin of pharmaceutical products, in total and by type of use, 2013–2017a b
(Percentages of total value)
Domestic production
Imports
6955
75
51 5842 46 45 47
238
27
68 71 66
3145
25
49 4258 54 55 53
7792
73
32 29 34
0
20
40
60
80
100
Tota
l
Inte
rmed
iate
use
(29%
)
Fina
l use
(71%
)
Tota
l
Inte
rmed
iate
use
(58%
)
Fina
l use
(42%
)
Tota
l
Inte
rmed
iate
use
(33%
)
Fina
l use
(67%
)
Tota
l
Inte
rmed
iate
use
(17%
)
Fina
l use
(83%
)
Tota
l
Inte
rmed
iate
use
(38%
)
Fina
l use
(62%
)
Brazil(2015)
Chile(2017)
Colombia(2017)
Costa Rica(2017)
Mexico(2013)
A. Latin America

117Chapter IIInternational Trade Outlook for Latin America and the Caribbean • 2021
Domestic production
Imports
B. Developed countries
6146
68 6039
6750
10
60 5636
68
4455
40
71 6982
69 65
97
3954
32 4061
3350
90
40 4464
32
5645
60
29 3118
31 353
0
20
40
60
80
100
Tota
l
Inte
rmed
iate
use
(29%
)
Fina
l use
(71%
)
Tota
l
Inte
rmed
iate
use
(27%
)
Fina
l use
(73%
)
Tota
l
Inte
rmed
iate
use
(18%
)
Fina
l use
(82%
)
Tota
l
Inte
rmed
iate
use
(39%
)
Fina
l use
(61%
)
Tota
l
Inte
rmed
iate
use
(25%
)
Fina
l use
(75%
)
Tota
l
Inte
rmed
iate
use
(80%
)
Fina
l use
(20%
)
Tota
l
Inte
rmed
iate
use
(88%
)
Fina
l use
(12%
)
United States(2017)
Belgium(2015)
France(2017)
Italy(2017)
United Kingdom(2017)
Rep. of Korea(2017)
Japan(2015)
Source: Economic Commission for Latin America and the Caribbean (ECLAC), on the basis of Brazilian Institute of Geography and Statistics (IBGE), Central Bank of Chile, National Administrative Department of Statistics (DANE), Central Bank of Costa Rica, National Institute of Statistics and Geography (INEGI), Organisation for Economic Co-operation and Development (OECD) and Ministry of Internal Affairs and Communications of Japan.
a Data are for the latest year available in each country, shown on the horizontal scale next to the country name.b The figure in brackets next to each product category (intermediate or final use) is its share of the total value of the country’s supply of pharmaceutical products.
The breakdown of local pharmaceutical production by the origin of value added also shows links with imports via the inputs directly or indirectly employed by the sector. Among the Latin American countries considered, Mexico, Costa Rica and, to a lesser extent, Chile are more integrated internationally, with an import content of locally manufactured products similar to that observed in countries such as France and Italy (around 25% to 35% of total value) and significantly higher than in the United States (see figure II.21).
Figure II.21 Latin America (5 countries) and developed countries (4 countries): local pharmaceutical sector production by origin of value added, 2012–2017a
(Percentages)
Domestic value added
Imported content
8274 79
69 64
94
72 65
86
1826 21
31 36
6
28 35
14
0
20
40
60
80
100
Braz
il(2
015)
Chile
(201
7)
Colo
mbi
a(2
017)
Cost
a Ri
ca(2
017)
Mex
ico
(201
3)
Unite
d St
ates
(201
2)
Fran
ce(2
017)
Italy
(201
7)
Japa
n(2
015)
Source: Economic Commission for Latin America and the Caribbean (ECLAC), on the basis of Brazilian Institute of Geography and Statistics (IBGE), Central Bank of Chile, National Administrative Department of Statistics (DANE), Central Bank of Costa Rica, National Institute of Statistics and Geography (INEGI), Organisation for Economic Co-operation and Development (OECD) and Ministry of Internal Affairs and Communications of Japan.
a Data are for the latest year available in each country, shown on the horizontal scale next to the country name.
Figure II.20 (concluded)

118 Economic Commission for Latin America and the Caribbean (ECLAC)Chapter II
The main imported inputs used in pharmaceutical production in the region come from the sector itself or from other sectors of the chemical industry: the combined share of these sectors ranges from 57% to 79%, depending on the country (see figure II.22). Analysis of the geographical origin of these inputs reveals that there is little intraregional productive integration in Brazil and Mexico, the region’s two largest pharmaceutical producers, since in both cases the main suppliers are outside the region (see figure II.23).
Figure II.22 Latin America (5 countries) and developed countries (4 countries): import content of local pharmaceutical production by sector of origin, 2012–2017a
(Percentages)
2 3
37 38
1029 32
61
3925 3
3 5 5 2 3
14
26 19
52
4047
10
24
23 42
11 2129 20
1714
1835
24
2316
6 103 8
17 14 13
0
20
40
60
80
100
Brazil(2015)
Chile(2017)
Colombia(2017)
Costa Rica(2017)
Mexico(2013)
UnitedStates(2012)
France(2017)
Italy(2017)
Japan(2015)
Farming, forestryand fisheries
Mining and quarryingPharmaceutical products
Other chemicalsOther manufacturingServices
Source: Economic Commission for Latin America and the Caribbean (ECLAC), on the basis of Brazilian Institute of Geography and Statistics (IBGE), Central Bank of Chile, National Administrative Department of Statistics (DANE), Central Bank of Costa Rica, National Institute of Statistics and Geography (INEGI), Organisation for Economic Co-operation and Development (OECD) and Ministry of Internal Affairs and Communications of Japan.
a Data are for the latest year available in each country, shown on the horizontal scale next to the country name.
Figure II.23 Latin America (5 countries): imports of basic chemical inputs and pharmaceutical inputs by region of origin, 2007 and 2019(Percentages of total value)
Latin America and the Caribbean
United States
European Union
IndiaRest of AsiaRest of world
A. Basic chemical inputs
11 9
27 21 23
7
3018
9
33
6 3 4 4
0
20
40
60
80
100
2007 2019 2007 2019 2007 2019 2007 2019 2007 2019Brazil Chile Colombia Costa Rica Mexico
China39
24
3433
51
49
30
28
8065
25
18
17
10
11
1217
14
12
10
11
23
9
19
7
1811
27
3
13
25 7
8 113 4 3 5
1 39 102 3 4 4 7 3 2 2
21
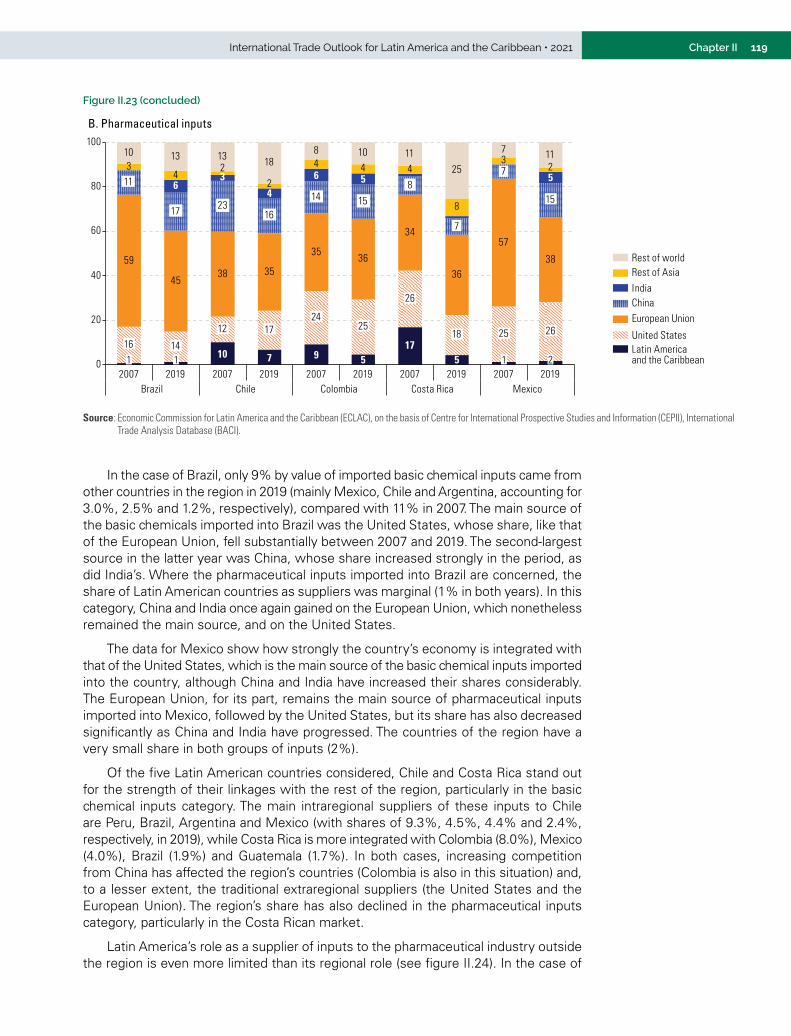
119Chapter IIInternational Trade Outlook for Latin America and the Caribbean • 2021
10 7 9 517
5
64
6 5 5
0
20
40
60
80
100
2007 2019 2007 2019 2007 2019 2007 2019 2007 2019Brazil Chile Colombia Costa Rica Mexico
1 1 1 216 14
12 1724
25
26
18 25 26
59
4538 35
3536
34
36
57
38
11
17 2316
14 15
8
7
7
15
33
42
2
4 4 4
8
32
10 13 13 188 10 11
25
7 11
B. Pharmaceutical inputs
Latin America and the Caribbean
United States
European Union
IndiaRest of AsiaRest of world
China
Source: Economic Commission for Latin America and the Caribbean (ECLAC), on the basis of Centre for International Prospective Studies and Information (CEPII), International Trade Analysis Database (BACI).
In the case of Brazil, only 9% by value of imported basic chemical inputs came from other countries in the region in 2019 (mainly Mexico, Chile and Argentina, accounting for 3.0%, 2.5% and 1.2%, respectively), compared with 11% in 2007. The main source of the basic chemicals imported into Brazil was the United States, whose share, like that of the European Union, fell substantially between 2007 and 2019. The second-largest source in the latter year was China, whose share increased strongly in the period, as did India’s. Where the pharmaceutical inputs imported into Brazil are concerned, the share of Latin American countries as suppliers was marginal (1% in both years). In this category, China and India once again gained on the European Union, which nonetheless remained the main source, and on the United States.
The data for Mexico show how strongly the country’s economy is integrated with that of the United States, which is the main source of the basic chemical inputs imported into the country, although China and India have increased their shares considerably. The European Union, for its part, remains the main source of pharmaceutical inputs imported into Mexico, followed by the United States, but its share has also decreased significantly as China and India have progressed. The countries of the region have a very small share in both groups of inputs (2%).
Of the five Latin American countries considered, Chile and Costa Rica stand out for the strength of their linkages with the rest of the region, particularly in the basic chemical inputs category. The main intraregional suppliers of these inputs to Chile are Peru, Brazil, Argentina and Mexico (with shares of 9.3%, 4.5%, 4.4% and 2.4%, respectively, in 2019), while Costa Rica is more integrated with Colombia (8.0%), Mexico (4.0%), Brazil (1.9%) and Guatemala (1.7%). In both cases, increasing competition from China has affected the region’s countries (Colombia is also in this situation) and, to a lesser extent, the traditional extraregional suppliers (the United States and the European Union). The region’s share has also declined in the pharmaceutical inputs category, particularly in the Costa Rican market.
Latin America’s role as a supplier of inputs to the pharmaceutical industry outside the region is even more limited than its regional role (see figure II.24). In the case of
Figure II.23 (concluded)

120 Economic Commission for Latin America and the Caribbean (ECLAC)Chapter II
the United States, only 7% of the supply of imported basic chemical inputs originated in Latin American countries in 2019, with the main source countries being Mexico (3.3%) and Brazil (1.9%); for pharmaceutical inputs, the region’s share was just 1%. In countries such as France and Italy (whose pharmaceutical industries are more internationally integrated than that of the United States) and Japan, Latin America’s share is also marginal.
Figure II.24 Developed countries (4 countries): imports of basic chemical inputs and pharmaceutical inputs by region of origin, 2007 and 2019(Percentages of total value)
7 7
3
6
32
4 4
1 1 1 1 2 3
7
16
37 4
921
27
A. Basic chemical inputs
8 819 18
53
35
64 6873
60 3022
1217
173
36 16
2118 19
6 10 15 1811 5
0
20
40
60
80
100
2007 2019 2007 2019 2007 2019 2007 2019United States France Italy Japan
22 Latin America and the Caribbean
United States
European Union
IndiaRest of AsiaRest of world
China
1 1 1 1 2
21 1610
21 21 24
69 69
5961
53
59
4046
7 5
45
3
4
128
8 123 6
4
210
6
14 12 12 11
29
13 14 13
0
20
40
60
80
100
2007 2019 2007 2019 2007 2019 2007 2019United States France Italy Japan
B. Pharmaceutical inputs
Latin America and the Caribbean
United States
European Union
IndiaRest of AsiaRest of world
China
Source: Economic Commission for Latin America and the Caribbean (ECLAC), on the basis of Centre for International Prospective Studies and Information (CEPII), International Trade Analysis Database (BACI).
Characterization of imports by price range shows that most of the basic chemical inputs imported by Brazil and Colombia from Latin America are high-priced products, while those imported by Chile and, to a lesser extent, Costa Rica are mainly in the medium-priced category (see figure II.25). In all four countries, intraregional imports of pharmaceutical inputs belong mostly to the low-priced group, a characteristic they share with inputs imported from outside the region (with the main exception of those from Switzerland, a major supplier of high-priced inputs).

121Chapter IIInternational Trade Outlook for Latin America and the Caribbean • 2021
Figure II.25 Latin America (4 countries): imports of basic chemical inputs and pharmaceutical inputs by price category and region of origin, 2019(Percentages of each region’s total)
High-pricedMedium-pricedLow-pricedN/A
A. Brazil
50
12 9 9
3523 17
7
42 36
26
2741
3
26
28
19
16
19
1
24
5541
88
3849
6474
39
64
6 8 3
0
20
40
60
80
100
Latin America and the Caribbean
United States European Union China India
Basi
cch
emic
al in
puts
Phar
mac
eutic
alin
puts
Basi
cch
emic
al in
puts
Phar
mac
eutic
alin
puts
Basi
cch
emic
al in
puts
Phar
mac
eutic
alin
puts
Basi
cch
emic
al in
puts
Basi
cch
emic
al in
puts
Phar
mac
eutic
alin
puts
Phar
mac
eutic
alin
puts
B. Chile
18 2517
10
53
31
9 3
49
26
69
7
79
3
24
944
37
16
6
12
66
3
87
20
6047
60
34
68
2 1 3
0
20
40
60
80
100
Latin America and the Caribbean
United States European Union China India
Basi
cch
emic
al in
puts
Phar
mac
eutic
alin
puts
Basi
cch
emic
al in
puts
Phar
mac
eutic
alin
puts
Basi
cch
emic
al in
puts
Phar
mac
eutic
alin
puts
Basi
cch
emic
al in
puts
Basi
cch
emic
al in
puts
Phar
mac
eutic
alin
puts
Phar
mac
eutic
alin
puts
High-pricedMedium-pricedLow-pricedN/A
C. Colombia
52
14 12 10
50
168 10
35
13
25
13
78
3
26
235
18
22
6
23
63
10
87
24
82
5872
43
81
110
0
20
40
60
80
100
Latin America and the Caribbean
United States European Union China India
Basi
cch
emic
al in
puts
Phar
mac
eutic
alin
puts
Basi
cch
emic
al in
puts
Phar
mac
eutic
alin
puts
Basi
cch
emic
al in
puts
Phar
mac
eutic
alin
puts
Basi
cch
emic
al in
puts
Basi
cch
emic
al in
puts
Phar
mac
eutic
alin
puts
Phar
mac
eutic
alin
puts
High-pricedMedium-pricedLow-pricedN/A
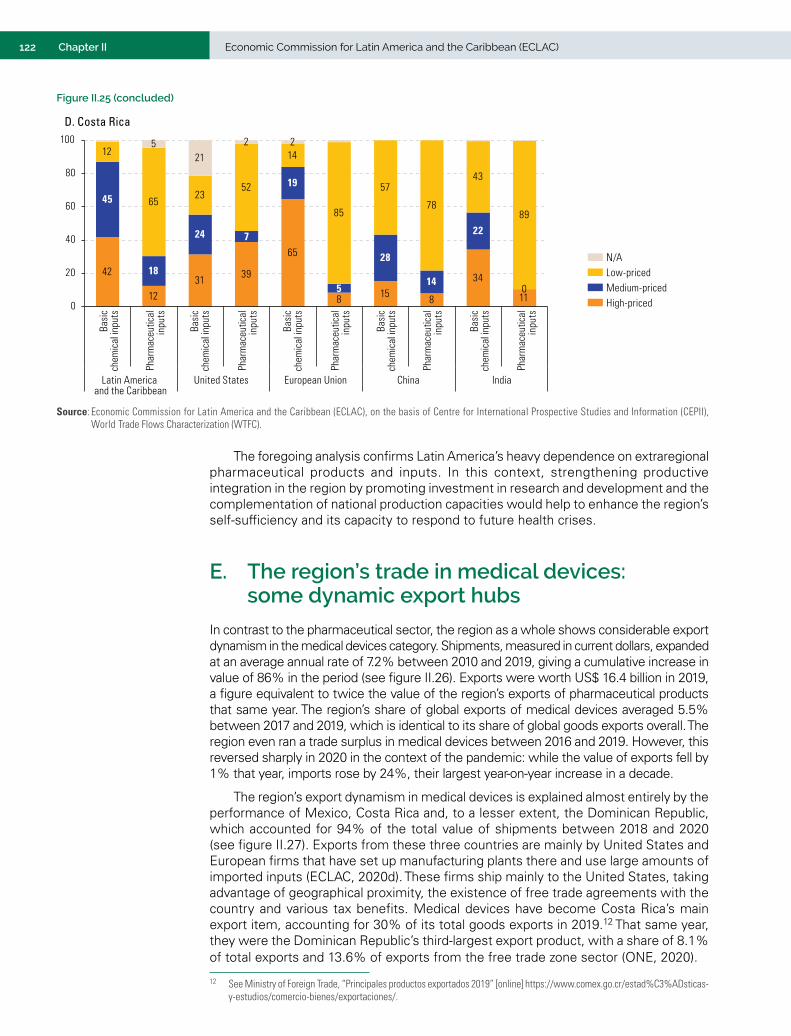
122 Economic Commission for Latin America and the Caribbean (ECLAC)Chapter II
D. Costa Rica
42
1231 39
65
8 15 8
34
11
45
18
24 7
19
5
28
14
22
0
12
6523
52
14
85
57
78
43
89
521
2 2
0
20
40
60
80
100
Latin America and the Caribbean
United States European Union China India
Basi
cch
emic
al in
puts
Phar
mac
eutic
alin
puts
Basi
cch
emic
al in
puts
Phar
mac
eutic
alin
puts
Basi
cch
emic
al in
puts
Phar
mac
eutic
alin
puts
Basi
cch
emic
al in
puts
Basi
cch
emic
al in
puts
Phar
mac
eutic
alin
puts
Phar
mac
eutic
alin
puts
High-pricedMedium-pricedLow-pricedN/A
Source: Economic Commission for Latin America and the Caribbean (ECLAC), on the basis of Centre for International Prospective Studies and Information (CEPII), World Trade Flows Characterization (WTFC).
The foregoing analysis confirms Latin America’s heavy dependence on extraregional pharmaceutical products and inputs. In this context, strengthening productive integration in the region by promoting investment in research and development and the complementation of national production capacities would help to enhance the region’s self-sufficiency and its capacity to respond to future health crises.
E. The region’s trade in medical devices: some dynamic export hubs
In contrast to the pharmaceutical sector, the region as a whole shows considerable export dynamism in the medical devices category. Shipments, measured in current dollars, expanded at an average annual rate of 7.2% between 2010 and 2019, giving a cumulative increase in value of 86% in the period (see figure II.26). Exports were worth US$ 16.4 billion in 2019, a figure equivalent to twice the value of the region’s exports of pharmaceutical products that same year. The region’s share of global exports of medical devices averaged 5.5% between 2017 and 2019, which is identical to its share of global goods exports overall. The region even ran a trade surplus in medical devices between 2016 and 2019. However, this reversed sharply in 2020 in the context of the pandemic: while the value of exports fell by 1% that year, imports rose by 24%, their largest year-on-year increase in a decade.
The region’s export dynamism in medical devices is explained almost entirely by the performance of Mexico, Costa Rica and, to a lesser extent, the Dominican Republic, which accounted for 94% of the total value of shipments between 2018 and 2020 (see figure II.27). Exports from these three countries are mainly by United States and European firms that have set up manufacturing plants there and use large amounts of imported inputs (ECLAC, 2020d). These firms ship mainly to the United States, taking advantage of geographical proximity, the existence of free trade agreements with the country and various tax benefits. Medical devices have become Costa Rica’s main export item, accounting for 30% of its total goods exports in 2019.12 That same year, they were the Dominican Republic’s third-largest export product, with a share of 8.1% of total exports and 13.6% of exports from the free trade zone sector (ONE, 2020).
12 See Ministry of Foreign Trade, “Principales productos exportados 2019” [online] https://www.comex.go.cr/estad%C3%ADsticas-y-estudios/comercio-bienes/exportaciones/.
Figure II.25 (concluded)

123Chapter IIInternational Trade Outlook for Latin America and the Caribbean • 2021
Figure II.26 Latin America and the Caribbean: trade in medical devices, 2010–2020a
(Billions of dollars)
ImportsExportsBalance
-5
0
5
10
15
20
2010 2011 2012 2013 2014 2015 2016 2017 2018 2019 2020
Source: Economic Commission for Latin America and the Caribbean (ECLAC), on the basis of United Nations, United Nations International Trade Statistics Database [online] https://comtrade.un.org/.
a Excludes Panama. The 2020 figures include mirror data for Chile, Costa Rica, the Dominican Republic, Ecuador, Honduras, Jamaica, Nicaragua, Paraguay, Peru, Saint Kitts and Nevis, Saint Lucia and Saint Vincent and the Grenadines.
Figure II.27 Latin America and the Caribbean: distribution of the trade in medical devices by country, 2018–2020 averagea
(Percentages)
Mexico(36)
Brazil(22)
Colombia(8)
Chile(8)
Argentina(5)
Peru(5)
Costa Rica(4)
Ecuador(2)
Dominican. Rep.(2)
Other countries(8)
Mexico(67)
Costa Rica(21)
Dominican. Rep.(6)
Brasil(3)
Other countries(3)
A. Exports B. Imports
Source: Economic Commission for Latin America and the Caribbean (ECLAC), on the basis of United Nations, United Nations International Trade Statistics Database [online] https://comtrade.un.org/.
a Excludes Panama. The 2020 figures include mirror data for Chile, Costa Rica, the Dominican Republic, Ecuador, Honduras, Jamaica, Nicaragua, Paraguay, Peru, Saint Kitts and Nevis, Saint Lucia and Saint Vincent and the Grenadines.
Regional imports of medical devices include both final goods, which supply demand from the countries’ health systems, and components used to produce these goods, some of which are exported. This is especially the case in countries that are production centres for transnational enterprises. Thus, in the period 2018–2020, Mexico was the leading regional importer of medical devices, both to meet the needs of its own population and to serve as inputs for the export sector. In the case of the region’s other main importers (Brazil, Colombia, Chile, Argentina and Peru, in descending order), imports go almost entirely to supply demand from their respective health systems.
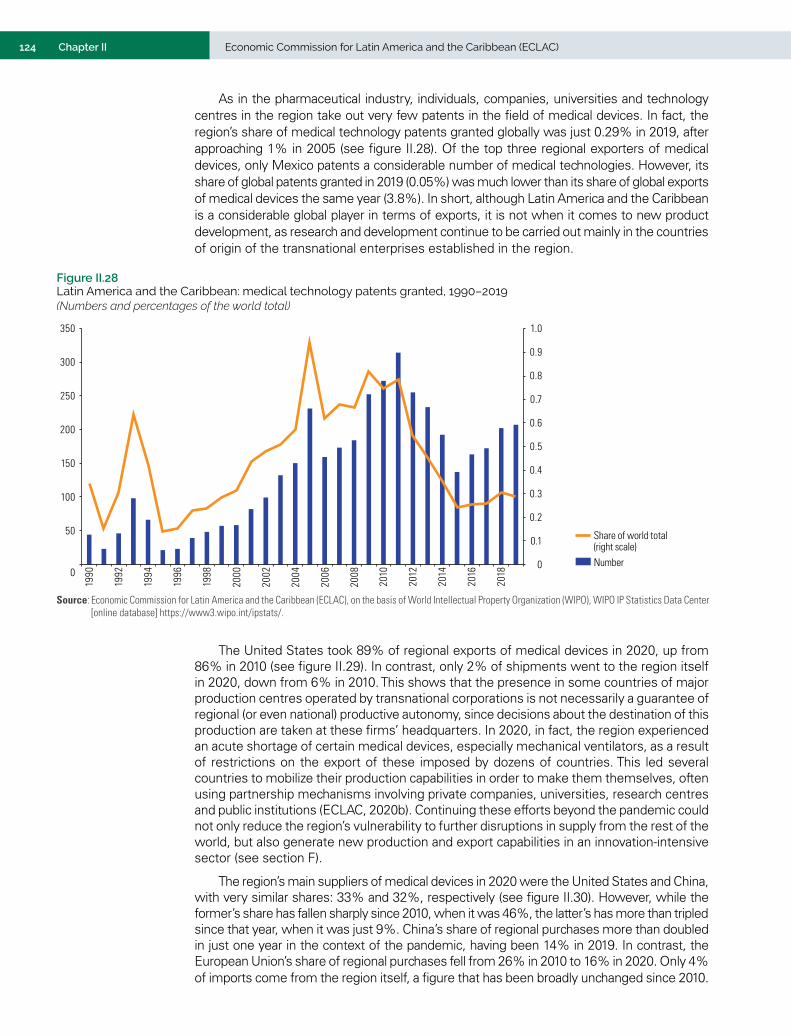
124 Economic Commission for Latin America and the Caribbean (ECLAC)Chapter II
Figure II.28 Latin America and the Caribbean: medical technology patents granted, 1990–2019(Numbers and percentages of the world total)
Number
Share of world total(right scale)
0
0.1
0.2
0.3
0.4
0.5
0.6
0.7
0.8
0.9
1.0
0
50
100
150
200
250
300
350
1990
1992
1994
1996
1998
2000
2002
2004
2006
2008
2010
2012
2014
2016
2018
Source: Economic Commission for Latin America and the Caribbean (ECLAC), on the basis of World Intellectual Property Organization (WIPO), WIPO IP Statistics Data Center [online database] https://www3.wipo.int/ipstats/.
The United States took 89% of regional exports of medical devices in 2020, up from 86% in 2010 (see figure II.29). In contrast, only 2% of shipments went to the region itself in 2020, down from 6% in 2010. This shows that the presence in some countries of major production centres operated by transnational corporations is not necessarily a guarantee of regional (or even national) productive autonomy, since decisions about the destination of this production are taken at these firms’ headquarters. In 2020, in fact, the region experienced an acute shortage of certain medical devices, especially mechanical ventilators, as a result of restrictions on the export of these imposed by dozens of countries. This led several countries to mobilize their production capabilities in order to make them themselves, often using partnership mechanisms involving private companies, universities, research centres and public institutions (ECLAC, 2020b). Continuing these efforts beyond the pandemic could not only reduce the region’s vulnerability to further disruptions in supply from the rest of the world, but also generate new production and export capabilities in an innovation-intensive sector (see section F).
The region’s main suppliers of medical devices in 2020 were the United States and China, with very similar shares: 33% and 32%, respectively (see figure II.30). However, while the former’s share has fallen sharply since 2010, when it was 46%, the latter’s has more than tripled since that year, when it was just 9%. China’s share of regional purchases more than doubled in just one year in the context of the pandemic, having been 14% in 2019. In contrast, the European Union’s share of regional purchases fell from 26% in 2010 to 16% in 2020. Only 4% of imports come from the region itself, a figure that has been broadly unchanged since 2010.
As in the pharmaceutical industry, individuals, companies, universities and technology centres in the region take out very few patents in the field of medical devices. In fact, the region’s share of medical technology patents granted globally was just 0.29% in 2019, after approaching 1% in 2005 (see figure II.28). Of the top three regional exporters of medical devices, only Mexico patents a considerable number of medical technologies. However, its share of global patents granted in 2019 (0.05%) was much lower than its share of global exports of medical devices the same year (3.8%). In short, although Latin America and the Caribbean is a considerable global player in terms of exports, it is not when it comes to new product development, as research and development continue to be carried out mainly in the countries of origin of the transnational enterprises established in the region.

125Chapter IIInternational Trade Outlook for Latin America and the Caribbean • 2021
Figure II.29 Latin America and the Caribbean: distribution of medical device exports by main destinations, 2010 and 2020a
(Billions of dollars)
20102020
0
2
4
6
8
10
12
14
16
United States European Union(28 countries)
Latin America and the Caribbean
Rest of world
Source: Economic Commission for Latin America and the Caribbean (ECLAC), on the basis of United Nations, United Nations International Trade Statistics Database [online] https://comtrade.un.org/.
a Excludes Panama. The 2020 figures include mirror data for Chile, Costa Rica, the Dominican Republic, Ecuador, Honduras, Jamaica, Nicaragua, Paraguay, Peru, Saint Kitts and Nevis, Saint Lucia and Saint Vincent and the Grenadines.
Figure II.30 Latin America and the Caribbean: distribution of imports of medical devices by main origins, 2010 and 2020a
(Billions of dollars)
20102020
0
1
2
3
4
5
6
7
United States China European Union(28 countries)
Rest of Asia Latin America and the Caribbean
Japan Rest of world
Source: Economic Commission for Latin America and the Caribbean (ECLAC), on the basis of United Nations, United Nations International Trade Statistics Database [online] https://comtrade.un.org/.
a Excludes Panama. The 2020 figures include mirror data for Chile, Costa Rica, the Dominican Republic, Ecuador, Honduras, Jamaica, Nicaragua, Paraguay, Peru, Saint Kitts and Nevis, Saint Lucia and Saint Vincent and the Grenadines.
The region’s exports of medical devices are highly concentrated by product. The two main categories exported (instruments and appliances not elsewhere specified, and syringes, needles, catheters and similar products) accounted for 62% of the total value of shipments in 2019. The region’s largest surpluses are in these two categories, even though they are also the largest import categories. By contrast, the region runs a large deficit in diagnostic reagents, used in polymerase chain reaction (PCR) tests to detect COVID-19 (see table II.7). Likewise, the region’s export profile is concentrated in low- and medium-complexity products, with a deficit in the high technology-intensive segment (see table II.8).

126 Economic Commission for Latin America and the Caribbean (ECLAC)Chapter II
Table II.7 Latin America and the Caribbean: main products exported in the medical devices sector, 2019a
(Millions of dollars and percentages)
Ranking HS 2007 codeb Description Technological
intensityExports Imports Balance
Amount Share Amount Share Amount1 901890 Instruments and appliances not elsewhere specified (defibrillators,
incubators, cardiac monitors, dialysis equipment, anaesthesia equipment, parts and accessories)
Medium 5 631 34.4 3 321 28.7 2 310
2 901839 Syringes, needles, catheters, cannulae and the like for medical use Low 4 489 27.4 1 606 13.9 2 8833 902139 Artificial parts of the body (excluding artificial teeth
and dental fittings and artificial joints)High 813 5.0 534 4.6 279
4 901819 Electro-diagnostic apparatus, including apparatus for functional exploratory examination or for checking physiological parameters
High 767 4.7 578 18.0 189
5 902110 Orthopaedic appliances and fracture appliances Low 619 3.8 494 4.3 125
6 630790 Textile masksc Low 603 3.7 614 5.3 -117 901920 Ozone therapy, oxygen therapy, aerosol therapy, artificial respiration
or other therapeutic respiration apparatus, nebulizersMedium 464 2.8 353 3.1 111
8 901832 Tubular metal needles and needles for sutures Low 413 2.5 404 3.5 9
9 902140 Hearing aids (excluding parts and accessories) High 286 1.7 200 1.7 8710 902190 Articles and appliances, which are worn or carried, or implanted in
the body, to compensate for a defect or disability (excluding artificial parts of the body, complete hearing aids and complete pacemakers)
High 261 1.6 440 3.8 -179
Subtotal for the top 10 products 14 347 87.6 8 544 86.8 5 80326 382200 Diagnostic or laboratory reagents on a backing and prepared diagnostic
or laboratory reagents whether or not on a backing, other than those of heading no. 3002 or 3006; certified reference material
49 0.3 1 408 12.2 -1 359
Source: Economic Commission for Latin America and the Caribbean (ECLAC), on the basis of United Nations, United Nations International Trade Statistics Database [online] https://comtrade.un.org/.
a Excludes Panama.b Harmonized Commodity Description and Coding System (HS).c This customs code includes other textile products.
Table II.8 Latin America and the Caribbean (33 countries): exports and imports of medical devices by technological intensity, 2018–2020 average(Millions of dollars)
CountryHigh-technology Low-technology Medium-technology
Trade balanceExports Imports Exports Imports Exports Imports
Latin America and the Caribbean 2 526.6 3 689.4 7 043.6 6 922.1 6 348.6 5 043.5 263.9South America 185.7 2 379.8 372.5 3 491.2 135.1 2 268.2 -7 445.8Argentina 5.6 302.4 25.1 349.4 9.5 215.3 -826.9Bolivia (Plurinational State of) 0.6 44.4 0.2 68.4 0.5 54.4 -165.9Brazil 113.4 1 184.8 234.2 1 399.8 86.8 893.8 -3 043.9Chile 11.2 267.6 18.2 474.3 10.7 385.9 -1 087.6Colombia 7.6 297.3 66.3 638.0 21.8 370.3 -1 209.9Ecuador 2.2 65.8 0.7 140.0 0.8 89.9 -292.1Paraguay 0.7 21.8 17.2 52.6 0.2 25.8 -82.1Peru 3.5 133.7 5.0 229.8 3.7 177.1 -528.5Uruguay 40.6 43.9 4.8 68.7 1.0 31.0 -97.2Venezuela (Bolivarian Republic of) 0.2 18.0 0.8 70.1 0.1 24.5 -111.6
Central America 876.9 205.8 1 605.6 649.5 986.0 306.7 2 306.5Costa Rica 857.6 114.3 1 541.9 308.5 981.2 169.6 2 788.3El Salvador 1.1 20.1 22.6 85.2 1.2 39.2 -119.5Guatemala 17.8 38.2 28.3 151.9 2.5 62.3 -203.7Honduras 0.1 13.2 0.4 55.5 0.1 18.1 -86.3Nicaragua 0.3 20.0 12.3 48.3 0.9 17.5 -72.3Panama 21.1 57.9 40.3 104.4 29.8 96.2 -167.3
Mexico 1 347.0 939.4 4 887.5 2 428.3 4 470.6 2 225.3 5 112.2

127Chapter IIInternational Trade Outlook for Latin America and the Caribbean • 2021
CountryHigh-technology Low-technology Medium-technology
Trade balanceExports Imports Exports Imports Exports Imports
The Caribbean 117.0 164.4 178.0 353.2 756.8 243.2 291.0
Antigua and Barbuda 0.0 3.5 0.0 1.3 0.0 0.9 -5.7
Bahamas 0.1 5.5 0.9 15.1 0.2 12.6 -32.1
Barbados 11.7 4.0 2.3 13.9 0.5 10.7 -14.0
Belize 0.0 1.0 0.9 6.6 0.0 1.9 -8.5
Dominica 0.6 44.4 0.2 68.4 0.5 54.4 -165.9
Grenada 0.0 1.9 0.0 3.5 0.1 1.9 -7.3
Guyana 0.1 2.7 0.1 8.5 0.2 6.3 -17.1
Haiti 0.0 1.2 3.8 11.6 0.1 3.8 -12.7
Jamaica 1.2 11.5 0.5 33.0 0.8 16.0 -58.0
Saint Kitts and Nevis 0.0 0.4 0.0 0.8 0.0 1.6 -2.7
Saint Vincent and the Grenadines 0.0 0.5 0.0 1.8 0.0 1.2 -3.5
Saint Lucia 0.0 0.8 0.1 3.7 0.1 1.7 -5.9
Suriname 0.0 1.6 0.1 9.7 0.5 5.4 -16.2
Trinidad and Tobago 11.7 4.0 2.3 13.9 0.5 10.7 -14.0
Cuba 0.3 20.7 0.6 38.4 0.5 19.9 -77.6
Dominican Republic 91.2 60.8 166.2 123.0 752.7 94.1 732.2
Source: Economic Commission for Latin America and the Caribbean (ECLAC), on the basis of United Nations, United Nations International Trade Statistics Database [online] https://comtrade.un.org/.
Table II.8 (conclusión)
F. The region’s production and technological capabilities in the medical devices sector13
1. The regional market in medical devices
Brazil, Mexico, Colombia, Argentina and Chile between them account for 93% of the demand for medical devices in the countries of the region for which information is available (see figure II.31). Brazil and Mexico supply a large share of their own markets with domestic production. However, the other parts of the market in these two countries and the markets of the rest of the region are mainly supplied by imports, 96% of which originate outside Latin America and the Caribbean. This is the case even in those countries whose trade in medical devices is in surplus. This is a consequence of the enormous diversity of products to be supplied and also of the limited industrial capacity of the countries in the region when it comes to meeting this demand. It should be noted that the productive and technological diversity of medical devices makes total self-sufficiency difficult even in developed countries, which have also suffered from the disruption of global supply chains caused by the pandemic.
In Costa Rica, Mexico, the Dominican Republic and Brazil, the value of domestic production of medical devices exceeds that of imports (see figure II.32), although in the case of the first three countries the bulk of this production is exported. Brazil is the country in the region that is best supplied by domestic production, in terms of both market share and volume. Argentina and Colombia supply between 20% and 25% of their own markets from local production, while in both Chile and Ecuador domestically supplied equipment accounts for only a marginal share of the market.
13 This section is based on Drucaroff (2021).

128 Economic Commission for Latin America and the Caribbean (ECLAC)Chapter II
Figure II.31 Latin America and the Caribbean (10 countries): estimated size of medical devices markets by value and cumulative shares of the total market, 2017–2019a
(Billions of dollars and percentages)
Amount
Cumulative share(right scale)
0
10
20
30
40
50
60
70
80
90
100
0
1
2
3
4
5
6
7
8
Brazil Mexico Colombia Argentina Chile Ecuador Dominican.Rep
Costa Rica Uruguay Bolivia(Plur. State of)
Source: S. Drucaroff, “Análisis de las fortalezas y debilidades de la industria de equipos e insumos médicos en América Latina y el Caribe”, Santiago, Economic Commission for Latin America and the Caribbean (ECLAC), 2021, unpublished; S. de los Santos, “Estudio para determinar las capacidades de producción de insumos y equipos críticos de la industria de salud en México, dentro del contexto de COVID-19”, Santiago, Economic Commission for Latin America and the Caribbean (ECLAC), 2020, unpublished; S. Drucaroff, “Políticas para promover la autonomía sanitaria basada en el desarrollo de proveedores estratégicos de dispositivos médicos”, document presented at the “El derecho a la salud en la Argentina post COVID-19: acceso universal y tecnología local como impulsores de desarrollo” seminar, Buenos Aires, Economic Commission for Latin America and the Caribbean/Deutsche Gesellschaft für Internationale Zusammenarbeit (ECLAC/GIZ), 23–24 June 2020; National Institute of Statistics of Chile, National Institute of Statistics of Uruguay, National Institute for the Monitoring of Medicines and Food (INVIMA), National Council of Free Trade Zones (CNZFE) and National Institute of Statistics and Censuses of Ecuador.
a The total market is the sum of the national markets of the countries presented in the chart.
Figure II.32 Latin America and the Caribbean (8 countries): domestic production and imports of medical devices, 2017–2019 averages(Percentages)
ImportsDomestic production
0
10
20
30
40
50
60
70
80
90
100
Costa Rica Dominican.Rep.
Mexico Brazil Argentina Colombia Chile Ecuador
Source: S. Drucaroff, “Análisis de las fortalezas y debilidades de la industria de equipos e insumos médicos en América Latina y el Caribe”, Santiago, Economic Commission for Latin America and the Caribbean (ECLAC), 2021, unpublished; S. de los Santos, “Estudio para determinar las capacidades de producción de insumos y equipos críticos de la industria de salud en México, dentro del contexto de COVID-19”, Santiago, Economic Commission for Latin America and the Caribbean (ECLAC), 2020, unpublished; S. Drucaroff, “Políticas para promover la autonomía sanitaria basada en el desarrollo de proveedores estratégicos de dispositivos médicos”, document presented at the “El derecho a la salud en la Argentina post COVID-19: acceso universal y tecnología local como impulsores de desarrollo” seminar, Buenos Aires, Economic Commission for Latin America and the Caribbean/Deutsche Gesellschaft für Internationale Zusammenarbeit (ECLAC/GIZ), 23–24 June 2020; National Institute of Statistics of Chile, National Institute of Statistics of Uruguay, National Institute for the Monitoring of Medicines and Food (INVIMA), National Council of Free Trade Zones (CNZFE) and National Institute of Statistics and Censuses of Ecuador.

129Chapter IIInternational Trade Outlook for Latin America and the Caribbean • 2021
The heterogeneous dynamics of the supply of medical devices in the region are reflected in employment and in the firms active in the sector (see table II.9). Mexico and Brazil have the largest amount of employment and enterprises, while Costa Rica and the Dominican Republic also have high levels of employment, driven by export processing zones. The differences in the size of the countries’ production sectors are considerable and reflect disparities in their ability to supply their own markets and to generate competitive advantages for exporting.
Table II.9 Latin America and the Caribbean (9 countries): employees and firms in the medical devices sector, 2019(Numbers)
Country Employees Firms
Brazil 75 000 5 417
Mexico 119 000 485
Argentina 6 700 355
Uruguay 1 123 213
Costa Rica 38 248 76
Colombia 5 136 64
Ecuador 1 067 48
Dominican Republic 24 342 34
Chile 1 350 29
Source: S. Drucaroff, “Análisis de las fortalezas y debilidades de la industria de equipos e insumos médicos en América Latina y el Caribe”, Santiago, Economic Commission for Latin America and the Caribbean (ECLAC), 2021, unpublished; S. de los Santos, “Estudio para determinar las capacidades de producción de insumos y equipos críticos de la industria de salud en México, dentro del contexto de COVID-19”, Santiago, Economic Commission for Latin America and the Caribbean (ECLAC), 2020, unpublished; S. Drucaroff, “Políticas para promover la autonomía sanitaria basada en el desarrollo de proveedores estratégicos de dispositivos médicos”, document presented at the “El derecho a la salud en la Argentina post COVID-19: acceso universal y tecnología local como impulsores de desarrollo” seminar, Buenos Aires, Economic Commission for Latin America and the Caribbean/Deutsche Gesellschaft für Internationale Zusammenarbeit (ECLAC/GIZ), 23–24 June 2020; National Institute of Statistics of Chile, National Institute of Statistics of Uruguay, National Institute for the Monitoring of Medicines and Food (INVIMA), National Council of Free Trade Zones (CNZFE) and National Institute of Statistics and Censuses of Ecuador.
Manufacturers have two distinct profiles in the region: locally owned small and medium-sized enterprises (SMEs) and the leading global transnationals in the sector. The former predominate in countries such as Brazil and Argentina, with some parts and components suppliers in Mexico also fitting this profile, while manufacturing in Costa Rica and the Dominican Republic and in the other parts of the industry in Mexico is dominated by transnationals.
2. Medical device manufacturing and the profile of manufacturers
The diversity of medical devices makes generic categorization of the manufacturing processes involved extremely difficult. For example, firms generally use steel and sheet iron as their main raw materials for the manufacture of a wide range of electromedical equipment, giving it a strong metallurgical profile. In the implant or prosthesis segments, a variety of basic materials are used depending on the purpose of the product, and finishing is usually highly customized. Disposables, on the other hand, are usually mass-produced and relatively undifferentiated and use turnkey technology, with technological progress depending on modernization of capital goods.
The processing stage entails different levels of industrial complexity depending on the type of product, as it may involve integration of third-party metal, electronic or plastic components or activities carried out in the plants themselves, ranging from painting to assembly and the manufacture of some critical components or accessories

130 Economic Commission for Latin America and the Caribbean (ECLAC)Chapter II
of the final product. Firms’ innovation demands drive other more traditional activities which can also contribute to product differentiation, including those relating to design, functionality, safety, efficiency in use and in some cases the design of bespoke capital goods for production processes.
For a wide range of medical devices, basic inputs are processed to create the structural support and casing of products, which are then assembled with a set of electrical and electronic components embodying a substantial part of the value added of medium- and high-complexity equipment. In most countries in the region, these components tend to be imported, so that having local manufacturing does not necessarily mean capturing the bulk of value added in the value chain. Access to these critical components is very important for domestically owned SMEs, since the availability of suppliers to grow the sector on the basis of products with short production runs is vital to the development of medium-technology equipment.
In contrast, leading global transnationals favour vertical integration of processes (while retaining multiple production locations) as a way of protecting innovation and ensuring quality. Although in recent years there has been decentralization towards suppliers of metal and electronic parts and components, value chains are governed hierarchically and this inner ring of critical suppliers are required to comply with strict quality certification standards and sign exclusivity contracts, so that transnationals still strongly protect innovation. The domination of a very substantial share of the global medical device trade by just 30 firms is indicative of the value chain hierarchy.
The strategy of vertical integration with offshoring of production is very costly for SMEs in the region, because of both the minimum scale required and the limitations they face in accessing finance to expand production. SMEs thus tend to develop medium- and long-term supplier relationships with other local or foreign SMEs as a strategy to differentiate themselves and reduce the capital they need to operate. Depending on the part or component to be developed, this type of production link-up may limit the technological learning of SMEs and delay the launch of new products. However, some SME manufacturers manage to develop partnerships and strategic business relationships with their counterparts to incorporate innovations in these components on the basis of their own innovation and design efforts. This is a virtuous co-development mechanism where the supplier’s reputation benefits from participation in an innovative end product. Having a say in specifications that result in greater customization of their products helps suppliers to differentiate themselves in the market and protects their intellectual property in the innovation.
The capabilities of firms operating in the medical devices sector (innovation, design, rapid compliance with product regulations, etc.) determine the hierarchy in the value chain, with leaders that are drivers of innovation at the top and followers that are product and price takers at the bottom. Likewise, these capabilities determine the characteristics of their relationship with strategic suppliers, especially when these are foreign firms operating in highly specific production niches.
The above considerations are important when it comes to designing and implementing policies to scale up the production capabilities of the region’s manufacturers towards greater complexity, and even more so in the face of supply chain disruption such as that caused by the pandemic. Public policies should focus not only on developing suppliers capable of replacing imported components, but also and vitally on increasing companies’ internal capabilities with a view to vertical integration or the development of strategic supply relationships that guarantee their sustainability over time.

131Chapter IIInternational Trade Outlook for Latin America and the Caribbean • 2021
3. Guidelines for identifying medical devices with export potential
Since the outbreak of the current pandemic, governments in the region have pursued various strategies to promote local production of medical devices such as mechanical ventilators, diagnostic kits and masks whose supply from imports was severely disrupted in 2020. These efforts have often been pursued through public-private consortia involving companies that have technologies applicable to the medical sector but do not necessarily operate in it on a regular basis. While these initiatives have been undertaken in response to a specific situation of scarcity, uncertainty about the duration of the pandemic and the possibility of further similar events have increased the interest of the region’s industrial policymakers in permanently strengthening local production capabilities. In this context, consideration should be given to the possibility not only of supplying part of each country’s domestic consumption requirements, but also of generating opportunities for exporting, particularly to the regional market.
In the light of the above considerations, we shall now propose an analytical framework that can enable countries to identify priority areas, setting out from the best possible starting conditions; i.e., to orient policy efforts towards the areas where they could have the greatest impact (see diagram II.2). This first opportunity filter allows the focus to be put on a subset or family of products for which countries have existing or latent competitive advantages. Given the breadth of these product families, it will then be necessary to identify opportunities regarding specific products, based on productive and technological feasibility, cost competitiveness and the scope for guaranteeing the supply of imported components and parts or manufacturing them locally. Lastly, it is proposed that a mission-oriented policy to apply a national medical device manufacturing strategy should be designed in the light of the current strengths of the production system and the search for production and trade complementarities with other countries in the region. This analysis can be undertaken in each country and also at the regional level.
Diagram II.2 Methodology for identifying areas of opportunity in the local development of medical devices
Potential production and technological capacity, cost competitiveness
and secure supply of componentsnot produced locally
Identification of competitive spaces by country on the basis of international trade indicators
Mission-oriented policy to encourage
local production of medical devices
Selection of products, identification of revealed or potential domestic
suppliers, attraction of regional foreign direct investment and search
for opportunities to achieve production complementarities in the region
Local production and technological capabilities
Revealed or potential trade advantages
Source: S. Drucaroff, “Análisis de las fortalezas y debilidades de la industria de equipos e insumos médicos en América Latina y el Caribe”, Santiago, Economic Commission for Latin America and the Caribbean (ECLAC), 2021, unpublished.
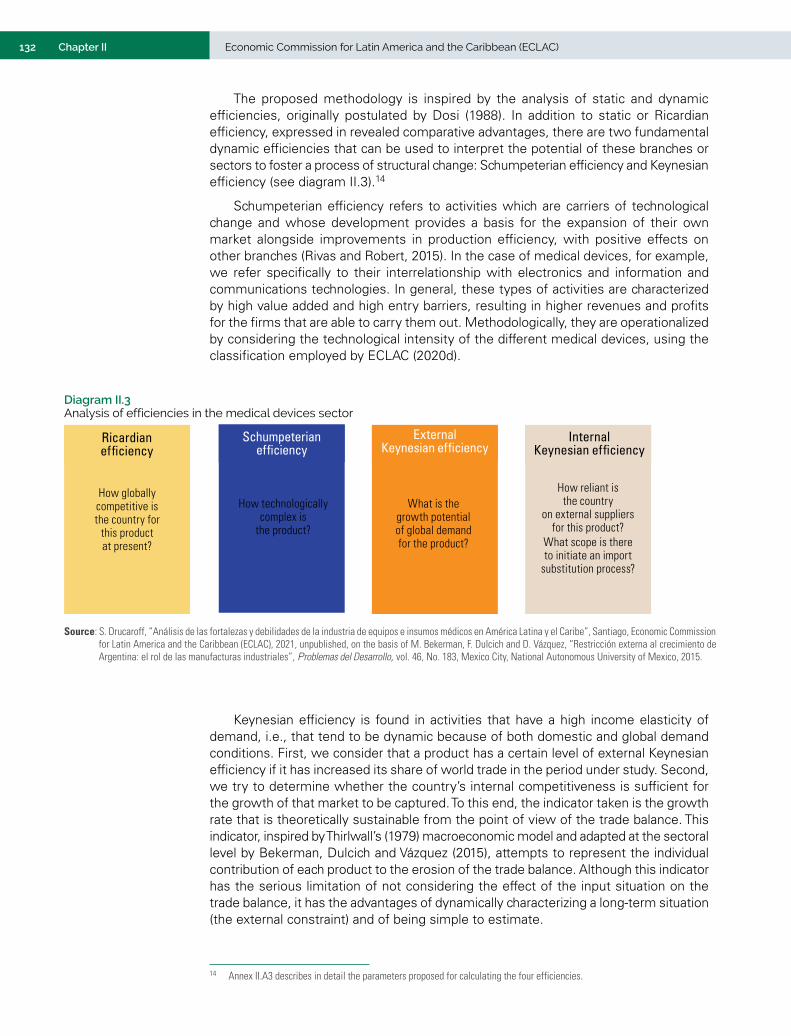
132 Economic Commission for Latin America and the Caribbean (ECLAC)Chapter II
The proposed methodology is inspired by the analysis of static and dynamic efficiencies, originally postulated by Dosi (1988). In addition to static or Ricardian efficiency, expressed in revealed comparative advantages, there are two fundamental dynamic efficiencies that can be used to interpret the potential of these branches or sectors to foster a process of structural change: Schumpeterian efficiency and Keynesian efficiency (see diagram II.3).14
Schumpeterian efficiency refers to activities which are carriers of technological change and whose development provides a basis for the expansion of their own market alongside improvements in production efficiency, with positive effects on other branches (Rivas and Robert, 2015). In the case of medical devices, for example, we refer specifically to their interrelationship with electronics and information and communications technologies. In general, these types of activities are characterized by high value added and high entry barriers, resulting in higher revenues and profits for the firms that are able to carry them out. Methodologically, they are operationalized by considering the technological intensity of the different medical devices, using the classification employed by ECLAC (2020d).
14 Annex II.A3 describes in detail the parameters proposed for calculating the four efficiencies.
Diagram II.3 Analysis of efficiencies in the medical devices sector
Ricardianefficiency
Schumpeterian efficiency
External Keynesian efficiency
Internal Keynesian efficiency
How globally competitive is the country for
this product at present?
How technologically complex is
the product?
How reliant isthe country
on external suppliers for this product?
What scope is there to initiate an import
substitution process?
What is the growth potential of global demand for the product?
Source: S. Drucaroff, “Análisis de las fortalezas y debilidades de la industria de equipos e insumos médicos en América Latina y el Caribe”, Santiago, Economic Commission for Latin America and the Caribbean (ECLAC), 2021, unpublished, on the basis of M. Bekerman, F. Dulcich and D. Vázquez, “Restricción externa al crecimiento de Argentina: el rol de las manufacturas industriales”, Problemas del Desarrollo, vol. 46, No. 183, Mexico City, National Autonomous University of Mexico, 2015.
Keynesian efficiency is found in activities that have a high income elasticity of demand, i.e., that tend to be dynamic because of both domestic and global demand conditions. First, we consider that a product has a certain level of external Keynesian efficiency if it has increased its share of world trade in the period under study. Second, we try to determine whether the country’s internal competitiveness is sufficient for the growth of that market to be captured. To this end, the indicator taken is the growth rate that is theoretically sustainable from the point of view of the trade balance. This indicator, inspired by Thirlwall’s (1979) macroeconomic model and adapted at the sectoral level by Bekerman, Dulcich and Vázquez (2015), attempts to represent the individual contribution of each product to the erosion of the trade balance. Although this indicator has the serious limitation of not considering the effect of the input situation on the trade balance, it has the advantages of dynamically characterizing a long-term situation (the external constraint) and of being simple to estimate.

133Chapter IIInternational Trade Outlook for Latin America and the Caribbean • 2021
The first dimension of the proposed methodology analyses the current specialization profile on the basis of Ricardian comparative advantages (see diagram II.4). If the level of specialization proves to be high, revealing Ricardian efficiency, the next step is to look at technological intensity and global market dynamics to assess whether the position appears sustainable or whether any measures to improve competitiveness are warranted. Lastly, technological intensity determines the competition conditions in that segment: in the case of low-technology products, scale and price determine competition conditions more than differentiation and innovation, while in the case of medium- and high-technology products, the accumulation of prior knowledge, investment in research and development and market differentiation are crucial to the competitive success of suppliers.
Diagram II.4 Policy options as determined by the analysis of efficiencies in the medical devices sector
Revealed comparative advantage (Ricardian efficiency)
Medium or low: pursue policies
Identificationof opportunities
to stimulate the production
of medical devices Medium: product differentiation, product and process design and
innovation, small and medium-sized enterprises predominate
High: research and development-intensive, multinationals predominate
Low: harder to promote
Evaluation of global demand (Keynesian efficiency I)
Technological complexity of products (Schumpeterian efficiency)
Evaluation of domestic competitiveness (Keynesian efficiency II)
Medium-low and medium-high:potentially worth prioritizing
High: should be prioritized
Low: the industry competeson scale or low wages
High: sustain competitiveness
Low: should not be prioritized
Medium or high: could beworth prioritizing
Source: S. Drucaroff, “Análisis de las fortalezas y debilidades de la industria de equipos e insumos médicos en América Latina y el Caribe”, Santiago, Economic Commission for Latin America and the Caribbean (ECLAC), 2021, unpublished.
In summary, the analytical framework presented here includes a weighting of the different efficiencies to identify a first group of products that could be prioritized. This exercise has to be supplemented by a detailed analysis of local capabilities in each country in respect of industrial and technological feasibility, the cost competitiveness of domestic manufacturing, and domestic integration of components (see table II.10). For example, for local production to be industrially and technologically feasible, producers must, at a minimum: meet international quality standards; operate on a scale sufficient to meet at least local demand; produce within shorter time frames than external suppliers; and be able to provide local technological support for the use, maintenance and repair of equipment.

134 Economic Commission for Latin America and the Caribbean (ECLAC)Chapter II
Industrial and technological feasibility
Competitividad en cuanto al costo que supone la fabricación nacional
Domestic integration of components
–Number of local manufacturers of the final product –Number of local manufacturers of parts and components – Institutions in the science and technology system with capabilities and know-how that can be transferred to the private sector –Skilled human resources –Non-local actors interested in reshoring
–Evaluation of the minimum efficient production scale and markets to be served –Tax regime and sectoral promotion regimes in operation for the activity –Tariff regime in operation –Access to and cost of financing for fixed capital investment and research and development –Economies of scope for manufacturers via diversification and increased scale of production
– Identification of critical components, exploded view diagram of the product – Feasibility of supplying all components locally or via imports – Identification of and contingency planning for parts that are difficult to source externally when global supply chains are under strain
Source: S. Drucaroff, “Análisis de las fortalezas y debilidades de la industria de equipos e insumos médicos en América Latina y el Caribe”, Santiago, Economic Commission for Latin America and the Caribbean (ECLAC), 2021, unpublished.
In decisions about local development of the medical devices sector, the cost competitiveness factor can only be left out of consideration in exceptional situations, i.e., when health policy dictates that it is better for supplies to be secured at any cost than for devices not to be available in a given time horizon. For example, a slowdown in demand for mechanical ventilators because of progress in the global campaign to vaccinate against COVID-19 and the discovery of treatments for the disease could threaten the sustainability of some manufacturers in the region if their production is not sufficiently diversified in the medium and long term.
G. The challenge of integrating trade and production in the health-care industry
The current pandemic and the disruptions it has caused in the supply of medicines, active ingredients and medical devices from abroad have highlighted how vulnerable the region is made by its heavy dependence on extraregional imports. In this context, numerous industrial policy initiatives have been implemented since 2020 to promote local production. The quest for greater levels of productive self-sufficiency in the health sector is now a shared concern throughout the region. This is evidenced by the request made to ECLAC in March 2021 by the Government of Mexico, as president pro tempore of the Community of Latin American and Caribbean States (CELAC), for ECLAC to develop a regional health-care self-sufficiency plan. The guidelines and recommendations provided in that document (ECLAC, 2021) refer specifically to the production of vaccines and medicines; however, they are also largely applicable to the medical devices sector. This is true of the need for greater regional coordination and integration in the trade, production and health spheres.
In the vast majority of the region’s countries, the local market is not large enough to support a competitive scale of production in either the pharmaceutical or the medical devices sector. This situation highlights the importance of implementing policies to promote greater integration of national markets in order to create a large, stable market that produces the incentives required to expand regional production. Particularly in the area of medical devices, it will be vital to manage the tensions between short- and long-term objectives in public investment decisions in order to ensure access to equipment for national health systems while creating incentives for regional manufacturing development. This calibration is important when assessing the
Table II.10 Important factors to be considered in evaluating medical device production capabilities

135Chapter IIInternational Trade Outlook for Latin America and the Caribbean • 2021
adoption or continuity of instruments that may give inconsistent signals, such as special zero-tariff import regimes for medical devices and purchases of these devices financed by loans from international lending agencies whose terms do not allow participation by regional manufacturers to be prioritized.
The production and marketing of medical products are heavily regulated because of their direct impact on people’s health and lives. Cooperation between national regulatory authorities is therefore an indispensable prerequisite for the creation of a regional market. Three lines of action are particularly important in this area: (i) using public procurement mechanisms for medicines to develop regional markets, (ii) implementing a regional platform for clinical trials and (iii) strengthening mechanisms for regulatory convergence and recognition.
Not only would joint procurement of medicines provide access to better prices because of the larger volumes purchased, but this State purchasing power could be used as an industrial policy instrument. The central objective of this line of action would be to improve, even out and coordinate national public procurement systems so that they facilitated the creation of demand for a large, stable regional market in medicines, thereby boosting intraregional trade and the development of regional suppliers. In the case of medical devices, planned procurement and standardization of technical requirements by the areas of the health system in which demand originates are essential to generate scale effects, something that requires institutional coordination mechanisms in countries with decentralized procurement systems.
While the ideal option from the point of view of maximizing scale is to coordinate public procurement at the level of the entire region, it is also important to take advantage of the arrangements that already exist within the various subregional integration mechanisms, such as the Southern Common Market (MERCOSUR), the Central American Integration System (SICA) and the Caribbean Community (CARICOM). It is also recommended that the countries of the region grant each other reciprocal public procurement concessions at least equivalent to those granted to various extraregional partners under free trade agreements. The rationale behind joint procurement of medicines is also applicable to medical devices, with the necessary adaptations to reflect certain characteristics of this segment, such as a slower procurement cycle, given that many devices have a useful life of several years.
The establishment of a clinical trials platform in Latin America and the Caribbean, starting with phase III clinical trials of COVID-19 vaccines, would increase the region’s clinical research capacity and position it as a potential co-developer in the vaccine and treatment development process. Clinical trial networks optimize the use of scarce research resources by avoiding duplication of effort and leveraging the research expertise of the network. Drawing on the findings of many studies allows rapid conclusions to be reached on the best candidate vaccines. Greater mutual recognition of approval decisions by regulatory authorities in the region would likewise help underpin the creation of a regional clinical trials platform. Mutual recognition of clinical trials by the regional reference authorities for medicines designated by the Pan American Health Organization (PAHO), namely those of Argentina, Brazil, Chile, Colombia, Cuba and Mexico, would be an important first step in this direction.
Regulations determine the barriers to market entry for medical products and, ultimately, whether or not a product can be marketed. Approval processes also influence how quickly a product enters the market. Moreover, the degree of regulatory harmonization
136 Economic Commission for Latin America and the Caribbean (ECLAC)Chapter II
and convergence between countries or mutual recognition of regulatory decisions can directly influence trade in medical products and the potential for the establishment of regional production and distribution chains for medicines and vaccines. In this context, what is proposed is to move towards the creation of a network of countries with harmonized regulations in which, under ideal conditions, a drug is registered in one country and, by means of an expedited procedure, this registration is recognized in the rest of the countries in the network. The logic of regulatory convergence in the field of medicines is equally applicable to medical devices, and in fact often involves the same national regulatory authorities.
The productive development of the regional pharmaceutical sector requires considerable investment in infrastructure and human resources, which can only be achieved gradually. It is therefore advisable to strengthen existing production capabilities and gradually increase the range of products on offer, the volume of production and the complexity of processes. The generic drugs in greatest demand in the region’s public health systems are patent-free, so they can be produced and marketed without major obstacles as regards intellectual property rights. In addition, these medicines share similar characteristics in terms of infrastructure and human resource requirements, so it would not be difficult for pharmaceutical laboratories already established in the region to expand their supply.
In addition to the recommendations already mentioned, the following measures would help to stimulate and develop the pharmaceutical industry in Latin America and the Caribbean:
• Identify strategies for drawing qualified local talent into the areas of medicine, pharmacy, biology and chemistry and incorporating it into the industrial and academic sectors in order to raise the overall level of both, since lack of human capital is the greatest constraint on the regional development of the health-care industry.
• Prioritize investment in research and development in the pharmaceutical sector to increase the value added incorporated into products, starting with those for which there is a local or regional supply of inputs, such as bioactives.
• Support industries that process natural products as raw materials for the production of pharmaceutical and parapharmaceutical products that can be marketed regionally and globally. Another recommendation along the same lines is to promote the study of active ingredients derived from plants, with the aim of applying this knowledge to the search for new therapeutic alternatives, and to encourage the organic cultivation of medicinal plants in indigenous communities.
• Make strategic use of the flexibility offered by the TRIPS agreement to maintain the balance between protection for innovation and the needs of public health.
• Have the HS codes for medicines reviewed by a committee of experts. Having a uniform regionwide tariff categorization would facilitate the analysis of trade in pharmaceutical products and the adoption of measures to promote trade and productive integration within the region.
Lastly, it is recommended that existing integration mechanisms and coordination forums in the region should incorporate the issue of productive integration in the health-care industry into their agendas at the highest level. This would provide a basis for follow-up and continuity of the initiatives adopted in an area that is critical for the development of production, technology and health care in the region.
137Chapter IIInternational Trade Outlook for Latin America and the Caribbean • 2021
Bibliography
Álvarez, C. and G. Herrera (2021), “Situación de las industrias de la salud en América Latina y de los esfuerzos en ciencia, tecnología, innovación y nuevas tecnologías digitales”, unpublished.
Ancuța, P. and A. Sonia (2020), “Oil press-cakes and meals valorization through circular economy approaches: a review”, Applied Sciences, vol. 10, No. 21, Basel, Multidisciplinary Digital Publishing Institute (MDPI).
Ballesteros, L. (2021), “Compuestos bioactivos en coco (Cocos nucifera L.): efecto del cultivar y región de cultivo”, Biotecnia, vol. 23, No. 2, Sonora, University of Sonora.
Bekerman, M., F. Dulcich and D. Vázquez (2015), “Restricción externa al crecimiento de Argentina: el rol de las manufacturas industriales”, Problemas del Desarrollo, vol. 46, No. 183, Mexico City, National Autonomous University of Mexico.
Campos, D. and others (2020), “Management of fruit industrial by-products: a case study on circular economy approach”, Molecules, vol. 25, No. 2, Basel, Multidisciplinary Digital Publishing Institute (MDPI).
Cassini, L. (2016), “Determinantes micro y meso económicos del desempeño exportador de empresas industriales en Argentina 2010–2012”, master thesis, San Martín, National University of San Martín.
Cevallos-Casals, B. and others (2006), “Selecting new peach and plum genotypes rich in phenolic compounds and enhanced functional properties”, Food Chemistry, vol. 96, No. 2, Amsterdam, Elsevier.
Chamorro, F. and others (2020), “Valorization of kiwi by-products for the recovery of bioactive compounds: circular economy model”, Proceedings, vol. 70, No. 1, Basel, Multidisciplinary Digital Publishing Institute (MDPI).
CNZFE (National Council of Free Trade Zones) (2020), Informe Estadístico Sector Zonas Francas 2019, Santo Domingo.
De los Santos, S. (2020), “Estudio para determinar las capacidades de producción de insumos y equipos críticos de la industria de salud en México, dentro del contexto de COVID-19”, Santiago, Economic Commission for Latin America and the Caribbean (ECLAC), unpublished.
Dosi, G. (1988), “Institutions and markets in a dynamic world”, The Manchester School, vol. 56, No. 2, Hoboken, Wiley.
Dosi, G., K. Pavitt and L. Soete (1990), The Economics of Technical Change and International Trade, LEM Book Series, Pisa, Sant’Anna School of Advanced Studies.
Drucaroff, S. (2021), “Análisis de las fortalezas y debilidades de la industria de equipos e insumos médicos en América Latina y el Caribe”, Santiago, Economic Commission for Latin America and the Caribbean (ECLAC), unpublished.
Durán, C. and others (2021), “Regulatory reliance to approve new medicinal products in Latin American and Caribbean countries”, Pan American Journal of Public Health, vol. 45, No. 10, Washington, D.C., Pan American Health Organization (PAHO).
Earling, M., T. Beadle and E. Niemeyer (2019), “Açai berry (Euterpe oleracea) dietary supplements: variations in anthocyanin and flavonoid concentrations, phenolic contents, and antioxidant properties”, Plant Foods for Human Nutrition, vol. 74, No. 3, Berlin, Springer.
ECLAC (Economic Commission for Latin America and the Caribbean) (2021), Plan for self-sufficiency in health matters in Latin America and the Caribbean: Lines of action and proposals (LC/TS.2021/115), Santiago, September.(2020a), “Restrictions on the export of medical products hamper efforts to contain coronavirus disease (COVID-19) in Latin America and the Caribbean”, COVID-19 Report, Santiago, May.(2020b), “Sectors and businesses facing COVID-19: emergency and reactivation”, COVID-19 Special Report, No. 4, Santiago, July. (2020c), Building a New Future: Transformative Recovery with Equality and Sustainability (LC/SES.38/3-P/Rev.1), Santiago.(2020d), Foreign Direct Investment in Latin America and the Caribbean, 2020 (LC/PUB.2020/15-P), Santiago.
Elasri, A. and E. Serradel (2020), “Fusiones y adquisiciones en la industria farmacéutica: la teoría de los caminos paralelos y los efectos de la COVID-19”, Barcelona, Open University of Catalonia, 8 June [online] https://economia-empresa.blogs.uoc.edu/es/fusiones-y-adquisiciones-en-la-industria-farmaceutica-la-teoria-de-los-caminos-paralelos-y-los-efectos-de-la-covid-19/.

138 Economic Commission for Latin America and the Caribbean (ECLAC)Chapter II
Elsevier (2020), “Fases de desarrollo de un nuevo fármaco”, Berlin, 8 June [online] https://www.elsevier.com/es-es/connect/medicina/edu-fases-de-desarrollo-de-un-nuevo-farmaco.
IFPMA (International Federation of Pharmaceutical Manufacturers and Associations) (2019), “Considerations for effective regulatory reliance: an industry perspective”, IFPMA Position Paper, 21 June [online] https://www.ifpma.org/wp-content/uploads/2019/06/IFPMA-Position-Paper-Regulatory-Reliance.pdf.
IPSCH (Public Health Institute of Chile) (2021), “Fases de desarrollo de las vacunas” [online] https://www.ispch.cl/anamed/farmacovigilancia/vacunas/fases-de-desarrollo-de-las-vacunas/.
López-Leon, S. and others (2021), “More than 50 long-term effects of COVID-19: a systematic review and meta-analysis”, Scientific Reports, No. 11, Berlin, Springer.
Martínez, J. (2016), “Pandemias y bioamenazas globales del siglo XXI”, Madrid, Elcano Royal Institute [online] http://www.realinstitutoelcano.org/wps/portal/rielcano_es/contenido?WCM_GLOBAL_CONTEXT=/elcano/elcano_es/zonas_es/ari42-2016-martinezhernandez-pandemias-bioamenazas-globales-siglo-21.
Maurer, H. (2001), “Bromelain: biochemistry, pharmacology and medical use”, Cellular and Molecular Life Sciences CMLS, vol. 58, No. 9, Berlin, Springer.
Mayo Clinic (2021), “Diseases and conditions” [online] https://www.mayoclinic.org/diseases-conditions. Morais, D. and others (2015), “Antioxidant activity, phenolics and UPLC–ESI (–)–MS of extracts
from different tropical fruits parts and processed peels”, Food Research International, vol. 77, No. 3, Amsterdam, Elsevier.
MSDsalud (2021), “Proceso de investigación, desarrollo y aprobación de un fármaco” [online] https://www.msdsalud.es/informacion-practica/proceso-investigacion-farmaco.html.
National Economic Prosecutor’s Office (2020), Estudio de Mercado sobre Medicamentos (EM03-2018), Santiago, January [online] https://www.fne.gob.cl/wp-content/uploads/2019/11/Informe_preliminar.pdf.
Novartis Pharmaceuticals (2021), “Proceso de desarrollo de fármacos” [online] https://www.novartis.es/innovacion/proceso-de-desarrollo-de-farmacos.
Nunes, M. and others (2018), “Olive pomace as a valuable source of bioactive compounds: a study regarding its lipid- and water-soluble components”, Science of The Total Environment, vol. 644, Amsterdam, Elsevier.
Olaya, E. (2006), “Caracterización del proceso productivo, logístico y regulatorio de los medicamentos”, Vitae, vol. 13, No. 2, Medellín, University of Antioquia.
ONE (National Bureau of Statistics) (2020), Anuario de Comercio Exterior 2020, Santo Domingo.Osorio, L. and others (2021), “The potential of selected agri-food loss and waste to contribute
to a circular economy: applications in the food, cosmetic and pharmaceutical industries”, Molecules, vol. 26, No. 2, Basel, Multidisciplinary Digital Publishing Institute (MDPI).
Ostwald, D. and others, “The global economic impact of the pharmaceutical industry”, Research Report, 2020 [online] https://www.ifpma.org/wp-content/uploads/2021/04/WifOR_Global_Economic_Footprint_Study_September_2020.pdf.
Peirano, F. (2017), “Equipamiento médico en la Argentina”, Santiago, Economic Commission for Latin America and the Caribbean (ECLAC), unpublished.
Raji, Z. and others (2017), “Extraction optimization and physicochemical properties of pectin from melon peel”, International Journal of Biological Macromolecules, vol. 98, Amsterdam, Elsevier.
Rivas, D. and V. Robert (2015), “Cambio estructural y desarrollo: eficiencia keynesiana y shumpeteriana en la industria manufacturera en la Argentina en el período 2003–2011”, Studies and Perspectives series, No. 42 (LC/L.4028), Buenos Aires, Economic Commission for Latin America and the Caribbean (ECLAC).
Ruiz, I. (2021), “Análisis de las fortalezas y debilidad de la industria farmacéutica en América Latina y el Caribe”, Santiago, Economic Commission for Latin America and the Caribbean (ECLAC), unpublished.
Sagar, N. and others (2018), “Fruit and vegetable waste: bioactive compounds, their extraction, and possible utilization”, Comprehensive Reviews in Food Science and Food Safety, vol. 17, No. 3, Hoboken, Wiley.
Sánchez, S. and others (2019), “Estructura de los niveles de concentración de mercado en el sector de elaborados farmacéuticos del Ecuador, período 2010–2017”, Revista Espacios, vol. 40, No. 18, Caracas, Grupo Editorial Espacios GEES.
Savatović, S. and others (2010), “Utilization of tomato waste as a source of polyphenolic antioxidants”, Acta Periodica Technologica, No. 41, Novi Sad, University of Novi Sad.
139Chapter IIInternational Trade Outlook for Latin America and the Caribbean • 2021
SIC (Superintendence of Industry and Commerce) (2020), “Estudios de Mercado: sector farmacéutico en Colombia”, Bogotá, December [online] https://www.sic.gov.co/sites/default/files/documentos/032021/ES-Sector-Farmaceutico-en-Colombia.pdf.
Thirlwall, A. (1979), “The balance of payments constraint as an explanation of international growth rate differences”, BNL Quarterly Review, vol. 32, No. 128, Rome, Banca Nazionale del Lavoro.
Tungmunnithum, D. and others (2018), “Flavonoids and other phenolic compounds from medicinal plants for pharmaceutical and medical aspects: an overview”, Medicines, vol. 5, No. 3, Basel, Multidisciplinary Digital Publishing Institute (MDPI).
UNAIDS (Joint United Nations Programme on HIV/AIDS) (2021), “AIDS by the numbers” [online] https://www.unaids.org/en.
WCO/WHO (World Customs Organization/World Health Organization) (2020), “HS classification reference for Covid-19 medical supplies. 3.01 Edition”, Brussels [online] http://www.wcoomd.org/-/media/wco/public/global/pdf/topics/nomenclature/covid_19/hs-classification-reference_edition-3_en.pdf?la=en.
WHO (World Health Organization) (2021a), “Regulation and prequalification” [online] https://www.who.int/teams/regulation-prequalification/regulation-and-safety/regulatory-convergence-networks/icdra. (2021b), WHO Coronavirus (COVID-19) Dashboard [online database] https://covid19.who.int/.(2018), “18th International Conference of Drug Regulatory Authorities. Smart safety surveillance: a life-cycle approach to promoting safety of medical products” [online] https://www.who.int/medicines/areas/quality_safety/regulation_legislation/icdra/WHO_DI_32-4_18ICDRA.pdf.(2017), China policies to promote local production of pharmaceutical products and protect public health, Geneva.(2016), “Good regulatory practices: guidelines for national regulatory authorities for medical products”, Working Document, No. QAS/16.686, Geneva, October.
WTO (World Trade Organization) (2021a), “Improving trade data for products essential to fight COVID-19: a possible way forward”, Information Note, Geneva, July [online] https://www.wto.org/english/tratop_e/covid19_e/trade_data_report_e.pdf. (2021b), “Trade in medical goods in the context of tackling COVID-19: developments in 2020”, Information Note, Geneva, June [online] https://www.wto.org/english/tratop_e/covid19_e/medical_goods_update_jun21_e.pdf.

140 Economic Commission for Latin America and the Caribbean (ECLAC)Chapter II
Annex II.A1 Tariff codes included in the health-care industry trade analysis
Tables II.A1.1, II.A1.2 and II.A1.3 provide a breakdown of the list of products making up the expanded health-care industry category. Some of these products, such as certain chemical inputs and machines, are used in several industries. For this reason, some correction factors were introduced. In the case of raw materials, a correction factor of 0.16 was taken, reflecting the pharmaceutical industry share of the Latin American and Caribbean chemical and pharmaceutical sector (16%). In the case of global raw material flows, the factor applied was 0.305, following the same metric (30.5%). For machinery and equipment, the correction factors used were 0.016 and 0.031 for the region and the world, since the pharmaceutical industry accounts for 1.6% and 3.1% of regional and global manufacturing GDP, respectively. The long-term analyses (2010–2020) used a combined converter that took account of the different versions of the Harmonized Commodity Description and Coding System used in the period (those of 2007, 2012 and 2017).
Table II.A1.1 Medicines included in the expanded health-care industry category
Category Codes of the 2017 Harmonized Commodity Description and Coding System
Glucose and glucose syrup; water; ethyl alcohol, sodium chloride, iodine, oxygen, fluorides, nitrites, salts of oxometallic acids; monocarboxylic acids
170230, 220190, 220710, 220720, 220890, 250100, 280120, 280440, 282619, 283410, 284161, 291521
Vitamin A; vitamins B1, D, B3, B6, B12, C and E; Other vitamins and their derivatives, unmixed 293353, 293621, 293622, 293623, 293624, 293625, 293626, 293627, 293628, 293629, 293690, 293712, 293721
Insulin and its salts; polypeptide hormones, protein hormones and glycoprotein hormones, steroids and their derivatives, such as hydrocortisone, prednisone (dehydrocortisone), prednisolone (dehydrohydrocortisone), hormones, steroids and their derivatives, prostaglandins, thromboxanes and leukotrienes
293712, 293719, 293721, 293722, 293723, 293729, 293750, 293790, 293941, 293961, 294110, 294120, 294130, 294140, 294150, 294190
Hormones, prostaglandins, thromboxanes and natural leukotrienes; vegetable alkaloids, ephedrine and its salts; ergot alkaloids and their derivatives; glands and other organs; extracts of glands or other organs; heparin and its salts; antisera and other blood fractions
300120, 300190, 300211, 300320, 300360, 300390
Antibiotics: penicillins and their derivatives with a penicillanic acid structure; streptomycins and their derivatives, tetracyclines and their derivatives, chloramphenicol and its derivatives, erythromycin and its derivatives; salts of all previously described antibiotics
300213, 300219, 300290
Immunological products, unmixed, not put up in measured doses or in forms or packings for retail sale 300410, 300420, 300431, 300432, 300439
Diagnostic reagents based on immunological tests 300215, 382200
Medicaments containing antimalarial active ingredients 300460
Vaccines for human and veterinary medicine 300220, 300230
Source: Economic Commission for Latin America and the Caribbean (ECLAC).

141Chapter IIInternational Trade Outlook for Latin America and the Caribbean • 2021
Table II.A1.2 Raw materials for the pharmaceutical industry included in the expanded health-care industry category
Product examples Codes of the 2017 Harmonized Commodity Description and Coding System
Crude glycerol, glycerol waters and glycerol lyes 152000
Oils and distilling products, aromatic hydrocarbon mixtures, paraffin wax, petroleum jelly
270710, 270720, 270730, 270740, 270750, 271210, 271220, 271290, 280110
Chlorine, iodine, fluorine, sulphur, hydrogen, nitrogen, boron, phosphorus, arsenic, selenium, sodium, hydrochloric acid, sulphuric acid, nitric acid, diphosphorus pentoxide, phosphoric acid
280120, 280130, 280200, 280300, 280410, 280421, 280429, 280430, 280450, 280461, 280469, 280470, 280480, 280490, 280511, 280512, 280519, 280530, 280540, 280610,280620, 280700, 280800, 280910, 280920
Fluorides, inorganic acids, carbon dioxide, silicon dioxide, inorganic oxygen compounds, chlorides, ammonia, hydroxides, hydroxides, oxides, peroxides and tyroxides
281111, 281119, 281121, 281122, 281129, 281210, 281290, 281310, 281390, 281410, 281420, 281511, 281512, 281520, 281530, 281610, 281640, 281810, 281830, 281910, 281990
Lithium oxides, lithium hydroxide, miscellaneous oxides, fluorides, chlorides, bromides, hypochlorites, chlorates and perchlorates
282010, 282090, 282110, 282120, 282200, 282300, 282410, 282490, 282510, 282520, 282710, 282720, 282731, 282732, 282735, 282739, 282741, 282749, 282751, 28275,282760, 282810, 282890, 282911, 282919, 282990
Sodium sulphides, sulphides and polysulphides other than sodium, dithionites and sulphoxylates, sulphites, thiosulphates, sulphates, peroxosulphates, nitrites, phosphinites, phosphates, carbonates, cyanides, silicates
283010, 283090, 283110, 283190, 283210, 283220, 283230, 283311, 283319, 283321, 283322, 283324, 283325, 283327, 283329, 283330, 283340, 283410, 283421, 283429283510, 283522, 283524, 283525, 283526, 283529, 283620, 283630, 283640, 283650, 283660, 283691, 283692, 283699, 283711, 283719, 283720, 283911, 283919, 283990
Borates; disodium tetraborate; borates, peroxoborates, salts, inorganic acids, proxyacids, nitrates, inorganic or organic compounds, phosphides, calcium and silicon carbides
284011, 284019, 284020, 284030, 284130, 284150, 284161, 284169, 284170, 284180, 284190, 284210, 284290, 284310, 284321, 284329, 284390, 284590, 284610, 284690, 284700, 284800, 284910, 284920, 284990
Hydrides, nitrides, azides, silicides and borides, inorganic or organic mercury compounds
285000, 285210, 285290, 285300
Cyclic hydrocarbons; halogenated hydrocarbon derivatives derived from aromatic hydrocarbons
2901, 2902, 2903,2904,2905,2906,2907,2908,2909
Epoxides, epoxyalcohols, epoxyphenols and epoxyethers, aldehydes; aldehyde-ethers aldehyde-phenols and aldehydes with other oxygen function
2910, 2911, 2912, 2913,2914, 2915, 2916, 2917, 2918, 2919
Esters; phosphoric and its salts, hypophosphoric esters; aromatic monoamines; aminoalcohols
2920, 2921, 2922, 2923, 2924, 2925, 296,2927, 2928, 2929
Organo-sulphur compounds; organo-inorganic compounds; heterocyclic compounds, nucleic acids and their salts, sulphonamides, plant alkaloids
2930, 2931,2932, 2933,2935, 2939,
Sugars; sucralose, lactose, etc. 294000, 294200
Dyes (disperse dyes, acids), pigments, mixtures of colouring matter, synthetic organic products
320411, 320412, 320413, 320414, 320415, 320416, 320417, 320419, 320420, 320490, 320500
Essential oils (orange, lemon, citrus fruits, mint, etc.), oils concentrated in fats, oral hygiene preparations
330112, 330113, 330119, 330124, 330125, 330129, 330190, 330690
Surface-active preparations for washing the skin; organic surface-active agents other than soap
340130, 340211, 340212, 340213, 340219
Activated carbon, tall oil, whether or not refined, ester gums 380210, 380300, 380630,
Monocarboxylic fatty acid oils, fatty alcohols 382311, 382312, 382313, 382319, 382370
Propylene and other olefinic polymers, propylene copolymers, halogenated olefin polymers, acrylic polymers, epoxy resins, alkyd resins
390210, 390220, 390230, 390290, 390461, 390469, 390610, 390690, 390730, 390750, 390910, 390920, 390930, 390940
Silicones, cumorane indene petroleum resins, polyterpenes, cellulose acetates, cellulose nitrates in primary forms, cellulose ethers, carboxymethyl cellulose, cellulose and its chemical derivatives
391000, 391110, 391211, 391212, 391220, 391231, 391239, 391290, 391400
Source: Economic Commission for Latin America and the Caribbean (ECLAC).

142 Economic Commission for Latin America and the Caribbean (ECLAC)Chapter II
Table II.A1.3 Pharmaceutical industry inputs and equipment and medical devices included in the expanded health-care industry category
Major groups Major subsectors Codes of the 2017 Harmonized Commodity Description and Coding System
Pharmaceutical industry inputs and equipment
Pharmaceutical industry equipment
Boilers, condensers and vaporizers 840211, 840212, 840220, 840290, 840310, 840390, 840410, 840420, 840490
Furnaces and incinerators 841710, 841780, 841790, 851410, 851420, 851430
Distilling plants 841940
Heat exchange units 841950, 841989, 841990
Filters and purifiers 842121, 842122, 842139, 842199
Packing machinery 842240
Weighing machines and scales 842310, 842320, 842330, 842381, 842382, 842389, 842390
Mould-making machines 847521, 847529, 847590, 847710, 847720, 847730, 847740, 847780, 847790, 847989, 847990, 848010, 848020, 848030, 848041, 848049, 848050, 848060, 848071, 848079
Machines for kneading and grinding 847982
Measuring instruments and apparatus
902610, 902680, 902690, 902710, 902810, 902820, 902830, 902890, 902910, 902920, 902990, 903090, 903210, 903220, 903281, 903289, 903290
Clinical laboratories Laboratory equipment 842119, 901010, 901060, 901090, 901120, 901190, 901210, 901290, 901600, 902720, 902730, 902790, 903120, 910291, 910299, 910610, 910690
Laboratory material 690911, 690912, 690919, 701710, 701720, 701790
Fungible material 300620, 382100, 382200
Medical devices
Medical devices Diagnostic and imaging equipment 900630, 901050, 901110, 901180, 901811, 901812, 901813, 901814, 901819, 901820, 902212, 902213, 902214, 902219, 902221, 902229, 902230, 902290
Medical and surgical instruments 901841, 901849, 901850, 901890
Laboratory equipment 902511, 902519, 841920, 902780, 903020
Therapeutic devices 871310, 871390, 901920, 902110, 902121, 902129, 902131, 902139, 902140, 902150, 902190
Disposable material 300510, 300590, 401490, 401511, 901831, 901832, 901839
Hospital furniture 940210, 940290
Personal protective equipment 630790, 900490, 902000
Source: Economic Commission for Latin America and the Caribbean (ECLAC), on the basis of World Trade Organization (WTO), “Trade in medical goods in the context of tackling COVID-19: developments in 2020”, Information Note, Geneva, 2021 [online] https://www.wto.org/english/tratop_e/covid19_e/medical_goods_update_jun21_e.pdf; World Customs Organization/World Health Organization (WCO/WHO), “HS classification reference for Covid-19 medical supplies. 3.01 Edition”, Brussels, 2020 [online] http://www.wcoomd.org/-/media/wco/public/global/pdf/topics/nomenclature/covid_19/hs-classification-reference_edition-3_en.pdf?la=en.

143Chapter IIInternational Trade Outlook for Latin America and the Caribbean • 2021
Annex II.A2Table II.A2.1 Latin America and the Caribbean (33 countries): trade in health-care industry products, 2018–2020 average(Millions of dollars)
Region, subregion or countryPharmaceutical productsb Inputs and equipmentc
Exports Imports Balance Exports Imports Balance
Latin America and the Caribbeana 7 664.9 33 714.5 -26 049.6 29 756.8 51 718.0 -21 961.2
South America 4 156.7 23 019.4 -18 862.7 2 127.3 18 377.5 -16 250.2
Argentina 694.6 2 957.2 -2 262.7 149.2 2 272.0 -2 122.8
Bolivia (Plurinational State of) 16.0 271.3 -255.3 6.2 338.8 -332.6
Brazil 1 899.1 11 270.6 -9 371.5 1 200.9 7 549.4 -6 348.6
Chile 630.3 1 975.3 -1 345.0 222.9 2 818.0 -2 595.1
Colombia 462.1 3 103.3 -2 641.2 325.7 2 438.9 -2 113.1
Ecuador 35.2 1 361.5 -1 326.3 24.4 656.3 -631.9
Paraguay 56.2 337.8 -281.7 31.7 331.9 -300.2
Peru 133.4 1 243.7 -1 110.3 83.5 1 411.0 -1 327.5
Uruguay 149.2 310.9 -161.7 74.1 339.5 -265.4
Venezuela (Bolivarian Republic of) 80.7 187.8 -107.1 8.7 221.7 -213.0
Central America 834.5 3 030.8 -2 196.4 4 134.4 3 224.5 910.0
Costa Rica 327.8 852.9 -525.1 3 707.5 1 501.8 2205.7
El Salvador 178.0 454.7 -276.7 203.4 403.2 -199.7
Guatemala 288.2 829.8 -541.6 181.2 681.3 -500.1
Honduras 15.0 521.1 -506.0 22.5 253.8 -231.2
Nicaragua 25.4 372.5 -347.0 19.7 384.4 -364.7
Panama 2 286.2 2485.8 -199.6 234.9 663.5 -428.6
Mexico 1 626.5 6 010.4 -4 383.9 21 775.7 27 260.2 -5 484.6
The Caribbean 1 047.2 1 653.8 -606.7 1 719.4 2 855.8 -1 136.4
Antigua and Barbuda 0.1 11.0 -10.9 0.1 25.9 -25.8
Bahamas 16.8 43.9 -27.1 10.4 105.8 -95.5
Barbados 27.7 48.9 -21.1 19.1 72.9 -53.8
Belize 2.2 13.7 -11.5 2.5 31.8 -29.3
Cuba 27.9 95.5 -67.6 2.7 206.7 -204.0
Dominica 16.0 271.3 -255.3 6.2 338.8 -332.6
Dominican Republic 518.0 795.4 -277.4 1 629.9 1 552.9 76.9
Grenada 0.2 8.2 -7.9 0.5 21.8 -21.3
Guyana 38.0 40.7 -2.7 3.6 74.0 -70.4
Haiti 7.6 45.2 -37.7 16.1 66.7 -50.6
Jamaica 6.4 200.5 -194.1 6.2 183.0 -176.8
Saint Kitts and Nevis 0.1 3.7 -3.6 0.3 8.9 -8.6
Saint Lucia 0.8 11.5 -10.7 1.5 18.6 -17.2
Saint Vincent and the Grenadines 0.1 5.2 -5.1 0.1 13.9 -13.7
Suriname 0.1 10.3 -10.2 1.1 60.9 -59.9
Trinidad and Tobago 385.1 48.9 336.2 19.1 72.9 -53.8
Source: Economic Commission for Latin America and the Caribbean (ECLAC), on the basis of United Nations, United Nations International Trade Statistics Database [online] https://comtrade.un.org/.
a Regional totals exclude Panama because of the difficulty of separating out re-exports from the Colón Free Trade Zone.b Includes raw materials and medicines. c Includes pharmaceutical industry machinery and equipment and medical devices.
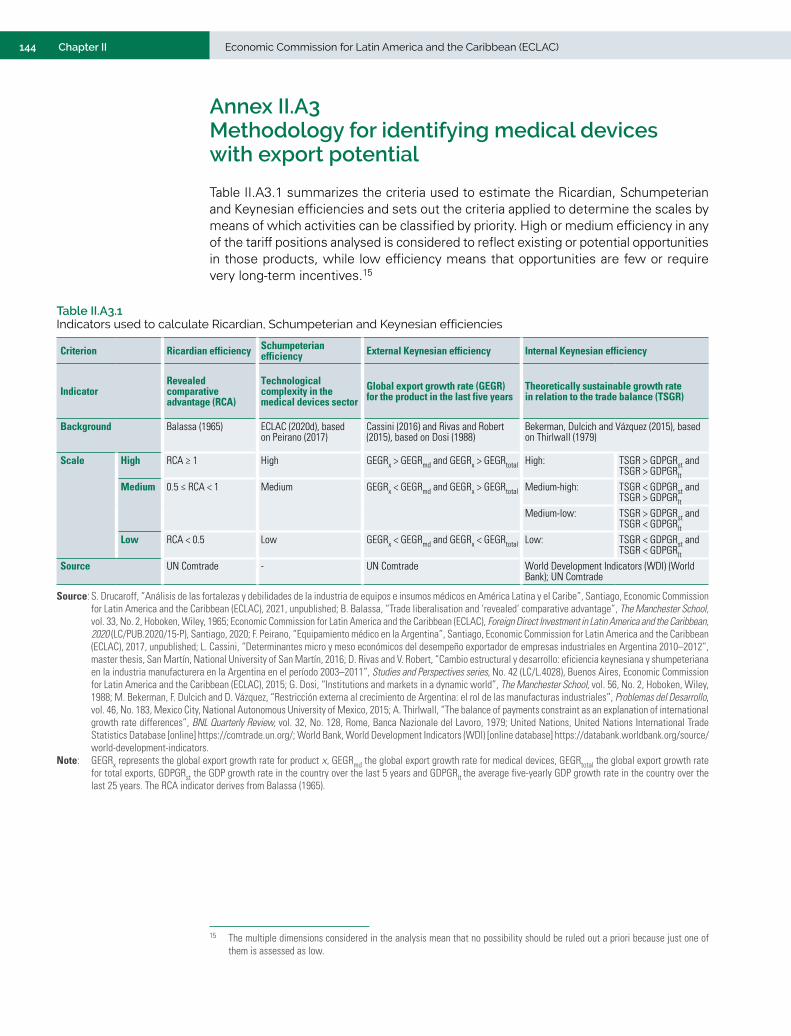
144 Economic Commission for Latin America and the Caribbean (ECLAC)Chapter II
Annex II.A3 Methodology for identifying medical devices with export potential
Table II.A3.1 summarizes the criteria used to estimate the Ricardian, Schumpeterian and Keynesian efficiencies and sets out the criteria applied to determine the scales by means of which activities can be classified by priority. High or medium efficiency in any of the tariff positions analysed is considered to reflect existing or potential opportunities in those products, while low efficiency means that opportunities are few or require very long-term incentives.15
15 The multiple dimensions considered in the analysis mean that no possibility should be ruled out a priori because just one of them is assessed as low.
Table II.A3.1 Indicators used to calculate Ricardian, Schumpeterian and Keynesian efficiencies
Criterion Ricardian efficiency Schumpeterian efficiency External Keynesian efficiency Internal Keynesian efficiency
IndicatorRevealed comparative advantage (RCA)
Technological complexity in the medical devices sector
Global export growth rate (GEGR) for the product in the last five years
Theoretically sustainable growth rate in relation to the trade balance (TSGR)
Background Balassa (1965) ECLAC (2020d), based on Peirano (2017)
Cassini (2016) and Rivas and Robert (2015), based on Dosi (1988)
Bekerman, Dulcich and Vázquez (2015), based on Thirlwall (1979)
Scale High RCA ≥ 1 High GEGRx > GEGRmd and GEGRx > GEGRtotal High: TSGR > GDPGRst and TSGR > GDPGRlt
Medium 0.5 ≤ RCA < 1 Medium GEGRx < GEGRmd and GEGRx > GEGRtotal Medium-high: TSGR < GDPGRst and TSGR > GDPGRlt
Medium-low: TSGR > GDPGRst and TSGR < GDPGRlt
Low RCA < 0.5 Low GEGRx < GEGRmd and GEGRx < GEGRtotal Low: TSGR < GDPGRst and TSGR < GDPGRlt
Source UN Comtrade - UN Comtrade World Development Indicators (WDI) (World Bank); UN Comtrade
Source: S. Drucaroff, “Análisis de las fortalezas y debilidades de la industria de equipos e insumos médicos en América Latina y el Caribe”, Santiago, Economic Commission for Latin America and the Caribbean (ECLAC), 2021, unpublished; B. Balassa, “Trade liberalisation and ‘revealed’ comparative advantage”, The Manchester School, vol. 33, No. 2, Hoboken, Wiley, 1965; Economic Commission for Latin America and the Caribbean (ECLAC), Foreign Direct Investment in Latin America and the Caribbean, 2020 (LC/PUB.2020/15-P), Santiago, 2020; F. Peirano, “Equipamiento médico en la Argentina”, Santiago, Economic Commission for Latin America and the Caribbean (ECLAC), 2017, unpublished; L. Cassini, “Determinantes micro y meso económicos del desempeño exportador de empresas industriales en Argentina 2010–2012”, master thesis, San Martín, National University of San Martín, 2016; D. Rivas and V. Robert, “Cambio estructural y desarrollo: eficiencia keynesiana y shumpeteriana en la industria manufacturera en la Argentina en el período 2003–2011”, Studies and Perspectives series, No. 42 (LC/L.4028), Buenos Aires, Economic Commission for Latin America and the Caribbean (ECLAC), 2015; G. Dosi, “Institutions and markets in a dynamic world”, The Manchester School, vol. 56, No. 2, Hoboken, Wiley, 1988; M. Bekerman, F. Dulcich and D. Vázquez, “Restricción externa al crecimiento de Argentina: el rol de las manufacturas industriales”, Problemas del Desarrollo, vol. 46, No. 183, Mexico City, National Autonomous University of Mexico, 2015; A. Thirlwall, “The balance of payments constraint as an explanation of international growth rate differences”, BNL Quarterly Review, vol. 32, No. 128, Rome, Banca Nazionale del Lavoro, 1979; United Nations, United Nations International Trade Statistics Database [online] https://comtrade.un.org/; World Bank, World Development Indicators (WDI) [online database] https://databank.worldbank.org/source/world-development-indicators.
Note: GEGRx represents the global export growth rate for product x, GEGRmd the global export growth rate for medical devices, GEGRtotal the global export growth rate for total exports, GDPGRst the GDP growth rate in the country over the last 5 years and GDPGRlt the average five-yearly GDP growth rate in the country over the last 25 years. The RCA indicator derives from Balassa (1965).

145Chapter IIInternational Trade Outlook for Latin America and the Caribbean • 2021
Table II.A3.2 Scores assigned to the Keynesian efficiency scales
Scale External Keynesian efficiency (EKE) Internal Keynesian efficiency (IKE)
High 3 points 4 points
Medium-high - 3 points
Medium 2 points -
Medium-low - 2 points
Low 1 point 1 point
Keynesian efficiency (KE) value
Total KE = (EKE*IKE)/max. (EKE*IKE)
Source: S. Drucaroff, “Análisis de las fortalezas y debilidades de la industria de equipos e insumos médicos en América Latina y el Caribe”, Santiago, Economic Commission for Latin America and the Caribbean (ECLAC), 2021, unpublished.
Once the efficiencies have been calculated, the priority activities for each country are established. For this analysis by product, a criterion for scoring Keynesian efficiencies is determined (see table II.A3.2) with the aim of ranking products by priority level. The scores thus obtained by the countries for particular products are multiplied and weighted by the maximum score obtainable, yielding an indicator that summarizes external and internal Keynesian efficiency.

147Chapter IIIInternational Trade Outlook for Latin America and the Caribbean • 2021
IIICHAPTER
How international trade contributes to a circular economy
Introduction
A. International trade should be part of the transformation to the circular economy
B. The region’s share of trade in circular products
C. Forestry-pulp-paper production chains have great circular potential
D. Integrating trade policies to enhance circular economy initiatives
E. Trade agreements can promote the circular economy
F. Recommendations for increasing the contribution of trade to the circular economy
Bibliography
Annex


149Chapter IIIInternational Trade Outlook for Latin America and the Caribbean • 2021 IIIIntroduction
The governments of several Latin American and Caribbean countries are promoting the circular economy in their quest for a more sustainable recovery from the coronavirus disease (COVID-19) pandemic. The circular economy stands in contrast to the dominant make-consume-dispose paradigm of the linear economy. It aims to make efficient use of sustainably sourced materials and energy, with a life-cycle approach. A circular economy is about preserving the value and usefulness of materials and products for as long as possible. This is achieved by applying eco-design, which incorporates the circular economy approach from the stage of product conception, through a sequence of processes that make it possible to maintain the quality and productivity of materials across successive life cycles, and the creation of new business models that reduce the material footprint and collaborate with the regeneration of natural systems (Ellen MacArthur Foundation, 2015). In addition, activities associated with the circular economy offer ample space to create better quality jobs and promote innovation, incorporate technological progress, diversify exports, adapt to and mitigate climate change, and foster regional cooperation (ECLAC, 2020).
In this context, this chapter analyses how international trade can advance the transition towards more circular economies. Trade encourages the generation of new business models and market niches in sectors associated with the circular economy. It also facilitates economies of scale, making it more profitable to transform waste into resources for new production cycles. The circularity potential of the region’s trade lies mainly in creating value from products and materials of organic origin. Trade agreements can boost trade in potentially circular products. The harmonization of environmental and trade agendas within countries, and coordination between trading partners, are essential for this. The new requirements associated with the circular economy emanating from the markets of advanced countries can provide an additional incentive to move towards more sustainable patterns of production and trade.
The COVID-19 crisis and the increasing impacts of climate change have intensified pressures on governments, businesses and consumers to implement circular strategies. For example, mobility restrictions and the temporary closure of many physical businesses reduced purchasing options, making the reuse and repair of goods more necessary and commonplace, with consequent improvements in resource efficiency. In addition, an increasing number of purchases are now conducted through online marketplaces that make it unnecessary to travel to a commercial establishment, but encourage reverse logistics that enable goods to be returned. In addition, a variety of extreme weather events, such as the forest fires and floods that have afflicted several parts of the world, have heightened public awareness of the environmental impact of the current production and consumption models.
Section A of this chapter discusses the linkages between trade and the circular economy. Section B describes global and regional trade flows in goods and services linked to the circular economy. Section C discusses the move towards global circular value chains and their potential in the region. Section D describes trade opportunities and barriers in circular economy strategies in the region. Lastly, section E analyses mechanisms that can help improve consistency between trade policy and circular economy objectives.

150 Economic Commission for Latin America and the Caribbean (ECLAC)Chapter III
A. International trade should be part of the transformation to the circular economy
The relationship between international trade and the circular economy has been little explored. A narrow view would consider countries as responsible only for increasing the circularity of the goods produced and consumed in their own territory. However, from a broader perspective, countries also generate environmental impacts through the portion of their production that is exported and also in the imported component of their consumption. Thus, a national circular economy strategy should consider its linkages with trade. This section highlights the contribution of international trade to the growth of materials consumption, with its consequent environmental impact. It then explains how trade can contribute to the adoption of circular solutions and it highlights two of the main challenges in this area: plastic pollution and the illegal waste trade.
1. The global material footprint multiplied in the last decades
The extraction and processing of natural resources, fuels and food are responsible for over 90% of global biodiversity loss and water stress, as well as nearly half of all greenhouse gas (GHG) emissions (International Resource Panel/UNEP, 2020). Between 1970 and 2017, the global consumption of materials grew by 3.4 times, from 27 billion to 92 billion tons. In the region, this consumption increased by 4.1 times (from 2.1 to 8.5 billion tons) and the region’s share of global materials consumption grew from 7.6% to 9.3% in that period (León, Lewinsohn and Sánchez, 2020).
Materials consumption does not consider what happens “upstream” in terms of additional resources (materials, energy, water and land) that have been used to produce the traded goods. Most of these resources end up as waste and emissions in their countries of origin. The material footprint concept, understood as the footprint associated with the extraction and domestic processing of resources, subtracting those embedded in exports and adding those embedded in imports, would reflect the true environmental impact of production and trade more accurately. In 2017, the amount of material resources extracted globally to produce traded goods was three times the amount contained in the final traded goods themselves (International Resource Panel/UNEP, 2020). The global material footprint more than doubled in size between 1990 and 2017, with Asia and the Pacific contributing the most to this expansion (see figure III.1, panel A).
In 2015, South America had the largest per capita material footprint (14 tons) in the region, reflecting its production and export specialization based on natural resource extraction (see figure III.1, panel B). Between 2000 and 2015, the region’s per capita material footprint grew by 26%, while Africa’s expanded by 19% and Europe’s increased by 16%. However, this growth was much less than that of China, where the footprint grew by 159% over the same period. In terms of levels, the region’s per capita material footprint exceeds only that of Africa, but is much smaller than that of several developed countries.

151Chapter IIIInternational Trade Outlook for Latin America and the Caribbean • 2021
Figure III.1 Selected countries and regions: global and per capita material footprint, 1990–2017a
Africa
Asia and PacificEastern Europe
EuropeLatin America and the Caribbean
North AmericaWestern Asia
0
10
20
30
40
50
60
70
80
90
100
1990 1992 1994 1996 1998 2000 2002 2004 2006 2008 2010 2012 2014 2016
A. Global material footprintb
(billions of tons)
0
5
10
15
20
25
30
35
40
45
Sout
h Am
eric
a
Cent
ral A
mer
ica
The
Carib
bean
Mex
ico
Latin
Am
erica
and
the
Carib
bean
Afric
a
Chin
a
Aust
ralia
and
New
Zea
land
Euro
pe
Japa
n
Unite
d St
ates
2015
19902000
B. Material footprint per capita(tons)
Source: Economic Commission for Latin America and the Caribbean (ECLAC), on the basis of International Resource Panel, “Global material flows database”. a The material footprint is measured as the footprint associated with the extraction and domestic processing of resources, minus the resources embedded in exports, plus
the resources contained in imports. b The sum of the regions represents the world as a whole.
A nation’s material footprint depends on its foreign trade. In 2017, for the average of the region’s countries, 27% of the production footprint was associated with exports (see figure III.2, panel A). For the average of the countries of Central America, the equivalent figure was 55% in that year, reflecting its greater export intensity. The region’s export footprint was larger than that of China, Japan and the United States, but smaller than the average for the countries of Africa and several other developed countries and regions. In addition, one quarter of the consumption footprint in the region’s countries was associated with imports in 2017 (see figure III.2, panel B). In the Central American and Caribbean countries, this share exceeded 50%. The share of imports in the region’s consumption footprint surpassed that of China, but was less than that of other countries and regions. The share of exports and imports in the material footprint grew in all countries and regions between 1990 and 2017, reflecting an increasingly interconnected global economy.

152 Economic Commission for Latin America and the Caribbean (ECLAC)Chapter III
Figure III.2 Selected countries and regions: share of trade in the material footprint of production and consumption, 1990, 2000 and 2017(Percentages)
2017
19902000
A. Proportion of the material footprint of production associated with exports
0
10
20
30
40
50
60
70
80
90
Sout
h Am
eric
a
Cent
ral A
mer
ica
The
Carib
bean
Mex
ico
Latin
Am
erica
and
the
Carib
bean
Afric
a
Chin
a
Aust
ralia
and
New
Zea
land
Euro
pe
Japa
n
Unite
d St
ates
2017
19902000
B. Proportion of the material footprint of consumption associated with imports
0
10
20
30
40
50
60
70
80
90
Sout
h Am
eric
a
Cent
ral A
mer
ica
The
Carib
bean
Mex
ico
Latin
Am
erica
and
the
Carib
bean
Afric
a
Chin
a
Aust
ralia
and
New
Zea
land
Euro
pe
Japa
n
Unite
d St
ates
Source: Economic Commission for Latin America and the Caribbean (ECLAC), on the basis of International Resource Panel, “Global material flows database”.
A comparison between the per capita physical and per capita raw-material-equivalent trade balances reveals the growing resource intensity of commodity flows between 1990 and 2015. According to the first type of balance, which measures internationally traded volumes only, the United States and the European Union are small net resource importers (see figure III.3, panel A). However, measured by the second type of balance, which takes into account the resources needed to produce the traded goods or embodied resources, these countries are significant importers of materials (see figure III.3, panel B). For example, in 2015, each person in the United States and the European Union mobilized an average of 11.6 tons and 9.8 tons, respectively, of material resources obtained from other parts of the world (in Japan this dependency was even higher at up to 20.7 tons per capita). External dependency has increased since 1990 in all three cases. In the region, the net outflow of material exports is also larger when measured in terms of raw material equivalents than with the physical balance, especially in South America.
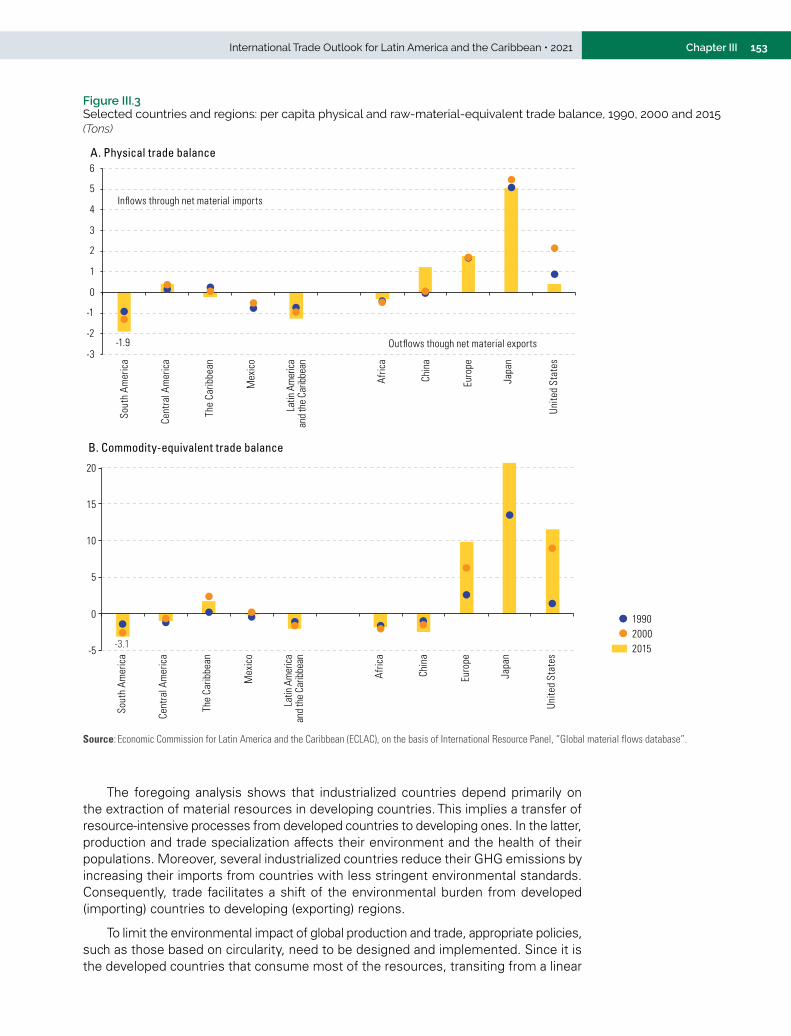
153Chapter IIIInternational Trade Outlook for Latin America and the Caribbean • 2021
Figure III.3 Selected countries and regions: per capita physical and raw-material-equivalent trade balance, 1990, 2000 and 2015(Tons)
2015
19902000
A. Physical trade balance
-1.9
Inflows through net material imports
Outflows though net material exports-3
-2
-1
0
1
2
3
4
5
6
Sout
h Am
eric
a
Cent
ral A
mer
ica
The
Carib
bean
Mex
ico
Latin
Am
erica
and
the
Carib
bean
Afric
a
Chin
a
Euro
pe
Japa
n
Unite
d St
ates
2015
19902000
B. Commodity-equivalent trade balance
-3.1-5
0
5
10
15
20
Sout
h Am
eric
a
Cent
ral A
mer
ica
The
Carib
bean
Mex
ico
Latin
Am
erica
and
the
Carib
bean
Afric
a
Chin
a
Euro
pe
Japa
n
Unite
d St
ates
Source: Economic Commission for Latin America and the Caribbean (ECLAC), on the basis of International Resource Panel, “Global material flows database”.
The foregoing analysis shows that industrialized countries depend primarily on the extraction of material resources in developing countries. This implies a transfer of resource-intensive processes from developed countries to developing ones. In the latter, production and trade specialization affects their environment and the health of their populations. Moreover, several industrialized countries reduce their GHG emissions by increasing their imports from countries with less stringent environmental standards. Consequently, trade facilitates a shift of the environmental burden from developed (importing) countries to developing (exporting) regions.
To limit the environmental impact of global production and trade, appropriate policies, such as those based on circularity, need to be designed and implemented. Since it is the developed countries that consume most of the resources, transiting from a linear

154 Economic Commission for Latin America and the Caribbean (ECLAC)Chapter III
to a circular economy could reduce their environmental impact and support countries in achieving their environmental goals. This goes hand in hand with improving the environmental and social standards applicable to resource extraction globally, particularly in countries with low levels of governance (International Resource Panel/UNEP, 2020). This issue is particularly urgent, given the current very low global circularity rate (8.6% in 2020).1 The next section discusses how trade can contribute to this transition, and the potential implications for the countries’ development.
2. International trade can promote local circular economy processes
International trade can contribute to the circular economy to the extent that public policies and private practices encourage recycling, waste recovery2 and the reuse of products and their components beyond national borders; and insofar as they promote the creation of global markets that stimulate the demand for circular products and circular business models. While the circular economy is being promoted at the local level (for example, in “circular cities”), in practice the scale and technologies required are not always available. In such cases, trade can provide solutions. Diagram III.1 shows how trade can contribute to the introduction of circular solutions in linear production chains. These solutions occur both within and outside national territories. While the former are already considered in many national circular economy strategies, international solutions have seldom been addressed. These are illustrated below, following the stages of a value chain.
1 For further details, see [online] https://www.circularity-gap.world/2021.2 Waste valorization (useful recovery) refers to “any operation the principal result of which is waste serving a useful purpose
by replacing other materials which would otherwise have been used to fulfil a particular function, or waste being prepared to fulfil that function, in the plant or in the wider economy.” (European Union, 2008).
Diagram III.1 Contribution of trade to the transition to the circular economy in a value chain
Trade in services
Global supply chains
Trade in used and second hand goods
Trade in refurbished and remanufactured goods
Trade in waste and scrap for recovery
Trade in secondary raw materials
Design Acquisition Production Logistics Sales andmarketing
Productuse End of life Residue
Trade flows
Recycling (secondary raw material)
Remanufacturing and refurbishing
National boundaries
Reuse(used goods)
Eco-designpolicies Repair
Product-as-service systems
Source: S. Yamaguchi, “International trade and circular economy: policy alignment”, OECD Trade and Environment Working Papers, No. 2021/02, Paris, OECD Publishing, 2021.

155Chapter IIIInternational Trade Outlook for Latin America and the Caribbean • 2021
Trade in services can provide circular solutions at each stage of the production chain, by diversifying the options available for maintaining and recovering the value of goods throughout their life cycle (e.g. by importing environmental services related to repair, reuse, remanufacturing, refurbishment and recycling processes). Services can also replace physical goods through “product-useful recovery” (servitization) arrangements, in which the supplier owns the good, while users either make temporary use of the good or else purchase the service without the supporting physical goods (such as lighting instead of lamps). In addition, services can facilitate collaborative use, for example, through platforms that give access to goods and services (accommodation, transport, audiovisual content, rental of tools or clothing, among others) for a fixed monthly fee or according to the use made of the service.
In the first link of the chain, design, both local firms and multinationals are implementing new types of products and services, together with greener and more circular business models. These are eco-designs that can be applied within each country and also exported to other markets. For example, some firms are conducting research, development and innovation to design products (such as automobiles, cell phones, appliances and machinery) using materials, parts and components that last longer or can be recycled or reused at the end of their useful life; or else they create the products with fewer materials, in such a way that they maintain and even improve their functionality.
At the raw material procurement stage, global supply chains play a central role. The raw materials supplied can be virgin or secondary (that is, the result of a waste recycling process, which can be of domestic or foreign origin). Several production chains already use waste as secondary inputs, such as the aluminium, other metals and pulp-paper-paperboard industries (see section C). However, making this phenomenon more widespread means developing global suppliers with economies of scale that will enable them to increase their supply.
The third link is production, where raw materials are transformed into intermediate inputs and final products. At this stage, there is great potential for the refurbishment3
and remanufacturing4 of used goods, thereby extending their useful life. Some mining machinery firms have remanufacturing centres in different regions. Remanufacturing is also applied to goods such as printers, aircraft parts, trucks, automobiles and medical equipment. Examples of products that are often remanufactured include cell phones and laptop computers. Remanufactured and refurbished products often face trade barriers, however, because they are classified as waste or used products, for which there are no common standards across countries (see section D).
The fourth and fifth links represent the sale and use of new and used products. The domestic marketing and international trade of used goods is a crucial part of the circular economy. They extend the useful life of the goods and increase resource use efficiency. Several (primarily industrialized) countries sell used goods, such as electronics, automobiles and clothing, to other markets (mostly developing ones). The latter become responsible for the disposal of these goods after the end of their useful life. Preventive maintenance and repair are key services for extending the useful life of products. The Internet of things (IoT) increasingly makes it possible to monitor the wear and tear of parts and pieces in real time, to optimize the maintenance and repair of equipment and machinery. These services are often marketed internationally, mainly through the commercial presence of multinational companies or the temporary relocation of service providers.
3 Refurbishing happens when a defective product that has been lightly used or never used is returned and then subsequently restored by the manufacturer or a third-party company that specializes in refurbishing. Oftentimes, the defect is either a cosmetic one or a simple issue that does not require the replacement or rebuilding of any of the product’s components (DXP, 2021).
4 Remanufacturing is a comprehensive and rigorous industrial process by which a previously sold, worn, or non-functional product or component is returned to a “like-new” or “better-than-new” condition and warranted in performance level and quality (RIC, 2021).

156 Economic Commission for Latin America and the Caribbean (ECLAC)Chapter III
The final stages are the end of life and the conversion of the product into waste and residues. In a circular economy system, waste is transformed back into inputs for new production cycles, through either technical or biological processes. Some wastes and residues are exported to other countries to be reused or valorized (see section B). In some cases, this raises concerns about potential environmental and social impacts, especially if the receiving countries have lax regulations in these domains.
The transition to the circular economy depends largely on changes in trade and foreign direct investment (FDI) flows, and on the transfer of technology and knowledge within global value chains, which account for almost three-quarters of world trade (OECD, 2020). Traditional global value chains (which organize a linear process that starts with the extraction of inputs for production through to their distribution, consumption and disposal) encourage little circularity. For this reason, achieving global circular value chains requires several changes, ranging from the eco-design of more sustainable products to the introduction of reverse supply chains, which pass through the consumer and back to the producer. All of this would extend the useful life of products and enable their valorization through recovery and management. Box III.1 describes several recent trends that can promote circularity within global value chains.
Box III.1 Three trends towards the circular economy in global value chains (GVCs)
First, several leading multinational firms, mainly from developed countries, are implementing changes by imposing requirements and conditions on their first- and second-tier suppliers to align with circularity (Schröder and others, 2018). However, there is a risk that the benefits gained by adopting a circular model will be concentrated in developed countries, at the expense of developing ones (Hofstetter and others, 2021).
Second, the policy frameworks of the green pacts and multilateral commitments to combat climate change encourage circularity within global value chains. For example, the Circular Economy Action Plan, part of the European Green Deal, includes more than 30 eco-design and circularity measures that can change the configuration, processes and business relationships within GVCs. Consumer empowerment, through increased information on the sustainable use of resources and the right to repair, promotes circularity and encourages firms producing final goods, and their suppliers, to extend the useful life of these products.
Third, circularity generates economic benefits in GVCs. At the macro level, the circular economy is expected to generate a net benefit of € 1.8 trillion for Europe by 2030 (Ellen MacArthur Foundation, 2015). This implies a radical transformation in the value chains led by large European multinationals. However, this trend is global and is related to savings and value capture in the global value chains in which circularity is most profitable.
Global value chains involving minerals and metals are among those with the greatest potential for circularity, given the high value and energy savings associated with their transformation for reuse as a primary input without loss of quality (Mulder and Albaladejo, 2020). These characteristics mean that GVCs in the mineral and metals sectors encourage the market for secondary raw materials obtained from the recovery, recycling and transformation of waste. Mineral and metal waste accounts for almost 80% of the value of the global waste trade, which grew by an average of almost 12% per year between 2002 and 2019. This demonstrates that “waste” is de facto a key resource for the competitiveness of the sector (Mulder and Albaladejo, 2020). Moreover, this is not a peculiarity of that sector, but is also applicable to other GVCs, such as the forestry-pulp-paper value chain discussed below.
Source: Economic Commission for Latin America and the Caribbean (ECLAC), on the basis of Ellen MacArthur Foundation, Hacia una economía circular: motivos económicos para una transición acelerada, 2015, J. Hofstetter and others, “From sustainable global value chains to circular economy – different silos, different perspectives, but many opportunities to build bridges”, Circular Economy and Sustainability, vol. 1, No. 1, 2021, N. Mulder and M. Albaladejo (coords.), “El comercio internacional y la economía circular en América Latina y el Caribe”, International Trade series, No. 159 (LC/TS.2020/174), Santiago, Economic Commission for Latin America and the Caribbean (ECLAC), 2020, and P. Schröder and others, “Circular economy and power relations in global value chains: tensions and trade-offs for lower income countries”, Resources, Conservation and Recycling, vol. 136, 2018.

157Chapter IIIInternational Trade Outlook for Latin America and the Caribbean • 2021
Circular economy strategies are not confined to the economic and environmental sphere, but have objectives that include the creation of green jobs, a just and inclusive transition and gender equity. They are expected to create green jobs associated with this new way of producing and consuming, and to enhance inclusive jobs through new business models, especially among small and medium-sized enterprises (SMEs), and especially in developing countries (Schröder and others, 2020). Special emphasis is placed on “a just transition to an environmentally sustainable economy”; in other words, how this new mode of production and consumption contributes towards the goals of decent work for all, social inclusion and poverty eradication (ILO, 2015). As in international environmental agreements, the incorporation of women is emphasized because the environmental impacts are differentiated. Climate change deepens inequality in the region and may also accentuate the sexual division of labour. This is especially important in Latin America and the Caribbean where public policies on gender equality are essential for sustainable development, including the circular economy (Aguilar Revelo, 2021). Examples of how these social issues are incorporated into circular strategies are described in box III.2.
Box III.2 The contribution of the circular economy to social inclusion and gender equity
A just transition to the circular economy promotes the formalization of informal workers who engage in waste collection and pre-treatment, since this contributes towards improving their working conditions and reducing gender inequalities (Schröder and others, 2020). In Chile, for example, the national strategy proposes that the transition to the circular economy should incorporate a gender perspective, both in the collaborative and participatory work that drives it and in the results of the changes, with a view to ensuring that opportunities are accessible to vulnerable groups and that gender equity and equality are considered (Government of Chile, n.d.). In Mexico, it is proposed that the future circular economy strategy incorporate a gender perspective, along with indicators on materials, water, energy and climate change. Specifically, it considers measuring the percentage of managerial posts held by women in the industry, in order to estimate progress in terms of gender inclusion in leadership positions. When assessing the quality of human capital, the percentage of women graduates in science and engineering is also taken into account (INECC, 2020).
As consumers, women are key actors in the final links of the value chain. Their purchasing preferences, their willingness to prolong the life of the goods they use, and their recycling activities have a significant impact on achieving a circular economy. Although their attitude towards recycling is only marginally “greener” than that of men, their gender roles as consumers and caregivers mean that they have a significant impact on the recycling of consumer goods. Moreover, women can benefit from more sustainable waste management, both as a source of income (savings and more efficient use of resources, green recycling businesses) and as a source of greater well-being and health in their homes by reducing waste (OECD, 2021). As producers, fashion is an important sector for the circular economy, in which women are very much involved. Of the 60 sustainable fashion brands that exist internationally, 52% have women in top management positions (OECD, 2021). The fashion industry, which is estimated to generate 4% of global GHG emissions (Global Fashion Agenda and McKinsey & Company, 2020), is also adapting to circular business models, with the resale of garments to multiple users, as well as garment rental and alterations.
Source: Economic Commission for Latin America and the Caribbean (ECLAC), on the basis of P. Schröder and others, La economía circular en América Latina y el Caribe: oportunidades para fomentar la resiliencia, Chatham House, 2020, Government of Chile, Propuesta: Hoja de ruta nacional a la economía circular para un Chile sin basura 2020–2040, n/d, Instituto Nacional de Ecología y Cambio Climático (INECC), Evaluación de la situación actual de la economía circular para el desarrollo de una hoja de ruta para Brasil, Chile, México y Uruguay. Informe final 2020, 2020, Organisation for Economic Co-operation and Development (OECD), Gender and the Environment: Building Evidence and Policies to Achieve the SDGs, Paris, OECD Publishing, 2021, and Global Fashion Agenda and McKinsey & Company, Fashion on Climate: How the Fashion Industry Can Urgently Act to Reduce its Greenhouse Gas Emissions, 2020.
158 Economic Commission for Latin America and the Caribbean (ECLAC)Chapter III
3. Balancing safety and economic efficiency in transboundary waste regulation
The waste trade has been at the centre of international debates in recent years, owing to the damage that some waste materials cause to human health and the environment. Much of the international waste trade is regulated by the Basel Convention on the Control of Transboundary Movements of Hazardous Wastes and their Disposal. This multilateral agreement, adopted under United Nations auspices in 1989 and in force since 1992, requires parties to limit and control transboundary movements of hazardous wastes so that they do not affect the environment or human health. Transboundary movements are allowed when: (i) the exporting country does not have the capacity to dispose of them; (ii) the wastes in question are used as raw materials for recycling or recovery industries in the importing country; or (iii) the transboundary movement meets other criteria agreed upon between the parties. The agreement also empowers countries to restrict the export or import of wastes in certain circumstances. The Convention sets out detailed transportation procedures, based on four steps (UNEP, 2015).5 In 2019, plastic wastes were added to the list of products covered by the Convention.
The fact that more and more waste is being produced, in the form of plastics and waste from electrical and electronic equipment (WEEE), has given rise to illegal disposal practices. Ever since China banned the import of solid waste, including plastics, in 2018, there has been a growing illegal trade that involves transit through several countries to conceal its origin. The main destinations are countries in South and South-East Asia, and also in Eastern Europe. The illegal treatment of these waste products in the receiving countries has increased through unauthorized recycling facilities. Shipments are made partly with misdeclarations (indicating plastic feedstock, for example). An increase in illegal waste treatment has also been detected in some exporting countries, as well as the burning of waste in both legal and illegal landfills. A number of current WEEE routes are being used to ship plastic waste, as some developing countries (particularly in Africa) often receive large quantities of plastic material as part of illegally imported e-waste (INTERPOL, 2020).
WEEE includes plastics and metals, the recovery of which generates revenue through their sale in the receiving countries. However, many WEEE items also contain toxic additives or hazardous substances, such as mercury, brominated flame retardants (BFRs) and chlorofluorocarbons (CFCs), or hydrochlorofluorocarbons (HCFCs), which makes handling them hazardous. Some studies report that between 7% and 20% of e-waste is exported from the United States and specific European countries. Some is exported in the form of used products to be sold (possibly after repair) in developing countries, while another portion is classified as scrap. A significant proportion is estimated to be exported illegally (Forti and others, 2020).
The short life cycle of electrical and electronic products, and their constant technological upgrading, mean that these products reach the end of their useful life quickly; and recycling them requires technology that is still scarce and concentrated in the developed countries. Thus, they are frequently exported to developing countries, in some cases as donations. Owing to the large volume of this type of waste, activities such as “urban mining” have gained popularity. However, given the lack of adequate technology for the recovery of the most valuable metals, such as those found in memory cards, developing countries are only able to dismantle the devices and then export the parts to developed countries, without being able to recover their full value. Extended producer responsibility systems implemented in some countries could stimulate the creation of suitable plants for these activities, along with other incentives.
5 These stages are: (i) notification; (ii) consent and issuance of the movement document; (iii) transboundary movement; and (iv) confirmation of disposal (UNEP, 2015).
159Chapter IIIInternational Trade Outlook for Latin America and the Caribbean • 2021
It is estimated that more than 8.3 billion tons of plastic have been produced since the emergence of plastic in the mid-nineteenth century. In 2017, global production was estimated at 348 million tons and, without adequate policies, this could triple by 2060. Only 30% of the plastic that has been produced is still in use, while some 6 billion tons have been discarded. After discounting the percentage that is recycled and incinerated, about three quarters of the plastic has ended up in landfills or is scattered throughout the environment and oceans. It thus enters the food chain and affect humans in multiple ways.
Close to 45% by volume of the global primary plastic production is exported. As value is added to them, their trade becomes less significant since they are targeted towards domestic production and consumption (UNCTAD, 2020). Between 14% and 18% of the plastics produced worldwide are formally recycled (World Economic Forum, 2020). This small proportion is explained partly by the fact that the plastics industry produces more than 30 different types of plastic, with different properties and applications. These become mixed with each other and also with other materials in a variety of ways, so their potential for recycling varies widely. Containers and other packaging account for two thirds of all plastics consumption (WTO, 2020). Global trade in plastics (all forms) accounted for 5% of the value of total merchandise trade in 2018, considering raw materials, final products and waste. Final products accounted for the highest value among plastics exports, at 41%; whereas, in volume terms, the largest exports corresponded to raw materials (resin or fibre pellets), which accounted for 56% of the total (UNCTAD, 2020).
One of the main difficulties associated with waste is its traceability. Once products enter a market and are traded or incorporated into value chains, it is impossible to follow their trajectory, particularly when they leave again through exports. However, certain technologies, such as blockchain, offer clear possibilities in terms of increasing the traceability of materials (Kouhizadeh, Zhu and Sarkis, 2019). Box III.3 describes a plastics traceability proposal that has recently emerged in the region, based on blockchain technology.
Box III.3 Plastic traceability and accounting through the “attribute storage” system
Although regulations and bans are being adopted ever more frequently, controlling plastic waste internationally is increasingly difficult. The advances in traceability introduced by governments and organizations of all kinds are insufficient; and there are no tools to effectively quantify the real dimensions of the challenge being faced, so technically feasible and economically responsible solutions have not yet been found. In this context, the Economic Commission for Latin America and the Caribbean (ECLAC), within the framework of the EUROCLIMA+ programme and with support from the Chilean presidency of the twenty-fifth session of the Conference of the Parties to the United Nations Framework Convention on Climate Change (COP 25), studied a proposal that would make it possible to monitor and account for plastic in the region’s economies.
The project on plastic traceability and accounting through the “attribute storage” system proposes the use of a blockchain-based information technology (IT) tool. For each product, the system will record the relevant data on its plastic content (weight, type, and so forth), which will be stored in a large database or digital pattern associated with its barcode. Each product is then assigned an equivalent value in blockchain, similar to cryptocurrencies, which circulates among the different actors in the economic cycle (producers, marketers, users and recyclers). These will have a virtual wallet and interact with the system through an interface. The actors are linked in this process through smart contracts; and they benefit from the process through incentives of varous types. Digital traceability enables products and by-products to be traced and accounted for from their origin to their destination, thereby making it possible to track, control and effectively manage the material.
The stored data, which is incorruptible and public, will make it possible to produce statistics that are useful for the economy, as well as for legal and tax obligations and auditing. The system can be extended to track other objects, inputs, and products in trade and in different sectors. In addition to the use of this data recording tool, the potential for recycling plastics chemically is being studied, which would make it possible to complete their circularity.
Source: J. Samaniego and others, “Trazabilidad y contabilidad del plástico mediante el sistema A.P.A.”, Project Documents (LC/TS.2021/69), Santiago, Economic Commission for Latin America and the Caribbean (ECLAC), 2021.

160 Economic Commission for Latin America and the Caribbean (ECLAC)Chapter III
B. The region’s share of trade in circular products
This section analyses the region’s share of world trade in circular products. To go beyond the waste trade (Mulder and Albaladejo, 2020), it highlights goods that could be circular if the transformation processes they may undergo in other markets are taken into consideration. In addition, statistics from the region’s main trading partners are reviewed in order to highlight specific products and sectors that form part of the bilateral exchange.
1. The search for circular products and services in international trade
In theory, any product or service can be “circular”, insofar as it participates in processes that contribute to an extension of its useful life; or if its design incorporates characteristics that allow its materials to be maintained in successive production processes. For example, a reused, recycled or recyclable product would meet this general definition. The alternatives are so varied that there is no exhaustive list of circular goods. In some cases, sharing the use of certain goods is the way to maximize their utility and make them circular. Moreover, technological advances have given rise to products and materials that meet circularity criteria, such as being recyclable or compostable. Kalmykova, Sadagopan and Rosado (2018) describe 45 circular strategies that are implemented at different stages of value the chains. In short, there are major challenges in classifying goods in terms of their circularity.
In addition to these complexities, the processes that contribute to circularity differ according to the physical characteristics of the materials in question. Accordingly, a distinction is made in the circular economy between materials and products of biological origin and those obtained from non-renewable resources (such as minerals and petroleum derivatives) (Ellen MacArthur Foundation (2015). In order to extend the life of this second group of materials, “technical cycles” involving reuse (second-hand products), repair, refurbishment and remanufacturing, are being promoted. By recycling these products and waste, secondary raw materials can be obtained for use in new production processes. Products of organic origin and their waste go through other cycles for valorization. For example, through the extraction of nutrients or enzymes, anaerobic digestion or composting, this type of material can be reincorporated into new production processes. Thus, waste from crop and livestock farming, fishing and aquaculture, as well as from wood and food, can be converted into inputs for animal feed, fertilizers, energy and heat generation, and so forth (Donner, Gohier and De Vries, 2020; CSA, 2014; Ellen MacArthur Foundation, 2015).
The definition of circular goods that are traded internationally poses an additional difficulty, namely the limited incorporation of circular characteristics in the coding system used. Traded goods are identified by the Harmonized System (HS) codes of the World Customs Organization (WCO). The tariff subheadings (six-digit codes) are used in a standardized way by all countries. However, their descriptions often do not include the characteristics of the goods under a circular economy approach. For example, with very few exceptions, there is no indication of whether the goods are new or used; and new products are included along with their waste in the same subheading. Some of the waste or residues have specific subheadings, although there is no way to identify those that will be recovered and transformed into secondary raw material. The new version of HS that is scheduled to enter into force in 2022 incorporates changes that will facilitate a better definition of some goods associated with the circular economy (see box III.4).
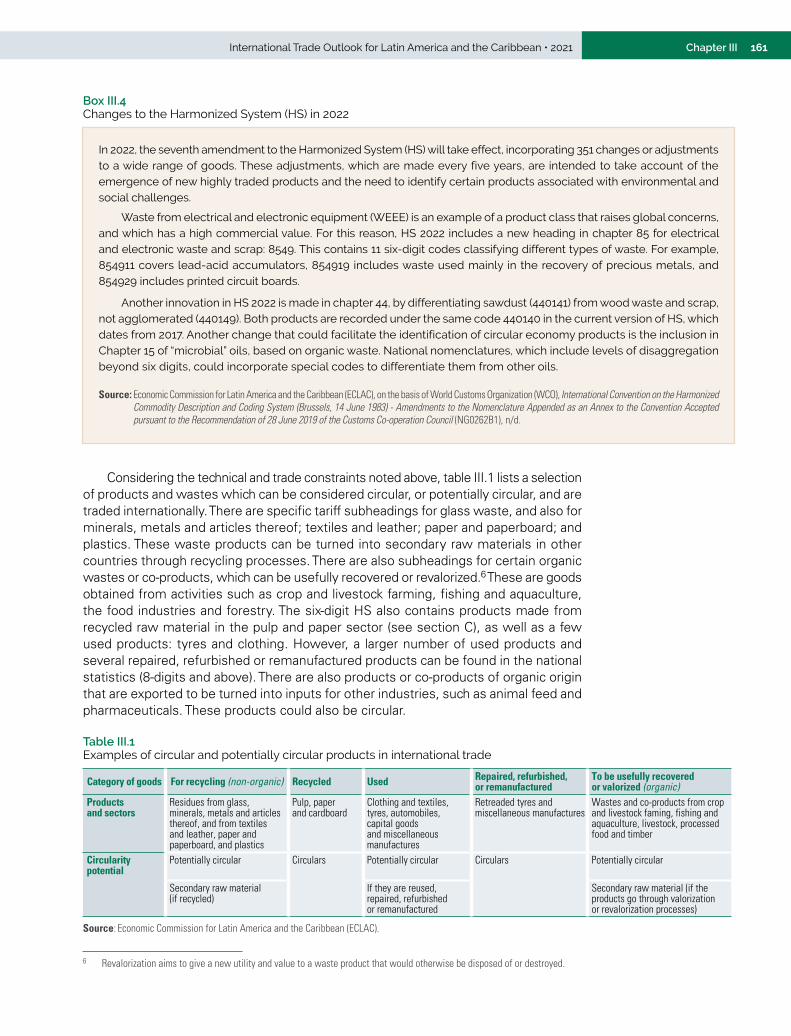
161Chapter IIIInternational Trade Outlook for Latin America and the Caribbean • 2021
Box III.4 Changes to the Harmonized System (HS) in 2022
In 2022, the seventh amendment to the Harmonized System (HS) will take effect, incorporating 351 changes or adjustments to a wide range of goods. These adjustments, which are made every five years, are intended to take account of the emergence of new highly traded products and the need to identify certain products associated with environmental and social challenges.
Waste from electrical and electronic equipment (WEEE) is an example of a product class that raises global concerns, and which has a high commercial value. For this reason, HS 2022 includes a new heading in chapter 85 for electrical and electronic waste and scrap: 8549. This contains 11 six-digit codes classifying different types of waste. For example, 854911 covers lead-acid accumulators, 854919 includes waste used mainly in the recovery of precious metals, and 854929 includes printed circuit boards.
Another innovation in HS 2022 is made in chapter 44, by differentiating sawdust (440141) from wood waste and scrap, not agglomerated (440149). Both products are recorded under the same code 440140 in the current version of HS, which dates from 2017. Another change that could facilitate the identification of circular economy products is the inclusion in Chapter 15 of “microbial” oils, based on organic waste. National nomenclatures, which include levels of disaggregation beyond six digits, could incorporate special codes to differentiate them from other oils.
Source: Economic Commission for Latin America and the Caribbean (ECLAC), on the basis of World Customs Organization (WCO), International Convention on the Harmonized Commodity Description and Coding System (Brussels, 14 June 1983) - Amendments to the Nomenclature Appended as an Annex to the Convention Accepted pursuant to the Recommendation of 28 June 2019 of the Customs Co-operation Council (NG0262B1), n/d.
Considering the technical and trade constraints noted above, table III.1 lists a selection of products and wastes which can be considered circular, or potentially circular, and are traded internationally. There are specific tariff subheadings for glass waste, and also for minerals, metals and articles thereof; textiles and leather; paper and paperboard; and plastics. These waste products can be turned into secondary raw materials in other countries through recycling processes. There are also subheadings for certain organic wastes or co-products, which can be usefully recovered or revalorized.6 These are goods obtained from activities such as crop and livestock farming, fishing and aquaculture, the food industries and forestry. The six-digit HS also contains products made from recycled raw material in the pulp and paper sector (see section C), as well as a few used products: tyres and clothing. However, a larger number of used products and several repaired, refurbished or remanufactured products can be found in the national statistics (8-digits and above). There are also products or co-products of organic origin that are exported to be turned into inputs for other industries, such as animal feed and pharmaceuticals. These products could also be circular.
6 Revalorization aims to give a new utility and value to a waste product that would otherwise be disposed of or destroyed.
Table III.1 Examples of circular and potentially circular products in international trade
Category of goods For recycling (non-organic) Recycled Used Repaired, refurbished, or remanufactured
To be usefully recovered or valorized (organic)
Products and sectors
Residues from glass, minerals, metals and articles thereof, and from textiles and leather, paper and paperboard, and plastics
Pulp, paper and cardboard
Clothing and textiles, tyres, automobiles, capital goods and miscellaneous manufactures
Retreaded tyres and miscellaneous manufactures
Wastes and co-products from crop and livestock faming, fishing and aquaculture, livestock, processed food and timber
Circularity potential
Potentially circular Circulars Potentially circular Circulars Potentially circular
Secondary raw material (if recycled)
If they are reused, repaired, refurbished or remanufactured
Secondary raw material (if the products go through valorization or revalorization processes)
Source: Economic Commission for Latin America and the Caribbean (ECLAC).

162 Economic Commission for Latin America and the Caribbean (ECLAC)Chapter III
2. Agrifood products make up the majority of the region’s circular goods
Circular and potentially circular products, as defined in this section, accounted for only 2.4% by volume and 0.9% by value of global merchandise trade in 2019.7 Between 2009 and 2019, the volume of goods exports associated with the circular economy increased from 338 billion tons to 445 billion tons, while the values associated with this trade fluctuated over time, to reach US$ 167 billion in 2019 (see figure III.4 panels A and B).
7 2019 is the latest year for which complete information is available at the global level. Figures for 2020 are available for some countries or regions, as will be discussed in the remainder of this section.
Figure III.4 Global exports of products associated with the circular economy, annual averages, 2009–2012, 2013–2016 and 2017–2019
A. By volume(billions of tons)
360
370
380
390
400
410
420
430
440
450
2009–2012 2013–2016 2017–2019
B. By value(billions of dollars)
164
166
168
170
172
174
176
2009–2012 2013–2016 2017–2019
Source: Economic Commission for Latin America and the Caribbean (ECLAC), on the basis of BACI (volume) and United Nations International Trade Statistics Database (value).

163Chapter IIIInternational Trade Outlook for Latin America and the Caribbean • 2021
The fluctuations in shipment values are explained largely by variations in the international price of scrap metal, particularly steel scrap. This price, in turn, depends on recycling costs and the prices of virgin raw materials. When the latter rise, scrap becomes more valuable as an alternative for producing secondary raw material (Mulder and Albaladejo, 2020). Despite variations in both volume and value, the composition of this trade has changed very little, with the main group being metal waste for recycling (44% in 2009 and 41% in 2019), followed by agrifood waste for valorization (30% in 2009 and 33% in 2019).
Asia and the European Union account for the bulk of waste trade. Forty per cent of global waste exports and imports (by value) were linked to the European Union in 2017–2018, although its share of global exports has been declining, while that of the United States is increasing. On the import side, the European share has also been declining in recent years, while that of Asia has been increasing, especially during the first decade of this century. Latin America and the Caribbean accounted for 11.9% of the value of world exports (13.4% in volume terms) and 3.9% of the value of global waste imports (4.9% in volume) in 2019.
Over the past two decades, the major countries and regions display different trends in their trade in circular and potentially circular products (see figure III.5). For example, while China’s exports have stayed at relatively low and uniform levels, its imports have increased significantly, despite slipping back in recent years. Since the 2000 decade, China has implemented various regulations that promote the circular economy in order to counteract some of the environmental impacts caused by its rapid economic growth.8 These regulations were initially based on the principles of reduce, reuse and recycle, and they have been progressively deepened, with an emphasis on industrial development and raw materials self-sufficiency (Holzmann and Günberg, 2021). In this way, the recycling industry increasingly absorbed domestic raw material with the result that exports started to decline. In 2017, China announced a series of bans and restrictions on waste imports, based on environmental and health criteria. These excluded “dirty” shipments, in other words those that had not received adequate pre-treatment and were more difficult and costly to deal with.
The United States saw its share of waste exports triple at the turn of the century, which coincides with the increase in Chinese imports of such goods (Mulder and Albaladejo, 2020). During this period, the value of waste shipments from the United States to China increased more than 15-fold. These accounted for 11% of total shipments to China and were concentrated in scrap metal and paper waste (Casey, 2012). Imports into the United States, on a much smaller scale, have remained stable (see panel B). While the country does not have a comprehensive circular economy policy framework, there are several partial initiatives that address circularity challenges. For example, the federal government supports the circular economy through its own energy consumption, since at least 7.5% of its total annual electricity consumption must come from renewable sources,9 including biomass, among which forestry and agricultural residues are explicitly identified. It is also working to reduce food loss and waste by 50% by 2030 and to set up a circular economy for plastics.10 11
8 The first law on the circular economy dates back to 2008, although specific programmes pursuing the same objectives already existed at that time.
9 Pursuant to section 203 of the Energy Policy Act of 2005.10 To do this, the federal government works with communities, organizations, businesses, and state and local governments.11 The United States Plastics Pact is a consortium led by The Recycling Partnership and World Wildlife Fund, created as part of the
Ellen MacArthur Foundation’s global Plastics Pact Network. It aims to unify stakeholders along the plastics value chain and is supported by businesses, research organizations, non-governmental organizations, universities, and state and local governments.

164 Economic Commission for Latin America and the Caribbean (ECLAC)Chapter III
Figure III.5 Selected countries and regions: exports and imports of products associated with the circular economy, 2002–2019 (Billions of tons)
A. China
0
10
20
30
40
50
60
70
2002
2003
2004
2005
2006
2007
2008
2009
2010
2011
2012
2013
2014
2015
2016
2017
2018
2019
Exports
Imports
B. United States
0
10
20
30
40
50
60
70
80
2002
2003
2004
2005
2006
2007
2008
2009
2010
2011
2012
2013
2014
2015
2016
2017
2018
2019
Exports
Imports
C. European Union
Exports
Imports
0
20
40
60
80
100
120
140
160
180
2002
2003
2004
2005
2006
2007
2008
2009
2010
2011
2012
2013
2014
2015
2016
2017
2018
2019

165Chapter IIIInternational Trade Outlook for Latin America and the Caribbean • 2021
D. Latin America
Exports
Imports
0
10
20
30
40
50
60
70
2002
2003
2004
2005
2006
2007
2008
2009
2010
2011
2012
2013
2014
2015
2016
2017
2018
2019
Source: Economic Commission for Latin America and the Caribbean (ECLAC), on the basis of BACI.
Figure III.5 (concluded)
In the case of the European Union, both exports and imports of circular products have been increasing since 2002 (apart from a break in 2009, when world trade contracted sharply). In the first decade of this century, the European Union model was biased towards imports, but since 2009, exports and imports have been broadly balanced. The European Union has been implementing policies to promote the circular economy since 2014. These go beyond waste and include measures relating to imports of raw materials and exports of higher value-added products (see section C). Nonetheless, its demanding recycling targets have been met partly through waste exports to China (until 2018) and Turkey (Joltreau, 2019; Kettunen, Gionfra and Monteville, 2019). In the case of Latin America and the Caribbean, there was a slight increase in both exports and imports, the former being much greater in volume (see figure III.5, panel D).
For Latin America and the Caribbean, the largest category in both exports and imports of circular goods, and in both volume and value, consists of goods to be valorized (see figure III.6).12 This large share is mainly explained by trade in residues from the extraction of soybean oil, which comes from one of the main regional food chains. The region is the world’s leading producer and exporter of soybeans, the demand for which has grown in recent years owing to their high protein and energy content. They are mainly used as animal feed but also as a meat and milk substitute (OECD/FAO, 2021). The cakes and other residues from oil extraction are rich in proteins and fibre, which can be used in various industrial processes for the production of bioplastics, biofuels, biopesticides and other inputs for the food and pharmaceutical industries (Ancuța and Sonia, 2020).
12 Globally, 67% of the value of goods associated with the circular economy consists of products for recycling, mostly metals and their manufactures. This group is also the most important volume terms, accounting for 56% of total shipments.

166 Economic Commission for Latin America and the Caribbean (ECLAC)Chapter III
Figure III.6 Latin America: composition of trade in products associated with the circular economy, by volume and category, average 2017–2019 (Percentages)
A. Exports B. Imports
For recycling(12.5)
For recycling(34.7)
For valorization(87.2)
For valorization(60.9)
Recycled(0.2)
Recycled(2.3)
Repaired(0)
Used(0.1)
Used(2.0)
Repaired(0.1)
Source: Economic Commission for Latin America and the Caribbean (ECLAC), on the basis of BACI.
3. The United States is the region’s main trading partner in circular goods
The detailed (10-digit) United States trade statistics make it easier to identify certain products of the circular economy at a greater level of detail than the six-digit HS code. For example, some used or remanufactured goods, especially associated with transport materials and machinery used in construction, are specified in detail. In the case of aluminium cans (which represent about 2.7% of what the United States imports from the region in terms of circular goods), the more granular classifications also make it possible to distinguish between aluminium waste resulting from industrial processes and other aluminium waste. In the case of plastic waste, a distinction is made between polyethylene terephthalate (PET) and other types.
In 2020, the United States exported US$ 32.158 billion in products related to the circular economy,13 representing about 2.3% of its total shipments.14 Almost half (46%) consisted of waste from minerals, metals and their manufactures, which largely explains the fluctuations in value (see figure III.7, panel A). Used transport equipment accounts for 20% of the value exported. The country also imported US$ 18.455 billion worth of goods associated with the circular economy in 2020, representing 0.8% of its total global merchandise imports. The imports in question consist mainly of transport equipment, especially used motor vehicles (43%), and residues of minerals, metals and their manufactures (42%). Exports of circular economy products from the United States to the Latin America and the Caribbean region amounted to US$ 5.865 billion in 2020, or 18% of its total shipments (see figure III.7, panel B). Meanwhile, its imports from the region amounted to US$ 2.328 billion in 2020, about 13% of its total imports. More than half of United States trade with the region is with Mexico (51% of its exports and 60% of its imports) (see figure III.7, panel D).
13 There are 407 products, which are listed by their 10-digit tariff code in the annex to this chapter.14 The database used, obtained from the United States Census Bureau, does not standardize the volumes of different types of
goods. As a result, it is impossible to perform an analysis of the quantities traded.

167Chapter IIIInternational Trade Outlook for Latin America and the Caribbean • 2021
Figure III.7 United States: trade with the world and with Latin America and the Caribbean in goods associated with the circular economy, 2002–2020(Millions of dollars)
A. World
0
5 000
10 000
15 000
20 000
25 000
30 000
35 000
2002
2003
2004
2005
2006
2007
2008
2009
2010
2011
2012
2013
2014
2015
2016
2017
2018
2019
2020
Exports Imports
B. Latin America and the Caribbean
0
1 000
2 000
3 000
4 000
5 000
6 000
7 000
2002
2003
2004
2005
2006
2007
2008
2009
2010
2011
2012
2013
2014
2015
2016
2017
2018
2019
2020
Exports Imports
C. The Caribbean
Exports Imports0
100
200
300
400
500
600
700
800
2002
2003
2004
2005
2006
2007
2008
2009
2010
2011
2012
2013
2014
2015
2016
2017
2018
2019
2020
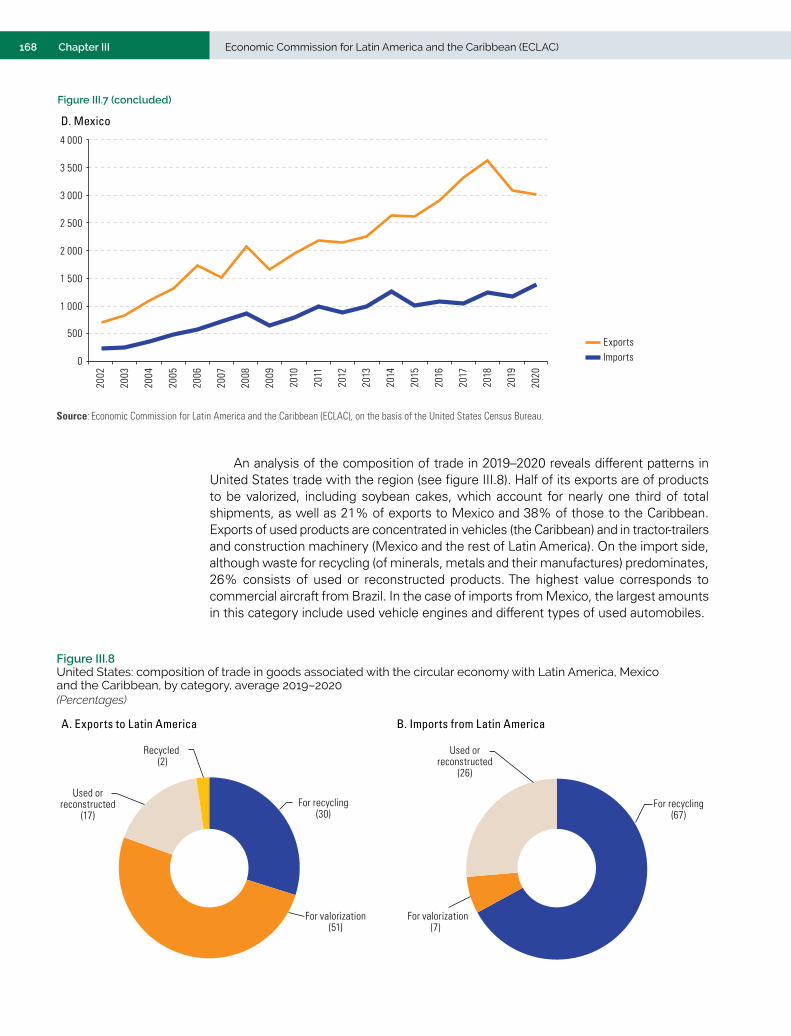
168 Economic Commission for Latin America and the Caribbean (ECLAC)Chapter III
D. Mexico
Exports Imports0
500
1 000
1 500
2 000
2 500
3 000
3 500
4 000
2002
2003
2004
2005
2006
2007
2008
2009
2010
2011
2012
2013
2014
2015
2016
2017
2018
2019
2020
Source: Economic Commission for Latin America and the Caribbean (ECLAC), on the basis of the United States Census Bureau.
Figure III.7 (concluded)
An analysis of the composition of trade in 2019–2020 reveals different patterns in United States trade with the region (see figure III.8). Half of its exports are of products to be valorized, including soybean cakes, which account for nearly one third of total shipments, as well as 21% of exports to Mexico and 38% of those to the Caribbean. Exports of used products are concentrated in vehicles (the Caribbean) and in tractor-trailers and construction machinery (Mexico and the rest of Latin America). On the import side, although waste for recycling (of minerals, metals and their manufactures) predominates, 26% consists of used or reconstructed products. The highest value corresponds to commercial aircraft from Brazil. In the case of imports from Mexico, the largest amounts in this category include used vehicle engines and different types of used automobiles.
Figure III.8 United States: composition of trade in goods associated with the circular economy with Latin America, Mexico and the Caribbean, by category, average 2019–2020(Percentages)
A. Exports to Latin America B. Imports from Latin America
For recycling (30)
For recycling (67)
For valorization(51)
For valorization(7)
Used orreconstructed
(17)
Used orreconstructed
(26)
Recycled (2)

169Chapter IIIInternational Trade Outlook for Latin America and the Caribbean • 2021
C. Exports to Mexico D. Imports from Mexico
For recycling (42)
For recycling (82)
For valorization(36)
For valorization(5)
Used orreconstructed
(18)
Used orreconstructed
(13)
Recycled (4)
E. Exports to the Caribbean F. Imports from the Caribbean
For valorization(39)
For recycling (99)
Used orreconstructed
(59)
Used orreconstructed
(1)
For recycling (2)
Source: Economic Commission for Latin America and the Caribbean (ECLAC), on the basis of the United States Census Bureau.
Figure III.8 (concluded)
4. The region exports waste to the European Union and imports used goods
The eight-digit European Union trade nomenclature also allows for a wider variety of products associated with the circular economy to be classified in greater detail than the six-digit HS.15 From this universe, exports and imports of goods associated with the circular economy represent about 1.5% of the value of European Union’s total merchandise trade (with exports and imports roughly in balance). In volume terms, the share of exports (6.0%) was higher than that of imports (4.3%) in 2020. In all cases (except export volume) the European Union’s intra-community trade exceeds its trade with the rest of the world. In the latter, exports to Latin America and the Caribbean accounted for just 1.4%, while imports from the region accounted for 7.8% in 2020. The European Union is a net importer of goods associated with the circular economy from the region, but a net exporter of such goods to the rest of the world (see figure III.9).
15 Eurostat’s “Comext” found 201 eight-digit tariff subheadings associated with the circular economy using the approach proposed in this section, compared to 123 six-digit subheadings.
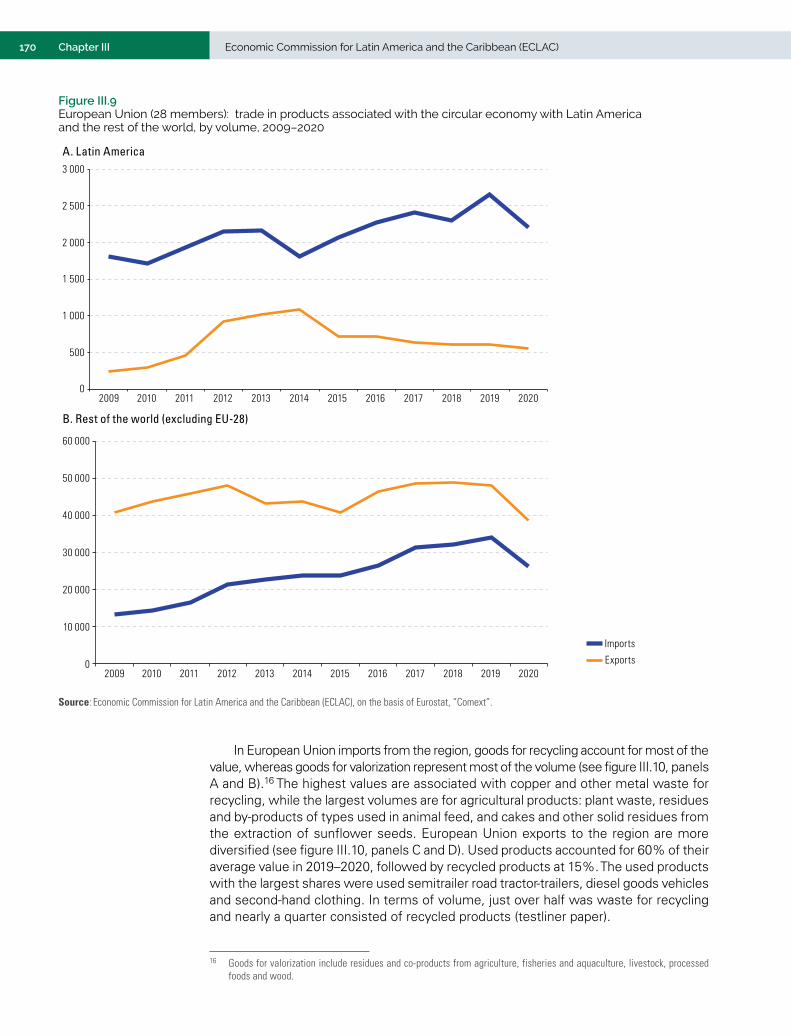
170 Economic Commission for Latin America and the Caribbean (ECLAC)Chapter III
Figure III.9 European Union (28 members): trade in products associated with the circular economy with Latin America and the rest of the world, by volume, 2009–2020
A. Latin America
Exports
Imports
0
500
1 000
1 500
2 000
2 500
3 000
2009 2010 2011 2012 2013 2014 2015 2016 2017 2018 2019 2020
B. Rest of the world (excluding EU-28)
Exports
Imports
2009 2010 2011 2012 2013 2014 2015 2016 2017 2018 2019 20200
10 000
20 000
30 000
40 000
50 000
60 000
Source: Economic Commission for Latin America and the Caribbean (ECLAC), on the basis of Eurostat, “Comext”.
In European Union imports from the region, goods for recycling account for most of the value, whereas goods for valorization represent most of the volume (see figure III.10, panels A and B).16 The highest values are associated with copper and other metal waste for recycling, while the largest volumes are for agricultural products: plant waste, residues and by-products of types used in animal feed, and cakes and other solid residues from the extraction of sunflower seeds. European Union exports to the region are more diversified (see figure III.10, panels C and D). Used products accounted for 60% of their average value in 2019–2020, followed by recycled products at 15%. The used products with the largest shares were used semitrailer road tractor-trailers, diesel goods vehicles and second-hand clothing. In terms of volume, just over half was waste for recycling and nearly a quarter consisted of recycled products (testliner paper).
16 Goods for valorization include residues and co-products from agriculture, fisheries and aquaculture, livestock, processed foods and wood.

171Chapter IIIInternational Trade Outlook for Latin America and the Caribbean • 2021
Figure III.10 European Union (28 members): trade in products associated with the circular economy with Latin America and the Caribbean, by category, average 2019–2020(Percentages)
A. Imports(by value)
B. Imports(by volume)
Recycled(64)
Recycled(21) For valorization
(79) For valorization
(34)
Used(0)
Used(2)
C. Exports(by value)
D. Exports(by volume)
For recycling(15) For recycling
(54)
For valorization(7)
Used(60)
Recycled(17)
Recycled(24)
Used(19)
For valorization(3)
Repaired(1)
Repaired(0)
Source: Economic Commission for Latin America and the Caribbean (ECLAC), on the basis of Eurostat, “Comext”.
The majority of European Union trade with the region takes place with South America: 66% in volume and 67% in value in 2020. Mexico and Central America account for 26% in volume terms and 27% in value, while the Caribbean accounts for 8% in volume and 6% in value. As figure III.11 shows, European Union imports are concentrated in shipments from Argentina and Brazil. The main destinations for European Union exports by value are (in descending order): Chile, Mexico, the Plurinational State of Bolivia and Brazil. In volume terms, the leading destinations are Colombia, Brazil and Mexico (also in descending order).

172 Economic Commission for Latin America and the Caribbean (ECLAC)Chapter III
Figure III.11 European Union (28 members): trade in products associated with the circular economy with Latin America and the Caribbean, by main partner, average 2019–2020(Percentages)
Panama
Bolivia (Plur. State of)
Colombia
Others
MexicoChile
BrazilArgentina
0 10 20 30 40 50 60 70 80 90 100
Exports from theEuropean Union to
Latin Americaand the Caribbean
(volume)
Imports from Latin Americaand the Caribbean to
the European Union(volume)
Exports from theEuropean Union to
Latin Americaand the Caribbean
(value)
Imports from Latin Americaand the Caribbean to
the European Union(value)
Source: Economic Commission for Latin America and the Caribbean (ECLAC), on the basis of Eurostat, “Comext”.
5. The region’s trade in circular goods with China is less diversified and on a smaller scale
China’s eight-digit tariff classification adds few specific subheadings associated with circular and potentially circular goods to those of the six-digit list.17 Of this goods universe, the share associated with the circular economy in China’s international trade is very small. In value terms, it corresponded to 0.14% of exports and 0.61% of imports in 2020. A decade ago, imports of such products accounted for 2.5% of total value, while exports were around 0.1%. In volume terms, in 2020, circular economy exports accounted for 0.2% of total exports, while the corresponding imports accounted for 1% of the total, the smallest percentage in the last 20 years. In 2009, imports of circular economy products peaked at 3.8% of the total, before starting to decline. The Latin American and Caribbean region accounts for a very small share of this trade: in exports, 3.8% in value and 2% in volume terms; and on the import side, 1.3% in value and 0.2% in volume terms. As figure III.12 shows, following significant increases in imports from the region during the first half of the past decade, bilateral trade has retreated to levels similar to those recorded at the turn of the century.
The region’s trade with China is not only less than its trade with other markets analysed, it is also more concentrated in products for recycling. As shown in panels A and B of figure III.13, products for recycling (especially components of electrical appliances and copper and aluminium waste) accounted for nearly all of China’s imports from the region in 2020. The most significant exception is the 5% of the volume imported in recycled paper. Chinese exports to the region are somewhat more diversified (see figure III.13, panels C and D), although, in value terms, recycling products account for three quarters of shipments. In terms of volume, however, half are agricultural goods for valorization, especially soybean cakes. Significant Chinese exports also include used clothing and used tyres for aircraft and automobiles (in order of magnitude).
17 143 subheadings have been defined in the case of China, compared to 123 at the six-digit level.

173Chapter IIIInternational Trade Outlook for Latin America and the Caribbean • 2021
Figure III.12 China: trade with Latin America in goods associated with the circular economy, by value and volume, 2002–2020
A. Volume(millions of tons)
Exports
Imports
0
200
400
600
800
1 000
1 200
1 400
2002
2003
2004
2005
2006
2007
2008
2009
2010
2011
2012
2013
2014
2015
2016
2017
2018
2019
2020
B. Value(millions of dollars)
Exports
Imports
0
200
400
600
800
1 000
1 200
1 400
1 600
1 800
2002
2003
2004
2005
2006
2007
2008
2009
2010
2011
2012
2013
2014
2015
2016
2017
2018
2019
2020
Source: Economic Commission for Latin America and the Caribbean (ECLAC), on the basis of Trade Map.Note: Volume data for Chinese exports to the rest of the world are based on the volume indices of the World Trade Organization (WTO).

174 Economic Commission for Latin America and the Caribbean (ECLAC)Chapter III
Figure III.13 China: trade in goods associated with the circular economy with Latin America and the Caribbean, by category, 2020(Percentages)
A. Imports(by value)
B. Imports(by volume)
For recycling(93)
For recycling(99)
For valorization(2)
For valorization(1)
Recycled(5)
C. Exports(by value)
D. Exports(by volume)
For recycling(36) For valorization
(18)
For recycling(74)
For valorization(51)
Used(8)
Used(13)
Source: Economic Commission for Latin America and the Caribbean (ECLAC), on the basis of Trade Map.
6. Recycling generates production linkages with other sectors
Input-output tables make it possible to analyse the production process of each sector and domestic intersectoral linkages, as well as the links with the rest of the world (reflected in import and export flows). Despite the potential of this tool, its application to the analysis of the circular economy is severely limited by the scarcity of disaggregated data on materials recycling and recovery activities.
This exercise uses the national input-output matrices of Chile (2013) and Colombia (2015) to characterize both countries’ materials recovery sector (class 3830 of the International Standard Industrial Classification of All Economic Activities (ISIC) Rev. 4), along with its production pattern and the degree of productive linkages with the rest of
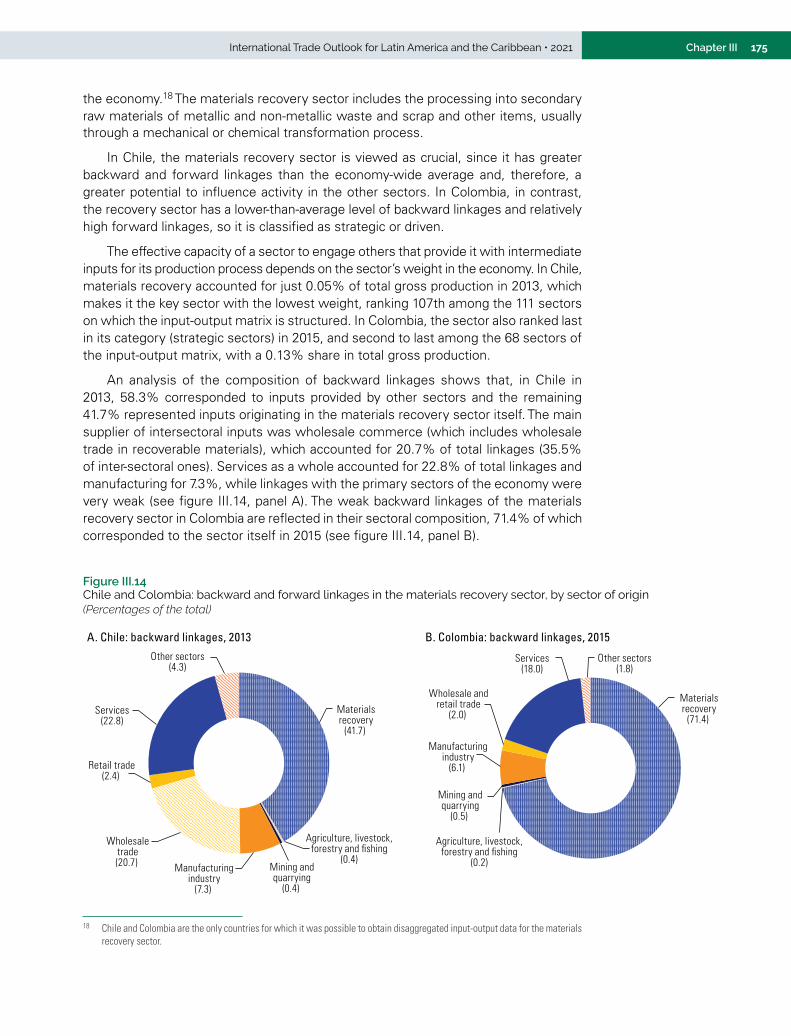
175Chapter IIIInternational Trade Outlook for Latin America and the Caribbean • 2021
the economy.18 The materials recovery sector includes the processing into secondary raw materials of metallic and non-metallic waste and scrap and other items, usually through a mechanical or chemical transformation process.
In Chile, the materials recovery sector is viewed as crucial, since it has greater backward and forward linkages than the economy-wide average and, therefore, a greater potential to influence activity in the other sectors. In Colombia, in contrast, the recovery sector has a lower-than-average level of backward linkages and relatively high forward linkages, so it is classified as strategic or driven.
The effective capacity of a sector to engage others that provide it with intermediate inputs for its production process depends on the sector’s weight in the economy. In Chile, materials recovery accounted for just 0.05% of total gross production in 2013, which makes it the key sector with the lowest weight, ranking 107th among the 111 sectors on which the input-output matrix is structured. In Colombia, the sector also ranked last in its category (strategic sectors) in 2015, and second to last among the 68 sectors of the input-output matrix, with a 0.13% share in total gross production.
An analysis of the composition of backward linkages shows that, in Chile in 2013, 58.3% corresponded to inputs provided by other sectors and the remaining 41.7% represented inputs originating in the materials recovery sector itself. The main supplier of intersectoral inputs was wholesale commerce (which includes wholesale trade in recoverable materials), which accounted for 20.7% of total linkages (35.5% of inter-sectoral ones). Services as a whole accounted for 22.8% of total linkages and manufacturing for 7.3%, while linkages with the primary sectors of the economy were very weak (see figure III.14, panel A). The weak backward linkages of the materials recovery sector in Colombia are reflected in their sectoral composition, 71.4% of which corresponded to the sector itself in 2015 (see figure III.14, panel B).
18 Chile and Colombia are the only countries for which it was possible to obtain disaggregated input-output data for the materials recovery sector.
Figure III.14 Chile and Colombia: backward and forward linkages in the materials recovery sector, by sector of origin(Percentages of the total)
A. Chile: backward linkages, 2013 B. Colombia: backward linkages, 2015
Materialsrecovery
(41.7)
Materialsrecovery
(71.4)
Agriculture, livestock,forestry and fishing
(0.4)
Agriculture, livestock,forestry and fishing
(0.2)Mining andquarrying
(0.4)
Mining andquarrying
(0.5)
Manufacturingindustry
(7.3)
Manufacturingindustry
(6.1)
Wholesaletrade(20.7)
Wholesale andretail trade
(2.0)
Retail trade(2.4)
Services(22.8)
Services(18.0)
Other sectors(4.3)
Other sectors(1.8)

176 Economic Commission for Latin America and the Caribbean (ECLAC)Chapter III
C. Chile: forward linkages, 2013 D. Colombia: forward linkages, 2015
Materialsrecovery
(35.7)
Agriculture,livestock, forestry
and fishing(0.9)
Agriculture, livestock,forestry and fishing
(0.8)
Mining andquarrying
(1.2)
Mining andquarrying
(0.3)
Manufacturingindustry(47.6)
Manufacturingindustry
(31.1)
Services(6.6)
Services(5.2)
Other sectors(8.0) Materials
recovery(52.1)
Other sectors(10.4)
Source: Economic Commission for Latin America and the Caribbean (ECLAC), on the basis of official input-output tables for the countries.
Figure III.14 (concluded)
Data on the destination of production also reveal significant differences between the two countries. Whereas, in Chile, nearly all materials recovery sales were for intermediate use, in Colombia they were distributed mainly between intermediate use and export (see figure III.15). In both countries, the sectoral composition of forward linkages shows that the main destinations within intermediate use are the sector itself and manufacturing industry (see figure III.14, panels C and D ). In the case of Chile, the links with the manufacture of other articles of paper and paperboard (37.8% of linkages with manufacturing industry and 18.0% of total linkages) include the manufacture of pulp (21.8% and 10.4%, respectively) and plastic products (17.3% and 8.2%, respectively). In Colombia, meanwhile, the bulk of linkages with manufacturing industry are in the manufacture of basic metallurgical products and processed metal products (68.5% of linkages with manufacturing sectors and 21.3% of total linkages), which reveals differences relative to Chile in the type of materials recovered. Although these linkages with manufacturing industry reflect the use of secondary raw materials in the manufacture of new products, materials recovery has a very small share of the supply of inter-sectoral inputs (direct and indirect) in both countries.19
International trade gives domestic sectors access to inputs produced in the rest of the world. An analysis of the import data in the input-output tables of Chile and Colombia shows that materials recovery is also a very minor source of imported inputs (0.03% and 0.12%, respectively). In the case of Chile, the main direct users of these intermediate-use products are the manufacture of plastic products (32.4%), the materials recovery sector itself (8.0%) and the production of concrete and other non-metallic mineral products (2.7%). In Colombia, the main importing sectors are the manufacture of basic metals and fabricated metal products (42.5%); the production of paper, paperboard and paper and paperboard products (17.9%); clothing manufacturing (9.6%); and the preparation, spinning, weaving and finishing of textiles and the manufacture of other textile products (4.8%).
19 In the case of Chile, materials recovery has the strongest inter-sectoral backward linkages in manufacturing industry in the manufacture of other articles of paper and paperboard (9.9%) and plastic products (3.0%). In Colombia, the main linkages are in the manufacture of basic metals and fabricated metal products (4.7%) and in the manufacture of electrical appliances and equipment, computer, electronic and optical products (2.4%).
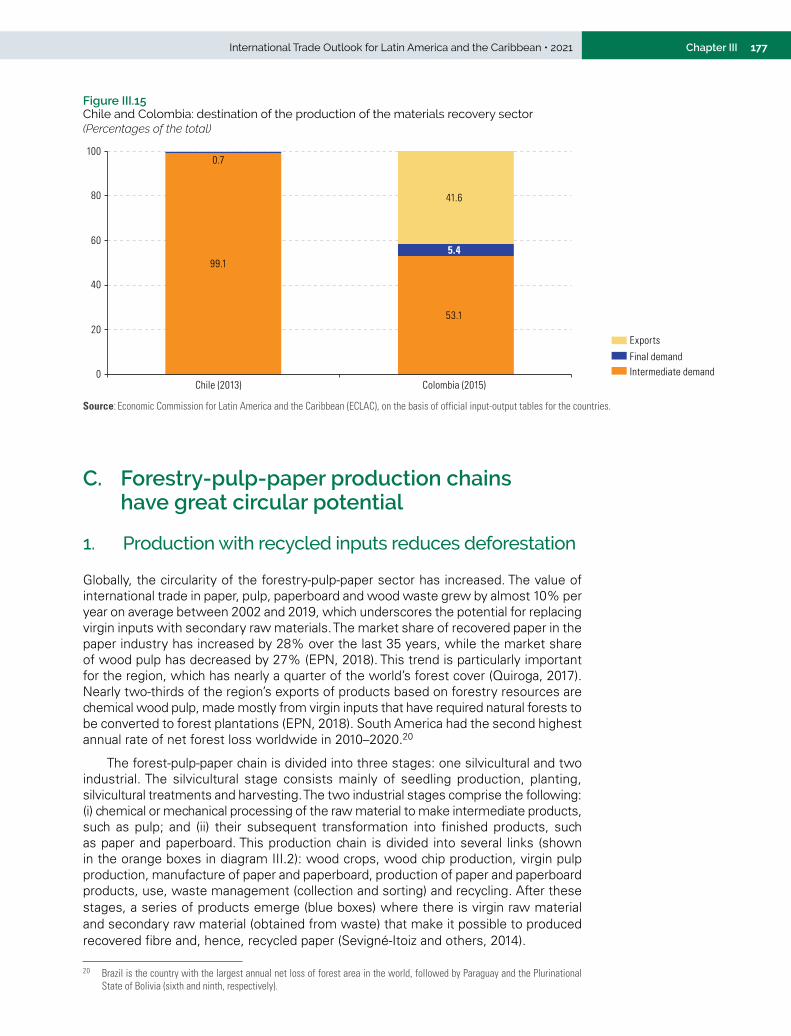
177Chapter IIIInternational Trade Outlook for Latin America and the Caribbean • 2021
Figure III.15 Chile and Colombia: destination of the production of the materials recovery sector(Percentages of the total)
Final demand
Exports
Intermediate demand
99.1
53.1
0.7
5.4
41.6
0
20
40
60
80
100
Chile (2013) Colombia (2015)
Source: Economic Commission for Latin America and the Caribbean (ECLAC), on the basis of official input-output tables for the countries.
C. Forestry-pulp-paper production chains have great circular potential
1. Production with recycled inputs reduces deforestation
Globally, the circularity of the forestry-pulp-paper sector has increased. The value of international trade in paper, pulp, paperboard and wood waste grew by almost 10% per year on average between 2002 and 2019, which underscores the potential for replacing virgin inputs with secondary raw materials. The market share of recovered paper in the paper industry has increased by 28% over the last 35 years, while the market share of wood pulp has decreased by 27% (EPN, 2018). This trend is particularly important for the region, which has nearly a quarter of the world’s forest cover (Quiroga, 2017). Nearly two-thirds of the region’s exports of products based on forestry resources are chemical wood pulp, made mostly from virgin inputs that have required natural forests to be converted to forest plantations (EPN, 2018). South America had the second highest annual rate of net forest loss worldwide in 2010–2020.20
The forest-pulp-paper chain is divided into three stages: one silvicultural and two industrial. The silvicultural stage consists mainly of seedling production, planting, silvicultural treatments and harvesting. The two industrial stages comprise the following: (i) chemical or mechanical processing of the raw material to make intermediate products, such as pulp; and (ii) their subsequent transformation into finished products, such as paper and paperboard. This production chain is divided into several links (shown in the orange boxes in diagram III.2): wood crops, wood chip production, virgin pulp production, manufacture of paper and paperboard, production of paper and paperboard products, use, waste management (collection and sorting) and recycling. After these stages, a series of products emerge (blue boxes) where there is virgin raw material and secondary raw material (obtained from waste) that make it possible to produced recovered fibre and, hence, recycled paper (Sevigné-Itoiz and others, 2014).
20 Brazil is the country with the largest annual net loss of forest area in the world, followed by Paraguay and the Plurinational State of Bolivia (sixth and ninth, respectively).

178 Economic Commission for Latin America and the Caribbean (ECLAC)Chapter III
Diagram III.2 Production process of the forestry-pulp-paper chain
Wood chipproduction
NewsprintSanitary
PackagingOthers
Use(stock)
Selectivelycollected paper
wasteScrap paper
waste
WastemanagementRecycling
EucalyptusPine
Wood
Virgin pulp
Paper residue scraps
Recovered paperRecoveredfibre
Trade flowsTransformation flows
Paper waste
Paper and paperboardproducts
International market
National market
Wood chips
Wood crops
Virgin pulpproduction
Chemical pulpMechanical pulpSemi-chemical
Manufactureof paper andpaperboard
NewsprintPrinting papers
Sanitary and householdPackaging paper
Carton boardCorrugated materials
Paper andpaperboard
Manufactureof paper andpaperboard
products
Used corrugatedcontainer-KraftUsed newsprintUsed magazine
paper
Source: E. Sevigne-Itoiz and others, “Methodology of supporting decision-making of waste management with material flow analysis (MFA) and consequential life cycle assessment (CLCA): case study of waste paper recycling”, Journal of Cleaner Production, vol. 105, 2014.
Promotion of the circular economy in the sector contributes to multiple savings in raw materials, energy and water, thereby making it a more efficient and environmentally friendly production alternative (see table III.2). The production of 1 ton of pulp from recycled secondary inputs is up to four times more efficient than production obtained from virgin inputs (EPN, 2018). The environmental impact goes far beyond deforestation, however, as there is also a direct impact on emissions of dioxins, pollutants and mercury associated with production obtained from virgin raw material.
Table III.2 Environmental impacts of recycled paper relative to virgin paper
Impact categories One metric ton of 100% recycled paper instead of virgin paper saves
One metric ton of 100% recycled newsprint instead of virgin paper saves
Fresh wood and equivalent trees
4.4 metric tons of wood, equivalent to 24 trees
2.3 metric tons of wood, equivalent to 14 trees
Total energy 39% 23%Greenhouse gases 58% 64%Water usage 9% 25%Ocean acidification 56% 74%Hazardous air pollutants 13% 46%Mercury emissions 20% 38%Dioxin emissions 26% 93%
Source: Environmental Paper Network (EPN), The State of the Global Paper Industry, 2018.
The sector’s circularity is promoted largely by a few leading firms. Ten firms accounted for 40% of global industry sales in 2015: three from the United States, three Japanese and four European. Regional firms generate just 7% of global sales (PWC, 2016). This small group of multinationals has great political influence, which enables them to impose the conditions on which transactions with the other actors and the subsystem’s supplier network are based. This distribution of power is also reproduced in the recycling circuits.
Several regional firms implement practices that can be characterized as circular.21 These include nutrient recycling, production from waste and scrap, third-party waste utilization, treatment of effluents, eco-design of sustainable products, use of advanced technologies for monitoring waste production, and soil conservation to ensure future forest replenishment
21 Information obtained in an interview with Pablo Montes, Environmental Affairs Coordinator at UPM Forestal Oriental.

179Chapter IIIInternational Trade Outlook for Latin America and the Caribbean • 2021
(Moraes and others, 2021; Van Ewijk, Stegemann and Ekins, 2021). In addition, informal recyclers play an important role in the region’s recovery, sorting and recycling industry. In Argentina, for example, they supply at least a quarter of the scrap consumed by this production sector (Schamber, 2008). Given the strategic role they play, they need to be included in this chain for the successful design and implementation of public policies.
2. Recycled inputs play a major role in the paper value chain
Between 2002 and 2019, the value of exports generated by the forestry-pulp-paper sector chain doubled globally and almost fivefold at the regional level. The chain includes several circular goods: paper and paperboard waste and scrap, products made from wood waste and scrap. In the same period, shipments of circular goods in this chain increased fourfold globally and by three times in the region. As a result, the share of waste in this chain’s global exports grew from 2.8% to 6.3% between 2002 and 2019 (see figure III.16). In Latin America and the Caribbean, however, it fluctuated between 0.9% in 2002 and 0.6% in 2019, owing to faster growth in shipments of wood pulp.
Figure III.16 World and Latin America and the Caribbean: total exports of the forestry-pulp-paper chain and circular goods within the chain, 2002–2019(Billions of dollars and percentages)
Share of circular goods(right scale)Total0
1
2
3
4
5
6
7
8
0
50
100
150
200
250
300
2002
2003
2004
2005
2006
2007
2008
2009
2010
2011
2012
2013
2014
2015
2016
2017
2018
2019
A. World
Share of circular goods(right scale)Total
B. Latin America and the Caribbean
0
0.2
0.4
0.6
0.8
1.0
1.2
1.4
0
5
10
15
20
25
30
2002
2003
2004
2005
2006
2007
2008
2009
2010
2011
2012
2013
2014
2015
2016
2017
2018
2019
Source: Economic Commission for Latin America and the Caribbean (ECLAC), on the basis of United Nations International Trade Statistics Database.
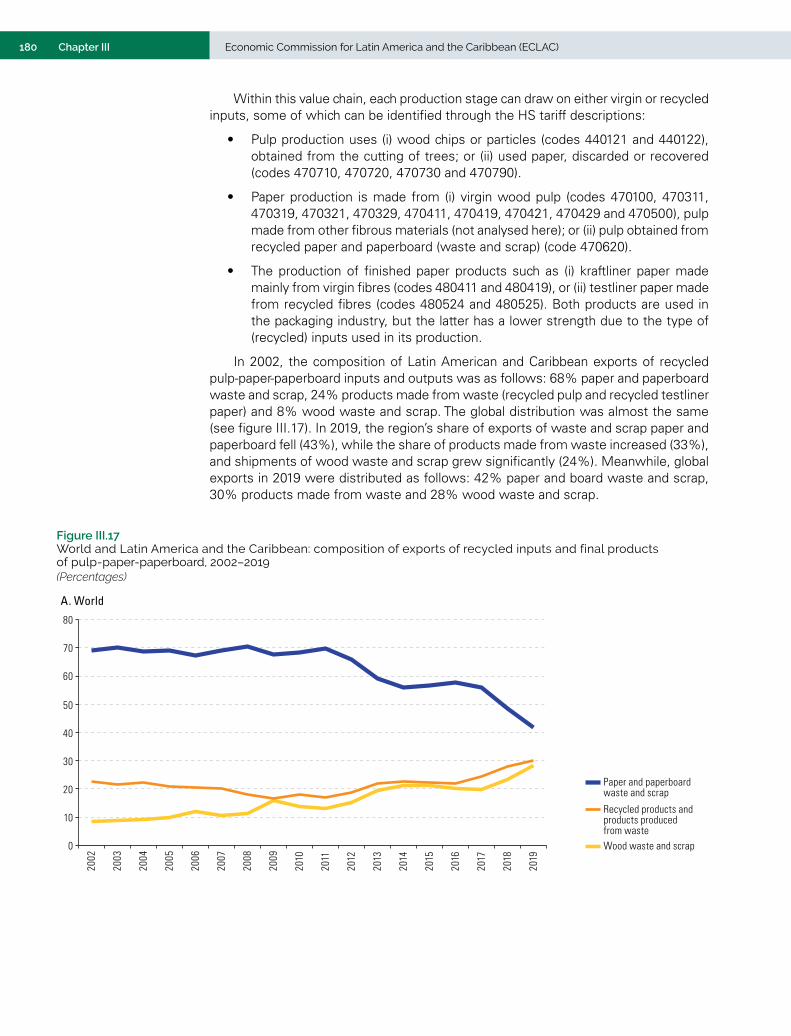
180 Economic Commission for Latin America and the Caribbean (ECLAC)Chapter III
Within this value chain, each production stage can draw on either virgin or recycled inputs, some of which can be identified through the HS tariff descriptions:
• Pulp production uses (i) wood chips or particles (codes 440121 and 440122), obtained from the cutting of trees; or (ii) used paper, discarded or recovered (codes 470710, 470720, 470730 and 470790).
• Paper production is made from (i) virgin wood pulp (codes 470100, 470311, 470319, 470321, 470329, 470411, 470419, 470421, 470429 and 470500), pulp made from other fibrous materials (not analysed here); or (ii) pulp obtained from recycled paper and paperboard (waste and scrap) (code 470620).
• The production of finished paper products such as (i) kraftliner paper made mainly from virgin fibres (codes 480411 and 480419), or (ii) testliner paper made from recycled fibres (codes 480524 and 480525). Both products are used in the packaging industry, but the latter has a lower strength due to the type of (recycled) inputs used in its production.
In 2002, the composition of Latin American and Caribbean exports of recycled pulp-paper-paperboard inputs and outputs was as follows: 68% paper and paperboard waste and scrap, 24% products made from waste (recycled pulp and recycled testliner paper) and 8% wood waste and scrap. The global distribution was almost the same (see figure III.17). In 2019, the region’s share of exports of waste and scrap paper and paperboard fell (43%), while the share of products made from waste increased (33%), and shipments of wood waste and scrap grew significantly (24%). Meanwhile, global exports in 2019 were distributed as follows: 42% paper and board waste and scrap, 30% products made from waste and 28% wood waste and scrap.
Figure III.17 World and Latin America and the Caribbean: composition of exports of recycled inputs and final products of pulp-paper-paperboard, 2002–2019(Percentages)
A. World
0
10
20
30
40
50
60
70
80
2002
2003
2004
2005
2006
2007
2008
2009
2010
2011
2012
2013
2014
2015
2016
2017
2018
2019
Paper and paperboardwaste and scrap
Recycled products andproducts producedfrom waste Wood waste and scrap
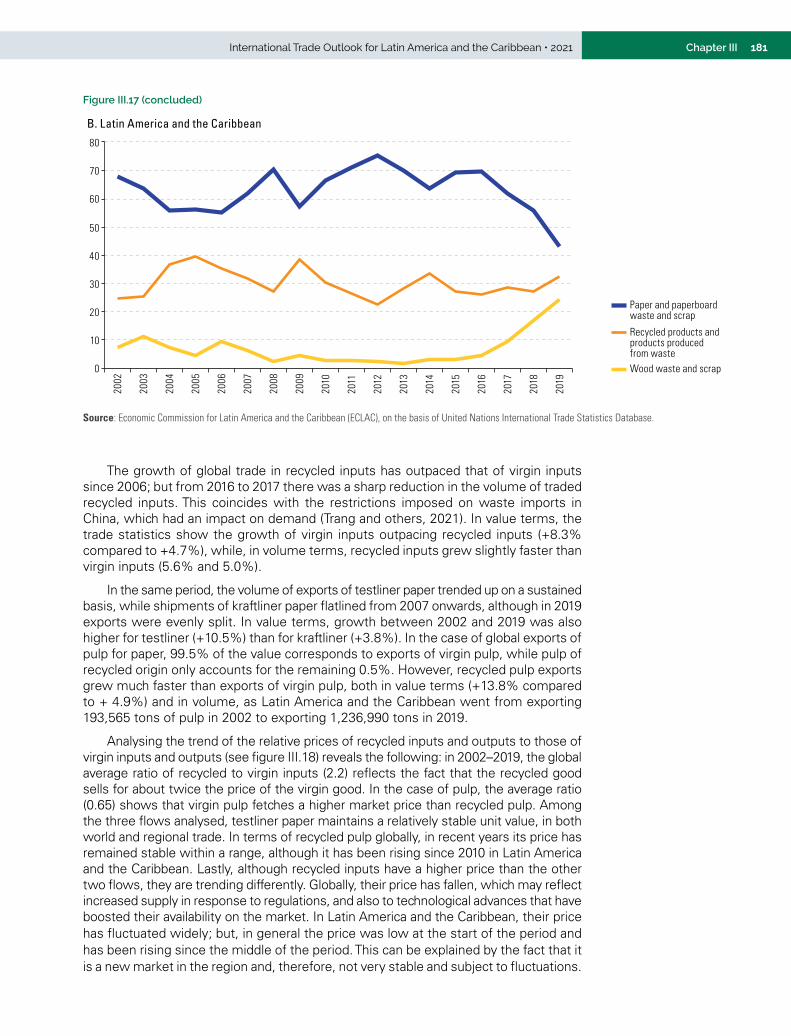
181Chapter IIIInternational Trade Outlook for Latin America and the Caribbean • 2021
Paper and paperboardwaste and scrap
Recycled products andproducts producedfrom waste Wood waste and scrap
B. Latin America and the Caribbean
0
10
20
30
40
50
60
70
80
2002
2003
2004
2005
2006
2007
2008
2009
2010
2011
2012
2013
2014
2015
2016
2017
2018
2019
Source: Economic Commission for Latin America and the Caribbean (ECLAC), on the basis of United Nations International Trade Statistics Database.
The growth of global trade in recycled inputs has outpaced that of virgin inputs since 2006; but from 2016 to 2017 there was a sharp reduction in the volume of traded recycled inputs. This coincides with the restrictions imposed on waste imports in China, which had an impact on demand (Trang and others, 2021). In value terms, the trade statistics show the growth of virgin inputs outpacing recycled inputs (+8.3% compared to +4.7%), while, in volume terms, recycled inputs grew slightly faster than virgin inputs (5.6% and 5.0%).
In the same period, the volume of exports of testliner paper trended up on a sustained basis, while shipments of kraftliner paper flatlined from 2007 onwards, although in 2019 exports were evenly split. In value terms, growth between 2002 and 2019 was also higher for testliner (+10.5%) than for kraftliner (+3.8%). In the case of global exports of pulp for paper, 99.5% of the value corresponds to exports of virgin pulp, while pulp of recycled origin only accounts for the remaining 0.5%. However, recycled pulp exports grew much faster than exports of virgin pulp, both in value terms (+13.8% compared to + 4.9%) and in volume, as Latin America and the Caribbean went from exporting 193,565 tons of pulp in 2002 to exporting 1,236,990 tons in 2019.
Analysing the trend of the relative prices of recycled inputs and outputs to those of virgin inputs and outputs (see figure III.18) reveals the following: in 2002–2019, the global average ratio of recycled to virgin inputs (2.2) reflects the fact that the recycled good sells for about twice the price of the virgin good. In the case of pulp, the average ratio (0.65) shows that virgin pulp fetches a higher market price than recycled pulp. Among the three flows analysed, testliner paper maintains a relatively stable unit value, in both world and regional trade. In terms of recycled pulp globally, in recent years its price has remained stable within a range, although it has been rising since 2010 in Latin America and the Caribbean. Lastly, although recycled inputs have a higher price than the other two flows, they are trending differently. Globally, their price has fallen, which may reflect increased supply in response to regulations, and also to technological advances that have boosted their availability on the market. In Latin America and the Caribbean, their price has fluctuated widely; but, in general the price was low at the start of the period and has been rising since the middle of the period. This can be explained by the fact that it is a new market in the region and, therefore, not very stable and subject to fluctuations.
Figure III.17 (concluded)

182 Economic Commission for Latin America and the Caribbean (ECLAC)Chapter III
Figure III.18 World and Latin America and the Caribbean: ratio of the unit value of recycled inputs and recycled end-products to the unit value of virgin pulp-paperboard inputs and end-products, 2002–2019(Dollars per kilogram)
A. World
0
0.5
1.0
1.5
2.0
2.5
3.0
3.5
2002
2003
2004
2005
2006
2007
2008
2009
2010
2011
2012
2013
2014
2015
2016
2017
2018
2019
Recycled inputs for pulp
Testliner paper (recycled)
Recycled pulp
B. Latin America and the Caribbean
0
0.5
1.0
1.5
2.0
2.5
3.0
3.5
2002
2003
2004
2005
2006
2007
2008
2009
2010
2011
2012
2013
2014
2015
2016
2017
2018
2019
Recycled inputs for pulp
Testliner paper (recycled)
Recycled pulp
Source: Economic Commission for Latin America and the Caribbean (ECLAC), on the basis of United Nations International Trade Statistics Database.
3. Circularity faces challenges in the paper value chain in the region
As one of the world’s largest forestry powers and the region’s leading producer, Brazil sells most of its paper production domestically, while exporting pulp rather than paper (Ohrn, 2020). Nonetheless, the country could move up the chain towards higher value-added activities, with a sustainable and circular strategy. As a leader in this change, it could trigger a domino effect on other firms and countries in the region that participate in the chain.
183Chapter IIIInternational Trade Outlook for Latin America and the Caribbean • 2021
International cooperation is the key to promoting more circular value chains in the pulp and paper sector (Zanetti and others, 2017). For example, the European Union already includes a forestry strategy in its Green Deal, which seeks to enhance forest protection and restoration by promoting (certified) deforestation-free supply chains and international cooperation. The promotion of a circular approach within these cooperation frameworks could drive a global transition.
Several instruments stimulate the supply of and demand for environmentally sustainable products. A growing number of firms use eco-labelling, seals or other types of distinction that add value and distinctiveness relative to non-certified processes or products. The growing environmental awareness among consumers is contributing to this trend. Examples of certification include the Forest Stewardship Council (FSC) and the Programme for the Endorsement of Forest Certification (PEFC). These instruments enable consumers to know which products are made from 100% recycled materials or contain recycled inputs. Other measures also drive more sustainable chains, such as carbon pricing, subsidies or incentives for recycling or secondary production, as well as green public procurement programmes.
Global trade trends show that secondary raw material of recycled origin is increasingly being used in the forest-pulp-paper chain. However, there are obstacles that hold back further circularity, including the difficulty of producing paper and paper board from recycled material alone. This is because paper can only be recycled five to seven times, because recycling shortens the fibre. and the result is an end-product of lower quality and strength. Sourcing virgin fibres in the production chain is therefore essential to meet the demand for quality paper and paperboard. This is not the case in other production chains, such as those based on minerals or metals, in which the quality of recycled products does not degrade.
Certain regulations also hinder greater use of recycled materials. These include rules on food packaging that impose specifications for their composition. Food cartons, for example, must be made from virgin material or, if recycled inputs are used, they must comply with specific regulations (Lacabana, 2019). Moreover, tighter forestry restrictions in one region could lead to destructive practices in others where environmental regulations are less stringent.
D. Integrating trade policies to enhance circular economy initiatives
Several countries are promoting circular economy initiatives that relate to different national policies, including trade policy. This section describes the priorities that have been proposed in the region to advance the circular economy, and a number of trade issues that could obstruct this goal.
1. Developed countries are leaders in policies to advance the circular economy
The European Union and the United States are the largest markets for circular goods in the region. Both are working on the issues and standards that will be prioritized in the coming years, thereby enabling public and private actors to anticipate the requirements and demands that will become increasingly common in global trade.

184 Economic Commission for Latin America and the Caribbean (ECLAC)Chapter III
The European Union is leading public policy efforts to move towards a global circular economy. The European Commission recognizes that the transformations needed to implement the circular economy require global markets that can create trade opportunities within and outside Europe, as well as the incorporation of natural resource suppliers, who are located at the start of the value chains. For these reasons, the Circular Economy Action Plan 2020 contains a set of standards that aim to ensure that all producers and importers in the European Union have more durable, reusable, upgradeable and repairable products, that are more energy- and resource-efficient. To this end, progress will be made in establishing minimum requirements for sustainability labels or logos and information tools, based on the environmental footprint methodology.
Before the end of 2023, the European Commission will table a bill proposing a framework for a sustainable food system applicable to all products sold on the European market, along with certification systems and sustainability labelling. Regulations will also be introduced to minimize the marketing of products associated with deforestation and forest degradation. Trade policy is also expected to promote commitments in key areas, such as animal welfare, pesticide use and combating antimicrobial resistance. While promoting strict rules on safety and sustainability, there also is a willingness to help small-scale farmers meet the standards and gain access to the European market (European Commission, 2020a and 2020b).
In the United States, the Commission for Environmental Cooperation (CEC) has the Strategic Plan 2021–2025,22 with pillars that include the circular economy, sustainable materials management and the reduction of marine litter pollution (including plastic and microplastic waste). Its activities and spheres of interest include fostering common understandings in various areas, including trade, as well as expanding environmentally friendly supply chains, reducing food loss and waste in the region, moving towards proper management of the chemicals contained in pesticides, and improving e-commerce and energy efficiency practices in the private sector (CEC, 2020).
To transition towards a global circular economy, public-private coordination bodies prioritizing specific sectors have been created at the global and regional levels. At the World Economic Forum, the Platform for Accelerating the Circular Economy (PACE) was launched in 2018, through which specific actions were proposed in early 2021 to advance global circularity in plastics, food products, electronics, textiles and capital goods.23 The representatives of governments in the region who are leading this initiative are the environment ministers of Chile, Colombia, Costa Rica, the Dominican Republic and Peru. With similar objectives, the Latin America and the Caribbean Circular Economy Coalition has been formed in the region, with the aim of coordinating the numerous existing public and private initiatives and supporting the transition to the circular economy with a regional perspective and life-cycle approach.24 The issues prioritized for the first year’s work are: plastics, cities and construction, electronic products, food and agriculture, industrial symbiosis and tourism.
Promoting the circular economy globally requires standards based on shared and verifiable criteria, to standardize circular processes, encourage the incorporation of good practices that result in new circular products and business models, and provide reliable information. So far, the standards associated with the circular economy are few. There are seals that ensure sustainable extractive processes in the case of certain raw
22 The Commission for Environmental Cooperation is a body created by the 1994 North American Agreement on Environmental Cooperation (NAAEC), which incorporates into this plan the commitments made by Canada, Mexico and the United States in their new free trade agreement.
23 See [online] https://pacecircular.org/action-agenda. 24 Its work areas are: advocacy, dialogue and leadership to increase understanding of the circular economy, and the formulation
of policy recommendations, research and knowledge development. See [online] https://www.coalicioneconomiacircular.org/#:~:text=The%20Coalici%20Coalici%20of%20Circular%20Economy%20has%20as%20main%20objectives%20to%20create%20life%20cycle%20thinking

185Chapter IIIInternational Trade Outlook for Latin America and the Caribbean • 2021
materials; and there are schemes to reduce the use of energy, water and materials in general, and others that promote the reduction and even elimination of waste production.
There are national standards focused on the circular economy that aim to guide firms in implementing a corporate circular strategy. In the United Kingdom, the BS8001 standard launched in 2017 by the British Standards Institute (BSI), seeks to implement circular economy principles in organizations.25 In France, the CP XP X30-901 standard of the AFNOR Group addresses the following topics: sustainable procurement, eco-design, industrial symbiosis, functional economy, responsible consumption, extension of service and management of products and materials at the end of their life cycle.26 At the product level, “cradle-to-cradle” certification has the longest track record. It considers five performance categories: material health (based on chemical components), material reuse, renewable energy and carbon management (the products are made with renewable energy), water management (water is considered a valuable resource and managed as such) and social equity (operations consider all people and natural systems).27
In Latin America, partnership initiatives have been created around environmental standards based on life-cycle analysis, with the aim of introducing this approach in different countries and sectors. In 2014, the Latin American and Caribbean Network of the Environmental Footprint of Coffee was created, organized by ECLAC around the development of the European standard. It is the only non-European Union group that was part of the discussion and is continuing its work until it has a regional framework that makes it possible to harmonize the description of environmental impacts related to the life cycle of green coffee in the region (Olmos Soto, 2019). In 2015, the Environmental Alliance of the Americas was created, which aims to create an environmental labelling and declaration system for the region, named the Environmental Seal of the Americas. Costa Rica, Colombia and Mexico already have this seal.
In 2018, Technical Committee TC 323 was established at the International Organization for Standardization (ISO) to develop guidance frameworks, support tools and requirements for implementing circular activities in organizations. These tools will be used to foster an improved and shared understanding of the circular economy; to put a framework in place to help organizations integrate relevant principles into their strategies and activities; to develop tools to evaluate the performance of circularity; to facilitate dialogue, communication and collaboration between different actors; to provide user-friendly documents to implement the circular economy; and to avoid the proliferation of standards, among other objectives. A total of 74 countries participate in this committee, including most of the countries in the region (ISO, 2019).
2. The countries of the region are also making progress in linking trade policy with the circular economy
Several countries in the region are building their circular economy strategies, and some already have roadmaps in place. Colombia was the first to establish an action plan in 2019. Since then, public initiatives have been reported in Uruguay, Peru, Chile and Ecuador (in chronological order). Other countries, such as Brazil, Costa Rica and Mexico, have made the circular economy a policy objective and are developing their own strategies. The Dominican Republic, El Salvador and Paraguay are also organizing nationally to address the issue.
25 See [online] https://www.bsigroup.com/es-ES/Normas/Las-ventajas-del-uso-de-las-normas/Como-hacerse-mas-sostenible-con-las-normas/bs-8001-economia-circular/.
26 See [online] https://www.afnor.org/en/news/practical-guide-circular-economy/.27 See [online] https://www.c2ccertified.org/get-certified/product-certification.

186 Economic Commission for Latin America and the Caribbean (ECLAC)Chapter III
These strategies seek to meet national climate and green development commitments, and to fulfil sustainable development agendas and improve the competitiveness and productivity of the economies. Each country has defined its own priorities, which do not always have a sectoral focus (see table III.3). Chile and Colombia, for example, establish cross-cutting strategies aimed at facilitating material flows. Colombia has defined lines of action for industrial materials and mass consumption products, containers and packaging, biomass, renewable energy, water and construction materials. In Ecuador, actions on production prioritize ten subsectors within manufacturing industry. Uruguay, in contrast, is focusing on its most consolidated industries. Mexico is working on a broader strategy, not only focused on waste. Peru has already presented an approach to manufacturing, which will be followed by strategies on agriculture and fisheries.
Table III.3 Latin America (selected countries): circular economy instruments and prioritized areas
Instrument Prioritized areas
Chile Roadmap for a Circular Chile by 2040 Cross-cutting (materials-centred)
Colombia National Circular Economy Strategy (2019) Cross-cutting for materials, water and energy
Ecuador Ecuador’s Circular Economy White Paper (2021) Agriculture, manufacturing and services
Mexico National Vision towards Sustainable Management: Zero Waste (2019) a Waste
Peru Roadmap to a Circular Economy in the Manufacturing Sector (2020) Industrial production b
Uruguay Circular Economy Action Plan (2019) Meat, dairy, forestry, food and packaging waste, servitization and materials valorization
Source: Economic Commission for Latin America and the Caribbean (ECLAC), on the basis of Government of Chile, Propuesta: Hoja de ruta nacional a la economía circular para un Chile sin basura 2020–2040, n/d, Government of Colombia, Estrategia nacional de economía circular: cierre de ciclos de materiales, innovación tecnológica, colaboración y nuevos modelos de negocio, Bogotá, 2019, Ministry of Production, Foreign Trade, Investments and Fisheries (MPCEIP), Libro blanco de economía circular de Ecuador, 2021, Secretariat of the Environment and Natural Resources, Visión nacional hacia una gestión sustentable: cero residuos, Mexico City, 2019, Government of Peru, “Decreto Supremo que Aprueba la Hoja de Ruta hacia una Economía Circular en el Sector Industria núm. 003–2020-PRODUCE”, 2020, and Uruguay, Plan de acción en economía circular, Montevideo, 2019.
Depending on which sectors are prioritized, the strategies define challenges in terms of innovation and Industry 4.0, aimed at generating technological solutions to exploit materials and the new business models associated with them. Other countries’ proposals reinforce the role of the bioeconomy, both in the search for new solutions for completing cycles, especially in the case of agricultural waste, and in the creation of new materials and products. Countries such as Argentina and Brazil have developed regulatory frameworks to prioritize the valorization of agricultural waste, more than other circular economy actions. Most countries in the region have implemented policies that facilitate the transition to the circular economy, including integrated solid waste management policies. Brazil, Colombia, Chile, Costa Rica, Honduras, Mexico, Peru and Uruguay are also implementing extended producer (and importer) responsibility schemes for prioritized products. In addition, 18 of the region’s countries have regulations to reduce the use of plastic packaging and encourage recycling (Schröder and others, 2020).
In the region, few strategies propose specific measures associated with trade or trade policy. A first group of measures relates to the promotion of circular enterprises and products. Others address issues related to market access and attracting FDI (see table III.4). Measures to promote circular enterprises and products include the creation or adoption of standards. For example, tools can be developed to help make materials traceable. Some countries are taking steps to establish registers of circular suppliers, which would make it possible to map supply in terms of export potential. In sustainable public procurement systems, the vast majority of countries are seeking to add circularity criteria, with a view to promoting new business models, especially among SMEs. In this context, the existing eco-labelling schemes are seen as a way of making information on circularity visible to consumers.

187Chapter IIIInternational Trade Outlook for Latin America and the Caribbean • 2021
Table III.4 Latin America (selected countries): trade and FDI-related actions in circular strategies
Actions envisaged Chile Colombia Ecuador Mexico Uruguay Peru
Promotion of circular firms and products
Certification of circular firms or products and materials traceability
X X X X X
Circular supplier registration programme (for internationalization)
X X
Circular public procurement X X X X X
Eco-labelling system, environmental seal X X X X X X
Access to international markets
Rules for the importation of circular products, used products and waste for valorization
X X
Review of tariffs and special clauses in trade agreements
X
Access to international financing
Search for international investment funds and presentation of startups
X X X X X
FDI incentives X
Source: Economic Commission for Latin America and the Caribbean (ECLAC).
In terms of access to international markets, Chile and Colombia are considering initiatives applicable to imported products, to: (i) confirm whether or not they are circular; or (ii) ratify whether it is possible to reuse or valorize them in the country. Ecuador mentions the possibility of adjusting import tariffs according to how certain goods contribute to valorization processes, or else based on the type of materials, in addition to including special clauses in trade agreements. With regard to FDI, most of the countries have prioritized the pursuit of foreign financing for enterprises, especially start-ups. Ecuador proposes to create specific incentives to attract FDI to the country in prioritized sectors.
The Colombian strategy, which is the first of its kind in the region, includes specific mandates on trade promotion, FDI attraction and international cooperation. It proposes that regulations related to the circular economy should, in the first instance, be aligned with trends in comparable countries, in order to promote international trade with sustainability criteria and also create mechanisms for sharing knowledge and good practices. It highlights the opportunities for Colombian firms in international markets to sell products differentiated by their contributions to sustainability. To this end, ProColombia, and organizations such as the National Association of Exporters (ANALDEX), will promote specific products, services and technologies in international markets, and attract FDI for projects that promote the transition to the circular economy. This highlights the importance of including trade promotion and FDI attraction agencies in circular economy work agendas and training programmes.
An example of coordination between national strategies based on the circular economy is the initiative on the sustainable management of plastics launched by the Pacific Alliance in 2019. The Alliance’s four member countries seek jointly to address aspects of the circular economy, spanning regulatory issues, research and modifications of materials and production processes, and public awareness and education. To this end, they foster a blue economy approach (focused on the oceans) and the search for alternatives to single-use plastic. The four countries aim to align their local, national and regional public policies and promote public-private initiatives (Pacific Alliance, 2019).
In Central America, partnering initiatives related to the circular economy are also starting to emerge, organized by the Central American Commission for Environment and Development (CCAD) of the Central American Integration System (SICA). In 2019, work began on a regional plastic waste management programme.28 In 2020, a working
28 See [online] https://www.sica.int/noticias/propuesta-de-nuevo-programa-de-manejo-de-desechos-plasticos_1_119561.html.

188 Economic Commission for Latin America and the Caribbean (ECLAC)Chapter III
arrangement was set up between CCAD and the Mexican Ministry of Environment and Natural Resources (SEMARNAT), which includes promotion of the circular economy. In June 2021, the “Circular Caribbean” project was launched, which aims to prevent the dumping of plastic waste in the sea. The project also intends to strengthen the capacities of public and private institutions and civil society to create a circular economy in the area. Belize, Costa Rica, the Dominican Republic,29 El Salvador, Guatemala, Honduras, Nicaragua and Panama are all participating in the project. In 2021, CCAD identified the circular economy as a priority strategy for post-pandemic recovery, for which it expects to develop circular standards for the region and specific pilot projects.30
3. Tariff and non-tariff barriers in the region may impede the transition to the circular economy
Tariff and non-tariff barriers applied to potentially circular products can hinder their international trade. For example, in some countries of the region, food industry waste faces higher tariffs than metal waste (see table III.5), even though both can be processed for further use. This could be related to the greater presence of the metal recycling industry, whereas biological waste requires specific technologies that are less readily available.
29 See [online] https://qroo.gob.mx/sema/caribe-circular-para-prevenir-residuos-plasticos-en-mares-de-centroamerica and https://www.giz.de/en/worldwide/92240.html.
30 See [online] https://minae.go.cr/noticias-minae/comunicados/126-costa-rica-preside-consejo-de-ministros-de-ambiente-ccad.
Table III.5 Latin America (selected countries): most-favoured-nation (MFN) tariffs on circular economy product subheadings, 2020(Percentages)
Country 2306 – Residues from oil extraction (excl. soybean)
2309 - Animal feed residues
7204 – Ferrous waste and scrap
7404 - Copper waste and scrap
Bolivia (Plurinational State of) 13.8 15 6.4 10
Brazil 6 10.1 0 2
Colombia 10 8.8 0 0
Costa Rica 5 12.8 0 0
Mexico 15 5.8 0 0
Source: Economic Commission for Latin America and the Caribbean (ECLAC), on the basis of World Trade Organization (WTO), “WTO Data”, n/d [online] https://data.wto.org/en [accessed on 21 July 2021].
Note: The figures shown for Brazil are also applicable to Argentina, Paraguay and Uruguay, with minor differences. The same is true for Costa Rica with respect to the other Central American Common Market countries. Chile has an average MFN tariff and a maximum MFN tariff of 6% for all products. The tariff level falls where trade agreements are in place.
Non-tariff measures can also impede the transition to a circular economy, as exemplified by bans on the importation of used goods and waste in general. In order to protect the environment, the entry of products that could be reused, remanufactured or converted into secondary raw materials is prohibited or hindered (Mulder and Albaladejo, 2020). An analysis of notifications of this type of measure to WTO showed that developing countries generally adopt defensive measures, focused on imports. In contrast, developed economies tend to focus on regulating or supporting activities that encourage a shift to green or circular trade patterns (WTO, 2020).
Between 2009 and 2020, 6,630 environment-related measures were notified to WTO, most of which (65%) were classified as technical barriers to trade. Of this total, 997 measures relate to aspects of the circular economy, such as waste and recycling. The United States and the countries of the European Union imposed the largest number of measures of this type (137 and 127, respectively in the period analysed). Latin American countries submitted 76 notifications. As shown in figure III.19, panel A, one third of the measures have targeted waste management and recycling, another

189Chapter IIIInternational Trade Outlook for Latin America and the Caribbean • 2021
third relate to the specific management of chemical, toxic and dangerous substances, and the remaining third combine a wide variety of objectives. In terms of the types of measure adopted (see figure III.19, panel B), 45% correspond to technical regulations, followed by bans (14%), use of licences (12%) and conformity assessment procedures (11%). The countries adopting the largest number of this type of measure in the region are Mexico (22 of the 76 measures), Costa Rica (10) and Ecuador (6).
Figure III.19 Latin America and the Caribbean: notifications to WTO on waste and recycling, 2009–2019(Percentages)
A. Targets of the measures B. Types of measure
Waste managementand recyclin
(34)
Prohibitions(14)
Management of chemical,toxic and hazardous
substances(30)
Licences(12)
Other(36)
Technical regulations(45)
Other(18)
Conformityassessment
(11)
Source: Economic Commission for Latin America and the Caribbean (ECLAC), on the basis of World Trade Organization (WTO), “Environmental database”, n/d [online] https://edb.wto.org/ [accessed on 19 August 2021].
Restrictions on imports of used products are often applied in the automotive sector. Owing to the critical role played by used vehicles in accidents, air pollution and GHG emissions, entry restrictions are applied on a variety of criteria. Despite the risk of causing negative impacts in importing countries, the establishment of minimum quality levels could contribute to renewal of the vehicle fleet and to the reuse of cars from other countries. One group of countries in the region has banned used car imports altogether; others restrict entry according to their age, giving preference to newer models; and a third group applies strict emission standards for the entry of this type of vehicle (see table III.6). It should be noted that bans do not necessarily prevent trade. For example, Chile imports used cars from Japan and re-exports them to other Southern Cone countries (UNEP, 2020). In some cases, restrictions on used products, such as automobiles, may discourage the establishment of remanufacturing, refurbishment or repair businesses.
Table III.6 Latin America and the Caribbean: used car import regulations, 2017
Regulation Prohibition Age limit (years) Emission standard limit
Countries Argentina, Bolivarian Republic of Venezuela, Brazil, Chile, Colombia, Ecuador and Uruguay
4–5 years: Antigua and Barbuda, Bahamas, Belize, Dominican Republic, Jamaica, Peru, the Plurinational State of Bolivia, and Trinidad and Tobago6–8 years: El Salvador, Guyana and Honduras9 years or more: Guatemala, Mexico, Nicaragua, and Paraguay
Euro 4: Costa Rica, Mexico and PeruEuro 2: Plurinational State of Bolivia
Source: Economic Commission for Latin America and the Caribbean (ECLAC), on the basis of United Nations Environment Programme (UNEP), Used Vehicles and the Environment. A Global Overview of Used Light Duty Vehicles: Flow, Scale and Regulation, 2020.

190 Economic Commission for Latin America and the Caribbean (ECLAC)Chapter III
E. Trade agreements can promote the circular economy
Environmental issues have increasingly been included in trade agreements since the 1990s (ECLAC, 2019). This reflects a recognition of international trade’s obvious environmental impacts and the contribution it can make to the transition towards more sustainable patterns of consumption and production. However, explicit references to the circular economy are still very rare in trade agreements and are confined to cooperation commitments. Those that exist all appear in agreements or negotiations involving the European Union.31
This section discusses how different instruments that are usually regulated in trade and investment agreements can foster the transition towards circularity. It therefore seeks to present alternatives for channelling trade policies and economic integration initiatives in the region in this direction; and it aims to promote greater mainstreaming of trade in national circular economy strategies. Such actions would increase the circular economy’s contribution to a transformative recovery with equality and sustainability, in line with the proposals made recently in ECLAC (2020).
The link between trade agreements and the circular economy can be conceptualized in a double-entry matrix (Bellmann and Sell, 2021). This presents the type of incentives or disincentives offered by the agreements, and also the level of intervention at which they are targeted (see table III.7).
31 These are the trade and cooperation agreement with the United Kingdom, signed in December 2020, and the draft agreements with Chile (modernization), Mexico (modernization), the Southern Common Market (MERCOSUR), Australia and New Zealand.
Table III.7 Types of incentive and levels of intervention of the circular economy-related provisions in trade agreements
Intervention levelType of incentive National policies Trade or foreign direct investment (FDI) flows
Promote the transition to the circular economy Provide incentives to adopt and scale-up circular and resource-efficient solutions.
Reduce barriers to trade and FDI, affecting goods and services related to the circular economy.
Discourage non-circular approaches Eliminate incentives that perpetuate non-circular approaches and inefficient use of resources.
Allow specific restrictions on trade and FDI to discourage non-circular approaches and inefficient resource use.
Source: Economic Commission for Latin America and the Caribbean (ECLAC), on the basis of C. Bellmann and M. Sell, Options to Incorporate Circular Economy Provisions in Regional Trade Agreements, International Institute for Sustainable Development (IISD), 2021.
A major difficulty in promoting the circular economy through trade policy instruments arises from the aforementioned limitations of the current tariff classification. This poses several problems, such as the difficulty of enforcing multilateral environmental agreements and controlling illicit flows.32 Other constraints relate to the lack of reliable statistics on trade flows in the different categories, and various negative effects arising from discrepancies between national definitions (such as one country prohibiting the export of machinery considered as waste to be remanufactured in another country). Thus, in order to align trade policy more closely with circular economy objectives, it is critical to incorporate the associated product categories into future HS revisions.
32 For example, the distinction between hazardous and non-hazardous wastes is crucial for implementation of the commitments contained in the Basel Convention.

191Chapter IIIInternational Trade Outlook for Latin America and the Caribbean • 2021
1. Market access instruments can promote circularity
Trade agreements can help disseminate circular solutions by reducing or eliminating tariffs on products such as machinery used for waste management, remanufacturing and recycling. There is currently no internationally agreed definition or list of goods associated with the circular economy. Moreover, such a list would need to be updated regularly, given the rapid pace of technological innovation associated with these types of solutions (Bellmann and Sell, 2021). Nonetheless, there are several lists of environmental goods that include products associated with the circular economy, which countries can use in their agreements (ECLAC, 2019).
From the circularity standpoint, the rationale for the waste trade is based on promoting recycling and thus reducing the primary extraction of raw materials at the global level. It is therefore crucial to include mechanisms in trade agreements to prevent waste from being exported to countries that do not have the capacity to recycle it, and it would end up either being incinerated or else accumulating in landfills. This problem is particularly acute in the case of plastic waste and WEEE, both because of the increasing volumes generated each year and because they have much lower rates of recycling than metal waste (see section A).
Reducing import restrictions on used goods is another trade policy instrument that is directly linked to the circular economy. This fosters the extension of life cycles, keeping products in use for as long as possible. From this point of view, international trade in used goods would in principle contribute to greater circularity at the global level. However, this is not problem-free. Firstly, it can slow down the dissemination of new, more environmentally efficient technologies in importing countries, especially if they are developing ones. Secondly, the inaccuracies of the current tariff classification may facilitate unscrupulous practices, such as scrap metal being exported as used goods. In short, it is impossible to state a priori that the lowering of import restrictions on used goods will foster the transition towards greater circularity. A case-by-case analysis is required (see section D).
One positive innovation is the distinction between used and remanufactured goods made in the United States-Mexico-Canada Agreement (USMCA), which was signed in November 2018 and has been in force since July 2020. Unlike its predecessor, the North American Free Trade Agreement (NAFTA), USMCA provides that if either party applies restrictions on the export or import of used goods, these will not apply to remanufactured products. The latter consist wholly or partly of recovered materials, but have a similar life expectancy and performance to those of their new counterparts.
All preferential trade agreements include a regime of origin, which specifies the criteria that an imported product must meet to be considered as originating in one of the member countries and thus qualify for tariff preferences. Rules of origin can be designed to encourage circular production processes, such as recycling and remanufacturing. One way of doing this is to consider the recycled materials incorporated in the production of an exported final good as originating in the exporting country, provided they have been collected there, irrespective of their true origin. This type of provision already exists in a number of agreements, such as the Pacific Alliance trade protocol, the Comprehensive and Progressive Agreement for Trans-Pacific Partnership, USMCA and the Chile-Viet Nam Free Trade Agreement.

192 Economic Commission for Latin America and the Caribbean (ECLAC)Chapter III
2. Regulatory cooperation can promote the harmonization of circularity rules
Governments are increasingly adopting regulatory instruments, either voluntary or mandatory, to promote circularity. Examples include eco-design requirements for products sold in their markets, extended producer responsibility (EPR) mechanisms, and labelling schemes that inform consumers about features such as product recyclability, durability and reparability.33 While these initiatives are crucial as incentives for circularity, they can also represent trade barriers if they result in a proliferation of different regulations and standards in each market (Yamaguchi, 2021). For example, the European Union’s Circular Economy Action Plan and China’s EPR framework vary in their ERP criteria and requirements , as well as in their recycling requirements, labelling schemes and extended legal guarantees. For exporters seeking to enter both the Chinese and European markets, these differences may require a different product design for each case (Bellmann and Van der Ven, 2020).
There are several ways in which trade agreements can reduce the costs arising from regulatory diversity between their member countries, without compromising the objective of promoting circularity (see table III.8). Regulatory cooperation can focus on procedural or substantive issues,34 and its modalities vary depending on aspects such as the existence of international standards, and differences in the level of development and regulatory capacities of the participating countries. In general, more advanced forms of cooperation, such as the harmonization or mutual recognition of standards, require a high degree of trust between the regulators in question. Accordingly, they tend to occur more frequently among highly integrated countries of similar levels of development. An example of this type of cooperation is the USMCA sectoral annex on energy efficiency standards, which contains a commitment by the three parties to the agreement to strive to harmonize their standards within nine years of the agreement entering into force.
33 Yamaguchi (2021) contains a list of labelling schemes linked to the circular economy.34 An example is the chapter on regulatory improvement in the Pacific Alliance trade protocol.
Table III.8 Examples of modalities of regulatory cooperation to promote circularity in trade agreements
Procedural cooperation Commitment of the parties to keep each other informed on the development of new regulatory instruments, including the chance to comment before they enter into forceCommitment by each party to promote coordination among its various regulatory agencies to avoid duplications and inconsistenciesCommitment by the parties to conduct ex ante and ex post evaluations of new regulatory instruments to see if there are ways of achieving the same objective that represent lower barriers to trade
Substantive cooperation Training and technical assistance programmes, seminars, sectoral dialoguesCommitment by the parties to use international standards (where they exist) to design their own regulatory instruments, unless such standards are inadequate to achieve the objectives being pursued by the countrya
Harmonization of standards and technical regulationsMutual recognition of standards and technical regulationsMutual recognition of conformity assessment proceduresb
Source: Economic Commission for Latin America and the Caribbean (ECLAC), on the basis of C. Bellmann and M. Sell, Options to Incorporate Circular Economy Provisions in Regional Trade Agreements, International Institute for Sustainable Development (IISD), 2021 and C. Bellmann and C. Van der Ven, “Greening regional trade agreements on non-tariff measures through technical barriers to trade and regulatory co-operation”, OECD Trade and Environment Working Papers, No. 2020/04, Paris, OECD Publishing, 2020.
a Work to develop various standards on the circular economy has been ongoing since 2019 under the auspices of the International Organization for Standardization (ISO). See [online] https://www.iso.org/committee/7203984.html.
b Under this type of agreement, each party maintains its own standards and technical regulations, but allows certain institutions of the other party (in this case, the exporting country) to certify that the product in question complies with them.

193Chapter IIIInternational Trade Outlook for Latin America and the Caribbean • 2021
3. Liberalization of trade in services contributes to circular economy strategies
Services play a central role in the circular economy. Firstly, the circular economy is intensive in service activities throughout the entire life cycle of products, ranging from their design through to their maintenance, repair, remanufacturing and recycling. Secondly, new “product-useful recovery” business models have emerged within the circular economy framework. The range of services that are relevant to the circular economy and can be traded internationally is very broad. In addition to environmental services such as waste management or environmental assessment of projects, general services such as research and development, design and installation, and equipment maintenance and repair also play an important role. New services are constantly emerging, as this is a process driven by the growing demand for circular solutions, digitalization and advances in technologies such as IoT.
The limited empirical evidence available indicates that trade in services linked to the circular economy occurs mainly through cross-border supply, known as mode 1 in the WTO General Agreement on Trade in Services (GATS), and the establishment of a commercial presence in the country where the service is provided (mode 3). A 2020 survey of 96 firms associated with the circular economy, based in Finland and other European countries, found that 55% of those exporting their services do so through mode 1 (mainly via the Internet), while 45% do so through mode 3 (Tamminen and others, 2020).
Trade agreements contribute more to the circular economy when they are not confined to the liberalization of environmental services, but extend to other relevant activities, especially in supply modes 1 and 3. Harmonization or mutual recognition of standards in areas such as reparability and recycling will also facilitate trade in services linked to the corresponding activities. Lastly, as an increasing number of services linked to the circular economy are delivered digitally, the removal of barriers to e-commerce should facilitate the international dissemination of such solutions.
4. Trade agreements can target subsidies, government procurement and FDI towards circular economy objectives
The production paradigm shift associated with the circular economy requires transforming production and consumption patterns that have been in place for decades. This means reformulating subsidy policies at the global level in order to discourage activities that perpetuate the current linear pattern and stimulate those that contribute to circularity. The former include various forms of fossil fuel subsidies, while the latter include subsidies for recycling, the production of secondary materials and the adoption of technologies that increase energy efficiency. However, WTO rules on subsidies have not evolved over the past quarter century to address this urgent challenge. In fact, there have been setbacks, with the expiry in 2000 of Article 8 of the Agreement on Subsidies and Countervailing Measures, which, subject to a number of conditions, declared subsidies for environmental conversion non-actionable.35
Given the lack of progress at the multilateral level, preferential trade agreements are another way to promote the circular economy. They can be deployed to: (i) make subsidies more transparent; (ii) reduce or eliminate subsidies that promote the linear model; and (iii) guarantee the right of countries to provide support for activities that
35 Non-actionable subsidies could not be challenged through the WTO dispute settlement mechanism, nor could countervailing measures be imposed on imported products that had received such subsidies.

194 Economic Commission for Latin America and the Caribbean (ECLAC)Chapter III
promote circularity (Bellmann and Sell, 2021). With regard to the first objective, it is possible to establish the obligation to notify subsidies that directly affect the circular economy, such as those granted to fossil fuels or to the primary production of plastic. At a higher level of ambition, agreements could contain commitments to reduce or eliminate such subsidies.36 Lastly, countries could agree not to question certain subsidies aimed at promoting circularity. In the region, an example of this approach is article 111 of the 2001 Revised Treaty of Chaguaramas establishing the Caribbean Community (CARICOM) and its Common Market. This article provides that CARICOM members shall not adopt trade measures against products benefiting from environmental adaptation subsidies, subject to the same conditions as provided for in article 8 of the Agreement on Subsidies and Countervailing Measures.
Public procurement is a strategic instrument for promoting the circular economy. In 2018, it accounted for 12% of global GDP, and it exceeded 15% of GDP in several developed and developing countries (Bosio and Djankov, 2020). Through procurement, governments can create markets for goods and services that fulfil circularity criteria. These may include not only requirements on the recycled content, reparability, durability and recyclability of the goods procured, but also service-based solutions (for example, contracting transport services instead of buying a fleet of cars for a ministry or municipality). In 2015, 84% of OECD member countries had policies in place to promote green public procurement (Yamaguchi, 2021).
Trade agreements often contain commitments on access to government procurement markets, which allow foreign suppliers to compete on equal terms with their local counterparts for procurements by certain entities above certain thresholds. In this context, trade agreements should confirm the right of parties to prioritize bidders that satisfy certain environmental criteria, including those linked to the circular economy. For example, before signing the Comprehensive Economic and Trade Agreement, the European Union and Canada adopted a joint interpretation which, among other things, reaffirms the right of the parties to use environmental, social and labour criteria in government procurement. In the region, the Pacific Alliance trade protocol guarantees the right of each country’s entities to apply technical specifications in their goods or services procurement that are intended to contribute to the conservation of natural resources or protect the environment.
Since the 1990s, trade agreements have increasingly included chapters on the protection of foreign investment, which often include obligations such as free transfer of funds, fair and equitable treatment, non-application of performance requirements and protection against indirect expropriation. In addition, these chapters often empower a foreign investor to sue the host State in international tribunals if it considers that any of these obligations have not been respected. On several occasions, disputes of this type have involved environmental measures (Yamaguchi, 2020). The sum total of these elements is increasingly being called into question globally, on the grounds that trade and investment agreements could hinder the ability of States to regulate in the public interest, particularly in terms of environmental protection (Gaukrodger, 2017).
In addition, FDI can play a crucial role in both the post-pandemic recovery and the transition to a green economy, particularly through the transfer of knowledge and technologies to regions and countries that are back-markers in this area. In this context, trade and investment agreements must strike a better balance between the rights and obligations of host States and the foreign investors, without encroaching on the former’s policy space. In recent years, several agreements have included provisions aimed at achieving such a balance on environmental issues (see table III.9). With appropriate adaptations, these could serve as a model for new provisions aimed at safeguarding the regulatory power of States in the circular economy.
36 Relevant precedents, albeit in a different domain, include the commitments to reduce fishing subsidies contained in the Comprehensive and Progressive Agreement for Trans-Pacific Partnership (CPTPP) and in USMCA.

195Chapter IIIInternational Trade Outlook for Latin America and the Caribbean • 2021
Table III.9 Examples of provisions included in trade and investment agreements to preserve the host State’s regulatory power on environmental issues
Type of provision Agreement in which it is found
Non-regression clauses (parties may not relax their environmental regulations in order to attract foreign investment)
China-European Union Comprehensive Agreement on Investment (section IV, subsection 2, articles 1 and 2)
Clarification that non-discriminatory environmental regulatory measures do not constitute indirect expropriation
New Zealand-Republic of Korea FTA (chapter 10, annex 10-B)aUSMCA (chapter 14, annex 14-B)bRegional Comprehensive Economic Partnership (RCEP) (chapter 10, annex 10-B)c
Application of performance requirements to foreign investment for environmental purposes
Pacific Alliance trade protocol (chapter 10, article 10.8)USMCA (chapter 14, article 14.10)Australia-Republic of Korea FTA (chapter 11, article 11.9)
Exclusion of environmental measures from investor-State dispute settlement. Australia-China FTA (Chapter 9, Article 9.11)
Source: Economic Commission for Latin America and the Caribbean (ECLAC), on the basis of C. Bellmann and M. Sell, Options to Incorporate Circular Economy Provisions in Regional Trade Agreements, International Institute for Sustainable Development (IISD), 2021, S. Yamaguchi, “Greening regional trade agreements on investment”, OECD Trade and Environment Working Papers, No. 2020/03, Paris, OECD Publishing, 2020, and the texts of the mentioned agreements.
a Free trade agreement. b United States-Mexico-Canada Agreement. c Regional Comprehensive Economic Partnership Agreement.
Trade and investment agreements can also incorporate specific circular economy obligations for foreign investors, such as complying with national EPR schemes or incorporating circular economy objectives in their projects and activities. To maximize their impact, such provisions could be included in the future agreement on investment facilitation for development, which is currently being negotiated at WTO.
F. Recommendations for increasing the contribution of trade to the circular economy
Trade has the potential to contribute to the circular economy at different levels: firm and product, national, regional and global. Circular businesses and products can be promoted through public policies and business practices that facilitate trade in goods associated with the circular economy, and encourage new business models in which trade in services is fundamental. At the national level, trade policy should be considered as complementing the generation of local standards and programmes with the potential of international markets. At the regional level, circular circuits can be created from currently untapped resources and from the industrial development of cutting-edge sectors, by fostering an international presence associated with circular goods and services. Globally, a circular economy needs to be built that fosters synergies with national and regional strategies, taking into account both the limitations and the potential of developing regions. In view of the above, the following initiatives are proposed.
1. Increased international cooperation
The contribution made by trade to the transition to a circular economy depends on how it interacts with national and international policies aimed at removing barriers; and in promoting public policies (in partnership with the private sector) that help preserve the value and utility of materials and products for as long as possible. In this way, the creation of new business models that reduce the material footprint while regenerating ecosystems is encouraged.
There is a need to liberalize trade in goods and services that contribute to circularity at every stage of production and consumption, especially at the end of the life of the goods in question. To this end, further progress is needed to define these products

196 Economic Commission for Latin America and the Caribbean (ECLAC)Chapter III
more precisely in the Harmonized System, which is used in customs procedures and trade negotiations. It would also be desirable to harmonize the definitions of circular goods (for example, used, refurbished and remanufactured goods) across national legislations. Liberalization and harmonization must go hand in hand with safeguarding human health and the environment, including in developing countries. They must also be accompanied by a transfer of technologies, knowledge and FDI to remedy current shortcomings. In particular, the extensive network of trade agreements that currently exist between the region and the European Union should be used to generate a biregional cooperation agenda linking trade and the circular economy.
The more stringent production requirements with which developed countries promote the circular economy could be interpreted as non-tariff barriers applied to exports from developing countries. However, these tools can also serve as opportunities to add value to local production, gain access to demanding markets and increase production efficiency through better management of waste and co-products. International trade can act as a vehicle to speed up the transition to the circular economy; and countries in the region should endeavour to capitalize on this opportunity as a path to sustainable economic development.
The creation of a circular global economy also requires active participation in bodies such as the WTO Informal Dialogue on Plastic Pollution and Environmentally Sustainable Plastics Trade, so that the specific challenges faced by the countries of the region and their production profile are taken into account. Although the challenges are global, the solutions must be adapted to local realities, which are not always considered in multilateral mechanisms. In fact, the challenge posed by plastic waste pollution has motivated regional groupings, such as the Pacific Alliance and the Caribbean coastal countries, to seek joint solutions. In this search, cooperation and trade can act in harness with national standards in order to achieve materials traceability and promote scalable business models and solutions based on the region’s biological wealth, such as bioplastics.
Subregional integration mechanisms are an ideal space for sharing experiences, harmonizing standards and leveraging joint solutions. The example of the Pacific Alliance on sustainable plastics management could be extended to its partner countries. Other mechanisms can help create spaces for reflection and policy definition based on what already exists, which has waste management as its main concern. Where EPR systems exist, regional dialogues can focus on the experiences of priority products, the vast majority of which are common to several countries.
At the regional level, work could be done to develop environmental regulations that transcend national borders. At the same time, the development of standards and certifications that endorse the circularity of processes could encourage firms to adopt sustainable measures. It would also be desirable for the Sustainable Development Goals linked to the transition to a circular economy to be translated into concrete business strategies and operations to promote and facilitate private sector involvement.
2. The promotion of more circular regional production chains
The potential of the circular economy will grow to the extent that regional production chains can be managed to add greater value to resources. In this context, the creation and promotion of new business models and products can help diversify regional exports and add value to them. The promotion of circular production chains could be strengthened

197Chapter IIIInternational Trade Outlook for Latin America and the Caribbean • 2021
in regionally integrated sectors, such as the pulp-paper-paperboard industry analysed in this chapter. This requires public-private coordination to facilitate collaboration between firms of different sizes, both local and foreign, in a network organized according to the comparative advantages of different areas. Regional or subregional circuits of secondary material production could thus be established, adding value in the same region. Joint promotion of such production would enable the region to position itself internationally on the basis of sustainability, thereby making this a factor of competitiveness.
There are several measures at different levels that could promote circularity in international supply chains. Future policies and governance in each chain should encourage the formation of circuits for recycled products or products derived from recycling. Among other things, demand for products made from virgin inputs could be discouraged when substitutes made from secondary inputs are available on the market. In addition, intraregional trade in recycled inputs could be promoted. These policies should go beyond the product itself, as EPR should also be promoted for the proper management, and thus recovery, of products discarded by the consumer.
Progress towards circularity can also be fostered from the public sector, through multiple actions. One of these involves developing national and regional roadmaps based on participatory processes in which the know-how and good practices of the region’s countries are shared. Another key enabler is the promotion of public policies giving fiscal and economic incentives for firms, especially micro, small and medium-sized enterprises (MSMEs) to make investments related to the circular economy. In addition, the public sector should focus on developing training activities and programmes to underpin the conversion to green and circular jobs. This is essential if the aim is to promote a just transition —understood as one that adopts a social justice approach that accompanies climate action, in which the central objective is to leave no one behind. Lastly, participatory and collaborative processes between the public and private sectors, civil society and international organizations must be encouraged.
From the private sector, flexibility and the capacity for organizational change are critical for adopting sustainable practices to enhance the firm’s competitiveness and profitability. Circularity must be mainstreamed throughout the business model, promoting research and development of sustainable and circular goods and processes, and investing in this area. To this end, it is important to transfer capacities and technologies from multinational firms to their subsidiaries abroad, so that these can be held to the same level of environmental standards. Training and awareness programmes must also be provided for workers.
Trade policy can stimulate circular products and value chains, and the creation of mechanisms for international cooperation around these issues, by incorporating environmental sustainability more forcefully into its instruments. Trade agreements can make a major contribution by including innovative ways of promoting circular products and businesses, for example through public procurement, rules of origin and other instruments.

198 Economic Commission for Latin America and the Caribbean (ECLAC)Chapter III
Bibliography
Aguilar Revelo, L. (2021), “La igualdad de género ante el cambio climático: ¿qué pueden hacer los mecanismos para el adelanto de las mujeres de América Latina y el Caribe?”, Gender Affairs series, No 159 (LC/TS.2021/79), Santiago, Economic Commission for Latin America and the Caribbean (ECLAC).
Ancuța, P. and A. Sonia (2020), “Oil press-cakes and meals valorization through circular economy approaches: a review”, Applied Sciences, vol. 10, No. 21, October.
Bellmann, C. and C. Van der Ven (2020), “Greening regional trade agreements on non-tariff measures through technical barriers to trade and regulatory co-operation”, OECD Trade and Environment Working Papers, No. 2020/04, Paris, OECD Publishing.
Bellmann, C. and M. Sell (2021), Options to Incorporate Circular Economy Provisions in Regional Trade Agreements, International Institute for Sustainable Development (IISD).
Bosio, E. and S. Djankov (2020), “How large is public procurement?”, World Bank Blogs, 5 February [online] https://blogs.worldbank.org/developmenttalk/how-large-public-procurement.
Casey, J. (2012), Patterns in U.S.-China Trade since China’s Accession to the World Trade Organization, U.S.-China Economic and Security Review Commission.
CEC (Commission for Environmental Cooperation) (2020), Strategic Plan for the Commission for Environmental Cooperation (CEC) 2021-2025: Renewing our Trilateral Commitment and Implementing the New Free Trade Agreement and its Supporting Environmental Cooperation Agreement. Canada, Mexico, and the United States – Three countries, one environment.
CFS (Committee on World Food Security) (2014), Food Losses and Waste in the Context of Sustainable Food Systems: a Report by the High Level Panel of Experts on Food Security and Nutrition, Roma.
Donner, M., R. Gohier and H. De Vries (2020), “A new circular business model typology for creating value from agro-waste”, Science of the Total Environment, vol. 716.
DXP (2021), “What does it mean when a product is remanufactured?” [online] https://www.dxpe.com/what-does-remanufactured-mean-vs-refurbished-rebuilt-refurbished/#.
Economic Commission for Latin America and the Caribbean (ECLAC) (2020), Building a New Future: Transformative Recovery with Equality and Sustainability (LC/SES.38/3-P/Rev.1), Santiago.(2019), International Trade Outlook for Latin America and the Caribbean, 2019 (LC/PUB.2019/20-P), Santiago.
Ellen MacArthur Foundation (2015), Towards a Circular Economy: Business Rationale for an Accelerated Transition [online] https://ellenmacarthurfoundation.org/towards-a-circular-economy-business-rationale-for-an-accelerated-transition.
EPN (Environmental Paper Network) (2018), The State of the Global Paper Industry. European Commission (2020a), Communication from the Commission to the European Parliament,
the Council, the European Economic and Social Committee and the Committee of the Regions. A Farm to Fork Strategy for a Fair, Healthy and Environmentally-friendly Food System.(2020b), Communication from the Commission to the European Parliament, the Council, the European Economic and Social Committee and the Committee of the Regions. A New Circular Economy Action Plan for a Cleaner and More Competitive Europe.
European Union (2008), “Directive 2008/98/EC of the European Parliament and of the Council of 19 November 2008 on waste and repealing certain Directives”, Official Journal of the European Union, L 312/3.
Forti, V. and others (2020), The Global E-waste Monitor 2020: Quantities, Flows and the Circular Economy Potential, Bonn/Geneva/Rotterdam, United Nations University/United Nations Institute for Training and Research/International Telecommunication Union/International Solid Waste Association.
Gaukrodger, D. (2017), “The balance between investor protection and the right to regulate in investment treaties: a scoping paper”, OECD Working Papers on International Investment, No. 2017/02, OECD Publishing.
Global Fashion Agenda and McKinsey & Company (2020), Fashion on Climate: How the Fashion Industry Can Urgently Act to Reduce its Greenhouse Gas Emissions.
Government of Chile (n/d), Propuesta: Hoja de ruta nacional a la economía circular para un Chile sin basura 2020-2040.
199Chapter IIIInternational Trade Outlook for Latin America and the Caribbean • 2021
Government of Colombia (2019), Estrategia nacional de economía circular: cierre de ciclos de materiales, innovación tecnológica, colaboración y nuevos modelos de negocio, Bogotá.
Government of Peru (2020), “Decreto Supremo que Aprueba la Hoja de Ruta hacia una Economía Circular en el Sector Industria núm. 003-2020-PRODUCE”.
Hofstetter, J. and others (2021), “From sustainable global value chains to circular economy – different silos, different perspectives, but many opportunities to build bridges”, Circular Economy and Sustainability, vol. 1, No. 1.
Holzmann, A. and N. Günberg (2021), “Greening’ China: an analysis of Beijing´s sustainable development strategies”, MERICS [online] https://merics.org/en/report/greening-china-analysis-beijings-sustainable-development-strategies.
ILO (International Labour Organization) (2015), Guidelines for a just transition towards environmentally sustainable economies and societies for all, Geneva.
INECC (Instituto Nacional de Ecología y Cambio Climático) (2020), Evaluación de la situación actual de la economía circular para el desarrollo de una hoja de ruta para Brasil, Chile, México y Uruguay. Informe final 2020.
International Resource Panel/UNEP (United Nations Environment Programme) (2020), Sustainable Trade in Resources: Global Material Flows, Circularity and Trade, Nairobi.
INTERPOL (International Criminal Police Organization) (2020), Strategic Analysis Report: Emerging Criminal Trends in the Global Plastic Waste Market since January 2018, Lyon.
ISO (International Organization for Standardization) (2019), ISO/TC 323 Circular Economy. Joltreau, E. (2019), (De)globalisation of International Plastic Waste Trade: Stakes at Play and
Perspectives, Paris, Êditoriaux de l’Ifri.Kalmykova, Y., M. Sadagopan and L. Rosado (2018), “Circular economy: from review of theories
and practices to development of implementation tools”, Resources, Conservation and Recycling, vol. 135.
Kettunen, M., S. Gionfra and M. Monteville (2019), EU Circular Economy and Trade: Improving Policy Coherence for Sustainable Development, Brussels, Institute for European Environmental Policy (IEEP).
Kouhizadeh, M., Q. Zhu and J. Sarkis (2019), “Blockchain and the circular economy: potential tensions and critical reflections from practice”, Production Planning and Control, vol. 31, No. 11-12.
Lacabana, M. (coord.) (2019), Economía y ambiente: el subsistema celulosa-papel en la Argentina, Bernal, National University of Quilmes.
León, M., J. L. Lewinsohn and J. Sánchez (2020), “Balanza comercial física e intercambio, uso y eficiencia de materiales en América Latina y el Caribe”, Natural Resources and Development series, No. 200 (LC/TS.2020/150), Santiago, Economic Commission for Latin America and the Caribbean (ECLAC).
Moraes, D. and others (2021), “Environmentally-responsible corporate: actions analysis of Latin American pulp and paper industry”, Environmental Challenges, vol. 4.
MPCEIP (Ministry of Production, Foreign Trade, Investments and Fisheries) (2021), Libro blanco de economía circular de Ecuador.
Mulder, N. and M. Albaladejo (coords.) (2020), “El comercio internacional y la economía circular en América Latina y el Caribe”, International Trade series, No. 159 (LC/TS.2020/174), Santiago, Economic Commission for Latin America and the Caribbean (ECLAC).
OECD (Organisation for Economic Co-operation and Development) (2021), Gender and the Environment: Building Evidence and Policies to Achieve the SDGs, Paris, OECD Publishing.(2020), “COVID-19 and global value chains: policy options to build more resilient production networks”, OECD Policy Responses to Coronavirus (COVID-19), Paris, OECD Publishing.
OECD/FAO (Organisation for Economic Co-operation and Development/Food and Agriculture Organzation of the United Nations) (2021), OCDE-FAO Agricultural outlook 2021-2030, Paris, OECD Publishing.
Ohrn, A. (2020), “Countries that make and trade paper”, 24 February [online] https://towardsdatascience.com/countries-that-make-and-trade-paper-bfd31b809f4c.
Olmos Soto, X. (2019), “El comercio internacional como incentivo a la sostenibilidad: la experiencia de la Red Latinoamericana y del Caribe de la Huella Ambiental del Café”, Project Documents (LC/TS.2019/121), Santiago, Economic Commission for Latin America and the Caribbean (ECLAC).
Pacific Alliance (2019), Declaración presidencial de la Alianza del Pacífico sobre la gestión sostenible de plásticos.
200 Economic Commission for Latin America and the Caribbean (ECLAC)Chapter III
PWC (PricewaterhouseCoopers LLP) (2016), Global Forest, Paper & Packaging Industry Survey: 2016 Edition Survey of 2015 Results.
Quiroga, R. (2017), “Contexto regional: situación y medición de los bosques en ALC”, Santiago, Economic Commission for Latin America and the Caribbean (ECLAC).
RIC (Remanufacturing Industries Council) (2021), “What is remanufacturing?” [online] http://www.remancouncil.org/educate/remanufacturing-information/what-is-remanufacturing.
Samaniego, J. and others (2021), “Trazabilidad y contabilidad del plástico mediante el sistema A.P.A.”, Project Documents (LC/TS.2021/69), Santiago, Economic Commission for Latin America and the Caribbean (ECLAC).
Schamber, P. (2008), De los desechos a las mercancías: una etnografía de los cartoneros, Buenos Aires, SB.
Schröder, P., A. Lemille and P. Desmond (2020), “Making the circular economy work for human development”, Resources, Conservation and Recycling, vol. 156.
Schröder, P. and others (2018), “Circular economy and power relations in global value chains: tensions and trade-offs for lower income countries,” Resources, Conservation and Recycling, vol. 136.
Schröder, P. and others (2020), La economía circular en América Latina y el Caribe: oportunidades para fomentar la resiliencia, Chatham House.
Secretariat of the Environment and Natural Resources (2019), Visión nacional hacia una gestión sustentable: cero residuos, Mexico City.
Sevigné-Itoiz, E. and others (2014), “Methodology of supporting decision-making of waste management with material flow analysis (MFA) and consequential life cycle assessment (CLCA): case study of waste paper recycling”, Journal of Cleaner Production, vol. 105.
Tamminen, S. and others (2020), Trading Services for a Circular Economy, International Institute for Sustainable Development (IISD).
Trang, T. and others (2021), “The impact of China’s tightening environmental regulations on international waste trade and logistics”, Sustainability, vol. 13, No. 2.
UNCTAD (United Nations Conference on Trade and Development) (2020), Impact of the COVID-19 Pandemic on Trade and Development: Transitioning to a New Normal, Geneva.
UNEP (United Nations Environment Programme) (2020), Waste Management during the COVID-19 Pandemic: from Response to Recovery.(2015), International trade control measures under the Basel, Rotterdam and Stockholm Conventions, Geneva.
Uruguay (2019), Plan de acción en economía circular, Montevideo.Van Ewijk, S., J. A. Stegemann and P. Ekins (2021), “Limited climate benefits of global recycling
of pulp and paper,” Nature Sustainability, vol. 4, No. 2.World Economic Forum (2020), Plastics, the Circular Economy and Global Trade, Geneva.WTO (World Trade Organization) (2020), Communication on Trade in Plastics, Sustainability
and Development by the United Nations Conference on Trade and Development (UNCTAD) (JOB/TE/63).
Yamaguchi, S. (2021), “International trade and circular economy: policy alignment”, OECD Trade and Environment Working Papers, No. 2021/02, Paris, OECD Publishing. (2020), “Greening regional trade agreements on investment”, OECD Trade and Environment Working Papers, No. 2020/03, Paris, OECD Publishing.
Zanetti, A. and others (2017), “Cambio climático y políticas públicas forestales en América Latina: una visión preliminar”, Project Documents (LC/W.728), Santiago, Economic Commission for Latin America and the Caribbean (ECLAC).
201Chapter IIIInternational Trade Outlook for Latin America and the Caribbean • 2021
Annex III.A1 Detailed subheadings used in the estimation of trade in circular and potentially circular goods
The detailed tariff subheadings related to circular and potentially circular goods were based on the list associated with waste and secondary raw materials published in Mulder and Albaladejo, 2020. This list was itself based on the lists of products included in the Basel Convention and the list contained in the OECD Council Decision of the Council on the Control of Transboundary Movements of Wastes Destined for Recovery Operations (OECD/LEGAL/0266).
In each of the listings analysed (ten-digit harmonized systems from the United States, eight-digit from the European Union and eight-digit from China), product descriptions were found that included keywords related to the technical and biological cycles described in the chapter, such as used, waste, scrap, residues, recycling, refurbished, remanufactured, repair(ed), for disposal, disassembly, charitable donation, resale, nonworking, recovery, offal and rebuilt. Descriptions associated with circular products and processes were identified through a case-by-case analysis.
The following detailed subheadings were identified in this way as circular or potentially circular goods, using the 2017 Harmonized System of the United States (HS 10D), the European Union (HS 8D) and China (HS 8D).
A. 10-digit subheadings of the United States Harmonized System associated with the circular economy
0501.00.00.00; 0502.10.00.00; 0510.00.20.00; 0510.00.40.10; 0510.00.40.20; 0510.00.40.40; 0511.99.20.00; 0511.99.33.00; 0901.90.10.00; 0901.90.20.00; 1404.90.90.20; 1522.00.00.00; 1802.00.00.00; 2303.10.00.10; 2303.10.00.20; 2303.10.00.40; 2303.20.00.20; 2303.20.00.40; 2303.30.00.00; 2304.00.00.00; 2305.00.00.00; 2306.10.00.00; 2306.20.00.00; 2306.30.00.00; 2306.41.00.00; 2306.49.00.00; 2306.50.00.00; 2306.60.00.00; 2306.90.01.20; 2306.90.01.30; 2306.90.01.50; 2307.00.00.00; 2308.00.98.20; 2308.00.98.90; 2401.30.03.00; 2401.30.06.00; 2401.30.09.00; 2401.30.13.00; 2401.30.16.00; 2401.30.19.00; 2401.30.23.10; 2401.30.23.20; 2401.30.23.35; 2401.30.23.40; 2401.30.23.50; 2401.30.23.60; 2401.30.23.90; 2401.30.25.10; 2401.30.25.20; 2401.30.25.35; 2401.30.25.40; 2401.30.25.50; 2401.30.25.60; 2401.30.25.90; 2401.30.27.10; 2401.30.27.20; 2401.30.27.35; 2401.30.27.40; 2401.30.27.50; 2401.30.27.60; 2401.30.27.90; 2401.30.33.10; 2401.30.33.20; 2401.30.33.35; 2401.30.33.40; 2401.30.33.50; 2401.30.33.60; 2401.30.33.90; 2401.30.35.10; 2401.30.35.20; 2401.30.35.35; 2401.30.35.40; 2401.30.35.50; 2401.30.35.60; 2401.30.35.90; 2401.30.37.10; 2401.30.37.20; 2401.30.37.35; 2401.30.37.40; 2401.30.37.50; 2401.30.37.60; 2401.30.37.90; 2401.30.70.10; 2401.30.70.20; 2401.30.70.35; 2401.30.70.40; 2401.30.70.50; 2401.30.70.60; 2401.30.70.90; 2525.30.00.00; 2618.00.00.00; 2619.00.30.00; 2619.00.90.00; 2620.11.00.00; 2620.19.30.00; 2620.19.60.10; 2620.19.60.20; 2620.19.60.30; 2620.19.60.40; 2620.19.60.50; 2620.21.00.10; 2620.21.00.20; 2620.21.00.30; 2620.21.00.40; 2620.21.00.50; 2620.29.00.10; 2620.29.00.20; 2620.29.00.30; 2620.29.00.40; 2620.29.00.50; 2620.30.00.10; 2620.30.00.20; 2620.30.00.30; 2620.30.00.40; 2620.30.00.50; 2620.40.00.30; 2620.40.00.60; 2620.60.10.00; 2620.60.90.00; 2620.91.00.00; 2620.99.10.00; 2620.99.20.00; 2620.99.30.00; 2620.99.50.00; 2620.99.75.20; 2620.99.75.60; 2620.99.75.80; 2620.99.75.90; 2620.99.85.00; 2621.10.00.00; 2621.90.00.00; 2710.91.00.00; 2710.99.05.00; 2710.99.10.00; 2710.99.16.00; 2710.99.21.00; 2710.99.31.00; 2710.99.32.00;

202 Economic Commission for Latin America and the Caribbean (ECLAC)Chapter III
2710.99.39.00; 2710.99.45.00; 2710.99.90.00; 3006.92.00.00; 3825.10.00.00; 3825.20.00.00; 3825.30.00.00; 3825.41.00.00; 3825.49.00.00; 3825.50.00.00; 3825.61.00.00; 3825.69.00.00; 3825.90.00.00; 3915.10.00.00; 3915.20.00.00; 3915.30.00.00; 3915.90.00.10; 3915.90.00.90; 4004.00.00.00; 4012.11.40.00; 4012.11.80.00; 4012.12.40.15; 4012.12.40.25; 4012.12.40.35; 4012.12.80.19; 4012.12.80.29; 4012.12.80.50; 4012.13.00.10; 4012.13.00.50; 4012.19.20.00; 4012.19.40.00; 4012.19.80.00; 4012.20.10.10; 4012.20.10.50; 4012.20.15.00; 4012.20.45.00; 4012.20.60.00; 4012.20.80.00; 4115.20.00.00; 4302.20.30.00; 4302.20.60.00; 4302.20.90.00; 4401.31.00.00; 4401.39.20.00; 4401.39.41.10; 4401.39.41.20; 4401.39.41.90; 4401.40.00.10; 4401.40.00.20; 4401.40.00.90; 4416.00.30.20; 4416.00.30.30; 4416.00.60.40; 4416.00.60.50; 4416.00.90.40; 4501.90.20.00; 4501.90.40.00; 4706.20.00.00; 4707.10.00.00; 4707.20.00.20; 4707.20.00.40; 4707.30.00.20; 4707.30.00.40; 4707.90.00.00; 4805.24.50.00; 4805.24.70.00; 4805.24.90.00; 4805.25.00.00; 5003.00.10.00; 5003.00.90.00; 5103.20.00.00; 5103.30.00.00; 5202.10.00.00; 5202.91.00.00; 5202.99.05.00; 5202.99.10.00; 5202.99.30.00; 5202.99.50.00; 5301.30.00.00; 5302.90.00.00; 5303.90.00.00; 5505.10.00.20; 5505.10.00.40; 5505.10.00.60; 5505.20.00.00; 6309.00.00.10; 6309.00.00.20; 6310.10.10.00; 6310.10.20.10; 6310.10.20.20; 6310.10.20.30; 6310.90.10.00; 6310.90.20.00; 7001.00.10.00; 7001.00.20.00; 7001.00.50.00; 7112.30.00.00; 7112.91.00.00; 7112.92.00.00; 7112.99.00.00; 7204.10.00.00; 7204.21.00.00; 7204.29.00.00; 7204.30.00.00; 7204.41.00.20; 7204.41.00.40; 7204.41.00.60; 7204.41.00.80; 7204.49.00.20; 7204.49.00.40; 7204.49.00.60; 7204.49.00.70; 7204.49.00.80; 7204.50.00.00; 7404.00.30.20; 7404.00.30.45; 7404.00.30.55; 7404.00.30.65; 7404.00.30.90; 7404.00.60.20; 7404.00.60.45; 7404.00.60.55; 7404.00.60.65; 7404.00.60.90; 7503.00.00.00; 7601.20.90.75; 7602.00.00.30; 7602.00.00.91; 7602.00.00.96; 7802.00.00.30; 7802.00.00.60; 7902.00.00.00; 8002.00.00.00; 8101.97.00.00; 8102.97.00.00; 8103.30.00.00; 8104.20.00.00; 8105.30.00.00; 8107.30.00.00; 8108.30.00.00; 8109.30.00.00; 8110.20.00.00; 8111.00.30.00; 8112.13.00.00; 8112.22.00.00; 8112.52.00.00; 8112.92.06.00; 8407.10.00.60; 8407.32.20.40; 8407.33.30.40; 8407.33.60.40; 8407.34.14.00; 8407.34.44.00; 8429.11.00.90; 8429.19.00.90; 8429.30.00.60; 8429.40.00.60; 8429.51.10.65; 8429.51.50.60; 8429.52.10.50; 8429.52.50.90; 8429.59.10.90; 8429.59.50.80; 8439.10.00.90; 8439.20.00.90; 8457.10.00.05; 8458.11.00.05; 8458.19.00.10; 8458.91.10.40; 8458.91.50.40; 8458.99.10.10; 8458.99.50.30; 8459.21.00.40; 8459.29.00.10; 8459.31.00.05; 8459.39.00.10; 8459.41.00.10; 8459.49.00.10; 8459.51.00.40; 8459.59.00.10; 8459.61.00.40; 8459.69.00.10; 8459.70.80.40; 8460.12.00.40; 8460.19.01.05; 8460.22.00.40; 8460.23.00.40; 8460.24.00.05; 8460.29.01.05; 8460.31.00.40; 8460.39.00.10; 8460.40.40.10; 8460.40.80.10; 8460.90.40.10; 8460.90.80.10; 8461.20.80.30; 8461.30.40.20; 8461.30.80.20; 8461.40.10.10; 8461.40.50.20; 8461.50.40.10; 8461.50.80.10; 8461.90.30.20; 8461.90.30.60; 8461.90.60.10; 8461.90.60.40; 8462.10.00.10; 8462.29.00.10; 8462.31.00.40; 8462.39.00.10; 8462.41.00.40; 8462.49.00.10; 8462.91.40.30; 8462.91.80.30; 8462.99.40.10; 8462.99.80.10; 8463.10.00.40; 8463.20.00.40; 8463.30.00.40; 8463.90.00.40; 8465.10.00.05; 8465.10.00.15; 8465.91.00.02; 8465.91.00.06; 8465.91.00.12; 8465.91.00.16; 8465.91.00.22; 8465.92.00.03; 8465.92.00.06; 8465.92.00.16; 8465.93.00.04; 8465.93.00.12; 8465.94.00.05; 8465.95.00.05; 8465.95.00.10; 8548.10.05.40; 8548.10.05.80; 8548.10.15.00; 8548.10.25.00; 8548.10.35.00; 8548.90.01.00; 8701.20.00.80; 8701.30.10.90; 8701.30.50.90; 8703.23.01.90; 8703.24.01.90; 8703.32.01.50; 8703.33.01.85; 8703.40.00.45; 8703.40.00.90; 8703.50.00.50; 8703.50.00.90; 8703.60.00.45; 8703.60.00.90; 8703.70.00.50; 8703.70.00.90; 8802.11.00.60; 8802.11.00.90; 8802.12.00.60; 8802.12.00.80; 8802.20.00.70; 8802.20.00.80; 8802.30.00.70; 8802.30.00.80; 8802.40.00.80; 8802.40.00.90; 8908.00.00.00; 9201.10.00.05; y 9201.20.00.05.

203Chapter IIIInternational Trade Outlook for Latin America and the Caribbean • 2021
B. 8-digit subheadings of Harmonized System of the European Union associated with the circular economy
2061010; 2062910; 2068010; 2069010; 5010000; 5021000; 5100000; 9019010; 9019090; 15220010; 15220031; 15220039; 15220091; 15220099; 18020000; 23031011; 23031019; 23031090; 23032010; 23032090; 23033000; 23050000; 23061000; 23062000; 23063000; 23064100; 23064900; 23065000; 23066000; 23069005; 23069011; 23069019; 23069090; 23070011; 23070019; 23070090; 23080090; 23099020; 24013000; 25253000; 26180000; 26190020; 26190090; 26201100; 26201900; 26202100; 26202900; 26203000; 26204000; 26206000; 26209100; 26209910; 26209920; 26209940; 26209960; 26209995; 26211000; 26219000; 27109100; 27109900; 30069200; 38251000; 38252000; 38253000; 38254100; 38254900; 38255000; 38256100; 38256900; 38259010; 38259090; 39151000; 39152000; 39153000; 39159011; 39159080; 40040000; 40121100; 40121200; 40121300; 40121900; 40122000; 41152000; 43022000; 44013100; 44013900; 44014010; 44014090; 45019000; 47062000; 47071000; 47072000; 47073010; 47073090; 47079010; 47079090; 48052400; 48052500; 50030000; 51032000; 51033000; 52021000; 52029100; 52029900; 53013000; 53029000; 53039000; 55051010; 55051030; 55051050; 55051070; 55051090; 55052000; 63051010; 63090000; 63101000; 63109000; 70010010; 70010091; 70010099; 71123000; 71129100; 71129200; 71129900; 72041000; 72042110; 72042190; 72042900; 72043000; 72044110; 72044191; 72044199; 72044910; 72044930; 72044990; 72045000; 73021090; 74040010; 74040091; 74040099; 75030010; 75030090; 76020011; 76020019; 76020090; 78020000; 79020000; 80020000; 81019700; 81029700; 81033000; 81042000; 81053000; 81073000; 81083000; 81093000; 81102000; 81110019; 81121300; 81122200; 81125200; 81129221; 81130040; 84073430; 84081011; 84081019; 84089027; 84431310; 85481010; 85481021; 85481029; 85481091; 85481099; 85489020; 85489030; 85489090; 87012090; 87021019; 87021099; 87029019; 87029039; 87032190; 87032290; 87032390; 87032490; 87033190; 87033290; 87033390; 87034090; 87036090; 87038090; 87042139; 87042199; 87042299; 87042399; 87043139; 87043199; 87043299; 87163980; 89080000; y 92011090.
C. 8-digit subheadings of the Chinese Harmonized System (HS 8D) associated with the circular economy
5010000; 5021010; 5021020; 5021030; 5029011; 5029012; 5029020; 5059010; 5069019; 5119940; 9019010; 9019020; 15220000; 18020000; 23031000; 23032000; 23033000; 23040010; 23040090; 23050000; 23061000; 23062000; 23063000; 23064100; 23064900; 23065000; 23066000; 23069000; 23070000; 24013000; 25253000; 26180010; 26180090; 26190000; 26201100; 26201900; 26202100; 26202900; 26203000; 26204000; 26206000; 26209100; 26209910; 26209990; 26211000; 26219000; 27109100; 27109900; 30069200; 38251000; 38252000; 38253000; 38254100; 38254900; 38255000; 38256100; 38256900; 38259000; 39151000; 39152000; 39153000; 39159010; 39159090; 40040000; 40121100; 40121200; 40121300; 40121900; 40122010; 40122090; 40129010; 40129020; 41152000; 43022000; 44013100; 44013900; 44014000; 45019010; 45019020; 47062000; 47071000; 47072000; 47073000; 47079000; 48052400; 48052500; 50030011; 50030012; 50030019; 50030091; 50030099; 51032010; 51032090; 51033000; 52021000; 52029100; 52029900; 53013000; 53029000; 53039000; 55051000; 55052000; 63090000; 63101000; 63109000; 70010000; 71123010; 71123090; 71129110; 71129120; 71129210; 71129220; 71129910; 71129920; 71129990; 72041000; 72042100; 72042900; 72043000; 72044100; 72044900; 72045000; 74040000; 75030000; 76020000; 78020000; 79020000; 80020000; 81019700; 81029700; 81033000; 81042000; 81053000; 81073000; 81083000; 81093000; 81102000; 81121300; 81122200; 81125200; 85481000; 85489000; y 89080000.
Source: Economic Commission for Latin America and the Caribbean (ECLAC), on the basis of United States Census Bureau, “USA Trade Online” [online] https://usatrade.census.gov/; Eurostat, “Combined Nomenclature (CN)” [online] https://ec.europa.eu/eurostat/web/international-trade-in-goods/methodology/classifications; and International Trade Centre (ITC), “Trade Map” [online] https://www.trademap.org/Index.aspx.

Publicaciones recientes de la CEPAL ECLAC recent publications
www.cepal.org/publicaciones
Informes Anuales/Annual ReportsTambién disponibles para años anteriores/Issues for previous years also available
Estudio Económico de América Latina y el Caribe 2021Economic Survey of Latin America and the Caribbean 2021
Balance Preliminar de las Economías de América Latina y el Caribe 2020Preliminary Overview of the Economies of Latin America and the Caribbean 2020
Panorama Social de América Latina 2020Social Panorama of Latin America 2020
La Inversión Extranjera Directa en América Latina y el Caribe 2021Foreign Direct Investment in Latin America and the Caribbean 2021
Anuario Estadístico de América Latina y el Caribe 2020Statistical Yearbook for Latin America and the Caribbean 2020
Perspectivas del Comercio Internacional de América Latina y el Caribe 2020International Trade Outlook for Latin America and the Caribbean 2020

El Pensamiento de la CEPAL/ECLAC Thinking
Libros y Documentos Institucionales/Institutional Books and Documents
Construir un nuevo futuro: una recuperación transformadora con igualdad y sostenibilidadBuilding a New Future: Transformative Recovery with Equality and Sustainability
La ineficiencia de la desigualdadThe Inefficiency of Inequality
Desarrollo e igualdad: el pensamiento de la CEPAL en su séptimo decenio. Textos seleccionados del período 2008-2018
Lineamientos y propuestas para un plan de autosuficiencia sanitaria para América Latina y el CaribePlan for self-sufficiency in health matters in Latin America and the Caribbean: lines of action and proposals
Desarrollo en transición: propuesta de concepto y medición para una cooperación renovada en América Latina y el CaribeDevelopment in transition: Concept and measurement proposal for renewed cooperation in Latin America and the Caribbean
Panorama Fiscal de América Latina y el Caribe 2021: los desafíos de la política fiscal en la recuperación transformadora pos-COVID-19Fiscal Panorama of Latin America and the Caribbean 2021: Fiscal policy challenges for transformative recovery post-COVID-19
Libros de la CEPAL/ECLAC Books
La tragedia ambiental de América Latina y el Caribe
La emergencia del cambio climático en América Latina y el Caribe: ¿seguimos esperando la catástrofe o pasamos a la acción?The climate emergency in Latin America and the Caribbean: The path ahead – resignation or action?
Los sistemas de pensiones en la encrucijada: desafíos para la sostenibilidad en América Latina
Páginas Selectas de la CEPAL/ECLAC Select Pages
Reflexiones sobre la gestión del agua en América Latina y el Caribe. Textos seleccionados 2002-2020
Las dimensiones del envejecimiento y los derechos de las personas mayores en América Latina y el Caribe. Textos seleccionados 2009-2020
Protección social universal en América Latina y el Caribe. Textos seleccionados 2006-2019

Revista CEPAL/CEPAL Review
Coediciones/Co-editions Copublicaciones/Co-publications
Documentos de Proyectos Project Documents
Series de la CEPAL/ECLAC Series
Observatorio Demográfico Demographic Observatory
Notas de Población
Informes Especiales COVID-19Special Reports COVID-19
Publicaciones de la CEPAL
Info
rme
s A
nu
ale
s
OBSE
RVA
TORIO
DEM
OG
RÁ
FICO
Libr
os d
e la
CEP
AL
Revi
sta
CEP
AL
Libr
os in
stitu
cion
ales
Pági
nas
Sele
ctas
Libros de la CEPALManuales de la CEPAL
Notas de Población
Cuadernos Estadísticos
www.cepal.org/es/suscripciones www.cepal.org/en/suscripciones
Subscribe to receive up-to-the-minute information on ECLAC publications
Suscríbase y reciba información oportuna sobre las publicaciones de la CEPAL
facebook.com/publicacionesdelacepal
www.cepal.org/publicaciones
Las publicaciones de la CEPAL también se pueden adquirir a través de: ECLAC publications also available at:
shop.un.orgTel. (1-888)254-4286Fax (1-800)338-4550
Contacto/Contact: [email protected]/Orders: [email protected]
United Nations PublicationsPO Box 960
Herndon, VA 20172USA

www.eclac.org