CEP AL - Repositorio CEPAL
174
CEP AL Review Executive Secretary of ECLAC Gert Rosenthal Deputy Executive Secretary Carlos Massad Director o f the Review Aníbal Pinto Technical Secretary Eugenio Lahera á I f UNITED NATIONS ECONOMIC COMMISSION FOR LATIN AMERICA AND THE CARIBBEAN SANTIAGO. CHILE, APRIL 1991
-
Upload
khangminh22 -
Category
Documents
-
view
1 -
download
0
Transcript of CEP AL - Repositorio CEPAL
CEP ALReview
Executive Secretary of ECLAC Gert Rosenthal
Deputy Executive Secretary Carlos Massad
Director o f the Review Aníbal Pinto
Technical Secretary Eugenio Lahera
á If
UNITED NATIONSECONOMIC COMMISSION FOR LATIN AMERICA AND THE CARIBBEAN
SANTIAGO. CHILE, APRIL 1991
CEPA L Review is prepared by the Secretariat of the Economic Corrimission for Latin America and the Caribbean. The views expressed in the signed articles, including the contributions of Secretariat staff
members, however, represent the personal opinions of the authors and do not necessarily reflect the views of the Organization. The designations employed and the presentation of material in this publication do not imply the expression of any opinion whatsoever on the part of the Secretariat concerning the legal status of
any country, territory, city or area or of its authorities, or concerning the delimitation of its frontiers or boundaries.
Notes and explanation of symbols
The following symbols are used in tables in the Review:Three dots (...) indicate that data are not available or are not separately reported.A dash (—) indicates that the amount is nil or negligible.A blank space in a table means that the item in question is not applicable.A minus sign (-) indicates a deficit or decrease, unless otherwise specified.A point (.) is used to indicate decimals.A slash (/) indicates a crop year or fiscal year, e.g. 1970/1971.Use of a hyphen (-) between years, e.g, 1971-1973, indicates reference to the complete number of calendar years involved, including the beginning and end years.References to “tons” mean metric tons, and to “dollars”. United States dollars, unless otherwise stated.Unless otherwise specified, references to annual rates of growth or variation signify compound annual rates. Individual figures and percentages in tables do not necessarily add up to the corresponding totals, because of rounding.
LC/G.1654-P
April 1991
UNITED NATIONS PUBLICATION
ISSN 0251-2920
ISBN 92-1-121167-0
Applications for the right to reproduce this work or parts thereof are welcomed and should be sent to the Secretary of the Publications Board, United Nations Headquarters, New York, NY 10017, U.S.A, Member States and their governmental institutions may reproduce this work without application, but are requested to mention the source and to inform the United Nations of such reproduction.
Copyright © United Nations 1991 All rights reserved
Printed in Chile
CEPALReview
Santiago, Chile April 1991 Number 43
CONTENTS
Democracy and economics. Gert Rosenthal, Executive Secretary, ECLAC.
External events, domestic policies and structural adjustment. Carlos Massad.
Latin America and the new finance and trade flows. Robert Devlin and Martine Guergil.
The competitiveness of Latin American industry. Gérard Picket.
Europe 92 and the Latin American economy. Miguel Izam.
The competitiveness of the small economies of the region. Rudolf Buitelaar and Juan Alberto Puentes.
Transfer of technology; the case of the Chile Foundation. TorbenHuss.
Debt conversion and territorial change. Antonio Daher.
The State and poverty in Costa Rica. Marvin Taylor-Dormond.
Prebisch and the relation between agriculture and industry. Carlos Cattaneo.
Celso Furtado: Doctor Honoris Causa. 'Wilson Cano.
Guidelines for contributors to CEPAL Review.
7
11
23
51
67
83
97
117
131
149
165
169


Democracy and economics*G e r t R o s e n t h a l , Executive Secretary, ECLAC
The topic which has brought us together at this Round Table organized by f l a c s o is by no means a trivial one. To begin with, the crisis which the Latin American societies have had to live through and the dizzy pace of the changes which are taking place in the world have brought into question all the traditional approaches of the social sciences. In this respect, it is necessary to reflect seriously on the basic premises of the various disciplines as well as on interdisciplinary co-operation in order to tackle social realities. Secondly, an analysis of the specific topic which has brought us together here (the relation between the social sciences and democratization) is particularly appropriate in the current Latin American context of the rebirth of democracy.
In general, all the social disciplines have a contribution to make to democratization. Thus, for example, among other aspects, sociology should identify the best and most effective forms of participation; anthropology should indicate the most suitable microrelations for the global support of democracy; social psychology should help to understand the swings in public opinion and aid in finding the underlying roots of mass phenomena, and political science should identify the forms of organization capable of providing a democratic interface between society at large and the State.
I think that now, in view of my profession and my current responsibilities as Executive Secretary of the Economic Commission for Latin America and the Caribbean, it is appropriate for me to approach democratization from the point of view of economics, in order to try to identify the interaction between economic and political phenomena and between development and democracy. This is a difficult task which was tackled in a notably profound and elegant manner, at least in our own organization, by José Medina Echavarn'a (Gurrieri, 1980). Another investigation which springs to mind is the monumental work of Albert O. Hirschman, who has devoted much of his life in one way or another to exploring the links between economics and politics. The reflections which I am going to set forth now were inspired by the contributions of both Medina Echavarria and Hirschman. I shall refer basically to the still unfinished quest for the causal relations between the two disciplines of economics and politics: what was originally known as political economy, before the academic separation of these two social sciences.
Until quite recently, the relations between economics and politics seemed to be perfectly unambiguous: economic phenomena determined political developments, or vice versa. To give only one example, it may be recalled that it was maintained that the forms of ownership of the means of production would determine the nature of the prevailing political régime.' Likewise, to give a more recent illustration, Guillermo O’Donnell held that import substitution policies were consistent with a certain type of political régime; i.e., bureaucratic authoritarianism (O’Donnell, 1975). Perhaps it is the extensive set of methodological instruments available to economics —more highly developed than those of the other social disciplines— which has encouraged attempts to seek the basis of politics in the principles of economics.
Similarly, political explanations have been put forward for economic phenomena, as
* Address delivered at the Round Table on the Social Sciences in the Democratization Process, beginning on 12 November 1990 in Santiago, Chile, as part of the Fourteenth Meeting of the Governing Council of the Latin American Faculty of Social Sciences ( f l a c s o ),
* In the simplified terms of schematic Marxism, for example, it may be recalled that slavery corresponded to the ancient form of production and absolute despotism: serfdom corresponded to feudalism and the monarchy, and the proletariat corresponds to capitalism and bourgeois democracy.
CEPAL REVIEW No. 43 ! April 1991
for example the inflationary effect of increased public spending before an electoral process. There have even been politicians who have maintained that economics should be placed at the service of politics. This crystal-clear determinism between what used to be known as the forces of production and production relations, or between the infrastructure and the superstructure, or between objective facts and ideology, was not restricted to the academic field. It also served to rationalize the establishment of those bureaucratic-authoritarian régimes which became the most important feature of what was until recently known as “real socialism”.
Equally deterministic, although at the other extreme of the ideological spectrum, are the assertions that democracy is the political régime most compatible with the successful functioning of the market. In order to sustain this assertion, it is adduced that the most advanced industrialized economies are all representative democracies. Likewise, it is maintained that the market attains its greatest potential in political régimes which place the defence of individual rights before the rationale of the State. These régimes are inspired by a kind of negative determinism which holds that the best State is the least State.^
Experience gives grounds for doubting such single-minded determinism, however. The example of India shows that democracy can also function in societies with very low levels of income. On the other hand, many cases in Latin America have shown that the free functioning of the market mechanisms is frequently accompanied by very pronounced inequalities in income levels which may ultimately be dysfunctional for democracy. It should be remembered that democracy and democratization assume not only the existence of the basic rules of representative democracy but also the concepts of equity, participation and full citizenship.
Some of the events which took place in 1989 have in fact largely disproved the idea that there is a single set of determining economic and political factors which establish the links between the two disciplines, or that there is a global paradigm which foreordains the degree to which economics determines politics, or vice versa. As we were reminded by Adam Michnik, who was so closely linked with the series of events that shook Poland and the rest of Central and Eastern Europe in recent years, “what we have learned during the past year (the most extraordinary of the whole 44 years of my life) is that in history there is no determinism” (Michnik, 1990, p. 7).
In view of what has happened both in the socialist world and in Latin America, it has become abundantly clear that the relations between economics and politics are indeterminate and that the search for totalizing paradigms can become an obstacle to understanding, as Hirschman already maintained twenty years ago (Hirschman, 1971, p. 342-360). It is now claimed rather that instead of making yet another appeal for a single “integrated social science” it is more fruitful to build bridges, in a “decentralized” manner, bridges both between these two disciplines and between them and the rest of the social sciences {ibid., pp. 1 and 2).
Adopting this approach and giving up any idea of an infallible, universal technique for weighing the influence of one phenomenon on another means abandoning the dream of finding a single synthetic paradigm which will integrate all the social disciplines. In this connection, with respect to the consolidation of democracy in Latin America, Hirschman
“ The aim of socialism is to overcome the supposed autonomy of economic factors predicated by liberalism” {Aron, 1972, p. 86),
^Supposedly because the market decentralizes, while planning centralizes, Charles Lindblom, however, has shown that this distinction is not so clear (Lindblom, 1977).
^The argument is that “order generated without any previous plan can considerably surpass any plans that men can invent” because of the "superior capacity (of capitalism) to make use of dispersed knowledge” (Hayek, 1988, p. 8).

DEMOCRACY AND ECONOMICS / G. Rosenthal
has offered some suggestions on the relations between economics and politics which are extremely relevant to the topic of this discussion {Hirschman, 1986, pp. 176-182).
Firstly, all good things do not necessarily come together. Economists have long debated the possible contradictions between growth and equity, for example. The debate is not yet over, but it must be admitted that there is at least a possibility that sometimes, when pursuing two highly desirable objectives such as economic growth and social equity, the attainment of one of these objectives must be given priority over the other, although of course the imbalance thus created can later be corrected.
Secondly, and in the same line of thought, development and democracy do not necessarily go hand in hand. Thus, the 1980s —the so-called “lost decade” for development— coincided with a process of opening up to democracy and transition from authoritarian régimes to civil governments, in contrast with what happened in the Great Depression of the 1930s, when the economic recession was accompanied by authoritarian governments.
Thirdly, uncertainty with regard to the paths to follow and the firmness of the opinions held may even be a “democratic virtue”. Thus, excessively cut and dried action programmes may be incompatible with the ongoing negotiation which democracy demands, and this may also be why the technocrats have rediscovered the virtues of pragmatism.
Finally, this leaning to uncertainty fits in very well with the definition of democracy proposed by E. P. Thompson: a process which is set in motion without anyone knowing for certain exactly where it is going to end (Thompson, 1966, p. 101). This means that in democratic régimes —in contrast with what happens in technocracies— it is preferable that the pretensions of all the social sciences should be on the modest side.
How are the foregoing considerations reflected in e c l a c ’s recent work? In this respect,1 should like to refer to our proposal entitled Changing production pattenu with social equity (ECLAt; 1990). In that document we maintain that the prime, common task of the countries of Latin America and the Caribbean — that of changing their production patterns within a context of growing social equity — must be carried out in a democratic, pluralistic and participative context. It is posited that this requirement should be fulfilled as a deliberate choice, not as the inevitable result of the emergence of other conditions.
In other words, we want development to take place in democracy, and we propose that specific efforts should be made to ensure that changing production patterns, equity and democracy back each other up. At the same time, however, we expressly recognize that there is nothing automatic or predetermined in all this. Facing up to such demands simultaneously represents a tremendous challenge which cannot be overcome on the basis of a single universally valid paradigm.
In conclusion, our proposal traces a course to follow and at the same time opens up a broad field for reflection and action on the part of the social sciences, in which some central issues for sociology and the political sciences stand out very prominently; reform of the State, transformation of the educational system, and the development of suitable forms of social consensus building and participation. In all these fields, reflection and action can only be carried out successfully through interdisciplinary co-operation. I wish to stress once again, however, that this does not mean that we are advocating a synthetic paradigm designed to integrate all the social disciplines and provide an infallible universal technique for weighing the influence of one phenomenon on another. It simply means that in respect of these issues, which are of such crucial importance for our times, we have before us a new field of co-operation between the regional institutions and the academic institutions working in the realm of the social sciences in the region.
10 CEPAL REVIEW No. 43 / April 1991
B ib liog rap h y
Aron, Raymond (1972), Politique et économie dans la doctrine marxiste, Etvdes politiques, Paris, Gallimard,
ECLAC (Economic Commission l'or Latin America and the Caribbean) (1990), Changing Production Patterns with So- cialEquity (ix:/G.1601-i'), Santiago, Chile, March. United Nations publication, Sales No.: E.90.ll,G.6.
Gurrieri, Adolfo (ed.) (1980), L a obra de J o s é M edina Echava- rria, Madrid, Ibero-American Co-operation Institute; Ediciones Cultura Hispánica.
Hayek, F.A. (1988), The fatai conceit, in W.W. Bartly lu (ed.), The Collected ^Norks o f F.A. Hayek, voi. 1, Chicago, The University of Chicago Press.
Hirschman, Albert O. (1971), The search for paradigms as
a hindrance to understanding, A Bias f o r H ope, New Haven, Yale University Press.
(1986), Notes on consolidating democracy in LatinAmerica, R ival Views o f M arket Society, New York, Viking.
Lindblom, Charles (1977), Politics and Markets, New York, Basic Books.
Michnik, Adam (1990), The two faces of Europe, New York Review o f Books, voi, xxxvil, No. 12, 19 July.
O’Donnell, Guillermo (1975), Reflexiones sobre las tendencias generales de cambio en el estado burocrático-autoritario, Buenos Aires, Centro de Estudios de Estado y Sociedad (CEDF..S), August.
Thompson, E.P. (1966), The M aking o f the English W orking Class, New York, Vantage Books.
CEPAL REVIEW No. 43
External events, domestic policies and structural adjustmentCarlos Massad*
This article examines the drop in the per capita product of the region from 1981 onwards due hotli to the stagnation of per capita production ca})<i(ity and the fact that the effective product was less than the potential product. Production capacity stagnated because investment fell to levels which were not high enough to ensure growth in the potential per capita product. This decline in investment, in turn, was due basically to the net transfers of re.sources abroad caused by the debt crisis and the severe deterioration in the terms of trade as from 1982.
The article posits that, in order for the region to grow at the rate of 5% per year, it would be necessary to invest between US$ 75 and US$ 85 billion more than is currently being invested. These resources could not be obtained from a single source. Solving the debt problem to the point of eliminating the net outward transfer of resources would supply only a third of the additional investment needed. Likewise, recovering the 1980 levels of the terms of trade —for which arduous negotiations and the application of difficult domestic policies would be needed— would provide only another third of the necessary financing. In any case, the fact that such resources were available would not automatically guarantee the necessary increase in investment, for which purpose strict specific policies would be required. The remaining third of the additional investment needed would require either greater indebtedness, or more saving, or both these things at once. It would also require increases in productivity and would need to be backed up by suitable domestic policies.
* D e p u ty E x e c u t iv e S e c r e t a r y o f KCl,.-\c. T h e a u t h o r w ish e s
to e x p r e s s h is th a n k s to J a i n i c C ^anipos f o r h is a s s is ta n c e in
c o m p u t a t io n a n d g e n e r a l m a t t e r s , a n d to O s v a ld o R o s a le s f o r
h is c o m m e n t s a n d a s s is ta n c e w ith t h e b ib l io g r a p h y .
IntroductionThe hard facts of the situation, including political events, have obliged most of the nations of Latin America to apply structural adjustment policies. The measures taken in this respect were in a sense a shot in the dark, as no body of theory had been prepared in advance, and the countries of the region were not in a position either to choose their policies freely or to bother too much about their timeliness and the most suitable rate and sequence for their application.
Although a limited consensus is now beginning to emerge on this matter, economic theory is still not able to answer all the queries regarding the dynamics of the economic adjustment or the timeliness and sequence of the necessary reforms (World Bank, 1985; Feinberg, 1986; Helleiner,1986).
Thus, for example, the scope and sequence of reforms aimed at trade and financial liberalization raise dilemmas with regard to economic policy, and the net effect continues to be the subject of a good deal of uncertainty in the theoretical analyses made on the subject (Zahler, 1980; McKinnon, 1982; Blejer and Sagari, 1988). Edwards (1987) is in favour of liberalizing the current account before the capital account and proposes a specific policy sequence: first, getting the fiscal deficit under control; secondly, reforming the domestic financial market and increasing interest rates, and finally, liberalizing the capital account.
A different view is taken by Lai (1987), who suggests first of all tackling the fiscal deficit and the distortions in the domestic capital market and then going on to a simultaneous drastic liberalization of the current and capital accounts, maintaining a floating exchange rate during these operations. The reasons for this would appear to be connected with political economics, since as these reforms would affect sectoral interests it would be necessary to act quickly to prevent the latter from organizing themselves.
Among the issues still under macroeconomic debate are those concerning matters such as the links between financial liberalization and saving and investment (Massad and Held, 1990) and between saving and interest rates (Khan and Knight, 1985; Massad and Eyzaguirre, 1990); the degree of intensity of the liberalization processes, that is to say, the final levels of the variables and

12 CEPAL REVIEW No. 43 / April 1991
the periods of'adjustment (Edwards, 1988); the optimum dimension and degree of government intervention (Ram, 1986), and the complementation or conflict between public and private investment (Blejer and Khan, 1984). Without a firm theoretical base, it is very difficult to clarify which costs could be attributed to the reform policies and which should be blamed on external or domestic events which may take place at the same time.
This paper examines the influence of such events on the product, distinguishing between the effects on production capacity and those on the effective product, and seeking to identify the main elements affecting these phenomena and
the options open to the countries of the region for returning to a climate of faster and sustainable growth.
Section I below explores the effects of external events on production capacity. Section II examines the factors behind the drop in the rate of utilization of that capacity. Section III seeks to give some idea of the growth needs and the resources that could be available for meeting them, and finally, section IV brings considerations of equity into the analysis and presents the main conclusions. The study covers Latin America and the Caribbean as a whole, but the main conclusions have been verified through studies of particular countries which are not presented here.
I
External events and the stagnation of production capacity
There were two main external events which affected the Latin American economies in the 1980s: the debt crisis, and the deterioration in the terms of trade. It was during this period that most of the adjustment policies were applied. The debt crisis in the 1980s and its consequences have been extensively analysed in recent economic publications, while the variations in the terms of trade and their effects on developing economies have been studied for more than half a century.
One way of getting an idea of the consequences of both the debt crisis and the deterioration in the terms of trade is to examine the historical behaviour of the gross domestic product.
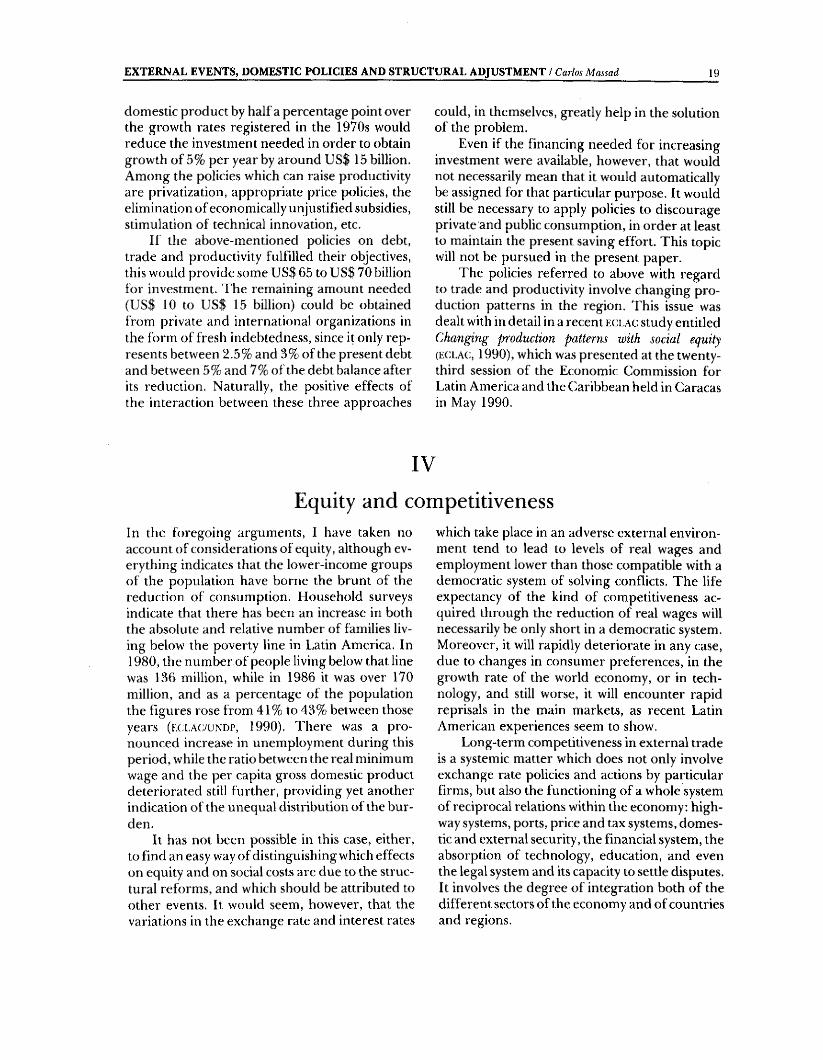
Figure 1 shows the evolution of the per capita ODP of the countries of the region for the period between 1970 and 1989. It will be noted that in 1989 that product was lower than it had been in 1980*. Such discouraging facts have led to the
According to data supplied by eclm: in December 1990, the results for 1990 were even worse ( e c l a c , 1990b),
assertion that the 1980s represented a lost decade as far as development was concerned.
This is not the whole story, however. There are two main factors that can explain the unfavourable evolution of the per capita o d p ; the stagnation in production capacity, and a level of effective production which was lower than the existing capacity. In order to distinguish between the effects of these two factors, we can carry out a very simple exercise involving the estimation of the latter capacity by using figures on net investment and certain assumptions on the prod- uct/capital ratios (Ramos and Eyzaguirre, 1989). If we consider the product/capital ratio registered in the 1970s as being valid for the 1980s, then we can calculate the production capacity for the latter decade, assuming also that the employment level of 1980 remains unchanged (see Appendix). Figure 1 also shows the results of this exercise and gives a comparison of the effective (;i>p with the potential tiop (or production capacity). It will be seen from this that in 1989 the potential per capita g d p was some 17 percentage points higher than the effective level.
It is clear from this result that the policies
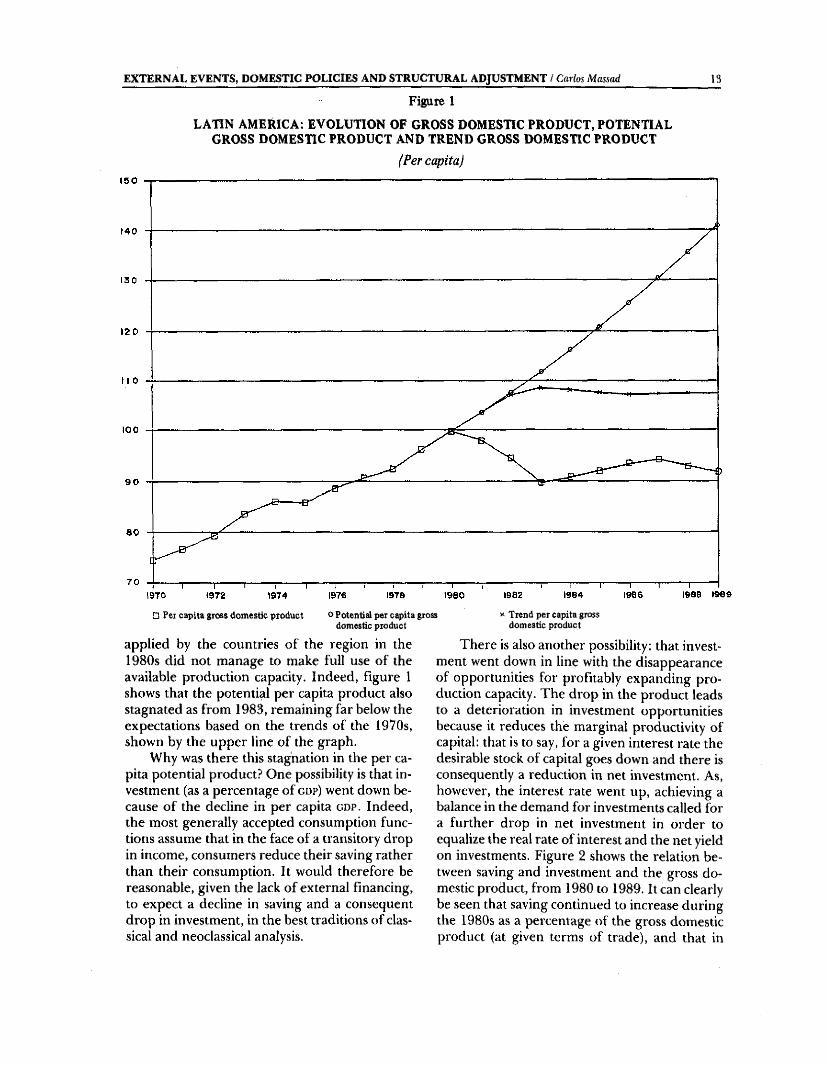
LATIN AMERICA; EVOLUTION OF GROSS DOMESTIC PRODUCT, POTENTIAL GROSS DOMESTIC PRODUCT AND TREND GROSS DOMESTIC PRODUCT
(Per capita)
EXTERNAL EVENTS, DOMESTIC POLICIES AND STRUCTURAL ADJUSTMENT / Carlos Massad__________
Figure 113
D Per capita groes domestic product ° Potenti^ per capitadomestic product
applied by the countries of the region in the 1980s did not manage to make full use of the available production capacity. Indeed, figure 1 shows that the potential per capita product also stagnated as from 1983, remaining far below the expectations based on the trends of the 1970s, shown by the upper line of the graph.
Why was there this stagnation in the per capita potential product? One possibility is that investment (as a percentage of g d p ) went down because of the decline in per capita g d p . Indeed, the most generally accepted consumption functions assume that in the face of a transitory drop in income, consumers reduce their saving rather than their consumption. It would therefore be reasonable, given the lack of external financing, to expect a decline in saving and a consequent drop in investment, in the best traditions of classical and neoclassical analysis.
gross « Trend per capita gross domestic product
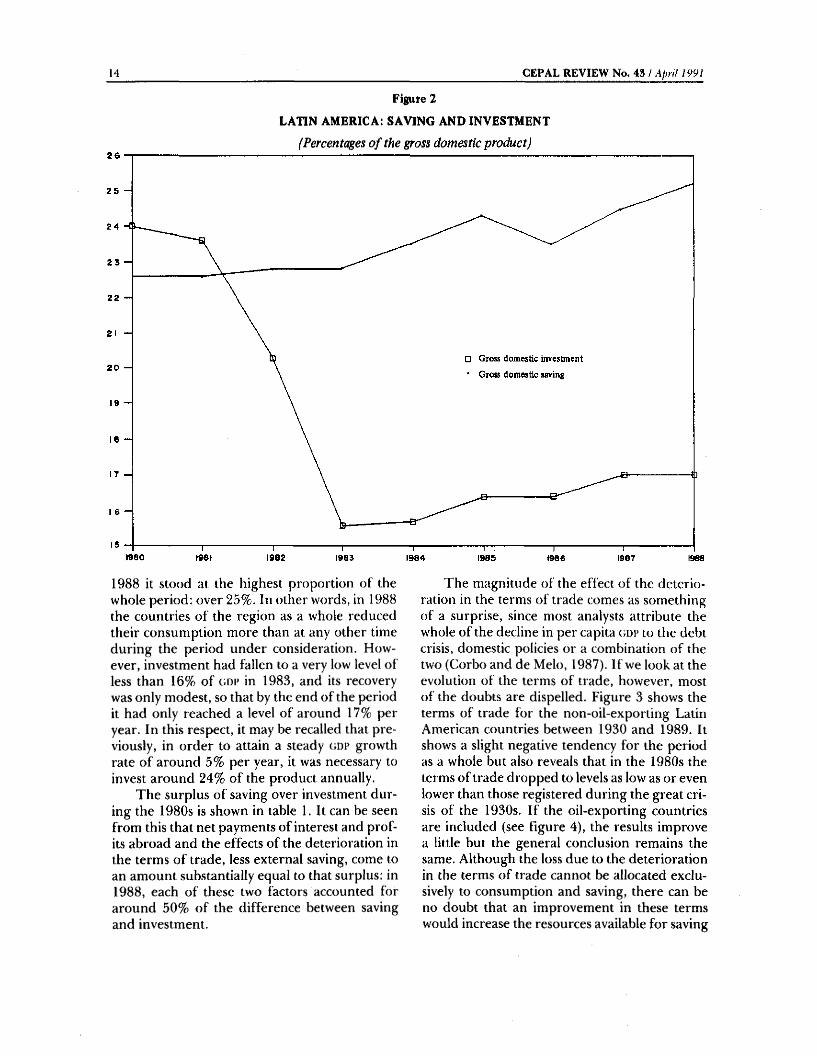
There is also another possibility: that investment went down in line with the disappearance of opportunities for profitably expanding production capacity. The drop in the product leads to a deterioration in investment opportunities because it reduces the marginal productivity of capital: that is to say, for a given interest rate the desirable stock of capital goes down and there is consequently a reduction in net investment. As, however, the interest rate went up, achieving a balance in the demand for investments called for a further drop in net investment in order to equalize the real rate of interest and the net yield on investments. Figure 2 shows the relation between saving and investment and the gross domestic product, from 1980 to 1989. It can clearly be seen that saving continued to increase during the 1980s as a percentage of the gross domestic product (at given terms of trade), and that in
14 CEPAL REVIEW No. 43 / Afnil 1991
Figure 2
LATIN AMERICA: SAVING AND INVESTMENT
(Percentages o f the gross domestic product)
1988 it stood at the highest proportion of the whole period: over 25%. In other words, in 1988 the countries of the region as a whole reduced their consumption more than at any other time during the period under consideration. However, investment had fallen to a very low level of less than 16% of tmi’ in 1983, and its recovery was only modest, so that by the end of the period it had only reached a level of around 17% per year. In this respect, it may be recalled that previously, in order to attain a steady odp growth rate of around 5% per year, it was necessary to invest around 24% of the product annually.
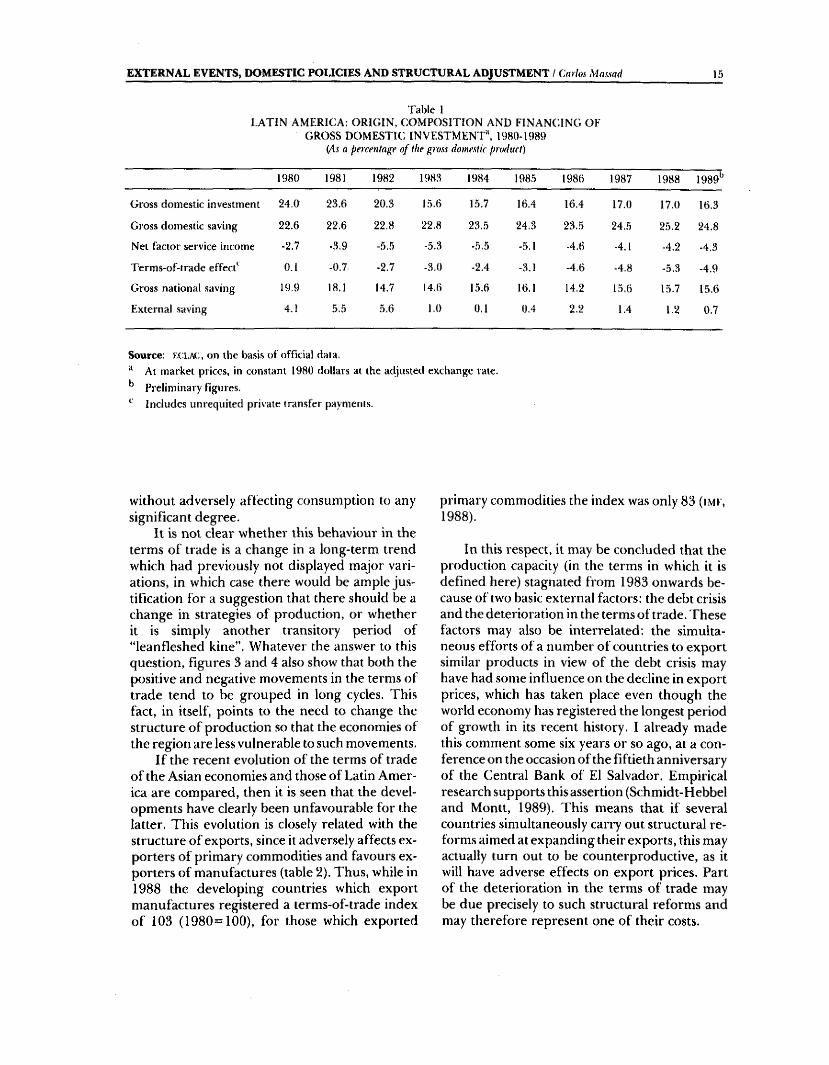
The surplus of saving over investment during the 1980s is shown in table 1. It can be seen from this that net payments of interest and profits abroad and the effects of the deterioration in the terms of trade, less external saving, come to an amount substantially equal to that surplus: in 1988, each of these two factors accounted for around 50% of the difference between saving and investment.
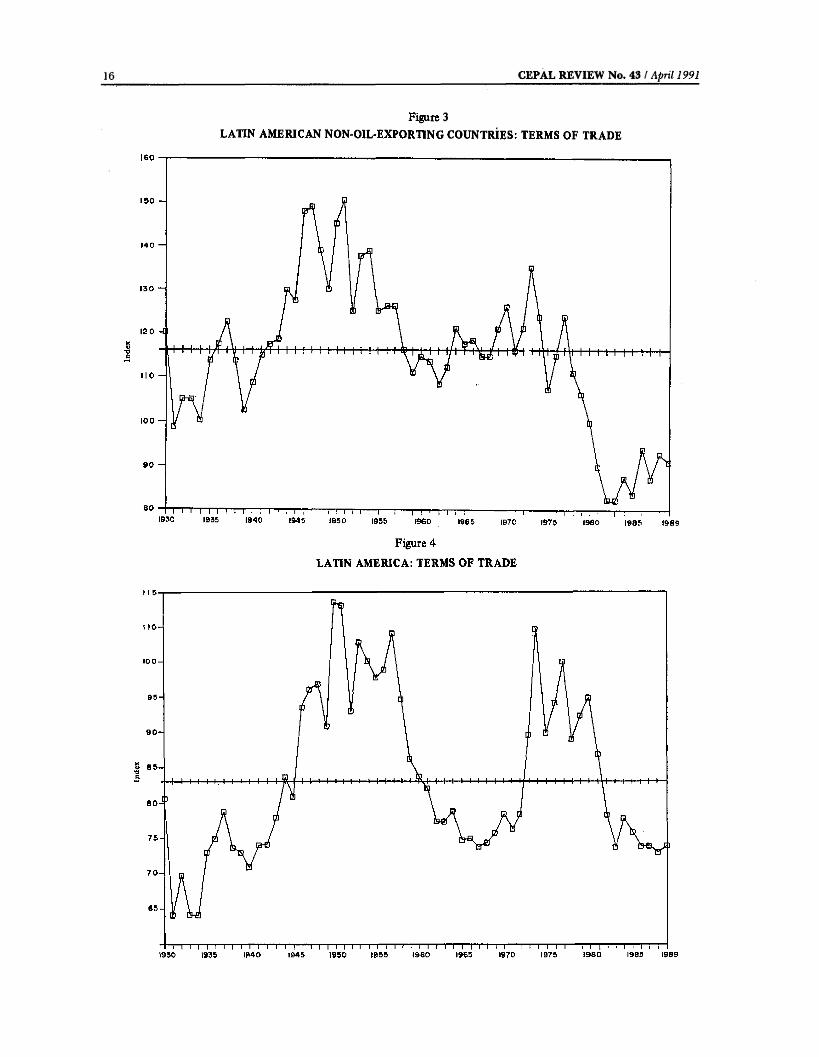
The magnitude of the effect of the deterioration in the terms of trade comes as something of a surprise, since most analysts attribute the whole of the decline in per capita c; d p to the debt crisis, domestic policies or a combination of the two (Corbo and de Melo, 1987). If we look at the evolution of the terms of trade, however, most of the doubts are dispelled. Figure 3 shows the terms of trade for the non-oil-exporting Latin American countries between 1930 and 1989. It shows a slight negative tendency for the period as a whole but also reveals that in the 1980s the terms of trade dropped to levels as low as or even lower than those registered during the great crisis of the 1930s. If the oil-exporting countries are included (see figure 4), the results improve a little but the general conclusion remains the same. Although the loss due to the deterioration in the terms of trade cannot be allocated exclusively to consumption and saving, there can be no doubt that an improvement in these terms would increase the resources available for saving
EXTERNAL EVENTS, DOMESTIC POLICIES AND STRUCTURAL ADJUSTMENT / Carlos Massad 15
Table 1LATIN AMERICA: ORIGIN, COMPOSITION AND FINANCING OF
GROSS DOM ESTIC INVESTM ENT^ 1989-1989(/li a percentage of the gross domestic product)
1980 1981 1982 1983 1984 1985 1986 1987 1988 lOSO*"
Gross domestic investment 24.0 23.6 20.3 15.6 15.7 16.4 16.4 17.0 17.0 16.3
Gross dome.stic saving 22.6 22.6 22.8 22.8 23.5 24.3 23.5 24.5 25.2 24.8
Net factor service income -2.7 -3,9 -5.5 -5.3 -5.5 -5.1 -4.6 -4.1 -4.2 -4,3
Terms-of-trade effecC 0.1 -0.7. -2.7 -3.0 -2.4 -3.1 -4.6 -4.8 -5,3 -4,9
Gross national saving 19.9 18.1 14.7 14.6 15.6 16.1 14,2 15.6 15.7 15.6
External saving 4.1 5.5 5,6 I.O 0.1 0.4 2.2 1.4 1.2 0.7
Source: ECi.Ai,, on the basis of official data. At market prices, in constant 1980 dollars at the adjusted exchange rate. Preliminary figures. Includes unrequited private transfer payments.
without adversely affecting consumption to any significant degree.
It is not clear whether this behaviour in the terms of trade is a change in a long-term trend which had previously not displayed major variations, in which case there would be ample justification for a suggestion that there should be a change in strategies of production, or whether it is simply another transitory period of “leanfleshed kine”. Whatever the answer to this question, figures 3 and 4 also show that both the positive and negative movements in the terms of trade tend to be grouped in long cycles. This fact, in itself, points to the need to change the structure of production so that the economies of the region are less vulnerable to such movements.
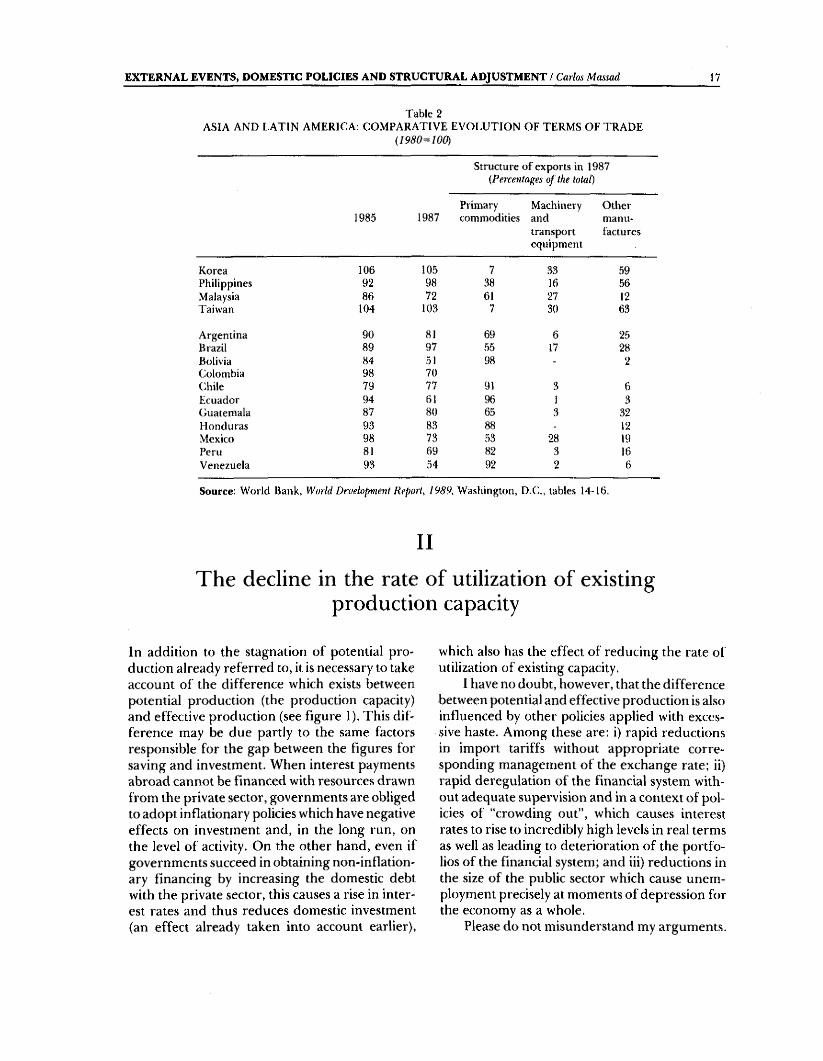
If the recent evolution of the terms of trade of the Asian economies and those of Latin America are compared, then it is seen that the developments have clearly been unfavourable for the latter. This evolution is closely related with the structure of exports, since it adversely affects exporters of primary commodities and favours exporters of manufactures (table 2). Thus, while in 1988 the developing countries which export manufactures registered a terms-of-trade index of 103 (1980=100), for those which exported
primary commodities the index was only 83 (imk,1988).
In this respect, it may be concluded that the production capacity (in the terms in which it is defined here) stagnated from 1983 onwards because of two basic external factors: the debt crisis and the deterioration in the terms of trade. These factors may also be interrelated; the simultaneous efforts of a number of countries to export similar products in view of the debt crisis may have had some influence on the decline in export prices, which has taken place even though the world economy has registered the longest period of growth in its recent history. 1 already made this comment some six years or so ago, at a conference on the occasion of the fiftieth anniversary of the Central Bank of El Salvador. Empirical research supports this assertion (Schmidt-Hebbel and Montt, 1989). This means that if several countries simultaneously carry out structural reforms aimed at expanding their exports, this may actually turn out to be counterproductive, as it will have adverse effects on export prices. Part of the deterioration in the terms of trade may be due precisely to such structural reforms and may therefore represent one of their costs.
16 CEPAL REVIEW No, 43 / April 1991
Figure 3LATIN AMERICAN NON-OIL-EXPORTING COUNTRIES: TERMS OF TRADE
EXTERNAL EVENTS, DOMESTIC POLICIES AND STRUCTURAL ADJUSTMENT ! Carlos Massad 17
Table 2ASIA AND LATIN AMERICA: COMPARATIVE EVOLUTION OF TERMS OF TRADE
{1980= 100)
Structure of exports in 1987{Percentages o f the total)
1985 1987Primarycommodities
Machineryandtransportequipment
Othermanufactures
Korea 106 105 7 33 59Philippines 92 98 38 16 56Malaysia 86 72 61 27 12Taiwan 104 103 7 30 63
Argentina 90 81 69 6 25Brazil 89 97 55 17 28Bolivia 84 51 98 - 2Colombia 98 70(;hile 79 77 91 3 6Ecuador 94 61 96 1 3Guatemala 87 80 65 3 32Honduras 93 83 88 - 12Mexico 98 73 53 28 19Peru 81 69 82 3 16Venezuela 93 54 92 2 6
Source: World Bank, World Development Report, 1989, Washington, D.C., tables 14-16.
II
The decline in the rate of utilization of existing production capacity
In addition to the stagnation of potential production already referred to, it is necessary to take account of the difference which exists between potential production (the production capacity) and effective production (see figure 1). This difference may be due partly to the same factors responsible for the gap between the figures for saving and investment. When interest payments abroad cannot be financed with resources drawn from the private sector, governments are obliged to adopt inflationary policies which have negative effects on investment and, in the long run, on the level of activity. On the other hand, even if governments succeed in obtaining non-inflation- ary financing by increasing the domestic debt with the private sector, this causes a rise in interest rates and thus reduces domestic investment (an effect already taken into account earlier),
which also has the effect of reducing the rate of utilization of existing capacity.
I have no doubt, however, that the difference between potential and effective production is also influenced by other policies applied with excessive haste. Among these are; i) rapid reductions in import tariffs without appropriate corresponding management of the exchange rate; ii) rapid deregulation of the financial system without adequate supervision and in a context of policies of “crowding out”, which causes interest rates to rise to incredibly high levels in real terms as well as leading to deterioration of the portfolios of the financial system; and iii) reductions in the size of the public sector which cause unemployment precisely at moments of depression for the economy as a whole.
Please do not misunderstand my arguments.
18 CEPAL REVIEW No. 43 / April 1991
All the foregoing policies are necessary and appropriate in certain circumstances. However, it is necessary to take into account both the general economic context in which they are to be applied and the already mentioned fact that there are serious doubts regarding the sequence in which they should be applied.
An aspect which has not been given so much attention is the time needed for these and other policies to give results. The Chilean experience seems to indicate that quite long periods are needed for policies to achieve their objectives. I ’hus, for example, the diversification of Chilean agricultural exports really began in the mid- 1960s, when a programme of expansion of fruit production was initiated and the agrarian reform
process was launched, creating a real market for agricultural land. The starting-point for the growth of forest industry exports, for its part, must be sought in the early 1960s, when an ambitious programme of subsidies for the planting of new afforested areas was established, leading to a rapid increase in the planting of pine trees. Tariff reductions, too, began in Chile in the second half of the 1960s: they were interrupted at the beginning of the 1970s but were resumed in the mid-1970s and reached the target levels fixed, after a temporary setback in the early 1980s. All this gives us a lesson: structural reforms take some lime to give results and, without adequate financing, they may involve high costs in the short term.
IllThe cost of recovering past growth rates
in the 1990sSome idea of the problems currently faced by the countries of Latin America can be gained from the fact that the difference between current saving and the investment needed to raise the gross domestic product by 5% per year amounts to some 7% or 8% of the latter, which, at the present levels of the product in the region, represents between US$ 75 and US$ 85 billion per year, assuming that the productivity of the economy remains unchanged.
Obviously, resources of this magnitude cannot come from a single source. It would be quite unrealistic to expect major increases in saving, and considerable amounts of new loans cannot be expected either. Consequently, it is necessary to adopt policies which attack the problem on several fronts at once.
fhe following examples may be useful for illustrating the kind of policies that the Latin American countries need in order to resume the pace of growth that they had in the 1970s: a) if the debt problem could be solved to the point of eliminating the outward transfer of resources from the region to the developed world (for example, through debt reduction or reduction of interest rates to around half their present levels).
this would make available for investment between US$ 25 and US$ 28 billion, which would, however, solve only one third of the total problem, and b) if the terms of trade returned to their 1980 level this would add a further LfS$ 25 billion to the investment funds, covering another third of the overall problem. Such a solution will not emerge by magic, however: it will call for the opening up of foreign markets, rapid growth of the world economy, and suitable domestic policies for taking advantage for the opportunities created in the external sphere.
Thus, we see that even if it were possible to achieve both these advances, with all the difficulties involved in them, this would still only cover two-thirds of the difference between current investment and the level which is effectively needed. Generating the remaining third would be essentially a domestic responsibility calling for the application of policies to increase the efficiency of the national economies and the deployment of fresh efforts to obtain some external financing.
Likewise by way of example, an increase in productivity which raised the growth of the gross
EXTERNAL EVENTS, DOMESTIC POLICIES AND STRUCTURAL ADJUSTMENT / Carlos Massad 19
domestic product by half a percentage point over the gro^vth rates registered in the 1970s would reduce the investment needed in order to obtain growth of 5% per year by around US$ 15 billion. Among the policies which can raise productivity are privatization, appropriate price policies, the elimination of economically unjustified subsidies, stimulation of technical innovation, etc.
If the above-mentioned policies on debt, trade and productivity fulfilled their objectives, this would provide some US$ 65 to US$ 70 billion for investment. The remaining amount needed (US$ 10 to US$ 15 billion) could be obtained from private and international organizations in the form of fresh indebtedness, since it only represents between 2.5% and 3% of the present debt and between 5% and 7% of the debt balance after its reduction. Naturally, the positive effects of the interaction between these three approaches
could, in themselves, greatly help in the solution of the problem.
Even if the financing needed for increasing investment were available, however, that would not necessarily mean that it would automatically be assigned for that particular purpose. It would still be necessary to apply policies to discourage private and public consumption, in order at least to maintain the present saving effort. This topic will not be pursued in the present paper.
The policies referred to above with regard to trade and productivity involve changing production patterns in the region. This issue was dealt with in detail in a recent e c l a c study entitled Changing production patterns with social equity ( E C L A C , 1990), which was presented at the twenty- third session of the Economic Commission for Latin America and the Caribbean held in Caracas in May 1990.
IVEquity and competitiveness
In the foregoing arguments, I have taken no account of considerations of equity, although everything indicates that the lower-income groups of the population have borne the brunt of the reduction of consumption. Household surveys indicate that there has been an increase in both the absolute and relative number of families living below the poverty line in Latin America. In 1980, the number of people living below that line was 136 million, while in 1986 it was over 170 million, and as a percentage of the population the figures rose from 41% to 43% between those years (eclac/undp, 1990). There was a pronounced increase in unemployment during this period, while the ratio between tbe real minimum wage and the per capita gross domestic product deteriorated still further, providing yet another indication of the unequal distribution of the burden.
It has not been possible in this case, either, to find an easy way of distinguishing which effects on equity and on social costs are due to the structural reforms, and which should be attributed to other events. It would seem, however, that the variations in the exchange rate and interest rates
which take place in an adverse external environment tend to lead to levels of real wages and employment lower than those compatible with a democratic system of solving conflicts. The life expectancy of the kind of competitiveness acquired through the reduction of real wages will necessarily be only short in a democratic system. Moreover, it will rapidly deteriorate in any case, due to changes in consumer preferences, in the growth rate of the world economy, or in technology, and still worse, it will encounter rapid reprisals in the main markets, as recent Latin American experiences seem to show.
Long-term competitiveness in external trade is a systemic matter which does not only involve exchange rate policies and actions by particular firms, but also the functioning of a whole system of reciprocal relations within the economy: highway systems, ports, price and tax systems, domestic and external security, the financial system, the absorption of technology, education, and even the legal system and its capacity to settle disputes. It involves the degree of integration both of the different sectors of the economy and of countries and regions.
20 CEPAL REVIEW No. 43 / Apnl 1991
In conclusion, I would simply like to say that structural reforms aimed at increasing competitiveness within the world economy involve much more than tariff reductions, deregulation, price corrections and reduction of the size of the public sector. 1 would also like to stress that such reforms cannot be expected to give positive results within a short space of time. These aspects are important when considering
the cost of the reforms. I'he same is true of financing, since the reassignment of resources is financially onerous and involves lengthy periods of waiting for results and reducing consumption, depending on the terms and availability of financing. All this deserves the most serious consideration, which in my opinion it has not yet received in either bilateral or multilateral financial forums.

EXTERNAL EVENTS, DOMESTIC POLICIES AND STRUCTURAL ADJUSTMENT / Carlos Massad 21
AppendixPROCEDURE FOR CALCULATING THE GROSS DOMESTIC PRODUCT,
TH E POTENTIAL GROSS DOMESTIC PRODUCT AND THE (PER CAPITA) TREND GROSS DOMESTIC PRODUCT
The effective gross domestic product {(iD P) is that which is obtained from the national accounts.The potential gross domestic product (PGDP) is that which would have been registered from 1980 onwards
with the net level of investment generated in that period but at the employment level of 1980 and the mean productivity of the period 1970-1980.
The trend gross domestic product (tgdp) is that which would have been registered from 1980 onwards if the levels of net investment and productivity of the 1975-1980 period and the level of employment of 1980 had been maintained.
Before the series for the PiiDP and the t g d p could be generated, it was necessary to calculate the marginal product/capital ratio (MPCR), that is to say, the variation of the product per unit of variation in net fixed capital formation. This latter concept excludes investment in stocks.
Net domestic fixed capital formation (ndp) is obtained by deducting from gross domestic fixed capital formation (GDF) the rate of depreciation, which is assumed to be equal to 10% of GDP. Thus;
NDF, = GDKt - 0 .1 *G D P j
In order to obtain the marginal productycapital ratio (mpcr), a special iterative method using the following assumptions was employed:
i) the Latin American economies operated at the same level of employment in the years 1970 and 1980, andii) that ratio was constant for the period under review.
The method consists in obtaining a marginal capital/product ratio such that, starting from (JDP ^ PtJDP for the year 1970 and considering the effective rate of net domestic fixed capital formation (ndf) for the 1970s, it gives a PGDP for the year 1980 which is equal to the effective (JDP for the same year.
After the corresponding calculations have been made, the Pc;dp for the period 1981 onwards is projected. This is obtained by using the following formula;
PGDP, = P G D P ,.i( l + MPCR * k,)
where: k, = (NDF/PtiDP),.,
The next step is the projection of the T(;dp for the period 1981 onwards, using the following formula:
T(;DP, = TGDP,_i(l + MPCR * klj
where: kr =( l / 6 )[(NDF/GDP),y7r,+ ..‘ + (NDF/(;DP)jyj,o]
That is to say, kx is the average of the net investment rate for the period 1975 through 1980.
The per capita calculations were made on the basis of population figures for each year supplied by the Latin American Demographic Centre ( C F l .A D F ) . The figures for the product and investment were supplied by E C L A C .
22 CEPAL REVIEW No. 43 / April 1991
B ib lio g ra p h y
Blejer, Mario and Mohsin Khan (1984): Government policy and private investment in developing countries, S ta ff Papers, vol. 31, No. 2, Washington, D.C,, International Monetary Fund ( IM F ) , June.
Blejer, Mario and Silvia Sagari (1988): Sequencing the liberalization of financial markets, Finance and Development, vol. 25, No. 1, Washington, D.C., International Monetary Fund ( IM F ) , March.
Corbo, Vittorio and Jaime de Melo (1987): Lessons from the Southern Cone policy reforms, Research Observer, vol, 2, No. 2, Washington, D.C., The World Bank, July.
E C L A C (Economic Commission for Latin America and the Caribbean) (1990a): Changing production patterns with social equity, LC/G. 1601-P, Santiago, Chile, March. United Nations publication, Sales No.: E.90.1I.G.6,
_______ (1990b): Preliminary overview o f the Latin Americanand Caribbean economy, 1990, lc/g.1646, Santiago, Chile, 19 December.
EC LA C /U N D F (1990): Magnitud de la pobreza en América Latina en los años ochenta (uA,.533), Santiago, Chile, May.
Edwards, Sebastian (1987): Sequencing economic liberalization in developing countries. Finance and Development, vol. 24, No.l, Washington, D.C., International Monetary Fund (IMF), March.
_______ (1988): La crisis de la deuda externa y las políticasde ajuste estructural en América Latina, Colección Estudios CIKPLAN, No. 23, Santiago, Chile, March.
Feinberg, Richard (1986): An open letter to the World Bank’s new President, ficíweííi Two Worlds: the World B an k’s Next Decade, Richard Feinberg (ed.), U.S. Third World Policy Perspectives, No. 7, Washington, D.C., Overseas Development Council (one;).
Frenkel, Jacob (1982): The order of economic liberalization: discussion, jEcoítfjmícPfí/icy in a World o f Change, K, Brunner and A.H. Meltzer (eds.), New York, North Holland.
Helleiner, Gerald (1986): Policy-based program lending: a look at the Bank’s new role. Between Two Worlds: the World B an k ’s Next Decade, Richard Feinberg (ed.), U.S. Third World Policy Perspectives, No. 7, Washington, D.C., Overseas Development Council (one),
IM F (International Monetary Fund) (1988): World Economic Outlook, Washington, D.C., April.
Khan, Mohsin and Malcolm Knight (1985): Fund-supported adjustment programs and economic growth. Occasional Papers, No. 41, Washington, D.C., International Monetary Fund ( IM F ) , November.
Lai, Deepak (1987): The political economy of economic liberalization, F/ic Wor/á Banft Ecotiowiic/icritcw, vol. 1, No. 2, Washington, D.C., The World Bank.
Massad, Carlos and Nicolás Eyzaguirre (eds.) (1990): Ahorro y form ación de capital. Experiencias latinoamericanas, Buenos Aires, Grupo Editor Latinoamericano.
Ma,ssad, Carlos and Gunther Held (eds.) (1990): Sistema f in a n c iero y asignación de recursos. Experiencias latinoamericanas y del Caribe, Buenos Aires, Grupo Editor Latinoamericano.
McKinnon, Ronald (1982): The order of economic liberalization: lessons from Chile and Argentina, Economic Policy in a World o f Change, K. Brunner and A.H. Meltzer (eds.). New York, North Holland.
Ram, Rati (1986): Government size and economic growth: a new framework and some evidence from cross-section and time-series data, American Economic Review, vol. 76, No. 1, Princeton, New Jersey, March.
Ramos, Joseph and Nicolás Eyzaguirre (1989): Restauración y mantenimiento de los equilibrios macroeconómicos básicos. Economic Commission for Latin America and the Caribbean (ec:lac), Santiago, Chile, November, mimeo. (To be published in E l Trimestre Económico, Mexico City).
Schmidt-Hebbel, Klaus and Felipe Montt (1989): Impactos externos, devaluaciones y precios de materias primas, Nicolás Eyzaguirre and Mario Valdivia (eds.). Políticas macroeconómicos y brecha externa: América Latina en los años ochenta (u 7g.1532-i*)> Economic Commission for Latin America and the Caribbean (F.C1.AC), Santiago, Chile, March. United Nations publication. Sales No.: S.89.11.G.10.
World Bank (1985): Structural adjustment lending: an evaluation of program design, World Bank Staff Working Papers, No. 735, Washington, D.C.
Zahler, Roberto (1980): "Monetary and real repercussions of financial opening-up to the exterior. The case of Chile 1975-1978”, cepal Review, No, 10 (e/gei*ai G.1110), Economic Commission for Latin America and the Caribbean (Et;LAc;), Santiago, Chile, April. United Nations publication, Sales No,: e.80.i i .g.2.
CEPAL REVIEW N" 43
Latin America and the new finance and trade flowsRobert Devlin and Marline Guerguil*
This article explores Latin America’s prospects with regard to international finance and trade in the 1990s. It is concluded that the external environment will probably be unfavourable, although there will be some opportunities for supporting the region’s structural adjustment processes,
The external financing prospects of most of the countries of the region are bleak, as they are still suffering from over-indebtedness, and the main financial Hows will come initially from the reduction in the current value of the existing debt through concerted or unilateral actions. Nevertheless, the countries of the region can take advantage of certain limited credit and investment mechanisms (“niche financing”) which will give them access to foreign capital in spite of their current over-indebtedness. The few countries which have begun to emerge from this latter situation will have a chance to re-enter the international capital markets.
As the access to external finance will probably be severely restricted, export promotion and the search for a better form of insertion in world trade will be indispensable elements in the economic policy of the 1990s. In view of recent world trade trends, a policy aimed at greater openness could be insufficient to improve this insertion on a stable basis, and it will be necessary to follow two additional lines of action; firstly, to strengthen Latin America’s bargaining power with the other countries and regions, especially in view of the growing emergence of regional blocs, and secondly, to apply an active industrial policy aimed at incorporating technical progress and raising the skill level of the labour force in order to achieve the authentic competitiveness which will make it possible to increase the region’s share in world trade and simultaneously raise the living standards of the population.
* S t a f f m e m b e r s o f t h e E c o n o m ic D e v e lo p m e n t D iv is io n
o f C(.:l .vc a n d th e jo i n t t'.u .A C iLM O o I n d u s t r y a n d T e c h n o lo g y
D iv is io n , r e s p e c t iv e ly .
Introduction**The 1980s was a period of severe crisis for Latin America. Because of its extraordinary breadth, this crisis gave rise to challenges on many fronts at the same time. On the one hand, it gave rise to a tremendous financial crisis which made it necessary to engage in five rounds of external debt renegotiations with creditors and was reflected in the precarious state of the public sector accounts. Furthermore, the serious economic crisis which then hit the region highlighted the need to rethink the development strategy which had prevailed since the 1930s. Consequently, there is now a generalized awareness of the need to effect thorough-going changes in the economies so that they can be modernized and become more competitive on the international level. The high cost of the economic crisis, together with the exclusive economic policies inherited from the past, also sparked off a serious social crisis.' Finally, the region also had to face up to a political crisis resulting from the authoritarian systems of the 1970s which are giving way in almost all the countries to a fragile and shaky transition to democracy.
The crisis affected so many aspects of national life that it has been extremely difficult to deal with. In the 1980s, there was deterioration in many areas, but also some progress. Nevertheless, the economic, political and social changes still needed continue to be of enormous magnitude and represent the real challenges of the 1990s. One of the most important conditioning factors of these changes, both in the area of commerce and finance, will be the external sector.
** This paper was originally prepared for the international seminar "Latin America in the New International Context”, sponsored by coRDEsand held in Quito from 2-4 July 1990. The authors wish to express their thanks for the valuable assistance received from Mario Paredes of the Kta.Ac: Economic Development Division and the useful comments made by Nora Lustig, Michael Mortimore, Ana Maria Alvarez, Alfred Watkins and the staff of the e c l a c ; Washington Office.
* For a detailed account of the crisis and the rounds of renegotiations with creditors, see e c l a c , 1984, 1988, 1989c and 1990d.
For an analysis of the economic crisis, with proposals for achieving a change in the production patterns of the region, see e c e m ;, 1990e.
24 CEPAL REVIEW No. 43 I April 1991
This article contains some reflections on the external environment which the Latin American countries will probably have to face in the 1990s
with regard to finance and trade, and it suggests some ways of taking advantage of the opportunities which may present themselves.
I
External financeThe prospects for securing finance in the 1990s are, generally speaking, gloomy. On the one hand, it is probable that Latin America’s access to private international capital markets will remain relatively restricted on account of the crisis in the region and the persistent problems of the debt overhang. On the other hand, finance from bilateral and multilateral public agencies (which are generally not so strictly governed by private risk criteria) could be restricted by various factors: firstly, the serious fiscal constraints of the creditor countries are already giving rise to resistance to the granting of new development finance resources; secondly, the possibility that the new political priorities of certain industrialized countries may end up by diverting official resources from Latin America to Eastern Europe cannot be ruled out, and finally, there is a growing tendency to make the disbursement of official loans subject to conditions which the recipient countries frequently find difficult and burdensome. Consequently, it may reasonably be expected that the changes needed in the region in the 1990s will have to be carried out within the context of serious external finance constraints. Nevertheless, even in this context there are still opportunities for the Latin American countries to obtain larger amounts of finance in these years, and indeed, some countries of the region may already be on the threshold of a return to international financial markets.
1. Reducing the debt and its service
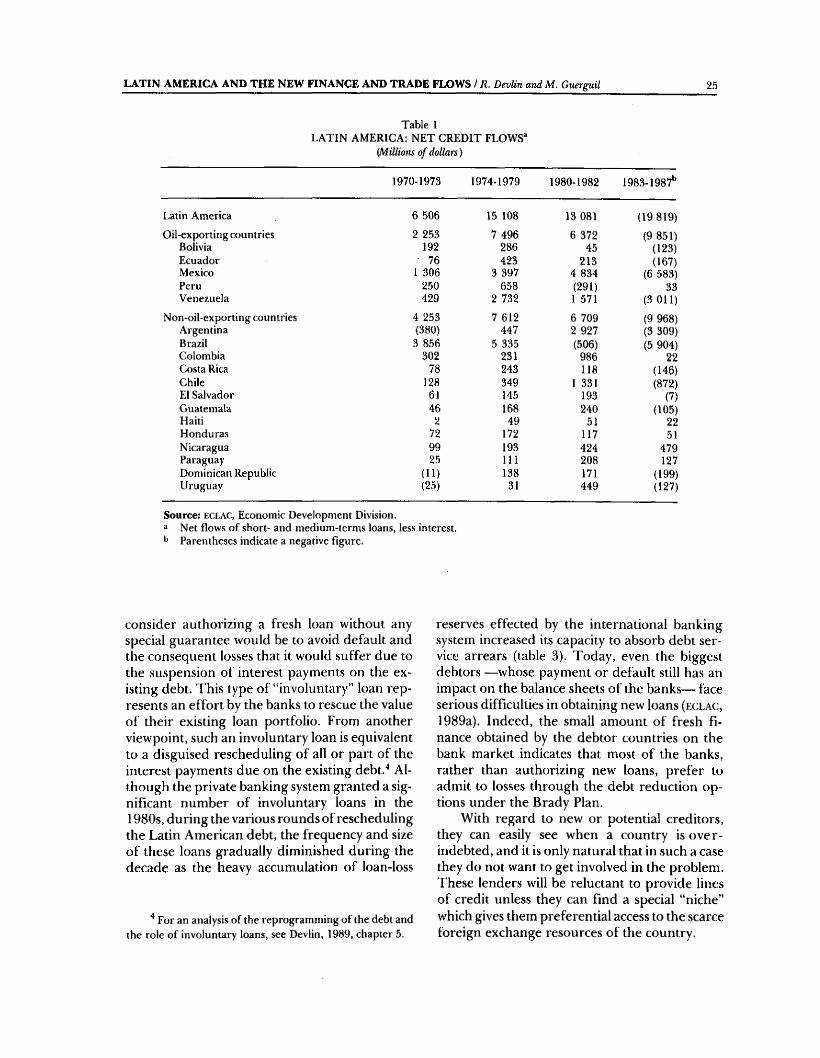
Since 1982, Latin America has made net transfers of resources to its foreign creditors amounting to almost US| 20 billion per year (table 1). This massive transfer (equivalent to 3% of the gross domestic product of the region) represents an extraordinary drain on resources which .seriously
weakens Latin America’s process of change. Consequently, as far as external finance is concerned, the first priority for many countries in the 1990s will be to reduce, or if possible eliminate, this negative resource transfer.^ In theory, there are two options for this purpose: the disbursement of new loans, or a reduction in the debt and its service. For most of the countries of the region, it is probably the latter option which offers the best possibilities for the coming years.
a) Incentives for seeking a reduction of indebtedness
Many Latin American countries are over- indebted, a fact which is recognized by the capital markets and is reflected in the big discounts at which the bank debt of these countries is traded on secondary markets (table 2). Without any doubt, the existence of an obvious state of overindebtedness reduces the willingness of creditors to grant new credits.
The majority of creditor banks consider that they are over-exposed in Latin America, and it is only logical that they should therefore seek to reduce their commitments in countries whose economic situation is seen as being difficult. Furthermore, the United States, Japanese and British banks are in an extremely delicate financial situation because of the new requirements of the Basle Committee regarding minimum levels of capital and the large number of loans of dubious value which these banks have given to clients in their respective domestic markets {P'inancial Times, 1990a, b and c and 7Te Ticonomist, 1990).
One of the few reasons why a bank might
For fuller information on the negative effects of the outward resource transfer on the future performance of the Latin American economies, see F.(:t,A(:/SEI,A, 1989.
LATIN AMERICA AND THE NEW FINANCE AND TRADE FLOWS t R. Devlin an dM . Guerguii 25
Table ILATIN AMERICA: NET CREDIT FLOWS“
{Millions o f dollars)
1970-1973 1974-1979 1980-1982 1983-1987*^
Latin America 6 506 15 108 13 081 (19 819)Oil-exporting countries 2 253 7 496 6 372 (9 851)
Bolivia 192 286 45 (123)Ecuador 76 423 213 (167)Mexico 1 306 3 397 4 834 (6 583)Peru 250 658 (291) 33Venezuela 429 2 732 1 571 (3 Oil)
Non-oil-exporting countries 4 253 7 612 6 709 (9 968)Argentina (380) 447 2 927 (3 309)Brazil 3 856 5 335 (506) (5 904)Colombia 302 231 986 22Costa Rica 78 243 118 (146)Chile 128 349 1 331 (872)El Salvador 61 145 193 (7)Guatemala 46 168 240 (105)Haiti 2 49 51 22Honduras 72 172 117 51Nicaragua 99 193 424 479Paraguay 25 111 208 127Dominican Republic (11) 138 171 (199)Uruguay (25) 31 449 (127)
Source; e c l a c , Economic Development Division, a Net flows of short- and medium-terms loans, less interest.
Parentheses indicate a negative figure.
consider authorizing a fresh loan without any special guarantee would be to avoid default and the consequent losses that it would suffer due to the suspension of interest payments on the existing debt. This type of “involuntary” loan represents an effort by the banks to rescue the value of their existing loan portfolio. From another viewpoint, such an involuntary loan is equivalent to a disguised rescheduling of all or part of the interest payments due on the existing debt."* Although the private banking system granted a significant number of involuntary loans in the 1980s, during the various rounds of rescheduling the Latin American debt, the frequency and size of these loans gradually diminished during the decade as the heavy accumulation of loan-loss
For an analysis of the reprogramming of the debt and the role of involuntary loans, see Devlin, 1989, chapter 5.
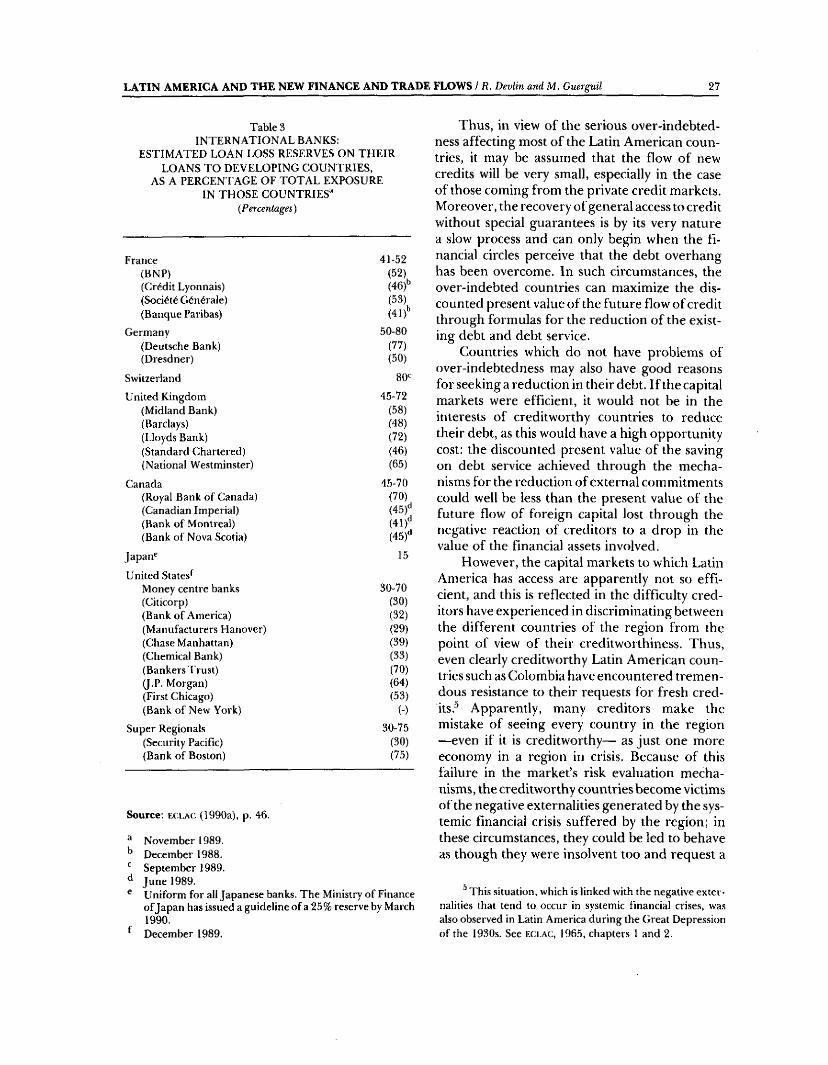
reserves effected by the international banking system increased its capacity to absorb debt service arrears (table 3). Today, even the biggest debtors —whose payment or default still has an impact on the balance sheets of the banks— face serious difficulties in obtaining new loans ( t : c L A C ,
1989a). Indeed, the small amount of fresh finance obtained by the debtor countries on the bank market indicates that most of the banks, rather than authorizing new loans, prefer to admit to losses through the debt reduction options under the Brady Plan.
With regard to new or potential creditors, they can easily see when a country is over- indebted, and it is only natural that in such a case they do not want to get involved in the problem. These lenders will be reluctant to provide lines of credit unless they can find a special “niche” which gives them preferential access to the scarce foreign exchange resources of the country.
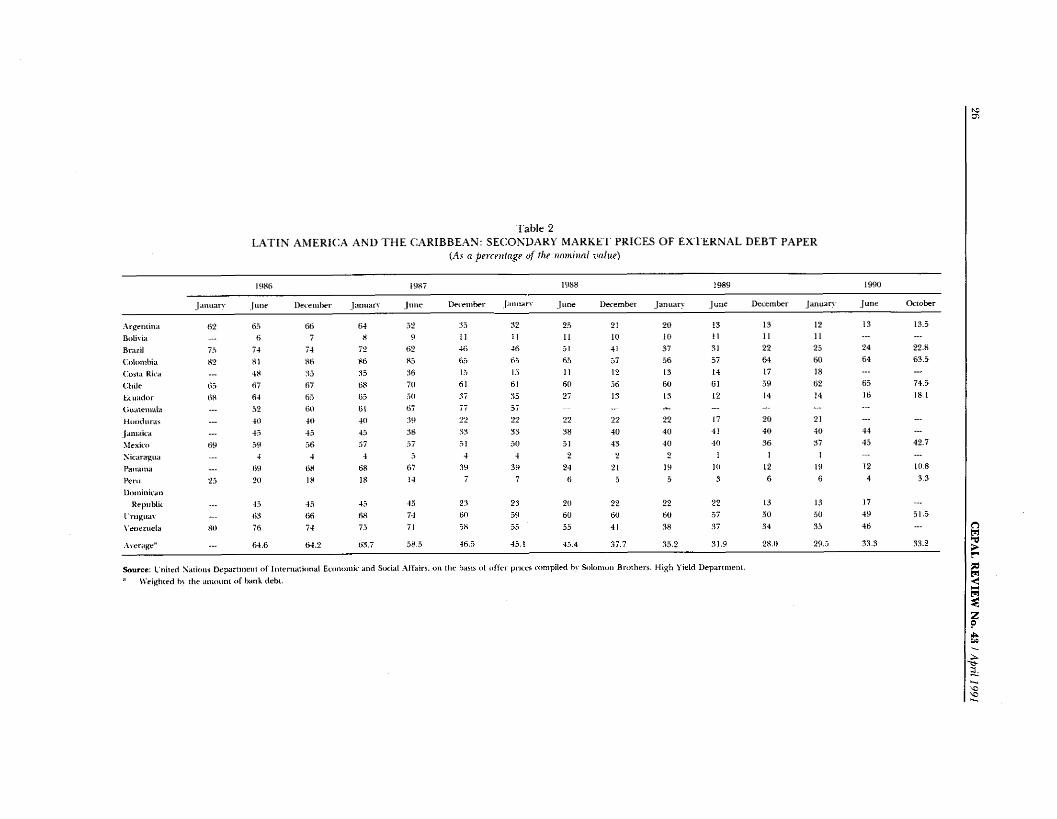
Table 2LATIN AMERICA AND THE CARIBBEAN; SECONDARY MARKET PRICES OF EXTERNAL DEBT PAPER
a percentage o f the nominal value)
19«f) 1987 1988 1989 1990
laiuiart [line Dec e miter [aniiarv |tine December [aniiarv J line December January June December January June October
.\rgentiiia 62 63 66 64 32 ;53 82 23 21 20 13 13 12 13 13.5
Bttlivia 6 7 8 9 n 11 11 10 10 11 11 11 . . . . . .
Brtizil 73 74 74 72 62 46 46 51 41 37 31 22 25 24 22.8
t'.olombia »2 81 86 86 83 6s3 63 63 57 56 57 64 60 64 63.3
(atsta Rica __ 48 ;i3 65 36 13 15 11 12 13 14 17 18 . . . . . .
Chile 63 67 67 68 70 61 61 60 36 60 61 59 62 65 74.5
Ectitidor 68 64 63 63 30 87 35 27 13 13 12 14 14 16 18.1
Ciutueinala — .32 66 61 67 77 57 — . . . . . . . . .
Hoiuluras — 40 46 40 :59 22 22 22 22 22 17 20 21 . . . “
jamak'a . . . 43 43 43 88 ;is 33 38 40 40 41 40 40 44 . . .
Mexico 69 39 36 37 37 31 30 51 43 40 40 36 37 43 42,7
Nicaragua . . . 4 4 4 3 4 4 2 2 2 1 1 !
I'anaina — 69 68 68 67 ;i9 39 24 21 19 10 12 19 12 10.8
Peru 23 20 18 18 14 7 7 6 5 5 3 6 6 4 3.3
Dot It in ¡can Republic 43 43 43 45 2;i 23 20 22 22 22 13 13 17
Lrugnat — 66 66 68 74 60 39 60 60 60 37 50 50 49 51.5
Veneitiela 86 76 74 73 71 38 35 53 4 ! 38 37 34 35 46
Avenige" . . . 64.6 64.2 68.7 38.3 46.3 43.1 45.4 37.7 33.2 31.9 28.0 29.5 33.3 33,2
Source: L tiited Nations Dcpiirtineiit o f Iiiw m atiooal Ecotitmiif and St>dal Affairs, on tlie basis o f o ile r prices compiled bv Solomon Brothers, High Yield Department.
■' Weighted b\ the amotitn o f bank debt.
Om>rpaP5<NNH
ze
NS-3.
LATIN AMERICA AND THE NEW FINANCE AND TRADE FLOWS / R. Devlin and M. Gwrguil 27
Table 3IN TERN ATIONAL BANKS:
ESTIM A TED LOAN LOSS RESERVES ON TH EIR LOANS T O DEVELOPING COUNTRIES,
AS A PERCENTAGE OF TO TA L EXPOSURE IN TH O SE COUNTRIES^
(Percentages}
France 41-52(BNP) (52)(Crédit Lyonnais) (46)^(Société Générale) (53)(Banque Paribas) (41)’’
Germany 50-80(Deutsche Bank) (77)(Dresdner) (50)
Switzerland 80^
United Kingdom 45-72(Midland Bank) (58)(Barclays) (48)(Lloyds Bank) (72)(Standard (Chartered) (46)(National Westminster) (65)
Canada 45-70(Royal Bank o f Canada) (70)(Canadian Imperial) (45)''(Bank of Montreal) (41)''(Bank o f Nova Scotia) (45)'*
Japan^ 15
United States^Money centre banks 30-70(Citicorp) (30)(Bank o f America) (32)(Manufacturers Hanover) (29)(Chase Manhattan) (39)(Chemical Bank) (33)(Bankers Trust) (70)(j.P . Morgan) (64)(First Chicago) (53)(Bank o f New York) (-)
Super Regionals 30-75(Security Pacific) (30)(Bank of Boston) (75)
Source: FX'.LAt: (1990a), p. 46.
November 1989. December 1988. September 1989. Jun e 1989.
® Uniform for all Japanese banks. The Ministry o f Finance o fjap an has issued a guideline o f a 25% reserve by March 1990.
December 1989.
Thus, in view of the serious over-indebtedness affecting most of the Latin American countries, it may be assumed that the flow of new credits will be very small, especially in the case of those coming from the private credit markets. Moreover, the recovery of general access to credit without special guarantees is by its very nature a slow process and can only begin when the financial circles perceive that the debt overhang has been overcome. In such circumstances, the over-indebted countries can maximize the discounted present value of the future flow of credit through formulas for the reduction of the existing debt and debt service.
Countries which do not have problems of over-indebtedness may also have good reasons for seeking a reduction in their debt. If the capital markets were efficient, it would not be in the interests of creditworthy countries to reduce their debt, as this would have a high opportunity cost: the discounted present value of the saving on debt service achieved through the mechanisms for the reduction of external commitments could well be less than the present value of the future flow of foreign capital lost through the negative reaction of creditors to a drop in the value of the financial assets involved.
However, the capital markets to which Latin America has access are apparently not so efficient, and this is reflected in the difficulty creditors have experienced in discriminating between the different countries of the region from the point of view of their creditworthiness. Thus, even clearly creditworthy Latin American countries such as Colombia have encountered tremendous resistance to their requests for fresh credits.*’ Apparently, many creditors make the mistake of seeing every country in the region —even if it is creditworthy— as just one more economy in a region in crisis. Because of this failure in the market’s risk evaluation mechanisms, the creditworthy countries become victims of the negative externalities generated by the systemic financial crisis suffered by the region; in these circumstances, they could be led to behave as though they were insolvent too and request a
^Thi.s situation, which is linked with the negative externalities that tend to occur in systemic financial crises, was also observed in Latin America during the Great Depression of the 1930s, See e c l a c , 1965, chapters 1 and 2.
28 CEPAL REVIEW No. 43 / April 1991
reduction in their debt. It would ¡appear that investors are incorporating this perverse phenomenon in their calculations of the value of the debt, since even the bank loans of the apparently creditworthy Latin American countries are circulating at big discounts in secondary markets.
b) Consensual debt reduction formulas
As already noted, the capital markets are apparently not well placed to grant fresh finance to the region on a global basis.** The problem of overindebtedness which is largely behind this situation is systemic in both its origins and in the solutions needed for it; the overexpansion of external commitments arose from the interaction of the policies of the debtor countries, the private banks and the industrialized countries (eclac, 1990a). Ultimately, it was the market, and not a particular banker or borrower, which went wrong in a particular institutional context. Moreover, the overindebtedness not only adversely affects the relations between the debtors and the banks involved but also hinders the activities of economic agents who are not financially overextended; hence, the social or public nature of the problem calls for public action to share the costs of a solution among debtors, creditors and, if necessary, the international public sector in general.
Although the systemic nature of the problem was visible from the beginning of the crisis, in its first years it was treated in official circles as exclusively a private matter which should be solved between creditors and debtors, with the least possible participation of the international public sector. Even when it became evident that the credit market had collapsed around Latin America, heavy emphasis continued to be placed on the need to respect private market criteria, ostensibly in order to restore the access of the debtor countries to fresh loans. Indeed, the possibility of obtaining fresh finance was usually used to justify the design of strategies whose aim was almost exclusively to avoid losses for the private banking system (Devlin, 1989, chapter 5). The other side of the coin was a massive net
However, there are opportunities for fresh finance which are examined below.
^ e c l a c : recognized this from the beginning: see e c ;l a c ,
1982.
transfer of resources from the debtor to the creditor countries.
The truth is that in view of the systemic nature of the debt overhang problem, a reduction in the debt or its service should have been sought at the beginning of the crisis. This approach, which is quite widely used to solve a systemic problem in the domestic credit markets of the industrialized countries,® is the only way of promoting an efficient adjustment for all the parties in the system and thus equitably sharing the costs of a solution. Unfortunately, it was only in 1989, with the appearance of the Brady Plan, that this broader public approach gained currency as a response to the problem of the Latin American debt overhang.
i) The Brady Plan. While it is true that incentives for reducing the debt have existed for many years, thanks to the Brady Plan the debtor countries can now in principle pursue a debt reduction policy with the full support of the international community. The new plan earmarks financial and institutional resources of the international public sector for the process of reducing the bank debt. Four debt reduction agreements have already been finalized (for Mexico, the Philippines, Costa Rica and Venezuela), financed with a total of over US$8 billion in loans from the World Bank, the International Monetary Fund and various individual governments (especially Japan).** In addition, Uruguay and Morocco have signed agreements in principle with their creditor banks.
The existence of the Brady Plan gives the Latin American countries a chance to reduce their debt service payments (and the negative resource transfer) on a consensual and non- conflictive basis. Undoubtedly, in the 1990s more countries in the region will seriously explore the new opportunities available in this field. At the same time, however, it should be noted that the Brady Plan presents some serious problems which could cause difficulties for the debtor countries.
The Brady Plan is basically a voluntary
** As in the case of the rescue measures in favour of the Chrysler Corporation and the City of New York, for example. See E C L A C , 1990a, table 4.
For details of the way the Brady Plan operates, see E C L A C , 1990a.
LATIN AMERICA AND THE NEW FINANCE AND TRADE FLOWS / R. Devlin and M. Guerguil 29
scheme whereby the private bank debt is repurchased, directly or indirectly, at a discount.The amount of reduction of the debt is thus closely conditioned by the price at which the debt is traded on the secondary market and by the finance available for carrying out the repurchase. The agreements reached so far under the Brady Plan have been the subject of intense debate, since a significant number of analysts consider that the net debt reductions thus achieved, and the effect that these will have on the foreign exchange flow, will be really quite limited. There are three main reasons why these results may be unsatisfactory; firstly, an insufficient supply of public finance to carry out the bank debt repurchase operations; secondly, insufficient coordination of the banks by the public agencies, thus permitting the banks to evade options that would effectively reduce the debt to levels that could be reasonably serviced, and thirdly, the absence of specific measures for tackling the problem of serving the official debt, which represents a heavy burden in many countries.
In view of these three serious shortcomings, it is possible that the Brady Plan will not serve to eliminate the debt overhang problem completely, so that many Latin American countries may only achieve a partial reduction of their excessive external commitments. Unfortunately, such a partial debt reduction scheme could ultimately bring more problems than solutions."
The benefits of the debt reduction are transmitted to the debtor country through two main channels: on the one hand, the cash flow improvement regarding foreign exchange and the fiscal accounts due to the reduction in the debt service; and on the other hand, the reduction in the private sector risk premium. There is thus, in principle, a greater possibility of achieving an ef fective structural adjustment and servicing the debt.
In a voluntary debt reduction scheme, the conversion of the debt into bonds sold at a discount, as illustrated by the agreement signed by Mexico, is an “indirect” debt repurchase operation. For an analysis of the equivalence between direct repurchase and conversion into bonds, see Dooley. 1988, pp. 714-722.
*S:CLAC has estimated that with the present level of public financing (US$ 30 to US$ 35 billion) the Brady Plan could reduce the net indebtedness of the region by only between 13% and 15%. See ECLAC, 1990a, pp. 107-108.
If the debt reduction operation does not clearly eliminate the overindebtedness, however, its benefits for the debtor country would seem to be rather ambiguous. Firstly, the cash flow effect will only be small compared with the finance needed to support a socially efficient adjustment, that is to say, one that also permits growth. Furthermore, it is well known that the partial repurchase of the excess debt may turn out to be a bad deal for the debtor country, since the marginal value of the debt thus retired may be less than the price paid for it.* Secondly, the unconditional defenders of the Brady Plan usually implicitly assume that there is a direct and continuous relationship between the debt reduction and the reduction in the private sector risk premium: thus, for example, a 30% reduction in overindebtedness would bring about a similar decline in the adverse expectations of investors. If we take into account the existence of barriers to information, the entrenched adverse expectations after eight years of crisis, and the interdependence of investors in regard to the taking of decisions, however, the most likely outcome is that in practice this relationship will not function in this way. This means that the reduction in the debt must pass a certain critical threshold before it brings about a significant decline in the medium-term private sector risk premium.
Thus, in the event that the Brady Plan only permits a partial reduction in the debt overhang, its benefits will generally speaking be ambiguous. For this reason, the participation of the debtor
When the probability that a Latin American country will pay its debts is uncertain, the discount registered on that country’s debt in the secondary markets will reflect this uncertainty. Let us assume that in an optimistic scenario the country can pay 100% of the debt, whereas in a pessimistic one it can only pay 25%. Let us also suppose that there is a one in four probability that it will comply with the optimistic scenario and a three in four probability that it will act according to the pessimistic one. In this case, the price of US$ 1 of debt on the secondary market will be 44 US cents, that is to say, the weighted average of the two scenarios. In the repurchase operation, the country will pay at least 44 US cents per dollar of debt, even though the marginal value of one rescued dollar for the debtor will only be 25 US cents, because of the low probability (25%) that the country will honour all its debt service commitments. Only if the overindebtedness problem is definitively eliminated can this dilemma be overcome. For a more detailed analysis of this problem, see Biilow and Rogoff, pp. 675-704.
30 CEPAL REVIEW No. 43 / 1991
countries in the plan could simply be an act of faith. This conclusion has real repercussions for the Latin American countries, since the Brady Plan urges debtors to use part of their scarce international reserves, the balance-of-payments support loans from the World Bank and the International Monetary Fund and the receipts from bilateral aid to finance the debt reduction operations. From the point of view of the alternative use that could be made of scarce foreign exchange resources, however, it is possible that the direct allocation of such resources to their original purpose (that is to say, balance-of-payments financing and investment projects) would give a greater yield than the ambiguous benefits provided by the partial reduction of the debt overhang.
Another drawback in a partial reduction of the debt overhang emerges when there is conversion of existing commitments into bonds, as an instrument for the repurchase of the debt on the secondary market. In this situation, regardless of the size of the discount, the debtor country could end up facing still greater rigidity in its future debt management. This is because bonds (unlike loans) are difficult to reschedule and to subject to the previously mentioned policy of involuntary loans. Thus, when the discount is not enough to eliminate the excess external liabilities, there is an even greater chance that subsequent payment problems will be solved through a formal default. Since bond holders are traditionally ill-disposed to put up with such default, the delinquent debtor country could eventually find itself swamped with lawsuits brought by discontented creditors.
These difficulties show that the Brady Plan —after having created expectations that it would offer a consensual mechanism for putting an end to the debt overhang problem in Latin America— will not necessarily be a panacea for the problem of the negative resource transfer. Furthermore, the Plan creates fresh dilemmas for the debtor countries (with regard to the best way of using their scarce of ficial loans) and for the multilateral agencies, which are now under pressure to extend their loans to activities with a dubious return. In contrast, the banks have better prospects of ending up in a relatively more favourable position, since if they wish they can sell off their
loans en masse and thus exit from the problems of Latin America.
In order to overcome these difficulties and increase its efficiency as a debt reduction vehicle and economic reactivation instrument, the Brady Plan would need, inter alia, to do the following: firstly, to treble to around US$ 90 billion the public resources available for financing the repurchase of bank paper on the secondary market;'' secondly, to strengthen the International Monetary Fund’s capacity to give official approval to the build-up of arrears by countries whose processes of adjustment (with growth) are being hindered by lack of co-operation from the private banks on debt reduction, and thirdly, to permit a sharp reduction in bilateral debt, together with the creation of new mechanisms to relieve the burden of multilateral obligations.*'^
These and other reforms could improve the efficiency of the Brady Plan and make its benefits dearer to the debtor countries. Unfortunately, the prospects for the Plan being strengthened in this way are not very bright. Faced as they are with their own fiscal imbalances, the governments of most of the creditor countries have shown themselves to be reluctant to finance large-scale international initiatives. Likewise, the possibility of creditor governments and multilateral finance agencies putting strong and sustained official pressure on the banks depends on a complicated set of interests and political forces which are indeed very difficult to control.
Consequently, in this early part of the 1990s the road towards a concerted and effective solution to the debt overhang problem still seems to be full of obstacles, and the Latin American countries will have to travel along that road with the greatest caution, since in some circumstances the
'^Wilh regard to the objective of rapidly eliminating the debt overhang, the alternative to more public financing for debt reduction would be an official scheme based on full coercion: for example, new legislation in the creditor coim- irics obliging the commercial banks to adjust the debt to levels which the debtor countries can service. However, the possibility that such a contlictive scheme will be adopted iti countries such as those of the North, where decisions are usually taken by consensus, is even more remote than the introduction of a well financed voluntarv scheme.
' *See these and other proposals for improving the operation of the Bradv Plan in I'ca.Ac;, 1990a, Chapter I\' and Rosenthal. 1990. pp„ 17-1Í0.
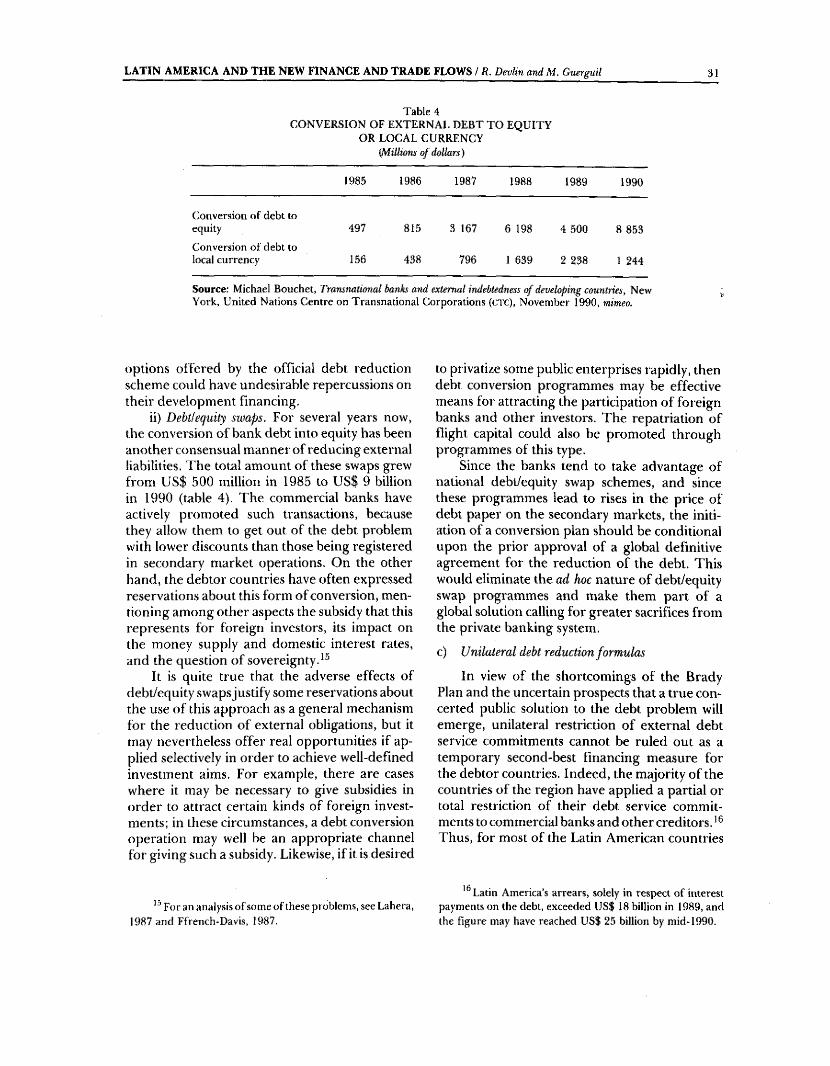
LATIN AMERICA AND THE NEW FINANCE AND TRADE FLOWS / R. Devlin and M. Guerguil 31
Table 4CONVERSION OF EXTERNAL DEBT TO EQUITY
OR LOCAL CURRENCYi/ii nitons o f dollars)
1985 1986 1987 1988 1989 1990
Conversion of debt toequity 497 815 3 167 6 198 4 500 8 853Conversion of debt tolocal currency 156 438 796 1 639 2 238 1 244
Source; Michael Bouchet, Transnational banks and external indebtedness o f developing countries^ New York, United Nations Centre on Transnational Corporations (CTC), November 1990, rnimeo.
options offered by the official debt reduction scheme could have undesirable repercussions on their development financing,
ii) Debtlequity swaps. For several years now, the conversion of bank debt into equity has been another consensual manner of reducing external liabilities. The total amount of these swaps grew from US$ 500 million in 1985 to US$ 9 billion in 1990 (table 4). The commercial banks have actively promoted such transactions, because they allow them to get out of the debt problem with lower discounts than those being registered in secondary market operations. On the other hand, the debtor countries have often expressed reservations about this form of conversion, mentioning among other aspects the subsidy that this represents for foreign investors, its impact on the money supply and domestic interest rates, and the question of sovereignty,^^
It is quite true that the adverse effects of debt7equity swaps justify some reservations about the use of this approach as a general mechanism for the reduction of external obligations, but it may nevertheless offer real opportunities if applied selectively in order to achieve well-defined investment aims. For example, there are cases where it may be necessary to give subsidies in order to attract certain kinds of foreign investments; in these circumstances, a debt conversion operation may well be an appropriate channel for giving such a subsidy. Likewise, if it is desired
to privatize some public enterprises rapidly, then debt conversion programmes may be effective means for attracting the participation of foreign banks and other investors. The repatriation of flight capital could also be promoted through programmes of this type.
Since the banks tend to take advantage of national debt/equity swap schemes, and since these programmes lead to rises in the price of debt paper on the secondary markets, the initiation of a conversion plan should be conditional upon the prior approval of a global definitive agreement for the reduction of the debt. This would eliminate the ad hoc nature of debt/equity swap programmes and make them part of a global solution calling for greater sacrifices from the private banking system,
c) Unilateral debt reduction formulas
In view of the shortcomings of the Brady Plan and the uncertain prospects that a true concerted public solution to the debt problem will emerge, unilateral restriction of external debt service commitments cannot be ruled out as a temporary second-best financing measure for the debtor countries. Indeed, the majority of the countries of the region have applied a partial or total restriction of their debt service commitments to commercial banks and other creditors. Thus, for most of the Latin American countries
' ’ For an analysis of some of these problems, see Lahera, 1987 and Ffrench-Davis, 1987.
° Latin America’s arrears, solely in respect of interest payments on the debt, exceeded US$ 18 billion in 1989, and the figure may have reached US$ 25 billion by mid-1990.
3 2 CEPAL REVIEW No. 43 / April 1991
the question is not whether they should restrict such payments but only how and for how long.
This is a tricky subject, and the benefits and costs of such a restriction will obviously depend on the specific circumstances of each country. Experience indicates that certain considerations should be taken into account if it is decided to formulate a national strategy in this respect, however.'^
To begin with, the main motive for embark-, ing on a restriction of payments is the lack of consensual options for dealing with excessive debt service payments and their destabilizing effects. Obviously, servicing an overvalued debt greatly prejudices the execution of programmes of structural change in the Latin American economies. In view of the operational problems of the Brady Plan, mentioned earlier, a unilateral restriction of payments may sometimes be the only way of securing the additional finance needed to support efficient programmes of adjustment and economic change.*^
Secondly, a payments restriction may be the first step towards the negotiation of a definitive debt reduction agreement. It is worth remembering that it is difficult to negotiate a substantial reduction in the debt when the debtor country is punctually servicing its contractual obligations. Paradoxical though this may seem, this conclusion reflects the fact that the banks always compare any agreement, no matter how modest it may be, with the status quo. If the debt is being serviced punctually, then obviously they are going to prefer the In contrast, restricting the debt service indicates the physical incapacity of the debtor to service his debt. In such circumstances, both parties know that time may be on the side of the debtor country, because any stagnation of the negotiations maintains the quo and thus maximizes the debt service relief. In contrast, any formal debt reduction agree-
' ECLAC has made some studies on the experience of the countries with regard to payments restrictions. For some preliminary background see Et;i.AC, 1990a, chapter V, and Altimir and Devlin (in the press).
'* It is interesting to note that against the background of the rather discouraging results of most of the adjustment programmes in Latin America, two of the cases considered to be “successful” (Costa Rica and Bolivia) used a moratorium to support their adjustment and stabilization programmes.
ment will mean an increase in the service payments compared with the statits quo thus improving the situation of the banks even though the formal reduction in the debt may be quite substantial.
Thirdly, the benefits that may be derived from a payments restriction will depend mainly on the way internal factors evolve. In order for the restriction to become an effective source of additional external finance and a basis for a possible definitive debt reduction agreement, the creditors must be made to perceive that this unilateral policy is viable and sustainable. Only then will they have an incentive to begin serious negotiations seeking a real solution for the debt overhang. The stability of the policy adopted with regard to the excessive service commitments on the old debt is also an important factor for minimizing the negative effects of the debt overhang on the behaviour of private investors; in other words, the adoption of clear and stable rules on the way the servicing of the old debt is to be handled may make it easier for new investors to identify “niches” offering them opportunities in the economy of the debtor country.
Still at the domestic level, the efficiency of the payments restriction will depend to a very large extent on the existence of a coherent economic programme aimed at securing effective structural adjustment. The coherence of the economic programme gives the payments restriction legitimacy, since it creates an objective basis for determining the medium and long-term payments capacity of the country, which will serve as a basis for the negotiations with the banks. It also inspires in the national economic agents a certain respect for the decisions of the economic team and generates a perception that the payments restriction forms part of a broader national initiative to improve the performance of the economy, with corresponding opportunities for obtaining profits. It has also been observed that foreign creditors and international agencies have shown some reluctance to level serious threats at a country’s payments restriction when it has been applying a respectable economic programme. In contrast, experience has shown that if the restriction is not backed up by a serious and sustainable economic programme, it rapidly loses prestige and may involve very high political and economic costs, possibly ending up being
L A T IN A M E R IC A A N D T H E N E W F IN A N C E A N D T R A D E F L O W S / R. Devlin and M . Guerguil 33
totally discredited as a means of neutralizing the debt overhang.
If the payments restriction is to be efficient, it also calls for careful political management. Fundamentally, the orderly management of the restriction depends to a large extent on the emergence of a national consensus which supports this measure as a reasonable temporary option in view of the limited alternatives offered by the creditors. Such a consensus does not arise automatically, but requires a political strategy and an information campaign directed at the national groups with the greatest influence on public opinion.
As well as establishing a firm domestic base to support the payments restriction, it is necessary to take precautions at the external level also. It may be useful to take measures designed to have a conciliatory effect on creditors, by presenting the restriction with the least possible fuss, for example, and emphasizing that it is a special measure forced upon the country by the unbearable burden of the resource transfer. Efforts may also be made to keep open the lines of communication with creditors by putting forward constructive formulas for overcoming the problem of the excessive nominal value of the debt. Finally, as a sign of goodwill, consideration may be given to the partial payment of the debt service commitments on the contractual debt, but only in amounts in keeping with the country’s payment capacity and the requirements of its economic programme. Furthermore, these symbolic payments should be on the current debt service and not in respect of accumulated arrears, since the latter are an integral part of the debt overhang problem and their solution must therefore await a definitive global agreement with creditors. In certain cases, it might even be useful to announce unilaterally — but always in a conciliatory manner— a payment plan benefitting certain creditors (it could be announced, for example, that X% of exports or of the gross domestic product will be devoted to debt service), in order to stabilize the expectations of the private agents with regard to access to foreign exchange.
*®The only country in Latin America which has carried out a form al unilateral payments plan is Peru. Although the restriction functioned relatively well to start with, its benefits were largely dissipated because o f serious problems in the
It is normal practice to exclude debts with multilateral finance agencies from payments restrictions. These agencies are not bound by the same risk evaluation criteria as the private capital markets, and consequently they form a potentially flexible source of finance; furthermore, running into arrears with multilateral credit institutions could be interpreted by third parties as an act of desperation which would discredit the whole management of the adjustment and transformation process. It is also worth taking measures to avoid any possible interruption in access to short-term lines of trade credit. Finally, still at the external level, it might be useful to take measures to protect the international reserves from possible hostile action by some private creditors (eclac, 1990a, chapter V).
Fourthly, in a well-ordered unilateral strategy it is necessary to take account of the time horizon of the restriction. Unilaterally limiting debt service is, by definition, a temporary tactic. Running up arrears may relieve one of the main negative effects of the debt overhang (that affecting cash flow), but not necessarily the other (the private sector risk premium). Consequently, it is desirable that the country should reach a definitive debt reduction agreement as soon as possible. This may take some time, however, especially if the debtor country is small and of little relative importance to the banking sy stem .F o r example, Costa Rica was in arrears for five years before finally reaching agreement with the banks in May 1990, while Bolivia has been in arrears with the banks since 1982; despite two big repurchase operations of its bank debt on the secondary market (at a price of 11 US cents per dollar), one-third of its commitments are still currently in arrears, awaiting some kind of agreement. The long- drawn-out nature of the banks’ response is another reason why the debtor country should take care to ensure that the payments restriction is orderly and sustainable and forms part of a successful economic programme in the areas of adjustment and stabilization.
country’s economic program m e. For an analysis o f Peru's unilateral payments plan, see Figueroa, in Altim ir and Devlin(editors) (in the press).
20 *T h e banks often hold up agreem ent with a small debtor in order to avoid setting precedents which could later become general in the negotiations with big debtors.
34 C E P A L R E V IE W N o . 4 3 / 1991
Finally, it may be noted that the Brady Plan has created circumstances whereby the imf may become a potential ally of countries with payments problems, for the Fund now has general authorization to disburse loans even though the recipient country has not reached prior agreement with the private banking system to cover the servicing of its debt. Thus, during 1989-1990 this agency disbursed loans to various countries which had not signed any agreement with their creditors, including some which even registered serious arrears in their debt service. The banking system received these disbursements with alarm, since they seriously weakened its own bargaining power.
While this new policy of the i m f is potentially valuable for the debtor countries, it must nevertheless be noted that its application is still very uncertain and there are apparently serious disagreements among the Directors of the Fund regarding the role which that institution should play in debt reduction processes. The regrettable vacillation of the Fund and of other multilateral agencies in the face of the Brazilian moratorium in 1990 is a good example of how these institutions may be subject to changing pressures from the industrialized countries over debt service arrears {F inancial Times, I990d).
Consequently, before entering into a standby credit agreement or expanded facility agreement with the IMF, debtor countries should negotiate with that agency the total amount of debt service which their economic programme can support in the medium term, also incorporating into the calculation their needs as regards investment and growth. The resulting estimate of their payment capacity should be a firm and explicit parameter of the structural adjustment programme with the Fund, subject to modification only after indisputable proof has been given of the existence of a surplus of foreign exchange and fiscal resources in the medium term.^* Indeed, it would be useful if the Fund undertook to defend that
P'or exam ple, the possibility o f a readjustm ent o f the level o f payments after the fifth year o f a structural adjustment program m e could be considered, provided that the actual situation o f the country justified it. Similarly, the recapture clauses should be even-handed and should provide for a reduction in the debt service if there is a drop in the country’s payment capacity.
estimate of payment capacity so that it could become the basis for negotiation with the banks over the debt reduction. Finally, the Fund should accept selective arrears in the debt service commitments of the countries to the banks when the latter are not willing to respect the estimates of the debtor country’s payment capacity,
2. Obtaining fresh financin g
As already noted, the systemic nature of the external debt problem has meant that both creditworthy debtors and insolvent countries of the region have faced equal difficulties in obtaining fresh resources on the international capital markets. Unless there is a drastic change in the external environment, this restriction will probably continue to be severe for much of the 1990s, Even so, however, there will be some opportunities for obtaining resources abroad.
a) The private markets
i) Credit financing. At the beginning of this article, reference was made to the difficulties that the countries are likely to face in gaining access ti) external financing. In effect, it is not reasonable to expect an abundant flow of private capital to a region which is clearly overindebted. Nevertheless, there will be circumstances in which financing will be available for specific enterprises and projects. I ’here will be foreign investors willing to take above-average risks if they are compensated with higher yields. At the same time, many of them will look for investment opportunities which permit them to insulate themselves as far as possible from sovereign and transfer risks. The financing of this type of investments can be termed “niche financing” (see some concrete examples of this in the appendix),
Transactions like these are already being carried out relatively frequently in Latin America.^ In this type of financing, the loans enjoy special (direct or indirect) collateral which enables the creditor to protect himself from the risk globally associated with the country. This special guaran-
For a more detailed description o f these transactions see Business Latin America, 2 April 1990, p. 102; América Económica, 1990, pp. 10-16; The Economist, 2 June 1990, p. 83; OKCI), Financial M arket Trends (Paris) (numbers corresponding to 1990), an d Latin Finance, )u n e 1990, p. 24.
L A T IN A M E R IC A A N D T H E N E W F IN A N C E A N D T R A D E F L O W S / R. Devlin and M . Guerguil 35
tee may take the f orm of the freezing of future export income at its place of origin; a thoroughly solvent foreign partner willing to back up the loan either directly or indirectly, or some solid asset outside the frontiers of the debtor country. Loans of this type are frequently made in the form of bonds, since many creditors feel that these instruments are less vulnerable to default. The cost of these new credits is usually very high (several points over l i b o r ) and the maturity is usually quite short (for example, three to five years). Investors often prefer to carry out this type of transaction with the private sector, because unlike the public sector, many Latin American private enterprises enjoy a relatively solid financial situation.
This form of private finance is not totally satisfactory, since it is conditioned by special arrangements which are usually difficult to organize and negotiate. However, in extremely tight capital markets it does at least give some relief. In fact, the niche financing of the 1990s is largely a repetition of what happened in Latin America and the Caribbean in the 1950s and 1960s, when most of the private loans had special direct or indirect guarantees in the form of blocked assets, or else were connected with direct foreign investment projects.
In order to promote niche financing, it is important that the debtor country should have preferential rules for dealing with the new debt so as to separate it as far as possible from the problems of the old debt. It is also necessary that there should be a clear policy designed to promote direct foreign investment in line with national priorities, since foreign enterprises, including the commercial banks, can generate parallel fresh finance through their investment projects in the debtor country.
“‘ So far, no Latin American country has defaulted on the service of its international bonds. For this reason, it is usually considered that bonds enjoy preferential treatm ent. At the same time, however, the situation regardinf^ bonds is obviously linked to the fact they represent a very small fraction o f the total external debt o f the region. Thu s, the opti- '■ mism of investors with regard to bonds could run into the same error o f composition which affected the decisions of the bankers in the 1970s. See Friedm an, 1977.
For exam ple, a recently privatized Mexican airline purchased new aircraft partly financed with a loan from the
It should also be noted that some countries are obtaining international credit without special guarantees. In 1990, Mexico will issue over US$2 billion of international bonds and other securities, and a significant part of these apparently do not have any special guarantee. Venezuela will also sell at least US$ 150 million of bonds in 1990 without any special security arrangements (West, 1990). Chile, for its part, obtained the first voluntary loan from the private banking system to a Latin American country since 1982, in the amount of US$ 20 million {i.dc Debt Report, 1990),
Mexico is the country which has gained most access to international credit without special guarantees, especially through bond issues. An important factor in this new form of credit (which could mark the beginning of a new credit cycle for Mexico) has been the success of the structural adjustment carried out by this country. The turning point for creditors seems to have been the Government’s announcement that it would privatize the national banking system (an important political symbol of the consolidation of the Government’s economic programme) and the manifest interest shown by the United States in economic integration with Mexico, which will open up many new investment opportunities. Other factors which had an influence in this respect were the recent rise in oil prices, which has given the country an easier foreign exchange position after the only relatively modest relief obtained through the Brady Plan agreement, and the heavy return flow of Mexican capital from abroad, attracted by the very high yield of the bonds issued by Mexican private and State enterprises.
ii) Direct foreign investment. In view of the credit restrictions on Latin America, it is expected that in the 1990s the countries will take more decided steps to exploit the opportunities for attracting foreign investors. The truth is that many countries of the region have not had very transparent policies regarding this source of financing: this partly explains why the levels of direct foreign investment in the region are only half those for Asia (table 5). It seems essential to streamline foreign investment policies, since transnational corporations bring their own fi-
(Tiase Manhattan Bank, which is one ot the new shareholders in the enterprise.
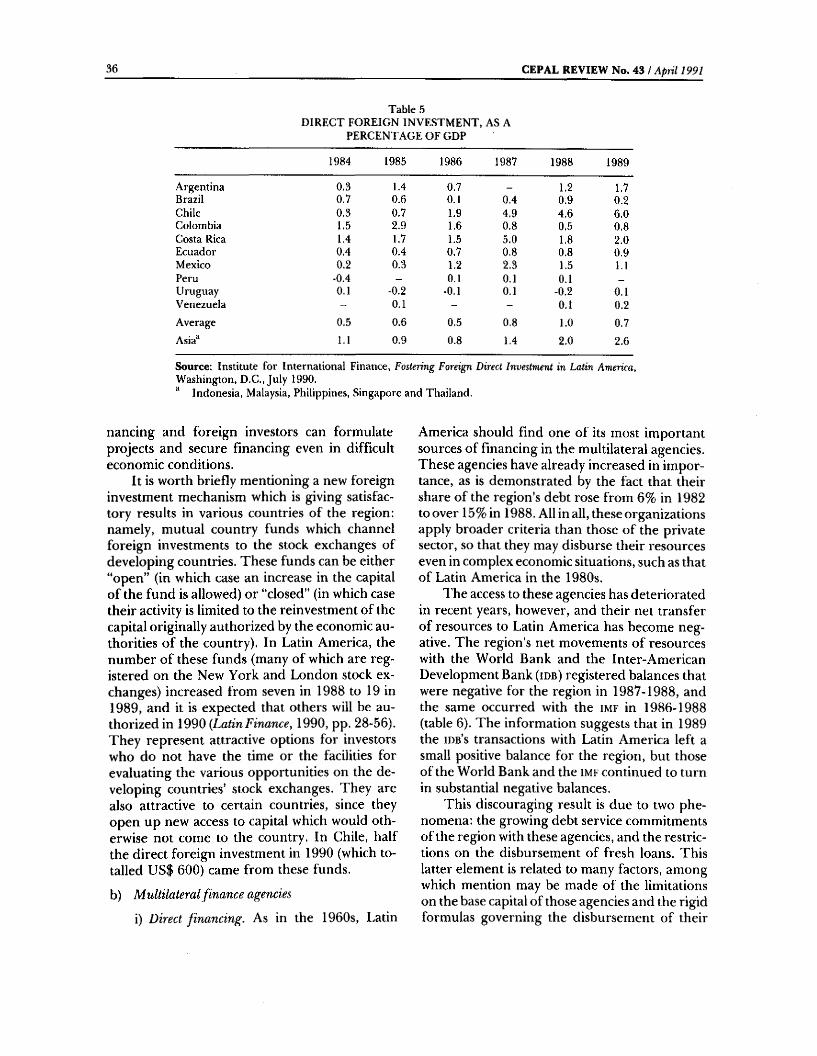
3 6 C E P A L R E V IE W N o . 4 3 / April 1991
Table 5D IR E C T FO REIG N IN V E ST M E N T , AS A
PER C EN TA G E O F GDP
1984 1985 1986 1987 1988 1989
Argentina 0.3 1.4 0.7 — 1.2 1,7Brazil 0.7 0.6 0.1 0.4 0.9 0.2Chile 0.3 0.7 1.9 4,9 4 .6 6 ,0Colombia 1.5 2.9 1.6 0.8 0.5 0 .8Costa Rica 1.4 1.7 1.5 5.0 1.8 2.0Ecuador 0.4 0.4 0.7 0.8 0.8 0 .9M exico 0.2 0.3 1.2 2,3 1.5 1.1Peru -0.4 - 0.1 0.1 0.1 _
Uruguay 0.1 -0.2 -0.1 0.1 -0.2 0.1Venezuela 0.1 - - 0.1 0.2
Average 0.5 0.6 0.5 0.8 1.0 0.7
Asia^ 1.1 0.9 0.8 1.4 2.0 2.6
Source: Institute for International Finance, Fostering Foreign Direct Investment in Latin America, W ashington, D ,C .,Ju ly 1990.■* Indonesia, Malaysia, Philippines, Singapore and Thailand.
nancing and foreign investors can formulate projects and secure financing even in difficult economic conditions.
It is worth briefly mentioning a new foreign investment mechanism which is giving satisfactory results in various countries of the region: namely, mutual country funds which channel foreign investments to the stock exchanges of developing countries. These funds can be either “open” (in which case an increase in the capital of the fund is allowed) or “closed” (in which case their activity is limited to the reinvestment of the capital originally authorized by the economic authorities of the country). In Latin America, the number of these funds (many of which are registered on the New York and London stock exchanges) increased from seven in 1988 to 19 in 1989, and it is expected that others will be authorized in 1990 {Latin Finance, 1990, pp. 28-56). They represent attractive options for investors who do not have the time or the facilities for evaluating the various opportunities on the developing countries’ stock exchanges. They are also attractive to certain countries, since they open up new access to capital which would otherwise not come to the country. In Chile, half the direct foreign investment in 1990 (which totalled US$ 600) came from these funds.
b) Multilateral finance agencies
i) Direct financing. As in the 1960s, Latin
America should find one of its most important sources of financing in the multilateral agencies. These agencies have already increased in importance, as is demonstrated by the fact that their share of the region’s debt rose from 6% in 1982 to over 15% in 1988. All in all, these organizations apply broader criteria than those of the private sector, so that they may disburse their resources even in complex economic situations, such as that of Latin America in the 1980s.
The access to these agencies has deteriorated in recent years, however, and their net transfer of resources to Latin America has become negative. The region’s net movements of resources with the World Bank and the Inter-American Development Bank (id b) registered balances that were negative for the region in 1987-1988, and the same occurred with the imf in 1986-1988 (table 6). The information suggests that in 1989 the idb’s transactions with Latin America left a small positive balance for the region, but those of the World Bank and the imf continued to turn in substantial negative balances.
This discouraging result is due to two phenomena: the growing debt service commitments of the region with these agencies, and the restrictions on the disbursement of fresh loans. This latter element is related to many factors, among which mention may be made of the limitations on the base capital of those agencies and the rigid formulas governing the disbursement of their
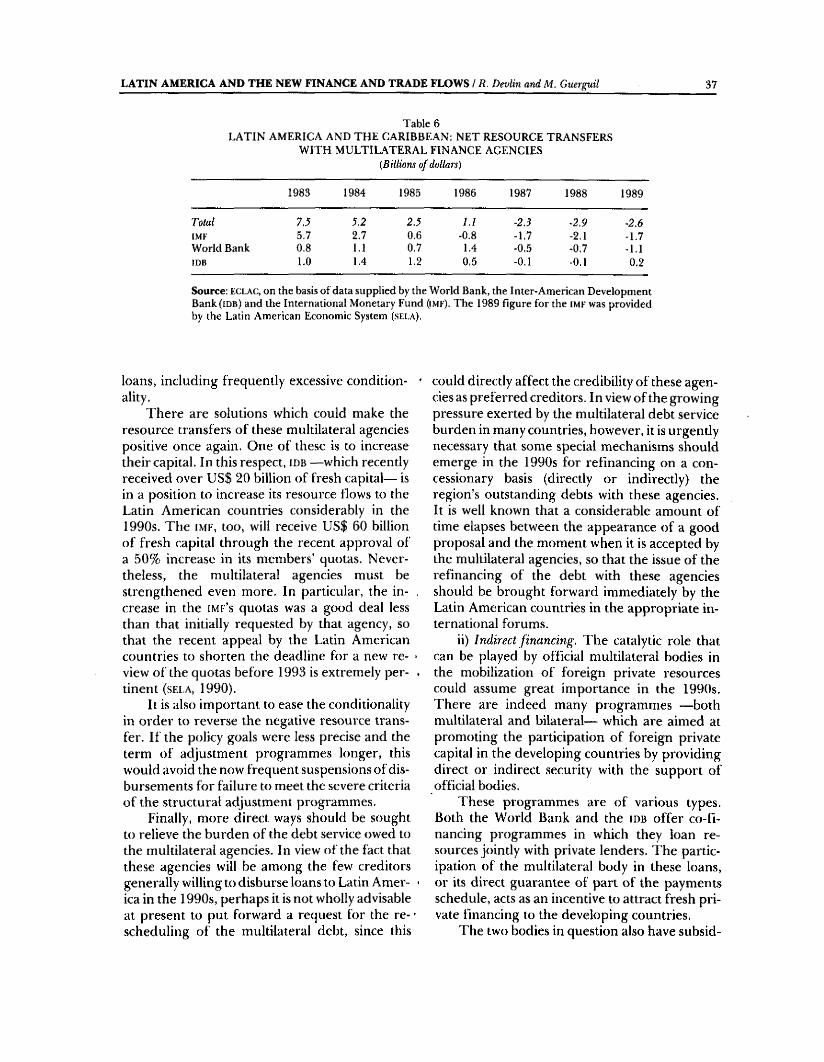
L A T IN A M E R IC A A N D T H E N E W F IN A N C E A N D T R A D E F L O W S / R. Devlin and M . Guerguil 37
T able 6L A T IN A M ERIC A AND T H E C A R IBBEA N ; N E T R ESO U R C E T R A N SFE R S
W IT H M U L T IL A T E R A L FIN A N CE A G EN CIES (Billions of dollars)
1983 1984 1985 1986 1987 1988 1989
Total 7.5 5.2 2.5 1.1 -2.3 -2.9 -2.6IMF ' 5.7 2.7 0.6 -0.8 -1.7 -2.1 -1.7W orld Bank 0.8 1.1 0.7 1.4 -0.5 -0,7 - l . IIC B 1.0 1.4 1.2 0.5 -0.1 -0.1 0.2
Source: e c l a c , on the basis o f data supplied by the W orld Bank, the Inter-A m erican Development Bank(iDB) and the International Monetary Fund (IME). T h e 1989 figure for the i m e was provided by the Latin American Econom ic System (s e l a ).
loans, including frequently excessive condition- ' ality.
There are solutions which could make the resource transfers of these multilateral agencies positive once again. One of these is to increase their capital. In this respect, idb —which recently received over US$ 20 billion of fresh capital— is in a position to increase its resource flows to the Latin American countries considerably in the 1990s. The imk, too, will receive US$ 60 billion of fresh capital through the recent approval of a 50% increase in its members’ quotas. Nevertheless, the multilateral agencies must be strengthened even more. In particular, the in- . crease in the imp’s quotas was a good deal less than that initially requested by that agency, so that the recent appeal by the Latin American countries to shorten the deadline for a new re- ■ view of the quotas before 1993 is extremely per- . tinent (sela, 1990).
It is also important to ease the conditionality in order to reverse the negative resource transfer. If the policy goals were less precise and the term of adjustment programmes longer, this would avoid the now frequent suspensions of disbursements for failure to meet the severe criteria of the structural adjustment programmes.
Finally, more direct ways should be sought to relieve the burden of the debt service owed to the multilateral agencies. In view of the fact that these agencies will be among the few creditors generally willing to disburse loans to Latin Amer- • ica in the 1990s, perhaps it is not wholly advisable at present to put forward a request for the re- • scheduling of the multilateral debt, since this
could directly affect the credibility of these agencies as preferred creditors. In view of the growing pressure exerted by the multilateral debt service burden in many countries, however, it is urgently necessary that some special mechanisms should emerge in the 1990s for refinancing on a concessionary basis (directly or indirectly) the region’s outstanding debts with these agencies. It is well known that a considerable amount of time elapses between the appearance of a good proposal and the moment when it is accepted by the multilateral agencies, so that the issue of the refinancing of the debt with these agencies should be brought forward immediately by the Latin American countries in the appropriate international forums.
ii) Indirect financing. The catalytic role that can be played by official multilateral bodies in the mobilization of foreign private resources could assume great importance in the 1990s. There are indeed many programmes —both multilateral and bilateral— which are aimed at promoting the participation of foreign private capital in the developing countries by providing direct or indirect security with the support of official bodies.
These programmes are of various types. Both the World Bank and the i d b offer co-financing programmes in which they loan resources jointly with private lenders. The participation of the multilateral body in these loans, or its direct guarantee of part of the payments schedule, acts as an incentive to attract fresh private financing to the developing countries.
The two bodies in question also have subsid
38 C E P A L R E V IE W N o . 4 3 / April 1991
iary organizations which act as catalysts for investments in the private sector of developing countries. Thus, for example, the International Finance Corporation (ifc) of the World Bank takes out equity in new enterprises in developing countries, lends to them from its own resources, and also organizes syndicated loans in the international credit markets for new projects proposed by the private sector in the developing countries. The mere fact that such multilateral agencies are participating in these new projects (as shareholders, lenders or agents) creates greater confidence and thus succeeds in attracting the participation of foreign investors.
Once again, perhaps the best way of describing the possibilities offered by this type of financing is to give a concrete example. In 1989 the Chilean enterprise “Celulosa Arauco y Constitución” succeeded in financing a fresh investment project totalling US$ 600 million, partly thanks to the participation of the ifc. The catalytic role of this official agency had various dimensions. On the one hand, the ifc used its high credit- worthiness to organize a syndicated loan of US$ 4.1 million on the international markets, which was underwritten by a considerable number of foreign banks even though the loan did not enjoy any special guarantee. The participation of the commercial banks was also stimulated by the ifc ’s decision to grant the enterprise a direct loan of US$ 40 million, plus US$ 15 million in the form of quasi-equity.
The catalytic role that can be played by official agencies is nothing new. However, not enough use has been made of it, possibly because of the abundance of private financing that was available in the 1970s. In the 1990s, the Latin American countries should take decided steps to explore opportunities of this type and they should pressure the official agencies to expand
the scope of such programmes as soon as possible.
c) Repatriation of flight capital
It is well known that the residents of many Latin American countries keep a large amount of resources abroad. Although all the experts agree that this flight capital has come to represent a considerable amount of resources, they are unable to agree on the proper way to measure it, so that no precise figures can be given in this respect. This has not prevented an extensive debate taking place on how to promote its return, however.
There can be no doubt that this private capital represents a potential source of external finance for the 1990s. Indeed, some analysts consider that its return could be a major factor in solving the problem of the net transfer of resources. Flight capital is a very volatile financial asset, however, and normally it is the first to leave a country and the last to return on a stable basis. Rather than being a potential solution to the debt problem, therefore, flight capital is rather a result of it. It cannot be expected to return in large amounts and on a permanent basis until there are expectations that the country can service its debt and grow at the same time. In many cases, these conditions can be attained only through a major reduction in the debt, carried out as part of a coherent structural adjustment programme.
The order of cause and effect should therefore be reversed; a prior condition for the return of this capital for longer than a few months is the achievement of a solution to the debt overhang. Even when this condition has been achieved, the return of such resources will also clearly depend on the adoption of coherent economic policies and clear rules on the treatment of private capital.
II
TradeAs the Latin American countries will probably have only limited access to external finance in the 1990s, the second challenge facing them is
that of generating sufficient foreign exchange to offset this drop in the availability of capital. The only sustainable way of generating such foreign
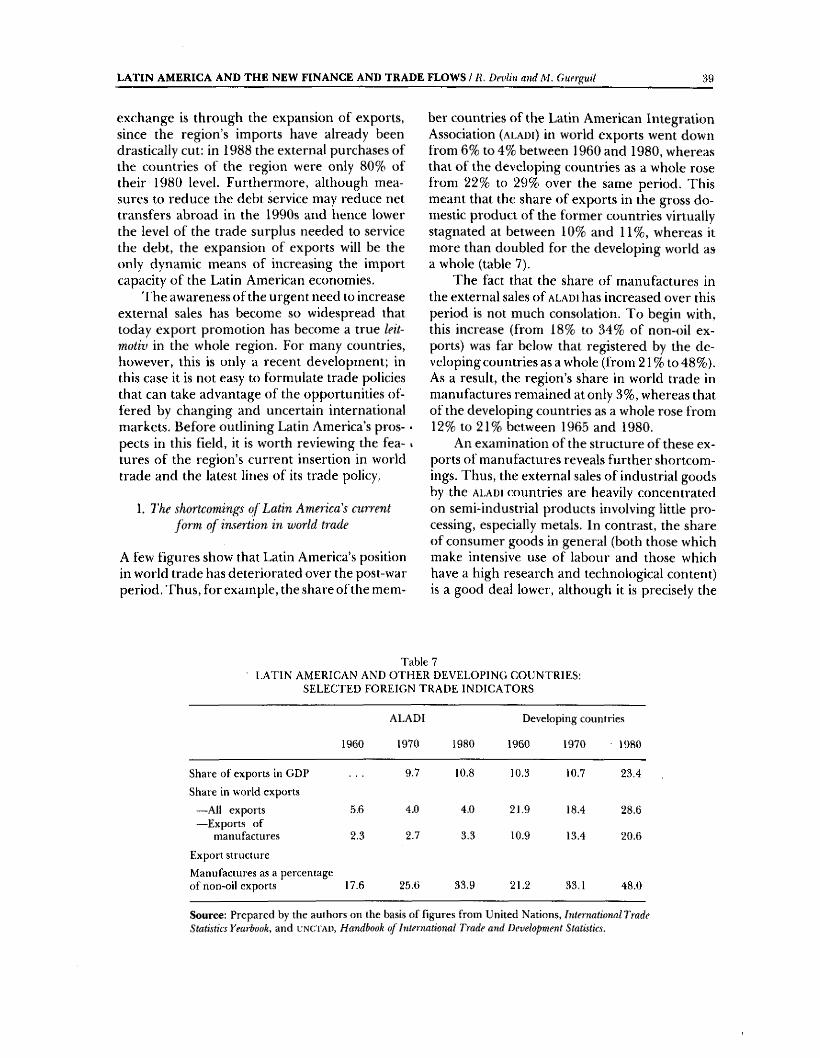
L A T IN A M E R IC A A N D T H E N E W F IN A N C E A N D T R A D E F L O W S / li. Devlin and M . Guerguil 39
exchange is through the expansion of exports, since the region’s imports have already been drastically cut: in 1988 the external purchases of the countries of the region were only 80% of their 1980 level. Furthermore, although measures to reduce the debt service may reduce net transfers abroad in the 1990s and hence lower the level of the trade surplus needed to service the debt, the expansion of exports will be the only dynamic means of increasing the import capacity of the Latin American economies.
The awareness of the urgent need to increase external sales has become so widespread that today export promotion has become a true leitmotiv in the whole region. For many countries, however, this is only a recent development; in this case it is not easy to formulate trade policies that can take advantage of the opportunities offered by changing and uncertain international markets. Before outlining Latin America’s prospects in this field, it is worth reviewing the features of the region’s current insertion in world trade and the latest lines of its trade policy,
1. T he shortcomings o f Latin Am erica’s current fo rm o f insertion in world trade
A few figures show that Latin America’s position in world trade has deteriorated over the post-war period. Thus, for example, the share of the mem
ber countries of the Latin American Integration Association ( a l a d i) in world exports went down from 6% to 4% between 1960 and 1980, whereas that of the developing countries as a whole rose from 22% to 29% over the same period. This meant that the share of exports in the gross domestic product of the former countries virtually stagnated at between 10% and 11%, whereas it more than doubled for the developing world as a whole (table 7).
The fact that the share of manufactures in the external sales of a l a d i has increased over this period is not much consolation. To begin with, this increase (from 18% to 34% of non-oil exports) was far below that registered by the developing countries as a whole (from 21 % to 48%). As a result, the region’s share in world trade in manufactures remained at only 3%, whereas that of the developing countries as a whole rose from 12% to 21% between 1965 and 1980.
An examination of the structure of these exports of manufactures reveals further shortcomings. Thus, the external sales of industrial goods by the a l a d i countries are heavily concentrated on semi-industrial products involving little processing, especially metals. In contrast, the share of consumer goods in general (both those which make intensive use of labour and those which have a high research and technological content) is a good deal lower, although it is precisely the
Table 7L A T IN A M ERICA N AND O T H E R D EV ELO PIN G C O U N T R IE S:
SE L E C T E D FO REIG N TR A D E IN D IC A T O R S
ALADI Developing countries
1960 1970 1980 1960 1970 1980
Share o f exports in GDP
Share in world exports
9.7 10.8 10.3 10.7 23.4
— All exports — Exports o f
5.6 4.0 4.0 21.9 18.4 28.6
m anufactures 2,3 2.7 3.3 10,9 13.4 20 ,6
Export structure
M anufactures as a percentage o f non-oil exports 17.6 25.6 33.9 21.2 33.1 48 .0
Source; Prepared by the authors on the basis o f figures from United Nations, Intertiationan'm de Statistics Yearbook, and u n c t a d , H andbook o f International Trade and Development Statistics.
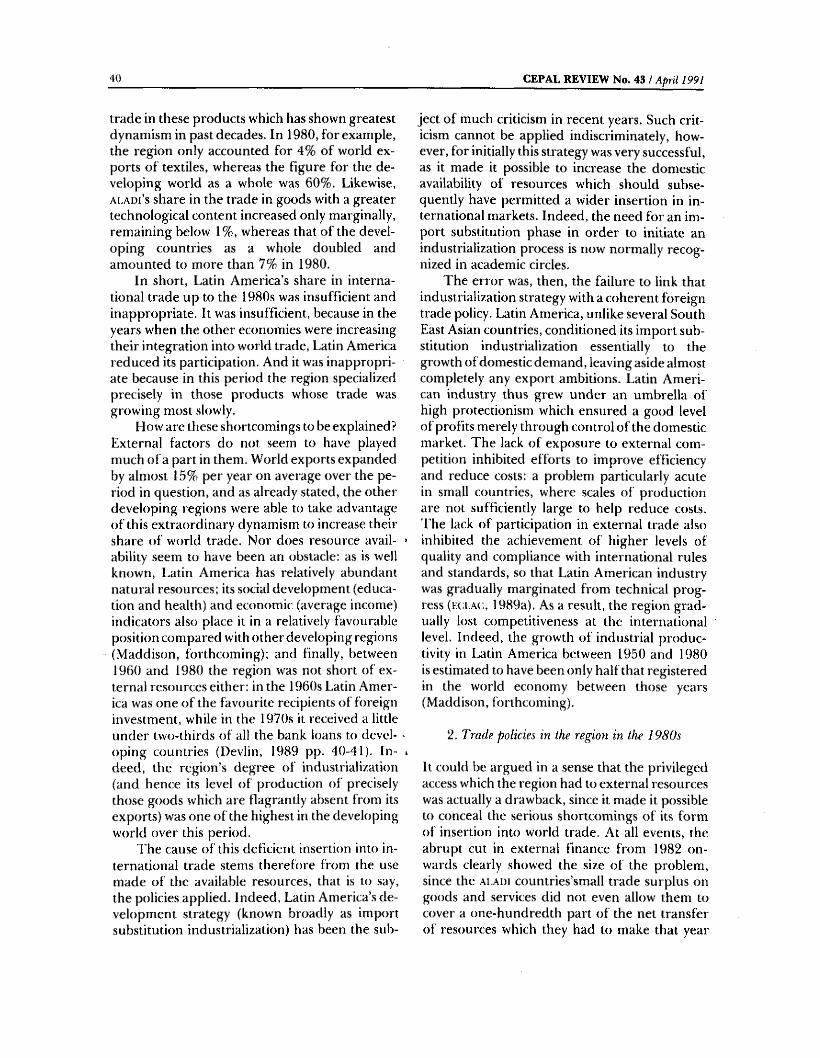
4 0 C E P A L R E V IE W N o . 4 3 / April 1991
trade in these products which has shown greatest dynamism in past decades. In 1980, for example, the region only accounted for 4% of world ex- ports of textiles, whereas the figure for the developing world as a whole was 60%. Likewise, A[,ADi’s share in the trade in goods with a greater technological content increased only marginally, remaining below 1%, whereas that of the developing countries as a whole doubled and amounted to more than 7% in 1980.
In short, Latin America’s share in international trade up to the 1980s was insufficient and inappropriate. It was insufficient, because in the years when the other economies were increasing their integration into world trade, Latin America reduced its participation. And it was inappropriate because in this period the region specialized precisely in those products whose trade was growing most slowly.
How are these shortcomings to be explained? External factors do not seem to have played much of a part in them. World exports expanded by almost 15% per year on average over the period in question, and as already stated, the other developing regions were able to take advantage of this extraordinary dynamism to increase their share of world trade. Nor does resource avail- • ability seem to have been an obstacle; as is well known, Latin America has relatively abundant natural resources: its social development (education and health) and economic (average income) indicators also place it in a relatively favourable position compared with other developing regions (Maddison, forthcoming); and finally, between 1960 and 1980 the region was not short of external resources either: in the 1960s Latin America was one of the favourite recipients of foreign investment, while in the 1970s it received a little under two-thirds of all the bank loans to devel- oping countries (Devlin, 1989 pp. 40-41). In- i deed, the region’s degree of indu.strialization (and hence its level of production of precisely those goods which are flagrantly absent from its exports) was one of the highest in the developing world over this period.
The cause of this deficient insertion into international trade stems therefore from the use made of the available res<mrces, that is to say, the policies applied. Indeed, Latin America’s development strategy (known broadly as import substitution industrialization) has been the sub
ject of much criticism in recent years. Such criticism cannot be applied indiscriminately, however, for initially this strategy was very successful, as it made it possible to increase the domestic availability of resources which should subsequently have permitted a wider insertion in international markets. Indeed, the need for an import substitution phase in order to initiate an industrialization process is now normally recognized in academic circles.
The error was, then, the failure to link that industrialization strategy with a coherent foreign trade policy. Latin America, unlike several South East Asian countries, conditioned its import substitution industrialization essentially to the growth of domestic demand, leaving aside almost completely any export ambitions. Latin American industry thus grew under an umbrella of high protectionism which ensured a good level of profits merely through control of the domestic market. The lack of exposure to external competition inhibited efforts to improve efficiency and reduce costs: a problem particularly acute in small countries, where scales of production are not sufficiently large to help reduce costs. Ehe lack of participation in external trade also inhibited the achievement of higher levels of quality and compliance with international rules and standards, so that Latin American industry was gradually marginated from technical progress (KU.At;, 1989a). As a result, the region gradually lost competitiveness at the international level. Indeed, the growth of industrial productivity in Latin America between 1950 and 1980 is estimated to have been only half that registered in the world economy between those years (Maddison, forthcoming).
2, Trade policies in the region in the 1980s
It could be argued in a sense that the privileged access which the region had to external resources was actually a drawback, since it made it possible to conceal the serious shortcomings of its form of inserticm into world trade. At all events, the abrupt cut in external finance from 1982 onwards clearly showed the size of the problem, since the aladi countries’small trade surplus i>n goods and services did not even allow them to cover a one-hundredth part of the net transfer of resources which they had to make that year
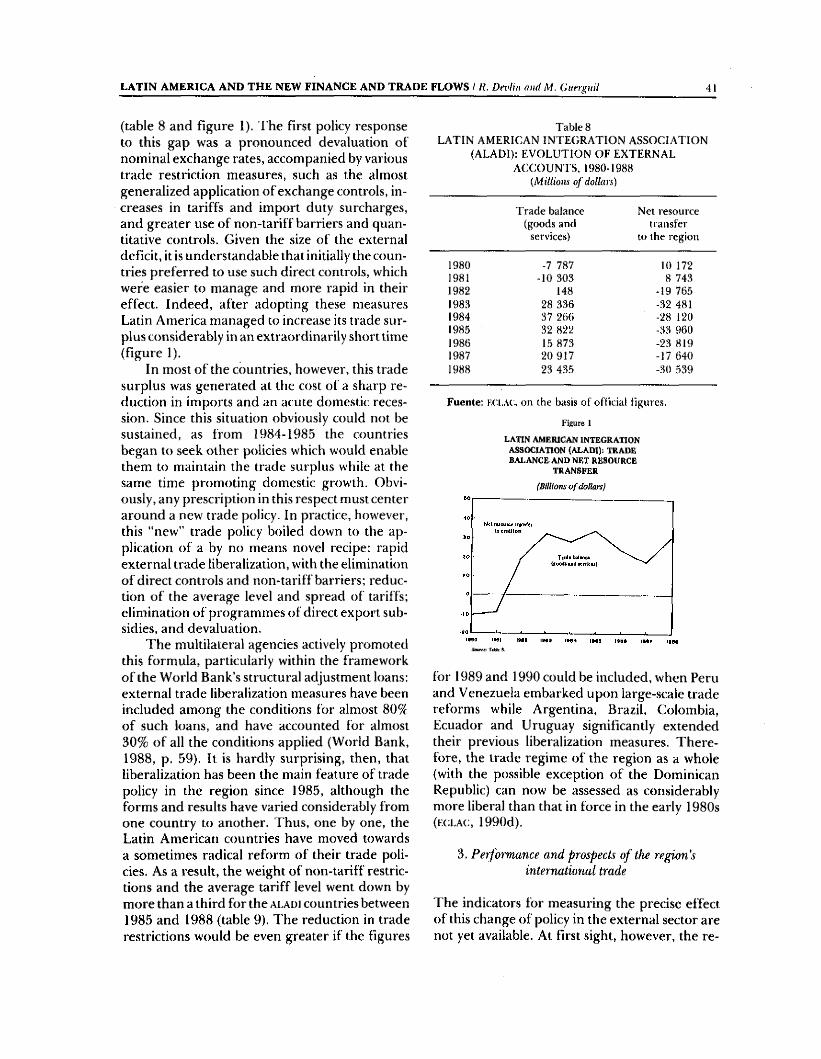
L A T IN A M E R IC A A N D T H E N E W F IN A N C E A N D T R A D E F L O W S / R. Devliji and M. Cuergui} 41
(table 8 and figure 1). The first policy response to this gap was a pronounced devaluation of nominal exchange rates, accompanied by various trade restrictii)n measures, such as the almost generalized application of exchange controls, increases in tariffs and import duty surcharges, and greater use of non-tariff barriers and quantitative controls. Given the size of the external deficit, it is understandable that initially the countries preferred to use such direct controls, which were easier to manage and more rapid in their effect. Indeed, after adopting these measures Latin America managed to increase its trade surplus considerably in an extraordinarily short time (figure 1).
In most of the countries, however, this trade surplus was generated at the cost of a sharp reduction in imports and an acute domestic recession. Since this situation obviously could not be sustained, as from 1984-1985 the countries began to seek other policies which would enable them to maintain the trade surplus while at the same time promoting domestic growth. Obviously, any prescription in this respect must center around a new trade policy. In practice, hi)wever, this “new” trade policy boiled down to the application of a by no means novel recipe: rapid external trade liberalization, with the elimination of direct controls and non-tariff barriers; reduction of the average level and spread of tariffs; elimination of programmes of direct export subsidies, and devaluation.
The multilateral agencies actively promoted this formula, particularly within the framework of the World Bank’s structural adjustment loans: external trade liberalization measures have been included among the conditions for almost of such loans, and have accounted for almost 30% of all the conditions applied (World Bank, 1988, p. 59). It is hardly surprising, then, that liberalization has been the main feature of trade policy in the region since 1985, although the forms and results have varied considerably from one country to another. Thus, one by one, the Latin American countries have moved towards a sometimes radical reform of their trade policies. As a result, the weight of non-tariff restrictions and the average tariff level went down by more than a third for the a l a d i countries between 1985 and 1988 (table 9). The reduction in trade restrictions would be even greater if the figures
Table 8L A T IN A M ERICA N IN T E G R A T IO N A SSO C IA T IO N
(A LA D I): E V O LU T IO N O F E X T E R N A L A C C O U N TS, 1980-1988
{Milliom o f dollars)
T rad e balance (goods and
services)
Net resource transfer
to the region
1980 -7 787 10 1721981 -10 30.3 8 7431982 148 -19 7651983 28 336 -32 4811984 37 266 -28 1201985 32 822 -33 9601986 15 873 -23 8191987 20 917 -17 6401988 23 436 -30 539
Fuente: KCl.AC, on the basis o f officiai figures.
Figure 1LATIN AMERICAN INTEGRATION
ASSOCIATION (ALADI); TRADE BALANCE AND NET RESOURCE
TRANSFER(Billions o f dollars)
for 1989 and 1990 could be included, when Peru and Venezuela embarked upon large-scale trade reforms while Argentina, Brazil, Colombia, Ecuador and Uruguay significantly extended their previous liberalization measures. Therefore, the trade regime of the region as a whole (with the possible exception of the Dominican Republic) can now be assessed as considerably more liberal than that in force in the early 1980s ( k c l a c , 1990d).
3. Performance and prospects o f the region's international trade
The indicators for measuring the precise effect of this change of policy in the external sector are not yet available. At first sight, however, the re-
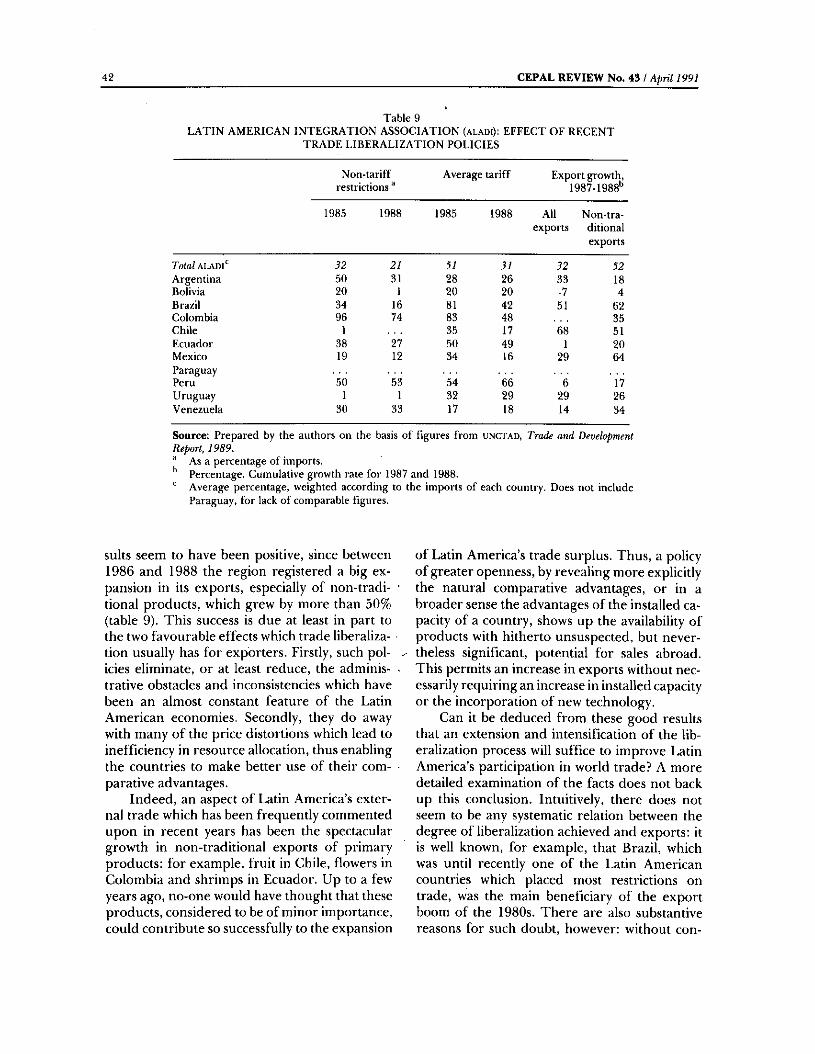
42 C E P A L R E V IE W N o , 4 3 / April 1991
Table 9L A T IN A M ERIC A N IN T E G R A T IO N A SSO C IA TIO N (aladi); E F F E C T OE R E C E N T
T R A D E L IB E R A L IZ A T IO N P O L IC IE S
N on-tariff restrictions ■*
Average tariff Export growth, 1987-1988*’
1985 1988 1985 1988 Allexports
N on-traditionalexports
Total ALADf 32 21 31 31 32 52A rgentina 50 31 28 26 33 18Bolivia 20 1 20 20 -7 4Brazil 34 16 81 42 51 62Colombia 96 74 83 48 35Chile 1 35 17 68 51Ecuador 38 27 50 49 1 20Mexico 19 12 34 16 29 64ParaguayPeru 50 53 54 66 6 17Uruguay 1 1 32 29 29 26Venezuela 30 33 17 18 14 34
Source; Prepared by the authors on the basis o f figures from unctad, Trade and Development Report, 1989. As a percentage o f imports. Percentage. Cumulative growth rate for 1987 and 1988. Average percentage, weighted according to the imports o f each country. Does not include
Paraguay, for lack o f comparable figures.
suits seem to have been positive, since between 1986 and 1988 the region registered a big expansion in its exports, especially of non-tradi- ■ tional products, which grew by more than 50% {table 9). This success is due at least in part to the two favourable effects which trade liberalization usually has for exporters. Firstly, such pol- . icies eliminate, or at least reduce, the adminis- * trative obstacles and inconsistencies which have been an almost constant feature of the Latin American economies. Secondly, they do away with many of the price distortions which lead to inefficiency in resource allocation, thus enabling the countries to make better use of their com- ■ parative advantages.
Indeed, an aspect of Latin America’s external trade which has been frequently commented upon in recent years has been the spectacular growth in non-traditional exports of primary products: for example, fruit in Chile, flowers in Colombia and shrimps in Ecuador. Up to a few years ago, no-one would have thought that these products, considered to be of minor importance, could contribute so successfully to the expansion
of Latin America’s trade surplus. Thus, a policy of greater openness, by revealing more explicitly the natural comparative advantages, or in a broader sense the advantages of the installed capacity of a country, shows up the availability of products with hitherto unsuspected, but nevertheless significant, potential for sales abroad. This permits an increase in exports without necessarily requiring an increase in installed capacity or the incorporation of new technology.
Can it be deduced from these good results that an extension and intensification of the liberalization process will suffice to improve Latin America’s participation in world trade? A more detailed examination of the facts does not back up this conclusion. Intuitively, there does not seem to be any systematic relation between the degree of liberalization achieved and exports: it is well known, for example, that Brazil, which was until recently one of the Latin American countries which placed most restrictions on trade, was the main beneficiary of the export boom of the 1980s. There are also substantive reasons for such doubt, however: without con
L A T IN A M E R IC A A N D T H E N E W F IN A N C E A N D T R A D E F L O W S / R. Devlin and M . Guerguil 4 3
sidering the domestic costs of liberalization, which may be extremely high but go beyond the scope of this study, one may question the capacity of such a policy alone to guarantee adequate export growth in the medium and long term, for better utilization of the natural comparative ad- ■ vantages of the country (which we already mentioned as a benefit of trade liberalization) will soon run into two types of limitations, some domestic and others external.
I'he external limitations are the easiest to identify. The international markets for primary commodities or semi-industrial products, where Latin America currently has clear comparative advantages, are paradoxically also the most severely restricted and controlled. The managed trade agreements governing trade in textiles, footwear, steel and motor vehicles, for example, to name only a few cases, are all too well known. I'hus, Latin America’s expanding exports have rapidly faced restrictions in these sectors, and the existing limitations (for example, on trade in textiles or steel) have become effectively binding as countries which were hitherto totally absent or not very active in such trade entered the mar- < kets. New barriers have also been erected in order to protect domestic producers of goods which were previously free from this type of restriction, such as flowers or certain particular types of fruit.^ The practice of managed trade has undoubtedly been growing in recent years, reaching some 10% of world trade in 1984. It has a particularly harmful impact for the major- * ity of Latin American countries, which are currently trying to increase their sales on world mar- • kets, since these agreements tend to protect the position of established exporters, to the detri- • ment of those recently entering the market.
An interesting exam ple is that o f the kiwi, a fruit which was until recently virtually unknown but which was introduced into the United States and European markets with considerable success by New Zealand producers. T h e growing demand for this fruit led a num ber o f farm ers in California to begin its cultivation, and consequently also to begin to pressure for restrictions on imports o f this product. Likewise, (Colombian flower exporters have had to defend themselves against an attempt to introduce a quota on the importation o f roses equal to 30% o f domestic consumption. For fu rther details on this latter case, see K ( : i .a c , 1990e, p. 70.
The adverse effects of this growing application of managed trade agreements is also complicated by the recent emergence or consolidation of big regional blocs in the world economy. One of these is currently taking shape in North America, with the free trade agreement signed in 1988 between the United States and Canada and the current negotiations for bringing Mexico into this scheme. One of the objectives of the so-called Bush Initiative, announced by the President of the United States at the end of June 1990, is to extend this free trade zone “from Alaska to Tierra del Fuego” through the negotiation of bilateral trade agreements which may be either straightforward free trade agreements or simply framework agreements that seek a gradual reduction of the barriers to trade between the United States and the other countries of the region.
With the consolidation of similar regional blocs in Europe and Asia and the stagnation of the multilateral trade negotiations in g a t i ' , the prospects of a free trade zone for the Americas cannot but attract countries which, in its absence, would run the risk of being left on the sidelines of major world trade flows. Thus, by the end of 1990 five countries of the region (Bolivia, Chile, Colombia, Ecuador and Mexico) had already signed framework agreements with the United States and one of them (Mexico) was well advanced in the negotiation of a free trade agreement. The idea of a regional bloc is also perfectly logical in economic terms: the United States is, after all, the main market for the region’s exports, since it absorbed 35% of the total external sales of ALAD! in 1989, In contrast, the share of these countries in the total exports of the United States has remained relatively modest (12%), thus leaving open significant potential for expansion ( e c l a c , 1990a).
The way to materialize this theoretically tempting objective does not appear to be so easy, however. Firstly, it will require negotiations between countries that are very different from the economic, trade and political point of view. The reciprocal concessions involved in such agreements could be very uneven because, for example, of the significant differences in tariffs currently observed. Latin American tariffs are still relatively high and uneven, even after the recent reforms, whereas the duties on Latin American
44 C E P A L R E V IE W N o , 4 3 / April 1991
exports to the United States are generally relatively low. Thus, the bulk of the trade concessions which that country could offer would be basically concentrated on the elimination of non-tariff barriers, especially in the areas of steel, textiles and agricultural, raw materials. It cannot be guaranteed, however, that the United States Congress will readily agree to eliminate protection for such sensitive sectors. '’ Furthermore, some countries —such as those of Central America and the Caribbean— could be adversely affected if they lost the preferential access to the United States market which they currently enjoy and had to compete with the bigger economies of the region.
In spite of these specific difficulties, the new features of world trade have made trade negotiation not so much an option as an obligatory step in order to achieve an efficient form of insertion in international trade. This means that in a context of more managed trade and tighter regional blocs, the factors determining the international insertion of countries have changed: thus, for an exporter country, its bargaining power has become even more important than its physical comparative advantages in determining its form of insertion in the market. Unfortunately, most of the countries of the region have not displayed much expertise in this field. To give a recent example, the Latin American countries have entered the g a t t negotiations in a relatively disunited manner and have consequently not been able to play a leading part in the negotiations on the liberalization of agricultural trade: a sector in which they would have a great deal to gain. As a result, the initiative in this field has remained in the hands of the United States and the European Economic Community, while Latin America’s role has been limited to accepting or rejecting the options presented by these two powers. It should also be stressed that the above- mentioned liberalization of trade in the region has been applied in a unilateral manner and has not been accompanied by the search for recip-
T h e difficult negotiations on the renewal o f the tariff benefits under the Caribbean Basin Initiative and the adoption by the U nited States Congress o f a law increasing restrictions on textile imports (subsequently vetoed by President Bush) are recently exam ples o f potential difficulties in this field.
rocal concessions which is usual in a process of reduction of trade barriers.
It is therefore very important that Latin America should begin to link its external negotiation policy more explicitly with its domestic trade policy. At the national level, there are some easily implemented measures that could help in this respect: for example, the more extensive and systematic use of the diplomatic network in order to publicize the region’s products; the provision of assistance in penetrating markets, and measures to prevent possible protectionist attacks' (ECLAC, 1990c). At the regional level, matters will undoubtedly be rather more difficult. It may be argued that, in view of the big disparities which exist between the countries of the region, both with regard to their size and to their degree of trade openness, there is not much room for a joint negotiating strategy. This does not, however, rule out the definition of a common frame of reference or the formation of subregional negotiating blocs ( e c l a c , 1990a). Another possibility is that of actually putting into practice the declarations of intent —so frequently repeated but so rarely fulfilled— regarding greater openness of intra-regional trade. The many regional bodies which exist could be used not only as forums for negotiations between Latin American countries, but also as negotiating instruments with countries from outside the region. Whatever the method adopted, it is essential to incorporate an aggressive negotiating strategy into trade policy, since without this Latin America will run the risk of remaining on the sidelines of the system of big regional blocs which is emerging.
There is another limitation, more of a qualitative nature, on strategies based on taking advantage of existing comparative advantages. This second limitation reflects the ongoing changes which are taking place in world production and marketing processes because of the constant advance of the technological frontier ( e c l a c , 1990e, chapter IV). In recent decades, for example, natural resources and even labour have been making a decreasing contribution to industrial activity. This has been due, inter alia, to the efforts to save energy and non-renewable resources, the growing replacement of natural raw materials with synthetic products, and the increasing mechanization of industrial processes. As a result, the strictly “material” content of industrial activity.
L A T IN A M E R IC A A N D T H E N E W F IN A N C E A N D T R A D E F L O W S ! R . Devlin and M . Guergmi 45
and consequently of the manufactures which are marketed, has been gradually going down in contrast with the growing share of the “intangible” content associated with information technology and scientific and technical knowledge. Furthermore, this tendency has been observed in a wide range of products, even in such traditional sectors as foodstuffs or clothing (ibid.,- p. 69). These changes have played a major part in the relative loss of dynamism of trade in traditional industrial goods (metal products and motor vehicles, for example) compared with branches incorporating a higher degree of technological innovation (electronics, microcomputation, informatics, biotechnology, the development and use of new materials, etc.).
Competitiveness based on the use of comparative advantages (whether abundance of natural resources or of labour) and on the existing idle capacity will therefore be bound to suffer a progressive decline because of the lower weight of such resources in the new production processes. In order to progress from this now spurious form of competitiveness to a more authentic one, the countries must be capable of identifying, imitating and adapting new production processes: that is, continually incorporating the technical progress taking place at the international level into their own processes (Fajnzyl- ber, 1988). This capability will depend not only on the reactions of enterprises to changes in prices, but also on many other factors (including the skill level of the labour force, the domestic entrepreneurial base, and the institutional configuration of the country) and their possible interactions. At all events, achieving authentic competitiveness is a process of a systemic nature, in the sense that it depends on a set of various types of synergies and externalities.
Consequently, the adoption of a system of appropriate relative prices and the maintenance of the main macroeconomic balances may well be a necessary condition for increasing the competitiveness of Latin America, but in no circumstances can it be sufficient on its own, especially in view of the lag in technology accumulated by the region over the 1970s and 1980s. This lag can only be offset through the adoption of an active industrial, technological and educational policy which is co-ordinated with trade policy in order to promote the incorporation of technical progress, higher levels of labour skills, and the linkage of the export sectors with the rest of the production structure.
There is no reason why such a policy should conflict with the trade liberalization efforts: on the contrary, as already noted, it calls for the elimination of the excessive tariff and non-tariff barriers which have hindered much of Latin America’s exports for. several decades past. Furthermore, the expansion of exports based on “natural” comparative advantages may be turned into a stepping-stone to exports of higher technological content if it is linked with the other activities and used to promote a “export mentality”. Trade liberalization on its own will not be enough, however; nor should it systematically take the radical form in which it has frequently been incorporated in the currently prevailing formulas. Thus, in view of the domestic costs of rapid liberalization, some countries may prefer a policy of gradual openness (and even the maintenance of selective and conditional protection for some activities that help to further technical progress) in order to increase their competitiveness progressively in so far as this trade policy permits more decided action in the industrial, technological and educational fields.
IllConclusions
The 1990s will probably be a period of financial restrictions for Latin America. In the area of conventional financing, access to private international capital markets will be difficult because
of the systemic problem of overindebtedness of the region, the financial difficulties of many commercial banks, the very complex economic, social and political changes which will have to be made,
4 6 C E P A L R E V IE W N o . 4 3 / A p n l 1991
and the traditionally slow recovery of confidence after such a serious crisis as that which shook Latin America in the 1980s,
Despite this complex financial picture, however, the countries of the region will have opportunities for finding some degree of relief It has been demonstrated that some foreign lenders and investors are willing to commit themselves in the region provided they can find some external guarantees or forms of security which free this new finance from the risks associated with overindebtedness. While this niche financing, including direct foreign investment, is not sufficient to solve the problem of financial constraints at the macroeconomic level, at least it offers the piissibility of promoting new activities of importance at the microeconomic or sectoral level. There are two drawbacks to this finance: it is often difficult to organize, and it is usually relatively expensive. For the countries which manage to eliminate, or at least bring under control, their debt overhang problem, there are prospects of a gradual and difficult return to the private capital markets. I'here were indeed some signs in 1990 that a few countries of the region were beginning a new voluntary relationship with the.se markets.
I he multilateral finance agencies will prob- ablv become one of the most important sources of credit for Latin America in the 1990s. In order to overcome the problem of the negative resource transfer which they currently register with the region, these agencies must increase their loans (through new agreements to expand their capital), ease the conditions which often hinder their disbursements, and strengthen and expand their programmes to catalyze foreign private capital (such as those providing for co-financing and those providing risk capital for private enterprises in the developing countries).
Finally, in view of the region’s enormous debt overhang and the current negative resource transfer affecting it, schemes for the reduction of debt and debt service will be another important source of financing. A consensual debt reduction programme is the best option in this respect. Although the Brady Plan raised hopes of a solution of this kind, it is now clear that it does not have sufficient public financial and institutional resources to eliminate the region’s debt overhang. In these circumstances, unilateral debt
service restriction by some of the Latin American countries may become a second-best but nevertheless effective solution for reducing the resource drain on the region. Indeed, in 1989-1990 most of the Latin American countries opted for this solution. Unless the Brady Plan is rapidly strengthened, this trend will probably become more pronounced in the 1990s and the countries of the region will make efforts to develop increasingly efficient unilateral schemes to back up their economic programmes aimed at adjustment with growth.
In spite of the above-mentioned possibilities of relieving the financial constraints, the region’s severely limited access to foreign capital makes it essential to formulate a new trade policy, as trade in goods and services will be the activity which will offer the greatest opportunities for increasing the region’s import capacity. In this field, the external environment does not look so negative: it is expected that in the 1990s world trade will grow on average 6% per year, a rate similar to that registered in the 1970s. Even so, however, an expansion of the region’s exports will require profound changes in external trade policy, which has excessively resorted to administrative restrictions and supported a less than coherent system of relative prices during most of the post-war period. These features have clearly limited the full exploitation on external markets of the very considerable natural and human re.sources which the region possesses. Most of the Latin American countries are conscious of this, and have now begun, albeit to different degrees and on different scales, to liberalize their trade transactions and give more decided support to their exports. Some encouraging results have already been registered in their external sales of non-traditional products.
It is by no means certain, however, that the maintenance or intensification of these liberalizing efforts will be enough to ensure the desired expansion of Latin American exports. In order to achieve this result, it will also be necessary to make profound qualitative changes in the region’s form of insertion in the world economy. In this respect, two main lines of action may be indicated. Fhe first is connected with the region’s external relations: a significant strengthening of Latin America’s negotiating capacity with other countries and regions is essential for the region

L A T IN A M E R IC A A N D T H E N E W F IN A N C E A N D T R A D E F L O W S / R. Devlin a7id M . Guerguil 4 7
not to be marginateci in a world of growing managed trade where a limited number of regional blocs is clearly emerging. The second concerns domestic policy: the experience of the countries which have secured a successful insertion in world trade (especially those of South-East Asia) shows the need for an active industrial policy to promote the incorporation of technical progress, improve the skill level of the labour force, and thus achieve an authentic and lasting competitiveness which will make it possible to increase the share in world trade while at the same time raising the living standards of the population.
In short, the management of the external
sector in both its financial and trade aspects in the 1990s will call for a great effort of imagination and a good deal of pragmatism. Imagination, because the conditions in both these spheres are changing extremely quickly and leave no room for the use of old schemes. Pragmatism, because rigid ideological schemes are equally unfit for these new conditions and could again impede the countries from taking full advantage of the new opportunities that are arising. The task is by no means easy, but there is reason to hope that Latin America, with its enormous reserves of human talent, will succeed in returning in the 1990s to the path of economic and social growth.

48 C E P A L R E V IE W N o . 4 3 / April 1991
A ppen d ix
N I C H E F I N A N C I N G IN L A T I N A M E R I C A
Telmex
T h i s M e x ic a n t e le p h o n e c o m p a n y o b t a in e d U S S 8 0 0 m ill io n in e x t e r n a l f in a n c in g in 1 9 8 9 . T h e s e c r e t o f th is a g r e e m e n t w as th e fa c t th a t th e lo a n w as g u a r a n t e e d w ith f u t u r e d o l la r in c o m e g e n e r a te d a b r o a d . T h u s , T e l m e x
h a s a r e c ip r o c a l a g r e e m e n t w ith th e U n ite d S ta te s t e le p h o n e c o r p o r a t io n A I '& T f o r t h e s e t t le m e n t o f a c c o u n ts in r e s p e c t o f t e le p h o n e t r a f f i c b e tw e e n M e x ic o a n d th e U n it e d S ta te s . A s t h e r e a r e m o r e t e le p h o n e ca lls w h ic h o r ig in a t e in t h e U n ite d S t a t e s , T e l m e x u s u a lly b u ild s u p p o s itiv e b a la n c e s w ith A T & T , a n d in r e c e n t y e a r s th e s e
h a v e a m o u n t e d to a r o u n d U S $ 1 b il l io n p e r y e a r . E e lm e x is u s in g th e s e a c c o u n ts r e c e iv a b le f r o m A T & T as a g u a r a n t e e f o r t h e n e w lo a n . T h u s , th e r e a l d e b t o r in th is t r a n s a c t io n is A d '& 'E , w h ic h , in th e e v e n t o f n o n - f u l f i lm e n t
by T e l m e x , w ill h a v e to h a n d o v e r its p a y m e n ts d ir e c t ly to th e c r e d i to r s o f th e M e x ic a n c o m p a n y , so t h a t in r e a l i ty th is g u a r a n t e e d t r a n s a c t io n r e p r e s e n ts a n o p e r a t io n o f v e ry low r is k f o r th e la t te r .
Lan ( liile
A C h ile a n e n t e r p r i s e m a d e a b id f o r th e p u r c h a s e o f L a n C h ile — a n a ir l in e w h ic h th e G o v e r n m e n t w a n te d to
p r iv a t iz e — a n d o b t a in e d U S $ 2 9 m il l io n f r o m M o r g a n G u a r a n ty T r u s t B a n k f o r th is p u r p o s e . T h i s u n u s u a l
t r a n s a c t io n w as p o s s ib le b e c a u s e o f a l in k b e tw e e n t h e C h ile a n p u r c h a s e r a n d t h e S c a n d in a v ia n a ir l in e S A S . S A S , w h ic h is a n im p o r t a n t c l ie n t o f M o r g a n G u a r a n ty , a lso u n d e r to o k to p u r c h a s e p a r t o f L a n C h ile d ir e c t ly ,
a n d it w as th is c o m m it m e n t by S A S wáth L a n C h ile w h ich p r o v id e d th e t r a n s a c t io n w ith t h e n e c e s s a r y s e c u r ity in o r d e r f o r t h e p u r c h a s e r to o b ta in f o r e ig n r e s o u r c e s .
Comisión Federal de Electricidad de México (CFE)
T h i s e n t e r p r i s e h a s a r r a n g e d to o b ta in U S S 2 S 5 m ill io n a b r o a d . I t u s u a lly se lls p a r t o f its e x c e s s g e n e r a t in g
c a p a c ity to th e S t a t e o f (C a lifo rn ia , U n ite d S ta te s , a n d is u s in g th is in c o m e f r o m a b r o a d a s a g u a r a n t e e f o r th e f o r e ig n lo a n .
L A T IN A M E R IC A A N D T H E N E W F IN A N C E A N D T R A D E F L O W S / R. Devlin and M . Guerguil 49
BibliographyAltimir, O scar and Robert Devlin (eds.)» Moratoria en América
Latina: la experiencia de los países (forthcoming).América Económica (1990), Mexico City, March.Bülow, Jerem y and K enneth R ogoff (1988), T h e buyback
boondoggle, in W .C. Brainard and George L. Perry {cds.), Brookings Papers on Economic Activity, No. 2, W ashington, D.C., T h e Brookings Institution,
Business International Co. (19 9 0 ),5uíÍMCísZ.aímdmmc«, New Y ork, 2 April.
C'l'C (United Nations C entre on Transnational Corporations) (1987), An interview with Ricardo Ffrench-Davis, CTC Reporter, No. 23 , New York, Spring,
Devlin, Robert (1989), Debt and the Crisis in Latin America: the Supply Side o f the Story, Princeton, New Jersey , Princeton University Press.
Dooley, Michael (1988), Self-financed buybacks and asset exchanges, ¡M F Staff Papers, vol, 35, No. 4, W ashington, D.C., International M onetary Fund (IMF), Decem ber.
ECLAC (Econom ic Commission for Latin America and the Caribbean) (1965), External Financing in Latin America (E/CN.12/649/Rev.l), New York. United Nations publication, Sales No.; 65,11,0.4,
________ (1982), Provisiorml Balance-sheet of the Latin AmericanEconomy during 1982 (e/cepal/i„279), Santiago, Chile, Decem ber.
________ (1984), Políticas de Ayuste y Renegociación de la DeudaExterna en América Latina, “Cuadernos de la c e p a l ” series, No. 48 (LC/g.1332), Santiago, Chile, December. United Nations publication. Sales No.: s.84,i i .g.18.
________ (1988), The Evolution o f the External Debt Problem inLatin America and the Caribbean, “Estudios e Inform es de la c e p a l " series. No. 72 (Lc/o.l487/Rev.2-P), Santiago, Chile, Septem ber. United Nations publication. Sales N o.; E .8 8 .ii ,a l0 .
________ (1989a), Preliminary Overview of the Economy of LatinAmerica and the Caribbean 1989 (l.t;/G.1586), Santiago, Chile, Decem ber.
________ (1989b), Comercio internacional e iruerción de AméricaLatina {tc/R.S22), Santiago, Chile, December,
________ (1989c), Transnational Bank Behaviour and the International Debt Crisis “Estudios e Inform es de la c e p a l "
series, No. 76 (l.c/a 1553/Rev.l-p), Santiago, Chile, Septem ber. U nited Nations publication. Sales No.; e.89,ilg.12.
________ (1990a), Latin America and the Caribbean: Options toReduce the Debt Burden (lc/g. 1605-P), Santiago, Chile, M arch. U nited Nations publication. Sales No.; E.90.1I.G.7.
(1990b), América Latina frente a la iniciativa Bush:
___ (W ashington O ffice) (1990d), Trade policy reform inLatin America in the 1980s, August, mimeo.
(1990e), Changing Production Patterns with Social Ecj-
un examen inicial (L(yR.924), Santiago, Chile, Septem ber.
____ (1990c), Latin American and Caribbean Lobbying forInternational Trade in Washington, D.C. (lg/g,1632), W ashington, D.C., Ju n e .
uííy (lc/g, 1601-p), Santiago, Chile. United Nations publication,Sales N o.: E.90.1I.G.6.
ECLAC^SELA (1989), Endeudamiento externo y crecimiento económico en América Latina y el Caribe: consecuencias económicas de la propuesta de reducción de la carga de la deuda formulada por la Secretaría Permanente del s e l a , comp a ra c i con las de escenarios alternativos (lc/r ,841), New York, December.
Fajnzylber, Fernando (1988), International competitiveness; agreed goal, hard task, cepal ficwiew, No. 36 (LC/g. 1537-p), Santiago, Chile, December.
Figueroa, Leonel (in the press). La administración de la m oratoria peruana, in O scar Altim ir and Robert Devlin (eds.). Moratoria en América Latina.
Financial Times (1990a), “Banks struggle to achieve capital adequacy”, London, 30 November.
________ (1990b), “T h e bankers' house o f cards”, London,12 November.
________ (1990c), “U .S. banks feel the squeeze”, London, 30October.
(1990d), “U .S. wants Brazil loans delayed becauseo f worry overarrears”, London, 16 November.
Friedm an, Irving (1977), The Emer^ng Role o f Private Banks in the Developing World, New Y ork, Citicorp.
Lahera, Eugenio (consultant) (1987), La conversión de la deuda externa: antecedentes, evolución y perspectivas (lc/r.614), Santiago, Chile, Septem ber.
Latin Finance (1990), New York, Eurom oney Inc., Ju n e .LD C Debt Reporter (1990), “nmb loan marks new era in Chile’s
debt strategy”, W ashington, D.C., 18 Septem ber.Lustig, Nora (1990), Poverty and Income Distribution in Latin
America in the 1980s: Selective Evidence and Policy Alternatives, W ashington, D.C., Inter-A m erican Dialogue, April.
Maddison, Angus (in the press), Growth and Slowdown in Latin America: a Long-run Comparative Perspective, ECLAG.
OECD (Organization for Econom ic Co-operation and Development) (1990), Financial Market Trends, Paris.
Rosenthal, Gert (1990), Beyond Brady, Latin Finance, New York, Euromoney Inc., Septem ber.
SELA (1990), Propuesta de América Latina y el Caribe para una solución del problema de su deuda externa. Capítulos del SE L A , No. 25, Caracas, A pril-June.
The Economist (1990), "Am erican banks thirst for capital”, London, 3 November.
West, Peter (consultant) (1990), El nuevo acceso de América Latina al m ercado internacional de capitales privados: una nota prelim inar, Santiago, Chile, eclag , Decem ber, mimeo.
W orld Bank (1988), Adjustment Lending. An Evaluation of Ten Years o f Experience, Policy and Research Series, No. 1, W ashington, D.C., December.

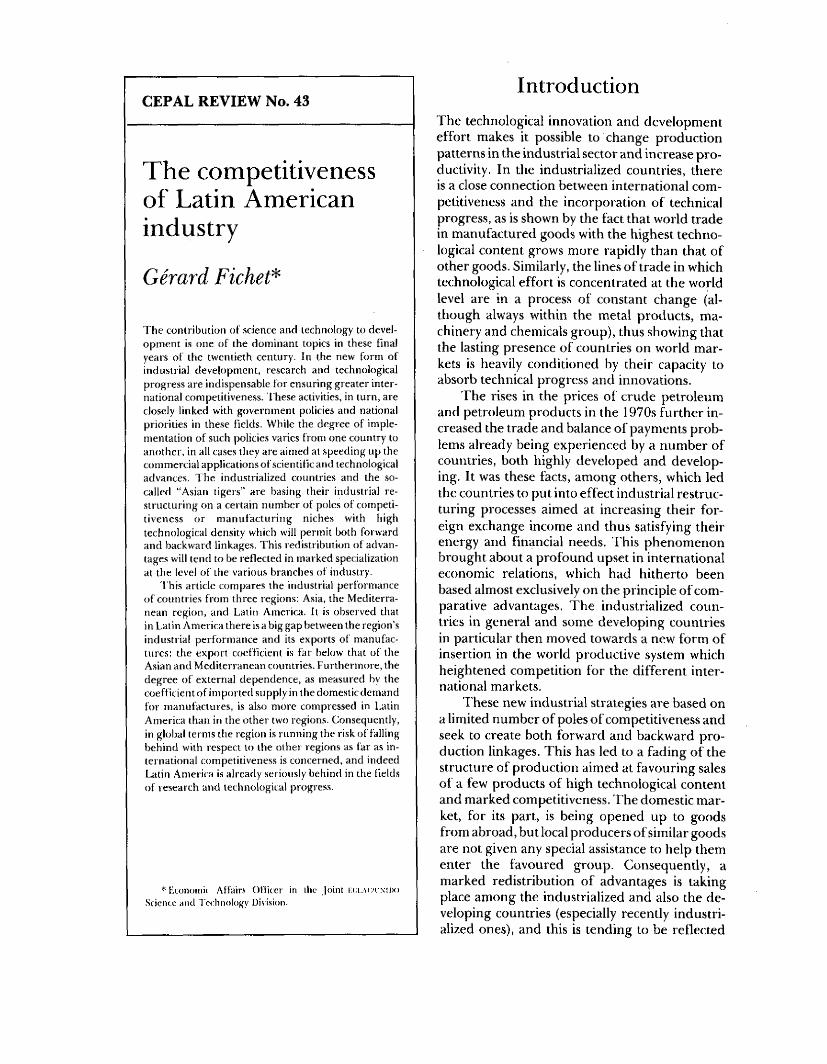
CEPAL REVIEW No. 43
The competitiveness of Latin American industryGérard Picket*
T h e contribution o f science and technology to developm ent is one o f the dom inant topics in these final years o f the twentieth century. In the new form o f industrial developm ent, research and technological progress are indispensable for ensuring greater international competitiveness. These activities, in turn, are closely linked with governm ent policies and national priorities in these fields. W hile the degree o f implementation o f such policies varies from one country to another, in all cases they are aimed at speeding up the com m ercial applications o f scientific and technological advances. T h e industrialized countries and the so- called “Asian tigers” are basing their industrial re structuring on a certain num ber of poles o f com petitiveness or m anul'acturing niches with high technological density which will permit both forward and backward linkages. T his redistribution of advantages will tend to be reflected in m arked specialization at the level o f the various branches o f industry,
I'his article com pares the industrial perform ance o f countries from three regions: Asia, the M editerranean region, and Latin America. It is observed that in Latin Am erica there is a big gap between the region’s industrial perform ance and its exports o f m anufactures: the export coefficient is far below that o f the Asian and M editerranean countries. Furtherm ore, the degree o f external dependence, as measured bv the coefficient o f imported supply in the domestic demand for m anufactures, is also m ore compressed in Latin Am erica than in the other two regions. Consequently, in global terms the region is running the risk o f falling behind with respect to the other regions as far as international competitiveness is concerned, and indeed Latin America is already seriously behind in the fields o f research and technological progress.
*Ktonom ic Affair.s Officer in the Joint r,ci„\(:/c\n)o Science and Technology DivLsion.
IntroductionThe technological innovation and development effort makes it possible to change production patterns in the industrial sector and increase productivity. In the industrialized countries, there is a close connection between international competitiveness and the incorporation of technical progress, as is shown by the fact that world trade in manufactured goods with the highest technological content grows more rapidly than that of other goods. Similarly, the lines of trade in which technological effort is concentrated at the world level are in a process of constant change (although always within the metal products, machinery and chemicals group), thus showing that the lasting presence of countries on world markets is heavily conditioned by their capacity to absorb technical progress and innovations.
The rises in the prices of crude petroleum and petroleum products in the 1970s further increased the trade and balance of payments problems already being experienced by a number of countries, both highly developed and developing. It was these facts, among others, which led the countries to put into effect industrial restructuring processes aimed at increasing their foreign exchange income and thus satisfying their energy and financial needs. This phenomenon brought about a profound upset in international economic relations, which had hitherto been based almost exclusively on the principle of comparative advantages. The industrialized countries in general and some developing countries in particular then moved towards a new form of insertion in the world productive system which heightened competition for the different international markets.
T hese new industrial strategies are based on a limited number of poles of competitiveness and seek to create both forward and backward production linkages. This has led to a fading of the structure of production aimed at favouring sales of a few products of high technological content and marked competitiveness. The domestic market, for its part, is being opened up to goods from abroad, but local producers of similar goods are not given any special assistance to help them enter the favoured group. Consequently, a marked redistribution of advantages is taking place among the industrialized and also the developing countries (especially recently industrialized ones), and this is tending to be reflected
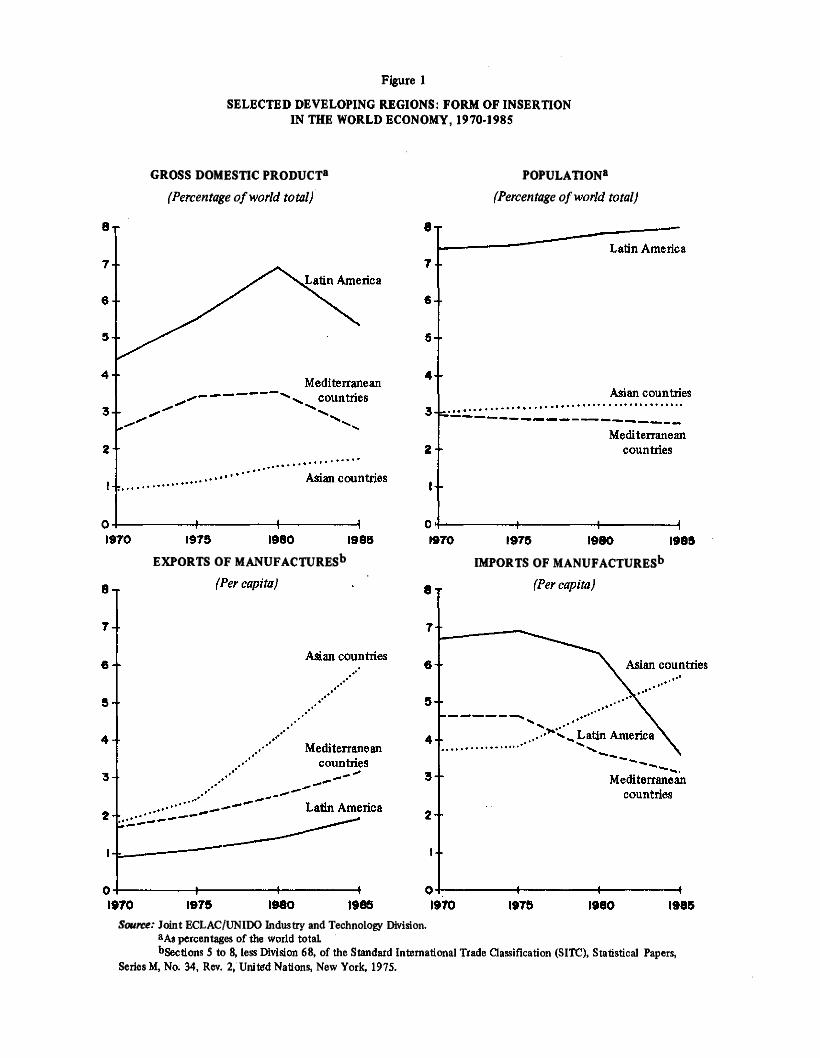
Figure 1
SELEC TED DEVELOPING REGIO NS: FORM OF IN SERTION IN THE WORLD ECONOMY, I9 7 0 -I9 8 S
GRO SS DOMESTIC PRODUCT®
(P ercentile o f world total)
POPULATION®
(Percentage o f world total)
EX PO R TS O F MANUFACTURES^ IMPORTS OF MANUFACTURES*»
Source: Joint ECLAC/UNIDO Industry and Technology Division.^As percentages of the world totaL^»Sections 5 to 8, less EHviaon 68, of the Standard International Trade aassification (SITC), Statistical Papers,
Series M, No. 34, Rev. 2, United Nations, New York, 1975.
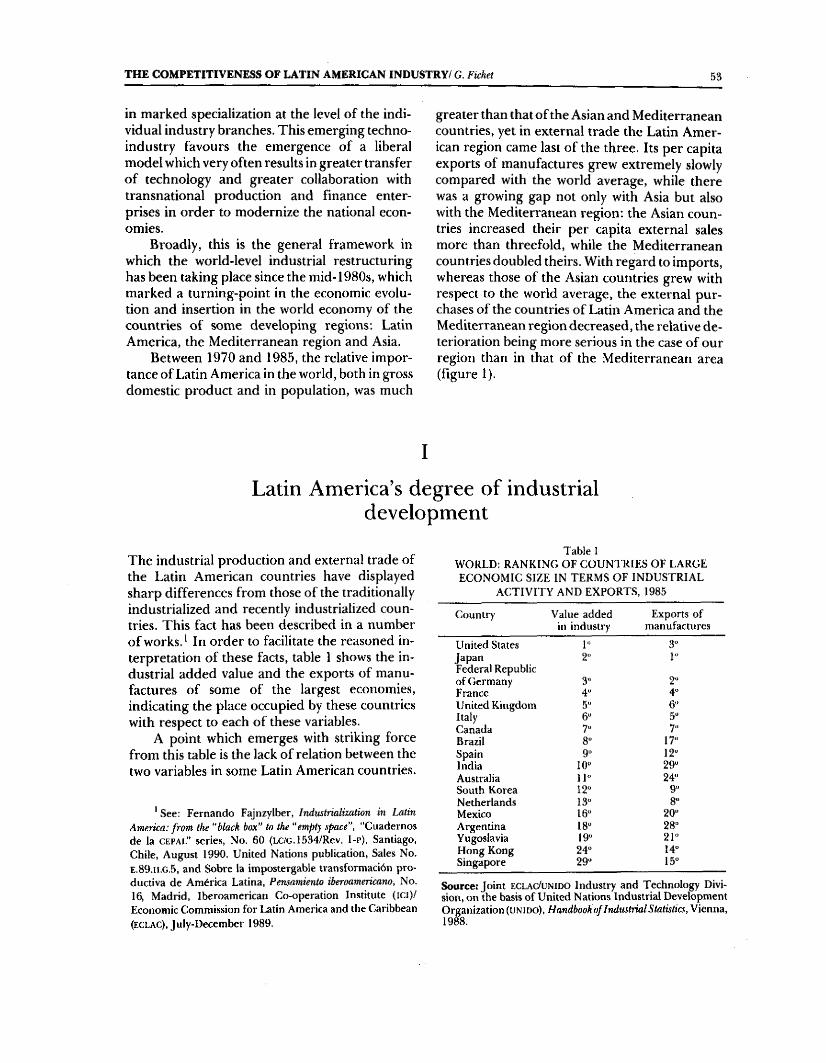
T H E C O M P E T IT IV E N E S S O F L A T IN A M E R IC A N IN D U S T R Y / G. Fichet 53
in marked specialization at the level of the individual industry branches. This emerging technoindustry favours the emergence of a liberal model which very often results in greater transfer of technology and greater collaboration with transnational production and finance enterprises in order to modernize the national economies.
Broadly, this is the general framework in which the world-level industrial restructuring has been taking place since the mid-1980s, which marked a turning-point in the economic evolution and insertion in the world economy of the countries of some developing regions: Latin America, the Mediterranean region and Asia.
Between 1970 and 1985, the relative importance of Latin America in the world, both in gross domestic product and in population, was much
greater than that of the Asian and Mediterranean countries, yet in external trade the Latin American region came last of the three. Its per capita exports of manufactures grew extremely slowly compared with the world average, while there was a growing gap not only with Asia but also with the Mediterranean region: the Asian countries increased their per capita external sales more than threefold, while the Mediterranean countries doubled theirs. With regard to imports, whereas those of the Asian countries grew with respect to the world average, the external purchases of the countries of Latin America and the Mediterranean region decreased, the relative deterioration being more serious in the case of our region than in that of the Mediterranean area (figure 1).
ILatin America’s degree of industrial
developmentThe industrial production and external trade of the Latin American countries have displayed sharp differences from those of the traditionally industrialized and recently industrialized countries. This fact has been described in a number of works.* In order to facilitate the reasoned interpretation of these facts, table 1 shows the industrial added value and the exports of manufactures of some of the largest economies, indicating the place occupied by these countries with respect to each of these variables.
A point which emerges with striking force from this table is the lack of relation between the two variables in some Latin American countries.
’ See: Fernando Fajnzylber, Industrialimtion in Latin Amenca: from the ‘'black box" to Ike “empty space", “Cuadernos de la c e p a l ” series, No. 60 (LC/G.1534/Rev, 1-p), Santiago, Chile, August 1990, United Nations publication, Sales No. E.89.II.G.5, and Sobre la impostergable transform ación productiva de Am érica Latina, Pensamiento iberoamericano. No. 16, M adrid, Iberoam erican Co-operation Institute ( iC i)/
Econom ic Commission for Latin America and the Caribbean (ECLAC), July-D ecem ber 1989.
T able 1W O RLD : RA N KIN G O F C O U N T R IE S O F LARGE EC O N O M IC SIZ E IN T ER M S O F IN D U ST R IA L
A C T IV IT Y AND E X P O R T S, 1985
Country Value added in industry
Exports o f manufactures
United States 1" 3“Jap anFederal Republic
2“ 1“
o f Germ any 3“ 2“France 4u 4“U nited Kingdom 5“ 6“Italy 6“ 5“Canada 7“ 7“Brazil 8“ 17“Spain 9" 12“India 10“ 29“Australia 11" 24“South Korea 12" 9"Netherlands 13“ 8"Mexico 16" 20"Argentina 18" 28"Yugoslavia 19“ 21"Hong Kong 24“ 14"Singapore 29“ 15“
Sou rce: Jo in t e c l a c /u n i d o Industry and Technology Division, on the basis o f U nited Nations Industrial Development Organization (U N ID O ), HandbookofIndustrialSlatislics, V ienna, 1988.
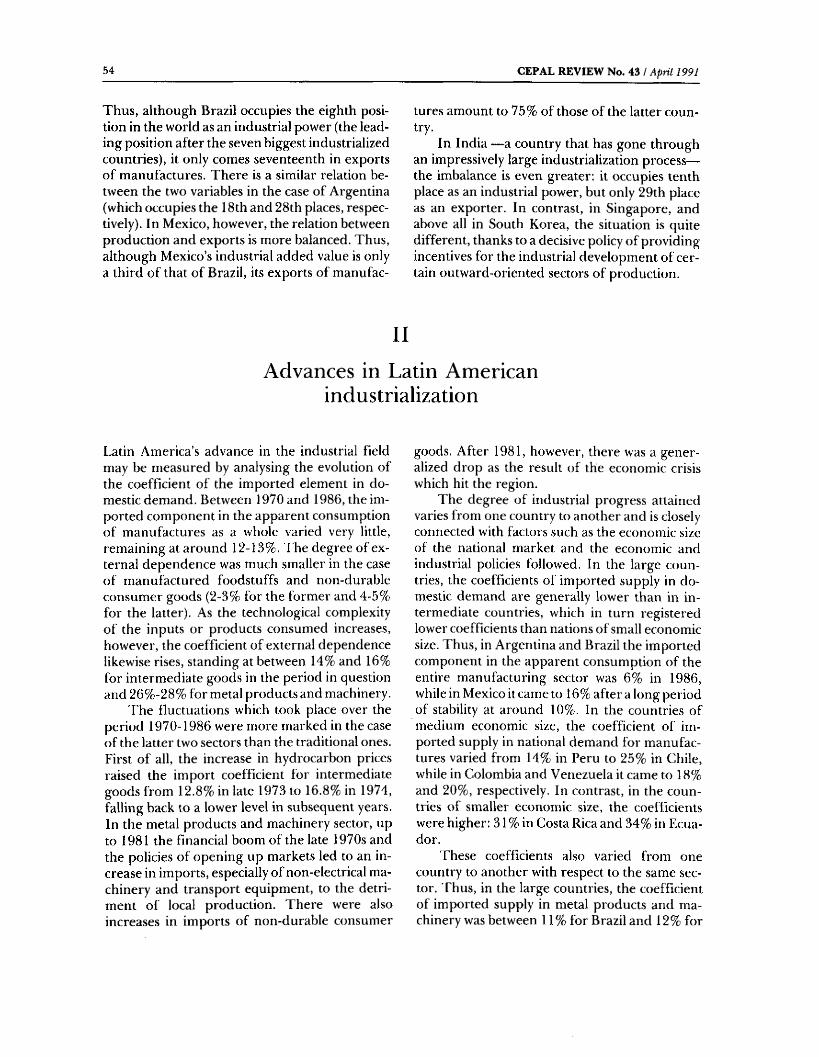
54 C E P A L R E V IE W N o , 4 3 / April 1991
Thus, although Brazil occupies the eighth position in the world as an industrial power (the leading position after the seven biggest industrialized countries), it only comes seventeenth in exports of manufactures. There is a similar relation between the two variables in the case of Argentina (which occupies the 18th and 28th places, respectively). In Mexico, however, the relation between production and exports is more balanced. Thus, although Mexico’s industrial added value is only a third of that of Brazil, its exports of manufac
tures amount to 75% of those of the latter country.
In India —a country that has gone through an impressively large industrialization process— the imbalance is even greater; it occupies tenth place as an industrial power, but only 29th place as an exporter. In contrast, in Singapore, and above all in South Korea, the situation is quite different, thanks to a decisive policy of providing incentives for the industrial development of certain outward-oriented sectors of production.
IIAdvances in Latin American
industrializationLatin America’s advance in the industrial field may be measured by analysing the evolution of the coefficient of the imported element in domestic demand. Between 1970 and 1986, the imported component in the apparent consumption of manufactures as a whole varied very little, remaining at around 12-13%. The degree of external dependence was much smaller in the case of manufactured foodstuffs and non-durable consumer goods (2-3% for the former and 4-5% for the latter). As the technological complexity of the inputs or products consumed increases, however, the coefficient of external dependence likewise rises, standing at between 14% and 16% for intermediate goods in the period in question and 26%-28% for metal products and machinery.
The fluctuations which took place over the period 1970-1986 were more marked in the case t)f the latter two sectors than the traditional ones. First of all, the increase in hydrocarbon prices raised the import coefficient for intermediate goods from 12.8% in late 1973 to 16.8% in 1974, falling back to a lower level in subsequent years. In the metal products and machinery sector, up to 1981 the financial boom of the late 1970s and the policies of opening up markets led to an increase in imports, especially of non-electrical machinery and transport equipment, to the detriment of local production. There were also increases in imports of non-durable consumer
goods. After 1981, however, there was a generalized drop as the result of the economic crisis which hit the region.
The degree of industrial progress attained varies from one country to another and is closely connected with factors such as the economic size of the national market and the economic and industrial policies followed. In the large countries, the coefficients of imported supply in domestic demand are generally lower than in intermediate countries, which in turn registered lower coefficients than nations of small economic size. Thus, in Argentina and Brazil the imported component in the apparent consumption of the entire manufacturing sector was 6% in 1986, while in Mexico it came to 16% after a long period of stability at around 10%. In the countries of medium economic size, the coefficient of imported supply in national demand for manufactures varied from 14% in Peru to 25% in Chile, while in Colombia and Venezuela it came to 18% and 20%, respectively. In contrast, in the countries of smaller economic size, the coefficients were higher: 31 % in Costa Rica and 34% in Ecuador.
These coefficients also varied from one country to another with respect to the same sector. Thus, in the large countries, the coefficient of imported supply in metal products and machinery was between 11 % for Brazil and 12% for
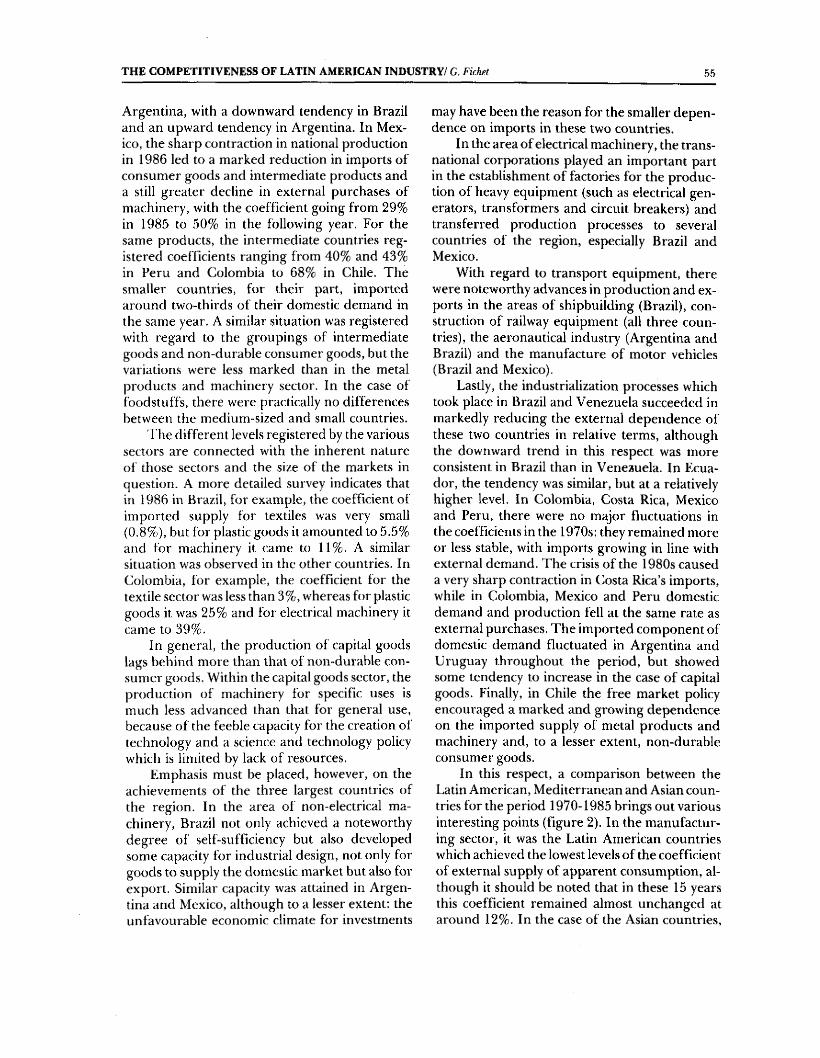
T H E C O M P E T IT IV E N E S S O F L A T IN A M E R IC A N IN D U S T R Y / G. Fichet 55
Argentina, with a downward tendency in Brazil and an upward tendency in Argentina. In Mexico, the sharp contraction in national production in 1986 led to a marked reduction in imports of consumer goods and intermediate products and a still greater decline in external purchases of machinery, with the coefficient going from 29% in 1985 to 50% in the following year. For the same products, the intermediate countries registered coefficients ranging from 40% and 43% in Peru and Colombia to 68% in Chile. The smaller countries, for their part, imported around two-thirds of their domestic demand in the same year. A similar situation was registered with regard to the groupings of intermediate gi)ods and non-durable consumer goods, but the variations were less marked than in the metal products and machinery sector. In the case of foodstuffs, there were practically no differences between the medium-sized and small countries.
Ihe different levels registered by the various sectors are connected with the inherent nature of those sectors and the size of the markets in question. A more detailed survey indicates that in 1986 in Brazil, for example, the coefficient of imported supply for textiles was very small (0.8%), but for plastic goods it amounted to 5.5% and for machinery it came to 11%. A similar situation was observed in the other countries. In Colombia, for example, the coefficient for the textile sector was less than 3%, whereas for plastic goods it was 25% and for electrical machinery it came to 39%.
In general, the production of capital goods lags behind more than that of non-durable consumer goods. Within the capital goods sector, the production of machinery for specific uses is much less advanced than that for general use, because of the feeble capacity for the creation of technology and a science and technology policy which is limited by lack of resources.
Emphasis must be placed, however, on the achievements of the three largest countries of the region. In the area of non-electrical machinery, Brazil not only achieved a noteworthy degree of self-sufficiency but also developed some capacity for industrial design, not only for goods to supply the domestic market but also for export. Similar capacity was attained in Argentina and Mexico, although to a lesser extent: the unfavourable economic climate for investments
may have been the reason for the smaller dependence on imports in these two countries.
In the area of electrical machinery, the transnational corporations played an important part in the establishment of factories for the production of heavy equipment (such as electrical generators, transformers and circuit breakers) and transferred production processes to several countries of the region, especially Brazil and Mexico.
With regard to transport equipment, there were noteworthy advances in production and exports in the areas of shipbuilding (Brazil), construction of railway equipment (all three countries), the aeronautical industry (Argentina and Brazil) and the manufacture of motor vehicles (Brazil and Mexico).
Lastly, the industrialization processes which took place in Brazil and Venezuela succeeded in markedly reducing the external dependence of these two countries in relative terms, although the downward trend in this respect was more consistent in Brazil than in Venezuela. In Ecuador, the tendency was similar, but at a relatively higher level. In Colombia, Costa Rica, Mexico and Peru, there were no major fluctuations in the coefficients in the 1970s: they remained more or less stable, with imports growing in line with external demand. The crisis of the 1980s caused a very sharp contraction in Costa Rica’s imports, while in Colombia, Mexico and Peru domestic demand and production fell at the same rate as external purchases. The imported component of domestic demand fluctuated in Argentina and Uruguay throughout the period, but showed some tendency to increase in the case of capital goods. Finally, in Chile the free market policy encouraged a marked and growing dependence on the imported supply of metal products and machinery and, to a lesser extent, non-durable consumer goods.
In this respect, a comparison between the Latin American, Mediterranean and Asian countries for the period 1970-1985 brings out various interesting points (figure 2). In the manufacturing sector, it was the Latin American countries which achieved the lowest levels of the coefficient of external supply of apparent consumption, although it should be noted that in these 15 years this coefficient remained almost unchanged at around 12%. In the case of the Asian countries.
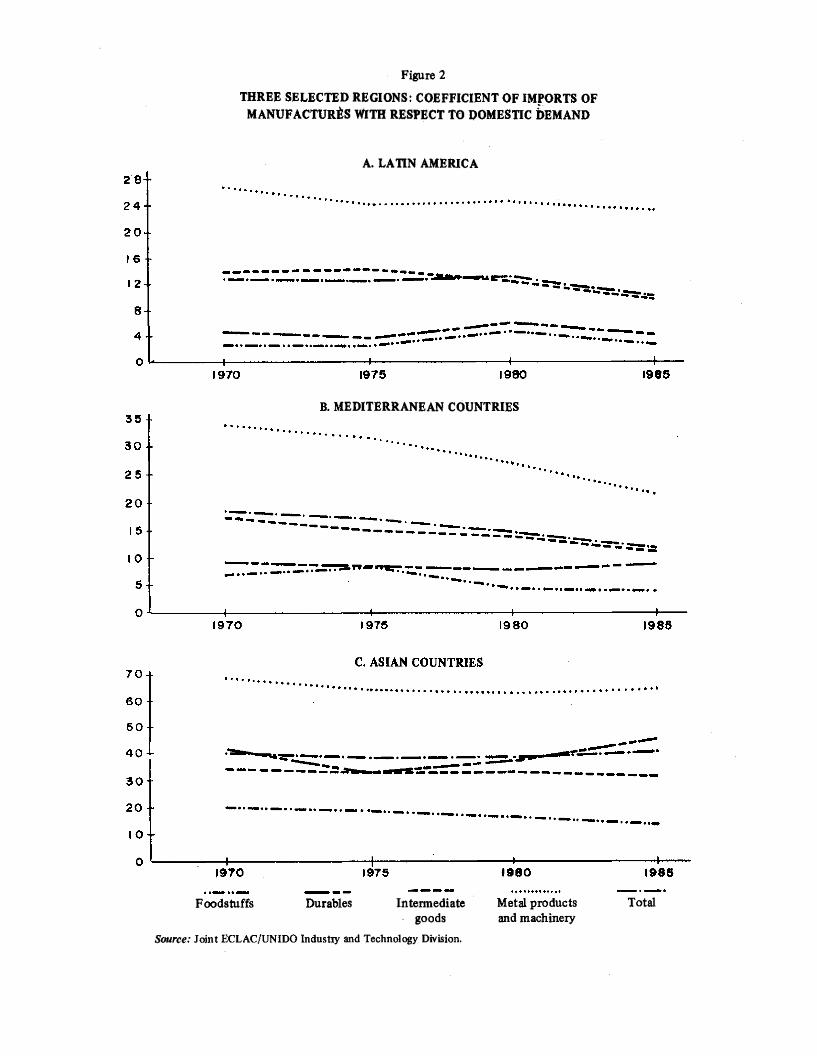
Figure 2
TH REE SELECTED REGIO N S; CO EFFICIEN T O F IM PORTS OF MANUFACTURÉS VrtTH R ESPEC T TO DOMESTIC Î>£MAND
A. LATIN AMERICA
B. M EDITERRANEAN COUNTRIES
Foodstuffs Durables Intermediategoods
S ou rce: J o in t E C LA C /U N ID O In d u stry and T echnology Division.
Metal products and machinery
Total

T H E C O M P E T IT IV E N E S S O F L A T IN A M E R IC A N IN D U S T R Y / G. Picket 57
this coefficient for the manufacturing sector likewise remained stable, but at around 40%: i.e., almost four times the figure for Latin America. The Mediterranean countries, however, which had greater margins for achieving a higher degree of domestic industrialization, managed to reduce their coefficient by almost two-thirds over the same period of time. In all three regions, the sector which depended least on imports was that of foodstuffs, which had fallen to minimal figures in Latin America (around 2.5%), while in the Mediterranean countries it went down from 7% to 4% over the period, and in the Asian countries from 20% to 14%.
The metal products and machinery sector, on the other hand, was the sector which was most heavily dependent on imports in all three re
gions: 65% of the domestic demand of the Asian countries was satisfied through imports in this sector, with the proportion remaining almost unchanged over the period. A similar tendency was displayed by Latin America, but at a lower level of only 23%. The Mediterranean countries, in contrast, reduced the coefficient of imported supply in their metal products and machinery sector by over 60%. In the case of intermediate goods, both the Latin American and the Mediterranean countries managed to bring down this coefficient, and this trend became even more marked in 1985 with the world crisis. In the Asian countries, however, imports once again grew almost as fast as domestic demand, so that the external dependence of this sector was almost three times greater, in relative terms, than that of the Latin American and Mediterranean countries.
I ll
External trade and industrializationThe traditional type of intersectoral complementation corresponds to the classical scheme of the international division of labour in which the countries which produce strategic raw materials and non-renewable natural resources trade these items for capital goods and consumer products. Another type of complementation is that in which there is a mutual interchange of locally produced industrial goods involving the intensive use of capital rather than of human resources.
In recent years, various indicators have been used to define the level of industrial development of a country and, ultimately, its degree of insertion in international trade. Among these indicators is the value of their total production and the components of their external trade. The differences between the various developing regions become more marked, however, when the index used is the relative weight of those sectors which stand out because of their dynamic effect on the development of manufacturing, such as the chemical industry and the production of machinery and transport equipment. These mature industries, which are generally capital-intensive, represent the threshold to a new phase of indus
trialization involving the production of goods which make intensive use of human resources and have a medium or high content of technology.
At the same time, the branches of industry with a high technological content account for an increasingly significant proportion of the external trade of these regions and indeed of world trade as a whole.
Thus, if we compare the export structures of the three regions we observe a broadly similar pattern: the foodstuffs branch has declined (with its relative importance going down by some 50% to make it the relatively least important industrial sector for the Asian and Mediterranean countries, although not for Latin America), while the more dynamic sectors have grown rapidly. In the latter case, the total share of chemical products and metal products and machinery in Latin America’s exports increased by a factor of 2.9, while in the case of the Asian countries it grew by a factor of 2.6. In the case of the Mediterranean countries, this proportion grew by a factor of only L3, since already in 1970 they had a substantial export base in these lines of production which was more than double that of the other
5 8 C E P A L R E V IE W N o . 4 3 / April 1991
two regions. In 1986, exports of chemical products and metal products and machinery by the Asian and Mediterranean countries represented 43% of their total exports of manufactures and thus formed their main export line, whereas in the case of Latin America these sales did not amount to more than 32% of the respective total, with the intermediate products sector consistently being the most important (37%), mainly because of the sales of copper and iron and steel products.
With regard to the structure of their imports of manufactures, Latin America and the Mediterranean countries showed a certain similarity: foodstuffs did not account for more than 6% of the total, while non-durable consumer goods amounted to between 6% and 10%. Intermediate products, for their part, formed about one-sixth of their imports.
The strategic secU)r was that of chemicals and metal products and machinery, whose relative weight in industrial imports was even greater than in exports: purchases of these types of goods abroad represented 64% of the total imports of manufactures of the Mediterranean countries (a proportion which remained almost unchanged during the period 1970-1986) and 74% of the corresponding imports by Latin America in T986. With regard to the Asian countries, their imports of food products were no greater in relative terms than in the above-mentioned cases, nor were their imports of intermediate products, but the share of non-durable consumer goods was relatively greater (one-fifth of the total). The main difference, however, lay in the relative weight of the products of the most dynamic sec
tors, which was less than that observed in Latin America and the Mediterranean countries but showed a steady upward trend (from 52% to 58% of the total between 1970 and 1986). The structure of the gross value of manufacturing production in the three groups of countries was less unbalanced between its different components than in the case of exports and imports, but the changes which took place in each grouping followed the trends registered in foreign trade.
It should be noted, however, that the relative share of the most dynamic sectors in the gross value of production was less than their share in exports. Thus, chemicals and metal products and machinery represented a little over 34% of the total industrial production of the Mediterranean countries, whereas the external sales of these products came to over 43% of their total exports of manufactures. A similar situation was observed in the Asian countries, where the respective percentages were 36% and 43%. These differences showed a tendency to increase with time, since at the beginning of the 1970s both percentage shares were on a similar level, but subsequently exports grew much faster than production. There was a similar trend in Latin America, but the results seem to indicate that this region did not take full advantage of the dynamic world demand for these products, for in 1970 the share of chemicals and metal products and machinery in the gross value of manufacturing production came to 29%, whereas the share of these products in exports was only 11%. In 1986, the two proportions both stood at 32%, which was a situation similar to that of the Mediterranean countries in 1970.
IV
Sectoral industrial specialization
Structural relations of complementarity can be identified by distinguishing between the sectors where the trade operations give a surplus and those where they do not. Analysis of the contribution made by each sector to the global manufacturing trade balance makes it possible to prepare sectoral profiles of industrial specialization
for each of them.' If the indicator for the contribution of a sector is positive, then its trade balance will be more favourable to the evolution
See Centre d’études prospectives et d’inform ations internationales {CEPii}, Economie mondiale: la montée des tensions, Paris, 1983.
T H E C O M P E T IT IV E N E S S O F L A T IN A M E R IC A N IN D U S T R Y / C. Fichet 5 9
of the whole than could be assumed from its percentage share in the overall trade in goods: consequently, the contribution by that sector to the global balance will be dynamic. If, on the other hand, the indicator for the sectoral contri-
that sector to the manufacturing trade balance will be less than the percentage representing its relative share in global industrial imports or exports.
fhe expression for the contribution indica-bution is negative, then the real contribution of tor (cont) is;
C O N Tk = 100 X (X k -M k )(X+M)/2
I
- 100 X(X -M )
(X+M)/2
II
(X k -M k )X + M )
III
where k = the sector, X = exports and M = imports.
Term I relates the trade balance of the industrial sector k to the average global trade in manufactures of the country.
Term II relates the global trade balance of the manufacturing sector with the average global trade in manufactures.
Term III shows the share of the trade flow of the sector in the global trade of the country.
1. Latin Am erican countries with exports based mainly on their natural resources
In many countries of the region, exports of goods with a high content of capital and technology have been very small, so that there has been a considerable deficit on the trade in these products. Their surpluses on the trade in industrially processed natural resources, in contrast, have helped to improve the overall manufacturing trade balance to some extent.
The processing of certain agricultural and marine products is of primary importance in Colombia, Costa Rica, Ecuador and Chile. Likewise, the processing of non-ferrous and ferrous metals in Chile and Venezuela; the manufacture of petroleum products in Colombia, Ecuador and Venezuela; the industrial processing of wood in Chile, Costa Rica and Ecuador, and the production of paper and pulp in Chile are activities whose indicators of their contribution to the trade balance, since they are clearly positive, confirm their dynamism compared with the other national industrial sectors. It is important to note, however, that metal resources in Chile, energy resources in Venezuela and food products in Ecuador have gradually been losing their position of almost monopolic predominance in favour of new sectors also based on natural resources.
Relatively few sectors producingnon-durable consumer goods and intermediate products have made a major contribution. In the case of Costa Rica, mention might be made of the products manufactured under the Central American Economic Integration Treaty (fertilizers, pharmaceutical products and tyres). Within this group of countries, it was the Colombian productive sector which showed the greatest structural diversification. In 1986, it managed to make up for the deficit on the production of machinery, steel and heavy chemicals thanks to the very favourable performance of almost all the other sectors (especially textiles, clothing, footwear, printing and publishing, ceramics, miscellaneous manufactures, and, of course, processed food products and petroleum products).
The metal products and machinery sector has registered substantial deficits, since in a number of countries the opening up of the domestic market led to a breakdown in the prevailing industrialization model. In general, the disappearance of a large part of the subsidies, together with tariff liberalization, left the metal products and machinery sector open to external competition and, without the protection to which it had been accustomed, its activity fell off. On the other hand, however, the intermediate products needed for the manufacture of non-durable consumer goods were sometimes subsidized.
2. Latin American countries with diversified exports
The present form of insertion of Argentina, Brazil and Mexico in international trade is departing from the traditional scheme exemplified by the foregoing cases. In these three countries, the relative size of the deficit on metal products and machinery is lending to go down and the trade surpluses achieved on a varied range of manufactures give grounds for expecting a certain

6 0 C E P A L R E V IE W N o . 4 3 / April 1991
degree of equilibrium in the current balance on industrial goods (Mexico) or even a substantial surplus (Brazil). Despite the content of manufactures in the exports of these three countries, their low labour costs and the importance of their branches of manufacturing based on natural resources caused them to share certain features with the countries of the previous group. Their industrialization has caused their degree of complementarity with the industrialized countries supplying capital g6ods to do down, while it has increased their capacity to compete in some sectors (for example textiles, clothing, footwear, beverages, printing and publishing, steel and ceramics).
Brazil has for some time been the Latin American country with the highest degree of diversification of production. The reduction in the indicator of the current balance contribution of foodstuffs by almost 70% between 1970 and 1986 was partly offset by greater diversification towards new lines of production such as textiles, beverages, leather, rubber, plastics, steel, metal products and motor vehicles.
In Mexico, the economic crisis of the 1980s caused a reorganization of industry which brought big changes in the metal products and machinery industries. These industries managed to reduce their imported component appreciably, thus contributing to the improvement in the global trade balance, especially in the case of electrical machinery and motor vehicles. On the other hand, the net contribution of the foodstuffs sector changed from a declining positive sign to a markedly negative one, turning the country into a net importer of foodstuffs.
3 . Comparison o f the sectoral profiles o f industrial specialization o f the Latin American, M editerranean
an d Asian countries
The sectoral industrial specialization profiles of the Mediterranean and Asian countries evolved differently from those of the great majority of the Latin American countries, since their poles of specialization were more diversified (as measured at the three-digit level of the International Standard Industrial Classification of all economic activities (isic)).
Between 1970 and 1986, these countries managed to sharply reduce the almost monopolic advantages of a few sectors: foodstuffs (Philippines, Spain, Turkey), wood and clothing (Korea) and non-ferrous metals (Thailand). Instead, new lines of production of non-durable consumer goods emerged whose dynamism helped to improve the manufacturing trade balance. Among these lines are textiles (Turkey, Yugoslavia), clothing (Thailand, Yugoslavia, Turkey and Philippines), footwear (Korea, Yugoslavia and Thailand), furniture (Yugoslavia) and miscellaneous manufactures (Thailand, Philippines and Korea). At the same time, there was a reduction in the external dependence of many branches requiring intermediate goods and metal products and machinery, leading in some cases to a marked improvement in their contribution to the global trade balance. This occurred in the case of industrial chemicals (Spain and Philippines), iron and steel products (Spain, Turkey and Philippines), transport equipment (Korea, Yugoslavia and Spain) and electrical machinery (Philippines and Spain).
VInternational competitiveness
The increase in the world demand for manufactures has boosted the external trade and production of these goods. The magnitude of the growth in exports and imports of manufactured products is now considered a clear reflection of the industrial and economic dynamism of the country producing and selling them.
1. Production and exports
The Asian countries were, of course, those which registered the most dynamic trade of the three regions analysed (see figure 3 and figure 1). Thus, in 1970 these countries exported a little over 25% of their global manufacturing output.
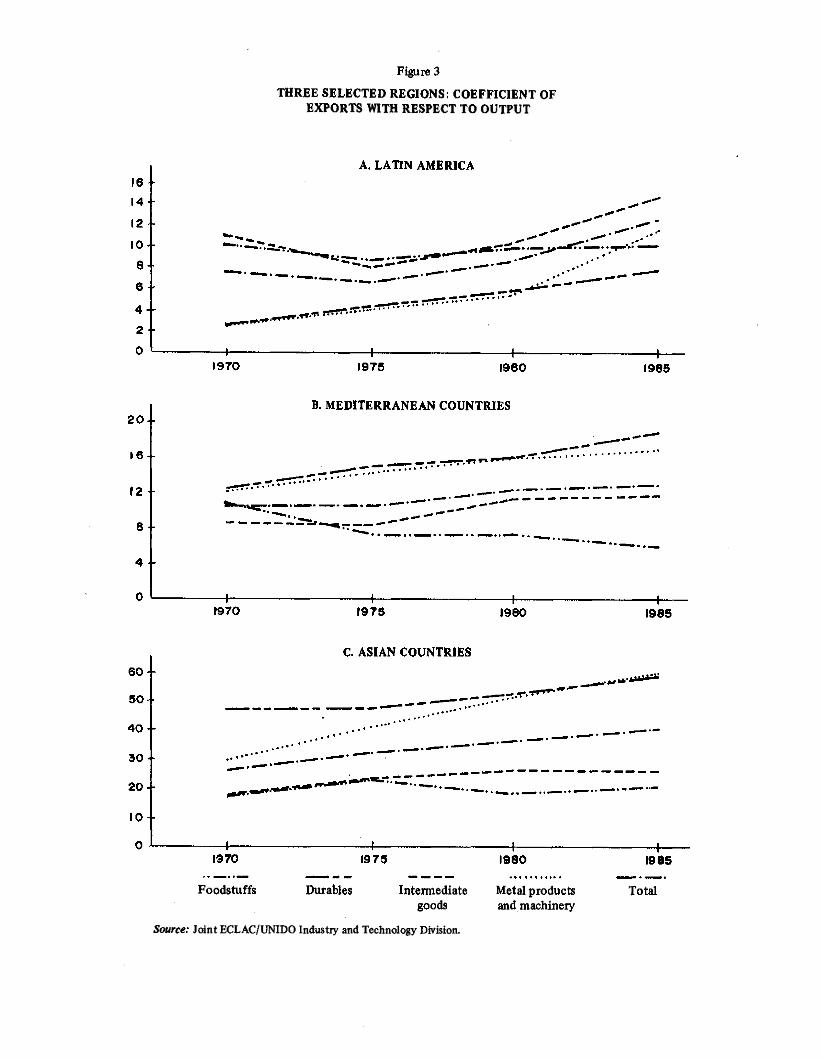
Figure 3
THREE SELEC TED REGION S; CO EFFICIEN T OF EXPO RTS WITH RESPECT TO OUTPUT
Foodstuffs Durables
Stm rce: J o in t E C LA C /U N ID O In d u stry a n d T echnology Division.
Intermediategoods
Metal products and machinery
Total
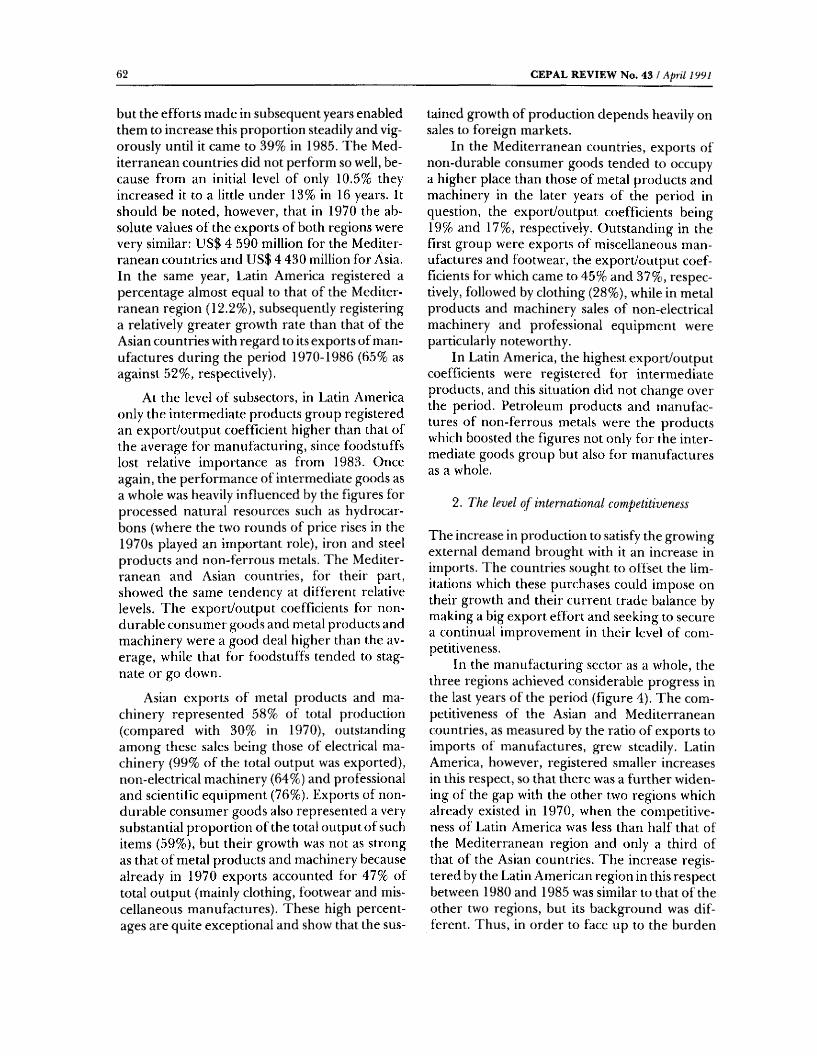
62 C E P A L R E V IE W N o . 4 3 / April 1991
but the efforts made in subsequent years enabled them to increase this proportion steadily and vigorously until it came to 39% in 1985. The Mediterranean countries did not perform so well, because from an initial level of only 10.5% they increased it to a little under 13% in 16 years. It should be noted, however, that in 1970 the absolute values of the exports of both regions were very similar: US$ 4 590 million for the Mediterranean countries and US$ 4 430 million for Asia. In the same year, Latin America registered a percentage almost equal to that of the Mediterranean region (12.2%), subsequently registering a relatively greater growth rate than that of the Asian countries with regard to its exports of manufactures during the period 1970-1986 (65% as against 52%, respectively).
At the level of subsectors, in Latin America only the intermediate products group registered an export/output coefficient higher than that of the average for manufacturing, since foodstuf fs lost relative importance as from 1983. Once again, the performance of intermediate goods as a whole was heavily influenced by the figures for processed natural resources such as hydrocarbons (where the two rounds of price rises in the 1970s played an important role), iron and steel products and non-ferrous metals. The Mediterranean and Asian countries, for their part, showed the same tendency at different relative levels. The export/output coefficients for nondurable consumer goods and metal products and machinery were a good deal higher than the average, while that for foodstuffs tended to stagnate or go down.
Asian exports of metal products and machinery represented 58% of total production (compared with 30% in 1970), outstanding among these sales being those of electrical machinery (99% of the total output was exported), non-electrical machinery (64%) and professional and scientific equipment (76%). Exports of nondurable consumer goods also represented a very substantial proportion of the total output of such items (59%), but their growth was not as strong as that of metal products and machinery because already in 1970 exports accounted for 47% of total output (mainly clothing, footwear and miscellaneous manufactures). These high percentages are quite exceptional and show that the sus
tained growth of production depends heavily on sales to foreign markets.
In the Mediterranean countries, exports of non-durable consumer goods tended to occupy a higher place than those of metal products and machinery in the later years of the period in question, the export/output coefficients being 19% and 17%, respectively. Outstanding in the first group were exports of miscellaneous manufactures and footwear, the export/output coefficients for which came to 45% and 37%, respectively, followed by clothing (28%), while in metal products and machinery sales of non-electrical machinery and professional equipment were particularly noteworthy.
In Latin America, the highest export/output coefficients were registered for intermediate products, and this situation did not change over the period. Petroleum products and manufactures of non-ferrous metals were the products which boosted the figures not only for the intermediate goods group but also for manufactures as a whole.
2, The level o f international competitiveness
The increase in production to satisfy the growing external demand brought with it an increase in imports. The countries sought to offset the limitations which these purchases could impose on their growth and their current trade balance by making a big export ef fort and seeking to secure a continual improvement in their level of competitiveness.
In the manufacturing sector as a whole, the three regions achieved considerable progress in the last years of the period (figure 4). The competitiveness of the Asian and Mediterranean countries, as measured by the ratio of exports to imports of manufactures, grew steadily. Latin America, however, registered smaller increases in this respect, so that there was a further widening of the gap with the other two regions which already existed in 1970, when the competitiveness of Latin America was less than half that of the Mediterranean region and only a third of that of the Asian countries. The increase registered by the Latin American region in this respect between 1980 and 1985 was similar to that of the other two regions, but its background was different. Thus, in order to face up to the burden
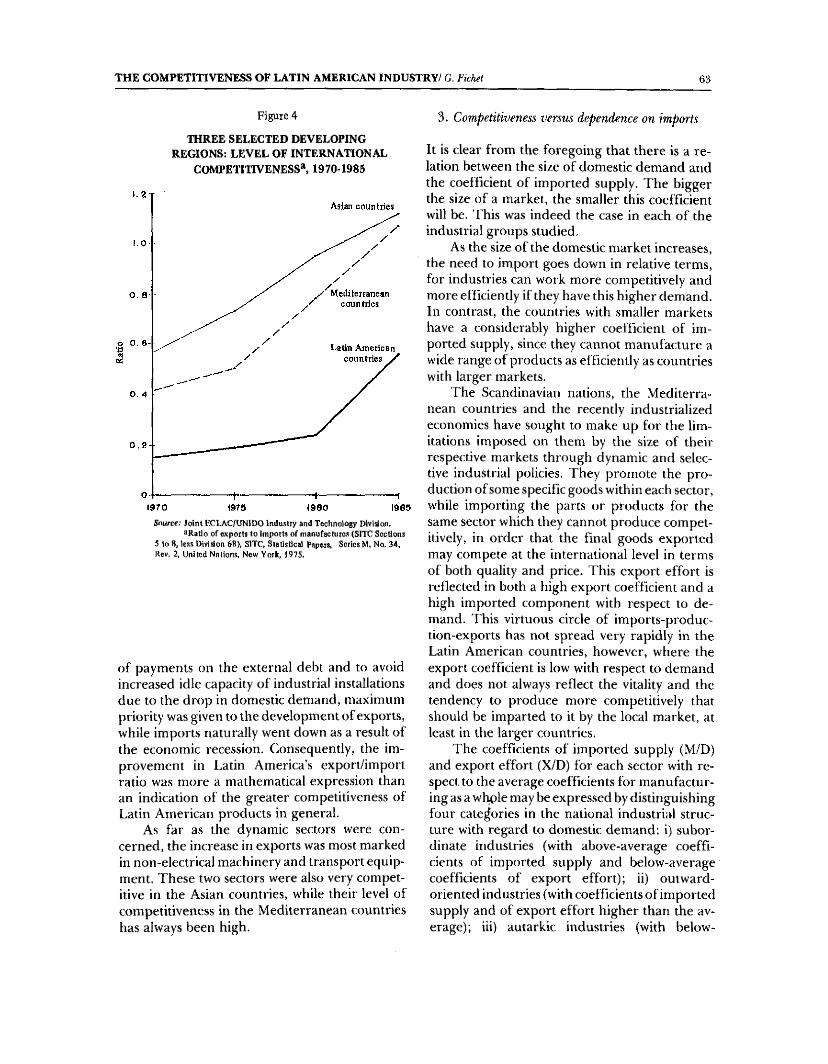
T H E C O M P E T IT IV E N E S S O F L A T IN A M E R IC A N IN D U S T R Y / G. Picket 6 3
Figure 4
THREE SELECTED DEVELOPING REGIONS: LEVEL OF INTERNATIONAL
COMPETITIVENESS^ 1970-1985
S ou rce: Joint t'CLAC/UNlDO Industry and Technology Division,aRatlo of exports to imports of manufactures (SITC Sections
5 to 8, less Division 68), SITC, Statistical Papers, Series M, No. 34, Rev. 2, United Nations, New York, 1975.
of payments on the external debt and to avoid increased idle capacity of industrial installations due to the drop in domestic demand, maximum priority was given to the development of exports, while imports naturally went down as a result of the economic recession. Consequently, the improvement in Latin America’s export/import ratio was more a mathematical expression than an indication of the greater competitiveness of Latin American products in general.
As far as the dynamic sectors were concerned, the increase in exports was most marked in non-electrical machinery and transport equipment. These two sectors were also very competitive in the Asian countries, while their level of competitiveness in the Mediterranean countries has always been high.
3 . Competitiveness versus dependence on imports
It is clear from the foregoing that there is a relation between the size of domestic demand and the coefficient of imported supply. The bigger the size of a market, the smaller this coefficient will be. This was indeed the case in each of the industrial groups studied.
As the size of the domestic market increases, the need to import goes down in relative terms, for industries can work more competitively and more efficiently if they have this higher demand. In contrast, the countries with smaller markets have a considerably higher coefficient of imported supply, since they cannot manufacture a wide range of products as efficiently as countries with larger markets.
The Scandinavian nations, the Mediterranean countries and the recently industrialized economies have sought to make up for the limitations imposed on them by the size of their respective markets through dynamic and selective industrial policies. They promote the production of some specific goods within each sector, while importing the parts or products for the same sector which they cannot produce competitively, in order that the final goods exported may compete at the international level in terms of both quality and price. This export effort is reflected in both a high export coefficient and a high imported component with respect to demand. This virtuous circle of imports-produc- tion-exports has not spread very rapidly in the Latin American countries, however, where the export coefficient is low with respect to demand and does not always reflect the vitality and the tendency to produce more competitively that should be imparted to it by the local market, at least in the larger countries.
The coefficients of imported supply (M/D) and export effort (X/D) for each sector with respect to the average coefficients for manufacturing as a whple may be expressed by distinguishing four categories in the national industriiil structure with regard to domestic demand; i) subordinate industries (with above-average coefficients of imported supply and below-average coefficients of export effort); ii) outward- oriented industries (with coefficients of imported supply and of export effort higher than the average); iii) autarkic industries (with below-
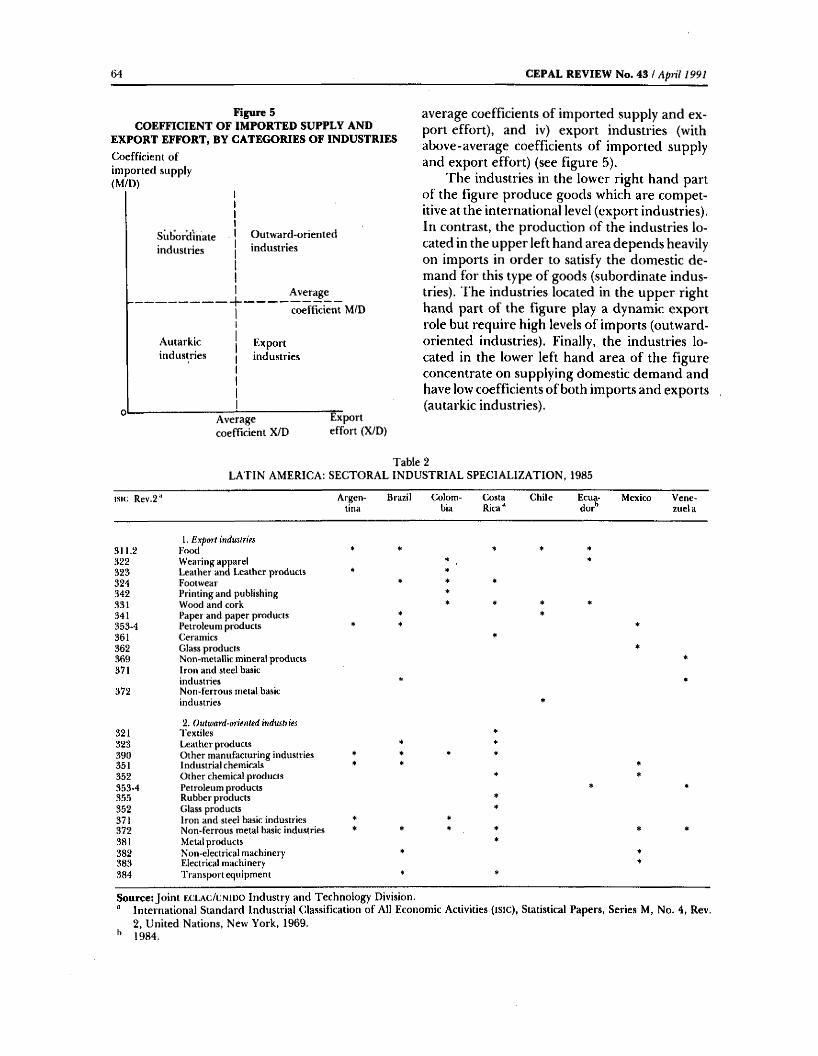
6 4 C E P A L R E V IE W N o , 4 3 / April 1991
Figure 5COEFFICIENT OF IMPORTED SUPPLY AND
EXPORT EFFORT, BY CATEGORIES OF INDUSTRIESCoefficient o f imported supply (M/D)
Subordinateindustries
Autarkicindustries
Outward-orientedindustries
Average
coefficient M/D
Exportindustries
Average coefficient X/D
Export effort (X/D)
average coefficients of imported supply and export effort), and iv) export industries {with above-average coefficients of imported supply and export effort) (see figure 5).
The industries in the lower right hand part of the figure produce goods which are competitive at the international level (export industries). In contrast, the production of the industries located in the upper left hand area depends heavily on imports in order to satisfy the domestic demand for this type of goods (subordinate industries). The industries located in the upper right hand part of the figure play a dynamic export role but require high levels of imports (outward- oriented industries). Finally, the industries located in the lower left hand area of the figure concentrate on supplying domestic demand and have low coefficients of both imports and exports (autarkic industries).
Table 2L A T IN A M ERIC A : SE C T O R A L IN D U ST R IA L SP E C IA LIZ A T IO N , 1985
isit: Rev.2’' Argen- Brazil Colom- Costa Chile Ecua- Mexico Vene-tina bia Rica“ dor’’ zuela
1. Export industries311.2 Food * * If * If
322 Wearing apparel >f >f
323 Lealher and Leather products * If
324 Footwear * >f
342 Printing and publishing *331 Wood and cork ♦ + * If
341 Paper and paper products If
353-4 Petroleum products * >f
361 Ceramics If
362 Glass products if
369 Non-metallic mineral products ♦371 Iron and steel bask
industries ♦ «372 Non-ferrous metal basic
industries *
2. Outward-oriented industries321 Textiles ♦323 Leather products * ♦390 Other manufacturing industries If * «351 Industrial chemicals * If *352 Other chemical products >f if
353-4 Petroleum products if 4
355 Rubber products If
352 Glass products >f
371 Iron and steel basic industries * *372 Non-ferrous metal basic industries ♦ If If if if 4
381 Metal products If
382 Non-electrical machinery * If
383 Electrical machinery If
384 Transport equipment If «
Sou rce; Jo in t e c l a c /L'n i d o Industry and Technology Division." International Standard Industrial Classification o f All Economic Activities (isic), Statistical Papers, Series M, No. 4 , Rev.
2 , U nited Nations, New York, 1969.1984.
THE COMPETITIVENESS OF LATIN AMERICAN INDUSTRY/ G. Fichei 6 5
The advances which took place in Latin American industry as from 1970 led to a different kind of organization of manufacturing which gave way, by 1986, to concentrated areas of sectoral specialization. The industrial sectors shown in table 2 registered an exports/demand coefficient higher than the national manufacturing average. The coefficient of the imported supply needed to satisfy demand was used to distinguish between export industries and outward-oriented industries.
In the case of the former, the export effort created poles of competitiveness in sectors which used natural comparative advantages to process abundant native resources: foodstuffs (tropical or temperate zone), steel, non-ferrous metals, petroleum products, leather products, wood and paper. In addition to these products there were some non-durable consumer goods such as footwear, ceramics, printing and publishing and glass. The great majority of these branches made a net contribution of more than 2% to the current balance: that is to say, their real contribution to
trade was at least 2% higher than their relative share in it, which confirms the international competitiveness of these sectors.
The products of the outward-oriented industries are also exported, but at a higher cost in terms of the trade balance, since their imported component is higher than the industrial average. Particularly noteworthy in respect of these exports is Costa Rica, which benefitted under the Central American Economic Integration Treaty from the installation of various manufacturing firms whose production and exports, however, depend heavily on imported elements. At the sectoral level, the most outstanding lines of production are miscellaneous manufactures, industrial chemicals, non-ferrous metals (in Chile), steel, and exports of metal products and machinery (in Brazil, Costa Rica and Mexico). T he experience built up with regard to exports by these sectors is very valuable and could help in the future to increase the competitiveness of a larger number of industrial branches or product lines.

CEPAL REVIEW No. 43
Europe 92 and the Latin American economyMiguel Izam*
This article analyzes the econom ic effects which the F.urope of 1992 could have on the countries o f Latin America. It exam ines the main factors which led to the signing o f the Single European Act in 1985, such as the loss o f competitiveness o f the European economies, the slow recovery o f the European Economic Càimmunity (rrc) after the two oil crises, and the rigid politico-institutional system o f the Community.
It also exam ines the econom ic links between Latin Am erica and the Community and concludes that over the long term these relations have weakened.
Einallv, it sets forth the positive and negative econom ic effects which Eurttpe 1992 could have on Latin America, Among the positive effects it highlights the boosting of' trade flows and the reduction o f international interest rates. Among the negative aspects, it emphasizes the possible formation o f a kind o f “fo rtress Europe" and the low level o f priority given to Latin Am erica in the Càimmunity’s scheme o f regional econom ic preferences.
It is concluded from the foregoing that Latin America could be m ore seriously affected than the rest o f the world if the economic effects o f Europe 1992 a ie unfavourable for the countries outside the Comm unity, while if' these effects are positive, Latin America will not benefit from them as much as the rest o f the world. T h e article ends by indicating some possible lines o f action for Latin America.
*F.conuniist in the r.ci.AC International Tracie and Developm ent Division.
IntroductionThe European Economic Community (e e c ) is considered to be the most advanced model of regional economic integration. Six States participated in its founding in 1957: France, Italy, Federal German Republic, Belgium, Holland and Luxembourg. A few years later, six other European nations entered the Community; Denmark, Great Britain, Ireland, Greece, Spain and Portugal.
The general objectives which the e e c has set itself are economic growth and higher living standards for its population, on the one hand, and peace and political union among the nations of Europe on the other. At a more instrumental level, the e e c has set as its objective since its beginnings the creation of a common market in which there is free circulation of people, goods, services and capital. T his has not yet been fully achieved.
In the course of its history, the e e c has had to face not only problems originating within itself, but also other challenges deriving from the need to adapt to the demands of the moment and the rapid changes taking place in various spheres of the world environment. Without a doubt, however, it was in the mid-1980s that the EEC had to face the most serious challenge since its foundation. That crisis resulted from the conjunction of three phenomena:
i) The slow economic recovery of the e e c ;
after the first and second oil shocks. On both occasions, the economic indicators of the Gommunity’s performance revealed that the inability of its economic system to respond to these challenges had structural causes. This situation was compounded by the obvious inability of the productive system to absorb the growing unemployment, whose features also suggested the existence of a structural problem;
ii) The loss of international competitiveness of the European economies, particularly with respect to the United States, Japan and the recently industrialized countries. To some extent this reflected a certain technological lag, which was manifested in low productivity, and the urgent need to restructure the Gommunity’s productive system and modify its weak form of insertion in the international economy;
iii) The extremely rigid politico-institutional system of the Community. It was imperative to make this system more flexible and reformulate
6 8 CEPAL REVIEW No. 43 ! April 1991
it SO that it could respond both to the new and dynamic international conditions and to the internal tensions which had long persisted within the Community and which threatened to affect its credibility both internally and externally.
The awareness of these elements led the e e c
countries to sign the Single European Act in February 1986. This was the option which Giulio Andreotti called “choosing between something or nothing”. Through the Single European Act the Community seeks to attain the following six objectives: the creation of a market without frontiers, greater economic and social cohesion, the emergence of a European social dimension, a common scientific and technological development policy, the strengthening of the European Monetary System, and co-ordinated action with regard to the environment.
The Single European Act has two key antecedents. The first of these is the determination of the cost of “non-Europe”. To this end, in 1985 the Commission ordered an investigation to quantify the cost that the absence of a single market would involve for the Community because of the maintenance of restrictions on the free movement of all the factors of production among its member countries: a cost estimated at around US$ 224 billion.
The second antecedent goes back to June 1985, when the Heads of State and Government of the EEC undertook to create the Single European Market, the bases for which were set forth in a White Paper. This document sets out a timetable for the adoption of some 300 measures designed to establish the free and full circulation of citizens, goods, services and financial resources among the twelve member countries of the Community, in accordance with the spirit of the treaties setting up the European Communi
ties, to which end it is aimed to gradually dismantle all physical, technical and fiscal frontiers before 31 December 1992.
The physical frontiers are the customs and immigration barriers and controls which persist under the principle of the division of the Community into national States. As the frontier checkpoints represent additional costs in terms of delays and administrative formalities and requirements, it is sought not just to simplify the existing procedures, but to do away completely with domestic frontier controls so as to expedite the movement of people and goods between countries.
The technical frontiers or barriers are the obstacles raised by the disparity of national legislation affecting the free circulation of goods and workers and the free provision of services, particularly financial services. In addition to dismantling such barriers, it is planned to establish a framework which favours collaboration between enterprises so that these can benefit from Euro- pean-scale production.
The/¿sea/ barriers are basically the problems deriving from the different rates of Value Added Tax applied by the various countries of the Community and their negative effects on competition and trade within the Community.
There can be no doubt that the implementation of the Single European Market will profoundly influence international economic relations. This article, however, limits itself to identifying and analyzing the probable economic effects that Europe 1992 will have on Latin America. As a first step, the following section examines the main elements which have characterized the economic links between that region and the e e c .
EUROPE 92 AND THE LATIN AMERICAN ECONOMY/ M. Izam 69
I
Economic relations between Latin America and the European Economic Community
I . Trade relations between Latin America and the e e c
The EEC is the world’s biggest trading partner. Its share in world exports rose from 34.8% in 1963 to nearly 38% in 1988, when the Federal Republic of Germany became the biggest exporter of goods in the world, accounting for 11.2% of the total value of international exports.
At the same time, trade in goods within the Community has been growing steadily. In 1963 it represented 48% of the total trade of the e e c ,
while by the end of the 1980s it came to 60%. It is expected that the Single European Market of 1992 will further stimulate this trend (Commission of the European Communities, 1989a).
With regard to geographical destination (excluding intra-Community trade), around 60% of the Community’s exports of goods goes to the industrialized countries, nearly 35% to the developing countries, and almost 6% to the Eastern European countries.^ This structure, which has remained almost unaltered for the last two decades, will undoubtedly undergo substantial changes as a result of the processes of economic liberalization now underway in Eastern Europe.
If we look at the geographical origin of the imports of goods from outside the Community, we see that between 1965 and 1986 the share of the developed countries increased from 51% to 56%, whereas that of the developing countries went down from 43% to 37%. This is the opposite to what occurred in japan, where the share of the developing countries in its imports increased from 40% to 51% over the same period, while in the United States this share remained at around 35%. The Eastern European countries, for their part, increased their share in the
' It is worth noting that the share o f the Eastern European m arkets in the Comm unity’s exports o f goods, at nearly 6% , is considerably greater than the 2% and the \% that those m arkets account for in the exports o f Jap an and the United States, respectively.
Community’s imports from 6% to 8% between 1965 and 1986.
If we look at these figures in greater detail, we see that the main participants in the trade with nations outside the Community are the countries of the European Free Trade Association (e f t a ), which accounted for 24% of the exports and 21% of the imports of goods of the Community in 1986. In second place came the United States, with 21% and 16%, respectively. In this respect, it may be noted that in 1975 the United States was three percentage points ahead of EFTA as a supplier of goods to the e e c , whereas in 1980 EFTA was five percentage points ahead of it.
The Community’s trade in goods with the developing countries also shows some interesting features which are worth noting. Three regions (Latin America, the recently industrialized Asian countries, and Africa)^ provide altogether 14% of the Community’s non-EEC imports of goods: a share which did not vary at all between 1975 and 1986. Of these three regions, Latin America is the only one whose share as a supplier of the EEC has gone down: Africa maintained its share, while the recently industrialized Asian countries increased theirs.
With regard to e e c exports, in contrast, these three developing regions as a whole have actually lost importance as a market for the Community’s sales outside the e e c , with their share going down from 16% to 12% over the same period. In this respect, the recently industrialized Asian countries maintained their share, whereas those of Africa and Latin America declined, especially in
For the purposes o f this part o f the study, Latin A m erica is taken to comprise the countries o f South and Central America, together with the Caribbean islands; the recently industrialized Asian countries are Singapore, Taiwan, Philippines, South Korea, Hong Kong and Malaysia, while Africa includes all the countries o f that region except South Africa, the North A frican M editerranean countries and the members o f the Organization o f Petroleum Exporting Countries (OPEC).
7 0 CEPAL REVIEW No. 43 / A pnl 1991
the case of the latter region. Thus, Latin America was the only one of these developing regions which lost importance for the e e c with regard to both imports and exports of goods outside the Community.
This happened in spite of the significant increase in the value of trade in goods between Latin America and the e e c in the 1970s and 1980s, for this increase was less than that of the total imports and exports of goods of the two regions, which explains why each of them has lost relative importance for the other as supplier and purchaser. Consequently, over the long term the trade relations between the two groups of countries have weakened.
Thus, in 1970 the e e c was the main purchaser of the exports of the Latin American Integration Association (a l a d i ),^ accounting for nearly 33% of them. In second place came the United States, which absorbed 28.4% of those exports. In 1987, however, exports to the latter country represented 33.4% of the total exports of goods of A LA D i, whereas those to the e e c were no more than 20%. Similarly, in 1970 over a quarter of A L A D i’s external purchases came from the Community, while in 1987 only a little over 20% did so.
The loss of relative importance of a l a d i in overall trade with the e e c is also noteworthy. In 1965, ALAD I absorbed 8.2% of the e e c ’s exports outside the Community and provided 10.5% of its imports. By 1988, however, these shares had fallen to 3.7% and 5,9% respectively, thus showing that this developing region was virtually mar- ginated from the European visible trade circuit.
Another two elements which help to sum up the nature of the trade in goods between Latin America and the e e c are the maintenance of a n
increasingly favourable trade balance for Latin America and the persistence of “uneven trade” between the two areas. Thus, whereas manufactures make up 85% of the Community’s exports of goods to Latin America, they still do not exceed 20% of that region’s sales of goods to the Common Market.
The low share of manufactures in Latin America’s exports to the e e c contrasts with the growing proportion of such products in the Community’s total imports of goods (almost 60%). This indicates that Latin America’s export effort should concentrate on manufactures.
2. The Latin American external debt and the e e c
Nearly 60% of Latin America’s external debt, which amounted at the end of the 1980s to US$ 416 billion, is with the international banking system. The region has 11 main creditors: eight European countries (United Kingdom, France, Federal Republic of Germany, Switzerland (which is not a member of the e e c ), Spain, Italy, Netherlands and Belgium), plus the United States, Canada and Japan.
Latin America’s joint credit balance with the banks of those eight European countries was close to US$ 99 billion at 1987 prices. It was slightly higher than the balance with the United States banks, and was a little over three times that of the Japanese banks.
The European banks have been seeking to reduce their credit exposure in Latin America, and after the Mexican crisis of 1982 they gradually began to build up contingency funds to guard against sovereign risk situations. This move was subsequently followed by many United States banks. Unlike the latter, the European banks can take advantage of favourable banking and fiscal regulations which even provide for substantial tax deductions. Thus, in 1989 the European banks had reserves covering between 50% and 80% of their commitments with developing countries, whereas the reserves of the United States banks were only between 30% and 70% of their commitments.
Partly because of their bigger reserves, the European banks have given only lukewarm support to the Brady Plan and are showing greater reluctance to make fresh loans at a time when they are seeking to reorient their credits towards the developed countries. At the end of 1986,
F or statistical reasons, the figures for a l a d i are used as though they were representative o f Latin America as a whole in most o f this section, but this does not affect the conclusions o f the analysis.
^This contradicts the generally accepted assertion to the contrary, which wa.s lent credence by the fact that the European banks showed less interest than the United States ones in seeking solutions to the debt problem.
EUROPE 92 AND THE LATIN AMERICAN ECONOMY/ M. Im m 71
nearly 60% of European international loans had been granted to industrialized countries, com- pared with less than 35% in the case of the United States banks (s e l a , 1988). As a result, the European banking system’s credits to Latin America have gone down to less than 8% of its total loans, although Spain and the United Kingdom still have relatively high commitments with that region.
The European governments maintain that direct responsibility with regard to the debt lies with the commercial banks, the debtor countries and the multilateral agencies. They also consider that their contribution to relieving the problem should be an indirect one, preferably through the reactivation of their economies and imports. Some European countries (especially France, the United Kingdom and Belgium), however, have played a leading role in the initiatives at the Venice (1987) and Toronto (1988) summits aimed at seeking to relieve somewhat the external debt burden of the less advanced countries.
The Commission of the European Communities, for its part, has taken a more flexible attitude to the external debt problem. It has accepted that the problem is of a political nature, and in 1985 and 1986 it acted as interlocutor with the Cartagena Agreement (which groups together 11 Latin American countries) in a dialogue aimed at reaching a global approximation that could serve as a basis for recommending initiatives in specialized forums. Despite the support of the European Parliament, however, the Commission’s efforts to forge a common European position and keep up a political dialogue with the debtor countries of Latin America were frustrated by lack of support from its member countries and the fact that the Commission did not have direct competence in this area.
The Commission’s competence on this matter is only indirect, being limited to the repercussions caused by the debt problem on its level of trade. In this respect, it has been estimated that over a million jobs have been lost in the e e c
because of the drop in European exports to the heavily indebted developing countries and that half of this loss may be attributed to the decline in Latin America’s imports because of the application of adjustment policies in the countries of the region (i r e l a , 1987, p. 21).
All in all, Europe’s participation in the search
for ways to relieve the Latin American external debt problem has not been very significant, and it seems unlikely that there will be a substantial flow of voluntary loans from Europe 1992 to Latin America. At the same time, the opening up of Eastern Europe and the political and economic interests of the e e c in that area give grounds for expecting that it will be competing with Latin America as a recipient of financial resources.
3. The EEC and its direct foreign investment in Latin America
In recent years, world flows of direct foreign investment have increased substantially, due basically to the improvement which has taken place in the world economy. However, they have continued to go primarily to the developed countries.
If we look at the countries which have received flows of direct foreign investment, we see that there has been a notable increase in the share of the developed countries and a sharp reduction in that corresponding to the developing countries (CTC, 1989). Between 1981 and 1983, the first-named countries received an average of 72.5% of the total amounts, while in the period1984-1987 this figure went up to 78.8%, the increase being basically absorbed by the United States, which has come to receive nearly 45% of the total world value of these flows. The relative importance of the developing countries as recipients of direct foreign investment, however, has gone down from an annual average of 27% in 1981-1983 to 21% in 1984-1987, due inter alia to the fact that many of these economies have faced extremely serious constraints.^
An analysis by regions indicates that Africa and West Asia maintained their share of direct foreign investment flows in general terms in the 1980s, with levels of 3% and 1%, respectively. Southeast Asia’s relative share went down from 11% in 1981-1983 to 9% in 1984-1987, and the same thing occurred in Latin America and the Caribbean, whose share fell from 13% to 8% be-
It should be noted that only in 1987 did the absolute value o f the flows o f direct foreign investment to the developing countries recover and exceed the level achieved in 1981.
7 2 CEPAL REVIEW No. 43 / April 1991
tween the two periods in question. This latter region suffered the biggest decline in its share as a recipient of direct foreign investment, with the average annual value of these investment flows going down in absolute terms from US$ 6.1 billion in 1981-1983 to US$ 5.8 billion in 1984-1987.
Between 1967 and 1988, the share of direct foreign investment from the Community in the total flow to Latin America grew from 23% to 28%.^ This increase is not very significant if it is compared with the growth in the Community's share of the total world value of direct foreign investment (which went up from 40.2% in 1967 to 51.2% in 1987). This lag in Latin America’s share raises the question of the need to analyse what relative importance Latin America will have for the EEC in the light of the Single European Market of 1992 and the opening up of Eastern Europe.
A, The EEC and its official development aid to Latin America
In the sphere of financial co-operation, the Community as a whole is the main world source of official development aid, with the United States and Japan occupying second and third place, respectively. The Community’s share in the world total of this aid rose from 32.7% in 1970-1971 to 35.3% in 1986-1987.
Leaving aside the bilateral contributions which member countries make of their own accord, the Community’s development co-operation (the origin of which goes back to the Treaty setting up the Community) has basically been oriented towards the developing countries or regions which are associated with it and with which it has maintained a specially privileged relationship: that is to say, the signatory countries of the Lomé Agreement, and some other nations located in the southern and eastern Mediterranean.
In fact, it was only 30 years after its establishment that the Community decided to extend its official aid to developing countries which were not formally associated with it. Only in 1976 did it begin to channel this aid, on an experimental
® Data obtained directly from the Jo in t eclac/c t c T ran snational Corporations Unit,
basis, to the developing countries of Asia and Latin America, which do not receive a very significant proportion of the total Community contribution. Thus, the Community’s contribution to Asia and Latin America in 1976-1988 came to nearly US$ 4.5 billion, of which Latin America only received 25%. Africa, for its part, received over 50% of the Community’s official development aid, whereas South America only received 4.8% of it.
Thus, Latin America only gained access to these benefits at a late stage, and the amounts it has managed to obtain are not very significant, not only compared with the developing regions that have preferential relations with the e e c , but also compared with other areas which are not formally associated with the Community. The reasons behind this attitude of the Community are, on the one hand, the fact that the e e c sees Latin America as a region at an intermediate level of development, while on the other the Latin American countries are felt to be in an area that is clearly linked with the United States.
5. Bilateral and subregional agreements between the EEC and Latin America
There are two types of co-operation agreements between the e e c and Latin America. On the one hand, there are those which the Community has signed with various subregions of Latin America because of the Community’s interest in establishing agreements with groups of countries considered to be relatively similar. Two such agreements are currently in effect: one with the Andean Pact and the other with the Central American countries. In addition, the e e c has signed individual co-operation agreements with three Latin American countries: Brazil, Mexico and Uruguay, All the above agreements are more along the lines of framework agreements, since they do not contain specific commitments, even with regard to technological collaboration, but serve rather as basis for dialogue to stimulate economic co-operation.
These agreements have not fully satisfied Latin American expectations, since their effects have been restricted by the limited instruments and resources available to the Community with respect to countries which are not associated with it. In particular, the agreements signed with the
EUROPE 92 AND THE LATIN AMERICAN ECONOMY/ A i. Imm 7 3
Latin American countries do not contain financial protocols, in contrast with the agreements in
effect between the e e c and the Mediterranean countries, for example.
II
The economic effects of Europe 1992 on Latin America
1, Potential benefits o f the Single European Market for the e e c
In order to obtain quantitative appraisals of the economic benefits that the Single European Market could bring, the Commission of the European Communities requested, inter alia, a study under the general direction of Paolo Cecchini, a former official of the Commission, which was published in summary form in 1988 in a volume known as the Cecchini Report.
It is concluded from the analysis that the elimination of physical, technical and fiscal frontiers referred to earlier will lead businessmen to reduce both their prices and their production costs, as they will be facing the pressure of much wider competition. This drop in prices, in turn, will stimulate demand, so that there will be an increase in production, which will lead to further cost reductions thanks to economies of scale. Benefits are also expected through the use of new trade strategies and the improvement of the efficiency of enterprises through the introduction of technological innovations and new production processes, all stimulated by the dynamics inherent in the internal market.
In particular, the Cecchini Report quantified the effects of the reduction of obstacles with respect to customs procedures, government purchases and financial services. It considered that the biggest benefits would come from the liberalization of the latter market, which it is hoped will lead to the transfer of the lower costs of financial services to the economy as a whole, thus reducing prices and increasing demand and production, while at the same time the favourable effects would lead to increased investment in response to the lower cost of credit.
According to the report, the above factors
would generate a 4.5% increase in the gross domestic product, the creation of 1.8 million new jobs, and a reduction of 6.1 % in consumer prices. The public sector balance would improve by the equivalent of 2.2% of the gross domestic product, since tax revenue would rise because of the increase in the product, while expenditure would go down because the keener competition on the market would bring down the prices of the goods purchased by the public sector. The greater competitiveness of exports would raise the Community’s current account balance with the rest of the world (which at present is more or less balanced in global terms) by the equivalent of 1% of the gross domestic product. These benefits would take place on a one-time basis and would be obtained in the medium term, four or five years after the integration programme was completed, that is to say, around 1997.
According to the Cecchini Report, if the governments of the EEC countries adopt more expansionary fiscal policies and spend the whole of the increase registered in the public sector balance, then the medium-term increase in the gross domestic product would rise from 4.5% to around 7%, the number of new Jobs would be close to five million, the public sector budget would remain in its present state, prices would fall by nearly 4.5%, and the current account of the Community would register a deficit equivalent to 0,5% of the gross domestic product.
Arguments have also been put forward pointing to the positive effects which Europe 1992 could have on the economy of the rest of the world. These arguments are considered below, more in termsof hypotheses than concrete analyses, since this is a topic which has not yet been fully dealt with and does not permit categorical conclusions.
74 CEPAL REVIEW No. 43 / April 1991
2. The possible favourable economic impact of Europe 1992 on the rest of the world
The Community has declared that the Single European Market will represent an important step forward in the search for greater deregulation and liberalization of international trade. In its view, Europe 1992 will not be an economic fortress but a trading venture. This optimistic outlook assumes that a regional free trade agreement can be a key element in the construction of a broader and more multilateral international trade system.
One of the main arguments put forward is that if the integration of the European market produces the expected high growth rates in the economies of the Community, then the corresponding increase in income could be reflected in a higher level of imports, which would boost international trade flows and raise economic activity in the rest of the world, since the Community is the developed region which is most open to international trade.
1 his same line of analysis maintains that protectionist pressures in the Community will be reduced, both because of the expected increase in the economic growth rate (close to 7% in the most favourable option) and through the generation of five million new jobs that such growth would bring about. Such pressures would also tend to go down because European Firms would improve their efficiency as they were able to take advantage of economies of scale.
Latin America could benefit from the higher level of imports of the e e c only if its export structure is in line with the real needs of the European market and if its export products are able to compete in terms of price and quality both with the rest of the world and with the more efficient European production.
One element which strengthens the argument for the reduction of protectionism by the Community against imports from the rest of the world is of an institutional nature. It is expected that the qualified vote introduced by the Single European Act will eliminate an important factor favouring protectionism, which is often demanded by the weaker nations, regions or sectors in order to cope with external competition.
Another favourable aspect would be the lower rate of inflation brought about by integra
tion of the Community’s market. It may be recalled that the Cecchini Report foresees a reduction in consumer prices, which could lead to lower interest rates if the inflationary expectations of the economic agents go down too. The possible reduction of international interest rates would particularly benefit the countries of Latin America, because of their high level of external indebtedness.
Moreover, if the e e c lowers the prices of its exports, the rest of the world would benefit both through more favourable conditions in their trade with the Community and through the benefits obtained from a more competitive international environment in which the United States and Japan would have to respond by reducing the prices of their exports in order to face up to possible improvements in production efficiency in the EEC.
Another effect of the restructuring of the Community scheme would derive from the possibility that in an as yet undetermined length of time the Community will have a single currency in which it will carry out all its transactions. This would be positive for two reasons; firstly, because it would reduce the number of international currencies, since in practice 11 of them would disappear, and secondly, because the European Currency Unit would become a third reserve currency (together with the US dollar and the Yen), thus facilitating the co-ordination of macroeconomic policies among the main industrialized countries.
Furthermore, it may be assumed that the Single European Market will involve the reassignment of the EEC’s budget, diverting financial resources from the biggest item of expenditure —the Common Agricultural Policy (c a p )— to research and development and to support for the regions of Europe most seriously affected by the need to adjust their economies to meet the new requirements for higher competitiveness.
The foregoing, together with the pressures exerted by many countries in g a t t to try to get the EEC to agree to liberalize trade in agricultural products, and the voices in Europe which point out the inefficiency of maintaining a Common Agricultural Policy like the present one, make the modification of the latter seem inevitable. Indeed, the e e c understands that further progress in the reform of this policy which was begun
EUROPE 92 AND THE LATIN AMERICAN ECONOMY/ M. Izam 75
in 1984 is an element that must be taken into account for the consolidation of the Single European Market.
This matter has significant international projections. The liberalization of world markets for agricultural products and the elimination of all types of support for their production, which is expected to take place gradually, will be an important stimulus for those countries (particularly developing nations) which have certain comparative advantages in the production of such goods.
3. Critical appraisal o f the Cecchini Report
Probably the most important criticism levelled at the Cecchini Report is that its projections of the economic benefits which the Community would obtain by integrating its markets are based only on the most favourable scenarios. It may be noted by way of illustration that according to one estimate (Peck, 1989, p. 21) the benefits could possibly amount to an increase of only 2% of the gross domestic product, instead of the rise of between 4.3% and 6.4% projected in the report.
Moreover, the Cecchini Report does not deal in depth with the economic adjustment that must necessarily take place in the nations of the Community, its intensity and duration, or the adverse effects it could have with regard to unemployment. In principle, certain enterprises in some countries of the e e c could suffer losses by being exposed to more intensive competition. Indeed, most of the benefits to be obtained by taking advantage of economies of scale would come from a restructuring process which would cause a by no means insignificant proportion of the enterprises of the Community to disappear.
According to a study by Smith and Venables (1988), the number of enterprises would go down in all branches of industry except cement and office machines. The most extreme case would be that of the footwear industry, where 207 of the 739 firms existing in the Community would disappear. Some countries would bear a particularly large proportion of these costs: for example, the United Kingdom would lose 46 of its 65 footwear companies, 31 of its 52 carpet companies, and one of its three motor vehicle firms.
Moreover, the problem of unemployment will probably become more critical in the short term, possibly causing serious social and political
pressures for the restoration of the previous levels of protection or demands that governments should bear the costs of the liberalization process. This would be reflected in higher expenditure on unemployment benefit or in the application of an expansionary fiscal policy which the public sector would have to finance through indebtedness with the private sector, thus possibly generating upward pressures on interest rates.
Finally, the success of the Community project will depend on the political will of the governments to accept a position which goes beyond national interests in certain matters: something that will not be easy to manage, since the benefits of the unification process will not be equitably distributed.
4. A different view of Europe 1992
Although from the European point of view the Single European Market is seen as a great movement towards deregulation and economic liberalization, some sectors in the rest of the world see it rather as an attempt to erect a fortress which will prevent the improvement and further development of economic relations with the e e c .
Thus, various economic interest groups, especially in the United States and Japan, fear that the intra-Community restrictions adopted will later be transferred to the exterior. In their view, the Single European Market will defend the Common Market from external competition: the process of deregulation will cause internal imbalances which will increase unemployment and produce still wider gaps between the different regions of the e e c , leading to social problems and the resurgence of national or local feelings which will finally be reflected in an increase in protectionism by the Community.
"Fhe question, then, is what will happen as from 1992 with regard to the protection which the EEC applies against imports from the rest of the world. In answering this question, it is necessary to single out at least two of the elements which make up the concept of protectionism. 4Te first of these is the common tariff rate, regarding which it is necessary to see if the new levels correspond or not to the weighted average of the levels currently prevailing in each of the countries. The second point is that of non-tariff barriers, regarding which it is important to know
7 6 CEPAL REVIEW No. 43 / April 1991
th e r u le s a n d r e q u ir e m e n t s w h ic h th e e e c is l ik e ly .
to im p o s e o n im p o r t s .
With regard to tariffs, there are some points of concern, since when the e e c was set up, the industrial tariffs were averaged on an arithmetical basis, whereas those applied to the agricultural sector were raised in line with the Common Agricultural Policy. When Spain entered the eec :,
its industrial tariffs were reduced, but its agricultural protection went up. These two situations gave rise to intensive negotiations both inside and outside GATT . The final decision was not very clear, even though this body lays down that in both customs unions and free trade areas, the level of protection against non-member countries should not be higher than that existing when these unions were set up (g a t t , 1948, article xxiv).
Another element which might tend to back up the theory of “fortress Europe” is the extraordinary growth registered in intra-Community trade. This grew from 48% in 1963 to nearly 60% of total Community trade today. Even so, however, it would appear that this increase — achieved to some extent at the expense of extra- Community trade — is not yet considered sufficient. Various European studies maintain that the current imports from outside the Community should be at least partially replaced by products of the EEC itself.
With regard to non-tariff protection, it may be noted that the harmonization of the trade regulations of the e e c does contain a positive element for the rest of the world. Thus, it will be easier and less costly and risky to deal with the countries of the Community on the basis of a single system of trade and economic rules and requirements, instead of negotiating individually with each of the 12 nations which now make up this integration scheme.
However, this harmonization will also have some negative effects for certain developing countries, since the trade preferences which some member countries of the Community have granted to certain developing nations will gradually be eliminated. As from 1993, these preferences will come under a common scheme to be decided by the EEt: itself.
With regard to this point, it may be noted that the Community will have still more power to perfect its arsenal of import restriction meas
ures, such as reciprocity agreements, antidumping mechanisms, and the new trade policy instrument ; these measures have been severely criticized by the rest of the world and have been accused of lacking transparency. Moreover, the preferences of European consumers are increasingly inclined towards high quality products whose technical specifications safeguard health' and the environment. This attitude could serve to legitimize the application of more sophisticated trade regulations by the Commission, which would thus try to satisfy the new demands of consumers, who represent the ultimate political support for the integration scheme.
At the same time, European producers are deploying all their influence in order to make the Commission adopt greater protectionist measures. A substantial proportion of businessmen in the Community are already producing goods which are in line with the new quality standards demanded by European consumers, so that they are in a position of relative advantage vis-à-vis foreign competition.
In view of the foregoing, it is reasonable to expect an increase in the number and a certain hardening in the nature of non-tariff measures, rather than a general rise in tariff rates, in order to provide temporary and selective protection for certain industries which have to adapt themselves to greater external competition within the Community, at least in such key sectors as electronics and informatics.
At all events. United States and Japanese firms plan to get inside the Community’s space as soon as possible, as a strategic way of avoiding conflicts which could arise with the possible increase in trade protectionism. Thus, the e e c is receiving a growing proportion of world direct foreign investment (c t c , 1989). Between 1981 and 1983, 15% of United States direct foreign investment went to the e e c , while between 1984 and 1987, the figure rose to 55%. Between the same years, the figures for Japan rose from 10% to 17%.
^This instrum ent enables private businessmen o f the Community to approach the (a)m mission directly in order to request protective measures against im ports that they claim are using “unfair trade practices“.
EUROPE 92 AND THE LATIN AMERICAN ECONOMY/ M. Im m 7 7
5. The relative importance of Latin America for the European Economic Community
a) The e f x and the industrialized countries
Two recent phenomena have once again placed the European Continent at the centre of world attention. The first of these is the further development of the Community’s integration scheme, with the probable incorporation into it of the countries which currently make up e f t a . The second phenomenon is related to the processes of political and economic reform which are underway in almost all the Eastern European countries and the redefinition of the political and economic links between those countries and the EEC.
This indicates that Europe is moving towards substantial changes in its political and economic relations, and the e e c is undoubtedly a leading actor in this process. The Community plays the role of the binding factor between the various countries of the Continent, in order to bring into effect the old idea of a unified Europe. For this reason, the e e c attaches high priority to its economic and political relations both with the six countries which currently make up e f t a (Switzerland, Austria, Sweden, Norway, Finland and Iceland) and with the Eastern European nations.
As already noted, the e f t a countries are not only the main trading partners of the e e c but have also been steadily increasing their economic links since the creation of a free trade area between the two groups in 1973. More recently, in June 1990, formal negotiations were begun between these two blocs of countries with a view to establishing a common economic space with free circulation of goods, services, labour and capital. This gives grounds for thinking that further e f t a
countries could also request their formal incorporation into the e e c , following the example of Austria, which formally applied to do this in1989. Such an expansion would not raise serious economic difficulties, since the levels of development of the e f t a countries are equal or superior to the Community average.
The EEC’s current position in this respect is clear. In June 1990, a high official of the Commission said that the Community had chosen to deepen its activities rather than expand them:
only after 1992, once it had achieved a better definition of itself, would it begin negotiations with the European countries which had applied to join it. Meanwhile, the e e c was negotiating with the e f t a countries to create a common economic space with them.®
With regard to the Eastern European countries, the momentous political changes which have been observed in them recently have also been reflected in the economic sphere, where the reforms are oriented basically towards the establishment of private ownership of the means of production and the fixing of prices through the market mechanisms.
Although the Western countries view the reforms applied in Eastern Europe with a certain amount of caution, it may be asserted that generally speaking they have shown great interest in these processes. Both the Group of Seven and the Organization for Economic Co-operation and Development (o e c d ) have referred on various occasions to the need to encourage the economic reform processes taking place in Eastern Europe, in order that these countries may be fully integrated into the world economy. Notwithstanding the great interest displayed by these two bodies and their possibility of establishing direct agreements in order to tighten their economic links with the Eastern European countries, both of them recognize that in this respect the EEC has a particularly privileged status because of the specific nature of its relations with these countries. It may be noted, for example, that at the Summit Meeting of the Seven, held in July 1989 in Paris, the e e c was given responsibility for co-ordinating the aid to be provided by the 24 OECD countries to Hungary and Poland in order to support the efforts of the latter countries to transform their economies.
In addition to the financial aid which the most highly developed Western countries plan to give to Eastern Europe, the Community’s budget also provides for credits totalling nearly US$ 3 billion to assist in the economic reconstruction of this area between 1990 and 1992. The Community has also granted a structural adjustment
® From the statement delivered by Mr. Vittorino Allocco, Head o f the Commission’s O ffice in Chile, on 5 Ju n e 1990 in the Catholic University o f Chile.
78 CEPAL REVIEW No. 43 / April 1991
loan to Hungary in the amount of US$ 1 billion and food aid to Pi)land in the amount of US$ 256 million.
Furthermore, all the Eastern European countries which adopt economic reforms designed to promote the functioning of the market forces can take advantage of credits from the European Bank for the Reconstruction and Development of Eastern Europe, which the e e c proposes to set up with capital of nearly US$ 13 billion.
This financial assistance has been complemented with a set of trade liberalization measures designed to reduce tariffs and eliminate nontariff barriers affecting the e e c *s imports from the Eastern European countries. In addition, certain exports from some countries of the area, such as Hungary and Poland, can take advantage of the EEC’s Generalized System of Preferences: a benefit which was subsequently also made available by other o e c d countries. Likewise, after Czechoslovakia had already done so, Bulgaria and Romania were able to take advantage of the EEC’s most-favoured- nation clause and they were also able to do so in some other o e c d countries.
The foregoing undoubtedly points to still closer trade relations between Western and Eastern Europe, which are already closer than the links between the latter area and the rest of the western world. Nearly 8% of the e e c ’s imports from outside the Community come from Eastern Europe: a percentage which is notably higher than the latter area’s share in the imports of the United States (around 1%) and Japan (nearly 2%). Likewise, nearly 70% of Eastern Europe’s exports of goods to OEt:D countries go to the e e c .
The reunification of Germany will undoubtedly lead to closer and deeper economic and political links between Eastern and Western Europe. Within this same context is the fact that Hungary wishes to enter the e e c as a full or associate member. Likewise, the President of Czechoslovakia has spoken of a “Central European” unit, with historical, cultural, political and economic links.
In this connection, a high official of the Commission said that the e e c was studying the possibility of transforming the co-operation agreements linking the Community with the Eastern European countries into true agreements of association, with institutional organs to ensure po
litical and economic co-ordination with them: a challenge which amounted ultimately to uniting the whole of the Old World around the same ideals in order to convert it into a vast area devoted to the pursuit of peace and freedom.^
The foregoing shows that the Eastern European countries are of enormous interest to the EEC and will be competing with Latin America for loans, development aid, trade facilities, and direct foreign investment.
Within the industrialized world that lies outside the limits of Europe, the Community has shown special interest in economic relations with the non-European member countries of o e c d . It maintains close links with them in the areas of trade and finance as well as direct foreign investment, and in fact the United States is the Community’s main trading partner within an overall scheme in which Japan is also a key element.
b) The EEC and the developing countries
Within the developing world, the e e c has great interest in its links with the Mediterranean countries: it has signed association or co-operation agreements with 12 of them as part of a global policy aimed at furthering the economic development of these countries and promoting mutual trade.
With regard to the Northern Mediterranean countries, the e e c grants customs concessions in respect of most of the industrial products sold by Yugoslavia, which has also obtained loans from the European Investment Bank in an amount of over US$ 700 million over the last five years. The e e c has also established special agreements with Turkey, Cyprus and Malta, whereby the industrial exports of those countries can enter the e e c without paying customs duties and without any limitation on volume, while concessions have also been made in respect of various agricultural products. Turkey, Cyprus and Malta have all officially applied to join the e e c .
In the case of the eight Southern Mediterranean countries, the e e c has signed agreements
^Address delivered by Mr. Vittorino Allocco, Head o f the Commission's O ffice in Chile, on 5 Ju n e 1990 in the Catholic University o f Chile.
EUROPE 92 AND THE LATIN AMERICAN ECONOMY/ M. Izam 79
on trade, industrial, technical and financial cooperation with all of them, whereby the industrial products of these countries have free access to the Community market, while specific concessions have also been granted for some agricultural products and financial assistance in the amount of US$ 2 billion has been provided over the period 1986-1991. Special mention may be made of the close economic links which the e ix : has with Morocco, which has also applied to join the Community.
Thti EEC also shows keen political and economic interest in the Arab nations of the Persian Gulf, due especially to its dependence on that region of the world for energy resources. Specifically, it is seeking to expand the existing trade agreements to cover trade collaboration, transfer of technology, investment incentives, agricultural development, and other matters connected with development co-operation.
There are also the 66 African, Caribbean and Pacific (a c p ) countries which are signatories of the Lomé Agreement, These are mostly excolonies of European countries, with which the EEC maintains especially privileged relations. Thus, with regard to trade, almost all the a c p
countries’ exports to the EEC can enter the Community free of all customs duties, and the Community has even granted preferences in respect of products which compete with its own agricultural sector (for example, sugar).
An integral part of this Agreement is the “Stabex” fund, which is designed to guarantee the income from exports of basic commodities by the a c p countries to the Community. Another similar system called “Sysmin” finances the maintenance and repair of mining installations, as well as economic reconversion when the mining potential of the ACP countries is seriously affected by unforeseeable circumstances.
In addition to these support elements, the range of co-operation instruments used by the Community in its relations with the a c p countries includes many other facilities. Financial and technical co-operation to those countries amounted to US$ 10 billion between 1985 and 1990 and was directed, inter alia, to rural and agricultural development, industrialization, economic infrastructure, social development, small and medium-sized enterprises, telecommunications, ports and water supplies.
These agreements are renewed every five years: the latest of them, known as Lomé IV, was signed in February 1990 and will run until 1995. The negotiation process which culminated in that agreement was different from the three preceding ones, since the original financial demands of the At;p countries were almost 53% higher than the amount offered by the Community. These countries considered that the effects of the structural adjustment processes on unemployment and public expenditure, plus the drop in the prices of some of their most important export commodities and their external debt burden, meant that the Community should reappraise its relationship and co-operation with them, particularly in financial matters but also in the area of trade.
Finally, reference should be made to the Asian developing countries which are not members of the Lomé Agreement and the Latin American countries. From the Community’s viewpoint —because of their low level of per capita income— the e e c gives the former priority over the latter, especially with regard to development assistance and co-operation.
c) The EEC and Latin America
It may thus be seen that Latin America has not only lagged behind in its economic relations with the EEC, but has also not received priority in the Community’s scheme of regional or geographical economic preferences. This situation contrasts sharply with the much closer political relatii)ns established between the two regions and the hope of even closer contacts when Spain and Portugal join the Community.
Since the e e c does not assign great economic importance to Latin America, the latter region may be more seriously affected than the rest of the world if the economic effects of Europe 1992 turn out to be negative for the countries outside the Community. On the other hand, if those effects are positive, Latin America will still not benefit from them as much as the rest of the world, be it developed or developing, western or eastern.
Consequently, in order to cope with the situation raised by the Single European Market, Latin America must understand that it forms part of a broader context of profound changes in the international economic system and that
8 0 CEPAL REVIEW No. 43 / April 1991
the great challenge this raises must be faced through regional as well as national efforts.
6. Some action guidelines
Everything indicates that in the medium term the process being carried out by tbe Community will lead to the improvement of its levels of production efficiency, with similar responses from the traditional industrialized countries and the countries of recent industrialization. It may therefore be expected that in the future international economic relations will be increasingly competitive. This future situation raises important challenges, but also offers opportunities which must be exploited. Some general guidelines for Latin America’s action in this respect are outlined below:
i) It is essential to ensure that Latin America’s new insertion in the international economy is in keeping with the new and dynamic changes in the structure of world demand. It is vital to make profound changes in the production of both goods and services in order to be able to respond in a competitive manner to the current international demands. This will only be possible through a process of changing production patterns with social equity"* which seeks to raise productivity, improve the efficiency of all factors of production, and increase the added value of exports.
ii) It is necessary to resume the path towards regional economic integration with renewed approaches having real, solid bases: a task which must be tackled in a manner that goes beyond the mere search for a geographical space which facilitates exports to third markets. Latin American integration must also be directed towards the configuration of a scheme which makes possible regional co-ordination and consensusbuilding in order to improve Latin America’s
' " fc L- lC has dealt at length with the issue o f changing production patterns with social equity, which is one o f its main concerns (see eclac, 1990a),
bargaining position both with the international finance agencies and vis-a-vis the great blocs of countries which are now acting jointly.
iii) With regard to the e e c , Latin America must seek, through its negotiating position, to raise its economic relations with the Community to a level similar to that existing in the political sphere. It should be noted in this respect that the argument put forward for decades by the e e c
in Justification of the low profile of the economic relations between the two regions has been “the absence of a valid interlocutor representing Latin America’s point of view”. Clearly, it is the responsibility of the region to demolish that argument, and the only way to do so is by speaking ■ with a single voice.
iv) With regard to the bilateral economic cooperation agreements between the Community and Latin American countries, the existing agreements with Brazil, Mexico and Uruguay must be further developed and it is essential to create suitable conditions for the establishment of similar agreements with as many Latin American nations as possible, in order to develop and improve the economic links between the two regions in all possible fields.
v) Efforts must be made to establish Latin American enterprises within the Community, as a means of ensuring the marketing of the region’s goods or services in that area. Consideration could also be given to the possibility of arriving at joint production agreements with e e c enterprises within the territory of the Community, which would enable Latin American enterprises to take part in European public sector tenders, where a certain minimum local content of products is required.
vi) In the financial field, Latin America should seek forms of finance different from those already existing in the Community, by offering realistic and stable incentives for foreign investment from the various member countries of the EEC. The investment projects thus agreed upon could well be accompanied by additional “voluntary” loans.
EUROPE 92 AND THE LATIN AMERICAN ECONOMY/ M. h a m 81
B ib lio g r
CEC (Commission o f the European C>ommunÌties) (1978), Treaties Establishing the European Communities, Luxem bourg.
________ (1985), de Europa, Luxem bourg.________ (1986), Un viaje a traves de Europa, Luxem bourg.________ (1987a), Europeaii Economy, No, 34, Brussels, No
vem ber.(1987b), Treaties Establishing the European Commutu-
ties. Abridged Edition, Luxem bourg.____ (1988a), European Economy, No. 38, Brussels, November.
____ (1988b), Bulletin o f the European Communities, vol.21, No. 10, Luxem bourg.
____ ( 1988c), Zíw//eíói o f the European Communities, vol. 21,Nos. 7/8, Luxem bourg.
____ (1988d), Bulletin o f the European Communities, vol.21, No. 9, Luxem bourg.
____ (1988e), La realización del mercado interior: tin espaciosin fronteras, Report on the status o f the work called for in Article 8B o f the Treaty, Brussels.
___ ( I 9H9r) ,E uropean Economy, No. 39, Brussels, March.___ ( I9 8 9 h ), European Economy, No. 40, Brussels, May.
(1989c), Trece años de cooperación a l desarrollo con losí’vj) de Asia y de América Latina: datos y resultados de la experiencia, 7 'e n -yearly report, Brussels,
____ (1989d), La aplicación de la ayuda financiera y técnicaen fa v o r de los países en vías de desarrollo de América Latina y Asia, Eleventh rep on o f the Commission to the Council and the European Parliam ent, Brussels.
____ {1989e), Bulletin o f the European Communities, vol. 22,No, 6, Luxem bourg.
____ (19891), Bulletin o f the European Communities, vol. 22,Nos. 7/8, Luxem bourg.
ci't; (United Nations Centre on Transnational Corporations) (1989), The c r c Reporter, No. 27, New York, Spring.
Dornbusch, Rudiger (1989), Europe 1992: m acroeconomic implications, Brookings Papers on Economic Activity, No. 2, W ashington, D.C., T h e Brookings Institution.
E t X A t ; (Economic Commission for Latin America and the Caribbean) (1989), Transnational Bank Behaviour and the International Debt Crisis (l.c/(;. 1553/Rev. 1-p), “Estudios e Inform es de la c e p a i .” series. No. 76, Santiago, Chile. United Nations publication. Sales No,: t..89.ii.t;. 12.
________ (1990a), Changing Production Patterns with Social Ecgm/y (i.(7(;, 1601-1*), Santiago, Chile, March. United Nations publication. Sales No.: F..9 0 .11.0.6.
________ (1990b), Latin America and the Caribbean: Options toReduce the Debt Burden (f (7g. 1605-P), Santiago, Chile, M arch. U nited Nations publication. Sales No.: E.90.ii.i;,7.
Fieleke, N orm an (1989), Europa 1992, Perspectivaseconomicas. No. 69 , W ashington, D.C., United States Inform ation Agency.
G A T E (General A greem ent on T ariffs and T rade) (1948), Geneva.
aphy
Cirabendorff, W olf (1989), Las relaciones de la Comunidad Europea con América Latina: una política sin ilusiones. Integración Latinoamericana, No. 144, Buenos Aires, In stitute for Latin American Integration ( ineal), April.
Harbek, Rudolf (1987), E l impacto de la Comunidad Europea en IcLs políticas exteriores de los países miembros, la form ación de la política exterior: los países desarrollados y América Latm a, Buenos Aires, Program m e o f Joint Studies on the In ternational Relations o f Latin America ( r i a i ) . Grupo Editor Latinoamericano.
Iglesias, Enrique (1987), Nuevas form as de cooperación entre la Comunidad Económ ica Europea y Am érica Latina, Estudios internacionales, año X X , No. 79, Santiago, Chile, RIAL, July-September.
Instituto de Estudios Económicos (1988), Los efectos del M ercado Unico Europeo, Revista del Instituto de Estudios Económicos, No. 4, Madrid.
|R E[. A (Institute for European-Latin American Relations) (1987), Europa occidental y la deuda externa de América Latina, Dossier No, 11, Madrid, Ju n e .
------------ (1989a), Relaciones entre la Comunidad Europea yAmérica Latina .'balance y perspectivas, basic docum ent, Madrid, mimeo.
(1989b), América Latina y Europa en los 90 : ¿haciauna nueva relación?. C onference Report No. 3, Madrid.
Julienne, Hubert (1987), Cooperación económica entre la Comunidad Europea f América Latina: posibilidades y opciones. W orking Docum ent No. 4 , M adrid, irela.
Koopmann, G, and H. Scharrer (1989), ‘Fortress Europe’- an illusion or a real danger?. Intereconomics, vol. 24 , Nt). 5, Hamburg, Verlag W eltarchiv (im bH , Septem ber-O c- tober,
O E C D (Organization for Econom ic Co-operation and Development) (Ì 988), Development Co-operation, Paris.
----------- (1989), Development Co-operation, Paris.Peck, M erton J .( 1989), Industrial organization and the gains
from Europe 1992, Brookings Papers on Economic Activity, No. 2, W ashington, D.C., T h e Brookings Institution.
-SF.l.A{Latin American Econom ic System) (1988), L a situación económica de la Comunidad Economica Eurofsea (cee) y sus relaciones con América Latina y el Caribe (sp/ci/xiv.O/Di), No. 11, Caracas.
________ (1989), Documento del grupo latinoamericano enBruselas: informe sobre las relaciones entre América Latina y la C o m u n id a d E u r o p e a (p e r ío d o 1 9 8 8 - 1 9 8 9 ) (sp/gl/xv,0/Dí), N o. 12, Caracas.
Sm ith, Alasdair and Anthony Venables ( 1988), An assessment based on a form al model o f im perfect com petition and economies o f scale, Research on the “Cost o f N on-Europe”. Basic Findings, vol. 2, Luxem bourg, O ffice for O fficial Publications o f the European Comm unities,
Viñals, José (1988), E l sistema monetario europeo. España y la política muer oeconómica. W orking D ocum ent No. 8804 , Madrid, Banco de España, Servicio de Estudios.

CEPAL REVIEW No. 43
The competitiveness of the small economies of the regionRudolf Buitelaar*Juan Alberto Puentes**
T his iiriide explores the diRnges in sources o f com petitiveness in the exports o f small countries to the industrialized mai'kei economies between 1978 and 1988,
T lie crisis o f the 1980s hit the small countries oi Latin America severely, and their development prospects became closely related to their pattern o f insertion in international markets. Im portant transform ations are taking place, rellected lor exam ple in the upsurge o f non-traditional exports.
I ’he analysis o f the items that registered export growth to the ot'.ct) countries between 1978 and 1988 reveals that unprocessed natural resources and the use o f unskilletl and cheap labour account for most o f this growth. Nevertheless, a considerable num ber o f items where the increase in exports was based on more diversified sources o f competitiveness, including the incorporation o f science and technology, can be ideiui- tlecl. These incltidc products that make use o f natural resources or cheap labour but fortify their competitive position through m arketing strategies o f product dif- fei'entiation; in addition, some examples can be found o f m anufactured exports linked to available natitral resoui'ces.
T he purpose o f this article is to contribute to the analvsis o f the specific conditions that small countries must face when transform ing their insertion in world m arkets. W hereas in large-and medium-sized coun- ti'ies o f the region considerable consensits exists regarding the superiority o f outward-oriented development strategies that emphasize competitiveness on the basis o( technical progress and human resources developm ent, the prospects for this tvpe o f development strategv in smaU countries seem to ne a m atter o f debate and l equire further specific analysis. 'I'he article comes to the following conclusion: there are examples in the experience o f the region which indicate that ihei'e are very sound reasons for seeking to prom ote tite competitiveness and the sustainabilitv o f the de- \'elopnieni o f small Latin American and Caribbean countries by taking advantage o f their comparative advantages and applying science and technology in sectors whose competitiveness has hitherto been based on unprocessed natural resources or the use o f cheap unskilled labour.
* [''.comanil' .\M:iirs (.Ifficci' in the Jo in t kci.ac/cm do In- ilu.sirv and I'cclinolofry division.
* * bconoitiic .'\t iaii',s Of ficer in the O ffice o f the K xeaitivc ■Senetan of la i.Ac.
IntroductionThe widespread literature on the development of small nations usually identifies income, geographical area and population as the main determinants of whether they are considered small or not (Kuznets, I960; Perkins and Syrquin,1989). Size-related constraints on development are normally associated with small domestic markets and limited resources, identified with common patterns such as higher trade ratios and less diversification on the supply side. Econometric evidence points to population as a particularly significant determinant of trade structure and diversification patterns. Furthermore, size has also been considered to be an important limitation of developing countries’ room to manoeuvre or to have policy options, which in turn tends to reinforce the constraints imposed by other variables such as ethnic divisions, location, limited natural resources, high consumer expectations and a narrow technological base (Seers, 1981). Ecological constraints resulting from a narrow resource base in highly populated small countries is also an issue of growing concern (Foy and Daly,1989). However, size also seems to have operated as an important positive challenge leading to what has been called “democratic corporatism”, allowing small Western European countries to combine political stability, social development and competitive open economies in order to adjust to a rapidly changing international economy (Katzenstein, 1985).
In the ca.se of the small Latin American and Caribbean nations the crisis of the 1980s that shook Latin America in general seems to have induced significant proce.sses of economic transformation involving increased exports of non- traditional products, in spite of its severe negative ef fects. A first objective of this paper is to identify some of the basic characteristics of this process. A second objective is to demonstrate that the competitiveness of increased exports has continued to be based mostly of these countries’ relative endowments of unskilled labour and natural resources, subject to constraints of a technological or environmental nature. A third objective is to explore or analyze trends which may lead to identifying ways of favouring the development of new sources of competitiveness which, in accordance with Eciwo’s recent proposal on “C^hanging Production Patterns with Social Equity” (e c i .a c ,
1990a), would involve not only traditional land
84 CEPAL REVIEW No. 43 / April 1991
and labour factors of production but also a gradual absorption or use of technical progress, applied both to production and marketing.
Following Kuznets’ seminal paper on small nations, an upper limit of 10 million (in 1988) was chosen as the determinant of those Latin American and Caribbean countries identified as small in this paper, while a lower limit of 1 million was established in order to exclude nations which are sometimes considered “microstates” and which have further specificities which differentiate them from slightly larger countries. After exclusion of the countries for which there are certain statistical data problems (Cuba and Panama), or where cases of increased exports are almost non-existent (Nicaragua), an analysis was undertaken of the evolution of the following twelve Latin American and Caribbean nations, consisting of four from the Caribbean: Trinidad and Tobago, Jamaica, Haiti and the Dominican Republic; four from Central America: Guatemala, El Salvador, Honduras and Costa Rica; and four from South America: Ecuador, Bolivia, Uruguay and Paraguay.
This paper analyses what appear to be the basic recent trends in small countries’ participation in the international economy, taking the performance of their exports to o e c d countries as an indicator of their competitiveness. To begin with, sources of competitiveness at the national level are considered (section i below), taking into account factor intensity of unskilled labour and natural resources. The next section (section u) then focuses on sources of competitiveness at the industry level, analyzing the growing complexity of new sources of competitiveness, including technological progress and industrial clustering.
The exercise uses import data registered in the OECD countries. This approach has the disadvantage that it does not necessarily provide a complete picture of the countries’ competitiveness. However, these data, which are homogeneous and recent, give an uncompromising view of international competitiveness, unblurred by the effect of reciprocal Caribbean or Latin American trade preferences.* The analysis is based on the comparison between 1978 and 1988 import data of OECD countries.^
I
Sources of competitiveness at the national level
Considerable progress has been made in the conceptualization of sources of competitiveness. Dosi and Soete state that “revealed comparative advantages appear to be the ex post result of sector- specific and country-specific learning dynamics, and of the related international and intrasectoral changes in competitiveness of firms and countries” (Dosi and Soete, 1988). According to Porter, the competitive advantage of nations would be determined by a “diamond” which involves the dynamic interaction of the factors of production, home demand, market structure and company strategy, and related and supporting industries (Porter, 1990).
In the case of small Latin American and Caribbean nations, the main and sometimes sole source of competitiveness of new exports would appear to be given by the relative availability of low-grade factors, including specifically unskil
led labour and (constrained to a greater extent by limited geographical area) natural resources.^ Furthermore, the relative weakness of the other determinants of competitiveness, often affected negatively by the small size of these countries (particularly as regards competition, size of home
’ T his approach excludes any normative consideration o f the effects o f reciprocal trade preferences, as well as o f the infant industry argum ent based on eventual exports to competitive m arkets after having access to preferential m arkets.
These data are CIF and therefore not com parable with the FOB export data o f the small countries themselves. Differences may also arise from timing o f (export or import) registration and from treatm ent o f free processing zones.
Including extremely fertile land, as on the Pacific coast o f Central America, favourable climate and beaches as in the Caribbean, and minerals.
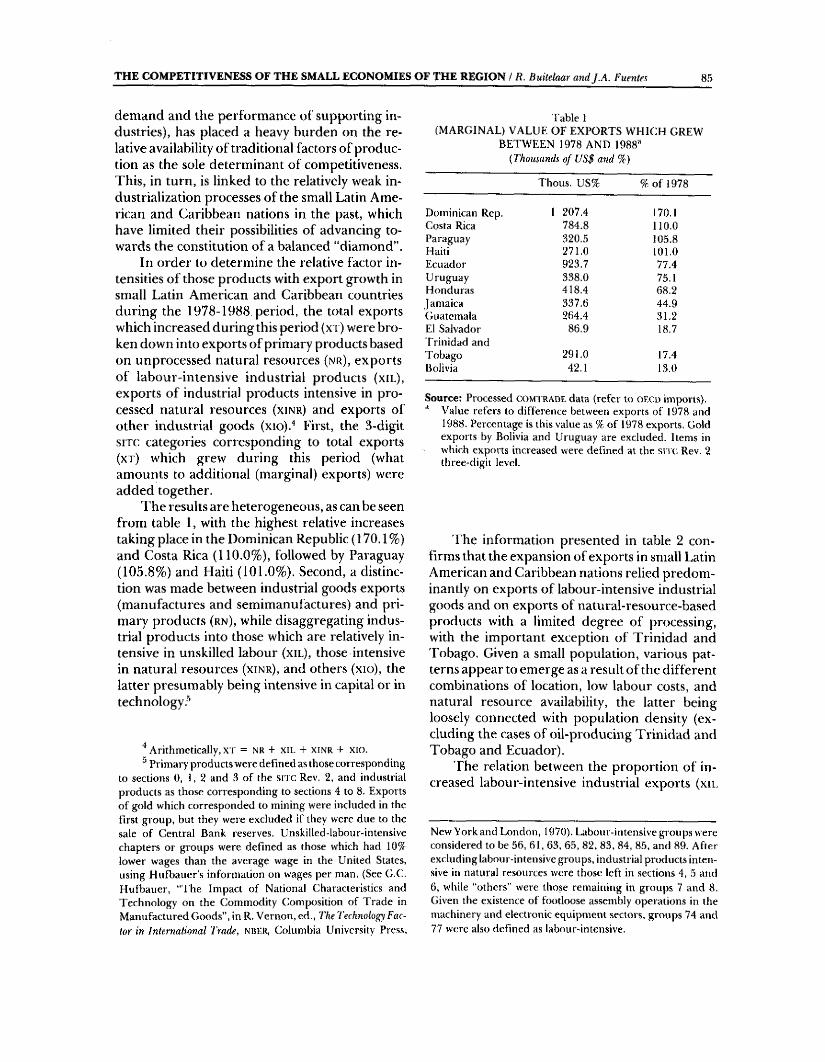
THE COMPETITIVENESS OF THE SMALL ECONOMIES OF THE REGION / R. B uiielaar and J .A . Puentes 8 5
demand and the performance of supporting industries), has placed a heavy burden on the relative availability of traditional factors of production as the sole determinant of competitiveness. This, in turn, is linked to the relatively weak industrialization processes of the small Latin American and Caribbean nations in the past, which have limited their possibilities of advancing towards the constitution of a balanced “diamond”.
In order to determine the relative factor intensities of those products with export growth in small Latin American and Caribbean countries during the 1978-1988 period, the total exports which increased during this period (x r) were broken down into exports of primary products based on unprocessed natural resources ( n r ) , exports of labour-intensive industrial products ( x i l ) ,
exports of industrial products intensive in processed natural resources ( x i n r ) and exports of other industrial goods (xio). First, the 3-digit siT( categories corresponding to total exports ( x t ) which grew during this period (what amounts to additional (marginal) exports) were added together.
The results are heterogeneous, as can be seen from table 1, with the highest relative increases taking place in the Dominican Republic (170.1 %) and Costa Rica (110.0%), followed by Paraguay (105.8%) and Haiti (101.0%). Second, a distinction was made between industrial goods exports (manufactures and semimanufactures) and primary products ( r n ) , while disaggregating industrial products into those which are relatively intensive in unskilled labour ( x i l ) , those intensive in natural resources ( x i n r ) , and others (xio), the latter presumably being intensive in capital or in technology.'^
Arithm etically, X T = NR + xiL + x i n r + xio. Primary products were defined as those corresponding
to sections 0, 1, 2 and 3 o f the sn c Rev. 2, and industrial products as those corresponding to sections 4 to 8. Exports o f gold which corresponded to mining were included in the first group, but they were excluded if they were due to the sale o f Central Bank reserves. Unskilled-labour-intensive chapters or groups were defined as those which had 10% lower wages than the average wage in the United States, using H u fbau er’s inform ation on wages per man, (See G.C. H ufbauer, “T h e Im pact o f National Characteristics and Technology on the Commodity Composition o f T rad e in M anufactured G oods", in R. V ernon, ed., Thf Technology Factor in international Trade, N B E R , Columbia University Press,
T able 1(M A RG IN A L) V A LU E O F E X P O R T S W H ICH GREW
BET W EE N 1978 AND lOSS“{Thousands o f US$ and %)
Thous. US% % o f 1978
Dominican Rep. 1 207.4 170.1Costa Rica 784.8 110.0Paraguay 320.5 105.8Haiti 271.0 101.0Ecuador 923.7 77.4Uruguay 338.0 75.1Honduras 418.4 68.2[amaica 337,6 44.9(Guatemala 264.4 31.2El Salvador 86.9 18.7Trinidad andTobago 291.0 17.4Bolivia 42.1 13.0
Source: Processed c o m i r a d e data (refer to o e c d imports). Value refers to d ifference between exports o f 1978 and 1988. Percentage is this value as % o f 1978 exports, Gold exports by Bolivia and Uruguay are excluded. Items in which exports increased were defined at the sri t. Rev. 2 three-digit level.
The information presented in table 2 confirms that the expansion of exports in small Latin American and Caribbean nations relied predominantly on exports of labour-intensive industrial goods and on exports of natural-resource-based products with a limited degree of processing, with the important exception of Trinidad and Tobago. Given a small population, various patterns appear to emerge as a result of the different combinations of location, low labour costs, and natural resource availability, the latter being loosely connected with population density (excluding the cases of oil-producing Trinidad and Tobago and Ecuador).
The relation between the proportion of increased labour-intensive industrial exports (xii.
New York and London, 1970). Labour-intensive groups were considered to be 56, 61, 63 , 65 , 82 , 83 , 84, 85, and 89. A fter excluding labour-intensive groups, industrial products intensive in natural resources w ere those left in sections 4, 5 and 6, while “others” were those rem aining in groups 7 and 8. Given the existence o f footloose assembly operations in the machinery and electronic equipm ent sectors, groups 74 and 77 were also defined as labour-intensive.
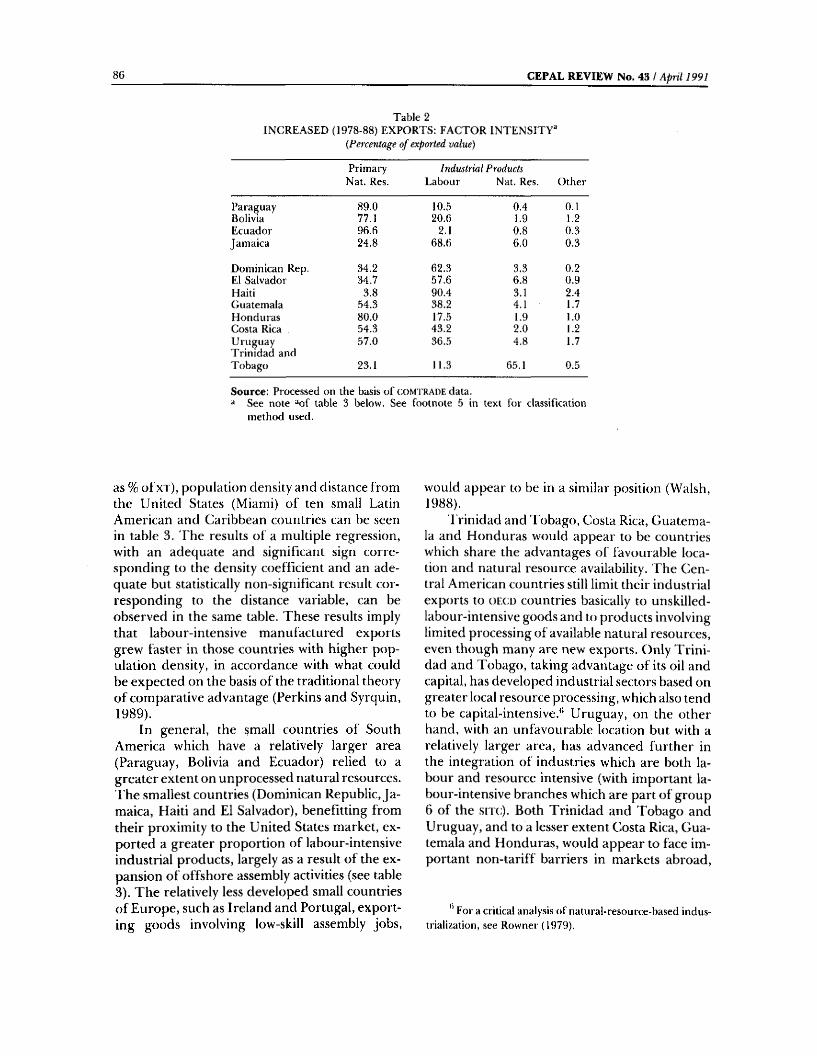
8 6 CEPAL REVIEW No. 43 / April 1991
Table 2IN C REA SED (1978-88) E X P O R T S: FA C T O R IN T E N S IT Y ‘S
{Percentage of exported value)
Primary Nat. Res.
Industrial Products Labour Nat. Res. O ther
Paraguay 89.0 10.5 0.4 0.1Bolivia 77.1 20.6 1.9 1.2Ecuador 96.6 2.1 0.8 0.3Jam aica 24.8 68.6 6.0 0.3
Dominican Rep. 34.2 62.3 3.3 0.2El Salvador 34.7 57.6 6.8 0.9Haiti 3.8 90.4 3.1 2.4Guatemala .54.3 38.2 4.1 1.7Honduras 80.0 17.5 1.9 1.0Costa Rica 54.3 43.2 2.0 1.2Uruguay Trinidad and
57.0 36.5 4.8 1.7
T obago 23.1 11.3 65.1 0.5
So u rce: Processed on the basis o f c o m t r a d e data, See note “o f table 3 below. See footnote 5 in text for classification
method used.
as % of’X T ) , population density and distance from the United States (Miami) of ten small Latin American and Caribbean countries can be seen in table 3, Fhe results of a multiple regression, with an adequate and significant sign corresponding to the density coefficient and an adequate but statistically non-significant result corresponding to the distance variable, can be observed in the same table. These results imply that labour-intensive manufactured exports grew faster in those countries with higher population density, in accordance with what could be expected on the basis of the traditional theory of comparative advantage (Perkins and Syrquin,1989).
In general, the small countries of South America which have a relatively larger area (Paraguay, Bolivia and Ecuador) relied to a greater extent on unprocessed natural resources. The smallest countries (Dominican Republic, Ja maica, Haiti and El Salvador), benefitting from their proximity to the United States market, exported a greater proportion of labour-intensive industrial products, largely as a result of the expansion of offshore assembly activities (see table3). The relatively less developed small countries of Europe, such as Ireland and Portugal, export- ing goods involving low-skill assembly jobs,
would appear to be in a similar position (Walsh, 1988).
Lrinidad and Tobago, Costa Rica, Guatemala and Honduras would appear to be countries which share the advantages of favourable location and natural resource availability. The Central American countries still limit their industrial exports to oecd countries basically to unskilled- labour-intensive goods and to products involving limited processing of available natural resources, even though many are new exports. Only Trinidad and Tobago, taking advantage of its oil and capital, has developed industrial sectors based on greater local resource processing, which also tend to be capital-intensive.*' Uruguay, on the other hand, with an unfavourable location but with a relatively larger area, has advanced further in the integration of industries which are both labour and resource intensive (with important labour-intensive branches which are part of group 6 of the siTc). Both Trinidad and Tobago and Uruguay, and to a lesser extent Costa Rica, Guatemala and Honduras, would appear to face important non-tariff barriers in markets abroad.
*' Eor a critical analysis o f natural-resource-based industrialization, see Rowner (1979).
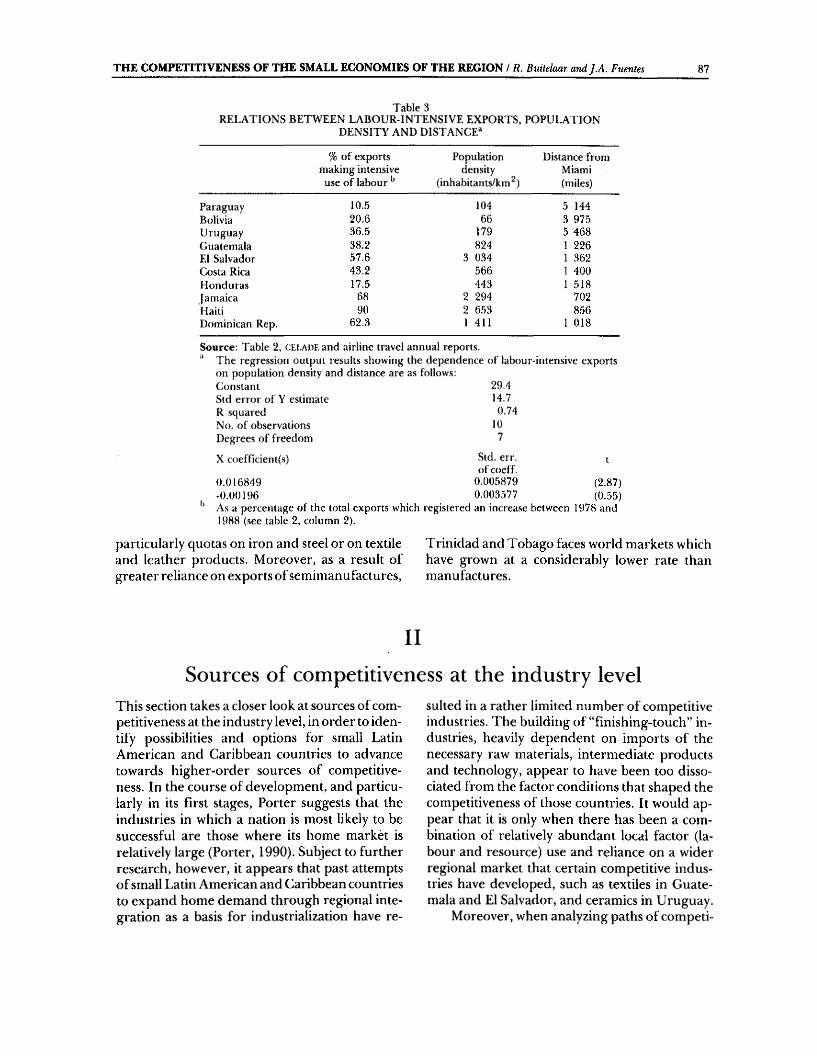
THE COMPETITIVENESS OF THE SMALL ECONOMIES OF THE REGION / R. B uiielaar and J .A . Fuentes 87
Table 3R E L A T IO N S B ET W EE N L A B O U R -IN T E N SIV E E X P O R T S, PO PU LA TIO N
D E N SIT Y AND D ISTA N C E“
% o f exports making intensive
use o f labour ^
Populationdensity
(inhabitants/km^)
Distance from Miami (miles)
Paraguay 10.5 104 5 144Bolivia 20.6 66 3 975Uruguay 36.5 179 5 468Guatem ala 38.2 824 1 226El Salvador 57.6 3 034 1 362Costa Rica 43.2 566 1 400Honduras 17.5 443 1 518Jam aica 68 2 294 702Haiti 90 2 653 856Dominican Rep. 62.3 1 411 1 018
Sou rce: Table 2, CKI.A15E and airline travel annual reports.T h e regression output results showing the dependence o f labour-inten.sive exports on population density and distance are as follows:Constant 29,4Std error o f Y estimate 14.7R squared 0.74No. o f observations 10D egrees o f freedom 7
X coefficient(s) Std. err, t o f coeff.
0 .0 1 6 8 4 9 0 .005879 (2.87)-0 .0 0 1 9 6 0 .003577 (0.55)As a percentage o f the total exports which registered 1988 (see table 2, column 2).
an increase between 1978 and
particularly quotas on iron and steel or on textile and leather products. Moreover, as a result of greater reliance on exports of semimanufactures,
Trinidad and Tobago faces world markets which have grown at a considerably lower rate than manufactures.
II
Sources of competitiveness at the industry levelThis section takes a closer look at sources of competitiveness at the industry level, in order to identify possibilities and options for small Latin American and Caribbean countries to advance towards higher-order sources of competitiveness. In the course of development, and particularly in its first stages. Porter suggests that the industries in which a nation is most likely to be successful are those where its home market is relatively large (Porter, 1990). Subject to further research, however, it appears that past attempts of small Latin American and Caribbean countries to expand home demand through regional integration as a basis for industrialization have re
sulted in a rather limited number of competitive industries. The building of “finishing-touch” industries, heavily dependent on imports of the necessary raw materials, intermediate products and technology, appear to have been too dissociated from the factor conditions that shaped the competitiveness of those countries. It would appear that it is only when there has been a combination of relatively abundant local factor (labour and resource) use and reliance on a wider regional market that certain competitive industries have developed, such as textiles in Guatemala and El Salvador, and ceramics in Uruguay.
Moreover, when analyzing paths of comped-
8 8 CEPAL REVIEW No. 43 / April 1991
tiveness at the industry level in the small Latin American and (Caribbean countries, the overall impression is that most growing exports cannot be explained by competitiveness strengthened by the application of science and technology, and the industries that provide the lion’s share of growing exports are not clearly related through vertical or horizontal links to other competitive industries or to technological services. However, some important exceptions may be noted, and the richness of sources of competitiveness at the industry level is greater than the overall picture might suggest (see table 4 and figure 1). Specifically, the degree of reliance on basic facti)r conditions as a source of competitiveness tends to vary widely, as does the extent tt> which technical progress has taken place.
a ) Labour-intensive manufacturing
The most striking phenomenon as regards orci) imports from small Latin American countries is the rise in offshore assembly t)perations (table 5) which take advantage of United States tariff legislation allowing import duties to be levied onlv upon value added abroad and not upon U.S. inputs.
In answer to a tsn c (U.S. International I rade Conuni.ssion) questionnaire (esnc, 1988),
officials of United States companies benefitting from offshore assembly provisions (formerly under U.S. I'ariff Schedule items 807.00 and 806.8 and presently under harmonized tariff schedule subheadings 9802 .00 .60 and 9802.00.80) responded that the establishment of production operations outside the United States was mainly based on labour cost differentials, urged bv pressure from imports. Lhe influence of the tariff provisions was generally seen to be secondary, while the presence of free zones or in-bond treatment by foreign governments came in third place.
rhis result conf irms the conclusion that most assembly operations in the small Latin American countries hat e been impelled by the availability of low-cost labour as their main source of competitiveness. 4'he contribution of assembly-type activities to long-term competitivene.ss is still open to debate. How'ever, the nature of this debate has changed over time. At first the question was whether assembly activities could contribute positively to a nation’s development, and a num
ber of well-known criticisms, associated with the enclave nature of these activities, were made. At present the discussion centers on the mechanisms that would allow the enhancement of the relationship between the domestic economy and assembly activities for export.
The main contribution of assembly activities to development lies in their generation of employment. From this point of view, there are only limited alternatives for countries with high unemployment, few natural resources and restricted home markets. Moreover, the diffusion of “industrial discipline” to a growing labour force may facilitate a future process of gradual upgrading of skills. Recent trends in some countries point to prospects for technology-intensive assembly operations that require a skilled labour force, although there are also possibilities of pollution-generating activities (Sánchez, 1990). The L'si'J'c report mentions possible technology transfer mechanisms, mainly through the acquisition of skills and discipline by the local work force and the mastering of process and product technology (usiic;, 1988). fhere is also evidence of local sales to di>mestic exporting firms, of subcontracting networks and of a growing supply of services to Free Zones ( l m d o , 1988). The question is to what extent these linkages may be policy-induced.
Not all labour-intensive manufacturing exports in the countries considered involve offshore assembly operations (table 4). I'he latter tend to be of greater relative importance in the Caribbean, LI Salvador and Costa Rica. In 1988 in the Dominican Republic, the Caribbean country with the most important of fshore assembly activities, employment generated by this sector was greater than employment generated by the rest of the non-sugar manufacturing sector, and foreign exchange earnings were greater than those produced by all remaining non-traditional exports (pRi A i.c, 1989). In other countries, including Honduras and Guatemala and, to a greater extent, Uruguay, labour-Ínten.sive manufacturing also tends to be inten.sive in the use of natural resi)urces (wood, cotton, leather and wi)ol products) and is integrated with the rest of the economy to a greater extent.
b) Natural-resource-intensive activities
Products based on the use of traditional and
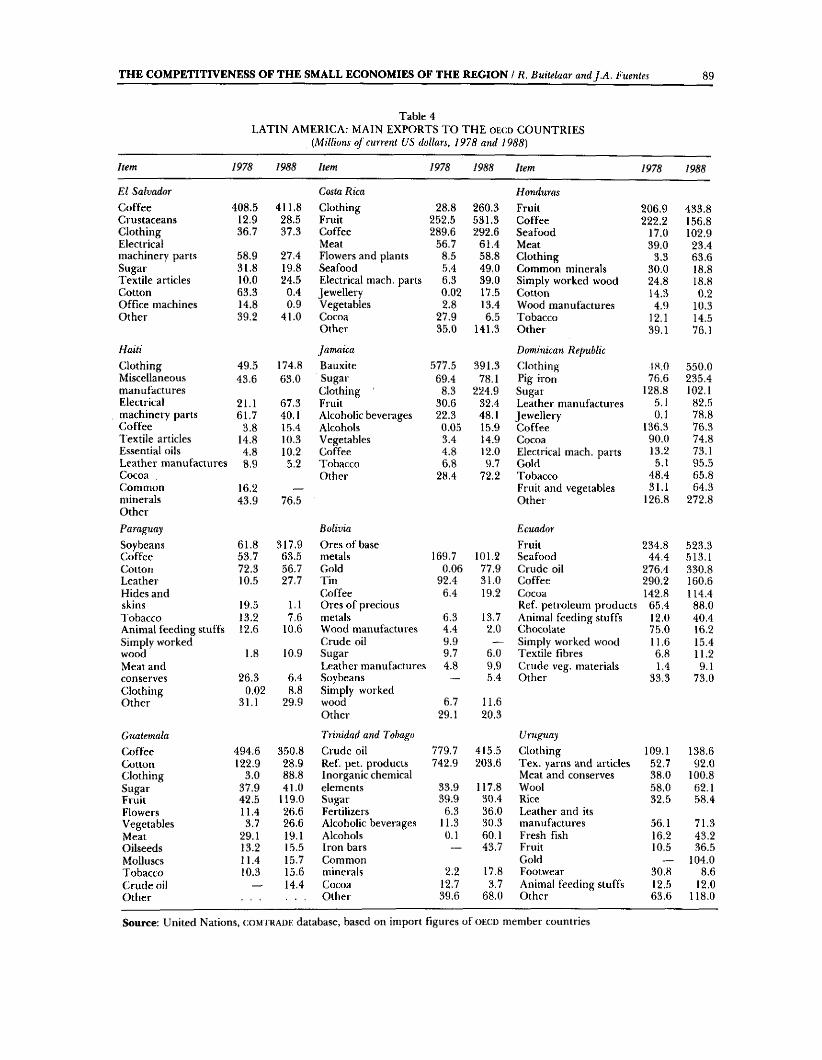
THE COMPETITIVENESS OF THE SMALL ECONOMIES OF THE REGION / R. Buitelaar and J .A . Fuentes 89
Table 4L A T IN A M ERIC A : MAIN E X P O R T S T O T H E oecd C O U N T R IE S
{Millions o f current US dollars, 1978 and 1988)
Item 1978 1988 Item 1978 1988 Item 1978 1988
El Salvador Costa Rica HondurasC o ffee 408 .5 411.8 Clothing 28.8 260.3 Fruit 206 .9 433 .8Crustaceans 12.9 28.5 Fruit 252.5 531.3 C offee 222.2 156.8Clothing 36.7 37.3 Coffee 289.6 292.6 Seafood 17.0 102.9Electrical Meat 56.7 61.4 Meat 39.0 23.4machinery parts 58.9 27.4 Flowers and plants 8.5 58.8 Clothing 3.3 63.6Sugar 31.8 19.8 Seafood 5,4 49,0 Comm on minerals 30.0 18.8T extile articles 10.0 24.5 Electrical mach. parts 6.3 39.0 Simply worked wood 24.8 18.8Cotton 63.3 0.4 Jewellery 0.02 17.5 Cotton 14.3 0.2O ffice machines 14.8 0.9 Vegetables 2.8 13.4 Wood m anufactures 4.9 10.3O ther 39.2 41.0 Cocoa 27.9 6.5 Tobacco 12.1 14.5
O ther 35,0 141.3 O ther 39.1 76.1
Haiti Jamaica Dominican RepublicClothing 49.5 174.8 Bauxite .577.5 391.3 Clothing 18.0 550.0Miscellaneous 43.6 63 ,0 Sugar 69.4 78,1 Pig iron 76.6 235.4m anufactures Clothing 8.3 224.9 Sugar 128.8 102.1Electrical 21.1 67.3 Fruit 30.6 32.4 Leather m anufactures 5.1 82.5machinery parts 61.7 40.1 Alcoholic beverages 22.3 48.1 Jew ellery 0.1 78.8C offee 3.8 15.4 Alcohols 0.05 15.9 C offee 136.3 76.3T extile articles 14.8 10.3 Vegetables 3.4 14.9 Cocoa 90.0 74.8Essential oils 4.8 10.2 Coffee 4.8 12.0 Electrical mach. parts 13.2 73.1Leather m anufactures 8,9 5.2 Tobacco 6.8 9.7 Gold 5.1 95.5Cocoa O ther 28.4 72.2 Tobacco 48 .4 65.8Com m on 16.2 — Fruit and vegetables 31.1 64.3minerals 43.9 76.5 O ther 126.8 272 .8O ther
Paraguay Bolivia EcuadorSoybeans 61.8 317.9 Ores o f base Fruit 234 .8 523.3C offee 53,7 63.5 metals 169.7 101.2 Seafood 44.4 513.1Cotton 72.3 56.7 Gold 0.06 77.9 Crude oil 276,4 330.8Leather 10.5 27,7 T in 92.4 31.0 C offee 290.2 160.6Hides and Coffee 6.4 19.2 Cocoa 142.8 114.4skins 19.5 1.1 Ores o f precious Ref. petroleum products 65.4 88.0T obacco 13.2 7.6 metals 6.3 13,7 Animal feeding stuffs 12.0 40.4Animal feeding stuffs 12.6 10.6 Wood m anufactures 4.4 2.0 Chocolate 75.0 16.2Simply worked Crude oil 9.9 — Simply worked wood 11,6 15.4wood 1.8 10,9 Sugar 9.7 6.0 T extile fibres 6.8 11.2Meat and Leather m anufactures 4.8 9,9 Crude veg. materials 1.4 9.1conserves 26.3 6,4 Soybeans 5.4 O ther 33.3 73.0Clothing 0.02 8.8 Simply workedO ther 31.1 29,9 wood 6.7 11.6
O ther 29.1 20.3
Guatemala Trinidad and Tobago UruguayC offee 494 .6 3.50.8 Crude oil 779.7 415,5 Clothing 109.1 138.6Cotton 122.9 28,9 Ref. pet. products 742.9 203 .6 T e x . yarns and articles 52.7 92.0Clothing 3.0 88.8 Inorganic chemical Meat and conserves 38 .0 100.8Sugar 37.9 41.0 elements 33.9 117.8 Wool 58 .0 62.1Fruit 42.5 119.0 Sugar 39.9 30.4 Rice 32.5 .58.4Flowers 11.4 26.6 Fertilizers 6.3 36.0 Leather and itsVegetables 3.7 26,6 Alcoholic beverages 11.3 30.3 m anufactures 56.1 71.3Meat 29.1 19.1 Alcohols 0.1 60.1 Fresh fish 16.2 43.2Oilseeds 13.2 15.5 Iron bars — 43.7 Fruit 10.5 36.5Molluscs 11.4 15.7 Common Gold — 104.0T obacco 10.3 15.6 minerals 2.2 17.8 Footwear 30.8 8.6Crude oil — 14.4 Cocoa 12.7 3.7 Animal feeding stuffs 12.5 12.0O ther O ther 39.6 68.0 O ther 63 .6 118.0
Source; United Nations, c o m t r a d e database, based on import figures o f o ecd m ember countries
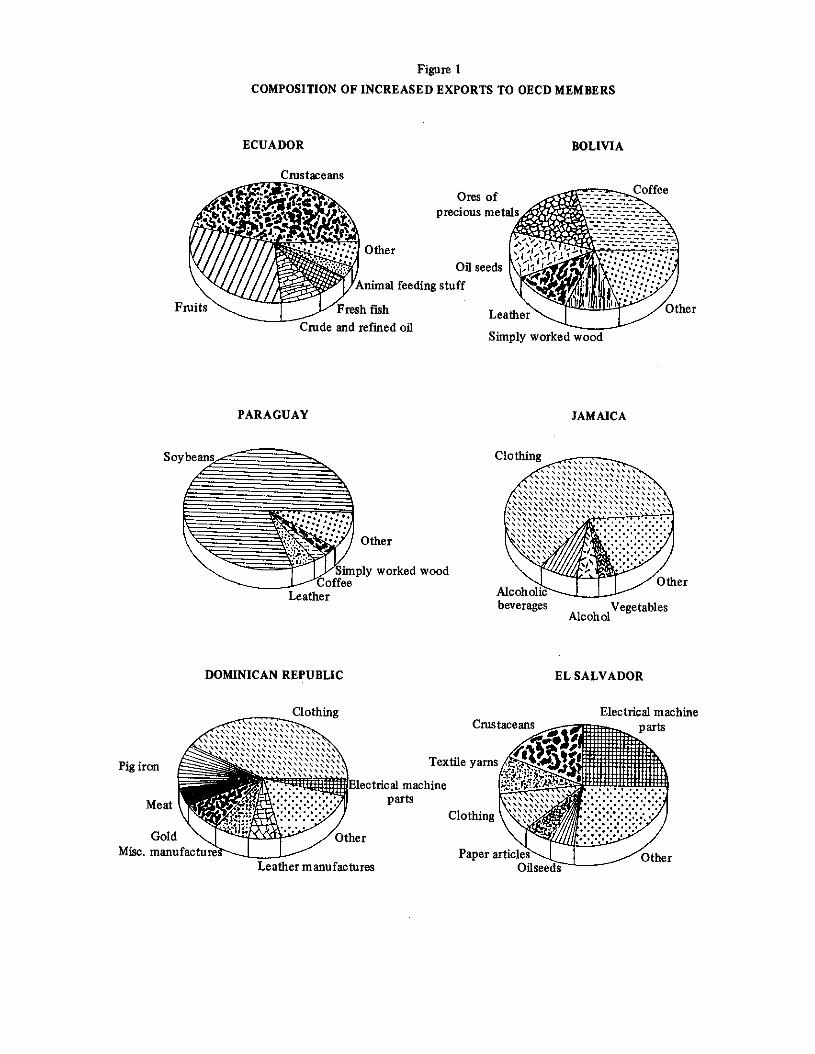
Figure 1
COMPOSITION OF INCREASED EXPORTS TO OECD MEMBERS
ECUADOR
Crustaceans
BOLIVIA
Fruits
Ores of precious metals
Oil seedsAnimal feeding stuff
Fresh fish
Coffee
Crude and refined oilLeather
Simply worked wood
Other
PARAGUAY JAMAICA
Soybeans
Other
Simply worked wood Coffee
Leather
Clothing
Alcoholicbeverages
Other
AlcoholVegetables
DOMINICAN REPUBLIC EL SALVADOR
Clothing
Pig iron
Meat
Gold Mise, manufacture
Crustaceans
Textile yams
telectrlcal machine parts
Other
Leather manufactures
Clothing
Paper articlesOilseedi
Electrical machine parts
Other
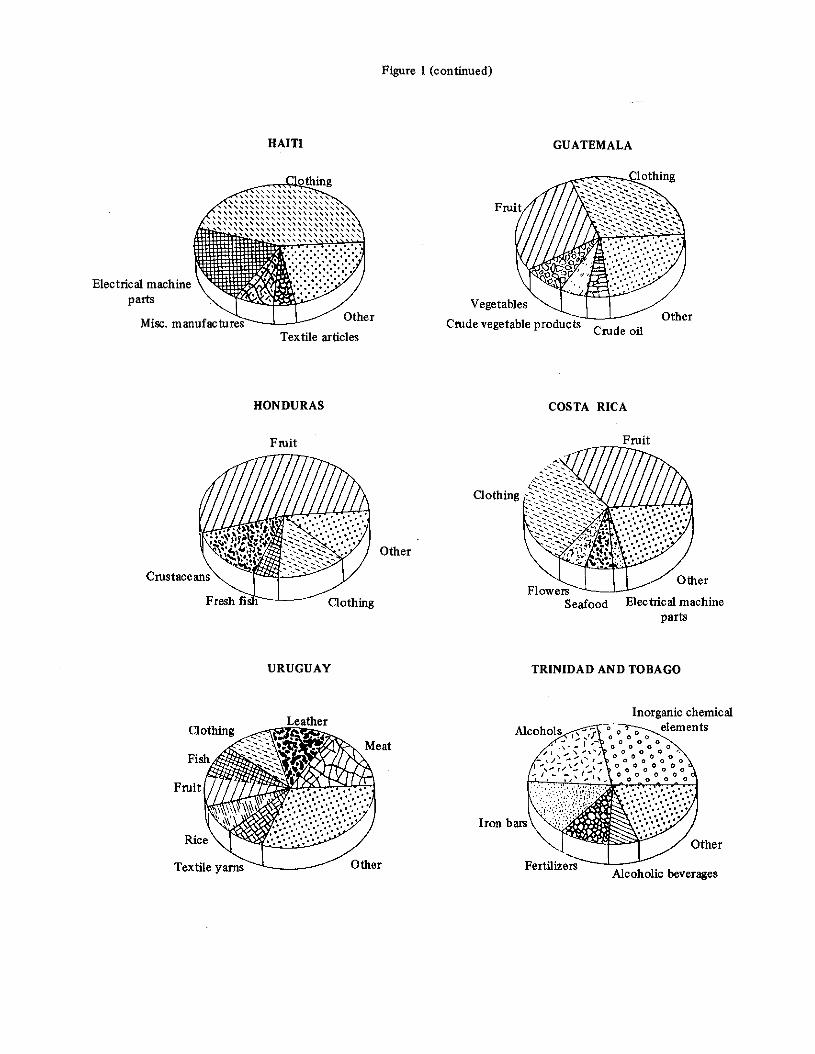
Figure 1 (continued)
HAITI GUATEMALA
Electrical machine parts
Mise, manufactures Other
Textile articles
HONDURAS
Fruit
COSTA RICA
Fruit
Clothing
Other
URUGUAY TRINIDAD AND TOBAGO
LeatherInorganic chemical

9 2 CEPAL REVIEW No. 43 / April 1991
I'ab le 5O FFSH O R E A SSEM BL Y E X P O R T S T O T H E
U N IT E D S T A T E S(% o f iota! exports to the US.)
Selected exporters 198.3 1986
Dorn. Rep. 13.8 22.4Q}Sta Rica 15.9 14.2Haiti 41.3 .38.6Guatem ala 0.2 1.5H onduras 4.9 5.3Jam aica 3.3 17,1
Source: L'snx., Annual Report on the Impact o f the Caribbean Basin Economic Recovery Act on US. Industries and Comumers. SecondReport, 1986, W ashington, D,C., Septem ber 1987 {Appendix A).
new resources with limited processing fared well in the 1978-1988 period. They include mostly fruit and seafood (see tables 4 and 5). Banana exports benefitted from relatively high prices in the latter part of the 1980s, and constitute an important source of foreign exchange and employment generation in Ecuador, Honduras, Costa Rica, Panama and Guatemala. These exports can be a source of competitiveness for downstream and upstream industries. During the banana boom in the late 1950s, Ecuador became a world-leading producer of plastic bags used to protect bananas in the growing process. The manufacture of baby food using banana compote is also a frequently studied though apparently less successful project. The development of the cardboard box industry in Costa Rica is basically due to demand derived from banana packaging requirements.
Other dynamic fruit exports (table 6) include pineapples and other tropical fruits with equal or greater upstream and downstream potential, such as tropical fruit juices.
Increased exports of vegetables have similar possibilities, whereas exports of ornamental plants, seeds and flowers face different technological and linkage requirements. Nevertheless, all of them involve the application of science and technology and the use of new production and marketing techniques, exemplified by the introduction of new varieties which compete successfully in developed country markets.
Seafood exports are examples of resource- constrained exports, as the success story of the
shrimp in Ecuador and several Central American countries demonstrates. As a result of the erosion of its natural resource base, an effort to master the technological complexities of shrimp larvae production in artificial circumstances is required to maintain the competitive edge of the industry. Mastering this technology could be a potential source of exports of related engineering services (eclac, 1990b).
c) Cases of “ niche products
The export data of certain small Latin American and Caribbean countries include a series of dynamic and competitive items whose weight in the total export figures is still relatively small. These are sometimes referred to as “niche” products (Katzenstein, 1985). The usual explanation of the upsurge of these “niche” products refers to the differentiation of products and markets, the globalization of industries and the related possibility of supplying items that have a relatively small world market, low price elasticity and high income elasticity. The search for niches has, in fact, become one of the basic pillars of the efforts of developed country enterprises to compete in international markets (Peters, 1988).
Nevertheless, large countries or enterprises may lack the flexibility needed to take advantage of very small market segments, while small enterprises or countries may benefit from specialization in these items. Furthermore, faced with the possibility of “injury” complaints in foreign markets, the ploy of remaining small within a given market so as not to threaten the larger supplier, and focusing on quality rather than on prices, would appear to be appropriate (Fundenberg and Tiróle, 1984). Fhus, “niche” products based on natural resources or specific country characteristics and including important design or product differentiation requirements may take advantage of both supply and demand- based sources of competitiveness. There are several examples of successful “niche” products in small Latin American and Caribbean countries;
A Uruguayan ceramic firm developed a technology adaptation based on locally available natural resources. Fhe use of firewood allowed the firm to attain special colour characteristics, and access to the Argentine market through a regional integration scheme stimulated a learning process in commercialization in foreign markets.
THE COMPETITIVENESS OF THE SMALL ECONOMIES OF THE REGION / R. Buitelaar (im iJ.A . Fuentes 9 3
T able 6M AIN E X P O R T S O F F R U IT S AND V ECiETA BLES
T O T H E USA{US$ million)
(joumry/si I t: heading 1978 1988
EC U A D O R0.573 Banana.s 124.2 232.305 Total 125.1 238.4
t;O S'FA RICA0579 Fresh fruit (pineapple) — 29.70573 Bananas 104.7 213.405 Total 111 262.9
(iU A T EM A EA0545 O ther fresh vegetables 3.1 10.90540 Vegetables, frozen — 12,10579 Fresh fruit (pineapple) 0,1 9.90573 Bananas 25.4 83.405 Total 28.8 121.3
H O N D U RA S057 9 Fresh f ruit (pineapple) tí 17,10573 Banana.s 119.9 239,405 Total 1 2 9 J 264.5
D O M IN IC A N R E P U B L IC054H V'egetable products
(sugar cane) 0.4 6.4t).5B5 Prepared vegetables 4.5 12.70579 Fresh fruit (pineapple) 1.2 8.505 Total 29.1 54.3
H A I'II0579 Fresh fruit (pineapple) 0.9 6.305 Total 1.2 6.7
lA M A ICA0.548 Vegetable products
(sugar cane) 0.4 6.405 Total ! 10. 7
PANAMA0579 Fresh fruit (pineapple) 0.2 7.60573 Bananas 39.6 66.305 Total 41.4 77.4
Source: coNfiRAnK.
high-quality towels showing colourful and typical Central American paintings.'
Blue Mountain Coffee from Jamaica, sold at a retail price double or even three times that of other arabiga varieties, exemplifies the case of product differentiation which emphasizes the ci)untry of i>rigin as well as the quality of a traditional commodity.
In Costa Rica, exports of jewels, doors and canes made from tropical hardwood have bene- fitted from the availability of valuable hardwoods and from designs adopted as a result of dose contact with buyers and knowledge of foreign markets.
Exports of tagua buttons from Ecuador are another case of a natural-resource-based niche. The tagua is a palmtree that produces a nut which dries si> hard that it is called natural ivory. A private and hobby-like research effort taking several decades, including design of machines and market research, resulted in a now nourishing industry with dozens of firms employing thousands of workers that produce buttons for exclusive fashion houses in Italy and France.”
rhe upsurge of “niche” exports suggests the diversification of sources of competitiveness. Factor-based sources of competitiveness combined with product differentiation and special marketing efforts would appear to explain these developments.
d) Searching for competitive commodity chaim
In view of the weakness of home demand as a single source of competitiveness, progress towards more sophisticated and diversified sources of competitiveness may rely upon supply-push rather than demand-pull mechanisms. I'hus, building efficient commodity chains that take as a starting point existing competitive industries could be a promising step towards achieving growing and sustainable competitiveness, especially for small countries, whereas the positive inlluence of expanded home demand on com-
At pre.sent, the firm is competitive in a variety of products in the most demanding markets
1990c and Hernández, 1989).A Salvadorian producer of textile articles
(towels) found a niche in foreign markets with
' Inlornnition l)ascd on ;i \'isit to the enterprise by one o f the authors.
” Based on a visit to enterprises by one of tlie authors. The results oi tliis stiidv were pul)Iished by CMDo, ¡¡(irin tnni
pnlUitd induslrifil l’l')VK.24. Vienna. Ju n e I9H9.
94 CEPAL REVIEW No. 43 / April 1991
petitiveness may be more significant at higher levels of income.^
Competitive commodity chains have been analyzed by Hopkins and Wallenstein (1986), Gereffi and Korzeniewicz (1990) and Porter (1990) from different points of view. For Hopkins and Wallerstein a commodity chain is a concept required to analyze the historical evolution of capitalism. It refers to the system of production processes and labour which results in the finished product. Gerefii and Korzeniewicz extend this concept to include not only the production but also the marketing process, including financial and trade services.
For Porter, relations between industries in clusters can strengthen the sources of competitiveness of those industries which are part of the cluster. Industries are not only linked vertically (buyer/supplier relations) as in the Waller- stein/Gereffi version, but also horizontally if they share common customers, technologies and skills; they therefore share common learning processes in both the production and marketing stages.
In spite of the predominance of exports based on the use of unskilled labour or unprocessed natural resources, a number of closely linked export items illustrate the potential of an export strategy based on competitive chains in small Latin American and Caribbean countries. This concept, rather than Porter’s dusters, is used in what follows since the analysis of horizontal linkages requires presently unavailable information on specific industries in these countries.
In Uruguay the most important competitive chain is the wool-based apparel chain. The country is a major wool exporter in the world market. Exports of wool and wool-based products include wool, tops, apparel and related articles. The sophistication of the clothing industry is such that more than a dozen firms in Uruguay have integrated computer-aided design and computer- aided manufacturing facilities. They employ their own designers who operate in the world’s fashion capitals. The strength of the apparel in-
' Nevertheless, exports of' “ethnic” products to, for instance, the Hispanic population in the United States may be facilitated by existing m arkets in Latin American countries.
dustry can be illustrated by the rise in cotton apparel, which is an industry more or less loosely linked to the wool industry through common customers, even though the country has to import the raw material.
In contrast, a commodity chain that seems to be losing its competitive edge in the activities with higher value-added is the meat-leather- dothing-footwear chain in Uruguay. The loss of competitiveness in the higher-productivity parts of the chain seems to result from protection of home production involving leather import regulations. The quality of national leather is not always homogeneous and delivery interruptions result in leather-using industries losing customers.
It is interesting to observe the difference of complexity of the oil-chemicals chain between Ecuador and I ’rinidad and Tobago. Whereas the oil crisis has hit Trinidad relatively harder, its oil-based chemicals are doing well on international markets. In spite of the availability of oil in Ecuador, however, efforts to diversify into oil- related chemicals have not been successful. In contrast, the wood, semi-manufactured wood and furniture chain in Honduras would appear to be a further example of competitiveness strengthened by a commodity chain. The move towards higher value-added activities is clear, with the necessary caveat that further development urgently requires prudent management of the natural resource base.
A clearer success story involves exports of textile products (particularly towels) in Guatemala, based on the vertical integration of marketing, design, and textile and cotton production. This case exemplifies the integration of two originally different activities: one based on regional import substitution and another on traditional exports to developed country markets. The application of integrated pest control in cotton production in this case also demonstrates the possibility of dealing with environmental concerns through innovations which strengthen both competitiveness and sustainability.
In terms of Porter’s “diamond”, the development of competitive chains means that the diversification of the sources of competitiveness includes not only factor conditions but also efficient supporting industries.
III
Conclusions
THE COMPETITIVENESS OF THE SMALL ECONOMIES OF THE REGION / R. Buitelaar and }.A , Puentes 95
Data on oix;n imports in 1978 and 1988 from a dozen small Latin American and Caribbean economies show that the primary and often sole source of competitiveness is the availability of low-cost unskilled labour and unprocessed natural resources. Declining prices of these countries’ traditional commodity exports made them extremely vulnerable to the financial upheavals of the 1980s. Assembly operations and fruit and seafood exports were in many cases the only options left open to increase foreign exchange earnings.
Changing production patterns with social equity, as proposed by e c l a c , is a formidable and daunting task of the 1990s for the small Latin American and Caribbean economies. Evidence of continued reliance on low-grade factor availability, including unskilled labour and natural resources, implies that increasing competitiveness must build upon these already established sources of comparative advantage. The option of relying on assembly activities made uncompetitive in the United States by high labour costs is likely to be important mostly for its employment-generation effects. Its learning and skill-creating effects could probably be enhanced through specific programmes, while creating incentives for greater linkages with the rest of the economy.
Combining labour and resource-intensive activities, while ensuring continued access to foreign markets (possibly through free trade agreements with the United States in particular) will be an important though difficult challenge to be met by small Latin American and Caribbean countries. Ensuring the application of science and technology to these sectors or to solely resource-based activities, both to improve competitiveness and to ensure environmental sustainability, will also be required. The fascinating success of some “niche” products poses the question of how to foster this kind of development, which in addition to past imagination and creativity and to a thorough knowledge of market conditions in very specialized segments, will require increased innovation and adaptability.
Finally, strengthening of national clusters as a supply-push mechanism to upgrade the sources of competitiveness may be a more realistic approach to development in this stage than relying exclusively on demand-pull mechanisms through an expanded home market. The implications for integration schemes are manifold. Their main task seems to lie in the creation of outward- oriented regional technological, commercial and educational co-operation mechanisms to upgrade the factor-based sources of competitiveness that have shaped the countries’ export structure and will continue to do so in the near future.
9 6 CEPAL REVIEW No. 43 / Af)ril 1991
BibliographyDemás, W .G. (1965), The Economics of Development in Small
Countries, with Special Reference to the Caribbean, Montreal, McGill University Press.
Dosi, G. and L, Soete (1988), Technical change and interna' tional trade, ( i. Dosi, C. Freem an and others (eds.), Technical Change and Economic Theory, London, Pinter Publishers.
F,ci,AC (Econom ic Commission for Latin America and the (ilaribbean) (1990a), C/írtítgtTig Production Patterns with Social Equity (i.c/c;,1601, ses.23/4), Santiago, Chile, 19 M arch. U nited Nations publication, Sales No.: E.90.1I.G.6.
________ (1990b), Shrim p cultivation in Ecuador, ChangingProduction Patterns with Social Equity 1601, sks.23/4), Santiago, Chile, 19 March, box V .4. United Nations publication. Sales No.: E.9Ü.H.G.6.
(1990c), Ceramics in Uruguay, Changing ProductionPatterns with Social Equity {1X'Jg.16{) \ , ses.23/4), Santiago, Chile, 19 M arch, box V .l . United Nations publication. Sales No.: f,.90. li.G .6.
Foy, G. and H. Daly (1989), Allocation, Distribution and Sccde as Determinants o f Environmental Degradation: Case Studies of Haiti, El Salvador and Costa Rica, Envirt)nmental Departm ent W orking Paper, No. 19, W ashington, D.Ci., W orld Bank, Septem ber.
Fundenberg, D. and J. T iró le (1984), T h e fat-cat effect, the puppy-dog ploy, and the lean and hungry look, The American Economic Review, vol. 74, No. 2, San Francisco, California, American Econom ic Association, May.
G ereffi, G. and Miguel Korzeniewicz (1990), Ciommodity chains and footwear exports in the semiperiphery, William M artin (ed.), Semiperipheral States in the World Economy, W estport, Greenwood Press.
H ernández, J. (1989), In form e sobre la empresa de cerámicas Metzen y Senna, Montevideo, eci,.A(: O ffice in Montevideo, T ransport and Communications Division, August, mimeo.
Hopkins, T eren ce K. and Im manuel Wallenstein (1986), Commodity chains in the world economy prior to 1800, Review, vol. X , Bingham ton, New York, Fernand Braudel (Center.
H ufbauer, G.C. (1970), T h e impact o f national characteristics and technology on the commodity composition o f trade in m anufactured goods, R. Vernon (ed.). The 7'echnology Factor in International Trade, New York, .\BER (National Bureau o f Econom ic Research, Inc.), Columbia University Press.
Katzenstein, P .J. (1985), Small States in World Markets. Industrial Policy m Europe, London, Cornell University Press.
Ktiznets, S. (1960), Economic growth o f small nations, E.A.G. Robinson (ed.). Economic Consequences o f the Size o f Na- tiom, London, Macmillan Publishing Co., Inc..
Lewis, V.A. (ed.) (1976), Size, Self-determination and International Relations, Kingston, Institute o f Social and Economic Research (ISF.R), University of the West Indies.
Perkins, D.W. and M. Syrquin (1989), Large countries: the influence o f size, H. Chenery and T .N . Srinivasan (eds.), Handbook of Development Economics, vol. I I , Amsterdam , Elsevier.
Peters, T . (1988), Thriving on Chaos. A Handbook for a Management Revolution, New York, Alfred A. Knopf, Inc.
Portel', M.E. (1990), The Competitive Advantage of Nations, New York, T h e Free Press.
1>RKAI.C (Regional Employment Program m e for Latin Am erica and the Caribbean) (1989), El sistema integrado de producción en el sector textilero de la República Dominicana, W orking document No. 334, Santiago, Chile, August.
Rowmer, M. (1979), Resource-based industrialization in the developing countries: a survey, yowr/irt/ o f Development Economics, vol. 6, No. 2, June,
Sánchez, R.A, (1990), Health and environmental risks o f the maquiladoras in Mexicali, Natural Resources Journal, vol, 30, No, 1, Albuquerque, New Mexico, University o f New Mexico School o f Law, W inter.
Seers, D. (1981), Development options: the strengths and weaknesses o f dependency theories in explaining a government's room to m anoeuvre, D. Seers (ed.), Dependency Theoiy. A Critical Reassessment, Dover, United States, Frances Pinter (Publishers) Ltd,
L'MDO (United Nations Industrial Development Organiza- titm) (1988), Export Proce.ssing Zones in Transition, The (mse of the Republic of Korea, Vienna, 10 Ju n e .
________ (1989a), Toward Linking Export Processing Zone Firmswith the Domestic Economy: the Cose of the Republic of the Philippines, Vienna, Ju n e .
(1989b), Hacia una política industrial ecuatoriana,Vienna, Ju n e .
L'sirc (United States International T rad e Commission) (1988), The Use and Economic Impact ofrsus Items 806.30 and 807.00, W ashington, D.C., May.
Walsh, V. (1988), Technology and the competitiveness o f small countries: a review, in C. Freem an and Bengt-Ake Lundvall (eds,). Small Countries Facing the Technological Revolution, London, Pinter Publishers.
CEPAL REVIEW No. 43
Transfer of technology: the case of the Chile FoundationTorben Huss*
Rcstfiictui'inji and tlic incorporation of modern tech- nolo^\ arc crucial in order to increase productivity and develop international competitiveness in Latin American industries.
'Lransnational corporations are tlie main source of' industrial technology in the world, and most countries in Latin America will continue to depend on access to (hat foreign technology to modernize their industries,
Lite process o f acqtiiring and assimilating foreign technologs is a dif f icult and resource-hungry business f or individual enterprises because it involves searching tor the most appropriate technology, bargaining for an optimal agreem ent with tlie foreign supplier and ada[)ting the technolijgv to local conditions. 'Lhe recipient enterprise must learn to master the technology in ortler to make the best use o f local resources and estairtisli an internationally competitive position. This article analyses the wavs in which the promotion and creation of' local constilting and engineering design organizations can improve and facilitate the transfer o f toi eign technology to Latin American countries by assisting national enterprises to better select, adapt and assimilate the imported technology.
This is highlighted in a case study o f the Chile Foundation, an innovative Chilean consulting and engineering design organization which represents one m anner o f overcom ing the barriers o f technology iranslei'.
.Associate K x ) X ' t t of llK’ Kc:i..u:a NCic.|oim Unitun'rran.s- naliunalCurpoi'ations. riieamiiur would like to thank Michael Mm tiinure of the Juint Unit fur valuable comments on this ai'ticle. 'I’lie inidrmtiiion provided by Pablo Herrera of the Chile I'oiindation is afso gieatb appreciated.
Introduction
The acquisition of technological capabilities is a basic requirement for the continued growth and development of the Latin American and Caribbean countries. Technological change has accelerated in recent years and the pace of technological progress is now understood to be of crucial importance for international trade and competitiveness.
In most of the countries in the region, however, the demand for technology cannot be met immediately by local technological capabilities. Accordingly, these countries depend on the transfer and diffusion of foreign technologies to transform and modernize their industries.
The process of acquiring technological capabilities abroad —that is, searching for the most appropriate technology, bargaining for an optimal agreement with the foreign supplier, and then assimilating the technology and adapting it to local conditions— is long and very resourcedemanding for individual enterprises. This is particularly so when the technology is not fully embodied in machinery and equipment that can be purchased ready-made, or when the technology is new and highly specialized.
Unfortunately, it is very difficult for policymakers in developing countries to solve these problems. Technology is not a homogeneous commodity. The costs, potential benefits and technical characteristics must be dealt with in the context of specific cases. There are few general rules or solutions available, but most research studies on technology transfer seem to agree that those developing countries which have the capacity to search out and evaluate foreign technology are usually able to acquire and apply the technologies they need on satisfactory terms.'
But how can governments in developing countries strengthen this capacity where it exists or implant it where it does not already exist?
I'his article analyses the ways in which the promotion and creation of local consulting and engineering design organizations (engineering service firms, l s k s ) can improve and facilitate the transfer of foreign technology to developing countries by assisting national enterprises to
' For an overview .see V ernon, 1988.
98 C E P A L R E V I E W N o . 43 / A p ril 1991
better select, adapt and assimilate the imported technology^ Special consideration will be given to the question of whether esfs formed as joint ventures between transnational corporations (tncs) and national agents carry greater potential to spread and strengthen esk capabilities in developing countries.
The article begins by discussing, in section I below, the specific meaning which will be ascribed to the terms “technology” and “transfer of technology”. Thereafter, different forms of technology transfer from i n c s to developing countries are discussed in order to understand why those forms of technology transfer in which the host country retains majority or total ownership of the investment project or enterprise have been gaining importance. Section I then proceeds ti) analyse the requirements and constraints that the recipient enterprise must satisfy in order to assimilate, adapt and diffuse the transferred technology effectively.
In section II of the article, esfs are characterized in order to examine how they can assist national enterprises in the technology transfer process, fhe section also analyses the constraints on local ESis in developing countries and discusses the question of whether joint ventures with transnational corporations simplify the difficult
start-up phase and provide the necessary technological capabilities.
In section III, a case study is presented in order to gain further insight into how a national E S F , in joint venture with a transnational corporation, can create such technological capabilities and facilitate technology transfer to a developing country. The advantage of the case study methodology is that it permits the analysis and comprehension of a complex situation in which many variables interrelate. The conclusions drawn may not be of general validity, but they present a specific experience that can be a valuable source for learning.
The case chosen is the Chile Foundation (i'undacidn Chile). The Chile Foundation is a joint venture between the Government of Chile and the us-based transnational corporation rrr, and its aim is to “transfer to Chile those technologies which can improve the utilization of the nation’s natural resources and productive capacity and stimulate the creation of new business enterprises based on these technologies” (Chile Foundation, 1986). The case study is primarily based on interviews with Mr. Pablo Herrera, Manager of the Chile Foundation, but it is also based on information taken from annual reports and other publications of the Foundation.
I
Technology and transfer of technology
1. Technology: a definition
It is important to clarify from the beginning the concept of technology used in this study. Often technology is understood as machinery and other forms of “hardware”. But it is more than that. It has to do with the knowledge needed to produce specific goods or services. Part of this knowledge is embodied in machines, but most of it is not. It is embodied in human skills, in manage-
‘ II should be established from the beginning, however, that this article intends to suggest that esk s are an important, but not o f tliemselves sufficient, condition for fulfilling development goals as regards technology transfer.
ment methods, in routines, and in organizational structures. Thus, E. Mansfield has defined technology as “the stock of knowledge (technical or management) which permits the introduction of new products or processes”. Technique differs from technology in that “the former is a method of production at a given moment which is defined by the equipment and the management method used, while the latter is the whole of the knowledge used in production" (Mansfield, 1968).
2. Transfer o f technology: a definition
Transfer of technology is best understood as the process of acquiring technological capability
T R A N S F E R O F T E C H N O L O G Y : T H E C A S E O F T H E C H I L E F O U N D A T I O N / T . H uss 99
from abroad. It consists of three stages; (i) the transfer of existing technologies to produce specific goods and services; (ii) the assimilation and diffusion of those technologies in the host economy; and (iii) the development of indigenous capacity for innovation (uNcrrc, 1987). Hence, technology transfer is not completed by acquiring technical knowledge (information embodied in blueprints or operational manuals) or the means of carrying it out such as capital goods. The technology transfer is only completed when the recipient fully understands the technology or has acquired the technological capability to use it effectively. I his requires the ability to adapt and modify the technology to local conditions and improve it through innovation. I'echnolog- ical capability can only be acquired through the formation of human capital, which is related to education, Job training, experience, and specific efforts to understand, adapt, improve or create technology.
3. D ifferent form s o f technology transfer
fransnational corporations (tncs) are the main source of industrial technology in the world, and the most important actors behind the international transfer of technology.Foreign direct investment (mi) has traditionally been the principal mode by which rxcs have transferred technology to developing countries because it involves continuing direct ownership of the technology. According to Richard E. Caves, it is important for a 1 \( : to retain control i)ver its technology because it is considered part of the firms “intangible assets". Such assets (like industrial property rights, unpatented know-how, marketing know-how, etc.) provide the firm with a competitive advantage over other Firms (Caves, 1982). This points to a relatively limited technology transfer by way of mi, because i ncs are reluctant to share their intangible assets. Fhe technology transfer primarily occurs through the establishment of linked industries within the local economy or through the secondment of trained personnel to local enterprises. Since the late 1970s, however, other mechanisms for technology transfer have been gaining importance, tncs are expanding their use of joint ventures and non-equity arrangements such as: (a) licensing; (b) franchising; (c) management contracts; (d) marketing con
tracts; (e) technical service contracts; (f) turnkey contracts; and (g) international subcontracting.
This broad range of international corporate activities is covered by the term “new forms of investment” (nfi). According to Charles Oman, these new forms of investment have the common denominator that a foreign company provides assets (e.g., equipment and technology) to an investment project or enterprise in a host country but local interests in the host country retain majority or total ownership of the investment project or enterprise (Oman, 1989). A number of factors have caused the growth of nm . "Fhe rapid expansion of tncs in the late 1960s and 1970s increased global competition among technology exporters, which enabled governments of developing countries to introduce restrictive legislation limiting the establishment of wholly-owned I NC subsidiaries. Many governments saw nfi as a way to enhance host-country control over production and increase technology transfer. But today the trend in most developing countries is to liberalize policy towards foreign direct investment (I'Di) in an attempt to attract more flows of such inve.stment. The decline in voluntary bank lending and the acute balance-of-payments problems that many countries face have resulted in a need for investment that surpasses previous concern over ownership shares, rni is also widely viewed as the principal source of new technology and access to international export markets, both of which are badly needed in order to increase international competitiveness.
Despite this setback for the original policy aims, there is evidence that kki will continue to gain importance in developing countries. First, some of the larger and more industrialized developing countries have already built up considerable local capacities in management, technology and equipment production and therefore are able to acquire and bargain for specific assets from foreign suppliers. Secondly, many incs have realized that a minority or even a non-equity position does not necessarily imply inadequate control of the intangible assets (e.g., technology). In fact, a growing number of fncs are finding that they can earn attractive returns from selling intangible assets without having to finance the investment projects, because this means reduced exposure to commercial and political risks compared with FDi. According to John Dunning and

100 C E P A L R E V I E W N o . 43 / A p ril 1991
John Cantwell, this is the case when the local partner has a valuable contribution to make, the technology is of a mature, standardized kind, or it is of secondary concern to the major activities in which the t n c is engaged (Dunning and Cantwell, 1986). Oman (1989) has also stressed that small- and medium-sized OECD-based firms which do not have the resources to undertake an f d i
operation use n k i as a strategy to internationalize their activities and compete with the major t n c s
and market share leaders.rhe question that arises now is whether nh
can result in an effective technology transfer to developing country enterprises and, if affirmative, what capabilities the recipient enterprises have to absorb the technology. This will be examined in the next section,
4. Technology transfer an d technical change in developing country enterprises
The dominant feature of enterprises in developing countries has been that they have remained more or less passive recipients of technology from i NCs. Protected behind trade barriers, local enterprises lacked incentives to embark on an active strategy to raise productivity through innovations. fechnology was purchased from i ncs because this was faster than developing it locally and the high costs of imported technology could be pa,ssed on to consumers. Early studies of technological development in the Third World focussed mainly on the problems associated with the transfer of technology from richer to poorer countries. Ehese problems were primarily related to the cost and appropriateness of the technology transferred. It was suggested that the recipient countries were paying too much for the technology because of their weak bargaining position vis-a-vis technology suppliers. National enterprises lacked information about alternative pn)duction possibilities and did not know the true value of the technology. This was due to the special characteristics of the technology market. As pointed out by Arrow, the fundamental paradox of that market was that the value of the technology was not known to the purchaser until he had the information, by which time in effect he had already acquired it without cost (Arrow, 1971).
The technology itself was considered to be
inappropriate to local conditions and resources in the majority of cases, and it was often utilized in an inefficient way by the recipient countries. It was also implicitly assumed that imported technology inhibited and replaced indigenous innovation efforts in developing countries.
In the late 1970s, case studies conducted at the enterprise level suggested a more dynamic relationship in which technology transfer under certain circumstances could induce indigenous innovative activities by the recipient enterprises (Fransman and King, 1987), The case studies of how enterprises assimilated and adapted imported technology revealed that the process of assimilating technology by the recipient enterprise often required problem-solving in which the solution was not given by the technology supplier. These problems were even greater when the conditions prevailing in the recipient country differed substantially from those of the country where the technology was developed. 'Ehe assimilation of technology, therefore, involved a process of technological change which in some cases led to the appearance of products and production processes that were considerably different from those in the developed countries.'*
It was pointed out in the case studies that the process of acquiring technological capabilities is very uncertain and not simply the automatic outcome of production experience (“learning by doing”). It cannot be expected that the mere fact of undertaking a specific type of production will result in a learning process and the development of capabilities to improve the ways of carrying out such production. To some extent, learning by doing is clearly a necessity in many phases of technological development. But it does not seem to be sufficient to maintain progress through all phases. Bell, in particular, has stressed that learning by doing is only one mechanism for augmenting technological capacity.^
Equally important for overcoming dis-
This has in many cases led to a South-South export o f technology (Dahlman and Sercovich, 1984).
See: Martin Bell, “ ‘Learning’ and the accumulation o f industrial technological capacity in developing countries”, in Martin Fransman and K. King (1987), pp, 187-209, I f this were the case, it would lead to the policy prescription that protection o f national enterprises (infant industries) was a sufficient means to enhance learning.
T R A N S F E R O F T E C H N O L O G Y : T H E C A S E O F T H E C H I L E F O U N D A T I O N / T. H uss 101
continuities and, perhaps, also for achieving overall efficient assimilation of imported tech- nology, is explicit investment in human capital (training of personnel and hiring of advisors), which will create a capacity for change and adaptation. The development of capabilities to assimilate and adapt imported technology successfully (thus improving productivity) depends on an active strategy for acquiring technology by the recipient enterprise. The optimal strategy will obviously vary across countries, sectors and enterprises, but there seems to be a wide measure of agreement that active technology transfer strategies should involve the following ele- ments/phases:a) Assessment of technology.b) Assimilation and adaption of technology to
local conditions.c) Diffusion of technology.d) Innovation,
These are considered briefly in the remainder of this section.
a) Assessment o f technology
In most industries, one sole technology is rarely the best for all circumstances. National factor endowments vary, as does the nature of intermediate inputs. Therefore, when choosing among alternative technologies, the recipient enterprises must find the most appropriate technology, that is, the one that makes optimum use of available resources. ’
'rhe first step to take in assessing and selecting a technology is to identify local needs and conditions. I'his is essential in developing countries, where the needs and conditions are often very different from those in the countries that supply most of the technology (Dahlman, Ross- Larson and Westphal, 1987). The benefits of such identification seem quite obvious, yet many investment projects in developing countries fail to do this. Specifically, the failure to identify local constraints is a repetitive problem which undermines many investments in developing countries. The typical constraints are in the areas of energy, transport, capital, skilled labour, and the supply of raw materials and other intermediate inputs.
^ T his is the definition o f appropriate technology used by Dahlman and W estphal (1983),
The second step is to search out the available technologies on the international market. This requires extensive information about different technology suppliers and is frequently by-passed because of the significant costs and capabilities required. Needless to say, the failure to do this has costly consequences in the long run.
The third step in assessing new technologies is to evaluate their associated benefits and cost, using prices that properly reflect relative scarcities (Dahlman and Westphal, 1983). This involves essentially economic considerations, but social and environmental aspects could also be analysed.
The fourth step is to decide if the capabilities that can be acquired from experience with different technologies will enable the enterprise to make future improvements and innovations in order to increase productivity, or move on to new activities. Some technologies open up more possibilities than others.
b) Assimilation and adaption o f technology to localconditions
Once the different technological possibilities have been properly assessed, then, ideally speaking, the enterprise should move on to the phase of assimilating and adapting the selected technology to local market conditions. Often, enterprises will experiment with more than one technology before making their final technology choice.
The aim is to understand the technology and ‘fit’ it to local conditions. The challenge is to take advantage of local demand and supply conditions to improve productivity and international competitiveness. fhis phase will most likely involve minor innovations or modifications of the technology to increase productivity, reduce costs, stretch capacity or improve quality. Many enterprises fail to achieve a sufficient understanding and effective adaption of the foreign technology before initiating full-scale commercial production. The consequences can be low productivity, loss of competitiveness and inadequate development of technological capacity to innovate and overcome production-related discontinuities. The constraints on enterprises during this important phase of the technology transfer process are, typically, lack of qualified personnel and absence of proper laboratories and test plant fácil-
102 C E P A L R E V I E W N o . 4 3 / A p r il 1991
ities. Another problem is that adapting technology can be a very long and therefore costly process because the initial production output with the new technology is low. Many enterprises do not have the economic resources to invest sufficient time in this process.
c) D iffusion o f technology
When the enterprise has gained sufficient knowledge of the technology’s potential and some experience in its use, the technology can be diffused on a larger scale. Additionally, efficient diffusion requires knowledge of capable construction companies, relevant management capabilities, sufficient capacity to bargain with local authorities, and economic resources to acquire an appropriate production site.
d) Innovation
As mentioned earlier, the efforts to assimilate and adapt technology to local conditions can lead to minor innovations (invention of new devices, products and production processes or improvements of the existing technology). It would be correct to speak of an ‘incremental’ or ‘evolutionary’ innovation process, to distinguish it from the more radical innovations (Herbert- Copley, 1989, p. 10). But as revealed in the above-
mentioned case-studies (see Fransman and King,1987), the innovation process (technical change) does not proceed at a constant rhythm or in a uniform direction. Innovations will often be the result of efforts to overcome constraints on the enterprise’s production capacity.
5. Conclusion
It should be stressed that a successful transfer of technology usually depends on a conscious decision and effort by the recipient enterprise to in vest time and economic and human resources in assessing and testing the technology, training personnel and contracting technical assistance. Even so, the process is very uncertain and the acquired technology may not necessarily increase the technological capacity of the enterprise.
The problem is that many enterprises, especially in their formative years, lack the experience and financial resources to conduct the necessary assessment, adaption, diffusion and modifications of the imported technology.
In the next section the characteristics and types of services offered by engineering service firms ( e s f s ) will be defined in order to see how they might offer a solution to the barriers to technology transfer.
II
Characteristics of Engineering Service Firms (ESFs)There is no hard-and-fast definition of e s f s . Here the definition is chosen on a functional basis and, accordingly, e s i-s can be defined as organizations that gather, organize, co-ordinate and apply knowledge for purposes of investment and production. They are characterized by a flexible and multidisciplinary approach to that activity. The services provided for the formulation or execution of an investment project can be of a technical, economic, financial, legal, environmental, or organizational character.
According to Roberts (1973), engineering service activities can be defined as “the set of methods and organizational structures which allow relevant scientific, technical and economic
knowledge to be gathered and converted into designs and instructions for the construction of specific projects’’. Hence, the role of e s f s is to keep up to date with international scientific advances and accumulate technological knowledge for the design and implementation of national investment projects. The discussion of e s f s below proceeds to define limits for the range of activities that can be described as technical engineering services.
1. Types o f services o ffered by e s f s
A.K. Malhotra (1980) has summarized the services offered by e s f s under the headings of preinvestment services, process and technological
T R A N S F E R O F T E C H N O L O G Y ; T H E C A S E O F T H E C H I L E F O U N D A T I O N I T . H uss 1 0 3
services, project implementation services, procurement and inspection services and, finally, operation and maintenance services. This classification is useful because it reflects the different phases of an investment project, and Table 1 has been prepared in line with it (it should be noted that in that table “procurement and inspection services” was modified to read “inspection and quality control services”). The aim of the table is to describe the purpose of the services offered, the type of information required, and the source of such information. Additionally, the table shows how these services correspond to the different stages in the technology transfer process.
a) Preinvestment services
rhe first stage of an investment project requires economic and technological engineering feasibility studies. Studies of the social impact and environmental consequences of the project will also often be relevant.
T he performance of these services requires an interdisciplinary team, with a knowledge of the technology available to the project, information on economic optimization methods, and the ability to carry out market and product analysis. The output typically will be a report evaluating different technology choices and also taking financial, economic, social and environmental issues into consideration. The report constitutes the basis for an investment decision, usually in the form of a recommendation to test specific technology alternatives. In the technology transfer process, this phase corresponds to the initial assessment of the technology available on the market.
c) Project implementation services
These services transform the project from a concept/proposal to an actual installation. The purpose is to acquire technology for large-scale production and execute the project proposal. The tasks involved are “preliminary engineering for selection of major equipment and materials, preparation of bid documents for suppliers, detailed engineering, including calculation and fabrication drawings, design and award of contracts, fabrication and supervision services” (Malhotra, 1980, p. 14). The engineering services will go hand-in-hand with construction supervision.
Project execution requires substantial human resources, management capability, detailed knowledge of technology, knowledge of equipment suppliers, etc.
In the technology transfer process these services correspond to bargaining with technology suppliers and the diffusion of technology.
d) Inspection and quality control services
rhe purpose of these services is to improve and standardize the quality of production to satisfy requirements of both export and domestic markets. T his involves factory inspection, testing of products and quality control according to established standards, inspection and quality control services demand familiarity with the relevant inspection codes and the standards required, detailed knowledge of equipment, suppliers and their specifications, and the availability of experienced inspectors. As part of the quality control activities, the esf can provide process and technological services if the product does not comply with standards.
b) Process an d technological services
These services involve the development of manufacturing process capabilities and the accumulation of knowledge of production methods, through research and tests of different technologies in laboratories, pilot plants, etc. Process and technological services may be conducted “in- house” by the ese or in collaboration with outside research institutions. In the technology transfer process these services correspond to the assimilation and adaption of technology to local conditions, culminating in the final choice of technology.
e) Operation an d m aintenance services
These services concern the effective functioning of plant and the elimination of production-related problems. Phis involves training of personnel, trouble-shooting, adaptation of technology, etc. The provision of operation and maintenance services requires experience knowledge of similar plants, and “learning by doing”.
Phis short summary of the services offered by ESES shows that they have the potential to assist national enterprises in all aspects of an investment project, and likewise during all phases of the technology transfer process
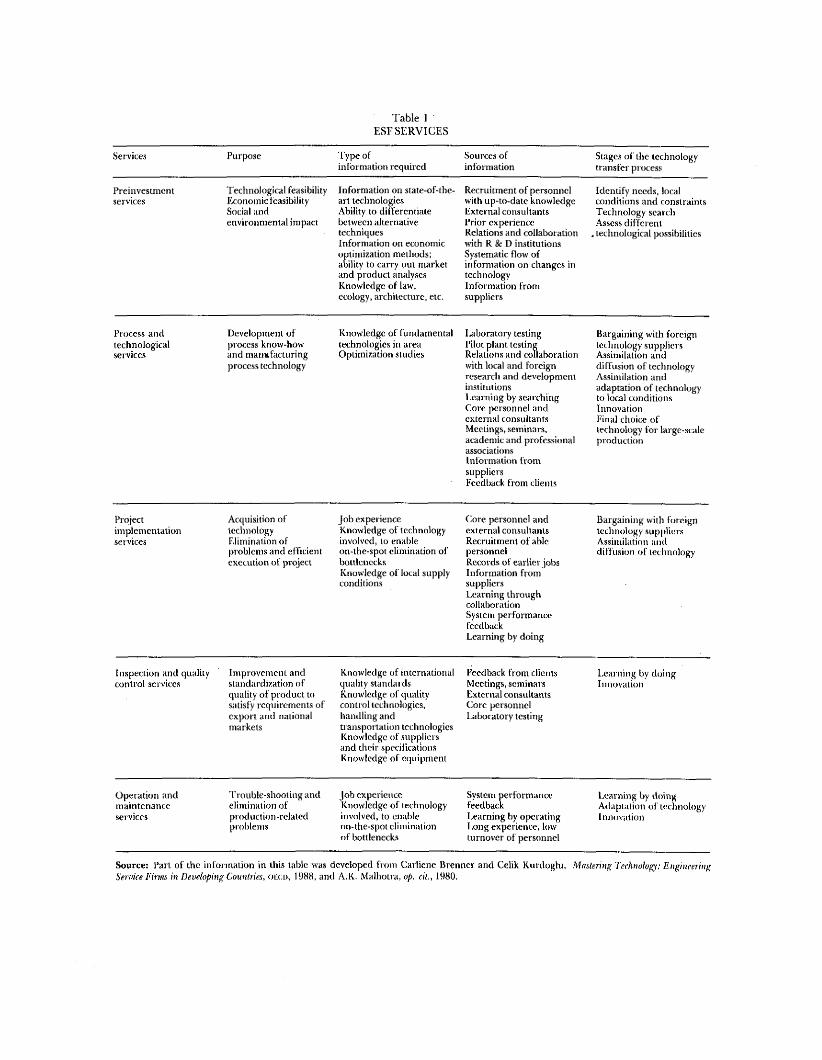
Table 1 ' E SF SE R V IC E S
Services Purpose Type ofinformation required
Sources of information
Stages of the technology transfer process
Prein vestment services
Technological feasibility Economic feasibility Social andenvironmental impact
Information on state-of-the- art technologies Ability to differentiate between alternative techniquesInformation on economic optimization methods; ability to carry out market and product analyses Knowledge of law, ecology, architecture, etc.
Recruitment of personnel with up-to-date knowledge External consultants Prior experience Relations and collaboration with R & D institutions Systematic flow of information on changes in technology Information from suppliers
identify needs, local conditions and constraints Technology search Assess different technological possibilities
Process andtechnologicalservices
Development of process know-how and mamcfacturing process technology
Knowledge of fundamental technologies in area Optimization studies
Laboratory testing Pilot plant testing Relattons and collaboration with local and foreign research and development institutionsLearning by searching Core personnel and external consultants Meetings, seminars, academic and professional associations Information from suppliersfeedback from clients
Bargaining with foreign technology suppliers Assimilation and diffusion of technology Assimilation and adaptation of technology to local conditions Innovation Final choice of technology for large-scale production
Projectimplementationservices
Acquisition of technology Elimination of problems and efficient execution of project
Job experience Knowledge of technology involved, to enable on-the-spot elimination of bottlenecksKnowledge of local supply conditions
Core personnel and external consultants Recruitment of able personnelRecords of earlier jobs Information from suppliers Learning through collaboration System performance feedbackLearning by doing
Bargaining with foreign technology suppliers Assimilation and diffusion of technology
Inspection and quality control services
Improvement and standardization of quality of product to sjitisfy requirements of export and national markets
Knowledge of international quality standards Knowledge of quality control technologies, handling andtiansportaiiontechnologies Knowledge of suppliers and their specifications Knowledge of equipment
Feedback from clients Meetings, seminars External consultants Core personnel Laboratory testing
Learning by doing Innovation
Operation andmaintenanceservices
Trouble-shooting and elimination of production-related problems
Job experience Knowledge of technology involved, to enable on-the-spot elimination of bottlenecks
System performance feedbackLearning by operating Long experience, low turnover of per.sonnel
Learning by doing Adaptation of technology Innovation
Source: Pari of the information in this tabic was developed from Ciaiiienc Brenner and Celik Kiirdoglii, M astering Technology: Engineering Senfice E irm in Developing Countries, oecd, 19H8, and A.K. Malhotra, op. cil., 1980,
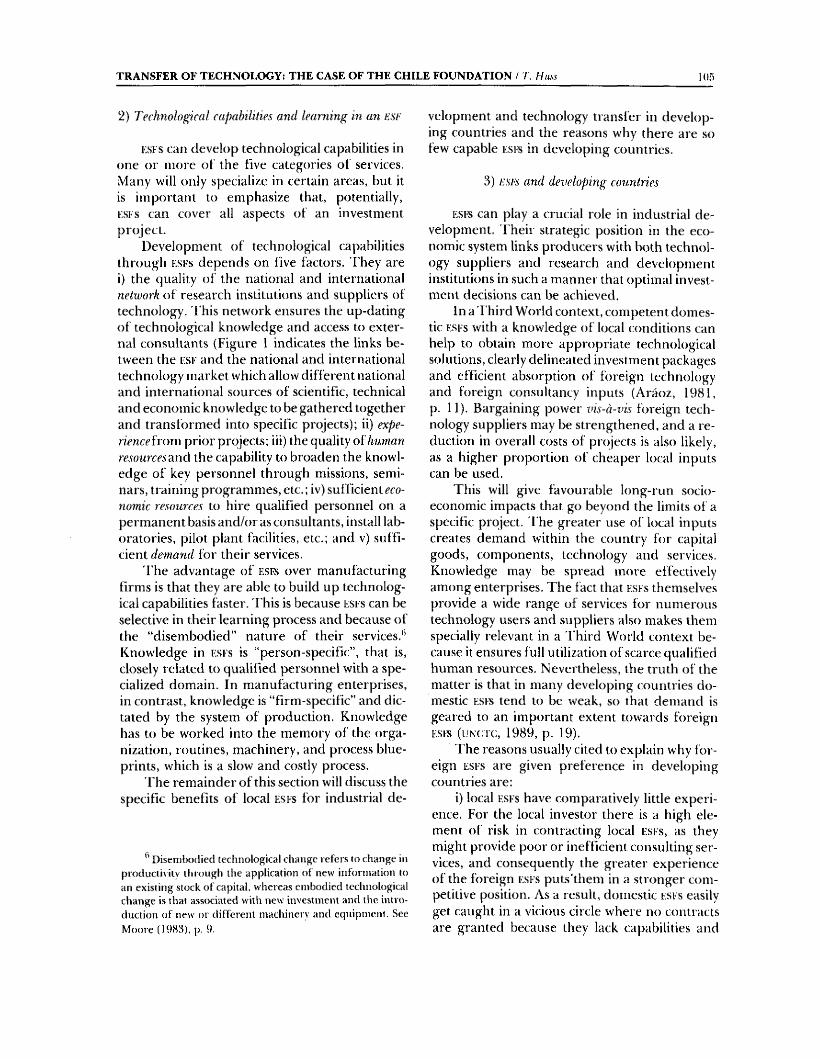
T R A N S F E R O F T E C H N O L O G Y : T H E C A S E O F T H E C H I L E F O U N D A T I O N / /, Htuss 1 0 3
2) Technological capabilities and learning in an esc
i:si- s can develop technological capabilities in one or more of the five categories of services. Many will only specialize in certain areas, but it is important to emphasize that, potentially, Ksi s can cover all aspects of an investment project.
Development of technological capabilities through Ksi'S depends on five factors. Fhey are i) the quality of the national and international network of research institutions and suppliers of technology. Fhis network ensures the up-dating i)f technological knowledge and access to external consultants (Figure 1 indicates the links between the I.SF and the national and international technology market which allow different national and international sources of scientific, technical and economic knowledge to be gathered together and transformed into specific projects); ii) experience horn prior projects; iii) the quality oihuman resources'and the capability to broaden the knowledge of key personnel through missions, seminars, training programmes, etc.; iv) sufficient economic 7'esources to hire qualified personnel on a permanent basis and/or as consultants, install laboratories, pilot plant facilities, etc.; and v) sufficient demand for their services.
rhe advantage of esfs over manufacturing firms is that they are able to build up technological capabilities faster. This is because esfs can be selective in their learning process and because of the “disembodied” nature of their services.*’ Knowledge in esfs is “person-specific”, that is, closely related to qualified personnel with a specialized domain. In manufacturing enterprises, in contrast, knowledge is “firm-specific” and dictated by the system of production. Knowledge has to be worked into the memory of the organization, routines, machinery, and process blueprints, which is a slow and costly process.
r h e rem aind er o f this section will discuss the specific benefits o f local esfs fo r industrial de-
*’ Disembodied technological change refers to change in producti^'itv through the application o f new information to an existing stock o f capital, whereas embodied technological change is that associated with new investment and the introduction o f new or different machinery and equipment. See M oore (1983), p. 9.
velopm ent and technology transfer in developing countries and the reasons why there are so few capable esfs in developing countries.
3) uses and developing countries
ESFS can play a crucial role in industrial developm ent. I heir strategic position in the econom ic system links producers with both technology suppliers and research and developm ent institutions in such a m anner that optim al investm ent decisions can be achieved.
In a Third World context, competent domestic ESFS with a knowledge of local conditions can help to obtain more appropriate technological solutions, clearly delineated investment packages and efficient absorption of foreign technology and foreign consultancy inputs (Araoz, 1981, p. 11). Bargaining power vis-ci-vis foreign technology suppliers may be strengthened, and a reduction in overall costs of projects is also likely, as a higher proportion i)f cheaper local inputs can be used.
This will give favourable long-run socioeconomic impacts that go beyond the limits of a specific project. The greater use of local inputs creates demand within the country for capital goods, components, technology and services. Knowledge may be spread more effectively among enterprises. The fact that esfs themselves provide a wide range of services for numerous technology users and suppliers also makes them specially relevant in a Third World context because it ensures full utilization of scarce qualified human resources. Nevertheless, the truth of the matter is that in many developing countries domestic ESFS tend to be weak, so that demand is geared to an important extent towards foreign ESFS (UNCTC, 1989, p. 19).
The reasons usually cited to explain why foreign ESFS are given preference in developing countries are:
i) local ESFS have comparatively little experience. For the local investor there is a high element of risk in contracting local esfs, as they might provide poor or inefficient consulting services, and consequently the greater experience of the foreign esfs puts'them in a stronger competitive position. As a result, domestic esfs easily get caught in a vicious circle where no contracts are granted because they lack capabilities and
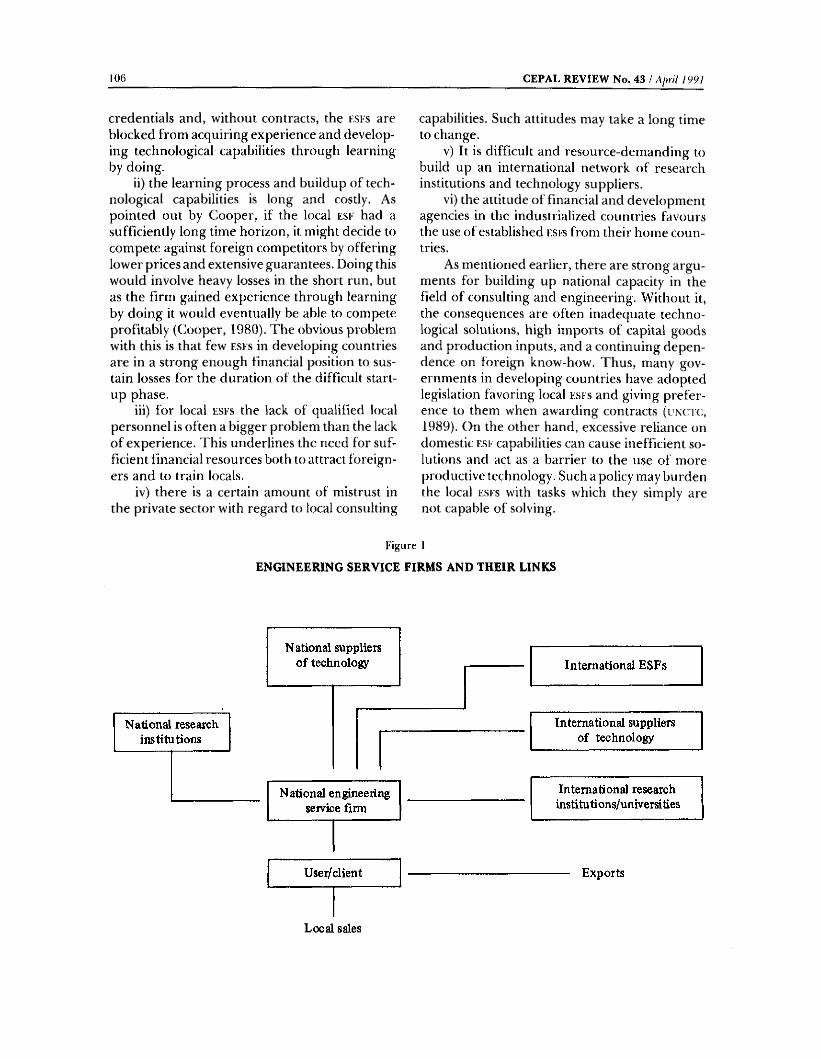
106 C E P A L R E V I E W N o . 43 / A p ii l ¡9 9 1
credentials and, without contracts, the esi s are blocked from acquiring experience and developing technological capabilities through learning by doing.
ii) the learning process and buildup of technological capabilities is long and costly. As pointed out by Cooper, if the local ese had a sufficiently long time horizon, it might decide to compete against foreign competitors by offering lower prices and extensive guarantees. Doing this would involve heavy losses in the short run, but as the firm gained experience through learning by doing it would eventually be able to compete profitably (Cooper, 1980). The obvious problem with this is that few eses in developing countries are in a strong enough financial position to sustain losses for the duration of the difficult startup phase.
iii) for local eses the lack of qualified local personnel is often a bigger problem than the lack of experience. This underlines the need for sufficient financial resources both to attract foreigners and to train locals.
iv) there is a certain amount of mistrust in the private secUir with regard to local consulting
capabilities. Such attitudes may take a long time to change.
v) It is difficult and resource-demanding to build up an international network of research institutions and technology suppliers.
vi) the attitude o f financial and developm ent agencies in the industrialized countries favours the use o f established Esis from their hom e cou ntries.
As mentioned earlier, there are strong arguments for building up national capacity in the field of consulting and engineering. Without it, the consequences are often inadequate technological solutions, high imports of capital goods and production inputs, and a continuing dependence on foreign know-how. Thus, many governments in developing countries have adopted legislation favoring local eses and giving preference to them when awarding contracts (uNtrrc, 1989). On the other hand, excessive reliance on domestic ese capabilities can cause inefficient solutions and act as a barrier to the use of more productive technology. Such a policy may burden the local eses with tasks which they simply are not capable of solving.
Figure 1
ENGINEERING SERVICE FIRMS AND THEIR LINKS
Local sales
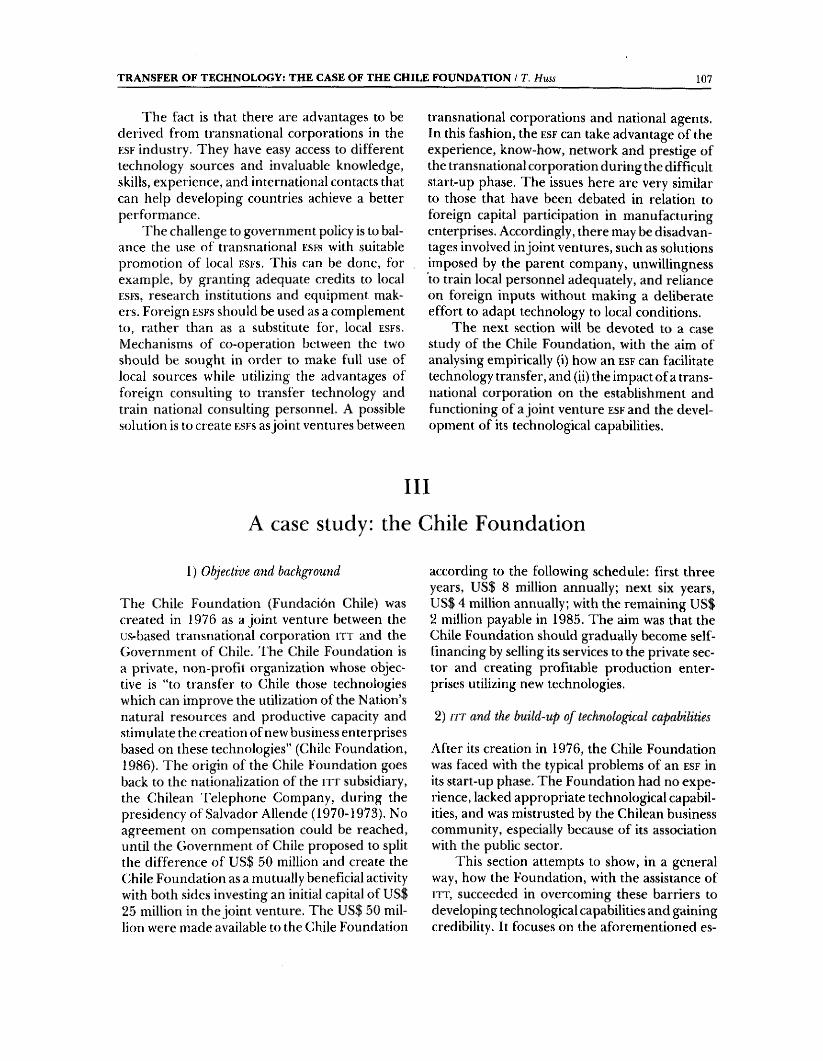
T R A N S F E R O F T E C H N O L O G Y : T H E C A S E O F T H E C H I L E F O U N D A T I O N / T. H uss 107
The fact is that there are advantages to be derived from transnational corporations in the KSF industry. They have easy access to different technology sources and invaluable knowledge, skills, experience, and international contacts that can help developing countries achieve a better performance.
The challenge to government policy is to balance the use of transnational fsfs with suitable promotion of local esfs. This can be done, for example, by granting adequate credits to local Esre, research institutions and equipment makers. Foreign esfs should be used as a complement to, rather than as a substitute for, local esfs. Mechanisms of co-operation between the two should be sought in order to make full use of local sources while utilizing the advantages of foreign consulting to transfer technology and train national consulting personnel. A possible solution is to create esfs as joint ventures between
transnational corporations and national agents. In this fashion, the esf can take advantage of the experience, know-how, network and prestige of the transnational corporation during the difficult start-up phase. The issues here are very similar to those that have been debated in relation to foreign capital participation in manufacturing enterprises. Accordingly, there may be disadvantages involved in joint ventures, such as solutions imposed by the parent company, unwillingness to train local personnel adequately, and reliance on foreign inputs without making a deliberate effort to adapt technology to local conditions.
The next section will be devoted to a case study of the Chile Foundation, with the aim of analysing empirically (i) how an esf can facilitate technology transfer, and (ii) the impact of a transnational corporation on the establishment and functioning of a joint venture esf and the development of its technological capabilities.
I l l
A case study: the Chile Foundation
1) Objective and background
The Chile Foundation (Fundación Chile) was created in 1976 as a joint venture between the us-based transnational corporation it t and the Government of Chile. The Chile Foundation is a private, non-profit organization whose objective is “to transfer to Chile those technologies which can improve the utilization of the Nation’s natural resources and productive capacity and stimulate the creation of new business enterprises based on these technologies” (Chile Foundation,1986). The origin of the Chile Foundation goes back to the nationalization of the it t subsidiary, the Chilean Telephone Company, during the presidency of Salvador Allende (1970-1973). No agreement on compensation could be reached, until the Government of Chile proposed to split the difference of US$ 50 million and create the Chile Foundation as a mutually beneficial activity with both sides investing an initial capital of US$ 25 million in the joint venture. The US$ 50 million were made available to the Chile Foundation
according to the following schedule; first three years, US| 8 million annually; next six years, US$ 4 million annually; with the remaining US$ 2 million payable in 1985. The aim was that the Chile Foundation should gradually become selffinancing by selling its services to the private sector and creating profitable production enterprises utilizing new technologies.
2) ITT and the build-up o f technological capabilities
After its creation in 1976, the Chile Foundation was faced with the typical problems of an esf in its start-up phase. The Foundation had no experience, lacked appropriate technological capabilities, and was mistrusted by the Chilean business community, especially because of its association with the public sector.
This section attempts to show, in a general way, how the Foundation, with the assistance of ITT, succeeded in overcoming these barriers to developing technological capabilities and gaining credibility. It focuses on the aforementioned es-
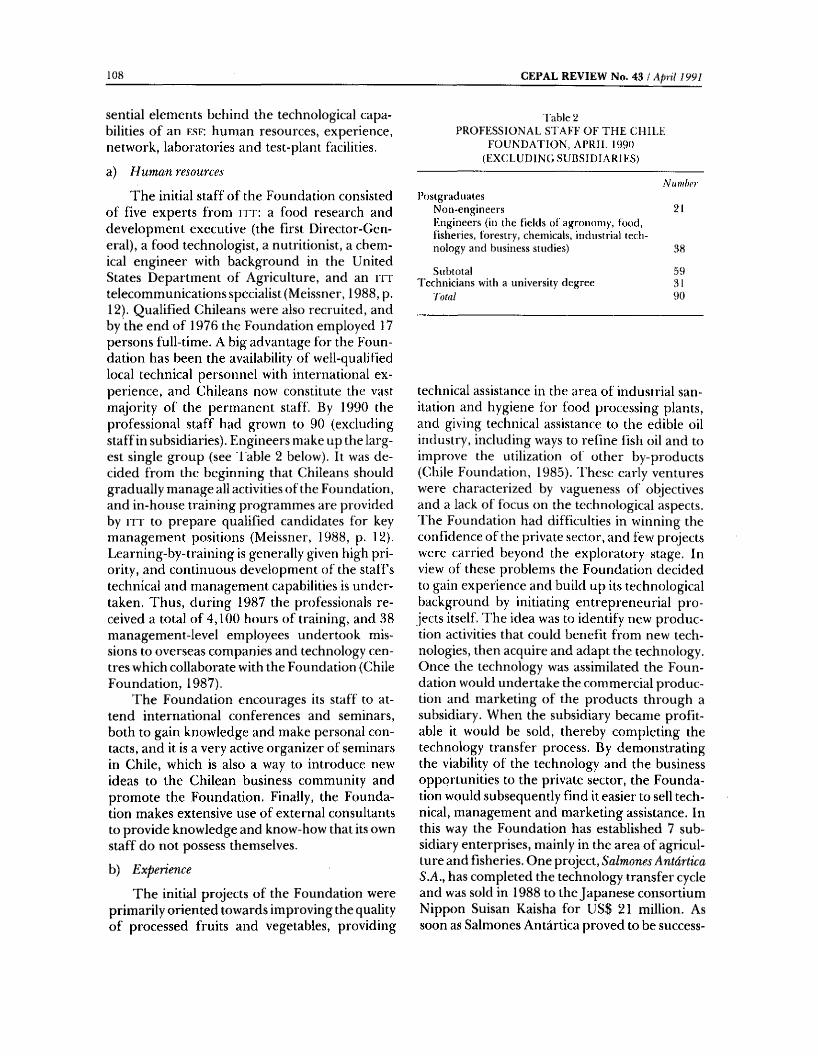
1 0 8 C E P A L R E V I E W No. 43 / A p ril 1991
sential elements behind the technological capabilities of an esf: human resources, experience, network, laboratories and test-plant facilities.a) Human resources
The initial staff of the Foundation consisted of five experts from itt: a food research and development executive (the first Director-General), a food technologist, a nutritionist, a chemical engineer with background in the United States Department of Agriculture, and an rn telecommunications specialist (Meissner, 1988, p. 12). Qualified Chileans were also recruited, and by the end of 1976 the Foundation employed 17 persons full-time. A big advantage for the Foundation has been the availability of well-qualified local technical personnel with international experience, and Chileans now constitute the vast majority of the permanent staff. By 1990 the professional staff had grown to 90 (excluding staff in subsidiaries). Engineers make up the largest single group (see Table 2 below). It was decided from the beginning that Chileans should gradually manage all activities of the Foundation, and in-house training programmes are provided by ITT to prepare qualified candidates for key management positions (Meissner, 1988, p. 12). Learning-by-training is generally given high priority, and continuous development of the staff s technical and management capabilities is undertaken. Thus, during 1987 the professionals received a total of 4,100 hours of training, and 38 management-level employees undertook missions to overseas companies and technology centres which collaborate with the Foundation (Chile Foundation, 1987).
The Foundation encourages its staff to attend international conferences and seminars, both to gain knowledge and make personal contacts, and it is a very active organizer of seminars in Chile, which is also a way to introduce new ideas to the Chilean business community and promote the Foundation. Finally, the Foundation makes extensive use of external consultants to provide knowledge and know-how that its own staff do not possess themselves.
b) Experience
The initial projects of the Foundation were primarily oriented towards improving the quality of processed fruits and vegetables, providing
Table 2P RO FESSIO N A L ST A F F O F T H E C H ILE
FO U N D A TIO N , A PR IL 1990 (EX C LU D IN G SU B SID IA R IE S)
NumberPostgraduates
N on-engineers 21Engineers (in the fields o f agronomy, food,Fisheries, forestry, chemicals, industrial technology and business studies) 38
SubtotalTechnicians with a university degree
593190
technical assistance in the area of industrial sanitation and hygiene for food processing plants, and giving technical assistance to the edible oil industry, including ways to refine fish oil and to improve the utilization of other by-products (Chile Foundation, 1985). Fhese early ventures were characterized by vagueness of objectives and a lack of focus on the technological aspects. Fhe Foundation had difficulties in winning the confidence of the private sector, and few projects were carried beyond the exploratory stage. In view of these problems the Foundation decided to gain experience and build up its technological background by initiating entrepreneurial projects itself. The idea was to identify new production activities that could benefit from new technologies, then acquire and adapt the technology. Once the technology was assimilated the Foundation would undertake the commercial production and marketing of the products through a subsidiary. When the subsidiary became profitable it would be sold, thereby completing the technology transfer process. By demonstrating the viability of the technology and the business opportunities to the private sector, the Foundation would subsequently find it easier to sell technical, management and marketing assistance. In this way the Foundation has established 7 subsidiary enterprises, mainly in the area of agriculture and fisheries. One project, Salmones AntàrticaS.A., has completed the technology transfer cycle and was sold in 1988 to the Japanese consortium Nippon Suisan Kaisha for US$ 21 million. As soon as Salmones Antàrtica proved to be success-
T R A N S F E R O F T E C H N O L O G Y ; T H E C A S E O F T H E C H I L E F O U N D A T I O N / T. H m s 109
fui, the Foundation’s technical assistance branch began promoting other ventures making the technology available to interested firms. In the next section of this article, the Salmones Antartica project is studied in detail in order to analyse how the Foundation approaches technology transfer, builds up its technological capabilities and provides technical assistance to the private sector.
c) Network
The association with rr r has provided access to a worldwide network of consultants and technology suppliers. Upon request, a liaison officer at ITT supplies the Foundation with information on technology suppliers, bibliographies, consultants, etc. A formal technical assistance contract has been established between it t and the Foundation, whereby the Foundation undertakes to i) reimburse rr i' for ail direct costs incurred in providing technical information {such as travel and subsistence of the personnel providing technical a.ssistance at the Foundation’s premises); ii) keep data confidential until otherwise authorized by rn ; and iii) inform it t of any invention, discovery or improvement that may result from research using substantial amounts of it t technical information, it t is free to use such new knowledge, reimbursing the Foundation for all direct expenditures related to the transfer of the information.
d) Laboratory and test-plant facilities
Fhe Foundation has devoted substantial resources to the establishment of laboratories and test-plant facilities. This has also been an important source of knowledge.
It is difficult to assess exactly why the Chile Foundation has been able to develop up-to-date technological capabilities in different fields of activity. Predictably, a number of projects have failed, but generally speaking the organization has been very enterprising, and most of the projects have had a substantial creative content and been successful in transferring new technologies to Chile. According to the Foundation itself, five important reasons can be cited to explain why the Foundation has been able to develop its technological capabilities:
i) The educational preparation and experience of both the staff transferred from it t to
Chile and the professionals available in Chile itself.
ii) The ample financial resources at the Foundation’s disposal during the initial stage of its existence. This allowed for investment in human resources by recruiting highly-qualified permanent staff, making extensive use of consultants, ensuring continuous updating of the capability of its personnel through training and study courses abroad, and installing laboratories and pilot plant facilities. Furthermore, this solid financial basis made it possible to pursue a bold entrepreneurial strategy and gain the necessary experience.
iii) Access to the rrr network, and the assistance of rrr in negotiations with technology suppliers and the private sector in Chile.
iv) The management principles used, which are largely based on the i t t Research and Development Case Method. The fundamental pillar upon which this case method rests is management-by-objectives, with the basic principles of flexibility and control. In the Foundation, the system is implemented in the following way:
The period from project idea to implementation is made as short as possible. When a staff member receives an outside request for technical assistance or wishes to pursue an idea, a project proposal is elaborated, which is presented to the Board of Directors and the Department of Finance and Administration. If the project is approved, a detailed budget for all resources needed is authorized. The staff member is granted considerable autonomy during project implementation, but management-by-objectives involves strict budget planning and control. In the Chile Foundation, each project or case manager must make a monthly report on the advance of the project and the resources used on personnel, travel, consultants, materials, laboratory work, machinery, telephone/fax communications, seminars, and miscellaneous items. The system implemented at the Chile Foundation allows for some flexibility in changing the authorized case budget, if this can be justified convincingly to the Director-General or Board of Directors.
v) The Foundation is business oriented in the sense that the projects undertaken must be profitable. Due to the special circumstances sur-
110 C E P A L R E V I E W N o . 4 3 / A p ril ¡9 9 1
rounding its creation, the Foundation as a whole is a non-profit organization, but the specific projects have to be economically feasible. Thus, a big effort is also made to seek out joint venture entrepreneurs willing to risk capital and to transfer new technologies to Chile.
A marketing department was established to strengthen staff capabilities in developing and implementing strategies for the marketing of the products and services offered by tbe Foundation. Among the tools used are short courses, workshops, seminars, publications, visits to the Foundation headquarters and enterprises, and public relations with the mass media.
It should be reiterated that it t was of fundamental importance in the development of the Chile Foundation’s technological capabilities. The provision of ample financial resources, transfer of personnel from it t headquarters, introduction of n r management methods and the access granted to the in network made possible a rapid build-up of capabilities. T he outcome has been the recruitment and continuous training of qualified Chilean personnel, use of consultants, construction of laboratories and test-plant facilities and, finally, development of the Foundations’s own national and international network through missions and the organization of seminars in Chile.
In the next section the Salmones Antartica project will be analysed in detail to show how the Foundation has transferred technology and built up technological capabilities in a specific field. The project will be analysed through the different stages of the technology transfer process: a) preinvestment studies (problem identification); b) choice and adaptation of technology to local conditions (process and technological studies); and c) assimilation and diffusion of technology (project implementation).
3) Salmones Antartica: an example o f effective technology transfer
a) Background (preinvestment studies)
Chile is one of the most important fishing nations in the world, with a catch of around 5 million tons a year, but most of the catch is transformed into low-grade fish meal for animal consumption. Consequently, the Chile Foundation
decided at a very early stage to explore the possibilities of transferring fishery-related technologies to increase the degree of processing of maritime resources, making the sector more productive and profitable.
One of the first projects of the Foundation was to explore the feasibility of establishing salmon fisheries in Chile. Salmon is one of the most highly-appreciated fish in the world and, therefore, could be an important source of income on export markets.
Fish of the salmon family are not native to the Southern Hemisphere, but Southern Chile’s climate and coastal geography, with fiords, islands, and protected bays, is very similar to the conditions prevailing in the Northern Hemisphere, where salmon live and reproduce naturally. Furthermore, the southern waters of Chile are clean, unpolluted, dear, fresh and oxygen- rich. Water temperatures and climatic conditions are also milder than in the Northern Hemisphere, where the winter growth rates of salmon are low and living conditions severe.
In short, Chile seemed ideal for raising salmon on a commercial scale. Two technologies were available for the acclimatization of salmon to Chilean waters.
'Fhe first is ''Ocean ranching technology". In the Northern Hemisphere salmon spawn in fresh waters and spend the first part of their life in the streams or lakes where they were born. When a salmon fry (called a smolt) reaches one year of age it migrates to the ocean, where it grows and matures. When ready to reproduce, a powerful instinct of the salmon forces it to return to the streams where it was born in order to mate.
This circuit is utilized in the ocean ranching technology. Initially, eggs are hatched and the salmon are raised to the smolt stage in fresh water under controlled conditions. Afterwards the salmon are released to mature in a natural oceanic environment. When the adults return to their original place of release to mate the fish are captured.
The ocean ranching technology is widely used along the west coast of Canada and the United States. In 1980, salmon landings in these areas totalled 400,000 tons. With a coastline of 5,000 km., an average of 80 tons of salmon was produced per kilometre. If the Chile Foundation could achieve a production of 40 tons per linear
T R A N S F E R O F T E C H N O L O G Y : T H E C A S E O F T H E C H I L E F O U N D A T I O N / 7. H uss i n
km., the 1 700 km. oi “salmon coastline” could produce 68,000 tons of ranch salmon annually. At a price of US$ 3 per kg., that would amount to over US$ 200 million (Meissner, 1988, p. 2l). There are, however, three problems related to ocean ranching: i) it is slow; ii) it is risky, because 1-1.5 per cent of the mature salmon must return merely in order to pay for the raising of the smolts, and iii) the returning salmon are in the public domain, so that anybody with a fishing license can go after them.
The second technology is ''cage cultivation" or "salmonfarming". Salmon farming involves the continuous rearing of salmon in enclosures throughout their life cycle, from eggs to harvest. The eggs are obtained from abroad, from a local hatchery, or by the artificial fertilization of self- owned brood stock. The latter requires the forming and keeping of brood fish and genetic selection. When the newborn salmon reach the smolt stage and start swimming they are transferred to a floating cage where they mature. The growth rate will depend on the salmon species farmed, the genetic strain, the amount and quality of fish feed, cage type and “fish management”.
Over the last 25 years, commercial cage cultivation of salmon has been well established as a viable business in several countries around the world. In 1985, Norway (now the largest producer), harvested 28 000 tons of farmed salmon. Japan and the United States, for their part, harvested approximately 7,000 tons (Lindbergh,1987). Cage cultivation has primarily been successful because high-quality fresh fish can be provided at times of the year when freshly captured ocean salmon are scarce or unavailable. Furthermore, the growers of farmed fish can grow the most sought-after species and to a significant degree configure the fish to the preferred color and fat content.
Initially, the Chile Foundation tried ocean ranching and released salmon on several locations in the Tenth Region of Chile. For as yet unknown reasons, however, the rate of returned salmon was very low. It was then decided to change to cage cultivation. The general advantages were also considered to be higher and the technological content was more challenging.
b) Choice and adaptation of technology (processand technological studies)
In 1981, the Chile Foundation decided to carry out a pilot project on the cage cultivation of salmon in fresh water with the aim of studying the technical and economic feasibility of salmon farming in Chile. Among the problems that had to be solved were; choice of specific cage design and technology, production of feed, identification and control of diseases, the study of currents,- oceanography, site selection and supply of salmon eggs.
The first step taken was to acquire the technology and installations to produce salmon eggs and grow salmon fingerlings to the smolt stage.
In order to gain time, this was done by buying Domsea, a small United States-owned hatchery in Curaco de Vêlez, in the southern part of Chile. There, salmon fingerlings were grown in fresh water to the smolt stage and then released, with the company seeking their return via the ocean ranching technology. Under the ownership of the Foundation, the company was renamed Salmones Antartica, and used as a pilot project site for cage cultivation.
The next step was to choose a production system and adapt the technology to Chilean conditions. First, staff members were sent on international missions to visit different salmon farms and attend seminars to make contacts and search for the appropriate technology. Several options were available. The most advanced and capital- intensive cage technology was found in Norway. But the technology was very costly and, furthermore, the Norwegians were reluctant to sell their equipment and know-how to a potential competitor, The choice fell on net pens or cages developed in the United States. The nets are normally hung from a square or rectangular structure that is supported by floats. Sizes vary from a few m3 to 50 m3. United States consultants from Seattle were hired to assist in the assimilation and adaptation of the production system to Chilean con-
‘ ditions. A major change in this respect was to make the fundamental structure out of wood instead of steel, in this way utilizing a cheap and abundant natural resource of Chile.
To achieve good quality and high growth rates, special attention had to be given to the feeding of the fish stock. Feed is the highest single
1 1 2 C E P A L R E V I E W N o . 43 / A p ril 1991
cost item involved in rearing salmon in cages and accounts for up to 40% or more of total costs up to harvest time (Lindbergh, 1987). The predom- inant constituents of standard salmon feed are fish meal, fish oil, carbohydrates, vitamins and binding agents (Romero, 1988). With the increased production of farmed fish, the animal feed industry has expanded and developed a number of fish feed manufacturing processes which involve the making of different forms of feed and sizes of feed particles. If salmon ranching was to be profitable in Chile, it was necessary for the Foundation to develop fish feed that made use of the large volumes of low-cost fish meal and oil available in the country. Through experiments with different fish feed mixtures at the Foundation’s pilot plant, a mixture was found which used exclusively local resources. The colour of the salmon meat is a result of the diet, so a special problem for the Foundation during the pilot project was to develop feed that would produce the attractive pink colour of salmon filet. This was solved by mixing Antarctic krill into the fish feed.
During the pilot project a number of other problems were solved, such as fish feeding techniques, disease control, changes in currents and water temperature, handling of eggs and smolts, selection of species and fish behaviour in cages. Fhe appropriate technologies relating to cage cultivation were adapted and modified by way of experiments (learning-by-doing), use of national and internatiortal consultants (learning by hiring) and training of permanent staff at ranch farms and fish technology centres abroad. The Foundation had an average of 10 staff members working on the salmon pilot project.
c) Diffusion of technology (project implementation)
In 1983, the success of the pilot project encouraged the Foundation to expand the import substitution production of salmon eggs and initiate commercial cage cultivation. Due to the favourable demand for Coho salmon, the internal rate of return was estimated to range from 36% with an annual output of 100 tons to 33% for an output of 600 tons (Meissner, 1988, p. 22).
The Foundation (Salmones Antàrtica) acquired four new farm sites and a large-scale expansion plan was initiated at these sites. In addition, Salmones Antàrtica built three new
hatcheries, a new feed plant and a salmon packing complex. The first commercial harvest of 200 tons was projected for 1986-1987, increasing to 400 tons thereafter. Accumulated losses were expected to peak at some US$ 1 million by 1985, and the first positive cash flow of about US$ 100 000 was projected for 1988, to be consolidated at US$ 2.5 million annually by 1990 and thereafter (Meissner, 1988, p. 22).
The implementation of commercial cage cultivation was carried out according to the project objectives, and in 1988 profits were generated. Thus, the technology transfer cycle was completed, and when the Foundation offered Salmones Antàrtica for sale it was bought by the Japanese seafood processing firm Nippon Suisan Kaisha for US$ 21 million (Lichmann, 1989, p. 72).
d) Technical assistance
The Foundation’s pioneering salmon project received a significant response in Chile. Between 1983 and 1985, 24 new salmon farms were initiated and total Chilean salmon production increased from 94 tons in 1983 to 1,144 tons in 1986, reaching 4,208 tons in 1988 (Wurmann,1990). The technological capabilities developed at the Foundation were such that it was possible to provide technical assistance to more than half of the new projects. The Foundation is still developing engineering and technical plans for several firms and encouraging others to become interested in salmon production. These technical assistance projects can be summarized as follows:
i) assistance in the technical and financial aspects, design and start-up of salmon farming projects.
ii) assistance in the design and building of feed plants.
Hi) assistance in the design and start-up of salmon packing plants.
iv) assistance in the control and prevention of disease.
v) assistance in the development of quality standards for Chilean salmon.
vi) organization and sponsorship of seminars to inform the private sector and stimulate investment in the industry (Chile Foundation, 1987b, p. 207).
T R A N S F E R O F T E C H N O L O G Y : T H E C A S E O F T H E C H I L E F O U N D A T I O N / T. Muss 113
e) Conchision of the case study
The Salmones Antàrtica project is a very eloquent example of effective technology transfer. It shows how the Chile Foundation first of all identified a potential business opportunity: the application of new technology to develop salmon farming in Chile. A conscious strategy was followed to search for the most appropriate technology and invest the necessary time and resources in assimilating and adapting it to local conditions. This was of fundamental importance, because it was during the adaptation process that the comparative advantages of Chilean salmon
farming were developed. For example, the use of cheap and abundant local resources for fish feed and cage construction have contributed significantly to the international competitiveness of Chilean salmon. Another important lesson to be derived from the Salmones Antàrtica project is the feasibility of investing in the development of technological capabilities and then selling the know-how (intangible assets) to third parties. Once the Foundation had built up technological capabilities in salmon farming and successfully diffused the technology, technical assistance provided to new projects became a major source of income and a way to expand activities.
IV
Conclusions
In many developing countries, extensive use has been made of imported technology as a basis for the establishment of new industries. Licenses and i)ther forms of technology transfer have fulfilled a demand for technology that could not be met immediately by local technological capabilities.
Fhe present study has emphasized that if foreign technology acquisition is to induce technical change and raise productivity of the recipient enterprise it requires an active technological strategy on behalf of the recipient. First, the enterprise must carry out an active search for alternative technology sources in order to track down the most appropriate technology and diminish the vulnerability that comes with overreliance on a single or few sources. Second, time and resources must be invested in skill formation and organizational changes in order to assimilate and effectively adapt the technology to local conditions. The latter is essential in order to develop comparative advantages and make the production internationally competitive. Third, in order to implement the technology for large scale production the enterprise must develop contacts with appropriate suppliers of equipment and materials, improve management capabilities and increase its own capacity to bargain with local authorities.
As mentioned in the introduction, it is very difficult for policy makers in developing countries to directly help national enterprises to accomplish all these requirements in order to transfer foreign technology effectively. The task of governments is, first of all, to create a macroeconomic environment that induces local enterprises to undertake an active technological strategy. The exposure of local enterprises to a certain degree of foreign competition is a good thing in this respect. Perhaps even more important, governments should support the development of a local scientific and technological infrastructure. The technological effort of local enterprises relies above all on the existence of a pool of trained workers and technicians and on publicly-funded R & D centres.
In the area of direct assistance to local enterprises receiving foreign technology, this article suggests that one solution is the creation of design engineering capabilities (engineering service firms). Their experience and strategic position in the economic system links producers with both technology suppliers and research and development institutions to ensure optimal investment decisions. Competent local f.sks with a knowledge of local conditions can also help enterprises to absorb and adapt foreign technology more efficiently. In many developing countries.
114 C E P A L R E V I E W N o . 4 3 / A p ril 1991
however, there are few domestic lisrs because of the many barriers to entry into the engineering services market. This is because many developing countries do not have the human resources to conduct engineering services, and it is a costly and lengthy process to hire and train the most qualified personnel. It is also costly and resourcedemanding to build up a useful national and international technological network. Another barrier to many Third World is the difficulty of gaining private sector confidence and obtaining the credentials and necessary experience to further develop their capabilities. An esf formed as a joint venture between a national agent (possibly the public sector) and a transnational partner that possess the needed skills and experience could be one solution for overcoming these barriers.
In the present study this idea has been ratified by analysing the achievements of the Chile Foundation: an esf joint venture between it t and the Government of Chile. The Foundation has successfully carried out projects in various fields related to technical assistance, information services and quality control, and it has also initiated full-scale commercial production through subsidiaries. The latter is not an activity normally associated with esfs, but it has provided a way of gaining experience and promoting new technologies in the Chilean private sector. The philosophy has been to identify new business opportunities that could benefit from foreign technology, transfer that technology from abroad, learn how to master it, and finally demonstrate the viability of the new technology by undertaking full-scale commercial production. Once profitable, the Foundation encourages the private sector to utilize the same production methods and provides the needed technical assistance.
The experience of the Foundation has confirmed that it pays to invest time and resources in adapting the technology properly, because it is mainly during this crucial phase in the tech
nology transfer process that the comparative advantages of the project are developed. As shown in the case study, it t played a decisive role in the development of the Foundation’s technological capabilities by transferring personnel from ITT headquarters, introducing management methods, granting access to its global technological network and, finally, training local personnel. ITT also provided the Foundation with the necessary credibility and support in negotiations with third parties.
It has become an “explicit policy goal” to gradually make the Foundation independent of ITT, and now, 15 years after its creation, the Foundation primarily relies on its own contacts and technological capabilities.Apart from it t ’s support, other important factors in the development of technological capabilities were the ample financial resources available during the start-up phase and the quality of the educational background of the professionals available for recruitment in Chile.
The final question to be addressed is the general validity of this case study: that is, whether the same scheme can be copied in other developing countries. The special circumstances surrounding the creation of the Foundation, and the interest of it t in improving its reputation in Chile, make the Chile Foundation a very special and exceptional case. It may be difficult to convince other I'NCs to invest US$ 25 million in a joint venture with the dubiously lucrative objective of transferring technology to a Third World country. But an obvious lesson to be learned from the case study is that a Third World government and a tnc can enter a mutually beneficial arrangement. In this case, the skills, experience and contacts provided by a tn c , together with the availability of skilled local personnel and a long-term investment in the development of technological capabilities, did result in effective technology transfer, together with the creation of profitable entrepreneurial projects.
T R A N S F E R O F T E C H N O L O G Y : T H E C A S E O F T H E C H I L E F O U N D A T I O N / 7. H uss 1 1 5
BibliogrAráoz, Alberto (ed.) (1981): C om uU ingandEn^neeringD esign
in Developing Countries, Ottawa, International Development Research Centre (iDRf:), p. 11.
Arrow, K, {1971): £5.w)i.í in the Theory o f Risk Bearing, Chicago, Markham ,
Ciaves, Richard E. (1982): M ultinalional Enterprises and Economic Analysis, Cam bridge, Cambridge University Press, Cdiapter 1.
Cjhile Foundation (Fundación Chile) (1985): Accomplishments 1976-198?.
________ (1986): Annual report 1986, Santiago, Chile, p. 3.________ (1987); Annual Report 1987, Santiago, Chile, p. 10.________ (1987b); “La industria del salmón en Chile: realidad
y perspectivas”, paper presented at the seminar “Perspectivas de !a Salnionicultura en Chile”, organized by the enhile Foundation, Santiago, Chile, March 17-19, p. 207.
Ck)oper, (diaries (1980): Policy interventions for technological innovation in developing countries, World Bank S ta ff Working Tapers, No, 441, W ashington, D.Ck, T h e World Bank, Decem ber, p. 8.
Dahlman, (kirl, B ru ce Ross-Larson and Larry E. Westphal (1987): M anaging technological development; lessons from the newly industrialized countries. World Bank S ta ff W orking Tapers, No. 717, W ashington, D,C,, T h e World Bank, Janu ary .
Dahlman, ( iarl and Francisco C. Sercovich (1984): Local developm ent and exports o f technology; the comparative advantages o f Argentina, Brazil, India, the Republic o f Korea and Mexico, World Bank S ta ff Working Tapers, No. 667, W ashington, D .(k, 'I'he World Bank.
Dahlman, (ja r l and Larry Westphal (1983): T h e transfer o f technology. Factors in the acquisition o f technology. F inance and Development, vol. 20, No, 4 , W ashington, D.C., T h e International Monetary Fund (iM F ), December.
Dunning, Jo h n H. and Jo h n A, Cantwell (1986): “T h e changing role o f multinational enterprises in the international creation, transfer and diffusion o f technology”, paper presented at the (conference on Innovation and D iffusion in Venice.
Fransm an, Martin and Kenneth King (eds) (1987): Technological Capability in the Third World, London, Macmillan, and Jo rg e M. Katz (ed.) (1987): Technology Generation in Latin American M anufacturing Industries, London, Macmillan. See the case studies in these works.
H erbert-Copley, B rent (1989): “Technical change in Latin A m erican m anufacturing firms: review and synthesis”: paper presented at the Annual C onference o f the Canadian Association o f Latin American and Caribbean Studies (CAi.ACS), Ottawa, O ctober, p. 10.
Lichm ann, Kerry (1989); Chile’s salmon strategy, Seafood Business, vol, 8, no. 4, July-August, p. 72.
Lindbergh, John E. (1987): “T h e economic potential for the
uphycommercial production o f Atlantic and Pacific salmon in Chile”, paper presented at the seminar “Perspectivas de la Salm onicultura en Chile”, organized by the Chile Foundation, Santiago, Chile, March 17-19.
M alhotra, A.K. (1980): Consulting and Design En^neering C apabilities in Developing Countries in Science and Technology fo r Development, a selection o f background papers for the main comparative report o f the S'lTi.project, Ottawa, International Development Research Centre (niRC).
Mansfield, E. (1968): Economics o f Technological Change, New York, Cited from François Chesnais, "Science, T ech n ology and Competitiveness”, sr i Review, No. 1, Paris, O rganization for Econom ic Co-operation and Development (OKCD), p. 93.
Meissner, Frank (1988): Technology Transfer in the Developing W orld: the Case o f the Chile Foundation, New York, Prae- ger.
Moore, Frederick T . (1983): Technological change and industrial development: issues and opportunities, World Bank S ta ff Working Tapers, No. 613, W ashington, D.C., T h e World Bank, p.9.
Oman, Charles (1989): New form s o f investment in developing country industries: mining, petrochem icals, automobiles, textiles, food. Development Centre Studie.s, Paris, T h e Development Centre o f the Organization for Economic Co-operation and Development (t)EC D ).
Roberts, Jo h n (1973): Engineering consultancy, industrialization and development in science, technology and development, in Charles C ooper (ed.), Science, Technology an d Development, London, 1973, cited from Carliene Brenner and Celik Kurdoglu, Mastering technology: engineering services firms in developing countries, Development Centre Tapers, Paris, Organization for Economic Co-operation and Development (oi:c d ), 1988,p. 11.
Romero, Ju an Jo sé (1988): “Efectos de variantes de elaboración sobre la calidad de alimentos para salmones”, paper presented at the sem inar “Técnicas de Cultivo y Manejo del Salm ón: Desarrollos Recientes”, organized by the Chile Foundation, Santiago, Chile, O ctober 19-21.
L 'N c r c (United Nations Centre on Transnational C orporations) (1987): Transnational Corporations and Technology Transfer: Effects and Tolicy Issues, New York, United Nations Publication, Sales No.; 87.II.A.4.
________ (1989)': Transnational Corporations in the Cortstrudionand Design Engineering Industry, New York, United N ations.
Vernon, Raymond (1988): Key factors in the application o f industrial technology in developing countries, kdi W orking Tapers, T h e W orld Bank.
W urmann, (Carlos (1990); Salm on farm ing in Chile; from reality to dreams?, infofihh International, No. 1, Janu - ary-February, p, 42.


CEPAL REVIEW No. 43
Debt conversion and territorial changeAntonio Daher*
T h e external debt o f C’-hile originated in various economic and social sectors and its territorial distribution was highly concentrated. T h e conversion o f that ex ternal debt has involved a sectoral and regional reassignment o f resources which has been reflected in m arked territorial change. T h ere is no direct correspondence between the economic and social geography o f the debt on the one hand and that o f the conversion process on the other.
In Chile, the trend towards greater economic openness in general and the conversion o f the debt in particular have made possible greater — albeit uneven— integration o f the regions o f the ciiuntry, as well as fuller integration into the international economy. At the same time, direct foreign investment and debt capitalization via C^hapter x ix display substantial d ifferences in sectoral additionality or substitution which are m anifested in dissimilar regional behaviour within the overall process o f territorial change.
* Professor and Researcher of the Institute of Urban Studies of the C atholic University of Chile.
This article is based on a presentation made at the Semi- nar/Discussion Workshop f or Researchers and Planners of the Southern (ione, sponsored by the Uruguayan Centre for Information and Suidie-s and the Inter-American Planning Society (Montevideo, November 1090). The author wishes to express his thanks for the valuable collaboration of the(Jentral Bank of Chile and the assistance given by Cristobal Crisosto of the Catholic University of Chile. This research project was sponsored by the Chilean National Fund for Science and Technology.
Introduction
At the beginning of the 1990s, Chile’s external debt totalled US$ 16 250 million, of which 74% corresponded to the public sector and the rest to the private sector. According to information from the Central Bank, in 1989 the debt was reduced by US$ 1 388 million, making a total reduction since 1985 of US$ 8 967 million.
An important mechanism in attaining this result was the conversion of the external debt. Although there are differences from one country to another, conversion generally involves the purchase by local residents or foreign investors of foreign-currency obligations of the debtor country at a certain rate of discount, for redenomination in local currency at a lower discount rate. If this operation is carried out by locally resident investors, it is equivalent to the repatriation of capital. The original debt is thus settled and the funds obtained can be used to acquire equity in local enterprises, increase expenditure on installations and equipment in existing enterprises, settle outstanding local currency liabilities, or any other authorized purpose (Lahera, 1987). These mechanisms for the prepayment of debts owed to the creditor banks operate essentially through the use of external debt promissory notes Si)ld at a discount on the international secondary market, and also through the direct capitalization or conversion of bank loans into equity (Ffrench-Davis, 1989a).
The main means of debt conversion in Chile are those laid down in Chapters xviii and xix of the Compendium of International Exchange Regulations of the Central Bank of Chile. Of the total debt reduction registered between 1985 and 1989, 35.1% was due to the application of Chapter XIX and 28.2% to the use of Chapter xviii. The percentage contribution of these two chapters to the overall reduction of the debt in 1989 was similar to their contribution in 1987 and1988.
Chapter xviii permits Chilean residents to purchase national debt abroad at a discount and convert it into local currency at prices freely negotiated between the new (Chilean) creditor and the debtor. For this purpose, Chilean residents can either use their own foreign exchange, repatriate funds from abroad, or purchase foreign exchange on the parallel market. Obviously, the local debtor will only carry out this transaction
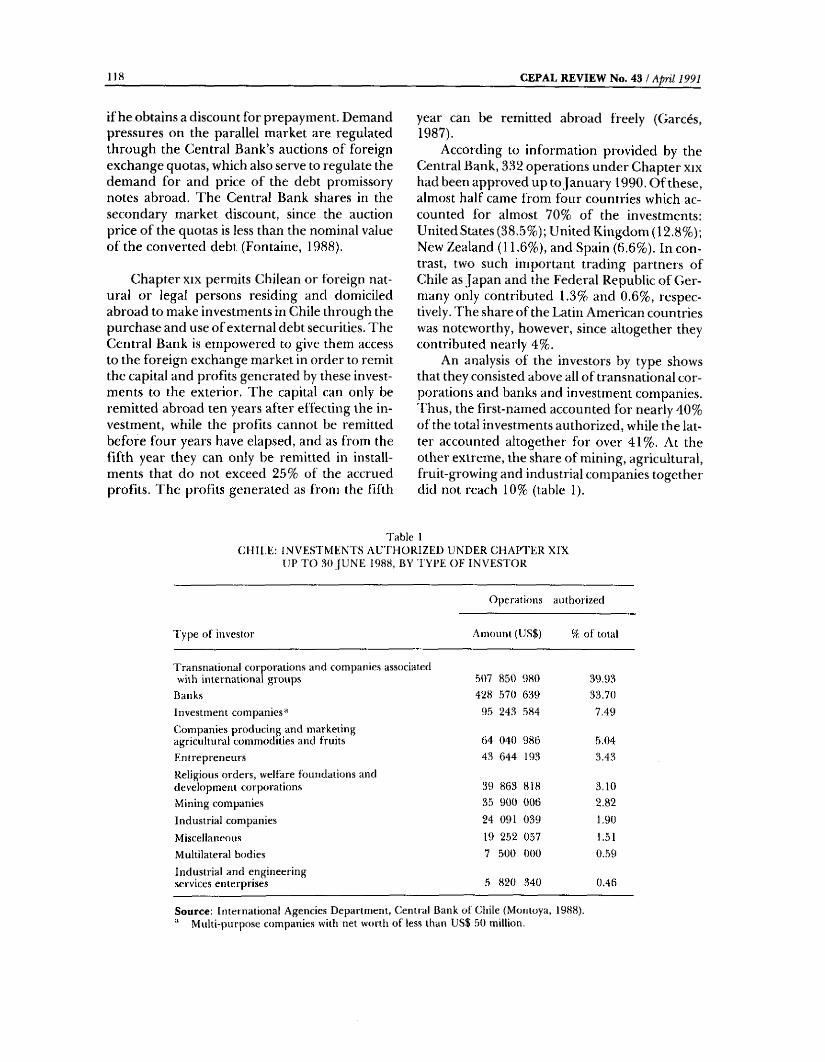
118 C E P A L R E V I E W N o. 43 / A p r il 1991
if he obtains a discount for prepayment. Demand pressures on the parallel market are regulated through the Central Bank’s auctions of foreign exchange quotas, which also serve to regulate the demand for and price of the debt promissory notes abroad. The Central Bank shares in the secondary market discount, since the auction price of the quotas is less than the nominal value of the converted debt (Fontaine, 1988).
Chapter xix permits Chilean or foreign natural or legal persons residing and domiciled abroad to make investments in Chile through the purchase and use of external debt securities. The Central Bank is empowered to give them access to the foreign exchange market in order to remit the capital and profits generated by these investments to the exterior. The capital can only be remitted abroad ten years after effecting the investment, while the profits cannot be remitted before four years have elapsed, and as from the fifth year they can only be remitted in installments that do not exceed 25% of the accrued profits. The profits generated as from the fifth
year can be remitted abroad freely (Garces, 1987).
According to information provided by the Central Bank, 332 operations under Chapter xix had been approved up to January 1990. Of these, almost half came from four countries which accounted for almost 70% of the investments: United States (38.5%); United Kingdom (12.8%); New Zealand (11.6%), and Spain (6.6%). In contrast, two such important trading partners of Chile as Japan and the Federal Republic of Germany only contributed 1.3% and 0.6%, respectively. The share of the Latin American countries was noteworthy, however, since altogether they contributed nearly 4%.
An analysis of the investors by type shows that they consisted above all of transnational corporations and banks and investment companies. Thus, the first-named accounted for nearly 40% of the total investments authorized, while the latter accounted altogether for over 41%. At the other extreme, the share of mining, agricultural, fruit-growing and industrial companies together did not reach 10% (table 1).
Table 1C H IL E : IN V E ST M E N T S A U TH O R IZ ED U N D ER C H A PTER X IX
UP T O 30 [U N E 1988, BY TYPE O F IN V ESTO R
Operations authorized
T yp e o f investor Amount (US$) % o f total
Transnational corporations and companie.s associatedwith international groups 507 850 980 39.93
Banks 428 .570 639 33.70
Investm ent companies^ 95 243 584 7.49
(Companies producing and m arketingagricultural commodities and fruits 64 040 986 5.04
Entrepreneu rs 43 644 193 3.43
Religious orders, welfare foundations anddevelopm ent corporations 39 863 818 3.10
Mining companie.s 35 900 006 2.82
Industrial companies 24 091 039 1.90
Miscellaneous 19 252 057 1.51
Multilateral bodies 7 500 000 0..59
Industrial and engineeringservices enterprises 5 820 340 0.46
So u rce: International Agencie,s Departm ent, Central Bank of Chile (Montoya, 1988). ■' Multi-purpose companies with net worth o f less than US$ .50 million.
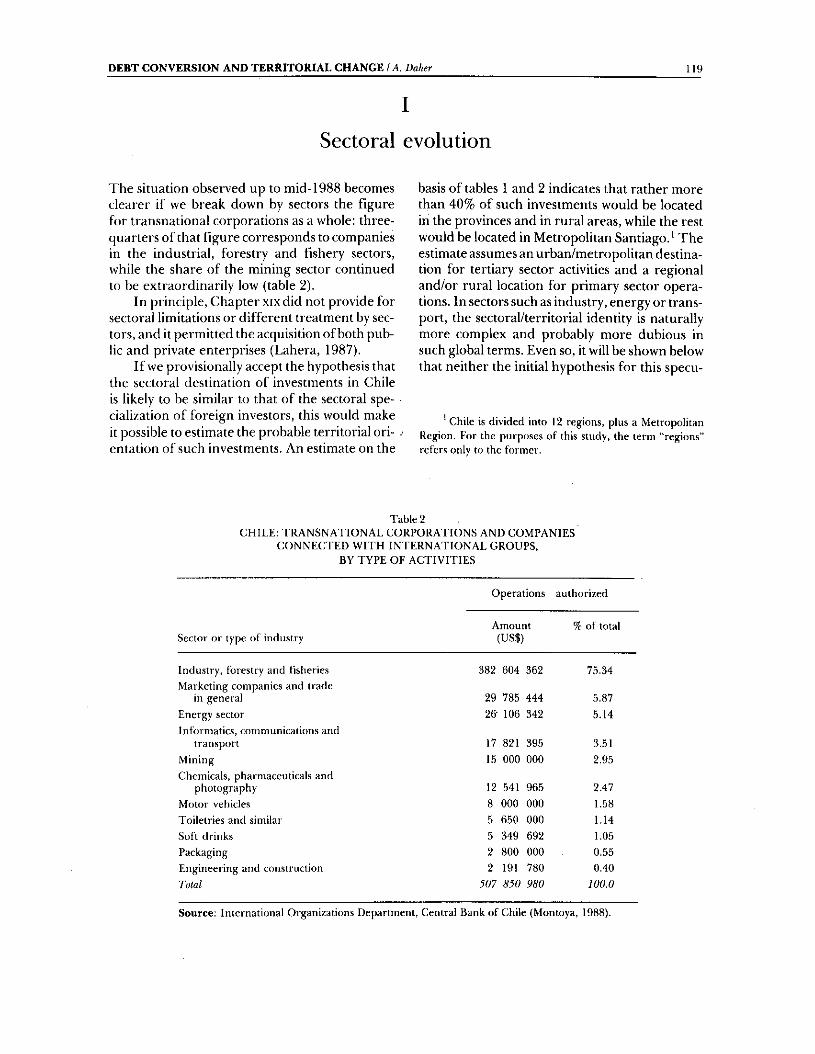
D E B T C O N V E R S I O N A N D T E R R I T O R I A L C H A N G E /v4. D a h er 1 1 9
I
Sectoral evolution
The situation observed up to mid-1988 becomes dearer if we break down by sectors the figure for transnational corporations as a whole: three- quarters of that figure corresponds to companies in the industrial, forestry and fishery sectors, while the share of the mining sector continued to be extraordinarily low (table 2).
In principle, Chapter xix did not provide for sectoral limitations or different treatment by sectors, and it permitted the acquisition of both public and private enterprises (Lahera, 1987).
If we provisionally accept the hypothesis that the sectoral destination of investments in Chile is likely to be similar to that of the sectoral specialization of foreign investors, this would make it possible to estimate the probable territorial ori- .■ entation of such investments. An estimate on the
basis of tables 1 and 2 indicates that rather more than 40% of such investments would be located in the provinces and in rural areas, while the rest would be located in Metropolitan Santiago. * The estimate assumes an urban/metropolitan destination for tertiary sector activities and a regional and/or rural location for primary sector operations. In sectors such as industry, energy or transport, the sectoral/territorial identity is naturally more complex and probably more dubious in such global terms. Even so, it will be shown below that neither the initial hypothesis for this specu-
' Chile is divided into 12 regions, plus a Metropolitan Region. For the purposes o f this study, the term “regions” refers only to the form er.
la b le 2C H IL E : T R A N SN A T IO N A L C O R PO R A TIO N S AND CO M PAN IES
C O N N EC TED W IT H IN TE R N A TIO N A L G RO U PS,B Y T Y P E O F A C T IV IT IE S
O perations authorized
Amount % o f totalSector or type o f industry (US$)
Indu,stry, forestry and fisheries 382 604 362 75.34M arketing companies and trade
in general 29 785 444 5.87
Energy sector
Inform atics, comm unications and
26- 106 342 5.14
transport 17 821 395 3.51
M ining 15 000 000 2.95
Chemicals, pharmaceuticals and photography 12 541 965 2.47
M otor vehicles 8 000 000 1.58
Toiletries and similar 5 650 000 1.14
Soft drinks 5 349 692 1,05
Packaging 2 800 000 0.55
Engineering and construction 2 191 780 0.40
Total 307 830 980 100.0
So u rce: International Organizations D epartm ent, Central Bank o f Chile (Montoya, 1988).

1 2 0 C E P A L R E V I E W N o . 43 / A p n l 1991
Table 3C H IL E : MAIN IN V E ST M E N T O PER A TIO N S A U T H O R IZ E D UNDER
C H A PTER XIX, AS A T 15 M ARCH 1989
Date Millions o f dollars
Foreigninvestor
(Country o f origin Localenterprise
20 .07 .88 173.9 Shell Overseas Invest. BV Netherlands Forestal Shell Ltda.
2 8 .01 .87 164.0 Carter Holt Harvey y Co. Cook Islands C arter H olt Harvey Ltda. Chile
07 .01 ,87 6 8 .0 Security Pacific National Bank and others
United States Security Pacific Chile and others
20 .07 .88 64 ,9 Scott Worldwide Inc. United States Scott Worldwide C^hile y Cía. Ltda,
11.11.87 61.6 Fletcher Chai. Chilean Inc. Ltd,
Cayman Islands Tasm an Forestal S.A.
2 6 .08 .87 59.3 Fletcher Chai. Chilean Inc. Ltd.
Cayman Islands Tasm an Forestal S.A.
02 .12 .87 59 .0 C arter Holt Harvey Cook Islands C arter Holt Harvey Ltda. Chile
18.01.89 53.0 Santiago de Chile Hotel Co. Panama Hotel Corporation of Chile S.A.
22 .1 2 ,8 6 48.6 Banesto Banking Corp. United States Cía. Industrial S.A.
0 8 ,01 .86 46.3 B .T . (Pacific) Ltda. and others United States B .T . (Pacific) Ltda. y Cía.
2 0 .07 .88 46 .0 La Serena (Chile) Invest. Ltd.
Bahamas Inv. La Serena Ltda.
09 .12 .87 30.0 Lao Minerals Inc. United States Minera Lao Chile S.A.
27 .01 .88 26.3 Citi Fishing Inv.Chile Ltda. and another
Bahamas Inv. Citibosques Ltda, and another.
0 9 .11 .88 25.0 Pacific Telephone Holdings and another
United States Inv, Telefónicas Ltda. and others
12.05.89 23.3 Nippon Suisan Kaisha Ltd, Japan Direct Investm ent in Salm ones Antartica
15 .03.89 22.3 Spie Batignolles S.A. France Valle Nevado S.A.
23 .11 .88 21.2 AgroindustrialDevelopment
United Kingdom Agro Industrial Investm ent, Chile
13.07.88 20.1 Select Andean Holdings United States Inv, Selecta Ltda.
2 1 .09 .88 20.0 Corp. Mapire Cía. Inti, De R.
Spain M apfre (^hile S.A,
Subtotal 1 032 .8 (49.88% ) 19 operations
Total 2 070.4 (100.00%) 246 operations
So u rce : Prepared by the author on the basis o f la i in fin a n c k , 1989.
lation nor its territorial implications are in line with reality.
It is therefore necessary to review the facts. As at October 1986, more than 40% of the operations carried out involved pension funds and
insurance companies, located above all in the capital. Between 1986 and 1987, of the 46 main transfers of ownership under Chapter xix, 48.8% concerned private enterprises, 19.5% public enterprises, 17.4% banks, and 8.7% insurance com-
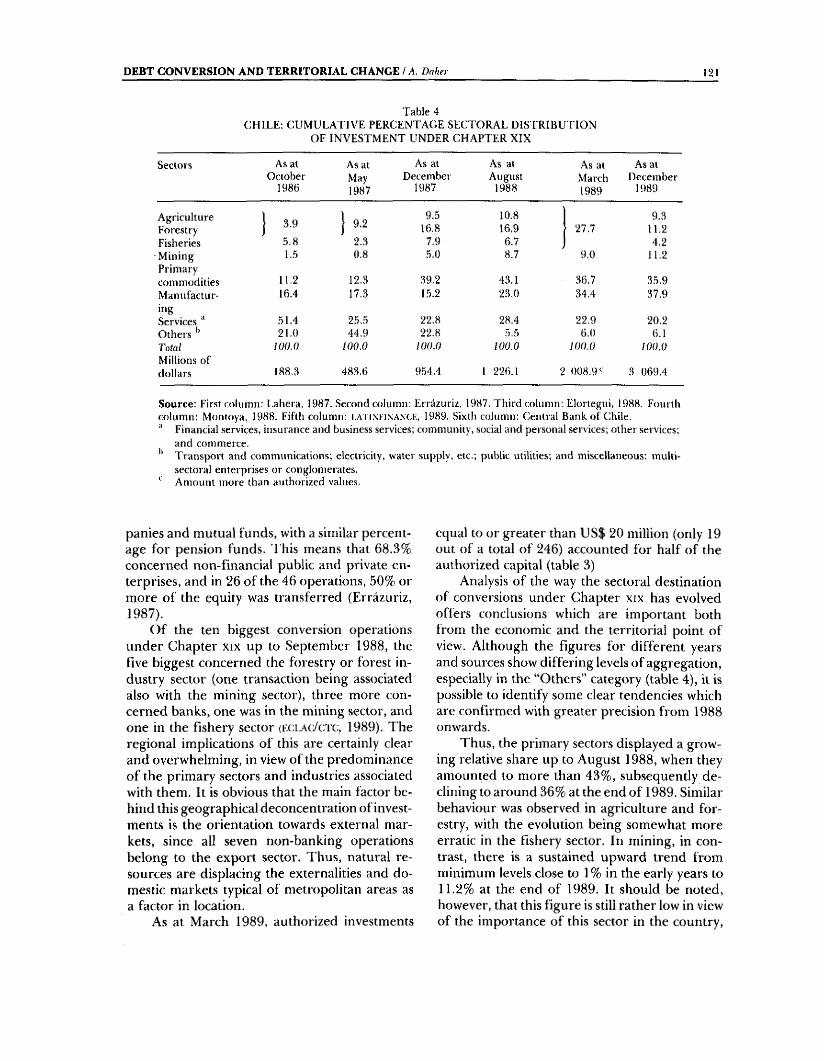
D E B T C O N V E R S I O N A N D T E R R I T O R I A L C H A N G E / A. D a h er 121
Table 4C H IL E : C U M U L A T IV E PER C EN TA G E SE C T O R A L D IS T R IB U T IO N
O F IN V E ST M E N T UNDER C H A PTER X IX
Sectors As at O ctober
1986
As at May 1987
As at December
1987
As at August
1988
As at March 1989
As atD ecem ber
1989
A griculture j 3.9 j 9.29.5 10.8
[ 27.79.3
Forestry 16.8 16.9 11.2Fisheries 5 .8 2.3 7.9 6.7 4.2M iningPrimary
1..5 0.8 5.0 8.7 9,0 11.2
com m odities 11.2 12.3 39,2 43.1 36.7 35.9M anufactur- 16.4 17.3 15.2 23,0 34.4 37.9ingServices ^ 51.4 25.5 22.8 28.4 22.9 20.2O thers 21.0 44.9 22.8 5.5 6.0 6.1TotalMillions o f
100.0 lOO.O ¡00.0 100.0 100.0 100.0
dollars 188.3 483 .6 954.4 1 226.1 2 008.9^ 3 069.4
So u rce: First column: Laliera, 1987. Second column: Errazuriz, 1987. T hird column: Elortegui, 1988. Fourth colum n: Montoya, 1988. Fifth column: i ,a i i n f i n a .n c k , 1989. Sixth column: {central Bank o f Chile.
Financial services, insurance and business services; community, social and personal services; other services; and comm erce.
'* T ransport and com m unications; electricity, water supply, etc.; public utilities; and m iscellaneous; multisectoral enterprises or conglom erates.Am ount m ore than authorized values.
parties and mutual funds, with a similar percentage for pension funds. This means that 68.3% concerned non-financial public and private enterprises, and in 26 of the 46 operations, 50% or more of the equity was transferred (Errázuriz, 1987).
Of the ten biggest conversion operations under Chapter xix up to September 1988, the five biggest concerned the forestry or forest industry sector (one transaction being associated also with the mining sector), three more concerned banks, one was in the mining sector, and one in the fishery sector (F.t;LAc:/(::rc, 1989). The regional implications of this are certainly clear and overwhelming, in view of the predominance of the primary sectors and industries associated with them. It is obvious that the main factor behind this geographical déconcentration of investments is the orientation towards external markets, since all seven non-banking operations belong to the export sector. Thus, natural resources are displacing the externalities and domestic markets typical of metropolitan areas as a factor in location.
As at March 1989, authorized investments
equal to or greater than US$ 20 million (only 19 out of a total of 246) accounted for half of the authorized capital (table 3)
Analysis of the way the sectoral destination of conversions under Chapter xix has evolved offers conclusions which are important both from the economic and the territorial point of view. Although the figures for different years and sources show differing levels of aggregation, especially in the “Others” category (table 4), it is possible to identify some clear tendencies which are confirmed with greater precision from 1988 onwards.
Thus, the primary sectors displayed a growing relative share up to August 1988, when they amounted to more than 43%, subsequently declining to around 36% at the end of 1989. Similar behaviour was observed in agriculture and forestry, with the evolution being somewhat more erratic in the fishery sector. In mining, in contrast, there is a sustained upward trend from minimum levels close to 1% in the early years to 11.2% at the end of 1989. It should be noted, however, that this figure is still rather low in view of the importance of this sector in the country.
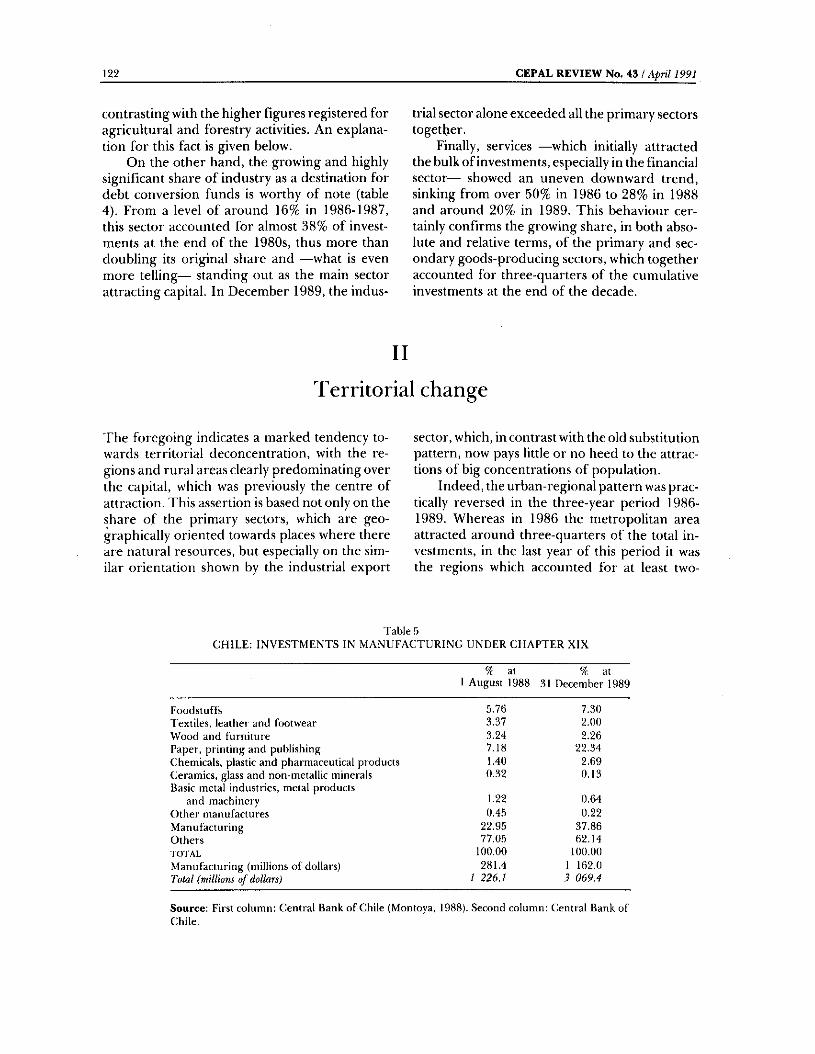
122 C E P A L R E V I E W N o . 43 / A p r il 1991
contrasting with the higher figures registered for agricultural and forestry activities. An explanation for this fact is given below.
On the other hand, the growing and highly significant share of industry as a destination for debt conversion funds is worthy of note (table4). From a level of around 16% in 1986-1987, this sector accounted for almost 38% of investments at the end of the 1980s, thus more than doubling its original share and —what is even more telling— standing out as the main sector attracting capital. In December 1989, the indus
trial sector alone exceeded all the primary sectors together.
Finally, services —which initially attracted the bulk of investments, especially in the financial sector— showed an uneven downward trend, sinking from over 50% in 1986 to 28% in 1988 and around 20% in 1989. This behaviour certainly confirms the growing share, in both absolute and relative terms, of the primary and secondary goods-producing sectors, which together accounted for three-quarters of the cumulative investments at the end of the decade.
II
Territorial change
The foregoing indicates a marked tendency towards territorial déconcentration, with the regions and rural areas clearly predominating over the capital, which was previously the centre of attraction. This assertion is based not only on the share of the primary sectors, which are geographically oriented towards places where there are natural resources, but especially on the similar orientation shown by the industrial export
sector, which, in contrast with the old substitution pattern, now pays little or no heed to the attractions of big concentrations of population.
Indeed, the urban-regional pattern was practically reversed in the three-year period 1986-1989. Whereas in 1986 the metropolitan area attracted around three-quarters of the total investments, in the last year of this period it was the regions which accounted for at least two-
Table 5C H IL E : IN V E ST M E N T S IN M A N U FA C TU RIN G U N D ER C H A PTER X IX
% at1 August 1988
% at31 Decem ber 1989
Foodstuffs 5 .76 7.30Fextiles, leather and footwear 3.37 2.00Wood and furniture 3.24 2.26Paper, printing and publishing 7.18 22.34(chemicals, plastic and pharmaceutical products 1.4Ü 2.69(Ceramics, glass and non-metallic minerals Basic metal industries, metal products
0 .32 0.13
and machinery 1.22 0.64O ther m anufactures 0.45 0.22M anufacturing 22.95 37.86O thers 77.05 62.14rOTAL 100.00 100.00M anufacturing (millions o f dollars) 281.4 1 162.0Total (millions o f dollars) 1 226.1 5 069.4
So u rce: First colum n: Central Bank o f Chile (Montoya, 1988). Second column: Central Bank o f Chile.
D E B T C O N V E R S I O N A N D T E R R I T O R I A L C H A N G E / A . Daher 1 2 3
thirds of the total capital investment. In absolute terms, this means that over US$ 2 billion has gone to the regions in only three years.
This raises the question of whether this debt conversion is not also a veritable geographical conversion.
Defining the above conclusions more accurately involves making a more disaggregated analysis of the manufacturing sector, which, as already noted, led the investment options under Chapter xix.
fable 5 indicates that in 1988 nearly one- third of all manufacturing was concentrated in paper production. If we add to the figure of 7.18% corresponding to that sector the 3.24% corresponding to the lumber industry, it may be concluded that almost half of all manufacturing is connected with the forestry sector, which has clear regional implications in Chile. If, in addition, we assume that 50% of investments in the chemical industry and in foodstuffs are located in the regions, it may be concluded that, even if we assume that all the other branches were located in urban or metropolitan areas, over 60% of the manufacturing investments made under Chapter xix are in the regions.
By the end of 1989, the manufacturing sector as a whole had sharply increased its relative share (almost 15 percentage points), especially in the industrial branches already mentioned (paper, foodstuffs and chemicals), although its share had gone down in the lumber industry. If we carry out the preceding calculation once again, it may be concluded this time that nearly 80% of the manufacturing financed under Chapter xix was established outside the Metropolitan Region.
This figure is particularly significant, regardless of its possible upward or downward fluctuations according to the assumptions adopted. T he resulting variations would in no case affect the general order of magnitude of this geographical déconcentration of industry: a sector traditionally identified with urbanization and metropolitanization.
But it is not only the primary sectors which have geographically relocated their resources: the industrial activities associated with them have also done so. Together, they upset and even reverse the tendencies towards territorial concentration.
Up to now, the analysis has been based on a
certain sectoral/territorial correspondence or identity: a necessary approach in view of the lack of information on the location of investments. For the same reason, although the conclusions are significant they are still too broad because they are limited to the regional/metropolitan dichotomy. This duality could conceal some important disparities between the regions, in view of their heterogeneous natural resource endowments and comparative advantages.
Table 6, which shows the regional distribution of investments under Chapter xix as at 1 March 1990, permits more specific conclusions to be drawn regarding the above-mentioned process of geographical desconcentration. It also makes it possible to verify the hypothetical results put forward (originating from the territorial derivation of sectoral information available for previous years).
To begin with, table 6 reveals that 72.15% of the investments under Chapter xix did not go to the Metropolitan Region, but to the rest of the country. 1 he Metropolitan Region (plus the investments denominated HO in the table) accounted for only 27.85%: a relatively low figure in view of the economic and demographic importance of this area, which contains 40% of the country’s population and generates 40% of the national product.
This low rate of attraction of investments is even more surprising in view of the fact that the Metropolitan Region is particularly rich in natural resources and its export fruit-growing activities and mining sector are of national significance.
Outstanding among the other regions of the country is the Eighth Region (Bio-Bio), with nearly 17% of all the Chapter xix investments in the whole country, equivalent to 60% of the total such investments in the Metropolitan Region. Although the Eighth Region is the second most heavily populated in the country and has a highly diversified economic base, its high rate of attraction of investments is explained fundamentally by the forestry sector and associated industries, in which this region occupies a leading place.
The most unusual case, however, is undoubtedly that of the Ninth Region (Araucama): in spite of its lower economic dynamism in the national context, its high levels of extreme poverty, its limited economic diversity and its lower levels
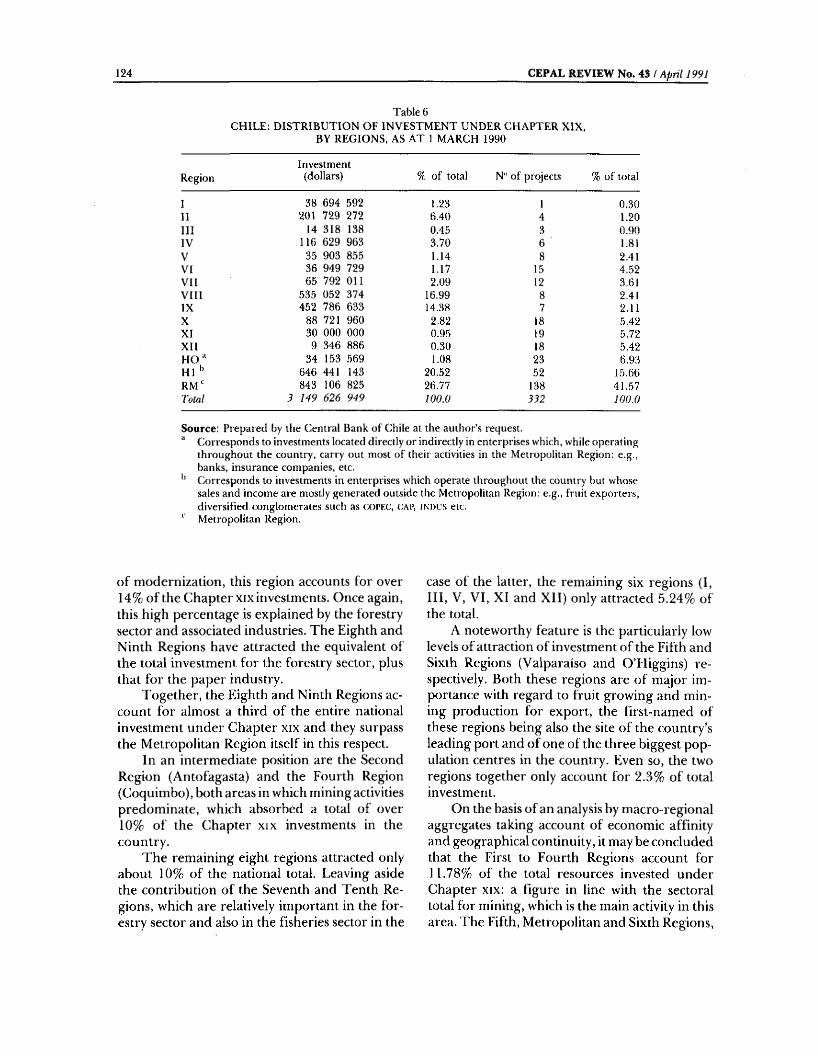
124 C E P A L R E V I E W N o . 43 / A p ril 1991
Table 6C H IL E : D IS T R IB U T IO N O F IN V E ST M E N T U N D ER C H A PT E R X IX ,
BY R EG IO N S, AS A T 1 MARCH 1990
RegionInvestment
(dollars) % o f total N" o f projects % o f total
I 38 694 592 1.23 1 0.3011 201 729 272 6 .40 4 1.20HI 14 318 138 0.45 3 0.90IV 116 629 963 3.70 6 1.81V 35 903 855 1.14 8 2.41VI 36 949 729 1.17 15 4,52V II 65 792 o n 2.09 12 3,61V III 535 052 374 16.99 8 2.41IX 452 786 633 14.38 7 2.11X 88 721 960 2.82 18 5.42XI 30 000 000 0.95 19 5.72X II 9 346 886 0.30 18 5.42HO ^ 34 153 .569 1.08 23 6.93HI 646 441 143 20.52 52 15.66R M " 843 106 825 26.77 138 41.57Total 3 ¡49 626 949 100.0 332 100.0
Sou rce: Prepared by the Central Bank o f Chile at the author’s request,“* Corresponds to investments located directly or indirectly in enterprises which, while operating
throughout the country, carry out most o f their activities in the M etropolitan Region: e.g,, banks, insurance companies, etc.Corresponds to investments in enterprises which operate throughout the country but whose sales and income are mostly generated outside the Metropolitan Region: e,g., fruit exporters, diversified conglom erates such as co i’Et;, INUUS etc.
Metropolitan Region.
of modernization, this region accounts for over 14% of the Chapter xix investments. Once again, this high percentage is explained by the forestry sector and associated industries. The Eighth and Ninth Regions have attracted the equivalent of the total investment for the forestry sector, plus that for the paper industry.
Together, the Eighth and Ninth Regions account for almost a third of the entire national investment under Chapter xix and they surpass the Metropolitan Region itself in this respect.
In an intermediate position are the Second Region (Antofagasta) and the Fourth Region (Coquimbo), both areas in which mining activities predominate, which absorbed a total of over 10% of the Chapter xix investments in the country.
The remaining eight regions attracted only about 10% of the national total. Leaving aside the contribution of the Seventh and Tenth Regions, which are relatively important in the forestry sector and also in the fisheries sector in the
case of the latter, the remaining six regions (I, III, V, VI, XI and XII) only attracted 5.24% of the total.
A noteworthy feature is the particularly low levels of attraction of investment of the Fifth and Sixth Regions (Valparaiso and O’Higgins) respectively. Both these regions are of major importance with regard to fruit growing and mining production for export, the first-named of these regions being also the site of the country’s leading port and of one of the three biggest population centres in the country. Even so, the two regions together only account for 2.3% of total investment.
On the basis of an analysis by macro-regional aggregates taking account of economic affinity and geographical continuity, it may be concluded that the First to Fourth Regions account for 11.78% of the total resources invested under Chapter xix: a figure in line with the sectoral total for mining, which is the main activity in this area. The Fifth, Metropolitan and Sixth Regions,
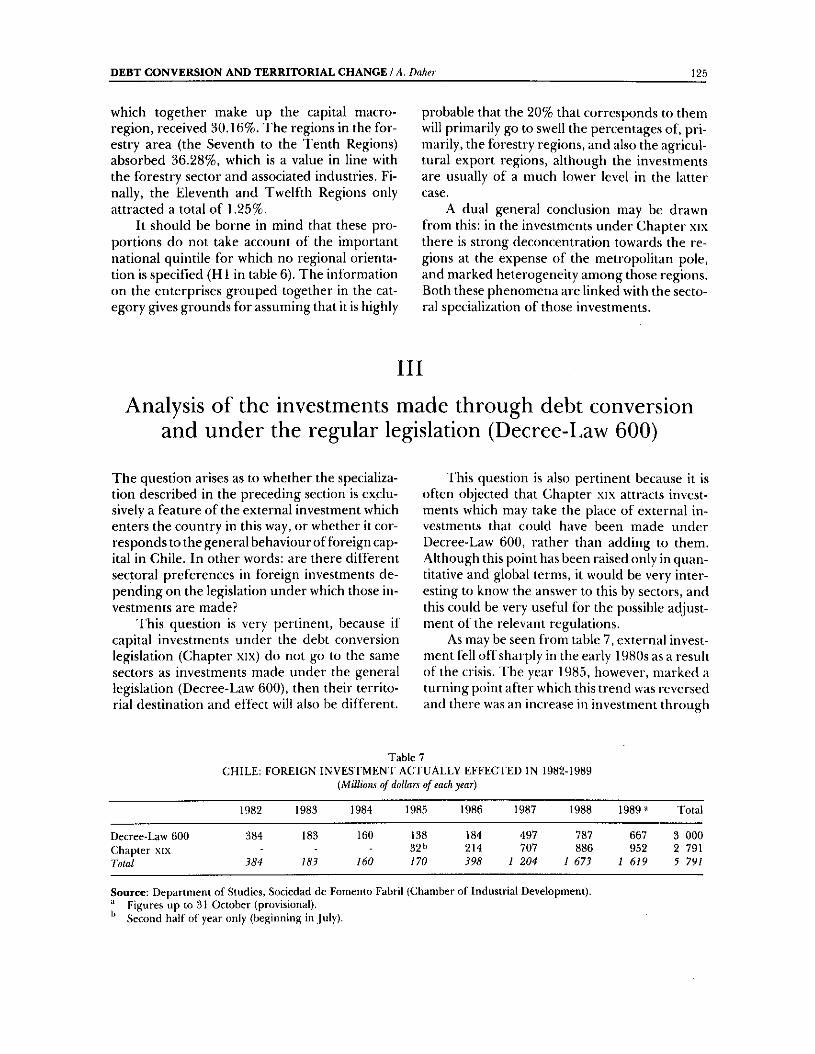
D E B T C O N V E R S I O N A N D T E R R I T O R I A L C H A N G E / A . Daher 12Ö
which together make up the capital macro- region, received 30.16%. The regions in the forestry area (the Seventh to the Tenth Regions) absorbed 36.28%, which is a value in line with the forestry sector and associated industries. Finally, the Eleventh and Twelfth Regions only attracted a total of 1.25%.
It should be borne in mind that these proportions do not take account of the important national quintile for which no regional orientation is specified (HI in table 6). The information on the enterprises grouped together in the cat- egory gives grounds for assuming that it is highly
probable that the 20% that corresponds to them will primarily go to swell the percentages of, primarily, the forestry regions, and also the agricultural export regions, although the investments are usually of a much lower level in the latter case.
A dual general conclusion may be drawn from this: in the investments under Chapter xix there is strong déconcentration towards the regions at the expense of the metropolitan pole, and marked heterogeneity among those regions. Both these phenomena are linked with the sectoral specialization of those investments.
I l l
Analysis of the investments made through debt conversion and under the regular legislation (Decree-Law 600)
The question arises as to whether the specialization described in the preceding section is exclusively a feature of the external investment which enters the country in this way, t>r whether it corresponds to the general behaviour of foreign capital in Chile. In other words: are there different sectoral preferences in foreign investments depending on the legislation under which those investments are made?
This question is very pertinent, because if capital investments under the debt conversion legislation (Chapter xix) do not go to the same sectors as investments made under the general legislation (Decree-Law 600), then their territorial destination and effect will also be different.
This question is also pertinent because it is often objected that Chapter xix attracts investments which may take the place of external investments that could have been made under Decree-Law 600, rather than adding to them. Although this point has been raised only in quantitative and global terms, it would be very interesting to know the answer to this by sectors, and this could be very useful for the possible adjustment of the relevant regulations.
As may be seen from table 7, external investment fell off sharply in the early 1980s as a result of the crisis. The year 1985, however, marked a turning point after which this trend was reversed and there was an increase in investment through
Table 7C H IL E : FO REIG N IN V E ST M E N T A C TU A LLY E FFE C T E D IN 1982-1989
{Millions of dollars of each year)
1982 1983 1984 1985 1986 1987 1988 1989« Total
Decree-Law 600 384 183 160 138 184 497 787 667 3 000C hapter xix - - - 32 214 707 886 952 2 791Total 384 183 160 170 398 1 204 1 673 1 619 5 791
So u rce: Departm ent o f Studies, Sociedad de Fom ento Fabril (Cham ber o f Industrial Development), Figures up to 31 O ctober (provisional).Second half o f year only (beginning in July).
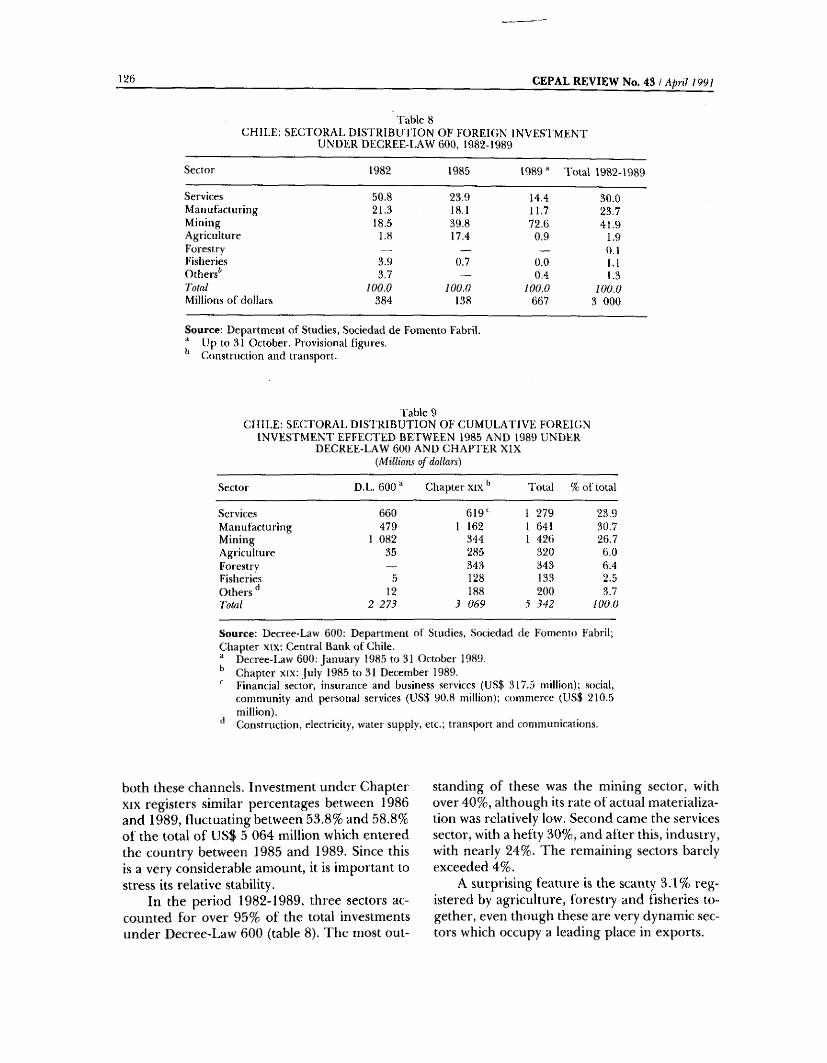
126 C E P A L R E V I E W N o . 43 / A p r il 1991
T able 8C H IL E : SE C T O R A L D IS T R IB U T IO N O F FO R EK iN IN V E ST M E N T
U N D ER D ECREE-LA W 600, 1982-1989
Sector 1982 1985 1989^ I 'o la l 1982-1989
Services 50.8 23,9 14,4 30.0M anufacturing 21.3 18.1 11.7 23.7M ining 18.5 39.8 72.6 41 .9A griculture 1.8 17.4 0.9 1.9Forestry — — — 0.1Fisheries 3.9 0.7 0.0 1.1Others^ 3,7 — . 0,4 1.3Total 100.0 100.0 100.0 100.0Millions o f dollars 384 138 667 3 000
So u rce ; D epartm enl o f Studies, Sodedad de Fom ento Fabril. ■* Up to 31 O ctober. Provisional figures.
Construction and transport.
T able 9C H IL E : SE C T O R A L D IS T R IB U T IO N O F C U M U L A T IV E FO REIG N
IN V E ST M E N T E FF E C T E D B ET W EE N 1985 AND 1989 U N D ER D EC REE-LA W 600 AND C H A PT E R X IX
{Millions of dollars)
Sector D.L. 6 0 0 “ Chapter x ix Total % o f total
Service,s 660 6 1 9 " 1 279 23.9M anufacturing 479 1 162 1 641 30.7M ining 1 082 344 1 426 26.7A griculture 35 285 320 6.0Forestry — 343 343 6.4Fisheries 5 128 133 2.5O thers 12 188 200 3.7Total 2 273 3 069 5 342 100.0
So u rce: Decree-Law 600: Department o f Studies, Sociedad de Fom ento Fabril; C hapter x tx : Central Bank o f Chile.“ Decree-Law 600; Janu ary 1985 to 31 O ctober 1989. Chapter x ix : July 1985 to 31 December 1989.
Financial sector, insurance and business services (U S$ 317.5 million); social, community and personal services (U S$ 90.8 million); comm erce (U S$ 210,5 million).Construction, electricity, water supply, etc.; transport and communications.
both these channels. Investment under Chapter XIX registers similar percentages between 1986 and 1989, fluctuating between 53.8% and 58.8% of the total of US$ 5 064 million which entered the country between 1985 and 1989. Since this is a very considerable amount, it is important to stress its relative stability.
In the period 1982-1989, three sectors accounted for over 95% of the total investments under Decree-Law 600 (table 8). The most out
standing of these was the mining sector, with over 40%, although its rate of actual materialization was relatively low. Second came the services sector, with a hefty 30%, and after this, industry, with nearly 24%. The remaining sectors barely exceeded 4%.
A surprising feature is the scanty 3.1% registered by agriculture, forestry and fisheries together, even though these are very dynamic sectors which occupy a leading place in exports.

D E B T C O N V E R S I O N A N D T E R R I T O R I A L C H A N G E ! A. D a h er 1 2 7
If we compare the sectoral distribution for the various years, a notable feature is the sharp drop in the share of services, from over half in 1982 to less than 15% in 1989. This trend is similar to that registered by the same sector with regard to investment under Chapter xix (table4).
Industry, on the other hand —in contrast with what happened in the debt conversion process (where it more than doubled its share to reach the first place among all the sectors)— displayed a downward trend with regard to investments under Decree-Law 600, declining in 1989 to almost half of the percentage which it registered in 1982. This inverse performance would appear to indicate that, for this sector, investments under Chapter xix have indeed taken the place of investments under the general legislation.
A similar conclusion may be reached with regard to agriculture, whose share increased strongly in 1985 (to over 17%), only to drop to less than 1% in 1989. Once again, the fisheries sector displays an atypical performance.
Just as significant as the total absence of the forestry sector in investments under Decree-Law 600 is the high and growing figure registered by the mining sector. Here, once again, it would appear that there has been a switch of investments between the two sets of regulations. Thus, it may be recalled that the forestry sector is very prominent in Chapter xix investments, whereas mining attracted a smaller, although growing, proportion of investments under that investment law.
From the territorial point of view (on the basis of a similar calculation to that made in respect of Chapter xix), Decree-Law 600 also shows a type of evolution which is increasingly in the direction of greater déconcentration. In 1982, less than 40% of direct investment was effected outside the metropolitan centre, but in 1985 the situation was reversed, since the regions attracted almost 70% of such investment, and by 1989 they absorbed over 80%. The mining sector played a decisive role in these figures.
Table 9 shows the sectoral behaviour of cumulative foreign investment between 1985 and 1989 and makes possible a comparative analysis (sectoral and territorial) between investments under Chapter xix and those under Decree-Law
600, for the entire period during which these two mechanisms operated together.
It may be noted from table 9 that three sectors (industry, raining and services) accounted for more than 80% of foreign investment over the five-year period. The leading role played by the industrial sector among economic activities as a whole is worthy of note. These figures also confirm, in spite of the trends towards greater diversification, the importance of the mining sector, which occupies a prominent second place. Although the non-traditional export sectors (agriculture, forestry and fisheries) only accounted for less than 15% altogether, it should not be forgotten that much of the figure for industry is associated with them.
Between 60 and 66% of total foreign investment over these five years went to the regions, depending on whether 60% or 80% of industry is given this geographical orientation. It is clear that Chapter xix alone is responsible for a greater regional trend in the distribution of investment than Decree-Law 600, particularly because of the greater relative weight of services in the latter.
Even so, between 1985 and 1989 an average of almost US$ 700 million per year went outside the metropolis solely under the heading of external investment. This figure is of course much greater than the total investments of the National Regional Development Fund.
Table 10 provides important conclusions on the additionality between the various investment instruments.
Table 10C H ILL : SL C T O R A L SPEC IA LIZ A TIO N OF
IN V E ST M E N T U N D ER DECREE-LA W 600 AND C H A PTER X IX ,
Sectors Decree-Law 600
(Chapter xix Total
Services 51.6 48.4 100.0Manu lacturing 29.2 70.8 100.0Mining 75.9 24.1 100.0A griciiluire 10.9 89.1 100.0Forestry — 100.0 100.0Fisheries 5.8 96.2 100.0Others 6.0 94.0 100.0Tolal 42.5 57.5 100.0
S o u r c e : I'able 9,
128 C E P A L R E V I E W N o . 43 / A p ril 1991
Mining is the only sector which clearly predominates in the investments under Decree-Law 600. In contrast, the investments under Chapter XIX cover 100% of the forestry investments and also account for very high percentages in fisheries, agriculture, industry and other sectors. In the services sector both mechanisms are more or less level, which is interesting in view of the special features of this sector.
The above sectoral specialization is an important item of background information both
for the trend projection of foreign investments and for the adjustment of the relevant legislation.
Various criticisms have been levelled at Chapter xix in the national context. A recent amendment ,to this law incorporated the most important of these criticisms, but the very fact that Chapter xix has been retained confirms its validity as a debt/equity conversion instrument. The amendments will not be without a certain impact in territorial terms, however.
IV
Conclusion
As a general conclusion, it may be stated that debt conversion has also resulted in veritable territorial conversion. Even under the hypothesis of zero fresh investment, the debt conversion involves a marked sectoral and regional reassignment of resources.
In spite of the big differences observed between the various regions of the country, the
overall process undoubtedly represents a significant departure from traditional trends. Ultimately, the causes of this change are, it is true, to be found in the general change which has taken place in the Chilean economy. Nevertheless, the debt (which greatly hastened this change) and its subsequent conversion contributed significantly to the adjustment which set off this regional revolution.
D E B T C O N V E R S I O N A N D T E R R I T O R I A L C H A N G E ! A . Daher 129
BibliographyBuiow, Jerem y and Kenneth Rogof'f (1988), T h e buyback
boondoggle: comm ents and discussion, William C. Brainard aiifl George L. Perry (eds,), Brookings Papers on Economic Activity, No. 2, W ashington, D.C.. T h e Brookings Institution,
ere. (U nited Nations C entre on Transnational'Corporations) (1988), Transnational Corporations in World Development: Trends and Prospects (s ivcr(/89). New York. United Nations publication. Sales No.: t;,88. i i .a .7.
D aher, A. (1989), “Ajuste económ ico y ajuste territorial en C hile”, paper presented at the seminar on Consecuencias Regionales de la Reestructuración de los M ercados Mundiales (Regional consequences of'the restructuring o f world m arkets), Buenos Aires, Centre for U rban and Regional Studies, F. Ebert Foundation.
"E l M ercurio" (1990): Lssue o f 3 February, section B l . Santiago, Chile.
Elortegui,C . (1988), “Endeudam iento interno y conversión de deuda en la econom ía chilena", Valparaíso, Chile, Ediciones Universitarias de Valparaíso.
Errázuriz, E. (1987), “Capitalización de la deuda externa y desnacionalización de la econom ía chilena” (Capitalization o f the external debt and denationalization o f the Chilean economy). Docum ento de trabajo No. 57, Santiago, Chile, Academia de Humanismo Cristiano, Program m e on the Economy o f Labour ( p e t ) , August.
Ffrench-D avis, R. (1989a), El conflicto entre la deuda y el crecim iento en Chile: tendencias y perspectivas. Colección Estudios c ie pla x . No. 26, Santiago, Chile, C orporación de investigaciones Económicas para Latinoam érica ( c i e p l a n ) . Ju n e .
________ (1989b), Debt-equity swaps in Chile, CambridgeJournal o f Economics, No. 1, voi. 14, London, Cambridge Politicai Economy Society Limited, Academic Press, M arch,
Fontaine, J .A . (1988), Los mecanismos de conversión de deuda en Chile, Estudios Públicos, No. 30, Santiago, Chile, C entro de Estudios Públicos, second quarter.
G arcés, F. (1987), Com entarios sobre conversiones de deuda en Chile, Boletín Mensual, No. 710, voi. 60 , Santiago, Chile, Banco Central de Chile, April.
GERMINES ((íestión de Empresas, Inversiones y Estudios) (1987), Análisis de la coyuntura económica. Inform e Gémines, No. 84 , Santiago, Chile, Septem ber.
Hilton, A, (1987), “Debt-equity swaps. Costs, benefits and prospects”, London, Financial Tim es Business In form ation.
Jo in t E :(:t.A (:/c'i (; Unit on Transnational Corporations (1989), “Debt/equity conversion program m es: guidelines for debtors", Santiago, Chile, Econom ic Commission for Latin America and the Caribbean ( e c l a c ) , mimeo.
Lahera, E. (1987), T h e conversion o f foreign debt viewed from Latin America, cepa/. RcvtViv, No. 32 (i.ao . 1473), Santiago, Chile, August.
Latinfinance (1989), Latinfinance, No. 8. Eurom oney Publications.
Massad, C. (1986), Alleviation o f the debt burden: historical experience and present need, cepa l Review, No. 30 (LC;/t;. 1 4 4 1), Santiago, Chile, December.
Montoya, I. (1988), “Disposiciones sobre conversión de deuda externa en Chile. Principales características y resultados”, paper presented at the twenty-fifth annual meeting o f Central Bank technicians o f the Americas, W ashington, D.C.
Nair, G. and M. Frazier (1987), Debt-equity conversion and privatization, Economic Impact, No. 60, W ashington, D.C., United States Inform ation Agency.
Reveco, J .M . (1988), Deuda externa y capitalización; análisis de la normativa de conversión, Documento de Trabajo, No. 15, V anexo, Santiago, Chile, Program a Regional de Investigaciones Económicas y Sociales del Cono Sur.
Roberts, D. and E. Rem olona (1987), Debt-swaps; a technique in developing country finance, Finance fo r Developing Countries, New York, G roup o f Thirty,
Rubin, S. (1987), “Guide to debt-equity swaps", The Economist, Special Report No. 1104, London, T h e Economist Publications, Septem ber,
Spieles, W. (1987), Indebtedness, debt-equity swaps and the heavily indebted countries. Intereconomics, vol. 22 , No. 3, Hamburg, Federal Republic o f Germ any, V erlag Weltarchiv GmbH, May-June,

CEPAL REVIEW No. 43
The State and poverty in Costa Rica
Marvin Taylor-Dormond"^
T h e free m arket philosophy is having a strong influence on policy design and econom ic strategies in the Latin A m erican countries, and this can lead to erosion o f State action in favour o f marginated groups as a result o f mistakenly entrusting the task o f redistribution to the “invisible hand" o f the market.
T h e idea o f econom ic efficiency does not include concern for distribution, however, so that it may be synonymous with extrem e inequality and injustice, thereby calling for State action in this matter, In the progress towards m ore generalized use o f the market, the function o f the State in the reallocation o f the product is vital, since the market is incapable o f looking after the needs o f marginated groups, for the simple reason that these groups do not have the necessary voice for taking part in the mercantile auction o f benefits.
T h is article seeks to contribute to the store o f knowledge on the role o f the State with regard to transfers and attention to the interests o f the poor in Costa Rica. An analysis is made o f the direct effect o f public subsidies —- provided through the health, education, housing, food, social security, and water and sanitation program mes — on the incidence and intensity o f poverty in Costa Rica. T h e results o f the research show that the action o f the t^osta Rican State in this field has a significant impact. T h e effect o f public social subsidies is to reduce total poverty from 2Q% to 1 and to narrow the global poverty gap by m ore than two-thirds. On the basis o f this evidence, it may be maintained that the State provision o f basic services to the population has not only made it possible to combat poverty in the country but is also a fundamental elem ent in the social stability and exercise o f democracy in Costa Rica.
* H e a d o f S t u d ie s a n d P o l ic ie s o f th e C e n t r a l A m e r ic a n
B a n k f o r E c o n o m ic I n t e g r a t i o n , T e g u c i g a l p a , H o n d u r a s .
T h e a u t h o r w is h e s t o e x p r e s s h is a p p r e c ia t io n o f t h e c o m
m e n t s a n d s u g g e s t i o n s m a d e b y A . M a s lo v e , J u a n D ie g o
T r e jo s , W .I . G i l le s p ie a n d A .R . J . R i t t e r , a s w ell a s th e v a lu a b le
s u p p o r t o f P a b lo S a u m a n a n d A d r iá n R o d r íg u e z in t h e p r e p
a r a t i o n o f p r e l im in a r y v e r s io n s . H e a ls o w ish e s to th a n k T c r e s a
d e B a c a a n d M ile n ta d e Q u in o n e z f o r t h e i r h e lp in t h e f in a l
p r o c e s s in g o f t h e m a n u s c r ip t .
IntroductionThe extent to which the free market philosophy is influencing economic policy design in the Latin American countries can lead to the erosion of State action in favour of marginated groups by mistakenly entrusting the task of redistribution to the “invisible hand” of the market rather than the visible hand of the State.
In this respect, a recent World Bank report not only maintains that poverty continues to be the greatest challenge to development policy but also argues that appropriate fiscal policies are essential for tackling poverty and that well- designed public spending can not only improve the access of the poor to services which are of basic importance for their existence but can also promote the development of human resources (World Bank, 1989, p. vi). Moreover, in its latest World Development Report the Bank reasserts this position and enlarges on it (World Bank, 1990, p. 3). This Report, which is devoted to the subject of poverty, indicates that in order to combat poverty successfully it must be attacked on two fronts which mutually strengthen each other; through initiatives which promote the productive use of the labour of the poor, and through the provision of this marginated section of the population with basic services, especially in the fields of education, health and nutrition. The Bank also maintains that a global approach to the problem of poverty calls for a well-designed programme for the transfer of income and for social security systems which complement the action taken on the two fronts mentioned above. Thus, far from condoning the abandonment of State efforts to satisfy the needs of marginated groups, it recognizes that this is a field where the public sector must play a dynamic role.
Furthermore, from the conceptual point of view, the inalienable responsibility of the State in the redistribution of the product is something which has been clearly established in the theory of public economics. A cornerstone in this respect is the classic work of Musgrave, who justified the redistributive function of the State by pointing out that unless the distribution pattern is accepted as being just (which is far from being the case in Latin America), the effective demand reflected in the market cannot be accepted as a guide for efficient resource use (Musgrave, 1968, p. 18). In the same respect, Prebisch pointed out that regardless of the economic efficiency of the
1 3 2 C E P A L R E V I E W N o . 4 3 / A p ril 1991
market, its deficiencies stem from the fact that demand is generated in a certain given income distribution, linked with a particular social structure which is highly inequitable and excludes a considerable part of the population from the benefits of development. It may be concluded from the foregoing that although the market laws may lead to rational solutions, the benefits of those solutions are restricted to a small privileged group and can hardly claim to be rational for the community at large (Prebisch, 1981, p. 16).
In short, while it is absurd to deny the virtues of the market as regards efficiency in resource assignment, the notion of economic efficiency is amoral and rules out considerations of distribution, so that it can easily be synonymous with extreme inequality and social injustice. Consequently, within the trend towards more generalized use of the market, the State has a vital role to play in the reassignment of the product, since the market is incapable of looking after the needs of the marginated groups, for the simple reason that these groups do not possess the necessary voice for participating in the mercantile auction of benefits.
In the light of this controversy, this article seeks to contribute to the store of knowledge on the role of the State in the transfer of resources and attention to the needs of the poor in Costa Rica. On the basis of the methodological framework used in studies on this topic carried out in developingcountries(Selowsky, 1979; Meerman, 1979), the article analyses the effects of the public subsidies granted through social programmes on the incidence and intensity of poverty in Costa Rica.
The topics dealt with in the article have been divided into four sections. Section I sets forth the methodological basis for the study, while section II examines the magnitude and intensity of poverty in the absence of the benefits of the social programmes. Section III analyses the magnitude and composition of the public subsidy given to social programmes and its distribution between the poor and the non-poor, while section IV gives estimates of the magnitude of poverty after taking into account the effects of the subsidy. Finally, the last section summarizes the conclusions of the study.
The methodological framework{.The concept o f income and poverty lines
In this article, a profile of absolute poverty in 1983 is established, using as a reference the income received by families. For this purpose — using the information compiled in a sample survey carried out in 1984 by the Economic Research Institute of the University of Costa Rica— two categories of income were defined: a) income excluding the benefits derived from public expenditure and b) income including those benefits.
The first category comprises monthly wages, profits {balance of personal activities), capital income (interest, dividends, and property rents, including the estimated income corresponding to the fact of living in one’s own house), value of income corresponding to production used for
home consumption, contributory pensions, * sickness benefits (benefits paid during temporary absence from work on account of sickness), sporadic transfers (lottery prizes, presents, payments under insurance policies, inheritances), and income from other sources (financial help from relatives, for example). Through this definition, it is sought to cover all income produced by the collective effort of family members, excluding all aid provided by the State.
This is a regular pension schem e in which workers make systematic contributions in order to receive a pension when they retire. O lder persons who are not covered by this scheme can apply for a pension under the non-contributory system, which is financed by the State. Because o f this latter fact, the pensions under this system are included as part o f State assistance programmes.
T H E S T A T E A N D P O V E R T Y I N C O S T A R I C A / M . Taylor-D orm ond 1 3 3
The second category of income includes the value of benefits derived from public spending in the social areas. Obviously, the income received under this second category gives a total income greater than (or at least equal to) that received under the first category.
Although the income per adult-equivalent is probably the most efficient reference indicator for measuring poverty (Trejos, 1983, pp. 61-62), the limitations of this variable, to which Mohan so rightly drew attention, make it desirable to adopt instead the per capita family income (Mohan, 1984, p. 5). Thus, by matching this per capita average with a poverty line likewise expressed in per capita terms, the families were classified into poor and non-poor.
In order to establish the absolute poverty line, the study by Mata and Murillo on the basic food shopping basket in Costa Rica was used, in which this basket is defined as “the amount of food consumed by an adult Costa Rican male (over 25, weighing 65 kgs and engaged in an average level of activity), which amounts to 2 900 calories per day” (Mata and Murillo, 1980).
The cost of the basic basket was calculated using the food prices determined by the Department of Statistics and Censuses of Costa Rica for the establishment of the consumer price index. This led to the estimation of two poverty lines: the first of these is the “extreme poverty line”, defined as the per capita value of the basic family basket; the second estimated line is the “basic poverty line”, which is somewhat higher than the first line because it takes account also of some non-food items.
In accordance with these two definitions, families were classified as a) extremely poor, if their per capita income is less than the monthly per capita cost of the basic family basket (families below the extreme poverty line (epl)); b) basically poor, if their per capita income is equal to or greater than the epl but less than the per capita cost of the “basic needs basket” (families below the basic poverty line (bpl)); and c) non-poor, if their income is equal to or greater than the bpl.
Absolute poverty lines were estimated for the urban and rural areas of Costa Rica. For the urban areas, the estimates gave a basic poverty line of 1 518 colones and an extreme poverty line of 964 colones, while for the rural areas the respective values were 1 260 and 800 colones.
Finally, various indexes have been designed for measuring the intensity of poverty. The index adopted in this article is that of the poverty gap, defined as the difference between the income of the family unit in question and the income needed to bring that unit up to a given poverty line (Beckerman, 1985, p. 7). An advantage of estimates based on the poverty gap is that they take account both of the number of poor families and the intensity of their poverty.
2. The redistributive effects of public spending
In this article, the notion of subsidy defined by Selowsky is used. According to this author, the provision of a good or service involves a subsidy whenever the cost of the product is greater than the direct expenditure made by the population receiving it (Selowsky, 1979, pp. 10-12). Use is also made here of the results and methodological procedures of a study on social public spending in Costa Rica carried out by the author in the Economic Research Institute of the University of Costa Rica together with other colleagues.^
The public sector can generate subsidies in three ways: a) through public spending, b) through public enterprises and c) through price controls. Most of the cases analysed in this study correspond to services subsidized through public spending. This kind of subsidy is provided through the Government budget, and its redistributive effect can be analysed in the light of three alternative approaches (eclac, 1981, p. 2). The first of these is based on the evaluation of the income generated by the factors of production of the goods and services provided by the Government. The second approach analyses the effect of public sector activity on the structure of production and resource allocation and, subsequently, the impact of the changes thus produced on the income received by the factors of
For an account o f various alternative form s o f m easurem ent, see Kakwani, 1980, chapter 15.
T h is study was part o f a research project on the redistributive effect o f social public spending in five Latin A m erican countries, carried out with financing from ID B and co-ordinated by the Program m e o f Jo in t Studies on Latin American Economic Integration ( e c i e l ). T h e Econom ic R esearch Institute has produced several working documents on the subject.
134 C E P A L R E V I E W N o . 43 / A p ril 1991
production. The third approach is centered on the direct benefits provided to those receiving public goods and services. Thus, in order to evaluate the redistributive effect of the benefits, their value in terms of income must be quantified.
With regard to this latter approach, one way of estimating the benefits is by using the valuation of them given by the family unit itself. This “benefits received” method involves difficult problems of measurement, however, so that the method suggested by the “cost incurred in favour o f ’ approach is often used (Gillespie, 1980, P- 68).
This article deals with the direct redistributive effects of public spending, so that the direct benefit approach is used and it is quantified via the budget, that is to say, using the “cost incurred in favour o f ’ approach. Within this approach, public spending was divided into the categories of consumption, capital expenditure and transfers. The treatment given to these categories for distributive purposes is in line with conventional theory and practice in the area of public finances.^
3. Selection o f public programmes and estimation o f the subsidy
The public programmes analysed here are those in the fields of education, health, social security, nutrition, housing and water supply and sanitation.
The education programmes cover preparatory, primary, secondary and higher education. Adult education, special education (for the mentally or physically hindered), technical training and post-secondary education are also taken into account. With regard to the subsidy corresponding to these programmes, it is considered that since in the case of education the beneficiaries are not obliged to make any direct payment in order to gain access to this service, the amount of the subsidy is equal to the spending of the State on the education of its citizens.
This subsidy was quantified on the basis of the budgets of the various national institutions connected with education, supplemented with es-
For a m ore detailed discussion o f these aspects, see Taylor, 1986, chapter I.
timates of capital expenditure (which covers the depreciation of assets), and of the profits that cbuld be earned on such an investment under the best possible circumstances.
In order to estimate the subsidy on health, the programme was divided into two classes: a) curative medicine and b) preventive medicine. Curative medicine, in turn, comprises hospitalization and outpatient services, while preventive medicine includes direct prevention and preventive medicine in general.
The method of estimation used in this case is basically the same as for education. Here, too, there is no direct payment for the service, so that the subsidy is equal to the total spending by the State on these programmes.
The data for estimating the subsidy were obtained from the budget of the Costa Rican Social Security Fund and the final clearance of the budget of the Ministry of Health. Once again, the subsidy deriving from the use of assets was calculated by estimating the opportunity cost of the investment.
With regard to the social security programmes, for analytical purposes these were divided into three groups: a) pension systems, including both contributory schemes and those which do not operate on this basis, b) cash benefits, unemployment payments, and other similar transfers, and c) social welfare, including both infant welfare programmes and programmes for handicapped persons and the aged. In estimating the subsidy in these three fields, only the amount of transfers was taken into account. The capital items were not taken into account since they formed only an insignificant percentage of the overall subsidy.
In estimating the subsidy in the case of nutritional programmes, three types of “end product” were defined: a) meals services (mainly for schools), b) food aid, and c) other programmes.
Estimation of the current expenditure on nutritional programmes was based on the final clearance of the budget of the agencies executing these programmes. In order to evaluate the capital cost, a physical inventory of the assets of educational centres and other institutions participating in nutritional programmes was used.
In order to estimate the housing subsidy, a different method from that used in the above cases was adopted. In this case, the subsidies were
T H E S T A T E A N D P O V E R T Y I N C O S T A R I C A / M . Taylor-D orm ond 1 3 5
classified into two categories: a) direct subsidies, and b) subsidies implicit in the financial terms. Direct subsidies are those granted through the provision of free services, free housing or transfers of funds for housing purposes. These kinds of programmes are carried out by the Joint Social Aid Institute ( i m a s ) and the National Housing and Urban Development Institute-
Implicit subsidies consist of the granting of favourable financial terms on housing loans. The importance of this type of subsidy lies in the fact that the banking system of Costa Rica is nationalized, so that the economic influence of the public sector through the financial system is of vital importance.’’
With regard to the method of estimation, the direct subsidy is equal to the cost incurred by the State in the provision of dwellings and the granting of transfers for this purpose, while the implicit subsidy is the result of multiplying the difference between the nominal interest rate charged to debtors and the effective cost of the funds by the total amount of the housing portfolio of the creditors.
The last group of programmes in question is that connected with water supply and sanita-
T h is study concentrates on the housing portfolio o f the national banking sistem. It also takes account o f other public institutions which provide housing loans, however, including the People’s Bank for Community Development, the Costa Rican Social Security Fund (ccss) and the National Insurance Institute.
tion. Here, the method of estimating the subsidy followed the same principles as those described above. Thus, the figures for current and capital expenditure were estimated on the basis of information from the National Institute of Water Supply and Sanitation and the records of various municipalities responsible for providing these services to their communities.
Since, in the case of water supply and sanitation, the beneficiaries make direct payment for this service (in contrast with the other cases analysed here), the subsidy was estimated by deducting the amount of such payments from the current and capital expenditure.
4. Distribution of the subsidy
The total subsidy received by a household when consuming a good or service is equivalent to the unit subsidy multiplied by the number of units consumed. Consequently, where appropriate, the unit of consumption was specified, together with the corresponding average subsidy for each programme.
Where a unit of consumption was specified, the allocation of the subsidy was calculated by multiplying the number of units consumed by each family by their respective unit cost. This was done in the case of education, health, pensions, some nutritional programmes, and water supply and sanitation. In other cases, ad hoc procedures were used, based on the particular characteristics of the programmes (Taylor, 1986, chapter II).
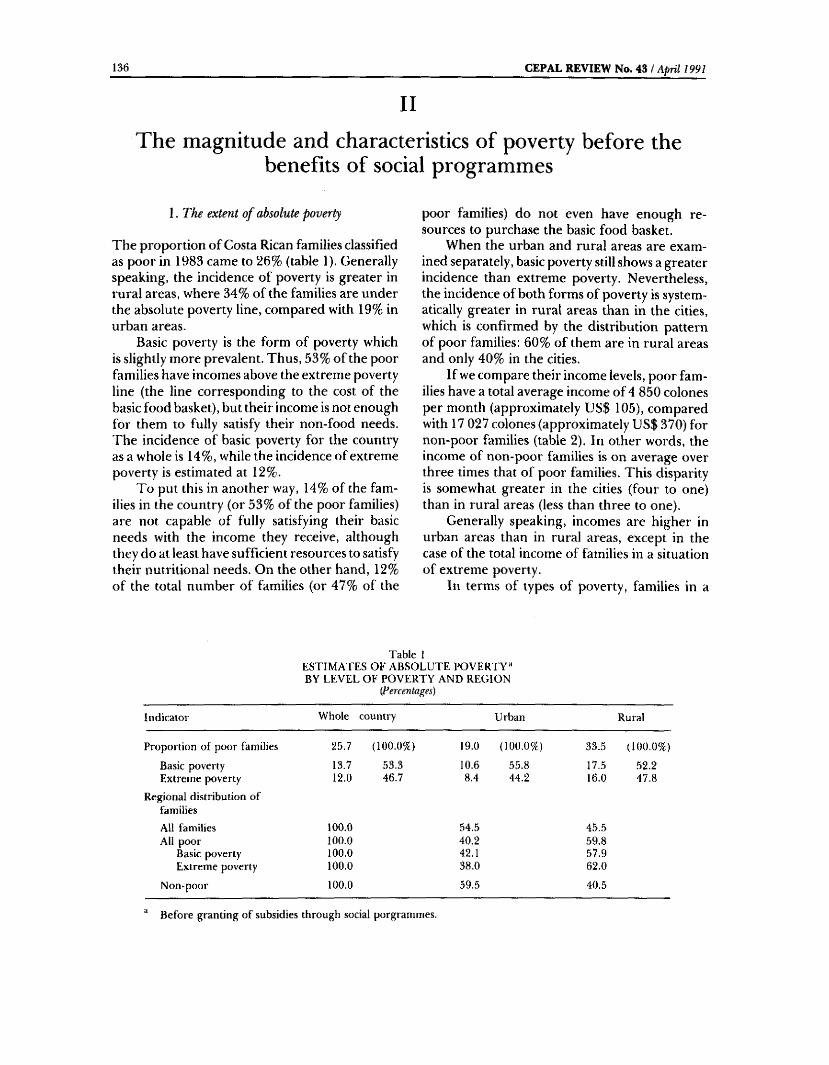
1 3 6 C E P A L R E V I E W N o . 4 3 / A p r il 1991
II
T he magnitude and characteristics of poverty before the benefits of social programmes
The extent o f absolute poverty
The proportion of Costa Rican families classified as poor in 1983 came to 26% (table 1). Generally speaking, the incidence of poverty is greater in rural areas, where 34% of the families are under the absolute poverty line, compared with 19% in urban areas.
Basic poverty is the form of poverty which is slightly more prevalent. Thus, 53% of the poor families have incomes above the extreme poverty line (the line corresponding to the cost of the basic food basket), but their income is not enough for them to fully satisfy their non-food needs. The incidence of basic poverty for the country as a whole is 14%, while the incidence of extreme poverty is estimated at 12%.
To put this in another way, 14% of the families in the country (or 53% of the poor families) are not capable of fully satisfying their basic needs with the income they receive, although they do at least have sufficient resources to satisfy their nutritional needs. On the other hand, 12% of the total number of families (or 47% of the
poor families) do not even have enough resources to purchase the basic food basket.
When the urban and rural areas are examined separately, basic poverty still shows a greater incidence than extreme poverty. Nevertheless, the incidence of both forms of poverty is systematically greater in rural areas than in the cities, which is confirmed by the distribution pattern of poor families: 60% of them are in rural areas and only 40% in the cities.
If we compare their income levels, poor families have a total average income of 4 850 colones per month (approximately US$ 105), compared with 17 027 colones (approximately US$ 370) for non-poor families (table 2). In other words, the income of non-poor families is on average over three times that of poor families. This disparity is somewhat greater in the cities (four to one) than in rural areas (less than three to one).
Generally speaking, incomes are higher in urban areas than in rural areas, except in the case of the total income of families in a situation of extreme poverty.
In terms of types of poverty, families in a
Table IE ST IM A T E S O F A B SO L U T E P O V E R T T " B Y L EV E L O F P O V ER T Y AND REGIO N
{Percentages)
Indicator Whole country Urban Rural
Proportion o f poor families 25.7 (100.0% ) 19.0 (100.0% ) 33.5 (100.0% )
Basic poverty 13.7 53.3 10.6 55.8 17.5 ,52.2Extrem e poverty 12.0 46.7 8.4 44.2 16.0 47 .8
Regional distribution o ffamilies
All families 100.0 54.5 45.5All poor 100.0 40.2 59.8
Basic poverty 100.0 42.1 57.9Extrem e poverty 100.0 38.0 62.0
N on-poor 100.0 59.5 40.5
B efore granting o f subsidies through social porgrammes
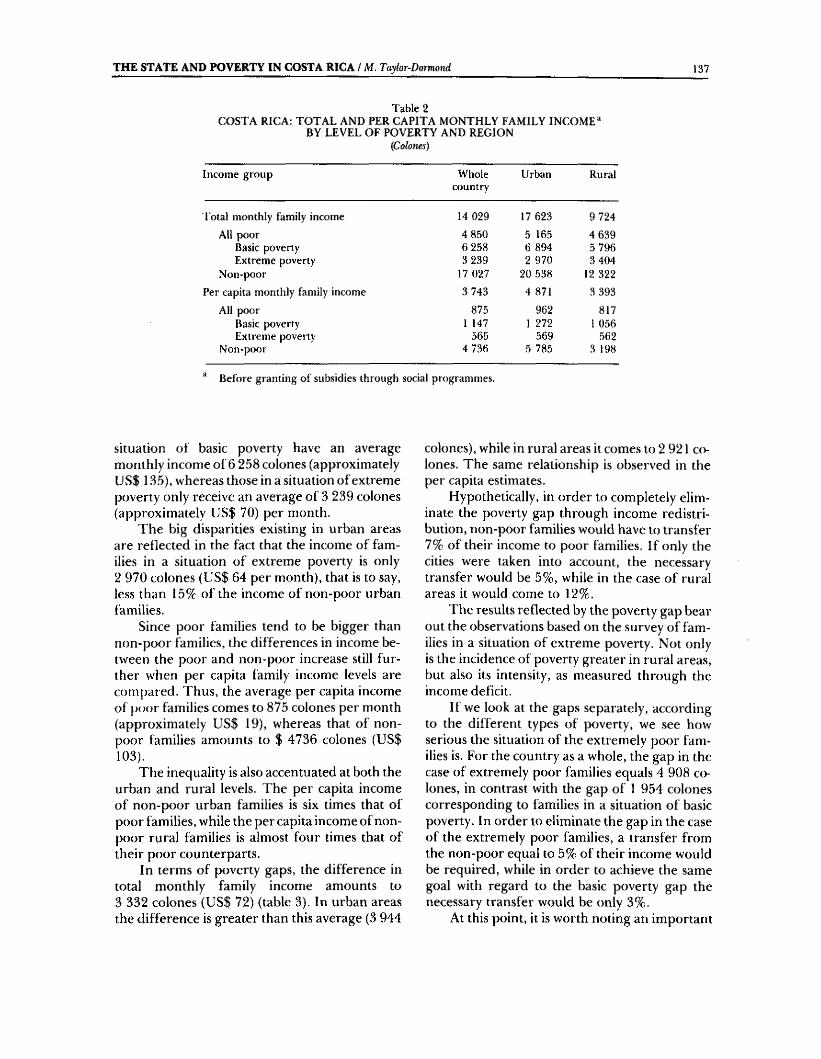
T H E S T A T E A N D P O V E R T Y I N C O S T A R I C A / M . T ay io r-D o m o nd 137
Table 2C O ST A RIC A : T O T A L AND PER C A PIT A M O N TH LY FA M ILY INCOME**
B Y L E V E L O F P O V E R T Y AND REG IO N(Cotones)
Incom e group Wholecountry
Urban Rural
T otal monthly family income 14 029 17 623 9 724
All poor 4 850 5 165 4 639Basic poverty 6 258 6 894 5 796Extrem e poverty 3 239 2 970 3 404
Non-poor 17 027 20 538 12 322
Per capita monthly family income 3 743 4 871 3 393
All poor 875 962 817Basic poverty 1 147 1 272 1 056Extrem e poverty 565 569 .562
Non-poor 4 736 5 785 3 198
B efore granting o f subsidies through social programmes.
situation of basic poverty have an average monthly income of 6 258 colones (approximately US$ 135), \vhereas those in a situation of extreme poverty only receive an average of 3 239 colones (approximately US$ 70) per month.
The big disparities existing in urban areas are reflected in the fact that the income of families in a situation of extreme poverty is only2 970 colones (US$ 64 per month), that is to say, less than 15% of the income of non-poor urban families.
Since poor families tend to be bigger than non-poor f amilies, the differences in income between the poor and non-poor increase still further when per capita family income levels are compared. Thus, the average per capita income of poor families comes to 875 colones per month (approximately US$ 19), whereas that of nonpoor families amounts to $ 4736 colones (US$ 103).
The inequality is also accentuated at both the urban and rural levels. The per capita income of non-poor urban families is six times that of poor families, while the per capita income of nonpoor rural families is almost four times that of their poor counterparts.
In terms of poverty gaps, the difference in total monthly family income amounts to3 332 colones (US$ 72) (table 3). In urban areas the difference is greater than this average (3 944
colones), while in rural areas it comes to 2 921 colones. The same relationship is observed in the per capita estimates.
Hypothetically, in order to completely eliminate the poverty gap through income redistribution, non-poor families would have to transfer 7% of their income to poor families. If only the cities were taken into account, the necessary transfer would be 5%, while in the case of rural areas it would come to 12%.
The results reflected by the poverty gap bear out the observations based on the survey of families in a situation of extreme poverty. Not only is the incidence of poverty greater in rural areas, but also its intensity, as measured through the income deficit.
If we look at the gaps separately, according to the different types of poverty, we see how serious the situation of the extremely poor families is. For the country as a whole, the gap in the case of extremely poor families equals 4 908 colones, in contrast with the gap of 1 954 colones corresponding to families in a situation of basic poverty. In order to eliminate the gap in the case of the extremely poor families, a transfer from the non-poor equal to 5% of their income would be required, while in order to achieve the same goal with regard to the basic poverty gap the necessary transfer would be only 3%.
At this point, it is worth noting an important
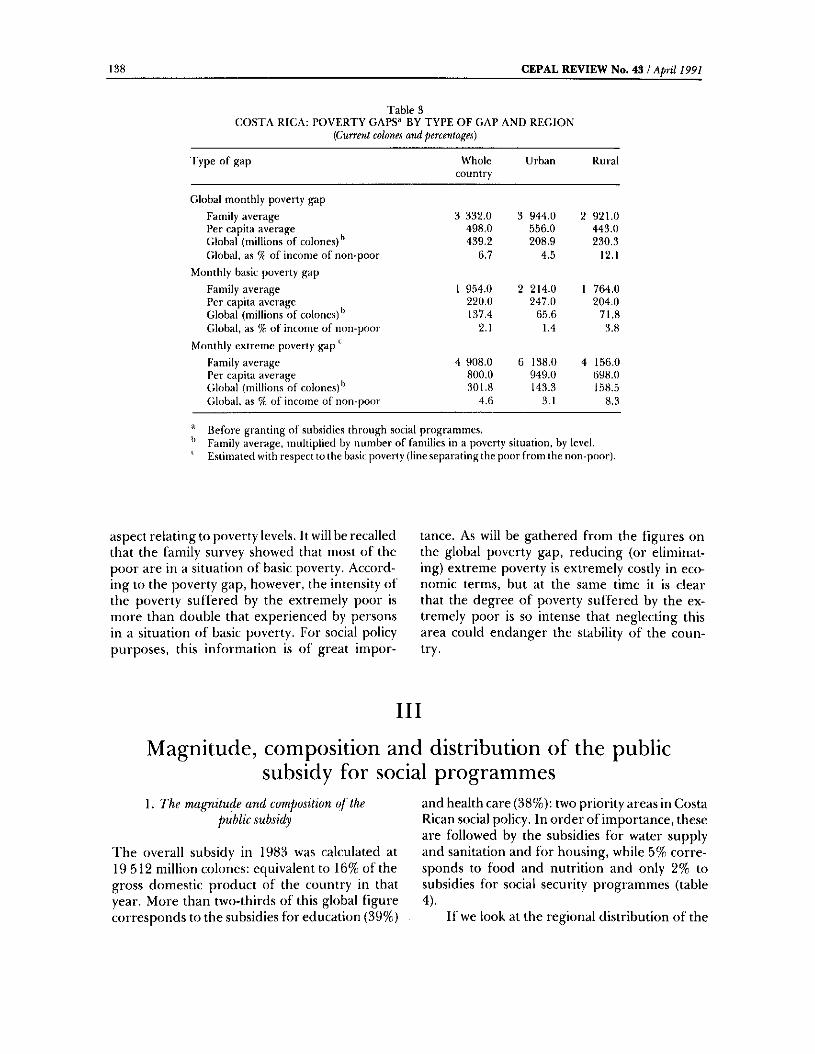
1 3 8 C E P A L R E V I E W N o . 43 / A p ril 1991
Ttiblc 3C O STA RIC A : P O V ER T Y GAPS« B Y T Y P E O F GAP AND REG IO N
ipurrent colonel and percentages)
Type o f gap Wholecountry
Urban Rural
Global monthly poverty gap
Family average 3 332.0 3 944.0 2 921.0Per capita average 498,0 556.0 443.0Global (millions o f colones)^ 439.2 208.9 230.3Global, as % o f income o f non-poor 6.7 4.5 12.1
Monthly basic poverty gap
Family average 1 954.0 2 214.0 1 764.0Per capita average 220.0 247.0 204.0Global (millions o f colones)'’ 137.4 65.6 71.8Cilobal, as % o f income o f non-poor 2.1 1.4 3.8
Monthly extrem e poverty gap ^Family average 4 908 ,0 6 138.0 4 156.0Per capita average 800.0 949.0 698.0Global (millions o f colones)'’ 301.8 143.3 158.5(ilobal, as % o f income o f non-poor 4.6 3.1 8.3
“ B efore granting o f subsidies through social programmes.Family average, multiplied by num ber o f families in a poverty situation, by level.
'' Estimated with respect to the basic poverty (line separating the poor from the non-poor).
aspect relating to poverty levels. It will be recalled that the family survey showed that most of the poor are in a situation of basic poverty. Accord- ing to the poverty gap, however, the intensity of the poverty suffered by the extremely poor is more than double that experienced by persons in a situation of basic poverty. For social policy purposes, this information is of great impor
tance. As will be gathered from the figures on the global poverty gap, reducing (or eliminating) extreme poverty is extremely costly in economic terms, but at the same time it is clear that the degree of poverty suffered by the extremely poor is so intense that neglecting this area could endanger the stability of the country.
I l l
Magnitude, composition and distribution of the public subsidy for social programmes
1. The magnitude and composition of the public subsidy
The overall subsidy in 1983 was calculated at 19 512 million colones: equivalent to 16% of the gross domestic product of the country in that year. More than two-thirds of this global figure corresponds to the subsidies for education (39%)
and health care (38%): two priority areas in Costa Rican social policy. In order of importance, these are followed by the subsidies for water supply and sanitation and for housing, while 5% corresponds to food and nutrition and only 2% to subsidies for social security programmes (table4).
If we look at the regional distribution of the
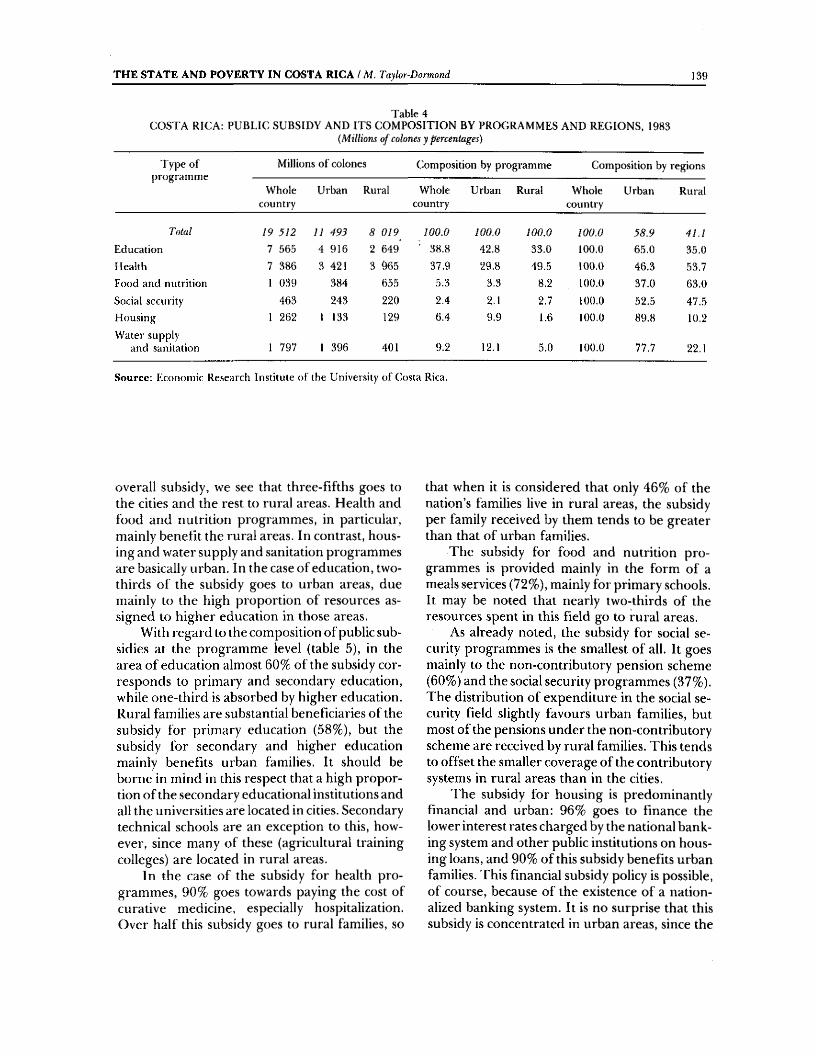
T H E S T A T E A N D P O V E R T Y I N C O S T A R I C A / M . Taylor-Dormond 139
Table 4C O STA RIC A : P U B L IC SU B SID Y AND IT S C O M PO SITIO N BY PRO GRAM M ES AND R EG IO N S, 1983
{Millions of colones y percentages)
Type o f program me
Millions o f colones Composition by programme Composition by regions
Whole Urban Rural Whole Urban Rural Whole Urban Ruralcountry country country
Total 19 312 11 493 8 019 100.0 100.0 100.0 100.0 38.9 41.1Education 7 565 4 916 2 649 ' 38.8 42.8 33.0 100.0 65.0 35.0
Health 7 386 3 421 3 965 37.9 29.8 49.5 100.0 46.3 .53.7
Food and nutrition 1 039 384 655 5.3 3,3 8.2 100.0 37.0 63.0
Social security 463 243 220 2.4 2.1 2.7 100.0 52.5 47.5
Hou.sing 1 262 1 133 129 6.4 9.9 1.6 100.0 89.8 10.2
W ater supply and sanitation 1 797 1 396 401 9.2 12.1 5.0 100.0 11.1 22.1
Source: Econom ic Research Institute of the University of Costa Rica.
overall subsidy, \ve see that three-fifths goes to the cities and the rest to rural areas. Health and food and nutrition programmes, in particular, mainly benefit the rural areas. In contrast, housing and water supply and sanitation programmes are basically urban. In the case of education, two- thirds of the subsidy goes to urban areas, due mainly to the high proportion of resources assigned to higher education in those areas.
With regard to the composition of public subsidies at the programme level (table 5), in the area of education almost 60% of the subsidy corresponds to primary and secondary education, while one-third is absorbed by higher education. Rural families are substantial beneficiaries of the subsidy for primary education (58%), but the subsidy for secondary and higher education mainly benefits urban families. It should be borne in mind in this respect that a high proportion of the secondary educational institutions and all the universities are located in cities. Secondary technical schools are an exception to this, however, since many of these (agricultural training colleges) are located in rural areas.
In the case of the subsidy for health programmes, 90% goes towards paying the cost of curative medicine, especially hospitalization. Over half this subsidy goes to rural families, so
that when it is considered that only 46% of the nation’s families live in rural areas, the subsidy per family received by them tends to be greater than that of urban families.
The subsidy for food and nutrition programmes is provided mainly in the form of a meals services (72%), mainly for primary schools. It may be noted that nearly two-thirds of the resources spent in this field go to rural areas.
As already noted, the subsidy for social security programmes is the smallest of all. It goes mainly to the non-contributory pension scheme (60%) and the social security programmes (37%). The distribution of expenditure in the social security field slightly favours urban families, but most of the pensions under the non-contributory scheme are received by rural families. This tends to offset the smaller coverage of the contributory systems in rural areas than in the cities.
The subsidy for housing is predominantly financial and urban: 96% goes to finance the lower interest rates charged by the national banking system and other public institutions on housing loans, and 90% of this subsidy benefits urban families. This financial subsidy policy is possible, of course, because of the existence of a nationalized banking system. It is no surprise that this subsidy is concentrated in urban areas, since the
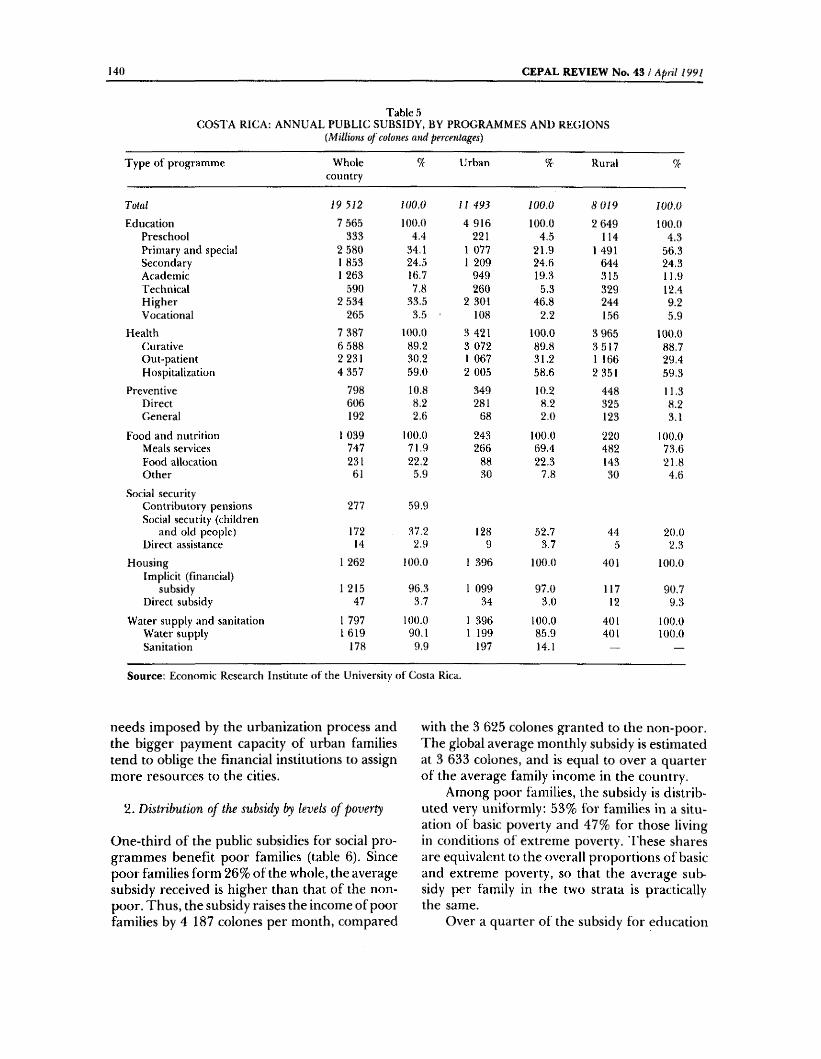
140 C E P A L R E V I E W N o . 43 / A p jt l 1991
Table 5(iO S T A RIC A : A N N UAL P U B L IC SU B SID Y , B Y PRO GRA M M ES AND R EG IO N S
(Millions o f colotm and percentages)
T yp e o f program m e W holecountry
% Urban % Rural %
Total 19 512 100.0 11 493 100.0 8 019 100.0Education 7 .565 100.0 4 916 100.0 2 649 100.0
Preschool 333 4.4 221 4,5 114 4.3Primary and special 2 580 34,1 1 077 21.9 1 491 56.3Secondary 1 853 24.5 1 209 24.6 644 24.3Academic 1 263 16.7 949 19.3 315 11.9T echnical 590 7.8 260 5.3 329 12.4H igher 2 534 33.5 2 301 46.8 244 9.2Vocational 263 3.5 ■ 108 2.2 L56 5.9
Health 7 387 100.0 3 421 100.0 3 965 lOO.OCurative 6 588 89.2 3 072 89.8 3 5 1 7 88.7Out-patient 2 231 30.2 1 067 31.2 1 166 29.4Hospitalization 4 357 59.0 2 005 58.6 2 351 59.3
Preventive 798 10.8 349 10.2 448 11.3D irect 606 8.2 281 8.2 325 8.2G eneral 192 2.6 68 2.0 123 3.1
Food and nutrition 1 039 100.0 243 100.0 220 100.0Meals services 747 71.9 266 69.4 482 73,6Food allocation 231 22,2 88 22.3 143 21.8O ther 61 5.9 30 7.8 30 4.6
Social .securityContributory pensions 277 59.9Social security (children
and old people) 172 37.2 128 52.7 44 20 .0D irect assistance 14 2.9 9 3.7 5 2.3
Housing 1 262 100.0 1 396 100.0 401 100.0Im plicit (financial)
subsidy 1 215 96.3 1 099 97.0 117 90.7D irect subsidy 47 3,7 34 3.0 12 9.3
W ater supply and sanitation 1 797 100.0 1 396 100.0 401 100.0W ater supply 1 619 90.1 1 199 85.9 401 100.0Sanitation 178 9,9 197 14.1 — —
Source: Econom ic Research Institute of the University ol Costa Rica.
needs imposed by the urbanization process and the bigger payment capacity of urban families tend to oblige the financial institutions to assign more resources to the cities.
2. Distribution of the subsidy by levels o f poverty
One-third of the public subsidies for social programmes benefit poor families (table 6). Since poor families form 26% of the whole, the average subsidy received is higher than that of the nonpoor. Thus, the subsidy raises the income of poor families by 4 187 colones per month, compared
with the 3 625 colones granted to the non-poor. The global average monthly subsidy is estimated at 3 633 colones, and is equal to over a quarter of the average family income in the country.
Among poor families, the subsidy is distributed very uniformly; 53% for families in a situation of basic poverty and 47% for those living in conditions of extreme poverty. These shares are equivalent to the overall proportions of basic and extreme poverty, so that the average subsidy per family in the two strata is practically the same.
Over a quarter of the subsidy for education

T H E S T A T E A N D P O V E R T Y I N C O S T A R I C A / M . T m lur-D ornum d 141
Table 6CX)STA RIC A : A LL O C A T IO N O F A N N UAL PU B LIC SU B SID Y BET W EE N PO O R AND
NON -PO O R, BY PROGRAM M ES{Culones and percentages)
Program m e and income group Total subsidy (millions)
9e Average subsidy per benellciary
family
All programme,s r.i Ö1Ü 100.0 43 596All poor b 2.">3 32.0 —
Basic poverty 3 293 16.9 50 220Extrem e poverty 2 960 15.1 50 940
Non-poor 13 259 68.0 41 924
Education 7 565 100.0 26 832All poor 2 100 27.8
Ba.sic poverty 1 213 16.0 26 664Extrem e poverty S87 11.8 22 212
N on-poor 5 465 72.2 27 816
Health 7 386 100.0 16 404Alll poor 2 764 37.4 —
Basic poverty 1 352 18.3 29 868Extrem e poverty 1 412 19.1 24 216
Non-poor 4 622 62.6 14 124
Food and nutrition 1 039 100.0 4 356All poor 584 56.2
Basic poverty 266 25.6 6 756Extrem e poverty 318 30.6 4 956
Non-poor 455 43.8 3 288
Social security 463 100.0All poor 305 65,9
Basic poverty 115 24.8Extrem e poverty 190 41.1
N on-poor 158 34,1
Housing 1 262 100.0 32 956All poor 144 IL 4 28 416
Basic poverty 144 11.4 28 416Extrem e poverty — — —
Non-poor 1 118 88.6 32 832
W ater supply and sanitation 1 797 100.0 5 256All poor 356 19.8 —
Basic poverty 203 11.3 4 236Extrem e poverty 153 8.5 4 560
Non-poor 1 441 80.2 5 544
So u rce: Econom ic Research Institute o f the University o f Otsta Rica.
is received by the poor, with those who are in a situation of basic poverty being somewhat more favoured. By levels of education, it has been estimated that 42% of those benefited in higher education come from the richest two deciles of families, whereas the opposite is observed in primary education. In secondary education the beneficiaries come mainly from the middle class groups (Trejos and Elizalde, 1985, p. 38).
The percentage of health expenditure assigned to the poor (37%) exceeds the estimated
proportion of poor families, so that the health subsidy per poor family benefiird averages some 50% more than that of the non-poor.
The subsidies on food and nutrition and social security are mainly oriented towards low- income families. Approximately two- thirds of the expenditure on these items goes to poor families, where it acts as an income support programme. It should be borne in mind, however, that these programmes make up the smallest subsidy categories analysed here.
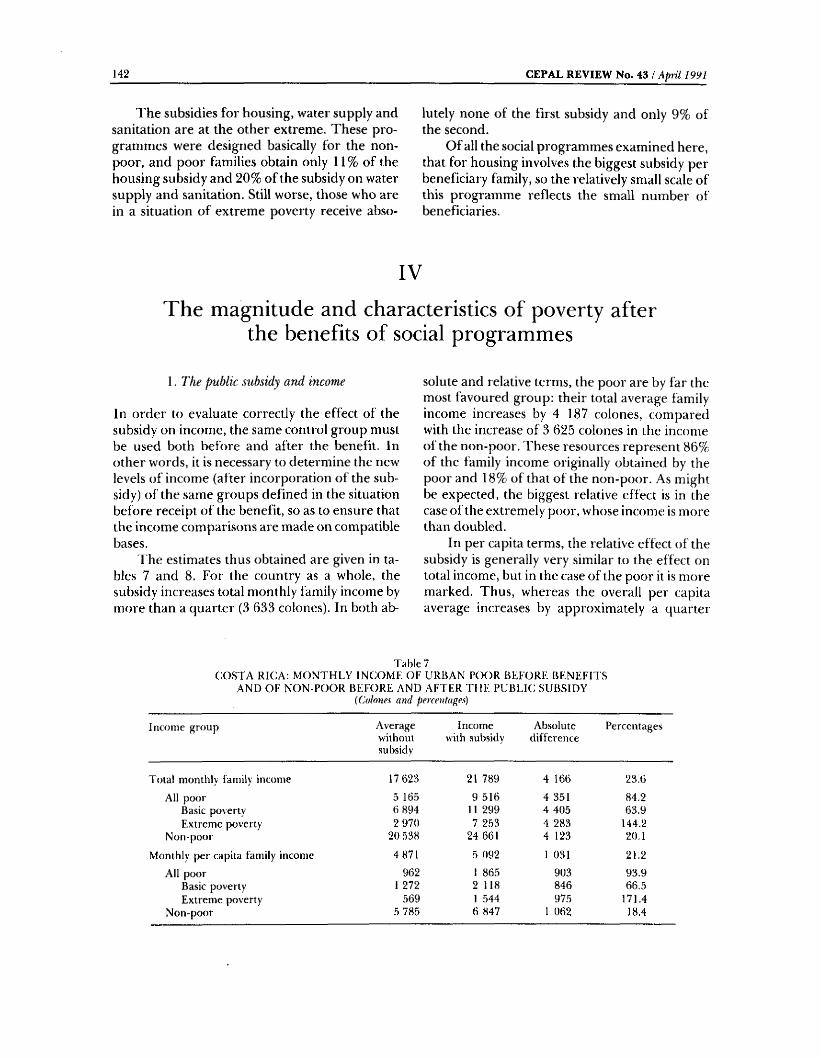
142 C E P A L R E V I E W N o , 43 / A p r il 1991
The subsidies for housing, water supply and sanitation are at the other extreme. These programmes were designed basically for the nonpoor, and poor families obtain only 11% of the housing subsidy and 20% of the subsidy on water supply and sanitation. Still worse, those who are in a situation of extreme poverty receive abso
lutely none of the first subsidy and only 9% of the second.
Of all the social programmes examined here, that for housing involves the biggest subsidy per beneficiary family, so the relatively small scale of this programme reflects the small number of beneficiaries.
IVThe magnitude and characteristics of poverty after
the benefits of social programmesThe public subsidy and income
In order to evaluate correctly the effect of the subsidy on income, the same control group must be used both before and after the benefit. In other words, it is necessary to determine the new levels of income (after incorporation of the subsidy) of the same groups defined in the situation before receipt of the benefit, so as to ensure that the income comparisons are made on compatible bases.
The estimates thus obtained are given in tables 7 and 8. For the country as a whole, the subsidy increases total monthly family income by more than a quarter (3 633 colones). In both ab
solute and relative terms, the poor are by far the most favoured group: their total average family income increases by 4 187 colones, compared with the increase of 3 625 colones in the income of the non-poor. These resources represent 86% of the family income originally obtained by the poor and 18% of that of the non-poor. As might be expected, the biggest relative effect is in the case of the extremely poor, whose income is more than doubled.
In per capita terms, the relative effect of the subsidy is generally very similar to the effect on total income, but in the case of the poor it is more marked. Thus, whereas the overall per capita average increases by approximately a quarter
Table 7C O STA RIC A : M O N TH LY IN CO M E O F URBAN POOR B E FO R E B E N E F IT S
AND O F N O N -PO O R B EFO R E AND A FTER T H E P U B LIC SU B SID Y(Cw/ttHM cmd percentages)
Incom e group Averagewithoutsubsidy
Incom e with subsidy
Absolutedifference
Percentages
T otal monthly family income 17 623 21 789 4 166 23.6
All poor 5 16.5 9 516 4 351 84.2Basic poverty 6 894 11 299 4 405 63 .9Extrem e poverty 2 970 7 253 4 283 144.2
Non-poor 20 538 24 661 4 123 20.1
Monthly per capita family income 4 871 5 092 1 031 21.2
All poor 962 1 865 903 93 .9Basic poverty 1 272 2 118 846 66.5Extrem e poverty 569 I 544 975 171.4
Non-poor 5 785 6 847 1 062 18.4
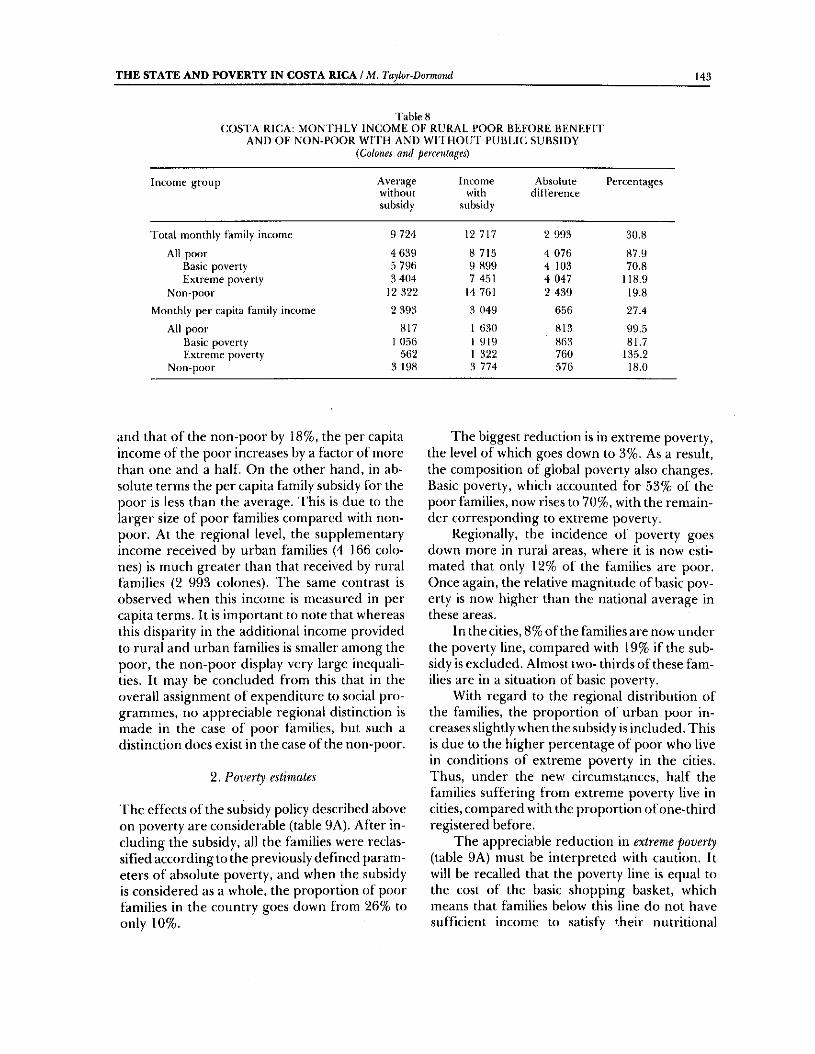
T H E S T A T E A N D P O V E R T Y I N C O S T A R I C A / M . Taylor-Dormond 1 4 3
Table 8C O STA RICA : M O N TH LY IN CO M E O F RURA L PO O R B EFO R E B E N E F IT
AND O F N O N -PO O R W IT H AND W IT H O U T P U B LIC SU B SID Y{Colones and percentages)
Incom e group Averagewithoutsubsidy
Incom ewith
subsidy
Absolutedifference
Percentages
T otal monthly family income 9 724 12 717 2 993 30.8
All poor 4 639 8 715 4 076 87.9Basic poverty 796 9 899 4 103 70,8Extrem e poverty 3 404 7 451 4 047 118,9
Non-poor 12 322 14 761 2 439 19.8
Monthly per capita family income 2 393 3 049 656 27.4
All poor 817 1 630 813 99.5Basic poverty 1 0.56 1 919 863 81.7Extrem e poverty 562 I 322 760 135.2
Non-poor 3 198 3 774 576 18.0
and that of the non-poor by 18%, the per capita income of the poor increases by a factor of more than one and a half. On the other hand, in absolute terms the per capita family subsidy for the poor is less than the average. This is due to the larger size of poor families compared with nonpoor. At the regional level, the supplementary income received by urban families (4 166 colones) is much greater than that received by rural families (2 993 colones). I’he same contrast is observed when this income is measured in per capita terms. It is impiirtant to note that whereas this disparity in the additional income provided to rural and urban families is smaller among the poor, the non-poor display very large inequalities. It may be concluded from this that in the overall assignment of expenditure to social programmes, no appreciable regional distinction is made in the case of poor families, but such a distinction does exist in the case of the non-poor.
2. Poverty estimates
rhe effects of the subsidy policy described above on poverty are considerable (table 9A). After including the subsidy, all the families were reclassified according to the previously defined parameters of absolute poverty, and when the subsidy is considered as a whole, the proportion of poor families in the country goes down from 26% to only 10%.
The biggest reduction is in extreme poverty, the level of which goes down to 3%. As a result, the composition of global poverty also changes. Basic poverty, which accounted for 53% of the poor families, now rises to 70%, with the remainder corresponding to extreme poverty.
Regionally, the incidence of poverty goes down more in rural areas, where it is now estimated that only 12% of the families are poor. Once again, the relative magnitude of basic poverty is now higher than the national average in these areas.
In the cities, 8% of the families are now under the poverty line, compared with 19% if the subsidy is excluded. Almost two- thirds of these families are in a situation of basic poverty.
With regard to the regional distribution of the families, the proportion of urban poor increases slightly when the subsidy is included. This is due to the higher percentage of poor who live in conditions of extreme poverty in the cities. Thus, under the new circumstances, half the families suffering from extreme poverty live in cities, compared with the proportion of one-third registered before.
The appreciable reduction in extreme poverty (table 9A) must be interpreted with caution. It will be recalled that the poverty line is equal ti) the cost of the basic shopping basket, which means that families below this line do not have sufficient income to satisfy their nutritional
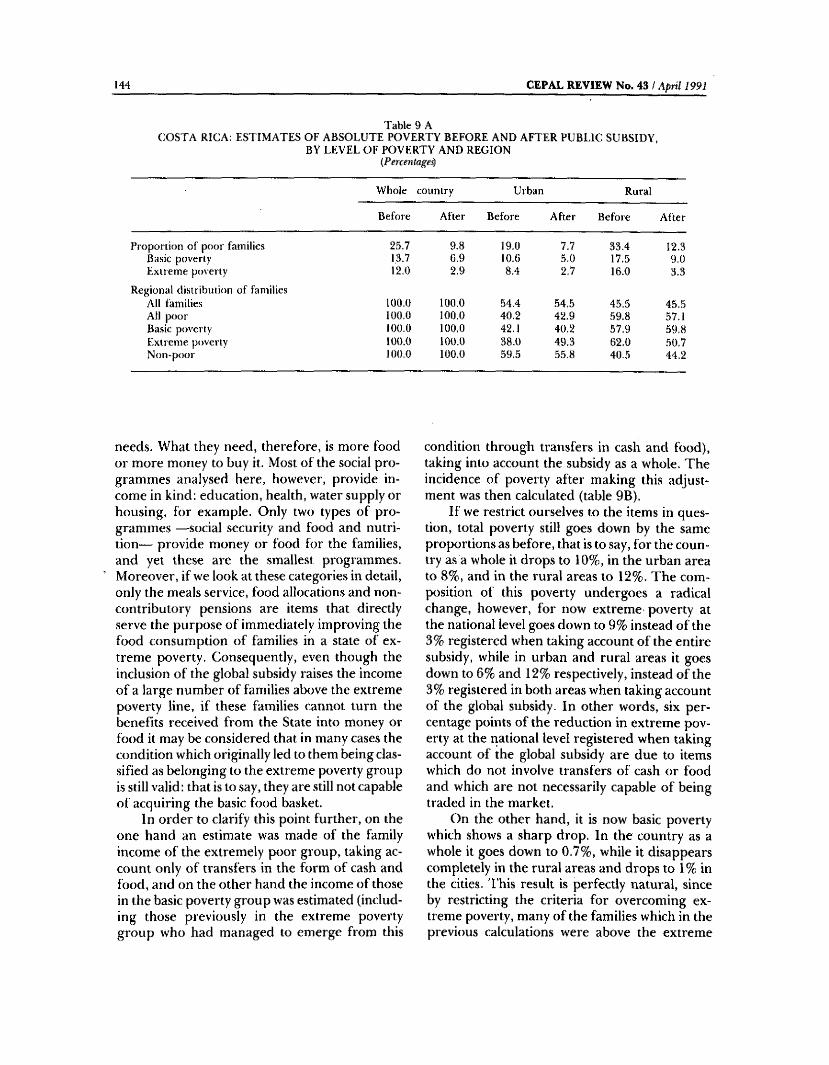
144 C E P A L R E V I E W N o . 4 3 / A p ril 1991
T able 9 AC:OSTA RICA : E ST IM A T E S O F A B SO L U T E PO V ER T Y B EFO R E AND A F T E R P U B LIC SU B SID Y ,
B Y L EV E L O F P O V ER T Y AND REG IO N{Percentage.'i}
Whole country Urban Rural
B efore After Before A fter B efore A fter
Proportion o f poor families 25.7 9.8 19.0 7.7 33.4 12.3Basic poverty 13.7 6.9 10.6 5.0 17.5 9.0Extrem e po\erty 12,0 2.9 8.4 2.7 16.0 3.3
Regional distribution o f familiesAll families 100.0 100.0 54.4 .54,5 45.5 45.5All poor 100.0 100.0 40,2 42.9 .59.8 57.1Basic poverty 100.0 100,0 42.1 40.2 57.9 59.8Extrem e poverty 100,0 100.0 38.0 49.3 62.0 50,7Non-poor 100.0 100.0 59.5 55.8 40.5 44.2
needs. What they need, therefore, is more food or more money to buy it. Most of the social programmes analysed here, however, provide income in kind: education, health, water supply or housing, for example. Only two types of programmes —social security and food and nutrition— provide money or food for the families, and yet these are the smallest programmes. Moreover, if we look at these categories in detail, only the meals service, food allocations and noncontributory pensions are items that directly serve the purpose of immediately improving the food consumption of families in a state of extreme poverty. Consequently, even though the inclusion of the global subsidy raises the income of a large number of families above the extreme poverty line, if these families cannot turn the benefits received from the State into money or food it may be considered that in many cases the condition which originally led to them being classified as belonging to the extreme poverty group is still valid: that is to say, they are still not capable of acquiring the basic food basket.
In order to clarify this point further, on the one hand an estimate was made of the family income of the extremely poor group, taking account only of transfers in the form of cash and food, and on the other hand the income of those in the basic poverty group was estimated (including those previously in the extreme poverty group who had managed to emerge from this
condition through transfers in cash and food), taking into account the subsidy as a whole. The incidence of poverty after making this adjustment was then calculated (table 9B).
If we restrict ourselves to the items in question, total poverty still goes down by the same proportions as before, that is to say, for the country as a whole it drops to 10%, in the urban area to 8%, and in the rural areas to 12%. The composition of this poverty undergoes a radical change, however, for now extreme poverty at the national level goes down to 9% instead of the 3% registered when taking account of the entire subsidy, while in urban and rural areas it goes down to 6% and 12% respectively, instead of the 3% registered in both areas when taking account of the global subsidy. In other words, six percentage points of the reduction in extreme poverty at the national level registered when taking account of the global subsidy are due to items which do not involve transfers of cash or food and which are not necessarily capable of being traded in the market.
On the other hand, it is now basic poverty which shows a sharp drop. In the country as a whole it goes down to 0.7%, while it disappears completely in the rural areas and drops to 1 % in the cities. This result is perfectly natural, since by restricting the criteria for overcoming extreme poverty, many of the families which in the previous calculations were above the extreme
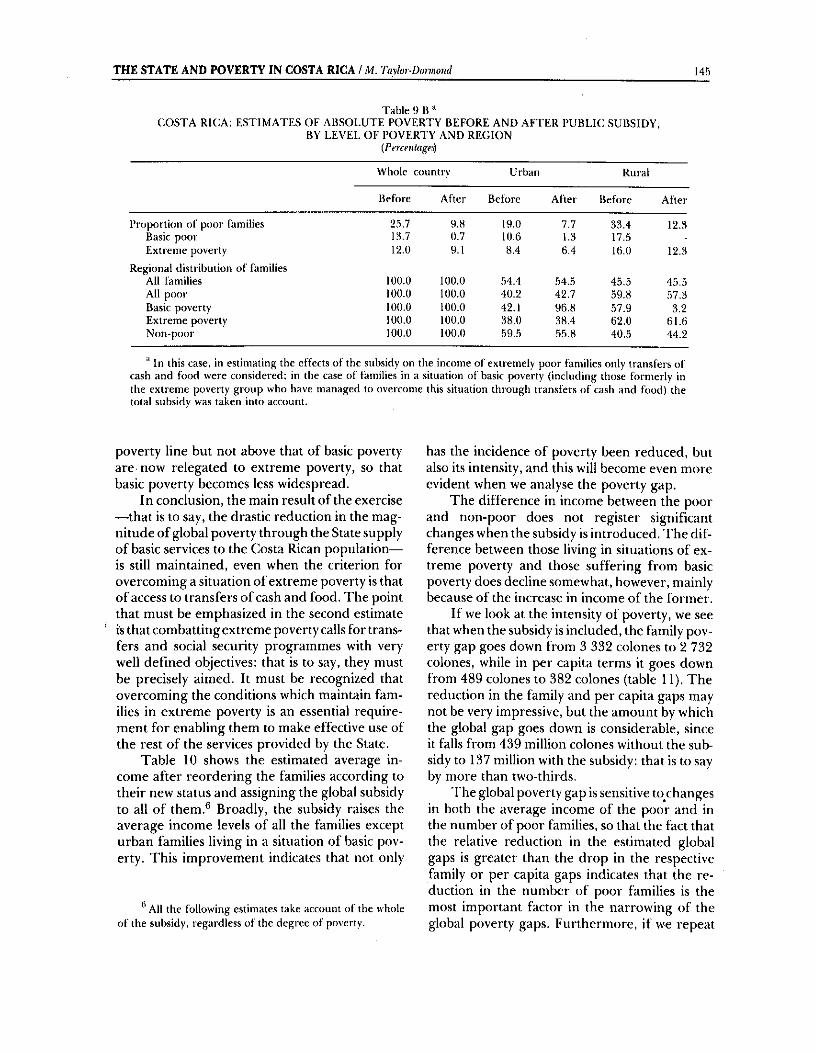
THE STATE AND POVERTY IN COSTA RICA / M. Tmlor^Domond M R
T able 9 BC O ST A RIC A : E ST IM A T E S O F A B SO L U T E PO V ER T Y B EFO R E AND A F T E R P U B L IC SU B SID Y ,
BY LEV E L O F PO V ER T Y AND REGIO N{Percentage^
Whole country Urban Rural
Before A fter Before After B efore A fter
Proportion o f poor families 25.7 9.« 19,0 7.7 33.4 12.3Basic poor KL7 0.7 10,6 1.3 17.5 -
Extrem e poverty 12.0 9.1 8.4 6,4 16.0 12.3
Regional distribution o f familiesAll families 100.0 100.0 54.4 .54.5 45.5 45,5All poor 100.0 100.0 40.2 42.7 59.8 57.3Basic poverty 100.0 100.0 42.1 96.8 .57.9 3.2Extrem e poverty 100.0 100.0 38.0 38.4 62.0 61.6N on-poor 100.0 100.0 59.5 .55.8 40.5 44.2
'* In this case, in estimating the effects o f the subsidy on the income o f extremely poor families only transfers o f cash and food were considered: in the case o f families in a situation o f basic poverty (including those form erly in the extrem e poverty group who have managed to overcome this situation through transfers o f cash and food) the total subsidy was taken into account.
poverty line but not above that of basic poverty are now relegated to extreme poverty, so that basic poverty becomes less widespread.
In conclusion, the main result of the exercise —that is to say, the drastic reduction in the magnitude of global poverty through the State supply of basic services to the Costa Rican population— is still maintained, even when the criterion for overcoming a situation of extreme poverty is that of access to transfers of cash and food. The point that must be emphasized in the second estimate is that combatting extreme poverty calls for transfers and social security programmes with very well defined objectives: that is to say, they must be precisely aimed. It must be recognized that overcoming the conditions which maintain families in extreme poverty is an essential requirement for enabling them to make effective use of the rest of the services provided by the State.
Table 10 shows the estimated average income after reordering the families according to their new status and assigning the global subsidy to all of them.^ Broadly, the subsidy raises the average income levels of all the families except urban families living in a situation of basic poverty. This improvement indicates that not only
All the following estimates take account o f the whole o f the subsidy, regardless o f the degree o f poverty.
has the incidence of poverty been reduced, but also its intensity, and this will become even more evident when we analyse the poverty gap.
The difference in income between the poor and non-poor does not register significant changes when the subsidy is introduced. The difference between those living in situations of extreme poverty and those suffering from basic poverty does decline somewhat, however, mainly because of the increase in income of the former.
If we look at the intensity of poverty, we see that when the subsidy is included, the family poverty gap goes down from 3 332 colones to 2 732 colones, while in per capita terms it goes down from 489 colones to 382 colones (table 11). The reduction in the family and per capita gaps may not be very impressive, but the amount by which the global gap goes down is considerable, since it falls from 439 million colones without the subsidy to 137 million with the subsidy: that is to say by more than two-thirds.
'fhe global poverty gap is sensitive to changes in both the average income of the poor and in the number of poor families, so that the fact that the relative reduction in the estimated global gaps is greater than the drop in the respective family or per capita gaps indicates that the reduction in the number of poor families is the most important factor in the narrowing of the gli>bal poverty gaps. Furthermore, if we repeat
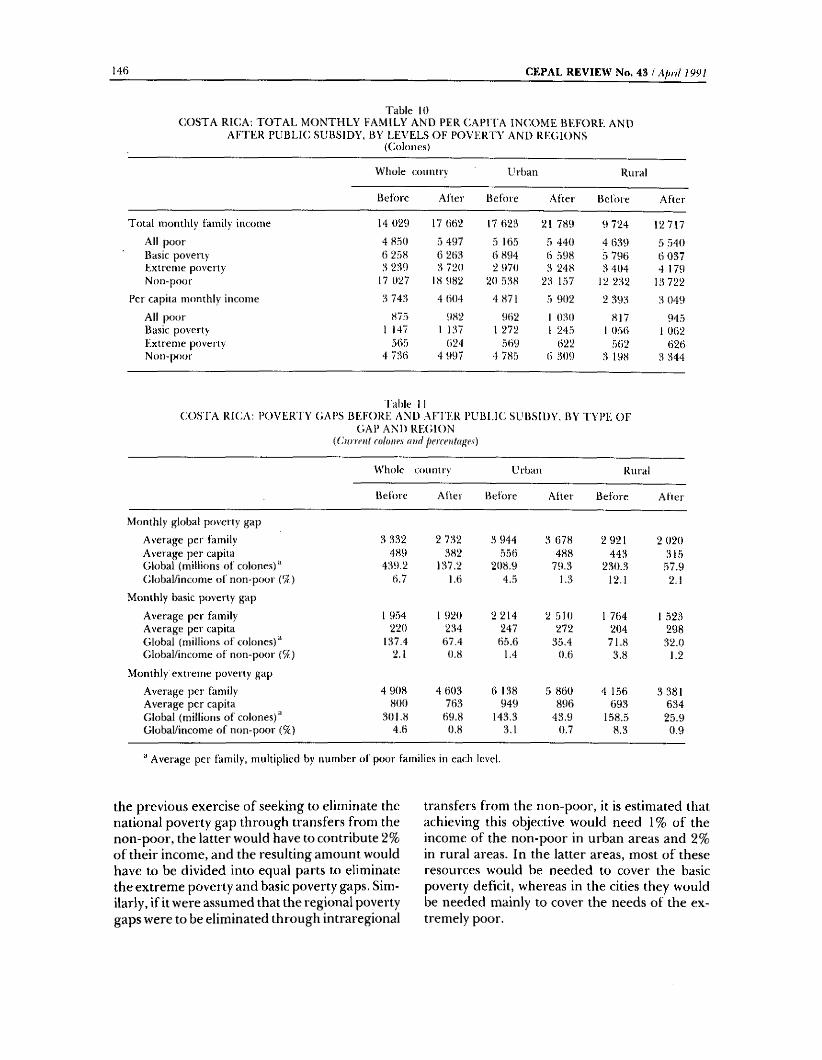
I4f) C E P A L R E V I E W N o . 43 / A fu il 1991
Table 10C O ST A RIC A : T O T A L M O N TH LY FA M ILY AND PER CAPI VA IN i’O M E B E F O R E AND
A F T E R p u b l i c : SU B SID Y . BY LEV ELS O F PO V ER T Y AND R EC IO N S(Coloiies)
W hole country Urban Rural
Before After Before After Before A fter
T otal monthly family income 14 0 ‘29 17 662 17 623 21 789 9 724 12 717
All poor 4 SÖ0 5 497 5 165 5 440 4 639 5 540Basic poverty 6 258 6 263 6 894 6 598 5 796 6 037Extrem e poverty .3 239 3 720 2 970 3 248 3 404 4 179Non-poor 17 027 18 982 20 5.38 23 157 12 232 13 722
Per capita monthly income 3 743 4 604 4 871 5 902 2 393 3 049
All poor 875 982 962 1 030 817 945Basic poverty 1 147 1 137 1 272 1 245 1 056 1 062Fixtreme poverty 565 624 569 622 562 626Non-poor 4 736 4 997 4 785 6 309 3 198 3 344
Table 11CO S I A R K ;A : p o v e r t y g a p s b e f o r e a n d a f t e r p u b l i c s u b s i d y , BY TYPE O F
GAP AND REGION{Cunriil and peyccnlages)
Whole country U rban Rural
Before After Before After Before A fter
Monthly global poverty gap
Average per family 3 332 2 732 3 944 3 678 2 921 2 020Average per capita 489 382 556 488 443 315(ilobal (millions o f colones)'^ 439.2 137.2 208 .9 79.3 230.3 57.9Global/income o f non-poor (9f ) 6.7 1.6 4.5 1.3 12.1 2.1
Monthly basic poverty gap
Average per family 1 954 1 920 2 214 2 510 1 764 1 .523Average per capita 220 234 247 272 204 298Cilobal (millions o f colones)*’ 137.4 67.4 65.6 35.4 71.8 32.0Global/income o f non-poor (%) 2.1 0.8 1.4 0.6 3.8 1.2
Monthly extrem e poverty gap
Average per family 4 908 4 603 6 138 5 860 4 156 3 381Average per capita 800 763 949 896 693 634Global (millions o f colones)‘‘ 301,8 69.8 143,3 43.9 158.5 25.9Global/income o f non-poor (%) 4.6 0.8 3.1 0.7 8.3 0.9
Average per family, multiplied by number o f poor families in each level.
the previous exercise of seeking to eliminate the national poverty gap through transfers from the non-poor, the latter would have to contribute 2% of their income, and the resulting amount would have to be divided into equal parts to eliminate the extreme poverty and basic poverty gaps. Similarly, if it were assumed that the regional poverty gaps were to be eliminated through intrarégional
transfers from the non-poor, it is estimated that achieving this objective would need 1% of the income of the non-poor in urban areas and 2% in rural areas. In the latter areas, most of these resources would be needed to cover the basic poverty deficit, whereas in the cities they would be needed mainly to cover the needs of the extremely poor.
T H E S T A T E A N D P O V E R T Y I N C O S T A R I C A / M . r a x h r -D o m o n d 147
ConclusionsOn the basis of the results obtained in this study, it may be asserted that the Costa Rican public sector has played a crucial role in caring for the needs of groups living in a situation of poverty, through the social programmes it operates. Implicitly or explicitly, there has been great concern in Costa Rican society for the marginated sector of the population. The resources assigned by the State to this group help to satisfy their basic needs, improve their income-generation capacity, introduce a notion of social justice, and reduce social pressures.
Many social science studies have been made with the aim of explaining the conformation and stability of Costa Rican society, which is based on principles of coexistence more advanced than those of other societies in the same region. These studies have shown that the efforts made by Costa Rican society to ensure that its citizens receive an adequate level of education, health care, food, water supply and other basic services are concrete positive elements which, together with the practice of democracy in that country, form an essential part of its material foundations.
In spite of the foregoing, however, the results of the present study also reveal some unsatisfied goals in a number of areas. The existence of fomilies living in a situation of extreme poverty is one of these. The statistics show a reduction in the incidence of extreme poverty, thanks to the action of the State, but behind the figures is the reality of thousands of Costa Ricans who cannot fully satisfy their food requirements.
Likewise, the concentration of expenditure on higher education facilities for high-income families, the concentration of the housing subsidy among the non-poor in contrast with the
existence of a big housing deficit, and the big difference in income between the poor and the non-poor are other aspects calling for special attention. Fortunately, the patience which Costa Ricans displayed during the serious economic crisis that began in the mid-1980s, together with their enthusiastic response in the three national elections subsequent to that crisis, have shown their confidence that these problems can be dealt with inside the existing political, social and economic system of the country.
In recent years, as part of the free-market philosophy, an aggressive campaign has been unleashed against the public sector. This position, which has been adopted in the name of efficiency, can lead to an extreme outcome which runs counter to the principles of coexistence that have given Costa Rican society an outstanding place in the developing world. In addition to this, however, it must not be forgotten — as the cases examined by the World Bank in its World Development Report 1990 show — that investment and public expenditure in the fields analysed in the present study are indispensable in order to bring about an increase in efficiency through improvement of the productivity of labour.
There is no doubt that the role of the Costa Rican State must be redefined in the search for economic efficiency. In view of the circumstances marked by a change in social thinking through which we are passing, however, mature reflection and prudence are advisable in considering changes in the economic and social structure. We trust that the continued accumulation of proofs such as have been presented in this paper will help to ensure a sensible approach to the future responsibilities of the State in Costa Rica.

148 C E P A L R E V I E W N o . 4 3 / A p ril 1991
BibliographyBeckerm an, W. (1985), Poverty and the Impact o f Income Main
tenance Programmes: Case Studies ofAmtralia, Belgium, Norway and Great Britain, Geneva, International Labour O rganisation (iLo).
ECLAC (Econom ic Commission for Latin America and the Caribbean) (1981), La política fiscal como instrumento para modificar la distribución del ingreso. Una aproximación metodológica, Mexico City.
Gillespie, W. (198ü), The Redistribution o f Income in Canada, Ottawa, Cage Publishing Limited.
Kakwani, N. (1980), Income, Ineqitality and Poverty: Methods of EstimationandPolicyApplicatio7is, New York, O xford University Press,
Mata L. and S, Murillo (1980), Canasta básica de los costarricenses ,/ííüúííí M M 'c«, San Jo sé , Costa Rica, Hospital Nacional de Niños.
M eerm an, J . (1979), Public Expenditure in Malaysia. Who Be i- efitsand Why, A W orld Bank Research Publication, London, O xford University Press.
M ohan, Rakesh (1984), An Anatomy o f the Distribution o f U rban Incom e. A T a le o f Tw o Cities in Colombia, World Bank Staff Working Papers, No. 650, W ashington, D.C,, W orld Bank.
Musgrave, R.A, (1968), Teoría de la hacienda pública, Madrid, McGraw-Hill Book Co..
Prebisch, R. (1981), Capitalismo periférico. Crisis y transformación, Mexico City, Fondo de Cultura Económica.
Selowsky, M, (1979), Who Benefits from Government Expenditure? A Case Study of Colombia, A W orld Bank Research Publication, New York, O xford University Press.
Taylor, M. (1986), Poverty and Public Expenditure on Social Programs, M.A. Thesis, Ottawa, Carleton University.
Taylor, M. (1986). Poverty and Public Expenditure on Social Programs, M.A. thesis, Ottawa, Carleton University.
T rejos, J .D . (1983), La distribución del ingreso de las familias co.starricenses: algunas características en 1977, San José , Costa Rica, Instituto de Investigaciones en Ciencias Económicas, Universidad de Costa Rica.
T rejos, J .D . and E, Elizalde (1985), Costa Rica: la distribución del ingreso y el acceso a los programas de carácter social, Docum ento de trabajo. No. 90 , San Jo sé , Costa Rica, Instituto de Investigaciones en Ciencias Económicas.
World Bank (1989), World Development Report 1989, New York, O xford University Press, Ju n e .
________ (1990), World Development Report 1990, New York,O xford University Press, Ju n e .

CEPAL REVIEW No. 43
Prebisch and the relation between agriculture and industry
Carlos Cattaneo*
T his article focuses on one o f the lesser-known facets o f the vast and fruitful work o f Raúl Prebisch in the field o f Latin American economics: i.e,, the work he did in the early 1950s on training in agricultural development plans and projects, at a time when this activity had barely begun in the countries o f the region, at least on an organic and systematic basis.
T his analysis o f Prebisch’s ideas in this field is based fundam entally on the cycle o f five lectures which he gave in O ctober 1951 as part o f a course organized by the Latin A m erican T rain ing Centre on Agricultural Plans and Projects and Related Matters. These lectures have the great merit o f showing us some basic concepts in Prebisch’s thinking (such as his integrative concept o f the econom ic development process o f the region), analysed from the agricultural standpoint, as his lectures were directed to a public made up mainly o f professionals connected with this sector, especially those discharging public functions in it.
* Agronomist, researcher o f the Raúl Prebisch Foundation. This study was carried out as part o f the research project ‘Raúl Presbisch's work in the area o f agricultural economics”, executed by the Raúl Prebisch Foundation. The author wishes to thank the staff o f the tci.AC/r.w) Joint Agriculture Division for their collaboration, especially Mr. jesús González Montero, who contributed information o f vital importance.
The conceptual framework: development
and undeveloped countriesIn his first lecture in this cycle,' Prebisch defined undeveloped countries as those having the following characteristics:
i) a high proportion of their economically active population worked in agriculture and other branches of primary production. Prebisch considered this to be the most outstanding characteristic of such countries;
ii) this population employed in primary activities used primitive techniques inferior to those of the developed countries, and
iii) their population growth rate was high.Prebisch established a relation between the
first two aspects by postulating that a high proportion of the active population was employed in primary activities precisely because the techniques used were primitive. He also stressed that these characteristics were not incompatible with a high degree of development of certain primary activities, such as those oriented towards exports, in view of the special interest of the developed countries in such branches. The developed countries had made a significant contribution to the spread of technology to those activities, because they provided food and raw materials for their own development. In areas of production directed almost exclusively to the domestic market, however, the situation was different, although each country had its own special characteristics deriving from its natural resources, climate and other aspects.
Proceeding to the analysis of what constituted a development process, he defined it as “the gradual spread of modern production technology to primary production and all the other branches of the economy in order to increase productivity and hence raise the per capita income of the population” (Lecture No. 1, p. 4). The consequences of that process were the same
Raúl Prebisch, “Problemas del desarrollo económ ico en América Latina”, Lecture No. 1, Latin A m erican Train in g Centre on Agricultural Plans and Projects and Related Matters, Santiago, Chile, 23 O ctober 1951, mimeo.
1 5 0 C E P A L R E V I E W No. 43 ! A p ril 1991
as those observed in all the central countries: a gradual reduction in the proportion of the active population working in primary production (although Prebisch stressed that this phenomenon also took place in industrial production, since part of the population employed in such activities moved over to the services sector). That reduction was due to the increase in productivity resulting from the spread of technology, which meant that fewer workers were needed in order to produce the same amount of goods (both agricultural and industrial). The process had different features, depending on whether it concerned an undeveloped country or a developed country: whereas in the former the active population displaced by the increase in productivity moved from one sector of the economy to another, in the latter these moves were within sectors.
Obviously, this kind of definition raised doubts regarding the precise limits for considering a country developed or undeveloped. Even in the Latin America of those days, countries such as Argentina and Uruguay were on a similar level to countries such as the United States or Canada in terms of the percentages of their active population employed in primary and industrial activities, d'his situation was also observed in other countries which might very superficially be considered “agriculturar, such as Australia, New Zealand and Denmark. Did this mean —asked Prebisch— that the development process had already ended in those countries? Obviously not! In those countries (and this was a point of fundamental importance in his analysis) there was a sufficiently wide margin for improving productivity in agriculture and transferring the "surplus” active population to industry or services. Prebisch posited that when this transfer of population took place between sectors, then the country in question was still undeveloped, whereas if it took place within sectors, then the country involved was a developed country.^ Consequently, and by quite a wide margin, the Latin American countries (including Argentina and Uruguay) were still in the first-named category.
“A trountry ceases to be undeveloped wlien agriculture and other branches o f primary production are no longer able to provide appreciable numbers o f workers for transfer to industry and other activities” (Lecture No, I, p. 5).
In short, the transition from one state to another depended on the generation of increases in productivity in each sector and the existence of displacements of workers within the sectors. In order to back up these assertions, Prebisch presented in his lectures some figures for various of the cases analysed. He showed how in the United Slates the proportion of the active population employed in agriculture had gone down from 72.5% in 1820 to 21.1% in 1940, with the surplus personnel from agriculture being transferred to industry and, in particular, services; thus, the percentage of the population employed in industry rose from 12.1% in 1820 to 30% in 1940, while in services the percentage rose from 15.4% to 48.8% between the same years. He also highlighted the cases of New Zealand and Denmark, which in mid-century showed values similar to those of the United States."*
Prebisch then went on to analyse the causes of the decline in the population employed in primary activities in proportion as technology was introduced into them. He stressed in particular two factors; i) the changes that higher income caused in the population’s demand, connected with the low income-elasticity of food (Engel’s Law) and ii) the changes that technology brought with it in the use of foodstuffs and raw materials (lower proportions of these in the final product, replacement of natural raw materials by synthetic products, and greater efficiency in their use through integral utilization of by-products).
In addition to these elements, which Prebisch
Prebisch said that the fact that the shift o f population from agriculture was to services rather than industry was due to an inherent characteristic o f economic developm ent, which required a larger am ount o f services {com m erce, tran,sport, State activities, etc.) as the process was intensified. He also warned, however, o f an aspect which was to be observed in the undeveloped countries: i.e,, the existence o f a wide range o f services o f very low productivity (Lecture No. 1, p. 6), l.ater, in the second lecture which he gave on this course, he mentioned this as an additional factor tend in g— through the downward pressure it exerted on wages, which was transferred to prices— to cause a deterioration in the terms o f trade which adversely affected the countries producing primary commodities (Lecture No, 2, p, 6).
** In 194.5, 239f o l the economically active population o f New Zealand worked in agriculture, 30.6% in industry and 46,2% in services. In the case o f Denm ark, the 1940 figures were 29%. for agriculture, 32.6% lor industry and 38,5% hir services (Lecture No, 1, p. 7),
P R E B I S C H A N D T H E R E L A T I O N B E T W E E N A G R I C U L T U R E A N D IN D U S T R Y / C . C atta n eo 1 5 1
described in an extremely detailed manner, there was another factor of great importance in his analysis: the fact that in industrial demand, the proportion accounted for by raw materials did not grow as fast as the value of the product. Thus, he said, “as production technology advances it is not possible for the same proportion of people previously employed in the primary production sectors to continue working in them, because changes in demand and in the type of products mean that relative demand for primary commodities will account for a progressively smaller share of the total demand of the community. Thus, it is absolutely inevitable that there should be a decline in the population employed in primary production as production technology advances” (Lecture No. 1, pp. 8-9).
From this fact, Prebisch drew one of the most important arguments for defending the need to industrialize the countries of the region, when he raised the question of where there could be industrial growth to absorb this displaced primary population. From his analytical standpoint, it was not reasonable to locate still more industry in the developed countries, since in practice the latter lacked an essential condition for making this feasible: the mobility of the human factor was hampered both by the restrictions that those countries imposed on such movement and by another series of characteristics (including those of a cultural nature to which Prebisch gave some prominence) which made labour mobility impossible in practice. Prebisch noted that, on the contrary, the process had taken place in the opposite
manner: the population displaced from primary production by technical progress had not moved to the industrial centres, but instead the machinery from those centres had tended to come to places where there were “people displaced by technical progress: that is to say, this process entails the industrialization of the periphery, as a most essential condition for the progress of agricultural technology” (Lecture No. 1, pp, 9-10). Indeed, Prebisch’s analysis even went so far as to question the need to extend technology to agriculture unless there were at the same time a process of industrialization of the countries of the region: “... to a large extent, there would be no point in extending technology to primary production, since if the people thus displaced from their jobs cannot emigrate and it is not possible to bring machinery in to industrialize their countries, then what will they do? What point would there be in technical progress in agriculture if the people displaced by this progress could not find jobs in other productive activities? There would be little or no sense in this” (Lecture No. l,p . 10).
Hence, for Prebisch, the industrialization of the periphery does not represent a choice, but a necessity imposed by the growth process itself: “There is no longer any question as to whether or not it is necessary to create industries when a country develops. It would appear to be totally inevitable that technical progress itself will make it necessary to create industries in order to absorb the people that cannot find jobs in agriculture and primary production ...” (Lecture No. 1, p. 9).
I I
The relation between agriculture and industry within the context of a development process
In the second lecture of the course,^ Prebisch tackled the subject of the relation between agri-
’ Raúl Prebisch, “Problemas del desarrollo económico en Am érica Latina”, Lecture No, 2, Latin American Training O n tr e on Agricultural Plans and Projects and Related Matters, Santiago, Chile, 24 O ctober 1951, mimeo.
culture and the other sectors of the economy in the development process. To begin with, he did so through questions which he put to his students as a stimulant. These questions were the following:
— Why has agriculture developed relatively slowly in some countries compared with industry?
1 5 2 C E P A L R E V I E W N o . 43 / A p r il 1991
— Why is it that industry is usually prosperous, but not agriculture?
— Why is it that in some countries traditional agriculture producing for domestic consumption has grown slowly whereas other new products for domestic consumption or certain export items have grown rapidly?
While it was not his intention to try to arrive at definitive conclusions which would solve these complex matters, Prebisch tried to set forth what he called an “analytical methodology” aimed at separating and suitably appraising the various elements that came together in inter-sectoral relations. He considered that the lack of a proper objective diagnosis of the situation —due precisely to the lack of a suitably rigorous method of analysing the problems— was a fundamental shortcoming which must be overcome.
Taking up the thread of his previous lecture, Prebisch started out from the following concept: the proportions of foodstuffs and industrial products which enter into overall consumption depend on the level of income and the preferences of consumers. Consequently, if the level of income in a country remains constant and there is merely an increase in population, even if the per capita food consumption is very low compared with a recommended diet or with the potential resources of the country, the consumptioni)f food will not increase. He drew a first conclusion from this: if there has been no increase in average per capita income, it can reasonably be assumed that the stagnation in food consumption is due to general factors other than those concerning agricultural production.
In order to demonstrate this assertion, he formulated a hypothesis in which he isolated the foreign trade variable by assuming it to be constant and limited his analysis to only two sectors; agriculture and industry. He also assumed that there were no limitations on the mobility of labour from one sector of production to another. Thus, he posited that the lack of congruence between the growth of industry and that of agriculture was due to two types of factors; i) those connected with the demand ior agricultural products, foodstuffs and raw materials, and ii) those concerning agricultural production and the degree to which such production responds to the stimuli of industry and other sectors. Among these factors, he primarily stressed all those relating to
technical progress in agriculture, dealing with the question of land tenure last of all.
This sequence showed the order of priorities which Prebisch assigned to the factors limiting agricultural development and also the sequence which he recommended for a proper study of the topic. Briefly, his approach was along the following lines; first of all, the demand for agricultural products should be studied, and if the limitations were not found to be in this area, the analysis should move to the question of supply, observing whether or not there was technical progress in agriculture, and if there were, looking into the structural factors involved, among which land tenure was one of the most important.
From this starting point, in order to verify the fulfilment of his hypothesis Prebisch embarked upon the analysis of various cases which showed how these factors worked in different situations. The elements he took into account were;
a) Absorption of labour by industry
In this respect he posited three situations;i) industry was not even capable of absorbing
natural population growth;ii) industry absorbed only the extra labour
due to natural population growth;iii) industry absorbed not only the labour
produced by natural population growth but also that which was surplus to the requirements of the primary sector.
b) The absence or existence o f technical progress inindustry
Bringing all these elements together (table 1) generated six different situations with different effects on agricultural development. Of the six situations presented, only three represented a stimulus for agriculture (cases 3, 5 and 6). In the other situations (cases 1, 2 and 4) either the extra labour due to the natural population growth was not absorbed, or else it was absorbed, but without simultaneous technical progress in the industrial sector.' In these circumstances, there was no stimulus for agricultural production, since if the development of industrial pro-
” In reality, a stimulus was generated in case 4 too, but it was only very slight.
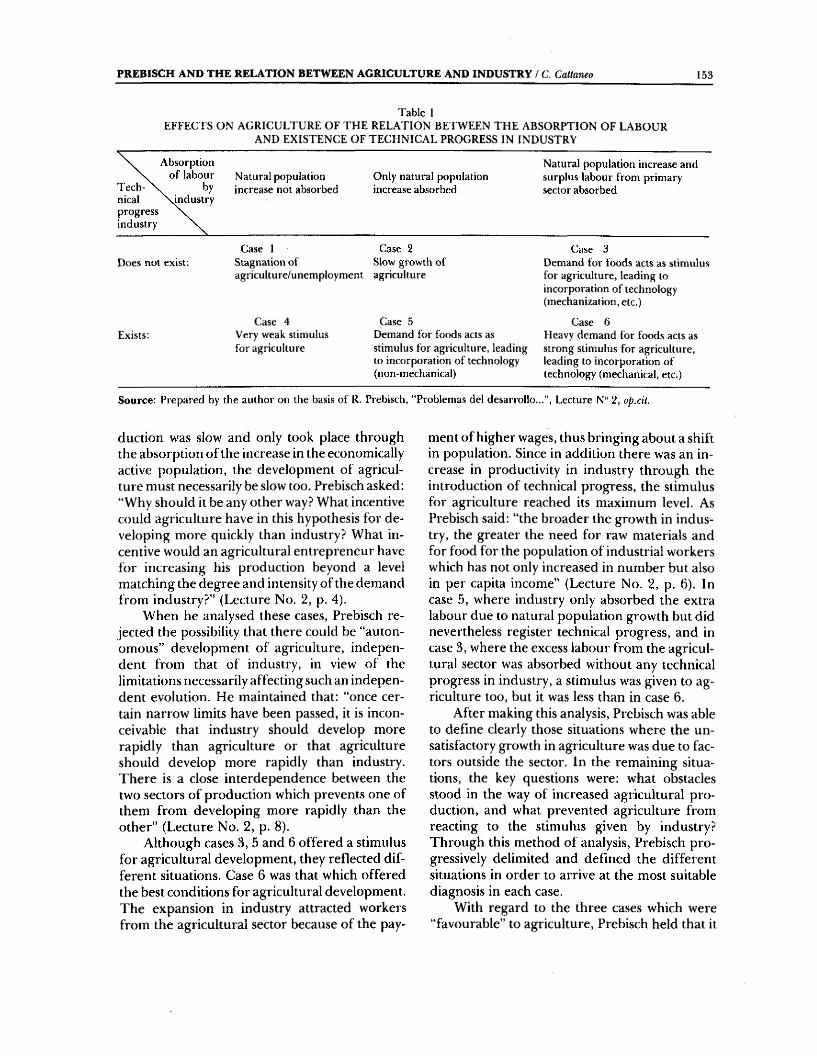
P R E B I S C H A N D T H E R E L A T I O N B E T W E E N A G R I C U L T U R E A N D I N D U S T R Y / C. Cattaneo 153
Table 1E FF E C T S ON A G R IC U L T U R E O F T H E R EL A T IO N B ET W EE N T H E A BSO R P T IO N O F L A BO U R
AND E X IST E N C E O F T E C H N IC A L PRO G RESS IN IN D U ST R Y
Absorption o f labour
T ech- bynical \ industryprogress industry
Natural population increase not absorbed
Only natural population increase absorbed
Natural population increase and surplus labour from primary sector absorbed
Case I Case 2 Case 3Does not exist; Stagnation o f Slow growth o f Demand for foods acts as stimulus
agriculture/unemploymem agriculture for agriculture, leading to incorporation o f technology (mechanization, etc.)
Case 4 Case 5 Case 6Exists: Very weak stimulus Demand for foods acts as Heavy demand for foods acts as
for agriculture stimulus for agriculture, leading to incorporation o f technology (non-mechanical)
strong stimulus for agriculture, leading to incorporation o f technology (mechanical, etc.)
So u rce ; Prepared by the author on the basis o f R. Prebisch, "Problem as del desarrollo...", Lecture N" 2, op.cit.
ducdon was slow and only took place through the absorption of the increase in the economically active population, the development of agriculture must necessarily be slow too. Prebisch asked: “Why should it be any other way? What incentive could agriculture have in this hypothesis for developing more quickly than industry? What incentive would an agricultural entrepreneur have for increasing his production beyond a level matching the degree and intensity of the demand from industry?” (Lecture No. 2, p. 4).
When he analysed these cases, Prebisch rejected the possibility that there could be “autonomous” development of agriculture, independent from that of industry, in view of the limitations necessarily affecting such an independent evolution. He maintained that: “once certain narrow limits have been passed, it is inconceivable that industry should develop more rapidly than agriculture or that agriculture should develop more rapidly than industry. There is a close interdependence between the two sectors of production which prevents one of them from developing more rapidly than the other” (Lecture No. 2, p. 8).
Although cases 3, 5 and 6 offered a stimulus for agricultural development, they reflected different situations. Case 6 was that which offered the best conditions for agricultural development. The expansion in industry attracted workers from the agricultural sector because of the pay
ment of higher wages, thus bringing about a shift in population. Since in addition there was an increase in productivity in industry through the introduction of technical progress, the stimulus for agriculture reached its maximum level. As Prebisch said: “the broader the growth in industry, the greater the need for raw materials and for food for the papulation of industrial workers which has not only increased in number but also in per capita income” (Lecture No. 2, p. 6). In case 5, where industry only absorbed the extra labour due to natural population growth but did nevertheless register technical progress, and in case 3, where the excess labour from the agricultural sector was absorbed without any technical progress in industry, a stimulus was given to agriculture too, but it was less than in case 6.
After making this analysis, Prebisch was able to define clearly those situations where the unsatisfactory growth in agriculture was due to factors outside the sector. In the remaining situations, the key questions were: what obstacles stood in the way of increased agricultural production, and what prevented agriculture from reacting to the stimulus given by industry? Through this method of analysis, Prebisch progressively delimited and defined the different situations in order to arrive at the most suitable diagnosis in each case.
With regard to the three cases which were “favourable” to agriculture, Prebisch held that it
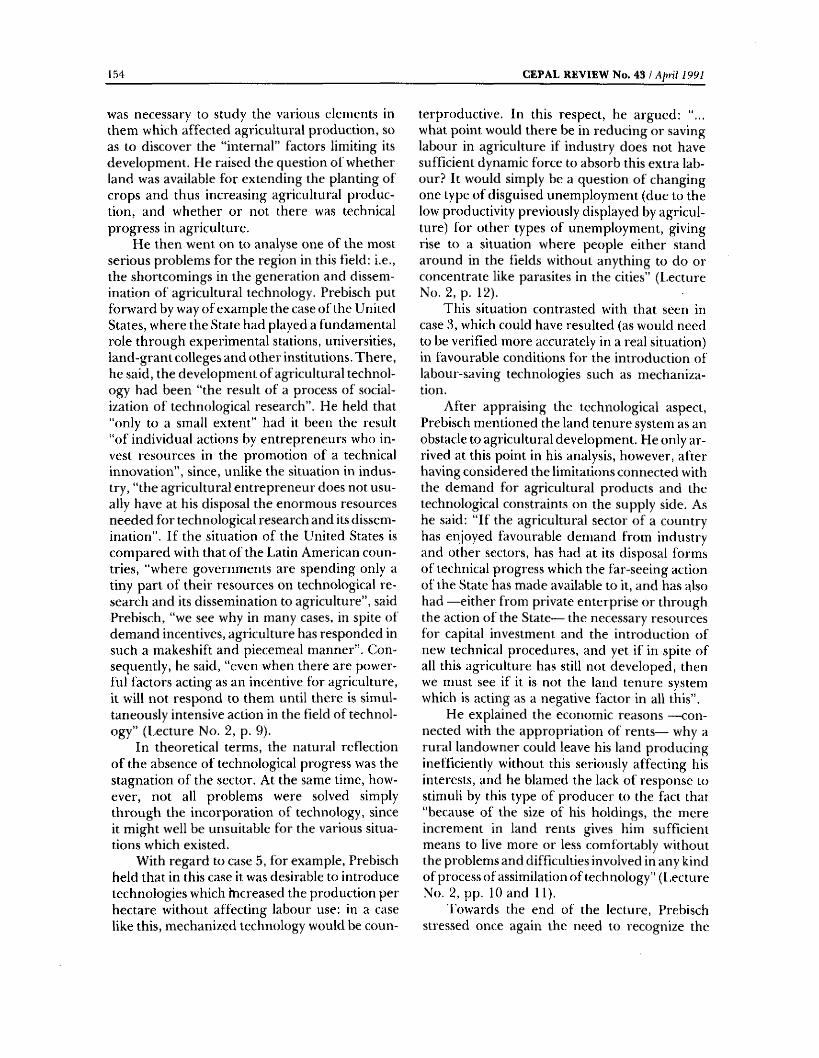
1 5 4 C E P A L R E V I E W N o . 43 / A p r il 1991
was necessary to study the various elements in them which affected agricultural production, so as to discover the “internal” factors limiting its development. He raised the question of whether land was available for extending the planting of crops and thus increasing agricultural production, and whether or not there was technical progress in agriculture.
He then went on to analyse one of the most serious problems for the region in this field: i.e., the shortcomings in the generation and dissemination of agricultural technology. Prebisch put forward by way of example the case of the United States, where the State had played a fundamental role through experimental stations, universities, land-grant colleges and other institutions. There, he said, the development of agricultural technology had been “the result of a process of socialization of technological research”. He held that “only to a small extent” had it been the result “of individual actions by entrepreneurs who invest resources in the promotion of a technical innovation”, since, unlike the situation in industry, “the agricultural entrepreneur does not usually have at his disposal the enormous resources needed for technological research and its dissemination”. If the situation of the United States is compared with that of the Latin American countries, “where governments are spending only a tiny part of their resources on technological research and its dissemination to agriculture”, said Prebisch, “we see why in many cases, in spite of demand incentives, agriculture has responded in such a makeshift and piecemeal manner”. Consequently, he said, “even when there are powerful factors acting as an incentive for agriculture, it will not respond to them until there is simultaneously intensive action in the field of technology” (Lecture No. 2, p. 9).
In theoretical terms, the natural reflection of the absence of technt)logical progress was the stagnation of the sector. At the same time, however, not all problems were solved simply through the incorporation of technology, since it might well be unsuitable for the various situations which existed.
With regard to case 5, for example, Prebisch held that in this case it was desirable to introduce technologies which increased the production per hectare without affecting labour use: in a case like this, mechanized technology would be coun
terproductive. In this respect, he argued: "... what point would there be in reducing or saving labour in agriculture if industry does not have sufficient dynamic force to absorb this extra labour? It would simply be a question of changing one type of disguised unemployment (due to the low productivity previously displayed by agriculture) for other types of unemployment, giving rise to a situation where people either stand around in the fields without anything to do or concentrate like parasites in the cities” (Lecture No. 2, p. 12).
This situation contrasted with that seen in case 3, which could have resulted (as would need to be verified more accurately in a real situation) in favourable conditions for the introduction of labour-saving technologies such as mechanization.
After appraising the technological aspect, Prebisch mentioned the land tenure system as an obstacle to agricultural development. He only arrived at this point in his analysis, however, after having considered the limitations connected with the demand for agricultural products and the technological constraints on the supply side. As he said: “If the agricultural sector of a country has enjoyed favourable demand from industry and other sectors, has had at its disposal forms of technical progress which the far-seeing action of the State has made available to it, and has also had —either from private enterprise or through the action of the State— the necessary resources for capital investment and the introduction of new technical procedures, and yet if in spite of all this agriculture has still not developed, then we must see if it is not the land tenure system which is acting as a negative factor in all this”.
He explained the economic reasons —connected with the appropriation of rents— why a rural landowner could leave his land producing inefficiently without this seriously affecting his interests, and he blamed the lack of response to stimuli by this type of producer to the fact that “because of the size of his holdings, the mere increment in land rents gives him sufficient means to live more or less comfortably without the problems and difficulties involved in any kind of process of assimilation of technology" (Lecture No. 2, pp. 10 and 11).
Fowards the end of the lecture, Prebisch stres.sed once again the need to recognize the
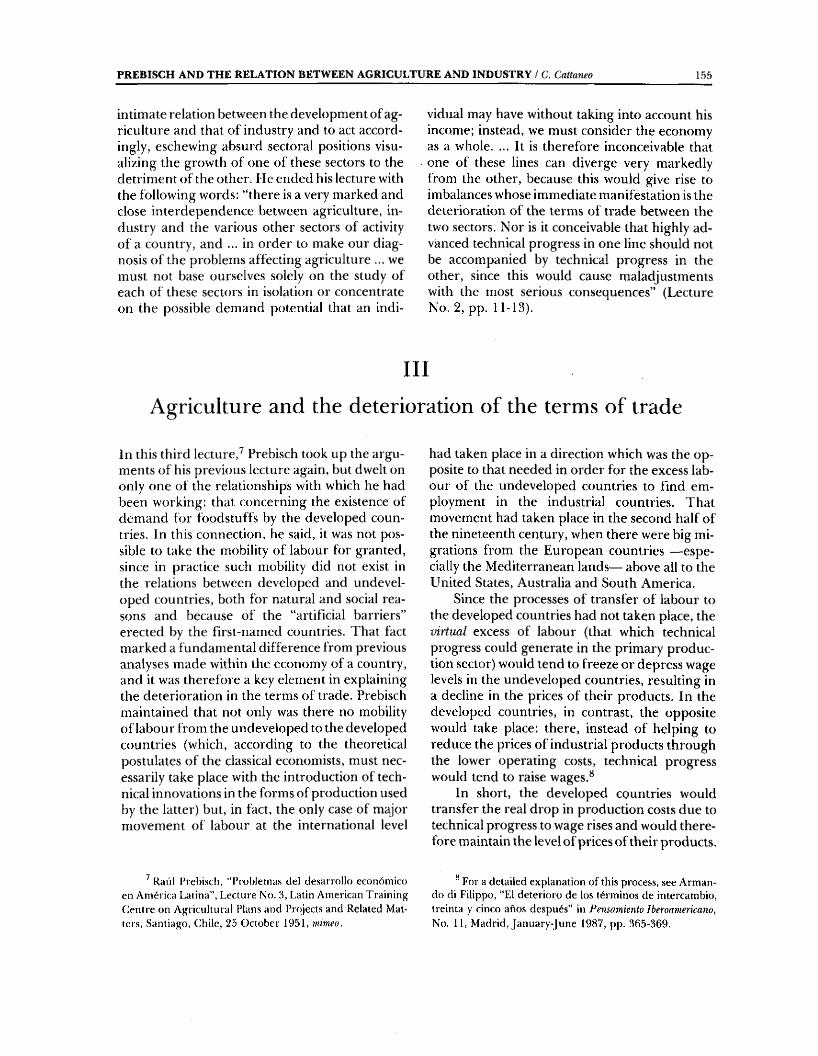
P R E B I S C H A N D T H E R E L A T I O N B E T W E E N A G R I C U L T U R E A N D IN D U S T R Y / C. Cattaneo 1 5 5
intimate relation between the development of agriculture and that of industry and to act accordingly, eschewing absurd sectoral positions visualizing the growth of one of these sectors to the detriment of the other. He ended his lecture with the following words: “there is a very marked and close interdependence between agriculture, industry and the various other sectors of activity of a country, and ... in order to make our diagnosis of the problems affecting agriculture ... we must not base ourselves solely on the study of each of these sectors in isolation or concentrate on the possible demand potential that an indi
vidual may have without taking into account his income; instead, we must consider the economy as a whole. ... It is therefore inconceivable that one of these lines can diverge very markedly from the other, because this would give rise to imbalances whose immediate manifestation is the deterioration of the terms of trade between the two sectors. Nor is it conceivable that highly advanced technical progress in one line should not be accompanied by technical progress in the other, since this would cause maladjustments with the most serious consequences” (Lecture No. 2, pp. 11-13).
IllAgriculture and the deterioration of the terms of trade
In this third lecture,^ Prebisch took up the arguments of his previous lecture again, but dwelt on only one of the relationships with which he had been working: that concerning the existence of demand for foodstuffs by the developed countries. In this connection, he said, it was not possible to take the mobility of labour for granted, since in practice such mobility did not exist in the relations between developed and undeveloped countries, both for natural and social reasons and because of the “artificial barriers” erected by the first-named countries. That fact marked a fundamental difference from previous analyses made within the economy of a country, and it was therefore a key element in explaining the deterioration in the terms of trade. Prebisch maintained that not only was there no mobility of labour from the undeveloped to the developed countries (which, according to the theoretical postulates of the classical economists, must necessarily take place with the introduction of technical innovations in the forms of production used by the latter) but, in fact, the only case of major movement of labour at the international level
had taken place in a direction which was the opposite to that needed in order for the excess labour of the undeveloped countries to find employment in the industrial countries. That movement had taken place in the second half of the nineteenth century, when there were big migrations from the European countries —especially the Mediterranean lands— above ail to the United States, Australia and South America.
Since the processes of transfer of labour to the developed countries had not taken place, the virtual excess of labour (that which technical progress could generate in the primary production sector) would tend to freeze or depress wage levels in the undeveloped countries, resulting in a decline in the prices of their products. In the developed countries, in contrast, the opposite would take place: there, instead of helping to reduce the prices of industrial products through the lower operating costs, technical progress would tend to raise wages.^
In short, the developed countries would transfer the real drop in production costs due to technical progress to wage rises and would therefore maintain the level of prices of their products.
Raúl Prebisdi, “Problemas del desarrollo económico en América Latina”, Lecture No. 3, Latin American Training C entre on Agricultural Plans and Projects and Related Matters, Santiago, Chile, 25 O ctober 1951, mimeo.
For a detailed explanation o f this process, see A rm ando di Filippo, "El deterioro de los términos de intercambio, treinta y cinco años después” in Pensamiento Iberoamericano, No. 11, Madrid, Janu ary-June 1987, pp. 365-369.
156 C E P A L R E V I E W N o . 43 / A p ril 1991
In contrast, the lack of progress in industrialization in the undeveloped countries would give rise to the opposite situation (table 2).
T able 2E F F E C T O F LA B O U R SU R PLU S D U E T O
IN C O R P O R A T IO N O F T E C H N IC A L PRO G RESS
In developed countries:Wages risePrices o f goods do not go down Technical progress is incorporated Benefits o f technical progress are retained
In non-developed countries:Wage levels rem ain unchanged or go down Prices o f prim ary commodities go down Benefits o f technical progress are not retained
Prebisch said in this respect: “By creating a labour surplus, technical progress demands that this labour should be absorbed by industry. And it is only if this labour is vigorously absorbed by industry that it will be possible to prevent the fruits of technical progress from being transmitted abroad in the form of lower prices. This explains the fundamental importance of the development of industry and other activities in order to absorb the surplus of manpower generated by technical progress in the primary production sector” (Lecture No. 3, p. 5).
On the basis of this argument, he indicated the “pointlessness” of disseminating technical progress in agriculture unless there was a parallel process of industrial development: “What would happen, I ask you, if this drop in the employed population were not matched by a dynamic force in industry and other activities that could absorb this population, provide it with the means of subsistence, and prevent it from adversely affecting the agricultural sector by tending to keep down wage levels? What good would it be to a country which is operating its agricultural sector with primitive techniques if it incorporated modern procedures which displaced labour from the sector but caused that same labour surplus to weigh down on rural wage levels” (Lecture No. 3, p. 6).
Linking together the two questions —that of intersectoral relations and that of the deterioration in the terms of trade— he said that “all the savings obtained through the reduction of production costs would merely be reflected in a drop
in international prices and, instead of making it possible to raise domestic wage levels, the results of the technical progress thus introduced into agriculture would oblige the country, because of the pressures of higher production, to lower its prices, so that instead of remaining within the country, the fruits of technical progress would be transferred abroad” {¡bid).
Prebisch then pursued his analysis of his theory of the deterioration in the terms of trade, although he did so cautiously and sought to keep down the tone of his formulations, noting that: “... I am not at this moment seeking to put forward any general theory on the terms of trade, but merely explaining a simple mechanism without which it would not be possible to understand the problem of the terms of trade ... I have not formulated any kind of immutable law but simply drawn attention to a phenomenon which occurred in a certain period of time under the influence of certain forces” (Lecture No. 3, pp. 6-7).
In referring to the factors intervening in the price movements registered among the countries producing foodstuffs and raw materials, he emphasized the following elements:
a) In the developed countries;i) the intensity of industrial growth (which
has a disproportionately small effect on the demand for foodstuffs and raw materials); and
ii) the barriers placed in the way of the entry of raw materials and foodstuffs from the undeveloped countries.^
b) In the undeveloped countries:i) the population growth rate;ii) the intensity of the technical progress tak
ing place in the primary production sector;'®iii) the amount of land available; andiv) the extent of the absorption of surplus
labour by industry and other activities.The existence of different relations between
the prices of primary commodities and those of
■’ This question, which was one o f Prebisch’s main concerns during his period at the head o f CNC'i'Al) (1964-1969), was dealt with in detail in the next lecture in the course we are analysing here.
®*Both factors (this one and that referred to in note 9 above) exerted considerable influence on the type o f employment and on wage levels.
P R E B I S C H A N D T H E R E L A T I O N B E T W E E N A G R I C U L T U R E A N D IN D U S T R Y / C. Calta>m> 157
industrial products, he observed, was explained by the combination of the above elements, which gave rise to a very varied range of situations. Prebisch’s theory regarding the behaviour of these factors sought to explain why those relations acted to the detriment of primary commodities. In order to demonstrate this theory, he took as his first example the opposite case: that is to say, one in which the terms of trade improved for a country producing such goods. In order for that to take place, one or more of the following situations had to exist: a) an increase in demand for the goods in question by the central countries; b) the absence of a plentiful supply of land for the production of the goods, or c) the easy incorporation into industry, at higher wages, of the labour displaced from the production of those goods because of the incorporation of technology.
Prebisch maintained: “'Phere are therefore a number of favourable factors (in this case) ... which help to keep up the value of the goods in question through active demand and enable the technical progress intr(iduced into this branch of production to give rise to higher wages. Why? Because in proportion as there is a surplus of labour, it is absorbed by industry at higher wages, and when it is absorbed at higher wages there also tends to be an increase in the wages of agricultural workers: that is to say, the introduction of technical progress has not caused wage levels to stagnate but to rise, assuming, of course, that the price of the goods in questi{)n has remained stable during the process of technical pnigress" (Lecture No. 3, pp. 9-10). In this hypothesis, the terms of trade of the goods in question with the industrial countries would have remained constant.
Another situation in which there would be an improvement in the terms of trade in favour of primary commodities would take place when it became necessary to use new land of lower productivity to satisfy the demand for the goods. In that case, argued Prebish, there would be an increase in land rents which would be reflected in an increase in the price of the goods, with consequent favourable effects on the terms of trade.
An analysis of what happened in agriculture in Argentina gave Prebisch an additional argument to back up his theory. In the 1920s, a pro
cess of mechanization of agricultural work was begun in that country because of the “high” cost of labour. Prebisch considered that this process perhaps went too far in economic terms, since within a short period there was a labour supply which was required neither by agriculture, which had now been partially mechanized, nor by industry, w hich was still in an incipient stage at that time. Consequently, wages did not rise, and this displaced labour became an incentive for extending production, thus helping to give rise, as a final result, to a situation of over-production of certain cereals (such as wheat) in the world. Prebisch concluded his analysis of this case in the following words: “this is a typical example of how technical progress tends to transfer its benefits to the ci)untries which purchase primarv commodities rather than remaining in the producer countries. An esseyitial condition in order to prevent this occurring is a high degree o f absorption of the surplus labour. When scanty absorption of the surplus labour force by industry is combined with an abundance of land opened up due to the expansion of means of transport, this represents the combination of two factors which are unfavourable from the point of view of prices. One of them prevents a rise in w'ages, while the other reduces production costs still further by bringing into cultivation land w ith higher yield. 'Lhus, the lower the degree of absorption of labour in industry and the higher the degree of opening up of new' land, the stronger w'ill be the effects on the levels of international prices (Lecture No. 3, p. 13).
Prebisch concluded this part of his lecture by setting forth his ideas on the matter in the light of the most usual situation (drop in prices and deterioration in the terms of trade) registered with respect to the products of the Latin American countries: “ Phis drop is probably due to the fact that while the benefits of the technical progress of the industrial countries have remained in those countries through the well- known phenomenon of higher wages, it may well be that in the countries which depend on primary products, because of the high rate of population growth and the slow industrialization — and I might also say because the terms of trade have deteriorated— all these factors have helped to transfer the benefits of technical progress in the countries producing primary commodities to the
1 5 8 C E P A L R E V I E W N o . 43 / A pH l 1991
industrial countries, through a relative drop in prices (lecture No. 3, p. 14). He also noted, however, that this theory could only be proved in absolute terms when a study was made on the
variations in prices on an artide-by-artide basis, in order to see how the factors inherent in the situations of the developed and undeveloped countries had operated in each case.
IV
Agriculture, industry and international trade
In this fourth lecture,** Prebisch began his reasoning process by asking whether or not it suited the undeveloped countries to embark on industrialization. In the light of the arguments of classical theory, the response must be a downright no. According to the logic of this school of thought, these countries should concentrate on producing more and better primary commodities in order to trade them for the manufactures produced in the centres. Why? Because industries installed in an undeveloped country could not compete, on account of their lower productivity, with similar industries already installed in the centres, unless some kind of protection was arranged. This raised the question: why use labour in “artificial industries” whose production costs are higher than in the great industrial centres, thus making necessary customs protection? Why, instead of using this labour for industrial production, should it not be used to increase agricultural production and thus expand exports? (Lecture No. 4, p, 3).
As we all know, Prebisch’s views in this respect did not coincide with the classical theories. I'his was confirmed by his assertion that “even though the productivity of the labour employed in such an industry may be well below that of the labour employed in the same kind of industry in an advanced industrial centre, there is nevertheless every justification for setting up such an industry if it gives employment to labour which has been displaced from the primary production sector by technical progress and would otherwise
'* Raúl Prebisch, “Problemas del desarrollo económico en América Latina”, lecture No. 4 , Latin American Training C entre on Agricultural Plans and Projects and Related Matters, Santiago, Chile. 23 O ctober 1951, mimeo.
not be employed. To the extent that this labour contributes to a net increase in the production of goods that the country needs, then there will be a net increase in the country’s income” (Lecture No. 4, p. 4). Indeed, Prebisch reasoned that; “because of technical progress, not so many people are needed in the primary production sector but more workers are required in order to satisfy the demand for industrial goods and services. If this is so, then it is not possible to see, logically, how undeveloped countries which have a high proportion of their economically active population in the primary production sector should continue to keep up that high proportion despite technical progress, sending abroad the agricultural products which they cannot consume themselves”. Finally, he said: “The mere statement of this hypothesis shows how absurd it is to pretend that, despite the introduction of technical progress, the proportion of the active population employed in primary production should be maintained at the same level”.
It is worth noting here, however, that Prebisch’s position on this subject was not absolutely categorical. He mixed it with a good deal of pragmatism when he recognized that the question which should really be asked was: “which is better, to employ these people by using the capital available to a community for industrial production or by using it to increase primary production and to export a larger quantity of such products?” (Lecture No. 5, p. 5). His answer was that this dilemma must be determined in the light of the results that each course of action would give.*
“We cannot take account only of the physical increase o f production that would result from the em ployment o f the labour made surplus by technical progress and by population
P R E B I S C H A N D T H E R E L A T I O N B E T W E E N A G R I C U L T U R E A N D IN D U S T R Y / C . Cattaneo 159
Thus, said Prebisch, perhaps in a small country whose production had little effect on the world market it would be reasonable to increase exports by channeling more resources towards agricultural production rather than towards the industrialization process. This would be so, provided that an increase in exportable output was not reflected in a drop in prices that would prevent a net increase in the income obtained. That is to say, it would be necessary to take account of the nature and size of the effect on prices in order to give a proper answer. If the answer were encouraging, concluded Prebisch, then it would indeed be advisable to increase exports rather than promoting industrial development.
He then went on to analyse more general situations, however, and approached the subject from a broader perspective, which led him to make a key assertion: before deciding in favour of one or the other of the alternatives, it was necessary to make a detailed analysis of the situation of each of the Latin American countries. He concluded that: “any increase in production beyond that required by the growth in demand — except in the case of some products which are affected in a particularly favourable manner by technical progress — leads to a drop in prices which may often be very severe, depending on the elasticity of demand” (Lecture No. 4, p. 6).
As we can see, Prebisch did not reject out of hand the “theoretical” possibility of taking advantage of the surplus labour force to secure increases in primary production. He took an objective attitude to the matter, however, and asked whether the whole of this production could really be sold on foreign markets without excessively affecting prices. The real situation in world trade at that time indicated that this was not possible, so that although this option might exist in theory, in practice there was no option but to promote industrialization. In order to demonstrate his assertions in that respect he even carried out a small numerical exercise.'^
Bearing in mind, however, that in Prebisch’s concept underdevelopment was a stage which
could eventually be left behind, it was necessary to think of a possible change in this respect when the undeveloped countries had reached the “rank” of the developed countries. In that case, when the population structure of the former came close to that of the latter, the continued absorption of agricultural labour in order to transf er it to industry would begin to be reflected in increasingly high costs. When that point was reached, argued Prebisch, the country would indeed have to pay close attention to the allocation of its productive resources to the various activities: the international trade problems would then be presented in the old classical terms. “Before that point is reached, however, as long as there is a labour surplus which cannot be economically absorbed by an increase in exportable production, then it is in the interests of that country to take that labour out of primary production and transfer it to industrial production, even though the latter may have higher costs than those of the international market” (Lecture No. 4, p. 9).
This clearly shows that in 1951 Prebisch did not totally reject the postulates of classical economics, considering them valid or suitable for explaining certain situations but not others, such as those concerning the undeveloped countries. Only when the latter countries had been turned into developed nations would the mechanisms described by the classical economists in this connection function perfectly. Before that point — which Latin America was still far from reaching— the application of such postulates would merely tend to aggravate the economic and social situation.
Prebisch stressed the importance of drawing a clear distinction between the above two stages in the development of a country in order to determine objectively the most suitable policy. In that respect, he slipped in a criticism of the Report of the Currie Mission to Colombia because it maintained that the installation of a steel industry would only suit that country if the production cost was equal to or less than the cost of
growth. W e must also look at the economic result that would be given”. (Lecture No. 4, p. 6).
'^Prebisch placed much emphasis on the low income- elasticity o f demand for primary commodities, which could contribute to a glut o f such goods.
“Bases de un Program a de Fom ento para Colombia. Inform e de una misión dirigida por Lauchlin Currie y auspiciada por el Banco Internacional de Reconstrucción y Fomento en colaboración con el Gobierno de Colombia”, B ogotá, Im prenta del Banco de la República, Septem ber 1950.
160 C E P A L R E V I E W N o . 43 ! A p r il 1991
the imported product. For Prebisch, “the theoretical concept underlying this appraisal is based on premises quite different from those arising from the actual conditions of these countries which have available human potential” (Lecture No. 4, p. 10). He went on to insist on one of his central topics: the need to incorporate technical progress in both agriculture and industry. Why? Because this surplus available labour was not real: it was potential or virtual —it was the surplus which would be produced when technical progress was introduced in primary production.
Prebisch also recommended acting cautiously in this field, however. There could be no question of “sacrificing” agriculture in favour of industry. Bearing in mind perhaps the situation of Argentina in that period, he reflected: “we have seen many cases in Latin America, and indeed some very important recent cases, where labour has been taken from primary production without having given that sector the means for introducing the technical progress that would make such labour surplus. Thus, labour has been taken away from the sector when there was not a real surplus, but only a virtual one. There might have been a surplus of labour if, for example, agriculture had been mechanized or if yields had been increased to such an extent that a smaller cultivated area would have been enough to cover domestic consumption and export needs. A country which makes the mistake of prematurely withdrawing factors of exportable production in order to transfer them to industry would be causing an economic disturbance which might or might not be temporary, depending on the measures taken by that country to introduce into agriculture or into primary production the technical progress needed to enable that production to grow again” (Lecture No. 4, p. 11).
Once again showing his pragmatic attitude to the subject, he argued: “1 do not establish my position in absolute terms, but in very relative terms. Phis surplus population must exist, but it will not do so unless industrial development has been accompanied by parallel technical development of agriculture. Otherwise, industry will stifle agriculture, causing serious problems for it without giving any timely solution”. He went on to recommend: “instead of seeking to correct an imbalance of this nature, it is quite obvious that it would be better to forestall it, that is to say, it
would be better to promote industrial development to such an extent as to absorb the workers being made redundant by technical progress in agriculture, and nothing more. I should like to place some stress on this aspect of the problem, in order to warn you in good time of the perils of the generalization of a situation of this type” (ibid).
On a more theoretical plane, he went on to analyze the changes implicit in the industrialization process. He also entered (remember that we are talking about a lecture given in 1951) on a matter which is quite topical today: that of the subsidies given by developed countries to their primary activities. Why do these countries need to give subsidies? The explanation given by Prebisch was the following; “industrialization causes a rise in wage levels, or at least it leads to the transfer of people who were working for low wages in primary production to industry, where wage levels are higher. In this respect, it increases the average wages of the community. If there is considerable labour mobility in a country, then this phenomenon of the transfer of workers from a low level to a higher level gradually raises the average wage level. Consequently, there is a rise in the wages paid in poorly paid occupations, both in agriculture and in domestic service: a typical case of the absorption of workers by more productive activities. Now, if this is so, if wages rise through this process o f ‘contagion’, of levelling-up as we have seen, and there are export activities whose technology has not been improved sufficiently to allow them to pay these higher wages, what is going to happen? The answer is that such activities simply cannot continue competing on the world market” (Lecture No. 4, p. 12). In such circumstances, it would be necessary to subsidize the activities in question in order to bring wages in all branches of production up to approximately the same level while not losing competitiveness due to the increased prices deriving from this process. Subsidies therefore had two causes: i) the trend towards the equalization of wages, and ii) the unequal technical progress of the different sectors and branches of the economy.
Prebisch put forward by way of example the case of the United States: “Why has the United States ... in spite of its tremendous efficiency in
PREBISCH AND THE RELATION BETWEEN AGRICULTURE AND INDUSTRY / C. C atta n eo 1 6 1
certain lines of production, had to give protection from foreign competition not only to agricultural activities but even to certain industries? It has had to do so for the same reason: perhaps because in these industries productivity has not progressed as much as in other sectors or in other countries, or perhaps because in other competing countries wage levels have risen less than in the United States, because of the smaller increases in productivity. Thus, in order to make up for this wage differential it has been forced to resort to protection” (Lecture No. 4, p. 12).
Comparing this example with that of the Latin American countries, he said: “If this is the situation in the United States, then we should try to get a clear idea in our minds of what the problem is going to be like in countries with much smaller resources and potential, and we should not be surprised at the need for protection in countries with a capital density as low as ours” (Lecture No. 4, pp. 13-14). He went on to add: “Our countries are countries which have little capital. The average level of per capita capital is far below that of the industrial countries. How can it be possible, then, if productivity is a function of the per capita level of capital, that countries which are still in a backward stage of economic development can suddenly acquire the levels of productivity of the industrialized countries without possessing the necessary capital for
this? ... If we cannot achieve similar levels of productivity, then how can it be maintained that we can develop our industry to absorb the surplus labour from the primary production sectors without suitable customs protection? Such protection will have different degrees of justification, of course, according to the industries in question, but it seems clear to me that, in view of the difference in productivity, it would not be possible to establish the large number of industries needed to absorb labour and raise the total productivity coefficient without making use of protection” (Lecture No. 4, pp. 13-14).
Now, Prebisch —and he was to make this abundantly clear in many of his subsequent works— was never in favour of indiscriminate protection. What he was talking about in this lecture was “the protection needed to make up for differences in productivity. There is a world of difference between this and the idea of defending wholesale and exaggerated protection” (Lecture No. 4, p. 15).
Could there be some solution which avoided the use of subsidies? Yes, indeed there was such a solution, but Prebisch rejected it out of hand, for it involved the lowering of wages, which would bring with it, as he himself had pointed out in previous lectures, a deterioration in the terms of trade with its whole sequel of adverse effects for the countries of the region.
VA development programme and policy
In this fifth lecture,*® Prebisch first of all stressed the neutrality that economic development plans should have in order to ensure that they were free of any possible suspicion of being merely ideological. For Prebisch, a programme was a mechanism which could be adopted and used within the context of various global policies.
'■’’ Raúl Prebisch, "Los problemas del desarrollo económ ico en Am érica Latina”, Lecture No. 5, Latin Am erican T rain in g C entre on Agricultural Plans and Projects and Related M atters, Santiago, Chile, 29 October 1951, mimeo.
whether they were markedly “interventionist” or were based on unrestrained private enterprise.
The need to adopt a programme was due to the need to foresee the course of events. Recalling no doubt his own experience in Argentina in the 1930s, he noted that in the Latin American countries, during the Second World War and the immediate post-war period, “improvisation due to the effect of new and often unforeseeable circumstances” had led to a series of maladjustments and imbalances which were “hindering the smooth and orderly development of our economies”. Those maladjustments were both external
162 CEPAL REVIEW No. 43 / April 1991
and internal, and the imbalances were a dynamic consequence of the growth process itself. Except in the case of Venezuela and one or two other countries, the exports of the Latin American countries did not expand sufficiently to allow a growing country to satisfy all its related import needs. However, said Prebisch, “the fact that this persistent tendency towards imbalance exists in a considerable number of cases does not mean that such imbalance is an inevitable consequence of growth”. In his opinion, the existence of such imbalance was due to the way the development process had taken place in the countries of the region; “devoid of any kind of programme”. Consequently, in his view the establishment of a programme represented a precautionary act, “an elementary act for taking in good time measures which, when improvised, lead to upsets and maladjustments, as experience has shown” (Lecture No. 5, pp. 4-5).
Prebisch stressed later on that the programme did not specify how the State should operate in order to meet the requirements. “We do not hold an opinion on this”, he said, but only on “the need to take some measures, by one means or another, to solve this problem” (Lecture No. 5, p, 5). In order to give a clearer idea of this aspect, he referred once again to Argentina, although without naming it directly. “There are countries”, he said, “which have tried to take the industrial impulse a very long way. As a result of this, the country has needed increasing amounts of raw materials and capital goods on the one hand, while on the other hand agriculture has been neglected, there have been big investments in industry and public works, but it has not been borne in mind that capital goods and raw materials were obtainable mainly through expi)rts. fhat aspect was overlooked, and agriculture was given neither the incentives nor the machinery needed to maintain and increase its volume of production”. “Thus”, he went on, “there comes a moment when the country cannot continue to progress in the industrial field because it does not have the resources to do so. It does not have external resources because agriculture has been neglected and has been given neither incentives nor means of capitalization which will enable it to produce the same or a larger amount than before with fewer workers”. He concluded this section by noting “so you
have here another case where the lack of a programme that takes due account of the different aspects of the economy has led a country into a dead end, seriously prejudicing the development of its economy” (Lecture No. 5, pp. 6-7),
Later on, Prebisch showed how it was necessary to start from a suitable diagnostic study in formulating an economic development programme. From that starting point, after having identified the key problems, it was necessary to find ways of solving them through the technical means and financial resources available for making the necessary investments. It would then be necessary to prepare a list of priorities for the efficient and effective allocation of those resources and means. Latin America’s lack of this “list and order of priorities”, which could only be provided through planning, thus represented one of the most serious limitations on the development process.
After this reasoning, Prebisch indicated what the role of agriculture should be in a programme. To begin with, he asked himself: “First of all, is it possible or desirable to prepare an agricultural programme without taking into account the main lines of a general economic programme? 1 think that would be a serious error. If this were done, it might be possible to solve one or another partial problem of agriculture, but if what is desired is to stimulate agriculture as a whole and cause it to meet certain objectives, I maintain that the objectives of an agricultural programme could not be defined independently of the objectives of a general economic programme. Why? Because they could turn out to be incompatible, since certain agricultural objectives depend on the fulfillment of other general economic objectives”. “Indeed”, he continued, "we often see that agricultural plans are aimed at encouraging the production of certain crops for import sub-
’®“This task, o f com paring and confronting ideas, this need to establish an order o f priorities, has not been satisfied. We have been tackling each o f the d ifferent aspects o f our problemas individually, in the light o f our own experience, but without any overall view” (Lecture No. 5, p. 8).
“I do not think we could find many exam ples at present o f Latin American countries which have managed, through a systematic effort by their responsible economists, to prepare this table which is indispensable as the starting point for a program m e” (Lecture No, 5, p. 9).
PREBISCH AND THE RELATION BETWEEN AGRICULTURE AND INDUSTRY / C. Cattaneo 1 6 3
stitution purposes. But how is it possible to determine whether such substitution is advisable in agriculture without knowing whether there are other substitution possibilities in industry which are more economical and more desirable for the country?” (Lecture No. 5, p. 11). In that respect he mentioned the example of Mexico, which, he considered, had come to the conclusion that it was advisable to increase its exports of primary commodities in order to pay for its import needs.
Finally, Prebisch gave some words of warning about certain aspects which worried him with
regard to the way the development process was proceeding in the countries of the region; some contradictions in policy matters; and some forms of luxury consumption which he considered to be incompatible with development, stressing the importance of the role of the tax system in that respect. In that connection, he coincided with the view expressed in the Report of the Currie Mission that land should be taxed according to its production capacity so that “high-productivity land which is badly cultivated should pay a tax” of such a level as to lead the owner to sell it or cultivate it much better (Lecture No. 5, p. 15).

Celso Furtado: Doctor Honoris Causa Wilson Cano*
This ceremony, at which Dr. Celso Furtado is being invested with the title of Doctor Honoris Causa, is above all an act of justice.
Today, we are honouring an outstanding citizen who has been the Master of all of us here.
Born and brought up in the sorely tried Northeast of Brazil, Celso Furtado was familiar since his earliest youth with the realities of human life in such an underdeveloped region.
With tenacious application, at the age of 24 he went on to study law in Rio de Janeiro, and at 28 he fulfilled the tremendous challenge of gaining his Doctorate in Economics in Paris, where he conceived the basic principles of the economics of underdevelopment. Living in a European society, he was able to contrast its level of development with the misery he had known and began to gain a better perception of the political, economic and social obstacles standing in the way of progress towards economic and social development.
At 29, he entered the United Nations Economic Commission for Latin America as an economist, subsequently assuming the important post of Director of the Economic Development Division. There, together with Noyola, Ahumada, Sunkel and later Aníbal Pinto, under the leadership of the fondly remembered Prebisch, he played a major part in the formulation of the basic ideas of the f.c l a c school of economic thought. In this period he was able to consolidate his theoretical and practical knowledge of the historical process of economic underdevelopment.
Since then, Furtado has become one of the main exponents of the theory of underdevelopment and a leading researcher in the economic history of Latin America, and especially of Brazil,
The integrity of his character, his sense of commitment to the struggle against poverty, his humanistic background and his sense of his public responsibilities led him to occupy high public posts, among which mention must be made of the following;
— Chairman (1953-1955) of the fclac/iínde Study Group which produced the basic ideas for the famous Plano de Metas of Juscelino Kubitschek;
— Director (1958-1959) of the National Economic Development Bank (iíndk);— Founder and first Superintendent (1960-1964) of Superintendency for the Economic
Development of the Northeast (sudene;);— Minister of Planning in the administration of President Joao Goulart (1962/1963).The violent military coup of April 1964, which deprived him of his civil rights, caused
his withdrawal from Brazilian public life for many years. With the return of democracy, however, he came back to assume the pi)sts of:
— Ambassador of Brazil to the European Economic Community (1985/1986).— Minister of Culture (1986/1988) in the Sarney administration.His academic life has been no less brilliant, including as it does distinguished periods
in the Universities of Yale and Columbia (u .s .a), Cambridge (u .k .) and the Sorbonne (France).As a writer, his extensive production includes innumerable articles published in Brazil
and abroad and no less than 27 published books, ten of which were translated into various foreign languages. Special mention must be made, inter alia, of his classic works Formado
* Brazilian economist: Professor o f Brazilian Economics and Co-ordinator o f the Research Com m ittee o f the Institute o f Economics o f the University o f C;ampinas (CMCAmi*).
Address delivered at the ceremony at which Celso Furtado was declared Doctor Honoris Causa o f the University o f Campinas, 21 August 1990.
166 CEP AL REVIEW No. 43 / April 1991
Economica do Brasil and Desenvolvimento e Subdesenvolvimento, published between 1959 and 1961 and adopted as text books for almost all the economics and social science courses of the country, as well as his more recent works A Fantasia Organizada (1985) and A Fantasia Desfeita (1989), the latter of which reflects his frustration at the economic and political crisis of his country.
His masterpiece, however, was Formando Econòmica do BrasiU ä pioneering analysis of our economic history which was the subject of various essays commemorating the thirtieth anniversary i)f its publication*. The fact that it has been translated into English, French, Italian, Spanish, Japanese, German and Polish is evidence of its great value and the worldwide interest it aroused.
In this connection, there is an amusing anecdote, which the author recounts in his Fantasia Organizada, regarding the nasty shock he received when he was informed of the loss of the original manuscripts of his future book towards the end of the 1950s. When he went to look for them in Brazil, he found them in a warehouse of the postal service, where they were being held as suspicious material...
Desenvolvimento e Subdesenvolvimento, also one of his most outstanding works, forms an obligatory part of any bibliography on the theory of economic development and has also been translated into English, French, Spanish and Persian.
A great deal of space and time would be needed to give a more complete picture of Furtado’s work and his main contributions to economic thinking.
Part of what is presented here was taken from the author’s own recent essay entitled Entre Inconformismo e Reformismo, while part of it comes from the contact I have had and continue to have with various of his works.
There is no need to recall that Furtado was one of the main creators of the theory of economic development. He made a large number of contributions in this field, and the following is a brief summary of some of them.
He was a pioneer among us in understanding the industrialization process in its broadest senseas a process involving the general transformation of society —notjust industrial activities proper— both in its productive and technical aspects and also in the political, social and cultural fields.
His rediscovery of the concept of the social surplus caused him to see economic development not as a process of quantitative expansion of the economy, but rather as one of qualitative transformation of society and development of the “productive forces”.
I would also like to recall his critical comments on the lectures given in Brazil in 1951 by Professor R. Nurkse, when the latter commented on the limitations of market size with regard to the greater use of capital and concluded that economic progress is not a spontaneous or automatic event and automatic stagnation could be assimilated to the “circular flow” of Schumpeter, In 1954, and also, later, in Desenvolvimento e Subdesenvolvimento, Furtado heavily criticized Schumpeter, demonstrating inter alia the false universality of his theory, in which it was claimed that “the entrepreneur is a phenomenon found in all social organizations, from socialist to tribal forms”, which implied isolating the entrepreneur from the world in which he lives. Finally, he demonstrated that, despite the importance of Schumpeter’s theory of innovation, understanding the advance of technology demands an explanation of the process of capital accumulation; that is to say, a historical explanation.
His main historico-theoretical reflections, especially in the 1950s, led Furtado and his main contemporaries of e c l a c to lay the foundations of i-c la c structuralism, taking up once again the analytical tradition of marxist thinking through the examination of social structures
* See the articles com m em orating .30 years o f economic training in Brazil, by Guido Mantega and Ricardo Bielschowsky, published in Revüía de Economía FoUtica, Vol. 9, No. 4 , O ctober-D ecem ber 1989.
CELSO FURTADO: DOCTOR HONORIS CAUSA / W. Cano 167
and, hence, the use of non-economic parameters in macroeconomic analyses, l'he agrarian structure, the social structure, the structure of distribution, the theory of dependence and the structuralist approach to inflation were the main theoretical, economic and social fruits of the KCLAC thinking in which Furtado had a decisive influence.
The summary I haveJust made of his main reflections highlights three major conclusions on the process of Latin American economic development which are still totally valid today:
i) The need to abandon the criterion of static comparative advantages as a basis for insertion into the international division of labour.
ii) The need to make planning an established practice.iii) The need to strengthen the role of society at large.The total failure of the attempts to reinstall a liberal economy in Latin America imme
diately after the Second World War provide ample proof of the first assertion. I'he chaotic situation into which most of the Latin American States declined fully proves the second assertion, while the authoritarian trends of the last 30 years confirm the third one.
His profound knowledge of economic history and his concern with the history and destiny of Latin America very soon caused him to understand that, from the maturity of the first Industrial Revolution onwards, the process of capitalist development shaped a certain international division of labour —the formation of an underdeveloped periphery— with the clear objective of appropriating part of the surplus generated there and, as a result, bringing about a concentrated, antisocial and antidemocratic form of domestic appropriation of part of the surplus.
Although a tireless fighter for the economic development of the periphery, he suffered the disappointment of finally having to acknowledge the virtual impossibility of extending the patterns of income and consumption observed in the developed countries to all the population strata of the underdeveloped nations. He came to this conclusion in his critical appraisal of the forecasts of disaster contained in The Limits to Growth published in 1972 by the Club of Rome. This reflection is to be found in his classic work O Mito do Desenvolvimento Economico, published in 1974.
With regard to the industrialization of Brazil, once again he was a pioneer in viewing it as a process which began with the recovery from the “crisis of ’29”, thus differentiating it from the previous period, which he called “export-led industrialization”.
With regard to the first phase in the Brazilian industrialization process (limited industrialization), some other contributions made by Furtado may be recalled:
i) His classic and pioneering interpretation of “Keynesian policies” —adopted by Vargas before Keynes himself had conceived his anti-cyclical policies— which set forth economic policy mechanisms to defend the levels of income and employment (1930-1933). The main structure of this analysis still stands today, in spite of the scanty empirical basis used at the time. The ideological attempts made to discredit him during his exile were a f ailure because of various works by other leading economists who reaffirmed the pioneering nature, correctness and continued validity of Furtado’s analyses.
ii) With his skill and his theoretical strength, he managed to systematize more effectively than Roberto Simonsen the theoretical and political arguments in favour of the industrialization of Brazil, definitively overthrowing the old and outworn arguments put forward by the more conservative currents of opinion in the country in the 1950s, whose principal representative and opponent of Roberto Simonsen —Eugénio Gudin— had the ideological effrontery to assert in his work “O caso das Nagoes Subdesenvolvidas” that economic development (and hence industrialization) depended on the climate and was more attainable in non-tropical countries...
However, a list of Furtado’s merits should not merely reflect partial dimensions of his full and prolific life. His gifts must be set forth in all their variety: his familiarity with history; his interdisciplinary approach; the strictness of his economic analysis; his wide-
168 CEP AL REVIEW No. 43 / Afm} ]99]
ranging theoretical understanding, and his commitment to politics. Above all, however, it is necessary to stress the humanistic dimension of Furtado and his constant search for the truth. Furthermore, we must recall his long-standing and unfailing commitment to democracy: an ideal ever present in all his writings and speeches.
In conclusion, may 1 -call Professor Celso Furtado our maes i ro: a word which we understand more in its content than in its form and take to mean someone who is a true teacher and creates veritable disciples.
It is my earnest hope that our younger economists will take advantage of his teachings: in order better to understand the problems of our heterogeneous society; in order that they may have the humility to realize how little we really know about the past; in order to cure the severe indigestion brought on by the last ten years of monetarism, debt, deficits and short-term problems; and in order never to fall back into neo-structuralist and neo- Schumpeterian pitfalls.
Finally, may they thus remember at all times that “investments, propensities and demand are mere abstract definitions” and that economics is a social science practiced by and for human beings.
Guidelines for contributors to CEPAL Review
I he editorial board of the Review are alw'ays interested in encouraging the publication of articles which analyse the economic and si)cial development of Latin America and the Caribbean. With this in mind, and in order to facilitate the presentation, consideration and publication of papers, they have prepared the following information and suggestions to serve as a guide to future contributors.
—The submission of an article assumes an undertaking by the author not to submit it simultaneously to other periodical publications.
—Papers should be submitted in Spanish, Portuguese or English, fhey will be translated into the appropriate language by F.Cl.AC.
—Papers should not be longer than S3 double-spaced letter-size pages {U.S. quarto), but shorter articles will also be considered. The original and one copy should be submitted, as should the diskettes, if any (in I B M or compatible WordPerfect format).
—All contributions should be accompanied by a note clearly indicating the title of the paper, the name of the author, the institution he belongs to, and his address. Authors are also requested to send in a short summary of the article (no more than 250 words) giving a brief description of its subject matter and main conclusions.
—Footnotes should be kept to the minimum, while bibliographical references and direct quotations should be carefully checked, since they are the responsibility of the author. It is also recommended that the number of tables and figures should be reduced to the minimum and that they should not duplicate information given in the text.
—Special attention should be paid to the bibliography. All the necessary information must be correctly stated in each case (name of the author or authors, complete title (including any subtitle), publisher, dty, month and year of publication and, in the case of a series, the title and corresponding volume number or part, etc.).
—I'he editorial board of the Review reserve the right to make any necessary revision or editorial changes required by the articles.
—Authors will receive a courtesy copy of the Review in which their article appears, plus 30 offprints of the article, both in Spanish and in English, at the time of publication in each language.
Anuario Estadístico de América Latina y el Caribe / Statistical Yearbook for Latín America and the Caribbean (bilingual)
ECLACpublications
ECONOMIC COMMISSION FOR LATIN AMERICA AND THE CARIBBEAN
Casitia 179-D Santiago de Chile
PERIODIC PUBLICATIONS
C E P A L Review
CEPA L R eview first appeared in 1976 as part of the Publications Programme of the Economic Commission for Latin America and the Caribbean, its aim being to make a contribution to the study of the economic and social development problems of the region. The views expressed in signed articles, including those by Secretariat staff members, are those of the authors and therefore do not necessarily reflect the point of view of the Organization.
CEPA L R eview is published in Spanish and English versions three times a year.
Annual subscription costs for 1991 are US$16 for the Spanish version and US$18 for the English version. The price of single issues is US$10 in both cases.
1980^ 617 pp.1981, 727 pp.1983, (1982/1983) 749 pp.1984, 761 pp.1985, 792 pp.
1986, 782 pp.1987, 714 pp.1988, 782 pp.1989, 770 pp.1990, 782 pp.
(Issues fo r previous years a lso av ailab le)
Libros de la C E P A L
1
Estudio Económico Economic Survey 9de América Latina of Latin Americay el Caribe and the Caribbean 101980, 664 pp. 1980, 629 pp.1981, 863 pp. 1981, 837 pp.
111982, v o l i 693 pp. 1982, voi. I 658 pp.1982, v o l l i 199 pp. 1982, voi. II 186 pp.
111983, v o l i 694 pp. 1983, voi. I 686 pp.1983, v o l l i 179 pp. 1983, voi. II 166 pp.1984, v o l i 702 pp. 1984, VOLI 685 pp. 121984, v o l l i 233 pp. 1984, voi. II 216 pp.1985, 672 pp. 1985, 660 pp. 121986, 734 pp. 1986, 729 pp.1987, 692 pp. 1987, 685 pp. 131988, 741 pp. 1988, 637 pp.1989, 821 pp.
14(Issues fo r previous years a lso available)
M anual d e proyectos d e desarrollo económ ico, 1958,5th. ed. 1980,264 pp.Manual on economic development projects, 1958,2nd. ed. 1972,242 pp.
Am érica Latina en el um bral de los añ os ochenta, 1979,2nd. ed. 1980,203 pp.
j^ u a, desarrollo y m edio am biente en A m érica Latina, 1980,443 pp.L os ban cos transnacionales y el financiam iento externo d e A m érica Latina. L a experiencia del Perú, 1980,265 pp.Transnational banks and the external finance of Latin America; the experience of Peru, 1985, 342 pp.
L a dim ensión am biental en los estilos de desarrollo de A m érica Latina, Osvaldo Sunkel, 1981,2nd. ed. 1984,136 pp.L a m ujer y e l desam ólo: guía para la planificación de íx og zm as y proyectos, 1984,115 pp.Women and development: guidelines for programme and project planning, 1982,3rd. ed. 1984,123 pp.
A frica y A m érica Latina: perspectivas de la coc^ ración intetveffonal, 1983,286 pp. Sobrevivencia cam pesina en ecosistem as de altura, vols. 1 y II, 1983,720 pp.L a m ujer en el sector popu lar urbano, A m érica Latina y e l Caribe, 1984,349 pp.A vances en la interpretación am biental d el desarrollo a p íco la de A m érica Latina, 1985, 236 pp.£/ decen io de la m ujer en el escenario latinoam ericano, 1986,216 pp.The decade for women in Latin America and the Caribbean; background and prospects, 1988,215 pp.
A m érica Latina: sistem a m onetario internacional y financiam iento externo, 1986,416 pp.Latin America; international monetary system and external financing, 1986,405 pp.R aúl Prebisch: Un aporte a l estudio de su pensam iento, 1987,146 pp.Cooperativism o latinoam ericano: antecedentes y perspectivas, 1989,371pp.
15 CEPAL, 40 añ os (1948-1988), 1988,85 pp.15 ECIAC 40 Years (1948-1988), 1989,83 pp.16 A m érica Latina en la econom ía m undial, 1988,
32117 G estión para e l desanxAlo d e cuencas de alta
m ontaña en la zona andina, 1988,1Í87 pp.18 Políticas m acm económ icas y brecha externa:
A m érica Latina en los años ochenta, 1989,201 pp.19 CEPAL, B iblioffu fia, 1948-1988, 1989,648 pp.20 D esam ólo agricola y participación cam pesina,
1989,404 pp.21 Planificación y gestión del desarrollo en áreas de
expansión de la fion tem a^ opecuaria en A m érica Latina, 1989,113 pp.
22 Transform ación ocupactonal y crisis social en A m érica ÍMtina, 1989,243 pp.
23 L a crisis urbana en A m érica Latina y el Caribe: reflexiones sobre alternativas d e solución, 1990, 197 pp.
24 The environmentat dimension in development planning I, 1991, 302 pp.
25 TransfimnacieUx productiva con equidad, 1990, 185 pp.
25 Changing production patterns with social equity,1990,177 pp.
26 A m érica Latina y el Caribe: opciones para reducir el p eso de la deuda, 1990,118 pp.
26 Latin America and the Caribbean: options to reduce the debt burden, 1990,110 pp.
MONOGRAPH SER IES
Cuadernos de la C E P A L
1 A m érica Latina: el nuevo escenario regional y m undial/Latin America; the new regional and world setting, (bilingual), 1975, 2nd. ed. 1985, 103 pp.
2 L as evctiuciones reson óles de la estrategia internacional d el desam ollo, 1975, 2nd. ed. 1984, 73 pp.
2 Regional appraisals of the international development s t r a t a , 1975,2nd. ed. 1985,82 pp.
3 D esarrollo hum ano, cam bio socia l y crecim iento en A m érica Latina, 1975, 2nd. ed. 1984,103 pp.
4 R elacim es com erciales, crisis m onetaria e in te^ c it^ económ ica en A m érica Latina, 1975, 85 pp.
5 Síntesis de la segunda evaluación re^onal de la estrategia internacional d el desam ollo, 1975, 72 pp.
6 Dinero de valor constante. Concepto, problem as y experiencias, Jorge Rose, 1975, 2nd. ed. 1984, 43 pp.
7 L a coyunm ra internacional y el sector externo, 1975, 2nd. ed. 1983, 106 pp.
8 L a industrialización latinoam ericana en los años setenta, 1975,2nd, ed. 1984,116 pp.
9 D os estudios sobre inflación 1972-1974. L a inflación en los países centrales. A m érica Latina y la inflación im portada, 1975,2nd. ed. 1984,57 pp.
s/n Canada and the foreign firm, D. Pollock, 1976, 43 pp.
10 Reactivación d el m ercado com ún centroam ericano, 1976,2nd. ed. 1984,149 pp.
11 In teffoción y cooperación entre países en desarrollo en e l àm bito a r e o la . Germánico Salgado, 1976,2nd. ed. 1985,62 pp.
12 Temas d el nuevo orden económ ico internacional, 1976,2nd. ed. 1984,85 pp.
13 En t<xno a las ideas de la CEPA L: desarrollo, industrialización y com ercio exterior, 1977, 2nd. ed. 1985,57 pp.
14 En tom o a las ideas de la CEPAL: problem as de la in du strializad^ en A m érica Latina, 1977, 2nd. ed. 1984,46 pp.
15 L os recursos hidráulicos de A m érica Latina. Inform e reponed, 1977,2nd. ed. 1984, 75 pp.
15 The water resources of Latin America. Regional report, 1977,2nd. ed. 1985,79 pp.
16 D esarrollo y cam bio socia l en Am érica Latina, 1977,2nd. ed. 1984,59 pp.
17 Estrategia internacional de desarrollo y establecim iento d e un nuevo (xden económ ico internacional, 1977,3rd. ed. 1984,61 pp.
17 International development strategy and establishment of a new international economic order, 1977,3rd. ed. 1985,59 pp.
18 R aíces históricas de las estructuras distributivas de Am érica Latina, A. di Filippo, 1977, 2nd. ed. 1983,64 pp.
19 D os estudios sobre endeudam iento externo,C. Massad y R. Zahler, 1977, 2nd. ed. 1986,66 pp.
s/n United States ~ Latin American trade and financial relations: some policy recommendations, S. Weintraub, 1977,44 pp.
20 Tendencias y proyecciones a largo p lazo del desarrollo econ óm ico d e A m érica Latina, 1978, 3rd. ed. 1985,134 pp.
21 25 añ os en la accu ltu ra de A m érica Latina: rasgos prindpales 1950-1975,1978,2nd. ed. 1983, 124 pp.
22 N otas sobre la fam ilia com o unidad socioeconóm ica, Carlos A. Borsotti, 1978, 2nd. ed. 1984,60 pp.
23 L a organización de la in firm ación para la evaluación d el desarrollo, Juan Sourrouüle, 1978, 2nd. ed. 1984,61 pp.
24 C ontabilidad nacional a precios constantes en A m érica Latina, 1978,2nd. ed. 1983,60 pp.
s/n Energy in Latin America: The Historical Record, J. Mullen, 1978,66 pp.
25 E cu ad or desafios y h ffv s de ¡a política económ ica en la fa s e de ejqnmsidn pettolem , 1979, 2nd ed 1984,153 pp.
26 L as transform aciones rurales en Am érica Latina: ¿desarrollo social o m of^nacit^?, 1979, 2nd, ed. 1984,160 pp.
27 L a dim ensión de la pcéreza en A m érica Latina, Oscar Altimir, 1979,2nd. ed. 1983,89 pp.
28 O r^ izac ión institucional para el control y m an ejo de la deuda externa. E l caso chileno, Rodolfo Hoffinan, 1979,35 pp.
29 L a política m onetaria y el ajuste de la balanza de pagos: tres estudios, 1979,2nd, ed. 1984,61 pp.
29 Monetary policy and balance of payments ac^ustment: three studies, 1979,60 pp.
30 A m érica Latina: las evaluaciones regionales de la estratega in tem acim al d el desarrollo en los años setenta, 1979,2nd. ed. 1982, 237 pp.
31 E ducación, im ágenes y estilos de desam ollo, G. Rama, 1979,2nd. ed. 1982, 72 pp.
32 M ovim ientos internacionales de capitales, R. H. Arriazu, 1979,2nd. ed. 1984,90 pp.
33 In fam ie sobre las inversiones directas extranjeras en A m érica Latina, A, E , Calcagno, 1980,2nd, ed. 1982,114 pp.
34 L as fluctuaciones de la industria manufacturera argentina, 1950-1778, D. Heymann, 1980,2nd. ed. 1984,234 pp.
35 Perspectivas de reajuste industricU: la Com unidad E con óm ica E uropea y lo s países en desarrollo, B. Evers, G. de Groot and W. Wageranans, 1980, 2nd. ed. 1984,69 pp.
36 Un análisis sobre la posibilidad de evaluar la solw n cia crediticia de los países en desarrollo, A. Saíeh, 1980,2nd. ed. 19^ , 82 pp,
37 H acia los censos latinoam ericanos de los años ochenta, 1981,146 pp.
s/n The economic relations of Latin America with Europe, 1980,2nd. ed. 1983,156 pp.
38 D esarrollo regon al argentino: la agicultura, J. Martin, 1981,2nd. ed. 1984, 111 pp.
39 Estratificación y m ovilidad ocupacional en A m érica Latina, C. Filgueira and C. Geneletti, 1981,2nd. ed. 1985,162 pp.
40 Program a de acción reg on alpara Am érica Latina en los añ os ochenta, 1981,2nd. ed. 1984,62 pp.
40 R^ional programme of action for Latin America in the 1980s, 1981,2nd. ed. 1984,57 pp.
41 E l desarrollo d e A m érica Latina y sus repercusiones en la educación. A lfabetism o y escolaridad básica, 1982,246 pp.
42 A m érica L atin a y la econom ía m undial d el café,1982,95 pp.
43 E l ciclo ganadero y la econom ía argentina, 1983,160 pp.
44 L as encuestas de hogares en Am érica Latina, 1983,122 pp.
45 L as cuentas nacionales en A m érica Latina y el Caribe, 1983,100 pp.
45 National accounts in Latín America and the Caribbean, 1983,97 pp.
46 D em anda de equipos para generación, transmisión y trm ^orm ación eléctrica en A m érica Latina, 1983,193 pp.
47 L a econom ía de A m érica Latina en 1982: evolución general, política cam biaría y renegociación de la deuda externa, 1984,104 pp.
48 P olíticas d e ajuste y renegodación de la deuda externa en Am érica Latina, 1984,102 pp.
49 L a econom ía d e A m érica Latina y el Caribe en 1983: evolución general, crisis y procesos de ajuste,1985.95 pp.
49 The economy of Latín America and the Caribbean in 1983: main trends, the impact of the crisis and the adjustment processes, 1985, 93 pp.
50 L a CEPAL, encam ación de una esperanza de A m érica Latina, Hernán Santa Cruz, 1985,77 pp.
51 H acia nuevas m odalidades de cooperación económ ica entre A m érica Latina y el Ja p ^ , 1986, 233 pp.
51 Towards new forms of economic co-operation between Latin America and Japan, 1987,245 pp.
52 L os conceptos básicos d el transporte m arítim o y la situación de la actividad en A m érica Latina, 1986,112 pp.
52 Basic concepts of maritime transport and its present status in Latin America and the Caribbean, 1987,114 pp.
53 Encuestas de ingresos y gastos. Conceptos y m étodos en la experiencia latinoam ericana. 1986,128 pp.
54 Crisis económ ica y políticas de ajuste, estabilización y crecimiento, 1986,123 pp.
54 The economic crisis: policies for adjustment, stabilization and growth, 1986,125 pp.
55 E l desarrollo de A m érica Latina y el C aribe: escollos, requisitos y opciones, 1987,184 pp.
55 Latin American and Caribbean development: obstacles, requirements and options, 1987, 184 pp.
56 L os bancos transnacionales y e l endeudam iento externo en la Argentina, 1987,112 pp.
57 E l [xoceso de desarrollo de la pequeña y m ediana em presa y su papel eñ el sistem a industrial: el caso de Italia, 1988,112 pp.
58 L a evolución de la econom ía d e Am érica Latina e n l9 8 6 ,im ,S 9 p p .
58 The evolution of the Latin American Economy in1986.1988.95 pp.
59 Protectionism: regional negotiation and defence strategies, 1988, 261 pp.
60 Industrialización en América Latma: de la "caja negra" al "casillerv vacio", F. Fajnzylber, 1989, 2nd ed 1990,176 ppp.
60 Industrialization in Latin America: from the **Black Box" to the "Empty Box", F. Fajnzylber,1990.172 pp.
61 Hacia un desmollo sostenido en América Latina y el Caribe: restricciones y requisitos, 1989,94 pp.
61 Towards sustained development in Latin America and the Caribbean: restrictions and requisites, 1989,93 pp.
62 La evolución de la economia de América Latina en 1987, 1989,87 pp.
62 The evoiution of the Latin American economy in 1987,1989,84 pp.
63 Elementos para el diseño de políticas industriales y tecnoló^as en América Latina,1990.172 pp.
64 La industria de transporte regular mtemacional y la competitividad del comercio exterior de los países de América Latina y el Caribe, 1989, 132 pp.
64 The international common-carrier transportation industry and the competitiveness of the foreign trade of the countries of Latin America and the Caribbean, 1989,116 pp.
65 Cambios estructurales en los puertos y la competiHvidad del comercio exterior de América Latínay el Caribe, 1991, 141 pp.
65 Structural Changes in Ports and the Competitiveness of Latin American and Caribbean Foreign Trade, 1990,126 pp.
Cuadernos Estadísticos de la C E P A L
1 América Latina" relación de precios del intercambio, 1976,2nd. ed. 1984,66 pp.
2 Indicadores del desarrollo económico y social en América Latina, 1976,2nd. ed. 1984,179 pp.
3 Series históricas del crecimiento de América Latina, 1978,2nd. ed. 1984,206 pp.
4 Estadísticas sobre la estructura del gasto de consumo de los hilares según jinalidad del gasto, porgupos de ingpeso, 1978,110 pp. (Out of print; replaced by No. 8 below)
5 El balance de pagos de América Latina, 1950-1977, 1979,2nd. ed. 1984,164 pp.
6 Distribución regional del producto interno bruto sectorial en los países de América Latina, 1981, 2nd. ed. 1985,68 pp.
7 Tablas de insumo-producto en América Latina, 1983,383 pp,
8 Estructura del gasto de consumo de los hogares segín firutlidad del gasto, por grupos de ingeso, 1984,146 pp.
9 (Mgen y destino del com ercio exterior de los países de la A sociación Latinoam ericana de Integración y del M ercado Común Centroam ericano, 1985, 546 pp.
10 A m érica Latina: balance de pagos, 1950-1984, 1986,357 pp.
11 E l com ercio exterior de bienes d e capital en A m érica Latina, 1986,288 pp.
12 A m érica Latina: indices del com ercio exterior, 1970-Í9S 4 ,1987,355 pp.
13 A m érica Latina: com ercio exterior según la clasificación industrial internacional uniform e de todas las actividades económ icas, 1987, Vol. I, 675 pp; Vol. II,675pp.
14 L a distribuciát d el in g cso en C olom bia, A ntecedentes estadísticos y carm terísticas socioeconóm icas de los receptores, 1988,156 pp.
Estudios e Informes de la C E P A L
1 Nicaragua: el im pacto d e la m utación política, 1981,2nd. ed. 1982,126 pp.
2 Perú 1968-1977: la política económ ica en un proceso de cam bio ^ ohal, 1981, 2nd. ed. 1982,166 pp.
3 L a industrialización d e A m érica Latina y la cooperación internacional, 1981,170 pp. (Out of print, wül not be reprinted.)
4 E stilos de desarrollo, m odernización y m edio am biente en la agricultura latinoam ericana, 1981, 4th. ed. 1984,130 pp.
5 E l desarrollo d e A m érica Latina en los años ochenta, 1981, 2nd. ed. 1982,153 pp,
5 Latín American development in the 1980s, 1981, ^ d . ed. 1982,134 pp.
6 Proyecciones del desarrollo latinoam ericano en los años ochenta, 1981,3rd. ed. 1985,96 pp.
6 Latín American development projections for the 1980s, 1982,2nd. ed. 1983,89 pp.
7 L as relaciones económ icas externas de A m érica Latina en los añ os ochenta, 1981, 2nd. ed. 1982, 180 pp.
8 IntegToción y cooperación regon ales en los años ochenta, 1982,2nd. ed. 1982,174 pp.
9 Estrategias de desarrollo sectorial para los años ochenta: industria y agicultura, 1981, 2nd. ed. 1985,100 pp.
10 D inám ica d el siS em pleo en A m érica Latina. PREÁLC, 1981,2nd. ed. 1985,101 pp.
11 Estilos de desarrollo d e la industria m anufacturera y m edio am biente en A m érica Latina, 1982, 2nd. ed. 1984,178 pp.
12 R elaciones ecm óm icas de A m érica Latina con los países m iem bros d el "Consejo de Asistencia Mutua Económ ica" 1982,154 pp.
13 C am pesinado y desarrollo a r e o la en Bolivia, 1982,175 pp.
14 £7 sector externo: indicadores y análisis de sus flu ctu aáon es. E l caso argettíino, 1982, 2nd. ed. 1985,216 pp.
15 Ingeniería y consultotía en Brasil y el Grupo A ndino, 1982,320
16 C inco estudios sobre la situación de la m ujer en A m érica Latina, 1982,2nd. ed. 1S^85,178 pp.
16 Five studies on the situation of women in Latin America, 1983,2nd. ed. 1984,188 pp.
17 Cuentas n acionales y producto m aterial en A m érica Latina, 1982,129 pp.
18 E l financiam iento de las exportaciones en A m érica Latina, 1983,212 pp.
19 M edición d el em pleo y de los ingresos rurales, 1982,2nd. ed. 1983,173 pp.
19 Measurement of employment and income in rural areas, 1983,184 pp.
20 E fectos m acrvecm óm icos de cam bios en las barreras a l com ercio y a l m ovim iento de capitales: un m odelo de sim ulación, 1982,68 pp.
21 L a em presa pública en la econom ía: la experiencia argentina, 1982,2nd. ed. 1985,134 pp.
22 L as em presas transnacim ales en la econ m tía de Chile, 1974-1980, 1983,178 pp.
23 L a gestión y la inform ática en las em pesas ferroviarias de A m érica Latina y España, 1983, 195 pp.
24 Establecim iento de em presas de reparaciát y m antenim iento d e contenedores en A m érica Latina y e l Caribe, 1983,314 pp.
24 Establishing ccmtainer repair and maintenance enterprises in Latín America and the Caribbean, 1983,236 pp.
25 A ^ ta p otable y saneam iento am biental en A m érica Latina, 1981-1990/Dña\án% water supply and sanitation in Latín America, 1981-1990 (bilingual), 1983,140 pp.
26 L o s ban cos transnacionales, el estado y el endeudam iento externo en Bolivia, 1983,282 pp.
27 P olítica económ ica y procesos de desarrollo. L a experiencia argentina entre 1976 y 1981, 1983, 157 pp.
28 E stilos de desarrollo, energfay m edio am biente: un estudio de caso exploratorio, 1983,129 pp.
29 Em presas transnacionales en la industria de alim entos. E l caso argentino: cereales y com e, 1983, 93 pp.
30 IndusOialización en Centroam érica, 1960-1980, 1983,168 pp.
31 D os estudios sobre em presas íransnacim ales en Brasil, 1983,141 pp.
32 L a crisis económ ica internacional y su repercusión en A m érica Latina, 1983,81pp.
33 L a afficultum cam pesina en sus relaciones con la industria, 1984,120 pp.
34 Cooperación económica entre Brasil y el Grupo Andino: el caso de los minerales y metales no ferrosos, 1983,148 pp.
35 La apicultura campesina y el mercado dealimentos: la dependencia externa y sus efectos en una economía abierta, 1984,201 pp.
36 El capital extranjero en la economía peruana,1984,178 pp.
37 Dos estudios sobre política arancelaria,1984,96 pp.
38 Estabilizad^ y libemlización econ^ica en el Cono Sur, 1984,193 pp.
39 La apicultura campesina y el mercado dealimentos: el caso de Haití y el de la República Dominicana, 1984,255 pp.
40 La industria siderúrgjca latinoamericana:tendencias y potencial, 1984, 280 pp.
41 La presencia de las empresas transnacionales en la economía ecuatoriana, 1984,77 pp.
42 Decios, salarios y empleo en la Argentina: estadísticas económicas de corto plazo, 1984, 378 pp.
43 El desamólo de la seguridad social en América Latina, 1985,348 pp.
44 Market structure, firm size and Brazilian exports, 1985,104 pp.
45 La planificad^ del transporte en países de A rnica Latina, 1985,247 pp.
46 La crisis en América Latina: su evaluación y perfectivas, 1985,119 pp.
47 La juventud en América Latina y el Caribe, 1985,181 pp.
48 Desarrollo de los recursos mineros de América Latina, 1985,145 pp.
48 Development of the mining resources of Latin America, 1989,160 pp.
49 Las relaciones económicas internacionales de América Latina y la cooperación regional, 1985, 224 pp.
50 América Latina y la economía mundial del algodón, 1985,122 pp.
51 Comercio y cooperación entre países de América Latina y países miembros del CAME, 1985,90pp.
52 Trade relations between Brazil and the United States, 1985,148 pp.
53 Los recursos hidricos de América Latina y el Caribe y su aprovechamiento, 1985,138 pp.
53 The water resources of Latin America and the Caribbean and their utilization, 1985,135 pp.
54 La pobreza en América Latina: dimensiones y políticas, 1985,155 pp.
55 Políticas de premoción de exportademes en alpinos pakes de América Latina, 1985,207 pp.
56 Las empresas transnacionales en la Argentina, 1986,222 pp.
57 El desarrollo frutícola y forestal en Chile y sus detivadones sociales, 1986,227 pp.
58 £7 cultivo del a lg o d ^ y la soya en e l Paragüey y sus derivaciones sociales, 1986,141 pp.
59 Expansión d el ctütivo de la caña de azúcar y de la ganaderia en e l n ord est del Brasil: un examen d el p ap el de la política pública y de sus derivaciemes económ icas y sociales, 1986,164 pp.
60 L as em presas Utmsnacionales en e l d esabollo colom biano, 1986,212 pp.
61 L as em presas tnm m acionales en la econom ía d el Paraguay, 1987,115 pp.
62 Problem as de la industria latinoam ericana en la fa s e crítica, 1986,113 pp.
63 R elad on es económ icas in íem acim ales y cooperación regional de Am érica Latina y el Caribe, 1987,272 pp.
63 International economic relations and regional co-(^ration in Latin America and the Caribbean, 1987,267 pp.
64 Tres enst^xjs sobre inflación y políticas de estabilización, 1986,2011^ .
65 L a industria farm acéutica y fatm oqubnica: desarrollo histórico y posibilidades firtums. Atgentirta, B rasil y M éxico, 1987, 177 pp.
66 D os estudios sobre A m érica Latina y e l Caribe y la écem om ía intem acim al, 1987,125 pp.
67 Reestructuración d e la industria automotriz m undial y perspectivas para A m érica Latina, 1987, 232 pp.
68 C ooperación latinoam ericana en servicios: antecedentes y perspectivas, 1988,155 pp.
69 D esarrollo y transform ación: estratega para superar la pobreza, 1988,114 pp.
69 Development and change: strat^ies for vanquishing poverty, 1988,114 pp.
70 L a evolución econ óm ica d el Ja p ^ y su im pacto en A m érica Latina, 1988,88 pp.
70 Ib e economic evolution of Japan and its impact on Latin America, 1990,79 pp.
71 L a gestión de los recursos hídricos en A m érica Latina y e l Caribe, 1989,256 pp.
72 L a evolución del problem a de la deuda externa en A m érica Latina y e l Caribe, 1988, TI pp.
72 The evolution of the external debt problem in Latin America and the Caribbean, 1988,69 pp.
73 Agricultura, comercio exterior y cooperación internacional, 1988,83 pp.
73 Agriculture, external trade and international co-operation, 1989,79 pp.
74 Reestructuración industrial y cambio tecnológeo: consecuencias para América Latina, 1989,105 pp.
75 £7 medio ambiente como factor de desarrollo, 1989,123 pp.
76 El comportamiento de los bancos transnacionales y la crisis internacional de endeudamiento, 1989, 214 pp.
76 IVansnational bank behaviour and the international debt crisis, 1989,198 pp.
77 Los recursos hídricos de América Latina y del Caribe: planificación, desastres naturales y contaminación, 1990,266 pp.
77 Ibe water resources of Latin America and the Caribbean - Planning hazards and pollution, 1990,252 pp.
78 La apertura financiera en Chile y el comportamiento de los bancos írartsnadonales, 1990,132 pp.
Serie INFOPLAN: Temas Especiales del Desarrollo
1 Resúmenes de documentos sobre deuda externa, 1986,324 pp.
2 Resúmenes de documentos sobre cooperación entre países en desarrollo, 1986,189 pp.
3 Resúmenes de documentos sobre recursos hídricos, 1987,290 pp.
4 Resúmenes de documentos sobre planificación y medio ambiente, 1987,111 pp.
5 Resúmenes de documentos sobre integración económica en América Latina y el Caribe, 1987, 273 pp.
6 Resúmenes de documentos sobre cooperacit^ entre países en desarrollo. Uparte, 1988,146 pp.
W* J»'*^ Cf* W* f * ^ ' ■ f^'^' ^ o ^ t J t ^ ^ 4,1^‘ ^ >1 i j y , ^ ^ ( - * ' * J > » ^ ^ V 1 : - ^ \ j i
ttffn«tK»a;tiiinK*ca&ai»it»itTi»«nf(aKM i«tti^«ft«, «nHt«iwM«4itn»r^«nnKji4«»ai«i«!i.
HOW TO OBTAIN UNITtD NATIONS PUBLICATIONS
United Nations publications may be obtained Irom bookstores and distributors throughout the world Consult your bookstore or write to: United Nations, Sales Section, New York or Geneva.
COMMENT SE PROCURER LES PUBLICATIONS DES NATIONS UNIES
Les publications des Nations Unies sont en vente dans les librairies et les agences dépositaires du monde entier Informez vous auprès de votre libraire ou adressez vous à : Nations Unies, Section des ventes, New York ou Genève,
KAK nO/IYMHTb H3AAMHA OFFAHH 3AUHH OB'BEUIHHEHHMX HAILHH
M anaoHir O p raH naau H H OA'S.ejrHHeHMbiK H auH ft momiko ttynMTb m. KKMntHbix Mftr«- aHHax H ar«HTCTaax bo bccx pxftoHxx MOpx H xboamtc cnpXBKM oO K3AXHhmx b xxiueM KKHMSHúM M arasHHe H/1H nHuiKTe no x zipccy : O praHH sauM X OO'bcAHHCHNaix H aitufl. CcxuHX no npoAXwe HanaMun. Hbro-nopx h/ih MCeHCBa.
COMO CONSEGUIR PUBLICACIONES DE LAS NACIONES UNIDAS
Las publicaciones de las Naciones Unidas están en venta en librerías y casas distribuidoras en todas partes del mundo. Consulte a su librero o diríjase a: Naciones Unidas, Sección de Ventas, Nueva York o Ginebra
Publications of the Economic Commission for Latin America and the Caribbean {e c l a c I and those of the Latin American and Caribbean Institute for Economic and Social Planning {iLPEsJ can be ordered from your local distributor or directly through:
United Nations Publications Sales Section— DC-2-866 New York, NY 10017 USA
United Nations PublicationsSales SectionPalais des Nations1211 Geneve 10, Switzerland
Distribution Unit CEPAL— Casilla 179-D Santiago, Chile