S9600549_en.pdf - Repositorio Digital CEPAL
42
V INT-1626 ) 1 ¡ Borrador para discusión Sólo para participantes 22 de Enero de 1996 CEPAL Comisión Económica para América Latina y el Caribe Vni Seminario R ^ional de Política Fiscal Organizado por CEPAL/PNUD con el copatrocinio de FMI, BID y Banco Mundial Santiago, Chile, 22-25 de Enero de 1996 ifg r "BUDGET INSTITUTIONS AND FISCAL PERFORMANCE IN LATIN AMERICA "*! Alberto Alesina Ricardo Hausmann Rudolf Hommes Ernesto Stein *! Las opiniones expresadas en este trabajo, el cual no ha sido sometido a revisión editorial, son de la exclusiva responsabilidad de los autores y pueden no coincidir con las de la Organización.
-
Upload
khangminh22 -
Category
Documents
-
view
4 -
download
0
Transcript of S9600549_en.pdf - Repositorio Digital CEPAL

V I N T - 1 6 2 6 ) 1
¡ Borrador para discusión
Sólo para participantes
22 de Enero de 1996
CEPAL
Comisión Económica para América Latina y el Caribe
V n i Seminario R^ional de Política Fiscal
Organizado por CEPAL/PNUD con el copatrocinio de FMI, BID y Banco Mundial
Santiago, Chile, 22-25 de Enero de 1996 ifg r
"BUDGET INSTITUTIONS AND FISCAL PERFORMANCE IN LATIN AMERICA "*!
Alberto Alesina Ricardo Hausmann
Rudolf Hommes Ernesto Stein
*! Las opiniones expresadas en este trabajo, el cual no ha sido sometido a revisión editorial, son de la exclusiva responsabilidad de los autores y pueden no coincidir con las de la Organización.


Preliminary draft Please do not quote or circulate without permission
BUDGET INSTITUTIONS AND FISCAL PERFORMANCE IN LATIN AMERICA
Alberto Asesina Ricardo Hausmann Harvard University IDB NBER and CEPR
Rudolf Hommes Ernesto Stein IDB IDB
September, 1995
The authors gratefully acknowledge the invaluable research assistance of Cristina García López, Sergio Schmukler and Luis Tineo. They would further like to thank Ricardo Caballero, Roberto Rigobón and Antonio Spilimbergo for very useful discussion.

'J '
1. Introduction
The last two decades have witnessed a sharp increase in public debt accumulation in many
countries around the world. While some countries have reacted promptly to this development, others
have delayed the necessary fiscal adjustments. The variance of cross-country fiscal experiences is
remarkable: even within economically homogeneous groups of countries, fiscal positions are very
different For instance, within the OECD group debt to GNP ratios currently range fi-om more than
120 percent to less than 40 percent Total deficits vary fiom more than ten percent of GDP to close
to zero. In Latin America, as Figure 1 shows, the variance of fiscal position is also very large. The
average central government deficits in the 1989-93 period ranged fi-om 13.6 per cent of GNP in
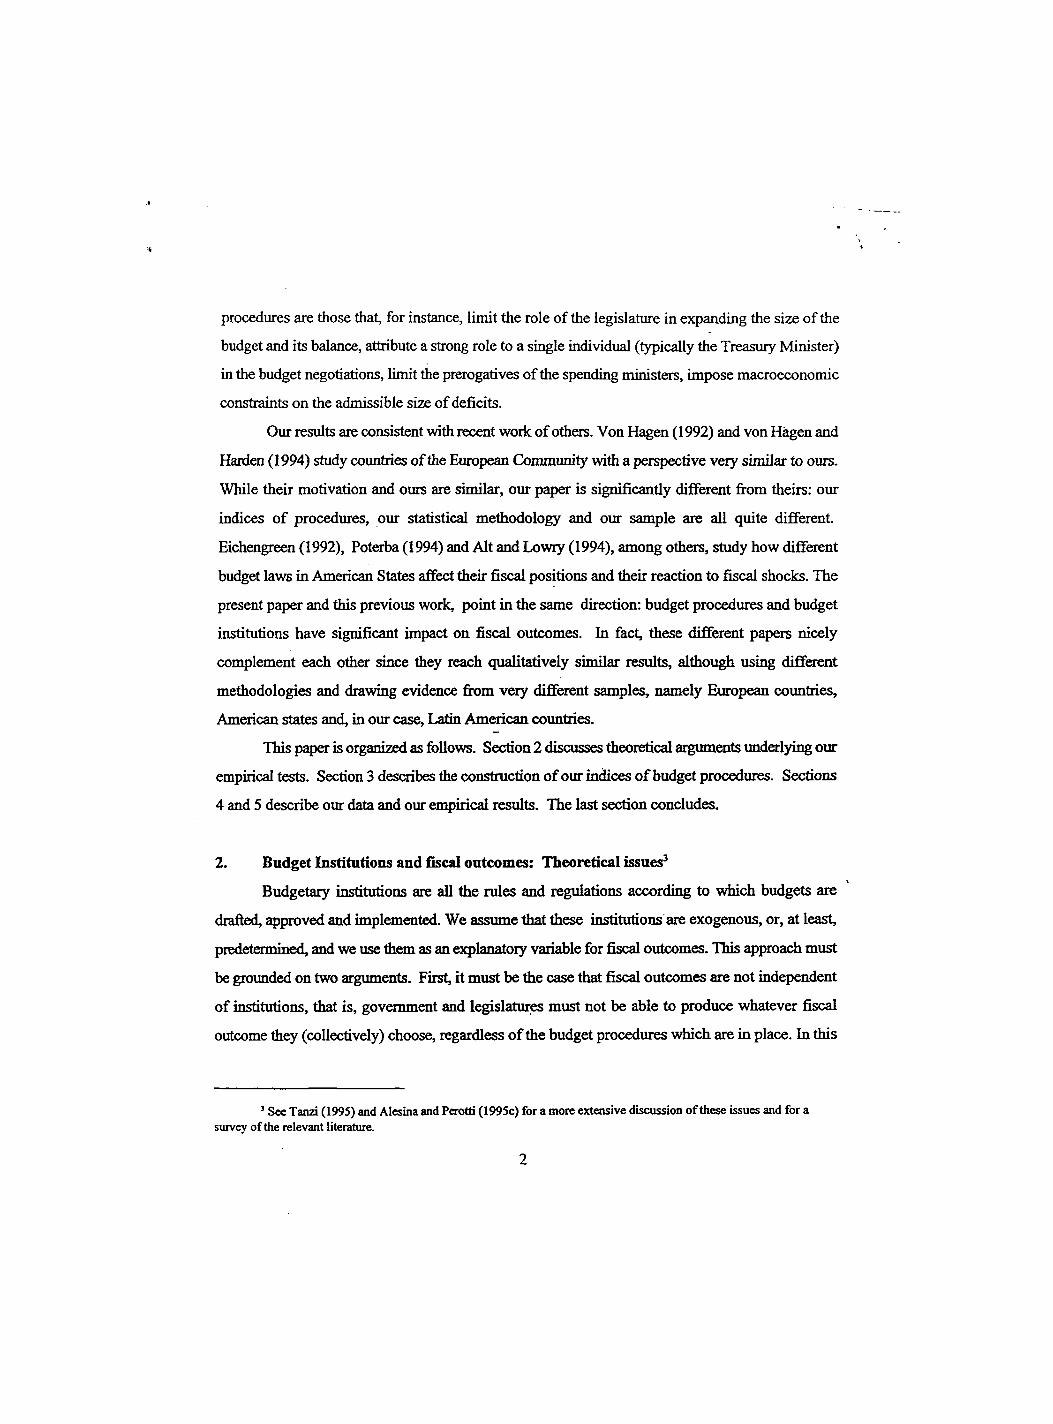
Guyana to a surplus of 3 percent of GNP in Jamaica. Figure 2 shows that this variance was even
higher in the early eighties, and has been declining since then, in conjunction with a widespread
improvement in the regions' fiscal accounts.
It is hard to e qplain these very large differences in fiscal positions purely based upon
economic differences or in the timing of "wars" and "recessions", as implied by the tax smoothing
theory of budget deficits, due to Barro (1979). Therefore, a recent lively literature has studied how
politico - institutional fectors can explain this cross-country variance of fiscal experiences'. This line
of research has emphasized political polarization, government structure and electoral systems as
some of the main political determinants of budget deficits. The evidence, drawn mostly fix>m OECD
economies, is generally favorable to this approach .
The goal of this paper is to e^qilain cross country differences in fiscal positions by focusing
upon the procedures which lead to the formulation, approval and implementation of the budget'
Unlike virtually all the literature on the subject, we consider not a sample of OECD countries, but
a sample of Latin American countries. We find that the nature of budget procedures strongly
influence fiscal outcomes. More specifically, what we define as more hierarchical/transparent and
less collegial procedures lead to lower primary deficits and more fiscal discipline. Hierarchical
' See Alesina and Pcrotti (1S>95 a) for a recent survey of this literature.
^ See, in particular Roubini and Sachs (1989a,b), Grilli, Masciandaro and Tabellini (I990)and Alesina and Perottí (1995 b)
1
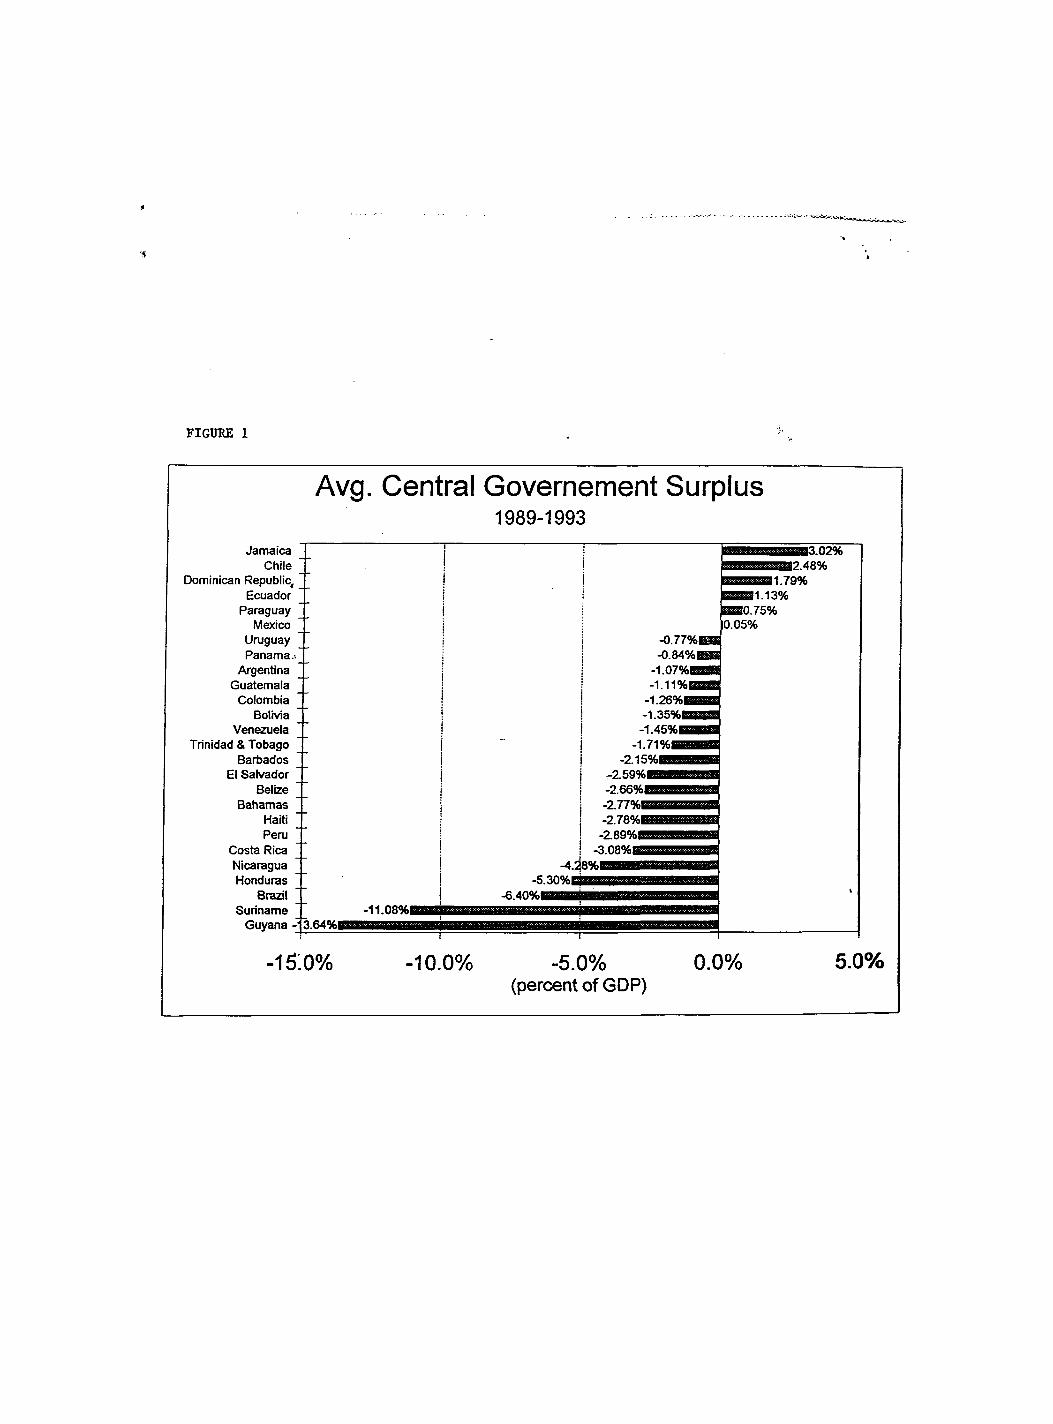
FIGURE 1
Avg. Central Governement Surplus 1989-1993
Jamaica Chile
Dominican Republic, 1 Ill 111111.79% Ecuador
Paraguay m o . 75% Mexico 0.05%
Uruguay -0.77%ras! Panama - 0 . 8 4 % ^
Argentina - i . 0 7 % m s Guatemala
Colombia -1 .26%BBm Bolrvia
Venezuela Trinidad & Tobago 1 7-lQZ.———•
Barbados El Salvador
Belize • Bahamas
Haiti " Peru
Costa Rica [ Nicaragua -4.Í nona uras
Brazit ; Suriname
Guyana
'O.OUTuB s nona uras
Brazit ; Suriname
Guyana
s nona uras
Brazit ; Suriname
Guyana
s
-i5:o% -10.0% -5.0% (percent of GDP)
0.0% 5.0%

FIGURE 2
Central Government: Average Regional Fiscal Surplus
1 9 7 0 1 9 7 2 1 9 7 4 1 9 7 6 1 9 7 8 1 9 8 0 1 9 8 2 1 9 8 4 1 9 8 6 1 9 8 8 1 9 9 0 1 9 9 2 1 9 9 4
dotted lines indicate standard deviations
procedures are those that, for instance, limit the role of the legislature in expanding the size of the
budget and its balance, attribute a strong role to a single individual (typically the Treasury Minister)
in the budget negotiations, limit the prerogatives of the spending ministers, impose macroeconomic
constraints on the admissible size of deficits.
Our results are consistent with recent work of others. Von Hagen (1992) and von Hágen and
Harden (1994) study countries of the European Community with a perspective very similar to ours.
While their motivation and ours are similar, our paper is significantly different firom theirs: our
indices of procedures, our statistical methodology and our sample are all quite different
Eichengreen (1992), Poterba (1994) and Alt and Lowry (1994), among others, study how different
budget laws in American States affect their fiscal positions and their reaction to fiscal shocks. The
present paper and this previous work, point in the same direction: budget procedures and budget
institutions have significant impact on fiscal outcomes. In fact, these different papers nicely
complement each other since they reach qualitatively similar results, although using different
methodologies and drawing evidence fi^om very different samples, namely European countries,
American states and, in our case, Latin American countries.
This paper is organized as follows. Section 2 discusses theoretical arguments imderlying our
empirical tests. Section 3 desoibes the construction of our indices of budget procedures. Sections
4 and 5 describe our data and our empirical results. The last section concludes.
2. Budget Institutions and fiscal outcomes: Theoretical issues^
Budgetary institutions are all the rules and regulations according to which budgets are
drafted, approved and implemented. We assume that these institutions are exogenous, or, at least,
predetermined, and we use them as an e3q)lanatoiy variable for fiscal outcomes. This approach must
be grounded on two argimients. First, it must be the case that fiscal outcomes are not independent
of institutions, that is, government and legislature must not be able to produce whatever fiscal
outcome they (collectively) choose, regardless of the budget procedures which are in place. In this
' See Tanzi (1995) and Alesina and Perotó (1995c) for a more extensive discussion of these issues and for a survey of the relevant literature.

section we discuss theoretical argmnents which suggest why institutions might in fact matter, and
below we test these arguments empirically. Second, it must be the case that institutions are not
themselves endogenous to the fiscal outcomes; that is, institutions cannot be easily changed as a
result of current or past fiscal outcomes. To a certain extent, institutions are indeed endogenous,
both to past fiscal outcomes and to "third factors". For instance, in the mediurri ong run
unsatisfactory fiscal performances may lead to reforms of budget institutions. In fact, in our sample
we observed a few important institutional reforms, in response to the large fiscal imbalances of the
early eighties. As we show below, the fiscal position of the reforming countries improved HOWCVCT,
budgetary institutions are relatively stable over time so that at least in the medium run (measured
in, say, up. to a decade or more) they can be considered fixed. Since it is costly and complex to
change institutions, the existing ones have to be very unsatisfactory, before it is worth changing
them; in other words there is a strong "status quo" bias in institutional reforms. If instiUitions are
relatively costly to change, than they can be considered predetermined explanatory variables. As
for the issue of "third factors" explaining both budgetary institutions and fiscal outcomes, one cannot
rule out a series of socio-cultural-political variables as candidates for this role^ These are issues
which, however, we largely ignore in this paper.
The government budget is the result of a collective decision process with several agents
involved: the Treasury, spending ministries, legislators, bureaucrats etc. The critical point is that
many of these agents have incentives to overexpand the budget and oceate deficits, vMe othar agents
have stronger incentives to internalize the overall government budget constraint For example
Weingast, Shepsle and Johnsen (1981) argue that legislators with geogr^hically based '
constituencies underestimate the cost of financing "poik barrel" projects, since the benefits are
concentrated locally and the taxes distributed nationally. Velasco (1995) argues that spending
ministers in a government create a "tragedy of the commons" situation, by favoring programs for
their departments which draw on a common pool of tax revenues. Since spending ministers have
relatively little incentives to internalize the budget constraint, a strong role for the Treasury Minister
* A similar discussion has emerged in the context of the literature on the effects o f Central Bank independence on inflation. On the particular issue of endogeneity of institutions (i.e. of mdqjendence of Central Banks), sec die discussion in Posen (1995) and Alesina (1995).

should enforce more fiscal discipline. More generally, budget institutions can influence fiscal
outcomes because they determine how the "game is played" amongst agents with different incentives
concerning fiscal discipline.
One can identify three types of budgetary institutions: i)laws (Constitutional or not) which
establish fiscal targets, such as balanced budget laws;- ii)procedural rules; iii)rules condeming the
transparency of the budget We examine them in turn.
2.i. Balanced budget laws
The theory of dynamic optimal taxation, which delivers the "tax smoothing" principle (Barro
(1979), Lucas and Stokey (1983)) implies that balanced budget laws are sub-optimal. In fact, these
laws would make it impossible to use budget deficits as the necessary buffer needed to implement
the tax smoothing policies, in years v^en spending is temporarily high or revenues temporarily low,
for given tax rates. Standard Keynesian arguments of countercyclical fiscal policy also point in the
same direction. ITieoretically, one can imagine contingent rules \^iiich allow for departures from
the balanced budget for cyclical reasons or for major natural or military calamities. However,
complicated rules are diflScult to implement, present monitoring problems and are rarely observed.
On the other hand, several arguments suggest that actual policies depart from principles of
optimality but, instead, are the result of various politically induced deficit biases. In these cases,
a balanced budget law may be a second best soliition. One would have to trade-off the distortions
of the balanced budget law on the optimal tax policies, against the reduction of politically induced
distortions on actual policies. In choosing along this trade ofii however, one needs to consider '
another objection to balanced budget laws: they create incentives to engage in creative accounting,
in order to'circumvent them. Thus, their "bite" is severely limited and they may actually be
counterproductive, since they make the entire budget process less transparent
An alternative to a balanced budget rule, which may achieve some of the benefits of the latter
without some of its costs of excessive rigidity, is a Macroeconomic Program Requirement In fact,
in a few countries in our sample, the government is required to prepare a budget which is consistent
' See the survey by Alesina and Pcrotti (1995a).
4
with a general macroeconomic program, often agreed upon with the Central Bank. These programs
typically include targets for the inflation rate, the external balance and monetary and fiscal policy
targets given certain assumption about the expected growth rate, saving rates etc. A Macroeconomic
Program Requirement may add some discipline to the budget process if it clearly identifies limits
to the size of the budget and its balance compatible with other economic goals.
2.ii. Procedural Rules
One can identify three phases in the budget process:
1) the formulation of a budget proposal within the executive;
2) the presentation and approval of the budget m the legislature;
3) the implementation of the budget by the bureaucracy.
We focus mostiy on the fia^ two aspects. We emphasize a critical trade-ofif between
institutions vdiich we define, for lack of a better word, "hierarchical" and institutions vidiich we
define "collegial". "Hierarchical" institutions emphasize a "top-bottom" approach. They attribute
a leading role to the Treasury Minister in the formulation of the budget within the executive, a
leading role of the executive vis a vis the legislature, they severely limit the prerogative of the latter
in amending the budget, and generally emphasize the power of the msgority. "Collegial" institutions
have the opposite features. Collegial institutions emphasize the democratic rule at every stage of the
process, such as the prerogatives of spending ministers within the government, the prerogatives of
the legislature vis a vis the govemmmt, and the rights of the minority opposition in the legislature.
We argue that "hierarchical" institutions promote fiscal discipline: thus, budget deficits should be
lower in countries with less "collegial" budget procedures.
Unfortunately, typically we do not have "fi:ee lunches", but trade offs. Here the trade off is
that vdiile "hierarchical" institutions may deliver fiscal discipline, they have the tendency to produce
budget heavily tilted in favor of the m^ority, thus, with more concentrated net benefits. This trade-
ofif emerges very clearly in the literature on voting rules on pork-bairel spending. As discussed
above, Weingast, Shepsle and Johnsen (1981) argue that representatives with geographically based
constituencies fevor spending programs with local benefits and national financing. As a result, in
equilibrium one observes an overejqjansion of the budget Baron (1989) and Baron and Ferejohn
(1991) study how different voting rules influence the spending allocation and efficiency of the

budget, defined as the ratio of total spending over total taxation. They emphasize a critical
distinction between "closed rules" and "open rules". A "closed rule" is one in which a proposal
made by a member of the legislature has to be voted immediately up or down. If the budget is
approved, the "game is over"; if it is rejected a new member of the legislature can make another
proposal which is voted, again, up or down. An "open rule" is one in v,1iich the proposàl made by
the member selected is subject to amendments on the floor. A proposal involves the choice of a
budget and an allocation of benefits amongst districts, i.e., representatives.
The critical difiference between the two procedures is that a closed rule attributes more power
to the first agenda setter. In fact, with a closed rule the agenda setter needs only to ofifer to the
minimal majority (50 percent plus one) enough benefits to make them prefer the proposal to the
continuation of the process with the proposal of another agenda setter, if the first proposal is rejected
With an open rule the power of the agenda setter is diminished, and he will take that into account
vvdien making a proposal. When making the first proposal the agenda setter faces a trade off. If he
offers a universal program, with benefits for evoy district, he may get immediate ^provai because
no legislator would want to amend. However, this strategy is expensive,' since it saves relatively
small benefits for the district of the agenda setter. On the other extreme, if the first ag^da setter
makes a proposal A^ch distributes benefits to a bare majority, there is a relatively high chance that
a member of the minority will be selected next period to make amendments, and he will object to
the proposal, attempting to form another majority.
These considerations provide the intuition for several results: 1. An open rule creates delays
in the approval of a proposal, where "delays" means that more than one vote is needed for a budget '
to pass. 2. A closed rule leads to the adoption of more inefficient budgets, namely budgets v^ere
the ratio of-aggregate benefits over aggregate taxation is lower. 3. A closed rule leads to the
adoption of "majoritarian" allocation ndes, i.e. such that the benefits are allocated to "50 percent
plus one" fi^ction of the legislature. Open rules may lead to a distribution of benefits in whidi more
than the minimum majority' of legislators receive positive net benefits. 4. With an open rule the
distribution of benefits within the winning majority are more egalitarian than with a closed rule.
These results highlight veiy clearly several aspects of the trade-off between hierarchical and
collegial procedures. A closed rule achieves a quick approval of proposal, at the cost of

implementing more "unfair" budgets. Budgets are unfair in the sense that they are tilted in favor of
those who make the first proposal, and always distribute benefits to the smallest possible majority.
This theoretical discussion has important empirical implications. First, wiiile in the
theoretical literature the "agenda setter'' is a randomly chosen legislator, in practice the government
is the agenda setter. Thus, "closed rules" ue those thatlimit the type of amendments to the budget
which the legislature can propose and more generally, attribute strong prerogatives to the
government vis a vis the legislature. Examples of these rules are those that prohibit legislative
amendments which increase the deficit and total spending. The "fairness" in the process can be
achieved by allowing open rules on the allocation of spending, once the total is approved by closed
rule. Second, we can also interpret negotiations within the governments fi-om the point of view of
closed and open rules. Arrangements close to a "closed rule" are those which attribute strong
prerogatives to the Treasury Minister vis a vis the spending ministers, if the Treasury Minister has
the agenda setting power in intra government negotiations on the budget preparation.
The "delay" caused by open rule in the approval process can be viewed as a cause of
persistent deficits, delaying fiscal adjustment, and resulting in debt accumulation. However, the
models reviewed above are not e3q)licitly dynamic, that is they do not consider directly the effect of
voting rules on debt accumulation, even though the result on delays of budget qjproval can be
interpreted in that direction. An explicitly dynamic model which allows for different procedural
rules is provided by Velasco (1995). He shows that if multiple spending agencies (for instance
spending ministers within a govemmoit) can influence the budget process, deficits emerge as a result
of a "tragedy of the commons" situation. Thus, Velasco's results provide further theoretical '
underpiiming to the view that a "strong" Treasury Minister vis a vis the spending ministers can
enforce fiscal discipline.
Ferejohn and iCreibhel (1987) discuss another important issue concerning the order of voting
in the legislature discussion of the budget Intuitively, one may argue that voting first on the overall
size of the budget and then on its composition should lead to more fiscal restraint than the opposite
sequence of votes. However, these two authors show that this intuitive result does not necessarily
hold. In feet, strategic legislators, when voting on the size of the budget, will anticipate how the first
vote will influence the second vote in the allocation. Thus, according to this paper it is impossible

to make an empirical prediction linking the order of votes with the final budget outcome.
Despite these authors' useful warning, we still believe that, particularly for the countries in our
sample, fiscal discipline is enhanced by procedures which require first a commitment to an overall
balance compatible with macroeconomic objectives, and then a discussion of spending composition.
2.iii. Transparency
Even the most stringent and hierarchical procedures can be circiunvented, and fiscal
discipline relaxed, if cumbersome and untrasparent budget documents open wide doors to creative
accounting.* Politicians have incentives to hide taxes, over emphasize the benefits of spending, and
hide goveijiment liabilities, equivalent to fiiture taxes. Thus, they have little incentive to produce
simple, clear, and transparent budgets.
Two theoretical aigimients support this claim. First the theory of fiscal illusion, (Buchanan
and Wagner (1977)), according to which the voters overestimate the benefits of public spending and
underestimate the costs of taxation, current and future. Lack of transparency of the budget can
increase the voters' confusion and reduce politicians' incentives to be fiscally responsible.
The second argument relies on the notion of "strategic ambiguity" of rational politicians
facing a rational electorate. Although not in the context of budget institutions, Cukierman and
Meltzer (1986) and Alesina and Cukierman (1990) amongst others, show that opportunistic
politicians would choose to introduce "noise" in the system, to make their choices less clear in the
eyes of the electorate. Although this noise has efficiency costs, it creates a strategic advantage for
the policy makers, who, in graeral, will nai choose to minimize the noise to maximize efficiency.
Rogofif and Sibert (1988) and Rogoflf (1990) raise a related point in the context of political
business cycles models. Th^ show that when a rational electorate cannot perfectly observe fiscal
variables, such as e^qienditure composition and/or the incidence of various forms of taxation, the
policy makers have incentives to follow loose fiscal policies in election years. These incentives
would disappear if the electorate were fully informed.
' Tanã (1995) and Alesina, Maré and Perotó (1995) argue that this problem is in fact, critical for Italy, a country with extremely cumbersome budget procedures and a veiy high debt/GDP ratio.
8
In practice, creative accounting can take a variety of forms. From strategically unreliable
forecasts of economic variables, to underprovision for entitlement programs, to transfers of liabilities
to other parts of the general governments not included in the budget of the Central Government For
reasons which are almost self evident it is quite difiScult to measure with a single number the degree
of transparency of a budget However, the difficixlty of measvirement does not diminish the critical
importance of this variable. Even the most "hierarchical" voting procedures or most stringent
balance budget laws can be severely imdermined by untrasparent budget documents which do not
reflect accurately the real fiscal situation.
2.ÍV. Summary
Ouf discussion suggests that: i) the presence of laws (or a binding macroeconomic program)
limiting the permissible size of deficits; ii) "hierarchical" voting procedures and iii) budget
transparency, should promote fiscal discipline, defined as low average deficits.
3. The index of budgetary institutions
3.i. The construction of the index
In order to study the incidence of budgetary institutions on fiscal outcomes, one needs a
measure of the institutions of different countries according to the hierarchical/transparent-
coUegial/untrasparent criteria sketched above. For this purpose, we created an index with several
components vdiich refer to all the steles of the budget preparation, approval and implementation.
The data for the construction of the index was collected through two questionnaires that were ^
answered by the budget directors of 20 Latin American and Caribbean coimtries.' In the first
questionnaire we obtained detailed information about the budgetary processes as they are today,
v ^ e through the second one we learned about tiieir evolution, as described by the changes in a set
of ten characteristics that cover the different stages of the budgetary process. It is on the basis of
these ten characteristics that we built our index. The information about the evolution of the
institutions over time -was necessary because a few countries have experienced reforms of their
^Both questionnaires are reproduced in Appendix C.
9

budgetary institutions during our sample period.
For each of the questions in the second questionnaire, countries were given a multiple choice
of answers to describe the present situation, and were asked to report the years in which changes in
the rules had occurred, as well as the nature of such changes. A summary of their answers is reported
in Appendix B. In each question, for each year, countries were assigned a score betweéti.O and 10
according to their answers, 10 for the case of the answer that we considered was the most
"hierarchical-transparent", and 0 for the one most "collegial-nontransparent". In some cases, their
answers to particular questions were complemented with more descriptive information contained in
the first questionnaire. For the case of answers that ranged in the middle of these extremes, we
assigned irjtermediate scores according to the number of possible answers. For example, if a question
admitted three answers the possible scores were 0, 5 and 10. If there were 4 possible answers, the
scores were 0,3.33,6.66 and 10.
In choosing the ten components of the index we followed two criteria. First, we wanted to
capture as many as possible of the features discussed in Section 2, \diich characterize budget
institutions on the hierarchical-collegial dimension. Second, we restricted ourselves to questiions
which received usable answers fi-om all the countries. In some cases, we also checked the answers
by comparing them to the available original written legislation. The advantage of using
questionnaires rather than the written legislation alone is twofold. First, answers to questionnaires
allow for an evaluation of "practices" above and beyond the letter of the law. Second, the amount
of information collected through the questionnaires is much largCT than it would have been possible
to obtain independently.
We now briefly illustrate each question. Question 1 inquires about the importance of a
macroeconomic program as a constraint for the elaboration of the budget by the executive branch.
We assigned 10 points for Üiose countries that reported that the macro program plays an important
role as a prerequisite for the submission of the budget to Congress, 5 points for "some importance",
and 0 for "not important or not required". Interestingly, in many countries in the region the
macroeconomic program does not play an important role in the budgetary process.
Question 2 addresses the issue of the relative standing of the budget authority, typically the
Treasury Minister, vis-a-vis the spending ministers in the budget preparation process. While
10

analyzing the answers to this question, we realized that the average tenure of a Treasury Minister is
very dijfferent in different countries. Regardless of the letter of the law, it would be difficult to argue
that a Treasury Minister has much influence if he is removed fi-om office every year. For this reason,
the answers to the questionnaire were combined with a measure of the average tenure of each finance
minister since 1980. We assigned 5 points to countries where the finance minister had a considerably
higher standing in discussions with the spending ministers in what respects to budget discussions,
2.5 points to for the case e re he/she has somewhat higher standing, and 0 for the case where they
are on equal footing. These scores were multiplied by 2 in cases where the average tenure of the
finance minister was larger than three years, and by 1.5 when the tenure was between 1.8 and 3
years. In th^ way, the maximum score is 10, as is the case with the other variables that conform our
index. Most of the variability in these question comes fi-om differences in the average tenure of the
Treasury Minister, since most countries reported that the Treasury Minister does have considerably
greater power than the spending ministers in budget discussions (see Appendix B).
Questions 3 and 4 reflect the relative power of the government and the legislature during the
discussions of the budget in Ck)ngress. In question 3, we ask about constraints on the legislature
regarding amendments to the government's proposed budget Those countries vdiere amendments
cannot increase the size of the budget and the deficit were ^ven 10 points. If Congress requires
government's approval to increase spending, we assigned 7.5 points, since in this case changes in
the size of the budget could be subject to negotiations, \N4iere Congress could agree to pass othar
legislation proposed by the govenmient in exchange for increases in the budget We assigned 5
points for the case wlioe Congress can only propose changes that may not increase the deficit This
constraint leaves a loophole for Congress to amend the budget increasing the ejqjenditure level, and
at the same time pass legislation a:eatii^ new revenues (more or less "real"), which might then fall
short of expectations, resulting in the end in larger deficits. Zero points were assigned in the case of
no constraints.
Question 4 asks hiqjpens if the budget is rejected or not passed by Congress within the
constitutionally established time fiame. Even in coimtries ^ ile e the budget has always been
approved on time, different rules in the event of rejection may result in different outcomes of the
budgetary process. The weaker the relative position of the government in this issue, the greater the
11
incentives to propose a larger budget, in order to insure passage through Congress. An extreme
"hierarchical" case, which applies to several countries in the region, is the one in which the budget
proposed by the government is executed, even if Congress rejects it or fails to approve it (10 points
were assigned to these countries). We considered the case where the previous year budget is adopted
more favorable to the government than the case in, which a new budget has to be presented to
Congress, as long as the government can redistribute spending between items. In the cases where
a new budget has to be presented, a greater degree of discretion for the govenmient in terms of
redistributing expenditures until the new budget is approved is given higher marks.
In some parliamentary governments, such as The Bahamas and Barbados, the government
would r e s ^ in case tiie budget is rejected In terms of the balance of power between Congress and
the government, this drastic possibility could go either way. One could argue that, since rejection
is very costly for the country. Congress will have incentives to always agree on a budget On the
other hand, this institutional arrangement may induce the government to propose a budget that is
more palatable to Congress. Thus we assigned an intemiediate score (5 points) to these countries.
Question 5 asks about the degree of borrowing autonomy by the govemmait The most
restrictive institution is one in which the government has legal restrictions in its ability to borrow.
Von Hagen and Hardin (1994) have suggested the creation of an independent agency in charge of
setting the borrowing ceilings. None of the Latin American countries have this institutional
arrangement. We considered it more conducive for fiscal discipline to have Congress setting a
ceiling on what the government may borrow, or approving total borrowing together with the budget,
rather than havii^ the government setting a constraint upon itself In feet, having Cor^ress setting'
the debt ceiling before the budget is approved is equivalent to discussing the size of the budget first,
and its composition later. Having each borrowing operation q)proved by Congress may have
negative effects, since it may lead to bargaining between government and Congress on other budget
issues, shifting the balance of power fi:om the Executive to Congress. The worst situation is that in
\diich the government can bonrow withoiit constraints, wiienever revenues fell short of ejqjenditures.
If the budget can be easily revised after its passage, it will not be taken very seriously, and
the whole budgetary process becomes less meaningful. In question 6 we inquire v^ether the budget
can be modified after approval by Congress, and on whose initiative. We assigned the best score in
12

the case where it is not possible to modify it (10 points). Consistent with the case of questions 3 and
4, we rate those systems where the initiative to modify the budget falls on the government as more
disciplined than those where it may be modified at Congress' initiative. However, provided the
government has the initiative, we assigned a larger number for the case where they require Congress
approval. When the government can modify the budget autonomously, we distinguished those
systems where they may do so up to a limit of 10 percent and those wdiere the limits are less stringent
or do not exist.
Question 7 asks vviiether the government can cut spending after the budget is passed. Here
there are conflicting arguments in favor of more or less discretion for the government in terms of its
ability to qut the budget Intuitively, it would seem that the possibility of cutting the budget will
result in better fiscal outcomes. However, it is also possible that the government will not have
incentives to submit a small budget to Congress if they can cut it later at their discretion. And later
on, it may be difficult to cut it even if this was intended fi-om the beginning. For this reason, we
assigned the highest score to those countries where the government can only cut the budget wdien
revenues are lower than projected, rather than those can cut without restrictions. The worse
situation is that in which the government cannot cut spending unilaterally imder any circumstance.
The next two questions attempt to capture important aspects of "transparency". In particular,
they focus upon whether the budget of the central government is truly meaningful, or v^ether other
public agencies, through their borrowing procedures, can make it less disdplined in an uncontrolled,
and untransparent way. Question 8 asks about the conditions for the central govraiment to assume
debt originally contracted by other agencies, and the fiequoicy of this occurrence. The ideal case in
terms of transparency is one in which the Central Government never assumes debt contracted by
other encies, but none of the countries had this type of arrangement ITie next best case is one in
the government only assumes the guaranteed debt, and this occurs only on an occasional basis.
Frequent cases of assuming guaranteed debt was considered as imtransparent as unfrequent
assumptions of debt, guaranteed or otherwise. A score of zero was given to those countries where
the Central Government fiequently assumes even the non-guaranteed debt In our first questiotmaire,
we asked 4lat percentage of the current Central Government debt was originally contracted by other
pubUc agencies. We used the response to this question to complement the one about the fi-equency
13

of debt assumption: the response "occasionally" was changed to "frequently" for those countries that
reported that a large portion of the current debt of the Central government was originally contracted
by other agencies.*
Question 9 inquires about the borrowing autonomy of the state and local governments, and
the public enterprises. The highest marks were assigned to those countries where these agencies
cannot borrow autonomously. In the case of the local govenunents, the requirement of approval by
the local legislature was not considered to add much discipline to the budgetary process compared
to the case wliere there are no restrictions to borrowing, which is clearly the worst case.
Finally, question 10 asks about the existence of constitutional constraints on the fiscal deficit,
such as balanced budget rules. None of the countries has a balanced budget rule, which would have
resulted in 10 points. 5 points were assigned to countries that answered that any deficit must be
propCTly financed, wliile zero points were given to those countries that responded that there are no
constitutional constraints on the deficit.
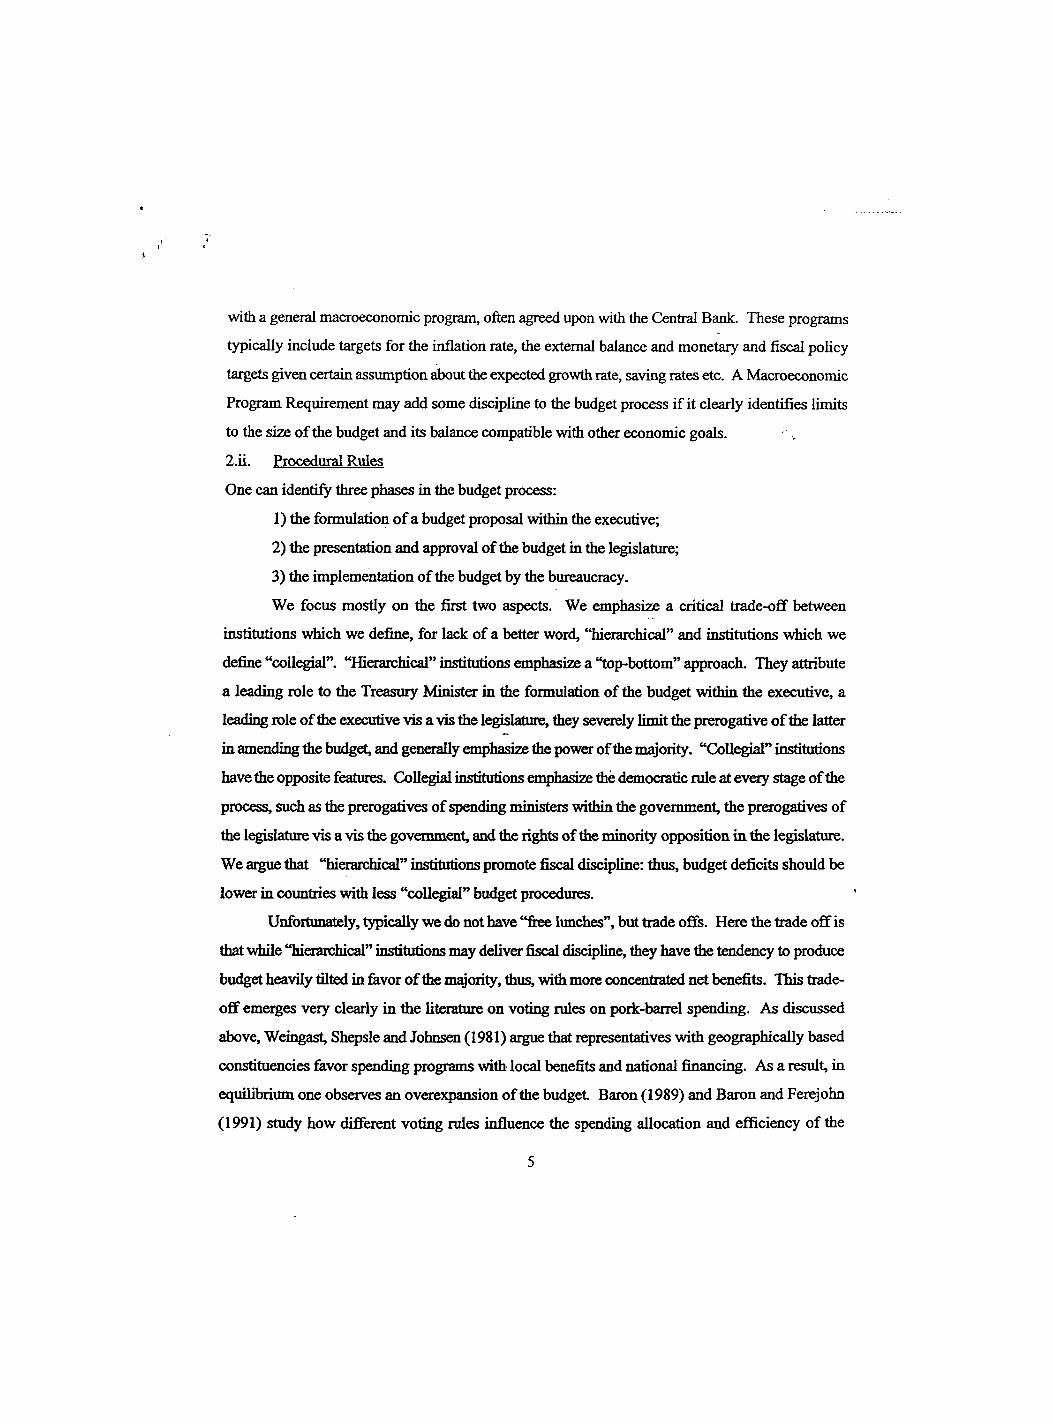
The simplest way of constructing an index based upon the ten question described above is
to simply add all the scores. This is in feet what we do. The value of the index for each country is
reported in Figure 3.
3.ii. RQbustness of the index tp changes in jts specification
The procedure of simply adding the scores of the different questions, of course, implies
giving equal weight to all the answers. It also implies that the different components of the index are
páfect substitutes. In other words, that having very hierarchical procedures in some aspects of the'
budgetary process, and very collegial procedures in others is the same, in terms of tiie overall index,
as having "intermediate" procedures in all aspects of the budgetary process. In order to check the
sensitivity of our results to these perfect substitutes and equal weights assumptions, we perform three
experiments. First we construct different indices with different assumption about substitutability
between components, by using the following formula:
*Within the group of countries than reported occasional assumption of guaranteed debt, Mexico was given a slightly higher score, since they report that the agencies which could not pay their debts were subject to restructuring or liquidation.
14
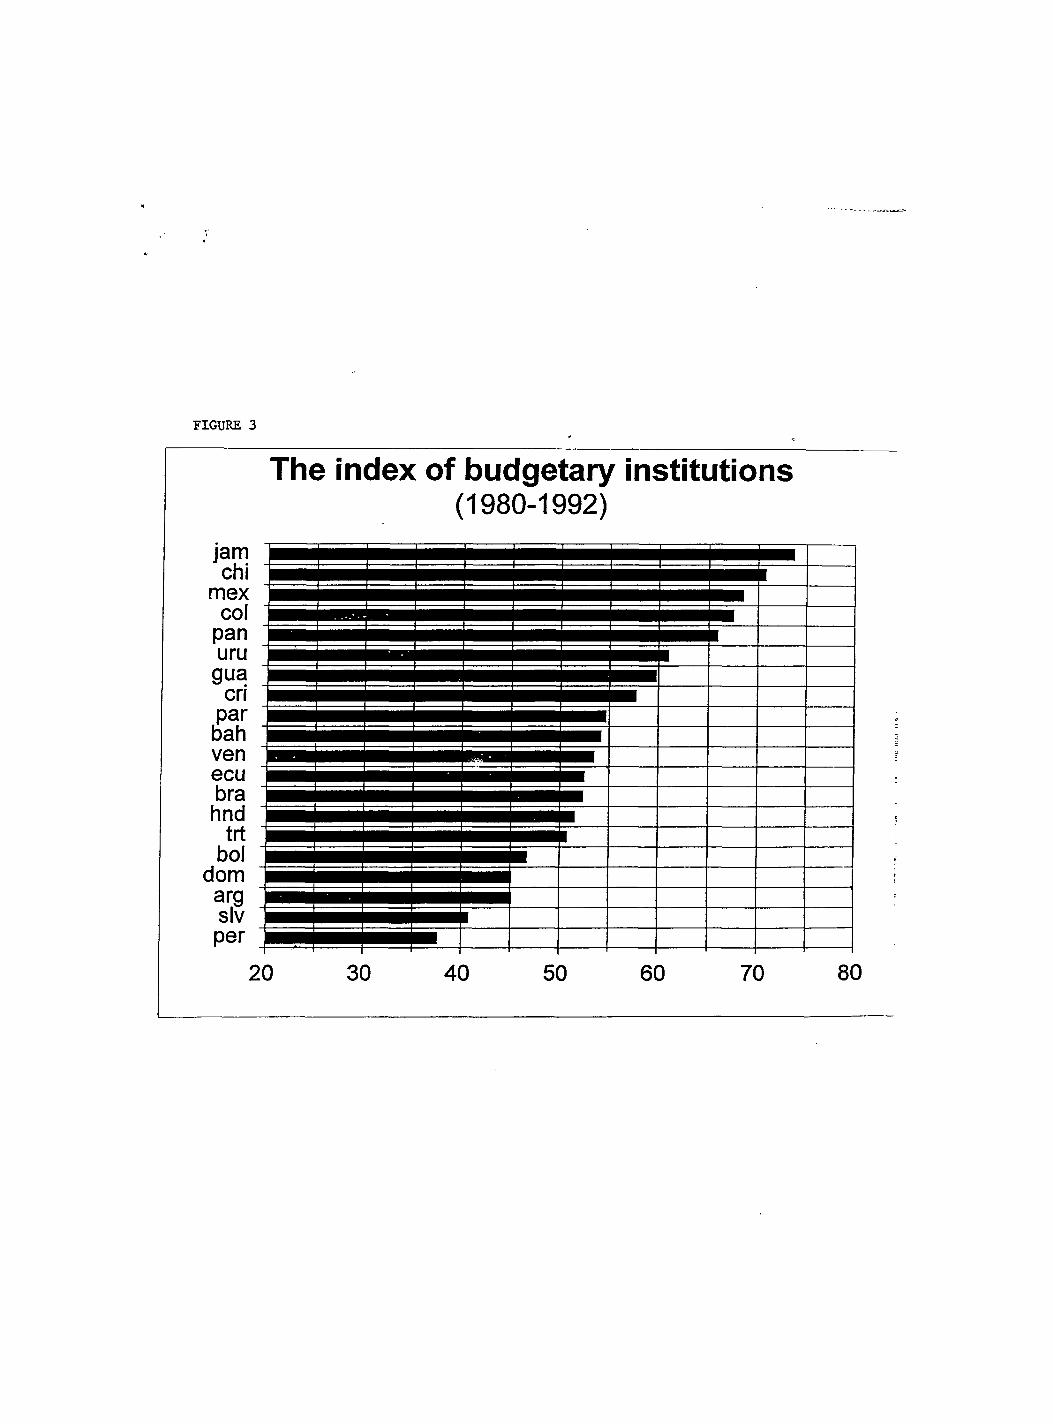
FIGURE 3
jam chi
mex col
pan uru
gua cri
par bah ven ecu bra hnd
trt bol
dom ara slv per
The index of budgetary institutions (1980-1992)
20 30 40 50 60 70 80

10
/ = 2 ^ / = 1
where the c, are the values of the different components of the mdex. When j=l, we have our main
index, where all the components are perfect substitutes and are simply added to each other. For 0 <
j <1, countries that show intermediate values in all categories will rank higher than those whose
institutions are very "hierarchical-transparent" in some respects, and very "coUegial-non transparent"
in others. The opposite will be true for the case of j > 1.' In order to check the robustness of the
index, we chose .4 and 2 as alternative values of j.'" Table 1 reports the ranking of countries
corresponding to the three different values of j. Note that countries are ranked according to their
average indices between 1980 and 1992, rather than the current state of their budgetary institutions,
wdiich in some cases have been subject to reform in recent years.
Table 1
Ranking of countries for different indices
j = .4 j = l j=2 Jamaica 1 1 1 Chile 4 2 2 Mexico 2 3 3 Colombia 3 4 5 Panama 5 5 4 Uruguay 6 6 7 Guatemala 11 7 6 Costa Rica 8 8 8 Paraguay 9 9 13 Bahamas 12 10 10 Vene2xiela 10 11 16 Ecuador 13 12 9
' A simple example of two countries and two components will illustrate this point Consider that for country A, c,^=IO and CJ M); and for country B, C,b=5 and 0,8=5. Then, for j=l , Ia=Ib=10. But if j=0.5, then Ia=3.16 while Ib=4.47. For j=2, Ia=100 while Ib=50.
"The reason to choose these values of j is that we feel comfortable enough that the true model of how the different components interact falls within this range. At j=3, for example, a country that had a value of 3 in each of the components would have an index equal to a country that has 10 in one component, 5 in two others, and zero in the other seven. This value of j seems to give an unreasonable premium to high scores in a reduced number of components. In contrast, for j=2, a country with S in all components would be the same as one that has 10 in one, S in six others, and zeros in the other three components. This seems more reasonable. Similar considerations were used to define .4 as the other "reasonable limit" for j.
15

Brazil 7 13 14 Honduras 14 14 12 Trinidad & Tobago 15 15 11 Bolivia 17 16 17 Dominican Republic 19 17 15 Argentina 18 18 18 El Salvador 16 19 20 Peru 20 20 19
The Spearman rank correlations between the first two indices is 0.941. That between the
second and third column is 0.938, while the rank correlation between the "extremes" is 0.842. These
correlations are very high, suggesting that the index is quite robust to changes in its specification.''
For the rest of the paper, therefore, we will utilize the index with j = 1.
A second approach to the problem of robustness is to divide the countries in three groups,
according to their ranking. In tiie group with the highest rankings we included Jamaica, Chile,
Mexico, Colombia, Panama, and Un^uay. As can be seen in table 1, these countries have budgetary
institutions that can be considered "hierarchical-transparent" regardless of the specification of the
index. In the middle group are Guatemala, Costa Rica, Paraguay, Hie Bahamas, Venezuela, Ecuador
and Brazil. Finally, Honduras, Trinidad and Tobago, Bolivia, Dominican Republic, Argentina, El
Salvador and Peru conform the group of countries which, on average, had "coUegial/non transparenf
budgetary institutions. The groups were divided according to our main index ranking, and at the
same time making sure that no country in the top group ranked badly under different specifications
of the index, and no country in the bottom group ranked well under different specifications. Most
of the countries whose ranking changed substantially under alternative indices fell in the middle >
group. As a result, the composition of these groupings is very robust, and would only change
marginally we used one of the alternative indices as a criteria for the division. In addition to the
regressions using our index, we will perform others using dummy variables based on these
groupings.
"Excqjtions to this are Guatemala, Venezuela, and most notably Brazil. The ranking in these countries does change significantly depending on the specification of the index. In the cases of Brazil and Venezuela, this is due to the fact that these countries have an unusual number o f answers that fell in between hierarchical and collegial. The exact opposite is true for the case of Guatemala.
16
Third, in section 5 below, we partially address the issue of equal weights, by grouping the
components of the index into subíndices, to check which of them seem to have a larger effect on the
budget balance.
4. Do budget institutions matter for fiscal performance?
4.i Model specification and data
We analyze yearly data between 1980 and 1992 for a sample of 20 countries in Latin
America and the Caribbean. The countries, which are listed in table 2 above, are those that answered
our second questionnaire. As a measure of fiscal performance, we use the ratio of the primary
deficits of the central government over GDP.' The reason to focus on the central government is thai
the availability of data on public sector deficits was limited for several countries. As a measure of
fiscal outcomes, the primary deficit is superior to the total deficit. One reason for this is that some
of the countries in the region have experienced episodes of very severe inflation over the period of
our study, and this has greatly affected the size of their interest payments. Beyond the effects of
inflation, the difference between primary and overall deficits is to a large extent predetermined by
accumulated debt, and does not necessarily reflect the government's current fiscal stance.
The index described in the previoxis section varies substantially across countries, but has litüe
time variation- For half of the countries in the region, the index is constant over time. In most of the
other coimtries, it changes only once during our sample period For this reason in our estimations
we treat the index as a cross-country variable. Our budget institutions variable (INDE5Q, therefore,
is the mean of the country's index during the sample period Alternatively, we use dummy variables
for the group of countries with highest rankings (HIGH), and for those in the middle group (MID).
The rest of the control variables used in our empirical analysis are listed in the following table; a
more detailed description is provided in Appendix A.
" The sources and details of all the data used in this study are reported in appendix A
17

Table 2
CATAS Dummy variable for natural catastrophes and wars
GDPGR Real GDP growth rate
fflGH Dummy for countries which have a high average value of the index
INTL Debt interest payments from the Central Govenmient as a share of GDP
MID Dummy for coimtries with an average value of the index in the middle range
OV65 Share of the population over 65 years old.
PED79 Stock of Public Sector External Debt as a share of GDP
PRCONG Real Private Consumption growth rate
TRADE. Rate of change of Terms of Trade times the degree of openness
UND15 Share of the population under 15 years old.
We followed two different estimatioti procedures. In the first one, we just run cross-country
regressions. A problem associated with this approach is that of scarcity of degrees of fireedom. In the
second approach, the estimation is done in two steps." In the first step, the primary deficits are
regressed on all the determinants which have time variation, and the coefiScients of these variables
are estimated. All variables in the first step eater as deviations from their coimtry means. Using the
first step estimation, a cross-country second step is run to obtain the estimate for the index.
Compared to the cross-country regressions, this procedure gains some degrees of fijeedom, since only
the index enters the second step as a right hand side variable. In addition, it uses all the available
information in the case of those variables that do have time variatiotL*
4.ii. Budget institutions and fiscal outcomes: are thev correlated?
"For a detailed description of the twp-step methodology see Hsiao (1989).
"Both the cross-countiy regressions and the second step regressions in the two-step procedure are estimated by weighted least squares in order to correct for the heteroskedasticity which arises because the number of observations used to calculate the mean values for those regressions differs across countries. For those regressions, the corrected R^ reported in tables 4 , 5 and 6 below correspond to the transformed model.
18

Figure 4 shows a scatter diagram where our index of budgetary institutions appears on the
horizontal axis, and the primary deficits on the vertical axis. For each country, both the index and
the primary deficit are averages for the period 1980-1992. The picture clearly shows that there is a
negative correlation between the index and the value of the primary deficits. The regression
coefiScient for the index shown in the graph is statistically significant, and suggests that a country
with an index value of 65 (fairly high) is expected to have average primary deficits \\iiich are nearly
2.8 percentage points of GDP lower than a country with an index of 45 (fairly low).
Similar results are found when we divide the countries into groups, according to their
ranking. The avenge index for each of the groups, together with their average primary deficit are
reported in table 3 below. Note that the difference in primary deficits between the HIGH dnd the
MID groups is much smaller than that between MID and LOW.:
T a b l e s
Group AVG Index AVGPrimDef
HIGH 67.91 -1.71%
MID 5416 -1.09%
LOW 44.34 1.82%
Figure 5 shows the same relationship as Figure 4, but restricted to years of democratic
govemmoit The reason to focus on democratic years is that it could be argued that our index better
reflects the budgetary institutioc^ during danocratic periods, since some of the components address
the relative^wer of the executive and the legislature. On the other hand, by focusing only on
democratic years, one loses many observations. In democratic years, the index continues to be
significant at the 5 percent level, and the coefiBcient is only reduced slightiy.'^
Figure 6 shows the evolution of the primary deficits for those countries that have gone
through reform of their budget institutions, as measured by changes in our index. This figure
'^Note in the figure that Brazil is the most notable outlier in the regression. If we exclude Brazil, which is also the country which is least robust to changes in the specification of the index, the coefficient for the index becomes 0.0125, it is significant at the 1 percent level.
19

FIGURE 4
Effect of Budget Institutions on Fiscal Outcomes
All years 0.06
0.04 A
õ 0.02 ií= 0
•D O
<0
i -0.02 o .
-0.04
-0.06 30
bol • hnd
5lv • arg frt nu a
per rlnm -
" •
cri
e«en
pan
bra
•
. . jam •
40 Cõêf raãf
ntercept 0.077 2.79 ndex -0.00139 -2.83
50 60 Index
70 8 0

FIGURE 5
Effect of Budget Institutions on Fiscal Outcomes
Democratic years o:o4
0.02 J
0 (D
^ - 0 . 0 2 (0
1 -0.04 Q.
O
-0.06
-0.08 30 40
"Cõêf Ç ü ã f Intercept 0.055 2.02 Index -0.00115 -2.36
50 60 index
70
i 1 |hnd 1 • itrt
1 1
pec^ • siv "y •
doíhfíU cri
bah - g . col a •
• pan
mex
. . jam
1-» m -ora • \
80

FIGÍDEE 6
Budget reform and fiscal outcomes
0.06
0.04
••g 0.02
0 <D
T3 ^ CD E ^ -0.02
-0.04
-0.06 30 40
« b o l l •
\
s h r l
s
\ \ « 9 1
\ m e x i •
p e r l
« 1 "
O i l
\ ^ -'
c o l l \
n a i 2 " r — - - - .
\ « i f ? «
V I '^ffe^'
• \
V "
5 3
i ?
mt
:
VO :
« 2
1 1 '
«
\ \ •
5
50 60 index
70 80

provides additional evidence of the importance of these institutions. Almost all the countries that
experienced an increase in the index showed reductions in their average primary deficits, the only
exception being Venezuela. The countries that showed the largest improvement in their institutions
are Argentina and Peru. In Argentina, reforms implemented in 1993 included an increase in the
importance of the macroeconomic program as a prerequisite for the elaboration of the budget, the
introduction of restrictions on the type of amendments that Congress can propose (they can no longer
propose amendments that increase the deficit), as well as constraints on the borrowing ability of the
government and the public enterprises. In addition, they modernized their information systems
allowing a much better control of the execution of the budget In Peru, which had the lowest index
in the region, important changes were introduced in 1990. The macroeconomic program, that until
then did not play any significant role in the elaboration of the budget, became very important; the
authority of the finance minister in budget discussions was increased, and Congress was limited in
its ability to propose amendments that increased the size of the budget or the deficit
4.iii. Regression analysis
a) CfQ s-cpuntry regressiops:
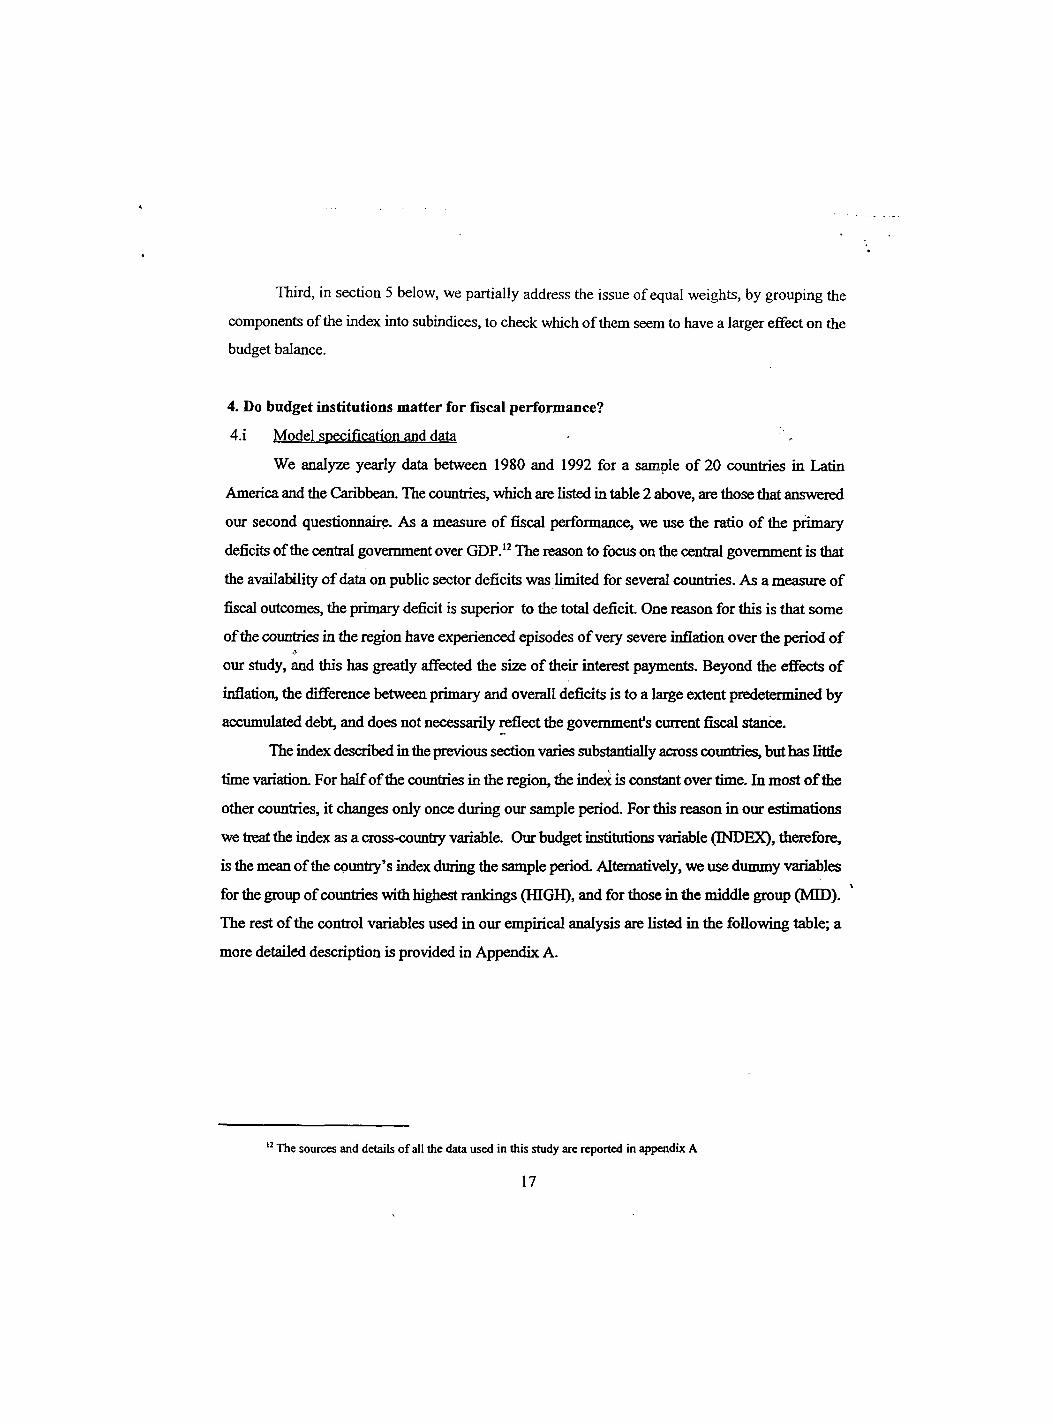
Table 4 presents the results of the cross-country regressions. The dependent variable is the
average primary deficit In the odd numbered columns, the effects of the budget institutions are
represented by the index. In the other ones, by the dummy variables MID and HIGH. In the first two
columns, we included the following control variables: TRADE is the growth in the terms of trade
interacted with the degree of openness of the economy. Since in some covmtries tax revenues are i
heavily linked to export activities and import tariffe, we expect growth in the terms of trade to be
associated with smaller deficits, and these effects to be more important for the case of economies that
are more opfen to international trade. OV65 and UND15 are the proportion of the population over
65 and under 15 years of age, respectively. These variables are expected to result in larger deficits
due to higher social security and education e:q)enditures, and to a lower proportion of tax payers.
The remaining control variable is the initial public external debt (PED79). This variable accounts
for the fact that highly indebted countries need to run primary surpluses in order to service their
debts. Total public debt would have been preferable, but the data was not available for a nimiber of
countries.
20

All the coefficients in the first regression have the predicted sign but, among the control
variables, only TRADE is significant at the 10 percent level. Both indicators of budgetary
institutions (the index and the dummies) appear to have a significant efifect on primary deficits, as
predicted by the theory. The value of the coefficient for HIGH may be interpreted as follows: on
average, a country with "hierarchical-transparent" institutions can be expected to have primary
deficits 2.9 percentage points lower than a country with "collegial-nontransparenf budget
procedures. In contrast, the difference between the top and middle countries seems to be rather small.
In the following columns we exclude the initial debt level (columns 3 and 4) and both the debt level
and the age composition variables (columns 5 and 6). The significance of the budgetary institutions
variables increases wiien these variables are excluded, and so does TRADE. The coefficients for the
index and the group dummies are very robust to changes in the specification of the regression, and
somewhat smaller compared to what was reported in the scatter diagram in Figure 4.
In the last two columns, we present the result of regressions similar to those in the previous
ones, but restricting the sample to include only years of democratic government Consistent with
A iiat we showed in the scatter diagrams, in this case the coefficient for the index is slightly smaller,
although still significant In contrast, the coefficients for the dummies HIGH and MID remain at the
same levels as in the case where the sample is not restricted.
bl Two step regressions:
In the first step we include several variables vi^ch control for economic determinants of
primary deficits. As Table 5 shows, we include: a) a measure of wars and natural calamities
(CATAS); b) a control for cyclical conditions, either the rate of growth of GDP (GDPGR) or the rate
of growth of private consumption (PRCONG); c) two measures of the age structure of the
population, UND15, the ratio of the population imder the age of 15 over the total and OV65, the ratio
of the population above 65 over the total; d) our measure of terms of trade interacted with openness
(TRADE); e) a lagged measure of interest payments (INTL) and Qthe lagged dependent variable.
In addition we always included year dummies, are not explicitly reported in the Table.
The first two variables, CATAS and GDPGR or PRCONG, are directly called for by the tax
smoothing theory. The age structure is important because it captures the ratio of active, tax paying
population relative to those who are not Lagged interest payments are meant to capture the fact that
21
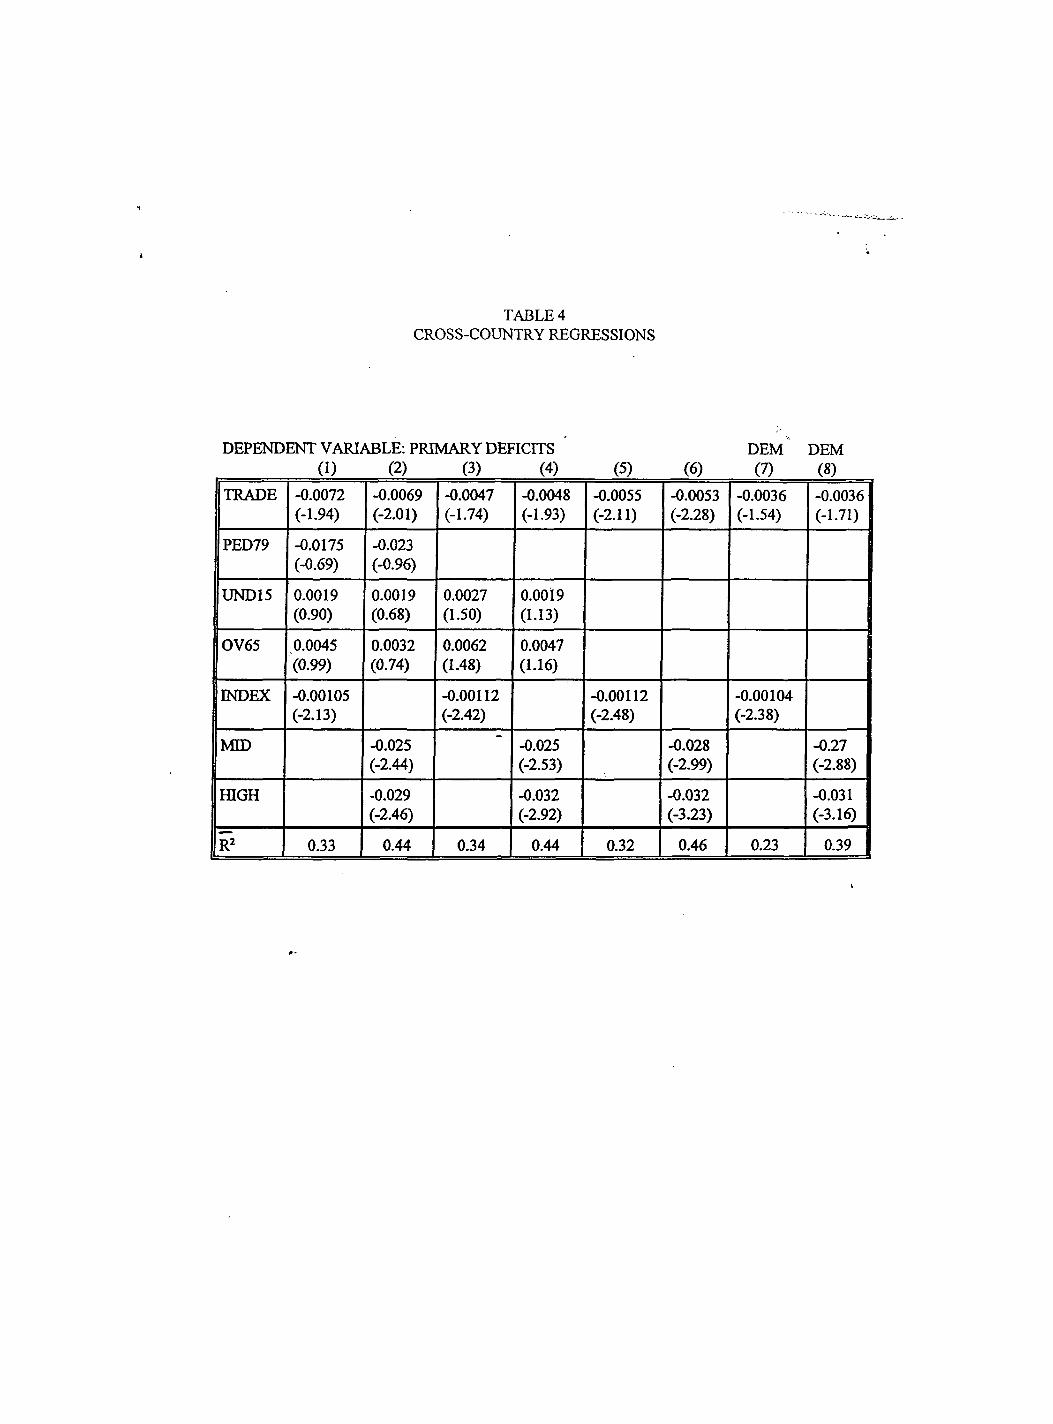
TABLE 4 CROSS-COUNTRY REGRESSIONS
DEPENDENT VARIABLE: PRIMARY DEFICITS DEM DEM (1) (2) (3) (4) (5) (6) (7) (8)
TRADE -0.0072 (-1.94)
-0.0069 (-2.01)
-0.0047 (-1.74)
-0.0048 (-1.93)
-0.0055 (-2.11)
-0.0053 (-2.28)
-0.0036 (-1.54)
-0.0036 (-1.71)
PED79 -0.0175 (-0.69)
-0.023 (-0.96)
UND15 0.0019 (0.90)
0.0019 (0.68)
0.0027 (1.50)
0.0019 (1.13)
OV65 0.0045 (0.99)
0.0032 (0.74)
0.0062 (1.48)
0.0047 (1.16)
INDEX -0.00105 (-2.13)
-0.00112 (-2.42)
-0.00112 (-2.48)
-0.00104 (-2.38)
MED -0.025 (-2.44)
-0.025 (-2.53)
-0.028 (-2.99)
-0.27 (-2.88)
fflGH -0.029 (-2.46)
-0.032 (-2.92)
-0.032 (-3.23)
-0.031 (-3.16)
R 0.33 0.44 0.34 0.44 0.32 0.46 0.23 0.39

countries which have accumulated a large interest burden are forced to run primary surpluses (or
smaller primary deficits) to meet interest obligations. The lagged dependent variable captures
persistence and the role of TRADE has been discussed above. The first stage regressions look
reasonable. All the coefiScients have the expected sign, and many of them are significant. Also note
that the coefiScients on the time dummies (not reported) highlight the average reduction of average
deficits in the sample period.
In the second step we use two measures of our index; the index itself and two dummies for
the middle and high groups. The results are generally consistent with the theory. The coefficients
on INDEX have always the correct sign, although they are not always significant at conventional
levels. However the coefficient on the HIGH group is always significant at the 5 per cent level in all
the specifications. On the other hand the coefficients on MED are always insignificant, indicating
that the dififerences in budget outcomes are observable mostly by comparing the top and the bottom
groups of countries. J
These results on the INDEX arc generally robust to a variety of sensitivity tests. For example,
we dropped, in turn, CATAS and TRADE fix)m the first step, and the results on the index or groiç
dummies do not change very much. When the age structure variables are not included, the
significance of the index improves notably, although the size of the coefficient is reduced. The
results on the index are also virtually unchanged when we instrument GDPGR (or PRCONG).
Finally, we also explored v ether the results change when we restrict the sample to democracy
years. Generally the results do not improve. As a matter of fact, the results on the index when
restricted to democracy years become more sensitive to the specification. In particular, the result on
the index seems to be affected by the cyclical variables included or excluded in the first stage.
5. A disaggi^at íon of the index
Our aggregate index summarizes a feirly large amount of different institutional features. One
may wonder of them is more directly correlated with fiscal performance. In order to shed
some Ught on this issue we considered four sub indices. Subindex 1 (SUBI) is given by the answers
to question 1 and 10, namely the importance of the macro program and the existence of
constitutional constraints on borrowing. Thus, this subindex captures something like the importance
of legislative and other constraints on the budget. Subindex 2 (SUB2) is the answer to question 2,
22

TABLES TWO STEP REGRESSION
DEPEÍÍDENT VARIABLE: PRIMARY DEFICIT (1) (2) (3)
1 TRADE;. -0.00061 -0.00061 -0.00062 1 TRADE;. (-2.27) (-2.29) (-2.25)^
CATASH 0.0089 0.0060 0.0090 (1.18) (0.79) (1.18)
loDPGRft -0.088 (-1.95)
IpRCONq^ -0.0177 1 (-0.651)
INTLi, -0.2194 -0.241 -0.220 (-2.55) (-2.79) (-2.49)
UNDlSft 0.0026 0.0033 0.00273 1 (0.94) (1.19) (0.95)
OV65« 0.0224 0.027 0.0258 (1.29) (1.56) (1.47)
PRDEFLH 0.4035 0.379 0.397 (6.19) (5.76) (5.87)
R2 0.53 0.54 0.53 j
1 INDEX,. -0.00128 (-1.50)
-0.00137 (-1.34)
-0.00184 (-1.96)
MEDi -0.000175 (-0.009)
0.00345 (0.15)
-0.0096 (-0.48)
fflGHj -0.0422 (-2.19)
-0.0462 (-1.98)
-0.0591 (-2.81)
R2 0.32 0.41 0.32 0.40 0.39 0.50
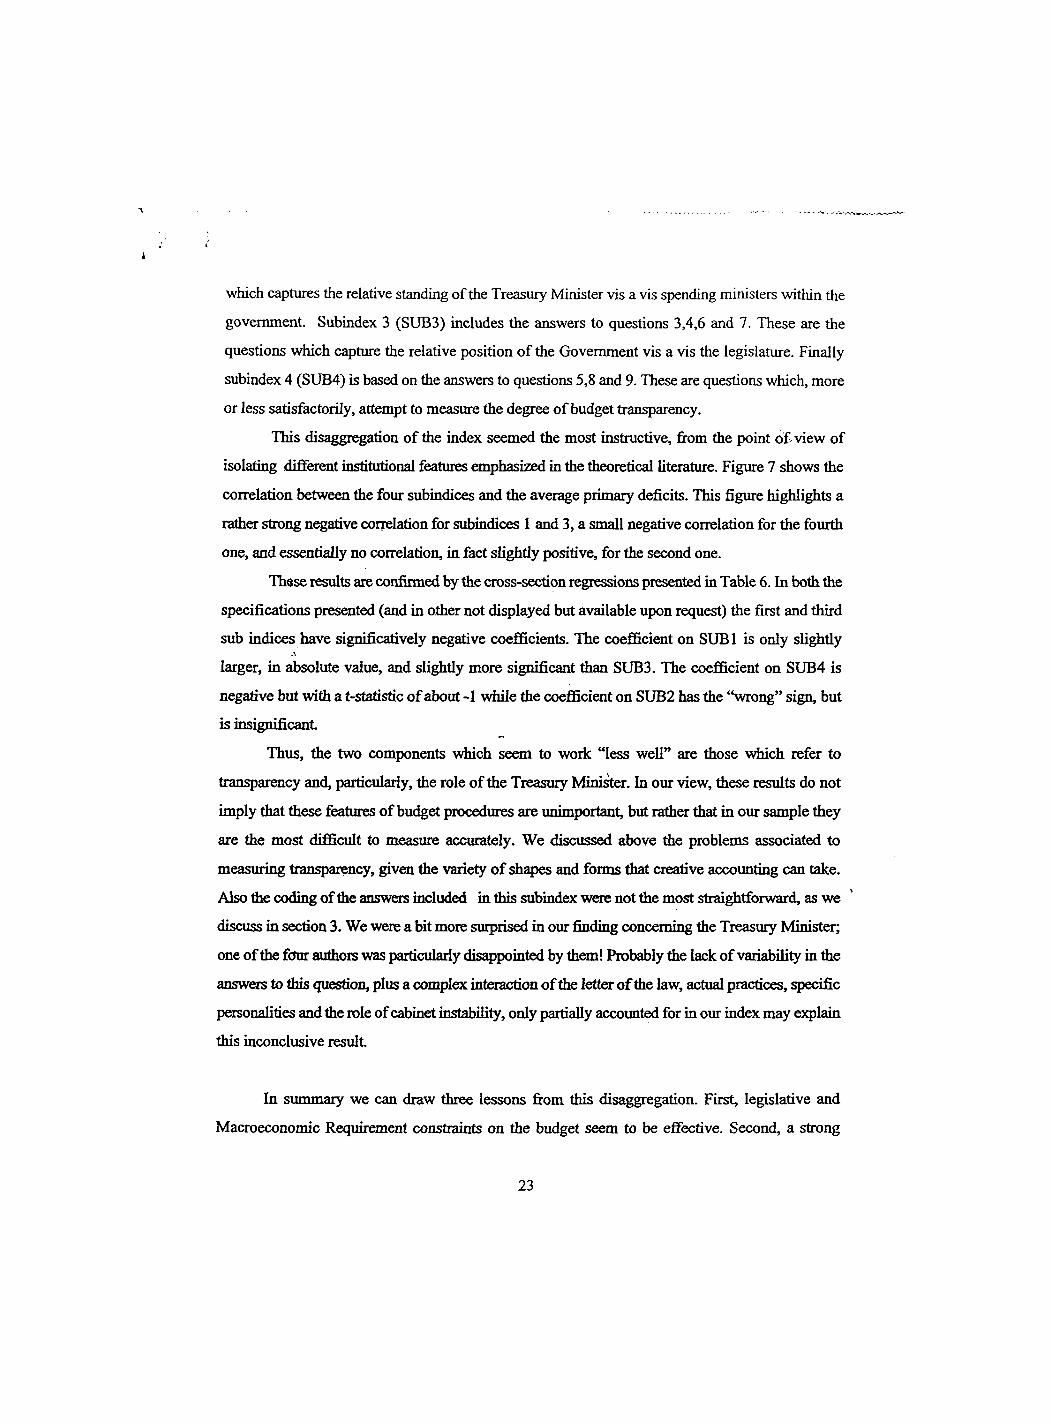
which captures the relative standing of the Treasury Minister vis a vis spending ministers within the
government. Subindex 3 (SUB3) includes the answers to questions 3,4,6 and 7. These are the
questions which capture the relative position of the Government vis a vis the legislature. Finally
subindex 4 (SUB4) is based on the answers to questions 5,8 and 9. These are questions which, more
or less satisfactorily, attempt to measure the degree of budget transparency.
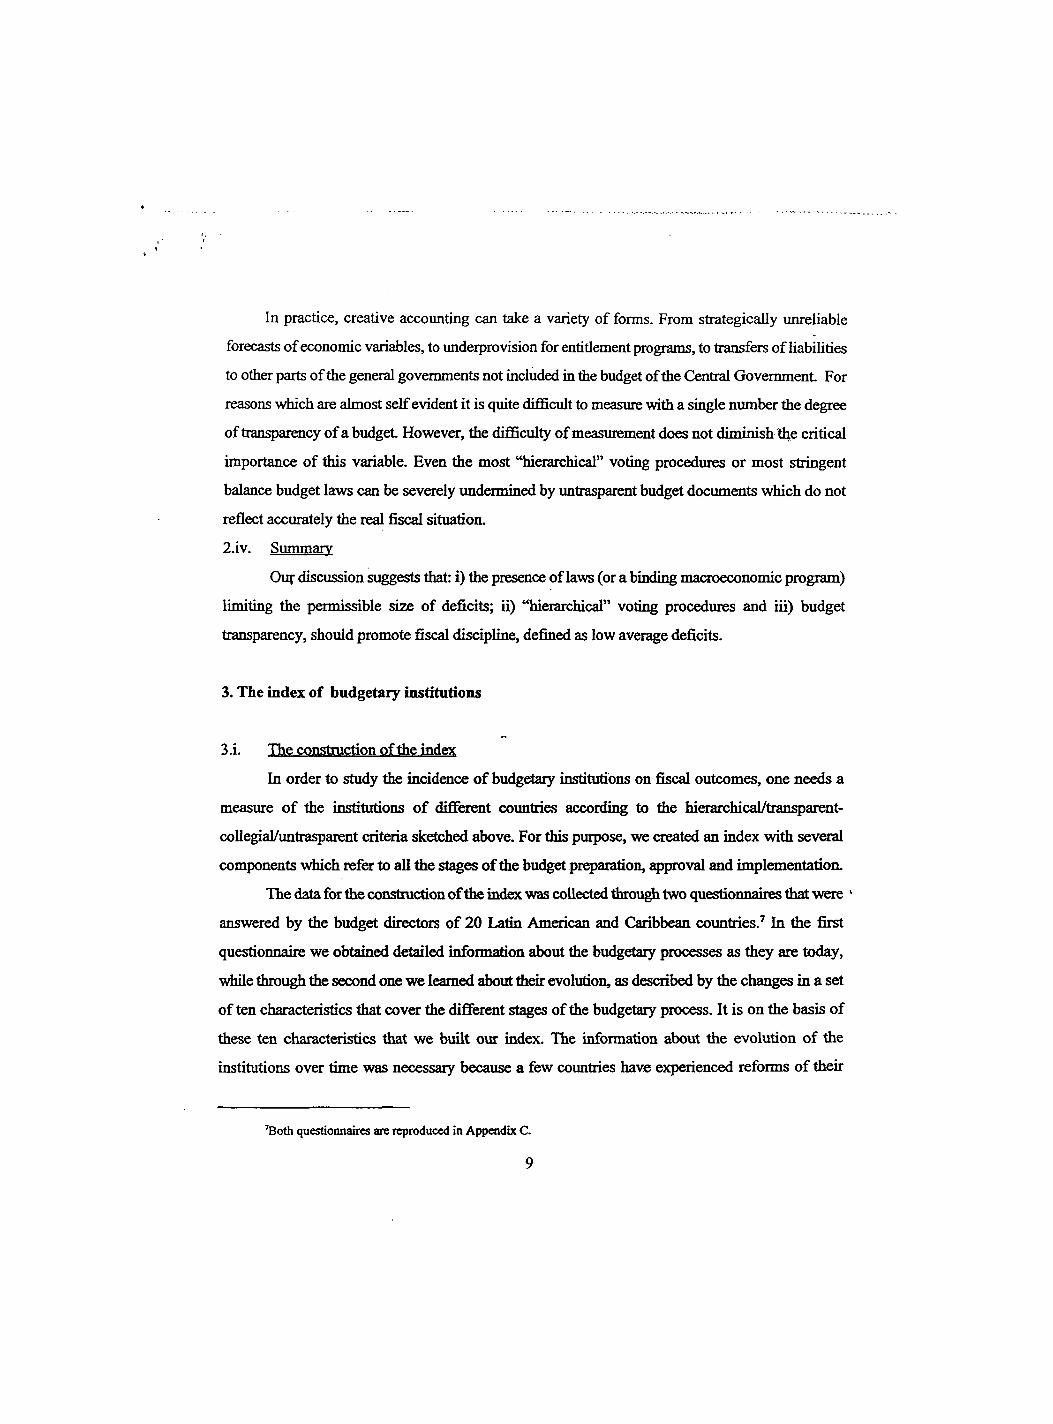
This disaggregation of the index seemed the most instructive, from the point of. view of
isolating different institutional features emphasized in the theoretical literature. Figure 7 shows the
correlation between the four subíndices and the average primary deficits. This figure highlights a
rather strong negative correlation for subindices 1 and 3, a small negative correlation for the fourth
one, and essentially no correlation, in fact slightly positive, for the second one.
These results are confirmed by the cross-section regressions presented in Table 6. In both the
specifications presented (and in other not displayed but available upon request) the first and third
sub indices have significatively negative coefficients. The coefficient on SUBI is only slightly
larger, in absolute value, and slightly more significant than SUB3. The coefficient on SUB4 is
negative but with a t-statistic of about -1 while the coefficient on SUB2 has the "wrong" sign, but
is insignificant
Thus, the two components seem to work "less well" are those v^ch refer to
transparency and, particularly, the role of the Treasury Minister. In our view, these results do not
imply that these features of budget procedures are unimportant, but rather that in our sample they
are the most difficult to measure accurately. We discussed above the problems associated to
measuring transparency, given the variety of shapes and forms that creative accounting can take.
Also the coding of the answers included in this subindex W C T C not the most straightforward, as we
discuss in section 3. We were a bit more sinprised in our finding concerning the Treasury Minister;
one of the fdnr authors was particularly disappointed by them! Probably the lack of variability in the
answers to this question, plus a complex interaction of the letter of the law, actual practices, specific
personalities and the role of cabinet instability, only partially accounted for in our index may explain
this inconclusive result.
In summary we can draw three lessons from this disaggregation. First, legislative and
Macroeconomic Requirement constraints on the budget seem to be efíèctive. Second, a strong
23

CO X d)
XJ c JQ 3 <0
O ê lU
(0 a> E
u w
LL C O
••1
2.
• / e « • 5"
A A I' c
7 í -
; • • — ^ y
lO CI
o to
lO _ (MCO
•o Ç ja
O (O CM
in
g .3 S ° S o o o
s s 9 9 «?
)py3p Xjeujud
SS
CO n 58
9
C5 s
X o T3
(0 O £ o u i 0 : 5 " — 3 M- CO ^
o
LU •C o
/ 3'
1
•g.
£
i 'V / E « «
I-
I-f •
1 / i'
o CO
in CM
o CM
lO "O S <n
o, O g g § g S o o o d 9 9
)pyap Ajeuiud
CO ^ o in •
| | J 9
«> 1 X] 3 CO
g
X (D
C JQ 3 (O
(O O E o 3 O
2 es 4>
« — < •»- re ^
u £ UJ
(6 O « u. c o
L II • / 1
g >
.é
?f 1" /
to
CM
CO T3 Ç XI s
<0
§ s s ° s s g o d C3 cp <5 o
tpysp Ájeuiud
s S
s?
•o ç 3 <0
CM (O ^ O ^ ê O E •O O 2 £ iá ía
-4-' <0
It: c UJ o
£ 5 • E
1- •gJ i»
1 ^ 1
l' i
CM
CM X 0) «>1
<0
« p> TJ «O ^ o
P o
g d o d
s s o o (loyap Xjeuiud
o d
g
3 U)
government vis a vis the legislature is important in enforcing fiscal discipline. Third, we need better
measures of transparency to address its quantitative impact on fiscal discipline.
6. Conclusions
Budget procedures influence the overall degree of fiscal discipline, at least in our sample of
Latin American countries. Together with similar results on European countries and American States,
this suggests that budget institutions are not irrelevant for fiscal stability and differences in these
institutions can contribute to explain the wide variance of fiscal experiences around the world.
Several questions remain open/F^ aggregate measures of procedures are imperfect, and sensitivity
analysis using different indices is particularly useful. Also, wdiile we briefly discussed how various
components of our aggregate index have different effects, much room for improvement is left m
imderstanding which institutional features are more important than others in enforcing fiscal
discipline.
(^^Séco^)the effects of different budget procedures may be different in different political
regimes; not only in democracies versus ^ctatorships, but also in presidential systems versus
parliamentary regimes, two party systems and coalition governments, etc. For instance, hierarchical
procedures may be particularly beneficial in countries with coalition governments, \ ^ c h typically
exhibit delays in fiscal adjustments.
( ^ ^ i ^ vdiile in this p ^ r we focus on effects of procedures on the levd of deficits,
budget rules may influence Jbe speed.of adjustment to shocks, as explicitly discussed in particular
by Poterba{1^94) and Alt and Lowry (1994) for the American States.
( f o u ^ ^ it would be quite useful to study v^e&er budg^reforms have the expected effect on
^scaloutcolngs. The evidence provided in this paper hints that this may in fact be the case, but much
more should be done on this point
24

TABLEÓ SUBINDICES
DEPENDENT VARIABLE: AVERAGE PRIMARY DEFICIT
(1) (2) 1 TRADE -0.00241 '
(-0.90)
SUBI -0.00250 -0.00270 (-2.42) (-2.69)
SUB2 0.00157 0.00198 (1.05) (1-41)
SUB3 -0.00194 -0.00212 (-2.44) (-2.76)
| s U B 4 -0.00107 -0.00107 j (-1.32) (-1.33)
0.44 0.45

References
Alesina, A., and A. Cukiennan, (1990): "The Politics of Ambiguity," Quarterly Journal of lies. November.
Alesina, A., (1995) : "Comment on Central Bank Independence," NBER Macroeconomic Annual, forthcoming.
Alesina, A., M. Mare, and R. Perotti, (1995): "Le Procedure di Bilancio in Italia: Analisi e Proposte," impublished.
Alesma, A., and R. Perotti, (1995b): "Fiscal E3q)ansions and Adjustments in OECD Coxmtries,'
Alesina, A., and R. Perotti, (1995c): "Budget Deficits and Budget Institutions," unplubished.
Alesina, A., and R. Perotti, (1995e): "The PoUtical Economy of Budget Deficits," IMF staff papers. March, 1-32.
Alt, J., and R. Lowry, (1994): "Divided Government and Budget Deficits: Evidence for the States," American Political Science Review, forüicoming.
Baron, D. (1989): "A Non-cooperative Theory of Legislative CoalitioDs"American Journal of Political Science. 1048-84.
Baron, D. (1991): "Majoritarian Incentives, Pork Barrel Programs and Procedural Control," American Journal of Political Science. 57-90, February.
Baron, D., and J. Ferejohn, (1989): "Bargaining in Legislatures," American Science Review. 83: 1181-1206.
Barro, R. (1979): "On the Determination of the Public Debt," Journal of Political Economy. 87: 940-947.
Buchanan, J., and R. Wagner, (1977): Democracv in Deficit Academic Press.
Eichengreen, B., (1992): "Should the Maastricht Treaty be Saved?," Princeton Studies in International Finance. No. 74, December
Ferejohn, J., and K. Krehbiel, (1987): "The Budget Process and the Size of the Budget," American Journal of Political Science. 31:296-320.
Grilli, v., D. Masciandaro, and G. Tabellini, (1991): "Political and Monetary Institutions and Public Finance Policies in the Industrial Democracies," Economic Policy. No. 13.

Hsiao, CH., (1989): "Analysis of Panel Data" Cambridge University Press.
Lucas, R., and N. Stokey, (1983): "Optimal Fiscal and Monetary Policy in an Economy without Capital." Journal of Monetary Economics. 12:55-94.
Posen, A., (1995): "Determinations of Central Bank Independence," NBER Macroeconomic Annual. 1995, forthcoming.
Poterba, J., (1994): "State Responses to Fiscal Crises: "Natural Experiments" for Studying the Effects of Budgetary Institutions." Journal of Political Economy, June.
Rogoff, K. (1990): "PoUtical Budget Cycles," American Economic Review. 80,1-16.
RogofiF, K., and A, Sibert (1988): "Elections and Macroeconomic Policy Cycles," Review of Economic Studies. 55:1-16.
Roubini, N., and J. Sachs, (1989a): "Political and Economic Determinants of Budget Deficits in the Industrial Democracies." European Economic Re\dew. 33:903-933 (May).
Roubini, N., and J. Sachs, (1989b): Çrçvemment Spending and Budget Deficits jn the Industrialized Countries. Economic Policy 8: 99-132 (April).
Tanzi, v., (1995): "International Systems ofPublic Expenditure: Lessons for Italy," Working paper Bank of Italy
Velasco, A., (1994): "A Model of Endogenous Fiscal Deficits and Delayed Fiscal Reforms" xmpublished.
Von Hagen, J., (1992): "Budgeting Procedures and Fiscal Performance in the European Community," impublished
Von Hagen, J., and I.J. Harden, (1994): "National Budget Process and Fiscal Performance" unpublished.
Weingast, B., K. Shepsle, and C. Johnsen, (1981): "The Political Economy of Benefits and Costs: A Neoclasical Approach to Distiibutive Politics," Journal of Political Economy. 89: 642-64 (August).

APPENDIX A: THE DATA SET
CATAS This is a dummy variable which measures natural catastrophes (major earthquakes, hurricanes, etc) and wars; it takes value 1 for catastrophes' years, and 0 otherwise. Sources: Direct survey to the lADB country economists for the countries studied. The World Almanac and Book of Facts, Ed. Robert Famighetti. Funk&Wagnalls Corporation, StMartin Press, New York, 1995
DICT Dummy for dictatorship, it takes value 1 in years when the government regime was a dictatorship, and value 0, otherwise Dictatorships are defined as those governments wdiich were not elected into office. Source: The Statesman's Year-Book. EABrian Hunter. StMartin Press, New York, 1993
4
GDPGR Real GDP growth rate, this variable was constructed as rate of growth of real GDP Source : Economic and Social Database(ESDB), lADB
HIGH Dummy for countries which have a high average value of the index Source: Own calculations
ENTL Total debt interest payments fixim the Central Government as a share of GDP Source: Economic and Social Database(ESDB), lADB
MID Dummy for countries which have an average value of the index in the middle range. Source: Own calculations
OV65 Share of the population over 65 years old. Actual data points for this variable were available every five years; for 1995, there were three estimates available, low, medium and high variant, the medium variant was the one used. The y ^ l y series was constructed by linear interpolation among every two data points. Source: The Sex and Age Distribution of the World Populations, The 1994 Revision, United Nations
PED79 Stock of Public External Debt, in US$, as a share of GDP, in US$. It was not available for Bahamas Source: Worid Debt Tables, Worid Bank 1995
PRDEF Primary Deficit of the Central Government as a share of GDP (a positive value represents a deficit, a negative value represents a surplus) Source: Economic and Social Database(ESDB), lADB

PRCONG Real Private Consumption growth rate, this variable was constructed as rate of growth of private real consumption, in local currency It was not available for Argentina Source : Worid Tables 1993-1994, Worid Bank, 1994
TRADE This variable was constructed as the product of the growth in the terms of trade times the degree of openness of the economy, defined as the sum of exports and imports of goods and seryices, in local currency, as a share of GDP, in local currency. Source: World Tables 1993-1994, World Bank, 1994
UND15 Share of the population under 15 years old. Actual data points for this variable were available every five years; for 1995, there were three estimates available, low, medium and high variant, the medium variant was the one used. The yearly series was constructed by linear interpolation among every two data points. Source: The Sex and Age Distribution of the World Populations, The 1994 Revision, United Nations, 1994
THE INDEX, ITS COMPONENTS AND SUBINDICES
INDEX Index of budgetary institutions. Sum of variables vl through vl 0
VI Macroeconomic program as a prerequisite for submission to congress V2 Minister of Finance has greater authority than other ministers in
budgetary matters, weighed by average office term of the Finance Minister
V3 Legal constraints on congress' authority to amend the gvf s proposed budget
V4 Options available to the government when its proposed budget is rejected or not passed by congress
V5 Govt' borrowing autonomy V6 Flexibility and execution V7 Gov^s ability to cut spending unilaterally after passage of the budget
by congress V8 Does the govt assume debt originally incurred by other public
entities? V9 Borrowing autonomy of state and local gvts of decentrali25ed
institutions and of state and local gvts of parastatals VIO Constitutional constraints on the fiscal deficits
SUB 1 Subindex 1. Constructed as the simi of variables vl and vl 0 SUB2 Subindex 2. Corresponds to variable v2 SUB3 Subindex 3. Constructed as the sum of variables v3, v4, v6, v7 SUB4 Subindex 4. Constructed as the sum of variables v5, v8, v9

%
Source: OCE's survey to the Budget Directors of the different countries and OCE's calculations