pdf - Repositorio Digital CEPAL
93
-
Upload
khangminh22 -
Category
Documents
-
view
1 -
download
0
Transcript of pdf - Repositorio Digital CEPAL


Alicia Bárcena Executive Secretary
Antonio Prado Deputy Executive Secretary
Hugo Eduardo Beteta Director
Subregional Headquarters of ECLAC in Mexico
This document was prepared by the International Trade and Industry Unit at the Economic Commission for Latin America and the Caribbean (ECLAC), Subregional Headquarters in Mexico. It was produced by Olaf J. de Groot, under the coordination of Jorge Mario Martínez Piva (Chief of Unit). Jennifer Alvarado, Martha Cordero, Jessica Cortés Allsopp, Lilia García, Marko Javorsek, Diana Ramírez, Joaquín Salido, Hugo Ventura and Pablo Yanes also made significant contributions.
The views expressed in this document, which was not submitted to formal editing, are those of the authors and do not necessarily coincide with those of the Organization.
The boundaries and names shown on the maps included in this publication do not imply official endorsement or acceptance by the United Nations.
Credit for photos used on the cover: Shutterstock.com
LC/MEX/L.1223 ● November 2016 © United Nations. Printed in Mexico City, Mexico
2016-033
.

Strengthening the relationship between India and Latin America and the Caribbean
TABLE OF CONTENTS

Strengthening the relationship between India and Latin America and the Caribbean
5
Foreword .......................................................................................................................................................................... 13
I. In a decelerating world, India is an important exception, whereas Latin American economies present a more complex picture ........................................................................................................................ 17
1. In a climate of low global growth, India is one of the countries with the highest growth rate ................. 19
2. India in perspective: Two decades of economic growth, the seventh largest economy in the world by GDP (third by PPP), on its way to becoming the world’s most populated country and the fastest-growing large economy in 2015 ............................................................................................... 20
3. The Indian economy has changed in the past few years and is now an economy driven primarily by its services sector ............................................................................................................................................. 21
4. India in perspective: Social progress that still has structural challenges to ensure full social and human development .................................................................................................................................... 22
5. India as a global and regional actor: Vision and priorities ............................................................................. 23
Prioritization of regional affairs: “neighborhood first” ................................................................................... 23
Securing a multilateral equilibrium in the Indo-Pacific zone: “act east” instead of “look east” ............... 23
Securing Indian presence in global governance issues ................................................................................... 24
6. The growth of Latin America and the Caribbean is heterogeneous between countries and subregions ...................................................................................................................................................... 25
7. In terms of social development, Latin America and the Caribbean and India face tough challenges ...... 26
8. In gender equality, Latin America and the Caribbean is in a better position than India ........................... 27
9. The volatility of international food prices make it difficult to eradicate poverty and hunger in India and Latin America and the Caribbean .................................................................................................... 28
II. In India, just as in Latin America and the Caribbean, international trade plays an important role. However, the bilateral relationship has much scope for growth ............................................................... 29
1. In 2015, India was the nineteenth largest exporter of goods in the world and the eighth largest exporter of services .............................................................................................................................................. 31
2. India has diversified its trade relations, but around 50% of its trade is still concentrated in Asia ........... 32
3. As a result of its trade policies, India has diversified its export basket. From being a net exporter of primary goods and natural resources, today its strengths are in exporting products with a higher added value ........................................................................................................................................... 33

Economic Commission for Latin America and the Caribbean
6
4. India is a net exporter of services ....................................................................................................................... 34
5. Imports in Latin America and the Caribbean come, for the most part, from China and the United States, but vary depending on the subregion ..................................................................................... 35
6. Exports in Latin America and the Caribbean are even more concentrated than its imports but also differ according to the subregion ............................................................................................................... 36
7. The structure of exports of different subregions of Latin America and the Caribbean explains the difference in export markets ........................................................................................................................ 37
8. Service exports in Latin America and the Caribbean are relatively low compared to those in India. Except for the countries in the Caribbean where the tourism sector is particularly important ..... 38
9. Trade relations between India and Latin America and the Caribbean have gradually improved in recent years. India has become an important trade partner for some countries, including Argentina, Brazil and Chile ................................................................................................................................ 39
10. Latin American and Caribbean exports are concentrated in a small number of products, mainly primary goods ......................................................................................................................................... 40
11. India has stood out as a growing exporter of medicine and it is the seventh supplier to Latin America and the Caribbean ...................................................................................................................... 41
12. Exports and imports of agriculture and livestock products have increased over the last 15 years .......... 42
13. The Tata Group is the primary Indian example of a diversified company with various activities throughout Latin America and the Caribbean ................................................................................................. 43
III. On a global scale, Latin America and the Caribbean are important recipients of foreign direct investment, while India has seen an increase in these flows in recent years .......................................... 45
1. India was the ninth largest recipient of FDI in the world in 2015, receiving the second largest sum of FDI in its history ...................................................................................................................................... 47
2. Indian companies play a minor role in foreign direct investment abroad ................................................... 48
3. India receives investments in various types of services, while Indian companies that invest abroad focus more on natural resources and energy ...................................................................................... 49
4. Much of Indian investment is focused on a few conglomerate companies ................................................. 50
5. Foreign direct investment in Latin America and the Caribbean is stable at 3%-4% of the GDP, although in 2015 flows fell by 10% .................................................................................................................... 51
6. The importance of FDI for the economy, as a percentage of GDP, is higher in the Caribbean and Central America than in South America ................................................................................................... 52

Strengthening the relationship between India and Latin America and the Caribbean
7
7. Brazil, Mexico and Chile are not only the main recipients of FDI, but also the most important investors .............................................................................................................................................. 53
8. FDI in natural resources is decreasing and renewable energy is becoming the most dynamic sector in Latin America and the Caribbean ...................................................................................................... 54
9. FDI flows between India and Latin America and the Caribbean have much room for growth ................ 55
10. In mergers and acquisitions, the role of Indian companies in Latin America is greater than the role of Latin American companies in India ...................................................................................................... 56
11. Indian companies are especially interested in Brazil and Mexico ................................................................. 57
12. Sometimes surprising sectors can play an important role. An example of a successful trans-Latin company is Cinépolis from Mexico ............................................................................................... 58
IV. There is great potential in the economic relationship between India and Latin America and the Caribbean, but to realize it various challenges must be overcome ............................................. 59
1. There are significant economic opportunities between India and Latin America and the Caribbean, but they come with certain challenges .............................................................................................................. 61
2. The Caribbean is an underestimated region, and for enterprising investors, there are important opportunities ...................................................................................................................................... 62
3. Trans-Latin companies, especially Brazilian ones, expand their activities in Asia, but without a particular sectorial focus .................................................................................................................................. 63
4. Different countries in Latin America offer multiple investment opportunities in free zones or in special economic zones ........................................................................................................................................ 64
5. In both regions, agriculture and agro-industry are especially relevant economically ............................... 65
6. The transition towards renewable energy presents a radical change in the energy sector ........................ 66
7. Changes in energy policy in Mexico focus on attracting international capital ............................................ 67
8. Latin America and the Caribbean is an important region for raw materials, while India has a growing demand for these products .............................................................................................................. 68
9. Aerospace cooperation provides fertile ground for South-South cooperation ............................................ 69
10. There are different types of challenges that the two regions have to overcome in order to strengthen economic links between them ......................................................................................................... 70
11. Air and maritime transport between India and Latin America and the Caribbean is complex, precarious and expensive .................................................................................................................................... 71

Economic Commission for Latin America and the Caribbean
8
12. Climate change is a threat to both regions, but it affects them in different ways ....................................... 72
13. Indian and Latin American currencies are depreciating ................................................................................ 73
14. Latin America and the Caribbean and India need policies that strengthen economic ties between them ....................................................................................................................................................... 74
15. India has signed a small number of trade agreements with Latin America and the Caribbean and its existing agreements are not very significant. There is fertile ground for negotiating new agreements that benefit both regions ........................................................................................................ 75
16. India and Latin America and the Caribbean could be impacted by the TPP in similar ways, but for the latter it would be greater due to its more significant trade relationship with the United States ....... 76
17. In South-South cooperation, India takes on the role of ¨emerging¨ donor................................................... 77
18. Foreign Direct Investment (FDI) has increased in India as others recognize its potentially positive influence ................................................................................................................................................. 78
19. In terms of regional coordination of trade policies and investment, there is room for improvement in Latin America and the Caribbean ................................................................................................................. 79
V. Conclusions and Recommendations ..................................................................................................................... 81
References ....................................................................................................................................................................... 85
TABLES
Table 1 India: Evolution of world development indicators, 1991-2013 .......................................................... 22
Table 2 Latin America and the Caribbean: Main 10 extraregional markets for goods exports, according to subregion, 2015 .................................................................................................................. 36
Table 3 Latin America and the Caribbean: Main 10 export products, by subregion, 2015 .......................... 37
Table 4 Latin America and the Caribbean: Three main export products to India, by country or subregion, circa 2015 ................................................................................................................................ 40
Table 5 World: Main FDI recipients, 2015 .......................................................................................................... 47
Table 6 Latin America and the Caribbean: The largest mergers and acquisitions, 2011-2015..................... 54
Table 7 India: Largest mergers and acquisitions by Latin American companies, 2005-2015 ...................... 56
Table 8 Latin America and the Caribbean: Largest mergers and acwuisitions by Indian companies, 2005-2015 .............................................................................................................................. 56
Table 9 Latin America and the Caribbean: Typology of Indian companies operating in the region ......... 57

Strengthening the relationship between India and Latin America and the Caribbean
9
Table 10 Latin America and the Caribbean: Trans-Latin companies with activities in Asia: Distribution by sectors, 2016 ................................................................................................................... 63
Table 11 Latin America and the Caribbean: free zones recorded by country and by type, 2016 .................. 64
Table 12 Five main OAD recipients, 2014 ............................................................................................................. 77
FIGURES Figure 1 World, India and selected regions: Annual GDP growth rates, 2000-2015 ....................................... 19
Figure 2 Selected regions: Annual GDP growth rates, 2000-2015 ..................................................................... 19
Figure 3 World: Participation in global GDP in purchasing parity, 2015 ........................................................ 20
Figure 4 India, Mexico and the world: GDP growth, 2000-2020 ........................................................................ 20
Figure 5 India: GDP participation by sector 1952-2013 ....................................................................................... 21
Figure 6 India: Gross Domestic Product by activity, 2014 .................................................................................. 21
Figure 7 India: Total population and percentage of population below the poverty line of 1.90 dollars per day, 1993-2011 ....................................................................................................................... 22
Figure 8 RCEP and TPP participants ..................................................................................................................... 24
Figure 9 Latin America and the Caribbean: GDP growth rate, 2015 ................................................................ 25
Figure 10 Latin America: Population living in poverty and indigence .............................................................. 26
Figure 11 India: Population living in poverty on less than 1.25 dollars and 2 dollars per day (2005 PPP) ... 26
Figure 12 India and Latin America and the Caribbean (LAC): Female participation indicators in various economic activities, 2005-2014 .............................................................................................. 27
Figure 13 India and Latin America and the Caribbean (selected countries): Female members of national parliaments, 2015 ....................................................................................................................... 27
Figure 14 Latin America and the Caribbean: Undernourishment prevalence, 1990-2016 ............................... 28
Figure 15 Food and beverages price index, January 2000-June 2016 .................................................................. 28
Figure 16 India: Evolution of goods and services exports, 2001-2015 ................................................................ 31
Figure 17 India: Participation in global goods and services exports, 2001-2015 ............................................... 31
Figure 18 India: Goods exports by sector, 2015 ..................................................................................................... 33
Figure 19 India: Goods imports by sector, 2015 ..................................................................................................... 33
Figure 20 World and India: Services exports, 2000-2015 ...................................................................................... 34
Figure 21 India: Services exports by category, 2005-2015 ..................................................................................... 34

Economic Commission for Latin America and the Caribbean
10
Figure 22 Latin America and the Caribbean: Main goods exports markets, 2001-2005 ................................... 35
Figure 23 Latin America and the Caribbean: Participation of imports from the United States and China, according to subregion, 2015 .............................................................................................. 35
Figure 24 Latin America and the Caribbean: Types of export products, 2015 .................................................. 37
Figure 25 Latin America and the Caribbean: Goods and services exports, 2015 .............................................. 38
Figure 26 Caribbean: Services exports, circa 2015 ................................................................................................. 38
Figure 27 Latin America and the Caribbean: Evolution of exports and imports to and from India, 2001-2015 ................................................................................................................................................... 39
Figure 28 Latin America and the Caribbean: Exports, Imports and trade balance with India, 2015 ............. 39
Figure 29 World and India: Annual growth rates for medications exports, 2001-2015 ................................... 41
Figure 30 India: Medications trade with Latin America and the Caribbean, 2001-2015 .................................. 41
Figure 31 Latin America and the Caribbean and India: Value of exports, imports and the trade balance of agro-industry products, 2000-2014 ...................................................................................... 42
Figure 32 Latin America and the Caribbean and India: Exports and imports of agro-industry products as a proportion of total exports and imports, 2000-2014 .................................................... 42
Figure 33 India: FDI inflows and global FDI participation, 2006-2015 ............................................................... 47
Figure 34 India: FDI abroad, 2001-2015 .................................................................................................................. 48
Figure 35 India: Value of scheduled projects abroad, by destination, 2006-2015 ............................................. 48
Figure 36 India: IED by sector, April 2013-March 2016 ........................................................................................ 49
Figure 37 India: Value of scheduled projects abroad, by sector, 2011-2015 ....................................................... 49
Figure 38 Tata Group: Sectorial distribution of scheduled investments, 2011-2015 ......................................... 50
Figure 39 India: Scheduled announcements by Indian companies as percentabge of total announcements, 2011-2015...................................................................................................................... 50
Figure 40 Latin America and the Caribbean: Foreign direct investment flows, 2000-2015 ............................. 51
Figure 41 Latin America and the Caribbean (selected countries): Foreign direct investment flows, 2014-2015 ................................................................................................................................................... 51
Figure 42 Latin America and the Caribbean: Foreign direct investment flows by country, 2015 .................. 52
Figure 43 Brazil, Chile and México: Participation in foreign direct investment in the region, 2000-2015 ................................................................................................................................................... 53
Figure 44 Latin America (selected countries): Stock of foreign direct investment abroad, 2005-2015 ........... 53

Strengthening the relationship between India and Latin America and the Caribbean
11
Figure 45 Latin America and the Caribbean: Announced projects in different sectors, 2005-2015 ................ 54
Figure 46 India: Destination of outward FDI from India in Latin America and the Caribbean, 2011-2015 .................................................................................................................................................... 55
Figure 47 India: FDI received by Latin America and the Caribbean, January 2000-March 2016 .................... 55
Figure 48 Latin America and the Caribbean: Distribution of Financial Flows from India, 2011-2015 ........... 57
Figure 49 India and Latin America and the Caribbean: Average growth of selected indicators compared to the world as a whole, 2006-2014 ..................................................................................... 61
Figure 50 Selected countries: Distribution of origin of population, the most recent year ............................... 62
Figure 51 Commonwealth member states in the Caribbean: Population, 2015 ................................................. 62
Figure 52 Latin America and the Caribbean: The 100 companies with the highest multi-Latin index, by sector, 2016 ............................................................................................................................... 63
Figure 53 Latin America and the Caribbean and India: Coffee Production, 1961-2013 ................................... 65
Figure 54 Latin America and the Caribbean and India: Meat and milk production, 1980-2012 ..................... 65
Figure 55 World: Biofuels production, 2015 ........................................................................................................... 66
Figure 56 Latin America and the Caribbean: Exports to the world and to India, by technology 2015 .......... 68
Figure 57 India: Imports from the world and Latin America and the Caribbean, by technology, 2015 ........ 68
Figure 58 Latin America and the Caribbean and India: Score according to the Doing Business index ......... 70
Figure 59 India and Latin America and the Caribbean: Estimated cost of exporting and importing a deliver of products, 2015 ...................................................................................................................... 71
Figure 60 India and Latin America and the Caribbean (selected countries): International ranking in a connectivity index, 2015 ................................................................................................................... 71
Figure 61 Global patterns of impacts in recent decades attributed to climate change ..................................... 72
Figure 62 Argentina, Brazil, Chile, Dominican Republic and Mexico: Nominal exchange rate, 2002-2015 .................................................................................................................................................... 73
Figure 63 India: Annual average exchange rate, 2002-2015 ................................................................................. 73
Figure 64 Latin America and the Caribbean and India (selected countries): Ranking of commercial opening, 2011 and 2015 ............................................................................................................................ 74
Figure 65 Latin America and the Caribbean and India: Exports to countries in the TPP, 2001-2015 ............. 76
Figure 66 India: Net ODA received, 1975-2014 ...................................................................................................... 77
Figure 67 India: Geographical distribution of OAD, by region, 2015 ................................................................. 77

Economic Commission for Latin America and the Caribbean
12
Figure 68 India: Foreign direct investment, net flows .......................................................................................... 78
Figure 69 Latin America and the Caribbean (19 countries): Total scores in the Global Survey on Trade Facilitation and Paperless Trade Implementation, 2015 .......................................................... 79
MAPS Map 1 India: Participation of its total goods exports, 2015 ............................................................................. 32
Map 2 India: Participation of its total goods imports, 2015 ............................................................................ 32
Map 3 Latin America and the Caribbean: Main 10 extraregional markets for goods exports and intraregional exports, 2015 .............................................................................................................. 36
BOXES Box 1 Tata Group in Latin America: Diversify and conquer ........................................................................ 43
Box 2 Mexico conquering India: The case of Cinépolis in India ................................................................... 58
Box 3 Energy reform in Mexico ......................................................................................................................... 67
Box 4 The aerospace industry: Cooperation between India and Latin America ........................................ 69
Box 5 Trade instruments in force signed by India .......................................................................................... 75

Strengthening the relationship between India and Latin America and the Caribbean
FOREWORD


Strengthening the relationship between India and Latin America and the Caribbean
15
he economic relationship between India and Latin America and the Caribbean is at an emerging stage, with significant room for growth in terms of international trade, foreign direct investment (FDI) and
cooperation between these two important regions. According to data from recent years, economic ties have grown every year, with 140% growth in trade between 2009 and 2004. There is enough evidence to believe that these ties will continue to grow in the coming years. India, along with the countries of Latin America and the Caribbean, is a “developing” country, meaning there are great investment opportunities for companies wishing to expand. On the other hand, despite their differences, both India and the Latin American and Caribbean region have generally shown rates of growth superior to those of “developed” countries, which has turned them into emerging and dynamic economic areas.
India is the best example of this trend. Among large economies it has the highest economic growth in the world, creating interesting opportunities for investors. At the same time, today India is more open to FDI and international trade, participating not only as an exporter of final goods, but also increasingly integrating into various global value chains. With this change, the country recognizes that open relations with other countries can support its long term development goals.
As a whole, the average rate of economic growth of Latin America and the Caribbean does not reach that of India. Nevertheless, the regional figures disguise the high heterogeneity of the region. In recent years, countries like Panama and the Dominican Republic have had high rates of growth which compete with India. Furthermore, the per capita income of Latin America and the Caribbean remains at a higher level than that of India, and as such the region may have special appeal for Indian companies.
However, economic growth is not the only benchmark by which we should measure the development of a nation. ECLAC has proposed that it is also important to tackle inequality, as an essential part of development. Unfortunately, in this field the Latin American and Caribbean region, unlike
T

Economic Commission for Latin America and the Caribbean
16
India, continues to face important challenges: It is the region with the highest inequality between the rich and the poor. It would be ideal for both regions if their improvement in economic relations were accompanied by a joint effort in the fight against inequality.
For ECLAC, Asia in general, and India in particular, plays a very important role as a source of new economic ideas, new business opportunities and new ways of relating between developing countries. It is also an important partner in terms of cooperation projects and has vast experience in matters of industrial policy. The formation of the New Development Bank, scientific cooperation programs, the strategic alliances between companies, experience in matters of economic policy and the cultural potential are some of the areas in which India and Latin America and the Caribbean can advance and deepen their relations.
ECLAC encourages both regions to pursue development by way of progressive structural change that is conducive to sustainable industrialization. Such a transformation reduces dependency on natural resources and is based on the innovative potential within the countries. This change must be accompanied by an environmental impetus, with investments that reduce the environmental burden. At the same time, as a commitment to innovation, it is vital that policymakers take into consideration the future of the workers and the transition towards more high-quality jobs with adequate social protection. Both regions can find ample room for collaboration which in turn changes the style of development, towards a more inclusive and sustainable one.
Alicia Bárcena Executive Secretary
Economic Commission for Latin America and the Caribbean (ECLAC)
I. IN A DECELERATING WORLD, INDIA
IS AN IMPORTANT EXCEPTION, WHEREAS LATIN AMERICAN
ECONOMIES PRESENT A MORE
COMPLEX PICTURE


Strengthening the relationship between India and Latin America and the Caribbean
19
1. In a climate of low global growth, India is one of the countries with the highest growth rate
The growth rate of the global economy has decelerated in the last five years. In 2015, the global economy grew 3.1% compared to the previous year. Emerging markets and developing economies presented more opportunities than advanced economies, with 4% growth in the first and 2% in the latter. Since 2010 the growth of emerging and developing economies has been decelerating, going from growth rates of 7.5% in 2010 to 4% in 2015. Global growth has been affected by the reduced number of economic opportunities in China, with its growth rate falling from 10.5% to 6.8% over the same period. In contrast, since 2013 India has experienced growth rates above 6.8%, reaching 7.3% in 2015.
Figure 1 World, India and selected regions: Annual GDP growth rates, 2000-2015 (Percentages)
Source: ECLAC, based on the IMF World Economic Outlook database.
In terms of regions, although the seven main advanced economies (G7) and the European Union have shown some economic recovery in the last few years (1.9% in 2015), they find themselves below the growth rates recorded by emerging and developing countries in Asia and Europe (6.5% and 3% respectively). The economic crisis of 2008-2009 had a negative effect on the countries of Latin America and the Caribbean. In 2009, the regional GDP shrunk by 1.3% compared to the previous year. In 2010, the region recovered and grew at a rate of 6%, but the following year it decelerated again. In 2015 the regional GDP contracted by 0.3% compared to 2014.
Figure 2 Selected regions: Annual GDP growth rates, 2000-2015 (Percentages)
Source: ECLAC, based on the IMF World Economic Outlook database. -6 -4
-2 0
2 4 6 8
10
12
2001 2003 2005 2007 2009 2011 2013 2015
World Developed economies Developing and transition economies
India
-10
-5
0
5
10
15
2001 2003 2005 2007 2009 2011 2013 2015
G7 economies European UnionEmerging and developing economies in Europe ASEAN-5Middle East and northern Africa Sub-Saharan AfricaWorld Emerging and developing
economies in AsiaLatin America and the Caribbean

Economic Commission for Latin America and the Caribbean
20
2. India in perspective: Two decades of economic growth, the seventh largest economy in the world by GDP (third by PPP), on its way to becoming the world’s most populated country and the fastest-growing large economy in 2015
The current global order is characterized by an interconnected and multi-polar equilibrium. The dynamism experienced by the so-called emerging and developing economies has fostered a change in global political-economic relations, making room for new actors with the power to influence and make decisions. Such is the case in India that since the 1990s it has emerged as a global actor and is regarded as one of the model economies in the global order. Its size, large population and economic strength all place the country as one of the decisive and powerful actors on the global stage. India has the seventh largest GDP in the world and the third largest in term of purchasing power parity.
Figure 3 World: Participation in global GDP in purchasing parity, 2015 (Percentages)
Source: Economic Commission for Latin America and the Caribbean (ECLAC), based on the World Development Indicators.
The increase in the global economic weight of India can be explained by constant growth during the last two decades. Since 2000, India has grown by rates above 4% annually,
stringing together five-year periods such as 2003-2007 with average rates above 7% and reaching records of around 10%, as was the case in 2007. After the deceleration caused by the 2008 global crisis, when the country experienced a growth rate of 3.7%, the Indian economy has again rebounded to register growth rates above 6%. Forecasts indicate that its performance in the next few years will be far better than that of the world economy.
Figure 4 India, Mexico and the world: GDP growth, 2000-2020
(Percentages)
Source: Economic Commission for Latin America and the Caribbean (ECLAC), based on the IMF World Economic Outlook database. * The figures for 2016-2020 are projections.
The post-crisis performance of the Indian economy has been more dynamic than that of other large and/or emerging economies, it reached a growth rate of 7.3% in 2015 and a forecast 7.5% for 2016. This is a faster rate of growth than that recorded by other large economies such as Brazil, China, the United States, Japan, Mexico or the European Union. It also exceeds the economic performance of the world as a whole.
Rest of the World34%
United States24
China15 Japan
6
Germany 5
United Kingdom4
France3
India3
Italy 2
Brazil 2
Canada2
India
MexicoWorld
-5-4-3-2
-10123
456789
10
11
2000 2005 2010 2015 2020

Strengthening the relationship between India and Latin America and the Caribbean
21
3. The Indian economy has changed in the past few years and is now an economy driven primarily by its services sector
Part of the ascent of India as a global actor can be explained by the structural change of its economy, which has moved towards a model in which manufacturing and services have progressively increased their relative importance. The greater participation of these sectors manifests itself in a larger contribution to the added value of the economy, which has been increasing in the last decade. India possesses a large and diversified industrial base, in which the petrochemical, pharmaceutical, engineering, automotive and textile sectors stand out. As for services, India has a productive base in telecommunications, information technology, the finance sector and outsourcing services, among others. In the same way, the wealth of the country and cultural diversity make it one of the most attractive tourist destinations in Asia and place it as leader of the South Asian region with a total of nearly 8 million yearly visitors.
Figure 5 India: GDP participation by sector 1952-2013 (Percentages)
Source: Economic Commission for Latin America and the Caribbean (ECLAC), based on the Open Government Data Platform India.
Activities related to the agriculture and livestock sector represented 17% of the GDP in 2014; the construction sector 8%; mining, manufacturing and public services 22%; transport, storage and communications 7%; shops, restaurants and hotels 12%; and other activities represent the remaining 34%.
Figure 6 India: Gross Domestic Product by activity, 2014 (Percentages)
Source: Economic Commission for Latin America and the Caribbean (ECLAC), based on the ESCAP Statistical Database. Note: 2014 is the last available year.
Agriculture17
Construction8
Mining, manufacturing
and public services
22Transport, storage and telecommunications
7
Commerce, restaurants and hotels
12
Other activities
34

Economic Commission for Latin America and the Caribbean
22
4. India in perspective: Social progress that still has structural challenges to ensure full social and human development
Along with economic results, India has achieved important advances in terms of development and social progress. The improvement of its socio-economic indicators shows how the country has managed to advance in social terms and attain higher levels of well-being for its population. However, it still has far to go to reach its full potential considering the size and dynamism of its economy.
Table 1 India: Evolution of world development indicators, 1991-2013
Indicator 1991 1995 2001 2006 2009 2011 2013 Fertility index (births per woman)
3.8 3.5 3.0 2.7 2.6 2.5 2.4
Hope of life (years)
58.8 60.2 62.6 64.5 65.4 66.0 66.5
Degree of literacy (Percentage of adults +15 years)
48.2 … 61.0 62.7 …. 69.3 ….
Gross national income per inhabitant (Atlas method, current dollars)
350 380 460 810 1.150 1 410 1 570*
Source: Economic Commission for Latin America and the Caribbean (ECLAC), based on the World Development Indicators database. * Data corresponds to 2014.
The socio-economic improvement of India can be observed in the rate of poverty reduction, particularly extreme poverty, a phenomenon that has occurred in a context of rapid population growth. India is the second-most populated country in the world and it is estimated that in 2022 its
population could reach 1.4 billion, overtaking China as the most populous country in the world. India has one of the most complex and diverse societies on the planet. Despite experiencing progress, there are still high rates of poverty and critical challenges such as access to clean water, maternal health and sustainable use of natural resources. Among the most urgent tasks is that of overcoming the high prevalence of undernourishment and malnutrition that affects its population. India did not achieve the Millennium Development Goal of reducing the population that suffers from hunger and continues to have high rates of undernourishment.
Figure 7 India: Total population and percentage of population below the poverty line of 1.90 dollars per day, 1993-2011 (Millions and percentages)
Source: Economic Commission for Latin America and the Caribbean (ECLAC), based on the Sustainable Development Goals database and the United Nations, Department of Economic and Social Affairs, Population Division.
46 38.4 31.4 21.3 0
200
400
600
800
1 000
1 200
1 400
1993 2004 2009 2011Population below the poverty line of 1.90 dollar per day
Strengthening the relationship between India and Latin America and the Caribbean
23
5. India as a global and regional actor: Vision and priorities
Indian foreign affairs policy is motivated by the principles 1 for peaceful coexistence and the Non-Aligned Movement. In recent years, India has adapted these principles to a global order that is no longer bipolar and where India could have more room for power and leadership. India has made foreign affairs policy one of its priorities by committing to solid and productive regional relations, including with China and Pakistan. The other major commitment in its foreign affairs policy is to consolidate Indian participation in global governance platforms. This focus supersedes the traditional non-aligned policy and can be summarized into three main aspects:
Prioritization of regional affairs “neighborhood first”. Ensure a multilateral equilibrium in the Indo-Pacific
zone: “act east” instead of “look east” Ensure an Indian presence in matters of global
governance.
Prioritization of regional affairs: “neighborhood first” India has chosen to give political and diplomatic priority to its neighboring countries including the small, insular states of the Pacific. It does this by means of material, financial and technical support such as improving the connectivity and infrastructure that allows for better integration and easier movement of goods, persons, capital and information. Furthermore, India participates in multilateral regional networks, with the exception of the Asia-Pacific Economic
Cooperation Forum. It is a member of regional discussion forums like the South Asian Association for Regional Cooperation; the East Asia Summit; the Asia Cooperation Dialogue; the Bay of Bengal Initiative for Multi-Sectoral Technical and Economic Cooperation; the Mekong-Ganga Cooperation; the Bangladesh, Bhutan, India, Nepal Initiative; the Shanghai Cooperation Organization and the ASEAN +6, a forum that unites the members of the Association of Southeast Asian Nations as well as Australia, China, India, Japan, New Zealand and the Republic of Korea.
Securing a multilateral equilibrium in the Indo-Pacific zone: “act east” instead of “look east” India has an active international agenda with respect to finance and trade. On the financial side, it is one of the founding members of the Asian Infrastructure Investment Bank, an institution that relies predominantly on regional capital (China and India are the largest shareholders with a capital of 30% and 8.5% respectively) and which complements the Asian Development Bank, whose majority shareholders are Japan and the United States. In the trade field, its strategy encompasses the negotiations of the Regional Comprehensive Economic Partnership (RCEP), an initiative that includes various countries that form part of the Trans-Pacific Partnership (TPP), as well as China and other regional, strategic partners of India. RCEP has been a forum in which India hopes to express its doubts over the services trade, intellectual property rights and labor mobility.
1 The five principles for a peaceful coexistence are: mutual respect for each other’s sovereignty and territorial integrity, mutual non-aggression, mutual non-interference in each other’s internal affairs, equality and cooperation for mutual benefit, and peaceful coexistence

Economic Commission for Latin America and the Caribbean
24
Figure 8 RCEP and TPP participants
Source: Economic Commission for Latin America and the Caribbean (ECLAC).
Securing Indian presence in global governance issues The end of the Cold War era that affected international relations for decades has led India to increase its presence in global governance bodies: G20, the East Asian Summit and
the BRICS 2 coalition. India also aspires to a permanent seat in the United Nations Security Council through its commitment to multilateralism and large contributions to the peacekeeping operations of the organization – currently India is the second biggest contributor of UN peacekeepers, with some 7,713 officials. India also leads two initiatives that seek to reconfigure global governance: The launch of the BRICS New Development Bank (NDB) and the launch of the International Solar Alliance (ISA), which is headquartered in India. Both initiatives seek to drive a global order which reflects, in a more inclusive manner, the relevance of emerging and developing countries. The BRICS NDB seeks to create channels of financial architecture different to those offered by the World Bank and the International Monetary Fund (IMF). Whereas ISA is a coalition of countries rich in solar exposure, mainly those situated on the Tropics of Cancer and Capricorn, to advance technology generation, knowledge transfer, the development of financing mechanisms and the increased use of solar energy. Currently there are 122 countries which make up this alliance.
2 An acronym that refers to countries that are considered to be politically and economically emerging, on a global scale. The countries considered to be in this group are: Brazil, the Russian Federation, India, China and South Africa.

Strengthening the relationship between India and Latin America and the Caribbean
25
6. The growth of Latin America and the Caribbean is heterogeneous between countries and subregions
The evolution of economic activity in the Latin American and Caribbean region shows significant differences between subregions and countries. The economies of South America contracted by 1.8% in 2015, a trend influenced primarily by Brazil and the Bolivarian Republic of Venezuela. These countries showed negative rates of -3.9% and -5.7% respectively. Excluding these countries from the calculations, the subregion has a growth of 2.5% in relation to the previous year. The subregion made up of countries in Central America and Mexico, whose main trade partner is the United States, grew by 2.7% in 2015. Between 2014 and 2015 the subregion of Central America recorded a growth rate of 4.2%. The dynamism of Panama and Nicaragua particularly stood out during that period with 5.8% and 4.9% growth respectively. In 2015 the growth rate of the Caribbean countries was 3.7%. Even so, at country level the growth is heterogeneous. Three countries experienced a contraction of GDP: The Bahamas, Dominica and Trinidad and Tobago. In contrast, the Dominican Republic continues to be the country with the highest growth in the Latin American and Caribbean region.
Figure 9 Latin America and the Caribbean: GDP growth rate, 2015 (Percentages)
Source: Economic Commission for Latin America and the Caribbean (ECLAC) based on CEPALSTAT. Note: The orange color corresponds to the subregion of South America, blue to the Caribbean and purple to Mexico and Central America.
-5,71,0
-2,1-2,0
1,62,4
3,83,33,0
5,84,9
2,50,8
3,61,2
3,04,1
5,12,5
0,37,0
-1,84,3
3,73,1
2,1-3,9
4,81,20,9
-1,72,4
4,1-0,5-0,5-0,5
-10,0 -5,0 0,0 5,0 10,0
Venezuela (Bol. Rep. of)Uruguay
Trinidad and TobagoSuriname
Saint Vincent and the…Saint Lucia
Saint Kitts and NevisPeru
ParaguayPanama
NicaraguaMexico
JamaicaHonduras
HaitiGuyana
GuatemalaGrenada
El SalvadorEcuador
Dominican RepublicDominica
CubaCosta Rica
ColombiaChileBrazil
Bolivia (Plur. State of)Belize
BarbadosBahamasArgentina
Antigua and BarbudaLatin America and the…
Latin AmericaCaribbean

Economic Commission for Latin America and the Caribbean
26
7. In terms of social development, Latin America and the Caribbean and India face tough challenges
In 2014, 28.2% of the Latin American population (168 million people) lived in poverty, of which 11.8% (70 million people) found themselves in a state of destitution. It is estimated that in 2015 both percentages increased as a result of the low regional economic growth in the past few years. Between 2013 and 2014 the number of people below the poverty line increased by 2 million in the region.
Figure 10 Latin America: Population living in poverty and indigence (Percentages)
Source: Economic Commission for Latin America and the Caribbean (ECLAC) based on CEPALSTAT. Note: Estimate corresponds to 19 countries in the region, including Haiti. Cuba is not included. The figures for 2015 are projections
Thanks to the economic growth of India in recent years, the country has been able to significantly reduce poverty. However, the fight against poverty is still one of the main challenges in India. According to the most recent statistical information, in 2011 59.2% of the Indian population was living on less than two dollars a day (2005 PPA), and 23.6% lived on less than 1.25 dollars a day.
Figure 11 India: Population living in poverty on less than 1.25 dollars and 2 dollars per day (2005 PPP) (Percentages)
Source: Economic Commission for Latin America and the Caribbean (ECLAC) based on the ESCAP Online Statistical Database.
18.622.6
18.6 19.3
12.9 12.1 11.7 11.3 11.9 11.8 12.4
40.5
48.443.8 43.9
33.531.1 29.7 28.2 28.1 28.2 29.2
0
10
20
30
40
50
60
1980 1990 1999 2002 2008 2010 2011 2012 2013 2014 2015Destitution Poverty
53.649.4
41.6
32.7
23.6
83.8 81.775.6
68.8
59.2
0
10
20
30
40
50
60
70
80
90
1987 1993 2004 2009 20111.25 dollars per day 2 dollars per day

Strengthening the relationship between India and Latin America and the Caribbean
27
8. In gender equality, Latin America and the Caribbean is in a better position than India
India has been a pioneer in terms of female political participation. In 1966, when Indira Gandhi was elected as head of state, she was one of the first women in the world to hold a position at that level. However, according to various economic participation indicators, women are still underrepresented in the economy. The labor participation rate of women in India is particularly low, while participation in education is very unequal between men and women.
Figure 12 India and Latin America and the Caribbean (LAC): Female participation indicators in various economic activities, 2005-2014 (Percentages)
Source: Economic Commission for Latin America and the Caribbean (ECLAC) based on the World Bank (2016). Note: The education figures refer to the 2005-2013 period. The figures for business owners refer to the most recent year for each region (2014-2015). For female labor-force participation there are currently no comparable global figures.
In Latin America and the Caribbean the situation is the opposite. While the economic participation of women is better than it is in India, the political prominence of women has been limited. In recent decades, various countries in the
region have had female heads of state, including Argentina, Brazil, Costa Rica, Jamaica, Nicaragua, Panama and Trinidad and Tobago. In general, however, gender inequality in Latin America and the Caribbean is at an intermediate level compared to the world as a whole. A commonly used indicator for analysing gender inequality is representation in national parliaments. In Latin America and the Caribbean, women represent 28% of national parliament positions in the region, above the global average. In India, women represent only 12% of the total.
Figure 13 India and Latin America and the Caribbean (selected countries): Female members of national parliaments, 2015 (Percentages)
Source: Economic Commission for Latin America and the Caribbean (ECLAC), based on the World Bank (2016). Note: The figures for Argentina refer to 2014.
0%
10%
20%
30%
40%
50%
60%World
0
10
20
30 40 50 60
India LAC India LAC India LAC India LAC India LAC
Labour force participation
Firms with female top manager
Female unemploy- ment rate
Female participationin secondaryeducation
Tertiary schoolenrollment (female)
World

Economic Commission for Latin America and the Caribbean
28
9. The volatility of international food prices make it difficult to eradicate poverty and hunger in India and Latin America and the Caribbean
Latin America and the Caribbean accomplished goal 1C of the Millennium Development Goals (DMGs) by reducing the number of people that suffer from hunger. In the period of 1990-1992, 14.7% of the population suffered from undernourishment, the figure fell to 5.5% in 2014-2016. , Unfortunately throughout the region there are big differences in terms of completing the aforementioned goal, Central America displays slower progress and the Caribbean is trailing behind. The prevalence of undernourishment in India continues to be high. Even so, there are signs of improvement in the rates of malnutrition in recent years. From 1990-1992, 23.7% of the population suffered from undernourishment, the percentage dropped to 15.2% from 2014-2016.
Figure 14 Latin America and the Caribbean: Undernourishment prevalence, 1990-2016 (Percentages of population)
Source: Economic Commission for Latin America and the Caribbean (ECLAC) based on FAO (2016). Note: The definition of the Caribbean given by FAO is more inclusive than that of ECLAC. This definition includes, among others, Cuba, Haiti and Puerto Rico, which has a substantial impact on the results of the analysis.
International food prices affect hunger eradication strategies in many ways. Small producers in rural areas can benefit from high prices. However, price increases affect poorer people, such as those in urban areas, who do not grow their own food. In addition, the high level of price volatility creates uncertainty in the market. As a result, even for people who could benefit from higher prices, investments in the sector could be affected. After the financial crisis, the volatility of food prices increased, resulting in more uncertainty.
Figure 15 Food and beverages price index, January 2000-June 2016 (Index, January 2000 = 100)
Source: Economic Commission for Latin America and the Caribbean (ECLAC) based on the International Monetary Fund.
0
5
10
15
20
25
30
35
India Caribbean South America Central America
0
50
100
150
200
250
300
Jan
2000
Jan
2001
Jan
2002
Jan
2003
Jan
2004
Jan
2005
Jan
2006
Jan
2007
Jan
2008
Jan
2009
Jan
2010
Jan
2011
Jan
2012
Jan
2013
Jan
2014
Jan
2015
Jan
2016

Strengthening the relationship between India and Latin America and the Caribbean
II. IN INDIA, JUST AS IN LATIN AMERICA AND THE CARIBBEAN, INTERNATIONAL TRADE PLAYS AN
IMPORTANT ROLE. HOWEVER, THE
BILATERAL RELATIONSHIP HAS MUCH
SCOPE FOR GROWTH


Strengthening the relationship between India and Latin America and the Caribbean
31
1. In 2015, India was the nineteenth largest exporter of goods in the world and the eighth largest exporter of services
The economic liberalization of India since 1991 has propelled its goods and services trade. Its goods exports has increased sixfold and its services exports have multiplied ninefold. Its annual trade growth rate has been 14% for its external goods sales and 17% for its services sales.
Figure 16 India: Evolution of goods and services exports, 2001-2015 (Billions of dollars)
Source: Economic Commission for Latin America and the Caribbean (ECLAC) based on COMTRADE and UNCTAD (2016).
One of the Indian trade policy objectives is to double its global participation in goods exports (to 3.5%) and to diversify its basket of exported goods and services. To
achieve this India aims to increase its local manufacturing, move up in the value chain, increase services exports and simplify commercial procedures.
Figure 17 India: Participation in global goods and services exports, 2001-2015 (Percentages)
Source: Economic Commission for Latin America and the Caribbean (ECLAC) based on COMTRADE and UNCTAD (2016).
The increase in Indian exports has resulted in a reduction of its goods trade deficit and an increase of its surplus in services in the past few years. The Indian share in the global services trade was 3.2% in 2015.
0
50
100
150
200
250
300
350
400
2001 2002 2003 2004 2005 2006 2007 2008 2009 2010 2011 2012 2013 2014 2015
Goods Services
0.0
0.5
1.0
1.5
2.0
2.5
3.0
3.5
2001 2003 2005 2007 2009 2011 2013 2015
Goods Services

Economic Commission for Latin America and the Caribbean
32
2. India has diversified its trade relations, but around 50% of its trade is still concentrated in Asia
Indian exports are focused in Asia, particularly in West Asia. In this region, the United Arab Emirates and Saudi Arabia are the main destinations. China and Singapore have also increased in relevance as destinations for Indian exports, to the detriment of other countries including Germany, Japan and the United Kingdom. However, the European Union is still the main export destination with 17% of total sales, followed by the United States at 15%.
Map 1 India: Participation of its total goods exports, 2015 (Percentages)
Source: Economic Commission for Latin America and the Caribbean (ECLAC) based on COMTRADE. Note: Association of Southeast Asian Nations (ASEAN): Brunei Darussalam, Cambodia, Indonesia, Laos, Malaysia, Myanmar, Philippines, Singapore, Thailand and Viet Nam.
In the past decade Indian imports from China and Saudi Arabia have increased substantially. In 2015, both countries were important sources of imports, after the European Union and the United States. Other Asian countries like Indonesia and the United Arab Emirates have also been increasing in importance as a source of imports. Latin America and the Caribbean is the region with the lowest amount of Indian exports and imports, a fact that reflects Indian trade policy. This region was the last in which the Indian government strengthened its trade policy, both for its geographical distance as well as its less significant historical relations.
Map 2 India: Participation of its total goods imports, 2015 (Percentages)
Source: Economic Commission for Latin America and the Caribbean (ECLAC) based on COMTRADE.

Strengthening the relationship between India and Latin America and the Caribbean
33
3. As a result of its trade policies, India has diversified its export basket. From being a net exporter of primary goods and natural resources, today its strengths are in exporting products with a higher added value
The main exports of India are manufactured articles, including diamonds, various textile products and steel. In the machinery and equipment sector, its main export products are transport vehicle motors and other parts of the automotive industry. India has also stood out for its precious stones and precious metals exports, as well as medicine in the chemical sector and food products such as rice.
Figure 18 India: Goods exports by sector, 2015 (Percentages)
Source: Economic Commission for Latin America and the Caribbean (ECLAC), based on COMTRADE. Note: Study rounded to one digit by the Standard International Trade Classification, revision 3.
The Indian import basket of India has also changed in the past few decades. The country has increased its primary goods imports, especially crude oil, copper and natural gas as inputs for the production of goods with higher added value. These basic products are acquired primarily from Asian countries like Saudi Arabia, Qatar, or the United Arab Emirates, as well as Latin American countries such as the Bolivarian Republic of Venezuela and Chile. In manufacturing, India has increased its imports with higher value added, mainly telecommunications equipment among others.
Figure 19 India: Goods imports by sector, 2015 (Percentages)
Source: Economic Commission for Latin America and the Caribbean (ECLAC) based on COMTRADE.
Oils, fats and waxes; 0.4
Manufactured goods; 26.2
Miscallaneous manufactured articles; 14.8
Beverages and tobacco; 0.4
Mineral fuels, lubricants and related materials; 11.9
Machinery and transport
equipment; 16.4
Crude materials, inedible, except
fuels; 3.2
Commodities and transactions not
classified elsewhere; 2.9
Food and live animals; 9.9
Chemicals and related products;
13.8
Oils, fats and waxes; 2.7
Manufactured goods; 14.4
Miscallaneous manufactured articles; 3.9
Beverages and tobacco; 0.1
Mineral fuels, lubricants and related materials; 26.8
Machinery and transport
equipment; 20.6
Crude materials, inedible, except
fuels; 5.5
Commodities and transactions not
classified elsewhere; 11.7
Food and live animals; 2.4
Chemicals and related products;
11.8

Economic Commission for Latin America and the Caribbean
34
4. India is a net exporter of services
Services exports make up 37% of the total exports of India and its surplus is around 4% of GDP. Its main exports are telecommunications services, information technology and business services, which have grown consistently, with the exception of 2009/2010 due to the global economic conditions at that time.
Figure 20 World and India: Services exports, 2000-2015 (Annual growth rates)
Source: Economic Commisssion for Latin America and the Caribbean (ECLAC) based on COMTRADE.
Since the 1990s Indian services exports have grown at a substantially faster pace than that of global services exports, including those of advanced economies. This trend is a result of various reforms that have been introduced to increase the competitiveness of this industry. The most notable policies to incentivize the sector include the establishment of special economic zones, fiscal concessions, the strengthening of
tertiary education and the importance given to the command of the English language.
Figure 21 India: Services exports by category, 2005-2015 (Billions of dollars)
Source: Economic Commission for Latin America and the Caribbean (ECLAC) based on COMTRADE.
Telecommunications is the most important sector and the one whose services exports show the highest rates of growth. This sector includes information technology industries, business processes, long distance business process outsourcing services (including call centers and finance and accounting centers) and the development of products and engineering services. The high competitiveness of India in this area has enabled the country to attract numerous multinational companies from developed countries as its main clients.
-20
-10
0
10
20
30
40
50
60
70
2001 2003 2005 2007 2009 2011 2013 2015
World India
0
10
20
30
40
50
60
70
2005 2006 2007 2008 2009 2010 2011 2012 2013 2014 2015Other services OthersFinancial services Information and CommunicationTransport Tourism

Strengthening the relationship between India and Latin America and the Caribbean
35
5. Imports in Latin America and the Caribbean come, for the most part, from China and the United States, but vary depending on the subregion
The United States continues to be the primary source of imports to Latin America and the Caribbean, responsible for 32% of goods imports from the region in 2015. However, China has been its fastest-growing partner, with Latin American imports between 2001 and 2015 increasing at an annual rate of 22.3%, significantly exceeding the growth rate of imports from the United States (4.7%) and the total imports (7.3%), during the same period.
Figure 22 Latin America and the Caribbean: Main goods exports markets, 2001-2005 (Billions of dollars)
Source: Economic Commission for Latin America and the Caribbean (ECLAC), based on COMTRADE.
Intraregional imports in Latin America have also been growing in recent decades, making up 16% of total imports in 2015. A slightly higher percentage than that of imports
from the European Union (14%), another main trade partner of Latin America and the Caribbean. However, the importance of the United States and China with respect to imports differs by subregion and country. For Central America and Mexico, as well as for the Caribbean countries (for whom the United States represents an even greater share), the United States is the main source of imports, responsible for around 50% of goods bought abroad. In South America (where market diversification is greater), China has become the main source of imports, above the United States.
Figure 23 Latin America and the Caribbean: Participation of imports from the United States and China, according to subregion, 2015 (Percentages)
Source: Economic Comission for Latin America and the Caribbean (ECLAC), based on COMTRADE.
0
200
400
600
800
1 000
1 200
2001
2002
2003
2004
2005
2006
2007
2008
2009
2010
2011
2012
2013
2014
2015
Latin America and the Caribbean China United States European Union Others45.4 41.8
18.4
16.88.6
19.5
10.7
10.216.8
7.223
23.7
19.9 16.5 21.5
0102030405060708090
100
Central America and Mexico Caribbean South AmericaUnited States China European Union Latin America and the Caribbean Others

Economic Commission for Latin America and the Caribbean
36
6. Exports in Latin America and the Caribbean are even more concentrated than its imports but also differ according to the subregion
In 2015, 45% of total Latin American exports were destined for the United States and 2.3% for Canada. The second extraregional market in terms of importance was Asia, where four of the top ten regional export markets were located, including China (9%) and India (2%). European countries form the third extraregional market in terms of importance. Intraregional exports between Latin American countries themselves have been growing at nearly the same rate as their global exports and reached 17% of total exports in 2015.
Map 3 Latin America and the Caribbean: Main 10 extraregional markets for goods exports and intraregional exports, 2015 (Percentages)
Source: Economic Commission for Latin America and the Caribbean (ECLAC), based on COMTRADE.
Just as is the case for their imports, Central America and Mexico stand out from the rest of the region for having the highest concentration of extraregional exports in just one market: the United States. This differs from the countries of the Caribbean where the United States market is important, but its market share is smaller. South American countries have China as their main destination, relegating the United States to second place. Both for the Caribbean and South America, India is found among the top ten export destinations.
Table 2 Latin America and the Caribbean: Main 10 extraregional markets for goods exports, according to subregion, 2015 (Percentages)
Central America and Mexico
The Caribbean South America
United States 77.8 United States
38.7 China 16.6
Canada 2.6 Canada 4.1 United States
16.5
China 1.3 France 3.0 The Netherlands
3.5
Germany 1.0 Spain 2.7 India 3.5 Spain 0.9 United
Kingdom 2.6 Japan 2.9
Japan 0.8 Belgium 2.0 Spain 2.2 Republic of Korea
0.7 Switzerland 2.0 Germany 2.2
The Netherlands
0.7 India 1.9 Republic of Korea
2.1
France 0.6 The Netherlands
1.5 Canada 1.7
United Kingdom
0.6 Germany 1.4 Switzerland 1.7
Source: Economic Commission for Latin America and the Caribbean (ECLAC), based on COMTRADE.

Strengthening the relationship between India and Latin America and the Caribbean
37
7. The structure of exports of different subregions of Latin America and the Caribbean explains the difference in export markets
Countries in Central America and Mexico focus on the exports of manufactures of differing complexity that are closely linked to the United States value chain. South American countries, on the other hand, remain focused on exports in the field of natural resources and its related manufactures, the demand for which is greater in transitional economies such as China and India. The importance of natural resources can also be seen in the exports of Caribbean countries, but to a lesser extent than that of South America.
Figure 24 Latin America and the Caribbean: Types of export products, 2015 (Percentages)
Source: Economic Commission for Latin America and the Caribbean (ECLAC), based on COMTRADE. Note: The categories correspond to PP: Raw materials, NRBM: Natural Resource-Based Manufactures, LTM: Low Technology Manufactures, MTM: Medium Technology Manufactures and HTM: High Technology Manufactures.
The export structure of Latin American and the Caribbean has made the region dependent on two phenomena. For Central America, Mexico and the Caribbean, changes in the United States economy strongly affect exports. With regard to South American countries, its exports and economy are subject to price fluctuations of raw materials such as soy, copper and oil, among other primary goods.
Table 3 Latin America and the Caribbean: Main 10 export products, by subregion, 2015
N° Central America and Mexico
The Caribbean South America
1 Tourist cars Petroleum gas Crude petroleum oils
2 Motor vehicle parts and accessories
Anhydrous ammonia
Soy beans
3 Vehicles for the transportation of goods
Acyclic alcohols Cooper ores
4 Crude petroleum oils
Petroleum oils Cakes and residues of soy oil
5 Data processing machines
Artificial corundum
Refined cooper and cooper alloys
6 TV sets Iron products Iron ores and concentrates
7 Telephone equipment
Mineral fertilizers
Gold in rough or powder
8 Conductive wires and cables
T-shirts Petroleum oils
9 Tractors Aluminium alloys
Coffee
10 Medical instruments and devices
Cane sugar Corn
Source: Economic Commission for Latin America and the Caribbean (ECLAC), based on COMTRADE.
0
10 20 304050607080 90
100
South America Mexico and Central AmericaPP MBNR LTM MTM HTM

Economic Commission for Latin America and the Caribbean
38
8. Service exports in Latin America and the Caribbean are relatively low compared to those in India. Except for the countries in the Caribbean where the tourism sector is particularly important
Latin American and Caribbean service exports made up 14% of the total sales of the region in 2015. Of these, tourist services were the most important category at 44% of total services exports. Services have grown at a slightly higher rate (6.4%) than goods (6.3%) over the past 15 years, but the region is still fundamentally an exporter of goods, except for the Caribbean countries that are net exporters of services.
Figure 25 Latin America and the Caribbean: Goods and services exports, 2015 (Percentages)
Source: Economic Commission for Latin America and the Caribbean (ECLAC), based on COMTRADE.
80% of Caribbean exports are services. Tourism is its principal export activity. In general, 74% of subregional
service exports belong to this category. Another one of the main export activities of importance is transport, which makes up 7% of total service exports. In third place are other business services. Goods exports are more important in but a few countries, such as Belize, Guyana, Haiti, Suriname and Trinidad and Tobago. The main source markets of the tourism sector of the Caribbean are the United States, Europe and Canada. Asian countries are not very prominent in the tourism statistics of the Caribbean. In 2014, 0.1% of CARICOM tourists hailed from South Asia, to which India belongs. The main poles of attraction in the English-speaking Caribbean are Jamaica (36% of the total tourism of the subregion), the Bahamas (26%) and Barbados (10%).
Figure 26 Caribbean: Services exports, circa 2015 (Percentages)
Source: Economic Commission for Latin America and the Caribbean (ECLAC), based on COMTRADE.
Services 14
Goods86
Transport16.7
Tourism44
Otherservices
38.6
0 10 20 30 40 50 60 70 80
Other services
Other
Governmentservices
Telecommunications
Transport
Tourism
Strengthening the relationship between India and Latin America and the Caribbean
39
9. Trade relations between India and Latin America and the Caribbean have gradually improved in recent years. India has become an important trade partner for some countries, including Argentina, Brazil and Chile
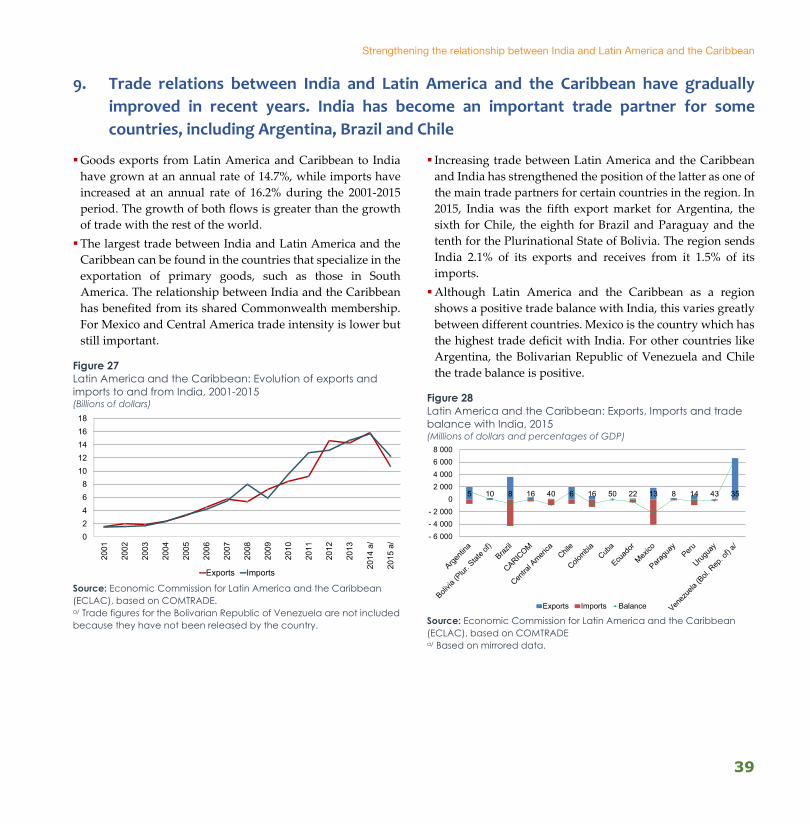
Goods exports from Latin America and Caribbean to India have grown at an annual rate of 14.7%, while imports have increased at an annual rate of 16.2% during the 2001-2015 period. The growth of both flows is greater than the growth of trade with the rest of the world. The largest trade between India and Latin America and the Caribbean can be found in the countries that specialize in the exportation of primary goods, such as those in South America. The relationship between India and the Caribbean has benefited from its shared Commonwealth membership. For Mexico and Central America trade intensity is lower but still important.
Figure 27 Latin America and the Caribbean: Evolution of exports and imports to and from India, 2001-2015 (Billions of dollars)
Source: Economic Commission for Latin America and the Caribbean (ECLAC), based on COMTRADE. a/ Trade figures for the Bolivarian Republic of Venezuela are not included because they have not been released by the country.
Increasing trade between Latin America and the Caribbean and India has strengthened the position of the latter as one of the main trade partners for certain countries in the region. In 2015, India was the fifth export market for Argentina, the sixth for Chile, the eighth for Brazil and Paraguay and the tenth for the Plurinational State of Bolivia. The region sends India 2.1% of its exports and receives from it 1.5% of its imports. Although Latin America and the Caribbean as a region shows a positive trade balance with India, this varies greatly between different countries. Mexico is the country which has the highest trade deficit with India. For other countries like Argentina, the Bolivarian Republic of Venezuela and Chile the trade balance is positive.
Figure 28 Latin America and the Caribbean: Exports, Imports and trade balance with India, 2015 (Millions of dollars and percentages of GDP)
Source: Economic Commission for Latin America and the Caribbean (ECLAC), based on COMTRADE a/ Based on mirrored data.
0 2 4 6 8
10 12 14 16 18
2001
2002
2003
2004
2005
2006
2007
2008
2009
2010
2011
2012
2013
2014
a/
2015
a/
Exports Imports
5 10 8 16 40 6 16 50 22 13 8 14 43 35
- 6 000- 4 000- 2 000
0 2 000 4 000 6 0008 000
Exports Imports Balance
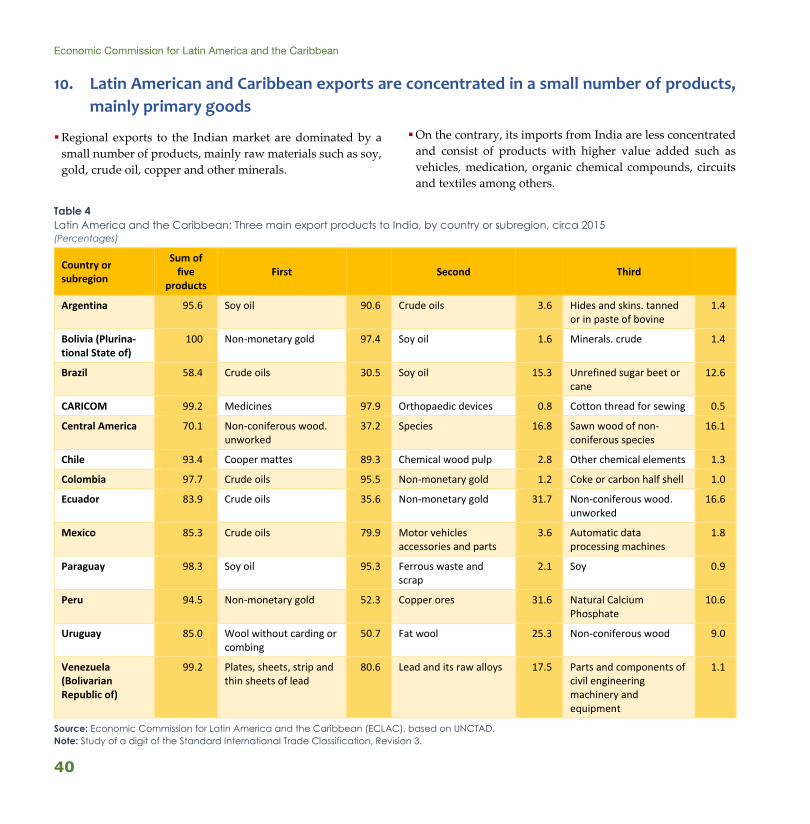
Economic Commission for Latin America and the Caribbean
40
10. Latin American and Caribbean exports are concentrated in a small number of products, mainly primary goods
Regional exports to the Indian market are dominated by a small number of products, mainly raw materials such as soy, gold, crude oil, copper and other minerals.
On the contrary, its imports from India are less concentrated and consist of products with higher value added such as vehicles, medication, organic chemical compounds, circuits and textiles among others.
Table 4 Latin America and the Caribbean: Three main export products to India, by country or subregion, circa 2015 (Percentages)
Country or subregion
Sum of five
products First Second Third
Argentina 95.6 Soy oil 90.6 Crude oils 3.6 Hides and skins. tanned or in paste of bovine
1.4
Bolivia (Plurina-tional State of)
100 Non-monetary gold 97.4 Soy oil 1.6 Minerals. crude 1.4
Brazil 58.4 Crude oils 30.5 Soy oil 15.3 Unrefined sugar beet or cane
12.6
CARICOM 99.2 Medicines 97.9 Orthopaedic devices 0.8 Cotton thread for sewing 0.5
Central America 70.1 Non-coniferous wood. unworked
37.2 Species 16.8 Sawn wood of non-coniferous species
16.1
Chile 93.4 Cooper mattes 89.3 Chemical wood pulp 2.8 Other chemical elements 1.3
Colombia 97.7 Crude oils 95.5 Non-monetary gold 1.2 Coke or carbon half shell 1.0
Ecuador 83.9 Crude oils 35.6 Non-monetary gold 31.7 Non-coniferous wood. unworked
16.6
Mexico 85.3 Crude oils 79.9 Motor vehicles accessories and parts
3.6 Automatic data processing machines
1.8
Paraguay 98.3 Soy oil 95.3 Ferrous waste and scrap
2.1 Soy 0.9
Peru 94.5 Non-monetary gold 52.3 Copper ores 31.6 Natural Calcium Phosphate
10.6
Uruguay 85.0 Wool without carding or combing
50.7 Fat wool 25.3 Non-coniferous wood 9.0
Venezuela (Bolivarian Republic of)
99.2 Plates, sheets, strip and thin sheets of lead
80.6 Lead and its raw alloys 17.5 Parts and components of civil engineering machinery and equipment
1.1
Source: Economic Commission for Latin America and the Caribbean (ECLAC), based on UNCTAD. Note: Study of a digit of the Standard International Trade Classification, Revision 3.

Strengthening the relationship between India and Latin America and the Caribbean
41
11. India has stood out as a growing exporter of medicine and it is the seventh supplier to Latin America and the Caribbean
India is the tenth largest exporter of medications in the world, with 2.7% of worldwide sales in 2015. Its average annual growth rate (19.2%) during 2001-2015 was the largest of the principal global exporters, which include Belgium, Switzerland, and the United States. Its main export destination is the United States, which accounts for 35% of its sales. Countries in Latin America and the Caribbean purchase 6.4% of its exports of medicine. Brazil receives 31% of regional exports, followed by Mexico (10%), the Bolivarian Republic of Venezuela (10%), Chile (7%), Colombia (6%) and the remaining 36% to the rest of the region.
Figure 29 World and India: Annual growth rates for medications exports, 2001-2015 (Percentages)
Source: Economic Commission for Latin America and the Caribbean (ECLAC), based on COMTRADE.
India also imports medications from Latin America and the Caribbean, especially from Brazil (74% of regional and 2% of global imports) and from Mexico (23% regional and 0.7% global), but at a lower value compared to its exports. Consequently, the Indian trade balance of medications with Latin America and the Caribbean is at a surplus. Brazil has increased exports of medication to India, displacing Mexico as the main provider. This is especially true for medications for the retail market that contain insulin, but do not contain any antibiotics.
Figure 30 India: Medications trade with Latin America and the Caribbean, 2001-2015 (Millions of dollars)
Source: Economic Commission for Latin America and the Caribbean (ECLAC), based on COMTRADE.
- 200
0
200
400
600
800
1 000
2001
2002
2003
2004
2005
2006
2007
2008
2009
2010
2011
2012
2013
2014
2015
Imports Exports Balance
-10-5 05
10152025303540
2003 2005 2007 2009 2011 2013 2015
World India

Economic Commission for Latin America and the Caribbean
42
12. Exports and imports of agriculture and livestock products have increased over the last 15 years
Since 2000, the value of Latin American and Caribbean trade in agriculture and livestock products has grown and a substantial trade surplus has developed. In Latin America and the Caribbean, exports grew at a faster rate than imports. Between 2000 and 2010, the situation in India was the reverse. However, in subsequent years its import growth rate came to a halt. The international trade surplus in Latin American and Caribbean farming products has exceeded that of India, in absolute and relative terms, from 2005 onwards.
Figure 31 Latin America and the Caribbean and India: Value of exports, imports and the trade balance of agro-industry products, 2000-2014 (Billions of dollars)
Source: Economic Commission for Latin America and the Caribbean (ECLAC), based on COMTRADE. Note: Agro-industry products include all products from chapters 1 to 24 in the Harmonized Commodity Description and Coding System.
International trade of farming products was more significant for Latin American and Caribbean economies, where it made up 2.2% of the total regional GDP in 2000 and 5.2% in 2014, whereas in India it made up only 1.4% of its GDP in 2000 and 3.7% in 2014. A similar result can be observed for the share of agricultural products in total exports and imports. For Latin America and the Caribbean, the export share increased from 15.7% in 2000 to 22.4% in 2014, whereas in India this percentage reached 12.3% in 2014.
Figure 32 Latin America and the Caribbean and India: Exports and imports of agro-industry products as a proportion of total exports and imports, 2000-2014 (Percentages)
Source: Economic Commission for Latin America and the Caribbean (ECLAC), based on COMTRADE.
0
50
100
150
0
50
100
150
200
250
2000 2005 2010 2014Exports Latin America and the CaribbeanImports Latin America and the CaribbeanExports IndiaImports IndiaBalance Latin America and the Caribbean (righthand axis)Balance India (righthand axis)
0
5
10
15
20
25
Export Import Export ImportLatin America and
the Caribbean India
2000 2005 2010 2014

Strengthening the relationship between India and Latin America and the Caribbean
43
13. The Tata Group is the primary Indian example of a diversified company with various activities throughout Latin America and the Caribbean
Box 1 Tata Group in Latin America: Diversify and conquer
Source: Economic Commission for Latin America and the Caribbean (ECLAC) based on Tata Consultancy Services Limited.


Strengthening the relationship between India and Latin America and the Caribbean
III. ON A GLOBAL SCALE, LATIN AMERICA AND THE CARIBBEAN
ARE IMPORTANT RECIPIENTS OF
FOREIGN DIRECT INVESTMENT, WHILE INDIA HAS SEEN AN INCREASE IN THESE FLOWS IN RECENT YEARS


Strengthening the relationship between India and Latin America and the Caribbean
47
1. India was the ninth largest recipient of FDI in the world in 2015, receiving the second largest sum of FDI in its history
India is an important recipient of FDI inflows. In 2015, the country was the ninth most important recipient, with inflows totaling 44.208 billion dollars. The United States is still the main recipient of FDI in the world, followed by Hong Kong (Special Administrative Region of China). Ireland is the fourth country that received more than 100 billion dollars in this year. Brazil is the main recipient of FDI flows to Latin America and the Caribbean and the fifth main recipient in the world in 2015.
Table 5 World: Main FDI recipients, 2015 (Billions of dollars)
N° Country IED 1 United States 379.9 2 Hong Kong (RAE of China) 174.9 3 China 135.6 4 Ireland 100.5 5 Brazil 75.1 6 Switzerland 68.8 7 Singapore 65.3 8 Canada 48.6 9 India 44.2 10 France 42.9
Source: Economic Commission for Latin America and the Caribbean (ECLAC), base don UNCTAD and official figures.
Until 2005, India received a small number of FDI inflows. During 2000-2005, the country received an average of 0.8% of global FDI inflows. Since 2006, the Indian share of global inflows has increased to between 2%-3%. In absolute terms, India shows high levels of fluctuations, receiving a record of 47.102 billion dollars in 2008, followed by a decrease to just
24.195 billion dollars in 2012. However, over the last four years FDI inflows have continually increased.
Figure 33 India: FDI inflows and global FDI participation, 2006-2015 (Billions of dollars and percentages)
Source: Economic Commission for Latin America and the Caribbean (ECLAC), based on UNCTAD.
According to the 2015 figures for India from the Department of Industrial Policy and Promotion (DIPP), its main investor was Singapore with 30% of FDI inflows. In second place was Mauritius, responsible for 21% of FDI inflows. It is likely, however, that Mauritius acts as a conduit for the FDI directed towards India. The role of other countries is much less significant than that of Singapore and Mauritius. Japan, the Netherlands and the United States represent 4%, 7% and 9% of the total respectively. The role of the United Kingdom is relatively minor, despite its special historic relationship with India.
0
1
2
3
4
5
0
10
20
30
40
50
2006 2007 2008 2009 2010 2011 2012 2013 2014 2015
FDI in India Indian share of global FDI (righthand axis)

Economic Commission for Latin America and the Caribbean
48
2. Indian companies play a minor role in foreign direct investment abroad
In 2008 India registered a record amount of FDI outflows to the rest of the world, at 21.142 billion dollars. In 2015, FDI abroad reached 7.501 billion dollars, equivalent to 0.5% of the world total.
Figure 34 India: FDI abroad, 2001-2015 (Billions of dollars and percentages)
Source: Economic Commission for Latin America and the Caribbean (ECLAC), based on UNCTAD.
Investment announcements, according to the FDI Markets database, paint a more complex picture. Indian companies planned around 20 billion dollars’ worth of investments annually during 2006-2015, with less variation than was shown in the balance of payments figures. 2014 had the lowest number of announced projects (13.4 billion dollars’ worth) and 2008 had the highest (27.4 billion dollars). 2015 was below the long term average with 15.1 billion dollars’ worth of announced projects.
Among the projects, the majority of them are aimed at other Asian countries (49% of the total). However, Africa is also of great importance for Indian countries, with 19% of the total in that period as a whole. The role of Europe has expanded in recent years, and the continent receives 15% of all announced investments. Latin America and the Caribbean plays a minor role, receiving 4% of these announcements.
Figure 35 India: Value of scheduled projects abroad, by destination, 2006-2015 (Percentages of total scheduled value)
Source: Economic Commission for Latin America and the Caribbean (ECLAC), based on fDi Markets. Note: Europe includes the Russian Federation. Data refers to scheduled projects, there is no guarantee that these projects will materialize.
0.0
0.5
1.0
1.5
2.0
2.5
0
5
10
15
20
25
2001 2003 2005 2007 2009 2011 2013 2015
FDI abroad FDI abroad as a percentage of GDP (righthand axis)
010
2030405060708090
100
2006 2007 2008 2009 2010 2011 2012 2013 2014 2015Asia AfricaEurope United StatesLatin America and the Caribbean Others

Strengthening the relationship between India and Latin America and the Caribbean
49
3. India receives investments in various types of services, while Indian companies that invest abroad focus more on natural resources and energy
FDI flows to India are concentrated on a small number of sectors. The services sector receives around a quarter of total foreign investments in the country, followed by the software and hardware sector, as well as the trade sector. With the exception of the automotive sector, few sectors involve manufacture investment. In the last three years, the sectors which have grown the most include the three largest sectors, including hotels and tourism, whereas the sectors which are shrinking in terms of FDI receipts are pharmaceuticals, energy and construction.
Figure 36 India: IED by sector, April 2013-March 2016 (Percentages)
Source: Economic Commission for Latin America and the Caribbean (ECLAC), based on the Department of Industrial Policy and Promotion (DIPP).
The panorama of Indian companies with investments abroad is very different. The main sectors are natural resources and its related processing, as well as energy. Much of the
investments in natural resources are related to exploration, which is very important for India. Another important point is that investments in natural resources and energy tend to be extremely capital-intensive, and as a result, projects can often require very large investments. The services and automotive sectors are others in which Indian companies have announced a great number of projects. Although, the Tata Group of India is the main leader in the automotive sector, others, such as the Mahindra Group, also have a significant presence in the aforementioned projects during this period.
Figure 37 India: Value of scheduled projects abroad, by sector, 2011-2015 (Percentages of total scheduled value)
Source: Economic Commission for Latin America and the Caribbean (ECLAC), based on fDi Markets. Note: Data refers to scheduled projects. There is no guarantee that these projects will be completed.
Services 24
Software and hardware
16
Commerce14
Automotive 12
Telecommunications10
Pharmaceuticals6
Chemicals5
Energy5
Hotels andtourism
4Construction
4
Others24
Natural resources
21Energy
19
Services15
Automotives12
Manufacturing10
Real estate 10
Chemicals5
Telecommu-nications
4Hotels andtourism 2Pharmaceuticals
2
Aerospace0
Others13

Economic Commission for Latin America and the Caribbean
50
4. Much of Indian investment is focused on a few conglomerate companies
The presence of conglomerates in India is very important, they are companies that are involved in a variety of sectors. The main example of this type of company is the Tata Group. This company represented 16% of all scheduled investments by Indian companies in 2011-2015. Outside of India, the company is best known for its activities in the automotive sector, but this sector only makes up 50% of planned investments in this period. Another 30% is made up by the energy sector and the rest is made up of other sectors. This is part of the diversification strategy of the company to gain a presence in many different sectors.
Figure 38 Tata Group: Sectorial distribution of scheduled investments, 2011-2015 (Percentages)
Source: Economic Commission for Latin America and the Caribbean (ECLAC), based on fDi Markets. Note: Data refers to scheduled projects. There is no guarantee that these projects will materialize.
However, this is not only the case for the Tata Group. Many Indian companies that have a significant role in investment abroad are mixed companies. For example Tata Group, Adani Enterprises LTd and Jindal Group have investments in a variety of sectors. But of course, this isn’t the only way in which Indian companies invest. For example, Sobha (real estate), Bharti Group (telecommunications) and Apollo Tyres (car tires) are some of the specialized Indian companies that limit their investments to these sectors.
Figure 39 India: Scheduled announcements by Indian companies as percentabge of total announcements, 2011-2015 (Percentages)
Source: Economic Commission for Latin America and the Caribbean (ECLAC), based on fDi Markets. Note: Data refers to scheduled projects. There is no guarantee that these projects will materialize.
Automotive 50
Energy 30
Services5 Hotels and
tourism5
Real estate5
Chemicals2
Natural resources
2Manufacturing
1
Telecommunications
Other5%

Strengthening the relationship between India and Latin America and the Caribbean
51
5. Foreign direct investment in Latin America and the Caribbean is stable at 3%-4% of the GDP, although in 2015 flows fell by 10%
After the global economic crisis, FDI inflows in Latin America and the Caribbean remained stable (as a percentage of the regional GDP). In absolute terms, they reached a maximum in 2011, and decreased slightly in subsequent years. However, it is important to understand that FDI inflows are affected by individual transactions, which could affect the figures of the region as a whole.
Figure 40 Latin America and the Caribbean: Foreign direct investment flows, 2000-2015 (Billions of dollars and percentage of GDP)
Source: Economic Commission for Latin America and the Caribbean (ECLAC), based on official figures (ECLAC, 2016b).
Due to the diversity of the region, FDI fluctuations can occur for many reasons. For example, mining countries, such as Chile, Colombia and Peru have been hit hard in recent years due to a drop in both demand for minerals and in their international price. On the other hand, manufacturing
countries such as Mexico and Central America have tended to see an increase in FDI receipts. The reduction observed in FDI flows to the region in 2015 was, for the most part, due to the decline of inflows experienced by Brazil.
Figure 41 Latin America and the Caribbean (selected countries): Foreign direct investment flows, 2014-2015 (Billions of dollars)
Source: Economic Commission for Latin America and the Caribbean (ECLAC), based on official figures (CEPAL 2016b).
FDI inflows to Brazil decreased by 23% in 2015, compared to 2014. This was as a result of a weak internal market and the internal decisions made by companies that have operations in the country. Mexico is the second largest recipient of FDI in the region, with an increase of 11% between 2014 and 2015. Mexico is followed by Chile, with FDI that decreased by 8%.
0123456789
0255075
100125150175200225
FDI inflows FDI inflow as share of GDP (righthand axis)
0102030405060708090
100
2014 2015
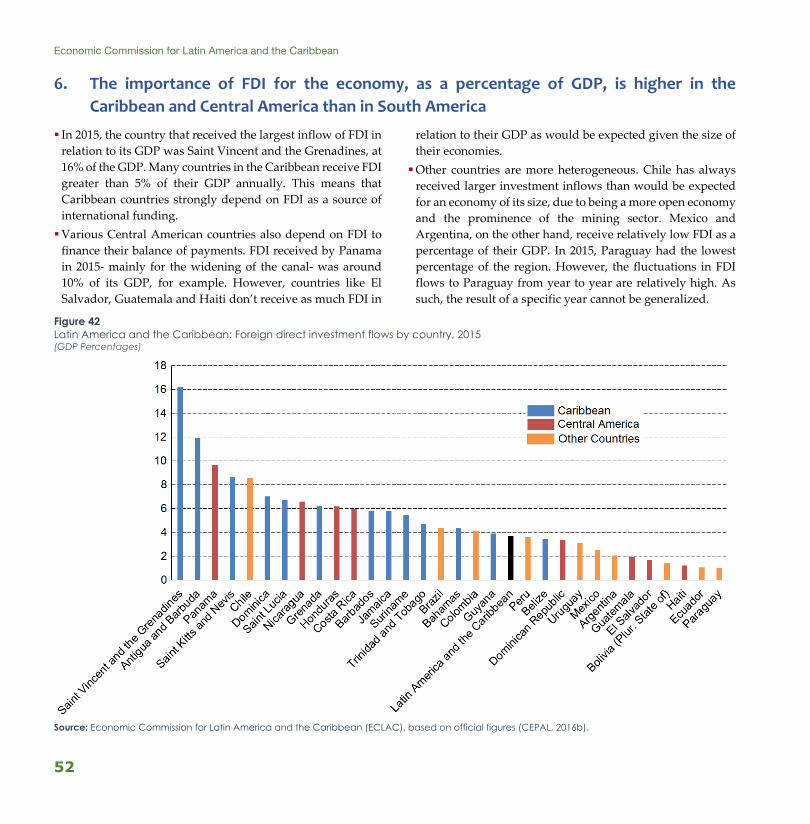
Economic Commission for Latin America and the Caribbean
52
6. The importance of FDI for the economy, as a percentage of GDP, is higher in the Caribbean and Central America than in South America
In 2015, the country that received the largest inflow of FDI in relation to its GDP was Saint Vincent and the Grenadines, at 16% of the GDP. Many countries in the Caribbean receive FDI greater than 5% of their GDP annually. This means that Caribbean countries strongly depend on FDI as a source of international funding. Various Central American countries also depend on FDI to finance their balance of payments. FDI received by Panama in 2015- mainly for the widening of the canal- was around 10% of its GDP, for example. However, countries like El Salvador, Guatemala and Haiti don’t receive as much FDI in
relation to their GDP as would be expected given the size of their economies. Other countries are more heterogeneous. Chile has always received larger investment inflows than would be expected for an economy of its size, due to being a more open economy and the prominence of the mining sector. Mexico and Argentina, on the other hand, receive relatively low FDI as a percentage of their GDP. In 2015, Paraguay had the lowest percentage of the region. However, the fluctuations in FDI flows to Paraguay from year to year are relatively high. As such, the result of a specific year cannot be generalized.
Figure 42 Latin America and the Caribbean: Foreign direct investment flows by country, 2015 (GDP Percentages)
Source: Economic Commission for Latin America and the Caribbean (ECLAC), based on official figures (CEPAL, 2016b).

Strengthening the relationship between India and Latin America and the Caribbean
53
7. Brazil, Mexico and Chile are not only the main recipients of FDI, but also the most important investors
During recent years, these three countries received around 70% of the FDI inflows of the region. For many years, Mexico was the main destination country, but after the global financial crisis, Brazil has become more important. With its internal market and natural resources opportunities, the newfound status of Brazil comes as no surprise. The surprise is the participation of Chile, a relatively small country. This has been due in large part to its mining sector, which attracts FDI.
Figure 43 Brazil, Chile and México: Participation in foreign direct investment in the region, 2000-2015 (Percentages)
Source: Economic Commission for Latin America and the Caribbean (ECLAC), based on official figures (CEPAL, 2016b).
In regards to FDI abroad, the same countries are the primary international investors. In fourth place is Colombia, whose
trans-Latin companies have been playing an ever more important role.
Figure 44 Latin America (selected countries): Stock of foreign direct investment abroad, 2005-2015 (Billions of dollars)
Source: Economic Commission for Latin America and the Caribbean (ECLAC), based on official figures (ECLAC 2016).
The most important trans-Latin companies in the region include various natural resources companies, such as Vale and Petrobras from Brazil and PDVSA from the Bolivarian Republic of Venezuela. These companies have a large global presence, whereas the majority of other trans-Latin companies still have a more regional focus. Many Chilean trans-Latin companies, for example, compete in the retail market sector and operate all over the region. Mexican companies, the majority of which in the manufactures and services sectors, also tend to look for markets abroad. Many of these have a presence in regional markets, which includes the United States in their case, as well as globally.
0
10
20
30
40
50
60
70
80
90
100
2000 2003 2006 2009 2012 2015Brazil Mexico Chile Other countries

Economic Commission for Latin America and the Caribbean
54
8. FDI in natural resources is decreasing and renewable energy is becoming the most dynamic sector in Latin America and the Caribbean
With respect to FDI, a big change has been observed across many sectors in the last ten years. In 2005, mining and hydrocarbon sectors made up 73% of scheduled investments, whereas in 2015, both sectors represented only 13% of all planned investments. On the other hand, the sectors which have grown the most include renewable energy (20% of new announcements in 2015), automotive (15%) and telecommunications (11%).
Figure 45 Latin America and the Caribbean: Announced projects in different sectors, 2005-2015 (Percentages)
Source: Economic Commission for Latin America and the Caribbean (ECLAC), based on FDI Markets. Note: Data refer to projects announced. There is no guarantee that such projects will materialize.
The growth of the renewable energy sector represents a big increase in investments in Chile during the past few years. However, other countries such as Brazil, Mexico, Peru and Uruguay have also received large investments in this sector. Several different types of companies are present among the largest mergers and acquisitions of the past few years. The purchase of the Mexican beer company Grupo Modelo in 2013 is still the largest acquisition in the region. Other large acquisitions involve telecommunications, mining and aviation sectors. The larger acquisitions were led by European companies, whereas acquisitions by trans-Latin companies, which are common, tend to be smaller in size.
Table 6 Latin America and the Caribbean: The largest mergers and acquisitions, 2011-2015 (Millions of dollars)
Country Acquisition Year Acquired by Origen Value Mexico Grupo
Modelo 2013 Anheuser-
Busch InBev
Belgium 17 231
Brazil Global Village Telecom
2015 Telefonica Spain 10 285
Peru Mina Las Bambas
2014 MMG Ltd and Associates
China 7 005
Brazil-Chile
Fusion between LAN and TAM
2012 LAN and TAM
Chile-Brazil
6 502
Brazil Actives in Aluminio de Vale
2015 Norsk Hydro
Norway 5 270
Source: Economic Commission for Latin America and the Caribbean (ECLAC), based on Bloomberg.
0
10
20
30
40
50
60
70
80
90
100
2005 2006 2007 2008 2009 2010 2011 2012 2013 2014 2015Renewable energy Automobiles and componentsTelecommunications Coal, petroleum and natural gasMetals (mining and processing)

Strengthening the relationship between India and Latin America and the Caribbean
55
9. FDI flows between India and Latin America and the Caribbean have much room for growth
It is difficult to analyse FDI flows between India and Latin America and the Caribbean, because complete data sources for these flows do not exist. However, using data from the Reserve Bank of India, it is possible to analyze access to foreign exchange for the purpose of foreign investment. These figures, however, do not include funds beated abroad, nor do they include reinvestment of profits.
Figure 46 India: Destination of outward FDI from India in Latin America and the Caribbean, 2011-2015 (Percentages)
Source: Economic Commission for Latin America and the Caribbean (ECLAC), based on Reserve Bank of India.
However, using the available data it is possible to identify various trends. Between 2011 and 2015, investment outflows totaled more than 136 billion dollars and only 0.4% of these were aimed at Latin America and the Caribbean. Out of the total number of Indian investments in Latin America and the
Caribbean, the Bahamas, 3 Brazil and Panama 4 received around a quarter of them. Chile and Mexico play a much less important role. On the other hand, India received only 0.2% of foreign investment from Latin America and the Caribbean between January 2000 and March 2016. According to statistics, the main source of investments in the region was Chile, followed by Mexico.
Figure 47 India: FDI received by Latin America and the Caribbean, January 2000-March 2016 (Percentages)
Source: Economic Commission for Latin America and the Caribbean (ECLAC), based on data from the Department of Industrial Policy and Promotion (DIPP).
3 Investments in the Bahamas can actually be destined to a third FDI recipient country, or can be looking for favorable tax systems, as Indian Express (2016) suggests. 4 Investments in Panama can have a third country as their final destination and could be using the Panamanian financial system solely for the ease with which corporate headquarters can establish themselves in this country.
Chile32
Mexico21
Saint Vincent and the
Grenadines11
Panama10
Bahamas8
Saint Kitts and Nevis7
Brazil5
Others6

Economic Commission for Latin America and the Caribbean
56
10. In mergers and acquisitions, the role of Indian companies in Latin America is greater than the role of Latin American companies in India
Mergers and acquisitions always play an important role in determining FDI. According to the UNCTAD World Investment Report of 2015, mergers and acquisitions made up 41% of global FDI. Due to the 67% growth in global mergers and acquisitions, global FDI increased by 38% between 2014 and 2015. In Latin America and the Caribbean, mergers and acquisitions played a minor role. Few significant acquisitions were carried out in 2015. In India, trans-Latin companies do not have a significant role to play. The only exception was the acquisition of a steel factory called SJK Steel Plant LTd., in 2007, by a group of investors. Many countries made up this group but its main investor was Brazilian. However, the main acquisitions are smaller in size, as can be seen from Table 7.
Table 7 India: Largest mergers and acquisitions by Latin American companies, 2005-2015 (Millions of dollars)
Fusion or acquisition
Year Acquired by Origen Value
SJK Steel Plant (90%)
2007 Investor Group Brazil 170
Shree Digvijay Cement
2012 Investor Group Brazil 25
Indo Tech Transformers (20%)
2008 Investor Group Mexico 18
Pennar Industries (20%)
2008 Investor Group Brazil 9
CustomerXPs Software Pvt Ltd
2012 JAFCO Investment Asia Pacific
Bolivarian Republic of Venezuela
4
Source: Economic Commission for Latin America and the Caribbean (ECLAC), based on Bloomberg. Note: This list contains only mergers and acquisitions whose estimated values were announced.
5 A relevant issue is the confusion in terms of the nationality of certain Indian companies. ArcelorMittal, for example, is one of the largest companies in the world. However, since its official headquarters is located in Luxembourg, it does not count as an Indian company in official statistics.
In Latin America, on the other hand, Indian companies carried out many large mergers and acquisitions. The main acquisitions were limited to a small number of sectors, including the oil sector and sugar factories. However, among smaller acquisitions there are also investments in manufacturing, chemicals and pharmaceuticals. Between 2005 and 2015, Bloomberg reported a total of 3.97 billion dollars in mergers and acquisitions. 5
Table 8 Latin America and the Caribbean: Largest mergers and acquisitions by Indian companies, 2005-2015 (Millions of dollars)
Country Fusion or acquisition
Year Acquired by Value
Brazil Renuka do Brazil (50%)
2010
Shree Renuka Sugars Ltd.
1 160
Brazil Bloque BC-10 (12%)
2013
Oil & Natural Gas Corp.
529
Bolivarian Republic of Venezuela
San Cristóbal Oilfield
2008
Oil & Natural Gas Corp.
450
Brazil Encana Brazil Petróleo
2007
Investor Group 283
Brazil Renuka Vale Do Ivai
2009
Shree Renuka Sugars Ltd.
240
Source: Economic Commission for Latin America and the Caribbean (ECLAC), based on Bloomberg.
The acquisition of Shree Renuka Sugars Ltd. in Brazil did not achieve their expectations: in 2015, the Brazilian subsidiary declared itself bankrupt. In 2016, with the help of the Brazilian legal system, the debts of the subsidiary were renegotiated to bailout the company. Among other factors, the future of the company will depend on sugar prices in the global market.

Strengthening the relationship between India and Latin America and the Caribbean
57
11. Indian companies are especially interested in Brazil and Mexico
Despite the less significant role that Indian companies play in Latin America and the Caribbean, there are exceptions among companies that operate in the region. Indian companies in Latin America and the Caribbean can be divided into various groups. The first group consists of trans-national companies in India. A good example of this is the Tata Group, the conglomerate that operates in many sectors. The second group consists of companies with operations in Latin America and the Caribbean that are specific to the region, such as the aforementioned Shree Renuka Sugars Ltd. Another example of a company in this category is Apeejay Shipping, which has invested vast sums in Panama where it operates an important branch. The third group is small companies, including the company Pidilite which owns a manufacturing company in Brazil called Pulvitec.
Table 9 Latin America and the Caribbean: Typology of Indian companies operating in the region
Type of company Example Active
Transnational Tata Group Argentina, Brazil, Chile, Colombia, Mexico, Panama, Peru, others
Infosys Brazil, Costa Rica, Mexico
Specific approach in the region
Apeejay Shipping Panama Shree Renuka Sugars Ltd.
Brazil
Small size RSB Transmissions Ltd. Mexico Pidilite Brazil
Others Torrente Pharmaceuticals
Brazil, Mexico
Glenmark Pharmaceuticals
Argentina, Brazil, Mexico and others
Source: Economic Commision for Latin America and the Caribbean (ECLAC).
The last group is for the companies that don’t belong to other groups. The main example is pharmaceuticals. Some of them have important activities in the region in the production and distribution of medicines in Latin America and the Caribbean. Torrent Pharmaceuticals as well as Glenmark Pharmaceuticals produce pharmaceuticals in the region and have an even wider distribution network. Although the figures from the Reserve Bank of India do not include all FDI flows, the figures show an important trend. The number of announcements shows geographic interests of Indian companies. In particular, Indian companies invest in Brazil (38% of investments to Latin America and the Caribbean are aimed at Brazil), Mexico (17%) and Peru (9%). The exception in the list is Guyana, which does not normally receive FDI inflows. However, historical ties and the presence of a significant Indian diaspora in the country explains the inflows it receives from India.
Figure 48 Latin America and the Caribbean: Distribution of Financial Flows from India, 2011-2015 (Percentages of number of projects)
Source: Economic Commission for Latin America and the Caribbean (ECLAC), based on Reserve Bank of India.
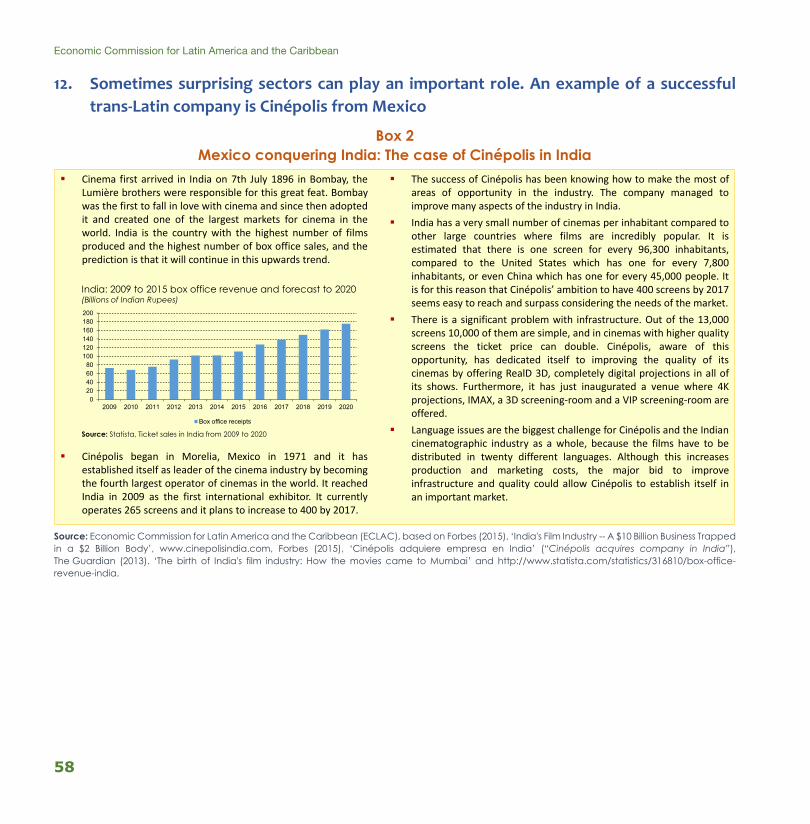
Economic Commission for Latin America and the Caribbean
58
12. Sometimes surprising sectors can play an important role. An example of a successful trans-Latin company is Cinépolis from Mexico
Box 2 Mexico conquering India: The case of Cinépolis in India
Source: Economic Commission for Latin America and the Caribbean (ECLAC), based on Forbes (2015), ‘India's Film Industry -- A $10 Billion Business Trapped in a $2 Billion Body’, www.cinepolisindia.com, Forbes (2015), ‘Cinépolis adquiere empresa en India’ (“Cinépolis acquires company in India”), The Guardian (2013). ‘The birth of India's film industry: How the movies came to Mumbai’ and http://www.statista.com/statistics/316810/box-office-revenue-india.
Cinema first arrived in India on 7th July 1896 in Bombay, theLumière brothers were responsible for this great feat. Bombaywas the first to fall in love with cinema and since then adoptedit and created one of the largest markets for cinema in theworld. India is the country with the highest number of filmsproduced and the highest number of box office sales, and theprediction is that it will continue in this upwards trend.
Source: Statista, Ticket sales in India from 2009 to 2020
Cinépolis began in Morelia, Mexico in 1971 and it hasestablished itself as leader of the cinema industry by becomingthe fourth largest operator of cinemas in the world. It reachedIndia in 2009 as the first international exhibitor. It currentlyoperates 265 screens and it plans to increase to 400 by 2017.
The success of Cinépolis has been knowing how to make the most ofareas of opportunity in the industry. The company managed toimprove many aspects of the industry in India.India has a very small number of cinemas per inhabitant compared toother large countries where films are incredibly popular. It isestimated that there is one screen for every 96,300 inhabitants,compared to the United States which has one for every 7,800inhabitants, or even China which has one for every 45,000 people. Itis for this reason that Cinépolis’ ambition to have 400 screens by 2017seems easy to reach and surpass considering the needs of the market.There is a significant problem with infrastructure. Out of the 13,000screens 10,000 of them are simple, and in cinemas with higher qualityscreens the ticket price can double. Cinépolis, aware of thisopportunity, has dedicated itself to improving the quality of itscinemas by offering RealD 3D, completely digital projections in all ofits shows. Furthermore, it has just inaugurated a venue where 4Kprojections, IMAX, a 3D screening-room and a VIP screening-room areoffered.Language issues are the biggest challenge for Cinépolis and the Indiancinematographic industry as a whole, because the films have to bedistributed in twenty different languages. Although this increasesproduction and marketing costs, the major bid to improveinfrastructure and quality could allow Cinépolis to establish itself inan important market.
020406080
100120140160180200
2009 2010 2011 2012 2013 2014 2015 2016 2017 2018 2019 2020
Box office receipts
India: 2009 to 2015 box office revenue and forecast to 2020(Billions of Indian Rupees)

Strengthening the relationship between India and Latin America and the Caribbean
IV. THERE IS GREAT POTENTIAL IN THE ECONOMIC RELATIONSHIP
BETWEEN INDIA AND LATIN AMERICA
AND THE CARIBBEAN, BUT TO REALIZE IT VARIOUS CHALLENGES MUST BE OVERCOME


Strengthening the relationship between India and Latin America and the Caribbean
61
1. There are significant economic opportunities between India and Latin America and the Caribbean, but they come with certain challenges
The previous chapters show that the economic relationship between India and Latin America and the Caribbean is still in its emerging phase. However, there are huge opportunities for strengthening economic ties. Trade between the two regions is already growing rapidly.
Figure 49 India and Latin America and the Caribbean: Average growth of selected indicators compared to the world as a whole, 2006-2014 (Percentages)
Source: Economic Commission for Latin America and the Caribbean (ECLAC), based on the World Bank data. Note: GDP growth refers to the period 2006-2015 and the production of electricity from renewable sources for the period 2006-2013.
There are three economic motivations that drive interaction between two regions and their economic actors: 1) The search for a new market; 2) The search for resources; and 3) The search for efficiency. For Latin American companies, India could be a good example of market-seeking behavior. With more than 1.250 billion consumers and an economic growth greater than any other Latin American country, the appeal of
its vast internal market is obvious. However, efficiency-seeking could also be part of the Indian appeal for Latin American companies. It is a country with advanced business services, which could help develop the productivity of Latin American companies. For Indian business owners, Latin America and the Caribbean has until now been seen above all as a source of natural resources, however, the region can also have other attractions. Put together, the region contains a market with more than 600 million consumers, with higher levels of consumption than that of India. Finally, as companies in the automotive sector have already discovered, the proximity to the United States is another important advantage that countries in Latin America and the Caribbean can offer. Both regions grow faster than the world as a whole according to various measures. Not only with respect to GDP growth, but also for tourism, FDI and trade. However, India and Latin America and the Caribbean have their own challenges which hinder the improvement of the economic relationship between the two regions. Among the problems that affect them, there is the large difference in business and trade culture, which may impede business relationships. The second important issue is the large geographic distance between the two. There are no direct flights and the time difference causes yet more problems. However, both challenges can be overcome because for certain types of industries, these characteristics can be an advantage, as could be the case for the editing, translation and printing industries.

Economic Commission for Latin America and the Caribbean
62
2. The Caribbean is an underestimated region, and for enterprising investors, there are important opportunities
For historical reasons, such as membership of the Commonwealth, some Caribbean countries have a significant population of Indian origin. The three main countries are Guyana, Suriname and Trinidad and Tobago, in which more than 25% of the population is of Indian origin. This type of diaspora creates a cultural affinity and could help the development of an economic relationship between India and these countries.
Figure 50 Selected countries: Distribution of origin of population, the most recent year (Thousands of people)
Source: Economic Commission for Latin America and the Caribbean (ECLAC), based on official figures.
For similar reasons, the other member states of the Commonwealth also form a potential market for India. 12 of the 53 member states of the Commonwealth are in the Caribbean, and they generally maintain a good relationship with other member states. The population of each of these states is not large, but as a whole they have a population of 6.6 million. The largest are Jamaica and Trinidad and Tobago, but even the member states of the Organization of Eastern
Caribbean States (OECS) could be interesting partners for certain Indian companies.
Figure 51 Commonwealth member states in the Caribbean: Population, 2015 (Thousands of people)
Source: Economic Commission for Latin America and the Caribbean (ECLAC), based on data from CEPALSTAT.
Caribbean states have their own challenges, from high transport costs to the development of their business environments. However, for business owners who are able to overcome these challenges, the potential of the region could be an opportunity. Until now, the main investors in the Caribbean originated from the United States or other Caribbean countries. There is relatively little investment from developing countries, except in the Bahamas, where Chinese companies play an important role.
0 200 400 600 800 1000 1200 1400
Trinidad and Tobago
Guyana
Suriname
Indian origin Other origin
Jamaica2 793
Trinidad and Tobago1 360
Guyana767
Bahamas388
Belize359
Barbados284
Saint Lucia185
Saint Vincent and the
Grenadines—109
Grenada107
Antigua and Barbuda
92Dominica
71Saint Kitts and
Nevis55
OECO619

Strengthening the relationship between India and Latin America and the Caribbean
63
3. Trans-Latin companies, especially Brazilian ones, expand their activities in Asia, but without a particular sectorial focus
The trans-Latin company with the most activity abroad is the Mexican company Mexichem, which has 81% of its employees outside of Mexico and records 88% of its sales outside of the country too. Mexichem is followed by the Mexican cement company Cemex and the Chilean airline Latam (América Economía, 2016).
Figure 52 Latin America and the Caribbean: The 100 companies with the highest multi-Latin index, by sector, 2016 (Percentages)
Source: Economic Commission for Latin America and the Caribbean (ECLAC), sobre datos de América Economía (2016).
Although trans-Latin companies are concentrated in the food and beverages sector (22% of the total amount), there are other significant sectors, like manufacturing, iron and steel, agro-industry and high technology companies. This
underlines the strengths of trans-Latin companies in the international market.
Table 10 Latin America and the Caribbean: Trans-Latin companies with activities in Asia: Distribution by sectors, 2016 (Number of trans-Latin companies)
Sector
Arge
ntin
a
Braz
il
Chile
Colo
mbi
a
Mex
ico
Peru
Tota
l
Air Transport 1 1 Agro Industry–Forestry
3 1 4
Food and drinks 1 2 1 1 4 1 10 Cement 1 1 2 Manufacture 4 4 Multisectorial 2 2 Other services 2 2 1 5 Chemistry 1 1 1 3 Natural resources 3 1 4 Steel-Metallurgy 1 1 1 3 Technology 1 2 1 4 Total 3 19 6 1 12 42
Source: Economic Commission for Latin America and the Caribbean (ECLAC), sobre los datos de América Economía (2016).
42% of trans-Latin companies are active in Asia, where the participation of the food and beverages sector stands out once again. 45% of trans-Latin companies with activities in Asia originate from Brazil, 29% from Mexico and 14% from Chile. Large companies from other Latin American countries do not yet have a significant presence in Asia.
Food and beverages
22
Other services18
Manufacturing10
Iron and steel industry
8
Natural resources
8Air transport
6 Agroindustry/Forestry
6Multi -sectoral
5
Technology5
Chemicals5
Cement4
Energy3
Others22

Economic Commission for Latin America and the Caribbean
64
4. Different countries in Latin America offer multiple investment opportunities in free zones or in special economic zones
In Latin America and the Caribbean there is a large network of free zones, defined as a designated geographic area within a country where tax incentives, custom duties and logistics infrastructure are offered to facilitate the import and re-export of goods or services. According to the Americas Free Trade Association (AZFA, by its initials in Spanish), there are 3,600 trade zones in the world, of which more than 13% are found in Latin America and the Caribbean. The majority of them focus on exports, be it promoting industrialization, assembly or commercial-lization as well as logistics services. Others, especially in Brazil, focus more on promoting local market access. There are also others that combine both types of free zones.
In Latin America and the Caribbean there are 322 free zones registered in the Latin American and Caribbean Economic System (SELA, by its initials in Spanish) database. Most of them are found in Colombia, the Dominican Republic and in the Central American countries. It is estimated that between 50% and 80% of exports from these countries originate in free zones. For countries in the region, free zones create employment, promote competition, attract investments and facilitate technology transfers as well as the inclusion of local companies into global value chains.
Table 11 Latin America and the Caribbean: free zones recorded by country and by type, 2016 (Number)
Country Commercial Industrial Maquila Services Total
Argentina 5 9 1 6 9 Bahamas 1 1 - 1 1 Belize 1 - - 1 1 Bolivia (Plurinational State of) 8 8 - - 10 Brazil 1 1 - - 1 Chile 2 2 - 1 2 Colombia 6 67 - 36 101 Costa Rica - 2 - 7 7 Cuba 1 1 - - 1 Dominican Republic 8 8 - 13 53 Ecuador 4 5 1 4 5 El Salvador 3 9 3 3 12 Guatemala 11 8 - 9 16 Honduras - 12 1 3 13 Jamaica - 2 - 5 5 Mexico - 3 1 1 4 Nicaragua 1 21 2 3 45 Panama 5 6 - 8 18 Paraguay - 1 - 1 2 Peru 1 1 1 - 1 Trinidad y Tobago - - - 1 1 Uruguay 3 5 - 5 9 Venezuela (Bolivarian Republic of) 2 3 - 2 5
Source: Economic Commission for Latin America and the Caribbean (ECLAC), based on the Latin American and the Caribbean Economic System (SELA, by its initials in Spanish). Note: Free zones can function as different types, which explains the totals not equaling the sum of all individual categories.

Strengthening the relationship between India and Latin America and the Caribbean
65
5. In both regions, agriculture and agro-industry are especially relevant economically
It is predicted that by 2050 there will be significant increases in the global demand for food, especially livestock (meat, eggs and dairy products), due to the growth in demand for animal protein in developing countries. In the last five years, the performance of African and Asian countries in the international markets of cocoa, coffee, banana, pineapple and yucca has improved to the detriment of Latin American and Caribbean countries. The countries in Latin America and the Caribbean continue to be competitive in the production of coffee, banana and pineapple but the gap in relation to its competitors is narrowing. Brazil is the main producer and exporter of coffee in the world and some Latin American countries focus on high-value niche markets, but Asian countries like Viet Nam, India, China and the Lao People’s Democratic Republic as well as African countries like the United Republic of Tanzania have increased their participation in the production of coffee as well as their global market share. This has resulted in a smaller participation for Brazil, Colombia, Guatemala, Peru, Costa Rica, El Salvador and other countries in the region. Viet Nam and India base their strategy primarily on increasing yields.
Figure 53 Latin America and the Caribbean and India: Coffee Production, 1961-2013 (Thousands of tons)
Source: Economic Commission for Latin America and the Caribbean (ECLAC), based on FAOSTAT (2016).
In Latin America and the Caribbean, livestock production continues to grow at an impressive rate. In the last decade,
meat and dairy production has increased rapidly, with the production of poultry at the forefront. Currently the Latin American region represents 25% of the global cattle production and more than 20% of the global poultry production. Meat production in India has maintained a modest growth rate. Meat production in India has maintained modest growth. A fundamental challenge for both is a model of sustainable livestock to decrease the harmful impacts on the environment.
Figure 54 Latin America and the Caribbean and India: Meat and milk production, 1980-2012 (Millions of tons)
Source: Economic Commission for Latin America and the Caribbean (ECLAC), based on FAOSTAT (2016).
Milk production has increased rapidly, especially since the year 2000. During 2000-2013, milk production in Latin America and the Caribbean grew by 39%, faster than the world average (32%). Brazil and Argentina are the main producers of milk, and Chile, Uruguay and Costa Rica have an emerging presence in the field. However, during the same period, Indian growth has been higher, at around 70%. The similarity in terms of climate and species provide an important opportunity for South-South cooperation in agricultural terms.
0
500
1 000
1 500
2 000
2 500
3 000
3 500
1961
1963
1965
1967
1969
1971
1973
1975
1977
1979
1981
1983
1985
1987
1989
1991
1993
1995
1997
1999
2001
2003
2005
2007
2009
2011
2013
Brazil Colombia Costa Rica El Salvador Guatemala India
0
20
40
60
80
100
120
140
160
1980 1985 1990 1995 2000 2005 2010Dairy in IndiaDairy in Latin America and the CaribbeanMeat in IndiaMeat in Latin America and the Caribbean

Economic Commission for Latin America and the Caribbean
66
6. The transition towards renewable energy presents a radical change in the energy sector
Energy transition is one of the major common challenges facing both India and Latin America and the Caribbean today. This implies specific challenges for fulfilling Goal 7 (energy) of the 2030 Agenda for Sustainable Development. Challenges include achieving universal access to modern energy services, increasing use of renewable energy and substantially improving energy efficiency. These are all efforts to reduce greenhouse gases and the use of fossil fuels in particular. Energy consumption is declining in most developed countries and China has also reduced the intensity of its energy use. India is therefore emerging as one of the main driving forces in the global demand for energy. Specialized agencies have carried out long-term energy forecasts and realized simulation models. These studies predict that India will be the biggest contributor to energy growth on a global scale (a quarter of the total growth by 2040). Even so, it is estimated that its energy consumption per capita will continue to be well below the world average. Forecasts developed by specialized agencies show that Asia will be the final destination for 80% of the coal trade, 75% of the oil trade and 60% of the natural gas trade in 2040. Latin America and the Caribbean are expected to continue exporting hydrocarbons, including petrol and natural gas. The experience India has in the field of refining combined with the investments expected to be made in Latin America and the Caribbean in this area is one potential field of synergy that stands out. In the future, non-conventional renewable energy (especially solar energy) will be enriched with new possibilities in electrical energy storage. Storage options will include new battery technologies and pumping stations.
Many people (hundreds of millions in India and tens of millions in Latin America) use biomass for activities such as cooking. There is therefore huge market potential in areas such as efficient technologies for wood pellet production and solar-powered cooking. Technological innovation in the energy sector is vital for cooperation between India and Latin America and the Caribbean. New technology is needed to help generate electricity and energy, particularly in rural areas where access to energy is limited. Universities and small and medium-sized companies could help to realize this, with a technology-based cluster development.
Figure 55 World: Biofuels production, 2015 (Percentages)
Source: Economic Commission for Latin America and the Caribbean (ECLAC), based on the International Energy Agency (2015) and BP (2016).
United States41.4
Canada1.4
Rest of the World 28.8 India
0.5 Brazil; 23.6
Argentina2.6
Colombia0.9
Mexico0.1
Others0.8
Latin America27.9

Strengthening the relationship between India and Latin America and the Caribbean
67
7. Changes in energy policy in Mexico focus on attracting international capital
Box 3 Energy reform in Mexico
Source: Estrada, Javier, “La reforma energética de México. Desafíos ante la coyuntura de bajos precios del petróleo”. [“Mexico energy reform. Challenges to the situation of low oil prices”], ECLAC Subregional Headquarters in Mexico. Unpublished.
Traditionally an oil-producing country, Mexico approved anenergy reform of great significance in 2013. The reform wasaimed at modernizing the energy sector, which for decadeshad been managed by state-owned enterprises. In thisreform, there are laws that state that clean energy mustgenerate 25% of all electricity by 2018, 30% by 2021, 35% by2024, 45% by 2036 and 60% by 2050. There will also be largeinvestment opportunities in the coming years.The December 2013 energy reform is aimed at allowingprivate investment in each value chains segment of theMexican energy sector, with some exceptions. Competition,investments and technological modernization are thereforeencouraged, to such a degree that Mexico can have asufficient and convenient energy supply at a competitiveprice.The reform does not imply the withdrawal of the State fromthe energy sector, but instead a redefinition of its role. Infact, the role of the State insofar as the management of thesector as a regulator, investor and operator will bereinforced. One of the main purposes of the reform is tostrengthen and modernize the state-owned petroleum andelectricity enterprises (PEMEX and CFE respectively) in orderto convert them into productive state-owned enterprises,giving them greater flexibility to invest efficiently, toconcentrate on the creation of economic value and tocompete in national and international markets, thusmaintaining their leadership position.The reform contains a broad spectrum of measures andinstitutions aimed at modernizing the energy sector of acountry that for decades was based on the exclusive nationalmanagement and control of the production of primaryenergy and the supply of secondary energy through a limitednumber of administrative units that are dependent on thefederal government, many of which were shown to beinadequate and insufficient in evolving with the economicdynamics of the country.
The new energy model collects and adapts the bestpractices of the different segments of the global energyindustry. Elsewhere, innovations and their developmentare studied with great interest.According to official sources, investment opportunities worth 190 billion dollars have been created, with projects in the following areas:
a) Hydrocarbons: four rounds of tenders for theexploration and extraction of hydrocarbons (11.3million dollars), pipelines (16 billion dollars, plannedinvestments for 2015-2019) and oil infrastructure(7.8 billion dollars).
b) Electricity: 90 billion dollars to generate 60GW and26 billion dollars for transmission and additionaldistribution (corresponding to the infrastructure tobe built in the period 2015-2029).
Opportunities related to value chains, which are generatedin all energy subsectors, are expected for the privatesector. Within these value chains, renewable energy,especially solar, stands out as a possibility for Mexicancompanies and for companies from countries with tradeagreements with Mexico to participate as potential keyplayers in the production and supply chains to providemirrors, reflectors, solar receptors, structural supports andengineering services. Equally, opportunities are foreseen inthe petroleum and gas industries, and indirectly in thetransport and development of electric cars
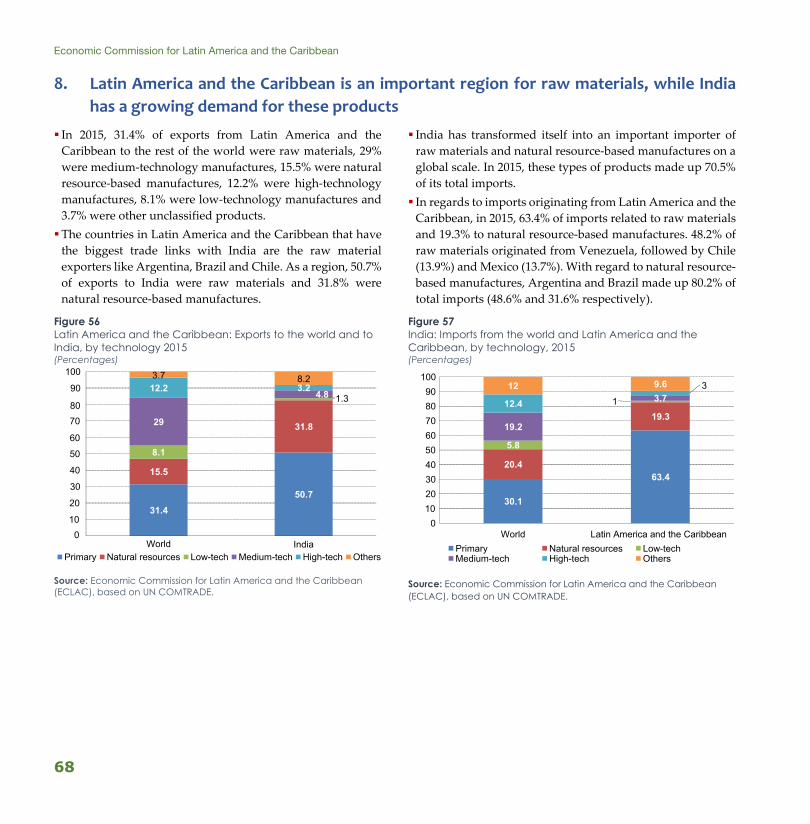
Economic Commission for Latin America and the Caribbean
68
8. Latin America and the Caribbean is an important region for raw materials, while India has a growing demand for these products
In 2015, 31.4% of exports from Latin America and the Caribbean to the rest of the world were raw materials, 29% were medium-technology manufactures, 15.5% were natural resource-based manufactures, 12.2% were high-technology manufactures, 8.1% were low-technology manufactures and 3.7% were other unclassified products. The countries in Latin America and the Caribbean that have the biggest trade links with India are the raw material exporters like Argentina, Brazil and Chile. As a region, 50.7% of exports to India were raw materials and 31.8% were natural resource-based manufactures.
Figure 56 Latin America and the Caribbean: Exports to the world and to India, by technology 2015 (Percentages)
Source: Economic Commission for Latin America and the Caribbean (ECLAC), based on UN COMTRADE.
India has transformed itself into an important importer of raw materials and natural resource-based manufactures on a global scale. In 2015, these types of products made up 70.5% of its total imports. In regards to imports originating from Latin America and the Caribbean, in 2015, 63.4% of imports related to raw materials and 19.3% to natural resource-based manufactures. 48.2% of raw materials originated from Venezuela, followed by Chile (13.9%) and Mexico (13.7%). With regard to natural resource-based manufactures, Argentina and Brazil made up 80.2% of total imports (48.6% and 31.6% respectively).
Figure 57 India: Imports from the world and Latin America and the Caribbean, by technology, 2015 (Percentages)
Source: Economic Commission for Latin America and the Caribbean (ECLAC), based on UN COMTRADE.
31.450.7
15.5
31.8
8.1
1.3
29
4.812.2 3.23.7 8.2
010
20
30
40
50
60
7080
90
100
World IndiaPrimary Natural resources Low-tech Medium-tech High-tech Others
30.1
63.420.4
19.3
5.8
1
19.2
3.712.4
312 9.6
0102030405060708090
100
World Latin America and the CaribbeanPrimary Natural resources Low-techMedium-tech High-tech Others

Strengthening the relationship between India and Latin America and the Caribbean
69
9. Aerospace cooperation provides fertile ground for South-South cooperation
Box 4 The aerospace industry: Cooperation between India and Latin America
Source: Economic Commission for Latin America and the Caribbean (ECLAC), based on Boeing (2016). Current market outlook 2016-2035. Boeing, Defence. (2015). Obtained from “India y Brasil debaten la cooperación en materia de defensa” [India and Brazil debate cooperation in defense], Moloma, A. (2012) Made in Mexico, obtained from “Latin America, the next big thing in aerospace industry”, Prensa Fonacit (2010). Aporrea, obtained from “Venezolanos se forman en India y Brasil en tecnología aeroespacial, República” [“Venezuelans are formed in India and Brazil in aerospace technology, Republic”], República de Chile, senado (2016). República de Chile, senado. Obtained from “Ratifican convenio internacional con India, que permite cooperación en materia de investigación aeroespacial” [“Ratify international agreement with India, which allows cooperation in aerospace research”] and, Sputnik (2016). Obtained from “La India interesada en impulsar la tecnología aeroespacial en Bolivia” [“India interested in boosting aerospace technology in Bolivia”].
The commercial and military aerospace industry will continue todevelop rapidly over the next twenty years. Boeing predicts that Indiawill need between 900 and 1000 commercial airplanes, at a value of100 billion dollars over the next twenty years.
The aerospace industry in Asia will have the highest demand, Chinaand India in particular have the largest markets and will continue togrow in coming years. It is estimated that air traffic will increase by 6%every year until 2035 and passenger traffic will represent 48.7% of theglobal market. Yearly increases of 100 million passengers are expectedin the air transport market, leading to Asian market demand for anestimated 15.130 planes, three times the demand for 2015.
World: Number of airplanes demanded by region, 2015 y 2030
level of foreign ownership for airlines to 49% and Mexicoand the United States have reached an agreement toliberalize air services. Air transport companies haveundergone substantial consolidation in recent years, whichcould improve efficiency levels in the sector.
India has reached cooperation agreements with Chile(2009), a military aerospace development agreement withBrazil (2015) and it also has a triangular agreement withboth the Bolivarian Republic of Venezuela and Brazil (2010)in which all participating countries have committed todeveloping high-quality Venezuelan human capital. This isbased on studies and research that have been carried out inspecialized schools in Brazil and India. In 2016, India beganto look for partnerships in Mexico to successfully developand launch satellites and the country is also interested ininvesting in the emerging Bolivian aerospace industry.
In Latin America, Brazil and Mexico have the most significantpresence in the aerospace market. Both countries containclusters that have managed to successfully integratethemselves into global value chains, supplying parts andcomponents; airplanes for agriculture, businesses anddefense; helicopters and maintenance and repair services.
Considering the huge demand in the aerospace sector,establishing agreements in this sector could help to developa strong and dynamic industry in India and Latin America.
Considering the huge demand that the Indian aerospace sectorwill have, the country has agreed on some collaborative allianceswith certain Latin American countries. The Latin Americanaerospace market is also expected to grow because certainregulatory changes and other developments will help to propelthe sector. Brazil has proposed to increase its maximum level of
6 350 6 910
4 610
1 370 1 550690
16 970
9 8207 920
3 510 3 660
1 460
0
2 000 4 000
6 000 8 000
10 000 12 000
14 000
16 000 18 000
Asia North America Europe Middle East Latin America Africa
2015 2030

Economic Commission for Latin America and the Caribbean
70
10. There are different types of challenges that the two regions have to overcome in order to strengthen economic links between them
India and Latin America and the Caribbean do not share a trade history, this is a challenge that both regions face. It has resulted in a lack of knowledge about ways of doing business, a lack of knowledge in terms of rules and regulations related to trade and investments, as well as a lack of knowledge about the cultural diversity of both regions. The Ease of Doing Business Index created by the World Bank highlights some of the obstacles that need to be overcome: reducing the difficulty and cost of complying with business regulations, paying taxes, access to energy and registering property, among others. India is in position 130 out of 189, which shows that further reforms in this country are necessary to facilitate business. In Latin America and the Caribbean, only the Plurinational State of Bolivia, Granada, Guyana, Haiti and the Bolivarian Republic of Venezuela are in a lower position than India.
Figure 58 Latin America and the Caribbean and India: Score according to the Doing Business index (Distance from the border [100 is the optimal])
Source: Economic Commission for Latin America and the Caribbean (ECLAC), based on the World Bank data. Note: The bars represent the different countries in Latin America and the Caribbean.
India limited the entry of FDI in certain sectors for a long time, and despite recent improvements, the country still has barriers to overcome. Fiscal and non-fiscal regulations are complex and differ between different states. On the other hand, Latin America and the Caribbean is made up of different countries, each with their own fiscal regime, regulations and trade agreements and partners. The region also has many rules of origin and tariff-reduction processes in place. This complicates decision-making for investors looking to invest in the region as a whole. For business owners, the Indian Council for Cultural Relations (ICCR) could facilitate rapprochement between India and Latin America and the Caribbean. The creation of trade promotion offices could also help to do this. The ICCR program operates cultural centers in numerous countries. Latin America and the Caribbean host some of the oldest cultural centers, with three Caribbean centers having been in place for a long time. In 2011, ICCR announced it was to expand its cultural centers, and as a result, the centers in São Paulo (Brazil) and Mexico City were opened. The centers serve as ambassadors to the countries they support by helping to improve their relationships with India. The vast Indian diplomatic presence in Latin America and the Caribbean and the growing presence of their Latin American counterparts in India, are firm steps towards cultural and information exchange that could help to facilitate business.
0
10
20
30
40
50
60
70
80
Latin America and the Caribbean India

Strengthening the relationship between India and Latin America and the Caribbean
71
11. Air and maritime transport between India and Latin America and the Caribbean is complex, precarious and expensive
To improve economic relations between the two regions, logistics play an important role. Two key logistical elements are air and maritime connectivity. In regards to the former, for example, flight times between Mumbai and the main cities in every country in Latin America and the Caribbean are a good indicator of convenience. On average, the quickest flights take more than 24 hours to reach their destination. São Paulo in Brazil is the only city reachable in under 20 hours. Such inconvenient connections limit the possibility of developing the economic relationship between the two regions.
Figure 59 India and Latin America and the Caribbean: Estimated cost of exporting and importing a delivery of products, 2015 (Dollars)
Source: Economic Commission for Latin America and the Caribbean (ECLAC), based on the World Bank data (Doing Business). (a) Refers to the Plurinational State of Bolivia, the Dominican Republic, Ecuador, Haiti, Paraguay and Uruguay.
Another essential factor for establishing an economic relationship between the two regions is the cost of transport between them. The World Bank calculates the costs of complying with the border requirements and of the documentation for importing and exporting, for almost all of the countries in the world. According to this information, the
export costs from India (515 dollars) is below the world average (563 dollars). The cost of importing in India is above the world average: 719 dollars compared to 665 dollars. In Latin America and the Caribbean there is a big difference between countries, the Plurinational State of Bolivia has the lowest cost for exports (90 dollars) and Ecuador for imports (325 dollars). The Bolivarian Republic of Venezuela has the highest costs for both imports and exports. The McKinsey Global Institute (2016) estimates a global connectivity index. In the top spots are Singapore, the Netherlands and the United States. India is in thirtieth place out of the 139 countries that are included in this ranking. In Latin America and the Caribbean, only Mexico is in a better position (21), whereas the majority of other Latin American countries are in the second half of the classification, which highlights a trade barrier between both regions.
Figure 60 India and Latin America and the Caribbean (selected countries): International ranking in a connectivity index, 2015 (Ranking among 139 countries)
Source: Economic Commission for Latin America and the Caribbean (ECLAC), based on McKinsey Global Institute (2016) data.
0
500
1 000
1 500
2 000
2 500
Exports Imports Exports of India Imports of India
0
20
40
60
80
100
120India

Economic Commission for Latin America and the Caribbean
72
12. Climate change is a threat to both regions, but it affects them in different ways
In the past few decades, climate change has affected both human and natural systems in all continents and oceans. The effects of recent extreme climate phenomena, such as heatwaves, droughts, floods, cyclones and forest fires, highlight a significant vulnerability and expose some ecosystems and many human systems to the current climactic variability. Its effects are significant considering that it suggests considerable risks for human and natural systems. For example, changes in precipitation and the melting of snow and ice are altering the water systems, which affects water resources in terms of quantity and quality. The availability of fresh water will decrease in regions situated in low latitudes, including agricultural irrigation areas in India and Latin America and the Caribbean. Climate related hazards exacerbate other stresses, this often affects livelihoods and is especially difficult for those living below the poverty line. Differences in vulnerability are not only due to distinct weather patterns. Divergent development processes leading to multidimensional inequality can also affect vulnerability to the impacts of climate change. It is estimated that the impact of climate change on Latin America and the Caribbean is considerable, due to how difficult it is for its population to adapt, its location and its economic dependence on susceptible activities like agriculture. Based on many studies that encompass a wide spectrum of regions and crops, the negative impacts of climate change on crop yields have been more visible than the positive impacts. It is expected that climate change will significantly affect food supplies. Knowing how to adapt is crucial when it comes to facing the threat of climate change. Preserving the genes of crops that can adapt to different environments is a useful strategy in
combatting climate change and its effects. In India, seed banks have been set up to promote food diversification and help the country adapt to climate change.
Figure 61 Global patterns of impacts in recent decades attributed to climate change
Source: Economic Commission for Latin America and the Caribbean (ECLAC), based on IPCC (2014).
Faced with an increase in hurricane occurrences in Honduras, farmers were able to produce higher yields of better varieties of corn with the ability to withstand environmental stress. In the Plurinational State of Bolivia, Colombia, Ecuador, India, Panama and Peru among others, indigenous organizations actively participate in the conservation and reintroduction of crops. These are local varieties of crops that include vegetables, tubers, grains, legumes and traditional fruits. This progress is an opportunity in itself for better cooperation between Latin America and the Caribbean and India.

Strengthening the relationship between India and Latin America and the Caribbean
73
13. Indian and Latin American currencies are depreciating
In the context of ever more open economies, countries are more susceptible to global financial events. Currency appreciation or depreciation can significantly affect internal microfinance conditions. Since 2014, emerging economies such as India and the Latin American and Caribbean countries have experienced currency depreciation with respect to the dollar. This has been due to changes in monetary policy in developed countries, among other factors. A primary example of this is the United States, basic products have dropped in price and its growth has decelerated.
Figure 62 Argentina, Brazil, Chile, Dominican Republic and Mexico: Nominal exchange rate, 2002-2015 (Index, 2002=100)
Source: Economic Commission for Latin America and the Caribbean (ECLAC).
Figure 63 India: Annual average exchange rate, 2002-2015 (Rupee per dollar)
Source: Economic Commission for Latin America and the Caribbean (ECLAC), based on ESCAP Statistical Database.
In Latin America and the Caribbean, nominal depreciation has affected inflation in several countries including Brazil (9%), Uruguay (8.7%) and the Bolivarian Republic of Venezuela (121.7%). The effect of rising real exchange rates on exports and on economic growth depends on various factors. These include the production structure, the role of the domestic market and also policies that encourage productivity and diversification of exports. In a climate of low global growth, the impact of an increased real exchange rate is marginal. This is done to increase exports and replace imports in countries with few technological capabilities (ECLAC, 2016).
0
50
100
150
200
250
300
350
2002 2003 2004 2005 2006 2007 2008 2009 2010 2011 2012 2013 2014 2015Argentina Brazil Chile Colombia Dominican Republic Mexico
40
45
50
55
60
65
70
2002 2003 2004 2005 2006 2007 2008 2009 2010 2011 2012 2013 2014 2015

Economic Commission for Latin America and the Caribbean
74
14. Latin America and the Caribbean and India need policies that strengthen economic ties between them
To improve economic ties between Latin America and the Caribbean, it is necessary to improve the relevant public policies. Trade and investment agreements and trade facilitation action plans could help in this respect.
Figure 64 Latin America and the Caribbean and India (selected countries): Ranking of commercial opening, 2011 and 2015 (Ranking)
Source: Economic Commission for Latin America and the Caribbean (ECLAC), based on data from the International Chamber of Commerce (2015).
Public policies have helped to transform both regions into increasingly open economies. In the past, India has not been very open to the international market, but this is now changing. According to a trade liberalization index, India improved its position compared to Latin American countries
between 2011 and 2015. The change was smaller, however, which shows there is still room to expand liberalization. On a scale from 0-6, India bettered its position from 2.4 to 2.6 and is classed as having “below-average liberalization” by the International Chamber of Commerce. Chile is the only country in Latin America that is classed as above average (>4.0), with a classification of 4.1. Brazil remained stable at 2.1, during the same period. Central American and Caribbean countries with more open economies do not appear on the list. Restrictions on FDI in India has limited its trade relations with the rest of the world. These rules are changing and there are now fewer sectors with such limitations, which makes India more appealing for foreign investment. Despite the heterogeneity of Latin American policies, it is necessary to create policies that are consistent with an openness to trade and investment if relations with India are to improve. A clear example of a policy that hinders productive relations is the restriction on free movement of capital. Direct communication is important for improving the relationship between India and Latin America and the Caribbean. Although many Latin American countries have diplomatic and trade offices in India, Brazil and Chile are the only countries in Latin America and the Caribbean with a partial free trade agreement with India. Expanding the availability of this type of agreement with other countries could have a major impact.
Venezuela (Bol. Rep. of)
Brazil
India
Argentina
Colombia
Mexico
Uruguay
Peru
Chile
2011 2015

Strengthening the relationship between India and Latin America and the Caribbean
75
15. India has signed a small number of trade agreements with Latin America and the Caribbean and its existing agreements are not very significant. There is fertile ground for negotiating new agreements that benefit both regions
The trade policy in India, created and implemented by the Department of Trade at the Ministry of Trade and Industry, aims to create an environment and infrastructure conducive to export growth. The 2015-2020 foreign trade policy for India aims to improve the role of the country in international trade and its participation in global exports from 2% to 3.5% by 2020. To achieve this objective, a stable environment for trade policies is needed. Constructing trade engagements with other regions is also necessary. In India, policies that promote exports and import policies are closely linked to internal policy factors. These include the regulation of domestic supplies and industrial policy, as well as short-term goals such as controlling inflation and commodity prices (WTO, 2015). Although using trade policy in this way reduces its predictability and undermines long-term business decisions, trade agreements with strategic partners could provide businesses with much-needed stability and predictability. India is a founding member of the World Trade Organization (WTO) and grants most-favored nation status to all members of the WTO. However, the Indian markets which interest Latin America and the Caribbean the most, still apply high tariffs. India has also negotiated various regional trade agreements, but the majority of them are with neighboring countries and other Asian countries. In Latin America and the Caribbean, India has signed partial trade agreements with Chile and Mercosur. India recognizes that there is room for commercial instruments and reciprocal trade growth. Furthermore, the agreements between India and Chile and Mercosur do not include regulations for trade services and there are very few tariff lines, this is due to the huge potential for increasing trade (Department of Commerce, 2015, 2016).
Box 5 Trade instruments in force signed by India • Agreement of cooperation with Nepal to control unauthorized trade
(2009) • SAARC Preferential Trading Arrangement (1995): Bangladesh, Bhutan,
India, Maldives, Nepal, Pakistan and Sri Lanka (SAPTA) • Agreement on South Asian Free Trade Area (2006): Afghanistan,
Bangladesh, Bhutan, India, Maldives, Nepal, Pakistan and Sri Lanka (SAFTA)
• The Asia-Pacific Trade Agreement (1976): Bangladesh, China, India, Republic of Korea, Laos and Sri Lanka, and its 2005 amendment (APTA)
• India-Singapore Comprehensive Economic Cooperation Agreement (2005)
• Malaysia-India Comprehensive Economic Cooperation Agreement (2011)
• India-Africa Trade Agreement (various countries): the People's Republic of Angola, the Republic of Botswana, the Federal Republic of Cameroon, the Republic of Côte d'Ivoire, the Republic of Ghana, the Republic of Liberia, the Republic of Mauritius, the People's Republic of Mozambique, the Republic of Nigeria, the Republic of Rwanda, Republic of Senegal, the Republic of South Africa, the Kingdom of Swaziland, the Republic of Seychelles, the Republic of Tanzania, the Republic of Uganda, the Republic of Zaire (DRC), the Republic of Zambia, the Republic of Zimbabwe (several years).
• India-Chile Partial Scope Trade Agreement (2007) • India-Afghanistan Partial Scope Trade Agreement (2003) • The Association of Southeast Asian Nations (ASEAN) (2010): Brunei
Darussalam, Cambodia, India, Indonesia, Lao PDR, Malaysia, Myanmar, Singapore, Thailand, Vietnam, the Philippines.
• Agreement on Trade, Commerce and Transit between India and Bhutan (2006)
• India-Japan Comprehensive Economic Partnership Agreement (2011) • India-Republic of Korea Comprehensive Economic Partnership
Agreement (2010) • India-MERCOSUR Partial Scope Agreement (2009) • India-Nepal Free Trade Agreement (2009) • India-Sri Lanka Free Trade Agreement (2001) • South Asian Association for Regional Cooperation (SAARC), SAARC
Agreement on Trade in Services (SATIS) (2010)
Source: Economic Commission for Latin America and the Caribbean (ECLAC), based on official information.

Economic Commission for Latin America and the Caribbean
76
16. India and Latin America and the Caribbean could be impacted by the TPP in similar ways, but for the latter it would be greater due to its more significant trade relationship with the United States
The Trans-Pacific Partnership (TPP) was signed in February 2016 by Australia, Brunei Darussalam, Canada, Chile, Japan, Malaysia, Mexico, New Zealand, Peru, Singapore, the United States and Viet Nam. The partnership presents a challenge for India and Latin American and Caribbean countries because once it comes into effect it could provoke trade deviation. The partnership also contains new trade themes that go beyond those regulated by the World Trade Organization (WTO). These include intellectual property policies, digital policies, environmental issues, state-owned enterprises and foreign investment regulation among others.
Figure 65 Latin America and the Caribbean and India: Exports to countries in the TPP, 2001-2015 (Billions of dollars)
Source: Economic Commission for Latin America and the Caribbean (ECLAC), based on COMTRADE.
The goods trade with TPP countries represents 27.5% of Indian exports and 54% of Latin America and the Caribbean exports. Of all TPP member countries, the United States is the
most important market for both India (55% of TPP exports) and Latin America and the Caribbean (82%). Market deviation in the United States, caused by market competition in Viet Nam or Japan, could therefore be one of the biggest consequences of this agreement. Other TPP countries are also important markets for India, especially Japan, Malaysia, Singapore and Viet Nam. India already has agreements with these countries, as such the effects of deviation would be smaller. For Latin America and the Caribbean, the TPP effects vary depending on the country and the trade relations it has with its members. India could see trade affected in the leather, textiles and plastics sectors. However, India aims to increase exports to Africa and Latin America and the Caribbean to mitigate losses in these sectors due to TPP. Policies to strengthen their competitiveness could also help to minimize the effects of trade deviation in the TPP market. The effects could be different for each country in Latin America and the Caribbean. For Chile, Mexico and Peru, who all form part of the agreement, the TPP brings challenges and opportunities. By integrating into a larger market they could benefit from global production chains, extend their trade to new partners in Asia and become more appealing for foreign investment, among other opportunities. For other countries in the region, the TPP will bring similar challenges as it does for India. This is especially true for countries that have closer trade ties to the United States, such as Central American and Caribbean countries. The textile and light industries will be the most affected in Central America and the Caribbean and the agricultural goods sector will be the most affected in South America.
0
100
200
300
400
500
600
India Latin America and the Caribbean

Strengthening the relationship between India and Latin America and the Caribbean
77
17. In South-South cooperation, India takes on the role of ¨emerging¨ donor
Through South-South cooperation mechanisms India aims to contribute to global progress. It also aims to serve other national interests including security, developing good neighboring relationships and other foreign relations priorities. India supported the establishment of the BRICS New Development Bank, a project that aims to strengthen sustainable development. It aims to do this by bolstering its own capacities and exchanging South-South experiences, as well as triangular experiences. Another South-South cooperation initiative of particular strategic interest to India is the Forum for India-Pacific Islands Cooperation, where the cooperative relations between India and the 14 island nations are discussed India is one of the largest recipients of Official Development Assistance (ODA). However, the ODA received has an increasingly smaller effect on the national public accounts, which reflects a development model which has managed to separate its progress from international aid. Despite being considered an “emerging donor”, India has been carrying out South-South cooperation operations since the 1950s. It has done this by means of technical assistance, donations and other exchanges with neighboring countries. The Indian government employs various tools and programs to aid development, both financial and non-financial, including technical assistance and trade assistance.
Table 12 Five main OAD recipients, 2014 (Millions of dollars)
Country
Myanmar 4 171 Afghanistan 4 164 India 3 029 Viet Nam 2 902 Indonesia 2 061
Source: Economic Commission for Latin America and the Caribbean (ECLAC), based on OECD-DAC (2016).
Figure 66 India: Net ODA received, 1975-2014 (Percentage of goods and services imports)
Source: Economic Commission for Latin America and the Caribbean (ECLAC), based on World Development Indicators database.
The estimated ODA budget for India for 2015-2016 is 1.6 billion dollars, which is distributed among projects in South East Asia. This reflects the national priorities of the country in terms of foreign actions. Latin America currently receives less than 1% of the ODA that India bestows.
Figure 67 India: Geographical distribution of OAD, by region, 2015 (Percentages)
Source: Economic Commission for Latin America and the Caribbean (ECLAC), based on Devex.com (2016)
0
5
10
15
20
25
30
1975
1978
1981
1984
1987
1990
1993
1996
1999
2002
2005
2008
2011
2014

Economic Commission for Latin America and the Caribbean
78
18. Foreign Direct Investment (FDI) has increased in India as others recognize its potentially positive influence
After its independence from the United Kingdom, India protected its economy for many decades. It was not until the 1990s that its economy began to gradually open. Among the Indian liberalization measures, was the elimination of FDI restrictions in certain sectors. The evolution of foreign investment policies can be broken down into three parts: restrictive policies from 1978-1992, permissive policies from 1992-2003 and liberal policies from 2003 onwards. These changes can be clearly observed in the FDI inflows that the country receives. India received very little FDI for many years, considering the fact that it has always been a large economy.
Figure 68 India: Foreign direct investment, net flows (Millions of dollars)
Source: The World Bank, Foreign direct investment, net inflows (BoP, current US$).
At first there were restrictions for most of the production sectors, but as the market was liberalized, a more flexible scheme was implemented. There are currently two ways of investing: the automatic route where the investors register themselves and present documentation to the Reserve Bank of India, or the alternative route which involves an application to the Foreign Investment Promotion Board. The scheme varies depending on the market in which someone wishes to invest However, a final legislative amendment eliminated the permits scheme for some sectors. The sectors that benefited from these reforms include national airlines, defense technology and telecommunications services. The new legislation for investment requires that a supplier be found, within the first three years, and be able to provide at least 30% of materials. The reforms have begun to yield results, they have gotten rid of delays and have eased processing. This year India went up twelve places in the Ease of Doing Business Index created by the World Bank. In 2016, foreign direct investment has grown by 40% compared to last year. Companies like Apple, with a small presence in India, expect to increase sales based on these reforms.
79 236 3 577 3 681
43 406
23 995
44 208
- 5 000 0
5 000 10 000 15 000 20 000 25 000 30 000 35 000 40 000 45 000 50 000
1975
1977
1979
1981
1983
1985
1987
1989
1991
1993
1995
1997
1999
2001
2003
2005
2007
2009
2011
2013
2015
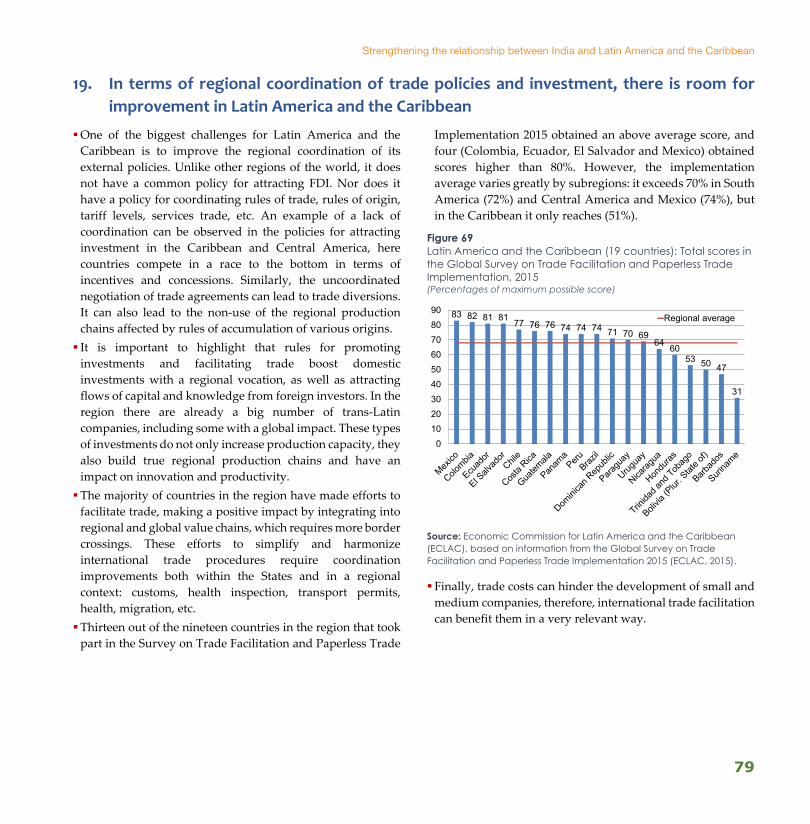
Strengthening the relationship between India and Latin America and the Caribbean
79
19. In terms of regional coordination of trade policies and investment, there is room for improvement in Latin America and the Caribbean
One of the biggest challenges for Latin America and the Caribbean is to improve the regional coordination of its external policies. Unlike other regions of the world, it does not have a common policy for attracting FDI. Nor does it have a policy for coordinating rules of trade, rules of origin, tariff levels, services trade, etc. An example of a lack of coordination can be observed in the policies for attracting investment in the Caribbean and Central America, here countries compete in a race to the bottom in terms of incentives and concessions. Similarly, the uncoordinated negotiation of trade agreements can lead to trade diversions. It can also lead to the non-use of the regional production chains affected by rules of accumulation of various origins. It is important to highlight that rules for promoting investments and facilitating trade boost domestic investments with a regional vocation, as well as attracting flows of capital and knowledge from foreign investors. In the region there are already a big number of trans-Latin companies, including some with a global impact. These types of investments do not only increase production capacity, they also build true regional production chains and have an impact on innovation and productivity. The majority of countries in the region have made efforts to facilitate trade, making a positive impact by integrating into regional and global value chains, which requires more border crossings. These efforts to simplify and harmonize international trade procedures require coordination improvements both within the States and in a regional context: customs, health inspection, transport permits, health, migration, etc. Thirteen out of the nineteen countries in the region that took part in the Survey on Trade Facilitation and Paperless Trade
Implementation 2015 obtained an above average score, and four (Colombia, Ecuador, El Salvador and Mexico) obtained scores higher than 80%. However, the implementation average varies greatly by subregions: it exceeds 70% in South America (72%) and Central America and Mexico (74%), but in the Caribbean it only reaches (51%).
Figure 69 Latin America and the Caribbean (19 countries): Total scores in the Global Survey on Trade Facilitation and Paperless Trade Implementation, 2015 (Percentages of maximum possible score)
Source: Economic Commission for Latin America and the Caribbean (ECLAC), based on information from the Global Survey on Trade Facilitation and Paperless Trade Implementation 2015 (ECLAC, 2015).
Finally, trade costs can hinder the development of small and medium companies, therefore, international trade facilitation can benefit them in a very relevant way.
83 82 81 81 77 76 76 74 74 74 71 70 6964 60
53 50 47
31
0102030405060708090
Regional average


Strengthening the relationship between India and Latin America and the Caribbean
V. CONCLUSIONS AND
RECOMMENDATIONS


Strengthening the relationship between India and Latin America and the Caribbean
83
Conclusions and recommendations
Slow economic growth in developed economies means that it should be up to developing regions to stimulate the global economy. However, the relationship between India and Latin America and the Caribbean still has some major challenges to overcome. These challenges have previously limited large investments, trade and cooperation and the regions have not been able to make the most of the opportunities that exist between them. It is important to take into account that markets in India and Latin America and the Caribbean are in many ways complementary; the former provides business services, manufactures and chemicals while the latter exports raw materials and has strategic alliances in services and manufacturing.
Both regions need to discuss necessary structural change in order to develop their relations. The Latin American and the Caribbean countries need public policies that are conducive to structural change and drive towards an economy with higher productivity and transformative capacity. This is necessary so that they no longer have to rely on solely exporting raw materials. It is encouraging to see that many new FDI announcements in the region are strongly involved with renewable energy and India could be a strategic partner in this field.
It is also important to note that these investment flows in renewable energy reflect a lack of productive capacity in the region with respect to this sector. To achieve industrial development, there needs to be an industrial sector linked to renewable energy. There is great potential for this type of energy in the region.
Public policy in India differs from that of Latin America and the Caribbean, especially when it comes to handling trade policy and attracting FDI. In India, domestic industries have been protected to a greater degree and for a longer time than in Latin America and the Caribbean.
Recently, the country has increased its openness to FDI inflows and trade development. The stability and predictability of trade and investment policies reduce uncertainty and increase the options for doing business. In this sense, India and Latin America and the Caribbean have gradually been reaching their goals, which leads to better options for mutual learning, cooperation and partnerships.
Both India and Latin America and the Caribbean are aware of the risks of a development model based on short-term visions, as well as one that does not take into account environmental impact. The environmental impact of human activity is increasing, and it is the responsibility of the governments around the world to combat climate change. Both regions share an outlook for sustainable development, this can be observed from the Paris Agreement that India signed on 2 October 2016. Sixteen countries from Latin America and the Caribbean also signed this agreement, 6 most of which are located in the Caribbean.
ECLAC believes that climate change and sustainable development challenges serve to promote a new production policy. This policy is based on an “environmental big push”, which advocates green Keynesianism and new long-term growth. India and Latin America and the Caribbean both have great environmental potential and both have much to gain from using this strategy and could find ways to implement it together.
The Latin American and Caribbean region has made great social progress in recent years, particularly in reducing poverty, malnutrition and gender inequality. These are some of the areas in which the region can support the process currently underway in India, to help discuss, design and implement these types of policies.
6 Most of the signatories from Latin America and Caribbean that have ratified the agreement are from the Caribbean subregion. Outside the Caribbean, the only Latin American signatories are Argentina, the Plurinational State of Bolivia, Costa Rica, Honduras, Mexico, Panama and Peru.

Economic Commission for Latin America and the Caribbean
84
Both regions rely on cooperation programs in different areas, but opportunities are still growing. Agriculture, aerospace cooperation and renewable energy are some examples of the sectors in which effective cooperation could benefit all participants. Both regions will need to
explore new ways of relating to each other and new international cooperation agreements. They will need to discuss rapprochement through trade and investment agreements that facilitate trade relations. For both regions, there is enormous potential for growth.

Strengthening the relationship between India and Latin America and the Caribbean
REFERENCES


Strengthening the relationship between India and Latin America and the Caribbean
87
América Economía (2016), “Ranking de Multilatinas”, pp. 32-42 Boeing (2016), Current market outlook 2016-2035. BP (2016), “Energy Outlook”. Cabrera, Á. (2016), 24 Horas, in “México e India pactan cooperación aeroespacial” (http://www.24-
horas.mx/mexico-e-india-pactan-cooperacion-aeroespacial/). Cinépolis (2016) (www.cinepolisindia.com). Defensa (2015), Defensa, in “India y Brasil debaten la cooperación en materia de defensa”
(http://www.defensa.com/frontend/defensa/india-brasil-debaten-cooperacion-materia-defensa-vn15976-vst164).
Department of Commerce (2015), "India's duty free tariff preference (DFTP) scheme for Least Developed Countries (LDCs)” (http://commerce.gov.in/trade/international_tpp_DFTP.pdf).
______ (2016), "International trade: Trade agreements" (http://commerce.nic.in/trade/ international_ta.asp?id=2&trade=i).
DESA (Department of Economic and Social Affairs), Population Division (2016), Sustainable Development Goals database (http://unstats.un.org/sdgs/indicators/database/), accessed 20 September.
______ (2016), UNdata base de datos (http://data.un.org/Default.aspx). Devex (2015), “India's 2015-16 foreign aid budget: Where the money is going” (https://www.devex.com/
news/india-s-2015-16-foreign-aid-budget-where-the-money-is-going-85666). DIPP (Department of Industrial Policy and Promotion) (several years), FDI Statistics (http://dipp.nic.in/
English/Publications/FDI_Statistics/FDI_Statistics.aspx). ECLAC (Economic Commission for Latin America and the Caribbean) (2015), Panorama de la inserción
internacional de América Latina y el Caribe 2015. La crisis del comercio regional: diagnóstico y perspectivas (LC/G.2650-P), United Nations publication, Santiago, Chile.
______ (2016a), CEPALSTAT, accessed 1 October. ______ (2016b), Foreign Direct Investment in Latin America and the Caribbean 2016 (LC/G.2680-P),
United Nations publication, Santiago, Chile. ______ (2016c), Balance Preliminar de las Economías de América Latina y el Caribe 2015 (LC/G.2655-P),
United Nations publication, Santiago, Chile. Education First (2016) (http://www.ef.com.mx/epi/regions/latin-america/). ESCAP (Economic and Social Commission for Asia and the Pacific) (2016), ESCAP Statistical Database,
accessed 20 September.

Economic Commission for Latin America and the Caribbean
88
Estrada, Javier, “La reforma energética de México. Desafíos ante la coyuntura de bajos precios del petróleo”, ECLAC/Mexico, unpublished (document under final review).
FAO (Food and Agriculture Organization of the United Nations) (2016), FAOSTAT, 1st October. fDi Markets Financial Times (2016), (www.fdimarkets.com), accessed 15 September. Forbes (2015), “Cinépolis adquiere empresa en India”. ______ (2015), “India's Film Industry. A $ 10 Billion Business Trapped in a $ 2 Billion Body”. IEA (International Energy Agency) (2015), Energy balances of non-OECD countries (2015 edition), Paris. IMF (International Monetary Fund) (2016), World Economic Outlook database
(http://www.imf.org/external/ datamapper/index.php), 1 October. Indian Express (2016), “Paying for real estate deals: Karnal to London via Bahamas, the route Indiabulls
promoter took” (http://indianexpress.com/article/india/india-news-india/panama-papers-panama -papers-india-indiabulls-indiabulls-realty-groups-paying-for-real-estate-deals-karnal-to-london-via-bahamas-the-route-indiabulls-promoter-took/.
International Chamber of Commerce (2015), “ICC Open Market Index”, (http://www.iccwbo.org/Global-influence/G20/Reports-and-Products/Open-Markets-Index/).
IPCC (Intergovernmental Panel on Climate Change) (2014), “Climate Change 2014: Synthesis Report. Contribution of Working Groups I, II and III to the Fifth Assessment Report of the Intergovernmental Panel on Climate Change”, Geneve.
McKinsey & Company (2016), “Digital Globalization: The New Era of Global Flows” (http://www.mckinsey.com/business-functions/mckinsey-digital/ our-insights/digital-globalization-the-new-era-of-global-flows).
Moloma, A. (2012), Made in Mexico, in “Latin America, the next big thing in aerospace industry” (http://www.madeinmexicoinc.com/latin-america-the-next-big-thing-in-aerospace-industry/).
National Informatics Centre (2016), “Open Government Data Platform India”, 1st October. OECD (Organisation for Economic Co-operation and Development) (2012), Trade-Related South-South
Co-operation: India (https://www.oecd.org/dac/aft/South-South_India.pdf). OECD-DAC (Development Assistance Committee) (2016), AID database (http://www.oecd.org/dac/stats/
aid-at-a-glance.htm), accessed 18 September. Prensa Fonacit (2010), Aporrea, in “Venezolanos se forman en India y Brasil en tecnología aeroespacial”
(http://www.aporrea.org/actualidad/n162177.html).
Strengthening the relationship between India and Latin America and the Caribbean
89
República de Chile, Senado (2016), República de Chile, Senado, in “Ratifican convenio internacional con India que permite cooperación en materia de investigación aeroespacial” (http://www.senado.cl/ratifican-convenio-internacional-con-india-que-permite-cooperacion-en-materia-de-investigacion-aeroespacial/prontus_senado/2016-05-31/174401.html).
Reserve Bank of India (several years), “Finances of Foreign Direct Investment Companies” (https://www.rbi.org.in).
SELA (Sistema Económico Latinoamericano y del Caribe), “Directorio de Zonas Francas”, (2016) (http://zonasfrancas.sela.org/directorio-de-zonas-francas), accessed 20 September.
Sputnik (2016), Sputnik, in “La India interesada en impulsar la tecnología aeroeaspacial en Bolivia” (https://mundo.sputniknews.com/economia/201604061058414133-india-bolivia/).
Statista (2016) (http://www.statista.com/statistics/316810/box-office-revenue-india), accessed 13 September.
Tata Consultancy Services Limited (2016) (http://www.tcs.com/), accessed 15 September. The Guardian (2013), “The birth of India's film industry: How the movies came to Mumbai”. UNCTAD (United Nations Conference on Trade and Development) (2016), UNCTADStat, accessed
1 October. United Nations Organization (2016), UN Comtrade, accessed 1 October. World Bank (2016) Doing Business 2016 (www.doingbusiness.org), accessed 20 September. ______ (2016), World Development Indicators, Bloomberg (2016), “Bloomberg database”, accessed
1 September. WTO (World Trade Organization) (2015), "Trade Policy Review, Report by the Secretariat, India"
(WT/TPR/S/313).