livestock in latin america 1 - Repositorio Digital CEPAL
112
c w . / o , / C 4 ¿) LIVESTOCK IN LATIN AMERICA 1/ Status, problems a nd prospects United Nations Food and Agriculture Organization
-
Upload
khangminh22 -
Category
Documents
-
view
1 -
download
0
Transcript of livestock in latin america 1 - Repositorio Digital CEPAL

c w . / o , / C 4 ¿)
LIVESTOCK IN LATIN AMERICA 1 / Status, problems a nd prospects
United Nations
Food and Agriculture Organization


r
Livestock in Latin America Status, problems and prospects
I. COLOMBIA, MEXICO, URUGUAY AND VENEZUELA
Report prepared in accordance with the joint programme
of the Economic Commission for Latin America
and the United Nations Food and Agriculture Organization
UNITED NATIONS New York, 1962

E/CN. 12/620
UNITED NATIONS PUBLICATION
Sales No.: 61. II.G. 7
Price : SU.S. 1.50; 10/6 stg.; Sw. fr. 6.50 (or equivalent in other currencies)

EXPLANATION OF SYMBOLS GENERAL INTRODUCTION . . .
CONTENTS Page
x xi
Colombia
Introduction and summary 3
I. Consumption of livestock commodities 1. Consumption levels, changes and trends 5
(a) Meat consumption 5 (b) Consumption of milk products and eggs 6
2. Composition of consumption by markets of origin 6 3. Consumption of fish and shellfish 7 4. Comparative levels of consumption and nutritional targets 7 5. Projections of domestic demand 8
(а) Historical trend of slaughter 8 (б) Projections of demand as a function of population and income 10
II. Available resources 1. Estimated livestock and poultry inventories 12 2. Area used for stock farming 14 3. Stock farming zones and their ecology 14
(a) Stock farming in the cold zone 14 (b) Stock farming in the subtropical zone 15 (c) Stock farming in the tropical zone 15
III. Characteristics of production 1. Breeds of livestock and their distribution
(a) Composition by breeds and types of livestock 15 (b) Distribution of breeds 16
2. Livestock production 17 3. Livestock yields 19
(а) Rates of extraction and production 20 (б) Yields 20 (c) Natality rates 20 (d) Mortality rates 20
IV. Factors limiting production and supply 20 1. Incidence of disease 20
(а) Infectious and contagious diseases (i) Foot-and-mouth disease 21
(ii) Brucellosis or infectious abortion 21 (iii) Tuberculosis 21 (iv) Paratuberculosis 21 (v) Trichomoniasis 22
(б) Parasitic diseases 22
iii

Page
(c) Other diseases (i) Bovine haematuria 22 (ii) Paralytic rabies 22
(iii) Deficiency diseases 23 2. Malnutrition
(a) Fodder crops and pastures. 23 (b) Feed concentrates 24 (c) Inefficient pasture management 24
3. Low level of improvement in breeding techniques 24 4. Management and administration problems 25 5. Deficiencies in the marketing and processing of livestock commodities
(a) Production and marketing 25 (b) Livestock and meat marketing 26 (c) Marketing of milk products 27 (d) Marketing of poultry and eggs„ 28 (e) Price fixing 28
Mexico
Introduction and summary 33
I. Livestock population 34
II. Production L Slaughtering and meat products 34 2. Production of milk and milk products 35
III. Utilization of resources for stock farming 1. Area used for stock farming • 36 2. Livestock areas and their ecology
(a) Northern zone 37 ib) Gulf of Mexico zone 37 (c) Central zone 37 (d) North Pacific zone • 38 (e) South Pacific zone 38
3. Breeds of cattle 38 4. Use of feed for livestock
(a) JFodder 38 (b) Food concentrates » — 39
IV. Livestock diseases 1. Infectious and contagious diseases 39 2. Parasitic diseases 39 3. Border health control 40
V. Management of livestock fyrms 40
iv

Page
VI. Marketing, of livestock products 1. Livestock and meat 41 2. Milk products 42
VII. Foreign trade in livestock products 1. Exports 4 2
2. Imports 43
VIII. Food supplies 1. Meat 45 2. Milk products 46
IX. Outlook for livestock development 1. Livestock potential 46 2. Livestock development campaigns 46
Uruguay
Introduction and summary 49
I. Available resources 1. Livestock and poultry inventories 51 2. Livestock area 53
II. Production characteristics 1. Breeds of livestock 53 2. Livestock production
(a) Total production 54 (b) Slaughter and meat production 55 (c) Production of milk and milk products 56 (d) Wool production 57 (e) Poultry production 57
3. Productivity and yield 57
III. Factors limiting production 58 1. Nutritional deficiencies 58 2. Animal pests and diseases 59 3. Other factors limiting production
(a) Defective management 59 (b) Marketing deficiencies 59
IV. Marketing and consumption of livestock products 1. Marketing systems
(a) Livestock and meat marketing 60 (b) Milk and milk products 60 (c) Poultry and eggs — 61 (d) Wool marketing 61
2. Livestock products: demand and consumption (a) Meat 61 (b) Milk, milk products and eggs 62 (c) Wool 62
v

Page
V. Exports of livestock products • • 63 1. Meat exports 63 2. Exports of wool and hides
(a) Wool • • • 65 (b) Hides 65
VI. Development incentives and prospects 66
Venezuela
Introduction and summary 69
I. Available resources 1. Livestock and poultry population 71 2. Pasture area and livestock zones 72
II. Characteristics of production 1. Livestock production
(a) Meat production 73 (b) Production of milk and milk products 75
2. Production trends (a) Meat 7 7
(b) Milk 7 7
3. Yields and productivity 78 (a) Rate of slaughter 78 (b) Meat yields 78 (c) Milk yields 79 (,d) Natality rate 79 (<?) Productivity of other factors 79
III. Factors limiting production 79 1. Livestock diseases 79
(а) Infectious and contagious diseases 79 (i) Foot-and-mouth disease 80
(ii) Bang's disease (Brucellosis abortus) 80 (iii) Bovine tuberculosis 80 (iv) Other infectious diseases 80
(б) Parasitic diseases 80 (c) Deficiency diseases 81
2. Nutritional deficiencies 81 (а) Pastures and grasses 81 (б) Inadequate pasture management 81 (c) Lack of supplementary feeding 82
3. Breed improvement • 82 4. Defective management 82 5. Marketing and distribution systems 82
(a) Livestock and meat marketing 83 (b) Marketing of milk products 84
vi
Page
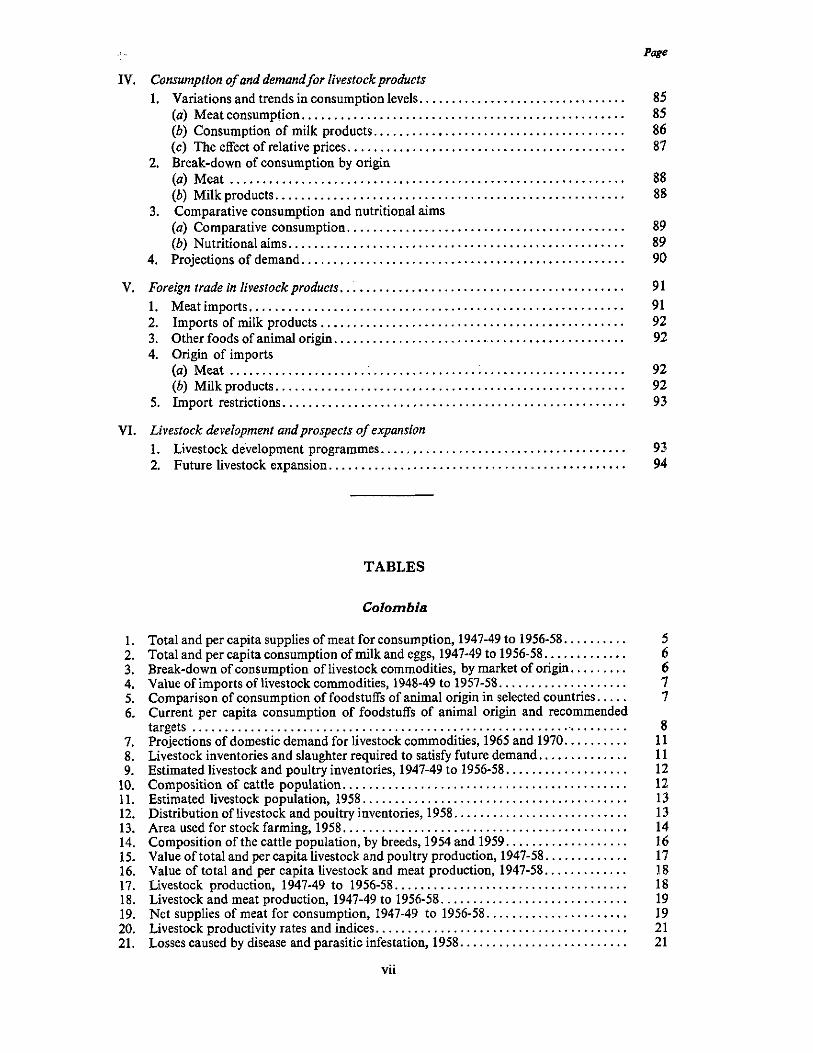
IV. Consumption of and demandfor livestock products 1. Variations and trends in consumption levels 85
(a) Meat consumption 85 (b) Consumption of milk products 86 (c) The effect of relative prices 87
2. Break-down of consumption by origin (a) Meat 88 (b) Milk products 88
3. Comparative consumption and nutritional aims (a) Comparative consumption 89 (b) Nutritional aims 89
4. Projections of demand 90
V. Foreign trade in livestock products... 91 1. Meat imports 91 2. Imports of milk products 92 3. Other foods of animal origin 92 4. Origin of imports
(a) Meat 92 lb) Milk products 92
5. Import restrictions 93
VI. Livestock development and prospects of expansion 1. Livestock development programmes 93 2. Future livestock expansion 94
TABLES
Colombia
1. Total and per capita supplies of meat for consumption, 1947-49 to 1956-58 5 2. Total and per capita consumption of milk and eggs, 1947-49 to 1956-58 6 3. Break-down of consumption of livestock commodities, by market of origin 6 4. Value of imports of livestock commodities, 1948-49 to 1957-58 7 5. Comparison of consumption of foodstuffs of animal origin in selected countries 7 6. Current per capita consumption of foodstuffs of animal origin and recommended
targets 8 7. Projections of domestic demand for livestock commodities, 1965 and 1970 11 8. Livestock inventories and slaughter required to satisfy future demand 11 9. Estimated livestock and poultry inventories, 1947-49 to 1956-58 12
10. Composition of cattle population 12 11. Estimated livestock population, 1958 13 12. Distribution of livestock and poultry inventories, 1958 13 13. Area used for stock farming, 1958 14 14. Composition of the cattle population, by breeds, 1954 and 1959 16 15. Value of total and per capita livestock and poultry production, 1947-58 17 16. Value of total and per capita livestock and meat production, 1947-58 18 17. Livestock production, 1947-49 to 1956-58 18 18. Livestock and meat production, 1947-49 to 1956-58 19 19. Net supplies of meat for consumption, 1947-49 to 1956-58 19 20. Livestock productivity rates and indices 21 21. Losses caused by disease and parasitic infestation, 1958 21
vii

Mexico
1. Livestock population 34 2. Slaughter of main species of livestock, 1948-58 34 3. Estimated production of carcass meat,, 1948-58 35 4. Milk production and use, 1957-58 36 5. Pasture area and carrying capacity, by states 37 6. Exports of beef cattle on the hoof and carcasses, 1948-59 42 7. Imports of livestock products, 1957-59 43 8. Value of imports of livestock products, 1957-59 44 9. Estimated meat consumption, in terms of carcass meat, 1948-58 45
10. Per capita meat consumption, 1948-58 45 11. Daily per capita consumption of meat and dairy products in selected rural areas, 1959 45 12. Total and per capita consumption of milk products, 1957 and 1958 46
Uruguay
1. Cattle and poultry inventories in selected years 51 2. Geographical distribution of cattle and sheep, 1956 and 1959 51 3. Sheep-to-cattle ratio by size of farm, 1956 — — 52 4. Livestock inventories expressed in standard units, 1959 52 5. Area used for stock-fanning in 1959 52 6. Estimated value of livestock output in selected years . 54 7. Estimated output of livestock and livestock products at constant prices,; 1946-59 54 8. Rate of slaughter of livestock, 1948-50 to 1960 55 9. Estimated production of red meat, 1948-50 and 1954-60 55
10. Milk production, 1948 to 1960 56 11. Wool production, 1947/48 to 1960/61 57 12. Productivity rates and indices in the livestock sector, 1959 58 13. Apparent meat consumption, 1948-50 to 1957-59 61 14. Value of exports of livestock products, 1951-60 63 15. Meat exports, 1951-60 63 16. Wool exports, 1951-60 64 17. Exports of hides, 1951-60 65
Venezuela
1. Estimated livestock and poultry population, 1950 to 1956 71 2. Estimated break-down of cattle population by livestock activity, 1956 72 3. Livestock population in standard units, 1956 73 4. Area used for livestock, 1950 and 1956 73 5. Pasture area and livestock density, 1956 73 6. Slaughter of livestock and poultry by species» 1946-1959 74 7. Production of red meat and poultry, 1947-49 to 1959. 74 8. Par capita red meat production, 1939-41 to 1959 75 9. Estimated production of milk and milk products» 1948-59 76
10. Imports of high-grade cattle, 1945-53 and 1958 77 11. Livestock production indices, 1950-59 78 12. Frequency of some infections and contagious diseases, 1954 and 1958 80 13. Commonest endoparasitic diseases» 1958 81 14. Regional distribution of the main slaughter-houses, 1958 83 15. Consumption of red meat, total and per capita, 1947-49 to 1956-58 86 16. Consumption of milk products» 1948-50 to 1956-58 87 17. Break-down of consumption of meat andmilk products, by origin, 1948-50 to 1956-58. 88 18. Comparative consumption of foods of animal origin in selected countries 89 19. Recommended nutritional standards and deficit in the per capita consumption of
goods of animal origin. 90
viii

Page
20. Projected demand for meat and actual consumption, 1958 90 21. Volume and value of imports of foods of animal origin, 1948-50 to 1956-58 92 22. Break-down of imports of preserved milk and cheese by origin, 1948-49 and 1958... 93
FIGURES
Colombia
I. Historical trend of cattle slaughter and population growth 9 II. Relative prices of meat, 1947-57 9
III. Area used for stock farming, 1958 15 IV. Indices of total and per capita livestock production, 1947-58 17 V. Meat production by species, 1956-58 19
VI. Losses due to livestock diseases, 1958 21
Mexico
I. Production of red meat, 1948-58 35
Uruguay
I. Total and per capita livestock production indices, 1946-59 54 II. Total and per capita production of red meat, 1950-60 55
III. Milk production total, per capita and population, 1948-60 56 IV. Relative pricss of beef, milk and eggs, 1950-59 62 V. Percentage of beef cattle slaughtered for export, 1916-60 64
Venezuela
I. Total meat production and population growth rate indices 77 II. Indices of apparent consumption and weighted prices of meat and milk products,
1951-58 86 III. Curves of parity prices of foods of animal origin in relation to the general price curve,
1951-59 87 IV. Percentage distribution of consumption of whole milk and milk products, 1951-52
to 1956-58 88 V. Projected and actual consumption of beef 91
ix

GENERAL INTRODUCTION
At the third meeting of the United Nations Food and Agriculture Organization (FAO) on Food and Agricul-ture Programmes and Prospects in Latin America, and at the sixth session of the Economic Commission for Latin America (ECLA), resolutions were adopted respect-ively requesting the secretariats of these two agencies to assign high priority to a study on the development of livestock production in Latin America. In compliance with these resolutions, ECLA and FAO agreed to promote such a study through their Joint Agriculture Division, bearing in mind the following basic objectives:
(a) Study of the current livestock situation and ana-lysis of the technical and economic factors which are hampering the production and distribution of livestock products;
(b) Consideration of the possibilities and outlook for the development of the livestock industry in the Latin American countries;
(c) Diagnosis of the livestock sector on lines such as will enable Governments to make use of the study in formulating their livestock development pro-grammes.
With these ends in view, several countries were singled out as representative both of geographical and climatic conditions and of the most important problems arising.
The present volume contains the studies on stock farming in Colombia, Mexico, Uruguay and Venezuela, and constitutes the first part of the overall analysis of the development of the Latin American livestock industry which ECLA and FAO are jointly carrying out. During a second phase, research will be conducted in the remain-ing representative countries chosen, and on the basis of the individual studies and the data available for other countries not included in the sample, the overall survey of the livestock industry in Latin America as a whole will be drafted.
The research and analysis by countries is basically planned or directed along the lines laid down for the overall livestock study, and hence it is on global state-ments and data that the greatest emphasis is placed.
Certain aspects, however, are fairly frequently discussed at the level of a particular area.
These studies are the first of their kind to be carried out in Latin America and, although they make no claim to cover every aspect of production functions and the livestock economy, they may be expected to shed some light on the basic problems which are obstructing the development of activities in this sector.
It should be recalled that in virtually all the Latin American countries there are deficiencies, sometimes of a serious nature, in agricultural statistics, especially those relating to livestock. They are not confined to delays in publishing statistical data ; in a number of cases such data simply do not exist. These limitations have been partly overcome by recourse to direct sources of infor-mation, and also through the formulation of estimates by the personnel of the Joint ECLA/FAO Agriculture Division.
The Division is unfortunately too short-staffed to have been able to proceed with the overall study as quickly as could be desired. Indeed, the studies presented here could not have been carried out but for the invaluable co-operation received from the countries concerned. The assistance received from the Governments of Colombia, Mexico, Uruguay and Venezuela in carrying out the respective studies is gratefully acknowledged. In Colom-bia, valuable co-operation was received from the Adminis-trative Department of Planning, the Ministry of Agricul-ture, the Stock Farmers' Federation and other agencies concerned with the promotion of the livestock industry. Most of the basic data used was obtained with the un-stinted co-operation of these Colombian governmental and private agencies. In Mexico, valuable help was given by the Livestock Department of the Ministry of Agriculture and by private sectors connected with the livestock industry. In the case of the study on Uruguay, extremely useful information and assistance were pro-vided by technical personnel from the Ministry of Agri-culture, particularly the Rural Economy Section. The Livestock and Agricultural Planning Departments of the Ministry of Agriculture collaborated very actively in the Venezuela study.
x¡

GENERAL INTRODUCTION
At the third meeting of the United Nations Food and Agriculture Organization (FAO) on Food and Agricul-ture Programmes and Prospects in Latin America, and at the sixth session of the Economic Commission for Latin America (ECLA), resolutions were adopted respect-ively requesting the secretariats of these two agencies to assign high priority to a study on the development of livestock production in Latin America. In compliance with these resolutions, ECLA and FAO agreed to promote such a study through their Joint Agriculture Division, bearing in mind the following basic objectives:
(a) Study of the current livestock situation and ana-lysis of the technical and economic factors which are hampering the production and distribution of livestock products;
(b) Consideration of the possibilities and outlook for the development of the livestock industry in the Latin American countries;
(c) Diagnosis of the livestock sector on lines such as will enable Governments to make use of the study in formulating their livestock development pro-grammes.
With these ends in view, several countries were singled out as representative both of geographical and climatic conditions and of the most important problems arising.
The present volume contains the studies on stock farming in Colombia, Mexico, Uruguay and Venezuela, and constitutes the first part of the overall analysis of the development of the Latin American livestock industry which ECLA and FAO are jointly carrying out. During a second phase, research will be conducted in the remain-ing representative countries chosen, and on the basis of the individual studies and the data available for other countries not included in the sample, the overall survey of the livestock industry in Latin America as a whole will be drafted.
The research and analysis by countries is basically planned or directed along the lines laid down for the overall livestock study, and hence it is on global state-ments and data that the greatest emphasis is placed.
Certain aspects, however, are fairly frequently discussed at the level of a particular area.
These studies are the first of their kind to be carried out in Latin America and, although they make no claim to cover every aspect of production functions and the livestock economy, they may be expected to shed some light on the basic problems which are obstructing the development of activities in this sector.
It should be recalled that in virtually all the Latin American countries there are deficiencies, sometimes of a serious nature, in agricultural statistics, especially those relating to livestock. They are not confined to delays in publishing statistical data ; in a number of cases such data simply do not exist. These limitations have been partly overcome by recourse to direct sources of infor-mation, and also through the formulation of estimates by the personnel of the Joint ECLA/FAO Agriculture Division.
The Division is unfortunately too short-staffed to have been able to proceed with the overall study as quickly as could be desired. Indeed, the studies presented here could not have been carried out but for the invaluable co-operation received from the countries concerned. The assistance received from the Governments of Colombia, Mexico, Uruguay and Venezuela in carrying out the respective studies is gratefully acknowledged. In Colom-bia, valuable co-operation was received from the Adminis-trative Department of Planning, the Ministry of Agricul-ture, the Stock Farmers' Federation and other agencies concerned with the promotion of the livestock industry. Most of the basic data used was obtained with the un-stinted co-operation of these Colombian governmental and private agencies. In Mexico, valuable help was given by the Livestock Department of the Ministry of Agriculture and by private sectors connected with the livestock industry. In the case of the study on Uruguay, extremely useful information and assistance were pro-vided by technical personnel from the Ministry of Agri-culture, particularly the Rural Economy Section. The Livestock and Agricultural Planning Departments of the Ministry of Agriculture collaborated very actively in the Venezuela study.
X I

Page
20. Projected demand for meat and actual consumption, 1958 90 21. Volume and value of imports of foods of animad origin, 1948-50 to 1956-58 92 22. Break-down of imports of preserved milk and cheese by origin, 1948-49 and 1958... 93
FIGURES
Colombia
I. Historical trend of cattle slaughter and population growth 9 II. Relative prices of meat, 1947-57 9
III. Area used for stock farming, 1958 15 IV. Indices of total and per capita livestock production, 1947-58 17 V. Meat production by species, 1956-58 19
VI. Losses due to livestock diseases, 1958 21
Mexico
I. Production of red meat, 1948-58 35
Uruguay
I. Total and per capita livestock production indices, 1946-59 54 II. Total and per capita production of red meat, 1950-60 55
III. Milk production total, per capita and population, 1948-60 56 IV. Relative pricss of beef, milk and eggs, 1950-59 62 V. Percentage of beef cattle slaughtered for export, 1916-60 64
Venezuela
I. Total meat production and population growth rate indices 77 II. Indices of apparent consumption and weighted prices of meat and milk products,
1951-58 86 III. Curves of parity prices of foods of animal origin in relation to the general price curve,
1951-59 87 IV. Percentage distribution of consumption of whole milk and milk products, 1951-52
to 1956-58 88 V. Projected and actual consumption of beef 91
ix

COLOMBIA

E/CN. 12/556
15 February 1961

INTRODUCTION AND SUMMARY
The present study was jointly prepared by the ECLA/FAO Agriculture Division, the ECLA/BTAO Advisory Group and the Administrative Department of Planning and Technical Services of Colombia. The substantive part of the study has been incorporated into the overall economic development programme drawn up by the Administrative Department of Planning and Technical Services.
Although the present paper makes no claim to cover all aspects of livestock activities, it may perhaps shed some light on the most important of the problems that are retarding the development of Colombia's livestock sector.
The study basically consists in a diagnosis of the stock farming situation from the standpoint of production, distribution and consumption of livestock products, with a few considerations on possible long-term changes in supply and demand and on the targets that it would be needful to attain. Aspects relating to the status, variations and trends of demand and consumption are dealt with first, and then the characteristics of supply, its limiting factors and its prospects of expansion. The presentation of the study is thus brought into line with the require-ments of the livestock development programming in which the Colombian Government is interested.
It may be stated, in short, that stock farming is of great importance for the Colombian economy, not only because of the value of livestock production but also because it is the prime source of protective foodstuffs and is a branch of activity that offers ample prospects of development.
The estimated value of animal production in 1956-58 averaged 2,665 million pesos per year.1 This figure, which represented output for domestic consumption only, was equivalent to slightly over 50 per cent of the total value of the foods consumed during the three years in question, except for certain beverages and for fisheries products. The chief contribution is made by beef produc-tion which, in terms of carcass meat, amounted to an average of 378,000 tons yearly in 1956-58 from the slaugh-ter of 1,744,300 head of cattle valued at 1,419 million pesos. Next in importance is milk production, calculated at nearly 920,000 tons, followed by poultry keeping and pig farming.
Notwithstanding the preponderance of stock farming in the agricultural sector, its rate of expansion has slowed down in the last ten years. For instance, the value added by livestock production did not increase more than 15 per cent between 1947-49 and 1956-58 which,
1 Value of meat from cattle, pigs, sheep, goats and poultry, plus the respective vaues of milk, egg and wool production, calculated at prices paid to the producer in 1958.
by being insufficient to offset population growth, was responsible for a 5 per cent contraction in output per capita.
Stock farming is also highly important as a source of protective foods for daily consumption. The meat, milk and eggs produced are kept entirely for internal markets and, although supplies per head are still low, imports are very small in comparison with the volume of domestic production.
In addition, Colombia's natural stock farming resources offer enormous development possibilities. In fact, the livestock potential is probably enough to supply the whole of the home market and eventually provide sur-pluses for export. This circumstance, taken in conjunction with Colombia's geographical position, the relative proxi-mity of countries that import livestock products and the deficit in world meat production, would more than justify the assignment of a high priority to the imple-mentation of an integrated livestock development pro-gramme.
In Colombia, stock farming is carried on in a variety of climates and zones of differing ecology. This naturally raises a wide range of problems and is responsible for the fact that its characteristics vary from one area to another.
The principal stock farming activity, besides milk production, is the breeding, raising and fattening of cattle. Colombia has about 14.5 million head of cattle,2
and some 30 million hectares of grazing land for the different species of animals. Only a third of this land is perennial artificial pasture, the remainder being perennial or seasonal natural grassland of inferior quality. If the stocks of the different species and the pasture area are expressed in terms of homogeneous units,3 the former would be 17.1 million head and the grazing area 13.7 mil-lion hectares. This is equivalent to a livestock density of 1.25 or, in other words, to one head of cattle per 0.8 hec-tares of artificial grazing. In 1958, 90 per cent of the cattle population was distributed among the sixteen depart-ments and the remainder among the intendencias and comisarias. A third is concentrated in the departments of Bolívar, Magdalena and Córdoba, on the Atlantic sea-board, which together form the principal stock-farming area of the country for meat production. Another third is to be found in the interior, mainly in Antioquia, Boyacá, Caldas, Cundinamarca and Tolima, and the remainder in the departments of the south-west (Cauca, Chocó, Huila, Nariño and Valle), in Santander del
2 Estimate for 1958, with an annual average of 14.2 million in 1956-58.
3 In terms of cattle and hectares of artificial pastureland, accord-ing to the respective conversion factors.
3

4 LIVESTOCK IN LATIN AMERICA
Norte and Santander del Sur and in the Llanos Orientales. Except on the Atlantic coast and in the Llanos, where the breeding of cattle for beef predominates, stock farm-ing is highly diversified and meat production is carried on in conjunction with dairy farming and other types of animal husbandry.
As far as its climate is concerned, Colombia is divided into three clearly differentiated stock-farming areas : (a) the tropical zone, which is the largest, and where the emphasis is on meat production, chiefly from criollo breeds and zebu-criollo half-breeds; (b) the subtropical zone, where dual-purpose stock farming is carried on (for meat and milk) with the Blanco Ovejinegro criollo breed; and (c) the cold zone, where the most important activities are milk production from specialized foreign breeds and mestizos of these breeds, and sheep farming. Pig and poultry farming is practised in the three climatic zones and in all the geopolitical divisions of the country. Stock farming is generally of the extensive type because, inter alia, of the low carrying capacity of the pastureland and the pre-eminence of criollo breeds. Despite the fact that these breeds have the advantage of a long tradition of adjustment to the Colombian environment, their average yield and low degree of genetic improvement prevent them from being exploited economically in accor-dance with intensive farming practices. Modern intensive systems with a high level of productivity are used solely in a few dairy plants in the cold zones and a limited number in the sub-tropical and tropical zones.
The prevalence of extensive stock farming and the low yield per head keep down the level of productivity in terms of meat or milk per unit of area. The rate of cattle production,4 for instance, is only 15 per cent. This very low level of yield is primarily due to the manifold problems besetting the fattening process, to the advanced age at which the livestock are slaughtered and to the factors limiting the reproduction of the cattle population, which prevent the herds from increasing quickly enough. Production per head of stock is scarcely 30.5 kilogrammes of carcass meat, a figure that compares very unfavourably with that of almost 50 kilogrammes in Argentina, Australia and Chile and that of more than 70 kilogrammes in France, the United Kingdom and the United States. The rate of slaughter, or percentage capacity of produc-tion for slaughter, is low not only for cattle (12.5), butalso for lesser livestock species. Yearly milk yield does not average more than 500 kilogrammes per cow, and the average birth rate is as low as 50 per cent.
The principal factors limiting production include: (á) the backwardness of techniques for handling livestock and running dairy plants; (b) the low technical level of livestock pasturing and feeding systems, of pest and disease control and treatment and of methods for the genetic improvement of different breeds; and (c) insuffi-cient complementarity or integration between stock farming and agriculture. This obviously impedes the proper utilization of the factors of production that is normally attainable in mixed farming.
4 Slaughter, clandestine exports and increase of inventories over cattle population.
Special stress should be laid on the heavy incidence of diseases which, apart from causing a high rate of morta-lity, also lead to production losses and delays. Animal pathology was responsible for losses to the value of 881 million pesos in 1958 among Colombian livestock, i.e., a third of the total value of livestock production registered in that year. The highest morbidity indices and the heaviest losses were caused by endoparasitic and ectoparasitic infestation, brucellosis (or epizootic abortion), foot-and-mouth disease, paratuberculosis and tuberculosis. Programmes for their control and eradi-cation should begin with foot-and-mouth disease since it is a serious obstacle to any livestock development plans aiming at meat exportation.
Qualitative and quantitative shortcomings in livestock feeding are undoubtedly another of the grave problems hindering livestock development and production. Among the innumerable drawbacks in this respect, the following are outstanding: (a) the farmers' lack of interest in the cultivation of those species of fodder crops that have a high nutritive value, such as the grasses and leguminous plants which are grown for artificial pastures, and which should be cultivated over a much larger area in order to replace natural grassland of inferior quality; (b) mismanagement and neglect of pastures, chiefly evidenced by lack of rotation — which, in its turn, is largely caused by failure to divide up the grazing-land sufficiently— overgrown and consequently woody grass, abundance of weeds, and under-diversification and unsuitable combi-nations of fodder crops; (c) insufficient use of supple-mentary feeds, such as fodder crops for cutting, hay and silage, grain crops, mineral compounds and other feed concentrates. To all these feeding problems, most of which are chronic, must be added the seasonal fodder shortages during periods of drought and in areas where the pasture land is hable to be flooded.
Among the more urgent problems affecting demand and supply in respect of livestock products, the most outstanding is the obvious disequilibrium between the supply of protective foodstuffs and the expansion of consumer requirements determined by the growth of the population and the rise in per capita income. The chief result of this imbalance has been an intensification of the pressure of unsatisfied demand and an upward trend in relative prices, especially for meat. Since production has not increased as fast as population, and the resulting deficits have not been covered by imports, per capita consumption levels have fallen, as has happened in the case of meat during the past decade; per capita supplies of beef and pork dropped from 34 kilogrammes in 1947-49 to an annual average of 32.7 kilogrammes in 1956-58. This means that in the last few years the supply has not been sufficient to keep abreast even of the natural increase in population. If this trend were to continue, under-consumption would assume more critical proportions in the years to come.
To judge from available data, substantial increments in production of livestock commodities—especially meat and milk—will have to be achieved if the potential demand predictable for the forthcoming decade is to be satisfied. Thus, for example, on the assumption that the population continues to grow at its present rate and

COLOMBIA : I . CONSUMPTION OF LIVESTOCK COMMODITIES 5
income at an average annual rate of 2.5 per cent, by 1970 total demand for meat might well amount to some 800,000 tons, which is a figure 71 per cent higher than the average supplies registered in the three-year period 1956-58. In order to cover this potential demand, a powerful impetus would have to be given to the livestock sector and related activities, primarily by the creation of stronger production incentives and the promotion of more efficient and comprehensive systems of marketing and processing livestock products.
In analysing supply characteristics and problems, it should be pointed out that the limitations noted are due not only to the stagnation of production, but also in large measure to matters outside the producers' control, such as the lack of progress in marketing practices, transport difficulties and the manifold deficiencies of the existing markets. Slaughtering and meat marketing systems are an unrivalled case in point. The unsatisfactory methods of moving and transporting cattle to the con-sumer centres result in annual losses amounting to 50 million pesos, mainly attributable to the animals' loss of weight. The absence of official standards for the
classification of livestock and meat and the fluctuating and uncontrolled prices at once aggravate the lack of market organization and allow numerous middlemen freedom of action, up to the farthest limits of speculation. All this is reflected in exorbitant marketing costs and margins which, given the deficiencies of marketing practices and the poor quality of the goods sold, obviously lay a heavy burden on consumers and reduce the share of producers in the end price. It is important to recall that the present structure of marketing is not only retarding production but is also preventing supply from responding to price variations.
As regards slaughter and processing, too, the situation is unfavourable. Here the principal criticism must be levelled at the decentralization of slaughtering in ill-equipped and anti-economic units, which are subjected to no competent sanitary inspection. Furthermore, almost all the slaughter-house by-products are wasted.
Lastly, it should be noted that meat, milk products and other foodstuffs are distributed and sold to the consumer in unsatisfactory conditions and, moreover, at a cost which is disproportionate to the services rendered.
I. CONSUMPTION OF LIVESTOCK COMMODITIES
1. CONSUMPTION LEVELS, CHANGES AND TRENDS
While consumption of foodstuffs of animal origin is not as low in Colombia as in many other Latin American countries, it is far from meeting ideal requirements or reaching dietetically recommendable standards. This unsatisfactory situation as regards consumption of the most important protective foods—meat, milk products and eggs—is caused by a variety of factors, outstanding among which are disposable income, relative prices and supply conditions. It should be noted that the average per capita consumption figures given for Colombia do not reflect the immense disparities observable in prac-tice between urban and rural consumption levels, nor the serious nature of under-consumption among the lower income groups. However, such theoretical averages facilitate an overall evaluation of the problem and constitute a very useful tool for the projection of future demand and the establishment of production targets.
(a) Meat consumption Total apparent meat consumption has amounted to
467,000 tons in recent years, which represents an 18 per cent increase over the 1947-49 figure. Nevertheless, in 1953-55 total consumption contracted in relation to the preceding period. Although, as a general rule, aggregate supplies showed a steady upward trend, the increase in the meat supply failed to keep pace with that of the population; and this state of affairs of course resulted in a deterioration of per capita consumption levels which, between 1947 and 1952, remained stationary at about 34 kilogrammes of red meat,5 and in 1953-55 dropped to an average of 31 kilogrammes. As from 1956, the mean per capital consumption figures rose considerably,
averaging 33 kilogrammes over the three-year period 1956-58, but it still fell short of the peak level attained some years before (see table 1).
Table 1 Colombia: Total and per capita supplies of meat
for consumption, 1947-49 to 1956-58 a
1947-49 1950-52 1953-55 1956-5S
Total (thousands of tons) 397.2 Beef 314.2 Pork 52.1 Mutton 3.0 Goat-flesh 2.9 Poultry 25.0
Per capita: aggregate (kilogrammes) 36.72 Beef 29.00 Pork 4.85 Mutton 0.28 Goat-flesh 0.27 Poultry 2.32 Indices 100.00
426.4 338.1
56.5 2.7 3.4
25.7
36.79 29.00
4.86 0.23 0.29 2.21
100.50
414.3 321.2
61.5 3.0 2.6
26.0
33.43 26.00
4.91 0.24 0.20 2.08
90.40
467.4 378.2
57.2 3.4 3.0
25.7
35.31 28.59
4.32 0.26 0.22 1.92
96.48
6 Beef, pork, mutton and goat-flesh, in terms of carcass meat.
Sources: Official slaughter statistics and estimates of slaughter in situ. " Including consumption corresponding to slaughter in situ.
For reasons relating to the supply situation and to dietary habits, beef consumption is heaviest, representing approximately 80 per cent of the total (including poultry). Pork accounts for 12 per cent, poultry for 6 per cent and mutton and goat-flesh for a very small proportion indeed. The preference for pork is quite marked, but consumption is severely restricted by supply difficulties and high prices.

6 LIVESTOCK IN LATIN AMERICA
(b) Consumption of milk products and eggs Total consumption of milk products, in terms of fluid
milk, stood at 952,000 tons in the three-year period 1956-58; this figure represented an increase of 22 per cent in relation to 1947-49 (see table 2). As per capita consump-tion was stabilized at 72 litres, the consumption increment is entirely attributable to the greater demand resulting from the growth of the population.6 According to esti-mates, 60 per cent is consumed in the urban centres, mainly in the form of fluid milk, and the remainder in the rural areas. Consequently, if the distribution of the population is taken into account, it may be concluded that per capita consumption of milk amounts to about 98 litres in the cities and larger towns, and to some 63 litres in rural and semi-urban districts. Clearly, then, so far as milk and milk products are concerned, current per capita con-sumption levels are far below those recommended by dieticians. As in the case of meat and eggs, the less privileged social classes consume very small quantities of milk products and sometimes none at all. The supply situation with regard to fresh milk is critical in many rural areas, especially in the sub-tropical and tropical zones where attention is concentrated on meat production.
Table 2 Colombia: Total and per capita consumption of milk
and eggs, 1947-49 to 1956-58
Milk Eggs
Total (Thousands
of tons) Per capita
(litre) Total
( millions of units)
Per capita (units)
1947-49 779.3 71.8 832.2 77 1950-52 832.7 71.8 852.8 82 1953-55 889.6 71.8 855.4 69 1956-58 951.7 71.9 859.3 65 1 Q C O
Percentage 122 100 103 84 1947-49
During the period under review, total egg consumption remained stationary at a little over 850 million units, which, allowing for the growth of the population, implies a 16 per cent reduction of per capita consumption in the course of ten years. It must be pointed out that this figure relates,to consumption of eggs in every form, including all foods containing them so that direct con-sumption of eggs is really low.
Lard is another livestock product of which a fairly large amount is consumed in Colombia, although year by year the volume decreases as edible vegetable fats and oils are progressively substituted for it. It is estimated that per capita consumption of lard stood at 2 kilogrammes in 1948-49 and dropped to less than 1 kilogramme in 1956-58.
2. COMPOSITION OF CONSUMPTION BY MARKETS OF ORIGIN
Consumption of foodstuffs of animal origin is based almost entirely on domestic production, the share of imports being extremely small, especially in the case of eggs and lard (see table 3). Effective demand for foreign livestock commodities might be substantially greater were it not for the tariff and other restrictions imposed with a view to protecting domestic production and encouraging the utilization of Colombia's own resources.
Consumption of imported meat is confined to processed and tinned products, as Colombia buys no fresh or refrigerated meat from abroad and cattle on the hoof have been imported for consumption only sporadically and on a very small scale. The milk products imported include preserved milk and certain special types of cheese for which there is only a very limited demand.
Table 3 Colombia: Break-down of consumption of livestock
commodities, by market of origin (Percentages)
Source: Estimates jointly prepared by the Ministry of Agriculture, The National Association of Milk Producers and Processers (Asociación Nacional de Productores e Industriales Lácteos —ANALAC), the Administrative Department of Programming and Technical Services, ECLA and FAO.
With respect to the composition of consumption, in the large urban centres fluid milk accounts for 75 per cent and cheese, butter and condensed and powdered milk for the remaining 25 per cent. The rural population, on the contrary, consumes relatively less fresh milk than cheese and junket, for example. The milk used in the country is generally boiled, whereas in the town at least half the amount consumed is pasteurized. Consumption of powdered and condensed or evaporated milk represents a very small proportion of the total, since, according to estimates, only 2 per cent of production is used for this purpose, while imports of such milk products are negli-gible.
Commodity Domestic production Imports
6 No adequate statistics are available on milk production and consumption in Colombia. The figures given in table 2 are merely estimates based on various food and consumption surveys carried out in Colombia by a number of national and international agencies.
Meat (1955-57) a . . . . 99.5 0.5 Total milk (1954-56) b . . . . 98.3 1.7 Eggs (1956-58) . . . . 100.0 —
Lard (1957-58) 98.1 1.9
Sources: Meat: ECLA/FAO Abastecimiento y comercio de carnes en América Latina (unpublished study in draft form), July 1959. Milk products: The role of agricultural commodities in a Latin American regional market (E/CN.12/499), p. 86.
11 Meat and livestock for consumption. 11 Milk and milk products.
Consumption of imported fresh eggs formerly reached fairly significant levels, but nowadays the whole of the supply is domestically produced. As consumer preferences for vegetable fats and oils are causing a steady decline in per capita consumption of lard, imports of lard as well as the contribution of domestic production have dwindled. Thus, in 1948-49 per capita imports of lard averaged 900 grammes, in sharp contrast to the corre-sponding figure of barely 16 grammes in 1957-58. Con-versely, in this second period imports of vegetable fats

COLOMBIA : I . CONSUMPTION OF LIVESTOCK COMMODITIES 7
and oils had increased to 51,700 tons7 as against average annual imports of only 9,487 tons in 1947-48. If, then, this trend towards the substitution of vegetable oils for animal fats continues, per capita consumption of the latter will be almost negligible in the future.
While it is true that the proportion of livestock commo-dities imported from foreign markets is tiny in comparison with the total volume of domestic production, the value of imports is not without its significance, since in 1957-58 it averaged 14.2 million pesos yearly—a much higher figure than the 9.9 million pesos' worth of imports regis-tered in 1948-49. Especially noteworthy is the increase not only in the value but also in the volume of imports of milk products, tallow and wool (see table 4).
Table 4 Colombia: Value of imports of livestock commodities,
1948-49 to 1957-58 (Annual average: pesos at current prices)
1948-49 1957-58
Food Meat preparations a 116,307 24,078 Preserved milk . 1,032,846 1,916,124 b
Butter 60,372 1,518" Cheese 16,628 690,591 " Eggs 1,747 2,660 Lard . 3,315,689 2,292,333
Livestock and poultry Cattle 0 672,416 227,780 Pigs for breeding 6,010 32,010 Incubator-hatched chickens . . 23,766 41,109
Raw materials Wool d . 4,139,145 8,961,970 Leaf fat e 559,641 2,025,023 Bristles, bones, horns, etc. . . . 1,752 196
TOTAL . 9,946,319 14,215,392
inland waters as well as by the sea off its coasts. The country's consumption of animal proteins, at present so limited, could unquestionably be raised considerably if bigger supplies of fish and shellfish were available at more moderate prices. It is not, strictly speaking, consumer habits that restrict demand for such foods; the tightness of the supply situation, especially in the interior of the country, is linked rather to the high costs of a fishing industry which has as yet made little progress in the adoption of modern techniques, as well as to processing, marketing, transport and conservation deficiencies, which are ultimately reflected in high relative prices.
4. COMPARATIVE LEVELS OF CONSUMPTION AND NUTRITIONAL TARGETS
A comparison of the differing levels of per 'capita consumption of the most important foodstuffs of animal origin in various countries indicates that, broadly speak-ing, Colombia is at a disadvantage in this respect in relation to the United States, Western Europe, Uruguay, Argentina, Paraguay, Brazil and Chile (see table 5). It is only slightly better off than the Central American countries, Mexico, Peru, Ecuador and one or two other South American countries. Thus, for instance, per capita consumption of red meat in Colombia is equivalent to barely 25 per cent of the amount consumed in Argen-tina and Uruguay, and 38 per cent of the corresponding figure for the United States. Consumption of milk, milk products and eggs—especially these last—also compares very unfavourably with that registered else-where.
Nor must it be forgotten that this disadvantage is not quantitative alone, since the quality and hygienic condi-
Table 5 Comparison of consumption of foodstuffs of animal origin
in selected countries (Annual average: kilogrammes)
Source: Anuario de Comercio Exterior. » Including bam and bacon. h Excluding donations by the United States, whose value in 1958 was
estimated at 20.8 million pesos. 0 Cattle for consumption and for reproduction. 4 Excluding wool tops. 6 Leaf fat and refined melted tallow.
3. CONSUMPTION OF FISH AND SHELLFISH
Although there are no basic data available on con-sumption of fish and shellfish, especially the catch from subsistence fishing along the River Magdalena, per capita supplies of these foods are known to be excep-tionally low. In 1959, for example, registered catches would seem to have contributed about 20,000 tons ;8 if the share of unregistered consumption catches is estimated at 60 per cent, gross supplies for consumption work out at 32,000 tons, representing a per capita consumption of 2 kilogrammes. This low level is strikingly dispropor-tionate to the vast resources offered by Colombia's
' See The role of agricultural commodities in a Latin American regional market (E/CN. 12/499), p. 139.
8 Ministry of Agriculture, Memoria, 1959.
Country Red meat» Milk » Eggs' Fish •
Uruguay 114 227 7 1 Argentina 112 251 6 2 Paraguay 47 83 United States 71 d 264 21 5 Netherlands 31 e 234 9 6 Denmark 50 e 212 8 13
50 e 10 6 36 65 5 2
Chile 34 116 5 13 Colombia 27 72 3 2
19 74 4 2 Nicaragua 18 Honduras 17 64 4 2
16 47 3 2
Sources: Milk and meat: as for table 3. Eggs and fish: FAO, Production yearbook, 1958. ,
a 1955-57: kilogrammes of carcass meat (beef, mutton, pork and goat-flesh). The figures do not include slaughter in situ.
6 1954-56: milk and milk products in terms of fluid milk. 0 1954-55 and 1954-56. " 1957-59. * 1954-55.
8 LIVESTOCK IN LATIN AMERICA
tions of the foodstuffs sold are often nothing short of deplorable. In the towns, sanitary inspection of food is highly deficient, both in slaughterhouses and milk plants or dairies, and in shops and market places where the goods are on sale to the public. There is no need to stress the serious social and economic implications of these nutri-tional deficiencies, whose principal effects are a number of diseases and increased mortality rates, and which are detrimental to the population's welfare as well as to its capacity for work.
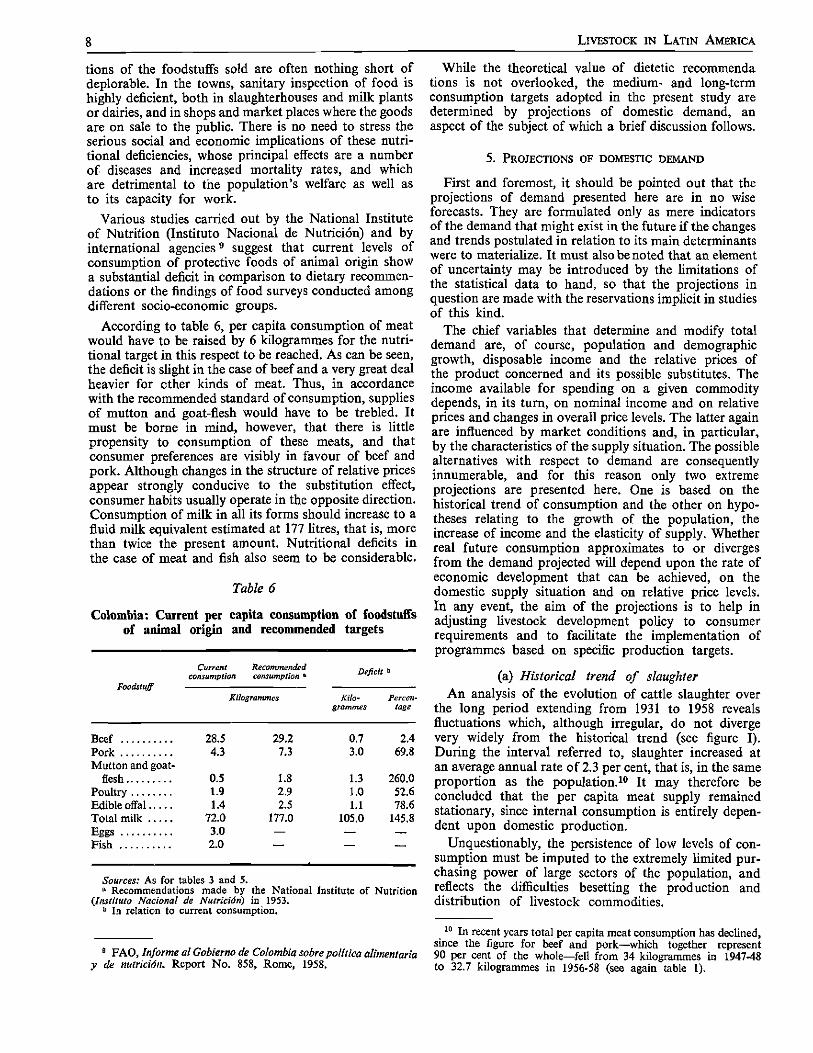
Various studies carried out by the National Institute of Nutrition (Instituto Nacional de Nutrición) and by international agencies9 suggest that current levels of consumption of protective foods of animal origin show a substantial deficit in comparison to dietary recommen-dations or the findings of food surveys conducted among different socio-economic groups.
According to table 6, per capita consumption of meat would have to be raised by 6 kilogrammes for the nutri-tional target in this respect to be reached. As can be seen, the deficit is slight in the case of beef and a very great deal heavier for other kinds of meat. Thus, in accordance with the recommended standard of consumption, supplies of mutton and goat-flesh would have to be trebled. It must be borne in mind, however, that there is little propensity to consumption of these meats, and that consumer preferences are visibly in favour of beef and pork. Although changes in the structure of relative prices appear strongly conducive to the substitution effect, consumer habits usually operate in the opposite direction. Consumption of milk in all its forms should increase to a fluid milk equivalent estimated at 177 litres, that is, more than twice the present amount. Nutritional deficits in the case of meat and fish also seem to be considerable.
Table 6
Colombia: Current per capita consumption of foodstuffs of animal origin and recommended targets
Foodstuff
Current consumption
Recommended consumption a Deficit b
Foodstuff Kilogrammes Kilo-
grammes Percen-
tage
Beef 2 8 . 5 2 9 . 2 0 . 7 2 . 4
Pork 4 . 3 7 . 3 3 . 0 6 9 . 8
Mutton and goat-flesh 0 . 5 1 . 8 1 . 3 2 6 0 . 0
Poultry 1 . 9 2 . 9 1 . 0 5 2 . 6
Edible offal 1 . 4 2 . 5 1 . 1 7 8 . 6
Total milk 7 2 . 0 1 7 7 . 0 1 0 5 . 0 1 4 5 . 8
Eggs 3 . 0 — — —
Fish 2 . 0 — — —
Sources: As for tables 3 and 5. a Recommendations made by the National Institute of Nutrition
(Instituto Nacional de Nutrición) in 1953. » In relation to current consumption.
While the theoretical value of dietetic recommenda tions is not overlooked, the medium- and long-term consumption targets adopted in the present study are determined by projections of domestic demand, an aspect of the subject of which a brief discussion follows.
5. PROJECTIONS OF DOMESTIC DEMAND
First and foremost, it should be pointed out that the projections of demand presented here are in no wise forecasts. They are formulated only as mere indicators of the demand that might exist in the future if the changes and trends postulated in relation to its main determinants were to materialize. It must also be noted that an element of uncertainty may be introduced by the limitations of the statistical data to hand, so that the projections in question are made with the reservations implicit in studies of this kind.
The chief variables that determine and modify total demand are, of course, population and demographic growth, disposable income and the relative prices of the product concerned and its possible substitutes. The income available for spending on a given commodity depends, in its turn, on nominal income and on relative prices and changes in overall price levels. The latter again are influenced by market conditions and, in particular, by the characteristics of the supply situation. The possible alternatives with respect to demand are consequently innumerable, and for this reason only two extreme projections are presented here. One is based on the historical trend of consumption and the other on hypo-theses relating to the growth of the population, the increase of income and the elasticity of supply. Whether real future consumption approximates to or diverges from the demand projected will depend upon the rate of economic development that can be achieved, on the domestic supply situation and on relative price levels. In any event, the aim of the projections is to help in adjusting livestock development policy to consumer requirements and to facilitate the implementation of programmes based on specific production targets.
(a) Historical trend of slaughter An analysis of the evolution of cattle slaughter over
the long period extending from 1931 to 1958 reveals fluctuations which, although irregular, do not diverge very widely from the historical trend (see figure I). During the interval referred to, slaughter increased at an average annual rate of 2.3 per cent, that is, in the same proportion as the population.10 It may therefore be concluded that the per capita meat supply remained stationary, since internal consumption is entirely depen-dent upon domestic production.
Unquestionably, the persistence of low levels of con-sumption must be imputed to the extremely limited pur-chasing power of large sectors of the population, and reflects the difficulties besetting the production and distribution of livestock commodities.
9 FAO, Informe al Gobierno de Colombia sobre política alimentaria y de nutrición. Report No. 858, Rome, 1958.
10 In recent years total per capita meat consumption has declined, since the figure for beef and pork—which together represent 90 per cent of the whole—fell from 34 kilogrammes in 1947-48 to 32.7 kilogrammes in 1956-58 (see again table 1).

COLOMBIA : I . CONSUMPTION OF LIVESTOCK COMMODITIES 9
Figure I Colombia: Historical trend of cattle slaughter
and population growth SEMI-LOGARITHMIC SCALE
2 5 0 0
2000
1500
1000
9 0 0
800
7 0 0
POPULATION (millions of Inhabitants)
CATTLE SLAUGHTER (thousands of head)
J I I I I I I I I LLII ILLI I ILL I 1 III II I I I I
20
1928 31 35 4 0 4 5 5 0 55 58 60 6 5
still remaining at an appreciably higher level than those of other foods. In the case of pork, the price increase was even greater.
The existence of wide disparities between the per capita consumption levels of different socio-economic groups—the advantage naturally being on the side of the higher income brackets, as will be seen later—would suggest that, if the present supply difficulties persist, such increased demand as might result from a rise in income would derive from the consumers with the highest pur-chasing power. This applies particularly to meat and milk products. Total expansion, however, would seem to be limited by the small number of consumers forming the more privileged income groups and the comparative inelasticity of demand at high levels of consumption.
In view of the fact that the rise in relative prices ab-sorbed the increase in disposable income—at least among consumers in the under-privileged classes—some indi-cation of its causes is appropriate here.
Attention will be drawn at a later stage to the many factors which are not only raising the cost of livestock production in Colombia but are at the same time limiting the productivity of the industries concerned. Suffice it to note here that those post-war years in which income was highest—in consequence of good coffee prices —largely coincided with the period of political unrest
Figure II Colombia: Relative prices of meat, 1947-57
(1947 = 100) N A T U R A L SCALE
It may well be asked, however, why the marked progress achieved by the Colombian economy in respect of income, especially during the first 10 years of the post-war period, has had no effect on the volume of per capita consumption of meat. While gross per capita income rose at the high annual rate of 5.8 per cent between 1945 and 1954,11 the per capita figure for aggregate meat consump-tion decreased from an average of 36.7 kilogrammes in the three-year period 1947-49 to 33.4 kilogrammes in 1953-55.
This situation must be attributed primarily to the high level and rising trend of relative prices of meat. Among the lower income groups in particular, the elasticity of demand for meat is exceedingly sensitive to changes in relative prices, so that a significant increase in the latter inevitably results in a reduction of per capita consump-tion, despite increments in disposable income. Figure II shows the upward movement of relative prices of beef and pork as against other basic foodstuffs on the retail market.12 Between 1947 and 1952, relative prices of beef rose by 50 per cent. From 1956 onwards, there was a marked improvement in the supply of cattle for slaugh-ter, and parity prices showed a tendency to decline, while
ieo
170
160
150
140
no
100
130 -
120 -
11 See The economic development of Colombia, United Nations publication, Sales No. 57.II.G.3., p. 12. ' 1947 4 8 5 0 51
12 Rice, beans, maize, potatoes, yucca (manioc), bananas and a Rjce, beans, maize, yucca (manioc), bananas and weat wheat. market).
(Bogotá

10 LIVESTOCK IN LATIN AMERICA
that scourged Colombia and had disturbing and detri-mental repercussions on livestock production in various parts of the country. Stocks were severely affected by the stagnation of the domestic supply and by import restric-tions, both of which tended to push up relative prices.
Given inelasticity of supply, per capita meat consump-tion is unlikely to increase, despite the probability of income improvements. On the contrary, the deterioration in per capita consumption registered during the past decade would be aggravated if the low levels of the historical trend of supply were to be maintained in the future. A projection of the historical trend of demand for beef shows that by 1970 it would reach 457,000 tons, which would represent an average per capita consumption of 26 kilogrammes, i.e., the same amount as in the three-year period 1953-55, but 2.5 kilogrammes less than the annual average for 1956-58. It should be noted that these figures are deduced from a projection of demand based only on the growth of the population within a rigid supply situation at relative price levels high enough to dis-courage per capita consumption. It is to be hoped that such conditions will not recur in the future, since the livestock development programme now in preparation allows for the satisfaction of a steadily growing potential demand.
To give some idea of the effective demand which would result from an improvement in purchasing power at various levels, the figures for annual per capita con-sumption of meat and milk in different socio-economic groups are presented below:
Income level
Low Medium High
Meat (kilogrammes). . . 20.0 28.2 43.8 Milk (litres) 50.0 93.4 147.2
If the growth of the population is taken into account and the purchasing power of the " low " income group is assumed to rise to the " medium" group's level, it appears that, in the course of five years, effective demand will probably expand by 34 per cent in the case of meat and 51 per cent in that of milk.13
(b) Projections of demand as a function of population and income
The projections to be formulated here do not relate to the effective demand that should be created in order to meet ideal standards of consumption from the nutri-tional point of view. From the economic standpoint, it is more important to ascertain the potential demand that might result if livestock development conditions were favourable, and subject to certain forecasts or hypotheses of population growth and of the annual increase in per capita income. The projections of demand presented in table 7 are based on the following assumptions:
(i) Annual rate of growth of the population, 2.3 per cent;
13 FAO, Informe al Gobierno de Colombia sobre política alimentaria y de nutrición.
(ii) Annual rate of real income increase, 2.5 per cent; (iii) Complete elasticity of supply; (iv) Stability of relative prices; (v) Income-elasticity of demand for beef, 0.6; for
pork, 0.9; for mutton, 0.0; for goat-flesh, 0.0; for poultry, 1.0; for milk, 1.1; and for eggs, 1.3.
There is little likelihood that all these circumstances will materialize, even over the long term and on the assumption that the rate of economic development can be speeded up. For the increment in disposable income to be reflected in a corresponding expansion of per capita consumption—in accordance with the elasticity coeffi-cients—the present structure of relative prices would have to be preserved and stabilized, especially in respect of livestock commodities and their substitutes. This, in turn, would be possible only if supply were completely elastic in relation to demand. What is more, without elasticity of supply, real consumption could not ade-quately meet potential demand. Given the characteristics of livestock production and the vegetative cycles of the species concerned, the elastic-supply hypothesis cannot be fulfilled,0 since import restrictions will continue to be imposed as a measure for the protection and encourage-ment of domestic production.
For the foregoing reasons, the demand projected on the bases listed does not represent a projection of real future consumption. It simply constitutes a useful tool for the programming of livestock development, and will give some idea of the extent to which production must be promoted if levels of consumption are to be progressively improved.
Total demand for meat as projected for 1965 would seem to be about 650,000 tons, that is, 38 per cent higher than in 1956-58. By 1970, it might reach approximately 800,000 tons, which would imply a 70 per cent increase in relation to the base period. Should the demand thus projected become effective, per capita meat consumption would rise from 35 kilogrammes in 1956-58 to 40 in 1965 and 43.7 in 1970 or, in other words, would register increments of 14 and 23 per cent, respectively (see table 7).
In relative terms, the biggest increases in total and per capita demand would affect poultry, pork and beef, in that order, because of their greater demand-elasticity in relation to improvements in purchasing power. Since the propensity to consumption of mutton and goat-flesh, on the contrary, is much less marked, the projection of demand for these meats does not suggest the likelihood of any significant expansion.
In the possible future composition of per capita consumption, some minor changes may be expected. The share of beef might decrease from its present 80 per cent to 78 per cent or under in 1970; that of pork might climb from 12 to 14 per cent, and that of poultry from 5 to 7 per cent; the contribution of mutton and goat-flesh might shrink to less than 1 per cent.
It may be safely asserted that, if the factors currently limiting the supply of livestock commodities were to continue in operation, the future production deficit would be very great. By 1970, unless stock farming is assisted and encouraged through integrated development programmes, it may amount to about 240,000 tons

COLOMBIA : I . CONSUMPTION OF LIVESTOCK COMMODITIES 11
Table 7 Colombia: Projections of domestic demand for livestock commodities, 1965 and 1970 a
1956-58 1965 1970
Commodity Total (thou-sands
of tons)
Per capita (kilo-
grammes)
Total (thou-sands
of tons)
Per capita (kilo-
grammes)
Total (thou-sands
of tons)
Per capita (kilo-
grammes)
Meat b 469.2 35.4 651 40.2 811 43.7 Beef 378.2 28.5 519 32.0 642 34.5 Pork 59.6 4.5 87 5.3 111 6.0 Mutton 3.5 0.3 4 0.3 5 0.3 Goat-flesh 2.2 0.2 3 0.2 3 0.2 Poultry 25.7 1.9 38 2.4 50 2.7 Milkc 951.7 71.9 1.448 89.4 1.905 102.4 Eggs 859.3d 65 e 1.361" 84 e 1.841" 99 ® Percentage increase in
relation to 1956-58 Beef 37 12 70 21 Pork 46 18 86 33 Mutton 14 — 25 —
Goat-flesh 13 — — —
Poultry 48 26 95 42 Meat in the aggregate 39 14 73 23
Milk 52 24 100 42 Eggs 58 29 114 52
Sources: ECLA/FAO. 0 Calculation based on hypothetical annual rates of increase of 2.3 and 2.5 per cent for population
and income respectively, and other assumptions. b Carcass meat. c Milk and milk products in terms of fluid milk. d Millions of units. e Units per capita.
(equivalent to approximately 1 million young fat stock), with an estimated value of 859 million pesos at 1958 prices, i.e., almost half the total expenditure on meat consumption estimated for 1956-58.
To judge from the projection of demand for milk and eggs, in ten years production would have to be doubled in order to establish a balance between supply and demand at satisfactory price levels. Among all foods of animal origin, consumption of eggs and milk products is the most likely to expand.
To satisfy potential demand for livestock commodities (including eggs) as projected for 1970, aggregate supplies would need to be increased by 75 per cent in relation to 1956-58. This would entail an average annual rate of expansion of livestock production of 6 per cent. Such an increment could be achieved only by the provision of steady and powerful incentives to the livestock sector and kindred activities, planned with an eye to the pro-gramming of livestock development and the appropriate production targets.
According to ECLA's recommendations to the Govern-ment of Colombia, the production targets to be aimed at in respect of meat would be those indicated in table 8. These objectives are compatible with Colombia's existing natural resources and with the yield and productivity indices that the implementation of the programme would make it possible to attain. They signify that the cattle population should increase to about 18 million head by 1965 and 21 million by 1970, which would allow for the production of about 2.3 and 2.9 million head, respectively, for slaughter. This in turn would imply that the average
annual rate of growth of inventories should be 3 per cent to achieve which birth rates would have to be raised and mortality indices lowered. Production of cattle for
Table 8 Colombia: Livestock inventories and slaughter required
to satisfy future demand a
Livestock species
1965
Total inven-tories
For slaughter
1970
Total inven-tories
For slaughter
(!Thousands of head)
Cattle 17,880 2,360 20,810 2,910 Pigs 2,340 1,450 2,980 1,850 Sheep 1,170 222 1,482 278 Goats 635 170 670 120
Average annual rate of increase
(Percentage)
1956-58 to 1965 1956-58 to 1970
Inventories Slaughter Inventories Slaughter
2.9 3.6 3.0 3.9 3.5 4.7 4.1 4.8 3.7 1.8 4.1 2.9 0.8 1.1 0.9 1.0
Sources: ECLA/FAO. a For bases of the projection, see table 7.

12 LIVESTOCK IN LATIN AMERICA
slaughter would need to increase at an average annual rate of 3.9 per cent.14 For the attainment of this objective
14 A higher rate of increase would probably enable livestock, meat or both to be exported without detriment to domestic con-sumption.
XL AVAILABLE
1. ESTIMATED LIVESTOCK AND POULTRY INVENTORIES
Like most Latin American countries, Colombia has no reliable statistics on inventories of the various animal species. The 1951 census was incomplete and gave evi-dence of serious technical errors, so that the data it provided were soon shelved. Other livestock population estimates prepared by the Ministry of Agriculture, and those based on farm sampling, are also regarded as of doubtful accuracy. Recourse was therefore had to the more recent estimate presented in table 9.
Table 9 Colombia: Estimated livestock and poultry inventories,
1947-49 to 1956-58 (Thousand head)
1947-49 1950-52 1953-55 1956-5S
Cattle 13,300 13,750 13,450 14,200 Pigs 2,270 2,453 1,850 1,773 Sheeps 1,088 1,217 1,100 878 Goats 710 721 582 595 Poultry 20,806 21,300 21,385 21,484
Sources: Estimates jointly prepared by the Ministry of Agriculture, the Stock Farmers' Federation (Confederación de Ganaderos), the Administrative Department of Programming and Technical Services, ECLA and FAO.
From this calculation it can be seen that cattle are the most important species, and that the inventories estimated for 1956-58 averaged approximately 14.2 million head, the figure for 1958 being 14.5 million. While this repre-sented a 6 per cent increase over the preceding three-year period, estimates for the latter show that cattle inventories were then 2 per cent smaller than in 1950-52. Observation of inventory changes year by year leads to the conclusion that the downward movement took place in 1951-54, and that 1955 witnessed the beginning of a recovery, thanks to which the peak level recorded in previous years (13.9 million in 1950) had already been regained by 1956. The causes of the liquidation of stocks and the decline in the cattle population in 1951-54 would seem to have included the political unrest which characterized that period—and which was accompanied by mass cattle stealing and abandonment of herds—the incidence of foot-and-mouth disease, excessive slaughter of cows fit for reproduction and the partial displacement of criollo stock by zebu cattle.
From 1955 onwards, cattle inventories began to follow a normal upward trend; between 1954 and 1958 the nume-rical increment would appear to have been 1.2 million head, and the average annual rate of increase 1.4 per cent. Nevertheless, this recent rate of growth is not rapid
the 12.5 per cent slaughter rate registered in 1956-58 would have to be raised to 14 per cent by 1970. In the case of pigs, production increments would have to be promoted mainly by means of a higher rate of slaughter.
RESOURCES
enough in relation to that of the population (2.3 per cent), and falls far short of the expansion of cattle farming achieved in other countries and even, in earlier periods, in Colombia itself. The increment in inventories —moderate in any case—resulted from the retention of more cows for breeding purposes, for which purpose the proportion of female animals slaughtered was reduced, fluctuating between 34 and 37 per cent in 1954-56, whereas from 1950 to 1953 it had averaged 42 per cent.
To judge from estimates based on the livestock sample surveys carried out by the National Administrative Department of Statistics (Departamento Administrativo Nacional de Estadística—DANE) and from other studies, the present composition of the cattle population, by sex and age, is probably as shown in table 10.
Table 10 Colombia: Composition of cattle population
Age or status of cattle Thousand head Percentage
Bulls Under 1 year 1 , 3 3 0 9 .17 From 1 to 2 years 1 ,163 8 . 0 2
Over 2 years 3 , 2 3 0 2 2 . 2 8
5,723 39.47
Cows Under 1 year 1 ,347 9 . 0 9
From 1 to 2 years 1,173 8 . 0 9 1 ,114 7 .68
Milk cows 2 , 6 6 9 18.41 1 ,862 12 .84
Old cows for fattening 6 1 2 4 . 2 2
TOTAL 8,777 60.53
GRAND TOTAL 1 4 , 5 0 0 100 .00
Sources: Estimates based on the agricultural samples taken by the National Administrative Department of Statistics (Departamento Administrativo Nacional de Estadística — DANE).
The data given in table 10 reveal the existence of a large proportion of male animals, especially in the group over 2 years of age, the reason being that the fattening and slaughter of young bulls usually takes place at 3 years of age and later. A high proportion of dry cows, without calves, can also be noted, which might be reduced in favour of the milk cow group. To achieve this, the number of stud bulls would have to be increased and the serving of the cows supervised and regulated; measures aimed at raising the natality index—such as the control of diseases and disorders affecting fertility—would need
COLOMBIA: I I . AVAILABLE RESOURCES 13
to be adopted; and an expanded artificial insemination service in certain stock farms would have to be established.
The following is an estimated percentage break-down of livestock species other than cattle, by age groups:
Pigs Under 6 months 52 6 months and over 48
Sheep Under 1 year 33 1 year and over 67
Goats Under 1 year 41 1 year and over 59
On sheep farms, the production of wool is more impor-tant than that of meat, with the result that every endeavour is made to keep the animals as long as possible. Hence the preponderance of sheep over 1 year of age. In addition, mortality is high among lambs.
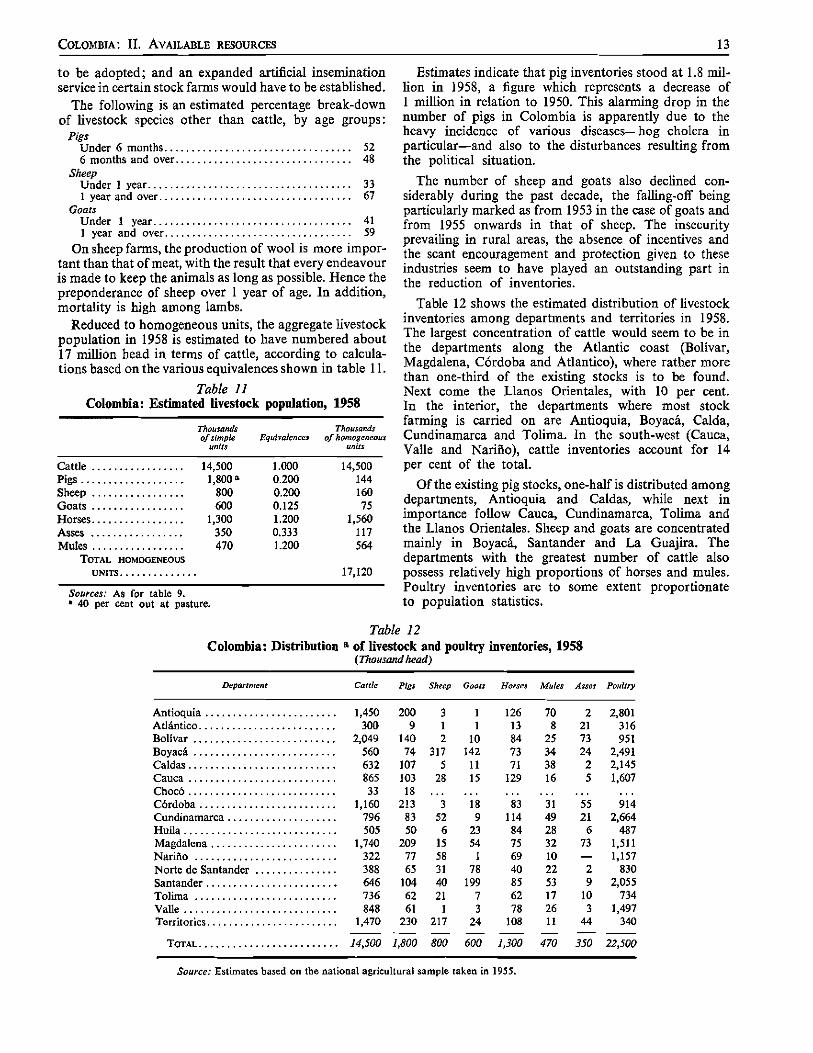
Reduced to homogeneous units, the aggregate livestock population in 1958 is estimated to have numbered about 17 million head in terms of cattle, according to calcula-tions based on the various equivalences shown in table 11.
Table 11 Colombia: Estimated livestock population, 1958
Thousands of simple
units Equivalences
Thousands of homogeneous
units
Cattle 14,500 1.000 14,500 Pigs 1,800 a 0.200 144 Sheep 800 0.200 160 Goats 600 0.125 75 Horses 1,300 1.200 1,560 Asses 350 0.333 117 Mules 470 1.200 564
TOTAL HOMOGENEOUS UNITS 17,120
Sources: As for table 9. ' 40 per cent out at pasture.
Estimates indicate that pig inventories stood at 1.8 mil-lion in 1958, a figure which represents a decrease of 1 million in relation to 1950. This alarming drop in the number of pigs in Colombia is apparently due to the heavy incidence of various diseases—hog cholera in particular—and also to the disturbances resulting from the political situation.
The number of sheep and goats also declined con-siderably during the past decade, the falling-off being particularly marked as from 1953 in the case of goats and from 1955 onwards in that of sheep. The insecurity prevailing in rural areas, the absence of incentives and the scant encouragement and protection given to these industries seem to have played an outstanding part in the reduction of inventories.
Table 12 shows the estimated distribution of livestock inventories among departments and territories in 1958. The largest concentration of cattle would seem to be in the departments along the Atlantic coast (Bolivar, Magdalena, Córdoba and Atlántico), where rather more than one-third of the existing stocks is to be found. Next come the Llanos Orientales, with 10 per cent. In the interior, the departments where most stock farming is carried on are Antioquia, Boyacá, Calda, Cundinamarca and Tolima. In the south-west (Cauca, Valle and Nariño), cattle inventories account for 14 per cent of the total.
Of the existing pig stocks, one-half is distributed among departments, Antioquia and Caldas, while next in importance follow Cauca, Cundinamarca, Tolima and the Llanos Orientales. Sheep and goats are concentrated mainly in Boyacá, Santander and La Guajira. The departments with the greatest number of cattle also possess relatively high proportions of horses and mules. Poultry inventories are to some extent proportionate to population statistics.
Table 12 Colombia: Distribution a of livestock and poultry inventories, 1958
(Thousand head)
Department Cattle Pigs Sheep Goats Horses Mutes Asses Poultry
Antioquia 1,450 Atlántico 300 Bolivar 2,049 Boyacá 560 Caldas 632 Cauca 865 Chocó 33 Córdoba 1,160 Cundinamarca 796 Huila 505 Magdalena 1,740 Nariño 322 Norte de Santander 388 Santander 646 Tolima 736 Valle 848 Territories 1,470
TOTAL 14,500
200 3 1 126 70 2 2,801 9 1 1 13 8 21 316
140 2 10 84 25 73 951 74 317 142 73 34 24 2,491
107 5 11 71 38 2 2,145 103 28 15 129 16 5 1,607 18 • . * . . • . . • . . . • . . . . .
213 3 18 83 31 55 914 83 52 9 114 49 21 2,664 50 6 23 84 28 6 487
209 15 54 75 32 73 1,511 77 58 1 69 10 — 1,157 65 31 78 40 22 2 830
104 40 199 85 53 9 2,055 62 21 7 62 17 10 734 61 1 3 78 26 3 1,497
230 217 24 108 11 44 340
1,800 800 600 1,300 470 350 22,500
Source: Estimates based on the national agricultural sample taken in 1955.

14 LIVESTOCK IN LATIN AMERICA
2. AREA USED FOR STOCK FARMING
The area used for stock farming and grazing totals about 30 million hectares, of which one-third consists of artificial pastures and the rest of grasslands and
stubblefields. The largest proportion is represented by seasonal natural pastures with very low carrying capacity, like those of the Llanos Orientales, where an average of 6 hectares and more is required for the maintenance of one animal (see table 13 and figure III.)
Table 13 Colombia: Area used for stock farming, 1958
(Thousands of hectares)
Departments Other territories Total
A. Stock farming area Perennial artificial pastures Perennial natural pastures Seasonal natural pastures Stubblefields Chaff, husks, etc., from farms crops
TOTAL
Inventories (homogeneous units) Density (number of head per hectare) Hectares per head
B. Area producing forage a
Equivalences
Perennial artificial pastures 0.545 Perennial natural pastures 0.250 Seasonal natural pastures 0.105 Stubblefields 0.200 Chaff, husks, etc. from farm crops 0.250
TOTAL
Inventories (homogeneous units)0
Density (homogeneous units per hectare producing forage)
Hectares per head
9,900 100 10,000 4,800 200 5,000 4,900 7,100 12,000 2,500 500 3,000
200 — 200
22,200 7,900 30,200 15,864 1,256 17,120
0.71 0.16 0.57 1.40 6.40 1.76
5,360 40 5,400 1,200 50 1,250
833 426 1,259 500 100 600
50 — 50
7,943 616 8,559 15,864 1,256 17,120
1.99 2.04 2.00 0.50 0.49 0.50
Sources: Estimates based on data supplied by tl B In terms of first-category perennial artificial p¡ b The unit 1.00 is taken as equivalent to 2 head
producing forage. 0 Including sheep, pigs and goats.
In homogeneous terms, and on the basis of the equi-valences given in table 9, Colombia's grazing and fodder crop area would seem to represent 13.7 million hectares of artificial pastures, over 90 per cent in the departments and the rest in " national territories ". Again in terms of homogeneous units, if horses, asses and mules are included in livestock inventories, the mean density of the animal population may be estimated at 1.25 head per hectare of artificial pasture, which means that 0.8 hec-tares are used to maintain 1 head of cattle. Obviously, even in a much smaller farming area forage capacity could be increased through the partial and progressive substitution of artificial for natural pastures and by means of more efficient pasture management.
3. STOCK FARMING ZONES AND THEIR ECOLOGY
Farms in Colombia vary widely in their characteristics and with regard to climatological, topographical and soil-category conditions. The structure of production and the quantity and quality of the resources used in stock farming are largely determined by these factors, especially climate. Colombian livestock production is
National Administrative Department of Statistics, ures. pressed in terms of homogeneous units per hectare
established mainly in three climatic zones—cold, subtropical and tropical. The first of these is considered particularly suitable and propitious to intensive farming on the basis of improved breeds, while the other two present certain unfavourable environmental conditions which constitute an obstacle to more intensive pro-duction.
(a) Stock farming in the cold zone The so-called cold zone lies at over 2,000 metres
above sea level and the temperatures registered fall below 18°C. Although the livestock area is much smaller than in the other two zones, its climate, topography and pasturage are particularly auspicious for farming based on specialized foreign breeds, above all those of the dairy and two-purpose type. On the Bogotá savannah, in the valleys of Ubaté, Simijaca and Chiquinquirá and in other cold areas in Boyocá, Antioquia, Nariño, Cauca, Valle and Tolima are concentrated the principal dairy farms, many of which are properly organized and can boast of high levels of production. Even so there is still plenty of room for improvement in yields and milk production in these parts of the country.

COLOMBIA: I I I . CHARACTERISTICS OF PRODUCTION 1 5
Figure III Colombia: Area used for stock farming, 1958
NATURAL SCALE
3 0
2 5
20
15
10
, Y Y Y Y Y Y Y . ^ Y Y Y Y Y Y ^ Y Y Y Y Y Y Y R Y Y Y Y Y Y Y Y Y Y Y Y Y ' Y Y Y Y Y Y H Y Y Y Y Y Y YJ
^ Y Y Y Y Y Y Y Y Y Y Y Y Y Y C Y Y Y Y Y Y 1 Y Y Y Y Y Y Y
Y Y Y Y Y Y Y Y Y Y Y Y Y
Í Y Y Y Y * Y I Y Y Y Y Y Y Y W Y V Y V Y w Vw VVvv Vvv» V Vvw Vvv VvwvV Vv v VvvvVVvv VvwV Vvw Vw W v Vvw w Vvv Vvw VwVv vVVv VVvv Vwv Vv vv VVvv Vwv Vwv vVvWvwV v vV vv VvVvwVvvVvvV v v Vv VwvVVvwW
vVvvVv Vwv Vvv v Vvv WvvVvvv V v» W v W v v Vvv VVvvVvwvVw V
V w Vw Viirvv Vv V v W v Vvv Vw V v Vvw Vwv VVvv V
H W K » ii ii un ii H i ii i ii ni ir ii i n ii ir ni ir ii i J i ii in H ii M HI i l hi in ll Vil I I I " I N " I N II " n r M ' I I I '
ARTIFICIAL PASTURES (lOmill ion hectares = 33 .3 percent)
PERENNIAL NATURAL P A S T U R E S ( Smi l l i on hectares = 16.6 per cent)
S E A S O N A L NATURAL P A S T U R E S (12 million hectares = 4 0 . 0 per cent)
S T U B B L E . ( 3 million hectares = 10.0 per cent)
(b) Stock farming in the subtropical zone The subtropical zone is situated at an altitude of
1,000 to 2,000 metres on the spurs of the mountain ranges that cut through the departments of Antioquia, Caldas, Cundinamarca, Santander, Boyacá, Cauca and Tolima. Among the factors limiting livestock development in this zone are its broken topography and the depletion of soil fertility as a result of continuous erosion, together with temperatures ranging from 18° to 23°C, and condu-cive to the existence and spread of a wide variety of pathogenous agents that cause serious livestock losses. It is here that the outlook for the economic farming of
selected foreign breeds is least promising. Nevertheless, since the livestock activities of this zone are combined with coffee growing and situated in the most densely populated parts of the country, the need for their main-tenance and protection is imperative. Moreover, soil utilization and conservation will necessarily afford increasing guaranteees to livestock development in Colombia's subtropical areas.
(c) Stock farming in the tropical zone The tropical zone is the most extensive of those where
stock farming is carried on and the one with the biggest animal inventories. Broadly speaking, it is characterized by extensive farming on flat or slightly undulating pasture-land, at a height of less than 1,000 metres above sea level, and in temperatures exceeding 23°C. Rainfall and soil fertility are extremely variable. The most important stock farming centres are in the Atlantic coast departments — especially Córdoba, Bolívar and Magdalena—and in the Llanos Orientales. Although the torrid zone does contain examples of technically and economically organized dairy farms, the tropical conditions prevailing are unfavourable to high-quality breeds of dairy cattle. On the other hand, predominant in this zone are the breeding and fattening of criollo and mestizo beef cattle, more readily adaptable to the rigours of the climate. Livestock yields and productivity in the Colombian tropics differ widely, ranging from minimal levels (among the half-wild cattle of the Llanos Orientales) to others that are very high (in many farms situated in the fertile lowlands along the Rivers Magdalena, Sinú, San Jorge and Cauca).
It is stock farming in the tropical zone that offers the best development prospects, not only because its produc-tivity can be substantially increased, but also because in the parts of the country concerned there are vast potential farming areas especially suitable for meat production. Such is the case, for example, in the depart-ments of Magdalena, Córdoba, Bolívar, Santander, Boya-cá and Cundinamarca, where it is calculated that about 5 million more hectares could be sown to pasture without detriment to forest reserves.15
See The economic development of Colombia, p. 168.
HI. CHARACTERISTICS OF PRODUCTION 1. BREEDS OF LIVESTOCK AND THEIR DISTRIBUTION
(a) Composition by breeds and types of livestock A great variety of breeds and types of livestock, both
native and of foreign origin, is found in Colombia. However, the predominance of criollo breeds is clearly evident in the different branches of stock farming, especially in the farmlands of the subtropical and torrid zones, where climatic factors peculiar to the tropics have manifestly retarded the process of adaptation of breeds imported from countries with a seasonal climate. It may be asserted that, with the exception of dairy herds in the temperate zone and some few dairy farms in the tropics, animal stocks are constituted mainly by native breeds of Iberian origin and, in a lesser proportion, by
mestizos and hybrids with widely varying characteristics. The criollo breeds offer the insuperable advantage of being very well adapted to the unfavourable conditions prevailing as regards climate, feeds and management. However, although many of them have qualities conducive to economic production, their yields are low because of the unsatisfactory conditions in which they are kept and the sluggishness of efforts at their selective improvement. For economic reasons—particularly factors linked to the demand for beef cattle—and as a result of the technical progress achieved in the breeding of improved types for the tropics, the criollo cattle breeds are being rapidly superseded by the zebu and the products of its hybridization. The participation of other high-yielding tropical breeds, like the Santa Gertrudis, although
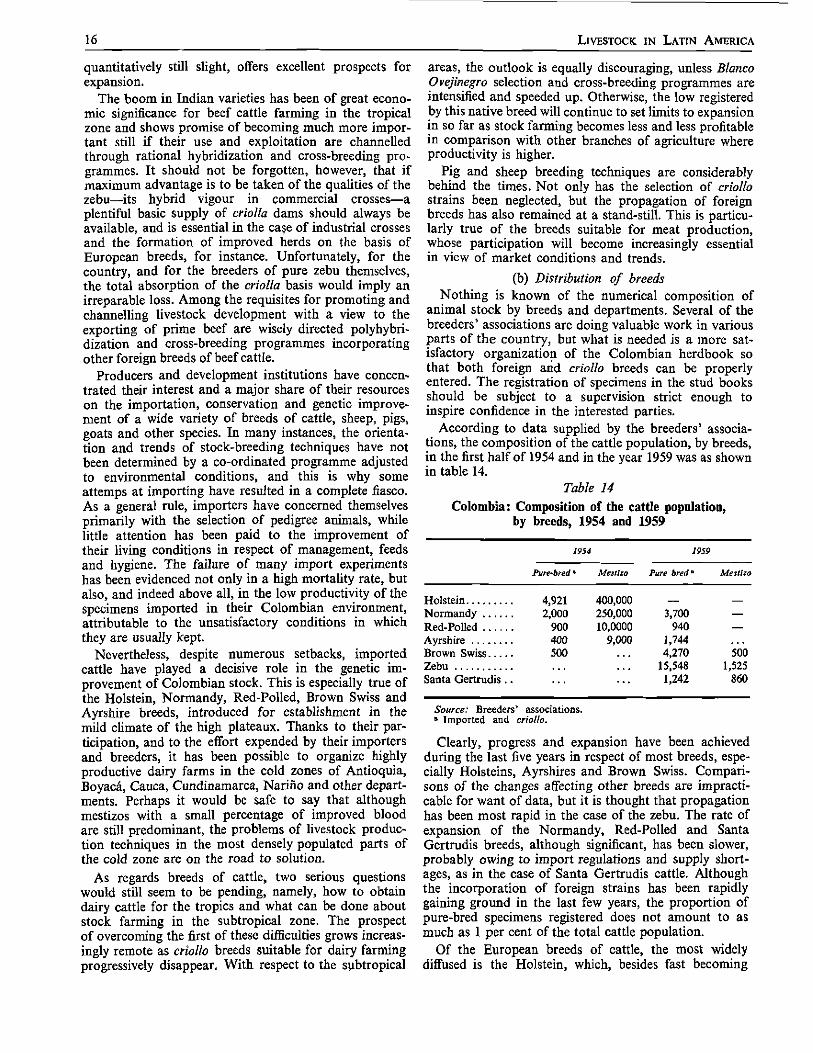
16 LIVESTOCK IN LATIN AMERICA
quantitatively still slight, offers excellent prospects for expansion.
The boom in Indian varieties has been of great econo-mic significance for beef cattle farming in the tropical zone and shows promise of becoming much more impor-tant still if their use and exploitation are channelled through rational hybridization and cross-breeding pro-grammes. It should not be forgotten, however, that if maximum advantage is to be taken of the qualities of the zebu—its hybrid vigour in commercial crosses—a plentiful basic supply of criolla dams should always be available, and is essential in the case of industrial crosses and the formation of improved herds on the basis of European breeds, for instance. Unfortunately, for the country, and for the breeders of pure zebu themselves, the total absorption of the criolla basis would imply an irreparable loss. Among the requisites for promoting and channelling livestock development with a view to the exporting of prime beef are wisely directed polyhybri-dization and cross-breeding programmes incorporating other foreign breeds of beef cattle.
Producers and development institutions have concen-trated their interest and a major share of their resources on the importation, conservation and genetic improve-ment of a wide variety of breeds of cattle, sheep, pigs, goats and other species. In many instances, the orienta-tion and trends of stock-breeding techniques have not been determined by a co-ordinated programme adjusted to environmental conditions, and this is why some attemps at importing have resulted in a complete fiasco. As a general rule, importers have concerned themselves primarily with the selection of pedigree animals, while little attention has been paid to the improvement of their living conditions in respect of management, feeds and hygiene. The failure of many import experiments has been evidenced not only in a high mortality rate, but also, and indeed above all, in the low productivity of the specimens imported in their Colombian environment, attributable to the unsatisfactory conditions in which they are usually kept.
Nevertheless, despite numerous setbacks, imported cattle have played a decisive role in the genetic im-provement of Colombian stock. This is especially true of the Holstein, Normandy, Red-Polled, Brown Swiss and Ayrshire breeds, introduced for establishment in the mild climate of the high plateaux. Thanks to their par-ticipation, and to the effort expended by their importers and breeders, it has been possible to organize highly productive dairy farms in the cold zones of Antioquia, Boyacá, Cauca, Cundinamarca, Nariño and other depart-ments. Perhaps it would be safe to say that although mestizos with a small percentage of improved blood are still predominant, the problems of livestock produc-tion techniques in the most densely populated parts of the cold zone are on the road to solution.
As regards breeds of cattle, two serious questions would still seem to be pending, namely, how to obtain dairy cattle for the tropics and what can be done about stock farming in the subtropical zone. The prospect of overcoming the first of these difficulties grows increas-ingly remote as criollo breeds suitable for dairy farming progressively disappear. With respect to the subtropical
areas, the outlook is equally discouraging, unless Blanco Ovejinegro selection and cross-breeding programmes are intensified and speeded up. Otherwise, the low registered by this native breed will continue to set limits to expansion in so far as stock farming becomes less and less profitable in comparison with other branches of agriculture where productivity is higher.
Pig and sheep breeding techniques are considerably behind the times. Not only has the selection of criollo strains been neglected, but the propagation of foreign breeds has also remained at a stand-still. This is particu-larly true of the breeds suitable for meat production, whose participation will become increasingly essential in view of market conditions and trends.
(b) Distribution of breeds Nothing is known of the numerical composition of
animal stock by breeds and departments. Several of the breeders' associations are doing valuable work in various parts of the country, but what is needed is a more sat-isfactory organization of the Colombian herdbook so that both foreign and criollo breeds can be properly entered. The registration of specimens in the stud books should be subject to a supervision strict enough to inspire confidence in the interested parties.
According to data supplied by the breeders' associa-tions, the composition of the cattle population, by breeds, in the first half of 1954 and in the year 1959 was as shown in table 14.
Table 14 Colombia: Composition of the cattle population,
by breeds, 1954 and 1959
¡954 1959
Pure-bred » Mestizo Pure bred a Mestizo
4,921 400,000 _ Normandy 2,000 250,000 3,700 —
Red-Polled 900 10,0000 940 —
400 9,000 1,744 Brown Swiss 500 4,270 500 Zebu , . . . . . 15,548 1,525 Santa Gertrudis . . . . . 1,242 860
Source: Breeders' associations. a Imported and criollo.
Clearly, progress and expansion have been achieved during the last five years in respect of most breeds, espe-cially Holsteins, Ayrshires and Brown Swiss. Compari-sons of the changes affecting other breeds are impracti-cable for want of data, but it is thought that propagation has been most rapid in the case of the zebu. The rate of expansion of the Normandy, Red-Polled and Santa Gertrudis breeds, although significant, has been slower, probably owing to import regulations and supply short-ages, as in the case of Santa Gertrudis cattle. Although the incorporation of foreign strains has been rapidly gaining ground in the last few years, the proportion of pure-bred specimens registered does not amount to as much as 1 per cent of the total cattle population.
Of the European breeds of cattle, the most widely diffused is the Holstein, which, besides fast becoming

COLOMBIA: I I I . CHARACTERISTICS OF PRODUCTION 17
increasingly common in the cold zones of Antioquia, Boyacá, Cundinamarca, Nariño, etc., has also yielded satisfactory results in parts of the country which were formerly considered unsuitable — the Cauca Valley, for example—thanks to the improvement achieved in envi-ronmental conditions and management practices. The Normandy breed is another that has been extensively propagated in the cold zones (although this applies not so much to pure-bred specimens and those with a high per-centage of improved blood as to animals with a Normandy strain); moreover, it was the first improved European breed to be imported into Colombia. The Red-Polled breed is gaining ground in Cundinamarca, Nariño, Cauca, Valle, Huila, etc., and seems highly suitable not only for rearing as a two-purpose pure breed, but also for sporadic crossing with native and zebu cattle. The propagation of the Brown Swiss breed during the last 15 years has been remarkable, especially in Cundina-marca, Valle, Norte de Santander, Boyacá, Caldas y Bolívar. This breed is regarded as a promising basis for dairy farming in tropical climates. Ayrshires have spread considerably in Antioquia where they have given evi-dence of ready adaptability and high yields. The Santa Gertrudis is found in Tolima, Córdoba, Bolívar and other departments. Although stocks of this breed in Colombia are small, owing to the difficulties of purchasing it in the United States, it is very popular for the production of prime beef—and even milk in the case of certain crosses —in hot climates. As has already been pointed out, the zebu has spread and multiplied at such bewildering speed that at the present time there is no part of Colom-bia's tropical zone where it is not met with, at least in cross-breeds.
Sheep stocks can probably be broken down by breeds as follows: criollo breeds of Spanish origin, with slight admixtures of foreign blood, 40 per cent; crosses with Suffolk (blackface) sheep, 30 per cent; the criollo La Gua-jira breed, 15 per cent; crosses with other breeds (Romney, Merino, etc.), 12 per cent; and African sheep, 3 per cent.
As regards pigs, the criollo type predominates in all departments, especially the Zungo Costeño, the Congo Santandereano, the Casco de Mula, the San Pedreño and the Cara de Palo, which lend themselves in greater or lesser degree to the production of fats, two-purpose farming, or meat production. Next in numerical impor-tance come the crosses with foreign breeds and, lastly, small nuclei of mestizos with a high percentage of im-proved blood and pure specimens of imported breeds, such as the Duroc Jersey, Poland China, Berkshire, Tamm-worth and Chester White.
2. LIVESTOCK PRODUCTION In 1956-59, the average annual value of livestock pro-
duction amounted to 2,665 millions pesos,16 including slaughter and export, inventory changes and the produc-tion of milk, eggs and wool. During the last ten years the development of livestock production has lagged far behind the growth of the population, with the resultant reduction of food supplies, since imports of livestock are virtually non-existent. Thus, in 1956-58, production was 16 per cent higher than in the three-year period 1947-49;
16 Measured in terms of prices received by the producer in 1958.
as the population increased between these two periods by almost 22 per cent, per capita production decreased by 6 per cent. It is important to note that the basic causes of the stagnation and decline of production were the liquidation of animal stocks and the falling-off in stock farming activities (see table 15 and figure IV).
Table 15 Colombia: Value of total and per capita livestock
and poultry production, 1947-58 (Thousands of pesos at 1958 prices)
Year
Livestock total» Per capita
Year Value Index Value Index
1947 2,276,260.0 98.7 214.6 100.9 1948 2,307,499.0 100.0 212.8 100.0 1949 2,337,102.0 101.3 210.8 99.1 1947-49 2,306,933.6 100.0 212.7 100.0 1950 2,400,800.0 104.1 211.8 99.6 1951 2,059,410.0 89.3 177.7 83.5 1952 2,088,530.0 90.5 176.3 82.9 1950-52 2,182,910.3 94.6 188.3 88.5 1953 2,053,921.0 89.0 169.6 79.7 1954 2,072,582.0 89.8 167.4 78.7 1955 2,387,042.0 103.5 188.6 88.7 1953-55 2,171,181.6 94.1 175.3 82.4 1956 2,562,132.0 111.1 198.0 93.1 1957 2,710,375.0 117.5 204.9 96.3 1958 2,722,200.0 118.0 201.3 94.6 1956-58 2,664,902.3 115.5 201.4 94.7
Source: ECLA/FAO, on the basis of official statistics. • Cattle, pigs, sheep, goats and poultry slaughtered, plus milk, wool
and eggs. Figure IV
Colombia: Indices of total and per capita livestock production, 1947-58
(1947—49 = 100) SEMI-LOGARITHMIC SCALE
1947 48 49 50 51 52 53 54 55 56 57 58

18 LIVESTOCK IN LATIN AMERICA
The production of livestock and poultry for consump-tion underwent substantial changes during the past 10 to 12 years. Between 1947 and 1950 it remained at a standstill, and between 1951 and 1954 it dropped sharply. As from 1956, aggregate meat and livestock production began to show signs of recovery, but although in 1957 and 1958 it expanded by about 18 per cent in relation to the 1947-48 figures, per capita production has not yet fully regained the ground lost. Its deterioration was particularly serious between 1951 and 1955. (See table 16.)
Table 16 Colombia: Value of total and per capita livestock
and meat production, 1947-58 a
(Thousands of pesos at 1958 prices)
Year or period Livestock and meat Per capita
Year or period Value Index Value Index
1947 . 1,726,500 99.1 162.7 101.0 1948 . 1,749,800 100.5 161.3 100.1 1949 . 1,748,000 100.4 157.7 98.7 1947-49 . 1,741,400 100,0 161.1 100.0 1950 . 1,803,000 103.5 159.1 98.7 1951 . 1,469,000 84.4 126.8 78.7 1952 . 1,487,600 85.4 125.6 78.0 1950-52 . 1,586,900 91.1 136.9 85.0 1953 . 1,439,700 82.7 118.9 73.8 1954 . 1,449,200 83.2 117.0 72.6 1955 . 1,753,100 100.7 138.5 86.0 1953-55 . 1,547,000 88,8 125.0 77.6 1956 . 1,932,100 111.0 149.3 92.7 1957 . 2,051,400 117.8 155.0 96.2 1958 . 2,050,600 117.8 151.6 94.1 1956-58 . 2,011,100 115.5 152.0 94.3
Source: Official registered slaughter statistics, estimates of clandestine slaughter and exports, and inventory changes.
11 Estimated value of inventory increments and of red meat.
Table 17 shows the main variations in production of the different species of livestock between the three-year periods 1947-49 and 1956-58. In 1950-52 and 1953-55 the production of cattle (for slaughter and export) declined by 13 and 18 per cent, respectively, in relation to the annual average for 1947-49. This contraction was due not only to the smaller number of cattle slaughtered in some years, but also to the fact that no increase in inventories was registered. In 1956-58, cattle production rose to 2.15 million head, which implied a 45 per cent increment with respect to the preceding three-year period. So considerable an expansion was attributable partly to a higher rate of cattle extraction—for domestic consumption and for clandestine export—and partly to the increase in the cattle population, estimated at an annual 300,000 head during recent years.
In the case of the remaining species—pigs, sheep and goats—production is represented by the number of animals slaughtered and by inventory changes, since Colombia has no foreign trade in these species, with the exception of the few imports whose purpose is to improve breeds. Pig production also underwent a relatively signi-
Table 17 Colombia: Livestock production, 1947-49 to 1956-58
(Thousands of head)
Species 1947-49 19S0-52 1953-55 1956-58
Cattle 1,774.8 1,562.4 1,479.4 2,151.3 Slaughter 1,470.5 1,555.4 1,467.4 1,774.3
Declared 1,335.0 1,414.0 1,334.0 1,613.0 Clandestine 135.5 141.4 133.4 161.3
Foreign trade balance: Imports — 1.3 — — 7.0 —
Exports + 5.6 + 7.0 + 19.0 + 77.0 Total net extraction... 1,474.8 1,562.4 1,479.4 1,851.3 Inventory changes 300.0 — — 300.0 Pigs 1,018.0 703.0 846.0 1,026.0
Slaughter a 814.0 803.0 1,004.0 1,002.0 Inventory changes . . 204.0 — 100.0 —158.0 24.0
236.1 173.3 128.5 113.4 Slaughter" 173.8 156.6 183.3 191.9 Inventory changes . . 62.3 16.7 — 54.8 — 78.5
216.3 199.8 119.5 158.6 Slaughter0 206.3 213.1 149.5 156.0 Inventory changes . . 10.0 — 13.3 — 30.0 2.6
Source: As for table 16. 0 Clandestine slaughter estimated at 30 per cent. b Clandestine slaughter estimated at 100 per cent. 0 Declared slaughter represents 8 per cent of the total.
ficant decline, although the volume of slaughter did not reflect this to any great extent, since its level was main-tained at the expense of breeding stock. During the last few years, pig production has recovered appreciably, but its level has been little higher than the average estimated for 1947-49, in which period a substantial increase in inventories was registered.
There has been a considerable falling-off in sheep and goat production in the past ten years, since slaughter of these species has been based in considerable measure in the breeding stock, thus impeding the enlargement of inventories. Slaughter of goats has dropped by about one-fourth since 1953.
Meat production, as represented both by animals slaughtered and by inventory increments, and classified by species of origin, can be studied in table 18. Beef accounts for over 80 per cent, pork for 12 per cent, poultry for 5 per cent and mutton and goat flesh for only 1 per cent. The percentage distribution given for the last period shows the most important production item is constituted by slaughter, which in the aggregate represents 89 per cent of global output. The difference is covered by inventory changes and the foreign trade balance. It may also be observed that, as a general rule, changes in meat production correspond to those noted for production expressed in terms of numbers of head. (See again table 17.) In the case of cattle, no numerical change in animal stocks was registered between 1950-52 and 1953-55, but in terms of meat, on the contrary, inventories declined because the utilizable weight of the animals slaughtered exceeded that corresponding to the number of head of cattle in some years of these two three-year periods.

COLOMBIA: I I I . CHARACTERISTICS OF PRODUCTION 19
Table 18 Colombia: Livestock and meat production, 1947-49 to 1956-58
(Thousands of tons)
Species 1947-49 1950-52 1953-55 1956-58 ^tage"'
Cattle 356.7 339.1 322.7 432.7 82.6 Slaughtering a 3 1 4 . 2 338 .1 321 .2 378 .2 7 1 . 2
Foreign trade balance 0 .7 1 .2 2 . 0 12 .3 2 .3
Inventory changes 4 1 . 8 — 0 . 2 — 0 .5 4 2 . 2 8 .1
Pigs 62.7 52.6 54.3 60.7 11.6 Slaughter" 52 .7 5 9 . 0 6 1 . 6 5 9 . 6 11 .4
Inventory changes 10 .0 — 6 . 4 — 7 .3 1.1 0 . 2
Sheep 4.0 3.4 2.2 2.4 0.5 Slaughtera 3.1 3.1 3.1 3 . 4 0 . 7
Inventory changes 0 . 8 0 .3 — 0 . 8 — 1.0 — 0 . 2
Goats 3.0 3.2 1.6 2.2 0.4 Slaughter a 2 . 9 3 . 4 2 .3 2 . 2 0 . 4
Inventory changes 0 .1 — 0 . 2 — 0 .7 —
Poultry 25.0 25.6 25.7 25.8 4.9
TOTAL 448.4 420.7 404.9 523.8 100.0
Source: Joint estimates by the Ministry of Agriculture, the Stock Farmers' Federation, the Adminis-trative Department of Programming and Technical Services, ECLA and FAO.
" Including estimated clandestine slaughter.
Since net supplies of meat for consumption are given by the volume slaughtered locally plus imports, from the basic data in table 17 and 18 they can be seen to have fluctuated during the period under analysis as shown in table 19 and figure V.
Table 19 Colombia: Net supplies of meat for consumption,
1947-49 to 1956-58 (Thousands of tons)
Figure V Colombia: Meat production, by species, 1956-58
(.Annual average in thousands of tons) NATURAL SCALE
400
350
Kind of meat 1947-49 1950-52 1953-55 1956-58 -
300 Beef 314 .5 338 .1 3 2 1 . 2 3 7 9 . 7
300 -
Pork, etc 52 .7 5 9 . 0 6 1 . 6 5 9 . 6 -
Mutton and lamb 3.1 3 .1 3 .1 3 . 4 -
Goat-flesh 2 . 9 3 . 4 2 .3 2 . 2 250 Poultry 2 5 . 0 2 5 . 6 2 5 . 7 2 5 . 8 -
TOTAL 398.2 429.2 413.9 470.7 -
Per capita (kilogrammes) 36.7 37.0 33.4 35.6 200 -
Source: See tables 16 and 18.
Thus, in 1950-52, the domestic meat supply showed an improvement of 8 per cent in relation to the preceding period, but per capita stocks remained at the same level. During the following three-year period, both total and per capita figures decreased, the latter by 3.6 kilogrammes, which meant that the annual per capita supply deteri-orated by about 10 per cent. In the most recent period (1956-58), total and per capita sypply conditions improved but at levels which were still lower than those registered in the first years covered by the analysis.
150
100
50
CATTLE
PIGS
POULTRY
SHEEP AND GOATS

20 LIVESTOCK IN LATIN AMERICA
3. LIVESTOCK YIELDS The physical productivity of the Colombian livestock
sector, like that of many other Latin American countries, is at a distinctly low level. Yields per animal are limited, as will be seen later, by a series of factors directly linked to the quality of the livestock, to nutritional deficiencies, to the incidence of disease and to unsatisfactory herd management.
Table 20 shows the relation between yields of meat, milk and other livestock commodities, per animal, and various rates of productivity and mortality are noted.
Table 20 Colombia: Livestock productivity rates and indices
Cattle Pigs Sheep Coats
Rate of extraction 13.0 56.5 21.9 26.2 Rate of production 15.2 57.9 13.0 26.6 Volume of meat per animal
slaughtered (kilogrammes) 213.3 59.5 18.0 14.1 Volume of meat per head
of stock (kilogrammes)... 30.5 34.2 2.7 3.8 Yield (kilogrammes) 500.0a . . . 1.5" Natality rate 50.0 Mortality rate 8.0 . . . 12.0 Morbidity rate 80.0
Source: ECLA/FAO, on the basis of official estimates and statistics. 4 Annual output of milk per cow in extensive stock farming. b Annual output of wool per sheep.
(a) Rates of extraction and production The rate of extraction is constituted by the proportion
of animals extracted for slaughter and export. The rate of production also includes the relative increase in inven-tories. In the case of cattle, for example, the average extraction figure in the three-year period 1956-58 was 1.85 million head17 which, if related to the average stock of cattle (14.2 million head), gives an extraction rate of 13 per cent. If the number of cattle allocated to inven-tories—estimated for the period in question at 300,000 head—is added to the number extracted for internal and external consumption, the total production figure obtained is 2.15 million head of cattle, which gives a production rate of 15 per cent. Obviously, both these rates are decidedly low and are indicative of poor yields. They are, in fact, far below those registered for stock farming in the United States, Australia and Argentina, where slaughter accounts for as much as 40, 28 and 23 per cent of inventories, respectively.
17 Average extraction (1,851,000) = declared slaughtering (1,613,000) + estimated clandestine slaughtering (161,300) + estimated clandestine exports (77,000).
A similar situation prevails with respect to other species of livestock. For pigs, the slaughter and production rates are in the neighbourhood of 57 per cent, which is only just above half the slaughter rate in the United States, where pig inventories are completely renewed from one year to the next. In Colombia, one-fifth of sheep inventories is slaughtered every year, whereas in other countries the corresponding figure easily reaches 50 per cent.
(b) Yields When reference is made to yield per animal slaughtered,
it must be borne in mind that, while the average weight of carcass meat is relatively high (200 kilogrammes and over in cattle), the yield in relation to the live weight of the animal is barely 50 per cent, as compared with 58 and 60 per cent in countries where types specially bred for the production of meat are prevalent. Meat yields per head of stock18 are low (30.5 kilogrammes),19 as a direct conse-quence of the low rate of slaughter in the case of cattle and, in that of pigs, sheep and goats, as the joint result of the poor meat yield per animal slaughtered and the low rate of slaughter.
Poultry meat averages scarcely 1.2 kilogrammes per unit, since intensive methods of fattening are practised on only a very few poultry farms. The rate of laying is approximately estimated at only 100 eggs per year.
According to estimates, milk yields per cow/year average no more than 500 litres, although in a small number of intensive dairy farms outputs of 3,000 litres per cow and over are registered.
Production of wool per head is not only slight (1.5 kilo-grammes yearly) but leaves much to be desired as regards quality and processing.
(c) Natality rates These are extremely low; the estimated average for
cattle is 50 per cent of the number of dams fit for repro-duction, in contrast with a birth rate of 80 to 90 per cent in countries where stock farming has reached an advanced stage of development. Although no information is avail-able on useful parturition rates in other species, these also are known to be very low.
(d) Mortality rates Mortality indices are extremely high for all species of
livestock, estimates indicating that 80 per cent of inven-tories are affected. Consequently, mortality rates are heavy, averaging 8 per cent in the case of cattle, 12 per cent for sheep and even higher percentages for pigs. The death rate is especially high among younger animals, reaching 20 and 30 per cent in the case of calves born on extensive farms and rangeland breeding stations.
18 Total production divided by inventories of the species concerned. 19 Argentina, 48 kilogrammes.
IV. FACTORS LIMITING PRODUCTION AND SUPPLY The causes determining the low livestock yields and
the supply difficulties encountered in respect of livestock commodities are manifold. Among the most important are the heavy incidence of animal pathologie, malnutrition, problems relating to breeding techniques, unsatisfactory farm management and, lastly, defective marketing and slaughtering systems.
1. INCIDENCE OF DISEASE In Colombia, animal pathology occasions very con-
siderable economic losses, both through the falling-off in production among the animals affected and through the high mortality rate registered. The degree of zoonosis is such that annual losses are estimated at a little over 830 million pesos, which is approximately équivalent
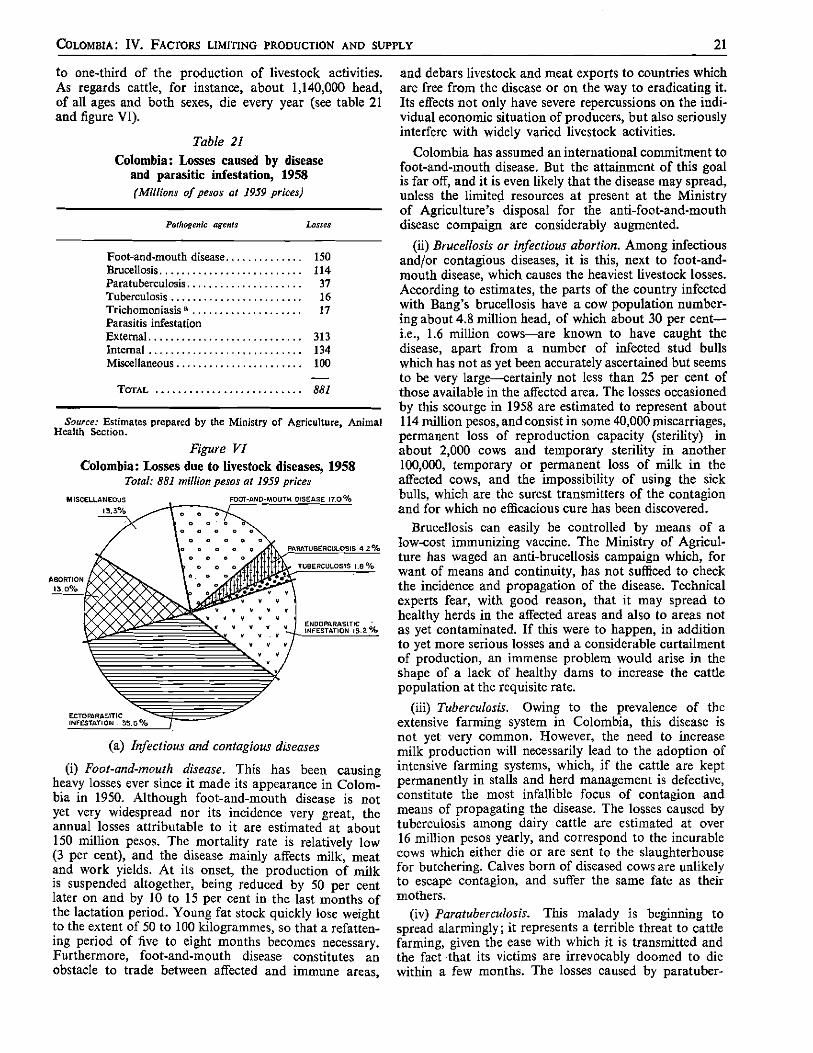
COLOMBIA: IV. FACTORS LIMITING PRODUCTION AND SUPPLY 21
to one-third of the production of livestock activities. As regards cattle, for instance, about 1,140,000 head, of all ages and both sexes, die every year (see table 21 and figure VI).
Table 21 Colombia: Losses caused by disease
and parasitic infestation, 1958 (Millions of pesos at 1959 prices)
Pathogenic agents Losses
Foot-and-mouth disease 150 Brucellosis 114 Paratuberculosis 37 Tuberculosis 16 Trichomoniasis a 17 Parasitis infestation External 313 Internal 134 Miscellaneous 100
T O T A L 881
Source: Estimates prepared by the Ministry of Agriculture, Animal Health Section.
Figure VI Colombia: Losses due to livestock diseases, 1958
Total: 881 million pesos at 1959 prices MISCELLANEOUS
13 .3% FOOT-AND-MOUTH DISEASE 17 .0%
PARATUBERCULOSIS 4 . 2 %
TUBERCULOSIS 1 . 8 %
ENDORARASITIC • INFESTATION 1 5 - 2 %
(a) Infectious and contagious diseases
(i) Foot-and-mouth disease. This has been causing heavy losses ever since it made its appearance in Colom-bia in 1950. Although foot-and-mouth disease is not yet very widespread nor its incidence very great, the annual losses attributable to it are estimated at about 150 million pesos. The mortality rate is relatively low (3 per cent), and the disease mainly affects milk, meat and work yields. At its onset, the production of milk is suspended altogether, being reduced by 50 per cent later on and by 10 to 15 per cent in the last months of the lactation period. Young fat stock quickly lose weight to the extent of 50 to 100 kilogrammes, so that a refatten-ing period of five to eight months becomes necessary. Furthermore, foot-and-mouth disease constitutes an obstacle to trade between affected and immune areas,
and debars livestock and meat exports to countries which are free from the disease or on the way to eradicating it. Its effects not only have severe repercussions on the indi-vidual economic situation of producers, but also seriously interfere with widely varied livestock activities.
Colombia has assumed an international commitment to foot-and-mouth disease. But the attainment of this goal is far off, and it is even likely that the disease may spread, unless the limited resources at present at the Ministry of Agriculture's disposal for the anti-foot-and-mouth disease compaign are considerably augmented.
(ii) Brucellosis or infectious abortion. Among infectious and/or contagious diseases, it is this, next to foot-and-mouth disease, which causes the heaviest livestock losses. According to estimates, the parts of the country infected with Bang's brucellosis have a cow population number-ing about 4.8 million head, of which about 30 per cent— i.e., 1.6 million cows—are known to have caught the disease, apart from a number of infected stud bulls which has not as yet been accurately ascertained but seems to be very large—certainly not less than 25 per cent of those available in the affected area. The losses occasioned by this scourge in 1958 are estimated to represent about 114 million pesos, and consist in some 40,000 miscarriages, permanent loss of reproduction capacity (sterility) in about 2,000 cows and temporary sterility in another 100,000, temporary or permanent loss of milk in the affected cows, and the impossibility of using the sick bulls, which are the surest transmitters of the contagion and for which no efficacious cure has been discovered.
Brucellosis can easily be controlled by means of a low-cost immunizing vaccine. The Ministry of Agricul-ture has waged an anti-brucellosis campaign which, for want of means and continuity, has not sufficed to check the incidence and propagation of the disease. Technical experts fear, with good reason, that it may spread to healthy herds in the affected areas and also to areas not as yet contaminated. If this were to happen, in addition to yet more serious losses and a considerable curtailment of production, an immense problem would arise in the shape of a lack of healthy dams to increase the cattle population at the requisite rate.
(iii) Tuberculosis. Owing to the prevalence of the extensive farming system in Colombia, this disease is not yet very common. However, the need to increase milk production will necessarily lead to the adoption of intensive farming systems, which, if the cattle are kept permanently in stalls and herd management is defective, constitute the most infallible focus of contagion and means of propagating the disease. The losses caused by tuberculosis among dairy cattle are estimated at over 16 million pesos yearly, and correspond to the incurable cows which either die or are sent to the slaughterhouse for butchering. Calves born of diseased cows are unlikely to escape contagion, and suffer the same fate as their mothers.
(iv) Paratuberculosis. This malady is beginning to spread alarmingly; it represents a terrible threat to cattle farming, given the ease with which it is transmitted and the fact that its victims are irrevocably doomed to die within a few months. The losses caused by paratuber-
22 LIVESTOCK IN LATIN AMERICA
culosis are estimated to have been 37 million pesos in 1958, and are determined by the depreciation of the sick animals, which generally reach the slaughterhouse in a wretched physical state and by the decrease in the milk output of cows which have contracted the illness.
In view of the importance acquired by these three diseases and the possibility that in the next few years they may rapidly spread, with the disastrous conse-quences indicated above, the immediate launching of an energetic and continuous campaign, primarily to control and subsequently to eradicate them, is felt to be a matter of the first necessity.
(v) Trichomoniasis. This disease, which causes mis-carriages among infected cows and often results in per-manent sterility, is beginning to spread alarmingly among foreign breeds of high-quality cattle in certain departments. Sampling carried out in selected herds has placed its incidence at 35 per cent of the number of stud bulls examined. It is usually through bulls that the conta-gion is transmitted to the cows they serve. The disease has no specific treatment, so that the sick animal must be segregated and, if it is not cured, destroyed.
Little is known of the losses attributable to trichomo-niasis. The farms where it was found to exist possessed 200 bulls, of which 70 were diseased, and the correspond-ing losses were estimated at 17 million pesos. At the present time the high-quality cattle menaced by the risk of contagion are valued at over 840 million pesos, so that it seems urgently necessary for a serious campaign to be initiated as soon as possible in order to wipe out the malady before this becomes difficult or impossible.
The anti-trichomoniasis campaign should coincide with the artificial insemination programme launched by the Ministry of Agriculture. For this purpose, it was estimated that the sum of 542,700 pesos which was available for the 1959 artificial insemination campaign should be raised to 1,468,000 in the budget for that of 1960.
(b) Parasitic diseases 20
Under this heading are catalogued the disorders pro-duced by parasitic agents, both internal and external. Losses caused by parasitic diseases are immense, being estimated at about 450 million pesos annually, of which 70 per cent represents ectoparasitic infestation.
Internal parasitosis, or endoparasitic infestation, affects all animal species, irrespective of climatic zones. Its incidence is enormous, especially among calves, either in the shape of direct action upon the infested organisms or inasmuch as it makes them an easy prey to deadly microbic infections. This situation is peculiarly aggra-vated by the inadequate or unsuitable feeds which the calves are generally given and the lack of hygienic condi-tions and medical attention while they are being reared and fattened.
External parasitosis or ectoparasitic infestation is a disease almost entirely confined to animals in the sub-tropical and tropical zones, where it affects 75 per cent
20 Data supplied by the Ministry of Agriculture, Animal Health Section.
of the stock. The chief external parasites from which Colombian cattle suffer are dermatobia, ticks, flies and horseflies. In the colder parts of the country, only lice and flies are worth mentioning.
External parasites inflict heavy losses on the national economy in various ways: by their spoliative action (as bloodsuckers), which leads to retarded development and loss of weight; through their role as vectors of such serious diseases as those caused by blood parasites (e.g., frog), which greatly raise the mortality index, especially among selected stock; and because of the imperfections occasioned in the hide of the infested animals and the consequent depreciation of its value.
If beef and dairy herds in the subtropical and tropical zones have failed to improve in quality, this is largely due to the action of parasites. Efforts to raise the standard of herds in these areas by the incorporation of highly select specimens have always been obstructed by the barrier of haematozoal diseases. Stock farmers anxious to obtain cattle which mature earlier and produce better yields therefore follow the Une of least resistance and make widespread use of the zebu, which is better equipped to withstand parasitic diseases and the germs they trans-mit.
(c) Other diseases (i) Bovine haematuria. This disease, which is very
common in hilly and recently cleared land in the sub-tropical zone, attacks only cattle, and primarily, indeed almost exclusively, cows. Its cause has not yet been clearly determined, for while some writers believe it to be produced by a filtrable virus, the majority are of the opinion that it is due to excessive acidity of the soil.
In Colombia, the geographical area subject to the disease extends all the way along the central and eastern Cordilleras, from 1,500 to 2,500 metres aboves sea level, with an incidence index of approximately 5 per cent. It is a chronic disease for which up to now no cure has been discovered and which inevitably terminates in the death of the animal from cachexy and anaemia.
If it is borne in mind that the cattle population of the subtropical zone accounts for 15 per cent of the total and that two-thirds of this proportion are cows, it can be seen that out of 1,400,000 cows the disease appa-rently attacks 5 per cent, i.e., 70,000 head, which at an average price of 500 pesos gives an annual loss of about 35 million pesos imputable to bovine heamaturia.
(ii) Paralytic rabies. Deadly, and difficult to control because of the nature of its vectors, this malady has for some time been making its appearance in Colombia among herds in specific areas such as the intendencia of La Guajira, the department of Magdalena, some municipalities in Antioquia and the San Vicente del Caguán district in Caquetá. No approximate informa-tion is available as to the number of losses caused annually by this disease, for as the areas in which it occurs are in the main remote and difficult of access, its pathology has been little studied as yet and every death which takes place is attributed to rabies. It constitutes a grave danger and inflicts enormous losses on the national economy, not

COLOMBIA: IV. FACTORS LIMITING PRODUCTION AND SUPPLY 23
only because of the resultant mortality but by reason of the huge sums that have to be expended on care of the sick animals and control of the disease.
Many animal diseases other than those mentioned above are found in Colombia, and in the aggregate cause substantial damage to livestock. Some of these are enzoo-tic, such as anthrax and Clostridium chauvoei, haemorrha-gic septicaemia, salmonellosis and colibacillosis in the case of cattle. Others, such as hog cholera, and Newcastle disease in poultry, are generally epizootic and give rise to a high rate of mortality.
(iii) Deficiency diseases. Diseases due to absence or deficiency of minerals and vitamins are directly associated with the chemical composition of soils, kinds of fodder crops and systems of feeding. They lead to death in some cases, to the diminution of milk and meat yields, etc., and to retarded growth as a result of disturbances of animal metabolism. Furthermore, the reproductive func-tions are affected, sometimes so seriously that the animals become infertile or fecundity is reduced; and this in turn greatly lowers the birth rate. Some of the most important minerals that are deficient are phosphorus, calcium and sodium among basic minerals, and manganese, iodine, iron, cobalt and other minor elements. Little attention has been devoted in Colombia to the provision of mineral compounds; nor has due importance been attached to the proportions that should be maintained between the amounts of phosphorus and calcium absorbed, a lack of balance in this respect being responsible for many cases of aphosphorosis and decalcification, which again is detrimental. Sodium chloride, so necessary for the metabolic functions, is not only usually administered in insufficient amounts, but in many cases is not supplied at all; according to estimates, the volume of salt annually consumed by livestock amounts to barely 17,500 tons, a tiny quantity if it is taken into account that the ideal figure would be 150,000 tons.
2. MALNUTRITION
(a) Fodder crops and pastures Alongside the heavy incidence of diseases and the
significant losses that they cause, another factor which limits livestock production and yields is the no less serious problem of malnutrition. With the exception of a small number of dairy herds in which the milk cows and stud bulls are given extra rations of feed concentrates, most cattle are turned out to graze on the range.
Feed resources differ in quantity and quality according to the part of the country and the kind of farm concerned. In the cold zone, for example, favourable environmental conditions facilitate the cultivation of leguminous fodder crops with a high food value, such as alfalfa and the various sorts of clover, as well as of many grasses (blue-grass, rye grass, fescue, etc.). Direct grazing is the com-mon practice, fodder crops for cutting being rarely grown.
In relative terms, livestock in the subtropical and tropical zones may be said to fare worse, partly owing to seasonal fodder shortage—especially in summer— and partly because of the poor quality of fodder crops. If the departmental stock farming areas are considered
in the aggregate, an average of 1.4 hectares is needed to maintain (not to fatten) one head of cattle, and annual meat production per hectare stands at barely 21 kilo-grammes, an exceptionally low figure in comparison with Argentina's output of 52 kilogrammes. In the intendencias and comisarías the situation is much more critical, since there are vast tracts where the animals suffer from malnutrition, especially during the rainy season and in summer. The resources available in these parts of the country usually consist in seasonal natural pas-tures of very low food value.
One of the chief criticisms that may be levelled at the livestock feeding systems prevalent in Colombia is that pastures are generally formed by a single kind of fodder crop, usually some sort of grass; the advantages of mixed pastures are almost unknown, and very little attention, or none at all, is devoted to the cultivation of leguminous plants in the tropical zone. This defect, together with unsatisfactory pasture management, con-tinuous pasturing practices and the fact that the fodder crops are allowed to grow too high and tough or pastures are over-utilized at the growing stage, reduces the pro-tein content and the volume of fodder per unit of area to very low levels. Stock farmers generally think in terms of quantities of forage, but ignore the concept of total protein yield, which in the final issue is what matters most for milk and meat production. Pasture is used at its best when the grass is kept short and tender through rotation grazing, or by means of several cuts during the growing season. Nevertheless, the continuous grazing system gives good results in rainy areas or seasons, as tender grass is then available in sufficient quantities. It should not be forgotten, however, that rotation grazing offers other advantages from the points of view of soil conservation and the control of weeds and livestock diseases.
It has already been pointed out that seasonal fodder shortages severely reduce output, especially where natural pastures are predominant, as well as in those areas where artificial pastures are available but are not properly conserved against periods of scarcity. A great deal of forage capacity is wasted during the rainy season, because surpluses are very seldom turned to account for hay and ensilage.
A common practice in subtropical zones is the cultiva-tion of a single fodder crop such as molasses grass (Melinis minutiflora), alongside a small proportion of other varieties. Fodder crops for hay and silage include imperial grass (Axonopus scoparius), but this is not very widely grown. In the low-lying and humid parts of the tropics Pará grass (Panicum barbinode) is cultivated, generally for fattening cattle, while in the less humid and dry tropical areas Guinea grass (Panicum maximum) and puntero or jaraguá (Hyparrhenia rufa) are predomi-nant. The tropical and subtropical stock farming areas of Colombia are characterized by the under-diversification of pasturage on one and the same farm; usually most of the grazing lots are formed by the same variety of artifical pasture—a grass of medium size, like puntero, or tall like Guinea grass—alongside which grow a few natural leguminous plants of high food value. Elephant grass {Pennisetum purpureum) and Guatemala grass

2 4 LIVESTOCK IN LATIN AMERICA
(Tripsacum laxum), so suitable for use as cut crops, are not very common.
Some progressive stock farmers in the tropics have interested themselves in growing leguminous fodder crops such as tropical kudzu (Pueraria phaseoloides) and velvet bean (Stizolobium deeringianum), as well as new species of grasses with a high food value and other useful quali-ties, like Pangóla grass (Digitada decumbens), a short perennial relatively rich in proteins,21 resistant to moderate flooding and to drought and capable of thriving in acid soils (up to PH 4.5) like those of the Llanos Orientales.22
The slowness of the progress achieved in pasture improve-ment and the very limited expansion of new species of fodder crops are mainly imputable to the difficulties encountered by stock farmers in obtaining improved seed.
(b) Feed concentrates As in almost all tropical areas, there is a marked
shortage of feed concentrates for livestock in Colombia. This is primarily due to the high price of grains—re-served mainly for human consumption — and to the limited supplies of the by-products of certain transforming plants and industries. Consumption of concentrates might reach a much higher level if there were no wastage of specific by-products of farms, slaughterhouses, mills, breweries, etc., which, if properly turned to account, would constitute an important source of less fibrous feeds with a high content of digestible nutrients.
One of the hindrances which has done most to retard the intensification of milk production, of other livestock industries—such as intensive cattle and pig fattening— and of poultry breeding is the extreme difficulty of obtaining supplementary feed rations in sufficient quan-tities and at reasonable prices. Mass imports of feed concentrates are not to be recommended even at compe-titive price levels, since domestic production, still in the initial stages of development, must be encouraged and protected. It would be advisable for the existing factories to do without imported raw materials as far as possible, in order not only to stimulate utilization of domestic resources but also to reduce the high production costs registered in the processing of feed concentrates. More widespread cultivation of cotton, sesame and coconuts— which are among the oleaginous crops most common in Colombia—and the organization and establishment of up-to-date cold storage plants and slaughterhouses where by-products are efficiently utilized, may, it is to be hoped, make it possible to improve the present unsatisfactory conditions in respect of the supply and distribution of supplementary feeds.
(c) Inefficient pasture management Apart from the disadvantages implied by the under-
diversification of pastures and the absence of satisfactory rotation grazing practices, little attention is devoted to the management and care of pastures, so that they often greatly deteriorate. The grass is allowed to grow so high
21 An average of 10 to 12 per cent (dry sample). 22 Point Four Programme, Servicio Técnico Agrícola Colombo-
Americano (STACA), Mejores pastos para las zonas tropicales de Colombia, Bogotá, July 1958.
and tough that its nutritive value is considerably reduced. Either weeds are not destroyed systematically, which in many cases seriously reduces carrying capacity, or the presence of poisonous plants is not controlled and investigated, which sometimes causes recurrent livestock losses. The application of fertilizers is not as yet practised even in poor soils or those whose fertility is depleted. Irrigation is utilized only in a few dairy farms. Lastly, there are seldom enough good watering-places and often no shade trees, so necessary in torrid climates. Division of the pastureland into grazing lots of suitable size is also frequently neglected, even in dairy farms which, as is common knowledge, need a considerable number of small lots to facilitate rotation grazing, rotation and pasturing of cattle by age groups or herds, etc.
3. LOW LEVEL OF IMPROVEMENT IN BREEDING TECHNIQUES
As has already been pointed out, yields are poor among most of the livestock species found on Colombian farms, owing partly to feeding and management defi-ciencies and partly to deplorable sanitary conditions and the low level of improvement in breeding techniques. Both among cattle and among pigs, sheep and goats, criollo breeds are predominant, as are also mestizos with a low percentage of improved blood, the farming of which becomes less economic or unprofitable as the value of the land increases, the mechanization of agriculture progresses and the price of current production inputs rises.
It has also been stated that the importing and rearing of improved pure breeds represents a valuable effort and a splendid contribution to the genetic improvement of Colombian livestock. Many cattle farms possess highly select nuclei of which the livestock industry in general and their owners in particular may be justly proud. Never-theless, their expansion should be expedited and, above all, they should be given the care in respect of feeding and management which they need if they are to produce yields worthy of their pedigree. Unless a change for the better takes place both in environmental conditions and in management and administration practices, the problem of breed improvement and of economic stock farming will persist in all its magnitude.
One of the crying needs of the livestock industry is the zoning of breeding techniques in accordance with the ecological conditions prevailing in each individual area, with due regard, of course, to agricultural development trends and to the characteristics and fluctuations of the market for livestock products. Official planning and guidance in the field of breeding techniques, import controls, credit distribution, artificial insemination services and breed research and extension campaigns must all form part of a co-ordinated programme for the improvement not only of foreign breeds but of the criollo nuclei whose good qualities are generally recognized. Allusion was made above to the need for improving and conserving certain indigenous nuclei, and stress was laid on the advisability of maintaining the basis of criolla dams needed for commercial crosses and for the forma-tion of new economic types by means of trihybridization. The presence of native stock thoroughly well adapted to the environment seems indispensable in certain zones where the climate is unfavourable and food resources

COLOMBIA: IV. FACTORS LIMITING PRODUCTION AND SUPPLY 25
are scanty, and where it will take decades for conditions to improve.
4. MANAGEMENT AND ADMINISTRATION PROBLEMS
The majority of the drawbacks and deficiencies con-nected with livestock production probably have their origin in the obsolete and even primitive practices which prevail in many stock farming activities. Careless feeding and management and the absence of technical adminis-tration are the factors responsible for the low productivity characterizing the Colombian livestock industry. This means that modern progress in the matter of breeds, animal diet and disease control have not been introduced into stock farming, precisely as a result of administrative defects. A detailed analysis of these problems is outside the scope of the present study, but a brief list of them and an indication of their origin will constitute implicit recommendations and will allow their relative importance to be defined.
Apart from the fact that, with the inevitable exceptions, most stock farmers are slow to adopt new techniques, absenteeism on the part of landowners tends to aggravate herd mismanagement and to intensify the managers' and herdsmen's tendency to cling to traditional routine prac-tices. This applies particularly to large farms run on over-extensive lines, on land which would be suitable for high-yielding crops and intensive stock farming.
In the course of the present study mention has been made of many of the deficiencies characterizing stock farming in Colombia and certain recommendations have been put forward. The chief defects more or less directly imputable to unsatisfactory farm management and ad-ministration are as follows:
(a) Want of salt licks, watering-places and shade trees; (b) Deterioration of pasture owing to lack of rotation,
over-utilization of carrying capacity and neglect of weed control;
(c) Undue size of grazing lots, as a result of which the grass is often allowed to grow tough and woody and herd management, classification and supervision are more difficult;
(d) Neglect of new-born calves and cows due to calve; (e) Neglect of regular application of health controls in
the shape of systematic innoculation, antiparasite baths and isolation and prompt treatment of diseased animals;
( / ) Failure to provide balanced mineral compounds; (g) Defective stud management and ignorance of
up-to-date reproduction practices. Lack of selection of sires and dams, for want of fecundation and yield records;
(A) Very limited utilization of artificial insemination services to offset the shortage of good stud bulls, speed up genetic improvement and control the incidence of such diseases as brucellosis and trichomoniasis;
(0 Unsatisfactory castration systems, defective brand-ing and general mishandling of stock.
The lack of proper farm management and organization is not evidenced in the foregoing deficiencies alone. Its unfavourable effects are also reflected in the absence of records of production and of its physical and monetary costs; in the want of programmes for more efficient
utilization of capital, land and labour resources; and in scanty and imperfect knowledge of supply and demand trends and of the market situation.
5. DEFICIENCIES IN THE MARKETING AND PROCESSING OF LIVESTOCK COMMODITIES
(a) Production and marketing In view of existing relations between livestock produc-
tion proper and trade in livestock commodities, the programming of livestock development cannot overlook the study of marketing conditions.
It must be recognized that, despite the effects or repercussions of the marketing situation on both the supply and the demand side, producers and consumers can do very little on their own account to change un-favourable conditions and express criticisms which will carry weight in the livestock commodity market. It is incumbent upon official agencies and producers' and consumers' associations to plan and co-ordinate their efforts with a view to eliminating, at least in part, the principal marketing deficiencies. It may be hoped that functions, services and organs of the marketing system will be established on a proper technical basis and consequently improve das livestock production is modern-ized and commercialized.
Certain circumstances hinder, if they do not altogether preclude, any improvement in the unsatisfactory organi-zation of the marketing system in Colombia. On the one hand, the lack of adequate means of transport and communication make the collection, transport and distri-bution of the commodities produced a slow and costly process. The most important population centres are situated in the Andean regions, whose broken topography constitutes a serious obstacle to the construction of metalled roads. Lorry services are well known to be more suitable for the transport of perishable goods—for example, foodstuffs of animal origin—because fewer loading and unloading operations are involved. But in view of the difficulty of providing good roads in sufficient number, the transport of certain products by air—fresh meat, for instance—will become more and more essential as the pressure of demand increases.
Again, certain patterns of farm tenure, such as the latifundia and minifundia systems, relatively common in stock farming, slow up the progress of marketing, intrinsically complex and costly as it is in the case of highly perishable livestock products such as meat, milk products and eggs. Livestock production on the lati-fundia is usually far behind the times and unresponsive to changes in demand orto consumer preferences. Small-scale production in fragmented farms or units is not in a position to assimilate modern advances in livestock pro-duction techniques; it produces for family consumption or for local sale in rural markets and townships where modern marketing organization is impossible. Lastly, the differences in quality and the wide variety of the goods produced make it difficult to standardize and classify them. This means that until the structure of production is altered and certain institutional changes are introduced, marketing will continue to be defective in many parts of the country. On the other hand, what can to a large extent be regulated

26 LIVESTOCK IN LATIN AMERICA
and established on a technical basis over the shorter term is the marketing of those livestock commodities which are intended for central markets and large towns.
The failure of the supply and provision of livestock commodities to react to the high demand-elasticity by which they are characterized is attributable not only to production difficulties, but also to the problems at present created by marketing systems. In response to the growth of demand and the rise in consumer prices a considerable expansion of production should be expected, just as it would be logical to assume an increase in effective demand at lower relative price levels, as modern produc-tion techniques are adopted and costs reduced. But this interaction is inoperative owing to unsatisfactory marketing conditions, lack of organization and the burden represented by marketing margins. Nor is the high cost of marketing in keeping with the services offered or the poor quality of the goods. While organized marketing would render inestimable services both to farmers and to consumers, ill-regulated marketing, slaughter and pro-cessing not only foster speculation and curb supply and demand, but also constitute a serious danger to consumers of meat and milk, because of the pathogenous agents these products may contain and because they are of so highly perishable a nature. It is these latter conditions that prevail in Colombia, as can be seen from the following paragraphs.
(b) Livestock and meat marketing The deficiencies affecting the rounding-up and trans-
port of livestock, as well as slaughter and meat distribution are manifold. The slaughterer purchases cattle for consumption purposes at small weekly cattle fairs in the local township, or directly from the farm itself, judging the weight by eye, and entirely regardless of standards of classification. In the leading towns, sale and purchase transactions are better organized, since they are conducted in market-places properly equipped with pens and weighing-machines, where the presence of a considerable number of buyers and sellers ensures more knowledge of supply and demand conditions. This is the case with the weekly cattle fairs at Medellin and Bogotá and those held at Giradot, Cartago, etc. Even there, classification systems are very rudimentary and standards of quality are far from uniform. What is more, cattle are usually brought to market in lots of widely differing types, kinds and sizes, apart from the fact that many animals reach the slaughterer's hands before the fattening process is complete.
It may safely be asserted that among the factors which do most to raise the price of meat livestock and meat itself in Colombia are the deplorable conditions in which animals are mobilized and transported from production to consumption centres. Cattle on the hoof which are driven for long days on end—from the Llanos for instance—lose up to 15 per cent of their weight, in addition to which, mortality must be taken into account. Serious losses of weight are also registered in animals taken by boat, since in some cases 15 days and more go by between the departure of the cattle from the farms, their arrival at the port of loading and their transport to the place of destination. This applies, for instance, to
young stock sent into the interior from Alto Sinú, Bolivar and Magdalena. Although lorry and rail transport cause fewer losses, they are in any event deficient and costly and the animals are badly mishandled in transit.
Monetary losses due to decrease in weight and to mortality among livestock in transit are substantial. It it is estimated that of the total number of cattle slaugh-tered in Colombia, one-third decreases in weight by 10 per cent on an average, and if the average live weight is calculated to be 400 kilogrammes per head, given a price of 2 pesos per kilogramme and a mortality rate of only 1 per cent, total losses work out at almost 50 million pesos yearly. This decrease in weight necessitates a period of refattening or additional fattening in places fairly close to the consumer centres, the cost of which also represents a loss that has to be absorbed, like the decline in weight, by the consumer, who pays more for the meat he buys.
Methods of slaughtering and slaughter-house services are extremely old-fashioned in most municipalities. Not only are the animals subjected to unnecessary suffering, but the actual slaughter and the handling of the meat are unsatisfactory. Conditions are unhygienic, and as a general rule there are no veterinary services such as are needed for proper inspection of the cattle on the hoof and of the meat itself. One of the chief drawbacks is that in Colombia there are too many small slaughter-houses where the volume of operations is not large enough to finance the equipment, constructions and services which would be required for efficient organiza-tion.
Among other serious deficiencies in the slaughter of livestock and handling of the meat, the by-products of slaughter are not efficiently utilized, and refrigeration facilities are lacking even in torrid climates where meat goes bad in a very few hours. The utilization of blood, certain kinds of offal, bones, horns, hair, etc., constitutes a valuable source of income in other countries because of the multiple uses to which these items can be put in the preparation of food concentrates, medicaments, etc., but in Colombia these possibilities seem to be completely overlooked. The value of the by-products would suffice to finance the equipment and organization of modern slaughter-houses in a reasonable length of time, and this in turn would reduce the costs burden on meat and hides, from which profits are obtained by the producer, the wholesale dealer, the slaughterer and the retailer.
It is true that there are a few modern slaughter-houses in the leading towns, but even there refrigeration is defec-tive and by-products are not efficiently utilized. It seems that very little advantage is taken of the technical progress achieved in the last few years in electric refrigeration, either for the storage and transport of meat or for that of milk, milk products and eggs, of which incalculable quantities are wasted for want of cold-storage facilities.
A frequent subject of discussion is the desirability of putting a stop to the decentralized slaughter which takes place in the small municipal slaughter-houses, and establishing abattoirs in strategic positions, whereby larger-scale operations, more efficacious organization and better services would be ensured. In many cases the solu-tion would be to equip some of the slaughter-houses

COLOMBIA: IV. FACTORS LIMITING PRODUCTION AND SUPPLY
already in existence for this purpose, and in others the establishment of new units close to certain consumer centres or in the major producer areas themselves would be justifiable.
The establishment of abattoirs or meat packing plants in the neighbourhood of livestock production centres is a matter which raises serious questions and in relation to which disastrous experiments have been made. Cases in point are the Villavicencia and Planeta Rica plants, which are well equipped and conveniently stituated, but in which activities have been severely restricted, and even suspended, sometimes owing to irregularities in the livestock supply and at other times because of difficulties in the financing of additional equipment and the expan-sion of operations. This last seems to have been the problem affecting the Planeta Rica plant. It must be pointed out that in Colombia the prejudice against refrigerated and especially frozen meat is strong, and that consumer preferences are wholly in favour of fresh meat. Hence meat has to be transported by air, a very costly service which, when meat prices are frozen at unremunerative levels, places the enterprises con-cerned at a competitive disadvantage. Apart from the fact that the great demand for fresh meat and the progress of overland transport at lower freight costs has visibly encouraged the practice of sending cattle on the hoof to slaughter-houses in the consumer centres, certain regulations and vested interests in these latter constitute an impediment to the delivery of meat from other areas.
As regards livestock and meat marketing organs, the chief difficulty lies in the endless number of middlemen, brokers, butchers, sales agents and wholesale and retail dealers. Their services are as a rule badly organized, and the inadequate regulation and lack of supervision of their activities facilitates speculation, perpetual price disequilibria and frequent supply fluctuations. This situation is largely attributable to the lack of satisfactory standard regulations for the operation of cattle markets, slaughter of livestock, transport and distribution of meat, sale to the public, price controls and many other aspects.
The retail meat trade in turn presents many problems, of which the most serious is the existence of a large number of butcher's shops or stalls where the volume of sales is insufficient to recompense the heavy cost of services and equipment, a situation which is of course reflected in very high meat prices. Furthermore, methods of butchering and classifying cuts are out of date; and the consumer often has to pay different prices for similar qualities of meat. In small towns the sale of meat is carried on in completely anti-hygienic conditions and entirely without organization, as is also the case in certain suburban areas and in the poorer districts of the large towns.
(c) Marketing of milk products The marketing of milk and milk products in general,
although not as badly organized as that of livestock and meat, is also defective. Its characteristics and chief problems are described below.
27
The following is an approximate break-down of milk production: 23
Percentage
For direct consumption, unprocessed 28.8 For direct consumption, pasteurized 17.8 Home-produced fresh milk, cheese and other items... 46.9 For the manufacture of cheese and butter 1.6 For the manufacture of different types of preserved
milk 4.9
The collection and transport of milk are unsatisfactory, especially if the product comes from small dairy farms and is intended for consumption or processing in neigh-bouring townships. Where no roads or railways exist, the milk cans or containers are transported by pack-animals and are exposed for several hours to sunlight and to continuous movement, which promotes fermen-tation. But for a few exceptions, there are no milk distribution centres for the collection, reconstitution and homogenization of the product, the reasons for which include market idiosyncrasies and certain habits of the consumers, who like the fat content of the milk to be visible in the containers.
The transport of milk to the larger towns is quicker and less defective but the use of tank wagons, lorries and refrigerated goods wagons is still far from common. Milk is often carried in Colombia for distances of 100 to 150 kilometres, and even farther, without being subjected to any kind of refrigeration except the cooling process, sometimes inadequate, which is practised immediately after milking.
Part of the adulteration which milk undergoes, by the addition of water or other substances, is usually effected while the milk is being taken to the consumer centres.
Various dairy farms produce high-quality and even certified milk, but what usually happens is that the milk distributed to the public is of a single grade or quality at standard prices. The quality of the milk sold for direct consumption is far from meeting hygienic standards, especially in the case of milk from farms where the cows are not stalled and mechanical milking is not practised, nor is there any control of certain diseases which can be transmitted to human beings. Sanitary inspection of herds covers only a very small proportion of dairy farms, and hence the regulations in force in this connexion are not complied with. Milk inspection and control in the large towns daily reveal that a substantial amount of the milk on sale is sour or adulterated or has a considerable content of bacteria, dirt and foreign bodies, owing to careless milking in byres, farmyards and pastures. It is worth while pointing out in this context that many consumers do without milk because of the unsatisfactory hygienic conditions in which it is produced.
As is well known, on leaving the farm the milk may go directly to the place of sale—as commonly happens in the case of small markets—or to pasteurization and processing plants. As a general rule, it is the producer who has to be individually responsible for the delivery of
23 Data supplied by the National Association of Milk Producers and Processers (Asociación Nacional de Productores e Industriales Lácteos — ANALAC).

28 LIVESTOCK IN LATIN AMERICA
the milk at its destination, as there are few producers' associations which fulfil marketing functions as in other countries.
In the marketing of milk and milk products middlemen do not play so great a part, as the only intermediary between producer and consumer is usually the retailer who buys from the pasteurization plant or from the manufacturers of milk products. In the case of raw milk, marketing margins are very small, since they are consti-tuted only by retail market costs, freight to the consumer centres being generally financed by the producers. What is more, the retail market offers very few services to the public both as regards distribution and in respect of handling, conservation and hygiene. The number of shops where milk is sold is very great, so that their volume of sales is extremely limited, and their services are ill-organized and subjected to very little supervision by the municipal health and food control institutions.
As regards the pasteurization plants and the factories processing the various forms of preserved milk, cheeses and butter, no complete data are available on their scale of operations, much less on their supply problems, costs structure, available equipment, financing arrange-ments, etc.
As previously noted, the proportion of milk which undergoes pasteurization is very small. Its consumption in the larger towns averages barely 50 per cent of total consumption of fluid milk.24 In most of the smaller towns, where the milk is bought raw and boiled by the consumers, pasteurization is not practised at all. It should be noted that the progress and expansion of pasteurization plants is to a large extent associated with improvement of production and milking conditions, and that the quality of much of the pasteurized milk is so poor and unreliable that consumers prefer boiling the milk themselves.
Up to mid-1959, the following were the milk processing plants and milk-product factories in existence in Colom-bia:
In Cundinamarca, the San Luis,25 Bogotá, Santa Fé, Compañía Lechera de la Sabana, San José, El Rodeo, Algarra, and Chucuita pasteurization plants, with an approximate daily distribution of 273,000 bottles in the Bogotá market. In addition, various cheese, butter and preserved milk factories, such as Industria Lechera Limitada, Alpina (condensed milk), etc.;
In Boyacá, one cheese factory (El Carmen) and the powdered milk plant at Chiquinquirá;
In Antioquia (Medellin), the Proleche, Central de Leche, San Martin and El Antojo pasteurization plants;
In Atlántico, the SILEDCO and Colechera pasteuri-zation plants (Barranquilla);
In Bolivar, the Polar and Lechería Higiénica, S.A. (LESA) pasteurizing plants (Cartagena) and Industria Lequerida Hnos.;
In Córdoba, the EPAC, for casein (Cereté);
24 In Bogotá, of a daily consumption which fluctuates between 400,000 and 500,000 bottles of 750 cubic centimetres each, 68 per cent corresponds to pasteurized milk and the rest to raw milk.
25 Also produces powdered milk.
In Caldas, ICODEL (Manizales), El Cedral (Pereira) and ILCA (Armenia);
In Valle, CICOLAC, a subsidiary of Nestlé (Bugala-grande), for the manufacture of powdered and condensed milk and special milk products, and the Salomia pas-teurization plant (Cali).
There are two milk cooling plants in Bogotá and others in Girardot, Ibagué and Cali.
Many home industries producing cheese and butter are also to be found in both urban and rural areas in various departments.
The relative marketing margin for pasteurized milk fluctuates round about 30 per cent, the producer receiving approximately 70 per cent of the price paid by the consumer.26
Fluid milk usually reaches the consumer centres and processing plants in cans or containers holding generally 40 and sometimes 20 litres and, in a few instances, in bottles holding 750 cubic centimetres. Pasteurized milk is also sold in 750-c.c. bottles; powdered milk, in packets of 40 kilogrammes for industrial uses, and in other sizes; and sweetened condensed milk in tins containing 100 and 397 grammes.27 Evaporated milk is no longer pro-duced for lack of demand.
(d) Marketing of poultry and eggs Marketing techniques for poultry and eggs display
serious defects from the stage of collection from scattered provincial sources to that of sale to the consumer in market-places and shops. Since poultry production is not industrialized and is usually undertaken as a small-scale home activity, a large number of sellers take their produce to the local market, where the middleman or dealer assembles it and transports it to the terminal markets.
The packing and transport of poultry and eggs are effected in primitive fashion, in lorries or railway goods wagons which are not specially conditioned. This is why losses due to breakage of eggs and mortality among poultry are heavy. Only a small number of industrialized poultry farms kill the birds before distributing them.
Classification of the produce is virtually non-existent, and it is sold to wholesalers, retailers and consumers, irrespective of quality and weight, in units of widely varying characteristics for which uniform prices are usually charged. Conservation and cold-storage facilities are found only in a very limited number of supermarkets and restaurants. Hence the substantial losses on account of addled and poor-quality eggs that reach the hands of the consumer.
(e) Price fixing In view of the constant fluctuations in the supply of
livestock products—largely seasonal, but attributable also to price variations resulting from cornering and the action of middlemen—the Colombian Government has
26 In November 1958, prices per bottle of milk were 39 centavos for the producer, 50 centavos at the pasteurization plant and 56 centavos for the Bogotá consumer.
27 With 8.1 per cent of fat, 55.8 per cent of carbohydrates and 8 per cent of proteins, the calorie equivalence being 337 per 100 grammes (CICOLAC).

COLOMBIA: IV. FACTORS LIMITING PRODUCTION AND SUPPLY 29
been obliged to intervene to a steadily increasing extent in markets and price levels. Unfortunately, the price control policy adopted has not been satisfactory, nor fair to the interests of producers, dealers and consumers alike; the price levels officially fixed are often arbitrary, since this delicate task is handed over to individuals with little knowledge of the matter or to agencies whose viewpoints are prejudiced and unilateral. Nor are basic data usually available either on production and marketing costs or on the structure of relative prices and substitution effects. Finally, price control takes absolutely no account of supply and demand conditions and trends, and the levels fixed are often discouraging to producers.
One of the most frequent defects is the freezing of price levels for unduly long periods, which results in maladjustments and disequilibria in relation to costs, since these are continually changing. In the case of meat, for example, the maximum price levels officially established are not favourable to the better-quality product, which in such circumstances finds itself ousted from the market in which intervention has taken place. Clearly, to encourage high-quality production and improve marketing conditions—both for meat and for milk products — the fixing of maximum prices for the best-quality products should be discontinued, or effica-cious support prices should be established.


MEXICO

E/CN.12/557 17 February 1961

INTRODUCTION AND SUMMARY
The livestock industry in Mexico plays a major role in the country's economy. The area normally devoted to stock raising amounts to nearly 70 million hectares, and about 500,000 persons are engaged in this occupation. The importance of the livestock sector in Mexico's economy is further shown by the high level of investment, which is estimated at some 80,000 million pesos (6,400 mil-lion dollars) and by the revenue in foreign currency produced by exports of cattle on the hoof and carcasses, which in the three-year period 1955-57 amounted to an annual average of about 17 million dollars. Lastly, al-though the contribution of the livestock sector to the gross national product amounts to only a third of the contribution of the agricultural sector as a whole, and represents little more than 4 per cent of the total, it is very substantial in absolute terms.1
Broadly speaking, the conditions and characteristic features of Mexico's livestock industry may be described as follows. If the livestock population is expressed in terms of a uniform unit (heavy cattle), Mexico now has some 23 million head at pasture, or in other words, the density of cattle to suitable land is approximately one animal to every four hectares.
Cattle raising is the main activity in the livestock industry and has made the greatest contribution to its development in recent years, by reason of the high rate of numerical increase, estimated at 4 per cent annually throughout the period 1950-58. The production of meat and milk has risen as a result of this rapid natural increase in the cattle population. This has had a favourable effect on the consumption of red meat, which remained stable at an average level of 17 kilogrammes per capita annually between 1952 and 1956, and rose by 17 per cent in 1957 and 1958. Much the same was true of the consumption of milk and dairy products. The situation in Mexico stands in contrast to that in some other Latin American countries, where there was a reduction in the level of consumption of these basic protective foods.
Stock farming in Mexico is decidedly of the extensive type. The breeding and rearing of cattle clearly predo-minate and the cattle fattening industry is relatively undeveloped. This situation is attributable to the limita-tions and difficulties in the supply of forage and other feed, especially in the semi-arid areas, and to the predo-minance of natural grasslands of low yield and small grazing capacity. Because of the nutritional deficiencies caused by the scarcity of forage and also because of the slow development of the animals, they are slaughtered at an advanced age, often when not fully fattened. The intensive type of cattle raising is only found on dairy farms near the large consumption centres, which usually have breeds especially adapted for production and maintain higher standards of animal care and manage-
1 4,274.5 million pesos (342 million dollars) in 1957.
ment. However, it should be added that, even on some modern dairy farms, feeding systems are still often patently backward so far as a balanced and proper diet for the animals is concerned, and there are glaring defects in breeding and production records—mainly owing to the lack of any official regulation and control.
Although in the last few years production has increased more rapidly in the livestock industry in Mexico than in other Latin American countries, the productivity indexes, which are low in themselves, show no significant increase. A few examples will illustrate this statement. The birth rate for cattle is only 55-60 per cent, and the slaughter rate only about 13 or 14 per cent. Meat yields are low for all species of livestock. The average carcass weight for cattle is 150 to 160 kilogrammes, the heaviest being carcasses of young mestizo bulls fattened in Las Huaste-cas, whose carcass weight may easily be as much as 200 kilogrammes or more. Average annual milk produc-tion per cow is only some 1,000 litres.
In addition to production difficulties and low produc-tivity there are very great shortcomings in the marketing of livestock and livestock products, and these short-comings seem to be particularly serious with respect to meat. Slaughtering is carried out in a large number of inadequately equipped municipal centres where the num-ber of animals killed is very low; this results in failure to make full use of the by-products, deterioration in the quality of meat and very unsatisfactory hygienic condi-tions. Further difficulties are created by the lack of any official technical standards for classifying livestock and meat, and by the existence of a large network of middle-men and dealers, who add to the cost of marketing and sometimes control and manipulate the supply and distri-bution of meat to suit their own ends. There is little regulation of marketing operations for livestock and livestock products to the detriment of the consumer, who at present is paying relatively very high prices, and also of the producers, whose share of the final price of meat is only 25 per cent.
Although the annual per capita consumption of meat and milk has risen appreciably in the last two years it is still undeniably low, amounting to only 20 kilogrammes of red meat and the equivalent of 81 litres of milk in all forms, figures which compare unfavourably with the much higher levels of consumption in many other Latin American countries. Although it was not possible, on the basis of the information available, to make a quantitative assessment of the income-elasticity of demand for these products, it is clear that, as in many other countries in the process of development, effective demand is heavier at the high income levels. In brief, the main reasons for the low levels of consumption are supply problems, consumer habits, high relative prices and extremely limited pur-chasing power.
33

34 LIVESTOCK IN LATIN AMERICA
The Government has announced a six-year national livestock development campaign, with the aim not only of increasing stocks for domestic consumption but also of expanding exports in view of the favourable situation with respect to world meat prices and the promising out-look in this market. Such a programme could be highly beneficial, since up to now, apart from the valuable services and campaigns of the Ministry of Agriculture and Livestock (Secretaría de Agricultura y Ganadería), the development of livestock activities has been left
almost entirely in the hands of private enterprise. This is partly attributable to the small number of specialists in animal husbandry and the economy of the livestock industry; furthermore, the present number of veterina-rians and specialists in breeding techniques is entirely inadequate, which is the main reason for the low technical level of animal husbandry in Mexico. Moreover, no studies have been made of the economy of the livestock sector, which suffers from considerable shortcomings and which is at present a virtually unexplored field.
I. LIVESTOCK POPULATION
As may be seen from table 1, the cattle population increased by 14.5 per cent between 1930 and 1940 and by 35.6 per cent between 1940 and 1950 (an annual average of 3.5 per cent). According to information from the Livestock Division (Subsecretaría de Ganadería), the increase in 1958 compared with 1950 will be 39.5 per cent
(an annual rate of 4.2 per cent). This is a high rate indeed and would normally imply optimum breeding conditions, which cannot be said to apply to Mexican livestock. It would therefore seem that recent figures for the cattle population have been optimistic, a view shared by many breeders, particularly those in the north of the country.
Table 1 Mexico: Livestock population
(Thousands of head)
1930 1940 1950 1955 1957 1958
Cattle 10,083 11,591 25,713 20,171 21,028 21,921 Sheep 3,674 4,452 5,086 6,766 7,091 7,441 Pigs 3,698 5,106 6,896 8,626 8,954 9,294 Goats 6,544 6,844 8,522 9,009 9,092 9,177
Source: The figures for 1930,1940, and 1950 were obtained from the corresponding livestock censuses; those for 1956, 1957 and 1958 are estimates by the Department of Agriculture and Livestock.
Uncertainty regarding the accuracy of the figures for the animal population, a feature common to virtually every country in the area, makes the rate of slaughter and
extraction difficult to calculate. Accordingly, these data must be considered provisional until the figures from the next crop and stock census are available.
H. PRODUCTION 1. SLAUGHTERING AND MEAT PRODUCTION
Before commenting on the figures in table 2, it should be pointed out that the data on slaughtering of heavy and light cattle vary according to the source of informa-tion. This is essentially due to discrepancies in estimates of in situ slaughtering.2 However, a steady increase in slaughtering in recent years is reported from all sources, which would seem to be in accordance with the rate of natural growth noted in the last few years.
The appreciable decline in the slaughtering of cattle and pigs in 1950 and 1951 is very probably a result of the " stamping ou t" campaigns instituted by the Govern-ment between 1947 and 1950 to eradicate foot-and-mouth disease, which entailed the destruction of over half a
Table 2 Mexico: Slaughter of main species of livestock
(Thousands of head)a
2 For 1957, the Livestock Division estimated that a total of 3.9 million head of cattle were slaughtered, whereas ECLA places this figure at 2.1 million. The figures in table 2 are a compromise, more closely reflecting actual conditions in the Mexican livestock industry.
Year Cattle Pigs Sheep Goat
1948 2,289 1,907 739 1,223 1949 2,286 1,965 1,018 1,038 1950 1,666 1,231 1,252 1,549 1951 2,148 1,019 838 876 1952 2,400 2,069 887 994 1953 2,188 2,195 938 1,428 1954 2,309 2,332 989 1,464 1955 2,255 2,383 1,040 1,501 1956 2,523 2,508 1,000 1,538 1957 3,077 2,630 1,048 1,577 1958 b 3,390 2,767 1,069 1,582
Source: Alfonso Reina C., La Industria de la Carne en México. 0 Including slaughter recorded by the Directorate-General of Statistics
slaughter for export and an estimate of slaughter in situ. " Provisional estimate.

MEXICO: I I . PRODUCTION 35
million head of cattle and nearly 480,000 pigs. This undoubtedly affected meat production.
In 1957, the cattle slaughtered in the Federal Dis-trict amounted to some 17 per cent of the total for the country, the chief source of supply being the Gulf of Mexico area, particularly from September to February.
According to the cattle population figures in table 1, the rate of slaughter was apparently 12.1 per cent in 1956,
14.6 per cent in 1957 and 15 per cent in 1958, which indicates more intensive extraction from herds. However, there seems to have been no obvious improvement in the yield of carcass meat per animal slaughtered, usually about 150 kg except for animals from the Huastecas region which are heavier because of better pastures and improved cross-breeding.3 On the basis of the data available, a weighted average of 158 kg of carcass meat and a yield of 19 kg per head of cattle were estimated for 1957-58.
Table 3 Mexico: Estimated production of carcass meat, 1948-1958 a
(Tons)
Year Cattle Pigs Sheep Goats Total
1948 343,350 95,350 10,346 15,889 464,935 1949 342,900 98,250 14,252 13,494 468,896 1950 249,900 61,550 17,528 21,686 350,664 1951 322,200 50,950 11,732 11,388 396,270 1952 360,000 103,450 12,418 13,916 489,784 1953 339,140 109,750 13,132 18,564 480,586 1954 357,895 116,600 13,846 19,032 507,373 1955 349,525 119,150 14,560 19,513 502,748 1956 391,065 125,400 14,000 19,994 550,459 1957 486,166 131,500 14,672 20,501 652,839 1958 525,450 138,350 14,966 20,566 699,332
Source: Basic data in table 2. ° Including an estimate of slaughter in situ and cold-storage plant slaughter for export but not the
meat equivalent of cattle exported on the hoof.
Figure I Mexico: Production of red meat, 1948-58
(Thousands of tons) NATURAL SCALE
700
600
500
«00
300
200
100
These yields are considerably lower than in many other Latin American countries owing to major shortages in the supply of fodder and the backwardness of cattle-fattening activities in Mexico.
Meat yields for pigs, sheep and goats are also relatively low, the averages being 50 kg, 14 kg and 13 kg of dressed meat respectively.
The meat production figures in table 3 were calculated on the basis of the estimated slaughter and average yield per animal. Analysis of the changes in total meat production during the past ten years shows that produc-tion in 1957-58 was 45 per cent higher than in 1948-49, the main increase being registered in the last two years, chiefly in the figures for beef. Beef accounted for three-quarters of total production, pork for one-fifth and goat-meat and mutton for 3 and 2 per cent respectively. This break-down was maintained virtually unchanged, except in 1950 and 1951 when the production of pork slumped, and it does not vary much from the distribution for Latin America as a whole (see also figure I).
2. PRODUCTION OF MILK AND MILK PRODUCTS
In the recent ECLA/FAO study on the role of agricul-tural commodities in a Latin American regional market,4
Mexico's total milk production was calculated at about 2 million tons for 1954-56. According to a FAO expert,5
the milk produced was used for the purposes described in table 4.
Source: Table 3. » Mutton and goat-meat.
3 Adequately fattened young steers, crossed with zebu and Brown Swiss, generally yield up to 230 kg of carcass meat.
4 E/CN. 12/499 (April 1959), p. 86. 5 F. Vieira de Sá, August 1959.

36 LIVESTOCK IN LATIN AMERICA
Table 4 Mexico: Milk production and use
(Millions of litres)
Cow's milk Goat's milk
1957 1958 1957-58
Fluid milk . . 1,785 1,844 130 For cheese 150 165 . 40 For butter 64 68 30 For evaporated milk 53 56 —
For powdered milk 42 47 —
For ice cream 25 20 For fresh cream 4 5
TOTAL 2,123 2,205 2C0
Source: Research carried out by F. Vieira de Sá, FAO expert.
According to previous figures, Mexico's total milk pro-duction is now apparently about 2.5 million tons,6
which represents a 25 per cent increase over 1954-56. It will be seen from table 4 that 84 per cent of cow's milk is used for direct consumption and only 16 per cent for the manufacture of milk products. A total of 65 per cent of goat's milk is consumed directly and the remaining 35 per cent is used for manufacturing cheese and butter. It is estimated that 42 per cent of the butter and 60 per cent of the cheese are manufactured in the same plants in which the milk is produced.
. Considering that 1,100,000 milk cows are responsible for total estimated production, the annual yield per animal amounts to some 2,218 littes. This is a relatively high figure and is explained by the fact that it relates to
plants engaged essentially in the production of milk. Since the total cow population is estimated at 6.9 million, annual output per cow apparently amounts to only 350 litres. The total goat population is estimated at 4.5 million, of which about half are milked.7 Annual produc-tion per milk goat is therefore some 90 to 100 litres.
The increase in milk production in 1958 should be attributed partly to good weather and the relative abun-dance of fodder in some areas, which is itself due to favourable rainfall during the year. It should be borne in mind, however, that the development of milk produc-tion in Mexico in recent years is partly due to the Govern-ment's milk promotion campaigns. Particular mention should be made of the artificial insemination service available in 36 official centres, from which it is hoped to obtain 40,000 head of high-grade cattle for communal (ejidal) and small farms.
Generally speaking, the Mexican dairy industry is still defective in many respects in spite of the interest shown by stock farmers and the action taken by the Government. Extensive husbandry is the rule—except in farms near the capital—and management is poor. Barns are rarely provided for cattle and little attention is given to feeding and sanitary conditions. Moreover, there is a complete lack of integrated crop and stock farming on combined farms, much needed on milk-producing ranches and ranges. Substantial imports of dairy cattle have been made under the dairy promotion programme but with disap-pointing results because of the poor handling and man-agement already mentioned.
6 The Livestock Division has estimated that production in 1918 will amount to 2.66 million tons.
' Goats of various breeds over 2 years old.
m . UTILIZATION OF RESOURCES FOR STOCK FARMING 1. AREA USED FOR STOCK FARMING
One of the chief causes of the low productivity of the Mexican livestock industry is the smallness of the area devoted to the cultivation of artificial pastures and the prevalence of natural pastures of low carrying capacity. The Livestock Division estimates artificial pastures at slightly over 1 million hectares, situated particularly in the States of Veracruz, San Luis Potosí, Hidalgo, Tamau-lipas and Tabasco. The main types are: Panicum barmi-node (Pará), Panicum maximum (Guinea), Panicetum Merkeron (Merkeron) and Panicetum purpureum (Ele-phant). Most of the remaining pasture-land is covered with natural plants—both perennial and seasonal—of little nutritional value and of low carrying capacity.
• According to table 5, the total pasture area amounts to slightly over 67 million hectares. It is estimated that 96 million hectares of land, including woodland and fallow land suitable for grazing, are used for livestock. This amounts to 4.2 hectares per unit of heavy cattle, since Mexico has approximately 23 million head of heavy cattle permanently at pasture.8 However, in the opinion
8 The ratio of sheep and goats, expressed in units of heavy cattle, is 5 to 1.
of many experts and breeders, the carrying capacity of the pastures is much lower than the average stated. According to data provided by livestock unions and other sources, actual carrying capacity varies within the limits stated in table 5. For obvious reasons it would be difficult to estimate reliable figures for carrying capacity, but the main trend of opinion seems to be that the real average for the country is slightly more than twice that suggested by the livestock density index computed on the basis of the census. There would thus seem to be either over-grazing or an excess of cattle population of varying intensity depending upon the State concerned. This is a most unfortunate situation since it leads to soil impover-ishment, reduces the supply of fodder per animal—thus hampering the process of growth and fattening—and increases the risk of animal diseases. A comparison of the data on area and number of animals shows that most of the over-grazing takes place in the central part of the country—particularly the States of Mexico, Puebla, Michoacán and Jalisco—and in the north. It should be borne in mind that the dairy farms where all or part of the animals are kept in byres, necessitating supplemen-tary feed rations and thus less pastures for grazing, are concentrated in the State of Mexico and the Federal District.

MEXICO: I I I . UTILIZATION OF RESOURCES FOR STOCK FARMING 37
Table 5 Mexico: Pasture area and carrying capacity, by States
Thousands Carrying of hectares capacity •
North Coahuila 8,282 18-50 Chihuahua 14,555 5-50 Durango 5,729 8-50 Nueva León 2,586 6-15 S. L. Potosí 2,698 1-15 Tamaulipas 1,670 1-15 Zacatecas 3,899 6-10
Gulf of Mexico Campeche 692 1-5 Quintana Roo 119 8-15 Tabasco 727 1-5 Veracruz 1,856 1-5 Yucatan 347 8-15
North Pacific Baja California 8-50 Nayarit 926 5-10 Sinaloa 1,443 5-10 Sonora 7,189 15-25
South Pacific Colima 208 4-10 Chiapas 1-5 Guerrero 2,205 5-10 Caxaca 1,420 3-10
Central Aguascalientes 268 5-10 Distrito Federal 13 5-15 Guanajuato 5-15 Hidalgo 1-15 Jalisco 4-10 Mexico. 446 5-15 Michoacán 2-10 Morelos 187 6-15 Puebla 802 6-15 Querétaro 418 6-15 Tlaxcala 78 1-15
TOTAL 67,376
Source: 1950 crop and stock census for area figures; and Alfonso Reina C., La Industria de la Carne en México, 1958.
» Hectares required per head of heavy cattle.
2. LIVESTOCK AREAS AND THEIR ECOLOGY 9
(a) Northern zone10
This zone extends over 39.4 million hectares used for livestock. The carrying capacity of the pastures varies between 6 and 50 hectares per head of full-grown cattle, with the exception of Las Huastecas, Tamaulipas and San Luis Potosí where, because of good weather and soil conditions, each hectare of natural pasture can carry two head of cattle and each hectare of artificial pasture can fatten three young steers in six months.
9 In accordance with the division of the country into " statistical-agricultural areas" by the Department of Statistics.
10 Coahuila, Chihuahua, Durango, Nuevo León, San Potosí, Tamaulipas and Zacatecas.
This vast zone is generally semi-arid, with very sparse vegetation and very poor natural pasture, which very often can be used only during and immediately after the rainy season. Except for the humid tropical region of Las Huastecas, the average temperature in most of the northern zone is 18° C,11 with annual precipitation levels ranging between 350 and 900 mm; cattle is raised here and then sent on to other regions for fattening. Cattle is sold in Nuevo Léon, Zacatecas, northern Tamaulipas and San Luis Potosí for fattening in the Las Huastecas region.
The northern zone is the most important area for raising beef cattle, having nearly 30 per cent of the coun-try's cattle population. Chihuahua is the major livestock State since it has 37 per cent of the zone's pasture area and 7.4 per cent of Mexico's cattle population. Half the country's goat population is also concentrated in the northern zone, which also has the second largest pig population (one-fifth of the total for the country as a whole).
(b) Gulf of Mexico zone 12
While the smallest in pasture area (3.7 million hectares), the Gulf of Mexico zone is the most important for the fattening of cattle. Because of the fertility of the soil, the abundant rainfall and the quality of the artificial pastures, each unit of area can carry up to three head of cattle in parts of Veracruz, Tabasco and Campeche. Veracruz, with half the pasture area in the zone and the second largest cattle and pig population in the country, is the most important livestock State in the Gulf of Mexico.
The climate is mainly dry in some areas of the Yucatán peninsula and thus the pasture-to-cattle ratio is much lower (from 8 to 15 hectares per head of full-grown cattle).
The region of Las Huastecas covers part of the States of Veracruz, Hidalgo, San Luis Potosí and Tamaulipas. The quality of its natural and artificial pasture is excellent, as is the quality of its livestock, considering the tropical conditions that prevail there. The average permanent carrying capacity is one head per hectare. This area produces some 200,000 fattened cattle per year, with a carcass meat yield of 240 to 250 kg per head; two-thirds of the output is consumed in the Federal District. Fodder in Las Huastecas is always in relatively abundant supply because the higher-altitude pastures of the " Guinea " {Panicum maximum) type are used during the rainy season and the lower pastures of the " Pará " (Panicum barminode) type can be used during the dry season, after the floods.
(c) Central zone13
This zone has a pasture area of 7.6 million hectares, with a carrying capacity of 5 to 10 hectares per head of cattle. The climate is very variable, ranging from dry with moderate precipitation to tropical with virtually
11 The temperate climate far north, where the temperature drops to 0° C in winter, constitutes an exception.
12 Campeche, Quintana Roo, Tabasco, Veracruz and Yucatán. 13 Aguascalientes, Federal District, Guanajuato, Hildago, Jalisco,
Mexico, Michoacán, Morelos, Puebla, Querétaro and Tlaxcala.

38 LIVESTOCK IN LATIN AMERICA
constant rainfall. It is the most densely populated area in the country, with the highest consumption of meat and milk. It also has the largest proportion of beef cattle — one-third of the total for the country.
Various strains of cattle are bred in this zone and most of the intensive dairy farming is carried out on its higher plateaux. Jalisco and Michoacán are the most important livestock States, with a cattle population estimated at more than 17 per cent of the total for the country. It also has the largest pig population—44 per cent of the total—raised and fattened on farms which, in the States of Guanajuato and Michoacán, sometimes have over 10,000 animals each. Half of the sheep population is in the Central zone, particularly in the States of Mexico, Puebla and Hidalgo. The goat population amounts to nearly 3 million head, or about one-third of the 1957 total estimated for the country as a whole by the Live-stock Division.
(d) North Pacific zone14
This zone is the second largest in pasture area (11.3 mil-lion hectares) but only third in cattle population because of the low pasture-to-cattle ratio which varies between 5 and 50 hectares per head of full grown cattle. However, conditions are improving noticeably in the northern areas of Baja California, Sonora and Sinaloa where irigation schemes will facilitate the intensive development cattle fattening and milk production. Pig, sheep and goat breeding is only carried out on a relatively small scale in this zone.
(e) South Pacific zone15
The pasture area here is estimated at 5.2 million hec-tares with a cattle population of 2.3 million head. The pasture-to-cattle ratio varies considerably (ranging from 1.5 to 10 hectares per head of heavy cattle). From 5 to 10 hectares per head are required in Guerrero, Oaxaca and Colima and even more in the semi-arid areas where the climate is dry. From 1 to 3 head of cattle per hectare, depending upon the condition and type of pasture, can be carried in northern Chiapas where the climate is tropical, with considerable rainfall, and the quality of the pasture is good. It ranks third after the central and northern zones in the size of the pig, sheep and goat populations, with 1.3 million, 455,000 and 883,000 head respectively.16
3. BREEDS OF CATTLE
According to the 1950 census, and assuming that there has been some genetic improvement, nearly 90 per cent of Mexican cattle was of the criollo or ordinary type. These animals have been raised from the Iberian strains introduced by the Spaniards, but they almost always show marked traits of the specialized breeds. On the other hand, since they are subjected to extensive cattle-raising practices, they display varying degrees of degene-ration, and their adjustment to their environment is
14 Baja California, Nayarit, Sinaloa and Sonora. 15 Colima, Chiapas, Guerrero and Oaxaca. 16 Estimates for 1957 by the Department of Agriculture and
Livestock.
still at a stage which is not propitious to early maturing or high yields. By far the greater part of the cattle popu-lation consists of about 20 million head of native and mestizo cattle and 1.9 million head of improved foreign strains. Of the latter, the Holstein breed is prevalent on dairy farms, the Brown Swiss and the zebu in Gulf of Mexico cattle farms and the Hereford in northern ranches.
Most of the cattle of specialized breeds are in the nor-thern zone, followed by the Central, North Pacific, Gulf of Mexico and South Pacific zones. The largest number of selected cattle of foreign breeds is to be found in the States of Chihuahua, Coahuila, Mexico, Durango, Vera-cruz and Sonora, in ascending order. Chihuahua, Jalisco, Veracruz, Sonora and Michoacán have the largest popu-lation of pure-bred bulls. In general, the ration of pure-bred to ordinary cattle is 1 to 6 for bulls and 1 to 12 for cows; cows constitute about 41 per cent of the total cattle population.
Most of the cattle are thus of native breeds, generally low in meat and milk output, but with the advantage of complete adaptation to local conditions. Accordingly they require less care and are more resistant to diseases and attacks by external parasites.
It should be noted that during the past few years the Mexican Government has encouraged the importing of breeding stock to improve both beef and dairy cattle. Thus, for instance, in the two-year period 1956-57, cattle imports sponsored by the Government amounted to 19,711 head for a total value of 5 million dollars. More than four-fifths were beef cattle breeds (Hereford, Santa Gertrudis, Brahman and Aberdeen Angus) and the remainder dairy stock (Holstein and Brown Swiss). These were all imported from the United States in accordance with the conditions applying to the Export-Import Bank loan to the Mexican Government for cattle imports.
The Government is also promoting genetic improve-ment by the practice of artificial insemination on experi-mental stock farms. Private enterprise is playing a leading role as regards breeding techniques and associations of cattle raisers and breeders of specialized strains are showing increasing interest in introducing new blood into their herds. It sould be borne in mind, however, that all these efforts to improve breeds ought to be supplemented by the establishment of breeders' associations for the more important species and the keeping of milk produc-tion records under the supervision or control of the competent section of the Department of Agriculture and Livestock. An official register for pure-bred cattle and production records would constitute a strong incentive to breeders and instil greater confidence in buyers.
4. USE OF FEED FOR LIVESTOCK
(a) Fodder Generally speaking, open-range pasture predominates
in Mexico and is practically the only way in which green fodder is supplied to livestock. The cultivation of fodder crops for cutting is not practised very widely except in intensive dairy farming, either for the purpose of obtaining additional green fodder for milk cows or for stocking as hay or silage.

MEXICO: IV . LIVESTOCK DISEASES 39
In the northern zone, green fodder is available for livestock only when grass growth is promoted by rainfall and therefore only dry fodder is given to the animals during the dry season. Conversely in the coastal areas of the Gulf of Mexico, where rainfall is plentiful, there is a permanent supply of green fodder.
Seasonal variations in the supply of fodder produce very sharp fluctuations in output volume. During the dry season, the yield of milk cows drops appreciably and the supply of fat young steers is considerably reduced. Fat cattle are in short supply between March and August, particularly in May and June. The supply becomes much more plentiful again towards the end and beginning of the year. In this connexion, technical assistance programmes and financing would be most useful as an incentive to stock farmers to follow fodder conservation practices as a general rule. Fluctuations in the number of cattle slaughtered in the Federal District coincide with seasonal variations in the fodder supply. However, they are not as severe as in some provinces because cattle-fattening is carried on permanently in the main supply centre—the Las Huastecas area.
The seasonal fodder shortage not only has an unfavour-able effect on output but also causes severe organic
ailments as a result of protein and vitamin deficiencies, encourages animal diseases and increases mortality.
(b) Food concentrates
The fodder shortage during the dry season would not be such a serious problem if food concentrates, now used only on a few farms where intensive methods are practised, were available on a much larger scale. Wider use should be made of agricultural by-products such as oil-seed, wheat-flour and cocoa shell cake, bran, molasses, etc., which are very often wasted, and also of some grains and minerals in the feeding of milk cows and young bulls in the process of being fattened. While the boom in the poultry and dairy industries has resulted in the establishment of plants manufacturing food concentrates and a sharp increase in the importing of animal feed preparations, the loss of foreign exchange17 this represents could be partly reduced if supplementary feeds were to be grown on the farms themselves. One method of achieving this is to combine crop and stock farming by means of mixed farms.
17 Amounting to approximately 10 million dollars in 1957.
IV. LIVESTOCK DISEASES
1. INFECTIOUS AND CONTAGIOUS DISEASES
The most common infectious and contagious diseases affecting livestock are anthrax, Clostridium chauvoei, septicemia haemorrhagica, brucellosis in cattle, goats and pigs, tuberculosis, paralytic rabies, infectious enteritis, hog cholera, mastitis, granular vaginitis and trichinosis.
Outbreaks of diseases of the anthrax type and septi-cemia haemorrhagica are generally sporadic because of the increasingly widespread practice of preventive vaccination, which affords a high degree of protection when applied periodically and systematically. Brucellosis (B. abortus), tuberculosis, mastitis and infectious pneumo-enteritis occur frequently in young dairy cattle. While the first three do not cause appreciable mortality, they substantially reduce milk output and calving. What is worse, they may constitute a serious threat to human health. Pneumoenteritis occurs frequently in very young calves and, together with coccidiosis and gastrointestinal and pulmonary parasites, produces a high rate of morta-lity.
The incidence of the above-mentioned diseases varies within a very wide range, depending upon sanitary conditions and controls. The mortality rate for which they are responsible, however, varies between 5 and 15 per cent in young animals and between 2 and 5 per cent in animals kept in byres and barns.
Foot-and-mouth disease, it should be noted, has been completed eradicated from Mexico, a process which involved heavy losses and a series of financial, economic and social problems. It broke out in 1946 in the State of Veracruz and spread rapidly to sixteen other States. The Government of the United States hastily sealed its borders to Mexican exports, which until then had
amounted to 500,000 head of cattle. Thanks to the efforts of the joint Mexican-United States commission for the eradication of foot-and-mouth disease and after having applied the " stamping-out" policy to 519,000 head of cattle and 472,000 pigs between March 1947 and June 1950 — nearly one million animals valued at 140 million Mexican pesos;18 the United States Government re-opened its borders to Mexican livestock and meat on 1 September 1952. The disease unfortunately reappeared in Veracruz and the border was closed again on 23 May 1953. Traffic in livestock and meat between the two countries was not renewed until the end of 1954, after the United States was satisfied that foot-and-mouth disease had been eradicated from Mexico, which is now considered completely free from the disease.
2. PARASITIC DISEASES
Parasitic diseases attack all species of animals at a very early age, their incidence and ravages being greater among young animals. Because of variations in climate and defective health control, these diseases are prevalent in all stock farming areas. According to the Health Section (Sección de Sanidad Pecuaria), of the Livestock Division, the main internal parasitic diseases are: piro-plasmosis, anaplasmosis, coccidiosis, fasciolosis, asca-riasis, strongylosis, taeniosis, filariasis, trichomoniasis and leptospirosis. The most common ectoparasites are ticks, hipoderma bovis, dermatobia hominis, mycosis and mange.
To these must be added protein, vitamin and mineral deficiencies—particularly of iodine, calcium, phosphorus,
18 Amount of compensation to which the stock farmers were entitled.
4 0 LIVESTOCK IN LATIN AMERICA
cobalt and magnesium—which retard the growth and fattening of cattle and sometimes are of a clinical nature difficult to identify etiologically and thus to combat.
3. BORDER HEALTH CONTROL
Harbour and border health regulations prohibit the entry of cattle, pigs, sheep, goats and horses from coun-tries where foot-and-mouth disease is considered to exist. These animals can only be imported from countries
free of foot-and-mouth disease subject to presentation of the relevant certificates testifying to their origin from a disease-free zone and to Bang agglutination, tuberculin, mallein, dourine, etc., tests. Direct inspection and vete-rinary examination at quarantine stations are also com-pulsory.
Most of the cattle imported into Mexico come from the United States and Canada, while sheep are also imported from Australia and New Zealand.
V. MANAGEMENT OF LIVESTOCK FARMS
The handling, organization and management of livestock and livestock enterprises are defective in many respects in the extensive farms which constitute the majority of the ranches in Mexico engaged in the breeding and fattening of cattle. The animals are kept out in the open, generally on unduly large ranges. Bulls are allowed to mingle permanently with calves, heifers and cows on farms for the breeding of non-dairy cattle, thus hampering controlled breeding. Under these conditions, sires are to a large extent wasted and cows and heifers are in calf before they are fully developed. The ratio of sires to females on this type of farm is esti-mated at one bull to 35 or more cows, whereas the best ratio under Mexican extensive farming conditions should be not more than 25 cows per bull.
Conditions for the care and handling of livestock are even worse in the semi-arid areas, where animals often have to walk long distances in search of watering-places. Cattle are not separated by type in these areas, nor is pas-ture rotation or supervision and inspection of cattle prac-tised to any extent. The handling and care of cattle are limited to gelding, branding and vaccinating, operations which are carried out only a few times a year. Obviously, the productivity of these farms is extremely low, although profitable because of the small input required.
Stock farming on common land (terrenos ejidales) is also primitive because various types of lifestock graze promiscuously on the same pastures and receive no other care. In view of the importance of stock farming on common land19 and of the innumerable problems it presents, the Mexican Government recently included common land stock farming as a new part of the agrarian reform programme aimed at the more rational develop-ment and handling of livestock and better use of pastures through rotation.
The levels of technology and management are higher on some dairy farms and cattle-fattening ranches. Because of the high price of land, particularly in areas near the large consumer centres, such as the Federal District, more intensive methods have to be applied, including the placing of cows in byres, at least during milking, when they receive extra feed in the form of forage, hay, silage or protein-rich concentrates essential
19 In 1951, the number of livestock in common land was 528,000 cattle, 337,000 sheep, 622,000 goats and 417,000 pigs. (FAO, Background Country Studies, No. 8.)
to milk production. These farms also undertake the artificial feeding of calves, controlled breeding—at times resorting to artificial insemination—and more efficient health control. They are, in fact, better organized farms and many of them own selected strains of cattle and very valuable pedigree animals. Nevertheless, according to the authoritative sources who were consulted in the course of the research on which this report is based, productivity could be doubled within a few years with the adoption of improved feeding, reproduction and disease control systems. This would in turn result in a higher yield of milk per cow, a higher calving rate and reduced mortality, which is high on farms where nursing cows are milked. In advocating improved techniques, emphasis should be placed primarily on pasture renewal and rotation because the practice has been to use pastures uninterruptedly year after year. The cultivation of pastures combining grass and legumes on small areas suitable for rotation and deferred grazing, depending on the season and type of farm concerned, should be recommended. In Mexico, as in many other countries in the area, the time-honoured practice is to overgraze in order to keep the grass short and avoid lignification. While this practice may be recommended in some cases, it may impede the normal growth of forage plants because lack of adequate rest retards the sprouting of stems and foliage and weakens them because the chlorophyll content is exhausted by over-grazing. One of the major disadvantages of permanent grazing is that the grass is not allowed to grow and therefore its carrying capacity is only one-third of what it would normally be per unit of area and time. It is thus ádvisable to manage pastures in such a way as to allow them to rest so that the grass can grow fully and thus be suitable for intensive grazing during short periods.
Another important problem, fairly common in Mexico, is the lack of livestock feed during the dry seasons. This shortage may be largely remedied by storing surplus fodder accumulated during the rainy seasons in the form of hay and by cultivating fodder crops for cutting to provide silage.
Control of internal parasites may sometimes be effected by systematic livestock rotation in order to break the growth cycle of parasites. The periodical tick-destroying bath is an easy method of promoting animal health. Other simple and cheap handling and management practices are the timely use of vaccines against local diseases and the supplying of mineral mixtures as required.

MEXICO: VI. MARKETING OF LIVESTOCK PRODUCTS 4 1
VI. MARKETING OF LIVESTOCK PRODUCTS
1. LIVESTOCK AND MEAT
In Mexico there are no fairs, special markets or auc-tions of cattle for consumption. Livestock is sold by breeders on their farms or ranches to middlemen, mer-chants, butchers, packers, supermarkets, etc. Livestock is sold by the head, and the price depends upon the degree of fattening, type of animal and estimated weight. Livestock is sold by the kilogramme or on the hoof on ranches and in slaughter-houses where scales are available.
Livestock is brought to abattoirs or slaughter-houses by rail, lorry or on foot. In some cases, the journey is difficult and takes several days, which causes the animals to lose weight; the loss sometimes amounts to 10 per cent and thus a further period of fattening is required.
It is estimated that nearly 75 per cent of the beef cattle is slaughtered in obsolete slaughter-houses, inade-quate both economically and from the point of view of health. Failure to use by-products such as blood, bones, hooves, etc., results in an annual loss estimated at 125 million pesos (10 million dollars). Many municipal slaughter-houses have no facilitities for the hygienic handling of meat, nor is there any inspection or control by veterinarians. This constitutes a serious threat to public health. These major defects can be attributed chiefly to the fact that slaughtering is usually carried out in a growing number of small municipal abattoirs where the small scale of operations does not justify the establishment of modern plants. Moreover, the municipalities usually manage the abattoirs strictly for the purposes of revenue, maintaining antiquated slaugh-tering taxes and receiving fees for the use of the abattoir.
The remaining 25 per cent of beef cattle is slaughtered and dressed in modern plants, either state-owned or private, with special facilities for the killing of animals, preservation of the meat by chilling and freezing, and the packing of meat products. The Ferreria slaughter-house in Mexico City is a state-run establishment of this type. It also has modern facilities for poultry-killing and has done much to improve conditions. Most of the meat consumed in the Federal District comes from this establishment. In order to make the fullest use of the plant's vast capacity, the Government seeks to have all slaughtering done there by levying heavy inspection taxes when meat comes from other sources. While the larger-scale operations lower costs and facilitate supplies to the Federal District, they should not be such as to force other modern plants to close down or limit their operations.20
There are about 22 meat-packing plants subject to federal inspection in Mexico, with an annual slaughter capacity of some 660,000 head of cattle. In recent years, however, they have only operated at from 20 to 25 per
20 According to information from the Mexican Farmers' Federa-tion, Empacadora de Santa Clara, S.A. had to suspend operations because the high government inspection tax compelled livestock suppliers and middlemen to send their cattle to the Ferreria slaughter-house.
cent of capacity because of current regulations on livestock exports and slaughter. Better use of these plants, which represent an investment of over 14 million dollars, would be made by increasing the export quota for packed meat under favourable conditions of external demand, by authorizing them to slaughter cattle for local consump-tion and by improving domestic production and supply conditions. It should be borne in mind that, while market conditions abroad at present favour the export of better-quality livestock on the hoof and the packing of inferior-quality meat, different and unexpected conditions might suddenly arise which would force a change in the compo-sition of exports. In short, protection of the meat-packing industry is not only justified from this point of view but also because it can play a much more important role in improving the marketing of meat.
The distribution and retail sale of meat are generally satisfactory in the Federal District and the larger towns because they are well regulated and in the hands of properly organized groups of merchants and butchers prepared to comply with the official regulations governing the transport, health inspection and sale of food. In the smaller centres and the semi-rural areas, on the other hand, meat is handled, transported and sold under conditions dangerous to public health.
One of the major marketing defects is the lack of official technical standards for the grading of livestock and meat. Again, carcasses are not properly cut into slices and pieces of different quality to suit the taste and purse of the consumer.
The technical and economic efficiency of livestock and meat marketing is, in short, low. These two aspects are not necessarily related, so that high costs are not the result of efficient service but the consequence of a dis-organized market.
As already seen, marketing practices, slaughtering and handling techniques and the scale or volume of activities in abattoirs and retail shops all contribute to high prices, independently of the quality of the services provided and of the product sold. Marketing margins and consumer prices are thus higher. There is often unnecessary dupli-cation of functions among some middlemen who are usually favourably placed to control supplies and fix prices. The same meat marketing problem exists in other Latin American countries also affected by fluctuating supplies and costs and by considerable speculation of varying origin.
It is essential, therefore, that the various marketing functions should be so organized as to stabilize costs and adjust the profits of middlemen to the services they actually perform. An adequate marketing margin would thus be established which would enable a satisfactory relationship to exist between the prices paid by the consumer and those received by the producer. Under present conditions in the Mexican meat market, the stock farmer receives only 25 per cent of the retail price, the remainder being distributed between the middlemen's profits (28 per cent), slaughtering fees and taxes (9 per

4 2 LIVESTOCK IN LATIN AMERICA
cent) and the retail butcher (38 per cent).21 This contrasts sharply with conditions in countries where livestock and meat marketing is properly organized, because the stock farmer's share of the retail price in those countries is two or three times larger.
2. MILK PRODUCTS
The marketing and processing of milk and milk pro-ducts also present a series of problems, of which the main aspects will be dealt with here.
Small producers usually deliver milk on the farm itself in containers of 20 to 30 litres to processing firms or to collecting suppliers, who transport the milk by tank truck, railway or lorry. In some cases the milk is taken to a neighbouring market by pack animals. Milk producers near the large consumer centres usually transport the milk to the consumer market or to the processing plant, and many provide bottled milk of the certified or pasteu-rized type.
During the assembling, collection and transport of milk there is wastage and loss, the latter due particularly to acid fermentation of milk and a rise in the bacterio-logical count.
In the Mexican markets, various types of liquid milk are distributed. Leche preferente is top grade, supplied by producers' associations in accordance with the provisions of, and subject to sanitary inspection by,
21 Alfonso Reina C., La industria de la carne en México, 1958.
the Ministry of Health, and destined mainly for the Federal District. Certified or pasteurized milk is regarded as second grade and is distributed by large enterprises and by co-operatives of small producers; in the Federal District and other large centres, most milk for direct consumption is of this type. In addition, reconstituted milk is distributed among the poorest sectors of the popu-lation. Lastly, there is a black market in milk that is neither pasteurized or otherwise processed and is more exposed than any other type of milk to adulteration by watering or the addition of other substances; the con-sumption of such milk in the Federal District in 1958 was estimated at 40 million litres, i.e., about 10 per cent of the total consumption in the District.
Processing plant activity has increased steadily. In 1958, the six milk powder plants stepped up production by about 12 per cent compared with the previous year, and there was a 5 per cent increase in the plants producing tinned milk (condensed and evaporated). Butter and cheese plants also expanded output, by 6 and 10 per cent respectively.22
Marketing of milk and milk products is carried on with a rather small number of middlemen. This is probably because, in many cases, producers join to form co-opera-tive or distributing agencies. Moreover, the producers themselves often treat and process milk and milk products.
22 Data provided by the FAO technical assistance mission in Mexico.
YE. FOREIGN TRADE IN LIVESTOCK PRODUCTS
1. EXPORTS
Mexico is a net exporter of meat, mainly in the form of cattle on the hoof,23 of which it is the second largest exporter in Latin America, coming next to Argentina. Table 6 shows an interruption in the exports of cattle on the hoof prior to 1951, because of the outbreak of foot-and-mouth disease at the end of 1946; the appreciable drop recorded in 1954 was also due to the same cause, since the United States, as stated above, again closed its frontiers as soon as it learned of the second outbreak. It can be seen that, as from 1957, foreign sales of cattle on the hoof have risen significantly, although without reaching the high figure of 587,000 cattle exported in 1943.
Changes in the volume of meat exports are largely dependent on trade in cattle; there was a noticeable increase in meat exports when exports of cattle on the hoof were suspended, and vice versa. However, in 1958 there was a marked expansion in exports of both products because of heavier demand and better prices in the United States market. Exports subsequently fell off in 1959 and 1960. The increase was recorded more particu-
larly in chilled and frozen meat, for which Mexico has a good market in the United States, although it also exports on a smaller scale to Central America, Chile and Europe.
Table 6 Mexico: Exports of beef cattle on the hoof and carcasses,
1948-59
Year On the hoof (.Thousands of head)
Carcasses 1
(Thousands of tons)
1948 _ 43.0 1949 — 51.0 1950 — 45.6 1951 — 4.9 1952 123,517 4.7 1953 134,595 12.6 1954 4,645 13.8 1955 243,434 8,7 1956 110,821 7.5 1957 350,540 7.6 1958 490,607 30.0 1959 374,000 21.5
23 Mainly cattle between 10 and 12 months old, with an average weight of 170 to 200 kilogrammes, destined for fattening in the south of the United States.
Source: ECLA estimates for the figures of exports of cattle on the hoof; trade yearbooks for meat.
* Not including horsemeat and unspecified meats, or offal.

MEXICO: VIT. FOREIGN TRADE IN LIVESTOCK PRODUCTS 4 3
As cattle and meat exports constitute an important source of dollars24 for Mexico, the Government is sponsoring and promoting greater development of livestock production, with the aim of doubling supplies for export within the next few years. This aim is part of the plan for expanding livestock production which will concentrate first on Yucatan, Campeche and Quintana Roo, where there is a livestock potential that can easily be exploited. In addition, a vast livestock campaign will be waged in the State of Veracruz as part of the national programme of livestock development. The general pro-gramme envisages an extension of artificial pastures and better management of pastures; the organization and extension of cattle-fattening activities; an increase in the number of meat-packing plants—mainly in actual production centres, so as to ensure a greater share of
24 In the three-year period 1955-57, the value of exports of cattle, meat and hides to the United States rose to an annual average of 17.4 million dollars (217.5 million pesos).
the profits for the producers—with the aim of reducing exports of cattle on the hoof and increasing meat exports; and finally, more vigorous and effective aid to producers in the way of credit and technical assistance.
2. IMPORTS
It can be seen from table 8 that Mexican imports of livestock products amounted to 115 million pesos in 1957, 70 million in 1958 and 80 million in 1959. Over half these amounts was for imports of breeding animals to improve strains, mainly cattle, in the first two years and a little less than half in the third; next in importance came foreign purchases of dairy products—principally milk powder—and last came meat and meat products, among which the largest amount was for offals and ham (see tables 7 and 8). The higher figure for imports in 1957 was due to the increased purchases of selected cattle from the United States, which is also the main supplier of the meat products and preserved milk imported by Mexico.
Table 7 Mexico: Imports of livestock products, 1957-59
¡957 1958 1959 General Import tariff
Item Product Quantity Thousands
of pesos Quantity Thousands of pesos Quantity Thousands
of pesos Unit Specific
Duty Ad valorem (percentageJ
Official price
Livestock for breeding 011-00-00 Goats 425 52 325 47 234 77 Head Exempt — a 011-01-00 Sheep 455 318 1,262 645 1,174 529 Head Exempt — a 011-02-00 Pigs 1,078 1,037 48 27 8,272 3,687 Head Exempt — a 011-03-00 Cattle 23,172 63,080 5,950 22,134 5,463 18,860 Head Exempt — a 011-03-01 Milk cows 8,833 13,213 2,764 12,850 3,259 13,213 Head Exempt — a
Livestock for food b
011-00-01 Goats — — 1 — — — Head + 2.00 13 80.00 011-01-01 Sheep 4 1 3 — 152 2 Head + 2.00 13 80.00 011-02-01 Pigs 34 2 1 — 2 1 Head Exempt 13 200.00 011-03-02 Cattle 13 45 2 — — — Head Exempt 13 220.00
Meat and meat preparations 020-01-00 Goat-meat, fresh or chilled 1 10 — — — — G.K. + 0.10 13 a 020-02-00 Mutton, fresh or chilled . . 1 8 — — — — G.K. + 0.10 13 a 020-03-00 Pork, fresh or chilled — — — — 42 236 G.K. + 0.10 13 a
020-04-00 Beef, fresh or chilled 1 11 1 14 15 137 G.K. + 0.10 13 a
020-04-01 Beef, frozen 1 11 1 7 1 7 G.K. + 0.05 13 a
020-99-02 Animal offals: entrails, or-gans, waste, parings, etc. 1,284 4,691 988 2,968 2,890 8,760 N.K. 0.20 — a
021-00-00 Ham, cooked or uncooked, not in airtight containers 5 73 10 205 1 21 N.K. + 1.00 40 17.00
021-00-01 Meat sausages, not in air-tight containers 16 310 17 334 5 94 N.K. + 1.00 40 20.00
021-00-98 Foods containing meat, not in airtight containers 2 38 5 70 2 12 N.K. + 1.50 45 11.50
021-00-99 Meat smoked, cooked, salt-ed or in brine, not in air-tight containers, n.e.s. . . . 5 44 1 6 1 5 N.K. + 0.30 35 15.50
022-00-01 Preserved beef or veal foods, whether or not including vegetables in whatever proportion, in airtight containers 37 318 32 264 72 498 N.K. + 1.50 45 11.50
022-00-02 Ham, cooked or uncooked, in airtight containers 121 2,363 96 2,209 106 2,287 N.K. + 1.00 40 22.00

44 LIVESTOCK IN LATIN AMERICA
Table 7 (continued)
1957 1958 1959 General import tariff
Item Product Thousands of pesos
Thousands of pesos
Thousands of pesos
Duty Official price Quantity Thousands
of pesos Quantity Thousands of pesos Quantity Thousands
of pesos Unit Specific Ad valorem (percentage)
Official price
022-00-03 Sausages in airtight contai-ners 30 538 32 654 22 431 N.K. + 1.40 40 20.00
022-00-04 Bacon in airtight containers 2 41 10 188 6 73 N.K. + 0.40 25 15.00 022-00-97 Foods containing meat, in
airtight containers 19 196 23 240 70 618 N.K. + 1.50 45 11.50 022-00-98 Meat smoked, cooked, salted
or in brine, not in airtight containers, n.e.s 2 18 1 12 6 61 N.K. + 1.50 45 11.50
Milk products 030-00-00 Milk, fresh, not in airtight
containers 98 361 51 155 69 186 G.K. + 0.05 1 3.00 030-00-01 Milk, fresh, in airtight
containers — — — — 1 2 G.K. + 0.50 35 3.50 030-00-02 Condensed milk 3 14 — — — — G.K. + 0.15 35 10.50 030-00-03 Evaporated milk 00 116 51 164 58 185 G.K. + 0.50 35 3.50 030-00-04 Milk in powder or block
form weighing less than 5 kg including container 537 5,113 216 1,776 732 4,523 N.K. + 0.60 30 12.00
030-00-05 Milk in powder or block form weighing more than 5 kg including container and with a fat content of up to 3 per cent 6,160 18,090 7,495 20,525 8,747 22,003 N.K. + 0.40 15 5.60
030-00-06 Milk in powder or block form weighing more than 5 kg including container and with a fat content of over 3 per cent 21 82 34 142 25 91 N.K. + 0.40 15 10.00
030-01-00 Butter 45 720 54 753 14 218 030-01-01 Butter substitutes (marga-
rines and oleomarga-rines), whether or not with milk added 1 21 1 34 1 15 N.K. + 0.80 25 16.00
030-02-00 Cheese and curd of all types 410 4,432 376 4,144 294 3,760 N.K. + 2.00 50 14.00
Sources: Foreign trade yearbooks. a No basic official price. 6 Importation prohibited.
The tariff structure and trade policy are clearly protec- of livestock for food is prohibited, and in most cases tionist. Except for breeding animals, all livestock and prior authorization and registration by the Ministry of livestock products are subject to both specific and ad Economic Affairs and the Ministry of Health and Welfare valorem duties. The latter are particularly high for imports are required for the importation of all other types of of meat products, preserved milk and cheeses. The import livestock.
Table 8
Mexico: Value of imports of livestock products, 1957-59
1957 1958 1959
Value (thousands of pesos)
Per-cen-tage
of total
Value (thousands of pesos)
Per-cen-tage
of total
Value 0thousands of pesos)
Per-cen-tage
of total
Breeding cattle 77,700 67 35,703 51 36,366 45 Dairy products . . . . 28,907 25 27,659 39 30,968 39 Meat products 8,669 8 7,171 10 13,240 16
TOTAL .... 115,276 100 70,533 100 80,574 100
Source: Table 7.

MEXICO: V I I I . FOOD SUPPLIES 45
v m . FOOD SUPPLIES 1. MEAT
As a result of the first outbreak of foot-and-mouth disease there was an appreciable drop in meat supplies in 1950 and 1951. Except for 1953, there has been a steady increase in supplies since 1952. As a result, con-sumption has risen and the volume of exports has expan-ded, especially in the last few years. In practice meat consumption in Mexico depends on national production, since the volume of imports is very small and consists mainly of special types of prepared meats (see table 9).
Table 9 Mexico: Estimated meat consumption,
in terms of carcass meat, 1948-58 (Thousands of tons)
Table 10 Mexico: Per capita meat consumption, 1948-58 a
(Kilogrammes)
Year Production a Exports 6 Imports Estimated consumption®
1948... 465 43.0 0.4 422.4 1949... 469 51.0 0.3 418.3 1950... 351 45.6 0.4 305.8 1951... 396 4.9 0.7 391.8 1952... 505 19.5 0.9 486.4 1953... 497 28.8 1.2 469.4 1954.... 508 14.6 0.9 494.3 1955.... 532 37.9 0.8 494.9 1956.... 564 20.8 1.3 541.9 1957.... 695 49.7 1.5 646.8 1958.... 754 88.9 1.2 666.3
Sources: Tables 2, 6 and 7, and foreign trade yearbooks. 8 Estimated from official slaughter-house records and figures reported
for in situ slaughtering, added to the meat equivalent of exports of livestock on the hoof.
6 For beef cattle on the hoof the average meat yield per animal is estimated as 120 kilogrammes.
0 Production minus exports and plus imports.
Although there has been a marked improvement in total meat supplies, table 10 shows that this has been only just sufficient to meet the greater demand caused by population increase; indeed, per capita consumption remained more or less stable between 1948 and 1956 at about 17 kilogrammes. In 1957 and 1958, there was a considerable increase (20 per cent) in the supplies available for per capita consumption because of an expansion in beef production. As a general observation, it may be said that for many years there has been little change in the per capita consumption of pork, mutton and goat-meat, except of course in 1950 and 1951.
With respect to the composition of consumption, beef and veal account for almost three-quarters (73-74 per cent), pork for 21-22 per cent and mutton, lamb and goat-meat for the remaining 5 per cent.
Per capita consumption of meat is notoriously low, amounting to less than a fifth of that in Uruguay and Argentina, and is far below the recommendable nutri-tional level (35-40 kilogrammes a year). Clearly the average consumption of 20 kilogrammes does not reflect the actual degree of under-consumption, since the highest levels are recorded in the Federal District and in the large towns, where higher incomes and better distribution
Year Beef Pork Coat-flesh Mutton Total
1948. . . . . . 12.3 3.9 0.6 0.4 17.2 1949. . . . . . 11.6 3.9 0.5 0.6 16.6 1950. . . . 7.9 2.4 0.8 0.7 11.8 1951. . . . . . 11.9 1.9 0.4 0.4 14.6 1952. . . . . . 13.0 3.8 0.5 0.4 17.7 1953. . . . . . 11.6 3.9 0.7 0.5 16.7 1954. . . . . . 11.9 4.0 0.7 0.5 17.1 1955. . . . . . 11.5 4.0 0.7 0.5 16.7 1956. . . . . . 12.6 4.1 0.6 0.5 17.8 1957. . . . . . 15.2 4.2 0.6 0.5 20,5 1958. . . . . . 15.3 4.3 0.6 0.5 20.7
Source: Table 3. 0 Not including the small consumption of imported meats, since its
inclusion would not appreciably affect the total per capita consumption figures.
facilities encourage effective demand, although a large sector of the population in these towns does not eat meat regularly because their purchasing power is too low.
Consumption levels in the rural areas are very low; this can be gathered from the data in table 11, which, although not very representative, give some idea of the situation. They show that these levels vary widely, the highest being in the areas where cattle are fattened (Tabasco and Guerrero) and the lowest in the high pla-teaux and the breeding and dairy cattle areas (México, Guanajuato, etc). Average annual per capita consump-tion among the rural population appears to be about 15 kilogrammes.25
Table 11 Mexico: Daily per capita consumption of meat and dairy products in selected rural areas, 1959
(Grammes)
Area Meat Milk Eggs Economic classification'
Tabasco . . . 113.0 19.0 13.0 B Guerrero . . . 75.0 100.0" 2.0 B Distrito Federal . . . 56.0 215.0 7.0 B Yucatán . . . 40.0 5.0 2.0 C San Luis Potosí , . . 37.0 217.0 b 4.0 C Tlaxcala . . . 26.8 10.0 6.0 B Mexico . . . 23.5 17.5 3.5 C Guanahuato 17.5 38.0 2.0 C
Source: Mexican Nutrition Institute. a Economic classification B represents a higher income level than C. 6 Including consumption of cheese in terms of fluid milk. 0 Semi-urban zone.
26 When the deviation formula was applied to the data in table 11, it was found that, within a 5 per cent margin of error, annual average consumption per capita could fluctuate between 8 and 20 kilo-grammes for meat and between 7 and 50 litres for milk. The data are not representative and are consequently subject to revision.
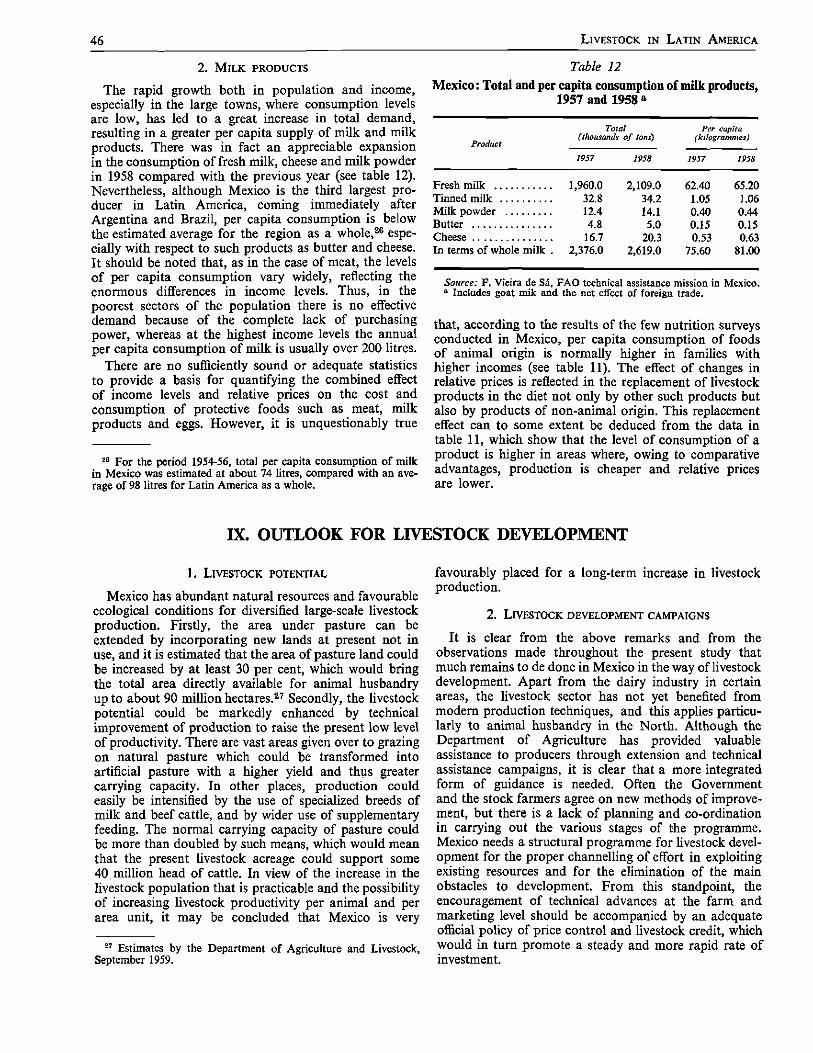
46 LIVESTOCK IN LATIN AMERICA
2. MILK PRODUCTS
The rapid growth both in population and income, especially in the large towns, where consumption levels are low, has led to a great increase in total demand, resulting in a greater per capita supply of milk and milk products. There was in fact an appreciable expansion in the consumption of fresh milk, cheese and milk powder in 1958 compared with the previous year (see table 12). Nevertheless, although Mexico is the third largest pro-ducer in Latin America, coming immediately after Argentina and Brazil, per capita consumption is below the estimated average for the region as a whole,26 espe-cially with respect to such products as butter and cheese. It should be noted that, as in the case of meat, the levels of per capita consumption vary widely, reflecting the enormous differences in income levels. Thus, in the poorest sectors of the population there is no effective demand because of the complete lack of purchasing power, whereas at the highest income levels the annual per capita consumption of milk is usually over 200 litres.
There are no sufficiently sound or adequate statistics to provide a basis for quantifying the combined effect of income levels and relative prices on the cost and consumption of protective foods such as meat, milk products and eggs. However, it is unquestionably true
26 For the period 1954-56, total per capita consumption of milk in Mexico was estimated at about 74 litres, compared with an ave-rage of 98 litres for Latin America as a whole.
Table 12 Mexico: Total and per capita consumption of milk products,
1957 and 1958 a
Total Per capita (thousands of tons) (kilogrammes)
Product 1957 1958 1957 1958
Fresh milk 1,960.0 2,109.0 62.40 65.20 Tinned milk 32.8 34.2 1.05 1.06 Milk powder 12.4 14.1 0.40 0.44 Butter 4.8 5.0 0.15 0.15 Cheese 16.7 20.3 0.53 0.63 In terms of whole milk . 2,376.0 2,619.0 75.60 81.00
Source: F. Vieira de Sá, FAO technical assistance mission in Mexico. 0 Includes goat mik and the net effect of foreign trade.
that, according to the results of the few nutrition surveys conducted in Mexico, per capita consumption of foods of animal origin is normally higher in families with higher incomes (see table 11). The effect of changes in relative prices is reflected in the replacement of livestock products in the diet not only by other such products but also by products of non-animal origin. This replacement effect can to some extent be deduced from the data in table 11, which show that the level of consumption of a product is higher in areas where, owing to comparative advantages, production is cheaper and relative prices are lower.
IX. OUTLOOK FOR LIVESTOCK DEVELOPMENT
1. LIVESTOCK POTENTIAL
Mexico has abundant natural resources and favourable ecological conditions for diversified large-scale livestock production. Firstly, the area under pasture can be extended by incorporating new lands at present not in use, and it is estimated that the area of pasture land could be increased by at least 30 per cent, which would bring the total area directly available for animal husbandry up to about 90 million hectares.27 Secondly, the livestock potential could be markedly enhanced by technical improvement of production to raise the present low level of productivity. There are vast areas given over to grazing on natural pasture which could be transformed into artificial pasture with a higher yield and thus greater carrying capacity. In other places, production could easily be intensified by the use of specialized breeds of milk and beef cattle, and by wider use of supplementary feeding. The normal carrying capacity of pasture could be more than doubled by such means, which would mean that the present livestock acreage could support some 40. million head of cattle. In view of the increase in the livestock population that is practicable and the possibility of increasing livestock productivity per animal and per area unit, it may be concluded that Mexico is very
27 Estimates by the Department of Agriculture and Livestock, September 1959.
favourably placed for a long-term increase in livestock production.
2. LIVESTOCK DEVELOPMENT CAMPAIGNS
It is clear from the above remarks and from the observations made throughout the present study that much remains to de done in Mexico in the way of livestock development. Apart from the dairy industry in certain areas, the livestock sector has not yet benefited from modern production techniques, and this applies particu-larly to animal husbandry in the North. Although the Department of Agriculture has provided valuable assistance to producers through extension and technical assistance campaigns, it is clear that a more integrated form of guidance is needed. Often the Government and the stock farmers agree on new methods of improve-ment, but there is a lack of planning and co-ordination in carrying out the various stages of the programme. Mexico needs a structural programme for livestock devel-opment for the proper channelling of effort in exploiting existing resources and for the elimination of the main obstacles to development. From this standpoint, the encouragement of technical advances at the farm and marketing level should be accompanied by an adequate official policy of price control and livestock credit, which would in turn promote a steady and more rapid rate of investment.

URUGUAY

E/CN. 12/594/Rev.l 9 August 1961

INTRODUCTION AND SUMMARY
This short study on stock farming in Uruguay leads to two basic conclusions: (1) the country's economy has depended largely on the development of the livestock industry; (2) livestock production shows a clear trend towards stagnation.
An important consideration is that almost the whole of Uruguay's total area of 187,000 square kilometres is devoted to agriculture; something over four-fifths of the agricultural area is used for livestock production, and only 9 per cent for crop farming. These circumstances and the fact that Uruguay has the highest number of livestock per capita and per square kilometre in Latin America are sufficient indication of the great importance of the livestock sector as a source of income and foreign exchange. In fact, the share of livestock products in the total value of Uruguay's exports has been as much as 82 per cent, and even in less favourable periods has not fallen below 65 per cent. Moreover, livestock pro-duction represents about three-fifths of the total value of agricultural production.
The considerable extent to which Uruguay's economy depends on the development and conditions of the livestock industry obviously has far-reaching repercus-sions in a time like the present, when stagnation in this industry has resulted in a sharp fall in exports and a decrease in per capita levels of consumption.
The main features of stock farming in Uruguay, its principal problems and the implications of its slow de-velopment are summarized below.
According to the last agricultural census in 1956, pasture-land amounted to some 14.8 million hectares, including stubble-fields and natural woodland that can be used by livestock. There is a marked preponderance of natural grasslands, which represent about 92 per cent of all pasture-land; the census recorded only 457,000 hec-tares of artificial pastures, a small fraction of the total. It should be noted that the area concerned is more or less permanently given to livestock production, since with few exceptions there is no combined crop and stock farming involving rotating land use. Furthermore, there is no prospect of expanding the pasture area, since there are no reserves of land available for the purpose. However, there is room for considerable increase in the carrying capacity of the land through the improvement of natural pastures, their partial replacement by artificial pastures, and better use of forage.
The livestock population of Uruguay consists basically of about 7.5 million cattle, 21.2 million sheep and 6 million pigs. Although some other Latin American countries, such as Brazil, Argentina, Mexico and Colom-bia, have larger cattle populations, Uruguay has the highest cattle density per square kilometre—45.1 and 42.0 head respectively, in 1927 and 1958.1 The cattle-
1 In 1958 other corresponding figures were: Argentina 14.7, Brazil 8.2, New Zealand 21.9 and Australia 2.2.
to-population ratio has fallen considerably, from 4.8 head per inhabitant in 1928 to 2.8 in 1958; nevertheless, Uruguay is still ahead of many other countries.2 With respect to sheep, Uruguay, with a density of about 132 head per square kilometre, has the highest density after Australia.
Most livestock production is of cattle and sheep, which constitute the basis of the livestock economy in Uruguay. These two species are reared in combination on most livestock farms, generally on large properties under a highly extensive system with low productivity. Only with respect to dairy farming and some industrial poultry farming enterprises is there a better use of resources and intensive production practices.
Mention should be made in this summary of the considerable changes in the physical volume of livestock production. Between 1946 and 1953 total and per capita production increased by 23 and 10 per cent, respectively. From 1954 the pace of production slackened, leading to reductions in per capita output; this was largely due to unfavourable climatic conditions, and in particular to the serious floods in 1959. The lower production in 1958 and 1959 was mainly due to the considerable reduction in the number of cattle and sheep slaughtered in those years. High prices and a severe drought in 1960 led to an appreciable increase in slaughterings in that year.
Prior to 1956 the percentage of sheep production was larger, with respect to wool and meat, but from then on the share of cattle production increased, and in 1959 represented over 50 per cent. Production of beef in that year represented 42 per cent of the total output.
In the period 1954-57 the production of red meat remained more or less at a standstill at about 350,000 tons, and fell abruptly by 50,000 tons in 1958 and 1959, or 28 per cent less than in 1950. Beef constituted 80 per cent of production, mutton 15 per cent and pork 5 per cent.
Milk production, on the other hand, increased steadily, rising to 720 million litres in 1958 and 750 million in 1960; in comparison with the average annual production for the three-year period 1948-50, this represented increases of 85 and 93 per cent respectively. Production undoubtedly increased more rapidly than population; in 1957-59 and 1960 the average annual production per capita was 243 and 272 litres respectively, greatly exceed-ing the figure of 163 litres for the period 1948-50. About two-thirds of production are for immediate consumption and the remainder for the production of cheese, butter and other milk products. It should be noted that this progress was not due to higher productivity but to expansion of dairy herds and of the area devoted to them encouraged by a policy of subsidies and the growth of real demand.
With respect to wool, average production increased 2 In 1958 corresponding figures were: Argentina 2.0, Brazil 1.1,
New Zealand 2.6 and Australia 1.7.
49

50 LIVESTOCK IN LATIN AMERICA
from 68,192 tons during 1947-48 to 79,489 tons in 1958-59, i.e., by 17 per cent, a rate close to the population growth rate between those two periods. The sharp rise in the wool crop between 1950/51 and 1956/57 was due to the increase in the number of sheep, in response to higher wool prices.
The main factors that seriously limit livestock pro-duction include (a) defective feeding practices, (b) the high incidence of disease, (c) inefficient stock and pasture management.
Inadequate feeding is due mainly to the seasonal shortages of fodder, the absence of fodder preservation practices and insufficient use of supplementary feed concentrates.
Livestock diseases and pests are responsible for heavy losses, both through deaths, which are especially high in young cattle and sheep, and through delayed growth and production in the sick animals. The estimated annual loss from infectious and contagious diseases and parasitic infestations is about 520 million pesos, which represents a third of the total value of the country's livestock and poultry production.
Management problems are equally serious, and have a very adverse effect on many aspects of production. Scant attention is given to the conservation and improve-ment of pastures and to rotation; certain health precau-tions which should be practised systematically as a matter of routine are often neglected, and there are no adminis-trative and management staff to facilitate the introduction of new livestock techniques.
In addition to problems related to feeding, animal health and management, livestock production is also hampered by credit restrictions, marketing weaknesses and the low level of reinvestment in improvements. However, the low yield is chiefly due to the technical shortcomings, and they constitute a serious obstacle to raising the low productivity prevailing in the livestock sector.
Despite the high quality of Uruguayan cattle, efficiency and productivity indices compare very unfavourably with those in such countries as Argentina, Australia, New Zealand and the United States. Thus the slaughtering rate is only 14 per cent, as a result of the slow process of preparing the cattle for slaughter, which usually takes place when the steers are four and a half or even five years old. Moreover, the fertility rate in the breeding farms, expressed in terms of the cow population, amounts to barely 60 per cent. About a third of the cows are not producing, whereas in efficient dairy farms where intensive farming is practised, up to 85 per cent of the cows can be kept more or less constantly in production. The average annual production of cows in milk is only about 1,200-1,400 litres.
Although Uruguay is better situated than some other Latin American countries with respect to the marketing of livestock products, there are nevertheless certain irregularities and shortcomings which discourage produ-cers or create serious problems in demand, or both. For example, the monopoly established in the supply of meat for Montevideo has led to a black market in meat, with unfortunate consequences in the uncontrolled acti-
vities of numerous middlemen and the resulting danger to the consumer inherent in the consumption of meat that escapes veterinary inspection.
As a result of this anomaly, there was an increase in the number of inadequately equipped and organized slaughter-houses, and a reduction in the operations of the large slaughter-houses with refrigeration facilities. Other marketing deficiencies are the lack of central markets for livestock for consumption, and the absence of uniform standards of classification either for livestock on the hoof or for meat.
The main shortcomings in the marketing of milk and milk products relate to the transporting of fresh milk to the processing and pasteurization plants, and to the lack of control of the milk sold in many urban centres in the interior. There is also a severe shortage of plants for the collection, cooling and pasteurization of milk.
Nor is there a central market for wool, which is sold at widely scattered points; this naturally increases costs and makes dificult any full knowledge of conditions and changes in supply and demand. Moreover, the mar-keting process is slowed down, and improvement of quality discouraged, because the producer does not preclassify the wool.
To sum up the matter of consumption and demand, although in 1959 domestic consumption of meat remained at the same level as during the three-year period 1948-50 (174,000 tons and 58,000 tons of beef and mutton respec-tively), this was at the expense of exports and implied a decline in per capita consumption.
Annual exports decreased from 100,000 tons during 1934-38 to 70,000 tons in 1951-53, and to an average of only 45,000 tons in 1958-60. Between 1953 and 1958 the value of exports fell by 91.5 million dollars. There are now at least twelve countries that export more meat than Uruguay.
Per capita consumption, which during the boom years for livestock amounted to 125 kg of red meat, fell to 106 kg in 1948-50 and to 95 kg in 1959. However, the last figure still represents one of the highest consumption levels in the world and far exceeds nutritional require-ments. Two main causes of the reduction in consumption were supply problems and an excessive increase in relative prices; in 1959 relative prices of beef were 250 per cent higher than in 1950, and in 1960 there were further increases.
In 1957-59 average per capita consumption of milk, expressed in terms of whole milk, was 238 litres, an increase of 46 per cent compared with 1948-50. This expansion in demand was made possible by relative prices favourable to the consumer. Lastly, it should be added that per capita consumption of meat and milk products in Uruguay is higher than in the rest of Latin America and in many other countries.
The foregoing summary shows that there is much room for improving the outlook for livestock production in Uruguay. There are ample opportunities for increasing the yield of existing stocks and for raising the production of meat, milk and wool per animal and per area unit. The limited area available in no way precludes the de-velopment of livestock production, since the enormous

URUGUAY: I . AVAILABLE RESOURCES 51
margin by which productivity could be increased repre-sents a vast livestock potential. There is an urgent need
I. AVAILABLE 1. LIVESTOCK AND POULTRY INVENTORIES
Since 1924 Uruguay has been taking agricultural censuses every five years, and there is thus fairly adequate statistical data available on the number of livestock and poultry in the country. The most recent figures are based on the 1956 agricultural census, estimates for subsequent years, and a livestock survey carried out in 1959.
The data in table 1 show that the cattle population of Uruguay is 7.59 million head; this figure is slightly higher than that for the 1956 census, 7 per cent lower than in 1951 and nearly 10 per cent lower than in 1924, when the number of cattle was at its peak (8.4 million head). The subsequent decline and the stabilization of the cattle population at the 1956 level is due to a number of causes, including prolonged periods of rain and drought, the high incidence of certain diseases, and economic factors directly related to the price policy. There has been an increase in the cattle population in almost all Latin Amer-ican countries in recent years, and the total for the region rose from 140 million head in 1951-55 to 162 million in I960;3 only in Uruguay and Chile did the inventories remain more or less at a standstill.
Table 1 Uruguay: Cattle and poultry inventories in selected years
(Thousand head)
1937 1946 1951 1956 1959
Cattle 8,297 6,821 8,154 7,433 7,600 a
Sheep 17,931 19,559 23,409 23,302 21,259 Pigs 346 274 259 381 400 Poultry 5,405 5,783 5,569 6,139 6,200
Source: Uruguayan agricultural censuses for the 1937, 1946, 1951 and 1956 figures; 1959 livestock survey, and estimates by the Ministry of Agriculture.
» Based on the 1959 livestock survey, which gave a figure of 6.99 mil-lion head of beef cattle, plus the dairy cattle population, estimated at some 600,000 head.
This stabilization of the cattle population would not have had an unfavourable effect if it had been counter-balanced by greater efficiency, especially with respect to the slaughtering rate. Unfortunately, as will be shown below, the Uruguayan yield remained low, at least with respect to meat.
Dairy cattle, on the other hand, not only increased in numbers, from 382,000 head in 1943 to 585,000 in 1956 (an average annual increase of 4 per cent), but dairy farmers seem to have attempted to increase unit yield, one reason being that they were driven to do so by the increase in the price of inputs such as labour, food supplements, medicaments, vaccines and many other cost components.
to remove existing obstacles and to devote additional resources and efforts to achieve this aim.
RESOURCES The sheep population is next to cattle in economic
importance. The 1959 estimate was 21.2 million head; compared with the number recorded in the 1951 and 1956 censuses, this represents a decrease of slightly over 2 million, mainly due to high mortality among the lambs and to the low birth rate resulting from very heavy rains.
Pigs and poultry are an additional source of meat production, and their estimated numbers are 400,000 and 6 million, respectively. Goats are of little economic importance in Uruguay, and their numbers are tending to decrease.
Table 2 shows that beef cattle are fairly well distributed among most of the departments, except for Canelones, Florida and San José in the south, which provide the milk supply for Montevideo, and the department of Colonia, an important dairy farm region in the south-west . which concentrates on the processing of milk products.
Sheep are also widely distributed in Uruguay, and cattle and sheep production are therefore found side by side throughout most of the country, and to some extent are competing in their use of the land. Thus, except for the department of Florida, where the numbers of both dairy cattle and sheep are comparatively high, the largest
Table 2
Uruguay: Geographical distribution of cattle and sheep, 1956 and 1959 (Thousand head)
Cattle
Department Beef cattle Dairy cattle 1959 1959 1956
457.0 5.6 1,578.9 Canelones 49.9 74.0 53.8 Cerro Largo 626.7 10.2 1,524.2
216.1 109.7 260.1 500.2 13.2 2,034.8 228.6 11.1 899.7 370.9 126.1 1,179.6 474.9 9.3 1,317.1
Maldonado 147.9 9.9 674.2 Montevideo 2.4 . . ..
524.6 23.9 2,001.0 Río Negro 367.8 10.1 1,173.2
445.2 6.6 918.8 423.1 8.3 1,094.5
Salto 569.0 8.4 1,257.0 76.0 107.3 190.8
400.1 27.0 987.9 Tacuarambó 640.3 15.2 1,997.9 Treinta y Tres 468.9 6.8 1,116.6
6,987.3 585.1 21,259.5
8 United States Department of Agriculture, Foreign Crops and Markets, 27 April 1961. Source: Ministry of Agriculture Department, of Rural Economy.
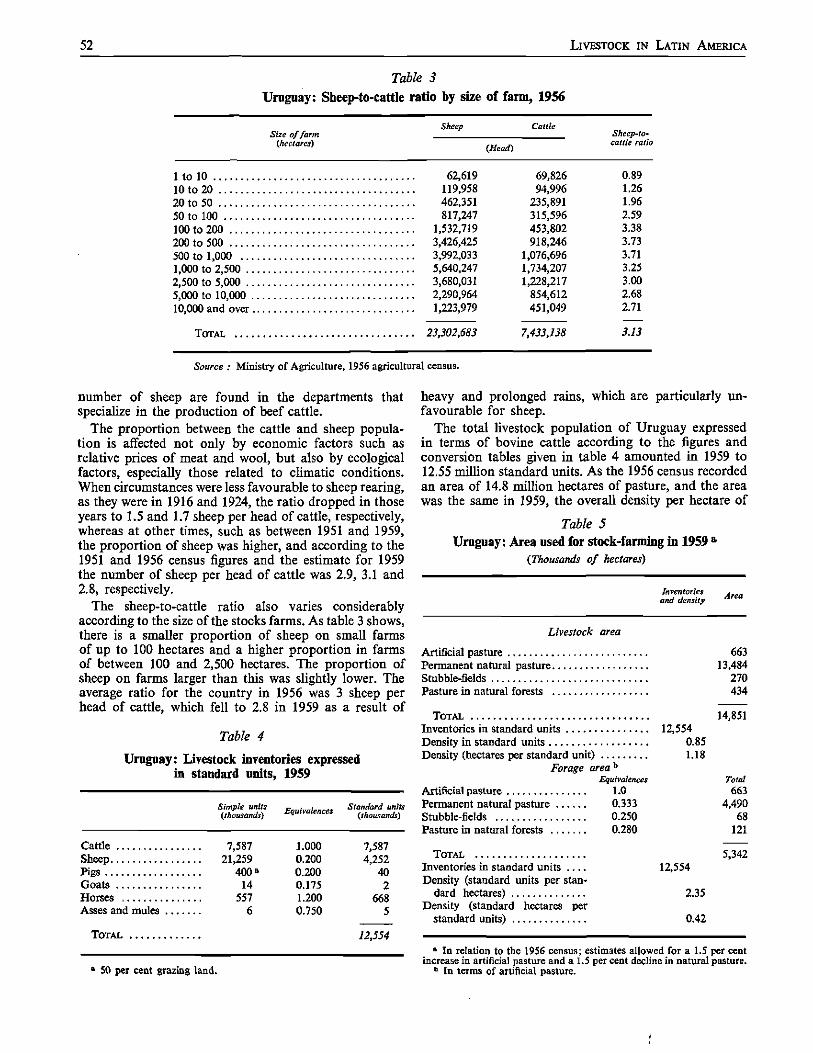
52 LIVESTOCK IN LATIN AMERICA
Table 3 Uruguay: Sheep-to-cattle ratio by size of farm, 1956
Sheep Cattle Sheep-to-Size of farm
Sheep Sheep-to-
(ihectares) (Head) cattle ratio
1 to 10 62,619 69,826 0.89 10 to 20 119,958 94,996 1.26 20 to 50 462,351 235,891 1.96 50 to 100 817,247 315,596 2.59 100 to 200 1,532,719 453,802 3.38 200 to 500 3,426,425 918,246 3.73 500 to 1,000 3,992,033 1,076,696 3.71 1,000 to 2,500 5,640,247 1,734,207 3.25 2,500 to 5,000 3,680,031 1,228,217 3.00 5,000 to 10,000 2,290,964 854,612 2.68 10,000 and over 1,223,979 451,049 2.71
TOTAL 23,302,683 7,433,138 3.13
Source : Ministry of Agriculture, 1956 agricultural census.
number of sheep are found in the departments that specialize in the production of beef cattle.
The proportion between the cattle and sheep popula-tion is affected not only by economic factors such as relative prices of meat and wool, but also by ecological factors, especially those related to climatic conditions. When circumstances were less favourable to sheep rearing, as they were in 1916 and 1924, the ratio dropped in those years to 1.5 and 1.7 sheep per head of cattle, respectively, whereas at other times, such as between 1951 and 1959, the proportion of sheep was higher, and according to the 1951 and 1956 census figures and the estimate for 1959 the number of sheep per head of cattle was 2.9, 3.1 and 2.8, respectively.
The sheep-to-cattle ratio also varies considerably according to the size of the stocks farms. As table 3 shows, there is a smaller proportion of sheep on small farms of up to 100 hectares and a higher proportion in farms of between 100 and 2,500 hectares. The proportion of sheep on farms larger than this was slightly lower. The average ratio for the country in 1956 was 3 sheep per head of cattle, which fell to 2.8 in 1959 as a result of
Table 4
Uruguay: Livestock inventories expressed in standard units, 1959
Simple units Cthousands) Equivalences Standard units
(ithousands)
Cattle 7,587 1.000 7,587 Sheep 21,259 0.200 4,252 Pigs 400a 0.200 40 Goats 14 0.175 2 Horses 557 1.200 668 Asses and mules . . . . 6 0.750 5
TOTAL 12,554
heavy and prolonged rains, which are particularly un-favourable for sheep.
The total livestock population of Uruguay expressed in terms of bovine cattle according to the figures and conversion tables given in table 4 amounted in 1959 to 12.55 million standard units. As the 1956 census recorded an area of 14.8 million hectares of pasture, and the area was the same in 1959, the overall density per hectare of
Table 5 Uruguay: Area used for stock-farming in 1959 a
(Thousands of hectares)
Inventories and density Area
» 50 per cent grazing land.
Livestock area
Artificial pasture 663 Permanent natural pasture 1 3 , 4 8 4 Stubble-fields 270 Pasture in natural forests 434
TOTAL 14,851 Inventories in standard units 12,554 Density in standard units 0.85 Density (hectares per standard unit) 1.18
Forage area b
Equivalences Total Artificial pasture 1.0 663 Permanent natural pasture 0 . 333 4 , 4 9 0 Stubble-fields 0.250 68 Pasture in natural forests 0.280 121
TOTAL 5 , 3 4 2 Inventories in standard units 1 2 , 5 5 4 Density (standard units per stan-
dard hectares) 2.35 Density (standard hectares per
standard units) 0.42
a In relation to the 1956 census; estimates allowed for a 1.5 per cent increase in artificial pasture and a 1.5 per cent decline in natural pasture.
" In terms of artificial pasture.
f

URUGUAY: I I . PRODUCTION CHARACTERISTICS 53
pasture amounted to 0.85 head of cattle. If the pasture area is expressed in terms of artificial pasture,4, the fodder area would represent 5.3 million standard hectares, giving a standard density of 2.35 head per fodder hectare; although this is not among the highest in Latin America, it is higher than that for other Latin American countries where stock farming is less developed.
2. LIVESTOCK AREA
According to official estimates for 1959 some 14.85 mil-lion hectares were devoted to livestock farming of all kinds in Uruguay. According to the figures in table 5, most of the area covered by usable pasture (91 per cent) is natural grassland; only 4.5 per cent consists of artificial pasture, the other 4.5 per cent consisting of stubble-fields and woods containing usable natural pasture.
The great predominance of natural pasture—with lower forage capacity—considerably reduces the average carrying capacity per unit of area. This, combined with an abundance of large enclosed fields and the virtual lack of proper rotation and pasture management means that the total forage area amounts to the equivalent of
4 See the equivalences in table 5.
only 5.3 million hectares of first-class pasture. Accordingly, any substantial increase in pasture capacity, whether for breeding purposes or for fattening, will depend not only on the replacement of a large part of natural by artificial pasture but also on the exclusive use of the most highly nutritive forage plants. As there is a limit on the possible extension of the livestock carrying area in Uruguay, livestock development programmes will necessarily have to stress both the improvement of existing pasture and the adoption and widespread use of modern methods of management.
The largest livestock area (7 million hectares) with the best quality pasture is in the southern and eastern part of the country where preference is given to breeding and fattening cattle and sheep. In the north and west, some 4.6 million hectares are also devoted to cattle and sheep breeding, although in those areas the carrying capacity is lower since the plant cover is shallow and pasture becomes exhausted in periods of prolonged drought. The main pasture land for fattening covers approxi-mately 1 million hectares in the Departments of Soriano and Rio Negro where the high soil fertility means that crop and stock farming can be combined and where the best meat producing stock farms are to be found.
H. PRODUCTION CHARACTERISTICS
1. BREEDS OF LIVESTOCK
Uruguay is, of all Latin America, the country which has made the greatest progress in improving breeds of livestock, particularly among cattle and sheep, which now consist of purely non -criollo breeds.5 The factors accounting for this improvement include favourable ecological conditions, the sustained efforts of stock-breeders, particularly of breeders' associations, the import of European pedigree stud animals, skilful cross-breeding practices based on the selection of a small number of breeds and official extension and research programmes.
Despite the high genetic quality of existing breeds and continued progress in breed selection, yields have re-mained stationary at low levels. The improvement of ani-mal husbandry is essential, although it is not in itself suffi-cient to increase productivity and must be bolstered by proper feeding, health control and good management. In this respect, much remains to be done in Uruguay.
Hereford cattle are the commonest breed in the country and account for 60 per cent of all beef cattle. Their extensive use is due not only to their high meat yield but also to their hardiness and ready adaptation to extensive grazing systems. Shorthorn (or Durham) beef cattle represent scarcely 8 per cent of herds as they need special care in feeding and highly nutritive pasture. Accordingly, they are restricted geographically to the fertile soils of Fray Bentos, El Cretácico, Soriano, Rio Negro and a few other areas where they give excellent yields. Very few Aberdeen Angus cattle are to be found. A consider-
In the 1916 stock census, criollo cattle and sheep represented only 4 and 0.5 per cent respectively.
able proportion (30 per cent) of beef consists of various crosses between different European breeds. Among dairy herds, three-fifths of the total are Holstein-Frisian cattle, the next most numerous being European cross-breeds, Normandy cattle—for both beef and milk—and other dairy breeds.6
Two-thirds of the total sheep population consist of the Corriedale breed, 30 per cent each of Merino and Rom-ney Marsh and the rest of Australian Merino and other wool bearing breeds.7 The break-down of sheep by breeds has been influenced by the requirements of the interna-tional wool market, where medium wools such as those obtained from the Corriedale and Romney Marsh breeds have predominated for some time past. The Merino, Australian Merino and Ideal breeds produce fine wool, but on a much smaller scale.
Among pigs, the most widespread breed is Berkshire and as a result the largest number of pure bred animals registered in the herdbooks are of that breed. The next most numerous are of the Jersey, Yorkshire and Poland China breeds.8 In the south-east of the country, in the department of Rocha and along the frontier with Brazil, a cross-bred pig of inferior quality is to be found. Its diet consists chiefly of palm fruit.
8 Between 1 July 1959 and 30 June 1960 the following cattle were registered in the Herdbook: 23,499 Hereford cattle, as compared with 2,142 Shorthorns and 1,044 Aberdeen Angus. For dairy cattle, 1,835 Holstein-Frisian cattle, 395 Normandy cattle, 147 Jerseys and 172 of other dairy breeds were registered.
7 Between 1 July 1959 and 30 June 1960 the following numbers of sheep were registered in the Herdbook: 5,363 Corriedale, 818 Aus-tralian Merino, 497 Ideal, 409 Merino and 191 of other breeds.
8 Between 1 July 1959 and 30 June 1960, 375 Berkshire, 282 Duroc Jersey and 140 Poland China were registered in the Herdbook.

54 LIVESTOCK IN LATIN AMERICA
Table 6
Uruguay: Estimated value of livestock output in selected years (Millions of Uruguayan pesos at current prices)
Product 1951 1956 1958 1959
Product Value Per cent Value Per cent Value Per cent Value Per cent
Cattle . . 186 34 300 52 362 47 808 55 Sheep . . 352 63 210 36 281 36 443 30 Pigs 19 3 30 5 40 5 110 ! n Poultry — — 40 7 94 12 110 S l j
TOTAL .. 557 100 580 100 777 100 1,471 100
2. LIVESTOCK PRODUCTION
(a) Total production
Livestock production in 1959 was valued at 1,471 mil-lion Uruguayan pesos at current prices. This represented an increase of 189 per cent over the 1958 figure. Broadly speaking, the increase was due to a rise in prices, par-ticularly of meat, for the physical volume of livestock production in fact fell slightly. Before 1956, the largest single percentage share of value was accounted for by sheep products; in 1959, on the contrary, cattle products, including both beef and milk, accounted for slightly more than half the total value; beef alone represented 42 per cent of total value. The relative share of sheep products was reduced by nearly 50 per cent between 1951 and 1959. The relative position of the value of pig and poultry production improved slightly (see table 6).
Table 7 and figure I show the changes in the physical volume of livestock and poultry production over the last fifteen years. From 1949 onwards, total production
Table 7 Uruguay: Estimated output of livestock
and livestock products at constant prices, 1946-59 a
(Thousands of Uruguayan pesos at 1959 prices)
Year Total Per capita
Value Index Value Index
1946 1,442,180 100.0 629.1 100.0 1947 1,308,291 90.7 564.1 89.7 1948 1,279,191 88.7 545.5 86.7 1949 1,526,362 105.8 640.1 101.7 1950 1,663,213 115.3 685.5 109.0 1951 1,571,142 108.9 636.7 101.2 1952 1,585,672 109.9 632.3 100.5 1953 1,777,959 123.3 695.0 110.5 1954 1,652,567 114.6 636.7 101.2 1955 1,582,857 109.8 601.4 95.6 1956 1,633,313 113.3 611.7 97.2 1957 1,650,753 114.5 609.4 96.9 1958 1,472,382 102.1 535.8 85.2 1959 1,470,998 102.0 527.7 83.9
Source: Ministry of Agriculture, Department of Rural Economy. * Cattle, sheep, pigs, poultry, wool, milk and eggs.
Figure I
Uruguay: Total and per capita livestock production indices, 1946-59
11946 = 100)
SEMI-LOGARITHMIC SCALE
160 •
140 —
130 -
120 -
110 —
100 •
90 —
8 0 -
TOTAL
PER CAPITA
I I I _L I I I _L 1 1 I I 1946 47 48 49 50 51 52 53 54 55 56 57 58 59
increased greatly, reaching its highest level in 1953 when figures represented a 23 per cent increase over the base year of 1946. During the same period per capita output increased by 10 per cent. Between 1954 and 1957 total production remained at relatively high levels although below the 1953 level. Per capita output fell sharply from 1955, and although there was no change in either 1956 or 1957, the 1959 level was 16 per cent below 1946. The sharp falls occurring in 1954, 1955, 1958 and 1959 should be attributed in part to poor climatic conditions and particularly to the floods which occurred in 1959.
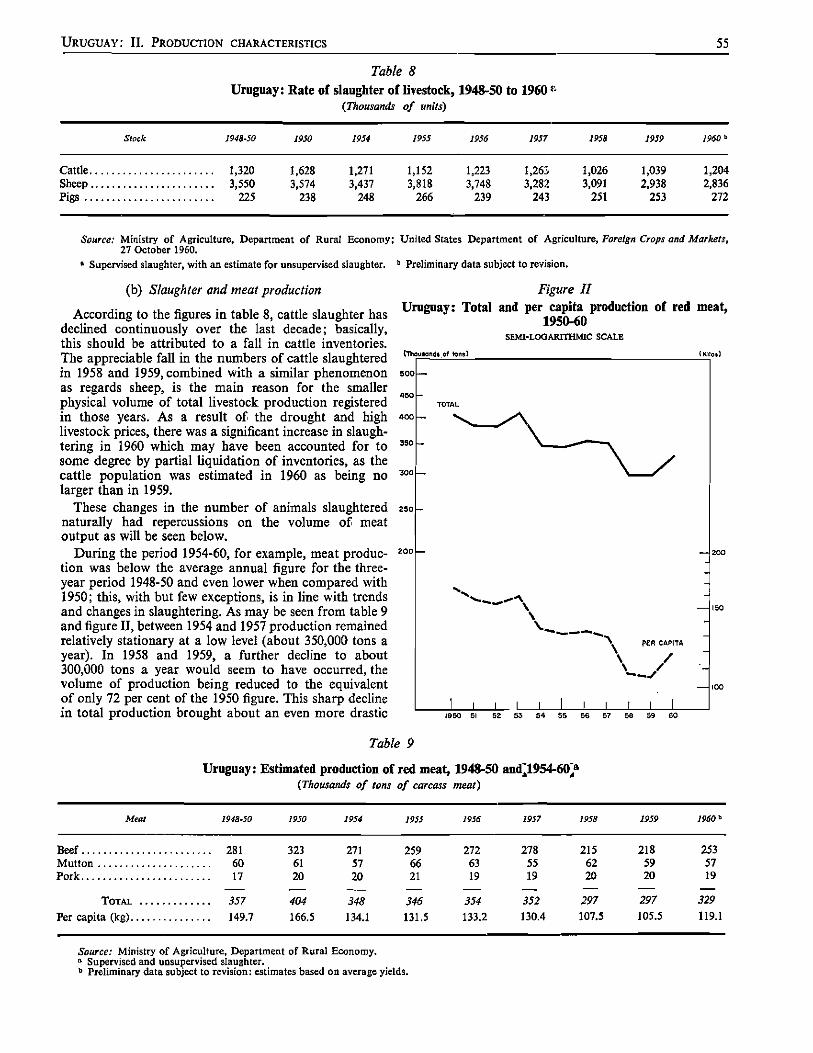
URUGUAY: I I . PRODUCTION CHARACTERISTICS 5 5
Table 8 Uruguay: Rate of slaughter of livestock, 1948-50 to 1960 "
(Thousands of units)
Stock 1948-50 1950 1954 1955 1956 1957 1958 1959 19606
Cattle 1,320 1,628 1,271 1,152 1,223 1,263 1,026 1,039 1,204 Sheep 3,550 3,574 3,437 3,818 3,748 3,282 3,091 2,938 2,836 Pigs 225 238 248 266 239 243 251 253 272
Source: Ministry of Agriculture, Department of Rural Economy; United States Department of Agriculture, Foreign Crops and Markets, 27 October 1960.
• Supervised slaughter, with an estimate for unsupervised slaughter. 6 Preliminary data subject to revision.
(b) Slaughter and meat production
According to the figures in table 8, cattle slaughter has declined continuously over the last decade; basically, this should be attributed to a fall in cattle inventories. The appreciable fall in the numbers of cattle slaughtered in 1958 and 1959, combined with a similar phenomenon as regards sheep, is the main reason for the smaller physical volume of total livestock production registered in those years. As a result of the drought and high livestock prices, there was a significant increase in slaugh-tering in 1960 which may have been accounted for to some degree by partial liquidation of inventories, as the cattle population was estimated in 1960 as being no larger than in 1959.
These changes in the number of animals slaughtered naturally had repercussions on the volume of meat output as will be seen below.
During the period 1954-60, for example, meat produc-tion was below the average annual figure for the three-year period 1948-50 and even lower when compared with 1950; this, with but few exceptions, is in fine with trends and changes in slaughtering. As may be seen from table 9 and figure II, between 1954 and 1957 production remained relatively stationary at a low level (about 350,000 tons a year). In 1958 and 1959, a further decline to about 300,000 tons a year would seem to have occurred, the volume of production being reduced to the equivalent of only 72 per cent of the 1950 figure. This sharp decline in total production brought about an even more drastic
Figure II Uruguay: Total and per capita production of red meat,
1950-60 SEMI-LOGARITHMIC SCALE
(Thoutandt of tons) < Kilos)
4 0 0 •
3 0 0 —
2 3 0 -
2 0 0 —
J L
; PER CAPITA
J L
200
ISO
100
1990 51 SZ 53 54 5 5 56 57 58 59
Table 9
Uruguay: Estimated production of red meat, 1948-50 and¡1954-60~a
(Thousands of tons of carcass meat)
Meat 1948-50 1950 1954 1955 1956 1957 1958 1959 I960"
Beef 281 323 271 259 272 278 215 218 253 Mutton 60 61 57 66 63 55 62 59 57 Pork 17 20 20 21 19 19 20 20 19
TOTAL 357 404 348 346 354 352 297 297 329
Per capita (kg) 149.7 166.5 134.1 131.5 133.2 130.4 107.5 105.5 119.1
Source: Ministry of Agriculture, Department of Rural Economy. " Supervised and unsupervised slaughter. b Preliminary data subject to revision: estimates based on average yields.

56 LIVESTOCK IN LATIN AMERICA
Table 10 Uruguay: Milk production, 1948 to 1960 a
(.Millions of litres)
,. , For industrial „„, .,„ ,ndex
Year. F°r d'rer purposes, Total penod consumption " ftc_ (litres) ^ pef cap¡ta
1948 258 92 350 149 90.0 91.4 1949 285 98 383 161 98.5 98.8 1950 325 107 432 178 111.0 109.2 1948-50 289 99 389 163 100.0 100.0 1951 338 145 483 196 124.2 120.2 1952 353 111 530 211 136.2 129.4 1953 371 178 549 215 141.1 131.9 1951-53 354 167 521 207 133.9 127.0 1954 392 176 568 219 146.0 134.4 1955 400 182 582 221 149.6 135.6 1956 422 190 612 230 157.3 141.1 1954-56 404 183 587 223 150.9 136.8 1957 470 210 680 252 174.8 154.6 1958 720 262 185.1 160.7 1959 600 215 154.2 131.9 1957-59 666 243 171.2 149.1 1960 750 272 192.8 166.9
0 Including all commercial and non-commercial dairies in the country.
fall in per capita output and had serious effects on the volume of exports and the per capita consumption level. These matters are considered in other sections of this paper. On the basis of slaughter figures and taking average yields, it may be concluded that meat production recov-ered appreciably in 1960.
As in all the main consumer countries, beef represents about four-fifths of total production. Mutton accounts for about 15 per cent, a relatively high proportion compared with other Latin American countries. Pork production barely reaches 5 per cent and goat produc-tion is tending to disappear altogether.
The distribution of production between internal consumption and export has also been subject to sub-stantial changes in Uruguay, as the country has, particu-larly since 1955, lost the traditionally important place it held on the international meat market.
(c) Production of milk and milk products
The output of milk and milk products has, unlike other sectors of livestock production, tended to rise steeply and continuously over the period 1948-58. In comparison with 1948-50, when the volume of milk production was 389 million litres, ourput in the three-year period 1957-59 had increased by 71 per cent. It was estimated that a record output of 720 million litres was achieved in 1958 and this figure would probably have been exceeded in 1959 had it not been for intense rain and floods. In 1960, output continued to increase and reached 750 million litres (see table 10 and figure III).
Figure III shows that output has increased faster than population, thus making more milk available per capita both for immediate consumption and for the preparation of milk products and other uses. In 1948-50, total average annual per capita milk output was 163 litres. This rose
to 243 litres in 1957-59 and to 272 litres in 1960, repre-senting increases of 49 and 67 per cent respectively.
Figure III
Uruguay: Milk production; total, per capita and population, 1948-60
(.1948-50 = 100) SEMI-LOGARITHMIC SCALE
190
170
160
150
120
100
90
80
TOTAL
PER CAPITA
POPULATION
1948 49 50 51 52 53 54 55 56 57 58 59 60

URUGUAY: I I . PRODUCTION CHARACTERISTICS 57
Output is divided into approximately two-thirds for raw milk consumption and one-third for the manufacture of milk products. According to estimates propared by the Ministry of Agriculture, cheese output in 1959 amounted to 9,000 tons, butter output to 5,600 tons and cream output to 1,000 tons.
Increases in output achieved in recent years have not resulted from improved productivity, since unit milk yield has remained more or less stationary. Nor did the lactation period or the number of cows in milk show any improvement. The policy of subsidies to producers adopted by the Government, and the increase in effective demand for milk, must be considered as the main factors stimulating output. There was also an increase in the area devoted to and funds invested in dairy cattle. The number of dairy farms in fact increased from 4,425 in 1943 to 8,556 in 1956 and 8,600 in 1959. In those same years, the number of cows in milk increased by 50 per cent, a figure fairly close to the increase in total milk production over the same period.
(d) Wool production
According to the 1956 agricultural census, wool pro-duction in that year amounted to 80.4 million kilo-grammes produced by 39,132 farms. Sheep farming for wool production covered an area of 14.8 million hectares, giving an average production figure of 5.4 kilogrammes of wool per hectare, in conditions of mixed farming alongside dairy farming or stock breeding for slaughter, or both. This explains the low average density (1.57 head) per hectare. The greatest concentration of sheep per unit of area was found in farms of 100 to 2,500 hectares, namely in those with the highest wool-bearing sheep-to-cattle ratio. Attention has already been drawn to this fact elsewhere in this paper (see table 3).
According to the figures in table 11 wool production increased between 1947-48 and 1960-61 from 68,192 tons to 79,489 tons or 17 per cent. This figure is close to the
Table 11 Uruguay: Wool production, 1947-48 to 1960-61
Farm year Total (.tons)
1947/48 68,192 100.0 1948/49 65,310 95.8 1949/50 74,070 108.6 1950/51 84,114 123.3 1951/52 85,411 125.3 1952/53 95,649 140.3 1953/54 88,351 129.6 1954/55 93,000 136.4 1955/56 91,605 134.3 1956/57 85,690 125.7 1957/58 79,767 117.0 1958/59 117.6 1959/60 68,170 a 97.0 1960/61 79,489a 116.6
Source: Ministery of Agriculture, Department of Rural Economy. " Estimates based on inventories and calculation on basis of average
yields.
population increase occurring over the same period and accordingly is in keeping with the established output of wool per capita.9
Although wool production per unit increased to a certain degree (from 3.6 kilogrammes in 1950/51 to 3.9 kilogrammes in 1955/56), as a result of more efficient techniques, the main increase in output must be attributed to the growth of flocks, with the addition of 570,000 sheep between the two years mentioned. There was a sharp increase in wool output after 1951, coinciding with the hostilities in Korea and the higher wool prices on external markets. Clearly, higher relative prices for wool as compared with meat led to some displacement of cattle.
(e) Poultry production
No adequate statistics are available showing changes and trends in the production of poultry for meat and eggs in Uruguay. A few estimates provide the following figures :
1948-50 1957-59
Poultry meat (tons) 9,000 13,000 Eggs (millions) 280 330
Percentage increase
46 18
Index (1947148 =< 100)
Annual per capita production of eggs remained stable at 117 units, while that of poultry meat increased from 4 to 4.7 kg between the two periods.
3. PRODUCTIVITY AND YIELD
Despite the favourable conditions in Uruguay with respect to climate, soil and improved animal husbandry techniques, indexes of physical production and efficiency are unquestionably low compared with those in other similary situated countries such as Argentina, Australia and New Zealand.10 However, Uruguay has the highest livestock density per square kilometre, with a high proportion of standard animal units per inhabitant.11
Nevertheless, the proportion has decreased in the last thirty years, from 7.3 units per inhabitant in 1927 to 4.5 in 1958, and the cattle-to-population ratio has fallen from 7.86 head per inhabitant in 1908 to only 2.82 in 1958.
The slaughtering rate for livestock for food is surpris-ingly low, particularly in comparison with Argentina, Australia and New Zealand, where the annual rate represents a much higher percentage of inventories. The slaughtering rate for beef cattle would obviously be con-siderably higher if the steers were killed at the age of
• Annual average of 29.3 kilogrammes in 1947/48-1949/50 and of 28.8 kilogrammes in 1960/61.
Percentage slaughtering rates were as follows: Cattle Sheep Pigs
Argentina (1958) 22.5 18.7 68.3 Australia (1959) 30.6 21.2 157.9 New Zealand (1959) 36.3 54.9 127.9 Uruguay (1959) 14.0 14.0 66.0
11 In 1958 the livestock densities and standard animal units per inhabitant were:
Animal units per Animal units square kilometre per inhabitant
Argentina 16.3 2.2 Australia 6.1 4.8 New Zealand 56.6 6.7 Uruguay 68.7 4.5

58 LIVESTOCK IN LATIN AMERICA
Table 12 Uruguay: Productivity rates and indices
in the livestock sector, 1959
Cattle Rate of slaughter 14 Meat per animal slaughtered (kilogrammes) 210 Meat per head of stock (kilogrammes) 28 Effective fertility rate a 60 Mortality rate 2.5 Meat (carcass) per hectare (kilogrammes) 14.5 Milk per milch cow (litres daily) 5 Milch cows (percentage) 66
Sheep Rate of slaughter 14 Meat per animal slaughtered (kilogrammes) 20 Meat per head of stock (kilogrammes) 3 Effective fertility rate a 68 Mortality rate 5 Meat (carcass) per hectare (kilogrammes) 4 Wool per animal (kilogrammes) 3.8
Pigs Rate of slaughter 66 Meat per animal slaughtered (kilogrammes) 78 Meat per head of stock (kilogrammes) 51 Effective fertility rate a 60 Mortality rate among full-grown pigs 5 Mortality rate among sucking-pigs 35
• See footnote 12 below.
three and a half or less, instead of at four and a half as they are in Uruguay. Moreover, the low slaughtering rate results in a low meat yield per head, and also explains the low production of meat per hectare (see table 12).
On the breeding farms the effective fertility rate12 is 12 Number of weaned calves expressed as a percentage of the
number of cows.
barely 60 per cent; although this is higher than in many Latin American countries, it is lower than in countries with technically advanced stock farming. This low productivity is the combined result of high mortality among very young calves and a low birth rate.
Yields are also low in dairy herds, since the output of milk per cow is about 5 litres daily and averages 1,200-1,400 litres per annum.13 In 1959 heavy rains reduced production per cow even further. The highest figures are registered for dairy farms in the Montevideo area. Again, the proportion of cows in milk is only 66 per cent or, to put it another way, one-third of the total number of cows remains unproductive, whereas in countries such as Canada, the Kingdom of the Netherlands, the United States and others, the productive proportion is as large as 80-90 per cent in well-organised dairy farms.
Among the smaller kinds of livestock, yields could be considerably improved, especially in respect to the birth rate among sheep and pigs and the rate of slaughter. The latter is low in the case of sheep because animals are kept back in order to ensure a bigger output of wool.
The wool yield per head gradually increased (reaching 3.8 kilogrammes in 1958/59) as a result of the control of sheep scab and of improved farm techniques. Accord-ing to the 1956 census data, it amounted to about 3 kilogrammes on farms of less than 200 hectares and some 3.5 kilogrammes on those of larger size. Production of wool per hectare fluctuated between 5.6 and 6 kilo-grammes in the case of farms ranging from 100 to 2,500 hectares; the lowest figures were registered on farms of under 10 and over 2,500 hectares, where there were fewer sheep per unit of area.
18 Note No. 61/1 (10 May 1961) of the FAO Committee on Commodity Problems records the following annual output of milk per cow, in terms of kilogrammes: Denmark, 3,630; France, 2,230; Kingdom of the Netherlands, 4,065; United Kingdom, 3,015; United States, 2,800.
HI. FACTORS LIMITING PRODUCTION This is not the place for an exhaustive analysis of all
the factors determining low yields or limiting production in Uruguay's livestock sector. Reference will be made only to those which constitute the heaviest drag on the development of stock farming.
1. NUTRITIONAL DEFICIENCIES
The slowness with which modern animal feeding practices are spreading is undoubtedly the problem most adversely affecting animal husbandry in Uruguay. In default of concentrated efforts to solve it satisfactorily, the country will remain under peril of a continued deteriora-tion of its position as a meat exporter and probably of a considerable reduction in per capita consumption levels as well.
In connexion with available grazing resources, it was stated that barely 4.5 per cent of the utilizable grassland is sown to artificial pastures or fodder crops. Conse-quently, the animals are generally turned out to graze on natural grasslands whose carrying capacity is low,
not so much because of the actual kinds of plants found as for other reasons of which the most important are neglect of weed control,14 as well as of rest and replace-ment of pastures and, above all, lack of crop rotation. To all this must be added over-grazing, the consequent loss of fertility displayed by certain soils and the tendency to grow a single type of grass. The application of fertilizers and the appropriate combination of fodder crops are practices seldom resorted to as means of solving such problems.
Nutritional deficiencies are particularly serious in summer and winter, during which seasons only one-third, or an even smaller proportion, of the volume or fodder produced throughout the year is available to livestock. Fodder supplies in spring and autumn represent about 70 per cent of the total, but a good deal of this seasonal plenty is wasted through failure to preserve the grass for lean periods. Ensilage and haymaking are uncommon,
14 It is estimated that at least 1 million hectares of farmland are so overrun by weeds as to be unusable.

URUGUAY: I I I . FACTORS LIMITING PRODUCTION 59
and are confined to a few properly organized dairy farms where cutting crops are currently grown and supplemen-tary feed rations based on concentrates are regularly provided.
With the progress of the pasture improvement programmes now under way, many of the nutritional deficiencies obstructing the development of Uruguay's livestock sector will probably be remedied.
Among the commonest grasses are several species belonging to the Paspalum, Andropogon, Axonopus, Stipa and other genera. Species of the last-named genus often lose their food value because they tend to become woody as a result of unsatisfactory pasture management. Rye grass, oats and barley are especially used as winter fodder. Pastures based on Sudan grass, and sweet sorghum and maize crops, are staple feed resources in autumn. Leguminous fodder crops include alfalfa (Medicago sativa) used for both cutting and grazing, and other species of this genus and of Trifolium (clover).
2. ANIMAL PESTS AND DISEASES
A' very wide variety of infectious and parasitic diseases affect the development and productivity of the livestock sector in Uruguay, on the one hand because of the mortality which some of them cause, and, on the other, because the sick animals give inferior yields of meat, milk, wool, etc. Special mention may be made of the following:
Foot-and-mouth disease. Despite the widespread prac-tice of inoculation, in respect of which Uruguay takes a relatively leading place among the Latin American countries (7.5 million applications in 1959), this infectious disease gives rise to economic losses estimated at about 80 million Uruguayan pesos, notwithstanding the mild endemic form it takes. Moreover, it impedes the expan-sion of meat exports to importer countries where the disease is not found.
Bang's disease (Brucellosis abortus). The incidence of this malady is heavy among both beef and dairy herds, partly because the inoculation of calves is not universally practised for want of satisfactory regulations. The losses caused by contagious abortion are estimated at a further 80 million pesos, and consist in calf mortality, decreases in milk production and genital ailments which diminish fertility or lead to permanent sterility, thus reducing the reproductive capacity of the herds.
Parasitic diseases. Internal parasites are responsible not only for frequent deaths among calves but also for declining yields among productive animals, losses under this head being estimated at about 200 million pesos. In reality, few stock farmers wage a systematic campaign against pulmonary and gastro-intestinal parasitic infesta-tions, which also make considerable inroads on sheep inventories.
It is calculated that 90 million pesos are lost every year throught the action of external parasites. These parasitic agents include sheep scab, which is being controlled with steadily increasing efficacy, but is still regarded as a factor seriously limiting wool production on many farms.
Ticks will be eradicated, according to estimates, within a period of not more than 5 years, on the basis of a
properly planned official campaign. They are found only in the north of Uruguay, and more than half of the natio-nal territory is considered to be free from them. As is well known, their harmful effects are multiple, deriving partly from their own spoliative action and partly from the heamatozoa of which they are vectors.
Other livestock diseases, such as mastitis in cows, infectious pneumoenteritis among calves, hog cholera, parasitic infestations not previously mentioned, mineral deficiencies, etc. also account for substantial losses.
It may be calculated that, in the aggregate, microbial parasitic agents cause the Uruguayan livestock sector annual losses amounting to over 500 million pesos, a sum equivalent to one-third of the value of total five-stock and poultry production. It should be pointed out that Uruguay is free from bovine paralytic rabies, from glanders among horses and Newcastle disease in poultry, maladies which give rise to considerable losses in other countries.
3. OTHER FACTORS LIMITING PRODUCTION
(a) Defective management
It is important to mention that practically all the Latin American countries are lagging far in the rear as regards farm management and administration techniques. This remark, already made in the studies on Brazil and Mexico, also applies to Uruguay, despite its stock farming tradition and the great progress achieved in genetic improvement. Nevertheless, the breeds developed are not giving the yields that might be expected, for want of rational systems of management.
Most producers have failed to assimilate modern stock farming techniques, for three principal reasons: first, because many of them are absentee landlords, secondly, because of the shortage of trained personnel capable of taking the owner's place in his absence and, thirdly, because a large number of farms are leased to tenants, a custom which discourages reinvestment in improvements. On the contrary, it ultimately leads to depletion of the soil and pastures, as a result of over-utilization and poor management. For example, the 1956 census revealed that in the main dairy farming areas in Uruguay only 35 per cent of the farms are run by their owners. Again, although large-scale farms where thoroughly up-to-date techniques are applied are to be found in various countries, most of the biggest ranches' factor productivity is often compara-tively low. In Uruguay, according to the above-mentioned census, about two-thirds of the total number of beef cattle belong to latifundio of over 1,000 hectares, which represent barely 5.4 per cent of the number of farms breeding cattle for slaughter and on which extremely extensive methods of farming are applied. Only one-third of Uruguay's beef cattle inventories, therefore, is found on farms of under 1,000 hectares. The smaller units run on intensive lines are usually dairy farms which are managed more carefully, and in some instances as well as the best dairy farms in other countries.
(b) Marketing deficiencies Although less striking than in other Latin American
countries, marketing deficiencies also constitute an obsta-

60 LIVESTOCK IN LATIN AMERICA
cle which in many cases discourages production. The most important relate to the lack of proper classification of the goods produced, to defective systems of collecting produce and transporting it to consumer centres, and to fluctuating market prices, and these in turn derive from the absence of appropriate regulations for the whole country. In other cases, as, for instance, in the centre, north and north-east of Uruguay, it is the want of ade-
quate transport facilities that hampers and retards the marketing process.
In the following section the chief characteristics of the marketing system are analysed.
The low level of investment in the livestock sector, insufficient credit facilities and the lack of steady encour-agement to producers are other factors militating against the development of livestock production in Uruguay.
IV. MARKETING AND CONSUMPTION OF LIVESTOCK PRODUCTS
1. MARKETING SYSTEMS
(a) Livestock and meat marketing Up to a few years ago the greatest volume of transac-
tions in livestock for consumption was concentrated in the Tablada Nacional, near Montevideo, and in the Tablada Anglo, 350 kilometres from the capital; at that time, refrigerating plants obtained their entire require-ments from these two markets. The inelasticity of the meat supply, the stagnation of production, the contraction of exports and the steady growth of vegetative internal demand registered in the last few years have radically altered certain meat marketing functions and channels.
As a result of the monopoly granted to the Frigorífico Nacional in 1958 for the supply of Montevideo, many slaughter-houses and butchers' shops situated outside the department of Montevideo could no longer continue to buy animals from the Tablada Nacional, and had to resort to direct purchases at cattle fairs and on the farms themselves. Today, only one-third of the animals sold for consumption are marketed at the Tablada Nacional and the Tablada Anglo. At the same time, the so-called " parallel" or black market for meat has been gradually expanding, with the consequent proliferation of slaughter-houses and shops which are not properly supervised. This in turn has resulted in increased disorganization of the marketing system, larger sales of meat to the consumer without the requisite veterinary inspection, and uncon-trolled speculation on the part of innumerable middlemen.
Another consequence of this situation has been a decline in the activity of the big slaughter-houses with refrigeration facilities, which has not only reduced em-ployment opportunities but has also raised costs. These large plants15 nowadays supply only 40 per cent of the meat used for domestic consumption and for export. While their cold storage capacity is ample and methods of slaughtering and utilization of by-products are properly organized, most of them are operating with obsolete equipment and out-of-date plant. A large proportion of livestock is killed in small slaughter-houses, which are anti-economic and poorly equipped and supervised. It seems that there is growing interest in the decentra-lization of slaughtering in economic modern slaughter-houses of lesser size.
Thanks to the recent authorization given to the Frigo-rífico Nacional to slaughter animals for consumer co-operatives, its activities are expected to expand and it is
15 Nacional, Del Cerro (merger of Armour and Swift), Castro and Anglo.
hoped that a regulatory influence will be exerted on the meat market.
Meat is not sold in accordance with a standard classi-fication, based on the various kinds and qualities, and in many cases its sale to the public is badly organized. The legislation which, in October 1958, authorized the sale of meat in cuts weighing as little as one kilogramme, properly packed, leaves the way open for the continued elimination of many of these shortcomings.
(b) Milk and milk products
The marketing of these commodities is better organized, but of course some problems exist, such as deficiencies in the transport of raw milk to the collecting centres and pasteurizing plants, as a result of which the milk turns sour or its grade and hygienic state deteriorate. Losses of this kind are due to the fact that the milk is often transported in unsuitable vehicles or for relatively long distances, and that no collection and concentration service operated on the basis of receiving and colling plants is available. This is particularly important in the case of milk for direct consumption.
Montevideo is the leading consumer market for pas-teurized milk, which represents approximately one-third of total production. The pasteurized milk market is susceptible of considerable expansion, since plants exist in only three towns. The National Milk Producers' Co-operative (Cooperativa Nacional de Productores de Leche — CONAPROLE) possesses two big plants in Montevideo.
Other milk markets, with different characteristics, are those found in urban centres in the interior, which meet the demand of at least half the Uruguayan population. In many of these the distribution and sale of milk pro-ducts are practically unsupervised, especially in cases where milk production can be regarded as a family enterprise.
Milk products—cheese, butter, etc.—are manufac-tured in 15 plants, of which 4 belong to CONAPROLE, apart from the two pasteurizing plants in Montevideo. It is estimated that 80 and 40 per cent of the total output of butter and cheese, respectively, are made in factories, while the remainder corresponds to production on the farms themselves. As regards the types and qualities of cheese and butter produced, and their marketing channels, various anomalies still remain to be rectified.
The chief centres producing milk for industrial pur-poses are situated in the departments of Colonia, San José and Soriano, particularly and, on a smaller scale, in

URUGUAY: IV . MARKETING AND CONSUMPTION OF LIVESTOCK PRODUCTS 61
certain parts of Paysandú, Río Negro, Salto, Flores, Cerro Largo, Tacuarembó and elsewhere.
(c) Poultry and eggs
It is a fact that the steady expansion of industrial poul-try-keeping has solved many of the marketing problems relating to poultry and eggs. The concentration of trans-actions in the big establishments and poultry-rearing co-operatives has had favourable repercussions on the transport, classification, conservation and sale of these perishable commodities. In contrast, home or non-specialized production is less satisfactorily marketed, and its distribution and sale are often effected by itinerant buyers, with little regard for transport, classification, storage and quality.
(d) Wool marketing Uruguay has no central wool markets such as are to be
found in other major wool-producing countries such as Australia, New Zealand, and South Africa — where wool is sold to merchants, industrialists and exporters at private sales or public auctions. The Uruguayan sheep-farmer usually sells his wool on the farm itself, and has little to do with middlemen and agents in Monte-video.
Apart from the inconvenience of selling wool at a number of different places all over the country, this system of direct sales raises the cost of marketing and limits the spread of information on market conditions and procedures. Moreover, the producer does not nor-mally grade his wool beforehand. This constitutes a handi-cap both to himself and to the buyer, delays sales, does not provide any incentive to improve the quality of the wool and gives rise to other marketing irregularities.
In order to remedy these shortcomings, encouragement is being given to co-operatives, extension services for the teaching of shearing and grading methods are being promoted, and information media on prices and the state of supply and demand are being expanded, thanks to the co-operation of the National Commission for the
Development of Sheepfarining (Comisión Nacional de Mejoramiento Ovino), breeders' associations, the Cham-ber of Commerce (Cámara Mercantil de Productos) and other agencies. Plans are under way to ensure that the wool co-operatives become genuine marketing orga-nizations, both for the domestic market and for export purposes, instead of limiting themselves simply to storing and selling on order, as do most of the 20 co-operatives that have been set up so far.
2. LIVESTOCK PRODUCTS: DEMAND AND CONSUMPTION
(a) Meat Years ago livestock production in Uruguay was
sufficiently flourishing to allow of a high level of domestic consumption of meat and at the same time to earn an appreciable amount of foreign exchange. But during the last decade the situation changed radically, as the stagna-tion and decline of cattle production led to a sharp drop in supplies for the home market and export.
Total consumption of beef and mutton, which repre-sented nearly 90 per cent of total real meat demand, amounted to 174,000 tons and 58,000 tons respectively in 1959. As table 13 indicates, these figures were at the same level as the annual average consumption in 1948-50. Even though overall beef consumption rallied in later years, its recovery was achieved at the expense of exports which in 1952 and 1953 had already contracted appreci-ably and dropped even lower after 1955. If these changes had not taken place, total per capita meat consumption would have declined even more, since production of other types of meat experienced only a moderate rise from 1951 onwards.
Total per capita meat consumption in Uruguay had been the highest in the world (125 kilogrammes of red meat). In 1948-50, average per capita consumption had already declined to 106 kilogrammes, and in 1959 it dropped sharply to 95 kilogrammes.
The composition of individual consumption also changed substantially, in both relative and absolute terms. With respect to the higher level of per capita consumption
Table 13 Uruguay: Apparent meat consumption, 1948-50 to 11957-59 a
1948-50 1951-53 1954-56 1957-59 1959
Total (thousands of tons) 253.7 Index (100.0) Beef 172.0 Mutton 58.8 Pork 13.6 Poultry 9.3
Per capita, aggregate (Kg) 106.4 Index (100.0) Beef 72.1 Mutton 24.7 Pork 5.7 Poultry 3.9
299.9 299.9 283.8 265.5 (118.2) (118.2) (111.8) (104.6) 220.0 209.0 195.0 174.0
50.5 58.7 56.2 58.5 18.4 19.9 19.6 19.7 11.0 12.3 13.0 13.3
119.6 114.0 103.3 95.2 (112.0) (107.0) (97.0) (90.0)
87.6 79.4 71.0 62.4 20.1 22.3 20.5 20.9
7.3 7.6 7.1 7.1 4.4 4.7 4.7 4.8
Sources: Estimates and data provided by the Ministry of Agriculture, Department ofRural Economy. 0 Including the estimate of consumption on farms.

62 LIVESTOCK IN LATIN AMERICA
achieved between 1951 and 1953, the proportion of beef rose to 73 per cent while that of the other types of meat, especially mutton, dropped to 17 per cent. On the other hand, the subsequent decline in consumption was due to a contraction in the share of beef. For instance, in 1959, out of a total per capita consumption of 95 kilo-grammes of meat, only 66 per cent consisted of beef, while the proportion of mutton increased to 22 per cent. In the case of pork and poultry, their relative proportions expanded slightly although their per capita consumption levels showed no change after 1951.
From the foregoing observations, it is clear that the Uruguayan consumer prefers beef to all other types of meat. Under present conditions, there is very little pros-pect of raising per capita consumption of the other types of meat to any appreciable extent unless a consider-able change takes place in the structure of relative prices and other incentives are created for enhancing demand. This would be even less likely to occur in future if any substantial increment were to take place in beef produc-tion.
It should be noted that the fall in consumption resulting from soaring relative prices for meat affected the lower income groups. It is evident that if the gap between supply and demand widens, the consequent rise in relative prices would discourage consumption among a broader segment of the population. The fact that meat prices in Uruguay have increased out of all proportion during the past ten years is easy to demonstrate with the aid of a few figures and the attached graph of relative prices (see figure IV). For instance, while the average price per kilogramme of live cattle in 1951 was 0.242 Uruguayan pesos, in 1959 it rose to 1.181 pesos and recorded an average of 1.935 pesos for the first ten months of I960,16
an increase of 388 and 700 per cent respectively. During the same period, the rise in absolute prices for milk17 was only 79 per cent in 1959 and 139 per cent in 1960. Figure IV shows that, except in 1956, the relative prices of beef have been climbing continuously and fairly evenly since 1950, while those of milk and eggs have remained at a comparatively low level, thereby stimulating demand.
(b) Milk, milk products and eggs Since foreign trade in these products is small and in-
significant in comparison with domestic consumption, the figures for production are almost the same as those for apparent consumption. Hence, it is unnecessary to analyse the changes that have been recorded in the levels of total and per capita consumption, although reference should of course be made to the relative posi-tion of consumption levels and other factors.
Average per capita consumption in 1957-59 was estimated at 238 litres of whole milk;18 this was not only an improvement over earlier periods, but placed Uruguay in a relatively favourable position in comparison with the other Latin American countries, except Argentina, and at more or less the same level as Denmark and the Kingdom of the Netherlands. If the substantial variations
16 Data provided by the Banco de la República Oriental del Uruguay, Suplemento Estadístico de la Revista Económica, Nos. 164 and 199.
17 Milk at the pasteurizing plant. 18 Milk and dairy products in terms of fluid milk equivalent.
Figure IV Uruguay: Relative prices of beef, milk and eggs, 1950-59
C1950 = 100) N A T U R A L SCALE
2 5 0
200 —
0 Rice, sweet potatoes, bread, potatoes, yerba.
between total average consumption in rural and urban zones are disregarded, nearly 69 per cent was represented by fresh milk, 16 per cent by butter and 15 per cent by cheese and other products. The annual per capita cheese supply is 3.3 kilogrammes, which is a reasonable amount, but that of butter is only 1.5 kilogrammes as against 15 kilogrammes or more in other countries.
With respect to the per capita consumption levels that are thought to be adequate from the nutritional point of view, meat consumption in Uruguay is twice the required figure while that of milk and dairy products is adequate if expressed in terms of whole milk. Egg con-sumption is estimated to be about 50 per cent below the recommended level,19 but is none the less higher than in a great many Latin American countries. Thus, the situa-tion in Uruguay as regards per capita consumption of basic protective foods is unquestionably favourable. The only exception is fish, the annual per capita consump-tion of 2 kilogrammes being one of the lowest in the region.
(c) Wool Wool consumption is almost 14 per cent of production,
compared with 6 per cent ten years ago. This amounts to a per capita consumption of 3.9 kilogrammes in 1959 as against 1.6 kilogrammes in 1949.
19 In 1959, it was 126 units as against the figures of 228 and 276 recommended at the Hot Springs Conference in 1943.

URUGUAY: V. EXPORTS OF LIVESTOCK PRODUCTS 63
V. EXPORTS OF LIVESTOCK PRODUCTS
Table 14 Uruguay: Value of exports of livestock products, 1951-60
(Thousands of dollars)
Year Cattle » Sheep 6 Total Percentage of total exports
1 9 5 1 5 2 , 5 8 0 1 3 2 , 7 6 4 1 7 6 , 3 4 4 7 4 . 6
1 9 5 2 4 4 , 4 3 8 1 0 1 , 7 0 2 1 4 6 , 1 4 0 6 9 . 8
1 9 5 3 4 4 , 8 8 5 1 7 6 , 5 1 5 2 2 1 , 4 0 0 8 2 . 0
1 9 5 4 4 9 , 7 1 2 1 3 3 , 3 7 2 1 8 3 , 0 8 4 7 3 . 5
1 9 5 5 1 2 , 1 1 2 1 1 3 , 6 2 4 1 2 5 , 7 3 6 6 8 . 3
1 9 5 6 2 3 , 4 1 2 1 3 6 , 0 8 7 1 5 9 , 4 9 9 7 5 . 5
1 9 5 7 2 9 , 0 4 8 6 7 , 3 9 3 9 6 , 4 4 1 7 5 . 1
1 9 5 8 1 7 , 2 6 9 8 4 , 1 7 1 1 0 1 , 4 4 0 6 5 . 3
1 9 5 9 2 1 , 5 2 9 5 7 , 7 1 2 7 9 , 2 4 1 8 0 . 9
I 9 6 0 0 3 3 , 9 3 8 5 9 , 8 3 2 9 3 , 6 7 0 8 4 . 4
Source: Banco de la República Oriental del Uruguay, Suplemento Estadístico de la Revista Económica, Nos. 164 and 199.
0 Beef and hides. 6 Meat, skins and wool. • First ten months
From the figures in table 14, it may be concluded that at least two-thirds to four-fifths of the total value of Uruguayan exports consist of livestock products—chiefly meat and wool and, to a lesser extent, ox hides and sheep-skins. This means that any changes in these export items have a considerable effect on the country's trade balance and ultimately on its economy.
If the changes that took place in the last decade alone are analysed, a clearly downward trend for exports is discernible. From an average annual value of 181.3 million dollars in 1951-53 they dropped to 91.5 million in 1958-60 —virtually a 50 per cent reduction. Table 14 shows that this decline affected cattle and sheep products alike, being particularly noticeable for the former between 1955 and
1959 and for the latter from 1957 onwards for reason which will be explained when the individual export commodities are discussed.
1. MEAT EXPORTS
With the exception of a few shipments of pork in 1951 and 1952, all the meat exported consisted of beef and mutton. Of these, beef was by far the most important in volume and value (see table 15); in 1951-53 beef constituted nearly 87 per cent of the export volume and as much as 97 per cent in 1958-60.
It has already been pointed out that Uruguay is gra-dually losing its status as a meat exporter. The decline that has taken place is considerable in both absolute
Table 15 Uruguay: Meat exports, 1951-60
(Volume in tons; value in thousands of dollars)
Year
Beef• Mutton b Total
Year Volume Value Volume Value Volume Value
1 9 5 1 . . . 7 6 , 2 3 0 3 5 , 7 0 6 4 , 8 9 4 1 , 7 2 9 8 1 , 1 2 4 3 7 , 4 3 5 1 9 5 2 . . . 5 1 , 5 4 9 2 9 , 4 8 6 1 2 , 0 8 7 4 , 9 7 3 6 3 , 6 3 6 3 4 , 4 5 9 1 9 5 3 . . . 5 7 , 2 8 3 3 2 , 1 2 1 6 , 5 5 0 1 , 8 1 1 6 3 , 8 3 3 3 3 , 9 3 2 1 9 5 4 . . . 6 7 , 3 1 3 3 8 , 6 1 3 7 , 0 0 8 2 , 4 9 3 7 4 , 3 2 1 4 1 , 1 0 6
1 9 5 5 . . . 8 , 5 1 4 5 , 6 7 1 6 5 5 2 3 2 9 , 1 6 9 5 , 9 0 3
1 9 5 6 . . . 3 6 , 2 8 4 1 6 , 8 0 7 8 , 4 3 1 2 , 1 3 7 4 4 , 7 1 5 1 8 , 9 4 4
1 9 5 7 . . . 4 7 , 2 8 9 2 1 , 7 0 9 5 , 4 0 5 1 , 5 0 1 5 2 , 6 9 4 2 3 , 2 1 0
1 9 5 8 . . . 2 6 , 5 3 7 1 1 , 8 9 3 2 , 3 5 9 6 9 3 2 8 , 8 9 6 1 1 , 5 8 6
1 9 5 9 . . . 3 1 , 8 0 2 1 5 , 4 3 3 1 , 4 7 7 3 4 2 3 3 , 2 7 9 1 5 , 7 7 5
1 9 6 0 ° . . . 6 9 , 1 9 3 2 7 , 0 9 7 8 6 3 5 6 9 , 2 7 9 2 1 , 1 3 2
Source: As for table 14. a Frozen, tinned, salted and jerked. b Frozen and tinned. 0 First ten months.

64 LIVESTOCK IN LATIN AMERICA
and relative terms. For instance, the volume of fresh, chilled and dressed meat exported decreased in round figures from 100,000 tons a year in 1934-38 to 70,000 in 1951-53 and approximately 45,000 in 1958-60. The percentage share of the world export market shrank from 14 per cent in 1948-50 to 6 per cent in 1956 and 1 per cent in 1958-59. This means that at least a dozen countries now export more meat than Uruguay. No attempt will be made here to embark upon a detailed investigation of the reasons for the reduction of exports in any given year, but among the more salient factors were the rise in production costs, which at times exceeded international meat prices, the discouraging exchange and subsidy policy, favourable wool prices and other factors which led to the stagnation and reduction of the cattle popula-tion and which, the level of physical productivity being the same, produced a decline in meat production. These circumstances, in addition to competition from other countries and the preference of the Uruguayan consumer for beef at any price, provoked a drastic change in the distribution of production between the home and foreign markets. Figure V shows the reduction that took place in the proportion of cattle slaughtered for export. Twenty-five years ago, more than half the production was sent abroad, whereas in 1955 the proportion had decreased to less than 10 per cent. In 1960, exports climbed to more than twice their figure in 1959, as a result of the complete liberalization of exchange rates at the end of 1959 and of the increased slaughtering of cattle after the severe drought in southern Uruguay during the first half of 1960.
Some recent changes have also been recorded in the markets to which Uruguayan exports were sent. In 1955-57, 59 per cent was shipped to the Federal Republic of Germany and the United Kingdom; these were followed in order of importance by other European countries, a few Latin American countries and, lastly, the United States. In 1959, the Federal Republic of Germany and the United Kingdom bought 50 per cent of the total value of Uruguay's exports and United States purchases
Figure V Uruguay: Percentage of beef cattle slaughtered for export,
1916-60 a
N A T U R A L SCALE
1916 2 0 25 3 0 35 4 0 4 5 5 0 8 5 6 0 " In terms of total slaughtered.
rose to nearly 4.5 million dollars — i.e., 28 per cent of the total. In that year, the United States was the biggest buyer of tinned meat from Uruguay. It should be men-tioned that Uruguay has seen its shipments of meat drop off at a time when world demand was expanding and international prices stood at a high level.
Table 16
Uruguay: Wool exports, 1950-61 (Volume in tons; value in thousands of dollars)
Wool Combed wool
Year Washed Semi-washed Creasy Ctops) Total value
Volume Value Volume Value Volume Value Volume Value
1 9 5 1 4 , 7 9 1 2 1 , 0 6 5 6 7 1 7 0 2 8 , 7 7 1 7 5 , 3 0 7 4 , 2 2 8 2 0 , 9 3 2 1 1 7 , 4 7 4 1 9 5 2 6 , 5 1 8 1 1 , 3 7 0 1 7 5 1 6 2 3 9 , 0 3 1 5 6 , 7 5 1 8 , 4 5 7 2 2 , 0 2 8 9 0 , 3 1 1 1 9 5 3 1 2 , 6 5 4 2 3 , 6 9 1 7 6 1 2 5 6 6 , 7 8 8 1 0 3 , 4 9 5 1 3 , 2 4 3 3 7 , 4 2 3 1 6 4 , 7 3 4 1 9 5 4 8 , 3 7 0 1 7 , 7 7 8 1 0 2 1 4 9 4 5 , 1 2 9 7 4 , 6 7 1 1 1 , 2 9 8 3 1 , 9 1 3 1 2 4 , 5 1 1 1 9 5 5 1 3 , 1 6 2 2 3 , 7 9 7 6 7 8 9 3 6 , 1 9 6 5 0 , 3 1 4 1 2 , 7 4 0 3 1 , 3 5 1 1 0 5 , 5 5 1
1 9 5 6 1 3 , 3 2 9 2 2 , 5 3 3 5 8 7 8 5 0 , 3 7 9 6 5 , 5 3 5 1 5 , 8 9 4 3 7 , 4 2 2 1 2 5 , 5 6 8 1 9 5 7 5 , 8 6 4 1 1 , 0 5 4 1 5 2 3 2 1 , 9 5 6 3 2 , 3 1 6 7 , 3 1 9 1 9 , 5 9 9 6 2 , 9 9 2
1 9 5 8 7 , 3 6 0 9 , 6 2 9 3 4 3 7 5 1 , 3 0 6 5 3 , 7 8 1 9 , 9 6 2 1 6 , 9 9 5 8 0 , 4 4 2
1 9 5 9 9 , 0 7 7 1 0 , 2 5 4 — — 2 5 , 9 8 1 2 4 , 1 0 1 1 2 , 2 3 0 1 9 , 8 9 3 5 4 , 2 4 8
1 9 6 0 a 6 , 5 1 7 9 , 5 7 3 — — 2 0 , 7 9 9 2 6 , 4 4 6 7 , 8 9 6 1 8 , 0 2 6 5 4 , 0 4 5
Source : B a n c o d e l a R e p ú b l i c a O r i e n t a l de l U r u g u a y , Suplemento Estadístico de la Revista Económica, N o s . 164 a n d 199. T e n first m o n t h s .
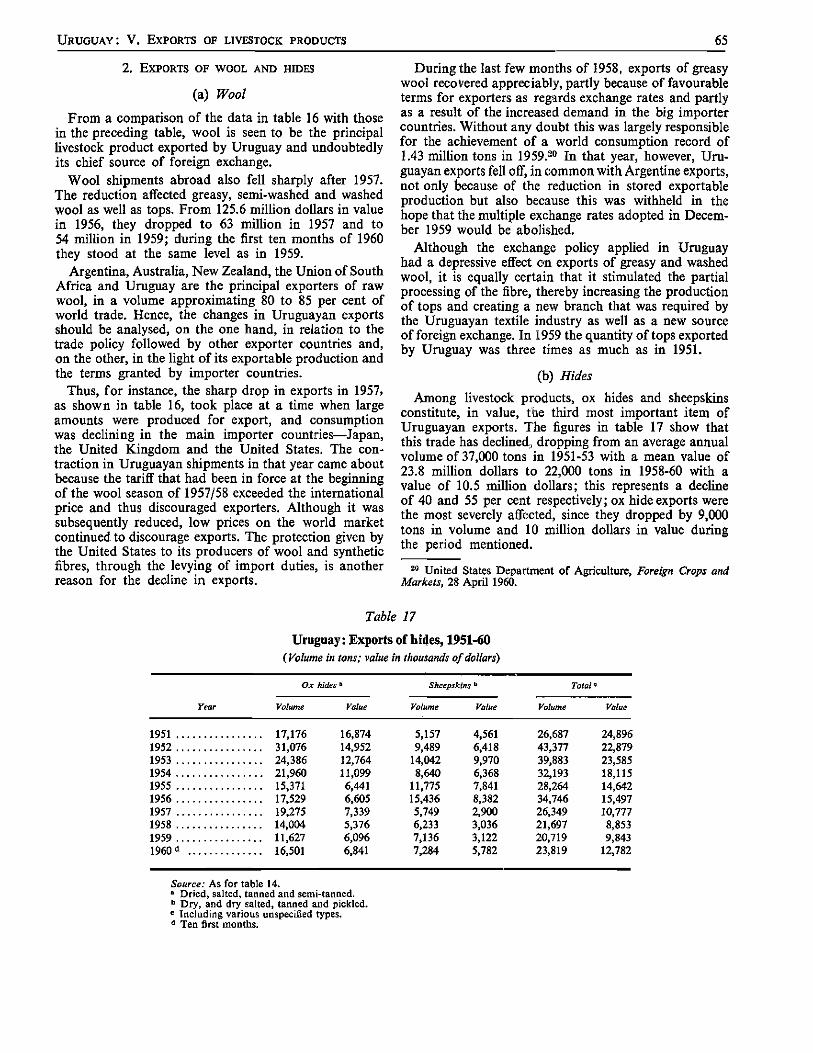
URUGUAY: V . EXPORTS OF LIVESTOCK PRODUCTS 65
2. EXPORTS OF WOOL AND HIDES
(a) Wool
From a comparison of the data in table 16 with those in the preceding table, wool is seen to be the principal livestock product exported by Uruguay and undoubtedly its chief source of foreign exchange.
Wool shipments abroad also fell sharply after 1957. The reduction affected greasy, semi-washed and washed wool as well as tops. From 125.6 million dollars in value in 1956, they dropped to 63 million in 1957 and to 54 million in 1959; during the first ten months of 1960 they stood at the same level as in 1959.
Argentina, Australia, New Zealand, the Union of South Africa and Uruguay are the principal exporters of raw wool, in a volume approximating 80 to 85 per cent of world trade. Hence, the changes in Uruguayan exports should be analysed, on the one hand, in relation to the trade policy followed by other exporter countries and, on the other, in the light of its exportable production and the terms granted by importer countries.
Thus, for instance, the sharp drop in exports in 1957, as shown in table 16, took place at a time when large amounts were produced for export, and consumption was declining in the main importer countries—Japan, the United Kingdom and the United States. The con-traction in Uruguayan shipments in that year came about because the tariff that had been in force at the beginning of the wool season of 1957/58 exceeded the international price and thus discouraged exporters. Although it was subsequently reduced, low prices on the world market continued to discourage exports. The protection given by the United States to its producers of wool and synthetic fibres, through the levying of import duties, is another reason for the decline in exports.
During the last few months of 1958, exports of greasy wool recovered appreciably, partly because of favourable terms for exporters as regards exchange rates and partly as a result of the increased demand in the big importer countries. Without any doubt this was largely responsible for the achievement of a world consumption record of 1.43 million tons in 1959.20 In that year, however, Uru-guayan exports fell off, in common with Argentine exports, not only because of the reduction in stored exportable production but also because this was withheld in the hope that the multiple exchange rates adopted in Decem-ber 1959 would be abolished.
Although the exchange policy applied in Uruguay had a depressive effect on exports of greasy and washed wool, it is equally certain that it stimulated the partial processing of the fibre, thereby increasing the production of tops and creating a new branch that was required by the Uruguayan textile industry as well as a new source of foreign exchange. In 1959 the quantity of tops exported by Uruguay was three times as much as in 1951.
(b) Hides
Among livestock products, ox hides and sheepskins constitute, in value, the third most important item of Uruguayan exports. The figures in table 17 show that this trade has declined, dropping from an average annual volume of 37,000 tons in 1951-53 with a mean value of 23.8 million dollars to 22,000 tons in 1958-60 with a value of 10.5 million dollars; this represents a decline of 40 and 55 per cent respectively; ox hide exports were the most severely affected, since they dropped by 9,000 tons in volume and 10 million dollars in value during the period mentioned.
20 United States Department of Agriculture, Foreign Crops and Markets, 28 April 1960.
Table 17
Uruguay: Exports of hides, 1951-60 ( Volume in tons; value in thousands of dollars)
Ox hides * Sheepskins " Total0
Year Volume Value Volume Value Volume Value
1951 17,176 16,874 5,157 4,561 26,687 24,896 1952 31,076 14,952 9,489 6,418 43,377 22,879 1953 24,386 12,764 14,042 9,970 39,883 23,585 1954 21,960 11,099 8,640 6,368 32,193 18,115 1955 15,371 6,441 11,775 7,841 28,264 14,642 1956 17,529 6,605 15,436 8,382 34,746 15,497 1957 19,275 7,339 5,749 2,900 26,349 10,777 1958 14,004 5,376 6,233 3,036 21,697 8,853 1959 11,627 6,096 7,136 3,122 20,719 9,843 1960d 16,501 6,841 7,284 5,782 23,819 12,782
Source: As for table 14. u Dried, salted, tanned and semi-tanned. b Dry, and dry salted, tanned and pickled. c Including various unspecified types. 4 Ten first months.

66 LIVESTOCK IN LATIN AMERICA
VI. DEVELOPMENT INCENTIVES AND PROSPECTS It is a well-known fact that conditions in Uruguay are,
relatively speaking, very favourable for the development of stock farming. It has a mild climate, particularly suitable for highly specialized breeds of European origin, a fairly fertile soil on which different high-yield forage species can be grown with the help of an evenly distri-buted rainfall, a great tradition as a stock farming country, and the experience and constant interest of the Uruguayan rancher.
In the past, full advantage was taken of these condi-tions and they placed the country in a privileged position. Available land reserves were taken over for stock farming purposes and animal husbandry was greatly improved. It is these factors, in conjunction with low production costs and broad markets, that were instrumental in helping stock farming to make such extraordinary pro-gress.
In the course of the last thirty years the situation was reversed and the golden age of stock farming changed to a period of stagnation marked by a sharp drop in exports and a reduction in supplies for the home market. The rise in production costs as a result of the increased cost of land and other inputs, the limited extent to which the stock farming area could be expanded, the reluctance to reinvest capital in improvements and the low levels of productivity are all factors that impede the develop-ment of livestock production in Uruguay. Despite the sustained efforts of official development organizations and producers' associations, it has proved impossible to remove these obstacles, partly because of the shortage of technical and financial resources. The Government and stock farmers are fully aware of the need to accu-mulate funds in order to improve the present situation, and realize that it is a difficult task which cannot be achieved in a short time. Until the protection and expan-sion of the livestock sector is planned on this basis, its development will continue to be slow and to lag behind that of other sectors of the economy.
From an analysis of the situation and the structure of livestock production in Uruguay, it may be concluded that the highest priority in programmes for livestock rehabilitation should be given to projects designed to raise the yield per animal and per unit of area. In other words, stress should be laid on the introduction of modern techniques into stock farming and on two production factors in particular: the improvement of the condition
and handling of pasture-land and the introduction of rational and modern methods of administration. The improvement of animal husbandry and the control of livestock diseases are less urgent problems. The cam-paigns sponsored by the Ministry of Agriculture and breeders' associations and the interest of farmers them-selves have led to effective progress in this respect. The animal population in Uruguay has the highest genetic value of any in Latin America but its yield is lower than it should be owing to dietary deficiencies and inadequate management.
During the last few years both the Government and the private sector have taken a more active interest in re-solving the critical situation of stock farming in Uruguay. To this end, a variety of programmes and campaigns have been put into effect under the auspices of the Departments of Livestock and Agronomy (Direcciones de Ganadería y de Agronomía), the Settlement Institute (Instituto de Colonización), producers' associations, such as the Society for the Improvement of Pasture-land (Sociedad de Mejoramiento de Praderas), and other organizations. The measures taken by the Parliament have also played an extremely important part, especially the plan for the technical improvement of farming which became law on 2 July 1957. Thanks to this plan, in which the International Bank for Reconstruction and Development and the United Nations Food and Agriculture Organization are co-operating, funds have already been earmarked for the improvement of 700 ranches. A sum was also recently set aside for the promo-tion of meat and milk production, through campaigns for better pasture-land, the application of fertilizers, soil conservation, the provision of water supplies, disease control, etc. The Inter-American Institute of Agricultural Sciences of the Organization of American States (Turri-alba, Costa Rica) (Instituto Interamericano de Ciencias Agrícolas), through the Montevideo regional office for the southern-zone countries, is also collaborating in the development of the livestock industry, mainly through extension services (Project 39, Technical Co-operation Programme).
It is hoped that research work, extension services and technical and financial assistance will be intensified in keeping with stock farmers' requirements and problems. In short, what stock farming needs is a powerful incentive for development which will improve its future prospects.

VENEZUELA

E/CN.12/558 9 March 1961

INTRODUCTION AND SUMMARY
The present study is not intended to be an exhaustive analysis of Venezuelan stock farming problems but only an exposition of some of the chief factors that have either promoted or retarded the production and distri-bution of livestock products in recent years. Venezuela's livestock and the supply and demand problems affecting its products have special characteristics which must be taken into account in an economic survey of Latin Amer-ican stock farming.
Notwithstanding the fact that the domestic supply of food products of animal origin has increased sub-tantially in recent years, present per capita consumption levels are still ostensibly low, in terms both of recom-mended nutritional standards and of Venezuela's current potential demand trends and volume. Thus, the average annual per capita consumption of red meat was 19 kg in 1956-58 and rose to about 22 kg in 1959, with beef accounting for four-fifths of the total. Earlier, it had remained static at an average of 17 kg and had even dropped slightly in the three-year periods 1950-52 and 1953-55, starting to increase from 1956 onwards. Annual per capita consumption of milk products, expressed as an aggregate in terms of fluid milk, climbed from an aver-age of 112 litres in 1951-52 to 135 litres in 1956-58. The main increase was registered in the consumption of pasteurized milk, which rose from an average of 4.6 litres in 1948-50 to 25.5 litres in 1956-58, the increase in the consumption of powdered milk being somewhat smaller. On the other hand, per capita consumption of cheese and butter remained stable in the past few years. An analysis of consumer trends shows that they are closely related to price levels. It should be noted at this point that the relative expansion in milk consumption is essentially related to lower real consumer prices.
An outstanding feature, well known in the Venezuelan animal food market, is the spectacular upward trend in the demand for these foodstuffs. Both population and income have grown at a rate unequalled in any other Latin American country.1 The high purchasing power and considerable elasticity of demand for the livestock products normally consumed in Venezuela tends to compensate for domestic consumption and production deficits through changes in foreign trade trends. For more than ten years Venezuela has suspended meat exports and has become an importer of meat. It is also the largest buyer of foreign milk products and eggs; for example, imports account for more than half the total consumption of milk products, expressed in terms of fluid milk. In 1956-58, the annual value of food imports of animal origin averaged about 156 million bolívares, of which 76.2 per cent was represented by
1 The annual population growth rate was extremely high (from 3.5 to 4.35 per cent) between 1950 and 1958, as was the per capita income growth rate which, according to the Central Bank (Memoria de 1958) averaged 6 per cent.
milk products, 23.3 per cent by eggs and less than 1 per cent by meat, poultry and lard. Between 1948-50 and 1956-58, imports of tinned milk increased by 54 per cent, cheese by 150 per cent and eggs by about 200 per cent. In spite of the campaigns to promote stock farming now being conducted and the increases which livestock production may achieve, demand is expected to outstrip domestic supply. As a result, imports will have to be resorted to in order to make up for inadequate domestic output, at least over the short and medium term.
Venezuela's livestock and poultry output is based on an estimated animal population of approximately 7 million cattle, 2.4 million pigs, over 1 million sheep and goats and about 12 million poultry. The number of animals other than goats increased between 1950 and 1956, the highest rate for beef cattle being registered in the past five years.
Annual production of red meat rose from 76,000 tons in 1947-49 to 119,000 tons in 1956-58 and 141,000 tons in 1959, an increase of 58 per cent and 85 per cent respec-tively, most of which has been achieved since 1956. This sharp rise is due not only to the larger number of animals slaughtered, the index for which rose by 61 points between the two periods, but also to the greater carcass meat yield of slaughtered cattle.2 Fluctuations in per capita meat output were relatively small between 1939-51 and 1953-55 and then remained fairly stable—at about 17 kg—compared with a per capita increase of 6 kg in 1959 over the period 1947-49.
Venezuela is one of the few Latin American countries in which the meat supply has expanded so markedly in the past few years. Brief mention should perhaps be made of some of the factors which have caused this. In the first place, there are the cattle which have entered Venezuela from Colombia. There is no record of the number of cattle involved, since this traffic is illegal, but there is information indicating that some 100,000 head annually have thus been brought into the country in recent years. The recent marked increase in the average weight of cattle on the hoof for slaughter and of the carcass meat yield seems to corroborate this estimate,3
In addition, mention should be made of the favourable effect of a series of measures taken by the Government to promote an increase in the cattle population and in livestock yield. These include frequent large-scale imports of various breeds, an activity in which Venezuela has headed all other Latin American countries.4 Health
2 An average of 168 kg per animal in 1956-58 compared with 155 kg in 1951-53 and 161 kg in 1954.
3 Colombian cattle brought into Venezuela and prepared for slaughter are usually heavier on the hoof and have a higher meat yield than Venezuelan cattle.
4 A total of 17,633 cattle of different breeds was imported be-tween 1945 and 1953, a figure which has increased considerably since then.
69

70 LIVESTOCK IN LATIN AMERICA
campaigns have also been carried out successfully, as indicated by the lower incidence and morbidity of pathogenous agents, the control of some diseases and the reduction in the death rate, with respect to which compa-rative figures are given in the relevant section of this report. The expansion of livestock credit is another incentive to production, but its effects will only be felt in future years, in view of the major effort made in 1958, unprecedented in the history of the Venezuelan livestock industry,5 now being carried out as a supplementary measure to the land reform Act adopted in March 1960.
Milk production has also increased substantially, its volume in 1959 being 102 per cent higher than in 1950. Production in the last two years covered in this report averaged about 400 million litres a year, of which 45 per cent was used for direct consumption, a little over 20 per cent for the manufacture of cheese, and the remaining 33 per cent for butter and powdered milk. The rise in the production of butter, powdered milk and pasteurized milk was particularly steep, especially for pasteurized milk, which rose from an average of 18 million litres in 1948-49 to 126 million in 1956-58 and 149 million in 1959. It should be noted that these increments resulted partly from the fact that less milk is used for cheese and butter, much of which is manufactured from imported cream.
The policy of subsidies to producers through pasteur-ization and processing plants and that of low prices to stimulate consumption are factors which have contri-buted to the expansion of the milk industry in Venezuela. Technological advances in dairy farming have also been of significance.
As in all tropical countries, but perhaps more so in Venezuela than in others, livestock productivity and yield are low, particularly with respect to meat. The reason for this is the extensive system of stock farming and fattening, often practised by primitive methods on natural pastures of little and often temporary nutritional value, and the predominance of the criollo breeds which are traditionally very low in yield.
The rate of slaughter—7.15 per cent of the livestock population, excluding in situ slaughter—is one of the lowest in Latin America. The live weight of beef cattle slaughtered averages only 340 kg per mature animal, with a carcass meat yield of less than half that figure. These two factors are responsible for the extremely low meat yield per head of cattle, which in 1956 was estimated at 13 kg compared with 48 kg in Argentina, 36 kg in Uruguay, 20 kg in Paraguay and figures which are twice as high as those for Venezuela in many other Latin American countries.
The average output of milk per cow is low—2 to 3 litres daily in herds of criollo or mestizo cattle with only a small percentage of improved blood—and the milking period is short. High-grade cows used on some dairy farms produce as much as 10 litres and even more of milk daily per head, but there are only very few such intensive farms.
6 By decree No. 58 of 22 February 1958, a loan of 660.5 million bolívares for a five-year livestock development plan was authorized.
The breeding efficiency rate barely averages 40 per cent,6 half the rate achieved in properly organized breeding farms, and is the result of a low birth-rate and high mortality among young animals.
The productivity of capital and labour engaged in livestock production is low, particularly for small farms lacking in advanced techniques and for some extensive breeding activities, where marginal yields barely cover the cost of these factors and may even be negative, as is the case for marginal productivity of land in some areas. Thus, the low investment yield hampers attempts to improve production and to introduce advanced tech-niques.
The reasons for the low productivity and yield of Venezuelan stock farming may be summed up as follows: (a) low carrying capacity of the pastures—2 to 4 hectares per animal—as a result of poor management and the fact that 80 per cent of the grazing area consists of natural pasture; (b) predominance of indigenous breeds of cattle which, while offering the advantage of adapta-bility to tropical conditions, have a low breeding effi-ciency rate; (c) incidence of cattle diseases and epidemics, causing high mortality and heavy financial losses; (d) low level of technique and primitive methods in the handling and management of livestock farms and ranches; (e) difficulties and shortcomings in the marketing, processing and distribution of livestock products.
As for the state-by-state break-down of livestock distribution and type of activity, most of the pasture area is usually used for the raising of beef cattle, which constitute the majority of the livestock population. This activity is carried on mostly in the States of Anzoátegui, Apure, Barinas, Bolívar, Cojedes, Guárico, Monagas and Portuguesa and in the Federal Territory of Delta Amacuro, which account for approximately 70 per cent of the cattle population and perhaps over 80 per cent of the total stock farming area. While meat production is its main purpose, cheese production is often a secondary, though relatively important, activity. Stock farming is the only activity in the "pasture area" and is often practised by the very extensive "open range" method because the low quality of the pasture is not conducive to fattening. Herds tend to be large, since some 33 to 46 per cent of the farms have 1,000 to 5,000 or more head of cattle, as for instance in Apure.
Zulia and Lara, in the north-eastern part of the country, are the chief dairy cattle areas, followed by Carabobo, Aragua, Miranda and the Federal District in central Venezuela. This region represents about 11 per cent of the total livestock area and 17 per cent of the cattle population. Intensive farming is practised here on a large scale, mostly on farms with good artificial pasture, supplementary feed, special dairy-cattle breeds or mestizo cattle with a high percentage of improved blood, and proper management. Herds tend to be rather small, four-fifths of the dairy farms having less than 100 head of cattle each.
Fattening, as yet not properly organized in Venezuela, is concentrated mostly in the States of Aragua, Miranda
6 Ratio of calves weaned to number of breeding cows available.

VENEZUELA: I . AVAILABLE RESOURCES 71
and Falcon, but is combined with breeding and even dairy activities on mixed farms in other States. Mixed stock farming is also practised in the States of Mérida, Táchira, Trujillo and others.
In short, Venezuela has areas and regions suitable not only for all branches of the beef cattle industry
but also for raising sheep and goats on a much larger scale. The country's livestock potential is being developed and long-term production prospects seem good, judging from the trend over the past few years and from the strong encouragement given to livestock development by the Government.
I. AVAILABLE RESOURCES
1. LIVESTOCK AND POULTRY POPULATION
As in other Latin American countries, an inventory of livestock is taken at very infrequent intervals, the last one having been carried out in 1950. Adequate data are therefore lacking on the livestock population in recent years and even more so on its present break-down by race, sex, grade, age and geographical distribution. To overcome these shortcomings, at least in part, the Ministry of Agriculture and Livestock has undertaken sample estimates and surveys, with special emphasis on cattle in view of its economic and numerical preponderance.
Venezuela would seem to have over 7 million head of cattle (or slightly more than one animal per inhabitant), 2.4 million pigs, a little over 1 million sheep and goats7
and about the same number of horses, and some 12 million poultry (see table 1).
Table 1 Venezuela: Estimated livestock and poultry population,
1950 to 1956 (Thousand head)
1950 1956
Cattle 5,769 7,162 Pigs 1,454 2,362 Sheep 101 176 Goats 1,288 921 Horses 344 533 Mules 62 130 Asses 387 427 Poultry 10,368 a 11,700
Sources: 1950 census figures, 1959 edition. The 1956 figures are taken from the Ministry of Agriculture, Crop and Livestock Planning Depart-ment, Encuesta agropecuaria nacional (National Crop and Livestock Survey). September 1957,
4 Chickens and pullets, cocks and hens, ducks and turkeys.
Although no data are available for estimating the annual livestock growth rate, it can be stated that the cattle population has increased at an annual rate of only some 2 per cent between 1937 and 1950, according to figures available from the respective censuses taken.8
If so, the cattle population is expanding at a much slower pace than the human population, particularly in areas where beef cattle is raised. This fact, together with the low productivity of livestock—in terms of animals selected for slaughter—has produced an acute imbalance
7 The goat population declined by 14 per cent between 1950 and 1956.
8 According to the Ministry of Agriculture, La industria ganadera de carne en Venezuela (Caracas, 1958), the cattle population amounted to 4,305,505 head in 1937 and to 5,673,797 in 1950.
in the meat supply vis-á-vis growing consumer require-ments. Between 1950 and 1956, the cattle population grew from 5.77 million head, according to the census, to 7.2 million, a figure based on the sampling survey; this is equivalent to an increase of approximately 26 per cent in six years, or an average annual rise of 4 per cent, which is virtually twice the rate recorded in the earlier period. A relative growth of this magnitude, such as has taken place in Venezuela during the past few years, can only be achieved in an expanding livestock industry. Its main results are apparent in the substantial increments in the production of meat and milk.9
With regard to the division of the cattle population by sex, the 1956 crop and livestock survey showed that, in round figures, 68 per cent were females and 32 per cent males. Breeding-cows—females over two years of age —constituted 46 per cent of the cattle population, a rather encouraging proportion from the point of view of reproduction.
Although the break-down of the cattle population by activities during the past few years is not known, it may be assumed to be moire or less similar to that determined by the sampling carried out in every State in 1954. Applying this percentage distribution to the estimated cattle population in 1956, the classification set out in table 2 was otained. The proportion of breeding-cows is clearly higher among dairy cattle (48.6 per cent) than on mixed or stock-raising farms. As a result, the percent-age of calves and heifers less than one year of age is also higher among dairy cattle. A comparison of the number of breeding-cows with the number of unweaned calves and heifers indicates that the efficiency rate or reproduc-tion is very low in the three types of cattle farming, amounting to only 38, 41 and 42 per cent in beef cattle farms, dairy farms and mixed farms respectively. The low birth rate and high mortality rate in young animals, as will be seen later, are responsible for the poor efficiency. Mixed farms have a higher proportion of males and females one to two years of age, because cattle-rearing10
is often not practised in breeding-farms and heifers are generally reared only on dairy-farms. Cattle-rearing is at times a specialized activity which is included here in the mixed group. The low percentage of steers (usually 10 per cent) indicates that the rate of slaughter and the annual production of cattle for slaughter are also low, since most of the cattle slaughtered consist of steers
9 The increase in the cattle population and more particularly in meat production can be attributed in part to clandestine exports of Colombian cattle to Venezuela. It is estimated that 120,000 head of cattle were thus brought into the country in 1958.
10 Raising of young bulls and steers or calves and heifers of 1 to 2 years of age.

72 LIVESTOCK IN LATIN AMERICA
Table 2 Venezuela: Estimated break-down of cattle population by livestock activity, 1956
Beef cattle farms • Dairy cattle 6 Mixed livestock0
Livestock n Z 7 " n Z 7 d n Z 7 d Percentage
Breeding cows d
Yearling calves and heifers e . . . Young bulls and steers' Heifers 6 Steers and bulls h
Stud bulls
T O T A L
2,286 45.6 592 878 17.5 242 525 10.5 118 628 12.5 145 564 11.3 105 132 2.6 16
5,013 100.0 1,218
48.6 405 43.5 19.8 178 19.1 9.7 109 11.7
11.9 144 15.5 8.6 76 8.2 1.3 19 2.0
100.0 931 100.0
Source: La Industria Ganadera de carne en Venezuela, 1958, tables V-2 and B-8, and 1956 Crop and Livestock Survey.
0 Anzoátegui, Apure, Barinas, Bolivar, Cojedas, Guárico, Monagas-Amacuro and Portuguesa. 6 Aragua, Carabobo, Lara, Miranda and Zulia. 0 Federal District, Falcón, Mérida, Nueva Esparta, Sucre, Táchira, Trujillo, Yaracuy and Amazonas. a Including heifers over 2 years of age. c Steers and heifers up to 1 year of age. ' Males between 1 and 2 years of age. s Heifers between 1 and 2 years of age. h Males over 2 years of age.
over 3 years of age. The proportion of steers is a little higher among beef cattle, although these include young steers not yet ready for slaughter.
While no completely specialized cattle production is to be found, either for meat or milk,11 States can be grouped according to the main type of cattle produced. Thus, for instance, it is estimated that at least 70 per cent of the cattle population is concentrated in the States of Anzoátegui, Apure, Barinas, Bolívar, Cojedes, Guárico, Monagas, Portuguesa and in the Federal Territory of Delta Amacuro, where the chief activity is the breeding of beef cattle. The States of Aragua, Carabobo, Lara, Miranda and Zulia account for 17 per cent of the animal population, chiefly dairy cattle, except for Aragua and Miranda where fattening is also practised. The remainder of the cattle population (13 per cent) is apparently divided among the Federal District, the States of Falcón, Mérida, Nueva Esparta, Sucre, Táchira, Trujillo and Yaracuy, and the Territory of Amazonas, which are chiefly engaged in mixed stock farming.
The chief livestock States are Apure, with nearly one-fifth of the total cattle population, Guárico and Zulia, with nearly one-fourth, and Bolivar, Barinas and Anzoá-tegui, with about one million head of cattle each. These six States seem to account for two-thirds of the cattle population, the remaining one-third being divided among the rest of the country.
By using the conversion or equivalence factors men-tioned in table 3, the total livestock population is reduced to standard units, expressed in terms of cattle. Thus, the total amounts to some 8.4 million head.
2. PASTURE AREA AND LIVESTOCK ZONES
A comparison of the pasture area, as given in the 1950 inventory and the 1956 survey, shows that it rose from
11 Most farms breed beef cattle or practise mixed stock farming, there being relatively few farms specializing in milk production.
Table 3 Venezuela: Livestock population in standards units, 1956
Thousands Thousands Livestock of simple Equivalence of standard
units units
Cattle 7,162 1.000 7,162 Pigs 2,362 a 0.200 189 Sheep 176 0.200 35 Goats 921 0.125 115 Horses 533 1.200 639 Mules 130 1.200 156 Asses 427 0.333 142 Standard units 8,438
Source: Table 1. a Conversion of only 40 per cent of the livestock population, corre-
sponding to the proportion in pasture.
13.8 million hectares in 1950 to 17.8 million in 1956, an increase of 13 per cent (see table 4). Relatively speaking, the most important change occurred in artificial pastures, which rose from 12 per cent of the total area in 1950 to 15 per cent in 1956. In spite of this favourable change, however, the proportion of natural pasture is still very high and this is reflected in the low carrying capacity usually found in most breeding areas where extensive grazing methods are practised and where from 2 to 4 hec-tares of grassland are required per head of cattle. In dairy farming areas where less extensive methods are used, the proportion of artificial pasture and its carrying capacity are much higher, as for instance in the States of Zulia, Lara, Aragua, Carabobo, Miranda, Falcón, Táchira, Trujillo and Yaracuy, where the average ratio of cattle to area is one head of cattle to one unit of area. It should be noted, however, that this more favourable ratio must be attributed not only to the better quality of the grasslands but also to more efficient ranch manage-ment and, in general, to better animal feeding methods.

VENEZUELA: I I . CHARACTERISTICS OF PRODUCTION 73
Table 4
Venezuela: Area used for livestock, 1950 and 1956
1950 1956
Thousands >,„„„.,,„„„ of hectares r«<X"taee
Thousands ~ . „ of hectares Per""laBe
Artificial pasture.... 1,660 12.0 Natural pasture 12,164 88.0
2,604 15,165
14.7 85.3
T O T A L 13,824 100.0 17,769 100.0
Table 5 Venezuela: Pasture area and livestock density, 1956
Source: Same as for table 1.
For the country as a whole, the proportion of the total area under grass is 2.5 hectares per head of cattle. How-ever, the actual forage area cannot be determined unless the natural and artificial grasslands are converted to standard units. Assuming that, as a rule, 1 hectare of artificial pasture has a carrying capacity 2.5 times greater than the perennial and seasonal natural grasslands com-bined, the total forage area would be 4.34 million hectares of grassland in terms of top-grade artificial pasture.
Thus, the existing ratio between standard livestock units and units of area under grass having been established, total livestock density would be 1.9 head of cattle per hectare, equivalent to 0.51 hectare per standard livestock unit (see table 5).
The most important area from the point of view of the concentration of livestock and volume of meat production is the so-called "grazing area" in which cattle-raising is the chief activity. Milk production plays a secondary role and the milk is used mainly for manufacturing cheese. In addition, it is the largest livestock area12
where the "open range" type of extensive farming is practised on natural grasslands of little nutritional value, very often of the seasonal type, technologically under-developed in respect of disease control, breed improve-ment and management. These shortcomings are primarily related to the large size of the farms and, in some cases, to the extensive farming methods used. In the States of Apure, Barinas, Bolivar, Cojedes and Monagas, for instance, from 33 to 46 per cent of the cattle are on farms which have herds of from 1,001 to 5,000 head each. In Apure, 20 per cent of the cattle is on even larger farms. As will be seen later, the livestock yields of the grazing area are rather low.
Thousands of hectares
Millions of standard units
Livestock area 17,769 Artificial pasture 2,604 Natural pasture 15,165 Population in standard units®.. 8,438 Density (head per hectare) 0.48 Hectares per head 2.1
Pasture area b 4,335 Artificial pasture 1,302 Natural pasture 3,033 Population in standard units a . . . 8,438 Livestock population per hectare
of pasture 1.94 Hectares per head 0.51
Source: Tables 3 and 4. » In terms of beef cattle, including light cattle. 6 In terms of top-grade permanent artificial pasture and on the basis
of the following preliminary equivalences: 0.500 for artificial pasture of either Category and 0.200 for perennial and seasonal natural pasture.
The other important livestock zone is the dairy farming region, with 11 per cent of the livestock area and 17 per cent of the cattle population in the five major dairy farm-ing States.13 Here the quality of the soil, the grassland and the cattle is higher and the level of technique more advanced. Zulia and Lara are the chief milk-producing States, the former chiefly because of favourable natural conditions14 and the latter mainly because of improved breeding and farm management. Next in importance is the dairy farming area in the central zone of the country, formed by the States of Carabobo, Aragua and Miranda. The special conditions prevailing in the "dairy farming zone" and the smaller size of the farms naturally permit the use of more intensive farming methods. Thus, for instance, in Carabobo and Aragua 88 per cent and 91 per cent of the stock farms, respectively, owned less than 100 head of cattle each in 1952, according to data obtained during the foot-and-mouth disease campaign undertaken by the Livestock Department.
Fattening is mainly carried out in Aragua, Miranda and Falcon, although rearing and fattening are also combined in other States such as Anzoátegui, Bolívar, Guárico, Monagas-Amacuro, Portuguesa and Táchira.
12 Slightly over 80 per cent of the total livestock area, according to the 1950 inventory.
13 Aragua, Carabobo, Lara, Miranda and Zulia. 14 Good soil quality, abundant rainfall and good pasture.
H. CHARACTERISTICS OF PRODUCTION 1. LIVESTOCK PRODUCTION
(a) Meat production Table 6 shows that the slaughter of livestock increased
virtually without interruption between 1946 and 1958. The slaughter of beef cattle rose to an annual average of 575,000 head in 1956-58 and to 673,000 head in 1959, an increase of 61 and 81 per cent respectively over 1947-49
when 357,000 head of cattle were slaughtered. The highest rates have been recorded since 1956. The annual average number of pigs slaughtered in 1956-58 was 535,000, 56 per cent more than in the base three-year period. The sharpest rise in the slaughter of pigs was registered in the last two years of the period under review. The slaughter of beef cattle and goats was 91 and 103 per cent higher in 1956-58, but declined sharply in 1959. The estimated

74 LIVESTOCK IN LATIN AMERICA
Table 6 Venezuela: Slaughter of livestock and poultry by species, 1946-1959
CRegistered slaughter, thousandhead)
Cattle Pigs Sheep Goats Poultry Year •
Number Index Number Index Number Index Number Index Number Index
194 6 363.0 101.8 1947 356.8 100.1 194 8 345.0 96.7 194 9 367.8 103.1 1947-49 356.6 100.0 195 0 405.6 113.7 195 1 443.6 124.4 195 2 459.5 128.8 1950-52 436.2 122.3 195 3 483.7 135.6 1954 474.0 132.9 195 5 495.0 138.8 1953-55 484.2 135.8 1956 508.3 142.5 1957 571.0 160.1 195 8 645.0 180.9 1956-58 574.7 161.2 195 9 672.9 188.7
311.7 90.6 22.9 99.6 293.2 85.2 24.1 104.8 344.0 100.0 19.0 82.6 394.9 114.8 26.0 113.0 344.0 100.0 23.0 100.0 403.4 117.3 30.3 131.7 374.3 108.8 26.0 113.0 395.7 115.0 45.1 196.1 391.2 113.7 33.8 146.9 433.2 125.9 42.6 185.2 478.3 139.0 41.0 178.2 444.8 129.3 38.9 169.1 452.1 131.4 40.8 177.5 468.4 136.1 38.7 168.3 555.1 161.4 47.0 204.3 582.2 169.2 46.5 202.1 535.2 155.6 44.0 191.3 620.3 180.3 27.5 119.6
43.1 91.3 —
51.0 108.0 . . . —
28.5 60.4 —
62.2 131.8 —
47.2 100 — —
64.8 137.3 1,520 100.0 50.6 107.2 2,080 136.8 49.7 105.3 3,920 258.0 55.0 116.5 2,510 165.1 54.6 115.7 5,200 342.1 63.8 135.2 6,880 452.6 89.7 190.0 6,960 457.9 69.3 146.8 6,346 418.8 91.1 193.0 7,680 505.3
101.6 215.2 9,120 600.0 94.5 200.2 11,360 747.4 96.0 203.4 9,387 617.6 75.2 159.3 16,080 1,058.0
Source: Ministry of Agriculture, Crop and Livestock Planning Department, Economic Research Division, Anuario Estadístico, 1954 and Memoria de 1959 of the Central Bank of Venezuela.
number of poultry killed in 1959 was slightly over ten times the 1950 figure.
As a result of the increase in the number of animals slaughtered, the total production of meat rose from 78,000 tons in 1947-49 to an annual average of 129,000 tons in 1956-58 and 158,000 tons in 1959, which is equi-valent to an annual average increase of 67 per cent in the three-year period 1956-58 and of 204 per cent in 1959 (see table 7).
Production by species is as follows : Cattle Pigs Sheep Goats Poultry
1947-49 78.4 18.2 0.5 0.9 1.9 1950-52 78.5 17.7 0.4 0.5 2.8 1953-55 75.2 17.6 0.4 0.7 6.1 1956-58 75.0 16.5 0.4 0.8 7.3 1959 73.6 15.5 0.3 0.5 10.1
Some changes in the break-down of production by species may be noted. Beef cattle, although output has
Table 7 Venezuela: Production of red meat and poultry, 1947-49 to 1959
(!Thousands of tons)
Year Cattle Pigs Sheep Goats Poultry Total
Number Index
1947-49 60.8 14.1 0.37 0.77 1.50 a 77.5a 100.0 1950 70.8 17.0 0.42 0.46 0.52 90.1 116.2 1951 70.7 15.4 0.40 0.44 2.08 89.1 115.0 1952 71.4 15.5 0.42 0.52 3.92 91.7 118.3 1950-52 71.0 16.0 0.41 0.47 2.51 90.4 116.6 1953 76.2 18.7 0.39 0.64 5.20 101.1 130.4 1954 77.7 18.6 0.47 0.66 6.88 104.3 134.6 1955 82.2 18.0 0.57 0.86 6.96 108.6 140.1 1953-55 78.7 18.4 0.48 0.72 6.33 104.6 135.0 1956 85.0 18.8 0.57 0.93 7.68 113.0 145.8 1957 95.5 21.4 0.50 1.10 9.12 127.7 164.8 1958 110.3 23.6 0.47 0.94 11.36 146.1 188.5 1956-58 96.9 21.3 0.51 0.99 9.39 129.1 166.6 1959 , . . 116.3 24.5 0.40 0.84 16.08 158.0 203.9
Source: Ministry of Agriculture, Crop and Livestock Planning Department for the base period and Memoria de 1959 of the Central Bank of Venezuela for the other years.
0 Figures subject to revision.

VENEZUELA: I I . CHARACTERISTICS OF PRODUCTION 75
declined, is still the biggest item, accounting for some three-fourths of the total and four-fifths of the red meat total. Pork is next, with about 18 per cent of the total volume, followed by goat meat and mutton, the relative percentage of which has also declined and amounts to a combined total of only about 1 per cent. The production of poultry meat has climbed steeply over the past few years. Actual meat production for the three smaller species of livestock is much greater because a considerable portion of the total slaughtered is not officially registered. While in situ slaughter of beef cattle is also common, it is not believed to exceed 10 per cent of the number sent to the abattoirs.
A study of changes in per capita meat production during the past twenty years shows that output has risen sharply only since 1956. In fact, the average annual per capita production was 19.4 kg in 1956-58, an increment of 3.2 kg over the three-year period 1947-49. Stated in index figures, this corresponds to a rise in per capita output of 20 per cent compared with the base three-year period.15
As may be seen from table 8, the rate of per capita pro-duction rose only slightly (from 16.0 to 16.9 kg) between 1939-41 and 1953-55.
Table 8 Venezuela: Per capita red meat production, 1939-41 to 1959
(Annual averages)
Period Kg per capita Index
1939-41 16.0 1945-46 16.8 1947-49 16.2 1950-52 16.8 1953-55 16.9 1956-58 19.4 1959 21.8
98.0 103.7 100.0 103.7 104.3 119.8 134.6
Source: As for table 7.
Venezuela is one of the few countries which in recent years has achieved so substantial a relative growth in the output of livestock for slaughter, as opposed to the decline in per capita consumption registered in many Latin American countries. The following are some of the factors which were responsible for this improvement:
(i) Livestock imports. Venezuela has led all other Latin American countries in livestock imports, at least during the past fifteen years. With respect to beef cattle, for instance, total imports of specimens for breed improve-ment amounted to 7,823 head between 1945 and 1953, four-fifths of which were females. Of all these imports 93 per cent were represented by Zebu cattle, either pure or mestizo. In subsequent years, imports of beef cattle breeds were stepped up, 9,443 head of Zebu cattle being imported in 1958.16 It need hardly be said that results of these imports were very favourable, not only as a
means of promoting livestock development but also as a method Of speeding up the production of early-maturing livestock and animals with a higher meat yield.
(ii) Livestock credit. The credit facilities recently grant-ed by the Government will undoubtedly have a decisive effect in promoting livestock development. Credit for the livestock industry has not only been more flexible and easier in the past few years but has increased considerably in volume, particularly through the Banco Agrícola y Pecuario. Particular importance should be attached to decree No. 58 of 22 February 1958, which established a live-year livestock promotion plan involving a total investment of 660.5 million bolívares for the develop-ment of 2,500 stock farms,17 mainly in the form of grass-land improvement, imports of improved specimens, construction of fences and provision of water supplies. This plan is intended to expedite output of beef and pork. Emphasis is placed, under this credit backed livestock development plan, on the channelling and supervision of investment, the capacity of the applicants for hard work and the possibilities of the farms to pay. The fact that the technical and financial direction of the plan has been entrusted to the Ministry of Agriculture and Live-stock and the Bank of Agriculture, respectively, augurs well for the future. This marked credit expansion, coupled with recent legislation on land reform, will act as a strong incentive to livestock production and related activities.
(iii) Health control. While diseases still take a heavy toll of livestock, the veterinary services of the Livestock Department have intensified their activities in recent years, particularly in order to improve and accelerate campaigns against foot-and-mouth disease, epizootic abortion and other ailments which are responsible not only for high mortality but also for considerable decreases in animal production. With respect to the foot-and-mouth disease campaign, for example, mass vaccina-tions in 1958 resulted in a sharp drop in the incidence of the disease, only 39 outbreaks being registered in 1958 as against 103 in 1957.
(b) Production of milk and milk products Total milk production in Venezuela amounts to some
400,000 tons, broken down approximately as follows: Percentage
Pasteurized milk 37 Raw milk 8 Cheese 22 Butter 18 Powdered milk 15
16 Per capita production in 1958 expanded only by an additional 5 kg compared with the figure for 1947-49.
16 Memoria y Cuenta del Ministro de Agricultura y Cría al Congreso Nacional, 1959, volume I.
17 The development plan for beef cattle and pigs covers the whole country which, for this purpose, is divided into 24 livestock units, as follows:
1 Coro 13 Valle de Pascua 2 Churuguara 14 Zaraza 3 Barquisimeto 15 Barcelona 4 San Critóbal 16 Aragua de Barcelona 5 Guardualito 17 Pariaguán 6 Barinas 18 Caicara de Orinoco 7 Arismendi 19 Ciudad Bolívar 8 Guanare 20 Maturín 9 San Carlos 21 Barrancas
10 Elorza 22 Upata 11 San Fernando 23 Maracaibo 12 Calabozo 24 Caracas
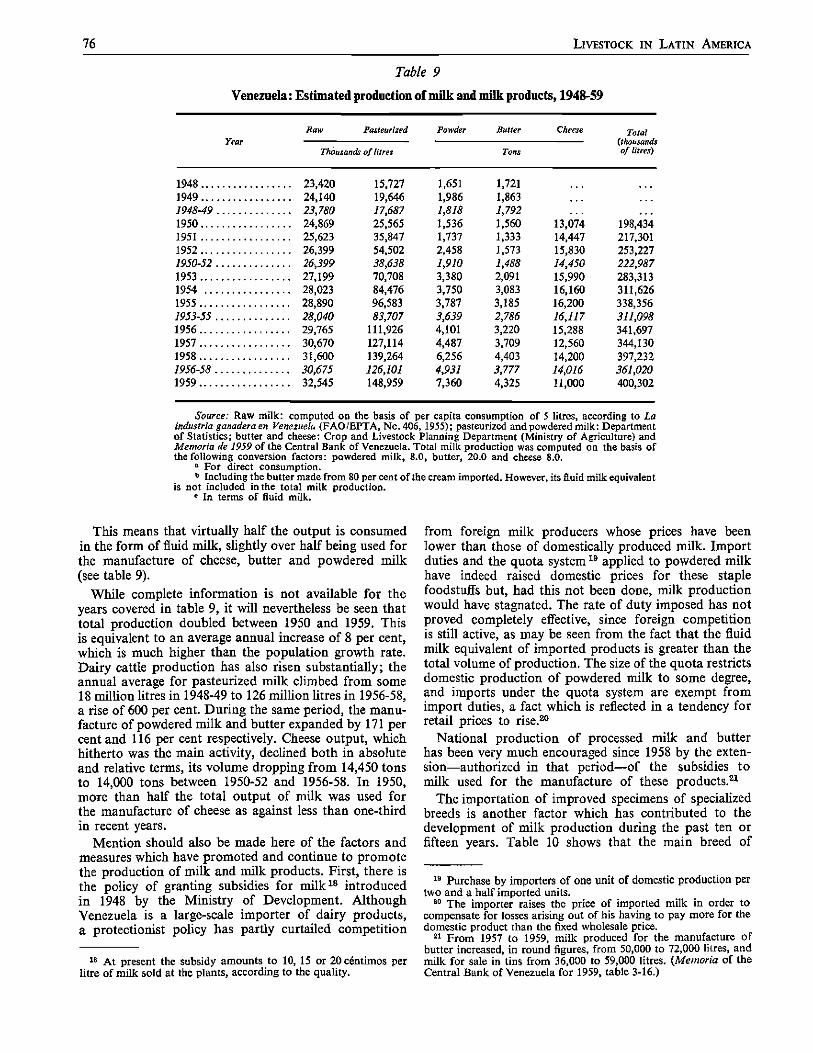
76 LIVESTOCK IN LATIN AMERICA
Table 9
Venezuela: Estimated production of milk and milk products, 1948-59
Year Raw Pasteurized Powder Butter Cheese Total
(thousands of litres)
Year Thousands of litres Tons
Total (thousands of litres)
1948 . . . . 23,420 15,727 1,651 1,721 1949 . . . . 24,140 19,646 1,986 1,863 ... . . . 1948-49 .... 23,780 17,687 1,818 1,792 .. . • • .
1950 . . . . 24,869 25,565 1,536 1,560 13,074 198,434 1951 . . . . 25,623 35,847 1,737 1,333 14,447 217,301 1952 . . . . 26,399 54,502 2,458 1,573 15,830 253,227 1950-52 .... 26,399 38,638 1,910 1,488 14,450 222,987 1953 . . . . 27,199 70,708 3,380 2,091 15,990 283,313 1954 . . . . 28,023 84,476 3,750 3,083 16,160 311,626 1955 . . . . 28,890 96,583 3,787 3,185 16,200 338,356 1953-55 .... 28,040 83,707 3,639 2,786 16,117 311,098 1956 . . . . 29,765 111,926 4,101 3,220 15,288 341,697 1957 . . . . 30,670 127,114 4,487 3,709 12,560 344,130 1958 . . . 31,600 139,264 6,256 4,403 14,200 397,232 1956-58 ... 30,675 126,101 4,931 3,777 14,016 361,020 1959 . . . 32,545 148,959 7,360 4,325 11,000 400,302
Source: Raw milk: computed on the basis of per capita consumption of 5 litres, according to La industria ganadera en Venezuela (FAO/EPTA, Nc. 406, 1955); pasteurized and powdered milk: Department of Statistics; butter and cheese: Crop and Livestock Planning Department (Ministry of Agriculture) and Memoria de 1959 of the Central Bank of Venezuela. Total milk production was computed on the basis of the following conversion factors: powdered milk, 8.0, butter, 20.0 and cheese 8.0.
° For direct consumption. 6 Including the butter made from 80 per cent of the cream imported. However, its fluid milk equivalent
is not included in the total milk production. ° In terms of fluid milk.
This means that virtually half the output is consumed in the form of fluid milk, slightly over half being used for the manufacture of cheese, butter and powdered milk (see table 9).
While complete information is not available for the years covered in table 9, it will nevertheless be seen that total production doubled between 1950 and 1959. This is equivalent to an average annual increase of 8 per cent, which is much higher than the population growth rate. Dairy cattle production has also risen substantially; the annual average for pasteurized milk climbed from some 18 million litres in 1948-49 to 126 million litres in 1956-58, a rise of 600 per cent. During the same period, the manu-facture of powdered milk and butter expanded by 171 per cent and 116 per cent respectively. Cheese output, which hitherto was the main activity, declined both in absolute and relative terms, its volume dropping from 14,450 tons to 14,000 tons between 1950-52 and 1956-58. In 1950, more than half the total output of milk was used for the manufacture of cheese as against less than one-third in recent years.
Mention should also be made here of the factors and measures which have promoted and continue to promote the production of milk and milk products. First, there is the policy of granting subsidies for milk18 introduced in 1948 by the Ministry of Development. Although Venezuela is a large-scale importer of dairy products, a protectionist policy has partly curtailed competition
18 At present the subsidy amounts to 10, 15 or 20 céntimos per litre of milk sold at the plants, according to the quality.
from foreign milk producers whose prices have been lower than those of domestically produced milk. Import duties and the quota system19 applied to powdered milk have indeed raised domestic prices for these staple foodstuffs but, had this not been done, milk production would have stagnated. The rate of duty imposed has not proved completely effective, since foreign competition is still active, as may be seen from the fact that the fluid milk equivalent of imported products is greater than the total volume of production. The size of the quota restricts domestic production of powdered milk to some degree, and imports under the quota system are exempt from import duties, a fact which is reflected in a tendency for retail prices to rise.20
National production of processed milk and butter has been very much encouraged since 1958 by the exten-sion—authorized in that period—of the subsidies to milk used for the manufacture of these products.21
The importation of improved specimens of specialized breeds is another factor which has contributed to the development of milk production during the past ten or fifteen years. Table 10 shows that the main breed of
19 Purchase by importers of one unit of domestic production per two and a half imported units.
20 The importer raises the price of imported milk in order to compensate for losses arising out of his having to pay more for the domestic product than the fixed wholesale price.
21 From 1957 to 1959, milk produced for the manufacture of butter increased, in round figures, from 50,000 to 72,000 litres, and milk for sale in tins from 36,000 to 59,000 litres. (Memoria of the Central Bank of Venezuela for 1959, table 3-16.)

VENEZUELA: I I . CHARACTERISTICS OF PRODUCTION 77
Table 10
Venezuela: Imports of high-grade cattle, 1945-53 and 1958 (Units)
Imported breeds Bulls
1945-53
Cows Total Bulls
1958
Cows Total
Holstein 307 5,645 5,952 29 1,064 1,093 Brown Swiss 430 1,400 1,830 48 201 249
237 1,628 1,865 4 24 28 Others 22 141 163 5 150 155
TOTAL 996 8,814 9,810 86 1,439 1,525
Source: La industria ganadera en Venezuela, Ministry of Agriculture publication, 1958, and Memoria y Cuenta del Ministro de Agricultura y Cría sobre el año 1958, volume I.
cattle imported was the Holstein, followed by the Brown Swiss and Jersey. Most of the animals were cows, as indicated in the table. Average annual imports amounted to 1,090 head in 1945-53, compared with 1,525 in 1958.
In addition, milk production was also accelerated by the Ministry of Agriculture's health campaigns against epizootic abortion, bovine tuberculosis and foot-and-mouth disease. These campaigns have been intensified in recent years, as have artificial insemination services and the registration of output.
2. PRODUCTION TRENDS
(a) Meat
Figure I shows meat production developments in Venezuela during the past twenty years and indicates the annual changes—in index figures—that have taken place, and the historical trends of production and of population growth. It is obvious that, except for a few years, production has risen steadily, albeit at an uneven rate which was particularly high during the past few years, the major increments being recorded in the periods 1944-46, 1949-50 and 1954-58.22 Another important fact is that meat output has been expanding more rapidly than the population and that, as a result, per capita production has risen. Thus, between 1939 and 1952 the production of red meat grew at an annual compound rate of 3.8 per cent, whereas the rate for the population was 3.0 per cent. While the population growth rate was higher between 1953 and 1958, meat output climbed to the appreciably high figure of 8.8 per cent, largely because of the incre-ments in 1957 and 1958.23 In 1957, the rate of slaughter for the four main species of livestock was high, and in 1958 the rise in production was due to the greater number of beef cattle slaughtered and the higher yield of carcass meat per animal.
Thus, not only total but also per capita production of meat has increased, substantially, raising the per capita consumption rate.
22 The higher rate of production during the past few years is apparently attributable in part to the effect of clandestine exports of Colombian cattle.
28 The slaughter of cattle and pigs continued to increase in 1959, as a result of which total output of red meat rose to 142,000 tons.
Figure I
Venezuela : Total meat production and population growth rate indices
SEMI-LOGARITHMIC SCALE
(b) Milk
Milk output lias also increased noticeably and steadily during the past ten years, particularly in 1952 and 1958, for the reasons stated earlier, although there was a slight falling-off in the three-year period 1955-57. As shown by the indices in table 11, the rate of production rose more rapidly for milk than for meat, milk output in 1958 being 73 per cent higher than in 1950, compared with an increase of about 52 per cent in meat production.

78 LIVESTOCK IN LATIN AMERICA
Table 11
Venezuela: Livestock production indices, 1950-59 (.1950 = 100)
Year Red meat Milk
1950 100.0 100.0 1951 97.6 109.5 1952 97.8 127.7 1953 98.9 142.8 1954 109.2 157.0 1955 115.5 170.5 1956 119.8 172.2 1957 136.0 173.4 1958 151.8 200.1 1959 189.8 201.7
Source: Tables 7 and 9.
3. YIELDS AND PRODUCTIVITY
The information available is not sufficient for a tho-rough analysis of the intensity of utilization of the various factors involved in livestock production, or of their yields or physical productivity. This is particularly true of capital and labour, in respect of which producers generally keep only a few haphazard records. At all events, certain data justify the statement that livestock productivity is exceptionally low, expecially on farms where extensive methods are practised. Moreover, this weakness is one which affects the livestock economy in almost all under-developed countries. It should be noted that the aggregate effect of poor yields makes itself felt in very low returns on investment, which is well known to be particularly heavy in the livestock sector, above all in relation to land and animals.
(a) Rate of slaughter It is difficult to indicate changes in production for
slaughter on the basis of livestock inventories, as fairly complete statistics in this respect are available only for 1950 and 1956. In these two years the rate of slaughter would seem to have been 7.15 and 7.10 per cent of cattle inventories;24 that is, no improvement in the rate of slaughter was registered. It may be asserted a priori that the rate of cattle slaughter did rise in 1957 and 1958, since had it remained the same, slaughter statistics for the latter year would imply the existence of a cattle population of about 9 million head, as against 7.16 million in 1956, which would mean a 25 per cent increment in two years. As so great an expansion is unlikely to have been achieved, it may be concluded that the increase in the volume of cattle slaughtered is more probably the effect of a higher slaughter rate and of clandestine imports. The tendency observable in the last few years to slaughter younger cattle than used to be the case would seem to confirm the foregoing statement. Given better feeding systems and breeds or types of cattle that are quicker to mature, the rate of slaughter might of course
24 Excluding in situ slaughter, not recorded in statistics but esti-mated at 10 per cent of registered slaughter, which would bring real slaughter rates up to 7.86 in 1950 and 7.81 in 1956.
be further raised, inasmuch as younger steers could be brought into satisfactory conditionfor the slaughter-house, to which they are still sent somewhat belatedly (at four to five years of age, on an average).
For pigs, sheep and goats the rate of slaughter is equally low, since registered slaughter represents barely one-fifth of inventories, whereas in countries whose livestock activities have attained a more advanced stage of develop-ment, stocks of these species are renewed from one year to the next. Even on the assumption that clandestine slaughter figures are high, the rate of slaughter is unlikely to exceed 50 per cent, owing to feeding and fattening problems.
(b) Meat yields Another indication of the low degree of efficiency
registered in meat production is afforded by the poor yields of the cattle that reach the slaughter-houses. Although the average five weight of beef cattle (340 kilo-grammes) cannot be considered low in absolute terms, what matters is the degree of fattening and the age of slaughter, and such a weight in the case of full-grown animals suggests that there is something wrong with the fattening practices adopted. Many animals do in fact reach the slaughter-houses in a frankly undesirable condition from this standpoint. Moreover, the carcass yield amounts to barely 50 per cent in bulls and steers and rather less in cows, the weighted average being 47 per cent. In short, so low a rate of slaughter and so poor a meat yield per head reduce meat production per unit of the cattle population to minimal levels, as is shown by the figure estimated for 1956—13 kilo-grammes 25—which is definitely unfavourable compared with 48 kilogrammes in Argentina, 36 in Uruguay and 20 in Paraguay.
It is important to note that average meat yields per head vary considerably from one State to another and even, in the same part of the country, from one year to the next. This is naturally due to differences in types of cattle, proportions of male and female animals slaughtered and kinds of pasture, as well as to climatic factors and to economic reasons which induce cattle fatteners to hasten or delay the sale of the animals in their hands.
The following were the variations in average annual beef yields for the country as a whole:
Year or period Kilogrammes 1945-47 172 1948-50 173 1951-53 155 1954 161 1955 166 1956 167 1957 167 1958 171 1959 173
It can be seen from the foregoing statistics that the average yield of carcass meat per animal slaughtered rose significantly from 1955 onwards. The greater expansion of total and per capita meat production in recent years must be attributed not only to the increase in the number
26 On the assumption that clandestine slaughter represents 10 per cent and that the average yield of carcass meat is 170 kilogrammes.

VENEZUELA: I I I . FACTORS LIMITING PRODUCTION 79
of cattle slaughtered, but also to the improvement in their utilizable weight.
As regards disparities between yields by areas, suffice it to note that the highest figures are registered in the Federal District, together with the States of Carabobo, Lara, Miranda, Táchira and Zulia, mainly owing to the predominance of slaughter of males and of animals whose live weight is greater; at the other extreme are found the States of Apure, Barinas, Bolívar, Cojedes, Guárico and Monagas, where yields fall below 150 kilogrammes, because supplies are based mainly on the slaughter of cows, as happens in all meat-producing areas which send their young bulls and steers to the more densely populated centres.
(c) Milk yields There are also appreciable differences in milk yields
per cow, resulting from the kind of cattle prevalent, the quality of the soil and of the available fodder, climate, and management and administration practices. In the milk-producing areas the daily yield per cow varies from upwards of 2 litres in dairy farms based on criollo herds to as much as 12 litres in farms possessing specialized breeds of foreign origin. In the south of the State of Zulia, the soil and climate are especially favourable for milk production, but the average yield per cow/day is only 4 to 5 litres, owing to the preponderance of criollo and low-yielding mestizo cattle. In the State of Lara and in the central zone of Venezuela natural conditions are less propitious, on account of the shortage of good fodder, due in its turn to the low rainfall, but yields are much higher because the farmers work with improved dairy breeds (Holstein, Brown Swiss and Jerseys, in particular) and devote more attention to the management and supplementary feeding of cows during the lactation deriod.
(d) Natality rate A series of factors are responsible for a level of repro-
ductive efficiency which must be considered really low, especially on extensive farms in the tropics. As a general
rule, the natality figure amounts to only 50 per cent of the cows that have entered upon the reproductive period, which means that, if the death rate for nursing calves— estimated at 10 per cent—is discounted, the reproductive efficiency rate would seem to be 40 per cent, or half that achieved on farms run entirely on the basis of modern breeding techniques. Unquestionably, this is due not only to the extensive farming systems current in Venezuela and the practice of grazing the cattle "out on the range" —which hinders the supervision and management of breeding stock—but also in large measure to protein and mineral deficiencies, to the incidence of diseases that adversely affect fertility and to the shortage of good stud bulls.
(e) Productivity of other factors
The productivity of the other factors of livestock production—land, capital and labour—varies consid-erably from one area to another, but on an average is strikingly low, especially on small and technologically under-developed farms. Thus, for example, in stock-breeding activities, the marginal yields of labour and capital barely suffice to cover the cost of the factors; the productivity of capital is sometimes much less than long-term interest rates on cash deposits and, of course, far below the rate of interest on capital invested in crop farming. Investment in improvements and the introduc-tion of more advanced techniques is remunerative only in the case of relatively large farms, which means that for small producers there is no incentive to take such steps. As for the land factor, its marginal productivity is negative.26 It is worth noting that productivity is much higher on farms where livestock activities are supple-mented by crop cultivation, as a logical result of the more efficient distribution and utilization of factors that can be achieved through the integration of crop and stock farming, or combined production.
28 On farms in the States of Barinas, Monagas and Guárico Occi-dental, according to research conducted by the Crop and Livestock Programming Department of the Ministry of Agriculture.
m . FACTORS LIMITING PRODUCTION The obstacles to the development of stock farming in
Venezuela derive from a wide variety of factors. The majority consist in defective production techniques, but others, like the unsatisfactory marketing of livestock commodities, are independent of producers' decisions and unconnected with the production process.
1. LIVESTOCK DISEASES
The heavy incidence of diseases which cause livestock mortality and losses in Venezuela is imputable not only to the tropical conditions in which stock farming is carried on in the Llanos and along the littoral, but also, and above all, to the fact that health control measures are not adopted everywhere as current practices. Through the Veterinary Unit of the National Department of Live-stock Production and other technical services, an increas-ingly intensive campaign is being waged to prevent disease and eliminate the commonest pathological agents
which cause the severest losses.27 The results achieved are encouraging, but the morbidity indices registered at present are still fairly high (see tables 12 and 13).
The death rate is approximately calculated at 12-15 per cent of nursing calves and 5 per cent of older animals. In rangeland areas, average mortality indices rise as high as from 25 to 30 per cent in calves and from 6 to 7 per cent in adult cattle.28
(a) Infectious and contagious diseases Although the economic losses caused by infectious
diseases have not been ascertained, they are known to
27 In 1958 the staff of the Sanitary Protection Unit of the Ministry of Agriculture gave preventive treatment in 591,127 cases and curative treatment in 108,166 others.
28 Census taken in 16 small stock farming areas in the States of Anzoátegui, Apure, Aragua, Barinas, Bolívar, Falcón, Guárico, Miranda and Táchira.

80 LIVESTOCK IN LATIN AMERICA
be responsible for high mortality figures and for retarding production of meat, milk, wool and other livestock commodities.
(i) Foot-and-mouth disease. This disease made its first appearance in Venezuela in 1950, and since then has made serious inroads on herds in various parts of the country. By 1954, it had already spread to the States of Aragua, Carabobo, Cojedes and Portuguesa, as well as the Federal District. A few years later (in 1958 and 1959) it was found in all States, with the exception of Bolivar, classified as an "uncontaminated area". However, the correspond-ing morbidity rate has been largely brought under control, thanks to mass inoculation in all the affected areas, disinfection, regulation of movement from one place to another, and other health measures. In 1958 the total number of cases officially inoculated against the " A " and " O " types of foot-and-mouth virus amounted to 3,167,218, and in the first half of 1959 inoculations with both types of virus had already reached a total of 1,852,366 at a cost of 2,373,375 bolivars.29
As already pointed out, the incidence of foot-and-mouth disease has been considerably modified, since in 1958 the number of outbreaks diagnosed was 39, as against 103 in the preceding year.
(ii) Bang's disease (Brucellosis abortus). This disease also occasions substantial losses, especially among breed-ing and dairy farms in the States of Carabobo, Lara, Mérida, Miranda, Trujillo and Zulia. To reduce the losses in question, inoculation with Strain 19 has been intensified, applications of this vaccine having numbered about 60,000 in 1958 and 43,865 in the first half of 1959; it was in the former year that inoculation was for the first time extended to the greater part of the country. Also in 1958, the sero-agglutination service performed over 6,000 tests, and this figure was exceeded in the first half of the following year.
(iii) Bovine tuberculosis. The rate of mortality among animals infected with this disease is not high, but bovine tuberculosis represents a grave danger to consumers. Its incidence is heaviest in farms where intensive methods are practised, and especially among herds in the Federal District and the States of Miranda, Aragua, Carabobo and Lara, that is, in the central zone, which is the most densely populated area. Prior to 1959, the level of infec-tion ascertained to exist was somewhat alarming, since in the Federal District and the State of Miranda 22 and 9 per cent, respectively, of the total number of cattle subjected to tuberculin tests were found to be infected. In 1958, 7,283 cases had been diagnosed out of a total of 136,103 tuberculin-tested cattle, which implied an average level of infection of 5.35 per cent; of the total number of sick animals, 1,017 were slaughtered in the course of the year, that is, 14 per cent of the reactors. But in the first half of 1959 the incidence of bovine tuberculosis was a good deal less, since tuberculin tests numbering 80,185
29 Ministry of Agriculture, Memoria del Ministro de Agricultura, 1959, and Material para la Segunda Convención de Gobernadores, 1959.
in all showed minimum and maximum levels of infection of only 0.10 and 0.85 per cent.30
(iv) Other infectious diseases. Other infectious and contagious diseases likewise cause significant losses among various animal species. Cases in point are hog cholera, infectious Coryza and Newcastle disease in poultry, pneumoenteritis among young cattle, haemorrha-gic septicaemia in several species, anthrax and Clostridium chauvoei, etc.
The spread and incidence of the agents that cause infectious or contagious diseases have been checked to a considerable extent through the special campaigns undertaken by the Sanitary Protection, Foot-and-Mouth Disease, Tuberculosis and Brucellosis Units of the Animal Health Division. In other aspects of veterinary pathology, more dependent upon the care taken by the farmers themselves, the progress of sanitary control measures has been very limited in the past few years. The incidence of Clostridium chauvoei, pneumoenteritis and haemorrhagic septicaemia, for instance, and the mortality caused by these diseases, are in fact still high (see table 12).
Table 12 Venezuela: Frequency of some infectious and contagious diseases, 1954 and 1958
1954 1958
Disease Number Number Number of cases of cases of deaths
diagnosed certified
Bang's disease (Brucellosis abortus) 806 447 446 62 52
Clostridium chauvoei 263 328 202 Hog cholera 3,247 4,144 423 Avian infectious coryza 51,308 12,509 340 Vesicular stomatitis a 1,019 1,601 26 Foot-and-mouth disease 3,116
2,968 —
Pneumoenteritis b 1,352 1,278 126 2,489 221 47
Bovins paralytic rabies 78 57 50 Haemorrhagic septicaemia 0 3,076 3,782 830 Bovine tuberculosis 7,283 1,017 1,017 d
Source: For 1954: Ministry of Agriculture, Department of Livestock Production, Animal Health Division, Información estadística, 1954. For 1958: Special report by the Animal Health Division,
a Especially in cattle. b In cattle. 0 In cattle, horses, pigs and poultry. a Slaughtered against compensation.
(b) Parasitic diseases Endoparasitic and ectoparasitic infestation is fairly
widespread in all stock farming areas in Venezuela, and although the mortality it causes is not high, it inflicts substantial losses on the livestock economy through the spoliative action of the parasites. Table 13, which registers only those cases of endoparasitic infestation which were certified by the Veterinary Unit, gives some idea of the frequency of the commonest parasitic diseases. As can
80 Material para la Segunda Convención de Gobernadores, p. 30.

VENEZUELA: I I I . FACTORS LIMITING PRODUCTION 81
be seen, blood parasites (anaplasma, babesia, piroplasma and trypanosoma) are much in evidence, cases of trypa-nosomiasis, piroplasmosis and anaplasmosis being the most numerous and responsible for the largest number of deaths. Gastro-intestinal and broncho-pulmonary parasitic infestations are decidedly frequent, particularly among young animals of all species, and the high mortality to which they usually lead is not generally shown in veterinary records.
Table 13 Venezuela: Commonest endoparasitic diseases, 1958
Number Number Disease of cases of deaths
diagnosed certified a
Anaplasmosis b 621 26 Babesiosis b 10 4 Piroplasmosis c 1,410 51 Trypanosomiasis0 21,760 202 Verminous bronchopneumonia a 1,604 1 Verminous bronchitis b 478 17 Cocciddiosis e 2,942 3 Gastro-intestinal parasitic infestation . . 5,964 24
Source: Direct information supplied by the Animal Health Division, Sanitary Protection Unit,
o These do not invariably correspond to cases previously diagnosed. " In cattle. c In cattle and horses. 4 Mainly in cattle. e In poultry and cattle.
Ectoparasitic infestation is also widespread, especially that produced by ticks and by torsalo (.Dermatobia hominis, locally known as gusano de monté). The former are not only harmful to development and to meat and milk yields, on account of the intensity of their spoliative effects, but are also vectors of other pathological agents, such as the three haemotozoa causing the diseases listed at the beginning of table 13. Torsalo damages the animals' hide, fosters mycosis and cutaneous infections, and, when the animal is very badly infested, is detrimental to production. This group of ectoparasites constitutes one of the most serious obstacles to the importation and adaptation of improved European breeds. Fortunately, the Ectoparasites Unit of the Animal Health Division is intensifying its campaign to exterminate them, by means of baths and spraying, and recently by systematic dosing and spraying with specific anti-torsalo insecticides. Venezuela may be said to have taken the lead in the use of such insecticides to eradicate torsalo, a parasite which up to a short time ago seemed impossible to control.
(c) Deficiency diseases This group includes a long list of organic disorders
and disturbances of animal metabolism, of whose origin farmers as a rule know little, and which are caused by the total or partial lack of mineral elements, proteins and vitamins. Most of these deficiencies are not apparent causes of mortality, but they are reflected in the retarding of growth and productive capacity, loss of weight, reduc-tion of fertility—and consequently of the birth rate— lowered resistance to disease, disorders of the nervous system, etc.
Among the commonest of the diseases and disorders caused by mineral deficiencies are hypophosphorosis and aphosphorosis, since phosphorus is the mineral in which both soils and pasturage are most seriously lacking; this is particularly true of the overgrown and toughened fodder plants so often to be seen in much of the grazing-land used for the extensive type of stock farming in Vene-zuela. Another problem in pastures of the latter kind is constituted by protein deficiencies, attributable to the predominance of grasses, which, as is common knowledge, are poor in nitrogenous substances.
Vitamin deficiencies, broadly speaking, affect only the poultry-keeping industry.
2. NUTRITIONAL DEFICIENCIES
Despite advances in animal nutrition in Venezuela in recent years, nutritional deficiencies are still a major obstacle to increased livestock production. Feeding methods are still obviously backward as regards grasses better adapted to the climate and of greater nutritive value, pasture management and the use of supplemen-tary feeds. The following observations, although brief, give some idea of the nutritional problems of the Vene-zuelan livestock industry.
(a) Pastures and grasses
In the extensive type of stock farming prevailing in Venezuela, the animals generally graze on large pastures or stretches of open range, consisting mainly of natural grasslands. More than 80 per cent of the total pasture land in Venezuela is of this type. Its carrying capacity is distinctly low, partly because of the predominance of natural grasses, often only seasonally available, and partly because of their low nutritive value. The most important native grasses include Gamelotillo (Paspalum plicatum), which is drought-resistant, and Carretero (Eragrostis maypurensis) and Lambedora (Leersia hexan-dra), which flourish only in humid soils. Where there is suitable soil and rainfall, some native legumes that are much more valuable as fodder grow in conjunction with the grasses.
Artificial pastures have a much higher carrying capa-city, but these constitute only 15 per cent of the total grazing land. Guinea grass (Panicum maximum) and Yaraguá (Hyparrhenia rufa) grow well in dry soil, and Pará (Panicum purpurascens) in humid conditions. Other high-quality artificial grasses such as pangóla grass (Digitaria decumbens) and Bermuda grass (Cynodon dactylon) are cultivated on a very small scale, but there seems to be a growing interest in their cultivation. The cultivated legumes include tropical kudzu (Pueraria phaseoloides), which is becoming more widely used because of its high nutritive value and its qualities as a soil protector.
(b) Inadequate pasture management The low carrying capacity is a result not only of the
type of grasses and of the predominance of a single grass,31 but also of ranch management, many aspects
31 Only on a few intensive and well-organized farms is there a combination of plants in one pasture.

82 LIVESTOCK IN LATIN AMERICA
of which are unsatisfactory. For example, the grasses are often left to grow for too long, so that their nutritive value is reduced and they become so tough that the animals refuse to eat them. Neglect is also often evidenced by the presence of weeds and even poisonous plants. Only a small number of livestock farmers practise sys-tematic pasture rotation, and it is fairly common practice to maintain perennial pasture with the same type of livestock grazing on it. The use of fertilizers, irrigation and reseeding are not among current livestock practices, and there is very little cultivation of fodder plants for cutting, even on dairy farms.
(c) Lack of supplementary feeding
The use of cut fodder, hay ensilage and concentrates is very limited, either because the farmers are not familiar with them, or because they are scarce and expensive.
In many livestock areas, conditions are favourable for the cultivation of fodder varieties suitable for making hay or ensilage, but it is not the practice to use such fodder, even during seasonal shortages of grasses. During the rainy season there is usually abundant growth on the pastures, in some areas to such an extent that hay or ensilage could be made, thus offsetting the enormous seasonal fluctuations in production, for example on dairy farms, caused by the lack of an adequate and balanced diet for milk cows during the dry season. Hay and ensilage could be produced at a comparatively low cost, but before these practices could become general, a campaign to demonstrate their advantages on a wider scale would be required.
Other supplementary foods for livestock—grain, molasses, oilcake (cottonseed, sesame, copra), by-products from slaughter-houses and breweries and commercial preparations—are also available on only a very limited scale and can only be obtained at very high prices.
It should be noted that one of the main reasons why supplementary foods are not available on most farms is the lack of integration in animal husbandry or of mixed livestock and crop farming, systems that are highly desirable and necessary if there is to be a more efficient utilization of the factors of production.
3. BREED IMPROVEMENT
Here too Venezuelan problems are very similar to those in other tropical and subtropical countries. The characteristic feature of stock farming in these areas is the presence of criollo breeds that require little care and are very resistant to the rigours of the climate, but in most cases give only a very low economic yield. The fact is that much livestock activity based on the breeding and raising of native strains has sunk to a level of marginal productivity—or at least of very low yield—as the use of the factors of production has become more compe-titive and costly. Often stock farming has been replaced by mechanized or higher-yield forms of agriculture, but the vast increase in the demand for livestock products means that animal production can survive even at the low levels of physical productivity of the native breeds. As stated previously, Venezuela has made a praiseworthy effort to raise the genetic level of its livestock. This has been done mainly by large and growing imports of speci-
mens of improved breeds, in order not only gradually to replace criollo strains that are not likely to lead to any improvement of stock, but also to develop pro-grammes of cross-breeding, hybridization and grading that have been shown or appear likely to be well suited to Venezuelan conditions. The beneficial effects of imports and the technical guidance that is being given justify expectations of even better results in the future.
In many areas conditions with respect to the soil, grasses, climate, organization, management, etc., are unfavourable and preclude the use of intensive systems with specialized foreign breeds, and attempts to establish them in such circumstances have resulted in complete failure. Hence in Venezuela, as in other tropical countries, the emphasis is on the selection and improvement of certain groups of criollo cattle, especially those with characteristics suited for milk production in the tropics, where the high temperatures limit the reproductive functions as well as milk production in specialized breeds of European origin. Increasing use of highly specialized breeds, both for milk and meat, will naturally depend on efforts to improve livestock conditions and on scientific progress in the field of disease and pest control, acclima-tization, nutrition, etc.
4. DEFECTIVE MANAGEMENT
Animal hygiene, the supply of fodder and supplemen-tary foods and the level of genetic improvement do not depend solely on ecological conditions, but can be considerably modified and improved by intelligent and progressive methods of administration and manage-ment on the farms and ranches. Unfortunately this particular factor of production tends to be neglected in the livestock sector, either because there is an absentee landlord, or because the landlord lacks the required administrative ability, or because management is left entirely to bailiffs or foremen with very limited qualifi-cations. Farmers are well aware that the herd's producti-vity is high when its health is well cared for, when its diet is adequate and balanced, and, from a longer-term standpoint, when there is control of stud services and births and the animals are selected on a yield basis. All this can usually be done with a relatively modest outlay of capital and labour, but many livestock producers fail to attach to the administrative and management aspects the importance they deserve. There are many operations and practices on stock farms that should be part of the routine of management and that can generally be carried out at little expense. The most important include periodic vaccination, anti-parasitic dips and treatments, castration at the proper time, control of reproduction and the timing of births, the admixture of minerals as required and the careful handling of animals. There should also be routine rotation and cleaning of pastures, records of production and mortality, and many other similar meas-ures connected with administration and organization.
5. MARKETING AND DISTRIBUTION SYSTEMS
The marketing, slaughtering and distribution of live-stock products are dealt with here as factors limiting livestock production, because although they are not production operations, the backward conditions in which

VENEZUELA: I I I . FACTORS LIMITING PRODUCTION 83
they are practised have adverse effects on the interests of the producers, and often also on the quality of the products. It is common knowledge that an efficient mar-keting organization benefits both the producer and the consumer; it ensures for the former the sale of his products at the most convenient time and place and at normal market prices, and for the consumer a regular supply of the products suitably graded as to quality and guaranteed as to hygienic conditions. This is not the case in Venezuela, where present conditions as regards marketing and slaugh-tering, meat, milk and other livestock products leave a great deal to be desired with respect both to marketing operations and to marketing organization and services. A detailed consideration of all these aspect and questions would not be appropriate in the present study, especially since they have been carefully studied and analysed for livestock and meat.32 Accordingly this section will merely outline the main features and point out the most obvious shortcomings.
(a) Livestock and meat marketing Although Venezuela has made considerable progress
in means of transport and roads, most animals for slaughter still travel to the consumption or fattening centres on the hoof, with consequent loss of weight33
and deaths. The transport of livestock by lorry and railway is also in need of improvement. Although it is true that the present decentralization of slaughtering reduces transport difficulties, it is equally true that the concentration and centralization of slaughtering and the establishment of large public cattle markets will not be possible without rapid and adequate means of transport. Moreover, centralized slaughtering requires established supply centres and a separate organization for fattening centres. Hence gradual centralization is advisable, through a number of strategically placed centres.
In addition to the transport problem, there is also the matter of the sale of livestock, since cattle fairs and trad-ing are not properly organized. The animals sent to market or directly to the abattoirs are usually of different ages and often deplorably lean, and there are no regula-tions on the subject or uniform standards of grading. Even in official purchases of cattle for slaughtering, the differences in price relate only to differences in carcass weight, regardless of the degree of fattening and quality of the animals, and this naturally destroys any incentive for the producers to provide animals of better quality.
Slaughtering and processing conditions are defective in the same way as in other countries—such as Bolivia, Brazil, Cuba, Colombia, Ecuador, Peru and Central America—where there are abattoirs in every munici-pality, however small the population. In many places there is no organized marketing of livestock for food; there are usually one or two slaughterers who buy a few steers or old cows on the same farm, carry out the slaughtering and other operations themselves at the municipal slaughter-house on payment of a fee, and then sell the meat in a small shop which has none of the
32 La industria ganadera en Venezuela and La industria ganadera de carne en Venezuela, 1958, published by the Ministry of Agricul-ture and Livestock.
33 The average loss is 8 per cent of live weight.
required equipment or facilities. Thus operations at small slaughter-houses are carried out in dangerously unhygienic conditions with no public health control; moreover, the limited volume of operations does not justify expenditure on a suitable and properly equipped building, far less the utilization of by-products, which involve machinery and trained staff. This is the situation in the semi-urban areas and in the small centres. In large towns and in more populated municipalities livestock and meat marketing is better organized, although much remains to be done as regards the marketing, slaughtering and processing of animal products.
Up to the end of 1958 the following was the calendar of breeding cattle fairs, according to direct information from the Statistical Division of the Ministry of Agri-culture and Livestock:
(1) San Cristóbal (Táchira), 21 January (2) Maracay (Aragua), 20 February (3) Valencia (Carabobo), 21 March (4) Maturin (Monagas), 15 April (5) San Felipe (Yaracuy), 1 May (6) Carora (Lara), 24 June (7) San Carlos (Zulia), 16 July (8) Táriba (Táchira), 16 August (9) Tovar (Mérida), 9 September
(10) Ciudad Bolívar (Bolívar), 15 October There is public health inspection of livestock and meat
at about 150 slaughter-houses. In many of them the volume of operations is small, with a daily slaughtering rate of 1 to 10 animals. A daily rate of over 50 head of cattle is recorded for very few abattoirs (see table 14).
The Ministry of Agriculture and Livestock, in order to remedy present defects in slaughtering, is carrying out a programme for the building or reconditioning of indus-trial abattoirs, preferably in the stock raising and fatten-ing areas and in conformity with studies on location, capacity and operation carried out by the Ministry.34
Table 14 Venezuela: Regional distribution
of the main slaughter-houses, 1958 a
Number State of slaughter-
houses
Federal District 3 Anzoátegui 12 Apure 6 Aragua 10 Barinas 7 Bolivar 4 Carabobo 5 Cojedes 4 Falcón 3 Guárico 6 Lara 11
Number State of slaughter-
houses
Mérida 11 Miranda 8 Monagas 2 Portuguesa 6 Sucre 6 Táchira 7 Trujillo 11 Yaracuy 6 Zulia 13 Amazonas territory 1 Delta Amacuro territory 1
Source: Statistical Division of the Crop and Livestock Planning Department of the Ministry of Agriculture.
a Subject to veterinary inspection provided by the Ministry of Health and Social Welfare.
34 W. Dubuc Marchiana, Recopilación sobre mataderos indus-triales (Caracas, 1958).
84 LIVESTOCK IN LATIN AMERICA
Considerable interest has been shown in Venezuela in the storage of meat products, as evidenced by the fact that at the end of 1958 there were 34 refrigerating plants in the country with a capacity of 109,140 cubic metres. But only about a quarter of this capacity has been used, because of the consumer's preference for fresh meat, and also because seasonal variations in the supply of livestock are not sufficient to leave large surpluses for storage and conservation.35 Moreover, refrigeration is not combined with the other processing operations, which would be the rational arrangement.
The operations included in the various stages of mar-keting are carried out by a large number of middlemen who do not have the specialized functions of their counterparts in the large towns, or else by wholesalers who undertake the slaughtering and the supplying of meat to retailers, institutional consumers and shop-keepers. Better organized marketing and distribution services are provided by a small number of producer-wholesalers who manage their own plants and sell the meat through various channels, or through a private or public industrial wholesaler.
Retail services vary in efficiency and volume of ope-rations according to whether they are in the large towns or small centres. In the latter, the small turnover and absence of suitable legislation mean that the retail sale of meat is carried out in unsatisfactory conditions. In the more populated centres, retail marketing conditions are better, but costs are rather high; there are many suitably equipped retail butchers, but the turnover is very low and the resulting high costs are passed on to the consumer in the form of high meat prices.36
The lack of specialized marketing operations and the great variations in the quality of the products result in high marketing margins that fluctuate enormously not only as between areas but even within a single market. The lack of proper grading and information also contri-butes to these discrepancies.
The large marketing margins in Venezuela are clearly due to the high marketing costs, attributable in turn to slaughtering and marketing systems that are still very unsatisfactory. These margins are obviously a heavy burden for the consumer and the high prices are unrelated either to the quality of the products or to the type óf service provided. Apart from the disadvantages of the large number of middlemen who add to marketing costs—although they provide important services, often in return for only a modest profit—it should be empha-sized that the profit margin on low-grade meat is usually quite unjustifiable, because of the small differentiation between the final prices and because of other marketing defects.
Up to a few years ago the slaughtering and marketing margin for beef in the Caracas market was 23 per cent of the final price, or 23 céntimos for each bolivar paid
36 The estimated seasonal variation in slaughtering is 12 to 13 per cent of the annual average, with the minimum levels in April, May and June and the maximum in December and January, for reasons relating to the condition of the pastures. (See La industria ganadera de carne en Venezuela.)
36 In the central zone of Venezuela there are over 3,000 retail butchers, with average sales of barely one-quarter carcass per day.
by the consumer, of which 16.8 céntimos went to the retailer and only 1.86 to the wholesaler, the rest being for transport and slaughtering costs. The average national pattern is different, since, in 1956, 57.7 of the price paid by the consumer went to the producer, 18.6 to the wholesaler and 23.7 to the retailer.37 Data on changes in marketing margins between 1950 and 1956 show that the producer's and retailer's share has increased steadily, while the wholesaler's share has decreased considerably. This change occurs as services become more specialized or efficient, as costs climb and the volume of operations expands; this is confirmed by the data given above for Caracas, where the meat market is better organized.
(b) Marketing of milk products Advances in the marketing, processing and distribution
of milk and milk products have been more rapid than for livestock and meat. The official policy of developing milk production and increasing consumption has bene-fited the producer, the processer and the consumer.
The situation with respect to milk collection and trans-port to the distribution and consumption centres has improved as a result of the building of new thoroughfares, road improvement and the organization of collection and transport services by the processing plants. Some weaknesses nevertheless remain to be remedied, especially with respect to the quality and condition of milk supplied by certain dairy farms that are in remote areas or that have no proper milking and refrigerating facilities. With respect to the production of cream, butter and cheese, there are also notorious shortcomings as regards quality, hygiene, conservation and distribution. Cream for butter-making is sent from dairy farms in remote areas to the towns where there are processing plants—Maracaibo, for instance—whence it is sent to the consumer centres. The same applies to cheese.
The marketing and processing of pasteurized milk are at a fairly advanced level and there has been a great expansion in recent years. In 1955, there were already 11 pasteurization plants in operation and 8 under con-struction; by the end of 1958 there had been a considerable increase, as shown by the following list:
Federal District Sindicato de le Leche, S.A. (Silsa) Federal District Cremería Nacional Federal District Marcor y Alaca (Soc.) Federal District Prolaca Federal District Kempis Federal District Lactuario Zulia Aragua Sindicato de la Leche, S.A. (Silsa)
Aragua Lechería Aragua, S.A. Aragua Lactuario Maracay Carabobo Industrias Lácteas de Carabobo, C.A. Guárico Productos Lácteos Llano Oriental, S.A. Lara Productos de Lara, C.A. Lara Hijos de Ramón Herrera, C.A. Lara Pasteurizadora del Norte, C.A. Miranda Pasteurizadora Caracas, C.A. Miranda Leche Delta, C.A. Miranda Industrias Lácteas Venezolanas (Inlaca) Miranda La Normanda Monagas Rafael Casas Táchira Pasteurizadora Táchira, C.A.
La industria de carne en Venezuela, 1958, op. cit.

VENEZUELA: IV. CONSUMPTION OF AND DEMAND FOR LIVESTOCK PRODUCTS 85
Zulia Vía Láctea, C.A. Zulia Unión de Productores Agrop. (Upaca) Zulia Lactuario y Explotaciones "Alfag" Zulia Indosa Zulia Empresa Láctea, S.A. Zulia Indulac Zulia Cremería Nacional Zulia Lactuario Perijá Zulia Agapeca
In 1958, the total volume of raw milk received at pasteurization plants amounted in round figures to 144 million litres, of which some 139 million were pas-teurized. Plant capacity greatly exceeds present supply; Caracas plants are working at between 60 and 90 per cent and other plants at only 30 or 40 per cent of capacity. Although this situation is favourable from the stand-point of future expansion of consumption, it poses the problem of high production costs in low-capacity pro-duction units, which is what most of the existing pasteu-rization plants are. The high price of pasteurized milk might logically be expected to fall with the growing use of available capacity, but this is not likely to happen except to a limited extent, since the trend is to set up plants in all the large towns because of the widespread preference for and consumption of this type of milk.38
The preserved milk trade has also expanded yearly as a result of the growing encouragement of production aimed at reducing the greater volume of imports.39 There
38 Grade B pasteurized milk with a bacterial count of not more than 50,000 per cubic centimetre and with an average fat content of 4.2 per cent, according to government regulations.
39 In September 1958 the subsidy for raw milk for processing was increased to 14 and 10 céntimos for second- and third-grade milk respectively, less than that for first-grade milk (15 céntimos per
are two plants for condensed and dried milk in Venezuela, one (Indulac) at Santa Barbara de Zulia, with a process-ing capacity of about 200,000 litres of raw milk daily, and the other, which has a much lower capacity, at Quebrada Arriba, Distrito Torres, in the State of Lara; these plants are subsidiaries of Nestlé and Borden, whose activities have greatly increased as a result of the change authorized early in 1958 in the proportion of imported to domestic milk powder, reducing the proportion from 6 : 1 to 5 : 1 40 Nevertheless, the first plant still has unused capacity; its equipment and organization are excellent, and its products are well known throughout the country.
The marketing margin for pasteurized milk sold in Caracas at the end of 1958 was approximately 30 per cent of the final retail price and 26.3 per cent of the price paid by institutional buyers. Thus the producer's share was 70 per cent of the retail price plus the Ministry of Development's subsidy paid through the processing plants. For milk powder the estimated margin is 1.60 bolívares per kilogramme. The prices paid to producers, which are not subject to any form of government control, are set by agreement between the producers and the processing plants through the Venezuelan Milk Council (Consejo Venezolano de la Leche), whose execu-tive board includes representatives of both groups. The Government does, on the other hand, have a say in the fixing of maximum consumer prices, through the same Council.
litre), for which the requirements are a reduction time of 6 hours at a maximum temperature of 10° C., herds that are officially inspected and free from tuberculosis and brucellosis, and staff with health certificates.
40 Towards the middle of 1960 the ratio was changed again to 4 :1 and in March 1961 to 2.5 : 1.
IV. CONSUMPTION OF AND DEMAND FOR LIVESTOCK PRODUCTS 1. VARIATIONS AND TRENDS IN CONSUMPTION LEVELS
Although the consumption levels for protein foods of animal origin in Venezuela have improved in recent years, they remain low in relation to nutritional require-ments. Under-consumption of meat, milk products and eggs is found especially among rural wage-earners and among the greater part of the lower-paid urban workers.
One favourable factor is the rapid increase in the effective demand resulting from population growth— one of the world's highest—and the visible increase in available income. These special socio-economic cir-cumstances, in conjunction with a fairly stable price level, have had the effect of encouraging the consumption of foods of animal origin. Figure II gives indices for the total consumption of meat and milk products and for their price levels during the period 1951-58. It can be seen that an appreciable expansion in consumption coincided with fairly stable price levels during this period and, in recent years, there has been an increase in per capita consumption for most such products. It is hoped that these improvements will continue, since conditions favour a greater supply of protein foods of animal origin from domestic production. The Venezuelan livestock industry will naturally have to be encouraged to attain
higher physical productivity in order to bring down production costs. By this means the natural level of relative prices will continue to stimulate consumption. The partial import substitution that may reasonably be expected calls for the encouragement of relatively low-cost domestic consumption.
(a) Meat consumption
Table 15 shows the almost continuous increase in the total consumption of meat of all types of livestock (excluding poultry) during the last decade, the indices for 1957 and 1958 being particularly high. Apparent consumption rose from an annual average of 81,000 tons in 1947-48 to 95,000 in 1953-55 and 119,000 in 1956-58, which is equivalent to an increase of 17 per cent in the first case and 47 per cent in the second. Something over 80 per cent of the consumption of red meat is represented by beef, 17 per cent by pork, and the small remaining balance by mutton and goat meat.
In recent years, total meat consumption has expanded faster than the population, despite the rapid population growth stimulated by immigration, which means that there has been an increase in per capita consumption.

86 LIVESTOCK IN LATIN AMERICA
Figure II
Venezuela: Indices of apparent consumption and weighted prices of meat and milk products, 1951-58 a
(1951 = 100) SEMI-LOGARITHMIC SCALE
260
200
100
80
CONSUMPTION OF MILK PRODUCTS
CONSUMPTION OF MEAT
MEAT PRICES
— . . MILK PROOUCT PRICES
J L 56 57 58
a Meat: beef and pork. Milk products: pasteurized milk, milk powder, butter and cheese.
Table 15
Venezuela: Consumption of red meat, total and per capita, 1947-49 to 1956-58a
(Annual averages)
1947-49 1950-52 1953-55 1956-58
Total consumption, all meats (thousands of tons) 81.0 88.0 95.0 119.3 Index (100.0) (108.6) (117.3) (147.3) Beef 65.8 71.8 76.2 96.9 Pork 14.1 15.2 17.6 20.8 Mutton 0.37 0.37 0.45 0.53 Goat meat 0.77 0.63 0.75 1.05
Per capita consumption, all meats (kilogr.)... 17.28 17.16 16.94 19.45 Index (100.00) (99.30) (98.03) (112.56) Beef 14.04 14.00 13.58 15.80 Pork 3.00 2.96 3.14 3.39 Mutton 0.08 0.07 0.08 0.09 Goat meat 0.16 0.13 0.14 0.17
Source: Data in table 7 and information from the Department of Trade on meat imports.
o Excluding meat from unregistered slaughterings.
The annual changes in per capita consumption in decent years are as follows:
Per capita Year consumption Year
Ikilogrammes)
1939 14.6 1950 . 1940 17.2 1951 . 1941 16.0 1952 . 1942 16.1 1953 . 1943 14.9 1954 . 1944 15.5 1955 . 1945 16.4 1956 . 1946 17.5 1957 . 1947 16.1 1958 . 1948 17.2 1959 . 1949 18.4
Per capita consumption
((kilogrammes)
18.6 16.9 16.3 17.0 17.1 17.2 17.4 19.5 21.1 22.0
The lowest average per capita consumption levels for meat are for the first period, 1939-47; from then on livestock exports were suspended and Venezuela became an importer of meat, especially frozen meat. The greatest volume of imports was during 1948-50,41 and there was a marked increase in per capita consumption precisely during those three years. Between 1951 and 1956, con-sumption fell off and settled at about 17 kilogrammes per person, but in 1957, 1958 and 1959 there was a sharp rise to 19.5, 21 and 22 kilogrammes per person respec-tively; these rises correspond to the considerable increase in slaughterings recorded for these years.
(b) Consumption of milk products The rapid development of Venezuela's economy
throughout the period 1950-5842 and the consequent increase in purchasing power also resulted in a greater consumption of milk and milk products. Apparent total annual consumption of milk products, expressed in terms of fluid milk, rose from 592 million litres in 1951-52 to 856 million litres in 1956-58, an increment of 44 per cent equivalent to an annual increase of about 8 per cent (see table 16). It can be seen from the break-down of consumption by origin that both domestic production and imports contributed to this improvement.
The most remarkable expansion was in the consump-tion of fluid milk, especially pasteurized milk, which rose from an annual volume of 22 million litres in 1948-50 to 157 million litres in 1956-58, a sixfold increase. There was also a fairly large increase (62 per cent) in the consumption of preserved milk. The total consump-tion of butter and cheese, on the other hand, has remained more or less stable during the last few years.
As the total consumption of milk products grew faster than the population, an increase in per capita consump-tion was possible, and this rose from the fluid milk equivalent of 114 litres in 1951-52 to 138 litres in 1956-58, which is an increment of about 21 per cent (see table 16). Per capita consumption rose spectacularly for pasteur-ized milk; it increased somewhat less, although still
41 Carcass weights of chilled meat imported from Argentina in 1948, 1949 and 1950 were 7,300, 7,583 and 5,155 tons respectively.
42 Between 1950 and 1958, the increase in the gross national product was higher in Venezuela (100 per cent) than in any other Latin American country, and at the same time the population growth attained the high rate of 29 per cent in eight years (Latin American Business Highlights, Vol. 10, No. 2).

VENEZUELA: IV. CONSUMPTION OF AND DEMAND FOR LIVESTOCK PRODUCTS 87
Table 16
Venezuela: Consumption of milk products,a
1948-50 to 1956-58
1948-50 1951-52 1953-55 1956-58
Total consumption, all pro-ducts (thousands of litres) 591,664 739,869 856,387
Fluid milk (thousands of litres) 22,282 35,593 111,747 156,677
Preserved milk (tons) 28,950 31,011 39,243 46,913 Cheese (tons) 19,530 21,142 21,381 Butter (tons) 4,134 4,289 3,644 4,021
Per capita consumption, all products (litres) 113.69 132.00 138.59
Fluid milk (litres) 4.60 6.47 19.92 25.54 Preserved milk (kilogr.)... 6.0 5.96 7.0 7.65 Cheese (kilogrammes) . . . 3.75 3.77 3.46 Butter (kilogrammes) 0.86 0.82 0.65 0.65
Source: Data from table 9, and information from the Ministry of Agriculture and the Department of Trade of the Ministry of Develop-ment, respectively, on imports during 1948-56 and 1956-58.
0 All milk products are expressed in terms of the fluid milk equivalent, calculated with the conversion factors given in table 9.
considerably, for milk powder and remained fairly stable for cheese and butter in recent years.
There was also considerable expansion in the con-sumption of other foods of animal origin such as eggs; between 1955 and 1959 the total consumption of eggs increased by 20 per cent, from 256 million units to 306 million.
(c) The effect of relative prices
As stated previously, increased total and per capita consumption of livestock products must be attributed not only to the vast growth in the population and to larger incomes, but also to the structure and favourable trends of relative prices. In some Latin American coun-tries, improvement in per capita income has not been reflected in a greater per capita consumption, because the effect of the additional income has been nullified by the concurrent rise in prices. In Venezuela, however, the relative prices of meat, milk products and eggs have been maintained at a level that encourages the greater consumption referred to previously. In recent years relative prices have tended to be fairly stable and in some cases have fallen. Between 1953 and 1959, for example, and more especially in 1958 and 1959, parity prices of pasteurized milk showed no substantial rise in relation to the general wholesale price level of 82 articles; on the contrary, in 1954, 1955 and 1956 they fell, and in 1957, 1958 and 1959 they remained stable. It is to this favourable development for the consumer that the spec-tacular rise in annual per capita consumption—from 6.47 litres in 1951-52 to 25.5 litres in 1956-58—must be attributed. The prices of milk powder, a very popular food in Venezuela, have also remained at a favourable level and have even fallen in recent years. Per capita consumption, variations in which have already been referred to, has expanded every year. The trend towards
low relative prices also applies to butter, cheese and eggs since 1954. Because of (the marked substitution effect as between milk products, there was a decrease in the per capita consumption of butter and cheese, despite their lower relative prices because of plentiful supplies on the world market and smaller domestic demand.
With respect to meat, the increase in per capita con-sumption in 1957, 1958 and 1959 was also appreciable, rising from 17.4 kilogrammes in 1956 to 19.5, 21 and 22 kg respectively in 1957, 1958 and 1959. Although there were rises in the relative prices of pork and beef, especially beef, these were only at the modest annual rate of 1 or 2 per cent, compared with an annual increase of 6 per cent in per capita national income43 during the period 1950-58 as a whole, and of 9 per cent during 1957 and 1958, when there was also higher per capita consumption. (See figure III.) The highest levels of per capita available income are for the more populous States and towns—Zulia and the Federal District— where per capita demand, supply and consumption of meat are all higher.
43 These are compound rates of increase of per capita national income, not available income, which for 1957 was calculated by the Central Bank as 1,773 bolívares compared with a per capita national income of 2,545 bolívares.
Figure III
Venezuela: Curves of parity prices of foods of animal origin in relation to the general price curve, 1951-59
(1951 = 100) NATURAL SCALE
120
115
IIO
IOO
9 0
8 5
80
> FRESH BEEF
PASTEURISED MILK
PORK
GENERAL PRICES = 100 MILK POWDER BUTTER
CHEESE
EGGS
5 3 5 4 5S
Source: Price indices and wholesale prices published by the Department of Statistics.

88 LIVESTOCK IN LATIN AMERICA
Table 17
Venezuela: Break-down of consumption or meat and milk products by origin, 1948-50 to 1956-58
(Average annual percentage)
1948-50 1951-52 1953-55 1956-58
Domestic Domestic Domestic , Domestic jm„„„, production Impor,s production Imports production Imports production lmporls
Red meat 92.3 7.7 99.4 0.6 99.9 0.1 99.9 0.1 Poultry 84.0 16.0 85.1 14.9 100.0 a 100.0 a
Milk powder 6.0 94.0 6.8 93.2 9.3 90.7 10.5 89.5 Cheese " 78.4 21.6 76.2 23.8 62.0 38.0 Butter 41.5 58.5 38.8 61.2 74.9 25.1 93.2 6.8 Whole milk c 41.3 58.7 49.3 50.7 47.6 52.4
Source: Tables 15 and 16 and data on imports from the Ministries of Agriculture and Development. a Imports amounted to less than 0.1 per cent of total consumption. 6 Annual imports were 2,947 tons for the three-year period 1948-50, compared with 4,220 tons during
1951-52. 0 Annual imports of preserved milk, cheese and butter averaged 316 litres (in terms of fluid milk)
in 1948-50.
2. BREAK-DOWN OF CONSUMPTION BY ORIGIN
(a) Meat It can be seen from table 17 that imports made no
significant contribution to meat consumption except during the three-year period 1948-50, when an annual average of 6,679 tons of frozen Argentine meat were imported. In subsequent years these imports were sus-pended and Venezuelan consumption of red meat came to depend almost entirely on domestic production, except for small imports of prepared, dried and salted meats and the illegal entry of livestock for food.
Before 1952, about 15 per cent of the poultry consumed came from North America and Europe; since 1952 there has been a substantial cut in these imports and their present contribution to consumption is negligible.
(b) Milk products It can be seen from the last column in table 17 and
from figure IV that more than half the total consumption of milk products—expressed in terms of fluid milk— is supplied by large-scale imports of milk powder, cheese and butter, especially of the first two. This means that there is wide scope for import substitution, develop-ment of better quality products and reduction of costs, in order to place the domestic product on a better footing to compete with imports.
Up to a few years ago most of the consumption of preserved milk was supplied by imports. Although domestic production of milk powder is expanding, it is still far from enough to meet the growing demand for this item; in 1956-58 domestic production supplied only about a tenth of consumption. Obviously the production of dried milk in Venezuela could be rapidly expanded, since there is an extensive market for it. As things are, however, it appears difficult to eliminate foreign competition; this could be done only by (a) reducing domestic production costs, (b) amending the trade treaty with the United States and (c) altering the
Figure IV
Venezuela: Percentage distribution of consumption of whole milk and milk products, 1951-52 to 1956-58
NATURAL SCALE
100
90
so
70
60
40
30
DOMESTIC PRODUCTION • IMPORTS
WHOLE MILK MILK POWDER CHEESE BUTTER
1951-52 56-58 51-52 56-86 51-52 56-58 51-52 56-58 53-55 53-55 53-55 53-55
quota proportion44 or replacing it altogether by other measures of protection and encouragement. In view of the high price at which milk is sold in Venezuela, the
44 On 23 June 1960, the quota proportion was reduced to 4 : 1; two weeks earlier it had been reduced to 4.5 : 1. It was subsequently reduced to 3.5 : 1.

VENEZUELA: IV. CONSUMPTION OF AND DEMAND FOR LIVESTOCK PRODUCTS 89
duty of 50 céntimos per kilogramme on imports of milk powder under the treaty with the United States is not a sufficient tariff restriction to discourage imports. A very high import duty would merely result in higher consumer prices. It should be noted that the exemption from duty of the imported product through the quota system is a purely fictitious measure. The importer does not in fact buy 1 kilogramme of domestic milk powder for every 3.5 kilogrammes he imports; he actually takes the duty upon himself, because, under the existing regulations, he is obliged to sell the domestic product for 37 per cent less than he pays for it. What happens is that he pays the domestic producer 29 bolívares for every 6 cases of milk powder he imports. The importer raises the price of the imported product to make up the loss. If he cannot do this, he pays the import duty and becomes free of the quota restrictions.
So long as the present import system remains in force, any reduction of the quota ratio will favour the domestic product, but at the same time the importer will prefer to pay the duty rather than buy the national product or else to replace milk powder imports with cheese, for instance. In practice it is difficult to determine the most appropriate proportion between domestic output and imports, because of variations in the former.
The consumption of chesse is also largely supplied by imports, and this tendency has become more marked in recent years. Thus, whereas in 1951-52 21 per cent of consumption was represented by imports, in 1956-58 the percentage rose to 38. This change, which, as explained previously, took place at a time when per capita con-sumption was being barely maintained, was obviously due to the reduction in domestic output that began in 1957, to the import substitution effect previously referred to and to the much higher quality of the foreign product.
With respect to butter consumption, table 17 show that there has been a marked change in favour of domestic production, since, whereas eight years ago more than half the consumption was supplied by imports,45 in 1956-58 the average contribution of imports had been reduced to 7 per cent. This change was due to an increase in domestic production—especially after 1956—further stimulated in 1958 by an extension of the subsidy to milk for butter making, to the existence of surpluses and to a falling-off in demand accompanied in recent years46 by the stabilization of per capita consumption.
There is also a considerable dependence on imports as regards other foods of animal origin. This applies to eggs, for which purchases abroad averaged 382 million units a year in 1957-59, which was approximately 95 per cent of the total available for consumption.47
3. COMPARATIVE CONSUMPTION AND NUTRITIONAL AIMS
(a) Comparative consumption Table 18 compares the per capita consumption of
meat, milk, eggs and fish in a number of Latin American 46 In fact the import contribution was even higher, since the
figures for domestic output include butter made with imported cream.
46 In 1959 butter imports were subjected to the prior licence requirement as a means of promoting production.
47 Archivos Venezolanos de Nutrición, January 1960.
Table 18
Comparative consumption of foods of animal origin in selected countries
(Annual per capita average in kilogrammes)
Red meats a Milk o Eggs° Fish «
Argentina 90 251 6 2 65 5 2
Chile 27 116 5 13 Colombia 27 72 3 2 Denmark 65 212 8 13
56 . . . 10 6 Netherlands 40 234 9 6 Honduras 17 64 4 2
21 d 74 4 2 Paraguay 59 83
16 47 3 2 United States 70 264 21 5 Uruguay 104 227 7 1 Venezuela 21 e 135 « 4 e 7»
Source: Meat: ECLA, on the basis of official figures, and United States Department of Agriculture, Foreign Crops and Markets, World Summaries: Crops and Livestock (29 September 1960). Milk: United Nations, The role of agricultural commodities in a Latin American regional market (E/CN.12/499). Eggs and fish : FAO, Production Yearbook 1958.
0 1958-59; kilogrammes of carcass meat of beef, pork, mutton and goat meat; the figures do not include the consumption of meat repre-sented by in situ slaughterings.
6 1954-56: milk and milk products expressed in terms of fluid milk. 0 1954-55 and 1954-56. d 1957-58; this includes estimated consumption of meat from in
situ slaughterings. e 1957-59. ' 1956: fresh fish (Archivos Venezolanos de Nutrición, January 1960).
and European countries. It can be seen that the annual average per capita consumption of livestock meat of all types (excluding poultry) in Venezuela is barely 21 kilogrammes, which is one of the lowest levels in Latin America. As stated previously, per capita supplies of meat have improved in recent years, but there is still a deplorable degree of under-consumption, both in relation to recommendable nutritional standards and, even more, in relation to the great demand in Venezuela for most foods of animal origin.
The consumption of milk products, on the other hand, has expanded more rapidly, so that the Venezuelan consumer is relatively well situated by comparison with the extremely low levels of consumption in such other Latin American countries as Brazil, Colombia, Honduras, Mexico and Peru.
Per capita consumption of eggs and fish is also rela-tively high in Venezuela, especially compared with that in other Latin American countries; this applies espe-cially to fish, for which the per capita consumption is higher than in any other Latin American country except Chile.
(b) Nutritional aims Despite the academic nature of nutritional standards
of consumption compared with the variety of factors that determine actual per capita consumption, it is important to compare figures of actual consumption

90 LIVESTOCK IN LATIN AMERICA
with the nutritional standards recommended for the Venezuelan consumer, since this is the only way of quan-tifying the deficit of various foods of animal origin in terms of the consumption recommended for a balanced diet adapted to local conditions.
What is mainly lacking in the consumption of red meat is beef, for which annual per capita consumption should be about 5 kilogrammes, which would represent an increase of 31 per cent over the present level of con-sumption. Consumption of pork should be stepped up by about 1 kilogramme per person. For fresh fish, too, the recommended level is far higher (51.5 per cent) than actual consumption in recent years (see table 19). Although at present no nutritional recommendations are available for mutton and goat meat, the present per capita levels of consumption seem to be in line with the dietary habits of the average consumer. With respect to milk products, nutritional requirements could probably be met by raising the present level of consumption (in terms of fluid milk) by about a third.
4. PROJECTIONS OF DEMAND
In the last few years there have been fundamental changes in Venezuela's economy. There is rapid growth both of industrial and urban development and also of population and national income. A major change is also expected in the livestock sector, as a result both of developments and trends in other sectors and of new policies aimed at improving methods of agricultural production and raising the rural population's standard of living. All these changes are likely to have a more or less direct influence in future on the supply of and demand for livestock products. Hence it would be at least difficult, if not hazardous, to attempt to predict what consumption is likely to be during the next five or ten years. It cannot
Table 20
Venezuela: Projected demand for meat and actual consumption, 1958
Projected Actual Difference between
Projection demand consumption projected and
actual consumption Projection projected and
actual consumption Tons (percentage)
A. Estimated population (6.09 million) and per capita consumption, 1939-52 83,210 110,300 32.6
B. Consumption trend, 1939-52 85,809 110,300 28.5 C. Estimated population (6.09 million) and nutritional target
of 20.72 kg per person 126,244 110,300 —12.6 D. Estimated population (6.82 million) and stable consump-
tion of 13.3 kg per person 90,594 110,300 21.8 E. Estimated population (6.82 million), average consump-
tion in 1954-56 (13.3 kg per person) and annual in-creases of 0.677 due to high income 91,160 110,300 21.0
F. Population growth of 4 per cent (6.82 million for 1958); average consumption in 1954-56 and annual increase of 1.8 per cent due to high income; elastic demand and constant prices 93,200 110,300 18.3
Source: Figures for projections A, B and C are from La industria ganadera en Venezuela, and those for projections D, E, and F from La industria ganadera de carne en Venezuela. The figures for actual consumption are taken from table 7.
Table 19
Venezuela: Recommended nutritional standards and deficit in the per capita consumption of foods of animal origin
Recommended Tm consumption
Kilogrammes
Deficit
Kilogrammes Percentage
Red meat, total.. 19.45 25.40 Beef. 15.80 20.72 Pork 3.39 4.42 Mutton and goat
meat 0.26 0.26 1.35 1.60
Fish» 6.60 10.00 Milk 135.00 Eggs0 3.7
5.95 4 . 9 2
1 . 0 3
0.25 3.40
30.51 31.14 30.38
18.52 51.52
Source: Tables 15 and 18 and data from the National Institute of Nutrition (Instituto Nacional de Nutrición) on recommended nutritional standards of consumption for Venezuela.
* 1956-58 average. •> Fresh fish, 1956. c 1957-59 average.
be foreseen what new price structure is likely to emerge, or what changes there will be in import trade, which could have a marked effect on demand and actual consumption. It is true that certain principles can be postulated, and certain tendencies assumed in the factors determining demand, as a basis for projecting the many alternative forms that future demand might take. Thus future production and supply requirements could be estimated and targets fixed for the execution of develop-ment programmes. Published studies on Venezuela's livestock industry include some projections of the

VENEZUELA: V. FOREIGN TRADE IN LIVESTOCK PRODUCTS 91
demand for meat in 1964 and 1967, but they need to be brought up to date and modified in the light of the consumption levels attained in the last few years and of recent and foreseeable trends in population, available income, elasticity of demand and relative prices. New projections of demand would give a potential and prob-able future consumption much higher than that cal-culated previously. New projections are not included in this study, it being considered more relevant, from the standpoint of analysis at least, to compare the figures for projected demand with those recorded for actual consumption in 1958, for example (see table 20 and figure V).
Actual consumption in 1958 exceeded almost all the projections of demand for that year, being 33 per cent higher than the most pessimistic projection (projection A) and 18 per cent higher than the figure for one of the optimistic projections (projection B), which is based on a completely elastic supply and consequently a stable price level.
Projection C calls for comment, however brief, because it is the only figure for projected consumption for 1958 that exceeds actual consumption for that year. This was not so much an economic projection as an esti-mate of potential consumption, on the assumption that the desirable nutritional standard could be met for beef, namely nearly 21 kilogrammes per person, which was 7 kilogrammes more than the average level for the three-year period 1954-56. It must be admitted that such a large estimated increase was unrealistic.
Effective consumption in 1958 also proved appreciably higher than the figures in the last three projections, despite the assumption of a much higher population growth than was in fact the case (6.3 million in 1958). On the other hand, the annual average increase in net per capita income was estimated at only 3 per cent, and the coefficient of income-elasticity of demand adopted was only 0.6, although consumer habits, the low level of consumption and certain surveys seem to indicate that it might well be between 0.8 and 0.9.
At present there is no adequate information on which to base a quantitative estimate of the relative effect of factors that might have led to such an unforeseen increase in consumption. However, it can be assumed a priori
that the relatively larger, and hence more elastic, volume of supply had the greatest effect. The comparatively small rise in parity prices/8 despite severe restrictions on meat imports and free market prices, appears to confirm that supply was the major factor in improving levels of consumption.
48 The current prices of livestock and meat in Venezuelan markets, compared with those in Colombia, are a strong encouragement to smuggling.
Figure V
Venezuela: Projected and actual consumption of beefa
NATURAL SCALE
ACTUAL CONSUMPTION
100 -
CONSUMPTION AS A FUNCTION OF THE TREND,
6 0 -
60 —
CONSUMPTION AS A FUNCTION OF POPULATION GROWTH
From 1953 actual consumption con be seen to d ¡verge from projected consumption
I 1 I I I ' I I I I I 1 I I I I I I 1 I I I I I I I 1939 4 0 4 5 5 0 5 5 60
Source : La industria ganadera en Venezuela, figure 7, plus data of actual consumption for 1953-58.
a Projections based on actual total and per capita consumption for 1939-52.
V. FOREIGN TRADE IN LIVESTOCK PRODUCTS Venezuela is the principal Latin America importer of greater purchasing power. These circumstances have
products of animal origin, especially foodstuffs. The influenced the structure and composition of foreign steady rise in demand caused by high growth rates of trade in animal products, producing changes which are population and income has increased the country's briefly analysed below, dependence on the import trade in the last few years, at least with respect to a number of milk products. This 1. MEAT IMPORTS has happened despite the policy of self-sufficiency, repeat-edly advocated, and despite measures restricting imports, l r \ e a r i e r y,ears> Venezuela was an exporter of live-whose effect has been nullified by the nature and increasing s t o c k> b u t t h e growing requirements of domestic con-extent of effective demand. Although a policy of develop- sumption not only led to the suspension of exports in 1947, ment and protection of domestic livestock production b u t . a l s o °bhged Venezuela in subsequent years to resort has been pursued, its growth has been less than the rate t o increasing imports of hvestock for food and various of increase in consumer trends resulting from Venezuela's grea te r e c o n o m i c d e v e l o p m e n t a n d f r o m consequen t ly 19 In 1934-38, annual exports of cattle averaged 27,000 head.

92 LIVESTOCK IN LATIN AMERICA
Table 21
Venezuela: Volume and value of imports of foods of animal origin, 1948-50 to 1956-58 tAnnual averages)
Volume Value (tons) (thousands of bolivars)
Food
1948-50 1951-52 1953-55 1956-58 1948-50 1951-52 1953-55 1956-58
Preserved milk Cheese Butter Cream Lard Eggs
5 , 6 4 2 5 1 8 5 5 4 7 1 3 , 2 4 4 . . . 1 7 4
1 , 8 2 1 1 , 2 5 1 1 9 2 3 7 , 5 8 2 4 , 5 7 2 9 3 1 0 1
2 7 , 2 2 6 2 8 , 9 1 4 3 5 , 6 0 4 4 1 , 9 8 2 7 0 , 7 4 0 7 3 , 1 6 4 8 7 , 4 3 6 9 5 , 0 1 8
2 , 9 4 7 4 , 4 2 0 5 , 0 2 5 7 , 3 6 5 8 , 7 9 5 1 0 , 9 0 6 1 3 , 1 7 8 1 8 , 1 1 1
2 , 4 2 0 2 , 8 3 6 8 5 8 2 4 4 1 1 , 3 4 3 8 , 9 5 0 3 , 3 5 8 1 , 0 7 4 — • . • 1 , 4 0 8 » 2 , 0 5 6 — . . . 3 , 9 0 4 " 5 , 0 0 6
5 , 2 0 2 3 , 5 5 5 6 0 4 3 7 4 6 , 9 0 7 4 , 1 6 1 7 1 0 4 8 3
7 , 1 1 3 1 0 , 5 5 2 1 3 , 4 7 3 1 9 , 3 7 1 1 5 , 5 5 6 2 1 , 4 7 0 2 3 , 2 8 2 3 6 , 4 5 4
T O T A L 134,167 123,2230 131,961d 156,423
Source: Department of Trade of the Ministry of Development. a Chilled, frozen and dried meat and meat in containers, not including ham, sausages and prepared
meats. b 1955. c Not including meat and cream. " Not including meat.
kinds of frozen meat. Thus, in the three-year period 1948-50 Venezuela imported an annual average of 5,642 tons of meat, representing an average value of 13.2 million bolívares. Although the purchase of large quantities of beef were suspended in subsequent years, as in the case of poultry (see table 21), Venezuela was still obliged to import beef cattle for more or less immediate consumption and, more recently, to import frozen meat, although only as a temporary measure. Some years ago there were substantial imports of poultry, but these have now been restricted.
2. IMPORTS OF MILK PRODUCTS
Milk products are the main item in the import trade; in the three-year period 1956-58, their average annual value was 119.2 bolívares, which was 76 per cent of the total purchases of foods of animal origin. One of the main items is preserved milk, for which the volume of imports expanded by 54 per cent between 1948-50 and 1956-58. There has also been a sizable increase in imports of cheese and cream in recent years, amounting in the case of cheese to 150 per cent. On the other hand, there was a marked drop in the volume of butter imports.
3. OTHER FOODS OF ANIMAL ORIGIN
During the base period, annual imports of lard reached an average of 5,202 tons, with a value of nearly 7 million bolívares. In 1951-52, imports were lower, although still considerable, but in subsequent years they declined because of a preference for vegetable oils and fats, and during the three-year period 1956-58 amounted to only 604 tons.
There was a marked upward movement in egg imports, the increase for the period under examination being 172 per cent. In 1956-58, the annual value of egg imports was 36.4 million bolívares, next in importance to milk products.
4. ORIGIN OF IMPORTS
(a) Meat In recent years—1958, for instance—most imports
have come from the United States, which supplies 80 per cent of the total imports of chilled, frozen and other (unspecified) meat. The remaining 20 per cent is imported from Spain, New Zealand, the Netherlands and other countries. Poultry imports also come mainly from the United States, but there are imports on a smaller scale from Canada, Curasao and Denmark.
(b) Milk products Venezuelan imports of preserved milk and cheese come
from many different countries, but mainly from Canada, Denmark, the Netherlands and the United States. Very little is imported from other Latin American countries, except for Argentine cheese (see table 22).
Between 1948 and 1958, there were considerable changes in the provenance of these imports. In 1948, purchases of milk powder and cheese in Denmark made up only a small proportion of the total, but in recent years they have increased substantially. The same applies to imports of preserved milk from the Netherlands, but not to pur-chases of Dutch cheese; the relative volume of imported Dutch cheese has shrunk considerably, from 41 per cent in 1948 and 62 per cent in 1952 to 25 per cent in 1958. Although the bulk of these imports, particularly preserved milk, still come from the United States, that country's relative contribution has declined in recent years. Before 1950, practically all the milk powder imported by Vene-zuela came from the United States. The tendency has been to expand the import trade with the other countries mentioned—such as Denmark and the Netherlands— where the relation between volume and price is more favourable for the Venezuelan importer. In 1948, no Italian cheese was bought, whereas in 1958 they consti-

VENEZUELA: VI . LIVESTOCK DEVELOPMENT AND PROSPECTS OF EXPANSION 93
Table 22
Venezuela: Break-down of imports of preserved milk and cheese by origin, 1948-49 and 1958
(Percentage)
Milk powder Cheese
o/oTigfn 1948-49 1958 1948 1958
Volume Value Volume Value Volume Value Volume Value
Argentina — — — — 30.0 22.0 14.0 16.0 Canada 0.8 0.5 23.0 26.0 — — — — Colombia — — — — 0.5 0.3 — — Denmark 0.1 0.1 18.7 14.6 1.0 1.0 28.0 21.0 Italy — — — — 0.2 0.2 15.0 21.0 Netherlands 0.7 0.6 22.0 16.8 41.0 48.0 25.0 21.0 United States 98.0 98.0 34.0 41.0 25.0 26.0 15.0 17.0
Source: Anuarios de Estadística Mercantil y Marítima and Boletín Mensual de Estadística, No. 12, 1958.
tuted 21 per cent of the total volume. Canada is also an important source of milk powder imports (23 per cent of the total volume in 1958, compared with less than 1 per cent in 1948-49).
Venezuelan imports of butter are supplied mainly by Argentina, Denmark, the Netherlands and the United States, which together contribute 99 per cent of the total. In 1958 Denmark shipped 82 per cent of the imported cream; the remaining 18 per cent came from the Nether-lands and the United States.
5. IMPORT RESTRICTIONS
Generally speaking, there are no direct restrictions on livestock imports, apart from customs duties.50 Yet, the
60 Specific duties in bolívares per kilogramme: butter 2.20; cheese 1.20; United States Cheddar 1.00; cream 1.30; and preserved milk 0.50.
restrictive effect of the duties has grown weaker as the consumer's purchasing power has become stronger and costs and domestic prices have risen. Furthermore, there were no exchange restrictions of any kind until the end of 1960. Nor are there quantitative restrictions, except for the quota system that applies to milk powder imported free of duty.
Nevertheless, in practice import licences and prior authorization have a considerable restrictive effect. For condensed milk, for example, an import licence from the Ministry of Development is required in advance; for ham, imports are authorized only to the extent necessary to make up the deficit between consumption and domestic production, and at present commercial imports of butter are prohibited on the grounds that domestic output is sufficient to supply consumer needs.
VI. LIVESTOCK DEVELOPMENT AND PROSPECTS OF EXPANSION 1. LIVESTOCK DEVELOPMENT PROGRAMMES
This is not the place to give a detailed account of the various compaigns and services organized by various official bodies in Venezuela, but mention should be made of some programmes of livestock development undertaken by the Ministry of Agriculture and Livestock and of the great expansion of livestock credit provided by the Banco Agrícola y Pecuario.
With respect to production problems, the Livestock Department of the Ministry of Agriculture and Livestock concentrated on eliminating factors that limit produc-tivity and on encouraging, at the same time, the more rapid expansion of the livestock population. Reference has already been made to the favourable effect of technical services for the diagnosis of animal diseases, the control of epizootics, the prevention and treatment of livestock diseases and pests, the control of animal movements, border and port inspection, and technical assistance; all these services are carried out through the 63 veterinary
stations and the special animal health campaigns, with the co-operation of other veterinary and research services. As a result of these campaigns, it has been possible to control many livestock and poultry diseases and to reduce the resulting deaths and other losses to the live-stock economy.
There has also been considerable progress in other aspects of the livestock industry, such as genealogical51
and milk production records, studies on cattle fattening and programmes for industrial slaughter-houses. The importing of improved breeds and the channelling of livestock credit into technically worthy activities, for both of which the Livestock Department is responsible, deserve special mention for their favourable impact on the development of Venezuela's livestock industry. Men-
61 Of the Zebu, Holstein, Brown Swiss, Jersey, Charolais, Santa Gertrudis, Guernsey, Pura Criolla Lechera, Brangus and Charbray breeds, there were only 65 cattle registered in 1950, compared with 2,133 in 1958 and 1,391 in the first half of 1959.
9 4 LIVESTOCK IN LATIN AMERICA
tion has already been made of the Livestock Develop-ment Plan, operating through credit, as an outstandingly important measure destined to have favourable effects on future meat production in Venezuela; this plan consti-tutes a very valuable contribution to the General Agrarian Reform Plan, which is already being carried out.
The Agriculture Department has also improved and extended its campaigns and research on grasses, preser-vation of fodder, livestock nutrition, promotion of poultry raising, selection of criollo breeds and comparative studies of foreign breeds. At the Experimental Centres of Mara-cay and Sanare, intensive research is being conducted on the cultivation and yield of various grasses and legumes for fodder.
The Crop and Livestock Programming Department of the Ministry of Agriculture and Livestock is organizing and promoting a series of studies and activities to supple-ment government action with respect to livestock and animal products. Increasing attention is being devoted to economic studies and statistical analyses of the pro-duction, distribution, processing and consumption of these products.
The Venezuelan Agrarian Reform Act is one of the principal measures adopted recently for the benefit of crop farmers and the rural population in general. Far-reaching changes in the country's agrarian structure are expected, since the reform was conceived as an integrated whole and is intended not only to ensure fulfilment of the social obligations entailed by rural land ownership, by regulating land tenure and requiring efficient land use by the owners, but also to conserve and develop natural resources, raise the rural worker's standard of living, encourage the organization of agricultural co-operatives, extend credit facilities for small and medium producers, establish rational methods of storage, transport, preser-vation, processing and distribution of products, and guarantee minimum prices for the producer. Consequently it is reasonable to expect great advances in the livestock sector in the future, through the organization of produc-tion in intensive economic units that are intended to replace the inefficient extensive type of stock farming that is often found on large farms with fertile arable soil.
2. FUTURE LIVESTOCK EXPANSION
It is not possible to make even an approximate quanti-tative estimate of the future increases in livestock produc-
tion that will result from the livestock credit plan, the current agrarian reform programme and other govern-ment and private activities aimed at developing the live-stock industry.
From the short-term and almost certainly also from the medium-term standpoint, Venezuela will have to continue to make up the deficit in its livestock production by importing various animal products, especially milk products. The low per capita consumption of essential foods of animal origin and the steadily rising purchasing power of the Venezuelan consumer, especially in the large towns, will continue to stimulate the demand for milk and meat. Domestic production cannot be expected to meet consumer requirements within the next few years. Hence increases in effective demand will probably continue to be met partly by imports, which will obviate sharp price increases leading to restrictions on consump-tion for the lower-income groups. In practice it is some-times difficult to determine what volume of imports will be consistent with the interests of domestic production and will not involve major changes in the structure and level of domestic prices. In any case, the development of existing self-sufficiency programmes in Venezuela with respect to cattle and other livestock products calls for the encouragement and protection of domestic pro-duction by appropriate regulation of import trade.
On a long-term basis, however, it can confidently be asserted that Venezuela can count on a level of livestock production sufficient to supply the domestic market at higher per capita levels of consumption if the present steady impetus to the livestock sector is maintained. Very substantial increases in production are planned, both through extending the area devoted to livestock and enlarging the herds and also through raising produc-tivity. This, in turn, will make it possible to improve the output-input ratio and thus to get a better return on the capital and labour that goes into the livestock eco-nomy. In conclusion, it should be pointed out that if profits and returns on livestock and related activities do not improve in relation to other sectors of the economy the rate of production in the livestock industry will remain insufficient to meet the steady expansion of effective demand resulting from high purchasing power. There is every reason to expect that government action will continue to provide the required incentives and to encourage a rate of livestock development fully consistent with the growth in other sectors of Venezuela's economy.


W H E R E TO B U Y U N I T E D N A T I O N S P U B L I C A T I O N S
AFRICA CAMEROUN: UBRAIRIE DU PEUPLE AFRICA!N LaGérante, B.P. 1197, Yaoundé. ETHIOPIA: INTERNATIONAL PRESS AGENCY P. O. Box 120, Addis Ababa. GHANA: UNIVERSITY BOOKSHOP University College of Ghana, Legon, Accra. MOROCCO: CENTRE DE DIFFUSION D0CUMEN-TAIRE DU B.E.P.I., 8, rue Michaux-Bellaire, Rabat. SOUTH AFRICA: VAN SCHAIK'S BOOK-STORE (PTY) LTD. Church Street, Box 724, Pretoria. UNITED ARAB REPUBLIC: LIBRAIRIE "LA RENAISSANCE D'ÉGYPTE" 9 Sh. Adly Pasha, Cairo.
ASIA BURMA: CURATOR, GOVT. BOOK DEPOT Rangoon.
CAMBODIA: ENTREPRISE KHMÉRE OE LIBRAIRIE Imprimerie & Papeterie Sari, Phnom-Penh. CEYLON: LAKE HOUSE BOOKSHOP Assoc. Newspapers of Ceylon, P. 0. Box 244, Colombo. CHINA: THE WORLD BOOK COMPANY, LTD. 99 Chung King Road, 1st Section, Taipeh, Taiwan. THE COMMERCIAL PRESS, LTD. 211 Honan Road, Shanghai. HONG KONG: THE SWINDON BOOK COMPANY 25 Nathan Road, Kowloon. INDIA: ORIENT LONGMANS Calcutta, Bombay, Madras, New Delhi and Hyderabad. OXFORD BOOK & STATIONERY COMPANY New Delhi and Calcutta. P. VARADACHARY & COMPANY Madras.
INDONESIA: PEMBANGUNAN, LTD. Gunung Sahari 84, Djakarta. JAPAN: MARUZEN COMPANY, LTD. 6 Tori-Nichome, Nihonbashi, Tokyo. KOREA, REPUBLIC OF: EUL-YOO PUBLISH-ING CO., LTD., 5, 2-KA, Chongno, Seoul. PAKISTAN:
THE PAKISTAN CO-OPERATIVE BOOK SOCIETY Dacca, East Pakistan.
PUBLISHERS UNITED, LTD. Lahore. THOMAS & THOMAS Karachi.
PHILIPPINES: ALEMAR'S BOOK STORE 769 Rizal Avenue, Manila. SINGAPORE: THE CITY BOOK STORE, LTD. Collyer Quay. THAILAND: PRAMUAN MIT, LTD. 55 Chakrawat Road, Wat Tuk, Bangkok. VIET-NAM, REPUBLIC OF: UBRAIRIE-PAPETERIE XUAN THU, 185, rue Tu-do, B.P. 283, Saigon.
EUROPE AUSTRIA: GEROLD & COMPANY Graben 31, Wien, 1. B. WÜLLERSTORFF Markus Sittikusstrasse 10, Salzburg.
BELGIUM: AGENCE ET MESSAGERIES DE LA PRESSE, S. A. 14-22, rue du Persil, Bruxelles.
CZECHOSLOVAKIA: CESKOSLOVENSKY SPISOVATEL, Národn! Trida 9, Praha 1. DENMARK: EJNAR MUNKSGAARD, LTD. Nerregade 6, Kabenhavn, K. FINLAND: AKATEEMINEN KIRJAKAUPPA 2 Keskuskatu, Helsinki. FRANCE: ÉDITIONS A. PÉDONE 13, rue Soufflot, Paris (V6). GERMANY, FEDERAL REPUBLIC OF: R. EISENSCHMIDT Schwanthaler Str. 59, Frankfurt/Main. ELWERT UND MEURER Hauptstrasse 101, Berlin-Schoneberg. ALEXANDER HORN Spiegelgasse 9, Wiesbaden. W. E. SAARBACH Gertrudenstrasse 30, Koln (1). GREECE: KAUFFMANN BOOKSHOP 28 Stadion Street, Athens. ICELAND: BOKAVERZLUN SIGFIJSAR EYMUNDSSONAR H. F. Austurstraeti 18, Reykjavik. IRELAND: STATIONERY OFFICE Dublin. ITALY: LIBRERIA COMMISSIONARIA SANSONI, Via Gino Capponi 26, Firenze, and Via D.A. Azuni 15/A, Roma. LUXEMBOURG: LIBRAIRIE J. TRAUSCH-SCHUMMER, Place du ThéStre, Luxembourg.
NETHERLANDS: N.V. MARTINUS NIJHOFf Lange Voorhout 9, 's-Gravenhage. NORWAY: JOHAN GRUNDT TANUM Karl Johansgate, 41, Oslo. PORTUGAL: LIVRARIA RODRIGUES Y CIA. 186 Rúa Aurea, Lisboa, SPAIN: LIBRERIA BOSCH 11 Ronda Universidad, Barcelona. LIBRERIA MUNDI-PRENSA Castello 37, Madrid.
SWEDEN: C. E. FRITZE'S KUNGL. HOVBOK-HANDEL A-B Fredsgatan 2, Stockholm.
SWITZERLAND: LIBRAIRIE PAYOT, S. A. Lausanne, Genéve. HANS RAUNHARDT Kirchgasse 17, Zürich 1. TURKEY: LIBRAIRIE HACHETTE 469 Istiklal Caddesi, Beyoglu, Istanbul. UNION OF SOVIET SOCIALIST REPUBLICS: MEZHDUNARODNAYA KNYIGA Smotenskaya Ploshchad, Moskva.
UNITED KINGDOM: H. M. STATIONERY OFFICE, P. O. Box 569, London, S.E.I (and HMSO branches in Belfast, Birmingham, Bristol, Cardiff, Edinburgh, Manchester). YUGOSLAVIA: CANKARJEVA ZALOZBA Ljubljana, Slovenia. DRZAVNO PREDUZECE Jugoslovenska Knjiga, Terazije 27/11, Beograd. PROSVJETA 5, Trg Bratstva i Jedinstva, Zagreb. PROSVETA PUBLISHING HOUSE Import-Export Division, P. O. Box 559, Terazije 16/1, Beograd.
LATIN AMERICA ARGENTINA: EDITORIAL SUDAMERICANA, S. A. Alsina 500, Buenos Aires. BOLIVIA: LIBRERIA SELECCIONES Casilla 972, La Paz. BRAZIL: LIVRARIA AGIR Rúa Mexico 98-B, Caixa Postal 3291, Rio de Janeiro. CHILE: EDITORIAL DEL PACIFICO Ahumada 57, Santiago. LIBRERIA IVENS Casilla 205, Santiago. COLOMBIA: LIBRERIA BUCHHOLZ Av. Jiménez de Quesada 8-40, 8ogotá.
COSTA RICA: IMPRENTA Y LIBRERIA TREJOS Apartado 1313, San José. CUBA: LA CASA BELGA O'Reilly 455, La Habana. DOMINICAN REPUBLIC: LIBRERIA DOMINICANA Mercedes 49, Santo Domingo. ECUADOR: LIBRERIA CIENTIFICA Casilla 362, Guayaquil. EL SALVADOR: MANUEL NAVAS Y CIA. la. Avenida sur 37, San Salvador. GUATEMALA: SOCIEDAD ECONOMICA-FINANCIERA, 6a. Av. 14-33, Guatemala City. HAITI: LIBRAIRIE "Á LA CARAVELLE" Port-au-Prince. HONDURAS: LIBRERIA PANAMERICANA Tegucigalpa. MEXICO: EDITORIAL HERMES, S. A. Ignacio Mariscal 41, México, D. F. PANAMA: JOSE MENENDEZ Agencia Internacional de Publicaciones, Apartado 2052, Av. 8A, sur 21-58, Panamá. PARAGUAY: AGENCIA DE LIBRERIAS DE SALVADOR NIZZA Calle Pte. Franco No. 39-43, Asunción. PERU: LIBRERIA INTERNACIONAL DEL PERU, S. A. Casilla 1417, Lima. URUGUAY: REPRESENTACION DE EDITORIALES. PROF. H. D'ELIA Plaza Cagancha 1342, 1° piso, Montevideo. VENEZUELA: LIBRERIA DEL ESTE, Av. Miranda, No. 52, Edf. Galipán, Caracas.
MIDDLE EAST IRAQ: MACKENZIE'S BOOKSHOP Baghdad. ISRAEL: BLUMSTEIN'S BOOKSTORES 35 Allenby Rd. and 48 Naehlat Benjamin St., Tel Aviv. JORDAN: JOSEPH I. BAHOUS & CO. Dar-ul-Kutub, Box 66, Amman. LEBANON: KHAYAT'S COLLEGE BOOK COOPERATIVE, 92-94, rue Bliss, Beirut.
NORTH AMERICA CANADA: THE QUEEN'S PRINTER Ottawa, Ontario.
UNITED STATES OF AMERICA: SALES SECTION, UNITED NATIONS, New York.
OCEANIA AUSTRALIA: MELBOURNE UNIVERSITY PRESS 369 Lonsdale Street, Melbourne, C. l . NEW ZEALAND: UNITED NATIONS ASSOCIATION OF NEW ZEALAND, C.P.O. 1011, Wellington.
[62E1]
Orders and inquiries from countries where sales agencies have not yet been established may be sent to: Sales Section, United Nations, New York. U.S.A., or to Sales Section, United Nations, Palais des Nations, Geneva, Switzerland.
Printed in France Price : S U.S. 1.50; 10/6 stg.; Sw. fr. 6.50 United Nations publication 22116—March 1962 — 2,450 (or equivalent in other currencies) Sales No. : 61.II.G.7
E/CN.12/620