Compacts for Equality - Repositorio CEPAL
330
2014 Compacts for Equality Towards a Sustainable Future Thirty-fifth session of ECLAC Lima, 5-9 May
-
Upload
khangminh22 -
Category
Documents
-
view
0 -
download
0
Transcript of Compacts for Equality - Repositorio CEPAL
2014
Compacts for EqualityTowards a Sustainable Future
Thirty-fifth session of ECLAC
Lima, 5-9 May
Compacts for EqualityTowards a Sustainable Future
Thirty-fifth session of ECLAC
Lima, 5-9 May
2014
Alicia BárcenaExecutive Secretary
Antonio PradoDeputy Executive Secretary
The preparation of this document was coordinated by Alicia Bárcena, Executive Secretary of ECLAC, with the collaboration of Antonio Prado, Deputy Executive Secretary, Martín Hopenhayn, Chief of the Social Development Division, and Verónica Amarante, Chief of the ECLAC office in Montevideo.
The drafting committee also comprised Verónica Amarante, Martín Hopenhayn and Gabriel Porcile, of ECLAC.
The following chiefs of substantive divisions, subregional headquarters and national offices of ECLAC participated in the preparation of the document: Jürgen Weller, Officer in Charge of the Economic Development Division, Pascual Gerstenfeld, Chief of the Statistics Division, Dirk Jaspers_Faijer, Chief of the Latin American and Caribbean Demographic Centre (CELADE)-Population Division of ECLAC, Osvaldo Rosales, Chief of the Division of International Trade and Integration, Jorge Máttar, Chief of the Latin American and Caribbean Institute for Economic and Social Planning (ILPES), Mario Cimoli, Chief of the Division of Production, Productivity and Management, Joseluis Samaniego, Chief of the Sustainable Development and Human Settlements Division, Ricardo Sánchez, Officer in Charge of the Natural Resources and Infrastructure Division, Sonia Montaño, Chief of the Division for Gender Affairs, Daniel Titelman, Chief of the Financing for Development Division, Hugo Beteta, Chief of the ECLAC subregional headquarters in Mexico, Diane Quarless, Chief of the ECLAC subregional headquarters for the Caribbean, Juan Carlos Ramírez, Chief of the ECLAC office in Bogota, Carlos Mussi, Chief of the ECLAC office in Brasilia, Martín Abeles, Chief of the ECLAC office in Buenos Aires, and Inés Bustillo, Chief of the ECLAC office in Washington, D.C.
Particular thanks are owed to the following staff members and former staff members of ECLAC for their collaboration with the work: Jean Acquatella, José Eduardo Alatorre, Vianka Aliaga, Hugo Altomonte, Andrés Arroyo, Omar Bello, Mariela Buonomo, Leandro Cabello, Manlio Coviello, Carlos de Miguel, Fabiana del Popolo, Ernesto Espíndola, Jimy Ferrer, Fernando Filgueira, Juan Alberto Fuentes, Luis Miguel Galindo, Marco Galván, José Javier Gómez, Daniela González, Francis Jones, Ricardo Jordán, Alejandro López, Xavier Mancero, Karina Martínez, Laetitia Montero, Wilson Peres, Mauricio Pereira, Esteban Pérez, Orlando Reyes, Nieves Rico, Monica Rodrigues, Adrián Rodríguez, Jorge Rodríguez, Miryam Saade, Lucía Scuro, Fernando Sossdorf, Humberto Soto, Osvaldo Sunkel, Varinia Tromben, Daniela Trucco, Heidi Ullman, Pamela Villalobos, Pablo Villatoro, Gordon Wilmsmeier, Pablo Yanes, Luis Yañez and Romain Zivy.
The following ECLAC consultants also worked on the preparation of the document: Mario Acuña, Malena Arcidiácono, Humberto Campodónico, David Candia, Guillermo Cruces, Nincen Figueroa, Leonardo Gasparini, Felipe Hugo, Benjamín Infante, Ricardo Infante, David Jaume, Mirentxu Jiménez, Luciano Losekann, Roxana Maurizio, Carlos Monge, Miguel Ojeda, Gustavo Pereira, Javiera Rauld, Andrés Rius, Víctor Rodríguez Padilla, Carolina Román, Silvana Sánchez Di Doménico, Monserrat Serio, Ann-Kathrin Sotz, Víctor Toledo, Beatriz Tovar de la Fe, Emmanuel Vázquez and Andrea Vigorito.
Explanatory notes- The following symbols are used in tables in this publication:- Three dots (…) indicate that data are not available or are not separately reported.- A minus sign (-) indicates a deficit or decrease, unless otherwise indicated.- The term “dollars” refers to United States dollars, unless otherwise specified.- Figures and percentages in tables may not necessarily add up to the corresponding totals due to rounding.- The denomination “Central America” includes the following countries: Belize, Costa Rica, El Salvador, Guatemala, Honduras, Nicaragua
and Panama.
Distr.: General • LC/G.2586(SES.35/3) • ISBN 978-92-1-121850-3 • April 2014 • Original: Spanish • 2014-28© United Nations • Printed in Santiago
3
Con
tent
s
Contents
Foreword ..............................................................................................................................................................13
Executive summary ..............................................................................................................................................19
Part 1The regional scenario ...........................................................................................................................................25
Chapter IEquality and sustainability at the current development crossroads in Latin America and the Caribbean .......................... 27
A. Structure and institutions: a model in the making ................................................................................................. 271. The co-evolution of structure and institutions in the region’s recent history .................................................... 282. Production structure, capacities and inequality .............................................................................................. 293. Inequality, taxes and transfers ......................................................................................................................... 314. Sustainable dynamics between productivity and equality ............................................................................... 37
B. Threats to the sustainability of egalitarian development ........................................................................................ 381. Economic sustainability: macroeconomic imbalances and structural change .................................................. 382. Equality and social sustainability .................................................................................................................... 453. Environmental sustainability ........................................................................................................................... 52
C. Final comments .................................................................................................................................................... 58Bibliography .............................................................................................................................................................. 60Annex ........................................................................................................................................................................ 62
Part 2Social and labour gaps .........................................................................................................................................63
IntroductionRethinking equality ...............................................................................................................................................65
Chapter IIEquality and inequality in Latin America and the Caribbean ........................................................................................... 69
A. Equality of resources: income distribution ............................................................................................................ 701. Recent trends in income inequality in the region ............................................................................................ 702. Inequality in the Caribbean ............................................................................................................................ 723. Other ways of viewing income inequality ...................................................................................................... 72
B. Equality of capabilities: some fundamental components ....................................................................................... 771. Inequality in educational attainment .............................................................................................................. 782. Inequality in access to information and communication technologies ............................................................ 793. Nutritional inequality ..................................................................................................................................... 814. Reproductive inequalities ............................................................................................................................... 835. Inequality in overcrowding ............................................................................................................................. 876. Inequality in access to durable goods ............................................................................................................. 89
C. Relational issues: school and residential segregation ............................................................................................ 901. School segregation ......................................................................................................................................... 902. Residential segregation ................................................................................................................................... 97
D. Equality, autonomy and mutual recognition: contributions from the gender perspective ....................................... 991. Feminism is broadening the semantic and political field of equality ............................................................... 992. Women, autonomy and income availability ................................................................................................. 1013. Recognition and deliberative spaces ............................................................................................................. 102
E. Profound inequalities: indigenous peoples ......................................................................................................... 104F. Equality, sociability and conflict: people's perceptions ....................................................................................... 109
1. Perceptions of income distribution ............................................................................................................... 1092. Interpersonal trust ......................................................................................................................................... 1103. Perceptions of social conflict between rich and poor .................................................................................... 110
G. Measuring equality: some challenges ................................................................................................................. 1111. Wealth ......................................................................................................................................................... 1112. Capturing high incomes in household surveys .............................................................................................. 1123. Information on mobility between generations and over the life cycle ........................................................... 113
4
Economic Commission for Latin America and the Caribbean (ECLAC)C
onte
nts
4. Information constraints in the Caribbean ...................................................................................................... 1135. Beyond resource equality ............................................................................................................................. 113
H. Final remarks ...................................................................................................................................................... 114Bibliography ............................................................................................................................................................ 115Annex ...................................................................................................................................................................... 119Methodological annex ............................................................................................................................................. 132
Chapter IIIThe world of work: The master key for equality ............................................................................................................. 135
A. Recent labour market trends: employment, income and productivity ................................................................. 135B. A structural look at productivity gaps ................................................................................................................. 143C. How the minimum wage furthers income equality ............................................................................................. 148D. Gender inequalities: labour market participation and income ............................................................................ 156
1. Participation, employment and unemployment ............................................................................................ 1562. Occupational segregation ............................................................................................................................. 1623. Wage differences .......................................................................................................................................... 165
E. Unpaid work ...................................................................................................................................................... 167F. The labour market and indigenous peoples: ethnic and gender inequalities ....................................................... 171G. Pension system affiliation ................................................................................................................................... 177H. Work, production structure and equality: closing gaps ....................................................................................... 178Bibliography ............................................................................................................................................................ 180Annex ...................................................................................................................................................................... 183
Part 3Consumption patterns, the environment and natural resources ..................................................................................... 185
IntroductionIntersecting approaches to development sustainability .................................................................................................. 187
Chapter IVEquality, sustainability and well-being in the sphere of consumption ............................................................................ 191
A. Consumption in ECLAC thinking ........................................................................................................................ 192B. Consumption, growth and development ............................................................................................................ 193
1. Consumption in Latin America and the Caribbean: stylized facts .................................................................. 1932. Household borrowing .................................................................................................................................. 206
C. Consumption by socioeconomic level ................................................................................................................ 2121. Expenditure and consumption: levels and inequality .................................................................................... 2132. The structure of expenditure ........................................................................................................................ 2153. Access to durable goods ............................................................................................................................... 218
D. Consumption of public and private services ....................................................................................................... 2221. Education ..................................................................................................................................................... 2222. Health care .................................................................................................................................................. 227
E. Concluding remarks ........................................................................................................................................... 228Bibliography ............................................................................................................................................................ 230Annex ...................................................................................................................................................................... 234
Chapter VDevelopment style and environmental sustainability: An unsolved equation ................................................................ 241
Introduction ............................................................................................................................................................. 241A. Consumption patterns and their environmental implications .............................................................................. 242
1. Energy, durable goods and hazardous waste ................................................................................................ 2422. Automobiles, fuels and air pollution ............................................................................................................. 246
B. The environment in national and global agendas ............................................................................................... 2511. The challenge of water ................................................................................................................................. 2522. Forests and biodiversity: a natural asset at risk .............................................................................................. 2553. The region’s fragility in the face of climate change ....................................................................................... 2574. Disasters caused by extreme natural events .................................................................................................. 2605. Conclusions ................................................................................................................................................. 261
Bibliography ............................................................................................................................................................ 263
5
Compacts for Equality: Towards a Sustainable Future
Con
tent
s
Chapter VINatural resource governance for structural change with equality .................................................................................. 267
A. Natural resources, structural change and equality: towards a virtuous circle ...................................................... 2681. Natural resources, equality and recognition ................................................................................................. 2692. Natural resources and structural change ....................................................................................................... 2713. Natural resources and infrastructure ............................................................................................................. 273
B. Ownership of natural resources .......................................................................................................................... 2741. Strategic aspects of natural resource ownership ............................................................................................ 2742. Resource ownership in the mining and oil sectors ....................................................................................... 2753. Mechanisms for State participation in the mining and oil sectors .................................................................. 276
C. State share in natural resource rents between 2000 and 2012 ............................................................................ 2781. State participation in the economic rent of the mining sector ....................................................................... 2782. State participation in the economic rent from hydrocarbons ........................................................................ 281
D. Distribution and use of fiscal revenues from mining and hydrocarbons: 2000-2012 ........................................... 2841. Legislation on the distribution and use of fiscal resources from extractive rents ............................................ 2842. Tendencies in the territorial and sectoral distribution of fiscal revenues from extractive rent......................... 288
E. Natural resource governance challenges in the framework of the post-2015 development agenda ..................... 291Bibliography ............................................................................................................................................................ 293
Part 4Closing considerations .................................................................................................................................................. 299
Chapter VIIPolitics, policy and the importance of compacts ........................................................................................................... 301
A. Reasons and conditions for a social compact for sustainability and equality ....................................................... 3021. Why are social compacts important? ............................................................................................................ 3022. The foundations of social compacts: the people and progressive realization of rights ................................... 3033. A diversity of compacts and of political and social stakeholders ................................................................... 3044. Participation and the institutional framework for a compact for equality....................................................... 306
B. Strategic components of compacts for equality, sustainability and structural change .......................................... 3091. A fiscal compact for equality ........................................................................................................................ 3102. A compact for investment, industrial policy and inclusive financing ............................................................. 3123. A compact for equality in employment ......................................................................................................... 3164. A compact for social welfare and public services ......................................................................................... 3175. A compact for environmental sustainability .................................................................................................. 3216. A compact for natural resource governance ................................................................................................. 3237. A compact among the international community for development and cooperation beyond 2015 ................. 326
Bibliography ............................................................................................................................................................ 328
TablesTable I.1 Types of income used for the analysis of distributive capacity ............................................................... 35Table I.2 Latin America (6 countries): Gini index for several income measures and impact
of transfers and taxes ............................................................................................................................ 35Table I.3 Internet and fixed and mobile broadband penetration, averages for 2009-2011 .................................... 44Table I.4 Latin America: labour market indicators ............................................................................................... 46Table I.5 Latin America: variation in employment and labour productivity, 2002-2011 ....................................... 46Table I.A.1 Effect of taxes and transfers on income distribution ............................................................................... 62Table II.1 Latin America (15 countries): wages as a share of gross domestic product (GDP) .................................. 73Table II.2 Latin America (14 countries): GDP share of wages and estimated earnings .......................................... 75Table II.3 Latin America (18 countries): average education completed, adult population, 2002-2011 .................. 78Table II.4 Latin America (18 countries): indices of inequality in years of education among
the adult population, 2002-2011 .......................................................................................................... 79Table II.5 Latin America (7 countries): prevalence of chronic undernutrition by income quintile,
selected years ....................................................................................................................................... 82Table II.6 The Caribbean (4 countries): prevalence of chronic undernutrition by income quintile, 2006 ............... 83Table II.7 Latin America (7 countries): concentration index for the prevalence of chronic undernutrition ............. 83Table II.8 Latin America (7 countries): proportion of women aged 19 and 20 who are mothers in the top
and bottom quintiles by urban or rural residence, and ratio of probability of adolescent motherhood in the top and bottom quintiles, 2000 and 2010 census rounds ........................................ 85
6
Economic Commission for Latin America and the Caribbean (ECLAC)C
onte
nts
Table II.9 Latin America (7 countries): inequality in the total fertility rate (TFR) and the rate of adolescent motherhood between top and bottom socioeconomic quintiles, 1990s and 2000s ............................... 86
Table II.10 Latin America (18 countries): incidence of overcrowding ..................................................................... 87Table II.11 The Caribbean (5 countries): incidence of overcrowding ...................................................................... 88Table II.12 Latin America (18 countries): indices of inequality in overcrowding, 2002-2011 .................................. 88Table II.13 Latin America (14 countries): durable goods index values, 2002 and 2011 ........................................... 89Table II.14 Latin America (20 cities): index of dissimilarity at the minor administrative division level,
2000 and 2010, and variation for three educational groups, 2000-2010 ............................................... 98Table II.15 Latin America (17 cities): index of dissimilarity at the minor administrative division level for
bottom and top socioeconomic deciles, 2000 and 2010, and variation 2000-2010 .............................. 99Table II.A.1 Latin America (17 countries): Gini index of income distribution, 1990, 2002 and 2011 ...................... 119Table II.A.2 The Caribbean (17 countries and territories): Gini index of expenditure distribution,
1996-2004 and 2005-2011 ................................................................................................................. 119Table II.A.3 Latin America (14 countries): segregation between the public and private school networks,
1992, 2000 and 2011 ......................................................................................................................... 120Table III.1 Latin America: employment by occupational category, 2002 and 2011 .............................................. 136Table III.2 Latin America and the Caribbean (23 countries): variation in GDP and in main labour
market indicators, 2002-2011 ............................................................................................................. 137Table III.3 Latin America: average labour productivity by sector, 2002 and 2011 ................................................ 144Table III.4 Latin America (18 countries): wage workers as a proportion of total employed, by
productivity level, 2002 and 2011 ...................................................................................................... 145Table III.5 Latin America (4 countries): minimum wage in relation to the wage distribution ................................ 153Table III.6 Latin America (4 countries): minimum wage coverage ........................................................................ 154Table III.7 Latin America (4 countries): distributive impacts of the minimum wage .............................................. 155Table III.8 Latin America (16 countries): pension system affiliation among employed persons ............................. 161Table III.9 Latin America (18 countries): female occupations, 2002 and 2011 ..................................................... 164Table III.10 Latin America (18 countries): Duncan’s index for all workers, private sector wage workers
and public sector wage workers, 2002 and 2011 ................................................................................ 165Table III.11 Latin America (18 countries): differences between average labour incomes for women
and men, 2002 and 2011 ................................................................................................................... 166Table III.12 Latin America (11 countries): economic participation rate of the population aged 15 and over,
by ethnicity, sex and residence, around 2010 ..................................................................................... 172Table III.13 Latin America (10 countries): employed persons aged 15 and over by sector of activity,
ethnicity and area of residence, around 2010 ..................................................................................... 174Table III.14 Latin America (10 countries): employed women aged 15 years and over by ethnicity
and occupational category, around 2010 ............................................................................................ 175Table III.15 Latin America (10 countries): employed men aged 15 years and over by ethnicity and
occupational category, around 2010 .................................................................................................. 176Table III.16 Latin America (17 countries): pension system affiliation ...................................................................... 178Table III.A.1 Latin America (18 countries): labour market indicators, 2002 and 2011 ............................................. 183Table IV.1 Latin America: cumulative annual growth in per capita GDP and per capita private
consumption, averages, 1990-2012 .................................................................................................... 194Table IV.2 Latin America, OECD countries and middle-income countries: average per capita private
consumption, 1990-2012 ................................................................................................................... 196Table IV.3 Latin America (18 countries): estimated income elasticity of demand for imports of
consumption goods, 1980-2010 ......................................................................................................... 200Table IV.4 Latin America: estimated income and price elasticity of demand for imports of
consumption goods, 1990-2010 ......................................................................................................... 200Table IV.5 Latin America (18 countries): estimated income elasticity of demand for imports of
passenger vehicles, 1980-2010 ........................................................................................................... 201Table IV.6 Latin America and the Caribbean (32 countries): ratio between private consumption and GDP, at current prices in local currency, 1970-2012 ................................................................... 202Table IV.7 Saving, investment and expenditure as proportions of GDP, weighted averages, 2000-2012 ................. 204Table IV.8 Latin America (selected countries): indicators of household indebtedness ........................................... 212Table IV.9 Latin America (17 countries): indexes of inequality in income, expenditure and per capita
consumption in households, around 2006 .......................................................................................... 214Table IV.10 Latin America (11 countries): variation in the Gini index for income and expenditure ........................ 215Table IV.11 European Union: structure of expenditure, around 2006 .................................................................... 216
7
Compacts for Equality: Towards a Sustainable Future
Con
tent
s
Table IV.12 Latin America (17 countries): expenditure on food as a proportion of total expenditure, by income decile, around 2005 .......................................................................................................... 217Table IV.13 Latin America (17 countries): ratio between the proportion of expenditure by item in the tenth and first deciles, around 2006 .............................................................................................. 218Table IV.14 Europe (selected countries): proportion of households with access to selected durable goods,
around 2006 ....................................................................................................................................... 220Table IV.15 Latin America (15 countries): ratios between the percentages of household access to durable
good and services by different income deciles, around 2011 .............................................................. 221Table IV.16 Latin America (17 countries): expenditure on education as a proportion of total household
expenditure, by income decile ............................................................................................................ 226Table IV.17 Latin America (17 countries): spending on health care as a proportion of total household
expenditure, by income decile ............................................................................................................ 227Table IV.A.1 Latin America (14 countries): attendance by children aged 4-18 years at public or private
educational establishments, by income decile, 2011 .......................................................................... 237Table IV.A.2 Americas: health-care coverage by providing sector, selected years .................................................... 238Table V.1 The World and Latin America and the Caribbean: income- and price-elasticity
of demand for energy .......................................................................................................................... 243Table V.2 Latin America and the Caribbean (13 countries): hazardous waste generation, 2006-2011 .................... 244Table V.3 Latin America (selected cities and countries): motorization rate per 1,000 inhabitants ........................ 248Table V.4 Latin America and the Caribbean and OECD countries: income and price elasticities
of demand for fuel .............................................................................................................................. 249Table V.5 World: deforestation trends ................................................................................................................. 257Table V.6 Likelihood of exceeding a temperature increase compared with the pre-industrial era ........................ 259Table V.7 Latin America and the Caribbean: estimates of disaster-related damage and losses by type
of event and area, 1972-2010 ............................................................................................................. 261Table VI.1 Selected regions and countries: indicators of technology effort in the production
structure, 2010 ................................................................................................................................... 272Table VI.2 Latin America and the Caribbean (selected countries): mining sector indicators and fiscal
contribution, 2000-2012 ..................................................................................................................... 279Table VI.3 Latin America and the Caribbean (selected countries): hydrocarbon sector indicators
and fiscal contribution, 2000-2012 ..................................................................................................... 282Table VI.4 World and Latin America and the Caribbean: hydrocarbon availability and impact on trade,
around 2012 ....................................................................................................................................... 283Table VI.5 Latin America and the Caribbean (selected countries): legal frameworks governing the
distribution and use of fiscal revenues ................................................................................................ 285Table VI.6 Latin America (selected countries): use of revenues from extractive rents distributed
by law to subnational governments ..................................................................................................... 287Table VI.7 Latin America (7 countries): centralized and decentralized distribution of three-year
mineral tax revenue, 2007-2009 and 2010-2012 ................................................................................ 288Table VI.8 Latin America (7 countries): centralized and decentralized distribution of three-year
hydrocarbon tax revenue, 2007-2009 and 2010-2012 ........................................................................ 289Table VI.9 Colombia: distribution of revenues from extractive rents, 2011-2015 ................................................. 290Table VI.10 Plurinational State of Bolivia and Peru: effective use of revenues from extractive industries
by subnational governments, average by sector, 2011-2012 ............................................................... 290
FiguresFigure I.1 Production structure and income distribution ....................................................................................... 30Figure I.2 Knowledge intensity of the production structure and education ............................................................ 31Figure I.3 Latin America, OECD countries and the European Union: evolution of the tax ratio,
unweighted averages, 1990-2011, 1990-2001 and 2001-2011 ............................................................. 32Figure I.4 Latin America and the Caribbean, OECD countries and the European Union (EU 15): composition
of tax revenue, unweighted averages, 1990-2011, 1990-2001 and 2001-2011 ..................................... 32Figure I.5 Latin America (16 countries): persons aged 65 years and over receiving pensions, around
2002 and 2011 ..................................................................................................................................... 33Figure I.6 Latin America and the Caribbean: coverage of and investment in conditional cash
transfer programmes ............................................................................................................................. 34Figure I.7 Latin America and the Caribbean: Gini index before and after taxes and transfers ................................ 36Figure I.8 Labour productivity and social spending as a percentage of GDP, around 1990 and 2010,
and inequality around 2010 .................................................................................................................. 37
8
Economic Commission for Latin America and the Caribbean (ECLAC)C
onte
nts
Figure I.9 Latin America: year-on-year change in quarterly GDP, weighted average, January 2008- December 2013 .................................................................................................................................... 38
Figure I.10 Latin America: GDP variation and contribution to growth of aggregate demand components, 1980-2013 ............................................................................................................................................ 39
Figure I.11 Latin America and the Caribbean: current account balance and components, 1990-2013 .................... 40Figure I.12 Latin America and the Caribbean: current account balance and financial account components,
1990-2013 ............................................................................................................................................ 41Figure I.13 Latin America and the Caribbean: total gross external debt, 1990-2013 ................................................ 41Figure I.14 Latin America: relative productivity with respect to that of the United States, 1990-2011 ..................... 43Figure I.15 Relative productivity with respect to that of the United States and ECLAC expanded index
of production structure complexity ....................................................................................................... 44Figure I.16 Latin America and the Caribbean (18 countries): labour participation and employment rates,
population aged 15-64 years, by income quintile, 2002 and 2011 ....................................................... 47Figure I.17 Latin America: poverty and indigence, 1980-2013 .............................................................................. 48Figure I.18 Latin America (17 countries): distribution of the population by vulnerability to poverty,
around 2010 ......................................................................................................................................... 49Figure I.19 Latin America (18 countries): population aged 20 to 24 years with completed secondary
school education, by income quintile, around 2010 ............................................................................. 50Figure I.20 Latin America (8 countries) and OECD average: distribution of mathematics performance
levels for the 2012 PISA test, by economic, social and cultural status (ESCS index) ............................... 51Figure I.21 Latin America and the Caribbean (21 countries): social public spending as a share of total
public spending, and total public spending as a share of GDP, 1992-1993 to 2010-2011 ....................... 51Figure I.22 Latin America and the Caribbean (21 countries): social public spending by sector,
1992-1993 to 2010-2011 ..................................................................................................................... 52Figure II.1 Latin America (17 countries): Gini index, 1990, 2002 and 2011 ........................................................... 70Figure II.2 The Caribbean (17 countries and territories): Gini coefficients for household expenditure,
1996-2004 and 2005-2011 ................................................................................................................... 72Figure II.3 Latin America (13 countries): wages as a share of GDP and Gini index, 2002-2009 ............................. 74Figure II.4 Latin America (17 countries): absolute and relative Gini indices, 2002-2011 ........................................ 76Figure II.5 Latin America (selected countries): Internet usage by income quintile, 2011-2012 ............................... 80Figure II.6 Latin America (11 countries): ratio between Internet access in the highest- and
lowest-income quintiles (quintile V/quintile I), around 2005-2010 ........................................................ 80Figure II.7 Latin America (11 countries): households with Internet access in urban and rural areas
and nationwide, around 2010 .............................................................................................................. 81Figure II.8 Latin America (7 countries): prevalence of chronic undernutrition in children under age 5 ...................... 82Figure II.9 Latin America: proportion of mothers belonging to the 15-19 age group and total
fertility rate, 1990, 2000 and 2010 ....................................................................................................... 84Figure II.10 Latin America (6 countries): inequality in the total fertility rate (TFR) and specific adolescent
fertility rate (15-19 age group) between the top and bottom socioeconomic levels, urban areas, 2000 and 2010 census rounds .......................................................................................... 85
Figure II.11 Latin America (6 countries): inequality in the total fertility rate (TFR) and specific adolescent fertility rate (15-19 age group) between the top and bottom socioeconomic quintiles, rural areas, 2000 and 2010 census rounds ............................................................................................ 86
Figure II.12 Latin America (14 countries): Gini index for the durable goods access indicator, 2002-2011 ................ 90Figure II.13 Latin America (14 countries): segregation between public and private school networks,
average values for the index of dissimilarity, 1992, 2000 and 2011 ...................................................... 92Figure II.14 Latin America (14 countries): segregation between public and private school networks,
average values for the index of isolation, 1992, 2000 and 2011 ........................................................... 92Figure II.15 Latin America (14 countries): segregation between public and private school networks,
average values for the centile gap index, 1992, 2000 and 2011 ............................................................ 93Figure II.16 Latin America (14 countries): segregation between public and private school networks
in primary education, 1992, 2000 and 2011 ......................................................................................... 93Figure II.17 Latin America (14 countries): segregation between public and private school networks
in secondary education, 1992, 2000 and 2011 ..................................................................................... 94Figure II.18 Latin America (14 countries): segregation between public and private school networks by
index of dissimilarity for income quintile I, 1992, 2000 and 2011 ........................................................ 95Figure II.19 Latin America (14 countries): segregation between public and private school networks by
index of isolation for income quintile I, 1992, 2000 and 2011 .............................................................. 96

9
Compacts for Equality: Towards a Sustainable Future
Con
tent
s
Figure II.20 Latin America (14 countries): segregation between public and private school networks by centile gap index, 1992, 2000 and 2011 .......................................................................................... 96
Figure II.21 Latin America (17 countries): women aged 15 or over not in education and without incomes of their own, by area of residence, 2011 ............................................................................................. 102
Figure II.22 Latin America (18 countries): women’s participation in ministerial cabinets, by term of presidential office, 2000-2012 ........................................................................................... 103
Figure II.23 Latin America (18 countries): women elected to national parliaments, single or lower house, 2002 and 2012 ................................................................................................................................... 103
Figure II.24 Latin America (6 countries): indigenous population by income quintile .............................................. 105Figure II.25 Latin America (6 countries): distribution of the indigenous population between
income quintiles ................................................................................................................................. 105Figure II.26 Latin America (7 countries): poverty rates in the indigenous and non-indigenous populations................ 106Figure II.27 Latin America (6 countries): indigence rates in the indigenous and non-
indigenous populations ....................................................................................................................... 106Figure II.28 Latin America (6 countries): primary education completion rates among indigenous
and non-indigenous people aged 15 to 19 .......................................................................................... 106Figure II.29 Latin America (6 countries): primary education completion rates among indigenous
and non-indigenous people aged 15 and over .................................................................................... 107Figure II.30 Latin America (6 countries): secondary education completion rates among indigenous
and non-indigenous people aged 20 to 24 .......................................................................................... 107Figure II.31 Latin America (6 countries): secondary education completion rates among indigenous
and non-indigenous people aged 20 and over .................................................................................... 108Figure II.32 Colombia, Honduras, Peru and Plurinational State of Bolivia: prevalence
of chronic undernutrition in children under age 5 by indigenous status .............................................. 108Figure II.33 Latin America (18 countries): perception of income distribution as unfair or very unfair,
2002-2011 .......................................................................................................................................... 109Figure II.34 Latin America (18 countries): perception of lack of trustworthiness, 2002-2011 .................................. 110Figure II.35 Latin America (18 countries): perception that the level of conflict is high
or very high, 2007-2010 ..................................................................................................................... 111Figure II.36 World (selected countries): total income share of the 1% of the population that
amasses the greatest wealth, around 2005 .......................................................................................... 112Figure II.A.1 Trends in income inequality in the world: Gini index for the distribution of disposable
per capita income ............................................................................................................................... 120Figure II.A.2 Trends in income inequality in the world: average Gini index of per capita
income distrubition ............................................................................................................................. 121Figure II.A.3 World (selected regions and groupings): income inequality by Gini index,
1990-2008 .......................................................................................................................................... 121Figure II.A.4 Latin America (18 countries): overcrowding by income percentile, 2002-2011 ................................... 122Figure II.A.5 Latin America (14 countries): durable goods index values by income percentile,
2002-2011 .......................................................................................................................................... 125Figure II.A.6 Latin America (18 countries): years of formal education of the population aged 25-65 years,
by income percentile, 2002-2011 ....................................................................................................... 128Figure II.A.7 Latin America (6 countries): chronic malnutrition concentration curves .............................................. 131Figure III.1 Latin America and the Caribbean: unemployment and GDP, 2002-2012 ............................................ 136Figure III.2 Latin America (17 countries): Gini coefficient for total income and labour income,
around 2002-2011 .............................................................................................................................. 137Figure III.3 Latin America (18 countries): skills premium (compared with the group with
no education), 2002 and 2011 ............................................................................................................ 138Figure III.4 Latin America and the Caribbean and other regions: GDP per person employed
by region, 1991-2012 ......................................................................................................................... 139Figure III.5 Latin America and the Caribbean (selected countries): GDP per person
employed, 2000-2012 ........................................................................................................................ 139Figure III.6 Latin America and the Caribbean (25 countries): average labour productivity, 2012 ........................... 140Figure III.7 Latin America and the Caribbean (selected countries): value added per person
employed, by sector, 2000-2011 ........................................................................................................ 141Figure III.8 Latin America and the Caribbean (15 countries): annual value added per person
employed, by sector, 2011 ................................................................................................................. 142Figure III.9 Latin America and the Caribbean (23 countries): contribution of intersectoral and intrasectoral
changes to annual variation in average labour productivity, 1990-2002 and 2002-2011 .................... 143
10
Economic Commission for Latin America and the Caribbean (ECLAC)C
onte
nts
Figure III.10 Latin America (18 countries): relative productivity between sectors, 2002 and 2011 .......................... 145Figure III.11 Latin America (18 countries): GDP and employment by productivity of sectors of activity,
2002 and 2011 ................................................................................................................................... 145Figure III.12 Latin America and the Caribbean (22 countries): annual average variation in the real
minimum wage, 2002-2010 ............................................................................................................... 148Figure III.13 Latin America and the Caribbean (22 countries): minimum wage in multiples of the
per capita poverty line, 2002-2011 ..................................................................................................... 150Figure III.14 Latin America and the Caribbean (22 countries): minimum wage, 2002-2011 .................................... 151Figure III.15 Latin America (selected countries): change in the real minimum wage, 2000-2012 ............................ 152Figure III.16 Latin America and the Caribbean (27 countries): labour participation rates by sex,
2002 and 2011 ................................................................................................................................... 157Figure III.17 Latin America and the Caribbean (25 countries): employment by sex, 2002 and 2011 ....................... 158Figure III.18 Latin America (18 countries): hours of paid work per week, by sex, 2002 and 2011 ........................... 158Figure III.19 Latin America (18 countries): part-time work by sex, 2002 and 2011 .................................................. 159Figure III.20 Latin America and the Caribbean (21 countries): unemployment by sex, 2002 and 2011 ...................... 160Figure III.21 Latin America (17 countries): employment and pension contribution gaps between
men and women, around 2011 ........................................................................................................... 161Figure III.22 Latin America (17 countries): simple average of the distribution of employees by sector
of activity and sex, national total, 2011 .............................................................................................. 163Figure III.23 Latin America (17 countries): simple average of the distribution of employed women
by sector of activity, national total, 2011 ............................................................................................ 163Figure III.24 Latin America (17 countries): Duncan’s index of occupational segregation among women,
2002 and 2011 ................................................................................................................................... 164Figure III.25 Latin America (17 countries): employment and wage gaps between men and women,
around 2011 ....................................................................................................................................... 166Figure III.26 Latin America (9 countries): time spent on paid and unpaid work, by sex, around 2011 ..................... 168Figure III.27 Latin America (9 countries): time spent on paid and unpaid work by the non-employed
population aged 15 years and over, by sex, around 2011 ................................................................... 169Figure III.28 OECD and Latin America and the Caribbean (selected countries): correlation between female
employment and time spent by men and women on unpaid work ...................................................... 170Figure III.29 Latin America (9 countries): time spent on unpaid work, by sex, professional category, age,
marital status and years of education .................................................................................................. 170Figure III.30 Latin America (11 countries): economic participation rates of the population aged 15 years
and over, by ethnicity, around 2010 ................................................................................................... 171Figure III.31 Latin America (11 countries): employed persons aged 15 years and over with 13 years
of schooling or more, by ethnicity and sex, around 2010 ................................................................... 173Figure III.32 Latin America (10 countries): gaps between women aged 15 years and over in domestic
employment by ethnicity and area of residence, around 2010 ............................................................ 177Figure IV.1 Latin America: average annual growth in per capita private consumption
and per capita GDP, 1991-2012 ......................................................................................................... 194Figure IV.2 Latin America (20 countries): per capita private consumption, 1990, 2000 and 2012 ......................... 195Figure IV.3 Latin America (selected countries): contribution of consumption to GDP growth
and of terms of trade to GNI growth, 1980-2012 ................................................................................ 195Figure IV.4 Central America (7 countries): contribution of consumption to GDP growth and of remittances
growth to GNI growth, 1980-2012 ..................................................................................................... 196Figure IV.5 Latin America (18 countries): imports of consumption goods and of passenger vehicles,
per capita, 1980-2010 ........................................................................................................................ 197Figure IV.6 Latin America and the Caribbean and OECD countries: ratio between private consumption
and GDP, weighted averages, 1970-2012 ........................................................................................... 202Figure IV.7 Latin America and the Caribbean: household consumption, average 2010-2012 ................................ 203Figure IV.8 Latin America and the Caribbean: volatility of per capita consumption compared
with OECD countries, average, 1970-2012 ......................................................................................... 205Figure IV.9 World (124 countries): relative volatility of per capita consumption and per capita GDP,
average, 1970-2012 ............................................................................................................................ 205Figure IV.10 Latin America and the Caribbean: relative volatility of per capita consumption and
per capita GDP, 1970-1990 and 1990-2012 ....................................................................................... 206Figure IV.11 Brazil: household indebtedness as a proportion of disposable income, January 2005-July 2012 ............. 208Figure IV.12 Brazil: credit card ownership by household income percentile, 2003 and 2009 ................................. 209
11
Compacts for Equality: Towards a Sustainable Future
Con
tent
s
Figure IV.13 Chile: number of credit cards and total amount of approved credit card limits, 1991-2011 ................ 209Figure IV.14 Peru: annual growth in credit to households and in employment, September 2009-
March 2013 ........................................................................................................................................ 210Figure IV.15 Chile: amount lent via credit cards and real wage index, 1991-2011 .................................................. 210Figure IV.16 Latin America: consumer indebtedness, 2011 ..................................................................................... 211Figure IV.17 Latin America and Europe: per capita GDP and debt-to-income ratio ................................................. 211Figure IV.18 Latin America (16 countries): household income, expenditure and per capita consumption,
averages, around 2006 ....................................................................................................................... 213Figure IV.19 Latin America (17 countries): distribution of household expenditure by per capita
income quintile, around 2006 ............................................................................................................ 213Figure IV.20 Latin America (17 countries): Gini index for income and expenditure, around 2006 ........................... 215Figure IV.21 Latin America (17 countries): structure of expenditure, around 2006 .................................................. 216Figure IV.22 Latin America (17 countries): per capita GDP and proportion of expenditure on food,
around 2006 ....................................................................................................................................... 216Figure IV.23 Latin America (12 countries): expenditure on food as a proportion of total expenditure
in urban and rural areas, around 2006 ................................................................................................ 217Figure IV.24 Latin America (16 countries): proportion of households with access to durable goods
by type of good, around 2011 ............................................................................................................. 219Figure IV.25 Latin America (13 countries): variation in the proportion of households with access to
automobiles, refrigerators and fixed telephony, around 1996 and 2011 .............................................. 220Figure IV.26 Latin America and the Caribbean: proportion of enrolment in private education,
1999 and 2011 ................................................................................................................................... 222Figure IV.27 Proportion of enrolment in private education, by level of education, 2000, 2005 and 2010 .................. 223Figure IV.28 Latin America (14 countries): enrolment in private primary education, 1990, 2000 and 2010 ................ 224Figure IV.29 Latin America (14 countries): enrolment in private secondary education, 1990, 2000 and 2010 ............ 225Figure IV.30 Latin America: attendance by children aged 4-18 years at public or private educational
establishments, by income decile, 2011 ............................................................................................. 226Figure IV.A.1 Latin America (18 countries): imports of consumption goods and passenger transport
vehicles, per capita, 1980-2010 .......................................................................................................... 234Figure IV.A.2 Latin America (16 countries): proportion of expenditure on food by household
composition, around 2006 .................................................................................................................. 237Figure V.1 Latin America (9 countries): household spending on energy (electricity, gas and other fuels)
as a proportion of total household spending and of total spending on energy for domestic use, by income quintile ....................................................................................................... 243
Figure V.2 Latin America and the Caribbean (18 countries): e-waste generation, per capita, 2012 ....................... 245Figure V.3 Latin America (16 countries): urban solid waste generation per capita, per day,
2000 and 2010 ................................................................................................................................... 245Figure V.4 Developed countries and Latin America (selected countries): correlation between motorization
rate and per capita GDP, 2003-2010 .................................................................................................. 246Figure V.5 Latin America (6 countries): examples of fossil fuel subsidies, 2011 .................................................... 247Figure V.6 Latin America (9 countries): household spending on fuel for transport (gasoline, diesel,
biodiesel), as a proportion of total household spending and as a proportion of total spending on fuel for transport, by income quintile .............................................................................. 248
Figure V.7 Latin America and the Caribbean (selected cities): annual average particulate matter (PM10) pollution, around 2008-2009 .............................................................................................................. 250
Figure V.8 Latin America (selected cities): PM2.5 concentrations compared with health standards, 2011 ................. 251Figure V.9 Latin America and the Caribbean: water availability per capita and water use distribution, 2011 ........... 252Figure V.10 Latin America and the Caribbean: access to drinking water, 1990-2011 ............................................. 253Figure V.11 Mexico (2009) and Peru (2010): proportion of women and men who report fetching water ................ 254Figure V.12 Ecuador (2007) and Peru (2010): time devoted by women and men to fetching water,
by area of residence ............................................................................................................................ 254Figure V.13 Latin America and the Caribbean: number of ecoregions and proportion of the global total ............... 256Figure V.14 Atmospheric concentration of greenhouse gases, 1980-2010 .............................................................. 258Figure V.15 Latin America and the Caribbean: costs of climatological and geological disasters, population
affected by type of event, and number of disasters, 1970-2009 ........................................................... 260Figure VI.1 Latin America (8 countries): share of royalties in total fiscal revenues from mining,
2000-2003 to 2010-2012 ................................................................................................................... 280
12
Economic Commission for Latin America and the Caribbean (ECLAC)C
onte
nts
BoxesBox I.1 Cities: places of interconnections, places of sustainabilities .................................................................. 58Box II.1 The debate surrounding the Millennium Development Goals and inequality ........................................ 77Box III.1 Structural heterogeneity and employment in Peru ............................................................................... 146Box III.2 The minimum wage in Mexico ........................................................................................................... 149Box III.3 Minimum wage, inequality and unemployment .................................................................................. 152Box III.4 Wage gaps: econometric estimations .................................................................................................. 167Box IV.1 Institutions and consumption .............................................................................................................. 205Box IV.2 Sources of information on household indebtedness ............................................................................ 207Box V.1 Latin America: environment-related tax measures ............................................................................... 247Box V.2 Case studies on sustainable public transport in Latin America ............................................................. 250Box V.3 Citizen mobilization, the right to water and the limits of top-down reforms: “water wars”
in Argentina and the Plurinational State of Bolivia .............................................................................. 256Box V.4 Latin America and the Caribbean: key physical impacts projected for the region in
a 2°C temperature rise scenario .......................................................................................................... 258Box VI.1 The rights of indigenous peoples ......................................................................................................... 270Box VI.2 Mexico and Peru: recent changes affecting hydrocarbon ownership regimes ...................................... 276Box VI.3 Chile: stabilization fund and countercyclical policy ............................................................................ 286Box VII.1 Tax reform in Uruguay ........................................................................................................................ 311Box VII.2 Participation and dialogue in Ecuador’s strategy for revamping its production matrix ......................... 313Box VII.3 Two success stories of inclusive financing for SMEs ............................................................................ 314Box VII.4 Cross-sectoral building of an inclusive social policy based on a life-cycle rationale:
“Inclusion for Growth” in Peru ........................................................................................................... 318Box VII.5 The construction of a compact for the creation of a solidarity-based pillar: the reform of
the pension system in Chile, 2005-2008 ............................................................................................. 319Box VII.6 Global compacts for environmental sustainability: key principles embodied in the
Rio Declaration on Environment and Development ............................................................................. 322Box VII.7 Norway’s social compact for sustainable natural resource development ............................................. 324
MapMap I.1 Latin America and the Caribbean: overview of projected patterns of climate change up to 2100 .......... 55
13
Compacts for Equality: Towards a Sustainable Future
Fore
wor
d
Foreword
A. BackgroundThe Latin American and Caribbean region has come to a crossroads. Significant strides have been made in reducing poverty and unemployment, and steps have been taken to improve income distribution, albeit with varying rates of progress from one country to another, reflecting their marked heterogeneity. Democratic systems have become consolidated in countries which, until a few years ago, had been devastated by civil war or in the grip of dictatorial regimes. Greater macroeconomic stability has been achieved, the public debt has been reined in and countercyclical policies have been deployed to mitigate the impact of external crises, both enrolment in and progression through education have risen and access to social safety nets has broadened.
Difficulties have been encountered in sustaining these advances or pursuing them beyond certain limits, however. Major challenges hamper both progress along the path towards equality and its broadening to the various spheres in which equality is at stake. Moreover, economic sustainability challenges abound as the business cycle enters a slower phase, with gaping lags remaining in production patterns. As regards environmental sustainability, the global challenges of climate change, coupled with the dynamics of consumption and urban concentration, pose serious negative environmental externalities that undermine the economy and the well-being of the population.
The 2008 crisis showed that the new world scenario would be fraught with restrictions and uncertainties. A slower and more unstable pace of growth took hold across the globe, especially in the industrialized world, but is now extending to the emerging economies, making it increasingly hard to adopt a global approach to problems that affect all countries. Divisions have arisen over how to govern the “realm of shortage”, where until recently abundance and the welfare State were taken for granted. This is especially true for countries on the European periphery, especially in the Mediterranean. The dilemmas —which once gripped Latin America and the Caribbean— between extreme austerity with fiscal adjustment and more Keynesian solutions for addressing the crisis have now emerged at the very heart of the developed world.
In Latin America and the Caribbean, the limits are drawn by a combination of external constraints and endogenous features. External constraints include slowing international trade, fluctuating commodity prices, volatile financial signals and the reordering of production into transnational value chains in which the countries of the region run the risk, once more, of missing an opportunity to gain a less asymmetric position. Among the endogenous problems are the region’s disjointed and outmoded production structure, the low levels of investment with little embedded technological progress, the high degree of informality in the labour market, welfare and capacity gaps, weak natural resource governance, consumption patterns that reflect large shortfalls in public services, serious environmental and energy pressures and persistent institutional shortcomings in terms of the ability to capture, regulate and allocate resources. Notwithstanding the differences between subregions, the region as a whole must address the challenge of closing the gaps posed by structural heterogeneity, external vulnerability and stark inequality.
The foregoing raises enormous challenges to efforts to move towards greater equality. The complexity of the present juncture and of the outlook for the short and medium terms calls for a progressive public policy and fiscal effort to increase equality. Thus, as proposed in the closing pages of this document, the balance between State, society and market must be redesigned in order to build compacts with support from stakeholders that can guarantee far-reaching political agreements. Only through compacts will it be possible to develop the institutional framework and
14
Economic Commission for Latin America and the Caribbean (ECLAC)Fo
rew
ord
the collective will to open up this policy space; and only through compacts will society be able to take ownership of the sense and content of such policies. As argued in Time for Equality1 and in Structural Change for Equality,2 a new equation between the State, society and the market, as appropriate for each national reality, is needed in which the actors endorse and internalize development strategies through collective accords. This is the only way to restore the sovereignty of our countries in finding their own paths, based on their own history and identity, and to surmount the unfair limitations long imposed by reason of origin, age, gender or ethnicity.
In short, notwithstanding the past decade of achievements in terms of economic growth, employment and various social indicators, albeit with differences between countries and subregions, investment rates and productivity remain low, and growth continues to rely heavily on private consumption skewed heavily towards imported goods and is, moreover, highly dependent on natural resources and international commodity prices. All of this generates serious balance-of-payment vulnerabilities, compounded by growing levels of violence and a backlog of unfulfilled responsibilities in key areas such as health, social security and education.
At this juncture of recent advances and the difficulties foreseen in sustaining and building on them in the medium term, ECLAC aims to consolidate the development approach it has been proposing to governments in the region over the past few years. It bases this approach on the values that modern and developed societies hold most dear: equality, environmental sustainability, well-being and democracy, from a medium- and long-term perspective, and in light of the hard lessons of history.
B. The ECLAC approach: the basis for our proposalsOne of the Commission’s main concerns, since its inception, has been to propose a model for sustainable development for the medium and long terms. Recently, the basic tenets of the development model have been revisited in light of the current challenges of equality and sustainability, as set forth in the position papers presented at the last two sessions of the Commission (Brasilia, 2010, and San Salvador, 2012).
On the occasion of its thirty-third session, held in 2010, ECLAC published the document entitled Time for Equality: Closing Gaps, Opening Trails. The form of development proposed therein revolved around the value of equality, taking a rights-based approach, with the maxim of equality for growth and growth for equality summing up the spirit of this proposal.
In macroeconomic terms, Time for Equality proposed, first, stabilizing exchange rates and resisting currency appreciation. It underscored the importance of a proactive fiscal system designed for reconciling macroeconomic equilibria with promotion of robust economic growth and reducing the volatility of production activity by keeping capacity utilization high. Accordingly, capital controls were advocated to regulate inflows and outflows of resources. These proposals diverged from the orthodox principles of the 1980s and 1990s, on the basis that these had forced the region’s production capacity into a sort of straitjacket. The more heterodox proposals formulated by ECLAC were in keeping with the new times. Not by chance were they echoed in the renewed public agendas and in documents put forth by the International Monetary Fund, the World Bank and other multilateral agencies. No longer is it anathema to discuss equality, progressive fiscal reform and more active State policies and take a long-term perspective on economic and production matters: on the contrary, these notions now form part of the accepted lexicon and of a shared vision.
Time for Equality, second, drew attention to the urgent need for structural change geared towards closing both internal and external gaps, so as to forge a less heterogeneous production structure. The macroeconomy, it was emphasized, should perform to the tune of structural change, promoting investment through active industrial policies, with special emphasis on support for small and medium-sized enterprises and on encouraging research and development.
Time for Equality reviewed three fundamental aspects of equality and inclusion, namely, the territorial dimension, employment and social protection. These aspects are not unrelated to the production sphere: as ECLAC has been
1 ECLAC, Time for Equality: Closing Gaps, Opening Trails (LC/G.2432(SES.33/3)), Santiago, Chile, 2010.2 ECLAC, Structural Change for Equality: An Integrated Approach to Development (LC/G.2524(SES.34/3)), Santiago, Chile, 2012.
15
Compacts for Equality: Towards a Sustainable Future
Fore
wor
d
maintaining, social issues are not played out in the social sphere alone. Territory, employment and social protection are intimately bound up with a production pattern that fosters territorial inclusion, generates productive employment and, hence, provides a more robust fiscal and contributory system to underpin social protection and capacity-building.
Social protection and investment must act as a lynchpin for growth in both equality and production. Protection against external shocks through basic income transfers, investment in early childhood care, the creation of care systems that support that investment and enable women to become fully integrated into the workforce: these are all part of structural change. They all help to build human capabilities, equalize opportunities and outcomes, make society more cohesive and tackle the intergenerational reproduction of exclusion at its roots.
The pillars of development proposed in Time for Equality were explored in greater depth in the position paper of the thirty-fourth session of ECLAC, entitled Structural Change for Equality: An Integrated Approach to Development. The structural change approach calls for management of the business cycle so as to leverage installed capacity utilization throughout the cycle. At the same time, innovation and investment must be promoted through industrial policymaking, in order to increasingly embed knowledge and build endogenous capacities in technological and production spheres, thereby generating dynamic comparative advantages. This does not mean turning aside from the potential benefits of commodity booms, but it does mean being aware that these upcycles are not sufficient for laying solid and sustainable foundations for growth and acting accordingly.
Retrospectively, it is clear that in the Latin American and Caribbean region expansionary cycles have been accompanied by real currency appreciation and, hence, balance-of-payment vulnerabilities. At the time of Structural Change for Equality, the 2003-2011 cycle appeared on the surface to have skirted this problem unscathed. Nevertheless, the strategic view taken in the document warned of this risk, which today has indeed materialized in a mounting current account deficit.
Underlying the link between boom and currency appreciation —which fetters sustained development— are a number of factors: the cyclical surge in capital flows and terms-of-trade variations, the region’s dependence on commodity exports, the absence of industrial and technology policies to leverage these cycles for structural change, a narrow view of the cycle in terms of nominal stability without regard for other targets such as employment and distribution, and a reluctance to regulate and manage international capital flows.
In Structural Change for Equality, ECLAC proposed a set of initiatives for transforming vicious cycles of unsustainability into virtuous circles for sustainable development. The thrust was that qualitative transformation of the production structure should drive and strengthen sectors and activities that are more knowledge-intensive and that generate faster-growing demand, while also creating more and better employment, which is the key to equality. This calls for a systemic approach that dovetails macroeconomic and fiscal policies with industrial and social policies.
C. The State and sustainable development Between 2003 and 2008, growth rates climbed in Latin America and the Caribbean and income distribution and other social indicators improved. This positive rendering was due largely to highly favourable external conditions, with burgeoning international trade, robust commodity prices, strong remittance flows and tourism earnings and abundant liquidity on international financial markets, with impacts that varied from one country to another but were on the whole beneficial. The impetus provided by the international conditions was accompanied by macroeconomic policy management which, with a few exceptions, prioritized maintaining fundamental equilibria.
The crisis that broke out in 2008 tested the ability of States to mitigate the impacts of a severe external shock and preserve equilibria. By mobilizing a range of political and financial resources and taking countercyclical action, governments were able to mitigate the social costs of the crisis —which during previous crises had been frankly brutal. The countries marshalled a timely response to the crisis, reconciling the need for urgent social action with economic caution. The test showed that public action and political will in the region had acquired a surprising maturity. It was evident that orthodox formulas no longer ruled, the political margin for manoeuvre had widened, and policymaking had gained much from the deepening of democracy.
16
Economic Commission for Latin America and the Caribbean (ECLAC)Fo
rew
ord
On the other hand, the commodity price boom and its macroeconomic impacts increased the region’s bias towards natural resource specialization. Public investment has not regained its role as a catalyst for growth, despite the shortfalls in infrastructure, and the private sector’s share in the delivery of essential services, such as education and health, has risen, while the undersupply of quality public services by the State has worsened. The more private consumption gains ground as a growth driver, the more difficult it becomes to forge social contracts for the provision of quality public services across different socioeconomic groups. Amid weak labour institutionality, informal employment and occupations remain pervasive.
One of the effects of the region’s hallmark —i.e. largely undiversified— production pattern is a tendency to consume goods with a high imported content. The fact that exports are linked more strongly to consumption than to investment, even amid a commodity price boom, suggests that structural change (and, hence, growth sustainability) has yet to become a priority in Latin American societies. Moreover, consumption patterns are from being environment-neutral. Clean technologies are needed to mitigate the impact of growth on the environment, along with collective forms of consumption (for example, good quality public transport rather than private automobiles) and more complex technologies. This, in turn, needs educated workers who are fully engaged with learning processes in changing structures. These growth conditions compatible with environmental preservation can be fulfilled only when the economy progresses from polarization to diversification, from segregation to social and production integration, and from individual to collective consumption. Such a change in the style of development cannot be achieved without leadership by the State.
While growth rates have remained positive, they have tailed off since 2011. The downturn in the natural resources cycle, along with the expected reduction in capital flows, tighter liquidity situation and possible rise in interest rates, leaves the region less favourably placed for the future. The reduction in poverty and inequality is showing signs of losing momentum, and the indigence rate has not come down at all. Furthermore, the emerging middle classes and vulnerable sectors that have only recently left poverty behind are placing greater demands on the State for sufficient good quality public and collective services, in such areas as public safety, transport, education and health.
Democracy is the central pillar of the new institutional framework and poses demands for equality in the broadest sense —encompassing fair distribution, rights and intergenerational opportunities— and the economy must respond to these expectations. The democratic framework has absorbed demands and is attempting to garner responses that will endow it with legitimacy, albeit still only partially. But this process is encountering limits: production, economic and social constraints and issues in terms of consumption and the environment. The main thrust of this document is to discuss those limits, understand how they work and propose strategies for overcoming them.
The “indignant” protesters in Brazil, the Chilean students who took to the streets, the various civic, environmentalist and grassroots movements and the shifts in electoral choices and leaderships may appear to be separate phenomena. But they can all be traced to a common cause: the difficulty in moving towards a style of development that will govern natural resources intelligently, combine greater well-being with better public services for all, substantially reduce wealth concentration and even out the unequal appropriation of the fruits of economic growth between the different agents of production.
The reasons for greater State involvement are as valid now as they were for the development strategies before the adjustments and privatizations of the 1980s and 1990s. It is still necessary to provide adequate public services and infrastructure, and in these areas the private sector’s response has proven limited, inadequate or even quasi-monopolistic. It is still necessary to compensate for the lack of consideration for future generations in the behaviour of the private sector, which leads to insufficient accumulation of capital or inadequate stewardship of the environment. And it is still necessary to avoid the concentration of power and wealth.
How and to what extent the response to these challenges can be resolved through policies will be determined by the collective decisions which are today —and must still be tomorrow— part of the public and democratic debate in the region. In this, the State is called upon to play a fundamental role. Democracy gives policies legitimacy through agreements and compacts forged with a strategic objective, as set forth in the final chapter of this document. It also helps to identify the type of development we want without sacrificing sovereign options or ignoring the constraints and possibilities presented at this historic turning point.
17
Compacts for Equality: Towards a Sustainable Future
D. Wrapping upIn the proposal which is further elaborated in this document, ECLAC treats equality as the core value, structural change as the path, and the art of politics and policymaking as the instrument by which it can be achieved. At this stage, policies need to be redirected so as to boost investment and instil a virtuous relationship between growth, productivity and environmental sustainability by embedding knowledge in production and generating high value added, as discussed in chapter I. The world of work must be endowed with greater inclusive potential and fiscal policy made to converge with social policies in order to reduce the multiple social gaps revealed by a multidimensional look at inequalities in the region, as proposed in chapters II and III. Consumption growth must be channeled so as to harmonize the timely provision of public services with consumption of private services, in the interests of social cohesion and environmental sustainability, as set forth in chapters IV and V. Lastly, policies must be geared to making resolute progress towards better and stronger governance and developing the natural resource endowment so as to build a more diversified, environmentally sustainable economy with synergies in employment and well-being, as proposed in chapter VI.
These are the issues that set before us the challenge of deepening proposals for this change of course at the strategic crossroads the region has reached today. The region must combine dynamic development that is sustainable over the medium and long terms with a systematic effort to attain higher levels of equality. Such equality is not understood only as equality of resources, that is, as better income distribution. It is understood, too, as greater equality of capabilities and agency, equality in the full exercise of citizenship and in dignity and reciprocal recognition among stakeholders. Recognizing individuals as equal and interdependent means that policies must be applied to promote their autonomy and mitigate their vulnerabilities. Incorporating the contributions of the gender, ethnic and environmental perspectives calls for policies on equality in the distribution of roles (in the family, at work and in politics), in the relationship between present and future generations and in the visibility and affirmation of collective identities.
A scheme for equality and future development such as that proposed by ECLAC in the documents cited and herein requires a virtuous interaction between institutions and structures: industrial policies capable of coordinating public and private agents to raise investment and shift sector composition to boost productivity; governance and use of the region’s comparative advantages in natural resources to build a diversified, knowledge-intensive economy with high value added and make the sphere of work more inclusive; regulation and channelling of consumption growth to harmonize public service delivery with private consumption, consistently with environmental sustainability; and construction of a sustainable taxation and social welfare system in order to achieve a high redistributive impact and expand capacity-building for society as a whole. Only through a virtuous dialectic between institutional change and structural change will it be possible to boost development in the strategic direction set forth in the following chapters.
Alicia Bárcena
Executive SecretaryEconomic Commission for Latin America
and the Caribbean (ECLAC)Fo
rew
ord

19
Exe
cutiv
e su
mm
ary
Compacts for Equality: Towards a Sustainable Future
Executive summary
This document discusses, in various spheres, the two major challenges to development in Latin America and the Caribbean, which are to achieve greater equality and to make development sustainable for future generations.
Chapter I summarizes the social, economic, environmental and natural-resource-governance constraints on sustainability, as well as the challenges associated with strategic development options. For this, a virtuous dialectic between institutions and structures —now lacking— is crucial. For example, public institutions that are supported by a robust fiscal framework and can provide adequate public services in transportation, health, entertainment and leisure can have a favourable impact on the structure of consumption, with positive effects on the environment, energy use and egalitarian access to wellbeing. Good governance of natural resources by institutions encourages production diversification, prevents corruption and profiteering and helps strike a better balance between resource use, creation of quality jobs and environmental conservation. Public trust in government institutions helps to address endemic problems of violence and social exclusion, and conversely, greater social inclusion through employment and social policies serves to build public trust in institutions and greater respect for the law and the rules of a peaceful democratic society.
A virtuous circle of better institutions and structures more suited to sustainable development and social equality undoubtedly requires collective accords or social compants in various spheres. Only policies enshrined in such compacts can provide a robust framework for medium and longterm lines of action: a compact for investment and structural change; a fiscal compact for striking a better balance between private goods and public services in the architecture of well-being; a compact for natural resources governance and environmental preservation, with an emphasis on solidarity with future generations and a more diversified, “green” production matrix; and a social and labour compact to build the State’s redistributive capacity in different areas of inequality and ensure that labour institutions keep pace with structural change in order to close gaps in relation to gender, output, quality employment and the division of benefits between capital and labour.
As stated at the beginning of chapter II of this document, the approach taken by ECLAC to equality draws on both utilitarian and capacity-based definitions while also going one step further, in line with broader concepts that treat equality as “relational,” that is, autonomy with reciprocal recognition. In this approach, considerations of gender, ethnicity and environmental sustainability, in both epistemological and political terms, expand the demand and imperative for equality into new dimensions. Demand for equality thus broadens to encompass the household, collective identities and future generations and is strongly linked to problems of inequality in the realms of power, work and daily life, with its cultural roots in discrimination.
Equality, as ECLAC understands it, includes equality of means, opportunities and capacities, but in the framework of a deeper understanding of equality as the equal dignity of citizens, in which individuals are simultaneously autonomous and vulnerable and should be acknowledged for both qualities mutually. Such acknowledgement is driven by the irreducible nature of rights but also from the need for greater collective solidarity and greater pluralism in accepting diverse groups and identities.
This understanding of equality also extends to participation, inasmuch as equal dignity means taking an active role in the decision-making processes that affect society as a whole, and not just enjoying resources and benefits by virtue of that condition. Participation, whether direct or representative, is essential to produce the opportunities for
20
Exe
cutiv
e su
mm
ary
Economic Commission for Latin America and the Caribbean (ECLAC)
deliberation that can evolve into social compacts. Such compacts, which lend political legitimacy to the direction of development, should engage a broad spectrum of societal and State actors, through various channels and in diverse forms and combinations.
This more complex notion of equality underpins chapters II and III, on social and labour gaps. In line with this approach, chapter II includes an analysis of gaps in means and capacities (income, living conditions, health and education) but also looks at recognition and relational aspects, such as engagement in networks or the degree of educational and spatial segregation, which are understood to be powerful tools for ensuring reciprocal recognition and establishing social conditions that strengthen autonomy and solidarity among different groups in society.
As this chapter illustrates, indicators that are lesser known than the (relative) Gini index, such as the indicator of absolute inequality and the indicator of functional income inequality, do not show the same favourable evolution in the past decade as the Gini index. Thus, this document presents a more nuanced analysis in terms of the depth of distributive gains. In terms of capacities, access to health care and education tends to be distributed more equitably, as a result of progress among the most disadvantaged groups, but enormous gaps persist in the quality of that access and in achievement and learning outcomes. In the relational aspects, no equality gains are seen in terms of education segregation, and the findings vary by country in terms of spatial segregation.
Lastly, the story told by the subjective indicators is that Latin Americans perceive income distribution as highly unfair, believe that there is little interpersonal trust in their societies and find the level of social conflict to be high. Together with the persistent segregation and gaps in the development of capacities and in the world of work, this suggests that equality, understood as the full exercise of autonomy with reciprocal acknowledgement, is a pending debt.
ECLAC argues that the world of work is critically important for understanding the drivers and links in the chain of inequality, as well as sustainability on the road to greater equality. Chapter III analyses the world of work as a fundamental arena in the concept of equality as defined by ECLAC. Work is not just the place where gaps in income and access to social security can be closed, but also a key sphere for mutual recognition through social interaction, socialization outside the home and development of potential to achieve greater personal autonomy.
For the period 2002-2011, chapter II identifies advances in several areas over this past decade, but also points up warning signs relating to structural components that drive inequality (both productive and social). As for the progress, labour productivity grew faster than in the two previous decades, and the minimum wage and the real wage rose as employment climbed and unemployment fell sharply. The percentage of workers contributing to the pension system increased, and in most of the countries, the ratio between participants in the highest and lowest quintiles decreased, indicating greater equality in this area. As for income, the decline in labour inequality has been the main factor driving the drop in inequality in total income.
The warning signs refer to the absence of structural changes in the production and social sectors. In production, most investment has gone to non-tradable sectors with high employment, as well as to primary tradable sectors (mining and agriculture) with variable output. There are symptoms of Dutch disease, with insufficient investment in diversifying tradable production. This means that despite the increase in investment, its contribution to structural change, understood as the reallocation of resources from lowproductivity sectors to high-productivity sectors, has been relatively limited in these countries. In comparative terms, the region achieved fewer productivity gains than East Asia, in particular, nor did it much narrow the gap with North America (United States and Canada).
In terms of social structures, despite the trends towards equality in participation, occupation and employment between men and women, sizeable differences remain, especially considering the gains made by women in education: women’s skills are still not put to full use by the labour markets. The chapter provides abundant evidence of the persistently high levels of occupational segregation and the glass ceiling for women, neither of which have improved over the decade. Neither have trends been particularly positive in terms of closing the large wage gaps between men and women, such that the situation is discouraging for women generally, and is particularly bleak for indigenous women. Lastly, the total workload borne by men and women remains stubbornly asymmetrical. Women work a double workday: in addition to their growing responsibilities in paid employment, they shoulder the burden of care for others (children, elderly), keeping house, and performing the social reproduction activities associated with the daily sustenance of the household. In short, gaps in the world of work clearly lead to gaps in equality, with autonomy distributed very inequitably by sex and productivity remaining relatively low and very uneven, and lacking the structural changes that would lead to a sustainable reduction in the gaps between the different sectors in the world of work.
21
Exe
cutiv
e su
mm
ary
Compacts for Equality: Towards a Sustainable Future
Meanwhile, the gains in earned income in recent years have increased the capacity for consumption of society in general. This is the topic of chapter IV. The expansion in consumption is positive insofar as it means that a larger percentage of the population has gained access to long-denied goods and services valued by society, at the same time as household income has risen, access to financing has broadened and some products have become cheaper thanks to economies of scale, unrestricted trade and the international division of labour.
Consumption is analysed as it relates to the economic, social and environmental spheres. For the economic sphere, this means considering the mechanisms that link consumption to key variables (national income, private debt, interest rates, imports), as well as analysing its volatility. For the social sphere, the analysis looks at consumption exclusions and deprivations and inequalities in consumption patterns, as well as the possible emergence of emulative consumption patterns in highly unequal societies. For the environmental sphere (which is explored further in the following chapter), the analysis points up the environmental sustainability risks associated with expansion of the prevailing consumption pattern.
Per capita private consumption performed strongly over the last decade, posting cumulative annual growth of 2.6%. It is the composition of regional demand that gives cause for concern, however: according to data from the World Bank, the weighted average ratio of consumption to GDP was 66% between 1970 and 2012, albeit trending downwards over that period. Moreover, in several countries in Latin America and the Caribbean consumption is more volatile than GDP.
Despite the expansion of private consumption, food continues to represent a major item of expenditure (40% of total spending on average in the region’s countries, compared with 25% in the European Union). The region’s sharp income inequality is also reflected in its expenditure. Distribution of per capita household expenditure by income quintile reveals striking disparities: the richest quintile spends four to eight times more than the poorest quintile. Yet, the gap in income is wider than the gap in spending and consumption.
The expansion in consumption may be interpreted as a potential improvement in well-being. However, the strong emphasis on private consumption of imported goods, which use large amounts of energy and pollute the air, raises several red flags. The first is the bias towards private consumption, which is more stratified by income, to the detriment of quality service provision by the public sector. This does nothing to increase equality, much less equality based on reciprocal recognition and attention to mutual vulnerabilities. That notion of equality is more strongly reflected when the well-being of society is addressed as a whole in fiscal compacts that are then translated into the delivery of public services and goods that everybody uses and consumes. The “flight” to private consumption, especially in sectors such as transportation, health and education, does not provide fertile ground for a fiscal compact with a redistributive slant.
The second red flag has to do with economic sustainability and transformation of the production sector, inasmuch as patterns of commodity-intensive production and import-intensive consumption are becoming entrenched. This is not new in the region, but it has taken on a new intensity.
The third red flag is the impact on the environment. In contrast with the bias towards private consumption, a consensus-driven public solution emphasizing shared alternatives would cut greenhouse gas emissions and use less non-renewable energy, as well as encouraging societal stakeholders to form agreements around energy matrixes that are more environmentally friendly and sustainable.
Chapter V focuses on this last problem, that is, on evaluating the sustainability problems associated with the prevailing consumption patterns and their negative externalities, such as waste generation, air pollution, environmental destruction and greater exploitation of renewable and non-renewable natural resources. The long-run growth trend in income means that the relative importance of food as an item of expenditure will decline over time, creating opportunities for the consumption of other goods and services. These new consumption opportunities will be decisive when it comes to defining sustainable consumption options. This chapter reflects on the risks that the region may face now or in the future, and provides an in-depth analysis of those aspects of private consumption that are environmentally most problematic: automobiles and gasoline, and durable goods associated with energy consumption and the generation of solid waste.
A case in point is the preeminence of private transportation in the structure of spending among the top quintiles. This structure of consumption often has a strong environmental impact that causes major negative externalities in the form of urban congestion and pollution. The increase in demand for durable goods has also direct negative consequences,
22
Exe
cutiv
e su
mm
ary
Economic Commission for Latin America and the Caribbean (ECLAC)
because it generates solid and hazardous waste and requires intensive energy use. The region’s energy consumption, like its gasoline consumption, is highly income-elastic but fairly price-inelastic compared with other regions. Looking ahead, economic growth in Latin America and the Caribbean is expected to drive a sustained rise in energy and gasoline consumption, which will be hard to control with price mechanisms. This has negative implications for air pollution and health in urban areas and will contribute to the carbon dioxide emissions that lead to climate change. Against this backdrop, the regulatory role of the State is fundamental, and efforts must be made to find alternatives to the existing consumption patterns and modalities of supply of public goods and services.
If consumption produces problematic externalities in terms of environmental sustainability, the fiscal compact and the production structure, then the interplay between structures and institutions is especially crucial in relation to natural resources. This is the topic of chapter VI.
The boom in international demand for primary goods (minerals, hydrocarbons, soybeans and other agricultural commodities) has been instrumental in strengthening the macroeconomic performance and fiscal position of the region’s exporting countries since 2003. The region cannot ignore its wealth of natural resources but it must be alert to the risks and problems associated with natural-resource-intensive production, another potential impediment to sustainable development. These risks include local currency appreciation, which lowers the price of imported goods (Dutch disease) to the detriment of national industry; the temptation of a rentier approach, which discourages the implementation of industrial policies to expand the country’s productive and technological base; and the risks associated with managing considerable government revenues under weak institutional conditions with little transparency and social oversight. The intensive exploitation of natural resources has also led to increasing environmental, social and ethnic conflicts around the extractive industries located on or near indigenous lands.
Case analysis shows that numerous challenges remain, including achieving efficient organization and establishing the institutional framework needed to leverage these sectors’ contribution to development. Compacts are urgently needed to ensure that the State collects a more progressive share of the revenues generated from natural resource exploitation, particularly during high price cycles such as in the past decade. This may involve changes to the tax code or greater coordination between the region’s countries on how investment in these sectors is handled to prevent detrimental tax competition that reduces the margin available to States to capture a percentage of the wealth generated from the exploitation of their resources. Another crucial step will be to develop institutional mechanisms that ensure efficient public investment of natural resource revenues, channelling these funds into specific investments to build capacity (education and health), infrastructure and technological innovation and development. Lastly, an effort must be made to develop the institutional capacity needed for public management of the socio-environmental conflicts arising from the development of natural resource sectors.
Finally, beyond governance of natural-resource revenues, there is still a need to develop a State policy and strategic vision for long-term production diversification and structural change to shift economies away from overreliance on the extractive sectors.
Chapter VII concludes by proposing a set of medium- and long-term policies that should be formalized in compacts. A social compact is a political instrument for implementing, in a democratic context, the institutional policies and reforms that the countries of Latin America and the Caribbean need in order to address the problems and challenges they face at the current crossroads. It is a long-term cooperation agreement between a country’s political and social stakeholder that can be adapted to cyclical changes, with an agreed protocol for information-sharing, consultations and negotiations. Such a tool makes it politically feasible to chart a new path of growth and structural change to ensure progressive and sustainable steps towards greater equality, based on proposals that have been developed and implemented by participatory and democratic methods and adapted to the specific conditions of each country. In so doing, the danger is avoided that structural change proposals for equality will remain in the realm of volunteerism and the expression of good intentions.
The compacts that are proposed in the final part of the document reflect the main policy considerations set out in the preceding chapters. First, a fiscal compact is needed to ensure that the State has the resources it needs to deploy policies that are strategically aimed at achieving equality, sustainability and structural change. The second proposal is a compact for investment and industrial policy, the main policy instrument by which the State can steer the dynamic of structural change. Third is a compact in the world of work, where reforms to labour institutions are
23
Exe
cutiv
e su
mm
ary
Compacts for Equality: Towards a Sustainable Future
crucial to establish virtuous connections between institutions and production structures in pursuit of greater equality, and to prevent workplace discrimination against specific groups.
The fourth proposal is for a compact for greater social well-being and better public services. The idea is to move towards greater shared use and better quality of public services, such as transportation, education, health and environmental services. Fifth, a compact for environmental sustainability is key to intergenerational solidarity and to recognition of the very diverse groups affected by the myriad forms of environmental degradation and the depletion of non-renewable resources. These compacts have two specific features: they require agreements at both the national and global levels, and they must have the engagement of civil society, also at both levels. Civil society must therefore be involved in generating all such collective accords.
A compact for natural-resource governance is particularly important. This requires an institutional framework for regulation, ownership and revenue collection that can harness revenue generated during upswings in the natural resources markets to promote greater production diversification, additional investment in innovation and development and funds to build capacity and improve access to a range of services. Lastly, the basic terms are proposed for a global compact for post2015 development and cooperation, a current topic of discussion in the international community.
In summary, this document aims to provide the countries with a development vision that will help them to navigate through the current crossroads, at which external cyclical constraints and lags in internal structures pose real challenges to sustainability and equality. Taking a long-run sustainable approach to development that advances towards greater equality is a long-term endeavour but one that begins today. That is the message transmitted here.


The regional scenario
Part 1
Chapter IEquality and sustainability at the current development crossroads in Latin America and the Caribbean
A. Structure and institutions: a model in the makingB. Threats to the sustainability of egalitarian developmentC. Final comments
Bibliography
Annex


27
Cha
pter
I
Compacts for Equality: Towards a Sustainable Future
Chapter I
Equality and sustainability at the current development crossroads in Latin America and the Caribbean
The Latin American and Caribbean region has, with considerable variation between countries, a mix of structures and institutions that produces highly segmented low-productivity economies, as well as societies with inequalities of means, capacities, relational networks and reciprocal recognition. The combination of poorly diversified structures, with few knowledge-intensive activities, and inefficient institutions that are often controlled by powerful economic and political interests leads to a primary —i.e. market-driven— distribution of resources that is highly unequal and, in turn, only marginally shaped by fiscal and social policies. Sharp inequality is not confined to means and resources, but rather encompasses various dimensions of wellbeing and individual capacities and permeates the relationships that these individuals form. Although the region has made major strides towards greater equality over the past decade, that progress is fragile. This recognition is the starting point; the challenge for the next decade is to move towards a new combination of structures and institutions capable of generating increasing levels of productivity and equality, in the framework of development with sustainability in different dimensions.
This chapter takes a closer look at how the interaction between production structures and institutions leads to different trajectories in terms of productivity and equality. Section 1 describes the regional situation and the paths for advancing towards higher levels of productivity and equality. The economic, social and environmental aspects of the constraints and challenges that the region faces on that path are analysed in section 2. Lastly, section 3 sets forth the policy challenges on the strategic horizon of equality and sustainability.
A. Structure and institutions: a model in the making The relationship between institutions and structure is complex, as each is influenced by the other, at myriad points of intersection. At times, equilibrium is achieved between a set of institutions and a certain production or social structure. These points of equilibrium are temporary and always subject to shocks, however; when the foundation supporting them shifts, the shocks also drive institutional and structural change. In some cases, the initial shock comes from the structures. For example, the emergence of new technological paradigms can rapidly weaken an institutional arrangement that seemed solid. Witness the impact that information and communication technologies (ICTs) had on different markets, from telecommunications to the recording industry, forcing a redefinition of the institutional framework (formal and informal) in which those markets operated.
Just as political-institutional changes affect social development, producing steps forward or backward in well-being and poverty levels and in the distribution of income and capacities, economic development too is affected by the interaction of institutional changes with transformations in the production base and social structures. The “creative destruction” process of the Schumpeterian school alludes not only to the redefinition of production sectors and
28
Cha
pter
IEconomic Commission for Latin America and the Caribbean (ECLAC)
technologies, but also to a process in which behavioural rules and social organizations are constructed or modified. Thus, structures and institutions exist in coevolution, and the transformation of one both reflects and conditions transformation in the other.
Production structures are defined by the economic sectors or activities that comprise them, by the relative importance of these sectors, by the set of productive and technological capacities associated with them and by the distribution of capacities among units of production. All these factors determine the distribution of productivities among agents, both within the economy and in relation to the firms at the international technological frontier. These production structures also shape trajectories of innovation and learning, and productivity dynamics.
Production structures shape and are in turn shaped by social structures. The characteristics of labour markets depend on the production structure, and worker training and skills are essential for consolidating the different production structures. Education and demand for capacities must move forward together, which will require coordination between State institutions as well as between the State and the production sector. Inequalities in income —both labour earnings and total income from all sources— as well as inequalities in wealth, will open up gaps in various dimensions (reproductive patterns, health gains, and many others).
In the neo-institutional literature, institutions are defined as a set of rules of behaviour (formal or informal) around which the expectations of agents converge, and which organize and structure their interaction. Formal rules include the laws and decrees under which policies are set out, as well as the overarching rules that define the political and social system (such as constitutional rules). Informal rules are patterns of behaviour and forms of socialization —often tacit— that structure interactions and make them more predictable.
Achieving a better understanding of the co-evolution of structures and institutions is crucial to understanding why some societies move towards higher levels of productivity, equality, well-being and development, while others remain trapped in mixes of low productivity, poor levels of well-being and sharper inequality.
1. The co-evolution of structure and institutions in the region’s recent history The region’s recent economic history has engendered a mix of structures and institutions whose limitations have become evident. A key shift occurred in the early 1980s, when institutions built during the State-led growth phase were undermined by the external debt crisis and the imposition of a new growth paradigm. The restrictions imposed by the crisis affected the fiscal and balance-of-payments positions simultaneously. Fiscal constraints drastically reduced the State’s capacity, while debt commitments compromised public and private investment, pushing down growth rates. These constraints, together with the conditions imposed by creditors during successive rounds of debt renegotiation, shaped the institutional framework that emerged in the late 1980s and early 1990s. This new institutional framework had a clear pro-market bias, and the institutions of the State-led industrialization process were dismantled. Within the new framework of institutions built to overcome the crisis, a period of structural adjustment reforms began that reached its apogee in the first half of the 1990s.
The reforms of this period favoured the privatization of State-owned enterprises and trade and financial liberalization, and gave market forces a stronger role in very diverse areas of the economy, including in education and health. The new institutions were built on these pillars. Institutional change was intended to create a balanced production structure, based on the comparative advantages afforded by cheap labour and natural resources. With regard to the production sector, the best industrial policy was held to be no policy at all, it being assumed that allocating resources by static comparative advantages would suffice to ensure output and productivity growth. In the social sphere, many countries privatized a good portion of their services and education and social protection systems, based on the analogous argument that competition in the social services market would lower costs, improve quality and broaden access. Twenty years on, the results have fallen short of these expectations.
As is often the case, the path towards a new arrangement of structures and institutions in the 1990s was neither linear nor free of setbacks, and complex combinations arose with institutions from the previous period. Trade liberalization and privatization never fully penetrated sectors which were important in terms of employment and production (e.g. the automotive industry) or revenue-generating export sectors (from copper in Chile to oil in Brazil and Mexico). The Mexican crisis of 1994-1995, which was largely the result of financial market speculation, demonstrated that transitioning to less regulated markets would not necessarily produce more efficient outcomes.
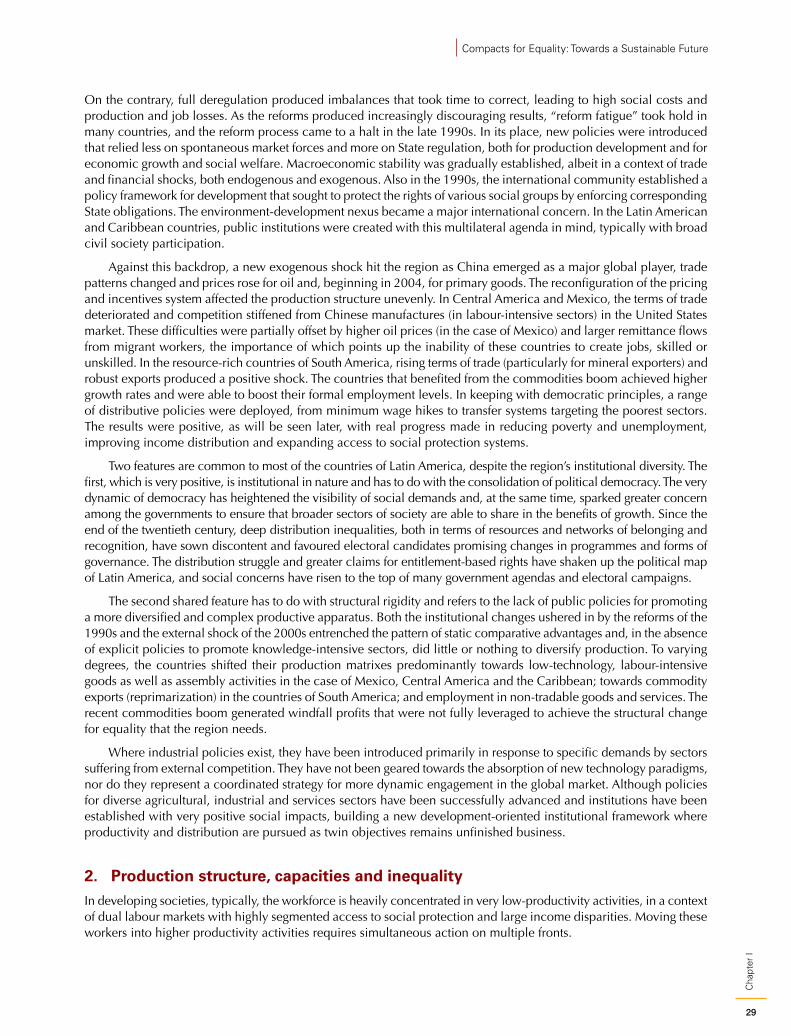
29
Cha
pter
I
Compacts for Equality: Towards a Sustainable Future
On the contrary, full deregulation produced imbalances that took time to correct, leading to high social costs and production and job losses. As the reforms produced increasingly discouraging results, “reform fatigue” took hold in many countries, and the reform process came to a halt in the late 1990s. In its place, new policies were introduced that relied less on spontaneous market forces and more on State regulation, both for production development and for economic growth and social welfare. Macroeconomic stability was gradually established, albeit in a context of trade and financial shocks, both endogenous and exogenous. Also in the 1990s, the international community established a policy framework for development that sought to protect the rights of various social groups by enforcing corresponding State obligations. The environment-development nexus became a major international concern. In the Latin American and Caribbean countries, public institutions were created with this multilateral agenda in mind, typically with broad civil society participation.
Against this backdrop, a new exogenous shock hit the region as China emerged as a major global player, trade patterns changed and prices rose for oil and, beginning in 2004, for primary goods. The reconfiguration of the pricing and incentives system affected the production structure unevenly. In Central America and Mexico, the terms of trade deteriorated and competition stiffened from Chinese manufactures (in labour-intensive sectors) in the United States market. These difficulties were partially offset by higher oil prices (in the case of Mexico) and larger remittance flows from migrant workers, the importance of which points up the inability of these countries to create jobs, skilled or unskilled. In the resource-rich countries of South America, rising terms of trade (particularly for mineral exporters) and robust exports produced a positive shock. The countries that benefited from the commodities boom achieved higher growth rates and were able to boost their formal employment levels. In keeping with democratic principles, a range of distributive policies were deployed, from minimum wage hikes to transfer systems targeting the poorest sectors. The results were positive, as will be seen later, with real progress made in reducing poverty and unemployment, improving income distribution and expanding access to social protection systems.
Two features are common to most of the countries of Latin America, despite the region’s institutional diversity. The first, which is very positive, is institutional in nature and has to do with the consolidation of political democracy. The very dynamic of democracy has heightened the visibility of social demands and, at the same time, sparked greater concern among the governments to ensure that broader sectors of society are able to share in the benefits of growth. Since the end of the twentieth century, deep distribution inequalities, both in terms of resources and networks of belonging and recognition, have sown discontent and favoured electoral candidates promising changes in programmes and forms of governance. The distribution struggle and greater claims for entitlement-based rights have shaken up the political map of Latin America, and social concerns have risen to the top of many government agendas and electoral campaigns.
The second shared feature has to do with structural rigidity and refers to the lack of public policies for promoting a more diversified and complex productive apparatus. Both the institutional changes ushered in by the reforms of the 1990s and the external shock of the 2000s entrenched the pattern of static comparative advantages and, in the absence of explicit policies to promote knowledge-intensive sectors, did little or nothing to diversify production. To varying degrees, the countries shifted their production matrixes predominantly towards low-technology, labour-intensive goods as well as assembly activities in the case of Mexico, Central America and the Caribbean; towards commodity exports (reprimarization) in the countries of South America; and employment in non-tradable goods and services. The recent commodities boom generated windfall profits that were not fully leveraged to achieve the structural change for equality that the region needs.
Where industrial policies exist, they have been introduced primarily in response to specific demands by sectors suffering from external competition. They have not been geared towards the absorption of new technology paradigms, nor do they represent a coordinated strategy for more dynamic engagement in the global market. Although policies for diverse agricultural, industrial and services sectors have been successfully advanced and institutions have been established with very positive social impacts, building a new development-oriented institutional framework where productivity and distribution are pursued as twin objectives remains unfinished business.
2. Production structure, capacities and inequality In developing societies, typically, the workforce is heavily concentrated in very low-productivity activities, in a context of dual labour markets with highly segmented access to social protection and large income disparities. Moving these workers into higher productivity activities requires simultaneous action on multiple fronts.
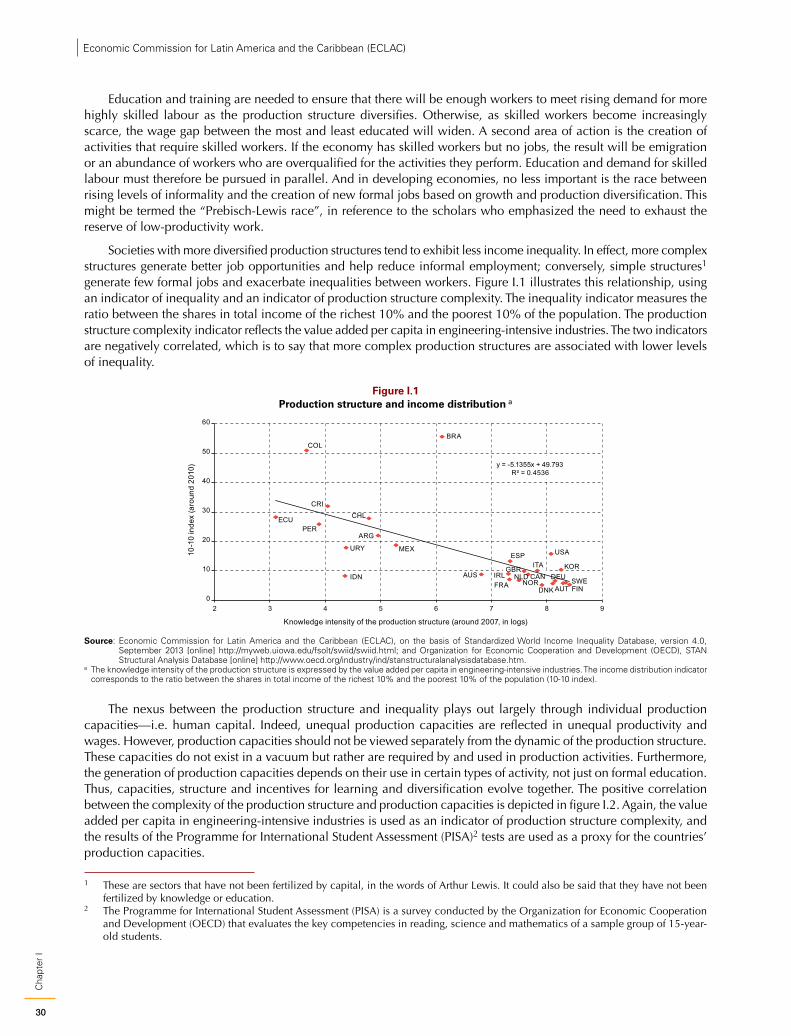
30
Cha
pter
IEconomic Commission for Latin America and the Caribbean (ECLAC)
Education and training are needed to ensure that there will be enough workers to meet rising demand for more highly skilled labour as the production structure diversifies. Otherwise, as skilled workers become increasingly scarce, the wage gap between the most and least educated will widen. A second area of action is the creation of activities that require skilled workers. If the economy has skilled workers but no jobs, the result will be emigration or an abundance of workers who are overqualified for the activities they perform. Education and demand for skilled labour must therefore be pursued in parallel. And in developing economies, no less important is the race between rising levels of informality and the creation of new formal jobs based on growth and production diversification. This might be termed the “Prebisch-Lewis race”, in reference to the scholars who emphasized the need to exhaust the reserve of low-productivity work.
Societies with more diversified production structures tend to exhibit less income inequality. In effect, more complex structures generate better job opportunities and help reduce informal employment; conversely, simple structures1 generate few formal jobs and exacerbate inequalities between workers. Figure I.1 illustrates this relationship, using an indicator of inequality and an indicator of production structure complexity. The inequality indicator measures the ratio between the shares in total income of the richest 10% and the poorest 10% of the population. The production structure complexity indicator reflects the value added per capita in engineering-intensive industries. The two indicators are negatively correlated, which is to say that more complex production structures are associated with lower levels of inequality.
Figure I.1 Production structure and income distribution a
10-1
0 in
dex
(aro
und
2010
)
ARG
AUS
AUT
BRA
CAN
CHL
COL
CRI
DNK
ECU
FINFRADEUIDN IRL
ITA KOR
MEX
NLDNOR
PER
ESP
SWE
GBR
USAURY
y = -5.1355x + 49.793R² = 0.4536
0
10
20
30
40
50
60
2 3 4 5 6 7 8 9
Knowledge intensity of the production structure (around 2007, in logs)
Source: Economic Commission for Latin America and the Caribbean (ECLAC), on the basis of Standardized World Income Inequality Database, version 4.0, September 2013 [online] http://myweb.uiowa.edu/fsolt/swiid/swiid.html; and Organization for Economic Cooperation and Development (OECD), STAN Structural Analysis Database [online] http://www.oecd.org/industry/ind/stanstructuralanalysisdatabase.htm.
a The knowledge intensity of the production structure is expressed by the value added per capita in engineering-intensive industries. The income distribution indicator corresponds to the ratio between the shares in total income of the richest 10% and the poorest 10% of the population (10-10 index).
The nexus between the production structure and inequality plays out largely through individual production capacities—i.e. human capital. Indeed, unequal production capacities are reflected in unequal productivity and wages. However, production capacities should not be viewed separately from the dynamic of the production structure. These capacities do not exist in a vacuum but rather are required by and used in production activities. Furthermore, the generation of production capacities depends on their use in certain types of activity, not just on formal education. Thus, capacities, structure and incentives for learning and diversification evolve together. The positive correlation between the complexity of the production structure and production capacities is depicted in figure I.2. Again, the value added per capita in engineering-intensive industries is used as an indicator of production structure complexity, and the results of the Programme for International Student Assessment (PISA)2 tests are used as a proxy for the countries’ production capacities.
1 These are sectors that have not been fertilized by capital, in the words of Arthur Lewis. It could also be said that they have not been fertilized by knowledge or education.
2 The Programme for International Student Assessment (PISA) is a survey conducted by the Organization for Economic Cooperation and Development (OECD) that evaluates the key competencies in reading, science and mathematics of a sample group of 15-year-old students.
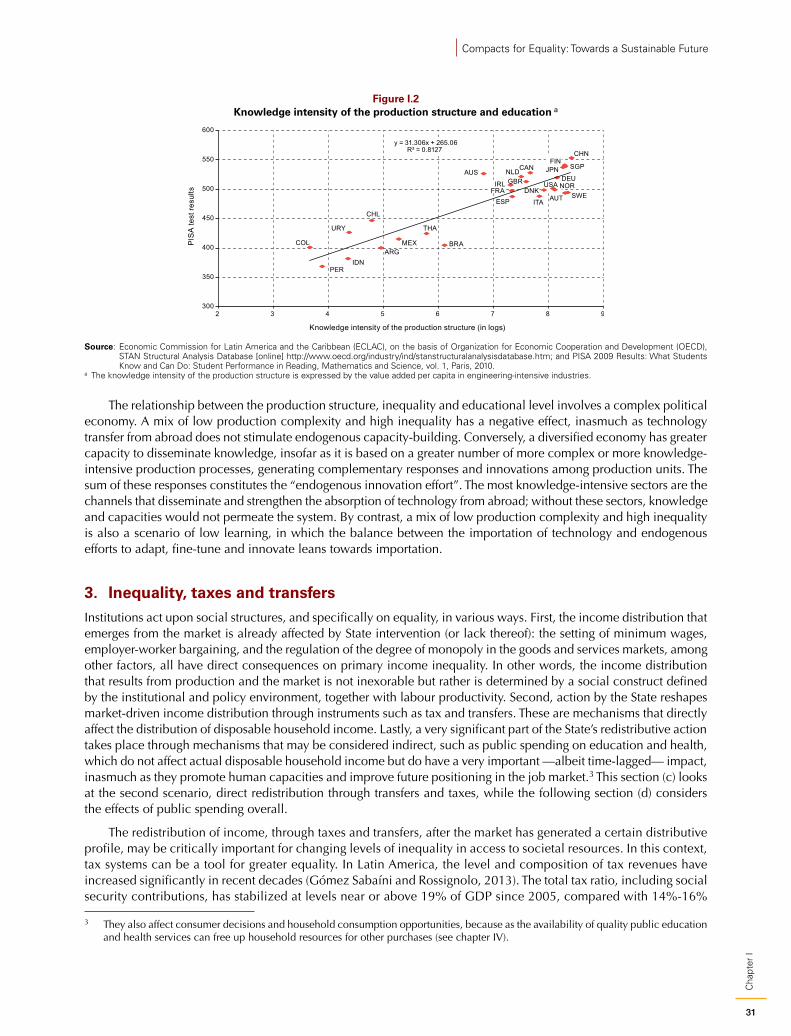
31
Cha
pter
I
Compacts for Equality: Towards a Sustainable Future
Figure I.2 Knowledge intensity of the production structure and education a
COL
PERIDN
URY
CHL
ARGMEX
THA
BRA
AUS
FRAESP
NLDGBR
CAN
ITA
IRL NORUSA
JPN SGPFIN
SWE
DEU
AUT
CHNy = 31.306x + 265.06
R² = 0.8127
300
350
400
450
500
550
600
2 3 4 5 6 7 8 9
PIS
A te
st re
sults
Knowledge intensity of the production structure (in logs)
DNK
Source: Economic Commission for Latin America and the Caribbean (ECLAC), on the basis of Organization for Economic Cooperation and Development (OECD), STAN Structural Analysis Database [online] http://www.oecd.org/industry/ind/stanstructuralanalysisdatabase.htm; and PISA 2009 Results: What Students Know and Can Do: Student Performance in Reading, Mathematics and Science, vol. 1, Paris, 2010.
a The knowledge intensity of the production structure is expressed by the value added per capita in engineering-intensive industries.
The relationship between the production structure, inequality and educational level involves a complex political economy. A mix of low production complexity and high inequality has a negative effect, inasmuch as technology transfer from abroad does not stimulate endogenous capacity-building. Conversely, a diversified economy has greater capacity to disseminate knowledge, insofar as it is based on a greater number of more complex or more knowledge-intensive production processes, generating complementary responses and innovations among production units. The sum of these responses constitutes the “endogenous innovation effort”. The most knowledge-intensive sectors are the channels that disseminate and strengthen the absorption of technology from abroad; without these sectors, knowledge and capacities would not permeate the system. By contrast, a mix of low production complexity and high inequality is also a scenario of low learning, in which the balance between the importation of technology and endogenous efforts to adapt, fine-tune and innovate leans towards importation.
3. Inequality, taxes and transfers Institutions act upon social structures, and specifically on equality, in various ways. First, the income distribution that emerges from the market is already affected by State intervention (or lack thereof): the setting of minimum wages, employer-worker bargaining, and the regulation of the degree of monopoly in the goods and services markets, among other factors, all have direct consequences on primary income inequality. In other words, the income distribution that results from production and the market is not inexorable but rather is determined by a social construct defined by the institutional and policy environment, together with labour productivity. Second, action by the State reshapes market-driven income distribution through instruments such as tax and transfers. These are mechanisms that directly affect the distribution of disposable household income. Lastly, a very significant part of the State’s redistributive action takes place through mechanisms that may be considered indirect, such as public spending on education and health, which do not affect actual disposable household income but do have a very important —albeit time-lagged— impact, inasmuch as they promote human capacities and improve future positioning in the job market.3 This section (c) looks at the second scenario, direct redistribution through transfers and taxes, while the following section (d) considers the effects of public spending overall.
The redistribution of income, through taxes and transfers, after the market has generated a certain distributive profile, may be critically important for changing levels of inequality in access to societal resources. In this context, tax systems can be a tool for greater equality. In Latin America, the level and composition of tax revenues have increased significantly in recent decades (Gómez Sabaíni and Rossignolo, 2013). The total tax ratio, including social security contributions, has stabilized at levels near or above 19% of GDP since 2005, compared with 14%-16%
3 They also affect consumer decisions and household consumption opportunities, because as the availability of quality public education and health services can free up household resources for other purchases (see chapter IV).
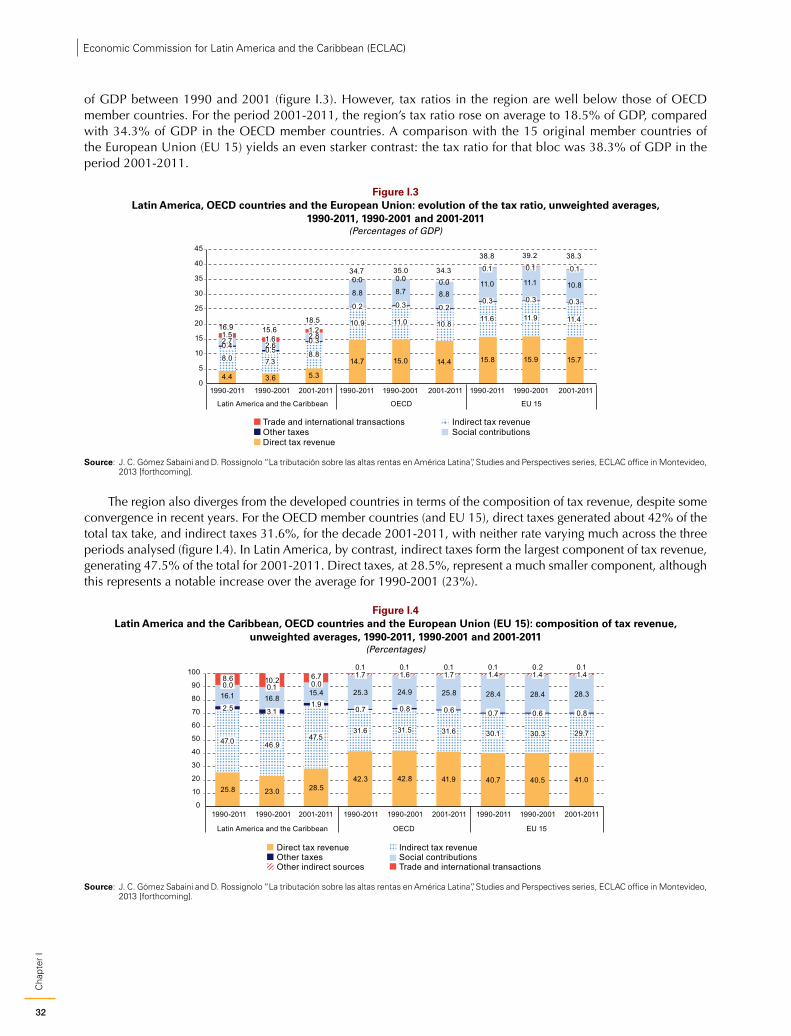
32
Cha
pter
IEconomic Commission for Latin America and the Caribbean (ECLAC)
of GDP between 1990 and 2001 (figure I.3). However, tax ratios in the region are well below those of OECD member countries. For the period 2001-2011, the region’s tax ratio rose on average to 18.5% of GDP, compared with 34.3% of GDP in the OECD member countries. A comparison with the 15 original member countries of the European Union (EU 15) yields an even starker contrast: the tax ratio for that bloc was 38.3% of GDP in the period 2001-2011.
Figure I.3 Latin America, OECD countries and the European Union: evolution of the tax ratio, unweighted averages,
1990-2011, 1990-2001 and 2001-2011(Percentages of GDP)
4.4 3.6 5.3
14.7 15.0 14.4 15.8 15.9 15.78.0 7.38.8
10.9 11.0 10.811.6 11.9 11.4
0.4 0.50.3
0.2 0.3 0.20.3 0.3 0.3
2.7 2.62.8
8.8 8.7 8.811.0 11.1 10.8
1.5 1.61.2
0.0 0.0 0.0
0.1 0.1 0.1
0
5
10
15
20
25
30
35
40
45
1990-2011 1990-2001 2001-2011 1990-2011 1990-2001 2001-2011 1990-2011 1990-2001 2001-2011
Latin America and the Caribbean OECD EU 15
Direct tax revenueOther taxes Social contributions
Indirect tax revenueTrade and international transactions
16.9 15.618.5
34.7 35.0 34.3
38.8 39.2 38.3
Source: J. C. Gómez Sabaini and D. Rossignolo “La tributación sobre las altas rentas en América Latina”, Studies and Perspectives series, ECLAC office in Montevideo,
2013 [forthcoming].
The region also diverges from the developed countries in terms of the composition of tax revenue, despite some convergence in recent years. For the OECD member countries (and EU 15), direct taxes generated about 42% of the total tax take, and indirect taxes 31.6%, for the decade 2001-2011, with neither rate varying much across the three periods analysed (figure I.4). In Latin America, by contrast, indirect taxes form the largest component of tax revenue, generating 47.5% of the total for 2001-2011. Direct taxes, at 28.5%, represent a much smaller component, although this represents a notable increase over the average for 1990-2001 (23%).
Figure I.4 Latin America and the Caribbean, OECD countries and the European Union (EU 15): composition of tax revenue,
unweighted averages, 1990-2011, 1990-2001 and 2001-2011(Percentages)
1990-2011 1990-2001 2001-2011 1990-2011 1990-2001 2001-2011 1990-2011 1990-2001 2001-2011
25.8 23.0 28.542.3 42.8 41.9 40.7 40.5 41.0
47.0 46.947.5
31.6 31.5 31.6 30.1 30.3 29.7
2.5 3.11.9
0.7 0.8 0.6 0.7 0.6 0.8
16.1 16.815.4 25.3 24.9 25.8 28.4 28.4 28.3
0.0 0.1 0.01.7 1.6 1.7 1.4 1.4 1.48.6 10.2 6.70.1 0.1 0.1 0.1 0.2 0.1
0
10
20
30
40
50
60
70
80
90
100
Direct tax revenue Indirect tax revenueOther taxes Social contributionsOther indirect sources Trade and international transactions
Latin America and the Caribbean OECD EU 15
Source: J. C. Gómez Sabaini and D. Rossignolo “La tributación sobre las altas rentas en América Latina”, Studies and Perspectives series, ECLAC office in Montevideo, 2013 [forthcoming].
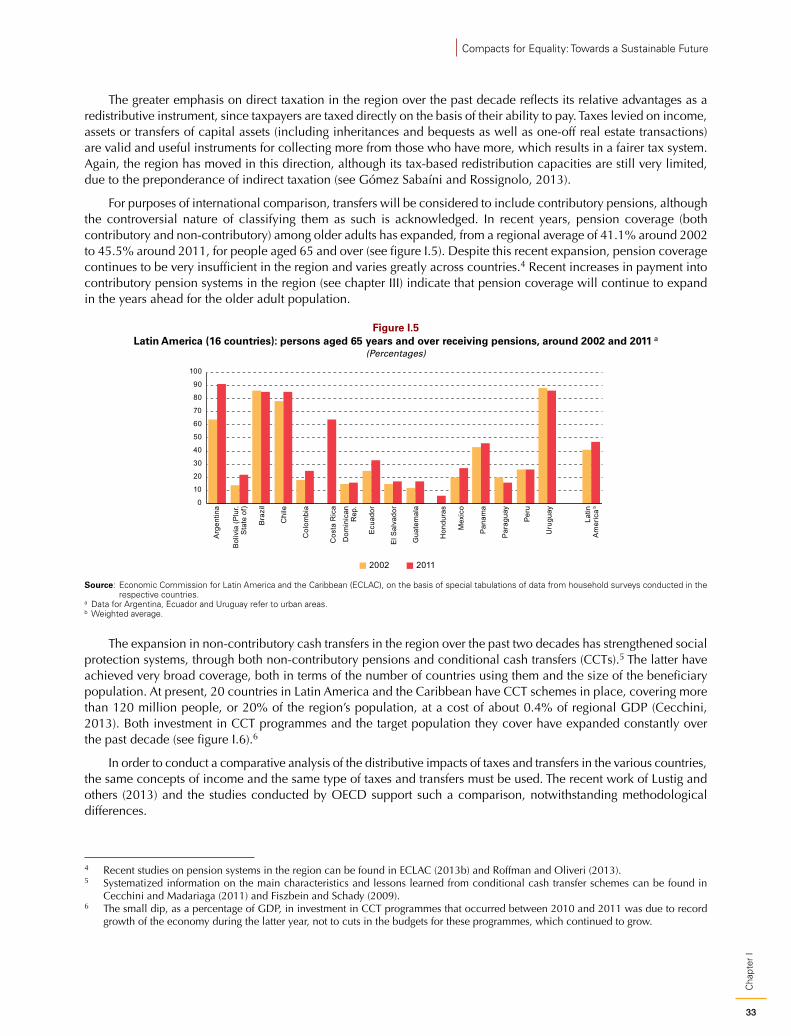
33
Cha
pter
I
Compacts for Equality: Towards a Sustainable Future
The greater emphasis on direct taxation in the region over the past decade reflects its relative advantages as a redistributive instrument, since taxpayers are taxed directly on the basis of their ability to pay. Taxes levied on income, assets or transfers of capital assets (including inheritances and bequests as well as one-off real estate transactions) are valid and useful instruments for collecting more from those who have more, which results in a fairer tax system. Again, the region has moved in this direction, although its tax-based redistribution capacities are still very limited, due to the preponderance of indirect taxation (see Gómez Sabaíni and Rossignolo, 2013).
For purposes of international comparison, transfers will be considered to include contributory pensions, although the controversial nature of classifying them as such is acknowledged. In recent years, pension coverage (both contributory and non-contributory) among older adults has expanded, from a regional average of 41.1% around 2002 to 45.5% around 2011, for people aged 65 and over (see figure I.5). Despite this recent expansion, pension coverage continues to be very insufficient in the region and varies greatly across countries.4 Recent increases in payment into contributory pension systems in the region (see chapter III) indicate that pension coverage will continue to expand in the years ahead for the older adult population.
Figure I.5 Latin America (16 countries): persons aged 65 years and over receiving pensions, around 2002 and 2011 a
(Percentages)
0
10
20
30
40
50
60
70
80
90
100
2002 2011
Arg
entin
a
Bol
ivia
(Plu
r.S
tate
of)
Bra
zil
Chi
le
Col
ombi
a
Cos
ta R
ica
Dom
inic
anR
ep.
Ecu
ador
El S
alva
dor
Gua
tem
ala
Hon
dura
s
Mex
ico
Pan
ama
Par
agua
y
Per
u
Uru
guay
Latin
Am
eric
a bSource: Economic Commission for Latin America and the Caribbean (ECLAC), on the basis of special tabulations of data from household surveys conducted in the
respective countries.a Data for Argentina, Ecuador and Uruguay refer to urban areas.b Weighted average.
The expansion in non-contributory cash transfers in the region over the past two decades has strengthened social protection systems, through both non-contributory pensions and conditional cash transfers (CCTs).5 The latter have achieved very broad coverage, both in terms of the number of countries using them and the size of the beneficiary population. At present, 20 countries in Latin America and the Caribbean have CCT schemes in place, covering more than 120 million people, or 20% of the region’s population, at a cost of about 0.4% of regional GDP (Cecchini, 2013). Both investment in CCT programmes and the target population they cover have expanded constantly over the past decade (see figure I.6).6
In order to conduct a comparative analysis of the distributive impacts of taxes and transfers in the various countries, the same concepts of income and the same type of taxes and transfers must be used. The recent work of Lustig and others (2013) and the studies conducted by OECD support such a comparison, notwithstanding methodological differences.
4 Recent studies on pension systems in the region can be found in ECLAC (2013b) and Roffman and Oliveri (2013). 5 Systematized information on the main characteristics and lessons learned from conditional cash transfer schemes can be found in
Cecchini and Madariaga (2011) and Fiszbein and Schady (2009).6 The small dip, as a percentage of GDP, in investment in CCT programmes that occurred between 2010 and 2011 was due to record
growth of the economy during the latter year, not to cuts in the budgets for these programmes, which continued to grow.
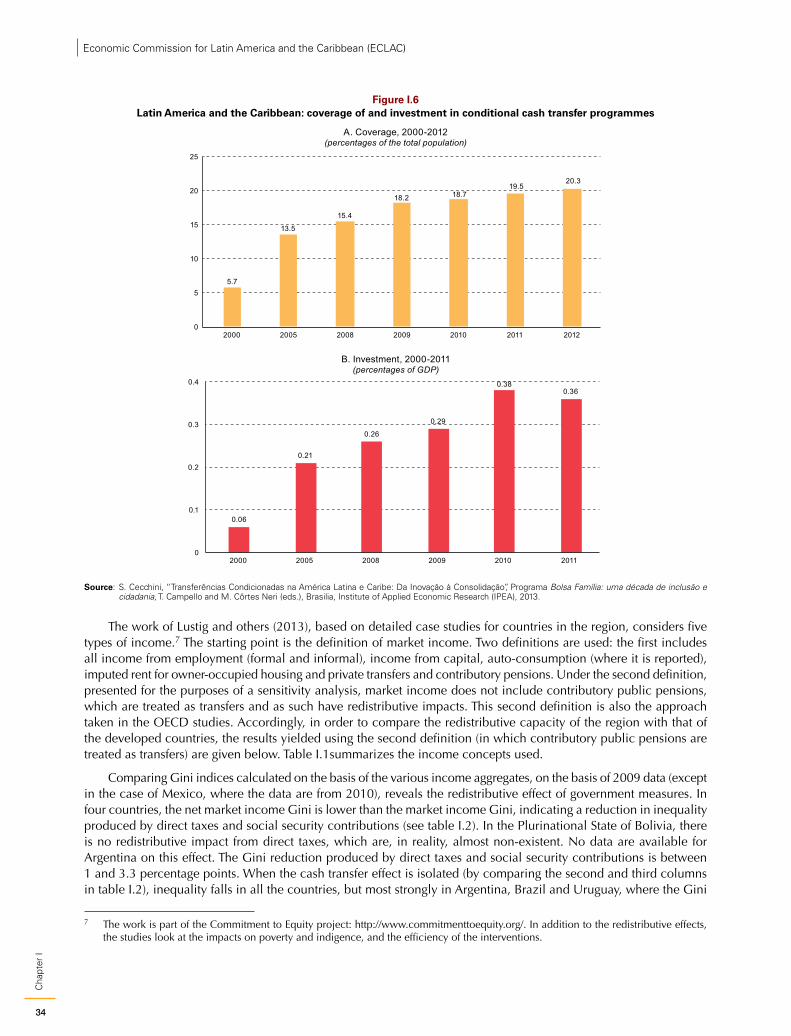
34
Cha
pter
IEconomic Commission for Latin America and the Caribbean (ECLAC)
Figure I.6 Latin America and the Caribbean: coverage of and investment in conditional cash transfer programmes
5.7
13.5
15.4
18.2 18.719.5
20.3
0
5
10
15
20
25
2000 2005 2008 2009 2010 2011 2012
A. Coverage, 2000-2012(percentages of the total population)
0.06
0.21
0.26
0.29
0.380.36
0
0.1
0.2
0.3
0.4
2000 2005 2008 2009 2010 2011
B. Investment, 2000-2011(percentages of GDP)
Source: S. Cecchini, “Transferências Condicionadas na América Latina e Caribe: Da Inovação à Consolidação”, Programa Bolsa Família: uma década de inclusão e cidadania, T. Campello and M. Côrtes Neri (eds.), Brasilia, Institute of Applied Economic Research (IPEA), 2013.
The work of Lustig and others (2013), based on detailed case studies for countries in the region, considers five types of income.7 The starting point is the definition of market income. Two definitions are used: the first includes all income from employment (formal and informal), income from capital, auto-consumption (where it is reported), imputed rent for owner-occupied housing and private transfers and contributory pensions. Under the second definition, presented for the purposes of a sensitivity analysis, market income does not include contributory public pensions, which are treated as transfers and as such have redistributive impacts. This second definition is also the approach taken in the OECD studies. Accordingly, in order to compare the redistributive capacity of the region with that of the developed countries, the results yielded using the second definition (in which contributory public pensions are treated as transfers) are given below. Table I.1summarizes the income concepts used.
Comparing Gini indices calculated on the basis of the various income aggregates, on the basis of 2009 data (except in the case of Mexico, where the data are from 2010), reveals the redistributive effect of government measures. In four countries, the net market income Gini is lower than the market income Gini, indicating a reduction in inequality produced by direct taxes and social security contributions (see table I.2). In the Plurinational State of Bolivia, there is no redistributive impact from direct taxes, which are, in reality, almost non-existent. No data are available for Argentina on this effect. The Gini reduction produced by direct taxes and social security contributions is between 1 and 3.3 percentage points. When the cash transfer effect is isolated (by comparing the second and third columns in table I.2), inequality falls in all the countries, but most strongly in Argentina, Brazil and Uruguay, where the Gini
7 The work is part of the Commitment to Equity project: http://www.commitmenttoequity.org/. In addition to the redistributive effects, the studies look at the impacts on poverty and indigence, and the efficiency of the interventions.
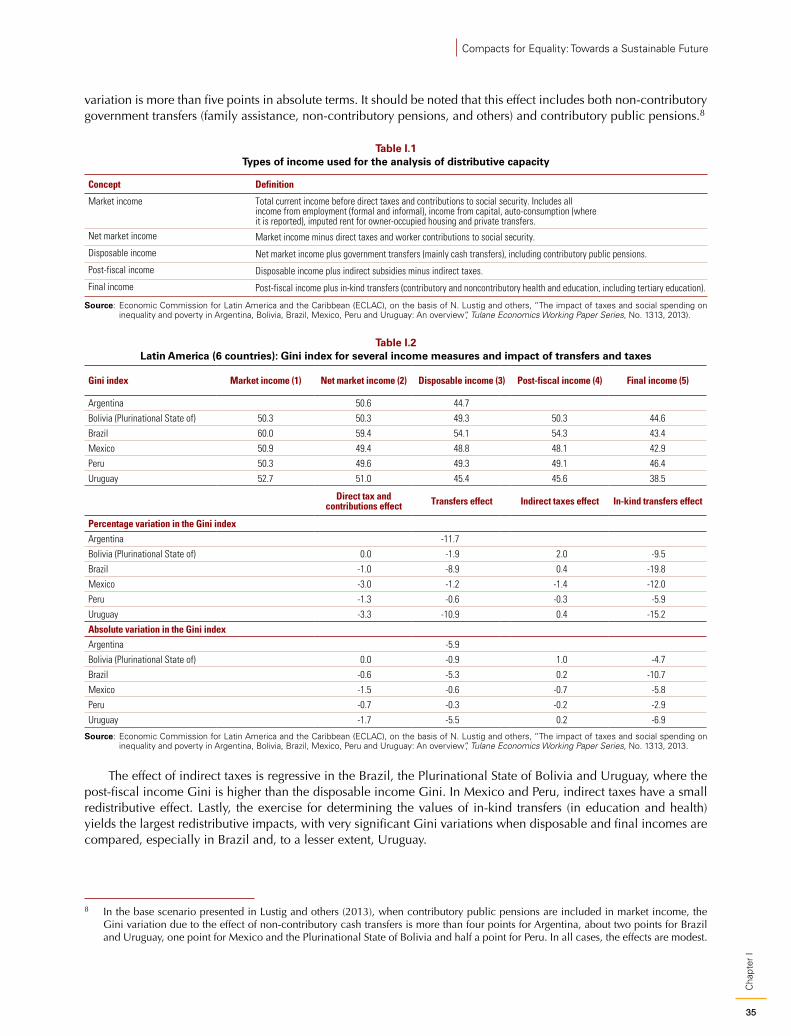
35
Cha
pter
I
Compacts for Equality: Towards a Sustainable Future
variation is more than five points in absolute terms. It should be noted that this effect includes both non-contributory government transfers (family assistance, non-contributory pensions, and others) and contributory public pensions.8
Table I.1 Types of income used for the analysis of distributive capacity
Concept Definition
Market income Total current income before direct taxes and contributions to social security. Includes all income from employment (formal and informal), income from capital, auto-consumption (where it is reported), imputed rent for owner-occupied housing and private transfers.
Net market income Market income minus direct taxes and worker contributions to social security.
Disposable income Net market income plus government transfers (mainly cash transfers), including contributory public pensions.
Post-fiscal income Disposable income plus indirect subsidies minus indirect taxes.
Final income Post-fiscal income plus in-kind transfers (contributory and noncontributory health and education, including tertiary education).
Source: Economic Commission for Latin America and the Caribbean (ECLAC), on the basis of N. Lustig and others, “The impact of taxes and social spending on inequality and poverty in Argentina, Bolivia, Brazil, Mexico, Peru and Uruguay: An overview”, Tulane Economics Working Paper Series, No. 1313, 2013).
Table I.2 Latin America (6 countries): Gini index for several income measures and impact of transfers and taxes
Gini index Market income (1) Net market income (2) Disposable income (3) Post-fiscal income (4) Final income (5)
Argentina 50.6 44.7
Bolivia (Plurinational State of) 50.3 50.3 49.3 50.3 44.6
Brazil 60.0 59.4 54.1 54.3 43.4
Mexico 50.9 49.4 48.8 48.1 42.9
Peru 50.3 49.6 49.3 49.1 46.4
Uruguay 52.7 51.0 45.4 45.6 38.5
Direct tax and contributions effect Transfers effect Indirect taxes effect In-kind transfers effect
Percentage variation in the Gini indexArgentina -11.7
Bolivia (Plurinational State of) 0.0 -1.9 2.0 -9.5
Brazil -1.0 -8.9 0.4 -19.8
Mexico -3.0 -1.2 -1.4 -12.0
Peru -1.3 -0.6 -0.3 -5.9
Uruguay -3.3 -10.9 0.4 -15.2
Absolute variation in the Gini indexArgentina -5.9
Bolivia (Plurinational State of) 0.0 -0.9 1.0 -4.7
Brazil -0.6 -5.3 0.2 -10.7
Mexico -1.5 -0.6 -0.7 -5.8
Peru -0.7 -0.3 -0.2 -2.9
Uruguay -1.7 -5.5 0.2 -6.9
Source: Economic Commission for Latin America and the Caribbean (ECLAC), on the basis of N. Lustig and others, “The impact of taxes and social spending on inequality and poverty in Argentina, Bolivia, Brazil, Mexico, Peru and Uruguay: An overview”, Tulane Economics Working Paper Series, No. 1313, 2013.
The effect of indirect taxes is regressive in the Brazil, the Plurinational State of Bolivia and Uruguay, where the post-fiscal income Gini is higher than the disposable income Gini. In Mexico and Peru, indirect taxes have a small redistributive effect. Lastly, the exercise for determining the values of in-kind transfers (in education and health) yields the largest redistributive impacts, with very significant Gini variations when disposable and final incomes are compared, especially in Brazil and, to a lesser extent, Uruguay.
8 In the base scenario presented in Lustig and others (2013), when contributory public pensions are included in market income, the Gini variation due to the effect of non-contributory cash transfers is more than four points for Argentina, about two points for Brazil and Uruguay, one point for Mexico and the Plurinational State of Bolivia and half a point for Peru. In all cases, the effects are modest.
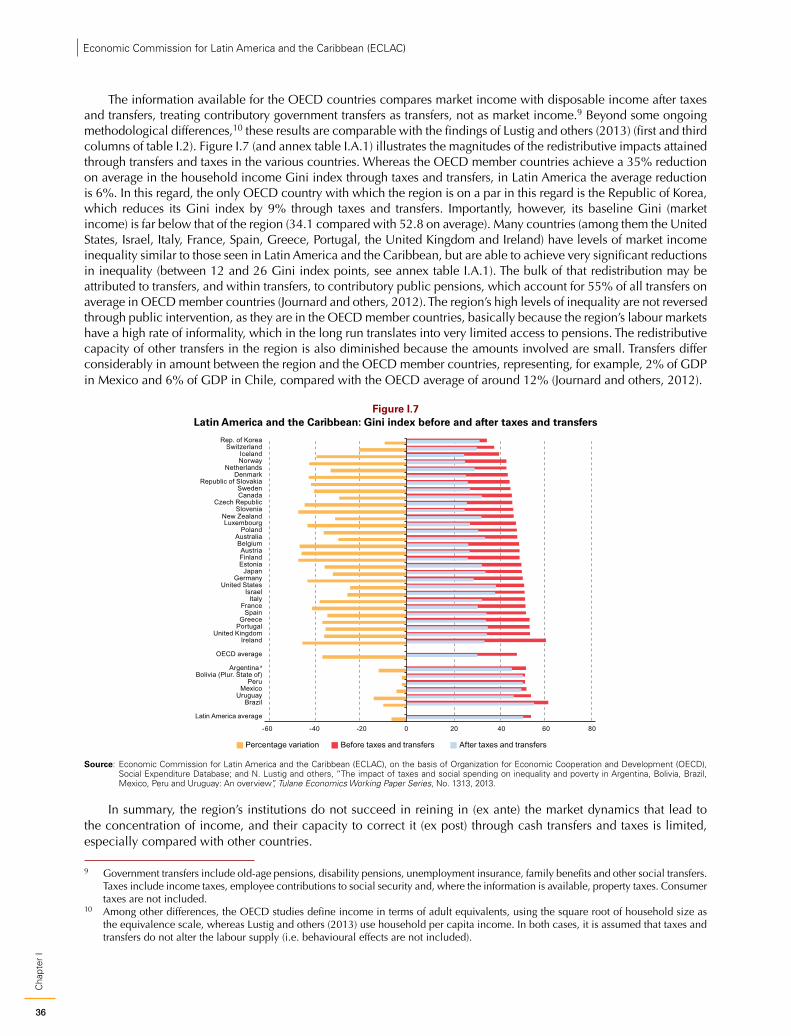
36
Cha
pter
IEconomic Commission for Latin America and the Caribbean (ECLAC)
The information available for the OECD countries compares market income with disposable income after taxes and transfers, treating contributory government transfers as transfers, not as market income.9 Beyond some ongoing methodological differences,10 these results are comparable with the findings of Lustig and others (2013) (first and third columns of table I.2). Figure I.7 (and annex table I.A.1) illustrates the magnitudes of the redistributive impacts attained through transfers and taxes in the various countries. Whereas the OECD member countries achieve a 35% reduction on average in the household income Gini index through taxes and transfers, in Latin America the average reduction is 6%. In this regard, the only OECD country with which the region is on a par in this regard is the Republic of Korea, which reduces its Gini index by 9% through taxes and transfers. Importantly, however, its baseline Gini (market income) is far below that of the region (34.1 compared with 52.8 on average). Many countries (among them the United States, Israel, Italy, France, Spain, Greece, Portugal, the United Kingdom and Ireland) have levels of market income inequality similar to those seen in Latin America and the Caribbean, but are able to achieve very significant reductions in inequality (between 12 and 26 Gini index points, see annex table I.A.1). The bulk of that redistribution may be attributed to transfers, and within transfers, to contributory public pensions, which account for 55% of all transfers on average in OECD member countries (Journard and others, 2012). The region’s high levels of inequality are not reversed through public intervention, as they are in the OECD member countries, basically because the region’s labour markets have a high rate of informality, which in the long run translates into very limited access to pensions. The redistributive capacity of other transfers in the region is also diminished because the amounts involved are small. Transfers differ considerably in amount between the region and the OECD member countries, representing, for example, 2% of GDP in Mexico and 6% of GDP in Chile, compared with the OECD average of around 12% (Journard and others, 2012).
Figure I.7 Latin America and the Caribbean: Gini index before and after taxes and transfers
-60 -40 -20 0 20 40 60 80
Before taxes and transfers After taxes and transfersPercentage variation
Rep. of KoreaSwitzerland
IcelandNorway
NetherlandsDenmark
Republic of SlovakiaSwedenCanada
Czech RepublicSlovenia
New ZealandLuxembourg
PolandAustraliaBelgiumAustriaFinlandEstonia
JapanGermany
United StatesIsrael
ItalyFrance
SpainGreece
PortugalUnited Kingdom
Ireland
OECD average
Argentina a
Bolivia (Plur. State of)Peru
MexicoUruguay
Brazil
Latin America average
Source: Economic Commission for Latin America and the Caribbean (ECLAC), on the basis of Organization for Economic Cooperation and Development (OECD), Social Expenditure Database; and N. Lustig and others, “The impact of taxes and social spending on inequality and poverty in Argentina, Bolivia, Brazil, Mexico, Peru and Uruguay: An overview”, Tulane Economics Working Paper Series, No. 1313, 2013.
In summary, the region’s institutions do not succeed in reining in (ex ante) the market dynamics that lead to the concentration of income, and their capacity to correct it (ex post) through cash transfers and taxes is limited, especially compared with other countries.
9 Government transfers include old-age pensions, disability pensions, unemployment insurance, family benefits and other social transfers. Taxes include income taxes, employee contributions to social security and, where the information is available, property taxes. Consumer taxes are not included.
10 Among other differences, the OECD studies define income in terms of adult equivalents, using the square root of household size as the equivalence scale, whereas Lustig and others (2013) use household per capita income. In both cases, it is assumed that taxes and transfers do not alter the labour supply (i.e. behavioural effects are not included).
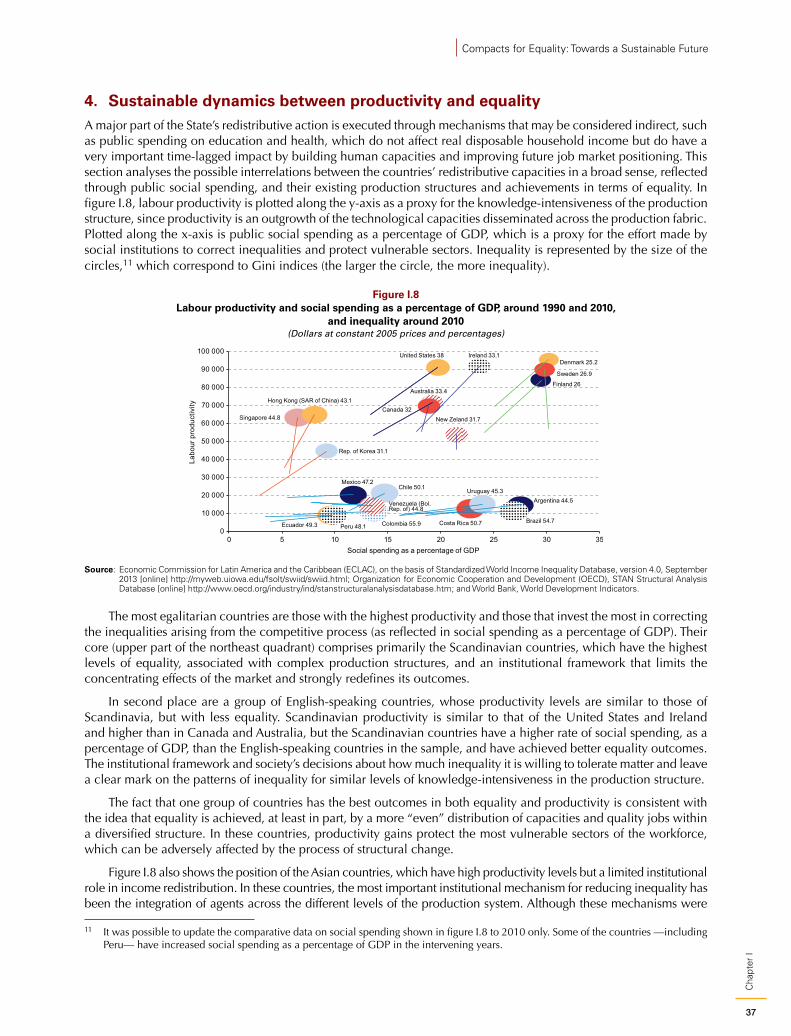
37
Cha
pter
I
Compacts for Equality: Towards a Sustainable Future
4. Sustainable dynamics between productivity and equality A major part of the State’s redistributive action is executed through mechanisms that may be considered indirect, such as public spending on education and health, which do not affect real disposable household income but do have a very important time-lagged impact by building human capacities and improving future job market positioning. This section analyses the possible interrelations between the countries’ redistributive capacities in a broad sense, reflected through public social spending, and their existing production structures and achievements in terms of equality. In figure I.8, labour productivity is plotted along the y-axis as a proxy for the knowledge-intensiveness of the production structure, since productivity is an outgrowth of the technological capacities disseminated across the production fabric. Plotted along the x-axis is public social spending as a percentage of GDP, which is a proxy for the effort made by social institutions to correct inequalities and protect vulnerable sectors. Inequality is represented by the size of the circles,11 which correspond to Gini indices (the larger the circle, the more inequality).
Figure I.8 Labour productivity and social spending as a percentage of GDP, around 1990 and 2010,
and inequality around 2010(Dollars at constant 2005 prices and percentages)
United States 38
Australia 33.4
Canada 32
Denmark 25.2
Finland 26
Ireland 33.1
New Zeland 31.7
Sweden 26.9
Rep. of Korea 31.1
Singapore 44.8
Hong Kong (SAR of China) 43.1
Argentina 44.5
Brazil 54.7
Chile 50.1
Colombia 55.9 Costa Rica 50.7Ecuador 49.3
Mexico 47.2
Peru 48.1
Uruguay 45.3
Venezuela (Bol.Rep. of) 44.8
0
10 000
20 000
30 000
40 000
50 000
60 000
70 000
80 000
90 000
100 000
0 5 10 15 20 25 30 35
Labo
ur p
rodu
ctiv
ity
Social spending as a percentage of GDP
Source: Economic Commission for Latin America and the Caribbean (ECLAC), on the basis of Standardized World Income Inequality Database, version 4.0, September 2013 [online] http://myweb.uiowa.edu/fsolt/swiid/swiid.html; Organization for Economic Cooperation and Development (OECD), STAN Structural Analysis Database [online] http://www.oecd.org/industry/ind/stanstructuralanalysisdatabase.htm; and World Bank, World Development Indicators.
The most egalitarian countries are those with the highest productivity and those that invest the most in correcting the inequalities arising from the competitive process (as reflected in social spending as a percentage of GDP). Their core (upper part of the northeast quadrant) comprises primarily the Scandinavian countries, which have the highest levels of equality, associated with complex production structures, and an institutional framework that limits the concentrating effects of the market and strongly redefines its outcomes.
In second place are a group of English-speaking countries, whose productivity levels are similar to those of Scandinavia, but with less equality. Scandinavian productivity is similar to that of the United States and Ireland and higher than in Canada and Australia, but the Scandinavian countries have a higher rate of social spending, as a percentage of GDP, than the English-speaking countries in the sample, and have achieved better equality outcomes. The institutional framework and society’s decisions about how much inequality it is willing to tolerate matter and leave a clear mark on the patterns of inequality for similar levels of knowledge-intensiveness in the production structure.
The fact that one group of countries has the best outcomes in both equality and productivity is consistent with the idea that equality is achieved, at least in part, by a more “even” distribution of capacities and quality jobs within a diversified structure. In these countries, productivity gains protect the most vulnerable sectors of the workforce, which can be adversely affected by the process of structural change.
Figure I.8 also shows the position of the Asian countries, which have high productivity levels but a limited institutional role in income redistribution. In these countries, the most important institutional mechanism for reducing inequality has been the integration of agents across the different levels of the production system. Although these mechanisms were
11 It was possible to update the comparative data on social spending shown in figure I.8 to 2010 only. Some of the countries —including Peru— have increased social spending as a percentage of GDP in the intervening years.
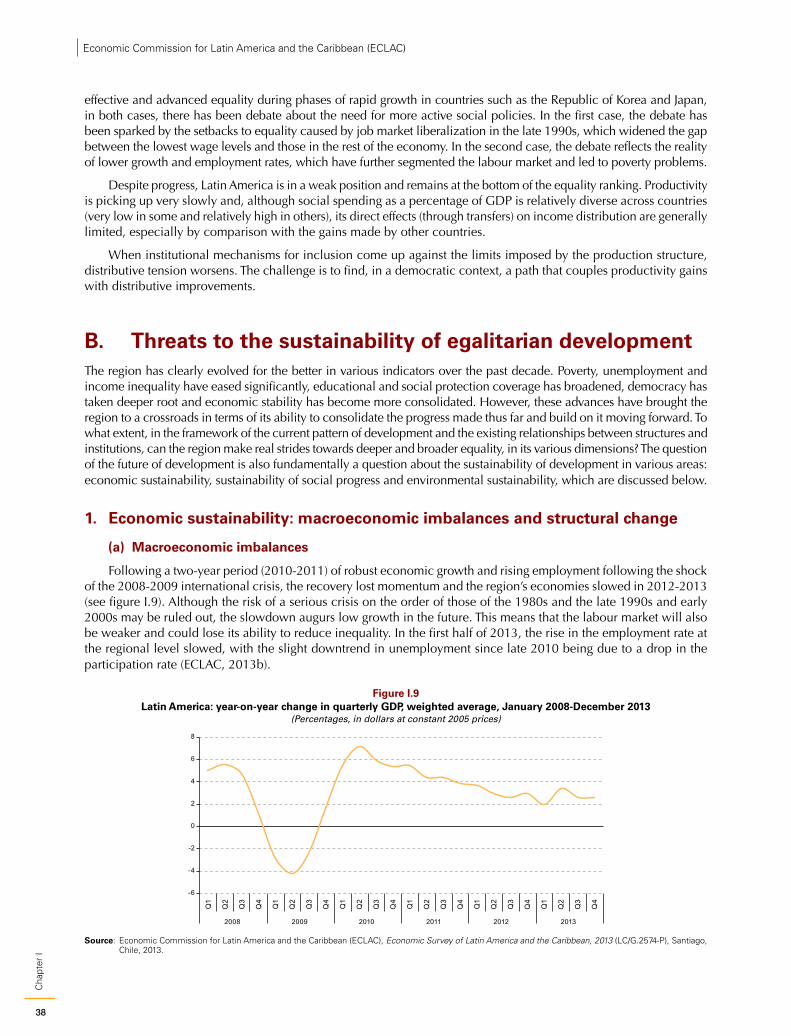
38
Cha
pter
IEconomic Commission for Latin America and the Caribbean (ECLAC)
effective and advanced equality during phases of rapid growth in countries such as the Republic of Korea and Japan, in both cases, there has been debate about the need for more active social policies. In the first case, the debate has been sparked by the setbacks to equality caused by job market liberalization in the late 1990s, which widened the gap between the lowest wage levels and those in the rest of the economy. In the second case, the debate reflects the reality of lower growth and employment rates, which have further segmented the labour market and led to poverty problems.
Despite progress, Latin America is in a weak position and remains at the bottom of the equality ranking. Productivity is picking up very slowly and, although social spending as a percentage of GDP is relatively diverse across countries (very low in some and relatively high in others), its direct effects (through transfers) on income distribution are generally limited, especially by comparison with the gains made by other countries.
When institutional mechanisms for inclusion come up against the limits imposed by the production structure, distributive tension worsens. The challenge is to find, in a democratic context, a path that couples productivity gains with distributive improvements.
B. Threats to the sustainability of egalitarian developmentThe region has clearly evolved for the better in various indicators over the past decade. Poverty, unemployment and income inequality have eased significantly, educational and social protection coverage has broadened, democracy has taken deeper root and economic stability has become more consolidated. However, these advances have brought the region to a crossroads in terms of its ability to consolidate the progress made thus far and build on it moving forward. To what extent, in the framework of the current pattern of development and the existing relationships between structures and institutions, can the region make real strides towards deeper and broader equality, in its various dimensions? The question of the future of development is also fundamentally a question about the sustainability of development in various areas: economic sustainability, sustainability of social progress and environmental sustainability, which are discussed below.
1. Economic sustainability: macroeconomic imbalances and structural change
(a) Macroeconomic imbalances
Following a two-year period (2010-2011) of robust economic growth and rising employment following the shock of the 2008-2009 international crisis, the recovery lost momentum and the region’s economies slowed in 2012-2013 (see figure I.9). Although the risk of a serious crisis on the order of those of the 1980s and the late 1990s and early 2000s may be ruled out, the slowdown augurs low growth in the future. This means that the labour market will also be weaker and could lose its ability to reduce inequality. In the first half of 2013, the rise in the employment rate at the regional level slowed, with the slight downtrend in unemployment since late 2010 being due to a drop in the participation rate (ECLAC, 2013b).
Figure I.9 Latin America: year-on-year change in quarterly GDP, weighted average, January 2008-December 2013
(Percentages, in dollars at constant 2005 prices)
-6
-4
-2
0
2
4
6
8
2008 2009 2010 2011 2012 2013
Q1
Q2
Q3
Q4
Q1
Q2
Q3
Q4
Q1
Q2
Q3
Q4
Q1
Q2
Q3
Q4
Q1
Q2
Q3
Q4
Q1
Q2
Q3
Q4
Source: Economic Commission for Latin America and the Caribbean (ECLAC), Economic Survey of Latin America and the Caribbean, 2013 (LC/G.2574-P), Santiago, Chile, 2013.
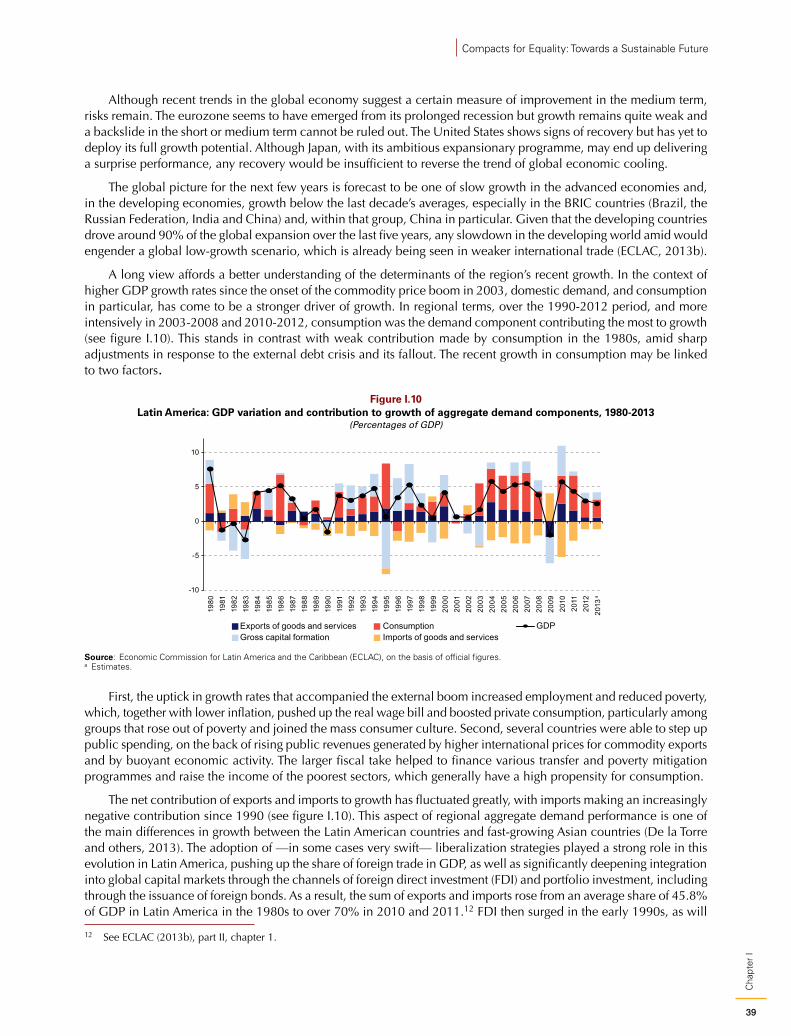
39
Cha
pter
I
Compacts for Equality: Towards a Sustainable Future
Although recent trends in the global economy suggest a certain measure of improvement in the medium term, risks remain. The eurozone seems to have emerged from its prolonged recession but growth remains quite weak and a backslide in the short or medium term cannot be ruled out. The United States shows signs of recovery but has yet to deploy its full growth potential. Although Japan, with its ambitious expansionary programme, may end up delivering a surprise performance, any recovery would be insufficient to reverse the trend of global economic cooling.
The global picture for the next few years is forecast to be one of slow growth in the advanced economies and, in the developing economies, growth below the last decade’s averages, especially in the BRIC countries (Brazil, the Russian Federation, India and China) and, within that group, China in particular. Given that the developing countries drove around 90% of the global expansion over the last five years, any slowdown in the developing world amid would engender a global low-growth scenario, which is already being seen in weaker international trade (ECLAC, 2013b).
A long view affords a better understanding of the determinants of the region’s recent growth. In the context of higher GDP growth rates since the onset of the commodity price boom in 2003, domestic demand, and consumption in particular, has come to be a stronger driver of growth. In regional terms, over the 1990-2012 period, and more intensively in 2003-2008 and 2010-2012, consumption was the demand component contributing the most to growth (see figure I.10). This stands in contrast with weak contribution made by consumption in the 1980s, amid sharp adjustments in response to the external debt crisis and its fallout. The recent growth in consumption may be linked to two factors.
Figure I.10 Latin America: GDP variation and contribution to growth of aggregate demand components, 1980-2013
(Percentages of GDP)
-10
-5
0
5
10
1980
1981
1982
1983
1984
1985
1986
1987
1988
1989
1990
1991
1992
1993
1994
1995
1996
1997
1998
1999
2000
2001
2002
2003
2004
2005
2006
2007
2008
2009
2010
2011
2012
2013
a
Exports of goods and services ConsumptionGross capital formation Imports of goods and services
GDP
Source: Economic Commission for Latin America and the Caribbean (ECLAC), on the basis of official figures.a Estimates.
First, the uptick in growth rates that accompanied the external boom increased employment and reduced poverty, which, together with lower inflation, pushed up the real wage bill and boosted private consumption, particularly among groups that rose out of poverty and joined the mass consumer culture. Second, several countries were able to step up public spending, on the back of rising public revenues generated by higher international prices for commodity exports and by buoyant economic activity. The larger fiscal take helped to finance various transfer and poverty mitigation programmes and raise the income of the poorest sectors, which generally have a high propensity for consumption.
The net contribution of exports and imports to growth has fluctuated greatly, with imports making an increasingly negative contribution since 1990 (see figure I.10). This aspect of regional aggregate demand performance is one of the main differences in growth between the Latin American countries and fast-growing Asian countries (De la Torre and others, 2013). The adoption of —in some cases very swift— liberalization strategies played a strong role in this evolution in Latin America, pushing up the share of foreign trade in GDP, as well as significantly deepening integration into global capital markets through the channels of foreign direct investment (FDI) and portfolio investment, including through the issuance of foreign bonds. As a result, the sum of exports and imports rose from an average share of 45.8% of GDP in Latin America in the 1980s to over 70% in 2010 and 2011.12 FDI then surged in the early 1990s, as will
12 See ECLAC (2013b), part II, chapter 1.
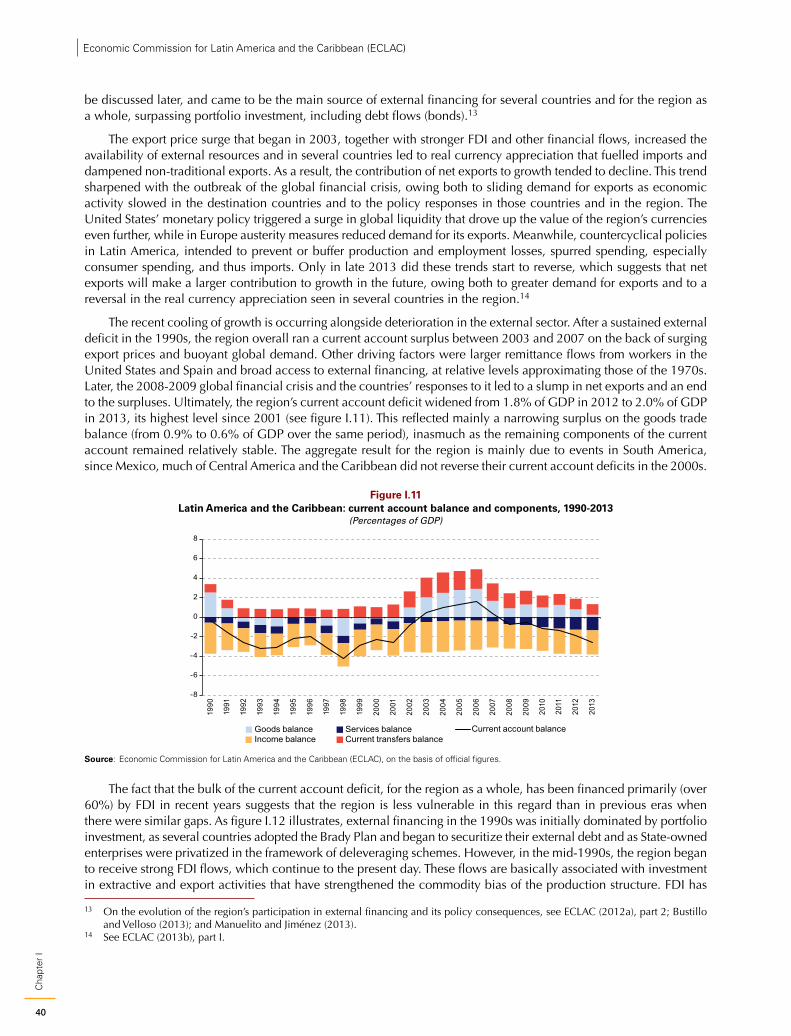
40
Cha
pter
IEconomic Commission for Latin America and the Caribbean (ECLAC)
be discussed later, and came to be the main source of external financing for several countries and for the region as a whole, surpassing portfolio investment, including debt flows (bonds).13
The export price surge that began in 2003, together with stronger FDI and other financial flows, increased the availability of external resources and in several countries led to real currency appreciation that fuelled imports and dampened non-traditional exports. As a result, the contribution of net exports to growth tended to decline. This trend sharpened with the outbreak of the global financial crisis, owing both to sliding demand for exports as economic activity slowed in the destination countries and to the policy responses in those countries and in the region. The United States’ monetary policy triggered a surge in global liquidity that drove up the value of the region’s currencies even further, while in Europe austerity measures reduced demand for its exports. Meanwhile, countercyclical policies in Latin America, intended to prevent or buffer production and employment losses, spurred spending, especially consumer spending, and thus imports. Only in late 2013 did these trends start to reverse, which suggests that net exports will make a larger contribution to growth in the future, owing both to greater demand for exports and to a reversal in the real currency appreciation seen in several countries in the region.14
The recent cooling of growth is occurring alongside deterioration in the external sector. After a sustained external deficit in the 1990s, the region overall ran a current account surplus between 2003 and 2007 on the back of surging export prices and buoyant global demand. Other driving factors were larger remittance flows from workers in the United States and Spain and broad access to external financing, at relative levels approximating those of the 1970s. Later, the 2008-2009 global financial crisis and the countries’ responses to it led to a slump in net exports and an end to the surpluses. Ultimately, the region’s current account deficit widened from 1.8% of GDP in 2012 to 2.0% of GDP in 2013, its highest level since 2001 (see figure I.11). This reflected mainly a narrowing surplus on the goods trade balance (from 0.9% to 0.6% of GDP over the same period), inasmuch as the remaining components of the current account remained relatively stable. The aggregate result for the region is mainly due to events in South America, since Mexico, much of Central America and the Caribbean did not reverse their current account deficits in the 2000s.
Figure I.11 Latin America and the Caribbean: current account balance and components, 1990-2013
(Percentages of GDP)
-8
-6
-4
-2
0
2
4
6
8
1990
1991
1992
1993
1994
1995
1996
1997
1998
1999
2000
2001
2002
2003
2004
2005
2006
2007
2008
2009
2010
2011
2012
2013
Goods balance Services balanceIncome balance Current transfers balance
Current account balance
Source: Economic Commission for Latin America and the Caribbean (ECLAC), on the basis of official figures.
The fact that the bulk of the current account deficit, for the region as a whole, has been financed primarily (over 60%) by FDI in recent years suggests that the region is less vulnerable in this regard than in previous eras when there were similar gaps. As figure I.12 illustrates, external financing in the 1990s was initially dominated by portfolio investment, as several countries adopted the Brady Plan and began to securitize their external debt and as State-owned enterprises were privatized in the framework of deleveraging schemes. However, in the mid-1990s, the region began to receive strong FDI flows, which continue to the present day. These flows are basically associated with investment in extractive and export activities that have strengthened the commodity bias of the production structure. FDI has
13 On the evolution of the region’s participation in external financing and its policy consequences, see ECLAC (2012a), part 2; Bustillo and Velloso (2013); and Manuelito and Jiménez (2013).
14 See ECLAC (2013b), part I.
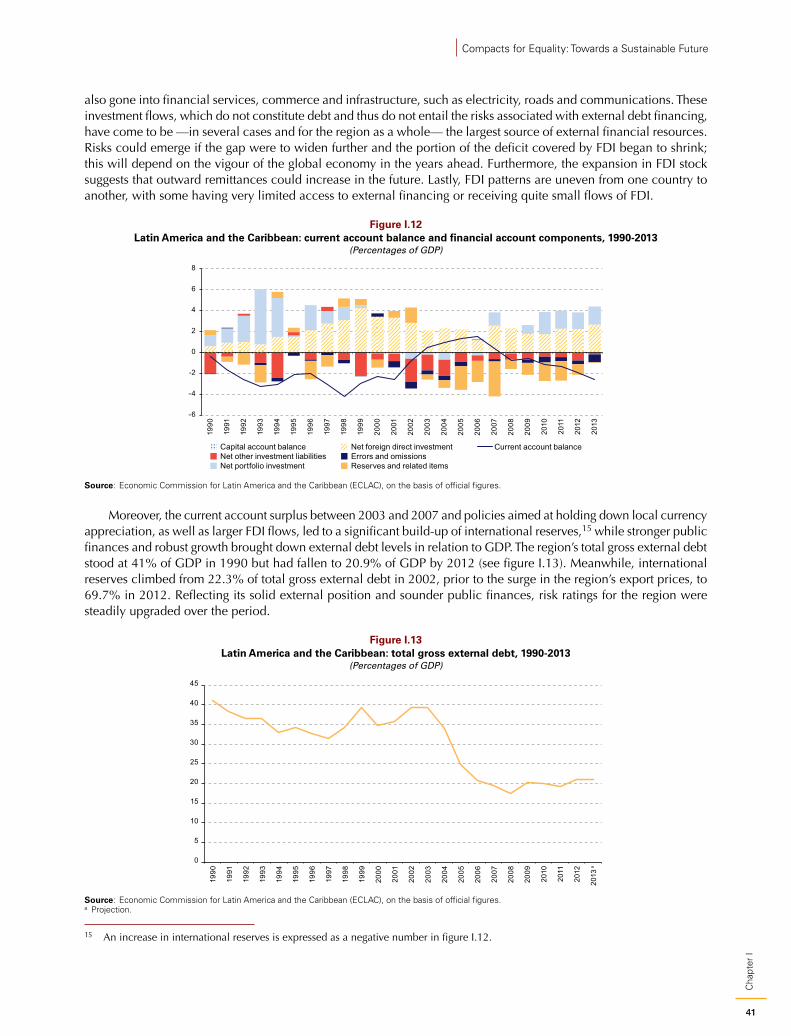
41
Cha
pter
I
Compacts for Equality: Towards a Sustainable Future
also gone into financial services, commerce and infrastructure, such as electricity, roads and communications. These investment flows, which do not constitute debt and thus do not entail the risks associated with external debt financing, have come to be —in several cases and for the region as a whole— the largest source of external financial resources. Risks could emerge if the gap were to widen further and the portion of the deficit covered by FDI began to shrink; this will depend on the vigour of the global economy in the years ahead. Furthermore, the expansion in FDI stock suggests that outward remittances could increase in the future. Lastly, FDI patterns are uneven from one country to another, with some having very limited access to external financing or receiving quite small flows of FDI.
Figure I.12 Latin America and the Caribbean: current account balance and financial account components, 1990-2013
(Percentages of GDP)
-6
-4
-2
0
2
4
6
8
1990
1991
1992
1993
1994
1995
1996
1997
1998
1999
2000
2001
2002
2003
2004
2005
2006
2007
2008
2009
2010
2011
2012
2013
Capital account balance
Net portfolio investmentNet other investment liabilities
Net foreign direct investmentErrors and omissionsReserves and related items
Current account balance
Source: Economic Commission for Latin America and the Caribbean (ECLAC), on the basis of official figures.
Moreover, the current account surplus between 2003 and 2007 and policies aimed at holding down local currency appreciation, as well as larger FDI flows, led to a significant build-up of international reserves,15 while stronger public finances and robust growth brought down external debt levels in relation to GDP. The region’s total gross external debt stood at 41% of GDP in 1990 but had fallen to 20.9% of GDP by 2012 (see figure I.13). Meanwhile, international reserves climbed from 22.3% of total gross external debt in 2002, prior to the surge in the region’s export prices, to 69.7% in 2012. Reflecting its solid external position and sounder public finances, risk ratings for the region were steadily upgraded over the period.
Figure I.13 Latin America and the Caribbean: total gross external debt, 1990-2013
(Percentages of GDP)
0
5
10
15
20
25
30
35
40
45
1990
1991
1992
1993
1994
1995
1996
1997
1998
1999
2000
2001
2002
2003
2004
2005
2006
2007
2008
2009
2010
2011
2012
2013
a
Source: Economic Commission for Latin America and the Caribbean (ECLAC), on the basis of official figures.a Projection.
15 An increase in international reserves is expressed as a negative number in figure I.12.
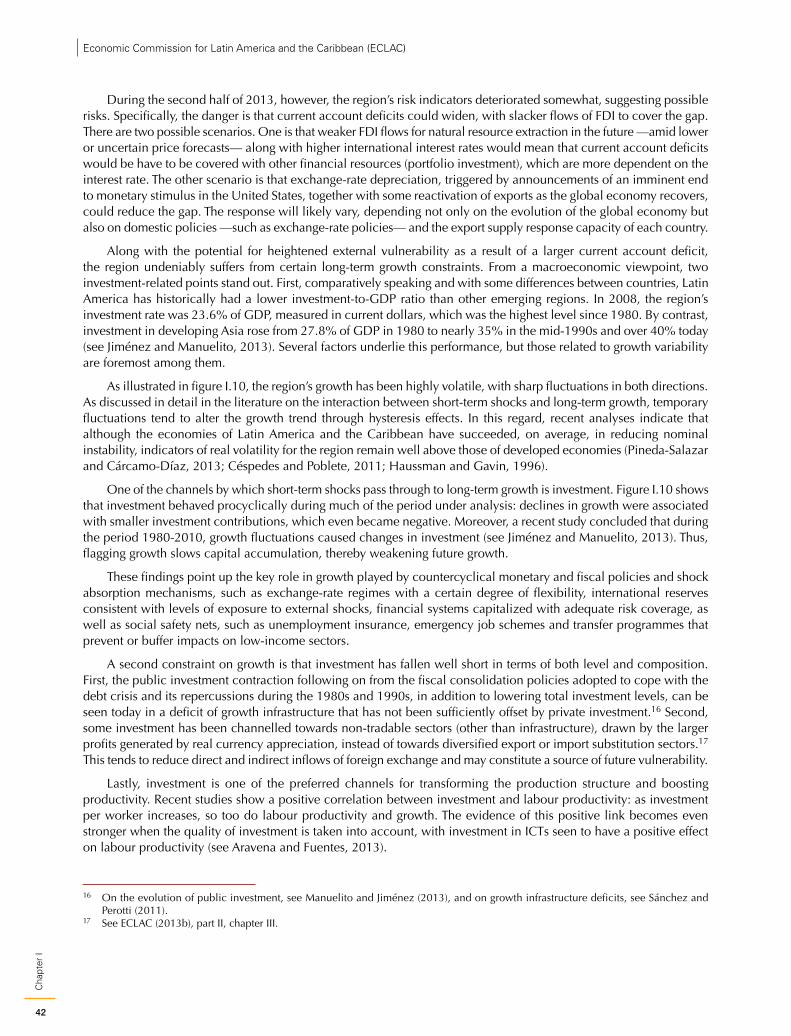
42
Cha
pter
IEconomic Commission for Latin America and the Caribbean (ECLAC)
During the second half of 2013, however, the region’s risk indicators deteriorated somewhat, suggesting possible risks. Specifically, the danger is that current account deficits could widen, with slacker flows of FDI to cover the gap. There are two possible scenarios. One is that weaker FDI flows for natural resource extraction in the future —amid lower or uncertain price forecasts— along with higher international interest rates would mean that current account deficits would be have to be covered with other financial resources (portfolio investment), which are more dependent on the interest rate. The other scenario is that exchange-rate depreciation, triggered by announcements of an imminent end to monetary stimulus in the United States, together with some reactivation of exports as the global economy recovers, could reduce the gap. The response will likely vary, depending not only on the evolution of the global economy but also on domestic policies —such as exchange-rate policies— and the export supply response capacity of each country.
Along with the potential for heightened external vulnerability as a result of a larger current account deficit, the region undeniably suffers from certain long-term growth constraints. From a macroeconomic viewpoint, two investment-related points stand out. First, comparatively speaking and with some differences between countries, Latin America has historically had a lower investment-to-GDP ratio than other emerging regions. In 2008, the region’s investment rate was 23.6% of GDP, measured in current dollars, which was the highest level since 1980. By contrast, investment in developing Asia rose from 27.8% of GDP in 1980 to nearly 35% in the mid-1990s and over 40% today (see Jiménez and Manuelito, 2013). Several factors underlie this performance, but those related to growth variability are foremost among them.
As illustrated in figure I.10, the region’s growth has been highly volatile, with sharp fluctuations in both directions. As discussed in detail in the literature on the interaction between short-term shocks and long-term growth, temporary fluctuations tend to alter the growth trend through hysteresis effects. In this regard, recent analyses indicate that although the economies of Latin America and the Caribbean have succeeded, on average, in reducing nominal instability, indicators of real volatility for the region remain well above those of developed economies (Pineda-Salazar and Cárcamo-Díaz, 2013; Céspedes and Poblete, 2011; Haussman and Gavin, 1996).
One of the channels by which short-term shocks pass through to long-term growth is investment. Figure I.10 shows that investment behaved procyclically during much of the period under analysis: declines in growth were associated with smaller investment contributions, which even became negative. Moreover, a recent study concluded that during the period 1980-2010, growth fluctuations caused changes in investment (see Jiménez and Manuelito, 2013). Thus, flagging growth slows capital accumulation, thereby weakening future growth.
These findings point up the key role in growth played by countercyclical monetary and fiscal policies and shock absorption mechanisms, such as exchange-rate regimes with a certain degree of flexibility, international reserves consistent with levels of exposure to external shocks, financial systems capitalized with adequate risk coverage, as well as social safety nets, such as unemployment insurance, emergency job schemes and transfer programmes that prevent or buffer impacts on low-income sectors.
A second constraint on growth is that investment has fallen well short in terms of both level and composition. First, the public investment contraction following on from the fiscal consolidation policies adopted to cope with the debt crisis and its repercussions during the 1980s and 1990s, in addition to lowering total investment levels, can be seen today in a deficit of growth infrastructure that has not been sufficiently offset by private investment.16 Second, some investment has been channelled towards non-tradable sectors (other than infrastructure), drawn by the larger profits generated by real currency appreciation, instead of towards diversified export or import substitution sectors.17 This tends to reduce direct and indirect inflows of foreign exchange and may constitute a source of future vulnerability.
Lastly, investment is one of the preferred channels for transforming the production structure and boosting productivity. Recent studies show a positive correlation between investment and labour productivity: as investment per worker increases, so too do labour productivity and growth. The evidence of this positive link becomes even stronger when the quality of investment is taken into account, with investment in ICTs seen to have a positive effect on labour productivity (see Aravena and Fuentes, 2013).
16 On the evolution of public investment, see Manuelito and Jiménez (2013), and on growth infrastructure deficits, see Sánchez and Perotti (2011).
17 See ECLAC (2013b), part II, chapter III.

43
Cha
pter
I
Compacts for Equality: Towards a Sustainable Future
Current account imbalances, weak investment and growth, and volatility in response to shocks in the commodities and financial markets reflect the restrictions imposed by the production structure. Macroeconomic imbalances can curb growth and thus the creation of quality jobs and equality gains. These imbalances, exacerbated in some cases by cyclical factors, reveal a more persistent structural problem: weak innovation and dissemination of technology in the region, with the attendant negative effects on productivity, as discussed below.
(b) Economies without structural change and little technical progress
The most advanced economies are working hard to develop and embed the new knowledge emerging from the current technological revolution into their production activities. The phenomenon is particularly relevant for instituting advanced manufacturing systems and gearing them towards sustainability, as reflected in the notion of green industrial policy. This process has gained momentum in the United States, Germany, the United Kingdom, France and countries of East Asia, where policies are being designed to incorporate and spread the use of these instruments.
The swift pace at which the developed countries are incorporating new technologies impacts heavily on the competitiveness of other economies, which can be measured by the relative productivity indicator. Relative productivity is defined as the labour productivity of a country or region with respect to a benchmark country on the technological frontier. This indicator is a proxy for the behaviour of the gap in technology capacity. A drop in the region’s relative productivity would make it harder to sustain growth and would require adjusting the level of activity (or employment) or the real exchange rate in order to regain competitiveness, to the detriment of equality, at least in the short run. Figure I.14 shows how Latin America’s relative productivity has evolved with respect to the United States since 1990 and confirms a negative trend that raises questions about the future: from 18% of the United States rate in 1990, the region’s productivity has fallen to just 15% twenty years later.
Figure I.14 Latin America: relative productivity with respect to that of the United States, 1990-2011 a
(Percentages)
12
13
14
15
16
17
18
19
20
21
22
1990
1991
1992
1993
1994
1995
1996
1997
1998
1 999
2000
2001
2002
2003
2004
2005
2006
2007
2008
2009
2010
2011
Source: Economic Commission for Latin America and the Caribbean (ECLAC), on the basis of CEPALSTAT database; World Bank, “World Development Indicators (WDI)”; Organization for Economic Cooperation and Development (OECD), OECDStat; International Labour Organization (ILO), Laborstat and Ilostat databases.
a For the calculation of labour productivity, the economically active population as estimated by the International Labour Organization (ILO) was used, corrected for the unemployment rate, also as estimated by ILO.
Catching up with the developed countries in terms of technology and productivity requires a shift towards more knowledge-intensive production structures. Productivity and structure move in tandem; changes in the production structure are tied to the evolution of productivity differentials between developing and developed countries. In other words, closing productivity gaps requires a certain degree of structural convergence, driven by public and private investment. Such investments must be broad in scope and sustained over time, with intensive use of technical progress.
The ratio between relative productivity (with respect to that of the United States) and an indicator of production structure complexity is shown in figure I.15, which clearly depicts the coevolution of technology, structure and relative productivity. An expanded complexity index, which combines various indicators of the production structure’s knowledge-intensity, was used as an indicator of complexity.
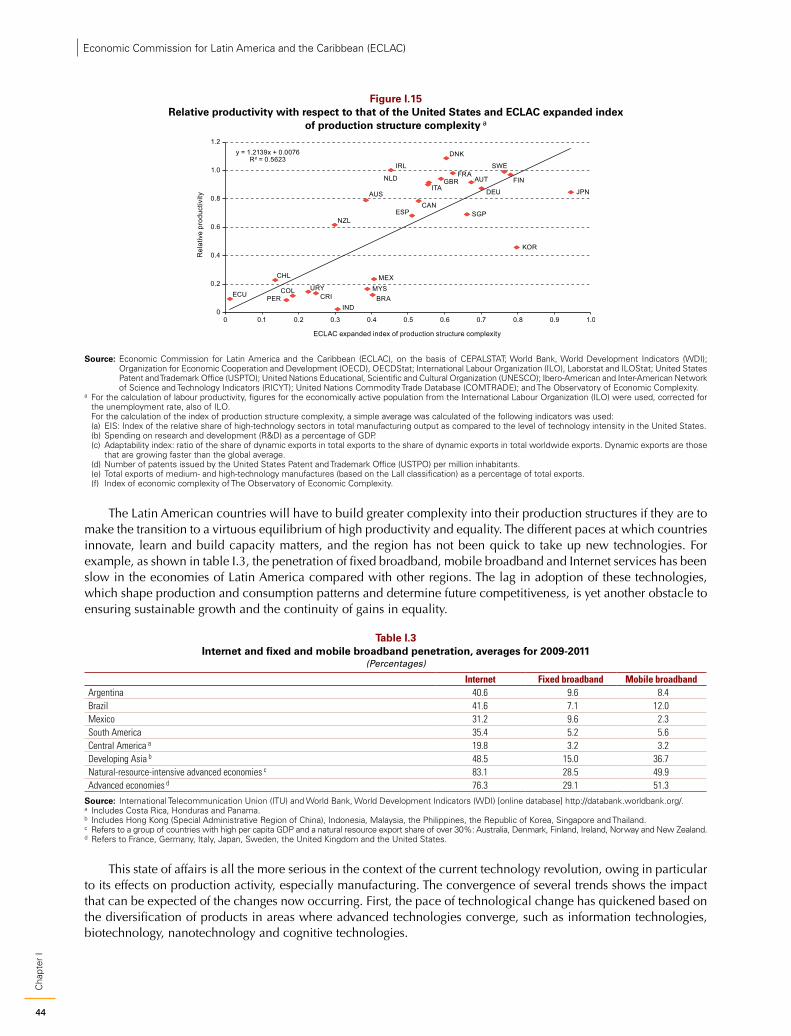
44
Cha
pter
IEconomic Commission for Latin America and the Caribbean (ECLAC)
Figure I.15 Relative productivity with respect to that of the United States and ECLAC expanded index
of production structure complexity a
ECU
CHL
PERCOL URY
CRI
NZL
IND
AUS
MYSBRA
MEX
IRL
ESPCAN
ITANLD GBR
DNK
FRA
SGP
AUT
DEU
SWE
FIN
KOR
JPN
y = 1.2139x + 0.0076R² = 0.5623
0
0.2
0.4
0.6
0.8
1.0
1.2
0 0.1 0.2 0.3 0.4 0.5 0.6 0.7 0.8 0.9 1.0
Rel
ativ
e pr
oduc
tivity
ECLAC expanded index of production structure complexity
Source: Economic Commission for Latin America and the Caribbean (ECLAC), on the basis of CEPALSTAT; World Bank, World Development Indicators (WDI); Organization for Economic Cooperation and Development (OECD), OECDStat; International Labour Organization (ILO), Laborstat and ILOStat; United States Patent and Trademark Office (USPTO); United Nations Educational, Scientific and Cultural Organization (UNESCO); Ibero-American and Inter-American Network of Science and Technology Indicators (RICYT); United Nations Commodity Trade Database (COMTRADE); and The Observatory of Economic Complexity.
a For the calculation of labour productivity, figures for the economically active population from the International Labour Organization (ILO) were used, corrected for the unemployment rate, also of ILO.
For the calculation of the index of production structure complexity, a simple average was calculated of the following indicators was used: (a) EIS: Index of the relative share of high-technology sectors in total manufacturing output as compared to the level of technology intensity in the United States. (b) Spending on research and development (R&D) as a percentage of GDP. (c) Adaptability index: ratio of the share of dynamic exports in total exports to the share of dynamic exports in total worldwide exports. Dynamic exports are those
that are growing faster than the global average. (d) Number of patents issued by the United States Patent and Trademark Office (USTPO) per million inhabitants. (e) Total exports of medium- and high-technology manufactures (based on the Lall classification) as a percentage of total exports. (f) Index of economic complexity of The Observatory of Economic Complexity.
The Latin American countries will have to build greater complexity into their production structures if they are to make the transition to a virtuous equilibrium of high productivity and equality. The different paces at which countries innovate, learn and build capacity matters, and the region has not been quick to take up new technologies. For example, as shown in table I.3, the penetration of fixed broadband, mobile broadband and Internet services has been slow in the economies of Latin America compared with other regions. The lag in adoption of these technologies, which shape production and consumption patterns and determine future competitiveness, is yet another obstacle to ensuring sustainable growth and the continuity of gains in equality.
Table I.3 Internet and fixed and mobile broadband penetration, averages for 2009-2011
(Percentages)
Internet Fixed broadband Mobile broadbandArgentina 40.6 9.6 8.4Brazil 41.6 7.1 12.0Mexico 31.2 9.6 2.3South America 35.4 5.2 5.6Central America a 19.8 3.2 3.2Developing Asia b 48.5 15.0 36.7Natural-resource-intensive advanced economies c 83.1 28.5 49.9Advanced economies d 76.3 29.1 51.3
Source: International Telecommunication Union (ITU) and World Bank, World Development Indicators (WDI) [online database] http://databank.worldbank.org/. a Includes Costa Rica, Honduras and Panama.b Includes Hong Kong (Special Administrative Region of China), Indonesia, Malaysia, the Philippines, the Republic of Korea, Singapore and Thailand.c Refers to a group of countries with high per capita GDP and a natural resource export share of over 30%: Australia, Denmark, Finland, Ireland, Norway and New Zealand.d Refers to France, Germany, Italy, Japan, Sweden, the United Kingdom and the United States.
This state of affairs is all the more serious in the context of the current technology revolution, owing in particular to its effects on production activity, especially manufacturing. The convergence of several trends shows the impact that can be expected of the changes now occurring. First, the pace of technological change has quickened based on the diversification of products in areas where advanced technologies converge, such as information technologies, biotechnology, nanotechnology and cognitive technologies.
45
Cha
pter
I
Compacts for Equality: Towards a Sustainable Future
Second, the fact that the most significant changes are occurring in areas at the intersection of technological trajectories means that radical changes cannot be anticipated simply by extrapolating from the dominant trends along each trajectory. This introduces a greater degree of uncertainty that can only be reduced by accumulating knowledge and managing big data, gathered from the digital footprints that individuals and companies leave as they use networks. Beyond the discussion as to whether current technological advances will have effects akin to those of previous major technological revolutions, such as the steam engine, the railroad, electricity and the internal combustion engine, the reality is that consumption and production patterns are changing at an unprecedented rate, which is cause for concern for a region like Latin America for which the production of new technologies is largely exogenous.
Third, an equally important process, albeit with less well-defined outcomes, is the reshaping of the market structure and of the production agents operating in them. On the one hand, new technologies, particularly ICTs (owing to their capacity to externalize production processes and transform manufacturing into externally-provided services), create opportunities for smaller firms by making economies of scale less important. Broader access to cloud computing services also helps small firms to lower the ICT capital costs of new operations, which should lead to larger numbers of firms in the marketplace, with positive impacts on job creation and competitiveness.
At the same time, network economies and economies in the management and maintenance of big data centres strengthen trends in the opposite direction by concentrating key services with one or a few global producers. The trend towards concentrated oligopoly or monopoly is evident in, for example, search engine services (Google), the production of advanced hardware and software (Apple), social networks (Facebook) and cloud computing services (Amazon). Although it is not clear which of these forces will prevail, history shows that in the long run, competition prevents the establishment and maintenance of oligopolies concentrated among the same operators, while scale, scope and network economies prevent the establishment of totally fragmented markets in perfect competition. The dichotomy between small and medium-sized firms (SMEs) and large corporations, with their corresponding effects on job creation, will continue, but its modalities will change in directions which the region’s countries would do well to monitor.
Lastly, new technologies are also redefining the comparative advantages of countries and territories. The most advanced countries have been proactively promoting this type of manufacturing, which has often translated into a resurgence of industrial policymaking and a return to more advanced manufacturing activities in former production hubs. The current thinking on this topic as well as the actions taken in these and other countries compel Latin America to address the issue in all its technological and public policy dimensions. The productivity gap, limited research and development in technology and weak industrial policies in most of the region’s countries are problems that must be tackled concomitantly. Deferring the adoption of industrial and technological policies will not only worsen the productivity gap but will also weaken the sustainability of advances in employment, wages and equality—unless the region invests in adopting technologies that allow it to compete in the global arena and reconcile the pressures of modern consumption with local capacity for producing goods and services that embrace the technological revolution.
2. Equality and social sustainability Discussion of social sustainability in Latin America and the Caribbean requires an exploration of the conditions underlying the gains in social indicators over the past decade. It also compels a closer look at the possibilities for resolving long-standing problems in the region, such as the high rate of inequality, capacity gaps, the redistributive inefficiency of the fiscal system, poor coverage of social protection systems and employment segmentation. The region’s social panorama is a mixed tableau of bright spots and problem areas, lending even greater urgency to the question of the sustainability of social progress.
(a) The labour market: improvements without structural change
The scale and scope of the advances made in reducing poverty and inequality cannot be fully captured without examining the dynamics of the labour market and public policies, looking at achievements as well as warnings signs ahead. With respect to the labour market, the favourable climate of the past decade is the starting point for understanding the gains made in terms of poverty and inequality. Indeed, the region’s indicators for employment, unemployment and labour-market participation are at a 20-year high (see table I.4). Employment growth has also produced a relative improvement in job quality, as wage employment has risen as a proportion of total employment and
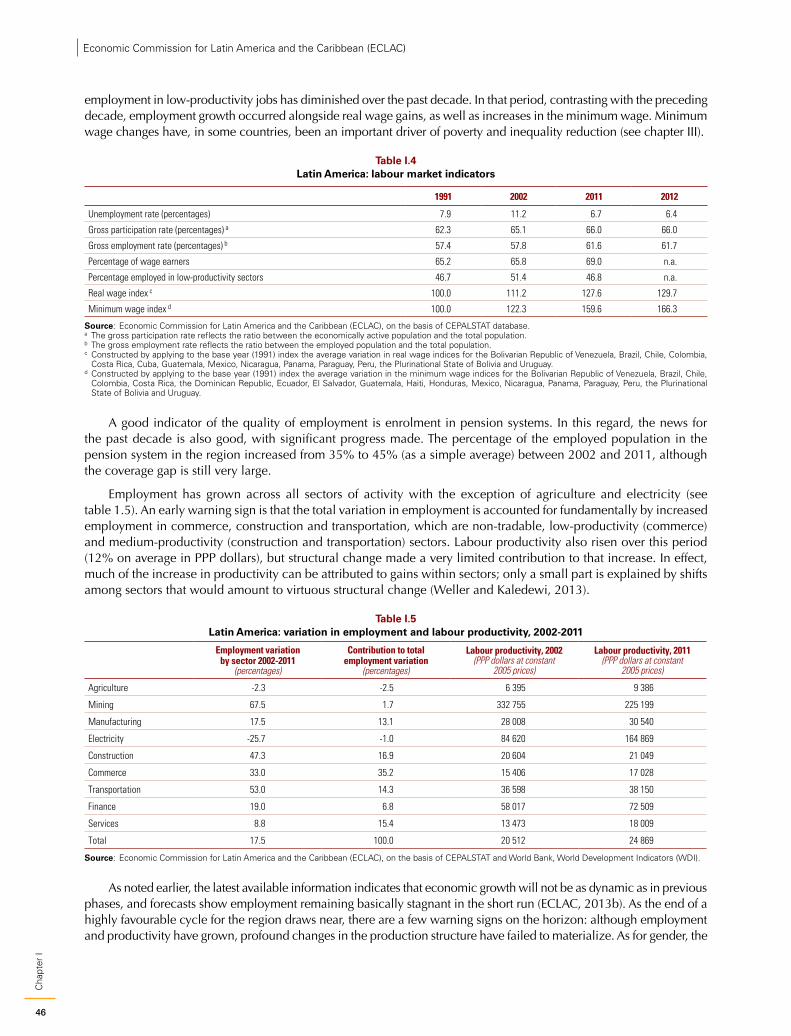
46
Cha
pter
IEconomic Commission for Latin America and the Caribbean (ECLAC)
employment in low-productivity jobs has diminished over the past decade. In that period, contrasting with the preceding decade, employment growth occurred alongside real wage gains, as well as increases in the minimum wage. Minimum wage changes have, in some countries, been an important driver of poverty and inequality reduction (see chapter III).
Table I.4 Latin America: labour market indicators
1991 2002 2011 2012
Unemployment rate (percentages) 7.9 11.2 6.7 6.4
Gross participation rate (percentages) a 62.3 65.1 66.0 66.0
Gross employment rate (percentages) b 57.4 57.8 61.6 61.7
Percentage of wage earners 65.2 65.8 69.0 n.a.
Percentage employed in low-productivity sectors 46.7 51.4 46.8 n.a.
Real wage index c 100.0 111.2 127.6 129.7
Minimum wage index d 100.0 122.3 159.6 166.3
Source: Economic Commission for Latin America and the Caribbean (ECLAC), on the basis of CEPALSTAT database.a The gross participation rate reflects the ratio between the economically active population and the total population.b The gross employment rate reflects the ratio between the employed population and the total population.c Constructed by applying to the base year (1991) index the average variation in real wage indices for the Bolivarian Republic of Venezuela, Brazil, Chile, Colombia,
Costa Rica, Cuba, Guatemala, Mexico, Nicaragua, Panama, Paraguay, Peru, the Plurinational State of Bolivia and Uruguay.d Constructed by applying to the base year (1991) index the average variation in the minimum wage indices for the Bolivarian Republic of Venezuela, Brazil, Chile,
Colombia, Costa Rica, the Dominican Republic, Ecuador, El Salvador, Guatemala, Haiti, Honduras, Mexico, Nicaragua, Panama, Paraguay, Peru, the Plurinational State of Bolivia and Uruguay.
A good indicator of the quality of employment is enrolment in pension systems. In this regard, the news for the past decade is also good, with significant progress made. The percentage of the employed population in the pension system in the region increased from 35% to 45% (as a simple average) between 2002 and 2011, although the coverage gap is still very large.
Employment has grown across all sectors of activity with the exception of agriculture and electricity (see table 1.5). An early warning sign is that the total variation in employment is accounted for fundamentally by increased employment in commerce, construction and transportation, which are non-tradable, low-productivity (commerce) and medium-productivity (construction and transportation) sectors. Labour productivity also risen over this period (12% on average in PPP dollars), but structural change made a very limited contribution to that increase. In effect, much of the increase in productivity can be attributed to gains within sectors; only a small part is explained by shifts among sectors that would amount to virtuous structural change (Weller and Kaledewi, 2013).
Table I.5 Latin America: variation in employment and labour productivity, 2002-2011
Employment variation by sector 2002-2011
(percentages)
Contribution to total employment variation
(percentages)
Labour productivity, 2002 (PPP dollars at constant
2005 prices)
Labour productivity, 2011 (PPP dollars at constant
2005 prices)
Agriculture -2.3 -2.5 6 395 9 386
Mining 67.5 1.7 332 755 225 199
Manufacturing 17.5 13.1 28 008 30 540
Electricity -25.7 -1.0 84 620 164 869
Construction 47.3 16.9 20 604 21 049
Commerce 33.0 35.2 15 406 17 028
Transportation 53.0 14.3 36 598 38 150
Finance 19.0 6.8 58 017 72 509
Services 8.8 15.4 13 473 18 009
Total 17.5 100.0 20 512 24 869
Source: Economic Commission for Latin America and the Caribbean (ECLAC), on the basis of CEPALSTAT and World Bank, World Development Indicators (WDI).
As noted earlier, the latest available information indicates that economic growth will not be as dynamic as in previous phases, and forecasts show employment remaining basically stagnant in the short run (ECLAC, 2013b). As the end of a highly favourable cycle for the region draws near, there are a few warning signs on the horizon: although employment and productivity have grown, profound changes in the production structure have failed to materialize. As for gender, the

47
Cha
pter
I
Compacts for Equality: Towards a Sustainable Future
analysis presented in chapter III shows that although gaps between men and women in participation, employment and (to a lesser extent) unemployment have narrowed, they are still significant, especially considering the major educational gains that women have made. Female workforce participation remains highly stratified (see figure I.16): women from low-income sectors show much lower participation and employment rates then women from upper-middle- and high-income sectors, with the gap being wider than for men (especially in the case of the participation rate). The high degree of differentiation in female workforce participation by income quintile is associated with the gendered pattern of division of labour, limited capacity to pay for care and household services, and maternity at early ages. These factors prevent many women from achieving economic autonomy and contributing income to the household.
Figure I.16 Latin America and the Caribbean (18 countries): labour participation and employment rates,
population aged 15-64 years, by income quintile, 2002 and 2011(Percentages)
30
40
50
60
70
80
90
Quintile I Quintile II Quintile III Quintile IV Quintile V
A. Participation rate
Men 2002 Men 2011Women 2002 Women 2011
30
40
50
60
70
80
90
Quintile I Quintile II Quintile III Quintile IV Quintile V
B. Employment rate
Source: Economic Commission for Latin America and the Caribbean (ECLAC), on the basis of special tabulations of data from household surveys.
For those women who do enter the labour market, sharp occupational segregation between men and women persists, as does the large wage gap. Employment remains highly segmented, with low social security coverage and deep gender- and ethnicity-based inequities (see chapter III). Men and women still have very different total workloads, with women working a double shift: in addition to their growing responsibilities in paid employment, they perform the bulk of caregiving and household work.
(b) Poverty and vulnerability: progress and warning signs
The direct corollary of rising employment and earnings in the region has been declining poverty. In 2013, the poverty rate in Latin America was 27.9% of the population; indigence, or extreme poverty, stood at 11.5% (see figure I.17). Thus, the poverty rate has fallen virtually uninterrupted over the past decade, by 16 percentage points since 2002. Extreme poverty has also dropped significantly since 2002, by nearly 8 percentage points, although the rate of decline has slowed in recent years, mainly due to food prices that have risen faster than the rate of general inflation.
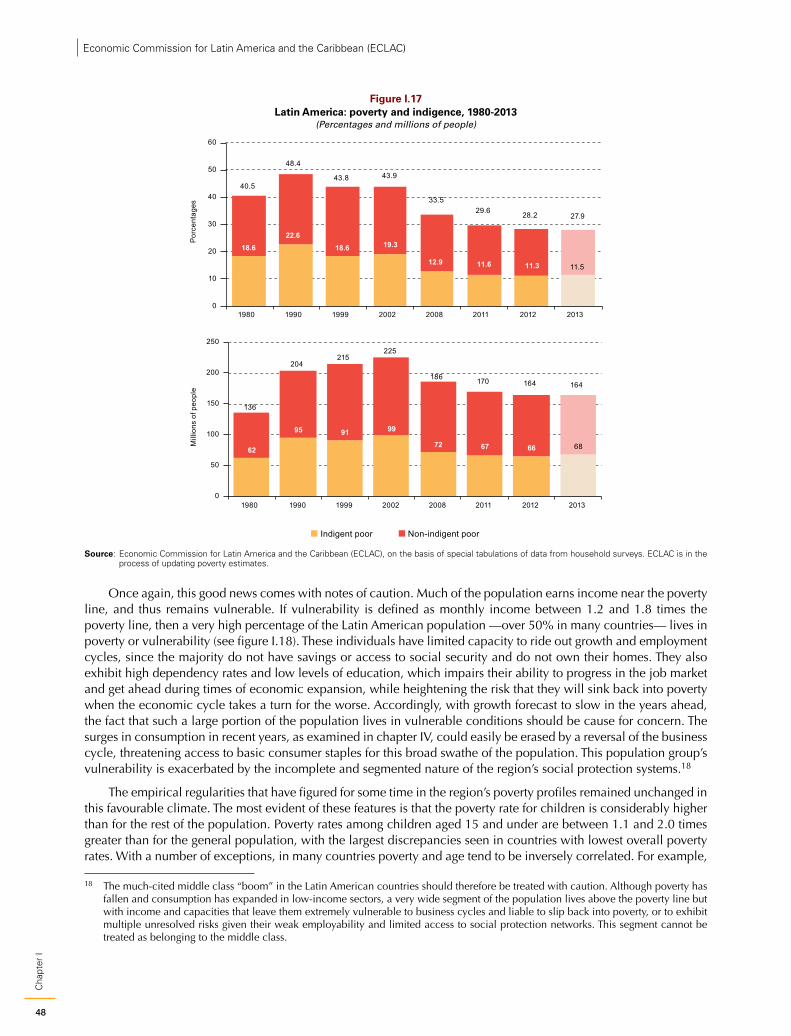
48
Cha
pter
IEconomic Commission for Latin America and the Caribbean (ECLAC)
Figure I.17 Latin America: poverty and indigence, 1980-2013
(Percentages and millions of people)
0
10
20
30
40
50
60
1980 1990 1999 2002 2008 2011 2012 2013
Por
cent
ages
18.622.6
18.6 19.3
12.9 11.6 11.3 11.5
40.5
48.4
43.8 43.9
33.529.6 28.2 27.9
Indigent poor Non-indigent poor
62
95 91 99
72 67 66 68
136
204215
225
186 170 164 164
0
50
100
150
200
250
1980 1990 1999 2002 2008 2011 2012 2013
Mill
ions
of p
eopl
e
Source: Economic Commission for Latin America and the Caribbean (ECLAC), on the basis of special tabulations of data from household surveys. ECLAC is in the process of updating poverty estimates.
Once again, this good news comes with notes of caution. Much of the population earns income near the poverty line, and thus remains vulnerable. If vulnerability is defined as monthly income between 1.2 and 1.8 times the poverty line, then a very high percentage of the Latin American population —over 50% in many countries— lives in poverty or vulnerability (see figure I.18). These individuals have limited capacity to ride out growth and employment cycles, since the majority do not have savings or access to social security and do not own their homes. They also exhibit high dependency rates and low levels of education, which impairs their ability to progress in the job market and get ahead during times of economic expansion, while heightening the risk that they will sink back into poverty when the economic cycle takes a turn for the worse. Accordingly, with growth forecast to slow in the years ahead, the fact that such a large portion of the population lives in vulnerable conditions should be cause for concern. The surges in consumption in recent years, as examined in chapter IV, could easily be erased by a reversal of the business cycle, threatening access to basic consumer staples for this broad swathe of the population. This population group’s vulnerability is exacerbated by the incomplete and segmented nature of the region’s social protection systems.18
The empirical regularities that have figured for some time in the region’s poverty profiles remained unchanged in this favourable climate. The most evident of these features is that the poverty rate for children is considerably higher than for the rest of the population. Poverty rates among children aged 15 and under are between 1.1 and 2.0 times greater than for the general population, with the largest discrepancies seen in countries with lowest overall poverty rates. With a number of exceptions, in many countries poverty and age tend to be inversely correlated. For example,
18 The much-cited middle class “boom” in the Latin American countries should therefore be treated with caution. Although poverty has fallen and consumption has expanded in low-income sectors, a very wide segment of the population lives above the poverty line but with income and capacities that leave them extremely vulnerable to business cycles and liable to slip back into poverty, or to exhibit multiple unresolved risks given their weak employability and limited access to social protection networks. This segment cannot be treated as belonging to the middle class.
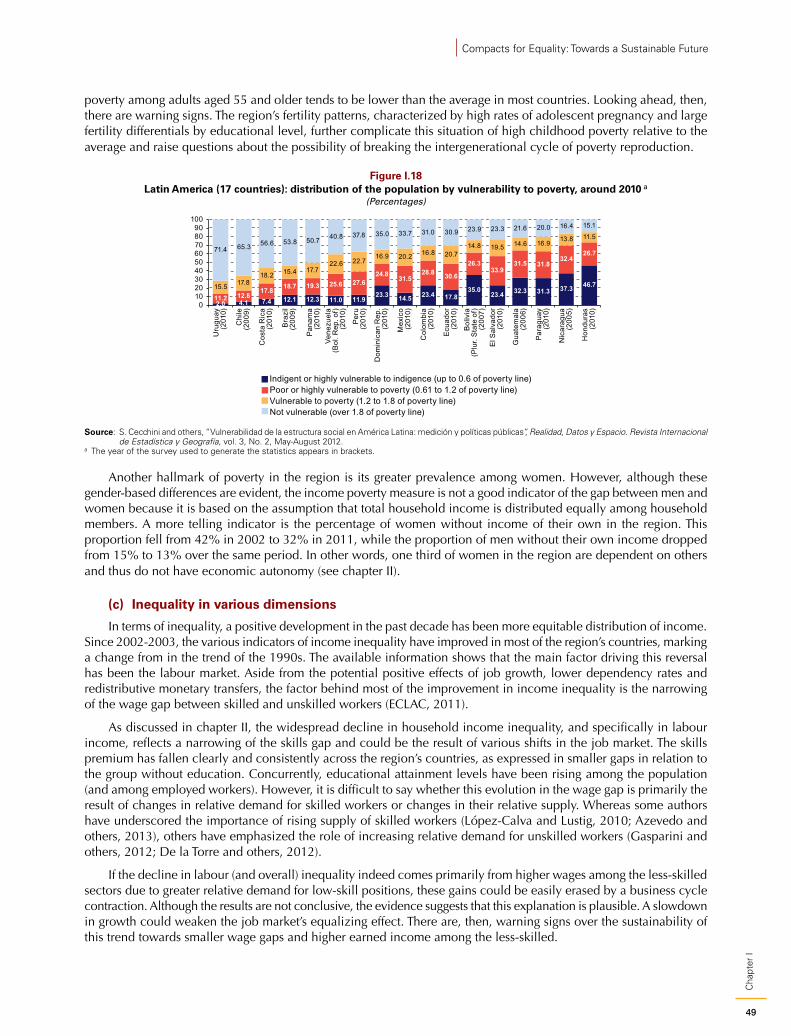
49
Cha
pter
I
Compacts for Equality: Towards a Sustainable Future
poverty among adults aged 55 and older tends to be lower than the average in most countries. Looking ahead, then, there are warning signs. The region’s fertility patterns, characterized by high rates of adolescent pregnancy and large fertility differentials by educational level, further complicate this situation of high childhood poverty relative to the average and raise questions about the possibility of breaking the intergenerational cycle of poverty reproduction.
Figure I.18 Latin America (17 countries): distribution of the population by vulnerability to poverty, around 2010 a
(Percentages)
2.0 4.1 7.4 12.1 12.3 11.0 11.923.3 14.5 23.4 17.8
35.023.4 32.3 31.3 37.3 46.7
11.2 12.817.8 18.7 19.3 25.6 27.6
24.831.5
28.8 30.6
26.333.9
31.5 31.832.4
26.7
15.5 17.818.2 15.4 17.7
22.6 22.716.9 20.2 16.8 20.7
14.8 19.5 14.6 16.9 13.8 11.5
71.4 65.3 56.6 53.8 50.7 40.8 37.8 35.0 33.7 31.0 30.9 23.9 23.3 21.6 20.0 16.4 15.1
0102030405060708090
100U
rugu
ay(2
010)
Chi
le(2
009)
Cos
ta R
ica
(201
0)
Bra
zil
(200
9)
Pan
ama
(201
0)Ve
nezu
ela
(Bol
. Rep
. of)
(201
0)
Per
u(2
010)
Dom
inic
an R
ep.
(201
0)
Mex
ico
(201
0)
Col
ombi
a(2
010)
Ecu
ador
(201
0)
Bol
ivia
(Plu
r. S
tate
of)
(200
7)E
l Sal
vado
r(2
010)
Gua
tem
ala
(200
6)
Par
agua
y(2
010)
Nic
arag
ua(2
005)
Hon
dura
s(2
010)
Indigent or highly vulnerable to indigence (up to 0.6 of poverty line)Poor or highly vulnerable to poverty (0.61 to 1.2 of poverty line)Vulnerable to poverty (1.2 to 1.8 of poverty line)Not vulnerable (over 1.8 of poverty line)
Source: S. Cecchini and others, “Vulnerabilidad de la estructura social en América Latina: medición y políticas públicas”, Realidad, Datos y Espacio. Revista Internacional de Estadística y Geografía, vol. 3, No. 2, May-August 2012.
a The year of the survey used to generate the statistics appears in brackets.
Another hallmark of poverty in the region is its greater prevalence among women. However, although these gender-based differences are evident, the income poverty measure is not a good indicator of the gap between men and women because it is based on the assumption that total household income is distributed equally among household members. A more telling indicator is the percentage of women without income of their own in the region. This proportion fell from 42% in 2002 to 32% in 2011, while the proportion of men without their own income dropped from 15% to 13% over the same period. In other words, one third of women in the region are dependent on others and thus do not have economic autonomy (see chapter II).
(c) Inequality in various dimensions
In terms of inequality, a positive development in the past decade has been more equitable distribution of income. Since 2002-2003, the various indicators of income inequality have improved in most of the region’s countries, marking a change from in the trend of the 1990s. The available information shows that the main factor driving this reversal has been the labour market. Aside from the potential positive effects of job growth, lower dependency rates and redistributive monetary transfers, the factor behind most of the improvement in income inequality is the narrowing of the wage gap between skilled and unskilled workers (ECLAC, 2011).
As discussed in chapter II, the widespread decline in household income inequality, and specifically in labour income, reflects a narrowing of the skills gap and could be the result of various shifts in the job market. The skills premium has fallen clearly and consistently across the region’s countries, as expressed in smaller gaps in relation to the group without education. Concurrently, educational attainment levels have been rising among the population (and among employed workers). However, it is difficult to say whether this evolution in the wage gap is primarily the result of changes in relative demand for skilled workers or changes in their relative supply. Whereas some authors have underscored the importance of rising supply of skilled workers (López-Calva and Lustig, 2010; Azevedo and others, 2013), others have emphasized the role of increasing relative demand for unskilled workers (Gasparini and others, 2012; De la Torre and others, 2012).
If the decline in labour (and overall) inequality indeed comes primarily from higher wages among the less-skilled sectors due to greater relative demand for low-skill positions, these gains could be easily erased by a business cycle contraction. Although the results are not conclusive, the evidence suggests that this explanation is plausible. A slowdown in growth could weaken the job market’s equalizing effect. There are, then, warning signs over the sustainability of this trend towards smaller wage gaps and higher earned income among the less-skilled.
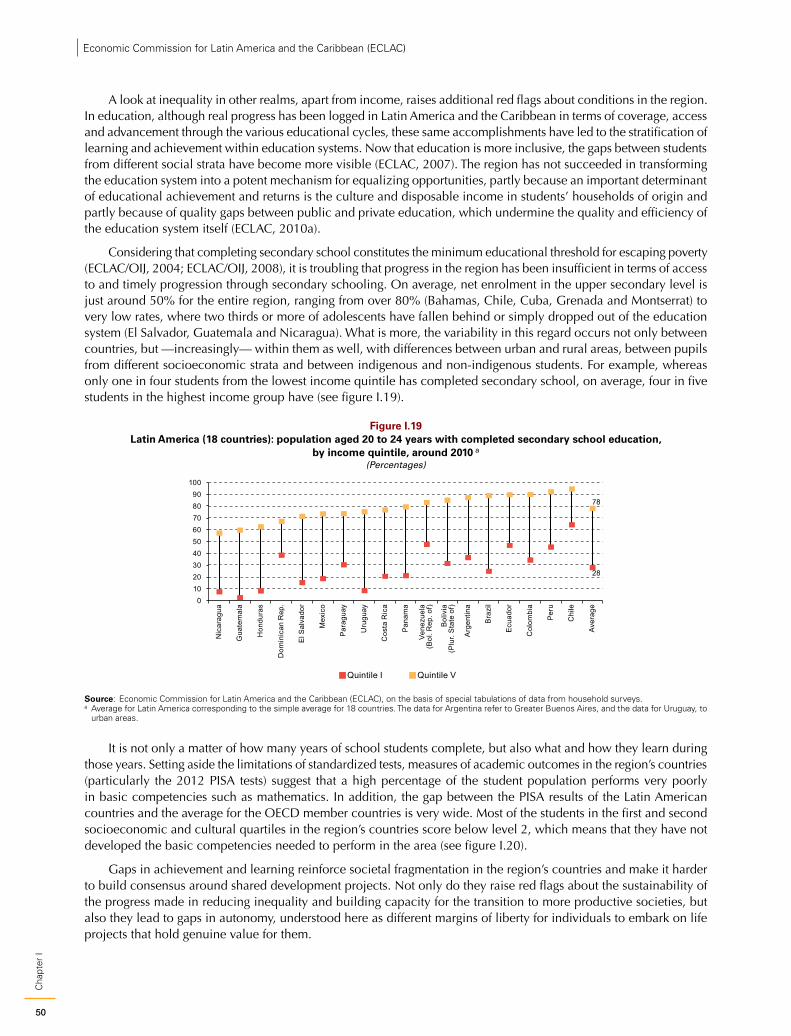
50
Cha
pter
IEconomic Commission for Latin America and the Caribbean (ECLAC)
A look at inequality in other realms, apart from income, raises additional red flags about conditions in the region. In education, although real progress has been logged in Latin America and the Caribbean in terms of coverage, access and advancement through the various educational cycles, these same accomplishments have led to the stratification of learning and achievement within education systems. Now that education is more inclusive, the gaps between students from different social strata have become more visible (ECLAC, 2007). The region has not succeeded in transforming the education system into a potent mechanism for equalizing opportunities, partly because an important determinant of educational achievement and returns is the culture and disposable income in students’ households of origin and partly because of quality gaps between public and private education, which undermine the quality and efficiency of the education system itself (ECLAC, 2010a).
Considering that completing secondary school constitutes the minimum educational threshold for escaping poverty (ECLAC/OIJ, 2004; ECLAC/OIJ, 2008), it is troubling that progress in the region has been insufficient in terms of access to and timely progression through secondary schooling. On average, net enrolment in the upper secondary level is just around 50% for the entire region, ranging from over 80% (Bahamas, Chile, Cuba, Grenada and Montserrat) to very low rates, where two thirds or more of adolescents have fallen behind or simply dropped out of the education system (El Salvador, Guatemala and Nicaragua). What is more, the variability in this regard occurs not only between countries, but —increasingly— within them as well, with differences between urban and rural areas, between pupils from different socioeconomic strata and between indigenous and non-indigenous students. For example, whereas only one in four students from the lowest income quintile has completed secondary school, on average, four in five students in the highest income group have (see figure I.19).
Figure I.19 Latin America (18 countries): population aged 20 to 24 years with completed secondary school education,
by income quintile, around 2010 a
(Percentages)
28
78
0102030405060708090
100
Nic
arag
ua
Gua
tem
ala
Hon
dura
s
Dom
inic
an R
ep.
El S
alva
dor
Mex
ico
Par
agua
y
Uru
guay
Cos
ta R
ica
Pan
ama
Vene
zuel
a(B
ol. R
ep. o
f)
Bol
ivia
(Plu
r. S
tate
of)
Arg
entin
a
Bra
zil
Ecu
ador
Col
ombi
a
Per
u
Chi
le
Ave
rage
Quintile I Quintile V
Source: Economic Commission for Latin America and the Caribbean (ECLAC), on the basis of special tabulations of data from household surveys.a Average for Latin America corresponding to the simple average for 18 countries. The data for Argentina refer to Greater Buenos Aires, and the data for Uruguay, to
urban areas.
It is not only a matter of how many years of school students complete, but also what and how they learn during those years. Setting aside the limitations of standardized tests, measures of academic outcomes in the region’s countries (particularly the 2012 PISA tests) suggest that a high percentage of the student population performs very poorly in basic competencies such as mathematics. In addition, the gap between the PISA results of the Latin American countries and the average for the OECD member countries is very wide. Most of the students in the first and second socioeconomic and cultural quartiles in the region’s countries score below level 2, which means that they have not developed the basic competencies needed to perform in the area (see figure I.20).
Gaps in achievement and learning reinforce societal fragmentation in the region’s countries and make it harder to build consensus around shared development projects. Not only do they raise red flags about the sustainability of the progress made in reducing inequality and building capacity for the transition to more productive societies, but also they lead to gaps in autonomy, understood here as different margins of liberty for individuals to embark on life projects that hold genuine value for them.
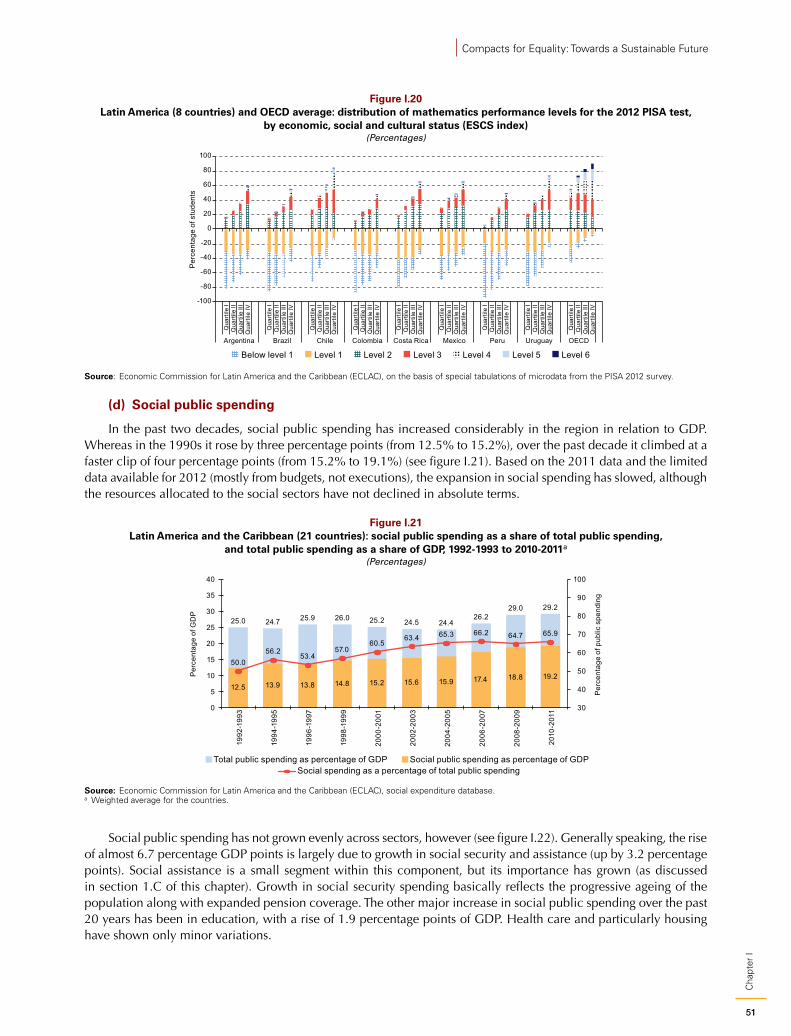
51
Cha
pter
I
Compacts for Equality: Towards a Sustainable Future
Figure I.20 Latin America (8 countries) and OECD average: distribution of mathematics performance levels for the 2012 PISA test,
by economic, social and cultural status (ESCS index)(Percentages)
-100
-80
-60
-40
-20
0
20
40
60
80
100
Qua
rtile
IQ
uart
ile II
Qua
rtile
III
Qua
rtile
IV
Qua
rtile
IQ
uart
ile II
Qua
rtile
III
Qua
rtile
IV
Qua
rtile
IQ
uart
ile II
Qua
rtile
III
Qua
rtile
IV
Qua
rtile
IQ
uart
ile II
Qua
rtile
III
Qua
rtile
IV
Qua
rtile
IQ
uart
ile II
Qua
rtile
III
Qua
rtile
IV
Qua
rtile
IQ
uart
ile II
Qua
rtile
III
Qua
rtile
IV
Qua
rtile
IQ
uart
ile II
Qua
rtile
III
Qua
rtile
IV
Qua
rtile
IQ
uart
ile II
Qua
rtile
III
Qua
rtile
IV
Qua
rtile
IQ
uart
ile II
Qua
rtile
III
Qua
rtile
IV
Argentina Brazil Chile Colombia Costa Rica Mexico Peru Uruguay OECD
Per
cent
age
of s
tude
nts
Level 1Below level 1 Level 2 Level 3 Level 4 Level 5 Level 6
Source: Economic Commission for Latin America and the Caribbean (ECLAC), on the basis of special tabulations of microdata from the PISA 2012 survey.
(d) Social public spending
In the past two decades, social public spending has increased considerably in the region in relation to GDP. Whereas in the 1990s it rose by three percentage points (from 12.5% to 15.2%), over the past decade it climbed at a faster clip of four percentage points (from 15.2% to 19.1%) (see figure I.21). Based on the 2011 data and the limited data available for 2012 (mostly from budgets, not executions), the expansion in social spending has slowed, although the resources allocated to the social sectors have not declined in absolute terms.
Figure I.21 Latin America and the Caribbean (21 countries): social public spending as a share of total public spending,
and total public spending as a share of GDP, 1992-1993 to 2010-2011a
(Percentages)
25.0 24.7 25.9 26.0 25.2 24.5 24.426.2
29.0 29.2
12.5 13.9 13.8 14.8 15.2 15.6 15.9 17.4 18.8 19.2
50.056.2
53.457.0
60.563.4 65.3 66.2 64.7 65.9
30
40
50
60
70
80
90
100
0
5
10
15
20
25
30
35
40
1992
-199
3
1994
-199
5
1996
-199
7
1998
-199
9
2000
-200
1
2002
-200
3
2004
-200
5
2006
-200
7
2008
-200
9
2010
-201
1
Per
cent
age
of p
ublic
spe
ndin
g
Per
cent
age
of G
DP
Total public spending as percentage of GDP Social public spending as percentage of GDPSocial spending as a percentage of total public spending
Source: Economic Commission for Latin America and the Caribbean (ECLAC), social expenditure database.a Weighted average for the countries.
Social public spending has not grown evenly across sectors, however (see figure I.22). Generally speaking, the rise of almost 6.7 percentage GDP points is largely due to growth in social security and assistance (up by 3.2 percentage points). Social assistance is a small segment within this component, but its importance has grown (as discussed in section 1.C of this chapter). Growth in social security spending basically reflects the progressive ageing of the population along with expanded pension coverage. The other major increase in social public spending over the past 20 years has been in education, with a rise of 1.9 percentage points of GDP. Health care and particularly housing have shown only minor variations.
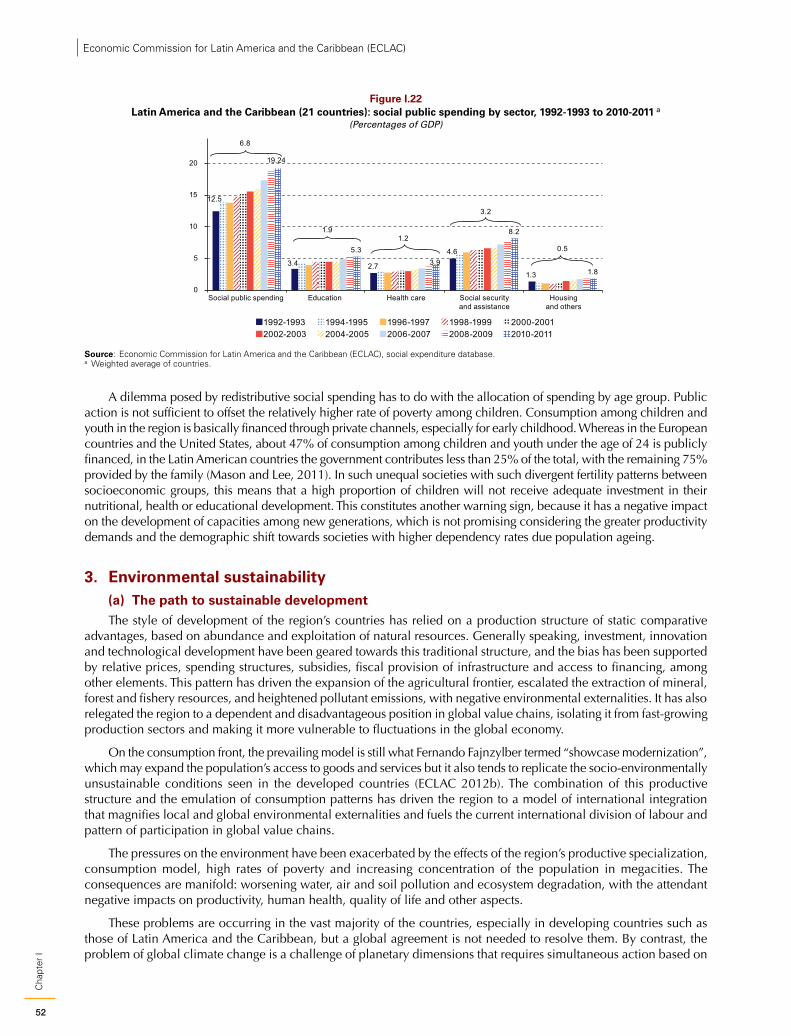
52
Cha
pter
IEconomic Commission for Latin America and the Caribbean (ECLAC)
Figure I.22 Latin America and the Caribbean (21 countries): social public spending by sector, 1992-1993 to 2010-2011 a
(Percentages of GDP)
12.5
3.4 2.7
4.6
1.3
19.24
5.3
3.9
8.2
1.8
0
5
10
15
20
Social public spending Education Health care Social securityand assistance
Housingand others
1992-1993 1994-1995 1996-1997 1998-1999 2000-20012002-2003 2004-2005 2006-2007 2008-2009 2010-2011
6.8
1.91.2
3.2
0.5
Source: Economic Commission for Latin America and the Caribbean (ECLAC), social expenditure database.a Weighted average of countries.
A dilemma posed by redistributive social spending has to do with the allocation of spending by age group. Public action is not sufficient to offset the relatively higher rate of poverty among children. Consumption among children and youth in the region is basically financed through private channels, especially for early childhood. Whereas in the European countries and the United States, about 47% of consumption among children and youth under the age of 24 is publicly financed, in the Latin American countries the government contributes less than 25% of the total, with the remaining 75% provided by the family (Mason and Lee, 2011). In such unequal societies with such divergent fertility patterns between socioeconomic groups, this means that a high proportion of children will not receive adequate investment in their nutritional, health or educational development. This constitutes another warning sign, because it has a negative impact on the development of capacities among new generations, which is not promising considering the greater productivity demands and the demographic shift towards societies with higher dependency rates due population ageing.
3. Environmental sustainability (a) The path to sustainable development The style of development of the region’s countries has relied on a production structure of static comparative
advantages, based on abundance and exploitation of natural resources. Generally speaking, investment, innovation and technological development have been geared towards this traditional structure, and the bias has been supported by relative prices, spending structures, subsidies, fiscal provision of infrastructure and access to financing, among other elements. This pattern has driven the expansion of the agricultural frontier, escalated the extraction of mineral, forest and fishery resources, and heightened pollutant emissions, with negative environmental externalities. It has also relegated the region to a dependent and disadvantageous position in global value chains, isolating it from fast-growing production sectors and making it more vulnerable to fluctuations in the global economy.
On the consumption front, the prevailing model is still what Fernando Fajnzylber termed “showcase modernization”, which may expand the population’s access to goods and services but it also tends to replicate the socio-environmentally unsustainable conditions seen in the developed countries (ECLAC 2012b). The combination of this productive structure and the emulation of consumption patterns has driven the region to a model of international integration that magnifies local and global environmental externalities and fuels the current international division of labour and pattern of participation in global value chains.
The pressures on the environment have been exacerbated by the effects of the region’s productive specialization, consumption model, high rates of poverty and increasing concentration of the population in megacities. The consequences are manifold: worsening water, air and soil pollution and ecosystem degradation, with the attendant negative impacts on productivity, human health, quality of life and other aspects.
These problems are occurring in the vast majority of the countries, especially in developing countries such as those of Latin America and the Caribbean, but a global agreement is not needed to resolve them. By contrast, the problem of global climate change is a challenge of planetary dimensions that requires simultaneous action based on
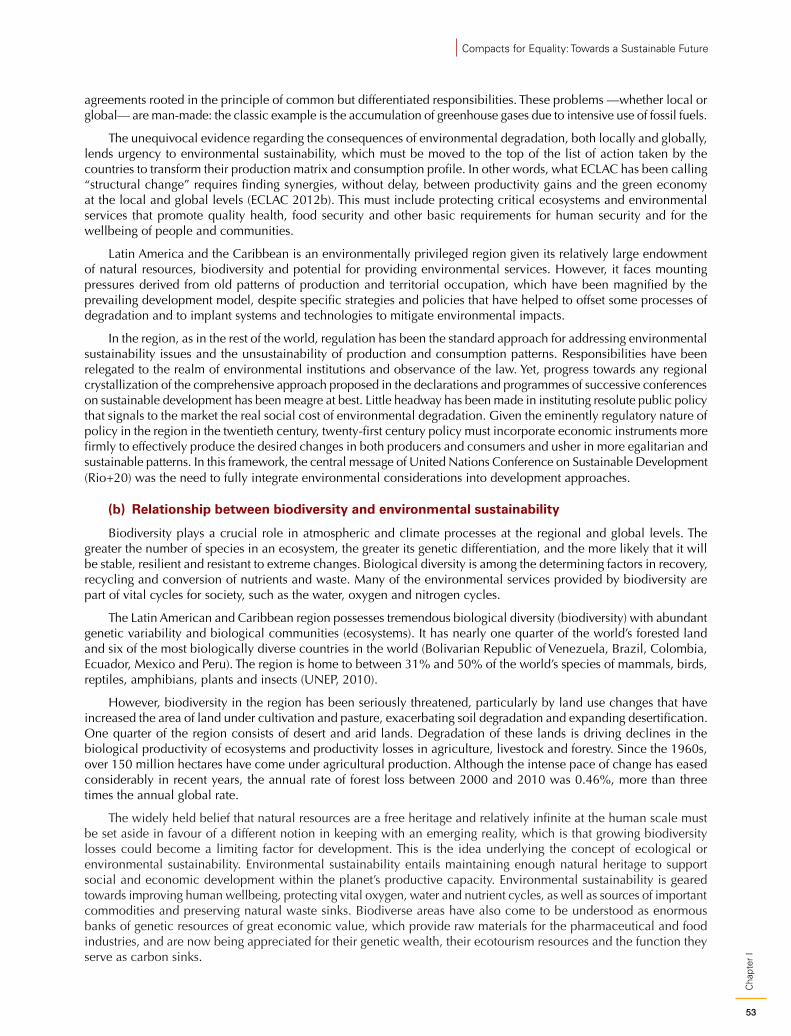
53
Cha
pter
I
Compacts for Equality: Towards a Sustainable Future
agreements rooted in the principle of common but differentiated responsibilities. These problems —whether local or global— are man-made: the classic example is the accumulation of greenhouse gases due to intensive use of fossil fuels.
The unequivocal evidence regarding the consequences of environmental degradation, both locally and globally, lends urgency to environmental sustainability, which must be moved to the top of the list of action taken by the countries to transform their production matrix and consumption profile. In other words, what ECLAC has been calling “structural change” requires finding synergies, without delay, between productivity gains and the green economy at the local and global levels (ECLAC 2012b). This must include protecting critical ecosystems and environmental services that promote quality health, food security and other basic requirements for human security and for the wellbeing of people and communities.
Latin America and the Caribbean is an environmentally privileged region given its relatively large endowment of natural resources, biodiversity and potential for providing environmental services. However, it faces mounting pressures derived from old patterns of production and territorial occupation, which have been magnified by the prevailing development model, despite specific strategies and policies that have helped to offset some processes of degradation and to implant systems and technologies to mitigate environmental impacts.
In the region, as in the rest of the world, regulation has been the standard approach for addressing environmental sustainability issues and the unsustainability of production and consumption patterns. Responsibilities have been relegated to the realm of environmental institutions and observance of the law. Yet, progress towards any regional crystallization of the comprehensive approach proposed in the declarations and programmes of successive conferences on sustainable development has been meagre at best. Little headway has been made in instituting resolute public policy that signals to the market the real social cost of environmental degradation. Given the eminently regulatory nature of policy in the region in the twentieth century, twenty-first century policy must incorporate economic instruments more firmly to effectively produce the desired changes in both producers and consumers and usher in more egalitarian and sustainable patterns. In this framework, the central message of United Nations Conference on Sustainable Development (Rio+20) was the need to fully integrate environmental considerations into development approaches.
(b) Relationship between biodiversity and environmental sustainability
Biodiversity plays a crucial role in atmospheric and climate processes at the regional and global levels. The greater the number of species in an ecosystem, the greater its genetic differentiation, and the more likely that it will be stable, resilient and resistant to extreme changes. Biological diversity is among the determining factors in recovery, recycling and conversion of nutrients and waste. Many of the environmental services provided by biodiversity are part of vital cycles for society, such as the water, oxygen and nitrogen cycles.
The Latin American and Caribbean region possesses tremendous biological diversity (biodiversity) with abundant genetic variability and biological communities (ecosystems). It has nearly one quarter of the world’s forested land and six of the most biologically diverse countries in the world (Bolivarian Republic of Venezuela, Brazil, Colombia, Ecuador, Mexico and Peru). The region is home to between 31% and 50% of the world’s species of mammals, birds, reptiles, amphibians, plants and insects (UNEP, 2010).
However, biodiversity in the region has been seriously threatened, particularly by land use changes that have increased the area of land under cultivation and pasture, exacerbating soil degradation and expanding desertification. One quarter of the region consists of desert and arid lands. Degradation of these lands is driving declines in the biological productivity of ecosystems and productivity losses in agriculture, livestock and forestry. Since the 1960s, over 150 million hectares have come under agricultural production. Although the intense pace of change has eased considerably in recent years, the annual rate of forest loss between 2000 and 2010 was 0.46%, more than three times the annual global rate.
The widely held belief that natural resources are a free heritage and relatively infinite at the human scale must be set aside in favour of a different notion in keeping with an emerging reality, which is that growing biodiversity losses could become a limiting factor for development. This is the idea underlying the concept of ecological or environmental sustainability. Environmental sustainability entails maintaining enough natural heritage to support social and economic development within the planet’s productive capacity. Environmental sustainability is geared towards improving human wellbeing, protecting vital oxygen, water and nutrient cycles, as well as sources of important commodities and preserving natural waste sinks. Biodiverse areas have also come to be understood as enormous banks of genetic resources of great economic value, which provide raw materials for the pharmaceutical and food industries, and are now being appreciated for their genetic wealth, their ecotourism resources and the function they serve as carbon sinks.
54
Cha
pter
IEconomic Commission for Latin America and the Caribbean (ECLAC)
Biodiversity cannot be kept intact. Therefore, in order to reconcile the objectives of social and economic development with the preservation of biological diversity, development models that work with biodiversity, and not at its expense, must be sought. This requires land use planning policies that support the selection of protected nature reserves, areas where productive rural areas maintain a medium level of biodiversity, and high-diversity corridors —biological corridors—interconnecting protected areas. The result is a mix of areas that offer different types of use and various levels of diversity. On this front, many of the region’s countries have made real efforts to conserve their natural wealth by establishing protected areas, especially under the Convention on Biological Diversity. Important regional efforts and experiences in this regard include the creation of the Mesoamerican Biological Corridor, in which Mexico and seven Central American countries participate, the expansion of the Serranía del Chiribiquete natural park in Colombia and that country’s policy of conservation in the Amazon region, as well as the tropical rainforest conservation programme in Brazil, which has spurred a strong expansion in protected areas in the region and has become the driving force in reducing deforestation in the Amazon region.
It is also now understood that the region showed signs in the past of a virtuous correlation between society and biodiversity. One example was the domestication of plants of tremendous economic value that were grown in species-rich areas inhabited by sophisticated ancient civilizations. This process was key in the development of agriculture and gave rise to hubs of origin of major crops such as maize, yucca, potatoes, peanuts, beans, squash, tomatoes, cacao, quinoa and others. An area of unfinished business is to protect these hubs of origin to conserve parent varieties whose genetic diversity could be the foundation of even greater biotechnological progress. And although it is true that there is still much to learn about biodiversity and its social and economic value, it is also the case, as Aldo Leopold stated, that we must not do with nature what we would not do while trying to solve a puzzle: lose the pieces before we know what it is all about.
Areas of great biodiversity provide local communities with a central repository of cultural symbols, and this is disrupted by infrastructure or investment projects which threaten or damage that biodiversity. This is true in the case of ecosystems and water resources under pressure by extractive industries, and the situation has been worsened by rising prices for mineral and hydrocarbon products, as well as by some technological innovations (such as deep-sea drilling), which have made it profitable to mine deposits that were previously economically unattractive, fuelling the number and intensity of socioenvironmental conflicts, as discussed in chapter VI. Among the environmental problems caused by the extractive industries are ground and surface water contamination, deforestation with the consequent loss of plant coverage, soil erosion and destabilization, and sedimentation of waterways, which alters the natural functioning of watersheds (UNEP, 2010). In addition, there is the risk of accidents, such as oil spills and breaches in tailings ponds. Mercury and arsenic contamination have been one consequence of gold mining and affect sensitive areas such as the Amazon basin.
Although the region’s countries have made considerable progress in creating environmental institutions and legislative frameworks that are more restrictive in terms of mineral exploration, there are enforcement weaknesses, especially because this type of production has garnered enormous earnings for the producing countries. Moreover, State capacities still suffer from serious limitations in terms of ability to review environmental impact assessments, oversee monitoring plans, close or abandon mines and provide solutions to the environmental liabilities of mining, restore damaged sites, ensure safety and prevent accidents, as well as in terms of corporate relations with indigenous communities and peoples. Against this backdrop, it is essential to work towards compacts that systematically promote the application of various principles that guarantee environmental preservation, as discussed in chapter VII. This requires consensus between investors, the State and stakeholder communities. Doing this work early on, during planning stages, helps to prevent problems, avoid conflicts and save resources.
(c) The region’s vulnerability to climate change and natural disasters
Atmospheric and oceanic temperatures have climbed, ice cover and glaciers have retreated, sea levels have risen and concentrations of greenhouse gases have increased. The expected impacts of these processes are significant for the Latin American and Caribbean region (see map I.1), and some are already being observed, in the form of extreme meteorological phenomena. Indeed, the incidence of climate-related disasters in the region increased by a factor of 2.4 between the periods 1970-1999 and 2000-2005, continuing the trend observed during the 1990s.
In Central America, the frequency of flooding has doubled in the past two decades (1990-2008) with respect to the period 1970-1989, and the frequency of tropical storms and large hurricanes has risen significantly (ECLAC, 2010b). In recent years, Colombia, Ecuador and Peru have been hit hard by the El Niño-Southern Oscillation (ENSO) phenomenon, which causes droughts or heavy rains.
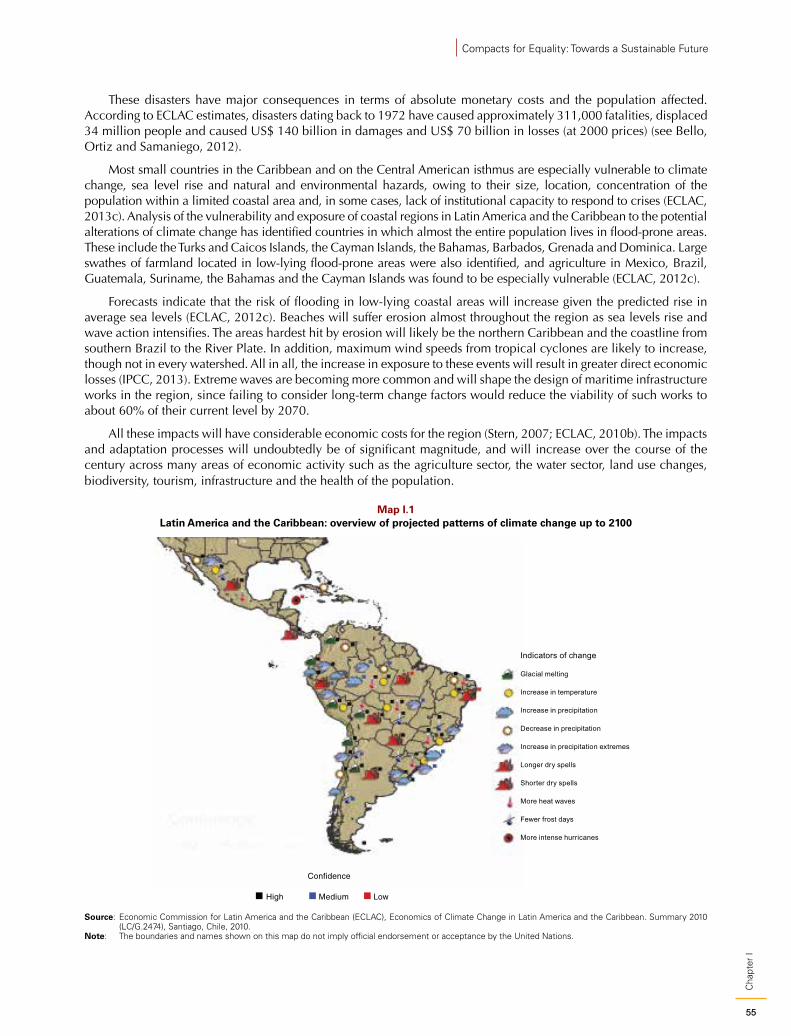
55
Cha
pter
I
Compacts for Equality: Towards a Sustainable Future
These disasters have major consequences in terms of absolute monetary costs and the population affected. According to ECLAC estimates, disasters dating back to 1972 have caused approximately 311,000 fatalities, displaced 34 million people and caused US$ 140 billion in damages and US$ 70 billion in losses (at 2000 prices) (see Bello, Ortiz and Samaniego, 2012).
Most small countries in the Caribbean and on the Central American isthmus are especially vulnerable to climate change, sea level rise and natural and environmental hazards, owing to their size, location, concentration of the population within a limited coastal area and, in some cases, lack of institutional capacity to respond to crises (ECLAC, 2013c). Analysis of the vulnerability and exposure of coastal regions in Latin America and the Caribbean to the potential alterations of climate change has identified countries in which almost the entire population lives in flood-prone areas. These include the Turks and Caicos Islands, the Cayman Islands, the Bahamas, Barbados, Grenada and Dominica. Large swathes of farmland located in low-lying flood-prone areas were also identified, and agriculture in Mexico, Brazil, Guatemala, Suriname, the Bahamas and the Cayman Islands was found to be especially vulnerable (ECLAC, 2012c).
Forecasts indicate that the risk of flooding in low-lying coastal areas will increase given the predicted rise in average sea levels (ECLAC, 2012c). Beaches will suffer erosion almost throughout the region as sea levels rise and wave action intensifies. The areas hardest hit by erosion will likely be the northern Caribbean and the coastline from southern Brazil to the River Plate. In addition, maximum wind speeds from tropical cyclones are likely to increase, though not in every watershed. All in all, the increase in exposure to these events will result in greater direct economic losses (IPCC, 2013). Extreme waves are becoming more common and will shape the design of maritime infrastructure works in the region, since failing to consider long-term change factors would reduce the viability of such works to about 60% of their current level by 2070.
All these impacts will have considerable economic costs for the region (Stern, 2007; ECLAC, 2010b). The impacts and adaptation processes will undoubtedly be of significant magnitude, and will increase over the course of the century across many areas of economic activity such as the agriculture sector, the water sector, land use changes, biodiversity, tourism, infrastructure and the health of the population.
Map I.1 Latin America and the Caribbean: overview of projected patterns of climate change up to 2100
Confidence
Indicators of change
Glacial melting
Increase in temperature
Increase in precipitation
Decrease in precipitation
Increase in precipitation extremes
Longer dry spells
Shorter dry spells
More heat waves
Fewer frost days
More intense hurricanes
High Medium Low
Source: Economic Commission for Latin America and the Caribbean (ECLAC), Economics of Climate Change in Latin America and the Caribbean. Summary 2010 (LC/G.2474), Santiago, Chile, 2010.
Note: The boundaries and names shown on this map do not imply official endorsement or acceptance by the United Nations.
56
Cha
pter
IEconomic Commission for Latin America and the Caribbean (ECLAC)
Despite having contributed little to cause global climate change, the region holds important opportunities for mitigating the problem that can also yield economic benefits. Latin America and the Caribbean has one of the cleanest energy supplies in relative terms. It generates electricity from hydropower at four times the global average. Other renewable energies, such as solar, wind, geothermal and wave power, although just emerging, have great potential in the region. The development of new technological options that promote low carbon intensity, as well as the economic costs of mitigation processes, will certainly be significant in areas such as energy, transportation and forest conservation, which will modify the current patterns of economic development (Galindo, 2009). Although these actions can have marginal mitigation effects at the global scale, they are important for ensuring environmentally sustainable development in the region. Building a culture of risk prevention and developing a large-scale climate change adaptation strategy are essential steps.
(d) Cities and their dynamics
Latin America and the Caribbean is a predominantly urban region. Of its 550 million people, 77% live in cities of more than 2,000 inhabitants, a rate that approaches 90% in the Southern Cone and is forecast to rise across the region to 85% by 2030. Cities with more than 20,000 inhabitants alone are home to two thirds of the region’s population, the highest rate in the world (ECLAC, 2012d). The system of cities in Latin America is highly varied in terms of size and conformation, but in general, the countries tend to have several megalopolises alongside strong urbanization and growing importance for medium-sized cities.
Cities have become the engines of the region’s economies and the source of numerous public goods that are key to the well-being and social cohesion of the population. It is estimated that between 60% and 70% of the GDP of Latin America and the Caribbean is generated in urban areas, where industry and services are usually concentrated (UN-Habitat, 2012). This output is further concentrated in just a few cities. The 40 largest cities in Latin America and the Caribbean generate over one third of regional GDP, and virtually half of that output comes from four megacities: São Paulo, Mexico City, Buenos Aires and Rio de Janeiro. Large cities are generally an aggregation of local municipalities and governments, which complicates urban management and planning (ECLAC 2012d). This is due, among other reasons, to the fact that the region relied on a highly centralized economic management model for decades, which tended to concentrate economic activity around the centres of political power (UN-Habitat, 2012).
Significantly, spatial and urban planning processes have weakened in the region and, in a context of poor public regulation, land use and social-spatial configuration are increasingly dictated by market forces, often alongside strong real estate speculation and private appropriation of urban rent. The result has been the emergence, on the one hand, of areas well equipped with public services, location, green spaces and people-centered landscapes and, on the other, low-cost housing farther and farther away from the city in response to spiralling urban land prices. Many large cities in Latin America have produced mass housing at great distances from urban centres and places of work and study, without adequate urban services or any sense of neighbourhood, which has escalated the level of conflict and eroded social cohesion in these areas. Mobility problems, too, have grown worse, with transportation spending on the rise in many households, and in extreme cases some housing even being abandoned. The region is now taking a critical second look at this model that prioritizes housing over urban community (Ziccardi, 2013). Thus, the symbolic vision of cities as places of equal opportunities and rights, of social engagement, where the city meets the citizen, is coming up against severe social-spatial segregation that limits contact and engagement between the various groups in society.
Addressing the rapid growth of cities, the weak supply of public goods and services and the implications for the environment and civic harmony is one of the priorities for the region. The deficiencies in urban planning are well known (Samaniego and others, 2009; Jordán and Martínez, 2009) and their environmental consequences are myriad, including an increase in the generation of refuse and solid and liquid waste, air pollution,19 unmet needs for access to safe drinking water and sanitation and pressures on adjacent ecosystems. At the same time, the deteriorating quality of the urban environment directly impacts the health and well-being of urban dwellers and their social inclusion.
19 Household pollution is an important factor in morbidity and mortality from respiratory disease in the region, but it also occurs in rural areas and is associated with burning biomass for heating and cooking. Its impact on health in the region is greater, though less recognized, than the impact of pollution from particulate matter and other gases found in cities. The worst affected countries are the Andean countries (Ecuador, Peru and the Plurinational State of Bolivia), some Central American countries and Haiti.
57
Cha
pter
I
Compacts for Equality: Towards a Sustainable Future
The production and consumption pattern in the region’s cities is fossil-fuel-intensive. As a result, over 100 million people in the region are exposed to air pollution levels that exceed WHO recommended limits (Cifuentes and others, 2005), which causes serious health problems. Particulate emissions, including precursors such as sulfur dioxide and nitrogen oxides, have various points of origin. Transportation is the main source of pollution, both directly and indirectly by loosening and stirring up dust. Paving roads, reducing sulfur content and making cleaner fuels, implementing vehicle inspection systems and modernizing the automotive fleet are some steps in the right direction for resolving these problems, but they must be strengthened. The truck and bus fleet is very old and poorly maintained and growing congestion is increasing emissions, production losses and other externalities.
Fixed sources, or industrial emissions, are the second largest source of emissions, although most of the cities affected have put in place and enforce rules and standards. The geographical location of some cities, such as Santiago and Mexico City, whose climate and topography generally hinder ventilation, generates episodes of thermal inversion that reduce the atmosphere’s natural capacity to disperse pollutants, periodically exposing the population to critical levels of pollutants.
Thus, the region’s urban population is up against a double environmental burden: the relatively recent and growing risks of air pollution and congestion have joined with the traditional threats associated with lack of access to safe drinking water and inadequate waste disposal. Although progress has been made —especially in urban centres— in terms of water and sanitation, some 130 million people in the region still lack these services, a figure similar to the number of people living in slums. Only 14% of wastewater is treated, and the corresponding figure for refuse is just 23%. Over the past 30 years, the volume of solid waste generated in the region has doubled, and the proportion of organic and toxic material has climbed. These conditions, against a backdrop of poverty, have a deleterious impact on health. Gastrointestinal illnesses are one of the main causes of child mortality in the region, an indicator that correlates directly and significantly with levels of poverty and inversely with the level of sanitation coverage, as well as with access to safe drinking water. In the countries where wastewater treatment has improved, there has been a notable reduction in the incidence of diseases such as hepatitis, cholera and typhoid fever.
An area of particular vulnerability is the large percentage of cities located on the coast or along very polluted waterways that empty into the ocean and the fact that nearly half of the region’s population lives within 100 km of the coast. It should come as no surprise, then, that coastal degradation and marine pollution are among the region’s worst environmental problems. Population pressures, infrastructure development in general and coastal tourism in particular have done much harm to coastal and marine ecosystems. Coral reefs have also been badly affected. In the Caribbean, 61% of reefs are threatened by tourism pressure and pollution, among other factors. The loss of these natural barriers makes coastal human settlements more vulnerable to meteorological phenomena. In general, the region’s oceans are affected by water pollution from urban and agricultural activities carried out on land, which increase nutrient loads and cause eutrophication, due to urban expansion and the lack of wastewater treatment, lack of control of substances discharged from ships and oil spills, and the lower volumes of river water emptying into the ocean, which raises salinity levels.
In the framework of these problems and challenges now facing the region, among governments and urban social movements and academia alike, the “urban question” is being reframed from a new vantage point: the right to the city as a macro public good, understood as the right of all city dwellers to social equality, the use and enjoyment of urban assets, expansion and enjoyment of public space, a healthy environment, democracy that is participatory and deliberative, the recognition of diversity and intercultural relations in urban contexts. This new vision is beginning to inspire urban planning, development and legislative processes. Cities that are already providing an emblematic example in this regard include Medellín and Bogotá in Colombia, Rosario in Argentina, Curitiba and Porto Alegre in Brazil and Mexico City, with its Charter for the Right to the City.
Lastly, land use planning and environmental and economic zooming play an increasingly important role in achieving the sustainable development of cities, and in avoiding the superposition of economic activities in countries with large natural-resource endowments. This will also help to reduce socioenvironmental conflicts.
58
Cha
pter
IEconomic Commission for Latin America and the Caribbean (ECLAC)
Box I.1 Cities: places of interconnections, places of sustainabilities
Cities are not merely a collection of households and production units for serving the market or for public consumption. They are a creation in and unto themselves, the product of structural factors and individual and collective behaviours, but also a condition and cause of behaviours and attitudes. Cities, according to a classic definition, are society manifested in physical form.
Private life unfolds in households but is not independent from the determinants of public space. Thus, consumption options and the activities of private life depend on the quantity and quality of services that the public space offers. Thus, a house can have many or few doors and windows to the street, depending on refuse collection, or many or few security bars and devices, according to the perception of security.
Private consumption will be the largest part of total consumption in the economy unless adequate public services are provided in the urban environment. In Latin America and the Caribbean, private household consumption makes up 70% of total consumption on average, compared with 53% in the OECD member countries (see chapter IV). The region’s relative poverty and tremendous inequality can be expressed in a simple equation: private household consumption, but not collective consumption, increases in the urban environment. Houses are increasingly equipped with goods from the “Fordist model” of consumption —automobiles, televisions, refrigerators, freezers, washing machines, vacuum cleaners, stoves— and “post-Fordist” goods —computers, mobile phones, tablets and game consoles. However, the city has insufficient productive and social infrastructure for this new affluence. The streets are clogged with automobiles, but the road system is deficient. Private consumption extends beyond the household, but collection and treatment systems cannot handle the volume of waste. Detergents and oils flow into the sewer system, but sanitation infrastructure is lacking. Water sources are more and more remote, reflecting the encroaching contamination of water tables, which raises the cost of this resource.
A similar phenomenon is taking place with regard to production units, which move a rising tide of manufactured goods or goods for processing, and even when environmental laws are observed —not always the case— air, water and soil pollution is on the rise. Pollution affects not only the urban and natural environments but also the work environment. Greenhouse gas emissions, particulate emissions and discharges of toxic liquids are an unfortunate inheritance of modern production and consumption models.
Great contradictions arise in this process. Firms struggle to increase their internal productivity but external diseconomies drive up their costs and reduce their competitiveness, inasmuch as the roads and highways used for shipping are overloaded and frequent flooding on access roads makes distribution difficult, increases job absenteeism and interrupts supply for production or commercial sale. Unions are fighting to shorten workdays but congested roads increase freight times, and real wage increases are lost as freight costs continue to escalate, all in exchange for increasingly poor service.
The care economy, which is now basically guaranteed in the private realm through paid or unpaid domestic work, is not supported by the supply of public health, education, transportation or security services. Expanding the public supply of care services without expanding urban mobility may not be fully effective; on the contrary, it may further impede the circulation of people and goods. These are necessary measures that must be implemented hand in hand.
It is crucial to increase urban mobility by providing clean mass transit. Better public services are needed for refuse collection and liquid and solid waste treatment, as well as maintaining and expanding parks, gardens, museums, sporting arenas and cultural facilities. All this is crucial for increasing the beneficial use of that macro public good that is the city and its spaces.
Source: Economic Commission for Latin America and the Caribbean (ECLAC).
C. Final commentsThe challenges of sustainable development in its various dimensions have been discussed throughout this chapter. It is especially troubling that the emerging pattern is a low-growth equilibrium, in which lack of capacities, inequality and poor productivity are reinforcing each other in a vicious cycle. Given that the region succeeded in raising its growth rates in the 2000s based on a production structure inherited from previous decades, this same structure could impose constraints on growth in a less favourable global economy, especially taking into account the swift pace of technological progress and the impact of the new technological paradigms on international competitiveness. And although poverty and inequality have fallen sharply, they remain very high, and there are signs that the downtrend may come to a halt in the next few years. In this framework, the challenge ahead is to advance structural change while preserving environmental sustainability and building new institutions that promote equality in its various dimensions.
As noted earlier, institutions are key to achieving structural change with equality: it falls to institutions to produce the agreements and arrangements needed to harmonize change in the production matrix, along with broader equality and environmental sustainability. This includes both the policy realm and changes in the rules of behaviour and engagement, including patterns of demand. Clearly, the market is not the institution that will promote that harmonization, particularly in the presence of an equilibrium that, rather, links low complexity in the production matrix with income inequality and low capacity development.
In the short run, it may seem more sensible to import green technologies than to make an endogenous effort to develop at least some of the capacities needed to produce them. In the long run, however, without these capacities
59
Cha
pter
I
Compacts for Equality: Towards a Sustainable Future
and without much higher investment, new sectors will not be competitive, nor will high-productivity jobs be created in the formal labour market. Unless endogenous capacities are developed, the growth path will continue to be rooted in natural resources and activities (such as mining) that are highly intensive in energy and other natural resources (such as water). The growth pattern cannot be sustainably transformed simply by importing a different type of capital and technological assets; endogenous capacities are the key to new growth paths with equality. Without these capacities, short-term advantages will be achieved at the cost of long-term employment and productivity problems.
Nothing is harder than bringing about structural and institutional change that requires a broad redistribution of both resources and power. The revenue that the State needs to implement policies for structural change has to come from those sectors that profit from the current patterns of economic growth (which have generated such large inequalities), and have power to influence in the political and economic arenas. These resources should also be used to finance quality public goods and services.
However, without the support of actors who have real power in the current structure, is it even realistic to put forward a new development policy? Four factors are proposed here that can work in favour of a new development policy for building structural change on the basis of equality in its various dimensions.
The first is the consolidation of democratic systems in all the region’s countries as the institution par excellence for regulating the political game. As with all historic processes, there are weaknesses and threats, as well as swifter progress in some countries than in others. Ways have to be found to correct the concentrating dynamics of the market in light of social demands for greater equality. Highly segregated societies tend to be more unstable and to generate strong political pendulums. Ensuring that the population has employment with rights and social protection is a way to promote political stability, which in turn contributes to economic stability.
Second, policy convergence is key to generating synergies between the various dimensions examined and thus to generating sustainable economic, social and environmental conditions. In the framework of a production transformation strategy linked to the provision of inclusive public services, creating opportunities for investment in clean energy technologies is an integral part of structural change. A region that has numerous megadiverse countries20 and a stock of deep traditional knowledge embedded in indigenous communities on the use of biodiversity and ecosystems can unleash virtuous circles between culture, technology and environmental sustainability. In this vein, macroeconomic policies must be tuned to industrial, social and environmental policies to achieve robust investment with technological progress as a central pillar of the structural change process.
Third, it is important to realize that the region is at a crossroads. The growth pattern of the 2000s, which was relatively successful, is beginning to show fissures and vulnerabilities, and change is needed. Fissures provide opportunities to reshape institutional arrangements and forge new social and political agreements that are compatible with a development pattern founded on both more equality and more sustainability. The success of democratic societies lies in recognizing these challenges and negotiating the establishment of new institutions that adapt to new scenarios or foster the necessary changes.
Fourth, the new development policy can be backed by a new international agenda that has increasingly shifted from poverty as the top priority to concern about inequality, from the centrality of economic growth to considerations of environmental sustainability, from an agenda targeting the poorest countries to a universal agenda for a paradigm shift.
Therein lies the crucial importance of collective accords or compacts in efforts to reorient development, as discussed in the final chapter. Compacts are agreements at various levels that seek to generate institutions in the broadest sense, that is to say, a set of rules or patterns of behaviour around which the expectations of social and political actors converge, and that effectively structure or coordinate their interactions. These compacts must change the policy and incentive framework to transform the existing structure and old institutions. They are a new point of social and political engagement for the stakeholders to achieve a collective vision on a path of high productivity with equality and environmental sustainability.
20 Mega-diverse countries are rich in varieties of plant and animal species, habitats and ecosystems.
60
Cha
pter
IEconomic Commission for Latin America and the Caribbean (ECLAC)
BibliographyAravena, Claudio and Juan Alberto Fuentes (2013), “El desempeño mediocre de la productividad laboral en América
Latina: una interpretación neoclásica”, Macroeconomía del Desarrollo series, No. 140 (LC/L.3725), Santiago, Chile, Economic Commission for Latin America and the Caribbean (ECLAC).
Azevedo, Joao Pedro and others (2013), “Fifteen years of inequality in Latin America: how have labor markets helped?”, Policy Research Working Paper, No. 6384, Washington, D.C., World Bank.
Bello, O., L. Ortiz and J. Samaniego (2012), “La estimación de los efectos de los desastres en América Latina, 1972-2010”, Santiago, Chile, Economic Commission for Latin America and the Caribbean (ECLAC), unpublished.
Bustillo, Inés and Helvia Velloso (2013), “Debt financing rollercoaster: Latin American and Caribbean access to international bond markets since the debt crisis, 1982-2012”, Libros de la CEPAL, No. 119 (LC/G.2570-P), Santiago, Chile, Economic Commission for Latin America and the Caribbean (ECLAC). United Nations publication, Sales No. E.13.II.G.12.
Cecchini, Simone (2013), “Transferências Condicionadas na América Latina e Caribe: Da Inovação à Consolidação”, Programa Bolsa Família: uma década de inclusão e cidadania, T. Campello and M. Côrtes Neri (eds.), Brasilia, Institute of Applied Economic Research (IPEA).
Cecchini, Simone and Aldo Madariaga (2011), “Programas de transferencias condicionadas: balance de la experiencia reciente en América Latina y el Caribe”, Santiago, Chile, Economic Commission for Latin America and the Caribbean (ECLAC).
Cecchini and others (2012), “Vulnerabilidad de la estructura social en América Latina: medición y políticas públicas”, Realidad, Datos y Espacio. Revista Internacional de Estadística y Geografía, vol. 3, No. 2, May-August.
Céspedes, Luis Felipe and Sergio Poblete (2011), “Política fiscal en países exportadores de bienes primarios: la experiencia chilena”, Volatilidad macroeconómica y respuestas de políticas, José María Fanelli, Juan Pablo Jiménez and Osvaldo Kacef (comps.), Project Documents, No. 396 (LC/W.396), Santiago, Chile, Economic Commission for Latin America and the Caribbean (ECLAC).
Cifuentes, Luis A. and others (2005), Urban Air Quality and Human Health in Latin America and the Caribbean, Washington, D.C., Inter-American Development Bank (IDB).
De la Torre, Augusto, Julian Messina and Samuel Pienknagura (2012), The Labor Market Story Behind Latin America’s Transformation, LAC Semiannual Report, No. 11884, Washington, D.C., World Bank.
De la Torre, Augusto and others (2013), Latin America and the Caribbean as Tailwinds Recede: In search of higher growth, Washington, D.C., World Bank.
ECLAC (Economic Commission for Latin America and the Caribbean) (2013a), Social Panorama of Latin America, 2013 (LC/G.2580), Santiago, Chile. United Nations publication, Sales No. E.14.II.G.6.(2013b), Economic Survey of Latin America and the Caribbean, 2013 (LC/G.2574-P), Santiago, Chile. (2013c), Sustainable Development in Latin America and the Caribbean. Follow-up to the United Nations development agenda beyond 2015 and to Rio+20 Preliminary version (LC/L.3590/Rev.1), Santiago, Chile.(2013d), Preliminary Overview of the Economies of Latin America and the Caribbean, 2013 (LC/G.2581-P), Santiago, Chile.(2012a), Economic Survey of Latin America and the Caribbean, 2010-2011, Santiago, Chile.(2012b), Structural Change for Equality: an integrated approach to development (LC/G.2524(SES.34/3)), Santiago, Chile.(2012c), “Efectos del cambio climático en la costa de América Latina y el Caribe. Impactos”, Project Documents, No. 484 (LC/W.484), Santiago, Chile.(2012d), Population, Territory and Sustainable Development (LC/L.3474(CEP.2/3)), Santiago, Chile. (2011), Social Panorama of Latin America 2011 (LC/G.2514-P), Santiago, Chile.(2010a), Social Panorama of Latin America, 2010 (LC/G.2481-P), Santiago, Chile. United Nations publication, Sales No. E.11.II.G.6. (2010b), Economics of Climate change in Latin America and the Caribbean. Summary 2010 (LC/G.2474), Santiago, Chile.(2007), Social Cohesion: inclusion and a sense of belonging in Latin America and the Caribbean (LC/G.2335), Santiago, Chile.
ECLAC/OIJ (Economic Commission for Latin America and the Caribbean/Ibero-American Youth Organization) (2008), Juventud y cohesión social en Iberoamérica: un modelo para armar (LC/G.2391), Santiago, Chile.(2004), La juventud en Iberoamérica: tendencias y urgencias (LC/L.2180), Santiago, Chile.
61
Cha
pter
I
Compacts for Equality: Towards a Sustainable Future
Fiszbein, Ariel and Norbert Schady (2009), “Conditional Cash Transfers: Reducing Present and Future Poverty”, Policy Research Report, No. 47603, Washington, D.C., World Bank.
Galindo, Luis Miguel (2009), La economía del cambio climático en México: Síntesis, Mexico City, Secretariat of the Environment and Natural Resources.
Gasparini, Leonardo and others (2012), “Educational upgrading and returns to skills in Latin America: evidence from a supply-demand framework, 1990-2010”, IZA Discussion Papers, No. 6244, Bonn, Institute for the Study of Labor (IZA).
Gómez Sabaini, Juan Carlos and Darío Rossignolo (2014), “La tributación sobre las altas rentas en América Latina”, Estudios y Perspectivas series, No. 13 (LC/L.3760), Montevideo, Oficina de la CEPAL en Montevideo.
Hausmann, Ricardo and Michael Gavin (1996), “Asegurar la estabilidad y el crecimiento en una región propensa a las sacudidas: los retos de políticas para América Latina”, Working Document, No. 4021, Washington, D.C., Inter-American Development Bank (IDB).
IPCC (Intergovernmental Panel on Climate Change) (2013), “Summary for Policymakers, Climate Change 2013: The Physical Science Basis. Contribution of Working Group I to the Fifth Assessment Report of the Intergovernmental Panel on Climate Change, T. F. Stocker and others (eds.), Cambridge, Cambridge University Press.
Jiménez, Luis Felipe and Sandra Manuelito (2013), “Rasgos estilizados de la relación entre inversión y crecimiento en América Latina y el Caribe, 1980-2012”, Macroeconomía del Desarrollo series, No. 136 (LC/L.3704), Santiago, Chile, Economic Commission for Latin America and the Caribbean (ECLAC).
Jordán, Ricardo and Rodrigo Martínez (2009), “Pobreza y precariedad urbana en América Latina y el Caribe. Situación actual y financiamiento de políticas y programas”, Project Documents, No. 245 (LC/W.245), Santiago, Chile, Economic Commission for Latin America and the Caribbean (ECLAC).
Joumard, Isabelle, Mauro Pisu and Debbie Bloch (2012), “Tackling income inequality: the role of taxes and transfers”, OECD Journal: Economic Studies, vol. 2012, No. 1, 4 January.
López-Calva, Luis Felipe and Nora Lustig (2010), Declining Inequality in Latin America: A Decade of Progress?, Washington, D. C., Brookings Institution Press.
Lustig, Nora and others (2013), “The impact of taxes and social spending on inequality and poverty in Argentina, Bolivia, Brazil, Mexico, Peru and Uruguay: An overview”, Tulane Economics Working Paper Series, No. 1313.
Manuelito, Sandra and Luis Felipe Jiménez (2013), “La inversión y el ahorro en América Latina: nuevos rasgos estilizados, requerimientos para el crecimiento y elementos de una estrategia para fortalecer su financiamiento”, Macroeconomía del Desarrollo series, No. 129 (LC/L.3603), Santiago, Chile, Economic Commission for Latin America and the Caribbean (ECLAC).
Mason, Andrew and Ronald Lee (2011), “El envejecimiento de la población y la economía generacional: Resultados principales”, Project Documents, No. 442 (LC/W.442), Santiago, Chile, Economic Commission for Latin America and the Caribbean (ECLAC).
Pineda-Salazar, Ramón and Rodrigo Cárcamo-Díaz (2013), “Política monetaria, cambiaria y macroprudencial para el desarrollo: volatilidad y crecimiento en América Latina y el Caribe, 1980-2011”, Macroeconomía del Desarrollo series, No. 142 (LC/L.3733), Santiago, Chile, Economic Commission for Latin America and the Caribbean (ECLAC).
Roffman, Rafael and M. Laura Oliveri (2012), “Pension coverage in Latin America. Trends and determinants”, Social Protection and Labor Discussion Paper, No. 1217, Washington, D. C., World Bank.
Samaniego, Joseluis (coord.) (2009), Climate change and development in Latin America and the Caribbean. Overview 2009 (LC/L.3140), Santiago, Chile, Economic Commission for Latin America and the Caribbean (ECLAC), February.
Sánchez, Ricardo J. and Daniel E. Perrotti (2011), “La brecha de infraestructura en América Latina y el Caribe”, Recursos Naturales e Infraestructura series, No. 153 (LC/L.3342), Santiago, Chile, Economic Commission for Latin America and the Caribbean (ECLAC).
Stern, Nicholas (2007), The Economics of Climate Change: The Stern Review, Cambridge University Press.UN-Habitat (United Nations Human Settlements Programme) (2012), State of Latin American and Caribbean Cities:
Towards a new urban transition, Nairobi.UNEP (United Nations Environment Programme) (2010), Latin America and the Caribbean: Environment Outlook
(GEO ALC 3), Panama City, UNEP Regional Office for Latin America and the Caribbean.Weller, Jürgen and Cornelia Kaldewei (2013), “Empleo, crecimiento sostenible e igualdad”, Macroeconomía del
Desarrollo series, No. 145 (LC/L.3743), Santiago, Chile, Economic Commission for Latin America and the Caribbean (ECLAC).
Ziccardi, Alicia (2013), “Palabras en la instalación del Consejo Nacional de Vivienda de México”, 7 October.
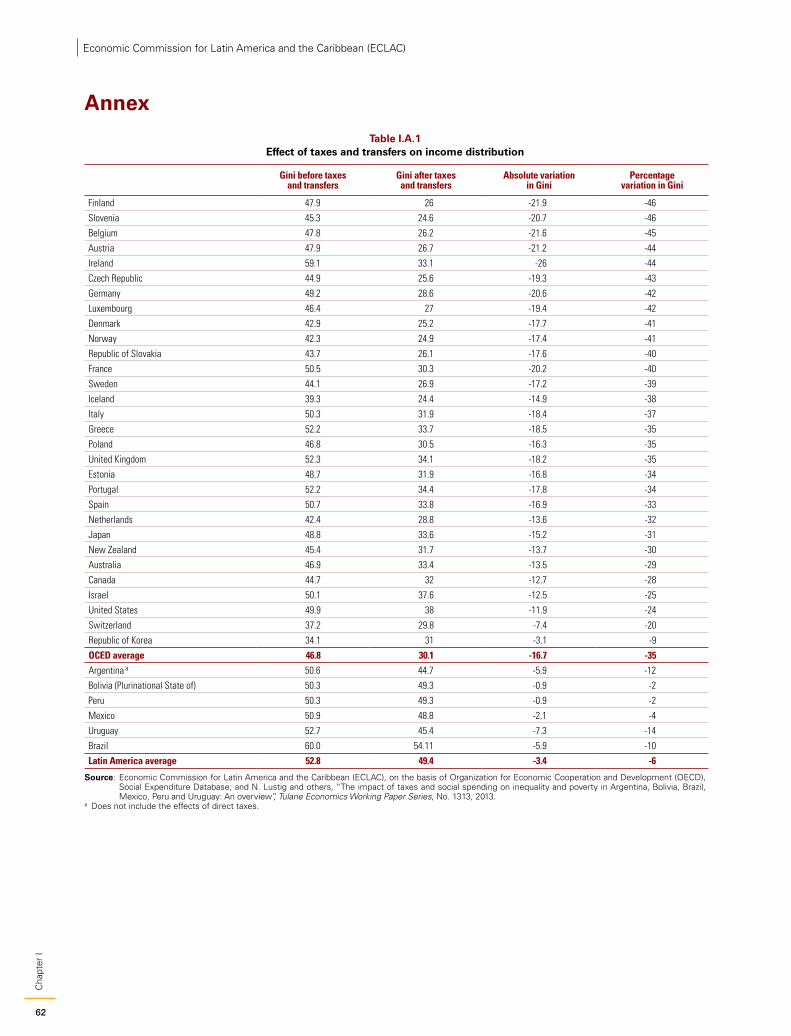
62
Cha
pter
IEconomic Commission for Latin America and the Caribbean (ECLAC)
Annex
Table I.A.1 Effect of taxes and transfers on income distribution
Gini before taxes and transfers
Gini after taxes and transfers
Absolute variation in Gini
Percentage variation in Gini
Finland 47.9 26 -21.9 -46
Slovenia 45.3 24.6 -20.7 -46
Belgium 47.8 26.2 -21.6 -45
Austria 47.9 26.7 -21.2 -44
Ireland 59.1 33.1 -26 -44
Czech Republic 44.9 25.6 -19.3 -43
Germany 49.2 28.6 -20.6 -42
Luxembourg 46.4 27 -19.4 -42
Denmark 42.9 25.2 -17.7 -41
Norway 42.3 24.9 -17.4 -41
Republic of Slovakia 43.7 26.1 -17.6 -40
France 50.5 30.3 -20.2 -40
Sweden 44.1 26.9 -17.2 -39
Iceland 39.3 24.4 -14.9 -38
Italy 50.3 31.9 -18.4 -37
Greece 52.2 33.7 -18.5 -35
Poland 46.8 30.5 -16.3 -35
United Kingdom 52.3 34.1 -18.2 -35
Estonia 48.7 31.9 -16.8 -34
Portugal 52.2 34.4 -17.8 -34
Spain 50.7 33.8 -16.9 -33
Netherlands 42.4 28.8 -13.6 -32
Japan 48.8 33.6 -15.2 -31
New Zealand 45.4 31.7 -13.7 -30
Australia 46.9 33.4 -13.5 -29
Canada 44.7 32 -12.7 -28
Israel 50.1 37.6 -12.5 -25
United States 49.9 38 -11.9 -24
Switzerland 37.2 29.8 -7.4 -20
Republic of Korea 34.1 31 -3.1 -9
OCED average 46.8 30.1 -16.7 -35Argentina a 50.6 44.7 -5.9 -12
Bolivia (Plurinational State of) 50.3 49.3 -0.9 -2
Peru 50.3 49.3 -0.9 -2
Mexico 50.9 48.8 -2.1 -4
Uruguay 52.7 45.4 -7.3 -14
Brazil 60.0 54.11 -5.9 -10
Latin America average 52.8 49.4 -3.4 -6
Source: Economic Commission for Latin America and the Caribbean (ECLAC), on the basis of Organization for Economic Cooperation and Development (OECD), Social Expenditure Database; and N. Lustig and others, “The impact of taxes and social spending on inequality and poverty in Argentina, Bolivia, Brazil, Mexico, Peru and Uruguay: An overview”, Tulane Economics Working Paper Series, No. 1313, 2013.
a Does not include the effects of direct taxes.
Social and labour gaps
Part 2
Introduction
Chapter IIEquality and inequality in Latin America and the Caribbean
A. Equality of resources: income distributionB. Equality of capabilities: some fundamental componentsC. Relational issues: school and residential segregationD. Equality, autonomy and mutual recognition: contributions from the gender perspectiveE. Profound inequalities: indigenous peoplesF. Equality, sociability and conflict: people's perceptionsG. Measuring equality: some challengesH. Final remarks
BibliographyAnnexMethodological annex
Chapter IIIThe world of work: The master key for equality
A. Recent labour market trends: employment, income and productivityB. A structural look at productivity gapsC. How the minimum wage furthers income equalityD. Gender inequalities: labour market participation and incomeE. Unpaid workF. The labour market and indigenous peoples: ethnic and gender inequalities G. Pension system affiliationH. Work, production structure and equality: closing gaps
BibliographyAnnex

Rethinking equality
1. The ECLAC vision for equality As put forth in Time for equality: closing gaps, opening trails, equality as a value is at the ideological core of modernity. First, the quest for equality is part of the drive to abolish privileges and establish equal rights for all individuals, regardless of origin, affiliations or position in society. And second, it calls not only for universal civil and political rights but also for advancing towards distributive justice in which everyone enjoys the benefits of progress and is recognized as equal in rights and dignity.
Time for equality held that equal rights, opportunities and well-being engender a greater sense of belonging to society, which stands in contrast to a late modernity that tends towards fragmentation, alienation and exclusion. Equality stands at the crossroads between economic growth, social inclusion and recognition of diversity. Time for equality also advocated a kind of development that forges a positive link between greater equality and gains in productivity, capacities and sustainable growth. This approach was further developed in Structural Change for Equality: An integrated vision of development.
The Latin American and Caribbean region faces formidable challenges. Despite recent progress it still has the worst income distribution in the world, along with multiple, mutually reinforcing inequalities. Some of these are discussed here in detail: inequalities in income; gaps in capacity development, in integration into the world of work and in access to social protection systems and networks of relationships; gender, ethnicity and generation gaps; gaps in access to power, in public visibility and in participation in policy deliberation forums; and gaps in quality of life, in healthy environments, in time availability and in recognition and respect.
Equality as a core value was left out of the development lexicon for decades; the very term was precluded by the rise of a model geared towards market-based solutions and the shrinking social functions of the State. Things have changed, however: equality, from a variety of perspectives, is back on the agenda. It cannot be ignored that in Latin America and the Caribbean changes in the political map and in electoral preferences, along with citizen movements, mark a clear turning point driving the demand for greater equality. At this pivotal moment in which voters combine with stakeholders and rights with mobilizations, the banner of equality is raised again, higher this time on the strength of collective subjects’ demands for recognition, dignity and autonomy. The sense of secular violation of social rights and of being rendered invisible by exclusion and segregated by a system that is perceived as one where the privileges of a few come at the expense of others, turns the demand for equality into a demand for dignity. Or, conversely, it is indignation that drives this talk of equality.
Associating equality with dignity is not new: indeed, it is at the root of republican modernity and the Enlightenment. Equality also extends to participation if it is understood that equal dignity, translated into rights, resources, opportunities and capacities, means being an active party to decision-making, not just enjoying the resources and benefits thereof. The ECLAC vision of equality is in line with this. The closing part of this document focuses on how strategic visions of a more egalitarian and sustainable development can be built into the rationale for collective accords between stakeholders.
Introduction
65
Intr
oduc
tion
Equality entails mutual recognition among parties of equal dignity. It also means acknowledging shared vulnerabilities that must be addressed together. Part 2 of the document reviews many dimensions of equality. It provides comprehensive information on the relative and absolute distribution of income, gaps in living conditions and reproduction, health, education, inclusion in the information society, school and residential segregation, gender and ethnicity gaps and citizen perceptions of equality and inequality.
Chapter III examines the many gaps in the world of work and how they converge to reproduce inequality. Like Chapter II, it highlights recent developments (in jobs, unemployment, income and productivity) but also flags persistent gaps and challenges on the road to overcoming them in a lower-growth scenario. Here the focus is on inequalities that reflect structural components of the world of work, especially the link between labour market and production structure. Chapter III also assesses the minimum wage as an institutional component and its impact on labour inequality, and it takes a closer look at equality gaps in the world of work from the perspective of gender, ethnicity, access to social security and unpaid work.
Discussing equality in practical terms leads to policies for recognition as well as redistributive policies. Recognition of difference cannot be a euphemism for acceptance of inequality. And risks should be socialized and reduced in the fairest and most timely manner. That is why one of the axes of the pro-equality policy that ECLAC has been advocating is the expansion of social protection systems. Behind these policies lies the conviction that equality entails forms of coexistence where priority should be given to reallocating resources and services so as to narrow entitlement gaps.
2. Equality in terms of autonomy with reciprocal recognitionAutonomy is one of the most cherished values of modern times. Different visions of development encompass different meanings of autonomy, ranging from possessive individualism and liberal utilitarianism linking autonomy to profit maximization and personal gain; to the human development approach that prioritizes individual and group capabilities and freedom to discern the best and worst alternatives (or those with the highest ethical value) for individual and collective life projects. In this latter sense, grounding the issue in both the Kantian tradition of moral philosophy and Rawls’ work on political philosophy gives individuals the capacity to govern their behaviour by rules that transcend self-interest, and to make laws and be guided by them so that everyone can pursue their life aspirations provided that they do not keep the others from doing the same. From this approach, autonomy involves both the search for and the fulfilment of the idea of the good life, and the commitment to equitable cooperation to put this principle into universal practice.
This idea of cooperation for the good life has been reflected in various chapters of this document: in the world of paid and unpaid work as discussed in chapter III; in consumption and the environment; and in agreements between stakeholders to establish more sustainable and egalitarian forms of development.
This vision of autonomy sees reciprocal recognition and differentiated vulnerability as two sides of the same coin. Broadening protection against vulnerability and risk while, at the same time, developing capacities and life options requires combining solidarity and autonomy. This draws a map for comprehensive policy action: from tax reforms to policies on production, social protection, employment, education, connectivity and affirmative action. In this framework, redistributive mechanisms must reflect the principle of mutual recognition among citizens to provide, through public action, opportunities for all individuals to lead autonomous lives.
To the extent that autonomy entails precisely this solidarity and reciprocal recognition, a development approach promoting autonomy must hold equality at its very heart. It calls for forms of organization and agreements that minimize vulnerabilities through cooperation and the distribution of an array of resources. This principle underlies both solidarity-based and contributory mechanisms in areas such as health and social security. Thus, belonging to social networks stems precisely from the need to promote autonomy alongside others and mitigate vulnerability to others.
Autonomy with reciprocal recognition is, in the ECLAC approach to development, the constituent value of the individual that all policies should be geared to achieve. To that end, inclusion and recognition should be built into development policies. They are complementary sides of the coin of government action in that such action recognizes the importance of developing capacities and opportunities to expand projects that people value while recognizing that dignity is inherent to all and that dignity entails reciprocal recognition of the aims to which individuals and groups alike attach the most value.
66
Intr
oduc
tion
Economic Commission for Latin America and the Caribbean (ECLAC)
Autonomy with reciprocal recognition implies self-understanding as equal in dignity, which forms the basis for a rights-based approach to development. Hence, equality of autonomy is highly consistent with equal rights or, rather, presupposes them. It requires, in keeping with civil rights, the absence of coercion and full recognition of civil liberties to enable individuals to undertake life projects in line with their own values. It also needs free action by citizens in deliberative, participatory and representative bodies, grounded primarily in political rights. Third, vulnerabilities that hinder effective autonomy in society must be addressed through a collective compact. This leads to the idea of full social rights and their translation into policies on transfers and benefits. Lastly, recognition as “equal and different” goes hand in hand with cultural rights, identity and recognition of that difference as it moves up the policy agenda.
Talk of equal rights brings us to the longest-neglected of social justice issues: how assets, benefits and resources are distributed across the whole of society; what redistributive role is incumbent on the State as the main guarantor and promoter of equality; how the various stakeholders take ownership of productivity gains in the economy; how social rights that require fiscal compacts on universal benefits are reflected in an explicit policy framework; and in what fields of development equality is affected, either positively or negatively.
3. Equality and deliberation: combining inclusion and recognition ECLAC recently put forth (see the Time for equality collection) that deliberative democracy is key to progress towards compacts for greater equality and for greater recognition. Recognition is part of the discussion between stakeholders seeking to agree on mechanisms for furthering equality. Deliberation also assumes that individuals have the capacities to engage in dialogue and exchange points of view in order to reach agreements for arbitrating differences and pursuing greater equality.
The social capacity to initiate or take part in public discussion is therefore a minimum requirement for being a citizen in the fullest sense, and is part of the positive exercise of autonomy. That is why the policy proposals in this document for promoting a model of sustainable development underpinned by the principle of equality come in the form of compacts that require dialogue and negotiation among stakeholders.
But civic equality also calls for restricting the power of influence groups, that is to say, counterbalancing the imbalances in voice, visibility, influence and other resources that make the discussion asymmetrical. Young’s deliberative criterion for inclusion combines both requirements: minimum capacities for effective participation on the part of some, and limits on the power and wealth of others that could impede or cancel out access to participation. Here it is important to recall that the distribution of income and wealth can end up being perceived as the outcome of positions of privilege and power of some over others, eroding self-understanding of citizens as equals. Political voice and economic privilege often go hand in hand, and governments face the challenge of democratizing the voice and promoting economic, social and cultural rights. That is the thrust of the compacts put forth at the end of this document.
67
Intr
oduc
tion
Compacts for Equality: Towards a Sustainable Future

69
Cha
pter
II
Compacts for Equality: Towards a Sustainable Future
Chapter II
Equality and inequality in Latin America and the Caribbean
The conception of equality presented earlier in this document encompasses much more than equality of resources. Not that resource inequality is considered unimportant; indeed, ECLAC has contributed substantially to its analysis by quantifying income inequality in recent decades and by analysing its determinants both in terms of structuralist theory and from the various perspectives developed within the institution itself.
Embracing issues of recognition, however, expands the conception of equality beyond distributive fairness —whose scope tends to be confined to the distribution of transferrable, quantifiable resources— and takes in other dimensions, such as capabilities. These are understood in a broad sense as comprising capacities, knowledge and skills that individuals succeed in acquiring and that enable them to embark upon life plans they consider worthwhile. It is also important, given the definition of equality proposed earlier, to consider equality in a “relational” context of socialization, autonomy and recognition, and to incorporate the subjective dimension of how people perceive the order they inhabit in terms of equality and inequality.
The aim of this chapter is to provide detailed information that reflects these different senses of equality, and by doing so to open up the range of policies that need to be mobilized to respond to precisely this multidimensional version of equality. It deals first with equality of resources by considering the recent evolution of income inequality in Latin America and the Caribbean. As well as briefly setting out possible explanations for the reduction in disparities over the past decade, it offers some innovative ways of looking at income inequality, including functional inequality and absolute inequality.
This is followed by a discussion of other dimensions of inequality, which can be grouped under the broad heading of capabilities and include education, access to connectivity via information and communication technologies (ICTs), and nutrition, patterns of reproduction and living conditions as reflected in overcrowding and access to durable goods. At the same time, the ECLAC concept of equality encompasses membership of social networks, groups and spaces whose keynote is intersubjectivity, because these are powerful tools for mutual recognition and for the development of social conditions conducive to autonomy. From this perspective, the third section of this chapter presents a further two innovative yardsticks: school segregation and residential segregation. Autonomy and recognition are dealt with in the fourth part of the chapter in relation to the situation of women, particularly as regards control of their own incomes and access to political and deliberative spaces. The situation of indigenous peoples and some of the inequalities affecting them are also considered. In addition, the sixth part sets out to present individuals’ perceptions of different aspects associated with mutual recognition by means of subjective indicators such as perceptions of distributive justice, interpersonal trust and social conflict. This wide-ranging illustration of equality in the region is followed by a reflection on some of the measurement challenges involved in improving diagnoses in these different dimensions of equality. The chapter concludes with some final comments.
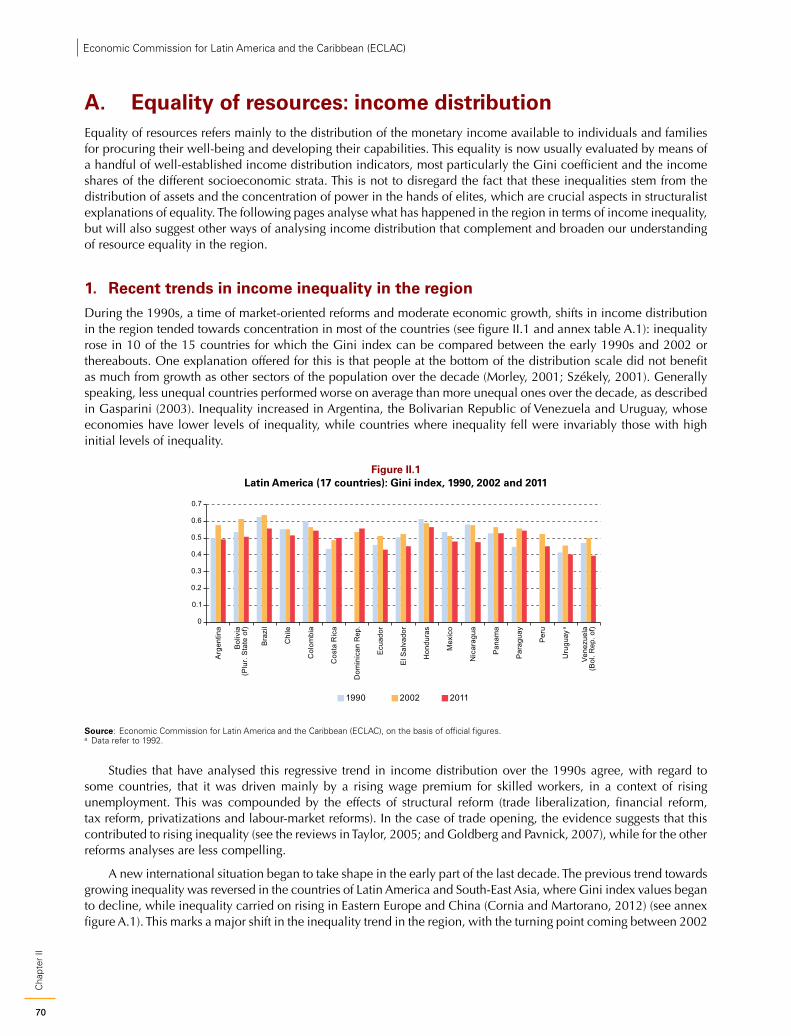
70
Cha
pter
IIEconomic Commission for Latin America and the Caribbean (ECLAC)
A. Equality of resources: income distributionEquality of resources refers mainly to the distribution of the monetary income available to individuals and families for procuring their well-being and developing their capabilities. This equality is now usually evaluated by means of a handful of well-established income distribution indicators, most particularly the Gini coefficient and the income shares of the different socioeconomic strata. This is not to disregard the fact that these inequalities stem from the distribution of assets and the concentration of power in the hands of elites, which are crucial aspects in structuralist explanations of equality. The following pages analyse what has happened in the region in terms of income inequality, but will also suggest other ways of analysing income distribution that complement and broaden our understanding of resource equality in the region.
1. Recent trends in income inequality in the regionDuring the 1990s, a time of market-oriented reforms and moderate economic growth, shifts in income distribution in the region tended towards concentration in most of the countries (see figure II.1 and annex table A.1): inequality rose in 10 of the 15 countries for which the Gini index can be compared between the early 1990s and 2002 or thereabouts. One explanation offered for this is that people at the bottom of the distribution scale did not benefit as much from growth as other sectors of the population over the decade (Morley, 2001; Székely, 2001). Generally speaking, less unequal countries performed worse on average than more unequal ones over the decade, as described in Gasparini (2003). Inequality increased in Argentina, the Bolivarian Republic of Venezuela and Uruguay, whose economies have lower levels of inequality, while countries where inequality fell were invariably those with high initial levels of inequality.
Figure II.1 Latin America (17 countries): Gini index, 1990, 2002 and 2011
0
0.1
0.2
0.3
0.4
0.5
0.6
0.7
Arg
entin
a
Bol
ivia
(Plu
r. S
tate
of)
Bra
zil
Chi
le
Col
ombi
a
Cos
ta R
ica
Dom
inic
an R
ep.
Ecu
ador
El S
alva
dor
Hon
dura
s
Mex
ico
Nic
arag
ua
Pan
ama
Par
agua
y
Per
u
Uru
guay
a
Vene
zuel
a(B
ol. R
ep. o
f)
1990 2002 2011
Source: Economic Commission for Latin America and the Caribbean (ECLAC), on the basis of official figures.a Data refer to 1992.
Studies that have analysed this regressive trend in income distribution over the 1990s agree, with regard to some countries, that it was driven mainly by a rising wage premium for skilled workers, in a context of rising unemployment. This was compounded by the effects of structural reform (trade liberalization, financial reform, tax reform, privatizations and labour-market reforms). In the case of trade opening, the evidence suggests that this contributed to rising inequality (see the reviews in Taylor, 2005; and Goldberg and Pavnick, 2007), while for the other reforms analyses are less compelling.
A new international situation began to take shape in the early part of the last decade. The previous trend towards growing inequality was reversed in the countries of Latin America and South-East Asia, where Gini index values began to decline, while inequality carried on rising in Eastern Europe and China (Cornia and Martorano, 2012) (see annex figure A.1). This marks a major shift in the inequality trend in the region, with the turning point coming between 2002
71
Cha
pter
II
Compacts for Equality: Towards a Sustainable Future
and 2003. The change has created a promising scenario, particularly after distribution indicators failed to improve in the 1990s. Even though Latin America and the Caribbean has kept its position as the world’s most unequal region (see annex figure A.2), 15 of 17 countries in the region show distributive improvements in the 2002-2011 period (see figure II.1). This recent downward trend is statistically significant, and it occurred amid sustained economic growth and poverty reduction in the region.
The distributive turnaround described has been interpreted in various ways. A microeconometric decomposition exercise presented by ECLAC (2011) notes that income per adult, and specifically earnings, were the main factor in the fall in inequality. The demographic factor was found to have had a modest effect on inequality, as the dependency ratio fell fairly evenly across all income levels. On the basis of an analysis of four middle-income countries in the region (Argentina, Brazil, Mexico and Peru), López-Calva and Lustig (2010) conclude that two main factors account for the easing inequality in the countries: a narrowing of the wage gap between high-skilled and low-skilled workers and, to a lesser extent, an increase in government transfers to the lowest-income households. This leads them to assert that in the famous “race between education and technology”, to use Tinbergen’s (1975) phrase, the former has taken the lead. Thus, whereas the demand for skills outpaced supply in the 1990s, the opposite appears to have happened in the past few years. Azevedo and others (2013), analysing the employed population in 15 countries of the region, also conclude that the decline in the education premium has been driven by a greater supply of skilled workers.
A different view is put forward by Gasparini and others (2012), who estimate the relative contribution of supply and demand factors to recent trends in the education premium in 16 countries of Latin America. They show that the relative supply of skilled and semi-skilled workers has been increasing since the 1990s. In both the 1990s and the 2000s, the returns on completion of secondary education diminished, while the returns on tertiary education increased in the 1990s but declined again in the 2000s. These authors argue that the rise in the skilled labour supply is not the only factor explaining the recent decline in inequality, and that the slowdown in relative demand for skilled labour in the last decade has also played a role. This shift in relative demand for workers with tertiary education appears to be a result of the commodity price surge, which has boosted demand for unskilled labour and driven down the education wage premium. De la Torre, Messina and Pienknagura (2012) also stress the importance of labour market changes, with workers moving from manufacturing sectors to service-intensive sectors tied to natural-resource-related production. The case studies presented in Cornia (2014) also show that the recent drop in inequality in the region has been facilitated by the commodity price upcycle, especially in the countries whose exports are most commodity-intensive. It is argued that this has not been the only cause, however, as inequality has also been falling in countries that are semi-industrialized or heavily dependent on remittances.
These findings are disturbing, to say the least. They suggest that a situation could be occurring in which sectoral composition, heavily influenced as it is by natural-resource-centred economies, is generating greater relative demand for low-skilled workers, thereby narrowing the gap in returns on education. Rather than a sign of development being reconciled with equality, this would be a warning that the combination of stagnating productivity and the region’s specialization pattern are sending out signals that discourage educational progression and capability development. While this evidence is not yet conclusive and the debate is still open, it is necessary to consider this possible scenario and assess the potential implications of this interpretation of the region’s recent decline in inequality.
The political dynamic behind the recent decline in inequality has also been important. Democratic life has given rise to new electoral preferences and brought social demands to greater prominence. This means that, in a positive cycle of economic stability, governments respond to these demands for social inclusion with new, more redistributive policies. In most cases, these are reforms inspired by the idea of “prudent redistribution with growth” (Cornia, 2010) by way of fiscal, employment and progressive transfer policies. Indeed, the fiscal system has generally become more redistributive than it was, although its contribution in this area remains limited (see chapter 1, section A.1.c). Redistributive policies and social reforms have not been the sole preserve of left-wing governments in the region; rather, the institutionalization of electoral competition in contexts of pronounced economic and social inequality seems to have led parties and governments of different ideological stripes to strive to respond to popular demands for equality and social inclusion (Roberts, 2014).
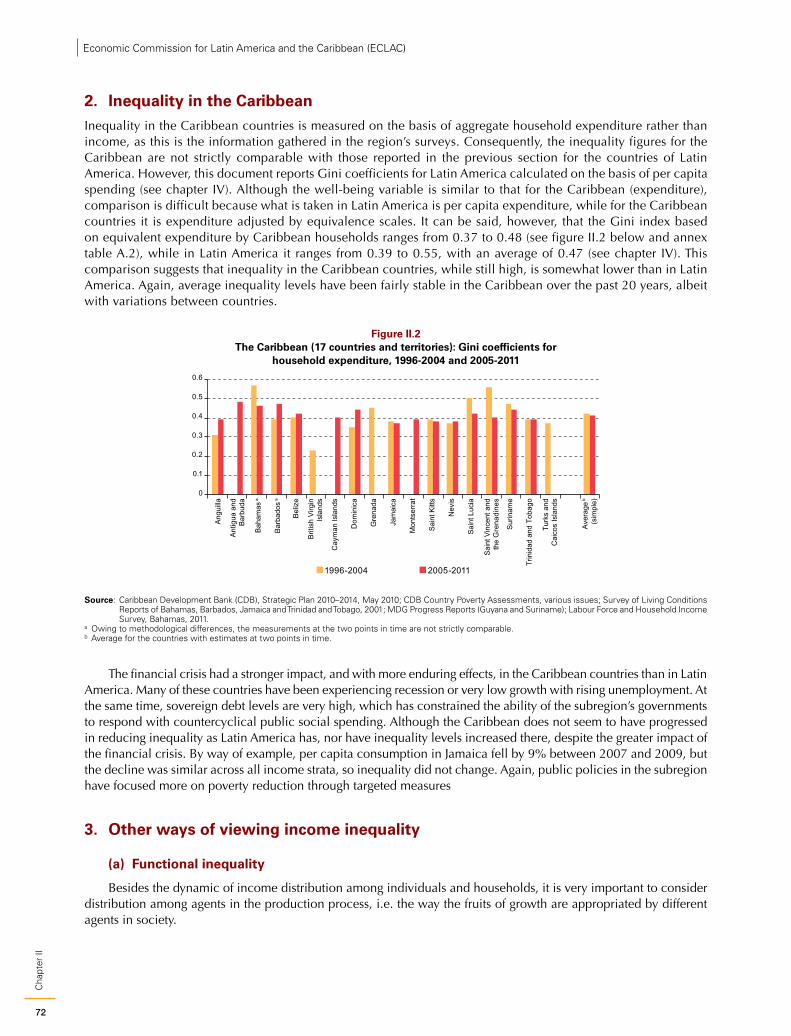
72
Cha
pter
IIEconomic Commission for Latin America and the Caribbean (ECLAC)
2. Inequality in the CaribbeanInequality in the Caribbean countries is measured on the basis of aggregate household expenditure rather than income, as this is the information gathered in the region’s surveys. Consequently, the inequality figures for the Caribbean are not strictly comparable with those reported in the previous section for the countries of Latin America. However, this document reports Gini coefficients for Latin America calculated on the basis of per capita spending (see chapter IV). Although the well-being variable is similar to that for the Caribbean (expenditure), comparison is difficult because what is taken in Latin America is per capita expenditure, while for the Caribbean countries it is expenditure adjusted by equivalence scales. It can be said, however, that the Gini index based on equivalent expenditure by Caribbean households ranges from 0.37 to 0.48 (see figure II.2 below and annex table A.2), while in Latin America it ranges from 0.39 to 0.55, with an average of 0.47 (see chapter IV). This comparison suggests that inequality in the Caribbean countries, while still high, is somewhat lower than in Latin America. Again, average inequality levels have been fairly stable in the Caribbean over the past 20 years, albeit with variations between countries.
Figure II.2 The Caribbean (17 countries and territories): Gini coefficients for
household expenditure, 1996-2004 and 2005-2011
0
0.1
0.2
0.3
0.4
0.5
0.6
1996-2004 2005-2011
Ang
uilla
Ant
igua
and
Barb
uda
Baha
mas
a
Barb
ados
a
Beliz
e
Briti
sh V
irgin
Isla
nds
Cay
man
Isla
nds
Dom
inic
a
Gre
nada
Jam
aica
Mon
tser
rat
Sain
t Kitt
s
Nev
is
Sain
t Luc
ia
Sain
t Vin
cent
and
the
Gre
nadi
nes
Sur
inam
e
Trin
idad
and
Tob
ago
Turk
s an
dC
aico
s Is
land
s
Ave
rage
b
(sim
ple)
Source: Caribbean Development Bank (CDB), Strategic Plan 2010–2014, May 2010; CDB Country Poverty Assessments, various issues; Survey of Living Conditions Reports of Bahamas, Barbados, Jamaica and Trinidad and Tobago, 2001; MDG Progress Reports (Guyana and Suriname); Labour Force and Household Income Survey, Bahamas, 2011.
a Owing to methodological differences, the measurements at the two points in time are not strictly comparable.b Average for the countries with estimates at two points in time.
The financial crisis had a stronger impact, and with more enduring effects, in the Caribbean countries than in Latin America. Many of these countries have been experiencing recession or very low growth with rising unemployment. At the same time, sovereign debt levels are very high, which has constrained the ability of the subregion’s governments to respond with countercyclical public social spending. Although the Caribbean does not seem to have progressed in reducing inequality as Latin America has, nor have inequality levels increased there, despite the greater impact of the financial crisis. By way of example, per capita consumption in Jamaica fell by 9% between 2007 and 2009, but the decline was similar across all income strata, so inequality did not change. Again, public policies in the subregion have focused more on poverty reduction through targeted measures
3. Other ways of viewing income inequality
(a) Functional inequality
Besides the dynamic of income distribution among individuals and households, it is very important to consider distribution among agents in the production process, i.e. the way the fruits of growth are appropriated by different agents in society.
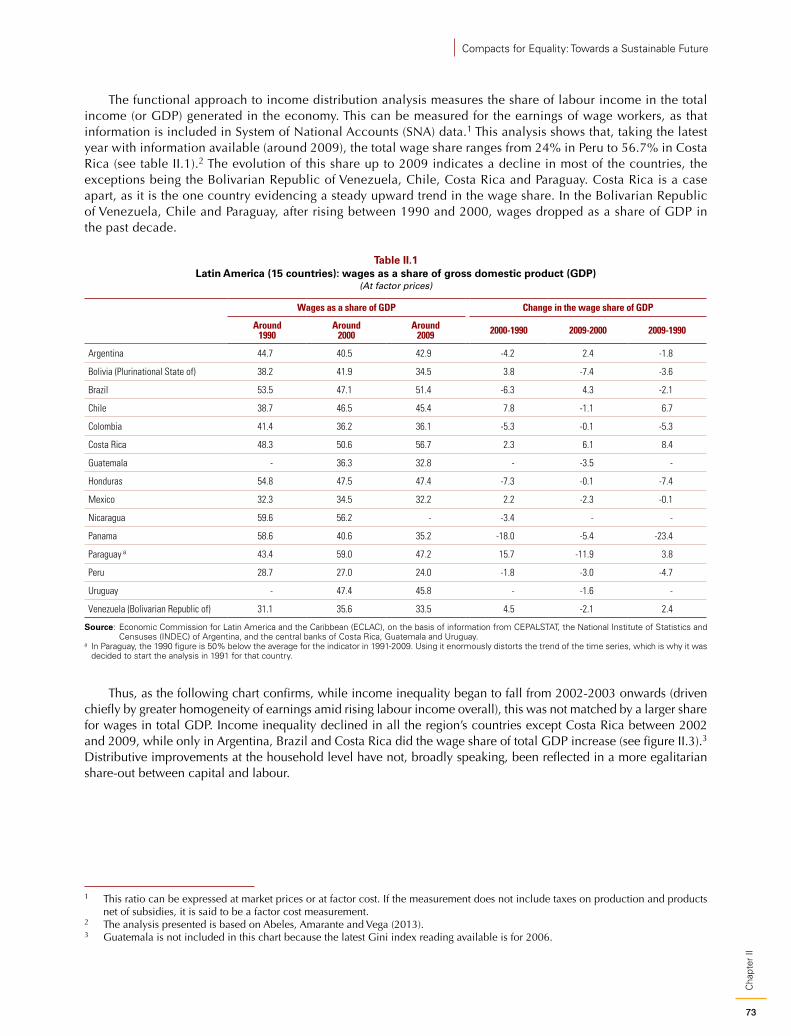
73
Cha
pter
II
Compacts for Equality: Towards a Sustainable Future
The functional approach to income distribution analysis measures the share of labour income in the total income (or GDP) generated in the economy. This can be measured for the earnings of wage workers, as that information is included in System of National Accounts (SNA) data.1 This analysis shows that, taking the latest year with information available (around 2009), the total wage share ranges from 24% in Peru to 56.7% in Costa Rica (see table II.1).2 The evolution of this share up to 2009 indicates a decline in most of the countries, the exceptions being the Bolivarian Republic of Venezuela, Chile, Costa Rica and Paraguay. Costa Rica is a case apart, as it is the one country evidencing a steady upward trend in the wage share. In the Bolivarian Republic of Venezuela, Chile and Paraguay, after rising between 1990 and 2000, wages dropped as a share of GDP in the past decade.
Table II.1 Latin America (15 countries): wages as a share of gross domestic product (GDP)
(At factor prices)
Wages as a share of GDP Change in the wage share of GDP
Around1990
Around2000
Around2009 2000-1990 2009-2000 2009-1990
Argentina 44.7 40.5 42.9 -4.2 2.4 -1.8
Bolivia (Plurinational State of) 38.2 41.9 34.5 3.8 -7.4 -3.6
Brazil 53.5 47.1 51.4 -6.3 4.3 -2.1
Chile 38.7 46.5 45.4 7.8 -1.1 6.7
Colombia 41.4 36.2 36.1 -5.3 -0.1 -5.3
Costa Rica 48.3 50.6 56.7 2.3 6.1 8.4
Guatemala - 36.3 32.8 - -3.5 -
Honduras 54.8 47.5 47.4 -7.3 -0.1 -7.4
Mexico 32.3 34.5 32.2 2.2 -2.3 -0.1
Nicaragua 59.6 56.2 - -3.4 - -
Panama 58.6 40.6 35.2 -18.0 -5.4 -23.4
Paraguay a 43.4 59.0 47.2 15.7 -11.9 3.8
Peru 28.7 27.0 24.0 -1.8 -3.0 -4.7
Uruguay - 47.4 45.8 - -1.6 -
Venezuela (Bolivarian Republic of) 31.1 35.6 33.5 4.5 -2.1 2.4
Source: Economic Commission for Latin America and the Caribbean (ECLAC), on the basis of information from CEPALSTAT, the National Institute of Statistics and Censuses (INDEC) of Argentina, and the central banks of Costa Rica, Guatemala and Uruguay.
a In Paraguay, the 1990 figure is 50% below the average for the indicator in 1991-2009. Using it enormously distorts the trend of the time series, which is why it was decided to start the analysis in 1991 for that country.
Thus, as the following chart confirms, while income inequality began to fall from 2002-2003 onwards (driven chiefly by greater homogeneity of earnings amid rising labour income overall), this was not matched by a larger share for wages in total GDP. Income inequality declined in all the region’s countries except Costa Rica between 2002 and 2009, while only in Argentina, Brazil and Costa Rica did the wage share of total GDP increase (see figure II.3).3 Distributive improvements at the household level have not, broadly speaking, been reflected in a more egalitarian share-out between capital and labour.
1 This ratio can be expressed at market prices or at factor cost. If the measurement does not include taxes on production and products net of subsidies, it is said to be a factor cost measurement.
2 The analysis presented is based on Abeles, Amarante and Vega (2013).3 Guatemala is not included in this chart because the latest Gini index reading available is for 2006.
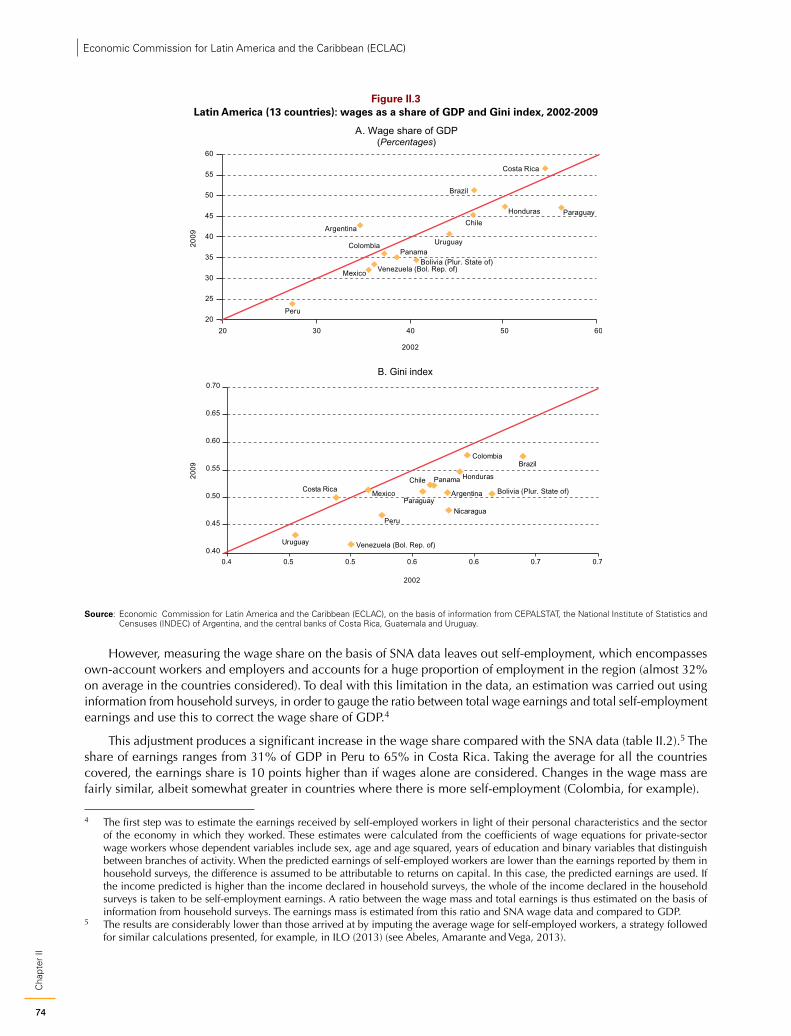
74
Cha
pter
IIEconomic Commission for Latin America and the Caribbean (ECLAC)
Figure II.3 Latin America (13 countries): wages as a share of GDP and Gini index, 2002-2009
Argentina
Bolivia (Plur. State of)
Brazil
Chile
Colombia
Costa Rica
Honduras
Mexico
Panama
Paraguay
Peru
Uruguay
Venezuela (Bol. Rep. of)
20
25
30
35
40
45
50
55
60
20 30 40 50 60
2009
2002
A. Wage share of GDP(Percentages)
B. Gini index
Argentina Bolivia (Plur. State of)
Brazil
Chile
Colombia
Costa Rica
Honduras
Mexico
Nicaragua
Panama
Paraguay
Peru
Uruguay Venezuela (Bol. Rep. of) 0.40
0.45
0.50
0.55
0.60
0.65
0.70
0.4 0.5 0.5 0.6 0.6 0.7 0.7
2009
2002
Source: Economic Commission for Latin America and the Caribbean (ECLAC), on the basis of information from CEPALSTAT, the National Institute of Statistics and Censuses (INDEC) of Argentina, and the central banks of Costa Rica, Guatemala and Uruguay.
However, measuring the wage share on the basis of SNA data leaves out self-employment, which encompasses own-account workers and employers and accounts for a huge proportion of employment in the region (almost 32% on average in the countries considered). To deal with this limitation in the data, an estimation was carried out using information from household surveys, in order to gauge the ratio between total wage earnings and total self-employment earnings and use this to correct the wage share of GDP.4
This adjustment produces a significant increase in the wage share compared with the SNA data (table II.2).5 The share of earnings ranges from 31% of GDP in Peru to 65% in Costa Rica. Taking the average for all the countries covered, the earnings share is 10 points higher than if wages alone are considered. Changes in the wage mass are fairly similar, albeit somewhat greater in countries where there is more self-employment (Colombia, for example).
4 The first step was to estimate the earnings received by self-employed workers in light of their personal characteristics and the sector of the economy in which they worked. These estimates were calculated from the coefficients of wage equations for private-sector wage workers whose dependent variables include sex, age and age squared, years of education and binary variables that distinguish between branches of activity. When the predicted earnings of self-employed workers are lower than the earnings reported by them in household surveys, the difference is assumed to be attributable to returns on capital. In this case, the predicted earnings are used. If the income predicted is higher than the income declared in household surveys, the whole of the income declared in the household surveys is taken to be self-employment earnings. A ratio between the wage mass and total earnings is thus estimated on the basis of information from household surveys. The earnings mass is estimated from this ratio and SNA wage data and compared to GDP.
5 The results are considerably lower than those arrived at by imputing the average wage for self-employed workers, a strategy followed for similar calculations presented, for example, in ILO (2013) (see Abeles, Amarante and Vega, 2013).
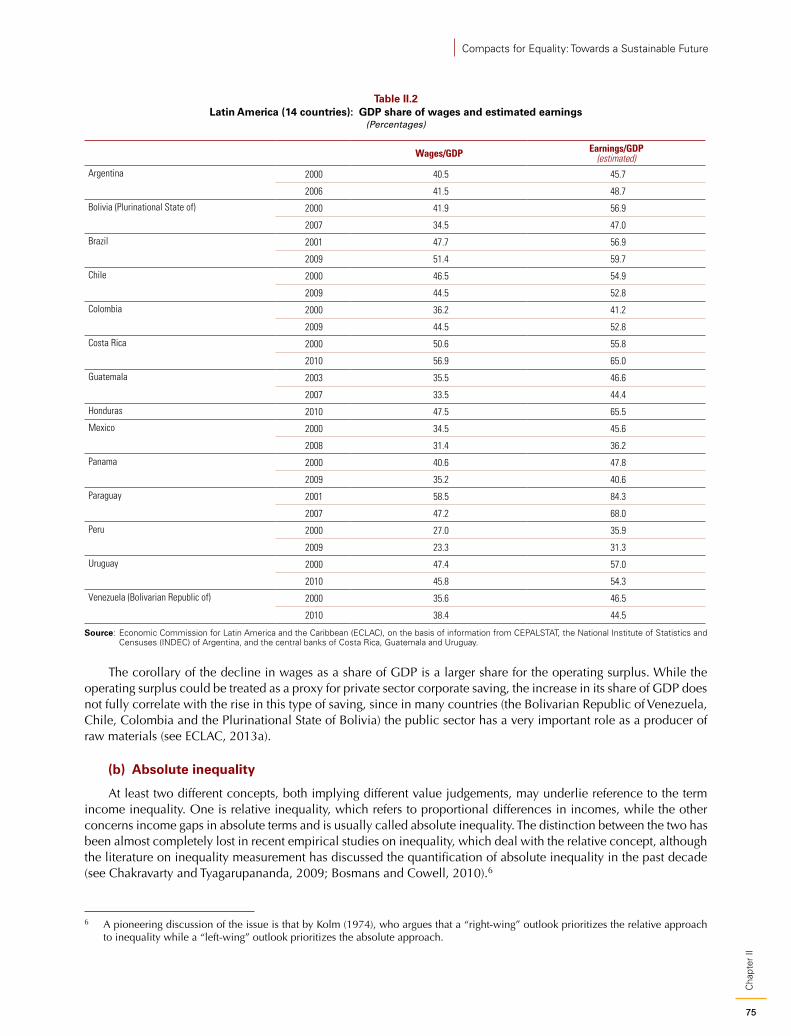
75
Cha
pter
II
Compacts for Equality: Towards a Sustainable Future
Table II.2 Latin America (14 countries): GDP share of wages and estimated earnings
(Percentages)
Wages/GDP Earnings/GDP(estimated)
Argentina 2000 40.5 45.7
2006 41.5 48.7
Bolivia (Plurinational State of) 2000 41.9 56.9
2007 34.5 47.0
Brazil 2001 47.7 56.9
2009 51.4 59.7
Chile 2000 46.5 54.9
2009 44.5 52.8
Colombia 2000 36.2 41.2
2009 44.5 52.8
Costa Rica 2000 50.6 55.8
2010 56.9 65.0
Guatemala 2003 35.5 46.6
2007 33.5 44.4
Honduras 2010 47.5 65.5
Mexico 2000 34.5 45.6
2008 31.4 36.2
Panama 2000 40.6 47.8
2009 35.2 40.6
Paraguay 2001 58.5 84.3
2007 47.2 68.0
Peru 2000 27.0 35.9
2009 23.3 31.3
Uruguay 2000 47.4 57.0
2010 45.8 54.3
Venezuela (Bolivarian Republic of) 2000 35.6 46.5
2010 38.4 44.5
Source: Economic Commission for Latin America and the Caribbean (ECLAC), on the basis of information from CEPALSTAT, the National Institute of Statistics and Censuses (INDEC) of Argentina, and the central banks of Costa Rica, Guatemala and Uruguay.
The corollary of the decline in wages as a share of GDP is a larger share for the operating surplus. While the operating surplus could be treated as a proxy for private sector corporate saving, the increase in its share of GDP does not fully correlate with the rise in this type of saving, since in many countries (the Bolivarian Republic of Venezuela, Chile, Colombia and the Plurinational State of Bolivia) the public sector has a very important role as a producer of raw materials (see ECLAC, 2013a).
(b) Absolute inequality
At least two different concepts, both implying different value judgements, may underlie reference to the term income inequality. One is relative inequality, which refers to proportional differences in incomes, while the other concerns income gaps in absolute terms and is usually called absolute inequality. The distinction between the two has been almost completely lost in recent empirical studies on inequality, which deal with the relative concept, although the literature on inequality measurement has discussed the quantification of absolute inequality in the past decade (see Chakravarty and Tyagarupananda, 2009; Bosmans and Cowell, 2010).6
6 A pioneering discussion of the issue is that by Kolm (1974), who argues that a “right-wing” outlook prioritizes the relative approach to inequality while a “left-wing” outlook prioritizes the absolute approach.
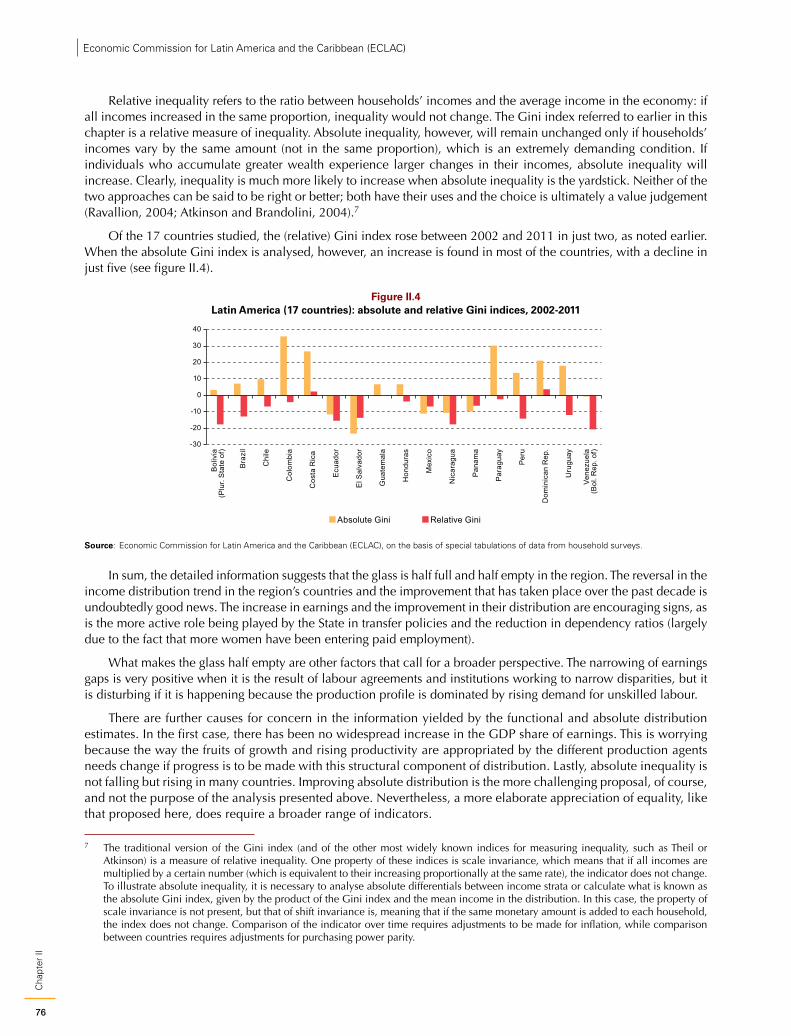
76
Cha
pter
IIEconomic Commission for Latin America and the Caribbean (ECLAC)
Relative inequality refers to the ratio between households’ incomes and the average income in the economy: if all incomes increased in the same proportion, inequality would not change. The Gini index referred to earlier in this chapter is a relative measure of inequality. Absolute inequality, however, will remain unchanged only if households’ incomes vary by the same amount (not in the same proportion), which is an extremely demanding condition. If individuals who accumulate greater wealth experience larger changes in their incomes, absolute inequality will increase. Clearly, inequality is much more likely to increase when absolute inequality is the yardstick. Neither of the two approaches can be said to be right or better; both have their uses and the choice is ultimately a value judgement (Ravallion, 2004; Atkinson and Brandolini, 2004).7
Of the 17 countries studied, the (relative) Gini index rose between 2002 and 2011 in just two, as noted earlier. When the absolute Gini index is analysed, however, an increase is found in most of the countries, with a decline in just five (see figure II.4).
Figure II.4 Latin America (17 countries): absolute and relative Gini indices, 2002-2011
-30
-20
-10
0
10
20
30
40
Bol
ivia
(Plu
r. S
tate
of)
Bra
zil
Chi
le
Col
ombi
a
Cos
ta R
ica
Ecu
ador
El S
alva
dor
Gua
tem
ala
Hon
dura
s
Mex
ico
Nic
arag
ua
Pan
ama
Par
agua
y
Per
u
Dom
inic
an R
ep.
Uru
guay
Vene
zuel
a(B
ol. R
ep. o
f)
Absolute Gini Relative Gini
Source: Economic Commission for Latin America and the Caribbean (ECLAC), on the basis of special tabulations of data from household surveys.
In sum, the detailed information suggests that the glass is half full and half empty in the region. The reversal in the income distribution trend in the region’s countries and the improvement that has taken place over the past decade is undoubtedly good news. The increase in earnings and the improvement in their distribution are encouraging signs, as is the more active role being played by the State in transfer policies and the reduction in dependency ratios (largely due to the fact that more women have been entering paid employment).
What makes the glass half empty are other factors that call for a broader perspective. The narrowing of earnings gaps is very positive when it is the result of labour agreements and institutions working to narrow disparities, but it is disturbing if it is happening because the production profile is dominated by rising demand for unskilled labour.
There are further causes for concern in the information yielded by the functional and absolute distribution estimates. In the first case, there has been no widespread increase in the GDP share of earnings. This is worrying because the way the fruits of growth and rising productivity are appropriated by the different production agents needs change if progress is to be made with this structural component of distribution. Lastly, absolute inequality is not falling but rising in many countries. Improving absolute distribution is the more challenging proposal, of course, and not the purpose of the analysis presented above. Nevertheless, a more elaborate appreciation of equality, like that proposed here, does require a broader range of indicators.
7 The traditional version of the Gini index (and of the other most widely known indices for measuring inequality, such as Theil or Atkinson) is a measure of relative inequality. One property of these indices is scale invariance, which means that if all incomes are multiplied by a certain number (which is equivalent to their increasing proportionally at the same rate), the indicator does not change. To illustrate absolute inequality, it is necessary to analyse absolute differentials between income strata or calculate what is known as the absolute Gini index, given by the product of the Gini index and the mean income in the distribution. In this case, the property of scale invariance is not present, but that of shift invariance is, meaning that if the same monetary amount is added to each household, the index does not change. Comparison of the indicator over time requires adjustments to be made for inflation, while comparison between countries requires adjustments for purchasing power parity.
77
Cha
pter
II
Compacts for Equality: Towards a Sustainable Future
Box II.1 The debate surrounding the Millennium Development Goals and inequality
The Millennium Development Goals formulated in 2000 gave substance to the principles of a development agenda subscribed to by the Member States of the United Nations in the Millennium Declaration. The goals, targets and indicators were conceived as a minimum level of living standards for the world’s inhabitants. In this way, the international community showed its central concern with overcoming critical deficiencies in different dimensions of development. In the recent global debate on the United Nations post-2015 development agenda, which analysed the possible weaknesses, inadequacies or unsuitability of these goals, one thing that came out strongly was the need to explicitly incorporate considerations of inequality when outlining the direction of future development.
The different ways of including this perspective were analysed over the course of the debate. One option would be to include a specific inequality goal, with a target for improvements in income distribution. Another would be to include inequality considerations in each of the other goals, establishing specific targets, which could be for narrowing gaps between different groups in the various dimensions (mortality, education, access to water and sanitation, among others). Along the same lines, it was proposed that the overall attainment indicators in the different dimensions should be weighted by socioeconomic stratum (giving greater weight to attainments in the lower quintiles, for instance). The inclusion of specific progress targets for the poorest or for excluded groups could also be extended,
as in the case of girls’ education in the Millennium Development Goals. All these options require detailed statistical information for monitoring.
While there has been general agreement on the importance of considering inequality in the future development agenda, controversy has surrounded the idea of including a specific goal and targets for inequality. Specifically, and in respect of income inequality, it has been argued that shared targets for acceptable levels of income inequality are much harder to agree upon and that each country should define its own goals in this area. The risk is that the difficulty of deciding on a common target could become an obstacle to progress in the debate, while detracting from the effort to achieve minimum targets. Furthermore, if it were decided to include a specific income inequality target, it would have to be aligned with the poverty target. Since the poverty target implicitly determines the prescribed variations in inequality for a given level of economic growth, specified targets for poverty and income inequality would have to be consistent.
The report of the High Level Panel of Eminent Persons on the Post-2015 Development Agenda concluded that no explicit income inequality targets should be included, the view being taken that national decision-making was a better answer than a global inequality target. The report does suggest, however, including specific targets for subgroups, such as socioeconomic quintiles and groups subject to discrimination, among others.
Source: Economic Commission for Latin America and the Caribbean (ECLAC), on the basis of the United Nations System Task Team on the Post-2015 Development Agenda, “Addressing inequalities: The heart of the post-2015 agenda and the future we want for all”, May 2012 [online] http://www.un.org/millenniumgoals/pdf/Think%20Pieces/10_inequalities.pdf; “Joint Appeal to Address the Problem of Inequality in the Post-2015 Framework”, 2013 [online] http://www.networkideas.org/news/mar2013/pdf/Inequality_Letter.pdf; A. Wasgtaff, “Should inequality be reflected in new international development goals?”, 2013 [online] http://blogs.worldbank.org/developmenttalk/should-inequality-be-reflected-in-the-new-international-development-goals; Stephan Klasen, “No, we don’t need an MDG for inequality”, The Broker, December 2012 [online] http://www.thebrokeronline.eu/Blogs/Inequality-debate/No-we-don-t-need-an-MDG-for-inequality; Martin Ravallion, “Let’s avoid creating a dog’s breakfast of MDGs”, The Broker, February 2013 [online] http://www.thebrokeronline.eu/Blogs/Inequality-debate/Let-s-avoid-creating-a-dog-s-breakfast-of-MDGs; High Level Panel of Eminent Persons on the Post-2015 Development Agenda, “A new global partnership: eradicate poverty and transform economies through sustainable development”, 2013 [online] http://www.un.org/sg/management/pdf/HLP_P2015_Report.pdf.
B. Equality of capabilities: some fundamental componentsWhen equality is associated with growing opportunities for personal and group autonomy, capability development is a vital part of it. In the conceptual framework adopted, as described earlier, capabilities mean capacities, knowledge and skills that expand people’s scope for agency and decision-making and enable them to participate more proactively in society and realize their potential and life plans more fully. Thus, equality also implies a fairer distribution of opportunities for everyone to develop their capabilities.
Capability-building takes place in different domains. This section looks at how these domains are distributed, on the basis of the information available in this regard on education, access to connectivity via ICTs, and nutrition. To these we have added three more areas, which are just as relevant to capability development, although perhaps less obviously so. The first of these is the incidence of adolescent motherhood in general, as well as by socioeconomic level. Adolescent pregnancy, very often unplanned, results in life paths that make it very hard to maintain the momentum of educational progression; it tends to occur in social contexts where there are few support networks; and it hinders capability development and the exercise of agency. Consequently, while autonomy in reproductive decision-making must be respected, there are situations that worsen inequalities of both income and capabilities over the whole life cycle that cannot be ignored.
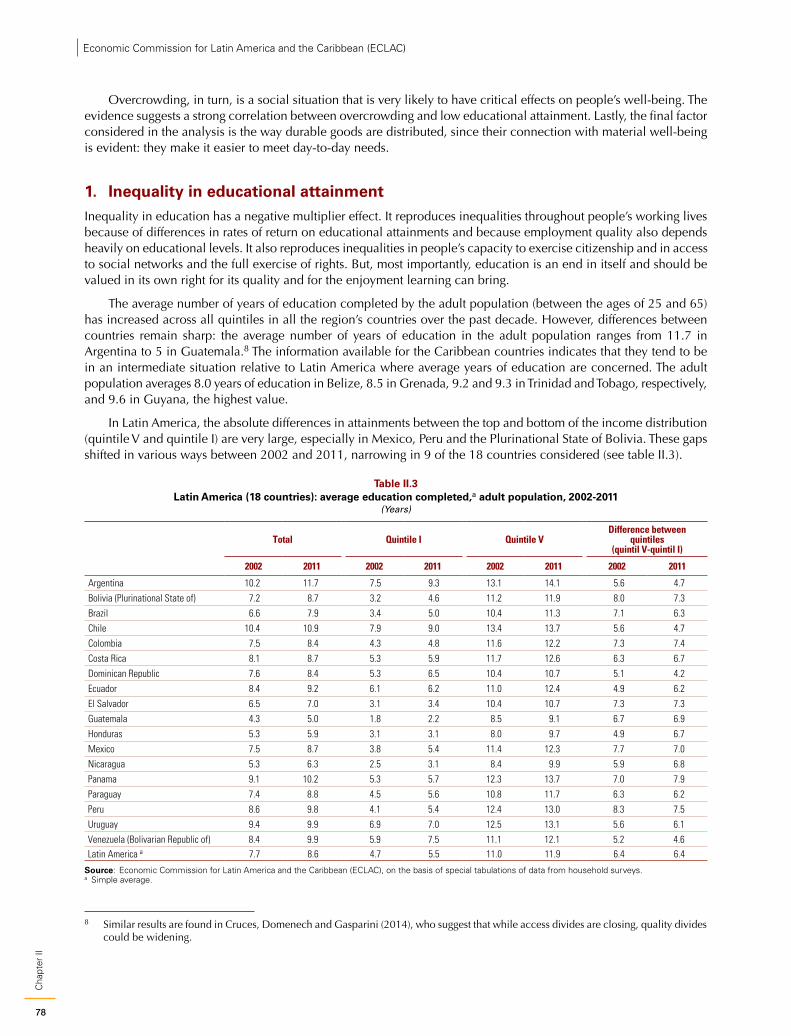
78
Cha
pter
IIEconomic Commission for Latin America and the Caribbean (ECLAC)
Overcrowding, in turn, is a social situation that is very likely to have critical effects on people’s well-being. The evidence suggests a strong correlation between overcrowding and low educational attainment. Lastly, the final factor considered in the analysis is the way durable goods are distributed, since their connection with material well-being is evident: they make it easier to meet day-to-day needs.
1. Inequality in educational attainmentInequality in education has a negative multiplier effect. It reproduces inequalities throughout people’s working lives because of differences in rates of return on educational attainments and because employment quality also depends heavily on educational levels. It also reproduces inequalities in people’s capacity to exercise citizenship and in access to social networks and the full exercise of rights. But, most importantly, education is an end in itself and should be valued in its own right for its quality and for the enjoyment learning can bring.
The average number of years of education completed by the adult population (between the ages of 25 and 65) has increased across all quintiles in all the region’s countries over the past decade. However, differences between countries remain sharp: the average number of years of education in the adult population ranges from 11.7 in Argentina to 5 in Guatemala.8 The information available for the Caribbean countries indicates that they tend to be in an intermediate situation relative to Latin America where average years of education are concerned. The adult population averages 8.0 years of education in Belize, 8.5 in Grenada, 9.2 and 9.3 in Trinidad and Tobago, respectively, and 9.6 in Guyana, the highest value.
In Latin America, the absolute differences in attainments between the top and bottom of the income distribution (quintile V and quintile I) are very large, especially in Mexico, Peru and the Plurinational State of Bolivia. These gaps shifted in various ways between 2002 and 2011, narrowing in 9 of the 18 countries considered (see table II.3).
Table II.3 Latin America (18 countries): average education completed,a adult population, 2002-2011
(Years)
Total Quintile I Quintile VDifference between
quintiles(quintil V-quintil I)
2002 2011 2002 2011 2002 2011 2002 2011
Argentina 10.2 11.7 7.5 9.3 13.1 14.1 5.6 4.7
Bolivia (Plurinational State of) 7.2 8.7 3.2 4.6 11.2 11.9 8.0 7.3
Brazil 6.6 7.9 3.4 5.0 10.4 11.3 7.1 6.3
Chile 10.4 10.9 7.9 9.0 13.4 13.7 5.6 4.7
Colombia 7.5 8.4 4.3 4.8 11.6 12.2 7.3 7.4
Costa Rica 8.1 8.7 5.3 5.9 11.7 12.6 6.3 6.7
Dominican Republic 7.6 8.4 5.3 6.5 10.4 10.7 5.1 4.2
Ecuador 8.4 9.2 6.1 6.2 11.0 12.4 4.9 6.2
El Salvador 6.5 7.0 3.1 3.4 10.4 10.7 7.3 7.3
Guatemala 4.3 5.0 1.8 2.2 8.5 9.1 6.7 6.9
Honduras 5.3 5.9 3.1 3.1 8.0 9.7 4.9 6.7
Mexico 7.5 8.7 3.8 5.4 11.4 12.3 7.7 7.0
Nicaragua 5.3 6.3 2.5 3.1 8.4 9.9 5.9 6.8
Panama 9.1 10.2 5.3 5.7 12.3 13.7 7.0 7.9
Paraguay 7.4 8.8 4.5 5.6 10.8 11.7 6.3 6.2
Peru 8.6 9.8 4.1 5.4 12.4 13.0 8.3 7.5
Uruguay 9.4 9.9 6.9 7.0 12.5 13.1 5.6 6.1
Venezuela (Bolivarian Republic of) 8.4 9.9 5.9 7.5 11.1 12.1 5.2 4.6Latin America a 7.7 8.6 4.7 5.5 11.0 11.9 6.4 6.4
Source: Economic Commission for Latin America and the Caribbean (ECLAC), on the basis of special tabulations of data from household surveys.a Simple average.
8 Similar results are found in Cruces, Domenech and Gasparini (2014), who suggest that while access divides are closing, quality divides could be widening.
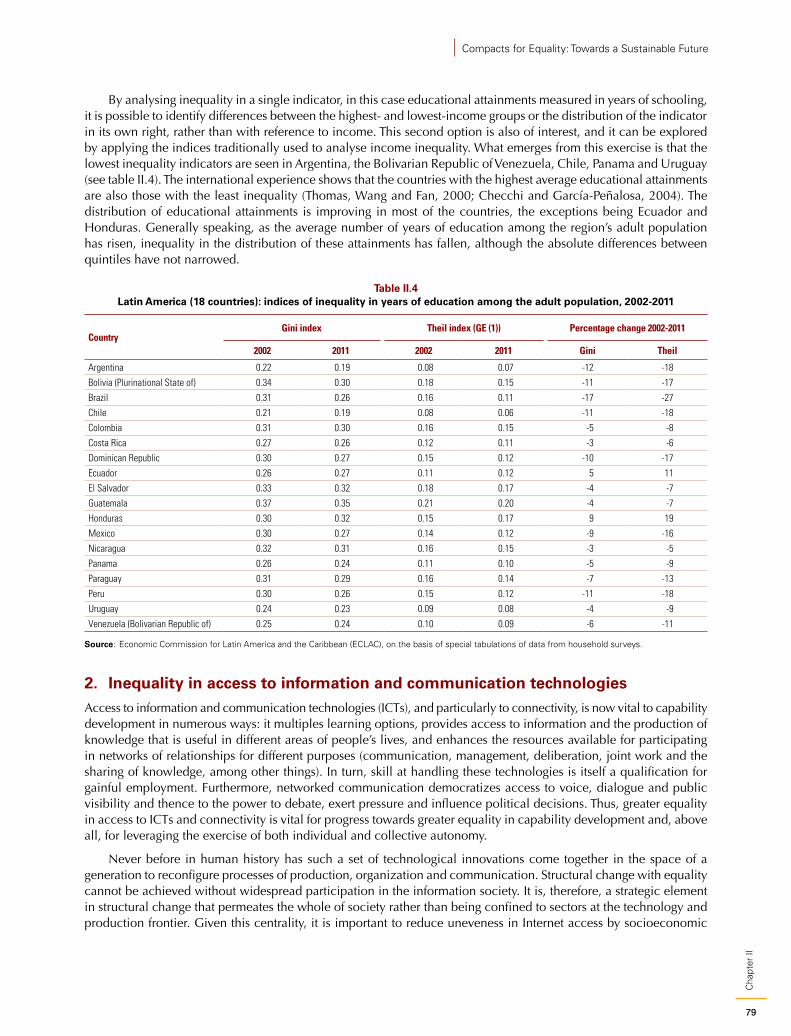
79
Cha
pter
II
Compacts for Equality: Towards a Sustainable Future
By analysing inequality in a single indicator, in this case educational attainments measured in years of schooling, it is possible to identify differences between the highest- and lowest-income groups or the distribution of the indicator in its own right, rather than with reference to income. This second option is also of interest, and it can be explored by applying the indices traditionally used to analyse income inequality. What emerges from this exercise is that the lowest inequality indicators are seen in Argentina, the Bolivarian Republic of Venezuela, Chile, Panama and Uruguay (see table II.4). The international experience shows that the countries with the highest average educational attainments are also those with the least inequality (Thomas, Wang and Fan, 2000; Checchi and García-Peñalosa, 2004). The distribution of educational attainments is improving in most of the countries, the exceptions being Ecuador and Honduras. Generally speaking, as the average number of years of education among the region’s adult population has risen, inequality in the distribution of these attainments has fallen, although the absolute differences between quintiles have not narrowed.
Table II.4 Latin America (18 countries): indices of inequality in years of education among the adult population, 2002-2011
CountryGini index Theil index (GE (1)) Percentage change 2002-2011
2002 2011 2002 2011 Gini Theil
Argentina 0.22 0.19 0.08 0.07 -12 -18
Bolivia (Plurinational State of) 0.34 0.30 0.18 0.15 -11 -17
Brazil 0.31 0.26 0.16 0.11 -17 -27
Chile 0.21 0.19 0.08 0.06 -11 -18
Colombia 0.31 0.30 0.16 0.15 -5 -8
Costa Rica 0.27 0.26 0.12 0.11 -3 -6
Dominican Republic 0.30 0.27 0.15 0.12 -10 -17
Ecuador 0.26 0.27 0.11 0.12 5 11
El Salvador 0.33 0.32 0.18 0.17 -4 -7
Guatemala 0.37 0.35 0.21 0.20 -4 -7
Honduras 0.30 0.32 0.15 0.17 9 19
Mexico 0.30 0.27 0.14 0.12 -9 -16
Nicaragua 0.32 0.31 0.16 0.15 -3 -5
Panama 0.26 0.24 0.11 0.10 -5 -9
Paraguay 0.31 0.29 0.16 0.14 -7 -13
Peru 0.30 0.26 0.15 0.12 -11 -18
Uruguay 0.24 0.23 0.09 0.08 -4 -9
Venezuela (Bolivarian Republic of) 0.25 0.24 0.10 0.09 -6 -11
Source: Economic Commission for Latin America and the Caribbean (ECLAC), on the basis of special tabulations of data from household surveys.
2. Inequality in access to information and communication technologiesAccess to information and communication technologies (ICTs), and particularly to connectivity, is now vital to capability development in numerous ways: it multiples learning options, provides access to information and the production of knowledge that is useful in different areas of people’s lives, and enhances the resources available for participating in networks of relationships for different purposes (communication, management, deliberation, joint work and the sharing of knowledge, among other things). In turn, skill at handling these technologies is itself a qualification for gainful employment. Furthermore, networked communication democratizes access to voice, dialogue and public visibility and thence to the power to debate, exert pressure and influence political decisions. Thus, greater equality in access to ICTs and connectivity is vital for progress towards greater equality in capability development and, above all, for leveraging the exercise of both individual and collective autonomy.
Never before in human history has such a set of technological innovations come together in the space of a generation to reconfigure processes of production, organization and communication. Structural change with equality cannot be achieved without widespread participation in the information society. It is, therefore, a strategic element in structural change that permeates the whole of society rather than being confined to sectors at the technology and production frontier. Given this centrality, it is important to reduce uneveness in Internet access by socioeconomic
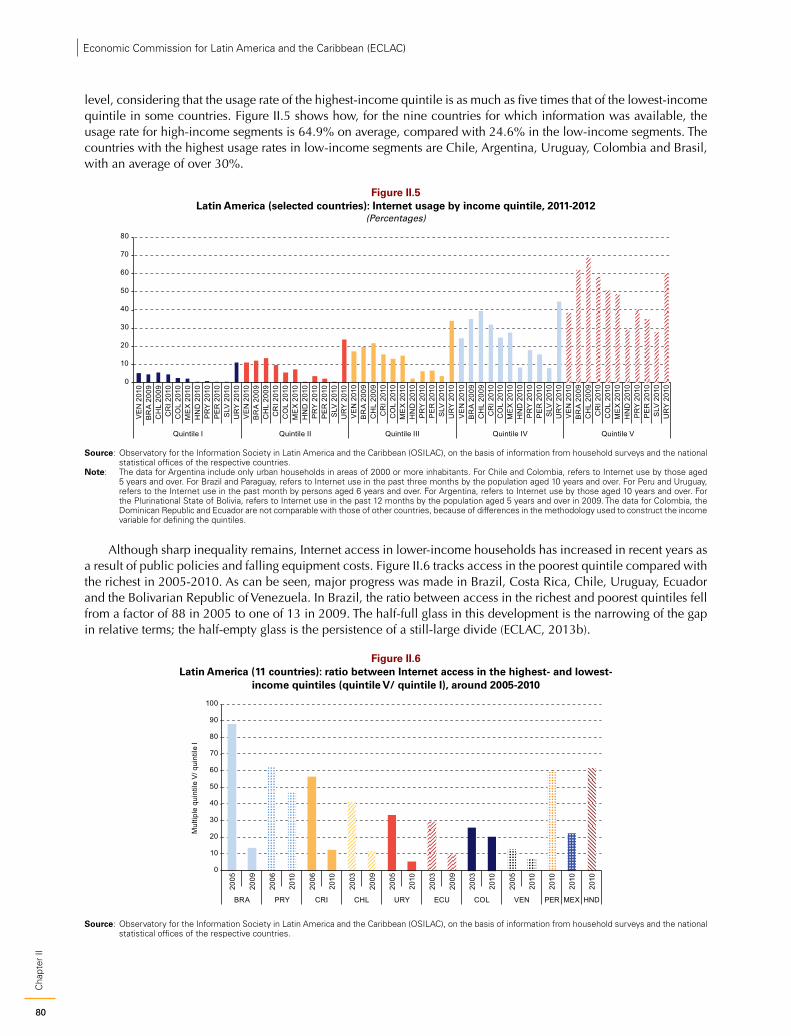
80
Cha
pter
IIEconomic Commission for Latin America and the Caribbean (ECLAC)
level, considering that the usage rate of the highest-income quintile is as much as five times that of the lowest-income quintile in some countries. Figure II.5 shows how, for the nine countries for which information was available, the usage rate for high-income segments is 64.9% on average, compared with 24.6% in the low-income segments. The countries with the highest usage rates in low-income segments are Chile, Argentina, Uruguay, Colombia and Brasil, with an average of over 30%.
Figure II.5 Latin America (selected countries): Internet usage by income quintile, 2011-2012
(Percentages)
0
10
20
30
40
50
60
70
80
VE
N 2
010
BR
A 2
009
CH
L 20
09C
RI 2
010
CO
L 20
10M
EX
201
0H
ND
201
0P
RY
201
0P
ER
201
0S
LV 2
010
UR
Y 2
010
VE
N 2
010
BR
A 2
009
CH
L 20
09C
RI 2
010
CO
L 20
10M
EX
201
0H
ND
201
0P
RY
201
0P
ER
201
0S
LV 2
010
UR
Y 2
010
VE
N 2
010
BR
A 2
009
CH
L 20
09C
RI 2
010
CO
L 20
10M
EX
201
0H
ND
201
0P
RY
201
0P
ER
201
0S
LV 2
010
UR
Y 2
010
VE
N 2
010
BR
A 2
009
CH
L 20
09C
RI 2
010
CO
L 20
10M
EX
201
0H
ND
201
0P
RY
201
0P
ER
201
0S
LV 2
010
UR
Y 2
010
VE
N 2
010
BR
A 2
009
CH
L 20
09C
RI 2
010
CO
L 20
10M
EX
201
0H
ND
201
0P
RY
201
0P
ER
201
0S
LV 2
010
UR
Y 2
010
Quintile I Quintile II Quintile III Quintile IV Quintile V
Source: Observatory for the Information Society in Latin America and the Caribbean (OSILAC), on the basis of information from household surveys and the national statistical offices of the respective countries.
Note: The data for Argentina include only urban households in areas of 2000 or more inhabitants. For Chile and Colombia, refers to Internet use by those aged 5 years and over. For Brazil and Paraguay, refers to Internet use in the past three months by the population aged 10 years and over. For Peru and Uruguay, refers to the Internet use in the past month by persons aged 6 years and over. For Argentina, refers to Internet use by those aged 10 years and over. For the Plurinational State of Bolivia, refers to Internet use in the past 12 months by the population aged 5 years and over in 2009. The data for Colombia, the Dominican Republic and Ecuador are not comparable with those of other countries, because of differences in the methodology used to construct the income variable for defining the quintiles.
Although sharp inequality remains, Internet access in lower-income households has increased in recent years as a result of public policies and falling equipment costs. Figure II.6 tracks access in the poorest quintile compared with the richest in 2005-2010. As can be seen, major progress was made in Brazil, Costa Rica, Chile, Uruguay, Ecuador and the Bolivarian Republic of Venezuela. In Brazil, the ratio between access in the richest and poorest quintiles fell from a factor of 88 in 2005 to one of 13 in 2009. The half-full glass in this development is the narrowing of the gap in relative terms; the half-empty glass is the persistence of a still-large divide (ECLAC, 2013b).
Figure II.6 Latin America (11 countries): ratio between Internet access in the highest- and lowest-
income quintiles (quintile V/ quintile I), around 2005-2010
0
10
20
30
40
50
60
70
80
90
100
2005
2009
2006
2010
2006
2010
2003
2009
2005
2010
2003
2009
2003
2010
2005
2010
2010
2010
2010
BRA PRY CRI CHL URY ECU COL VEN PER MEX HND
Mul
tiple
qui
ntile
V/ q
uint
ile I
Source: Observatory for the Information Society in Latin America and the Caribbean (OSILAC), on the basis of information from household surveys and the national statistical offices of the respective countries.
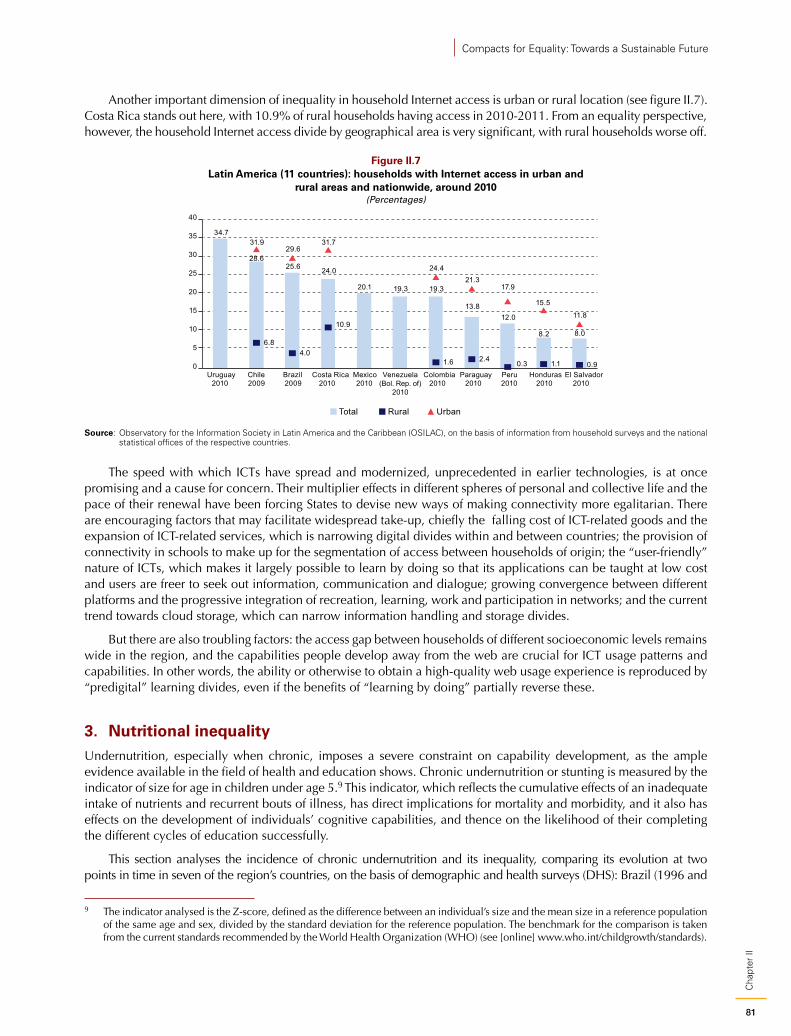
81
Cha
pter
II
Compacts for Equality: Towards a Sustainable Future
Another important dimension of inequality in household Internet access is urban or rural location (see figure II.7). Costa Rica stands out here, with 10.9% of rural households having access in 2010-2011. From an equality perspective, however, the household Internet access divide by geographical area is very significant, with rural households worse off.
Figure II.7 Latin America (11 countries): households with Internet access in urban and
rural areas and nationwide, around 2010 (Percentages)
34.7
28.625.6 24.0
20.1 19.3 19.3
13.812.0
8.2 8.06.8
4.0
10.9
1.6 2.40.3 1.1 0.9
31.929.6
31.7
24.421.3
17.9
15.5
11.8
0
5
10
15
20
25
30
35
40
Uruguay2010
Chile2009
Brazil2009
Costa Rica2010
Mexico2010
Venezuela(Bol. Rep. of)
2010
Colombia2010
Paraguay 2010
Peru2010
Honduras2010
El Salvador2010
Total Rural Urban
Source: Observatory for the Information Society in Latin America and the Caribbean (OSILAC), on the basis of information from household surveys and the national statistical offices of the respective countries.
The speed with which ICTs have spread and modernized, unprecedented in earlier technologies, is at once promising and a cause for concern. Their multiplier effects in different spheres of personal and collective life and the pace of their renewal have been forcing States to devise new ways of making connectivity more egalitarian. There are encouraging factors that may facilitate widespread take-up, chiefly the falling cost of ICT-related goods and the expansion of ICT-related services, which is narrowing digital divides within and between countries; the provision of connectivity in schools to make up for the segmentation of access between households of origin; the “user-friendly” nature of ICTs, which makes it largely possible to learn by doing so that its applications can be taught at low cost and users are freer to seek out information, communication and dialogue; growing convergence between different platforms and the progressive integration of recreation, learning, work and participation in networks; and the current trend towards cloud storage, which can narrow information handling and storage divides.
But there are also troubling factors: the access gap between households of different socioeconomic levels remains wide in the region, and the capabilities people develop away from the web are crucial for ICT usage patterns and capabilities. In other words, the ability or otherwise to obtain a high-quality web usage experience is reproduced by “predigital” learning divides, even if the benefits of “learning by doing” partially reverse these.
3. Nutritional inequalityUndernutrition, especially when chronic, imposes a severe constraint on capability development, as the ample evidence available in the field of health and education shows. Chronic undernutrition or stunting is measured by the indicator of size for age in children under age 5.9 This indicator, which reflects the cumulative effects of an inadequate intake of nutrients and recurrent bouts of illness, has direct implications for mortality and morbidity, and it also has effects on the development of individuals’ cognitive capabilities, and thence on the likelihood of their completing the different cycles of education successfully.
This section analyses the incidence of chronic undernutrition and its inequality, comparing its evolution at two points in time in seven of the region’s countries, on the basis of demographic and health surveys (DHS): Brazil (1996 and
9 The indicator analysed is the Z-score, defined as the difference between an individual’s size and the mean size in a reference population of the same age and sex, divided by the standard deviation for the reference population. The benchmark for the comparison is taken from the current standards recommended by the World Health Organization (WHO) (see [online] www.who.int/childgrowth/standards).
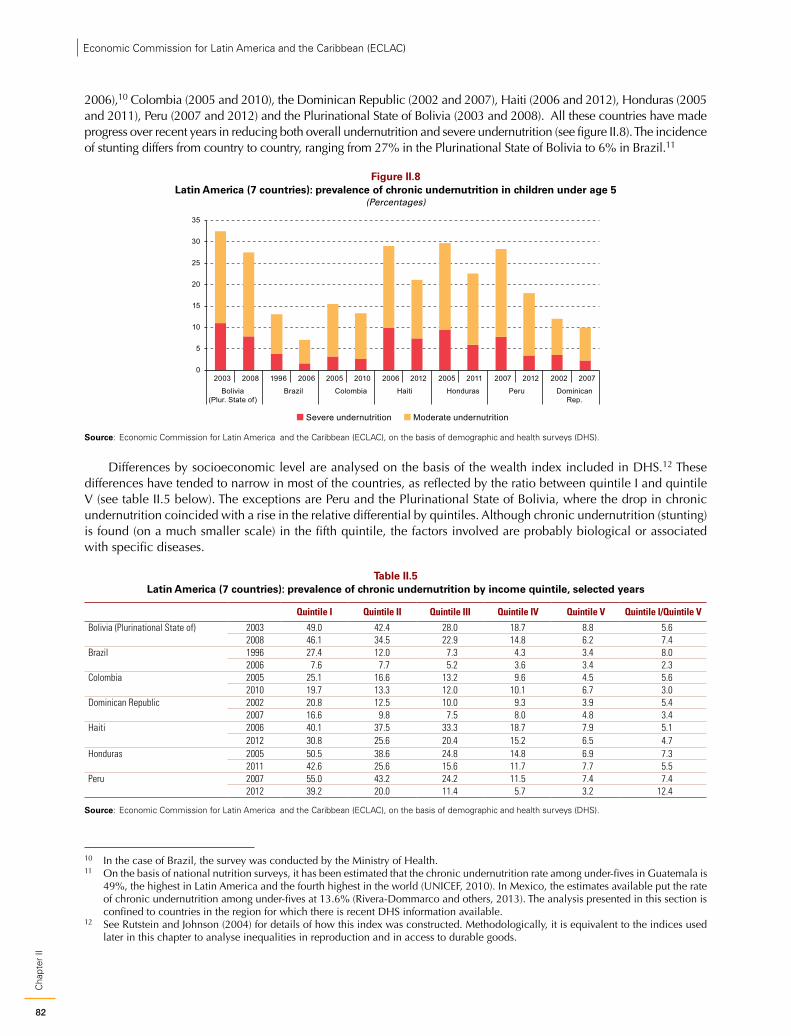
82
Cha
pter
IIEconomic Commission for Latin America and the Caribbean (ECLAC)
2006),10 Colombia (2005 and 2010), the Dominican Republic (2002 and 2007), Haiti (2006 and 2012), Honduras (2005 and 2011), Peru (2007 and 2012) and the Plurinational State of Bolivia (2003 and 2008). All these countries have made progress over recent years in reducing both overall undernutrition and severe undernutrition (see figure II.8). The incidence of stunting differs from country to country, ranging from 27% in the Plurinational State of Bolivia to 6% in Brazil.11
Figure II.8 Latin America (7 countries): prevalence of chronic undernutrition in children under age 5
(Percentages)
0
5
10
15
20
25
30
35
2003 2008 1996 2006 2005 2010 2006 2012 2005 2011 2007 2012 2002 2007
Bolivia(Plur. State of)
Brazil Colombia Haiti Honduras Peru DominicanRep.
Severe undernutrition Moderate undernutrition
Source: Economic Commission for Latin America and the Caribbean (ECLAC), on the basis of demographic and health surveys (DHS).
Differences by socioeconomic level are analysed on the basis of the wealth index included in DHS.12 These differences have tended to narrow in most of the countries, as reflected by the ratio between quintile I and quintile V (see table II.5 below). The exceptions are Peru and the Plurinational State of Bolivia, where the drop in chronic undernutrition coincided with a rise in the relative differential by quintiles. Although chronic undernutrition (stunting) is found (on a much smaller scale) in the fifth quintile, the factors involved are probably biological or associated with specific diseases.
Table II.5 Latin America (7 countries): prevalence of chronic undernutrition by income quintile, selected years
Quintile I Quintile II Quintile III Quintile IV Quintile V Quintile I/Quintile V
Bolivia (Plurinational State of) 2003 49.0 42.4 28.0 18.7 8.8 5.62008 46.1 34.5 22.9 14.8 6.2 7.4
Brazil 1996 27.4 12.0 7.3 4.3 3.4 8.02006 7.6 7.7 5.2 3.6 3.4 2.3
Colombia 2005 25.1 16.6 13.2 9.6 4.5 5.62010 19.7 13.3 12.0 10.1 6.7 3.0
Dominican Republic 2002 20.8 12.5 10.0 9.3 3.9 5.42007 16.6 9.8 7.5 8.0 4.8 3.4
Haiti 2006 40.1 37.5 33.3 18.7 7.9 5.12012 30.8 25.6 20.4 15.2 6.5 4.7
Honduras 2005 50.5 38.6 24.8 14.8 6.9 7.32011 42.6 25.6 15.6 11.7 7.7 5.5
Peru 2007 55.0 43.2 24.2 11.5 7.4 7.42012 39.2 20.0 11.4 5.7 3.2 12.4
Source: Economic Commission for Latin America and the Caribbean (ECLAC), on the basis of demographic and health surveys (DHS).
10 In the case of Brazil, the survey was conducted by the Ministry of Health.11 On the basis of national nutrition surveys, it has been estimated that the chronic undernutrition rate among under-fives in Guatemala is
49%, the highest in Latin America and the fourth highest in the world (UNICEF, 2010). In Mexico, the estimates available put the rate of chronic undernutrition among under-fives at 13.6% (Rivera-Dommarco and others, 2013). The analysis presented in this section is confined to countries in the region for which there is recent DHS information available.
12 See Rutstein and Johnson (2004) for details of how this index was constructed. Methodologically, it is equivalent to the indices used later in this chapter to analyse inequalities in reproduction and in access to durable goods.
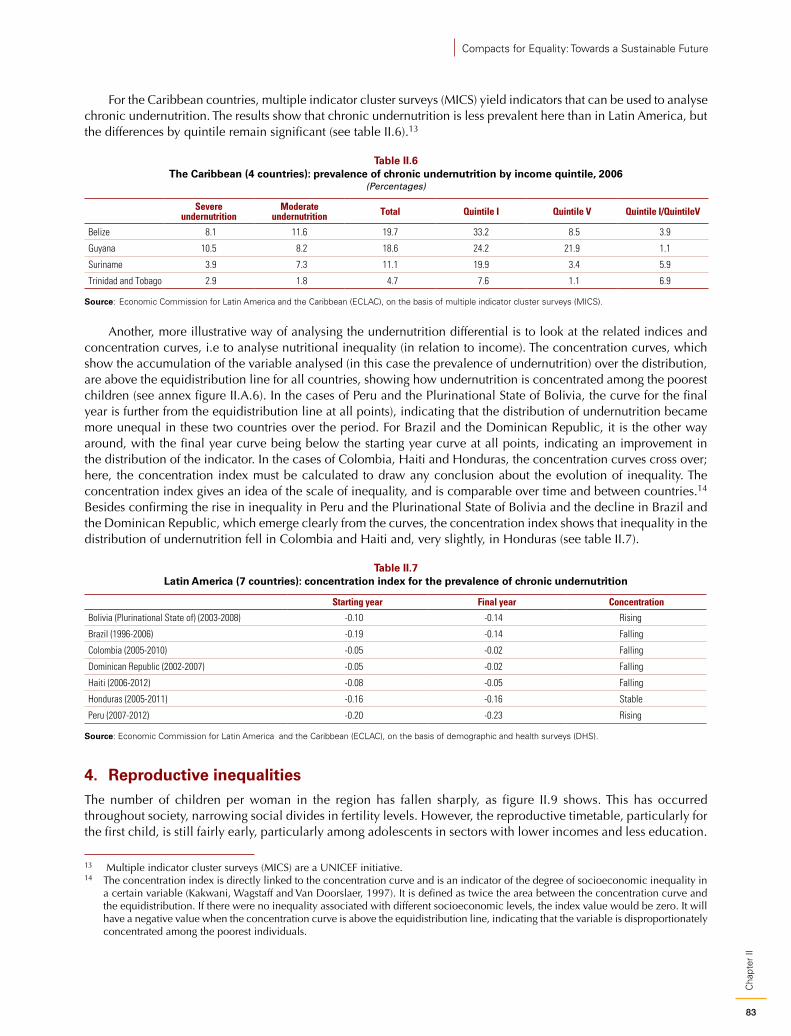
83
Cha
pter
II
Compacts for Equality: Towards a Sustainable Future
For the Caribbean countries, multiple indicator cluster surveys (MICS) yield indicators that can be used to analyse chronic undernutrition. The results show that chronic undernutrition is less prevalent here than in Latin America, but the differences by quintile remain significant (see table II.6).13
Table II.6 The Caribbean (4 countries): prevalence of chronic undernutrition by income quintile, 2006
(Percentages)
Severe undernutrition
Moderate undernutrition Total Quintile I Quintile V Quintile I/QuintileV
Belize 8.1 11.6 19.7 33.2 8.5 3.9
Guyana 10.5 8.2 18.6 24.2 21.9 1.1
Suriname 3.9 7.3 11.1 19.9 3.4 5.9
Trinidad and Tobago 2.9 1.8 4.7 7.6 1.1 6.9
Source: Economic Commission for Latin America and the Caribbean (ECLAC), on the basis of multiple indicator cluster surveys (MICS).
Another, more illustrative way of analysing the undernutrition differential is to look at the related indices and concentration curves, i.e to analyse nutritional inequality (in relation to income). The concentration curves, which show the accumulation of the variable analysed (in this case the prevalence of undernutrition) over the distribution, are above the equidistribution line for all countries, showing how undernutrition is concentrated among the poorest children (see annex figure II.A.6). In the cases of Peru and the Plurinational State of Bolivia, the curve for the final year is further from the equidistribution line at all points), indicating that the distribution of undernutrition became more unequal in these two countries over the period. For Brazil and the Dominican Republic, it is the other way around, with the final year curve being below the starting year curve at all points, indicating an improvement in the distribution of the indicator. In the cases of Colombia, Haiti and Honduras, the concentration curves cross over; here, the concentration index must be calculated to draw any conclusion about the evolution of inequality. The concentration index gives an idea of the scale of inequality, and is comparable over time and between countries.14 Besides confirming the rise in inequality in Peru and the Plurinational State of Bolivia and the decline in Brazil and the Dominican Republic, which emerge clearly from the curves, the concentration index shows that inequality in the distribution of undernutrition fell in Colombia and Haiti and, very slightly, in Honduras (see table II.7).
Table II.7 Latin America (7 countries): concentration index for the prevalence of chronic undernutrition
Starting year Final year Concentration
Bolivia (Plurinational State of) (2003-2008) -0.10 -0.14 Rising
Brazil (1996-2006) -0.19 -0.14 Falling
Colombia (2005-2010) -0.05 -0.02 Falling
Dominican Republic (2002-2007) -0.05 -0.02 Falling
Haiti (2006-2012) -0.08 -0.05 Falling
Honduras (2005-2011) -0.16 -0.16 Stable
Peru (2007-2012) -0.20 -0.23 Rising
Source: Economic Commission for Latin America and the Caribbean (ECLAC), on the basis of demographic and health surveys (DHS).
4. Reproductive inequalitiesThe number of children per woman in the region has fallen sharply, as figure II.9 shows. This has occurred throughout society, narrowing social divides in fertility levels. However, the reproductive timetable, particularly for the first child, is still fairly early, particularly among adolescents in sectors with lower incomes and less education.
13 Multiple indicator cluster surveys (MICS) are a UNICEF initiative.14 The concentration index is directly linked to the concentration curve and is an indicator of the degree of socioeconomic inequality in
a certain variable (Kakwani, Wagstaff and Van Doorslaer, 1997). It is defined as twice the area between the concentration curve and the equidistribution. If there were no inequality associated with different socioeconomic levels, the index value would be zero. It will have a negative value when the concentration curve is above the equidistribution line, indicating that the variable is disproportionately concentrated among the poorest individuals.
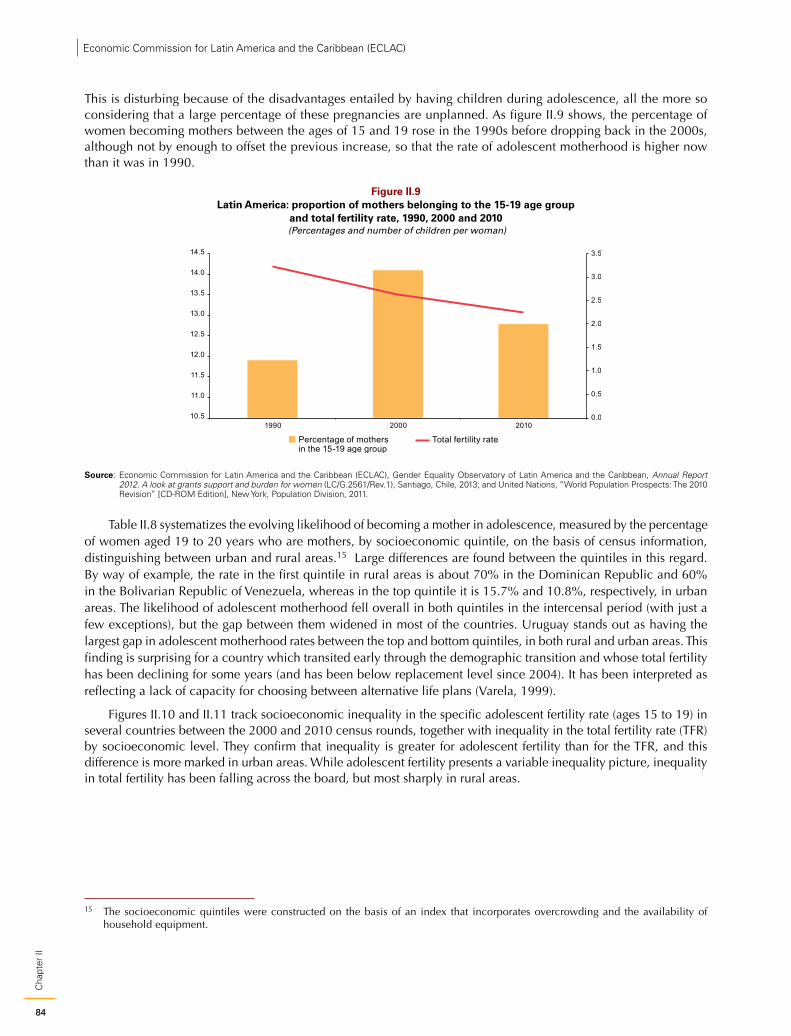
84
Cha
pter
IIEconomic Commission for Latin America and the Caribbean (ECLAC)
This is disturbing because of the disadvantages entailed by having children during adolescence, all the more so considering that a large percentage of these pregnancies are unplanned. As figure II.9 shows, the percentage of women becoming mothers between the ages of 15 and 19 rose in the 1990s before dropping back in the 2000s, although not by enough to offset the previous increase, so that the rate of adolescent motherhood is higher now than it was in 1990.
Figure II.9 Latin America: proportion of mothers belonging to the 15-19 age group
and total fertility rate, 1990, 2000 and 2010 (Percentages and number of children per woman)
0.0
0.5
1.0
1.5
2.0
2.5
3.0
3.5
10.5
11.0
11.5
12.0
12.5
13.0
13.5
14.0
14.5
1990 2000 2010
Percentage of mothers in the 15-19 age group
Total fertility rate
Source: Economic Commission for Latin America and the Caribbean (ECLAC), Gender Equality Observatory of Latin America and the Caribbean, Annual Report 2012. A look at grants support and burden for women (LC/G.2561/Rev.1), Santiago, Chile, 2013; and United Nations, “World Population Prospects: The 2010 Revision” [CD-ROM Edition], New York, Population Division, 2011.
Table II.8 systematizes the evolving likelihood of becoming a mother in adolescence, measured by the percentage of women aged 19 to 20 years who are mothers, by socioeconomic quintile, on the basis of census information, distinguishing between urban and rural areas.15 Large differences are found between the quintiles in this regard. By way of example, the rate in the first quintile in rural areas is about 70% in the Dominican Republic and 60% in the Bolivarian Republic of Venezuela, whereas in the top quintile it is 15.7% and 10.8%, respectively, in urban areas. The likelihood of adolescent motherhood fell overall in both quintiles in the intercensal period (with just a few exceptions), but the gap between them widened in most of the countries. Uruguay stands out as having the largest gap in adolescent motherhood rates between the top and bottom quintiles, in both rural and urban areas. This finding is surprising for a country which transited early through the demographic transition and whose total fertility has been declining for some years (and has been below replacement level since 2004). It has been interpreted as reflecting a lack of capacity for choosing between alternative life plans (Varela, 1999).
Figures II.10 and II.11 track socioeconomic inequality in the specific adolescent fertility rate (ages 15 to 19) in several countries between the 2000 and 2010 census rounds, together with inequality in the total fertility rate (TFR) by socioeconomic level. They confirm that inequality is greater for adolescent fertility than for the TFR, and this difference is more marked in urban areas. While adolescent fertility presents a variable inequality picture, inequality in total fertility has been falling across the board, but most sharply in rural areas.
15 The socioeconomic quintiles were constructed on the basis of an index that incorporates overcrowding and the availability of household equipment.
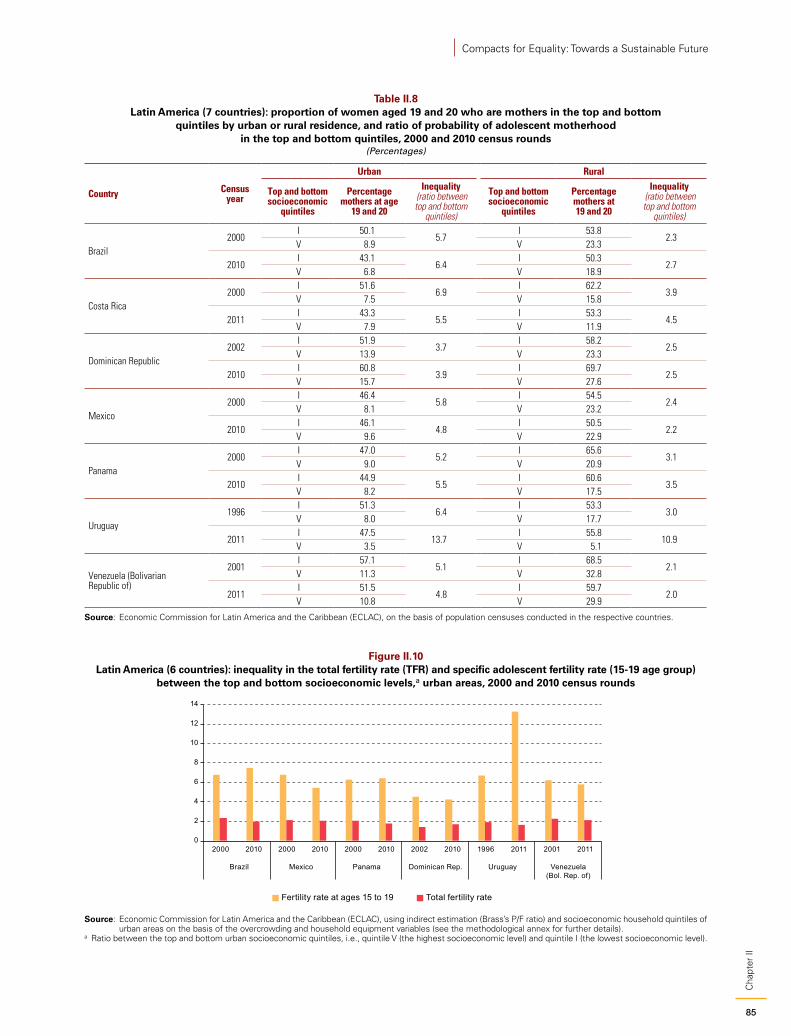
85
Cha
pter
II
Compacts for Equality: Towards a Sustainable Future
Table II.8 Latin America (7 countries): proportion of women aged 19 and 20 who are mothers in the top and bottom
quintiles by urban or rural residence, and ratio of probability of adolescent motherhood in the top and bottom quintiles, 2000 and 2010 census rounds
(Percentages)
Country Census year
Urban Rural
Top and bottom socioeconomic
quintiles
Percentage mothers at age
19 and 20
Inequality (ratio between top and bottom
quintiles)
Top and bottom socioeconomic
quintiles
Percentage mothers at 19 and 20
Inequality (ratio between top and bottom
quintiles)
Brazil2000
I 50.15.7
I 53.82.3
V 8.9 V 23.3
2010I 43.1
6.4I 50.3
2.7V 6.8 V 18.9
Costa Rica2000
I 51.66.9
I 62.23.9
V 7.5 V 15.8
2011I 43.3
5.5I 53.3
4.5V 7.9 V 11.9
Dominican Republic2002
I 51.93.7
I 58.22.5
V 13.9 V 23.3
2010I 60.8
3.9I 69.7
2.5V 15.7 V 27.6
Mexico2000
I 46.45.8
I 54.52.4
V 8.1 V 23.2
2010I 46.1
4.8I 50.5
2.2V 9.6 V 22.9
Panama2000
I 47.05.2
I 65.63.1
V 9.0 V 20.9
2010I 44.9
5.5I 60.6
3.5V 8.2 V 17.5
Uruguay1996
I 51.36.4
I 53.33.0
V 8.0 V 17.7
2011I 47.5
13.7I 55.8
10.9V 3.5 V 5.1
Venezuela (Bolivarian Republic of)
2001I 57.1
5.1I 68.5
2.1V 11.3 V 32.8
2011I 51.5
4.8I 59.7
2.0V 10.8 V 29.9
Source: Economic Commission for Latin America and the Caribbean (ECLAC), on the basis of population censuses conducted in the respective countries.
Figure II.10 Latin America (6 countries): inequality in the total fertility rate (TFR) and specific adolescent fertility rate (15-19 age group)
between the top and bottom socioeconomic levels,a urban areas, 2000 and 2010 census rounds
0
2
4
6
8
10
12
14
2000 2010 2000 2010 2000 2010 2002 2010 1996 2011 2001 2011
Brazil Mexico Panama Dominican Rep. Uruguay Venezuela(Bol. Rep. of)
Fertility rate at ages 15 to 19 Total fertility rate
Source: Economic Commission for Latin America and the Caribbean (ECLAC), using indirect estimation (Brass’s P/F ratio) and socioeconomic household quintiles of urban areas on the basis of the overcrowding and household equipment variables (see the methodological annex for further details).
a Ratio between the top and bottom urban socioeconomic quintiles, i.e., quintile V (the highest socioeconomic level) and quintile I (the lowest socioeconomic level).
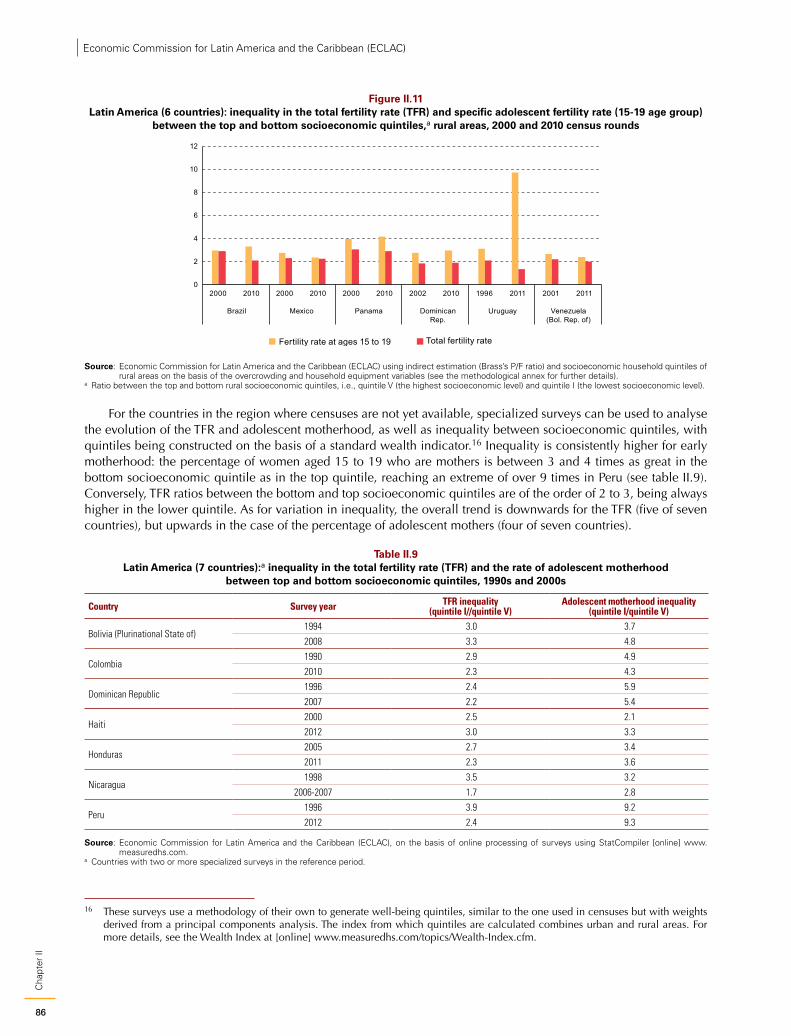
86
Cha
pter
IIEconomic Commission for Latin America and the Caribbean (ECLAC)
Figure II.11 Latin America (6 countries): inequality in the total fertility rate (TFR) and specific adolescent fertility rate (15-19 age group)
between the top and bottom socioeconomic quintiles,a rural areas, 2000 and 2010 census rounds
Total fertility rate
0
2
4
6
8
10
12
2000 2010 2000 2010 2000 2010 2002 2010 1996 2011 2001 2011
Brazil Mexico Panama DominicanRep.
Uruguay Venezuela(Bol. Rep. of)
Fertility rate at ages 15 to 19
Source: Economic Commission for Latin America and the Caribbean (ECLAC) using indirect estimation (Brass’s P/F ratio) and socioeconomic household quintiles of rural areas on the basis of the overcrowding and household equipment variables (see the methodological annex for further details).
a Ratio between the top and bottom rural socioeconomic quintiles, i.e., quintile V (the highest socioeconomic level) and quintile I (the lowest socioeconomic level).
For the countries in the region where censuses are not yet available, specialized surveys can be used to analyse the evolution of the TFR and adolescent motherhood, as well as inequality between socioeconomic quintiles, with quintiles being constructed on the basis of a standard wealth indicator.16 Inequality is consistently higher for early motherhood: the percentage of women aged 15 to 19 who are mothers is between 3 and 4 times as great in the bottom socioeconomic quintile as in the top quintile, reaching an extreme of over 9 times in Peru (see table II.9). Conversely, TFR ratios between the bottom and top socioeconomic quintiles are of the order of 2 to 3, being always higher in the lower quintile. As for variation in inequality, the overall trend is downwards for the TFR (five of seven countries), but upwards in the case of the percentage of adolescent mothers (four of seven countries).
Table II.9 Latin America (7 countries):a inequality in the total fertility rate (TFR) and the rate of adolescent motherhood
between top and bottom socioeconomic quintiles, 1990s and 2000s
Country Survey year TFR inequality(quintile I//quintile V)
Adolescent motherhood inequality (quintile I/quintile V)
Bolivia (Plurinational State of)1994 3.0 3.7
2008 3.3 4.8
Colombia1990 2.9 4.9
2010 2.3 4.3
Dominican Republic1996 2.4 5.9
2007 2.2 5.4
Haiti2000 2.5 2.1
2012 3.0 3.3
Honduras2005 2.7 3.4
2011 2.3 3.6
Nicaragua1998 3.5 3.2
2006-2007 1.7 2.8
Peru1996 3.9 9.2
2012 2.4 9.3
Source: Economic Commission for Latin America and the Caribbean (ECLAC), on the basis of online processing of surveys using StatCompiler [online] www.measuredhs.com.
a Countries with two or more specialized surveys in the reference period.
16 These surveys use a methodology of their own to generate well-being quintiles, similar to the one used in censuses but with weights derived from a principal components analysis. The index from which quintiles are calculated combines urban and rural areas. For more details, see the Wealth Index at [online] www.measuredhs.com/topics/Wealth-Index.cfm.
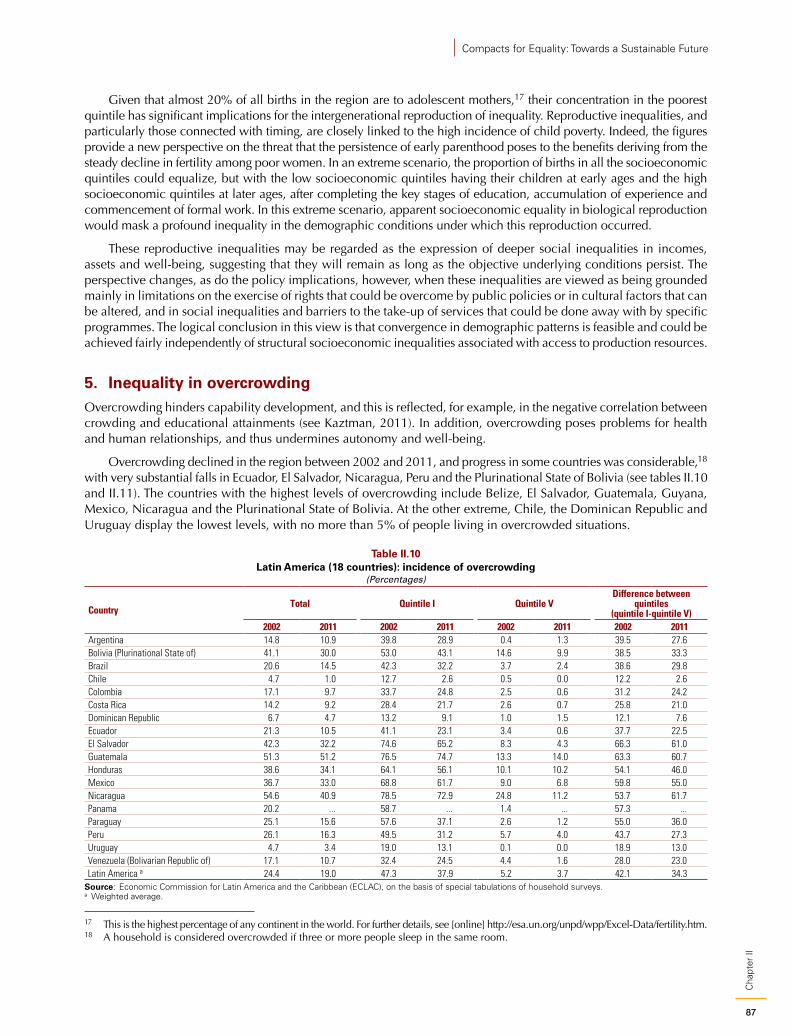
87
Cha
pter
II
Compacts for Equality: Towards a Sustainable Future
Given that almost 20% of all births in the region are to adolescent mothers,17 their concentration in the poorest quintile has significant implications for the intergenerational reproduction of inequality. Reproductive inequalities, and particularly those connected with timing, are closely linked to the high incidence of child poverty. Indeed, the figures provide a new perspective on the threat that the persistence of early parenthood poses to the benefits deriving from the steady decline in fertility among poor women. In an extreme scenario, the proportion of births in all the socioeconomic quintiles could equalize, but with the low socioeconomic quintiles having their children at early ages and the high socioeconomic quintiles at later ages, after completing the key stages of education, accumulation of experience and commencement of formal work. In this extreme scenario, apparent socioeconomic equality in biological reproduction would mask a profound inequality in the demographic conditions under which this reproduction occurred.
These reproductive inequalities may be regarded as the expression of deeper social inequalities in incomes, assets and well-being, suggesting that they will remain as long as the objective underlying conditions persist. The perspective changes, as do the policy implications, however, when these inequalities are viewed as being grounded mainly in limitations on the exercise of rights that could be overcome by public policies or in cultural factors that can be altered, and in social inequalities and barriers to the take-up of services that could be done away with by specific programmes. The logical conclusion in this view is that convergence in demographic patterns is feasible and could be achieved fairly independently of structural socioeconomic inequalities associated with access to production resources.
5. Inequality in overcrowdingOvercrowding hinders capability development, and this is reflected, for example, in the negative correlation between crowding and educational attainments (see Kaztman, 2011). In addition, overcrowding poses problems for health and human relationships, and thus undermines autonomy and well-being.
Overcrowding declined in the region between 2002 and 2011, and progress in some countries was considerable,18 with very substantial falls in Ecuador, El Salvador, Nicaragua, Peru and the Plurinational State of Bolivia (see tables II.10 and II.11). The countries with the highest levels of overcrowding include Belize, El Salvador, Guatemala, Guyana, Mexico, Nicaragua and the Plurinational State of Bolivia. At the other extreme, Chile, the Dominican Republic and Uruguay display the lowest levels, with no more than 5% of people living in overcrowded situations.
Table II.10 Latin America (18 countries): incidence of overcrowding
(Percentages)
CountryTotal Quintile I Quintile V
Difference between quintiles
(quintile I-quintile V)2002 2011 2002 2011 2002 2011 2002 2011
Argentina 14.8 10.9 39.8 28.9 0.4 1.3 39.5 27.6Bolivia (Plurinational State of) 41.1 30.0 53.0 43.1 14.6 9.9 38.5 33.3Brazil 20.6 14.5 42.3 32.2 3.7 2.4 38.6 29.8Chile 4.7 1.0 12.7 2.6 0.5 0.0 12.2 2.6Colombia 17.1 9.7 33.7 24.8 2.5 0.6 31.2 24.2Costa Rica 14.2 9.2 28.4 21.7 2.6 0.7 25.8 21.0Dominican Republic 6.7 4.7 13.2 9.1 1.0 1.5 12.1 7.6Ecuador 21.3 10.5 41.1 23.1 3.4 0.6 37.7 22.5El Salvador 42.3 32.2 74.6 65.2 8.3 4.3 66.3 61.0Guatemala 51.3 51.2 76.5 74.7 13.3 14.0 63.3 60.7Honduras 38.6 34.1 64.1 56.1 10.1 10.2 54.1 46.0Mexico 36.7 33.0 68.8 61.7 9.0 6.8 59.8 55.0Nicaragua 54.6 40.9 78.5 72.9 24.8 11.2 53.7 61.7Panama 20.2 ... 58.7 ... 1.4 ... 57.3 ...Paraguay 25.1 15.6 57.6 37.1 2.6 1.2 55.0 36.0Peru 26.1 16.3 49.5 31.2 5.7 4.0 43.7 27.3Uruguay 4.7 3.4 19.0 13.1 0.1 0.0 18.9 13.0Venezuela (Bolivarian Republic of) 17.1 10.7 32.4 24.5 4.4 1.6 28.0 23.0Latin America a 24.4 19.0 47.3 37.9 5.2 3.7 42.1 34.3
Source: Economic Commission for Latin America and the Caribbean (ECLAC), on the basis of special tabulations of household surveys.a Weighted average.
17 This is the highest percentage of any continent in the world. For further details, see [online] http://esa.un.org/unpd/wpp/Excel-Data/fertility.htm.18 A household is considered overcrowded if three or more people sleep in the same room.
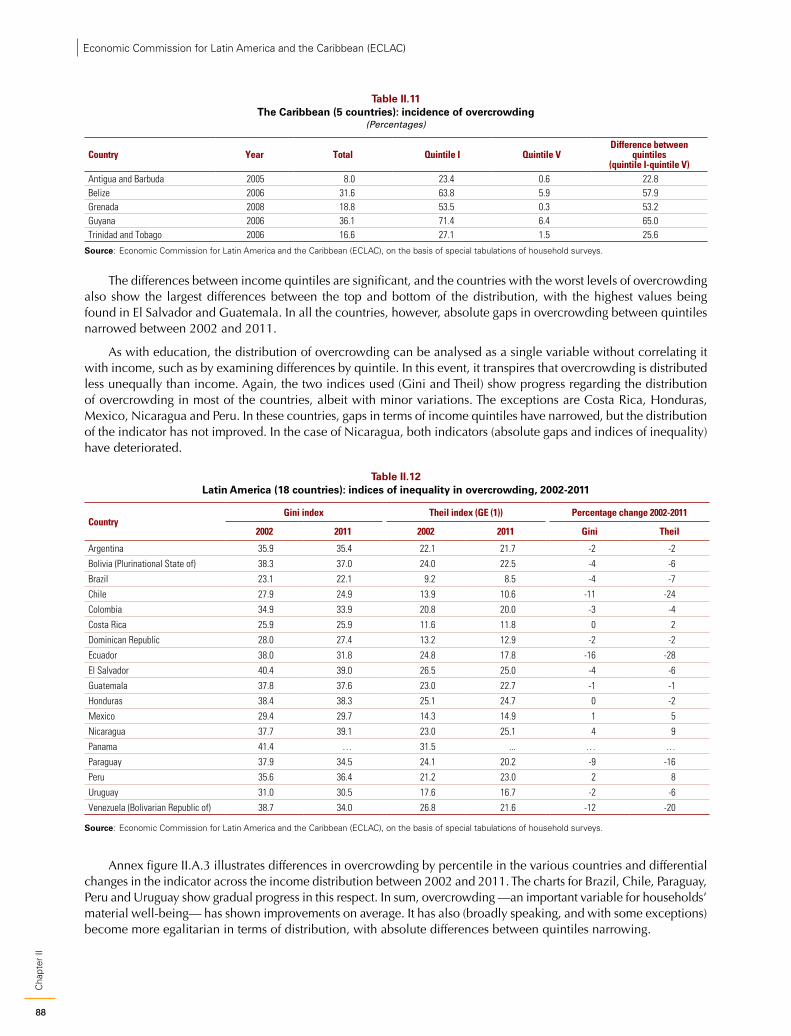
88
Cha
pter
IIEconomic Commission for Latin America and the Caribbean (ECLAC)
Table II.11 The Caribbean (5 countries): incidence of overcrowding
(Percentages)
Country Year Total Quintile I Quintile VDifference between
quintiles (quintile I-quintile V)
Antigua and Barbuda 2005 8.0 23.4 0.6 22.8Belize 2006 31.6 63.8 5.9 57.9Grenada 2008 18.8 53.5 0.3 53.2Guyana 2006 36.1 71.4 6.4 65.0Trinidad and Tobago 2006 16.6 27.1 1.5 25.6
Source: Economic Commission for Latin America and the Caribbean (ECLAC), on the basis of special tabulations of household surveys.
The differences between income quintiles are significant, and the countries with the worst levels of overcrowding also show the largest differences between the top and bottom of the distribution, with the highest values being found in El Salvador and Guatemala. In all the countries, however, absolute gaps in overcrowding between quintiles narrowed between 2002 and 2011.
As with education, the distribution of overcrowding can be analysed as a single variable without correlating it with income, such as by examining differences by quintile. In this event, it transpires that overcrowding is distributed less unequally than income. Again, the two indices used (Gini and Theil) show progress regarding the distribution of overcrowding in most of the countries, albeit with minor variations. The exceptions are Costa Rica, Honduras, Mexico, Nicaragua and Peru. In these countries, gaps in terms of income quintiles have narrowed, but the distribution of the indicator has not improved. In the case of Nicaragua, both indicators (absolute gaps and indices of inequality) have deteriorated.
Table II.12 Latin America (18 countries): indices of inequality in overcrowding, 2002-2011
CountryGini index Theil index (GE (1)) Percentage change 2002-2011
2002 2011 2002 2011 Gini Theil
Argentina 35.9 35.4 22.1 21.7 -2 -2
Bolivia (Plurinational State of) 38.3 37.0 24.0 22.5 -4 -6
Brazil 23.1 22.1 9.2 8.5 -4 -7
Chile 27.9 24.9 13.9 10.6 -11 -24
Colombia 34.9 33.9 20.8 20.0 -3 -4
Costa Rica 25.9 25.9 11.6 11.8 0 2
Dominican Republic 28.0 27.4 13.2 12.9 -2 -2
Ecuador 38.0 31.8 24.8 17.8 -16 -28
El Salvador 40.4 39.0 26.5 25.0 -4 -6
Guatemala 37.8 37.6 23.0 22.7 -1 -1
Honduras 38.4 38.3 25.1 24.7 0 -2
Mexico 29.4 29.7 14.3 14.9 1 5
Nicaragua 37.7 39.1 23.0 25.1 4 9
Panama 41.4 … 31.5 ... … …
Paraguay 37.9 34.5 24.1 20.2 -9 -16
Peru 35.6 36.4 21.2 23.0 2 8
Uruguay 31.0 30.5 17.6 16.7 -2 -6
Venezuela (Bolivarian Republic of) 38.7 34.0 26.8 21.6 -12 -20
Source: Economic Commission for Latin America and the Caribbean (ECLAC), on the basis of special tabulations of household surveys.
Annex figure II.A.3 illustrates differences in overcrowding by percentile in the various countries and differential changes in the indicator across the income distribution between 2002 and 2011. The charts for Brazil, Chile, Paraguay, Peru and Uruguay show gradual progress in this respect. In sum, overcrowding —an important variable for households’ material well-being— has shown improvements on average. It has also (broadly speaking, and with some exceptions) become more egalitarian in terms of distribution, with absolute differences between quintiles narrowing.

89
Cha
pter
II
Compacts for Equality: Towards a Sustainable Future
6. Inequality in access to durable goodsOne way of measuring the material well-being of individuals is by analysing their access to durable goods (for example, an automobile, refrigerator, washing machine, computer, water heater, and telephone). Having these goods also helps to build capabilities inasmuch as they facilitate communication, mobility, nutrition and health.
Access to durable goods is examined below, on the basis of information from continuous household surveys. Access to a variety of durable goods can be synthesized by means of a composite index, i.e. an indicator that combines in a single figure the availability of multiple durable goods in households.19 The goods used to construct the index in each country depend on the information available, and thus differ between countries. For each, the same goods are taken at two points in time and the index is normalized. This means that indices are comparable over time in each country but are not comparable between countries.20 A first aspect that clearly emerges is that, on average, households in all countries have gained more access to durable goods during the recent period of income growth, as the indicator has risen (see table II.13). Conversely, differences between income quintiles are significant, and they only narrowed in absolute terms in 5 of the 14 countries.
Table II.13 Latin America (14 countries): durable goods index values, 2002 and 2011a
Total Quintile I Quintile V Diferencia entre quintiles(quintil V-quintil I)
2002 2011 2002 2011 2002 2011 2002 2011
Bolivia (Plurinational State of) 0.5 0.9 0.1 0.4 1.0 1.3 0.9 1.0
Brazil 1.2 1.5 0.6 1.0 1.8 1.9 1.2 0.9
Chile 1.2 1.6 0.6 1.2 1.9 2.1 1.3 1.0
Colombia 0.9 1.0 0.4 0.4 1.4 1.5 1.0 1.1
Costa Rica 1.0 1.2 0.6 0.7 1.5 1.8 0.9 1.1
Dominican Republic 1.0 1.0 0.7 0.7 1.4 1.5 0.8 0.8
El Salvador 0.8 1.1 0.3 0.4 1.4 1.8 1.1 1.4
Honduras 0.5 0.9 0.1 0.3 1.1 1.5 1.0 1.2
Mexico 1.2 1.6 0.3 0.7 2.0 2.4 1.7 1.7
Nicaragua 0.4 0.9 0.1 0.3 0.8 1.5 0.7 1.2
Paraguay 0.6 1.2 0.2 0.5 1.3 2.0 1.1 1.4
Peru 0.6 1.1 0.1 0.3 1.3 1.8 1.3 1.5
Uruguay 1.3 1.9 0.7 1.2 1.8 2.4 1.2 1.1
Venezuela (Bolivarian Republic of) 1.1 1.2 0.6 0.9 1.5 1.4 0.9 0.5
Source: Economic Commission for Latin America and the Caribbean (ECLAC), on the basis of special tabulations of household surveys.a The index cannot be used for comparisons between countries because the basket of durable goods varies by country, but it does allow for comparisons within
each country between the top and bottom quintiles and over time.
When the distribution of durable goods access is considered, independently of income, by calculating the Gini index (constructed for the unstandardized indicator to avoid negative values), the index is found to have declined between 2002 and 2011 in all the region’s countries except the Dominican Republic, indicating progress towards equality in terms of durable goods access. The countries with the greatest improvements in the indicator are the Bolivarian Republic of Venezuela, Honduras, Nicaragua, Paraguay, Peru and the Plurinational State of Bolivia, which were generally the ones with the greatest inequality in respect of durable goods in 2002. At the end of the period, the countries with the lowest levels of inequality in durable goods access were the Bolivarian Republic of Venezuela, Brazil and Uruguay. Figure II.12 illustrates changes in the indicator across the distribution for each country. Generally speaking, the region displays advances in both average access to and distribution of durable goods, although absolute gaps between quintiles have widened in many countries.
19 The indicator is similar to the DHS wealth indicator used in this chapter to analyse inequalities in nutrition, and to the socioeconomic indicator used to analyse reproductive inequalities. It is based on the one proposed by Filmer and Pritchett (2001), and the details are presented in the methodological annex.
20 This indicator is calculated for 14 countries. The surveys of Argentina, Ecuador, Guatemala and Panama do not provide a basis for a sound analysis of a reasonable number of durable goods at the two points in time.
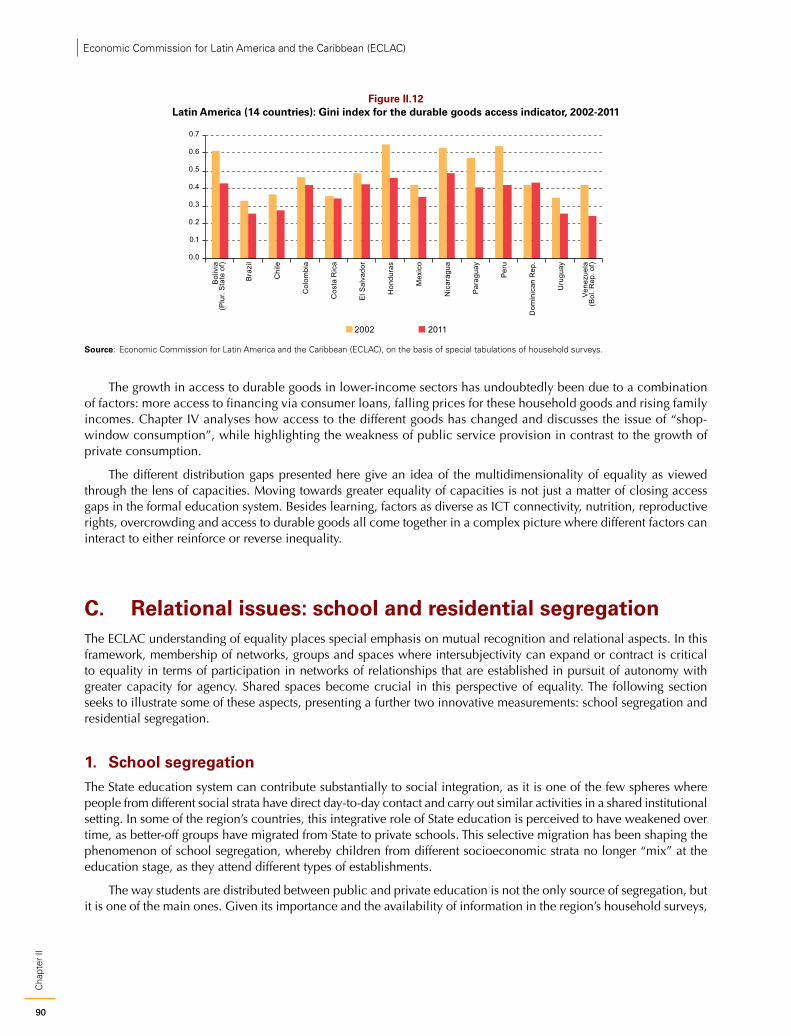
90
Cha
pter
IIEconomic Commission for Latin America and the Caribbean (ECLAC)
Figure II.12 Latin America (14 countries): Gini index for the durable goods access indicator, 2002-2011
0.0
0.1
0.2
0.3
0.4
0.5
0.6
0.7
Bol
ivia
(Plu
r. S
tate
of)
Bra
zil
Chi
le
Col
ombi
a
Cos
ta R
ica
El S
alva
dor
Hon
dura
s
Mex
ico
Nic
arag
ua
Par
agua
y
Per
u
Dom
inic
an R
ep.
Uru
guay
Vene
zuel
a(B
ol. R
ep. o
f)
2002 2011
Source: Economic Commission for Latin America and the Caribbean (ECLAC), on the basis of special tabulations of household surveys.
The growth in access to durable goods in lower-income sectors has undoubtedly been due to a combination of factors: more access to financing via consumer loans, falling prices for these household goods and rising family incomes. Chapter IV analyses how access to the different goods has changed and discusses the issue of “shop-window consumption”, while highlighting the weakness of public service provision in contrast to the growth of private consumption.
The different distribution gaps presented here give an idea of the multidimensionality of equality as viewed through the lens of capacities. Moving towards greater equality of capacities is not just a matter of closing access gaps in the formal education system. Besides learning, factors as diverse as ICT connectivity, nutrition, reproductive rights, overcrowding and access to durable goods all come together in a complex picture where different factors can interact to either reinforce or reverse inequality.
C. Relational issues: school and residential segregationThe ECLAC understanding of equality places special emphasis on mutual recognition and relational aspects. In this framework, membership of networks, groups and spaces where intersubjectivity can expand or contract is critical to equality in terms of participation in networks of relationships that are established in pursuit of autonomy with greater capacity for agency. Shared spaces become crucial in this perspective of equality. The following section seeks to illustrate some of these aspects, presenting a further two innovative measurements: school segregation and residential segregation.
1. School segregationThe State education system can contribute substantially to social integration, as it is one of the few spheres where people from different social strata have direct day-to-day contact and carry out similar activities in a shared institutional setting. In some of the region’s countries, this integrative role of State education is perceived to have weakened over time, as better-off groups have migrated from State to private schools. This selective migration has been shaping the phenomenon of school segregation, whereby children from different socioeconomic strata no longer “mix” at the education stage, as they attend different types of establishments.
The way students are distributed between public and private education is not the only source of segregation, but it is one of the main ones. Given its importance and the availability of information in the region’s household surveys,
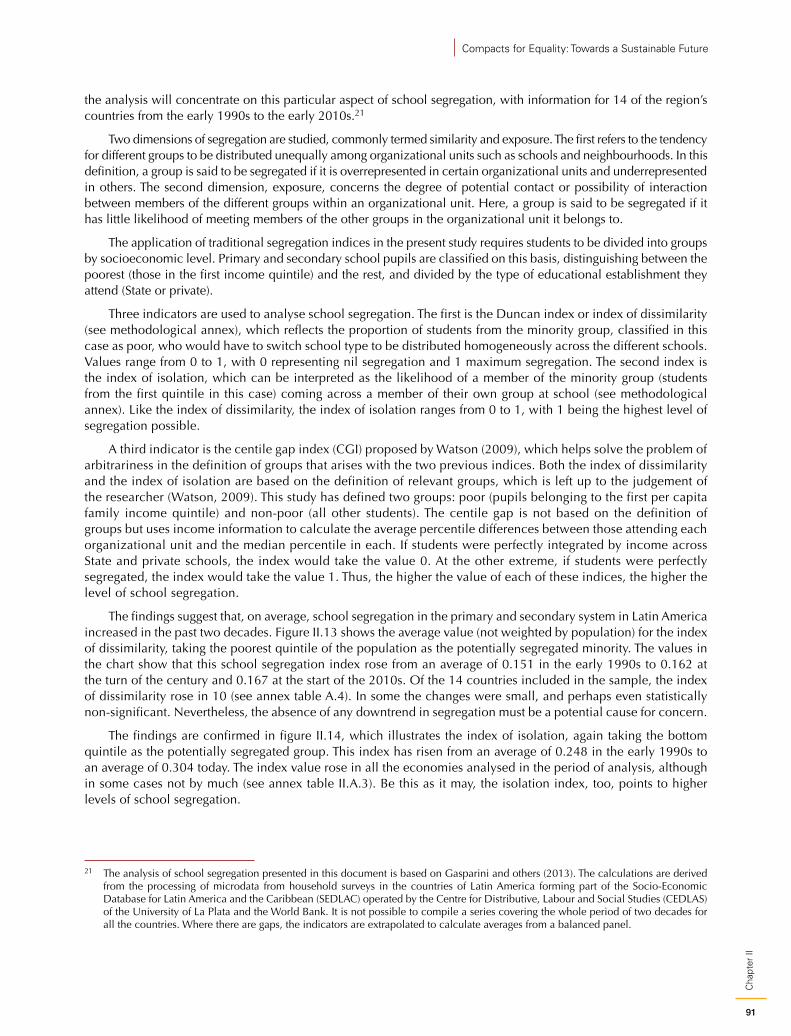
91
Cha
pter
II
Compacts for Equality: Towards a Sustainable Future
the analysis will concentrate on this particular aspect of school segregation, with information for 14 of the region’s countries from the early 1990s to the early 2010s.21
Two dimensions of segregation are studied, commonly termed similarity and exposure. The first refers to the tendency for different groups to be distributed unequally among organizational units such as schools and neighbourhoods. In this definition, a group is said to be segregated if it is overrepresented in certain organizational units and underrepresented in others. The second dimension, exposure, concerns the degree of potential contact or possibility of interaction between members of the different groups within an organizational unit. Here, a group is said to be segregated if it has little likelihood of meeting members of the other groups in the organizational unit it belongs to.
The application of traditional segregation indices in the present study requires students to be divided into groups by socioeconomic level. Primary and secondary school pupils are classified on this basis, distinguishing between the poorest (those in the first income quintile) and the rest, and divided by the type of educational establishment they attend (State or private).
Three indicators are used to analyse school segregation. The first is the Duncan index or index of dissimilarity (see methodological annex), which reflects the proportion of students from the minority group, classified in this case as poor, who would have to switch school type to be distributed homogeneously across the different schools. Values range from 0 to 1, with 0 representing nil segregation and 1 maximum segregation. The second index is the index of isolation, which can be interpreted as the likelihood of a member of the minority group (students from the first quintile in this case) coming across a member of their own group at school (see methodological annex). Like the index of dissimilarity, the index of isolation ranges from 0 to 1, with 1 being the highest level of segregation possible.
A third indicator is the centile gap index (CGI) proposed by Watson (2009), which helps solve the problem of arbitrariness in the definition of groups that arises with the two previous indices. Both the index of dissimilarity and the index of isolation are based on the definition of relevant groups, which is left up to the judgement of the researcher (Watson, 2009). This study has defined two groups: poor (pupils belonging to the first per capita family income quintile) and non-poor (all other students). The centile gap is not based on the definition of groups but uses income information to calculate the average percentile differences between those attending each organizational unit and the median percentile in each. If students were perfectly integrated by income across State and private schools, the index would take the value 0. At the other extreme, if students were perfectly segregated, the index would take the value 1. Thus, the higher the value of each of these indices, the higher the level of school segregation.
The findings suggest that, on average, school segregation in the primary and secondary system in Latin America increased in the past two decades. Figure II.13 shows the average value (not weighted by population) for the index of dissimilarity, taking the poorest quintile of the population as the potentially segregated minority. The values in the chart show that this school segregation index rose from an average of 0.151 in the early 1990s to 0.162 at the turn of the century and 0.167 at the start of the 2010s. Of the 14 countries included in the sample, the index of dissimilarity rose in 10 (see annex table A.4). In some the changes were small, and perhaps even statistically non-significant. Nevertheless, the absence of any downtrend in segregation must be a potential cause for concern.
The findings are confirmed in figure II.14, which illustrates the index of isolation, again taking the bottom quintile as the potentially segregated group. This index has risen from an average of 0.248 in the early 1990s to an average of 0.304 today. The index value rose in all the economies analysed in the period of analysis, although in some cases not by much (see annex table II.A.3). Be this as it may, the isolation index, too, points to higher levels of school segregation.
21 The analysis of school segregation presented in this document is based on Gasparini and others (2013). The calculations are derived from the processing of microdata from household surveys in the countries of Latin America forming part of the Socio-Economic Database for Latin America and the Caribbean (SEDLAC) operated by the Centre for Distributive, Labour and Social Studies (CEDLAS) of the University of La Plata and the World Bank. It is not possible to compile a series covering the whole period of two decades for all the countries. Where there are gaps, the indicators are extrapolated to calculate averages from a balanced panel.
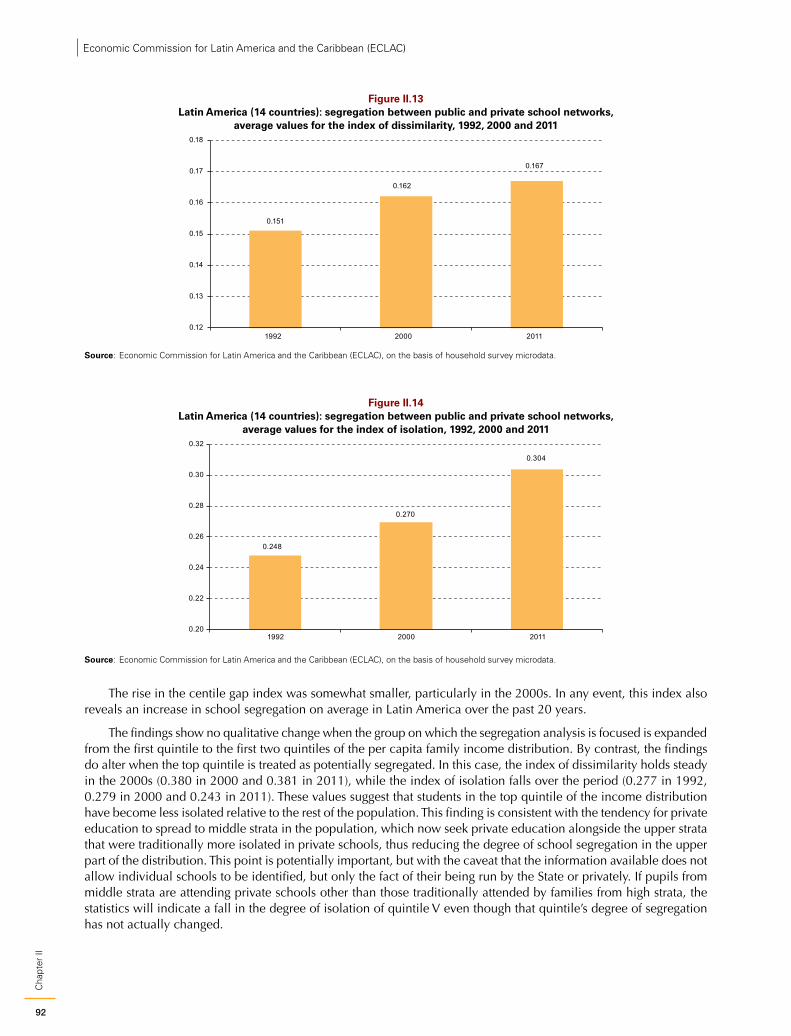
92
Cha
pter
IIEconomic Commission for Latin America and the Caribbean (ECLAC)
Figure II.13 Latin America (14 countries): segregation between public and private school networks,
average values for the index of dissimilarity, 1992, 2000 and 2011
0.151
0.162
0.167
0.12
0.13
0.14
0.15
0.16
0.17
0.18
1992 2000 2011
Source: Economic Commission for Latin America and the Caribbean (ECLAC), on the basis of household survey microdata.
Figure II.14 Latin America (14 countries): segregation between public and private school networks,
average values for the index of isolation, 1992, 2000 and 2011
0.248
0.270
0.304
0.20
0.22
0.24
0.26
0.28
0.30
0.32
1992 2000 2011
Source: Economic Commission for Latin America and the Caribbean (ECLAC), on the basis of household survey microdata.
The rise in the centile gap index was somewhat smaller, particularly in the 2000s. In any event, this index also reveals an increase in school segregation on average in Latin America over the past 20 years.
The findings show no qualitative change when the group on which the segregation analysis is focused is expanded from the first quintile to the first two quintiles of the per capita family income distribution. By contrast, the findings do alter when the top quintile is treated as potentially segregated. In this case, the index of dissimilarity holds steady in the 2000s (0.380 in 2000 and 0.381 in 2011), while the index of isolation falls over the period (0.277 in 1992, 0.279 in 2000 and 0.243 in 2011). These values suggest that students in the top quintile of the income distribution have become less isolated relative to the rest of the population. This finding is consistent with the tendency for private education to spread to middle strata in the population, which now seek private education alongside the upper strata that were traditionally more isolated in private schools, thus reducing the degree of school segregation in the upper part of the distribution. This point is potentially important, but with the caveat that the information available does not allow individual schools to be identified, but only the fact of their being run by the State or privately. If pupils from middle strata are attending private schools other than those traditionally attended by families from high strata, the statistics will indicate a fall in the degree of isolation of quintile V even though that quintile’s degree of segregation has not actually changed.
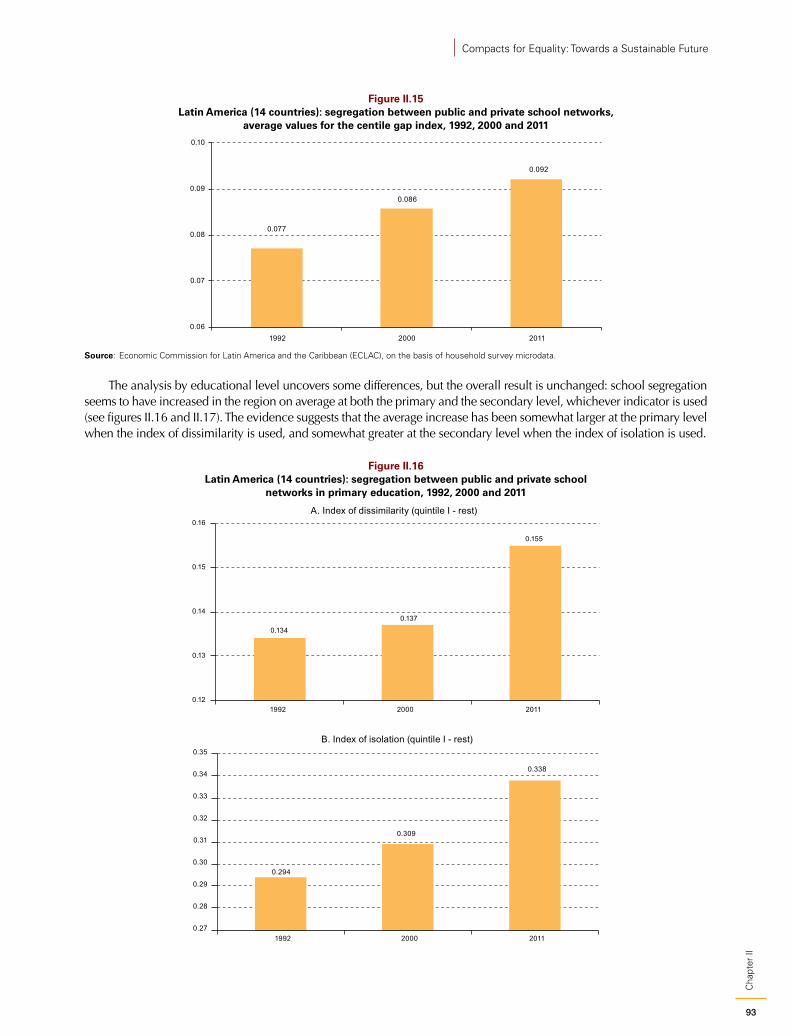
93
Cha
pter
II
Compacts for Equality: Towards a Sustainable Future
Figure II.15 Latin America (14 countries): segregation between public and private school networks,
average values for the centile gap index, 1992, 2000 and 2011
0.077
0.086
0.092
0.06
0.07
0.08
0.09
0.10
1992 2000 2011
Source: Economic Commission for Latin America and the Caribbean (ECLAC), on the basis of household survey microdata.
The analysis by educational level uncovers some differences, but the overall result is unchanged: school segregation seems to have increased in the region on average at both the primary and the secondary level, whichever indicator is used (see figures II.16 and II.17). The evidence suggests that the average increase has been somewhat larger at the primary level when the index of dissimilarity is used, and somewhat greater at the secondary level when the index of isolation is used.
Figure II.16 Latin America (14 countries): segregation between public and private school
networks in primary education, 1992, 2000 and 2011
0.134
0.137
0.155
0.12
0.13
0.14
0.15
0.16
1992 2000 2011
A. Index of dissimilarity (quintile I - rest)
0.294
0.309
0.338
0.27
0.28
0.29
0.30
0.31
0.32
0.33
0.34
0.35
1992 2000 2011
B. Index of isolation (quintile I - rest)
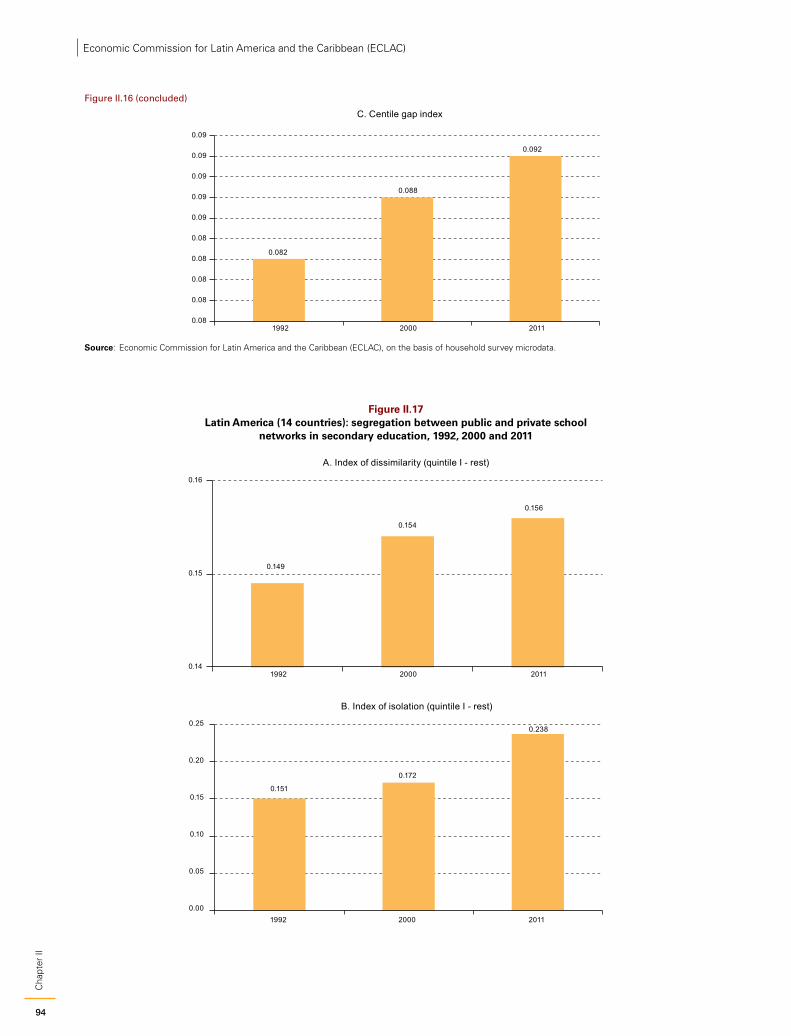
94
Cha
pter
IIEconomic Commission for Latin America and the Caribbean (ECLAC)
0.082
0.088
0.092
0.08
0.08
0.08
0.08
0.08
0.09
0.09
0.09
0.09
0.09
1992 2000 2011
C. Centile gap index
Source: Economic Commission for Latin America and the Caribbean (ECLAC), on the basis of household survey microdata.
Figure II.17 Latin America (14 countries): segregation between public and private school
networks in secondary education, 1992, 2000 and 2011
0.149
0.154
0.156
0.14
0.15
0.16
1992 2000 2011
A. Index of dissimilarity (quintile I - rest)
0.151
0.172
0.238
0.00
0.05
0.10
0.15
0.20
0.25
1992 2000 2011
B. Index of isolation (quintile I - rest)
Figure II.16 (concluded)
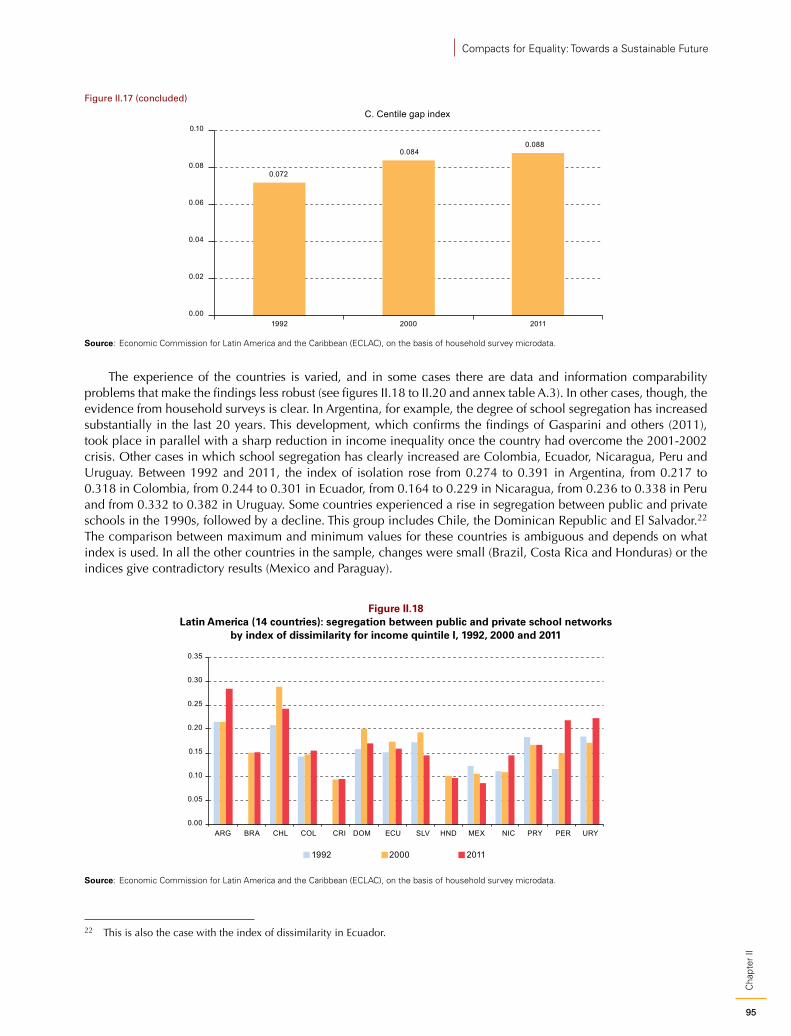
95
Cha
pter
II
Compacts for Equality: Towards a Sustainable Future
0.072
0.0840.088
0.00
0.02
0.04
0.06
0.08
0.10
1992 2000 2011
C. Centile gap index
Source: Economic Commission for Latin America and the Caribbean (ECLAC), on the basis of household survey microdata.
The experience of the countries is varied, and in some cases there are data and information comparability problems that make the findings less robust (see figures II.18 to II.20 and annex table A.3). In other cases, though, the evidence from household surveys is clear. In Argentina, for example, the degree of school segregation has increased substantially in the last 20 years. This development, which confirms the findings of Gasparini and others (2011), took place in parallel with a sharp reduction in income inequality once the country had overcome the 2001-2002 crisis. Other cases in which school segregation has clearly increased are Colombia, Ecuador, Nicaragua, Peru and Uruguay. Between 1992 and 2011, the index of isolation rose from 0.274 to 0.391 in Argentina, from 0.217 to 0.318 in Colombia, from 0.244 to 0.301 in Ecuador, from 0.164 to 0.229 in Nicaragua, from 0.236 to 0.338 in Peru and from 0.332 to 0.382 in Uruguay. Some countries experienced a rise in segregation between public and private schools in the 1990s, followed by a decline. This group includes Chile, the Dominican Republic and El Salvador.22 The comparison between maximum and minimum values for these countries is ambiguous and depends on what index is used. In all the other countries in the sample, changes were small (Brazil, Costa Rica and Honduras) or the indices give contradictory results (Mexico and Paraguay).
Figure II.18 Latin America (14 countries): segregation between public and private school networks
by index of dissimilarity for income quintile I, 1992, 2000 and 2011
0.00
0.05
0.10
0.15
0.20
0.25
0.30
0.35
ARG BRA CHL COL CRI DOM ECU SLV HND MEX NIC PRY PER URY
1992 2000 2011
Source: Economic Commission for Latin America and the Caribbean (ECLAC), on the basis of household survey microdata.
22 This is also the case with the index of dissimilarity in Ecuador.
Figure II.17 (concluded)
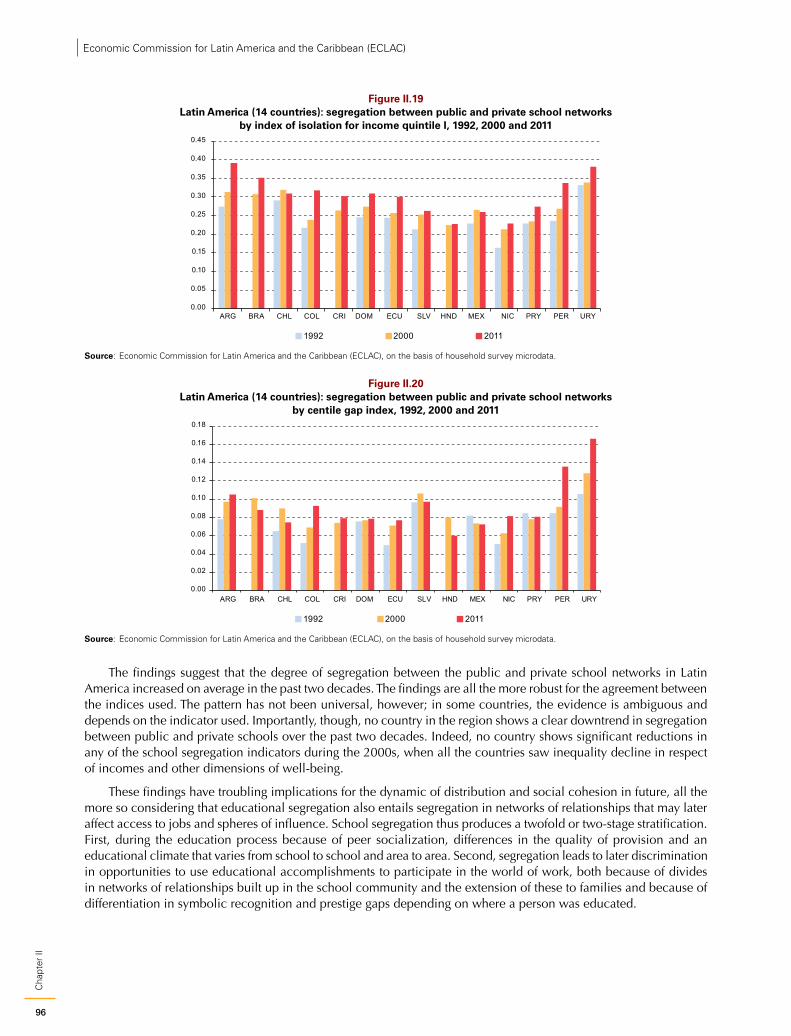
96
Cha
pter
IIEconomic Commission for Latin America and the Caribbean (ECLAC)
Figure II.19 Latin America (14 countries): segregation between public and private school networks
by index of isolation for income quintile I, 1992, 2000 and 2011
1992 2000 2011
0.00
0.05
0.10
0.15
0.20
0.25
0.30
0.35
0.40
0.45
ARG BRA CHL COL CRI DOM ECU SLV HND MEX NIC PRY PER URY
Source: Economic Commission for Latin America and the Caribbean (ECLAC), on the basis of household survey microdata.
Figure II.20 Latin America (14 countries): segregation between public and private school networks
by centile gap index, 1992, 2000 and 2011
1992 2000 2011
0.00
0.02
0.04
0.06
0.08
0.10
0.12
0.14
0.16
0.18
ARG BRA CHL COL CRI DOM ECU SLV HND MEX NIC PRY PER URY
Source: Economic Commission for Latin America and the Caribbean (ECLAC), on the basis of household survey microdata.
The findings suggest that the degree of segregation between the public and private school networks in Latin America increased on average in the past two decades. The findings are all the more robust for the agreement between the indices used. The pattern has not been universal, however; in some countries, the evidence is ambiguous and depends on the indicator used. Importantly, though, no country in the region shows a clear downtrend in segregation between public and private schools over the past two decades. Indeed, no country shows significant reductions in any of the school segregation indicators during the 2000s, when all the countries saw inequality decline in respect of incomes and other dimensions of well-being.
These findings have troubling implications for the dynamic of distribution and social cohesion in future, all the more so considering that educational segregation also entails segregation in networks of relationships that may later affect access to jobs and spheres of influence. School segregation thus produces a twofold or two-stage stratification. First, during the education process because of peer socialization, differences in the quality of provision and an educational climate that varies from school to school and area to area. Second, segregation leads to later discrimination in opportunities to use educational accomplishments to participate in the world of work, both because of divides in networks of relationships built up in the school community and the extension of these to families and because of differentiation in symbolic recognition and prestige gaps depending on where a person was educated.
97
Cha
pter
II
Compacts for Equality: Towards a Sustainable Future
2. Residential segregationAnother important sphere of social interaction is the residential space. Residential segregation means that the different socioeconomic groups in a city or metropolis live separately, with little or no sharing of residential space. At the extreme, each residential space within a city23 presents complete socioeconomic homogeneity and is completely differentiated from the spaces where the other socioeconomic groups live.
Socioeconomic inequality and residential segregation are not the same thing. Residential segregation cannot occur without social inequality, because a society that is wholly egalitarian in its socioeconomic make-up will contain no groups (classes or strata) that can be differentiated by their geographical location. Conversely, high levels of socioeconomic inequality may be found in both segregated and unsegregated cities.
Territorial concentration, like social inequality, also tends to be “inherited” and reproduced, particularly through market mechanisms (the price of land and housing), urban planning regulations, local financing rules and public policies and procedures (particularly for housing and transport). The territorial character of segregation means, however, that people’s geographical mobility is a key factor, as it can alter their residential situation and, in the aggregate, change the levels and patterns of residential segregation.
Residential segregation has a negative connotation of exclusion and confinement that is detrimental to an excluded or disadvantaged social group. Consequently, residential segregation has forward and backward linkages with disadvantage. However, there is also territorial concentration of the “well-off” population, and the degree of its “residential segregation” can be calculated. This concentration operates as a mechanism for reproducing wealth between generations, but it stands out for being the outcome of circumstances and decisions conducive to the socioeconomic homogenization of the areas where high-income groups live, either because residents of a lower socioeconomic level leave or because there are barriers to the arrival of individuals and families of lower socioeconomic level.
The following analysis is based on Duncan’s index of dissimilarity (see methodological annex). Two socioeconomic variables are used: the level of education of the household head and the socioeconomic level of the household (on the basis of household equipment). In the case of education, the age of the household head is controlled for to ensure that the segregation pattern observed was not due exclusively to an exogenous age effect.24 Ten countries with available microdata from the 2000 and 2010 census rounds are considered.25 In these countries, a selection was made of cities with over 1 million inhabitants (the exception being Cuenca in Ecuador, which has no more than 500,000 inhabitants) that had different urban situations and could thus be taken as representative of the different metropolitan dynamics in each country.
Table II.14 confirms a stylized fact already documented in the specialized literature (Pérez-Campuzano, 2011; IDB, 2011; Roberts and Wilson, 2009; Rodríguez, 2009; Dureau and others, 2002). In all the cities,26 higher levels of segregation are found in the group with a high level of education (tertiary education or above). This is reflected in the simple mean of the sample, which is of the order of 13, 7 and 22 in the 2010 round for the lower, medium and high education groups, respectively. These values are interpreted as the percentage of each group’s population that would have to be redistributed geographically to achieve zero segregation, which would be when the territorial distribution of the two groups being compared is identical. These figures confirm the exclusive location pattern of the best-off groups in the region’s cities, tending as they do to live in areas that are fairly well connected to the commercial and financial centres of their cities, are fairly self-sufficient in services, and have high land and housing prices, which have the effect of expelling poor households or impeding the entry of poor individuals or households. The extent to which these well-to-do groups are sealed off has serious implications for their connections with the rest of society, and it is also a powerful mechanism for reproducing wealth and concentrating economic power.
23 Municipalities, communes or districts, neighbourhoods, settlements, blocks.24 The calculations were carried out using two levels of geographical disaggregation, that of the minor administrative division (MIAD)
and a sublevel, the subMIAD. The text presents the results for the more aggregate scale, the messages being in agreement in both cases.25 Argentina, the Bolivarian Republic of Venezuela, Brazil, Costa Rica, the Dominican Republic, Ecuador, Mexico, Panama, Peru and
Uruguay. Cities were defined territorially in terms of metropolitan areas, for which official criteria were used together with academic studies and other inputs. The territorial definition used is identical for the two censuses, meaning that there is intercensal comparability, at least on the MIAD scale.
26 With the exception of the area of Tijuana (Mexico), which is a special case because it only has three municipalities that correspond to the definition used in the calculations.
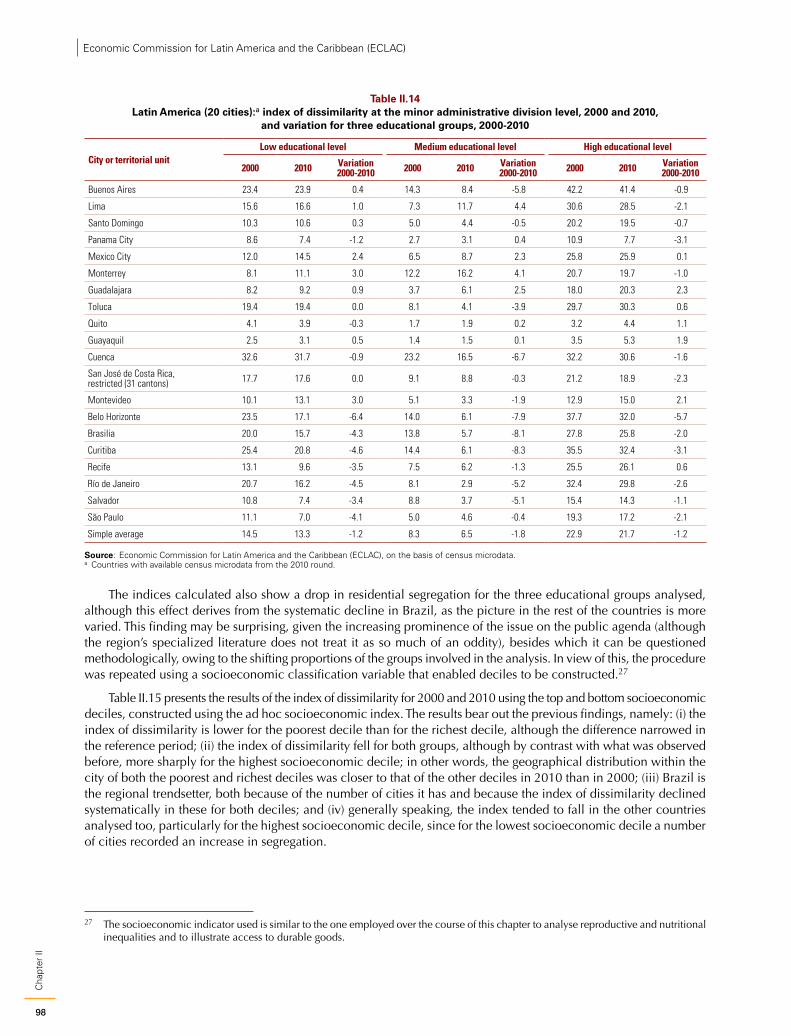
98
Cha
pter
IIEconomic Commission for Latin America and the Caribbean (ECLAC)
Table II.14 Latin America (20 cities):a index of dissimilarity at the minor administrative division level, 2000 and 2010,
and variation for three educational groups, 2000-2010
City or territorial unitLow educational level Medium educational level High educational level
2000 2010 Variation 2000-2010 2000 2010 Variation
2000-2010 2000 2010 Variation 2000-2010
Buenos Aires 23.4 23.9 0.4 14.3 8.4 -5.8 42.2 41.4 -0.9
Lima 15.6 16.6 1.0 7.3 11.7 4.4 30.6 28.5 -2.1
Santo Domingo 10.3 10.6 0.3 5.0 4.4 -0.5 20.2 19.5 -0.7
Panama City 8.6 7.4 -1.2 2.7 3.1 0.4 10.9 7.7 -3.1
Mexico City 12.0 14.5 2.4 6.5 8.7 2.3 25.8 25.9 0.1
Monterrey 8.1 11.1 3.0 12.2 16.2 4.1 20.7 19.7 -1.0
Guadalajara 8.2 9.2 0.9 3.7 6.1 2.5 18.0 20.3 2.3
Toluca 19.4 19.4 0.0 8.1 4.1 -3.9 29.7 30.3 0.6
Quito 4.1 3.9 -0.3 1.7 1.9 0.2 3.2 4.4 1.1
Guayaquil 2.5 3.1 0.5 1.4 1.5 0.1 3.5 5.3 1.9
Cuenca 32.6 31.7 -0.9 23.2 16.5 -6.7 32.2 30.6 -1.6
San José de Costa Rica, restricted (31 cantons) 17.7 17.6 0.0 9.1 8.8 -0.3 21.2 18.9 -2.3
Montevideo 10.1 13.1 3.0 5.1 3.3 -1.9 12.9 15.0 2.1
Belo Horizonte 23.5 17.1 -6.4 14.0 6.1 -7.9 37.7 32.0 -5.7
Brasilia 20.0 15.7 -4.3 13.8 5.7 -8.1 27.8 25.8 -2.0
Curitiba 25.4 20.8 -4.6 14.4 6.1 -8.3 35.5 32.4 -3.1
Recife 13.1 9.6 -3.5 7.5 6.2 -1.3 25.5 26.1 0.6
Río de Janeiro 20.7 16.2 -4.5 8.1 2.9 -5.2 32.4 29.8 -2.6
Salvador 10.8 7.4 -3.4 8.8 3.7 -5.1 15.4 14.3 -1.1
São Paulo 11.1 7.0 -4.1 5.0 4.6 -0.4 19.3 17.2 -2.1
Simple average 14.5 13.3 -1.2 8.3 6.5 -1.8 22.9 21.7 -1.2
Source: Economic Commission for Latin America and the Caribbean (ECLAC), on the basis of census microdata.a Countries with available census microdata from the 2010 round.
The indices calculated also show a drop in residential segregation for the three educational groups analysed, although this effect derives from the systematic decline in Brazil, as the picture in the rest of the countries is more varied. This finding may be surprising, given the increasing prominence of the issue on the public agenda (although the region’s specialized literature does not treat it as so much of an oddity), besides which it can be questioned methodologically, owing to the shifting proportions of the groups involved in the analysis. In view of this, the procedure was repeated using a socioeconomic classification variable that enabled deciles to be constructed.27
Table II.15 presents the results of the index of dissimilarity for 2000 and 2010 using the top and bottom socioeconomic deciles, constructed using the ad hoc socioeconomic index. The results bear out the previous findings, namely: (i) the index of dissimilarity is lower for the poorest decile than for the richest decile, although the difference narrowed in the reference period; (ii) the index of dissimilarity fell for both groups, although by contrast with what was observed before, more sharply for the highest socioeconomic decile; in other words, the geographical distribution within the city of both the poorest and richest deciles was closer to that of the other deciles in 2010 than in 2000; (iii) Brazil is the regional trendsetter, both because of the number of cities it has and because the index of dissimilarity declined systematically in these for both deciles; and (iv) generally speaking, the index tended to fall in the other countries analysed too, particularly for the highest socioeconomic decile, since for the lowest socioeconomic decile a number of cities recorded an increase in segregation.
27 The socioeconomic indicator used is similar to the one employed over the course of this chapter to analyse reproductive and nutritional inequalities and to illustrate access to durable goods.
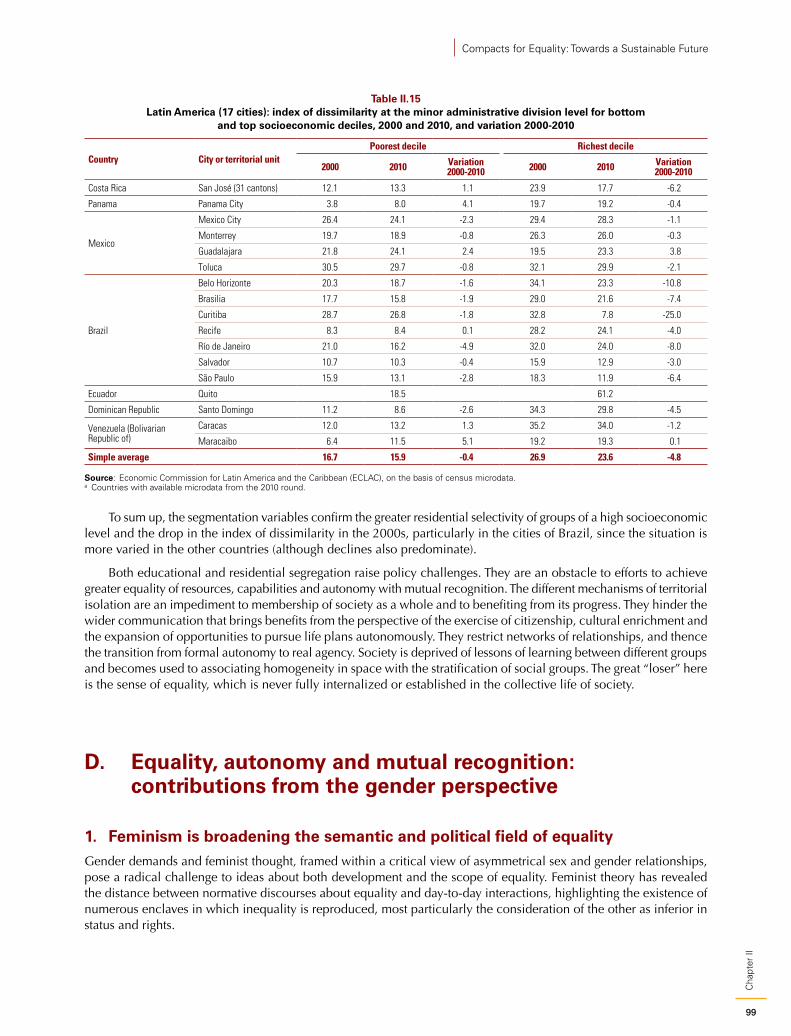
99
Cha
pter
II
Compacts for Equality: Towards a Sustainable Future
Table II.15 Latin America (17 cities): index of dissimilarity at the minor administrative division level for bottom
and top socioeconomic deciles, 2000 and 2010, and variation 2000-2010
Country City or territorial unitPoorest decile Richest decile
2000 2010 Variation 2000-2010 2000 2010 Variation
2000-2010
Costa Rica San José (31 cantons) 12.1 13.3 1.1 23.9 17.7 -6.2
Panama Panama City 3.8 8.0 4.1 19.7 19.2 -0.4
Mexico
Mexico City 26.4 24.1 -2.3 29.4 28.3 -1.1
Monterrey 19.7 18.9 -0.8 26.3 26.0 -0.3
Guadalajara 21.8 24.1 2.4 19.5 23.3 3.8
Toluca 30.5 29.7 -0.8 32.1 29.9 -2.1
Brazil
Belo Horizonte 20.3 18.7 -1.6 34.1 23.3 -10.8
Brasilia 17.7 15.8 -1.9 29.0 21.6 -7.4
Curitiba 28.7 26.8 -1.8 32.8 7.8 -25.0
Recife 8.3 8.4 0.1 28.2 24.1 -4.0
Río de Janeiro 21.0 16.2 -4.9 32.0 24.0 -8.0
Salvador 10.7 10.3 -0.4 15.9 12.9 -3.0
São Paulo 15.9 13.1 -2.8 18.3 11.9 -6.4
Ecuador Quito 18.5 61.2
Dominican Republic Santo Domingo 11.2 8.6 -2.6 34.3 29.8 -4.5
Venezuela (Bolivarian Republic of)
Caracas 12.0 13.2 1.3 35.2 34.0 -1.2
Maracaibo 6.4 11.5 5.1 19.2 19.3 0.1
Simple average 16.7 15.9 -0.4 26.9 23.6 -4.8
Source: Economic Commission for Latin America and the Caribbean (ECLAC), on the basis of census microdata.a Countries with available microdata from the 2010 round.
To sum up, the segmentation variables confirm the greater residential selectivity of groups of a high socioeconomic level and the drop in the index of dissimilarity in the 2000s, particularly in the cities of Brazil, since the situation is more varied in the other countries (although declines also predominate).
Both educational and residential segregation raise policy challenges. They are an obstacle to efforts to achieve greater equality of resources, capabilities and autonomy with mutual recognition. The different mechanisms of territorial isolation are an impediment to membership of society as a whole and to benefiting from its progress. They hinder the wider communication that brings benefits from the perspective of the exercise of citizenship, cultural enrichment and the expansion of opportunities to pursue life plans autonomously. They restrict networks of relationships, and thence the transition from formal autonomy to real agency. Society is deprived of lessons of learning between different groups and becomes used to associating homogeneity in space with the stratification of social groups. The great “loser” here is the sense of equality, which is never fully internalized or established in the collective life of society.
D. Equality, autonomy and mutual recognition: contributions from the gender perspective
1. Feminism is broadening the semantic and political field of equalityGender demands and feminist thought, framed within a critical view of asymmetrical sex and gender relationships, pose a radical challenge to ideas about both development and the scope of equality. Feminist theory has revealed the distance between normative discourses about equality and day-to-day interactions, highlighting the existence of numerous enclaves in which inequality is reproduced, most particularly the consideration of the other as inferior in status and rights.
100
Cha
pter
IIEconomic Commission for Latin America and the Caribbean (ECLAC)
The gender approach is highly relevant in the perspective of equal rights and autonomy with mutual recognition as presented in the opening pages of this chapter. In fact, feminism has made a particular contribution to the development of autonomy with mutual recognition, emphasizing both the processes whereby autonomy is acquired and developed and the circumstances of oppression and domination apparent in the social relationships enshrined both by institutions and by intrafamily ties. At the same time, feminist thinking has indissolubly conjoined the ideas of equality and liberty, distribution and recognition as principles and objects of development. It has thus shown that equality can only be exercised when there is autonomy, i.e. when decisions, capabilities and personal development do not depend on others. Furthermore, feminism provides a critical view of the individualistic concept of autonomy, conceiving autonomy instead as relational (MacKenzie and Stoljar, 2000).
Although this approach offers a spectrum of ideas and proposals that cannot be properly dealt with in these pages, it is important to highlight some of the elements that are crucial to equality and to autonomy with mutual recognition. First, equality of resources and equality of opportunities are not enough. To put it another way, a policy of equal opportunities needs to take account of the differences in starting conditions between men and women in terms of socialization, the history of male accumulation of power, the continuing sexual division of labour and discriminatory sociocultural patterns. Thus, it is not just a matter of guaranteeing equality of basic access (to education, for example), since gender inequalities are embedded in power relationships in everything from politics to the domestic sphere. In addition, gender relations conspire against equality over the whole life cycle and gender-based disparities are internalized in multiple mechanisms of cultural reproduction, whence the importance of pursuing autonomy with recognition and equality of rights.28
Secondly, and in keeping with the above, gender demands have raised the need to reverse long-standing inequalities by means of differential affirmative action. Paradoxically, equality requires formulas of statutory inequality to do away with the unfavourable consequences of de facto differences.
In the third place, the gender perspective entails an obligation to reformulate the scope of citizenship in the relationship between the public and the private. From this perspective, equality of rights does not pertain only to the sphere of public life or extended sociability, as the predominant conception would have it, since in the private sphere, and especially in domestic life, there are relationships between actors whose power is clearly asymmetrical, to the detriment of women. “The personal is political” is more than a rallying cry: it is a truth that calls into question the established limits of equal rights, since “indoor” inequalities are at work not only in customary rules but also in people’s behaviour. Precisely because equal rights, in their institutional formulation, are very unlikely to ensure reciprocity of treatment in the private sphere (where the law has less power over relationships), it is important to formulate equality in terms of relational autonomy. This is a substantial contribution of the gender approach to equality.
The separation between the public and private spheres and the modern idea of the radical difference between men and women were crucial to the criteria of inclusion, exclusion and classification that have underpinned the forms of citizenship in our era. The modern State was founded on a sharp separation between the public and private spheres and on a hierarchical gender order. Politicizing the private (in the twofold sense of making it an object of policy and conceiving it as a space of power and negotiation) is part of the equality agenda we are proposing here.
One area in which the unequal power relations between men and women stretches this dichotomy between the public and the private is violence against women. This is an extreme expression of discrimination against women and of their lack of autonomy, not only physical autonomy, but also economic and decision-making autonomy. Violence against women cannot be analysed and tackled in isolation, but must be considered bound up with the economic, social and cultural inequality that operate in the power relations between men and women, which are in turn mirrored in inequality of resources in the private and public domains and are directly related to the unequal distribution of labour, especially unpaid domestic work.
Although States in the region have undertaken commitments in this regard which are reflected in national and international legislation to prevent, punish and eradicate violence against women and in different response programmes
28 A clear example of this is the right to health, with recognition increasingly being given to the implications of the specific needs of women and to sexual and reproductive rights. The effects of avoidable mortality, unsafe abortion, sexual violence, the transmission of HIV among “monogamous” women and reproductive cancers, among other things, illustrate the centrality of sexual and reproductive rights as both determinants and outcomes of development.
101
Cha
pter
II
Compacts for Equality: Towards a Sustainable Future
and initiatives to measure violence, better institutional arrangements are still needed to ensure an integrated approach and guarantee rights and access to justice.
In the fourth place, the gender perspective places access to spheres of public deliberation and political power at the heart of equality. In arguing that women have traditionally been confined to the private space and excluded from the exercise of power, it brings out the asymmetries that underlie the reproduction of power. Demands for gender parity in high-level public positions are aimed precisely at transforming politics in pursuit of greater equality in deliberation and the exercise of power. Proposing this from the gender perspective does not make it exclusively a gender issue; rather, it involves a deeper questioning of power asymmetries as obstacles to the progress of democracy.
In the fifth place, the gender perspective treats as crucial issues subjects that have traditionally been overlooked, such as intrafamily or intra-household equality,29 equality in time availability and equality in the relationship between paid and unpaid work.
A clear example is the world of care. Only since the subject was taken up in feminist literature and the gender approach has it been possible not only to see it as critical to social reproduction and the economy, but also to grasp clearly the acute gender inequalities in the time and effort put into this activity, and the failure to treat caregiving as work. This failure is due to the traditional division between the public and domestic spheres, whereby the domestic nature of care work is the basis for excluding it from citizens’ rights and thence from the benefits of development. Accordingly, talking openly about this “lost dimension” of development means expanding the notion of citizenship to include recognition of the importance to society of domestic responsibilities and caregiving. Because care responsibilities have been confined almost exclusively to the private sphere, and therefore treated as a private matter, it has been very difficult to make caregiving a real object of law (Fraser, 1997). And since women invest so much more of their time than men in care activities, they ultimately suffer more “time poverty”. Accordingly, the feminist literature and gender demands have turned a spotlight on another dimension of inequality: inequality of disposable time between men and women, which undoubtedly implies inequality in terms of the ability to develop resources and capacities.
The following pages examine two areas of gender equality and inequality that clearly illustrate the two dimensions highlighted in this document: autonomy and mutual recognition. First, by examining the dynamic of women’s economic autonomy, as manifested in the availability to them of incomes of their own, which is unquestionably crucial to the reduction of asymmetries of autonomy between men and women. And second, by considering political autonomy (as a form of mutual recognition), manifested in the progressive incorporation of women in the main deliberative spaces of politics. Chapter III, which analyses the world of work, considers of gender differences in that domain.
2. Women, autonomy and income availabilityThe indicator for the proportions of the two sexes lacking incomes of their own is meant to illustrate women’s lack of economic autonomy in Latin America. This indicator is not without its limitations, since income may not be sufficient to guarantee autonomy. It is hard to carry out an analysis from a gender perspective using traditional measures of poverty because these are based on household per capita income. Using this indicator means assuming that the distribution of income within households is egalitarian, which masks the lack of autonomy experienced by women who do not perform remunerated activities because they are devoted to domestic work and care of others (mainly children, and dependent family members). Individual income may come from paid work (whether on a waged or self-employed basis), rents from ownership of physical or financial assets,30 or other incomes such as pensions, subsidies or transfers, whether provided by the government to households and individuals or taking place between households.
The proportion of women without incomes of their own in the region dropped from 42% in 2002 to 32% in 2011, while the proportion of men in the same position dropped from 15% to 13% in that period (see figure II.21).31 Nonetheless, a third of women over the age of 15 and not in education are still unable to generate income and are
29 A complex vision of equality should also measure income inequality by gender within households, although such a proposition is highly problematical. Be that as it may, using income distribution as a measure is to suppose that the total household income is distributed equitably among its members, which precludes obtaining information on the real differential situation of men and women.
30 Such rents are not properly captured in surveys, either in general or disaggregated by sex.31 The indicator is defined as the proportion of the female (male) population aged 15 or over who do not receive individual monetary
incomes and are not studying (depending on their activity status) relative to the total female (male) population aged 15 or over who are not studying. The result is expressed in percentages.
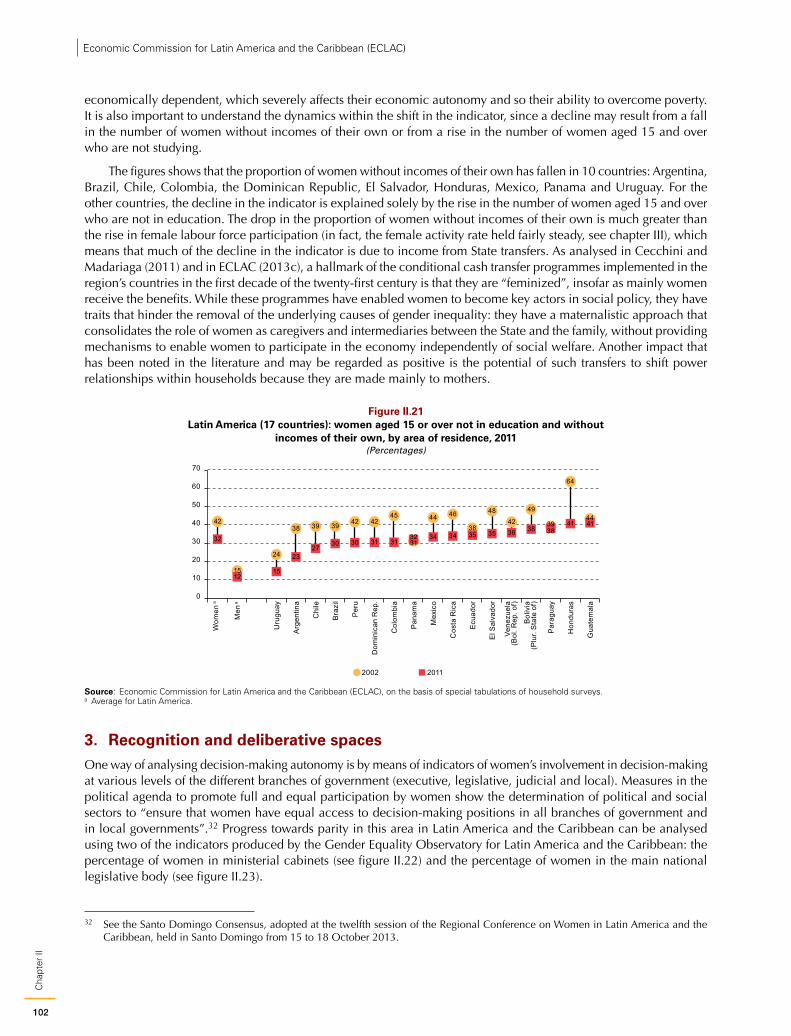
102
Cha
pter
IIEconomic Commission for Latin America and the Caribbean (ECLAC)
economically dependent, which severely affects their economic autonomy and so their ability to overcome poverty. It is also important to understand the dynamics within the shift in the indicator, since a decline may result from a fall in the number of women without incomes of their own or from a rise in the number of women aged 15 and over who are not studying.
The figures shows that the proportion of women without incomes of their own has fallen in 10 countries: Argentina, Brazil, Chile, Colombia, the Dominican Republic, El Salvador, Honduras, Mexico, Panama and Uruguay. For the other countries, the decline in the indicator is explained solely by the rise in the number of women aged 15 and over who are not in education. The drop in the proportion of women without incomes of their own is much greater than the rise in female labour force participation (in fact, the female activity rate held fairly steady, see chapter III), which means that much of the decline in the indicator is due to income from State transfers. As analysed in Cecchini and Madariaga (2011) and in ECLAC (2013c), a hallmark of the conditional cash transfer programmes implemented in the region’s countries in the first decade of the twenty-first century is that they are “feminized”, insofar as mainly women receive the benefits. While these programmes have enabled women to become key actors in social policy, they have traits that hinder the removal of the underlying causes of gender inequality: they have a maternalistic approach that consolidates the role of women as caregivers and intermediaries between the State and the family, without providing mechanisms to enable women to participate in the economy independently of social welfare. Another impact that has been noted in the literature and may be regarded as positive is the potential of such transfers to shift power relationships within households because they are made mainly to mothers.
Figure II.21 Latin America (17 countries): women aged 15 or over not in education and without
incomes of their own, by area of residence, 2011 (Percentages)
42
15
24
38 39 39 42 4245
31
44 46
38
4842
49
39
64
44
32
1215
2327
30 30 31 3132 34 34 35 35 36 38 38
41 41
0
10
20
30
40
50
60
70
Wom
en a
Men
a
Uru
guay
Arg
entin
a
Chi
le
Bra
zil
Per
u
Dom
inic
an R
ep.
Col
ombi
a
Pan
ama
Mex
ico
Cos
ta R
ica
Ecu
ador
El S
alva
dor
Par
agua
y
Hon
dura
s
Gua
tem
ala
2002 2011
Vene
zuel
a(B
ol. R
ep. o
f)
Bol
ivia
(Plu
r. S
tate
of)
Source: Economic Commission for Latin America and the Caribbean (ECLAC), on the basis of special tabulations of household surveys. a Average for Latin America.
3. Recognition and deliberative spacesOne way of analysing decision-making autonomy is by means of indicators of women’s involvement in decision-making at various levels of the different branches of government (executive, legislative, judicial and local). Measures in the political agenda to promote full and equal participation by women show the determination of political and social sectors to “ensure that women have equal access to decision-making positions in all branches of government and in local governments”.32 Progress towards parity in this area in Latin America and the Caribbean can be analysed using two of the indicators produced by the Gender Equality Observatory for Latin America and the Caribbean: the percentage of women in ministerial cabinets (see figure II.22) and the percentage of women in the main national legislative body (see figure II.23).
32 See the Santo Domingo Consensus, adopted at the twelfth session of the Regional Conference on Women in Latin America and the Caribbean, held in Santo Domingo from 15 to 18 October 2013.
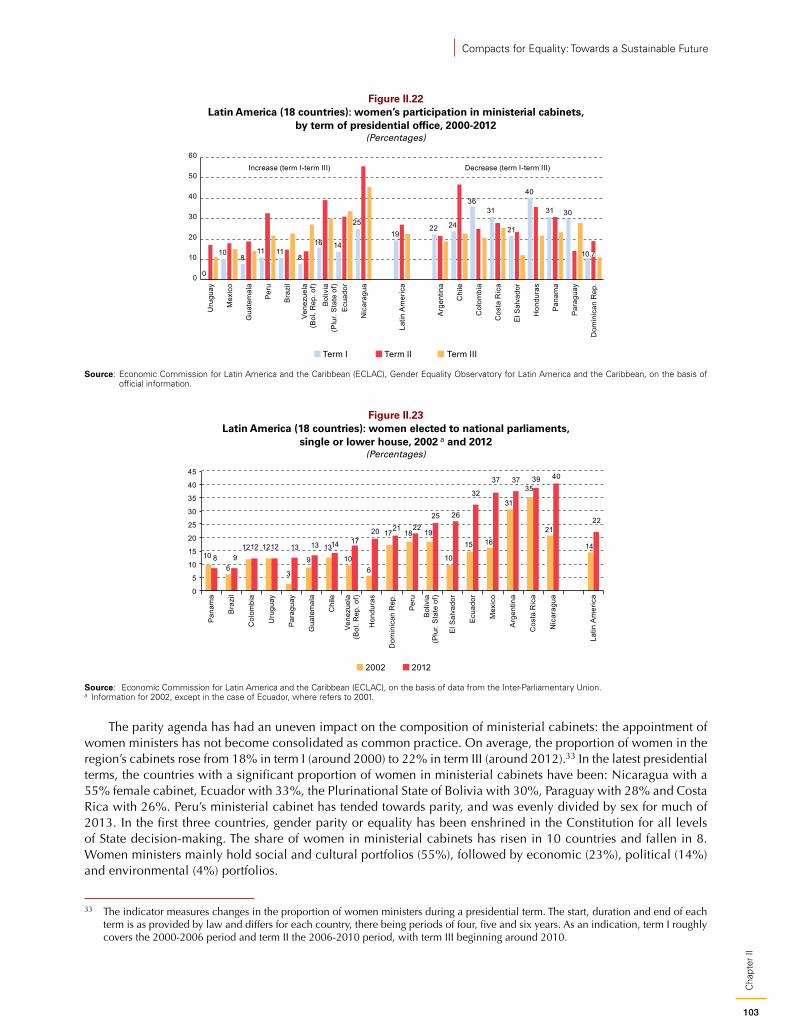
103
Cha
pter
II
Compacts for Equality: Towards a Sustainable Future
Figure II.22 Latin America (18 countries): women’s participation in ministerial cabinets,
by term of presidential office, 2000-2012 (Percentages)
Vene
zuel
a(B
ol. R
ep. o
f)
0
108
11 118
16 14
2519
22 24
3631
21
40
31 30
10.7
0
10
20
30
40
50
60
Uru
guay
Mex
ico
Gua
tem
ala
Per
u
Bra
zil
Bol
ivia
(Plu
r. S
tate
of)
Ecu
ador
Nic
arag
ua
Latin
Am
eric
a
Arg
entin
a
Chi
le
Col
ombi
a
Cos
ta R
ica
El S
alva
dor
Hon
dura
s
Pan
ama
Par
agua
y
Dom
inic
an R
ep.
Term I Term II Term III
Increase (term I-term III) Decrease (term I-term III)
Source: Economic Commission for Latin America and the Caribbean (ECLAC), Gender Equality Observatory for Latin America and the Caribbean, on the basis of official information.
Figure II.23 Latin America (18 countries): women elected to national parliaments,
single or lower house, 2002 a and 2012 (Percentages)
10
6
12 12
3
9
1310
6
17 18 19
10
15 16
31
35
21
148 9
12 12 13 13 14 1720 21 22
25 26
32
37 37 39 40
22
0
5
10
15
20
25
30
35
40
45
Pan
ama
Bra
zil
Col
ombi
a
Uru
guay
Par
agua
y
Gua
tem
ala
Chi
le
Vene
zuel
a(B
ol. R
ep. o
f)
Hon
dura
s
Dom
inic
an R
ep.
Per
u
Bol
ivia
(Plu
r. S
tate
of)
El S
alva
dor
Ecu
ador
Mex
ico
Arg
entin
a
Cos
ta R
ica
Nic
arag
ua
Latin
Am
eric
a
2002 2012
Source: Economic Commission for Latin America and the Caribbean (ECLAC), on the basis of data from the Inter-Parliamentary Union.a Information for 2002, except in the case of Ecuador, where refers to 2001.
The parity agenda has had an uneven impact on the composition of ministerial cabinets: the appointment of women ministers has not become consolidated as common practice. On average, the proportion of women in the region’s cabinets rose from 18% in term I (around 2000) to 22% in term III (around 2012).33 In the latest presidential terms, the countries with a significant proportion of women in ministerial cabinets have been: Nicaragua with a 55% female cabinet, Ecuador with 33%, the Plurinational State of Bolivia with 30%, Paraguay with 28% and Costa Rica with 26%. Peru’s ministerial cabinet has tended towards parity, and was evenly divided by sex for much of 2013. In the first three countries, gender parity or equality has been enshrined in the Constitution for all levels of State decision-making. The share of women in ministerial cabinets has risen in 10 countries and fallen in 8. Women ministers mainly hold social and cultural portfolios (55%), followed by economic (23%), political (14%) and environmental (4%) portfolios.
33 The indicator measures changes in the proportion of women ministers during a presidential term. The start, duration and end of each term is as provided by law and differs for each country, there being periods of four, five and six years. As an indication, term I roughly covers the 2000-2006 period and term II the 2006-2010 period, with term III beginning around 2010.
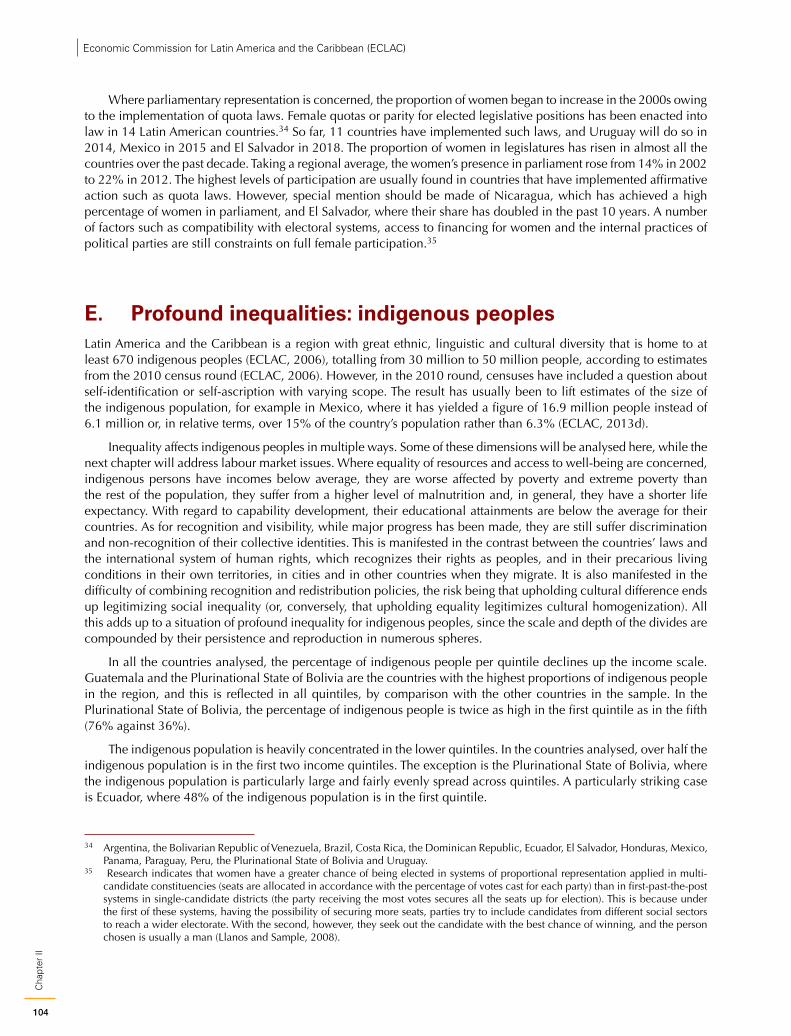
104
Cha
pter
IIEconomic Commission for Latin America and the Caribbean (ECLAC)
Where parliamentary representation is concerned, the proportion of women began to increase in the 2000s owing to the implementation of quota laws. Female quotas or parity for elected legislative positions has been enacted into law in 14 Latin American countries.34 So far, 11 countries have implemented such laws, and Uruguay will do so in 2014, Mexico in 2015 and El Salvador in 2018. The proportion of women in legislatures has risen in almost all the countries over the past decade. Taking a regional average, the women’s presence in parliament rose from 14% in 2002 to 22% in 2012. The highest levels of participation are usually found in countries that have implemented affirmative action such as quota laws. However, special mention should be made of Nicaragua, which has achieved a high percentage of women in parliament, and El Salvador, where their share has doubled in the past 10 years. A number of factors such as compatibility with electoral systems, access to financing for women and the internal practices of political parties are still constraints on full female participation.35
E. Profound inequalities: indigenous peoplesLatin America and the Caribbean is a region with great ethnic, linguistic and cultural diversity that is home to at least 670 indigenous peoples (ECLAC, 2006), totalling from 30 million to 50 million people, according to estimates from the 2010 census round (ECLAC, 2006). However, in the 2010 round, censuses have included a question about self-identification or self-ascription with varying scope. The result has usually been to lift estimates of the size of the indigenous population, for example in Mexico, where it has yielded a figure of 16.9 million people instead of 6.1 million or, in relative terms, over 15% of the country’s population rather than 6.3% (ECLAC, 2013d).
Inequality affects indigenous peoples in multiple ways. Some of these dimensions will be analysed here, while the next chapter will address labour market issues. Where equality of resources and access to well-being are concerned, indigenous persons have incomes below average, they are worse affected by poverty and extreme poverty than the rest of the population, they suffer from a higher level of malnutrition and, in general, they have a shorter life expectancy. With regard to capability development, their educational attainments are below the average for their countries. As for recognition and visibility, while major progress has been made, they are still suffer discrimination and non-recognition of their collective identities. This is manifested in the contrast between the countries’ laws and the international system of human rights, which recognizes their rights as peoples, and in their precarious living conditions in their own territories, in cities and in other countries when they migrate. It is also manifested in the difficulty of combining recognition and redistribution policies, the risk being that upholding cultural difference ends up legitimizing social inequality (or, conversely, that upholding equality legitimizes cultural homogenization). All this adds up to a situation of profound inequality for indigenous peoples, since the scale and depth of the divides are compounded by their persistence and reproduction in numerous spheres.
In all the countries analysed, the percentage of indigenous people per quintile declines up the income scale. Guatemala and the Plurinational State of Bolivia are the countries with the highest proportions of indigenous people in the region, and this is reflected in all quintiles, by comparison with the other countries in the sample. In the Plurinational State of Bolivia, the percentage of indigenous people is twice as high in the first quintile as in the fifth (76% against 36%).
The indigenous population is heavily concentrated in the lower quintiles. In the countries analysed, over half the indigenous population is in the first two income quintiles. The exception is the Plurinational State of Bolivia, where the indigenous population is particularly large and fairly evenly spread across quintiles. A particularly striking case is Ecuador, where 48% of the indigenous population is in the first quintile.
34 Argentina, the Bolivarian Republic of Venezuela, Brazil, Costa Rica, the Dominican Republic, Ecuador, El Salvador, Honduras, Mexico, Panama, Paraguay, Peru, the Plurinational State of Bolivia and Uruguay.
35 Research indicates that women have a greater chance of being elected in systems of proportional representation applied in multi-candidate constituencies (seats are allocated in accordance with the percentage of votes cast for each party) than in first-past-the-post systems in single-candidate districts (the party receiving the most votes secures all the seats up for election). This is because under the first of these systems, having the possibility of securing more seats, parties try to include candidates from different social sectors to reach a wider electorate. With the second, however, they seek out the candidate with the best chance of winning, and the person chosen is usually a man (Llanos and Sample, 2008).
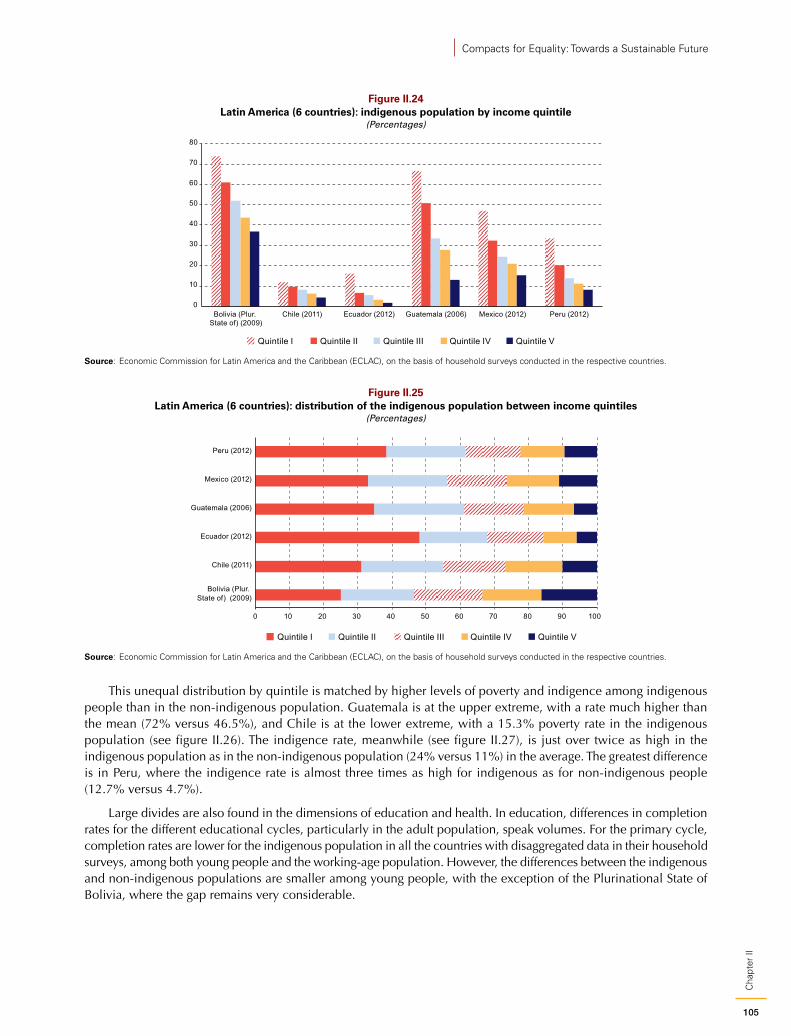
105
Cha
pter
II
Compacts for Equality: Towards a Sustainable Future
Figure II.24 Latin America (6 countries): indigenous population by income quintile
(Percentages)
0
10
20
30
40
50
60
70
80
Bolivia (Plur. State of) (2009)
Chile (2011) Ecuador (2012) Guatemala (2006) Mexico (2012) Peru (2012)
Quintile I Quintile II Quintile III Quintile IV Quintile V
Source: Economic Commission for Latin America and the Caribbean (ECLAC), on the basis of household surveys conducted in the respective countries.
Figure II.25 Latin America (6 countries): distribution of the indigenous population between income quintiles
(Percentages)
0 10 20 30 40 50 60 70 80 90 100
Bolivia (Plur. State of) (2009)
Chile (2011)
Ecuador (2012)
Guatemala (2006)
Mexico (2012)
Peru (2012)
Quintile I Quintile II Quintile III Quintile IV Quintile V
Source: Economic Commission for Latin America and the Caribbean (ECLAC), on the basis of household surveys conducted in the respective countries.
This unequal distribution by quintile is matched by higher levels of poverty and indigence among indigenous people than in the non-indigenous population. Guatemala is at the upper extreme, with a rate much higher than the mean (72% versus 46.5%), and Chile is at the lower extreme, with a 15.3% poverty rate in the indigenous population (see figure II.26). The indigence rate, meanwhile (see figure II.27), is just over twice as high in the indigenous population as in the non-indigenous population (24% versus 11%) in the average. The greatest difference is in Peru, where the indigence rate is almost three times as high for indigenous as for non-indigenous people (12.7% versus 4.7%).
Large divides are also found in the dimensions of education and health. In education, differences in completion rates for the different educational cycles, particularly in the adult population, speak volumes. For the primary cycle, completion rates are lower for the indigenous population in all the countries with disaggregated data in their household surveys, among both young people and the working-age population. However, the differences between the indigenous and non-indigenous populations are smaller among young people, with the exception of the Plurinational State of Bolivia, where the gap remains very considerable.
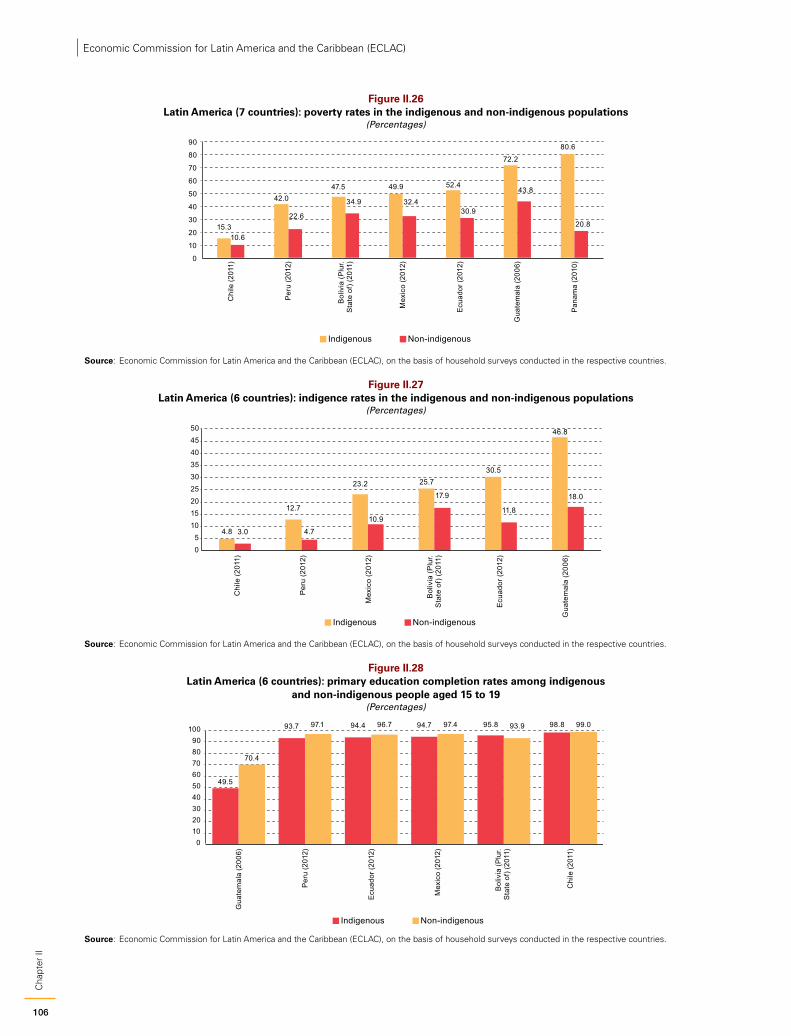
106
Cha
pter
IIEconomic Commission for Latin America and the Caribbean (ECLAC)
Figure II.26 Latin America (7 countries): poverty rates in the indigenous and non-indigenous populations
(Percentages)
15.3
42.047.5 49.9 52.4
72.2
80.6
10.6
22.6
34.9 32.430.9
43.8
20.8
0
10
20
30
40
50
60
70
80
90
Chi
le (2
011)
Per
u (2
012)
Bol
ivia
(Plu
r.S
tate
of)
(201
1)
Mex
ico
(201
2)
Ecu
ador
(201
2)
Gua
tem
ala
(200
6)
Pan
ama
(201
0)
Indigenous Non-indigenous
Source: Economic Commission for Latin America and the Caribbean (ECLAC), on the basis of household surveys conducted in the respective countries.
Figure II.27 Latin America (6 countries): indigence rates in the indigenous and non-indigenous populations
(Percentages)
4.8
12.7
23.2 25.730.5
46.8
3.0 4.710.9
17.9
11.8
18.0
05
101520253035404550
Chi
le (2
011)
Per
u (2
012)
Mex
ico
(201
2)
Bol
ivia
(Plu
r.S
tate
of)
(201
1)
Ecu
ador
(201
2)
Gua
tem
ala
(200
6)
Indigenous Non-indigenous
Source: Economic Commission for Latin America and the Caribbean (ECLAC), on the basis of household surveys conducted in the respective countries.
Figure II.28 Latin America (6 countries): primary education completion rates among indigenous
and non-indigenous people aged 15 to 19(Percentages)
49.5
93.7 94.4 94.7 95.8 98.8
70.4
97.1 96.7 97.4 93.9 99.0
0102030405060708090
100
Gua
tem
ala
(200
6)
Per
u (2
012)
Ecu
ador
(201
2)
Mex
ico
(201
2)
Bol
ivia
(Plu
r.S
tate
of)
(201
1)
Chi
le (2
011)
Indigenous Non-indigenous
Source: Economic Commission for Latin America and the Caribbean (ECLAC), on the basis of household surveys conducted in the respective countries.
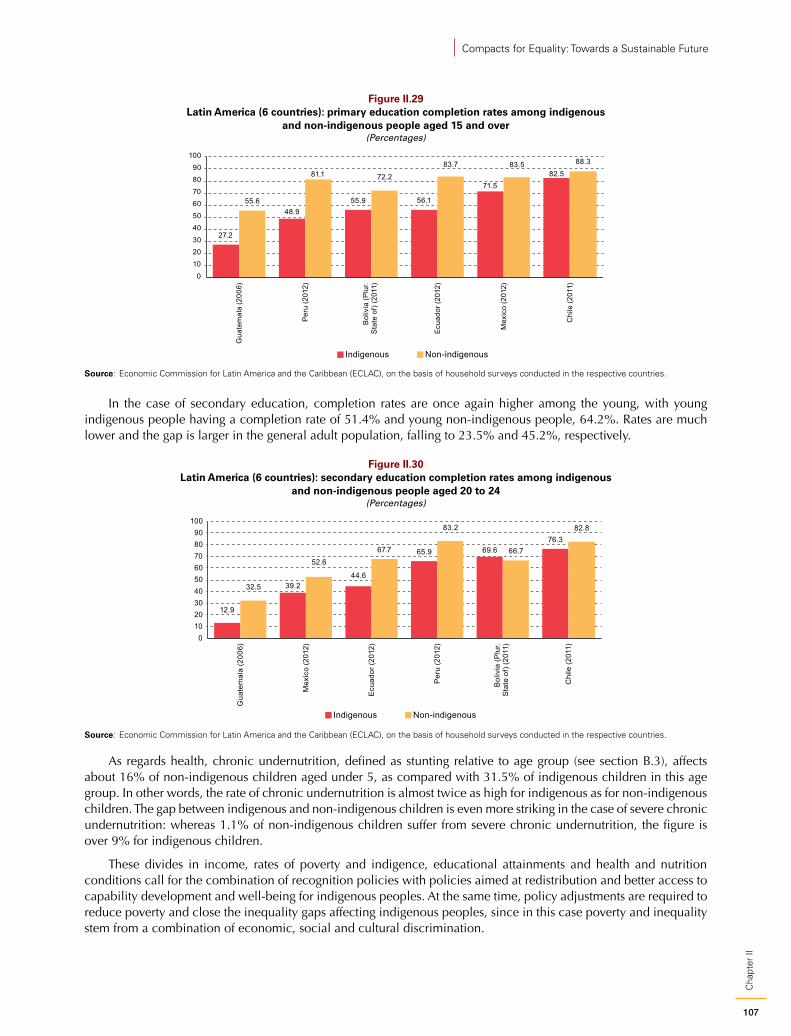
107
Cha
pter
II
Compacts for Equality: Towards a Sustainable Future
Figure II.29 Latin America (6 countries): primary education completion rates among indigenous
and non-indigenous people aged 15 and over(Percentages)
27.2
48.955.9 56.1
71.582.5
55.6
81.1 72.2
83.7 83.5 88.3
0102030405060708090
100
Gua
tem
ala
(200
6)
Per
u (2
012)
Bol
ivia
(Plu
r.S
tate
of)
(201
1)
Ecu
ador
(201
2)
Mex
ico
(201
2)
Chi
le (2
011)
Indigenous Non-indigenous
Source: Economic Commission for Latin America and the Caribbean (ECLAC), on the basis of household surveys conducted in the respective countries.
In the case of secondary education, completion rates are once again higher among the young, with young indigenous people having a completion rate of 51.4% and young non-indigenous people, 64.2%. Rates are much lower and the gap is larger in the general adult population, falling to 23.5% and 45.2%, respectively.
Figure II.30 Latin America (6 countries): secondary education completion rates among indigenous
and non-indigenous people aged 20 to 24(Percentages)
12.9
39.244.6
65.9 69.676.3
32.5
52.667.7
83.2
66.7
82.8
0102030405060708090
100
Gua
tem
ala
(200
6)
Mex
ico
(201
2)
Ecu
ador
(201
2)
Per
u (2
012)
Bol
ivia
(Plu
r.S
tate
of)
(201
1)
Chi
le (2
011)
Indigenous Non-indigenous
Source: Economic Commission for Latin America and the Caribbean (ECLAC), on the basis of household surveys conducted in the respective countries.
As regards health, chronic undernutrition, defined as stunting relative to age group (see section B.3), affects about 16% of non-indigenous children aged under 5, as compared with 31.5% of indigenous children in this age group. In other words, the rate of chronic undernutrition is almost twice as high for indigenous as for non-indigenous children. The gap between indigenous and non-indigenous children is even more striking in the case of severe chronic undernutrition: whereas 1.1% of non-indigenous children suffer from severe chronic undernutrition, the figure is over 9% for indigenous children.
These divides in income, rates of poverty and indigence, educational attainments and health and nutrition conditions call for the combination of recognition policies with policies aimed at redistribution and better access to capability development and well-being for indigenous peoples. At the same time, policy adjustments are required to reduce poverty and close the inequality gaps affecting indigenous peoples, since in this case poverty and inequality stem from a combination of economic, social and cultural discrimination.
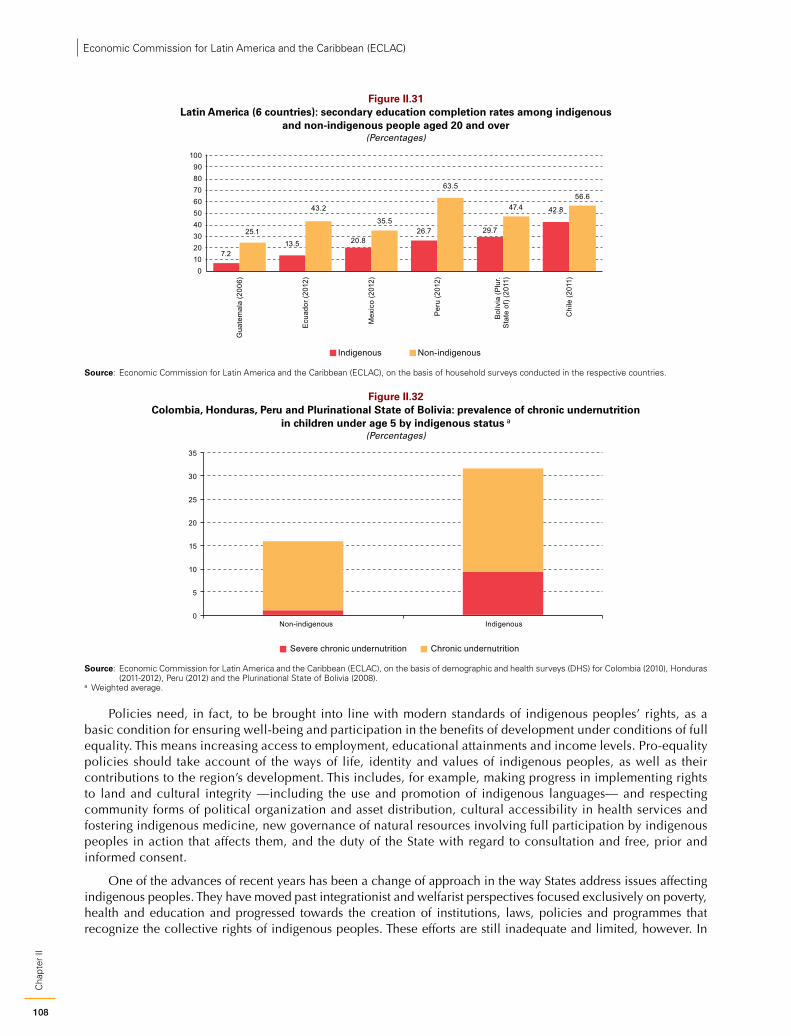
108
Cha
pter
IIEconomic Commission for Latin America and the Caribbean (ECLAC)
Figure II.31 Latin America (6 countries): secondary education completion rates among indigenous
and non-indigenous people aged 20 and over(Percentages)
7.213.5 20.8
26.7 29.7
42.8
25.1
43.2
35.5
63.5
47.456.6
0102030405060708090
100
Gua
tem
ala
(200
6)
Ecu
ador
(201
2)
Mex
ico
(201
2)
Per
u (2
012)
Bol
ivia
(Plu
r.S
tate
of)
(201
1)
Chi
le (2
011)
Indigenous Non-indigenous
Source: Economic Commission for Latin America and the Caribbean (ECLAC), on the basis of household surveys conducted in the respective countries.
Figure II.32 Colombia, Honduras, Peru and Plurinational State of Bolivia: prevalence of chronic undernutrition
in children under age 5 by indigenous status a (Percentages)
0
5
10
15
20
25
30
35
Non-indigenous Indigenous
Severe chronic undernutrition Chronic undernutrition
Source: Economic Commission for Latin America and the Caribbean (ECLAC), on the basis of demographic and health surveys (DHS) for Colombia (2010), Honduras (2011-2012), Peru (2012) and the Plurinational State of Bolivia (2008).
a Weighted average.
Policies need, in fact, to be brought into line with modern standards of indigenous peoples’ rights, as a basic condition for ensuring well-being and participation in the benefits of development under conditions of full equality. This means increasing access to employment, educational attainments and income levels. Pro-equality policies should take account of the ways of life, identity and values of indigenous peoples, as well as their contributions to the region’s development. This includes, for example, making progress in implementing rights to land and cultural integrity —including the use and promotion of indigenous languages— and respecting community forms of political organization and asset distribution, cultural accessibility in health services and fostering indigenous medicine, new governance of natural resources involving full participation by indigenous peoples in action that affects them, and the duty of the State with regard to consultation and free, prior and informed consent.
One of the advances of recent years has been a change of approach in the way States address issues affecting indigenous peoples. They have moved past integrationist and welfarist perspectives focused exclusively on poverty, health and education and progressed towards the creation of institutions, laws, policies and programmes that recognize the collective rights of indigenous peoples. These efforts are still inadequate and limited, however. In
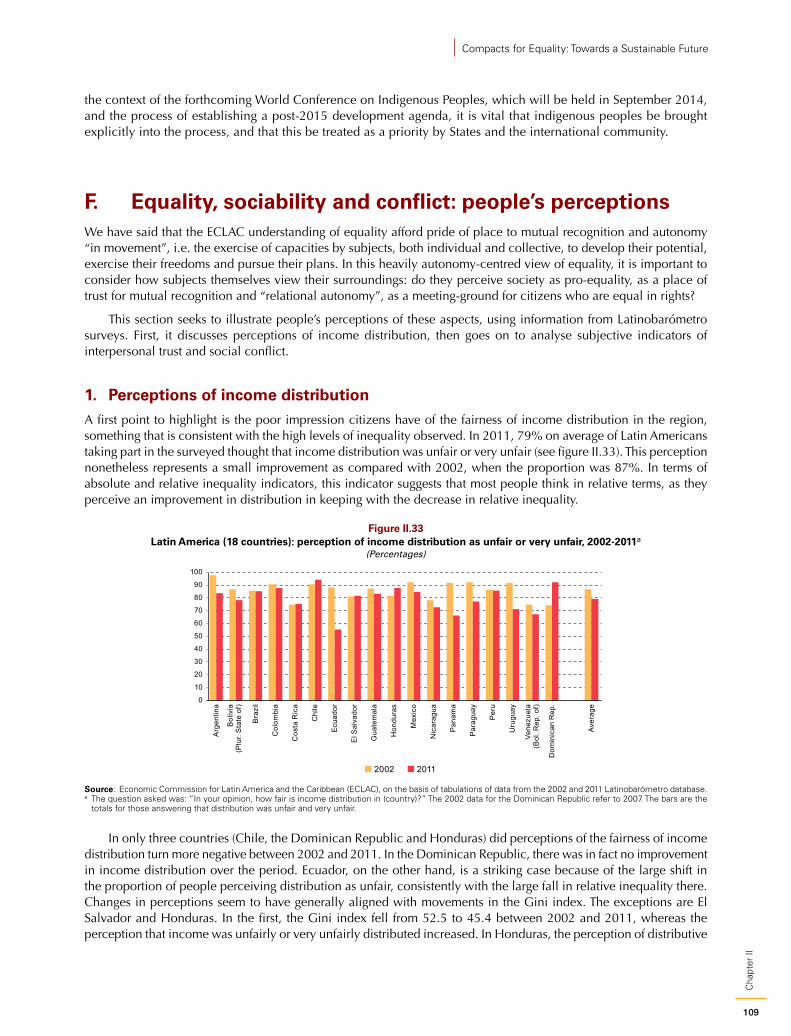
109
Cha
pter
II
Compacts for Equality: Towards a Sustainable Future
the context of the forthcoming World Conference on Indigenous Peoples, which will be held in September 2014, and the process of establishing a post-2015 development agenda, it is vital that indigenous peoples be brought explicitly into the process, and that this be treated as a priority by States and the international community.
F. Equality, sociability and conflict: people’s perceptionsWe have said that the ECLAC understanding of equality afford pride of place to mutual recognition and autonomy “in movement”, i.e. the exercise of capacities by subjects, both individual and collective, to develop their potential, exercise their freedoms and pursue their plans. In this heavily autonomy-centred view of equality, it is important to consider how subjects themselves view their surroundings: do they perceive society as pro-equality, as a place of trust for mutual recognition and “relational autonomy”, as a meeting-ground for citizens who are equal in rights?
This section seeks to illustrate people’s perceptions of these aspects, using information from Latinobarómetro surveys. First, it discusses perceptions of income distribution, then goes on to analyse subjective indicators of interpersonal trust and social conflict.
1. Perceptions of income distributionA first point to highlight is the poor impression citizens have of the fairness of income distribution in the region, something that is consistent with the high levels of inequality observed. In 2011, 79% on average of Latin Americans taking part in the surveyed thought that income distribution was unfair or very unfair (see figure II.33). This perception nonetheless represents a small improvement as compared with 2002, when the proportion was 87%. In terms of absolute and relative inequality indicators, this indicator suggests that most people think in relative terms, as they perceive an improvement in distribution in keeping with the decrease in relative inequality.
Figure II.33 Latin America (18 countries): perception of income distribution as unfair or very unfair, 2002-2011a
(Percentages)
0
10
20
30
40
50
60
70
80
90
100
Arg
entin
a
Bol
ivia
(Plu
r. S
tate
of)
Bra
zil
Col
ombi
a
Cos
ta R
ica
Chi
le
Ecu
ador
El S
alva
dor
Gua
tem
ala
Hon
dura
s
Mex
ico
Nic
arag
ua
Pan
ama
Par
agua
y
Per
u
Uru
guay
Vene
zuel
a(B
ol. R
ep. o
f)
Dom
inic
an R
ep.
Ave
rage
2002 2011
Source: Economic Commission for Latin America and the Caribbean (ECLAC), on the basis of tabulations of data from the 2002 and 2011 Latinobarómetro database.a The question asked was: “In your opinion, how fair is income distribution in (country)?” The 2002 data for the Dominican Republic refer to 2007. The bars are the
totals for those answering that distribution was unfair and very unfair.
In only three countries (Chile, the Dominican Republic and Honduras) did perceptions of the fairness of income distribution turn more negative between 2002 and 2011. In the Dominican Republic, there was in fact no improvement in income distribution over the period. Ecuador, on the other hand, is a striking case because of the large shift in the proportion of people perceiving distribution as unfair, consistently with the large fall in relative inequality there. Changes in perceptions seem to have generally aligned with movements in the Gini index. The exceptions are El Salvador and Honduras. In the first, the Gini index fell from 52.5 to 45.4 between 2002 and 2011, whereas the perception that income was unfairly or very unfairly distributed increased. In Honduras, the perception of distributive
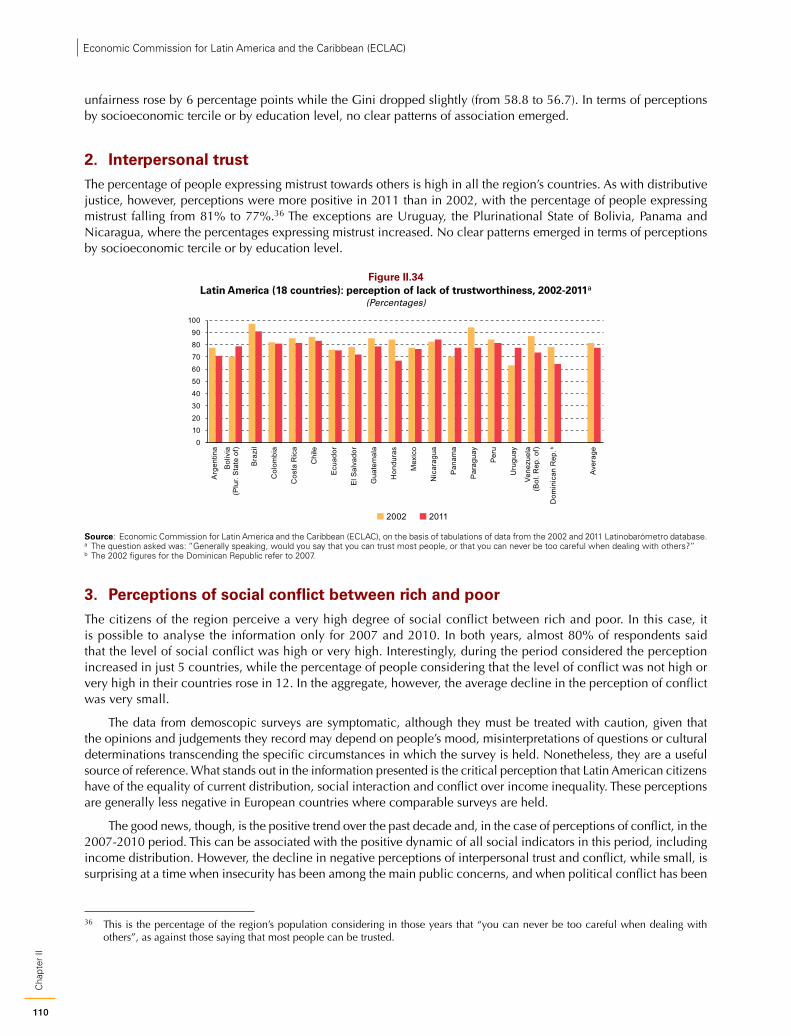
110
Cha
pter
IIEconomic Commission for Latin America and the Caribbean (ECLAC)
unfairness rose by 6 percentage points while the Gini dropped slightly (from 58.8 to 56.7). In terms of perceptions by socioeconomic tercile or by education level, no clear patterns of association emerged.
2. Interpersonal trustThe percentage of people expressing mistrust towards others is high in all the region’s countries. As with distributive justice, however, perceptions were more positive in 2011 than in 2002, with the percentage of people expressing mistrust falling from 81% to 77%.36 The exceptions are Uruguay, the Plurinational State of Bolivia, Panama and Nicaragua, where the percentages expressing mistrust increased. No clear patterns emerged in terms of perceptions by socioeconomic tercile or by education level.
Figure II.34 Latin America (18 countries): perception of lack of trustworthiness, 2002-2011a
(Percentages)
0
10
20
30
40
50
60
70
80
90
100
2002 2011
Arg
entin
a
Bol
ivia
(Plu
r. S
tate
of)
Bra
zil
Col
ombi
a
Cos
ta R
ica
Chi
le
Ecu
ador
El S
alva
dor
Gua
tem
ala
Hon
dura
s
Mex
ico
Nic
arag
ua
Pan
ama
Par
agua
y
Per
u
Uru
guay
Vene
zuel
a(B
ol. R
ep. o
f)
Dom
inic
an R
ep. b
Ave
rage
Source: Economic Commission for Latin America and the Caribbean (ECLAC), on the basis of tabulations of data from the 2002 and 2011 Latinobarómetro database.a The question asked was: “Generally speaking, would you say that you can trust most people, or that you can never be too careful when dealing with others?” b The 2002 figures for the Dominican Republic refer to 2007.
3. Perceptions of social conflict between rich and poorThe citizens of the region perceive a very high degree of social conflict between rich and poor. In this case, it is possible to analyse the information only for 2007 and 2010. In both years, almost 80% of respondents said that the level of social conflict was high or very high. Interestingly, during the period considered the perception increased in just 5 countries, while the percentage of people considering that the level of conflict was not high or very high in their countries rose in 12. In the aggregate, however, the average decline in the perception of conflict was very small.
The data from demoscopic surveys are symptomatic, although they must be treated with caution, given that the opinions and judgements they record may depend on people’s mood, misinterpretations of questions or cultural determinations transcending the specific circumstances in which the survey is held. Nonetheless, they are a useful source of reference. What stands out in the information presented is the critical perception that Latin American citizens have of the equality of current distribution, social interaction and conflict over income inequality. These perceptions are generally less negative in European countries where comparable surveys are held.
The good news, though, is the positive trend over the past decade and, in the case of perceptions of conflict, in the 2007-2010 period. This can be associated with the positive dynamic of all social indicators in this period, including income distribution. However, the decline in negative perceptions of interpersonal trust and conflict, while small, is surprising at a time when insecurity has been among the main public concerns, and when political conflict has been
36 This is the percentage of the region’s population considering in those years that “you can never be too careful when dealing with others”, as against those saying that most people can be trusted.
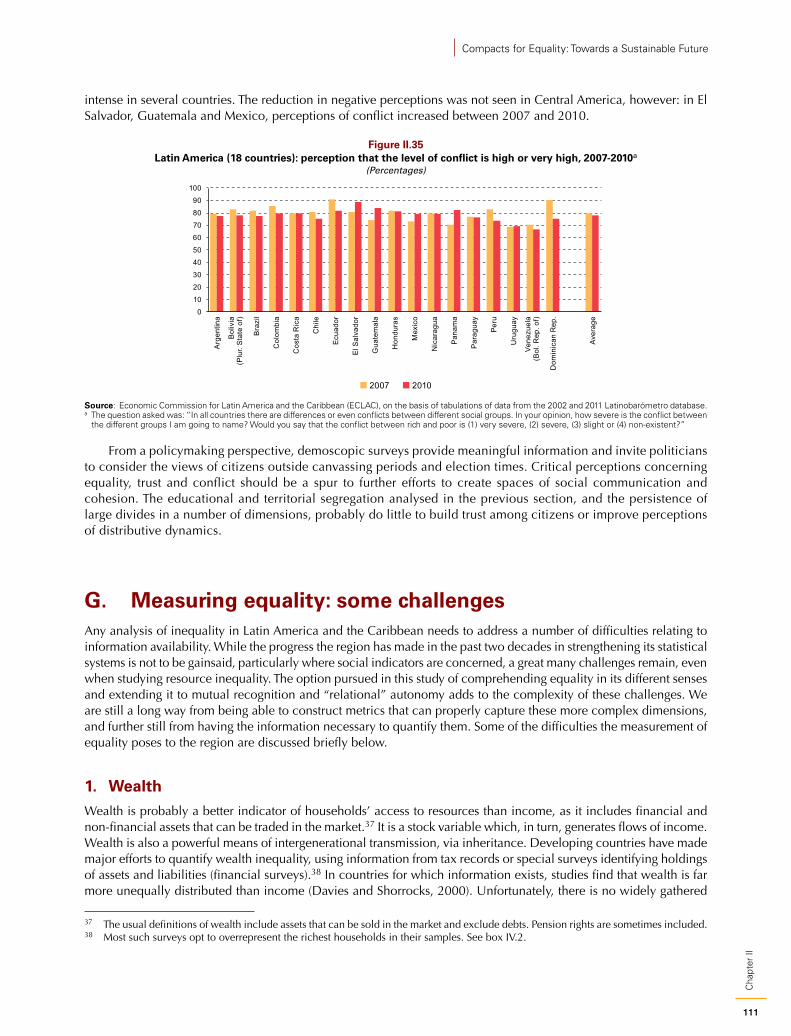
111
Cha
pter
II
Compacts for Equality: Towards a Sustainable Future
intense in several countries. The reduction in negative perceptions was not seen in Central America, however: in El Salvador, Guatemala and Mexico, perceptions of conflict increased between 2007 and 2010.
Figure II.35 Latin America (18 countries): perception that the level of conflict is high or very high, 2007-2010a
(Percentages)
2007 2010
0
10
20
30
40
50
60
70
80
90
100
Arg
entin
a
Bol
ivia
(Plu
r. S
tate
of)
Bra
zil
Col
ombi
a
Cos
ta R
ica
Chi
le
Ecu
ador
El S
alva
dor
Gua
tem
ala
Hon
dura
s
Mex
ico
Nic
arag
ua
Pan
ama
Par
agua
y
Per
u
Uru
guay
Vene
zuel
a(B
ol. R
ep. o
f)
Dom
inic
an R
ep.
Ave
rage
Source: Economic Commission for Latin America and the Caribbean (ECLAC), on the basis of tabulations of data from the 2002 and 2011 Latinobarómetro database.a The question asked was: “In all countries there are differences or even conflicts between different social groups. In your opinion, how severe is the conflict between
the different groups I am going to name? Would you say that the conflict between rich and poor is (1) very severe, (2) severe, (3) slight or (4) non-existent?”
From a policymaking perspective, demoscopic surveys provide meaningful information and invite politicians to consider the views of citizens outside canvassing periods and election times. Critical perceptions concerning equality, trust and conflict should be a spur to further efforts to create spaces of social communication and cohesion. The educational and territorial segregation analysed in the previous section, and the persistence of large divides in a number of dimensions, probably do little to build trust among citizens or improve perceptions of distributive dynamics.
G. Measuring equality: some challengesAny analysis of inequality in Latin America and the Caribbean needs to address a number of difficulties relating to information availability. While the progress the region has made in the past two decades in strengthening its statistical systems is not to be gainsaid, particularly where social indicators are concerned, a great many challenges remain, even when studying resource inequality. The option pursued in this study of comprehending equality in its different senses and extending it to mutual recognition and “relational” autonomy adds to the complexity of these challenges. We are still a long way from being able to construct metrics that can properly capture these more complex dimensions, and further still from having the information necessary to quantify them. Some of the difficulties the measurement of equality poses to the region are discussed briefly below.
1. WealthWealth is probably a better indicator of households’ access to resources than income, as it includes financial and non-financial assets that can be traded in the market.37 It is a stock variable which, in turn, generates flows of income. Wealth is also a powerful means of intergenerational transmission, via inheritance. Developing countries have made major efforts to quantify wealth inequality, using information from tax records or special surveys identifying holdings of assets and liabilities (financial surveys).38 In countries for which information exists, studies find that wealth is far more unequally distributed than income (Davies and Shorrocks, 2000). Unfortunately, there is no widely gathered
37 The usual definitions of wealth include assets that can be sold in the market and exclude debts. Pension rights are sometimes included. 38 Most such surveys opt to overrepresent the richest households in their samples. See box IV.2.
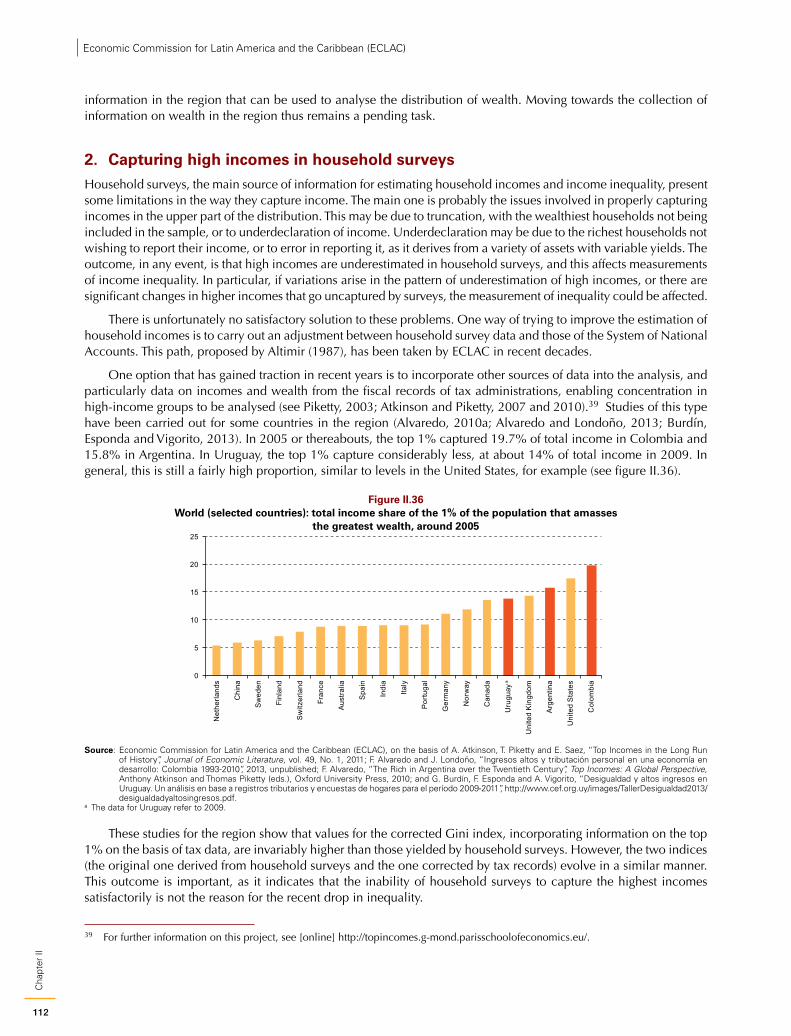
112
Cha
pter
IIEconomic Commission for Latin America and the Caribbean (ECLAC)
information in the region that can be used to analyse the distribution of wealth. Moving towards the collection of information on wealth in the region thus remains a pending task.
2. Capturing high incomes in household surveysHousehold surveys, the main source of information for estimating household incomes and income inequality, present some limitations in the way they capture income. The main one is probably the issues involved in properly capturing incomes in the upper part of the distribution. This may be due to truncation, with the wealthiest households not being included in the sample, or to underdeclaration of income. Underdeclaration may be due to the richest households not wishing to report their income, or to error in reporting it, as it derives from a variety of assets with variable yields. The outcome, in any event, is that high incomes are underestimated in household surveys, and this affects measurements of income inequality. In particular, if variations arise in the pattern of underestimation of high incomes, or there are significant changes in higher incomes that go uncaptured by surveys, the measurement of inequality could be affected.
There is unfortunately no satisfactory solution to these problems. One way of trying to improve the estimation of household incomes is to carry out an adjustment between household survey data and those of the System of National Accounts. This path, proposed by Altimir (1987), has been taken by ECLAC in recent decades.
One option that has gained traction in recent years is to incorporate other sources of data into the analysis, and particularly data on incomes and wealth from the fiscal records of tax administrations, enabling concentration in high-income groups to be analysed (see Piketty, 2003; Atkinson and Piketty, 2007 and 2010).39 Studies of this type have been carried out for some countries in the region (Alvaredo, 2010a; Alvaredo and Londoño, 2013; Burdín, Esponda and Vigorito, 2013). In 2005 or thereabouts, the top 1% captured 19.7% of total income in Colombia and 15.8% in Argentina. In Uruguay, the top 1% capture considerably less, at about 14% of total income in 2009. In general, this is still a fairly high proportion, similar to levels in the United States, for example (see figure II.36).
Figure II.36 World (selected countries): total income share of the 1% of the population that amasses
the greatest wealth, around 2005
0
5
10
15
20
25
Net
herla
nds
Chi
na
Sw
eden
Finl
and
Sw
itzer
land
Fran
ce
Aus
tralia
Spa
in
Indi
a
Italy
Por
tuga
l
Ger
man
y
Nor
way
Can
ada
Uru
guay
a
Uni
ted
Kin
gdom
Arg
entin
a
Uni
ted
Sta
tes
Col
ombi
a
Source: Economic Commission for Latin America and the Caribbean (ECLAC), on the basis of A. Atkinson, T. Piketty and E. Saez, “Top Incomes in the Long Run of History”, Journal of Economic Literature, vol. 49, No. 1, 2011; F. Alvaredo and J. Londoño, “Ingresos altos y tributación personal en una economía en desarrollo: Colombia 1993-2010”, 2013, unpublished; F. Alvaredo, “The Rich in Argentina over the Twentieth Century”, Top Incomes: A Global Perspective, Anthony Atkinson and Thomas Piketty (eds.), Oxford University Press, 2010; and G. Burdín, F. Esponda and A. Vigorito, “Desigualdad y altos ingresos en Uruguay. Un análisis en base a registros tributarios y encuestas de hogares para el período 2009-2011”, http://www.cef.org.uy/images/TallerDesigualdad2013/desigualdadyaltosingresos.pdf.
a The data for Uruguay refer to 2009.
These studies for the region show that values for the corrected Gini index, incorporating information on the top 1% on the basis of tax data, are invariably higher than those yielded by household surveys. However, the two indices (the original one derived from household surveys and the one corrected by tax records) evolve in a similar manner. This outcome is important, as it indicates that the inability of household surveys to capture the highest incomes satisfactorily is not the reason for the recent drop in inequality.
39 For further information on this project, see [online] http://topincomes.g-mond.parisschoolofeconomics.eu/.
113
Cha
pter
II
Compacts for Equality: Towards a Sustainable Future
3. Information on mobility between generations and over the life cycleAnother major constraint on the analysis of inequality from a broader perspective is the scarcity of long-range panel data that can be used to observe the trajectory of individuals and households over a sufficiently long time period. In the first case, movements are analysed by taking two points in an individual’s life, while in the second movements between generations are examined (parents and children). The sociological tradition has stressed mobility in terms of social classes or occupational groups, whereas economists usually analyse mobility in terms of income (or education). To analyse mobility both between generations and over the life cycle of individuals, it would be desirable to have longitudinal information. Few panel data are available in the region, and they are usually from rotating panels of household surveys that are observed for a small number of rounds or collected unsystematically.40 Examples of this type of information are the rotating panel surveys of Argentina, Bolivarian Republic of Venezuela, Brazil, Chile, Mexico, and Peru (Amarante, 2013). Data of this type are useful for analysing occupational mobility but not intergenerational transmission. Accordingly, improving research into inequality transmission mechanisms in the region is another major challenge.
4. Information constraints in the CaribbeanFor almost 20 years, poverty and inequality in the Caribbean have been measured by Country Poverty Assessments (CPAs), coordinated mainly by the Caribbean Development Bank (CDB) and based on surveys of household expenditure or living conditions. More recently, studies have begun to include qualitative methods in order to incorporate the viewpoints of people living in poverty (participatory poverty studies). The purpose here is to develop action plans that can help to identify policies, strategies, programmes and projects for reducing poverty and improve living conditions. Since the mid-1990s, about 30 CPAs have been carried out in the English-speaking countries of the Caribbean. Most countries have had at least two CPAs and most territories at least one. The only country with annually available poverty and inequality statistics is Jamaica, where the Planning Institute has conducted a living conditions survey annually since 1989.
Although the surveys vary in their content from country to country and there are some differences in methodology too, they have a common approach and are consistent across all the countries. The statistics derived from these surveys are a very useful source of information on the Caribbean subregion, and they should continue to be strengthened and expanded in the coming years. Again, this information could be better exploited and contribute to improved diagnoses and policy discussion if it were available for research purposes (obviously with safeguards for confidentiality). It is not standard practice to make the data available to users, although the situation varies by country. If the data were available and there were greater harmonization, major advances could be made in the discussion of a number of socioeconomic issues. Poverty statistics and their comparability could also be improved by greater harmonization of criteria, such as those for calculating poverty lines.
The greatest weakness in the case of the Caribbean is the almost complete lack of household income statistics, which makes it hard to compare the poverty and inequality measurements of this subregion with those of the Latin American countries, for example. The absence of this information also precludes analysis of labour earnings or of the impacts of government transfers and taxes on household welfare.
5. Beyond resource equalityOperationalizing the different understandings of equality and calculating indicators to capture its evolution is a difficult task when the approach is extended beyond equality of resources. The debate about relevant capabilities and the best way to measure equality in these has been wide-ranging (see, among others, Nussbaum, 2001; Robeyns, 2005), but remains open. More complex notions such as agency and autonomy are even harder to quantify, and progress here is much more recent. The measurement for women’s economic autonomy presented in this chapter is an attempt to make progress in this regard. Other examples of efforts of this kind in relation to agency can be found in Alkire (2005) and Ibrahim and Alkire (2007). A great deal still needs to be done to introduce metrics capable of
40 A number of mobility studies in the region have sought to deal with this limitation by using other methodological approaches. For a summary of the evidence on the subject for the region, see Azevedo and Bouillon (2009).
114
Cha
pter
IIEconomic Commission for Latin America and the Caribbean (ECLAC)
capturing relationships of mutual recognition. All these difficulties should spur redoubled efforts towards the definition of a metric suited to broader conceptions of equality, eschewing the reductionism of treating equality as confined to aspects which are strictly quantifiable (today, basically resources). The challenges encompass both the creation of new indicators and the generation of new statistical information with which to calculate them. In all likelihood, this information will have to be produced essentially by way of regional research initiatives.
H. Final remarksWhat do we mean when we talk about equality? This chapter has attempted to address that question in all its potential ramifications. On the basis that, conceptually, equality refers to resources, capabilities, agency, autonomy, protection from vulnerabilities and mutual recognition, we have considered it necessary to construct a diagnosis, through our reading of reality, that might correspond in some measure to this concept of complex equality. In ECLAC (2010), we discussed equality in terms of citizenship, i.e. as equality of rights. The aim now has been to take a further step, since it is precisely in the complex value of equality that the richness of development is at stake.
Understanding the different facets of inequality in the region and their evolution requires a wide-ranging approach incorporating different dimensions and indicators. The reduction in income inequality experienced by the region’s countries in the past decade is well known, even if the main determinants of the decline are still unclear. This reduction is good news, but raises all sorts of questions. Regarding its sustainability, there is a strong likelihood that it is due mainly to the economic cycle and thus could easily be reversed in short order. As for the indicator itself, it needs to be qualified by others whose diagnoses are not so encouraging. Thus, for example, functional income distribution and absolute income inequality did not show the same favourable evolution over the decade. This means a broader perspective is required to find out what is happening with the concentration of wealth and the appropriation of the fruits of growth.
None of this is to gainsay recent achievements in a number of dimensions. The foregoing pages show that overcrowding is on the decline, the divides between socioeconomic groups are narrowing and income is being distributed in a more egalitarian way. Access to durable goods is also improving, and inequality in the distribution of this access is diminishing, although the absolute gaps between socioeconomic groups are not. The number of years of education completed by the adult population has been increasing and divides in this attainment are narrowing, and connectivity divides are likewise lessening, although there are still large absolute inequalities. Nutritional indicators for children under age 5 are improving, but in some of the countries undernutrition is becoming even more concentrated than before in the poor population. The likelihood of becoming an adolescent mother remains high but is beginning to fall, although absolute gaps in this sphere are widening.
Besides this detailed perspective on advances and gaps in the equality of capability development, the more “relational” dimension of equality has critical aspects but also encouraging ones. We have seen that segregation in the education system has been increasing in most of the countries when the poorest quintile of the population is considered as a minority. Some improvements have been seen with regard to residential segregation, Brazil being a case in point. Autonomy and mutual recognition, which are central to equality, are not easy to measure. The effort has been made to do so in this chapter on the basis of gender equality dimensions such as economic autonomy, looking at women’s own incomes and their autonomy or empowerment, through participation in established deliberative institutions, for example. Progress can be seen over the past decade in both cases, although there is still a clear asymmetry between the sexes, to the detriment of women.
The situation of indigenous peoples merits special consideration from an expanded equality perspective, as it shows unequivocally how lack of recognition for their collective identity is conjoined with lack of access to assets that would enable them to reap a greater share of the fruits of development. It is clearly important, then, to combine recognition policies with redistribution policies, particularly when equality is defined, as it is here, in terms of autonomy and interdependence.
All these facets of equality and inequality go to make up the mosaic that citizens experience, internalize and challenge. Thus, the picture citizens have formed is also a mixed one. Surveys that are comparable over time show
115
Cha
pter
II
Compacts for Equality: Towards a Sustainable Future
a positive, albeit incipient, evolution over the course of the last decade in the way people view inequality, social interaction and conflict. Yet a very large percentage still consider that they live in highly unequal societies where social interaction is difficult and levels of conflict are high.
Unquestionably, this multidimensional perspective calls for corresponding policies to bring about greater equality for developing and using capabilities in the production sphere and in life plans, both personal and collective. This de facto interrelationship needs to be matched by an integrated policy approach that can enhance synergies and break vicious cycles. Thus, for example, housing policies to prevent overcrowding can help to improve equality of attainments and learning in education; school infrastructure policies can create more widespread access to ICTs for children and young people from low-income families; policies to promote the full exercise of reproductive rights can prevent adolescents from dropping out of school while, conversely, policies to help pupils stay in and progress through school expand the range of life plans that are possible for adolescents; an expansion of childcare and early education services can be accompanied by nutrition programmes for children at risk, while programmes of nutritional check-ups in the first year of life impact children’s preparedness for learning at school later.
The overview offered here underscores the importance of the questions asked in the foreword and first chapter about equality and sustainability in Latin America and the Caribbean in the future and about the need for profound transformations to harmonize these two imperatives in synergy. These transformations must combine a production pattern that is more socially inclusive and environmentally sustainable and a State with a redistributive capacity that expands access to well-being, promotes capability development and sends out positive signals to encourage equality through mutual recognition combined with the widespread exercise of both individual and collective autonomy.
BibliographyAbeles, Martín, Verónica Amarante and Daniel Vega (2013), “La distribución funcional del ingreso en América Latina”,
Santiago, Chile, Economic Commission for Latin America and the Caribbean (ECLAC), unpublished. Alkire, S. (2005), “Subjective quantitative studies of human agency”, Social Indicators Research, vol. 74, No. 1.Altimir, Oscar (1987), “Income distribution statistics in Latin America and their reliability”, Review of Income and
Wealth, vol. 33, No. 2.Alvaredo, Facundo (2010a), “A note on the relationship between top income shares and the Gini Coefficient, C.E.P.R.
Discussion Papers, No. 8071. (2010b), “The rich in Argentina over the Twentieth Century”, Top Incomes: A Global Perspective, Anthony Atkinson
and Thomas Piketty (eds.), Oxford University Press.Alvaredo, Facundo and Juliana Londoño (2013), “Ingresos altos y tributación personal en una economía en desarrollo:
Colombia 1993-2010”, unpublished.Amarante, Verónica (2013), Income inequality in Latin America. Data challenges and availability from a comparative
perspective (LC/L.3695), Santiago, Chile, Economic Commission for Latin America and the Caribbean (ECLAC).Atkinson, Anthony B. and Andrea Brandolini (2004), “I cambiamenti di lungo periodo nelle diseguaglianze di reddito
nei paesi industrializzati”, Rivista Italiana degli Economisti, No. 3.Atkinson, Anthony B. and Thomas Piketty (2010), Top Incomes: A Global Perspective, Oxford University Press. (eds.) (2007), Top Incomes over the Twentieth Century: a contrast between continental European and English-
Speaking countries, Oxford University Press.Atkinson, Anthony B., Thomas Piketty and Emmanuel Saez (2011), “Top incomes in the long run of History”, Journal
of Economic Literature, vol. 49, No. 1.Attanasio, Orazio, Pinelopi K. Goldberg and Nina Pavcnik (2004), “Trade reforms and wage inequality in Colombia”,
Journal of Development Economics, vol. 74, No. 2, August.Azevedo, Viviane and Cesar Bouillon (2009), “Social mobility in Latin America: a review of existing evidence”,
Research Department Working Paper, No. 4634, Inter-American Development Bank (IDB).Azevedo, Joao Pedro and others (2013), “Fifteen years of inequality in Latin America : how have labor markets
helped ?”, Policy Research Working Paper, No. 6384, Washington, D.C., World Bank.
116
Cha
pter
IIEconomic Commission for Latin America and the Caribbean (ECLAC)
Berman, E. and S. Machin (2000), “Skill-biased technology transfer around the world”, Oxford Review of Economic Policy, vol. 16, No. 3, September.
Bosmans, Kristof and Frank A. Cowell (2010), “The class of absolute decomposable inequality measures”, Economics Letters, vol. 109, No. 3.
Burdin, Gabriel, Fernando Esponda and Andrea Vigorito (2013), “Desigualdad y altos ingresos en Uruguay. Un análisis en base a registros tributarios y encuestas de hogares para el período 2009-2011” [online] http://www.cef.org.uy/images/TallerDesigualdad2013/desigualdadyaltosingresos.pdf.
Casacuberta, Carlos and Marcel Vaillant (2002), “Trade and wages in Uruguay in the 1990’s”, Economic Papers, No. 0902.
Cecchini, Simone and Aldo Madariaga (2011), “Programas de transferencias condicionadas: balance de la experiencia reciente en América Latina y el Caribe”, Cuadernos de la CEPAL, No. 95 (LC/G.2497-P), Santiago, Chile, Economic Commission for Latin America and the Caribbean (ECLAC). United Nations publication, Sales No. S.11.II.G.55.
Chakravarty, Satya and Swami Tyagarupananda (2009), “The subgroup decomposable intermediate indices of inequality”, Spanish Economic Review, vol. 11, No. 2.
Checchi, Daniele and Cecilia García-Peñalosa (2004), “Risk and the distribution of human capital”, Economics Letters, vol. 82, No. 1.
Cornia, Giovanni Andrea (2014) (ed.), Falling Inequality in Latin America. Policy changes and lessons, Oxford, Oxford University Press.
(2010), “Income distribution under Latin America’s new left regimes”, Journal of Human Development and Capabilities, vol. 11, No. 1.
Cornia, Giovanni y Bruno Martorano (2012), “Development policies and income inequality in selected developing regions, 1980–2010”, UNCTAD Discussion Papers, No. 210, United Nations Conference on Trade and Development (UNCTAD).
Cruces G., C. Domenech and L. Gasparini (2014), “Inequality in education: evidence for Latin America”, Falling Inequality in Latin America. Policy changes and lessons, Giovanni Andrea Cornia (ed.), Oxford, Oxford University Press.
Davies, James B. and Anthony F. Shorrocks (2000), “The distribution of wealth”, Handbook of Income Distribution, Anthony B. Atkinson and François Bourguignon (eds.), Elsevier.
De la Torre, Augusto, Julian Messina and Samuel Pienknagura (2012), The Labor Market Story Behind Latin America’s Transformation, LAC Semiannual Report, No. 11884, Washington, D.C., World Bank.
Dureau, Francoise and others (eds.) (2002), Metrópolis en movimiento una comparación internacional, Bogota, Alfaomega.ECLAC (Economic Commission for Latin America and the Caribbean) (2013a), Economic Survey of Latin America
and the Caribbean, 2013 (LC/G.2574-P), Santiago, Chile. (2013b), Economía digital para el cambio estructural y la igualdad (LC/L.3602), Santiago, Chile. (2013c), Gender Equality Observatory of Latin America and the Caribbean. Annual Report 2012. A look at grants
support and burden for women (LC/G.2561), Santiago, Chile. (2013d), Mujeres indígenas en América Latina: dinámicas demográficas y sociales en el marco de los derechos
humanos (LC/W.558), Santiago, Chile. (2011), Social Panorama of Latin America, 2011 (LC/G.2514-P), Santiago, Chile. United Nations publication, Sales
No. E.12.II.G.6. (2010), Time for Equality: Closing Gaps, Opening Trails (LC/G.2432(SES.33/3)), Santiago, Chile. (2006), Social Panorama of Latin America, 2006 (LC/G.2326–P), Santiago, Chile. United Nations publication,
Sales No. E.06.II.G.133.Filmer, Deon and Lant H. Pritchett (2001), “Estimating wealth effects without expenditure data-or tears: an application
to educational enrollments in States of India”, Demography, vol. 38, No. 1.Fraser, Nancy (1997), Iustitia interrupta: reflexiones críticas desde la posición «postsocialista», Bogota, Siglo del
Hombre Editores.Galiani, Sebastian and Pablo Sanguinetti (2003), “The impact of trade liberalizationon wage inequality: Evidence
from Argentina”, Journal of Development Economics, vol. 72, No. 2.Gasparini, Leonardo (2003), “Different lives: inequality in Latin America and the Caribbean”, Inequality in Latin
America and the Caribbean Breaking with History?, David M. De Ferranti and others (eds.), Washington, D.C., World Bank.
Gasparini, Leonardo and others (2013), “La segregación escolar público privada en América Latina”, Santiago, Chile, Economic Commission for Latin America and the Caribbean (ECLAC), unpublished.
117
Cha
pter
II
Compacts for Equality: Towards a Sustainable Future
(2012), “Educational upgrading and returns to skills in Latin America: evidence from a supply-demand framework, 1990-2010”, IZA Discussion Papers, No. 6244, Bonn, Institute for the Study of Labor (IZA).
(2011), “La segregación escolar en Argentina. Reconstruyendo la evidencia”, Documento de Trabajo, No. 0123, Center for Distributive, Labour and Social Studies (CEDLAS), Universidad Nacional de La Plata.
Gindling, T. H. and Donald Robbins (2001), “Patterns and sources of changing wage inequality in Chile and Costa Rica during structural adjustment”, World Development, vol. 29, No. 4.
Goldberg, Pinelopi Koujianou and Nina Pavcnik (2007), “Distributional effects of globalization in developing countries, Journal of Economic Literature, vol. 45, No. 1.
Ibrahim, S. and S. Alkire (2007), “Agency and empowerment: a proposal for internationally comparable indicators”, Oxford Development Studies, Taylor and Francis Journals, vol. 35, No. 4.
IDB (Inter-American Development Bank) (2011), “Sostenibilidad urbana en América Latina y el Caribe”, Washington, D.C. [online] http://idbdocs.iadb.org/wsdocs/getdocument.aspx?docnum=35786040.
ILO (International Labour Organization) (2013), Global Wage Report 2012/13: Wages and Equitable Growth, Geneva.Kakwani, N., A. Wagstaff and E. van Doorslaer (1997), “Socioeconomic inequalities in health: Measurement,
computation, and statistical inference”, Journal of Econometrics, vol. 77, No. 1.Katzman R. (2011), “Infancia en América Latina: Privaciones habitacionales y desarrollo de capital humano”, Project
Documents, No. 431 (LC/W.431), Santiago, Chile, Economic Commission for Latin America and the Caribbean (ECLAC)/United Nations Children’s Fund (UNICEF).
Kolm, S-Ch. (1974), “Rectifiances et dominances integrales de tous degres”, Technical Report, Paris, CEPREMAP.Llanos, Beatriz and Kristen Sample (2008), 30 años de democracia: ¿en la cresta de la ola? Participación política de
la mujer en América Latina, Lima, International Institute for Democracy and Electoral Assistance (IDEA).López-Calva, Luis Felipe and Nora Lustig (2010), Declining Inequality in Latin America: A Decade of Progress?,
Brookings Institution Press.Mackenzie, C. and N. Stoljar (eds.) (2000), Relational Autonomy. Feminist Perspectives on Autonomy, Agency and
the Social Self, New York, Oxford University Press.Morley, Samuel A. (2001), “The Income Distribution Problem in Latin America and the Caribbean”, Libros de la
CEPAL, No. 65 (LC/G.2127-P/I), Santiago, Chile, Economic Commission for Latin America and the Caribbean (ECLAC). United Nations publication, Sales No. E.01.II.G.20.
Nussbaum, M. (2001), Women and Human Development: The Capabilities Approach, New York, Cambridge University Press.
Pérez-Campuzano, Enrique (2011), “Segregación socioespacial urbana. Debates contemporáneos e implicaciones para las ciudades mexicanas”, Estudios Demográficos y Urbanos, vol. 26, No. 2.
Piketty, Thomas (2003), “Income inequality in France, 1901-1998”, Journal of Political Economy, vol. 111, No. 5.Ravallion, Martin (2004), “Competing concepts of inequality in the globalization debate”, Policy Research Working
Paper, No. 3243, Washington, D.C., World Bank.Revenga, Ana (1997), “Employment and wage effects of trade liberalization: the case of Mexican manufacturing”,
Journal of Labor Economics, vol. 15, No. S3. Rivera-Dommarco, Juan Ángel and others (2013), “Desnutrición crónica en México en el último cuarto de siglo:
análisis de cuatro encuestas nacionales”, Salud Pública de México, vol. 55, No. 2.Roberts, Keneth M. (2014), “The politics of inequality and redistribution in Latin America’s post-adjustment era”,
Falling Inequality in Latin America. Policy changes and lessons, G.A. Cornia (ed.), Oxford University Press. Roberts, Bryan and Robert H. Wilson (2009), Urban Segregation and Governance in the Americas, New York,
Palgrave Macmillan.Robeyns, Ingrid (2005), “The capability approach: a theoretical survey”, Journal of Human Development, vol. 6, No. 1.Rodríguez, J. (2009), “Dinámica demográfica y asuntos de la agenda urbana en América Latina: ¿Qué aporta el
procesamiento de microdatos censales?”, Notas de Población, No. 86 (LC/G.2349-P), Santiago, Chile, Economic Commission for Latin America and the Caribbean (ECLAC). United Nations publication, Sales No. S.09.II.G.09.
Rutstein, S.O. and K. Johnson (2004), “The DHS Wealth Index”, DHS Comparative Reports, No. 6.Székely Pardo, Miguel (2001), “The 1990s in Latin America: another decade of persistent inequality, but with somewhat
lower poverty”, Working Paper, No. 454, Washington, D.C., Inter-American Development Bank (IDB).Taylor, L. (2005), “External liberalization, economic performance and distribution in Latin America and elsewhere”,
G.A. Cornia (ed.), Inequality, Growth and Poverty in an Era of Liberalization and Globalization, Oxford, Oxford University Press.
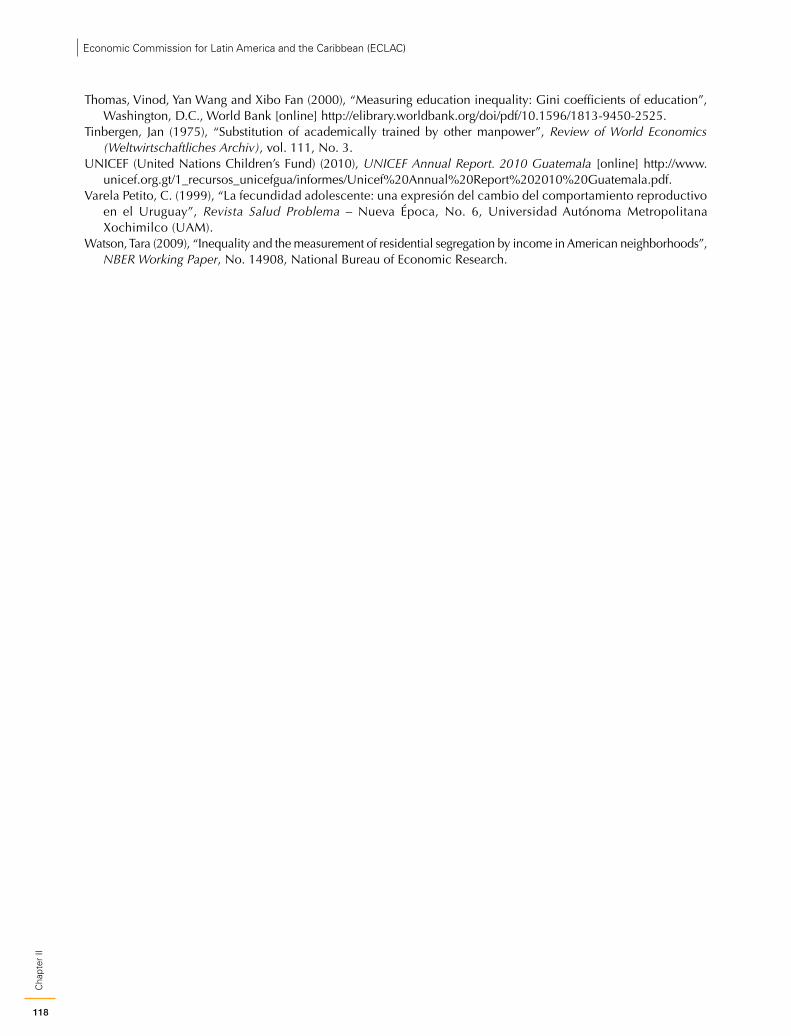
118
Cha
pter
IIEconomic Commission for Latin America and the Caribbean (ECLAC)
Thomas, Vinod, Yan Wang and Xibo Fan (2000), “Measuring education inequality: Gini coefficients of education”, Washington, D.C., World Bank [online] http://elibrary.worldbank.org/doi/pdf/10.1596/1813-9450-2525.
Tinbergen, Jan (1975), “Substitution of academically trained by other manpower”, Review of World Economics (Weltwirtschaftliches Archiv), vol. 111, No. 3.
UNICEF (United Nations Children’s Fund) (2010), UNICEF Annual Report. 2010 Guatemala [online] http://www.unicef.org.gt/1_recursos_unicefgua/informes/Unicef%20Annual%20Report%202010%20Guatemala.pdf.
Varela Petito, C. (1999), “La fecundidad adolescente: una expresión del cambio del comportamiento reproductivo en el Uruguay”, Revista Salud Problema – Nueva Época, No. 6, Universidad Autónoma Metropolitana Xochimilco (UAM).
Watson, Tara (2009), “Inequality and the measurement of residential segregation by income in American neighborhoods”, NBER Working Paper, No. 14908, National Bureau of Economic Research.
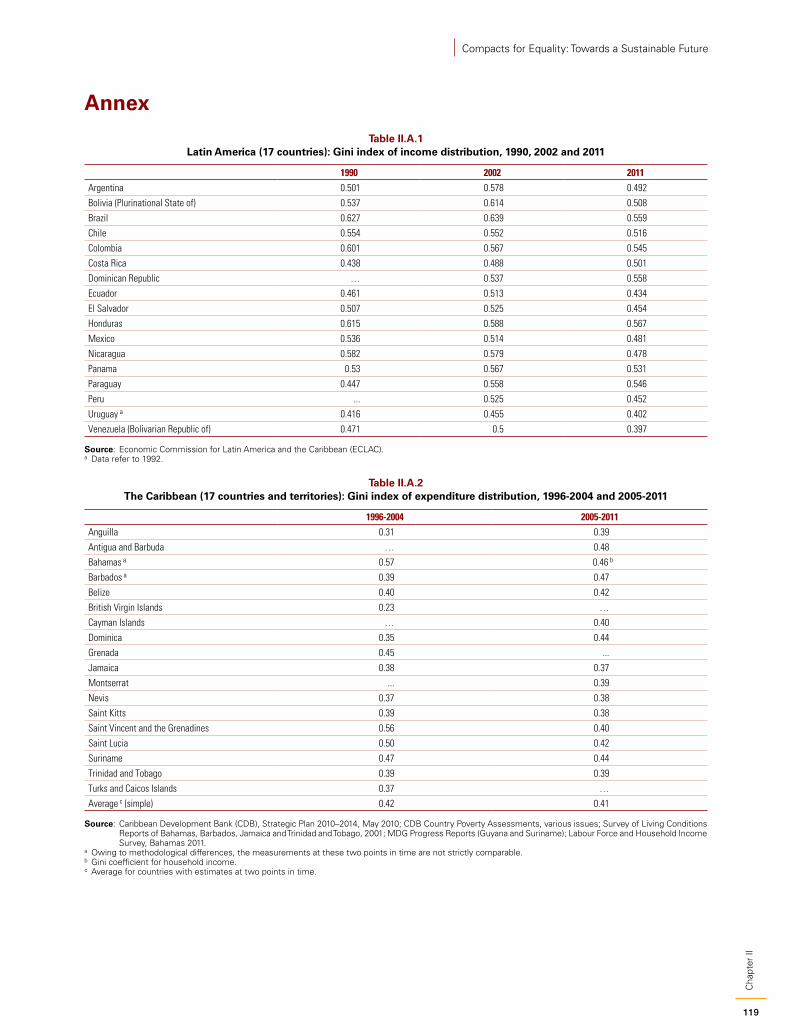
119
Cha
pter
II
Compacts for Equality: Towards a Sustainable Future
Annex
Table II.A.1 Latin America (17 countries): Gini index of income distribution, 1990, 2002 and 2011
1990 2002 2011Argentina 0.501 0.578 0.492
Bolivia (Plurinational State of) 0.537 0.614 0.508
Brazil 0.627 0.639 0.559
Chile 0.554 0.552 0.516
Colombia 0.601 0.567 0.545
Costa Rica 0.438 0.488 0.501
Dominican Republic … 0.537 0.558
Ecuador 0.461 0.513 0.434
El Salvador 0.507 0.525 0.454
Honduras 0.615 0.588 0.567
Mexico 0.536 0.514 0.481
Nicaragua 0.582 0.579 0.478
Panama 0.53 0.567 0.531
Paraguay 0.447 0.558 0.546
Peru ... 0.525 0.452
Uruguay a 0.416 0.455 0.402
Venezuela (Bolivarian Republic of) 0.471 0.5 0.397
Source: Economic Commission for Latin America and the Caribbean (ECLAC).a Data refer to 1992.
Table II.A.2 The Caribbean (17 countries and territories): Gini index of expenditure distribution, 1996-2004 and 2005-2011
1996-2004 2005-2011Anguilla 0.31 0.39
Antigua and Barbuda … 0.48
Bahamas a 0.57 0.46 b
Barbados a 0.39 0.47
Belize 0.40 0.42
British Virgin Islands 0.23 …
Cayman Islands … 0.40
Dominica 0.35 0.44
Grenada 0.45 ...
Jamaica 0.38 0.37
Montserrat ... 0.39
Nevis 0.37 0.38
Saint Kitts 0.39 0.38
Saint Vincent and the Grenadines 0.56 0.40
Saint Lucia 0.50 0.42
Suriname 0.47 0.44
Trinidad and Tobago 0.39 0.39
Turks and Caicos Islands 0.37 …
Average c (simple) 0.42 0.41
Source: Caribbean Development Bank (CDB), Strategic Plan 2010–2014, May 2010; CDB Country Poverty Assessments, various issues; Survey of Living Conditions Reports of Bahamas, Barbados, Jamaica and Trinidad and Tobago, 2001; MDG Progress Reports (Guyana and Suriname); Labour Force and Household Income Survey, Bahamas 2011.
a Owing to methodological differences, the measurements at these two points in time are not strictly comparable.b Gini coefficient for household income.c Average for countries with estimates at two points in time.

120
Cha
pter
IIEconomic Commission for Latin America and the Caribbean (ECLAC)
Table II.A.3 Latin America (14 countries): segregation between the public and private school networks, 1992, 2000 and 2011
ARG BRA CHL COL CRI DOM ECU SLV HND MEX NIC PER PRY URY
Dissimilarity index 1992 0.215 0.209 0.143 0.158 0.152 0.173 0.123 0.112 0.116 0.184 0.184
2000 0.216 0.15 0.289 0.147 0.094 0.201 0.173 0.194 0.101 0.106 0.109 0.149 0.167 0.171
2011 0.284 0.152 0.243 0.154 0.095 0.17 0.16 0.145 0.097 0.086 0.145 0.218 0.166 0.223
Isolation index 1992 0.274 0.291 0.217 0.246 0.244 0.214 0.229 0.164 0.236 0.229 0.332
2000 0.313 0.308 0.319 0.239 0.265 0.274 0.257 0.253 0.224 0.265 0.213 0.269 0.235 0.339
2011 0.391 0.351 0.309 0.318 0.302 0.309 0.301 0.263 0.228 0.26 0.229 0.338 0.274 0.382
Centile gap index 1992 0.078 0.065 0.052 0.076 0.05 0.096 0.082 0.051 0.085 0.085 0.106
2000 0.097 0.101 0.09 0.069 0.074 0.077 0.071 0.106 0.08 0.074 0.063 0.092 0.078 0.128
2011 0.105 0.088 0.075 0.093 0.079 0.079 0.077 0.097 0.06 0.072 0.081 0.136 0.081 0.166
Source: Economic Commission for Latin America and the Caribbean (ECLAC), on the basis of household survey microdata.
Figure II.A.1 Trends in income inequality in the world: Gini index for the distribution of disposable per capita income
44
46
48
50
52
54
56
1980
1982
1984
1986
1988
1990
1992
1994
1996
1998
2000
2002
2004
2006
2008
2010
A. Latin America (18 countries), 1980-2010
39
40
41
42
43
44
45
1980
1982
1984
1986
1988
1990
1992
1994
1996
1998
2000
2002
2004
2006
2008
2010
B. South-East Asia (4 countries), 1980-2008
Source: Giovanni Cornia and Bruno Martorano, “Development policies and income inequality in selected developing regions, 1980–2010”, UNCTAD Discussion Papers, No. 210, United Nations Conference on Trade and Development (UNCTAD), 2012.
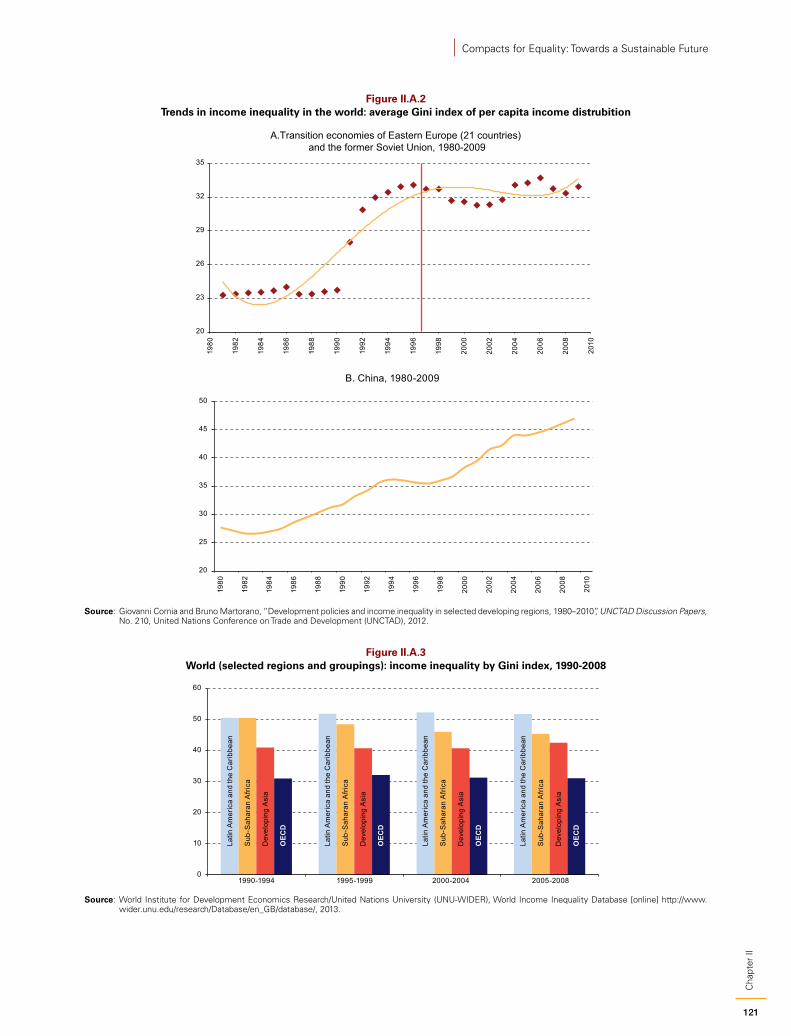
121
Cha
pter
II
Compacts for Equality: Towards a Sustainable Future
Figure II.A.2 Trends in income inequality in the world: average Gini index of per capita income distrubition
20
23
26
29
32
35
1980
1982
1984
1986
1988
1990
1992
1994
1996
1998
2000
2002
2004
2006
2008
2010
A.Transition economies of Eastern Europe (21 countries) and the former Soviet Union, 1980-2009
20
25
30
35
40
45
50
1980
1982
1984
1986
1988
1990
1992
1994
1996
1998
2000
2002
2004
2006
2008
2010
B. China, 1980-2009
Source: Giovanni Cornia and Bruno Martorano, “Development policies and income inequality in selected developing regions, 1980–2010”, UNCTAD Discussion Papers, No. 210, United Nations Conference on Trade and Development (UNCTAD), 2012.
Figure II.A.3 World (selected regions and groupings): income inequality by Gini index, 1990-2008
Latin
Am
eric
a an
d th
e C
arib
bean
Latin
Am
eric
a an
d th
e C
arib
bean
Latin
Am
eric
a an
d th
e C
arib
bean
Latin
Am
eric
a an
d th
e C
arib
bean
Sub
-Sah
aran
Afr
ica
Sub
-Sah
aran
Afr
ica
Sub
-Sah
aran
Afr
ica
Sub
-Sah
aran
Afr
ica
Dev
elop
ing
Asi
a
Dev
elop
ing
Asi
a
Dev
elop
ing
Asi
a
Dev
elop
ing
Asi
a
OECD
OECD
OECD
OECD
0
10
20
30
40
50
60
1990-1994 1995-1999 2000-2004 2005-2008
Source: World Institute for Development Economics Research/United Nations University (UNU-WIDER), World Income Inequality Database [online] http://www.wider.unu.edu/research/Database/en_GB/database/, 2013.

122
Cha
pter
IIEconomic Commission for Latin America and the Caribbean (ECLAC)
Figure II.A.4 Latin America (18 countries): overcrowding by income percentile, 2002-2011
(Number of people per room)
A. Argentina B. Bolivia (Plurinational State of)
C. Brazil D. Chile
E. Colombia F. Costa Rica
0.0
0.5
1.0
1.5
2.0
2.5
3.0
3.5
0.0
0.5
1.0
1.5
2.0
2.5
3.0
3.5
4.0
4.5
0.0
0.5
1.0
1.5
2.0
2.5
3.0
3.5
0.0
0.5
1.0
1.5
2.0
2.5
0.0
0.5
1.0
1.5
2.0
2.5
3.0
0.0
0.5
1.0
1.5
2.0
2.5
3.0
2002 2011
50 10 15 20 25 30 35 40 45 50 55 60 65 70 75 80 85 90 95 100
50 10 15 20 25 30 35 40 45 50 55 60 65 70 75 80 85 90 95 100
50 10 15 20 25 30 35 40 45 50 55 60 65 70 75 80 85 90 95 100 50 10 15 20 25 30 35 40 45 50 55 60 65 70 75 80 85 90 95 100
50 10 15 20 25 30 35 40 45 50 55 60 65 70 75 80 85 90 95 100
50 10 15 20 25 30 35 40 45 50 55 60 65 70 75 80 85 90 95 100
123
Cha
pter
II
Compacts for Equality: Towards a Sustainable Future
G. Ecuador H. El Salvador
I. Guatemala J. Honduras
K. Mexico L. Nicaragua
0.0
0.5
1.0
1.5
2.0
2.5
3.0
3.5
4.0
0.0
1.0
2.0
3.0
4.0
5.0
6.0
0.0
1.0
2.0
3.0
4.0
5.0
6.0
7.0
8.0
0.0
0.5
1.0
1.5
2.0
2.5
3.0
3.5
4.0
4.5
0.0
1.0
2.0
3.0
4.0
5.0
6.0
0.0
1.0
2.0
3.0
4.0
5.0
6.0
7.0
2002 2011
50 10 15 20 25 30 35 40 45 50 55 60 65 70 75 80 85 90 95 100
50 10 15 20 25 30 35 40 45 50 55 60 65 70 75 80 85 90 95 100
50 10 15 20 25 30 35 40 45 50 55 60 65 70 75 80 85 90 95 100 50 10 15 20 25 30 35 40 45 50 55 60 65 70 75 80 85 90 95 100
50 10 15 20 25 30 35 40 45 50 55 60 65 70 75 80 85 90 95 100
50 10 15 20 25 30 35 40 45 50 55 60 65 70 75 80 85 90 95 100
Figure II.A.4 (continued)
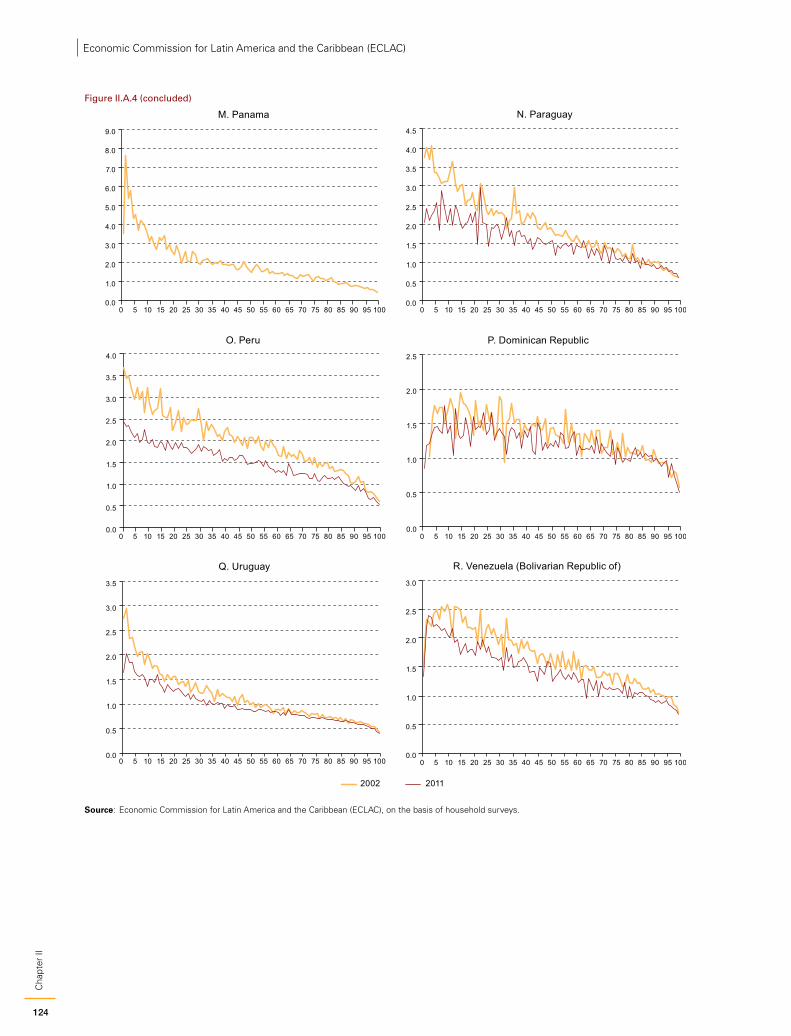
124
Cha
pter
IIEconomic Commission for Latin America and the Caribbean (ECLAC)
M. Panama N. Paraguay
O. Peru P. Dominican Republic
Q. Uruguay R. Venezuela (Bolivarian Republic of)
0.0
1.0
2.0
3.0
4.0
5.0
6.0
7.0
8.0
9.0
0.0
0.5
1.0
1.5
2.0
2.5
3.0
3.5
4.0
4.5
0.0
0.5
1.0
1.5
2.0
2.5
3.0
3.5
4.0
0.0
0.5
1.0
1.5
2.0
2.5
0.0
0.5
1.0
1.5
2.0
2.5
3.0
3.5
0.0
0.5
1.0
1.5
2.0
2.5
3.0
2002 2011
50 10 15 20 25 30 35 40 45 50 55 60 65 70 75 80 85 90 95 100 50 10 15 20 25 30 35 40 45 50 55 60 65 70 75 80 85 90 95 100
50 10 15 20 25 30 35 40 45 50 55 60 65 70 75 80 85 90 95 100
50 10 15 20 25 30 35 40 45 50 55 60 65 70 75 80 85 90 95 100
50 10 15 20 25 30 35 40 45 50 55 60 65 70 75 80 85 90 95 100
50 10 15 20 25 30 35 40 45 50 55 60 65 70 75 80 85 90 95 100
Source: Economic Commission for Latin America and the Caribbean (ECLAC), on the basis of household surveys.
Figure II.A.4 (concluded)
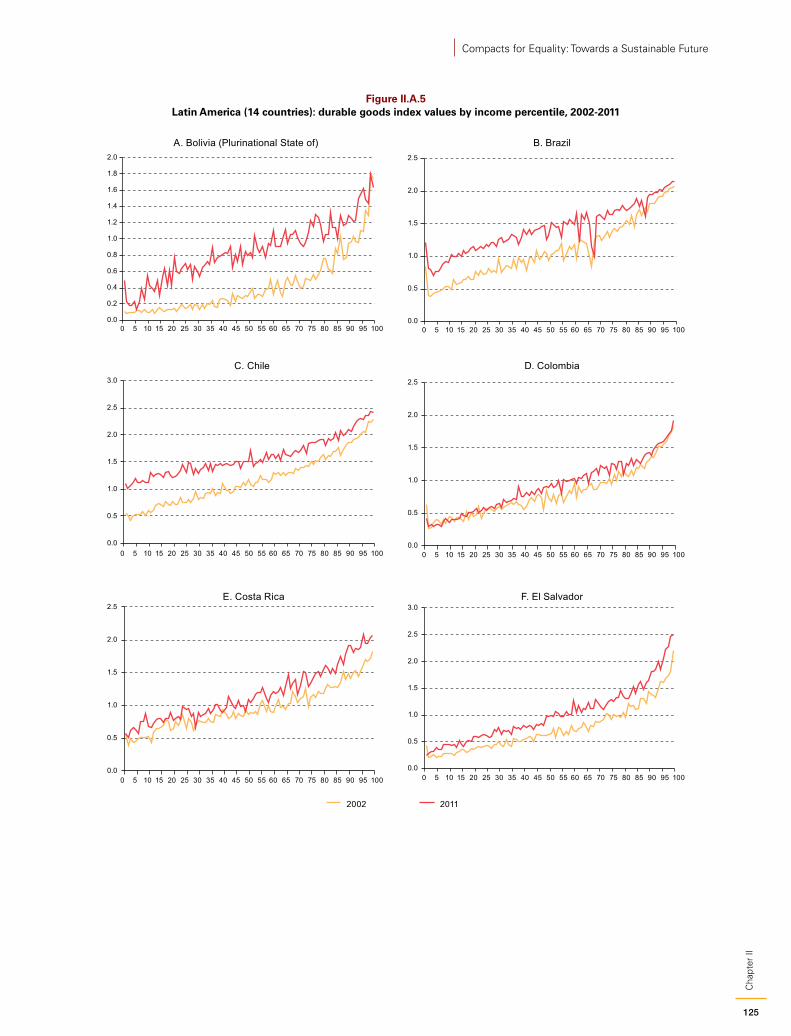
125
Cha
pter
II
Compacts for Equality: Towards a Sustainable Future
Figure II.A.5 Latin America (14 countries): durable goods index values by income percentile, 2002-2011
B. Brazil
C. Chile D. Colombia
E. Costa Rica F. El Salvador
0.0
0.2
0.4
0.6
0.8
1.0
1.2
1.4
1.6
1.8
2.0
0.0
0.5
1.0
1.5
2.0
2.5
0.0
0.5
1.0
1.5
2.0
2.5
3.0
0.0
0.5
1.0
1.5
2.0
2.5
0.0
0.5
1.0
1.5
2.0
2.5
0.0
0.5
1.0
1.5
2.0
2.5
3.0
A. Bolivia (Plurinational State of)
50 10 15 20 25 30 35 40 45 50 55 60 65 70 75 80 85 90 95 100 50 10 15 20 25 30 35 40 45 50 55 60 65 70 75 80 85 90 95 100
50 10 15 20 25 30 35 40 45 50 55 60 65 70 75 80 85 90 95 100 50 10 15 20 25 30 35 40 45 50 55 60 65 70 75 80 85 90 95 100
50 10 15 20 25 30 35 40 45 50 55 60 65 70 75 80 85 90 95 100 50 10 15 20 25 30 35 40 45 50 55 60 65 70 75 80 85 90 95 100
2002 2011
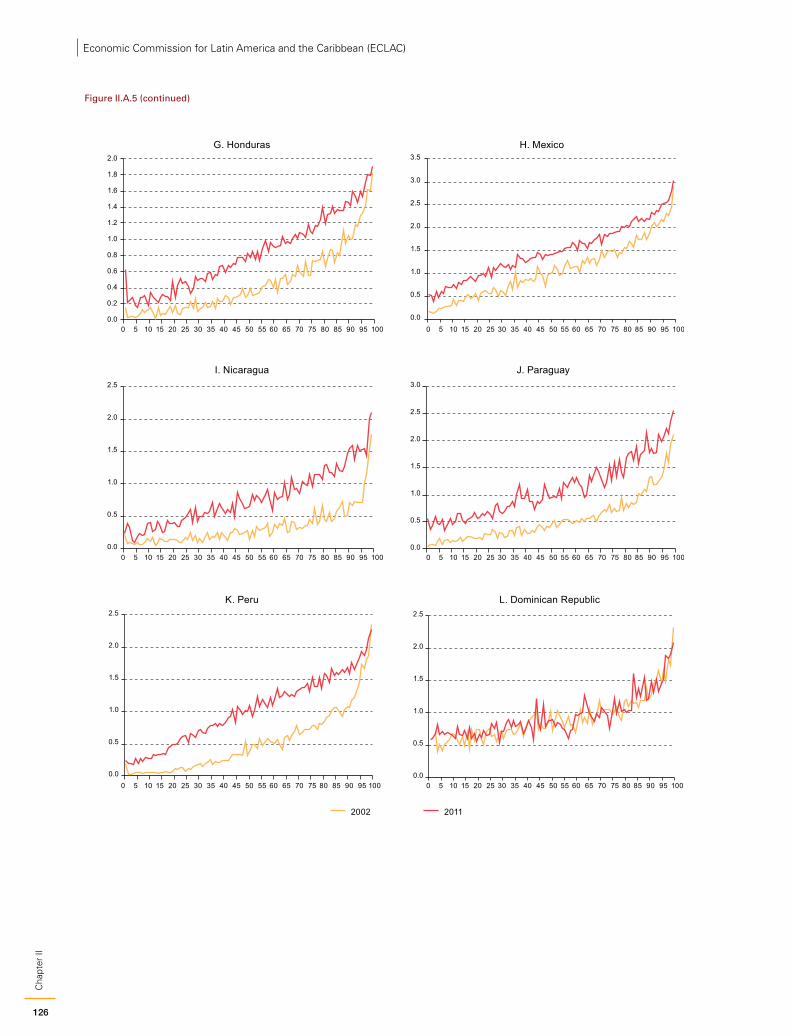
126
Cha
pter
IIEconomic Commission for Latin America and the Caribbean (ECLAC)
G. Honduras H. Mexico
I. Nicaragua J. Paraguay
K. Peru L. Dominican Republic
0.0
0.2
0.4
0.6
0.8
1.0
1.2
1.4
1.6
1.8
2.0
0.0
0.5
1.0
1.5
2.0
2.5
3.0
3.5
0.0
0.5
1.0
1.5
2.0
2.5
0.0
0.5
1.0
1.5
2.0
2.5
3.0
0.0
0.5
1.0
1.5
2.0
2.5
0.0
0.5
1.0
1.5
2.0
2.5
50 10 15 20 25 30 35 40 45 50 55 60 65 70 75 80 85 90 95 100 50 10 15 20 25 30 35 40 45 50 55 60 65 70 75 80 85 90 95 100
50 10 15 20 25 30 35 40 45 50 55 60 65 70 75 80 85 90 95 100 50 10 15 20 25 30 35 40 45 50 55 60 65 70 75 80 85 90 95 100
50 10 15 20 25 30 35 40 45 50 55 60 65 70 75 80 85 90 95 100 50 10 15 20 25 30 35 40 45 50 55 60 65 70 75 80 85 90 95 100
2002 2011
Figure II.A.5 (continued)
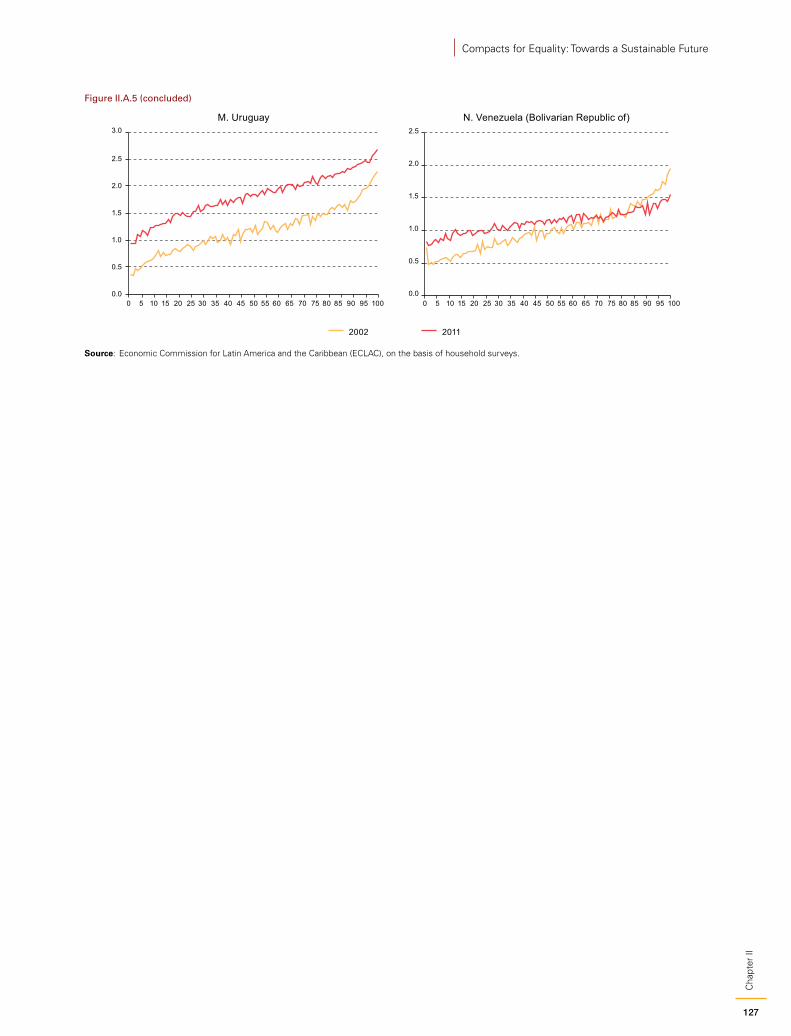
127
Cha
pter
II
Compacts for Equality: Towards a Sustainable Future
M. Uruguay N. Venezuela (Bolivarian Republic of)
0.0
0.5
1.0
1.5
2.0
2.5
3.0
0.0
0.5
1.0
1.5
2.0
2.5
2002 2011
50 10 15 20 25 30 35 40 45 50 55 60 65 70 75 80 85 90 95 100 50 10 15 20 25 30 35 40 45 50 55 60 65 70 75 80 85 90 95 100
Source: Economic Commission for Latin America and the Caribbean (ECLAC), on the basis of household surveys.
Figure II.A.5 (concluded)
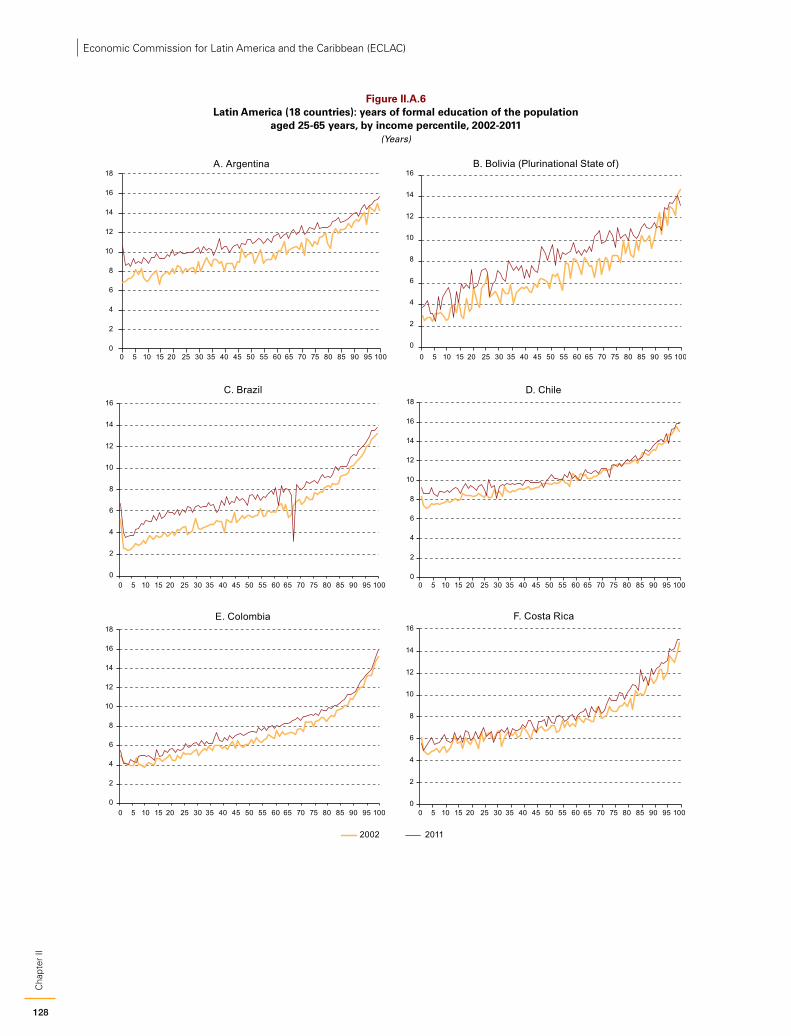
128
Cha
pter
IIEconomic Commission for Latin America and the Caribbean (ECLAC)
Figure II.A.6 Latin America (18 countries): years of formal education of the population
aged 25-65 years, by income percentile, 2002-2011(Years)
A. Argentina B. Bolivia (Plurinational State of)
C. Brazil D. Chile
E. Colombia F. Costa Rica
2002 2011
0
2
4
6
8
10
12
14
16
18
0
2
4
6
8
10
12
14
16
0
2
4
6
8
10
12
14
16
0
2
4
6
8
10
12
14
16
18
0
2
4
6
8
10
12
14
16
18
0
2
4
6
8
10
12
14
16
50 10 15 20 25 30 35 40 45 50 55 60 65 70 75 80 85 90 95 100 50 10 15 20 25 30 35 40 45 50 55 60 65 70 75 80 85 90 95 100
50 10 15 20 25 30 35 40 45 50 55 60 65 70 75 80 85 90 95 100 50 10 15 20 25 30 35 40 45 50 55 60 65 70 75 80 85 90 95 100
50 10 15 20 25 30 35 40 45 50 55 60 65 70 75 80 85 90 95 100 50 10 15 20 25 30 35 40 45 50 55 60 65 70 75 80 85 90 95 100
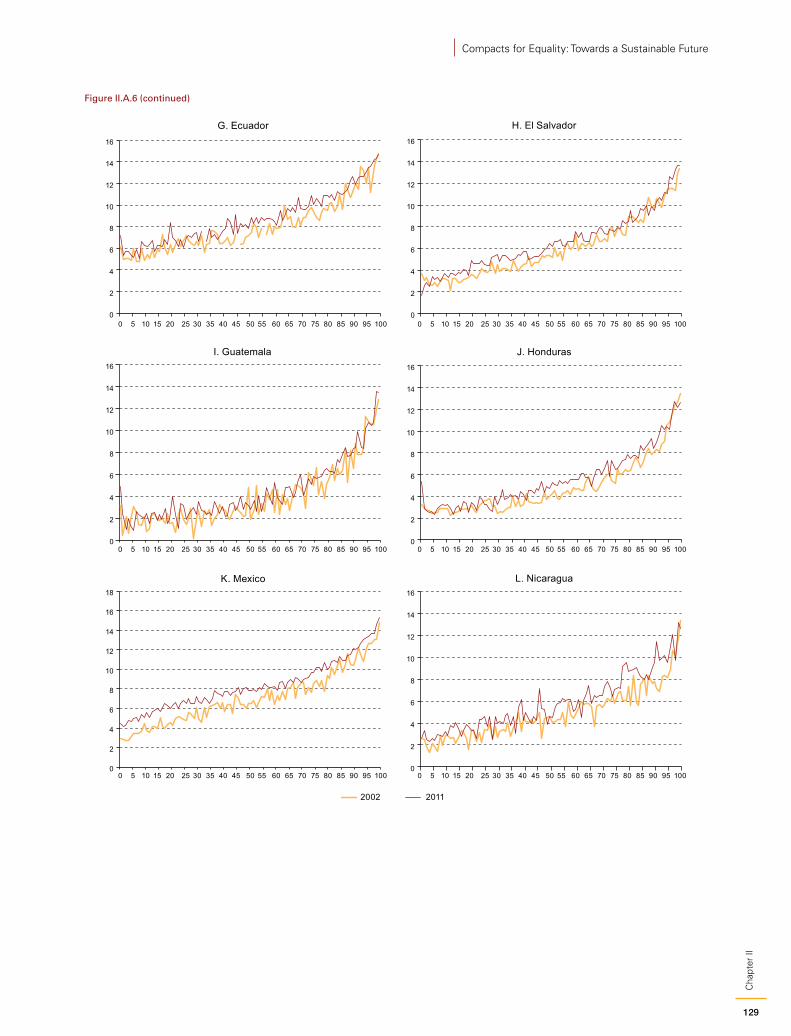
129
Cha
pter
II
Compacts for Equality: Towards a Sustainable Future
G. Ecuador H. El Salvador
I. Guatemala J. Honduras
K. Mexico L. Nicaragua
2002 2011
0
2
4
6
8
10
12
14
16
0
2
4
6
8
10
12
14
16
0
2
4
6
8
10
12
14
16
0
2
4
6
8
10
12
14
16
0
2
4
6
8
10
12
14
16
18
0
2
4
6
8
10
12
14
16
50 10 15 20 25 30 35 40 45 50 55 60 65 70 75 80 85 90 95 100 50 10 15 20 25 30 35 40 45 50 55 60 65 70 75 80 85 90 95 100
50 10 15 20 25 30 35 40 45 50 55 60 65 70 75 80 85 90 95 100 50 10 15 20 25 30 35 40 45 50 55 60 65 70 75 80 85 90 95 100
50 10 15 20 25 30 35 40 45 50 55 60 65 70 75 80 85 90 95 100 50 10 15 20 25 30 35 40 45 50 55 60 65 70 75 80 85 90 95 100
Figure II.A.6 (continued)
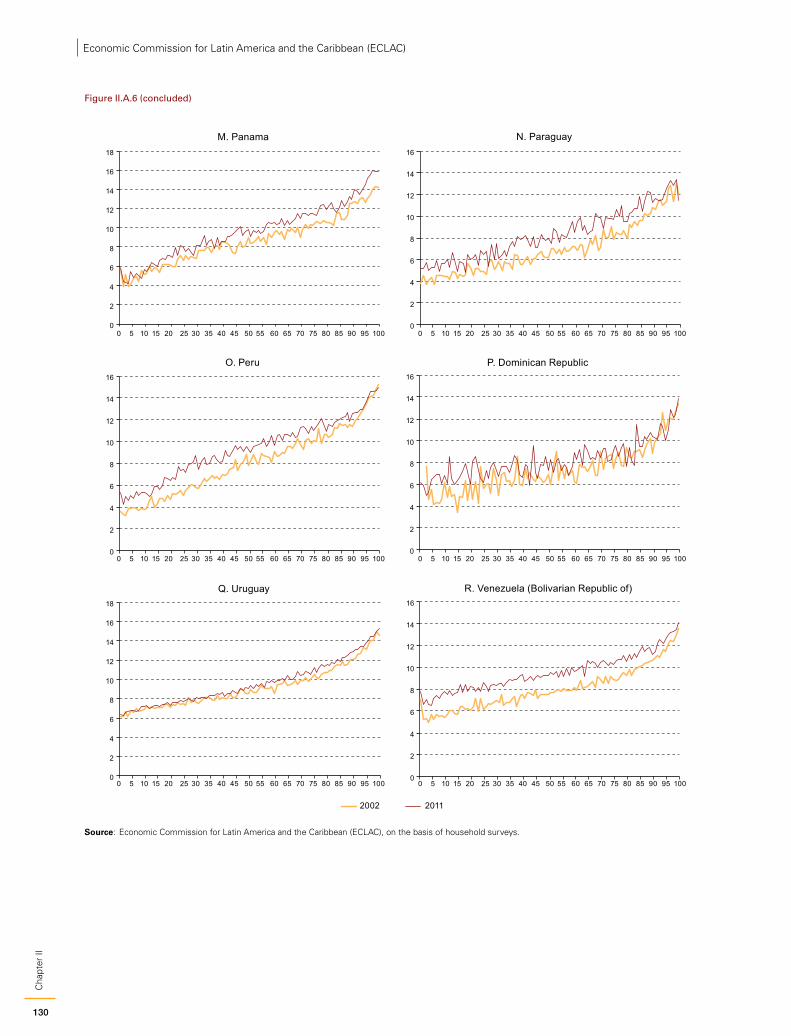
130
Cha
pter
IIEconomic Commission for Latin America and the Caribbean (ECLAC)
M. Panama N. Paraguay
O. Peru P. Dominican Republic
Q. Uruguay R. Venezuela (Bolivarian Republic of)
2002 2011
0
2
4
6
8
10
12
14
16
18
0
2
4
6
8
10
12
14
16
0
2
4
6
8
10
12
14
16
0
2
4
6
8
10
12
14
16
0
2
4
6
8
10
12
14
16
18
0
2
4
6
8
10
12
14
16
50 10 15 20 25 30 35 40 45 50 55 60 65 70 75 80 85 90 95 100 50 10 15 20 25 30 35 40 45 50 55 60 65 70 75 80 85 90 95 100
50 10 15 20 25 30 35 40 45 50 55 60 65 70 75 80 85 90 95 100 50 10 15 20 25 30 35 40 45 50 55 60 65 70 75 80 85 90 95 100
50 10 15 20 25 30 35 40 45 50 55 60 65 70 75 80 85 90 95 100 50 10 15 20 25 30 35 40 45 50 55 60 65 70 75 80 85 90 95 100
Source: Economic Commission for Latin America and the Caribbean (ECLAC), on the basis of household surveys.
Figure II.A.6 (concluded)
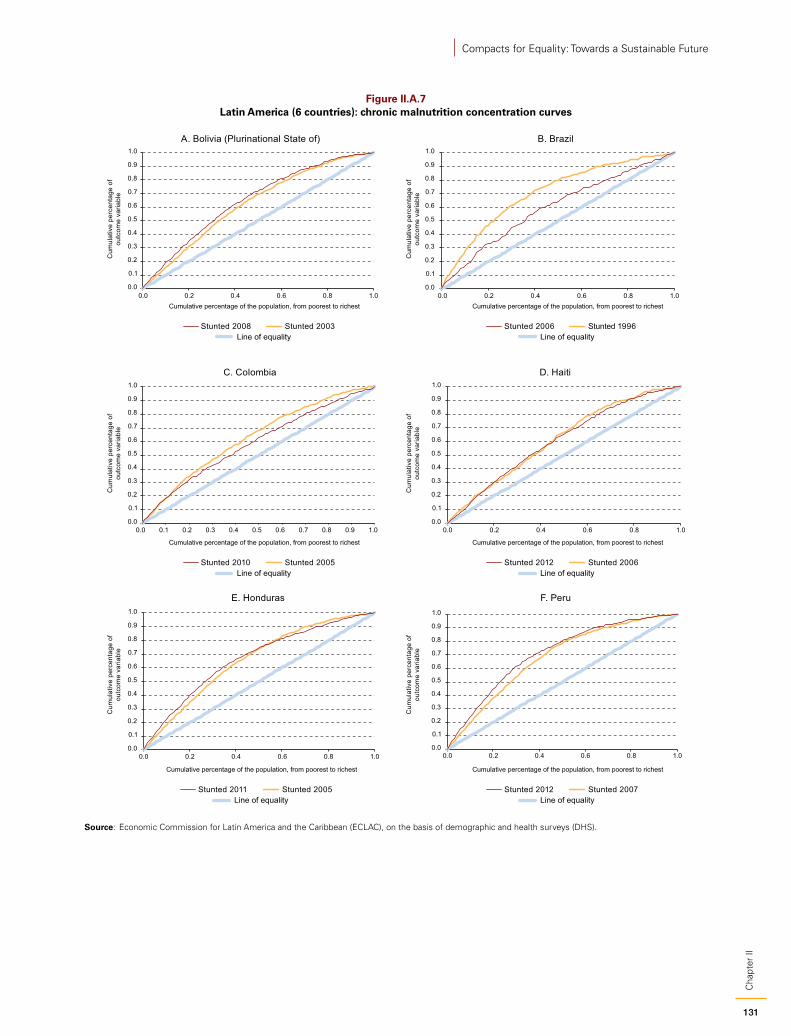
131
Cha
pter
II
Compacts for Equality: Towards a Sustainable Future
Figure II.A.7 Latin America (6 countries): chronic malnutrition concentration curves
0.0
0.1
0.2
0.3
0.4
0.5
0.6
0.7
0.8
0.9
1.0
0.0 0.2 0.4 0.6 0.8 1.00.0
0.1
0.2
0.3
0.4
0.5
0.6
0.7
0.8
0.9
1.0
0.0 0.2 0.4 0.6 0.8 1.0
0.0
0.1
0.2
0.3
0.4
0.5
0.6
0.7
0.8
0.9
1.0
0.0 0.1 0.2 0.3 0.4 0.5 0.6 0.7 0.8 0.9 1.00.0
0.1
0.2
0.3
0.4
0.5
0.6
0.7
0.8
0.9
1.0
0.0 0.2 0.4 0.6 0.8 1.0
0.0
0.1
0.2
0.3
0.4
0.5
0.6
0.7
0.8
0.9
1.0
0.0 0.2 0.4 0.6 0.8 1.00.0
0.1
0.2
0.3
0.4
0.5
0.6
0.7
0.8
0.9
1.0
0.0 0.2 0.4 0.6 0.8 1.0
A. Bolivia (Plurinational State of) B. Brazil
C. Colombia D. Haiti
E. Honduras F. Peru
Line of equalityStunted 2008 Stunted 2003
Cumulative percentage of the population, from poorest to richest
Line of equalityStunted 2010 Stunted 2005
Cumulative percentage of the population, from poorest to richest
Line of equalityStunted 2011 Stunted 2005
Cumulative percentage of the population, from poorest to richest
Line of equalityStunted 2006 Stunted 1996
Cumulative percentage of the population, from poorest to richest
Line of equalityStunted 2012 Stunted 2006
Cumulative percentage of the population, from poorest to richest
Line of equalityStunted 2012 Stunted 2007
Cumulative percentage of the population, from poorest to richest
Cum
ulat
ive
perc
enta
ge o
f ou
tcom
e va
riabl
e
Cum
ulat
ive
perc
enta
ge o
f ou
tcom
e va
riabl
e
Cum
ulat
ive
perc
enta
ge o
f ou
tcom
e va
riabl
e
Cum
ulat
ive
perc
enta
ge o
f ou
tcom
e va
riabl
e
Cum
ulat
ive
perc
enta
ge o
f ou
tcom
e va
riabl
e
Cum
ulat
ive
perc
enta
ge o
f ou
tcom
e va
riabl
e
Source: Economic Commission for Latin America and the Caribbean (ECLAC), on the basis of demographic and health surveys (DHS).
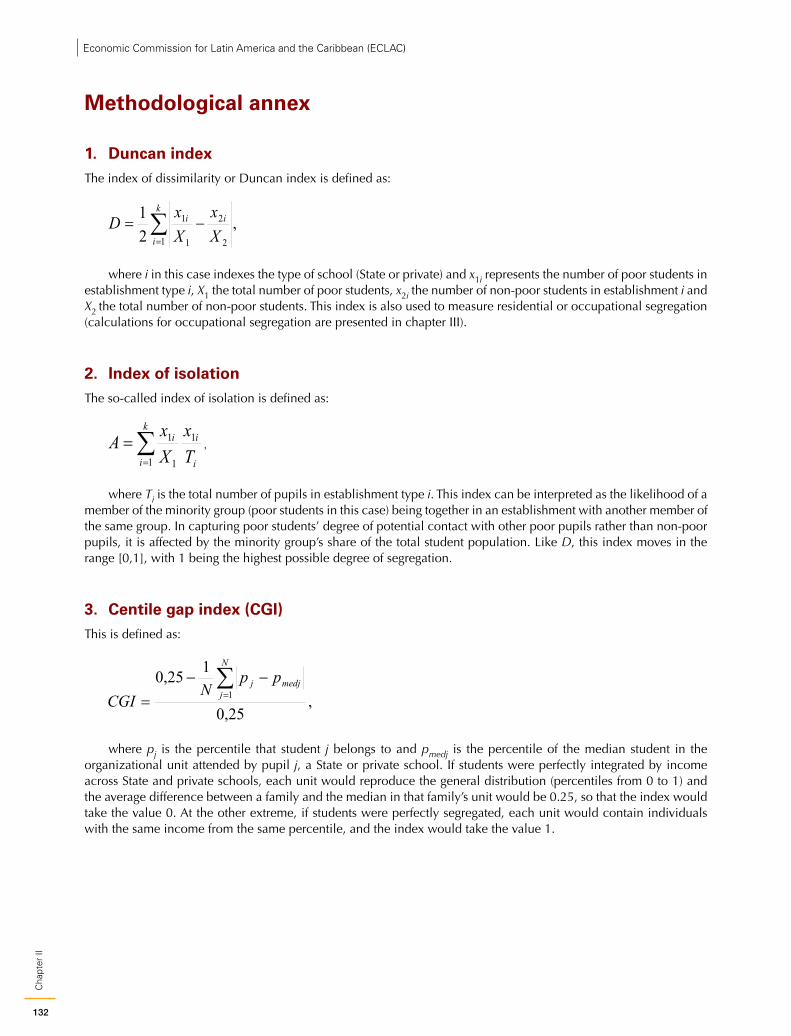
132
Cha
pter
IIEconomic Commission for Latin America and the Caribbean (ECLAC)
Methodological annex
1. Duncan indexThe index of dissimilarity or Duncan index is defined as:
where i in this case indexes the type of school (State or private) and x1i represents the number of poor students in establishment type i, X1 the total number of poor students, x2i the number of non-poor students in establishment i and X2 the total number of non-poor students. This index is also used to measure residential or occupational segregation (calculations for occupational segregation are presented in chapter III).
2. Index of isolationThe so-called index of isolation is defined as:
where Ti is the total number of pupils in establishment type i. This index can be interpreted as the likelihood of a member of the minority group (poor students in this case) being together in an establishment with another member of the same group. In capturing poor students’ degree of potential contact with other poor pupils rather than non-poor pupils, it is affected by the minority group’s share of the total student population. Like D, this index moves in the range [0,1], with 1 being the highest possible degree of segregation.
3. Centile gap index (CGI)This is defined as:
where pj is the percentile that student j belongs to and pmedj is the percentile of the median student in the organizational unit attended by pupil j, a State or private school. If students were perfectly integrated by income across State and private schools, each unit would reproduce the general distribution (percentiles from 0 to 1) and the average difference between a family and the median in that family’s unit would be 0.25, so that the index would take the value 0. At the other extreme, if students were perfectly segregated, each unit would contain individuals with the same income from the same percentile, and the index would take the value 1.

133
Cha
pter
II
Compacts for Equality: Towards a Sustainable Future
4. The Filmer-Pritchett asset index (2001)Filmer and Pritchett (2001) propose the construction of an asset index by means of a principal components analysis. This index is highly correlated with the level of household income. It can be represented by the formula below:
where
Aj is the durable goods index value for each of the households
i is the average for the asseti composing the index
si is the standard deviation for the asseti composing the index
xji is the average of asseti for all households in the sample
fi represents the weight determined by the first principal component of each asset in the index
In other words, the index is represented by the sum of the product between the weight of the asset in the index and the Z-score of households for ownership of each of the assets. The advantage of this method is that it can be used to determine the weight of each good in the indicator using statistical criteria that give the index internal consistency and robustness. It thus makes it possible to extract from a set of variables a straight-line combination that captures the most information common to the variables. The information on the weight of each good in the index is extracted from the first principal component yielded by the statistical analysis, which may be termed the scoring factor.

135
Cha
pter
III
Compacts for Equality: Towards a Sustainable Future
Chapter III
The world of work: The master key for equality
The world of work plays a fundamental role in creating and perpetuating the inequalities that characterize Latin American societies. Work provides the largest share of household income in the region and is the source of income distribution inequalities. But it is also at the root of other, equally important inequalities that go well beyond income and have to do with participation and access to occupations and jobs, where gender and ethnicity asymmetries are substantial. The world of work is also a cornerstone of the ECLAC view of equality, in which social relations and mutual recognition are paramount. Work mediates recognition among individuals and collective actors, such as when a person is recognized by the State upon being ensured a minimum wage or entering the social security system.
This world of work does not encompass just paid work, but unpaid work as well; decisions and opportunities for participation in these two areas are closely linked. A comprehensive look at inequality such as the one set out in these pages should cover inequalities in unpaid work, including domestic work, where relational aspects and reciprocal recognition play an important role.
This chapter presents a detailed analysis of trends in the world of work over the past decade. First, it provides an overview of recent trends in key labour market indicators (occupation, unemployment, income and productivity). It then examines the link between the labour market and the production structure, analysing the events of the past decade, followed by a look at the minimum wage and its potential impact on labour inequality based on new evidence for four countries of the region. Next, inequalities in the labour market are examined in greater detail from the standpoint of gender, ethnicity and access to social security. The chapter then takes up inequalities in unpaid work and ends with some concluding remarks. As in the previous chapter, it identifies progress made over the past decade but posts some warning signs too, highlighting persistent inequalities in structural components of the world of work.
A. Recent labour market trends: employment, income and productivity
The past decade in Latin America and the Caribbean has (except for 2009) been marked by sustained per capita GDP growth, as seen in very favourable trends across key labour market indicators. The unemployment rate in the countries of the region fell from 11.2% to 6.3% between 2002 and 2013 (see figure III.1); the overall employment rate went from 52% to 57% during the period.
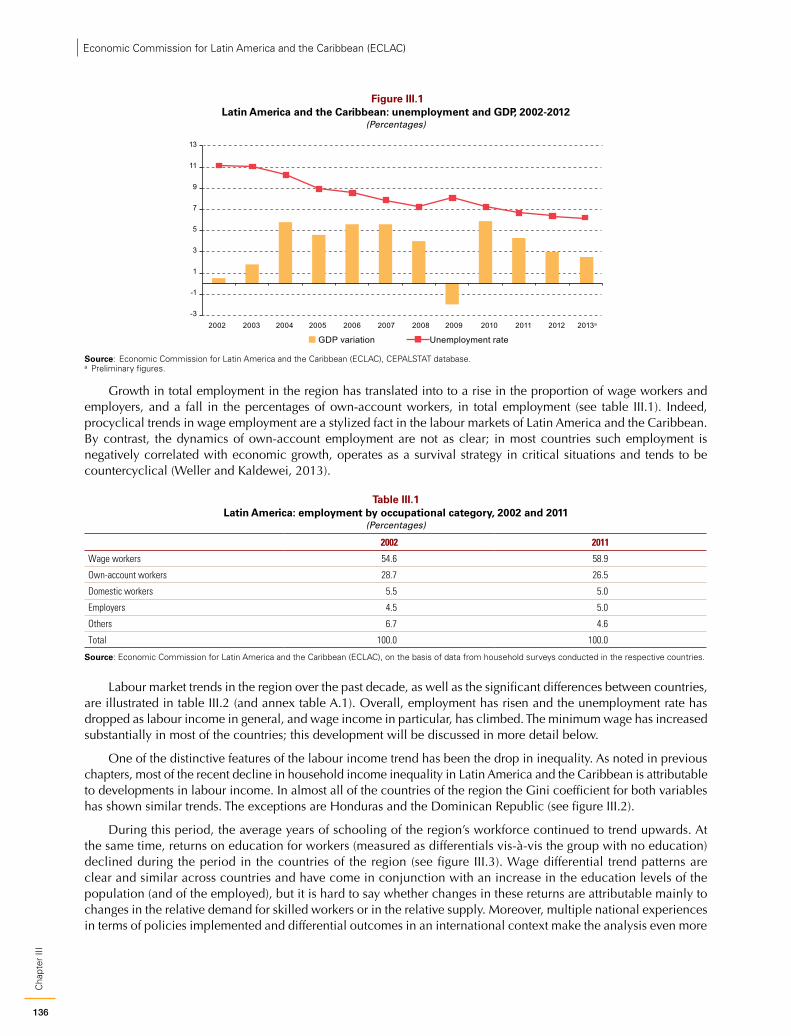
136
Cha
pter
III
Economic Commission for Latin America and the Caribbean (ECLAC)
Figure III.1 Latin America and the Caribbean: unemployment and GDP, 2002-2012
(Percentages)
-3
-1
1
3
5
7
9
11
13
2002 2003 2004 2005 2006 2007 2008 2009 2010 2011 2012 2013a
GDP variation Unemployment rate
Source: Economic Commission for Latin America and the Caribbean (ECLAC), CEPALSTAT database.a Preliminary figures.
Growth in total employment in the region has translated into to a rise in the proportion of wage workers and employers, and a fall in the percentages of own-account workers, in total employment (see table III.1). Indeed, procyclical trends in wage employment are a stylized fact in the labour markets of Latin America and the Caribbean. By contrast, the dynamics of own-account employment are not as clear; in most countries such employment is negatively correlated with economic growth, operates as a survival strategy in critical situations and tends to be countercyclical (Weller and Kaldewei, 2013).
Table III.1 Latin America: employment by occupational category, 2002 and 2011
(Percentages)
2002 2011
Wage workers 54.6 58.9
Own-account workers 28.7 26.5
Domestic workers 5.5 5.0
Employers 4.5 5.0
Others 6.7 4.6
Total 100.0 100.0
Source: Economic Commission for Latin America and the Caribbean (ECLAC), on the basis of data from household surveys conducted in the respective countries.
Labour market trends in the region over the past decade, as well as the significant differences between countries, are illustrated in table III.2 (and annex table A.1). Overall, employment has risen and the unemployment rate has dropped as labour income in general, and wage income in particular, has climbed. The minimum wage has increased substantially in most of the countries; this development will be discussed in more detail below.
One of the distinctive features of the labour income trend has been the drop in inequality. As noted in previous chapters, most of the recent decline in household income inequality in Latin America and the Caribbean is attributable to developments in labour income. In almost all of the countries of the region the Gini coefficient for both variables has shown similar trends. The exceptions are Honduras and the Dominican Republic (see figure III.2).
During this period, the average years of schooling of the region’s workforce continued to trend upwards. At the same time, returns on education for workers (measured as differentials vis-à-vis the group with no education) declined during the period in the countries of the region (see figure III.3). Wage differential trend patterns are clear and similar across countries and have come in conjunction with an increase in the education levels of the population (and of the employed), but it is hard to say whether changes in these returns are attributable mainly to changes in the relative demand for skilled workers or in the relative supply. Moreover, multiple national experiences in terms of policies implemented and differential outcomes in an international context make the analysis even more
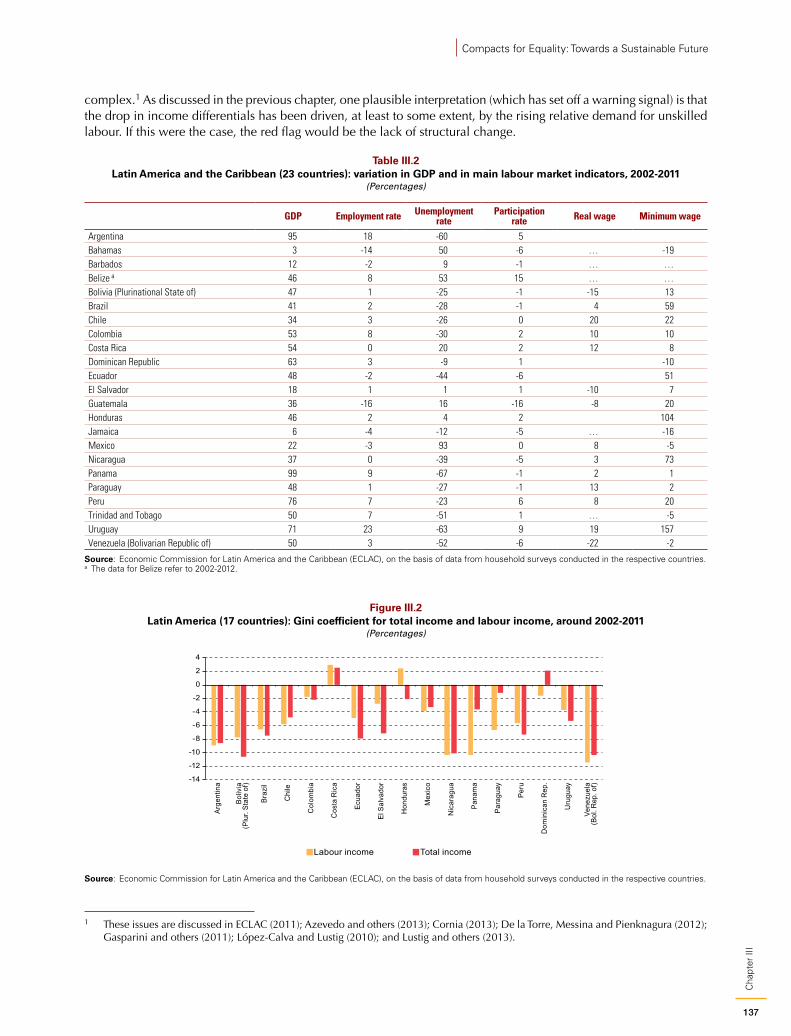
137
Cha
pter
III
Compacts for Equality: Towards a Sustainable Future
complex.1 As discussed in the previous chapter, one plausible interpretation (which has set off a warning signal) is that the drop in income differentials has been driven, at least to some extent, by the rising relative demand for unskilled labour. If this were the case, the red flag would be the lack of structural change.
Table III.2 Latin America and the Caribbean (23 countries): variation in GDP and in main labour market indicators, 2002-2011
(Percentages)
GDP Employment rate Unemployment rate
Participation rate Real wage Minimum wage
Argentina 95 18 -60 5Bahamas 3 -14 50 -6 … -19Barbados 12 -2 9 -1 … …Belize a 46 8 53 15 … …Bolivia (Plurinational State of) 47 1 -25 -1 -15 13Brazil 41 2 -28 -1 4 59Chile 34 3 -26 0 20 22Colombia 53 8 -30 2 10 10Costa Rica 54 0 20 2 12 8Dominican Republic 63 3 -9 1 -10Ecuador 48 -2 -44 -6 51El Salvador 18 1 1 1 -10 7Guatemala 36 -16 16 -16 -8 20Honduras 46 2 4 2 104Jamaica 6 -4 -12 -5 … -16Mexico 22 -3 93 0 8 -5Nicaragua 37 0 -39 -5 3 73Panama 99 9 -67 -1 2 1Paraguay 48 1 -27 -1 13 2Peru 76 7 -23 6 8 20Trinidad and Tobago 50 7 -51 1 … -5Uruguay 71 23 -63 9 19 157Venezuela (Bolivarian Republic of) 50 3 -52 -6 -22 -2
Source: Economic Commission for Latin America and the Caribbean (ECLAC), on the basis of data from household surveys conducted in the respective countries.a The data for Belize refer to 2002-2012.
Figure III.2 Latin America (17 countries): Gini coefficient for total income and labour income, around 2002-2011
(Percentages)
-14
-12
-10
-8
-6
-4
-2
0
2
4
Arg
entin
a
Boliv
ia(P
lur.
Stat
e of
)
Braz
il
Chi
le
Col
ombi
a
Cos
ta R
ica
Ecua
dor
El S
alva
dor
Hon
dura
s
Mex
ico
Nic
arag
ua
Pana
ma
Para
guay
Peru
Dom
inic
an R
ep.
Uru
guay
Vene
zuel
a(B
ol. R
ep. o
f)
Labour income Total income
Source: Economic Commission for Latin America and the Caribbean (ECLAC), on the basis of data from household surveys conducted in the respective countries.
1 These issues are discussed in ECLAC (2011); Azevedo and others (2013); Cornia (2013); De la Torre, Messina and Pienknagura (2012); Gasparini and others (2011); López-Calva and Lustig (2010); and Lustig and others (2013).
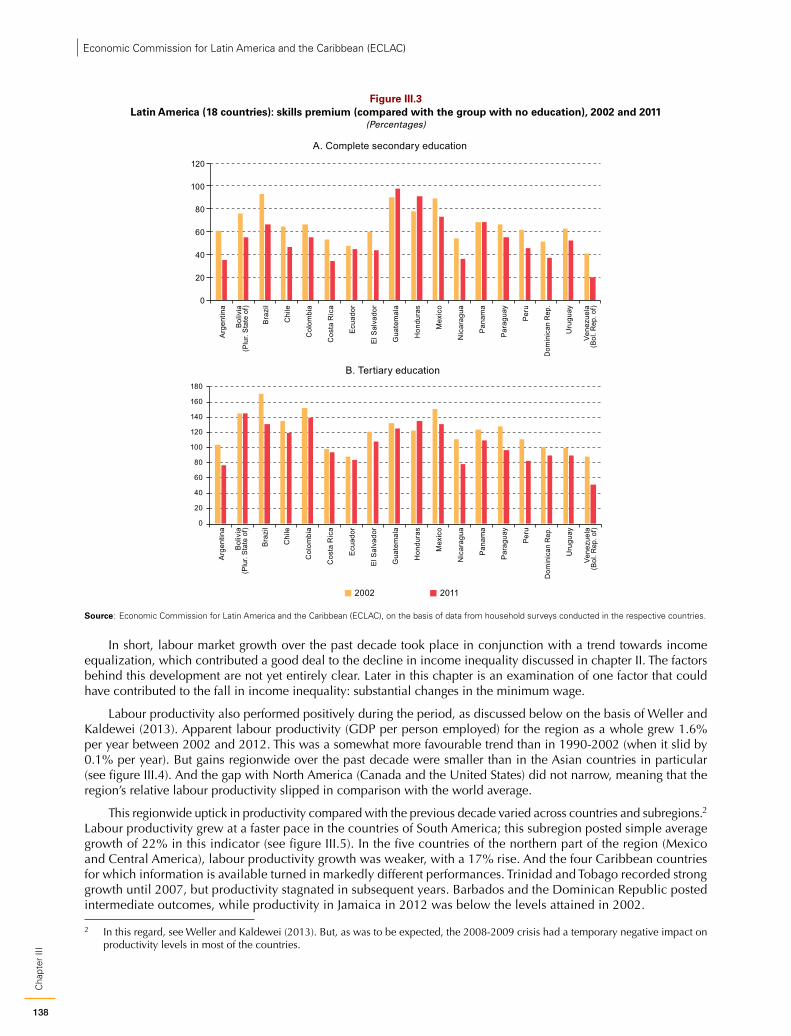
138
Cha
pter
III
Economic Commission for Latin America and the Caribbean (ECLAC)
Figure III.3 Latin America (18 countries): skills premium (compared with the group with no education), 2002 and 2011
(Percentages)
A. Complete secondary education
0
20
40
60
80
100
120
Arg
entin
a
Bol
ivia
(Plu
r. St
ate
of)
Bra
zil
Chi
le
Col
ombi
a
Cos
ta R
ica
Ecu
ador
El S
alva
dor
Gua
tem
ala
Hon
dura
s
Mex
ico
Nic
arag
ua
Pan
ama
Par
agua
y
Per
u
Dom
inic
an R
ep.
Uru
guay
Vene
zuel
a(B
ol. R
ep. o
f)2002 2011
B. Tertiary education
0
20
40
60
80
100
120
140
160
180
Arg
entin
a
Bol
ivia
(Plu
r. St
ate
of)
Bra
zil
Chi
le
Col
ombi
a
Cos
ta R
ica
Ecu
ador
El S
alva
dor
Gua
tem
ala
Hon
dura
s
Mex
ico
Nic
arag
ua
Pan
ama
Par
agua
y
Per
u
Dom
inic
an R
ep.
Uru
guay
Vene
zuel
a(B
ol. R
ep. o
f)
Source: Economic Commission for Latin America and the Caribbean (ECLAC), on the basis of data from household surveys conducted in the respective countries.
In short, labour market growth over the past decade took place in conjunction with a trend towards income equalization, which contributed a good deal to the decline in income inequality discussed in chapter II. The factors behind this development are not yet entirely clear. Later in this chapter is an examination of one factor that could have contributed to the fall in income inequality: substantial changes in the minimum wage.
Labour productivity also performed positively during the period, as discussed below on the basis of Weller and Kaldewei (2013). Apparent labour productivity (GDP per person employed) for the region as a whole grew 1.6% per year between 2002 and 2012. This was a somewhat more favourable trend than in 1990-2002 (when it slid by 0.1% per year). But gains regionwide over the past decade were smaller than in the Asian countries in particular (see figure III.4). And the gap with North America (Canada and the United States) did not narrow, meaning that the region’s relative labour productivity slipped in comparison with the world average.
This regionwide uptick in productivity compared with the previous decade varied across countries and subregions.2 Labour productivity grew at a faster pace in the countries of South America; this subregion posted simple average growth of 22% in this indicator (see figure III.5). In the five countries of the northern part of the region (Mexico and Central America), labour productivity growth was weaker, with a 17% rise. And the four Caribbean countries for which information is available turned in markedly different performances. Trinidad and Tobago recorded strong growth until 2007, but productivity stagnated in subsequent years. Barbados and the Dominican Republic posted intermediate outcomes, while productivity in Jamaica in 2012 was below the levels attained in 2002.
2 In this regard, see Weller and Kaldewei (2013). But, as was to be expected, the 2008-2009 crisis had a temporary negative impact on productivity levels in most of the countries.

139
Cha
pter
III
Compacts for Equality: Towards a Sustainable Future
Figure III.4 Latin America and the Caribbean and other regions: GDP per person employed by region, 1991-2012a
(Dollars at constant 2000 prices)
0
10 000
20 000
30 000
40 000
50 000
60 000
70 000
80 000
0
5 000
10 000
15 000
20 000
25 000
1991
1992
1993
1994
1995
1996
1997
1998
1999
2000
2001
2002
2003
2004
2005
2006
2007
2008
2009
2010
2011
2012
World Latin America and the Caribbean North AfricaSub-Saharan Africa
South-East Asia and the Pacific East Asia Developed economies and European Union
Source: Economic Commission for Latin America and the Caribbean (ECLAC), on the basis of information from the World Bank and International Labour Organization (ILO), Key Indicators of the Labour Market (KILM).
a The right scale applies to the developed economies and the European Union, and the left applies to all the others.
Figure III.5 Latin America and the Caribbean (selected countries): GDP per person employed, 2000-2012a
(Index: 2002=100)
90
100
110
120
130
140
150
2000 2001 2002 2003 2004 2005 2006 2007 2008 2009 2010 2011 2012
Brazil Chile Colombia EcuadorPeru Venezuela (Bol. Rep. of) South America (simple average)
A. South America
90
100
110
120
130
140
150
2000 2001 2002 2003 2004 2005 2006 2007 2008 2009 2010 2011 2012
Costa Rica El Salvador HondurasMexico Panama Mexico and Central America (simple average)
B. Central America and Mexico
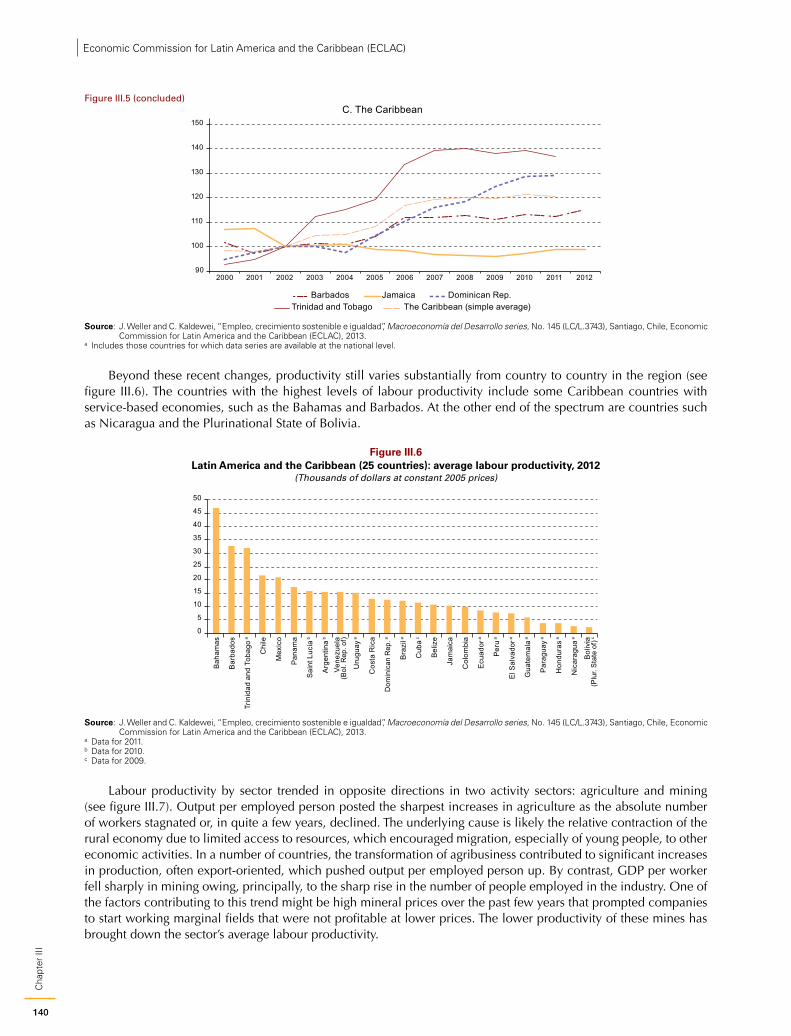
140
Cha
pter
III
Economic Commission for Latin America and the Caribbean (ECLAC)
C. The Caribbean
90
100
110
120
130
140
150
2000 2001 2002 2003 2004 2005 2006 2007 2008 2009 2010 2011 2012
Barbados Jamaica Dominican Rep.Trinidad and Tobago The Caribbean (simple average)
Source: J. Weller and C. Kaldewei, “Empleo, crecimiento sostenible e igualdad”, Macroeconomía del Desarrollo series, No. 145 (LC/L.3743), Santiago, Chile, Economic Commission for Latin America and the Caribbean (ECLAC), 2013.
a Includes those countries for which data series are available at the national level.
Beyond these recent changes, productivity still varies substantially from country to country in the region (see figure III.6). The countries with the highest levels of labour productivity include some Caribbean countries with service-based economies, such as the Bahamas and Barbados. At the other end of the spectrum are countries such as Nicaragua and the Plurinational State of Bolivia.
Figure III.6 Latin America and the Caribbean (25 countries): average labour productivity, 2012
(Thousands of dollars at constant 2005 prices)
0
5
10
15
20
25
30
35
40
45
50
Bah
amas
Bar
bado
s
Trin
idad
and
Tob
ago a
Chi
le
Mex
ico
Pan
ama
Sai
nt L
ucia
b
Arg
entin
a b
Vene
zuel
a( B
ol. R
ep. o
f)
Uru
guay
a
Cos
ta R
ica
Dom
inic
an R
ep. a
Bra
zil a
Cub
a c
Bel
ize
Jam
aica
Col
ombi
a
Ecu
ador
a
Per
u a
El S
alva
dor a
Gua
tem
ala a
Par
agua
y a
Hon
dura
s a
Nic
arag
ua a
Bol
ivia
(Plu
r. St
ate
of) c
Source: J. Weller and C. Kaldewei, “Empleo, crecimiento sostenible e igualdad”, Macroeconomía del Desarrollo series, No. 145 (LC/L.3743), Santiago, Chile, Economic Commission for Latin America and the Caribbean (ECLAC), 2013.
a Data for 2011. b Data for 2010.c Data for 2009.
Labour productivity by sector trended in opposite directions in two activity sectors: agriculture and mining (see figure III.7). Output per employed person posted the sharpest increases in agriculture as the absolute number of workers stagnated or, in quite a few years, declined. The underlying cause is likely the relative contraction of the rural economy due to limited access to resources, which encouraged migration, especially of young people, to other economic activities. In a number of countries, the transformation of agribusiness contributed to significant increases in production, often export-oriented, which pushed output per employed person up. By contrast, GDP per worker fell sharply in mining owing, principally, to the sharp rise in the number of people employed in the industry. One of the factors contributing to this trend might be high mineral prices over the past few years that prompted companies to start working marginal fields that were not profitable at lower prices. The lower productivity of these mines has brought down the sector’s average labour productivity.
Figure III.5 (concluded)
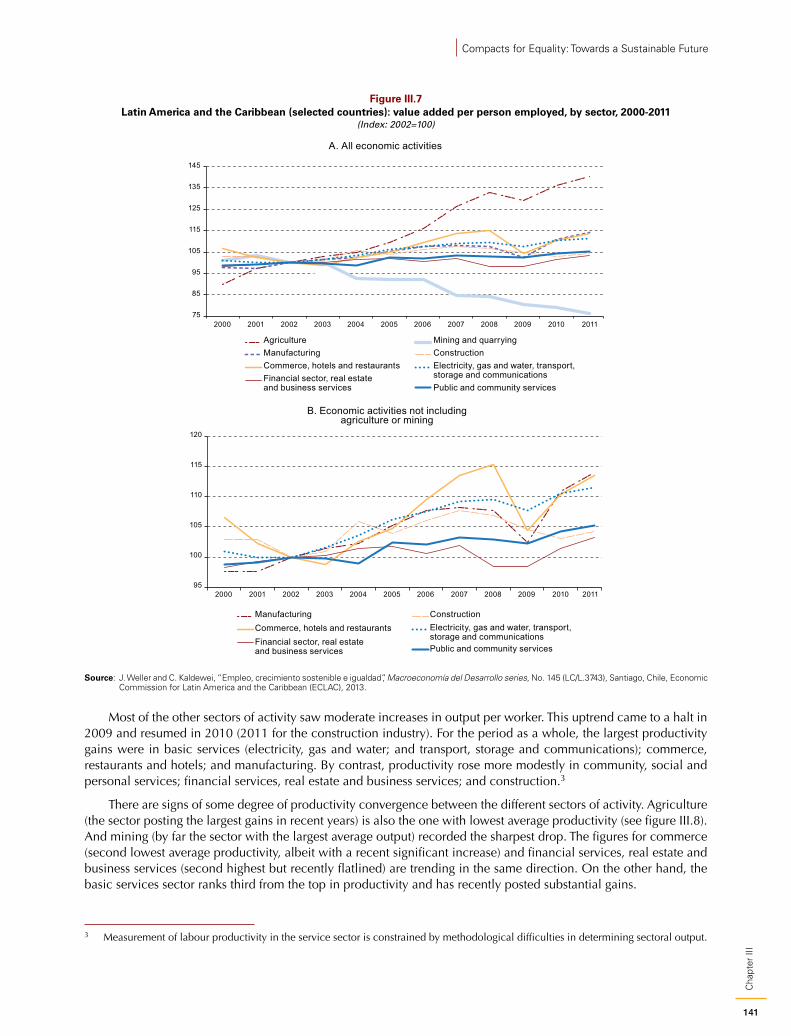
141
Cha
pter
III
Compacts for Equality: Towards a Sustainable Future
Figure III.7 Latin America and the Caribbean (selected countries): value added per person employed, by sector, 2000-2011
(Index: 2002=100)
75
85
95
105
115
125
135
145
2000 2001 2002 2003 2004 2005 2006 2007 2008 2009 2010 2011
AgricultureManufacturingCommerce, hotels and restaurantsFinancial sector, real estateand business services
Mining and quarryingConstructionElectricity, gas and water, transport,storage and communicationsPublic and community services
A. All economic activities
95
100
105
110
115
120
2000 2001 2002 2003 2004 2005 2006 2007 2008 2009 2010 2011
ManufacturingCommerce, hotels and restaurantsFinancial sector, real estateand business services
ConstructionElectricity, gas and water, transport,storage and communicationsPublic and community services
B. Economic activities not includingagriculture or mining
Source: J. Weller and C. Kaldewei, “Empleo, crecimiento sostenible e igualdad”, Macroeconomía del Desarrollo series, No. 145 (LC/L.3743), Santiago, Chile, Economic Commission for Latin America and the Caribbean (ECLAC), 2013.
Most of the other sectors of activity saw moderate increases in output per worker. This uptrend came to a halt in 2009 and resumed in 2010 (2011 for the construction industry). For the period as a whole, the largest productivity gains were in basic services (electricity, gas and water; and transport, storage and communications); commerce, restaurants and hotels; and manufacturing. By contrast, productivity rose more modestly in community, social and personal services; financial services, real estate and business services; and construction.3
There are signs of some degree of productivity convergence between the different sectors of activity. Agriculture (the sector posting the largest gains in recent years) is also the one with lowest average productivity (see figure III.8). And mining (by far the sector with the largest average output) recorded the sharpest drop. The figures for commerce (second lowest average productivity, albeit with a recent significant increase) and financial services, real estate and business services (second highest but recently flatlined) are trending in the same direction. On the other hand, the basic services sector ranks third from the top in productivity and has recently posted substantial gains.
3 Measurement of labour productivity in the service sector is constrained by methodological difficulties in determining sectoral output.
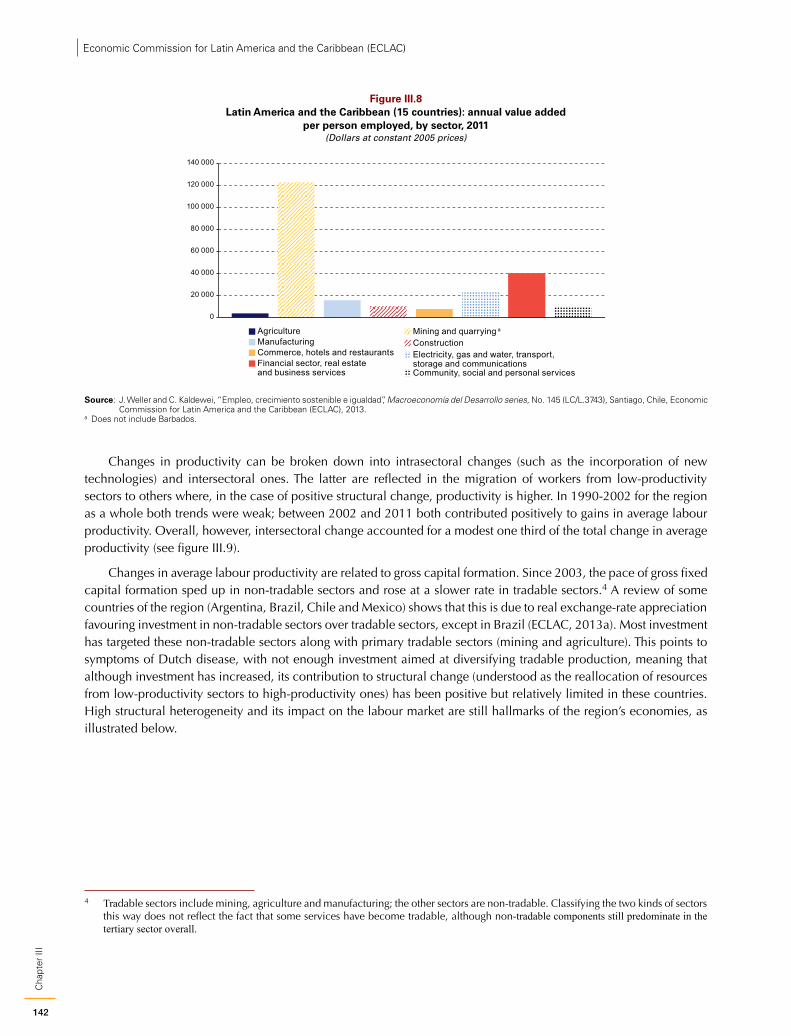
142
Cha
pter
III
Economic Commission for Latin America and the Caribbean (ECLAC)
Figure III.8 Latin America and the Caribbean (15 countries): annual value added
per person employed, by sector, 2011(Dollars at constant 2005 prices)
0
20 000
40 000
60 000
80 000
100 000
120 000
140 000
Agriculture Mining and quarrying a Manufacturing ConstructionCommerce, hotels and restaurants Electricity, gas and water, transport,
storage and communicationsFinancial sector, real estate and business services Community, social and personal services
Source: J. Weller and C. Kaldewei, “Empleo, crecimiento sostenible e igualdad”, Macroeconomía del Desarrollo series, No. 145 (LC/L.3743), Santiago, Chile, Economic Commission for Latin America and the Caribbean (ECLAC), 2013.
a Does not include Barbados.
Changes in productivity can be broken down into intrasectoral changes (such as the incorporation of new technologies) and intersectoral ones. The latter are reflected in the migration of workers from low-productivity sectors to others where, in the case of positive structural change, productivity is higher. In 1990-2002 for the region as a whole both trends were weak; between 2002 and 2011 both contributed positively to gains in average labour productivity. Overall, however, intersectoral change accounted for a modest one third of the total change in average productivity (see figure III.9).
Changes in average labour productivity are related to gross capital formation. Since 2003, the pace of gross fixed capital formation sped up in non-tradable sectors and rose at a slower rate in tradable sectors.4 A review of some countries of the region (Argentina, Brazil, Chile and Mexico) shows that this is due to real exchange-rate appreciation favouring investment in non-tradable sectors over tradable sectors, except in Brazil (ECLAC, 2013a). Most investment has targeted these non-tradable sectors along with primary tradable sectors (mining and agriculture). This points to symptoms of Dutch disease, with not enough investment aimed at diversifying tradable production, meaning that although investment has increased, its contribution to structural change (understood as the reallocation of resources from low-productivity sectors to high-productivity ones) has been positive but relatively limited in these countries. High structural heterogeneity and its impact on the labour market are still hallmarks of the region’s economies, as illustrated below.
4 Tradable sectors include mining, agriculture and manufacturing; the other sectors are non-tradable. Classifying the two kinds of sectors this way does not reflect the fact that some services have become tradable, although non-tradable components still predominate in the tertiary sector overall.
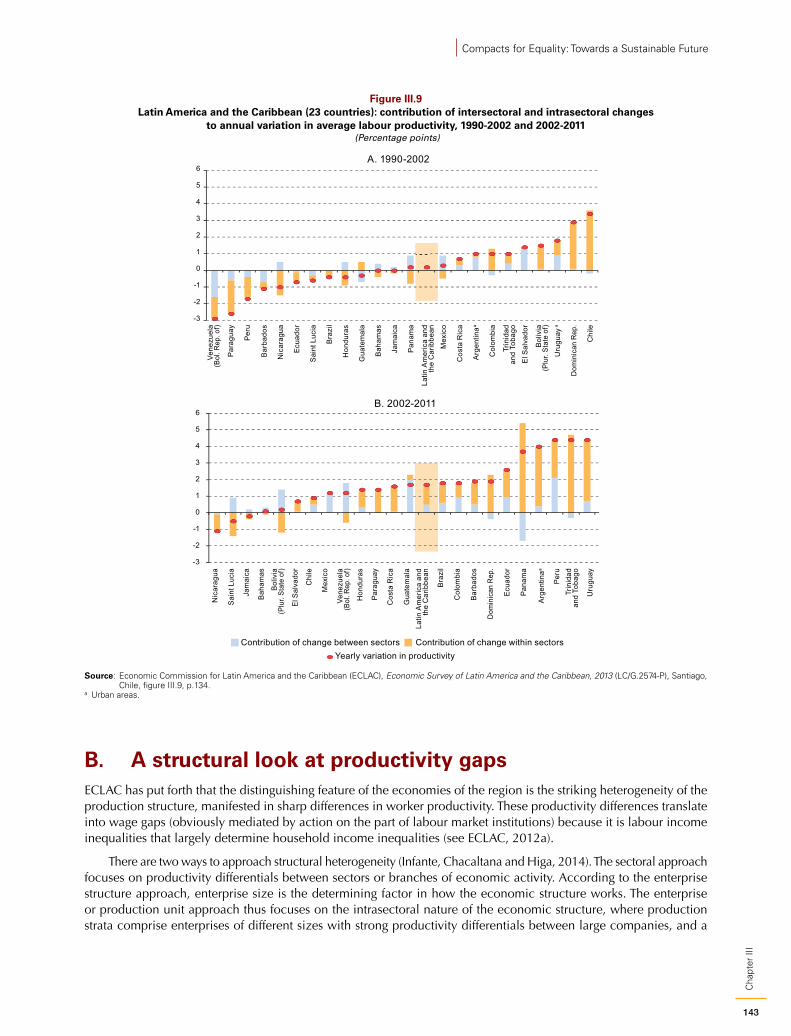
143
Cha
pter
III
Compacts for Equality: Towards a Sustainable Future
Figure III.9 Latin America and the Caribbean (23 countries): contribution of intersectoral and intrasectoral changes
to annual variation in average labour productivity, 1990-2002 and 2002-2011 (Percentage points)
-3
-2
-1
0
1
2
3
4
5
6
Vene
zuel
a(B
ol. R
ep. o
f)
Par
agua
y
Bar
bado
s
Nic
arag
ua
Ecu
ador
Sai
nt L
ucia
Bra
zil
Hon
dura
s
Gua
tem
ala
Bah
amas
Jam
aica
Pan
ama
Latin
Am
eric
a an
dth
e C
arib
bean
Mex
ico
Cos
ta R
ica
Arg
entin
aa
Col
ombi
a
Trin
idad
and
Tob
ago
El S
alva
dor
Bol
ivia
(Plu
r. St
ate
of)
Uru
guay
a
Dom
inic
an R
ep.
Chi
le
A. 1990-2002
Per
u
Contribution of change between sectors Contribution of change within sectorsYearly variation in productivity
Peru
Nic
arag
ua
Sai
nt L
ucia
Jam
aica
Bah
amas
Bol
ivia
(Plu
r. St
ate
of)
El S
alva
dor
Chi
le
Mex
ico
Vene
zuel
a(B
ol. R
ep. o
f)
Hon
dura
s
Para
guay
Cos
ta R
ica
Gua
tem
ala
Latin
Am
eric
a an
dth
e C
arib
bean
Bra
zil
Col
ombi
a
Bar
bado
s
Dom
inic
an R
ep.
Ecua
dor
Pana
ma
Arg
entin
aa
Trin
idad
and
Tob
ago
Uru
guay
-3
-2
-1
0
1
2
3
4
5
6B. 2002-2011
Source: Economic Commission for Latin America and the Caribbean (ECLAC), Economic Survey of Latin America and the Caribbean, 2013 (LC/G.2574-P), Santiago, Chile, figure III.9, p.134.
a Urban areas.
B. A structural look at productivity gapsECLAC has put forth that the distinguishing feature of the economies of the region is the striking heterogeneity of the production structure, manifested in sharp differences in worker productivity. These productivity differences translate into wage gaps (obviously mediated by action on the part of labour market institutions) because it is labour income inequalities that largely determine household income inequalities (see ECLAC, 2012a).
There are two ways to approach structural heterogeneity (Infante, Chacaltana and Higa, 2014). The sectoral approach focuses on productivity differentials between sectors or branches of economic activity. According to the enterprise structure approach, enterprise size is the determining factor in how the economic structure works. The enterprise or production unit approach thus focuses on the intrasectoral nature of the economic structure, where production strata comprise enterprises of different sizes with strong productivity differentials between large companies, and a
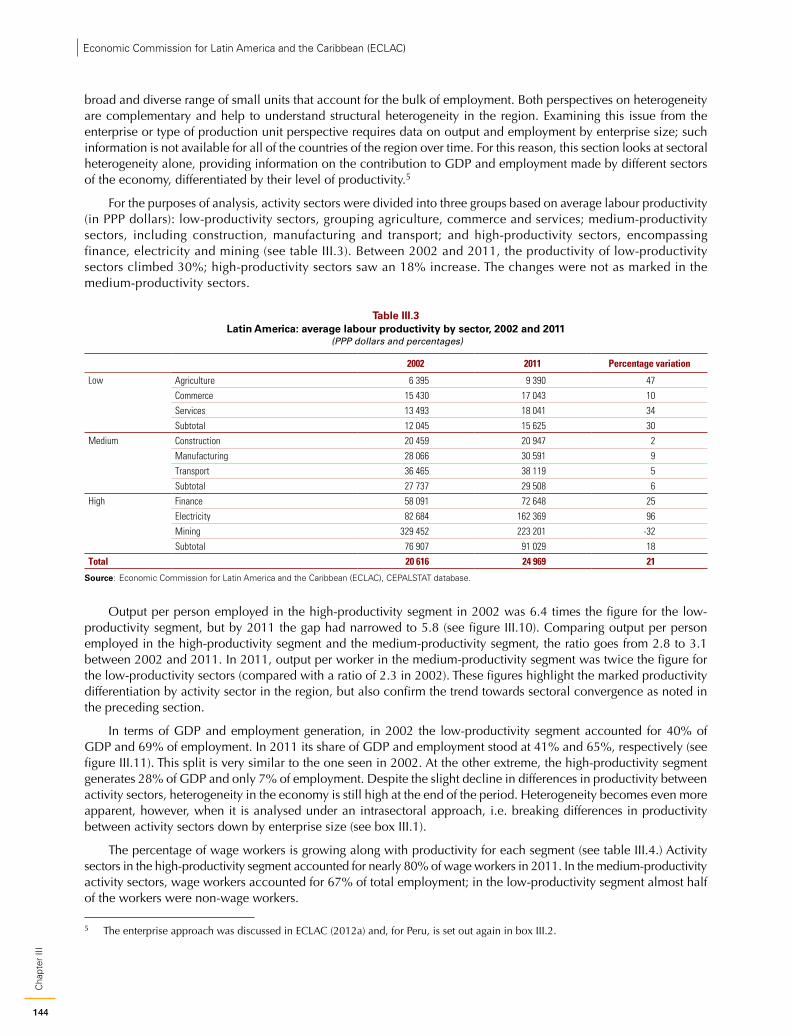
144
Cha
pter
III
Economic Commission for Latin America and the Caribbean (ECLAC)
broad and diverse range of small units that account for the bulk of employment. Both perspectives on heterogeneity are complementary and help to understand structural heterogeneity in the region. Examining this issue from the enterprise or type of production unit perspective requires data on output and employment by enterprise size; such information is not available for all of the countries of the region over time. For this reason, this section looks at sectoral heterogeneity alone, providing information on the contribution to GDP and employment made by different sectors of the economy, differentiated by their level of productivity.5
For the purposes of analysis, activity sectors were divided into three groups based on average labour productivity (in PPP dollars): low-productivity sectors, grouping agriculture, commerce and services; medium-productivity sectors, including construction, manufacturing and transport; and high-productivity sectors, encompassing finance, electricity and mining (see table III.3). Between 2002 and 2011, the productivity of low-productivity sectors climbed 30%; high-productivity sectors saw an 18% increase. The changes were not as marked in the medium-productivity sectors.
Table III.3 Latin America: average labour productivity by sector, 2002 and 2011
(PPP dollars and percentages)
2002 2011 Percentage variation
Low Agriculture 6 395 9 390 47
Commerce 15 430 17 043 10
Services 13 493 18 041 34
Subtotal 12 045 15 625 30Medium Construction 20 459 20 947 2
Manufacturing 28 066 30 591 9
Transport 36 465 38 119 5
Subtotal 27 737 29 508 6High Finance 58 091 72 648 25
Electricity 82 684 162 369 96
Mining 329 452 223 201 -32
Subtotal 76 907 91 029 18
Total 20 616 24 969 21
Source: Economic Commission for Latin America and the Caribbean (ECLAC), CEPALSTAT database.
Output per person employed in the high-productivity segment in 2002 was 6.4 times the figure for the low-productivity segment, but by 2011 the gap had narrowed to 5.8 (see figure III.10). Comparing output per person employed in the high-productivity segment and the medium-productivity segment, the ratio goes from 2.8 to 3.1 between 2002 and 2011. In 2011, output per worker in the medium-productivity segment was twice the figure for the low-productivity sectors (compared with a ratio of 2.3 in 2002). These figures highlight the marked productivity differentiation by activity sector in the region, but also confirm the trend towards sectoral convergence as noted in the preceding section.
In terms of GDP and employment generation, in 2002 the low-productivity segment accounted for 40% of GDP and 69% of employment. In 2011 its share of GDP and employment stood at 41% and 65%, respectively (see figure III.11). This split is very similar to the one seen in 2002. At the other extreme, the high-productivity segment generates 28% of GDP and only 7% of employment. Despite the slight decline in differences in productivity between activity sectors, heterogeneity in the economy is still high at the end of the period. Heterogeneity becomes even more apparent, however, when it is analysed under an intrasectoral approach, i.e. breaking differences in productivity between activity sectors down by enterprise size (see box III.1).
The percentage of wage workers is growing along with productivity for each segment (see table III.4.) Activity sectors in the high-productivity segment accounted for nearly 80% of wage workers in 2011. In the medium-productivity activity sectors, wage workers accounted for 67% of total employment; in the low-productivity segment almost half of the workers were non-wage workers.
5 The enterprise approach was discussed in ECLAC (2012a) and, for Peru, is set out again in box III.2.
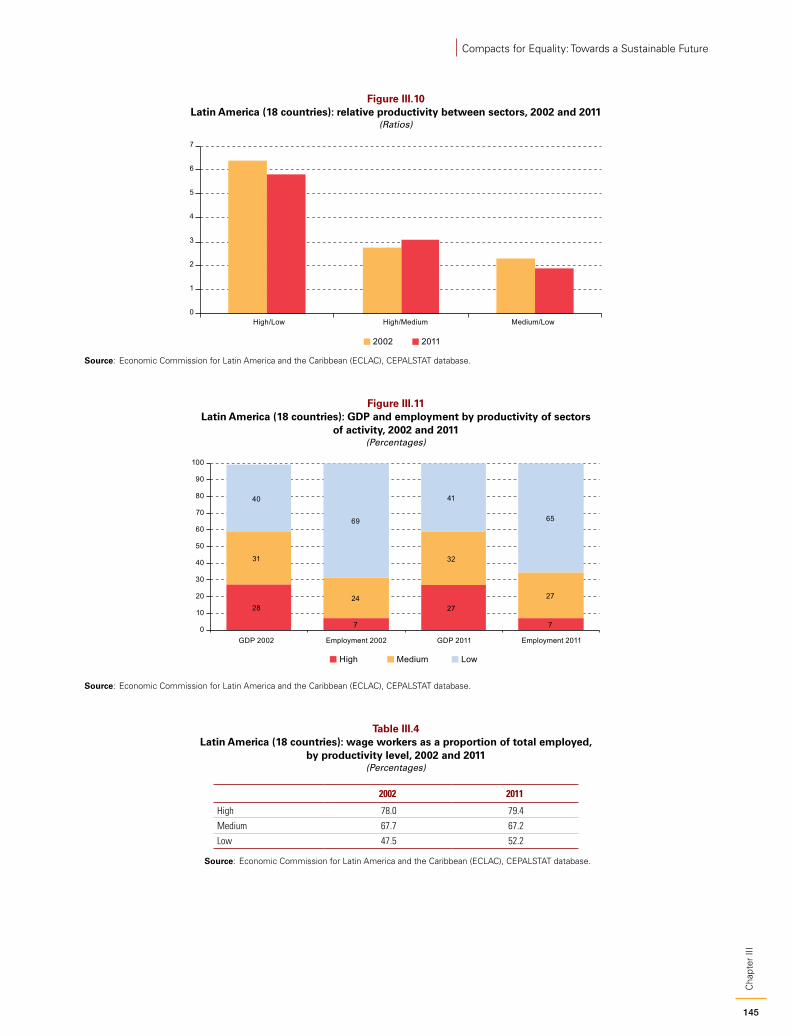
145
Cha
pter
III
Compacts for Equality: Towards a Sustainable Future
Figure III.10 Latin America (18 countries): relative productivity between sectors, 2002 and 2011
(Ratios)
0
1
2
3
4
5
6
7
High/Low High/Medium Medium/Low
2002 2011
Source: Economic Commission for Latin America and the Caribbean (ECLAC), CEPALSTAT database.
Figure III.11 Latin America (18 countries): GDP and employment by productivity of sectors
of activity, 2002 and 2011(Percentages)
28
7
27
7
31
24
32
27
40
69
41
65
0
10
20
30
40
50
60
70
80
90
100
GDP 2002 Employment 2002 GDP 2011 Employment 2011
High Medium Low
Source: Economic Commission for Latin America and the Caribbean (ECLAC), CEPALSTAT database.
Table III.4 Latin America (18 countries): wage workers as a proportion of total employed,
by productivity level, 2002 and 2011(Percentages)
2002 2011
High 78.0 79.4
Medium 67.7 67.2
Low 47.5 52.2
Source: Economic Commission for Latin America and the Caribbean (ECLAC), CEPALSTAT database.
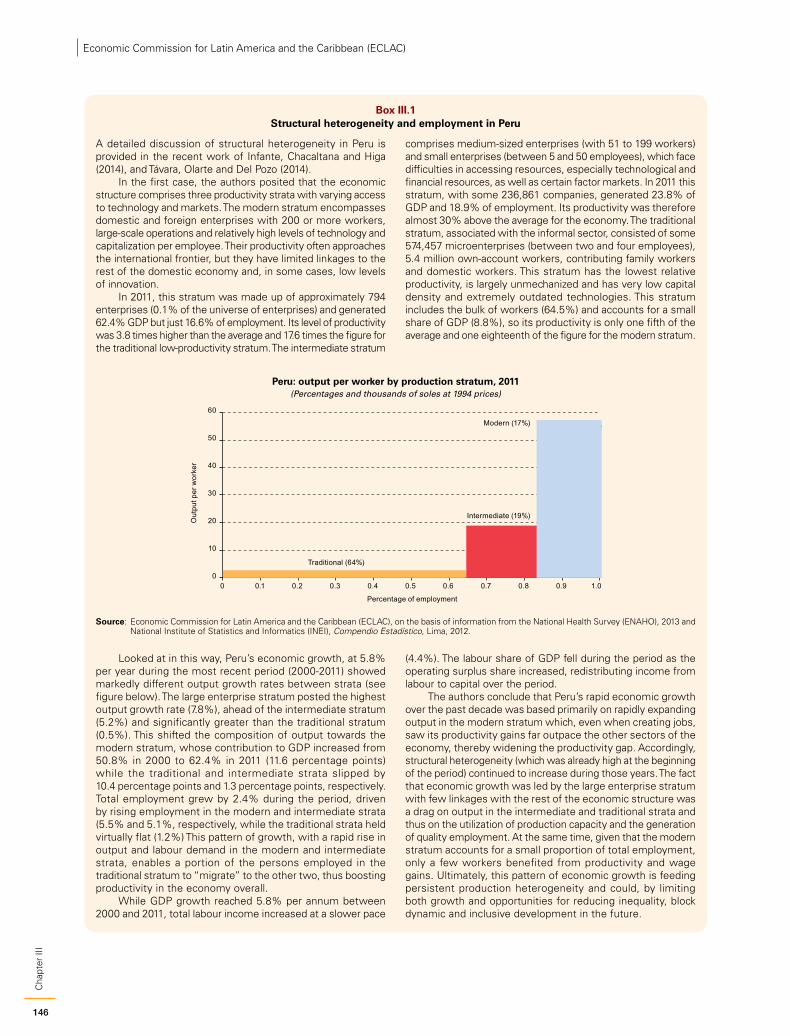
146
Cha
pter
III
Economic Commission for Latin America and the Caribbean (ECLAC)
Box III.1 Structural heterogeneity and employment in Peru
A detailed discussion of structural heterogeneity in Peru is provided in the recent work of Infante, Chacaltana and Higa (2014), and Távara, Olarte and Del Pozo (2014).
In the first case, the authors posited that the economic structure comprises three productivity strata with varying access to technology and markets. The modern stratum encompasses domestic and foreign enterprises with 200 or more workers, large-scale operations and relatively high levels of technology and capitalization per employee. Their productivity often approaches the international frontier, but they have limited linkages to the rest of the domestic economy and, in some cases, low levels of innovation.
In 2011, this stratum was made up of approximately 794 enterprises (0.1% of the universe of enterprises) and generated 62.4% GDP but just 16.6% of employment. Its level of productivity was 3.8 times higher than the average and 17.6 times the figure for the traditional low-productivity stratum. The intermediate stratum
comprises medium-sized enterprises (with 51 to 199 workers) and small enterprises (between 5 and 50 employees), which face difficulties in accessing resources, especially technological and financial resources, as well as certain factor markets. In 2011 this stratum, with some 236,861 companies, generated 23.8% of GDP and 18.9% of employment. Its productivity was therefore almost 30% above the average for the economy. The traditional stratum, associated with the informal sector, consisted of some 574,457 microenterprises (between two and four employees), 5.4 million own-account workers, contributing family workers and domestic workers. This stratum has the lowest relative productivity, is largely unmechanized and has very low capital density and extremely outdated technologies. This stratum includes the bulk of workers (64.5%) and accounts for a small share of GDP (8.8%), so its productivity is only one fifth of the average and one eighteenth of the figure for the modern stratum.
Peru: output per worker by production stratum, 2011(Percentages and thousands of soles at 1994 prices)
0
10
20
30
40
50
60
0 0.1 0.2 0.3 0.4 0.5 0.6 0.7 0.8 0.9 1.0
Out
put p
er w
orke
r
Percentage of employment
Intermediate (19%)
Traditional (64%)
Modern (17%)
Source: Economic Commission for Latin America and the Caribbean (ECLAC), on the basis of information from the National Health Survey (ENAHO), 2013 and National Institute of Statistics and Informatics (INEI), Compendio Estadístico, Lima, 2012.
Looked at in this way, Peru’s economic growth, at 5.8% per year during the most recent period (2000-2011) showed markedly different output growth rates between strata (see figure below). The large enterprise stratum posted the highest output growth rate (7.8%), ahead of the intermediate stratum (5.2%) and significantly greater than the traditional stratum (0.5%). This shifted the composition of output towards the modern stratum, whose contribution to GDP increased from 50.8% in 2000 to 62.4% in 2011 (11.6 percentage points) while the traditional and intermediate strata slipped by 10.4 percentage points and 1.3 percentage points, respectively. Total employment grew by 2.4% during the period, driven by rising employment in the modern and intermediate strata (5.5% and 5.1%, respectively, while the traditional strata held virtually flat (1.2%) This pattern of growth, with a rapid rise in output and labour demand in the modern and intermediate strata, enables a portion of the persons employed in the traditional stratum to “migrate” to the other two, thus boosting productivity in the economy overall.
While GDP growth reached 5.8% per annum between 2000 and 2011, total labour income increased at a slower pace
(4.4%). The labour share of GDP fell during the period as the operating surplus share increased, redistributing income from labour to capital over the period.
The authors conclude that Peru’s rapid economic growth over the past decade was based primarily on rapidly expanding output in the modern stratum which, even when creating jobs, saw its productivity gains far outpace the other sectors of the economy, thereby widening the productivity gap. Accordingly, structural heterogeneity (which was already high at the beginning of the period) continued to increase during those years. The fact that economic growth was led by the large enterprise stratum with few linkages with the rest of the economic structure was a drag on output in the intermediate and traditional strata and thus on the utilization of production capacity and the generation of quality employment. At the same time, given that the modern stratum accounts for a small proportion of total employment, only a few workers benefited from productivity and wage gains. Ultimately, this pattern of economic growth is feeding persistent production heterogeneity and could, by limiting both growth and opportunities for reducing inequality, block dynamic and inclusive development in the future.
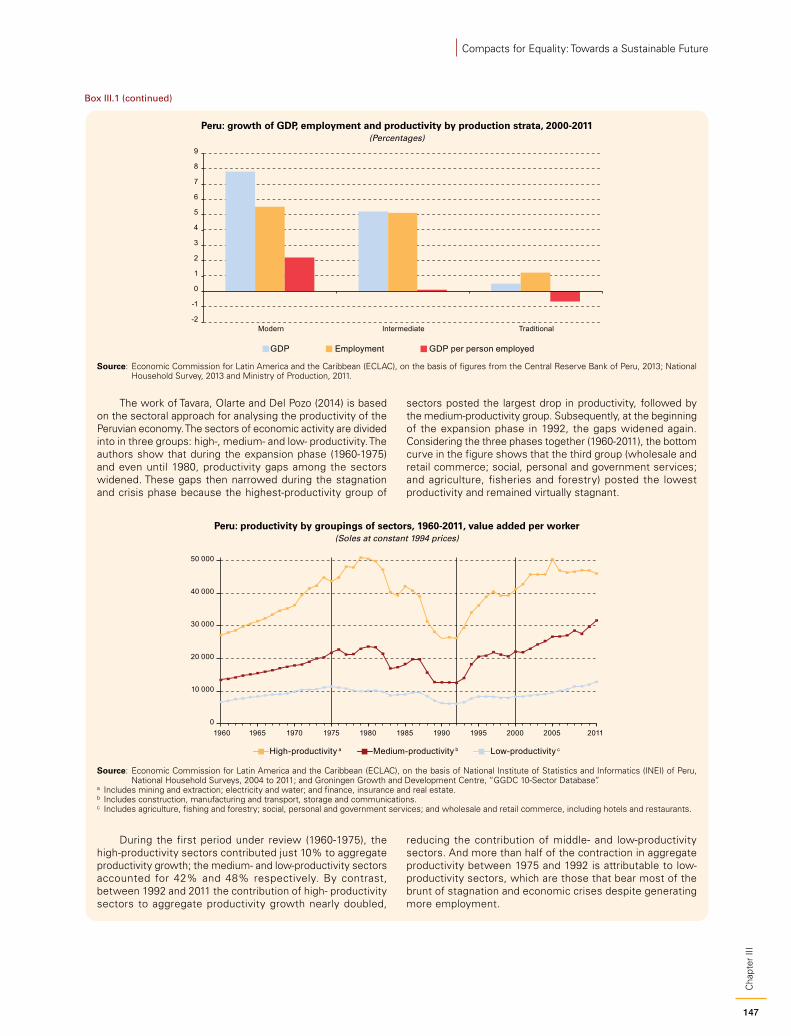
147
Cha
pter
III
Compacts for Equality: Towards a Sustainable Future
Peru: growth of GDP, employment and productivity by production strata, 2000-2011(Percentages)
-2
-1
0
1
2
3
4
5
6
7
8
9
Modern Intermediate Traditional
EmploymentGDP GDP per person employed
Source: Economic Commission for Latin America and the Caribbean (ECLAC), on the basis of figures from the Central Reserve Bank of Peru, 2013; National Household Survey, 2013 and Ministry of Production, 2011.
The work of Tavara, Olarte and Del Pozo (2014) is based on the sectoral approach for analysing the productivity of the Peruvian economy. The sectors of economic activity are divided into in three groups: high-, medium- and low- productivity. The authors show that during the expansion phase (1960-1975) and even until 1980, productivity gaps among the sectors widened. These gaps then narrowed during the stagnation and crisis phase because the highest-productivity group of
sectors posted the largest drop in productivity, followed by the medium-productivity group. Subsequently, at the beginning of the expansion phase in 1992, the gaps widened again. Considering the three phases together (1960-2011), the bottom curve in the figure shows that the third group (wholesale and retail commerce; social, personal and government services; and agriculture, fisheries and forestry) posted the lowest productivity and remained virtually stagnant.
Peru: productivity by groupings of sectors, 1960-2011, value added per worker(Soles at constant 1994 prices)
0
10 000
20 000
30 000
40 000
50 000
1960 1965 1970 1975 1980 1985 1990 1995 2000 2005 2011
High-productivity a Medium-productivity b Low-productivity c
Source: Economic Commission for Latin America and the Caribbean (ECLAC), on the basis of National Institute of Statistics and Informatics (INEI) of Peru, National Household Surveys, 2004 to 2011; and Groningen Growth and Development Centre, “GGDC 10-Sector Database”.
a Includes mining and extraction; electricity and water; and finance, insurance and real estate.b Includes construction, manufacturing and transport, storage and communications.c Includes agriculture, fishing and forestry; social, personal and government services; and wholesale and retail commerce, including hotels and restaurants.
During the first period under review (1960-1975), the high-productivity sectors contributed just 10% to aggregate productivity growth; the medium- and low-productivity sectors accounted for 42% and 48% respectively. By contrast, between 1992 and 2011 the contribution of high- productivity sectors to aggregate productivity growth nearly doubled,
reducing the contribution of middle- and low-productivity sectors. And more than half of the contraction in aggregate productivity between 1975 and 1992 is attributable to low-productivity sectors, which are those that bear most of the brunt of stagnation and economic crises despite generating more employment.
Box III.1 (continued)
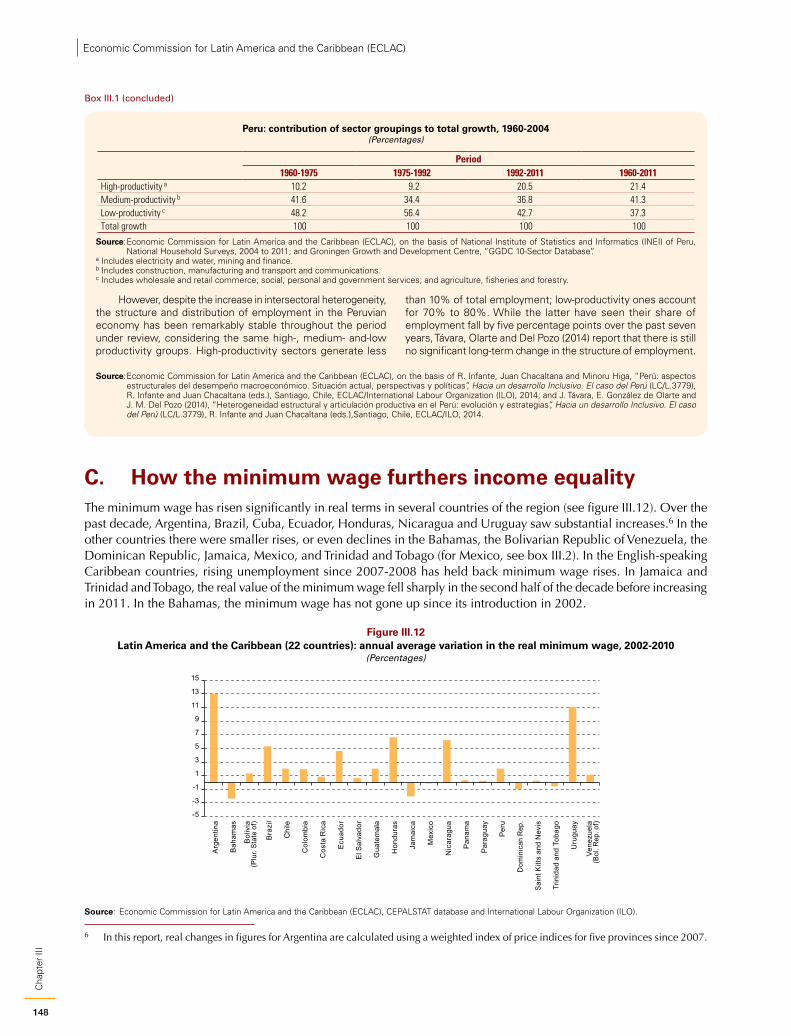
148
Cha
pter
III
Economic Commission for Latin America and the Caribbean (ECLAC)
Peru: contribution of sector groupings to total growth, 1960-2004(Percentages)
Period 1960-1975 1975-1992 1992-2011 1960-2011
High-productivity a 10.2 9.2 20.5 21.4Medium-productivity b 41.6 34.4 36.8 41.3Low-productivity c 48.2 56.4 42.7 37.3Total growth 100 100 100 100
Source: Economic Commission for Latin America and the Caribbean (ECLAC), on the basis of National Institute of Statistics and Informatics (INEI) of Peru, National Household Surveys, 2004 to 2011; and Groningen Growth and Development Centre, “GGDC 10-Sector Database”.
a Includes electricity and water, mining and finance.b Includes construction, manufacturing and transport and communications.c Includes wholesale and retail commerce; social, personal and government services; and agriculture, fisheries and forestry.
However, despite the increase in intersectoral heterogeneity, the structure and distribution of employment in the Peruvian economy has been remarkably stable throughout the period under review, considering the same high-, medium- and-low productivity groups. High-productivity sectors generate less
than 10% of total employment; low-productivity ones account for 70% to 80%. While the latter have seen their share of employment fall by five percentage points over the past seven years, Távara, Olarte and Del Pozo (2014) report that there is still no significant long-term change in the structure of employment.
Source: Economic Commission for Latin America and the Caribbean (ECLAC), on the basis of R. Infante, Juan Chacaltana and Minoru Higa, “Perú: aspectos estructurales del desempeño macroeconómico. Situación actual, perspectivas y políticas”, Hacia un desarrollo Inclusivo. El caso del Perú (LC/L.3779), R. Infante and Juan Chacaltana (eds.), Santiago, Chile, ECLAC/International Labour Organization (ILO), 2014; and J. Távara, E. González de Olarte and J. M. Del Pozo (2014), “Heterogeneidad estructural y articulación productiva en el Perú: evolución y estrategias”, Hacia un desarrollo Inclusivo. El caso del Perú (LC/L.3779), R. Infante and Juan Chacaltana (eds.),Santiago, Chile, ECLAC/ILO, 2014.
C. How the minimum wage furthers income equalityThe minimum wage has risen significantly in real terms in several countries of the region (see figure III.12). Over the past decade, Argentina, Brazil, Cuba, Ecuador, Honduras, Nicaragua and Uruguay saw substantial increases.6 In the other countries there were smaller rises, or even declines in the Bahamas, the Bolivarian Republic of Venezuela, the Dominican Republic, Jamaica, Mexico, and Trinidad and Tobago (for Mexico, see box III.2). In the English-speaking Caribbean countries, rising unemployment since 2007-2008 has held back minimum wage rises. In Jamaica and Trinidad and Tobago, the real value of the minimum wage fell sharply in the second half of the decade before increasing in 2011. In the Bahamas, the minimum wage has not gone up since its introduction in 2002.
Figure III.12 Latin America and the Caribbean (22 countries): annual average variation in the real minimum wage, 2002-2010
(Percentages)
-5
-3
-1
1
3
5
7
9
11
13
15
Arg
entin
a
Bah
amas
Bol
ivia
(Plu
r. St
ate
of)
Bra
zil
Chi
le
Col
ombi
a
Cos
ta R
ica
Ecu
ador
El S
alva
dor
Gua
tem
ala
Hon
dura
s
Jam
aica
Mex
ico
Nic
arag
ua
Pan
ama
Par
agua
y
Per
u
Dom
inic
an R
ep.
Sai
nt K
itts
and
Nev
is
Trin
idad
and
Tob
ago
Uru
guay
Vene
zuel
a(B
ol. R
ep. o
f)
Source: Economic Commission for Latin America and the Caribbean (ECLAC), CEPALSTAT database and International Labour Organization (ILO).
6 In this report, real changes in figures for Argentina are calculated using a weighted index of price indices for five provinces since 2007.
Box III.1 (concluded)
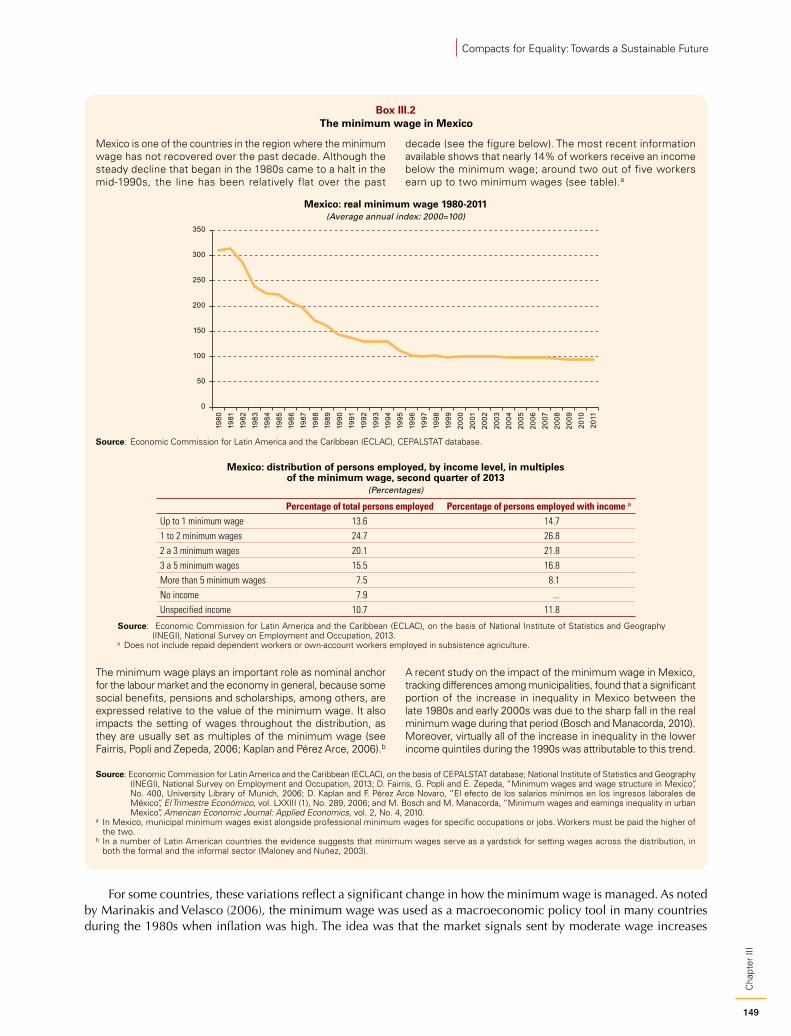
149
Cha
pter
III
Compacts for Equality: Towards a Sustainable Future
Box III.2 The minimum wage in Mexico
Mexico is one of the countries in the region where the minimum wage has not recovered over the past decade. Although the steady decline that began in the 1980s came to a halt in the mid-1990s, the line has been relatively flat over the past
decade (see the figure below). The most recent information available shows that nearly 14% of workers receive an income below the minimum wage; around two out of five workers earn up to two minimum wages (see table).a
Mexico: real minimum wage 1980-2011(Average annual index: 2000=100)
0
50
100
150
200
250
300
35019
8019
8119
8219
8319
8419
8519
8619
8719
8819
8919
9019
9119
9219
9319
9419
9519
9619
9719
9819
9920
0020
0120
0220
0320
0420
0520
0620
0720
0820
0920
1020
11 Source: Economic Commission for Latin America and the Caribbean (ECLAC), CEPALSTAT database.
Mexico: distribution of persons employed, by income level, in multiples of the minimum wage, second quarter of 2013
(Percentages)
Percentage of total persons employed Percentage of persons employed with income a
Up to 1 minimum wage 13.6 14.71 to 2 minimum wages 24.7 26.82 a 3 minimum wages 20.1 21.83 a 5 minimum wages 15.5 16.8More than 5 minimum wages 7.5 8.1No income 7.9 ...Unspecified income 10.7 11.8
Source: Economic Commission for Latin America and the Caribbean (ECLAC), on the basis of National Institute of Statistics and Geography (INEGI), National Survey on Employment and Occupation, 2013.
a Does not include repaid dependent workers or own-account workers employed in subsistence agriculture.
The minimum wage plays an important role as nominal anchor for the labour market and the economy in general, because some social benefits, pensions and scholarships, among others, are expressed relative to the value of the minimum wage. It also impacts the setting of wages throughout the distribution, as they are usually set as multiples of the minimum wage (see Fairris, Popli and Zepeda, 2006; Kaplan and Pérez Arce, 2006).b
A recent study on the impact of the minimum wage in Mexico, tracking differences among municipalities, found that a significant portion of the increase in inequality in Mexico between the late 1980s and early 2000s was due to the sharp fall in the real minimum wage during that period (Bosch and Manacorda, 2010). Moreover, virtually all of the increase in inequality in the lower income quintiles during the 1990s was attributable to this trend.
Source: Economic Commission for Latin America and the Caribbean (ECLAC), on the basis of CEPALSTAT database; National Institute of Statistics and Geography (INEGI), National Survey on Employment and Occupation, 2013; D. Fairris, G. Popli and E. Zepeda, “Minimum wages and wage structure in Mexico”, No. 400, University Library of Munich, 2006; D. Kaplan and F. Pérez Arce Novaro, “El efecto de los salarios mínimos en los ingresos laborales de México”, El Trimestre Económico, vol. LXXIII (1), No. 289, 2006; and M. Bosch and M. Manacorda, “Minimum wages and earnings inequality in urban Mexico”, American Economic Journal: Applied Economics, vol. 2, No. 4, 2010.
a In Mexico, municipal minimum wages exist alongside professional minimum wages for specific occupations or jobs. Workers must be paid the higher of the two.
b In a number of Latin American countries the evidence suggests that minimum wages serve as a yardstick for setting wages across the distribution, in both the formal and the informal sector (Maloney and Nuñez, 2003).
For some countries, these variations reflect a significant change in how the minimum wage is managed. As noted by Marinakis and Velasco (2006), the minimum wage was used as a macroeconomic policy tool in many countries during the 1980s when inflation was high. The idea was that the market signals sent by moderate wage increases
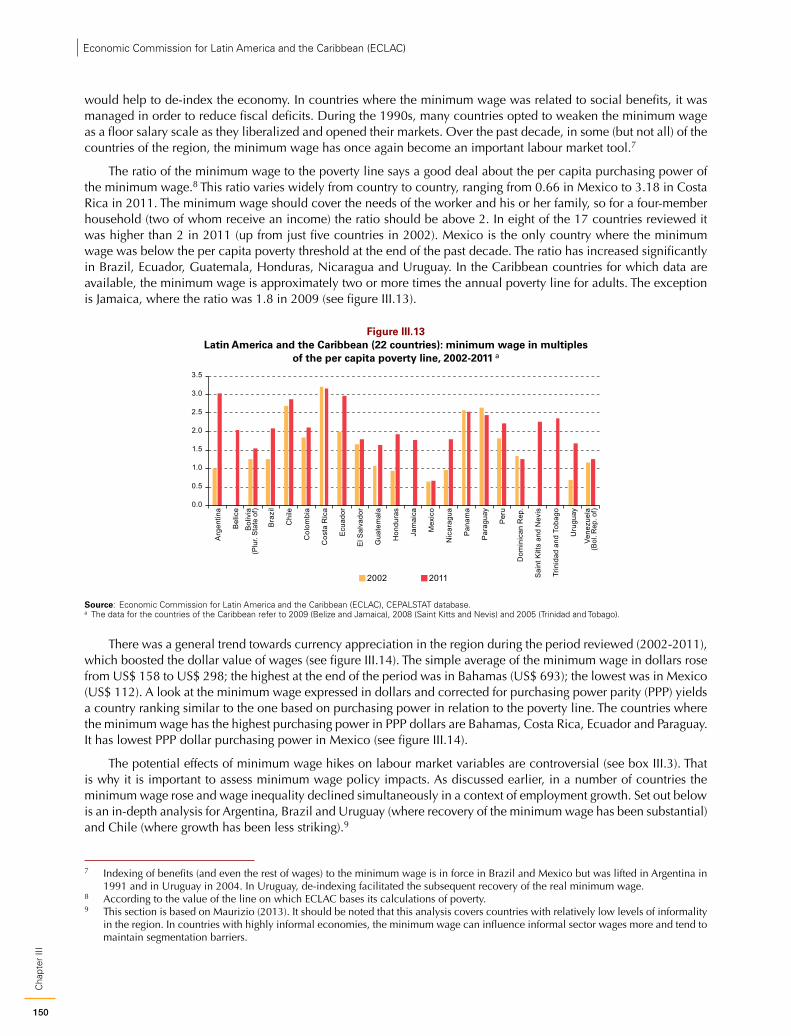
150
Cha
pter
III
Economic Commission for Latin America and the Caribbean (ECLAC)
would help to de-index the economy. In countries where the minimum wage was related to social benefits, it was managed in order to reduce fiscal deficits. During the 1990s, many countries opted to weaken the minimum wage as a floor salary scale as they liberalized and opened their markets. Over the past decade, in some (but not all) of the countries of the region, the minimum wage has once again become an important labour market tool.7
The ratio of the minimum wage to the poverty line says a good deal about the per capita purchasing power of the minimum wage.8 This ratio varies widely from country to country, ranging from 0.66 in Mexico to 3.18 in Costa Rica in 2011. The minimum wage should cover the needs of the worker and his or her family, so for a four-member household (two of whom receive an income) the ratio should be above 2. In eight of the 17 countries reviewed it was higher than 2 in 2011 (up from just five countries in 2002). Mexico is the only country where the minimum wage was below the per capita poverty threshold at the end of the past decade. The ratio has increased significantly in Brazil, Ecuador, Guatemala, Honduras, Nicaragua and Uruguay. In the Caribbean countries for which data are available, the minimum wage is approximately two or more times the annual poverty line for adults. The exception is Jamaica, where the ratio was 1.8 in 2009 (see figure III.13).
Figure III.13 Latin America and the Caribbean (22 countries): minimum wage in multiples
of the per capita poverty line, 2002-2011 a
0.0
0.5
1.0
1.5
2.0
2.5
3.0
3.5
Arg
entin
a
Bel
ice
Bol
ivia
(Plu
r. St
ate
of)
Bra
zil
Chi
le
Col
ombi
a
Cos
ta R
ica
Ecu
ador
El S
alva
dor
Gua
tem
ala
Hon
dura
s
Jam
aica
Mex
ico
Nic
arag
ua
Pan
ama
Par
agua
y
Per
u
Dom
inic
an R
ep.
Sai
nt K
itts
and
Nev
is
Trin
idad
and
Tob
ago
Uru
guay
Vene
zuel
a(B
ol. R
ep. o
f)
2002 2011
Source: Economic Commission for Latin America and the Caribbean (ECLAC), CEPALSTAT database.a The data for the countries of the Caribbean refer to 2009 (Belize and Jamaica), 2008 (Saint Kitts and Nevis) and 2005 (Trinidad and Tobago).
There was a general trend towards currency appreciation in the region during the period reviewed (2002-2011), which boosted the dollar value of wages (see figure III.14). The simple average of the minimum wage in dollars rose from US$ 158 to US$ 298; the highest at the end of the period was in Bahamas (US$ 693); the lowest was in Mexico (US$ 112). A look at the minimum wage expressed in dollars and corrected for purchasing power parity (PPP) yields a country ranking similar to the one based on purchasing power in relation to the poverty line. The countries where the minimum wage has the highest purchasing power in PPP dollars are Bahamas, Costa Rica, Ecuador and Paraguay. It has lowest PPP dollar purchasing power in Mexico (see figure III.14).
The potential effects of minimum wage hikes on labour market variables are controversial (see box III.3). That is why it is important to assess minimum wage policy impacts. As discussed earlier, in a number of countries the minimum wage rose and wage inequality declined simultaneously in a context of employment growth. Set out below is an in-depth analysis for Argentina, Brazil and Uruguay (where recovery of the minimum wage has been substantial) and Chile (where growth has been less striking).9
7 Indexing of benefits (and even the rest of wages) to the minimum wage is in force in Brazil and Mexico but was lifted in Argentina in 1991 and in Uruguay in 2004. In Uruguay, de-indexing facilitated the subsequent recovery of the real minimum wage.
8 According to the value of the line on which ECLAC bases its calculations of poverty.9 This section is based on Maurizio (2013). It should be noted that this analysis covers countries with relatively low levels of informality
in the region. In countries with highly informal economies, the minimum wage can influence informal sector wages more and tend to maintain segmentation barriers.
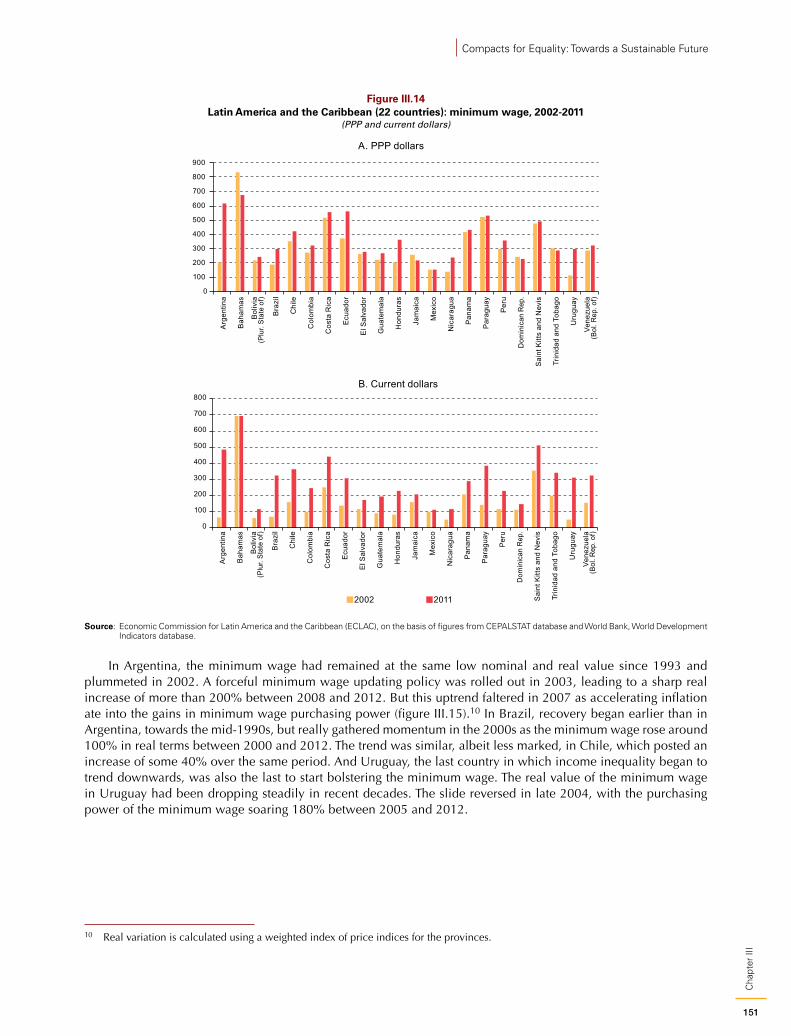
151
Cha
pter
III
Compacts for Equality: Towards a Sustainable Future
Figure III.14 Latin America and the Caribbean (22 countries): minimum wage, 2002-2011
(PPP and current dollars)
0
100
200
300
400
500
600
700
800
900
Arg
entin
a
Bah
amas
Bol
ivia
(Plu
r. St
ate
of)
Bra
zil
Chi
le
Col
ombi
a
Cos
ta R
ica
Ecu
ador
El S
alva
dor
Gua
tem
ala
Hon
dura
s
Jam
aica
Mex
ico
Nic
arag
ua
Pan
ama
Par
agua
y
Per
u
Dom
inic
an R
ep.
Sai
nt K
itts
and
Nev
is
Trin
idad
and
Tob
ago
Uru
guay
Vene
zuel
a(B
ol. R
ep. o
f)
A. PPP dollars
0
100
200
300
400
500
600
700
800
Arg
entin
a
Bah
amas
Bol
ivia
(Plu
r. St
ate
of)
Bra
zil
Chi
le
Col
ombi
a
Cos
ta R
ica
Ecu
ador
El S
alva
dor
Gua
tem
ala
Hon
dura
s
Jam
aica
Mex
ico
Nic
arag
ua
Pan
ama
Par
agua
y
Per
u
Dom
inic
an R
ep.
Sai
nt K
itts
and
Nev
is
Trin
idad
and
Tob
ago
Uru
guay
Vene
zuel
a(B
ol. R
ep. o
f)2002 2011
B. Current dollars
Source: Economic Commission for Latin America and the Caribbean (ECLAC), on the basis of figures from CEPALSTAT database and World Bank, World Development Indicators database.
In Argentina, the minimum wage had remained at the same low nominal and real value since 1993 and plummeted in 2002. A forceful minimum wage updating policy was rolled out in 2003, leading to a sharp real increase of more than 200% between 2008 and 2012. But this uptrend faltered in 2007 as accelerating inflation ate into the gains in minimum wage purchasing power (figure III.15).10 In Brazil, recovery began earlier than in Argentina, towards the mid-1990s, but really gathered momentum in the 2000s as the minimum wage rose around 100% in real terms between 2000 and 2012. The trend was similar, albeit less marked, in Chile, which posted an increase of some 40% over the same period. And Uruguay, the last country in which income inequality began to trend downwards, was also the last to start bolstering the minimum wage. The real value of the minimum wage in Uruguay had been dropping steadily in recent decades. The slide reversed in late 2004, with the purchasing power of the minimum wage soaring 180% between 2005 and 2012.
10 Real variation is calculated using a weighted index of price indices for the provinces.
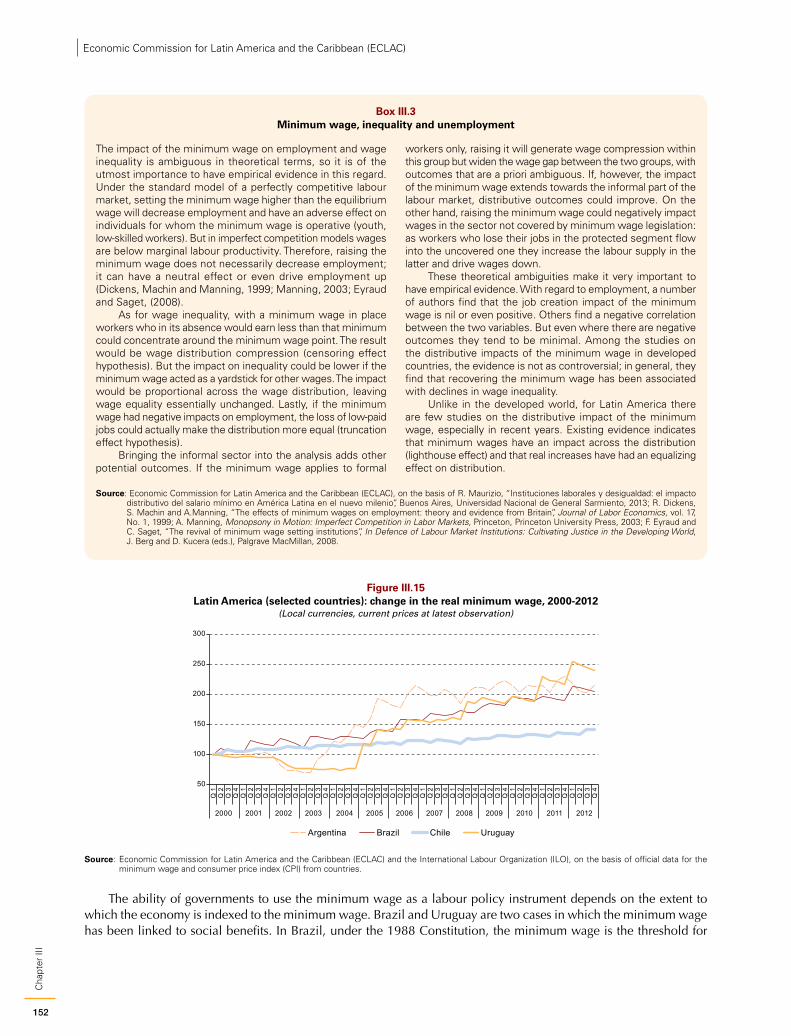
152
Cha
pter
III
Economic Commission for Latin America and the Caribbean (ECLAC)
Box III.3 Minimum wage, inequality and unemployment
The impact of the minimum wage on employment and wage inequality is ambiguous in theoretical terms, so it is of the utmost importance to have empirical evidence in this regard. Under the standard model of a perfectly competitive labour market, setting the minimum wage higher than the equilibrium wage will decrease employment and have an adverse effect on individuals for whom the minimum wage is operative (youth, low-skilled workers). But in imperfect competition models wages are below marginal labour productivity. Therefore, raising the minimum wage does not necessarily decrease employment; it can have a neutral effect or even drive employment up (Dickens, Machin and Manning, 1999; Manning, 2003; Eyraud and Saget, (2008).
As for wage inequality, with a minimum wage in place workers who in its absence would earn less than that minimum could concentrate around the minimum wage point. The result would be wage distribution compression (censoring effect hypothesis). But the impact on inequality could be lower if the minimum wage acted as a yardstick for other wages. The impact would be proportional across the wage distribution, leaving wage equality essentially unchanged. Lastly, if the minimum wage had negative impacts on employment, the loss of low-paid jobs could actually make the distribution more equal (truncation effect hypothesis).
Bringing the informal sector into the analysis adds other potential outcomes. If the minimum wage applies to formal
workers only, raising it will generate wage compression within this group but widen the wage gap between the two groups, with outcomes that are a priori ambiguous. If, however, the impact of the minimum wage extends towards the informal part of the labour market, distributive outcomes could improve. On the other hand, raising the minimum wage could negatively impact wages in the sector not covered by minimum wage legislation: as workers who lose their jobs in the protected segment flow into the uncovered one they increase the labour supply in the latter and drive wages down.
These theoretical ambiguities make it very important to have empirical evidence. With regard to employment, a number of authors find that the job creation impact of the minimum wage is nil or even positive. Others find a negative correlation between the two variables. But even where there are negative outcomes they tend to be minimal. Among the studies on the distributive impacts of the minimum wage in developed countries, the evidence is not as controversial; in general, they find that recovering the minimum wage has been associated with declines in wage inequality.
Unlike in the developed world, for Latin America there are few studies on the distributive impact of the minimum wage, especially in recent years. Existing evidence indicates that minimum wages have an impact across the distribution (lighthouse effect) and that real increases have had an equalizing effect on distribution.
Source: Economic Commission for Latin America and the Caribbean (ECLAC), on the basis of R. Maurizio, “Instituciones laborales y desigualdad: el impacto distributivo del salario mínimo en América Latina en el nuevo milenio”, Buenos Aires, Universidad Nacional de General Sarmiento, 2013; R. Dickens, S. Machin and A.Manning, “The effects of minimum wages on employment: theory and evidence from Britain”, Journal of Labor Economics, vol. 17, No. 1, 1999; A. Manning, Monopsony in Motion: Imperfect Competition in Labor Markets, Princeton, Princeton University Press, 2003; F. Eyraud and C. Saget, “The revival of minimum wage setting institutions”, In Defence of Labour Market Institutions: Cultivating Justice in the Developing World, J. Berg and D. Kucera (eds.), Palgrave MacMillan, 2008.
Figure III.15 Latin America (selected countries): change in the real minimum wage, 2000-2012
(Local currencies, current prices at latest observation)
50
100
150
200
250
300
Q 1
Q 2
Q 3
Q 4
Q 1
Q 2
Q 3
Q 4
Q 1
Q 2
Q 3
Q 4
Q 1
Q 2
Q 3
Q 4
Q 1
Q 2
Q 3
Q 4
Q 1
Q 2
Q 3
Q 4
Q 1
Q 2
Q 3
Q 4
Q 1
Q 2
Q 3
Q 4
Q 1
Q 2
Q 3
Q 4
Q 1
Q 2
Q 3
Q 4
Q 1
Q 2
Q 3
Q 4
Q 1
Q 2
Q 3
Q 4
Q 1
Q 2
Q 3
Q 4
2000 2001 2002 2003 2004 2005 2006 2007 2008 2009 2010 2011 2012
Argentina Brazil Chile Uruguay
Source: Economic Commission for Latin America and the Caribbean (ECLAC) and the International Labour Organization (ILO), on the basis of official data for the minimum wage and consumer price index (CPI) from countries.
The ability of governments to use the minimum wage as a labour policy instrument depends on the extent to which the economy is indexed to the minimum wage. Brazil and Uruguay are two cases in which the minimum wage has been linked to social benefits. In Brazil, under the 1988 Constitution, the minimum wage is the threshold for
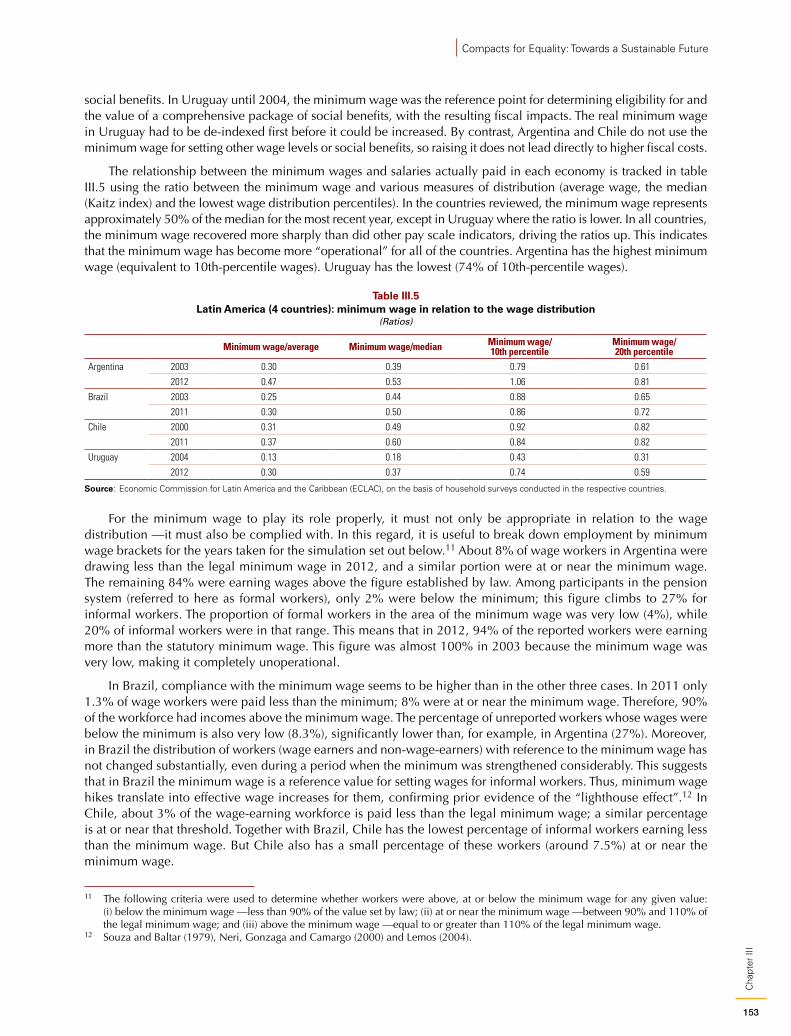
153
Cha
pter
III
Compacts for Equality: Towards a Sustainable Future
social benefits. In Uruguay until 2004, the minimum wage was the reference point for determining eligibility for and the value of a comprehensive package of social benefits, with the resulting fiscal impacts. The real minimum wage in Uruguay had to be de-indexed first before it could be increased. By contrast, Argentina and Chile do not use the minimum wage for setting other wage levels or social benefits, so raising it does not lead directly to higher fiscal costs.
The relationship between the minimum wages and salaries actually paid in each economy is tracked in table III.5 using the ratio between the minimum wage and various measures of distribution (average wage, the median (Kaitz index) and the lowest wage distribution percentiles). In the countries reviewed, the minimum wage represents approximately 50% of the median for the most recent year, except in Uruguay where the ratio is lower. In all countries, the minimum wage recovered more sharply than did other pay scale indicators, driving the ratios up. This indicates that the minimum wage has become more “operational” for all of the countries. Argentina has the highest minimum wage (equivalent to 10th-percentile wages). Uruguay has the lowest (74% of 10th-percentile wages).
Table III.5 Latin America (4 countries): minimum wage in relation to the wage distribution
(Ratios)
Minimum wage/average Minimum wage/median Minimum wage/ 10th percentile
Minimum wage/ 20th percentile
Argentina 2003 0.30 0.39 0.79 0.61
2012 0.47 0.53 1.06 0.81
Brazil 2003 0.25 0.44 0.88 0.65
2011 0.30 0.50 0.86 0.72
Chile 2000 0.31 0.49 0.92 0.82
2011 0.37 0.60 0.84 0.82
Uruguay 2004 0.13 0.18 0.43 0.31
2012 0.30 0.37 0.74 0.59
Source: Economic Commission for Latin America and the Caribbean (ECLAC), on the basis of household surveys conducted in the respective countries.
For the minimum wage to play its role properly, it must not only be appropriate in relation to the wage distribution —it must also be complied with. In this regard, it is useful to break down employment by minimum wage brackets for the years taken for the simulation set out below.11 About 8% of wage workers in Argentina were drawing less than the legal minimum wage in 2012, and a similar portion were at or near the minimum wage. The remaining 84% were earning wages above the figure established by law. Among participants in the pension system (referred to here as formal workers), only 2% were below the minimum; this figure climbs to 27% for informal workers. The proportion of formal workers in the area of the minimum wage was very low (4%), while 20% of informal workers were in that range. This means that in 2012, 94% of the reported workers were earning more than the statutory minimum wage. This figure was almost 100% in 2003 because the minimum wage was very low, making it completely unoperational.
In Brazil, compliance with the minimum wage seems to be higher than in the other three cases. In 2011 only 1.3% of wage workers were paid less than the minimum; 8% were at or near the minimum wage. Therefore, 90% of the workforce had incomes above the minimum wage. The percentage of unreported workers whose wages were below the minimum is also very low (8.3%), significantly lower than, for example, in Argentina (27%). Moreover, in Brazil the distribution of workers (wage earners and non-wage-earners) with reference to the minimum wage has not changed substantially, even during a period when the minimum was strengthened considerably. This suggests that in Brazil the minimum wage is a reference value for setting wages for informal workers. Thus, minimum wage hikes translate into effective wage increases for them, confirming prior evidence of the “lighthouse effect”.12 In Chile, about 3% of the wage-earning workforce is paid less than the legal minimum wage; a similar percentage is at or near that threshold. Together with Brazil, Chile has the lowest percentage of informal workers earning less than the minimum wage. But Chile also has a small percentage of these workers (around 7.5%) at or near the minimum wage.
11 The following criteria were used to determine whether workers were above, at or below the minimum wage for any given value: (i) below the minimum wage —less than 90% of the value set by law; (ii) at or near the minimum wage —between 90% and 110% of the legal minimum wage; and (iii) above the minimum wage —equal to or greater than 110% of the legal minimum wage.
12 Souza and Baltar (1979), Neri, Gonzaga and Camargo (2000) and Lemos (2004).
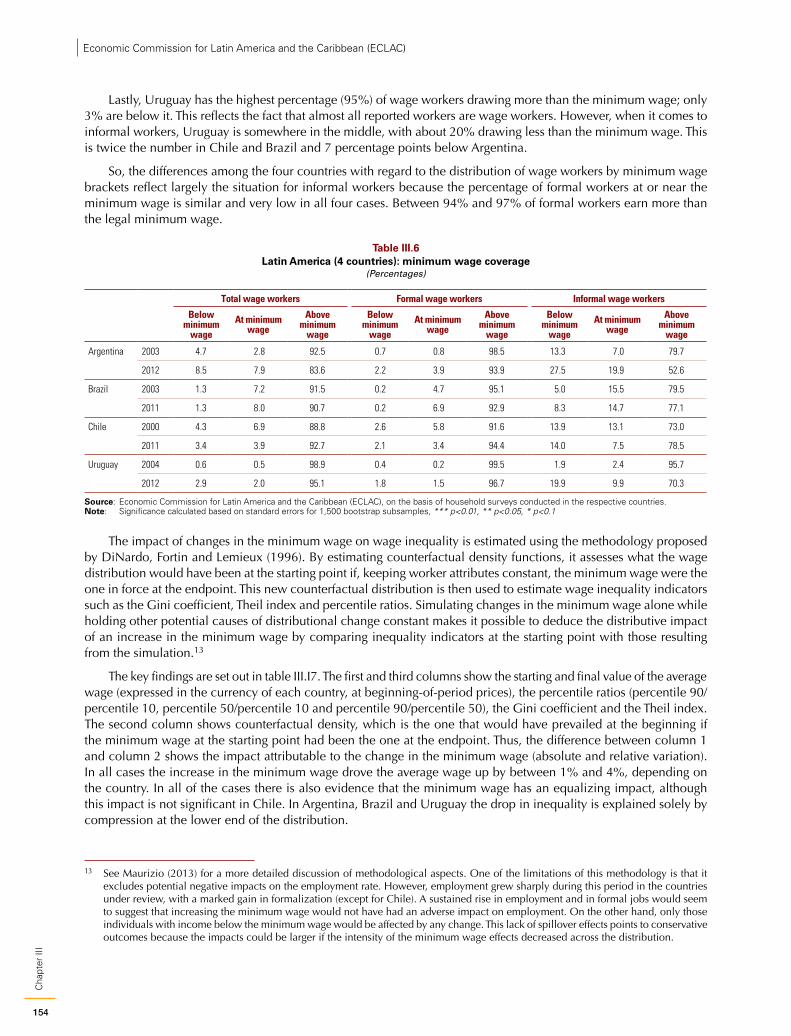
154
Cha
pter
III
Economic Commission for Latin America and the Caribbean (ECLAC)
Lastly, Uruguay has the highest percentage (95%) of wage workers drawing more than the minimum wage; only 3% are below it. This reflects the fact that almost all reported workers are wage workers. However, when it comes to informal workers, Uruguay is somewhere in the middle, with about 20% drawing less than the minimum wage. This is twice the number in Chile and Brazil and 7 percentage points below Argentina.
So, the differences among the four countries with regard to the distribution of wage workers by minimum wage brackets reflect largely the situation for informal workers because the percentage of formal workers at or near the minimum wage is similar and very low in all four cases. Between 94% and 97% of formal workers earn more than the legal minimum wage.
Table III.6 Latin America (4 countries): minimum wage coverage
(Percentages)
Total wage workers Formal wage workers Informal wage workers
Below minimum
wageAt minimum
wageAbove
minimum wage
Below minimum
wageAt minimum
wageAbove
minimum wage
Below minimum
wageAt minimum
wageAbove
minimum wage
Argentina 2003 4.7 2.8 92.5 0.7 0.8 98.5 13.3 7.0 79.7
2012 8.5 7.9 83.6 2.2 3.9 93.9 27.5 19.9 52.6
Brazil 2003 1.3 7.2 91.5 0.2 4.7 95.1 5.0 15.5 79.5
2011 1.3 8.0 90.7 0.2 6.9 92.9 8.3 14.7 77.1
Chile 2000 4.3 6.9 88.8 2.6 5.8 91.6 13.9 13.1 73.0
2011 3.4 3.9 92.7 2.1 3.4 94.4 14.0 7.5 78.5
Uruguay 2004 0.6 0.5 98.9 0.4 0.2 99.5 1.9 2.4 95.7
2012 2.9 2.0 95.1 1.8 1.5 96.7 19.9 9.9 70.3
Source: Economic Commission for Latin America and the Caribbean (ECLAC), on the basis of household surveys conducted in the respective countries.Note: Significance calculated based on standard errors for 1,500 bootstrap subsamples, *** p<0.01, ** p<0.05, * p<0.1
The impact of changes in the minimum wage on wage inequality is estimated using the methodology proposed by DiNardo, Fortin and Lemieux (1996). By estimating counterfactual density functions, it assesses what the wage distribution would have been at the starting point if, keeping worker attributes constant, the minimum wage were the one in force at the endpoint. This new counterfactual distribution is then used to estimate wage inequality indicators such as the Gini coefficient, Theil index and percentile ratios. Simulating changes in the minimum wage alone while holding other potential causes of distributional change constant makes it possible to deduce the distributive impact of an increase in the minimum wage by comparing inequality indicators at the starting point with those resulting from the simulation.13
The key findings are set out in table III.I7. The first and third columns show the starting and final value of the average wage (expressed in the currency of each country, at beginning-of-period prices), the percentile ratios (percentile 90/percentile 10, percentile 50/percentile 10 and percentile 90/percentile 50), the Gini coefficient and the Theil index. The second column shows counterfactual density, which is the one that would have prevailed at the beginning if the minimum wage at the starting point had been the one at the endpoint. Thus, the difference between column 1 and column 2 shows the impact attributable to the change in the minimum wage (absolute and relative variation). In all cases the increase in the minimum wage drove the average wage up by between 1% and 4%, depending on the country. In all of the cases there is also evidence that the minimum wage has an equalizing impact, although this impact is not significant in Chile. In Argentina, Brazil and Uruguay the drop in inequality is explained solely by compression at the lower end of the distribution.
13 See Maurizio (2013) for a more detailed discussion of methodological aspects. One of the limitations of this methodology is that it excludes potential negative impacts on the employment rate. However, employment grew sharply during this period in the countries under review, with a marked gain in formalization (except for Chile). A sustained rise in employment and in formal jobs would seem to suggest that increasing the minimum wage would not have had an adverse impact on employment. On the other hand, only those individuals with income below the minimum wage would be affected by any change. This lack of spillover effects points to conservative outcomes because the impacts could be larger if the intensity of the minimum wage effects decreased across the distribution.
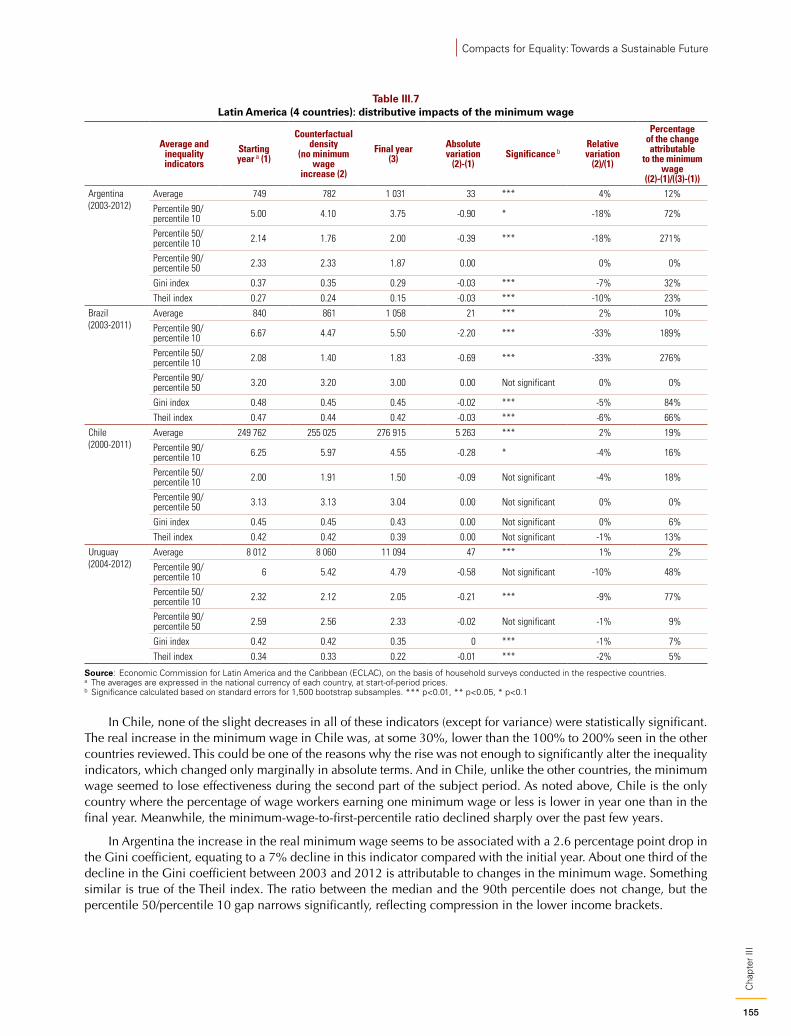
155
Cha
pter
III
Compacts for Equality: Towards a Sustainable Future
Table III.7 Latin America (4 countries): distributive impacts of the minimum wage
Average and
inequality indicators
Starting year a (1)
Counterfactual density
(no minimum wage
increase (2)
Final year (3)
Absolute variation
(2)-(1)Significance b
Relative variation
(2)/(1)
Percentage of the change attributable
to the minimum wage
((2)-(1)/((3)-(1))Argentina(2003-2012)
Average 749 782 1 031 33 *** 4% 12%Percentile 90/ percentile 10 5.00 4.10 3.75 -0.90 * -18% 72%
Percentile 50/ percentile 10 2.14 1.76 2.00 -0.39 *** -18% 271%
Percentile 90/ percentile 50 2.33 2.33 1.87 0.00 0% 0%
Gini index 0.37 0.35 0.29 -0.03 *** -7% 32%
Theil index 0.27 0.24 0.15 -0.03 *** -10% 23%Brazil(2003-2011)
Average 840 861 1 058 21 *** 2% 10%Percentile 90/ percentile 10 6.67 4.47 5.50 -2.20 *** -33% 189%
Percentile 50/ percentile 10 2.08 1.40 1.83 -0.69 *** -33% 276%
Percentile 90/ percentile 50 3.20 3.20 3.00 0.00 Not significant 0% 0%
Gini index 0.48 0.45 0.45 -0.02 *** -5% 84%
Theil index 0.47 0.44 0.42 -0.03 *** -6% 66%Chile(2000-2011)
Average 249 762 255 025 276 915 5 263 *** 2% 19%Percentile 90/ percentile 10 6.25 5.97 4.55 -0.28 * -4% 16%
Percentile 50/ percentile 10 2.00 1.91 1.50 -0.09 Not significant -4% 18%
Percentile 90/ percentile 50 3.13 3.13 3.04 0.00 Not significant 0% 0%
Gini index 0.45 0.45 0.43 0.00 Not significant 0% 6%
Theil index 0.42 0.42 0.39 0.00 Not significant -1% 13%Uruguay(2004-2012)
Average 8 012 8 060 11 094 47 *** 1% 2%Percentile 90/ percentile 10 6 5.42 4.79 -0.58 Not significant -10% 48%
Percentile 50/ percentile 10 2.32 2.12 2.05 -0.21 *** -9% 77%
Percentile 90/ percentile 50 2.59 2.56 2.33 -0.02 Not significant -1% 9%
Gini index 0.42 0.42 0.35 0 *** -1% 7%
Theil index 0.34 0.33 0.22 -0.01 *** -2% 5%
Source: Economic Commission for Latin America and the Caribbean (ECLAC), on the basis of household surveys conducted in the respective countries.a The averages are expressed in the national currency of each country, at start-of-period prices.b Significance calculated based on standard errors for 1,500 bootstrap subsamples. *** p<0.01, ** p<0.05, * p<0.1
In Chile, none of the slight decreases in all of these indicators (except for variance) were statistically significant. The real increase in the minimum wage in Chile was, at some 30%, lower than the 100% to 200% seen in the other countries reviewed. This could be one of the reasons why the rise was not enough to significantly alter the inequality indicators, which changed only marginally in absolute terms. And in Chile, unlike the other countries, the minimum wage seemed to lose effectiveness during the second part of the subject period. As noted above, Chile is the only country where the percentage of wage workers earning one minimum wage or less is lower in year one than in the final year. Meanwhile, the minimum-wage-to-first-percentile ratio declined sharply over the past few years.
In Argentina the increase in the real minimum wage seems to be associated with a 2.6 percentage point drop in the Gini coefficient, equating to a 7% decline in this indicator compared with the initial year. About one third of the decline in the Gini coefficient between 2003 and 2012 is attributable to changes in the minimum wage. Something similar is true of the Theil index. The ratio between the median and the 90th percentile does not change, but the percentile 50/percentile 10 gap narrows significantly, reflecting compression in the lower income brackets.
156
Cha
pter
III
Economic Commission for Latin America and the Caribbean (ECLAC)
In Brazil, the Gini coefficient fell by 2.4 percentage points (5%). The rise in the minimum wage has a very significant impact, accounting for 84% of the total drop in the Gini. As in Argentina, the equalizing impact is seen only at the bottom of the distribution. Unlike in the case of Argentina, however, the decrease is large enough to significantly narrow the gap between the outlier percentiles, 90 and 10. The results suggest that with the minimum wage effect alone, the ratio between percentile 50 and percentile 10 of the end year would have been even lower than was actually recorded.
In Uruguay, the equalizing effects were smaller than in the two other cases. The Gini coefficient fell 0.5 percentage points; changes in the minimum wage accounted for some 7% of the total decline in the Gini between 2004 and 2012. Outcomes for the Theil index were similar. Once again, the narrowing of the gap between the outlier percentiles of the distribution reflects only the impact at the low end, where the portion attributable to this factor was 77%.
As discussed, recent explanations for declining inequality in the region have focused on factors driving supply and demand for workers at different qualification levels. These findings suggest the importance of considering, in addition, the role of labour institutions in the distributive improvements in some countries of the region. Narrowing wage differentials could indeed be the result, in turn, of strengthening of the minimum wage and other tools, such as collective bargaining. It should be noted that the minimum wage hikes in the cases under review took place during a period of employment growth, particularly in Argentina, Brazil and Uruguay, amid a strong drive for labour market formalization.
D. Gender inequalities: labour market participation and income
The sharp gender differences in the labour market range from labour market participation decisions to their outcomes in terms of occupation, unemployment and social security contributions. Since the examination is limited to the universe of employed persons, these differences are expressed in access to certain jobs, concentration in certain occupations and differences in pay. This section discusses these issues in depth, taking account of regional trends over the past decade.
1. Participation, employment and unemploymentAn increasing percentage of women have entered the labour market over the past four decades in all of the countries of the region, albeit at different rates and to varying degrees. This trend has held over the past decade but at a significantly slower pace compared with changes in the past. In addition, the main features of the female labour participation rate remain unchanged: women with a higher education level, a smaller family burden and more resources to pay for care services have the highest economic participation rate (ECLAC, 2013b) (see figure III.16).
Even though female participation rates have increased steadily, they are, in all of the countries of the region, significantly lower than the rates for men. In Guatemala and Honduras, they are approximately half the rate for men, while the greatest similarity in labour force participation between men and women occurs in the English-speaking Caribbean and Peru, the Plurinational State of Bolivia and Uruguay (see figure III.16). The evolution of labour market participation has differed by sex: the rate for men fell in 19 of the 27 countries while the rate for women rose in 22. This differential trend has narrowed gender gaps in most of the countries, and female participation rates in 2011 were closer to those for men than they were in 2002. The exceptions are Guatemala, where female participation rates fell, and the Bahamas, Ecuador, Nicaragua, Saint Lucia and the Bolivarian Republic of Venezuela, where they held steady (see figure III.16). The widest gaps are in the countries of Central America.
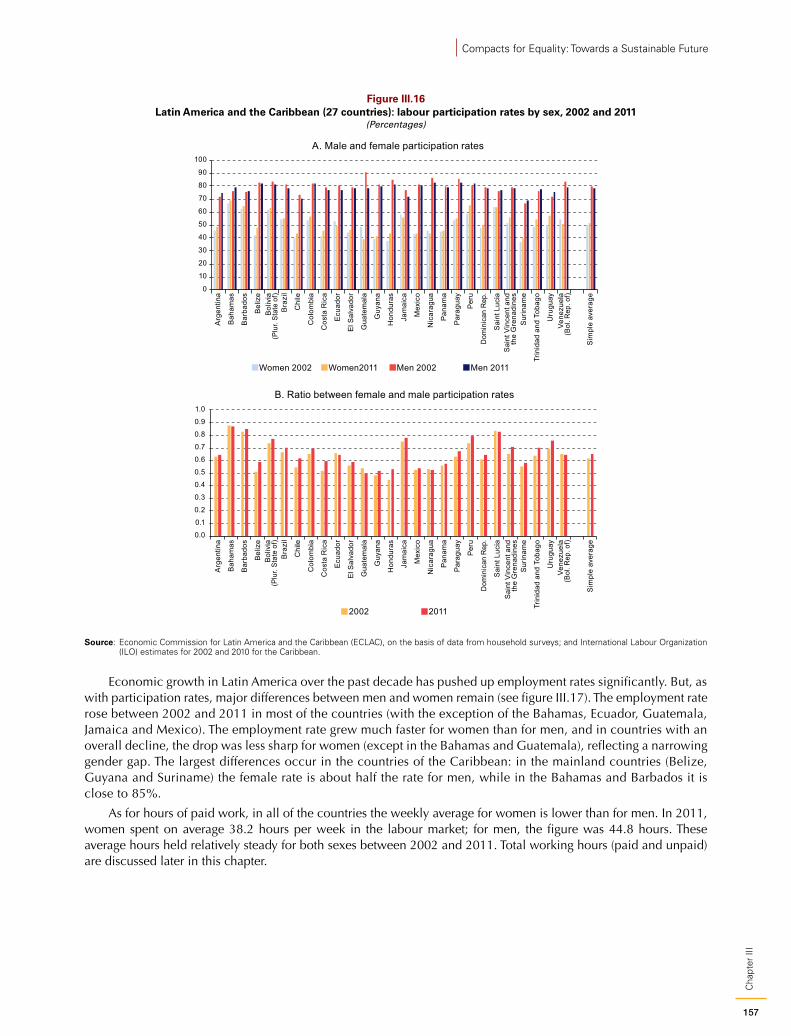
157
Cha
pter
III
Compacts for Equality: Towards a Sustainable Future
Figure III.16 Latin America and the Caribbean (27 countries): labour participation rates by sex, 2002 and 2011
(Percentages)
0
10
20
30
40
50
60
70
80
90
100
Arg
entin
a
Bah
amas
Bar
bado
s
Bel
ize
Bol
ivia
(Plu
r. St
ate
of)
Bra
zil
Chi
le
Col
ombi
a
Cos
ta R
ica
Ecu
ador
El S
alva
dor
Gua
tem
ala
Guy
ana
Hon
dura
s
Jam
aica
Mex
ico
Nic
arag
ua
Pan
ama
Par
agua
y
Per
u
Dom
inic
an R
ep.
Sai
nt L
ucia
Sai
nt V
ince
nt a
ndth
e G
rena
dine
sS
urin
ame
Trin
idad
and
Tob
ago
Uru
guay
Vene
zuel
a(B
ol. R
ep. o
f)
Sim
ple
aver
age
Women 2002 Women2011 Men 2002 Men 2011
A. Male and female participation rates
0.0
0.1
0.2
0.3
0.4
0.5
0.6
0.7
0.8
0.9
1.0
Arg
entin
a
Bah
amas
Bar
bado
s
Bel
ize
Bol
ivia
(Plu
r. St
ate
of)
Bra
zil
Chi
le
Col
ombi
a
Cos
ta R
ica
Ecu
ador
El S
alva
dor
Gua
tem
ala
Guy
ana
Hon
dura
s
Jam
aica
Mex
ico
Nic
arag
ua
Pan
ama
Par
agua
y
Per
u
Dom
inic
an R
ep.
Sai
nt L
ucia
Sai
nt V
ince
nt a
ndth
e G
rena
dine
sS
urin
ame
Trin
idad
and
Tob
ago
Uru
guay
Vene
zuel
a(B
ol. R
ep. o
f)
Sim
ple
aver
age
2002 2011
B. Ratio between female and male participation rates
Source: Economic Commission for Latin America and the Caribbean (ECLAC), on the basis of data from household surveys; and International Labour Organization (ILO) estimates for 2002 and 2010 for the Caribbean.
Economic growth in Latin America over the past decade has pushed up employment rates significantly. But, as with participation rates, major differences between men and women remain (see figure III.17). The employment rate rose between 2002 and 2011 in most of the countries (with the exception of the Bahamas, Ecuador, Guatemala, Jamaica and Mexico). The employment rate grew much faster for women than for men, and in countries with an overall decline, the drop was less sharp for women (except in the Bahamas and Guatemala), reflecting a narrowing gender gap. The largest differences occur in the countries of the Caribbean: in the mainland countries (Belize, Guyana and Suriname) the female rate is about half the rate for men, while in the Bahamas and Barbados it is close to 85%.
As for hours of paid work, in all of the countries the weekly average for women is lower than for men. In 2011, women spent on average 38.2 hours per week in the labour market; for men, the figure was 44.8 hours. These average hours held relatively steady for both sexes between 2002 and 2011. Total working hours (paid and unpaid) are discussed later in this chapter.
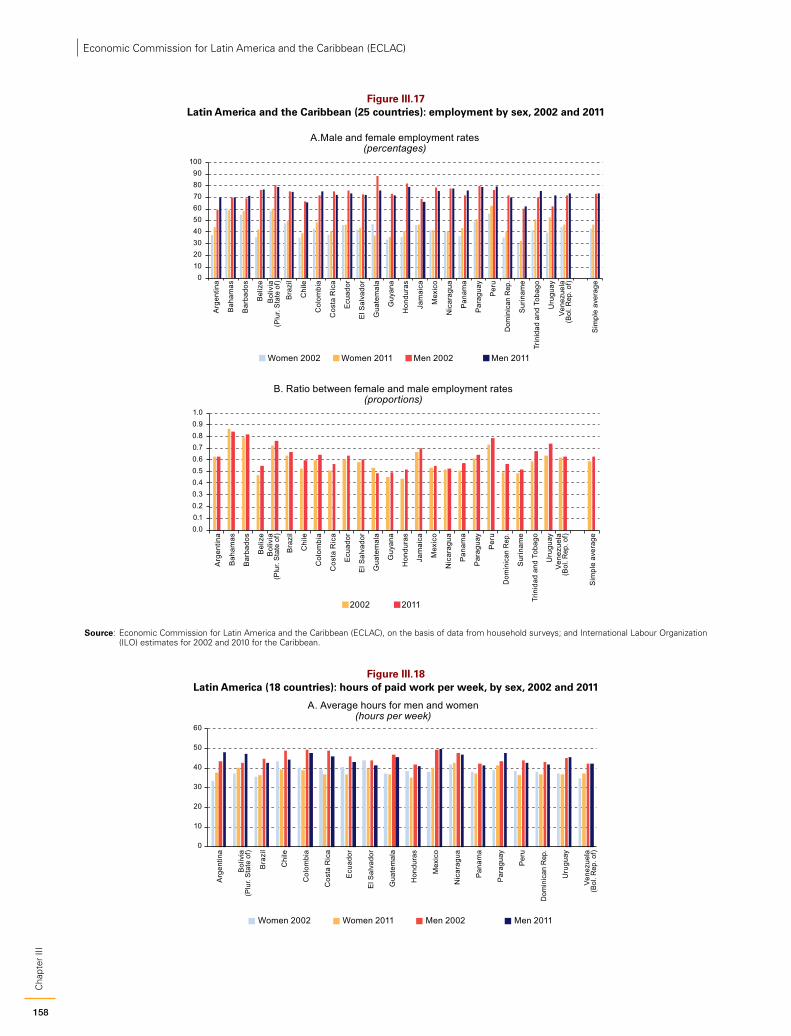
158
Cha
pter
III
Economic Commission for Latin America and the Caribbean (ECLAC)
Figure III.17 Latin America and the Caribbean (25 countries): employment by sex, 2002 and 2011
0102030405060708090
100
Arg
entin
a
Bah
amas
Bar
bado
s
Bel
ize
Bol
ivia
(Plu
r. St
ate
of)
Bra
zil
Chi
le
Col
ombi
a
Cos
ta R
ica
Ecu
ador
El S
alva
dor
Gua
tem
ala
Guy
ana
Hon
dura
s
Jam
aica
Mex
ico
Nic
arag
ua
Pan
ama
Par
agua
y
Per
u
Dom
inic
an R
ep.
Sur
inam
e
Trin
idad
and
Tob
ago
Uru
guay
Vene
zuel
a(B
ol. R
ep. o
f)
Sim
ple
aver
age
Women 2002 Women 2011 Men 2002 Men 2011
A.Male and female employment rates(percentages)
0.00.10.20.30.40.50.60.70.80.91.0
Arg
entin
a
Bah
amas
Bar
bado
s
Bel
ize
Bol
ivia
(Plu
r. St
ate
of)
Bra
zil
Chi
le
Col
ombi
a
Cos
ta R
ica
Ecu
ador
El S
alva
dor
Gua
tem
ala
Guy
ana
Hon
dura
s
Jam
aica
Mex
ico
Nic
arag
ua
Pan
ama
Par
agua
y
Per
u
Dom
inic
an R
ep.
Sur
inam
e
Trin
idad
and
Tob
ago
Uru
guay
Vene
zuel
a(B
ol. R
ep. o
f)
Sim
ple
aver
age
2002 2011
B. Ratio between female and male employment rates(proportions)
Source: Economic Commission for Latin America and the Caribbean (ECLAC), on the basis of data from household surveys; and International Labour Organization (ILO) estimates for 2002 and 2010 for the Caribbean.
Figure III.18 Latin America (18 countries): hours of paid work per week, by sex, 2002 and 2011
0
10
20
30
40
50
60
Arg
entin
a
Bol
ivia
(Plu
r. St
ate
of)
Bra
zil
Chi
le
Col
ombi
a
Cos
ta R
ica
Ecu
ador
El S
alva
dor
Gua
tem
ala
Hon
dura
s
Mex
ico
Nic
arag
ua
Pan
ama
Par
agua
y
Per
u
Dom
inic
an R
ep.
Uru
guay
Vene
zuel
a(B
ol. R
ep. o
f)
Women 2002 Women 2011 Men 2002 Men 2011
A. Average hours for men and women(hours per week)
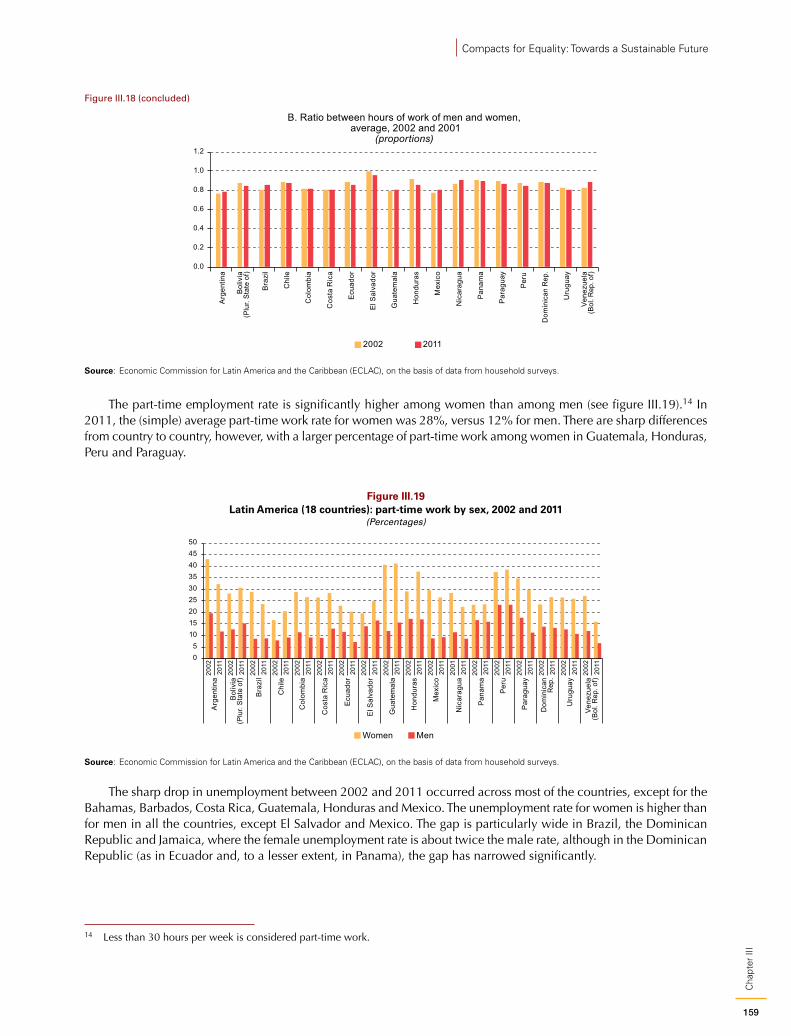
159
Cha
pter
III
Compacts for Equality: Towards a Sustainable Future
Dom
inic
an R
ep.
B. Ratio between hours of work of men and women, average, 2002 and 2001
(proportions)
0.0
0.2
0.4
0.6
0.8
1.0
1.2
Arg
entin
a
Bol
ivia
(Plu
r. St
ate
of)
Bra
zil
Chi
le
Col
ombi
a
Cos
ta R
ica
Ecu
ador
El S
alva
dor
Gua
tem
ala
Hon
dura
s
Mex
ico
Nic
arag
ua
Pan
ama
Par
agua
y
Per
u
Uru
guay
Vene
zuel
a(B
ol. R
ep. o
f)
2002 2011
Source: Economic Commission for Latin America and the Caribbean (ECLAC), on the basis of data from household surveys.
The part-time employment rate is significantly higher among women than among men (see figure III.19).14 In 2011, the (simple) average part-time work rate for women was 28%, versus 12% for men. There are sharp differences from country to country, however, with a larger percentage of part-time work among women in Guatemala, Honduras, Peru and Paraguay.
Figure III.19 Latin America (18 countries): part-time work by sex, 2002 and 2011
(Percentages)
05
101520253035404550
2002
2011
2002
2011
2002
2011
2002
2011
2002
2011
2002
2011
2002
2011
2002
2011
2002
2011
2002
2011
2002
2011
2001
2011
2002
2011
2002
2011
2002
2011
2002
2011
2002
2011
2002
2011
Arg
entin
a
Bol
ivia
(Plu
r. St
ate
of)
Bra
zil
Chi
le
Col
ombi
a
Cos
ta R
ica
Ecu
ador
El S
alva
dor
Gua
tem
ala
Hon
dura
s
Mex
ico
Nic
arag
ua
Pan
ama
Per
u
Par
agua
y
Dom
inic
anR
ep.
Uru
guay
Vene
zuel
a(B
ol. R
ep. o
f)
Women Men
Source: Economic Commission for Latin America and the Caribbean (ECLAC), on the basis of data from household surveys.
The sharp drop in unemployment between 2002 and 2011 occurred across most of the countries, except for the Bahamas, Barbados, Costa Rica, Guatemala, Honduras and Mexico. The unemployment rate for women is higher than for men in all the countries, except El Salvador and Mexico. The gap is particularly wide in Brazil, the Dominican Republic and Jamaica, where the female unemployment rate is about twice the male rate, although in the Dominican Republic (as in Ecuador and, to a lesser extent, in Panama), the gap has narrowed significantly.
14 Less than 30 hours per week is considered part-time work.
Figure III.18 (concluded)
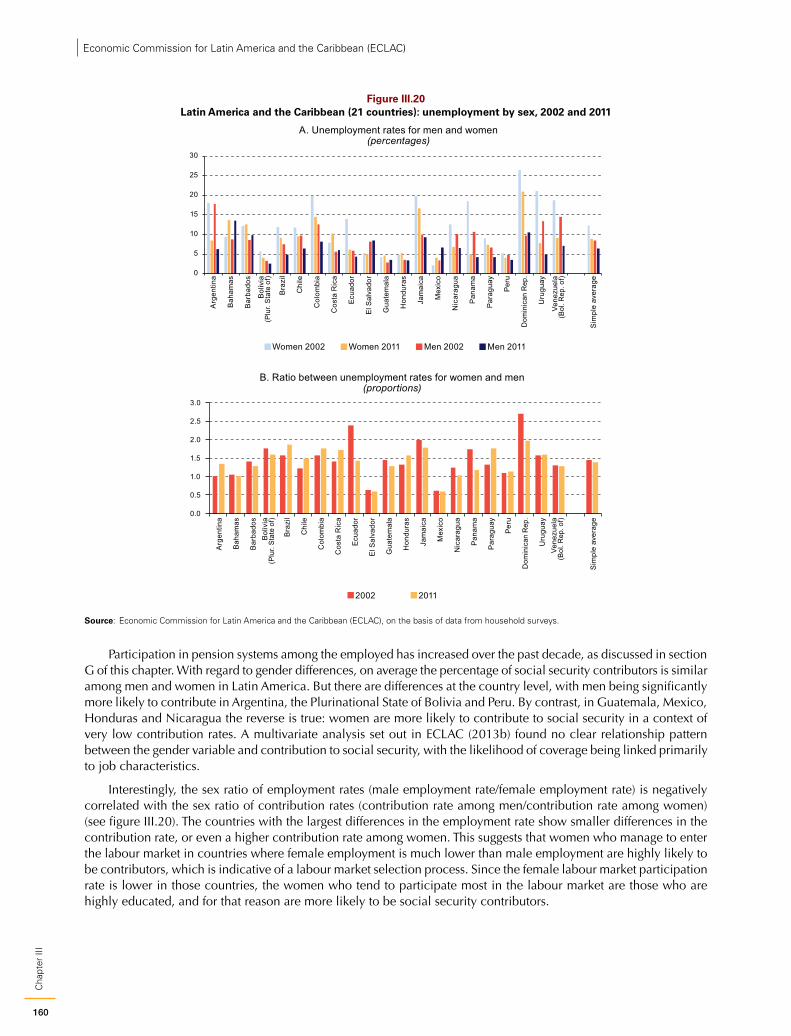
160
Cha
pter
III
Economic Commission for Latin America and the Caribbean (ECLAC)
Figure III.20 Latin America and the Caribbean (21 countries): unemployment by sex, 2002 and 2011
0
5
10
15
20
25
30
Arg
entin
a
Bah
amas
Bar
bado
s
Bol
ivia
(Plu
r. St
ate
of)
Bra
zil
Chi
le
Col
ombi
a
Cos
ta R
ica
Ecu
ador
El S
alva
dor
Gua
tem
ala
Hon
dura
s
Jam
aica
Mex
ico
Nic
arag
ua
Pan
ama
Par
agua
y
Per
u
Dom
inic
an R
ep.
Uru
guay
Vene
zuel
a(B
ol. R
ep. o
f)
Sim
ple
aver
age
Women 2002 Women 2011 Men 2002 Men 2011
A. Unemployment rates for men and women(percentages)
0.0
0.5
1.0
1.5
2.0
2.5
3.0
Arg
entin
a
Bah
amas
Bar
bado
sB
oliv
ia(P
lur.
Stat
e of
)
Bra
zil
Chi
le
Col
ombi
a
Cos
ta R
ica
Ecu
ador
El S
alva
dor
Gua
tem
ala
Hon
dura
s
Jam
aica
Mex
ico
Nic
arag
ua
Pan
ama
Par
agua
y
Per
u
Dom
inic
an R
ep.
Uru
guay
Vene
zuel
a(B
ol. R
ep. o
f)
Sim
ple
aver
age
2002 2011
B. Ratio between unemployment rates for women and men(proportions)
Source: Economic Commission for Latin America and the Caribbean (ECLAC), on the basis of data from household surveys.
Participation in pension systems among the employed has increased over the past decade, as discussed in section G of this chapter. With regard to gender differences, on average the percentage of social security contributors is similar among men and women in Latin America. But there are differences at the country level, with men being significantly more likely to contribute in Argentina, the Plurinational State of Bolivia and Peru. By contrast, in Guatemala, Mexico, Honduras and Nicaragua the reverse is true: women are more likely to contribute to social security in a context of very low contribution rates. A multivariate analysis set out in ECLAC (2013b) found no clear relationship pattern between the gender variable and contribution to social security, with the likelihood of coverage being linked primarily to job characteristics.
Interestingly, the sex ratio of employment rates (male employment rate/female employment rate) is negatively correlated with the sex ratio of contribution rates (contribution rate among men/contribution rate among women) (see figure III.20). The countries with the largest differences in the employment rate show smaller differences in the contribution rate, or even a higher contribution rate among women. This suggests that women who manage to enter the labour market in countries where female employment is much lower than male employment are highly likely to be contributors, which is indicative of a labour market selection process. Since the female labour market participation rate is lower in those countries, the women who tend to participate most in the labour market are those who are highly educated, and for that reason are more likely to be social security contributors.
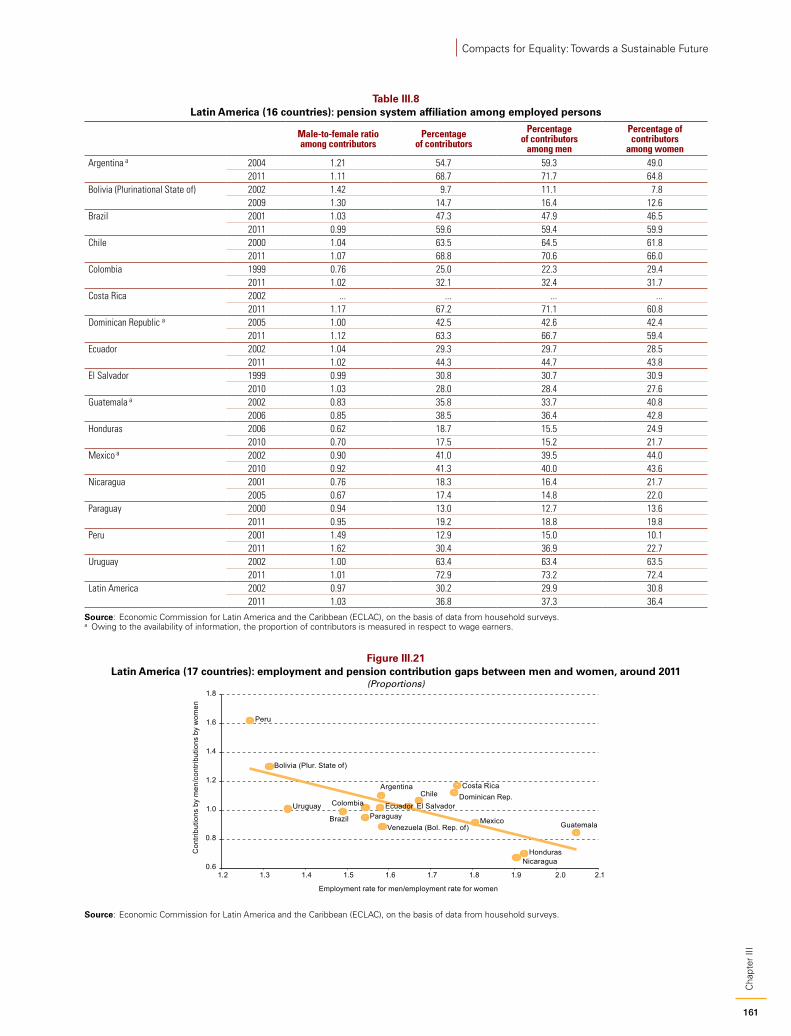
161
Cha
pter
III
Compacts for Equality: Towards a Sustainable Future
Table III.8 Latin America (16 countries): pension system affiliation among employed persons
Male-to-female ratio among contributors
Percentage of contributors
Percentage of contributors
among men
Percentage of contributors
among womenArgentina a 2004 1.21 54.7 59.3 49.0
2011 1.11 68.7 71.7 64.8Bolivia (Plurinational State of) 2002 1.42 9.7 11.1 7.8
2009 1.30 14.7 16.4 12.6Brazil 2001 1.03 47.3 47.9 46.5
2011 0.99 59.6 59.4 59.9Chile 2000 1.04 63.5 64.5 61.8
2011 1.07 68.8 70.6 66.0Colombia 1999 0.76 25.0 22.3 29.4
2011 1.02 32.1 32.4 31.7Costa Rica 2002 ... ... ... ...
2011 1.17 67.2 71.1 60.8Dominican Republic a 2005 1.00 42.5 42.6 42.4
2011 1.12 63.3 66.7 59.4Ecuador 2002 1.04 29.3 29.7 28.5
2011 1.02 44.3 44.7 43.8El Salvador 1999 0.99 30.8 30.7 30.9
2010 1.03 28.0 28.4 27.6Guatemala a 2002 0.83 35.8 33.7 40.8
2006 0.85 38.5 36.4 42.8Honduras 2006 0.62 18.7 15.5 24.9
2010 0.70 17.5 15.2 21.7Mexico a 2002 0.90 41.0 39.5 44.0
2010 0.92 41.3 40.0 43.6Nicaragua 2001 0.76 18.3 16.4 21.7
2005 0.67 17.4 14.8 22.0Paraguay 2000 0.94 13.0 12.7 13.6
2011 0.95 19.2 18.8 19.8Peru 2001 1.49 12.9 15.0 10.1
2011 1.62 30.4 36.9 22.7Uruguay 2002 1.00 63.4 63.4 63.5
2011 1.01 72.9 73.2 72.4Latin America 2002 0.97 30.2 29.9 30.8
2011 1.03 36.8 37.3 36.4
Source: Economic Commission for Latin America and the Caribbean (ECLAC), on the basis of data from household surveys.a Owing to the availability of information, the proportion of contributors is measured in respect to wage earners.
Figure III.21 Latin America (17 countries): employment and pension contribution gaps between men and women, around 2011
(Proportions)
Argentina
Bolivia (Plur. State of)
Brazil
ChileColombia
Costa Rica
El Salvador
Guatemala
Honduras
Mexico
Nicaragua
Paraguay
Peru
Dominican Rep.Uruguay
Venezuela (Bol. Rep. of)
0.6
0.8
1.0
1.2
1.4
1.6
1.8
1.2 1.3 1.4 1.5 1.6 1.7 1.8 1.9 2.0 2.1
Con
trib
utio
ns b
y m
en/c
ontr
ibut
ions
by
wom
en
Employment rate for men/employment rate for women
Ecuador
Source: Economic Commission for Latin America and the Caribbean (ECLAC), on the basis of data from household surveys.
162
Cha
pter
III
Economic Commission for Latin America and the Caribbean (ECLAC)
Summing up, gender gaps have narrowed in terms of labour market participation and employment in most of the countries (as have, to a lesser extent, unemployment rate gaps). But they are still significant even where women have overcome their educational disadvantages, and this implies large potential losses in productivity and household income. However, it is not just a matter of reducing household income gaps by increasing women’s pay. It is also very important to close the employment gaps so as to advance equality in other areas, such as the full exercise of autonomy, the development of individual capacities and potential, access to contributory social protection and participation in society beyond the household.
There is no question that there is ample scope for public policy here, ranging from labour policies to care policies, which will be addressed below. Achieving the best policy design requires precise and detailed information on female labour market engagement and an understanding of the processes under way. This is the focus of the next two sections, which examine occupational segregation and income differences by sex.
2. Occupational segregation
Occupational segregation by sex is the crowding of women in a small number of occupations (and the resulting predominantly female- or male-dominated ones) along with a male-dominated occupational hierarchy. The distribution of men and women in different occupations is horizontal segregation; the distribution of men and women by occupational hierarchy is known as vertical segregation.
Gendered occupational segregation has its own implications, and it can impact relative pay. According to Bergmann’s hypothesis (1974), the crowding of women in female occupations turns these occupations into lower-paid ones owing to the growing female labour supply and the short supply of jobs for women. Empirical evidence indicates that occupational segregation indeed accounts for much of the wage gap between women and men (Macpherson and Hirsch, 1995; Altonji and Blank, 1999; Olivetti and Petrongolo, 2008 and Miller, 2009, among others). This segregation is largely due to attitudes on the part of employers or of workers themselves as to what occupations are appropriate for women. This is part of a learned social construct shaped by power relationships underlying the gendered division of labour within households. In turn, labour discrimination can influence decisions taken by individuals, particularly women, before entering the market. What is more, in some cases occupational segregation can result from educational segregation, which to some extent reflects women’s options and preferences but can also stem from social norms and learned behaviour.15
Occupational segregation, then, operates across multiple dimensions of equality and inequality, underpinned by underlying inequalities in terms of recognition, roles and relationships, cultural patterns and power. For that very reason, the scope of public policy action in this sphere is broad, ranging from antidiscrimination policies to care policies.
Before embarking on an analysis of occupational segregation, it is useful to look at segregation in terms of sectors of activity and the distribution of women by occupational category. Both factors, together with occupational segregation, cast light on the differential labour market participation of women. Women are far more concentrated in certain branches of activity than men (see figure III.22); almost 70% are crowded into two sectors: public administration, education, health and social services (39%); and commerce (30%). The two main branches of activity for men are agriculture (24%) and commerce (20%). The concentration of women in these two sectors is seen in all the countries (see figure III.23), with the exception of the Plurinational State of Bolivia and Peru, where agriculture is in second place (accounting for more female employment than commerce).
15 A number of studies show that a significant part of the wage differential between men and women with tertiary education is explained by the specialization of their university studies: women tend to be overrepresented in service-related studies, leading to lower pay (see McDonald and Thornton, 2007; Chevalier, 2007; Cepeda and Barón, 2012).
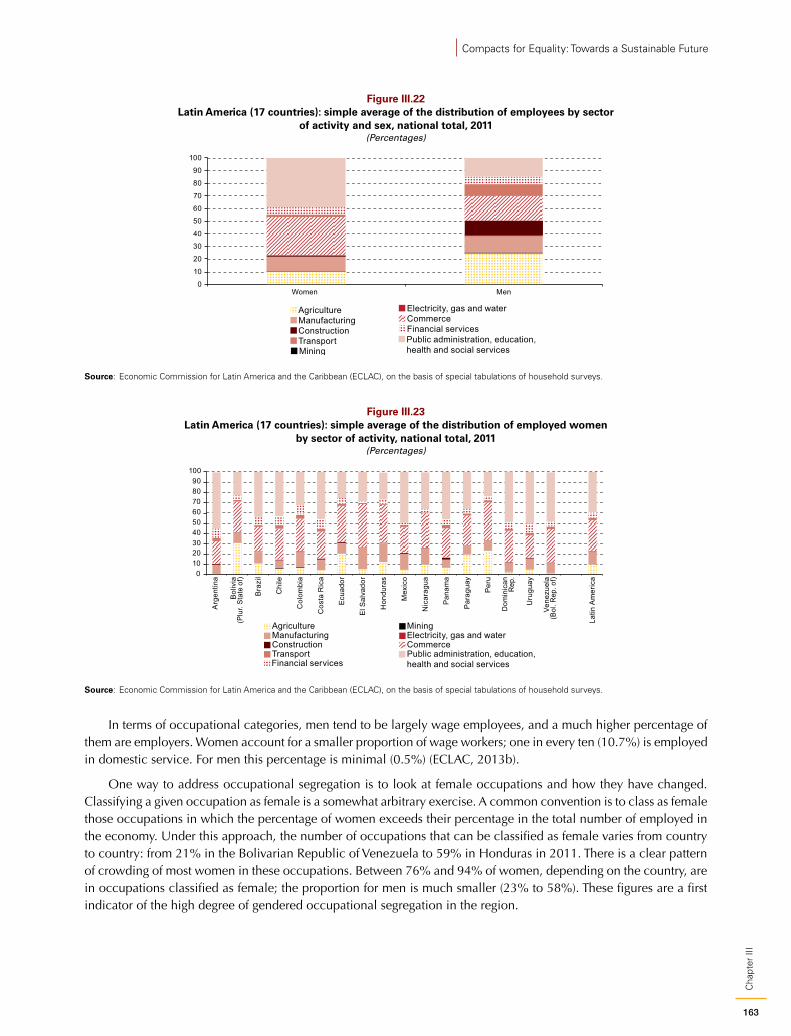
163
Cha
pter
III
Compacts for Equality: Towards a Sustainable Future
Figure III.22 Latin America (17 countries): simple average of the distribution of employees by sector
of activity and sex, national total, 2011(Percentages)
0
10
20
30
40
50
60
70
80
90
100
Women Men
Agriculture
Mining
ManufacturingElectricity, gas and water
ConstructionCommerce
TransportFinancial servicesPublic administration, education,health and social services
Source: Economic Commission for Latin America and the Caribbean (ECLAC), on the basis of special tabulations of household surveys.
Figure III.23 Latin America (17 countries): simple average of the distribution of employed women
by sector of activity, national total, 2011(Percentages)
0102030405060708090
100
Arg
entin
a
Bol
ivia
(Plu
r. St
ate
of)
Bra
zil
Chi
le
Col
ombi
a
Cos
ta R
ica
Ecu
ador
El S
alva
dor
Hon
dura
s
Mex
ico
Nic
arag
ua
Pan
ama
Par
agua
y
Per
u
Dom
inic
anR
ep.
Uru
guay
Vene
zuel
a(B
ol. R
ep. o
f)
Latin
Am
eric
a
Agriculture MiningManufacturing Electricity, gas and waterConstruction CommerceTransportFinancial services
Public administration, education,health and social services
Source: Economic Commission for Latin America and the Caribbean (ECLAC), on the basis of special tabulations of household surveys.
In terms of occupational categories, men tend to be largely wage employees, and a much higher percentage of them are employers. Women account for a smaller proportion of wage workers; one in every ten (10.7%) is employed in domestic service. For men this percentage is minimal (0.5%) (ECLAC, 2013b).
One way to address occupational segregation is to look at female occupations and how they have changed. Classifying a given occupation as female is a somewhat arbitrary exercise. A common convention is to class as female those occupations in which the percentage of women exceeds their percentage in the total number of employed in the economy. Under this approach, the number of occupations that can be classified as female varies from country to country: from 21% in the Bolivarian Republic of Venezuela to 59% in Honduras in 2011. There is a clear pattern of crowding of most women in these occupations. Between 76% and 94% of women, depending on the country, are in occupations classified as female; the proportion for men is much smaller (23% to 58%). These figures are a first indicator of the high degree of gendered occupational segregation in the region.
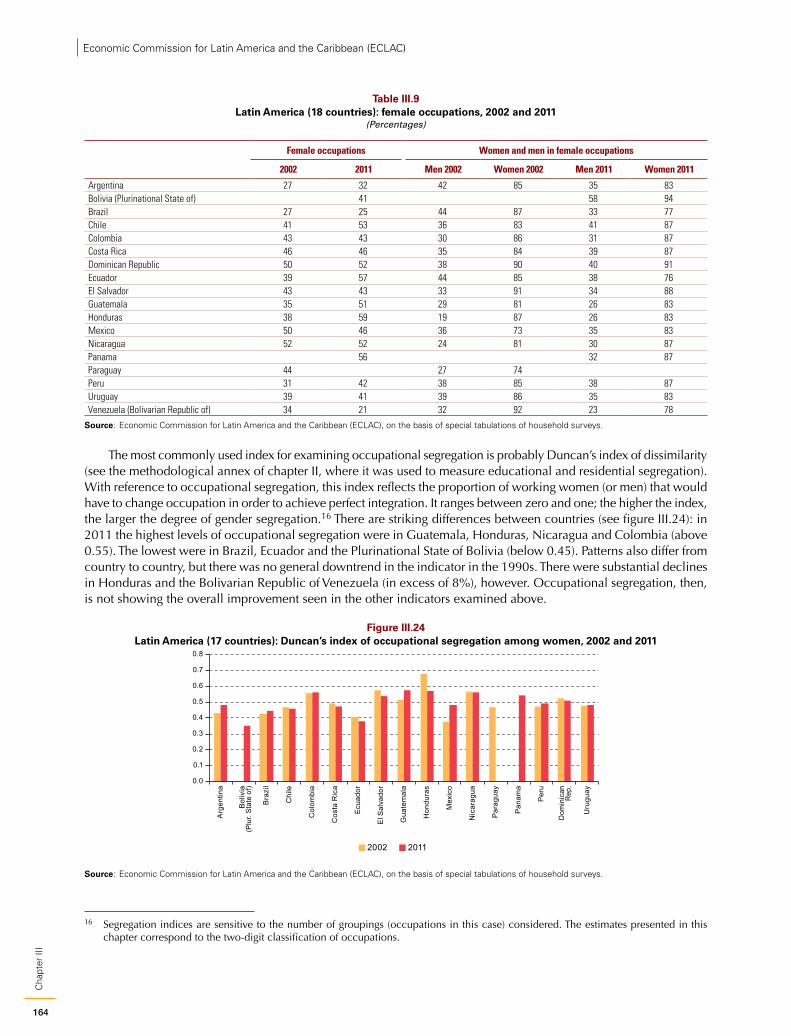
164
Cha
pter
III
Economic Commission for Latin America and the Caribbean (ECLAC)
Table III.9 Latin America (18 countries): female occupations, 2002 and 2011
(Percentages)
Female occupations Women and men in female occupations
2002 2011 Men 2002 Women 2002 Men 2011 Women 2011
Argentina 27 32 42 85 35 83Bolivia (Plurinational State of) 41 58 94Brazil 27 25 44 87 33 77Chile 41 53 36 83 41 87Colombia 43 43 30 86 31 87Costa Rica 46 46 35 84 39 87Dominican Republic 50 52 38 90 40 91Ecuador 39 57 44 85 38 76El Salvador 43 43 33 91 34 88Guatemala 35 51 29 81 26 83Honduras 38 59 19 87 26 83Mexico 50 46 36 73 35 83Nicaragua 52 52 24 81 30 87Panama 56 32 87Paraguay 44 27 74Peru 31 42 38 85 38 87Uruguay 39 41 39 86 35 83Venezuela (Bolivarian Republic of) 34 21 32 92 23 78
Source: Economic Commission for Latin America and the Caribbean (ECLAC), on the basis of special tabulations of household surveys.
The most commonly used index for examining occupational segregation is probably Duncan’s index of dissimilarity (see the methodological annex of chapter II, where it was used to measure educational and residential segregation). With reference to occupational segregation, this index reflects the proportion of working women (or men) that would have to change occupation in order to achieve perfect integration. It ranges between zero and one; the higher the index, the larger the degree of gender segregation.16 There are striking differences between countries (see figure III.24): in 2011 the highest levels of occupational segregation were in Guatemala, Honduras, Nicaragua and Colombia (above 0.55). The lowest were in Brazil, Ecuador and the Plurinational State of Bolivia (below 0.45). Patterns also differ from country to country, but there was no general downtrend in the indicator in the 1990s. There were substantial declines in Honduras and the Bolivarian Republic of Venezuela (in excess of 8%), however. Occupational segregation, then, is not showing the overall improvement seen in the other indicators examined above.
Figure III.24 Latin America (17 countries): Duncan’s index of occupational segregation among women, 2002 and 2011
0.0
0.1
0.2
0.3
0.4
0.5
0.6
0.7
0.8
Arg
entin
a
Bol
ivia
(Plu
r. St
ate
of)
Bra
zil
Chi
le
Col
ombi
a
Cos
ta R
ica
Ecu
ador
El S
alva
dor
Gua
tem
ala
Hon
dura
s
Mex
ico
Nic
arag
ua
Par
agua
y
Pan
ama
Per
u
Dom
inic
anR
ep.
Uru
guay
2002 2011
Source: Economic Commission for Latin America and the Caribbean (ECLAC), on the basis of special tabulations of household surveys.
16 Segregation indices are sensitive to the number of groupings (occupations in this case) considered. The estimates presented in this chapter correspond to the two-digit classification of occupations.
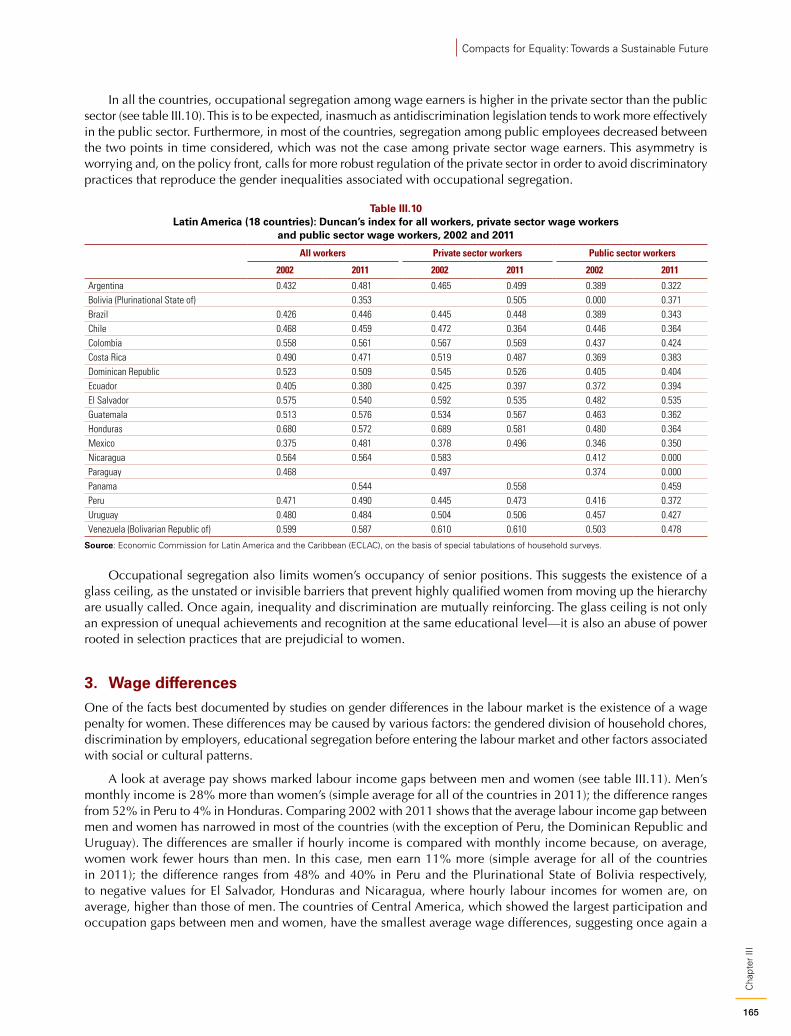
165
Cha
pter
III
Compacts for Equality: Towards a Sustainable Future
In all the countries, occupational segregation among wage earners is higher in the private sector than the public sector (see table III.10). This is to be expected, inasmuch as antidiscrimination legislation tends to work more effectively in the public sector. Furthermore, in most of the countries, segregation among public employees decreased between the two points in time considered, which was not the case among private sector wage earners. This asymmetry is worrying and, on the policy front, calls for more robust regulation of the private sector in order to avoid discriminatory practices that reproduce the gender inequalities associated with occupational segregation.
Table III.10 Latin America (18 countries): Duncan’s index for all workers, private sector wage workers
and public sector wage workers, 2002 and 2011
All workers Private sector workers Public sector workers
2002 2011 2002 2011 2002 2011
Argentina 0.432 0.481 0.465 0.499 0.389 0.322Bolivia (Plurinational State of) 0.353 0.505 0.000 0.371Brazil 0.426 0.446 0.445 0.448 0.389 0.343Chile 0.468 0.459 0.472 0.364 0.446 0.364Colombia 0.558 0.561 0.567 0.569 0.437 0.424Costa Rica 0.490 0.471 0.519 0.487 0.369 0.383Dominican Republic 0.523 0.509 0.545 0.526 0.405 0.404Ecuador 0.405 0.380 0.425 0.397 0.372 0.394El Salvador 0.575 0.540 0.592 0.535 0.482 0.535Guatemala 0.513 0.576 0.534 0.567 0.463 0.362Honduras 0.680 0.572 0.689 0.581 0.480 0.364Mexico 0.375 0.481 0.378 0.496 0.346 0.350Nicaragua 0.564 0.564 0.583 0.412 0.000Paraguay 0.468 0.497 0.374 0.000Panama 0.544 0.558 0.459Peru 0.471 0.490 0.445 0.473 0.416 0.372Uruguay 0.480 0.484 0.504 0.506 0.457 0.427Venezuela (Bolivarian Republic of) 0.599 0.587 0.610 0.610 0.503 0.478
Source: Economic Commission for Latin America and the Caribbean (ECLAC), on the basis of special tabulations of household surveys.
Occupational segregation also limits women’s occupancy of senior positions. This suggests the existence of a glass ceiling, as the unstated or invisible barriers that prevent highly qualified women from moving up the hierarchy are usually called. Once again, inequality and discrimination are mutually reinforcing. The glass ceiling is not only an expression of unequal achievements and recognition at the same educational level—it is also an abuse of power rooted in selection practices that are prejudicial to women.
3. Wage differencesOne of the facts best documented by studies on gender differences in the labour market is the existence of a wage penalty for women. These differences may be caused by various factors: the gendered division of household chores, discrimination by employers, educational segregation before entering the labour market and other factors associated with social or cultural patterns.
A look at average pay shows marked labour income gaps between men and women (see table III.11). Men’s monthly income is 28% more than women’s (simple average for all of the countries in 2011); the difference ranges from 52% in Peru to 4% in Honduras. Comparing 2002 with 2011 shows that the average labour income gap between men and women has narrowed in most of the countries (with the exception of Peru, the Dominican Republic and Uruguay). The differences are smaller if hourly income is compared with monthly income because, on average, women work fewer hours than men. In this case, men earn 11% more (simple average for all of the countries in 2011); the difference ranges from 48% and 40% in Peru and the Plurinational State of Bolivia respectively, to negative values for El Salvador, Honduras and Nicaragua, where hourly labour incomes for women are, on average, higher than those of men. The countries of Central America, which showed the largest participation and occupation gaps between men and women, have the smallest average wage differences, suggesting once again a
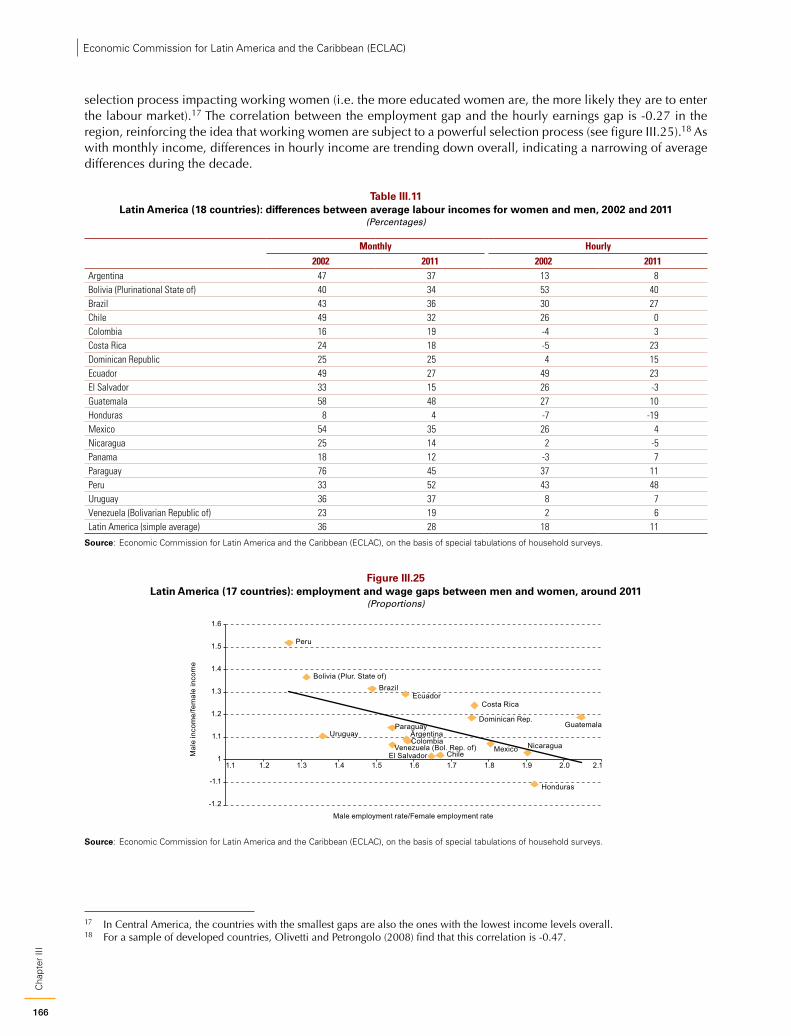
166
Cha
pter
III
Economic Commission for Latin America and the Caribbean (ECLAC)
selection process impacting working women (i.e. the more educated women are, the more likely they are to enter the labour market).17 The correlation between the employment gap and the hourly earnings gap is -0.27 in the region, reinforcing the idea that working women are subject to a powerful selection process (see figure III.25).18 As with monthly income, differences in hourly income are trending down overall, indicating a narrowing of average differences during the decade.
Table III.11 Latin America (18 countries): differences between average labour incomes for women and men, 2002 and 2011
(Percentages)
Monthly Hourly2002 2011 2002 2011
Argentina 47 37 13 8Bolivia (Plurinational State of) 40 34 53 40Brazil 43 36 30 27Chile 49 32 26 0Colombia 16 19 -4 3Costa Rica 24 18 -5 23Dominican Republic 25 25 4 15Ecuador 49 27 49 23El Salvador 33 15 26 -3Guatemala 58 48 27 10Honduras 8 4 -7 -19Mexico 54 35 26 4Nicaragua 25 14 2 -5Panama 18 12 -3 7Paraguay 76 45 37 11Peru 33 52 43 48Uruguay 36 37 8 7Venezuela (Bolivarian Republic of) 23 19 2 6Latin America (simple average) 36 28 18 11
Source: Economic Commission for Latin America and the Caribbean (ECLAC), on the basis of special tabulations of household surveys.
Figure III.25 Latin America (17 countries): employment and wage gaps between men and women, around 2011
(Proportions)
Argentina
Bolivia (Plur. State of)Brazil
Chile
Colombia
Costa RicaEcuador
El Salvador
Guatemala
Honduras
Mexico Nicaragua
Paraguay
Peru
Dominican Rep.
Uruguay
Venezuela (Bol. Rep. of)
-1.2
-1.1
1
1.1
1.2
1.3
1.4
1.5
1.6
1.1 1.2 1.3 1.4 1.5 1.6 1.7 1.8 1.9 2.0 2.1
Mal
e in
com
e/fe
mal
e in
com
e
Male employment rate/Female employment rate
Source: Economic Commission for Latin America and the Caribbean (ECLAC), on the basis of special tabulations of household surveys.
17 In Central America, the countries with the smallest gaps are also the ones with the lowest income levels overall.18 For a sample of developed countries, Olivetti and Petrongolo (2008) find that this correlation is -0.47.
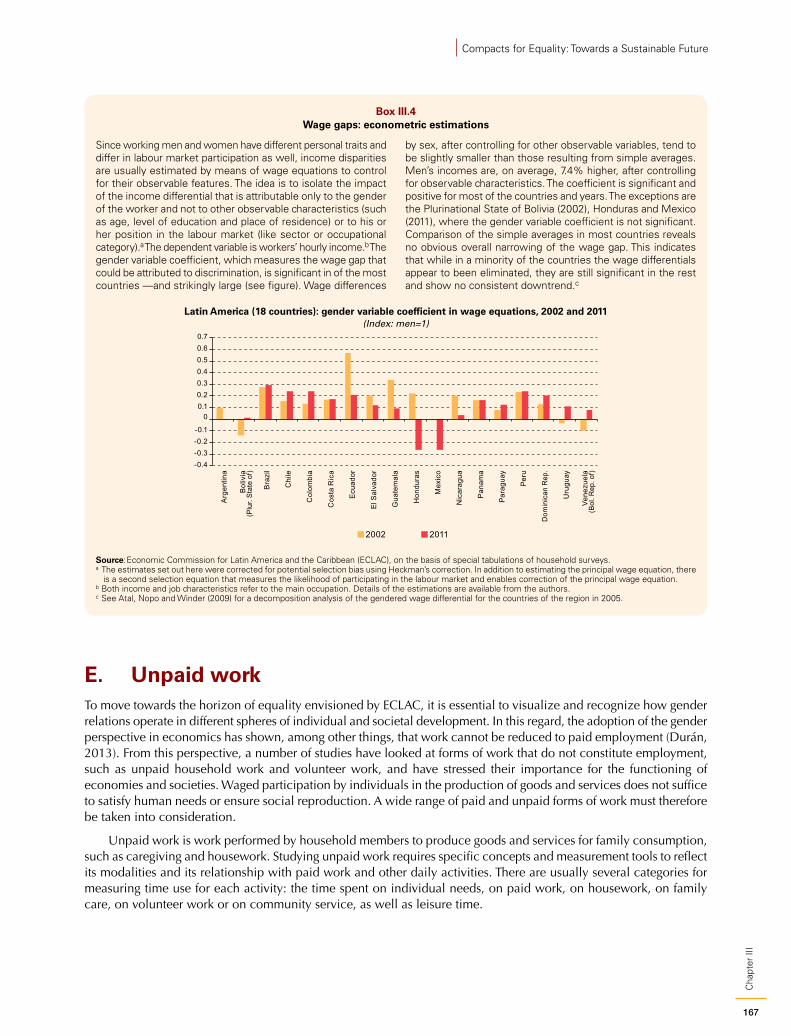
167
Cha
pter
III
Compacts for Equality: Towards a Sustainable Future
Box III.4 Wage gaps: econometric estimations
Since working men and women have different personal traits and differ in labour market participation as well, income disparities are usually estimated by means of wage equations to control for their observable features. The idea is to isolate the impact of the income differential that is attributable only to the gender of the worker and not to other observable characteristics (such as age, level of education and place of residence) or to his or her position in the labour market (like sector or occupational category).a The dependent variable is workers’ hourly income.b The gender variable coefficient, which measures the wage gap that could be attributed to discrimination, is significant in of the most countries —and strikingly large (see figure). Wage differences
by sex, after controlling for other observable variables, tend to be slightly smaller than those resulting from simple averages. Men’s incomes are, on average, 7.4% higher, after controlling for observable characteristics. The coefficient is significant and positive for most of the countries and years. The exceptions are the Plurinational State of Bolivia (2002), Honduras and Mexico (2011), where the gender variable coefficient is not significant. Comparison of the simple averages in most countries reveals no obvious overall narrowing of the wage gap. This indicates that while in a minority of the countries the wage differentials appear to been eliminated, they are still significant in the rest and show no consistent downtrend.c
Latin America (18 countries): gender variable coefficient in wage equations, 2002 and 2011(Index: men=1)
-0.4-0.3-0.2-0.1
00.10.20.30.40.50.60.7
Arg
entin
a
Bol
ivia
(Plu
r. St
ate
of)
Bra
zil
Chi
le
Col
ombi
a
Cos
ta R
ica
Ecu
ador
El S
alva
dor
Gua
tem
ala
Hon
dura
s
Mex
ico
Nic
arag
ua
Pan
ama
Par
agua
y
Per
u
Dom
inic
an R
ep.
Uru
guay
Vene
zuel
a(B
ol. R
ep. o
f)
2002 2011
Source: Economic Commission for Latin America and the Caribbean (ECLAC), on the basis of special tabulations of household surveys.a The estimates set out here were corrected for potential selection bias using Heckman’s correction. In addition to estimating the principal wage equation, there
is a second selection equation that measures the likelihood of participating in the labour market and enables correction of the principal wage equation.b Both income and job characteristics refer to the main occupation. Details of the estimations are available from the authors. c See Atal, Nopo and Winder (2009) for a decomposition analysis of the gendered wage differential for the countries of the region in 2005.
E. Unpaid workTo move towards the horizon of equality envisioned by ECLAC, it is essential to visualize and recognize how gender relations operate in different spheres of individual and societal development. In this regard, the adoption of the gender perspective in economics has shown, among other things, that work cannot be reduced to paid employment (Durán, 2013). From this perspective, a number of studies have looked at forms of work that do not constitute employment, such as unpaid household work and volunteer work, and have stressed their importance for the functioning of economies and societies. Waged participation by individuals in the production of goods and services does not suffice to satisfy human needs or ensure social reproduction. A wide range of paid and unpaid forms of work must therefore be taken into consideration.
Unpaid work is work performed by household members to produce goods and services for family consumption, such as caregiving and housework. Studying unpaid work requires specific concepts and measurement tools to reflect its modalities and its relationship with paid work and other daily activities. There are usually several categories for measuring time use for each activity: the time spent on individual needs, on paid work, on housework, on family care, on volunteer work or on community service, as well as leisure time.
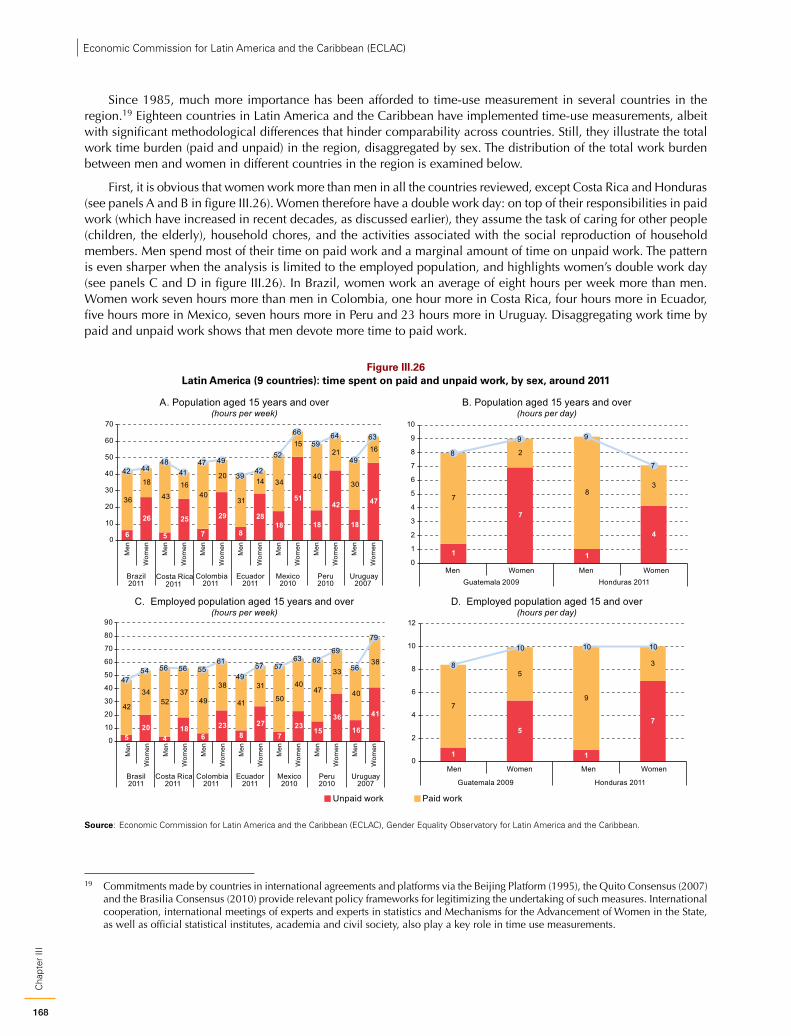
168
Cha
pter
III
Economic Commission for Latin America and the Caribbean (ECLAC)
Since 1985, much more importance has been afforded to time-use measurement in several countries in the region.19 Eighteen countries in Latin America and the Caribbean have implemented time-use measurements, albeit with significant methodological differences that hinder comparability across countries. Still, they illustrate the total work time burden (paid and unpaid) in the region, disaggregated by sex. The distribution of the total work burden between men and women in different countries in the region is examined below.
First, it is obvious that women work more than men in all the countries reviewed, except Costa Rica and Honduras (see panels A and B in figure III.26). Women therefore have a double work day: on top of their responsibilities in paid work (which have increased in recent decades, as discussed earlier), they assume the task of caring for other people (children, the elderly), household chores, and the activities associated with the social reproduction of household members. Men spend most of their time on paid work and a marginal amount of time on unpaid work. The pattern is even sharper when the analysis is limited to the employed population, and highlights women’s double work day (see panels C and D in figure III.26). In Brazil, women work an average of eight hours per week more than men. Women work seven hours more than men in Colombia, one hour more in Costa Rica, four hours more in Ecuador, five hours more in Mexico, seven hours more in Peru and 23 hours more in Uruguay. Disaggregating work time by paid and unpaid work shows that men devote more time to paid work.
Figure III.26 Latin America (9 countries): time spent on paid and unpaid work, by sex, around 2011
A. Population aged 15 years and over(hours per week)
B. Population aged 15 years and over (hours per day)
C. Employed population aged 15 years and over (hours per week)
D. Employed population aged 15 and over (hours per day)
6
26
5
25
7
29
8
2818
51
18
42
18
4736
18
4316
40
20
31
14 34
15
40
21
30
16
42 4448
4147 49
3942
52
6659
64
49
63
0
10
20
30
40
50
60
70
Men
Wom
en
Men
Wom
en
Men
Wom
en
Men
Wom
en
Men
Wom
en
Men
Wom
en
Men
Wom
en
Brazil2011
Costa Rica2011
Colombia2011
Ecuador2011
Mexico2010
Peru2010
Uruguay2007
Unpaid work Paid work
1
7
1
4
7
2
83
8
9 9
7
0
1
2
3
4
5
6
7
8
9
10
Men Women Men WomenGuatemala 2009 Honduras 2011
520
418
623
827
723
15
36
16
4142
3452
3749
38
41
31
50
4047
33
40
38
4754 56 56 55
61
4957 57
63 6269
56
79
0
10
20
30
40
50
60
70
80
90
Brasil2011
Costa Rica2011
Colombia2011
Ecuador2011
Mexico2010
Peru2010
Uruguay2007
Men
Wom
en
Men
Wom
en
Men
Wom
en
Men
Wom
en
Men
Wom
en
Men
Wom
en
Men
Wom
en
1
5
1
7
7
5
9
38
10 10 10
0
2
4
6
8
10
12
Men Women Men Women
Guatemala 2009 Honduras 2011
Source: Economic Commission for Latin America and the Caribbean (ECLAC), Gender Equality Observatory for Latin America and the Caribbean.
19 Commitments made by countries in international agreements and platforms via the Beijing Platform (1995), the Quito Consensus (2007) and the Brasilia Consensus (2010) provide relevant policy frameworks for legitimizing the undertaking of such measures. International cooperation, international meetings of experts and experts in statistics and Mechanisms for the Advancement of Women in the State, as well as official statistical institutes, academia and civil society, also play a key role in time use measurements.
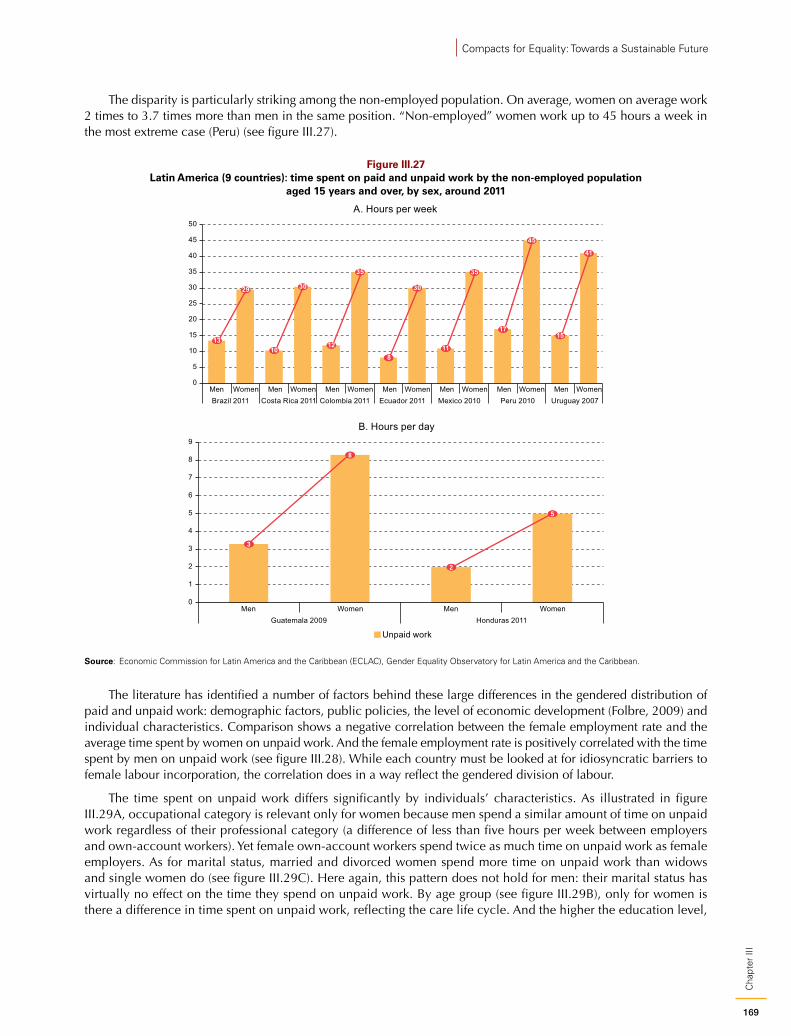
169
Cha
pter
III
Compacts for Equality: Towards a Sustainable Future
The disparity is particularly striking among the non-employed population. On average, women on average work 2 times to 3.7 times more than men in the same position. “Non-employed” women work up to 45 hours a week in the most extreme case (Peru) (see figure III.27).
Figure III.27 Latin America (9 countries): time spent on paid and unpaid work by the non-employed population
aged 15 years and over, by sex, around 2011
13
29
10
30
12
35
8
30
11
35
17
45
15
41
0
5
10
15
20
25
30
35
40
45
50
Men Women Men Women Men Women Men Women Men Women Men Women Men WomenBrazil 2011 Costa Rica 2011 Colombia 2011 Ecuador 2011 Mexico 2010 Peru 2010 Uruguay 2007
A. Hours per week
B. Hours per day
3
8
2
5
0
1
2
3
4
5
6
7
8
9
Men Women Men WomenGuatemala 2009 Honduras 2011
Unpaid work
Source: Economic Commission for Latin America and the Caribbean (ECLAC), Gender Equality Observatory for Latin America and the Caribbean.
The literature has identified a number of factors behind these large differences in the gendered distribution of paid and unpaid work: demographic factors, public policies, the level of economic development (Folbre, 2009) and individual characteristics. Comparison shows a negative correlation between the female employment rate and the average time spent by women on unpaid work. And the female employment rate is positively correlated with the time spent by men on unpaid work (see figure III.28). While each country must be looked at for idiosyncratic barriers to female labour incorporation, the correlation does in a way reflect the gendered division of labour.
The time spent on unpaid work differs significantly by individuals’ characteristics. As illustrated in figure III.29A, occupational category is relevant only for women because men spend a similar amount of time on unpaid work regardless of their professional category (a difference of less than five hours per week between employers and own-account workers). Yet female own-account workers spend twice as much time on unpaid work as female employers. As for marital status, married and divorced women spend more time on unpaid work than widows and single women do (see figure III.29C). Here again, this pattern does not hold for men: their marital status has virtually no effect on the time they spend on unpaid work. By age group (see figure III.29B), only for women is there a difference in time spent on unpaid work, reflecting the care life cycle. And the higher the education level,
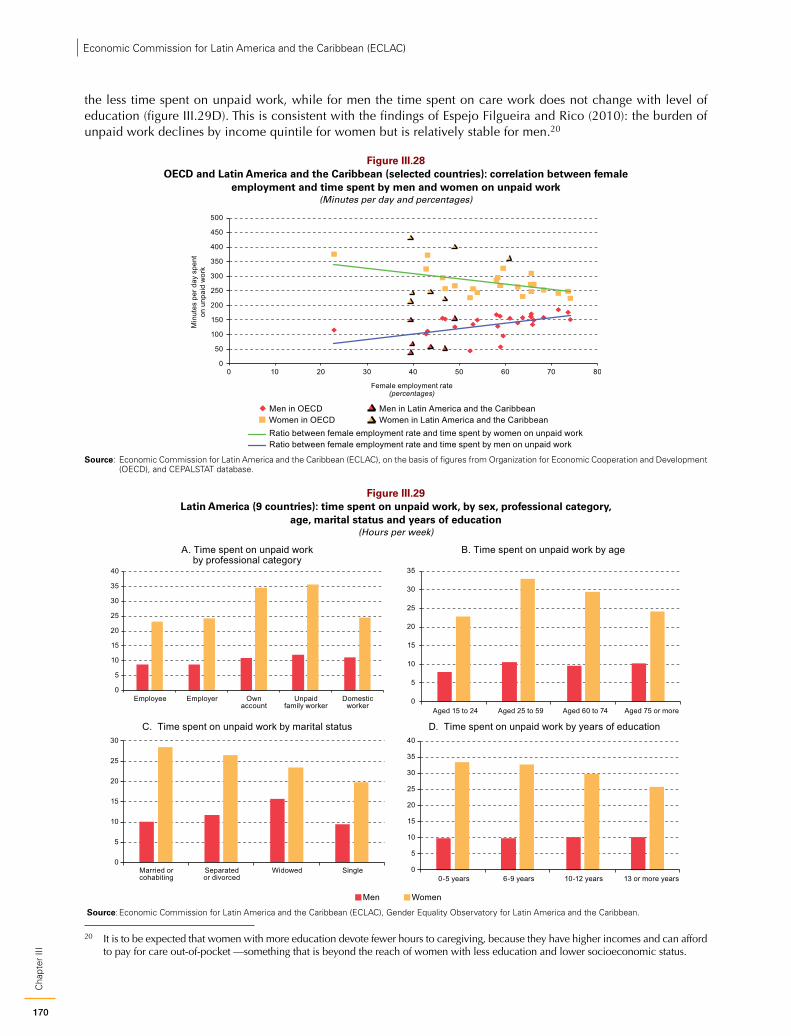
170
Cha
pter
III
Economic Commission for Latin America and the Caribbean (ECLAC)
the less time spent on unpaid work, while for men the time spent on care work does not change with level of education (figure III.29D). This is consistent with the findings of Espejo Filgueira and Rico (2010): the burden of unpaid work declines by income quintile for women but is relatively stable for men.20
Figure III.28 OECD and Latin America and the Caribbean (selected countries): correlation between female
employment and time spent by men and women on unpaid work(Minutes per day and percentages)
0
50
100
150
200
250
300
350
400
450
500
0 10 20 30 40 50 60 70 80
Men in OECD
Ratio between female employment rate and time spent by women on unpaid work
Men in Latin America and the CaribbeanWomen in OECD Women in Latin America and the Caribbean
Ratio between female employment rate and time spent by men on unpaid work
Min
utes
per
day
spe
nton
unp
aid
wor
k
Female employment rate(percentages)
Source: Economic Commission for Latin America and the Caribbean (ECLAC), on the basis of figures from Organization for Economic Cooperation and Development (OECD), and CEPALSTAT database.
Figure III.29 Latin America (9 countries): time spent on unpaid work, by sex, professional category,
age, marital status and years of education (Hours per week)
0
5
10
15
20
25
30
35
40
Employee Employer Ownaccount
Unpaidfamily worker
Domesticworker
A. Time spent on unpaid workby professional category
B. Time spent on unpaid work by age
0
5
10
15
20
25
30
35
Aged 15 to 24 Aged 25 to 59 Aged 60 to 74 Aged 75 or more
C. Time spent on unpaid work by marital status D. Time spent on unpaid work by years of education
0
5
10
15
20
25
30
Married orcohabiting
Separatedor divorced
Widowed Single 0
5
10
15
20
25
30
35
40
0-5 years 6-9 years 10-12 years 13 or more years
Men Women
Source: Economic Commission for Latin America and the Caribbean (ECLAC), Gender Equality Observatory for Latin America and the Caribbean.
20 It is to be expected that women with more education devote fewer hours to caregiving, because they have higher incomes and can afford to pay for care out-of-pocket —something that is beyond the reach of women with less education and lower socioeconomic status.
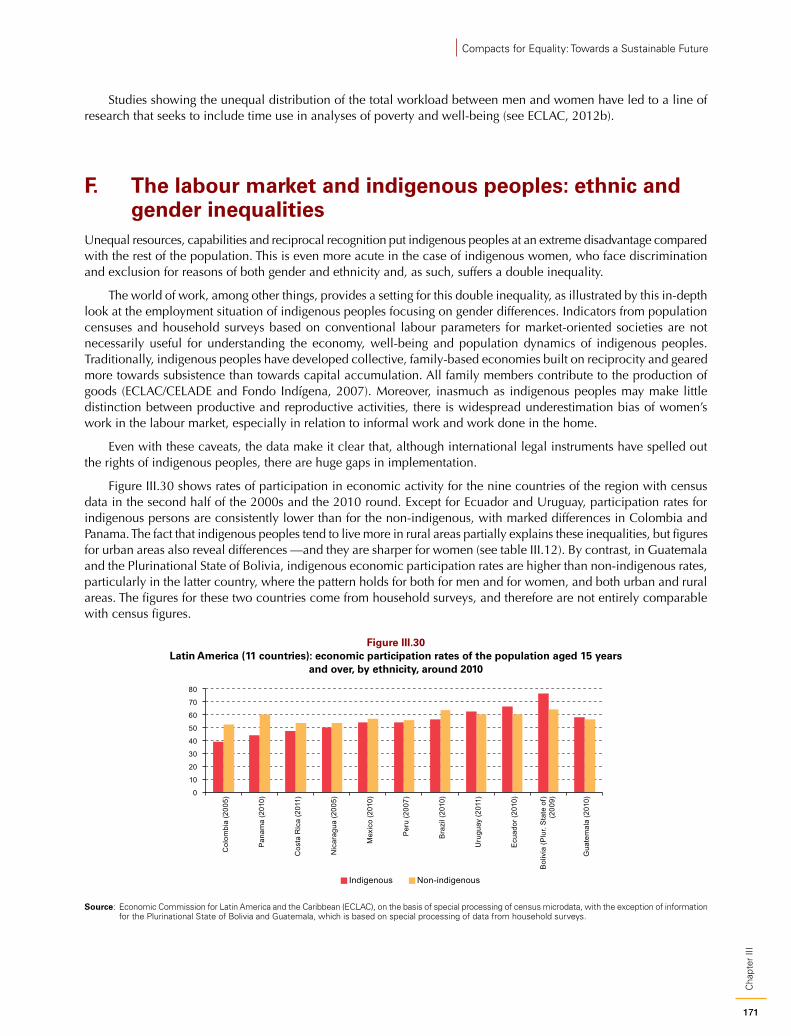
171
Cha
pter
III
Compacts for Equality: Towards a Sustainable Future
Studies showing the unequal distribution of the total workload between men and women have led to a line of research that seeks to include time use in analyses of poverty and well-being (see ECLAC, 2012b).
F. The labour market and indigenous peoples: ethnic and gender inequalities
Unequal resources, capabilities and reciprocal recognition put indigenous peoples at an extreme disadvantage compared with the rest of the population. This is even more acute in the case of indigenous women, who face discrimination and exclusion for reasons of both gender and ethnicity and, as such, suffers a double inequality.
The world of work, among other things, provides a setting for this double inequality, as illustrated by this in-depth look at the employment situation of indigenous peoples focusing on gender differences. Indicators from population censuses and household surveys based on conventional labour parameters for market-oriented societies are not necessarily useful for understanding the economy, well-being and population dynamics of indigenous peoples. Traditionally, indigenous peoples have developed collective, family-based economies built on reciprocity and geared more towards subsistence than towards capital accumulation. All family members contribute to the production of goods (ECLAC/CELADE and Fondo Indígena, 2007). Moreover, inasmuch as indigenous peoples may make little distinction between productive and reproductive activities, there is widespread underestimation bias of women’s work in the labour market, especially in relation to informal work and work done in the home.
Even with these caveats, the data make it clear that, although international legal instruments have spelled out the rights of indigenous peoples, there are huge gaps in implementation.
Figure III.30 shows rates of participation in economic activity for the nine countries of the region with census data in the second half of the 2000s and the 2010 round. Except for Ecuador and Uruguay, participation rates for indigenous persons are consistently lower than for the non-indigenous, with marked differences in Colombia and Panama. The fact that indigenous peoples tend to live more in rural areas partially explains these inequalities, but figures for urban areas also reveal differences —and they are sharper for women (see table III.12). By contrast, in Guatemala and the Plurinational State of Bolivia, indigenous economic participation rates are higher than non-indigenous rates, particularly in the latter country, where the pattern holds for both for men and for women, and both urban and rural areas. The figures for these two countries come from household surveys, and therefore are not entirely comparable with census figures.
Figure III.30 Latin America (11 countries): economic participation rates of the population aged 15 years
and over, by ethnicity, around 2010
0
10
20
30
40
50
60
70
80
Col
ombi
a (2
005)
Pan
ama
(201
0)
Cos
ta R
ica
(201
1)
Nic
arag
ua (2
005)
Mex
ico
(201
0)
Per
u (2
007)
Bra
zil (
2010
)
Uru
guay
(201
1)
Ecu
ador
(201
0)
Bol
ivia
(Plu
r. S
tate
of)
(200
9)
Gua
tem
ala
(201
0)
Indigenous Non-indigenous
Source: Economic Commission for Latin America and the Caribbean (ECLAC), on the basis of special processing of census microdata, with the exception of information for the Plurinational State of Bolivia and Guatemala, which is based on special processing of data from household surveys.
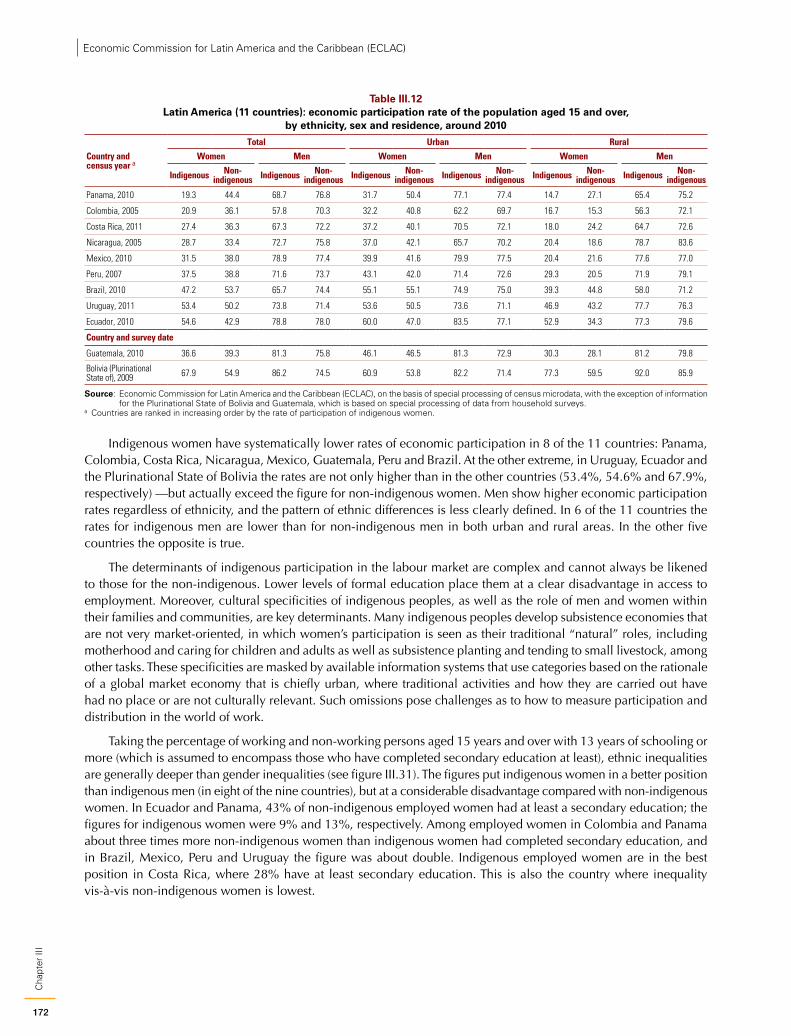
172
Cha
pter
III
Economic Commission for Latin America and the Caribbean (ECLAC)
Table III.12 Latin America (11 countries): economic participation rate of the population aged 15 and over,
by ethnicity, sex and residence, around 2010
Country and census year a
Total Urban Rural
Women Men Women Men Women Men
Indigenous Non-indigenous Indigenous Non-
indigenous Indigenous Non-indigenous Indigenous Non-
indigenous Indigenous Non-indigenous Indigenous Non-
indigenous
Panama, 2010 19.3 44.4 68.7 76.8 31.7 50.4 77.1 77.4 14.7 27.1 65.4 75.2
Colombia, 2005 20.9 36.1 57.8 70.3 32.2 40.8 62.2 69.7 16.7 15.3 56.3 72.1
Costa Rica, 2011 27.4 36.3 67.3 72.2 37.2 40.1 70.5 72.1 18.0 24.2 64.7 72.6
Nicaragua, 2005 28.7 33.4 72.7 75.8 37.0 42.1 65.7 70.2 20.4 18.6 78.7 83.6
Mexico, 2010 31.5 38.0 78.9 77.4 39.9 41.6 79.9 77.5 20.4 21.6 77.6 77.0
Peru, 2007 37.5 38.8 71.6 73.7 43.1 42.0 71.4 72.6 29.3 20.5 71.9 79.1
Brazil, 2010 47.2 53.7 65.7 74.4 55.1 55.1 74.9 75.0 39.3 44.8 58.0 71.2
Uruguay, 2011 53.4 50.2 73.8 71.4 53.6 50.5 73.6 71.1 46.9 43.2 77.7 76.3
Ecuador, 2010 54.6 42.9 78.8 78.0 60.0 47.0 83.5 77.1 52.9 34.3 77.3 79.6
Country and survey date
Guatemala, 2010 36.6 39.3 81.3 75.8 46.1 46.5 81.3 72.9 30.3 28.1 81.2 79.8
Bolivia (Plurinational State of), 2009 67.9 54.9 86.2 74.5 60.9 53.8 82.2 71.4 77.3 59.5 92.0 85.9
Source: Economic Commission for Latin America and the Caribbean (ECLAC), on the basis of special processing of census microdata, with the exception of information for the Plurinational State of Bolivia and Guatemala, which is based on special processing of data from household surveys.
a Countries are ranked in increasing order by the rate of participation of indigenous women.
Indigenous women have systematically lower rates of economic participation in 8 of the 11 countries: Panama, Colombia, Costa Rica, Nicaragua, Mexico, Guatemala, Peru and Brazil. At the other extreme, in Uruguay, Ecuador and the Plurinational State of Bolivia the rates are not only higher than in the other countries (53.4%, 54.6% and 67.9%, respectively) —but actually exceed the figure for non-indigenous women. Men show higher economic participation rates regardless of ethnicity, and the pattern of ethnic differences is less clearly defined. In 6 of the 11 countries the rates for indigenous men are lower than for non-indigenous men in both urban and rural areas. In the other five countries the opposite is true.
The determinants of indigenous participation in the labour market are complex and cannot always be likened to those for the non-indigenous. Lower levels of formal education place them at a clear disadvantage in access to employment. Moreover, cultural specificities of indigenous peoples, as well as the role of men and women within their families and communities, are key determinants. Many indigenous peoples develop subsistence economies that are not very market-oriented, in which women’s participation is seen as their traditional “natural” roles, including motherhood and caring for children and adults as well as subsistence planting and tending to small livestock, among other tasks. These specificities are masked by available information systems that use categories based on the rationale of a global market economy that is chiefly urban, where traditional activities and how they are carried out have had no place or are not culturally relevant. Such omissions pose challenges as to how to measure participation and distribution in the world of work.
Taking the percentage of working and non-working persons aged 15 years and over with 13 years of schooling or more (which is assumed to encompass those who have completed secondary education at least), ethnic inequalities are generally deeper than gender inequalities (see figure III.31). The figures put indigenous women in a better position than indigenous men (in eight of the nine countries), but at a considerable disadvantage compared with non-indigenous women. In Ecuador and Panama, 43% of non-indigenous employed women had at least a secondary education; the figures for indigenous women were 9% and 13%, respectively. Among employed women in Colombia and Panama about three times more non-indigenous women than indigenous women had completed secondary education, and in Brazil, Mexico, Peru and Uruguay the figure was about double. Indigenous employed women are in the best position in Costa Rica, where 28% have at least secondary education. This is also the country where inequality vis-à-vis non-indigenous women is lowest.
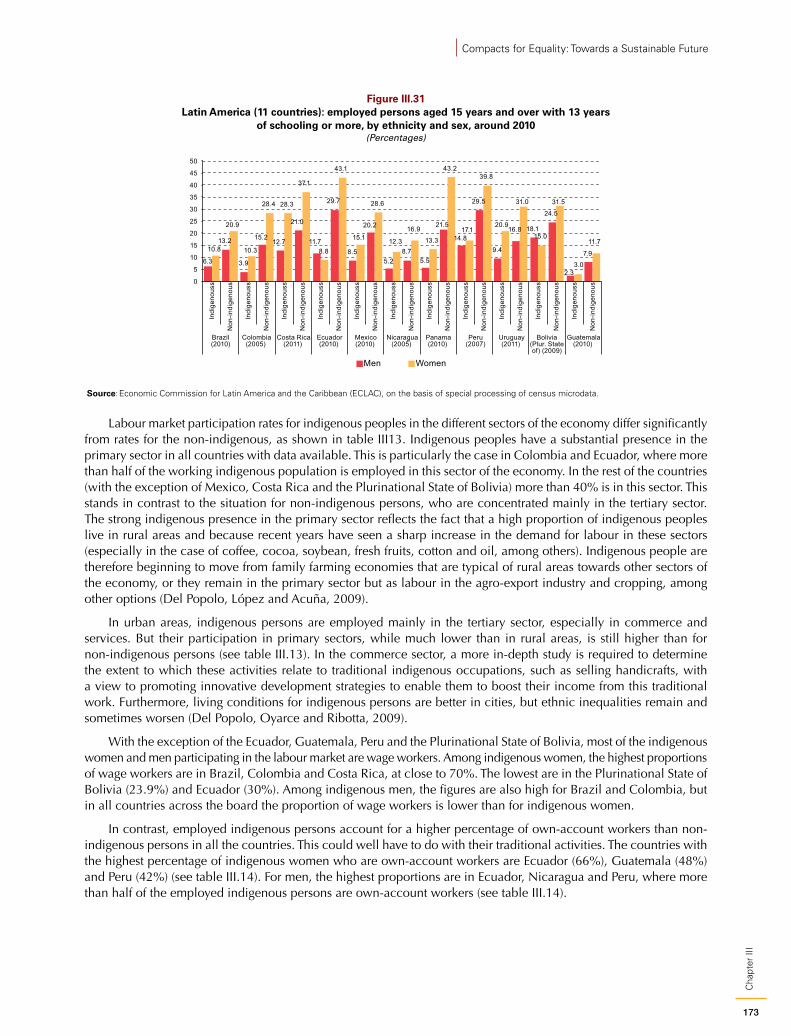
173
Cha
pter
III
Compacts for Equality: Towards a Sustainable Future
Figure III.31 Latin America (11 countries): employed persons aged 15 years and over with 13 years
of schooling or more, by ethnicity and sex, around 2010 (Percentages)
6.3
13.2
3.9
15.212.7
21.0
11.7
29.7
8.5
20.2
5.28.7
5.5
21.5
14.8
29.5
9.4
16.8 18.1
24.5
2.3
7.910.8
20.9
10.3
28.4 28.3
37.1
8.8
43.1
15.1
28.6
12.3
16.9
13.3
43.2
17.1
39.8
20.9
31.0
15.0
31.5
3.0
11.7
0
5
10
15
20
25
30
35
40
45
50
Indi
geno
uss
Non
-indi
geno
us
Indi
geno
uss
Non
-indi
geno
us
Indi
geno
uss
Non
-indi
geno
us
Indi
geno
uss
Non
-indi
geno
us
Indi
geno
uss
Non
-indi
geno
us
Indi
geno
uss
Non
-indi
geno
us
Indi
geno
uss
Non
-indi
geno
us
Indi
geno
uss
Non
-indi
geno
us
Indi
geno
uss
Non
-indi
geno
us
Indi
geno
uss
Non
-indi
geno
us
Indi
geno
uss
Non
-indi
geno
us
Brazil(2010)
Colombia(2005)
Costa Rica(2011)
Ecuador(2010)
Mexico(2010)
Nicaragua(2005)
Panama(2010)
Peru(2007)
Uruguay(2011)
Bolivia(Plur. Stateof) (2009)
Guatemala(2010)
Men Women
Source: Economic Commission for Latin America and the Caribbean (ECLAC), on the basis of special processing of census microdata.
Labour market participation rates for indigenous peoples in the different sectors of the economy differ significantly from rates for the non-indigenous, as shown in table III13. Indigenous peoples have a substantial presence in the primary sector in all countries with data available. This is particularly the case in Colombia and Ecuador, where more than half of the working indigenous population is employed in this sector of the economy. In the rest of the countries (with the exception of Mexico, Costa Rica and the Plurinational State of Bolivia) more than 40% is in this sector. This stands in contrast to the situation for non-indigenous persons, who are concentrated mainly in the tertiary sector. The strong indigenous presence in the primary sector reflects the fact that a high proportion of indigenous peoples live in rural areas and because recent years have seen a sharp increase in the demand for labour in these sectors (especially in the case of coffee, cocoa, soybean, fresh fruits, cotton and oil, among others). Indigenous people are therefore beginning to move from family farming economies that are typical of rural areas towards other sectors of the economy, or they remain in the primary sector but as labour in the agro-export industry and cropping, among other options (Del Popolo, López and Acuña, 2009).
In urban areas, indigenous persons are employed mainly in the tertiary sector, especially in commerce and services. But their participation in primary sectors, while much lower than in rural areas, is still higher than for non-indigenous persons (see table III.13). In the commerce sector, a more in-depth study is required to determine the extent to which these activities relate to traditional indigenous occupations, such as selling handicrafts, with a view to promoting innovative development strategies to enable them to boost their income from this traditional work. Furthermore, living conditions for indigenous persons are better in cities, but ethnic inequalities remain and sometimes worsen (Del Popolo, Oyarce and Ribotta, 2009).
With the exception of the Ecuador, Guatemala, Peru and the Plurinational State of Bolivia, most of the indigenous women and men participating in the labour market are wage workers. Among indigenous women, the highest proportions of wage workers are in Brazil, Colombia and Costa Rica, at close to 70%. The lowest are in the Plurinational State of Bolivia (23.9%) and Ecuador (30%). Among indigenous men, the figures are also high for Brazil and Colombia, but in all countries across the board the proportion of wage workers is lower than for indigenous women.
In contrast, employed indigenous persons account for a higher percentage of own-account workers than non-indigenous persons in all the countries. This could well have to do with their traditional activities. The countries with the highest percentage of indigenous women who are own-account workers are Ecuador (66%), Guatemala (48%) and Peru (42%) (see table III.14). For men, the highest proportions are in Ecuador, Nicaragua and Peru, where more than half of the employed indigenous persons are own-account workers (see table III.14).
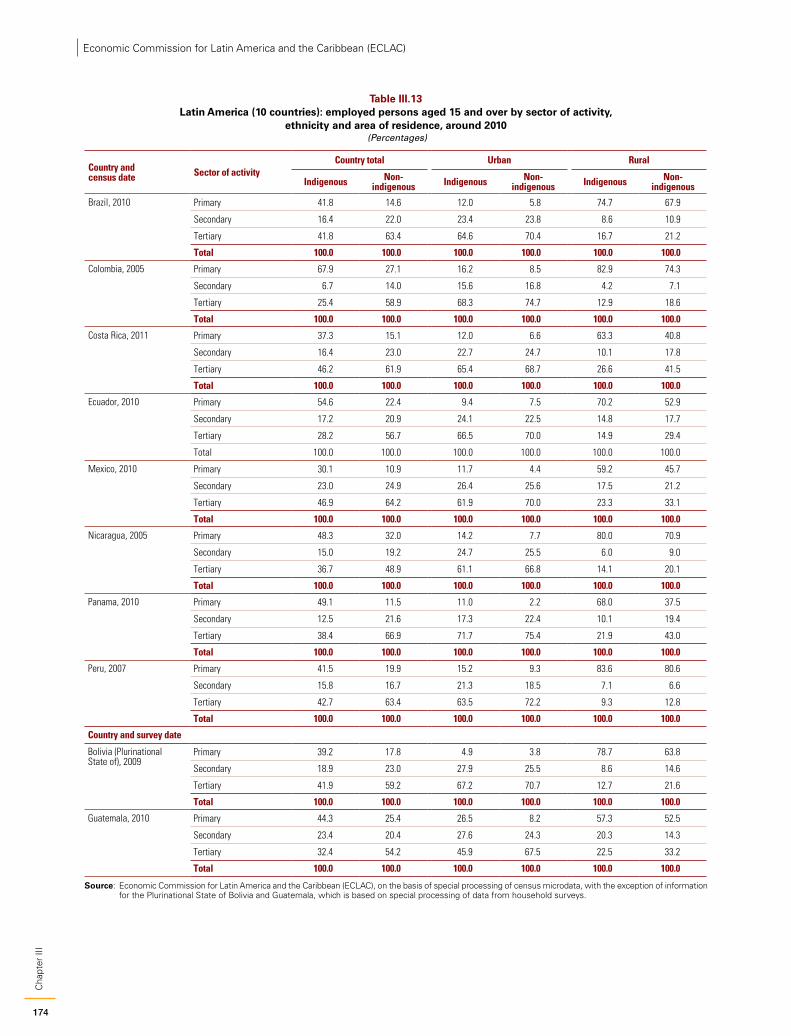
174
Cha
pter
III
Economic Commission for Latin America and the Caribbean (ECLAC)
Table III.13 Latin America (10 countries): employed persons aged 15 and over by sector of activity,
ethnicity and area of residence, around 2010 (Percentages)
Country and census date Sector of activity
Country total Urban Rural
Indigenous Non-indigenous Indigenous Non-
indigenous Indigenous Non-indigenous
Brazil, 2010 Primary 41.8 14.6 12.0 5.8 74.7 67.9
Secondary 16.4 22.0 23.4 23.8 8.6 10.9
Tertiary 41.8 63.4 64.6 70.4 16.7 21.2
Total 100.0 100.0 100.0 100.0 100.0 100.0
Colombia, 2005 Primary 67.9 27.1 16.2 8.5 82.9 74.3
Secondary 6.7 14.0 15.6 16.8 4.2 7.1
Tertiary 25.4 58.9 68.3 74.7 12.9 18.6
Total 100.0 100.0 100.0 100.0 100.0 100.0
Costa Rica, 2011 Primary 37.3 15.1 12.0 6.6 63.3 40.8
Secondary 16.4 23.0 22.7 24.7 10.1 17.8
Tertiary 46.2 61.9 65.4 68.7 26.6 41.5
Total 100.0 100.0 100.0 100.0 100.0 100.0
Ecuador, 2010 Primary 54.6 22.4 9.4 7.5 70.2 52.9
Secondary 17.2 20.9 24.1 22.5 14.8 17.7
Tertiary 28.2 56.7 66.5 70.0 14.9 29.4
Total 100.0 100.0 100.0 100.0 100.0 100.0
Mexico, 2010 Primary 30.1 10.9 11.7 4.4 59.2 45.7
Secondary 23.0 24.9 26.4 25.6 17.5 21.2
Tertiary 46.9 64.2 61.9 70.0 23.3 33.1
Total 100.0 100.0 100.0 100.0 100.0 100.0
Nicaragua, 2005 Primary 48.3 32.0 14.2 7.7 80.0 70.9
Secondary 15.0 19.2 24.7 25.5 6.0 9.0
Tertiary 36.7 48.9 61.1 66.8 14.1 20.1
Total 100.0 100.0 100.0 100.0 100.0 100.0
Panama, 2010 Primary 49.1 11.5 11.0 2.2 68.0 37.5
Secondary 12.5 21.6 17.3 22.4 10.1 19.4
Tertiary 38.4 66.9 71.7 75.4 21.9 43.0
Total 100.0 100.0 100.0 100.0 100.0 100.0
Peru, 2007 Primary 41.5 19.9 15.2 9.3 83.6 80.6
Secondary 15.8 16.7 21.3 18.5 7.1 6.6
Tertiary 42.7 63.4 63.5 72.2 9.3 12.8
Total 100.0 100.0 100.0 100.0 100.0 100.0
Country and survey date
Bolivia (Plurinational State of), 2009
Primary 39.2 17.8 4.9 3.8 78.7 63.8
Secondary 18.9 23.0 27.9 25.5 8.6 14.6
Tertiary 41.9 59.2 67.2 70.7 12.7 21.6
Total 100.0 100.0 100.0 100.0 100.0 100.0
Guatemala, 2010 Primary 44.3 25.4 26.5 8.2 57.3 52.5
Secondary 23.4 20.4 27.6 24.3 20.3 14.3
Tertiary 32.4 54.2 45.9 67.5 22.5 33.2
Total 100.0 100.0 100.0 100.0 100.0 100.0
Source: Economic Commission for Latin America and the Caribbean (ECLAC), on the basis of special processing of census microdata, with the exception of information for the Plurinational State of Bolivia and Guatemala, which is based on special processing of data from household surveys.
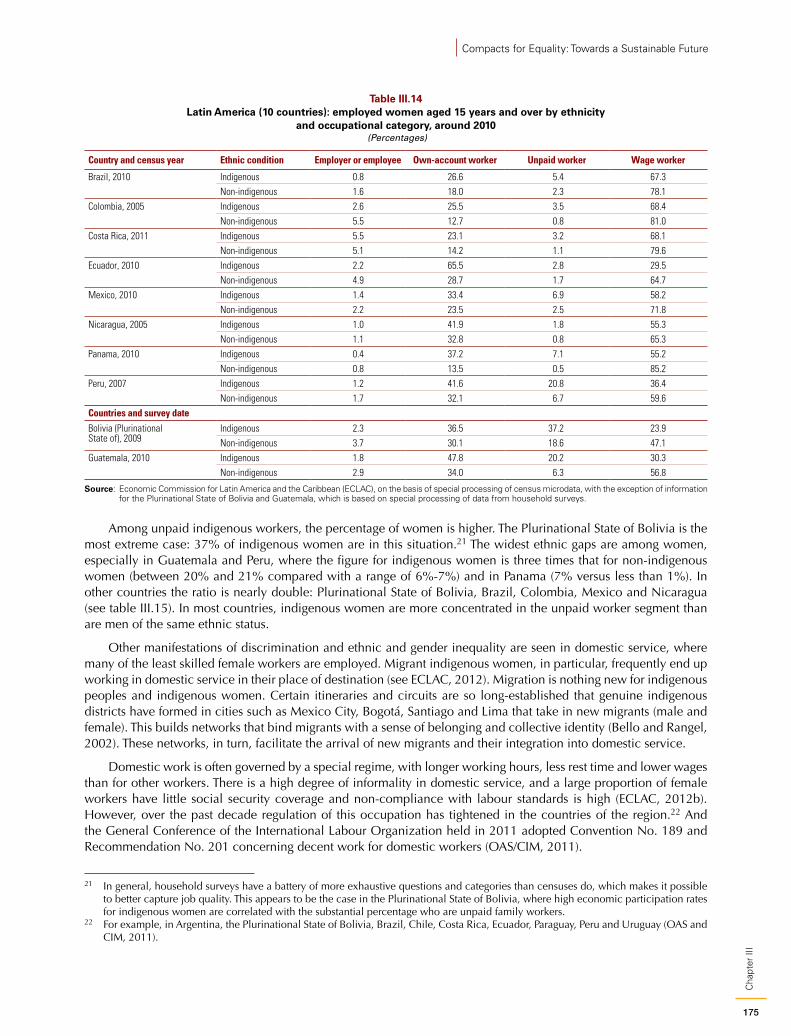
175
Cha
pter
III
Compacts for Equality: Towards a Sustainable Future
Table III.14 Latin America (10 countries): employed women aged 15 years and over by ethnicity
and occupational category, around 2010 (Percentages)
Country and census year Ethnic condition Employer or employee Own-account worker Unpaid worker Wage worker
Brazil, 2010 Indigenous 0.8 26.6 5.4 67.3Non-indigenous 1.6 18.0 2.3 78.1
Colombia, 2005 Indigenous 2.6 25.5 3.5 68.4Non-indigenous 5.5 12.7 0.8 81.0
Costa Rica, 2011 Indigenous 5.5 23.1 3.2 68.1Non-indigenous 5.1 14.2 1.1 79.6
Ecuador, 2010 Indigenous 2.2 65.5 2.8 29.5Non-indigenous 4.9 28.7 1.7 64.7
Mexico, 2010 Indigenous 1.4 33.4 6.9 58.2Non-indigenous 2.2 23.5 2.5 71.8
Nicaragua, 2005 Indigenous 1.0 41.9 1.8 55.3Non-indigenous 1.1 32.8 0.8 65.3
Panama, 2010 Indigenous 0.4 37.2 7.1 55.2Non-indigenous 0.8 13.5 0.5 85.2
Peru, 2007 Indigenous 1.2 41.6 20.8 36.4Non-indigenous 1.7 32.1 6.7 59.6
Countries and survey date
Bolivia (Plurinational State of), 2009
Indigenous 2.3 36.5 37.2 23.9Non-indigenous 3.7 30.1 18.6 47.1
Guatemala, 2010 Indigenous 1.8 47.8 20.2 30.3Non-indigenous 2.9 34.0 6.3 56.8
Source: Economic Commission for Latin America and the Caribbean (ECLAC), on the basis of special processing of census microdata, with the exception of information for the Plurinational State of Bolivia and Guatemala, which is based on special processing of data from household surveys.
Among unpaid indigenous workers, the percentage of women is higher. The Plurinational State of Bolivia is the most extreme case: 37% of indigenous women are in this situation.21 The widest ethnic gaps are among women, especially in Guatemala and Peru, where the figure for indigenous women is three times that for non-indigenous women (between 20% and 21% compared with a range of 6%-7%) and in Panama (7% versus less than 1%). In other countries the ratio is nearly double: Plurinational State of Bolivia, Brazil, Colombia, Mexico and Nicaragua (see table III.15). In most countries, indigenous women are more concentrated in the unpaid worker segment than are men of the same ethnic status.
Other manifestations of discrimination and ethnic and gender inequality are seen in domestic service, where many of the least skilled female workers are employed. Migrant indigenous women, in particular, frequently end up working in domestic service in their place of destination (see ECLAC, 2012). Migration is nothing new for indigenous peoples and indigenous women. Certain itineraries and circuits are so long-established that genuine indigenous districts have formed in cities such as Mexico City, Bogotá, Santiago and Lima that take in new migrants (male and female). This builds networks that bind migrants with a sense of belonging and collective identity (Bello and Rangel, 2002). These networks, in turn, facilitate the arrival of new migrants and their integration into domestic service.
Domestic work is often governed by a special regime, with longer working hours, less rest time and lower wages than for other workers. There is a high degree of informality in domestic service, and a large proportion of female workers have little social security coverage and non-compliance with labour standards is high (ECLAC, 2012b). However, over the past decade regulation of this occupation has tightened in the countries of the region.22 And the General Conference of the International Labour Organization held in 2011 adopted Convention No. 189 and Recommendation No. 201 concerning decent work for domestic workers (OAS/CIM, 2011).
21 In general, household surveys have a battery of more exhaustive questions and categories than censuses do, which makes it possible to better capture job quality. This appears to be the case in the Plurinational State of Bolivia, where high economic participation rates for indigenous women are correlated with the substantial percentage who are unpaid family workers.
22 For example, in Argentina, the Plurinational State of Bolivia, Brazil, Chile, Costa Rica, Ecuador, Paraguay, Peru and Uruguay (OAS and CIM, 2011).
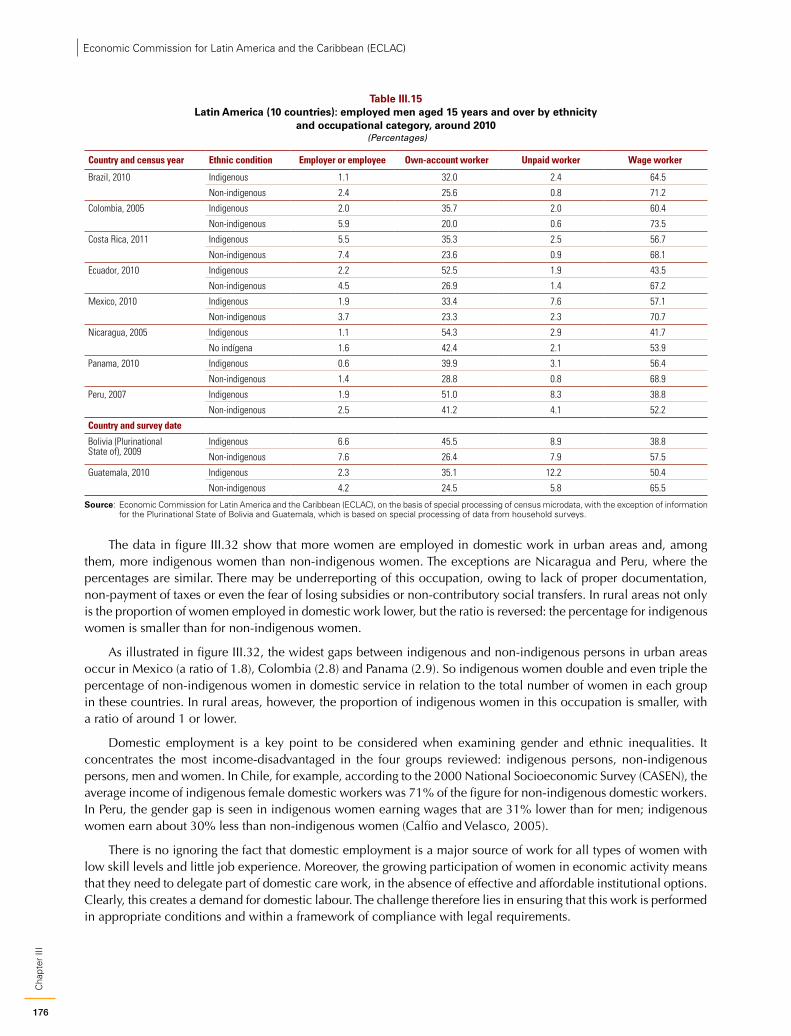
176
Cha
pter
III
Economic Commission for Latin America and the Caribbean (ECLAC)
Table III.15 Latin America (10 countries): employed men aged 15 years and over by ethnicity
and occupational category, around 2010 (Percentages)
Country and census year Ethnic condition Employer or employee Own-account worker Unpaid worker Wage worker
Brazil, 2010 Indigenous 1.1 32.0 2.4 64.5
Non-indigenous 2.4 25.6 0.8 71.2
Colombia, 2005 Indigenous 2.0 35.7 2.0 60.4
Non-indigenous 5.9 20.0 0.6 73.5
Costa Rica, 2011 Indigenous 5.5 35.3 2.5 56.7
Non-indigenous 7.4 23.6 0.9 68.1
Ecuador, 2010 Indigenous 2.2 52.5 1.9 43.5
Non-indigenous 4.5 26.9 1.4 67.2
Mexico, 2010 Indigenous 1.9 33.4 7.6 57.1
Non-indigenous 3.7 23.3 2.3 70.7
Nicaragua, 2005 Indigenous 1.1 54.3 2.9 41.7
No indígena 1.6 42.4 2.1 53.9
Panama, 2010 Indigenous 0.6 39.9 3.1 56.4
Non-indigenous 1.4 28.8 0.8 68.9
Peru, 2007 Indigenous 1.9 51.0 8.3 38.8
Non-indigenous 2.5 41.2 4.1 52.2
Country and survey date
Bolivia (Plurinational State of), 2009
Indigenous 6.6 45.5 8.9 38.8
Non-indigenous 7.6 26.4 7.9 57.5
Guatemala, 2010 Indigenous 2.3 35.1 12.2 50.4
Non-indigenous 4.2 24.5 5.8 65.5
Source: Economic Commission for Latin America and the Caribbean (ECLAC), on the basis of special processing of census microdata, with the exception of information for the Plurinational State of Bolivia and Guatemala, which is based on special processing of data from household surveys.
The data in figure III.32 show that more women are employed in domestic work in urban areas and, among them, more indigenous women than non-indigenous women. The exceptions are Nicaragua and Peru, where the percentages are similar. There may be underreporting of this occupation, owing to lack of proper documentation, non-payment of taxes or even the fear of losing subsidies or non-contributory social transfers. In rural areas not only is the proportion of women employed in domestic work lower, but the ratio is reversed: the percentage for indigenous women is smaller than for non-indigenous women.
As illustrated in figure III.32, the widest gaps between indigenous and non-indigenous persons in urban areas occur in Mexico (a ratio of 1.8), Colombia (2.8) and Panama (2.9). So indigenous women double and even triple the percentage of non-indigenous women in domestic service in relation to the total number of women in each group in these countries. In rural areas, however, the proportion of indigenous women in this occupation is smaller, with a ratio of around 1 or lower.
Domestic employment is a key point to be considered when examining gender and ethnic inequalities. It concentrates the most income-disadvantaged in the four groups reviewed: indigenous persons, non-indigenous persons, men and women. In Chile, for example, according to the 2000 National Socioeconomic Survey (CASEN), the average income of indigenous female domestic workers was 71% of the figure for non-indigenous domestic workers. In Peru, the gender gap is seen in indigenous women earning wages that are 31% lower than for men; indigenous women earn about 30% less than non-indigenous women (Calfio and Velasco, 2005).
There is no ignoring the fact that domestic employment is a major source of work for all types of women with low skill levels and little job experience. Moreover, the growing participation of women in economic activity means that they need to delegate part of domestic care work, in the absence of effective and affordable institutional options. Clearly, this creates a demand for domestic labour. The challenge therefore lies in ensuring that this work is performed in appropriate conditions and within a framework of compliance with legal requirements.
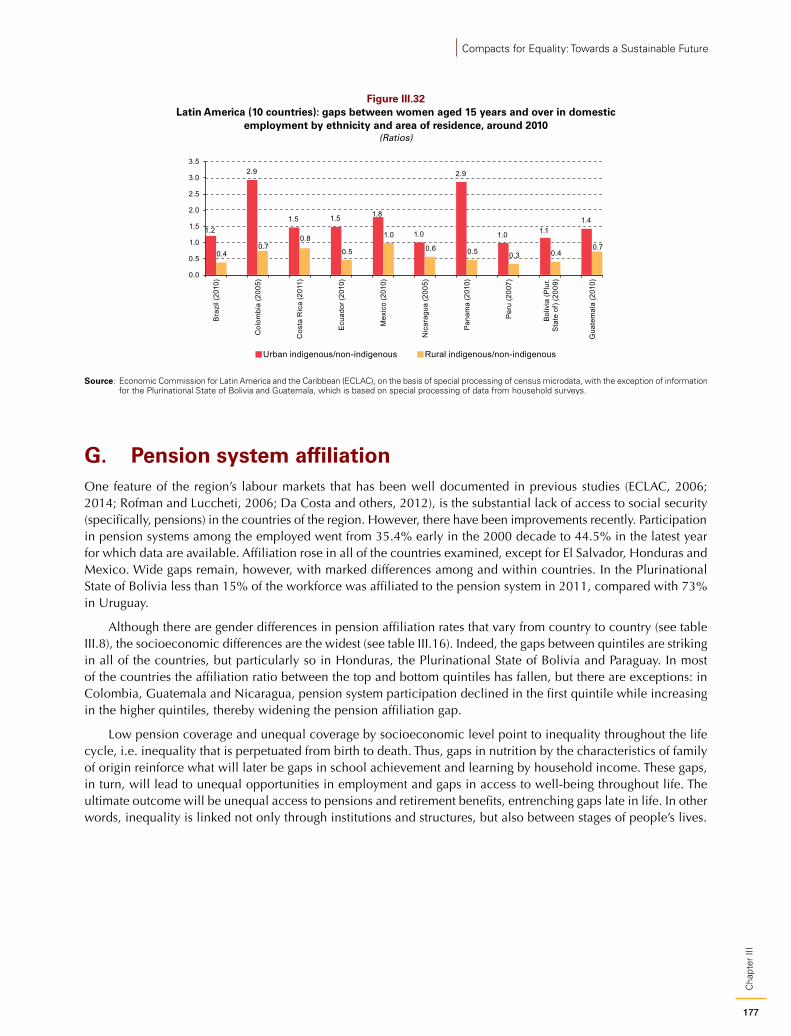
177
Cha
pter
III
Compacts for Equality: Towards a Sustainable Future
Figure III.32 Latin America (10 countries): gaps between women aged 15 years and over in domestic
employment by ethnicity and area of residence, around 2010(Ratios)
1.2
2.9
1.5 1.5 1.8
1.0
2.9
1.0 1.11.4
0.40.7
0.8
0.5
1.0
0.6 0.5 0.3 0.40.7
0.0
0.5
1.0
1.5
2.0
2.5
3.0
3.5
Bra
zil (
2010
)
Col
ombi
a (2
005)
Cos
ta R
ica
(201
1)
Ecu
ador
(201
0)
Mex
ico
(201
0)
Nic
arag
ua (2
005)
Pan
ama
(201
0)
Per
u (2
007)
Bol
ivia
(Plu
r.S
tate
of)
(200
9)
Gua
tem
ala
(201
0)
Urban indigenous/non-indigenous Rural indigenous/non-indigenous
Source: Economic Commission for Latin America and the Caribbean (ECLAC), on the basis of special processing of census microdata, with the exception of information for the Plurinational State of Bolivia and Guatemala, which is based on special processing of data from household surveys.
G. Pension system affiliationOne feature of the region’s labour markets that has been well documented in previous studies (ECLAC, 2006; 2014; Rofman and Luccheti, 2006; Da Costa and others, 2012), is the substantial lack of access to social security (specifically, pensions) in the countries of the region. However, there have been improvements recently. Participation in pension systems among the employed went from 35.4% early in the 2000 decade to 44.5% in the latest year for which data are available. Affiliation rose in all of the countries examined, except for El Salvador, Honduras and Mexico. Wide gaps remain, however, with marked differences among and within countries. In the Plurinational State of Bolivia less than 15% of the workforce was affiliated to the pension system in 2011, compared with 73% in Uruguay.
Although there are gender differences in pension affiliation rates that vary from country to country (see table III.8), the socioeconomic differences are the widest (see table III.16). Indeed, the gaps between quintiles are striking in all of the countries, but particularly so in Honduras, the Plurinational State of Bolivia and Paraguay. In most of the countries the affiliation ratio between the top and bottom quintiles has fallen, but there are exceptions: in Colombia, Guatemala and Nicaragua, pension system participation declined in the first quintile while increasing in the higher quintiles, thereby widening the pension affiliation gap.
Low pension coverage and unequal coverage by socioeconomic level point to inequality throughout the life cycle, i.e. inequality that is perpetuated from birth to death. Thus, gaps in nutrition by the characteristics of family of origin reinforce what will later be gaps in school achievement and learning by household income. These gaps, in turn, will lead to unequal opportunities in employment and gaps in access to well-being throughout life. The ultimate outcome will be unequal access to pensions and retirement benefits, entrenching gaps late in life. In other words, inequality is linked not only through institutions and structures, but also between stages of people’s lives.

178
Cha
pter
III
Economic Commission for Latin America and the Caribbean (ECLAC)
Table III.16 Latin America (17 countries): pension system affiliation
(Percentages)
Year Total Quintile I Quintile V Ratio between quintile V and quintile I
Argentina a 2004 54.7 13.9 79.9 5.72011 68.7 32.7 87.5 2.7
Bolivia (Plurinational State of) 2002 9.7 0.5 25.8 56.22009 14.7 1.3 29.0 23.0
Brazil 2001 47.3 15.4 68.2 4.42011 59.6 24.7 76.0 3.1
Chile 2000 63.5 43.3 72.5 1.72011 68.8 54.6 73.5 1.3
Colombia 1999 25.0 3.4 47.0 13.82011 32.1 2.1 59.8 27.9
Costa Rica 2002 … … … …2011 67.2 41.6 82.0 2.0
Dominican Republic a 2005 42.5 26.8 53.7 2.02011 63.3 44.8 76.0 1.7
Ecuador 2002 29.3 10.6 48.0 4.52011 44.3 16.5 67.6 4.1
El Salvador 1999 30.8 2.8 56.5 20.52010 28.0 3.1 50.4 16.0
Guatemala a 2002 35.8 9.5 58.7 6.22006 38.5 5.1 60.8 11.8
Honduras 2006 18.7 0.2 42.1 247.42010 17.5 0.4 41.4 103.4
Mexico a 2002 41.0 7.6 66.6 8.82010 41.3 9.9 64.0 6.4
Nicaragua 2001 18.3 3.0 30.5 10.12005 17.4 2.6 31.2 12.1
Paraguay 2000 13.0 0.4 26.5 71.52011 19.2 0.7 33.5 50.7
Peru 2001 12.9 0.6 30.4 53.42011 30.4 4.9 53.6 10.9
Uruguay 2002 63.4 25.7 84.8 3.32011 72.9 37.1 90.4 2.4
Venezuela (Bolivarian Republic of) a
2002 60.9 33.6 76.6 2.32011 72.8 45.1 85.8 1.9
Latin America b 2002 35.4 12.3 54.2 4.42011 44.5 19.2 62.5 3.2
Source: Economic Commission for Latin America and the Caribbean (ECLAC), on the basis of special processing of census microdata, with the exception of information for the Plurinational State of Bolivia and Guatemala, which is based on special processing of data from household surveys.
a In these countries the universe refers to wage workers.b Simple average. Excludes countries without measurements for the two points in time.
H. Work, production structure and equality: closing gapsThe stylized facts and detailed information presented in this chapter once again paint a picture of a glass half full or half empty. On the one hand, they highlight the positive trend in key labour market indicators over the past decade: increased employment, a falling unemployment rate and higher labour productivity and formalization. At the same time, worker income rose, and income dispersion declined; at least in some of the countries of the region this was linked to a strengthening of the minimum wage. From a gender perspective, the participation rate gap between women and men narrowed, as did the gap in terms of employment and access to social security.
179
Cha
pter
III
Compacts for Equality: Towards a Sustainable Future
On the other hand, the rigidity of the economic structure casts a shadow over the promising recent developments. The latest available data show slowing labour market indicators, bringing into question the sustainability of recent progress and the potential for building on it. This is cause for concern, because the more structural characteristics of the region’s labour markets have remained essentially unchanged. Production heterogeneity is still high and this combines with weak labour institutions to produce marked wage dispersion. Gender gaps are still wide, and there has been no substantial change in gendered occupational segregation. And there is no sign of progress regarding the disadvantageous labour market situation of the indigenous population and peoples, which is particularly detrimental to women.
The dynamics of the world of work bring together the different aspects of equality laid out at the beginning of this document. Labour income and income distribution are critical for resource equality. Job quality and access to decent employment embody one of the pillars of equal rights, namely the right to work. Non-discrimination on the basis of gender or ethnicity is tied to equality associated with recognition, non-discrimination, full exercise of acquired capacities, and the relational dimension of autonomy.
The difficulties in closing productivity gaps owing to structural heterogeneity also pose obstacles to equality for the full exercise and development of capacities. Because it stratifies the region’s production structures, heterogeneity produces striking differences in each production sector’s contribution to GDP and employment. There is an inverted pyramid effect, whereby the most productive sectors generate the least employment and the least productive sectors, the most employment. Thus, the largest appropriation of gains (share of GDP) is in the high stratum, which accounts for around one out of every five employed persons. This perpetuates the strong link between structural heterogeneity and inequality in income, in the appropriation of gains among workers, and in job quality.
Structural heterogeneity not only leads to income concentration, but also segments the labour market. The clearest expression of this is the division between high- and low-productivity employment. The former is closer to the technological forefront, with a higher level of education, better working conditions and greater protection from labour institutions. Low-productivity employment concentrates lower-income workers with lower levels of education, instability, limited social security coverage and lack of employment contracts. The incorporation of Latin American women into the labour market remains heavily stratified, and greater childcare pressure and the glaring lack of protection in this sphere for the most vulnerable sectors reflect a rigid circuit of inequality (ECLAC, 2011).
This context of multiple labour market inequalities calls for robust State intervention in the areas of production, labour regulation and institutions, labour market policy and redistribution of child care. It is necessary to bolster labour institutions to make robust progress on formalizing employment, closing the gaps in labour law implementation, achieving a fairer distribution in the appropriation of gains and enhancing relational autonomy and mutual recognition in the organization of work. We must move towards a different production structure that is intensive in activities that build capacities in the world of work and narrow productivity gaps. Public investment is needed in quality technical training, in step with shifts in demand and in coordination with sectoral development policies, in order to enhance labour productivity and employability, especially among young people from low-income sectors. Through cross-cutting policies ranging from legislation to oversight and the mass media, gender and ethnic discrimination in access paths, pay and role-setting must be reversed. Those are all long-range challenges, but change in all these areas cannot be deferred if the goal is to build more equal societies progressing towards equality in a sustainable manner.
These are the foundations for a social compact in the world of work. This compact should embody a strategic vision and a broad-based programme for narrowing productivity, labour income and employment quality gaps and harmonizing the time spent by both genders on paid and unpaid work. Since the segmented labour world is heavily conditioned by structural heterogeneity, the compact must link structural change with institutional progress and convergent productivity in the world of work. The goal is to move both structure and institutions in a coordinated manner to establish virtuous circles that can underpin greater equality and sustainability. To this end, society must agree to boost capacity-building, learning and knowledge, and to increase investment in production.
180
Cha
pter
III
Economic Commission for Latin America and the Caribbean (ECLAC)
BibliographyAltonji, Joseph G. and Rebecca M. Blank (1999), “Race and gender in the labor market”, Handbook of Labor
Economics, Elsevier.Atal, Juan Pablo, Hugo Nopo and Natalia Winder (2009), “New century, old disparities: gender and ethnic wage
gaps in Latin America”, Research Department Working Paper, No. 4640, Washington, D.C., Inter-American Development Bank.
Azevedo, Joao Pedro and others (2013), “Fifteen years of inequality in Latin America : how have labor markets helped ?”, Policy Research Working Paper, No. 6384, Washington, D.C., World Bank.
Bello, Álvaro and Marta Rangel (2002), “Equity and exclusion in Latin America and the Caribbean: the case of indigenous and Afro-descendant peoples”, CEPAL Review, No. 76 (LC/G.2175-P), Santiago, Chile, Economic Commission for Latin America and the Caribbean (ECLAC).
Bergmann, Barbara R. (1974), “Occupational segregation, wages and profits when employers discriminate by race or sex”, Eastern Economic Journal, vol. 1, No. 2.
Bosch, Mariano and Marco Manacorda (2010), “Minimum wages and earnings inequality in urban Mexico”, American Economic Journal of Applied Economics, vol. 2, No. 4.
Calfio, Margarita y Luisa Velasco (2005), “Mujeres indígenas en América Latina: brechas de género o de etnia?”, paper presented at the seminar on indigenous and Afro-descendant peoples in Latin America and the Caribbean, Santiago, Chile, Economic Commission for Latin America and the Caribbean (ECLAC), 27-29 April.
Cepeda, Emiliani, Laura and Juan D. Barón (2012), “Educational segregation and the gender wage gap for recent college graduates in Colombia”, IZA Papers, No. 6361, Institute for the Study of Labor (IZA).
Chevalier, Arnaud (2007), “Education, occupation and career expectations: determinants of the gender pay gap for UK graduates”, Oxford Bulletin of Economics and Statistics, vol. 69, No. 6.
Cornia, Giovanni and Bruno Martorano (2012), “Development policies and income inequality in selected developing regions, 1980-2010”, UNCTAD Discussion Papers, No. 210, United Nations Conference on Trade and Development (UNCTAD).
Da Costa, Rita and others (2011), “The economy of the possible: pensions and informality in Latin America”, Working Paper, No. 295, Paris, OECD Publishing.
De la Torre, Augusto, Julian Messina and Samuel Pienknagura (2012), The Labor Market Story Behind Latin America’s Transformation, LAC Semiannual Report, No. 11884, Washington, D.C., World Bank.
Del Popolo, Fabiana, Mariana López and Mario Acuña (2009), Juventud indígena y afrodescendiente en América Latina: inequidades sociodemográficas y desafíos de políticas, Madrid, Economic Commission for Latin America and the Caribbean (ECLAC)/Ibero-American Youth Organization (OIJ).
Del Popolo, Fabiana, Ana María Oyarce and Bruno Ribotta (2009), “Indigenous urbanos en América Latina: algunos resultados censales y su relación con los Objetivos de Desarrollo del Milenio”, Notas de Población, No. 86 (LC/G.2349-P), Santiago, Chile, Economic Commission for Latin America and the Caribbean (ECLAC).
Dickens, Richard, Stephen Machin and Alan Manning (1999), “The effects of minimum wages on employment: theory and evidence from Britain”, Journal of Labor Economics, vol. 17, No. 1.
DiNardo, John, Nicole M. Fortin and Thomas Lemieux (1996), “Labor market institutions and the distribution of wages, 1973-1992: A semiparametric approach”, Econometrica, vol. 64, No. 5.
Durán, María-Ángeles (2013), “Género y desarrollo”, Santiago, Chile, Economic Commission for Latin America and the Caribbean (ECLAC), unpublished.
ECLAC (Economic Commission for Latin America and the Caribbean) (2013a), Economic Survey of Latin America and the Caribbean, 2013 (LC/G.2574-P), Santiago, Chile.
(2013b), Women in the Digital Economy: breaking through the equality threshold (LC/L.3666(CRM.12/3), Santiago, Chile.
(2012a), Structural Change for Equality: an integrated approach to development (LC/G.2524(SES.34/3)), Santiago, Chile.
(2012b), Social Panorama of Latin America, 2012 (LC/G.2557-P), Santiago, Chile. (2011), Social Panorama of Latin America, 2011 (LC/G.2514-P), Santiago, Chile. (2006), Shaping the Future of Social Protection: Access, Financing and Solidarity (LC/G.2294(SES.31/3))
Santiago, Chile.
181
Cha
pter
III
Compacts for Equality: Towards a Sustainable Future
ECLAC/Indigenous Fund (Economic Commission for Latin America and the Caribbean/ Fund for the Development of the Indigenous Peoples of Latin America and the Caribbean) (2007), Sistema de Indicadores Sociodemográfico de Poblaciones y Pueblos Indigenous de América Latina (SISPPI). Guía para el usuario (versión preliminar), Santiago, Chile, Latin America and Caribbean Demographic Centre (CELADE)-Population Division [online] http://celade.cepal.org/redatam/PRYESP/SISPPI/SISPPI_notastecnicas.pdf.
Espejo, A., F. Filgueira and N. Rico (2010), “Familias latinoamericanas: organización del trabajo no remunerado y de cuidado”, Project Documents, No. 354 (LC/W.354), Santiago, Chile, Economic Commission for Latin America and the Caribbean (ECLAC).
Eyraud, F. and C. Saget (2008), “The revival of minimum wage setting institutions”, In Defence of Labour Market Institutions: Cultivating Justice in the Developing World, J. Berg and D. Kucera (eds.), Palgrave MacMillan.
Fairris, David, Gurleen Popli and Eduardo Zepeda (2006), “Minimum wages and wage structure in Mexico”, Review of Social Economy, No. 400, University Library of Munich.
Folbre, Nancy (2009), “Time use and living standards”, Social Indicators Research, vol. 93, No. 1.Freeman, Richard B. (2009), “Labor regulations, unions, and social protection in developing countries: Market
distortions or efficient institutions?”, NBER Working Paper, No. 14789, National Bureau of Economic Research.Gasparini, Leonardo and others (2012), “Educational upgrading and returns to skills in Latin America: evidence
from a supply-demand framework, 1990-2010”, IZA Discussion Papers, No. 6244, Bonn, Institute for the Study of Labor (IZA).
Heckman, James J. (1979), “Sample selection bias as a specification error”, Econometrica, vol. 47, No. 1.Infante, Ricardo and Juan Chacaltana (2014), Hacia un desarrollo inclusivo. El caso del Perú (LC/L.3779), Santiago,
Chile, Economic Commission for Latin America and the Caribbean (ECLAC).Infante, Ricardo, Juan Chacaltana and Minoru Higa (2014), “Perú. Aspectos estructurales del desempeño macroeconómico.
Situación actual, perspectivas y políticas”, Hacia un desarrollo inclusivo. El caso del Perú (LC/L.3779), R. Infante and J. Chacaltana, Santiago, Chile, Economic Commission for Latin America and the Caribbean (ECLAC).
Kaplan, David S. and Francisco Pérez Arce Novaro (2006), “El efecto de los salarios mínimos en los ingresos laborales de México”, El Trimestre Económico, vol. LXXIII (1), No. 289.
Lemos, Sara (2004), “The effects of the minimum wage in the formal and informal sectors in Brazil”, Working Paper, No. 04/8, Department of Economics, University of Leicester.
López-Calva, Luis Felipe and Nora Lustig (2010), Declining Inequality in Latin America: A Decade of Progress?, Brookings Institution Press.
Lustig, Nora and others (2013), “The impact of taxes and social spending on inequality and poverty in Argentina, Bolivia, Brazil, Mexico, Peru and Uruguay: An overview”, Tulane Economics Working Paper Series, No. 1313.
Macpherson, David A. and Barry T. Hirsch (1995), “Wages and gender composition: why do women’s jobs pay less?”, Journal of Labor Economics, vol. 13, No. 3.
Maloney, William F. and Jairo Nunez Mendez (2003), “Measuring the impact of minimum wages: evidence from Latin America”, NBER Working Papers, No. 9800, National Bureau of Economic Research.
Manning, Alan (2003), Monopsony in Motion: Imperfect Competition in Labor Markets, Princeton, Princeton University Press.
Marinakis, Andrés and Juan Jacobo Velasco (2006),¿Para qué sirve el salario mínimo?: elementos para su determinación en los países del Cono Sur, Santiago, Chile, International Labour Organization (ILO).
Maurizio, Roxana (2013), “El impacto distributivo del salario mínimo en Argentina, Brasil, Chile y Uruguay”, Santiago, Chile, Economic Commission for Latin America and the Caribbean (ECLAC), unpublished.
McDonald, Judith A. and Robert J. Thornton (2007), “Do new male and female college graduates receive unequal pay?”, Journal of Human Resources, vol. 42, No. 1.
Miller, Paul (2009), “The gender pay gap in the US: does sector make a difference?, Journal of Labor Research, vol. 30, No. 1.
Neri, M., G. Gonzaga and J. Camargo (2000), “Efeitos informais do salario mínimo e probeza”, Texto Para Discussão, No. 724, Rio de Janeiro, Institute of Applied Economic Research (IPEA).
OAS/IACW (Organization of American States/ Inter-American Commission of Women) (2011), “Avance de la igualdad de género en el marco del trabajo decente” [online] www.oas.org/es/cim/docs/AvanceGeneroTrabajoDecente-SP%5BFinal-Web%5D.pdf.
Olivetti, Claudia and Barbara Petrongolo (2008), “Unequal pay or unequal employment? A cross-country analysis of gender gaps”, Journal of Labor Economics, vol. 26, No. 4.
182
Cha
pter
III
Economic Commission for Latin America and the Caribbean (ECLAC)
Rofman, Rafael and Leonardo Lucchetti (2006), “Sistemas de pensiones en América Latina: conceptos y mediciones de cobertura”, Social Protection Discussion Paper, No. 0616, World Bank.
Souza, P.R. and P.E. Baltar (1979), “Salário Minimo e Taxa de Salários no Brasil”, Pesquisa e Planejamento Economico, Rio de Janeiro, Institute of Applied Economic Research (IPEA), December.
Távara, J., Efraín González de Olarte and Juan Manuel Del Pozo (2014), “Heterogeneidad estructural y articulación productiva en el Perú: evolución y estrategias”, Hacia un desarrollo inclusivo. El caso del Perú (LC/L.3779), R. Infante and J. Chacaltana, Santiago, Chile, Economic Commission for Latin America and the Caribbean (ECLAC).
Weller, Jürgen (2012), “Crecimiento, empleo y distribución de ingresos en América Latina”, Macroeconomía del Desarrollo series, No. 122 (LC/L.3516), Santiago, Chile, Economic Commission for Latin America and the Caribbean (ECLAC).
Weller, Jürgen and Cornelia Kaldewei (2013), “Empleo, crecimiento sostenible e igualdad”, Macroeconomía del Desarrollo series, No. 145 (LC/L.3743), Santiago, Chile, Economic Commission for Latin America and the Caribbean (ECLAC).
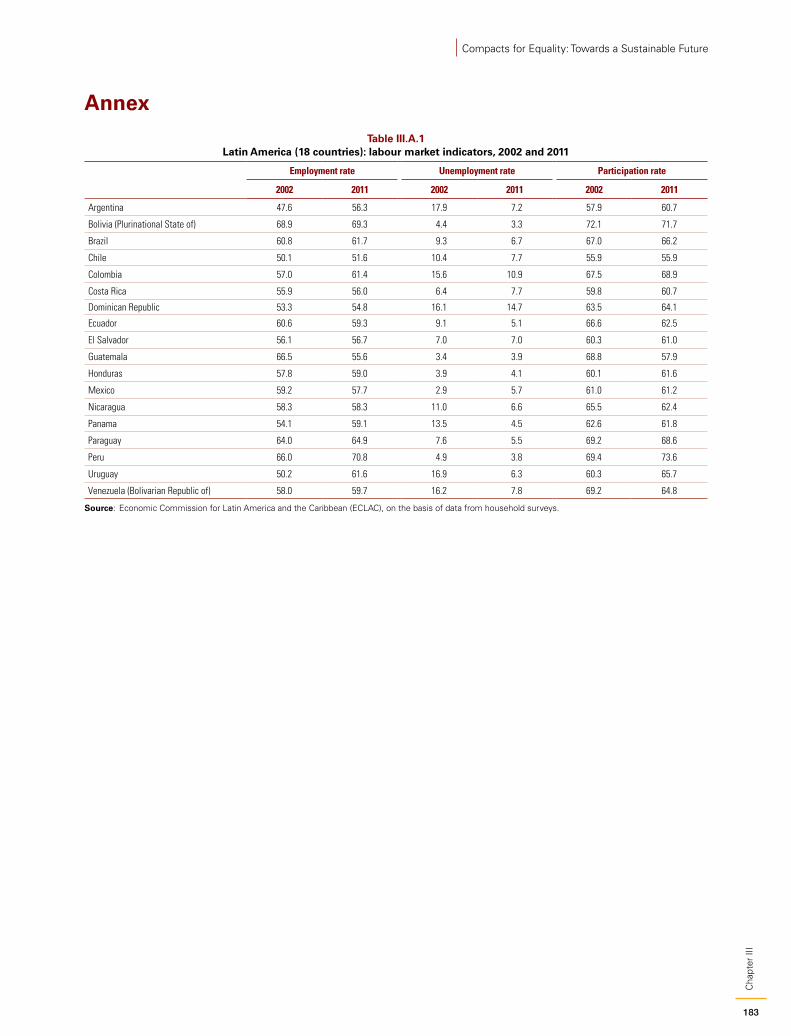
183
Cha
pter
III
Compacts for Equality: Towards a Sustainable Future
Annex
Table III.A.1 Latin America (18 countries): labour market indicators, 2002 and 2011
Employment rate Unemployment rate Participation rate
2002 2011 2002 2011 2002 2011
Argentina 47.6 56.3 17.9 7.2 57.9 60.7
Bolivia (Plurinational State of) 68.9 69.3 4.4 3.3 72.1 71.7
Brazil 60.8 61.7 9.3 6.7 67.0 66.2
Chile 50.1 51.6 10.4 7.7 55.9 55.9
Colombia 57.0 61.4 15.6 10.9 67.5 68.9
Costa Rica 55.9 56.0 6.4 7.7 59.8 60.7
Dominican Republic 53.3 54.8 16.1 14.7 63.5 64.1
Ecuador 60.6 59.3 9.1 5.1 66.6 62.5
El Salvador 56.1 56.7 7.0 7.0 60.3 61.0
Guatemala 66.5 55.6 3.4 3.9 68.8 57.9
Honduras 57.8 59.0 3.9 4.1 60.1 61.6
Mexico 59.2 57.7 2.9 5.7 61.0 61.2
Nicaragua 58.3 58.3 11.0 6.6 65.5 62.4
Panama 54.1 59.1 13.5 4.5 62.6 61.8
Paraguay 64.0 64.9 7.6 5.5 69.2 68.6
Peru 66.0 70.8 4.9 3.8 69.4 73.6
Uruguay 50.2 61.6 16.9 6.3 60.3 65.7
Venezuela (Bolivarian Republic of) 58.0 59.7 16.2 7.8 69.2 64.8
Source: Economic Commission for Latin America and the Caribbean (ECLAC), on the basis of data from household surveys.

Compacts for Equality: Towards a Sustainable FuturePactos para la igualdad: hacia un futuro sostenible
Consumption patterns, the environment and natural resources
Part 3
IntroductionChapter IVEquality, sustainability and well-being in the sphere of consumption
A. Consumption in ECLAC thinkingB. Consumption, growth and developmentC. Consumption by socioeconomic levelD. Consumption of public and private servicesE. Concluding remarks
BibliographyAnnex
Chapter VDevelopment style and environmental sustainability: An unsolved equation
IntroductionA. Consumption patterns and their environmental implicationsB. The environment in national and global agendas
Bibliography
Chapter VINatural resource governance for structural change with equality
A. Natural resources, structural change and equality: towards a virtuous circleB. Ownership of natural resourcesC. State share in natural resource rents between 2000 and 2012 D. Distribution and use of fiscal revenues from mining and hydrocarbons: 2000-2012 E. Natural resource governance challenges in the framework of the post-2015 development agenda
Bibliography

187
Intr
oduc
tion
Compacts for Equality: Towards a Sustainable Future
Introduction
187
Intersecting approaches to development sustainability
This part of the document takes a fresh look at equality within the framework of consumption and considers how consumption dynamics lean towards public or private consumption and how they impact general well-being. It examines, in particular, how consumption patterns, on the one hand, and natural resources production, on the other, severely challenge development sustainability, in ways that make themselves felt in relation to medium-term economic growth, the environment and social cohesion.
In this framework, the challenge of intergenerational equality is addressed from an environmental perspective, focusing on the negative environmental externalities of the existing consumption pattern and on access to basic resources such as water. Also discussed are the challenges to equality posed by the high price of natural resources on the global market. Here, the regime of ownership and appropriation and the use of rents from natural-resource exploitation are crucial for boosting the sector’s distributive impact in terms of capacity development and the provision of well-being.
Rising consumption has cut across social strata over the past decade in Latin America and the Caribbean. Greater disposable income and access to credit for low- and-middle income groups have enabled them to fulfil their aspirations, improve their quality of life and share more actively in the benefits of growth. High-income groups, meanwhile, have intensified and diversified their patterns of high consumption.
This expansion of consumption mirrors the kind of development that is predominant in the region, namely: (i) the stratification of consumption against a backdrop of high social, educational and family profile segmentation; (ii) integration into the transnational economy and culture, with patterns of consumption whereby supply from expanded markets is boosted by demand-side promotion of positional consumption, i.e. consumption motivated by status symbols or upward social mobility; (iii) a specific matrix for the supply and quality of public and private goods and services, with a robust market presence and individual consumption versus poor quality and poor coverage of public services such as transport, health and education.
All this is leading to unequal, vertically segmented consumption patterns with baskets of goods and services that differ greatly in level, composition and quality, and in which some groups still face substantial exclusion and deprivation. It is also feeding a differentiated balance between privately- and publicly-sourced goods on the basis of socioeconomic groups. Another outcome is negative environmental externalities that could jeopardize the quality of life of future generations because of the consumption patterns of current generations.
It is not always easy to distinguish positional consumption from consumption underpinning greater well-being. Moreover, differentiating between essential and superfluous consumption can lead to Manichaean approaches far removed from the one discussed here. Yet, what is being seen in reality is sustained economic growth with high levels of wealth concentration combined with a rising proportion of middle-income households, a stronger role for the market in the supply and diversification of goods and services, and the globalization of identity-building patterns of consumption centred on positional consumption. All these elements impact the consumption component and its

188
Intr
oduc
tion
Economic Commission for Latin America and the Caribbean (ECLAC)
relationship with other factors in the dynamics of development. The rapid expansion of design industries in all fields, and the diversification of supply in clothing, automobiles and entertainment are part of markets with a strong bias towards positional consumption and consumption of private goods and services. At the highest strata in the countries of the region, rising disposable wealth is accompanied by luxury consumption patterns.
As will be seen in chapter IV, the patterns of consumption of public goods and services differ by income bracket. For example, lower socioeconomic sectors use public transport while the other sectors abandon it in favour of private transport. Transport is a useful example that may be applied to areas of well-being, as well, such as health and education. This form of public-private mix is bad for sustainability, because it erodes social cohesion and reduces the willingness to build social and fiscal compacts to secure a better spread of well-being from economic growth. If today’s social mobility pushes middle-income sectors towards private transport, there is little likelihood of social and fiscal support for investing in high-quality, more environmentally sustainable public transport. Such migration tends to increase environmental degradation and reduce quality of life, particularly in cities. Something similar occurs with education and health in many countries in the region, especially in the two highest income deciles: migration to private services segments access, stratifies service quality and makes it harder to achieve meaningful improvements in public services. Ultimately, this has regressive distributive impacts on well-being and capacity development.
Societal coexistence is thus heavily mediated by consumption expectations and forms of prestige and reciprocal recognition on the basis of what people consume. The predominant pattern of consumption not only shapes societal coexistence and the distribution of the benefits of development; it also impacts economic performance and the environment. In Latin America and the Caribbean, demand is especially strong for products that have a high imported input content or are energy- and fuel-intensive. Environmental sustainability, as discussed in depth in chapter V, is thus eroded by worsening negative externalities such as depletion of non-renewable energy resources, high carbon emissions, environmental and air pollution, congestion and deteriorating quality of life in cities.
The imbalance between the structure of weakly diversified domestic supply and the structure of demand for goods and services provided by the global economy is funded, in much of the region, by exports of renewable and non-renewable natural resources. This pattern, which combines intensive use of renewable and non-renewable resources with the current expansion in consumption, yields a development model that is not sustainable economically, socially or environmentally. It is a pattern not conducive to endogenous capacity development, production structure diversification, resilience to external shocks triggered by global price and demand volatility, the spread of well-being through higher productive employment and broader consumption of public goods, or the curbing of environmental degradation caused by heavy use of polluting sources of energy.
It is not easy to reverse the inertia of a dominant development model that combines a highly natural-resource-intensive export structure, consumption patterns based on high demand for imported goods, a strong bias towards segmentation, and negative energy and environmental externalities. Yet it must be reversed for the sake of the threefold sustainability advocated herein: economic, social and environmental.
On the environmental front, as discussed in chapter V, the challenge posed by climate change must be addressed. A long-term scenario that is consistent with climate goals does not seem feasible with the current production structure and infrastructure, and the tendency is still to use fossil-fuel-intensive technologies (often with positive incentives such as fossil fuel subsidies or unpaid negative externalities).
As noted in chapter VI, the region can hardly disregard its vast stock of natural resources. But it must be aware of the risks and challenges associated with natural-resource-intensive production. These risks include national currency appreciation that lowers the cost of imported goods and hurts domestic industry (“Dutch disease”); the potential for rent-seeking that acts as a disincentive to economic policies geared towards expanding a country’s production and technology base; and the risks associated with managing substantial public rents with weak institutions. Such a balance (where overconsumption is paid for by rent-seeking based on exploitation of natural resources) is not conducive to sustainable development, and it is not new in the region.
A key challenge for the institutions-structure interface is therefore to consolidate a regulatory framework that makes it possible to capitalize on this vast stock of natural resources so as to build a production structure that is more technology-intensive and more diversified, and where the allocation of rents is geared towards greater equality in access to well-being, capacity development and reciprocal recognition among stakeholders. Governance along these lines must ensure that the exploitation of natural resources is tied in with economic development, with the
189
Intr
oduc
tion
Compacts for Equality: Towards a Sustainable Future
kind of supply chains that are created or encouraged, with the type of infrastructure that is put in place, and with the effort expended on protecting the environment and the rights of peoples and communities living in areas where these resources are exploited.
It is time to reverse the vicious cycles that link high private consumption with an inadequate supply of public services, with negative environmental externalities and with a poorly diversified production model in which high natural resource revenues do little to build capacity or endogenize technical progress. Doing so requires comprehensive compacts between the various stakeholders involved, as will be discussed in the final section of this document.

191
Cha
pter
IV
Compacts for Equality: Towards a Sustainable Future
Chapter IV
Equality, sustainability and well-being in the sphere of consumption
Over two decades ago, ECLAC coined the term “empty box” to refer to the fact that no country in the region had been able to combine economic growth with significant progress towards equality (Fajnzylber, 1992). At the same time, ECLAC was revisiting its traditional thesis on consumption patterns that emulated those of the upper classes and it was suggested that more equitable societies could mean a more austere consumption pattern capable of promoting higher levels of saving and thereby greater long-term growth. And, in fact, unlike what has occurred in Asian countries, in Latin America economic growth periods have been characterized by sharply climbing consumption.
The situation today in the region —having trodden a path of strong economic growth, with powerful expansion in private consumption but also a significant decrease in its inequality levels— invites us to rethink the role of consumption in its development. But the question now arises with fresh nuances. Consumption must be viewed not only from the macroeconomic perspective, in terms of the mechanisms that connect it with other variables (especially national income, but also private debt and imports), but also as an indicator of well-being. The analysis must now incorporate consumption exclusions and deprivations, as well as patterns differentiated by socioeconomic level and possible copycat effects between groups. What is more, the way in which consumption of private and public services in some areas in particular (education, health, transport) combines at different points in the income distribution may significantly affect social integration.
The approach taken here acknowledges that the analysis of consumption does not fall within the exclusive purview of economic discipline. Other disciplines have questioned the role of consumption in contemporary society and have attempted to distinguish forms of consumption that further individual autonomy from those that do not. Whereas the traditional economic vision sees consumers as sovereign individuals making free choices, from other perspectives today’s consumer societies lead people to set themselves unattainable consumption goals, leading to frustration and eroding their autonomy and self-esteem (see, among others, Cortina, 2002; Barber, 2007; and Frank, 2007).
This chapter begins by reviewing the main contributions ECLAC has made to conceptualizing the role of consumption in the region’s economies. It then looks in detail at how private consumption has behaved in the recent processes experienced in Latin America and examines inequality in consumption levels and differentiated patterns.1 Later, the combinations of publicly and privately provided service consumption and their potential impacts are discussed. This is followed by concluding comments.
1 Sections A, B and C of this chapter are based on Rius, Román and Vigorito (2013).
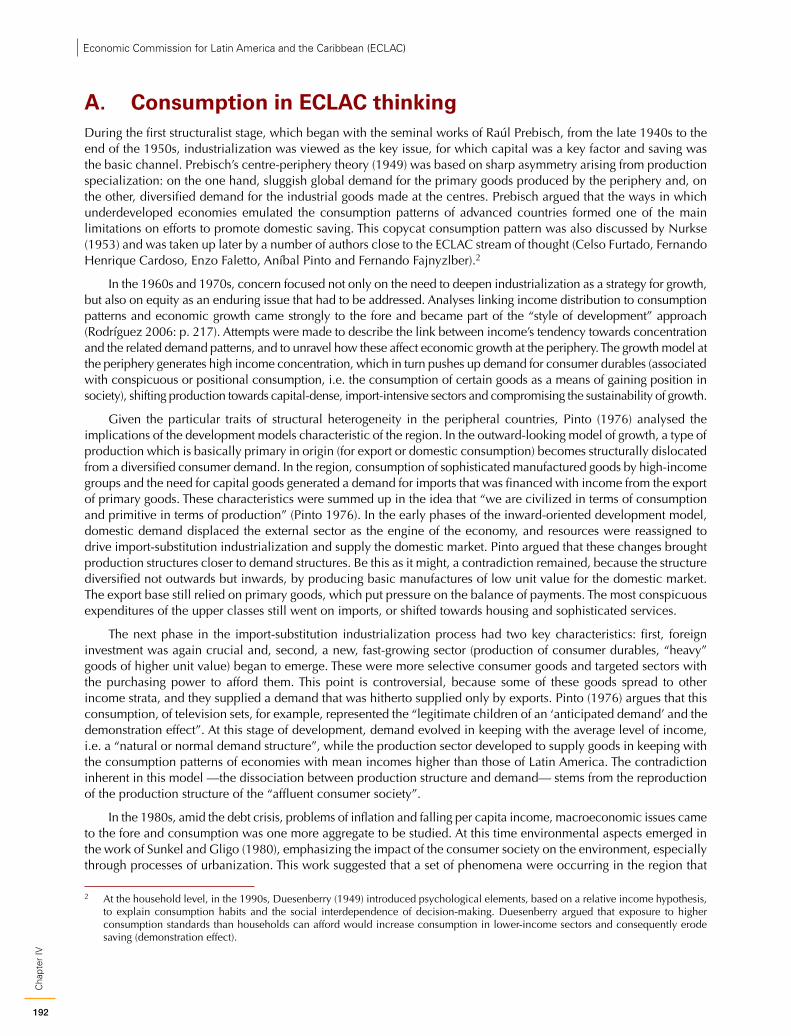
192
Cha
pter
IVEconomic Commission for Latin America and the Caribbean (ECLAC)
A. Consumption in ECLAC thinkingDuring the first structuralist stage, which began with the seminal works of Raúl Prebisch, from the late 1940s to the end of the 1950s, industrialization was viewed as the key issue, for which capital was a key factor and saving was the basic channel. Prebisch’s centre-periphery theory (1949) was based on sharp asymmetry arising from production specialization: on the one hand, sluggish global demand for the primary goods produced by the periphery and, on the other, diversified demand for the industrial goods made at the centres. Prebisch argued that the ways in which underdeveloped economies emulated the consumption patterns of advanced countries formed one of the main limitations on efforts to promote domestic saving. This copycat consumption pattern was also discussed by Nurkse (1953) and was taken up later by a number of authors close to the ECLAC stream of thought (Celso Furtado, Fernando Henrique Cardoso, Enzo Faletto, Aníbal Pinto and Fernando Fajnyzlber).2
In the 1960s and 1970s, concern focused not only on the need to deepen industrialization as a strategy for growth, but also on equity as an enduring issue that had to be addressed. Analyses linking income distribution to consumption patterns and economic growth came strongly to the fore and became part of the “style of development” approach (Rodríguez 2006: p. 217). Attempts were made to describe the link between income’s tendency towards concentration and the related demand patterns, and to unravel how these affect economic growth at the periphery. The growth model at the periphery generates high income concentration, which in turn pushes up demand for consumer durables (associated with conspicuous or positional consumption, i.e. the consumption of certain goods as a means of gaining position in society), shifting production towards capital-dense, import-intensive sectors and compromising the sustainability of growth.
Given the particular traits of structural heterogeneity in the peripheral countries, Pinto (1976) analysed the implications of the development models characteristic of the region. In the outward-looking model of growth, a type of production which is basically primary in origin (for export or domestic consumption) becomes structurally dislocated from a diversified consumer demand. In the region, consumption of sophisticated manufactured goods by high-income groups and the need for capital goods generated a demand for imports that was financed with income from the export of primary goods. These characteristics were summed up in the idea that “we are civilized in terms of consumption and primitive in terms of production” (Pinto 1976). In the early phases of the inward-oriented development model, domestic demand displaced the external sector as the engine of the economy, and resources were reassigned to drive import-substitution industrialization and supply the domestic market. Pinto argued that these changes brought production structures closer to demand structures. Be this as it might, a contradiction remained, because the structure diversified not outwards but inwards, by producing basic manufactures of low unit value for the domestic market. The export base still relied on primary goods, which put pressure on the balance of payments. The most conspicuous expenditures of the upper classes still went on imports, or shifted towards housing and sophisticated services.
The next phase in the import-substitution industrialization process had two key characteristics: first, foreign investment was again crucial and, second, a new, fast-growing sector (production of consumer durables, “heavy” goods of higher unit value) began to emerge. These were more selective consumer goods and targeted sectors with the purchasing power to afford them. This point is controversial, because some of these goods spread to other income strata, and they supplied a demand that was hitherto supplied only by exports. Pinto (1976) argues that this consumption, of television sets, for example, represented the “legitimate children of an ‘anticipated demand’ and the demonstration effect”. At this stage of development, demand evolved in keeping with the average level of income, i.e. a “natural or normal demand structure”, while the production sector developed to supply goods in keeping with the consumption patterns of economies with mean incomes higher than those of Latin America. The contradiction inherent in this model —the dissociation between production structure and demand— stems from the reproduction of the production structure of the “affluent consumer society”.
In the 1980s, amid the debt crisis, problems of inflation and falling per capita income, macroeconomic issues came to the fore and consumption was one more aggregate to be studied. At this time environmental aspects emerged in the work of Sunkel and Gligo (1980), emphasizing the impact of the consumer society on the environment, especially through processes of urbanization. This work suggested that a set of phenomena were occurring in the region that
2 At the household level, in the 1990s, Duesenberry (1949) introduced psychological elements, based on a relative income hypothesis, to explain consumption habits and the social interdependence of decision-making. Duesenberry argued that exposure to higher consumption standards than households can afford would increase consumption in lower-income sectors and consequently erode saving (demonstration effect).
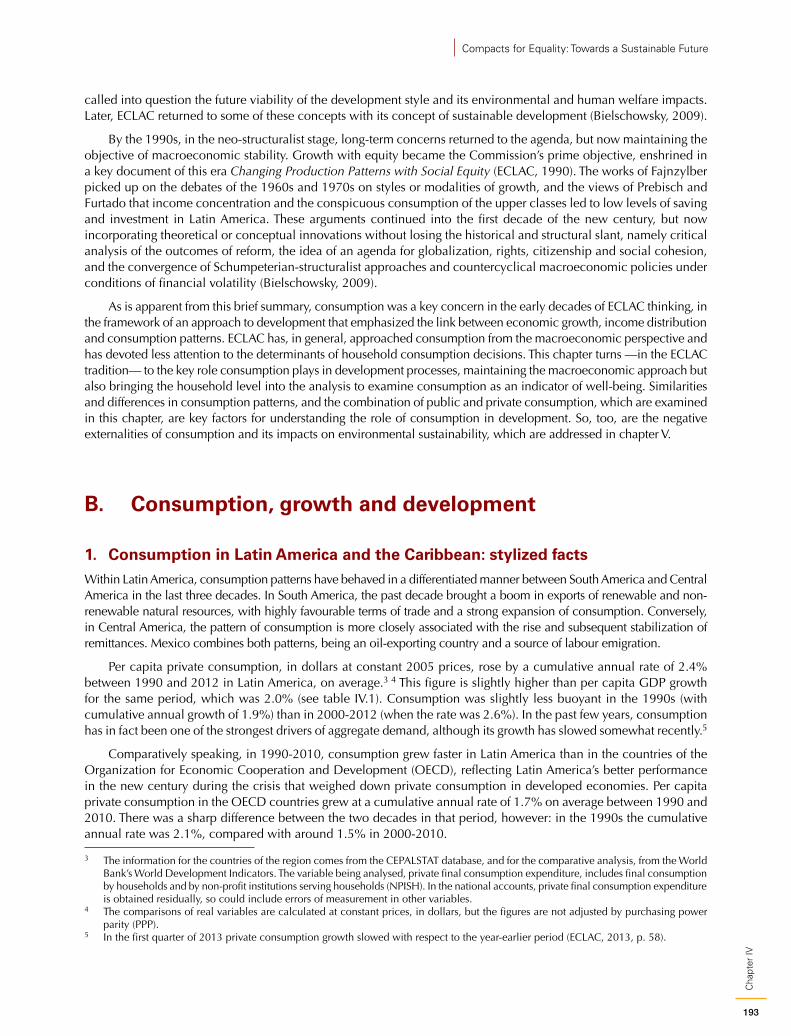
193
Cha
pter
IV
Compacts for Equality: Towards a Sustainable Future
called into question the future viability of the development style and its environmental and human welfare impacts. Later, ECLAC returned to some of these concepts with its concept of sustainable development (Bielschowsky, 2009).
By the 1990s, in the neo-structuralist stage, long-term concerns returned to the agenda, but now maintaining the objective of macroeconomic stability. Growth with equity became the Commission’s prime objective, enshrined in a key document of this era Changing Production Patterns with Social Equity (ECLAC, 1990). The works of Fajnzylber picked up on the debates of the 1960s and 1970s on styles or modalities of growth, and the views of Prebisch and Furtado that income concentration and the conspicuous consumption of the upper classes led to low levels of saving and investment in Latin America. These arguments continued into the first decade of the new century, but now incorporating theoretical or conceptual innovations without losing the historical and structural slant, namely critical analysis of the outcomes of reform, the idea of an agenda for globalization, rights, citizenship and social cohesion, and the convergence of Schumpeterian-structuralist approaches and countercyclical macroeconomic policies under conditions of financial volatility (Bielschowsky, 2009).
As is apparent from this brief summary, consumption was a key concern in the early decades of ECLAC thinking, in the framework of an approach to development that emphasized the link between economic growth, income distribution and consumption patterns. ECLAC has, in general, approached consumption from the macroeconomic perspective and has devoted less attention to the determinants of household consumption decisions. This chapter turns —in the ECLAC tradition— to the key role consumption plays in development processes, maintaining the macroeconomic approach but also bringing the household level into the analysis to examine consumption as an indicator of well-being. Similarities and differences in consumption patterns, and the combination of public and private consumption, which are examined in this chapter, are key factors for understanding the role of consumption in development. So, too, are the negative externalities of consumption and its impacts on environmental sustainability, which are addressed in chapter V.
B. Consumption, growth and development
1. Consumption in Latin America and the Caribbean: stylized factsWithin Latin America, consumption patterns have behaved in a differentiated manner between South America and Central America in the last three decades. In South America, the past decade brought a boom in exports of renewable and non-renewable natural resources, with highly favourable terms of trade and a strong expansion of consumption. Conversely, in Central America, the pattern of consumption is more closely associated with the rise and subsequent stabilization of remittances. Mexico combines both patterns, being an oil-exporting country and a source of labour emigration.
Per capita private consumption, in dollars at constant 2005 prices, rose by a cumulative annual rate of 2.4% between 1990 and 2012 in Latin America, on average.3 4 This figure is slightly higher than per capita GDP growth for the same period, which was 2.0% (see table IV.1). Consumption was slightly less buoyant in the 1990s (with cumulative annual growth of 1.9%) than in 2000-2012 (when the rate was 2.6%). In the past few years, consumption has in fact been one of the strongest drivers of aggregate demand, although its growth has slowed somewhat recently.5
Comparatively speaking, in 1990-2010, consumption grew faster in Latin America than in the countries of the Organization for Economic Cooperation and Development (OECD), reflecting Latin America’s better performance in the new century during the crisis that weighed down private consumption in developed economies. Per capita private consumption in the OECD countries grew at a cumulative annual rate of 1.7% on average between 1990 and 2010. There was a sharp difference between the two decades in that period, however: in the 1990s the cumulative annual rate was 2.1%, compared with around 1.5% in 2000-2010.
3 The information for the countries of the region comes from the CEPALSTAT database, and for the comparative analysis, from the World Bank’s World Development Indicators. The variable being analysed, private final consumption expenditure, includes final consumption by households and by non-profit institutions serving households (NPISH). In the national accounts, private final consumption expenditure is obtained residually, so could include errors of measurement in other variables.
4 The comparisons of real variables are calculated at constant prices, in dollars, but the figures are not adjusted by purchasing power parity (PPP).
5 In the first quarter of 2013 private consumption growth slowed with respect to the year-earlier period (ECLAC, 2013, p. 58).
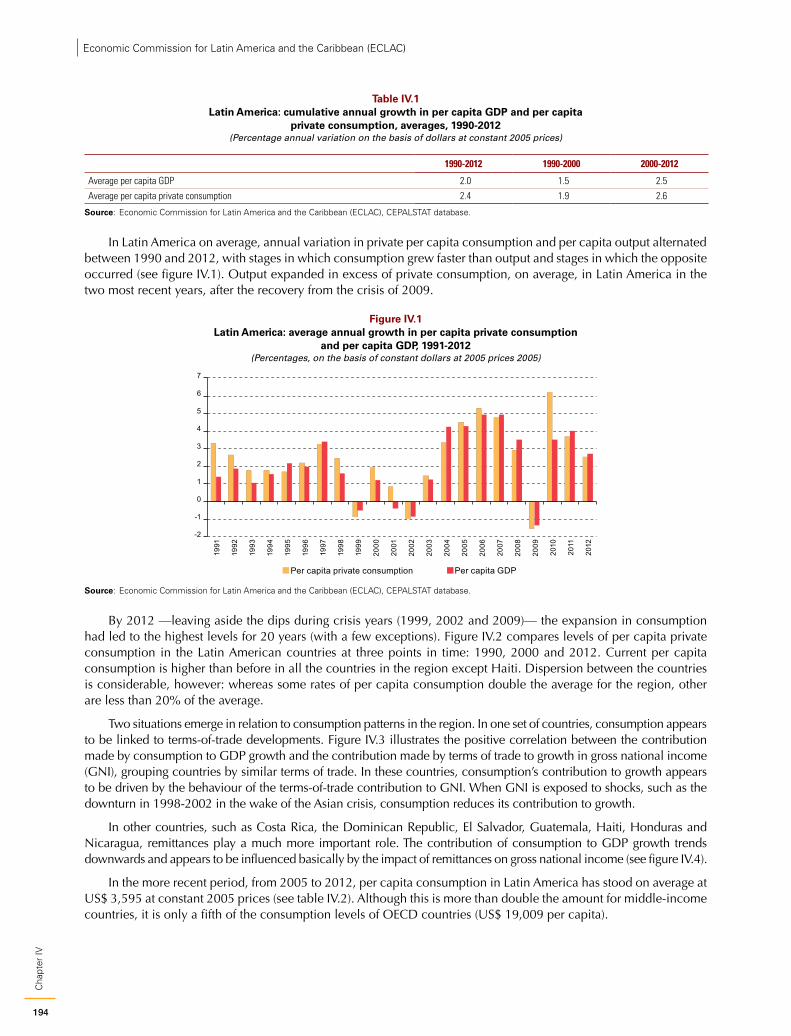
194
Cha
pter
IVEconomic Commission for Latin America and the Caribbean (ECLAC)
Table IV.1 Latin America: cumulative annual growth in per capita GDP and per capita
private consumption, averages, 1990-2012 (Percentage annual variation on the basis of dollars at constant 2005 prices)
1990-2012 1990-2000 2000-2012
Average per capita GDP 2.0 1.5 2.5
Average per capita private consumption 2.4 1.9 2.6
Source: Economic Commission for Latin America and the Caribbean (ECLAC), CEPALSTAT database.
In Latin America on average, annual variation in private per capita consumption and per capita output alternated between 1990 and 2012, with stages in which consumption grew faster than output and stages in which the opposite occurred (see figure IV.1). Output expanded in excess of private consumption, on average, in Latin America in the two most recent years, after the recovery from the crisis of 2009.
Figure IV.1 Latin America: average annual growth in per capita private consumption
and per capita GDP, 1991-2012(Percentages, on the basis of constant dollars at 2005 prices 2005)
-2
-1
0
1
2
3
4
5
6
7
1991
1992
1993
1994
1995
1996
1997
1998
1999
2000
2001
2002
2003
2004
2005
2006
2007
2008
2009
2010
2011
2012
Per capita private consumption Per capita GDP
Source: Economic Commission for Latin America and the Caribbean (ECLAC), CEPALSTAT database.
By 2012 —leaving aside the dips during crisis years (1999, 2002 and 2009)— the expansion in consumption had led to the highest levels for 20 years (with a few exceptions). Figure IV.2 compares levels of per capita private consumption in the Latin American countries at three points in time: 1990, 2000 and 2012. Current per capita consumption is higher than before in all the countries in the region except Haiti. Dispersion between the countries is considerable, however: whereas some rates of per capita consumption double the average for the region, other are less than 20% of the average.
Two situations emerge in relation to consumption patterns in the region. In one set of countries, consumption appears to be linked to terms-of-trade developments. Figure IV.3 illustrates the positive correlation between the contribution made by consumption to GDP growth and the contribution made by terms of trade to growth in gross national income (GNI), grouping countries by similar terms of trade. In these countries, consumption’s contribution to growth appears to be driven by the behaviour of the terms-of-trade contribution to GNI. When GNI is exposed to shocks, such as the downturn in 1998-2002 in the wake of the Asian crisis, consumption reduces its contribution to growth.
In other countries, such as Costa Rica, the Dominican Republic, El Salvador, Guatemala, Haiti, Honduras and Nicaragua, remittances play a much more important role. The contribution of consumption to GDP growth trends downwards and appears to be influenced basically by the impact of remittances on gross national income (see figure IV.4).
In the more recent period, from 2005 to 2012, per capita consumption in Latin America has stood on average at US$ 3,595 at constant 2005 prices (see table IV.2). Although this is more than double the amount for middle-income countries, it is only a fifth of the consumption levels of OECD countries (US$ 19,009 per capita).
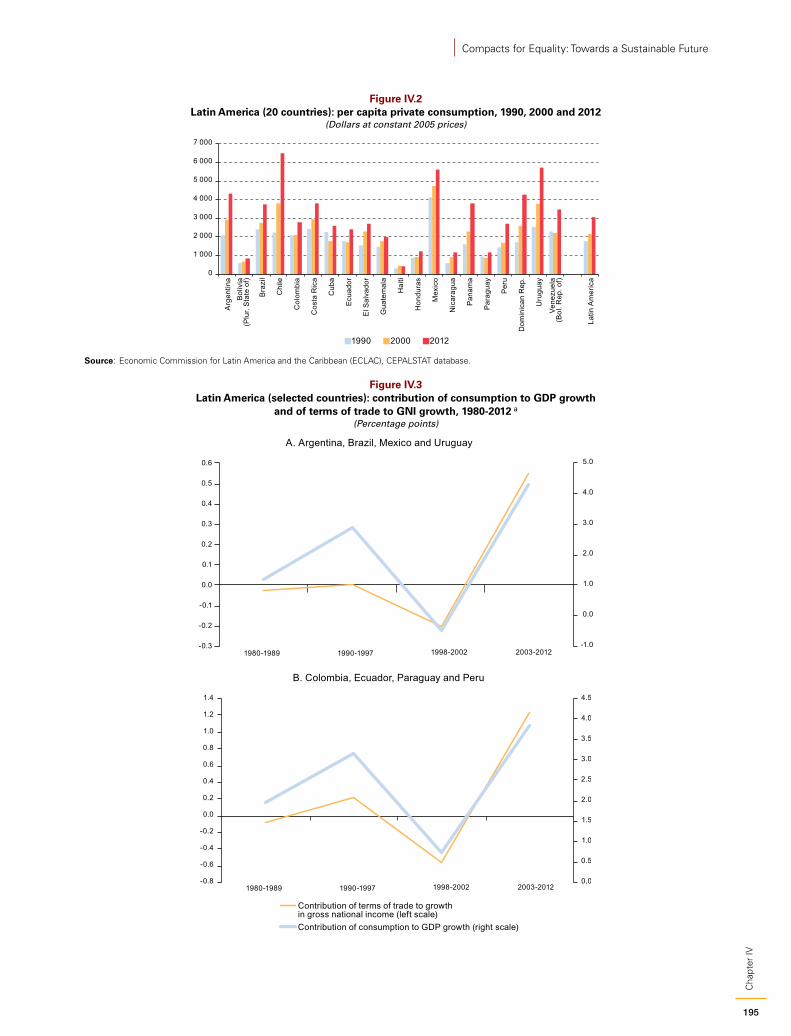
195
Cha
pter
IV
Compacts for Equality: Towards a Sustainable Future
Figure IV.2 Latin America (20 countries): per capita private consumption, 1990, 2000 and 2012
(Dollars at constant 2005 prices)
0
1 000
2 000
3 000
4 000
5 000
6 000
7 000
Arg
entin
aB
oliv
ia(P
lur.
Sta
te o
f)
Bra
zil
Chi
le
Col
ombi
a
Cos
ta R
ica
Cub
a
Ecu
ador
El S
alva
dor
Gua
tem
ala
Hai
ti
Hon
dura
s
Mex
ico
Nic
arag
ua
Pan
ama
Par
agua
y
Per
u
Dom
inic
an R
ep.
Uru
guay
Vene
zuel
a(B
ol. R
ep. o
f)
Latin
Am
eric
a
1990 2000 2012
Source: Economic Commission for Latin America and the Caribbean (ECLAC), CEPALSTAT database.
Figure IV.3 Latin America (selected countries): contribution of consumption to GDP growth
and of terms of trade to GNI growth, 1980-2012 a
(Percentage points)
-1.0
0.0
1.0
2.0
3.0
4.0
5.0
-0.3
-0.2
-0.1
0.0
0.1
0.2
0.3
0.4
0.5
0.6
1980-1989 1990-1997 1998-2002 2003-2012
A. Argentina, Brazil, Mexico and Uruguay
1980-1989 1990-1997 1998-2002 2003-2012
B. Colombia, Ecuador, Paraguay and Peru
0,0
0.5
1.0
1.5
2.0
2.5
3.0
3.5
4.0
4.5
-0.8
-0.6
-0.4
-0.2
0.0
0.2
0.4
0.6
0.8
1.0
1.2
1.4
Contribution of terms of trade to growth in gross national income (left scale) Contribution of consumption to GDP growth (right scale)
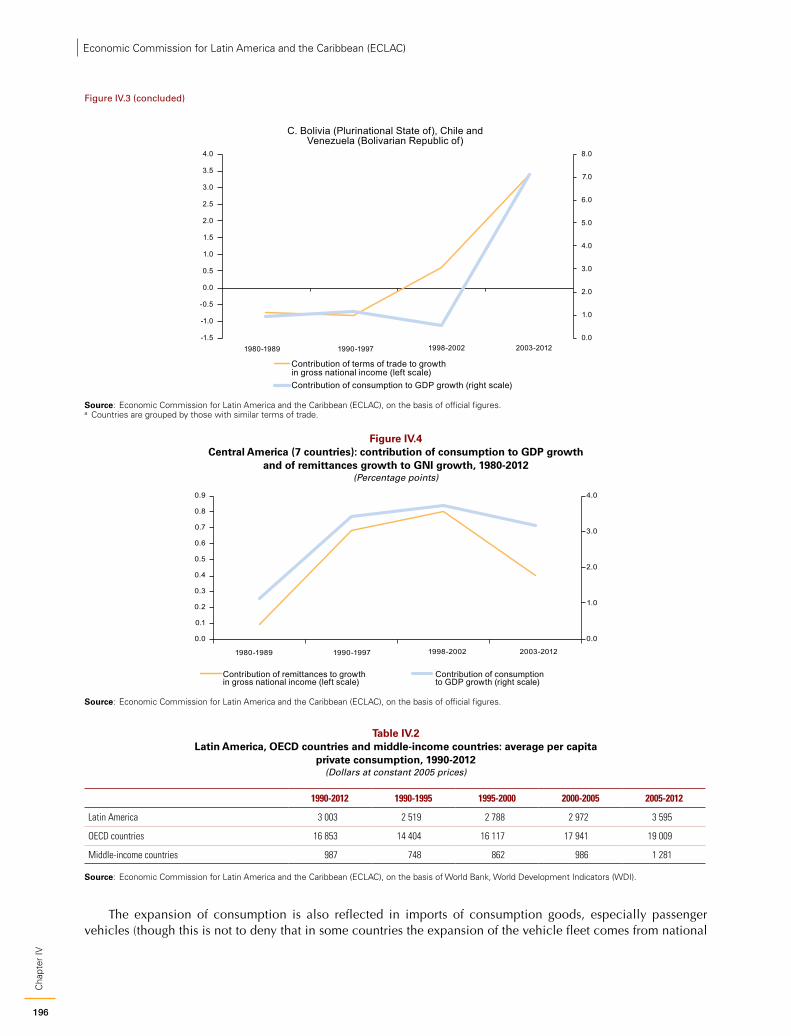
196
Cha
pter
IVEconomic Commission for Latin America and the Caribbean (ECLAC)
1980-1989 1990-1997 1998-2002 2003-20120.0
1.0
2.0
3.0
4.0
5.0
6.0
7.0
8.0
-1.5
-1.0
-0.5
0.0
0.5
1.0
1.5
2.0
2.5
3.0
3.5
4.0
Contribution of terms of trade to growth in gross national income (left scale) Contribution of consumption to GDP growth (right scale)
C. Bolivia (Plurinational State of), Chile andVenezuela (Bolivarian Republic of)
Source: Economic Commission for Latin America and the Caribbean (ECLAC), on the basis of official figures.a Countries are grouped by those with similar terms of trade.
Figure IV.4 Central America (7 countries): contribution of consumption to GDP growth
and of remittances growth to GNI growth, 1980-2012(Percentage points)
1980-1989 1990-1997 1998-2002 2003-2012
0.0
1.0
2.0
3.0
4.0
0.0
0.1
0.2
0.3
0.4
0.5
0.6
0.7
0.8
0.9
Contribution of remittances to growth in gross national income (left scale)
Contribution of consumption to GDP growth (right scale)
Source: Economic Commission for Latin America and the Caribbean (ECLAC), on the basis of official figures.
Table IV.2 Latin America, OECD countries and middle-income countries: average per capita
private consumption, 1990-2012(Dollars at constant 2005 prices)
1990-2012 1990-1995 1995-2000 2000-2005 2005-2012
Latin America 3 003 2 519 2 788 2 972 3 595
OECD countries 16 853 14 404 16 117 17 941 19 009
Middle-income countries 987 748 862 986 1 281
Source: Economic Commission for Latin America and the Caribbean (ECLAC), on the basis of World Bank, World Development Indicators (WDI).
The expansion of consumption is also reflected in imports of consumption goods, especially passenger vehicles (though this is not to deny that in some countries the expansion of the vehicle fleet comes from national
Figure IV.3 (concluded)
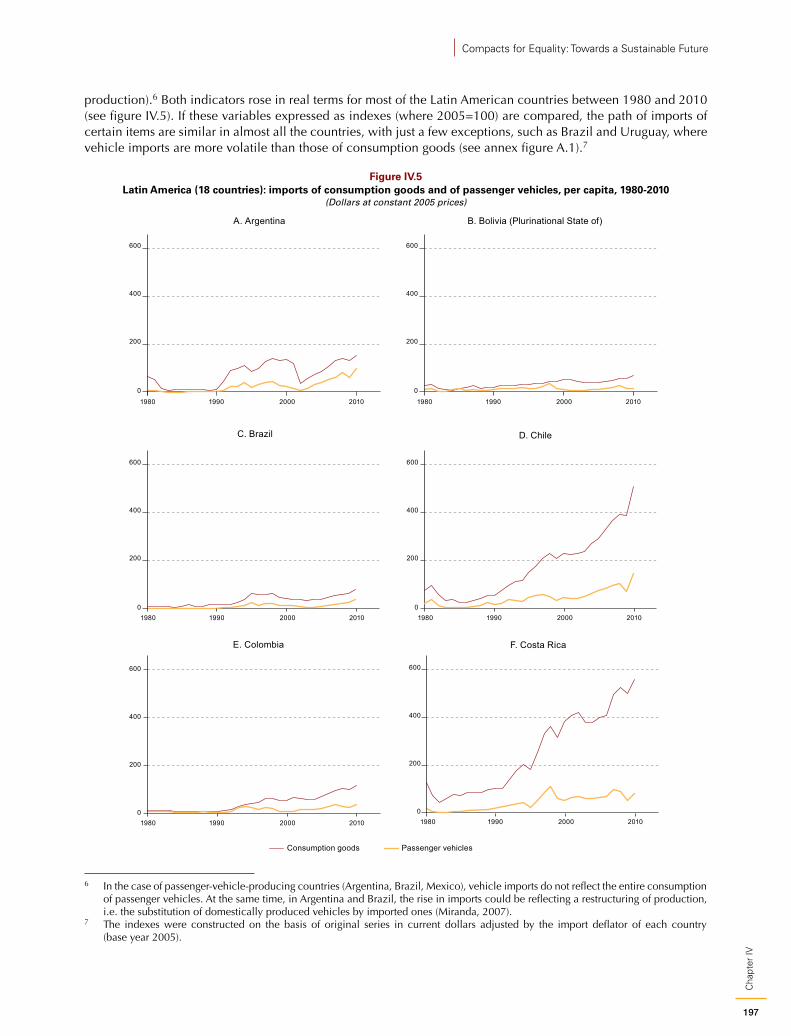
197
Cha
pter
IV
Compacts for Equality: Towards a Sustainable Future
production).6 Both indicators rose in real terms for most of the Latin American countries between 1980 and 2010 (see figure IV.5). If these variables expressed as indexes (where 2005=100) are compared, the path of imports of certain items are similar in almost all the countries, with just a few exceptions, such as Brazil and Uruguay, where vehicle imports are more volatile than those of consumption goods (see annex figure A.1).7
Figure IV.5 Latin America (18 countries): imports of consumption goods and of passenger vehicles, per capita, 1980-2010
(Dollars at constant 2005 prices)
C. Brazil
0
1980 1990 2000 2010
200
400
600
0
1980 1990 2000 2010
200
400
600
B. Bolivia (Plurinational State of)A. Argentina
0
200
400
600
1980 1990 2000 2010
0
200
400
600
1980 1990 2000 2010
0
200
400
600
1980 1990 2000 2010
0
200
400
600
1980 1990 2000 2010
D. Chile
E. Colombia F. Costa Rica
Consumption goods Passenger vehicles
6 In the case of passenger-vehicle-producing countries (Argentina, Brazil, Mexico), vehicle imports do not reflect the entire consumption of passenger vehicles. At the same time, in Argentina and Brazil, the rise in imports could be reflecting a restructuring of production, i.e. the substitution of domestically produced vehicles by imported ones (Miranda, 2007).
7 The indexes were constructed on the basis of original series in current dollars adjusted by the import deflator of each country (base year 2005).
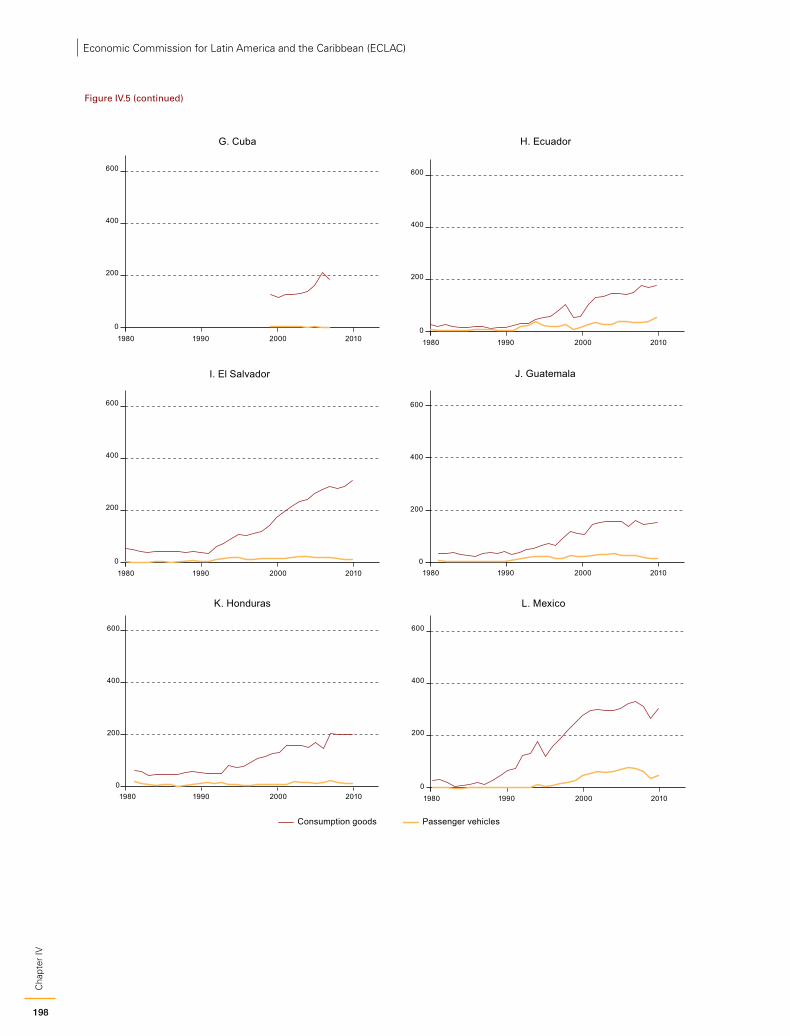
198
Cha
pter
IVEconomic Commission for Latin America and the Caribbean (ECLAC)
0
200
400
600
1980 1990 2000 2010
0
200
400
600
1980 1990 2000 2010
G. Cuba
0
1980 1990 2000 2010
200
400
600
0
1980 1990 2000 2010
200
400
600
0
1980 1990 2000 2010
200
400
600
H. Ecuador
I. El Salvador J. Guatemala
K. Honduras L. Mexico
0
1980 1990 2000 2010
200
400
600
Consumption goods Passenger vehicles
Figure IV.5 (continued)
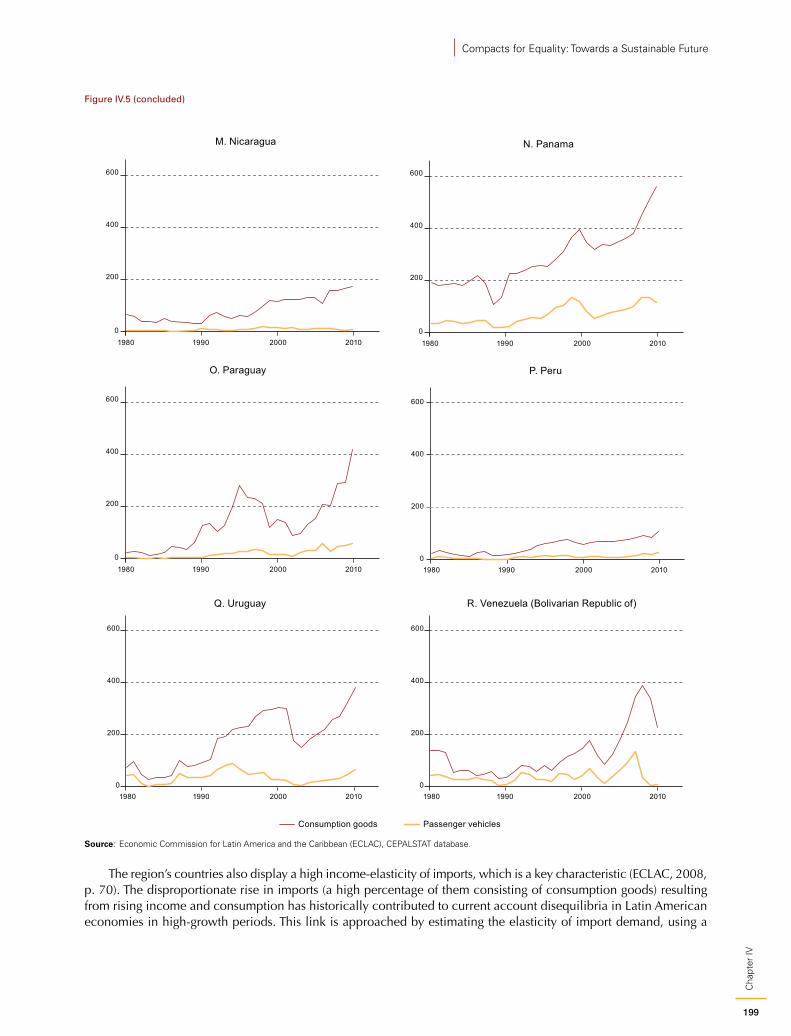
199
Cha
pter
IV
Compacts for Equality: Towards a Sustainable Future
0
200
400
600
1980 1990 2000 2010
0
200
400
600
1980 1990 2000 2010
0
1980 1990 2000 2010
200
400
600
0
1980 1990 2000 2010
200
400
600
0
1980 1990 2000 2010
200
400
600
M. Nicaragua N. Panama
O. Paraguay P. Peru
R. Venezuela (Bolivarian Republic of)
0
200
400
600
1980 1990 2000 2010
Q. Uruguay
Consumption goods Passenger vehicles
Source: Economic Commission for Latin America and the Caribbean (ECLAC), CEPALSTAT database.
The region’s countries also display a high income-elasticity of imports, which is a key characteristic (ECLAC, 2008, p. 70). The disproportionate rise in imports (a high percentage of them consisting of consumption goods) resulting from rising income and consumption has historically contributed to current account disequilibria in Latin American economies in high-growth periods. This link is approached by estimating the elasticity of import demand, using a
Figure IV.5 (concluded)
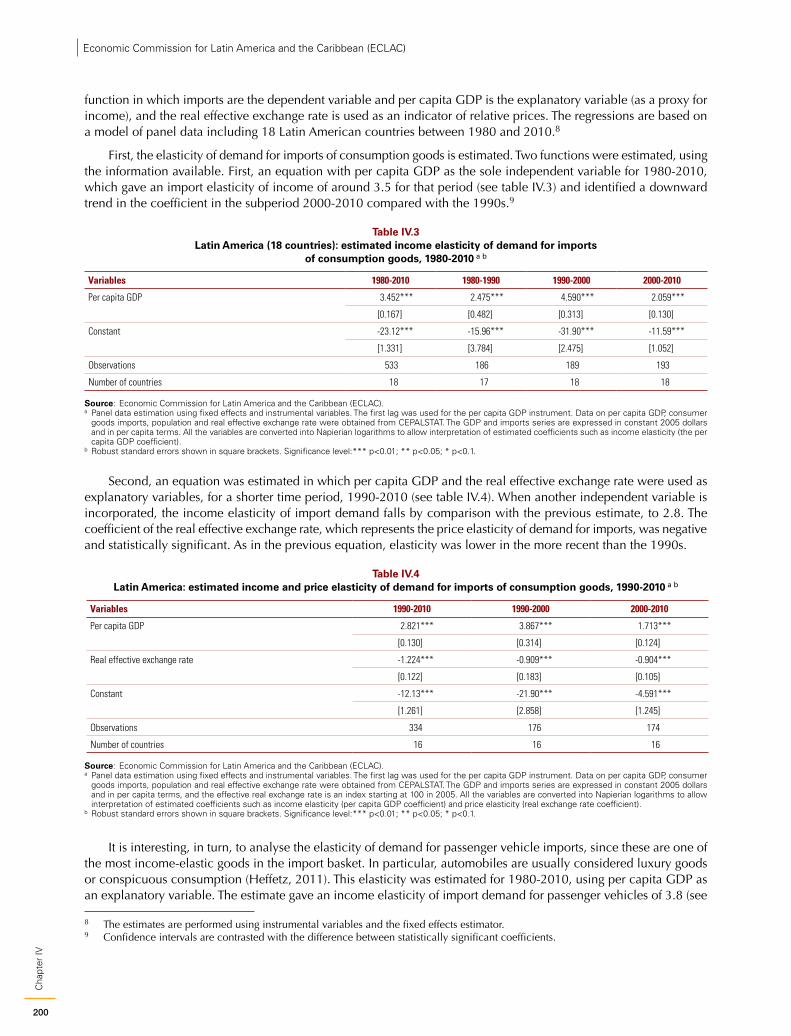
200
Cha
pter
IVEconomic Commission for Latin America and the Caribbean (ECLAC)
function in which imports are the dependent variable and per capita GDP is the explanatory variable (as a proxy for income), and the real effective exchange rate is used as an indicator of relative prices. The regressions are based on a model of panel data including 18 Latin American countries between 1980 and 2010.8
First, the elasticity of demand for imports of consumption goods is estimated. Two functions were estimated, using the information available. First, an equation with per capita GDP as the sole independent variable for 1980-2010, which gave an import elasticity of income of around 3.5 for that period (see table IV.3) and identified a downward trend in the coefficient in the subperiod 2000-2010 compared with the 1990s.9
Table IV.3 Latin America (18 countries): estimated income elasticity of demand for imports
of consumption goods, 1980-2010 a b
Variables 1980-2010 1980-1990 1990-2000 2000-2010
Per capita GDP 3.452*** 2.475*** 4.590*** 2.059***
[0.167] [0.482] [0.313] [0.130]
Constant -23.12*** -15.96*** -31.90*** -11.59***
[1.331] [3.784] [2.475] [1.052]
Observations 533 186 189 193
Number of countries 18 17 18 18
Source: Economic Commission for Latin America and the Caribbean (ECLAC).a Panel data estimation using fixed effects and instrumental variables. The first lag was used for the per capita GDP instrument. Data on per capita GDP, consumer
goods imports, population and real effective exchange rate were obtained from CEPALSTAT. The GDP and imports series are expressed in constant 2005 dollars and in per capita terms. All the variables are converted into Napierian logarithms to allow interpretation of estimated coefficients such as income elasticity (the per capita GDP coefficient).
b Robust standard errors shown in square brackets. Significance level:*** p<0.01; ** p<0.05; * p<0.1.
Second, an equation was estimated in which per capita GDP and the real effective exchange rate were used as explanatory variables, for a shorter time period, 1990-2010 (see table IV.4). When another independent variable is incorporated, the income elasticity of import demand falls by comparison with the previous estimate, to 2.8. The coefficient of the real effective exchange rate, which represents the price elasticity of demand for imports, was negative and statistically significant. As in the previous equation, elasticity was lower in the more recent than the 1990s.
Table IV.4 Latin America: estimated income and price elasticity of demand for imports of consumption goods, 1990-2010 a b
Variables 1990-2010 1990-2000 2000-2010
Per capita GDP 2.821*** 3.867*** 1.713***
[0.130] [0.314] [0.124]
Real effective exchange rate -1.224*** -0.909*** -0.904***
[0.122] [0.183] [0.105]
Constant -12.13*** -21.90*** -4.591***
[1.261] [2.858] [1.245]
Observations 334 176 174
Number of countries 16 16 16
Source: Economic Commission for Latin America and the Caribbean (ECLAC).a Panel data estimation using fixed effects and instrumental variables. The first lag was used for the per capita GDP instrument. Data on per capita GDP, consumer
goods imports, population and real effective exchange rate were obtained from CEPALSTAT. The GDP and imports series are expressed in constant 2005 dollars and in per capita terms, and the effective real exchange rate is an index starting at 100 in 2005. All the variables are converted into Napierian logarithms to allow interpretation of estimated coefficients such as income elasticity (per capita GDP coefficient) and price elasticity (real exchange rate coefficient).
b Robust standard errors shown in square brackets. Significance level:*** p<0.01; ** p<0.05; * p<0.1.
It is interesting, in turn, to analyse the elasticity of demand for passenger vehicle imports, since these are one of the most income-elastic goods in the import basket. In particular, automobiles are usually considered luxury goods or conspicuous consumption (Heffetz, 2011). This elasticity was estimated for 1980-2010, using per capita GDP as an explanatory variable. The estimate gave an income elasticity of import demand for passenger vehicles of 3.8 (see
8 The estimates are performed using instrumental variables and the fixed effects estimator. 9 Confidence intervals are contrasted with the difference between statistically significant coefficients.
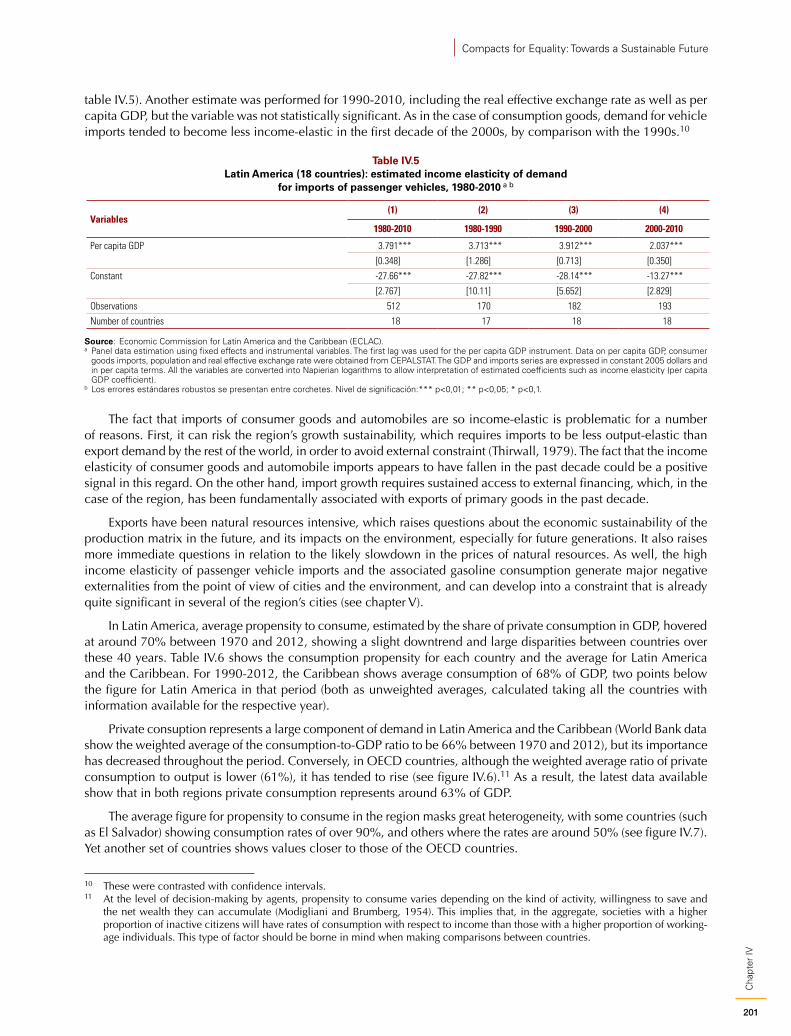
201
Cha
pter
IV
Compacts for Equality: Towards a Sustainable Future
table IV.5). Another estimate was performed for 1990-2010, including the real effective exchange rate as well as per capita GDP, but the variable was not statistically significant. As in the case of consumption goods, demand for vehicle imports tended to become less income-elastic in the first decade of the 2000s, by comparison with the 1990s.10
Table IV.5 Latin America (18 countries): estimated income elasticity of demand
for imports of passenger vehicles, 1980-2010 a b
Variables(1) (2) (3) (4)
1980-2010 1980-1990 1990-2000 2000-2010
Per capita GDP 3.791*** 3.713*** 3.912*** 2.037***
[0.348] [1.286] [0.713] [0.350]
Constant -27.66*** -27.82*** -28.14*** -13.27***
[2.767] [10.11] [5.652] [2.829]
Observations 512 170 182 193
Number of countries 18 17 18 18
Source: Economic Commission for Latin America and the Caribbean (ECLAC).a Panel data estimation using fixed effects and instrumental variables. The first lag was used for the per capita GDP instrument. Data on per capita GDP, consumer
goods imports, population and real effective exchange rate were obtained from CEPALSTAT. The GDP and imports series are expressed in constant 2005 dollars and in per capita terms. All the variables are converted into Napierian logarithms to allow interpretation of estimated coefficients such as income elasticity (per capita GDP coefficient).
b Los errores estándares robustos se presentan entre corchetes. Nivel de significación:*** p<0,01; ** p<0,05; * p<0,1.
The fact that imports of consumer goods and automobiles are so income-elastic is problematic for a number of reasons. First, it can risk the region’s growth sustainability, which requires imports to be less output-elastic than export demand by the rest of the world, in order to avoid external constraint (Thirwall, 1979). The fact that the income elasticity of consumer goods and automobile imports appears to have fallen in the past decade could be a positive signal in this regard. On the other hand, import growth requires sustained access to external financing, which, in the case of the region, has been fundamentally associated with exports of primary goods in the past decade.
Exports have been natural resources intensive, which raises questions about the economic sustainability of the production matrix in the future, and its impacts on the environment, especially for future generations. It also raises more immediate questions in relation to the likely slowdown in the prices of natural resources. As well, the high income elasticity of passenger vehicle imports and the associated gasoline consumption generate major negative externalities from the point of view of cities and the environment, and can develop into a constraint that is already quite significant in several of the region’s cities (see chapter V).
In Latin America, average propensity to consume, estimated by the share of private consumption in GDP, hovered at around 70% between 1970 and 2012, showing a slight downtrend and large disparities between countries over these 40 years. Table IV.6 shows the consumption propensity for each country and the average for Latin America and the Caribbean. For 1990-2012, the Caribbean shows average consumption of 68% of GDP, two points below the figure for Latin America in that period (both as unweighted averages, calculated taking all the countries with information available for the respective year).
Private consuption represents a large component of demand in Latin America and the Caribbean (World Bank data show the weighted average of the consumption-to-GDP ratio to be 66% between 1970 and 2012), but its importance has decreased throughout the period. Conversely, in OECD countries, although the weighted average ratio of private consumption to output is lower (61%), it has tended to rise (see figure IV.6).11 As a result, the latest data available show that in both regions private consumption represents around 63% of GDP.
The average figure for propensity to consume in the region masks great heterogeneity, with some countries (such as El Salvador) showing consumption rates of over 90%, and others where the rates are around 50% (see figure IV.7). Yet another set of countries shows values closer to those of the OECD countries.
10 These were contrasted with confidence intervals.11 At the level of decision-making by agents, propensity to consume varies depending on the kind of activity, willingness to save and
the net wealth they can accumulate (Modigliani and Brumberg, 1954). This implies that, in the aggregate, societies with a higher proportion of inactive citizens will have rates of consumption with respect to income than those with a higher proportion of working-age individuals. This type of factor should be borne in mind when making comparisons between countries.
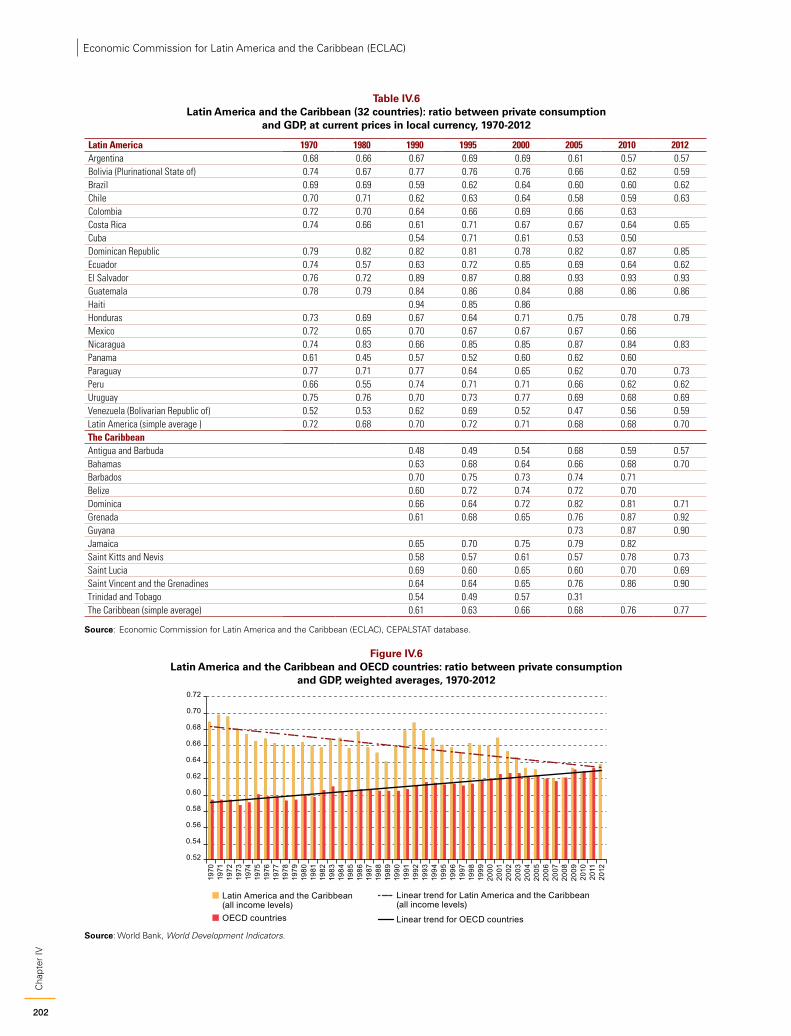
202
Cha
pter
IVEconomic Commission for Latin America and the Caribbean (ECLAC)
Table IV.6 Latin America and the Caribbean (32 countries): ratio between private consumption
and GDP, at current prices in local currency, 1970-2012
Latin America 1970 1980 1990 1995 2000 2005 2010 2012Argentina 0.68 0.66 0.67 0.69 0.69 0.61 0.57 0.57Bolivia (Plurinational State of) 0.74 0.67 0.77 0.76 0.76 0.66 0.62 0.59Brazil 0.69 0.69 0.59 0.62 0.64 0.60 0.60 0.62Chile 0.70 0.71 0.62 0.63 0.64 0.58 0.59 0.63Colombia 0.72 0.70 0.64 0.66 0.69 0.66 0.63Costa Rica 0.74 0.66 0.61 0.71 0.67 0.67 0.64 0.65Cuba 0.54 0.71 0.61 0.53 0.50Dominican Republic 0.79 0.82 0.82 0.81 0.78 0.82 0.87 0.85Ecuador 0.74 0.57 0.63 0.72 0.65 0.69 0.64 0.62El Salvador 0.76 0.72 0.89 0.87 0.88 0.93 0.93 0.93Guatemala 0.78 0.79 0.84 0.86 0.84 0.88 0.86 0.86Haiti 0.94 0.85 0.86Honduras 0.73 0.69 0.67 0.64 0.71 0.75 0.78 0.79Mexico 0.72 0.65 0.70 0.67 0.67 0.67 0.66Nicaragua 0.74 0.83 0.66 0.85 0.85 0.87 0.84 0.83Panama 0.61 0.45 0.57 0.52 0.60 0.62 0.60Paraguay 0.77 0.71 0.77 0.64 0.65 0.62 0.70 0.73Peru 0.66 0.55 0.74 0.71 0.71 0.66 0.62 0.62Uruguay 0.75 0.76 0.70 0.73 0.77 0.69 0.68 0.69Venezuela (Bolivarian Republic of) 0.52 0.53 0.62 0.69 0.52 0.47 0.56 0.59Latin America (simple average ) 0.72 0.68 0.70 0.72 0.71 0.68 0.68 0.70The CaribbeanAntigua and Barbuda 0.48 0.49 0.54 0.68 0.59 0.57Bahamas 0.63 0.68 0.64 0.66 0.68 0.70Barbados 0.70 0.75 0.73 0.74 0.71Belize 0.60 0.72 0.74 0.72 0.70Dominica 0.66 0.64 0.72 0.82 0.81 0.71Grenada 0.61 0.68 0.65 0.76 0.87 0.92Guyana 0.73 0.87 0.90Jamaica 0.65 0.70 0.75 0.79 0.82Saint Kitts and Nevis 0.58 0.57 0.61 0.57 0.78 0.73Saint Lucia 0.69 0.60 0.65 0.60 0.70 0.69Saint Vincent and the Grenadines 0.64 0.64 0.65 0.76 0.86 0.90Trinidad and Tobago 0.54 0.49 0.57 0.31The Caribbean (simple average) 0.61 0.63 0.66 0.68 0.76 0.77
Source: Economic Commission for Latin America and the Caribbean (ECLAC), CEPALSTAT database.
Figure IV.6 Latin America and the Caribbean and OECD countries: ratio between private consumption
and GDP, weighted averages, 1970-2012
0.52
0.54
0.56
0.58
0.60
0.62
0.64
0.66
0.68
0.70
0.72
1970
1971
1972
1973
1974
1975
1976
1977
1978
1979
1980
1981
1982
1983
1984
1985
1986
1987
1988
1989
1990
1991
1992
1993
1994
1995
1996
1997
1998
1999
2000
2001
2002
2003
2004
2005
2006
2007
2008
2009
2010
2011
2012
Latin America and the Caribbean(all income levels)OECD countries
Linear trend for Latin America and the Caribbean (all income levels)
Linear trend for OECD countries
Source: World Bank, World Development Indicators.
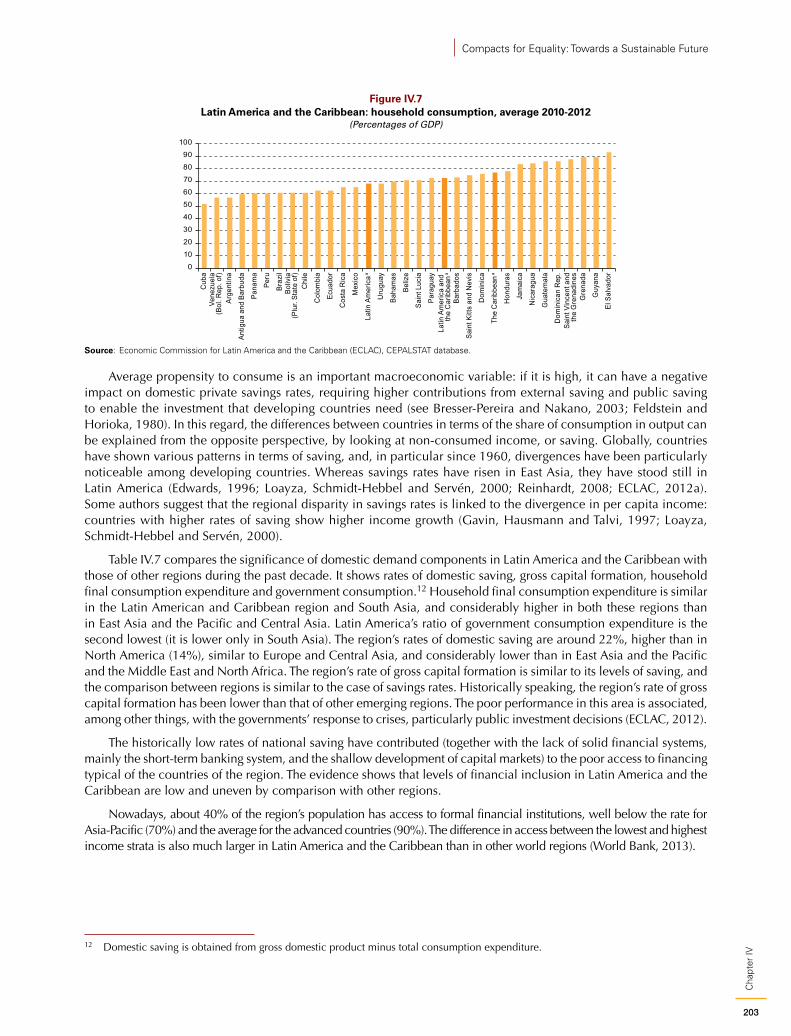
203
Cha
pter
IV
Compacts for Equality: Towards a Sustainable Future
Figure IV.7 Latin America and the Caribbean: household consumption, average 2010-2012
(Percentages of GDP)
0
10
20
30
40
50
60
70
80
90
100
Cub
aVe
nezu
ela
(Bol
. Rep
. of)
Arge
ntin
a
Antig
ua a
nd B
arbu
da
Pana
ma
Peru
Braz
ilBo
livia
(Plu
r. St
ate
of)
Chi
le
Col
ombi
a
Ecua
dor
Cos
ta R
ica
Mex
ico
Latin
Am
eric
a a
Uru
guay
Baha
mas
Beliz
e
Sain
t Luc
ia
Para
guay
Latin
Am
eric
a an
d th
e C
arib
bean
a
Barb
ados
Sain
t Kitt
s an
d N
evis
Dom
inic
a
The
Car
ibbe
an a
Hon
dura
s
Jam
aica
Nic
arag
ua
Gua
tem
ala
Dom
inic
an R
ep.
Sain
t Vin
cent
and
the
Gre
nadi
nes
Gre
nada
Guy
ana
El S
alva
dor
Source: Economic Commission for Latin America and the Caribbean (ECLAC), CEPALSTAT database.
Average propensity to consume is an important macroeconomic variable: if it is high, it can have a negative impact on domestic private savings rates, requiring higher contributions from external saving and public saving to enable the investment that developing countries need (see Bresser-Pereira and Nakano, 2003; Feldstein and Horioka, 1980). In this regard, the differences between countries in terms of the share of consumption in output can be explained from the opposite perspective, by looking at non-consumed income, or saving. Globally, countries have shown various patterns in terms of saving, and, in particular since 1960, divergences have been particularly noticeable among developing countries. Whereas savings rates have risen in East Asia, they have stood still in Latin America (Edwards, 1996; Loayza, Schmidt-Hebbel and Servén, 2000; Reinhardt, 2008; ECLAC, 2012a). Some authors suggest that the regional disparity in savings rates is linked to the divergence in per capita income: countries with higher rates of saving show higher income growth (Gavin, Hausmann and Talvi, 1997; Loayza, Schmidt-Hebbel and Servén, 2000).
Table IV.7 compares the significance of domestic demand components in Latin America and the Caribbean with those of other regions during the past decade. It shows rates of domestic saving, gross capital formation, household final consumption expenditure and government consumption.12 Household final consumption expenditure is similar in the Latin American and Caribbean region and South Asia, and considerably higher in both these regions than in East Asia and the Pacific and Central Asia. Latin America’s ratio of government consumption expenditure is the second lowest (it is lower only in South Asia). The region’s rates of domestic saving are around 22%, higher than in North America (14%), similar to Europe and Central Asia, and considerably lower than in East Asia and the Pacific and the Middle East and North Africa. The region’s rate of gross capital formation is similar to its levels of saving, and the comparison between regions is similar to the case of savings rates. Historically speaking, the region’s rate of gross capital formation has been lower than that of other emerging regions. The poor performance in this area is associated, among other things, with the governments’ response to crises, particularly public investment decisions (ECLAC, 2012).
The historically low rates of national saving have contributed (together with the lack of solid financial systems, mainly the short-term banking system, and the shallow development of capital markets) to the poor access to financing typical of the countries of the region. The evidence shows that levels of financial inclusion in Latin America and the Caribbean are low and uneven by comparison with other regions.
Nowadays, about 40% of the region’s population has access to formal financial institutions, well below the rate for Asia-Pacific (70%) and the average for the advanced countries (90%). The difference in access between the lowest and highest income strata is also much larger in Latin America and the Caribbean than in other world regions (World Bank, 2013).
12 Domestic saving is obtained from gross domestic product minus total consumption expenditure.

204
Cha
pter
IVEconomic Commission for Latin America and the Caribbean (ECLAC)
Table IV.7 Saving, investment and expenditure as proportions of GDP, weighted averages, 2000-2012
(Percentages)
2000-2012 Domestic saving Gross capital formation Household consumption Government consumption
Latin America and the Caribbean 21.7 21.0 63.5 14.8
North America 14.1 18.1 69.4 16.6
East Asia and the Pacific 30.5 27.8 53.4 16.1
Europe and Central Asia 21.7 20.1 57.9 20.4
South Asia 26.3 30.6 63.0 10.7
The Middle East and North Africa 35.2 24.4 48.0 16.8
Sub-Saharan Africa 17.3 20.1 65.8 16.9
High-income countries (OECD) 19.1 19.9 62.4 18.6
Middle-income countries 30.5 29.6 55.6 13.9
Lower-middle-income countries 24.5 28.0 64.2 11.3
Upper-middle-income countries 32.3 30.1 53.1 14.7
Low-income countries 9.8 21.7 79.5 10.7
World 21.8 21.6 60.7 17.6
Source: Economic Commission for Latin America and the Caribbean (ECLAC), on the basis of World Bank, World Development Indicators.
Constraints on households’ access to financing may explain, at least in part, the fact that consumption is as volatile as income in some countries, including those in Latin America and the Caribbean. In fact, in a perfect capital market, agents can borrow even if their current optimum consumption exceeds their current income, which should lead to “smooth” consumption paths not so dependent on business cycles. However, if consumers lack access to credit (i.e. liquidity constraints), their current consumption will be restricted to their current income.
Latin America’s long-term economic performance has been notoriously and persistently volatile (Bértola and Ocampo 2010; Fanelli, 2006 and 2008). What is more, in the region, consumption can be even more volatile than output, whereas the developed countries have achieved smoother consumption trajectories (ECLAC, 2010 and 2008; Fanelli, Lorenzo and Oddone, 2003; Rius, 2008; Toledo, 2008). Far from softening the income trajectory, aggregate consumption in the region seems to reproduce income volatility. As a result, income shocks are passed through unattenuated to private consumption and, therefore, to living standards. The institutional set-ups in the region may be least partly responsible for this volatility of consumption (see box IV.1).
Consumption volatility can be illustrated using standard deviations in its growth rate, or real volatility. This information is shown for the period 1970-2012, in figure IV.8, with the countries ranked by average per capita income. Generally speaking, per capita consumption is more variable in countries with lower average levels of per capita GDP. Accordingly, the countries of Latin America and the Caribbean figure among those with lower income levels and less stable consumption than the developed countries.
When per capita consumption volatility is compared with per capita output volatility, it is apparent that several Latin American and Caribbean and African countries are located in the part of the graph where rates of volatility are higher for consumption than for output (see figure IV.9), which has been identified as excessive volatility.13 Conversely, most OECD countries are close to the 45-degree line, which means that their economies have less or even no excessive volatility. Among the Latin American countries, 81% of the sample examined show excessive volatility (in the period 1970-2012), compared with 45% of the sample of OECD countries.
Looking at the data by subperiods shows that in the past few decades the countries of Latin America and the Caribbean have managed to stabilize the trajectory of consumption and lessen output volatility (see figure IV.10).
13 The concept of excessive volatility is intended to identify the component of total variability in the output growth rate that is not explained by fundamentals. Since this phenomenon cannot be observed empirically, it is proposed to use the standard model of complete markets. In this regard, it is inefficient for consumption to be more volatile than income. It can be inferred that consumption that is more unstable than output is a sign of an unwanted degree of volatility and financial market failures (ECLAC, 2008).
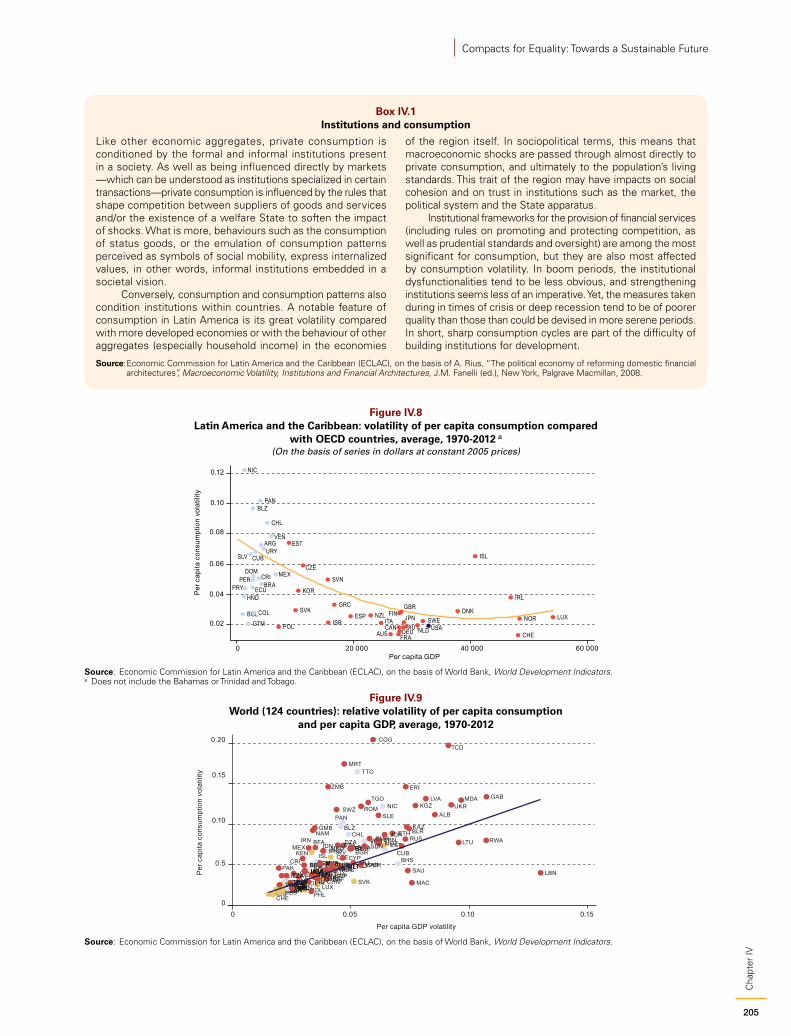
205
Cha
pter
IV
Compacts for Equality: Towards a Sustainable Future
Box IV.1 Institutions and consumption
Like other economic aggregates, private consumption is conditioned by the formal and informal institutions present in a society. As well as being influenced directly by markets —which can be understood as institutions specialized in certain transactions—private consumption is influenced by the rules that shape competition between suppliers of goods and services and/or the existence of a welfare State to soften the impact of shocks. What is more, behaviours such as the consumption of status goods, or the emulation of consumption patterns perceived as symbols of social mobility, express internalized values, in other words, informal institutions embedded in a societal vision.
Conversely, consumption and consumption patterns also condition institutions within countries. A notable feature of consumption in Latin America is its great volatility compared with more developed economies or with the behaviour of other aggregates (especially household income) in the economies
of the region itself. In sociopolitical terms, this means that macroeconomic shocks are passed through almost directly to private consumption, and ultimately to the population’s living standards. This trait of the region may have impacts on social cohesion and on trust in institutions such as the market, the political system and the State apparatus.
Institutional frameworks for the provision of financial services (including rules on promoting and protecting competition, as well as prudential standards and oversight) are among the most significant for consumption, but they are also most affected by consumption volatility. In boom periods, the institutional dysfunctionalities tend to be less obvious, and strengthening institutions seems less of an imperative. Yet, the measures taken during in times of crisis or deep recession tend to be of poorer quality than those than could be devised in more serene periods. In short, sharp consumption cycles are part of the difficulty of building institutions for development.
Source: Economic Commission for Latin America and the Caribbean (ECLAC), on the basis of A. Rius, “The political economy of reforming domestic financial architectures”, Macroeconomic Volatility, Institutions and Financial Architectures, J.M. Fanelli (ed.), New York, Palgrave Macmillan, 2008.
Figure IV.8 Latin America and the Caribbean: volatility of per capita consumption compared
with OECD countries, average, 1970-2012 a
(On the basis of series in dollars at constant 2005 prices)
0.12
0.10
0.08
0.06
0.04
0.02
Per
cap
ita c
onsu
mpt
ion
vola
tility
0 20 000 40 000 60 000Per capita GDP
BLZ
BOL
BRA
CHL
COL
CRI
CUB
DOM
ECU
SLV
GTM
HND
MEX
NIC
PAN
PRYPER
URY
VEN
CZE
EST
GRC
ISR
KOR
NZL
POL
SVK
SVN
ESP
ARG
AUSAUTCAN
DNKFIN
FRADEU
ISL
IRL
JPN LUX
NLD
NORSWE
CHE
GBR
USAITA
Source: Economic Commission for Latin America and the Caribbean (ECLAC), on the basis of World Bank, World Development Indicators.a Does not include the Bahamas or Trinidad and Tobago.
Figure IV.9 World (124 countries): relative volatility of per capita consumption
and per capita GDP, average, 1970-2012
AUSBELBELCANCAN
CZE
DNK
EST
FIN
DEU
GRC
ISL
ITAITAJPN
KOR
LUXNLDNZL
POLSVK
SVN
ESPSWESWE
CHE
GBRUSAUSA
BHS
BLZ
BOL
CHL
COLCOLCOLCOL
CRICUB
ECU
SLV
GTMGTM
HND
MEX
NIC
PAN
PRYPRY PER
TTO
URYURYVENVEN
BGDBGD
INDNPLNPLNPLNPLNPLNPLNPL
PAKLKA
ALB
DZADZA
BLR
BENBEN
BWABRN
BGRBGR
BFA CMR
CPVCAF
TCD
CHNCHN
ZAR
COG
HRV
CYP
EGY
ERI
ETH
GAB
GMB
HKGHUN
IDNIRN
JORKAZ
KEN
KGZLVA
LBN
LTU
MAC
MKDMKD
MDGMYSMYS MLIMLTMLTMLT
MRT
MDA
MAR
MOZ
NAM
PHL
PRT
ROM
RUS RWA
SAUSEN
SLE
SGPZAFZAFZAFZAFZAFZAF
SDN
SWZ
TZATZA THA
TGO
TUNTUNTUNTURTUR
UGAUGAUGAUGAUGAUGAUGAUGAUGA
UKR
VNMVNM
ZMB
0
0.5
0.10
0.15
0.20
Per
cap
ita c
onsu
mpt
ion
vola
tility
0 0.05 0.10 0.15
Per capita GDP volatility
Source: Economic Commission for Latin America and the Caribbean (ECLAC), on the basis of World Bank, World Development Indicators.
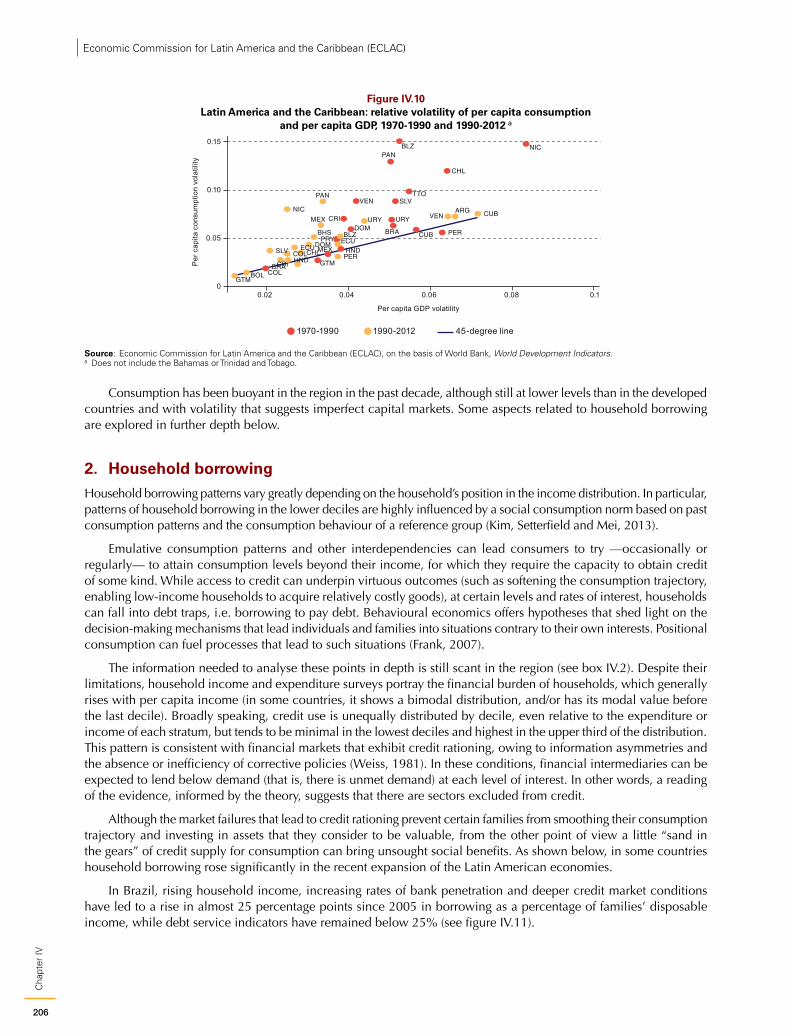
206
Cha
pter
IVEconomic Commission for Latin America and the Caribbean (ECLAC)
Figure IV.10 Latin America and the Caribbean: relative volatility of per capita consumption
and per capita GDP, 1970-1990 and 1990-2012 a
0
0.05
0.10
0.15
Per
cap
ita c
onsu
mpt
ion
vola
tility
0.02 0.04 0.06 0.08 0.1
Per capita GDP volatility
BLZ
BRA
CHL
COL
CRI
CUBDOM
ECU
SLV
GTM
HNDMEX
NICPAN
PER
TTO
URY
VENARG
BHS BLZ
BOLBRA
CHLCOL
CRI
CUB
DOMECUSLV
GTM
HND
MEX
NIC
PAN
PRY
PER
URY VEN
45-degree line1970-1990 1990-2012
Source: Economic Commission for Latin America and the Caribbean (ECLAC), on the basis of World Bank, World Development Indicators.a Does not include the Bahamas or Trinidad and Tobago.
Consumption has been buoyant in the region in the past decade, although still at lower levels than in the developed countries and with volatility that suggests imperfect capital markets. Some aspects related to household borrowing are explored in further depth below.
2. Household borrowingHousehold borrowing patterns vary greatly depending on the household’s position in the income distribution. In particular, patterns of household borrowing in the lower deciles are highly influenced by a social consumption norm based on past consumption patterns and the consumption behaviour of a reference group (Kim, Setterfield and Mei, 2013).
Emulative consumption patterns and other interdependencies can lead consumers to try —occasionally or regularly— to attain consumption levels beyond their income, for which they require the capacity to obtain credit of some kind. While access to credit can underpin virtuous outcomes (such as softening the consumption trajectory, enabling low-income households to acquire relatively costly goods), at certain levels and rates of interest, households can fall into debt traps, i.e. borrowing to pay debt. Behavioural economics offers hypotheses that shed light on the decision-making mechanisms that lead individuals and families into situations contrary to their own interests. Positional consumption can fuel processes that lead to such situations (Frank, 2007).
The information needed to analyse these points in depth is still scant in the region (see box IV.2). Despite their limitations, household income and expenditure surveys portray the financial burden of households, which generally rises with per capita income (in some countries, it shows a bimodal distribution, and/or has its modal value before the last decile). Broadly speaking, credit use is unequally distributed by decile, even relative to the expenditure or income of each stratum, but tends to be minimal in the lowest deciles and highest in the upper third of the distribution. This pattern is consistent with financial markets that exhibit credit rationing, owing to information asymmetries and the absence or inefficiency of corrective policies (Weiss, 1981). In these conditions, financial intermediaries can be expected to lend below demand (that is, there is unmet demand) at each level of interest. In other words, a reading of the evidence, informed by the theory, suggests that there are sectors excluded from credit.
Although the market failures that lead to credit rationing prevent certain families from smoothing their consumption trajectory and investing in assets that they consider to be valuable, from the other point of view a little “sand in the gears” of credit supply for consumption can bring unsought social benefits. As shown below, in some countries household borrowing rose significantly in the recent expansion of the Latin American economies.
In Brazil, rising household income, increasing rates of bank penetration and deeper credit market conditions have led to a rise in almost 25 percentage points since 2005 in borrowing as a percentage of families’ disposable income, while debt service indicators have remained below 25% (see figure IV.11).
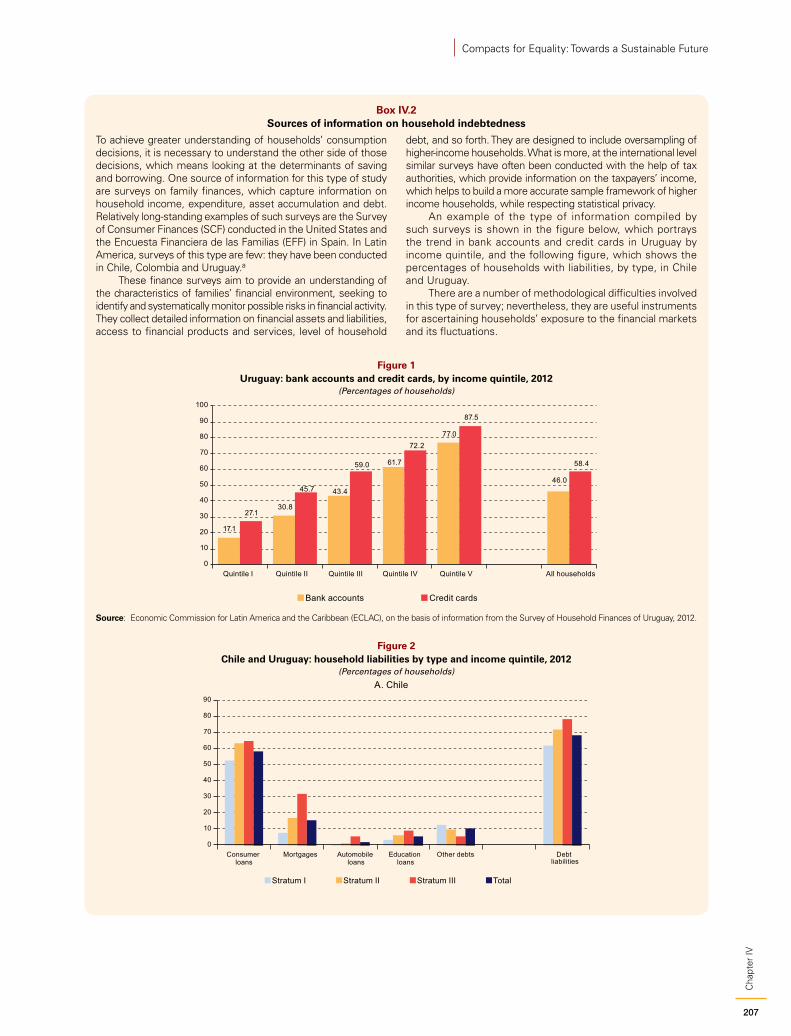
207
Cha
pter
IV
Compacts for Equality: Towards a Sustainable Future
Box IV.2 Sources of information on household indebtedness
To achieve greater understanding of households’ consumption decisions, it is necessary to understand the other side of those decisions, which means looking at the determinants of saving and borrowing. One source of information for this type of study are surveys on family finances, which capture information on household income, expenditure, asset accumulation and debt. Relatively long-standing examples of such surveys are the Survey of Consumer Finances (SCF) conducted in the United States and the Encuesta Financiera de las Familias (EFF) in Spain. In Latin America, surveys of this type are few: they have been conducted in Chile, Colombia and Uruguay.a
These finance surveys aim to provide an understanding of the characteristics of families’ financial environment, seeking to identify and systematically monitor possible risks in financial activity. They collect detailed information on financial assets and liabilities, access to financial products and services, level of household
debt, and so forth. They are designed to include oversampling of higher-income households. What is more, at the international level similar surveys have often been conducted with the help of tax authorities, which provide information on the taxpayers’ income, which helps to build a more accurate sample framework of higher income households, while respecting statistical privacy.
An example of the type of information compiled by such surveys is shown in the figure below, which portrays the trend in bank accounts and credit cards in Uruguay by income quintile, and the following figure, which shows the percentages of households with liabilities, by type, in Chile and Uruguay.
There are a number of methodological difficulties involved in this type of survey; nevertheless, they are useful instruments for ascertaining households’ exposure to the financial markets and its fluctuations.
Figure 1 Uruguay: bank accounts and credit cards, by income quintile, 2012
(Percentages of households)
17.1
30.8
43.4
61.7
77.0
46.0
27.1
45.7
59.0
72.2
87.5
58.4
0
10
20
30
40
50
60
70
80
90
100
Quintile I Quintile II Quintile III Quintile IV Quintile V All households
Bank accounts Credit cards
Source: Economic Commission for Latin America and the Caribbean (ECLAC), on the basis of information from the Survey of Household Finances of Uruguay, 2012.
Figure 2 Chile and Uruguay: household liabilities by type and income quintile, 2012
(Percentages of households)
0
10
20
30
40
50
60
70
80
90
Consumer loans
Mortgages Automobile loans
Education loans
Other debts Debt liabilities
Stratum I Stratum II Stratum III Total
A. Chile
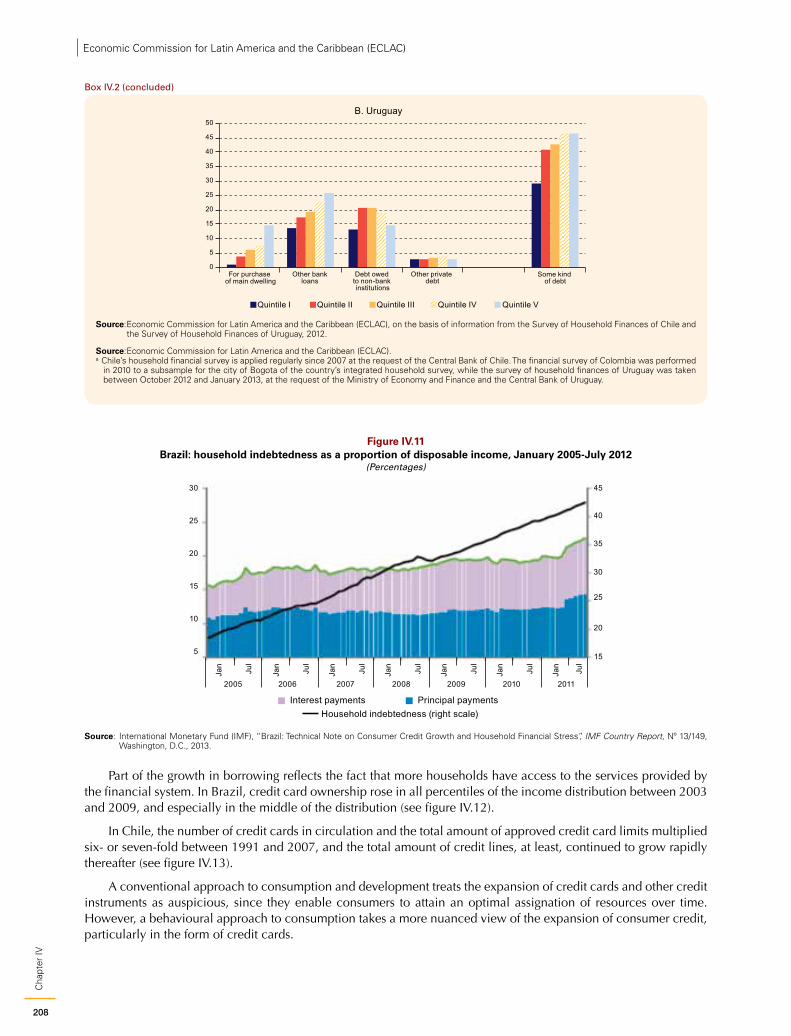
208
Cha
pter
IVEconomic Commission for Latin America and the Caribbean (ECLAC)
0
5
10
15
20
25
30
35
40
45
50
For purchase of main dwelling
Quintile I Quintile II Quintile III Quintile IV Quintile V
Debt owed to non-bank institutions
Other bankloans
Other private debt
Some kind of debt
B. Uruguay
Source: Economic Commission for Latin America and the Caribbean (ECLAC), on the basis of information from the Survey of Household Finances of Chile and the Survey of Household Finances of Uruguay, 2012.
Source: Economic Commission for Latin America and the Caribbean (ECLAC).a Chile’s household financial survey is applied regularly since 2007 at the request of the Central Bank of Chile. The financial survey of Colombia was performed
in 2010 to a subsample for the city of Bogota of the country’s integrated household survey, while the survey of household finances of Uruguay was taken between October 2012 and January 2013, at the request of the Ministry of Economy and Finance and the Central Bank of Uruguay.
Box IV.2 (concluded)
Figure IV.11 Brazil: household indebtedness as a proportion of disposable income, January 2005-July 2012
(Percentages)
30
25
20
15
10
5
2005 2006 2007 2008 2009 2010 2011
Jan
Jul
Jan
Jul
Jan
Jul
Jan
Jul
Jan
Jul
Jan
Jul
Jan
Jul
40
45
35
30
25
20
15
Interest payments Principal paymentsHousehold indebtedness (right scale)
Source: International Monetary Fund (IMF), “Brazil: Technical Note on Consumer Credit Growth and Household Financial Stress”, IMF Country Report, Nº 13/149, Washington, D.C., 2013.
Part of the growth in borrowing reflects the fact that more households have access to the services provided by the financial system. In Brazil, credit card ownership rose in all percentiles of the income distribution between 2003 and 2009, and especially in the middle of the distribution (see figure IV.12).
In Chile, the number of credit cards in circulation and the total amount of approved credit card limits multiplied six- or seven-fold between 1991 and 2007, and the total amount of credit lines, at least, continued to grow rapidly thereafter (see figure IV.13).
A conventional approach to consumption and development treats the expansion of credit cards and other credit instruments as auspicious, since they enable consumers to attain an optimal assignation of resources over time. However, a behavioural approach to consumption takes a more nuanced view of the expansion of consumer credit, particularly in the form of credit cards.
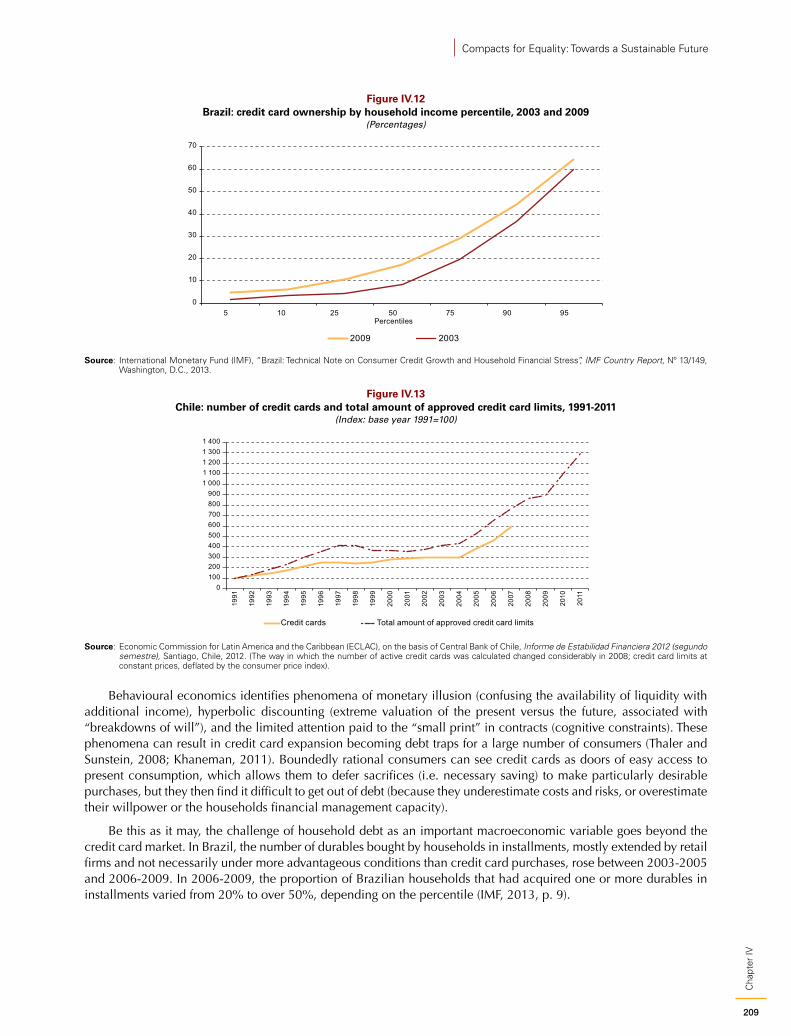
209
Cha
pter
IV
Compacts for Equality: Towards a Sustainable Future
Figure IV.12 Brazil: credit card ownership by household income percentile, 2003 and 2009
(Percentages)
0
10
20
30
40
50
60
70
5 10 25 50 75 90 95Percentiles
2009 2003
Source: International Monetary Fund (IMF), “Brazil: Technical Note on Consumer Credit Growth and Household Financial Stress”, IMF Country Report, Nº 13/149, Washington, D.C., 2013.
Figure IV.13 Chile: number of credit cards and total amount of approved credit card limits, 1991-2011
(Index: base year 1991=100)
0100200300400500600700800900
1 0001 1001 2001 3001 400
1991
1992
1993
1994
1995
1996
1997
1998
1999
2000
2001
2002
2003
2004
2005
2006
2007
2008
2009
2010
2011
Credit cards Total amount of approved credit card limits
Source: Economic Commission for Latin America and the Caribbean (ECLAC), on the basis of Central Bank of Chile, Informe de Estabilidad Financiera 2012 (segundo semestre), Santiago, Chile, 2012. (The way in which the number of active credit cards was calculated changed considerably in 2008; credit card limits at constant prices, deflated by the consumer price index).
Behavioural economics identifies phenomena of monetary illusion (confusing the availability of liquidity with additional income), hyperbolic discounting (extreme valuation of the present versus the future, associated with “breakdowns of will”), and the limited attention paid to the “small print” in contracts (cognitive constraints). These phenomena can result in credit card expansion becoming debt traps for a large number of consumers (Thaler and Sunstein, 2008; Khaneman, 2011). Boundedly rational consumers can see credit cards as doors of easy access to present consumption, which allows them to defer sacrifices (i.e. necessary saving) to make particularly desirable purchases, but they then find it difficult to get out of debt (because they underestimate costs and risks, or overestimate their willpower or the households financial management capacity).
Be this as it may, the challenge of household debt as an important macroeconomic variable goes beyond the credit card market. In Brazil, the number of durables bought by households in installments, mostly extended by retail firms and not necessarily under more advantageous conditions than credit card purchases, rose between 2003-2005 and 2006-2009. In 2006-2009, the proportion of Brazilian households that had acquired one or more durables in installments varied from 20% to over 50%, depending on the percentile (IMF, 2013, p. 9).
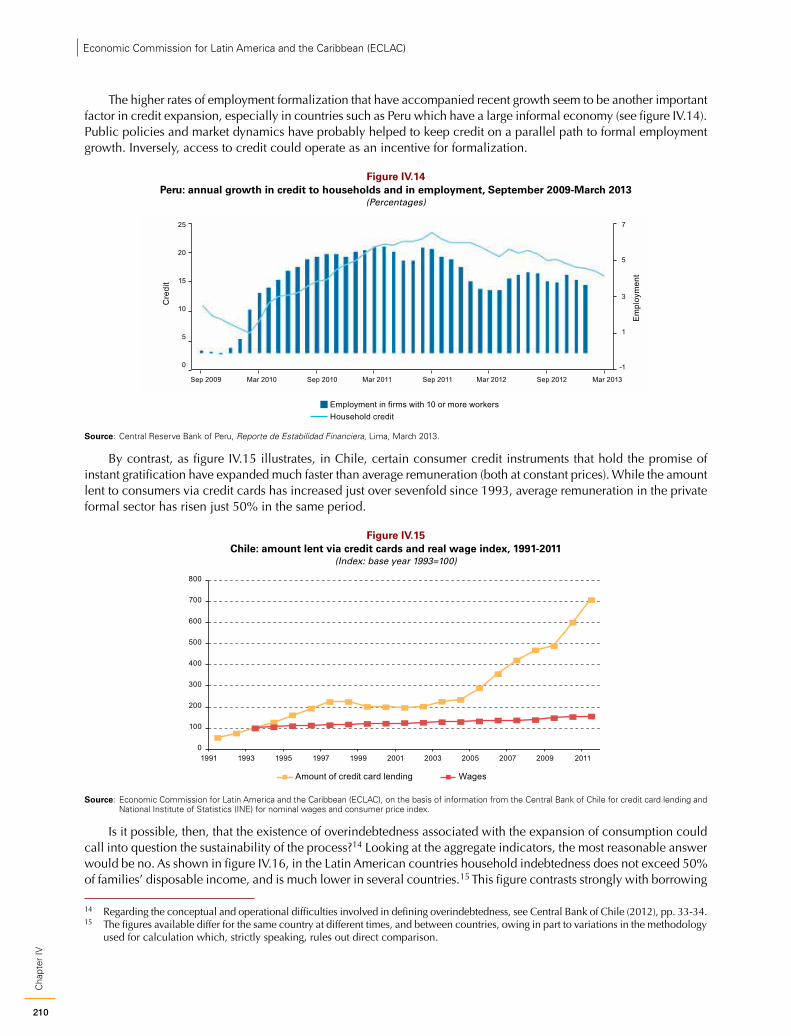
210
Cha
pter
IVEconomic Commission for Latin America and the Caribbean (ECLAC)
The higher rates of employment formalization that have accompanied recent growth seem to be another important factor in credit expansion, especially in countries such as Peru which have a large informal economy (see figure IV.14). Public policies and market dynamics have probably helped to keep credit on a parallel path to formal employment growth. Inversely, access to credit could operate as an incentive for formalization.
Figure IV.14 Peru: annual growth in credit to households and in employment, September 2009-March 2013
(Percentages)
Sep 2009 Mar 2010 Sep 2010 Mar 2011 Sep 2011 Mar 2012 Mar 2013Sep 2012
25 7
5
3
1
-1
20
15
Cre
dit
Em
ploy
men
t
10
5
0
Employment in firms with 10 or more workersHousehold credit
Source: Central Reserve Bank of Peru, Reporte de Estabilidad Financiera, Lima, March 2013.
By contrast, as figure IV.15 illustrates, in Chile, certain consumer credit instruments that hold the promise of instant gratification have expanded much faster than average remuneration (both at constant prices). While the amount lent to consumers via credit cards has increased just over sevenfold since 1993, average remuneration in the private formal sector has risen just 50% in the same period.
Figure IV.15 Chile: amount lent via credit cards and real wage index, 1991-2011
(Index: base year 1993=100)
0
100
200
300
400
500
600
700
800
1991 1993 1995 1997 1999 2001 2003 2005 2007 2009 2011
Amount of credit card lending Wages
Source: Economic Commission for Latin America and the Caribbean (ECLAC), on the basis of information from the Central Bank of Chile for credit card lending and National Institute of Statistics (INE) for nominal wages and consumer price index.
Is it possible, then, that the existence of overindebtedness associated with the expansion of consumption could call into question the sustainability of the process?14 Looking at the aggregate indicators, the most reasonable answer would be no. As shown in figure IV.16, in the Latin American countries household indebtedness does not exceed 50% of families’ disposable income, and is much lower in several countries.15 This figure contrasts strongly with borrowing
14 Regarding the conceptual and operational difficulties involved in defining overindebtedness, see Central Bank of Chile (2012), pp. 33-34.15 The figures available differ for the same country at different times, and between countries, owing in part to variations in the methodology
used for calculation which, strictly speaking, rules out direct comparison.
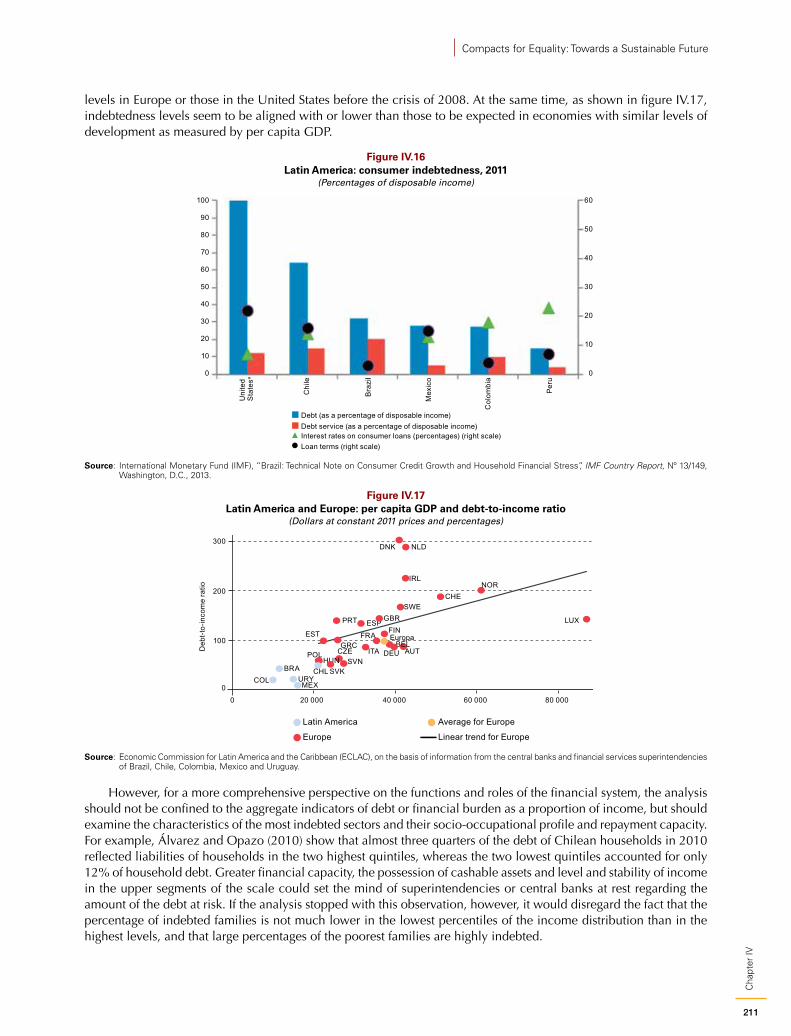
211
Cha
pter
IV
Compacts for Equality: Towards a Sustainable Future
levels in Europe or those in the United States before the crisis of 2008. At the same time, as shown in figure IV.17, indebtedness levels seem to be aligned with or lower than those to be expected in economies with similar levels of development as measured by per capita GDP.
Figure IV.16 Latin America: consumer indebtedness, 2011
(Percentages of disposable income)
100
90
80
70
60
50
40
30
20
10
0
60
50
40
30
20
10
0
Uni
ted
Sta
tesa
Chi
le
Bra
zil
Mex
ico
Col
ombi
a
Per
u
Debt (as a percentage of disposable income)Debt service (as a percentage of disposable income)Interest rates on consumer loans (percentages) (right scale)Loan terms (right scale)
Source: International Monetary Fund (IMF), “Brazil: Technical Note on Consumer Credit Growth and Household Financial Stress”, IMF Country Report, Nº 13/149, Washington, D.C., 2013.
Figure IV.17 Latin America and Europe: per capita GDP and debt-to-income ratio
(Dollars at constant 2011 prices and percentages)
300
200
100
00 20 000 40 000 60 000 80 000
AUTBEL
CZE
DNK
EST FINFRA
DEUGRC
HUN
IRL
ITA
LUX
NLD
NOR
POL
PRT
SVKSVN
ESP
SWECHE
GBR
BRA CHLCOL
MEXURY
Europa
Deb
t-to-
inco
me
ratio
Latin America Average for Europe
Linear trend for EuropeEurope
Source: Economic Commission for Latin America and the Caribbean (ECLAC), on the basis of information from the central banks and financial services superintendencies of Brazil, Chile, Colombia, Mexico and Uruguay.
However, for a more comprehensive perspective on the functions and roles of the financial system, the analysis should not be confined to the aggregate indicators of debt or financial burden as a proportion of income, but should examine the characteristics of the most indebted sectors and their socio-occupational profile and repayment capacity. For example, Álvarez and Opazo (2010) show that almost three quarters of the debt of Chilean households in 2010 reflected liabilities of households in the two highest quintiles, whereas the two lowest quintiles accounted for only 12% of household debt. Greater financial capacity, the possession of cashable assets and level and stability of income in the upper segments of the scale could set the mind of superintendencies or central banks at rest regarding the amount of the debt at risk. If the analysis stopped with this observation, however, it would disregard the fact that the percentage of indebted families is not much lower in the lowest percentiles of the income distribution than in the highest levels, and that large percentages of the poorest families are highly indebted.
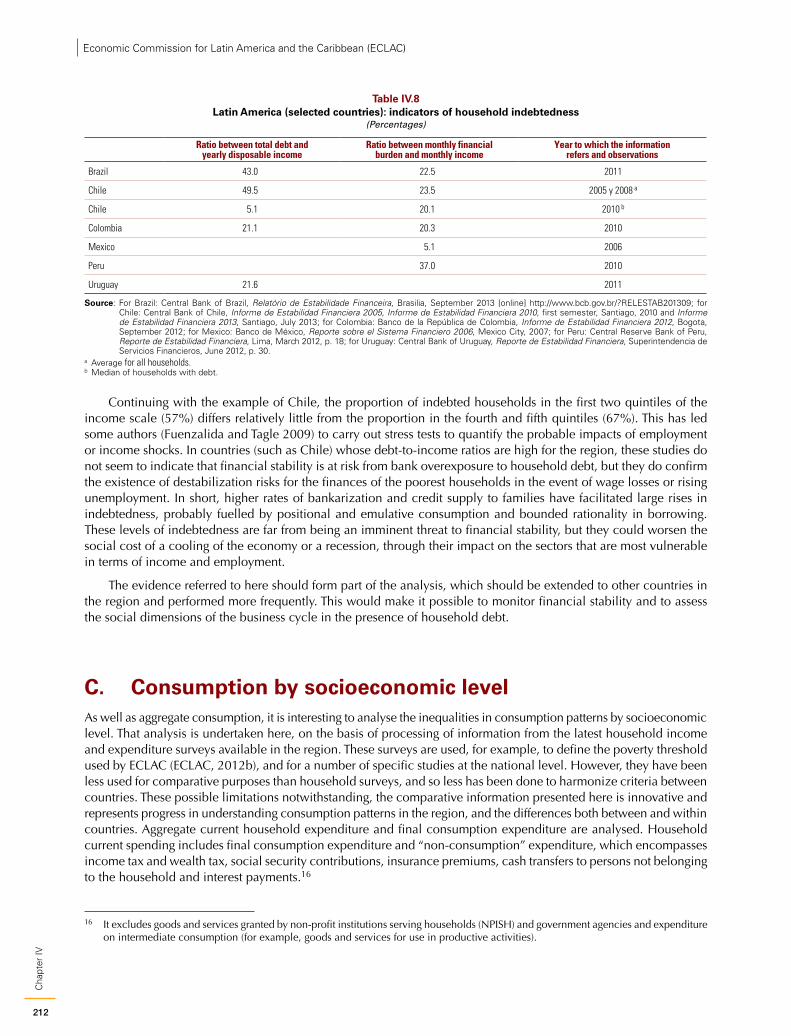
212
Cha
pter
IVEconomic Commission for Latin America and the Caribbean (ECLAC)
Table IV.8 Latin America (selected countries): indicators of household indebtedness
(Percentages)
Ratio between total debt and yearly disposable income
Ratio between monthly financial burden and monthly income
Year to which the information refers and observations
Brazil 43.0 22.5 2011
Chile 49.5 23.5 2005 y 2008 a
Chile 5.1 20.1 2010 b
Colombia 21.1 20.3 2010
Mexico 5.1 2006
Peru 37.0 2010
Uruguay 21.6 2011
Source: For Brazil: Central Bank of Brazil, Relatório de Estabilidade Financeira, Brasilia, September 2013 [online] http://www.bcb.gov.br/?RELESTAB201309; for Chile: Central Bank of Chile, Informe de Estabilidad Financiera 2005, Informe de Estabilidad Financiera 2010, first semester, Santiago, 2010 and Informe de Estabilidad Financiera 2013, Santiago, July 2013; for Colombia: Banco de la República de Colombia, Informe de Estabilidad Financiera 2012, Bogota, September 2012; for Mexico: Banco de México, Reporte sobre el Sistema Financiero 2006, Mexico City, 2007; for Peru: Central Reserve Bank of Peru, Reporte de Estabilidad Financiera, Lima, March 2012, p. 18; for Uruguay: Central Bank of Uruguay, Reporte de Estabilidad Financiera, Superintendencia de Servicios Financieros, June 2012, p. 30.
a Average for all households.b Median of households with debt.
Continuing with the example of Chile, the proportion of indebted households in the first two quintiles of the income scale (57%) differs relatively little from the proportion in the fourth and fifth quintiles (67%). This has led some authors (Fuenzalida and Tagle 2009) to carry out stress tests to quantify the probable impacts of employment or income shocks. In countries (such as Chile) whose debt-to-income ratios are high for the region, these studies do not seem to indicate that financial stability is at risk from bank overexposure to household debt, but they do confirm the existence of destabilization risks for the finances of the poorest households in the event of wage losses or rising unemployment. In short, higher rates of bankarization and credit supply to families have facilitated large rises in indebtedness, probably fuelled by positional and emulative consumption and bounded rationality in borrowing. These levels of indebtedness are far from being an imminent threat to financial stability, but they could worsen the social cost of a cooling of the economy or a recession, through their impact on the sectors that are most vulnerable in terms of income and employment.
The evidence referred to here should form part of the analysis, which should be extended to other countries in the region and performed more frequently. This would make it possible to monitor financial stability and to assess the social dimensions of the business cycle in the presence of household debt.
C. Consumption by socioeconomic level As well as aggregate consumption, it is interesting to analyse the inequalities in consumption patterns by socioeconomic level. That analysis is undertaken here, on the basis of processing of information from the latest household income and expenditure surveys available in the region. These surveys are used, for example, to define the poverty threshold used by ECLAC (ECLAC, 2012b), and for a number of specific studies at the national level. However, they have been less used for comparative purposes than household surveys, and so less has been done to harmonize criteria between countries. These possible limitations notwithstanding, the comparative information presented here is innovative and represents progress in understanding consumption patterns in the region, and the differences both between and within countries. Aggregate current household expenditure and final consumption expenditure are analysed. Household current spending includes final consumption expenditure and “non-consumption” expenditure, which encompasses income tax and wealth tax, social security contributions, insurance premiums, cash transfers to persons not belonging to the household and interest payments.16
16 It excludes goods and services granted by non-profit institutions serving households (NPISH) and government agencies and expenditure on intermediate consumption (for example, goods and services for use in productive activities).
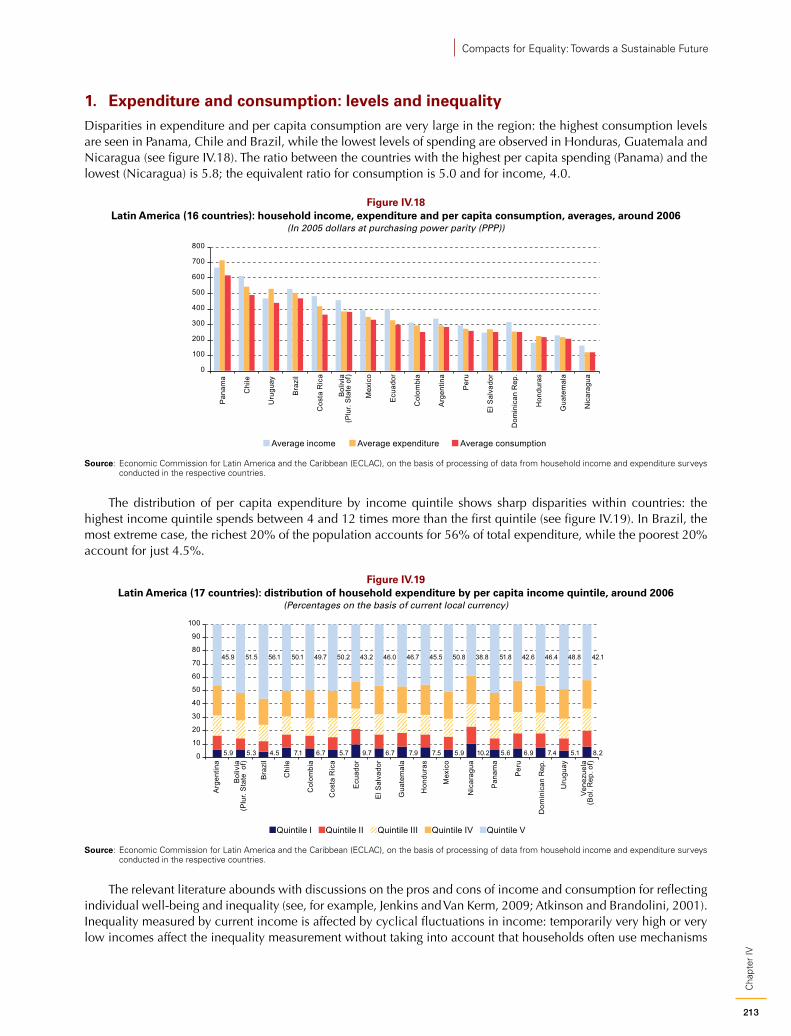
213
Cha
pter
IV
Compacts for Equality: Towards a Sustainable Future
1. Expenditure and consumption: levels and inequality Disparities in expenditure and per capita consumption are very large in the region: the highest consumption levels are seen in Panama, Chile and Brazil, while the lowest levels of spending are observed in Honduras, Guatemala and Nicaragua (see figure IV.18). The ratio between the countries with the highest per capita spending (Panama) and the lowest (Nicaragua) is 5.8; the equivalent ratio for consumption is 5.0 and for income, 4.0.
Figure IV.18 Latin America (16 countries): household income, expenditure and per capita consumption, averages, around 2006
(In 2005 dollars at purchasing power parity (PPP))
0
100
200
300
400
500
600
700
800
Pan
ama
Chi
le
Uru
guay
Bra
zil
Cos
ta R
ica
Bol
ivia
(Plu
r. S
tate
of)
Mex
ico
Ecu
ador
Col
ombi
a
Arg
entin
a
Per
u
El S
alva
dor
Dom
inic
an R
ep.
Hon
dura
s
Gua
tem
ala
Nic
arag
ua
Average income Average expenditure Average consumption
Source: Economic Commission for Latin America and the Caribbean (ECLAC), on the basis of processing of data from household income and expenditure surveys conducted in the respective countries.
The distribution of per capita expenditure by income quintile shows sharp disparities within countries: the highest income quintile spends between 4 and 12 times more than the first quintile (see figure IV.19). In Brazil, the most extreme case, the richest 20% of the population accounts for 56% of total expenditure, while the poorest 20% account for just 4.5%.
Figure IV.19 Latin America (17 countries): distribution of household expenditure by per capita income quintile, around 2006
(Percentages on the basis of current local currency)
5.9 5.3 4.5 7.1 6.7 5.7 9.7 6.7 7.9 7.5 5.9 10.2 5.6 6.9 7.4 5.1 8.2
45.9 51.5 56.1 50.1 49.7 50.2 43.2 46.0 46.7 45.5 50.8 38.8 51.8 42.6 46.4 48.8 42.1
0
10
20
30
40
50
60
70
80
90
100
Arg
entin
a
Bol
ivia
(Plu
r. S
tate
of)
Bra
zil
Chi
le
Col
ombi
a
Cos
ta R
ica
Ecu
ador
El S
alva
dor
Gua
tem
ala
Hon
dura
s
Mex
ico
Nic
arag
ua
Pan
ama
Per
u
Dom
inic
an R
ep.
Uru
guay
Vene
zuel
a(B
ol. R
ep. o
f)
Quintile I Quintile II Quintile III Quintile IV Quintile V
Source: Economic Commission for Latin America and the Caribbean (ECLAC), on the basis of processing of data from household income and expenditure surveys conducted in the respective countries.
The relevant literature abounds with discussions on the pros and cons of income and consumption for reflecting individual well-being and inequality (see, for example, Jenkins and Van Kerm, 2009; Atkinson and Brandolini, 2001). Inequality measured by current income is affected by cyclical fluctuations in income: temporarily very high or very low incomes affect the inequality measurement without taking into account that households often use mechanisms
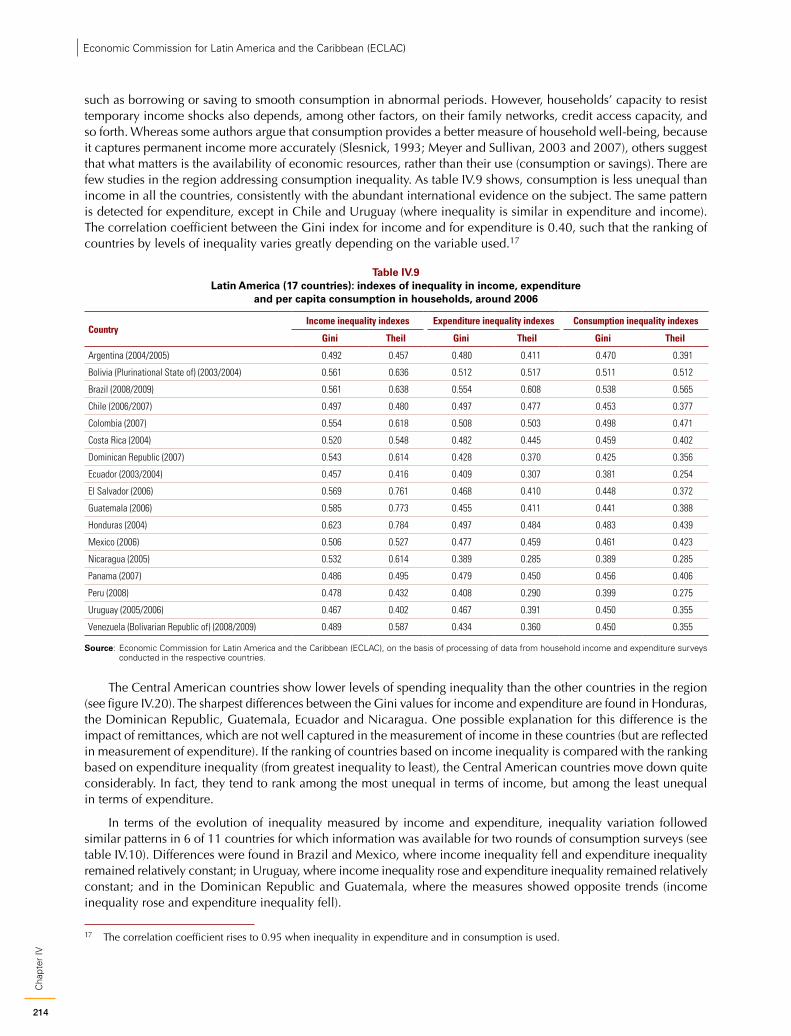
214
Cha
pter
IVEconomic Commission for Latin America and the Caribbean (ECLAC)
such as borrowing or saving to smooth consumption in abnormal periods. However, households’ capacity to resist temporary income shocks also depends, among other factors, on their family networks, credit access capacity, and so forth. Whereas some authors argue that consumption provides a better measure of household well-being, because it captures permanent income more accurately (Slesnick, 1993; Meyer and Sullivan, 2003 and 2007), others suggest that what matters is the availability of economic resources, rather than their use (consumption or savings). There are few studies in the region addressing consumption inequality. As table IV.9 shows, consumption is less unequal than income in all the countries, consistently with the abundant international evidence on the subject. The same pattern is detected for expenditure, except in Chile and Uruguay (where inequality is similar in expenditure and income). The correlation coefficient between the Gini index for income and for expenditure is 0.40, such that the ranking of countries by levels of inequality varies greatly depending on the variable used.17
Table IV.9 Latin America (17 countries): indexes of inequality in income, expenditure
and per capita consumption in households, around 2006
CountryIncome inequality indexes Expenditure inequality indexes Consumption inequality indexes
Gini Theil Gini Theil Gini Theil
Argentina (2004/2005) 0.492 0.457 0.480 0.411 0.470 0.391
Bolivia (Plurinational State of) (2003/2004) 0.561 0.636 0.512 0.517 0.511 0.512
Brazil (2008/2009) 0.561 0.638 0.554 0.608 0.538 0.565
Chile (2006/2007) 0.497 0.480 0.497 0.477 0.453 0.377
Colombia (2007) 0.554 0.618 0.508 0.503 0.498 0.471
Costa Rica (2004) 0.520 0.548 0.482 0.445 0.459 0.402
Dominican Republic (2007) 0.543 0.614 0.428 0.370 0.425 0.356
Ecuador (2003/2004) 0.457 0.416 0.409 0.307 0.381 0.254
El Salvador (2006) 0.569 0.761 0.468 0.410 0.448 0.372
Guatemala (2006) 0.585 0.773 0.455 0.411 0.441 0.388
Honduras (2004) 0.623 0.784 0.497 0.484 0.483 0.439
Mexico (2006) 0.506 0.527 0.477 0.459 0.461 0.423
Nicaragua (2005) 0.532 0.614 0.389 0.285 0.389 0.285
Panama (2007) 0.486 0.495 0.479 0.450 0.456 0.406
Peru (2008) 0.478 0.432 0.408 0.290 0.399 0.275
Uruguay (2005/2006) 0.467 0.402 0.467 0.391 0.450 0.355
Venezuela (Bolivarian Republic of) (2008/2009) 0.489 0.587 0.434 0.360 0.450 0.355
Source: Economic Commission for Latin America and the Caribbean (ECLAC), on the basis of processing of data from household income and expenditure surveys conducted in the respective countries.
The Central American countries show lower levels of spending inequality than the other countries in the region (see figure IV.20). The sharpest differences between the Gini values for income and expenditure are found in Honduras, the Dominican Republic, Guatemala, Ecuador and Nicaragua. One possible explanation for this difference is the impact of remittances, which are not well captured in the measurement of income in these countries (but are reflected in measurement of expenditure). If the ranking of countries based on income inequality is compared with the ranking based on expenditure inequality (from greatest inequality to least), the Central American countries move down quite considerably. In fact, they tend to rank among the most unequal in terms of income, but among the least unequal in terms of expenditure.
In terms of the evolution of inequality measured by income and expenditure, inequality variation followed similar patterns in 6 of 11 countries for which information was available for two rounds of consumption surveys (see table IV.10). Differences were found in Brazil and Mexico, where income inequality fell and expenditure inequality remained relatively constant; in Uruguay, where income inequality rose and expenditure inequality remained relatively constant; and in the Dominican Republic and Guatemala, where the measures showed opposite trends (income inequality rose and expenditure inequality fell).
17 The correlation coefficient rises to 0.95 when inequality in expenditure and in consumption is used.

215
Cha
pter
IV
Compacts for Equality: Towards a Sustainable Future
Figure IV.20 Latin America (17 countries): Gini index for income and expenditure, around 2006 a
0
0.1
0.2
0.3
0.4
0.5
0.6
0.7
Income Expenditure
Bra
zil (
2008
/200
9)
Bol
ivia
(Plu
r. S
tate
of)
(200
3/20
04)
Col
ombi
a (2
007)
Chi
le (2
006/
2007
)
Hon
dura
s (2
004)
Cos
ta R
ica
(200
4)
Arg
entin
a(2
004/
2005
)
Pan
ama
(200
7)
Mex
ico
(200
6)
El S
alva
dor (
2006
)
Uru
guay
(200
5/20
06)
Gua
tem
ala
(200
6)
Ven
ezue
la (B
ol. R
ep. o
f)(2
008/
2009
)
Dom
inic
an R
ep.
(200
7)
Ecu
ador
(200
3/20
04)
Per
u (2
008)
Nic
arag
ua (2
005)
Source: Economic Commission for Latin America and the Caribbean (ECLAC), on the basis of processing of data from household income and expenditure surveys conducted in the respective countries.
a Countries are ranked in descending order by Gini index for expenditure.
Table IV.10 Latin America (11 countries): variation in the Gini index for income and expenditure
(Percentages)
Periods compared Income Expenditure
Argentina 1996 and 2004/2005 0,8 2,8
Brazil 2002 and 2008/2009 -5,3 0,9
Chile 1996/1997 and 2006/2007 -3,2 -3,8
Colombia 1994/1995 and 2007 9,3 10,9
Dominican Republic 1998 and 2007 14,7 -20,8
Guatemala 1998 and 2006 4,4 -10,9
Mexico 1996 and 2006 -3,9 0,0
Nicaragua 2001 and 2005 -8,1 -17,3
Panama 1997 and 2007 -4,0 -6,1
Peru 2003 and 2008 -8,6 -10,1
Uruguay 1994/1995 and 2004/2006 6,0 0,0
Source: Economic Commission for Latin America and the Caribbean (ECLAC), on the basis of processing of data from household income and expenditure surveys conducted in the respective countries.
2. The structure of expenditureThe most salient feature of the structure of expenditure in the countries in the region is the large proportion spent on food consumption, typically of middle- and low-income countries (see figure IV.21). On average, the Latin American and Caribbean countries devote 32% of their spending to food. This figure is lowest in Brazil and highest in Nicaragua. The second largest item is housing expenditures (17%), followed by transport (9%). The differences in spending structure between the Latin American and the European countries show that in the European Union, spending on housing is higher than on food (see table IV.11). This reflects both higher income levels and smaller household sizes, as well as relative prices.
Examination of per capita GDP in the countries and the proportion of spending on food within total expenditure confirms Engel’s law, namely that as income rises, the proportion of income spent on food falls, although the relation is not linear (see figure IV.22).
Engel’s law also holds for the different levels of income within countries. In the unweighted average for the countries examined, the lowest income decile devotes 50% of spending to food, compared with 22% —less than half— for the richest decile.
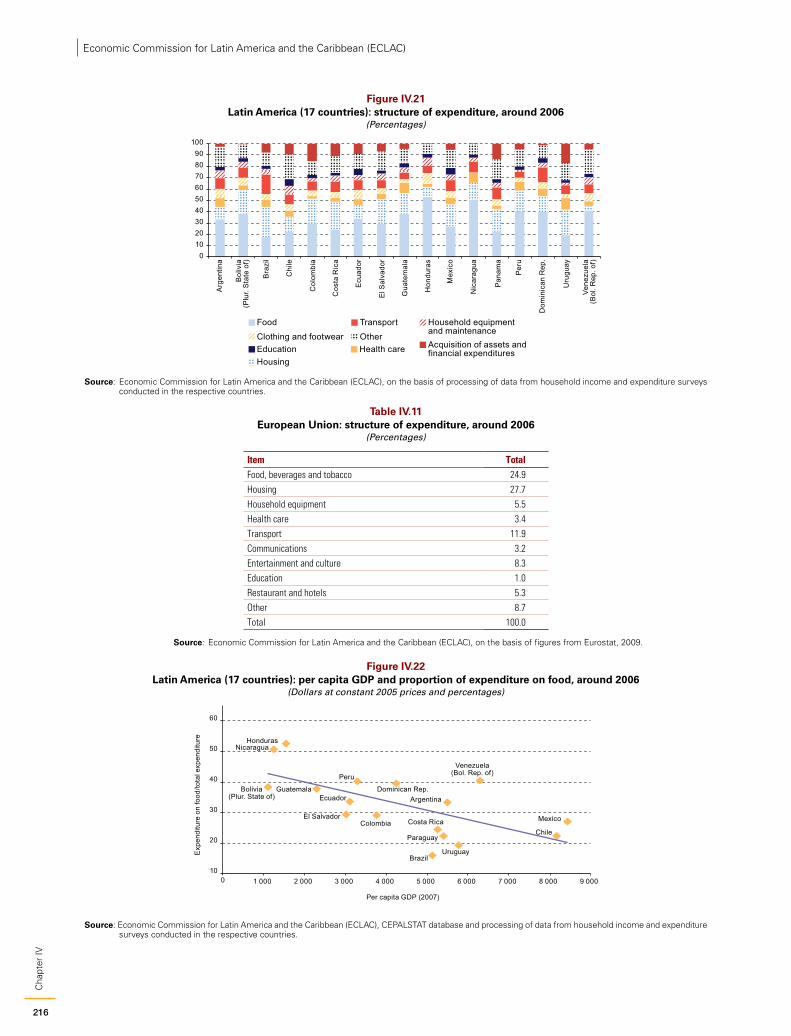
216
Cha
pter
IVEconomic Commission for Latin America and the Caribbean (ECLAC)
Figure IV.21 Latin America (17 countries): structure of expenditure, around 2006
(Percentages)
0102030405060708090
100
Food
Clothing and footwearEducationHousing
Transport
OtherHealth care
Household equipment and maintenanceAcquisition of assets and financial expenditures
Arg
entin
a
Bol
ivia
(Plu
r. S
tate
of)
Bra
zil
Chi
le
Col
ombi
a
Cos
ta R
ica
Ecu
ador
El S
alva
dor
Gua
tem
ala
Hon
dura
s
Mex
ico
Nic
arag
ua
Pan
ama
Per
u
Dom
inic
an R
ep.
Uru
guay
Vene
zuel
a(B
ol. R
ep. o
f)
Source: Economic Commission for Latin America and the Caribbean (ECLAC), on the basis of processing of data from household income and expenditure surveys conducted in the respective countries.
Table IV.11 European Union: structure of expenditure, around 2006
(Percentages)
Item TotalFood, beverages and tobacco 24.9Housing 27.7Household equipment 5.5Health care 3.4Transport 11.9Communications 3.2Entertainment and culture 8.3Education 1.0Restaurant and hotels 5.3Other 8.7Total 100.0
Source: Economic Commission for Latin America and the Caribbean (ECLAC), on the basis of figures from Eurostat, 2009.
Figure IV.22 Latin America (17 countries): per capita GDP and proportion of expenditure on food, around 2006
(Dollars at constant 2005 prices and percentages)
ArgentinaBolivia
(Plur. State of)
Brazil
ChileColombia Costa Rica
Ecuador
El Salvador
Guatemala
Honduras
Mexico
Nicaragua
Paraguay
Peru
Dominican Rep.
Uruguay
Venezuela(Bol. Rep. of)
10
20
30
40
50
60
0 1 000 2 000 3 000 4 000 5 000 6 000 7 000 8 000 9 000
Exp
endi
ture
on
food
/tota
l exp
endi
ture
Per capita GDP (2007)
Source: Economic Commission for Latin America and the Caribbean (ECLAC), CEPALSTAT database and processing of data from household income and expenditure surveys conducted in the respective countries.
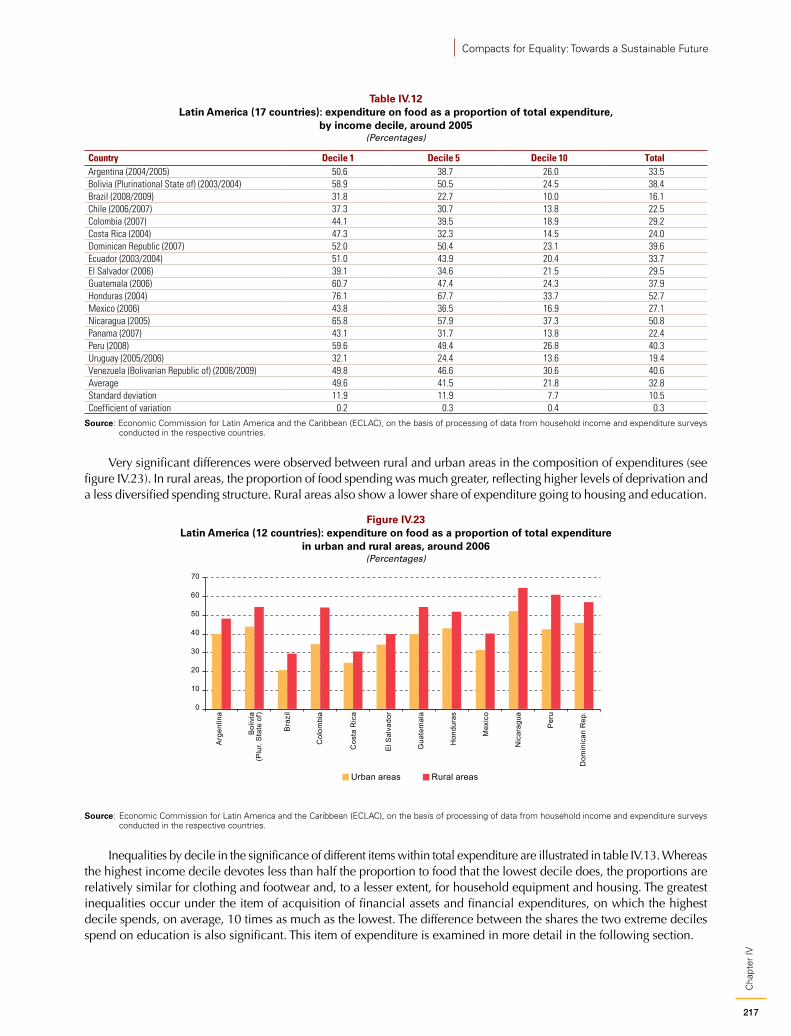
217
Cha
pter
IV
Compacts for Equality: Towards a Sustainable Future
Table IV.12 Latin America (17 countries): expenditure on food as a proportion of total expenditure,
by income decile, around 2005 (Percentages)
Country Decile 1 Decile 5 Decile 10 TotalArgentina (2004/2005) 50.6 38.7 26.0 33.5Bolivia (Plurinational State of) (2003/2004) 58.9 50.5 24.5 38.4Brazil (2008/2009) 31.8 22.7 10.0 16.1Chile (2006/2007) 37.3 30.7 13.8 22.5Colombia (2007) 44.1 39.5 18.9 29.2Costa Rica (2004) 47.3 32.3 14.5 24.0Dominican Republic (2007) 52.0 50.4 23.1 39.6Ecuador (2003/2004) 51.0 43.9 20.4 33.7El Salvador (2006) 39.1 34.6 21.5 29.5Guatemala (2006) 60.7 47.4 24.3 37.9Honduras (2004) 76.1 67.7 33.7 52.7Mexico (2006) 43.8 36.5 16.9 27.1Nicaragua (2005) 65.8 57.9 37.3 50.8Panama (2007) 43.1 31.7 13.8 22.4Peru (2008) 59.6 49.4 26.8 40.3Uruguay (2005/2006) 32.1 24.4 13.6 19.4Venezuela (Bolivarian Republic of) (2008/2009) 49.8 46.6 30.6 40.6Average 49.6 41.5 21.8 32.8Standard deviation 11.9 11.9 7.7 10.5Coefficient of variation 0.2 0.3 0.4 0.3
Source: Economic Commission for Latin America and the Caribbean (ECLAC), on the basis of processing of data from household income and expenditure surveys conducted in the respective countries.
Very significant differences were observed between rural and urban areas in the composition of expenditures (see figure IV.23). In rural areas, the proportion of food spending was much greater, reflecting higher levels of deprivation and a less diversified spending structure. Rural areas also show a lower share of expenditure going to housing and education.
Figure IV.23 Latin America (12 countries): expenditure on food as a proportion of total expenditure
in urban and rural areas, around 2006(Percentages)
Arg
entin
a
Bol
ivia
(Plu
r. S
tate
of)
Bra
zil
Col
ombi
a
Cos
ta R
ica
El S
alva
dor
Gua
tem
ala
Hon
dura
s
Mex
ico
Nic
arag
ua
Per
u
Dom
inic
an R
ep.0
10
20
30
40
50
60
70
Urban areas Rural areas
Source: Economic Commission for Latin America and the Caribbean (ECLAC), on the basis of processing of data from household income and expenditure surveys conducted in the respective countries.
Inequalities by decile in the significance of different items within total expenditure are illustrated in table IV.13. Whereas the highest income decile devotes less than half the proportion to food that the lowest decile does, the proportions are relatively similar for clothing and footwear and, to a lesser extent, for household equipment and housing. The greatest inequalities occur under the item of acquisition of financial assets and financial expenditures, on which the highest decile spends, on average, 10 times as much as the lowest. The difference between the shares the two extreme deciles spend on education is also significant. This item of expenditure is examined in more detail in the following section.
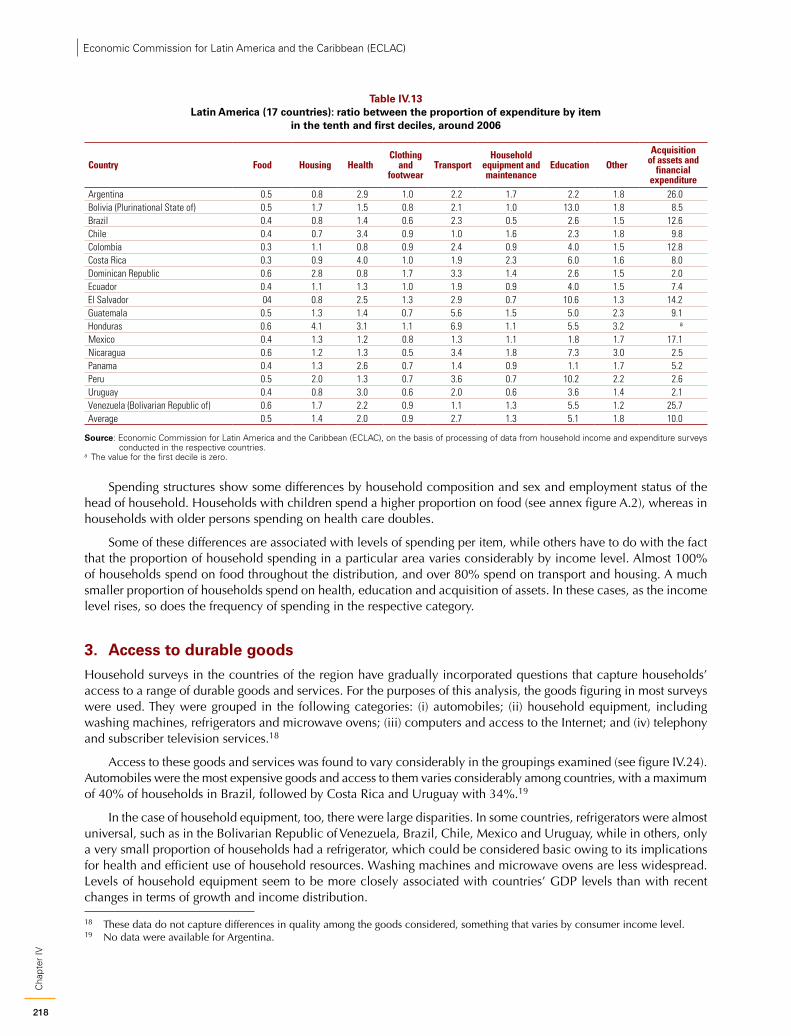
218
Cha
pter
IVEconomic Commission for Latin America and the Caribbean (ECLAC)
Table IV.13 Latin America (17 countries): ratio between the proportion of expenditure by item
in the tenth and first deciles, around 2006
Country Food Housing HealthClothing
and footwear
TransportHousehold
equipment and maintenance
Education OtherAcquisition
of assets and financial
expenditureArgentina 0.5 0.8 2.9 1.0 2.2 1.7 2.2 1.8 26.0Bolivia (Plurinational State of) 0.5 1.7 1.5 0.8 2.1 1.0 13.0 1.8 8.5Brazil 0.4 0.8 1.4 0.6 2.3 0.5 2.6 1.5 12.6Chile 0.4 0.7 3.4 0.9 1.0 1.6 2.3 1.8 9.8Colombia 0.3 1.1 0.8 0.9 2.4 0.9 4.0 1.5 12.8Costa Rica 0.3 0.9 4.0 1.0 1.9 2.3 6.0 1.6 8.0Dominican Republic 0.6 2.8 0.8 1.7 3.3 1.4 2.6 1.5 2.0Ecuador 0.4 1.1 1.3 1.0 1.9 0.9 4.0 1.5 7.4El Salvador 04 0.8 2.5 1.3 2.9 0.7 10.6 1.3 14.2Guatemala 0.5 1.3 1.4 0.7 5.6 1.5 5.0 2.3 9.1Honduras 0.6 4.1 3.1 1.1 6.9 1.1 5.5 3.2 a
Mexico 0.4 1.3 1.2 0.8 1.3 1.1 1.8 1.7 17.1Nicaragua 0.6 1.2 1.3 0.5 3.4 1.8 7.3 3.0 2.5Panama 0.4 1.3 2.6 0.7 1.4 0.9 1.1 1.7 5.2Peru 0.5 2.0 1.3 0.7 3.6 0.7 10.2 2.2 2.6Uruguay 0.4 0.8 3.0 0.6 2.0 0.6 3.6 1.4 2.1Venezuela (Bolivarian Republic of) 0.6 1.7 2.2 0.9 1.1 1.3 5.5 1.2 25.7Average 0.5 1.4 2.0 0.9 2.7 1.3 5.1 1.8 10.0
Source: Economic Commission for Latin America and the Caribbean (ECLAC), on the basis of processing of data from household income and expenditure surveys conducted in the respective countries.
a The value for the first decile is zero.
Spending structures show some differences by household composition and sex and employment status of the head of household. Households with children spend a higher proportion on food (see annex figure A.2), whereas in households with older persons spending on health care doubles.
Some of these differences are associated with levels of spending per item, while others have to do with the fact that the proportion of household spending in a particular area varies considerably by income level. Almost 100% of households spend on food throughout the distribution, and over 80% spend on transport and housing. A much smaller proportion of households spend on health, education and acquisition of assets. In these cases, as the income level rises, so does the frequency of spending in the respective category.
3. Access to durable goodsHousehold surveys in the countries of the region have gradually incorporated questions that capture households’ access to a range of durable goods and services. For the purposes of this analysis, the goods figuring in most surveys were used. They were grouped in the following categories: (i) automobiles; (ii) household equipment, including washing machines, refrigerators and microwave ovens; (iii) computers and access to the Internet; and (iv) telephony and subscriber television services.18
Access to these goods and services was found to vary considerably in the groupings examined (see figure IV.24). Automobiles were the most expensive goods and access to them varies considerably among countries, with a maximum of 40% of households in Brazil, followed by Costa Rica and Uruguay with 34%.19
In the case of household equipment, too, there were large disparities. In some countries, refrigerators were almost universal, such as in the Bolivarian Republic of Venezuela, Brazil, Chile, Mexico and Uruguay, while in others, only a very small proportion of households had a refrigerator, which could be considered basic owing to its implications for health and efficient use of household resources. Washing machines and microwave ovens are less widespread. Levels of household equipment seem to be more closely associated with countries’ GDP levels than with recent changes in terms of growth and income distribution.
18 These data do not capture differences in quality among the goods considered, something that varies by consumer income level.19 No data were available for Argentina.
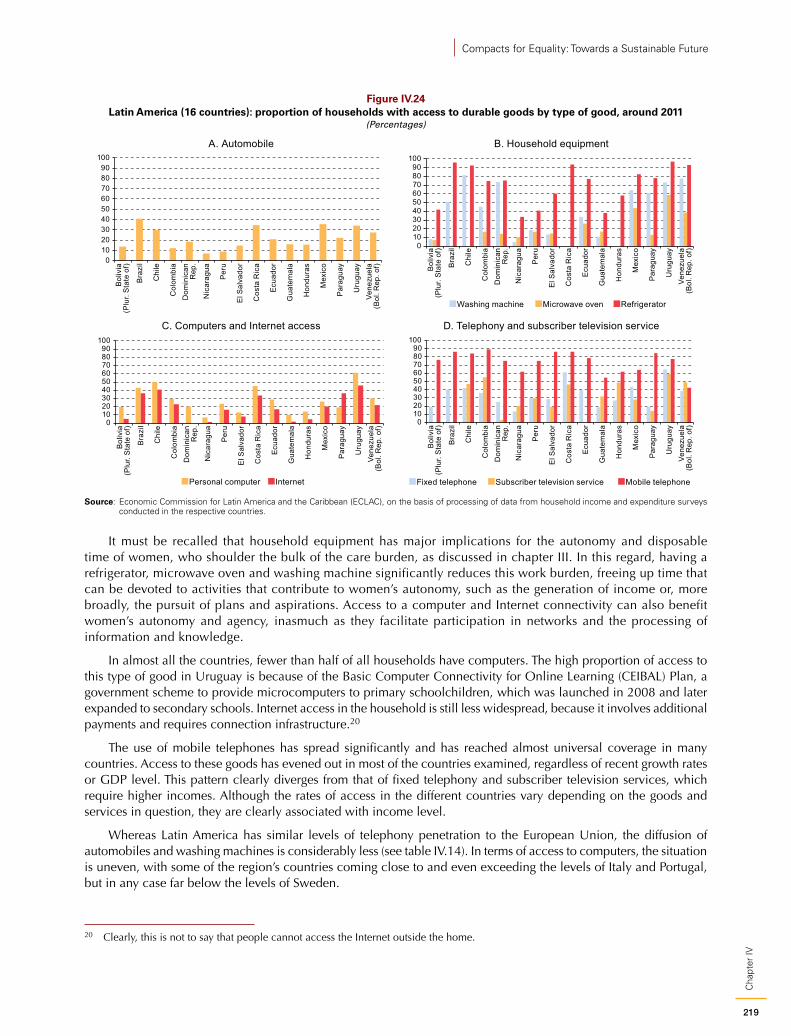
219
Cha
pter
IV
Compacts for Equality: Towards a Sustainable Future
Figure IV.24 Latin America (16 countries): proportion of households with access to durable goods by type of good, around 2011
(Percentages)
A. Automobile B. Household equipment
C. Computers and Internet access D. Telephony and subscriber television service
0102030405060708090
100
Bol
ivia
(Plu
r. S
tate
of)
Bra
zil
Chi
le
Col
ombi
aD
omin
ican
Rep
.
Nic
arag
ua
Per
u
El S
alva
dor
Cos
ta R
ica
Ecu
ador
Gua
tem
ala
Hon
dura
s
Mex
ico
Par
agua
y
Uru
guay
Vene
zuel
a(B
ol. R
ep. o
f)
0102030405060708090
100
Bol
ivia
(Plu
r. S
tate
of)
Bra
zil
Chi
le
Col
ombi
a D
omin
ican
Rep
.
Nic
arag
ua
Per
u
El S
alva
dor
Cos
ta R
ica
Ecu
ador
Gua
tem
ala
Hon
dura
s
Mex
ico
Par
agua
y
Uru
guay
Vene
zuel
a(B
ol. R
ep. o
f)
Washing machine Microwave oven Refrigerator
0102030405060708090
100
Bol
ivia
(Plu
r. S
tate
of)
Bra
zil
Chi
le
Col
ombi
aD
omin
ican
Rep
.
Nic
arag
ua
Per
u
El S
alva
dor
Cos
ta R
ica
Ecu
ador
Gua
tem
ala
Hon
dura
s
Mex
ico
Par
agua
y
Uru
guay
Vene
zuel
a(B
ol. R
ep. o
f)
Personal computer Internet
0102030405060708090
100
Bol
ivia
(Plu
r. S
tate
of)
Bra
zil
Chi
le
Col
ombi
aD
omin
ican
Rep
.
Nic
arag
ua
Per
u
El S
alva
dor
Cos
ta R
ica
Ecu
ador
Gua
tem
ala
Hon
dura
s
Mex
ico
Par
agua
y
Uru
guay
Vene
zuel
a(B
ol. R
ep. o
f)
Fixed telephone Subscriber television service Mobile telephone
Source: Economic Commission for Latin America and the Caribbean (ECLAC), on the basis of processing of data from household income and expenditure surveys conducted in the respective countries.
It must be recalled that household equipment has major implications for the autonomy and disposable time of women, who shoulder the bulk of the care burden, as discussed in chapter III. In this regard, having a refrigerator, microwave oven and washing machine significantly reduces this work burden, freeing up time that can be devoted to activities that contribute to women’s autonomy, such as the generation of income or, more broadly, the pursuit of plans and aspirations. Access to a computer and Internet connectivity can also benefit women’s autonomy and agency, inasmuch as they facilitate participation in networks and the processing of information and knowledge.
In almost all the countries, fewer than half of all households have computers. The high proportion of access to this type of good in Uruguay is because of the Basic Computer Connectivity for Online Learning (CEIBAL) Plan, a government scheme to provide microcomputers to primary schoolchildren, which was launched in 2008 and later expanded to secondary schools. Internet access in the household is still less widespread, because it involves additional payments and requires connection infrastructure.20
The use of mobile telephones has spread significantly and has reached almost universal coverage in many countries. Access to these goods has evened out in most of the countries examined, regardless of recent growth rates or GDP level. This pattern clearly diverges from that of fixed telephony and subscriber television services, which require higher incomes. Although the rates of access in the different countries vary depending on the goods and services in question, they are clearly associated with income level.
Whereas Latin America has similar levels of telephony penetration to the European Union, the diffusion of automobiles and washing machines is considerably less (see table IV.14). In terms of access to computers, the situation is uneven, with some of the region’s countries coming close to and even exceeding the levels of Italy and Portugal, but in any case far below the levels of Sweden.
20 Clearly, this is not to say that people cannot access the Internet outside the home.
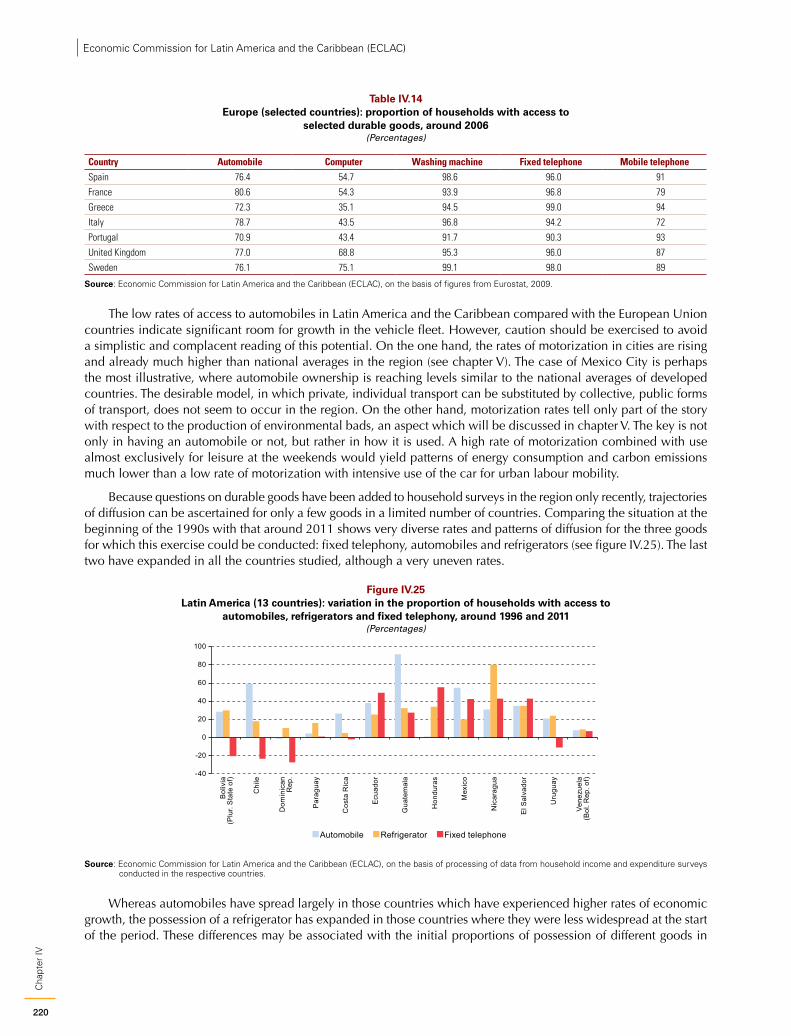
220
Cha
pter
IVEconomic Commission for Latin America and the Caribbean (ECLAC)
Table IV.14 Europe (selected countries): proportion of households with access to
selected durable goods, around 2006(Percentages)
Country Automobile Computer Washing machine Fixed telephone Mobile telephoneSpain 76.4 54.7 98.6 96.0 91
France 80.6 54.3 93.9 96.8 79
Greece 72.3 35.1 94.5 99.0 94
Italy 78.7 43.5 96.8 94.2 72
Portugal 70.9 43.4 91.7 90.3 93
United Kingdom 77.0 68.8 95.3 96.0 87
Sweden 76.1 75.1 99.1 98.0 89
Source: Economic Commission for Latin America and the Caribbean (ECLAC), on the basis of figures from Eurostat, 2009.
The low rates of access to automobiles in Latin America and the Caribbean compared with the European Union countries indicate significant room for growth in the vehicle fleet. However, caution should be exercised to avoid a simplistic and complacent reading of this potential. On the one hand, the rates of motorization in cities are rising and already much higher than national averages in the region (see chapter V). The case of Mexico City is perhaps the most illustrative, where automobile ownership is reaching levels similar to the national averages of developed countries. The desirable model, in which private, individual transport can be substituted by collective, public forms of transport, does not seem to occur in the region. On the other hand, motorization rates tell only part of the story with respect to the production of environmental bads, an aspect which will be discussed in chapter V. The key is not only in having an automobile or not, but rather in how it is used. A high rate of motorization combined with use almost exclusively for leisure at the weekends would yield patterns of energy consumption and carbon emissions much lower than a low rate of motorization with intensive use of the car for urban labour mobility.
Because questions on durable goods have been added to household surveys in the region only recently, trajectories of diffusion can be ascertained for only a few goods in a limited number of countries. Comparing the situation at the beginning of the 1990s with that around 2011 shows very diverse rates and patterns of diffusion for the three goods for which this exercise could be conducted: fixed telephony, automobiles and refrigerators (see figure IV.25). The last two have expanded in all the countries studied, although a very uneven rates.
Figure IV.25 Latin America (13 countries): variation in the proportion of households with access to
automobiles, refrigerators and fixed telephony, around 1996 and 2011(Percentages)
-40
-20
0
20
40
60
80
100
Bol
ivia
(Plu
r. S
tate
of)
Chi
le
Dom
inic
anR
ep.
Par
agua
y
Cos
ta R
ica
Ecu
ador
Gua
tem
ala
Hon
dura
s
Mex
ico
Nic
arag
ua
El S
alva
dor
Uru
guay
Vene
zuel
a(B
ol. R
ep. o
f)
Automobile Refrigerator Fixed telephone
Source: Economic Commission for Latin America and the Caribbean (ECLAC), on the basis of processing of data from household income and expenditure surveys conducted in the respective countries.
Whereas automobiles have spread largely in those countries which have experienced higher rates of economic growth, the possession of a refrigerator has expanded in those countries where they were less widespread at the start of the period. These differences may be associated with the initial proportions of possession of different goods in
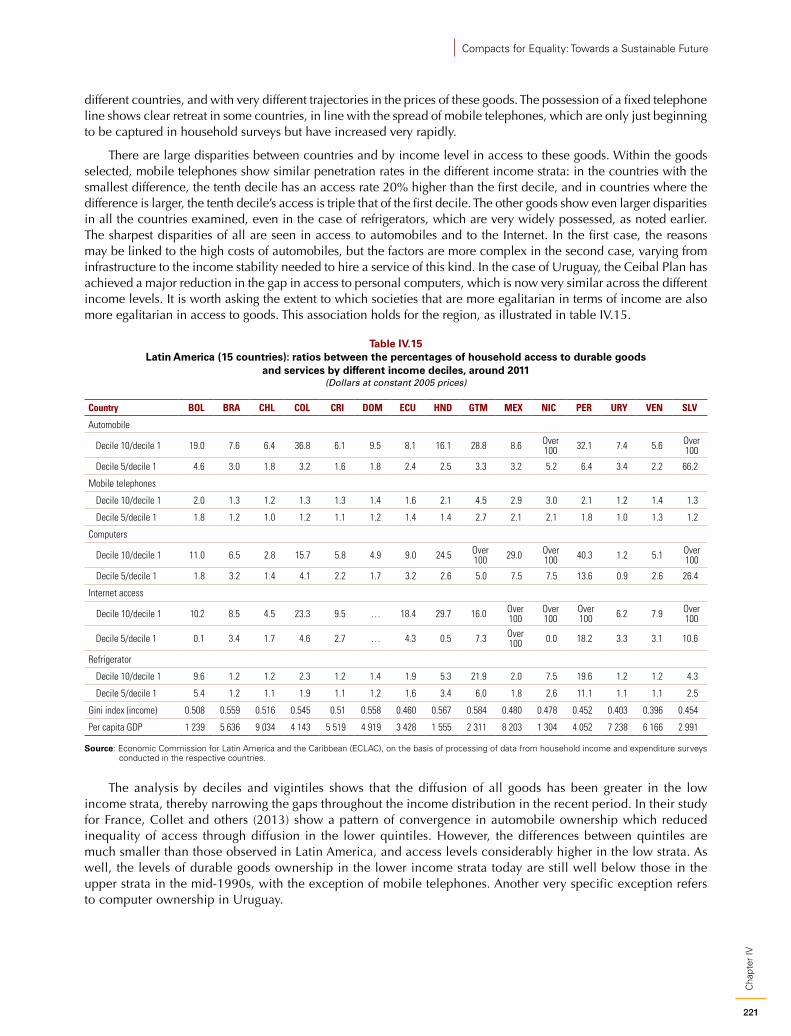
221
Cha
pter
IV
Compacts for Equality: Towards a Sustainable Future
different countries, and with very different trajectories in the prices of these goods. The possession of a fixed telephone line shows clear retreat in some countries, in line with the spread of mobile telephones, which are only just beginning to be captured in household surveys but have increased very rapidly.
There are large disparities between countries and by income level in access to these goods. Within the goods selected, mobile telephones show similar penetration rates in the different income strata: in the countries with the smallest difference, the tenth decile has an access rate 20% higher than the first decile, and in countries where the difference is larger, the tenth decile’s access is triple that of the first decile. The other goods show even larger disparities in all the countries examined, even in the case of refrigerators, which are very widely possessed, as noted earlier. The sharpest disparities of all are seen in access to automobiles and to the Internet. In the first case, the reasons may be linked to the high costs of automobiles, but the factors are more complex in the second case, varying from infrastructure to the income stability needed to hire a service of this kind. In the case of Uruguay, the Ceibal Plan has achieved a major reduction in the gap in access to personal computers, which is now very similar across the different income levels. It is worth asking the extent to which societies that are more egalitarian in terms of income are also more egalitarian in access to goods. This association holds for the region, as illustrated in table IV.15.
Table IV.15 Latin America (15 countries): ratios between the percentages of household access to durable goods
and services by different income deciles, around 2011 (Dollars at constant 2005 prices)
Country BOL BRA CHL COL CRI DOM ECU HND GTM MEX NIC PER URY VEN SLV
Automobile
Decile 10/decile 1 19.0 7.6 6.4 36.8 6.1 9.5 8.1 16.1 28.8 8.6 Over 100 32.1 7.4 5.6 Over
100
Decile 5/decile 1 4.6 3.0 1.8 3.2 1.6 1.8 2.4 2.5 3.3 3.2 5.2 6.4 3.4 2.2 66.2
Mobile telephones
Decile 10/decile 1 2.0 1.3 1.2 1.3 1.3 1.4 1.6 2.1 4.5 2.9 3.0 2.1 1.2 1.4 1.3
Decile 5/decile 1 1.8 1.2 1.0 1.2 1.1 1.2 1.4 1.4 2.7 2.1 2.1 1.8 1.0 1.3 1.2
Computers
Decile 10/decile 1 11.0 6.5 2.8 15.7 5.8 4.9 9.0 24.5 Over100 29.0 Over
100 40.3 1.2 5.1 Over 100
Decile 5/decile 1 1.8 3.2 1.4 4.1 2.2 1.7 3.2 2.6 5.0 7.5 7.5 13.6 0.9 2.6 26.4
Internet access
Decile 10/decile 1 10.2 8.5 4.5 23.3 9.5 … 18.4 29.7 16.0 Over 100
Over 100
Over 100 6.2 7.9 Over
100
Decile 5/decile 1 0.1 3.4 1.7 4.6 2.7 … 4.3 0.5 7.3 Over 100 0.0 18.2 3.3 3.1 10.6
Refrigerator
Decile 10/decile 1 9.6 1.2 1.2 2.3 1.2 1.4 1.9 5.3 21.9 2.0 7.5 19.6 1.2 1.2 4.3
Decile 5/decile 1 5.4 1.2 1.1 1.9 1.1 1.2 1.6 3.4 6.0 1.8 2.6 11.1 1.1 1.1 2.5
Gini index (income) 0.508 0.559 0.516 0.545 0.51 0.558 0.460 0.567 0.584 0.480 0.478 0.452 0.403 0.396 0.454
Per capita GDP 1 239 5 636 9 034 4 143 5 519 4 919 3 428 1 555 2 311 8 203 1 304 4 052 7 238 6 166 2 991
Source: Economic Commission for Latin America and the Caribbean (ECLAC), on the basis of processing of data from household income and expenditure surveys conducted in the respective countries.
The analysis by deciles and vigintiles shows that the diffusion of all goods has been greater in the low income strata, thereby narrowing the gaps throughout the income distribution in the recent period. In their study for France, Collet and others (2013) show a pattern of convergence in automobile ownership which reduced inequality of access through diffusion in the lower quintiles. However, the differences between quintiles are much smaller than those observed in Latin America, and access levels considerably higher in the low strata. As well, the levels of durable goods ownership in the lower income strata today are still well below those in the upper strata in the mid-1990s, with the exception of mobile telephones. Another very specific exception refers to computer ownership in Uruguay.
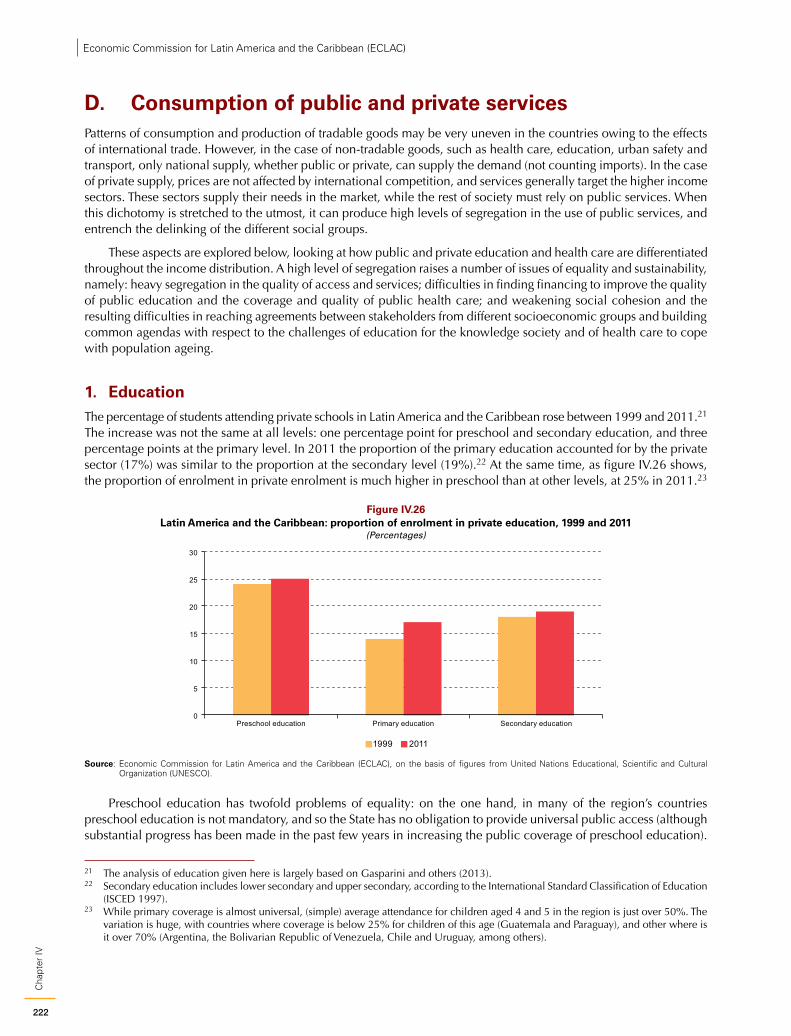
222
Cha
pter
IVEconomic Commission for Latin America and the Caribbean (ECLAC)
D. Consumption of public and private servicesPatterns of consumption and production of tradable goods may be very uneven in the countries owing to the effects of international trade. However, in the case of non-tradable goods, such as health care, education, urban safety and transport, only national supply, whether public or private, can supply the demand (not counting imports). In the case of private supply, prices are not affected by international competition, and services generally target the higher income sectors. These sectors supply their needs in the market, while the rest of society must rely on public services. When this dichotomy is stretched to the utmost, it can produce high levels of segregation in the use of public services, and entrench the delinking of the different social groups.
These aspects are explored below, looking at how public and private education and health care are differentiated throughout the income distribution. A high level of segregation raises a number of issues of equality and sustainability, namely: heavy segregation in the quality of access and services; difficulties in finding financing to improve the quality of public education and the coverage and quality of public health care; and weakening social cohesion and the resulting difficulties in reaching agreements between stakeholders from different socioeconomic groups and building common agendas with respect to the challenges of education for the knowledge society and of health care to cope with population ageing.
1. EducationThe percentage of students attending private schools in Latin America and the Caribbean rose between 1999 and 2011.21 The increase was not the same at all levels: one percentage point for preschool and secondary education, and three percentage points at the primary level. In 2011 the proportion of the primary education accounted for by the private sector (17%) was similar to the proportion at the secondary level (19%).22 At the same time, as figure IV.26 shows, the proportion of enrolment in private enrolment is much higher in preschool than at other levels, at 25% in 2011.23
Figure IV.26 Latin America and the Caribbean: proportion of enrolment in private education, 1999 and 2011
(Percentages)
0
5
10
15
20
25
30
Preschool education Primary education Secondary education
1999 2011
Source: Economic Commission for Latin America and the Caribbean (ECLAC), on the basis of figures from United Nations Educational, Scientific and Cultural Organization (UNESCO).
Preschool education has twofold problems of equality: on the one hand, in many of the region’s countries preschool education is not mandatory, and so the State has no obligation to provide universal public access (although substantial progress has been made in the past few years in increasing the public coverage of preschool education).
21 The analysis of education given here is largely based on Gasparini and others (2013).22 Secondary education includes lower secondary and upper secondary, according to the International Standard Classification of Education
(ISCED 1997).23 While primary coverage is almost universal, (simple) average attendance for children aged 4 and 5 in the region is just over 50%. The
variation is huge, with countries where coverage is below 25% for children of this age (Guatemala and Paraguay), and other where is it over 70% (Argentina, the Bolivarian Republic of Venezuela, Chile and Uruguay, among others).

223
Cha
pter
IV
Compacts for Equality: Towards a Sustainable Future
Accordingly, segregation by socioeconomic level is still much higher in preschool education than at the primary or secondary levels. On the other hand, gaps in preschool education access and quality are critical for educational trajectories in the later stages of education, because early stimulus and learning of basic skills mark out significant differences in the later development of learning capacities.
In the Latin American and Caribbean countries, the percentage of enrolment in private primary education is higher than the average for both the developed and the developing countries globally. In terms of percentage points, this gap remained unchanged between 2000 and 2010 with respect to the developing countries, and rose with respect to the developed countries. These gaps are not seen to the same extent in secondary education. As figure IV.27 shows, the percentage of students attending private secondary schools in the region is no higher than the average worldwide or for the developing countries for the years examined. In 2000 the percentage was similar to the global average, although higher than the rate for the developed countries (by 4 percentage points). The developing countries, meanwhile, showed a percentage of private enrolment 5 points higher than in Latin America and the Caribbean. By 2010, enrolment in private secondary education had risen by one percentage point in Latin America and the Caribbean, and three percentage points globally.
Figure IV.27 Proportion of enrolment in private education, by level of education, 2000, 2005 and 2010
(Percentages)
A. Primary education
8
10
12
14
16
18
2000 2005 2010
B. Secondary education
12
14
16
18
20
22
24
26
2000 2005 2010
World Developed countries Developing countries Latin America and the Caribbean
Source: Economic Commission for Latin America and the Caribbean (ECLAC), on the basis of figures from United Nations Educational, Scientific and Cultural Organization (UNESCO).
When countries are examined individually, the period of comparison can be expanded to two decades in some cases. In this regard, major differences are found in public coverage between countries. At the primary level, Chile stands out for the significance of the private sector, whereas in Costa Rica, Honduras and Mexico the private sector accounts for less than 10%. The percentage of enrolment in private primary education rose in almost all the countries
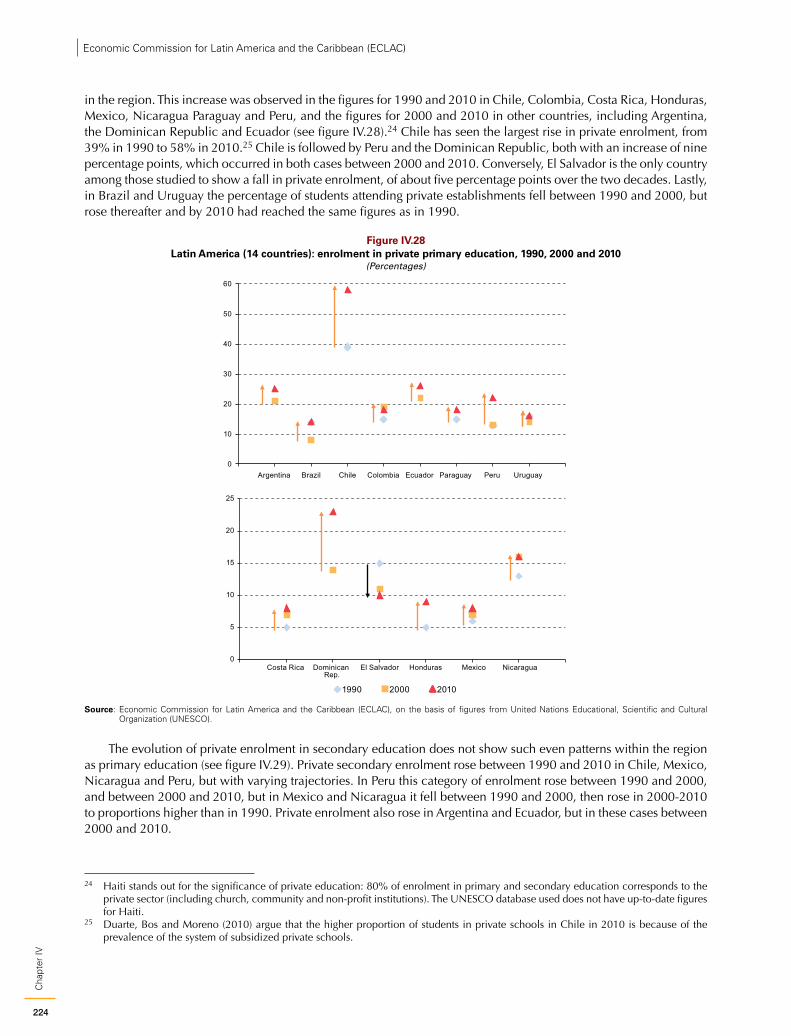
224
Cha
pter
IVEconomic Commission for Latin America and the Caribbean (ECLAC)
in the region. This increase was observed in the figures for 1990 and 2010 in Chile, Colombia, Costa Rica, Honduras, Mexico, Nicaragua Paraguay and Peru, and the figures for 2000 and 2010 in other countries, including Argentina, the Dominican Republic and Ecuador (see figure IV.28).24 Chile has seen the largest rise in private enrolment, from 39% in 1990 to 58% in 2010.25 Chile is followed by Peru and the Dominican Republic, both with an increase of nine percentage points, which occurred in both cases between 2000 and 2010. Conversely, El Salvador is the only country among those studied to show a fall in private enrolment, of about five percentage points over the two decades. Lastly, in Brazil and Uruguay the percentage of students attending private establishments fell between 1990 and 2000, but rose thereafter and by 2010 had reached the same figures as in 1990.
Figure IV.28 Latin America (14 countries): enrolment in private primary education, 1990, 2000 and 2010
(Percentages)
Argentina Brazil Chile Colombia Ecuador Paraguay Peru Uruguay0
10
20
30
40
50
60
1990 2000 2010
Costa Rica Dominican Rep.
El Salvador Honduras Mexico Nicaragua0
5
10
15
20
25
Source: Economic Commission for Latin America and the Caribbean (ECLAC), on the basis of figures from United Nations Educational, Scientific and Cultural Organization (UNESCO).
The evolution of private enrolment in secondary education does not show such even patterns within the region as primary education (see figure IV.29). Private secondary enrolment rose between 1990 and 2010 in Chile, Mexico, Nicaragua and Peru, but with varying trajectories. In Peru this category of enrolment rose between 1990 and 2000, and between 2000 and 2010, but in Mexico and Nicaragua it fell between 1990 and 2000, then rose in 2000-2010 to proportions higher than in 1990. Private enrolment also rose in Argentina and Ecuador, but in these cases between 2000 and 2010.
24 Haiti stands out for the significance of private education: 80% of enrolment in primary and secondary education corresponds to the private sector (including church, community and non-profit institutions). The UNESCO database used does not have up-to-date figures for Haiti.
25 Duarte, Bos and Moreno (2010) argue that the higher proportion of students in private schools in Chile in 2010 is because of the prevalence of the system of subsidized private schools.
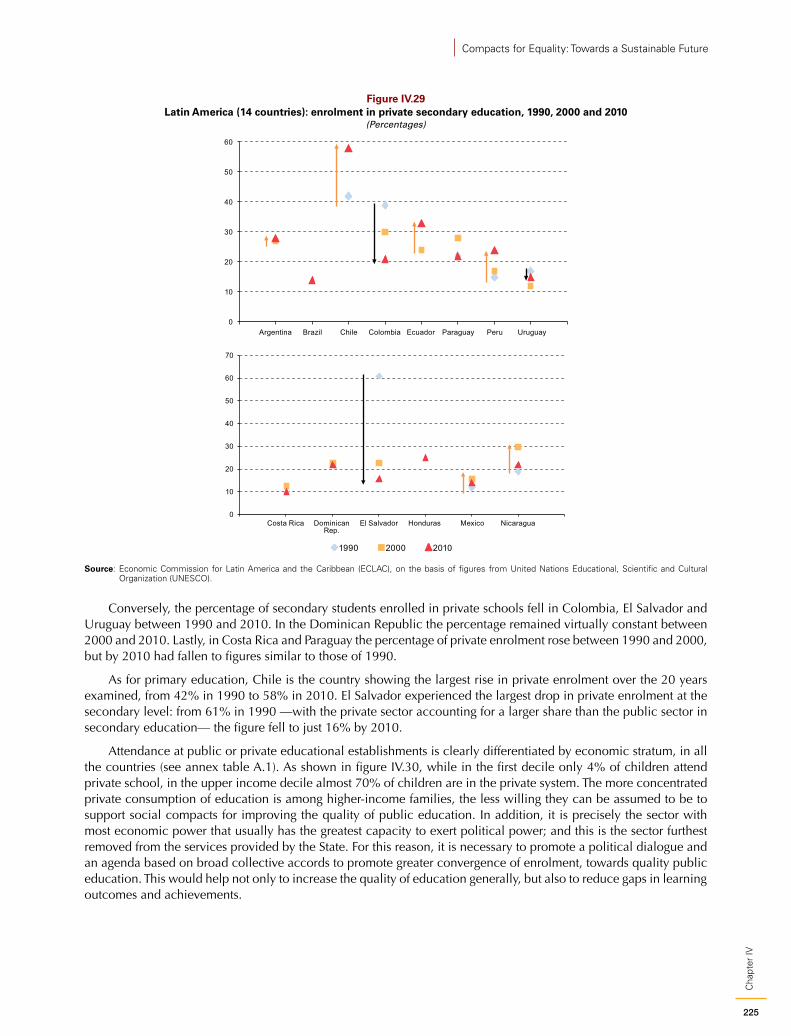
225
Cha
pter
IV
Compacts for Equality: Towards a Sustainable Future
Figure IV.29 Latin America (14 countries): enrolment in private secondary education, 1990, 2000 and 2010
(Percentages)
0
10
20
30
40
50
60
Argentina Brazil Chile Colombia Ecuador Paraguay Peru Uruguay
Costa Rica DominicanRep.
El Salvador Honduras Mexico Nicaragua0
10
20
30
40
50
60
70
1990 2000 2010
Source: Economic Commission for Latin America and the Caribbean (ECLAC), on the basis of figures from United Nations Educational, Scientific and Cultural Organization (UNESCO).
Conversely, the percentage of secondary students enrolled in private schools fell in Colombia, El Salvador and Uruguay between 1990 and 2010. In the Dominican Republic the percentage remained virtually constant between 2000 and 2010. Lastly, in Costa Rica and Paraguay the percentage of private enrolment rose between 1990 and 2000, but by 2010 had fallen to figures similar to those of 1990.
As for primary education, Chile is the country showing the largest rise in private enrolment over the 20 years examined, from 42% in 1990 to 58% in 2010. El Salvador experienced the largest drop in private enrolment at the secondary level: from 61% in 1990 —with the private sector accounting for a larger share than the public sector in secondary education— the figure fell to just 16% by 2010.
Attendance at public or private educational establishments is clearly differentiated by economic stratum, in all the countries (see annex table A.1). As shown in figure IV.30, while in the first decile only 4% of children attend private school, in the upper income decile almost 70% of children are in the private system. The more concentrated private consumption of education is among higher-income families, the less willing they can be assumed to be to support social compacts for improving the quality of public education. In addition, it is precisely the sector with most economic power that usually has the greatest capacity to exert political power; and this is the sector furthest removed from the services provided by the State. For this reason, it is necessary to promote a political dialogue and an agenda based on broad collective accords to promote greater convergence of enrolment, towards quality public education. This would help not only to increase the quality of education generally, but also to reduce gaps in learning outcomes and achievements.
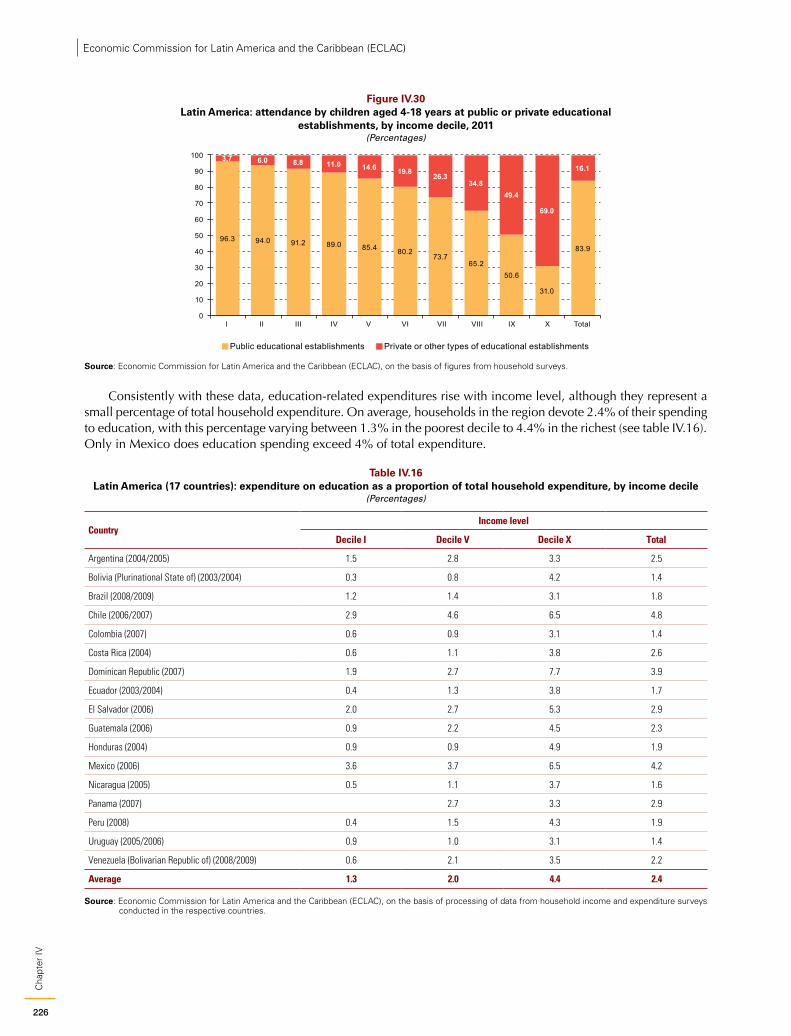
226
Cha
pter
IVEconomic Commission for Latin America and the Caribbean (ECLAC)
Figure IV.30 Latin America: attendance by children aged 4-18 years at public or private educational
establishments, by income decile, 2011(Percentages)
96.3 94.0 91.2 89.0 85.4 80.273.7
65.250.6
31.0
83.9
3.7 6.0 8.8 11.0 14.6 19.826.3
34.849.4
69.0
16.1
0
10
20
30
40
50
60
70
80
90
100
I II III IV V VI VII VIII IX X Total
Public educational establishments Private or other types of educational establishments
Source: Economic Commission for Latin America and the Caribbean (ECLAC), on the basis of figures from household surveys.
Consistently with these data, education-related expenditures rise with income level, although they represent a small percentage of total household expenditure. On average, households in the region devote 2.4% of their spending to education, with this percentage varying between 1.3% in the poorest decile to 4.4% in the richest (see table IV.16). Only in Mexico does education spending exceed 4% of total expenditure.
Table IV.16 Latin America (17 countries): expenditure on education as a proportion of total household expenditure, by income decile
(Percentages)
CountryIncome level
Decile I Decile V Decile X Total
Argentina (2004/2005) 1.5 2.8 3.3 2.5
Bolivia (Plurinational State of) (2003/2004) 0.3 0.8 4.2 1.4
Brazil (2008/2009) 1.2 1.4 3.1 1.8
Chile (2006/2007) 2.9 4.6 6.5 4.8
Colombia (2007) 0.6 0.9 3.1 1.4
Costa Rica (2004) 0.6 1.1 3.8 2.6
Dominican Republic (2007) 1.9 2.7 7.7 3.9
Ecuador (2003/2004) 0.4 1.3 3.8 1.7
El Salvador (2006) 2.0 2.7 5.3 2.9
Guatemala (2006) 0.9 2.2 4.5 2.3
Honduras (2004) 0.9 0.9 4.9 1.9
Mexico (2006) 3.6 3.7 6.5 4.2
Nicaragua (2005) 0.5 1.1 3.7 1.6
Panama (2007) 2.7 3.3 2.9
Peru (2008) 0.4 1.5 4.3 1.9
Uruguay (2005/2006) 0.9 1.0 3.1 1.4
Venezuela (Bolivarian Republic of) (2008/2009) 0.6 2.1 3.5 2.2
Average 1.3 2.0 4.4 2.4
Source: Economic Commission for Latin America and the Caribbean (ECLAC), on the basis of processing of data from household income and expenditure surveys conducted in the respective countries.
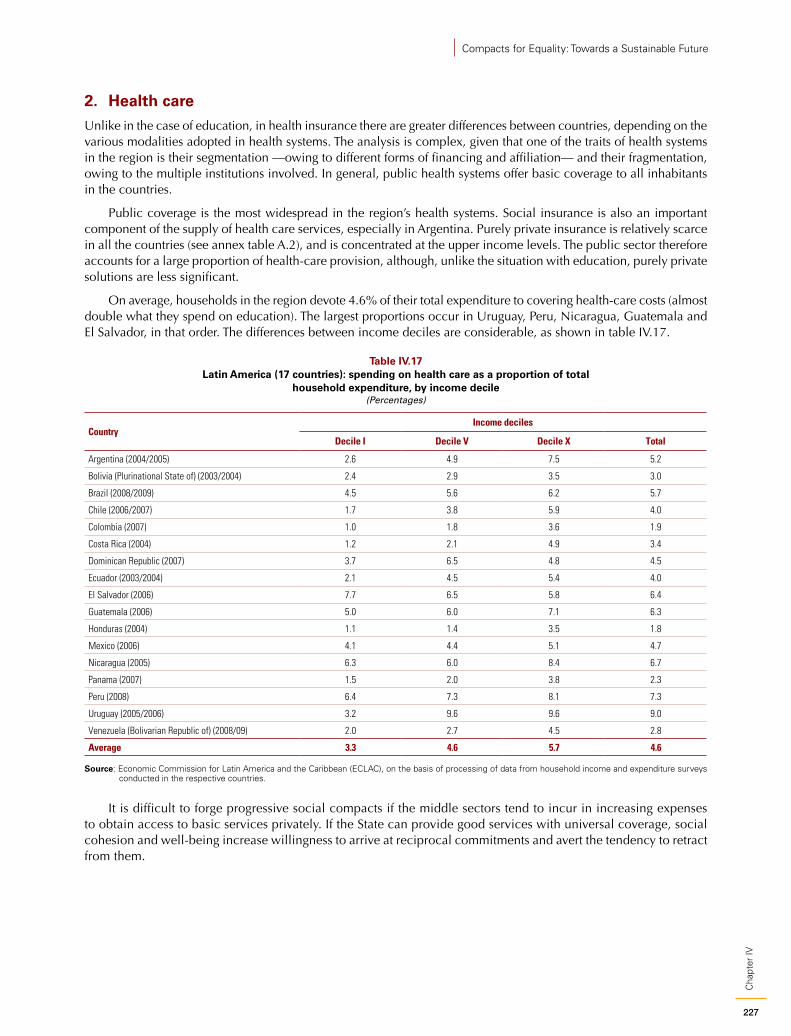
227
Cha
pter
IV
Compacts for Equality: Towards a Sustainable Future
2. Health careUnlike in the case of education, in health insurance there are greater differences between countries, depending on the various modalities adopted in health systems. The analysis is complex, given that one of the traits of health systems in the region is their segmentation —owing to different forms of financing and affiliation— and their fragmentation, owing to the multiple institutions involved. In general, public health systems offer basic coverage to all inhabitants in the countries.
Public coverage is the most widespread in the region’s health systems. Social insurance is also an important component of the supply of health care services, especially in Argentina. Purely private insurance is relatively scarce in all the countries (see annex table A.2), and is concentrated at the upper income levels. The public sector therefore accounts for a large proportion of health-care provision, although, unlike the situation with education, purely private solutions are less significant.
On average, households in the region devote 4.6% of their total expenditure to covering health-care costs (almost double what they spend on education). The largest proportions occur in Uruguay, Peru, Nicaragua, Guatemala and El Salvador, in that order. The differences between income deciles are considerable, as shown in table IV.17.
Table IV.17 Latin America (17 countries): spending on health care as a proportion of total
household expenditure, by income decile(Percentages)
CountryIncome deciles
Decile I Decile V Decile X Total
Argentina (2004/2005) 2.6 4.9 7.5 5.2
Bolivia (Plurinational State of) (2003/2004) 2.4 2.9 3.5 3.0
Brazil (2008/2009) 4.5 5.6 6.2 5.7
Chile (2006/2007) 1.7 3.8 5.9 4.0
Colombia (2007) 1.0 1.8 3.6 1.9
Costa Rica (2004) 1.2 2.1 4.9 3.4
Dominican Republic (2007) 3.7 6.5 4.8 4.5
Ecuador (2003/2004) 2.1 4.5 5.4 4.0
El Salvador (2006) 7.7 6.5 5.8 6.4
Guatemala (2006) 5.0 6.0 7.1 6.3
Honduras (2004) 1.1 1.4 3.5 1.8
Mexico (2006) 4.1 4.4 5.1 4.7
Nicaragua (2005) 6.3 6.0 8.4 6.7
Panama (2007) 1.5 2.0 3.8 2.3
Peru (2008) 6.4 7.3 8.1 7.3
Uruguay (2005/2006) 3.2 9.6 9.6 9.0
Venezuela (Bolivarian Republic of) (2008/09) 2.0 2.7 4.5 2.8
Average 3.3 4.6 5.7 4.6
Source: Economic Commission for Latin America and the Caribbean (ECLAC), on the basis of processing of data from household income and expenditure surveys conducted in the respective countries.
It is difficult to forge progressive social compacts if the middle sectors tend to incur in increasing expenses to obtain access to basic services privately. If the State can provide good services with universal coverage, social cohesion and well-being increase willingness to arrive at reciprocal commitments and avert the tendency to retract from them.
228
Cha
pter
IVEconomic Commission for Latin America and the Caribbean (ECLAC)
E. Concluding remarksAs noted at the beginning of this chapter, consumption patterns form part of countries’ style of development. In Latin America and the Caribbean, concerns over emulative and shop-window consumption have been present for several decades. Those concerns are related to economic sustainability, given the link between the production pattern (and production investment) and the expansion of consumption. These are also linked to equality, in terms of fairer distribution of access to the means to achieve well-being; and to environmental sustainability vis-à-vis future generations, given the negative impacts rising consumption can have on pollution, energy use and the accumulation of waste (see chapter V).
In the Latin American and Caribbean region, consumption has risen strongly in the past decade, as the data presented in this chapter have shown. This brings positive effects, because part of the rise in consumption is associated with increased well-being in sectors that were deprived in the past, and it contributes to better living standards, which, in turn, enable better use of time and more opportunities for capacity-building. This occurs, for example, with the spread of access to household appliances and personal computers, broader access to education and health services, and, where public transport is inadequate, access to automobiles.
Although the situation today is different from the historical context in which ECLAC first put forwards its reflections on consumption in past decades, there are recurrent risks that cannot be ignored. One arises from the fact that consumption is extremely procyclical, which exposes the economies to vulnerability issues that can be precipitated in recession, in the event of a fall in the prices of natural resources (in South America) or in remittances (in Central America), or when overly simple production structures lose economic vigour. The strong link between expanding consumption with a large imported component and the flow of resources from the export of commodities represents an equation whose sustainability is at best uncertain. Although in recent years the countries have been able to stabilize their consumption trajectories and lessen output volatility, the relative volatility between the two aggregates is still a hallmark of the region internationally. This raises uncertainties over the future sustainability of rising consumption, because the combination of high volatility and preponderantly private consumption worsens vulnerability to a range of shocks.
Although credit growth is positive inasmuch as it gives households opportunities for intertemporal reallocation of consumption to meet their needs, consumers are prone to falling into debt traps, as explained by behavioural economics, and high rates of credit penetration can magnify the impacts of even quite small shocks. This points to a problem of sustainability in credit expansion, with greater exposure of the indebted population with fewer assets; and in terms of equality, information asymmetries and access to credit in general make borrowing costs higher for lower-income sectors. The development of financial systems is a complex process which requires public and financial policies aimed at strengthening, among other things, institutionality and economic stability and legal institutions, and creating new instruments for managing economic and financial risk. Beyond consumption, in shallow financial markets and underdeveloped capital markets, mobilizing domestic resources for investment in the production sector needs a battery of economic and financial policies to develop financial markets and promote saving to underpin long-term financing.
Another source of concern is that the upper income levels, favoured by wealth concentration, tend to show a pattern of consumption very intensive in high-cost private services and luxury goods, with a high imported content. This erodes the “quality of society” by confining group relations to their differentiated consumption levels. It worsens well-being gaps between consumers of high-end private goods and services and consumers of lower-quality public services. The data show that spending by the upper income deciles is proportionally higher in categories such as transport, education and health care —precisely those in which there is a clear shortfall in public service delivery. As ECLAC has stressed, this weakens the construction of fiscal pacts that would underpin greater convergence between different sectors of society as regards goods and services consumption. Higher spending on fuels and on automobiles in the upper income deciles also makes these sectors contribute more to air pollution, urban congestion and the consumption of energy from non-renewable sources. Thus, inequality also operates in environmental externalities.
Public-private segregation in services consumption can, therefore, affect social cohesion adversely. The stronger private consumption becomes, whether positional or seeking the quality lacking in public services, the more the social groups become delinked from one another. Autonomy thus increasingly becomes a value that celebrates individualism,
229
Cha
pter
IV
Compacts for Equality: Towards a Sustainable Future
instead of combining with collective solutions to well-being issues. The figure of the consumer becomes more and more distanced from the figure of the citizen and, what is worse, the citizen tends to become confused with the consumer.
These factors raise sustainability issues, in terms of both social cohesion and fiscality. The possibility of building progressive social compacts depends to a great extent on the support of the middle and upper sectors of society, which will be less likely to give it if they are obliged to incur increasingly in personal expenditure to obtain access to basic services privately. If the State can provide good services with universal coverage in health, education, transport, security, utilities and the environment, social cohesion and well-being will boost willingness to engage in reciprocal commitments and lessen the tendency to retract from them.
Social compacts regarding consumption need at least three pillars of agreement. The first is a twofold fiscal covenant with tax reform on the one hand and delivery of strongly welfare-linked public services, on the other. Both these aspects must be included in the respective agreement. More resources needed to be captured through taxation in order to improve service provision, and taxes have to be progressive if this equation is to increase equality. At the same time, access to services needs to be extended to the sectors most deprived of them. A social compact that encompasses these two sides of the same coin is at once the means to and the purpose of greater social cohesion, or, it could be said, of a “better quality of society”.
A second pillar for a social compact on consumption must contain strategic guidelines for calibrating the expansion of consumption with investment in the production sector. A high-consumption society that has undiversified production and is highly dependent on the value of its raw materials is not a sustainable society. Financing consumption through the commodities boom has its limits. An agreement is needed to pair the expansion of consumption for greater well-being with investment to achieve a production structure that increases social inclusion through employment, and builds resilience to external shocks through diversification. The balance between consumption and production, and the dynamics of both, are also crucial for maintaining the long-term equilibrium of the current account.
In other words, changes in consumption patterns need to be combined with efforts to raise rates of investment and change its composition. It is very difficult to change patterns of demand without change in patterns of supply. Low rates of investment going to non-tradable sectors or to natural resources that are hostage to the commodity lottery, do little to reduce the volatility of consumption or to shift it towards less polluting products and processes. A broader supply, at lower prices, of environmentally friendly goods and services needs to be paired with efforts to educate consumers and reduce inequalities. In this regard, generating key industrial policy incentives to raise investment in new sectors is a sine qua non for transforming consumption modalities.
A third pillar of agreement has to do with the environmental and energy-related externalities of the consumption pattern. Taxing pollution and excessive energy consumption is necessary to promote greater solidarity with future generations.26 It is evident today that shop-window consumption, the increase in the vehicle fleet, the expansion of energy spending at above rates of per capita GDP growth, and the waste produced by the planned obsolescence market pose serious problems of air pollution, urban congestion, accumulation of non-degradable waste and heavy pressures on the energy matrix, as will be discussed in the next chapter. For this reason, consumption and its implications for future generations should be the subject of a social compact that links all the stakeholders is a solidary manner and conditions consumption standards to a vision of a sustainable future. “Environmental citizenship” involves rights and obligations in this regard.
We are all consumers and we are all citizens. But consumption must not become a substitute for citizenship. We cannot be consumers at the cost of our sense of citizenship and that is why it is important to strike a better balance between private consumption and public services, and between quality of life today and tomorrow. Consumption must be grounded in a sense of citizenship, and so must be thought out collectively on the basis of a rationale of well-being and sustainability.
Conversely, thought must also be given to the new citizen in terms of his or her rights as a consumer. Today’s consumer and user societies suffer increasingly from heavy asymmetries of information and power. This brings us to a fourth pillar for a social compact on consumption: the State must be allocated powers to regulate the agents, whether public or private, that provide the goods and services which condition quality of life. Regulations must enable consumers, as citizens, to demand quality and timeliness in the provision of these goods and services, as well as a fair price.
26 As well as taxing pollution, other, complementary mechanisms can be used to tackle the negative externalities of consultation, for example administrative or criminal punishment of activities that degrade the environment. This requires an integrated approach to environmental, health and penal regulation, in order to balance the various tools in the best possible manner.
230
Cha
pter
IVEconomic Commission for Latin America and the Caribbean (ECLAC)
Recent discussions in a number of disciplines shed light on a possible route to solving these dilemmas. Adela Cortina (2002) suggests autonomy, fairness (in the sense of what is considered fair), responsibility and happiness as essential attributes of a kind of consumption that is compatible with the autonomous development of the individual. Since not all forms of consumption fulfil these criteria, these attributes could help to determine which forms should be facilitated to attain equity in certain areas of basic consumption. These principles could also help to guide educational content. Other approaches (environmentalist ones, for example) would certainly propose a different set of criteria. It therefore seems essential for the government system to broker a debate on these issues, and to take into account the visions of all the stakeholders involved.
BibliographyAkerlof, G. A. and R.E. Kranton (2011), Identity Economics: How our identities shape our work, wages, and well-
being, Princeton, Princeton University Press.Albin, P. S. (1998), Barriers and Bounds to Rationality: Essays on economic complexity and dynamics in interactive
systems, D. K. Foley (ed.), Princeton, Princeton University Press.Álvarez, R. and A. Opazo (2010), “Endeudamiento de los hogares en Chile: análisis e implicancias para la estabilidad
financiera”, Informe de Estabilidad Financiera, primer semestre 2010, Central Bank of Chile.Apergis, N. and C. Tsoumas (2009), “A survey of the Feldstein–Horioka puzzle: what has been done and where we
stand”, Research in Economics, vol. 63, No. 2. Atkinson, A.B. and A. Brandolini (2001), “Promise and pitfalls in the use of secondary datasets: income inequality in
OECD countries”, Working Paper, No. 379, Banca Italia, Servizio di Studi.Barber, B. (2007), Consumed: How Markets Corrupt Children, Infantilize Adults and Swallow Citizens Whole,
New York, Norton. Bértola, L. and J.A. Ocampo (2010), Desarrollo, vaivenes y desigualdad: una historia económica de América Latina
desde la independencia, Ibero-American Secretariat (SEGIB).Bielschowsky, R. (2009), “Sixty years of ECLAC: structuralism and neo-structuralism”, CEPAL Review, No. 97
(LC/G.2400-P), Santiago, Chile, Economic Commission for Latin America and the Caribbean (ECLAC). Bresser-Pereira, L.C. and Y. Nakano (2003), “Economic growth with foreign savings?”, Revista de Economía Política,
vol. 22, No. 2.Cardoso, F.H. and E. Faletto (1971), [1969] Dependencia y desarrollo de América Latina, Fundación de Cultura
Universitaria.Castilla, C. (2010), “Subjective poverty and reference dependence”, Working Paper, No. 2010/76, World Institute
for Development Economics Research (WIDER)/United Nations University (UNU). Central Bank of Chile (2012), Informe de Estabilidad Financiera 2012 (segundo semestre), Santiago, Chile.Clark, A. E., P. Frijters and M.A. Shields (2008), “Relative income, happiness, and utility: an explanation for the
Easterlin paradox and other puzzles”, Journal of Economic Literature, vol. 46, No. 1. Collet, R. and others (2013), “Diffusion of car ownership and use in France”, presentation at the fifth meeting of the
Society for the Study of Economic Inequality (ECINEQ), Bari.Congdon, W. J., J.R. Kling and S. Mullainathan (2011), Policy and Choice: Public Finance Through the Lens of
Behavioral Economics, Brookings Institution Press.Cornia, G. A. (2010), “Income distribution under Latin America’s new left regimes”, Journal of Human Development
and Capabilities, vol. 11, No. 1.Cortina, A. (2002), Por una ética del consumo, Madrid, Taurus.Deaton, A. (2005), “Measuring poverty in a growing world (or measuring growth in a poor world)”, Review of
Economics and Statistics, vol. 87, No. 1.Deaton, A. and S. Zaidi (2002), “Guidelines for constructing consumption aggregates for welfare analysis”, Princeton,
Department of Economics, Princeton University.Di Tella, R., R.J. MacCulloch and R Haisken-De New (2010), “Happiness adaptation to income and to status in an
individual panel”, Journal of Economic Behavior and Organization, vol. 76, No. 3.Duarte, J., M.S. Bos and M. Moreno (2010), “¿Enseñan mejor las escuelas privadas en América Latina? Estudio
comparativo usando los resultados del SERCE”, Notas Técnicas, No. 5, Inter-American Development Bank (IDB).
231
Cha
pter
IV
Compacts for Equality: Towards a Sustainable Future
Duesenberry, J. S. (1949), Income, Saving, and the Theory of Consumer Behavior, vol. 87, Harvard University Press. Easterlin, R. A. (1974), “Does economic growth improve the human lot? Some empirical evidence”, Nations and
Households in Economic Growth, Moses Abramovitz, Paul A. David and Melvin Warren Reder (eds.), Academic Press.ECLAC (Economic Commission for Latin America and the Caribbean) (2013), Economic Survey of Latin America and
the Caribbean, 2013 (LC/G.2574-P), Santiago, Chile. United Nations publication, Sales No. E.13.II.G.3.(2012a), Structural Change for Equality: an integrated approach to development (LC/G.2524(SES.34/3)), Santiago, Chile.(2012b), Social Panorama of Latin America, 2012 (LC/G.2557-P), Santiago, Chile.(2010), Economic Survey of Latin America and the Caribbean2009-2010 (LC/G.2458-P), Santiago, Chile. United Nations publication, Sales No. E.10.II.G.3.(2008), Structural Change and Productivity Growth - 20 Years Later. Old problems, new opportunities (LC/G.2367(SES.32/3)), Santiago, Chile.(1990), Changing Production Patterns with Social Equity. The Prime Task of Latin American and Caribbean Development in the 1990s (LC/G.1601-P), Santiago, Chile.
Edwards, S. (1996), “Why are Latin America’s savings rates so low? An international comparative analysis”, Journal of Development Economics, vol. 51, No. 1.
Fajnzylber, F. (1992), “Industrialización en América Latina. De la «caja negra» al «casillero vacío»”, Nueva Sociedad, No. 18.(1983), La industrialización trunca de América Latina, Mexico City, Editorial Nueva Imagen.
Fanelli, J. M. (2008), “Volatilidad y crisis en América Latina: evidencia empírica y políticas”, Santiago, Chile, Economic Commission for Latin America and the Caribbean (ECLAC).(2007), “Domestic financial architecture, macro-volatility, and institutions: The Argentine case”, Macroeconomic Volatility, Institutions, and Financial Architectures. The Developing World Experience, New York, Palgrave MacMillan.(2006), Domestic Financial Architecture, Macro–volatility and Institutions: The Argentine Case, Buenos Aires, Centro de Estudios de Estado y Sociedad (CEDES).
Fanelli, J.M., F. Lorenzo and G. Oddone (2003), “Fluctuaciones y crecimiento económico de América Latina durante la década del noventa: evaluación y agenda política”, Revista de Economía; Información Comercial Española (ICE), N° 806, abril.
Feldstein, M. and C. Horioka (1980), “Domestic saving and international capital flows”, Economic Journal, vol. 90, No. 358.Fisher, I. (1930), The Theory of Interest, New York.Frank, R. H. (2007), Falling Behind: How Rising Inequality Harms the Middle Class, Berkeley, University of California Press.Friedman, M. (1957), A Theory of the Consumption Function, Princeton, Princeton University Press.Fuenzalida, M. and J.R. Tagle (2009), “Households’ financial vulnerability”, Documentos de Trabajo, vol. 540, No. 1,
Santiago, Chile, Central Bank of Chile.Furtado, C. (1966), Subdesarrollo y estancamiento en América Latina, Buenos Aires, Editorial Universitaria.Gasparini, L. and others (2013), “La segregación escolar público-privada en América Latina”, Santiago, Chile, Economic
Commission for Latin America and the Caribbean (ECLAC), unpublished.Gavin, M., R. Hausmann and E. Talvi (1997), “Saving behavior in Latin America: overview and policy issues”, Working
Paper, No. 346, Inter-American Development Bank (IDB).Graham, C. and A. Felton (2006), “Inequality and happiness: insights from Latin America”, The Journal of Economic
Inequality, vol. 4, No. 1.Guillen-Royo, M. (2011), “Reference group consumption and the subjective wellbeing of the poor in Peru”, Journal
of Economic Psychology, vol. 32, No. 2.Heffetz, O. (2011), “A test of conspicuous consumption: Visibility and income elasticities”, Review of Economics
and Statistics, vol. 93, No. 4.IMF (International Monetary Fund) (2013), “Brazil: Technical Note on Consumer Credit Growth and Household
Financial Stress”, IMF Country Report, No. 13/149, Washington, D.C.Kaldor, N. (1957), “A model of economic growth”, The Economic Journal, vol. 67, No. 268. Kalecki, M. (1954), Theory of Economic Dynamics: An Essay on Cyclical and Long-run Changes in Capitalist Economy,
George Allen & Unwin.Kim, Y., M. Setterfield and Y. Mei (2013), “A theory of aggregate consumption”, Working Paper, No. 13-01, Trinity
College Department of Economics.Langlois, R. N. (2001), “Knowledge, consumption, and endogenous growth”, Escaping Satiation. The demand side
of economic growth, Ulrich Witt (ed.), Berlin, Springer.
232
Cha
pter
IVEconomic Commission for Latin America and the Caribbean (ECLAC)
Layard, R. (2005), “Rethinking public economics: The implications of rivalry and habit”, Economics and Happiness: Framing the Analysis, Luigino Bruni and Pier Luigi Porta (eds.), New York, Oxford University Press.
Loayza, N., K. Schmidt-Hebbel and L. Servén (2000), “What drives private saving across the world?”, Review of Economics and Statistics, vol. 82, No. 2.
López-Calva, L. F. and N. Lustig (2010), Declining Inequality in Latin America: A decade of progress, New York, Brookings Institution Press.
Lora, E. (2008), Beyond Facts. Understanding Quality of Life, Washington, D.C., Inter-American Development Bank (IDB).McCombie, J.S., A.P. Thirlwall and P. Thompson (1994), Economic Growth and the Balance-of-Payments Constraint,
New York, St. Martin’s Press.Metcalfe, J. S. (2001), “Consumption, preferences, and the evolutionary agenda”, Escaping Satiation. The demand
side of economic growth, Ulrich Witt (ed.), Berlin, Springer.Milesi-Ferrett, G. M. and A. Razin (1997), “Current account sustainability: selected East Asian and Latin American
experiences”, NBER Working Paper, No. 5791, National Bureau of Economic Research.Modigliani, F. and R. Brumberg (1954), “Utility analysis and the consumption function: An interpretation of cross-
section data”, The Collected Papers of Franco Modigliani, vol. 1.Nurkse, R. (1953), Problems of Capital Formation in Underdeveloped Countries, Oxford, Basil Backwell.Ocampo, J. A., R. Bajraj and J. Martin (2003), A Decade of Light and Shadow. Latin America and the Caribbean in
the 1990s (LC/G.2205-P), Santiago, Chile, Economic Commission for Latin America and the Caribbean (ECLAC).Owen, B.M. (2005), “Competition policy in emerging economies”, SIEPR Discussion Paper, No. 04-10, Stanford,
Stanford University.PAHO (Pan American Health Organization) (2012), Health Conditions in the Americas, 2012 Edition, Washington, D.C.Pasinetti, L. L. (2007), Keynes and the Cambridge Keynesians: A revolution in Economics’ to be accomplished,
Cambridge University Press.Phelps, E. S. and R. Frydman (eds.) (1983), Individual Forecasting and Aggregate Outcomes. “Rational expectations”
examined, Cambridge University Press.Pinto, Aníbal (2008), “Styles of development in Latin America”, CEPAL Review, No. 96 (LC/G.2396-P), Santiago,
Chile, Economic Commission for Latin America and the Caribbean (ECLAC).(1976), Heterogeneidad estructural y modelo de desarrollo reciente de la América Latina, México, D.F., Fondo de Cultura Universitaria.
Prebisch, R. (1949), The economic development of Latin America and its principal problems (E/CN.12/89), Santiago, Chile, Economic Commission for Latin America and the Caribbean (ECLAC).
Primi, A. (2009), “Nurkse and the early Latin American structuralists: a reflection on development theory, industrialization and their relevance today”, Ragnar Nurkse (1907–2007): Classical Development Economics and its Relevance for Today, Rainer Kattel, Jan A. Kregel and Erik S. Reinert (eds.), Anthem Press.
Ray, D. (2002), “Aspirations, Poverty and Economic Change”, unpublished.Reinhardt, N. (2008), “The conundrum of low saving rates in Latin America”, Development Policy Review, vol. 26, No. 6.Rius, A. (2008), “The political economy of reforming domestic financial architectures”, Macroeconomic Volatility, Institutions
and Financial Architectures. The developing world experience, J. M. Fanelli (ed.), New York, Palgrave Macmillan.Rius, A., C. Román and A. Vigorito (2013), “Consumo y desarrollo”, Santiago, Chile, Economic Commission for Latin
America and the Caribbean (ECLAC), unpublished.Rodríguez, O. (2006), El estructuralismo latinoamericano, Mexico City, Siglo XXI. Rojas, M. (2008), “Relative income and well-being in Latin America” [online] http://www.iadb.org/res/laresnetwork/
files/pr316finaldraft.pdf. Rojas, M. and E. Jiménez (2008), “Pobreza subjetiva en México: el papel de las normas de evaluación del ingreso”, Perfiles
Latinoamericanos, vol. 16, No. 32.Schor, J. (1997), “New analytic bases for an economic critique of the consumer society”, The Consumer Society,
N. Goodwin, F. Ackerman and D. Kiron (eds.), Washington, D.C., Island Press.Sen, A. (1999), Development as Freedom, New York, Oxford University Press. Senik, C. (2011), “Will GDP growth increase happiness in developing countries?”, IZA Discussion Paper, No. 5595. Serra, J. and M.C. Tavares (1974), “Más allá del estancamiento. Una discusión sobre el estilo del desarrollo reciente
en Brasil”, Desarrollo latinoamericano: ensayos críticos, Serie Lecturas de El Trimestre Económico, No. 6, J. Serra (ed.), Mexico City, Fondo de Cultura Económica.
233
Cha
pter
IV
Compacts for Equality: Towards a Sustainable Future
Setterfield, M. (ed.) (2002), The Economics of Demand-Led Growth: challenging the supply-side vision of the long run, Cheltenham, Edward Elgar.
Snowdon, B., H.R. Vane and P. Wynarczyk (1994), A Modern Guide to Macroeconomics: an introduction to competing schools of thought, Cheltenham, Edward Elgar.
Stewart, T., J. Clarke and S. Joekes (2007), Competition Law in Action: Experiences from developing countries, Ottawa, International Development Research Center (IDRC).
Stiglitz, J. E. and A. Weiss (1981), “Credit rationing in markets with imperfect information”, The American Economic Review, vol. 71, No. 3.
Stutzer, A. and B. S. Frey (2010), “Recent advances in the economics of individual subjective well-being”, Social Research: An International Quarterly, vol. 77, No. 2.
Sunkel, O. (1971), “Capitalismo transnacional y desintegración nacional en la América Latina”, El Trimestre Económico, vol. 38, No. 150 (2).
Sunkel, O. and N. Gligo (1980), Estilos de desarrollo y medio ambiente en América Latina, Mexico City, Fondo de Cultura Económica.
Tavares, M. C. (1973), “Distribuição de renda, acumulação e padrões de industrialização”, A controversia sobre distribuição de renda e desenvolvimento, Rio de Janeiro, Zahr Editores.
Thaler, R. H. and C. R. Sunstein (2008), Nudge: Improving Decisions about Health, Wealth, and Happiness, Yale University Press.
Thirlwall, A. P. (1979), “The balance of payments constraint as an explanation of international growth rate differences”, BNL Quarterly Review, vol. 32, No. 128, Banca Nazionale del Lavoro.
Toledo, Manuel (2008), “Understanding business cycles in Latin America”, paper presented at the Workshop on Macroeconomic Policy and Cyclical Fluctuations, Santiago, Chile, Economic Commission for Latin America and the Caribbean (ECLAC), April, unpublished.
Veblen, T. (1965), The Theory of the Leisure Class: 1899, AM Kelley.Witt, U. (2001), “Learning to consume. A theory of wants and the growth of demand”, Journal of Evolutionary Economics,
vol. 11, No. 1.World Bank (2013), Global Financial Inclusion Database (Global Findex) [online] http://datatopics.worldbank.org/
financialinclusion/.
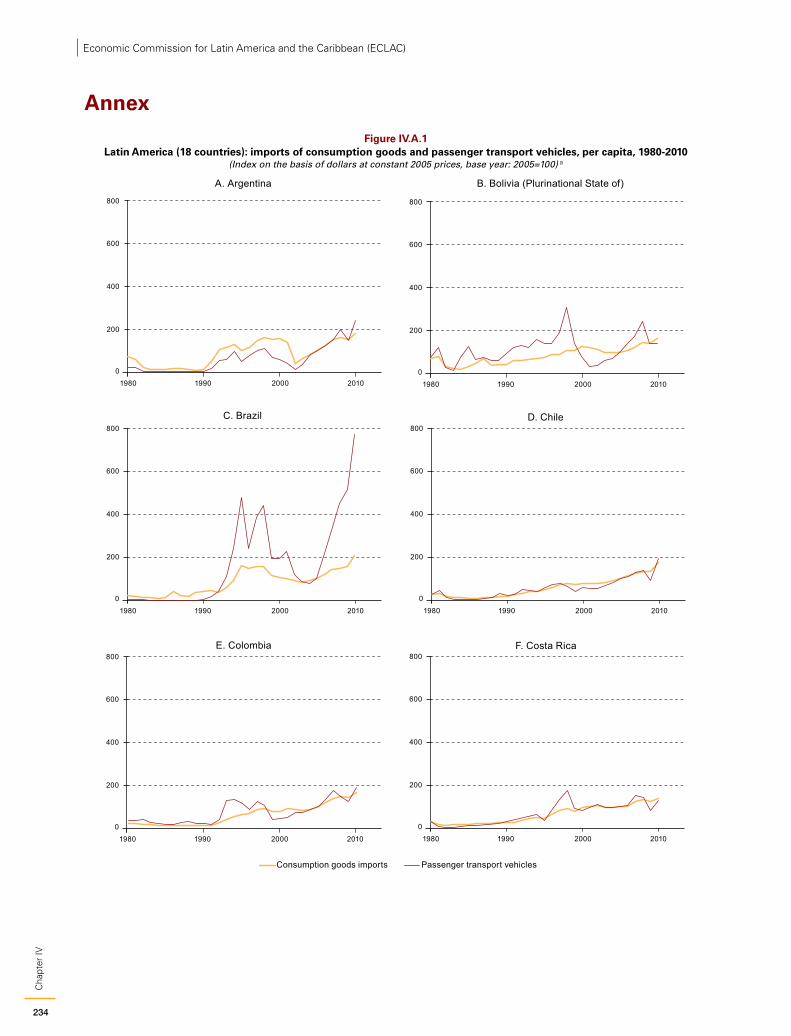
234
Cha
pter
IVEconomic Commission for Latin America and the Caribbean (ECLAC)
Annex
Figure IV.A.1 Latin America (18 countries): imports of consumption goods and passenger transport vehicles, per capita, 1980-2010
(Index on the basis of dollars at constant 2005 prices, base year: 2005=100) a
C. Brazil
B. Bolivia (Plurinational State of)A. Argentina
D. Chile
E. Colombia F. Costa Rica
0
1980 1990 2000 2010
200
400
800
600
0
1980 1990 2000 2010
200
400
800
600
0
1980 1990 2000 2010
200
400
800
600
0
1980 1990 2000 2010
200
400
800
600
0
1980 1990 2000 2010
200
400
800
600
0
1980 1990 2000 2010
200
400
800
600
Consumption goods imports Passenger transport vehicles
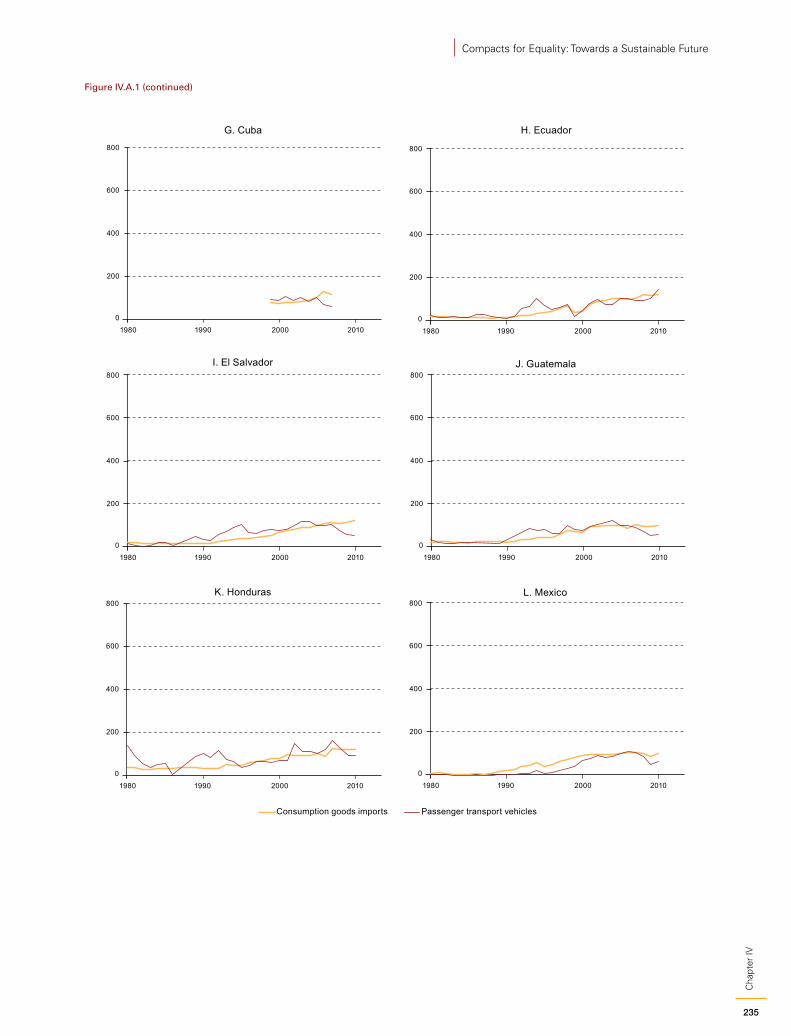
235
Cha
pter
IV
Compacts for Equality: Towards a Sustainable Future
I. El Salvador
H. EcuadorG. Cuba
J. Guatemala
K. Honduras L. Mexico
0
1980 1990 2000 2010
200
400
800
600
0
1980 1990 2000 2010
200
400
800
600
0
1980 1990 2000 2010
200
400
800
600
0
1980 1990 2000 2010
200
400
800
600
0
1980 1990 2000 2010
200
400
800
600
0
1980 1990 2000 2010
200
400
800
600
Consumption goods imports Passenger transport vehicles
Figure IV.A.1 (continued)
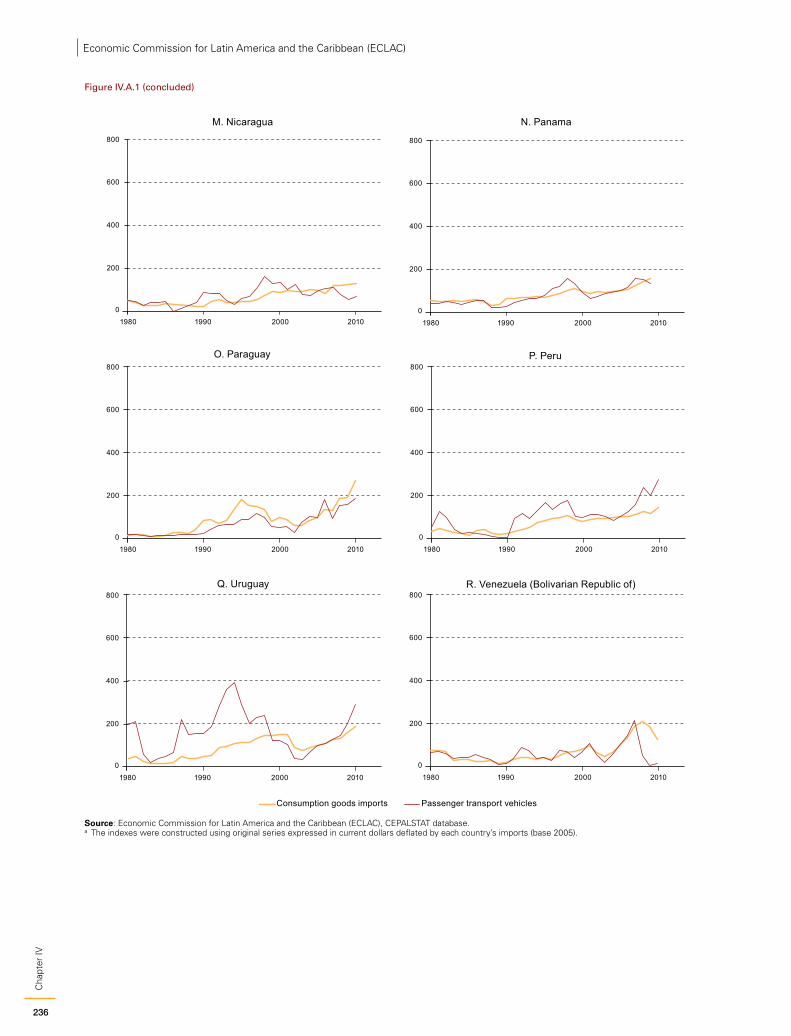
236
Cha
pter
IVEconomic Commission for Latin America and the Caribbean (ECLAC)
O. Paraguay
N. PanamaM. Nicaragua
P. Peru
Q. Uruguay R. Venezuela (Bolivarian Republic of)
0
1980 1990 2000 2010
200
400
800
600
0
1980 1990 2000 2010
200
400
800
600
0
1980 1990 2000 2010
200
400
800
600
0
1980 1990 2000 2010
200
400
800
600
0
1980 1990 2000 2010
200
400
800
600
0
1980 1990 2000 2010
200
400
800
600
Consumption goods imports Passenger transport vehicles
Source: Economic Commission for Latin America and the Caribbean (ECLAC), CEPALSTAT database.a The indexes were constructed using original series expressed in current dollars deflated by each country’s imports (base 2005).
Figure IV.A.1 (concluded)
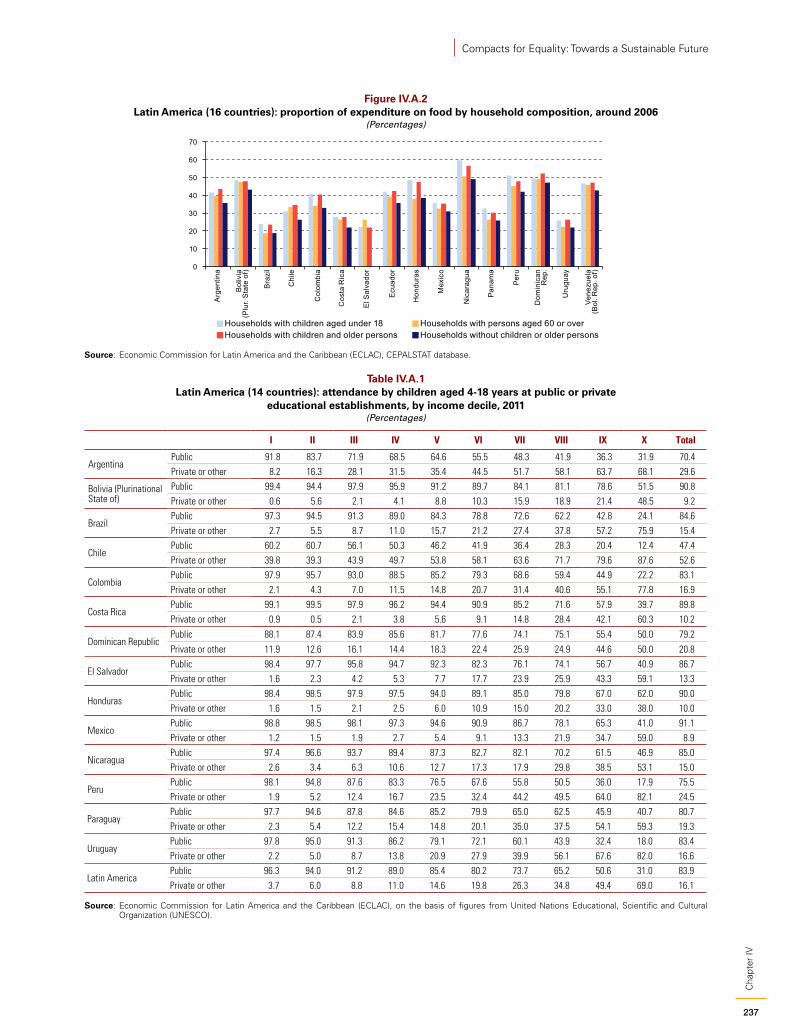
237
Cha
pter
IV
Compacts for Equality: Towards a Sustainable Future
Figure IV.A.2 Latin America (16 countries): proportion of expenditure on food by household composition, around 2006
(Percentages)
0
10
20
30
40
50
60
70
Households with children aged under 18 Households with persons aged 60 or overHouseholds with children and older persons Households without children or older persons
Arg
entin
a
Bol
ivia
(Plu
r. S
tate
of)
Bra
zil
Chi
le
Col
ombi
a
Cos
ta R
ica
Ecu
ador
El S
alva
dor
Hon
dura
s
Mex
ico
Nic
arag
ua
Pan
ama
Per
u
Dom
inic
anR
ep.
Uru
guay
Vene
zuel
a(B
ol. R
ep. o
f)
Source: Economic Commission for Latin America and the Caribbean (ECLAC), CEPALSTAT database.
Table IV.A.1 Latin America (14 countries): attendance by children aged 4-18 years at public or private
educational establishments, by income decile, 2011(Percentages)
I II III IV V VI VII VIII IX X Total
ArgentinaPublic 91.8 83.7 71.9 68.5 64.6 55.5 48.3 41.9 36.3 31.9 70.4Private or other 8.2 16.3 28.1 31.5 35.4 44.5 51.7 58.1 63.7 68.1 29.6
Bolivia (Plurinational State of)
Public 99.4 94.4 97.9 95.9 91.2 89.7 84.1 81.1 78.6 51.5 90.8Private or other 0.6 5.6 2.1 4.1 8.8 10.3 15.9 18.9 21.4 48.5 9.2
BrazilPublic 97.3 94.5 91.3 89.0 84.3 78.8 72.6 62.2 42.8 24.1 84.6Private or other 2.7 5.5 8.7 11.0 15.7 21.2 27.4 37.8 57.2 75.9 15.4
ChilePublic 60.2 60.7 56.1 50.3 46.2 41.9 36.4 28.3 20.4 12.4 47.4Private or other 39.8 39.3 43.9 49.7 53.8 58.1 63.6 71.7 79.6 87.6 52.6
ColombiaPublic 97.9 95.7 93.0 88.5 85.2 79.3 68.6 59.4 44.9 22.2 83.1Private or other 2.1 4.3 7.0 11.5 14.8 20.7 31.4 40.6 55.1 77.8 16.9
Costa RicaPublic 99.1 99.5 97.9 96.2 94.4 90.9 85.2 71.6 57.9 39.7 89.8Private or other 0.9 0.5 2.1 3.8 5.6 9.1 14.8 28.4 42.1 60.3 10.2
Dominican Republic Public 88.1 87.4 83.9 85.6 81.7 77.6 74.1 75.1 55.4 50.0 79.2
Private or other 11.9 12.6 16.1 14.4 18.3 22.4 25.9 24.9 44.6 50.0 20.8
El SalvadorPublic 98.4 97.7 95.8 94.7 92.3 82.3 76.1 74.1 56.7 40.9 86.7Private or other 1.6 2.3 4.2 5.3 7.7 17.7 23.9 25.9 43.3 59.1 13.3
HondurasPublic 98.4 98.5 97.9 97.5 94.0 89.1 85.0 79.8 67.0 62.0 90.0Private or other 1.6 1.5 2.1 2.5 6.0 10.9 15.0 20.2 33.0 38.0 10.0
MexicoPublic 98.8 98.5 98.1 97.3 94.6 90.9 86.7 78.1 65.3 41.0 91.1Private or other 1.2 1.5 1.9 2.7 5.4 9.1 13.3 21.9 34.7 59.0 8.9
NicaraguaPublic 97.4 96.6 93.7 89.4 87.3 82.7 82.1 70.2 61.5 46.9 85.0Private or other 2.6 3.4 6.3 10.6 12.7 17.3 17.9 29.8 38.5 53.1 15.0
PeruPublic 98.1 94.8 87.6 83.3 76.5 67.6 55.8 50.5 36.0 17.9 75.5Private or other 1.9 5.2 12.4 16.7 23.5 32.4 44.2 49.5 64.0 82.1 24.5
ParaguayPublic 97.7 94.6 87.8 84.6 85.2 79.9 65.0 62.5 45.9 40.7 80.7Private or other 2.3 5.4 12.2 15.4 14.8 20.1 35.0 37.5 54.1 59.3 19.3
UruguayPublic 97.8 95.0 91.3 86.2 79.1 72.1 60.1 43.9 32.4 18.0 83.4Private or other 2.2 5.0 8.7 13.8 20.9 27.9 39.9 56.1 67.6 82.0 16.6
Latin AmericaPublic 96.3 94.0 91.2 89.0 85.4 80.2 73.7 65.2 50.6 31.0 83.9Private or other 3.7 6.0 8.8 11.0 14.6 19.8 26.3 34.8 49.4 69.0 16.1
Source: Economic Commission for Latin America and the Caribbean (ECLAC), on the basis of figures from United Nations Educational, Scientific and Cultural Organization (UNESCO).
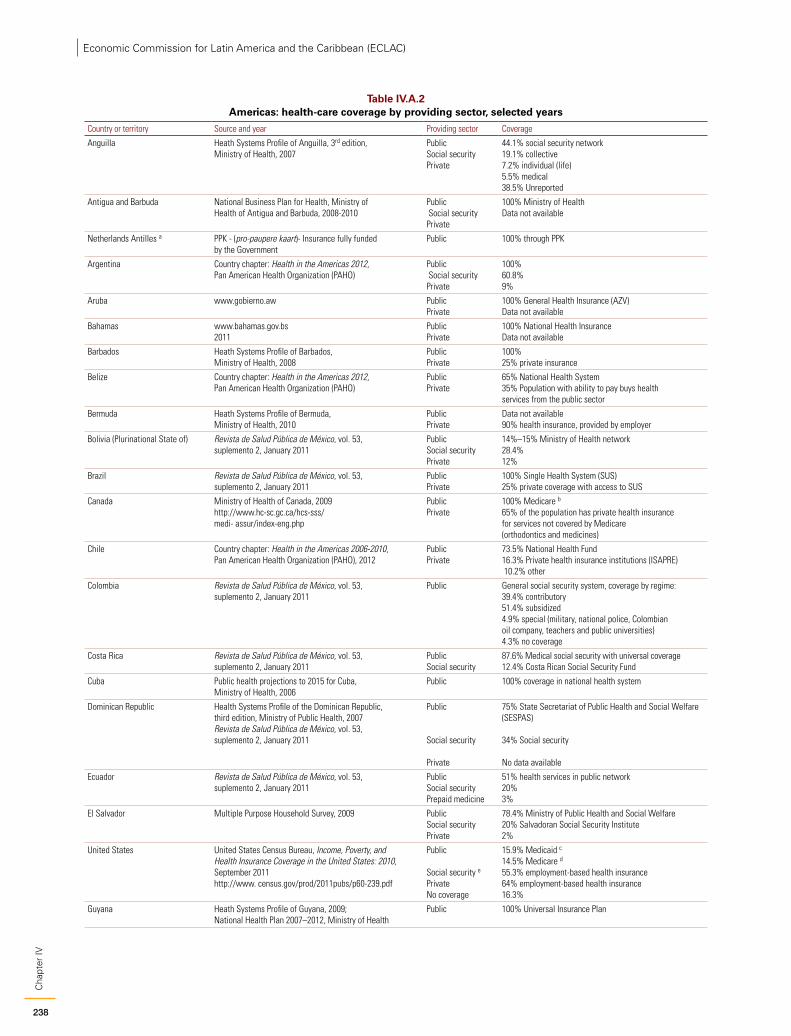
238
Cha
pter
IVEconomic Commission for Latin America and the Caribbean (ECLAC)
Table IV.A.2 Americas: health-care coverage by providing sector, selected years
Country or territory Source and year Providing sector Coverage
Anguilla Heath Systems Profile of Anguilla, 3rd edition, Ministry of Health, 2007
PublicSocial securityPrivate
44.1% social security network 19.1% collective 7.2% individual (life) 5.5% medical 38.5% Unreported
Antigua and Barbuda National Business Plan for Health, Ministry of Health of Antigua and Barbuda, 2008-2010
Public Social securityPrivate
100% Ministry of Health Data not available
Netherlands Antilles a PPK - (pro-paupere kaart)- Insurance fully funded by the Government
Public 100% through PPK
Argentina Country chapter: Health in the Americas 2012, Pan American Health Organization (PAHO)
Public Social securityPrivate
100% 60.8% 9%
Aruba www.gobierno.aw Public Private
100% General Health Insurance (AZV) Data not available
Bahamas www.bahamas.gov.bs 2011
Public Private
100% National Health InsuranceData not available
Barbados Heath Systems Profile of Barbados, Ministry of Health, 2008
Public Private
100% 25% private insurance
Belize Country chapter: Health in the Americas 2012, Pan American Health Organization (PAHO)
Public Private
65% National Health System 35% Population with ability to pay buys health services from the public sector
Bermuda Heath Systems Profile of Bermuda, Ministry of Health, 2010
Public Private
Data not available 90% health insurance, provided by employer
Bolivia (Plurinational State of) Revista de Salud Pública de México, vol. 53, suplemento 2, January 2011
PublicSocial security Private
14%–15% Ministry of Health network 28.4% 12%
Brazil Revista de Salud Pública de México, vol. 53, suplemento 2, January 2011
Public Private
100% Single Health System (SUS) 25% private coverage with access to SUS
Canada Ministry of Health of Canada, 2009 http://www.hc-sc.gc.ca/hcs-sss/ medi- assur/index-eng.php
Public Private
100% Medicare b
65% of the population has private health insurance for services not covered by Medicare (orthodontics and medicines)
Chile Country chapter: Health in the Americas 2006-2010, Pan American Health Organization (PAHO), 2012
Public Private
73.5% National Health Fund 16.3% Private health insurance institutions (ISAPRE) 10.2% other
Colombia Revista de Salud Pública de México, vol. 53, suplemento 2, January 2011
Public General social security system, coverage by regime: 39.4% contributory 51.4% subsidized 4.9% special (military, national police, Colombian oil company, teachers and public universities) 4.3% no coverage
Costa Rica Revista de Salud Pública de México, vol. 53, suplemento 2, January 2011
PublicSocial security
87.6% Medical social security with universal coverage12.4% Costa Rican Social Security Fund
Cuba Public health projections to 2015 for Cuba, Ministry of Health, 2006
Public 100% coverage in national health system
Dominican Republic Health Systems Profile of the Dominican Republic, third edition, Ministry of Public Health, 2007 Revista de Salud Pública de México, vol. 53, suplemento 2, January 2011
Public Social security
Private
75% State Secretariat of Public Health and Social Welfare (SESPAS) 34% Social security No data available
Ecuador Revista de Salud Pública de México, vol. 53, suplemento 2, January 2011
PublicSocial security Prepaid medicine
51% health services in public network 20% 3%
El Salvador Multiple Purpose Household Survey, 2009 PublicSocial security Private
78.4% Ministry of Public Health and Social Welfare20% Salvadoran Social Security Institute 2%
United States United States Census Bureau, Income, Poverty, and Health Insurance Coverage in the United States: 2010, September 2011http://www. census.gov/prod/2011pubs/p60-239.pdf
Public
Social security e Private No coverage
15.9% Medicaid c 14.5% Medicare d 55.3% employment-based health insurance64% employment-based health insurance 16.3%
Guyana Heath Systems Profile of Guyana, 2009; National Health Plan 2007–2012, Ministry of Health
Public 100% Universal Insurance Plan
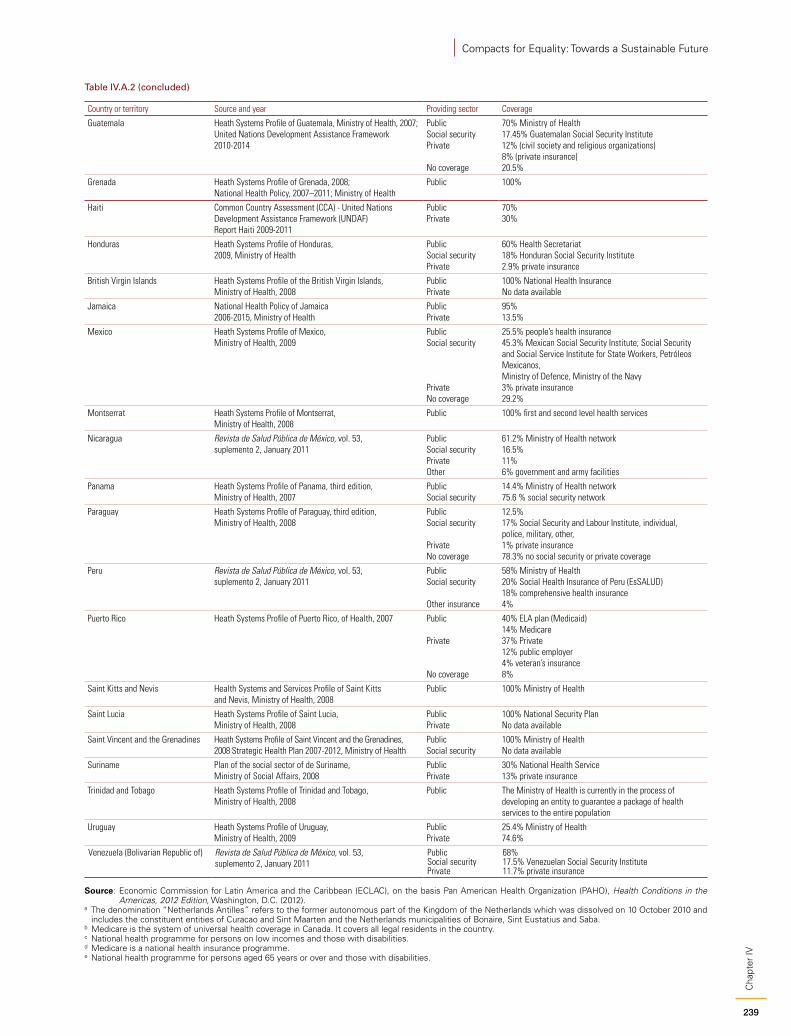
239
Cha
pter
IV
Compacts for Equality: Towards a Sustainable Future
Country or territory Source and year Providing sector Coverage
Guatemala Heath Systems Profile of Guatemala, Ministry of Health, 2007; United Nations Development Assistance Framework 2010-2014
PublicSocial security Private
No coverage
70% Ministry of Health 17.45% Guatemalan Social Security Institute 12% (civil society and religious organizations) 8% (private insurance) 20.5%
Grenada Heath Systems Profile of Grenada, 2008; National Health Policy, 2007–2011; Ministry of Health
Public 100%
Haiti Common Country Assessment (CCA) - United Nations Development Assistance Framework (UNDAF) Report Haiti 2009-2011
Public Private
70% 30%
Honduras Heath Systems Profile of Honduras, 2009, Ministry of Health
PublicSocial security Private
60% Health Secretariat 18% Honduran Social Security Institute 2.9% private insurance
British Virgin Islands Heath Systems Profile of the British Virgin Islands, Ministry of Health, 2008
Public Private
100% National Health Insurance No data available
Jamaica National Health Policy of Jamaica 2006-2015, Ministry of Health
Public Private
95% 13.5%
Mexico Heath Systems Profile of Mexico, Ministry of Health, 2009
Public Social security Private No coverage
25.5% people’s health insurance 45.3% Mexican Social Security Institute; Social Security and Social Service Institute for State Workers, Petróleos Mexicanos, Ministry of Defence, Ministry of the Navy 3% private insurance 29.2%
Montserrat Heath Systems Profile of Montserrat, Ministry of Health, 2008
Public 100% first and second level health services
Nicaragua Revista de Salud Pública de México, vol. 53, suplemento 2, January 2011
Public Social security Private Other
61.2% Ministry of Health network 16.5% 11% 6% government and army facilities
Panama Heath Systems Profile of Panama, third edition, Ministry of Health, 2007
Public Social security
14.4% Ministry of Health network 75.6 % social security network
Paraguay Heath Systems Profile of Paraguay, third edition, Ministry of Health, 2008
Public Social security Private No coverage
12.5% 17% Social Security and Labour Institute, individual, police, military, other, 1% private insurance 78.3% no social security or private coverage
Peru Revista de Salud Pública de México, vol. 53, suplemento 2, January 2011
Public Social security Other insurance
58% Ministry of Health 20% Social Health Insurance of Peru (EsSALUD) 18% comprehensive health insurance 4%
Puerto Rico Heath Systems Profile of Puerto Rico, of Health, 2007 Public Private No coverage
40% ELA plan (Medicaid) 14% Medicare 37% Private 12% public employer 4% veteran’s insurance 8%
Saint Kitts and Nevis Health Systems and Services Profile of Saint Kitts and Nevis, Ministry of Health, 2008
Public 100% Ministry of Health
Saint Lucia Heath Systems Profile of Saint Lucia, Ministry of Health, 2008
Public Private
100% National Security Plan No data available
Saint Vincent and the Grenadines Heath Systems Profile of Saint Vincent and the Grenadines, 2008 Strategic Health Plan 2007-2012, Ministry of Health
Public Social security
100% Ministry of Health No data available
Suriname Plan of the social sector of de Suriname, Ministry of Social Affairs, 2008
Public Private
30% National Health Service 13% private insurance
Trinidad and Tobago Heath Systems Profile of Trinidad and Tobago, Ministry of Health, 2008
Public The Ministry of Health is currently in the process of developing an entity to guarantee a package of health services to the entire population
Uruguay Heath Systems Profile of Uruguay, Ministry of Health, 2009
Public Private
25.4% Ministry of Health 74.6%
Venezuela (Bolivarian Republic of) Revista de Salud Pública de México, vol. 53, suplemento 2, January 2011
PublicSocial security Private
68% 17.5% Venezuelan Social Security Institute 11.7% private insurance
Source: Economic Commission for Latin America and the Caribbean (ECLAC), on the basis Pan American Health Organization (PAHO), Health Conditions in the Americas, 2012 Edition, Washington, D.C. (2012).
a The denomination “Netherlands Antilles” refers to the former autonomous part of the Kingdom of the Netherlands which was dissolved on 10 October 2010 and includes the constituent entities of Curacao and Sint Maarten and the Netherlands municipalities of Bonaire, Sint Eustatius and Saba.
b Medicare is the system of universal health coverage in Canada. It covers all legal residents in the country.c National health programme for persons on low incomes and those with disabilities.d Medicare is a national health insurance programme.e National health programme for persons aged 65 years or over and those with disabilities.
Table IV.A.2 (concluded)

241
Cha
pter
V
Compacts for Equality: Towards a Sustainable Future
Chapter V
Development style and environmental sustainability: An unsolved equation
IntroductionThe equality perspective advocated by ECLAC includes ecosystem and environmental stewardship that can sustain the development of future generations. In this approach, it is crucial to take account of the environmental dimension of sustainable development and, in so doing, to pay particular attention to how existing patterns of production and consumption could affect the quality of life in the future. If a deteriorating quality of life is the price that future generations end up paying for the economic, social and environmental decisions of present generations, this amounts to frank disregard for their rights.
The environmental dimension is, then, a key part of intergenerational solidarity and concern for development sustainability at both the global and the national level. This thinking emerged from the United Nations conferences on sustainable development, including the United Nations Conference on Environment and Development, held in Rio de Janeiro in 1992, the World Summit on Sustainable Development, held in Johannesburg in 2002, and the United Nations Conference on Sustainable Development (Rio+20), held in 2012. These conferences defined sustainable development as one that “that meets the needs of the present without compromising the ability of future generations to meet their own needs” (Brundtland, 1987). They stressed the urgent need to work towards a new production and consumption paradigm where an environmental dimension is built into the economy and legislation because ecological limits and environmental degradation overlap traditional issues of poverty and inequality.
At the national level there is an urgent need to address deteriorating water, soil and air quality, especially in urban areas that are now home to more than 80% of the population, and to halt desertification and biodiversity loss in order to ensure sustainable agriculture, livestock production, mining and forestry. At the global level the greatest challenge is climate change. There is sufficient evidence that global climate change has reached dangerous thresholds that require a change of direction, especially in energy. This relates to production patterns that depend on high carbon-emission fossil energy. Climate change will impose limits and force a shift in production paradigms and consumption patterns. Now, facing global warming, the destruction of the environment and the crisis in energy sources, the world is more interdependent than it has ever been before.
For Latin America and the Caribbean, climate change could become a new constraint for economic growth. Or, if addressed in a timely, comprehensive manner, it can open opportunities to renew and improve infrastructure and urbanization, upgrade production processes, create more efficient transport methods with lower emissions and gradually move towards a lower-carbon development pattern. Such a change can make a meaningful contribution to increasing equality and driving production convergence as long as it improves the quality of the public services for the well-being of the disadvantaged. Evidence also points to global warming as both causing and intensifying weather-related disasters, which are far more severe in developing countries, particularly in Central America and the Caribbean.
242
Cha
pter
VEconomic Commission for Latin America and the Caribbean (ECLAC)
At the United Nations Conference on Sustainable Development (Rio+20) it was put forth that existing unsustainable consumption and production patterns are at the root of ongoing global environmental deterioration. Sustainable consumption decisions are made in two main areas: promoting the consumption of sustainably-produced goods, and encouraging consumption of goods that are in themselves energy- and resource-efficient and do not generate polluting emissions and wastes (or generate very little).
Sustainable consumption and production are therefore very closely linked: to achieve sustainable consumption, goods that are produced through sustainable processes and/or are energy- and natural resource-efficient and non-polluting must be available and affordable. For such goods to be available, there must be demand, the technology must exist and producing them must be profitable. Achieving this virtuous interaction between production and sustainable consumption is not simple, and it enshrines considerable scope for government action in terms of regulations, taxes, subsidies, technological innovation, information and education, among others (Jackson and Marks, 1999; Ferrer-i-Carbonell and Bergh, 2004; Sachs, 2009).
The challenge is to reconcile environmental issues with structural change that can increase productivity and close the gaps between groups in order to move towards greater equality. The great development challenge for the future of the region is to combine environmental sustainability, increased productivity in the world of work and greater social equity. This challenge requires promoting industrial policies that fully incorporate technological innovation associated with cleaner, more efficient production. This is no easy task, especially at a point in history when, in the wake of the crisis of the late 2000s, much of the international community has redrawn the global agenda, lowering the political and financial priority of environmental issues.
This chapter discusses the potential negative environmental impacts of some prevailing patterns of consumption. It focuses on aspects of consumption in Latin America and the Caribbean that are most problematic in energy and environmental terms, and on the challenges they pose, including waste management. It goes on to examine major challenges at the national level, such as water and forest management. Lastly, it looks at issues that are more global in nature and call for an international agenda. Some of these are climate change and disaster management, and how the approach to these is changing in Latin America and the Caribbean.
A. Consumption patterns and their environmental implications
As seen in the previous chapter, consumption in Latin America and the Caribbean soared during the past two decades. Owing to rapid urbanization, more than 80% of the population lives in cities with more than 20,000 inhabitants. This growth has had a positive impact on well-being, but it has also brought negative consequences and externalities such as higher fossil fuel consumption, waste generation, air pollution, environmental destruction and increased exploitation of renewable and non-renewable natural resources (Sunkel and Gligo, 1980; Escudero and Lerda, 1996).
This section tracks consumption patterns in the region and their relationship with environmental sustainability in two areas: growing consumption of energy and durable goods; and consumption of automobiles and gasoline. Both are sources of polluting emissions and waste in cities.
1. Energy, durable goods and hazardous wasteEconomic growth in the Latin American and Caribbean countries is highly dependent on energy from fossil fuels. Between 1980 and 2010, the region’s GDP grew at an average annual rate of 2.6%; energy consumption rose 2.4% during the same period (ECLAC, 2010a, 2009a). The link between economic growth and energy consumption is complex because there are several kinds of bidirectional causality between the two variables (Ozturk, 2010; Chen, Chen and Chen, 2012, Stern, 2013).
The response sensitivity of energy demand to long-term income trends in Latin America and the Caribbean is around 0.9, estimated on the basis of global and regional evidence synthesized via meta-analysis. The world average
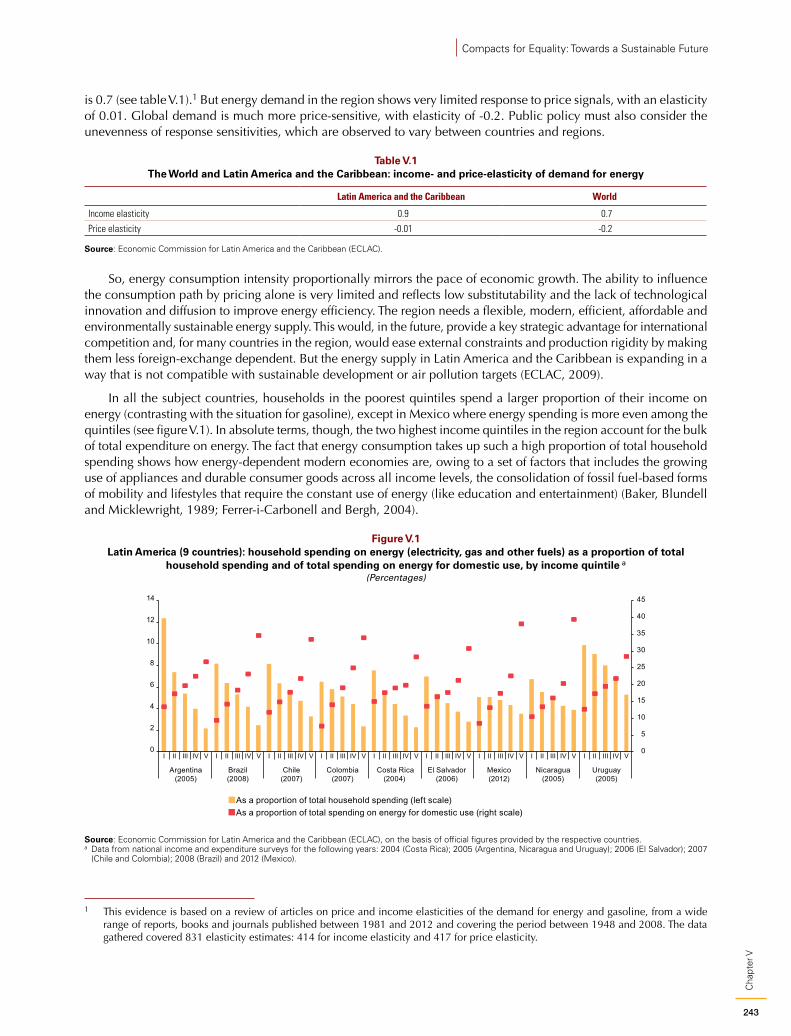
243
Cha
pter
V
Compacts for Equality: Towards a Sustainable Future
is 0.7 (see table V.1).1 But energy demand in the region shows very limited response to price signals, with an elasticity of 0.01. Global demand is much more price-sensitive, with elasticity of -0.2. Public policy must also consider the unevenness of response sensitivities, which are observed to vary between countries and regions.
Table V.1 The World and Latin America and the Caribbean: income- and price-elasticity of demand for energy
Latin America and the Caribbean World
Income elasticity 0.9 0.7
Price elasticity -0.01 -0.2
Source: Economic Commission for Latin America and the Caribbean (ECLAC).
So, energy consumption intensity proportionally mirrors the pace of economic growth. The ability to influence the consumption path by pricing alone is very limited and reflects low substitutability and the lack of technological innovation and diffusion to improve energy efficiency. The region needs a flexible, modern, efficient, affordable and environmentally sustainable energy supply. This would, in the future, provide a key strategic advantage for international competition and, for many countries in the region, would ease external constraints and production rigidity by making them less foreign-exchange dependent. But the energy supply in Latin America and the Caribbean is expanding in a way that is not compatible with sustainable development or air pollution targets (ECLAC, 2009).
In all the subject countries, households in the poorest quintiles spend a larger proportion of their income on energy (contrasting with the situation for gasoline), except in Mexico where energy spending is more even among the quintiles (see figure V.1). In absolute terms, though, the two highest income quintiles in the region account for the bulk of total expenditure on energy. The fact that energy consumption takes up such a high proportion of total household spending shows how energy-dependent modern economies are, owing to a set of factors that includes the growing use of appliances and durable consumer goods across all income levels, the consolidation of fossil fuel-based forms of mobility and lifestyles that require the constant use of energy (like education and entertainment) (Baker, Blundell and Micklewright, 1989; Ferrer-i-Carbonell and Bergh, 2004).
Figure V.1 Latin America (9 countries): household spending on energy (electricity, gas and other fuels) as a proportion of total
household spending and of total spending on energy for domestic use, by income quintile a
(Percentages)
0
5
10
15
20
25
30
35
40
45
0
2
4
6
8
10
12
14
I II III IV V I II III IV V I II III IV V I II III IV V I II III IV V I II III IV V I II III IV V I II III IV V I II III IV V
Argentina(2005)
Brazil(2008)
Chile(2007)
Colombia(2007)
Costa Rica(2004)
El Salvador(2006)
Mexico(2012)
Nicaragua(2005)
Uruguay(2005)
As a proportion of total household spending (left scale)As a proportion of total spending on energy for domestic use (right scale)
Source: Economic Commission for Latin America and the Caribbean (ECLAC), on the basis of official figures provided by the respective countries.a Data from national income and expenditure surveys for the following years: 2004 (Costa Rica); 2005 (Argentina, Nicaragua and Uruguay); 2006 (El Salvador); 2007
(Chile and Colombia); 2008 (Brazil) and 2012 (Mexico).
1 This evidence is based on a review of articles on price and income elasticities of the demand for energy and gasoline, from a wide range of reports, books and journals published between 1981 and 2012 and covering the period between 1948 and 2008. The data gathered covered 831 elasticity estimates: 414 for income elasticity and 417 for price elasticity.
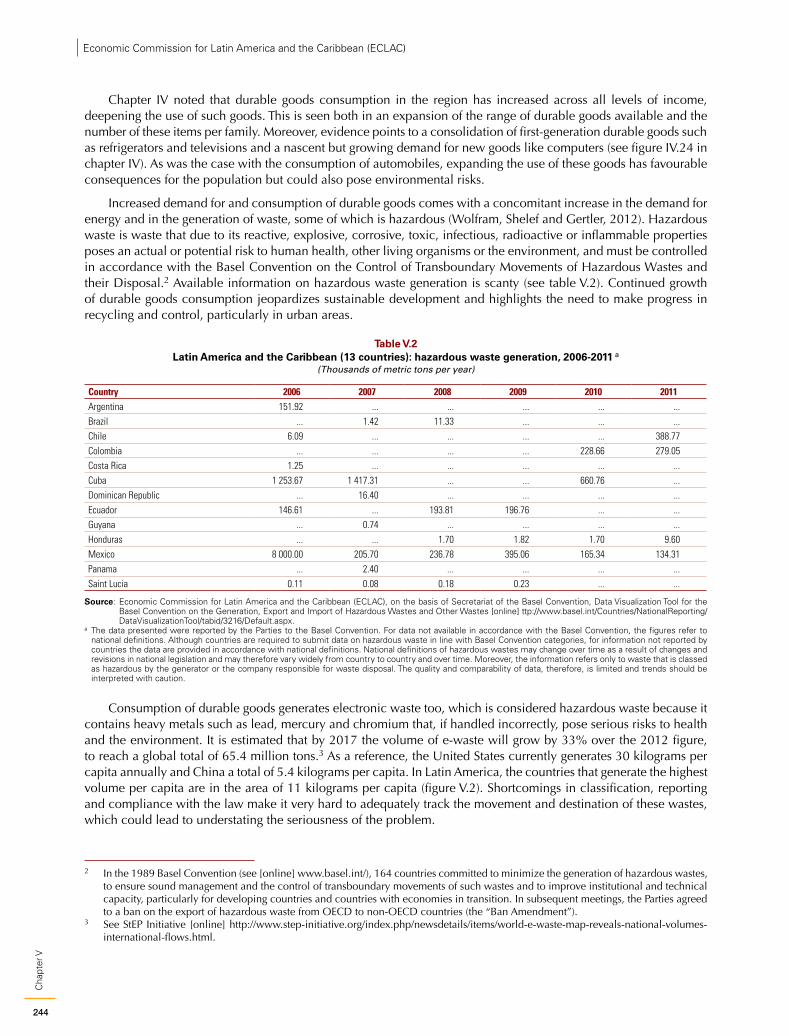
244
Cha
pter
VEconomic Commission for Latin America and the Caribbean (ECLAC)
Chapter IV noted that durable goods consumption in the region has increased across all levels of income, deepening the use of such goods. This is seen both in an expansion of the range of durable goods available and the number of these items per family. Moreover, evidence points to a consolidation of first-generation durable goods such as refrigerators and televisions and a nascent but growing demand for new goods like computers (see figure IV.24 in chapter IV). As was the case with the consumption of automobiles, expanding the use of these goods has favourable consequences for the population but could also pose environmental risks.
Increased demand for and consumption of durable goods comes with a concomitant increase in the demand for energy and in the generation of waste, some of which is hazardous (Wolfram, Shelef and Gertler, 2012). Hazardous waste is waste that due to its reactive, explosive, corrosive, toxic, infectious, radioactive or inflammable properties poses an actual or potential risk to human health, other living organisms or the environment, and must be controlled in accordance with the Basel Convention on the Control of Transboundary Movements of Hazardous Wastes and their Disposal.2 Available information on hazardous waste generation is scanty (see table V.2). Continued growth of durable goods consumption jeopardizes sustainable development and highlights the need to make progress in recycling and control, particularly in urban areas.
Table V.2 Latin America and the Caribbean (13 countries): hazardous waste generation, 2006-2011 a
(Thousands of metric tons per year)
Country 2006 2007 2008 2009 2010 2011Argentina 151.92 ... ... ... ... ...Brazil ... 1.42 11.33 ... ... ...Chile 6.09 ... ... ... ... 388.77Colombia ... ... ... ... 228.66 279.05Costa Rica 1.25 ... ... ... ... ...Cuba 1 253.67 1 417.31 ... ... 660.76 ...Dominican Republic ... 16.40 ... ... ... ...Ecuador 146.61 ... 193.81 196.76 ... ...Guyana ... 0.74 ... ... ... ...Honduras ... ... 1.70 1.82 1.70 9.60Mexico 8 000.00 205.70 236.78 395.06 165.34 134.31Panama ... 2.40 ... ... ... ...Saint Lucia 0.11 0.08 0.18 0.23 ... ...
Source: Economic Commission for Latin America and the Caribbean (ECLAC), on the basis of Secretariat of the Basel Convention, Data Visualization Tool for the Basel Convention on the Generation, Export and Import of Hazardous Wastes and Other Wastes [online] ttp://www.basel.int/Countries/NationalReporting/DataVisualizationTool/tabid/3216/Default.aspx.
a The data presented were reported by the Parties to the Basel Convention. For data not available in accordance with the Basel Convention, the figures refer to national definitions. Although countries are required to submit data on hazardous waste in line with Basel Convention categories, for information not reported by countries the data are provided in accordance with national definitions. National definitions of hazardous wastes may change over time as a result of changes and revisions in national legislation and may therefore vary widely from country to country and over time. Moreover, the information refers only to waste that is classed as hazardous by the generator or the company responsible for waste disposal. The quality and comparability of data, therefore, is limited and trends should be interpreted with caution.
Consumption of durable goods generates electronic waste too, which is considered hazardous waste because it contains heavy metals such as lead, mercury and chromium that, if handled incorrectly, pose serious risks to health and the environment. It is estimated that by 2017 the volume of e-waste will grow by 33% over the 2012 figure, to reach a global total of 65.4 million tons.3 As a reference, the United States currently generates 30 kilograms per capita annually and China a total of 5.4 kilograms per capita. In Latin America, the countries that generate the highest volume per capita are in the area of 11 kilograms per capita (figure V.2). Shortcomings in classification, reporting and compliance with the law make it very hard to adequately track the movement and destination of these wastes, which could lead to understating the seriousness of the problem.
2 In the 1989 Basel Convention (see [online] www.basel.int/), 164 countries committed to minimize the generation of hazardous wastes, to ensure sound management and the control of transboundary movements of such wastes and to improve institutional and technical capacity, particularly for developing countries and countries with economies in transition. In subsequent meetings, the Parties agreed to a ban on the export of hazardous waste from OECD to non-OECD countries (the “Ban Amendment”).
3 See StEP Initiative [online] http://www.step-initiative.org/index.php/newsdetails/items/world-e-waste-map-reveals-national-volumes-international-flows.html.
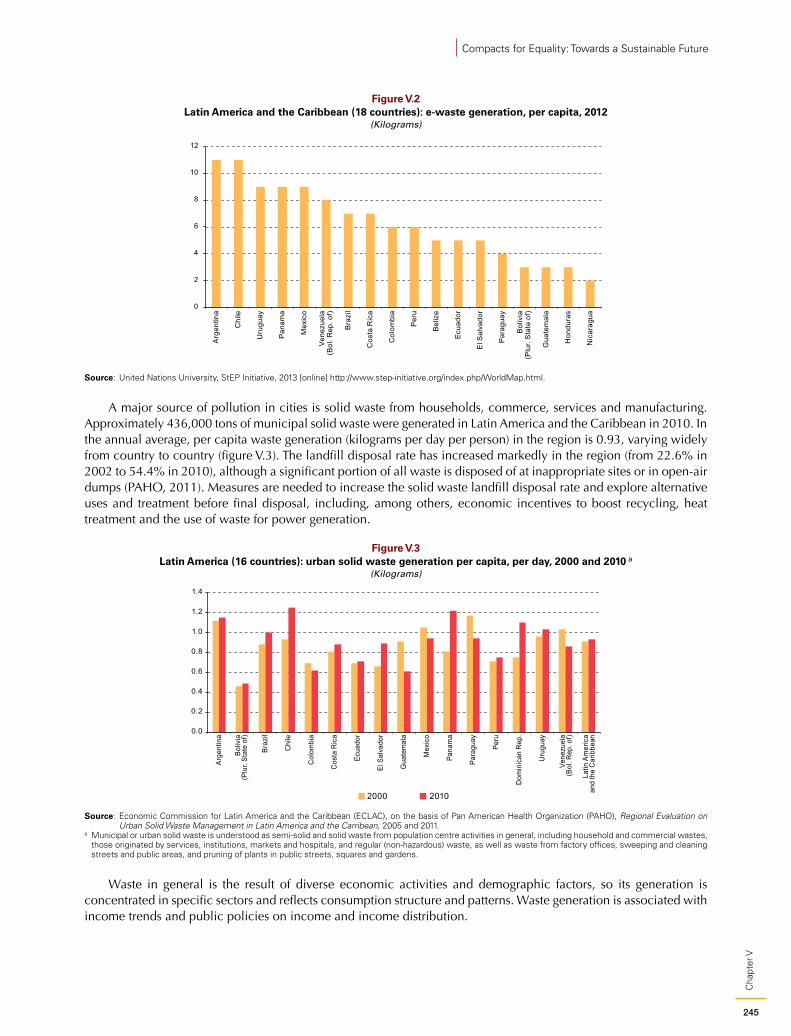
245
Cha
pter
V
Compacts for Equality: Towards a Sustainable Future
Figure V.2 Latin America and the Caribbean (18 countries): e-waste generation, per capita, 2012
(Kilograms)
0
2
4
6
8
10
12
Arg
entin
a
Chi
le
Uru
guay
Pan
ama
Mex
ico
Vene
zuel
a(B
ol. R
ep. o
f)
Bra
zil
Cos
ta R
ica
Col
ombi
a
Per
u
Bel
ize
Ecu
ador
El S
alva
dor
Par
agua
y
Bol
ivia
(Plu
r. S
tate
of)
Gua
tem
ala
Hon
dura
s
Nic
arag
ua
Source: United Nations University, StEP Initiative, 2013 [online] http://www.step-initiative.org/index.php/WorldMap.html.
A major source of pollution in cities is solid waste from households, commerce, services and manufacturing. Approximately 436,000 tons of municipal solid waste were generated in Latin America and the Caribbean in 2010. In the annual average, per capita waste generation (kilograms per day per person) in the region is 0.93, varying widely from country to country (figure V.3). The landfill disposal rate has increased markedly in the region (from 22.6% in 2002 to 54.4% in 2010), although a significant portion of all waste is disposed of at inappropriate sites or in open-air dumps (PAHO, 2011). Measures are needed to increase the solid waste landfill disposal rate and explore alternative uses and treatment before final disposal, including, among others, economic incentives to boost recycling, heat treatment and the use of waste for power generation.
Figure V.3 Latin America (16 countries): urban solid waste generation per capita, per day, 2000 and 2010 a
(Kilograms)
0.0
0.2
0.4
0.6
0.8
1.0
1.2
1.4
Arge
ntin
a
Boliv
ia(P
lur.
Stat
e of
)
Braz
il
Chi
le
Col
ombi
a
Cos
ta R
ica
Ecua
dor
El S
alva
dor
Gua
tem
ala
Mex
ico
Pana
ma
Para
guay
Peru
Dom
inic
an R
ep.
Uru
guay
Vene
zuel
a(B
ol. R
ep. o
f)
Latin
Am
eric
aan
d th
e C
arib
bean
2000 2010
Source: Economic Commission for Latin America and the Caribbean (ECLAC), on the basis of Pan American Health Organization (PAHO), Regional Evaluation on Urban Solid Waste Management in Latin America and the Carribean, 2005 and 2011.
a Municipal or urban solid waste is understood as semi-solid and solid waste from population centre activities in general, including household and commercial wastes, those originated by services, institutions, markets and hospitals, and regular (non-hazardous) waste, as well as waste from factory offices, sweeping and cleaning streets and public areas, and pruning of plants in public streets, squares and gardens.
Waste in general is the result of diverse economic activities and demographic factors, so its generation is concentrated in specific sectors and reflects consumption structure and patterns. Waste generation is associated with income trends and public policies on income and income distribution.
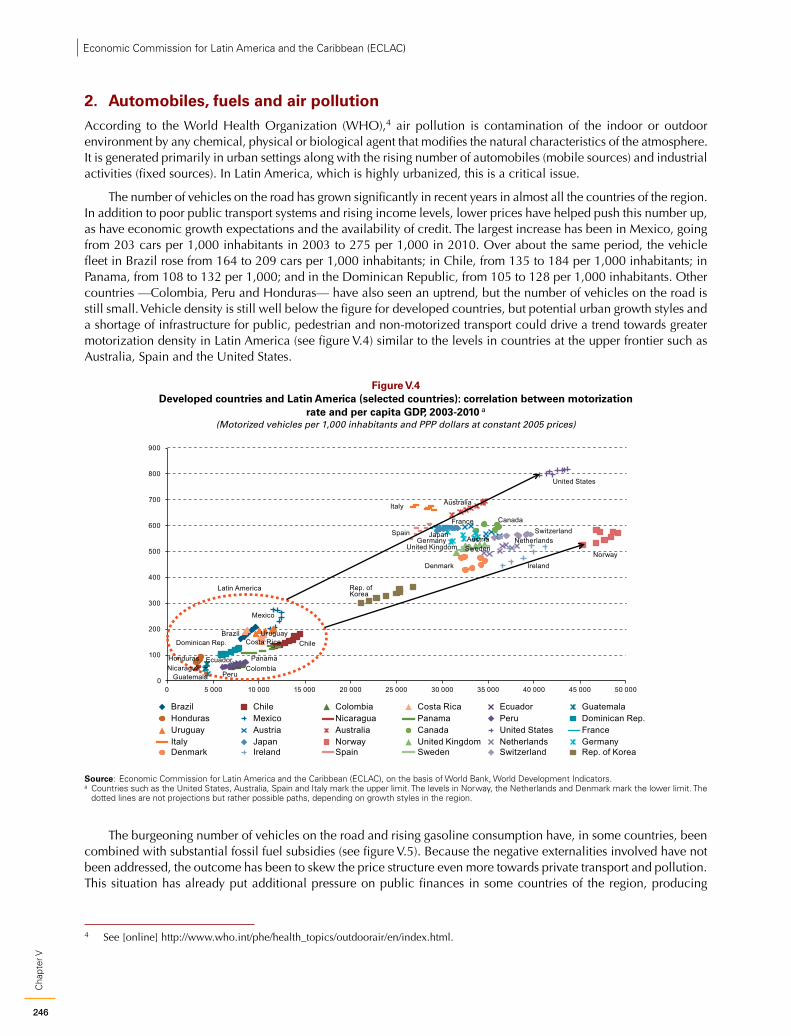
246
Cha
pter
VEconomic Commission for Latin America and the Caribbean (ECLAC)
2. Automobiles, fuels and air pollutionAccording to the World Health Organization (WHO),4 air pollution is contamination of the indoor or outdoor environment by any chemical, physical or biological agent that modifies the natural characteristics of the atmosphere. It is generated primarily in urban settings along with the rising number of automobiles (mobile sources) and industrial activities (fixed sources). In Latin America, which is highly urbanized, this is a critical issue.
The number of vehicles on the road has grown significantly in recent years in almost all the countries of the region. In addition to poor public transport systems and rising income levels, lower prices have helped push this number up, as have economic growth expectations and the availability of credit. The largest increase has been in Mexico, going from 203 cars per 1,000 inhabitants in 2003 to 275 per 1,000 in 2010. Over about the same period, the vehicle fleet in Brazil rose from 164 to 209 cars per 1,000 inhabitants; in Chile, from 135 to 184 per 1,000 inhabitants; in Panama, from 108 to 132 per 1,000; and in the Dominican Republic, from 105 to 128 per 1,000 inhabitants. Other countries —Colombia, Peru and Honduras— have also seen an uptrend, but the number of vehicles on the road is still small. Vehicle density is still well below the figure for developed countries, but potential urban growth styles and a shortage of infrastructure for public, pedestrian and non-motorized transport could drive a trend towards greater motorization density in Latin America (see figure V.4) similar to the levels in countries at the upper frontier such as Australia, Spain and the United States.
Figure V.4 Developed countries and Latin America (selected countries): correlation between motorization
rate and per capita GDP, 2003-2010 a
(Motorized vehicles per 1,000 inhabitants and PPP dollars at constant 2005 prices)
BrazilChile
Colombia
Costa Rica
Ecuador
Guatemala
Honduras
Mexico
NicaraguaPanama
Peru
Dominican Rep.Uruguay
Austria
Australia
Canada
United States
France
Italy
Japan
NorwayUnited Kingdom
NetherlandsGermany
Denmark Ireland
Spain
Sweden
Switzerland
Rep. ofKorea
0
100
200
300
400
500
600
700
800
900
0 5 000 10 000 15 000 20 000 25 000 30 000 35 000 40 000 45 000 50 000
Brazil Chile Colombia Costa Rica Ecuador GuatemalaHonduras Mexico Nicaragua Panama Peru Dominican Rep.Uruguay Austria Australia Canada United States FranceItaly Japan Norway United Kingdom Netherlands GermanyDenmark Ireland Spain Sweden Switzerland Rep. of Korea
Latin America
Source: Economic Commission for Latin America and the Caribbean (ECLAC), on the basis of World Bank, World Development Indicators.a Countries such as the United States, Australia, Spain and Italy mark the upper limit. The levels in Norway, the Netherlands and Denmark mark the lower limit. The
dotted lines are not projections but rather possible paths, depending on growth styles in the region.
The burgeoning number of vehicles on the road and rising gasoline consumption have, in some countries, been combined with substantial fossil fuel subsidies (see figure V.5). Because the negative externalities involved have not been addressed, the outcome has been to skew the price structure even more towards private transport and pollution. This situation has already put additional pressure on public finances in some countries of the region, producing
4 See [online] http://www.who.int/phe/health_topics/outdoorair/en/index.html.
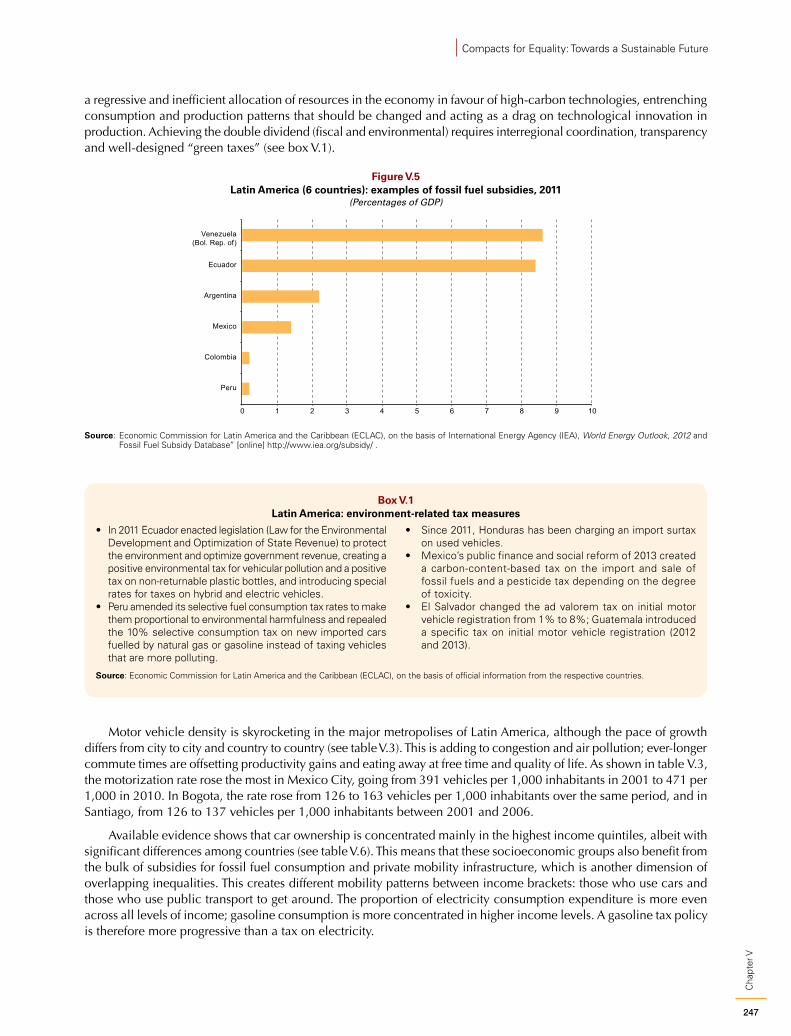
247
Cha
pter
V
Compacts for Equality: Towards a Sustainable Future
a regressive and inefficient allocation of resources in the economy in favour of high-carbon technologies, entrenching consumption and production patterns that should be changed and acting as a drag on technological innovation in production. Achieving the double dividend (fiscal and environmental) requires interregional coordination, transparency and well-designed “green taxes” (see box V.1).
Figure V.5 Latin America (6 countries): examples of fossil fuel subsidies, 2011
(Percentages of GDP)
0 1 2 3 4 5 6 7 8 9 10
Peru
Colombia
Mexico
Argentina
Ecuador
Venezuela(Bol. Rep. of)
Source: Economic Commission for Latin America and the Caribbean (ECLAC), on the basis of International Energy Agency (IEA), World Energy Outlook, 2012 and Fossil Fuel Subsidy Database” [online] http://www.iea.org/subsidy/ .
Box V.1 Latin America: environment-related tax measures
• In 2011 Ecuador enacted legislation (Law for the Environmental Development and Optimization of State Revenue) to protect the environment and optimize government revenue, creating a positive environmental tax for vehicular pollution and a positive tax on non-returnable plastic bottles, and introducing special rates for taxes on hybrid and electric vehicles.
• Peru amended its selective fuel consumption tax rates to make them proportional to environmental harmfulness and repealed the 10% selective consumption tax on new imported cars fuelled by natural gas or gasoline instead of taxing vehicles that are more polluting.
• Since 2011, Honduras has been charging an import surtax on used vehicles.
• Mexico’s public finance and social reform of 2013 created a carbon-content-based tax on the import and sale of fossil fuels and a pesticide tax depending on the degree of toxicity.
• El Salvador changed the ad valorem tax on initial motor vehicle registration from 1% to 8%; Guatemala introduced a specific tax on initial motor vehicle registration (2012 and 2013).
Source: Economic Commission for Latin America and the Caribbean (ECLAC), on the basis of official information from the respective countries.
Motor vehicle density is skyrocketing in the major metropolises of Latin America, although the pace of growth differs from city to city and country to country (see table V.3). This is adding to congestion and air pollution; ever-longer commute times are offsetting productivity gains and eating away at free time and quality of life. As shown in table V.3, the motorization rate rose the most in Mexico City, going from 391 vehicles per 1,000 inhabitants in 2001 to 471 per 1,000 in 2010. In Bogota, the rate rose from 126 to 163 vehicles per 1,000 inhabitants over the same period, and in Santiago, from 126 to 137 vehicles per 1,000 inhabitants between 2001 and 2006.
Available evidence shows that car ownership is concentrated mainly in the highest income quintiles, albeit with significant differences among countries (see table V.6). This means that these socioeconomic groups also benefit from the bulk of subsidies for fossil fuel consumption and private mobility infrastructure, which is another dimension of overlapping inequalities. This creates different mobility patterns between income brackets: those who use cars and those who use public transport to get around. The proportion of electricity consumption expenditure is more even across all levels of income; gasoline consumption is more concentrated in higher income levels. A gasoline tax policy is therefore more progressive than a tax on electricity.
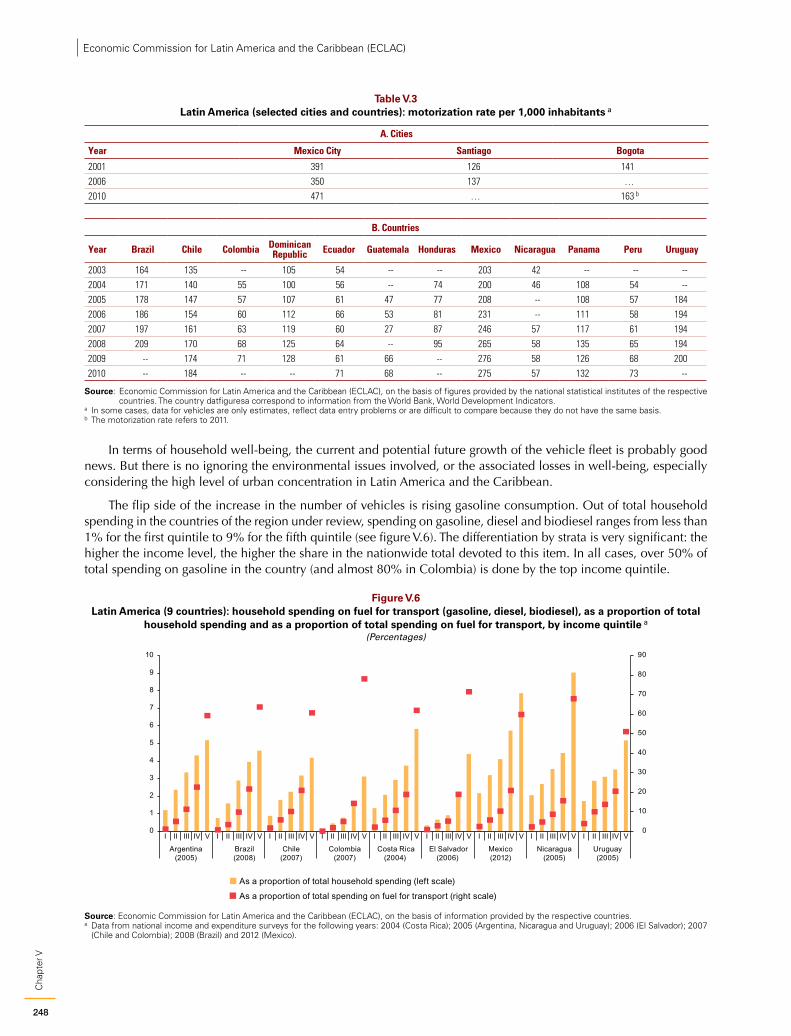
248
Cha
pter
VEconomic Commission for Latin America and the Caribbean (ECLAC)
Table V.3 Latin America (selected cities and countries): motorization rate per 1,000 inhabitants a
A. Cities
Year Mexico City Santiago Bogota
2001 391 126 1412006 350 137 … 2010 471 … 163 b
B. Countries
Year Brazil Chile Colombia Dominican Republic Ecuador Guatemala Honduras Mexico Nicaragua Panama Peru Uruguay
2003 164 135 -- 105 54 -- -- 203 42 -- -- --2004 171 140 55 100 56 -- 74 200 46 108 54 --2005 178 147 57 107 61 47 77 208 -- 108 57 1842006 186 154 60 112 66 53 81 231 -- 111 58 1942007 197 161 63 119 60 27 87 246 57 117 61 1942008 209 170 68 125 64 -- 95 265 58 135 65 1942009 -- 174 71 128 61 66 -- 276 58 126 68 2002010 -- 184 -- -- 71 68 -- 275 57 132 73 --
Source: Economic Commission for Latin America and the Caribbean (ECLAC), on the basis of figures provided by the national statistical institutes of the respective countries. The country datfiguresa correspond to information from the World Bank, World Development Indicators.
a In some cases, data for vehicles are only estimates, reflect data entry problems or are difficult to compare because they do not have the same basis. b The motorization rate refers to 2011.
In terms of household well-being, the current and potential future growth of the vehicle fleet is probably good news. But there is no ignoring the environmental issues involved, or the associated losses in well-being, especially considering the high level of urban concentration in Latin America and the Caribbean.
The flip side of the increase in the number of vehicles is rising gasoline consumption. Out of total household spending in the countries of the region under review, spending on gasoline, diesel and biodiesel ranges from less than 1% for the first quintile to 9% for the fifth quintile (see figure V.6). The differentiation by strata is very significant: the higher the income level, the higher the share in the nationwide total devoted to this item. In all cases, over 50% of total spending on gasoline in the country (and almost 80% in Colombia) is done by the top income quintile.
Figure V.6 Latin America (9 countries): household spending on fuel for transport (gasoline, diesel, biodiesel), as a proportion of total
household spending and as a proportion of total spending on fuel for transport, by income quintile a
(Percentages)
0
10
20
30
40
50
60
70
80
90
0
1
2
3
4
5
6
7
8
9
10
I II III IV V I II III IV V I II III IV V I II III IV V I II III IV V I II III IV V I II III IV V I II III IV V I II III IV V
Argentina(2005)
Brazil(2008)
Chile(2007)
Colombia(2007)
Costa Rica(2004)
El Salvador(2006)
Mexico(2012)
Nicaragua(2005)
Uruguay(2005)
As a proportion of total household spending (left scale)
As a proportion of total spending on fuel for transport (right scale)
Source: Economic Commission for Latin America and the Caribbean (ECLAC), on the basis of information provided by the respective countries.a Data from national income and expenditure surveys for the following years: 2004 (Costa Rica); 2005 (Argentina, Nicaragua and Uruguay); 2006 (El Salvador); 2007
(Chile and Colombia); 2008 (Brazil) and 2012 (Mexico).
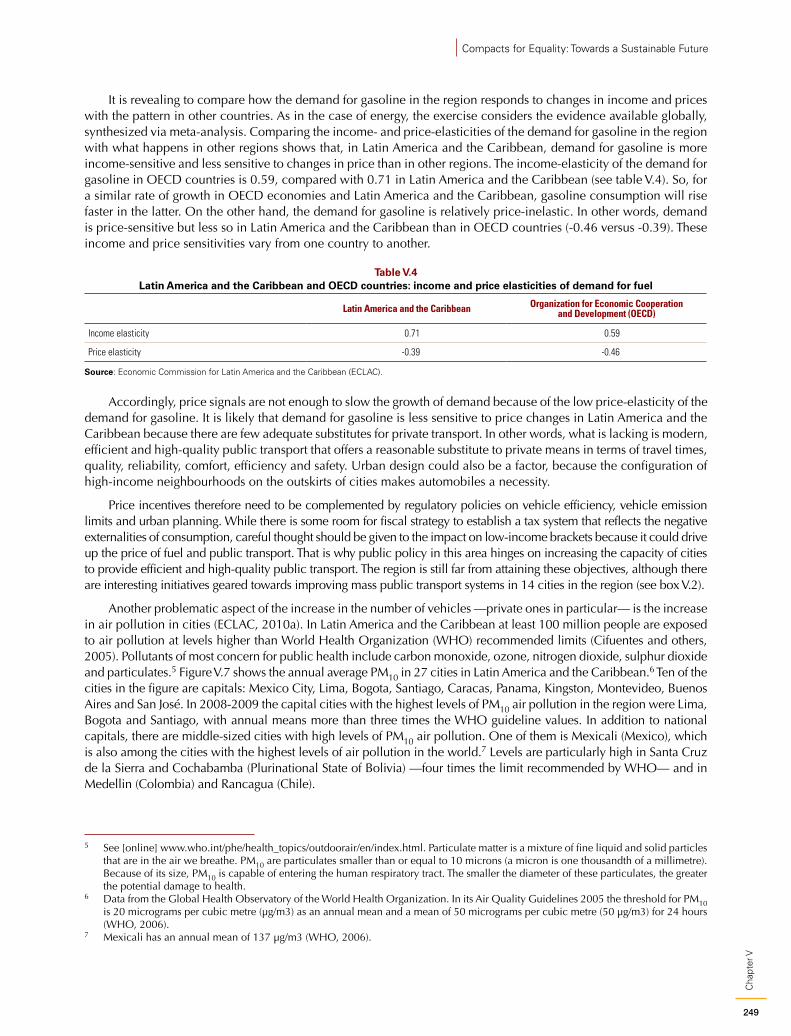
249
Cha
pter
V
Compacts for Equality: Towards a Sustainable Future
It is revealing to compare how the demand for gasoline in the region responds to changes in income and prices with the pattern in other countries. As in the case of energy, the exercise considers the evidence available globally, synthesized via meta-analysis. Comparing the income- and price-elasticities of the demand for gasoline in the region with what happens in other regions shows that, in Latin America and the Caribbean, demand for gasoline is more income-sensitive and less sensitive to changes in price than in other regions. The income-elasticity of the demand for gasoline in OECD countries is 0.59, compared with 0.71 in Latin America and the Caribbean (see table V.4). So, for a similar rate of growth in OECD economies and Latin America and the Caribbean, gasoline consumption will rise faster in the latter. On the other hand, the demand for gasoline is relatively price-inelastic. In other words, demand is price-sensitive but less so in Latin America and the Caribbean than in OECD countries (-0.46 versus -0.39). These income and price sensitivities vary from one country to another.
Table V.4 Latin America and the Caribbean and OECD countries: income and price elasticities of demand for fuel
Latin America and the Caribbean Organization for Economic Cooperation and Development (OECD)
Income elasticity 0.71 0.59
Price elasticity -0.39 -0.46
Source: Economic Commission for Latin America and the Caribbean (ECLAC).
Accordingly, price signals are not enough to slow the growth of demand because of the low price-elasticity of the demand for gasoline. It is likely that demand for gasoline is less sensitive to price changes in Latin America and the Caribbean because there are few adequate substitutes for private transport. In other words, what is lacking is modern, efficient and high-quality public transport that offers a reasonable substitute to private means in terms of travel times, quality, reliability, comfort, efficiency and safety. Urban design could also be a factor, because the configuration of high-income neighbourhoods on the outskirts of cities makes automobiles a necessity.
Price incentives therefore need to be complemented by regulatory policies on vehicle efficiency, vehicle emission limits and urban planning. While there is some room for fiscal strategy to establish a tax system that reflects the negative externalities of consumption, careful thought should be given to the impact on low-income brackets because it could drive up the price of fuel and public transport. That is why public policy in this area hinges on increasing the capacity of cities to provide efficient and high-quality public transport. The region is still far from attaining these objectives, although there are interesting initiatives geared towards improving mass public transport systems in 14 cities in the region (see box V.2).
Another problematic aspect of the increase in the number of vehicles —private ones in particular— is the increase in air pollution in cities (ECLAC, 2010a). In Latin America and the Caribbean at least 100 million people are exposed to air pollution at levels higher than World Health Organization (WHO) recommended limits (Cifuentes and others, 2005). Pollutants of most concern for public health include carbon monoxide, ozone, nitrogen dioxide, sulphur dioxide and particulates.5 Figure V.7 shows the annual average PM10 in 27 cities in Latin America and the Caribbean.6 Ten of the cities in the figure are capitals: Mexico City, Lima, Bogota, Santiago, Caracas, Panama, Kingston, Montevideo, Buenos Aires and San José. In 2008-2009 the capital cities with the highest levels of PM10 air pollution in the region were Lima, Bogota and Santiago, with annual means more than three times the WHO guideline values. In addition to national capitals, there are middle-sized cities with high levels of PM10 air pollution. One of them is Mexicali (Mexico), which is also among the cities with the highest levels of air pollution in the world.7 Levels are particularly high in Santa Cruz de la Sierra and Cochabamba (Plurinational State of Bolivia) —four times the limit recommended by WHO— and in Medellin (Colombia) and Rancagua (Chile).
5 See [online] www.who.int/phe/health_topics/outdoorair/en/index.html. Particulate matter is a mixture of fine liquid and solid particles that are in the air we breathe. PM10 are particulates smaller than or equal to 10 microns (a micron is one thousandth of a millimetre). Because of its size, PM10 is capable of entering the human respiratory tract. The smaller the diameter of these particulates, the greater the potential damage to health.
6 Data from the Global Health Observatory of the World Health Organization. In its Air Quality Guidelines 2005 the threshold for PM10 is 20 micrograms per cubic metre (µg/m3) as an annual mean and a mean of 50 micrograms per cubic metre (50 µg/m3) for 24 hours (WHO, 2006).
7 Mexicali has an annual mean of 137 µg/m3 (WHO, 2006).
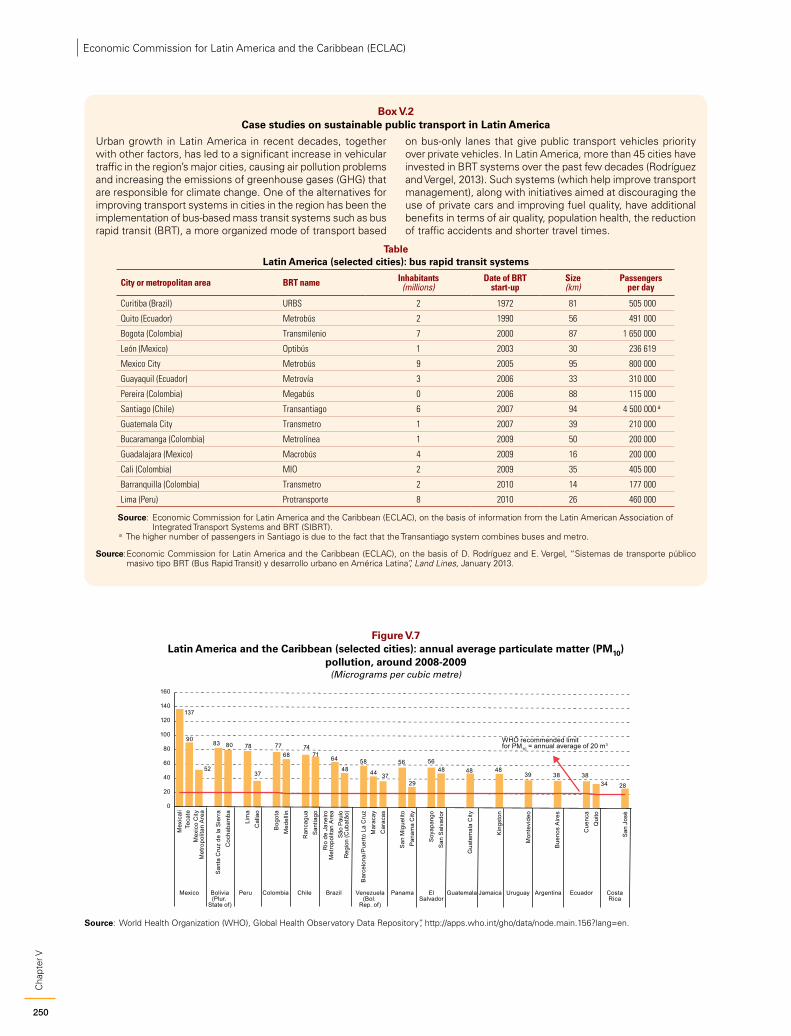
250
Cha
pter
VEconomic Commission for Latin America and the Caribbean (ECLAC)
Box V.2 Case studies on sustainable public transport in Latin America
Urban growth in Latin America in recent decades, together with other factors, has led to a significant increase in vehicular traffic in the region’s major cities, causing air pollution problems and increasing the emissions of greenhouse gases (GHG) that are responsible for climate change. One of the alternatives for improving transport systems in cities in the region has been the implementation of bus-based mass transit systems such as bus rapid transit (BRT), a more organized mode of transport based
on bus-only lanes that give public transport vehicles priority over private vehicles. In Latin America, more than 45 cities have invested in BRT systems over the past few decades (Rodríguez and Vergel, 2013). Such systems (which help improve transport management), along with initiatives aimed at discouraging the use of private cars and improving fuel quality, have additional benefits in terms of air quality, population health, the reduction of traffic accidents and shorter travel times.
Table Latin America (selected cities): bus rapid transit systems
City or metropolitan area BRT name Inhabitants (millions)
Date of BRT start-up
Size (km)
Passengers per day
Curitiba (Brazil) URBS 2 1972 81 505 000
Quito (Ecuador) Metrobús 2 1990 56 491 000
Bogota (Colombia) Transmilenio 7 2000 87 1 650 000
León (Mexico) Optibús 1 2003 30 236 619
Mexico City Metrobús 9 2005 95 800 000
Guayaquil (Ecuador) Metrovía 3 2006 33 310 000
Pereira (Colombia) Megabús 0 2006 88 115 000
Santiago (Chile) Transantiago 6 2007 94 4 500 000 a
Guatemala City Transmetro 1 2007 39 210 000
Bucaramanga (Colombia) Metrolínea 1 2009 50 200 000
Guadalajara (Mexico) Macrobús 4 2009 16 200 000
Cali (Colombia) MIO 2 2009 35 405 000
Barranquilla (Colombia) Transmetro 2 2010 14 177 000
Lima (Peru) Protransporte 8 2010 26 460 000
Source: Economic Commission for Latin America and the Caribbean (ECLAC), on the basis of information from the Latin American Association of Integrated Transport Systems and BRT (SIBRT).
a The higher number of passengers in Santiago is due to the fact that the Transantiago system combines buses and metro.
Source: Economic Commission for Latin America and the Caribbean (ECLAC), on the basis of D. Rodríguez and E. Vergel, “Sistemas de transporte público masivo tipo BRT (Bus Rapid Transit) y desarrollo urbano en América Latina”, Land Lines, January 2013.
Figure V.7 Latin America and the Caribbean (selected cities): annual average particulate matter (PM10)
pollution, around 2008-2009(Micrograms per cubic metre)
2834383839
48484856
29
56
3744
5848
6471
7468
77
37
788083
52
90
137
0
20
40
60
80
100
120
140
160
San
Jos
é
Qui
toC
uenc
a
Bue
nos
Aire
s
Mon
tevi
deo
Kin
gsto
n
Gua
tem
ala
City
San
Sal
vado
rS
oyap
ango
Pan
ama
City
San
Mig
uelit
o
Car
acas
Mar
acay
Bar
celo
na/P
uert
o La
Cru
z
São
Pau
lo R
egio
n (C
ubat
âo)
Rio
de
Jane
iroM
etro
polit
an A
rea
San
tiago
Ran
cagu
a
Med
ellín
Bog
ota
Cal
lao
Lim
a
Coc
haba
mba
San
ta C
ruz
de la
Sie
rra
Mex
ico
City
Met
ropo
litan
Are
a
Teca
teM
exic
ali
CostaRica
EcuadorArgentinaUruguayJamaicaGuatemalaElSalvador
PanamaVenezuela(Bol.
Rep. of)
BrazilChileColombiaPeruBolivia(Plur.
State of)
Mexico
WHO recommended limitfor PM10 = annual average of 20 m3
Source: World Health Organization (WHO), Global Health Observatory Data Repository”, http://apps.who.int/gho/data/node.main.156?lang=en.
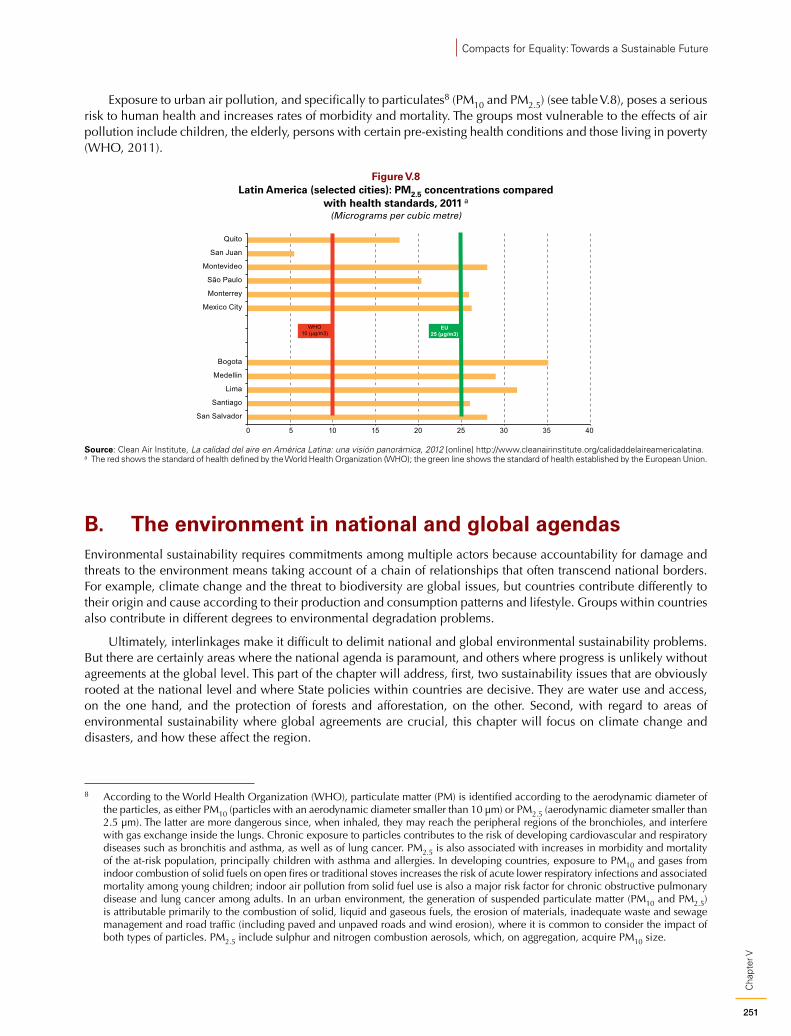
251
Cha
pter
V
Compacts for Equality: Towards a Sustainable Future
Exposure to urban air pollution, and specifically to particulates8 (PM10 and PM2.5) (see table V.8), poses a serious risk to human health and increases rates of morbidity and mortality. The groups most vulnerable to the effects of air pollution include children, the elderly, persons with certain pre-existing health conditions and those living in poverty (WHO, 2011).
Figure V.8 Latin America (selected cities): PM2.5 concentrations compared
with health standards, 2011 a
(Micrograms per cubic metre)
0 5 10 15 20 25 30 35 40
San Salvador
Santiago
Lima
Medellin
Bogota
Mexico City
Monterrey
São Paulo
Montevideo
San Juan
Quito
WHO10 (μg/m3)
EU25 (μg/m3)
Source: Clean Air Institute, La calidad del aire en América Latina: una visión panorámica, 2012 [online] http://www.cleanairinstitute.org/calidaddelaireamericalatina.a The red shows the standard of health defined by the World Health Organization (WHO); the green line shows the standard of health established by the European Union.
B. The environment in national and global agendasEnvironmental sustainability requires commitments among multiple actors because accountability for damage and threats to the environment means taking account of a chain of relationships that often transcend national borders. For example, climate change and the threat to biodiversity are global issues, but countries contribute differently to their origin and cause according to their production and consumption patterns and lifestyle. Groups within countries also contribute in different degrees to environmental degradation problems.
Ultimately, interlinkages make it difficult to delimit national and global environmental sustainability problems. But there are certainly areas where the national agenda is paramount, and others where progress is unlikely without agreements at the global level. This part of the chapter will address, first, two sustainability issues that are obviously rooted at the national level and where State policies within countries are decisive. They are water use and access, on the one hand, and the protection of forests and afforestation, on the other. Second, with regard to areas of environmental sustainability where global agreements are crucial, this chapter will focus on climate change and disasters, and how these affect the region.
8 According to the World Health Organization (WHO), particulate matter (PM) is identified according to the aerodynamic diameter of the particles, as either PM10 (particles with an aerodynamic diameter smaller than 10 µm) or PM2.5 (aerodynamic diameter smaller than 2.5 µm). The latter are more dangerous since, when inhaled, they may reach the peripheral regions of the bronchioles, and interfere with gas exchange inside the lungs. Chronic exposure to particles contributes to the risk of developing cardiovascular and respiratory diseases such as bronchitis and asthma, as well as of lung cancer. PM2.5 is also associated with increases in morbidity and mortality of the at-risk population, principally children with asthma and allergies. In developing countries, exposure to PM10 and gases from indoor combustion of solid fuels on open fires or traditional stoves increases the risk of acute lower respiratory infections and associated mortality among young children; indoor air pollution from solid fuel use is also a major risk factor for chronic obstructive pulmonary disease and lung cancer among adults. In an urban environment, the generation of suspended particulate matter (PM10 and PM2.5) is attributable primarily to the combustion of solid, liquid and gaseous fuels, the erosion of materials, inadequate waste and sewage management and road traffic (including paved and unpaved roads and wind erosion), where it is common to consider the impact of both types of particles. PM2.5 include sulphur and nitrogen combustion aerosols, which, on aggregation, acquire PM10 size.
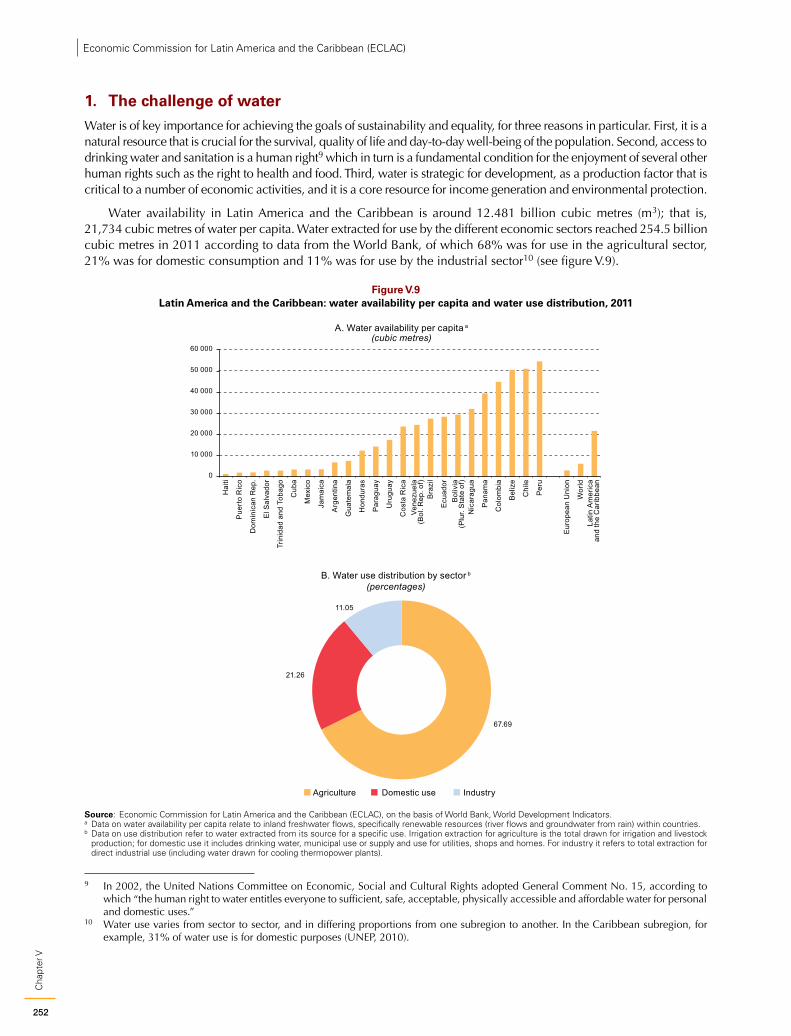
252
Cha
pter
VEconomic Commission for Latin America and the Caribbean (ECLAC)
1. The challenge of water Water is of key importance for achieving the goals of sustainability and equality, for three reasons in particular. First, it is a natural resource that is crucial for the survival, quality of life and day-to-day well-being of the population. Second, access to drinking water and sanitation is a human right9 which in turn is a fundamental condition for the enjoyment of several other human rights such as the right to health and food. Third, water is strategic for development, as a production factor that is critical to a number of economic activities, and it is a core resource for income generation and environmental protection.
Water availability in Latin America and the Caribbean is around 12.481 billion cubic metres (m3); that is, 21,734 cubic metres of water per capita. Water extracted for use by the different economic sectors reached 254.5 billion cubic metres in 2011 according to data from the World Bank, of which 68% was for use in the agricultural sector, 21% was for domestic consumption and 11% was for use by the industrial sector10 (see figure V.9).
Figure V.9 Latin America and the Caribbean: water availability per capita and water use distribution, 2011
0
10 000
20 000
30 000
40 000
50 000
60 000
Hai
ti
Pue
rto
Ric
o
Dom
inic
an R
ep.
El S
alva
dor
Trin
idad
and
Tob
ago
Cub
a
Mex
ico
Jam
aica
Arg
entin
a
Gua
tem
ala
Hon
dura
s
Par
agua
y
Uru
guay
Cos
ta R
ica
Vene
zuel
a(B
ol. R
ep. o
f)B
razi
l
Ecu
ador
Bol
ivia
(Plu
r. S
tate
of)
Nic
arag
ua
Pan
ama
Col
ombi
a
Bel
ize
Chi
le
Per
u
Eur
opea
n U
nion
Wor
ldLa
tin A
mer
ica
and
the
Car
ibbe
an
A. Water availability per capita a
(cubic metres)
67.69
21.26
11.05
Agriculture Domestic use Industry
B. Water use distribution by sector b
(percentages)
Source: Economic Commission for Latin America and the Caribbean (ECLAC), on the basis of World Bank, World Development Indicators.a Data on water availability per capita relate to inland freshwater flows, specifically renewable resources (river flows and groundwater from rain) within countries. b Data on use distribution refer to water extracted from its source for a specific use. Irrigation extraction for agriculture is the total drawn for irrigation and livestock
production; for domestic use it includes drinking water, municipal use or supply and use for utilities, shops and homes. For industry it refers to total extraction for direct industrial use (including water drawn for cooling thermopower plants).
9 In 2002, the United Nations Committee on Economic, Social and Cultural Rights adopted General Comment No. 15, according to which “the human right to water entitles everyone to sufficient, safe, acceptable, physically accessible and affordable water for personal and domestic uses.”
10 Water use varies from sector to sector, and in differing proportions from one subregion to another. In the Caribbean subregion, for example, 31% of water use is for domestic purposes (UNEP, 2010).
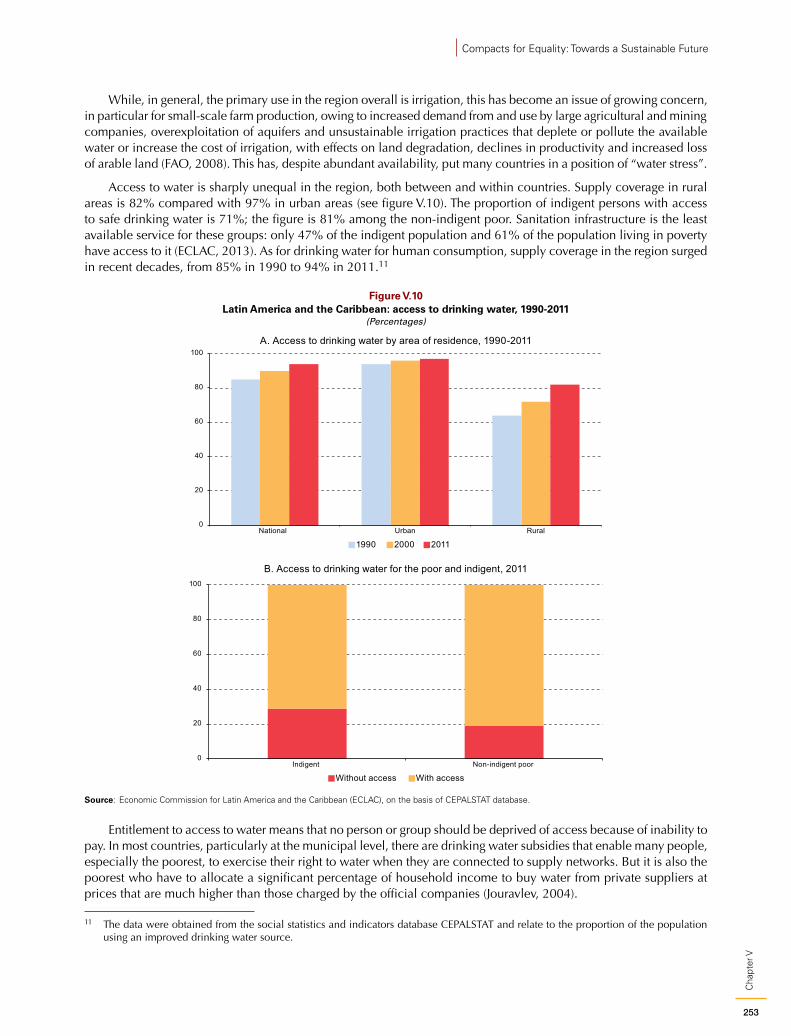
253
Cha
pter
V
Compacts for Equality: Towards a Sustainable Future
While, in general, the primary use in the region overall is irrigation, this has become an issue of growing concern, in particular for small-scale farm production, owing to increased demand from and use by large agricultural and mining companies, overexploitation of aquifers and unsustainable irrigation practices that deplete or pollute the available water or increase the cost of irrigation, with effects on land degradation, declines in productivity and increased loss of arable land (FAO, 2008). This has, despite abundant availability, put many countries in a position of “water stress”.
Access to water is sharply unequal in the region, both between and within countries. Supply coverage in rural areas is 82% compared with 97% in urban areas (see figure V.10). The proportion of indigent persons with access to safe drinking water is 71%; the figure is 81% among the non-indigent poor. Sanitation infrastructure is the least available service for these groups: only 47% of the indigent population and 61% of the population living in poverty have access to it (ECLAC, 2013). As for drinking water for human consumption, supply coverage in the region surged in recent decades, from 85% in 1990 to 94% in 2011.11
Figure V.10 Latin America and the Caribbean: access to drinking water, 1990-2011
(Percentages)
0
20
40
60
80
100
National Urban Rural
1990 2000 2011
A. Access to drinking water by area of residence, 1990-2011
0
20
40
60
80
100
Indigent Non-indigent poor
Without access With access
B. Access to drinking water for the poor and indigent, 2011
Source: Economic Commission for Latin America and the Caribbean (ECLAC), on the basis of CEPALSTAT database.
Entitlement to access to water means that no person or group should be deprived of access because of inability to pay. In most countries, particularly at the municipal level, there are drinking water subsidies that enable many people, especially the poorest, to exercise their right to water when they are connected to supply networks. But it is also the poorest who have to allocate a significant percentage of household income to buy water from private suppliers at prices that are much higher than those charged by the official companies (Jouravlev, 2004).
11 The data were obtained from the social statistics and indicators database CEPALSTAT and relate to the proportion of the population using an improved drinking water source.
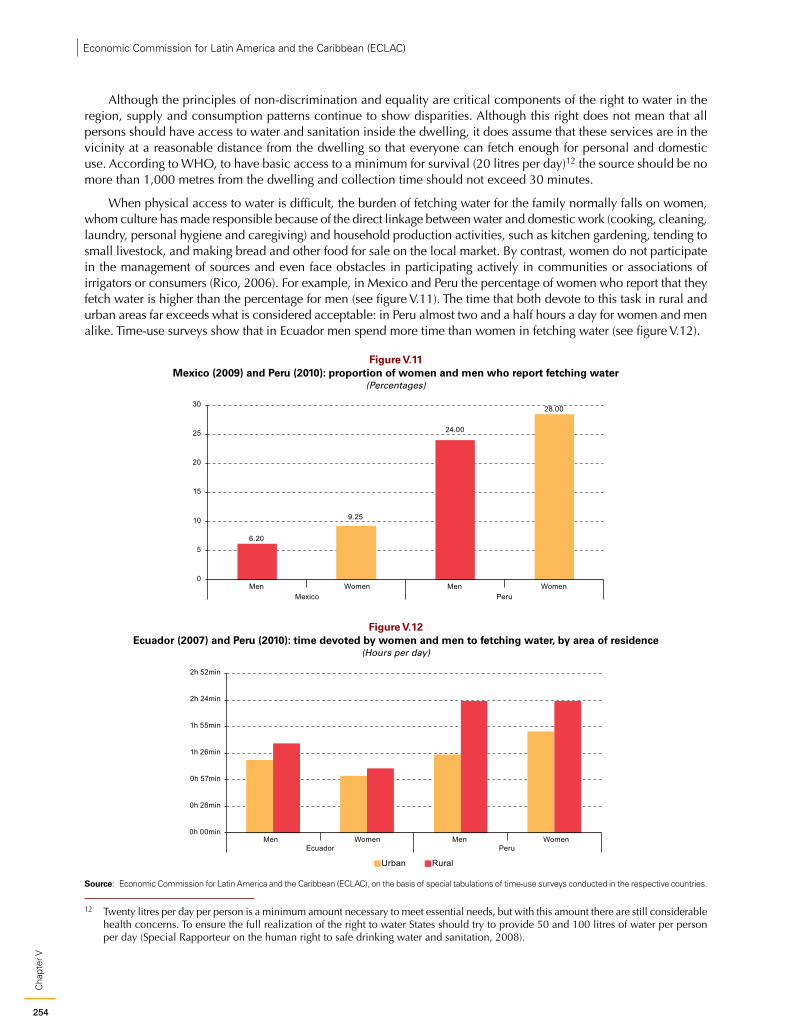
254
Cha
pter
VEconomic Commission for Latin America and the Caribbean (ECLAC)
Although the principles of non-discrimination and equality are critical components of the right to water in the region, supply and consumption patterns continue to show disparities. Although this right does not mean that all persons should have access to water and sanitation inside the dwelling, it does assume that these services are in the vicinity at a reasonable distance from the dwelling so that everyone can fetch enough for personal and domestic use. According to WHO, to have basic access to a minimum for survival (20 litres per day)12 the source should be no more than 1,000 metres from the dwelling and collection time should not exceed 30 minutes.
When physical access to water is difficult, the burden of fetching water for the family normally falls on women, whom culture has made responsible because of the direct linkage between water and domestic work (cooking, cleaning, laundry, personal hygiene and caregiving) and household production activities, such as kitchen gardening, tending to small livestock, and making bread and other food for sale on the local market. By contrast, women do not participate in the management of sources and even face obstacles in participating actively in communities or associations of irrigators or consumers (Rico, 2006). For example, in Mexico and Peru the percentage of women who report that they fetch water is higher than the percentage for men (see figure V.11). The time that both devote to this task in rural and urban areas far exceeds what is considered acceptable: in Peru almost two and a half hours a day for women and men alike. Time-use surveys show that in Ecuador men spend more time than women in fetching water (see figure V.12).
Figure V.11 Mexico (2009) and Peru (2010): proportion of women and men who report fetching water
(Percentages)
6.20
9.25
24.00
28.00
0
5
10
15
20
25
30
Men Women Men WomenMexico Peru
Figure V.12 Ecuador (2007) and Peru (2010): time devoted by women and men to fetching water, by area of residence
(Hours per day)
0h 00min
0h 28min
0h 57min
1h 26min
1h 55min
2h 24min
2h 52min
Men Women Men WomenEcuador Peru
Urban Rural
Source: Economic Commission for Latin America and the Caribbean (ECLAC), on the basis of special tabulations of time-use surveys conducted in the respective countries.
12 Twenty litres per day per person is a minimum amount necessary to meet essential needs, but with this amount there are still considerable health concerns. To ensure the full realization of the right to water States should try to provide 50 and 100 litres of water per person per day (Special Rapporteur on the human right to safe drinking water and sanitation, 2008).
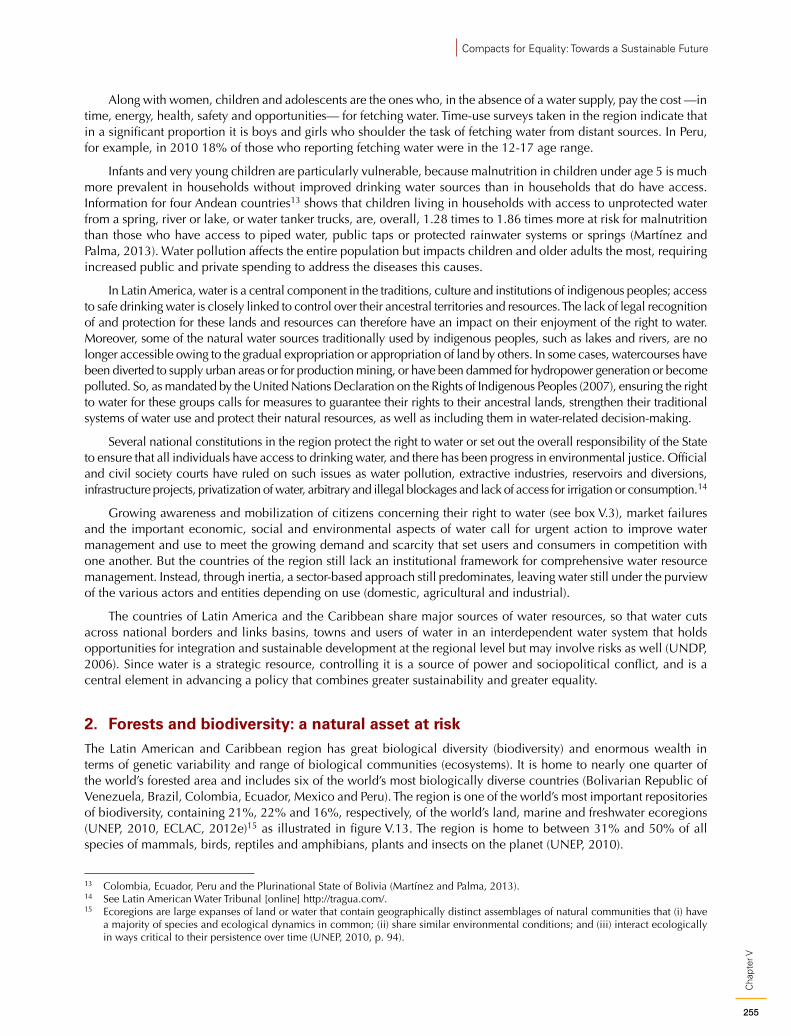
255
Cha
pter
V
Compacts for Equality: Towards a Sustainable Future
Along with women, children and adolescents are the ones who, in the absence of a water supply, pay the cost —in time, energy, health, safety and opportunities— for fetching water. Time-use surveys taken in the region indicate that in a significant proportion it is boys and girls who shoulder the task of fetching water from distant sources. In Peru, for example, in 2010 18% of those who reporting fetching water were in the 12-17 age range.
Infants and very young children are particularly vulnerable, because malnutrition in children under age 5 is much more prevalent in households without improved drinking water sources than in households that do have access. Information for four Andean countries13 shows that children living in households with access to unprotected water from a spring, river or lake, or water tanker trucks, are, overall, 1.28 times to 1.86 times more at risk for malnutrition than those who have access to piped water, public taps or protected rainwater systems or springs (Martínez and Palma, 2013). Water pollution affects the entire population but impacts children and older adults the most, requiring increased public and private spending to address the diseases this causes.
In Latin America, water is a central component in the traditions, culture and institutions of indigenous peoples; access to safe drinking water is closely linked to control over their ancestral territories and resources. The lack of legal recognition of and protection for these lands and resources can therefore have an impact on their enjoyment of the right to water. Moreover, some of the natural water sources traditionally used by indigenous peoples, such as lakes and rivers, are no longer accessible owing to the gradual expropriation or appropriation of land by others. In some cases, watercourses have been diverted to supply urban areas or for production mining, or have been dammed for hydropower generation or become polluted. So, as mandated by the United Nations Declaration on the Rights of Indigenous Peoples (2007), ensuring the right to water for these groups calls for measures to guarantee their rights to their ancestral lands, strengthen their traditional systems of water use and protect their natural resources, as well as including them in water-related decision-making.
Several national constitutions in the region protect the right to water or set out the overall responsibility of the State to ensure that all individuals have access to drinking water, and there has been progress in environmental justice. Official and civil society courts have ruled on such issues as water pollution, extractive industries, reservoirs and diversions, infrastructure projects, privatization of water, arbitrary and illegal blockages and lack of access for irrigation or consumption.14
Growing awareness and mobilization of citizens concerning their right to water (see box V.3), market failures and the important economic, social and environmental aspects of water call for urgent action to improve water management and use to meet the growing demand and scarcity that set users and consumers in competition with one another. But the countries of the region still lack an institutional framework for comprehensive water resource management. Instead, through inertia, a sector-based approach still predominates, leaving water still under the purview of the various actors and entities depending on use (domestic, agricultural and industrial).
The countries of Latin America and the Caribbean share major sources of water resources, so that water cuts across national borders and links basins, towns and users of water in an interdependent water system that holds opportunities for integration and sustainable development at the regional level but may involve risks as well (UNDP, 2006). Since water is a strategic resource, controlling it is a source of power and sociopolitical conflict, and is a central element in advancing a policy that combines greater sustainability and greater equality.
2. Forests and biodiversity: a natural asset at riskThe Latin American and Caribbean region has great biological diversity (biodiversity) and enormous wealth in terms of genetic variability and range of biological communities (ecosystems). It is home to nearly one quarter of the world’s forested area and includes six of the world’s most biologically diverse countries (Bolivarian Republic of Venezuela, Brazil, Colombia, Ecuador, Mexico and Peru). The region is one of the world’s most important repositories of biodiversity, containing 21%, 22% and 16%, respectively, of the world’s land, marine and freshwater ecoregions (UNEP, 2010, ECLAC, 2012e)15 as illustrated in figure V.13. The region is home to between 31% and 50% of all species of mammals, birds, reptiles and amphibians, plants and insects on the planet (UNEP, 2010).
13 Colombia, Ecuador, Peru and the Plurinational State of Bolivia (Martínez and Palma, 2013). 14 See Latin American Water Tribunal [online] http://tragua.com/.15 Ecoregions are large expanses of land or water that contain geographically distinct assemblages of natural communities that (i) have
a majority of species and ecological dynamics in common; (ii) share similar environmental conditions; and (iii) interact ecologically in ways critical to their persistence over time (UNEP, 2010, p. 94).
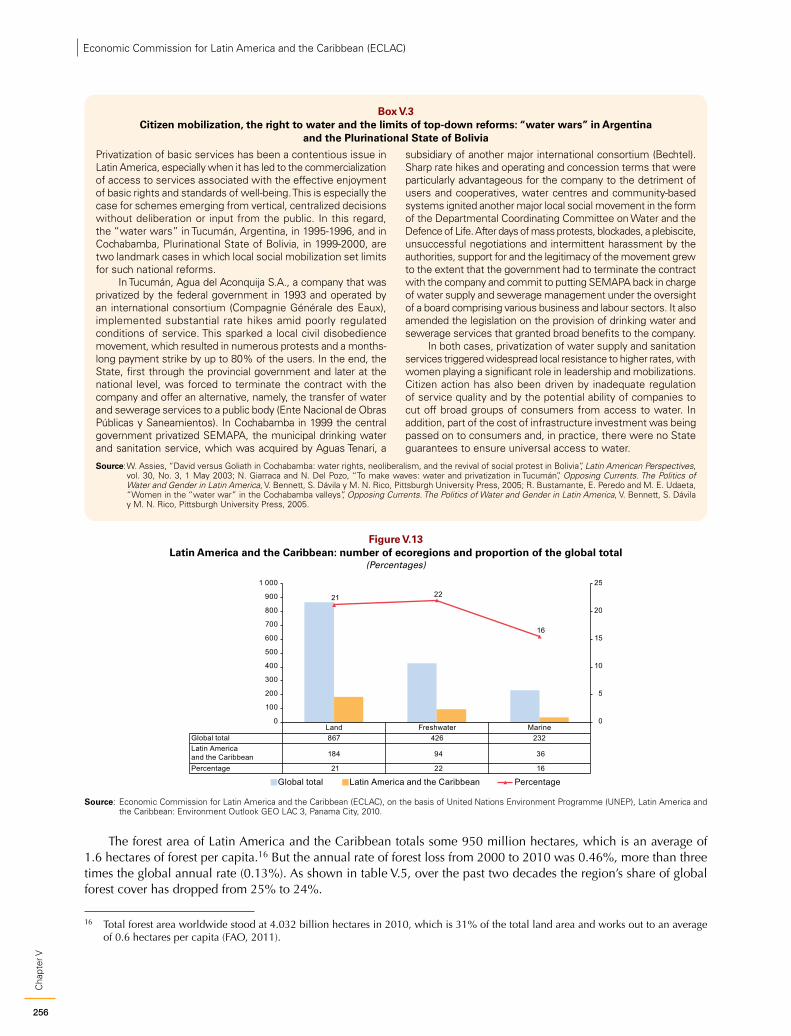
256
Cha
pter
VEconomic Commission for Latin America and the Caribbean (ECLAC)
Box V.3 Citizen mobilization, the right to water and the limits of top-down reforms: “water wars” in Argentina
and the Plurinational State of Bolivia
Privatization of basic services has been a contentious issue in Latin America, especially when it has led to the commercialization of access to services associated with the effective enjoyment of basic rights and standards of well-being. This is especially the case for schemes emerging from vertical, centralized decisions without deliberation or input from the public. In this regard, the “water wars” in Tucumán, Argentina, in 1995-1996, and in Cochabamba, Plurinational State of Bolivia, in 1999-2000, are two landmark cases in which local social mobilization set limits for such national reforms.
In Tucumán, Agua del Aconquija S.A., a company that was privatized by the federal government in 1993 and operated by an international consortium (Compagnie Générale des Eaux), implemented substantial rate hikes amid poorly regulated conditions of service. This sparked a local civil disobedience movement, which resulted in numerous protests and a months-long payment strike by up to 80% of the users. In the end, the State, first through the provincial government and later at the national level, was forced to terminate the contract with the company and offer an alternative, namely, the transfer of water and sewerage services to a public body (Ente Nacional de Obras Públicas y Saneamientos). In Cochabamba in 1999 the central government privatized SEMAPA, the municipal drinking water and sanitation service, which was acquired by Aguas Tenari, a
subsidiary of another major international consortium (Bechtel). Sharp rate hikes and operating and concession terms that were particularly advantageous for the company to the detriment of users and cooperatives, water centres and community-based systems ignited another major local social movement in the form of the Departmental Coordinating Committee on Water and the Defence of Life. After days of mass protests, blockades, a plebiscite, unsuccessful negotiations and intermittent harassment by the authorities, support for and the legitimacy of the movement grew to the extent that the government had to terminate the contract with the company and commit to putting SEMAPA back in charge of water supply and sewerage management under the oversight of a board comprising various business and labour sectors. It also amended the legislation on the provision of drinking water and sewerage services that granted broad benefits to the company.
In both cases, privatization of water supply and sanitation services triggered widespread local resistance to higher rates, with women playing a significant role in leadership and mobilizations. Citizen action has also been driven by inadequate regulation of service quality and by the potential ability of companies to cut off broad groups of consumers from access to water. In addition, part of the cost of infrastructure investment was being passed on to consumers and, in practice, there were no State guarantees to ensure universal access to water.
Source: W. Assies, “David versus Goliath in Cochabamba: water rights, neoliberalism, and the revival of social protest in Bolivia”, Latin American Perspectives, vol. 30, No. 3, 1 May 2003; N. Giarraca and N. Del Pozo, “To make waves: water and privatization in Tucumán”, Opposing Currents. The Politics of Water and Gender in Latin America, V. Bennett, S. Dávila y M. N. Rico, Pittsburgh University Press, 2005; R. Bustamante, E. Peredo and M. E. Udaeta, “Women in the “water war” in the Cochabamba valleys”, Opposing Currents. The Politics of Water and Gender in Latin America, V. Bennett, S. Dávila y M. N. Rico, Pittsburgh University Press, 2005.
Figure V.13 Latin America and the Caribbean: number of ecoregions and proportion of the global total
(Percentages)
Land Freshwater MarineGlobal total 867 426 232Latin America and the Caribbean 184 94 36
Percentage 21 22 16
21 22
16
0
5
10
15
20
25
0
100
200
300
400
500
600
700
800
900
1 000
Global total Latin America and the Caribbean Percentage
Source: Economic Commission for Latin America and the Caribbean (ECLAC), on the basis of United Nations Environment Programme (UNEP), Latin America and the Caribbean: Environment Outlook GEO LAC 3, Panama City, 2010.
The forest area of Latin America and the Caribbean totals some 950 million hectares, which is an average of 1.6 hectares of forest per capita.16 But the annual rate of forest loss from 2000 to 2010 was 0.46%, more than three times the global annual rate (0.13%). As shown in table V.5, over the past two decades the region’s share of global forest cover has dropped from 25% to 24%.
16 Total forest area worldwide stood at 4.032 billion hectares in 2010, which is 31% of the total land area and works out to an average of 0.6 hectares per capita (FAO, 2011).
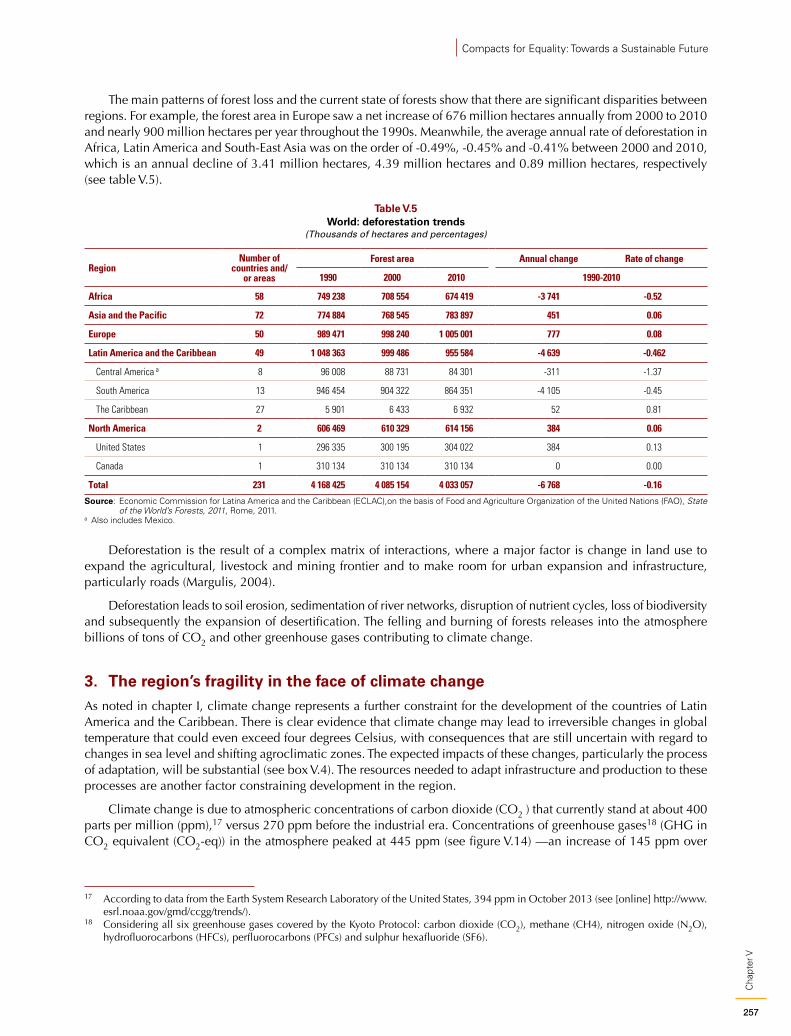
257
Cha
pter
V
Compacts for Equality: Towards a Sustainable Future
The main patterns of forest loss and the current state of forests show that there are significant disparities between regions. For example, the forest area in Europe saw a net increase of 676 million hectares annually from 2000 to 2010 and nearly 900 million hectares per year throughout the 1990s. Meanwhile, the average annual rate of deforestation in Africa, Latin America and South-East Asia was on the order of -0.49%, -0.45% and -0.41% between 2000 and 2010, which is an annual decline of 3.41 million hectares, 4.39 million hectares and 0.89 million hectares, respectively (see table V.5).
Table V.5 World: deforestation trends
(Thousands of hectares and percentages)
RegionNumber of
countries and/or areas
Forest area Annual change Rate of change
1990 2000 2010 1990-2010
Africa 58 749 238 708 554 674 419 -3 741 -0.52
Asia and the Pacific 72 774 884 768 545 783 897 451 0.06
Europe 50 989 471 998 240 1 005 001 777 0.08
Latin America and the Caribbean 49 1 048 363 999 486 955 584 -4 639 -0.462
Central America a 8 96 008 88 731 84 301 -311 -1.37
South America 13 946 454 904 322 864 351 -4 105 -0.45
The Caribbean 27 5 901 6 433 6 932 52 0.81
North America 2 606 469 610 329 614 156 384 0.06
United States 1 296 335 300 195 304 022 384 0.13
Canada 1 310 134 310 134 310 134 0 0.00
Total 231 4 168 425 4 085 154 4 033 057 -6 768 -0.16
Source: Economic Commission for Latina America and the Caribbean (ECLAC),on the basis of Food and Agriculture Organization of the United Nations (FAO), State of the World’s Forests, 2011, Rome, 2011.
a Also includes Mexico.
Deforestation is the result of a complex matrix of interactions, where a major factor is change in land use to expand the agricultural, livestock and mining frontier and to make room for urban expansion and infrastructure, particularly roads (Margulis, 2004).
Deforestation leads to soil erosion, sedimentation of river networks, disruption of nutrient cycles, loss of biodiversity and subsequently the expansion of desertification. The felling and burning of forests releases into the atmosphere billions of tons of CO2 and other greenhouse gases contributing to climate change.
3. The region’s fragility in the face of climate changeAs noted in chapter I, climate change represents a further constraint for the development of the countries of Latin America and the Caribbean. There is clear evidence that climate change may lead to irreversible changes in global temperature that could even exceed four degrees Celsius, with consequences that are still uncertain with regard to changes in sea level and shifting agroclimatic zones. The expected impacts of these changes, particularly the process of adaptation, will be substantial (see box V.4). The resources needed to adapt infrastructure and production to these processes are another factor constraining development in the region.
Climate change is due to atmospheric concentrations of carbon dioxide (CO2 ) that currently stand at about 400 parts per million (ppm),17 versus 270 ppm before the industrial era. Concentrations of greenhouse gases18 (GHG in CO2 equivalent (CO2-eq)) in the atmosphere peaked at 445 ppm (see figure V.14) —an increase of 145 ppm over
17 According to data from the Earth System Research Laboratory of the United States, 394 ppm in October 2013 (see [online] http://www.esrl.noaa.gov/gmd/ccgg/trends/).
18 Considering all six greenhouse gases covered by the Kyoto Protocol: carbon dioxide (CO2), methane (CH4), nitrogen oxide (N2O), hydrofluorocarbons (HFCs), perfluorocarbons (PFCs) and sulphur hexafluoride (SF6).
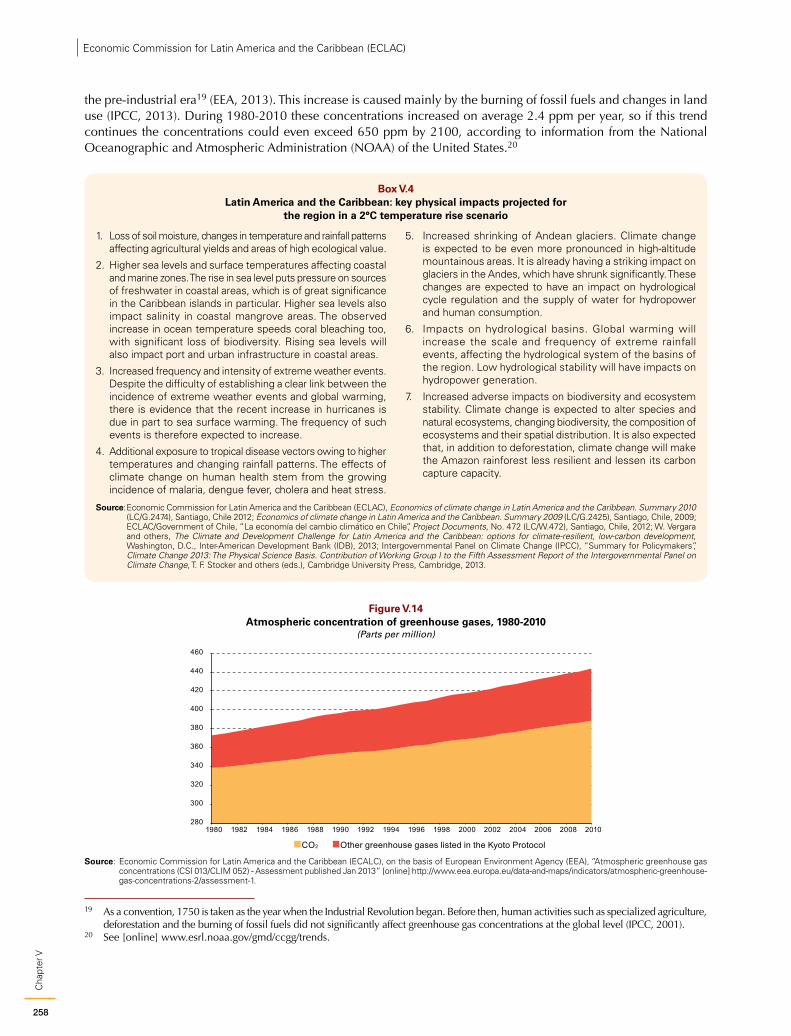
258
Cha
pter
VEconomic Commission for Latin America and the Caribbean (ECLAC)
the pre-industrial era19 (EEA, 2013). This increase is caused mainly by the burning of fossil fuels and changes in land use (IPCC, 2013). During 1980-2010 these concentrations increased on average 2.4 ppm per year, so if this trend continues the concentrations could even exceed 650 ppm by 2100, according to information from the National Oceanographic and Atmospheric Administration (NOAA) of the United States.20
19 As a convention, 1750 is taken as the year when the Industrial Revolution began. Before then, human activities such as specialized agriculture, deforestation and the burning of fossil fuels did not significantly affect greenhouse gas concentrations at the global level (IPCC, 2001).
20 See [online] www.esrl.noaa.gov/gmd/ccgg/trends.
Box V.4 Latin America and the Caribbean: key physical impacts projected for
the region in a 2°C temperature rise scenario
1. Loss of soil moisture, changes in temperature and rainfall patterns affecting agricultural yields and areas of high ecological value.
2. Higher sea levels and surface temperatures affecting coastal and marine zones. The rise in sea level puts pressure on sources of freshwater in coastal areas, which is of great significance in the Caribbean islands in particular. Higher sea levels also impact salinity in coastal mangrove areas. The observed increase in ocean temperature speeds coral bleaching too, with significant loss of biodiversity. Rising sea levels will also impact port and urban infrastructure in coastal areas.
3. Increased frequency and intensity of extreme weather events. Despite the difficulty of establishing a clear link between the incidence of extreme weather events and global warming, there is evidence that the recent increase in hurricanes is due in part to sea surface warming. The frequency of such events is therefore expected to increase.
4. Additional exposure to tropical disease vectors owing to higher temperatures and changing rainfall patterns. The effects of climate change on human health stem from the growing incidence of malaria, dengue fever, cholera and heat stress.
5. Increased shrinking of Andean glaciers. Climate change is expected to be even more pronounced in high-altitude mountainous areas. It is already having a striking impact on glaciers in the Andes, which have shrunk significantly. These changes are expected to have an impact on hydrological cycle regulation and the supply of water for hydropower and human consumption.
6. Impacts on hydrological basins. Global warming will increase the scale and frequency of extreme rainfall events, affecting the hydrological system of the basins of the region. Low hydrological stability will have impacts on hydropower generation.
7. Increased adverse impacts on biodiversity and ecosystem stability. Climate change is expected to alter species and natural ecosystems, changing biodiversity, the composition of ecosystems and their spatial distribution. It is also expected that, in addition to deforestation, climate change will make the Amazon rainforest less resilient and lessen its carbon capture capacity.
Source: Economic Commission for Latin America and the Caribbean (ECLAC), Economics of climate change in Latin America and the Caribbean. Summary 2010 (LC/G.2474), Santiago, Chile 2012; Economics of climate change in Latin America and the Caribbean. Summary 2009 (LC/G.2425), Santiago, Chile, 2009; ECLAC/Government of Chile, “La economía del cambio climático en Chile”, Project Documents, No. 472 (LC/W.472), Santiago, Chile, 2012; W. Vergara and others, The Climate and Development Challenge for Latin America and the Caribbean: options for climate-resilient, low-carbon development, Washington, D.C., Inter-American Development Bank (IDB), 2013; Intergovernmental Panel on Climate Change (IPCC), “Summary for Policymakers”, Climate Change 2013: The Physical Science Basis. Contribution of Working Group I to the Fifth Assessment Report of the Intergovernmental Panel on Climate Change, T. F. Stocker and others (eds.), Cambridge University Press, Cambridge, 2013.
Figure V.14 Atmospheric concentration of greenhouse gases, 1980-2010
(Parts per million)
280
300
320
340
360
380
400
420
440
460
1980 1982 1984 1986 1988 1990 1992 1994 1996 1998 2000 2002 2004 2006 2008 2010
CO2 Other greenhouse gases listed in the Kyoto Protocol
Source: Economic Commission for Latin America and the Caribbean (ECALC), on the basis of European Environment Agency (EEA), “Atmospheric greenhouse gas concentrations (CSI 013/CLIM 052) - Assessment published Jan 2013” [online] http://www.eea.europa.eu/data-and-maps/indicators/atmospheric-greenhouse-gas-concentrations-2/assessment-1.
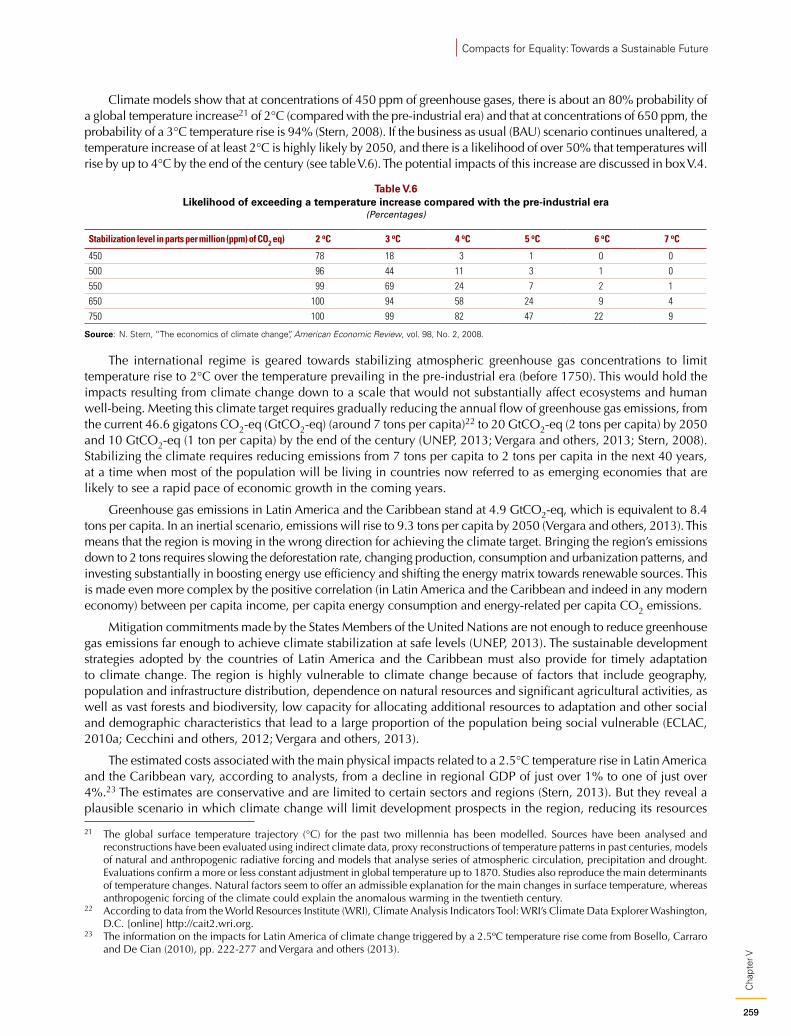
259
Cha
pter
V
Compacts for Equality: Towards a Sustainable Future
Climate models show that at concentrations of 450 ppm of greenhouse gases, there is about an 80% probability of a global temperature increase21 of 2°C (compared with the pre-industrial era) and that at concentrations of 650 ppm, the probability of a 3°C temperature rise is 94% (Stern, 2008). If the business as usual (BAU) scenario continues unaltered, a temperature increase of at least 2°C is highly likely by 2050, and there is a likelihood of over 50% that temperatures will rise by up to 4°C by the end of the century (see table V.6). The potential impacts of this increase are discussed in box V.4.
Table V.6 Likelihood of exceeding a temperature increase compared with the pre-industrial era
(Percentages)
Stabilization level in parts per million (ppm) of CO2 eq) 2 oC 3 oC 4 oC 5 oC 6 oC 7 oC
450 78 18 3 1 0 0
500 96 44 11 3 1 0
550 99 69 24 7 2 1
650 100 94 58 24 9 4
750 100 99 82 47 22 9
Source: N. Stern, “The economics of climate change”, American Economic Review, vol. 98, No. 2, 2008.
The international regime is geared towards stabilizing atmospheric greenhouse gas concentrations to limit temperature rise to 2°C over the temperature prevailing in the pre-industrial era (before 1750). This would hold the impacts resulting from climate change down to a scale that would not substantially affect ecosystems and human well-being. Meeting this climate target requires gradually reducing the annual flow of greenhouse gas emissions, from the current 46.6 gigatons CO2-eq (GtCO2-eq) (around 7 tons per capita)22 to 20 GtCO2-eq (2 tons per capita) by 2050 and 10 GtCO2-eq (1 ton per capita) by the end of the century (UNEP, 2013; Vergara and others, 2013; Stern, 2008). Stabilizing the climate requires reducing emissions from 7 tons per capita to 2 tons per capita in the next 40 years, at a time when most of the population will be living in countries now referred to as emerging economies that are likely to see a rapid pace of economic growth in the coming years.
Greenhouse gas emissions in Latin America and the Caribbean stand at 4.9 GtCO2-eq, which is equivalent to 8.4 tons per capita. In an inertial scenario, emissions will rise to 9.3 tons per capita by 2050 (Vergara and others, 2013). This means that the region is moving in the wrong direction for achieving the climate target. Bringing the region’s emissions down to 2 tons requires slowing the deforestation rate, changing production, consumption and urbanization patterns, and investing substantially in boosting energy use efficiency and shifting the energy matrix towards renewable sources. This is made even more complex by the positive correlation (in Latin America and the Caribbean and indeed in any modern economy) between per capita income, per capita energy consumption and energy-related per capita CO2 emissions.
Mitigation commitments made by the States Members of the United Nations are not enough to reduce greenhouse gas emissions far enough to achieve climate stabilization at safe levels (UNEP, 2013). The sustainable development strategies adopted by the countries of Latin America and the Caribbean must also provide for timely adaptation to climate change. The region is highly vulnerable to climate change because of factors that include geography, population and infrastructure distribution, dependence on natural resources and significant agricultural activities, as well as vast forests and biodiversity, low capacity for allocating additional resources to adaptation and other social and demographic characteristics that lead to a large proportion of the population being social vulnerable (ECLAC, 2010a; Cecchini and others, 2012; Vergara and others, 2013).
The estimated costs associated with the main physical impacts related to a 2.5°C temperature rise in Latin America and the Caribbean vary, according to analysts, from a decline in regional GDP of just over 1% to one of just over 4%.23 The estimates are conservative and are limited to certain sectors and regions (Stern, 2013). But they reveal a plausible scenario in which climate change will limit development prospects in the region, reducing its resources
21 The global surface temperature trajectory (°C) for the past two millennia has been modelled. Sources have been analysed and reconstructions have been evaluated using indirect climate data, proxy reconstructions of temperature patterns in past centuries, models of natural and anthropogenic radiative forcing and models that analyse series of atmospheric circulation, precipitation and drought. Evaluations confirm a more or less constant adjustment in global temperature up to 1870. Studies also reproduce the main determinants of temperature changes. Natural factors seem to offer an admissible explanation for the main changes in surface temperature, whereas anthropogenic forcing of the climate could explain the anomalous warming in the twentieth century.
22 According to data from the World Resources Institute (WRI), Climate Analysis Indicators Tool: WRI’s Climate Data Explorer Washington, D.C. [online] http://cait2.wri.org.
23 The information on the impacts for Latin America of climate change triggered by a 2.5ºC temperature rise come from Bosello, Carraro and De Cian (2010), pp. 222-277 and Vergara and others (2013).
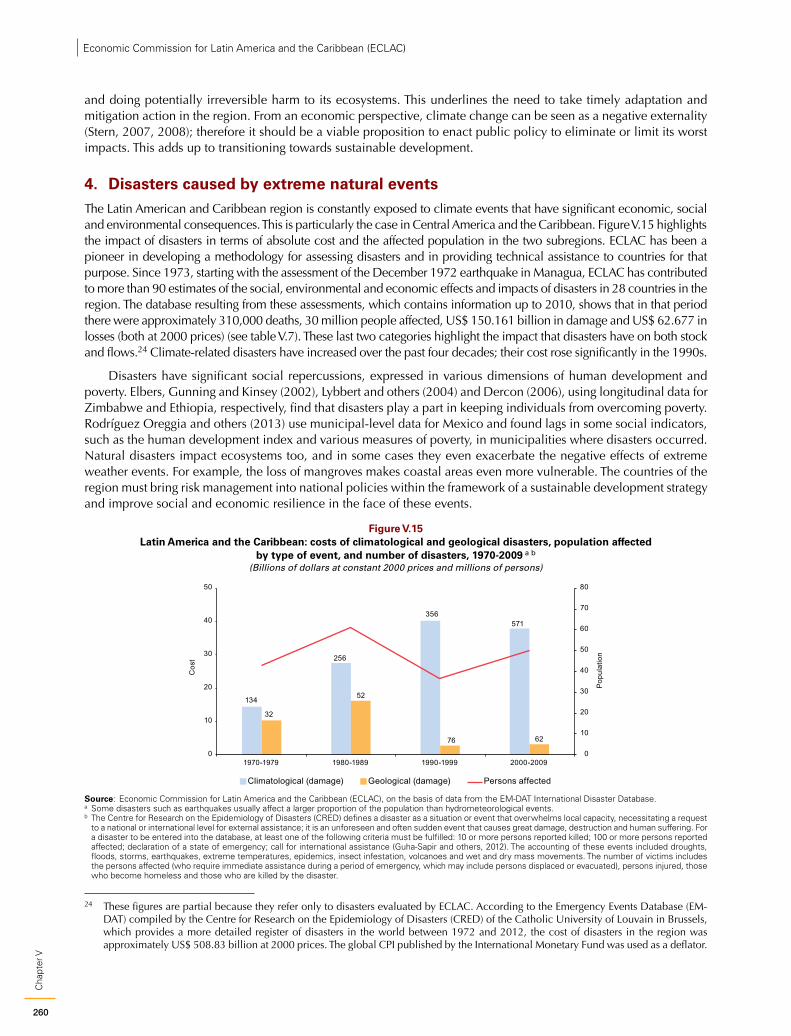
260
Cha
pter
VEconomic Commission for Latin America and the Caribbean (ECLAC)
and doing potentially irreversible harm to its ecosystems. This underlines the need to take timely adaptation and mitigation action in the region. From an economic perspective, climate change can be seen as a negative externality (Stern, 2007, 2008); therefore it should be a viable proposition to enact public policy to eliminate or limit its worst impacts. This adds up to transitioning towards sustainable development.
4. Disasters caused by extreme natural eventsThe Latin American and Caribbean region is constantly exposed to climate events that have significant economic, social and environmental consequences. This is particularly the case in Central America and the Caribbean. Figure V.15 highlights the impact of disasters in terms of absolute cost and the affected population in the two subregions. ECLAC has been a pioneer in developing a methodology for assessing disasters and in providing technical assistance to countries for that purpose. Since 1973, starting with the assessment of the December 1972 earthquake in Managua, ECLAC has contributed to more than 90 estimates of the social, environmental and economic effects and impacts of disasters in 28 countries in the region. The database resulting from these assessments, which contains information up to 2010, shows that in that period there were approximately 310,000 deaths, 30 million people affected, US$ 150.161 billion in damage and US$ 62.677 in losses (both at 2000 prices) (see table V.7). These last two categories highlight the impact that disasters have on both stock and flows.24 Climate-related disasters have increased over the past four decades; their cost rose significantly in the 1990s.
Disasters have significant social repercussions, expressed in various dimensions of human development and poverty. Elbers, Gunning and Kinsey (2002), Lybbert and others (2004) and Dercon (2006), using longitudinal data for Zimbabwe and Ethiopia, respectively, find that disasters play a part in keeping individuals from overcoming poverty. Rodríguez Oreggia and others (2013) use municipal-level data for Mexico and found lags in some social indicators, such as the human development index and various measures of poverty, in municipalities where disasters occurred. Natural disasters impact ecosystems too, and in some cases they even exacerbate the negative effects of extreme weather events. For example, the loss of mangroves makes coastal areas even more vulnerable. The countries of the region must bring risk management into national policies within the framework of a sustainable development strategy and improve social and economic resilience in the face of these events.
Figure V.15 Latin America and the Caribbean: costs of climatological and geological disasters, population affected
by type of event, and number of disasters, 1970-2009 a b
(Billions of dollars at constant 2000 prices and millions of persons)
Cos
t
Pop
ulat
ion
0
10
20
30
40
50
60
70
80
0
10
20
30
40
50
1970-1979 1980-1989 1990-1999 2000-2009
Climatological (damage) Geological (damage) Persons affected
134
32
256
52
571
76 62
356
Source: Economic Commission for Latin America and the Caribbean (ECLAC), on the basis of data from the EM-DAT International Disaster Database. a Some disasters such as earthquakes usually affect a larger proportion of the population than hydrometeorological events. b The Centre for Research on the Epidemiology of Disasters (CRED) defines a disaster as a situation or event that overwhelms local capacity, necessitating a request
to a national or international level for external assistance; it is an unforeseen and often sudden event that causes great damage, destruction and human suffering. For a disaster to be entered into the database, at least one of the following criteria must be fulfilled: 10 or more persons reported killed; 100 or more persons reported affected; declaration of a state of emergency; call for international assistance (Guha-Sapir and others, 2012). The accounting of these events included droughts, floods, storms, earthquakes, extreme temperatures, epidemics, insect infestation, volcanoes and wet and dry mass movements. The number of victims includes the persons affected (who require immediate assistance during a period of emergency, which may include persons displaced or evacuated), persons injured, those who become homeless and those who are killed by the disaster.
24 These figures are partial because they refer only to disasters evaluated by ECLAC. According to the Emergency Events Database (EM-DAT) compiled by the Centre for Research on the Epidemiology of Disasters (CRED) of the Catholic University of Louvain in Brussels, which provides a more detailed register of disasters in the world between 1972 and 2012, the cost of disasters in the region was approximately US$ 508.83 billion at 2000 prices. The global CPI published by the International Monetary Fund was used as a deflator.

261
Cha
pter
V
Compacts for Equality: Towards a Sustainable Future
Table V.7 Latin America and the Caribbean: estimates of disaster-related damage and losses
by type of event and area, 1972-2010(Millions of dollars at constant 2000 prices)
Type and location of the disaster Damage Losses Total cost a Average damage
Average losses
Damage/ loss ratio
All disasters 150 161 62 677 213 585 1 950 746 2.4Climatological disasters 69 066 37 361 106 427 1 084 541 1.8Hurricanes and storms, Central America 13 088 4 560 17 640 818 304 2.8Hurricanes and storms, the Caribbean 14 122 7 827 21012 705 391 1.7Hurricanes and storms, Mexico 1 659 2 094 3 754 553 698 0.8La Niña phenomenon, South America 4 364 1 113 5 478 1 455 371 3.9La Niña phenomenon, Central America 2 904 1 111 4 013 726 222 2.6El Niño phenomenon, South America 25 384 17 087 42 471 2 820 1 899 1.5Extreme precipitation (flooding and landslides) 7 543 3 431 10 974 838 381 2.1Drought (Central America) 0 135 135 0 27 0.0Geophysical disasters 80 948 19 132 100 078 6 745 1 739 4.2Geophysical, Central America 49 799 8 383 58 179 7 114 1 397 5.9Geophysical, South America 2 873 4 670 7 543 1 436 2 335 0.6Geophysical, the Caribbean 2 979 2 454 5 433 2 979 2 453 1.2Geophysical, Mexico 25 297 3 626 28 923 12 648 1 813 6.9Mixed disasters, Central America 894 486 1 368 441 243 1.8Biological 0 5 697 5 697 0 2 849 0.0
Source: Economic Commission for Latin America and the Caribbean (ECLAC), on the basis of disaster impact assessments conducted by ECLAC between 1972 and 2010.a The total cost does not include disasters for which damage and loss estimates are not available. These correspond to disasters in Antigua and Barbuda (1974) and
Grenada (1975). If these disasters were included the total cost would rise to US$ 213.348 billion.
5. ConclusionsSocial equality, environmental sustainability and economic growth with innovation do not have to be mutually exclusive. The great challenge is to identify synergies among them. The strategic vision that joins these three areas must have three basic premises, namely: growth for equality, equality for growth, and growth and equality with environmental sustainability.
The prevailing style of development in the region is one of inertia, or an “equilibrium” that erodes the basis of its own sustainability. The region’s production structure, specific infrastructure, prevailing technological paradigm with little production innovation, political economy with misguided economic incentives and subsidies, and private and public goods consumption matrix yield an equilibrium with very little environmental sustainability. There is no question that reversing it requires State policies grounded in comprehensive social compacts, with clear road maps and long-term goals.
Transport is a telling example of “dis-equilibrium” in the public/private and individual/collective mix. The low price-elasticity of demand for gasoline points to a dearth of suitable alternatives to private transport. The high concentration of spending on gasoline in the upper quintile clearly flags the segmentation of transport modes in the population. The lack of modern, safe and good-quality public transport leads to high spending on private transport in the upper income quintiles (Galindo and others, 2013). This consumption structure often has a heavy environmental impact with significant negative externalities, mainly in urban areas: air quality falls short of international health standards in many cities in the region. This configuration is not unrelated to political-economic factors that make it difficult to eliminate subsidies such as those for fossil fuels.
Rising demand for durable goods also has a direct negative impact on the environment and the population, notwithstanding their benefits in terms of increasing material well-being. They generate solid waste and hazardous waste, and they increase energy consumption. In Latin America and the Caribbean, energy consumption, like gasoline consumption, is highly income-elastic and fairly price-inelastic compared with other regions.
The rise in energy and gasoline consumption associated with economic growth cannot be controlled by pricing mechanisms alone. This dynamic has negative impacts on air pollution and health in urban areas and in terms of CO2 emissions that contribute to climate change. Beyond Latin America and the Caribbean, rising consumption worldwide is also incompatible with sustainable development in keeping, for example, with climate change mitigation targets

262
Cha
pter
VEconomic Commission for Latin America and the Caribbean (ECLAC)
for CO2 emissions by 2050, which cannot be achieved if fossil-fuel based energy consumption continues to grow (Hepburn and Stern, 2008).
Moving towards sustainable development requires recognizing the risks as well as the benefits of consumption and taking government action as necessary to mitigate or minimize those risks. A strategy for taxing fossil fuels can, besides slowing the growth of demand, help to generate additional fiscal resources that can be used to build new urban infrastructure or to build up intergenerational solidarity funds. This means not only taxing negative externalities caused by fossil fuels in an adequate manner, but also assessing the design of compensatory policies targeting low-income brackets that could be impacted by direct price increases for fuels or spillover effects on the price of food or public transport. Measures must also be sought to increase the rate of solid waste disposal in landfills and to find alternatives for using and treating solid waste before final disposal. Here too, economic incentives may be useful to increase recycling, heat treatment and the use of waste for power generation, among other possibilities. But when key goods are price-inelastic, tax measures and changes in relative pricing are not enough. The supply of clean energy needs to be increased in order to replace the most polluting ones. And standards and restrictions need to be put in place to limit the inefficient use of natural resources, together with policies to support the changeover.
The evidence discussed in this chapter suggests the need to change the growth pattern, which is taking the same trajectory as in the English-speaking developed countries. The move should be in the direction of the Nordic pattern, which is more compatible with sustainability. Meanwhile, it cannot be ignored that current production processes reflect a dominant paradigm that is based on the available infrastructure and shapes technological possibilities down the road. Changing these constraints requires time and significant structural changes. This change cannot take place without active industrial policies that increasingly build in the components of a green economy.
Green industrial policy should be based on bringing the new clean technologies increasingly into production processes, with a large and growing role for local capacities, reducing dependence on imports for obtaining less polluting goods and processes. Existing industries should be restructured, and new activities with positive environmental impacts created (such as the production of clean energies like biodiesel, and the recycling and reuse of materials) These new activities can generate complex production linkages and drive high local innovativeness.
Shifting towards greener growth paths is an increasingly urgent challenge. The adverse effects of climate change weigh heavily on the economies of the region, whose production structures are highly dependent on the environment (agriculture, livestock and tourism); they disproportionately affect the poorest people, who are the most vulnerable to climate impacts. Furthermore, global markets are likely to shift to accommodate more stringent environmental standards, which could make the region less competitive. This makes it all the more urgent to embrace the green technology revolution creatively.
At the same time, the mounting loss and low economic value attributed to the natural heritage in Latin America and the Caribbean (forests, soil, pastureland and water), especially in mountainous countries such as those of the Andean region, increase the risks associated with natural disasters and worsen vulnerability to climate change, in turn affecting the provision of public goods and services. Mechanisms are needed to counter this trend, such as funds, incentives and public investment programmes that build in risk management and disaster prevention, especially in the most vulnerable localities.
Agenda 21, which emerged from the Earth Summit (1992), introduced the concept of unsustainable production and consumption patterns, showing the disparity between consumption levels in high- and low-income sectors and thus the differentiated levels of accountability for breaching global limits. The dominant pattern of consumption in the developed West is not replicable at the global level. Twenty years on, evidence continues to build around this absolute limitation.25 The issue is one of scale and equality: not all humanity can match the dominant pattern of consumption, waste and production and social inefficiency. Advances in technology have not, for market reasons, been able to reverse the scale effect or the rebound effect, or innovate at the pace required to provide alternatives instead of just marginal gains.
25 The report of the Network for Sustainable Solutions led by Jeffrey Sachs proves once more that the growth rate necessary for lower-income sectors to achieve levels of consumption that are comparable with higher-income ones is out of reach. With a different approach, Mathis Wackernagel studies the same subject expressed in terms of biocapacity (hectare equivalent for sustaining a pattern of consumption as an accounting unit) (Wackernagel and Rees, 1996).
263
Cha
pter
V
Compacts for Equality: Towards a Sustainable Future
Thinking about sustainable production and consumption patterns led to initiatives such as cleaner industrial production centres, the promotion of the 4 Rs (reduce, reuse, recycle, recover), savings campaigns and individual contributions. Market niches have even emerged that recognize positive externalities, such as fair trade and organic production, and have grown as part of an industry operating in such fields as decontamination, remediation, capture of efficiency opportunities and transparency in business reporting practices. Much of the progress has been driven by considerations of health, ethics and restrictive legislation. But it remains to be seen whether the economic responses are enough: the price and investment system has not yet internalized the real costs of economic activity. Some incentives have been created, but there is not the same will to disincentivize practices that have negative externalities, despite, in many cases, the considerable time already elapsed since their identification. National accounting systems do not yet report the state of social and environmental assets so as to properly reflect national wealth and advances in development.
Latin America and the Caribbean has a rich natural heritage, with 20% of the world’s forest area and six megadiverse countries. A third of the world’s potential crop land and freshwater reserves also lie in the region and, thanks to Brazil, it represents 31% of global production of biofuels. Latin America and the Caribbean accounts for 13% of global oil production, 47% of worldwide copper production and 48% of the global production of soybean. In other words, the region is rich in natural resources and very successful in the export of raw materials. But do we know how to manage them? Have we been able to add value to them or industrialize our economies beyond the maquila sector? Do we know how to capitalize on productivity gains (especially in view of high international prices) in order to redistribute them in our society? Do we have common criteria for royalties and for regulating foreign investment in a coordinated manner?
Herein lies a major challenge: natural resource governance, which is the subject of the next chapter. A high export yield based on raw materials is of little use if the profits are not distributed throughout society, if the high prices are not leveraged for investing in innovation and diversifying the production structure or if those resources are exploited without safeguarding the environment and preserving strategic resources. It is quite a challenge to reverse the trend towards reprimarization of our economies, especially in South America. To do so, we must better manage the financial resources gained, so as to invest in the creation of other forms of physical, human and technological capital. And we must achieve all this with the full inclusion of workers, promoting new skills and knowledge.
BibliographyAssies, Willem (2003), “David versus Goliath in Cochabamba: water rights, neoliberalism, and the revival of social
protest in Bolivia”, Latin American Perspectives, vol. 30, No. 3, 1 May.Baker, Paul, Richard Blundell and John Micklewright (1989), “Modelling household energy expenditures using micro-
data”, Economic Journal, vol. 99, No. 397, Royal Economic Society.Bello, O., L. Ortiz and J. Samaniego (2012), “La estimación de impacto económico y social de los desastres naturales
en América Latina, 1972-2010”, Santiago, Chile, Economic Commission for Latin America and the Caribbean (ECLAC), unpublished.
Bennett, Vivienne, Sonia Dávila and María Nieves Rico (2005), Opposing Currents. The Politics of Water and Gender in Latin America, Pittsburgh, University of Pittsburgh Press.
Bosello, F., C. Carraro and E. De Cian (2010), “Market- and policy-driven adaptation”, Smart Solutions to Climate Change: Comparing Costs and Benefits, Bjørn Lomborg (ed.), Cambridge University Press.
Brundtland, Gro Harlem (1987), Our Common Future, New York, Oxford University Press.Bustamante, Rocío, Elizabeth Peredo and María Esther Udaeta (2005), “Women in the “water war” in the Cochabamba
valleys”, Opposing Currents: The Politics of Water and Gender in Latin America, V. Bennett, S. Dávila-Poblete and N. Rico, University of Pittsburgh Press.
Cecchini, Simone and others (2012), “Vulnerabilidad de la estructura social en América Latina: medición y políticas públicas”, Revista Internacional de Estadística y Geografía, vol. 3, No. 2.
264
Cha
pter
VEconomic Commission for Latin America and the Caribbean (ECLAC)
Chen, Ping-Yu, Sheng-Tung Chen and Chi-Chung Chen (2012), “Energy consumption and economic growth. New evidence from meta analysis”, Energy Policy, vol. 44, May.
Cifuentes, Luis and others (2005), “Urban Air Quality and Human Health in Latin America and the Caribbean”, Pan American Health Organization (PAHO)/Inter-American Development Bank (IDB) [online] http://www.iadb.org/es/publicaciones/detalle,7101.html?id=18964 [date of reference: 22 May 2013].
Dercon, Stefan (2006), “Economic reform, growth and the poor: Evidence from rural Ethiopia”, Journal of Development Economics, vol. 81, No. 1.
EEA (European Environment Agency) (2013), “Atmospheric greenhouse gas concentrations (CSI 013/CLIM 052)-Assessment published Jan 2013” [online] http://www.eea.europa.eu/data-and-maps/indicators/atmospheric-greenhouse-gas-concentrations-2/assessment-1.
ECLAC (Economic Commission for Latin America and the Caribbean) (2013), Social Panorama of Latin America, 2012 (LC/G.2557-P) Santiago, Chile.(2012), Sustainable Development 20 Years on from the Earth Summit: Progress, gaps and strategic guidelines for Latin America and the Caribbean (LC/L.3346/Rev.1), Santiago, Chile, United Nations.(2011), “Efectos del cambio climático en la costa de América Latina y el Caribe. Impactos”, Santiago, Chile, unpublished.(2010a), Economics of climate change in Latin America and the Caribbean. Summary 2010, (LC/G.2474), Santiago, Chile.(2010b), “La economía del cambio climático en Uruguay: Síntesis”, Project Documents, No. 330 (LC/W.330), Santiago, Chile.(2009), La economía del cambio climático en América Latina y el Caribe. Síntesis 2009 (LC/G.2425), Santiago, Chile, November.
ECLAC/Government of Chile (2009), “La economía del cambio climático en Chile. Síntesis 2009”, Project Documents, No. 288 (LC/W.288), Santiago, Chile, December.
Elbers, C., J. Gunning and B. Kinsey (2002), “Convergence, shocks and poverty”, Discussion Paper, No. 2002–035/2, Amsterdam, Tinbergen Institute.
Escudero, Juan and Sandra Lerda (1996), “Implicancias ambientales de los cambios en los patrones de consumo en Chile”, Sustentabilidad ambiental del crecimiento económico chileno, Osvaldo Sunkel (ed.), Santiago, Chile, Sustainable Development Programme, University of Chile.
FAO (Food and Agriculture Organization of the United Nations) (2011), State of the World Forests 2011, Rome.(2010), Global Forest Resources Assessment 2010. Main report, FAO Forestry Paper, No. 163, Rome.(2008), The State of Food Insecurity in the World. High food prices and food security:threats and opportunities, Rome.
Ferrer-i-Carbonell, Ada and Jeroen C. J. M. van den Bergh (2004), “A micro-econometric analysis of determinants of unsustainable consumption in The Netherlands”, Environmental and Resource Economics, vol. 27, No. 4, 1 de abril.
Galindo, Luis Miguel and others, (2013), “Paradojas y riesgos del crecimiento económico en América Latina y el Caribe: una visión ambiental de largo plazo”, Santiago, Chile, Economic Commission for Latin America and the Caribbean (ECLAC), unpublished.
Giarraca, Norma and Norma del Pozo (2005), “To make waves: water and privatization in Tucumán”, Opposing Currents. The Politics of Water and Gender in Latin America, V. Bennett, S. Dávila and M. N. Rico, Pittsburgh University Press.
Guha-Sapir, Debby and others (2012), Annual Disaster Statistical Review 2011. The numbers and trends, Brussels, Centre for Research on the Epidemiology of Disasters (CRED).
Hepburn, C. and N. Stern (2008), “A new global deal on climate change”, Oxford Review of Economic Policy, vol. 24, No. 2.IEA (International Energy Agency) (2012), World Energy Outlook 2012, Paris, OECD Publishing.IPCC (Intergovernmental Panel on Climate Change) (2013), “Summary for Policymakers”, Climate Change 2013: The
Physical Science Basis. Contribution of Working Group I to the Fifth Assessment Report of the Intergovernmental Panel on Climate Change, T. F. Stocker and others (eds.), Cambridge, Cambridge University Press.(2001), Climate Change 2001: The Scientific Basis, J. T. Houghton and others (eds.), Cambridge, Cambridge University Press.
Jackson, Tim and Nic Marks (1999), “Consumption, sustainable welfare and human needs—with reference to UK expenditure patterns between 1954 and 1994”, Ecological Economics, vol. 28, No. 3, March.
Jouravlev, Andrei (2004), “Los servicios de agua potable y saneamiento en el umbral del siglo XXI”, Recursos Naturales e Infraestructura series, No. 74 (LC/L.2169-P), Santiago, Chile, Economic Commission for Latin America and the Caribbean (ECLAC).
265
Cha
pter
V
Compacts for Equality: Towards a Sustainable Future
Lybbert, T. and others (2004), “Stochastic wealth dynamics and risk management among a poor population”, Economic Journal, vol. 114, No. 498.
Margulis, S. (2004), Causes of Deforestation of the Brazilian Amazon, Washington, D.C., World Bank.Martínez, Rodrigo and Amalia Palma (2013), “Seguridad alimentaria y nutricional en cuatro países andinos. Una
propuesta de seguimiento y análisis”, Políticas Sociales series, Santiago, Chile, Economic Commission for Latin America and the Caribbean (ECLAC).
Ozturk, Ilhan (2010), “A literature survey on energy–growth nexus”, Energy Policy, vol. 38, No. 1, January.PAHO (Pan American Health Organization) (2011), Informe Regional del Proyecto “Evaluación Regional del Manejo
de Residuos Sólidos Urbanos en ALC 2010”, Washington, D.C, PAHO/Inter-American Development Bank (IDB).Rico, María Nieves (2006), “Género y agua”, La gota de la vida: Hacia una gestión sustentable y democrática del
agua, Mexico City, Fundación Heinrich Böll. Rodríguez, Daniel and Erik Vergel (2013), “Sistemas de transporte público masivo tipo BRT (Bus Rapid Transit) y
desarrollo urbano en América Latina”, Land Lines, enero. Rodríguez-Oreggia, E. and others (2013), “Natural disasters, human development and poverty at the municipal level
in México”, Journal of Development Studies, vol. 49, No. 3.Sachs, Jeffrey (2009), Common Wealth: Economics for a Crowded Planet, New York, Penguin.Stern, Nicholas (2013), “The structure of economic modeling of the potential impacts of climate change: grafting gross
underestimation of risk onto already narrow science models”, Journal of Economic Literature, vol. 51, No. 3, September.(2008), “The economics of climate change”, American Economic Review, vol. 98, No. 2, May.(2007), The Economics of Climate Change: The Stern Review, Cambridge University Press, January.
Sunkel, Osvaldo and Nicolo Gligo (eds.) (1980), Estilos de desarrollo y medio ambiente en la América Latina, Lecturas del Trimestre Económico, vol. 1, Mexico City, Fondo de Cultura Económica.
UNDP (United Nations Development Programme) (2006), Human Development Report 2006. Beyond scarcity: power, poverty and the global water crisis, New York, Oxford University Press.
UNEP (United Nations Environment Programme) (2010), Environment Outlook for Latin America and the Caribbean: GEO LAC 3, Panama City.(2013), The Emissions Gap Report 2013, Nairobi.
Vergara, Walter and others (2013), The Climate and Development Challenge for Latin America and the Caribbean: options for climate-resilient, low-carbon development, Inter-American Development Bank.
Wackernagel, M. and W. Rees (1996), Our Ecological Footprint: Reducing Human Impact on the Earth, New Society Press.WHO (World Health Organization) (2011), “Air quality and health”, Factsheet, No. 313 [online] http://www.who.
int/mediacentre/factsheets/fs313/en/.(2006), Air Quality Guidelines. Global Update 2005, Geneva.
Wolfram, Catherine, Orie Shelef and Paul Gertler (2012), “How will energy demand develop in the developing world?”, Journal of Economic Perspectives, vol. 26, No. 1, February.

267
Cha
pter
VI
Compacts for Equality: Towards a Sustainable Future
Chapter VI
Natural resource governance for structural change with equality
Economic growth in the region between 2003 and 2008, as well as rising consumption and declining poverty and inequality rates over the past decade (as discussed in earlier chapters) was associated with, among other factors, the high prices of natural resources during that period. Rising international prices of natural resources starting in 2003, with record highs in 2007, brought unprecedented growth in primary sector export value in Latin America and the Caribbean. After falling in July-August 2008 owing to the global financial crisis, commodity prices rebounded and reached, in 2010-2012, levels that nearly —but not quite— matched the previous peak. This favourable cycle did much to improve the macroeconomic performance and fiscal position of the region’s exporting countries.
This recent performance serves as a reminder that the region should not disregard its comparative advantage in natural resources or their great potential. Nor should it ignore the risks of development that is dependent on the primary sectors or, therefore, the need to develop institutional capacities for managing them responsibly. However, as argued throughout this chapter, capitalizing on this set of factors must be combined with progress towards a more diversified production structure, bringing more technical change into the mix and creating quality jobs to sustain societies with higher levels of equality and development opportunities for all.
There are at least two, mutually reinforcing, ways to achieve this synergy. The track followed by a number of industrialized countries shows that it is possible to achieve a virtuous process with technological change, greater value added, diversification and productivity gains starting from a natural-resource-based production system. These sectors can support endogenous innovation that differentiates national products on the international stage while leveraging the development of new industries.
At the same time, sustainable and socially inclusive development of natural resource extraction sectors must go hand-in-hand with proper governance of natural resources to address the many long-term fiscal, regulatory, macroeconomic, public investment and other challenges that countries must overcome to achieve the desired virtuous path. That is the focus of this chapter.
Proper governance of natural resource sectors is crucial. It is reflected in the effective capacity of the State to take the political action needed to ensure that natural resources are exploited in a way that contributes effectively to inclusive economic development, generating production linkages with the rest of the domestic economy, driving the development of appropriate infrastructure to avoid enclaves of natural resource-based exports and combining the growth of these sectors with safeguards for the environment and the rights of peoples and communities, among other goals.
Natural resource governance operates through a set of formal institutions and sovereign policies that determine how ownership of resources —and control and distribution of the rents from their exploitation — is managed. Governance also includes the proper working of mechanisms and instruments (such as stabilization funds, saving and investment and macrofiscal rules) that countries establish in order to ensure efficient public investment of these rents in keeping
268
Cha
pter
VIEconomic Commission for Latin America and the Caribbean (ECLAC)
with long-term fiscal stability and in order to prevent the negative macroeconomic impacts of volatile commodity price cycles and associated foreign currency flows. Proper governance of natural resources must also address public management and resolution of social and environmental conflicts that inevitably arise from large-scale exploitation projects in these sectors.1
Advancing towards a new governance of natural resources that effectively contributes to the structural change for equality advocated by ECLAC is one of the greatest challenges facing the region. As discussed throughout the chapter, this involves a shift in the existing paradigm for natural resources exploitation. Section A of this chapter conceptually reviews the interaction between natural resources, structural change and equality. Section B looks at ownership of natural resources in the region. Section C analyses the participation of the State and patterns of rent appropriation from natural resources exploitation, particularly during the most recent commodity price cycle between 2003 and 2012. The mining sector and the hydrocarbon sector are analysed separately, comparing their differentiated behaviour in response to the price cycle. Section D identifies pending natural-resource-governance challenges in countries of the region, with the ultimate aim of maximizing the contribution of these sectors to structural change with equality.
A. Natural resources, structural change and equality: towards a virtuous circle
There is a widespread perception that the most natural-resource-rich countries tend to be less economically developed than those lacking in natural resources. The empirical literature associated with this hypothesis, known as the natural resources “curse”, examines the various channels through which it might operate. A major focus has been on the impact that greater foreign-exchange earnings from the exploitation of natural resources has on the exchange rate, triggering national currency appreciation. This is known as the Dutch disease,2 where currency appreciation leads to lower relative prices for imported goods and encourages consumption of imported instead of domestically produced goods. Currency appreciation also pushes up the relative cost of domestic industrial products, making them less competitive in international export markets.
This negative impact on the production matrix is heightened as investment is displaced towards the natural resource sector to the detriment of greater production diversification. Natural resource price volatility can also spark wide fluctuations in tax revenues and economic growth. Moreover, the natural resource extraction industries (such as mining and hydrocarbons) tend to be very capital-intensive but much less intensive in direct job creation. These characteristics promote rent concentration, resulting in higher levels of inequality. To the extent that the exploitation of natural resources creates only weak demand for a highly-skilled workforce,3 developing those resources does not foster higher education levels among the population, nor does it stimulate the emergence of more technology-intensive production.
International experience shows instances of countries where exploitation of natural resources leads to a political economy in which a small group captures the rents and uses them to reinforce patterns of inequality and social segregation and to maintain authoritarian control over the political apparatus. In such cases the rents are not used for production purposes, or they are squandered on volatile current expenditure with negative consequences. There are also cases of “developmental” governments, giving rise to a political economy in which the State captures most of the rents and uses them effectively to invest in education or to boost social cohesion through sustainable redistribution
1 Governance is defined here as the joint action and exercise of public authority by agents of the State (executive, legislative, judicial, sector regulatory agencies, and others) through the existing framework of policies, institutions and regulations. Governance of natural resources is exercised through the set of formal institutions (such as the constitutional framework, legislation, the fiscal framework and sectoral regulation), informal institutions (the rules implicit in standard practice) and sovereign political decisions that, all together, influence how the extractive sectors operate. This governance structure determines property ownership regimes (laws on concessions, for example), tax frameworks (tax treatment specific to these sectors), mechanisms for saving, distributing and using public rents from these sectors (investment and stabilization funds) and other functions governing activities associated with natural resource extractive sectors. See ECLAC (2012c, 2013a and 2013b) and Acquatella and others (2013).
2 A natural resource export boom is not the only variable that can trigger overvaluation. The Latin American experience of the 1970s through the 1990s shows how the combination of high international liquidity and high interest rates can result in marked overvaluation that is not associated with an export boom but rather driven by external financial flows.
3 However, this is not entirely true of the oil industry (particularly offshore oil drilling). Both of these industries require skilled workers and engineering services for operation, maintenance and management.
269
Cha
pter
VI
Compacts for Equality: Towards a Sustainable Future
mechanisms that can simultaneously foster productivity and equality. In this case, natural resources, structural change and equality would not be mutually exclusive options, but rather form a virtuous circle.
The so-called natural resources “curse” is not so much a set of factors as the result of a certain type of political economy that blocks the exercise of effective governance to pursue the industrial and technology policies needed to drive structural change towards greater equality. Abundant natural resources and lagging development are thus not inexorably connected, nor does the connection hold for all countries. A number of developed countries (among them, Australia, Canada, Norway, New Zealand and the United States) have abundant, intensively-exploited natural resources, low levels of inequality and high levels of productive investment with intensive capacity development. A look at national experiences therefore suggests that there are other elements to be considered in order to understand the link between natural resources, development and equality.
There have been many efforts to find empirical evidence of the relationship between natural resources and economic growth, on the one hand, and natural resources and inequality, on the other, as well as the channels that link these variables. Older, cross-cutting studies found a negative correlation between natural resources abundance and economic growth (for example, Sachs and Warner, 1995). But more recent studies, based on panel data, find that there is no significant correlation, or that the correlation is even positive (for example, Lederman and Maloney, 2006). Something similar occurs when examining the relationship between abundance of natural resources and inequality: it is not possible to reach a general conclusion on the nature of this relationship based on empirical evidence.4
This ambiguity is more intriguing than surprising, because it indicates that there are multiple factors mediating the link between natural resources, economic performance and inequality, and that they are difficult to adequately capture in this kind of study. These factors have to do primarily with institutional aspects and can encompass levels of corruption, degree of compliance with and enforcement of laws, concentration of power in the elite, level of transparency in the management of rents and the presence of social oversight mechanisms, among others (Collier and Goderis, 2007; van der Ploeg, 2011). The findings set out by Mehlum and others (2006) and Iimi (2007) would be consistent with this idea because they show that natural resources are associated with higher levels of economic growth in countries with strong institutions,5 and with low levels of growth in countries with weak institutions6. Collier (2010) reaffirmed that “the resource curse is confined to countries with weak governance.”
This assessment of the importance of institutional factors calls for further examination of the aspects involved, and in particular a more in-depth look at the specific dimensions that improved governance of natural resources should encompass. Only then will it be possible to pinpoint the principles that should guide agreements on natural resource governance, so as to advance towards structural change with equality.
1. Natural resources, equality and recognitionThere are a number of facets to the relationship between natural resource exploitation and equality. Most of the focus has been on the potential correlation between natural-resource-intensive production and higher levels of inequality. As discussed above, the empirical literature shows no conclusive evidence thus far, beyond the potential influence of institutional conditions and mediation.
4 Such estimates have substantial limitations relating to information quality (particularly in the case of inequality), the importance of the variables omitted and potential endogeneity. The findings are highly sensitive to the periods reviewed, the sample of countries and the measurement of variables. In addition, long-term impacts (which such estimates usually seek to identify) must be distinguished from the short-term impacts of booms (Collier and Goderis, 2011).
5 The idea that institutional aspects determine the potential for exploiting a country’s natural resources, and that those institutions are in turn dependent on a set of factors, is not new in the literature. The strong link between the set of factors, production structure and institutional framework had already been raised by Sunkel and Paz (1975) and more recently taken up again by the neo-institutionalist current (Engerman and Sokoloff, 2000; Acemoglu and others, 2002; and Robinson, Torvik and Verdier, 2006, among others).
6 The literature refers particularly to weak financial and fiscal institutions as the most critical ones in the case of natural resources. Financial institutions are important because they can manage trade-offs in the timing of rent flows from natural resources through stabilization and investment funds. Fiscal institutions are key because of the need for institutions that ensure strict fiscal discipline (like macrofiscal rules) in order to decouple natural resource rent cycles from political cycles and the temptation to inflate short-term current spending during rent booms. Those countries with fiscal institutions mandated to stabilize public expenditure and saving or public investment over long-term horizons are the only ones that manage to avoid the adverse macroeconomic impacts of volatile public spending and the temptation to overborrow, with its negative impact on long-term economic growth.
270
Cha
pter
VIEconomic Commission for Latin America and the Caribbean (ECLAC)
There are other aspects of the relationship between natural resource exploitation and equality that are of interest. The inequalities associated with the territorial distribution of rents from the exploitation of these resources among locations or geographical areas and among levels of government within each country provide one example. Intergenerational equality is another relevant dimension. Natural resources are finite, so their sustainability needs to be safeguarded for future generations, deploying the necessary tools to prevent irreversible damage and avoid passing on the cost of their depletion by present generations.
The idea of equality entails equal dignity, mutual recognition, respect and consideration of the opinions of others. Recent experience in the region makes it clear that natural resource exploitation often sparks conflict arising from displacement and relocation of communities, including indigenous peoples. Addressing these conflicts on a basis of equality entails correcting for imbalances in voice, visibility, influence and other resources that can make deliberations asymmetrical.
Some of the investments aimed at new or expanded extraction projects have been very controversial because of their socioenvironmental and distributive impacts. The triggers of conflict have ranged from water, soil and air pollution to territorial issues, lack of prior informed consent from the affected communities, violation of human rights, non-compliance with corporate social responsibility (CSR) policies by some of the mining or drilling companies and the efforts of some communities to secure a larger share of the economic benefits of resource exploitation.
In areas of the region where water is a scarce resource, competition between inherently exclusive uses sets off conflict. The mining industry requires significant quantities of water in areas where local communities face challenges in obtaining it, both for their economic activities and for basic drinking water needs. In Latin America situations have arisen where the granting of water rights has impacted aquifer flows in water-stressed areas, causing high levels of salinity and heavy metal content in streams and microbasins. This has hurt traditional subsistence farming communities owing to low water availability.7
Social and environmental conflicts are an emerging face of citizen demands for greater equality. They mobilize groups and peoples who are directly or indirectly affected by the exploitation of these resources. Their demands tend to combine specific issues concerning vital resources (access to water, land and other production resources having to do with the environment) with distributive demands rooted in long-standing socioeconomic lags, and issues of recognition and identity when indigenous peoples are involved (see box VI.1).
7 This has happened in specific areas of some countries, like the Huasco valley in Chile, Cajamarca in Peru and Lavaca in Argentina. See Centro de Cambio Global, 2010.
Box VI.1 The rights of indigenous peoples
A worldwide study conducted by the United Nations Special Rapporteur on the rights of indigenous peoples identified 226 ongoing socioenvironmental conflicts between 2010 and 2013 in indigenous territories of America related to extractive mining and hydrocarbon projects (see [online] www.unsr.jamesanaya.org). They encompass virtually all of the countries of Latin America, except Guyana, Suriname and Uruguay. Conflicts can be described as follows: (i) Conflicts arising from inadequate or non-existent judicial safeguards for indigenous peoples’ rights over their lands, waters and natural resources, biodiversity and territories; (ii) conflicts stemming from disturbance of sacred sites; (iii) conflicts related to poor or non-existent independent assessments of the environmental, social, economic and territorial impact of extraction projects; (iv) conflicts over the State’s failure to fulfil its duty to consult with indigenous peoples and implement safeguards and measures to protect their rights before awarding concessions or authorizing extraction projects; (v) conflicts caused by excluding indigenous peoples from sharing in the benefits of the exploitation of resources in their territories; and (vi) conflicts due to criminalization of indigenous social protest against investment projects that affect their rights and territories.
One of the unresolved challenges to the growth of the extractive industries how to integrate the rights of indigenous peoples into a new model of natural resource governance. A number of organizations of the United Nations system have interpreted human rights standards concerning indigenous peoples and developed principles and guidelines on extractive industries and the rights of indigenous peoples.a The baseline is that international standards and practice have recognized that indigenous peoples have a sui generis right to communal ownership of land, territories and natural resources which they have traditionally used or occupied, namely, in accordance with their culturally differentiated patterns of use and occupation (articles 24 to 29 of the United Nations Declaration on the Rights of Indigenous Peoples; articles 13 to 17 of International Labour Organization (ILO) Convention No. 169 concerning Indigenous and Tribal Peoples in Independent Countries. These standards encompass a wide range of activities that are not necessarily limited to economic subsistence activities but include cultural and spiritual uses of the territory and the resources needed for their economic and social development as peoples. The international normative understanding is that the right of indigenous peoples to lands, territories and natural resources comes from their

271
Cha
pter
VI
Compacts for Equality: Towards a Sustainable Future
own common law, values, traditions and customs, and hence predates and is independent from State recognition in the form of an official deed of ownership. This means that the States of the region need to establish regulatory regimes that recognize and fully respect these rights and must provide for sanctions and effective remedies when these rights are violated. The participation of indigenous peoples in strategic planning should be ensured through appropriate representation arrangements.
The consent of indigenous peoples must be sought for extractive industries within indigenous territories. Procedures for consultation on proposed extraction activities are channels that enable indigenous peoples to contribute actively to the prior assessment of all the potential impacts of a proposed activity. Project impact studies and the identification of appropriate measures to offset any negative impacts and ensure a share of the benefits are a necessary part of the consultation process.
The establishment of mechanisms for the peoples affected by such projects to participate in the benefits thereof is explicitly regulated in article 15 paragraph 2 of Convention No. 169 and has been reiterated, among others, by jurisprudence of the Inter-American Court of Human Rights and the Committee on the Elimination of Racial Discrimination (CERD). There should be a clear distinction between participating in the benefits of a project as a right of indigenous peoples and “fair compensation for any damages which they may sustain as a result of such activities.”a
Corporate social responsibility policies have been implemented to foster more responsible operation and improve relations between companies and affected communities. These policies seek to reduce the potential impacts of exploitation and improve the living conditions of affected communities through specific projects. But the failure of companies to keep agreements initially offered has sparked considerable conflict in some cases.
Indigenous peoples’ right to prior consultation is another important tool which has been used in some countries. This is particularly important in areas of natural resource exploitation and other environmentally sensitive areas where indigenous peoples have a presence. In Peru, for example, in 2013 two consultation processes were concluded between indigenous peoples and the State, one concerning the Kichua-Maijuna Regional Conservation Area and the other, hydrocarbons block 169.
One unresolved issue is remediation of cumulative environmental liabilities resulting from mining that have built up over years owing to improper handling of waste and the lack of specific regulations on mine closure. In many cases, the responsible party is unknown and there is no legislation requiring remediation. Financial institutions have begun to pay more attention to environmental liabilities and other socioenvironmental risks when considering financing new projects. All these factors have led the extractive industry and States to step up their efforts to prevent socioenvironmental conflict and manage it appropriately when it does occur.
Source: Latin American and Caribbean Demographic Centre (CELADE)-Population Division of ECLAC, on the basis of Victor Toledo, “Auge primario exportador, derechos de pueblos indígenas y desafíos de nueva gobernanza de los recursos naturales”, Santiago, Chile, Economic Commission for Latin America and the Caribbean (ECLAC), 2014, unpublished.
a See United Nations, Report of the Special Rapporteur on the rights of indigenous peoples, James Anaya. Extractive industries and indigenous peoples (A/HRC/24/4), New York, July 2013.
Over the past decade these conflicts have gained in political relevance and moved up public agendas as they have come to bear on infrastructure development and projects of national importance, and draw the attention of broad sectors of society, both nationally and globally. In many cases the growing judicialization of these conflicts reveals the inability on the part of the State and the lack of effective mechanisms to resolve tensions and asymmetries among social stakeholders in an expeditious and timely manner. Because of these social pressures, the countries of the region are increasingly faced with the need for innovative processes to reach political agreements for expeditious resolution of these conflicts, as well as new institutional and judicial mechanisms to regulate the impact of natural resource exploitation, along with appropriate sanctions and compensation.
The pressure that socioenvironmental conflict brings to bear on the public apparatus touches upon a number of the dimensions of equality discussed herein. First, it impacts intergenerational equality, when the exploitation of natural resources negatively impacts the environment and the availability of natural resources for future generations. Second, it affects equality as mutual recognition, when the impact is on lands and resources of indigenous peoples who claim their collective rights to their ancestral heritage and use of the resources. Lastly, it impacts equality in terms of ownership and distribution of rents, given the high concentration of rents, their limited distribution in the social setting where the extractive activity takes place and, often, lack of transparency and of mechanisms for social oversight of how the resources are managed and used by both the public and the private sector.
2. Natural resources and structural changeJust as there is no unequivocal relationship between exploitation of natural resources and impact on equality and inequality, there are no rigid linkages either between exploitation of natural resources and the dynamics of structural change. Once again, the quality of governance through existing institutions, policies and rules of the game is crucial. Governance should address the risk of natural resource abundance inhibiting sectoral diversification and structural change. This requires a special effort in learning and in incorporating technical progress, and in promoting knowledge-intensive sectors.
Box VI.1 (concluded)
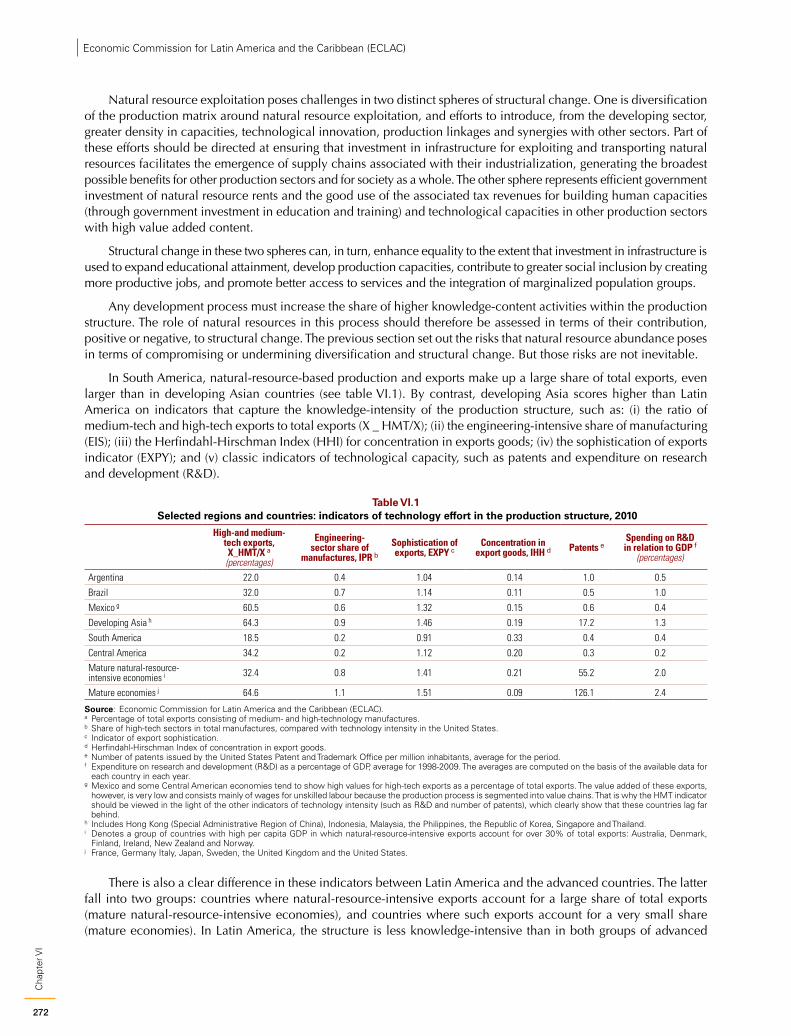
272
Cha
pter
VIEconomic Commission for Latin America and the Caribbean (ECLAC)
Natural resource exploitation poses challenges in two distinct spheres of structural change. One is diversification of the production matrix around natural resource exploitation, and efforts to introduce, from the developing sector, greater density in capacities, technological innovation, production linkages and synergies with other sectors. Part of these efforts should be directed at ensuring that investment in infrastructure for exploiting and transporting natural resources facilitates the emergence of supply chains associated with their industrialization, generating the broadest possible benefits for other production sectors and for society as a whole. The other sphere represents efficient government investment of natural resource rents and the good use of the associated tax revenues for building human capacities (through government investment in education and training) and technological capacities in other production sectors with high value added content.
Structural change in these two spheres can, in turn, enhance equality to the extent that investment in infrastructure is used to expand educational attainment, develop production capacities, contribute to greater social inclusion by creating more productive jobs, and promote better access to services and the integration of marginalized population groups.
Any development process must increase the share of higher knowledge-content activities within the production structure. The role of natural resources in this process should therefore be assessed in terms of their contribution, positive or negative, to structural change. The previous section set out the risks that natural resource abundance poses in terms of compromising or undermining diversification and structural change. But those risks are not inevitable.
In South America, natural-resource-based production and exports make up a large share of total exports, even larger than in developing Asian countries (see table VI.1). By contrast, developing Asia scores higher than Latin America on indicators that capture the knowledge-intensity of the production structure, such as: (i) the ratio of medium-tech and high-tech exports to total exports (X _ HMT/X); (ii) the engineering-intensive share of manufacturing (EIS); (iii) the Herfindahl-Hirschman Index (HHI) for concentration in exports goods; (iv) the sophistication of exports indicator (EXPY); and (v) classic indicators of technological capacity, such as patents and expenditure on research and development (R&D).
Table VI.1 Selected regions and countries: indicators of technology effort in the production structure, 2010
High-and medium-
tech exports, X_HMT/X a (percentages)
Engineering-sector share of
manufactures, IPR b
Sophistication of exports, EXPY c
Concentration in export goods, IHH d Patents e
Spending on R&D in relation to GDP f
(percentages)
Argentina 22.0 0.4 1.04 0.14 1.0 0.5
Brazil 32.0 0.7 1.14 0.11 0.5 1.0
Mexico g 60.5 0.6 1.32 0.15 0.6 0.4
Developing Asia h 64.3 0.9 1.46 0.19 17.2 1.3
South America 18.5 0.2 0.91 0.33 0.4 0.4
Central America 34.2 0.2 1.12 0.20 0.3 0.2Mature natural-resource-intensive economies i 32.4 0.8 1.41 0.21 55.2 2.0
Mature economies j 64.6 1.1 1.51 0.09 126.1 2.4
Source: Economic Commission for Latin America and the Caribbean (ECLAC).a Percentage of total exports consisting of medium- and high-technology manufactures.b Share of high-tech sectors in total manufactures, compared with technology intensity in the United States.c Indicator of export sophistication. d Herfindahl-Hirschman Index of concentration in export goods.e Number of patents issued by the United States Patent and Trademark Office per million inhabitants, average for the period.f Expenditure on research and development (R&D) as a percentage of GDP, average for 1998-2009. The averages are computed on the basis of the available data for
each country in each year.g Mexico and some Central American economies tend to show high values for high-tech exports as a percentage of total exports. The value added of these exports,
however, is very low and consists mainly of wages for unskilled labour because the production process is segmented into value chains. That is why the HMT indicator should be viewed in the light of the other indicators of technology intensity (such as R&D and number of patents), which clearly show that these countries lag far behind.
h Includes Hong Kong (Special Administrative Region of China), Indonesia, Malaysia, the Philippines, the Republic of Korea, Singapore and Thailand. i Denotes a group of countries with high per capita GDP in which natural-resource-intensive exports account for over 30% of total exports: Australia, Denmark,
Finland, Ireland, New Zealand and Norway.j France, Germany Italy, Japan, Sweden, the United Kingdom and the United States.
There is also a clear difference in these indicators between Latin America and the advanced countries. The latter fall into two groups: countries where natural-resource-intensive exports account for a large share of total exports (mature natural-resource-intensive economies), and countries where such exports account for a very small share (mature economies). In Latin America, the structure is less knowledge-intensive than in both groups of advanced
273
Cha
pter
VI
Compacts for Equality: Towards a Sustainable Future
countries, including those that are natural-resource-intensive. This confirms the idea that natural resources are not per se a curse. There are countries that, through appropriate policies, were able to overcome the so-called natural resource curse, using those resources to build new capabilities.
As mentioned above, one of the variables through which a natural resource boom influences the production structure is the real exchange rate. Improving terms of trade and faster growth can put downward pressure on the nominal exchange rate and upward pressure on nominal domestic prices, both for tradable goods (imported inflation) and non-tradables (rising aggregate-demand effect).8 The recent natural resource boom has not been the only factor behind recent currency appreciation in the region, however.
During 2003-2012 there were two distinct stages in the behaviour of the balance-of-payments current account. Between 2003 and 2008, current-account surpluses and substantial capital inflows resulted in a significant build-up of international reserves. In this case, it is fair to say that both factors together influenced the appreciation of national currencies. The 2009-2012 period was marked by fallout from the 2008 financial crisis, which cooled soaring natural resource prices (especially for minerals and agricultural products, but not oil), amid the return of capital flows to the region. Those years also witnessed current account deterioration in several countries, such as Brazil, Ecuador, Colombia, Chile (starting in 2011), Mexico and Peru. In this case capital flows funded the current account deficit and even allowed for a build-up of international reserves.
Capital flows played the greater role in national currency appreciation in recent years (ECLAC, 2013c, p.7), making it necessary to identify the sources of overvaluation and consider their potential interaction. Ismail (2010), for example, notes that the negative impact of a country’s oil exports on the aggregate value of its manufactures is stronger when the capital account is open (see also Ros, 1997). This recent experience in the region shows that natural resource governance must also mesh with macroeconomic policies (particularly during certain international financial scenarios) and, more specifically, with policies for controlling capital inflows and macroprudential policies aimed at preventing asset bubbles.
3. Natural resources and infrastructureInfrastructure is a facilitating factor for economic activity; it is a mechanism for promoting equality too because it can improve the availability of basic services such as water and electricity as well as access to education, health and other services. Efficient infrastructure thus benefits all economic activities, and societies in general.
It is important, then, to consider whether investment in infrastructure for exploiting natural resources has the desired synergy impacts: whether it generates positive externalities by promoting better access and connecting geographical areas, whether it expands services to cover excluded groups, and whether it lays the logistic groundwork for greater diversification of activities. Historically, infrastructure has been developed in keeping with the requirements of the most significant export sectors (such as renewable and non-renewable natural resources). High-volume bulk exports of natural resources (like iron and coal) require large-scale physical transport and logistics infrastructure in the form of corridors. Infrastructure in developing and natural-resource-exporting countries has often been used primarily to meet the needs of major mining and drilling companies and has led to the development of infrastructure enclaves. This blocks suppliers and processors from effective participation in commodity value chains.
Ongoing extraction of renewable and non-renewable resources has helped fuel rising demand for infrastructure networks in the region. That demand has not been fully met. The demand for transport for the region’s main natural resources increased 56% by tonnage between 2003 and 2010, and the geography of that trade has changed significantly. In 2010, 69% of these commodities went to Asia and the Pacific; accordingly, 93% of exports were shipped by sea. While there is enough international sea freight capacity to meet this demand, the greater volume has major implications for the region because of the need for sufficient ground infrastructure capacity to transport goods from point of origin to port of export.
8 Both movements make a country less competitive and can push certain activities to extinction (especially in manufacturing). These activities lose ground not because companies lag behind technologically or in relative productivity, but rather because of real currency appreciation. This is compounded by the impact of differential yields on resource allocation, inasmuch as an export boom can draw scarce resources away from the non-tradable sector.
274
Cha
pter
VIEconomic Commission for Latin America and the Caribbean (ECLAC)
Using most of the transport infrastructure for natural resource exports has worsened the infrastructure deficit that exists virtually across the entire region and has implications for logistics services, in the form of high costs (Wilmsmeier and Sánchez, 2012). The infrastructure gap in Latin America and the Caribbean has been estimated as equivalent to 6.2% of GDP per year (Perrotti and Sánchez, 2011). And exploitation of natural resources requires transport of heavy loads, which impacts roads, highways and railways. For example, in Norway almost 50% of infrastructure investment goes to infrastructure maintenance.
The natural resource boom holds the potential for alleviating the region’s infrastructure deficit by fostering the development of infrastructure geared towards output diversification. But the privatization of mining and the industrialization of agricultural production (wheat and soybean farming, for example) have not, so far, generated positive linkages involving related infrastructure, denying other sectors the opportunity to take advantage of infrastructure improvements. Despite economic growth in recent decades, the countries of the region have not managed to close the longstanding infrastructure gap.
The challenge therefore lies in framing the exploitation of natural resources in the policy horizon for equality in the broad sense. This entails capacity-building, public investment of rents taking a long-term view to ensure widespread well-being both now and in the future, territorial distribution of the benefits along with adequate infrastructure, and recognition of the social actors that can contribute and benefit through effective linkage to supply chains associated with the development of these sectors.
B. Ownership of natural resourcesA strategically important part of natural resource governance has to do with the legal frameworks, tools and definitions by which States govern ownership of those resources. Case histories in the region and empirical evidence show that these frameworks have a bearing both on the appropriation and distribution of gains from the exploitation of natural resources and on whether (and how) non-renewable natural resources further more inclusive development. Here, again, the institutions and political decisions that shape governance are critical.
Sovereignty to regulate ownership of assets defined as being in the “public domain” is crucial for ensuring that the processes for exploiting them and the associated rents endogenize the benefits (capacities, technology and fiscal resources for social and economic investment) and mitigate negative externalities, such as environmental impacts and depletion of non-renewable resources.
1. Strategic aspects of natural resource ownershipThe constitutions of the countries in the region tend to agree that natural resources (renewable and non-renewable) are State-owned and in the public domain (see table VI.5). Their use should not be divorced from the national interest and the common good. Therefore, the State should have full sovereignty over natural resources and set the terms for exploiting them. On these grounds, the State grants rights (of usage, in the case of renewable resources like water) or concession (in the case of non-renewable natural resources) to a holder who has a real right to the concession or to the use of the resource, but not to the resource itself.
In federal countries, the notion of public good can lead to confusion as to the ownership of resources. In Argentina, for example, original domain (which comes from mining law) refers to State sovereignty over the territory. It is not tied to ownership of resources. The authority to manage resources in keeping with rational and sustainable use thereof falls to the national congress. This authority can be complemented by means of provincial laws, which may have stricter (certainly never looser) requirements than national legislation and are always subordinate to the latter (Rebasa, 2012). In this case, original domain does not convey ownership but rather the right to enforce legislation and specific regulations. Nevertheless (and despite widespread acceptance that natural resources are assets in the public domain), there is no ignoring that in certain sets of laws (including constitutions) there could be disagreement on this, with the risk that those assets could be left without legal protection. For ECLAC, assets in the public domain should come under a special regime consisting primarily of the attributes of inalienability, inextinguishability and unseizability.
275
Cha
pter
VI
Compacts for Equality: Towards a Sustainable Future
Changing scopes and definitions of resource ownership and exploitation thereof by the public sector or the private sector are a source of tension that is specific to each type of exploitation. One of them, which is examined in this chapter, is the potential contradiction between encouraging investment and ensuring that the participation of the State in economic rents is progressive, that is, that the State’s participation becomes proportionately greater during price boom cycles that generate windfall earnings.9 This tension appears both in the oil sector and in the mining sector. How progressive State participation is depends on regulation and tax schemes, which vary widely across the region. So, the State’s share of economic rents also varies widely, as discussed below.
Another kind of tension between the different approaches to natural resource ownership can be seen in tax competition between countries to attract investment, usually foreign direct investment. Greater coordination and harmonization of tax and environmental treatment among investment-receiving countries seems necessary to keep the easing of policy instruments (fiscal policy in general and tax policy in particular) from perversely fuelling tax competition between countries in order to attract investment. This would work against more sustainable exploitation of these resources with greater public participation in the rents.
In regimes where most resources are in the public domain or under eminent domain, governments play a crucial role in the design and implementation of regulatory and fiscal frameworks and in macroeconomic management, strategic planning, public policy design and implementation and management of socioenvironmental conflict, among other functions. The fulfilment of that role requires institutional innovation and public administration capacity-building to optimize the social benefits of exploiting those resources (ECLAC, 2013a and 2013b). And public ownership of resources gives rise to demand for intergenerational equity: a system of exploitation and appropriation of its benefits that preserves the value of the stock of resources for future generations.
2. Resource ownership in the mining and oil sectorsIn mining, the determination that subsurface resources belong to the State under public domain has a number of implications. Besides legitimizing the collection of royalties (discussed below), State ownership means that mining concession holders cannot book the asset value of proven reserves. This has credit rating implications for these companies, because their assets will be lower than if resources belonged to the discoverer.
Similarly, in the event of expropriation, the value of any compensation to the concession holder will not include the value of those reserves because the concession holder does not own them. In Chile, there is an obvious contradiction between the constitution (which establishes State ownership of subsurface resources as a public good) and the mining code, which provides that mining concessions, once granted, are open-ended. Compensation in the event of revocation includes all potential future flows from exploitation of current reserves, which amounts to ownership.
As for hydrocarbons, the prevailing approach in the region is that they are inalienable property of the State. This applies both to hydrocarbons in the ground and to those already extracted. When hydrocarbons are exploited by private companies, legislation is often enacted to ensure supply for the domestic market.
In Ecuador, the 2008 Constitution requires that private companies that exploit hydrocarbons sell them to the State at a price determined according to a commercial formula. In Brazil there is also a very clear requirement that private contractors meet domestic market needs first. In Argentina, legislation prior to 2002 accorded full ownership of hydrocarbons to the contractors, who could sell them after paying a royalty. This was amended by a number of laws passed after 2002, which created a withholding tax on oil exports and require suspension of natural gas exports to third countries when domestic market supply is threatened.
The approach is different in Peru, where the licensee owns the hydrocarbons and therefore decides what to do with them (article 8 of Law No. 26221). This legislation can spark tensions, because even when the government establishes the need for domestic supply in a particular situation, the licensee may have different priorities and block implementation of the government’s decision.10
Recent changes related to hydrocarbon ownership regimes in Mexico and Peru are set out in box VI.2.
9 See ECLAC (2012c) and Acquatella and others (2013).10 This happened with the export of gas from Camisea gas field block 56 and could happen with Camisea block 58. The government
holds that it should go to supply the South Andean gas pipeline, which is currently open for bidding.
276
Cha
pter
VIEconomic Commission for Latin America and the Caribbean (ECLAC)
Box VI.2 Mexico and Peru: recent changes affecting hydrocarbon ownership regimes
1. Mexico, a shift in assumptions and in the energy model
Mexico recently made a significant change regarding energy (both electricity and hydrocarbons) with the declared purpose of attracting more investment, boosting job creation, increasing the pace of economic growth, promoting technological change and strengthening public finances. The constitutional reform approved in Mexico in December 2013 substantially changes the country’s energy model.
Since 1938 Mexico had built its own petroleum model under constitutional reforms approved in 1940 and 1959, grounded in national ownership of hydrocarbons (from exploration and extraction to commercialization), the State’s exclusive right to exploit these resources and State appropriation of 100% of oil rents. This model, which lasted for more than 70 years, has been replaced by a new constitutional framework under which the nation owns only hydrocarbons in situ, the State no longer has exclusive oil rights and private investment is allowed under several kinds of contract: service contracts, utility or production-sharing agreements and licenses.
Although the reform provides for a “Round Zero” in awarding fields for development, opening to private investment means, in essence, that State ownership of 100% of oil rents will be replaced by combinations under which the rents will be shared with private investors.
The reform also entails a substantial change in the institutional framework: Petróleos Mexicanos (PEMEX) will cease to be a decentralized State agency and will become a State-owned production company; the Mexican Petroleum Fund for Stabilization and Development is created as a public trust with the Bank of Mexico, the central bank, acting as trustee; new attributes are vested in the Ministry of Energy and the National Hydrocarbon Commission; the role of the Ministry of Finance and Public Credit is redefined; the legal nature of the Energy Regulatory Commission is changed and new powers are conferred to it; instructions were issued to establish the National Natural Gas Control Centre and the National Energy Control Centre (CENACE). This is, in short, a sweeping reform package including three new articles in the constitution (25, 27 and 28) plus 21 transitional articles.
It is too early to determine the impact of this shift. Time will tell whether it meets expectations regarding investment, employment, economic growth and public finances.
2. Peru: Talara refinery upgrade and reorganization of Petróleos del Perú (PETROPERÚ)
In December 2013, the executive branch sent a bill to congress declaring that it was a public necessity and in the national interest to modernize the Talara refinery in order to preserve the air and public health and take action to strengthen the corporate governance of PETROPERÚ. Congress passed the bill by a large majority. According to Law No. 30130, the Talara refinery modernization project is justified by the need to reduce the sulphur content of fuels. Apart from desulphurization, the project includes expanding refining capacity (from 65,000 barrels a day to 95,000 barrels a day) and technological improvements for heavy crude oil refining. PETROPERÚ will invest US$ 2.73 billion (to be financed with foreign debt); another US$ 730 million in periphery works will be awarded to private companies.
The law makes three additional provisions. The first is opening the company to private capital, up to a 49% stake; this is more than the ceiling set by Law No. 29817 enacted in 2011 (which authorized PETROPERÚ to trade up to 20% of its shares on the Lima stock exchange). Second, the law bars PETROPERÚ from investing in projects that generate liabilities or contingent liabilities. There is therefore no way of knowing whether PETROPERÚ will be able to return to upstream operations (which it exited in 1996 when its production blocks were bid out to private companies) by operating block 64 in Selva Norte. This would bring in additional revenue for the company and improve its cash flow and thus its ability to pay off the loan it will take out to finance the Talara refinery. The third issue relates to a reorganization plan for maximizing the value of the company, including an administrative reorganization, restructuring its debt, repairing its finances and legal affairs, and ensuring the sustainability of its stock.
In short, approval of the modernization plan makes for continuity of the company’s operations. As for the three additional provisions, their impacts on the performance of PETROPERÚ remain to be seen. However, many analysts consider the most important thing to be ensuring vertical integration, because this would provide access to oil rents, which it now lacks.
Source: Economic Commission for Latin America and the Caribbean (ECLAC), on the basis of official information from the respective countries.
3. Mechanisms for State participation in the mining and oil sectorsIn the mining sector, production is usually under operating concessions that the State awards to private firms. The main instrument for State participation in mining rents is the corporate profit tax paid by mining companies, sometimes along with other, specific taxes as well as royalties (which are considered non-tax payments to the State, as owner of the resource). The exception is CODELCO, a Chilean State-owned enterprise through which the State is directly involved in exploitation.
Ownership of natural resources gives States the option of charging third parties a royalty on each unit of resource extracted, among other payments, in return for the right to operate those resources. Royalties are in addition to taxes on all business operations. There are different formulas for determining royalties payable, which in turn may have different consequences in terms of levels of activity of extractive industries, in particular the levels of extraction and investment in exploration. One possibility is to link the royalty amount to a benchmark that is a proxy for the
277
Cha
pter
VI
Compacts for Equality: Towards a Sustainable Future
profitability of the operation, plus a component to take account of deposit depletion. Another option is basing it on the gross value of the mineral extracted.
The first option (linking the royalty to profitability) is preferable in theory; in practice, it turns royalty payments into the equivalent of a specific tax that marginally increases the normal tax burden paid by a company on its reported profits (corporate profit tax). However, linking royalties to profitability means that the tax authorities need independent estimates of profits. This requires a level of institutional development that is not always found in developing mining countries.
Accordingly, royalties are often assessed on the gross value of mineral extracted, which is directly observable. This option has the disadvantage of making the effective tax burden (taxes plus ad valorem royalty) regressive and penalizing less profitable projects because they pay royalties whether are not they make a profit. Under this modality, the effective tax burden is unknown ex ante and depends on the characteristics of each deposit, which determine the cost of extraction (Otto and others, 2006). Therefore, it is not possible to estimate a priori the royalty impact on exploration and development operations nor whether the rate adequately captures the proportion of the rents corresponding to depletion of the State-owned resource.
In practice, in the countries of the region (particularly in the mining sector), royalties end up being a mechanism for marginally increasing the effective corporate profit tax rate paid by mining companies. In a way, the countries have resorted to royalties as a means to ensure that the mining sector pays a marginally higher tax than companies in other economic sectors, on the grounds that they are extracting a State-owned non-renewable resource.11
As will be seen in the following section, the State’s share of mining rents varies widely across the region: between 25% and 35% during 2003-2008 in countries with a longstanding mining tradition, albeit significantly smaller (between 10% and 15%) in other countries of the region. In response to the price boom that began in 2003, several countries of the region (Chile and Peru for example) introduced new royalties in an effort to complement the corporate income tax take. But the contribution of the new royalties has been relatively minor. The fact that the principal instrument for State participation is a tax on profits reported by the mining companies themselves highlights how important it is for governments to have independent mechanisms and specific indicators to make sure that the sector’s profits and costs are transparent throughout price cycles. This is an unresolved issue in most of the countries. Having a State-owned enterprise whose reporting can ensure transparency in profits and costs could partially meet this need. Unlike in the mining sector, in the hydrocarbon sector State-owned enterprises (like PEMEX, PDVSA, PetroEcuador, YPF and YPFB) and mixed-ownership enterprises in which the State has a majority stake (such as Petrobras and Ecopetrol) continue to play a leading role. The State’s take as a percentage of potential economic rents of the hydrocarbon sector ranged from 34% to 78% in exporting countries in 2010-2012. These values are in line with the international trend in most oil exporting countries and reflect a larger direct participation of the State through public and mixed-ownership oil companies, as well as the longer track record that oil tax systems have in designing fiscal and contractual instruments that ensure that the State’s share of the sector’s rents is progressive, as discussed below.12
In countries with substantial hydrocarbon deposits, fiscal regimes and instruments have evolved over time to ensure public appropriation of rents. Direct participation of the State, either through public enterprises or through shareholdings, is the general rule. In the oil sector, other common practices include scaled royalties, windfall taxes (triggered when prices rise above certain thresholds) and the use of risk- or production-sharing contracts, to ensure a larger and progressive participation by the State in hydrocarbon rents during oil price upcycles.13
A principle that should guide the design of taxes on the exploitation of natural resources is progressiveness, that is, a proportionately greater State share during price booms that generate extraordinary revenues for the sector. Although there are difficulties in operationalizing the concept of extraordinary rents, they may be understood as
11 Comparative experience regarding royalty rates and modalities shows that the results cannot be generalized. The effective royalty rate depends on how it interacts with the rest of the taxes in the tax system (national and state level). It is here that the countries differ substantially. For example, in some cases the royalty is considered a cost of production and is therefore deductible from taxable income, thereby reducing its impact. In other cases it is an additional tax on profits. Accordingly, royalty rates are not directly comparable among countries (or among states in the same country) and must be corrected to take into account the sector’s overall tax burden.
12 A review of the data published by the Extractive Industries Transparency Initiative (EITI) for 29 member countries shows that, overall, States receive a higher percentage of total economic rents from hydrocarbons than from mining. Peru is the only EITI member country in Latin America and the Caribbean.
13 In response to the price cycle, some of these progressive tools have been used since 2000 by a number of oil producing countries such as the Bolivarian Republic of Venezuela, Ecuador, the Plurinational State of Bolivia, the United Kingdom and the United States.
278
Cha
pter
VIEconomic Commission for Latin America and the Caribbean (ECLAC)
cumulative gains that clearly exceed the rate of return that, in international practice, the industry usually requires in order to invest in development projects in these sectors. At such rates of return, States have theoretical justification for taxing these extraordinary rents without impacting the investment dynamic or the usual return on capital investments for extractive operations.14
C. State share in natural resource rents between 2000 and 201215
State appropriation and efficient investment of natural resource rents is a crucial determinant of development in countries where such resources account for a high percentage of output and exports. This is especially true in periods of high international prices, as has been the case for the countries of South America and Mexico since the early 1990s, particularly (but not only) in sectors like hydrocarbons and metal mining.
To design State policies for linking rents to capacity-building, infrastructure, productive investment and well-being, information is needed on how much these rents contribute to fiscal robustness and how States invest that revenue. These issues are discussed below.
1. State participation in the economic rent of the mining sectorIn Latin America and the Caribbean, the economic rent of the mining sector, as a percentage of GDP, tripled during the price surge (2004-2009) compared with 2000-2003 (see table VI.2), rising from 0.6% to 1.98% of regional GDP.16 The countries with the largest gains in the estimated rents of the mining sector across the two periods were Peru (up from 0.2% of GDP to 7.5% of GDP), the Plurinational State of Bolivia (from 0.1% of GDP to 2.4% of GDP), Colombia (from 0.3% to 1.9% of GDP), Chile (from 6.5% to 17.3% of GDP) and Brazil (from 0.9% to 2.3% of GDP) (see column three in table VI.2).
From this economic rent, estimated for the mining sector aggregated at the national level, come: (i) the fiscal payments received by the State in the form of taxes, royalties or other levies; (ii) the private earnings of the extractive companies; and (iii) payment of the factors of production used beyond the extraction stage, consisting mostly in remuneration of personnel employed by the extractive companies. This rise in the mining sector’s economic rent in 2004-2009 considerably swelled the fiscal revenues from the mining sector in absolute terms. The countries that saw the largest gains in fiscal revenues from the mining sector were the Plurinational State of Bolivia (where the figure climbed from 0.1% of GDP to 0.64% of GDP), Chile (from 0.93% to 6.18% of GDP) and Peru (from 0.39% to 2.05% of GDP), followed by Colombia (from 0.17% of GDP to 0.43% of GDP) and Brazil (from 0.07% to 0.15% of GDP) (see column four in table V.2).
Mining sector rent continued to grow during the most recent period (from 2010 to 2012), albeit at a slower pace, averaging 2.65% of regional GDP. In all of the countries except Chile,17 fiscal revenue paid by the mining sector rose again in absolute terms.
14 After the international commodities price boom in 2003-2012, a number of multilateral organizations have weighed the advisability of tax models like the resource rent tax (RRT), where cumulative income is taxed progressively over the life cycle of the resource extracted at each site.
15 This section is based on ECLAC (2013a, 2013b and 2012c) and Acquatella and others (2013).16 The World Development Indicators (WDI) statistical database of the World Bank publishes mineral rent (as a percentage of GDP) by
country, which is estimated as the value of output at an international price less the cost of production at the minehead (cost of extraction at the minehead, including the opportunity cost of capital in the mining operation) for a basket of 10 minerals: tin, gold, lead, zinc, iron, copper, nickel, silver, bauxite and phosphate). Mineral rent (as a percentage of GDP) is used as a proxy for total economic rent generated by the mining sector of each country.
17 Due to the economic environment in 2010-2012, the CODELCO fiscal contribution shrank by nearly 40% and the contribution by private mining interests fell by 16%. The reasons for this include the rising cost of mine operations in Chile (such as high energy costs) and declining ore grades in some deposits. Still, Chile continues to have the highest mineral rent (16.7% of GDP) of any country in the region.
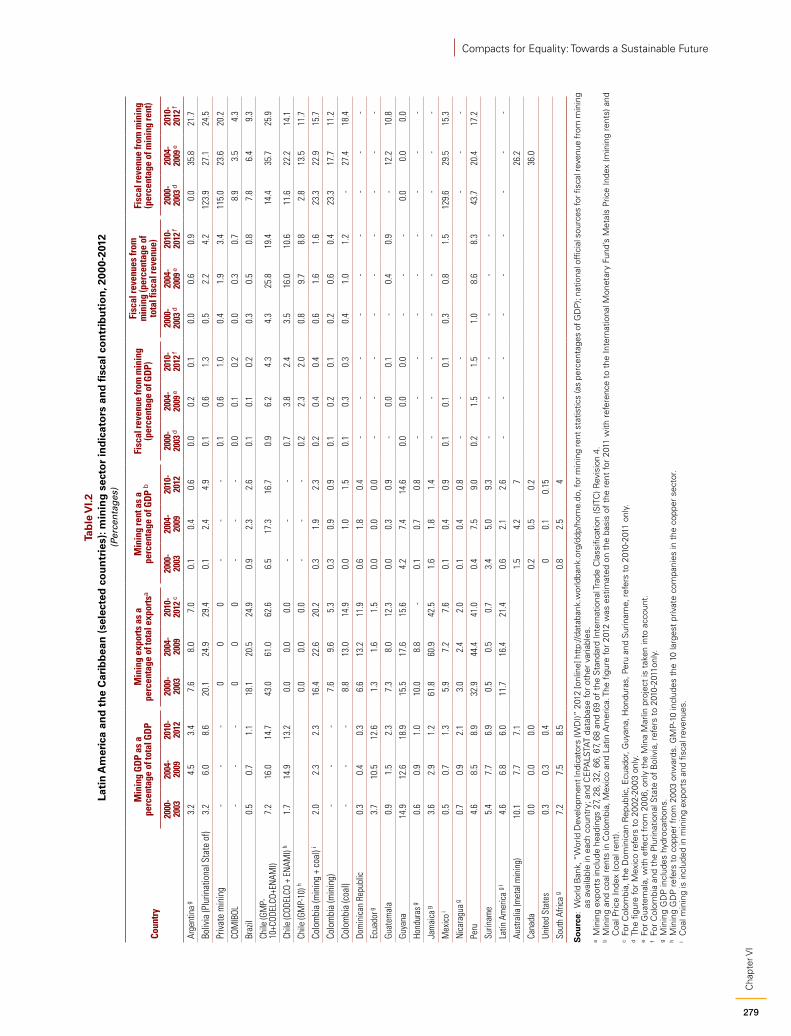
279
Cha
pter
VI
Compacts for Equality: Towards a Sustainable Future
Tab
le V
I.2
Lati
n A
mer
ica
and
th
e C
arib
bea
n (
sele
cted
co
un
trie
s): m
inin
g s
ecto
r in
dic
ato
rs a
nd
fis
cal c
on
trib
uti
on
, 200
0-20
12(P
erce
nta
ges
)
Coun
try
Min
ing
GDP
as a
pe
rcen
tage
of t
otal
GDP
Min
ing
expo
rts a
s a
perc
enta
ge o
f tot
al e
xpor
tsa
Min
ing
rent
as
a pe
rcen
tage
of G
DP b
Fisc
al re
venu
e fro
m m
inin
g (p
erce
ntag
e of
GDP
)Fi
scal
reve
nues
from
m
inin
g (p
erce
ntag
e of
to
tal f
isca
l rev
enue
)Fi
scal
reve
nue
from
min
ing
(per
cent
age
of m
inin
g re
nt)
2000
-20
0320
04-
2009
2010
-20
1220
00-
2003
2004
-20
0920
10-
2012
c20
00-
2003
2004
-20
0920
10-
2012
2000
-20
03 d
2004
-20
09 e
2010
-20
12 f
2000
-20
03 d
2004
-20
09 e
2010
-20
12 f
2000
-20
03 d
2004
-20
09 e
2010
-20
12 f
Arge
ntin
a g3.
24.
53.
47.
68.
07.
00.
10.
40.
60.
00.
20.
10.
00.
60.
90.
035
.821
.7
Boliv
ia (P
lurin
atio
nal S
tate
of)
3.2
6.0
8.6
20.1
24.9
29.4
0.1
2.4
4.9
0.1
0.6
1.3
0.5
2.2
4.2
123.
927
.124
.5
Priv
ate
min
ing
--
-0
00
--
-0.
10.
61.
00.
41.
93.
411
5.0
23.6
20.2
COM
IBOL
--
-0
00
--
-0.
00.
10.
20.
00.
30.
78.
93.
54.
3
Braz
il0.
50.
71.
118
.120
.524
.90.
92.
32.
60.
10.
10.
20.
30.
50.
87.
86.
49.
3
Chile
(GM
P-10
+COD
ELCO
+EN
AMI)
7.2
16.0
14.7
43.0
61.0
62.6
6.5
17.3
16.7
0.9
6.2
4.3
4.3
25.8
19.4
14.4
35.7
25.9
Chile
(COD
ELCO
+ E
NAM
I) h
1.7
14.9
13.2
0.0
0.0
0.0
--
-0.
73.
82.
43.
516
.010
.611
.622
.214
.1
Chile
(GM
P-10
) h0.
00.
00.
0-
--
0.2
2.3
2.0
0.8
9.7
8.8
2.8
13.5
11.7
Colo
mbi
a (m
inin
g +
coal
) i2.
02.
32.
316
.422
.620
.20.
31.
92.
30.
20.
40.
40.
61.
61.
623
.322
.915
.7
Colo
mbi
a (m
inin
g)-
--
7.6
9.6
5.3
0.3
0.9
0.9
0.1
0.2
0.1
0.2
0.6
0.4
23.3
17.7
11.2
Colo
mbi
a (c
oal)
--
-8.
813
.014
.90.
01.
01.
50.
10.
30.
30.
41.
01.
2-
27.4
18.4
Dom
inic
an R
epub
lic0.
30.
40.
36.
613
.211
.90.
61.
80.
4-
--
--
--
--
Ecua
dor g
3.7
10.5
12.6
1.3
1.6
1.5
0.0
0.0
0.0
--
--
--
--
-
Guat
emal
a0.
91.
52.
37.
38.
012
.30.
00.
30.
9-
0.0
0.1
-0.
40.
9-
12.2
10.8
Guya
na14
.912
.618
.915
.517
.615
.64.
27.
414
.60.
00.
00.
0-
--
0.0
0.0
0.0
Hond
uras
g0.
60.
91.
010
.08.
8-
0.1
0.7
0.8
--
--
--
--
-
Jam
aica
g3.
62.
91.
261
.860
.942
.51.
61.
81.
4-
--
--
--
--
Mex
ico i
0.5
0.7
1.3
5.9
7.2
7.6
0.1
0.4
0.9
0.1
0.1
0.1
0.3
0.8
1.5
129.
629
.515
.3
Nic
arag
ua g
0.7
0.9
2.1
3.0
2.4
2.0
0.1
0.4
0.8
--
--
--
Peru
4.6
8.5
8.9
32.9
44.4
41.0
0.4
7.5
9.0
0.2
1.5
1.5
1.0
8.6
8.3
43.7
20.4
17.2
Surin
ame
5.4
7.7
6.9
0.5
0.5
0.7
3.4
5.0
9.3
--
--
--
Latin
Am
eric
a g
i4.
66.
86.
011
.716
.421
.40.
62.
12.
6-
--
--
--
--
Aust
ralia
(met
al m
inin
g)10
.17.
77.
11.
54.
27
26.2
Cana
da0.
00.
00.
00.
20.
50.
236
.0
Unite
d St
ates
0.3
0.3
0.4
00.
10.
15
Sout
h Af
rica
g7.
27.
58.
50.
82.
54
So
urc
e: W
orld
Ban
k, “
Wor
ld D
evel
opm
ent I
ndic
ator
s (W
DI)”
201
2 [o
nlin
e] h
ttp:
//dat
aban
k.w
orld
bank
.org
/ddp
/hom
e.do
, for
min
ing
rent
sta
tistic
s (a
s pe
rcen
tage
s of
GD
P);
natio
nal o
ffic
ial s
ourc
es fo
r fis
cal r
even
ue fr
om m
inin
g as
ava
ilabl
e in
eac
h co
untr
y; a
nd C
EPA
LSTA
T da
taba
se fo
r ot
her
varia
bles
.a
Min
ing
expo
rts
incl
ude
head
ings
27,
28,
32,
66,
67,
68
and
69 o
f th
e S
tand
ard
Inte
rnat
iona
l Tra
de C
lass
ifica
tion
(SIT
C) R
evis
ion
4.b
Min
ing
and
coal
ren
ts in
Col
ombi
a, M
exic
o an
d La
tin A
mer
ica.
The
fig
ure
for
2012
was
est
imat
ed o
n th
e ba
sis
of t
he r
ent
for
2011
with
ref
eren
ce t
o th
e In
tern
atio
nal M
onet
ary
Fund
’s M
etal
s Pr
ice
Inde
x (m
inin
g re
nts)
and
C
oal P
rice
Inde
x (c
oal r
ent)
.c
For
Col
ombi
a, t
he D
omin
ican
Rep
ublic
, Ecu
ador
, Guy
ana,
Hon
dura
s, P
eru
and
Sur
inam
e, r
efer
s to
201
0-20
11 o
nly.
d Th
e fig
ure
for
Mex
ico
refe
rs t
o 20
02-2
003
only
.e
For
Gua
tem
ala,
with
effe
ct f
rom
200
6, o
nly
the
Min
a M
arlin
pro
ject
is t
aken
into
acc
ount
.f
For
Col
ombi
a an
d th
e P
lurin
atio
nal S
tate
of
Bol
ivia
, ref
ers
to 2
010-
2011
only
.g
Min
ing
GD
P in
clud
es h
ydro
carb
ons.
h M
inin
g G
DP
ref
ers
to c
oppe
r fr
om 2
003
onw
ards
. GM
P-10
incl
udes
the
10
larg
est
prív
ate
com
pani
es in
the
cop
per
sect
or.
i C
oal m
inin
g is
incl
uded
in m
inin
g ex
port
s an
d fis
cal r
even
ues.
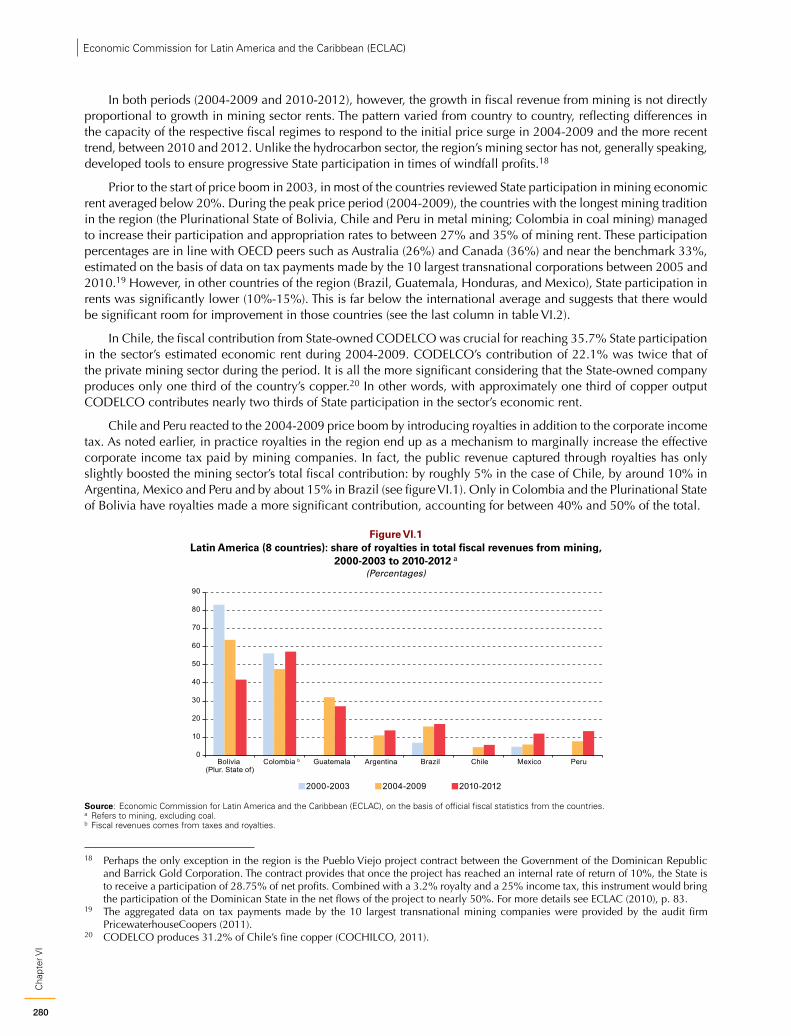
280
Cha
pter
VIEconomic Commission for Latin America and the Caribbean (ECLAC)
In both periods (2004-2009 and 2010-2012), however, the growth in fiscal revenue from mining is not directly proportional to growth in mining sector rents. The pattern varied from country to country, reflecting differences in the capacity of the respective fiscal regimes to respond to the initial price surge in 2004-2009 and the more recent trend, between 2010 and 2012. Unlike the hydrocarbon sector, the region’s mining sector has not, generally speaking, developed tools to ensure progressive State participation in times of windfall profits.18
Prior to the start of price boom in 2003, in most of the countries reviewed State participation in mining economic rent averaged below 20%. During the peak price period (2004-2009), the countries with the longest mining tradition in the region (the Plurinational State of Bolivia, Chile and Peru in metal mining; Colombia in coal mining) managed to increase their participation and appropriation rates to between 27% and 35% of mining rent. These participation percentages are in line with OECD peers such as Australia (26%) and Canada (36%) and near the benchmark 33%, estimated on the basis of data on tax payments made by the 10 largest transnational corporations between 2005 and 2010.19 However, in other countries of the region (Brazil, Guatemala, Honduras, and Mexico), State participation in rents was significantly lower (10%-15%). This is far below the international average and suggests that there would be significant room for improvement in those countries (see the last column in table VI.2).
In Chile, the fiscal contribution from State-owned CODELCO was crucial for reaching 35.7% State participation in the sector’s estimated economic rent during 2004-2009. CODELCO’s contribution of 22.1% was twice that of the private mining sector during the period. It is all the more significant considering that the State-owned company produces only one third of the country’s copper.20 In other words, with approximately one third of copper output CODELCO contributes nearly two thirds of State participation in the sector’s economic rent.
Chile and Peru reacted to the 2004-2009 price boom by introducing royalties in addition to the corporate income tax. As noted earlier, in practice royalties in the region end up as a mechanism to marginally increase the effective corporate income tax paid by mining companies. In fact, the public revenue captured through royalties has only slightly boosted the mining sector’s total fiscal contribution: by roughly 5% in the case of Chile, by around 10% in Argentina, Mexico and Peru and by about 15% in Brazil (see figure VI.1). Only in Colombia and the Plurinational State of Bolivia have royalties made a more significant contribution, accounting for between 40% and 50% of the total.
Figure VI.1 Latin America (8 countries): share of royalties in total fiscal revenues from mining,
2000-2003 to 2010-2012 a
(Percentages)
0
10
20
30
40
50
60
70
80
90
Bolivia (Plur. State of)
Colombia b Guatemala Argentina Brazil Chile Mexico Peru
2000-2003 2004-2009 2010-2012
Source: Economic Commission for Latin America and the Caribbean (ECLAC), on the basis of official fiscal statistics from the countries.a Refers to mining, excluding coal.b Fiscal revenues comes from taxes and royalties.
18 Perhaps the only exception in the region is the Pueblo Viejo project contract between the Government of the Dominican Republic and Barrick Gold Corporation. The contract provides that once the project has reached an internal rate of return of 10%, the State is to receive a participation of 28.75% of net profits. Combined with a 3.2% royalty and a 25% income tax, this instrument would bring the participation of the Dominican State in the net flows of the project to nearly 50%. For more details see ECLAC (2010), p. 83.
19 The aggregated data on tax payments made by the 10 largest transnational mining companies were provided by the audit firm PricewaterhouseCoopers (2011).
20 CODELCO produces 31.2% of Chile’s fine copper (COCHILCO, 2011).
281
Cha
pter
VI
Compacts for Equality: Towards a Sustainable Future
In all the subject countries, the mining sector’s contribution to fiscal revenues rose four- or five-fold during the price boom between 2004 and 2009, compared with the average contribution for the period 2000 to 2003. In the most recent period, from 2010 to 2012, the figures have stabilized at levels similar to 2004-2009 in Peru (12%) and Colombia (1.6%). But they continued to climb significantly in the Plurinational State of Bolivia (from 2.2% to 4.2%) and other countries such as Mexico (0.8% to 1.5%), Guatemala (0.3% to 0.9%) and Argentina (0.6% a 0.9%). While this growth started at relatively low levels of participation in total tax revenue in these countries, it reflects the growing importance of the mining sector as a source of fiscal revenues.
Given the magnitude of the price boom and indicators of extraordinary mining profits during 2003-2012, governments should strengthen their capacity to audit the mining sector and have independent profit indicators to ensure that tax collections are in line with existing legal frameworks. As noted earlier, since the principal instrument for State participation is tax on profits reported by the mining companies themselves, governments need to have independent mechanisms and specific indicators to make sure that profits and costs are transparent throughout price cycles. This is something which has not been achieved in most of the countries in the region.
The countries should move towards greater integration and coordination of actions for making progressive adjustments to the tax regime and harmonizing the terms for mining investments. In particular, perverse fiscal competition should be avoided as it is counterproductive to maintain regimes that are looser than the international average, have already served their purpose and are unsuited to the sector’s new regional environment.
The mix between the State company’s contributions and those of the private mining sector in Chile suggests that having a State enterprise operating in the sector can be important to raise the public share in economic rents under current regimes based primarily on taxing profits. Chile is so far the only country in the region with a State-owned mining company that accounts for significant percentage of output and is capable of ensuring transparency in earnings and costs by acting as a model or “witness” company within the sector.
However, CODELCO is lagging behind the major private mining companies in terms of investment. If this pattern continues, the State company will see its share of domestic copper output decline over the medium and long terms. This would run contrary to the objective of increasing the public share in mining rents because CODELCO accounts for most of the fiscal contribution made by the Chilean mining sector.
The inability of States to maintain an optimal investment profile on the upstream side of their public enterprises so as to sustain and expand their current levels of output is a syndrome that also afflicts public oil companies in the region. And it inevitably leads to the loss of competitiveness and consequent weakening of their fiscal contribution. The major producing countries have yet to counterbalance the objectives of extracting fiscal resources from State-owned enterprises without jeopardizing the investments needed to consolidate their competitive position and their sustainability as a source of public resources for future generations.
2. State participation in the economic rent from hydrocarbonsWhen the price cycle upswing began, the producing countries of the region saw the sector’s share of total exports and its GDP contribution grow. In the Bolivarian Republic of Venezuela, Ecuador, the Plurinational State of Bolivia and Trinidad and Tobago, the sector accounted for more than half of total exports at the end of the period (see table VI.3).
In most of the countries, high international prices buoyed the sector’s potential economic rent. However, in others, such as Argentina, the Bolivarian Republic of Venezuela and Mexico,21 the effect of the price surge may have been dampened by declining production in the main oil fields, which would have slowed or even reversed growth in economic rent in both absolute and relative terms. In any case, analyses based on potential economic rent —calculated on the basis of international prices, not necessarily effectively-traded prices— should be specific to each country and caution should be exercised in generalizing and using them.22
21 In Mexico, the price surge had a larger impact than declining output at the main oilfield (Cantarel). The steady price rise resulted in substantial oil surpluses, especially during 2000-2006. In Mexico, an oil surplus is the positive difference between the estimated price of a barrel of oil in the following year’s expenditure budget and the actual price obtained.
22 For Argentina, the Plurinational State of Bolivia, Ecuador and the Bolivarian Republic of Venezuela this potential economic rent could be overestimated because a percentage of output is sold on the domestic market at a price that is lower than the international price.
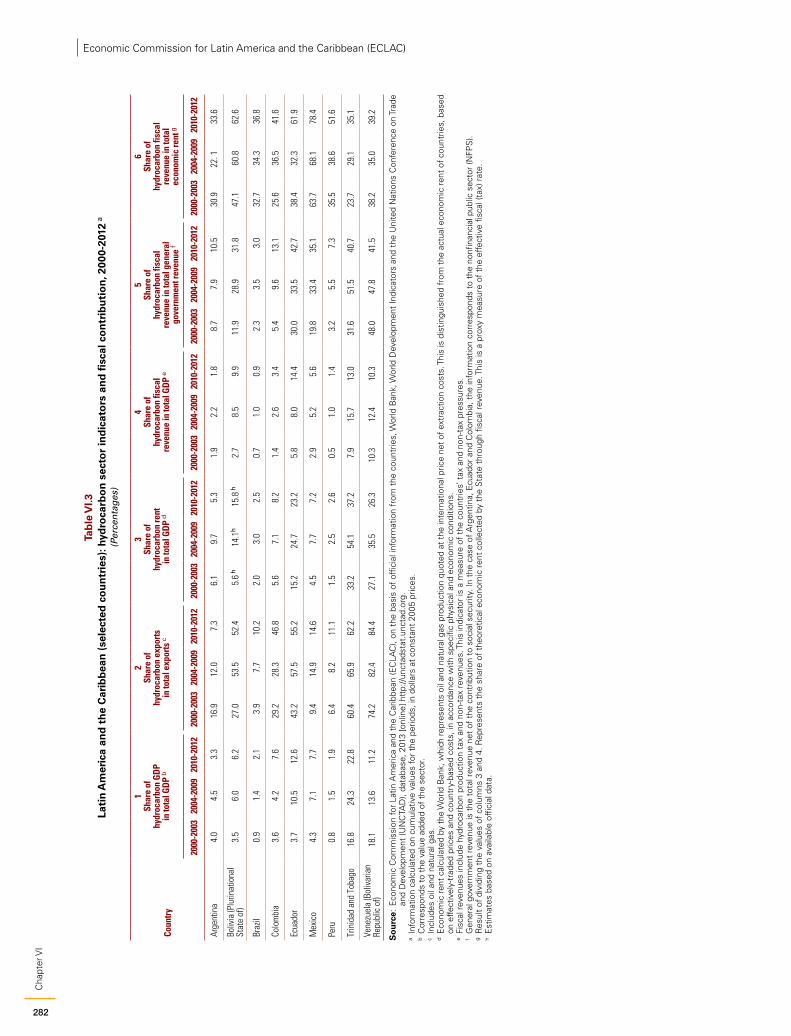
282
Cha
pter
VIEconomic Commission for Latin America and the Caribbean (ECLAC)
Tab
le V
I.3
Lati
n A
mer
ica
and
th
e C
arib
bea
n (
sele
cted
co
un
trie
s): h
ydro
carb
on
sec
tor
ind
icat
ors
an
d f
isca
l co
ntr
ibu
tio
n, 2
000-
2012
a
(Per
cen
tag
es)
Coun
try
1Sh
are
ofhy
droc
arbo
n GD
Pin
tota
l GDP
b
2Sh
are
ofhy
droc
arbo
n ex
ports
in to
tal e
xpor
ts c
3Sh
are
ofhy
droc
arbo
n re
ntin
tota
l GDP
d
4Sh
are
ofhy
droc
arbo
n fis
cal
reve
nue
in to
tal G
DP e
5Sh
are
ofhy
droc
arbo
n fis
cal
reve
nue
in to
tal g
ener
algo
vern
men
t rev
enue
f
6Sh
are
ofhy
droc
arbo
n fis
cal
reve
nue
in to
tal
econ
omic
rent
g
2000
-200
320
04-2
009
2010
-201
220
00-2
003
2004
-200
920
10-2
012
2000
-200
320
04-2
009
2010
-201
220
00-2
003
2004
-200
920
10-2
012
2000
-200
320
04-2
009
2010
-201
220
00-2
003
2004
-200
920
10-2
012
Arge
ntin
a4.
04.
53.
316
.912
.07.
36.
19.
75.
31.
92.
21.
88.
77.
910
.530
.922
. 133
.6
Boliv
ia (P
lurin
atio
nal
Stat
e of
)3.
56.
06.
227
.053
.552
.45.
6 h14
.1h
15.8
h2.
78.
59.
911
.928
.931
.847
.160
.862
.6
Braz
il0.
91.
42.
13.
97.
710
.22.
03.
02.
50.
71.
00.
92.
33.
53.
032
.734
.336
.8
Colo
mbi
a3.
64.
27.
629
.228
.346
.85.
67.
18.
21.
42.
63.
45.
49.
613
.125
.636
.541
.6
Ecua
dor
3.7
10.5
12.6
43.2
57.5
55.2
15.2
24.7
23.2
5.8
8.0
14.4
30.0
33.5
42.7
38.4
32.3
61.9
Mex
ico
4.3
7.1
7.7
9.4
14.9
14.6
4.5
7.7
7.2
2.9
5.2
5.6
19.8
33.4
35.1
63.7
68.1
78.4
Peru
0.8
1.5
1.9
6.4
8.2
11.1
1.5
2.5
2.6
0.5
1.0
1.4
3.2
5.5
7.3
35.5
38.6
51.6
Trin
idad
and
Tob
ago
16.8
24.3
22.8
60.4
65.9
62.2
33.2
54.1
37.2
7.9
15.7
13.0
31.6
51.5
40.7
23.7
29.1
35.1
Vene
zuel
a (B
oliv
aria
n Re
publ
ic o
f)18
.113
.611
.274
.282
.484
.427
.135
.526
.310
.312
.410
.348
.047
.841
.538
.235
.039
.2
So
urc
e: E
cono
mic
Com
mis
sion
for
Latin
Am
eric
a an
d th
e C
arib
bean
(EC
LAC
), on
the
bas
is o
f of
ficia
l inf
orm
atio
n fr
om t
he c
ount
ries,
Wor
ld B
ank,
Wor
ld D
evel
opm
ent
Indi
cato
rs a
nd t
he U
nite
d N
atio
ns C
onfe
renc
e on
Trad
e an
d D
evel
opm
ent
(UN
CTA
D),
data
base
, 201
3 [o
nlin
e] h
ttp:
//unc
tads
tat.
unct
ad.o
rg.
a In
form
atio
n ca
lcul
ated
on
cum
ulat
ive
valu
es fo
r th
e pe
riods
, in
dolla
rs a
t co
nsta
nt 2
005
pric
es.
b C
orre
spon
ds t
o th
e va
lue
adde
d of
the
sec
tor.
c In
clud
es o
il an
d na
tura
l gas
.d
Eco
nom
ic re
nt c
alcu
late
d by
the
Wor
ld B
ank,
whi
ch re
pres
ents
oil
and
natu
ral g
as p
rodu
ctio
n qu
oted
at t
he in
tern
atio
nal p
rice
net o
f ext
ract
ion
cost
s. T
his
is d
istin
guis
hed
from
the
actu
al e
cono
mic
rent
of c
ount
ries,
bas
ed
on e
ffect
ivel
y-tr
aded
pric
es a
nd c
ount
ry-b
ased
cos
ts, i
n ac
cord
ance
with
spe
cific
phy
sica
l and
eco
nom
ic c
ondi
tions
.e
Fisc
al r
even
ues
incl
ude
hydr
ocar
bon
prod
uctio
n ta
x an
d no
n-ta
x re
venu
es. T
his
indi
cato
r is
a m
easu
re o
f th
e co
untr
ies’
tax
and
non
-tax
pre
ssur
es.
f G
ener
al g
over
nmen
t re
venu
e is
the
tot
al r
even
ue n
et o
f th
e co
ntrib
utio
n to
soc
ial s
ecur
ity. I
n th
e ca
se o
f Arg
entin
a, E
cuad
or a
nd C
olom
bia,
the
info
rmat
ion
corr
espo
nds
to t
he n
onfin
anci
al p
ublic
sec
tor
(NFP
S).
g R
esul
t of
div
idin
g th
e va
lues
of
colu
mns
3 a
nd 4
. Rep
rese
nts
the
shar
e of
the
oret
ical
eco
nom
ic r
ent
colle
cted
by
the
Sta
te t
hrou
gh f
isca
l rev
enue
. Thi
s is
a p
roxy
mea
sure
of
the
effe
ctiv
e fis
cal (
tax)
rat
e.h
Est
imat
es b
ased
on
avai
labl
e of
ficia
l dat
a.
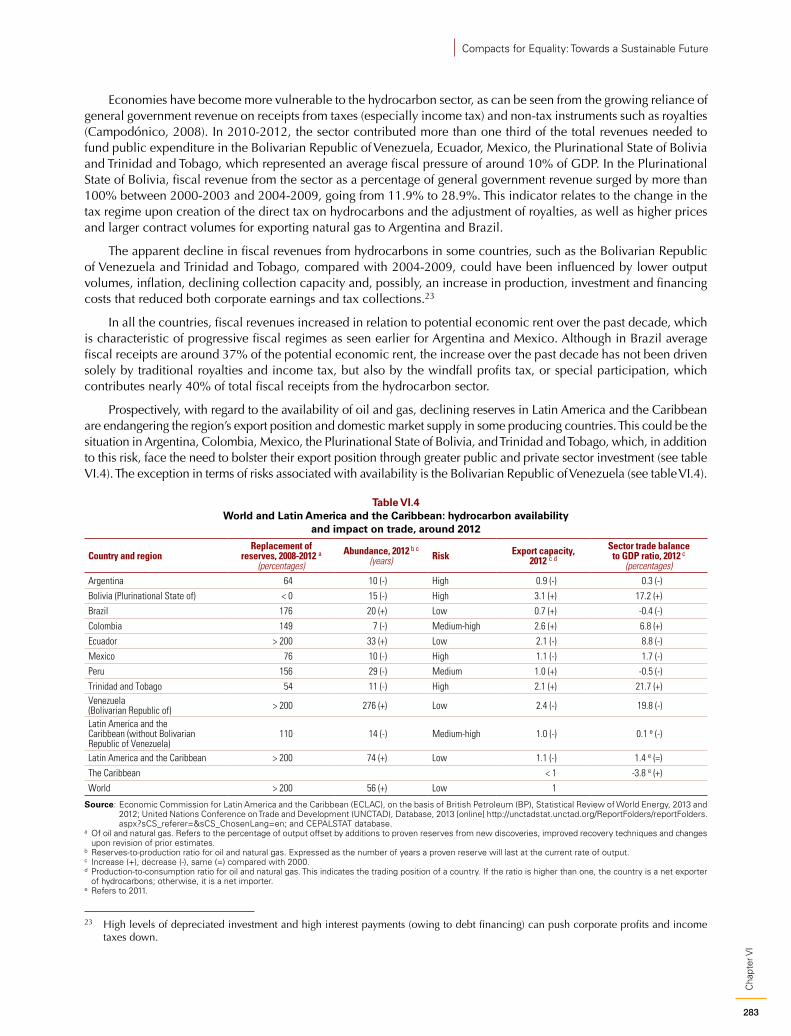
283
Cha
pter
VI
Compacts for Equality: Towards a Sustainable Future
Economies have become more vulnerable to the hydrocarbon sector, as can be seen from the growing reliance of general government revenue on receipts from taxes (especially income tax) and non-tax instruments such as royalties (Campodónico, 2008). In 2010-2012, the sector contributed more than one third of the total revenues needed to fund public expenditure in the Bolivarian Republic of Venezuela, Ecuador, Mexico, the Plurinational State of Bolivia and Trinidad and Tobago, which represented an average fiscal pressure of around 10% of GDP. In the Plurinational State of Bolivia, fiscal revenue from the sector as a percentage of general government revenue surged by more than 100% between 2000-2003 and 2004-2009, going from 11.9% to 28.9%. This indicator relates to the change in the tax regime upon creation of the direct tax on hydrocarbons and the adjustment of royalties, as well as higher prices and larger contract volumes for exporting natural gas to Argentina and Brazil.
The apparent decline in fiscal revenues from hydrocarbons in some countries, such as the Bolivarian Republic of Venezuela and Trinidad and Tobago, compared with 2004-2009, could have been influenced by lower output volumes, inflation, declining collection capacity and, possibly, an increase in production, investment and financing costs that reduced both corporate earnings and tax collections.23
In all the countries, fiscal revenues increased in relation to potential economic rent over the past decade, which is characteristic of progressive fiscal regimes as seen earlier for Argentina and Mexico. Although in Brazil average fiscal receipts are around 37% of the potential economic rent, the increase over the past decade has not been driven solely by traditional royalties and income tax, but also by the windfall profits tax, or special participation, which contributes nearly 40% of total fiscal receipts from the hydrocarbon sector.
Prospectively, with regard to the availability of oil and gas, declining reserves in Latin America and the Caribbean are endangering the region’s export position and domestic market supply in some producing countries. This could be the situation in Argentina, Colombia, Mexico, the Plurinational State of Bolivia, and Trinidad and Tobago, which, in addition to this risk, face the need to bolster their export position through greater public and private sector investment (see table VI.4). The exception in terms of risks associated with availability is the Bolivarian Republic of Venezuela (see table VI.4).
Table VI.4 World and Latin America and the Caribbean: hydrocarbon availability
and impact on trade, around 2012
Country and regionReplacement of
reserves, 2008-2012 a(percentages)
Abundance, 2012 b c
(years) Risk Export capacity, 2012 c d
Sector trade balance to GDP ratio, 2012 c
(percentages)Argentina 64 10 (-) High 0.9 (-) 0.3 (-)
Bolivia (Plurinational State of) < 0 15 (-) High 3.1 (+) 17.2 (+)
Brazil 176 20 (+) Low 0.7 (+) -0.4 (-)
Colombia 149 7 (-) Medium-high 2.6 (+) 6.8 (+)
Ecuador > 200 33 (+) Low 2.1 (-) 8.8 (-)
Mexico 76 10 (-) High 1.1 (-) 1.7 (-)
Peru 156 29 (-) Medium 1.0 (+) -0.5 (-)
Trinidad and Tobago 54 11 (-) High 2.1 (+) 21.7 (+)Venezuela(Bolivarian Republic of) > 200 276 (+) Low 2.4 (-) 19.8 (-)
Latin America and the Caribbean (without Bolivarian Republic of Venezuela)
110 14 (-) Medium-high 1.0 (-) 0.1 e (-)
Latin America and the Caribbean > 200 74 (+) Low 1.1 (-) 1.4 e (=)
The Caribbean < 1 -3.8 e (+)
World > 200 56 (+) Low 1
Source: Economic Commission for Latin America and the Caribbean (ECLAC), on the basis of British Petroleum (BP), Statistical Review of World Energy, 2013 and 2012; United Nations Conference on Trade and Development (UNCTAD), Database, 2013 [online] http://unctadstat.unctad.org/ReportFolders/reportFolders.aspx?sCS_referer=&sCS_ChosenLang=en; and CEPALSTAT database.
a Of oil and natural gas. Refers to the percentage of output offset by additions to proven reserves from new discoveries, improved recovery techniques and changes upon revision of prior estimates.
b Reserves-to-production ratio for oil and natural gas. Expressed as the number of years a proven reserve will last at the current rate of output.c Increase (+), decrease (-), same (=) compared with 2000.d Production-to-consumption ratio for oil and natural gas. This indicates the trading position of a country. If the ratio is higher than one, the country is a net exporter
of hydrocarbons; otherwise, it is a net importer.e Refers to 2011.
23 High levels of depreciated investment and high interest payments (owing to debt financing) can push corporate profits and income taxes down.
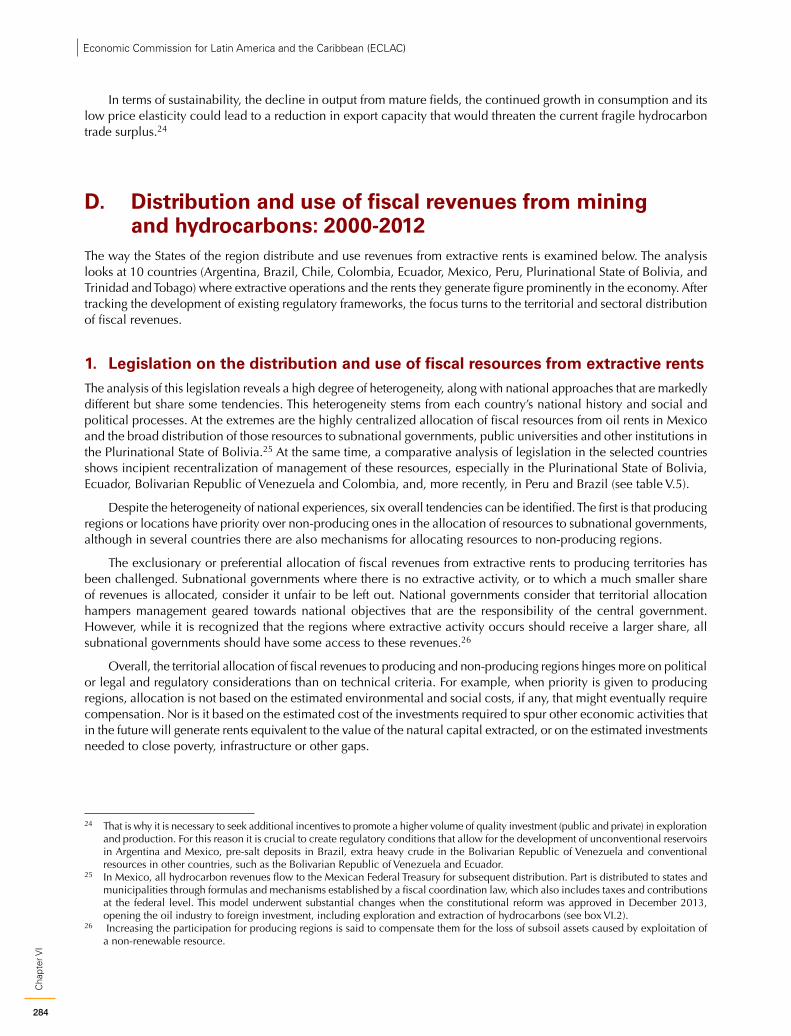
284
Cha
pter
VIEconomic Commission for Latin America and the Caribbean (ECLAC)
In terms of sustainability, the decline in output from mature fields, the continued growth in consumption and its low price elasticity could lead to a reduction in export capacity that would threaten the current fragile hydrocarbon trade surplus.24
D. Distribution and use of fiscal revenues from mining and hydrocarbons: 2000-2012
The way the States of the region distribute and use revenues from extractive rents is examined below. The analysis looks at 10 countries (Argentina, Brazil, Chile, Colombia, Ecuador, Mexico, Peru, Plurinational State of Bolivia, and Trinidad and Tobago) where extractive operations and the rents they generate figure prominently in the economy. After tracking the development of existing regulatory frameworks, the focus turns to the territorial and sectoral distribution of fiscal revenues.
1. Legislation on the distribution and use of fiscal resources from extractive rentsThe analysis of this legislation reveals a high degree of heterogeneity, along with national approaches that are markedly different but share some tendencies. This heterogeneity stems from each country’s national history and social and political processes. At the extremes are the highly centralized allocation of fiscal resources from oil rents in Mexico and the broad distribution of those resources to subnational governments, public universities and other institutions in the Plurinational State of Bolivia.25 At the same time, a comparative analysis of legislation in the selected countries shows incipient recentralization of management of these resources, especially in the Plurinational State of Bolivia, Ecuador, Bolivarian Republic of Venezuela and Colombia, and, more recently, in Peru and Brazil (see table V.5).
Despite the heterogeneity of national experiences, six overall tendencies can be identified. The first is that producing regions or locations have priority over non-producing ones in the allocation of resources to subnational governments, although in several countries there are also mechanisms for allocating resources to non-producing regions.
The exclusionary or preferential allocation of fiscal revenues from extractive rents to producing territories has been challenged. Subnational governments where there is no extractive activity, or to which a much smaller share of revenues is allocated, consider it unfair to be left out. National governments consider that territorial allocation hampers management geared towards national objectives that are the responsibility of the central government. However, while it is recognized that the regions where extractive activity occurs should receive a larger share, all subnational governments should have some access to these revenues.26
Overall, the territorial allocation of fiscal revenues to producing and non-producing regions hinges more on political or legal and regulatory considerations than on technical criteria. For example, when priority is given to producing regions, allocation is not based on the estimated environmental and social costs, if any, that might eventually require compensation. Nor is it based on the estimated cost of the investments required to spur other economic activities that in the future will generate rents equivalent to the value of the natural capital extracted, or on the estimated investments needed to close poverty, infrastructure or other gaps.
24 That is why it is necessary to seek additional incentives to promote a higher volume of quality investment (public and private) in exploration and production. For this reason it is crucial to create regulatory conditions that allow for the development of unconventional reservoirs in Argentina and Mexico, pre-salt deposits in Brazil, extra heavy crude in the Bolivarian Republic of Venezuela and conventional resources in other countries, such as the Bolivarian Republic of Venezuela and Ecuador.
25 In Mexico, all hydrocarbon revenues flow to the Mexican Federal Treasury for subsequent distribution. Part is distributed to states and municipalities through formulas and mechanisms established by a fiscal coordination law, which also includes taxes and contributions at the federal level. This model underwent substantial changes when the constitutional reform was approved in December 2013, opening the oil industry to foreign investment, including exploration and extraction of hydrocarbons (see box VI.2).
26 Increasing the participation for producing regions is said to compensate them for the loss of subsoil assets caused by exploitation of a non-renewable resource.
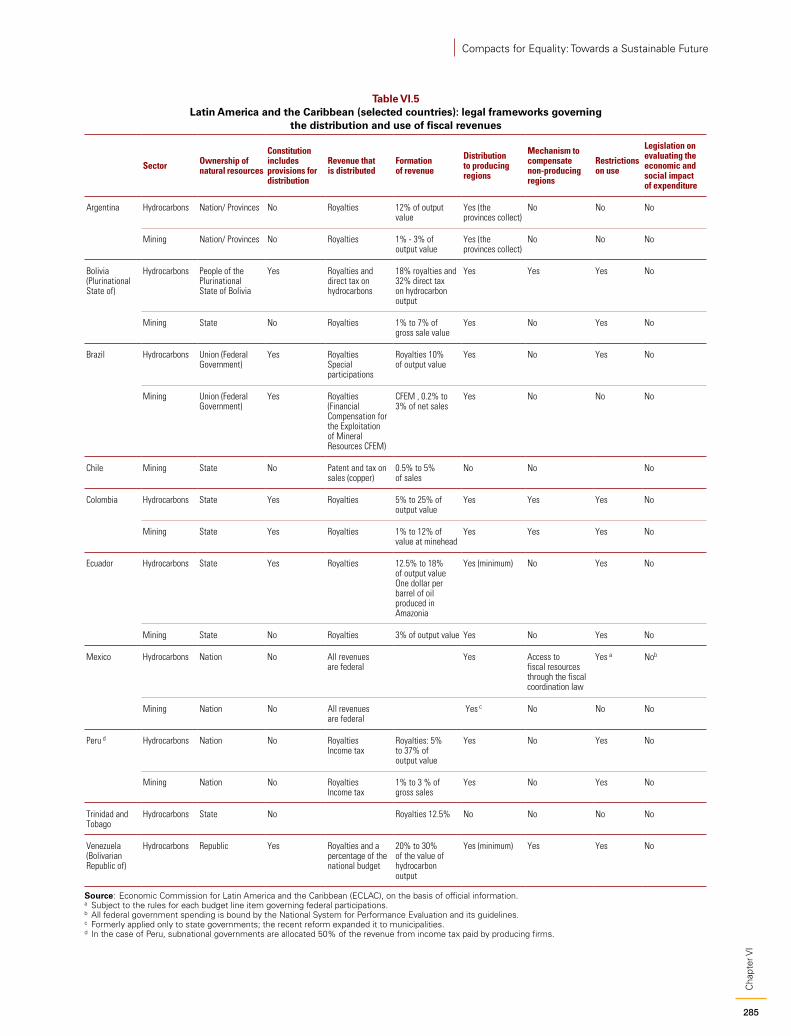
285
Cha
pter
VI
Compacts for Equality: Towards a Sustainable Future
Table VI.5 Latin America and the Caribbean (selected countries): legal frameworks governing
the distribution and use of fiscal revenues
Sector Ownership of natural resources
Constitution includes provisions for distribution
Revenue that is distributed
Formation of revenue
Distribution to producing regions
Mechanism to compensate non-producing regions
Restrictions on use
Legislation on evaluating the economic and social impact of expenditure
Argentina Hydrocarbons Nation/ Provinces No Royalties 12% of output value
Yes (the provinces collect)
No No No
Mining Nation/ Provinces No Royalties 1% - 3% of output value
Yes (the provinces collect)
No No No
Bolivia (Plurinational State of)
Hydrocarbons People of the Plurinational State of Bolivia
Yes Royalties and direct tax on hydrocarbons
18% royalties and 32% direct tax on hydrocarbon output
Yes Yes Yes No
Mining State No Royalties 1% to 7% of gross sale value
Yes No Yes No
Brazil Hydrocarbons Union (Federal Government)
Yes RoyaltiesSpecial participations
Royalties 10% of output value
Yes No Yes No
Mining Union (Federal Government)
Yes Royalties (Financial Compensation for the Exploitation of Mineral Resources CFEM)
CFEM , 0.2% to 3% of net sales
Yes No No No
Chile Mining State No Patent and tax on sales (copper)
0.5% to 5% of sales
No No No
Colombia Hydrocarbons State Yes Royalties 5% to 25% of output value
Yes Yes Yes No
Mining State Yes Royalties 1% to 12% of value at minehead
Yes Yes Yes No
Ecuador Hydrocarbons State Yes Royalties 12.5% to 18% of output valueOne dollar per barrel of oil produced in Amazonia
Yes (minimum) No Yes No
Mining State No Royalties 3% of output value Yes No Yes No
Mexico Hydrocarbons Nation No All revenues are federal
Yes Access to fiscal resources through the fiscal coordination law
Yes a Nob
Mining Nation No All revenues are federal
Yes c No No No
Peru d Hydrocarbons Nation No RoyaltiesIncome tax
Royalties: 5% to 37% of output value
Yes No Yes No
Mining Nation No RoyaltiesIncome tax
1% to 3 % of gross sales
Yes No Yes No
Trinidad and Tobago
Hydrocarbons State No Royalties 12.5% No No No No
Venezuela (Bolivarian Republic of)
Hydrocarbons Republic Yes Royalties and a percentage of the national budget
20% to 30% of the value of hydrocarbon output
Yes (minimum) Yes Yes No
Source: Economic Commission for Latin America and the Caribbean (ECLAC), on the basis of official information.a Subject to the rules for each budget line item governing federal participations.b All federal government spending is bound by the National System for Performance Evaluation and its guidelines.c Formerly applied only to state governments; the recent reform expanded it to municipalities.d In the case of Peru, subnational governments are allocated 50% of the revenue from income tax paid by producing firms.
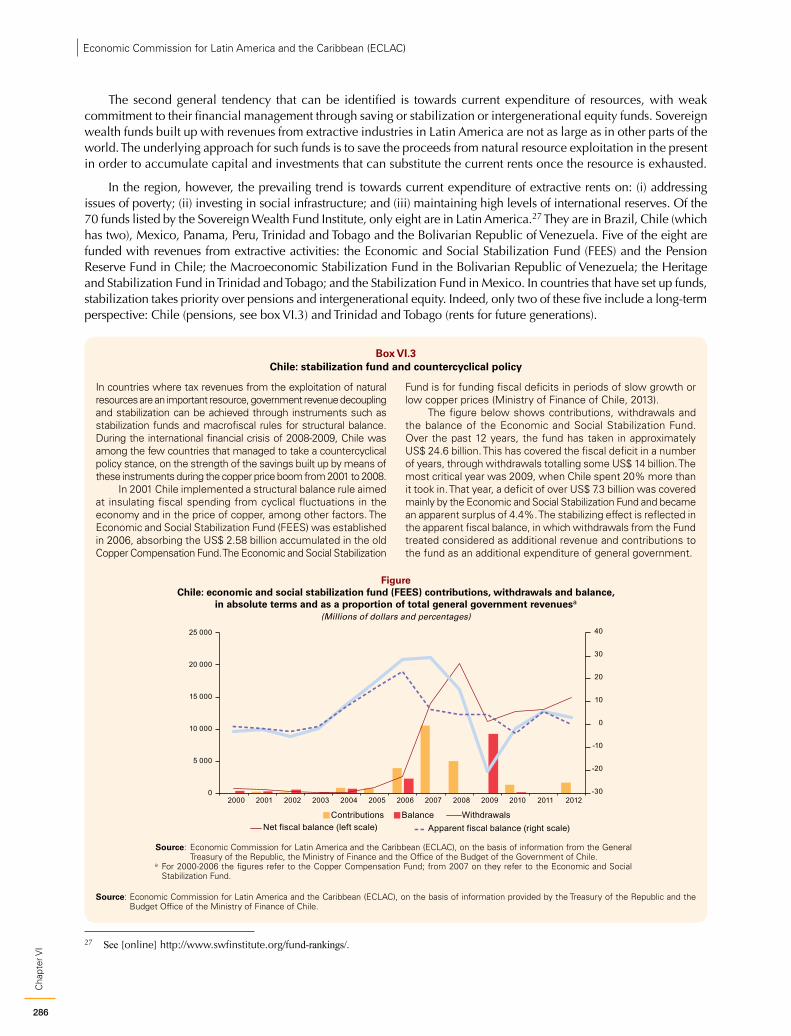
286
Cha
pter
VIEconomic Commission for Latin America and the Caribbean (ECLAC)
The second general tendency that can be identified is towards current expenditure of resources, with weak commitment to their financial management through saving or stabilization or intergenerational equity funds. Sovereign wealth funds built up with revenues from extractive industries in Latin America are not as large as in other parts of the world. The underlying approach for such funds is to save the proceeds from natural resource exploitation in the present in order to accumulate capital and investments that can substitute the current rents once the resource is exhausted.
In the region, however, the prevailing trend is towards current expenditure of extractive rents on: (i) addressing issues of poverty; (ii) investing in social infrastructure; and (iii) maintaining high levels of international reserves. Of the 70 funds listed by the Sovereign Wealth Fund Institute, only eight are in Latin America.27 They are in Brazil, Chile (which has two), Mexico, Panama, Peru, Trinidad and Tobago and the Bolivarian Republic of Venezuela. Five of the eight are funded with revenues from extractive activities: the Economic and Social Stabilization Fund (FEES) and the Pension Reserve Fund in Chile; the Macroeconomic Stabilization Fund in the Bolivarian Republic of Venezuela; the Heritage and Stabilization Fund in Trinidad and Tobago; and the Stabilization Fund in Mexico. In countries that have set up funds, stabilization takes priority over pensions and intergenerational equity. Indeed, only two of these five include a long-term perspective: Chile (pensions, see box VI.3) and Trinidad and Tobago (rents for future generations).
27 See [online] http://www.swfinstitute.org/fund-rankings/.
Box VI.3 Chile: stabilization fund and countercyclical policy
In countries where tax revenues from the exploitation of natural resources are an important resource, government revenue decoupling and stabilization can be achieved through instruments such as stabilization funds and macrofiscal rules for structural balance. During the international financial crisis of 2008-2009, Chile was among the few countries that managed to take a countercyclical policy stance, on the strength of the savings built up by means of these instruments during the copper price boom from 2001 to 2008.
In 2001 Chile implemented a structural balance rule aimed at insulating fiscal spending from cyclical fluctuations in the economy and in the price of copper, among other factors. The Economic and Social Stabilization Fund (FEES) was established in 2006, absorbing the US$ 2.58 billion accumulated in the old Copper Compensation Fund. The Economic and Social Stabilization
Fund is for funding fiscal deficits in periods of slow growth or low copper prices (Ministry of Finance of Chile, 2013).
The figure below shows contributions, withdrawals and the balance of the Economic and Social Stabilization Fund. Over the past 12 years, the fund has taken in approximately US$ 24.6 billion. This has covered the fiscal deficit in a number of years, through withdrawals totalling some US$ 14 billion. The most critical year was 2009, when Chile spent 20% more than it took in. That year, a deficit of over US$ 7.3 billion was covered mainly by the Economic and Social Stabilization Fund and became an apparent surplus of 4.4%. The stabilizing effect is reflected in the apparent fiscal balance, in which withdrawals from the Fund treated considered as additional revenue and contributions to the fund as an additional expenditure of general government.
Figure Chile: economic and social stabilization fund (FEES) contributions, withdrawals and balance,
in absolute terms and as a proportion of total general government revenuesa
(Millions of dollars and percentages)
-30
-20
-10
0
10
20
30
40
0
5 000
10 000
15 000
20 000
25 000
2000 2001 2002 2003 2004 2005 2006 2007 2008 2009 2010 2011 2012
Contributions Balance WithdrawalsNet fiscal balance (left scale) Apparent fiscal balance (right scale)
Source: Economic Commission for Latin America and the Caribbean (ECLAC), on the basis of information from the General Treasury of the Republic, the Ministry of Finance and the Office of the Budget of the Government of Chile.
a For 2000-2006 the figures refer to the Copper Compensation Fund; from 2007 on they refer to the Economic and Social Stabilization Fund.
Source: Economic Commission for Latin America and the Caribbean (ECLAC), on the basis of information provided by the Treasury of the Republic and the Budget Office of the Ministry of Finance of Chile.
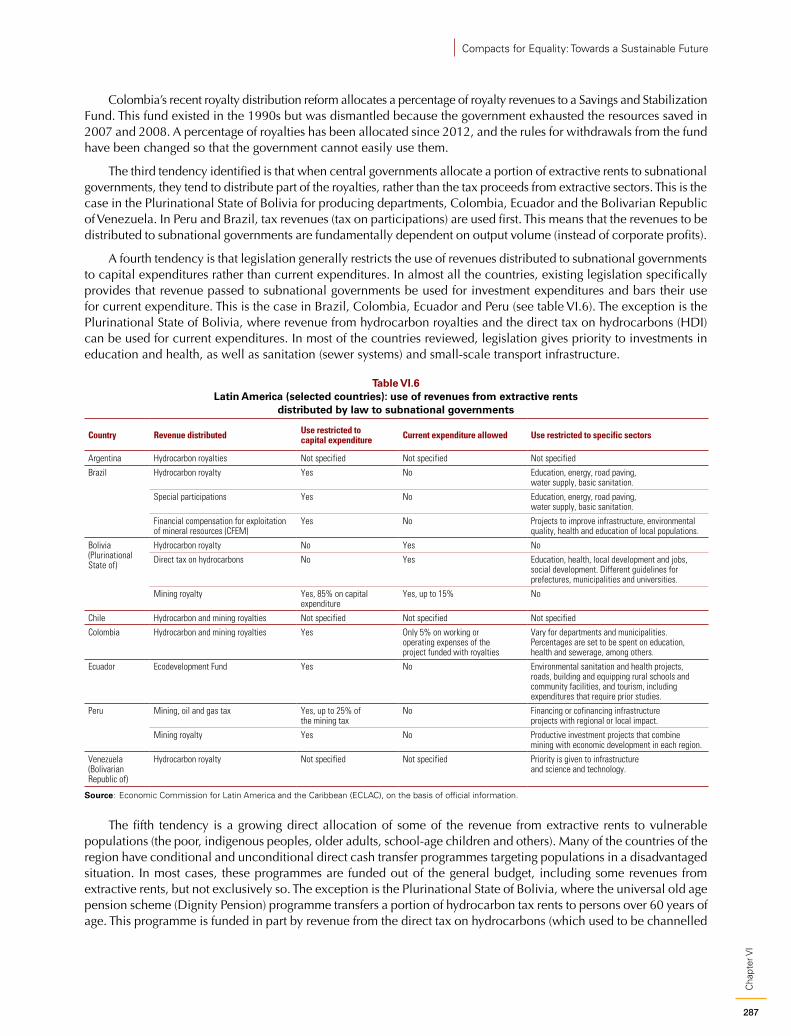
287
Cha
pter
VI
Compacts for Equality: Towards a Sustainable Future
Colombia’s recent royalty distribution reform allocates a percentage of royalty revenues to a Savings and Stabilization Fund. This fund existed in the 1990s but was dismantled because the government exhausted the resources saved in 2007 and 2008. A percentage of royalties has been allocated since 2012, and the rules for withdrawals from the fund have been changed so that the government cannot easily use them.
The third tendency identified is that when central governments allocate a portion of extractive rents to subnational governments, they tend to distribute part of the royalties, rather than the tax proceeds from extractive sectors. This is the case in the Plurinational State of Bolivia for producing departments, Colombia, Ecuador and the Bolivarian Republic of Venezuela. In Peru and Brazil, tax revenues (tax on participations) are used first. This means that the revenues to be distributed to subnational governments are fundamentally dependent on output volume (instead of corporate profits).
A fourth tendency is that legislation generally restricts the use of revenues distributed to subnational governments to capital expenditures rather than current expenditures. In almost all the countries, existing legislation specifically provides that revenue passed to subnational governments be used for investment expenditures and bars their use for current expenditure. This is the case in Brazil, Colombia, Ecuador and Peru (see table VI.6). The exception is the Plurinational State of Bolivia, where revenue from hydrocarbon royalties and the direct tax on hydrocarbons (HDI) can be used for current expenditures. In most of the countries reviewed, legislation gives priority to investments in education and health, as well as sanitation (sewer systems) and small-scale transport infrastructure.
Table VI.6 Latin America (selected countries): use of revenues from extractive rents
distributed by law to subnational governments
Country Revenue distributed Use restricted to capital expenditure Current expenditure allowed Use restricted to specific sectors
Argentina Hydrocarbon royalties Not specified Not specified Not specified
Brazil Hydrocarbon royalty Yes No Education, energy, road paving, water supply, basic sanitation.
Special participations Yes No Education, energy, road paving, water supply, basic sanitation.
Financial compensation for exploitation of mineral resources (CFEM)
Yes No Projects to improve infrastructure, environmental quality, health and education of local populations.
Bolivia (Plurinational State of)
Hydrocarbon royalty No Yes No
Direct tax on hydrocarbons No Yes Education, health, local development and jobs, social development. Different guidelines for prefectures, municipalities and universities.
Mining royalty Yes, 85% on capital expenditure
Yes, up to 15% No
Chile Hydrocarbon and mining royalties Not specified Not specified Not specified
Colombia Hydrocarbon and mining royalties Yes Only 5% on working or operating expenses of the project funded with royalties
Vary for departments and municipalities. Percentages are set to be spent on education, health and sewerage, among others.
Ecuador Ecodevelopment Fund Yes No Environmental sanitation and health projects, roads, building and equipping rural schools and community facilities, and tourism, including expenditures that require prior studies.
Peru Mining, oil and gas tax Yes, up to 25% of the mining tax
No Financing or cofinancing infrastructure projects with regional or local impact.
Mining royalty Yes No Productive investment projects that combine mining with economic development in each region.
Venezuela (Bolivarian Republic of)
Hydrocarbon royalty Not specified Not specified Priority is given to infrastructure and science and technology.
Source: Economic Commission for Latin America and the Caribbean (ECLAC), on the basis of official information.
The fifth tendency is a growing direct allocation of some of the revenue from extractive rents to vulnerable populations (the poor, indigenous peoples, older adults, school-age children and others). Many of the countries of the region have conditional and unconditional direct cash transfer programmes targeting populations in a disadvantaged situation. In most cases, these programmes are funded out of the general budget, including some revenues from extractive rents, but not exclusively so. The exception is the Plurinational State of Bolivia, where the universal old age pension scheme (Dignity Pension) programme transfers a portion of hydrocarbon tax rents to persons over 60 years of age. This programme is funded in part by revenue from the direct tax on hydrocarbons (which used to be channelled
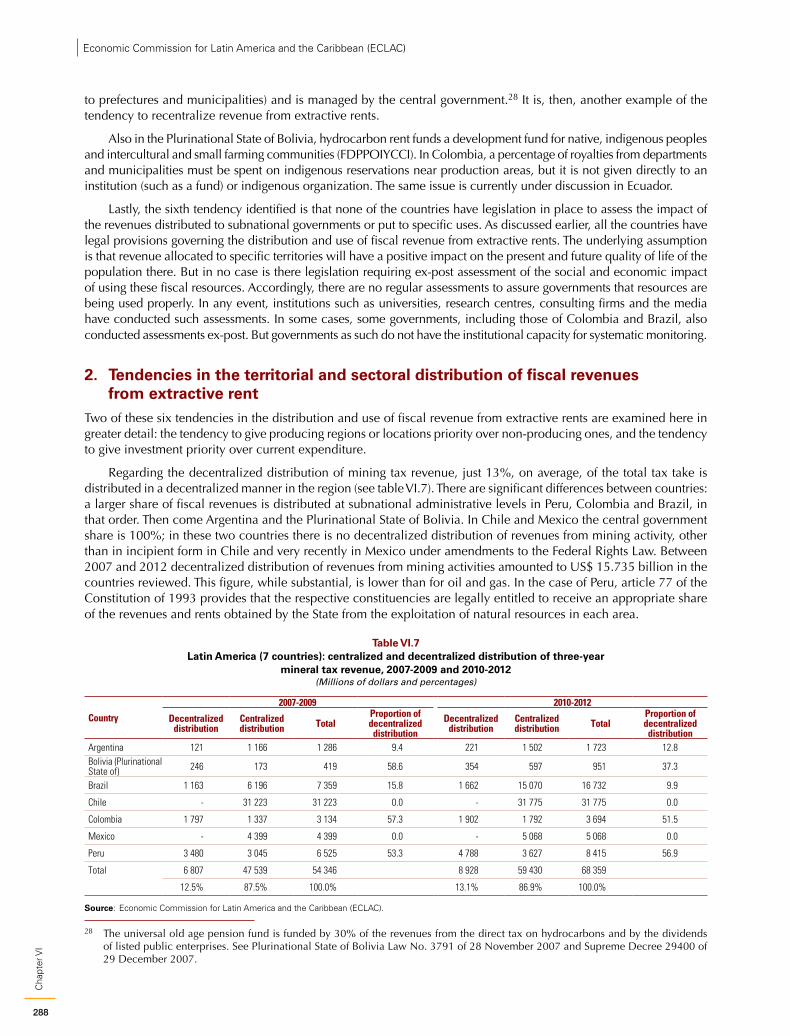
288
Cha
pter
VIEconomic Commission for Latin America and the Caribbean (ECLAC)
to prefectures and municipalities) and is managed by the central government.28 It is, then, another example of the tendency to recentralize revenue from extractive rents.
Also in the Plurinational State of Bolivia, hydrocarbon rent funds a development fund for native, indigenous peoples and intercultural and small farming communities (FDPPOIYCCI). In Colombia, a percentage of royalties from departments and municipalities must be spent on indigenous reservations near production areas, but it is not given directly to an institution (such as a fund) or indigenous organization. The same issue is currently under discussion in Ecuador.
Lastly, the sixth tendency identified is that none of the countries have legislation in place to assess the impact of the revenues distributed to subnational governments or put to specific uses. As discussed earlier, all the countries have legal provisions governing the distribution and use of fiscal revenue from extractive rents. The underlying assumption is that revenue allocated to specific territories will have a positive impact on the present and future quality of life of the population there. But in no case is there legislation requiring ex-post assessment of the social and economic impact of using these fiscal resources. Accordingly, there are no regular assessments to assure governments that resources are being used properly. In any event, institutions such as universities, research centres, consulting firms and the media have conducted such assessments. In some cases, some governments, including those of Colombia and Brazil, also conducted assessments ex-post. But governments as such do not have the institutional capacity for systematic monitoring.
2. Tendencies in the territorial and sectoral distribution of fiscal revenues from extractive rent
Two of these six tendencies in the distribution and use of fiscal revenue from extractive rents are examined here in greater detail: the tendency to give producing regions or locations priority over non-producing ones, and the tendency to give investment priority over current expenditure.
Regarding the decentralized distribution of mining tax revenue, just 13%, on average, of the total tax take is distributed in a decentralized manner in the region (see table VI.7). There are significant differences between countries: a larger share of fiscal revenues is distributed at subnational administrative levels in Peru, Colombia and Brazil, in that order. Then come Argentina and the Plurinational State of Bolivia. In Chile and Mexico the central government share is 100%; in these two countries there is no decentralized distribution of revenues from mining activity, other than in incipient form in Chile and very recently in Mexico under amendments to the Federal Rights Law. Between 2007 and 2012 decentralized distribution of revenues from mining activities amounted to US$ 15.735 billion in the countries reviewed. This figure, while substantial, is lower than for oil and gas. In the case of Peru, article 77 of the Constitution of 1993 provides that the respective constituencies are legally entitled to receive an appropriate share of the revenues and rents obtained by the State from the exploitation of natural resources in each area.
Table VI.7 Latin America (7 countries): centralized and decentralized distribution of three-year
mineral tax revenue, 2007-2009 and 2010-2012(Millions of dollars and percentages)
Country
2007-2009 2010-2012
Decentralized distribution
Centralized distribution Total
Proportion of decentralized distribution
Decentralized distribution
Centralized distribution Total
Proportion of decentralized distribution
Argentina 121 1 166 1 286 9.4 221 1 502 1 723 12.8Bolivia (Plurinational State of) 246 173 419 58.6 354 597 951 37.3
Brazil 1 163 6 196 7 359 15.8 1 662 15 070 16 732 9.9
Chile - 31 223 31 223 0.0 - 31 775 31 775 0.0
Colombia 1 797 1 337 3 134 57.3 1 902 1 792 3 694 51.5
Mexico - 4 399 4 399 0.0 - 5 068 5 068 0.0
Peru 3 480 3 045 6 525 53.3 4 788 3 627 8 415 56.9
Total 6 807 47 539 54 346 8 928 59 430 68 359
12.5% 87.5% 100.0% 13.1% 86.9% 100.0%
Source: Economic Commission for Latin America and the Caribbean (ECLAC).
28 The universal old age pension fund is funded by 30% of the revenues from the direct tax on hydrocarbons and by the dividends of listed public enterprises. See Plurinational State of Bolivia Law No. 3791 of 28 November 2007 and Supreme Decree 29400 of 29 December 2007.
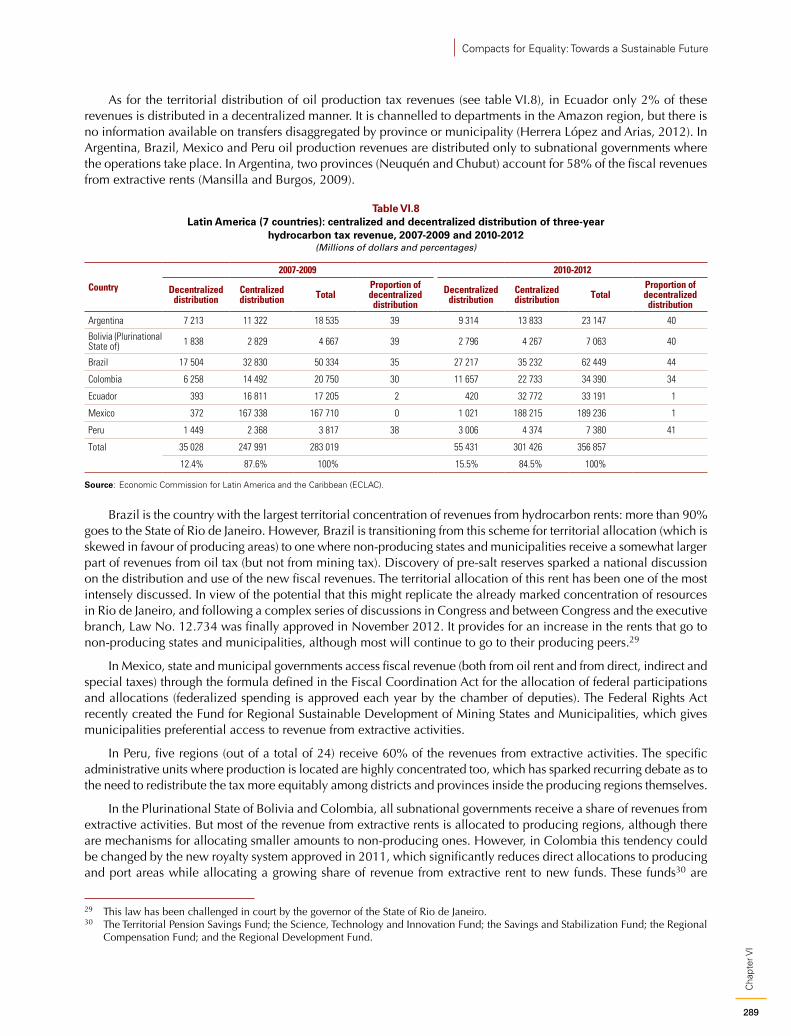
289
Cha
pter
VI
Compacts for Equality: Towards a Sustainable Future
As for the territorial distribution of oil production tax revenues (see table VI.8), in Ecuador only 2% of these revenues is distributed in a decentralized manner. It is channelled to departments in the Amazon region, but there is no information available on transfers disaggregated by province or municipality (Herrera López and Arias, 2012). In Argentina, Brazil, Mexico and Peru oil production revenues are distributed only to subnational governments where the operations take place. In Argentina, two provinces (Neuquén and Chubut) account for 58% of the fiscal revenues from extractive rents (Mansilla and Burgos, 2009).
Table VI.8 Latin America (7 countries): centralized and decentralized distribution of three-year
hydrocarbon tax revenue, 2007-2009 and 2010-2012(Millions of dollars and percentages)
Country
2007-2009 2010-2012
Decentralized distribution
Centralized distribution Total
Proportion of decentralized distribution
Decentralized distribution
Centralized distribution Total
Proportion of decentralized distribution
Argentina 7 213 11 322 18 535 39 9 314 13 833 23 147 40
Bolivia (Plurinational State of) 1 838 2 829 4 667 39 2 796 4 267 7 063 40
Brazil 17 504 32 830 50 334 35 27 217 35 232 62 449 44
Colombia 6 258 14 492 20 750 30 11 657 22 733 34 390 34
Ecuador 393 16 811 17 205 2 420 32 772 33 191 1
Mexico 372 167 338 167 710 0 1 021 188 215 189 236 1
Peru 1 449 2 368 3 817 38 3 006 4 374 7 380 41
Total 35 028 247 991 283 019 55 431 301 426 356 857
12.4% 87.6% 100% 15.5% 84.5% 100%
Source: Economic Commission for Latin America and the Caribbean (ECLAC).
Brazil is the country with the largest territorial concentration of revenues from hydrocarbon rents: more than 90% goes to the State of Rio de Janeiro. However, Brazil is transitioning from this scheme for territorial allocation (which is skewed in favour of producing areas) to one where non-producing states and municipalities receive a somewhat larger part of revenues from oil tax (but not from mining tax). Discovery of pre-salt reserves sparked a national discussion on the distribution and use of the new fiscal revenues. The territorial allocation of this rent has been one of the most intensely discussed. In view of the potential that this might replicate the already marked concentration of resources in Rio de Janeiro, and following a complex series of discussions in Congress and between Congress and the executive branch, Law No. 12.734 was finally approved in November 2012. It provides for an increase in the rents that go to non-producing states and municipalities, although most will continue to go to their producing peers.29
In Mexico, state and municipal governments access fiscal revenue (both from oil rent and from direct, indirect and special taxes) through the formula defined in the Fiscal Coordination Act for the allocation of federal participations and allocations (federalized spending is approved each year by the chamber of deputies). The Federal Rights Act recently created the Fund for Regional Sustainable Development of Mining States and Municipalities, which gives municipalities preferential access to revenue from extractive activities.
In Peru, five regions (out of a total of 24) receive 60% of the revenues from extractive activities. The specific administrative units where production is located are highly concentrated too, which has sparked recurring debate as to the need to redistribute the tax more equitably among districts and provinces inside the producing regions themselves.
In the Plurinational State of Bolivia and Colombia, all subnational governments receive a share of revenues from extractive activities. But most of the revenue from extractive rents is allocated to producing regions, although there are mechanisms for allocating smaller amounts to non-producing ones. However, in Colombia this tendency could be changed by the new royalty system approved in 2011, which significantly reduces direct allocations to producing and port areas while allocating a growing share of revenue from extractive rent to new funds. These funds30 are
29 This law has been challenged in court by the governor of the State of Rio de Janeiro.30 The Territorial Pension Savings Fund; the Science, Technology and Innovation Fund; the Savings and Stabilization Fund; the Regional
Compensation Fund; and the Regional Development Fund.
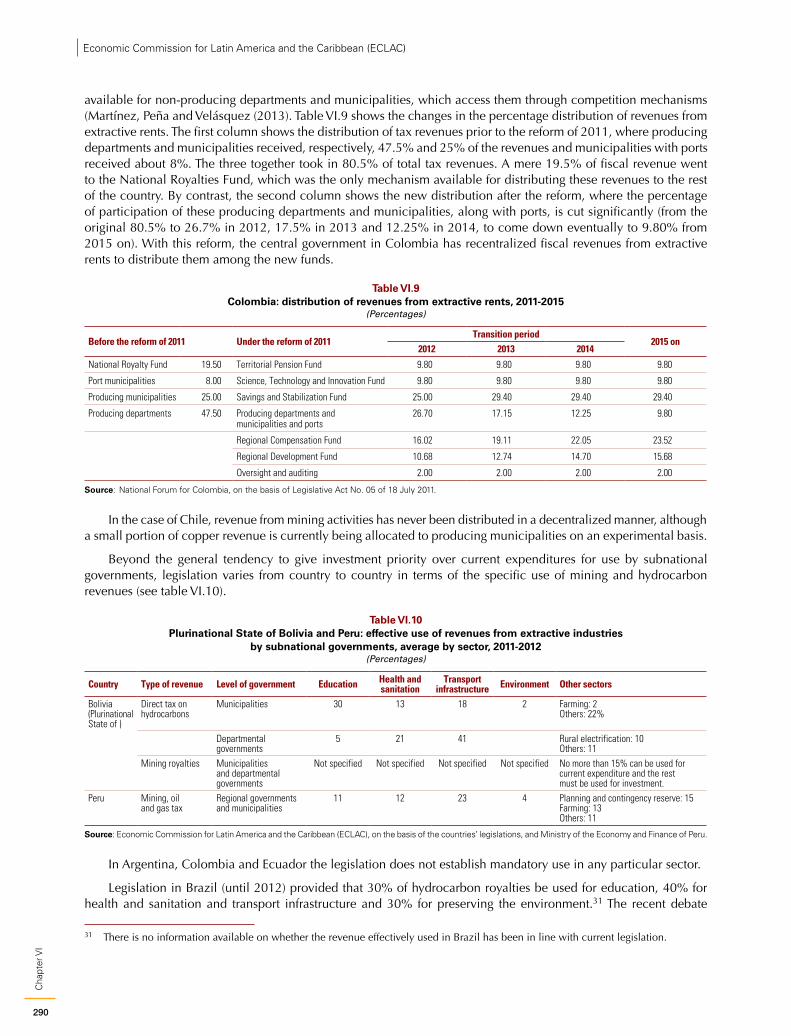
290
Cha
pter
VIEconomic Commission for Latin America and the Caribbean (ECLAC)
available for non-producing departments and municipalities, which access them through competition mechanisms (Martínez, Peña and Velásquez (2013). Table VI.9 shows the changes in the percentage distribution of revenues from extractive rents. The first column shows the distribution of tax revenues prior to the reform of 2011, where producing departments and municipalities received, respectively, 47.5% and 25% of the revenues and municipalities with ports received about 8%. The three together took in 80.5% of total tax revenues. A mere 19.5% of fiscal revenue went to the National Royalties Fund, which was the only mechanism available for distributing these revenues to the rest of the country. By contrast, the second column shows the new distribution after the reform, where the percentage of participation of these producing departments and municipalities, along with ports, is cut significantly (from the original 80.5% to 26.7% in 2012, 17.5% in 2013 and 12.25% in 2014, to come down eventually to 9.80% from 2015 on). With this reform, the central government in Colombia has recentralized fiscal revenues from extractive rents to distribute them among the new funds.
Table VI.9 Colombia: distribution of revenues from extractive rents, 2011-2015
(Percentages)
Before the reform of 2011 Under the reform of 2011Transition period
2015 on2012 2013 2014
National Royalty Fund 19.50 Territorial Pension Fund 9.80 9.80 9.80 9.80
Port municipalities 8.00 Science, Technology and Innovation Fund 9.80 9.80 9.80 9.80
Producing municipalities 25.00 Savings and Stabilization Fund 25.00 29.40 29.40 29.40
Producing departments 47.50 Producing departments and municipalities and ports
26.70 17.15 12.25 9.80
Regional Compensation Fund 16.02 19.11 22.05 23.52
Regional Development Fund 10.68 12.74 14.70 15.68
Oversight and auditing 2.00 2.00 2.00 2.00
Source: National Forum for Colombia, on the basis of Legislative Act No. 05 of 18 July 2011.
In the case of Chile, revenue from mining activities has never been distributed in a decentralized manner, although a small portion of copper revenue is currently being allocated to producing municipalities on an experimental basis.
Beyond the general tendency to give investment priority over current expenditures for use by subnational governments, legislation varies from country to country in terms of the specific use of mining and hydrocarbon revenues (see table VI.10).
Table VI.10 Plurinational State of Bolivia and Peru: effective use of revenues from extractive industries
by subnational governments, average by sector, 2011-2012(Percentages)
Country Type of revenue Level of government Education Health and sanitation
Transport infrastructure Environment Other sectors
Bolivia (Plurinational State of )
Direct tax on hydrocarbons
Municipalities 30 13 18 2 Farming: 2Others: 22%
Departmental governments
5 21 41 Rural electrification: 10Others: 11
Mining royalties Municipalities and departmental governments
Not specified Not specified Not specified Not specified No more than 15% can be used for current expenditure and the rest must be used for investment.
Peru Mining, oil and gas tax
Regional governments and municipalities
11 12 23 4 Planning and contingency reserve: 15Farming: 13Others: 11
Source: Economic Commission for Latin America and the Caribbean (ECLAC), on the basis of the countries’ legislations, and Ministry of the Economy and Finance of Peru.
In Argentina, Colombia and Ecuador the legislation does not establish mandatory use in any particular sector.
Legislation in Brazil (until 2012) provided that 30% of hydrocarbon royalties be used for education, 40% for health and sanitation and transport infrastructure and 30% for preserving the environment.31 The recent debate
31 There is no information available on whether the revenue effectively used in Brazil has been in line with current legislation.
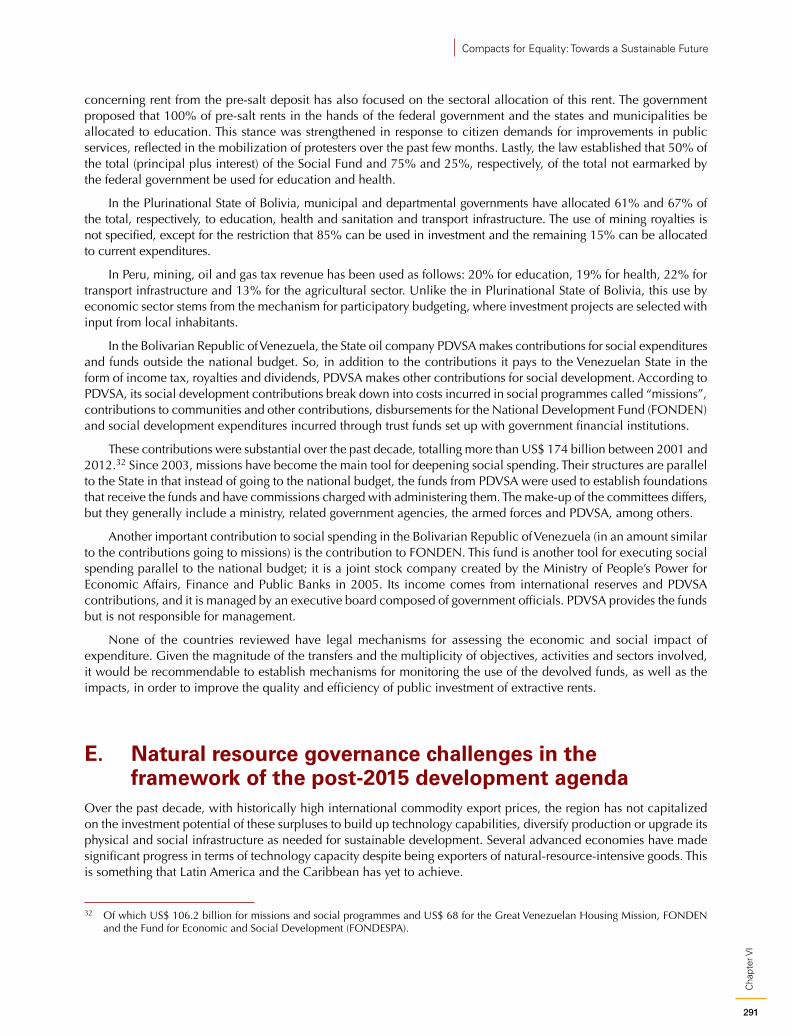
291
Cha
pter
VI
Compacts for Equality: Towards a Sustainable Future
concerning rent from the pre-salt deposit has also focused on the sectoral allocation of this rent. The government proposed that 100% of pre-salt rents in the hands of the federal government and the states and municipalities be allocated to education. This stance was strengthened in response to citizen demands for improvements in public services, reflected in the mobilization of protesters over the past few months. Lastly, the law established that 50% of the total (principal plus interest) of the Social Fund and 75% and 25%, respectively, of the total not earmarked by the federal government be used for education and health.
In the Plurinational State of Bolivia, municipal and departmental governments have allocated 61% and 67% of the total, respectively, to education, health and sanitation and transport infrastructure. The use of mining royalties is not specified, except for the restriction that 85% can be used in investment and the remaining 15% can be allocated to current expenditures.
In Peru, mining, oil and gas tax revenue has been used as follows: 20% for education, 19% for health, 22% for transport infrastructure and 13% for the agricultural sector. Unlike the in Plurinational State of Bolivia, this use by economic sector stems from the mechanism for participatory budgeting, where investment projects are selected with input from local inhabitants.
In the Bolivarian Republic of Venezuela, the State oil company PDVSA makes contributions for social expenditures and funds outside the national budget. So, in addition to the contributions it pays to the Venezuelan State in the form of income tax, royalties and dividends, PDVSA makes other contributions for social development. According to PDVSA, its social development contributions break down into costs incurred in social programmes called “missions”, contributions to communities and other contributions, disbursements for the National Development Fund (FONDEN) and social development expenditures incurred through trust funds set up with government financial institutions.
These contributions were substantial over the past decade, totalling more than US$ 174 billion between 2001 and 2012.32 Since 2003, missions have become the main tool for deepening social spending. Their structures are parallel to the State in that instead of going to the national budget, the funds from PDVSA were used to establish foundations that receive the funds and have commissions charged with administering them. The make-up of the committees differs, but they generally include a ministry, related government agencies, the armed forces and PDVSA, among others.
Another important contribution to social spending in the Bolivarian Republic of Venezuela (in an amount similar to the contributions going to missions) is the contribution to FONDEN. This fund is another tool for executing social spending parallel to the national budget; it is a joint stock company created by the Ministry of People’s Power for Economic Affairs, Finance and Public Banks in 2005. Its income comes from international reserves and PDVSA contributions, and it is managed by an executive board composed of government officials. PDVSA provides the funds but is not responsible for management.
None of the countries reviewed have legal mechanisms for assessing the economic and social impact of expenditure. Given the magnitude of the transfers and the multiplicity of objectives, activities and sectors involved, it would be recommendable to establish mechanisms for monitoring the use of the devolved funds, as well as the impacts, in order to improve the quality and efficiency of public investment of extractive rents.
E. Natural resource governance challenges in the framework of the post-2015 development agenda
Over the past decade, with historically high international commodity export prices, the region has not capitalized on the investment potential of these surpluses to build up technology capabilities, diversify production or upgrade its physical and social infrastructure as needed for sustainable development. Several advanced economies have made significant progress in terms of technology capacity despite being exporters of natural-resource-intensive goods. This is something that Latin America and the Caribbean has yet to achieve.
32 Of which US$ 106.2 billion for missions and social programmes and US$ 68 for the Great Venezuelan Housing Mission, FONDEN and the Fund for Economic and Social Development (FONDESPA).
292
Cha
pter
VIEconomic Commission for Latin America and the Caribbean (ECLAC)
The positive terms-of-trade shock in natural resources between 2003 and 2012 spurred economic growth and the availability of financial resources, but its potential for structural change was not seized nor was it prioritized on public agendas. On the contrary, the natural resource price boom primarily fuelled a surge in consumption (see chapter IV), with potential negative environmental impacts (see chapter V). There was no strategic prioritization of public investment based on long-term economic and environmental sustainability criteria. The region is replicating an asymmetrical pattern with, on the one hand, a production matrix that is lacking in diversification, sophistication and innovation, with high dependence on natural resource revenues (currently exacerbated by high international prices) and, on the other hand, increasing consumption heavily biased towards imported goods. In a future scenario of flat or falling global commodity demand and natural resource prices, such an equation could trigger serious trade and fiscal imbalances, among other undesirable outcomes.
These vulnerabilities underscore the major challenge to improve natural resources governance, in order to ensure that the ownership, distribution and ultimate investment of resource rents effectively contributes to achieving the structural change with social inclusion that the post-2015 development agenda calls for. This chapter has reviewed developments in these spheres concerning the mining and hydrocarbon sector in the countries in the region. The review leads to the conclusion that it is essential to consolidate an institutional and regulatory framework that can leverage this set of factors to build a more technology-intensive and more highly diversified production structure, with the end goal being the effective public investment of resource rents for the promotion of greater equality in access to well-being, educational opportunities and mutual recognition among stakeholders, in a framework of justice and intergenerational equity.
Natural resource governance within the horizon of structural change is critical at two different stages of the process. The first stage is the development of the sector itself. Here, coordinated efforts are needed to boost capacity density, technological innovation, linkages and synergies with other sectors, as well as the social benefits of investment in infrastructure for exploiting and transporting natural resources. A second stage in the process concerns the way tax revenues from natural resource rents are used for general investment in human capacities (education and training), social protection, infrastructure, technology development and innovation in other production sectors with a high value added component.33 The ultimate objective is to leave future generations the production capacities and means to achieve sustainable development.
Coordination through policies and State institutions at these two points in the process is essential for generating virtuous circles linking the exploitation of natural resources to structural change. Although it might seem ambitious, this is possible and has indeed been achieved in industrialized countries with large natural resource endowments. In turn, structural change impacts positively on equality, insofar as expanded educational attainment and the development of production capacities brings greater social inclusion through more productive jobs, greater access to services and linkages through better infrastructure, and increased public resources for expanded coverage of social protection systems.
Changing the current paradigm for exploiting natural resources through improved natural resources governance compatible with sustainability and calls for forging broad-based social compacts around these goals. This subject is taken up in chapter VII.
33 Although this investment tends to be made through current expenditure and its financing may not always come from natural resource revenues, which are by nature changeable and volatile, there have been positive experiences with funds created from natural resource rents for capacity-building and other types of social investment. For example, in Peru revenues from the extractive industries are already used for advanced human capital formation (the university tax) and for social investment.
293
Cha
pter
VI
Compacts for Equality: Towards a Sustainable Future
BibliographyAcemoglu, D. and others (2002), “Reversal of fortune: geography and institutions in the making of the modern world
income distribution”, Quarterly Journal of Economics, No. 117.Acquatella, J. and others (2013), “Rentas de recursos naturales no renovables en América Latina y el Caribe: Evolución
1990-2011 y participación estatal”, Seminarios y Conferencias series, No. 72 (LC/L.3645), Santiago, Chile, Economic Commission for Latin America and the Caribbean (ECLAC), June.
Adler, Gustavo and Sebastián Sosa (2011), “Commodity price cycles: the perils of mismanaging the boom”, IMF Working Paper, No. WP/11/283, Washington, D.C., International Monetary Fund.
Birdsall, N. and J.L. Londoño (1997), “Asset inequality matters: an assessment of the world bank’s approach to poverty reduction”, The American Economic Review, vol. 87, No. 2.
Bourland, Brad and Paul Gamble (2011), “Saudi Arabia’s coming oil and fiscal challenge”, Jadwa Investment, July.BP (British Petroleum) (2013), “Statistical Review of World Energy 2013” [online] http://www.bp.com/statisticalreview. (2012), “Statistical Review of World Energy 2012” [online] http://www.bp.com/statisticalreview. (2011), “Statistical Review of World Energy 2011” [online] http://www.bp.com/statisticalreview. Brunnschweiler, C. and E. H. Bulte (2008), “The resource curse revisited and revised: a tale of paradoxes and red
herrings”, Journal of Environmental Economics and Management, No. 55.Buccellato, T. and M. Alessandrini (2009), “Natural resources: a blessing or a curse? The role of inequality”, Discussion
Paper, No. 98, Centre for Financial and Management Studies.Campodónico, Humberto (2008), “Renta petrolera y minera en países seleccionados de América Latina”,
Project Documents, No. 188 (LC/W.188), Santiago, Chile, Economic Commission for Latin America and the Caribbean (ECLAC).
Centro de Cambio Global (2010), “Relación entre agua energía y cambio climático”, Santiago, Chile, Pontificia Universidad Católica de Chile, January.
Chong, A. and M. Gradstein (2007), “Inequality and institutions”, The Review of Economics and Statistics, vol. 89, No. 3.COCHILCO (Chilean Copper Commission) (2013), Consumo de agua en la minería del cobre año 2012, Santiago, Chile. (2011), Anuario de Estadísticas del Cobre y otros Minerales 1992-2011, Santiago, Chile. (2009), “Proyección consumo de agua en la minería del cobre 2009-2020”, Informe Gestión del recurso hídrico
y la minería en Chile, Santiago, Chile.Collier, Paul (2010), The Plundered Planet: Why We Must--and How We Can Manage Nature for Global Prosperity,
New York, Oxford University Press.Collier, P. and B. Goderis (2011), “Commodity prices and growth: an empirical investigation”, European Economic
Review, vol. 56, No. 6. (2007), “Commodity prices, growth, and the natural resource curse: Reconciling a conundrum”, Working Paper
Series, No. 274, Centre for the Study of African Economies.D’Elia, Yolanda and others (2008), “Las misiones sociales en Venezuela”, Caracas, Instituto Latinoamericano de
Investigaciones Sociales (ILDES).Davis, G.A. (2009), “Extractive economies, growth and the poor”, Mining, Society, and a Sustainable World, Jeremy
Richards (ed.), Berlin, Springer-Verlag. (2004), “An empirical investigation of mining and sustainable development”, Working Paper, Colorado School
of Mines [online] http://inside.mines.edu/~gdavis/Papers/pov_August_18.pdfS.Davis, G.A. and A.L.Vásquez Cordano (2013), “The fate of the poor in growing mineral and energy economies”,
Resources Policy, vol. 38, No. 2.De Gregorio, J. and L. Jong-Wha (2002), “Education and income inequality: new evidence from cross-country data”,
Review of Income and Wealth, vol. 48, No. 3.Deaton, B.J. and E. Niman (2012), “An empirical examination of the relationship between mining employment and
poverty in the Appalachian region”, Applied Economics, No. 44.Dourojeanni, Axel, Andrei Jouravlev and Guillermo Chávez (2002), “Gestión del agua a nivel de cuencas: teoría y
práctica”, Recursos Naturales e Infraestructura series, No. 47 (LC/L.1777-P), Santiago, Chile, Economic Commission for Latin America and the Caribbean (ECLAC).
Easterly, W. (2001), “The middle class consensus and economic development”, Journal of Economic Growth, vol. 6, No. 4.Echeme, I.I. and E.C. Ubani (2010), “A correlation of natural resource management and level of development in
developing countries: a case of Nigeria”, Report and Opinion, vol. 2, No. 7.
294
Cha
pter
VIEconomic Commission for Latin America and the Caribbean (ECLAC)
ECLAC (Economic Commission for Latin America and the Caribbean) (2013a), Natural resources: status and trends towards a regional development agenda in Latin America and the Caribbean (LC/L.3748), Santiago, Chile, December.
(2013b), Natural resources within the Union of South American Nations: status and trends for a regional development agenda (LC/L.3627), Santiago, Chile, May.
(2013c), Updated Economic Overview of Latin America and the Caribbean 2012, April 2013 (LC/G.2564), Santiago, Chile.
(2012a), Economic Survey of Latin America and the Caribbean, 2012 (LC/G.2546-P), Santiago, Chile, octubre. United Nations publication, Sales No. E.12.II.G.3.
(2012b), Latin America and the Caribbean in the World Economy 2011-2012 (LC/G.2547-P), Santiago, Chile. United Nations publication, Sales No. E.12.II.G.5.
(2012c), “Rentas de recursos naturales no renovables en América Latina y el Caribe: Evolución 1990-2010 y participación estatal”, paper presented at the seminar Natural Resources Government in Latin America and the Caribbean, Santiago, Chile, 24-25 April.
(2012d), Structural Change for Equality: An Integrated Approach to Development (LC/G.2524(SES.34/3)), Santiago, Chile.
(2012e), “CEPALSTAT database” [online] http://websie.eclac.cl/infest/ajax/cepalstat.asp?carpeta=estadisticas. (2011), Foreign Direct Investment in Latin America and the Caribbean, 2010 (LC/G.2494-P), Santiago, Chile.
United Nations publication, Sales No. E.11.II.G.4. (2010), Foreign Direct Investment in Latin America and the Caribbean, 2009 (LC/G.2447-P), Santiago, Chile.
United Nations publication, Sales No. E.10.II.G.4. (2008), Foreign Direct Investment in Latin America and the Caribbean, 2007 (LC/G.2360-P), Santiago, Chile.
United Nations publication, Sales No. E.08.II.G.11.EIA (Energy Information Administration) (2012), “International Energy Statistics” [online] http://www.eia.gov/cfapps/
ipdbproject/IEDIndex3.cfm. (2011a), “Country analysis briefs: Argentina” [online] http://www.eia.gov.us. (2011b), “Country analysis briefs: Estado Plurinacional de Bolivia” [online] http://www.eia.doe.gov.us. (2011c), “Country analysis briefs: Brazil” [online] http://www.eia.doe.gov.us. (2011d), “Country analysis briefs: Colombia” [online] http://www.eia.doe.gov.us. (2011e), “Country analysis briefs: Ecuador” [online] http://www.eia.doe.gov.us. (2011f), “Country analysis briefs: Mexico” [online] http://www.eia.doe.gov.us. (2011g), “Country analysis briefs: Peru” [online] http://www.eia.doe.gov.us. (2011h), “Country analysis briefs: Venezuela” [online] http://www.eia.doe.gov.us.Engerman, S. and K. Sokoloff (2002), “Factor endowments, inequality, and paths of development among new world
economies”, NBER Working Paper, No. 9259. (2000), “Institutions, factor endowments, and paths of development in the new world”, Journal of Economic
Perspectives, vol. 14, No. 3. (1997), “Factor endowments, institutions, and differential paths of growth among new world economies: a view
from economic historians of the United States”, Economic Growth and Latin American Economic Historiography, S. Haber (ed.), Cambridge, MIT Press.
ENI (2012), “World Oil and Gas Review 2012” [online] http://www.eni.com/world-oil-gas-review/pages/home.shtml. (2010), “World Oil and Gas Review 2010”. Escobal, J. (2005), “The role of public infrastructure in market development in rural Peru”, MPRA Paper, No. 727,
Wageningen University.Fum, R.M. and R. Hodler (2010), “Natural resources and income inequality: The role of ethnic divisions”, Economics
Letters, vol. 107, No. 3. Fundación Milenio (2013), Informe de Milenio sobre la Economía. Gestión 2012, La Paz. (2012), Informe de Milenio sobre la Economía. Gestión 2011, La Paz. (2011), Informe de Milenio sobre la Economía. Gestión 2010, La Paz.Galvis, L.A. and Meisel Roca A. (2010), “Persistencia de las desigualdades regionales en Colombia: Un análisis
espacial”, Documento de Trabajo sobre Economía Regional, No. 120, Cartagena, Banco de la República.Goderis, B. and S.W. Malone (2011), “Natural resource booms and inequality: Theory and evidence”, Scandinavian
Journal of Economics, No. 113.
295
Cha
pter
VI
Compacts for Equality: Towards a Sustainable Future
Gupta, S., H. Davoodi and R. Alonso-Terme (2002), “Does corruption affect income inequality and poverty?”, Economics of Governance, No. 3.
Gyimah-Brempong, K. and S. de Gyimah-Brempong (2006), “Corruption, growth, and income distribution: are there regional differences?”, Economics of Governance, vol. 7, No. 3.
Gylfason, T. (2007), “The international economics of natural resources and growth”, Minerals and Energy, vol. 22, No. 1–2. (2001), “Natural resources, education, and economic development”, European Economic Review, No. 45. Gylfason, T. and G. Zoega (2003), “Inequality and economic growth: do natural resources matter?”, Inequality and
Growth: Theory and Policy Implications, Theo S. Eicher and Stephen J. Turnovsky (eds.), Cambridge, MIT Press. Hajkowicz, S.A., S. Heyenga and K. Moffat (2011), “The relationship between mining and socio-economic well being
in Australia’s regions”, Resources Policy, vol. 36, No. 1.Hernández Martínez, E. (2011), “Los recursos naturales y el patrimonio de la Nación”, Ius Et Praxis. Revista de la
Facultad de Derecho de la Universidad de Lima, No. 42.Herrera, Juan José, Julio López and Karla Arias (2012), “El liderazgo de la gestión petrolera regresa al Estado, monitoreo
2011”, Lupa Fiscal, No. 4, Quito, Grupo Faro, December. Humphreys, M., J.D. Sachs and J. Stiglitz (2007), Escaping the Resource Curse, Columbia University Press, May.IDEA (International Institute for Democracy and Electoral Assistance) (2008), Memoria del seminario internacional
Gestión de los hidrocarburos: experiencias de otros países productores, La Paz.IEA (International Energy Agency) (2013), “Medium-Term Oil Market Report 2013”. (2012), “Golden Rules for a Golden Age of Gas”. (2012b), “World Energy Outlook 2012”. (2011), “World Energy Outlook 2011”. (2010), “World Energy Outlook 2010”.Iimi, A. (2007), “Escaping from the resource curse: evidence from Botswana and the rest of the world”, IMF Staff
Papers, vol. 54, No. 4.IMF (International Monetary Fund) (2010), The Taxation of Petroleum and Minerals: principles, problems and practices,
Washington, D.C.Isham, J. and others (2005), “The varieties of resource experience. Natural resource export structures and the political
economy of growth”, The World Bank Economic Review, vol. 19, No. 2.Ismail, Kareem (2010), “The structural manifestation of the `Dutch disease’: the case of oil exporting countries”, IMF
Working Paper, No. WP/10/103, Washington, D.C., International Monetary Fund.James, A. and D. Aadland (2011), “The curse of natural resources: An empirical investigation of U.S. counties”,
Resource and Energy Economics, vol. 33, No. 2.Johnston, Daniel (1994), International Petroleum Fiscal Systems and Production-Sharing Contracts, PennWell.Keefer, P. and S. Knack (2002), “Polarization, politics, and property rights: links between inequality and growth”,
Public Choice, No. 111.Khelil, Chakib (1995), “Fiscal systems for oil”, Note, No. 46, World Bank, May. Lagos, G. and E. Blanco (2010), “Mining and development in the region of Antofagasta”, Resources Policy, vol. 35, No. 4.Lardé, Jeannette, Eduardo Chaparro and Cristian Parra (2008), “El aporte del sector minero al desarrollo humano en
Chile: el caso de la región de Antofagasta”, Recursos Naturales e Infraestructura series, No. 130 (LC/L.2845-P/E), Santiago, Chile, Economic Commission for Latin America and the Caribbean (ECLAC).
Lavanderos, L., J. Gastó and P. Rodrigo (eds.) (1994), “Hacia un ordenamiento ecológico-administrativo del territorio”, Santiago, Chile, Ministerio de Bienes Nacionales.
Leamer, E.E. and others (1999), “Does natural resource abundance increase Latin American income inequality”, Journal of Development Economics, vol. 59.
Lederman, Daniel and William F. Maloney (eds.) (2006), Neither Curse nor Destiny: Natural Resources and Development, Washington, D.C., World Bank/Stanford University Press.
Li, H., L. Xu and H. Zou (2000), “Corruption, income distribution, and growth”, Economics and Politics, vol. 12, No. 2.Liscow, Z.D. (2013), “Do property rights promote investment but cause deforestation? Quasi-experimental evidence
from Nicaragua”, Journal of Environmental Economics and Management, No. 65.Loayza, N. and C. Raddatz (2010), “The composition of growth matters for poverty alleviation”, Journal of Development
Economics, vol. 93, No. 1.Ludevid, Manuel (1996), El cambio global en el medio ambiente, Alfaomega.
296
Cha
pter
VIEconomic Commission for Latin America and the Caribbean (ECLAC)
Mansilla, Diego and Martín Burgos Zeballosn (2009), “Las regalías hidrocarburíferas en la desigualdad fiscal provincial”, Realidad Económica, No. 246, agosto-septiembre.
Martínez Céspedes, René y María del Carmen Inch (2012), “A siete años del IDH ¿En qué se gastan los recursos?”, Debate Público, No. 22 [online] www.jubileobolivia.org.bo.
Martínez, Mario, Juliana Peña and Fabio Velásquez (2013), “El sector extractivo en Colombia 2011-2012”, Foro Nacional por Colombia.
Mehlum H., K. Moene and R. Torvik (2006), “Institutions and the resource curse”, The Economic Journal, vol. 116, January.Mideksa, T.K. (2013), “The economic impact of natural resources”, Journal of Environmental Economics and
Management, No. 65.Ministry of Finance of Chile (2013), Informe anual Fondos Soberanos 2012, Santiago, Chile, Biblioteca del Congreso Nacional.Mountinho dos Santos, Edmilson (2008), “La industria del petróleo brasileña. Marco regulatorio”, Memoria del
seminario internacional Gestión de los hidrocarburos: experiencias de otros países productores, International Institute for Democracy and Electoral Assistance (IDEA) [online] http://www.idea.int/publications/management_of_hydrocarbons/upload/inlay_Gesti%C3%B3n-de-los-Hidrocarburos.pdf.
Narain, U., S. Gupta and K. van’t Veld (2008), “Poverty and resource dependence in rural India”, Ecological Economics, vol. 66, No. 1.
Ocampo, José Antonio (2012), “How well has Latin America fared during the global financial crisis?”, The Global Economic Crisis in Latin America: Impacts and Prospects, Michael Cohen (ed.), Milton Park, Routledge.
Otto, James and others (2006), Mining Royalties: A Global Study of Their Impact on Investors, Government, and Civil Society, Washington, D.C., World Bank.
Partridge, M.D., M.R. Betz and L. Lobao (2012), “Natural curse and poverty in Appalachian America. Natural resources and the dynamics of income and wealth inequality in rural America”, American Journal of Agricultural Economics, vol. 95, No. 2.
Perrotti, D. and R. Sánchez (2011), “La brecha de infraestructura en América Latina y el Caribe”, Recursos Naturales e Infraestructura series, No. 153 (LC/L.3342), Santiago, Chile, Economic Commission for Latin America and the Caribbean (ECLAC).
Petrobras (2013) [online] http://www.petrobras.com/en/home.htm. (2012), “Pre-sal panorama e oportunidades”, September [online] http://www.investidorpetrobras.com.br/pt/
apresentacoes/apresentacao-rio-oil-and-gas-pre-sal-carlos-tadeu-fraga.htm.Rebasa, M. (2012), “Propiedad de las riquezas mineras, petroleras y gasíferas. Los recursos son de todos”, Página 12,
1 April.Robinson, J., R. Torvik and T. Verdier (2006), “Political foundations of the resource curse”, Journal of Development
Economics, vol. 79.Roemer, M. and M.K. Gugerty (1997), “Does economic growth reduce poverty?”, Technical Paper, Harvard Institute
for International Development.Rosanvallon, Pierre (2012), La sociedad de iguales, Madrid, Manantial. Ross, M. (2007), “How can mineral rich States reduce inequality?, Reversing the Resource Curse, Macartan Humphreys,
Jeffrey Sachs and Joseph Stiglitz (eds.), New York, Columbia University Press. (2001), Extractive Sectors and the Poor, Boston, Oxfam. (1999), “The political economy of the resource curse”, World Politics, No. 51, January.Rousseau, Isabelle (2008), “La industria mexicana del petróleo: PEMEX y los principios de buen gobierno”, Memoria
del seminario internacional Gestión de los hidrocarburos: experiencias de otros países productores, International Institute for Democracy and Electoral Assistance (IDEA) [online] http://www.idea.int/publications/management_of_hydrocarbons/upload/inlay_Gesti%C3%B3n-de-los-Hidrocarburos.pdf.
Saade Hazin, Miryam (2013), “Desarrollo minero y conflictos ambientales: los casos de Colombia, México y Perú”, Macroecomía del Desarrollo series, No. 137 (LC/L.3706), Santiago, Chile, Economic Commission for Latin America and the Caribbean (ECLAC), September.
Sachs, J. D. and A. Warner (1995), “Natural resource abundance and economic growth”, NBER Working Paper, No. 5398, Cambridge, National Bureau of Economic Research.
Saint-Paul, G. and T. Verdier (1993), “Education, democracy and growth”, Journal of Development Economics, vol. 42, No. 2.Sala-i-Martin, X. and A. Subramanian (2003), “Addressing the natural resource curse: an illustration from Nigeria”,
NBER Working Paper, No. 9804, National Bureau of Economic Research.
297
Cha
pter
VI
Compacts for Equality: Towards a Sustainable Future
Sinnott, E., J. Nash and A. de la Torre (2010), Natural Resources in Latin America and The Caribbean. Beyond Booms and Busts?, Washington, D.C., World Bank.
Slaibe Postali, F. A. y M. Nishijima (2013), “Oil windfalls in Brazil and their long-run social impacts”, Resources Policy, vol. 38, No. 1.
Spilimbergo, A., J.L. Londonño and M. Székely (1999), “Income distribution, factor endowments, and trade openness”, Journal of Development Economics, vol. 59, No. 1.
Stijns, J.-P. (2009), “Mineral wealth and human capital accumulation: a nonparametric approach”, Applied Economics, vol. 41, No. 23.
Sunkel, O. and P. Paz (1975), El subdesarrollo latinoamericano y la teoría del desarrollo, Mexico City, Siglo XXI.Sylwester, K. (2004), “A note on geography, institutions, and income inequality”, Economic Letters, vol. 85, No. 2.Tinbergen, J. (1975), Income Distribution, Amsterdam, North-Holland.Trinidad and Tobago, Government of (2012), “Review of the Economy 2012, Stimulating Growth, Generating Prosperity”. UNCTAD (United Nations Conference on Trade and Development) (2013), Database [online] http://unctadstat.unctad.
org/ReportFolders/reportFolders.aspx?sCS_referer=&sCS_ChosenLang=en.Van der Ploeg, F. (2011), “Natural resources: curse or blessing?”, Journal of Economic Literature, vol. 49, No. 2.Van der Ploeg, F. and S. Poelhekke (2010), “The pungent smell of ‘‘red herrings’’: Subsoil assets, rents, volatility and
the resource curse”, Journal of Environmental Economics and Management, No. 60.WHO/UNICEF (World Health Organization/United Nations Children’s Fund (2012), Progress on Drinking Water and
Sanitation: 2012 update, WHO/UNICEF Joint Monitoring Programme for Water Supply and Sanitation. Wilmsmeier, G. and R. Sánchez (2011), “Liner shipping networks and market concentration”, International Handbook
of Maritime Economics, K.P.B. Cullinane (ed.), Cheltenham, Edward Elgar.World Bank (2013), “World Development Indicators (WDI)” [online] http://databank.worldbank.org/ddp/home.do. Yuxiang, K. and Z. Chen (2011), “Resource abundance and financial development: Evidence from China” Resources
Policy, vol. 36, No. 1.

Compacts for Equality: Towards a Sustainable Future
Closing considerations
Part 4
Chapter VIIPolitics, policy and the importance of compacts
A. Reasons and conditions for a social compact for sustainability and equalityB. Strategic components of compacts for equality, sustainability and structural change
Bibliography

301
Cha
pter
VII
Compacts for Equality: Towards a Sustainable Future
Chapter VII
Politics, policy and the importance of compacts
A social compact is a political instrument for putting into place, within a democratic framework, institutional reforms and policies such as those that the countries of Latin America and the Caribbean need at the development crossroads they have now reached. Through social dialogue, it provides a way of broadening the horizon of political and policy actions. As framed in this document, equality is the core value underpinning that horizon, and structural change with innovation and environmental sustainability are the pillars that, together, must drive equality forward. A social compact is, moreover, especially important now because the region is approaching a crossroads at which slowing growth in trade and consumption could call for bold decisions regarding social protection, investment and fiscal policy.
This chapter will focus on the importance of entering into such a covenant with a long-term vision and a short-term sense of practicality. The objective is to enable political and social stakeholders to arrive at agreements and develop sustainable cooperative relationships while making provision for changes in future circumstances and devising consensus-based procedures for disseminating information, making assessments and engaging in consultations and negotiations. This approach can enhance the political viability of a new kind of development path by drawing on proposals that will have been formulated and implemented on a participatory, democratic basis and that can be adapted to the specific features of each country. This also offers a way of deepening democracy in the countries’ societies by laying the groundwork for a broader form of participation: one that is not limited to simply going to the polls but instead encompasses full engagement in creating and taking part in public forums and initiatives and formulating collective medium- and long-term goals.
At the last two sessions of ECLAC, held in Brasilia in 2010 and in San Salvador in 2012, the Commission underscored the importance of entering into such compacts in order to forge a new type of relationship among the State, the market and society. In Time for Equality: closing gaps, opening trails (ECLAC, 2010), the Commission advocated the creation of social and fiscal accords that could have a greater redistributional effect and could strengthen the role of the State and public policy in the transition to an institutional structure that is more effective in upholding labour and social rights. The Commission also said that the formulation of such a social compact must be based on three major pillars for the effort to reconnect the State, the market and society: the overriding importance of the general good and the provision of public goods, a concerted strategic vision, and the restitution of the role of political action (ibid., p. 215). Two years further on, in Structural Change for Equality: An Integrated Approach to Development (ECLAC, 2012), the Commission again highlighted the importance of policy tools in bringing the joint efforts of the State, the market and civil society to bear in the implementation of a strategy for structural change with equality. It thus reaffirmed the key role played by the formation of agreements in giving shape to a politically viable, sustainable approach that can enjoy the support of the citizenry, asserting that “any strategy involving radical changes, conflicting interests, resource investment alternatives and tensions between short- and long-term impacts will require covenants” (ECLAC, 2012, p. 278).
Today, at a time when the interrelationships among the State, the market and society are undergoing such profound changes, and societies face a broad spectrum of unmet needs and social demands, a social compact is more necessary than ever. For society, these changes include an increase in the role of non-governmental organizations

302
Cha
pter
VIIEconomic Commission for Latin America and the Caribbean (ECLAC)
in activities ranging from social networking to public protests, together with some degree of disenchantment with institutionalized forms of political participation, as reflected in challenges to traditional political parties or to bodies, such as national legislatures, that are supposed to represent the people. These changes are coupled with increased demands on the State, especially since the international financial crisis of 2008-2009, and with the State’s assumption of a more proactive role in dealing with the fallout from the market’s failure to regulate itself. The world of business has not been untouched by these concerns, and it must take part in the process of negotiation and consensus-building. While the existence of legitimate conflicts among the various components of society must not be side-stepped or ignored, these processes are nonetheless what will make it possible to forge new types of interconnections among the countries’ various social and political stakeholders.
The first part of the following section explores the reasons why the formation of social compacts in the region is more important than ever. This is followed by an in-depth look at the nature of compacts with the citizenry, human rights and the role of the State in a democracy and a discussion of some of the procedural requirements for the successful establishment of such agreements. The final part outlines, from a long-term perspective, the strategic content of the negotiations needed in order to arrive at social compacts that will open up the horizon for proposals for structural changes that will usher in greater equality.
A. Reasons and conditions for a social compact for sustainability and equality
1. Why are social compacts important?The Latin American and Caribbean region is approaching a crossroads, and the time has come for the region to revisit the way in which its institutions and structures are linked to one another so that they can tackle long-standing problems of unsustainability and inequality and build its capacity for dealing with a global situation that is placing greater constraints on growth. On its present growth path, the region is running up against major hurdles in its efforts to secure an increasing level of well-being for the majority of the Latin American and Caribbean population; the region needs to find a different path —a path involving structural change coupled with greater equality— if it is to cope with the situation as it stands today. Entering into a compact involves achieving agreement among political and social stakeholders on the array of institutions —laws and standards and the agencies that uphold them— and public policies that will be needed in order to ensure that this new path is plotted out on the basis of careful deliberation and that it will be effective in leading the region forward.
The shared long-term (intertemporal) vision and reciprocal commitments assumed as part of the process of developing a social compact help to ensure that political and social stakeholders’ expectations will tend to converge and that they will have greater ownership of proposals for change. This, in turn, will provide the underpinnings for politically and socially sustainable policies and institutions whose implementation will be more viable. Government by majorities or by minorities grouped into shifting coalitions can exist without social compacts of the type discussed here. Legislative coalitions are often insufficient, volatile or unstable, however. They can lack representativeness in the eyes of many social stakeholders. All this makes it difficult to establish public policy orientations with broad support and social legitimacy. In this sort of situation, compacts have the advantage of providing an avenue for combining a long-term intertemporal interrelationship with a broad-based participatory process, and this kind of combination can be especially appropriate and effective in high-uncertainty situations such as the one that exists today.
Social compacts can also lend greater political viability to institutional reforms if the associated consultations and negotiations lead to the formation of linkages among majority political and social sectors and couple these linkages with the definition of clearer positions that are more broadly supported by those sectors’ representatives. This can generate a gradual build-up of momentum that will bolster their ability to have a political impact. This same type of process can help to encourage stakeholders that hold veto power to adopt more flexible positions, especially if the long-term vision underlying the compact entails shared benefits. It can also lead to the formation of broad-based
303
Cha
pter
VII
Compacts for Equality: Towards a Sustainable Future
majorities and even to consensus, although it is also true that the different interests, values and perceptions involved in these processes can give rise to serious conflicts and protracted negotiations.
The region came to a similar turning point in the 1980s, when it had to reform its institutional structure in order to adapt it to a deteriorating international situation marked by severe trade and financial imbalances (in terms of the countries’ external debt, in particular) that called for immediate action. The region dealt with the situation by undertaking structural adjustments, in line with Washington-consensus policies, that had far-reaching institutional implications. This approach proved to be of very limited effectiveness in resolving the problems of the time. What is more, it was shaped by policy recommendations that came from outside the Latin American and Caribbean region and whose implementation often ran against the grain of the democratic systems and practices that were being consolidated throughout the region at the time. In addition, by eroding the legitimacy of the governments of the region and limiting the scope of the policies that each country could introduce, it undercut the response capacity of the region’s new democratic governments, which were confronted with an altered international situation that afforded priority to the self-regulating functions of the market. In this way, the implementation of the Washington consensus also undermined the consolidation of democracy in the region (Lechini 2008).
At the crossroads that the Latin American and Caribbean region now finds itself approaching, the region will not only be called upon to devise new policy proposals and institutional structures in order to cope with changing circumstances and development constraints, as has been discussed in this document. In addition, participatory mechanisms have to be put in place in order to ensure that these reforms will be politically viable and sustainable and will bolster the countries’ democratic institutions during times of social effervescence when new, non-institutional modes of participation are emerging. By contributing to the formation of long-term agreements based on shared expectations, social compacts make it possible to identify and capitalize on the advantages afforded by sustained, mutually beneficial ties among different political and social actors. They can thus be used to implement strategic institutional reforms on a democratic, rather than authoritarian, basis that will be much less likely to be overturned later on. They also make it possible to move in directions that reflect the demands and aspirations of society rather than allowing the development agenda to be determined by the global commercial, economic and financial complex.
2. The foundations of social compacts: the people and progressive realization of rightsThe type of equality espoused by ECLAC is based on a conceptualization of the people as active and passive parties to the covenants being advocated here. This assumes the presence of an actor that combines autonomy (i.e. agency) with vulnerability (i.e. reliance on others for the realization of one’s life plan). Special attention must therefore be devoted to individuals’ material and cultural circumstances in order to ensure that they are fully integrated into society, but this conceptualization also entails seeing these persons as being capable of reaching agreement (entering into a compact) with other people on the norms or standards that will govern their lives.
In the framework of a vision of the self that goes beyond individual rationality to encompass collective self-determination and consideration for others, and taking equality as a normative horizon, public policies can and should be viewed as compacts among the parties involved, starting from the recognition of others as a basic principle. Moreover, the citizen as a bearer of rights forms the ethical and political basis for equality. Conversely, the denial or negation of others —and, hence, of their rights— has historically been a trait associated with an incomplete form of citizenship in Latin America and the Caribbean and is one of the factors underlying inequality in the region. Accordingly, solidarity among individuals and among society as a whole, particularly with groups that have been excluded from the mainstream, should be enshrined in minimum thresholds that guarantee all members of society access to certain social goods.
If a social compact is to build the capacity of the people and ensure that their rights are upheld, the State must be able to follow through and make sure that this happens. A compact of this sort cannot take the place of the development of laws and standards or of social legitimacy, and this has traditionally been the greatest failing of the region’s political institutions. When such a compact is established, it falls to the State to make sure that the associated rights are protected. These obligations have to do both with outcomes (the extent to which people enjoy their rights) and behaviours (the action taken to assert those rights). While recognizing that the obligation to uphold these rights is primarily borne by the State, this function is not solely incumbent upon the executive branch, which has the ability to initiate legislation and to design and implement policy, but also on the judiciary and the legislature.
304
Cha
pter
VIIEconomic Commission for Latin America and the Caribbean (ECLAC)
The fulfilment of these obligations entails recognition of the fact that the people’s rights correspond to collective aims that are served by public institutions for which public funding should be provided.1 Given the scarcity of resources, advances in the progressive realization of these rights will be contingent upon the availability of resources and upon how they are distributed. Hence the importance of entering into fiscal compacts as a means of increasing the availability of those resources.
The progressive realization of rights represents an effort to resolve the apparent contradiction between the legal obligation to respect, protect and enforce all these rights, on the one hand, and, on the other, the fact that resources are in scarce supply and that this obligation can therefore not be fully discharged immediately. The aim is to evaluate the degree to which rights are being upheld, not only from the standpoint of rights-holders (the people) but also, and especially, from the standpoint of duty-holders, particularly States.
The concept of the progressive realization of rights means accepting that States do not fully honour all economic and social rights immediately, providing that: (i) steps are taken towards their realization making the best possible use of available resources; (ii) action is taken as expeditiously as possible; (iii) no retrogression is acceptable; and (iv) core obligations (fundamental rights) are fulfilled with immediate effect (OHCHR 2004, pp. 22-25).
The progressive fulfilment of the obligations deriving from a social compact may also be influenced by the fact that the idea of what constitutes a “decent life” or an acceptable standard of living is a variable concept that changes over time. Consequently, these obligations may also vary over time and may have to be redefined (Courtis and Espejo, 2007). This is in keeping with the relational approach to the social contract, which focuses on establishing long-term cooperative relationships among stakeholders that can be adjusted and rebalanced through negotiations based on procedures that are devised by mutual agreement;2 in the case of a compact for equality, this approach should lead to successive reductions in inequality. These long-term cooperative relationships are also seen as one of the cornerstones of the credibility that a social compact for equality should enjoy and are in line with the role to be played by voice and loyalty, as pointed out by Hirschman (1970).
Hirschman was particularly critical of the bias inherent in traditional economic theory’s overemphasis on “exit” as the economic explanation for what happens when an organization runs into problems. This stands out with particular clarity in the explanation provided for the path followed by inefficient firms, which, according to this thinking, will be obliged to exit the market. As an alternative option, he raises the possibility of altering the existing situation through the use of “voice”, understood as an influential participatory political process that will also be contingent upon the possibilities for abandoning or exiting the situation and the degree of loyalty that exists at any given time. In the presence of such participatory political processes (characterized as voice combined with a full exercise of citizenship), a State that is endowed with bureaucratic and technical capacities and resources —but that is bereft of the capacity for the political management of complex consultations and negotiations— may doom efforts to establish a compact to failure. What is needed is a highly transparent State that has the ability to engage in dialogue with historically marginalized sectors and that is open to providing the kind of accountability that will give it credibility as a partner in the social compact.
3. A diversity of compacts and of political and social stakeholders The actual forms taken by social compacts vary widely, ranging from efforts to re-establish a State or renew shared commitments in times of crisis when entrenched paradigms are being challenged, to agreements that, while not modifying the obligations traditionally assumed by the people (acceptance that the exercise of power is legitimate and acceptance of the State’s imposition of certain duties, the renunciation of the use of violence by private parties and acceptance of the State’s monopoly on the use of force), can involve processes of incremental change (Maldonado
1 The types of rights which cost the most to protect or uphold are economic and social rights (e.g. the right to food, to an education, to appropriate health care, to adequate housing and to decent employment), the protection of civil, political and cultural rights, as well as economic and social rights, requires funding derived from tax revenues. See Holmes and Sunstein (1999).
2 Rather than being regarded as a traditional or classic contract that specifies all the relevant obligations in detail, a social compact can be seen as a relational contract that lays out set procedures for negotiation, renegotiation and an equitable distribution of costs and that places priority on the long-term relationship among stakeholders. This approach offers a way of responding to the criticism that, in its traditional form, the social contract was seen as being based on an imagined foundational moment, which is an unconvincing fiction (Courtis and Espejo, 2007).
305
Cha
pter
VII
Compacts for Equality: Towards a Sustainable Future
and Palma, 2013). Compacts entailing incremental change may be established with less conflict yet may still have a transformative impact over the medium and long terms.
A distinction should also be drawn between broad-based social compacts that are entered into by a wide range of social and political forces and “elite” covenants, in which no more than a small number of leaders take part. The distinction is not always easy to make, since the establishment of either type of agreement involves negotiations among a relatively small number of political spokespersons. Negotiators with a broader representational base, more transparent and extensive consultations, the existence of mechanisms for participation by historically marginalized groups and social mobilization may all, however, be taken as signs that the social compact in question is an inclusive one rather than one of elites.
Past cases in which long-term social compacts have been established as a means of reshaping the State include that of Costa Rica in 1948, but there are also many cases of ongoing negotiations with high and low points that have given rise to implicit, shifting types of agreements, including ones that are fairly wide in scope that have emerged from negotiations on specific topics, such as fiscal issues (Moore, 2008). Chile provides one example of a transitional covenant. In the wake of the 1988 referendum, the country embarked upon a transition to democracy that posed formidable challenges in terms of the nation’s governance. The option of pursuing incremental change was chosen on the basis of a partial consensus among elite groups within the government, the business community and political parties, without any formal agreement having been concluded.
The more broad-based types of social compacts would appear to be more in keeping with the relational approach to social contracts, which focuses on agreements that are open to dialogue and renegotiation on the basis of agreed procedures and in which long-term cooperative relationships among the stakeholders play a vital role (Courtis and Espejo, 2007). Agreements help to establish reliable and credible relationships among the main stakeholders over the long term. They can therefore help to address legitimacy problems in societies that are being eroded and in which the ties that bind individuals to society are being debilitated by modernization, changes in the division of labour and globalization (ECLAC 2007, p. 17).
Examples of compacts that have been entered into in the past also illustrate how influential the historical context has been in determining the viability or scope of those agreements and the associated institutional reforms. Times of crisis and the resolution of crises and conflicts have all paved the way for the establishment of compacts, but this has not been the case of periods when inertial processes inherited from the past have predominated. This historical tension between the will to change and the dampening effect of inertia has shaped the scope of social compacts and the degree to which different stakeholders have participated in them. In given contexts, other determinants have also come into play, however, such as the political strategies of the different stakeholders and how they have interacted in the shorter term.
The varying degrees of institutional development of the different social stakeholders in each country, which is also tied in with the issue of their representation, poses a particular challenge in this respect. Whereas some of the stakeholders in society have clearly defined and established interests and can assert their positions in public debate, other stakeholders face serious restrictions of visibility, voice and representativeness.
In the contest for interests and visibility among the actors which are the object and the subject of compacts, the case of gender demands warrants special mention. Some noteworthy national accords have been forged in this area. In 2013 in Peru, for instance, the Minister for Women’s Affairs, the Minister of Production, the Minister of Labour and Employment, the Minister of Foreign Trade and Tourism and the Minister for Foreign Affairs —all of whom are women— agreed to launch a high-level political dialogue as a means of searching for comprehensive, sustainable ways to meet the country’s development needs that would be in keeping with respect for women’s rights and responsive to their demands. Access to financing and markets, innovation, the use of technology and training based on a gender perspective are all seen as tools for going beyond the minimalist kind of approach that has confined its focus to small-scale, largely unsustainable ventures. Participants in this dialogue include representatives of private-sector stakeholders such as the Federation of Women Entrepreneurs and the Chamber of Commerce, and it is open to civil society organizations as well.
The need to increase women’s participation in decision-making circles in large, medium-sized and small businesses is one of the focuses of the dialogue. This focus is the result of an openness to development policies whose objective is to improve the quality of employment for women, direct investment towards high-productivity sectors, improve
306
Cha
pter
VIIEconomic Commission for Latin America and the Caribbean (ECLAC)
the business environment for female entrepreneurs and promote policies aimed at providing men and women with a better work-life balance as a means of removing one of the main obstacles to gender equality. The leadership displayed by these women ministers is playing a key role in the consolidation of policies to promote equality.
Certain challenges are also involved in providing the requisite representation of groups seeking to address climate change and environmental issues because these problems do not have an immediately recognizable effect on the day-to-day situation, although they will clearly have an intergenerational impact. These concerns tend to be underrepresented in the economy and in political negotiations, which is why future generations need to have a voice. While civil society organizations are certainly putting these demands forward, it is nonetheless the duty of the State to assign special priority to these issues in the interests of intergenerational equality.
4. Participation and the institutional framework for a compact for equalityBased on the above considerations relating to the rationale for compacts and their foundational elements, guidelines can be developed for procedures geared towards successful negotiations and outcomes. These procedures are outlined in the following discussion.
(a) If the desired changes are to be achieved, participatory processes should counterbalance existing power asymmetries
When seeking to establish a social compact, it is important to recognize the value of setting the stage for a confrontation of the interests involved (for example, among the different groups, and between short- and long-term interests), as well as the complexities inherent in the participation of many different stakeholders (some with formal decision-making power, others with interests of their own, others that are taking part as political stakeholders, as technical teams, as members of civil society, and so forth) and the fact that many public policy inroads have been made as a result of major political and social conflicts. In the process of arriving at a social compact, these tensions and conflicts must be seen as stages of the process involved in achieving agreements that lead towards greater equality. Many of these tensions may stem from the processes involved in democratic participation and public deliberations. These processes have an intrinsic value in that they engender mutual understanding among the participants and their perception of one another as equals, as well as greater equality.
Whether or not it will be possible to translate those conflicts into lasting institutional reforms will depend on the ability to carry forward negotiations leading to the formation of a social compact. The viability of a social compact will be determined, in large part, by how willing the stakeholders are to cooperate with one another, but its success —especially in terms of contributing to the achievement of greater equality— will also be determined by the extent to which the participating stakeholders reflect the interests of society at large and especially of marginalized social sectors. Thus, on the one hand, it is important to ensure the presence of factors that can foster intertemporal cooperation, which include the evident advantages of not deviating from the path of cooperation and of having a suitable number of participants, a regular, institutionalized form of interaction, a shared, long-term time horizon and enforcement mechanisms (Scartasini and others, 2011, pp. 17-21).
On the other hand, however, power asymmetries play a crucial role in the negotiation of social compacts and, if not rectified, can result in agreements that will hinder pro-equality institutional fiscal or labour reforms. Some of these asymmetries are reflected in the existence of large segments of the population that have little or nothing to do with the State, that feel that they do not benefit from it in any way (e.g. the informal sector) and that, to use Hirschman’s term, have chosen to exit the social contract that should exist between the State and members of society. In these cases, calls for institutional reform (especially cross-cutting, across-the-board initiatives focusing on such issues as gender equity and the formalization of employment and economic activity in general) will play an essential role in encouraging these sectors to engage in the negotiation of a compact for equality (ECLAC, 2013a).
In the case of compacts in which dialogue, renegotiation and rebalancing are especially important (as opposed to foundational social contracts) and in which equality is a priority, the participation of traditionally excluded sectors is fundamental not only during the initial stages of consultation and negotiation, but also during the later stages of
307
Cha
pter
VII
Compacts for Equality: Towards a Sustainable Future
monitoring, evaluation and renegotiation.3 What is more, given the existing power asymmetries that are reflected in an underrepresentation of marginalized sectors, it is important not only to ensure representative or delegated participation, but also to open up a variety of channels for consultation, deliberation, consensus-building and evaluation. Specific procedural measures should be put in place to rule out coercion and ensure reciprocity, inclusiveness and symmetry for all participants. At the same time, however, a solid connection must be forged between these efforts to encourage diverse participation and the established democratic institutional structure, and especially the power groups in the legislature, in order to ensure not only the viability of the agreements reached regarding legislative changes, if deemed advisable, but also to ensure that the common good prevails.4
In some cases a social compact may help to make up for the weakness of political parties holding seats in the legislature or may provide a counterbalance by furnishing a broader representative base, but the legislative and representational functions of political parties —while varying from one country in the region to the next— are irreplaceable. History has clearly demonstrated that compacts may include or exclude certain sectors, but that when political parties are excluded, efforts to reach a consensus are most often doomed to failure, and the limitations of today’s representative democracies are laid bare. There are at least two reasons for this. In the short term political parties play a key role in decision-making within the legislature, so they are needed if the social compact entails any legal or constitutional changes. In the medium and longer terms, parties mediate between the electorate and policymaking, especially during the initially lengthy period of implementing the compact. If the parties are left out of the process, they will not commit to assuming the costs associated with giving effect to the compact, which is therefore likely to lose programmatic importance in subsequent electoral periods as time goes on.
Greater participation by social stakeholders is of key importance when political parties are weak or unresponsive to social demands or to broader spheres of democratic participation. In such instances, there is a case to be made for using budgetary resources to ensure the symmetric participation of sectors that start out at a disadvantage. This will allow them to develop approaches that are backed up by solid technical expertise and that will protect their interests and put them on an equal footing with other sectors or interest groups that are better able to mobilize technical and financial resources. It is also important to keep channels of communication open, to conduct regular assessments and to have arrangements for making readjustments when necessary. A proper distribution of information in order to ensure transparency is another important factor, as will be discussed in greater depth in a later section.
(b) The negotiation of compacts must be underpinned by a well-defined institutional structure
The institutional structure associated with a national social compact is not independent of the negotiation process, especially as it relates to implementation, monitoring and the evaluation of results. Generally speaking, three elements must be in place in order for negotiations to begin: (i) Firm support and follow-up on the part of the State, and particularly the executive branch (especially the president or prime minister)5 or legislature, which is necessary in order for the implementation of the resulting agreement to be feasible and for its introduction to be seen as a viable initiative; (ii) The ability to mobilize the qualified human resources required to formulate a technically solid initial proposal; and (iii) The initiators to be sufficiently representative and to have enough political credibility with the main stakeholders that will ultimately negotiate the agreement. This can be achieved by identifying recognized leaders who have the necessary technical expertise and a high political profile to preside over the committees that will be tasked with developing the initial proposal. The members of these committees should be political spokespersons or leaders and technical experts who are representative of the main social and political groups involved in negotiating the compact.
This stage in the formulation of the proposal should be coupled with parallel information activities and consultations prior to the start-up of negotiations. Clear-cut strategies and methodologies for setting out a roadmap to follow should also be in place. The way in which forums or consultations should be set up and the methods used to ensure the broad dissemination of information about the aims being pursued will vary from country to country, but in any case the points
3 This is all the more important in cases where a foundational agreement has been reached by political and social elites without the genuine participation of broad sectors of the population (Courtis and Espejo, 2007).
4 Specific ways of helping to establish ties between a diverse range of stakeholders and the legislature include townhall meetings, consultations with social organizations as part of the budget preparation process and the use of participatory mechanisms for monitoring budget execution and for ensuring accountability.
5 The presidents of Brazil and Mexico have played a central role in the recent initiatives to promote social compacts launched in those two countries.
308
Cha
pter
VIIEconomic Commission for Latin America and the Caribbean (ECLAC)
discussed in the following sections on participation, transparency and the achievement of consensus or a majority agreement will need to be taken into account. It is usually difficult to determine how much time will be needed to ensure broad-based, balanced participation and to carry out all the steps involved in information dissemination and in conducting consultations and the negotiations themselves, so a flexible approach is to be recommended. The steps taken to establish such a compact and to follow through on it should be such as to ensure the representativeness, legitimacy, credibility and sustainability of the exercise involved in its formulation and fulfilment.
(c) Targeted political strategies are needed in order to deal with stakeholders that hold veto power
Another possible asymmetry may be signalled by the presence of stakeholders that are able to wield some type of veto power. Such power may be held by constitutional courts or members of the legislature because there are formal rules and procedures that influence the decision-making process in democratic systems of government, or it may be held by employers’ associations or the bureaucracy, in which case it may have to do with informal rules and procedures that are an inherent part of corporatist systems (Maldonado and Palma, 2013). In the presence of these kinds of asymmetries, ongoing dialogue and renegotiation based on a long-term horizon may gradually bring about changes that will influence the minority groups holding veto power. These processes may reduce these groups’ political might (power) in some cases —such as when majority sectors gradually join forces— or, in others, may convince these groups to adopt more flexible positions. Ongoing dialogue based on a long time horizon can help to bring this about.
In any event, political action, guided by the public interest, must be brought to bear in order to resolve the problems that arise when stakeholders that have not been formally invested with authority nonetheless wield veto power. The agenda for such action should be a broad one that benefits all stakeholders (e.g. ranging from labour policies to the promotion of investment). By the same token, the more collective the process is, the more effective it may be in convincing minority groups with veto power to be more flexible.
(d) A majority-based approach should be preferred to a consensus-based one, with certain exceptions
Because compacts involve long-term relationships, they will not necessarily forestall conflicts. What they will do, however, is provide means of dealing with conflicts and, insofar as possible, of getting at the root of the problem and preventing issues from spiralling out of control. While broad-based consensus is desirable, it does not imply unanimity among all actors, in all spheres and in all subjects, so it should not be treated as a requirement for the establishment of agreements. If it were, it could, in effect, give veto power to minority groups that are not strongly affected by the issue under discussion, to the detriment of the majority.
Two guidelines may be useful in this respect. First, veto power should be provided to a given group via the rules governing the negotiation (e.g. making consensus a requirement or using a different mechanism) only if that group’s main activity or basic living conditions or livelihood may be threatened. This would be the case, for example, of local communities whose habitat could be destroyed by a natural resource development project.6 In such cases, it is essential for these stakeholders to be brought into the process, even if they may not make up a majority of the actual negotiators. Second, in other cases the introduction of an escape (exit) clause or of mechanisms that allow for an influential role (voice) in respect of specific issues may facilitate efforts to reach broad-based (whether consensus-based or not) agreements. The advisability of using this option will have to be weighed in each specific case.
(e) Transparency contributes to dialogue and assessment
Transparency is a prerequisite for participation, accountability and the exercise of agency. Within the broad context of the deliberations on different proposals involved in reaching agreement on a social compact and their critical evaluation, information should be made available to all those taking part in the negotiation of a social compact. Broad-coverage, reliable statistics can contribute to a convergence of different parties’ interpretations of existing problems and of their analyses of the situation. If few or no statistics are available, there is much less of a shared frame of reference for the negotiation process. Statistics can also be used in monitoring and evaluating compliance and in measuring advances in the progressive realization of rights (Fukuda-Parr, Lawson-Remer and Randolph, 2009).
6 It is important to distinguish this type of situation (especially in the case of rural communities) from that of local communities that oppose investment projects in their vicinity that they would find acceptable if they were sited elsewhere (the “not in my backyard”, or NIMBY, stance).
309
Cha
pter
VII
Compacts for Equality: Towards a Sustainable Future
It is significant that some of the first steps agreed upon in the political dialogue about women’s rights and demands in a number of countries have been the provision of statistical (and hence political) visibility to the role that women play in the economy. Time-use surveys and satellite household accounts are increasingly being used to measure all the (paid and unpaid) work that men and women do.
The dissemination and discussion of technical studies prepared by highly credible experts can help to achieve broader participation in consultations and negotiations and to expand the range of issues on which agreement may be reached. As noted earlier, this can help to convince stakeholders with veto power to show greater flexibility. Studies and discussions can contribute to a wide-ranging collective learning process that can, in turn, encourage the various parties to adopt more open, flexible attitudes that can help them find points of convergence. Ready access to an ample supply of public information can also spur wide-ranging deliberations and dialogue that can help to lead the way towards agreements of various kinds, and a number of countries are working to bring this about by passing public information laws and making their government institutions more transparent. The development of a communication strategy and the use of spokespersons who have the support of all the stakeholders concerned can also contribute to the negotiations and their follow-up.
(f) Compliance guarantees
Certain compliance guarantees must be in place in order to ensure that social compacts do not become a dead letter due to a failure to implement the agreed changes and in order to sustain long-term cooperative relationships among the parties to the compact. One of the main elements is respect for the parties’ civil and political rights (freedom of conscience, freedom of expression, freedom of assembly, freedom to demonstrate, freedom of association, the right to vote, the right to petition, the right to form political parties, the right to stand for election and the right to equal access to other public offices) so that the fulfilment of the obligations that have been assumed can be monitored on an independent basis (ECLAC, 2007, p. 149). Respect for these rights is an essential component of the exercise of citizenship, which is one of the pillars of a social compact.
It is also advisable to set up forums or mechanisms for reporting and evaluating instances of non-compliance and for the settlement of disputes. A sufficient degree of transparency is called for to ensure that the information needed to evaluate advances or delays is available, and methods need to be devised for identifying cases of non-compliance. For example, the statistical indicators mentioned earlier than can be used to gauge advances in the progressive realization of rights (Courtis and Espejo 2007). The role of voice, as characterized by Hirschman, is crucial in this connection.
One of the institutional arrangements that can help to ensure that a compact will be honoured is the appointment (and funding) of an agency to monitor and evaluate compliance. There is always the option of bringing claims of non-compliance before the courts, but the nature of adversarial judicial proceedings makes it difficult to take all of the interests that are at stake into consideration. In addition, using litigation to take the place of policymaking and voluntary means of policy compliance introduces rigidities that can undermine relational social compacts, which are intended to establish a long-term, cooperative —rather than confrontational— relationship among the parties concerned.
B. Strategic components of compacts for equality, sustainability and structural change
As noted earlier, the region has reached a crossroads. Throughout its recent history, the Latin American and Caribbean region has been moving along an unsustainable development path that is associated with lagging growth and sharp inequalities and has made very little headway in bringing about structural change. And while it is true that, over the past decade, the region has been helped along by a tailwind, that wind now seems to be weakening as the external situation becomes more and more problematic. What is being proposed here is that the region forsake that path and —with the help of a package of remodelled policy and institutional reforms— embark on a new and sustainable growth path with increasing degrees of equality.
This will entail a major shift in the way that the region deals with external constraints and endogenous factors that curb its development. The external constraints that it must learn to cope with include slowing international
310
Cha
pter
VIIEconomic Commission for Latin America and the Caribbean (ECLAC)
trade, stagnating global demand, increased uncertainty about the signals coming from financial markets and about access to financing, and the region’s lack of sufficient linkages with today’s shifting global value chains. The region’s internal problems include an outmoded, disjointed production structure, labour markets with large informal sectors, low investment and a failure to incorporate technical progress, welfare gaps, gaps in capacity, poor natural resource governance, consumption patterns that reflect shortfalls in public services and that put a great deal of pressure on the environment and the energy supply, and institutional shortcomings in terms of the ability to capture, regulate and allocate resources.
In order to turn this situation around, ECLAC is proposing an approach for transforming the region’s development process in which equality is the core element, structural change is the way forward and politics is the means to that end. At this stage, policies need to be redirected towards sharply boosting investment in order to create a virtuous cycle among growth, productivity and environmental sustainability by incorporating knowledge into production and generating a high level of value added, as discussed in chapter I; by making the labour market more inclusive and promoting greater convergence between tax reforms and social policies with a clearly redistributive bias in order to reduce the various types of inequalities troubling the region, as explained in chapters II and III; by balancing the growth of private consumption with a regular supply of high-quality public services in order to pave the way for greater social cohesion and environmental sustainability, as emphasized in chapters IV and V; and by instituting an appropriate system of natural resource governance as a basis for further diversifying environmentally sustainable forms of production that will have positive impacts on employment and the level of well-being, as discussed in chapter VI.
Turning these ideas into reality will require the formation of social compacts, since these strategic medium- and long-term propositions involve a wide range of actors and will call for public policies of undisputed legitimacy. Clearly, the specific nature of these social development compacts for sustainability and equality will vary depending on the conditions existing in each country. These conditions include the level of institutional development, the nature of the production matrix, the tax system, the political model and political culture of the country, social conditions, available capacities and various other factors. Yet despite the enormous differences in the profiles of the different countries, the main thrust of these compacts is the same, as they will all be based on a strategic view of the development process at today’s historic crossroads.
In this framework, an overview of a number of principles and major objectives which could serve as a substantive platform for compacts of this type is offered below. This platform could be used as a basis for defining specific procedures and the specific content of each compact, which will depend on the political, institutional, economic and social conditions existing in the individual countries. The agreements to be negotiated regarding what principles are to serve as a foundation or platform for these collective accords may not provide enough of a basis for defining their specific content or the associated legislation, but they can contribute to an initial convergence of positions or at least to progress towards a meeting of minds. Subsequent negotiations can then be pursued with a view to agreeing on procedures, programmatic agendas and compromises.
The principles that could underpin the compacts discussed and their major objectives are discussed in the following section. Given the breadth of the themes discussed throughout this document, which proposes a strategic approach to development on the basis of sustainability, equality and structural change, the areas in which compacts could be established involve an equally diverse range of policies. This is not to suggest that in every country it is equally urgent or feasible to advance simultaneously on all fronts, nor that every country has the same capacities for consensus-building, negotiations and implementation of State policies.
1. A fiscal compact for equalityFiscal policy should be used to generate countercyclical effects that will help to stabilize the macroeconomy and to support growth and income redistribution. One of its core functions is to provide the financing needed to honour the commitments assumed as part of the compact for equality and sustainable development. The fiscal compact or covenant is therefore not just another agreement; it is the one that makes other compacts financially viable and that provides the strongest bridge between obligations and benefits for society. The fiscal compact is also one of the crucial elements in building a more robust public institutional structure that will be more effective in reshaping society’s production and social structures.
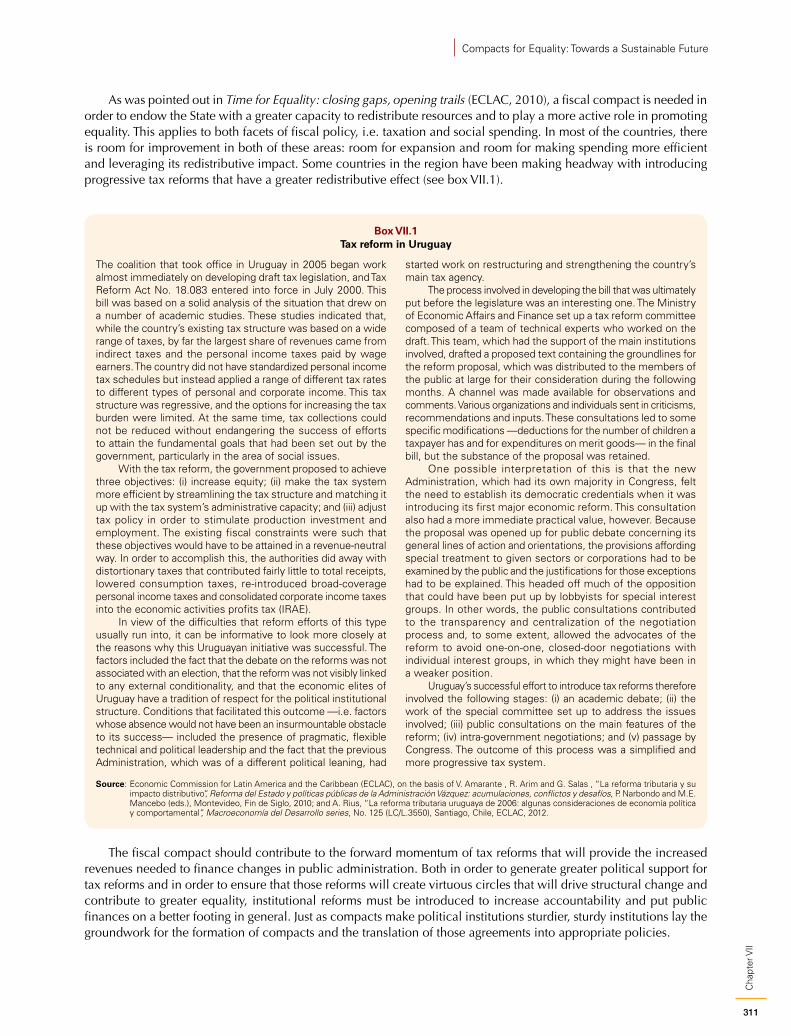
311
Cha
pter
VII
Compacts for Equality: Towards a Sustainable Future
As was pointed out in Time for Equality: closing gaps, opening trails (ECLAC, 2010), a fiscal compact is needed in order to endow the State with a greater capacity to redistribute resources and to play a more active role in promoting equality. This applies to both facets of fiscal policy, i.e. taxation and social spending. In most of the countries, there is room for improvement in both of these areas: room for expansion and room for making spending more efficient and leveraging its redistributive impact. Some countries in the region have been making headway with introducing progressive tax reforms that have a greater redistributive effect (see box VII.1).
Box VII.1 Tax reform in Uruguay
The coalition that took office in Uruguay in 2005 began work almost immediately on developing draft tax legislation, and Tax Reform Act No. 18.083 entered into force in July 2000. This bill was based on a solid analysis of the situation that drew on a number of academic studies. These studies indicated that, while the country’s existing tax structure was based on a wide range of taxes, by far the largest share of revenues came from indirect taxes and the personal income taxes paid by wage earners. The country did not have standardized personal income tax schedules but instead applied a range of different tax rates to different types of personal and corporate income. This tax structure was regressive, and the options for increasing the tax burden were limited. At the same time, tax collections could not be reduced without endangering the success of efforts to attain the fundamental goals that had been set out by the government, particularly in the area of social issues.
With the tax reform, the government proposed to achieve three objectives: (i) increase equity; (ii) make the tax system more efficient by streamlining the tax structure and matching it up with the tax system’s administrative capacity; and (iii) adjust tax policy in order to stimulate production investment and employment. The existing fiscal constraints were such that these objectives would have to be attained in a revenue-neutral way. In order to accomplish this, the authorities did away with distortionary taxes that contributed fairly little to total receipts, lowered consumption taxes, re-introduced broad-coverage personal income taxes and consolidated corporate income taxes into the economic activities profits tax (IRAE).
In view of the difficulties that reform efforts of this type usually run into, it can be informative to look more closely at the reasons why this Uruguayan initiative was successful. The factors included the fact that the debate on the reforms was not associated with an election, that the reform was not visibly linked to any external conditionality, and that the economic elites of Uruguay have a tradition of respect for the political institutional structure. Conditions that facilitated this outcome —i.e. factors whose absence would not have been an insurmountable obstacle to its success— included the presence of pragmatic, flexible technical and political leadership and the fact that the previous Administration, which was of a different political leaning, had
started work on restructuring and strengthening the country’s main tax agency.
The process involved in developing the bill that was ultimately put before the legislature was an interesting one. The Ministry of Economic Affairs and Finance set up a tax reform committee composed of a team of technical experts who worked on the draft. This team, which had the support of the main institutions involved, drafted a proposed text containing the groundlines for the reform proposal, which was distributed to the members of the public at large for their consideration during the following months. A channel was made available for observations and comments. Various organizations and individuals sent in criticisms, recommendations and inputs. These consultations led to some specific modifications —deductions for the number of children a taxpayer has and for expenditures on merit goods— in the final bill, but the substance of the proposal was retained.
One possible interpretation of this is that the new Administration, which had its own majority in Congress, felt the need to establish its democratic credentials when it was introducing its first major economic reform. This consultation also had a more immediate practical value, however. Because the proposal was opened up for public debate concerning its general lines of action and orientations, the provisions affording special treatment to given sectors or corporations had to be examined by the public and the justifications for those exceptions had to be explained. This headed off much of the opposition that could have been put up by lobbyists for special interest groups. In other words, the public consultations contributed to the transparency and centralization of the negotiation process and, to some extent, allowed the advocates of the reform to avoid one-on-one, closed-door negotiations with individual interest groups, in which they might have been in a weaker position.
Uruguay’s successful effort to introduce tax reforms therefore involved the following stages: (i) an academic debate; (ii) the work of the special committee set up to address the issues involved; (iii) public consultations on the main features of the reform; (iv) intra-government negotiations; and (v) passage by Congress. The outcome of this process was a simplified and more progressive tax system.
Source: Economic Commission for Latin America and the Caribbean (ECLAC), on the basis of V. Amarante , R. Arim and G. Salas , “La reforma tributaria y su impacto distributivo”, Reforma del Estado y políticas públicas de la Administración Vázquez: acumulaciones, conflictos y desafíos, P. Narbondo and M.E. Mancebo (eds.), Montevideo, Fin de Siglo, 2010; and A. Rius, “La reforma tributaria uruguaya de 2006: algunas consideraciones de economía política y comportamental”, Macroeconomía del Desarrollo series, No. 125 (LC/L.3550), Santiago, Chile, ECLAC, 2012.
The fiscal compact should contribute to the forward momentum of tax reforms that will provide the increased revenues needed to finance changes in public administration. Both in order to generate greater political support for tax reforms and in order to ensure that those reforms will create virtuous circles that will drive structural change and contribute to greater equality, institutional reforms must be introduced to increase accountability and put public finances on a better footing in general. Just as compacts make political institutions sturdier, sturdy institutions lay the groundwork for the formation of compacts and the translation of those agreements into appropriate policies.
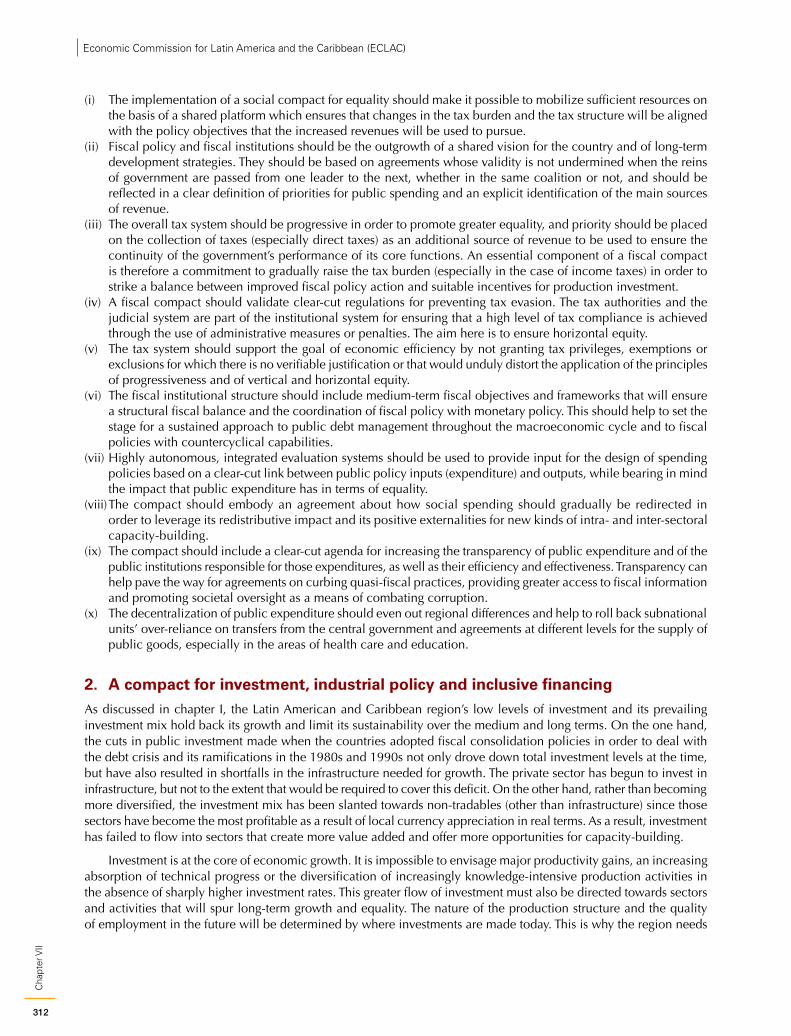
312
Cha
pter
VIIEconomic Commission for Latin America and the Caribbean (ECLAC)
(i) The implementation of a social compact for equality should make it possible to mobilize sufficient resources on the basis of a shared platform which ensures that changes in the tax burden and the tax structure will be aligned with the policy objectives that the increased revenues will be used to pursue.
(ii) Fiscal policy and fiscal institutions should be the outgrowth of a shared vision for the country and of long-term development strategies. They should be based on agreements whose validity is not undermined when the reins of government are passed from one leader to the next, whether in the same coalition or not, and should be reflected in a clear definition of priorities for public spending and an explicit identification of the main sources of revenue.
(iii) The overall tax system should be progressive in order to promote greater equality, and priority should be placed on the collection of taxes (especially direct taxes) as an additional source of revenue to be used to ensure the continuity of the government’s performance of its core functions. An essential component of a fiscal compact is therefore a commitment to gradually raise the tax burden (especially in the case of income taxes) in order to strike a balance between improved fiscal policy action and suitable incentives for production investment.
(iv) A fiscal compact should validate clear-cut regulations for preventing tax evasion. The tax authorities and the judicial system are part of the institutional system for ensuring that a high level of tax compliance is achieved through the use of administrative measures or penalties. The aim here is to ensure horizontal equity.
(v) The tax system should support the goal of economic efficiency by not granting tax privileges, exemptions or exclusions for which there is no verifiable justification or that would unduly distort the application of the principles of progressiveness and of vertical and horizontal equity.
(vi) The fiscal institutional structure should include medium-term fiscal objectives and frameworks that will ensure a structural fiscal balance and the coordination of fiscal policy with monetary policy. This should help to set the stage for a sustained approach to public debt management throughout the macroeconomic cycle and to fiscal policies with countercyclical capabilities.
(vii) Highly autonomous, integrated evaluation systems should be used to provide input for the design of spending policies based on a clear-cut link between public policy inputs (expenditure) and outputs, while bearing in mind the impact that public expenditure has in terms of equality.
(viii) The compact should embody an agreement about how social spending should gradually be redirected in order to leverage its redistributive impact and its positive externalities for new kinds of intra- and inter-sectoral capacity-building.
(ix) The compact should include a clear-cut agenda for increasing the transparency of public expenditure and of the public institutions responsible for those expenditures, as well as their efficiency and effectiveness. Transparency can help pave the way for agreements on curbing quasi-fiscal practices, providing greater access to fiscal information and promoting societal oversight as a means of combating corruption.
(x) The decentralization of public expenditure should even out regional differences and help to roll back subnational units’ over-reliance on transfers from the central government and agreements at different levels for the supply of public goods, especially in the areas of health care and education.
2. A compact for investment, industrial policy and inclusive financingAs discussed in chapter I, the Latin American and Caribbean region’s low levels of investment and its prevailing investment mix hold back its growth and limit its sustainability over the medium and long terms. On the one hand, the cuts in public investment made when the countries adopted fiscal consolidation policies in order to deal with the debt crisis and its ramifications in the 1980s and 1990s not only drove down total investment levels at the time, but have also resulted in shortfalls in the infrastructure needed for growth. The private sector has begun to invest in infrastructure, but not to the extent that would be required to cover this deficit. On the other hand, rather than becoming more diversified, the investment mix has been slanted towards non-tradables (other than infrastructure) since those sectors have become the most profitable as a result of local currency appreciation in real terms. As a result, investment has failed to flow into sectors that create more value added and offer more opportunities for capacity-building.
Investment is at the core of economic growth. It is impossible to envisage major productivity gains, an increasing absorption of technical progress or the diversification of increasingly knowledge-intensive production activities in the absence of sharply higher investment rates. This greater flow of investment must also be directed towards sectors and activities that will spur long-term growth and equality. The nature of the production structure and the quality of employment in the future will be determined by where investments are made today. This is why the region needs
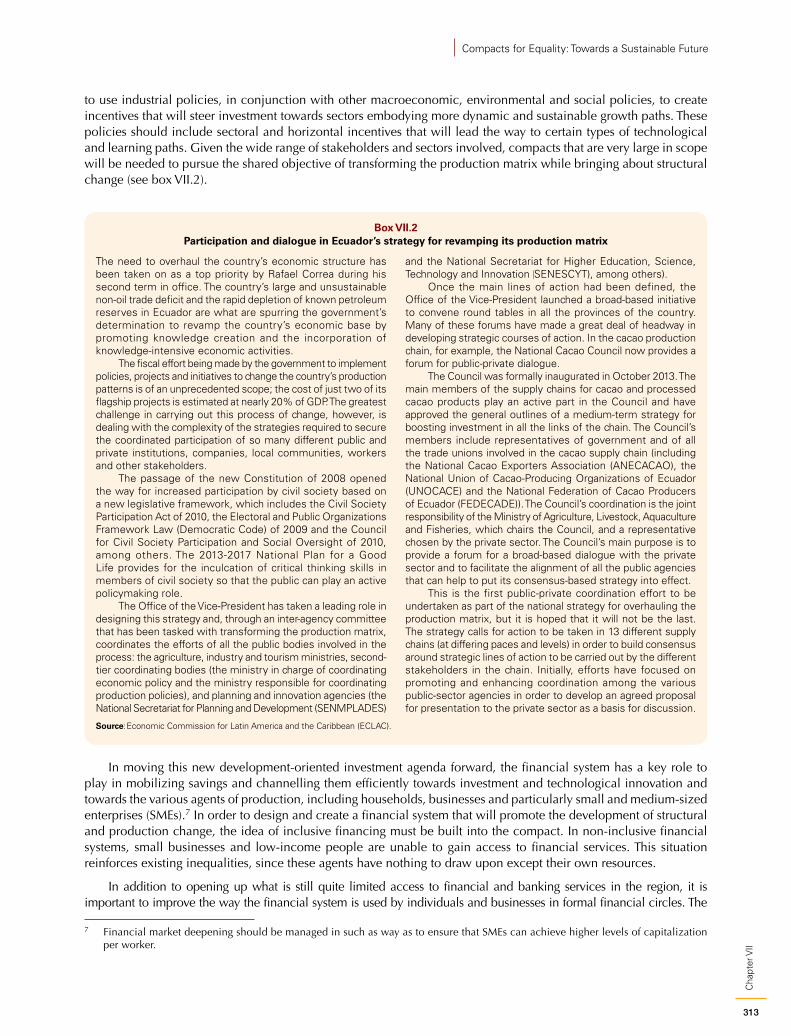
313
Cha
pter
VII
Compacts for Equality: Towards a Sustainable Future
to use industrial policies, in conjunction with other macroeconomic, environmental and social policies, to create incentives that will steer investment towards sectors embodying more dynamic and sustainable growth paths. These policies should include sectoral and horizontal incentives that will lead the way to certain types of technological and learning paths. Given the wide range of stakeholders and sectors involved, compacts that are very large in scope will be needed to pursue the shared objective of transforming the production matrix while bringing about structural change (see box VII.2).
Box VII.2 Participation and dialogue in Ecuador’s strategy for revamping its production matrix
The need to overhaul the country’s economic structure has been taken on as a top priority by Rafael Correa during his second term in office. The country’s large and unsustainable non-oil trade deficit and the rapid depletion of known petroleum reserves in Ecuador are what are spurring the government’s determination to revamp the country’s economic base by promoting knowledge creation and the incorporation of knowledge-intensive economic activities.
The fiscal effort being made by the government to implement policies, projects and initiatives to change the country’s production patterns is of an unprecedented scope; the cost of just two of its flagship projects is estimated at nearly 20% of GDP. The greatest challenge in carrying out this process of change, however, is dealing with the complexity of the strategies required to secure the coordinated participation of so many different public and private institutions, companies, local communities, workers and other stakeholders.
The passage of the new Constitution of 2008 opened the way for increased participation by civil society based on a new legislative framework, which includes the Civil Society Participation Act of 2010, the Electoral and Public Organizations Framework Law (Democratic Code) of 2009 and the Council for Civil Society Participation and Social Oversight of 2010, among others. The 2013-2017 National Plan for a Good Life provides for the inculcation of critical thinking skills in members of civil society so that the public can play an active policymaking role.
The Office of the Vice-President has taken a leading role in designing this strategy and, through an inter-agency committee that has been tasked with transforming the production matrix, coordinates the efforts of all the public bodies involved in the process: the agriculture, industry and tourism ministries, second-tier coordinating bodies (the ministry in charge of coordinating economic policy and the ministry responsible for coordinating production policies), and planning and innovation agencies (the National Secretariat for Planning and Development (SENMPLADES)
and the National Secretariat for Higher Education, Science, Technology and Innovation (SENESCYT), among others).
Once the main lines of action had been defined, the Office of the Vice-President launched a broad-based initiative to convene round tables in all the provinces of the country. Many of these forums have made a great deal of headway in developing strategic courses of action. In the cacao production chain, for example, the National Cacao Council now provides a forum for public-private dialogue.
The Council was formally inaugurated in October 2013. The main members of the supply chains for cacao and processed cacao products play an active part in the Council and have approved the general outlines of a medium-term strategy for boosting investment in all the links of the chain. The Council’s members include representatives of government and of all the trade unions involved in the cacao supply chain (including the National Cacao Exporters Association (ANECACAO), the National Union of Cacao-Producing Organizations of Ecuador (UNOCACE) and the National Federation of Cacao Producers of Ecuador (FEDECADE)). The Council’s coordination is the joint responsibility of the Ministry of Agriculture, Livestock, Aquaculture and Fisheries, which chairs the Council, and a representative chosen by the private sector. The Council’s main purpose is to provide a forum for a broad-based dialogue with the private sector and to facilitate the alignment of all the public agencies that can help to put its consensus-based strategy into effect.
This is the first public-private coordination effort to be undertaken as part of the national strategy for overhauling the production matrix, but it is hoped that it will not be the last. The strategy calls for action to be taken in 13 different supply chains (at differing paces and levels) in order to build consensus around strategic lines of action to be carried out by the different stakeholders in the chain. Initially, efforts have focused on promoting and enhancing coordination among the various public-sector agencies in order to develop an agreed proposal for presentation to the private sector as a basis for discussion.
Source: Economic Commission for Latin America and the Caribbean (ECLAC).
In moving this new development-oriented investment agenda forward, the financial system has a key role to play in mobilizing savings and channelling them efficiently towards investment and technological innovation and towards the various agents of production, including households, businesses and particularly small and medium-sized enterprises (SMEs).7 In order to design and create a financial system that will promote the development of structural and production change, the idea of inclusive financing must be built into the compact. In non-inclusive financial systems, small businesses and low-income people are unable to gain access to financial services. This situation reinforces existing inequalities, since these agents have nothing to draw upon except their own resources.
In addition to opening up what is still quite limited access to financial and banking services in the region, it is important to improve the way the financial system is used by individuals and businesses in formal financial circles. The
7 Financial market deepening should be managed in such as way as to ensure that SMEs can achieve higher levels of capitalization per worker.
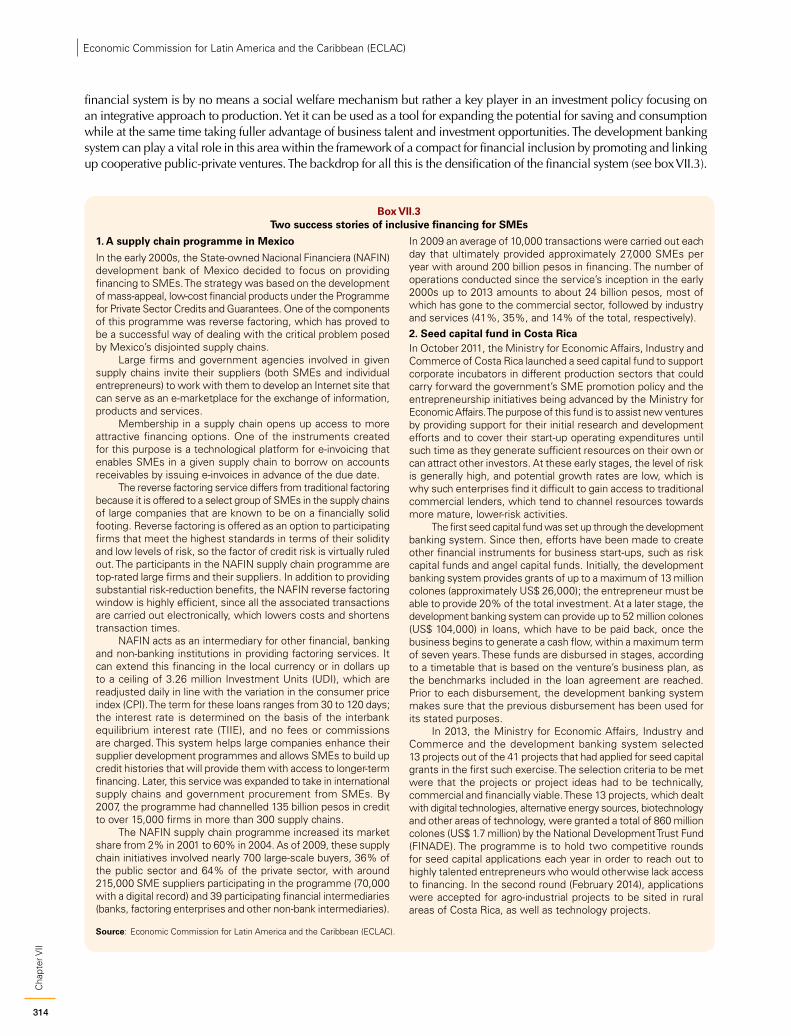
314
Cha
pter
VIIEconomic Commission for Latin America and the Caribbean (ECLAC)
financial system is by no means a social welfare mechanism but rather a key player in an investment policy focusing on an integrative approach to production. Yet it can be used as a tool for expanding the potential for saving and consumption while at the same time taking fuller advantage of business talent and investment opportunities. The development banking system can play a vital role in this area within the framework of a compact for financial inclusion by promoting and linking up cooperative public-private ventures. The backdrop for all this is the densification of the financial system (see box VII.3).
Box VII.3 Two success stories of inclusive financing for SMEs
1. A supply chain programme in Mexico
In the early 2000s, the State-owned Nacional Financiera (NAFIN) development bank of Mexico decided to focus on providing financing to SMEs. The strategy was based on the development of mass-appeal, low-cost financial products under the Programme for Private Sector Credits and Guarantees. One of the components of this programme was reverse factoring, which has proved to be a successful way of dealing with the critical problem posed by Mexico’s disjointed supply chains.
Large firms and government agencies involved in given supply chains invite their suppliers (both SMEs and individual entrepreneurs) to work with them to develop an Internet site that can serve as an e-marketplace for the exchange of information, products and services.
Membership in a supply chain opens up access to more attractive financing options. One of the instruments created for this purpose is a technological platform for e-invoicing that enables SMEs in a given supply chain to borrow on accounts receivables by issuing e-invoices in advance of the due date.
The reverse factoring service differs from traditional factoring because it is offered to a select group of SMEs in the supply chains of large companies that are known to be on a financially solid footing. Reverse factoring is offered as an option to participating firms that meet the highest standards in terms of their solidity and low levels of risk, so the factor of credit risk is virtually ruled out. The participants in the NAFIN supply chain programme are top-rated large firms and their suppliers. In addition to providing substantial risk-reduction benefits, the NAFIN reverse factoring window is highly efficient, since all the associated transactions are carried out electronically, which lowers costs and shortens transaction times.
NAFIN acts as an intermediary for other financial, banking and non-banking institutions in providing factoring services. It can extend this financing in the local currency or in dollars up to a ceiling of 3.26 million Investment Units (UDI), which are readjusted daily in line with the variation in the consumer price index (CPI). The term for these loans ranges from 30 to 120 days; the interest rate is determined on the basis of the interbank equilibrium interest rate (TIIE), and no fees or commissions are charged. This system helps large companies enhance their supplier development programmes and allows SMEs to build up credit histories that will provide them with access to longer-term financing. Later, this service was expanded to take in international supply chains and government procurement from SMEs. By 2007, the programme had channelled 135 billion pesos in credit to over 15,000 firms in more than 300 supply chains.
The NAFIN supply chain programme increased its market share from 2% in 2001 to 60% in 2004. As of 2009, these supply chain initiatives involved nearly 700 large-scale buyers, 36% of the public sector and 64% of the private sector, with around 215,000 SME suppliers participating in the programme (70,000 with a digital record) and 39 participating financial intermediaries (banks, factoring enterprises and other non-bank intermediaries).
In 2009 an average of 10,000 transactions were carried out each day that ultimately provided approximately 27,000 SMEs per year with around 200 billion pesos in financing. The number of operations conducted since the service’s inception in the early 2000s up to 2013 amounts to about 24 billion pesos, most of which has gone to the commercial sector, followed by industry and services (41%, 35%, and 14% of the total, respectively).2. Seed capital fund in Costa RicaIn October 2011, the Ministry for Economic Affairs, Industry and Commerce of Costa Rica launched a seed capital fund to support corporate incubators in different production sectors that could carry forward the government’s SME promotion policy and the entrepreneurship initiatives being advanced by the Ministry for Economic Affairs. The purpose of this fund is to assist new ventures by providing support for their initial research and development efforts and to cover their start-up operating expenditures until such time as they generate sufficient resources on their own or can attract other investors. At these early stages, the level of risk is generally high, and potential growth rates are low, which is why such enterprises find it difficult to gain access to traditional commercial lenders, which tend to channel resources towards more mature, lower-risk activities.
The first seed capital fund was set up through the development banking system. Since then, efforts have been made to create other financial instruments for business start-ups, such as risk capital funds and angel capital funds. Initially, the development banking system provides grants of up to a maximum of 13 million colones (approximately US$ 26,000); the entrepreneur must be able to provide 20% of the total investment. At a later stage, the development banking system can provide up to 52 million colones (US$ 104,000) in loans, which have to be paid back, once the business begins to generate a cash flow, within a maximum term of seven years. These funds are disbursed in stages, according to a timetable that is based on the venture’s business plan, as the benchmarks included in the loan agreement are reached. Prior to each disbursement, the development banking system makes sure that the previous disbursement has been used for its stated purposes.
In 2013, the Ministry for Economic Affairs, Industry and Commerce and the development banking system selected 13 projects out of the 41 projects that had applied for seed capital grants in the first such exercise. The selection criteria to be met were that the projects or project ideas had to be technically, commercial and financially viable. These 13 projects, which dealt with digital technologies, alternative energy sources, biotechnology and other areas of technology, were granted a total of 860 million colones (US$ 1.7 million) by the National Development Trust Fund (FINADE). The programme is to hold two competitive rounds for seed capital applications each year in order to reach out to highly talented entrepreneurs who would otherwise lack access to financing. In the second round (February 2014), applications were accepted for agro-industrial projects to be sited in rural areas of Costa Rica, as well as technology projects.
Source: Economic Commission for Latin America and the Caribbean (ECLAC).
315
Cha
pter
VII
Compacts for Equality: Towards a Sustainable Future
Increased investment should be bolstered by industrial policy, which should be regarded as a policy of State for at least two reasons. The first is that industrial policy acts as the lynchpin that holds institutions and structures together as the transition is made towards structural change. The region has lagged far behind in this respect, as ECLAC has been pointing out for quite some time (see ECLAC, 2012). Designing and implementing industrial policies is a strategic development priority and is part of the State’s institutional development responsibilities. The second reason is that private business circles in the region have not displayed the drive or will to invest in innovation and development. This is why the governments of the region are called upon to address its existing productivity lags and gaps, the lack of sufficient investment and its failure to place priority on technological research and development.
(i) Investment is the main driver of structural change and of the incorporation of technological progress. It therefore should be provided with special support by means of the following:• An institutional framework that promotes a strategic, long-term approach to investment projects, coordination
between the State and agents of production in designing and implementing policies and programmes, and the prevention and management of conflicts.
• A short-term macroeconomic policy that will ensure financial and price stability, together with a stable growth path and the full use of installed capacity through the implementation of countercyclical policies and the maintenance of internal and external macroeconomic equilibria.
• Complementarity among macroeconomic policies designed to keep relative prices at levels that will stimulate investment in tradable sectors,8 training policies aimed at helping workers (including young workers) to adapt to structural changes, environmental policies that will spur environmentally sustainable investments and avoid generating externalities that could dampen investment in general, and industrial, technological and SME support policies that will pave the way for productivity gains.
(ii) Since higher levels of investment and the diversification of investment boost productivity, industrial policy should be used to provide incentives (tax subsidies, credit support and complementary public investment) for investment in knowledge-intensive tradables.
(iii) Investment promotion policies should be designed in a way that takes into account the impact that they can have in terms of innovation, learning and high-quality jobs. In the case of foreign direct investment, these policies need to ensure that investment is not confined to assembly plants and natural resource projects that do not have linkages with other national production activities and that it promotes the creation of learning opportunities and linkages with the domestic production structure.9
(iv) A policy aimed at reducing structural heterogeneity and fostering equality should help SMEs to form linkages with more dynamic production circuits within given sectors or activities. Such policies should also help these businesses to build endogenous capacity for innovating and learning. This policy line can be supported by development agencies and public development banks. SMEs also need to be linked into global value chains; financing agencies in this area should identify dynamic and high-impact projects.
(v) An institutional framework should be created in which technology supply and demand are complementary. This should be done by: developing science and technology networks and support mechanisms to help innovative firms move closer to the technological frontier; fostering partnerships between public and private agents in the areas of science and technology and research and development; and establishing or strengthening financial mechanisms to help innovative firms to gain entry to highly competitive markets.
(vi) The thrust of an inclusive financing policy should be to provide financial services to people and businesses that have not had access to the formal financial system before and to improve the way in which participants in the formal financial circuit make use of that system. Financial innovation should be used as a tool for ensuring that households and businesses are brought into the financial system via a greater densification of financial services.
(vii) Promoting inclusive financial innovation also entails finding ways to match up public and private agendas. Ways and means need to be devised of using public policies to attract private-sector ventures, with the help of suitable incentives, and channelling them towards the achievement of productivity gains that will make the labour market more inclusive.
(viii) A compact for inclusive financing should provide for a bigger role for development banks in mobilizing resources for long-term financing to various income groups and in complementing private banking activities.
8 Although the real exchange rate can help to encourage investment in tradable sectors, it is not a substitute for longer-term efforts to boost total factor productivity in both tradable and non-tradable sectors. This must be one of the main policy objectives with a view to ensuring growth over the long run.
9 The potential of FDI to transfer technology to local firms must be leveraged. Institutions that promote science and technology should promote the formation of mutually beneficial linkages between technology-intensive firms and local firms.
316
Cha
pter
VIIEconomic Commission for Latin America and the Caribbean (ECLAC)
3. A compact for equality in employment As discussed in chapter III, a great many of the inequalities seen in Latin American societies arise and are perpetuated in the labour market, which is the main source of household income. The marked heterogeneity of the production sector, combined with the weakness of the region’s labour institutions, results in sharp heterogeneity in wage levels. Gender- and ethnic-based differentials in access to employment and in occupational and wage distributions remain acute. The labour market also is the hub of many aspects of the complex pattern of equality that is being proposed here as a development value. Labour income and its distribution are what determine the degree of equality of means, while access to employment and the quality of employment are the factors that uphold fundamental rights, and the many forms of discrimination that exist are what shifts the balance away from equality and towards inequality in terms of the mutual recognition of acquired skills and their full use.
As stated in the closing section of chapter III, in order to address the many inequalities existing in the labour market, the action of the State is crucial in matters relating to production, the regulation and institutional structure of the labour market, labour policy and redistributive childcare arrangements. Stronger labour institutions can help to formalize employment in a region where the high degree of labour informality has proved to be intractable in the face of efforts to reduce it. Stronger institutions in this sector will also help to enforce labour laws, distribute the benefits of labour more fairly and strengthen reciprocal recognition between the various actors in the world of labour. Institutional reform will generate synergies in terms of equality and inclusiveness that will play a vital role in backstopping changes in the production structure.
A compact in this area should encompass a strategic vision and a broad-based support programme focused on narrowing gaps in productivity, labour income and the quality of employment and on striking a balance in terms of time and gender between paid and unpaid work. Since the labour market is so segmented and so heavily influenced by the prevailing patterns of structural heterogeneity, the compact to be reached in this connection should link structural changes with institutional and convergent productivity inroads. The aim is to move labour structures and institutions forward, on a coordinated basis in a way that will create virtuous circles for the promotion of greater equality and greater sustainability. In order to achieve this goal, society must enter into a compact for the generation of greater skills, learning and knowledge in conjunction with increased investment in production.
A comprehensive labour policy should coordinate macroeconomic policies (including countercyclical policy measures) and sectoral policies in order to ensure that the priority objective of providing people with productive, decent forms of employment is incorporated into macroeconomic policy; that job losses are kept to an absolute minimum and that the unemployed are protected during the low points of the business cycle and during the transitional stages of the production matrix; and that the production structure is shifted in a way that will narrow internal and external productivity gaps and promote skill-building.
(i) The institutional framework for the labour market should be based on a mutual recognition of social and labour-related considerations that will serve as a platform for the pursuit of the twofold objective of ensuring that the labour market functions efficiently and protecting the market participants that are in the weakest position.
(ii) The institutional structure should provide a framework that will spur productivity gains and foster an equitable appropriation of the resulting benefits. It must also ensure a sufficient supply of skilled labour and foster the capacity to increase the knowledge and innovation content of local output. At the same time, it must ensure a fair distribution of income and, more specifically, of productivity gains.
(iii) A minimum wage policy should figure as part of the compact relating to the institutional structure of the labour market. This policy should have a long-term horizon and provide for a progressive increase in the minimum wage that is in keeping with the country’s macroeconomic, production and credit policies. The debate on this subject will also provide an opportunity for different countries to coordinate their minimum wage policies.
(iv) Labour market institutions should provide more protection for the unemployed. As proposed in ECLAC (2010), the funding for unemployment insurance should be provided for or expanded (based on everything from unemployment taxes to general revenues) and the eligibility requirements should be broadened as well (with the spectrum running from formal-sector workers with seniority to temporary workers with little contractual protection). The aim should be to create national employment systems that include complementary arrangements for unemployment insurance, job searches, skills certification and training. Special attention should be devoted to youth unemployment, since the jobless rate for young people is so much higher than it is for adults.
317
Cha
pter
VII
Compacts for Equality: Towards a Sustainable Future
(v) A countercyclical unemployment insurance fund should be set up for use in times of peak unemployment, linked up with proactive State-directed job creation policies and policies focusing on training and on the coordination of labour demand and supply.
(vi) The linkages between labour institutions and social protection systems form a crucial substructure for the development of societal and labour-related compacts. The compact to be forged in this area should provide means of putting aside disincentives for participation in the labour market and should foster the convergence of social welfare policies —especially those influencing transfer payments and support for low-income sectors— designed to bring people into (or back into) the labour force.
(vii) Labour institutions should develop a range of regulatory mechanisms and incentives to help move employers and workers into the formal sector of the economy.
(viii) These institutions should also work to put a stop to gender-based discrimination and discrimination against given ethnic and age groups in terms of access to employment, wages, career paths and work-related roles.
(ix) Gender mainstreaming in employment must be achieved, and in order to do this, the constraints associated with the existing sexual division of labour will have to be overcome, women will have to be encouraged to enter the labour market and discrimination will have to be countered by means of differentiated measures targeting institutions, policies and programmes while according full recognition to the importance of unremunerated labour. Women’s economic autonomy should be a crucial element that binds together gender policies and gender-sensitive labour policies.
(x) The regulatory framework should uphold corporate social responsibility in the labour market, in terms of environmental issues and in society as a whole.
4. A compact for social welfare and public servicesThe main objectives of the institutions of a welfare State are to narrow opportunity and achievement gaps, help members of the public to cope with the risks that they face, and invest in and promote skill-building in a way that will support both equality and productivity.
A compact for social welfare and public services should therefore embody policies that will ensure universal access to a threshold level of consumption, along with regulations that will roll back distortions and shield people from the risks existing in service and insurance markets. This compact should also, however, be a constituent part of a strategy for bringing about structural change and achieving equality. It must therefore include measures to promote women’s full participation in paid employment and ensure adequate investment in early childhood services, education and health, and promote the generation and dissemination of knowledge and skills that will build capacity in the population and prepare its members to be full partners in and drivers of an economy based on knowledge and technical progress.
In respect of social issues, the focus has been on the pivotal role of the State in pursuing the equality agenda on the basis of the pillars of social protection and promotion (ECLAC, 2010). The State is of crucial importance because, in terms of support for well-being and the supply and demand of public goods, the market, when left to its own devices, has widened quality gaps rather than narrowing them. Accordingly, the State needs to be a much more active player in ensuring the well-being of the population.
In this framework, a fiscal compact will be needed to ensure that the necessary funds will be available for social spending and for the implementation of social policies. This is particularly the case in some countries of the region where social spending levels are far too low, both in relative and in absolute terms, to turn social policy into an effective tool for achieving even a basic minimum level of well-being. Public social expenditure has to be increased (to near or above 19% of GDP) and its countercyclical bias has to be strengthened. But simply raising spending is not enough. The architecture of expenditure has to be reworked to make it more egalitarian, to shape it to conform to today’s risk structures and to gear it towards the mobilization of the countries’ production capacities.
Thus, as well as boosting the available resources, this compact must embody institutional changes that will endow public policymakers with the recognition and management capacity needed to convince a large majority of the population to make use of a more ready supply of higher-quality public services and public goods. Another element that is needed is for the State to play a leading role in building more inclusive social protection networks that have fewer gaps in coverage and offer better health-care benefits, assistance policies and support programmes for
318
Cha
pter
VIIEconomic Commission for Latin America and the Caribbean (ECLAC)
at-risk households, as well as a pension system that, given the gaps in social security coverage, has a strong solidarity (redistributive or non-contributory) pillar to protect vulnerable population groups at different stages of the life cycle (see box VII.4). The fourth consideration is that only the State is in a position to undertake sweeping reforms in the education system in order to reduce the differentials in capacity-building between different groups in society and to gear the learning process towards meeting the challenges posed by structural change, cultural change and the need for the citizenry to play a full-fledged role in building a democratic society. Finally, gender mainstreaming in public policy and in the labour market, as well as the specificity of the issues and challenges associated with the rights of indigenous peoples, clearly call for government coordination and regulation in order to reconcile the vectors of equality of means with the vectors of equality of mutual recognition and autonomy.
Box VII.4 Cross-sectoral building of an inclusive social policy based on a life-cycle rationale: “Inclusion for Growth” in Peru
The debate on development and social inclusion policy is taking shape within the Inter-Ministerial Commission for Social Affairs (CIAS) of the Government of Peru, in the framework of the National Development and Social Inclusion Strategy entitled “Inclusion for Growth”. The Commission comprises 12 ministers of State and is a multi-sectoral forum for discussing State policy and social spending. The Ministry of Development and Social Inclusion (MIDIS) acts as technical secretariat for the Commission.
The Inclusion for Growth strategy provides a framework to guide the action of all sectors and levels of government working in the area of development and social inclusion in behalf of people living in poverty and exclusion, with a view to coordinating action and adopting an approach that covers the entire life cycle. The purpose of the strategy is to narrow existing gaps in public service coverage and quality and capacity development, as well as to promote equality of opportunities regardless of place of birth, income, language and parents’ educational level.
Endorsed by 14 ministers in April 2013 and spearheaded by MIDIS, the strategy is being implemented in close cooperation with regional and local governments and the various sectors of activity. The work includes recognizing the competencies and processes in place, making sure that the strategy will focus on the priorities of the parties, and providing technical assistance and support to consolidate the administrative capacities necessary for implementation.
Inclusion for Growth prioritizes five key areas and takes an inclusive approach that covers different stages of the life cycle:
• (1) Child nutrition (0 to 3 years)• (2) Early childhood development (0 to 5 years)
• (3) Comprehensive development of children and adolescents (6 to 17 years)
• (4) Economic inclusion (18-64 years)• (5) Protection of older adults (65 years and over)The expected outcomes in these key areas are, respectively:• To reduce the prevalence of chronic undernutrition in
childhood.• To boost physical, cognitive, motor, emotional and social
development during early childhood.• To improve educational, occupational, and personal
development skills, as appropriate for the person’s age.• To increase independent household income.• To boost the well-being of older adults.The Government of Peru contributes to results in areas
1 and 2 of the Inclusion for Growth strategy through the Fund to Promote the Achievement of Social Results (FED). This fund is a mechanism that creates incentives for greater efficiency and effectiveness in spending public resources and rewards improvement in the management of national and regional government entities. With regard to area 4 of the strategy, through the Fund for Economic Inclusion in Rural Areas (FONIE), the Government of Peru is financing infrastructure projects that close gaps in basic service coverage and quality (including water, sanitation, electrification, telecommunications, secondary roads and bridle paths) that will benefit the rural population of 570 districts (around 3.2 million Peruvians) that have historically been excluded from the country’s development. “Infrastructure packages”, along with other programmes, are financed through FONIE, and their income multiplier effect has been amply demonstrated at the national and international levels.
Source: Economic Commission for Latin America and the Caribbean (ECLAC) on the basis of information provided by the Ministry of Development and Social Inclusion (MIDIS) of Peru.
(i) An effort must be made to move towards a universal platform for social protection based on increasingly integrated social protection systems that include a strong non-contributory pillar in keeping with an equal rights approach (see box VII.5). The compact should therefore include a road map for the progressive expansion of coverage and of the range of benefits offered, along with the corresponding increase in the resources needed to accomplish that expansion. Along the same lines, the range of assistance programmes needs to be expanded and, at one and the same time, those programmes need to be designed in such a way as to spur capacity-building and the development of appropriate policies so that they will promote, rather than limit, the autonomy of the persons benefiting from them. The compact should also provide for the development of a public support network that will allow people to reconcile paid and unpaid work and pave the way for the entry of women into the labour market.
319
Cha
pter
VII
Compacts for Equality: Towards a Sustainable Future
Box VII.5 The construction of a compact for the creation of a solidarity-based pillar: the reform
of the pension system in Chile, 2005-2008
The 2008 reform of Chile’s pension system was passed with the support of all its political parties. It has had major fiscal and social implications, inasmuch as it has closed gaps in coverage, levelled the playing field in terms of access, established basic minimum levels of well-being for the elderly, and endowed the State with greater regulatory and oversight powers. Most importantly, the reform provided for the establishment of a new solidarity pillar of the pension system that affords universal coverage, and it reinstated the State in its role as a guarantor of social security benefits for the poorest 60% of the population. The solidarity pillar includes a basic, non-contributory pension for people who have not accumulated enough funds in their pension account to obtain a minimum guaranteed pension payment, as well as a solidarity pension contribution to top up the pensions of low-income pensioners. In addition, an allowance is given to women for each live-born or adopted child; all women are entitled to this allowance, regardless of whether or not they have paid into the pension system and regardless of whether or not they are living below the poverty line. The system also includes subsidies for the recruitment of young workers and has expanded coverage and benefits for independent workers. Finally, it has bolstered the State’s ability to regulate the pension system and the pension fund administrative boards (AFPs). The reason why this reform is such a milestone is that it dealt with an emblematic sector of public policy which, until that time, had remained basically untouched since its conversion to a fully funded capitalization system under the military regime in 1981. In addition, it was a sector in which private actors —the AFP industry— wielded enormous influence.
There were four stages in the political and institutional process involved in developing this pension reform plan. During the 2005 presidential campaign, the reform of the pension system was at the very top of the public agenda and was a core component of the election platform of the candidate of the Coalition for Democracy
Party, Michelle Bachelet. In 2006, after she had taken office, she convened an advisory council made up of acknowledged experts in the field who held a diverse range of views on the subject. The members of the Presidential Advisory Council, comprising both advocates and critics of the existing system, were tasked with carrying out a thorough analysis, consulting with social and economic stakeholders across the board, and developing a series of feasible proposals for closing coverage gaps, reducing inequalities overall and gender inequalities in particular, and guaranteeing a basic minimum pension for all. The baseline analysis undertaken by the Advisory Council turned up a mounting volume of empirical evidence on the shortcomings and inequities of the existing pension system. Based on the Advisory Council’s recommendations, a council of ministers headed up by the Minister of Labour and the Minister of Finance drafted a legislative bill that was then submitted to Congress. Following negotiations in both houses of the legislature and the introduction of some changes, the reform bill was passed unanimously. As one of the outcomes of those negotiations, the government agreed that it would not include a provision in the main document that would have allowed private- and public-sector banks to act as pension fund administrators.
This process was viable thanks to the window of opportunity provided by a combination of the following elements: (i) the fact that the reform of the pension system was placed at the top of the public and governmental agenda; (ii) the growing body of empirical evidence concerning the flaws in the pension system’s coverage and its shortcomings in terms of equity; (iii) the development of a proposal by a technically competent group of recognized experts with a range of views on the subject (the Presidential Advisory Council); and (iv) the willingness of the participants to negotiate a socially progressive reform package that would not undermine the basic system of fully funded individual pension accounts.
Source: Carlos F. Maldonado Valera and Andrea F. Palma Roco, “La construcción de pactos y consensos en materia de política social. El caso de la reforma previsional en Chile, 2005-2008”, Políticas Sociales series, No. 183 (LC/L.3665), Santiago, Chile, Economic Commission for Latin America and the Caribbean (ELAC), September 2013; Andras Uthoff, “La reforma del sistema de pensiones en Chile”, Financiamiento del Desarrollo series, No. 240 (LC/L.3422), Santiago, Chile, ECLAC, November 2011.
(ii) The compact for social well-being should also set standards for transfer payments in order to protect people whose income levels place them in a vulnerable position. The first step should be to set up a targeted or universal income-transfer system based on a specified income floor rate for older adults and to develop other guaranteed-income systems that are not tied to the labour market and that are flexible enough to be expanded during recessions. As part of these systems, basic, non-contributory income transfers for low-income families with children should be created or expanded, and subsidies should be provided to vulnerable households that are forced out of their contributory insurance schemes during economic crises.
(iii) Health policies should be geared towards developing a less segmented health system and should provide for a basic package of preventive care as well as quality medical treatment for the entire population, regardless of an individual’s purchasing power or participation in the formal labour market.
(iv) In education, where inequalities between people of different social and economic backgrounds have long been perpetuated, rather than rolled back, the State has an important role to play in promoting broader coverage of pre-primary education (especially for income groups that cannot afford to pay for it out-of-pocket), lengthening the school day in public schools, helping to ensure that low-income students stay in school until they complete their secondary education, gradually narrowing the differences in the quality of education that exist among public schools and between public and private schools, and developing a universal information and communications technologies (ICT) platform for public schools.
320
Cha
pter
VIIEconomic Commission for Latin America and the Caribbean (ECLAC)
(v) It is not enough simply to recognize the rights of indigenous peoples and to promote appreciation for cultural diversity. Policies must be devised and implemented —on the basis of respect for and recognition of those peoples’ collective rights— that will bring about an appreciable improvement in their access to social rights and public goods, in their control over the material and intellectual resources present in their territories and in their ability to make use of those resources, and in their access to a greater share of public resources for use in plotting out and following their own development paths. A national covenant or compact for equality presupposes an agreement that a steady decrease in poverty and in the inequality experienced by indigenous peoples should be a national objective. The goal should be pursued by means of consistent, long-term policies that incorporate a recognition of indigenous peoples’ cultures and a redistributive rationale, that reflect the need to do away with discrimination and racism as a public policy priority, and that set ambitious goals and provide for suitable participatory and consultative processes.
Social well-being is not simply a function of participation in the labour market and social security coverage, however. A collective accord must also provide some kind of link between consumption patterns (or patterns in the use of the fruits of growth in income and finance) and more equal access to well-being. It is not a question of using coercive policies to block people’s legitimate aspirations in terms of consumption, but rather of shaping incentives, disincentives and trade-offs that will foster a better balance between private expenditure and the supply of public services and public goods.
The agenda for social institutions should include the delivery of fundamental public goods and services such as public safety, environmental protection and urban planning, along with the necessary financing for the delivery of these goods and services throughout the country. Regulatory frameworks, tax systems and urban investment arrangements should limit upper-middle-income and upper-income sectors’ options for avoiding “public bads” (by choosing to live in gated communities, hiring private security services, using private means of transport, etc.) and promote the use of collective systems (public transport, the public commons, high-quality waste management systems). Basic health and education systems should be of a high enough quality to attract middle-income sectors.
The delivery of public services that can be used by all sectors of the population in these various areas is, at one and the same time, a condition for the conclusion of a social compact, one of the substantive components of the compact, a means of concluding such a compact and one of its objectives. The idea is, on the one hand, to reverse the vicious cycle whereby public-private segmentation in the provision of the means to attain a given level of well-being is linked to difficulties in achieving social cohesiveness and concluding social compacts and, on the other hand, to help cultivate virtuous cycles entailing greater cohesiveness, a greater willingness to enter into collective agreements and a shared use of better-quality public services. The social compact should therefore define a set of goods and services that are of public interest and place timely limits on the privatization of basic levels of well-being. It should thus aim towards universal coverage in the provision of these goods and services, avoiding the segmentation often found in targeted welfare policies, in exclusively contributory insurance systems and in market solutions.
We are all consumers and we are all citizens, but the idea of citizenship must not be sacrificed to or subsumed under consumption. Consumption should be viewed within the framework of social citizenship, which provides scope for the well-being of all. It is also important to ensure that, insofar as it relates to public consumption, the compact includes regulations that will protect the consumer from abuses, whether in the form of a failure to provide proper information, overpricing or a failure to provide reasonably priced services of a suitable quality within an acceptable time frame.
A social compact on consumption will have to entail agreements on three issues as a minimum.
• An equation that links a more progressive and robust tax system with an evident improvement in the delivery of public services that are clearly effective in increasing well-being and building capacity, especially in the areas of transport, health, education, the environment and public security services. As discussed in chapter IV, a social compact that encompasses these two sides of the same coin is both a means to and an end of greater social cohesion or, in other words, a better society.
• The compact should encompass policies and tools for calibrating the expansion of consumption with investment in the production sector. A society with high levels of consumption and a largely undiversified production
321
Cha
pter
VII
Compacts for Equality: Towards a Sustainable Future
mix that relies heavily on the value of its raw materials is not sustainable. The expansion of consumption in ways that will increase overall well-being must go hand in hand with productive investments that will promote greater social inclusiveness in the labour market and that will enable society to deal with external constraints by increasing its productivity. A dynamic balance between consumption and production is also crucial for maintaining a balanced current account over the long term. Thus, a compact for sustainability and equality must help to increase people’s access to the well-being that can be attained through consumption and, at the same time, endow the whole of society with greater capacities and production assets.
• As discussed in chapter IV, a compact for consumption should assign the State a clearly defined role in regulating and overseeing public and private suppliers of goods and services that influence consumers’ or users’ quality of life. This type of regulation will bring consumption within the purview of citizen-based concerns by enabling consumers or users to demand that these goods and services are of a high quality, are delivered on time and are available at a fair price.
5. A compact for environmental sustainabilityEnvironmental sustainability poses enormous challenges in terms of intergenerational solidarity, recognition of the wide range of groups that are adversely affected by the exhaustion of non-renewable resources, and environmental degradation. It is also a key factor in agreements whose scope transcends national borders, since environmentally responsible action is something that concerns the entire planet. Two particular features of such compacts are, first, that they must be both national and global in scope and, second, that they must engage civil society very actively, on both of these scales.
There is no question about the fact that environmental issues and the debate regarding access to public goods have risen towards the top of the political agenda at both the national and international levels over the past decade. Environmental movements have expanded and have come to inform the objectives and strategies of groups struggling to achieve various social goals. The demands of environmental movements have thus become intertwined with those of indigenous, campesino and grassroots communities striving to defend their land and water rights, to protest against the impact of extractive industries, to improve the quality of life of urban dwellers and to achieve other social objectives. Those demands have also evolved and expanded beyond the prevention of environmental degradation to include the preservation of environmental sustainability as a cornerstone of present and future well-being. Social organizations have refocused their political agenda towards the formation of a citizenry whose members are increasingly aware of their rights and responsibilities in terms of sustainable development and who have brought the issue of equality into the debate regarding access to natural resources, the right to live in a healthy environment, and access to information, to the opportunity to participate and to environmental justice.
The growing involvement of organized civil society in putting forward demands relating to environmental sustainability has been coupled with greater opportunities for the participation of civil society in international forums, especially since the 1992 United Nations Conference on Environment and Development in Rio de Janeiro, Brazil. Starting with that meeting, non-governmental organizations took part in all the global conferences held in the 1990s in what became known as the “social cycle” or the “social decade” of the United Nations. The agreements reached at those conferences fed into one another and contributed to the consolidation of a new ethical and policy-based system of cooperation that gave expression to new international legal principles (see box VII.6). These new principles are framed in the Rio Declaration on Environment and Development and have been echoed in sustainable development agreements such as the Convention on Biological Diversity and the United Nations Framework Convention on Climate Change.
Growing environmental awareness is pointing up new areas of potential conflict between industrialized and developing countries, between advocates for environmental protection and the proponents of economic growth, and between this generation and the next. There is an awareness of the fact that current consumption must not jeopardize the well-being of future generations. As will be discussed in the following section, natural resources must be included in the equation because, apart from the fact that their development could translate into future shortages, the methods used to extract them and the benefits derived from those production activities should include a large redistributive component and must not generate environmental liabilities.
322
Cha
pter
VIIEconomic Commission for Latin America and the Caribbean (ECLAC)
Box VII.6 Global compacts for environmental sustainability: key principles embodied
in the Rio Declaration on Environment and Development
Principle No. 7 (common but differentiated responsibilities) has significant political implications because it entails an implicit recognition of the environmental debt owed by developed countries to the rest of the international community as a consequence of the environmental externalities generated by their industrialization process. This principle implies that industrialized countries are under an obligation to make greater commitments than developing countries in the implementation of multilateral environmental agreements. It also reflects the differences existing between different groups of countries in terms of the part they have played in the past in the generation of global environmental externalities and in the specific commitments that they have made to undertake mitigation efforts in line with their financial and technological capabilities.
Principle No. 15 (the precautionary principle) states that the lack of absolute scientific certainty as to the threat of grave or irreversible environmental damage should not be cited as a reason for deferring the adoption of measures for averting or minimizing that threat. Experience has demonstrated that scientific certainty is often attained too late to provide the time required to design appropriate environmental measures to halt irreversible processes or to counter those that have gathered a great deal of momentum.
Principle No. 16 (the polluter pays), which was espoused by the Organization for Economic Cooperation and Development (OECD) in 1972, has been put forward in a variety of resolutions and declarations and is gaining acceptance as an international principle with legal implications for the conceptualization of human rights and the development of environmental laws and regulations. The application of this principle can contribute to the full internalization and more equitable distribution of the environmental costs of the production and/or consumption of a given product by means of a pricing system that reflects all the costs associated with the degradation of resources, pollution and other externalities linked to the production and/or consumption of a specific good or service.
Principle No. 10 (the right to knowledge) has to do with the right of workers and communities to have accurate information about the environmental hazards to which they are being exposed in their workplaces and homes. The legal conceptualization of this right is gaining in importance in the design of the latest-generation environmental management tools based on reputational incentives for the compilation and public dissemination of information on the environmental records of economic agents and for the provision of unhindered access to that information.
Source: Economic Commission for Latin America and the Caribbean (ECLAC), on the basis of Rio Declaration on Environment and Development, 1992.
The Latin American and Caribbean region must meld its responses to environmental challenges with structural change that will boost productivity and close the gaps between different groups in order to move towards greater equality. The compact must therefore provide for a transition to a green economy and include policy tools for reshaping consumption patterns in ways that will result in less pollution, less waste and a better balance between private consumption and the supply of public services.
(i) In the course of international negotiations, an effort should be made to build alliances among the countries of the region and to develop shared visions of global climate security as a global public good whose provision must be supported by greater efforts on the part of industrialized countries based on the principle of common but differentiated responsibilities (see box VII.5).
(ii) Public policies must be put in place that will help the countries to adapt to climate change based on a risk-management model that will help communities to become more resilient and to reduce the risks associated with natural disasters.
(iii) Land management systems must regulate changes in land use and protect existing stores of biodiversity, with the top priority being to preserve those ecosystems that are essential for human life.
(iv) These compacts should establish the shape of the energy matrix. This should be done through consultations involving both experts and the citizenry with a view to generating political will on the part of a wide range of stakeholders to invest in a matrix that will be sustainable over time, will keep the use of non-renewable and dirty energy sources to a minimum, and will offer the citizenry clarity about the long-term benefits of what may, in the short term, be very costly investments.
(v) An effort should be made to provide a greater supply of higher-quality public services, especially in areas subject to major negative externalities, such as transport, in order to reconcile the desire for consumption-based well-being with the constraints imposed by the negative environmental externalities (particularly pollution) of consumption.
(vi) Water use needs to be regulated on the basis of the needs of individuals and production units, and those that make an abusive use of this resource, that coopt water sources or watercourses and thus deny access to population groups, or that pollute bodies of water with household or industrial waste or mining tailings should be taxed or fined. Steps should be taken to preserve the region’s aquifers so that coming generations will have access to those water resources and distribution should be regulated in order to ensure fair pricing, equality of access and, where appropriate, differentiated rates based on the ability-to-pay principle.
323
Cha
pter
VII
Compacts for Equality: Towards a Sustainable Future
(vii) All the relevant policies (industrial, science and technology, fiscal, environmental and training policies) need to be strategically oriented towards the creation of dynamic comparative advantages based on knowledge-intensive production activities that make less intensive use of polluting emissions and materials.
(viii) There is a need to show greater solidarity with future generations, and one of the ways of doing this is to tax or penalize polluters and those who waste energy. Serious environmental problems that affect the entire population are being generated by high levels of consumption of waste-producing, planned-obsolescence goods, the steadily growing number of vehicles and their impact in terms of pollution and congestion, and the fact that the increase in energy consumption is outdistancing per capita GDP growth and putting mounting pressure on the energy matrix. By the same token, this strong link between consumption and the environment needs to be taken into account in a social compact in which stakeholders work together in solidarity with one another to regulate consumption with a view to its long-term sustainability.
(ix) A compact for environmental sustainability should also block the negative environmental externalities of consumption with the help of taxes on fossil fuels. This will not only curb demand, but will also generate additional revenues that can be used to develop new types of urban infrastructure and to create intergenerational solidarity funds. In addition to this taxation tool, the compact should also provide for compensatory policies to assist low-income groups that may have to bear the brunt of higher fuel prices or the second-order effects of those price hikes on food and public transport costs.
(x) A road map needs to be plotted out for expanding the use of landfills for solid waste disposal and developing alternative approaches for the use and treatment of solid wastes prior to their disposal. Economic incentives can be useful means of promoting recycling, thermal waste treatment and the use of waste to generate energy.
6. A compact for natural resource governanceIn competing to attract investment in natural resources development, the countries of the region have used policies that sometimes end up strengthening the power of investors and large corporations through deregulation, the relaxation of commercial and financial requirements, tax cuts and tax exemptions. In so doing, they have weakened the role of the State and its capacity to oversee and control the development of natural resources.
The results of playing by these rules have largely been undesirable: the appropriation of land without consideration for the ecosystems involved; intensive mining and intensive harvesting of the seas and of other natural resources; and the increasing concentration of the ownership of natural resources in the hands of vast transnational corporations, especially in the mining, oil, timber and fishery sectors. No other segment of society has gained such a privileged position at the global and local levels as large national and transnational companies. Apart from some early steps towards voluntary self-regulation and some concessions to the principles of corporate social responsibility, the concentration of power in these corporations and the ways in which they wield that power have been detrimental to the environment and to the preservation of strategic resources in many regions of the planet.
Moving towards the governance of natural resources in tandem with structural change for equality is one of the greatest challenges confronting the region. The resource curse can be avoided, but in order to do so, the region must have an appropriate institutional architecture. This has been demonstrated by resource-rich countries outside the region which have maintained governance over those resources on the basis of compacts that provide for a combination of capacity-building, wage convergence, countercyclical use of part of the rents from natural resources, and investment in innovation and technology (see box VII.7).
Chapter VI discussed the challenge of achieving governance over the region’s natural resources, which touches upon the system of ownership, appropriation and use of rents and on the system for the settlement of disputes relating to resource development. A proper institutional and regulatory framework must be in place if the region is to prevent the high international prices for its natural resources from generating Dutch-disease distortions, and if it is to stop its ample natural resource endowment from triggering various forms of rent-seeking behaviour. The region must make use of that endowment to shape a more technology-intensive and more diversified production structure in which economic rents are used to pursue the ultimate aim of promoting greater equality in access to well-being, capacity-building and mutual recognition among the actors involved.
324
Cha
pter
VIIEconomic Commission for Latin America and the Caribbean (ECLAC)
Box VII.7 Norway’s social compact for sustainable natural resource development
There is a twofold explanation for Norway’s success in avoiding economic problems such as the resource curse or Dutch disease that are associated with the development of natural resources:
• Its position as a developed country with a highly diversified economy and a very cohesive society, combined with the solid democratic, economic and social institutions, the separation and independence of the branches of government, high levels of education and of scientific and industrial development, respect for property rights, a strong work ethic, legal certainty and social security.
• The implementation of public policies that had been designed on the basis of a long-term vision.
Unlike in most of the oil-exporting countries, particularly the developing ones, Norway’s governmental, parliamentary and industrial leaders detected and recognized the issues that were looming when the country began drilling for oil in 1971 (see Grisanti [online] http://www.petroleoyv.com/website/uploads/GRISANTI.pdf). Those leaders decided that they would maintain a constant ratio between oil revenues and GDP in order to lessen the economy’s reliance on oil production. Over a span of three decades, the level of oil revenues relative to national income remained unchanged, thanks to fiscal, monetary and industrial policies developed expressly for that purpose (Larsen 2004).
Larsen outlined a policy package made up of seven policy tools that account for Norway’s success:
• Pay hikes in the oil industry were capped on the basis of the marginal productivity of the manufacturing sector. The aim of this measure was to block the factor movement effect.
• To ward off the spending effect, the State Petroleum Fund (SPF) was set up and conservative fiscal policies were introduced in order to keep tax revenues and outlays in balance. In addition, public expenditure was capped and some external debts were paid off, especially at points in time when the economy was working at full capacity, in order to shield the production apparatus from the effects of currency appreciation and maintain the global competitiveness of tradable-goods producers.
• In order to forestall any spillover-loss effect, the State strengthened its national human capital formation process in the area of offshore production by means of a proactive policy targeting the petroleum sector, rather than relying on foreign human resources. Technology centres were set up for its growing export platform.
• Priority was placed on investment in education and in research and development (R&D), and considerable resources were channelled into this effort. Scholarships for specialized studies abroad were provided, the funds needed in order to increase the number of hours devoted to teaching and research were supplied, and centres of excellence were created.
• Countercyclical macroeconomic policies were agreed upon, thereby lending greater political legitimacy to the use of oil revenues as a means of counteracting any economic recession that might occur. The returns or profits afforded by the Petroleum Fund could then be used in the place of other options for funding proactive government policies.
• Labour policies were introduced to centralize worker-employer negotiations, create a neutral, independent agency to gauge productivity gains in the manufacturing sector and use them as ceilings for mean wage hikes in
all sectors, encourage women to participate in the labour market, and improve the coordination of information on the labour market by creating recruitment and skill-building centres.
• As part of the compact, industrial policies were introduced that were devoted to boosting the productivity and efficiency of manufacturing enterprises and pooling the technical and management skills and knowledge involved in industrial processes.
The intergenerational fund The Global Norwegian Pension Fund (Statens pensjonsfond utland (SPU) was inaugurated in 1990 to serve as a tool for the prudential management of oil revenues. Ever since the first net transfer was made in 1996, the Fund has been growing by leaps and bounds. It now has assets estimated at 2 trillion kroner (US$ 375 billion), which makes it one of the largest single-owner funds in the world. A third of that portfolio (i.e. approximately US$ 125 billion) is invested in bonds and shares in the United States market, which is the biggest single destination country for investment from the Fund. The Fund’s resources were expected to increase considerably in the coming years, with the expected figure for early 2012 being some 3.5 trillion kroner (US$ 600 billion).
Rent-seeking and the Norwegian social compact Norway’s social model embodies a philosophy of life for each individual. There is a social consensus as to the need to uphold the principle that Norway should provide an excellent public education for all and that the public health system, which should be funded by a basic contribution from each worker, should not exclude anybody.
The introduction of public policies designed to stave off the Dutch disease would not have been possible in the absence of a social contract (Eichengreen, 1996) and a system of collective standards shared by the members of Norwegian society. Larsen and other authors, such as Rodrik and Auty, contend that the natural resource curse is the outgrowth of social conflicts that are themselves triggered by struggles over income distribution.
Larsen describes four different types of rent-seeking behaviour on the part of mining companies:
• Rent-seeking based on large-scale social conflicts• Small-scale illegal rent-seeking• Small-scale legal rent-seeking• Rent-seeking based on flaws in the political or institutional
system. In Norway, the country’s political parties and leaders share
the core values embodied in the social contract and the country’s system of collective standards. These agreements, in addition to the legal order in a democratic society, are what make the Norwegian social model viable and successful. By contrast, in oil and mining companies in some developing countries, large-scale rent-seeking, small-scale legal and illegal rent-seeking, and rent-seeking that exploits flaws in the party system and electoral system are a breeding ground for the natural resource curse and Dutch disease.
Calculating marginal wage productivity The agency that measures productivity gains in the various sectors and that sets wage levels is the Norwegian Technical Calculation Committee for Wage Settlements (Det tekniske beregningsutvalget for inntektsoppgjørene (TBU)). Created in 1967, its main goal is to arrive at a broad-based vision, shared
325
Cha
pter
VII
Compacts for Equality: Towards a Sustainable Future
by all social sectors, of the way forward for Norway’s economy. Its main areas of responsibility are described below.
In connection with income settlements, the Committee presents the best possible background figures in a form that, as far as possible, helps to prevent disagreements from arising between the parties concerned. At the request of the Ministry of Labour and Social Affairs, the Committee must be able to clarify the nature of the proposals being put forward in connection with special income policy matters.
TBU submits summary reports on the conclusion of income settlements to the Ministry of Labour and Social Inclusion. It also submits two annual reports on trends in wages, income,
prices and the competitiveness of the manufacturing sector in Norway. It also analyses the outlook for the Norwegian and international economies. TBU estimates of wage trends cover all the main sectors of the economy. It also calculates estimates of wage divergence and its possible implications. The TBU calculations are generally accepted as valid by the different social groups involved and provide a solid foundation for yearly renegotiations in the sector.
The Government Contact Committee (Regjeringens Kontaktutvalg) is a tripartite body in which representatives of the government, trade unions and social stakeholders discuss issues related to Norway’s policies on labour income.
Source: Economic Commission for Latin America and the Caribbean (ECLAC), on the basis of Luis Grisanti, “Noruega siembra el petróleo”, Petróleo YV [online] http://www.petroleoyv.com/website/uploads/GRISANTI.pdf; Erling Røed Larsen, “Escaping the resource curse and the Dutch disease? When and why Norway caught up with and forged ahead of Its neighbors”, Statistics Norway, 2004; B. Eichengreen, “Institutions and economic growth: Europe after World War II”, Economic Growth in Europe Since 1945, Cambridge, Cambridge University Press, 1996.
As noted in the preceding chapter, this type of governance is the institutional counterpart of the effort to deepen structural change, while ensuring that the region’s natural resources are harvested in a way that will give rise to genuine economic development, with virtuous-circle production linkages, infrastructure that will help to create synergies between production and social uses, environmental sustainability and full respect for the rights of peoples and communities.
(i) The State must introduce a more progressive structure in the use of natural resource rents, particularly during long-lasting price booms such as the present one. This objective may be achieved by updating the tax system in these sectors to make it more progressive and by means of closer coordination among the countries of the region in dealing with investment in these sectors; this kind of coordination could help governments avoid the sort of fiscal competition that reduces their ability to capture a greater share of the wealth generated by natural resource development projects.
(ii) It is necessary to frame a State policy and strategic vision of production diversification and long-term structural change, to gradually free the economy from its excessive dependence on extractive industries This requires careful analysis of criteria for investment in infrastructure in order to actively support those objectives as well as promote production linkages between extractive activities and the production of goods and services that increasingly incorporate technical progress and value added and become less intensive in polluting materials and emissions (see also the principles for industrial policy and investment).
(iii) Natural resource governance compacts should provide for the creation of institutional mechanisms —such as stabilization funds or oil wealth trust funds— to ensure that the economic rents derived from natural resources are channelled into sustainable investments rather than private consumption. These rents should be efficiently invested in education and health, infrastructure, innovation and the development of technology in order to lay a solid foundation for well-being, capacity-building and innovation over the long term. This, in turn, will call for a skilful handling of the difficult political economy choices involved in the public investment of natural resource rents and their distribution among different groups in society and different levels of government.
(iv) The State must also build the necessary institutional capacity for managing the socio-environmental conflicts that are triggered by the development of natural resource sectors. Most of the countries have seen an increase in the number and the litigation of disputes associated with the development of mining projects and the energy, transport and other types of infrastructure needed to implement natural resource projects. This trend bears witness to the lack of the government policies, institutional capacity and smoothly functioning compensatory and dispute-settlement mechanisms that are needed to reconcile the legitimate social demands of groups impacted by these projects with the economic development of the resources that give the region its main comparative advantages in international trade. A solid institutional structure is required to forestall conflicts or, when they do arise, handle them appropriately and transparently through consultations (free, prior and informed consent) and through the use of clearly defined environmental and labour regulations. Exploration and production activities must also be properly regulated on the basis of established international standards such as ILO Convention No. 169 on Indigenous and Tribal Peoples and the Equator Principles, among others.
(v) Develop mechanisms to ensure transparency and the availability of public information on the management of extractive rents, promoting social and democratic oversight of its use, in both the public and private sectors.
Box VII.7 (concluded)
326
Cha
pter
VIIEconomic Commission for Latin America and the Caribbean (ECLAC)
7. A compact among the international community for development and cooperation beyond 2015
The international community closed out the 1990s with the Millennium Declaration, a development milestone that opened the way for the Millennium Development Goals. One of the stellar achievements of the Millennium Development Goals agenda has been the worldwide acceptance of the Goals and their effectiveness in marshalling resources and focusing the political debate on the struggle to end poverty.
However, focusing exclusively on poverty reduction and basic minimum levels of well-being as the cornerstone of development policy is an approach that has fallen short of the mark. Having policymakers focus solely on poverty, hunger, maternal and child health, and access to drinking water, without any consideration of the inequalities and asymmetries between population groups that arise at the national and global levels in the course of the development process, leaves no scope for addressing deeper, more thoroughgoing economic and social changes. In order for the region to confront the new and old challenges that it faces, as discussed in this document, a development model needs to be forged on the basis of structural changes for equality and sustainability that will close the many longstanding gaps in equality that exist within and across the countries of the region.
Between 2010 and 2012, there was a wide-ranging international debate in the framework of the preparations for the United Nations Conference on Sustainable Development (Rio+20), held to review the implementation of the agreements reached at the Earth Summit 20 years earlier. This process brought together the agendas of specialized multilateral agencies, which agree on the urgent need for a broader view of what are known as sustainable development objectives, providing for an integrated approach to meeting the economic, social and environmental challenges of the twenty-first century. Within this framework, the objectives are to boost labour productivity, ensure that people have decent jobs and full access to labour rights, and increase the availability of education to improve labour market integration, build greater civic awareness, foster informed participation in political activity and promote greater integration into society.
One of the greatest challenges is to make societies more inclusive, with equality at the centre of the agenda and a particular emphasis on the full integration of women, with physical, economic and political autonomy. The goal is to achieve environmental sustainability with full internalization of economic and social costs, and to progress towards new technology paradigms. A crucial step is to transition from the Millennium Development Goals to sustainable development goals (SDGs), for which a global agenda will have to be agreed upon in the next few years. This agenda must have the commitment of all the countries on fundamental development issues, and must not adopt a prescriptive approach towards less developed countries in exchange for conditional financing from the industrialized countries.
In the multilateral lexicon, this process is referred to as the debate on the post-2015 development agenda, and it represents an opportunity to propose a wide-ranging multilateral agreement geared towards sustainable development with equality in the framework of equal political, social, economic and cultural rights. This process could lead the international community to agree on overarching objectives that would then provide a framework for resource allocation criteria and for policymaking and the policy debate.
The debate on the post-2015 development agenda revolves around nine pillars which represent the priorities that are informing global and national discussions: inequality (in all dimensions, including gender), health, education, growth and employment, environmental sustainability, food security and nutrition, governance, conflicts and fragilities, and population dynamics. From the vantage point of the Latin American and Caribbean countries, the transition from an approach based on the Millennium Development Goals to one that is based on sustainable development goals needs to be supported by buffer stocks that will mitigate the impact of the costs of that transition and provide a means of consolidating and reinforcing the ground gained as the countries move towards an environmentally sustainable, socially and economically inclusive development model.
One crucial issue in the debate on the post-2015 development agenda is the delivery of global public goods that require multilateral governance —such as financial stability and climate security— and the provision of collective goods —such as the preservation of ecosystemic integrity, the conservation of biodiversity and of the seas, and the protection of humanity from pandemics. In order to address this issue, global compacts will be needed, along with international institutions that can oversee the logical progression and ways of organizing collective action and that can address the need to design a global, coherent and inclusive system of governance.
327
Cha
pter
VII
Compacts for Equality: Towards a Sustainable Future
The Latin American and Caribbean countries have been playing an active part in the global effort to forge a post-2015 development agenda. The individual countries have adopted differing stances in some areas, but they are nonetheless in agreement on at least seven aspects:
(i) The remaining achievement gaps in the Millennium Development Goals must be closed. (ii) The situation in the region is changing, and there are emerging challenges to be met in such areas as energy,
demographics, urbanization, natural disasters and public safety.(iii) A new development model is needed: one that is based on structural change for equality and environmental
sustainability and can close existing gaps in production and society.(iv) The minimum threshold of social well-being has risen, which calls for an agenda with the principle of equality
at its core and social policies with universal coverage.(v) Policy and institutions matter, which means tackling key issues in terms of regulation, oversight, financing
and governance. (vi) A greater range of ways of measuring progress are needed, in addition to GDP indicators, in order to inform
decision-making in respect of sustainable development paths. (vii) Efforts have to be made to build a global system of governance for development. This process should provide
genuine opportunities for socially participatory decision-making. Priority should be placed on achieving global policy coherence in the areas of sustainable development, fair trade, technology transfer, international financial reform and new financing mechanisms, advocacy of South-South cooperation and the strengthening of mechanisms for encouraging the participation of all members of society.
In laying the foundations for a global compact of this sort, the fact has to be borne in mind that, while the Millennium Development Goals agenda has not been entirely fulfilled, especially in some developing countries and region, it is nonetheless important to agree on universal objectives and to move beyond minimalist concepts of development. At the same time, these goals must be defined in a flexible way that takes individual countries’ circumstances and priorities into consideration. The compact should also cover the means to be used in giving effect to the agreements that it encompasses and improvement of the world’s financial architecture, particularly with regard to mechanisms for providing financing and for technology transfer.
This global compact should target an economic structure capable of attaining threshold levels of environmental sustainability and social well-being for the majority of the population. Its scope should go beyond the satisfaction of basic needs to encompass reduction of the deep-seated inequalities and asymmetries that divide one society from the next. This involves leaving behind the traditional premise of development assistance, whereby the rich countries help out developing countries and prescribe the kinds of action they should take in order to combat poverty. The idea is to form a global compact that expresses solidarity with coming generations who will be living in a world marked by greater uncertainty and more severe shortages of natural resources. It will also involve advocating the conclusion of international trade, environmental and social agreements that will respect the principle of shared but differentiated responsibilities and that will not shift the heaviest costs onto the shoulders of the poorest and most vulnerable countries.
In order to accomplish this, representative, politically legitimized leaders will be needed to strengthen multilateral frameworks and improve the governance of development. A universal, inclusive form of global governance is needed that will reflect the interests, needs and aims of the international community. The provisions of the different international treaties and agreements that are already in existence need to be harmonized, as do the negotiations undertaken and the commitments assumed in the various international trade, climate, environmental, social and financial forums. The region needs to develop a new approach for agreeing on these types of changes more quickly, for establishing more clearly defined goals and for introducing inclusive, efficient mechanisms to ensure accountability.
A comprehensive compact will also need regional consensuses for harmonizing criteria on the achievement of a more equitable and sustainable form of natural resource governance. This will also entail reaching some degree of political agreement on the creation of fiscal mechanisms that will allow States to capture natural resource rents and channel them into environmentally sustainable production infrastructure, human resource development, social protection and natural heritage conservation.
These achievements will not be possible without more participatory and transparent democracies in which the citizenry is intimately involved in deciding what type of society is to be built. Principle 10 of the Rio Declaration, which clearly advocates transparency, environmental justice and access to information as a basis for deepening democracy and surmounting global asymmetries, should be fully upheld in this respect.
328
Cha
pter
VIIEconomic Commission for Latin America and the Caribbean (ECLAC)
BibliographyCourtis, C. and N. Espejo (2007), “Por un “contrato de cohesión social”: apuntes exploratorios”, Políticas Sociales series,
No. 129 (LC/L.2699-P/E), Santiago, Chile, Economic Commission for Latin America and the Caribbean (ECLAC).ECLAC (Economic Commission for Latin America and the Caribbean) (2013a), Fiscal Panorama of Latin America and
the Caribbean: tax reform and renewal of the fiscal covenant (LC/L.3580), Santiago, Chile. (2013b), Preliminary Overview of the Economies of Latin America and the Caribbean, 2013 (LC/G.2581),
Santiago, Chile. (2012), Structural Change for Equality: an integrated approach to development (LC/G.2524(SES.34/3)),
Santiago, Chile. (2010), Time for Equality: closing gaps, opening trails (LC/G.2423(SES.33/3)), Santiago, Chile. (2007), Social Cohesion. Inclusion and a Sense of Belonging in Latin America and the Caribbean (LC/G.2335/
Rev.1), Santiago, Chile, ECLAC/Ibero-American Secretariat (SEGIB).Fukuda-Parr, S., T. Lwason-Remer and S. Randolph, (2009), “An index of economic and social rights fulfillment:
concept and methodology”, Journal of Human Rights, No. 8.Hirschman, A.O. (1970), Exit, Voice and Loyalty. Responses to Decline in Firms, Organizations and States, Cambridge,
Harvard University Press. (1981), Essays in Trespassing. Economics to Politics and Beyond, Cambridge, Cambridge University Press.Holmes, S. and C. R. Sunstein (1999), The Cost of Rights. Why Liberty Depends on Taxes, New York, W.W. Norton & Company.Lechini, Gladys (ed.) (2008), La globalización y el Consenso de Washington: sus influencias sobre la democracia y el
desarrollo en el sur, Buenos Aires, Latin American Social Sciences Council (CLACSO).Maldonado, C.F. and A.F. Palma (2013), “La construcción de pactos y consensos en materia de política social: apuntes
para un marco de análisis”, Políticas Sociales series, No. 179 (LC/L.3660), Santiago, Chile, Economic Commission for Latin America and the Caribbean (ECLAC).
Moore, M. (2008), “Between coercion and contract: competing narratives on taxation and governance”, Taxation and State-Building in Developing Countries. Capacity and Consent, D. Bräutigam, O.H. Fjeldstad and M. Moore (eds.), Cambridge, Cambridge University Press.
Morgado Valenzuela, Emilio (2010), “Lineamientos para un diálogo socio-laboral exitoso”, presentación en el seminario Bases y perspectivas del diálogo sociolaboral. Los casos de Costa Rica, El Salvador y Perú, Santiago, Chile, 11-12 August, Economic Commission for Latin America and the Caribbean (ECLAC)/Spanish Agency for International Development Cooperation (AECID) [online] http://www.cepal.cl/de/agenda/2/40322/Emilio_Morgadom.pdf.
OHCHR (Office of the United Nations High Commissioner for Human Rights) (2004), Human Rights and Poverty Reduction, A Conceptual Framework (HR/PUB/04/1), New York.
Pinto, A. and A. Flisfisch (2011), El estado de ciudadanía. Transformaciones, logros y desafíos del Estado en América Latina en el siglo XIX, Buenos Aires, Sudamericana.
Scartascini, C. and others (eds.) (2011), Policymaking in Latin America: How Politics Shapes Policies, Washington, D.C., Inter-American Development Bank (IDB).
Sen, A. (2010), The Idea of Justice, New York, Penguin.
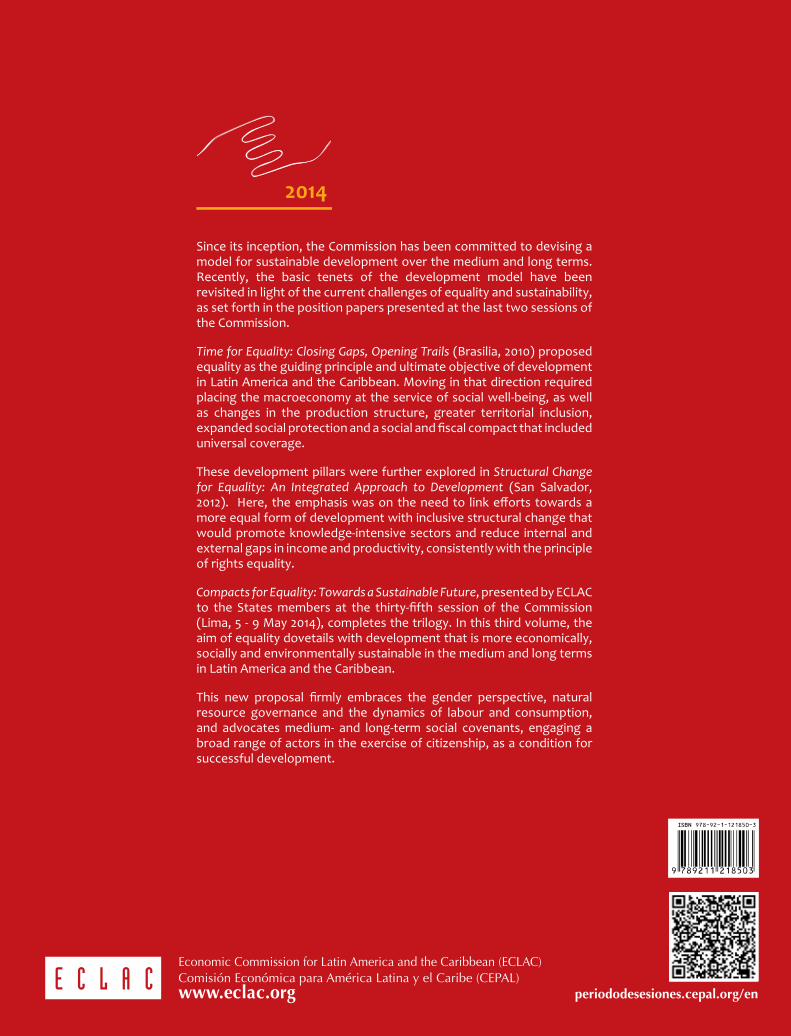
periododesesiones.cepal.org/en
Since its inception, the Commission has been committed to devising a model for sustainable development over the medium and long terms. Recently, the basic tenets of the development model have been revisited in light of the current challenges of equality and sustainability, as set forth in the position papers presented at the last two sessions of the Commission.
Time for Equality: Closing Gaps, Opening Trails (Brasilia, 2010) proposed equality as the guiding principle and ultimate objective of development in Latin America and the Caribbean. Moving in that direction required placing the macroeconomy at the service of social well-being, as well as changes in the production structure, greater territorial inclusion, expanded social protection and a social and fiscal compact that included universal coverage.
These development pillars were further explored in Structural Change for Equality: An Integrated Approach to Development (San Salvador, 2012). Here, the emphasis was on the need to link efforts towards a more equal form of development with inclusive structural change that would promote knowledge-intensive sectors and reduce internal and external gaps in income and productivity, consistently with the principle of rights equality.
Compacts for Equality: Towards a Sustainable Future, presented by ECLAC to the States members at the thirty-fifth session of the Commission (Lima, 5 - 9 May 2014), completes the trilogy. In this third volume, the aim of equality dovetails with development that is more economically, socially and environmentally sustainable in the medium and long terms in Latin America and the Caribbean.
This new proposal firmly embraces the gender perspective, natural resource governance and the dynamics of labour and consumption, and advocates medium- and long-term social covenants, engaging a broad range of actors in the exercise of citizenship, as a condition for successful development.