CEPAL Review 82
224
-
Upload
khangminh22 -
Category
Documents
-
view
1 -
download
0
Transcript of CEPAL Review 82


L C /G .2220-P — A pril 2004
United Nations Publication
ISB N 92-1 -1 2 1 5 3 7 -4 ISSN p rin ted version 0251-2920 ISSN online version 1684-0348
c e p a l R eview is prepared by the Secretariat o f the Econom ic Com m ission for Latin A m erica and the Caribbean. The views expressed in the signed articles, including the contributions o f Secretariat staff members, however, represent the personal opinion o f the authors and do not necessarily reflect the views o f the Organization. The designations employed and the presentation o f m aterial in this publication do not imply the expression o f any opinion whatsoever on the part o f the Secretariat concerning the legal status o f any country, territory, city or area or its authorities, or concerning the delimitation o f its frontiers or boundaries.
c e p a l Review is published in Spanish and English versions three times a year.A nnual subscrip tion costs for 2004 are U S$ 30 fo r the Spanish version and U S$ 35 for the English version. The price o f single issues is U S$ 15 in both cases, plus postage and packing.The cost o f a tw o-year subscription (2004-2005) is US$ 50 for the Spanish-language version and US$ 60 fo r English.A subscription application form m ay be found just before the section “Recent e c l a c Publications” .
Applications for the right to reproduce this w ork or parts thereof are w elcom ed and should be sent to the Secretary o f the Publications Board, United Nations Headquarters, New York, N.Y. 10017, U.S.A. Member States and their governmental institutions may reproduce this w ork without application, but are requested to m ention the source and inform the United Nations o f such reproduction.
C opyright © U nited N ations 2004 All rights reserved
Printed in Chile

N A C I O N E S U N I D A S
C E P II L
JOSÉ LUIS MA CH I NE A E x e c u t i v e S e t c r y
A L I C I A BÁRCENA D e p u t y E x e c u t i v e e S a c y
E C O N O M IC C O M M IS IO N F O R L A T IN A M E R IC A A N D T H E C A R IB B E A N


A LR e v i e w
N u m b e r 8 2
A p r i l 2 0 0 4
S a n t i a g o , C h i l e
C o m m i s i o n f o r
L A t i n A m e r i c a
t h e C a r i b e a n C E PO s c a r A l t i m i r
D i i e c t o r
R e y n a l d o B a j r a j De p u t y E x e c u t i v e c D o r
C E P fi L

Notes and explanation of symbols The fo llow ing sym bols are used in tables in the Review:
( .. .) Three dots indicate that data are not available or are not separately reported.
(— ) A dash indicates that the amount is nil or negligible.
A blank space in a table means that the item in question is not applicable.
(-) A minus sign indicates a deficit or decrease, unless otherwise specified.
(.) A point is used to indicate decimals.
(/) A slash indicates a crop year or fiscal year, e.g., 2001/2002.
(-) Use o f a hyphen between years, e.g., 2001-2002, indicates reference to the complete number o f calen-dar years involved, including the beginning and end years.
References to “tons” mean metric tons, and to “dollars”, United States dollars, unless otherwise stated.Unless otherwise stated, references to annual rates o f growth or variation signify compound annual rates.Individual figures and percentages in tables do not necessarily add up to the corresponding totals, because o f rounding.
Guidelines for contributorsto c e p a l Review
The editorial board of the Review are always interested in encouraging the publication of articles which analyse the economic and social development of LatinAmerica and the Caribbean. With this in mind, and in order to facilitate the presentation, consideration and publication of papers, they have prepared the following information and suggestions to serve as a guide to future contributors.
• The submission of an article assumes an undertaking by the author not to submit it simultaneously to other periodical publications.
• Papers should be submitted in Spanish, English, French or Portuguese.They will be translated into the appropriate language by ECLA C .
• Every article must be accompanied by a short summary (of about 150 words) giving a brief description of its subject matter and main conclusions. This summary will also be published on the e c l a c Home Page on the Internet.
• Papers should not be longer than 10,000 words, including the summary, notes and bibliography, if applicable, but shorter articles will also be considered.
• One copy of the original text should be submitted, accompanied by a copy on diskette (Word for Windows 95 or 98 format), to c e p a l Review, casilla 179-D, Santiago, Chile. In the absence of the copy on diskette, two printed or typed copies should be provided.Texts may also be sent by e-mail to: [email protected].
• All contributions should be accompanied by a note clearly indicating the title of the pape,r the name of the author the institution he belongs to, his nationality, his address, fax and telephone numbers, and his e-mail address.
• Footnotes should be kept to the minimum, as should the number of tables and figures, which should not duplicate information given in the text. When preparing figures it should be borne in mind that they will be printed in black and white. Finally, the location of tables and figures should be indicated at the appropriate point in the text, but they should be included separately at the end of the article.
• Special attention should be paid to the bibliography, which should not be excessively long.All the necessary information must be correctly stated in each case (name of the author or authors, complete title (including any subtitle), publisher, city, month and year of publication and, in the case of a series, the title and corresponding volume number or part, etc.).
• The editorial board of the Review reserve the right to make any necessary revision or editorial changes in the articles, including their titles.
• Authors will receive a one-year courtesy subscription to theReview, plus 30 offprints of their article, both in Spanish and in English, at the time of publication in each language.

C E P A L R E V I E W 8 2
S U M M A R Y
The devious maze of the international order: the importation of reforms 7David Ibarra
Foreign banks in Latin America: a paradoxical result 19Graciela Moguillansky, Rogerio Studart and Sebastián Vergara
A proposal for unitary taxes on the profits of transnational corporations 37Andrew Mold
Regional integration and macroeconomic coordination in Latin America 55Hubert Escaith
Import substitution in high-tech industries: Prebisch lives in Asia! 75Alice H. Amsden
Industrial competitiveness in Brazil ten years after economic liberalization 91Joño Carlos Ferraz, David Kupfer and Mariana Iootty
The influence of capital origin on Brazilian foreign trade patterns 119Célio Hiratuka and Fernanda De Negri
Information and knowledge: the diffusion of information and communicationtechnologies in the Argentine manufacturing sector 137Gabriel Yoguel, Marta Novick, Darío Milesi, Sonia Roitter and José Borello
Local economic development and decentralization in Latin America 155Francisco Alburquerque, in memory o f Gabriel Aghón
Migrations, the labour market and poverty in Greater Buenos Aires 171Rosalía Cortés and Fernando Groisman
Households, poverty and policy in times of crisis. Mexico, 1992-1996 191Benjamin Davis, Sudhanshu Handa and Humberto Soto
CEPAL Review on the Internet 215
Recent ECLAC publications 217
A P R I L 2 0 0 4


7
D a v id Ib a r r a
F o r m e r E C L A C s t a f f m e m b e r .
F o r m e r M i n i s t e r o f F in a n c e ,
U n i t e d M e x i c a n S t a t e s
f dibarra@ prodigy.net.m x
C E P A L R E V I E W 8 2 • A P R I L 2 0 0 4
The devious maze of the international orderthe importation of reforms
David Ibarra
T-M- his p a p e r s e e k s t o m a k e a h i s t o r i c a l r e v i e w o f t h e m o d e l s
w h i c h h av e g u i d e d t h e i n t e r n a t i o n a l e c o n o m i c o r d e r s i n c e t h e las t
c e n t u r y : h o w a n d w h y t h e y e v o l v e d unt i l b i p o l a r i s m sp i l l ed o v e r i n t o
i n t e r n a t i o n a l r e l a t i o n s a n d t h e n e o l i be r a l i d e o l o g y t o o k r oo t . It a lso
e x a m i n e s t h e a d j u s t m e n t s t h a t t h e c o u n t r i e s on t h e p e r i p h e r y ha ve
m a d e in o r d e r t o a d a p t t o t h e s e m o d e l s . In Lat in A m e r i c a , t h e a b r u p t
o p e n i n g o f f r o n t i e r s a n d t h e a b o l i t i o n o f p r o t e c t i o n i s m , b u t w i t h o u t
an a p p r o p r i a t e i n s t i t u t i o n a l f r a m e w o r k , h a v e g i ve n r i se t o l o w e r e c o
n o m i c d e v e l o p m e n t , d e t e r i o r a t i o n in t h e s o c i a l f ie l d , a n d t h e
d i s c r e d i t i n g o f d e m o c r a c y . T h i s a na l ys i s , w h e n a p p l i e d t o s p e c i f i c
c h a n g e s w h i c h h av e t a k e n p l a c e in t h e m o d e l s a d o p t e d a n d t h e w a y
t h e y h av e b e e n i m p l e m e n t e d in t h e r eg i o n , r eve a l s t h e i r r e l at ive
d e g r e e s o f v a l i d i t y a nd t h e e x i s t e n c e o f c o n s i d e r a b l e a re as o f l e e w a y
w h i c h h a v e so fa r b e e n i n s u f f i c i e n t l y e x p l o i t e d .

8 C E P A L R E V I E W 8 2 • A P R I L 2 0 0 4
IIntroduction
For over two decades, the basic neoliberal economic policy package has remained unaltered in spite of the succession of governments of different political inclinations which have taken office all over Latin America. At best, proposals have been put forward for second- or third-generation reforms designed to make up a posteriori —a decade later— for the shortcomings or imperfections of the original measures.1
The initial proposals were successful in correcting the imbalances in prices, the fiscal accounts and external indebtedness which plagues the Latin American economies in the 1980s, but in most cases they were a resounding failure in terms of satisfying the basic popular demands: promoting growth, employment and distributional equity; strengthening social rather than merely political democracy, or taking full advantage of the removal of frontiers all over the world.
Furthermore, in a number of cases the presidential candidates, such as Fujimori and Menem, won their election on the basis of anti-neoliberal policy platforms, only to turn later into singularly enthusiastic implementers of the reforms contained in the Washington Consensus. Even social democratic governments have had to curb initiatives seeking to depart from the prevailing orthodox approach, because of the risk of losing the support of foreign interests or powerful domestic groups. Thus, the policies and objectives of governments, whatever their political leaning, have never been independent of the unitary concept which has determined the common denominators of the continent or, hence, of the approaches taken by preceding governments, even when there has been a transfer of power from one political party to another. It is hardly surprising, then, that the strategies applied have proved to be almost identical even when there has been a change of the political groups in power, thus failing to reflect the people’s will. It is therefore important to explain how the roads to be followed are defined, how national priorities and objectives are chosen, and how the national social and political balances are reconciled with those of the external eco-
A decisive influence has undoubtedly been exerted in this by the new configuration and rules of the world order, which have found the Latin American countries not only ill-prepared but also weakened by the effects of the 1980s debt crisis. When countries are struggling to cope with the imbalances of that decade, the international financial agencies make their support subject to compliance with certain conditions. These criteria have sometimes caused national policies to follow directions other than those that the governments would have chosen of their own free will. It should be noted that these rules have been multiplied in recent times and have been aimed at promoting the adoption of neoliberal-type structural reforms rather than favouring development.2 Under the pressure of these circumstances, governments have adopted compromises which have caused them to open up their markets and dismantle protectionist measures, those reflecting authoritarian and populist approaches, and many of the measures for the protection of workers and businessmen.
Free trade, deregulation and the withdrawal of the State from productive activities run counter to criteria, values and policies for which the free play of the market is only an imperfect substitute, especially when the systems of institutions of the countries concerned are incipient or suffer from serious gaps. Let us take two simple examples. Financial liberalization, in the absence of mechanisms to regulate the market, has given rise to a wave of banking crises in much of Latin America. Likewise, the abrupt elimination of frontiers has created a system in which competition is not between equals but often between advanced foreign producers and backward domestic producers, with
2 The programmes o f the International Monetary Fund (IMF) have been criticized as being over-restrictive, as being designed to compress demand, and as neglecting the development o f the countries concerned. In the opinion o f Feldstein, the IMF should resist the temptation to force reforms on the countries. The criticisms o f the World Bank have accused it o f giving up the financing o f investment projects and concentrating instead on the promotion o f globalizing reforms, while paying little attention to protection o f the environment and increasing the supply o f public goods. See Feldstein (1998), Rodrik (2000), Kapur and Webb (2000), Kahn and Sharma (2001) and Buira (2003).
nomic environment.
1 See W illiamson (1990) and Kuczynski and W illiamson (2003).
THE DEVIO US MAZE O F THE INTERNATIO NAL ORDER: THE IMPORTATION OF REFO RM S • DAVID IBARRA

C E P A L R E V I E W 8 2 • A P R I L 2 0 0 4 9
effects which have been destructive but rarely in the Schumpeterian sense.
At all events, by being forced to enter more or less abruptly into a globalized world, the countries of the region are being forced to absorb enormous historical imbalances, since their institutional structure is incompatible with the demands of markets that know no frontiers, and the mix of winners and losers in the political and economic game has been radically altered. While the countries of the periphery naturally do not have much influence on the direction of the changes in the international order, they have to cope with the problems of the speed and manner in which their economies have to absorb the resulting changes. In effect, the one-sided impact of the reforms gives rise to a disorderly and divided transition within the countries which impedes the formation of flexible national consensuses that can facilitate economic and political change.
It is important to limit the division of common interests that were previously united by nationalism. Today, the Latin American societies are deeply divided internally: the interests of labour groups are divided between skilled and unskilled workers, between those working in the modern sector of the economy and those in the informal sector, and between those employed in big firms and those working in small and medium-sized enterprises. The same sort of thing occurs in the business sector: there is a division of interests between foreign and domestic investors, between importers and those producing for the domestic market, between large firms and smaller ones, and between the real and financial sectors of the economy.
Similar divisions exist among the different social groups, political parties and between the provinces and metropolitan areas of the countries.
All this has led to internal divisions: while the alliances which have been formed between the national and foreign elites ensure the punctual fulfillment of international demands, national arrangements to lighten the enormous social costs of the relevant changes are constantly put off. For this reason, people have begun to be disappointed with democracy, to feel that elections do not serve to change anything, and that one government is much the same as another.
In the following pages, we will try to put the models of the world economic order in their proper dimension: to strip them of their sacred aura. Thus, section II makes a historical review of the forces which originally led to the disappearance of the colonial world and subsequently to the end of the bipolarity of international relations, giving way eventually to the predominance of the neoliberal ideology which has resulted in tensions between the world order and national democracies and between free trade and the domestic development of the Latin American countries. In section III, the level of abstraction of the analysis is lowered in order to make a critical analysis of specific changes over the last half-century in the models advocated by the central countries for the development of the periphery. These changes have modified the validity of these rules and reveal that there are substantial areas of leeway which have so far been only poorly exploited by the Latin American countries.
THE DEVIO US MAZE OF THE INTERNATIO NAL ORDER: THE IMPORTATION OF REFO RM S • DAVID IBARRA

10 C E P A L R E V I E W 8 2 • A P R I L 2 0 0 4
IIHistorical overview
In the first half of the past century, colonialism finally disappeared and a number of totalitarian regimes collapsed. Between 1945 and the present day, the number of sovereign nations increased from 45 to almost 200.3 The prevailing ideas led to the creation of a large number of States which, in order to be members of the international community, had to make themselves responsible for their internal order and development, thus representing a further step in the process of Westernization of the nations.
Looking back, the breakdown of the colonial pact involved deep changes in the international order and the way societies on the periphery link up with it. Many of the forms of support previously given by the metropolitan countries and the linkages with the latter in terms of trade, production specialization and finance were cancelled or reduced. There were, however, new opportunities for the establishment of links with a broader range of developed countries, and above all there was more room for the economic and political independence of the newly independent nations. Libertarian ideas and struggles between the dominant countries softened the demands made on subordinate countries, facilitating the reorientation of their internal forces towards the interests of the Third World.4
At this time, modernization of the State was considered to be essential in order to achieve an effective development strategy. Nationalism and social engineering were therefore put forward as ways to liberalize the development of the former colonies and the countries of the periphery in general. This, together with the changes in economic and social structures brought about by the changes in the international order, made it necessary to abandon rigidly economistic approaches and embrace instead the broader concepts of political economy and integrated social development.5 The world order of the time needed legitimate States able to keep order and seek the well-being of their countries.
Likewise, the end of the Second World War and
the desire to avoid possible conflicts between nations (especially the superpowers) led to the creation of the Security Council as the supreme political organ of the United Nations and guarantor of international collective security. Within this Council, the power of veto possessed by its five permanent members served as a means of impeding the dominance of one or the other of the great blocs into which the world was divided. At the same time, the extension of the competitive struggle of the Cold War to the Third World increased the opportunities both for development support and for the freedom of governments to run the economic and social affairs of their countries within a range of predominantly Keynesian styles.
This situation favoured more intensive development on the periphery, especially in Latin America. Since economic and political models are ideological constructs which inevitably reflect the rationalization of interests, as well as the consensual views of First World academics, however, they are not and cannot be unchangeable. Through them, the central countries seek to regulate the behaviour of the countries on the periphery and lay down the conditions for their incorporation into the international community. There are incentives and punishments which range from access to the markets of the industrialized countries to political alliances or ostracism.
In a dependent relationship it is not necessary for a country to be a colony in order to suffer limitations on its sovereignty, nor does full sovereignty depend on being a member of the United Nations (Badie, 1992). As long as the First World holds the economic, political and military power and its institutions generate the ideas that guide the world, develop the most advanced technologies and products and fix the rules of the international order, the countries of the periphery will continue to be subordinates even though they may have some leeway for action. In any case, the emancipation histories of those countries usually involve the idea of integration, not separation: they are the stories of peoples excluded from the main community of nations who strive to gain entry to it and follow its rules. This explains the enormous integrating power of universal models which also usually bring with them the formation of alliances of interests between the
3 See Croeker, 2003, pp. 32-45.4 See Cardoso and Faletto (1970), Furtado (1965), Migdal (1988) and Dos Santos (2003).5 See Cardoso and Faletto (1970).
THE DEVIO US MAZE O F THE INTERNATIO NAL ORDER: THE IMPORTATION OF REFO RM S • DAVID IBARRA

C E P A L R E V I E W 8 2 • A P R I L 2 0 0 4 11
elites of the dominant and dominated countries, leading to a symbiotic relationship from which it is hard to escape.6
In the second half of the twentieth century, the changes in the economies of the industrial societies speeded up. The forces of production and cross-border trade created situations of mutual dependence between countries which came up against the safeguards characteristic of national sovereignty. At the same time, private or semi-public actors emerged who weakened the power of national governments. More recently, the collapse of the socialist countries became another central element in the changing realities and models, by doing away with the division of ideological approaches that marked the early post-war years.
The disappearance of bipolarity from the world and the new world economic conditions clamour for far-reaching reformulations of the models governing the international order. The transnationalization of production and trade demands the abolition of frontiers and the international convergence of national economic and social policies - and even cultures - in order to ensure the security of trade, production and capital flows from the world centres.
This accounts for the emphasis on deregulation, the opening up of frontiers, the elimination of State participation in production, and the elevation of price stability to the level of a central objective of governments. The former concern for the domestic well-being of countries and for growth has given way to the requirements of globalization as such. In exchange for the renunciation of economic sovereignty, a boost has been given to the formal modernization of democracy and the international convergence of political systems to correspond with the Anglo-Saxon model.
There has been undeniable progress in this latter respect, as reflected in the decline in authoritarian regimes on the periphery, but this progress has remained incomplete because in many cases it has not been possible to ensure sustained development or to meet the needs of the population in terms of employment, income, security or access to social services. To a certain extent, the progress in terms of the formalization of the political order has been cancelled out by the disturbing effects of economic change. This is where the tensions caused by the unrealistic assumption that economic and socio-political phenomena are independent of each other becomes apparent: an assumed inde
6 See Said (1993).
pendence which is necessary if one wishes to maintain the illusion of national sovereignties untouched by the new international order.
Changes in the universal rules of conduct of States have caused breaks with the past, especially in the case of nations on the periphery. Thus, the war in Iraq led to the abandonment of the political multilateralism of the Security Council; in Africa the new nation-States have not yet been consolidated, but must already be dismantled for the benefit of globalization; and the civilizing promises of the dominant discourse about free trade and formal democracy are already crumbling: first, because of the growing inequalities within and between countries, and second, because there are States which are formally democratic and sovereign but have their hands tied when it comes to meeting reasonable demands by their citizens.
The abandonment of the goals for Third World growth is in stark contrast with the emphasis and efforts placed on reducing inflationary pressures and creating a favourable climate for transnationalized trade or investment flows. The concentration of efforts on the stabilization of prices all over the world has been tremendously persistent and successful. Thus, after standing at almost 16% in 1985-1989 and over 30% between 1990 and 1994, world inflation sank to 4% in 2000-2003. Between the first and last periods, the average rise in prices went down from 4% to 2% in the advanced countries, from 48% to less than 6% in the developing economies as a whole, and from 186% to 8% in Latin America. This was achieved at the cost of innumerable institutional reforms, policy changes and social sacrifices: suffice it to mention the abolition of national frontiers, deregulation and the decline of national monopolies, the independence of central banks, or extreme fiscal discipline, carried to the point of ruling out any type of anti-cyclical action.7
Much less effort has been made to raise and equalize world growth, however. The world economy is in a phase of unsteady development: it grew at the rate of 3.6% per year between 1985 and 1989, 1.4% between 1990 and 1994, and 3% between 2000 and 2003, while Latin America reached only 1.5% in these last four years. On average, the rise in per capita income between 1975 and 2000 shows that the gap between rich and poor is widening still further: the countries with high levels of human development registered an increase of 2.1% per year, those with intermediate
7 See Rogoff (2003).
THE DEVIO US MAZE OF THE INTERNATIO NAL ORDER: THE IMPORTATION OF REFO RM S • DAVID IBARRA

12 C E P A L R E V I E W 8 2 • A P R I L 2 0 0 4
levels 1.6%, and the poorest nations, only 0.5%. Latin America also lost ground, since its per capita GDP grew by only 0.7% per year over this quarter-century period.8
The post-modern tension between world-level demands and those of the national democracies is eroding the foundations of nationalism as the primary source of identity and of unity of the citizens around collective goals such as development or the defence of their own interests. Over the last two decades, at least in Latin America, the first-named demands have been punctually met, but the satisfaction of the second ones has been systematically postponed. It is paradoxical to see how the efforts to democratize the peripheral States have taken place side by side with a relentless assault on nationalism, which, like it or not, captures the imagination and aspirations of the people and, above all, seeks self-government for society. For two decades now, in Latin America vital State functions have been turned over to the hidden hand of globalized markets and governments have renounced the use of the main instruments of social engineering and the underlying development and employment policies.9 As a result, countries have been put in a position where foreign investment and the sale of the best national enterprises to foreign owners are used to provide - but only temporarily - the resources to shore up the economic apparatus of the first-, second- and third- generation neoliberal reform process, while the social structures and ultimately the prestige of democracy itself continue to crumble. The ideologized view that the State commits all kinds of errors, while the hidden hand of the market possesses all kinds of virtues, is still alive, although the market has shown itself to be deaf to almost all the legitimate demands of the citizens of developing countries.
As a result, the social tensions associated with the dominant model have grown so strong that they can no longer be concealed. This is shown by facts ranging from the social decay and symptoms of ungovernability that affect the underdeveloped areas, and the failure of the members of the European Union to comply with their budget ceilings, to the failures of the Seattle (1999) and Cancún (2003) ministerial meetings of the World Trade Organization. It is also shown by the persistence of hunger, poverty and disease in vast areas of the world,10 even including some segments of the industrialized nations.
8 See UNDP (2002).9 See Ibarra (2003).10 According to the United Nations, over 1,150 million people had to survive on less than a dollar a day in 1999. See UNDP (2002).
Like it or not, globalization and its demands have closed off the ways towards incorporation into the industrialized world that were followed by the nationalist societies of Germany, Japan or the United States itself. The leeway in this respect has narrowed and changed, since the international rules now in vogue do not permit industrial protectionism and subsidies, public enterprises, or the fixing of national economic priorities or maintenance of deficits by governments. These privileges are now confined to the advanced countries, as shown by their anti-cyclical policies or the protection given to their agriculture and industry: for these and other reasons they have budget deficits much higher than those considered acceptable for peripheral coun- tries11 and they permit the absorption by the public authorities of the losses of their big enterprises.12 Likewise, the governments of the First World maintain or adopt protectionist measures in response to domestic political or electoral pressures, in violation of the spirit or letter of international laws and agreements. The refusal to do away with agricultural subsidies, the agonizingly slow opening up of their markets for textile products, or the recent protectionist actions of the United States government (in the case of steel, among others) are typical examples of flagrant imbalances in the international trade regime which prejudice above all the countries of the periphery.
At the present time, one way of incorporating countries into development with a view to future access to the First World is that followed by India, China or the south-east Asian countries. These countries have been orthodox in the defence of their interests and heterodox in their observance of the universal models. Their elites and governments have united to establish development strategies, create economic power centres, apply industrial policies, subsidies and tax reductions and attract investments, while at the same time mixing improvements in the well-being of the population with sometimes repressive social policies. In this way, they have weakened their economic and technological dependence relationships, obtained greater leeway for action, and at the same time taken advantage of the worldwide opening up of markets.13
Another way, albeit slower and more uncertain,
11 The budget deficit o f the United States is 5%-6% o f GDP, that o f Germany 3-4%, that o f France 3-4%, and that o f Japan 7%. See IMF (2003) and OECD (2003).12 Such as Chrysler, A ir France, savings and loan associations, the Capital Risk Management Fund and Japanese banks, to name only a few. See Ho and Lin (1991).13 See Amsden (2001).
THE DEVIO US MAZE O F THE INTERNATIO NAL ORDER: THE IMPORTATION OF REFO RM S • DAVID IBARRA

C E P A L R E V I E W 8 2 • A P R I L 2 0 0 4 13
would be to redouble the efforts made in international forums to secure a change in the universal models so as to make them more equitable and favourable for the development of the periphery. In this field, as the Fifth Ministerial Conference of the WTO (Cancún, 2003) showed, real progress still seems to be far off in view of the vested interests and reluctance of the advanced countries. Nevertheless, some progress is being made. The First World’s concern to channel aid preferentially to the poorest areas of the globe, as manifested at the International Conference on Financing for Development (Monterrey, 2002), seems to be a step in the right direction, although halting and incomplete, provided such aid is not linked to a demand that the beneficiary countries must first carry out the first-, second- and third-generation reforms.
The innovative proposals made in the developing world present a wide range of variants. Because of their enormous population and internal diversity, China and India are areas of multinational integration which even represent or could represent serious political and economic challenges to the leading world centres. This enables them to enjoy greater freedom to remodel the rules governing the world order. The south-east Asian countries, under the protective umbrella of Japan and the other giants of the region, have benefited and continue to benefit from degrees of political and economic heterodoxy not enjoyed by other areas of the periphery.
In Latin America, the possibilities seem smaller, but by no means non-existent. Central America has not yet succeeded in reaching the stage of political integration or even of the convergence of national economic policies. Paradoxically, the experiment of the Central American Common Market and the possible political union which was to follow it (there is already a Central American Parliament) has been held up by the abolition of trade frontiers worldwide and the multiplicity of rules for the new world order which were designed for nation-States. The Mercosur countries have better prospects because of the joint size of Brazil and Argentina, but in addition to the sequels of the various crises they are faced with political and economic strategy disparities which do not appear to be easy to reconcile, especially against the background of
the existing international tensions and the continental free trade project sponsored by the United States. In the case of Mexico, there are opportunities which have not yet been exploited because of its proximity to the United States and its integration with that country’s vast markets. In short, the possibility of freely shaping the future of Latin America seems to be running up against hegemonic influences which hinder the formation of innovative systems of its own. Even greater obstacles stand in the way of the evolution of Africa and the Moslem Arab world, but even there initiatives are being put forward.
All in all, however, the available options for independent development are shrinking (Chang, 2002), and against all the ideas of nationalism this is leading almost inexorably to the political incorporation of the Third World countries into the multinational integration blocs into which the world of the future will probably be divided and which will be on a more even footing for competing with each other. Naturally, the advance of the globalizing post-modern model will lead to a significant loss of cultural, social and economic diversity in the world, as well as keeping citizens far removed from participation in the decisions which most affect their social life, especially in the case of the groups which will be absorbed by the dominant power centres. The process of the merging or integration of countries is already well advanced in Europe, although less so in North America, and it could still run into obstacles, resistance and even ethnic prejudice in various parts of the world.
Looking into the future, this process -together with the gradual abandonment of multilateralism by the great economic and political centres of the world- hints at a return to a multipolar world in the not so distant future, with all the advantages and disadvantages that that entails.14 At the same time, the shortcomings and failures of economic neoliberalism and the war against terrorism suggest the possible return -however remote it may be- of political economy, in the sense of creating a more balanced relationship between the economy and society, between the State and the market, and between the rights of the individual and collective or basic human rights.
14 See K ennedy (1993), C onnelly and K ennedy (1994) and Kupchan (2003).
THE DEVIO US MAZE OF THE INTERNATIO NAL ORDER: THE IMPORTATION OF REFO RM S • DAVID IBARRA

14 C E P A L R E V I E W 8 2 • A P R I L 2 0 0 4
IIIThe importation
The economic models and paradigms we import are not immutable: they change with circumstances and with the inevitable confrontations between forecasts and actual results. We may refer, for example, to the evolution of the conceptions of the industrialized countries - which we accept for ourselves - about the development of the periphery. These conceptions frequently place emphasis, in a general and simplified manner, on some fundamental obstacle to progress, leaving aside any other order of priorities.
History permits us to clarify these questions. Between 1940 and 1950 underdevelopment was explained by the insufficiency of investment and saving, which should be made good through the entry of international funds. It was believed that by increasing capital formation it would be feasible to move the factors of production from low- to high-productivity sectors. International trade was considered to be good, but not sufficient to open the doors of development: consequently, some protectionism and moderate external account deficits, to be covered by injections of capital from abroad, were considered to be acceptable, as was the transfer of resources from traditional to modern activities with support from active industrial policies, even if this was reflected in fiscal deficits, provided these were only small.
Some progress was made in these ideas during the following years (the 1960s and the first half of the 1970s), when it was discovered that the insufficient supply of entrepreneurial cadres was limiting the absorption of resources from the First World and reducing the effectiveness of the promotional measures of governments and international agencies. Following this logic, the deliberate promotion of business training and measures to make up for shortcomings in this respect were incorporated into government programmes. The peripheral countries were persuaded to set up development banks, to encourage joint investments in strategic areas of the economy, and to strengthen national capacity for training and project evaluation. Contrary to what it is doing now, the World Bank promoted the establishment of development banks all over Latin America, set up the International Finance Corporation -hich provides backing for private enterprises and projects- and the Economic
of reforms
Development Institute for the training of business cadres. Up to this point, the changes made in the models may be described as fine-tuning which does not depart from the basic tenets of the international order of the early postwar years and of Keynesianism.
From then on, however, the recommendations by the First World to the peripheral countries changed rapidly until they penetrated to the core of the countries’ economic policies. Now, the central objective ceased to be the lack of saving, investment or business capacity: these were only petty sins. The new diagnosis held that the problem lay in a distorted price structure which limited the absorption of labour and led to sub-optimal rates of GDP growth. The main blame of this phenomenon was laid at the door of State interventionism which aggravated faulty resource allocation, promoted the use of capital-intensive techniques, and gave rise to unproductive rents protected by official policies. The remedy therefore lay in competitive exports with a high labour content. To this end, it was recommended to open up markets and do away with subsidies and all protectionist measures, including State participation in production. The technological backwardness or deficient trade networks of the peripheral countries did not matter, as the market would soon reveal the real competitive advantages of each country.
This was how the neoliberal explanation of development began. Countries must abandon State Keynesianism at the economic level and nationalism in the political field. On the one hand, governmental failures and the inability of the State to take the place of the wisdom of the market were highlighted as the reason for the main structural imbalances in the economy, while on the other hand it was held that renewed access to development could be achieved through an increase in exports, which depended on the liberalization of product and capital markets.
In practice, however, an increase in export trade is not something that can be achieved immediately, nor is it easy to make exports the driving force of developing economies. In contrast, the abolition of frontiers is usually accompanied by an avalanche of imports which destroys domestic enterprises and favours the formation of privileged export enclaves, while foreign
THE DEVIO US MAZE O F THE INTERNATIO NAL ORDER: THE IMPORTATION OF REFO RM S • DAVID IBARRA

C E P A L R E V I E W 8 2 • A P R I L 2 0 0 4 15
investment, rather than giving rise to new products and jobs, often serves only to finance the transfer of the best domestic resources and enterprises into foreign hands. Furthermore, such investment can hardly take the place of public investment in infrastructure or human capital or the supply of many non-tradeable goods and services (energy, transport or essential production services), and much less can it define a country’s long-term strategy for its insertion in world markets.
Nevertheless, the views of the centres prevailed. The Latin American countries liberalized their markets and deregulated their economies, in the belief that this would open the door to rapid development or win the First World’s acquiescence. What actually happened was at variance with these hopes, however: over more than two decades (1980-2000) the pace of Latin American development fell to half of that reached in the previous thirty years, with high levels of unemployment, marginalization and enormous maladjustments in the labour market. Reformulation of the models was therefore called for.
The abundance of skilled human resources was rapidly identified as the reason for the success of some nations (Southeast Asia), while a shortage of such resources was an obstacle to development. The World Bank’s 1991 annual report repeats the neoliberal discourse of previous years, but it adds a new ingredient: investment in human capital as a precondition for development (World Bank, 1991). This represented some progress in the model, but it does not solve all the problems, for the training and optimal use of human capital requires growth and complementary facilities which are not created spontaneously by the market.
A revisionist approach to the First World’s recommendations gained greater strength in the second half of the 1990s. Once again, the contrast between the meagre results and the enormous social costs of the Latin American reforms based on greater openness, as compared with the success of the activist governments of the Asian countries, led to an exercise of reformulation and the rediscovery of the State as the appropriate agent for leading the transition to globalization. Without good governance, it was said, the reforms would not give the expected results or secure the development of the peripheral countries. This assertion was correct, but insufficient, as the proper play of democracy cannot be reduced merely to questions of administrative efficiency, as suggested. Reluctantly, it
began to be accepted that the State and the political sphere have an essential part to play in the handling of domestic political reforms and external relations.15
Good governance, or at least better governance, is undoubtedly essential for achieving sustained development. There is a risk, however, that excellence in this respect may be made a prior requisite for gaining access to the solidarity and aid of the First World, as was made clear at the International Conference on Financing for Development (Monterrey, 2002). Adapting to a world without frontiers, completing institutional reform, applying healthy macroeconomic and microeconomic policies, deregulating markets, guaranteeing the rule of law, eliminating corruption, lessening the complaints of those who have lost as a result of the changes made, and achieving so many of the other requirements implicit in the term “good governance” is practically equivalent to having already solved the basic obstacles not only to development but also to the transition to a world without frontiers. Like it or not, sustained development, democratic modernization and adaptation to the new international order are slow and painful processes of adjustment which can hardly be imposed as entry conditions that could only be satisfied by the most advanced nations of the world, not the poorest ones.
The last migration of the paradigm advocated by the international financial organizations - which is not shared by the whole of the First World - seems to raise the concerted fight against poverty to the level of an international priority. In view of the fact that social decay is getting worse rather than better, poverty is no longer seen as being exclusively the result of government errors and over-regulation of markets, but is also attributed to systemic effects of the new international order.
This fundamental qualitative leap forward is expressed in the World Development Report 20002001 (World Bank, 2001a), which proposes a threepronged strategy that goes beyond the economic level to address political issues. First, it recommends multiplying the economic opportunities of the poor by measures to strengthen their income from scarce assets (land and education) through both market-based and non-market-based policies. Second, it supports the strengthening of social safety nets in order to reduce the extreme vulnerability of the excluded segment of
15 See World Bank (1993 and 1997), Stiglitz (1998), McGuire(1997), Ibarra (2001), Abramovitz (1989) and Rodrik (1995).
THE DEVIO US MAZE OF THE INTERNATIO NAL ORDER: THE IMPORTATION OF REFO RM S • DAVID IBARRA

16 C E P A L R E V I E W 8 2 • A P R I L 2 0 0 4
the population. Third, it suggests reforms designed to transfer greater political power to the poor so that public institutions will be more ready to attend to their demands. Finally, it admits that there are multiple ways to development and to the eradication of poverty, and the specific ways adopted must depend on national priorities. Thus, it is beginning to be accepted that it is wrong to recommend standardized policies, in view of the diversity of the historical and institutional situations of each country, and to put economic, social and political reforms in watertight compartments where they have no mutual influence.
This represents an enormous leap forward, because it is now admitted that the importance of relations based on the market, as an area of competition among individual private actors acting strategically to gain profits, must be viewed in more relative terms and must be complemented by political relations based on a very different logic: the sovereignty of the people, the State of law, and other practices for democratic participation and consensus-building.16 This clearly brings out the underlying unresolved tension between the values of the market and those of democracy.
Much has been said on what the peripheral nations should do to achieve success in their access to the globalized world. Little has been done, however, to make the conditions of competition more equitable and to create institutions to limit the polarizing effects of the free play of the market, that is to say, to create an institutional architecture which is sufficiently transnational to humanize development and make it sustainable. Over twenty years ago, the Brandt Report put forward some indispensable political actions for this purpose, when it asserted the need to give the countries of the South a more equitable share of international power and decision-making, to allow their production centres to grow, to regulate the practices of transnational enterprises, to ease the debt burden, and to promote development (Brandt, 1980).
As we have seen, the First World development model has been constantly evolving, and the institutions and policies of the peripheral countries have also changed at its behest, at the cost of enormous disparities with their actual situations. The great leap forward of the twentieth century took place when national economic sovereignty was sacrificed for the benefit of greater openness and the return of its pow-
being made subordinate to the goals of a globalized world. Development aid thus gave up the financing of investment projects and openly embarked instead on the task of promoting the neoliberal reform process. Now, while continuing to insist on the maintenance of the parameters of that process, the fight against poverty has been added to the model, as though there were no contradictions between the two goals.17
The changes in international conceptions on development are due to some extent to a better understanding of the problems, but they primarily reflect the changing interests of the powers which formulate and reformulate those paradigms. The proposals have been completed and fine-tuned, as shown by the identification of the so-called second- and third-generation reforms (which strictly speaking should have accompanied or preceded the reforms initially promoted), but they are still far from addressing the complex dilemmas of the neoliberal transition of the various peripheral countries,18 especially the establishment of a new stable balance between the functions of the market and those of the State.
Let us look at a typical case. The financial openness process, or global financial integration, as it is now called, was carried out in most of the Latin American countries on the unproven assumption that it would have positive effects on economic growth and the deepening of financial flows. Subsequently, empirical studies made by the IMF19 concluded that no robust and significant relation could be found between financial integration and development. Furthermore, in the case of the peripheral countries a frequent association was found between financial
17 As already noted, the distribution o f the international funds to combat poverty depends on countries being granted a seal o f “good governance” for satisfying the main requirements o f the neoliberal reform process. According to the World Bank, “Although some empirical controversies persist, government performance is increasingly accepted by researchers and especially by policymakers as a guide to aid allocation. Government performance is generally agreed to include economic policy, other anti-poverty programs, and the quality o f governance and institutional capacity” (World Bank, 2001b, p. 93). The new ingredients added to the model do not eliminate the linking o f aid with the application o f the reforms advocated by Washington but are additional to this requirement.18 The paradigmatic components o f the Washington Consensus are now accompanied with a host o f new reforms designed to promote profound institutional changes (good governance, reform o f the legal system, reform o f property rights, labour reforms, eradication of corruption, reform o f the regulatory system) which, i f im plemented, would supposedly make good shortcomings in the initial measures o f the Consensus. See W illiamson (1990).19 See Rogoff and others (2003) and Agosin and Ffrench-Davis (1996).
ers to the market, with the objectives of each country
16 See M cCarthy (1995).
THE DEVIO US MAZE O F THE INTERNATIO NAL ORDER: THE IMPORTATION OF REFO RM S • DAVID IBARRA
C E P A L R E V I E W 8 2 • A P R I L 2 0 0 4 17
liberalization and increased volatility of consumption (the latter variable was considered to be a better than GDP as a measure of the well-being of the population) or proclivity to crises and contagion. By imposing small controls on capital, Chile was able to avoid the serious pro-cyclical problems due to oscillations in short-term foreign capital flows.
On the other hand, the IMF’s studies seem to show that there is a certain minimum organizational and institutional threshold below which financial integration does not help countries much and may even cause them damage. This happens in the absence of a solid legal and supervisory infrastructure, codes of conduct for transnational corporations, and low levels of corruption, among other factors. It would be hard for most of the countries of the periphery to meet these requirements, because of their backwardness and the fact that their institutions corresponded to the previous system of financial protectionism and not to full internal and external financial freedom. Consequently, the institutional framework which was essential for the transition was absent, incomplete or only incipient, as well as often corresponding to a level of development not yet reached by the those countries. The Mexican banking crisis is a clear example of long-standing disparity between reforms and an outdated institutional framework.20
By way of conclusion, we cannot but note the inconstant nature of the models proposed by the First World and the imperfections of the transnational institutions and their conceptions on how to harmonize the
economic and social development of the peripheral countries with the place they are forced to occupy in the new world order. Economies are integrated and become interdependent, but the transnational institutions needed to lessen the polarizing excesses of the market are yet to be created or else are at an extremely incipient stage. This is why it is necessary to proceed cautiously rather than unquestioningly adopt the model rules which the central countries want to impose. The imported models are usually over-simplistic in failing to take account of the mutual influences between the economic, political and social spheres, and they are also at fault in seeking to standardize policies and reforms without bearing in mind the special historical and institutional features or degree of development of each individual country. Consequently, these models should not be viewed as immovable dogmas but rather as flexible guidelines for international coexistence, within which to incorporate and safeguard each country’s own goals and interests. Ultimately, the success of modernization and development programmes depends on them springing from proposals which are broadly shared within each country, not on copying outside ideas supposed to be applicable to all nations.21 This, and no other, was the road which the United States, Germany and Japan followed in their entry into the industrialized world and which is being followed by South Korea, Taiwan, China and India today.22
(Original: Spanish)
21 These criteria are already beginning to be taken into account in the new rules on conditionality adopted by the Executive Board of the IMF late in 2002 (IMF, 2002).22 See Bourgin (1989), List (1885), World Bank (1993), Amsden(2001), Skocpol and others (1985), Komiya and others (1988), and
1 See Ibarra (1998). Stiglitz and Yusuf (2003).
THE DEVIO US MAZE OF THE INTERNATIO NAL ORDER: THE IMPORTATION OF REFO RM S • DAVID IBARRA

18 C E P A L R E V I E W 8 2 • A P R I L 2 0 0 4
Bibliography
Abramovitz, M. (1989): Thinking About Growth and Other Essays on Economic Growth and Welfare, New York, Cambridge University Press.
Agosin, M. and R. Ffrench-Davis (1996): Managing capital inflows in Latin America, in M. Ul Haq, I. Kaul and I. Grunberg (eds.), The Tobin Tax: Coping with Financial Volatility, New York, Oxford University Press.
Amsden, A. (2001): The R ise o f the Rest: Challenges to the West from Late-Industrializing Economies, New York, Oxford University Press.
Badie, B. (1992): L ’E ta t importé: l'occidentalisation de l ’ordre politique, Paris, Librairie Arthème Fayard.
Buira, A. (2003): Challenges to the World B ank and the IMF, London, Anthem Press.
Bourgin, F. (1989): The Great Challenge: The M yth o f Laissez-Faire in the Early Republic, New York, Harper & Row.
Brandt, W. (1980): North-South: A Program fo r Survival, London, Pan Books.
Cardoso, F.H. and E. Faletto (1970): Dependencia y desarrollo en América Latina, Mexico City, Siglo XXI Editores.
Connelly, M. and P. Kennedy (1994): Must it be the rest against theWest?, Atlantic M onthly, vol. 274, No. 6, Boston, Atlantic Monthly Co.
Croeker, C. (2003): Engaging failing states, Foreign A ffairs, vol. 82, No. 5, New York, Council on Foreign Relations.
Chang, H.J. (2002): Kicking Away the Ladder, London, Wimbledon Publishing Co.
Dos Santos, T. (2003): Imperialismo y dependencia, Mexico City, Editorial Era.
Feldstein, M. (1998): Refocusing the IMF, Foreign Affairs, vol. 77, No. 2, New York, Council on Foreign Relations.
Furtado, C. (1965): D evelopm ent and Stagnation in Latin America: A Structural Approach , New Haven, Yale University Press.
Ho, Y. and T. Lin (1991): Structural adjustment in free market economy, in H. Patrich (ed.), Nine Industrialized Economies, New York, Columbia University Press.
Ibarra, D. (1998): El FOBAPROA y la reforma financiera, E l Universal, Mexico City, 19, 20 and 21 October.
(2001): Testimonios críticos, Mexico City, Cántaro Editores. (2003): México: transición sin desarrollo, exposition pre
sented at the N ational Econom ic Forum, N ational Autonomous University o f Mexico (Mexico City, 14 August 2003).
IMF (International Monetary Fund) (2002): Guidelines on conditionality: Principles, Modalities, Evaluation and Review, September [http://www.imf.org].
(2003): World Economic Outlook, September, Washington,D.C.
Kahn, M. and S. Sharma (2001): IMF Conditionality and Country Ownership o f Programs, IMF Working Paper, No. 01/142, Washington, D.C., International Monetary Fund.
Kapur, D. and R. Webb (2000): Governance-related Conditionalities o f the International Financial Institutions, Discussion Paper Series, No. 6, UNCTAD/GDS/MDPB/G24/6, Geneva, United Nations Conference on Trade and Development (UNCTAD).
Kennedy, P. (1993): Preparing fo r the Twenty-first Century, New York, Random House.
Komiya, R. and others (1988): Industrial Policy in Japan, New York, Academic Press.
Kuczynski, P. and J. Williamson (2003): After the Washington Consensus: Restarting Growth and Reform in Latin America, Washington, D.C., Institute for International Economics.
Kupchan, C. (2003): The E nd o f the America Era, New York, Alfred A. Knopf.
List, F. (1885): The National System o f Political Economy, London, Longman.
McCarthy, T. (1995): Ideals and illusions: on reconstruction and deconstruction, Contemporary Critical Theory, Cambridge, Massachusetts, The M IT Press.
McGuire, J. (1997): Rethinking Development in East Asia and Latin Am erica, Los Angeles, California, Pacific Council on International Policy.
Migdal, J. (1988): Strong Societies and Weak States: State-Society Relations and Capabilities in the Third World, Princeton, Princeton University Press.
OECD (Organisation for Economic Co-operation and Development) (2003): Economic Outlook, Paris.
Rodrik, D. (1995): Getting intervention right: how South Korea and Taiwan grew rich, Econom ic P olicy , No. 20, London, Blackwell Publishing, April.
______ (2000): Governing the global economy: does one architectural style fit all?, in S. Collins and R. Lawrence (eds.), Brookings Trade Forum 1999, Washington, D.C., The Brookings Institution.
Rogoff, K. (2003): Globalization and Global Disinflation, document prepared for the Federal Reserve Bank o f Kansas City, Jackson Hale.
Rogoff, K. and others (2003): Effects o f Financial Globalization on Developing Countries: Some Empirical Evidence, Occasional Paper, No. 220, Washington, D.C., International Monetary Fund (IMF).
Said, E. (1993): Culture and Imperialism, New York, Alfred A. Knopf.
Skocpol, T. and others (1985): Bringing the State B ack In, Cambridge, Massachusetts, Cambridge University Press.
Stiglitz, J. (1998): M ore Instruments and Broader Goals: M oving towards the Post-Washington Consensus, Helsinki, United N ations University/W orld Institute for D evelopm ent Economic Research (WIDER).
Stiglitz, J. and S. Yusuf (2003): Rethinking the E ast A sia Miracle, New York, Oxford University Press.
UNDP (United Nations Development Programme) (2002): Human Developm ent Report 2002, New York, Oxford University Press.
Williamson, J. (1990): W hat Washington means by policy reform, in J. Williamson (ed.), Latin American Adjustment, Washington, D.C., Institute for Inter-national Economics.
World Bank (1991): Annual Report, 1991, Washington, D.C. (1993): The E ast A sian Miracle: Economic Growth and
Public Policy, Oxford, Oxford University Press. (1997): World D evelopm ent Report 1997. The State in a
Changing World, Oxford, Oxford University Press. (2001a): World D evelopm ent Report 2000/2001: Attacking
Poverty, Washington, D.C. (2001b): Global Developm ent Finance, Washing-ton, D.C.
THE DEVIO US MAZE O F THE INTERNATIO NAL ORDER: THE IMPORTATION OF REFO RM S • DAVID IBARRA

19
C E P A L R E V I E W 8 2 • A P R I L 2 0 0 4
G ra c ie la M o g u i l la n s k y
I n v e s tm e n t a n d C o r p o r a t e
S t r a te g ie s Un it, E C L A C
f gm oguiUansky@ eclac.cl
R o g e r io S t u d a r t
F in a n c ia l S p e c ia l is t ,
S u s ta in a b le D e v e lo p m e n t
D e p a r t m e n t ,
I n te r - A m e r ic a n D e v e lo p m e n t B a n k
(IDB).
T h i s p a p e r w a s p r o d u c e d w h i le th is
a u t h o r w a s an E c o n o m ic A f fa ir s
O f f ic e r in t h e E C L A C E c o n o m ic
D e v e lo p m e n t D iv is ion
f rogerios@ iadb.org
S e b a s t i á n V e rga ra
C o n s u l t a n t , I n v e s tm e n t an d
C o r p o r a t e S t r a te g ie s Un it, E C L A C
f severgara@ eclac.cl
Foreign banks in Latin America: a paradoxical result
Graciela Moguillansky, Rogerio Studart and Sebastián Vergara
D.u r i n g t h e 1 9 9 0 s t h e r e w a s a d r a m a t i c i n c r e a s e in t h e
p r e s e n c e o f f o r e i g n b a n k i n g in L a t i n A m e r i c a . M a c r o e c o n o m i c
s t a b i l i t y a n d e c o n o m i c r e f o r m s , e s p e c i a l l y c a p i t a l m a r k e t a n d
f i n a n c i a l l i b e r a l i z a t i o n , c r e a t e d a t t r a c t i v e c o n d i t i o n s f o r b a n k s
w h i c h w e r e l o o k i n g f o r e c o n o m i e s o f s c a l e a n d w o r l d w i d e
g r o w t h . A t t h e s a m e t i m e g o v e r n m e n t s h o p e d t h a t f o r e i g n b a n k
p e n e t r a t i o n w o u l d p r o v i d e a s o l u t i o n t o t h e n e e d t o i n c r e a s e
c a p i t a l w i t h i n t h e s y s t e m , as w e l l as r e p r e s e n t i n g an i n s u r a n c e
a g a i n s t s y s t e m i c r i sk . T h e e f f o r t s t o a t t r a c t f o r e i g n i n v e s t m e n t
c o i n c i d e d w i t h t h e s t r a t e g y o f t h e l e a d i n g p l a y e r s t o b e c o m e
g l o b a l b a n k s . N o w t h a t t h e i n i t i a l p e n e t r a t i o n h a s b e e n a c h i e v e d ,
i t is w o r t h a n a l y z i n g w h a t t h e i m p a c t s h a v e b e e n o n t h e p e r
f o r m a n c e o f t h e f i n a n c i a l s y s t e m . T h e m a i n c o n c l u s i o n is t h a t
t h e r e h a s b e e n a p o s i t i v e o u t c o m e f o r t h e r e g i o n in t e r m s o f
m i c r o e c o n o m i c e f f i c i e n c y , b u t t h i s c o n t r a s t s w i t h t h e m a c r o e c o
n o m i c i m p a c t .

20 C E P A L R E V I E W 8 2 • A P R I L 2 0 0 4
IStructural characteristics and problems
of banking systems prior to the 1990s
For the purpose of this analysis, attention needs to be drawn to four basic characteristics of the Latin American financial system, which have been present throughout its history and in some cases still persist today. The first is that the region’s banks have predominantly focused on traditional commercial-banking activities, while the securities market remained very poorly developed, and was in fact non-existent in many countries. Secondly, despite the systemic importance of banks, the volume of lending in relation to Gross Domestic Product (GDP) was and remains very small. Thirdly, the State has traditionally played a major role in the financial sector, and this has been associated (albeit without proven causality) with a concentration of private-sector banking activity in the short-term credit segment. Public-sector financing institutions have tended to specialize in long-term funding, generally linked to the national development plans that were commonplace until the 1970s. Lastly, the region’s banking systems have always been characterized by their shallowness and narrow coverage.1 This has meant that a significant fraction of firms and families have little or no access to credit, and that private financing is characterized by large spreads, and
hence high interest rates on loans, with very short maturities.
Government policy to attract foreign banks stemmed directly from the need to resolve these structural problems in the banking sector. So-called “firstgeneration” financial reforms (table 1 and box 1) were an attempt to increase sectoral competitiveness and improve efficiency by liberalizing its operations and reducing State intervention, both directly (downsizing of the public financial sector) and indirectly (lower reserve requirements, together with deregulation of interest rates and directed credit mechanisms).
The structural reforms created a new macroeconomic environment, which in turn had effects on the way banks operated. In many cases, this interaction between the performance of the banking system and the new macroeconomic climate generated tensions or banking crises that had two broad consequences: firstly, the introduction of a new wave of (second generation) reforms aimed at strengthening the institutional framework (through new regulation and supervision); and secondly, the adoption of an explicit policy to attract international banks, which led to privatization and acquisition processes.
TABLE 1
Latin America: First-generation reforms of the financial system
Country Liberalization o f interest rates
Start o f an intensive period o f privatization
Adoption o f capital adequacy requirements
Bank reserves
1990
(%)
2000
Tension (1) or systemic crises
following reform (2)Argentina 1989 1995 1991 24 4 1995(2)Bolivia 1985 1992 1995 25 9 1985(1)Brazil 1989 1997 1995 15 12 1994 (1)Chile 1974a 1974-1987 1989 6 5 1982(2)Colombia 1979 1993 1992 38 8 1998(2)Costa Rica 1995 1984 1995 43 18 1994(1)Mexico 1988 1992 1994 5 7 1994(2)Paraguay 1990 1984 1991 33 26 1995(1)Peru 1991 1993 1993 31 26 1995(1)Uruguay 1974 1974 1992 45 22 1982(2)Venezuela 1989 1996 1993 18 29 1994(2)
Source: Prepared by the authors, on the basis o f ECLAC (1995 and 1996).a The banks were intervened between 1982 and 1984; the system was reliberalized starting in 1985.
1 This refers to the proportion o f enterprises and families with access to credit.
FO REIGN BANKS IN LATIN AM ERICA: A PARADOXICAL RESULT • G RACIELA MOGUILLANSKY, ROGERIO STUDART A ND SEB ASTIÁ N VERGARA

C E P A L R E V I E W 8 2 • A P R I L 2 0 0 4 21
Box 1F i r s t - a n d s e c o n d - g e n e r a t i o n f i n a n c i a l r e f o r m s i n l a t i n A m e r i c a
The financial reforms introduced in Latin America during the last two decades differed from country to country, not only in terms of when the reforms were implemented but also in their intensity and scope. To simplify the analysis, however, they can be divided into two phases, in some cases overlapping in time: the first phase, which can be described as first-generation reforms, entailed dismantling State controls on the returns to financial assets (especially interest rates), on the allocation of financial resources, and on the entry of agents into the system (lowering of entry barriers). All of this was accompanied by financial opening to the exterior. In terms of regulatory reform, this phase also included the adoption of capital requirements in compliance with the Basel Accord of 1988. As shown in table 1, this process took place between 1985 and 1995 in many countries, and it was often followed by economic crises, frequently stemming from the exponential growth of bank lending that had occurred earlier.
Given the problems of stability that emerged from the mid-1990s onwards, many countries began to implement second-generation reforms aimed at enhancing regulatory and supervisory mechanisms, in order to make their domestic banking systems sounder. These reforms were particularly intensive following the “tequila crisis”, which in many countries had destabilized the financial system and in others had triggered an outright banking crisis. This second wave of reforms, particularly those implemented following the Basel Accord, required banks to maintain a level of capital that was adequate in relation to the risk attached to their banking assets; to evaluate and rate their loan portfolios more carefully according to the structure of those risks; and to provide more transparent information to the supervisory bodies.
The pace and depth of regulatory and supervisory reform in each country were directly related to the strength of the effect of the “tequila crisis” on the banking sector in question, and the desire of the domestic authorities to rapidly restore “business as usual” in institutions and markets. For example, while regulatory adjustments were minimal in Chile during the second half of the 1990s, far-reaching changes were made in Argentina, Brazil and Mexico. In most of the countries hit by the crisis, reform began with a restructuring of the domestic banking sector; this process was accompanied by State guarantees, and usually included an injection of liquidity into the system, all of which facilitated bank mergers and acquisitions. In this process, giving incentives for foreign banks to enter the market became an overt policy. The State guarantees extended to the financial system were generally accompanied by requirements relating to deposit insurance, capital requirements and greater liquidity.
The financial reforms of the 1990s overtly encouraged the entry of foreign banks. First-generation reforms had allowed banks to operate in markets that had previously been off-limits -providing services such as factoring and leasing, for example- and had also facilitated stock-market operations, particularly brokerage, underwriting and pension-fund management. As we shall see below, these additional freedoms and broader scope of action were fundamental for the operations of international banks, particularly as their strategy had now shifted towards universalization. In their attempt to grant equivalent legal status to all nations, second-generation reforms created a regulatory and supervisory environment similar to that prevailing in developed economies, thereby opening the doors to foreign banks. In this respect, the two generations of reforms complemented each other to create a climate more suited to the expansion strategies of international banks.
Source: Prepared by the authors on the basis of Stallings and Studart (2001).
FO REIGN BANKS IN LATIN AM ERICA: A PARADOXICAL RESULT • G RACIELA M OGUILLANSKY, RO G ERIO STUDART A ND SEBASTIÁN VER G A RA

22 C E P A L R E V I E W 8 2 • A P R I L 2 0 0 4
1. Financial market liberalization, crisis andrestructuring: from the “tequila crisis” to 1997
An essential background for understanding the current development of the Latin American banking system is the financial liberalization that took place between the 1980s and 1990s, both locally and internationally. Chile was an exception to this, however, having begun the process a decade earlier than the other countries in the region. Starting from a system in which State authorities set interest rates, directed credit and required a high proportion of bank deposits to be held as reserve requirements, commercial banks were now given freedom to decide where and how much to lend, and at what price. More or less at the same time, capital-market liberalization enabled local banks to borrow in foreign currency, and allowed foreign banks to operate in the local market. Frequently, these changes were implemented without an adequate system of bank regulation and supervision in place, which in several instances led to problems in regional banks whose executives had little or no experience in analyzing local credit, let alone the international market.
The initial financial deregulation also affected business goals. Existing institutions could now engage in new activities and become “universal banks”. This allowed them to operate in securities and insurance markets, provide asset-management services, and hold equity positions in non-financial firms. To some extent, this process mirrored what was happening in the industrialized countries, but with the difference that the securities market in the region remained very underdeveloped. Accordingly, despite greater diversification, bank portfolios were restricted to short-term securities dealing, insurance products and real-estate activities.
Financial opening and deregulation did not yield the expected results, however. Instead, they provoked credit booms, mismatches between currencies and maturities, and ultimately banking crises. As had happened in Chile during the external debt crisis, then in Mexico in 1994, East Asia in 1998 and Argentina in 2001, mistakes made by local actors themselves were reason enough for crisis, but when compounded by external shocks, the situation became much more serious (Held and Jiménez, 2001). By the mid-1990s, banking crises had become a new feature of Latin America’s financial systems, and bank bailouts by government had become commonplace. Initially, salvage operations were limited to non-recoverable port
folios, but this was later followed by bank recapitalization, then liquidation, or mergers and acquisitions by foreign banks. Subsequently, in order to avert future crises, banking regulation and supervision were introduced, greater information and transparency were required, and in some cases deposit insurance was put in place. As a result of these crises, the initial expectations of financial reform changed: financial liberalization was and remains a condition for long-term market development, but the latter cannot be achieved without stability in the system. This aim spawned a debate which clearly highlighted two specific needs: firstly, to regulate and supervise the sector, and secondly, to attract foreign banks.
2. The macroeconomic environment
Unlike events in the preceding decade, the macroeconomic climate of the 1990s was one of accelerating growth, which fostered a rapid expansion of shortterm lending to consumers and firms. Capital-market liberalization, at a time of abundant liquidity in the international financial market, attracted foreign capital inflows, thereby removing the traditional external constraint on the expansion of demand and imports. This facilitated low-inflation growth, particularly in countries that had adopted stabilization programmes based on an exchange-rate anchor, combined with rapid commercial opening. In this situation, the banks faced strong demand for short-term credit and were able to expand their operations merely by accommodating it. In the second place, the international scenario allowed all banks, local and foreign alike, to increase their external financing. This phenomenon is related to more stable exchange rates and the development of the international derivatives market, which enabled financial investors to partially hedge exchange-rate risk and uncertainty.
3. From changes in financial regulation and supervision to the entry of international banks
A major obstacle to development of the financial system in Latin American countries, and particularly for attracting foreign banks, was the absence of appropriate institutions for regulation and supervision - a key
FO REIGN BANKS IN LATIN AM ERICA: A PARADOXICAL RESULT • G RACIELA MOGUILLANSKY, ROGERIO STUDART A ND SEB ASTIÁ N VERGARA

C E P A L R E V I E W 8 2 • A P R I L 2 0 0 4 23
element for the development of market infrastructure. This shortcoming had discouraged foreign banks from engaging in credit transactions with local consumers or firms. Laws on guarantees were inefficient or nonexistent, for example, and legal rulings could be indefinitely postponed and arbitrarily overturned once adopted. Anglo-Saxon law, commonly followed in the international financial market, was unknown in the region, and in general there were no legal precedents, which made the outcome of litigation unpredictable. Given that the development of certain segments of the financial system generally requires long-term contracts, regulatory shortcomings prevented such development - and in many cases still prevent it - by leaving foreign banks permanently exposed to the risk of contracts being breached. This undermined their competitive advantages because, in the absence of appropriate legislation, information management and knowledge of potential clients and the authorities become particularly important, and local institutions clearly held the advantage in these domains.
The reforms to financial regulation formally or informally removed the entry barriers facing foreign banks, thanks to which they began to move into the region and gain an increasingly large market share (table 2). Three vehicles were used in this process: privatizations, mergers and acquisitions, together with greenfield investments driven by the expansion needs of individual corporations. As a result, within a few
years foreign banking institutions were owners of over half of the region’s largest banks as measured by assets. Another change stemming from the opening- up policy was the acceptance of greater concentration in the banking industry, with the number of banks decreasing as a result of privatizations, mergers and acquisitions. As shown in table 3, this phenomenon has not been exclusive to the region, since Asia and to a lesser degree Central Europe have experienced a similar trend, albeit with certain differences. Whereas concentration has generally declined in Asia and Central Europe, in Latin America the market shares of the three largest and 10 largest banks have increased, with numerous smaller firms disappearing altogether.
TABLE 2
Latin America (seven countries): Foreign banks’ share of banking assets in the Region, 1990-2001(Percentages)
1990 1994 1999 2000 2001
Argentina 10 18 49 49 61Brazil 6 8 17 23 49Chile 19 16 54 54 62Colombia 8 6 18 26 34Mexico 0 1 19 24 90Peru 4 7 33 40 61Venezuela 1 1 42 42 59
Source: Prepared by the authors on the basis o f IMF (2000), BIS (2001b) and Salomon Smith Barney (2001).
TABLE 3
Latin America, Asia and Central Europe: Indicators of concentration in the banking sector, 1994-2000(Share o f total deposits)
Country
1994 2000
Number o f banks
Three largest banks (%)
Ten largest banks (%)
Number o f banks
Three largest banks (%)
Ten largest banks (%)
Latin AmericaArgentina 206 39.1 73.1 113 39.8 80.7Brazil 245 49.9 78.8 193 55.2 85.6Chile 37 39.5 79.1 29 39.5 82.0Mexico 36 48.3 80.8 23 56.3 94.5Venezuela 43 43.9 78.6 42 46.7 75.7
AsiaRepublic o f Korea 30 52.8 86.9 13 43.5 77.7Malaysia 25 44.7 78.3 10 43.4 82.2Philippines 41 39.0 80.3 27 39.6 73.3Thailand 15 47.5 83.5 13 41.7 79.4
Central EuropeCzech Republic 55 72.0 97.0 42 69.7 90.3Hungary 40 57.9 84.7 39 51.5 80.7Poland 82 52.8 86.7 77 43.5 77.7Turkey 72 40.7 79.1 79 35.9 72.0
Source: Stallings and Studart (2001) and IMF (2001, p. 11).
FO REIGN BANKS IN LATIN AM ERICA: A PARADOXICAL RESULT • G RACIELA M OGUILLANSKY, RO G ERIO STUDART A ND SEBASTIÁN VER G A RA
24 C E P A L R E V I E W 8 2 • A P R I L 2 0 0 4
The environm ent in which foreign banks entered the region in the 1990s
Unlike the pattern in industrialized countries, the financial sector in Latin America continues to be dominated by banks, with little development of other types of financial institutions. Nonetheless, significant changes have occurred in recent years. Firstly, markets have become broader and deeper. This occurred partly as a result of the spectacular reduction in inflation rates throughout the region - price increases today are in single digits, compared to three and even four digits in the 1980s. As a result, families and firms are now more willing to hold money and other financial assets,
thereby providing the basic requirements for development of the financial system. The stronger institutional framework obtained from regulation and financial supervision reduces the risks run by individual agents. In terms of market deepening, the ratio of money supply (M2) to GDP increased significantly in several countries in Latin America during 1992-2000 (ECLAC, 2003). Some diversification has also taken place in the capital market, in response to multiple causes: increased capital flows up to 1998; privatization of social security; and the deregulation of institutional investors, which led to increased investment in securitized instruments and generated a virtuous circle in several of the region’s economies (ECLAC, 2003).
IIForeign banks: microeconomic efficiency
versus macroeconomic effectiveness
4
This section analyses the impact that foreign banks have had on microeconomic efficiency and macroeconomic effectiveness, particularly in terms of solving the problems that have traditionally afflicted the Latin American financial system. This obviously has consequences for the financial constraints facing firms and the stability of the regional banking system. The microeconomic indicators presented here are not very different from those used in other studies, since they compare the performance of foreign and local banks in terms of profitability, efficiency and liquidity. To simplify, we refer to this as the microeconomic efficiency of the banking system. Despite their limitations, these indicators are normally used to evaluate the way in which banks are operating, and their degree of risk exposure. The counterpart at the aggregate level would be macroeconomic effectiveness. To study this aspect, we analyse access to credit by the productive sector and families, together with the corresponding interest rates and spreads, and the contribution made by the banking system to stability.
As is true of most economic analysis, the step from micro- to macroeconomic performance is not a direct one. Nonetheless, some of the results presented below suggest that the microeconomic efficiency of the regional banking system increased during the 1990s, thanks partly to the role played by foreign banks. In the
macroeconomic domain, however, cost of and access to credit and stability all failed to improve. This section attempts to explain this paradox.
1. Microeconomic efficiency
Three indicators in particular can be used to compare the performance of banking institutions: profitability, efficiency and liquidity. Given that the foreign banks only gained a strong presence in Latin America in the late 1990s, the analysis considers the period 19972001. The data cover the 20 largest institutions in terms of total assets in the countries where international banks were mainly concentrated: Argentina, Brazil, Chile, Colombia, Mexico, Peru and Venezuela. The 20 largest banks generally encompass over 80% of the system.
When evaluating microeconomic performance, it must be remembered that the local banking system has faced strong competition from foreign banks in their drive to gain market share. This has certainly forced the local players, especially the larger ones, to become more efficient. o n this point, it is interesting to consider not only the average performance trend for the two groups, but also the deviation from the mean, since this
FO REIGN BAN KS IN LATIN AM ERICA: A PARADOXICAL RESULT • G RACIELA MOGUILLANSKY, RO G ERIO STUDART A ND SEBASTIÁN VER G A RA

C E P A L R E V I E W 8 2 • A P R I L 2 0 0 4 25
can be used as an indicator of the capacity of small entities to incorporate new technologies and raise their performance in a more competitive environment.
a) Indicators o f profitability
Taking Latin America as a whole, there are no statistically significant differences in profitability between local and foreign banks2 (table 4), whether measured as the return on assets or as the return on equity. A similar analysis for each individual country confirms this result. After acquiring local institutions, foreign banks took a series of measures, which will undoubtedly enhance efficiency and profitability in the future, although possibly raising costs in the short run. In strategic terms, these banks are just beginning to move out of a positioning phase towards one of
increasing profitability.Additional confirmation of the scant difference in
profitability between local and foreign banks, whether measured in relation to assets or with respect to capital, is the similarity of their period-to-period trends, which display a very high correlation - 0.74 on average for the entire set of countries.3 Nonetheless, variance analysis reveals less dispersion among foreign banks than in local ones: profitability varies more among local institutions than among their foreign competitors, as is verified by the available statistics, especially in Argentina, Chile and Mexico. This is probably because local banks are considerably more heterogeneous than their foreign counterparts in terms of size, liquidity, target markets and managerial and technological structures.
Latin America (seven countries): indicators of the profitability of local and foreign banks, 1997-2001
Country Return on assets Return on equity
Local banks Foreign banks Local banks Foreign banks
1997-2001 1997 2001 1997-2001 1997 2001 1997-2001 1997 2001 1997-2001 1997 2001
Argentina 0.79 0.33 1.78 0.30 -0.72 0.29 3.06 2.49 5.87 6.03 2.13 7.43Brazil 0.90 1.04 0.49 0.71 0.20 0.60 12.30 13.08 5.26 8.47 0.23 7.17Chile 0.81 1.85 0.99 0.57 0.38 0.72 13.11 12.38 15.82 10.45 6.34 14.17Colombia -0.11 1.33 1.03 -0.63 -0.11 0.15 7.43 8.18 9.79 1.35 -2.65 0.15Mexico 1.16 0.60 2.45 1.21 1.09 1.82 6.88 0.48 9.36 11.20 7.64 19.29Peru 0.76 0.70 1.18 0.37 -0.20 0.21 7.77 10.63 6.86 4.48 0.29 3.70Venezuela 2.20 2.19 2.20 1.92 2.11 n.a. 14.94 20.66 2.56 16.24 15.74
Source: Prepared by the authors on the basis o f Latin Banking Guide & Directory (2002).
Latin america (seven countries): indicators of the efficiency of local and foreign banks, 1997-2001
TABLE 4
TABLE 5
Country Overdue loans/gross loans Operating expenses/total income
Local banks Foreign banks Local banks Foreign banks
1997-2001 1997 2001 1997-2001 1997 2001 1997-2001 1997 2001 1997-2001 1997 2001
Argentina 10.86 13.01 12.06a 5.92 5.80 6.01 79.91 102.1 21.9 85.13 163.9 19.06Brazil 10.29 5.84 14.13 4.68 1.91 7.37 79.74 84.4 76.3 93.10 115.9 67.2Chile 1.58 0.97 1.82 1.03 0.37 1.31 82.80 77.9 69.8 65.03 63.7 62.9Colombia 8.01 5.54 3.96 6.10 4.91 3.69 102.79 82.1 64.6 125.29 92.4 74.5Mexico 6.17 6.21 6.43 1.96 1.48 2.09 108.59 102.4 73.2 90.27 86.0 63.7Peru 6.78 4.61 7.70 6.43 4.91 6.36 91.67 83.7 78.2 114.78 106.4 84.9Venezuela 7.02 3.42 12.15 6.59 2.05 73.86 65.3 70.9 75.26 72.0
Source: Prepared by the authors on the basis o f Latin Banking Guide & Directory (2002). a 2000.
2 This is measured by the probability o f overlap between the confidence intervals o f the means. The confidence interval considers the standard deviation with respect to the mean o f each group, thereby taking into account in the comparison not only the mean value, but also its dispersion (see table A.1 o f the Appendix).
3 The correlation is very low for Argentina, however, and negative in the case o f Peru. Brazil, Chile, Colombia, Mexico and Venezuela register correlations that range between 0.46 and 0.92
FO REIGN BANKS IN LATIN AM ERICA: A PARADOXICAL RESULT • G RACIELA M OGUILLANSKY, RO G ERIO STUDART A ND SEBASTIÁN VER G A RA

26 C E P A L R E V I E W 8 2 • A P R I L 2 0 0 4
b) Indicators o f efficiency
The analysis in this case is based on two indicators normally used by banking regulators: i) operating expenses in relation to total income; and ii) overdue loans as a percentage of the total loan portfolio. The first of these indicators measures operating efficiency, while the second is a fairly crude approximation to the quality of risk management (table 5). Analysis of the data reveals an interesting initial result, namely a general improvement in the operational efficiency of local banks during the period studied. In six of the seven countries, both foreign and local banks significantly reduced their ratio of operating expenses to total expenditure.4 Most of this efficiency improvement has occurred since 2000, which suggests that it may be linked to processes of operations rationalization, optimization of human resources, and the incorporation of new technologies and technological platforms that the banking industry is embarked upon. In Argentina, notwithstanding the financial crisis, efficiency improved continuously between 1997 and 2001 in local and foreign banks alike. In Brazil, on the other hand, the efficiency of local banks remained relative stable, before increasing slightly during 1999-2001, while the foreign banks registered a more substantial improvement. In Colombia, Mexico and Peru, efficiency trended steadily upwards from 1999 onwards in both types of banks.
Although in terms of overlapping confidence intervals there are no statistically significant differences in risk management between local and foreign banks, the coefficient is always lower among the latter. Unlike their local counterparts, foreign banks maintained a relatively healthy loan portfolio on average throughout the period under analysis. This should not be surprising, because most foreign banks were embarked upon an aggressive policy of loan restructuring when they began activities in Latin America, as a key element of their positioning strategy in the region. The policies of SCH (Banco Santander Central Hispano) and BBVA (Banco Bilbao Vizcaya Argentaria) in Argentina, Brazil, Chile and Mexico are clear examples of this. Comparing data over time, however, the percentage of non-performing loans in the total portfolio of each country shows no sign of
decreasing. This is true for national and foreign banks alike, and is explained by the worsening macroeconomic situation in the region, which has resulted in many firms and families falling into payment arrears, despite the banks’ efforts to improve risk management.
c) Indicators o f liquidity
The liquidity indicator chosen here is the effective availability of loanable funds - understood as the difference between total credits and provisions for non-performing loans- over total deposits: thus, liquidity indicator = (total credits - provisions)/total deposits
The larger this difference, the greater is the risk being incurred by the bank; and, conversely, the smaller the difference the more cautious is its strategy. This is because the variation in loans reflects the bank’s level of indebtedness; but a larger provision against non-performing loans indicates either that the bank is subject to more stringent regulatory constraints or simply that it expects loan recovery to be more difficult.
The liquidity situation differs across countries (table 6 and figure A.1 of the appendix). In Brazil, for example, foreign banks were more liquid than local ones throughout the period, and increasingly so in 2000 and 2001; but at the same time, the liquidity of foreign banks in Brazil is the most heterogeneous of the region. Thus, while liquidity is higher on average among foreign banks than among local ones, the dispersion is so great that it is hard to draw aggregate conclusions, which therefore weakens the initial argument. The opposite is true of Chile and Mexico, since local banks have a liquidity index that is both higher and more stable (smaller standard deviation).
Another interesting phenomenon is the sharp drop in liquidity registered among foreign banks following the Asian and Russian crises. In Argentina this indicator declined steadily from 1997 to 2001 for all types of banks, with no major differences between local and foreign players. Given that, in general, all banks have seen their loan portfolios deteriorate, it is hardly surprising that they have adopted a more prudent policy. Rather than changes in ownership, this attitude seems to reflect a more uncertain economic climate, which leads us to the final point in the analysis, namely, the macroeconomic effectiveness of foreign banks in the region.
4 In Chile, foreign banks have been much more efficient than their local counterparts. Nonetheless, competition in the market has forced local banks to cut costs, so this indicator has shown a persistent narrowing of the gap each year, to the point where the difference in 2001 was no longer statistically significant.
FO REIGN BANKS IN LATIN AM ERICA: A PARADOXICAL RESULT • G RACIELA MOGUILLANSKY, ROGERIO STUDART A ND SEB ASTIÁ N VERGARA

C E P A L R E V I E W 8 2 4 A P R I L 2 0 0 4 27
TABLE 6
Latin America (seven countries): Effective availability o f loanable funds in relation to total deposits, as a liquidity indicator, 1997-2001(Percentages)
Local banks Foreign banks
1997-2001 1997 2001 1997-2001 1997 2001
Argentinaa 84.5 97.0 90.9 91.9 93.9 82.1Brazil 95.2 102.1 71.9 201.5 163.8 167.3Chile 111.6 118.3 108.7 95.2 139.6 85.2Colombia 142.0 105.5 128.9 192.9 112.2 208.1Mexico 106.9 108.2 132.9 74.9 90.0 44.1Peru 134.0 113.2 118.2 130.2 165.7 95.4Venezuela 74.2 66.1 107.5 68.5 73.4
Source: ECLAC, on the basis o f Latin Banking Guide & Directory (2002). a In the case o f Argentina, the figures are for 2000.
2. Macroeconomic impact
The microeconomic analysis shows that while foreign banks do not differ significantly from local ones in an operational sense, they do act much more prudently in assessing and managing risk, and they make significantly higher provisions against losses than local banks do. This is a genuine benefit for the region. Nonetheless, a microeconomically sounder banking system is not necessarily better, per se, for economic development. Greater macroeconomic effectiveness would be obtained only if foreign banks were indeed helping to improve (or mitigate) bad credit conditions -in other words, if they improved the existing supply, cost and maturity conditions of financing. Despite constraints arising from data availability and the period of analysis, the present section attempts to evaluate this.
a) Foreign banks and the aggregate supplyo f credit
The strengthening of international banks in Latin America in the late 1990s coincided with a period that was particularly unfavourable for the expansion of banking activities, due to slower growth and the instability that followed in the wake of the Asian crisis. Powerful external shocks (financial problems and a loss of trade momentum), compounded by the corresponding domestic responses, nearly always resulted in monetary tightening. Given the wider spreads and higher capital costs that such policies usually entail, a vicious circle tends to be generated between credit and risk (because of greater insolvency), and the banks necessarily become more conservative. In some coun
tries, such as Argentina and Ecuador, the period was also characterized by banking crises.
It is no surprise, therefore, that in many Latin American countries the deepening process among pri- vate-sector banks (expansion of credit to broader sectors of the population) has stalled since 1997. As shown in figure 1, which considers seven countries, the ratio of private credit to GDP was lower in 2001 than in 1998 everywhere except Chile; and in 1998 it was already far below the level prevailing in most other developing countries (let alone developed ones). Indeed, the credit standstill seems even more worrying in view of the average interest rates being charged on loans in those countries (see table 7), because part of the variation in loans consists of existing credit being renewed (rollovers). A situation where the rate of variation in loans is less than the average interest rate charged in the system could be an indication of effective contraction in the supply of credit; in other words, the volume being rolled over does not include the payment needed for debt service, so the effective availability of financing for expenditure is correspondingly less. In 2001, there were signs of this phenomenon in several countries of the region (ECLAC, 2002).
In some countries the situation is particularly alarming. In Mexico, for example, the real supply of credit has fallen almost continuously since the “tequila crisis” of 1994, dropping from 35% of GDP in that year to about 10% in 2001, as the banks have been engaged in an ongoing process of writing off the large number of impaired loans. In that country, a substantial proportion of the financing of domestic activity consists of supplier credits and foreign loans. Moreover, the restructuring of the banking system led to a vigorous entry of foreign banks (see box 2), as a
FO REIGN BANKS IN LATIN AM ERICA: A PARADOXICAL RESULT • G RACIELA M OGUILLANSKY, RO G ERIO STUDART A ND SEBASTIÁN VER G A RA

28 C E P A L R E V I E W 8 2 • A P R I L 2 0 0 4
result of which Mexico has recently become the country with greatest foreign participation in the region. Even so, given the negative impact of the retrenchment in the United States economy, bank credit is not showing signs of recovery.
The situation in Argentina was highly unsatisfactory even before the upheaval of 2001. Lending began to stall in the period between the Asian and Russian crises, and the situation worsened during the ensuing years. Between 2000 and 2001, lending fell by nearly
FIG U R E 1
Latin America: Ratio of credit to GDP, 1991-2001(Percentages)
- " A r t e - m i — I ' d » Mtex — Wæ
Source: ECLAC, on the basis o f IMF (2002).
18%, and the system collapsed completely following the ending of the convertibility regime and the implementation of the freeze on bank deposits known as the “corralito”. In general, the credit standstill is directly related to a more cautious attitude among the banks, especially foreign ones. If one considers the portfolio distribution of the banks in the region, the credit crunch is not surprising: in three countries (Argentina, Brazil and Chile), there was a reduction in the share of loans in total bank assets, local and foreign alike, reflecting the fact that banks sought lower-risk assets, such as government bonds. In Mexico and Colombia, loans declined in relation to total assets in local banks, but not in the case of their foreign counterparts.
TA BLE 7
Latin America: Variation in lending to the private sector in constant 1998 values and real interest rates, 1997-2001(Percentages)
Real variation in credit Real interest rates on loans1997-2000 2000-2001 1997-2000 2000 2001
Argentina 1.4 -17.6 11.0 12.7 27.0Brazil 11.4 14.4 66.6 48.1 46.4Chile 6.8 9.1 11.0 9.7 9.5Colombia -1.5 12.9 16.1 9.5 12.4Mexico -4.2 -7.5 9.6 9.4 8.6Peru 4.2 -2.6 23.8 23.2 21.4Venezuela 0.2 26.4 6.1 11.2 9.0
Source: ECLAC, on the basis o f IMF (2002).
FO REIGN BANKS IN LATIN AM ERICA: A PARADOXICAL RESULT • G RACIELA MOGUILLANSKY, ROGERIO STUDART A ND SEB ASTIÁ N VERGARA

C E P A L R E V I E W 8 2 • A P R I L 2 0 0 4 29
Box 2Fo r e i g n b a n k s d o m i n a t e t h e M e x i c a n b a n k i n g s y s t e m , b u t c r e d i t f a i l s t o r e c o v e r
The Mexican banking sector was reprivatized in the early 1990s, in a process involving Mexican shareholders. As the legislation of that time did not allow more than 20% foreign ownership of banks, international financial corporations chose to maintain a presence exclusively through representation offices. The new owners of the banks came from the management of Mexican stock market firms; their experience in lending and risk analysis was virtually non-existent. This, compounded by regulation and supervision shortcomings, magnified the financial crisis and economic recession that befell the country in late 1994 and 1995. The need to recapitalize the banking system, together with the signing of the NAFTA agreement, provoked major institutional changes in the Mexican financial system, including the removal of obstacles to the entry of foreign banks. By signing up to NAFTA, Mexico had undertaken to open up the financial sector to international competition (albeit in different ways for different intermediaries), and this meant participation by foreign capital in local banking institutions. The process occurred in two stages; until 1998 foreign ownership of a bank’s equity was limited to 50%; but thereafter the limit was completely lifted, thereby fully liberalizing the sector.
Opening-up occurred as part of a general restructuring of the banking sector, which had been severely weakened by the “tequila crisis” and by a massive non-performing portfolio. To promote capitalization of the banking sector, the State took over the non-performing portfolio amounting to some US$ 120 billion. This was managed by the Bank Savings Protection Fund (FOBAPROA), which subsequently became the Bank Savings Protection Institute (IPAB). The fund was recognized as public debt guaranteed by the State, on which the latter paid interest of the order of 40% per year until late 2000 - firstly to local banks and then to foreign ones. The sale of local banks to foreign banking institutions involved large volumes of foreign exchange. In 2000, BBVA paid US$ 1.75 billion to acquire Bancomer. Its rival, BSCH, purchased Serfin for US$ 1.56 billion in 2001, and Citigroup paid US$ 12.5 billion for Banco Nacional de México (BANAMEX). The final entrant, HSBC Holdings, paid US$ 1.14 billion in August 2002 for the Bital financial group, the fourth-largest player in the Mexican financial system. As these monies went straight into the hands of the banks’ former shareholders, the process did nothing to reduce the bank debt which the State had had to assume in order to bail out the system.
Foreign banks have also had access to cheaper funds than those mentioned above, but this did not result in credit expansion or lower costs for Mexican firms. The fact that domestic banks have been acquired by foreign institutions has not altered their oligopoly status or risk-aversion, and they continue mainly to live off high yields obtained on risk-free assets, such as public bonds. This means that their rent-seeking relationship with the State has not changed. Bank profits grew rapidly following their acquisition by foreign institutions (see figure 2). Although the yield on public bonds has fallen sharply (in 2002 it dropped below 10%), instead of lending to firms or families, the banks have raised their service commissions to shore up their profitability. This partly explains why credit has ground to a standstill in Mexico: the change of ownership in the private bank sector has not stimulated greater competition, and banks have accommodated their strategy to portfolio-allocation and risk-evaluation practices that discourage lending. The recession of recent years, compounded by doubts that bankruptcy legislation would be effectively enforced, have been powerful motives for banks not to alter their behaviour.
Source: Prepared by the authors.
FO REIGN BANKS IN LATIN AM ERICA: A PARADOXICAL RESULT • G RACIELA M OGUILLANSKY, RO G ERIO STUDART A ND SEBASTIÁN VER G A RA

30 C E P A L R E V I E W 8 2 • A P R I L 2 0 0 4
F IG U R E 2
Mexico: Net income of the banking system, 1997-2001(Millions o f dollars)
2000 ---------------------------------------------------------------------------------
1500 ------------------------------------------------------ = . --------- —
1000 —
500 --------- —
0 — ----- — i— -------— i— -------— i— ------— i— ------— i1997 1998 1999 2000 2001
Source: Prepared by the authors on the basis o f Latin Finance (2002) and Latin Banking Guide & Directory (2002).
b) Spreads and the cost o f credit
With regard to bank intermediation, although spreads actually narrowed between 1997 and 2001 in nearly all the Latin American countries, spreads have remained large, resulting in average interest rates that are far above inernational levels. In Brazil, for example, spreads remain above 30%, with lending rates over 45%, despite the central bank having implemented an explicit policy since 1999 to reduce spreads through lower compulsory reserve requirements and measures to increase competitiveness and transparency,
among others. Despite the significant increase in for- eign-bank participation in the region, only two of the seven countries analyzed (Chile and Venezuela) had spreads no larger than 6% in 2001; but even this was far above the averages in OECD and Asian countries.
Except for Brazil, there are no figures that distinguish foreign and local banks in terms of spread, although the signs are that they are quite similar. In Brazil, spreads among local and foreign banks are not only very similar, but they also follow the same time trend. Although the increase in spreads is a reaction to higher risk stemming from macroeconomic instability, this is unrelated to the increase in overdue loans or in the reserves made by the banks. As shown in table 9, in at least three countries (Brazil, Chile and Venezuela) local banks made smaller provisions against the non-performing portfolio in 2001 than the average for the period 1997-2001; the same is true of foreign banks in Brazil and Chile. To summarize, the entry of foreign banks has not had a very significant effect on the cost of capital, since this responds more to the macroeconomic climate than to differences in cost management, for local and foreign players alike. Foreign banks seem to be adapting to the regional reality rather than imposing their own dynamic on the determination of capital costs.
TABLE 8
Latin America (15 countries): Bank intermediation spreads, 1997-2001
Country Deposit rates Spreads Lending rates
1997 2002 1997 2002 1997 2002Argentina 7.0 40.9 2.1 10.8 9.2 56.2Bolivia 14.7 9.3 30.8 10.5 50.1 20.8Brazil 24.4 18.6 43.3 36.2 78.2 61.5Chile 12.0 3.9 3.3 3.8 15.7 7.9Colombia 24.1 9.2 8.1 6.8 34.2 16.5Costa Rica 13.0 11.3 8.4 13.5 22.5 26.3Ecuador 28.1 5.4 11.7 9.2 43.0 15.1Guatemala 5.8 7.0 12.1 9.3 18.6 16.9Honduras 21.3 14.1 8.9 7.7 32.1 22.9Mexico 14.7 2.9 8.6 6.3 24.5 9.3Panama 7.0 5.0 3.4 5.2 10.6 10.5Paraguay 13.0 22.5 13.1 9.4 27.8 34.0Peru 15.0 4.1 13.0 10.2 30.0 14.7Uruguay 19.6 33.5 43.4 64.9 71.6 120.1Venezuela 14.7 29.3 7.8 5.9 23.7 36.9Simple average Latin America 15.6 14.5 14.5 14.0 32.8 31.3Weighted average L. America 18.6 14.6 21.6 18.4 45.0 36.3Simple average OECDa 0.1 3.7 3.8Simple average Asiab 1.9 3.5 5.4
Source: Prepared by the authors on the basis o f IMF (2002).a Sample includes Germany, Italy, Japan, Netherlands, Spain, Switzerland and the United States. b Sample consists o f Indonesia, South Korea, Malaysia, Philippines, Singapore and Thailand.
FO REIGN BANKS IN LATIN AM ERICA: A PARADOXICAL RESULT • G RACIELA MOGUILLANSKY, ROGERIO STUDART A ND SEB ASTIÁ N VERGARA

C E P A L R E V I E W 8 2 • A P R I L 2 0 0 4 31
TABLE 9
Latin America: Ratio between provisions for doubtful loans and non-performing loans, 1997-2001
Local banks Foreign banks
1997-2001 1997 2001 1997-2001 1997 2001
Argentina 2.68 0.72 4.22 1.90 0.75 5.13Brazil 1.43 1.67 0.74 1.58 1.83 0.62Chile 2.14 2.71 1.76 2.69 2.85 1.57Colombia 0.78 0.48 2.05 0.98 0.54 1.84Mexico 1.84 1.27 2.75 2.47 1.00 1.59Peru 1.18 1.37 1.42 1.21 1.01 1.43Venezuela 1.67 2.45 1.39 1.82 2.03
Source: Prepared by the authors on the basis o f IMF (2002).
c) Stability o f the banking sector
To evaluate the impact of foreign banks on the macroeconomic effectiveness of regional banking systems, a different criterion is useful, namely stability. Before the arrival of foreign banks, much was said about their likely beneficial effect in terms of making the system less fragile. At least three arguments were deployed: i) foreign banks would have more sophisticated risk-management systems, based on more rigorous supervision by the authorities in their countries of origin; ii) they would be less vulnerable to the region’s domestic cycles, because their effective exposure to them would be relatively small in relation to their broad global diversification; and iii) local subsidiaries of foreign banks would always be able to rely on their parent companies in the event of abrupt swings in liquidity.
Considering only indicators of risk management and provision against losses, clearly the foreign banks must have contributed to a sounder banking system. Nonetheless, as Stallings and Studart (2001) indicate, the violent macroeconomic shocks of recent years rendered even the most sophisticated monitoring and riskmanagement systems ineffective. In fact, in highly unstable macroeconomic situations, such systems may even aggravate risk, given their well-known pro-cyclical properties.5 Accordingly, it is not surprising that foreign banks, which in general have more sophisticated (and more conservative) risk evaluation systems than
their local counterparts, end up reacting to economic cycles in a much more accentuated fashion.
As regards the argument that the global diversification of foreign banks has positive effects on stability, the other side of the coin is that these banks are much more sensitive than local ones to expectation shocks originating in the advanced economies. For that reason, just as international banks have reduced their exposure to the region’s economies (BIS, 2001a), their local subsidiaries have adopted an increasingly cautious stance.
Lastly, in response to the argument that foreign banks can count on unconditional support from their parent companies at times of liquidity loss, two comments need to be made. Firstly, the possibility of supporting their subsidiaries is compromised by the fact that the parent company has to maintain in its country of origin a level of capital compatible with the weighted risk of its assets. This is because episodes of financial crisis in an emerging country are usually reflected in its “country-risk” rating, and any contribution from the parent company has to represent an expansion of its global capital. As seen recently in the Argentine crisis, this places severe restrictions on the ability of parent companies to supply funds at times of major macroeconomic uncertainty and/or liquidity crisis in emerging economies. Secondly, there are provisions in financial- system regulations that prohibit supporting the liquidity of an ailing subsidiary under certain circumstances. For example, legislation in the United States6 establishes that a bank is not obliged to pay deposits made in a subsidiary abroad, if it is unable to do so because: a) a state of war, insurrection or civil revolt exists; or b) because it is prevented by an action or instrument of the government of the host country, undertaken without explicit written agreement with the bank. This law was added to the existing legislation in 1994, after Citibank was taken to court by depositors in the Philippines and Vietnam and lost the respective cases.
In short, the macroeconomic effectiveness of the banking system is profoundly damaged by the current macroeconomic climate, which is extremely unfavourable for banking activity. This climate generates a more cautious attitude on the part of the banks, which in turn leads to a credit standstill, maintenance of
5 As Borio, Farfine and Lowe (2001) show, the pro-cyclical nature o f the banking system, stems from the fact that most risk evaluation systems work with a horizon that is too short to accurately determine default risks and correctly value the financial and real assets used as collateral. Accordingly, at times o f economic retrenchment, risk indicators tend to rise very sharply, while the values o f the assets posted in guarantee decline. As a result o f these two movements, the banking system as a whole tends to behave more
cautiously, leading to a credit contraction (or slowdown in its growth), which, in turn, ends up generating a vicious circle. As the macroeconomy becomes more volatile, credit risk is evaluated more cautiously, which intensifies the pro-cyclical nature o f the system.6 See section 25C of the Federal Reserve Act (section 326 of the Riegle-Neal Interstate Banking and Branching Efficiency Act, codified in 12 U.S Code section 633).
FO REIGN BANKS IN LATIN AM ERICA: A PARADOXICAL RESULT • G RACIELA M OGUILLANSKY, RO G ERIO STUDART A ND SEBASTIÁN VER G A RA

32 C E P A L R E V I E W 8 2 • A P R I L 2 0 0 4
very large spreads and a shortening of loan maturities. In order to avoid greater losses arising from macroeconomic instability in the region (especially in countries that suffered currency crises
IIIConclusions
The major presence of international banks in Latin America during the 1990s partly reflected their strategy of seeking markets throughout the world, and partly reflected changes in the economic climate and institutional context in the region. Regional penetration has produced costs and benefits, both for banking investors and for the financial systems concerned. In terms of benefits, until 2001 when the Argentine crisis broke out, foreign banks grew on a sustained basis, gaining a significant share of domestic banking systems, ranging from 34% in Colombia to 90% in Mexico in 2001. A decade earlier, Chile had been the country with greatest foreign participation, but this accounted for less than 20% of the market at that time. In addition, the profitability of foreign banks’ activities in the region was growing, whether measured by the return on assets or the return on equity; in some cases it exceeded the bank’s overall rate of return. At the same time, the foreign banks were expanding their participation in the capital market, especially in pension-fund management, one of the most attractive businesses for financial institutions.
The costs arose from various sources, including the region’s instability and its vulnerability to external shocks and currency crises; in many cases foreign banks also underestimated the local competition (Brazil is a good example of this). The Argentine crisis clearly marked the turning point in their expansion strategy, although the cost of this crisis depended on the importance of Latin America and particularly Argentina in the bank’s global business. At one extreme are the Spanish banks, whose interests in the region represented between 26% and 29% of their total assets. At the other are banks that only expanded in the treasury management or corporate banking segments. In the middle is Citigroup, whose global diversification prevented it from being seriously affected by the deterioration in regional conditions, notwithstanding its by no means negligible interests in the region (7% of total assets).
similar to that in Argentina), foreign banks adopt a more conservative stance, which entails maintaining high liquidity and therefore relatively low lending levels.
The analysis also shows that while foreign banks do not differ significantly from local ones in terms of operating efficiency, they do act more cautiously in the evaluation and management of risk. Nonetheless, the fact that there is no statistically significant efficiency difference between local and foreign banks does not mean they have not had a positive impact in the region. Clearly, the competition generated by the entry of foreign banks has galvanized efforts by local banks to cut costs and enhance profitability, in order to protect themselves from being driven out of the market. In fact, despite the oligopolistic nature of the industry, competition nowadays between large local banks and foreign ones is very strong. The interesting thing about the financial sector is that all competitors have access to state-of-the-art technology. As this is relatively cheap, it is not exclusive to foreign banks, thanks to progress made in information and communication technology, which the financial system uses particularly intensively. Nonetheless, with few exceptions -Chile being one- the cost reduction generated by technological progress has not been passed on in the form of cheaper financial services either for firms or for individuals. Worse still, it has also failed to improve access to credit for firms.
Accordingly, the positive outcome for the region in terms of microeconomic efficiency stands in contrast to the macroeconomic impact (the effectiveness of foreign-bank participation in the system), as measured by the conditions under which credit is extended, the availability of business financing, and the stability of the system. The analysis leads to the conclusion that foreign banks have not had a significant effect at this level: they are more cautious than their local counterparts when extending credit, and their response to crises is clearly pro-cyclical, all of which intensifies the effects of monetary tightening. Despite management efficiency, interest-rate spreads only narrowed in four of the seven countries analyzed, and even in those they remained extremely high - way above rates in
FO REIGN BAN KS IN LATIN AM ERICA: A PARADOXICAL RESULT • G RACIELA MOGUILLANSKY, RO G ERIO STUDART A ND SEBASTIÁN VER G A RA

C E P A L R E V I E W 8 2 • A P R I L 2 0 0 4 33
Asia, not to mention those in OECD countries. Spreads have reacted more to the macroeconomic environment than to differences in cost management, and foreign banks seem to be adapting to the national reality in this respect, rather than imposing their own dynamic on the cost of capital.
Lastly, in terms of reaction to systemic crises, the experience of recent years has shown that the behaviour of transnational corporations towards their subsidiaries and branches depends on a number of
factors: the institutional framework in the corporation’s country of origin; the institutional framework in the host country; and steps taken by the local authorities during the crises. In practice, the parent companies of international banks cannot be considered lenders of last resort; their behaviour at times of crisis has depended on the nature of the problems the banks were facing in the host country and the type of establishment in question.
FO REIGN BANKS IN LATIN AM ERICA: A PARADOXICAL RESULT • G RACIELA M OGUILLANSKY, RO G ERIO STUDART A ND SEBASTIÁN VER G A RA

34 C E P A L R E V I E W 8 2 • A P R I L 2 0 0 4
Appendix
Latin America (6 countries): Trend of liquidity index in each country, by type of bank, 1997-2001
]M7 1WS IW 2ÜM :ilul
Source: Latin Finance (2002).
FO REIGN BANKS IN LATIN AM ERICA: A PARADOXICAL RESULT • G RACIELA MOGUILLANSKY, ROGERIO STUDART A ND SEB ASTIÁ N VERGARA

C E P A L R E V I E W 8 2 A P R I L 2 0 0 4 35
TABLE A.1
Latin America (seven countries): Confidence in the region, by profitability indicators, 1997-2001a
Country Return on assets Return on equity
Local banks Foreign banks Local banks Foreign banks
Argentina 0.25 ~ 1.32 -0.16 ~ 0.77 -2.35 ~ 8.48 3.43 ~ 8.62Brazil 0.57 ~ 1.23 0.44 ~ 0.98 9.52 ~ 15.07 4.35 ~ 12.59Chile 0.64 ~ 0.98 0.45 ~ 0.68 10.55 ~ 15.67 8.16 ~ 12.74Colombia -1.02 ~ 0.78 -0.57 ~ 0.75 3.95 ~ 10.91 4.74 ~ 11.75Mexico 0.48 ~ 1.83 0.78 ~ 1.64 3.43 ~ 10.32 7.86 ~ 14.53Peru 0.34 ~ 1.17 0.13 ~ 0.90 5.39 ~ 10.1 2.21 ~ 8.86Venezuela 1.65 ~ 2.74 1.77 ~ 2.97 12.36 ~ 17.01 11.63 ~ 19.22
Source: ECLAC, on the basis o f Latin Banking Guide & Directory (2002). a 95% of confidence.
TABLE A.2
Latin America (seven countries): Confidence in the region, by efficiency indicators, 1997-2001a
Country Overdue loans /Gross loans Operation expenses/Total income
Local banks Foreign banks Local banks Foreign banks
Argentina 63.1 ~ 96.1 66.7 ~ 103.4 8.2 ~ 13.3 4.6 ~ 7.2Brazil 75.4 ~ 85.0 75.6 ~ 110.8 7.1 ~ 13.4 3.3 ~ 6.0Chile 74.4 ~ 91.1 57.0 ~ 73.0 1.2 ~ 1.9 0.7 ~ 1.2Colombia 87.4 ~ 118.1 82.2 ~ 140.3 6.3 ~ 9.6 4.6 ~ 7.6Mexico 80.8 ~ 136.3 79.6 ~ 101.4 4.6 ~ 7.6 0.9 ~ 2.9Peru 87.0 ~ 96.2 84.6 ~ 110.1 5.5 ~ 8.0 5.3 ~ 7.3Venezuela 70.0 ~ 77.6 69.9 ~ 80.5 4.5 ~ 9.4 3.1 ~ 5.4
Source: ECLAC, on the basis o f Latin Banking Guide & Directory (2002). a 95% of confidence.
(Original: English)
Bibliography
BIS (Bank for International Settlements) (2001a): Cycles and the financial systems, B IS Annual Report, Basel.
(2001b): The Banking Industry in the Emerging M arketE conom ies: Competition, C onsolidation and System ic Stability, BIS Papers, No. 4, Basel.
Borio, C., C. Farfine and P. Lowe (2001): Procyclicality o f the Financial System and Financial Stability: Issues and Policy Options, BIS Papers, No. 1, Basel.
ECLAC (Econom ic Com m ission for Latin A m erica and the Caribbean) (1995): Reformas económicas en Am érica Latina: una síntesis de la experiencia en once países, LC/R.1606, Santiago, Chile.
_______ (1996): Strengthening Development. The Interplay offMacro- and Microeconoomics, “Libros de la CEPAL” series, No. 42, LC/G.1898-P, Santiago, Chile, July. United Nations publication, Sales No. E.96.II.G.2.
(2002): Foreign In-vestment in Latin Am erica and theCaribbean. 2001 Report, LC/G.2178-P, Santiago, Chile, October. United Nations publication, Sales No. E.02.II.G.47.
(2003): Foreign In-vestment in Latin Am erica and theCaribbean. 2002 Report, LC/G.2198-P, Santiago, Chile, April. United Nations publication, Sales No. E.03.II.G.11.
Held, G. and L.F. Jiménez (2001): Liberalización financiera, crisis y reforma del sistema bancario chileno: 1974-1999, in R. French-Davis and B. Stallings (eds.), Reformas, crecimiento y políticas sociales en Chile desde 1973, Santiago, Chile, ECLAC/LOM Ediciones.
IMF (International Monetary Fund) (2000): International Capital M arkets: Developments, Prospects, and Key Policy Issues, Washington, D.C.
(2001): International Capital M arkets: Develop-ments,Prospects, and Key Policy Issues, Washington, D.C.
(2002): International Financial Statistics, Washington,D.C., June.
Latin Banking Guide & D irectory (2002): http: www.latinfinance. com, August.
Latin Finance (2002): http://www.latinfinance.com, September. Salomon Smith Barney (2001): Foreign Financial Institutions in
Latin America. 2001 Update, New York, December.Stallings, B. and R. Studart (2001): Financial Regulation and
Supervision in Emerging M arkets: The Experience o f Latin Am erica since the Tequila Crisis, W IDER Discussion Paper, No. 2002/45, Helsinki, United Nations University.
FO REIGN BANKS IN LATIN AM ERICA: A PARADOXICAL RESULT • G RACIELA M OGUILLANSKY, RO G ERIO STUDART A ND SEBASTIÁN VER G A RA

37
A n d r e w M o ld
T r a d e a n d R e g io n a l
I n t e g r a t i o n D iv is i o n ,
U n i t e d N a t i o n s E c o n o m i c
C o m m i s s i o n f o r A f r i c a ,
A d d i s A b a b a , E t h i o p ia
f andym old2003@ yahoo.com
C E P A L R E V I E W 8 2 • A P R I L 2 0 0 4
A proposal for unitary taxes on the profitsof transnational corporations
Andrew Mold
F.M - o r e i g n d i r e c t i n v e s t m e n t (FDI) in d e v e l o p i n g c o u n t r i e s h as b ee n
i n c r e a s i n g at an u n p r e c e d e n t e d r a t e , a n d t h e p r o f i t a b i l i t y o f t h e
o p e r a t i o n s o f t h e i n v e s t i n g f i r m s in p o o r r e g i o n s l ike S u b - S a h a r a n
A f r i c a is e x t r a o r d i n a r i l y h i g h . Ye t at t h e s a m e t i m e t h e r e is g r o w i n g
e v i d e n c e t h a t t r a n s n a t i o n a l c o r p o r a t i o n s (TNCs) are p a y i n g less a nd
less in t e r m s o f tax. T h e d e v e l o p i n g c o u n t r i e s in p a r t i c u l a r h av e s u f
f e r ed f r o m t h i s — it ha s b e e n e s t i m a t e d t h a t d e v e l o p i n g c o u n t r y g o v
e r n m e n t s l o se at l e a s t U S $ 3 5 b i l l i on a y e a r o f r e v e n u e t h r o u g h t ax
a v o i d a n c e p r a c t i c e s . Th i s p a p e r p r e s e n t s e m p i r i c a l e v i d e n c e a n d a
p r o p o s a l f o r a p p l y i n g a u n i t a r y t a x s y s t e m on t h e p ro f i t s o f T N C s .
S u c h a s y s t e m w o u l d e l i m i n a t e o n e o f t h e m o s t p o w e r f u l m e c h a
n i s m s at t h e d i s p o s a l o f T N C s f o r i l l egal l y a v o i d i n g t a x p a y m e n t s —
t r a n s f e r p r i c in g . T h e p a p e r c o n c l u d e s b y a r g u i n g t h a t a p r o p o s a l fo r
a u n i t a r y t a x s y s t e m on a w o r l d w i d e b a s i s m a y b e s u f f i c i e n t t o
u n b l o c k t h e n e g o t i a t i o n s on a m u l t i l a t e r a l i n v e s t m e n t c o d e .

38 C E P A L R E V I E W 8 2 • A P R I L 2 0 0 4
IIntroduction
After a lost decade of structural adjustment and reductions in government expenditure, there is a growing acknowledgement that developing countries should be searching for new sources of revenue. It has recently been estimated, for example, that there is a shortfall of up to US$80 billion per year in developing countries between what is spent and what should be spent to ensure universal access to basic health and education (Mehrotra, Vandemoortele and Delamonica, 2000). Yet as a result of continuous pressure from the international financial institutions to reduce expenditure, the capacity of the State to provide such services has been seriously weakened in many regions.
Indeed, in some countries revenues are so low that the State is in danger of disintegrating. In Guatemala, for instance, State expenditure currently barely reaches 10% of GDP, and the government has apparently given up any pretence of meeting its obligations with regard to the provision of basic social services, shifting its responsibilities onto the NGO sector: a role which NGOs are obviously ill-equipped to fulfill. In a similar vein, commenting on the case of Mexico, the ex-President of Uruguay Julio María Sanguinetti recently asked “how is it possible to carry out social programmes in Chiapas when the fiscal pressure of the Mexican State is equivalent to only 10% of GDP?” 1 The irony is that these trends have coincided with a growing consensus on the need to build up State and institutional capacity if any progress is to be made in the eradication of poverty. Increasingly, the international financial institutions and many donor governments are putting emphasis on “getting the institutions right” and attaching “governance-related conditionalities”, but there seems to be little predisposition towards finding new ways to provide the necessary finance to support these changes.
In such a context, it seems only logical to place more emphasis on revenue-creating strategies. Ambitious proposals for taxes to help finance development such as the Tobin Tax have apparently fallen by the wayside, in part because of doubts about their effectiveness, and in part simply because of a lack of
political will to push the proposals through.2 Little attention, on the other hand, has been paid to the possibility of increasing tax revenue through more efficient taxation of the operations of transnational corporations (TNCs). Foreign direct investment (FDI) towards developing countries has increased more than fourfold since the early 1990s (from an average of US$ 47 billion between 1988-1993 to US$ 238 billion in 2000 (UNCTAD, 2002, Annex, Table B.1.). The growing globalization of international production confers enormous benefits on TNCs. Facilitated by liberalization and structural adjustment programmes, they have been able to enter new markets in developing countries, and have participated in privatization programmes, buying public assets often at highly favourable prices. Reflecting the opportunities available, and contrary to popular opinion, in developing regions profitability can be extraordinarily high. For example, data for United States companies reveal an average profit rate for operations in Sub-Saharan Africa in excess of 25% over the last five years (Mold,2001). In other words, companies recover their initial investment in just four years. Clearly, globalization has been good for the largest TNCs.
Yet there are signs that the boom in FDI has been accompanied by a growing ability of TNCs to avoid tax payments in the jurisdictions where they have operations. Some of the evidence is anecdotal. For instance, a few years ago it was revealed that Newscorp Investments, a holding company with 101 subsidiaries owned by the Australian media tycoon Rupert Murdoch, had made £1.4 billion in profits since June 1987, but had paid no net British corporation tax at all (The Economist, 1999). The situation clearly has to be explained in terms of the company’s extensive use of tax loopholes to shelter profits in tax havens.
Newscorp Investments is far from an isolated example. A systematic study in the United States (McIntyre and Nguyen, 2000) found that household names such as Goodyear, Texaco, Colgate-Palmolive, MCI WorldCom and eight other large corporations
---------------------------------------------------------------------------------------------- 2 For a discussion o f the practicalities involved see Haq Kaul and1 See E l pa ís 2001 p. 7. Grunberg (1996).
A PRO PO SAL FOR UNITARY TAXES ON THE PROFITS OF TRANSNATIO NAL CO RPO RATIO NS • AN D R E W MOLD

C E P A L R E V I E W 8 2 • A P R I L 2 0 0 4 39
earned more than US$12.2 billion in profits in the period from 1996-98, but none of them ended up paying corporate income taxes in the United States over the same period. Of the 250 large publicly traded companies analyzed in the study, a total of 24 owed no tax or received credits against past or future tax obligations in 1998, and 71 paid taxes at less than half the official 35% corporate rate during the three-year period. Similarly, a study by Altshuler, Grubert and Newlon (1998) on the effective tax rates paid abroad by large United States manufacturing affiliates revealed that average rates had fallen by more than 15 percentage points between 1984 and 1992.
Developing countries are particularly vulnerable to this type of tax avoidance strategies. Although the level of fiscal pressure is generally lower than in industrialized countries, they have far less institutional capacity to control tax evasion. Typically, they lack sufficient information from the parent company to be able to challenge transfer pricing and other forms of tax avoidance. Much of their FDI is located in sectors like the oil industry, electronics and forestry products, where the potential for tax avoidance is high. Because a considerable share of total developing country trade is under the control of TNCs, such countries are typically more vulnerable to tax avoidance practices through the over- or under- invoicing of imports and exports.
Moreover, in many developing countries a combination of low corporate taxes and the extensive use of tax breaks and tax holidays to attract foreign investment has meant that TNCs have reduced their tax liabilities dramatically. One of the most extreme cases is that of the 15 export processing zones/free trade zones set up in Honduras, where foreign firms have been granted permanent exemption from all taxes. But tax holidays of between 10-20 years are nowadays fairly commonplace in developing countries.3 Sri Lanka, for example, has 6 export processing zones (EPZs) which enjoy 10 to 20 year holidays for new large export projects or selected industries. These initiatives continue, in spite of an emerging consensus that, from a developmental perspective, these kinds of measures are ineffective or even counterproductive in the long run.4 These trends should force policy makers to consider
alternative methods of raising revenue. The existing system is clearly failing in terms of equity. This is true both from the point of view of what we could call internal and international equity- internal equity in the sense that within individual countries wage earners are increasingly having to finance through taxes the bulk of government expenditure, whereas internationally mobile capital is benefiting from a reduction in effective tax rates, and international equity in so far as there is evidence that tax income from TNC operations has been falling more rapidly in developing countries than in the industrialized countries. Indeed, the only “winners” in all this are the TNCs themselves and the tax havens with the lowest effective tax rates. Thus, whereas stocks of FDI for the world as a whole increased approximately ten-fold over the period from 1980 to 2000, the Cayman Islands experienced a more than 100-fold increase, to US$24.9 billion. With a population of only 36,000, this represents a massive US$700,000 of foreign investment per inhabitant. Similarly, Bermuda’s investment stock rose US$10 billion in just one year, from 2000 to 2001, and now stands at a total of more than US$66 billion. To put these figures in perspective, this is higher than the US$50 billion investment stock for the whole of Japan and, for a population of just 64,000, represents more than US$1 million per inhabitant (UNCTAD, 2002, Table B.3).
Beyond straightforward fraud, one of the principal ways in which TNCs manage to shift income towards low tax jurisdictions, and thereby reduce effective tax rates, is through transfer pricing. Transfer pricing involves manipulating the prices of intra-firm transfers of goods and services so as to lower tax liabilities in countries with high marginal tax rates, and increase profits in countries where the tax liability is correspondingly low. Over 80% of TNCs in one study admitted to facing a transfer pricing inquiry from local or foreign tax authorities at some point.5 Although it is illegal in principle, in reality transfer pricing is very hard for tax authorities to control. For many intra-firm transfers, it is very difficult for local authorities to establish a “correct” arms-length price. For instance, some types of components or intermediate products may be readily available on the open market, and thus it is relatively easy to compare the price paid by a subsidiary with the open market price. But other products may be specific to a particular company, and thus
3 A list o f selected export processing zones in developing countries elaborated by UNCTAD (1999 Annex table A.IX.3) reveals a total o f 16 EPZs with across-the-board tax exemptions. A further 15 EPZs enjoy a 10 to 20 year tax holiday.4 See for instance the article by IMF economists Zee Stotsky andLey (2002).
5 Lorraine Eden (1998) Taxing M ultinationals University of Toronto Press p.635 cited by Giddens (2000:102).
A PRO PO SAL FOR UNITARY TAXES ON THE PRO FITS OF TRANSNATIO NAL CO RPO RATIO NS • AN D R E W MOLD

40 C E P A L R E V I E W 8 2 • A P R I L 2 0 0 4
impossible to value in terms of a “market price”. This leaves tax authorities with a dilemma. How should they estimate the “correct” price of a product traded between affiliates? These difficulties are compounded when one considers that TNCs share all kinds of managerial and innovative resources (e.g. patents). The intangible nature of these goods and services means that in practice it is impossible to assign costs accurately between affiliates. It is not surprising, then, that TNCs have considerable leeway to adjust intra-firm prices so as to reduce tax liabilities to a minimum. Notwithstanding all these difficulties, tax authorities cling to the principle that for tax purposes each affiliate of a TNC should be considered as an independent unit.
Of course, in reality it has always been a fiction to consider the subsidiaries of TNCs as free-standing entities. As Vernon (1998, p.40) has commented, “in the real world, the profit allocated to each country by a multinational enterprise commonly is an artefact whose size is determined largely by precedent and by the debating skill of lawyers and accountants.” In an increasingly globalized world, however, where subsidiaries become deeply enmeshed in the international network of the firm, this fiction is rapidly becoming unsustainable. As we shall go on to show, it is also a very costly fiction for the host countries.
This brief paper offers a proposal for a different system of taxing TNC profits: unitary taxes. Briefly, unitary tax systems involve using some notional allocation of global profits instead of the declared profits by individual subsidiaries. This makes sense because the objective of the TNC is to maximize group profits; company administrators are generally indifferent to where those profits show up within the multinational network. Under a unitary tax system, the amount of profit taxes to be paid in each country would be assigned according to some criterion such as the share of each subsidiary in global sales, employment or assets.6
Clearly, this kind of system would not avoid all forms of tax avoidance. Action would still need to be taken to counter the multitude of other (illegal) methods of tax evasion. Fraudulent accounting practices, like those evident in the WorldCom and Enron scandals in the United States, would still be a problem.7 But a unitary system would significantly reduce the capacity of TNCs to shift profits from one location to another at will. The system would have the advantage of greater transparency, and would help to increase the overall tax take, freeing up resources which could be used to help achieve developmental objectives such as the universal provision of basic health and education. Although they may be reluctant to admit it, such a system might even result in long-run benefits for the TNCs themselves, reducing the need for them to devote valuable managerial time and resources to finding ways of minimizing their tax bills, and instead allowing them to pay more attention to building up the competitive strengths of their companies.
6 There is a risk in including labour in formula apportionment. The imposition o f a unitary tax system does not prevent different countries from imposing different corporate tax rates. Thus in countries with high relative corporate tax rates formula apportionment based on employment may provide a perverse incentive for TNCs to substitute capital for labour exaggerating a bias which already exists within the TNC because o f its relatively cheap access to capital. Evidence on this point from the U.S. experience can be found in Goolsbee and Maydew (1998). Given the priority attached to employment creation in both developing and industrialized countries it may be better to base unitary taxes on an alternative indicator or a combination o f different variables (see section IV).
7 Ironically o f course both the Enron and WorldCom cases meant higher tax payments because they involved the artificial inflation o f real profits - the losers in this case were principally the shareholders o f the companies in question. For a prescient critical analysis o f Enron’s operations ju st before the scandal broke see Bayliss and Hall (2001).
A PRO PO SAL FOR UNITARY TAXES ON THE PROFITS OF TRANSNATIO NAL CO RPO RATIO NS • AN D R E W MOLD

C E P A L R E V I E W 8 2 • A P R I L 2 0 0 4 41
iiEvidence of tax
Studies on the determinants of foreign direct investment both in developing and industrialized countries reveal that TNCs generally value highly locations with good infrastructure, a well-educated workforce, high-quality social services, etc.8 These are all public goods which are best provided by governments. Yet, at the same time, TNCs appear to be increasingly reticent to pay their contribution towards financing these public goods. In the United States, for example, corporate income taxes as a percentage of gross earnings fell from over 40% at the beginning of the 1960s to an average of only 21.5% between 1990-1996 (Poterba, 1999, table 3).9 As a share of United States federal tax revenue, corporate income taxes provided 32% of total revenue in 1952, but by 1999 the figure was only 10% (Weisbrot, Naiman and Kim, 2000, p. 15). For the Organization for Economic Cooperation and Development (OECD) as a whole, corporate taxes now account for only 8% of fiscal revenue, equivalent to just 3% of GDP (FitzGerald, 2001, p.7).
There are basically two channels through which globalization has facilitated such a big reduction in tax rates. Firstly, the growing importance of trade that takes place within the firm (i.e., between affiliates and the parent company) is enhancing the ability of firms with international operations to shift profits from one tax jurisdiction to another. Intra-firm trade now accounts for approximately a third of all world trade. This creates enormous problems for the national tax authorities, due to the use of “transfer prices” by TNCs and the likelihood that these enterprises manipulate these transfer prices to move profits to the jurisdictions where taxes are low. Moreover, as Tanzi (2000, p. 18) observes, “under present tax arrangements this problem is likely to grow. The tax authorities of many countries are now worried about this
avoidance by TNCs
trend, but are often at a loss on what to do about it”.The other means by which TNCs are managing
to reduce their effective tax rates is the pressure on governments to reduce taxation on internationally mobile capital. Governments are increasingly putting policies into place to attract foreign investment. Since 1991, a further 58 nations have begun to apply investment promotion policies, making a total of 116 countries that now do so (Moran, 1998, p.37). One of the most popular measures for attracting foreign investment is the granting of tax concessions. As an International Labour Organisation (ILO) report comments, “in a world characterized by a decisive trend towards “globalization”, where liberalization of trade and capital flows has become increasingly prevalent, the temptation for nation-States to engage in “competitive de-taxation” and “competitive deregulation” is self-evident” (ILO, 1997, p.70). Indeed, there are growing fears that this process is degenerating into a damaging “race to the bottom”, whereby the tax base of States is gradually eroded and the remaining tax burden falls disproportionately on non-mobile factors (especially labour) (Kozul-Wright and Rowthorn, 1998; Radaelli, 1999).10
This trend is easily observable in statutory corporation tax rates. In the past, countries typically levied taxes on the net incomes of corporations at marginal rates ranging from 30% to 50% (Caves, 1996, p.189). Moreover, there was little difference in corporation tax rates between developing and industrialized countries. In contrast, nowadays there is evidence of a widening gap between OECD and developing country rates. Few developing countries apply corporate tax rates in excess of 20%. According to estimates by Oxfam (2000), if developing countries were applying OECD corporate tax rates their
8 An extensive review o f econometric studies on the locational determinants o f FDI is to be found in Mold (2000).9 In the United States case at least it may be misleading to attribute this fall in corporative income tax rates to trends related to globalization: the main cause would seem to be the passing of theEconomic Recovery Act o f 1981 which resulted in a sharp declinein corporation tax rates (Poterba 1999 p.13).
10 O f course there is nothing new in these fears. In an article published back in 1974 entitled “Coming Investment Wars” Bergsten was particularly prophetic on this point: “M any investments are largely indifferent to location and hence close to zero-sum games; in such cases a decision that is one party’s gain is another party’s loss. Furthermore world welfare may actually decline as a result of some foreign investments such as those induced primarily by host- country tax preferences” (Bergsten 1974 p.145)
A PRO PO SAL FOR UNITARY TAXES ON THE PRO FITS OF TRANSNATIO NAL CO RPO RATIO NS • AN D R E W MOLD

42 C E P A L R E V I E W 8 2 • A P R I L 2 0 0 4
revenues would be at least US$35 billion higher.11 But the changes are even more notable when effective tax rates are calculated.12 For instance, calculations carried out for this study on data for majority-owned subsidiaries of United States firms reveal that on a worldwide basis their average effective tax rates have fallen from 49.6% of pre-tax income in 1983 to a mere 23.3% in 1998 (see Annex and figure 1).
Developed and developing countries: Effective tax rates paid by United States majority-owned affiliates, 1983 and 1999(Porcentage)
Source: Prepared by the author on the basis o f United States Department o f Commerce data (see Annex).
11 This figure was calculated using an estimated FDI inward stock for developing countries o f US$1219 billion. It was assumed that that stock gave a rate o f return o f 20% and the tax rate was set at a typical OECD rate o f 35%. On that basis developing countries should be receiving tax revenues o f around US$85 billion a year from foreign corporations but they actually receive around US$50 billion per year at most. As the authors o f the study concede how ever this is likely to be an extremely conservative estimate as not only do official figures tend to understate the true value o f FDI stock but also these figures fail to take account o f the financial transactions o f large firms.12 Effective tax rates are defined as the ratio o f foreign income taxes to gross income (the sum o f net income plus foreign income taxes). If a high nominal rate o f corporation tax is accompanied by generous dispensations then a large discrepancy can appear between nominal and effective rates. From the point o f view o f the companies themselves what matters is obviously the effective rate.
Insofar as these figures probably substantially underestimate true pre-tax income, real effective tax rates are likely to be even lower. Moreover, whereas effective tax rates were marginally higher in developing countries than in the industrialized countries in 1983, by 1998 that relationship had been inverted, and effective rates were on average higher in developed countries (19.9% versus 23.1%).13 Another point which stands out from the figures calculated in the Annex is the large dispersion in effective tax rates. Thus, whereas in countries like Nigeria or Indonesia the effective tax rates in 1999 were 53.3% and 32.2 % respectively, for Luxembourg, Bermuda, Panama or Switzerland the corresponding figures were only 2.5%, 2.8%, 0.5% and 5.7%. The incentive to shift pre-tax profits towards the latter tax jurisdictions is obviously very strong indeed.14, 15
13 These findings are broadly comparable with the conclusions o f a study carried out by Altshuler Grubert and Newlon (1998) on the average effective tax rates for large United States manufacturing firms. Their study was based on data from the US Treasury corporate tax files between 1980 and 1992. They found that rates fell by more than 15 percentage points between 1984 and 1992. Falls in effective taxation rates were particularly sharp in m any developing countries.14 Some developing areas in particular Africa appear to have very high effective tax rates. These figures do not necessarily reflect high overall rates however. Rather they reflect the sectoral spread o f investment (principally in the oil and mining industries) where the share o f gross income retained by the host government is relatively high. Thus in the case o f Nigeria for instance whereas the effective rate for all industries was 32.4% according to figures provided in the aforementioned study by Altshuler Grubert and Newlon (1998) the effective tax rate for United States manufacturing firms in Nigeria was only 13%. The high apparent tax rates on the oil and mining sectors may also be the product o f extensive transfer pricing activity giving a misleading impression o f real effective tax rates.15 There is an important caveat to be made here. Some importantsource countries o f FDI provide foreign tax credits that can be offset against taxable income. For instance the US government obtains very little corporate tax revenue from the profits o f US firms in high-tax countries since the taxable profits in those countries generate foreign tax credits that erase any residual US tax liability. By contrast a large fraction roughly 40% o f US revenue from taxing the foreign profits o f United States corporations comes from taxing their tax haven profits (Hines and Rice 1994 p.150). Thus tax credit systems can lead to the perverse result o f larger tax payments in the investor’s home country. Because o f this phenomenon in some circles tax holidays have become known as “reverse foreign aid” (Wells and Allen 2002 p.8). It would be interesting to extend our analysis to countries which do not provide extensive tax credits like France - we could expect much higher incentives to switch profits to low tax jurisdictions in these cases.
FIG U R E 1
A PRO PO SAL FOR UNITARY TAXES ON THE PROFITS OF TRANSNATIO NAL CO RPO RATIO NS • AN D R E W MOLD

C E P A L R E V I E W 8 2 • A P R I L 2 0 0 4 43
iiiThe implications
From the point of view of reducing the overall tax take, the repercussions of such “investment wars” are potentially very damaging for developing countries. Tax breaks and holidays are becoming increasingly generous. In some cases, such as Honduras, Jamaica, Namibia and Senegal, firms have been granted permanent tax exemptions. Tax holidays in export processing zones have on occasions been stretched out to as much as 20 years. Yet one of the ironies of offering increasingly generous tax breaks is that the evidence regarding the impact of tax regulations on business location decisions is ambiguous. For instance, a detailed study by Wells and Allen (2002) into the elimination of tax holidays in Indonesia found no detectable impact on the subsequent ability of the country to attract substantial flows of foreign investment. Likewise, in an econometric study of the locational decisions taken by U.S. and Japanese manufacturing firms in 74 host countries, Kumar (1999) finds scant evidence that lower tax rates or tax incentives affect the decision to produce in developing countries. Indeed, the results of some of Kumar's regressions seem to suggest that higher tax rates were positively related to higher levels of production by foreign subsidiaries.16 Although there are obviously individual cases where tax rates have affected the final decision, on the whole TNCs seem to take a long-term view of locational decisions, and are more likely to be swayed by factors such as the quality of local infrastructure, the availability of a well-educated workforce and, probably most importantly of all, a dynamic local market.
Findings such as these lead credence to the idea that governments have conceded too much to TNCs in exchange for too little - tax competition is not even a very effective way to attract long-term foreign investment. Indeed, there are other more effective ways of
16 For a recent review of these studies see Morriset and Pimia(2002). It is true that some more recent studies do find a relationship between fiscal pressure and investment studies: much would seem to depend on how the tax variable is defined in the regression analysis (effective tax rates would seem to have much stronger explanatory power than nominal tax rates). Nonetheless as Hines (1996a p.8) acknowledges even in these studies the impact o f tax rates on the location and volume of investment still tends to be relatively small.
for developing countries
attracting FDI rather than having to depend on tax breaks. It has been suggested, for example, that a better policy would be to support investment in human capital, education, or local technological capacity (MacEwan, 2001, pp.299-300). That way, if the subsidiary is eventually closed, or lost to a country with a lower tax rate, then at least the government retains the benefits of the initial investment in terms of a better educated workforce or an improved infrastructure. If the only incentive offered is a low tax rate, all is lost if the company finally decides to locate elsewhere.
In addition, despite the great enthusiasm shown by policymakers, for developing countries as a group the potential gains to be reaped by attracting FDI through tax breaks and reductions are probably limited. For instance, it has been estimated that total employment in developing country Export Processing Zones (EPZs) is no more than 4 million (Dicken, 1998, p.131).17 Jobs in EPZs typically represent no more than 5% of total employment in the manufacturing sector of developing countries: a tiny amount compared with the estimated 300 million people who work in the "informal sectors" (Madeley, 1999, p.113). When one considers that there are an estimated 1,200 million people living on less than US$1 a day, it is clear that the potential impact of EPZs on poverty reduction is limited.18 It is also no coincidence that, with the exception of Mexico and China, the developing countries that have made best use of these practices to attract foreign investment tend to be relatively small island States such as Mauritius. In short, as models which other developing countries could follow, their relevance is limited. Reviewing the evidence, one group of IMF economists conceded that “setting-up and/or maintaining export processing zones is rarely advisable” (Zee, Stotsky and Ley, 2002, p. 1507). Yet governments of developing countries have allocated substantial amounts of scare funds, and forfeited a considerable
17 M oreover those jobs are highly concentrated geographically. Mexico alone accounts for 600 000 jobs and China too is responsible for a large share o f total employment in EPZs. The vast majority o f developing countries have an insignificant share in the employment generated by such zones.18 There are o f course all kinds o f potential spillover effects to be gained from the entry o f foreign firms. But there is no automatic guarantee that such positive spillovers will be forthcoming.
A PRO PO SAL FOR UNITARY TAXES ON THE PRO FITS OF TRANSNATIO NAL CO RPO RATIO NS • AND REW MOLD

44 C E P A L R E V I E W 8 2 • A P R I L 2 0 0 4
amount of tax income, to attract companies into EPZs.Of course, the proposal made in this paper to
revive the debate on unitary taxes can do little to avoid tax competition and “investment wars”. That is a problem which clearly requires greater coordination between tax authorities. But the transfer pricing problem can indeed be tackled through unitary taxes. Developing countries are particularly susceptible to income shifting of this kind. Much of their investment stock is in primary industries. Sectors like the oil industry are renowned for their ability to move funds in and out of countries. Transfer pricing is facilitated by the large volume of cross-border transactions in the mining and oil sectors. Nor do developing country fiscal authorities have the capacity to control transfer pricing activities to the same extent as the developed countries.
There are a number of other incentives which encourage TNCs to indulge in intensive transfer pricing activity in developing countries. Although in the past profit taxes have tended to be lower than in industrialized countries, the level of ad valorem tariffs on trade is still usually higher in developing countries. By under-invoicing the true cost of intra-firm imports or exports, TNCs often use transfer pricing to minimize payments of trade duties. Similarly, as a way of promoting the reinvestment of earnings in the host economy, developing country governments have traditionally imposed more restrictions on profit repatriation than developed counties. In the face of such restrictions, however, the transfer price mechanism has provided TNCs with an alternative form of shifting income out of a country (Grimwade, 2000, p.149).
To what extent is the potential for manipulation of transfer prices actually used to the detriment of developing countries? Most of the empirical studies on this subject date back to the 1970s and 1980s. But, as Elson (1995, p.305) observes, the few systematic investigations that have been carried out have all shown that transfer prices are used to the detriment of developing countries. For instance, one early study by Vaitsos (1977) into the pharmaceutical industry in
Colombia revealed that reported profits accounted for only 3.4% of effective returns; royalties for 14.0%, and over-pricing for 82.6%. The additional cost of pharmaceutical imports alone for the Colombian economy was estimated at US$20 million a year. In addition, there was a substantial loss of government tax revenue - amounting to US$10 million a year - where transfer pricing was used to under-report profits. Investigations carried out by Lall and Streeten (1977, p.153) confirmed this pattern of systematic overpricing of imports by the pharmaceutical industry in Colombia: some individual items were found to be overpriced by up to 5,000-6,000%. Such practices were also prevalent in the rubber and electrical industries. More recent studies have tended to focus on comparisons of pre-tax profitability levels as an indirect measure of transfer pricing activity. An extensive study based on 1982 data carried out by Hines and Rice (1994) into the profitability of US affiliates in 59 host countries revealed that on average a 1% higher tax rate reduced the declared before-tax profitability by 2.3%.
It has often been argued that one way of minimizing abusive transfer pricing activity of this kind is to enforce joint ventures; local partners are hardly likely to countenance the massive shifting of income abroad. But the international liberalization of investment codes is making it increasingly difficult to impose joint ventures on TNCs. Moreover, even where local partners exist, they are often kept in the dark regarding the structure of costs. The true level of profitability is thus extremely difficult to gauge. As a former managing director of the Nigerian National Petroleum Corporation, a joint venture with Shell, commented: “proper cost monitoring of their [Shell’s] operations has eluded us and one could conclude that what actually keeps these companies in operation is not the theoretical margin but the returns which they build into their costs” (Obi and Soremekun, 1995, cited in Frynas, 1998, p.20).
A PRO PO SAL FOR UNITARY TAXES ON THE PROFITS OF TRANSNATIO NAL CO RPO RATIO NS • AN D R E W MOLD
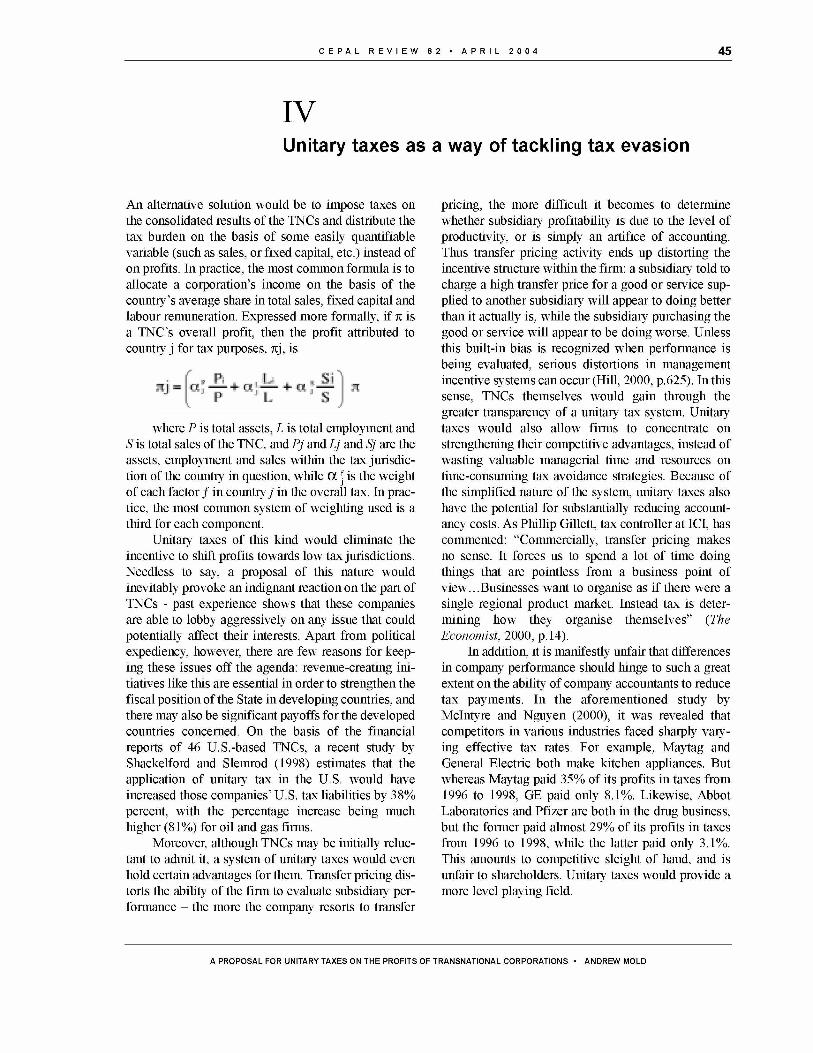
C E P A L R E V I E W 8 2 • A P R I L 2 0 0 4 45
IVUnitary taxes as a way of tackling tax evasion
An alternative solution would be to impose taxes on the consolidated results of the TNCs and distribute the tax burden on the basis of some easily quantifiable variable (such as sales, or fixed capital, etc.) instead of on profits. In practice, the most common formula is to allocate a corporation’s income on the basis of the country’s average share in total sales, fixed capital and labour remuneration. Expressed more formally, if n is a TNC’s overall profit, then the profit attributed to country j for tax purposes, nj, is
=
where P is total assets, L is total employment and S is total sales of the TNC, and Pj and Lj and Sj are the assets, employment and sales within the tax jurisdiction of the country in question, while a f is the weight of each factor f in country j in the overall tax. In practice, the most common system of weighting used is a third for each component.
Unitary taxes of this kind would eliminate the incentive to shift profits towards low tax jurisdictions. Needless to say, a proposal of this nature would inevitably provoke an indignant reaction on the part of TNCs - past experience shows that these companies are able to lobby aggressively on any issue that could potentially affect their interests. Apart from political expediency, however, there are few reasons for keeping these issues off the agenda: revenue-creating initiatives like this are essential in order to strengthen the fiscal position of the State in developing countries, and there may also be significant payoffs for the developed countries concerned. On the basis of the financial reports of 46 U.S.-based TNCs, a recent study by Shackelford and Slemrod (1998) estimates that the application of unitary tax in the U.S. would have increased those companies’ U.S. tax liabilities by 38% percent, with the percentage increase being much higher (81%) for oil and gas firms.
Moreover, although TNCs may be initially reluctant to admit it, a system of unitary taxes would even hold certain advantages for them. Transfer pricing distorts the ability of the firm to evaluate subsidiary performance - the more the company resorts to transfer
pricing, the more difficult it becomes to determine whether subsidiary profitability is due to the level of productivity, or is simply an artifice of accounting. Thus transfer pricing activity ends up distorting the incentive structure within the firm: a subsidiary told to charge a high transfer price for a good or service supplied to another subsidiary will appear to doing better than it actually is, while the subsidiary purchasing the good or service will appear to be doing worse. Unless this built-in bias is recognized when performance is being evaluated, serious distortions in management incentive systems can occur (Hill, 2000, p.625). In this sense, TNCs themselves would gain through the greater transparency of a unitary tax system. Unitary taxes would also allow firms to concentrate on strengthening their competitive advantages, instead of wasting valuable managerial time and resources on time-consuming tax avoidance strategies. Because of the simplified nature of the system, unitary taxes also have the potential for substantially reducing accountancy costs. As Phillip Gillett, tax controller at ICI, has commented: “Commercially, transfer pricing makes no sense. It forces us to spend a lot of time doing things that are pointless from a business point of view...Businesses want to organise as if there were a single regional product market. Instead tax is determining how they organise themselves” (The Economist, 2000, p.14).
In addition, it is manifestly unfair that differences in company performance should hinge to such a great extent on the ability of company accountants to reduce tax payments. In the aforementioned study by McIntyre and Nguyen (2000), it was revealed that competitors in various industries faced sharply varying effective tax rates. For example, Maytag and General Electric both make kitchen appliances. But whereas Maytag paid 35% of its profits in taxes from 1996 to 1998, GE paid only 8.1%. Likewise, Abbot Laboratories and Pfizer are both in the drug business, but the former paid almost 29% of its profits in taxes from 1996 to 1998, while the latter paid only 3.1%. This amounts to competitive sleight of hand, and is unfair to shareholders. Unitary taxes would provide a more level playing field.
A PRO PO SAL FOR UNITARY TAXES ON THE PRO FITS OF TRANSNATIO NAL CO RPO RATIO NS • AND REW MOLD

46 C E P A L R E V I E W 8 2 • A P R I L 2 0 0 4
VUnitary taxes in
Tax reforms are never easy: tax systems tend to evolve in a topsy-turvy fashion, and although the outcome often appears irrational and unjust to outsiders, domestic political interests are created which often stop well-intentioned reforms in their tracks. The experience of the economist Nicholas Kaldor is instructive here. Throughout the 1950s and 1960s Kaldor took part in many tax missions to developing countries. Although many of his proposals were based on sound economic principles and would have provided the basis for a more equitable tax system, few countries were willing, or able, to follow his tax prescriptions. In Ghana, for instance, Kaldor was asked by Prime Minister Nkrumah to advise on the budgetary position and tax system during the economic crisis there in 1961. Kaldor wanted to reform company taxation to prevent foreign firms escaping tax through transfer pricing, and to introduce a scheme of compulsory saving to aid the development effort. Politically, however, his proposals were untenable, and they led to political agitation and a workers’ strike (Thirlwall, 2003, pp.522-524).
Cautionary tales such as this are no reason for not lobbying for change, however. Unitary taxes are not innovative - they have been tried before - and in this sense important lessons can be drawn from past experience.19 Indeed, it is one of the ironies of the process of globalization that unitary taxes were first implemented in the single most important source country of FDI in the world - the United States. In fact, no state in the U.S. attempts for tax purposes to measure the within-state profits of multistate enterprises by requiring separate accounting. Instead, all states use some variety of formula to apportion total U.S. (and, in some cases, worldwide) profits among the states (Shackelford and Slemrod, 1998, p.41). In the 1980s twelve U.S. states adopted a worldwide unitary tax.20 State legislators were aware of the ease with which
19 To our knowledge the first author to argue that countries ought to abandon the separate-accounting approach in favour o f a form ula apportionment approach was Musgrave (1973).20 Much of this account o f the United States experience in theapplication o f unitary taxes is drawn from Glickman and Woodward(1989 pp.210-213). See also Hines (1996b).
practice
TNCs could avoid state profit taxes, simply by shifting income towards states with a lower tax burden. Unitary taxes were thus championed by state comptrollers as a way of minimizing tax avoidance through transfer pricing.
The political reaction against these measures was almost immediate. The constitutionality of this method of state taxation was questioned in the courts on numerous occasions. At least twenty nations filed official protests in the United States on behalf of TNCs, complaining that the taxes subjected foreign firms to double taxation, required burdensome accounting procedures, and forced TNCs to write detailed reports on their global operations. As California is one of the favourite locations for gaining a foothold in the United States market, that state’s unitary tax legislation provoked a particularly adverse response. As Vernon (1998, p.42) noted, California’s initiative to abandon any pretence to value tax liabilities using arms-length prices on intra-firm transfers “horrified the international community, almost as if the misguided state authorities were breaching some infallible religious principle”.21 Under fierce pressure from TNCs and foreign governments, every state but Alaska ended up repealing unitary tax laws.
Nonetheless, the lesson to be learned from the United States experience is not that unitary taxes are unpractical, nor politically untenable. Rather, the US case demonstrates the need to apply unitary taxes across the board. Because only a small majority of US states imposed unitary taxes, TNCs were able to play off one state against another, simply by threatening to withdraw their investments. In the end, this pressure paid dividends for the foreign TNCs. One of the first states to repent was Oregon, which rescinded its unitary tax in 1984. The incident which provoked a reconsideration of the policy was the loss of an important Japanese investment by automobile manu-
21 In the event much o f the outrage was exaggerated. For instance despite Japanese TN Cs’ well-known antipathy towards the state’s unitary tax law California managed to attract more Japanese investment than any other state. O f 295 new manufacturing plants announced by Japanese companies from the early 1970s up to 1985 109 (37%) went to the Far West with California dominating the p icture (Glickman and Woodward 1989 p.210).
A PRO PO SAL FOR UNITARY TAXES ON THE PROFITS OF TRANSNATIO NAL CO RPO RATIO NS • AN D R E W MOLD

C E P A L R E V I E W 8 2 • A P R I L 2 0 0 4 47
facturers Mitsubishi, an investment which finally went to North Carolina.22 The campaign against the unitary taxes reached a showdown in Sacramento, where lobbyists for the TNCs argued that California would lose investment dollars if the method of assessment was not repealed. By the end of 1980s, only Alaska had managed to resist the pressure to capitulate and abandon the unitary tax code.23
Arguably, however, the scenario would have been very different if worldwide unitary taxes were imposed across the 50 US states simultaneously. The United States is such an important market for foreign companies that a massive withdrawal of foreign investments would have been inconceivable. The same is also true of the European Union (EU) - any single member State acting on its own is likely to have to confront a barrage of complaints and threats from TNCs. But concerted action simultaneously on the part of all fifteen member States would make it very difficult for TNCs to take any evasive action. For instance, the EU currently accounts for around 48% of worldwide sales and 56% of value added produced by United States affiliates abroad.24 It would consti-
tute an important strategic error on the part of most TNCs to withdraw from such a market simply to avoid tax payments.
For developing countries, of course, the situation is obviously more delicate - if they try to impose new tax measures, they are far more likely to suffer the consequences of retaliation on the part of TNCs. Even here, however, experience suggests that the bark of the multinationals is often worse than their bite.25 The number of cases where multinationals have actually pulled out of a country are relatively few. Even when quite draconian measures have been imposed against multinationals in developing countries, most have stayed put.26 Anyhow, it is likely that the firms that might be lost as a result of the change towards a unitary tax system are precisely the firms that developing countries should not be very eager to attract anyway: highly mobile firms that do not care much about the services (education, for example) that exist in their host countries are not firms that are likely to make a big contribution to development.27 In this sense, a unitary tax system could even enhance the quality of foreign investment received.
22 In fact a report prepared for the state administration on the reasons for the loss o f the project to North Carolina concluded that ultimately Oregon lost the plant because market proximity was the key factor in the decision process and Mitsubishi wanted to settle close to the East Coast market. The officials also concluded that “while the unitary tax was carefully evaluated by the Japanese it does not appear to have been a critical factor in their decision to build in N orth Carolina rather than Salem ” (cited in G lickm an and Woodward 1989 p.212).23 California M ontana and North Dakota also continue to have worldwide unitary tax systems but in these cases their use is optional for taxpayers (Hines 1996b p.1079).24 Data taken from US Department o f Commerce U.S. Direct Investment Abroad Benchmark Survey 1999 [http://www.bea.doc. gov/bea/ai/newiid.htm].
25 For instance in the March 2000 Budget the British government announced the prohibition o f using m ixer companies which enable British-based transnationals to lower their overall tax liabilities (Grant 2000). The British government estimated that the change would cost the transnationals some £300 million in extra tax payments. But the figure was strongly contested by business lobbies which alleged that the total cost could run into several billion pounds. Even the Financial Times however noted a “whiff o f hysteria” surrounding private sector assessments o f the impact o f the changes. In the event the only concession that the Government offered was a nine-month delay in the implementation o f the new measures. This case is especially interesting because it demonstrates the extent to which even a purportedly pro-business government like the Blair administration is capable o f making big business back down i f it is concerted in its action and is sure that it has got its arguments right.26 The most commonly cited examples o f multinationals pulling out o f a developing country are the departure o f IBM Coca-Cola and Exxon from India in the 1970s. But that dispute was related to restrictions on majority ownership imposed by the Indian government and was in no way related to taxation issues.27 I am grateful to Arthur MacEwan for this point.
A PRO PO SAL FOR UNITARY TAXES ON THE PRO FITS OF TRANSNATIO NAL CO RPO RATIO NS • AN D R E W MOLD
48 C E P A L R E V I E W 8 2 • A P R I L 2 0 0 4
VIConclusions
This paper has argued in favour of a new unitary tax system on the profits of TNCs as a way of helping to finance development-related expenditures on social services and infrastructure. Back-of-the-envelope calculations by Oxfam UK suggest that evasion of tax by these companies is currently costing at least US$35 billion a year in lost revenues for developing countries. Although not the only mechanism, transfer pricing is one of the principal ways through which TNCs manage to reduce their tax “exposure”. Unitary taxes would eliminate the incentive to carry out this form of pricing.
At the same time, it should be stressed that unitary taxes do not take away the ability of countries or regions to offer lower tax rates. As a part of regional policy, for instance, it might be considered perfectly acceptable to have lower corporate tax rates to avoid an excessive concentration of economic activity and to spread the benefits of economic growth toward less- developed peripheral areas. Likewise, developing countries could continue to offer lower tax rates as a way of attracting internationally mobile investment.
The advantage of the unitary tax system would be its inherent transparency - it would be far more difficult for firms to shirk their fiscal responsibilities. Hopefully, business leaders too could be made to see that a fair tax system in the long term is in their own interests. Not only would a unitary tax system simplify their accountancy practices, and allow them to concentrate valuable managerial time on strengthening their competitive advantages, but they would also benefit in numerous other ways from public expenditures on infrastructure, social programmes, etc. By improving the health and education of their employees, TNCs could also be important beneficiaries of social expenditures through higher productivity. The links are indirect, of course, and the benefits long-term ones, but the preference of direct investors for developed market economies with high levels of social protection surely suggests that responsible companies are aware of these potential benefits, and are usually prepared to make a fair contribution to funding them.
Although coordination would obviously be desirable, it is worth stressing that the imposition of a unitary tax system by any single country or group of countries does not in principle require greater coordination
between tax authorities or exhaustive international negotiations. Consolidated results are always required by company shareholders, no matter where the multinational is registered. Of course, different accounting conventions mean that reported profits will vary depending on where the company is inscribed, and for the efficient working of a unitary system, it would be convenient that all companies followed the same accounting practices. But the failure to have a completely homogeneous accounting system at the international level would not impede the application of a unitary tax by any country or set of countries which wished to apply it (though they might wish to pressure multinationals within their territory to abide by either America’s generally accepted accounting principles (GAAP) or the London-based International Accounting Standards Board (IASB)).28
Fortunately, concerns over tax evasion are common to both developing and industrialized countries. The globalization of markets is giving rise to fears that traditional forms of raising revenues are increasingly threatened. An initiative to resolve these problems is thus far more likely to succeed. Concern about current trends has been expressed even within the IMF: an institution not normally associated with worries over the impact of low taxation rates. One recent paper by Fund economist Vito Tanzi (2000) warns: “while the fiscal house is still standing and looks solid, one can visualize many fiscal termites that are busily gnawing at its foundations”. The ability of TNCs to indulge in illegal transfer pricing activity is undoubtedly one of the fiscal termites to which Tanzi refers.
Of course, whatever its merits, the proposal on unitary taxes would meet with much opposition amongst business lobby groups. However, the arguments in favour of unitary taxes are sufficiently strong to prevent these political pressures from sidetracking a reform along these lines. So far, all efforts to reform tax codes have been directed towards eliminating international double taxation: measures which international
28 Depending on which o f these two accounting systems is used discrepancies in the reported profits can often be large. In the aftermath o f the Enron and WorldCom scandals the probability o f the IASB standards gaining the upper hand has been enhanced considerably. See The Economist (2002).
A PRO PO SAL FOR UNITARY TAXES ON THE PROFITS OF TRANSNATIO NAL CO RPO RATIO NS • AN D R E W MOLD

C E P A L R E V I E W 8 2 • A P R I L 2 0 0 4 49
investors have obviously been very keen to support. In view of the evidence regarding the fall in effective tax rates paid by TNCs, this emphasis is manifestly unfair. Against this backdrop, the imposition of unitary taxes would provide an important impetus to reform. International legislation should provide the basis for levelling up of standards, rather than levelling down, as it has tended to do up to now. One possibility to make the proposal politically more palatable may be to lower corporate tax rates through unitary taxes. TNCs might be more prepared to countenance a unitary tax system if the base rates were lower. From the point of view of governments, too, it might be preferable to have a lower rate, but to achieve more efficient revenue collection.
The European Union is in a good position to take action on this issue. Although progress has been slow up until now, there is a growing consensus on the need to take action to prevent tax competition and tax evasion among member States (Radaelli,1999). The imposition of a Europe-wide unitary tax system would provide a much-needed impetus to tax reform. Action by
the EU along these lines would set a good precedent which other countries could then follow. Bearing in mind the fact that approximately 85% of TNCs are incorporated in OECD countries, the OECD also represents a good forum for proposing a shift towards unitary taxes. So far, attempts to approve an international legal framework for FDI, such as the OECD’s ill-fated Multinational Agreement on Investment (MAI), have only contributed to relaxing controls on foreign companies. In this context, a proposal to strengthen the ability of nation States to raise a fair share of taxes on the operations of TNCs might be sufficient to tip the balance in favour of any future agreement: support for the initiative would be broader, and developing countries would feel that they are not merely conceding ground to the TNCs, but also gaining something out of the agreement. Bold initiatives such as this are clearly required to restore greater fairness and equity to the global economic system, and should be part and parcel of any future proposals.
(Original: English)
A PRO PO SAL FOR UNITARY TAXES ON THE PRO FITS OF TRANSNATIO NAL CO RPO RATIO NS • AND REW MOLD

50 C E P A L R E V I E W 8 2 • A P R I L 2 0 0 4
Annex
World: Effective tax rates on United States majority owned affiliates, 1983 and 1999(Millions o f dollars and percentages)
1983 1999 % change in effective 1983-1999
tax rate
Foreign income taxes
( i)
Netincome
(2)
Effective tax rate
(1)/[(1)+(2)]
Foreign income taxes
(1)
Netincome
(2)
Effective tax rate
(1)/[(1)+(2)]
All countries 30 122 30 600 49.6 45 791 160 490 22.2 -55.3
Canada 3 700 5 588 39.8 6 676 14 951 30.9 -22.5
Europe 12 075 12 503 49.1 22 464 91 467 19.7 -59.9
Austria 47 80 37.0 259 599 30.2 -18.4Belgium 265 453 36.9 916 2 570 26.3 -28.8Denmark 65 175 27.1 234 790 22.9 -15.6Finland 38 54 41.3 161 282 36.3 -12.0France 736 666 52.5 2 089 3 610 36.7 -30.2
Germany 1 316 1 766 42.7 3 513 8 375 29.6 -30.8Greece 13 25 34.2 153 204 42.9 25.3Ireland 31 1 090 2.8 1 141 13 147 8.0 188.8Italy 488 744 39.6 1 869 2 235 45.5 15.0Luxembourg 32 88 26.7 100 3 906 2.5 -90.6Netherlands 486 494 49.6 1 825 15 669 10.4 -79.0
Norway 2 197 827 72.7 1 022 1 052 49.3 -32.2Portugal 25 29 46.3 258 939 21.6 -53.4Spain 137 16 89.5 899 2 439 26.9 -69.9Sweden 132 169 43.9 424 1 617 20.8 -52.6Switzerland 233 1 504 13.4 653 10 713 5.7 -57.2Turkey 26 39 40.0 127 118 51.8 29.6United Kingdom 5 800 4 197 58.0 6 266 22 602 21.7 -62.6Others 2 842 2 805 50.3 165 460 26.4 -47.5
Latin Americaand other western 2 509 5 129 32.8 4 481 26 000 14.7 -55.2hemisphere countries
South America 1 648 1 003 62.2 1 540 3 012 33.8 -45.6
Argentina 47 392 10.7 375 350 51.7 383.1Brazil 740 268 73.4 553 880 38.6 -47.4Chile 59 50 54.1 172 586 22.7 -58.1Colombia 185 125 59.7 227 475 32.3 -45.8Ecuador - 61 - 25 27 48.1 -Peru 125 119 51.2 83 14 85.6 67.0Venezuela 196 -41 126.5 39 642 5.7 -95.5Others - 28 - 66 37 64.1 -
Central America 422 517 44.9 2 297 6 979 24.8 -44.9
Costa Rica - - - 37 40 48.1 -Honduras - - - 22 26 45.8 -Mexico 274 -229 608.9 2 179 4 805 31.2 -94.9Panama 85 648 11.6 10 1 939 0.5 -95.6Others 62 98 38.8 49 170 22.4 -42.3
Other westernhemisphere countries 439 3 610 10.8 644 16 009 3.9 -64.3
Barbados 7 141 4.7 158 1 337 10.6 123.4Bermuda 36 1 664 2.1 238 8 175 2.8 33.6
Dominican Rep. 9 26 25.7 15 509 2.9 -88.9Netherlands Ant. 221 1 283 14.7 - - - -
A PRO PO SAL FOR UNITARY TAXES ON THE PROFITS OF TRANSNATIO NAL CO RPO RATIO NS • AN D R E W MOLD

C E P A L R E V I E W 8 2 • A P R I L 2 0 0 4 51
(continuation)1983 1999 % change
Foreign income taxes
( i)
Netincome
(2)
Effective tax rate
(1)/[(1)+(2)]
Foreign income taxes
(1)
Netincome
(2)
Effective tax rate
(1)/[(1)+(2)]
in effective 1983-1999
tax rate
Trinidad and Tobago 140 100 58.3 - - - -
Common wealth islands o f the Caribbean 1 286 0.3 85 4 817 1.7 397.7
Others 27 110 19.7 148 1 171 11.2 -43.1
Africa 4494 724 86.1 2 039 2 242 47.6 -44.7
Egypt (D) 515 125 461 21.3 -Nigeria 1 421 357 79.9 1 096 960 53.3 -33.3South Africa 272 388 41.2 99 169 36.9 -10.4Others 4 494 724 86.1 720 652 52.5 -39.1
M iddle East 2 162 516 80.7 1 022 1 343 43.2 -46.5
Israel 53 90 37.1 110 342 24.3 -34.3Saudi Arabia 461 104 81.6 29 206 12.3 -84.9United Arab Emirates 1 618 292 84.7 133 163 44.9 -47.0Others 29 31 48.3 751 632 54.3 12.3
Asia and Pacific 7 810 9 261 45.8 9 054 24 126 27.3 -40.4
Australia 989 597 62.4 1 020 3 157 24.4 -60.8China - - 249 912 21.4 -Hong Kong 73 662 9.9 450 4 111 9.9 -0.7India 32 21 60.4 134 -27 125.2 107.4Indonesia 2 383 1 779 57.3 1 069 2 249 32.2 -43.7Japan 764 776 49.6 4 136 4 848 46.0 -7.2Korea Republic of 31 88 26.1 361 787 31.4 20.7Malaysia 213 431 33.1 228 1 601 12.5 -62.3New Zealand 37 74 33.3 78 106 42.4 27.2Philippines 83 59 58.5 214 724 22.8 -61.0Singapore 109 631 14.7 524 3 905 11.8 -19.7Taiwan 43 184 18.9 297 980 23.3 22.8Thailand 36 40 47.4 218 647 25.2 -46.8Others 3 017 3 919 43.5 78 127 38.0 -12.5
International 104 384 21.3 55 360 13.3 -37.8
Addenda:European Uniona 9 232 9 698 48.8 20 106 78 984 20.3 -58.4OPECb 8 342 2 690 75.6 2 996 4 648 39.2 -48.2
Developed countriesc 17 565 19 538 47.3 34 374 114 529 23.1 -51.2
Developing countriesd 12 557 11 062 53.2 11 417 45 961 19.9 -62.6
Source: Prepared by the author on the basis o f US Department o f Commerce data [http://www.bea.doc.gov/bea/ai/newiid.htm]. a Consisted o f 10 countries in 1983 and 15 in 1999. b Organization o f Petroleum Exporting Countries.c Developed countries include Europe Canada Australia New Zealand and Japan. d Developing countries include the rest o f the world.
A PRO PO SAL FOR UNITARY TAXES ON THE PRO FITS OF TRANSNATIO NAL CO RPO RATIO NS • AN D R E W MOLD

52 C E P A L R E V I E W 8 2 • A P R I L 2 0 0 4
Bibliography
Altshuler R., H. Grubert and S. Newlon (1998): Has US Investment A broad B ecom e more Sensitive to Tax Rates?, NBER W orking Paper, No. 6383, Cambridge, M assachusetts, National Bureau o f Economic Research.
Bayliss, K. and D. Hall (2001): Enron: A Corporate Contribution to Global Inequality, London, Public Services International Research Unit, U niversity o f Greenwich, June [www. psiru.org].
Bergsten, C. (1974): Multinationals: the games and the rules. Coming investment wars?, Foreign Affairs, vol. 53, No. 1, New York, Council on Foreign Relations, October.
Caves, R. (1996): M ultinational Enterprise and Economic Analysis second edition, Cambridge, M assachusetts, Cambridge University Press.
Dicken, P (1998): Global Shift- Transforming the World Economy, London, Paul Chapman Publishing Ltd.
Eden, L. (1998): Taxing Multinationals, Toronto, University o f Toronto Press.
E l país (2001): El autoritarismo amenaza a Latinoamérica si no se resuelven los graves problemas sociales, 11 May.
Elson, D. (1995): Transnational corporations: dominance and dependency in the world economy, in S.Corbridge (ed.), D evelopm ent Studies: A Reader, London, Arnold (orginally published in 1988).
FitzGerald, V. (2001): Regulating Large International Firms, QEH W orking Paper Series (QEHW PS64), Oxford, Queen E lizabeth House, January [http://w w w 2.qeh.ox.ac.uk/ research/qehwp.html].
Frynas, J. (1998): Is Political Instability H armful to Business? The Case o f Shell in Nigeria, Saint Andrews, University o f Saint Andrews.
Glickman, N. and D. Woodward (1989): The New Competitors: H ow Foreign Investors are Changing the U.S. Economy, New York, Basic Books.
Goolsbee, A. and E. Maydew (1998): Coveting the N eighbor’s M anufacturing: The D ilem m a o f State IncomeApportionment, NBER Working Paper, No. 6614, Cambridge, Massachusetts, National Bureau o f Economic Research, June [http://www.nber.org/ papers/w6614].
Grant, W. (2000): Globalisation, B ig Business and the B lair Government, CSGR Working Paper, No. 58/00, Warwick, Centre for the Study of Globalisation and Regionalisation, University o f Warwick, August [http://www.csgr.org].
Grimwade, N. (2000): International Trade: New Patterns o f Trade, Production and Investm ent, second edition, London, Routledge.
Haq, M. ul, I. Kaul and I. Grunenberg (eds.) (1996): The Tobin Tax. Coping with F inancial Volatility, New York, Oxford University Press.
Hill, C. (2000): International Business: Competing in the Global Marketplace, third edition, Boston, Irwin McGraw-Hill.
Hines, J. (1996a): Tax Policy and the Activities o f M ultinational Corporations, NBER Working Paper, No. 5589, Cambridge, Massachusetts, National Bureau o f Economic Research, May.
(1996b): Altered states: Taxes and the location o f foreigndirect investment in America, American Economic Review, vol 86, No. 5, Nashville, Tennessee, American Economic Association.,
Hines, J. and E. Rice (1994): Fiscal paradise: foreign tax havens and American business, Quarterly Journal o f Economics, vol.
109, No. 1, Cambridge, Massachusetts, The MIT Press, February.
ILO (International Labour Organization) (1997): World Labour Report: Industrial Relations, D emocracy and Social Stability, Geneva.
Kozul-Wright, R. and R. Rowthorn (1998): Spoilt for choice? Multinational corporations and the geography o f international production, Oxford Review o f Economic Policy, vol. 14, No. 2., Oxford, Oxford University Press.
Kumar, N. (1999): Explaining the geography and depth o f international production: the case o f US and Japanese multinational enterprises, Weltwirtschaftliches Archiv, vol. 136, No. 3, Kiel, Kiel Institute for World Economics.
Lall, S. and P. Streeten (1977): Foreign Investment, Transnationals and Developing Countries, London, Macmillan.
MacEwan, A. (2001): ¿Neoliberalismo o democracia? Estrategia económica, mercados y alternativos para el siglo XXI, Barcelona, Intermón Oxfam.
Madeley, J. (1999): B ig Business, Poor Peoples: The Impact o f Transnational Corporations on the W orld’s Poor, London, Zed Books.
McIntyre, R. and T. Nguyen (2000): Corporate Income Taxes in the 1990s, Washington, D.C., Institute on Taxation and Economic Policy, October.
Mehrotra, S., J. Vandemoortele and D. Delamonica (2000): Basic Services fo r A ll? Public Spending and the Social Dimensions o f Poverty, Florence, Innocenti Research Centre [http://www.unicef-icdc.org/publications/pdf/ basice.pdf].
Mold, A. (2000): Empresas multinacionales, integración europea y las economías periféricas: un análisis de la dinámica espacial del mercado único, Doctoral thesis, Madrid, Facultad de Ciencias Económ icas y Em presariales, U niversidad Complutense de Madrid.
(2001): Past Experience and Future Perspectives fo r ForeignDirect Investment in Nigeria , working paper, DT04/2001, Madrid, Instituto Complutense de Estudios Internacionales [http://www.ucm.es/info/icei/ publica/doctra.html].
Moran, T. (1998): Foreign D irect Investment and Development: The New Agenda fo r Developing Countries and Economies in Transition , Washington, D.C., Institute for International Economics.
Morisset, J. and N. Pirnia (2002): How tax policy and incentives affect foreign direct investment: a review, in L. Wells, N. Allen and others, Using Tax Incentives to Compete fo r Foreign Investment: Are They Worth the Cost?, Occasional Paper, No. 15, Washington, D.C., International Finance Corporation/W orld Bank.
Musgrave, P. (1973): International tax base division and the multinational corporation, Public Finance, vol. 27, No. 4.
Oxfam (2000): Tax Havens: Releasing the H idden Billions fo r Poverty Eradication, Oxford, United Kingdom.
Poterba, J. (1999): The Rate o f Return to Corporate Capital and Factor Shares: N ew Estim ates Using R evised N ational Income Accounts and Capital Stock Data, NBER Working Paper, No. 6263, Cambridge, Massachusetts, National Bureau o f Economic Research [www.nber.org/papers/w6263].
Radaelli, C. (1999): Harmful tax competition in the EU: policy narratives and advocacy coalitions, Journal o f Common M arket Studies , vol 37, No. 4, London, Blackwell Publishers, December.
A PRO PO SAL FOR UNITARY TAXES ON THE PROFITS OF TRANSNATIO NAL CO RPO RATIO NS • AN D R E W MOLD

C E P A L R E V I E W 8 2 • A P R I L 2 0 0 4 53
Shackelford, D. and J. Slemrod (1998): The revenue consequences o f using formula apportionment to calculate U.S. and foreign- source income: a firm-level analysis, International Tax and P ublic Finance, vol. 5, Amsterdam, Kluwer Academic Publishers.
Tanzi, V. (2000): Globalisation and the Future o f Social Protection, IM F Working Paper, No. 12, Washington, D.C., International Monetary Fund (IMF).
The Economist (1999): London, 20 March. , (2000): A survey o f globalisation and tax: the mystery o f
the vanishing taxpayer, London, 29 January._______ (2002): International accounting standards: the impossible
dream, London, 28 February.Thirlwall, A. (2003): Growth and Development, seventh edition,
New York, Palgrave Macmillan.UNCTAD (United Nations Conference on Trade and Development)
(1999): World Investm ent R eport 1999: Foreign D irect Investm ent and the Challenge o f Developm ent, UNCTAD/W IR/1999, New York, United Nations. United Nations publication, Sales No.
(2002), World In-vestment Report 2002: Trans-nationalCorporations and E xport Com petitiveness, UNCTAD/
WIR/2002, New York, United Nations. United Nations publication, Sales No. E.02.II.D.4.
Vaitsos, C. (1977): Distribución del ingreso y empresas transnacionales, Mexico City, Fondo de Cultura Económica.
Vernon, R. (1998): In the H urricane’s Eye: The Troubled Prospects o f M ultinational Enterprises, Cambridge, Massachusetts, Harvard University Press.
Weisbrot, M., R. Naiman and J. Kim (2000): The Emperor H as N o Growth: Declining Economic Growth Rates in the Era o f Globalization, London, Centre for Economic Policy Research (CEPR), September [http://www.cepr.net/IM F/The_Emperor _Has_No_Growth.htm].
Wells, L. and N. Allen (2002): Tax holidays to attract foreign investment: lessons from two experiments, in L. Wells, N. Allen and others, Using Tax Incentives to Com pete fo r Foreign Investment: Are They Worth the Cost?, Occasional Paper, No 15, Washington, D.C., International Finance Corporation /World Bank.
Zee H., J. Stotsky and E. Ley (2002): Tax incentives for business investment: a primer for policy makers in developing countries, World Developm ent, vol. 30, No. 9, Am sterdam Elsevier Science Publishers.
A PRO PO SAL FOR UNITARY TAXES ON THE PRO FITS OF TRANSNATIO NAL CO RPO RATIO NS • AN D R E W MOLD


55
H u b e r t E sca i th
D i rec to r , S t a t i s t i c s a n d
E c o n o m ic P r o je c t i o n s
D iv is ion , E C L A C
f hescaith@ eclac.cl
C E P A L R E V I E W 8 2 • A P R I L 2 0 0 4
Regional integration and macroeconomiccoordination in Latin America
Hubert Escaith
The con tag ion aspec ts o f the f inancial and exchange - ra te cr ises in
recen t years d e m o n s t ra te the need to ex tend the dom a in o f m a c r o e c o
nom ic po l icy f ro m the national d im ens ion to the regional one . This paper
p resents the m ain c o n c e p ts and cha l lenges beh ind m a c ro e c o n o m ic po l icy
coopera t ion in Latin Am erica and the C ar ibbean and evaluates them from
a g a m e - th e o ry pe rspec t ive . U n d e r certa in cond i t ions related to the debate
on opt imal cu rrency areas, enter ing into a coopera t ive dyn a m ic will be b e n
eficial for all part ic ipants. Moreover, it is show n tha t because the welfare
gains f rom regional coopera t ion are endogenous , coopera t ion will e ve n tu
ally b e co m e stable , even in the p resence o f a Pr isoner' s D i lemma. Albeit
p rom is ing at the subreg iona l level, however, the initial cond i t ions observed
in Latin Am erica are still far f rom the cond i t ions o f se lf-susta ined dynamics.
A t the initial s tage o f coord ina t ion , coopera t ion is unstab le , and a formal
institut ional sett ing is needed to s ta rt and coo rd ina te the coopera t ive
process. In add it ion, m ore t rad it ional polic ies o f t rade in tegrat ion shou ld be
pursued.

56 C E P A L R E V I E W 8 2 • A P R I L 2 0 0 4
IIntroduction
The early 1990s opened a new era for the analysis of economic interactions among the Latin American and Caribbean countries. Shocks were transmitted by two channels: real and financial. Intra-regional trade recuperated strongly thanks to the wave of trade liberalization and the resumption of economic growth after the “lost decade” that marked the 1980s. The first years of the 1990s also coincided with the large scale introduction of new financial instruments that allowed operators to trade riskier papers, opening the door to an active market of financial titles issued by the so-called “emerging economies”. As a result of this innovation, the settlement of the old debt problem through the Brady agreement, and an increasing flow of foreign direct investment, the net transfer of resources to the region became once again positive, and growth resumed.
But the resumption of growth was accompanied by higher volatility, due to the nature of the new international financial market, where contagion and herding have become a prominent reality. As a result, shocks initiating in one country will have direct impacts upon trade and other real variables, financial spreads and exchange rates in its neighbouring geographical area, as well as upon the international business climate, if the troubled country is large enough (e.g., Argentina, Brazil or Mexico). This common destiny, in spite of differences in policies or fundamentals from one country to another, is a clear symptom of the emergence of a subregional dimension as a result of trade integration and financial globalization (Studart,2002)
This paper is based on a number o f separate contributions made to a research agenda on regional integration, exchange rate regimes and macroeconomic coordination, implemented in the framework of the ECLAC/European Commission Macroeconomic Dialogue Network (REDIMA). The arguments presented here benefited greatly from the discussions, com m ents and suggestions o f Christian Ghymers, Igor Paunovic and Rogerio Studart, as well as the network participants. Needless to say, I alone am responsible for any remaining errors and analytical gaps.
Because of this common component, national macroeconomic stability (including its real aspects) should now be treated as a regional public good. The existence of such externalities calls for more coordination of national economic policies in the region. Despite these interdependencies, and notwithstanding major initiatives to promote macroeconomic coordination in several subregions of Latin America and the Caribbean, cooperation does not always emerge naturally, even though it would be optimal for it to do so. Reflecting on this situation, Escaith, Ghymers and Studart (2002) state that “it is striking that there is no systematic, operational regional or subregional scheme to deal with these regional or subregional spillovers... Indeed, economic policies are still totally uncoordinated and all the decisions continue to be taken in close-knit national circles without considering any spillovers at all. The clearest symptom of this is the choice of exchange-rate regimes based on strictly national considerations.”
In other words, and considering the macro-economic coordination problem from a game-theory perspective, it is obvious that the dominant “non-coordi- nated” strategies adopted by the countries of Latin America and the Caribbean do not coincide with the social optimum that could be achieved by incorporating regional cooperation. Ghymers (2001) considers that most institutional failures from a regional coordination perspective can be analyzed from the Prisoner’s Dilemma perspective.
Starting from this premise, the present essay shows that, by incorporating recent conceptual advances in the theory of currency unions, macroeconomic coordination within regional integration schemes provides a feasible and robust solution to the Prisoner’s Dilemma. The criteria for the existence of a solution are then compared with the statistical regularities observed in the region. Finally, section IV describes the institutional settings that would make possible such coordination, and section V synthesizes the main findings.
REG IO NAL INTEGRATION A ND M ACRO EC O N O M IC COORDINATIO N IN LATIN AM ER IC A • HUBERT ESCAITH

C E P A L R E V I E W 8 2 • A P R I L 2 0 0 4 57
IIMacroeconomic coordination, the Prisoner’s Dilemma, and the problem
of inefficient equilibrium
As described in Ghymers (2001), one of the main obstacles to regional cooperation is the belief that there is a conflict between national interest and regional integration. According to this author, although most governments understand that coordinated policies would, in a perfect world, be the most suitable way of dealing with the issues and challenges presented by globalization, practical criteria lead them to implement non-coordinated policies aimed at optimizing purely national and short-sighted objectives. This situation, where individual rationality impedes coordination, is known as the Prisoner’s Dilemma.
1. Cooperation and the Prisoner's Dilemma
The so-called Prisoner’s Dilemma is an unfortunate social situation where myopic and selfish attitudes dominate, despite the fact that cooperation would be the best policy from a social perspective. In other words, it is a game where each player has an incentive to play in a non-cooperative way, either because playing dirty maximizes one’s personal reward if the other party plays fair (i.e., follows a cooperative strategy), or minimizes one’s losses if the other party decides to defect from the cooperative agreement and plays dirty himself.
The name comes from a story used by A.W. Tucker. Two suspects are taken into custody, cannot communicate with each other, and have two options: either to confess or not to confess the crime. If both confess, they will receive a jail sentence of five years. If neither confesses, they will probably be convinced of minor offences and receive a one-year sentence each. But if one confesses and the other does not, the suspect who confesses will be set free, while the other will receive a ten-year sentence. In this game, the dominant individual (non-cooperative) strategy is not to trust the other prisoner and confess to avoid the maximum punishment.
Technically, the equilibrium in this game is not a
Pareto optimum: both players would be better off it they opt for not confessing. Table 1 represents symbolically the strategies and outcomes of a 2x2 ordinal game that leads to a Prisoner’s Dilemma. Strategies C are for cooperation, and D for defection. R stands for the reward for mutual cooperation, T for the temptation to defect from that approach, P for the punishment in the event of mutual defection, and S for the sucker’s payoff to the player who cooperates when the other does not.
TABLE 1
Symbolic representation of a 2x2 Prisoner's Dilemma game
Player A \ B Cooperate (C) Defect (D)
Cooperate (C) (R,R) (S,T)
Defect (D) (T,S) (P,P)
Source: Prepared by the author.
A game is basically defined as a Prisoner’s Dilemma when, for both players, T>R>P>S2 This ranking ensures that each player has a dominant strategy that results in an equilibrium with a Pareto-inferior outcome. In such a situation, players - be they individuals, firms or States - that follow the irrefutable logic of purely rational and selfish strategies may find themselves caught in a sub-optimal situation.
Hence, it is not easy to attain spontaneously a cooperative equilibrium. Unless there is a credible and enforceable commitment on the part of the players, or coordination by an external referee, cooperation will remain elusive, even if the players are allowed to communicate with each other in advance: each player has an incentive to play in a non-cooperative way. When generalized to more than two players, this becomes a version of the so-called “Tragedy of the Commons”
1 Another condition, applying to repeated games, is that the players cannot get out o f their dilemma by taking turns to randomly exploit each other. This means that R>(T+S)/2 (Axelrod, 1984).
R EG IO NAL INTEGRATION A ND M ACRO EC O N O M IC COO RDINATIO N IN LATIN AM ER IC A • HUBERT ESCAITH

58 C E P A L R E V I E W 8 2 • A P R I L 2 0 0 4
(Hardin, 1968). Decisions that are rational from the point of view of each individual become defective from the collective point of view.
One way out of the dilemma is to consider that the players have the option of building agreements through communication. Clearly, if the parties are able to negotiate a binding agreement, the dilemma disappears. Penalties may be built in to punish uncooperative behaviour, so that for each player R>T>P>S. Obviously, in the case of sovereign countries, which are the actors to be considered in the macroeconomic coordination game, international agreements-cum- penalties (such as the Maastricht Treaty in Europe) are not always legally enforceable, and could be subject to abrogation or renegotiation if one party considers that its “higher” State interests are at stake.
Thus, communication by itself does not solve the dilemma in this context, and the problem of governments is how to make credible commitments. This typical macro-policy problem could also be studied from the game-theory point of view. Indeed, it is still possible to reach a cooperative outcome without a formal binding contract, when games are considered in a dynamic perspective. Time is an important factor is resolving cooperation deficits. The fact that players have to meet again and again pave the way for “nice” strategies to develop, even when players are selfish: cooperation is based upon self-interest, without the aid of central or supra-national authorities. Two key requisites for cooperation to thrive in this context are that the cooperation must be based on reciprocity, and the weight of future outcomes must be important enough to make this reciprocity stable.
Players in real life, be they individuals, firms, or countries, do not play the game just once, but interact over and over again. Thus, each player can develop a reputation and earn credibility 2 about his behaviour and learn about other players’ conduct. The players not only learn about each other’s behaviour, but also become capable of rewarding cooperative forms of conduct (strategy C) or punishing uncooperative ones (D).
This strategy is called the Tit-for-Tat strategy: player A starts out cooperating, and continues to do so as long as the other player B cooperates. If B does not
cooperate and plays the D strategy, there is still time to counter attack with one’s own D strategy, and avoid the disastrous CD or DC outcomes. This Tit-for-Tat strategy is the best alternative when games are infinitely repeated or at least repeated with a sufficient number of iterations. When games are finite, however, there is a high probability that the other (perfectly rational) player will use the selfish and uncooperative strategy in the last occurrence of the game, since the other player does not have the possibility to retaliate. Because of the same reasoning, there will be no cooperation at the next-to-last occurrence, and so on.
However, cooperation may prevail, because in real life the hypothesis of pure rationality and pure selfishness is not always representative of the actual behaviour of players. As demonstrated by Axelrod (1984), cooperation can emerge even in a world of unconditional defection, if at least some of the players are willing to initiate the game using a cooperative (“nice”) strategy. Cooperation can evolve from small clusters of individuals who base their cooperation on reciprocity and have even a small proportion of their interaction with each other. In the author’s words “The most promising finding is that, if the facts of Cooperation Theory are known by the participants with foresight, the evolution of cooperation can be speeded-up.” (Axelrod, 1984, p.24).
2. Costs and benefits of coordination
The technical part of the discussion about the benefits and costs associated with macroeconomic coordination is usually analysed from the standpoint of the Optimal Currency Areas criteria (OCA).3 Countries considering whether to adopt the currency of a third country (e.g., dollarization) or to join a currency union (e.g., the European Economic and Monetary Union) weigh the potential benefits against the expected costs. Since Mundell (1961) developed the concept of OCA, the criteria are defined in terms of trade relationship and symmetry or asymmetry of external shocks. The greater the linkage, the more desirable a union; to compensate for imperfections in the first two criteria, two additional ones are considered: degree of labour mobility and/or system of fiscal transfers.
In the Mundell-Fleming model, then, the nature2 The concepts o f reputation and credibility in game theory are very complex and require assumptions about the degree o f rationality o f players, asymmetric information, the different characters o f the players, and many other ingredients. Since our purpose is only to present basic concepts o f game theory, we have tried to make all this as simple as possible.
3 See Escaith and Paunovic (2003) for examples o f fiscal cooperation.
REG IO NAL INTEGRATION A ND M ACRO EC O N O M IC COORDINATIO N IN LATIN AM ER IC A • HUBERT ESCAITH

C E P A L R E V I E W 8 2 • A P R I L 2 0 0 4 59
of the exchange rate regime determines the degree of freedom for using monetary policy as a response to external (real) shocks. In a pegged regime, a shock would be transmitted directly to the economy through the reduction/increase in international reserves and the resulting reduction/increase in the money supply and hence, given nominal rigidities, in aggregate demand. A flexible exchange rate would permit more flexible use of monetary policy to counteract the external shock and adjust relative prices, at the expense of higher inflation levels.
According to Mundell (1961),4 currency area optimality occurs when the benefits of relinquishing the exchange rate as an internal adjustment instrument outweigh the costs of adopting a single currency in a fixed exchange regime. These criteria indicate the specific conditions under which it is advantageous for a group of economies to adopt a single currency, based on an analysis of the (microeconomic) gains of efficiency and the (macroeconomic) costs of the loss of flexibility.
The usefulness/sustainability of an OCA is often determined as a function of labour mobility, economic size and openness, similarity of production structure and the symmetry (or asymmetry) of economic shocks. Deep trade interrelationships, symmetrical exposure to external shocks and synchronization of business cycles increase the expected net benefits of adopting a common currency and a common monetary policy. Indeed, shocks affecting all the countries in a similar fashion, at the same point in their business cycle, do not call for a change in exchange rates. Labour market flexibility and mobility reduce the real adjustment costs when shocks and cycles are not perfectly symmetrical, while the existence of fiscal compensation schemes opens up the possibility of transfers between losers and winners.
Despite their theoretical interest and the qualitative guidance they provide, the practical usefulness of OCA criteria is limited. In particular, they are not fully operational for decision-making purposes, as in practice they cannot be used to quantify a balance of costs and benefits (McCallum, 1999). Moreover, a more recent trend in the literature centres on two empirical questions that reassess the relevance of the abovementioned OCA criteria.
The first of these questions examines the problem of the balance between costs and benefits by revising
the actual cost for a country of losing the ability to use the exchange rate as a policy instrument and looks at the effectiveness of nominal adjustments of the exchange rate. When an economy suffers a nominal shock, adjusting parities is not an adequate instrument, and a regime with a fixed exchange rate will do better in terms of welfare.5 Indeed, the exchange rate is potentially useful as an instrument in situations when shocks are simultaneously country-specific, real and temporary. According to this literature, the probability of such situations is becoming smaller as trade integration reduces the significance of national borders and as stability-oriented policies curtail policy- induced shocks. Furthermore, contemporary advocates of monetary unions think that the pure and perfect exchange-rate flexibility option is not the correct alternative when discussing costs and benefits of OCAs, because modern-day trade and financial interrelationships make pure flexibility a nonviable option (Buti and Sapir, 1998).
The second “revisionist” trend in the OCA literature is of special interest from the point of view of the present essay. Regional trade integration increases business-cycle correlation and promotes new institutional initiatives that will set up a positive feedback loop for intraregional trade itself. Thus, cooperation creates its own conditions of sustainability. In the following section, we will discuss these aspects in greater detail and show how they apply to the Prisoner’s Dilemma issue.
3. Dynamic gains from regional coordination of macroeconomic policies
As already noted, recent developments in the positive theory of OCA and the European Monetary Union (EMU) experience show that the optimality criteria are in fact endogenous. As stated by Frankel and Rose (1996), and as illustrated by the case of the European Union, the suitability of OCA criteria cannot be judged on the basis of historical data, since the structure of the national economies - especially their trade structure - will be affected by the creation of a currency area and is likely to change. In those authors’ words, the OCA criteria are jointly endogenous:
“Countries are likely deliberately to link their currencies to those of some of their most important
4 McKinnon (1963) and Kenen (1969) are also important contributors to the standard literature on OCAs. 5 See Parrado and Velasco (2002).
R EG IO NAL INTEGRATION A ND M ACRO EC O N O M IC COO RDINATIO N IN LATIN AM ER IC A • HUBERT ESCAITH

60 C E P A L R E V I E W 8 2 • A P R I L 2 0 0 4
trading partners, in order to capture gains associated with greater exchange rate stability. In doing so, they lose the ability to set monetary policy independently of those neighbors. The fact that their monetary policy will be closely tied to that of their neighbors could result in an observed positive association between trade link and income links. In other words, the association could be the result of countries’ application of the OCA criterion, rather than an aspect of economic structure that is invariant to the exchange rate regimes.” (p. 15).
As a consequence, the authors state in their conclusion (p. 22) that “some countries may appear, on the basis of historical data, to be poor candidates for EMU entry. But EMU entry per se, for whatever reason, may provide a substantial impetus for trade expansion; this in turn may result in more highly correlated business cycles. That is, a country is more likely to satisfy the criteria for entry into a currency union ex post than ex ante. ”
In this endogenous framework, regional monetary and exchange rate coordination can be represented by a new kind of a non-zero sum game, where the positive outcome increases when the game is repeated: the more you play, the more you gain. Because of objective reasons, linked to the OCA criteria (weaknesses of trade and financial integration, asymmetry of business cycles), and subjective factors (reduced credibility of regional commitments and weak institutional enforcement procedures), initial gains from consensuating regional policy response to external shocks may be low compared with the outcome of non-cooperative strategies. We recognize here the typical Prisoner’s Dilemma problem, where the structure of incentives is perverse. But because of the endogenous nature of the OCA criteria, as time goes by and the more countries interact, the higher is the welfare gain obtained from coordination and the lower the temptation to defect.
If we go back to the formal representation of the
Prisoner’s Dilemma (table 1), the gain from cooperation R(t) depends positively on the number of times the game is repeated (t).
dR/dt > 0
Figure 1 gives a tree representation of this game. The first letter in parentheses denotes the strategy of A, while the second is the strategy of B. For simplicity, let us assume that B applies a tit-for-tat strategy. Both countries cooperate in the initial round and gain R0.• If A defects in the first iteration, he gains T and B
suffers the S outcome, but both gain only P in the second round, once B applies the tit-for-tat countermove.
• If A cooperates, both countries gain R1, withR 1>R 0.The same reasoning applies to subsequent moves,
with Rf>R(t - 1).Thanks to the endogenous and incremental nature
of R t in this class of games, the gains from cooperation should increase with time such as to reach the situation when R(t*)>T. Remember that a Prisoner’s Dilemma exists only when, for both players, T>R>P>S and the dominant strategy dictates that each player should defect and follow a non-cooperative strategy. After repeating the game up to time t*, welfare gains from cooperation increase to a point where defecting is no longer the dominant strategy (see figure 2 for a graphic representation of the outcome of the cooperative game).
Obviously, the initial stages of the cooperative game are critical for its success, when Rt is lower than T or too close to it, thus making the net gain from cooperation too uncertain. This caveat is particularly important when referring to the Latin American situation, where the initial degree of trade and financial integration is weaker than in the European case.
Game tree representationFIG U RE 1
CoopitfMa tu*, E||h Dc-fed (T, I Cooperate (K|, R]>
D c fe d (P« I1)
Defect (T, H) C n ^n d c ( ft-i, R t )
I1) Dtfcd (1\S)
Defed (P. P) 1Lfefcct l'>
C ooperate ( K j , R j !
eie..
REG IO NAL INTEGRATION A ND M ACRO EC O N O M IC COORDINATIO N IN LATIN AM ER IC A • HUBERT ESCAITH

C E P A L R E V I E W 8 2 • A P R I L 2 0 0 4 61
Dynamic gains from cooperation and the Prisoner’s DilemmaFIG U R E 2
Source: Escaith and Paunovic (2003).
iiiEconomic convergence, integration and policy
coordination in Latin America
As already noted, despite their limitations OCA criteria are a good starting point to look at the feasibility of initiating a dynamic process of policy coordination in a regional framework. The issue depends not only on national considerations, but also on externalities linked to the regional dimension of the transmission of shocks.
The evolution of the Latin American and Caribbean economies since the mid-1980s shows a convergence in terms of macroeconomic policies and achievements. Confronted with the negative shock of the debt crisis of 1982, the necessary adjustment following the reversal of net financial resource transfers from the rest of the world and episodes of high to hyperinflation, most countries embarked upon stabilization programmes. These programmes shared a nuclear set of common objectives, strategies and instruments. The increased dependence on external finance during the 1990s also led to a reduction in the
freedom of domestic policy makers to diverge from orthodox policies.
The trend not only affected macroeconomic policies stricto sensu, but also brought a deeper transformation of the institutional framework via structural reforms. The evolution of reform indexes (ECLAC, 2001) shows that by the end of the 1990s most Latin American and Caribbean countries had achieved convergence in terms of trade, financial and capital liberalization reforms.
As a result of these trends, most of the countries of the region entered the 2000s with many shared characteristics, not only in their way of thinking about making economic policies, but also in the results -both positive and negative- of those policies. Sharing common objectives, institutional frameworks and instruments provides quite fertile ground for macroeconomic policy coordination. Whether it is optimal to integrate this dimension into the national strategies
R EG IO NAL INTEGRATION A ND M ACRO EC O N O M IC COO RDINATIO N IN LATIN AM ER IC A • HUBERT ESCAITH

62 C E P A L R E V I E W 8 2 • A P R I L 2 0 0 4
depends in part on the comparative review of their exposure to external shocks. The first aspect to be analyzed is trade integration.
1. Trade integration
One of the central factors in macroeconomic policy coordination and OCA is the degree of trade interrelationship between potential partner countries throughout the trade sector. This is traditionally analyzed in terms of trade flows and symmetry of external shocks.
a) Intraregional trade
Since 1991, with the recovery from the 1982 debt crisis, trade with other Latin American and Caribbean countries, especially within integration subregions (Andean Community, CARICOM, Central American Common Market, Mercosur), has increased much faster than trade with other countries, at least up to1998. Thus, intraregional trade, which represented 13% of total exports in 1991, rose to 20% in 1998: an implicit growth rate of almost 15% annually in real terms. Due to the crisis in Mercosur and a decline in the Andean group, this share went down to 16% in 2002, reducing the annual growth rate over the 1991-
2002 period to 9% (table 2). This growth is particularly significant from our perspective, because trade has grown much more rapidly than the domestic product, increasing its contribution to the level of economic activity.
TABLE 2
Latin America and the Caribbean: Trends in trade and domestic product, 1991-2002
Latin America Average annual growth ratea
and the Caribbean (LAC) 1991-1998 1991-2002
Total supply 4.5 3.3
GDP 3.3 2.5Imports o f goods and services 12.0 8.0Exports o f goods and services 8.5 7.3
Exports to otherLatin American countries b 14.8 9.2
Source: Prepared by the author on the basis o f ECLAC data. a Percent, from data at constant 1995 prices b Estimated from data at current prices.
Economic transactions within each subregional integration scheme have been taking on an increasingly important role (figure 3), not only in quantitative but also, and especially, in qualitative terms: while trade with countries outside the region is composed of
Integration schemes: Trade within subregions, in relation to total exports(Percentages)
Source: ECLAC (2002a).
F IG U R E 3
REG IO NAL INTEGRATION A ND M ACRO EC O N O M IC COORDINATIO N IN LATIN AM ER IC A • HUBERT ESCAITH

C E P A L R E V I E W 8 2 • A P R I L 2 0 0 4 63
traditional products (commodities or processed primary products), in South America intraregional trade is based on manufactured products, allowing national economies to diversify their export base (Benavente, 2001). Mexico, Central America and the Caribbean countries, on the other hand, have diversified their exports thanks to their privileged access to the United States market (“maquiladora” industries) or their natural advantages in terms of tourism.
This trend has two important (and potentially conflicting) consequences for the purposes of the present paper. First, it increases the transmission of shocks through trade, in the traditional OCA perspective, and thus is a factor of greater interdependence between countries. Second, it increases the potential for conflict between national exchange rate policies, as these exports consist of consumer and intermediary products that are sensitive to relative prices. Thus, devaluation by one of the regional trading partners could have a strong impact on regional trade flows, triggering regional tensions (as occurred in Mercosur after devaluations in Brazil or Argentina) or competitive devaluations (as in Europe in the late 1970s). Obviously, these cross-effects are directly relevant to both the choice of national exchange rate regime and the potential gains from regional coordination.6
b) Terms o f trade
In small open developing economies, terms of trade fluctuations (variations in the prices of a country’s exports relative to those of its imports) are a major source of instability. Structural characteristics make export prices very volatile because of the high proportion of commodities and there is little capacity for substituting imports internally (because of their higher technological content), even when their relative prices increase. Non-transitory shifts in relative prices, as exemplified by structural trends in terms of trade is an issue that has been receiving attention for quite a long time.7
Short-term fluctuations in relative prices are perhaps more damaging to investment than long-term trends, as volatility increases systemic uncertainty and diminishes the capacity for sound decision-making. These fluctuations are also more relevant when it comes to macroeconomic policy coordination, especially when the explicit objective of that policy is to stabilize nomi
6 See CEI (2003) for a review o f the cooperation issues from a M ercosur perspective.7 See Ocampo and Parra (2003).
nal and real variables, i.e., to smooth out high-frequency fluctuations.
As shown in figure 4, the dynamics of terms of trade has been quite different across countries over the past ten years in terms of trends8 and volatility. As an annual average over the 1991-2002 period, six countries out of nineteen suffered negative shocks and eleven had positive ones. This resulted in a small positive annual average of 0.2% for the region as a whole (0.6% as a simple average of individual countries), the extremes ranging from -2.4% (Nicaragua) to 3.7% (Venezuela).
Volatility is very different from country to country, with standard deviations ranging from as low as 2.6 in Mexico, which has the advantage of a diversified export structure, to as high as 21.6 in Venezuela, a monoexporter of oil. The volatility for consolidated exports is low for the region as a whole (3.4 when all exports are consolidated), but reaches 8.1 if computed as a simple average of the countries.
Looking at the correlation between countries, one notes that most countries in the region share a common positive interdependence, while a small group evidences diverging behaviour. This is best seen from section B of figure 4, which shows the clustering of the Latin American and Caribbean countries according to a breakdown of the principal components of their terms of trade variations. On the first two axes, which jointly explain 65% of total variance, one may note a first cluster of countries in the northwest quadrant, composed of Ecuador, Venezuela, Argentina and, to a lesser degree, Colombia and Mexico. These are oil-exporting countries. Panama is isolated because of its specificity as a processing and transit zone.
Except for Bolivia, all the other countries of the region are clustered into a compact group in the western part of the figure. This cluster includes all the countries in the Central American Common Market and almost all the Mercosur countries except Argentina. This means that the countries from these two integration areas share the same (short-term) trends for terms-of- trade variations, which is an important basis for coordinating a regional response to common external shocks. The situation of the Andean countries is more diversified from this point of view, because of their respective specialization in oil exports (Ecuador and Venezuela, but also Colombia) or in other minerals (Bolivia, Peru).
8 The term “trends” is used here in the sense o f tendency, and does not refer to what statisticians may understand by deterministic trends (e.g., in contrast to random movements).
R EG IO NAL INTEGRATION A ND M ACRO EC O N O M IC COO RDINATIO N IN LATIN AM ER IC A • HUBERT ESCAITH

64 C E P A L R E V I E W 8 2 A P R I L 2 0 0 4
F IG U R E 4
Latin America and the Caribbean: Terms of Trade, 1991-2001
A: i i-'L-ii.iir1 : i i I « Udii ( 'itviuTkMf
VEn
Annual Yarialii.ns in Im re of Innk. avrrqp; 1401 2001
SLVNIC
i_CHLllh l>p a n
IK H.ecu
PKVPER [OTMBRACAI ^ mAPCJUKYu r ip f)VALC
i=c
H E X —-J-.0 0.0 5.D IF jO 20.fl 25.0
11. ’W
H -, i u r r i . ' i n f iV jy j j i-rrc iv u r i j ü i . -v i1 i . t a .1 ì f f i J Y ö r j / J U f t i i i ì . t . v j w r .l
Source: Prepared by the author on the basis o f ECLAC data.
REG IO NAL INTEGRATION A ND M ACRO EC O N O M IC COORDINATIO N IN LATIN AM ER IC A • HUBERT ESCAITH
C E P A L R E V I E W 8 2 • A P R I L 2 0 0 4 65
c) Effective exchange rates
Exposure to common terms-of-trade shocks and stronger intraregional trade should lead to greater covariation of effective real exchange rates (ERERs). The calculation of these rates takes into account the evolution of the country’s bilateral exchange rates in relation to each of its trading partners, correcting for differences in the respective domestic rates of inflation and weighting for the relative importance of the trading partner in a country’s total trade.
The ERER is a widely accepted measure of shortterm macroeconomic competitiveness. As such, it is an important indicator to monitor in any trade integration scheme: when the ERER rises (or decreases), the country in question gains (or loses) competitiveness with regard to the (weighted) average for its trading partner. Obviously, when regional partners account for a significant share of external trade, variations in neighbouring countries’ exchange rates (or internal prices) will greatly affect the overall trade competitiveness of each country.
This merely quantitative and mechanical effect is compounded by the potentially greater price elasticity of intraregional trade. Because intraregional trade in Latin America is more intensive in manufactured goods, demand is potentially more sensitive to changes in relative prices than in the case of the goods exported to the rest of world, which in Latin America (and especially in South America) are mainly primary products, whose prices are set internationally. The firms that participate in intraregional commerce are in general smaller than those trading with the rest of the world and more sensitive to transitory changes in relative prices.
Correlation coefficients between the exchange rates of the Latin American and Caribbean countries were calculated from 1992 up to the first semester of 2003 for the quarterly variations of four categories of real exchange rates: i) the bilateral rate with the United States economy, ii) the effective rate with regional trading partners (a weighted average of the bilateral exchange rate, adjusted by the difference in inflation rates), iii) the effective rate with non-regional trading partners (excluding the United States of America), andiv) the effective exchange rate for all trading partners (regional and non-regional). Contemporary correlation coefficients were calculated, thus capturing only the direct and most observable effects. The trading partners were weighted by their exports to the reporting country.
The correlation coefficients obtained for the ERER with regional partners are the most interesting in the present case, as they reflect the intensity of the shocks passed from one country of the region to the others through the exchange rate, either by trade or by other causes. They are clearly a prime indicator of macroeconomic integration. When there are close trade relationships within a subregional integration scheme, a positive impulse in one country (a gain in exchange rate competitiveness) should result in a negative one in the regional trading partners.
By construction, because of the symmetry of trade relationships, the sum of the correlation coefficients is close to zero when considering all the Latin American and Caribbean countries that enter in the calculation of the regional ERER. The closer the intraregional trade relationship, the higher the positive and negative variations. But part of the interaction analyzed through the behaviour of regional ERERs may be due to a third, external, factor to which all countries in the region react simultaneously (an external shock of large magnitude, such as the Asian and Russian crises of 1997-1998, for example). To filter out this noise, the correlation coefficients obtained for real exchange rates with the US dollar were subtracted from the results obtained with the regional ERER. An index was constructed using the sum of the absolute values of the results obtained for each country, normalized by the total across countries (figure 5).
As expected, the largest countries of the region (Argentina, Brazil and Mexico) are among those showing the greatest interaction with the rest of Latin America and the Caribbean. Great care should be taken not to draw definitive conclusions from this index, however. Despite the filtering process used, the index remains subject to “spurious” correlation effects which affect9 the results, Also, the index is better calculated on “normal years”, because great asymmetrical shocks affecting a smaller economy may create noise in the indexing procedure. For example, Uruguay has been closely integrated into the Mercosur economy and ranked high in the index calculated from 1992 up to 2001 (6.6). The large devaluation of 2002 had no significant impact on the effective exchange rate of Uruguay’ s trade partners, due to the small size of its economy, and the resulting effect was a drop of
9 For example, higher international oil prices can affect the nominal exchange rate o f oil exporting countries, such as Venezuela, and the internal rate o f inflation o f importers, thus affecting simultaneously the ERER o f both exporters and importers, even if they do not have close economic relations.
R EG IO NAL INTEGRATION A ND M ACRO EC O N O M IC COO RDINATIO N IN LATIN AM ER IC A • HUBERT ESCAITH

66 C E P A L R E V I E W 8 2 • A P R I L 2 0 0 4
F IG U R E 5
Latin America and the Caribbean: Regional exchange rate integration index
k ^ u n l cwlianpr mie ¡rtcÿntiûd index (kü 211______________ ryj___ m i_________m.it
— I vac
■BKB Ji P tR
------------------------------ 3i.7HI■ Liar
■ - ——I noM
I ITO
■ CJ'J'M
JAM
I co n .
■ n r u t IPBV
A M I tu x .
I SLV
» VEN
I - i ftflA"I MEX
Source: Prepared by the author.
more than two points in its integration index (to 4.4) when the 2002 and 2003 periods are incorporated.
Another conclusion may be drawn when looking at the ERER with non-regional trading partners (excluding the USA). It is striking that i) most elements of the correlation matrix are positive and ii) many have a high value compared with the regional ERER and the bilateral US dollar tables. This intuition is confirmed when principal component analysis is applied to the real exchange rate variations. In this case, the higher the co-movement among the original series, the fewer the common factors needed to “explain” the total variance of the sample. It is clear from table 3 than co-movements are higher when exchange rate variations are considered in relation with “other” trade partners rather than with the USA or regional partners. In the first case, the first factor explains 40% of the variance: i.e., approximately double the value encountered in the two other cases. The same difference persists when considering second and (albeit less so) third) factors.
TABLE 3
Latin America and the Caribbean: Quarterly real exchange rate variations, 1992-2003: principal component analysis(Results obtained fo r the f ir s t fo u r components)
Factor 1 Factor 2 Factor 3 Factor 4
LAC Partners
Eigenvalue 4.4 3.5 2.7 2.3% variance 22.2 17.5 13.4 11.5% cumulative 22.2 39.8 53.2 64.7
Bilateral with USA
Eigenvalue 3.9 2.1 2.0 1.8% variance 19.3 10.5 10.1
0000
% cumulative 19.3 29.8 40.0 48.7
Other trading partners
Eigenvalue 8.0 2.6 1.6 1.3% variance 40.0 12.9 8.0 6.3% cumulative 40.0 52.9 60.9 67.2
Source: Prepared by the author.
REG IO NAL INTEGRATION A ND M ACRO EC O N O M IC COORDINATIO N IN LATIN AM ER IC A • HUBERT ESCAITH

C E P A L R E V I E W 8 2 • A P R I L 2 0 0 4 67
It appears that most of the Latin American and Caribbean countries share a common trend with respect to non-US dollar currencies (basically European and Asian currencies in our sample). This is easily explained considering that de facto or de jure these economies belong to the dollar area, and thus tend to share the same exchange rate fluctuations with other international currencies.
2. Internal economic cycles
In the previous sections, we looked at the transmission of shocks via terms-of-trade or exchange-rate channels. In view of the high external vulnerability of the region, these shocks would be expected to have an impact on short-term growth dynamics. In the present section, we will look into the coincidence of the “real cycles” within the region.10
Two set of indicators are used for this purpose, one being the quarter-to-quarter seasonally adjusted GDP growth rate, and the other the size of the output gap. These were calculated by reference to a medium-term tendency obtained by smoothing real GDP time series, applying the widely used Hodrick-Prescott (HP) filter to the data. A standard value of 1600 was utilized to parameterize the filter, and the quarterly series were extrapolated at both ends of the sample, to reduce the well- known end-point sensibility of the HP filter.
Tendencies for GDP growth using the filtered series capture the medium-term trends observed during the 1990s up to 2002. Figure 6 shows two different dynamics at the beginning of the present decade. The low-growth subset was composed of South American countries severely hit by the 1997-1999 crisis that affected many emerging economies. This crisis affected in particular the Southern Cone economies, especially in the context of the Argentine turmoil in 2001-2002. Mexico and the Caribbean and Central American coun-
Latin America: Evolution of potential GDP, 1993-2002
Source: Prepared by the author on the basis o f data provided by the ECLAC Economic Projections Centre.
10 In this purely descriptive context, “real cycles” should be under- For a more in-depth study on cycle co-movements in Latin America,stood as GDP fluctuations around an observed trend, and do not see Cerro and Pineda (2002).refer to the source (monetary or real) o f the observed fluctuation.
FIG U R E 6
R EG IO NAL INTEGRATION A ND M ACRO EC O N O M IC COO RDINATIO N IN LATIN AM ER IC A • HUBERT ESCAITH

68 C E P A L R E V I E W 8 2 • A P R I L 2 0 0 4
tries were able to escape the 1997-1999 turbulence thanks to their closer links to the booming United States economy and lesser dependence on exports based on primary products. When the USA, together with other industrialized economies, eventually went into recession in the second half of 2001, this difference vanished.
Analysis of short-term GDP fluctuations confirms this heterogeneity. The quarterly GDP variations show little correlation across the region as a whole, confirming the results obtained by Cerro and Pineda (2002). An interesting pattern emerges, however, when looking at i) the evolution of the correlation over the 1993-2002 period and ii) the situation within each of the subregions. Not only is the correlation higher when calculated within each subregion, but it also increases over time (table 4).
TABLE 4
Latin America and the Caribbean:Quarterly GDP variations, 1993-2002(Inter-country correlation coefficients)
Correlation within Correlationeach subregion within
Average correlation LAC regionwithin: Average
Period averages: Mercosur AndeanGroup
Meso-America3
Total 1993-2002 0.15 0.14 0.06 0.111993-1997 -0.01 0.07 -0.08 0.051998-2002 0.31 0.20 0.19 0.16
Source: Prepared by the author on the basis o f ECLAC data . aMexico, Central America and Dominican Republic.
Review of the correlation coefficients obtained for the output gaps (percentage difference between potential and observed GDP) shows that the moderate co-variation of economic activity across the region is nevertheless higher than the coincidence observed in
output gaps. This is confirmed by the results of the principal component analysis. As shown in table 5, the first factor has a greater representation power in the case of quarterly variation of total GDP, compared to the output gaps.
These results indicate that although the co-variation of economic activity in the region is still diffuse, it has been increasing over the period studied and in general the Latin American and Caribbean countries have tended to cluster around common subregional patterns. This is quite an interesting feature considering that the correlation of business cycles across countries is an argument in favour of macroeconomic policy coordination and optimum currency areas.11 Nevertheless, the weakness of the linkage indicates that the Latin American region is still far from the self-reinforcing situation corresponding to the right part of figure 2 above ( R>T ). As a consequence, macroeconomic coordination per se is far from being a sufficient condition for closer integration, and more traditional integration policies have to be maintained and deepened.
TABLE 5
Latin America and the Caribbean: QuarterlyGDP variations and output gaps, 1993-2002(principal components)
Factor1 Factor 2 Factor 3 Factor4
Quarter to quarter variation
Eigenvalue 4.8 2.5 1.7 1.3% variance 34.2 17.9 12.5 9.1% cumulative 34.2 52.2 64.6 73.8
Output GapEigenvalue 3.6 2.8 2.3 1.4% variance 25.5 19.7 16.5 10.0% cumulative 25.5 45.2 61.7 71.7
Source: Prepared by the author.
11 Albeit not a necessary one if one takes into consideration the endogeneity o f these OCA criteria, as we already mentioned.
REG IO NAL INTEGRATION A ND M ACRO EC O N O M IC COORDINATIO N IN LATIN AM ER IC A • HUBERT ESCAITH

C E P A L R E V I E W 8 2 • A P R I L 2 0 0 4 69
IVInstitutional criteria for initiating and maintaining coordination
In the previous sections, we have seen that the Latin American and Caribbean economies show at least some of the necessary conditions for benefiting from macroeconomic cooperation, and that the expected welfare gains are probably a positive function of time. Despite its potential and increasing benefits, however, initiating a programme of policy coordination is only part of the story, as many other challenges remain.
As analysed by Kronberger (2002), even in the case of the endogeneity of the OCA criteria, there are important difficulties to face, especially in the case of emerging economies. In particular, for the endogenous process to initiate, there is a need for a strong political will and a firm political consensus. The following section identifies and briefly comments on some of these issues.
1. Uncertainty and the size of the “union”
Defining a common strategy for macroeconomic cooperation between sovereign States faces several obstacles in a real life situation. The first of them, obviously, is the uncertainty about the net outcome of cooperation (balance of costs and benefits of cooperation). As we saw, both traditional and endogenous OCA criteria provide a guide to this aspect, and the prospects for Latin America and the Caribbean are positive, at least at the sub-regional level.
Probably the second most important obstacle is the uncertainty concerning the behaviour of other players: an aspect that can be analyzed from the institutional perspective. As we mentioned earlier, this uncertainty, which is prejudicial to a cooperative outcome in a finite game, can be controlled and reduced by the possibility of committing players, through an enforceable agreement, to adopt a cooperative strategy. In our present case, this would be achieved through treaties regulating international relations between countries, but the difficulty of enforcing contracts (i.e., devising penalties) among sovereign States should not be underestimated.
Demopoulos and Yannacopoulos (2001) incorporate this practical aspect by analyzing the costs and benefits of macroeconomic coordination in the context of a currency area, as a function of its size. As a currency area expands, the benefits from adopting a single currency increase, but not as fast as the difficulties of agreeing on a common set of policies and enforcing them as new countries, with macroeconomic problems of their own, join the area. Because transaction costs are assumed to increase faster than benefits, there is an optimum threshold in terms of the number of participating countries.
From this brief summary it may be deduced that, in the presence of the Prisoner’s Dilemma, several key points have to be clarified in order to advance the case for regional cooperation on macroeconomic policy.
The first set of critical factors relates to the nature of costs and benefits. Cooperation should not only be beneficial for all participants, but those benefits must also be sufficiently larger than in the case of an alternative, non-cooperative approach. At the same time, they must be easily identifiable and not too uncertain, in order to define a clear incentive to cooperate.
Second, it must be ensured that there are not too many players, and that they can be induced to accept reasonably binding commitments to cooperate. Building an appropriate institutional framework to provide for suitable commitment technology is a key element in this respect.
These two argument, applied to the Latin American and Caribbean context, point in the direction of a form of cooperation limited -a t least initially- to sub-regional partners, and based on a strong regional institutions.
2. Credibility of national and regional macro-policies
This institutional commitment technology needed to increase the credibility of the decision agreed upon is key to understanding the importance of a proper
R EG IO NAL INTEGRATION A ND M ACRO EC O N O M IC COO RDINATIO N IN LATIN AM ER IC A • HUBERT ESCAITH

70 C E P A L R E V I E W 8 2 • A P R I L 2 0 0 4
institutional setting in the design of a sub-regional coordination mechanism. This arrangement, as argued in Escaith, Ghymers and Studart (2002), should include the appropriate monitoring and endorsement/disqualification capacities, and calls for the existence of a formal institutional arrangement at the supra-national level. Such a mechanism must offer national governments a set of positive and negative incentives to cooperate in the coordination of macroeconomic policies, as well as a well-designed negotiation, monitoring and reporting system that creates an effective system of checks and balances.
Also, this institutional commitment must be workable and credible, which means that the conditions and criteria stated earlier regarding the optimal size of an OCA apply also to these aspects. Because the initial benefits Rt may be low and uncertain as long as t<t*, a strategy of defection of one of the players due to the Prisoner's Dilemma situation is a real possibility. Therefore, a proper formal institutional arrangement will be vital in order for a cooperative game to be sustained. Ideally, the institutional setting must incorporate penalties for non-cooperative behaviour, in order to lower T and the temptation to defect, as in the European case.
Once the game has been repeated a sufficient number of times, so that credibility has been established and welfare gains have become clear to all players, they will have an incentive to continue, even when transitory conditions provide an incentive to defect.12 In addition to the arguments of the endogenous gains from cooperation, one could add that with the passing of time and the building-up of regional institutions, regional integration and policy coordination gain credibility with national and international agents: a key factor in the sustainability of national macroeconomic.
As noted earlier, political economy considerations are taking on an increasing role in the analysis of macroeconomic policymaking. The same trend can be observed in applied development economics, where research brings together the work of economists and political scientists to focus on governance and on the interaction of economic and political factors in the
making and working of actual policy. As often occurs in developing countries, when competing objectives cannot be reached simultaneously with the current set of policy instruments, policymakers are constrained to second-best solutions. In such a situation, competing objectives must be reached sequentially, and shortterm deviation from pre-announced policies should not be mistaken for an abandonment of initial goals.
This means that the long-term commitments announced by the policymakers must be credible. When the national situation is less than favourable in that respect, policy-takers may be tempted to interpret short-term deviations from pre-announced targets by policymakers as discretional shifts in policy, and hedge against this risk (for example by reducing their demand for national currency). Bringing in the supranational dimension can help to avoid this outcome. Persson and Tabellini (1990) state that the decision to join a supra-national arrangement provides a regional “commitment technology” that gives more credibility to policymakers.
By providing external auditing of the macroeconomic situation, regional monitoring and analysis will help to discriminate between exogenous and endogenous policy shocks when actual inflation deviates from the pre-established target. Provided that regional institutions are sufficiently isolated from national pressures, they would also be instrumental in consolidating the credibility of the national institutions when deviations between ex ante objectives and ex post achievements are unintended and due to external factors. Being regionally negotiated and self-imposed, the ownership factor should help in facilitating the definition of a consensus between policymakers and civil society on the need to respect national commitments, unlike other international monitoring arrangements (e.g., by the International Monetary Fund).
3. The uncertainty of the model
Because the application of economic theory to real-life situations is not always unambiguous, there is always a probability of error when adopting a particular model. Uncertainty about parameters and disagreement among coalition partners about the right economic model to follow pose a real challenge to a cooperative economic policy. Policymakers may have different beliefs about how an economy actually works. Disagreement is obviously not an obstacle to cooperation, but because
12 As recently exemplified by the European case, regional commitments to reduce the fiscal deficit may be counterbalanced by shortterm national considerations. Nevertheless, member countries, even the largest ones as in the cases o f France and Germany, take the political consequences o f a regional sanction very seriously and the prospect, and hence the consequences, o f a breach o f the regional rules have fuelled a strong debate in Europe.
REG IO NAL INTEGRATION A ND M ACRO EC O N O M IC COORDINATIO N IN LATIN AM ER IC A • HUBERT ESCAITH

C E P A L R E V I E W 8 2 • A P R I L 2 0 0 4 71
of the uncertainty about the “true model”, negotiations may lead to the adoption of a wrong model and result in less welfare than non-cooperation.
Uncertainty may reduce the present value of the expected welfare benefits. Translated into the Prisoner’s Dilemma perspective, a simple tit for tat strategy to achieve cooperation is collectively stable if, and only if, the weight of the future outcome w in today’s decisions is large enough.
On the other hand, -as occurs with the gradual welfare gains from OCAs- part of this uncertainty is endogenously determined and changes with the number of times the “coordination game” is played. In this case, as we shall see, uncertainty is reduced through cooperation (while the expected welfare gains from OCAs are increased). When both policies and models are subject to choice, policymakers have four options:i) they may make no attempt to agree on the appropriate model or to coordinate their policies; ii) they may exchange information or bargain over the model, but make no attempt to choose their policies jointly; iii) they may not discuss which model should be used, but may coordinate their policy choices explicitly (they do not discuss the justification for their policies); and lastly, iv) they may agree both on the choice of the model and on coordination of their policies. Hughes Hallet (1995) shows that disagreement over the model, in a situation of uncertainty, can still be beneficial for policymakers if it leads to an exchange of information, thus reducing with the passing of time the risk of serious losses.
In practice, countries that enter into an active process of macroeconomic coordination do so after an extensive period of dialogue, exchange of information, mutual monitoring and convergence. The European Union is perhaps the best example of this process of
reduction of uncertainty through the sharing of information and mutual monitoring. In the Latin American region, there are several examples of similar processes, and in all subregional integration groups, national decision-makers are actively engaged in a dialogue to reduce uncertainty concerning the key parameters of their respective economies.
Usually, the first step is to establish convergence criteria for key indicators (as in the Macroeconomic Monitoring Group (GMM) in Mercosur, or as these indicators were set in the Andean region, the Caribbean or the Central American Common Market).13 This process of defining common concept for the monitoring of the respective economies from a regional perspective is an important step in promoting a regional dialogue on key variables, defining transparent criteria and building mutual trust among regional partners: all aspects whose importance cannot be underestimated.
These processes are still at an initial stage, and more efforts should be made to define more precisely the models underlying the national economies and their interactions. This implies specifying the key parameters of each national economy forming part of the subregional group and modelling the interdependence between them. In addition, unlike the countries of the European Union, those constituting the Latin American and Caribbean region are developing economies, i.e., economies where the key parameters and the systemic response to impulses are prone to rapid and substantial change. Thus, it is even more important in the Latin American context than in the European Union to maintain close monitoring of the key indicators and foster a common programme of analysis of the reaction functions to external and policy impulses.
13 See ECLAC (2002a), Chapter V.
R EG IO NAL INTEGRATION A ND M ACRO EC O N O M IC COO RDINATIO N IN LATIN AM ER IC A • HUBERT ESCAITH

72 C E P A L R E V I E W 8 2 • A P R I L 2 0 0 4
VConclusions
This article has shown that, despite favourable indications, there is still a large gap between the actual dynamic of shock transmission in the region and the demanding conditions sets by pure OCA criteria, even when considering only the subregional dimension. The recent developments in the positive theory of endogenous OCAs, however, indicate that full observance of the OCA concept is not a necessity for the initiation of mutually beneficial coordination. If the dynamic of the cooperative game works well, then the iteration of the cooperative game should naturally guide the countries out of the Prisoner’s Dilemma. In the absence of a leader country, cooperation must begin with a (minimum) consensus of the participating countries: a process that calls for a preliminary phase of confidence-building based on dialogue and exchange of information and culminates in a regional agreement. That agreement should include the necessary commitment technology to initiate and maintain the cooperative game at least in the first phase of implementation, when benefits are still diffuse and temptation to defect is strong. This commitment technology should therefore include features that increase both the immediate benefits of cooperation (such as the Structural Funds in the European Union) and the cost of defection (peer pressure from within the region and loss of reputation on international markets).
In this particular framework, the probability of cooperation is enhanced when there are fewer players, when each player’s discounting of the future benefits is sufficiently low (i.e., if players are farsighted), when they are interacting frequently, and when the benefits and costs associated with each strategy are well known. Through dialogue and cooperation, systemic uncertainty will be reduced and welfare gains will increase. In this case, the outcome of the iterated Prisoner’s Dilemma game will result in the repeated selection of a cooperative strategy in every repetition of the game. In contrast, cooperation breaks down or never even begins when there are too many parties,
when players are short-sighted, or when benefit conditions and key parameters are rapidly changing.
From the technical standpoint, regional cooperation is the most appropriate forum when the regional partners’ economic policies are themselves the source of externalities, as is the case when instability and lack of credibility in one country cause contagion of neighbouring economies. Thus, providing the regional institutional arrangements function well, regional cooperative solutions are at least comparable -if not superior- to individual national solutions on both technical and institutional grounds.
Translating these theoretical conclusions into practical regional economics, this means that countries which have commercial and financial relations, which interact frequently, and which cannot escape from the consequences their decisions have on their partners, have a strong probability of entering into a cooperative dynamic which will be beneficial for all the cooperating participants and will be stable, at least within the original cluster. All these arguments point in the direction of a subregional arrangement, at least in the early phase of policy coordination. From a more political perspective, the commitment-cum-monitoring technology deriving from subregional negotiation among peers is also easier to legitimate than extra-regional supervision. From a broader perspective, regional cooperation in the face of large external financial shocks is also the most appropriate way to face the asymmetries built into the new international financial system, where purely national answers are notably insufficient (Ocampo, 2001). In the present situation, however, the degree of integration is still too weak for macroeconomic coordination to be self-enforcing. Efforts to promote macroeconomic coordination should be complementary to, and not a substitute for, more traditional policies designed to deepen trade relations and strengthen the institutional structure for integration.
(Original: English)
REG IO NAL INTEGRATION A ND M ACRO EC O N O M IC COORDINATIO N IN LATIN AM ER IC A • HUBERT ESCAITH

C E P A L R E V I E W 8 2 • A P R I L 2 0 0 4 73
Bibliography
Axelrod, R. (1984): The Evolution o f Cooperation, New York, Basic Books.
Benavente, J.M. (2001): E xportaciones de m anufacturas de Am érica Latina: ¿desarme unilateral o integración regional?, “M acroeconomía del desarrollo” series, No. 3, LC/L.1523-P, Santiago, Chile, ECLAC. United Nations publication, Sales No. S.01.II.G.66.
Buti, M. and A. Sapir (eds.) (1998): Economic Policy in EMU: A Study by the E uropean Com m ission Services, Oxford, Clarendon Press.
CEI (Centro de Economía Internacional) (2003): Cooperación macroeconómica en el Mercosur: un análisis de la interdependencia y una propuesta de cooperación, Estudios del CEI, No. 4, Buenos Aires, April.
ECLAC (Econom ic Com m ission for Latin A m erica and the Caribbean) (2000): Economic Survey o f Latin Am erica and the Caribbean, 1999-2000, LC/G.2104-P, Santiago, Chile. United Nations publication, Sales No. E.00.II.G.70.
(2001): E conom ic Survey o f L atin A m erica and theCaribbean, 2000-2001, LC/G.2139-P, Santiago, Chile. United Nations publication, Sales No. E.01.II.G.2.
(2002a): Latin America and the Caribbean in the WorldEconomy, 2000-2001, LC/G.2149-P, Santiago, Chile. United Nations publication, Sales No. .02.II.G.6.
(2002b): Current Conditions and Outlook 2002. EconomicSurvey o f Latin Am erica and the Caribbean, 2001-2002, LC/G.2184-P, Santiago, Chile, August. United Nations publication, Sales No. E.02.II.G.71.
Cerro, A.M. and J. Pineda (2002): Do common cycles exist in Latin American countries?, Latin American Research Abstracts, No. 17, Dallas, Center for Latin American Economics, Federal Reserve Bank of Dallas.
Demopoulos, G. and N. Yannacopoulos (2001): On the optimality of a currency area o f a given size, Journal o f Policy Modeling , vol. 23, No. 1, Amsterdam, Elsevier Science, January.
Escaith, H. and I. Paunovic (2003): Regional Integration in Latin A m erica and D ynam ic G ains from M acroeconomic Cooperation, “M acroeconomía del desarrollo” series, No. 24, LC/L.1933-P, Santiago, Chile, ECLAC, July. United Nations publication, Sales No. E.03.II.G.92.
Escaith, H ., C. Ghym ers and R. Studart (2002): Regional Integration and the Issue o f Choosing an Appropriate Exchange-Rate Regime in Latin Am erica , “Macro-economía del desarrollo” series, No. 14, LC/L.1732-P, Santiago, Chile, ECLAC, August. United Nations publication, Sales No. E.02.II.G.86.
Frankel, J. and A.K. Rose (1996): The Endogeneity o f the Optimum Currency Area Criteria, NBER Working Paper, No. 5700,
Cambridge, Massachusetts, August.Ghymers, C. (2001): La problemática de la coordinación de políti
cas económicas, “Macroeconomía del desarrollo” series, No. 10, LC/L. 1674-P, Santiago, Chile, ECLAC, December. United Nations publication, Sales No. S.01.II.G.209.
Hardin, G. (1968): The tragedy of the commons, Science , No. 162, New York, American Association for the Advancement o f Science.
Hughes Hallet, A.J. (1995): Policy bargains and the problem of model selection, Journal o f Economic Dynamics and Control, vol. 19, No. 5-7, Amsterdam, Elsevier Science.
Kenen, P. (1969): Theory o f optimum currency areas: an eclectic view, in R.A. Mundell and A.K. Swoboda (eds.), Monetary Problems o f the International Economy , Chicago, University o f Chicago Press.
Kronberger, R. (2002): Cost-benefit analysis o f a m onetary union for MERCOSUR, with particular emphasis on the optimum area theory, Integration and Trade, vol. 6, No. 16, Buenos Aires, Institute for Latin American and Caribbean Integration (INTAL), January-June.
McCallum, B. (1999): Theoretical Issues Pertaining to Monetary U nions , N BER W orking Paper, No. 7393, Cambridge, M assachusetts, N ational Bureau o f Economic Research, October.
M cKinnon, R.I. (1963): Optim um currency areas, A m erican Economic Review, vol. 53, Nashville, Tennessee, American Economic Association, September.
Mundell, R. (1961): The theory o f optimum currency areas, Am erican Econom ic Review , vol. 51, No. 4, Nashville, Tennessee, American Economic Association.
Ocampo, J.A. (2001): International Asymmetries and the Design o f the International Financial System, “Temas de coyuntura” series, No. 15, LC/L.1525-P, Santiago, Chile, ECLAC, April. United Nations publication, Sales No. E.01.II.G.70.
Ocampo, J.A. and M.A. Parra (2003): The terms of trade for commodities in the twentieth century, CEPAL Review , No. 79, LC/G.2200-P, Santiago, Chile, April.
Parrado, E. and A. Velasco (2002): Alternative Monetary Rules in the Open Economy: a W elfare-Based Approach, in N. Loayza and R. Soto (eds.), Inflation Targeting: Design, Performance, C hallenges, “Central Banking, Analysis and Economic Policies” series, Santiago, Chile, Central Bank o f Chile.
Persson, T. and G. Tabellini (1990): M acroeconomic Policy, Credibility and Politics, Switzerland, Harwood Academic Publishers GmbH.
Studart, R. (2002): Financial integration, instability and m acroeconomic performance in the 1990s: some possible perverse links, Santiago, Chile, ECLAC (unpublished).
R EG IO NAL INTEGRATION A ND M ACRO EC O N O M IC COO RDINATIO N IN LATIN AM ER IC A • HUBERT ESCAITH


75
C E P A L R E V I E W 8 2 • A P R I L 2 0 0 4
Import substitution in high-tech industries:Prebisch lives in Asia!
Alice H. Amsden
Pr e b is c h " l ive s " in A s ia b e c a u s e le a d in g A s ia n g o v e r n m e n t s still
a c t i v e l y p r o m o t e i m p o r t s u b s t i t u t i o n o f h i g h - t e c h p a r t s a n d
c o m p o n e n t s . B u t t h e y use p r o m o t io n a l m e a s u re s o th e r th a n ta r i f f
p r o t e c t io n to d o s o . G ive n p e r f o r m a n c e s t a n d a r d s , t h e y have been
h ig h ly s u c c e s s f u l . N o w L a t in A m e r i c a is b e h in d A s ia n la te c o m e r s
b e c a u s e it m is s e d b e c o m in g a p la y e r in th e in fo rm a t io n t e c h n o lo g y
r e v o lu t io n . B u t La t in A m e r i c a can sti ll lea rn f r o m A s ia r a th e r th a n th e
W a s h in g to n C o n s e n s u s a b o u t h o w n a t io n a l l y o w n e d e n te r p r is e s can
bu i ld m a tu re h ig h - t e c h in d u s t r ie s in f ie ld s o th e r th a n e le c t ro n ic s .
A l i c e H. A m s d e n
B a r t o n L. W e l l e r P r o f e s s o r o f
P o l i t i c a l E c o n o m y ,
M a s s a c h u s e t t s I n s t i t u t e o f
T e c h n o l o g y (MIT)
f am sden@ m it.edu

76 C E P A L R E V I E W 8 2 • A P R I L 2 0 0 4
IIntroduction
Raúl Prebisch became associated in the 1950s with Latin America’s controversial policies of import substitution and anti-export growth.1 Despite the rise of basic industry that resulted from that strategy, import substitution was disparaged for its inefficiency and balance-of-payments problems in the mid-1980s, if not earlier. The policies and institutions that had supported it were dismantled amidst a global wave of liberalization, and Latin America’s markets were opened to exports from overseas and still greater investments from multinational firms.
Ironically, as Latin America was obliterating its past, Asia was reinventing import substitution for high-tech industries, and was growing faster than Latin America under a liberal regime. A high proportion of the value of many electronics devices (such as notebooks and cell phones) was initially imported. Government policy was oriented towards import substituting the parts and components that made up these products as a way to create high-paid domestic jobs and globally competitive nationally owned enterprises. The import substitution policies to promote hightech production in China, India, Korea and Taiwan (hereafter referred to as Asia) were less distortionary than those used to promote mid-tech industry, insofar as they did not involve high tariff protection. Nevertheless, the Asian State began to play an extremely activist role in jump-starting the high-tech sector: a role with which Raúl Prebisch would have been familiar. In China, India, Korea and Taiwan, the governments were involved in the smallest details,
such as cherry-picking specific companies for subsidies (in the form of residence in a science park, for example) and spinning off parts of government labs to create new firms.
Asia’s promotion of science and technology and regional development deviated from the free market ethos of the Washington Consensus, but such interventionist measures were legal under the World Trade Organization (WTO). WTO members may still promote science and technology at the company level, much as the United States does through its Department of Defense (a staunch supporter of the computer industry) and its National Institute of Health (a champion of bio-tech). WTO members may also promote regional development (by offering subsidies to companies that locate in underdeveloped areas), as countries with North-South income inequalities tend to do in the European Union.
The first part of this paper is designed to convey the sheer extent of government intervention in hightech industry, using Taiwan as an example.2 This discussion should be of interest to economists who are considering how to develop the anaemic high-tech industries of Argentina, Brazil (somewhat less anaemic), Chile and Mexico.3
The last section of the paper speculates on why Latin America’s high-tech industries have stalled and what would be necessary to get an Asian-type approach up and running. The emphasis is on national rather than foreign ownership.
This study was prepared originally for the sem inar "Development theory at the threshold o f the twenty-first century", organized by ECLAC in Santiago, Chile, to mark the centenary o f the birth o f Raúl Prebisch.1 The latter charge is unfair. As early as 1968, Prebisch strongly advised the Argentine government to combine import substitution with export activity (Mallon and Sourrouille, 1975).
2 This section is based on Amsden and Chu (2003).3 Hereinafter, the term “Latin America” will be used to refer to these four countries.
IMPORT SUBSTITUTIO N IN HIG H-TECH INDUSTRIES: PREBISCH LIVES IN ASIA! A LIC E H. AM SDEN

C E P A L R E V I E W 8 2 • A P R I L 2 0 0 4 77
iiNational ownership and the high-tech industry
The emergence of high-tech industries in countries of relatively recent industrialization (“latecomers”) —even the mature high-tech industries that constitute most latecomers’ high-tech sector— requires entrepreneurship insofar as it entails the creation of the experienced human resources on which those industries depend. There is a great risk that such resources will exit from the firm that created them. Thus, either skill formation must initially be undertaken by the government, with the objective of diffusing capabilities to the private sector, or private firms must be entrepreneurial enough to grow and diversify sufficiently to retain the resources in which they invested.
As late as 2000, the high-tech sector in latecomer countries entailed mature products; Korea and Taiwan, for example, began to produce notebooks and cell phones only after such products had been produced in large volume in high-wage countries. Product maturity implies a relatively low gross margin that is rapidly falling over time. To reap profits in such an industry, a firm must enter quickly before profitability falls further, and it must produce at a high volume to overcome thin margins. Ramping up fast and adapting products in order to be quick to market involves risk-taking and entrepreneurship, since it requires investing in the creation of a new set of skills, coordinating their formation, raising the funds to finance this, and implementing and monitoring the whole process (Amsden and Chu, 2003).
The requisite skills may be cultivated by either State-owned or privately owned organizations, but nationally owned firms have a greater incentive than foreign-owned organizations to take the lead. National firms enjoy lower opportunity costs, more local knowledge and a higher probability of using the same sunk assets in a related local industry than do their foreign counterparts. The first entrants into a high-tech industry in latecomer countries are therefore likely to be nationally owned (State or private) entities. Multinational companies may once have played a formative role in developing labour-intensive, export- oriented industries in latecomers, and they may enter into high-tech industries and accelerate an existing growth momentum.4 However, it may be assumed as a hypothesis that the pioneers of high-tech industry in latecomer countries will be nationally owned firms with either direct or indirect experience in mid-tech sectors or in another type of economic activity, such as marketing foreign products (Amsden and Hikino, 1994).
Table 1 shows the share of high-tech industry in manufacturing value added in selected Latin American and Asian economies for the years 1980 and 1995 (the last year for which comparable data are available). The higher share of high-tech in China, India, Korea and Taiwan compared with Argentina, Chile and Mexico is striking. Only Brazil compares with the Asian countries in the extent to which its manufacturing sector is dominated by high-tech.
4 On the sequential tim ing o f foreign direct investment, seeAmsden (2001).
IMPORT SUBSTITUTIO N IN HIG H-TECH INDUSTRIES: PREBISCH LIVES IN ASIA! • A LICE H. AM SDEN

78 C E P A L R E V I E W 8 2 • A P R I L 2 0 0 4
TABLE 1
Percentage of manufacturing value added in high-tech industries, 1980 and 1995(Percentages)
1995 Argentina Brazil Chile China India Indonesia Korea Malaysia Mexico
Other chemical products 3.5 10.1 8.0 1.9 7.9 3.6 4.7 2.2 7.2Non-electrical machinery 3.1 7.5 1.8 11.1 8.3 1.0 8.4 5.0 3.3Electrical machinery 3.0 8.0 1.5 9.9 8.4 3.1 14.4 27.4 3.2Transport equipment 7.4 10.4 2.0 6.3 8.5 8.9 10.7 4.7 10.1Professional and scientific goods 0.4 0.8 0.2 1.1 0.7 0.1 0.8 1.2 1.7Total 17.4 36.8 13.3 30.2 33.7 16.6 39.1 40.5 25.6
Taiwan Thailand Turkey Rest Japan France UK US(average)
Other chemical products 2.7 2.5 4.7 4.9 5.8 6.1 7.0 6.8Non-electrical machinery 5.2 3.3 4.5 5.2 12.1 7.0 11.3 10.5Electrical machinery 17.3 5.5 6.0 9.0 14.7 10.0 8.4 9.6Transport equipment 7.4 5.2 6.7 7.4 10.6 10.9 10.4 11.6Professional and scientific goods 1.0 0.9 0.3 0.8 1.3 1.5 1.6 5.8Total 33.6 17.3 22.3 27.2 44.4 35.6 38.8 44.3
1980 Argentina Brazil Chile China India Indonesia Korea Malaysia Mexico
Other chemical products 4.9 4.9 6.5 3.3 8.1 7.1 5.2 3.2 5.2Non-electrical machinery 5.5 10.0 1.9 15.1 8.6 1.6 3.4 3.2 4.8Electrical machinery 3.7 6.3 1.8 3.6 8.1 5.3 8.1 12.3 4.4Transport equipment 9.3 7.8 2.5 3.4 8.3 6.4 5.9 4.2 6.9Professional and scientific goods 0.4 0.6 0.1 9.2 0.7 0.1 1.1 0.7 0.7Total 23.8 29.8 12.9 34.6 33.9 20.4 23.8 23.6 22.1
Taiwan Thailand Turkey Rest Japan France UK US(average)
Other chemical products 1.0 2.7 3.6 4.7 4.6 3.9 4.6 4.6Non-electrical machinery 1.9 1.9 4.7 5.2 11.6 10.1 13.0 13.3Electrical machinery 7.0 3.8 4.3 5.7 11.5 8.9 9.3 9.7Transport equipment 2.5 3.7 5.0 5.5 9.5 11.0 10.7 10.6Professional and scientific goods 0.9 0.3 0.1 1.2 1.7 1.4 1.3 3.6Total 13.4 12.4 17.6 22.3 38.7 35.2 38.9 41.9
Source: Amsden (2001).
These differences can be attributed to the ownership of the firms and to government initiative. In turn, the importance of national versus foreign ownership and the activism of the State have deep historical roots involving the nature of prewar manufacturing experience and technology transfer (Amsden, 2001).5 Two major types of transfer may be distinguished: emigré and colonial. National ownership and government initiatives to promote high-tech sectors tend to be greater
5 This paper does not discuss the cases o f Malaysia, Indonesia and Thailand, whose manufacturing sectors are relatively young com pared with the four Latin American and four Asian countries discussed. M alaysia’s share o f high-tech industry is high in terms of manufacturing value added owing to labour-intensive electronics assembly, which is not high-tech in terms o f skill content. For a more detailed discussion, see Amsden (2001). Nevertheless, both Thailand and M alaysia have begun to invest heavily in R&D. Investments in technology in Indonesia were never negligible. Over 25 years ago, Indonesia sent a large contingent o f engineers to the Department o f Aeronautics and Astronautics at the Massachusetts Institute o f Technology in order to build its aerospace industry.
in countries with colonial —rather than emigré— prewar manufacturing experience.6
In the emigré form of experience, technological capabilities and business organizations were transferred by means of foreign individuals (and later companies) that located operations in a latecomer setting. Like the North Americans and Europeans in Latin America and the Chinese in Asia (Malaysia, Indonesia and Thailand), such emigrés are a major source of modern business know-how and skill formation. The boundaries between national ownership and foreign ownership become blurred, and government policy
6 The measurement o f national versus foreign ownership across countries in any particular industry, or in the manufacturing sector at large, is vexed by different definitions o f “foreign” — the percentage o f equity in an investment that is foreign owned. The available cross-country data, however, suggest that foreign direct investment (FDI) is much more important in the manufacturing industries of Latin America than in Asia (as defined above): see Amsden (2001).
IMPORT SUBSTITUTIO N IN HIGH-TECH INDUSTRIES: PREBISCH LIVES IN ASIA! • A LICE H. AM SDEN

C E P A L R E V I E W 8 2 • A P R I L 2 0 0 4 79
towards promoting national ownership over foreign ownership is at best ambivalent. In identity politics, it is unclear who is a foreigner and who is a national.
In the colonial type of prewar manufacturing experience, business know-how and foreign skills were transferred by firms that resided in the home country of the colonial ruler. For example, the major nationality of foreign firms in India was British, while in Korea and Taiwan, it was Japanese. This form of technology transfer was favourable to national ownership because colonialism eventually ended in decolonization, which had many positive impacts on countries that had succeeded in acquiring prewar manufacturing experience. Foreign political rule was displaced by national political rule, and colonial firms typically were taken over by nationals. In Indonesia, roughly 400 Dutch-owned companies were left behind —albeit practically gutted— when Dutch domination ended (Lindblad, 1996). In India, British enterprise either sold out to Indian buyers or could not compete against them (Tomlinson, 1981). In Korea and Taiwan, Japanese manufacturing enterprise and banks fell into the hands of national governments (Amsden, 1989; Fields, 1995). In China, foreign-owned firms were appropriated after the Chinese Communist revolution. Decolonization thus cleared the way for nationally owned companies to grow, whereas emigres tended to crowd out nationally owned firms in industries subject to economies of scale.7 In turn, nationally owned firms, especially those originating in mid-tech industry, often became the entrepreneurs behind the rise of high-tech industries and services such as the computer industry, telecommunications, finance and high-speed trains, as in the cases of Korea and Taiwan.8
Decolonization also created a culture of nationalism, which gave rise to political demands for land reform and government policies to promote nationally owned firms and the high-tech industry. Economic nationalism took many forms, but all shared the objectives of creating an alternative to multinational enterprise and generating the wherewithal to move up the ladder of comparative advantage, beyond labor-intensive or raw-material-intensive industries. This required, first, government-owned national research and development (R&D) laboratories, such as the
defence-related labs in China and India, which became breeding grounds for private high-tech industries, and second, investments in tertiary education, which tended to be high in Asia.
Finally, nationalism tended to foster an ethos of equality, which was patently absent under colonial rule. All four Asian countries discussed above introduced land reform in varying degrees of radicalism, with the most radical in China and the least in India. Land reform abolished the large estates that had earned Ricardian rents (that is, above normal profits) in prewar years. With such profit-making opportunities gone, the opportunity costs of investing in manufacturing industries were lowered, making manufacturing a more attractive financial venture than it had been when consolidated holdings of land and mining rights characterized the agricultural sector, broadly defined. The reduction of opportunity costs outside manufacturing also made it less costly for the government to subsidize manufacturing activity in order to lure capital and human resources out of agriculture and into new import-substitution manufacturing industries (Amsden, 2001).
The degree of high-tech activity, measured in table 1 as the share of high-tech industry in total manufacturing value added, therefore tends to be higher in Asia than in Latin America. The exception is Brazil, where the State launched a highly nationalistic project to develop local capabilities to manufacture mini-computers. This project was generally unsuccessful, in part because of weaknesses in tertiary education and lack of experience among nationally owned firms, which were stronger in the realm of finance than manufacturing (Evans, 1995; Sridharan, 1996).
The difference in high-tech development in Latin America and Asia can thus be attributed to history, specifically to whether prewar manufacturing experience was acquired through emigration or colonialism.
The question now becomes how and why to promote high-tech industry in emigre-dominated economies. But first the paper examines the case of Taiwan, where both the emigres (from the Shanghai region of China) and decolonization were critical in moving beyond late development, based on mid-technology industries.
7 For the Argentine automobile industry, see Cochran and Reina (1962).8 On Taiwan, see Amsden and Chu (2003).
IMPORT SUBSTITUTIO N IN HIG H-TECH INDUSTRIES: PREBISCH LIVES IN ASIA! ALICE H. AM SDEN

80 C E P A L R E V I E W 8 2 • A P R I L 2 0 0 4
IIIGovernment leadership in high-tech in Taiwan
The Taiwanese government’s role in promoting hightech was major insofar as it was meant to create the new market segments in which national companies could then compete. Its strategy featured import substitution and the germination of parts suppliers around a lead firm, or “second mover” (the first latecomer firm to enter a mature high-tech industry). Whereas the government had spawned new industries in the old economy using State-owned enterprises and import- substituting policy tools such as tariff protection, local content regulations and development banking, it did so in the new economy using spin-offs from State-owned research institutes and science parks, together with import-substituting policy tools such as subsidies to public and private R&D, tax breaks and financially favourable conditions for residents of science parks.
By 2000, there were more than 15,000 professionals in Taiwan who had at one time or another worked for ITRI, the government’s premier research center devoted to high-tech industry.9 Of these 15,000 professionals, more than 12,000 had, in fact, gone to work in such industry. Of these 12,000, 5,000 had been employed in Hsinchu Science-Based Industrial Park.10 ITRI was also responsible for spinning off the two pillars of Taiwan’s semiconductor industry, the United Microelectronics Corporation (UMC) and the Taiwan Semiconductor Manufacturing Company (TSMC).
The government sought to break technological bottlenecks to enable nationally owned second movers to compete globally in “new” high-tech subindustries, and then to pass on their know-how to local parts suppliers. By the 1970s, the fast growth of labour-intensive exports had depleted Taiwan’s “unlimited” labour reserves, and major projects in heavy industry were already in place. It was thus strongly believed that the next set of growth opportunities had to be created in high-tech industry, and that the government had to play a major role in cultivating them. “To many policy makers in Taiwan, the classical price-mechanism
9 ITRI is the Industrial Technology Research Institute.10 The ITRI (2001) and Industrial Technology Information Service (ITIS) reports are available athttp://www.itri.org.tw/eng/about/annual/annual98/spec_pg3.jsp
type of resource allocation was simply too slow a process to promote industrial development. They advocated that more direct industrial policy measures be considered to speed up development of high-tech industry” (San, 1995, p. 35).
The government promoted high-tech industry on several fronts, including fiscal policy, the creation of science parks, and the pro-active investments of public R&D institutes, some of which assumed multiple roles. ITRI, for example, undertook key technology projects to give a head start to pivotal industries, such as semiconductors and personal computers (PCs). Its spin-offs thus became Taiwan’s leading firms in integrated circuit design. ITRI also actively initiated projects to explore major areas in which it believed the private sector might profitably invest next. After an industry got started, ITRI would undertake smaller- scale projects to substitute for the importation of key components. The government’s objective was always to create local growth opportunities and local value added, besides upgrading the level of local technology. All forms of promotion converged in industries judged to be strategic in terms of their technology intensity, value added, market potential, industrial linkages, energy consumption and pollution content.
The government passed the “Development of Critical Components and Products Act” in 1992 to select 66 inputs for import substitution in an effort to reduce a persistent trade deficit with Japan.11 Despite a bias in favour of imports on the part of domestic users of high-tech components, scarcities of such components promised high prices and high profits for firms that could make them instead of importing them. Users of such inputs had an added incentive to make them in-house in order to stabilize their supply. For its
11 Taiwan’s annual trade deficit with Japan grew in US dollars to about ten billion in 1991 from only two billion or three billion in the first ha lf o f the 1980s. Japan was the only trading partner against which Taiwan persistently ran a large trade deficit. Nevertheless, the share o f Taiwan’s imports from Japan out o f total imports was relatively stable in this period; it remained at around 30%. Import dependence on Japan was thus probably a better indicator o f Taiwan’s technological dependence than its trade imbalance. Arguably, therefore, the passage o f the “Development o f Critical Components and Products Act” had less to do with trade structure than with industrial upgrading.
IMPORT SUBSTITUTIO N IN HIG H-TECH INDUSTRIES: PREBISCH LIVES IN ASIA! A LIC E H. AM SDEN

C E P A L R E V I E W 8 2 • A P R I L 2 0 0 4 81
part, the government became committed to the substitution of imports of high-tech components to prevent hollowing out, or the movement of manufacturing jobs overseas.
Government leadership in strengthening science
and technology (S&T) is illustrated below using the examples of compact disk-read-only memory devices (CD-ROMs), liquid crystal displays (LCDs) and integrated circuit (IC) design. Key government programmes are then briefly reviewed.
IVImport substitution cum high-tech promotion
1. CD-ROMs
The CD-ROM, an optical storage device,12 was chosen by the Taiwan government as a target industry in 1992 after extended discussion among government officials, academics and leading business people. Several related key technologies, such as the optical pick-up head, were also identified for promotion. The Department of Industrial Technology (DoIT) in the Ministry of Economic Affairs (MOEA) handled the so-called supply side: it invited research institutes, mainly ITRI, to submit R&D proposals to develop the selected items. Resources came from the Science and Technology R&D fund in four consecutive years, from 1993 to 1996. By the end of 1996, the total budget was roughly US$10 million.
The Industrial Development Board of the MOEA handled the so-called demand side by inviting private companies (based on specified criteria) to participate in the development process. The programmes involved were the “Regulations Governing the Development of New Industrial Products by Private Enterprises” and the “Regulations Governing Assistance in the Development of Leading Products.” These two programmes provided R&D grants to private enterprises to engage in new
product development. The grants were to be repaid if and when sales actually materialized.
The CD-ROM project involved 25 firms in joint development and technology transfer.13 Four patents were derived for CD-ROMs and 24 for CD-ROM pick-up heads. Ramp-up was astonishingly fast. As indicated in table 2, Taiwan’s share of CD-ROMs in world output rose from 1% in 1994 (218,000 units) to 50% only five years later (48,690,000 units).
CD-ROM production, 1991-1999a
YearOutput,
thousands o f unitsB/A ITRI cooperation
A. World B. Taiwan % (number o f firms)
1991 936 11992 1 050 71993 6 740 251994 17 966 218 1 251995 38 572 3 600 9 251996 51 000 9 170 18 251997 61 000 16 000 261998 89 300 30 780 351999 96 860 48 690 50
Source: ITRI (1997) and Market Intelligence Center (various years). a CD-ROM = compact disk read-only memory.
TABLE 2
12 Information on CD-ROMs is derived from the following sources: Industrial Development Bureau (various years), ITRI (1997), ERSO (1994), Hsiao (1994) and Market Intelligence Center (various, no. 2267).
13 Interviewed firms include BTC, Inventec, Acer, U-Max, and Lite-On. BTC and Lite-On were also involved in the project to develop the CD-ROM pick-up head.
IMPORT SUBSTITUTIO N IN HIG H-TECH INDUSTRIES: PREBISCH LIVES IN ASIA! • A LICE H. AM SDEN

82 C E P A L R E V I E W 8 2 • A P R I L 2 0 0 4
TABLE 3
Technological upgrading in the CD-ROM industry, 1994-1999(Percentage o f total output)
Year CD-ROM read peed2 4 6 8 10-12 16 20 24 32 36 40 44-48 >50 Total
1994 100 1001995 40 47 13 1001996 13 67 20 1001997a 23 22 55 1001998b 2 11 27 60 1001999b 6 31 47 16 100
Source: Market Intelligence Center (various years). a = second half; b = fourth quarter.
Although the firms that acquired CD-ROM technology from ITRI were able to begin assembly operations at once, and although the CD-ROM at the time was already a mature product, technological change continued to be rapid. As shown in table 3, manufacturers had to upgrade their know-how repeatedly to produce faster CD-ROMs. Moreover, they had to import key components from Japan. Local production of disks and spindles gradually came on line, but the two most critical inputs, the optical pick-up head and the ASIC set, were still being imported after 1996, although ITRI was in the process of developing them.
Taiwanese firms moved ahead of Japan as the major producers of CD-ROMs, but Japanese companies were shifting to other new and improved models, such as the DVD-ROM and the CD-RW. Most Taiwanese firms were reluctant to enter into DVD- ROM production because they considered the royalty fees demanded by Japanese companies prohibitive, but then ITRI transferred DVD-ROM technology to 13 firms in 1997. Around 2000 the price of the DVD- ROM was twice that of the CD-ROM, but replacement of one with the other was expected to be slow.
2. Liquid crystal displays (TFT-LCDs)
Liquid crystal displays14 were pioneered in the late 1970s and 1980s by Japanese firms, first in their simpler forms (twisted nematic, or TN, and supertwisted nematic, or STN) and then in their more complex form (thin film transistor, or TFT).15 The latter represented a great
14 Information on the liquid crystal display (LCD) industry is from Wong and Matthews (1998), Linden and others (1998) and ITRI (1999 and 2000b).15 An LCD is the best-known example o f the type o f microelectronic flat panel display which is used in electronic calculators, laptop computers and other applications.
challenge to manufacturers owing to their extremely high financial and processing requirements. Profitability depended on low defect rates and high yields.
By the mid-1990s, some Korean chaebols (such as Samsung, Hyundai and LG), in collaboration with the ministries responsible for promoting technological innovation, had succeeded in entering the TFT-LCD industry and providing a modest challenge to Japanese hegemony. Some Taiwanese firms were competitively producing TN- and STN-LCDs by the early 1990s, but they hesitated to enter the more capital-intensive TFT- LCD market.
Two events probably pushed them into action. Prior to the 1997 Asian financial crisis, Samsung, Hyundai and LG had planned large expansions to catch up with Japanese manufacturers, but the crisis led them to mothball their plans. At the same time, Japanese business groups that were suffering from prolonged recession and overcapacity became unable or unwilling to continue making the huge investments in TFT-LCDs necessary to keep up with the competition. A few, therefore, decided to cooperate with Taiwanese firms by granting them technology licenses and giving them OEM orders.16 Suddenly, therefore, leading Taiwanese firms announced plans to obtain technology from Japanese partners and make big investments to produce TFT-LCDs.
The entry of Taiwanese firms changed the global distribution of large TFT-LCD capacity. Taiwan’s share of global capacity increased from zero percent in 1998, to 2% in 1999, 15% in 2000, and 26% in the first quarter of 2001. With these huge increases in capacity,
16 A join t venture between IBM and Toshiba formed in 1989 ceased making LCDs for computers in May 2001. Toshiba will use its Japan facility to make LCDs for cell phones, and IBM will use it for ultra-high-resolution applications such as medical devices (Nikkei Weekly, 2001).
IMPORT SUBSTITUTIO N IN HIGH-TECH INDUSTRIES: PREBISCH LIVES IN ASIA! • A LICE H. AM SDEN

C E P A L R E V I E W 8 2 • A P R I L 2 0 0 4 83
the international price of TFT-LCDs fell sharply, and the price of a 14.1-inch TFT notebook panel dropped from US$1100 in the third quarter of 1997 to a little over US$600 in the fourth quarter of 2000. With large investments and falling prices, mergers and acquisitions came onto the agenda of the firms in this sector.
ITRI had initiated an R&D project on TFT-LCDs in 1988, but no Taiwanese firm relied on ITRI’s technology when the time came to invest in TFT-LCD capacity. In this respect, ITRI’s efforts were a failure. Nevertheless, the competitiveness of the high-tech groups that entered into TFT-LCD production in Taiwan depended on further technological development, and it was expected that ITRI would play a leading role at this higher stage. Indeed, it established Taiwan’s first low-temperature polysilicone (LTPS) TFT-LCD laboratory in 2000 and has developed some key components for more advanced types of panel display.
3. Integrated circuit (IC) design
The basis of a networked semiconductor industry stemmed from the Taiwanese government’s creation of two world-class semiconductor manufacturers: United Microelectronics Corporation (UMC) in 1980, which is still government-owned, and the larger Taiwan Semiconductor Manufacturing Company (TSMC) in 1987. Both were spin-offs from experimental IC factories set up by the government-owned Electronics Research and Service Organization (ERSO), although they emerged at different stages and from different projects17 TSMC was also a “foundry” that specialized only in wafer production, eschewing investment in auxiliary operations, unlike the vertically integrated device manufacturers (IDMs) that dominated the semiconductor industry worldwide.18 The specialization strategy was the outcome of a deliberate government decision influenced by a prominent State official, K.T. Li, and Morris Chang, who came to Taiwan at the government’s invitation in 1985 to head ITRI and later TSMC.19 Chang was a former senior vice president at
17 ERSO is part o f ITRI.18 The stages involved in the production o f an integrated circuit are design, manufacturing, masking (or sealing), packaging and testing.19 UMC ultimately adopted TSM C’s strategy and became less vertically integrated, assuming the structure o f a foundry.
Texas Instruments and had been the highest ranking Chinese-American in the United States high-tech industry.
Three IC design companies (Quasel, Mosel and Vitelic) were established in Taiwan with government support by returnees (Taiwanese living abroad who return to live and work in Taiwan) from the United States. In 1985, all three were in financial trouble, and they again requested government help.20 They wanted a local specialized foundry that could provide them with much faster and better service than large-scale foreign integrated device manufacturers, who regarded their orders as peripheral to their main business. The intellectual property of a design was also better protected by a foundry than an IDM.
Taiwan’s IC design industry leapt from eight houses in 1985 to fifty houses in 1988. Sales grew 175% in 1988 and 143% in 1989. This was “partly due to the growth of the domestic market and partly due to the establishment of TSMC”.21 In 1999, 91% of the fabrication work demanded by Taiwan’s IC design houses was done locally. The top seven IC design houses are estimated to have accounted for 60% to 70% of total IC design revenue. In the same year, 62% of semiconductor output was sold locally.22
Taiwan’s IC design companies benefited from local supporting industries other than foundries. The IC mask industry, like the foundry industry, was set up by the government. ERSO transferred mask technology from two American companies —IMR in 1977 and Electromask in 1980— and began providing commercial masking services to local IC producers. The responsible division was then spun off as the Taiwan Mask Corporation in 1989.23 Having a domestic masking service is estimated to have saved local firms 20 days or more in the complete IC production cycle (Lin, 1987).
Some United States electronics firms had moved into southern Taiwan’s export processing zone in the 1960s to do packaging, testing and assembly (such as
20 ERSO started a multi-project chip programme with the National Science Council in 1983 to help build up IC design capabilities in Taiwan’s universities (Chen and Sewell, 1996). Mosel and Vitelic merged in December 1991 and now manufacture and market worldwide dynamic random access memory (DRAM) chips and other products. Revenues were US$880 million in 2000. Quasel is no longer in business.21 Market Intelligence Center (1989, p. 390); see also Lin (1987) and Chiang and Tsai (2000).22 Ministry o f Finance website (www.mof.gio.gov.tw/taiwan-web- site/5-gp/eu/tables.htm).23 See ERSO, 1994.
IMPORT SUBSTITUTIO N IN HIG H-TECH INDUSTRIES: PREBISCH LIVES IN ASIA! ALICE H. AM SDEN

84 C E P A L R E V I E W 8 2 • A P R I L 2 0 0 4
General Instrument, Motorola, Microchip and Texas Instruments). These industries were gradually localized; both Motorola and Microchip, for example, sold their packaging capacity to nationally owned firms in1999. In that year Taiwan’s packaging capacity ranked first in the world: 99% of domestic packaging demand was supplied locally, and local packagers got half their business from domestic firms (ITRI, 2000a).
The human resources involved in the IC design industry, like the IC industry as a whole, came largely from ERSO and other government institutions or programmes and, to a lesser extent, from abroad. Most of the early IC design houses, such as Syntek (1982),
Holtek (1983), and PTD (1986) were either ERSO spin-offs or were set up by former ERSO staff. These firms, in turn, had unintended spin-offs of their own, such as Chip Design Technology (1985) and Tontek (1986), which spun off from Syntek. When foreign design firms, such as Motorola and Philips, set up IC design facilities in Taiwan in the late 1980s, they either recruited from ERSO or asked ERSO to conduct their training courses (Lin, 1987). Returnees became important only in the 1990s. Of the top ten IC design houses in Taiwan, it is estimated that two were run by returnees in 1989, but that number had increased to five by 1995 (Hsu, 1997).
VStart-ups: firm-level targeting
Taiwan was one of the first latecomer countries in which venture capitalism flourished, playing a major role in supporting Taiwan’s high-tech industry.24 The government was the catalyst: it began promoting private venture capital funds to finance start-ups in 1983, and it also founded its own venture capital firm around the same time.25
Nevertheless, venture capitalism cannot be credited with Taiwan’s large (although steeply declining) number of start-ups. According to venture capital data for 1995-2000, start-ups received only a minor share of funds. Of the five stages of a firm’s life cycle (seeding, start-up, ramp-up, maturity and restructuring), start-up
24 “Seventy percent o f VC [venture capital] investments have been in computer-related and electronics sectors. The rest occurs in communications, industrial products, and medical/biotechnology. The concentration by Taiwan’s VC on technological rather than traditional industries, which is similar to the case o f Singapore and South Korea, can be explained by the tax incentives which channel VC towards technological enterprise investments” (Wang, 1995, p. 86).25 In 1983 the M inistry o f Finance introduced a statute (“Regulations Governing Venture Capital Investment Enterprises”) that laid down guidelines for the organization o f venture capital firms, their minimum capital requirements, and rules for the m anagement and supervision o f their funds. The first venture capital company to be created was Multiventure Capital Corp. (1984), a joint venture between Acer and Continental Construction. A second joint venture was founded in 1986 between an American venture capital firm (Hambrest & Quest) and various government agencies, in which 49% o f the firm s’ minimum capital requirements came from the governm ent’s development fund (the Executive Yuan) and a quasi-development bank (Chiao-Tung). See Tzeng (1991) and Taiwan Venture Capital Association (www.tvca.org.tw/indexe.htm).
received only 13.3% of total venture capital funding in 1995.26 Assuming the available data are accurate, the lion’s share of funding went to ramp-up and maturity (the former included the transformation of privately held companies into publicly held companies through initial public offerings, or IPOs)27 By 2000, the share of total venture capital allocated to start-ups had risen to 32.8%, but this was still below the share allotted to expansion and maturity.
In cases in which an outside agent incubated a start-up, that agent was typically the government rather than a private venture capitalist. The government sometimes nurtured a start-up directly, as in its founding of Taiwan’s two world-class State-owned semiconductor foundries, UMC and TSMC. Usually, however, the government nurtured start-ups indirectly by providing them with the finance, facilities and access to bottleneck technologies that were necessary for them to grow.
A major form of incubation in Taiwan was the science park, with the first located south of Taipei in
26 The funding of start-ups by the venture capital industry m ay have been more important in the 1980s than in the 1990s. It has been estimated that o f the 80 firms operating in Hsinchu Science Park in 1987, as many as 43 were financed by venture capitalists (Liu and others, 1989).27 “The achievements o f VCs in directing technological enterprises about how to go public with their stock are considerable” (Wang, 1995, p. 90). Public offerings were the m ajor exit strategy o f venture capital investors.
IMPORT SUBSTITUTIO N IN HIG H-TECH INDUSTRIES: PREBISCH LIVES IN ASIA! A LIC E H. AM SDEN

C E P A L R E V I E W 8 2 • A P R I L 2 0 0 4 85
Hsinchu and the second in Tainan in southern Taiwan. Start-ups were cherry-picked by the government for residence in these parks. Park residents received a set of comprehensive and generous subsidies that included tax and import duty exemptions, grants and subsidized credit, below-market rents for high-quality factory buildings or sites, living amenities for high-cali- bre researchers (including bilingual language instruction for expatriates’ children), and access to government and university research facilities. “The engine of economic growth in the 1980s in Taiwan [was] the information industry, while the science-based industri
al park [was] the driver of that engine” (Liu and others, 1989, p. 35).28 Hsinchu Science-Based Industrial Park accounted for a large and increasing share of Taiwan’s total R&D spending —as much as 18% in 1998— although it accounted for less than 1% of total output (sales as a share of gross national product). Finally, while the number of Ph.D.s in Taiwan grew from 6,000 in 1990 to roughly 16,000 in 1998, the share employed by firms in Hsinchu Science-Based Industrial Park rose just as sharply, from 2% to over 6% in the same period.
VIPerformance standards
Thus, despite the government’s lip-service to liberalization and despite its opening of markets to greater foreign competition, industrial policy continued to play an important role in Taiwan’s high-tech industries. The general success of industrial policy (as measured by global market share in information technology) stemmed from the maturity of the technology Taiwan was acquiring and to the performance standards observed.
The high-tech products that Taiwan targeted for import substitution were already mature by world standards, in that sales had already reached a high level before the products were manufactured in Taiwan. Thus, the government’s targeting was not a shot in the dark: national enterprises had to face economic uncertainty, but they were not also confronting the technological unknown. Still, the potential margin of error on the government’s part was large because technological uncertainty was not necessarily trivial even among mature products. For example, the government made the right choice, among several possibilities, in the case of information technology. Its “decision to bet on CMOS proved critical for Taiwan’s ability to synchronize the development of semiconductor technology and its PC-based information technology so as to achieve a high synergy effect” (Chang and Tsai, 2000, p. 187)29
28 See also Chang (1992), Yang (1998) and Hsinchu Science-Based Industrial Park (2000), publication no. 2309.29 CMOS stands for complementary metal-oxide semiconductor.For more about this decision, see Chang and others (1994).
The government’s choices were based on careful and concerted studies of technological developments and trends by committees of government, business and university experts. In addition, the allocation of subsidies generally succeeded because, as in the past, the government tied the support to concrete, measurable and monitorable performance standards.30 What was different in the high-tech stage of upgrading was that these standards tended to emphasize investment in assets that were knowledge-based.
Performance standards functioned in Taiwan’s high-tech industries on two dimensions: as criteria that firms had to meet to be eligible for government subsidies, and as a condition for continuing to receive the incentives granted. The government had to be selective because the demand for subsidies by firms and research institutes exceeded supply. Conditionality itself worked because Taiwan’s manufacturing sector —as evidenced by interviews with firms— had accumulated enough experience and skills to potentially produce high-tech products profitably. As projects became profitable, they generated the revenue for beneficiaries to repay their loans and to meet government R&D requirements — the programme’s cardinal condition. Successful projects, in turn, reinforced the government’s commitment to promotion.
30 For a general discussion of performance standards in the success o f government intervention in late industrialization, see Amsden(2001).
IMPORT SUBSTITUTIO N IN HIG H-TECH INDUSTRIES: PREBISCH LIVES IN ASIA! ALICE H. AM SDEN

86 C E P A L R E V I E W 8 2 • A P R I L 2 0 0 4
The conditions for admission into Hsinchu Science-Based Industrial Park (circa 1980) were as follows:i) A firm had to have the ability to design products
for manufacturing according to a business plan;ii) It had to have produced products that had under
gone initial R&D that was still in process;iii) It had to have manufactured products with a
potential for development and innovation;iv) It had to have experience in high-level innovation
and R&D in a research department that conformed with a minimum specified size;
v) It had to have adopted production processes that required either training in advanced technology or the spending of fairly large sums on R&D;
vi) It was required, within three years after marketing a product or service, to employ a staff with no less than 50 % local technical personnel; and
vii) Its operations had to contribute significantly to Taiwan’s economic reconstruction and national defence (Liu and others, 1989).Winners were selected by a tripartite committee
of experts drawn from private industry, government and academic circles, as in other government programmes.
To qualify for government funds for strategic products or industries (such as CD-ROMs or TFT- LCDs), the following standards had to be met:i) Firms had to demonstrate their financial sound
ness and economic capabilities;ii) They had to prove that they operated a research
department; andiii) They had to demonstrate substantial past R&D
achievements.
Once a product receiving government promotion was successfully developed, intellectual property rights were handled as follows:i) Ownership was shared equally, as jointly owned
property, by the Ministry of Economic Affairs (MOEA) and the firm that had developed the product, since the government had invested 50 % of total development costs;
ii) If the MOEA wished to sell part of its intellectual property rights, the firm that shared these rights with the government had the right of first refusal; and
iii) In the event that the firm failed to engage in production or to initiate sales of the targeted leading product within three years after the completion of the development plan (for reasons such as bankruptcy, marketing strategy or operational difficulties), the firm not only lost its intellectual property rights entirely, but also had to repay in installments the money the government had invested. To receive subsidies for R&D, firms in strategic
industries had to commit to spending a certain fraction of their own revenues on additional R&D. The fraction partially depended on firm size: the larger the firm, the greater the fraction. If the amount spent was below the prescribed ratio, then the firm had to contribute the balance to a research and development fund designated by the government.
All told, the government pro-actively promoted the accumulation of knowledge-based assets in strategic industries to maintain Taiwan’s standing as a production base. The performance standards it exacted for its subsidies further promoted high value added.
IMPORT SUBSTITUTIO N IN HIGH-TECH INDUSTRIES: PREBISCH LIVES IN ASIA! • A LICE H. AM SDEN

C E P A L R E V I E W 8 2 • A P R I L 2 0 0 4 87
V IIHigh-tech industry in Latin America
A high-tech industry is one whose technology is still tacit rather than explicit owing to firm-specific, proprietary capabilities that create novel products and earn above-normal rents. High-tech industries are thus desirable for a country because they require highwage, skilled workers and offer opportunities for entrepreneurs to earn technological profits. By definition, the rate of return of a high-tech product is still above normal for a latecomer even when technology is mature by advanced-country standards.
The domination of the United States and Asia in electronics makes it very difficult for newcomers to enter this field. In the case of Asia, not only is the region the low-cost manufacturer of virtually all mature electronics products owing to well-developed private firms and national innovation systems, but Asian producers also benefit from national and regional external economies (Fujita and others, 2000).
Latin America has two possibilities to create high-tech industry and, concomitantly, the firms and skilled workers necessary for such industry to thrive. First, it can “induce” foreign-owned firms that dominate industries such as automobiles to do more R&D locally. As evident from table 1, a broad definition of high-tech includes industries that are not especially R&D-intensive, such as transportation equipment, alongside electronics and chemicals, for example, which are the two most R&D-intensive industries. Nevertheless, leading producers of automobiles, such as Volkswagen and General Motors, have large corporate laboratories at home. They have an incentive to transfer R&D activity to latecomers owing to lower engineering costs. They also have a disincentive to do so, however, given the shortage of experienced skilled workers, uncertain property rights, and an unwillingness on the part of scientists at corporate labs to relinquish control over the most interesting research projects. Top management wants to keep these projects at home, under surveillance.
The Singapore government was able to overcome these resistances on the part of foreign firms, which accounted for about 80% of the country’s total manufacturing value added, by systematically and deliberately creating a system of incentives and a set of institutions to make foreign firms do more local R&D
(Amsden and others, 2001). In fact, the most advanced and promising R&D in terms of skill formation and new product development was undertaken by government-owned labs, acting independently. Such labs also worked with foreign companies to help them solve their production problems and, later, problems related to more advanced research. In addition, the government was scrupulous in protecting intellectual property and in subsidizing research and training by the private sector. This contributed to an increasing effort on the part of foreign firms to undertake R&D in Singapore. A similar scenario could be imagined for Latin America.
Second, Latin America has excelled in the production of petrochemicals. Some countries, especially Brazil and at one time Argentina, were also good at pharmaceuticals. These two industries, combined with bio-tech, comprise a large sector with diverse opportunities for new, high-tech products.
Research and development expenditure , 1985 & 1995(As a percentage o f gross national product)
1985a 1995b
Korea 1.8 2.8Taiwan 1.2 1.8India 0.9 0.8Chile 0.5 0.7Brazil 0.7 0.6Turkey 0.6 0.6China 0.5Argentina 0.4 0.4Malaysia 0.4Indonesia 0.3 0.1Thailand 0.3 0.1Mexico 0.2 0.0
Source: All countries except Taiwan: UNESCO, various years; Taiwan: Taiwan National Science Council, 1996. a The data are for the following years: India and Indonesia, 1986; Brazil, Korea, Mexico and Turkey, 1987; Chile and Taiwan, 1988. b The data are for the following years: Malaysia, 1992; Mexico, 1993; India and Korea, 1994.
Whatever the potential, R&D for all industries to date accounts for a much lower share of gross national product (GNP) in Latin America than in Asia
TABLE 4
IMPORT SUBSTITUTIO N IN HIG H-TECH INDUSTRIES: PREBISCH LIVES IN ASIA! • A LICE H. AM SDEN

88 C E P A L R E V I E W 8 2 • A P R I L 2 0 0 4
(table 4). Very few Latin American firms are active in R&D, including firms in Brazil (Alcorta and Peres, 1998). The education system is not oriented towards research that has industrial applications, and government laboratories have been neglected in the liberal spirit of cutting back public expenditures. Latin America must therefore undertake substantial policy making and institution building if it is to promote high-tech industry. The problem is not the rules of the WTO (although these generally don’t help), but rather the inappropriate technology-related institutions that exist as a result of the Washington Consensus.
Institution building in favour of high-tech growth was a major part of Taiwan’s success, as seen above in
the case of the CD-ROM, TFT-LCD and IC design industries. These institutions, which involved a large but disciplined role for the government, were of the type that motivated Raúl Prebisch’s writings on economic development. Hence, it is true to say that Raúl Prebisch lives in Asia.
Clearly, most investments in new technology, whether private or public, fail. If countries do not invest in technology, however, their economies will almost certainly fail too. Will Latin America open the door again to neo-Prebisch policies, this time aimed at building industries that are high tech?
(Original: English)
Bibliography
Alcorta, L. and W. Peres (1998): Innovation systems and technological specialization in Latin America and the Caribbean, Research Policy, No. 26, Amsterdam, Elsevier Science.
Amsden, A.H. (1989): A s ia ’s N ext Giant: South Korea and Late Industrialization, New York, Oxford University Press.
(2001), The R ise o f ‘the R e s t’: Challenges to the West fromLate-Industria lizing Econom ies, New York, Oxford University Press.
Amsden, A.H. and others (2001): Do foreign companies conduct R&D in developing countries?, A New Approach to Analyzing the Level o f R& D with an Analysis o f Singapore, Tokyo, Asian Development Bank Institute.
Amsden, A.H. and T. Hikino (1994): Project execution capability, organizational know-how and conglomerate corporate growth in late industrialization, Industrial and Corporate Change, vol. 3, No. 1, Oxford, Oxford University Press.
Amsden, A.H. and W.W. Chu (2003): Beyond Late Development: Taiwan’s Upgrading Policies, Cambridge, Massachusetts, M IT Press.
Cochran, T. and R. Reina (1962): Entrepreneurship in Argentine Culture, Philadelphia, University o f Pennsylvania Press.
Chang, C.C. (1992): The D evelopm ent o f Taiwan’s Personal Com puter Industry. Taiw an’s E nterprises in G lobal Perspective, New York.
Chang, P.L. and C.T. Tsai (2000): Evolution o f technology developm ent strategies for Taiwan’s semiconductor industry: form ation o f research consortia, Industry and Innovation, vol. 7, No. 2, London, Taylor & Francis Group.
Chang, P.L. and others (1994): The formation process o f Taiwan’s IC industry. Method o f technology transfer, Technovation, vol. 14, No. 3, Amsterdam, Elsevier Science.
Chen, C.F. and G. Sewell (1996): Strategies for technological development in South Korea and Taiwan: the case o f semiconductors, Research Policy , No. 25, Amsterdam, Elsevier Science.
ERSO (Electronics Research and Service Organization) (1994): ERSO: The F irst Twenty Years, Hsinchu, Taipei.
Evans, P. (1995): Em bedded Autonomy: States and Industrial Transformation, Princeton, Princeton University Press.
Fields, K.J. (1995): Enterprise and the State in Korea and Taiwan, Ithaca, Cornell University Press.
Fujita, M. and others (2000): The Spatial Economy: Cities, Regions, and International Trade, Cambridge, Massachusetts, MIT Press.
Hsiao, F.H. (1994): Taiwan’s Industrial Policy and Industrial Development, Taipei, Far East Economic Research.
Hsinchu Science-Based Industrial Park (2000): Publication No. 2309, Hsinchu.
Hsu, J.Y. (1997): An historical study o f Taiwan’s IC industry, Journal o f Geography Science, No. 23, Taipei, National Taiwan University.
Industrial D evelopm ent Bureau (various years): Industria l Developm ent Yearbook, Taipei.
ITIS (Industrial Technology Information Service) (1998): Annual Report, 1998 [http://w w w .itri.org.tw /eng/about /annual/ annual 98/spec_pg3.jsp].
ITRI (Industrial Technology Research Institute) (1997): Summary Report o f the K ey Components and Products Project, Taipei.
(1999): Taiwan’s Prospects fo r Developing the TFT-LCDIndustry, Taipei.
(2000a): A Study o f Taiwan's Semiconductor Companies,Taipei, Industrial Technology Research Institute (ITRI)/Industrial Economics and Knowledge Center (IEK) [http://www.itri.org.tw/eng/about/annual/annual98/spec_pg3. jsp].
_______ (2000b): Study on the D evelopm ent Trend o f the F la t PanelD isp lay Industry Taipei [http://w w w .itri.org.tw/eng/about/annual/annual98/spec_pg3.jsp].
Lin, H.M. (1987): A study o f an emerging industry in a LDC: A case study o f Taiwan’s IC industry, Economics, Taipei, National Taiwan University.
Lindblad, J.T. (ed.) (1996): Historical Foundations o f a National Economy in Indonesia, 1890s-1990s, Amsterdam, North- Holland.
Linden, G. and others (1998): Flying geese as moving targets: are Korea and Taiwan catching up with Japan in advanced displays?, Industry and Innovation, vol. 5, No. 1, London, Taylor & Francis Group.
Liu, P.K.C. and others (1989): New technologies, industry and trade: the Taiwan experience, Industry o f Free China, Taipei, November.
M allon, R.D. and W.J.V. Sourrouille (1975): Econom ic Policymaking in a Conflict Society: The Argentine Case, Cambridge, Massachusetts, Harvard University Press.
Market Intelligence Center (1989): IT Industry Yearbook, 1989, Taipei, Institute for Information Industry.
IMPORT SUBSTITUTIO N IN HIGH-TECH INDUSTRIES: PREBISCH LIVES IN ASIA! • A LICE H. AM SDEN

C E P A L R E V I E W 8 2 • A P R I L 2 0 0 4 89
_______ (various years): IT Industry Yearbook, Taipei, Institute forInformation Industry.
Nikkei Weekly (2001): IBM, Toshiba calling halt to LCD output, Tokyo.
San, G. (1995): A n Overview o f Policy Priorities fo r Industrial D evelopm ent in Taiwan, Taipei, National Central University.
Sridharan, E. (1996): The P olitica l Econom y o f Industrial Promotion: Indian, Brazilian, and Korean Electronics in Comparative Perspective, 1969-1994, Westport, Praeger.
Tomlinson, B.R. (1981): Colonial firms and the decline o f colonialism in Eastern India, 1914-47, M odern A sian Studies, vol. 15, No. 3, New York, Cambridge University Press.
Tzeng, Y.C. (1991): Leaders o f Taiwan’s venture capital industry, Wealth Magazine, June.
Wang, L.R. (1995): Taiwan’s venture capital: policies and impacts, Journal o f Industry Studies, vol. 2, No. 1, London, Taylor & Francis Group.
Wong, P.K. and J.A. Matthews (1998): Competing in the global flat panel display industry: introduction, Industry and Innovation , vol. 5, No. 1, London, Taylor & Francis Group.
Yang, Y.R. (1998): The political economy o f a science park, Economics, Taipei, National Taiwan University.
IMPORT SUBSTITUTIO N IN HIG H-TECH INDUSTRIES: PREBISCH LIVES IN ASIA! • A LICE H. AM SDEN


91
J o à o C a r l o s F e r r a z
D i r e c t o r , D i v i s i o n o f P r o d u c t i o n
P r o d u c t i v i t y a n d M a n a g e m e n t
E C L A C
^ j c f e r r a z @ e c l a c . c l
D a v i d K u p f e r
I n s t i t u t e o f E c o n o m i c s o f t h e
F e d e r a l
U n i v e r s i t y o f R i o d e J a n e i r o
( U F R J ) , B r a z i l
^ k u p f e r @ i c . u f r j . b r
M a r i a n a I o o t t y
U n i v e r s i t y o f R i o d e J a n e i r o
( U F R J ) , B r a z i l
^ m i o o t t y @ i e . u f r j . b r
C E P A L R E V I E W 8 2 • A P R I L 2 0 0 4
Industrial competitiveness in Brazil ten years after economic liberalization
Joao Carlos Ferraz, David Kupfer and Mariana Ic
T„ A - his a r t ic le e x a m in e s th e n a tu re an d e x te n t o f th e c h a n g e s in
B ra z i l ia n in d u s t r y a f te r ten y e a rs o f e c o n o m ic l ib e ra l iz a t io n . T he a r t i
c le d e m o n s t r a t e s t h a t m o s t s t r u c tu r a l fe a tu re s o f B raz i l ian in d u s t r y
re m a in u n c h a n g e d e x c e p t in t h e m a n a g e m e n t o f p r o d u c t i o n
p ro c e s s e s and in th e o w n e r s h ip s t r u c tu r e o f f i rm s , as r a t io n a l iz a t io n
a n d in w a r d in te r n a t io n a l i z a t i o n b e c a m e g e n e ra l i z e d p ro c e s s e s .
B raz i l m a y fa c e a d e v e lo p m e n t p a ra d o x in th e y e a rs to c o m e .
H is to r y s u g g e s t s t h a t lo ca l c a p i ta l an d in n o v a t io n c a p a b i l i t i e s have
b e e n o u t s ta n d in g fe a tu re s o f c o u n t r ie s s u c c e s s fu l in a c h ie v in g s u s
ta in e d e c o n o m ic d e v e lo p m e n t . If in te rn a t io n a l i z a t io n o f o w n e r s h ip is
to re m a in and lo ca l in n o v a t io n c a p a b i l i t i e s are to be p u rs u e d , th e n
B ra z i l ia n p r i v a te a n d p u b l i c p o l i c y m a k e r s m u s t d e p a r t f r o m
e s ta b l i s h e d p o l i c y p ra c t i c e s and s e e k n e w w a y s o f re g u la t in g and
in d u c in g f i rm s t o w a r d s loca l va lu e c re a t io n .

92 C E P A L R E V I E W 8 2 • A P R I L 2 0 0 4
IIntroduction
In 1996, we published, in CEPAL Review and in a book with Lia Haguenauer,1 an in-depth analysis of the competitiveness of Brazilian industry (Ferraz, Kupfer and Haguenauer, 1996a and 1996b). The present article2 updates that analysis by examining the nature and extent of changes in Brazilian industry between 1990 and 2002, a period of significant institutional and economic transformation. Economic liberalization became the central feature of the national regime of incentives and regulations and, after decades of high inflation, price stabilization was achieved, becoming thereafter a major target of macroeconomic policies. But, during the same period, low rates of growth, with frequent annual oscillations, prevailed.
Elsewhere, in most developed and developing countries, economic liberalization also became the prevalent regime of incentives and regulations, while international flows of capital, goods and services and the diffusion of information technologies were accelerating. In Latin America, within the context of the North American Free Trade Agreement (NAFTA), Mexico became a specialized supplier to the United States in the assembly of electronic goods and other labour-intensive industries. Chile modified its industrial matrix, shifting towards exploiting and transforming its natural resource base to generate products for export, supported by sophisticated logistics. Argentina changed its strategy several times; for some time it seemed that the country would constitute an important specialized industrial base for the Mercosur market, but the negative consequences of the Argentine convertibility plan resulted in the dismantling of a significant portion of its industrial base.
1 This article is dedicated to Lia Haguenauer. We will always miss her companionship, professionalism and personal integrity. Our writings will never again be so sharp and clear.2 Sectoral information is derived from “Estudo da Competitividade de Cadeias Integradas no Brasil” (www.mdic.gov.br), a research project contracted by the Brazilian governm ent to the State University at Campinas (UNICAMP) and coordinated by Luciano Coutinho, M ariano Laplane, David Kupfer and Elizabeth Farina. We are in debt with them and also with Achyles Barcelos da Costa, Fabio Erber, Fernando Sarti, Germano Mendes de Paula, José Rubens Doria Porto, Marcia Azanha Ferraz Dias de Moraes,
What happened in Brazil? To what extent did institutional reform induce changes in industry? Did investment rates increase, incorporating new activities? Which ones ceased to exist? Are firms relying on those capabilities - for example in the field of innovation that are widely known as conforming the basis for sustained or expanded market shares?
It was these questions which guided us in this article. In section II we will update the 1996 discussion on patterns of competition and competitiveness. Section III provides an account of the most important institutional changes and an overview of the evolution of industry between 1990 and 2002. Sections IV to VII are focused on the analysis of competitiveness of four industrial sectors: commodities, durable goods, traditional industries and innovation carrier industries. Finally, section VIII gives an overall balance, indicating the common features and differences between these sectors.
Our 1996 contribution was based on extensive research carried out in the early 1990s (Coutinho and Ferraz, 1994). Since then, no other comprehensive work has been undertaken which would allow a systematic update on industrial competitiveness. The most important research has been the “Estudo da Competitividade de Cadeias Integradas no Brasil” made by the Ministry of Development, Industry and External Trade (MDIC) (www.mdic.gov.br), covering 20 industrial sectors, which constituted the informational basis for this article.
Marcos Fava Neves, M aria Gra9a Derengowsky Fonseca, Matheus Kfouri Marino, Mauro Thury de Vieira Sa, Rafael Oliva, Roberto Vermulm and Victor Prochnik for their high-quality sectoral analyses. The National Council for Scientific and Technological Research (CNPq) and the Carlos Filho de Amparo Research Foundation o f the state o f Rio de Janeiro (FAPERJ) provided support for the activities carried out by the authors in the Industry and Competitiveness Research Group o f the Institute o f Economics o f the Federal University o f Rio de Janeiro (UFRJ). This article is based on a report produced for the Institute o f Developing Economies, Japan (Hamaguchi, 2003).
INDUSTRIAL C O M PETITIVENESS IN BRAZIL TEN Y EA RS A FTER ECO NO M IC LIBERALIZATION • JOAO CAR LO S FERRAZ, DAVID KUPFERA N D M ARIANA IOOTTY

C E P A L R E V I E W 8 2 • A P R I L 2 0 0 4 93
iiCompetitiveness
In this article, competitive firms are considered to be those capable of formulating and implementing strategies leading to sustained or expanded market position in the segment of industry where they operate. To be competitive, a firm’s strategies, capabilities and performance must be coherent with the pattern of competition (PoC) prevalent in the activity in which it operates. Patterns of competition are defined as the collection of competitive driving factors required for success in an industry. As competitiveness is defined at the firm level, it is possible to consider, by aggregation, that a sector is competitive if a large proportion of sectoral production value originates from competitive firms at a given moment of time.
Competitiveness must be viewed as a dynamic concept for two reasons. Firstly, it is associated with previously accumulated capabilities of firms. Thus, present capacity results from past strategic decisions on where economic resources should be allocated. Revealed market position or productive performance indicate whether past strategies and capabilities were adequate or not. In this sense, present capabilities or market position do not necessarily ensure future competitiveness. Secondly, important competitive driving factors conforming the PoC may change due to strategies pursued by innovative firms. Thus competitiveness must be evaluated against the expected, not necessarily the current, pattern of competition at a given moment of time.
Given the large number of possible factors intervening in the PoC, it is necessary to organize them according to some type of criterion. A simple and workable criterion is one in which the factors are organized according to the capacity of a firm to influence their direction and evolution.
Some key factors (internal factors) lie within the boundaries of the firm, where it has complete control. Others (structural factors) are industry-specific and have an equal level of importance for all firms operating in similar market segments. In general, individual firms have only limited and indirect control over structural factors. Finally, there is a collection of drivers (macro factors) which are associated with generic framework conditions surrounding a firm and are
and patterns of competition
beyond its capacity to exert direct influence. Thus, a competitive process has a systemic character, determined not only by the individual firm’s efforts, but also by the nature of the industry in which it operates and by economic and institutional aspects.
Sectoral analyses of competition are usually based on structural or behavioural taxonomies. In this article, drawing on the classical works of Steindl, Labini, Scherer, Porter and Pavitt, we propose the existence of four industrial groups - commodity industries; durable goods industries; traditional industries and innovation carrier industries, each comprising industrial sectors possessing similar competitive drivers at the firm and structural levels.
Firms can be successful by offering: i) cost advantages, ii) product differentiation, iii) responsiveness, or iv) technologically sophisticated products. Very few firms can achieve excellence simultaneously in every source of competitive advantage. Competitive firms are those that focus on and develop coherent strategies, capabilities and performance in the factors making up the dominant pattern of competition in the specific industry in which they operate.
Cost competition prevails in the commodity sector. Products are intrinsically undifferentiated, and competitive firms are those capable of achieving the lowest unit costs and the highest production volumes possible, as well as having control over access to inputs and efficient logistics systems, thus reducing input and distribution costs.
Product differentiation is important in the durable goods industries. Most advanced firms try to concentrate their capabilities in design and marketing functions, while production may be extensively sub-contracted. The mobilization and supervision of partners is an essential source of competitive advantage.
Responsiveness is a priority for traditional industries. Firms target market niches aiming at specific consumers, stratified by income, age, etc. Business capacity requirements3 are less strict than in other industrial groups, but management and supervisory skills are vital for success.
3 Understood as the overall set o f skills, technical knowledge, capabilities and experience o f the firm.
INDUSTRIAL CO M PETITIVENESS IN BRAZIL TEN Y EA RS A FTE R ECO NO M IC LIBERALIZATIO N • JO A O CARLO S FERRAZ, DAVID KUPFERA ND M ARIANA IOOTTY

94 C E P A L R E V I E W 8 2 • A P R I L 2 0 0 4
Innovation carriers operate in specific market capabilities and access to updated science and tech-segments. These firms must have strong technological nology laboratories.
IIIInstitutional change and industrial performance
1. Economic liberalization
Economic liberalization, acceleration of trade and cross-border capital flows and the diffusion of information technologies delineated the international context of the 1990s. In Brazil, industry faced two consecutive local competitive shocks - economic liberalization and monetary stabilization. Reforms were aimed at: i) economic deregulation, including the end of price control mechanisms for goods and services and the elimination of protected markets and other regulatory constraints on foreign investment; ii) liberalization of the external sector, including the reduction of trade tariffs and non-tariff barriers and deregulation of the capital account, and iii) privatization of manufacturing industries and public utility services.
Macroeconomic changes were equally important. They were closely associated with the monetary reform implemented under the Plano Real in 1994 and with the subsequent return of capital inflows due to increasing international liquidity and higher local interest rates when compared to other national markets. The Plano Real successfully reduced the inflationary spiral,4 resulting in the short term in growth of real wages. That, associated with the resurgence of credit lines for consumption, implied significant increases in aggregate demand. The return of capital inflows —direct investment rose from US$ 600 million in 1993 to US$ 29.1 billion in 1998— was very important for financing current account deficits, mergers and acquisitions and capital investment. Overvaluation of the national currency followed, and it was pushed even further by a set of specific policies defined by the Central Bank between 1994 and 1999.
The appreciation in the exchange rate and the high interest rates, together with low tariffs and lower barriers to the entry of foreign firms, imposed a new competitive environment on industry. The immediate result was a rapid deterioration in the trade balance. Foreign capital inflows financed trade deficits but, at the same time, the vulnerability of the country’s external accounts increased to levels not compatible with macroeconomic stability. Consequently, the negative impacts of external financial dependence were revealed not only in the weak growth of expansion- related investments, but also in insufficient GDP growth during the 1990s.
2. Industrial performance
a ) The same structure of production, but with many fewer workers
The share of Brazilian industry in the economy did not change throughout the 1990s (Rocha and Kupfer, 2002). Among the different industrial groups (table 1), industrial commodities, durable goods and food and beverages showed a better performance due to the income effect generated by the Plano Real (in the case of durable goods and food and beverages) and/or better terms of trade and export performance (industrial commodities and durable goods). The performance of the innovation carriers was notably good around 1995, as a result of better prospects created by the success of the Plano Real, but this was followed by a return of slow growth, as imports expanded significantly and expectations of a better future were not fulfilled.
4 Inflation rates went down from more than 1,000% in 1993 to 20% in 1995 and 5% in 1997.
INDUSTRIAL C O M PETITIVENESS IN BRAZIL TEN Y EA RS A FTER ECO NO M IC LIBERALIZATION • JOAO CAR LO S FERRAZ, DAVID KUPFERA N D M ARIANA IOOTTY

C E P A L R E V I E W 8 2 • A P R I L 2 0 0 4 95
Brazil: Output in different industries, selected years(1991=100)
1991 1995 1998 2000
Industrial commodities 100.0 109.6 126.8 138.2Agriculture commodities Traditional industry,
100.0 97.2 101.2 98.9
except food and beverages 100.0 104.8 101.3 104.3Food and beverages 100.0 121.6 128.9 130.5Innovation carriers 100.0 120.0 105.6 108.2Durable goods 100.0 147.6 133.9 148.6Manufacturing 100.0 113.4 117.4 124.2
Source: Monthly Industrial Survey o f the Brazilian Institute of Geography and Statistics (IBGE).
Output and employment in Brazilian manufacturing industry, 1985-1999
Source: M onthly Industrial Survey and M onthly Employment Survey o f the Brazilian Institute o f Geography and Statistics (IBGE).
D u rin g the 1980s, em p loym ent levels fluctuated , but closely fo llo w e d the erratic evo lu tio n o f p roduction . H o w ever, as show n in figu re 1, since the early
1990s, the g ro w th rates o f p roduction and em p lo y m ent started to d iverge, p articu larly a fte r 1993. T h a t
was a very im portan t change o f trajectory, resulting in
the doub ling o f the outpu t-to -lab ou r ratio and h igher
production e ffic iency betw een 1990 and 1 999 .5
5 M ost available evidence in Brazil is based on series o f production value, not on (ideal) series o f value added.
M a n y econom ists id en tify the beg inn ing o f the
1990s as the b reak p o in t in the re la tion betw een p ro d u c tio n and em p lo y m en t. F o r G o n za g a (1 9 9 6 ) , A m adeo and Soares (1 9 9 6 ) and B o n e lli (1 9 9 6 ), this
increasing divergence indicates s ign ificant techno logica l change in the econom y in term s o f p roduction
processes a n d /o r o rg an iza tio n . T h is e x p la n a tio n
places emphasis on in tra - and in te r-f irm transform ations, due to s tab ilization , trade lib e ra liza tio n and
econom ic deregu lation that defined new effic iency
param eters fo r the strategic beh av iou r o f corporations. In reality, as the analysis ahead w i l l show, in
m ost sectors a large proportion o f firm s d id indeed go
through a s ign ificant m o d ern iza tion process, strongly
biased tow ards cost rationalization . T h is ra tion a liza tio n included the adoption o f im proved organ ization a l techniques; the in troduction o f in fo rm atio n tech
nologies and equ ipm ent in adm in is tra tion and p ro duction; changes in the product p o rtfo lio in the d irectio n o f g reater specialization; subcontracting, de-ver- tica liza tio n , and increased use o f im ported com ponents. These changes d irectly im p lie d a lo w e r dem and
fo r industrial em ploym ent, fo r the same leve l o f p ro duction. I t is an open question w h e th er em p loym ent rates w i l l ever catch up w ith past losses.
b) Unchanged trade specialization
Foreign trade expanded sign ificantly during the
1990s, fro m U S $ 50 b illio n in 1990 to U S $ 107 b illio n
in 2002. B etw een 1990 and 1993 trade levels and the
trade balance rem ained unchanged, suggesting that, per
se, ta r if f re form had only a m in o r im pact on the inter
national insertion o f industry. A fte r stabilization cum
currency overvaluation and further ta r if f reductions, fo reign trade expanded steadily up to 1997, especially
in the case o f imports. Thus, w h ile exports rose at a
moderate rate, im ports trebled betw een 1990 and 1997. A s a result, the trade balance deteriorated and, after 14
years o f surpluses, in 1997 the trade d efic it reached
U S $ 8.2 b illio n . Regardless o f this expansion, h ow ever, B ra z il ’s share in w o rld trade has declined fro m 1 .4%
in the m id -1980s to 0 .7 5 % in 2001.The 1997 A s ian crisis triggered o ff a period o f
uncertainty in B raz il. International liqu id ity and trade
receded and external vu ln erab ility increased, leading to
an exchange crisis that resulted in the depreciation o f
the R ea l and the introduction o f a floating system in
January 1999. F ro m then onwards im ports declined, b u t n ever b e lo w U S $ 40 b illio n , w h ile exports
increased steadily, resulting in trade surpluses in 2001
TABLE 1
FIG U R E 1
INDUSTRIAL CO M PETITIVENESS IN BRAZIL TEN Y EA RS A FTE R ECO NO M IC LIBERALIZATIO N • JO A O CARLO S FERRAZ, DAVID KUPFERA ND M ARIANA IOOTTY

96 C E P A L R E V I E W 8 2 • A P R I L 2 0 0 4
and 2002. Concurrently with the expansion of total Brazilian foreign trade, the ratios of exports and imports to domestic production in manufacturing increased steadily. Thus, between 1990 and 2001 the export ratio increased from 8.0% to 14.9% while the import ratio trebled, from 4.3% to 14.8%.
Firstly, industrial commodities, together with durables and products of innovation carriers, were responsible for 72% of the US$ 107 billion total trade in 2002. Secondly, in industrial commodities, trade has been expanding steadily but imports and exports are quite balanced. Contrary to what might be expected, imports of industrial commodities are quite large, especially of chemicals. Thirdly, the pattern of foreign trade in durables and products of innovation carriers is quite different. Most Brazilian trade deficits are to be found in these industrial groups. Between 1996 and 2001, annual deficits remained above US$ 10 billion. Imports increased steadily, receding only in 2002, concurrently with the acceleration of devaluation of the
Figure 2 shows the imports and exports of four industrial groups, reflecting the above-mentioned substantial expansion of Brazilian foreign trade and, most important, the existence of sharp differences in the nature of Brazilian imports and exports.6
Real. Exports reacted positively only after 2000. Fourthly, agricultural commodities are responsible for an important trade surplus, reaching US 20 billion in 2002; exports have been increasing steadily while imports are not significant. Finally, trade flows in the traditional industrial group were relatively stable, at around US$ 10 billion for most of the decade. In short, foreign trade expanded substantially but the nature of the international insertion of Brazilian industry remained unchanged
6 Commodities were divided into industrial and agricultural, while durables and innovation carriers were merged together, due to statistical constraints.
Brazil: Foreign trade, by industrial groups, 1989-2002
Source: GIC-IE data bank o f the Federal University o f Rio de Janeiro, based on information from Alice Data Bank.
FIGURE 2
INDUSTRIAL C O M PETITIVENESS IN BRAZIL TEN Y EA RS A FTER ECO NO M IC LIBERALIZATION • JOAO CAR LO S FERRAZ, DAVID KUPFERA N D M ARIANA IOOTTY

C E P A L R E V I E W 8 2 • A P R I L 2 0 0 4 97
c) Ownership change, stagnation of capital and R&D investment
Unlike what occurred in the structure of production, changes in the ownership structure of industry were very pronounced. As shown in table 2, privatization and mergers and acquisitions amounted to US$ 128 billion between 1990 and 1999. As might be expected, the value per transaction in privatization was much higher than in mergers and acquisitions. The first phase of privatization (1991-1995) involved steelworks, mining and petrochemicals. In the second half of the 1990s electrical power, financial services and telecommunications were privatized. This last sector alone was responsible for US$ 30 billion in government revenue. Foreign investors were responsible for 76.9% of the privatization operations and 71.4% of the mergers and acquisitions.
According to Rocha and Kupfer (2002), among the 300 largest corporations in Brazil, State-owned firms reduced their market share (sales revenue) from 44.6% in 1991 to 24.3% in 1999; multinationals expanded from 14.8% to 36.4%, while local capital maintained its position. The authors suggest that ownership change among leading firms occurred in two phases. Between 1991 and 1996, the share of State- owned firms was transferred to private firms, regard
less of their nationality, as a result of privatization of industrial firms. Between 1996 and 1999 revenue was transferred from national firms (State or privately owned) to multinational firms.
Asset acquisition and transfers reshaped the country’s ownership landscape but did not lead to further increases in capital investment. In Brazil, the 1990s was marked by only a modest expansion of gross fixed capital. According to Bielschowsky (1998), the share of industrial investment as a proportion of GDP amounted to 2.2% in the period from 1988 to 1993, compared with 4.5% during the 1970s. Between 1995 and 1997 investment rates increased to 3.2%, mostly associated with localized equipment renovation.
In fact, as shown in table 3, out of an universe of 72,000 industrial firms, with total sales of R$ 582 billion in 2000, 19,000 firms spent R$ 22 billion (or 3.8% of sales revenue) on activities associated with modernization and innovation, ranging from training to R&D. Of these 19,000, 15,500 firms focused their expenditure on machinery acquisition. A smaller group of firms (10% of total industrial firms) invested0.64% of sales in R&D activities, but within this select group there were large differences: the bigger the firm, the greater its commitment to R&D.
TABLE 2
Brazil: Privatization, mergers and acquisitions, 1990-1999(Value in m illions o f dollars)
1990 1991 1992 1993 1994 1995 1996 1997 1998 1999 Total
Privatization (value) Privatization
0 2 096 2 447 3 026 620 1 123 4 829 16 087 27 540 3 797 61 564
(number o f transactions) Mergers and acquisitions
0 4 14 6 9 7 13 20 31 9 113
(value)aMergers and acquisitions
639 274 359 3 329 1 146 4 734 6 059 9 899 26 292 15 161 67 893
(number o f transactions) 13 20 27 49 55 90 129 154 264 254 1 055
Source: GIC-IE databank o f the Federal University o f Rio de Janeiro, based on information from Thomson Financial Securities. a According to declared value o f transactions.
TABLE 3
Brazil: Net revenue of firms and expenditure on innovation activities, 2000
Expenditure on innovation activities
Num ber o f firms Net revenue Total M achinery acquisition Internal R&D
(R$ million) Number o f firms
(R$ million)
Value
(R$ million)
Num ber o f firms
Value
(R$ million)
Number o f firms
Value
72 005 582 406.1 19 165 22 343.8 15 540 11 667.3 7 412 3 741.6
Source: Industrial Survey on Technological Innovation (IBGE, 2000).
INDUSTRIAL CO M PETITIVENESS IN BRAZIL TEN Y EA RS A FTE R ECO NO M IC LIBERALIZATIO N • JO A O CARLO S FERRAZ, DAVID KUPFERA ND M ARIANA IOOTTY

98 C E P A L R E V I E W 8 2 • A P R I L 2 0 0 4
IVIndustrial commodities: Low cost for exports, differentiation
for the local market
1. Pattern of competition then and now: widening and deepening the search for lower costs
Commodity-related industries are engaged in the production of intermediate inputs for industrial or final consumption through large-scale production processes, and cost reduction is the driving factor in competition. Due to increasing competitive pressures from developing countries, markets of developed countries are being defended in favour of local firms by means of explicit protectionist measures (see first two columns of table 4).
Commodities are intrinsically undifferentiated, and production efficiency and economies of scale are ensured by three complementary means: highly capital-intensive plants, preferential access to inputs (raw materials and energy sources) and transport logistics. In such a context, large, multi-plant companies, operating internationally are capable of expanding the frontiers of the important competitive driving factors. During the last decade, local leading international firms have become larger and more internationalized through mergers and acquisitions.
At the level of the firm, core competences are related to five sources of competitive advantages: management, acquisition of or access to process technology, inputs, transport, and distribution networks and preferential clients. The diffusion of information systems based on microelectronics technologies has provided the technical base for co-ordinating large- scale operations and logistics.
The pattern of competition among firms has remained closely associated with what is known as homogeneous oligopoly. Competing firms try to gain knowledge of market perspectives and behaviour of
rivals, on a global basis. Thus, for competitive success, it is of fundamental importance to correctly anticipate demand growth and/or effectively respond to changes in price and quantity demanded by local and international markets.
Aggressive firms are those implementing merger/acquisition-based investment strategies and expanding capacity ahead of the growth in demand for current products. Revenue possibilities have expanded significantly in the past ten years, by means of widening product portfolio, exploring transportation assets for third parties or selling-off surplus energy. Preferential access to capital markets is of vital importance. In this respect, large and internationalized companies have considerable advantages over firms operating single plants or in a limited number of national markets.
International competition in a context of liberalized national economies has strengthened a historical trend: although prices of most commodities fluctuate in line with world economic cycles, relative prices have shown a declining trend, raising serious terms of trade problems for commodity-dependent exporting nations.
Steel, pulp and paper and concentrated orange juice, along with other commodity industries like soybeans and iron ore, are considered to be pillars of Brazilian international competitiveness. In these industries, in 2002, Brazil had a significant share of international export markets: 80% in concentrated orange juice, 37% in sugar, 34% in soybeans, 32% in coffee and 16% in the meat industry. In 1990, the relatively small size of leading companies and the low levels of product value-added were the main competitive challenges facing Brazilian commodity producers. Since then these challenges have been only partially addressed, while other sources of competitiveness have been enhanced (see last two columns of table 4).
INDUSTRIAL C O M PETITIVENESS IN BRAZIL TEN Y EA RS A FTER ECO NO M IC LIBERALIZATION • JOAO CAR LO S FERRAZ, DAVID KUPFERA N D M ARIANA IOOTTY

C E P A L R E V I E W 8 2 • A P R I L 2 0 0 4 99
TABLE 4
Brazil: Patterns of competition and competitiveness in commodities: then and now
Sources o f competitive advantages
Cost-based POC Main factors of competitiveness, 1990
Cost-based POC Main factors o f competitiveness, 2002
Braziliancompetitiveness,1990
Braziliancompetitiveness,2002
Internal factors
Management
Production
Sales
Innovation
Process control
Mass flow and energy efficiency
Access to distribution channels
Process technology
No change
Efficient
Efficient
Efficient
Incipient local efforts
More efficient
More efforts in energy control
More efficient
Incipient local efforts
Structural factors
Market
Standardization
Price, technical conformity
Access to international trade
No change
Prominence in low value added segments
Low growth of demand
Low unit value for exports and higher unit value for local markets
Cyclical with changing terms o f trade
Configuration o f industry
Company and plant level economies o f scale
Access to raw materials and transport logistics
Specialized technical services
No change
Reasonable efforts
Efficient plant size but low size o f companies; prominence of State-owned enterprises; low investments abroad
Good access to inputs and deficiencies in logistics
Reasonable efforts
Increased size but still below international benchmarks
More efficient
Regulation and incentives regime
Anti-dumping and trade policy
Environmental protection
Cost o f capital
Increased importance
Increased importance
No change
Trade restrictions
Some restrictions High
Tax distortions
Risk o f cartelization, incipient privatization
Stronger restrictions
Stronger restrictions Still high
No change
Privatization completed but ownership not consolidated
Source: Prepared by the authors.
2. Competitiveness in 2002: Ownership consolidation and product upgrading must continue
a ) Increasing size of firms
Privatization of the steel industry and mergers and acquisitions in pulp and paper have changed the ownership landscape of the commodities industrial group. Even so, when compared to their international counterparts, Brazilian firms remain relatively small and oriented towards the local market. Further
changes may occur, leading to greater concentration of market structures and, perhaps, acquisitions by Brazilian firms of other corporations abroad.
In the steel industry, two outstanding processes have taken place: the privatization process initiated in the late 1980s, and a substantial investment drive in stages of the production process associated with the generation of new, higher unit value products to be sold on the local market.
Six large steel companies and six small ones were privatized in Brazil, for a total of US$ 5.7 billion.
INDUSTRIAL CO M PETITIVENESS IN BRAZIL TEN Y EA RS A FTE R ECO NO M IC LIBERALIZATIO N • JO A O CARLO S FERRAZ, DAVID KUPFERA ND M ARIANA IOOTTY

100 C E P A L R E V I E W 8 2 • A P R I L 2 0 0 4
Local capital predominated in the privatization process. Financial institutions accounted for 33.6%, pension funds for 15% and industrial corporations for 21.8% of the total value of privatization. Due largely to the privatization technique used (i.e., auctions), an outstanding feature of the second half of the 1990s was ownership instability and further asset transactions. After privatization was completed 20 private merger and acquisition transactions were carried out. Between 1990 and 2000, only 17% of the production units (measured in terms of physical capacity) had not undergone at least one change in ownership. Besides ownership changes, between 1994 and 2000 the industry invested an average of US$ 1.4 billion. This was rather unexpected, given the country’s macroeconomic uncertainties and those arising from the privatization process itself. Most investments were focused in
the rolling area, enabling product upgrading.In pulp and paper, at the end of the twentieth cen
tury, there were 220 companies. In 2000, total sales reached US$ 7.5 billion; the largest 11 integrated companies were responsible for two-thirds of this total, showing the importance of plant- and company-level economies of scale for this industry. During that year, the four largest producers of pulp accounted for 70% of total production. In the paper segment, concentration levels are lower, but they have been increasing since 1990. In that year, the five largest producers were responsible for 39.5% of total production; ten years later that share had increased to 51.4%. Ownership concentration levels were increased through a very active process of mergers and acquisitions, as shown in table 5.
TABLE 5
Brazil: Main mergers and acquisitions in the pulp and paper sector, 1992-2001
Company sold Controlling company Date Share Product
Simao Votorantim 1992 100% Printing paperMad. Saguario Orsa 1996 100% W rapping paperNicolaus Papeis Md Papeis 1997 100% Special paper + cardboardKlabin Tissue Kimberly Klabin 1998 50% TissueInpacel Champion / International Paper 1998 100% Lightweight coated paperCelpav Votorantim 1988 100% Printing paperIgaras Klabin/Riverwwod 2000 100% Pulp / kraftlinerKlabin Joint Venture until 2002
Norske Skog2000 50+50% Newsprint
Jarcel Orsa 2000 100% Pulp
Pisa Norske Skog 2000 100% PAR + newsprintChampion L. International Paper 2000 100% Pulp + printing paper.Bahia Sul Suzano 2001 100% Pulp + paperCenibra JBP 2001 100% PulpPortucel Suzano + Sonae 2001 28% Pulp + paperAracruz Votorantim 2001 26% Pulp
Source: Fonseca (2002).
TABLE 6
Brazil: Verticalization and supply contracts in the pasteurized orange juice production chain
Selling company (1)
Distribution company (2)
Relationbetween (1) and (2)
Packaging company (3)
Relation between(2) and (3)
Processing company (4)
Relation between (3) and (4)
Nestle Nestle Vertical Cargill Contract Cargill VerticalD an’ Fresh Danone Vertical Citrovita Contract Citrovita VerticalLeco Leco Vertical Citrovita Contract Citrovita VerticalYes Paulista Contract Cargill Contract Cargill VerticalParmalat Parmalat Vertical Parmalat Vertical Parmalat VerticalCarrefour Carrefour Vertical Cargill Contract Cargill VerticalSendas Sendas Vertical Nova América Contract Nova América Vertical
Source: Compiled from Neves and Marino (2002).
INDUSTRIAL C O M PETITIVENESS IN BRAZIL TEN Y EA RS A FTER ECO NO M IC LIBERALIZATION • JOAO CAR LO S FERRAZ, DAVID KUPFERA N D M ARIANA IOOTTY

C E P A L R E V I E W 8 2 • A P R I L 2 0 0 4 101
In the citrus industry there are tw o segments. In
the fro zen concentrated orange ju ic e segment, firm s
control the processing stage and co-ordinate the associated logistics (fro m orange plantations to packaging). M o s t active firm s have m oved to the south o f the U S A , acquiring o r investing in new processing units and even
some plantations. C o -ord ination capabilities have been
developed and im portant clients, like C oca-C ola, have
transferred the m anagem ent o f the ir production units in
the U n ite d States to a B raz ilia n company. This is an
im portant change fro m the early 1990s, due to the need
to sidestep im port restrictions. The industry has also
becom e m ore concentrated: the export share o f the fou r
largest producers increased fro m 7 0 % to 9 0 % betw een
1997 and 2001. B u t these firm s still rem ain distant fro m fin a l consumers: they are typ ical com m odity pro ducers, re ly ing fo r com petitiveness on the lo w cost o f
the ir undifferentiated product.In the pasteurized orange ju ic e segment, w h ich
has been expanding rap id ly in B ra z il, the m arket structure is d ifferent. A s shown in table 6, in the ir search fo r
econom ies o f scale firm s have fo llo w e d d iffe rent v e r- tica liza tio n strategies. A t one extrem e, close to the
resource base, processing firm s have vertica lized into
packaging operations. A t the other extrem e, close to
the f in a l consumer, com panies have incorporated distrib u tion activities. In most cases, econom ic relations
betw een these tw o extrem es invo lve supply contracts
betw een d iffe rent companies.
b) Low unit value for exports, high unit value forthe local market
B raz ilian com m odity producers supply international markets predom inantly w ith lo w unit value
products. Since the early 1990s they have consolidated th e ir com petitive position b y investing in d istribution networks and closer relations w ith large clients. F o r the B ra z ilia n m arket, how ever, firm s have evolved
tow ards w iden ing and upgrading th e ir product p ortfo lio . C om pared w ith exports, sales to the local m arket have h igher u n it value. Th is dual track strategy has
been consolidated throughout the years. I t rem ains to
be seen w hether the experience gained in the local m arket m ay prove useful fo r conquering new and
m ore valuab le segments in international markets in the
years to come.In 1999, in value terms, the w orld share o f
B ra z ilia n steel sem i-fin ished products was 14 .1% , but in galvan ized sheets it was only 0 .4 % , w h ile the share
o f sem i-fin ished products in to ta l B raz ilia n steel exports increased fro m 3 9 .2 % in 1990 to 6 8 .4 % in
2001 , in term s o f physical production. Th is expansion
was attained in spite o f the context o f increasing protectionist barriers. In the local m arket, how ever, tota l steel consum ption increased 8 9 % betw een 1992 and
2001 , w h ile the g ro w th in galvan ized sheets reached
40 2 % . O v e r 5 0 % o f tota l dem and cam e fro m the autom otive and c iv il construction sectors.
TABLE 7
Brazil and other selected countries: Production costs o f cold rolled sheet steel, April 2001(US$/dispatched ton)
United States Japan Germany United Kingdom S. Korea China Brazil
Raw materials 115 106 109 105 112 118 103Coal 27 27 26 24 28 28 37Iron ore 55 56 62 58 59 75 40Scrap / Direct reduction iron 33 26 21 23 25 15 26
Other raw materials 172 150 148 153 134 152 135
Labour costsa 154 142 136 113 62 26 57Hourly wage 38 36 34 27.6 13 1.25 10.5
Total operational costs 441 398 392 371 308 297 295
Financial costs 39 60 40 46 42 50 67Depreciation 29 40 30 26 30 30 32Interest 10 20 10 20 12 20 35
Total cost 480 458 432 417 350 347 362
Source: Paula (2002) a In man-hours per ton.
INDUSTRIAL CO M PETITIVENESS IN BRAZIL TEN Y EA RS A FTE R ECO NO M IC LIBERALIZATIO N • JO A O CARLO S FERRAZ, DAVID KUPFERA ND M ARIANA IOOTTY

102 C E P A L R E V I E W 8 2 • A P R I L 2 0 0 4
The high level of competitiveness in low value added products is also reflected in the industry’s cost structure. As may be seen from table 7, the competitiveness of the Brazilian steel industry stems from the low level of labour and iron ore costs. Financial costs and the cost of coal have long been the basic source of competitive disadvantage.
Cost advantages in pulp production are quite similar. In 2001, Brazilian industry led in the production of short fibre pulp, with a 19.4% share of total world supply, a 7-point increase over the 1990 market share. Between 1990 and 2001 this branch expanded by 9.5% annually, surpassed only by the expansion of Indonesia, a latecomer to the industry. In value terms, exports increased from US$ 556 million in the early 1990s to US$ 1.3 billion in 2000.
In paper production the picture is very different, both in terms of volume of production and share in world markets. In 2000, Brazil produced 7,188 tons of paper, while international production reached 323,295 tons. Although the Brazilian industry grew by 4.3% during the 1990s, its international market share for all types of papers is very small and has remained unchanged: 2.0% in 1991 and 2.2% in 2000.
Five types of papers accounted for more than 50% of exports in 2000 - printing/writing, non-coated paper, toilet paper, cardboard and kraft liner. Ten years before, the proportion was higher, at 70%. Since 1990, however, in value terms paper exports have remained below US$ 1 billion in most years. Thus, in 2000, 62% of total paper production was sold in the local market; 22% represented self-consumption by the producers and only 15% was exported.
The citrus industry follows a similar dual track strategy. In the frozen concentrated orange juice (FCOJ) segment, Brazil is an international leader; in the pasteurized orange juice (POJ) segment sales are directed to the local market. The latter requires more sophisticated industrial operations and is very close to the final consumer market, requiring significant marketing efforts.
During the 1990s 50% of total world orange juice and 80% of FCOJ were produced in Brazil, generating, on average, US$ 1 billion in foreign exchange. Like other commodity producers, Brazil is very dependent on the fluctuations of international prices. While total exports of FCOJ expanded from 785 million tons in 1990 to 1,234 million in 2000, export revenues reached a peak of US$ 1.3 billion in 1995, decreasing to US$ 800 million in 2001.
Most developed markets for FCOJ are stagnating, while developing regions are expanding their consumption. It is estimated that West Europeans consume 24 litres of fruit juice per year, while East Europeans consume 5 litres per year, having increased their consumption 80% between 1995 and 2000. This context has led to reactions from important consumer/producer countries through the imposition of trade barriers, like the 56% ad valorem tariff imposed by the United States. In the POJ segment market perspectives are positive. While annual consumption levels of POJ in the USA reach 40 litres, in Brazil total orange juice consumption is around 20 litres/year. Of that, only 1 litre is POJ, but annual rates of growth in this segment are very high, at around 30%.
c) Cost control
Throughout the 1990s, companies placed considerable emphasis on actions closely associated with the reduction of direct costs, especially raw materials and transport. Lowering energy costs was an important investment item, given its high weight in total costs and the supply crisis the country faced in 2001. Companies also consolidated their capabilities to operate technically updated plants efficiently, but they still relied on capital goods suppliers to define the technological possibilities of improving processes.
The investment drive in the steel industry had a direct impact on efficiency levels. Even though output levels remained around 25 million tons per year, modernization of installations and sharp cuts in employment levels - at an annual average rate of 7.6% between 1989 and 2000 resulted in corresponding marked improvements in productivity levels, from 11 to 5.4 man-hours per ton, between 1991 and 2000 (see figure 3).
Investments in pulp and paper were not as pronounced as in steel, but in order to maintain their competitiveness firms expanded backward integration towards rationalized eucalyptus forests. In 1990, out of 64 million hectares planted by the industry, eucalyptus forests occupied 42 million and pine forests 20 million. Ten years later, the area of pine plantations remained constant while 100 million hectares of eucalyptus forests were planted.
The competitiveness of the citrus sector also lies in its privileged access to inputs. There have been considerable technological efforts to improve the productivity of the agricultural base of the industry. The most significant achievement was the 2002 DNA
INDUSTRIAL C O M PETITIVENESS IN BRAZIL TEN Y EA RS A FTER ECO NO M IC LIBERALIZATION • JOAO CAR LO S FERRAZ, DAVID KUPFERA N D M ARIANA IOOTTY
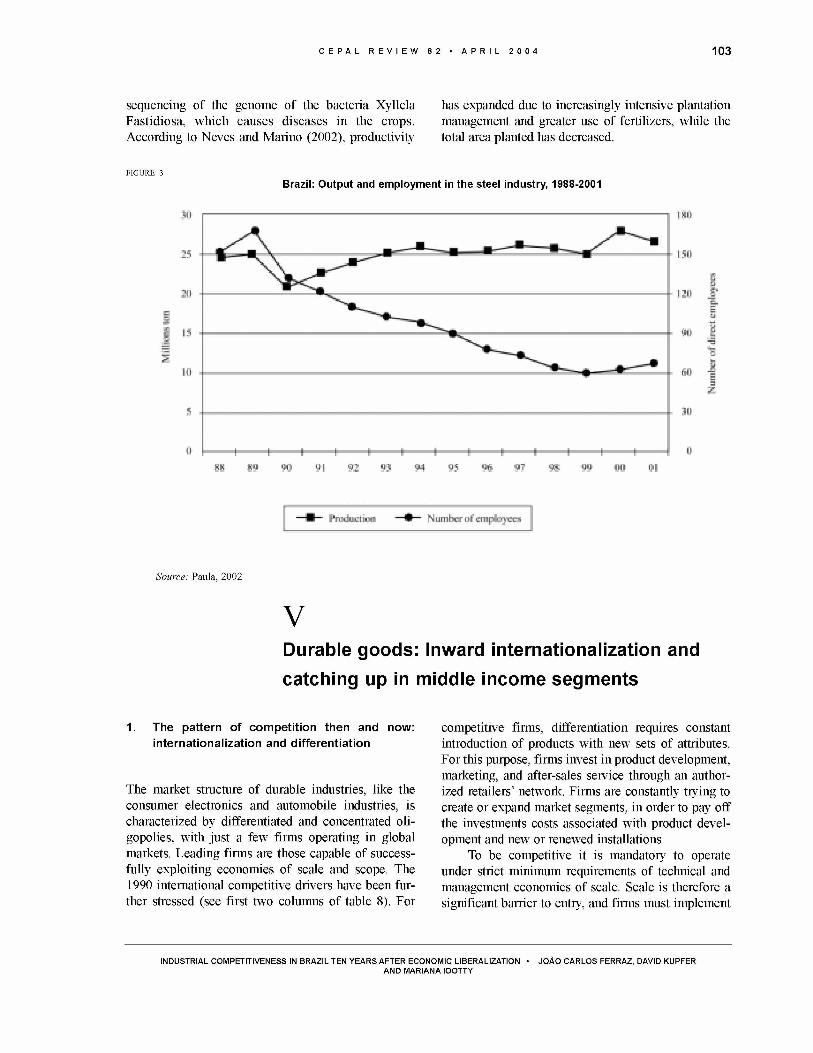
C E P A L R E V I E W 8 2 • A P R I L 2 0 0 4 103
sequencing of the genome of the bacteria Xyllela Fastidiosa, which causes diseases in the crops. According to Neves and Marino (2002), productivity
1. The pattern of competition then and now: internationalization and differentiation
The market structure of durable industries, like the consumer electronics and automobile industries, is characterized by differentiated and concentrated oligopolies, with just a few firms operating in global markets. Leading firms are those capable of successfully exploiting economies of scale and scope. The 1990 international competitive drivers have been further stressed (see first two columns of table 8). For
has expanded due to increasingly intensive plantation management and greater use of fertilizers, while the total area planted has decreased.
competitive firms, differentiation requires constant introduction of products with new sets of attributes. For this purpose, firms invest in product development, marketing, and after-sales service through an authorized retailers’ network. Firms are constantly trying to create or expand market segments, in order to pay off the investments costs associated with product development and new or renewed installations.
To be competitive it is mandatory to operate under strict minimum requirements of technical and management economies of scale. Scale is therefore a significant barrier to entry, and firms must implement
Brazil: Output and employment in the steel industry, 1988-2001
Source: Paula, 2002
VDurable goods: Inward internationalization and
catching up in middle income segments
FIG U R E 3
INDUSTRIAL CO M PETITIVENESS IN BRAZIL TEN Y EA RS A FTE R ECO NO M IC LIBERALIZATIO N • JO A O CARLO S FERRAZ, DAVID KUPFERA ND M ARIANA IOOTTY
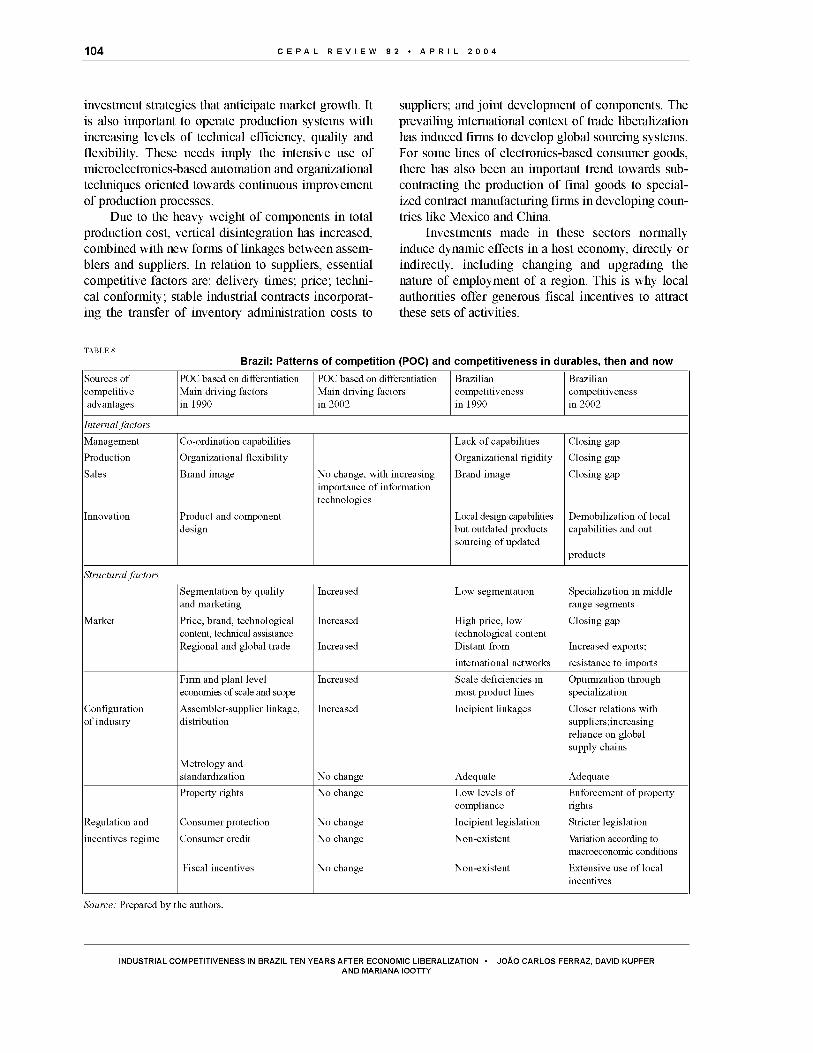
104 C E P A L R E V I E W 8 2 • A P R I L 2 0 0 4
investment strategies that anticipate market growth. It is also important to operate production systems with increasing levels of technical efficiency, quality and flexibility. These needs imply the intensive use of microelectronics-based automation and organizational techniques oriented towards continuous improvement of production processes.
Due to the heavy weight of components in total production cost, vertical disintegration has increased, combined with new forms of linkages between assemblers and suppliers. In relation to suppliers, essential competitive factors are: delivery times; price; technical conformity; stable industrial contracts incorporating the transfer of inventory administration costs to
suppliers; and joint development of components. The prevailing international context of trade liberalization has induced firms to develop global sourcing systems. For some lines of electronics-based consumer goods, there has also been an important trend towards subcontracting the production of final goods to specialized contract manufacturing firms in developing countries like Mexico and China.
Investments made in these sectors normally induce dynamic effects in a host economy, directly or indirectly, including changing and upgrading the nature of employment of a region. This is why local authorities offer generous fiscal incentives to attract these sets of activities.
Brazil: Patterns of competition (POC) and competitiveness in durables, then and nowTABLE 8
Sources of POC based on differentiation POC based on differentiation Brazilian Braziliancompetitiveadvantages
Main driving factors in 1990
Main driving factors in 2002
competitiveness in 1990
competitivenessin 2002
Internal factors
Management Co-ordination capabilities Lack o f capabilities Closing gap
Production Organizational flexibility Organizational rigidity Closing gap
Sales Brand image No change, with increasing importance o f information technologies
Brand image Closing gap
Innovation Product and component design
Local design capabilities but outdated products sourcing o f updated
Demobilization o f local capabilities and out
products
Structural factors
Segmentation by quality and marketing
Increased Low segmentation Specialization in middle range segments
Market Price, brand, technological content, technical assistance Regional and global trade
Increased
Increased
High price, low technological content Distant from
international networks
Closing gap
Increased exports;
resistance to imports
Firm and plant level economies of scale and scope
Increased Scale deficiencies in most product lines
Optimization through specialization
Configuration o f industry
Assembler-supplier linkage, distribution
Increased Incipient linkages Closer relations with suppliers;increasing reliance on global supply chains
M etrology and standardization No change Adequate Adequate
Property rights No change Low levels of compliance
Enforcement o f property rights
Regulation and Consumer protection No change Incipient legislation Stricter legislation
incentives regime Consumer credit No change Non-existent Variation according to macroeconomic conditions
Fiscal incentives No change Non-existent Extensive use o f local incentives
Source: Prepared by the authors.
INDUSTRIAL C O M PETITIVENESS IN BRAZIL TEN Y EA RS A FTER ECO NO M IC LIBERALIZATION • JOAO CAR LO S FERRAZ, DAVID KUPFERA N D M ARIANA IOOTTY

C E P A L R E V I E W 8 2 • A P R I L 2 0 0 4 105
In Brazil, the consumer electronics and automotive industries were strongly impacted by the Plano Real and trade liberalization. On the one hand, an “income effect” sharply expanded demand levels; on the other hand, trade liberalization imposed new and more rigid benchmarks for product attributes, such as price and technical specifications.
During the 1990s, firms in Brazil not only demonstrated the capacity to resist international competition but also to implement pro-active strategies to exploit the expansion in demand through investment in new production capacity and higher levels of imports of parts and components (see the last two columns of table 8). New entries took the form of green field investment, especially in automobile assembly, and acquisition of existing auto parts businesses. New entrants in consumer electronics combined both investment modes. By 2002, the internationalization of ownership, already a structural feature in these industries, was practically complete. Representatives of most international leading players are currently operating in Brazil. As a result, Brazil has become an important production platform for mid- dle-range products, such as sub-compact cars, on the international scene. Given the oscillating, low-growth trends of the Brazilian economy throughout the decade, however, most firms have yet to make full use of the new installations.
2. Competitiveness in 2002: successful catching up, but demand constraints still impose limits on further growth
a ) Capacity expansion and internationalization
In consumer electronics, the market expansion of the first half of the 1990s induced the entry of new players and the growth of existing competitors. New investments (and entrants) were observed in the television and video segment, while mergers and acquisitions were more pronounced in the freezers, refrigerators, cookers and washing machines segments.
The industry went through two different phases. After the period of recession in the early 1990s, manufacturers of audio and video products improved performance due to significant increases in consumption levels, mostly among lower social classes. For instance, sales of TV sets, which were about 2 million units in 1990, increased to the unprecedented level of8.5 million units by 1996. But, just as production expanded in that period, it quickly contracted during the second half of the 1990s, falling to nearly half the 1996 volume by the end of the decade (Sa, 2002).
The high levels of credit default among low- budget consumers damaged the sales of major shopping outlets, leading to the bankruptcy of some leading chains and thus reducing the sales revenue of most
TABLE 9
Brazil: New assembly plants in the automotive sector, 1996-2001
Firm Type o f product Location Year
Volkswagen Engines Sao Carlos-SP 1996Volkswagen Lorries and buses Resende-RJ 1996Honda Cars Sumaré-SP 1997Mitsubishi Light commercial vehicles Catalao-GO 1998Renault Cars and engines Sao José dos Pinhais-PR 1998Toyota Cars Indaiatuba-SP 1998Daimler Chrysler Cars Campo Largo- PR 1999GM Components Mogi das Cruzes-SP 1999Volkswagen-Audi Cars Sao José dos Pinhais-PR 1999Mercedes Cars Juiz de Fora - MG 2000GM Cars Gravataí-RS 2000Iveco Engines Sete Lagoas-MG 2000Ford Cars Camaçari-BA 2001Nissan Light commercial vehicles Sao José dos Pinhais-PR 2001Peugeot-Citroen Cars and engines Porto Real-RJ 2001
Source: Sarti (2002)
INDUSTRIAL CO M PETITIVENESS IN BRAZIL TEN Y EA RS A FTE R ECO NO M IC LIBERALIZATIO N • JO A O CARLO S FERRAZ, DAVID KUPFERA ND M ARIANA IOOTTY

106 C E P A L R E V I E W 8 2 • A P R I L 2 0 0 4
electronics m anufacturers. A s a result, the consum er
electronics industry w en t through a reorganization
process w h ic h included the bankruptcy o f some local firm s and the closing d ow n o f local operations by fo r e ign firm s.
T he inverted V shape o f te lev is ion sales shows
how vo la tile the B ra z ilia n econom y has been and, fro m a technical perspective, h ow production o f consum er electronics item s can be expanded and reduced
very quickly, enabling firm s to respond to positive and
negative evolu tion in demand.In car assembly, green f ie ld investm ent prevailed.
Table 9 shows the im pressive add ition o f new capacity to the segment during the second h a lf o f the 1990s
both by existing producers and newcom ers.W h ile new entrants and plants in car assembly
increased com petitive pressures, investm ents in auto
parts also brought in new firm s, but not v ia green fie ld
projects. F o llo w in g international trends, mergers and
acquisitions was the dom inant m ode o f entry. H ence, as only a sm all p roportion o f resources w ere devoted
to production expansion, h igher rates o f in ternationaliza tio n and m arket concentration w ere observed. In
1994, local capital accounted fo r at least 5 0 % o f total capital, sales and investm ent, but b y the end o f the
decade, the share o f loca lly ow ned firm s was dow n to
approxim ately 25% .The perform ance o f this industria l group was
very m uch in fluenced b y the evolu tion o f aggregate
demand. F o r exam ple, in 2000 the sales revenue o f the
audio and video m arkets p lum m eted to U S $ 3.5 b i l lion: fa r b e lo w the U S $ 8.1 b illio n reached in 1996.
Id le capacity is m ore pronounced in auto producers, as
they are not able to shut dow n capacity as easily as
producers in the consum er electronics sector.
b) Specialization and modernization
B y 2 0 0 2 , the B raz ilia n consum er electronics and
autom otive industries becam e specialized in m id d le - range segments. F irm s invested in upgrading technical specifications to in ternational levels, w h ile re ly in g on
established technology standards, im ported com ponents and im ported fin ished products fo r the lo w e r and
upper-end segments. Th is option can be expla ined by
tw o factors: firstly , the size and incom e p ro file o f local dem and, and secondly, the com petitive pressure fro m
im ports, w h ic h im posed strict m in im u m levels o f
product attributes.Th is industria l branch has ye t to compensate the
v o la tile loca l dem and w ith greater exposure to in ternational trade; exports in the audio and v ideo segments have rem ained at around U S $ 350 m illio n since
1990, representing a very sm all proportion o f local sales; im ports o f f in a l goods w ere around U S $ 150
m illio n , increasing to U S $ 450 m illio n w hen local
dem and expanded. The m ain destinations o f exports
w ere A rgentina, H ungary, Ita ly and Spain. T he in fant but g row ing exports have not been able to compensate
fo r the sign ificant increase in the va lue o f im ports o f
electronic com ponents fro m South K o rea and Japan, however. A ccord ing to Sa (2 0 0 2 ), although tota l trade
defic it in electronic com ponents decreased fro m U S $1.5 b illio n in 1997 to U S $ 1.1 b illio n in 2000 , the lack
o f production capacity in this segment constitutes a
m ajo r structural weakness o f B raz il.In the au tom otive sector, regardless o f o w n er
ship changes, investm ents w ere s ign ificant and the
B ra z ilia n com petitive gap was s ign ifican tly reduced
in term s o f product attributes and e ffic ien cy levels o f
insta llations. In aggregate term s, as show n in table
10, the n um ber o f cars produced p er w o rk e r p er yea r
has treb led b etw een 1990 and 2 0 0 1 , reaching 21 .3
units. A t the same tim e e m p lo y m en t fe l l fro m
117 ,396 posts in 1990 to 8 5 ,2 5 7 in 2 0 0 1 , in spite o f
new investm ents.
TABLE 10
Brazil: Employment and productivity in the car assembly sector, 1990-2001
1990 1992 1994 1996 1998 2001
Employment117 396 105 664 107 134 101 857 83 049 85
257Labourproductivity3 7.8 10.2 14.8 17.7 19.1 21.3
Source: Sarti (2002)3 Units per worker in the year in question.
INDUSTRIAL C O M PETITIVENESS IN BRAZIL TEN Y EA RS A FTER ECO NO M IC LIBERALIZATION • JOAO CAR LO S FERRAZ, DAVID KUPFERA N D M ARIANA IOOTTY

C E P A L R E V I E W 8 2 A P R I L 2 0 0 4 107
At this point, it is important to call attention to changes in the nature of assembly-supplier relations in the automotive sector. Firstly, suppliers were induced to set up production facilities very close to assembly units, to enable de-verticalization and just-in-time operations. Most new plants were designed under the condominium concept, in which specific areas were designated to be occupied by selected auto parts corporations that would enjoy exclusive relations with assemblers. In return they had to share investment costs. Secondly, in line with new forms of relations, auto parts companies -now for the most part subsidiaries of key international players- developed intense intra-firm trade, thereby expanding auto parts imports from their parent transnational corporations. Between 1989 and 2001, auto parts imports increased 300%, reaching US$ 4.3 billions in 2001, with a trade
deficit of US$ 445 million.Within a context of capacity expansion, modern
ization and ownership change, auto sales in Brazil increased from 713,000 units in 1990 to 1.9 million in 1997, going down to 1.6 million units in 2001. Most auto assemblers operating in Brazil focused on the subcompact segment, with engines in the 1000 to 2000cc range. In 2001, 71% of domestic production was related with this segment. The international trade of the Brazilian auto industry was marked by strong complementarities with Argentina: after a brief expansion in the post-trade liberalization years, the level of cars imports was reduced to US$ 2 billion in the 2000/2001 biennium. Almost 66% of these imports came from Argentina. By the same token, 44% of Argentine auto imports come from Brazil.
VITraditional industries: competitive constraints
are still defined by unequal income levels
The pattern of competition then and now: market segmentation and networking
Market segmentation is an inherent feature of traditional industries. Variety prevails, in terms of number and technical specifications of products, nature of production processes (assembly, flow and batch production), minimum size of technical economies of scale, levels of verticalization and outsourcing, and organizational format of the companies.
Industrial sectors are very sensitive to oscillations in demand, and responsiveness is the key competitive driver of these industries (see first two columns of table 11). Responsiveness is important for two reasons. Firstly, through considerable marketing efforts, companies constantly try to introduce new designs and create niches to impose themselves in their markets. If successful, immediate demand expansion follows. When this happens, they must increase production levels to correspond with growth in demand, while keeping delivery times under control. Secondly, demand levels are subject to seasonal oscillations, imposing the need for constant adaptation of production levels. Compliance with these two sources of oscillations in
demand is facilitated by the relative technical simplicity of production processes and the low investment costs in expanding capacity. Apart from the importance of imposing new consumer habits, investment in these industries is closely associated with changes in demand levels.
The degree of market segmentation is defined by the size and income profile of a given consumer population. The higher the income level, the less relative importance the price attribute will have and the greater the value of attributes associated with satisfying particular specifications of clients. Nationwide, if high income levels prevail, firms with similar competences will co-exist, while operating in different market segments. In contrast, when income differentials are significant, firms with very differentiated competences will co-exist in similar markets. It is important to note that, given the relatively low unit value of traditional products in consumer baskets, high levels of product renovation and differentiated competences among firms may prevail, even in a context of very unequal income levels, if the absolute size of the market is considerable, as in the case of Brazil.
Entrepreneurial skills for promoting product renovation and keeping organizational formats up to date
INDUSTRIAL CO M PETITIVENESS IN BRAZIL TEN Y EA RS A FTE R ECO NO M IC LIBERALIZATIO N • JO A O CARLO S FERRAZ, DAVID KUPFERA ND M ARIANA IOOTTY

108 C E P A L R E V I E W 8 2 A P R I L 2 0 0 4
-especially in regard to design, marketing, quality control systems and relations with suppliers- are essential for competitive success in traditional industries. The basic sources of technical change for these industries are the equipment and input supplier industries. In the
past ten years an increasing role has been played by information technology-related equipment and chemical inputs. Those corporations capable of gaining access to such equipment and inputs on better terms will enjoy competitive advantages.
Brazil: Patterns of competition and competitiveness in traditional industries: then and now
Sources o fcom petitive advantages
PO C based on responsiveness M ain drivers, 1990
PO C based on responsiveness M ain drivers, 2002
Braziliancom petitiveness, 1990
Braziliancom petitiveness, 2002
Internal factors
M anagem ent Entrepreneurial skills Increasing im portance o f creating new m arket segm ents
Heterogeneity, w ith a core group o f com petitive firm s
Increased heterogeneity: leaders close to the international frontier
Production Q uality control G reater flexibility and outsourcing
Incipient Increased com petence
Sales M arket inform ation Increasing im portance o f m arketing
Incipient Increased com petence
Innovation Em bodied technology, Increasing im portance Strategy based on Im provem ents in fewlearning by doing o f design copying segm ents and products
Structural factors
Segm entation by levels o f incom e and type o f product
Increased Lim ited segm entation due to inequalities in incom e levels
Inequalities rem ained but segm entation increased
M arket Price, brand, delivery times, custom er orientation
Increased Low use o f product attributes
G reater use o f price and custom er orientation attributes
Local and international trade Increased im portance o f insertion in international supply chains
Potential large size o f national m arket but reliance on local trade; threats from im ports
D em and fluctuation due to econom ic instability; incipient international exposure
C onfiguration
Econom ies o f agglom eration and netw orking
G reat increase L im ited to few segm ents
Increased num ber o f local clusters; relocation to low er labour cost regions
o f industry Efficient supply o f equipm ent N o change D eficient supply o f equipm ent
Expansion o f equipm ent im ports w ith better price/efficiency ratio
M etrology, standardization, certification; m arket and technical inform ation; training
N o change Low efforts and lack o f coordination
Im provem ents restricted to m edium -sized and large com panies
A nti-dum ping policy Increased, due to preferential access under bilateral agreem ents
Low level o f use Increased use in local m arkets
Regim e o f regulation Com petition and consum er N o change Infant level, unfair Increased but stilland incentives protection policies com petition from
inform al sectorincipient im portance; unfair com petition from inform al sector rem ains
Support for SMEs Increase in size and scope Lack o f effective instrum ents
Im provem ents in support for m anagem ent bu t lack o f financial instrum ents rem ains
Tax system N o change A nti-com petitive bias B ias rem ains
Source: Prepared by the authors.
INDUSTRIAL C O M PETITIVENESS IN BRAZIL TEN Y EA RS A FTER ECO NO M IC LIBERALIZATION • JOAO CAR LO S FERRAZ, DAVID KUPFERA N D M ARIANA IOOTTY

C E P A L R E V I E W 8 2 • A P R I L 2 0 0 4 109
Privileged access to suppliers is related to size: smaller companies can survive in specific market niches, but they may face economic and financial difficulties in mobilizing the resources they need to fully exploit equipment- and input-related sources of competitive advantage. Given the inherent economic variety of these industries, this may be the basic reason for the growing trend for companies to organize themselves horizontally and/or vertically around local production clusters. Through such local clusters, companies can benefit from another source of competitive advantage: economies of agglomeration, through which they share costs associated with all aspects of their economic activity: infrastructure, labour and other inputs, design and marketing, information systems, etc.
Traditional industries are among the oldest industrial activities in Brazil, and competitive heterogeneity was and still is an important structural feature. The coexistence of very differentiated levels of competence among firms in each sector -and even among stages of production, within a given firm - can be directly associated with the country’s remarkably uneven income distribution profile.
In 1990 competitiveness was directly associated with size: large firms were likely to be more competent than their smaller counterparts. Larger firms were able to explore different market segments, to invest in modernization and to export. The analysis of textile, footwear and furniture industries indicates that, in 2002, such structural feature still prevailed, although,
as shown in the last two columns of table 11, some progress has been observed. The rate of product renovation has increased, through explicit and increased design efforts. Production modernization has been facilitated by the incorporation of more efficient machinery. Local clusters have emerged and are being consolidated in different industrial segments and regions of the country, while companies have further explored low labour cost opportunities, by transferring installations to the Northeast of the country.
2. Competitiveness in 2002: increasing responsiveness, but heterogeneity still prevails
a ) Asymmetric capabilities
The footwear industry exports 30% of its total production, while the textiles and garment industries focus on the domestic market. Until the mid-1990s, most footwear exports were directed to low-end market segments, where the price attribute is important. In spite of competitive pressure from Chinese producers, export performance has evolved positively during the 1990s. As shown in table 12, exports increased from US$ 1.1 billion in 1990 to US$ 1.6 billion in 2001. Unit prices have also increased, indicating that the industry is upgrading its product portfolio. It is necessary to bear in mind that, since 1999, devaluation has helped exports.
TABLE 12
Brazil: Footwear exports, selected years
Year Value (US$ million) Pairs (millions) Average unit price (US$)
1990 1 107 143 7.741995 1 414 138 10.252000 1 547 163 9.522001 1 615 171 9.43
Source: Costa (2002).
TABLE 13
Number of establishments, employment and sales revenue in the textile, chemical fibres and garment industries, 2000
Chemical fibres Textiles Garments
Establishments 25 3 305 18 797Employment (1,000 jobs) 15 339 1 233Production (1,000 ton/year) 640 1 750 1 287Annual sales (US$ billion) 1.4 16.6 27.2
Source: Prochnik (2002).
INDUSTRIAL CO M PETITIVENESS IN BRAZIL TEN Y EA RS A FTE R ECO NO M IC LIBERALIZATIO N • JO A O CARLO S FERRAZ, DAVID KUPFERA ND M ARIANA IOOTTY

110 C E P A L R E V I E W 8 2 • A P R I L 2 0 0 4
Other factors have also contributed to the sector’s international performance: fiscal incentives and export credits; the consolidation of gains from economies of agglomeration, especially in the southern state of Rio Grande do Sul, and the accumulated export experience. Nevertheless, labour costs still provide an important competitive edge to Brazilian production. In 1993 labour costs in Brazil were US$ 1 per man-hour, compared to US$ 0.5 in China, US$ 2.5 in Korea and US$ 8 in Spain. A study by Costa (2002) demonstrates the importance of the exchange rate to this export sector. During the 1994/1998 period, when the Real was overvalued, total employment fell by 56,000, but as demand expanded -between 1999 and 2000 exports increased by US$ 270 million (26 million pairs of shoes)- companies quickly contracted 29,000 more workers.
In the textiles sector there are important econom
ic differences between the three most important segments -textiles, chemical fibres and garments - as shown in table 13.
The combined sales of 22,000 establishments, employing 1.5 million workers, amounted to US$ 45.2 billion in 2000. The production of chemical fibres is technically more complex and the plants are larger and generally controlled by foreign-owned firms. At the other extreme, in the garment industry, small and medium-sized locally-owned firms prevail, employing 1.2 million workers in 18,000 establishments.
In contrast with the footwear industry, the international performance of the Brazilian textile industry, as shown in table 14, was never economically significant, even though in some segments, such as the garment industry, the competitiveness drivers are similar to those prevailing in the footwear industry.
TABLE 14
Brazil: World trade and Brazil’s share in the textiles and garment sectors, 1995-2000
Textiles 1995 1996 1997 1998 1999 2000
World trade (US$ billion) 111.1 113.6 119.3 112.5 113.0 126.1Brazil’s share in exports (%) 0.90 0.89 0.86 0.79 0.73 0.71Brazil’s share in imports (%) 1.23 0.98 1.01 0.95 0.79 0.88
Garments
World trade (US$ billion) 124.0 128.7 141.9 149.3 150.0 165.5Brazil’s share in exports (%) 0.24 0.19 0.15 0.12 0.12 0.17Brazil’s share in imports (%) 0.30 0.29 0.32 0.25 0.14 0.11
Source: Compiled from Prochnik (2002).
b) Modernization and relocation of production
A modernization drive was also observed in this industrial group, but with very special features, including relocation towards the low-cost Northeast region of Brazil.
In the footwear industry, companies modernized production processes and product portfolio, including the introduction of automated equipment and new organizational techniques associated with raising quality and decreasing waste and down time. There were also concerted efforts to increase product lines in association with higher process flexibility.
In the textiles and garment sector, modernization was stimulated by three sources of dynamism. Firstly, during the first half of the 1990s, the Plano Real induced positive expectations in relation to growth of demand; secondly, starting in 1995, the National
Economic and Social Development Bank, BNDES, financed a US$ 2 billion programme for machinery acquisition, especially for larger firms; and thirdly, import liberalization and an overvalued Real on one hand, and advances in technology, on the other, offered the possibility of importing updated machinery at lower prices. Investments in new machinery implied changes in production processes, with a negative impact on employment levels in the sector, which, as in other countries, fell substantially (by 40.7%) between 1990 and 2000.
Concurrently, a significant number of companies in these sectors migrated from the Southeast to the Northeast (table 15), looking for lower labour costs and generous tax incentives, including VAT exemptions, the provision of physical infrastructure and export credit lines.
INDUSTRIAL C O M PETITIVENESS IN BRAZIL TEN Y EA RS A FTER ECO NO M IC LIBERALIZATION • JOAO CAR LO S FERRAZ, DAVID KUPFERA N D M ARIANA IOOTTY

C E P A L R E V I E W 8 2 ■• A P R I L 2 0 0 4 111
TABLE 15
Brazil: Share of different regions in textile production, 1990-2000
Sector Northeast Southeast South Total
1990 2000 1990 2000 1990 2000
Fibres 24.9 35.4 55.2 42.6 17.2 21.7 100Fabrics 17.6 21.5 65.6 62.0 12.8 13.7 100Knitwear 2.8 10.0 39.9 35.2 55.7 53.5 100Garments 8.0 11.3 66.6 56.1 21.6 25.4 100Total 13.3 19.6 56.8 49.0 26.8 28.5 100
Source: Prochnik 2002
VIIInnovation carriers: progress, setbacks and
a fragile competitiveness
1. The pattern of competition then and now: theincreasing role of innovation
Inn ovation carriers are firm s that engage in activities
capable o f inducing progress in other econom ic ac tiv ities, through technical change incorporated in capital goods and components they produce. M a rk e t segmentation is the m ain feature o f the dem and fo r such
goods. Since th e ir products have specific applications, in general each f ir m competes d irectly w ith ve ry fe w
rivals. O v e r the years, and w ith the pervasive spread o f
in fo rm ation technologies, the leaders in this sector
have evolved fro m supplying equipm ent and have
becom e providers o f technical solutions and services
to clients.F irm s o f this type m ust devote considerable
resources to research and developm ent (R & D ) ac tiv ities, re flecting the fac t that the m ost im portant com petitive d river is the capacity to im p lem ent product innovations and to address particu lar demands o f
clients in specific m arket segments (see firs t tw o
colum ns o f table 16). Inn ovation capabilities are also
the m ost im portant b arrie r to entry. G ro w in g R & D
costs have led to the emergence o f d iffe rent form s o f
alliances am ong firm s, m ostly w ith the a im o f d ilu ting
technological risks. These features m ean that there is
an im portan t ro le fo r p ub lic o r p riva te research
centres.D u e to the strategic role o f innovation carriers,
nations w ith com plex industrial structures have alw ays
im p lem ented active policies to prom ote and consolidate the com petitiveness o f these enterprises in local and international m arkets. In add ition to support fo r
tec h n o lo g ic a l d eve lo pm en t, im p o rt restrictions, favourable financing conditions, governm ent purchasing p ow er and fisca l incentives are frequently used
mechanisms.O f a ll industrial groups, B ra z ilia n innovation car
riers suffered the w orst consequences o f econom ic l ib eralization. B efore this process, firm s had reasonable
levels o f p ro d u ctio n capacity and w e ll-q u a lif ie d
hum an resources, especially in m echanical engineering, as the result o f a long learn ing process associated
w ith an expanding local m arket and active industrial policies o f the 1970s and 1980s. E v e n then, however, m ost producers o f m echanical engineering and e lectron ics-based eq u ip m en t w e re not c o m p e titiv e ly
strong, d isp laying h igh levels o f ve rtica liza tion and
d iversification , dependence on fo re ig n technological suppliers, and m erely inc ip ien t relations w ith the local scientific infrastructure.
In the course o f the 1990s, producers o f m echanical engineering and telecom m unication equipm ents
and com puters shared a com m on feature: substantial strengthening o f th e ir p ro d u ctio n capab ilities . H o w ever, this was not enough to resist fo re ig n com
petitive pressures. N e w entrants fro m abroad acquired
local firm s, and in tra -firm im ports w ere extensively
used (see last tw o colum ns o f table 16).
INDUSTRIAL CO M PETITIVENESS IN BRAZIL TEN Y EA RS A FTE R ECO NO M IC LIBERALIZATIO N • JO Ä O CARLO S FERRAZ, DAVID KUPFERA ND M ARIANA IOOTTY

112 C E P A L R E V I E W 8 2 • A P R I L 2 0 0 4
TABLE 16
Brazil: Patterns of competition (POC) and competitiveness in innovation carriers, then and now
Sources o f competitive advantages
POC based on innovation Main competitive drivers, 1990
POC based on innovation Main competitive drivers,2002
Braziliancompetitiveness,1990
Braziliancompetitiveness,2002
Internal factors
Management Integration of R&D, production and marketing
No change Low capabilities Low capabilities, but increasing marketing efforts
Production Design for manufacturing No change Some capabilities in mechanical engineering
Reliance on imported design
Sales Market creation and business-to- business marketing
Increased, due to t he useof information technologies
Low capabilities Increased
Innovation R&D + design Increased capabilities, due to the use o f information technologies
Low capabilities Increasing reliance on imported technology
Structural factors
Segmentation by technical needs
No Change Capabilities in lower-end segments
Increased segmentation
Market Attention to client specifications
Increased Excessive standardization Increased responsive ness
Local and regional trade Increased Exports o f standard and technologically simple equipmentgoods to Latin America
Increased imports of components from OECD and exports o f final
Economies o f specialization Relative diversification Excessive diversification and verticalization
No clear pattern discernible
Configuration Interaction with users Increased Low interaction Increasing interactionof industry
Science and technology systems
Increased Incipient Low technological investment
Intellectual property rights Increased Nationalistic regulations Enforcement of property rights
Regulatory and Selective protection Decreased Nationalistic regulations Excessive liberalizationincentive regime
Risk support No change Non-existent Limited
Credit for users No change Limited Limited
State purchasing power Decreased Few attempts Not in place
Source: Porto (2002).
2. Com petitiveness in 2002: modernization,import dependence and ownership internationalization
a) Growth, modernization, de-verticalization and product upgrading
Suppliers o f telecom m unications equipm ent considerably expanded th e ir production capacity due to
the rig id expansion targets im posed upon telecom m unica tion u tilities during the p riv a tiza tio n process.
C om puter assem bly becam e in ternationalized through
foreign direct investm ent in new fac ilities and asset acquisition and substantial increases in im ports o f
components, as a result o f changes in leg is la tion w h ich
equalized opportunities fo r loca l and foreign-ow ned
firm s, In the face o f g row ing im ports, producers o f
m echan ica l eng ineering-based goods p rom oted a
ra tio n a liza tio n process resu ltin g in a s ig n ifican t decrease in production capacity.
INDUSTRIAL C O M PETITIVENESS IN BRAZIL TEN Y EA RS A FTER ECO NO M IC LIBERALIZATION • JOAO CAR LO S FERRAZ, DAVID KUPFERA N D M ARIANA IOOTTY

C E P A L R E V I E W 8 2 • A P R I L 2 0 0 4 113
Corporate efforts w ere focused on the introductio n o f new organizational techniques to ensure greater
effic iency o f p roduction processes, and reduction and
specialization o f product p ortfo lio . Through the adoptio n o f ju s t-in -tim e methods and subcontracting, the
m echanical engineering sector was able to im prove
effic iency and m ain ta in m in im u m levels o f production , w ith a negative im pact on em ploym ent levels
(w h ic h dropped fro m 3 3 1 ,9 0 0 in 1990 to 160 ,200 in
1999). In line w ith this trend, com puter firm s firs t o f
a ll outsourced adm inistrative activities and subsequently introduced new organizational techniques that required fe w e r staff, resulting in sharp reductions in
em p lo ym en t levels . Thus, a fte r em p lo ym en t had
expanded fro m 4 2 ,9 2 4 in 1984 to 74 ,15 5 in 1989, by
1999 the to ta l num ber o f em ployees in the com puter
industry was d ow n to 38 ,45 0 (Porto, 2002).
L o w investm ent levels and trade libera liza tion
sign ificantly affected the producers o f m echanical engineering equipm ent. W h ile apparent consum ption
decreased fro m U S $ 17.2 b illio n in 1990 to U S $ 14.4
b illio n in 20 0 0 , im ports increased and loca l production
decreased substantially. D u rin g the decade, w h ile p ro duction levels declined steadily, exports and im ports
evolved cyc lically , w ith an u pw ard trend u n til 1997
and declines thereafter (table 17).
TABLE 17
Brazil: production and international trade in mechanical equipment, 1990-2000(US$ billion)
Year Production Exports Imports Tradebalance
Apparentconsumption
Export coefficient %
Import coefficient %
1990 16.7 2.6 3.2 -0.5 17.2 15.9 18.51995 14.3 3.8 6.9 -3.1 17.4 26.6 39.82000 11.5 3.5 6.4 -2.9 14.4 30.5 44.7
Source: Vermulm and Erber (2002).
T he scenario fo r suppliers o f telecom m unications
equipm ent was ve ry d iffe rent fro m that o f the m echanica l engineering sector. In the second h a lf o f the
1990s, this industry faced expanding dem and due to
the rules on the p riva tiza tion o f telecom m unications
u tilities , coupled w ith intensive technical progress. A n
estim ate by O liv a (2 0 0 2 ) suggests that under the
inv e s tm e n t-in d u c tive ru les o f concessions, sales
am ounted to U S $ 20 b illio n b etw een 1998 and 2000.
D a ta fro m O liv a (2 0 0 2 ) also show that sales rev enue in 2 0 0 0 was 1 24% higher than the 1995 level.
These figures alone indicate that the g row th in dem and
attracted firm s to install new assem bly units in the
country. B ra z ilia n firm s w ere very e ffic ien t in setting
up local fac ilities , re ly in g strongly on g lobal sourcing
to ensure delivery tim es to clients. Th is is the reason
w h y the industry ’s trade d efic it reached U S $ 2 b illio n
in 2001: the result o f U $ 3.5 b illio n o f im ports (4 3 %
fro m the U n ite d States, 2 6 % fro m the European
U n io n ) and U S $ 1.5 b illio n o f exports (9 0 % to L a tin
A m erica ).
W ith regard to the com puter industry (computers
and com ponents), Porto (2 0 0 2 ) found a b ig expansion
in sales, fro m U S $ 6 b illio n in 1990 to U S $ 10.7 b i l lio n in 1998. Since then g row th has slow ed down.
These figures suggest that the com puter industry has
m anaged to outgrow com ponent production. To a large
extent, this is expla ined b y the increasing reliance o f
this industry on im ported components.Indeed, w hen contrasting im ports o f components
and im ports o f f in a l com puter goods (table 18), the
disparity is quite clear: fro m 1997 to 2001 the average
annual va lue o f com ponents im ports equalled U S $ 5.1
b illio n , w h ile that o f im ported com puters am ounted to
U S $ 1.02 b illio n . M o re im portant, w h en local com puter sales decreased — after 2 0 0 0 — and the R e a l was
devalued — afte r 1999— , com puter im ports rem ained
re la tive ly stable but im ports o f electronic components
increased even more.
INDUSTRIAL CO M PETITIVENESS IN BRAZIL TEN Y EA RS A FTE R ECO NO M IC LIBERALIZATIO N • JO A O CAR LO S FERRAZ, DAVID KUPFERA ND M ARIANA IOOTTY

114 C E P A L R E V I E W 8 2 • A P R I L 2 0 0 4
TABLE 18
Brazil: Computer industry imports and exports, 1997-2001(US$ million)
Year 1997 1998 1999 2000 2001
Exports (1+2) 1 331 1 458 1 587 1 865 1 809
1. Computers 255 235 323 346 2512. Components 1 076 1 223 1 264 1 519 1 558
of which, components for computers
91 124 151 144 146
Imports (3+4) 6 406 5 840 5 874 7 690 6 793
3. Computers 1 232 1 090 855 1 080 1 0324. Components 5 174 4 750 4 839 6 610 5 761
of which, components for computers
562 671 665 856 782
Trade balance 5 075 4 382 4 287 5 825 4 984
Source: Porto (2002).
b) The division of labour between local and foreign-owned firms
T he com petitiveness o f B ra z ilia n m echanical
engineering capital goods is h igher in product lines o f
lo w and m ed ium technological intensity, w here product cycles have matured.
Price com petitiveness is decisive, and com pany
advantages lie in p riv ileg ed access to low -cost inputs
and labour. B ra z ilia n industry is also com petitive in
specific m arket niches, especially w here the equ ip m ent is techn ica lly m ore sophisticated, requ iring
strong interactions betw een suppliers and clients, and
local and reg ional dem and is re la tive ly h igh in econom ic terms.
H ow ever, some o f the structural features o f the
1980s, especially the d iv is ion o f labour betw een local and foreign producers, have not changed. L oca lly
owned companies are prevalent in low -technology segments, w h ile fo re ig n companies dom inate sophisticated product lines. The companies that have managed to
survive the hardships o f the 1990s have im proved the ir
competitiveness: they are leaner in terms o f production
processes and product portfolios. Specialization levels
have increased, and this m ay constitute the basis upon
w h ic h to grow in the years to com e. E v e n so, most o f
the com petitive challenges o f the early 1990s rem ain, especially those related to the continuing weakness o f
the technological capab ility base.In telecom m unications, despite the increasing
reliance on im ports, to a great extent dem and could be
supplied fro m local sources because o f the industry ’s
previous experience w ith in B raz il. M o s t o f the in ternational players w ere already established in the country before econom ic libera liza tion , and some local firm s w ere also very active, b u t the expansion o f
dem and brought in new fo re ig n firm s, through the
acquisition o f local firm s. A s a result, in 2 0 0 0 fo re ig n
companies contro lled 9 1 .3 % o f the U S $ 8 .8 b illio n
tota l sales o f the sector in that yea r (O liv a , 2002).Indeed, according to Porto (2 0 0 2 ), w h en a broad
er d e fin itio n is g iven to the com puter and telecom m unications industries, the p icture does not change very
much. T he gross sales o f the in fo rm ation technology
industries increased fro m U S $ 16 b illio n to U S $ 30
b illio n betw een 1996 and 2 000 , w ith fo reign-ow ned
firm s expanding the ir m arket share fro m 4 8 .2 % to
6 5 .8% , at the expense o f loca lly -o w ned private firm s.
INDUSTRIAL C O M PETITIVENESS IN BRAZIL TEN Y EA RS A FTER ECO NO M IC LIBERALIZATION • JOÄO CAR LO S FERRAZ, DAVID KUPFERA N D M ARIANA IOOTTY

C E P A L R E V I E W 8 2 • A P R I L 2 0 0 4 115
V IIIAfter ten years of economic liberalization, rationalization and inward internationalization
in Brazil: What comes next?
The institu tional transition tow ards a new “ m arket- driven” paradigm was not a sm ooth process and uncer
tain ty increased, especially unpredictab ility in terms
o f the extent o f entry o f new com petitors and im p orted goods. F irm s lost the capacity to forecast the real size o f the ir m arkets and reacted b y undertaking
defensive actions, most o f them associated w ith cost reduction , p ro du ction ra tio n a liza tio n and product renew al, w h ic h led to further reductions o f the already
lo w levels o f m icroeconom ic confidence. These lo w
levels o f confidence w ere accom panied by a negative
propensity to invest, w ith s im ila rly negative repercussions on m acroeconom ic sustainability and econom ic
growth.A balance o f the “M ad e in B ra z il” production
structure, ten years a fter econom ic libera liza tion , displays a s trik ing ly d iffe rent feature fro m those o f other
L a tin A m erican countries: betw een 1990 and 2002
very fe w genuinely new econom ic activities w ere
added to the country ’s industrial m atrix , and very few
previously existing activities ceased to exist.M o s t im portant changes w ere observed in the
m anagem ent o f production processes and in the o w n ership landscape o f industry. M o d e rn iz a tio n and
inw ard in ternationalization w ere the most outstanding, econom ically sign ificant and generalized processes
tak ing place in B ra z ilia n industry in the 1990-2002
period. These processes do not rea lly represent inno v a tio n in the Schum peterian sense. F oreign capita l has
alw ays had a prom inent ro le in industry, because the
B ra z ilia n econom y was n ever closed to fo re ig n o w n ership as it was in fo re ig n trade. A s fo r m odernization ,
around the m id -1980s leading firm s in most industrial sectors w ere already introducing updated organizational techniques to increase effic iency and quality
(Ferraz, K u p fe r and Haguenauer, 1996a).O v e r the years, m odern ization and inw ard in ter
n a tio n a liza tio n w ere strengthened am ong lead in g
firm s and extensively d iffused across sectors, assuming econom ically sign ificant proportions. T he ro le o f
fo re ig n capita l was considerably strengthened, espe
c ia lly in dynam ic industrial segments. M o d ern iza tion
provided the basis upon w hich firm s w ithstood com petitive pressures fro m expanding im ports and the
entry o f new com petitors. T he w ide d iffus ion o f
labour-saving techniques and m achinery, d e-vertical- ization and subcontracting and the lack o f sustained
g ro w th in d em and le v e ls caused a d ec lin e in
em ploym ent never seen before in B raz ilia n history.
M o d e rn iz a tio n was strong ly b iased tow ards
ra tionalization rather than tow ards expanding production capacity and developing innovation capabilities to
support the introduction o f new processes and products. Fac in g changing m acroeconom ic conditions, industrialists w ere not w illin g to invest in new plants
and even less in R & D , the most uncertain o f a ll investments.
M o re interestingly, m odernization d id not induce
changes in the re lative position o f firm s. Those that were re la tive ly stronger in the pre-change period have
shown better adaptive capacity and vice-versa. Large
firm s and those w hich were foreign-ow ned, operating
in the industrial com m odities o r durables sectors and
located in the southern part o f the country, have
w idened the re lative gap separating them fro m firm s
lo w e r dow n on the com petitive ladder.Foreign trade expanded significantly, fro m U S $
50 b illio n in 1990 to U S $ 100 b illio n in 2001. B u t
trade patterns rem ained re la tive ly unchanged: im ported goods had h ig h incom e elasticity o f dem and, w hile
lo w unit values p revailed in exports. Production m odern ization benefited fro m im ported electronic com ponents and chem ical inputs, w h ile the industrial com m odities group s till generates most o f the country ’s
fo re ig n exchange. Trade deficits soared and w ere overcom e only in 2 000 , a fter a heavy currency devaluation . Regardless o f these advances, the share o f
B raz ilia n foreign trade in w orld trade has declined
fro m 1 .4% in the m id -1980s to 0 .7 5 % in 2001.
M ergers and acquisitions changed the ownership
landscape o f B raz ilia n industry, strongly re in forcing
the share o f fo re ig n capital. M oreo ver, betw een 1990
INDUSTRIAL CO M PETITIVENESS IN BRAZIL TEN Y EA RS A FTE R ECO NO M IC LIBERALIZATIO N • JO A O CARLO S FERRAZ, DAVID KUPFERA ND M ARIANA IOOTTY

116 C E P A L R E V I E W 8 2 • A P R I L 2 0 0 4
and 2 0 0 2 , investments in new plants and capacity
expansion w ere carried out only in a ve ry fe w sectors: steel, autom otive products, consum er electronics and
telecom m unications equipm ent. These are exam ples
o f positive reactions to the expansion in dem and and
pro-active responses to increasing com petition, and
they are interesting in ind icating a p ro -g ro w th v ita lity
in B raz ilia n industry.A m o n g industrial groups, some interesting regu
larities exist. Strong com petitiveness has been and
rem ains essentially associated w ith com m odity p ro ducers, w here local capital is s till prevalent. B u t com m odity producers have fo llo w e d a dual-track strategy: exports o f lo w u n it va lue products and internal sales o f
high u n it va lue goods. In the durables sectors, com petitiveness was strengthened — especially in m id d le - range products — through investments in new plants, increasing p roduct d iffe re n tia tio n and expand ing
im ports o f components. F ore ig n firm s are dom inant and exports are increasing. H eterogeneity is s till an
im portant feature o f trad itional industries, in w h ich
local capita l m ostly predominates. Responsiveness —
a key com petitive d rive r — has increased, along w ith
the fo rm atio n o f loca l p roduction clusters and the re lo cation o f plants to low -cost regions, especially the
Northeast. A m o n g innovation carriers, weaknesses
still p reva il, a lthough the firm s s ign ificantly im proved
th e ir ab ility to d e live r equipm ent w hen dem and was
expand ing . O w n e rs h ip in te rn a tio n a liza tio n has
increased, inducing a m arked d iv is ion o f labour: fo r
eign firm s contro l the assem bly o f equipm ent and the
im portation o f strategic components, w h ile loca lly
ow ned firm s are e ither suppliers o f standardized com ponents o r producers o f tec h n o lo g ic a lly sim ple
machinery.
In short, B raz ilia n industry has shown considerable capac ity to adapt to in s titu tio n a l change. C om petitive capabilities w ere reinforced, thanks to a
m odernization drive strongly biased tow ards ra tionalization. Interestingly, how ever, in a fe w areas w here
g row th prospects w ere h igh, industry responded by
expanding capacity. Nevertheless, responsiveness to
the challenges im posed b y econom ic libera liza tion and
g row th prospects is unevenly distributed, favouring
those firm s w ith previously accum ulated capabilities. M o s t probably this was an im portant fac to r in the
acceleration o f ownership internationalization.
Consequently, B ra z il m ay face a developm ent paradox in the years to com e. H is to ry tells us that local capital and innovation capabilities have been outstanding features in countries w h ic h have been successful in sustaining econom ic developm ent. I f o w nership in ternationalization is to rem ain and local innovation capabilities are to be prom oted, then B raz ilia n p rivate and public p o licy makers must seek new w ays o f
attracting the necessary investments. To a great extent, this w i l l m ean an im portant departure fro m established
policy practices, tow ards new w ays o f regulating and
inducing firm s to increase local va lue creation.
(Original: English)
Bibliography
Amadeo, E. and R.R. Soares (1996): Abertura, produtividade e orga- nizaçâo industrial, Rio de Janeiro, International Centre for Education, Labour and Technology Transfer (CIET)/National Industrial Apprenticeship Service (SENAI), unpublished.
Bielschowsky, R. (1998): Investimentos na industria brasileira, 1995/97. Características e determinantes, Rio de Janeiro, National Confederation o f Industry (CNI).
Bonelli, R. (1996): Produtividade industrial nos anos 90: controvér- sias e quase-fatos, Economia brasileira em perspectiva, vol 2, Brasilia, Institute o f Applied Economic Research (IPEA).
Costa, A.B. (2002): Estudo da com petitividade de cadeias integradas: couro e calçados, Brasilia, M inistry o fDevelopment, Industry and Commerce (MDIC), unpublished.
Coutinho, L. and J.C. Ferraz (coords.) (1994): Estudo da competi- tividade da indústria brasileira, Campinas, Editora Papirus.
Ferraz, J.C., D. Kupfer and L. Haguenauer (1996a): The competitive challenge for Brazilian industry, CEPAL Review, No. 58, LC/G.1916-P, Santiago, Chile, April.
(1996b): Made in Brazil: desafíos competitivos para aindústria brasileira, Rio de Janeiro, Campus.
Fonseca, M.G.D. (2002): Estudo da competitividade de cadeias integradas: papel e celulose, Brasilia, M inistry o fDevelopment, Industry and Commerce (MDIC), unpublished.
Gonzaga, G. (1996): Determinat^ao do emprego industrial no Brasil, Rio de Janeiro, International Centre for Education, Labour and Technology Transfer (CIET)/ N ational Industrial Apprenticeship Service (SENAI), unpublished.
Hamaguchi, N. (2003): A Study on the Impact of Economic Liberalization in Brazil: 1995-2002, Las Series, No. 4, Tokyo, Japan External Trade Organization (JETRO), unpublished.
IBGE (Brazilian Geographical and Statistical Institute) (2000): Industrial Survey on Technological Innovation, Brasilia.
Neves, M.F. and M.K. Marino (2002): Estudo da competitividade de cadeias integradas: suco de laranja, Brasilia, Ministry o f Development, Industry and Commerce (MDIC), unpublished.
Oliva, R. (2002): Estudo da competitividade de cadeias integradas: equipamentos de telecomunica9oes, Brasilia, Ministry o f Development, Industry and Commerce (MDIC), unpublished.
Paula, G.M. (2002): Estudo da com petitividade de cadeias integradas: siderurgia, Brasilia, Ministry o f Development,
INDUSTRIAL C O M PETITIVENESS IN BRAZIL TEN Y EA RS A FTER ECO NO M IC LIBERALIZATION • JOAO CAR LO S FERRAZ, DAVID KUPFERA N D M ARIANA IOOTTY
C E P A L R E V I E W 8 2 • A P R I L 2 0 0 4 117
Industry and Commerce (MDIC), unpublished.Porto, J.R .D (2002): Estudo da com petitividade de cadeias
integradas: informática, Brasilia, Ministry o f Development, Industry and Commerce (MDIC), unpublished.
Prochnik, V. (2002): Estudo da com petitividade de cadeias integradas: textil e vestuário, Brasilia, M inistry o f Development, Industry and Commerce (MDIC), unpublished.
Rocha, F. and D. Kupfer (2002): Structural changes and specialization in Brazilian industry: the evolution o f leading companies and the M & Aprocess, The Developing Economies, vol. 3, No. 40, Tokyo, Institute o f D eveloping Econom ies (IDE), December.
INDUSTRIAL CO M PETITIVENESS IN BRAZIL TEN Y EA RS A FTE R ECO NO M IC LIBERALIZATIO N • JO Ä O CARLO S FERRAZ, DAVID KUPFERA ND M ARIANA IOOTTY
Sá, M.T.V.S (2002): Estudo da com petitividade de cadeias integradas: eletrónica de consumo, Brasilia, Ministry o f Development, Industry and Commerce (MDIC), unpublished.
Sarti, F. (2002): Estudo da competitividade de cadeias integradas: automobilística, Brasilia, Ministry o f Development, Industry and Commerce (MDIC), unpublished.
Vermulm, R. and F. Erber (2002): Estudo da competitividade de cadeias integradas: bens de capital mecánicos, Brasilia, Ministry o f Development, Industry and Commerce (MDIC), unpublished.


119
C e l i o H i r a t u k a
R e s e a r c h F e l l o w o f t h e
C e n t e r f o r I n d u s t r i a l E c o n o m i c s
a n d T e c h n o l o g y ( NE I T) ,
I n s t i t u t e o f E c o n o m i c s ( IE) ,
S t a t e U n i v e r s i t y o f C a m p i n a s
/ celio@ eco.unicam p.br
F e r n a n d a D e N e g r i
R e s e a r c h F e l l o w , N E I T / I D E ,
S t a t e U n i v e r s i t y o f C a m p i n a s
/ fdenegri@ eco.unicam p.br
C E P A L R E V I E W 8 2 • A P R I L 2 0 0 4
The influence of capital originon Brazilian foreign trade patterns
Celio Hiratuka and Fernanda De Negri
TJ ^ h i s a r t i c l e a i m s t o d e t e r m i n e w h e t h e r t h e g e o g r a p h i c a l p a t t e r n
o f t h e e x t e r n a l t r a d e o f f o r e i g n - o w n e d e n t e r p r i s e s in Brazi l d i f fe rs
f r o m t h a t o f d o m e s t i c e n t e r p r i s e s a n d w h e t h e r , in t h e c a s e o f f o re i gn
e n t e r p r i s e s , t h e r e g i o n o f o r i g i n o f t h e i r c a p i t a l is an i m p o r t a n t f a c t o r
in d e t e r m i n i n g t h a t p a t t e r n , b o t h in t e r m s o f t h e o r i g i n a n d
d e s t i n a t i o n o f t h e i r i m p o r t s a n d e x p o r t s a nd w i t h r eg a r d t o t he
t e c h n o l o g i c a l c o n t e n t o f t h e p a t t e r n . T h e m e t h o d o l o g y e m p l o y e d
w a s p a ne l a na l ys i s , a p p l i e d t o a r e p r e s e n t a t i v e s e t o f e n t e r p r i s e s ,
u s i n g t r a d e d a t a b r o k e n d o w n by r e g i o n f o r 1 9 8 9 , 1 9 9 7 a n d 2 0 0 0 .

120C E P A L R E V I E W 8 2 • A P R I L 2 0 0 4
IIntroduction
F oreign enterprises have alw ays had a large share in
the B ra z ilia n econom y. This was the result o f econom ic policies w h ic h fo r m any years prom oted the in ternationalization o f the national productive system as a
means o f econom ic developm ent and incorporation
into the w o rld m arket. Argum ents such as the need fo r
fo re ig n savings, greater technological capacity and the
fo re ig n enterprises’ better position in fo re ig n trade
w ere o ften adduced to ju s tify the role o f fo re ig n capita l in the country. The presence o f fo re ig n enterprises, especially in “heavy” industry, was indeed a decisive
fac tor in B ra z il ’s industria liza tion process, because
the ir activ ities com plem ented those o f the private-sec- to r and State enterprises responsible fo r the “ lig h t”
sectors o f industry and the infrastructural sectors, respectively.
T he g row ing in ternationalization o f the B raz ilia n
econom y, as a result o f a fresh w ave o f fo re ig n direct investm ent (F D I) in the 1990s, rev ived the debate on
the ro le o f fo re ig n enterprises. In recent years there
have also been some changes w h ic h are extrem ely
im portant in term s o f this debate and in terms o f the
effects o f in ternationalization on the perform ance o f
the national productive sector.F irstly , there is the process o f trade and financ ia l
lib e ra liza tio n in the early 1990s, w h ic h increased the
coefficients o f exports and im ports and, in some
respects, m ade the B ra z ilia n econom y m ore vu ln era b le to changes in g lo b a lize d f in a n c ia l m arkets. Secondly, there are the reg ional trade agreements such
as M E R C O S U R and the negotiations fo r the establishm ent o f a Free Trade A rea o f the A m ericas (F T A A )
and an agreem ent betw een M E R C O S U R and the
European U n io n , w h ic h are lik e ly to have sign ificant effects on the fo re ig n trade perform ance o f the country
in the com ing years.I t was in this context that m any o f the recent stud
ies on the role o f fo re ig n enterprises sought to analyze
the ir effects on trade flow s. In particular, the greater
openness o f the econom y seems to have led some analysts to b elieve that the ro le o f fo re ig n enterprises in
The authors wish to acknowledge the comments made by an anonymous referee o f the CEPAL Review and by colleagues from the Nucleo de Economia Industrial y Technologia.
B ra z il ’s fo re ig n trade w o u ld becom e m ore sign ificant and b en efic ia l fo r the country. Various studies also
sought to com pare the trade perform ance o f fo re ig n
enterprises w ith that o f dom estic firm s. In general, the
results obtained showed that there w ere d ifferences
betw een the perform ance o f the tw o types o f enterprises: the fo re ig n enterprises showed greater integratio n w ith the exterior, although this was m ore p ro nounced in the case o f im ports than o f exports.
T he a im o f this study, apart fro m iden tify ing the
trading differences b etw een dom estic and fo re ig n
enterprises, is to go m ore deeply into the possible
causes o f these differences. O ne o f these causes, w h ich
has far-reaching im plications in v ie w o f the possible
signing o f trade agreements w ith the F T A A and the
European U n io n , has to do w ith the influence o f the
reg ion o f o rig in o f the capita l o f fo re ig n enterprises on
the patterns o f o rig in and destination and technolog ical content o f B ra z il ’s fo re ig n trade. Th is artic le therefore seeks to appraise the regional trading pattern o f
fo re ig n enterprises in B ra z il as a function o f the
regions o f o rig in o f the ir capita l and the ir d ifferences
w ith dom estic enterprises and fo re ig n enterprises in
other regions.Th is article is d iv ided into s ix sections. The fo l
lo w in g section, section I I , b rie fly addresses the re la tions betw een fo re ig n d irect investm ent (F D I) , the
activities o f transnational corporations and trade flow s
in the recent past. Section I I I sum m arizes the m ain
results o f the studies on fo re ig n enterprises and trade
in B ra z il m ade during the 1990s. Section I V contains
an econom etric analysis on a panel o f 165 fo re ig n and
dom estic industrial enterprises on the basis o f data fo r
1989, 1997 and 2 0 0 0 w ith a v ie w to iden tify ing
reg ional trade differences betw een the enterprises
according to the ir nationality and the reg ion o f o rig in
o f th e ir capital. Section V seeks to determ ine i f the
technological density o f fo re ig n enterprises’ trade
influences th e ir reg ional trade pattern and, m ore
specifically, how m uch it influences the ir trade flow s
w ith the ir reg ion o f orig in . F in a lly , section V I presents
the m ain conclusions o f the study, together w ith some
inferences that m ay be d raw n in term s o f econom ic
and trade policy.
THE INFLUENCE OF CAPITAL ORIG IN ON BRAZILIAN FO REIGN TRADE PATTERNS • CÉLIO H IR A TU K A A N D FERNANDA DE NEGRI

C E P A L R E V I E W 8 2 • A P R I L 2 0 0 4 121
iiThe effects of foreign direct investment and
transnational corporations on international trade
The rap id g row th o f trade and F D I flow s has been
g iven a great deal o f attention recently in international econom ic studies. A s m ay be seen fro m table 1, both
these flow s, b u t particu larly those o f F D I, have g row n
on average considerably faster than w o rld G D P over
the last 20 years.I t m ay also be seen fro m that table that a counter
part to the faster g row th o f F D I flo w s than w o rld trade
and the w o rld product was an increase in the im p ortance o f transnational corporations in the g lobal economy. T he tota l sales o f the subsidiaries o f those enterprises cam e to U S $ 15.6 b illio n in the yea r 2000 ,
w h ic h represents added va lue o f some U S $ 3.1 b illio n . T he average annual g row th rate betw een 1982 and
2 000 was 8 .9 % fo r sales and 8 % fo r va lue added, w h ile the share o f the subsidiaries o f transnational corporations in the generation o f w o rld G D P rose fro m
5 .6 % to 1 0 .1% over the same period. I t should be
noted that these figures do not include the product generated b y the operations o f the parent firm s in the ir
hom e countries, b u t only that o f th e ir subsidiaries
abroad, thus u n d er-es tim ating the to ta l share o f
transnational corporations in the generation o f w o rld
w ealth .
TABLE 1
Economic indicators of world as a whole and of subsidiaries of transnational corporations, 1982, 1990 and 2000(Billions o f 2000 dollars)
1982 1990 2000 Variation between 1982 and 2000
(annual average, %)
World dataFDI flows 77 239 1 271 16.9World GDP 14 086 24 518 31 363 4.5Exports 2 492 3 977 6 338 5.3
Data fo r subsidiaries o f transnational corporationsa
Sales 3 373 6 256 15 680 8.9Assets 2 601 6 804 21 102 12.3Product 789 1 625 3 167 8.0Exports 889 1 335 3 572 8.0
Product o f transnational subsidiaries/world GDP (%) 5.6 6.6 10.1Exports o f transnational subsidiaries/world exports (%) 35.7 33.5 56.4
Source: United Nations Conference on Trade and Development (UNCTAD). a For 2000: UNCTAD estimate.
I t is also im portant to note that the share o f the
transnational subsidiaries in the to ta l G D P o f the
industria l sector is considerably greater than those o f
the p rim ary sector and o f com m erce and services. A ccord ing to calculations m ade by L ipsey (1 9 9 8 ) in
1990 the in ternationalized product in industry at the
w o rld level, that is to say, the proportion o f a country ’s
product contro lled b y enterprises based in other countries, represented 16 % o f w o rld industria l G D P, and
this percentage m ust have increased still fu rth er in
recent years.A s fo r trade flow s, in 1999 the tota l exports o f
transnational subsidiaries w ere estim ated to am ount to
U S $ 3.5 b illions , representing nearly 5 6 % o f tota l
w o rld exports, com pared w ith 3 5 .7 % in 1982. The
share o f the parent firm s is not included in this figure
in this case either, thus under-estim ating once m ore the
inc id ence o f transn atio na l corporations in to ta l
THE INFLUENCE OF CAPITAL ORIGIN ON BRAZILIAN FOREIGN TRADE PATTERNS CÉLIO HIRATUKA A ND FERNAN DA DE NEGRI

122 C E P A L R E V I E W 8 2 • A P R I L 2 0 0 4
exports. E v e n so, these data c learly show that F D I and
in ternational trade are interdependent phenom ena, and
also that an increasing share o f trade flow s is under the
control o f transnationals. A ccord ing to estimates o f the
U n ite d N a tio n s C o nference on T rade and
D eve lop m ent (U N C T A D , 1995), a lm ost tw o-th irds o f
w o rld trade involves a transnational corporation in
some w ay, and nearly h a lf o f this figu re corresponds to
in tra -firm trade. In o ther w ords, trade w ith in transnational corporations represents alm ost a th ird o f total w o rld trade.
T his phenom enon has g iven rise to a large num b er o f theoretical and practical studies w h ic h seek to
iden tify the relations betw een F D I flow s , the activities
o f transnational corporations and trade flo w s by treating these variables in a m ore integrated manner.
The e ffect o f the activities o f transnational firm s
on trade flow s was neglected fo r a lon g tim e in trade
theory. The fo rm a l expression o f H eckscher-O lin -type
com parative advantage m odels included am ong its
various p rio r assumptions the hypothesis that the fac tors o f production w ere im m ovab le and could hence
only be analysed in the country w here they w ere located. Furtherm ore, the idea o f the enterprise inherent in
the m odel was that o f a production u n it m anufacturing
only one product in a single plant, in an environm ent w here there was perfect com petition in a ll markets. This excluded in advance the possibility o f the existence o f transnational corporations, both because it w o u ld be im possible fo r the enterprises o f one country
to use the factors o f p roduction o f another or fo r a fo r-
eign-ow ned f irm to b u ild up any k in d o f advantage
over dom estic firm s in producing fo r the loca l m arket, in v ie w o f the hypothesis o f perfect com petition.
A lth o u g h trade theories w h ic h exc lude the
transnational corporations are s till som etimes used as
explanatory models, the recognition that the activities
o f transnational corporations influence trade flow s and
patterns has stim ulated the preparation o f studies
w h ic h seek to incorporate this aspect in equ ilib riu m
m odels based on the new international trade theories.B asically , tw o m a in lines o f argum ent can be
iden tified to exp la in the emergence o f transnational corporations in the new trade patterns. T he firs t line, expounded in p articu lar b y H e lp m a n (1 9 8 4 ) and
H e lp m a n and K rug m an (1 9 8 5 ), seeks to exp la in the
vertica l investments o f such corporations, w h ich have
the characteristic o f carry ing out d iffe rent stages in the
production chain in d iffe rent countries, tak ing advantage o f the d isparities betw een the proportions o f p ro duction factors in each country. In these m odels, the
firm s are assumed to concentrate activ ities re lating to
m ore capita l-in tensive business functions in the country w ith the b iggest re la tive end ow m ent o f this
resource, exporting those services a production unit located in the country w ith the best endow m ent o f
labour, w h ic h w o u ld then export the end-product. In ternational investm ent log ic is therefore assumed to
be connected w ith the possibility o f separating the v a rious stages o f production to take advantage o f the d if ferences in factor costs, thus g iv in g rise to in tra -firm
trade in business functions and end-products.T he second lin e o f argum ent, developed by
authors such as B rainard (1 9 9 3 ), M arkusen (1 9 9 5 ) and
M arkusen and Venables (1 9 9 8 ), analyses horizontal investm ents, nam ely, the transnational establishm ent o f plants w ith s im ila r product lines in countries w h ich
are s im ila r in term s o f m arket size, incom e, and
end ow m ent o f factors o f p roduction . H o riz o n ta l investm ent is assumed to take place w h en the transport costs and prices o f a p lant are h igh and its econom ies
o f scale at the p lant le v e l are sm all com pared w ith the
economies o f scale at the le v e l o f the f irm as a w hole. These patterns w o u ld exp la in the g row ing cross-flows
o f F D I am ong developed countries. T he equ ilib riu m
situation in w h ic h the transnational corporations prev a il w o u ld result in the predom inance o f d irect sales in
the countries w here the subsidiaries are located, to the
detrim ent o f exports.Some studies1 w h ic h depart fro m the equ ilib riu m
m odels and are closer to the literature on the operations o f transnational corporations state that the in teraction betw een the increase in com petition at the
w o rld level, the deregulation and /or libe ra liza tion o f
markets and the spread o f in fo rm ation technologies in
recent years have caused transnational corporations to
seek som ething m ore than ju s t the exp lo ita tion o f fac
to r cost differences or new markets.F D I flo w s have also com e to be d irected towards
the ra tiona lization o f the already established structure, in order to take advantages o f the econom ies o f scale
availab le through the u n ified m anagem ent o f geographically dispersed production activities and the
acquisition o f assets that prom ote tra in ing fo r com pet itio n and help to attain strategic goals in g lobal and
regional markets.W hereas previously the chain o f va lue o f enter
prises was reproduced alm ost in fu ll in each subsidiary, the expansion and ra tiona lization o f that struc
1 Such as those by Chesnais (1996), D unning (1993) and UNCTAD (2002a and 2002b).
THE INFLUENCE OF CAPITAL ORIG IN ON BRAZILIAN FO REIGN TRADE PATTERNS • CÉLIO H IR A TU K A A N D FERNANDA DE NEGRI

C E P A L R E V I E W 8 2 • A P R I L 2 0 0 4 123
ture has resulted in a m ore fragm ented chain in w h ich
the subsidiaries carry out activities and functions that fo rm part o f a m uch m ore com plex international d iv i
sion o f labour. The decision to assign a production or
business activ ity to a g iven place has come to be based
on the expectation that this w i l l m ake a contribu tion to
the g lobal perform ance o f the transnational corporations. Subsidiaries have begun to specialize in particula r areas and to provide com ponents o r a particu lar
line o f products to the rest o f the netw ork, e ither w ith in a reg ion o r w o rld w id e , even tak in g on business
functions fo r the line in question, such as organizing
purchases and research and developm ent activities
(U N C T A D , 1995).
A s the accum ulation potential o f transnational corporations has com e to depend on the w a y they
organize, coordinate and g loba lly integrate th e ir v a r ious activities, there has been an increase in the flow s
o f in fo rm ation and resources betw een the parent f irm
and its subsidiaries, as w e ll as am ong the various subsidiaries themselves. These flow s invo lve everything
fro m financ ia l to technological resources, includ ing a ll types o f in fo rm ation connected w ith business m anagement. The m ost v is ib le aspect o f this in tegration is the
f lo w o f products. The greater share o f transnational corporations in trade flow s, as show n in table 1, reflects not only the quantitative increase in the in ternationalization o f b ig corporations, but also changes in
the ir w ay o f acting and new objectives o f F D I flow s.T he already noted increase in in tra -firm trade is
also d irectly related w ith the expansion and integration
o f the activities o f transnational corporations at the
w o rld level. A s noted by A nderson and Fredriksson
(2 0 0 0 ), in tra -firm trade has increased in recent years
not only w ith respect to interm ediate products, but also
end-products.Consequently, any analysis o f trade flo w s and
patterns must take into account the fact that a g row ing
proportion o f those flo w s corresponds to internal operations o f the transnational corporations o r subcontracting arrangements, and therefore does not invo lve pure
m arket transactions.In the present context, the reorganization o f
w o rld production and m arketing chains, w h ic h is nec
essarily accom panied by structural changes in the
trade patterns o f the countries o f o rig in and destination
o f F D I, form s part o f the inherent log ic o f the transnational corporations. A ccord ing to M o rtim o re , Vergara
and K a tz (2 0 0 1 ) and U N C T A D (20 0 2 a ), one o f the
m ain factors w h ic h has conditioned the insertion o f the
developing countries in in ternational trade flow s, especially o f m ore technology-in tensive products, has
been the ir partic ipation in the in ternationally integrated production systems organized b y the b ig transnational corporations.
In the next section w e w il l analyze the studies
w h ic h have been m ade w ith a v ie w to establishing the
effects o f the activities o f the transnational corporations on B ra z il ’s external trade in recent years.
IIITransnational firms and Brazil’s external trade in the 1990s
F D I flo w s into the B ra z ilia n econom y w ere quite low
throughout the 1980s, but they increased in the 1990s, and especially during the second h a lf o f that decade. B etw een 1990 and 1995 the average in flo w was U S $
2 b illio n per year, and this le v e l rose steadily up to the
yea r 2000. Since then, the investm ent in flo w has
shown a dow nw ard trend, but it s till rem ains quite
high. B ra z il ’s share in both w o rld F D I flo w s and in the
tota l am ount received by developing countries was
also h ig her than at the beg inn ing o f the decade in re lative term s (tab le 2).
THE INFLUENCE OF CAPITAL ORIGIN ON BRAZILIAN FOREIGN TRADE PATTERNS CÉLIO HIRATUKA A ND FERNAN DA DE NEGRI

124 C E P A L R E V I E W 8 2 • A P R I L 2 0 0 4
TABLE 2
World, developing countries and Brazil: Foreign direct investment flows received(Millions o f dollars)
Countries and regions 1990-1995a 1996 1997 1998 1999 2000 2001
World 225 321 386 140 478 082 694 457 1 088 263 1 491 934 735 146
Developing countries 74 288 152 685 191 022 187 611 225 140 237 894 204 801
Brazil 2 000 10 792 18 993 28 856 28 578 32 779 22 457
Brazil/world 0.9 2.8 4.0 4.2 2.6 2.2 3.1
Brazil/developing countries 2.7 7.1 9.9 15.4 12.7 13.8 11.0
Source: Prepared by the authors on the basis o f data from the Central Bank o f Brazil, ECLAC and UNCTAD. a Annual average.
A s a counterpart to the h ig h levels o f F D I in flow s, there was also an increase in the im portance
o f fo reign-ow ned firm s in B ra z il ’s p roduction and fo r e ign trade structures. A ccord ing to data on the 500
biggest private firm s in the country, in 1989 foreign-
ow ned firm s accounted fo r 3 0 % o f the num ber o f
firm s and 4 1 % o f sales, and by the yea r 2 0 0 0 those f ig ures had risen to 4 6 % and 5 6 % , respectively (Laplane
and Sarti, 2002).A s the im portance o f fo re ig n firm s increased, the
effects o f th e ir activities on the industrial structure o f
B ra z il becam e the subject o f renew ed study, especially as regards trade flow s.
Various authors have analyzed the trade p erfo rm ance o f fore ig n-o w n ed firm s and have iden tified the
differences w ith the trade patterns o f dom estic firm s, using various d ifferent data bases and m ethodologies.
M o re ira (1 9 9 9 ), fo r exam ple, w orked w ith data
on the incom e tax paid b y legal persons in 1997, covering alm ost 2 6 ,00 0 firm s, and observed that in a particu lar sector and size range o f firm s the exports o f fo r e ign firm s w ere 1 79% higher on average than those o f
dom estic firm s, w h ile th e ir im ports w ere 3 1 6 % h igher
on average.U s in g the same data base, P inheiro and M o re ira
(2 0 0 0 ) found that fo re ign-ow ned firm s w ere m ore
lik e ly to export and that the expected va lue o f the ir
exports was 3 2 % higher than that o f dom estic firm s. In
the same study it was also noted that as the size o f the
firm s increased, the d ifference betw een the exports o f
fo reign-ow ned and dom estic firm s grew smaller. The
m odel also included other variables, such as total incom e, intensity o f capital and labour use, average
wages and qualifications o f the w orkers, concentration, and use o f the installed capacity o f the firm s ’ sectors o f activity. In this study, the authors d id not
address the differences betw een the tw o groups o f
firm s as regards im ports.O n the basis o f data on the 500 biggest firm s in
B raz il, Chudnovsky and L op ez (2 0 0 2 ) carried out
another exercise to id en tify the differences in the trade
perform ance o f dom estic and foreign-ow ned firm s. In
that study, the authors found an increase in the im port coefficients o f fo re ig n firm s in B ra z il in the 19922000 period and a sm all decrease in the ir export coefficients. U s in g statistical hypothesis tests in w h ich
they too k account o f the sector and size o f the firm , they found that in 1992 there w ere no sign ificant d if ferences betw een the trade coefficients o f fo re ig n and
dom estic firm s. In 1997 and 2 0 0 0 , how ever, a lthough
there w ere no m ajo r disparities betw een export co e fficients, the differences betw een the f irm s ’ im p ort coefficients w ere indeed significant.
D e N e g ri (2 0 0 3 ), whose study was based on
m icro-data fro m the annual industria l surveys covering alm ost 54 ,000 firm s in the period fro m 1996 to
2000 , made a panel data analysis and also found a d iscrepancy in the trade behaviour o f fo re ig n and dom estic firm s. Once m ore, the d ifference in favo u r o f the
fo re ig n firm s was m uch greater in the case o f im ports
than o f exports. The results o f the random effects
m odel, w h ic h included such factors as size, p roductiv ity, sk ill levels o f the labo ur force, and differences in
the product and sector o f activity, ind icated that fo r eign firm s exported 7 0 % and im ported 2 9 0 % more
than dom estic companies.In short, the studies show that orientation towards
the ex terio r is greater am ong foreign-ow ned firm s than
am ong dom estic ones, especia lly in the case o f
im ports. The contrast is not so m arked fo r exports, especially in the case o f large firm s.
A s w e ll as this d ifference in trade perform ance,
THE INFLUENCE OF CAPITAL ORIG IN ON BRAZILIAN FO REIGN TRADE PATTERNS • CÉLIO H IR A TU K A A N D FERNANDA DE NEGRI
C E P A L R E V I E W 8 2 • A P R I L 2 0 0 4 125
another im portant aspect o f the effects o f the activities
o f fo reign-ow ned firm s concerns the o rig in and destination o f trade flow s. Th is aspect deserves to be analyzed m ore fu lly , since it has im portant im plications
fo r the debate on the consequences o f the integration
agreements currently being negotiated by B raz il. As
noted b y B aum ann and C arneiro (2 0 0 2 ), tak ing into
account the capital o rig in and im pact o f transnational firm s can have im portant im plications fo r studies
w h ic h seek to analyze the effects o f in tegration
processes but assume that transactions only take place
betw een to ta lly independent agents.T he study by Lap lane and others (2 0 0 1 ), w h ich
was based on a sample o f 100 large foreign-ow ned
firm s in 1997, finds that these firm s concentrated nearly 4 0 % o f the ir external sales in the countries o f
M E R C O S U R and the L a tin A m erican In tegration
A ssociation ( A L A D I) , w h ile th e ir sales to m ore developed regions w ere considerably smaller: 1 6 .6% to the
N o rth A m erican Free Trade A re a (N A F T A ) and 18 .5%
to the E uropean U n ion . O n the other hand, the ir
im ports cam e m ain ly fro m the m ore developed regions
(2 7 .7 % fro m N o rth A m e ric a and 3 6 % fro m the
European U n io n ). T he authors relate this pattern w ith
the role p layed b y the B ra z ilia n subsidiaries in the
strategies o f th e ir parent firm s, w h ic h conditioned
in tra -f irm trade and favo ured the im p o rta tio n o f
inputs, com ponents and fin a l products (especially
those o f greatest technological density) fro m the parent f irm o r fro m other subsidiaries in m ore developed
regions, w h ile g iv in g p rio rity attention to the domestic
m arket and exports to M E R C O S U R and A L A D I.T he analysis by P inheiro and M o re ira (20 0 0 )
reproduces the estimates g iven b y the m odel referred
to earlie r fo r d ifferent regions and notes that the
greater p robab ility o f exporting displayed by fo reign- ow ned firm s com pared w ith dom estic ones is m ain tained in a ll m arkets. T he exports o f both types o f
firm s are d irected p rim a rily to L a tin A m erica , in second place to the other industria lized countries, except fo r the U n ite d States and Canada, and in th ird p lace to
the la tter tw o countries.T he study by B aum ann and Carneiro (2 0 0 2 ) aims
to m ake a m ore exp lic it analysis o f the influence o f
in tra -firm trade and to f in d out to w hat extent the geographical concentration o f exports is related w ith the
country o f o rig in o f the transnational firm s operating
in B raz il. In v ie w o f the lack o f detailed in fo rm ation
on the le v e l o f in tra -firm trade in that country, the
authors resort to the hypothesis proposed by B aum ann
(1 9 9 3 ) that, fo r a g iven transnational f irm w ith a g iven
country o f o rig in , the transactions carried out w ith that country w i l l be m ain ly w ith the parent f irm or through
m arketing channels organized by that f irm . A ltho ug h it
is possible that some transactions w ith the country o f
o rig in w i l l not be o f an in tra -firm nature, the approxi
m ation used b y these authors is the best availab le in
v ie w o f the lim ita tions o f the availab le data.U s ing a p rob it m odel, B aum ann and Carneiro
seek to identify the factors w h ic h exp la in the increase
in exports betw een 1995 and 2 0 0 0 in a set o f 43 firm s. A p art fro m the degree o f openness o f the f irm o r the
variations in its sales, it is notew orthy that the exports
w ere m ain ly to the M E R C O S U R countries, N A F T A
and the future F T A A . O n the basis o f these results, the
authors test the factors exp la in ing the va ria tio n in
exports in those tw o years to fo u r types o f markets
- th e dom estic m arket, M E R C O S U R , N o rth A m erica
and the future F T A A - and conclude that the firm s
w h ic h registered rap id g row th in th e ir sales d id so by
chan ne ling th e m p re fe re n tia lly to those regions; according to the ir study, the greater the w e igh t o f
external trade com pared w ith the incom e o f a f irm , the
greater the probab ility that that f irm w i l l d irect a g ro w ing share o f its exports to its country o f origin . These
authors also note tha t fo re ig n -o w n e d firm s also
acquire a considerable part o f th e ir im ports in the
country o f o rig in o f the ir capital, although they do not specify the m odel fo r exp la in ing this.
T h e ev idence assem bled in B a u m a n n and
C arneiro (2 0 0 2 ) w o u ld appear to indicate that an eva luation o f the effects o f reg ional accords based exc lu sively on considerations o f trade d iversion and creation w o u ld be d istorted because it does not take
account o f the influence o f transnational corporations
on trade flow s. The sum m ary m ade by Castilho (2 0 0 2 )
o f several studies w h ic h seek to analyze the possible
effects o f F T A A and the M E R C O S U R -E u ro p e a n
U n io n agreem ent shows that in spite o f the varie ty o f
m ethodologies used, none o f these studies takes
account o f the w e igh t o f transnationals and in tra -firm
trade.F in a lly , m ention must be m ade o f the study by
Coutinho and others (2 0 0 3 ), w h ich , although it does
not e xp lic itly analyze the influence o f foreign-ow ned
firm s on reg ional trade patterns, but rather the com petitive situation and prospects o f a set o f production
chains v is -à -v is the new rounds o f negotiations on
F T A A and the M E R C O S U R -E u ro p e a n U n io n agree
m ent, does take into account, in its analysis and summ arized results, the im portance o f the strategies adopted by transnational corporations. A ccord ing to this
THE INFLUENCE OF CAPITAL ORIGIN ON BRAZILIAN FOREIGN TRADE PATTERNS CÉLIO HIRATUKA A ND FERNAN DA DE NEGRI

126 C E P A L R E V I E W 8 2 • A P R I L 2 0 0 4
study, the positive effects o f integration agreements on conditional upon the possibility o f those subsidiariesproduction chains w here the subsidiaries o f transna- becom ing better export p latform s than other sub-tional corporations are the leading p layers w o u ld be sidiaries o f the f irm or the parent f irm itself.
IVThe geographical orientation of the foreign trade
of subsidiaries of foreign-owned firms in Brazil
1. General characteristics of the sample
A s the d ifferences betw een dom estic and fo re ig n - ow ned firm s in term s o f vo lu m e o f trade w ere already
noted in a num ber o f studies, this section w i l l seek to
iden tify and classify those differences according to
regions o f o rig in and destination o f fo re ig n trade. The
question w e must answ er here is w hether, in this
respect, the trade pattern o f fore ig n-o w n ed firm s is
d iffe ren t fro m that o f dom estic ones, and w hether, in
the case o f fore ig n-o w n ed firm s, th e ir reg ion o f o rig in
carries m uch w e ig h t in determ in ing th e ir pattern o f
trade w ith the d iffe ren t regions.In order to f in d the answ er to this, w e used fo r
eign trade data fo r 80 dom estic and 85 fore ig n-o w n ed
firm s in 1989, 1997 and 2 000 . A l l the firm s are am ong
the 500 b iggest firm s in B ra z il and w ere selected fo r
h aving m ain ta ined this status in a ll three o f the years
in question. O f the fore ig n-o w n ed firm s, 33 are fro m
the U n ite d States and Canada, 42 fro m the European
U n io n , 7 fro m A sia , and 3 fro m other areas o f the
w orld .T he availab le data include the vo lu m e o f im ports
and exports by region o f destination and o rig in , sales
turnover, and sector o f ac tiv ity o f each f irm .2 A l l the
variables are expressed in U .S . dollars at 2 0 0 0 prices, deflated b y the U n ite d States W holesale Price Index.
T he firm s included in the panel represent nearly
3 0 % o f the to ta l sales o f the industrial sector and
alm ost 3 0 % o f the exports and over 2 0 % o f the tota l
im ports o f the country in the p erio d s tud ied .3 Consequently, a lthough the sample is re la tive ly sm all, it is h igh ly representative, so that some o f the conclusions o f this analysis can be extrapolated to industry
as a w hole.T he data g iven in table 3 on the nationality o f the
firm s and the vo lu m e o f th e ir trade b y the destination
o f th e ir exports and the o rig in o f th e ir im ports a llo w
us to obtain a firs t approxim ation o f th e ir regional trade pattern. T he L a tin A m eric a n m arket does not seem to be very im portant fo r the dom estic firm s, especially in term s o f exports, since only less than
10% o f th e ir exports go to it. T he s ituation changes in
the case o f im ports, how ever, since a m a jo r percentage
o f the external purchases o f those firm s com e fro m the
A L A D I countries. T he rest o f th e ir trade is fa ir ly w e ll d is trib u ted am o n g the N A F T A countries , the
E uropean U n io n and the rest o f the w o rld , the firs t tw o
o f these destinations being the m ost im portant.T he exports o f firm s fro m N A F T A and the
European U n io n , fo r th e ir part, go m ain ly to th e ir m ar
kets o f o rig in and to L a tin A m eric a , especia lly
M E R C O S U R . In 1989 this was not an im portant m arke t fo r those firm s, but the situation changed in the
1990s w ith the deepening o f the bonds betw een the
m em ber countries. H o w ever, a lthough they are still significant, the coeffic ients o f exports to M E R C O S U R w e n t d ow n m arked ly betw een 1997 and 2 0 0 0 as
a result o f the exchange rate mism atches caused b y the
devaluation o f the B ra z ilia n real early in 1999 and the
subsequent crisis in A rgentina. The data c learly show
2 The sector o f activity is defined according to the National Classification o f Economic Activities (CNAE) at the two-digit level, taking the most representative product in the firm ’s overall sales.
3 The total value o f industrial sales was obtained from the annual industrial surveys o f the Brazilian Geographical and Statistical Institute (IBGE), which makes a census o f the industrial firms (manufacturing and mineral extraction) with over 30 employees. Firms with fewer than 30 employees are covered in the sample. The sales o f the firms in the panel are gross sales, whereas the sales
THE INFLUENCE OF CAPITAL ORIG IN ON BRAZILIAN FO REIGN TRADE PATTERNS • CÉLIO H IR A TU K A A N D FERNANDA DE NEGRI

C E P A L R E V I E W 8 2 • A P R I L 2 0 0 4 127
the im portance o f the m arkets o f o rig in in the im ports
o f the subsidiaries o f European and N A F T A -b a s e d
firm s, w h ich is m uch greater than in the case o f
exports.T he A s ian firm s are those w h ic h are m ost close
ly integrated w ith th e ir countries o f o rig in , both in
term s o f im ports and exports. A s ia is the o rig in and
destination o f over h a lf the fo re ig n trade o f those
firm s. F igure 1 g ives data on the average values fo r
the three years studied, w h ic h c learly illustrate these
conclusions.A ltho ug h the results are quite clear, a m ore p re
cise analysis o f this trade pattern can be m ade through
an econom etric m odel w h ic h isolates the possible
in fluence o f a f i rm ’s sector o f ac tiv ity and size on the
o rig in and destination o f its fo re ig n trade.
TABLE 3
Brazil: External trade of selected firms as a proportion of total external trade of the country, by origin of capital and region of origin or destination of imports and exports, 1989, 1997 and 2000(Percentages)
Origin o f capital Year Exports, by destination Imports, by origin
MERC NAFTA ALADI EU Asia Restof
world
MERC NAFTA ALADI EU Asia Resto f
world
Brazil 1989 3 21 1 29 33 13 8 38 13 21 9 11
1997 9 19 3 25 26 16 7 33 12 21 15 12
2000 6 30 2 30 17 14 9 40 11 23 9 8
NAFTA 1989 4 39 8 25 14 10 4 66 2 16 11 1
1997 32 23 12 15 8 9 6 47 1 26 11 9
2000 25 21 13 23 8 11 21 49 1 19 6 4
European Union 1989 5 28 8 47 4 8 11 17 3 66 2 2
1997 32 14 14 22 8 10 20 11 2 49 7 11
2000 19 31 10 28 4 9 15 19 0 54 10 2
Asia 1989 1 11 3 15 66 4 3 17 0 8 72 0
1997 10 11 9 15 54 1 2 22 0 3 72 2
2000 5 21 3 20 50 1 3 19 0 6 70 1
Rest o f world 1989 8 4 1 66 10 11 0 59 2 7 1 32
1997 18 7 1 30 14 30 0 66 6 14 0 13
2000 11 4 4 28 27 26 2 74 1 17 1 5
Source: Prepared by the authors on the basis o f data from the Ministry o f Foreign Trade (SECEX).
THE INFLUENCE OF CAPITAL ORIGIN ON BRAZILIAN FOREIGN TRADE PATTERNS CÉLIO HIRATUKA A ND FERNAN DA DE NEGRI

128 C E P A L R E V I E W 8 2 • A P R I L 2 0 0 4
Brazil: Exports and imports of selected firms, according to origin of capital and region of origin/destination. Average for 1989, 1997 and 2000
F IG U R E 1
2. Econometric procedures
T he sample used is a panel o f various firm s w ith data
fo r three years. This fo rm at requires a d iffe rent type o f
econom etric m odel fro m the trad itional cross-sectional regression models. A s in a cross-sectional m odel,
the panel m odel captures the specific effects on in d ividuals, but u n like that m odel it can also capture tim e-
specific dynam ic effects. O ne o f the advantages o f the
m odel used over cross-sectional analysis is the possib ility o f tak ing account o f the heterogeneity that exists
am ong ind iv iduals through the estim ation o f in d iv id u al effects, thus separating the effects o f the explana-
THE INFLUENCE OF CAPITAL ORIG IN ON BRAZILIAN FO REIGN TRADE PATTERNS • CÉLIO H IR A TU K A A N D FERNANDA DE NEGRI
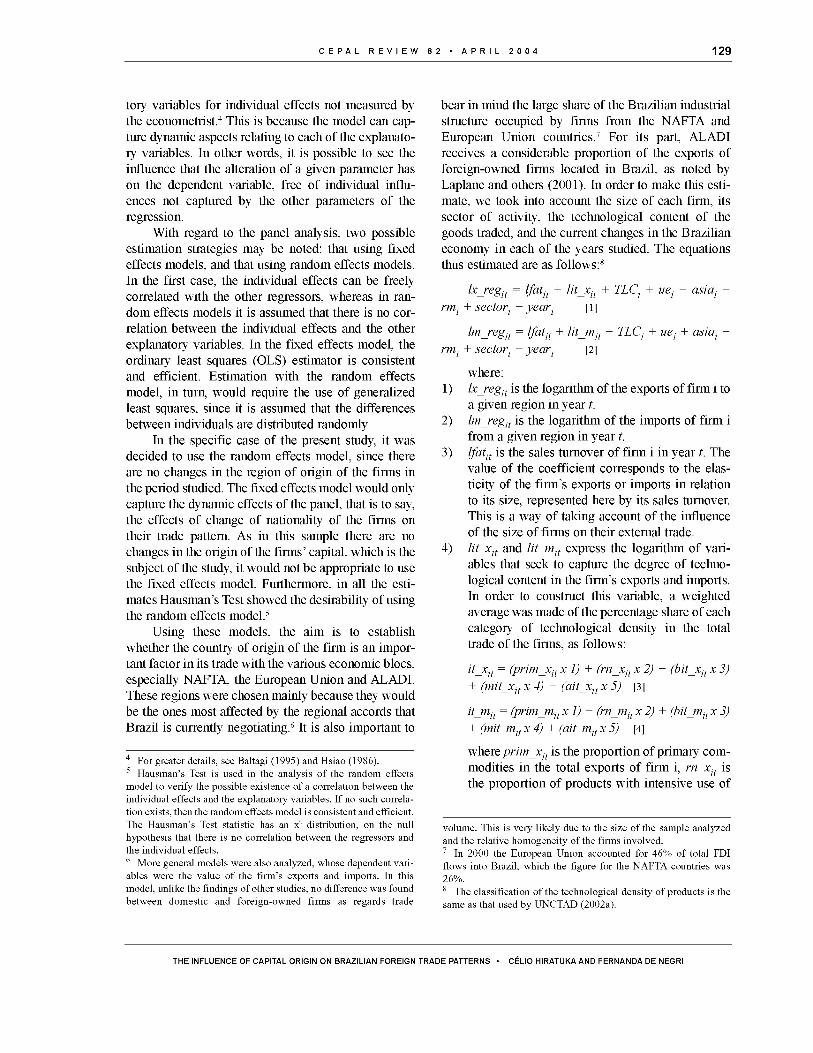
C E P A L R E V I E W 8 2 • A P R I L 2 0 0 4 129
tory variables fo r in d iv idu al effects not m easured by
the econom etrist.4 Th is is because the m odel can capture dynam ic aspects re la ting to each o f the explanatory variables. In o ther w ords, it is possible to see the
influence that the a lteration o f a g iven param eter has
on the dependent variab le , free o f ind iv idu al in flu ences not captured by the other parameters o f the
regression.
W ith regard to the panel analysis, tw o possible
estim ation strategies m ay be noted: that using fixed
effects m odels, and that using random effects models. In the firs t case, the ind iv idu al effects can be free ly
correlated w ith the o ther regressors, whereas in random effects m odels it is assumed that there is no correlation betw een the ind iv idual effects and the other
explanatory variables. In the fixe d effects m odel, the
ordinary least squares (O L S ) estim ator is consistent and effic ient. Estim ation w ith the random effects
m odel, in turn, w o u ld require the use o f generalized
least squares, since it is assumed that the d ifferences
betw een ind iv iduals are distributed random ly.In the specific case o f the present study, it was
decided to use the random effects m odel, since there
are no changes in the region o f o rig in o f the firm s in
the period studied. T he fixe d effects m odel w o u ld only
capture the dynam ic effects o f the panel, that is to say, the effects o f change o f nationality o f the firm s on
the ir trade pattern. A s in this sample there are no
changes in the o rig in o f the f irm s ’ capital, w h ic h is the
subject o f the study, it w o u ld not be appropriate to use
the fix e d effects m odel. Furtherm ore, in a ll the estimates H ausm an ’s Test showed the desirab ility o f using
the random effects m odel.5U s in g these m odels, the a im is to establish
w hether the country o f o rig in o f the f irm is an im por
tant fac to r in its trade w ith the various econom ic blocs, especially N A F T A , the European U n io n and A L A D I .
These regions w ere chosen m ain ly because they w ou ld
be the ones most affected by the regional accords that B ra z il is currently negotiating.6 I t is also im portant to
b ear in m in d the large share o f the B raz ilia n industrial structure occupied by firm s fro m the N A F T A and
E uropean U n io n countries.7 F o r its part, A L A D I
receives a considerable proportion o f the exports o f
fo reign-ow ned firm s located in B ra z il, as noted by
Lap lane and others (20 0 1 ). In order to m ake this estimate, w e took into account the size o f each firm , its
sector o f activ ity , the technological content o f the
goods traded, and the current changes in the B raz ilia n
econom y in each o f the years studied. The equations
thus estim ated are as fo llo w s :8
lx_regit = lfatit + lit_xjt + TLCi + uet + asiai +rmi + sectorj + yeari [1]
lm_regjt = lfatjt + lit_mjt + TLCj + uej + asiaj +rmt + sectori + yeari [2]
where:1) lx_regit is the logarithm o f the exports o f f irm i to
a g iven reg ion in yea r t.2 ) lm_regit is the log arithm o f the im ports o f f irm i
fro m a g iven region in y e a r t.3 ) lfatit is the sales turnover o f f irm i in yea r t. The
value o f the coeffic ien t corresponds to the elastic ity o f the f i rm ’s exports o r im ports in relation
to its size, represented here b y its sales turnover. This is a w ay o f tak ing account o f the influence
o f the size o f firm s on the ir external trade.4 ) lit_xit and lit_mit express the log arithm o f v a r i
ables that seek to capture the degree o f technolog ical content in the f i r m ’s exports and imports. In o rder to construct this variab le , a w eighted
average was m ade o f the percentage share o f each
category o f technological density in the tota l trade o f the firm s, as fo llow s:
it_xit = (prim_xitx 1) + (rn_xitx 2) + (bit_xitx 3) + (mit_xitx 4) + (ait_xitx 5) [3]
it_mit = (prim_mitx 1) + (rn_mitx 2) + (bit_mitx 3) + (mit_mit x 4) + (ait_mit x 5) [4]
w here prim_xit is the proportion o f p rim ary com
m odities in the to ta l exports o f f irm i, rn_xit is
the proportion o f products w ith intensive use o f
4 For greater details, see Baltagi (1995) and Hsiao (1986).5 Hausm an’s Test is used in the analysis o f the random effects model to verify the possible existence o f a correlation between the individual effects and the explanatory variables. If no such correlation exists, then the random effects model is consistent and efficient. The Hausm an’s Test statistic has an x2 distribution, on the null hypothesis that there is no correlation between the regressors and the individual effects.6 More general models were also analyzed, whose dependent variables were the value o f the firm ’s exports and imports. In thismodel, unlike the findings o f other studies, no difference was foundbetween domestic and foreign-owned firms as regards trade
volume. This is very likely due to the size o f the sample analyzed and the relative homogeneity o f the firms involved.7 In 2000 the European Union accounted for 46% of total FDI flows into Brazil, which the figure for the NAFTA countries was 26%.8 The classification o f the technological density o f products is the same as that used by UNCTAD (2002a).
THE INFLUENCE OF CAPITAL ORIGIN ON BRAZILIAN FOREIGN TRADE PATTERNS CELIO HIRATUKA A ND FERNAN DA DE NEGRI

130 C E P A L R E V I E W 8 2 • A P R I L 2 0 0 4
natural resources, and bit_xit, mit_xit and ait_xit respectively represent the proportions of products of low, medium and high technology. The same procedure was used to calculate the technological content of imports. The degree of technological content of trade is measured on a scale from 1 to 5.
5) TLCi, uei, asiai and rmi are binary variables that identify the origin of the capital of firm i: NAFTA, the European Union (EU), Asia and the rest of the world. The coefficients of these variables indicate to what extent the behaviour of firms from each of these regions differs from that of domestic firms.
6) sector represents a set of 12 binary variables designed to capture the differences between the 13 sectors making up the sample.
7) year represents the two binary variables used to capture the differences between the years 1989, 1997 and 2000 which have affected the different firms in the same way. In this way, it is hoped to prevent the differences observed between domestic and foreign-owned firms and between foreign- owned firms from different regions from being contaminated by conjunctural factors.
3. Results of the estimates
The results obtained from these estimates are given in table 4. As far as trade with Latin America is concerned, there are no significant differences between foreign-owned and domestic firms.9 European firms are an exception in this respect, since they tend to import more from Latin America than the others, but their coefficient is not very significant. This result seems to be in contradiction with the figures given in table 3, which suggest that the Latin American market played an important role in the exports of European and NAFTA firms. This apparent contradiction can be explained because the econometric exercise was based on individualized data for the firms, such as size and sector. Thus, the aggregate data in table 3 may not
reflect a generalized form of behaviour on the part of all the firms. It should also be borne in mind that the coefficient of the model may be conditioned by the limited importance the Latin American market had for European and NAFTA firms in 1989. Furthermore, that table referred to the proportion of total exports of the firms to the different markets and to absolute volumes of trade. Indeed, it is in trade with the developed countries that the differences between foreign-owned and domestic firms are most significant, at least as far as imports are concerned.
With regard to trade with the NAFTA countries, there are no significant differences either between the two groups of firms as regards their exports to that region. The disparity in the volume of imports is quite marked, however. The regression coefficients indicate that firms from the United States, Canada and the rest of the world tend to import significantly larger volumes from NAFTA countries than domestic firms, as already suggested in table 3.10 It may be noted that this difference is not due to the sector of activity of the firms, as might be argued on the basis of the initial data, since this was one of the control variables inserted in the model. The coefficient of the dummy variable on the origin of the firms’ capital indicates that NAFTA firms tend to register average import volumes which are over 3,000% higher than those of firms from other regions.11
The volume of exports to the European Union does not differ much either among firms which are of different nationalities but are of similar size, operate in the same sector, and market products of similar technological density. As in the previous case, however, imports from the European Union by European firms considerably exceed those of domestic firms (by 1,600% on average). Firms from the NAFTA countries also tend to import more from the European Union than domestic firms, although in this case the difference is not so marked. It was also observed that Asian firms tend to import less from the European Union than domestic firms and hence less than the subsidiaries of European firms. This is because of the high import coefficient of Asian firms from their region of origin (table 3 and figure 1 above).
9 As is customary when using binary variables in the regression model, the dummy variable distinguishing domestic firms was left out o f the equation so that the coefficients o f the other dummy variables for the region (NAFTA, the EU and Asia) can be interpreted in relation to it.
10 were no Mexican firms in the sample.11 As the dependent variable is in logarithmic form but the dummy variable is not, this percentage can only be obtained through the following transform: [10^- 1] x 100.
THE INFLUENCE OF CAPITAL ORIG IN ON BRAZILIAN FO REIGN TRADE PATTERNS • CÉLIO H IR A TU K A A N D FERNANDA DE NEGRI

C E P A L R E V I E W 8 2 • A P R I L 2 0 0 4 131
TABLE 4
Brazil: Results of estimates of exports and imports of firms to and from specific regionsa
Latin Americab
Variables Exports Imports
Estimate t test Estimate t test
Intercept -5.57 -7.24* -6.15 -4.80*Lfat 0.98 7.91* 1.14 6.24*Lit 0.16 0.59 -0.52 1.14NAFTA 0.33 0.98 0.40 0.78Rest o f world 0.93 1.10 0.19 0.13Asia 0.33 0.44 -0.91 -0.78European Union 0.42 1.25 0.98 1.83**
Num ber o f firms 144 126R2 0.43 0.26Hausman (Pr>m) 0.25 0.51
North American Free Trade Agreement (NAFTA)
Variables Exports Imports
Estimate t test Estimate t test
Intercept -4.25 -3.85* -6.84 -8.68*Lfat 0.87 4.90* 1.17 9.74*Lit 0.91 1.85** -0.20 1.03NAFTA -0.16 -0.31 1.53 4.06*Rest o f world 1.11 0.56 1.72 1.78**Asia -0.01 -0.01 0.004 0.01European Union -0.41 -0.82 0.07 0.20
Number of firms 125 154R2 0.19 0.38Hausman (Pr>m) 0.09 0.12
European Union
Variables Exports Imports
Estimate t test Estimate t test
Intercept -0.97 -0.75 -6.58 -9.86*Lfat 0.56 2.72* 1.09 10.69*Lit 0.31 0.75 0.45 2.75*NAFTA -0.39 -0.64 0.57 1.83**Rest of world 0.82 0.46 -0.01 -0.01Asia -1.28 -0.90 -1.07 -1.75**European Union 0.54 0.89 1.23 4.09*
Number of firms 135 154R2 0.11 0.40Hausman (Pr>m) 0.31 0.99
Source: Prepared by the authors.a * variable significant at 5%. ** variable significant at 10%. b M ERCOSUR and ALADI, except Mexico.
In general term s, these results indicate a d ifferent trade pattern betw een dom estic and foreign-ow ned
firm s and also am ong the fo reign-ow ned firm s them selves. There w o u ld appear to be a very strong lin k
betw een the subsidiaries o f fore ig n-o w n ed firm s and
the ir regions o f o rig in in the case o f im ports, possibly
due to in tra -firm trade by the subsidiaries in B ra z il w ith th e ir parent firm s. This is not the case w ith
B ra z ilia n exports to those countries, how ever, since
there was no observed tendency fo r such subsidiaries
to export to the ir respective regions o f origin.A ccord in g to L ap lan e and S arti (2 0 0 2 ) and
H ira tu k a (2 0 0 2 ), these results m ay be interpreted as a
consequence o f the in ternationalization strategies o f
the B ra z ilia n subsidiaries o f fo re ig n firm s or even o f
the fo rm o f insertion o f those subsidiaries in the g lob al strategies o f the ir parent firm s. The m ain a im o f this
insertion is to serve the local m arket and the adjo in ing
region, w ith o u t p lay in g an im portant role as suppliers
o f m ore developed regions. Th is characteristic, w h ich
is shared by b o th the N A F T A and E uropean U n io n
firm s, results in a lopsided pattern o f integration w ith
the ir regions o f o rig in w h ic h is m uch m ore m arked in
the case o f im ports than in that o f exports.O ne o f the aim s o f the present study is to deter
m ine w hether the technological density o f the trade o f
dom estic and fore ig n-o w n ed firm s is one o f the factors
exp la in ing the above-m entioned im balance in the
trade flo w s w ith the regions o f origin . Th is a im is ju s tifie d b y the tendency o f the transnational corporations
to in ternalize the production o f technology-in tensive
goods, as h ighlighted in a num ber o f theoretical studies on the subject.12 F ilip e , Fontoura and Saucier
(2 0 0 2 ) analyzed the in tra -firm trade patterns o f U n ited
States transnational corporations and confirm ed that technological density is a determ in ing fac to r in in tra f irm trade. Thus, such trade is bound to have a greater
content o f technology than trade w ith independent firm s. Th is m atter w i l l be addressed in greater depth in
the fo llo w in g section, through an analysis o f the fo r-
eign -ow ned firm s included in the panel.
12 See for example Casson and Pearce (1993).
THE INFLUENCE OF CAPITAL ORIGIN ON BRAZILIAN FOREIGN TRADE PATTERNS CELIO HIRATUKA A ND FERNAN DA DE NEGRI

132 C E P A L R E V I E W 8 2 • A P R I L 2 0 0 4
VThe influence of the technological density
of products on the trade patterns
of foreign-owned firms in Brazil
I t was seen in the previous section that European and
U n ite d States firm s have a greater tendency to im port fro m the ir regions o f o rig in than firm s o f o ther nation
alities. M u c h o f the trade w ith the reg ion o f o rig in
probably takes place betw een the subsidiary and its
parent firm : i.e ., the channel used by the B ra z ilia n subsidiary to trade w ith its country o f o rig in is the parent firm . F o r this reason, and because o f the lack o f spec ific data on in tra -firm trade in B ra z il, trade w ith the
country o f o rig in is o ften used as a p roxy variab le fo r
in tra -firm trade (B aum ann, 1993).
T he determ in ing factors o f in tra -firm trade m ay
be d iffe rent fro m those determ in ing the o vera ll trade
o f firm s. In tra -f irm trade m ay be due to specific strategies o f each f irm , to sectoral aspects, o r - and this is
w hat w e seek to determ ine in this section - to the technological content o f the products traded.
In order to evaluate the extent to w h ich the technological content influences the trade o f a fore ign- owned f irm w ith its reg ion o f origin , equations on
exports and im ports to and fro m that reg ion w ere analyzed. A s in the previous section, the m ethodology
used was panel data analysis. D om estic firm s, and
those fro m the “ rest o f the w o rld ” w ere rem oved fro m
the in itia l sample, leaving only the Asian, European
and N A F T A firm s. The equations used w ere as follow s:
lx_roit = lfa tit + lit_xit + TLCi + asiai + sectori + yeari [5 ]
lm_roit = lfa tit + lit_m it + TLCi + asiai + sectori + yeari [6 ]
w here lx_roit and lm_roit are the exports and im ports
o f f irm i to its reg ion o f o rig in in year t, in logarithm ic
fo rm . The other variables are the same as those g iven
in section IV .2 above.13 T he results obtained are g iven
in table 5.
TABLE 5
Brazil: Results of estimated exports and imports of foreign-owned firms to and from their respective regions of origina
Variables Exports Imports
Estimate t test Estimate t testIntercept 0,10 0,05 -7,16 -7,85*Lfat 0,73 2,63* 1,01 8,05*Lit -0,04 -0,08 0,93 3,85*NAFTA 0,46 0,71 0,10 0,30Asia 1,93 1,51 0,02 0,03
Num ber o f firms 72 81R2 0,18 0,52Hausman (Pr>m) 0,41 0,99
a Variable significant at 5%.
T he firs t im portant result concerns the co e fficients o f the dum m y variables ind icating the o rig in o f
the firm s ’ capital. These show that there are no substantial differences am ong the transnational firm s o f
d iffe ren t nationalities as regards trade w ith th e ir
respective countries o f orig in . T he vo lu m e o f in tra f irm trade o f the N A F T A firm s, fo r exam ple, is quite
sim ilar to that o f the European firm s, w h ic h are the
basis fo r com parison in the m odel, and the A s ian ones.W ith regard to the technological density o f the
in tra -firm trade o f the transnational corporations, the
results show that as the technological content o f the
im ports o f these firm s rises, there is a corresponding
rise in the ir im ports fro m th e ir reg ion o f orig in . F o r
every increase o f one percentage po in t in the ind icator
o f technological density o f the products im ported by
the f irm , the vo lu m e o f im ports fro m its reg ion o f o ri
g in rises b y 0 .9 3% . In the case o f exports to the reg ion
o f orig in , in contrast, the technological density is not statistically significant. I t should be borne in m in d that these results are not affected b y the f i r m ’s sector o f
activ ity, since this is one o f the control variables
inserted in the model.I t m ay therefore be concluded that the technolog
ical density o f the im ports by transnational firm s fro m
the ir reg ion o f o rig in is greater than that o f the ir total
13 In this case, the dummy variable distinguishing the European firms was left out o f the equation in order for the coefficients o f the other dummy variables for the region (NAFTA and Asia) to be interpreted in relation to it.
THE INFLUENCE OF CAPITAL ORIG IN ON BRAZILIAN FO REIGN TRADE PATTERNS • CÉLIO H IR A TU K A A N D FERNANDA DE NEGRI

C E P A L R E V I E W 8 2 • A P R I L 2 0 0 4 133
im ports, w h ic h m ay be explained b y the greater
propensity o f the firm s to im p ort fro m th e ir o w n
regions, as show n in the previous section. In other
w ords, the greater vo lu m e o f im ports fro m the ir region
o f o rig in m ay be due to the technological dependence
o f the subsidiaries o f fo re ig n firm s on the ir parent firm s, bearing in m in d the previously expla ined re la tionship betw een trade w ith the reg ion o f o rig in and
in tra -firm trade.
This result m ay be due to the tendency o f the
transnational corporations to in ternalize m ore technology-in tensive production rather than trading it free ly
on the m arket. Such in ternalization prevents new tech
nologies developed by the corporations fro m being
read ily im ita ted b y com petitors. In the specific case o f
B ra z il, the im balance betw een exports and im ports
m ay be related w ith the role p layed by the B raz ilia n
subsidiaries o f transnational corporations w ith in the
o vera ll operations o f the parent firm . A ccord ing to
Lap lane and Sarti (1 9 9 7 and 1999), the m a in attraction
o f the country fo r fo re ig n investm ent is the exp lo ita t io n o f the dom estic and reg io n a l m arkets. A ccord ingly , the subsidiaries in B ra z il are m ostly not authorized to act as g lobal suppliers o f the transnational corporation b u t fo rm part o f its w o rld netw ork, acquiring interm ediate o r f in a l products w ith a h igher
technological content fro m the parent f irm o r its subsidiaries in developed countries, as noted by Lap lane
and others (2 0 0 1 ) and H ira tu k a (20 0 2 ).
VIFinal Remarks
A ccord ing to the Census o f Fore ig n C apita l made by
the C entral B a n k o f B ra z il, fo reign-ow ned firm s made
6 0 % o f the exports and 5 6 % o f the country ’s im ports
in the yea r 2000. A s the in tra -firm trade o f those firm s
accounted fo r 6 3 % o f th e ir exports and 5 7 % o f the ir
im ports, it m ay be concluded that alm ost 3 8 % o f
B ra z il ’s tota l exports and 3 3 % o f its tota l im ports corresponded to in tra -firm trade.
I t is therefore extrem ely im portant to determ ine
the effects o f the activities o f fo re ign-ow ned firm s on
B ra z il ’s fo re ig n trade. A s noted in section I I I , a num
b e r o f studies have p o in ted o u t the d ifferences
betw een the trade behaviour o f fo reign-ow ned firm s
and that o f domestic firm s, em phasizing that the disparities are m uch m ore m arked in im ports than in
exports.T he present study represents an im portant contri
b u tion in this fie ld , since the results o f the m odel support the hypothesis that in tra -firm trade is one o f the
factors e x p la in in g the d iffe rences in b eh a v io u r
betw een dom estic and fore ig n-o w n ed firm s. In our
v iew , the fac t that firm s belong ing to the U n ited
States, Canada and Europe im port m ore products fro m
the ir regions o f o rig in than other firm s, w h ile not dis
p lay in g any s ign ificant differences fro m them in terms
o f the regions o f destination o f the ir exports, reflects
the position that the B ra z ilia n subsidiaries o f fo re ign
corporations occupy in the global strategies o f their
parent firm s.In a w o rld context in w h ich the transnational
corporations are seeking to reorganize the ir production
networks in order to m ax im ize the results o f their
g lo b a l operations as a w h o le , the ro le o f th e ir
subsidiaries in B ra z il seems to be m ore im portant in
terms o f access to the local m arket than as a lin k in the
global supply netw ork fo r o ther regions, especially
w hen the technological content o f the products traded
is taken into account.Tw o im portant inferences m ay be d raw n fro m
these conclusions. The firs t concerns com petitiveness
and fo re ig n trade policies. M a n y developing countries
have striven to apply active policies to attract investments, w h ile at the same tim e seeking to im prove the
contribu tion o f transnational firm s to fo re ig n trade and
industrial developm ent (U N C T A D , 2002b ). Such p o licies are based on a recognition that the investm ent and
p lan t location decisions o f the great transnational corporations have increasingly strong effects on trade
flow s. Th is is a fac t w h ich must be taken into account w hen d rafting policies on F D I o r trade policies aim ed
at sectors w here those corporations predom inate. In
the case o f B ra z il, a deeper know ledge m ust be gained
o f the factors condition ing the use o f internal trade
n etw orks by the b ig corporations, in o rd er to
THE INFLUENCE OF CAPITAL ORIGIN ON BRAZILIAN FOREIGN TRADE PATTERNS CÉLIO HIRATUKA A ND FERNAN DA DE NEGRI

134 C E P A L R E V I E W 8 2 • A P R I L 2 0 0 4
determ ine to w h a t extent those factors can be the subje c t o f public policies designed to increase the positive
effects on exports.The second inference concerns the simultaneous
trade negotiations w h ic h are tak ing place on the F T A A
and the accord b e tw e e n M E R C O S U R and the
European U n ion . A s B aum ann and C arneiro (2 0 0 2 )
and Coutinho and others (2 0 0 3 ) observed, the studies
being made to evaluate the effects o f reg ional agreements are lim ite d because they do not take account o f
the effects o f in tra -firm trade o r the strategies o f the
transnational corporations. T hey must therefore be
com plem ented w ith studies w h ic h recognize that an
im portant part o f the trade w ith those regions does not fo llo w the trad itional trading pattern because it is no
longer carried out betw een independent firm s.This means that the agreements must be analyzed
not only as a fun ctio n o f the ir im m ediate effects on
trade flo w s b u t also th e ir im pact on the fo re ig n investments to be made by new firm s or firm s w h ic h are
already installed in the country. In o ther w ords, the
regional agreements can have im portant effects on the
activities o f the B raz ilia n subsidiaries o f fo re ig n firm s
and th e ir insertion w ith in the organizational structure
o f the parent firm s, and these effects w i l l undoubtedly
be reflected in the trade flow s.Thus, fo r exam ple, the ta r if f reductions w ith in the
fram ew o rk o f reg ional preference agreements could
lead to a decision to replace production w ith in the
country w ith exports to the local m arket fro m the
reg ion o f o rig in o f the parent f irm o r fro m subsidiaries
located in other countries covered b y the agreement, thus fu rth er strengthening the in flo w o f in tra -firm
imports. I t is also possible that part o f the exports fro m
B ra z il to other countries fo rm in g part o f the agreements w i l l be replaced w ith exports fro m other places
w here the parent f irm has subsidiaries. I t m ay also be
that the trade preferences w i l l strengthen the position
o f subsidiaries located in B ra z il through b etter u tiliz a tio n o f the transnational f irm s ’ o w n channels to serve
the closest outside markets.These aspects h igh ligh t the im portance o f gain ing
a better understanding o f the w ay in w h ic h the invest
ments o f transnational firm s influence trade flow s, especially in B raz il, w here those firm s are the leaders
in various industrial branches. W e hope that the present study w i l l help to obtain a fu lle r understanding o f
some o f these issues and w i l l stim ulate new studies in
the same direction.(Original: Portuguese)
Bibliography
Anderson, T. and T. Fredriksson (2000): Distinction between interm ediate and finished products in intra-firm trade, International Journal of Industrial Organization, vol. 18, No. 5, Amsterdam, Elsevier Science.
Baltagi, B.H. (1995): Econometric Analysis of Panel Data, London, John Wiley & Sons Ltd.
Baumann, R. (1993): Um a avaliaçâo das exportaçôes intrafirma do Brasil: 1980 e 1990, Pesquisa eplanejamento econòmico, vol. 23, No. 3, Brasilia, Institute o f Applied Economic Research (IPEA), December.
Baumann, R. and F.G. Carneiro (2002): Behaviour o f Brazilian export firms: implications for the Free Trade Area o f the Americas, CEPAL Review, No. 78, LC/G.2187-P, Santiago, Chile, December.
Brainard, L. (1993): An empirical assessment o f the proximity-con- centration trade-off between multinational sales and trade, American Economic Review, vol. 87, No. 4, Nashville, Tennessee, American Economic Association.
Casson, M.C. and R.D. Pearce (1993): Intra-firm trade and developing countries, in H .P Gray (ed.), Transnational Corporations and International Trade and Payments, London, The U nited Nations L ibrary on Transnational Corporations.
Castilho, M. (2002): Impactos de acordos comerciais sobre a economia brasileira: resenho dos trabalhos recentes, Texto
para discussao, No. 936, Brasilia, Institute o f Applied Economic Research (IPEA).
Chesnais, F. (1996): A mundializagao do capital, Sao Paulo, Xama.Chudnovsky, D. and A. López (coords.) (2002): Integración region
al e inversión extranjera directa: el caso del MERCOSUR, Buenos Aires, Inter-A m erican D evelopm ent Bank(IDB)/Institute for the Integration o f Latin America and the Caribbean (INTAL).
Coutinho, L. and others (2003): Estudo da competitividade de cadeias integradas no Brasil: impacto das zonas de livre comércio (http://w w w .eco.unicam p.br/projetos/ neit/neit- pesq.html).
De Negri, F. (2003): Desempenho comercial das empresas estrangeiras no Brasil na década de 90, M aster’s Thesis, Campinas, Institute o f Econom ics, State U niversity at Campinas (UNICAMP).
Dunning, J. (1993): Multinational Enterprises and the Global Economy, Reading, Addison-Wesley Publishers.
Filipe, J.P , A .P Fontoura and P. Saucier (2002): US Intrafirm Trade: Sectoral, Country and Locational Determinants in the 90s, Working Paper, No. 2002/7, Lisbon, Universidade Técnica de Lisboa.
Helpman, H. (1984): A simple theory o f trade with multinational corporation, Journal of Political Economy, No. 92, Chicago, The University o f Chicago Press, June.
THE INFLUENCE OF CAPITAL ORIG IN ON BRAZILIAN FO REIGN TRADE PATTERNS • CÉLIO H IR A TU K A A N D FERNANDA DE NEGRI

C E P A L R E V I E W 8 2 • A P R I L 2 0 0 4 135
Helpman, H. and P. Krugman (1985): M arket Structure and International Trade, Cambridge, Massachusetts, The MIT Press.
Hiratuka, C. (2002): Empresas transnacionais e comércio exterior: uma análise das estratégias das filia is brasileiras no contexto de abertura económica, Doctoral Thesis, Campinas, Institute o f Economics, State University at Campinas (UNICAMP).
Hsiao, C. (1986): Analysis o f Panel Data, London, Cambridge University Press.
Laplane, M.F and others (2001): La inversión extranjera directa en el MERCOSUR. El caso brasileño, in D. Chudnovsky (org.), E l boom de inversión extranjera directa en el MERCOSUR, Madrid, Siglo Veintiuno.
Laplane, M.F. and F. Sarti (1997): Investimento direto estrangeiro e a retom ada do crescimento sustentado nos anos 90, Economia e sociedade, No. 8, Campinas, Institute o f Economics, State University at Campinas (UNICAMP).
(1999): Investimento direto estrangeiro e o impacto na balança comercial nos anos 90, Texto para discussâo, No. 629, Brasilia, Institute o f Applied Economic Research (IPEA).
______ (2002): O investimento direto estrangeiro e a internacional-izaçâo da economia brasileira nos anos 90, Economia e sociedade, No. 18, Campinas, Institute o f Economics, State University at Campinas (UNICAMP).
Lipsey, R. (1998): Internationalized Production in Developed and Developing Countries and in Industry Sectors, NBER Working Paper, No. 6,405, Cambridge, M assachusetts, N ational Bureau o f Economic Research.
Markusen, J. (1995): The boundaries o f multinational enterprise and the theory o f international trade, Journal o f Economic Perspectives, vol. 9, No. 2, Nashville, Tennessee, American Economic Association.
Markusen, J. and A. Venables (1998): Multinational firms and the New Trade Theory, Journal o f International Economics, No. 46, Madison, Wisconsin, University o f Wisconsin.
Moreira, M.M. (1999): Estrangeiros em um a economia aberta: impactos recentes sobre produtividade, co n cen tra lo e comércio exterior, in F. Giambiagi and M.M. Moreira (orgs.), A economia brasileira nos anos 90, Rio de Janeiro, Banco Nacional de Desenvolvimento Econòmico e Social (BNDES).
Mortimore, M., S. Vergara and J. Katz (2001): L a competitividad internacional en el desarrollo nacional: implicancias para la política de inversión extranjera directa (IED) en la América Latina, “Desarrollo productivo” series, No. 107, LC/L.1586- P, Santiago, Chile, ECLAC. United Nations publication, Sales No. S.01.II.G.130.
Pinheiro, A.C. a n d M M . M oreira (2000): O perfil dos exportadores brasileiros de manufaturados nos anos 90: quais as impli- cagoes de política?, Texto para discussao, No. 80, Rio de Janeiro, Banco Nacional de Desenvolvimento Econòmico e Social (BNDES).
UNCTAD (United Nations Conference on Trade and Development) (1995): W orld Investm ent Report 1995. Transnational C orporations and Com petitiveness , UNCTAD/DTCI/26, Geneva, United Nations. United Nations publication, Sales No. E.95.II.A.9.
(2002a): Trade and D evelopm ent Report 2002. DevelopingCountries in World Trade, UNCTAD /TDR/2002, New York, United Nations. United Nations publication, Sales No. E.02.II.D.2.
(2002b): World In-vestment Report 2002: TransnationalCorporations and E xport Competiti-veness, UNCTAD/WIR/2002, New York, United Nations. United Nations publication, Sales No. E.02.II.D.4.
THE INFLUENCE OF CAPITAL ORIGIN ON BRAZILIAN FOREIGN TRADE PATTERNS CÉLIO HIRATUKA A ND FERNAN DA DE NEGRI


137
G a b r i e l Y o g u e l
I n s t i t u t e o f I n d u s t r y ( I DEI )
U n i v e r s i d a d d e G e n e r a l
S a r m i e n t o ( U N G S )
f gyoguel@ ungs.edu.ar
M a r t a N o v i c k
N a t i o n a l C o u n c i l o n S c i e n t i f i c
a n d T e c h n i c a l R e s e a r c h
( C O N I C E T ) a n d I D E I / U N G S
f m novick@ ciudad.com .ar
D a r í o Mi l es i
I D E I / U N G S
f d m i l e s i @ u n g s . e d u . a r
S o n i a R o i t t e r
I D E I / U N G S
f sroitter@ ungs.edu.ar
J o s é B o r e l l o
I n s t i t u t e f o r t h e G r e a t e r
B u e n o s A i r e s C o n u r b a t i o n
( C O N U R B A N O ) , U N G S
f jborello@ ungs.edu .ar
C E P A L R E V I E W 8 2 • A P R I L 2 0 0 4
Information and knowledge: the diffusion of informati and communication technologiesin the Argentine manufacturing sector
Gabriel Yoguel, Marta Novick, Dario Milesi, Sonia Roitter and Jose Borello
This art icle seeks to m ak e a con t r i bu t ion to the s t ud y of in format ion
and k n o w l e d g e in Lat in Amer i ca, w i t h special at tent ion to t he use and d i f
fusion o f i nformat ion and c o m m u n i c a t i o n t ec hno lo g i es (ICT) in Argent i ne
manuf ac t ur ing . It a d dr ess es t w o main a s pe c ts of this subject : the real
ex t ent o f the use and di f fusion of ICT, and its l inks wi t h the overal l p e r
f o r m a n c e of enterpr i ses ( innovat ion capaci ty, organizat ion of w o r k and
compet i t i veness) . It s tud ies and s umm ar i ze s the use and di f fusion of t ho se
tech no lo g i es in Ar gen t i ne i ndust ry in order to i) p resen t an empi r i cal m a p
of thei r use and di f fusion in t he Ar gent i ne manuf ac t u r i ng se ct o r and ii)
ident i fy the l inkages o f such di f fusion wi t h the e n d o g e n o u s capabi l i t i es of
the enterpr ises. It mainta ins t hat the incorpor at ion and use o f t h os e t e c h
nologies c a n n o t be analyzed w i t h o u t t ak ing into cons idera t ion the degree
of d e v e l o p m e n t of e n d o g e n o u s capabi l i t i es achieved by the f i rms in q u e s
t ion. On the basis o f a survey of 2 46 Ar gent i ne industr ial enterpr ises, it
d r a ws s o m e co nc lu s i on s on the w a y Ar gent i ne enterpr i ses use ICT, not
only in order to imp ro ve w h a t they are al ready doing, b ut also to gener at e
n e w kn owl ed ge.

138 C E P A L R E V I E W 8 2 • A P R I L 2 0 0 4
IIntroduction
This article aims to m ake a contribu tion to the debate
on in fo rm ation and know ledge in the L a tin A m erican
econom y and society. I t focuses on the use and d iffu sion o f in fo rm ation and com m unication technologies
( IC T ) in the A rgentine m anufacturing sector, w ith spe
c ia l attention to tw o m a in aspects o f this subject: the
real extent o f the use and d iffus ion o f IC T , and the ir
links w ith the o vera ll perform ance o f enterprises
(innovation capacity, organ ization o f w o rk and com
petitiveness).In v ie w o f the great transform ations w h ic h have
taken place in those technologies and the changes that this involves fo r society, a varie ty o f questions arise
w h ic h this article w i l l seek to address. Thus, w hat is
the extent o f the d iffus ion o f IC T in A rgentine m anu
facturing, especially w hen considered fro m a systemic
poin t o f v iew ? Is a certain threshold o f p rio r cod ified
and tac it know ledge required in order to gain access to
IC T , o r is it possible to cut corners? Is the m ove
towards the use o f IC T an autom atic process, o r does
it ca ll fo r specific policies? M oreover, w hat is the lin k
betw een the spread o f IC T and developm ent o f the
endogenous capabilities o f enterprises? C an there be
generalized developm ent o f IC T in a society w ithou t previous organizational changes and w ith o u t structures to fac ilita te learning? C an such technologies
spread evenly am ong the d iffe rent segments o f p ro duction and society?
This artic le w i l l provide elements to help to
address these questions fro m tw o perspectives. F irs t o f
a ll, w e w i l l seek to outline a basic descriptive m ap o f
the situation b y ana lyzing the results o f a survey o f
246 A rgentine industrial firm s, in order to g ive an idea
o f the e ffective d iffus ion o f IC T in the m anufacturing
sector. Th is survey also perm its some inferences to be
draw n on the effective capacity o f firm s to use IC T in
the generation o f new know ledge. The central argum ent in this respect is that the incorporation and e ffec tive use o f in fo rm ation and com m unication technolo-
This article form s part o f the research project entitled “Information and communication technologies (ICT) in Argentina: Origin, diffusion and future prospects” , financed by the Universidad Nacional de General Sarmiento, the Agency for the Promotion o f Scientific and Technical Research (PICT 2002-2003, 02-09515) and CONICET (PIP/070).
gies is a function o f other capabilities achieved by the
firm s, and the use and d iffus ion o f IC T cannot be eva luated in iso lation fro m this evolu tionary path. F o r a
start, it is considered that the e ffic ien t incorporation
and optim al use o f in fo rm ation and com m unication
technologies to m ake possible the generation o f new
know ledge is only possible in firm s that are already
developing innovation capabilities and have some
degree o f com petitiveness. Th is is because o f the fu n dam ental d ifference w h ic h exists betw een in fo rm ation
and know ledge, w h ic h cannot be overcom e through
the m ere incorporation o f IC T out o f context. Thus,
w ith the new technologies it is re la tive ly easy to reproduce in fo rm ation , even in large amounts and in the
m ost va ried form s (alphanum eric, graphical, audio, visual). I t is m uch m ore d ifficu lt, how ever, to reproduce know ledge, especially w h en this is tac it,1 since in
order to turn this into in fo rm ation it is necessary firs t o f a ll to cod ify it. A s know ledge cannot be cod ified
absolutely and com pletely, how ever, its reproduction
m ust also be achieved through experience, teaching
and training.In order to contribute to the debate on these m at
ters, section I I b e lo w contains a theoretical analysis o f
the differences betw een in fo rm ation and know ledge
and the linkages betw een the d iffus ion o f IC T and the
developm ent o f endogenous capabilities. Section I I I
sets out the analytical dim ensions taken into account in order to estim ate the degree o f in fo rm ation and
com m unication technology use and the developm ent o f endogenous capabilities in enterprises. Section I V
firs t o f a ll describes the general characteristics o f the
panel o f firm s considered and the degree o f d iffus ion
o f IC T am ong them and then goes on to present the
results o f an analysis o f hom ogeneous clusters
designed to iden tify groups o f firm s w ith d ifferent degrees o f developm ent o f the tw o attributes in question. F in a lly , section V gives the m a in conclusions o f
the study.
1 Understood as the stock o f learning possessed by individualswhich cannot be defined, codified, published or fully expressed and which differs from one person to another, but which could be shared to a substantial extent by colleagues and fellow-workers with a similar background o f experience (Dosi, 1998, cited in Cimoli and Correa, 2003).
INFORMATION A ND KNOW LEDGE: THE DIFFUSIO N OF INFORMATION A ND CO M M UNICATIO N TECHNO LO G IES IN THE ARG ENTINEM ANUFACTURING SEC TO R • G ABRIEL YOG UEL, MARTA NOVICK, DARÍO MILESI, SON IA RO ITTER A ND JO S É BORELLO

C E P A L R E V I E W 8 2 • A P R I L 2 0 0 4 139
iiInformation and knowledge: linkages between
endogenous capabilities and the diffusion
of information and communication technologies
In recent years, both the econom ic literature and the
press have m ade extensive reference to the existence
o f new paradigm s regarding technological and social change, due to the confluence o f tw o great currents: on
the one hand, w hat has becom e kn o w n as the in fo rm ation society, and on the other, the generalized spread o f
new in fo rm ation and com m unication technologies. T h e expressions “ kn o w led g e-b ased socie ty”
(Lugones, B ianco and others, 2 0 0 3 ), “ in fo rm ation
society” (C aste lls , 1 9 9 8 ) and “ n ew econ om y” , depending on the d iffe rent authors, sometim es appear
to be s im ila r in m eaning, sometim es d ifferent, and
sometim es com plem entary.L un d v a ll (2 0 0 3 ), fo r exam ple, accepts the idea o f
a new era as a w o rk in g hypothesis and shares the basic
assum ption that the w idespread d iffus ion and use o f
in fo rm ation and com m unication technologies represents a fundam ental change in the econom y and society. H e critic izes the concept o f the “new econom y” , how ever, on the grounds that it takes a sim plistic v ie w
o f the problem , since it ignores the need to m ake sign ifican t changes and institu tional reform s that w i l l effec tive ly prom ote learn ing processes.
C im o li and C orrea (2 0 0 3 ) note that the debate on
in fo rm ation and know ledge has been under w ay fo r at least three decades b u t has gained even greater im p etus w ith the arriva l o f new technologies.2 There are
tw o w e ll-d e fin ed positions in this debate: one is the
v ie w that a lm ost a ll in fo rm a tio n is kn o w led g e
(C ow an , D a v id and Foray, 2 0 0 0 ), so that in the fin a l analysis m ore in fo rm ation necessarily means m ore
know ledge, w h ile the other, m uch m ore cautious, position emphasizes the differences that exist betw een
in fo rm ation and know ledge and sees the production o f
know ledge as a com plex process w h ic h does not necessarily take place autom atically as a result o f an
increase in in fo rm ation (Johnson, M o h e r and others, 2002).
2 See Cimoli and Dosi (1995), Dosi (1998) and Dosi, Orsenigo and Sylos Labini (2002).
I t is this la tte r v ie w that has been gain ing ground. I t holds that know ledge is fundam entally a cognitive
capacity associated w ith the possibility o f interpreting
and transform ing in form ation . In fo rm ation , in con
trast, is a set o f data w h ic h are structured and fo rm atted b u t are inert and inactive u n til they are interpreted
by those w ho have the necessary capacity to handle
them (Lugones, B ianco and others, 2003).This d ifferentia tion -b u t at the same tim e interac
t io n - betw een in fo rm ation and know ledge is not
som ething w h ic h is closed in on itself, but must also
be incorporated into the learn ing process as an a u x iliary factor. A s noted b y R u lla n i (2 0 0 0 ), know ledge
only m aintains its va lue i f it is constantly regenerated
and expanded through learn ing and the various transform ations in the cognitive cycle outlined b y N o naka
and Takeuchi (1 9 9 9 ), in w h ic h in fo rm ation and k n o w l
edge continually interact. Th is cycle begins w ith the
socia lization o f tac it know ledge in specific contexts; its externa lization to other contexts a fter codification;
the com bination o f d iffe rent levels o f cod ified k n o w ledge in o rder to increase its com plexity, and fin a lly , its
in ternalization (transform ation o f specific cod ified
know ledge) w ith in the context o f the enterprise w h ich
is carry ing out learn ing processes in this w ay .3 In this
sense, in fo rm ation and com m unication technologies
can be functional to the developm ent o f learning
processes i f they reach a certain le v e l o f com plexity
and also i f they m ake it possible to speed up the phases o f the above-m entioned cognitive cycle.
In o ther w ords, these technologies could only
have a sign ificant influence on com petitiveness i f
there is p rio r o r sim ultaneous technical and organizational change w h ic h m akes it possible to optim ize
them and w h ic h involves the d efin ition o f technolog i
cal m anagem ent strategies and policies, the developm ent o f m odels and systems fo r the organization o f
3 If used systemically, for example, ICT would give rise to stimuli for the codification, externalization and circulation o f tacit knowledge, and would function as a vehicle for the circulation and qualitative transformation of the codified knowledge.
INFORMATION A ND KNOW LEDGE: THE DIFFUSION OF INFORMATION A ND CO M M UNICATIO N TECHNO LO G IES IN THE A R G ENTINEMANUFACTURING SECTOR • G ABRIEL YO G UEL, MARTA NOVICK, DARÍO MILESI, SON IA RO ITTER A ND JO S É BORELLO

140 C E P A L R E V I E W 8 2 • A P R I L 2 0 0 4
w o rk designed to make the generation and circu lation
o f know ledge v iab le , and an organizational structure
w h ic h facilita tes the com m unication and learn ing
processes. In this respect, IC T could be said to have a
dual im pact on the cod ification o f know ledge. W h ile
on the one hand these technologies p erm it greater codification , on the other they require m ore and m ore tacit skills in order to m ake possible its transform ation
(L u n d va ll, 2 0 0 3 ). Consequently, IC T fac ilita te access
to in fo rm ation , b u t this is only transform ed into skills
i f there is a certain m in im u m threshold o f know ledge
am ong ind iv iduals , enterprises and loca l agents, and
society as a w hole. Thus, the potential o f these technologies only emerges w ith in the context o f systemic
processes, w h ic h must integrate endogenous skills on
various levels. O therw ise, these processes w i l l be
severely lim ite d and reduced to the mere c ircu lation o f
in form ation . Th is set o f elements perm its us to put fo r w ard the hypothesis that in fo rm ation and com m unicatio n technologies are a dependent variab le o f other
structural factors, especially the endogenous skills
b u ilt up in the course o f the evolu tionary path fo llow ed b y enterprises.
T his interdependence, w h ic h is observed in m any
o f the developed countries in a re la tive ly systemic
fo rm , w o u ld appear to have a m ore d isjo inted characte r in m ost o f the L a tin A m erican countries, because o f
the lo w e r w e ig h t o f know ledge in the pub lic debate
and in the sectors w h ic h shape the specialization pattern. A num ber o f studies have ind icated that, un like
the situation p reva ilin g in the developed countries,4 in
L a tin A m erica , w ith in the fram ew o rk o f a h igh degree
o f structural heterogeneity, the p reva ilin g situation is
one of: i) lo w levels o f technological skills; i i ) a sm all and shallow presence in production networks; i i i ) a
specialization pattern w h ic h is not very com plex;5 iv )
lim ite d institu tional developm ent, and v ) a lack o f system ic policies. In this context, L a tin A m erican enter
prises, and especially the re la tive ly sm all ones, are
m arked by the ir lim ite d innovation capabilities and
expressed in the ir very lim ite d partic ipation in g lobal networks and virtuous territo ria l systems, and the isolated nature both o f the com petitive dim ensions they
som etim es manage to atta in and the ir efforts in term s
o f tra in ing and consultancy. Th is situation is m ade still w orse by the extrem e weakness o f the pub lic area7 and the strong presence o f fo re ig n d irect investm ent, w hose d ec is io n -m a k in g and R & D investm ent
processes o ften take place in the parent firm s o r sim p ly take no account o f loca l needs.
Th is structural heterogeneity was fu rth er accentuated in the 1990s b y the b ig differences in g row th rates
and the deterioration o f the already regressive incom e
distribution conditions (C im o li and Correa, 2002; Perez and Stum po, 2 0 0 1 ). A s a result, production systems have been generated in L a tin A m erica w hich , because o f the very lim ite d presence o f the key fac tor
o f the new technological m odel (know ledge), are
m arked by th e ir lo w levels o f com plex ity and the ir
h ig h degrees o f vu lnerab ility . Because o f this set o f
weaknesses, the m arket fa ils to select the m ost inno va tive form s o f conduct,8 and this lim its the advance
o f learn ing processes and the generation o f dynam ic
com petitive advantages.C im o li and C orrea (2 0 0 3 ) exp la in how some o f
the above-m entioned characteristics con d ition the
spread and systemic use o f IC T in the region. In the
firs t place, these technologies are strongly correlated
w ith the leve l o f incom e, w h ic h means that there is an
access b arrie r (Peirano and B ianco , 2 0 0 2 ). In the second place, the interpretation and decodification o f
in fo rm ation demands certain m in im u m thresholds o f
cod ified and tac it know ledge w hich , as already noted, are rare in the region.
Consequently, p lacing emphasis on the innovatio n econom y o r the know ledge society as yardsticks
is subject to a num ber o f lim it in g factors connected
7 In many cases, economic openness without the creation o f the necessary institutions has gradually destroyed the evolutionary path followed by territorial systems which had made some progress in learning processes. In these cases, the conflict between openness and a closed situation results in territorial systems which lose their identity because o f excessive openness (Poma, 2000).8 In addition to the problems already mentioned, there are also, on the one hand, the prevalence o f a linear innovation model which dissociates both science and technology and the generation o f knowledge from the production o f goods, while on the other hand there is a severe level o f disconnection between the demands o f enterprises (which are sometimes not explicitly expressed) and the supply o f private consultancy and training services, as well as the extreme weakness o f the institutions needed in order for the market to function (Yoguel, Neuman and others, 1997).
endogenous skills ,6 the ir self-centered tendencies, as
4 See Reinert (1996), Lall (2001), and Dosi, Pavitt and Soete (1990).5 This presence is marked by scanty backward linkages and the predominance o f commodities: goods which make intensive use o f natural resources, with little processing or other forms of preparation (Cimoli and Correa, 2002; Perez and Stumpo, 2001). Consequently, during the expansive stage in the 1990s which culminated with the Asian crisis, seven out o f every ten workers were engaged in low- productivity activities (Ocampo, 2001).6 See Bisang, Lugones and Yoguel (2002); Cimoli and Katz (2002);Milesi (2002); OECD (1995), and Yoguel and Rabetino (2002).
INFORMATION A ND KNOW LEDGE: THE DIFFUSIO N OF INFORMATION A ND CO M M UNICATIO N TECHNO LO G IES IN THE ARG ENTINEM ANUFACTURING SEC TO R • G ABRIEL YOG UEL, MARTA NOVICK, DARÍO MILESI, SON IA RO ITTER A ND JO S É BORELLO

C E P A L R E V I E W 8 2 • A P R I L 2 0 0 4 141
w ith the structural conditions o f the L a tin A m erican
econom ies. In order fo r it to be possible to generate a
virtuous c irc le b etw een IC T and the advance o f
know ledge, p ro found technical and organizational changes are needed in enterprises and institutions. Therefore, this technology cannot be v ie w ed as an
autonom ous factor w h ich , b y its sole presence, guarantees learn ing processes or the developm ent o f skills. This w o u ld be s im ila r - in a new fo rm - to the now
discredited technological determ inism o f the 1980s
w h ic h associated electronic autom ation w ith social and productive developm ent.
IIIThe analytical dimensions considered
in this study
A s already noted, the incorporation o f in fo rm ation and
com m unication technologies in enterprises can usefully be analyzed as a process w h ic h is dependent on the
p rio r tec h n o lo g ic a l p a th a lready fo llo w e d . Consequently, a necessary condition fo r these technologies to be functional to the developm ent o f com petitive advantages b y the enterprises is the existence
o f endogenous capab ilities w h ic h can boost the
processes o f generation, c ircu lation and appropriation
o f in fo rm ation associated w ith the spread o f IC T .9In the approach taken in the present study, the
dim ension connected w ith the use o f IC T is equated
w ith the set o f in fo rm ation and com m unication tools
used by enterprises to circulate in fo rm ation both in the
areas o f m anagem ent and adm inistration and in that o f
production, at the vertical and the horizontal levels. The dim ensions connected w ith endogenous skills, fo r
the ir part, seek to analyze the generation o f know ledge
and the possibility o f learn ing in those enterprises. The
m ain hypothesis o f this study is that the d iffusion o f
IC T should be linked w ith the degree o f developm ent o f endogenous skills. In other words, proper (o r inadequate) use o f IC T as a means to facilitate the circu lation
o f in fo rm ation depends on the greater (o r lesser) degree
o f developm ent o f endogenous capabilities.The present study, therefore, not only evaluates
the degree o f d iffus ion o f IC T in the sample enterprises b u t also takes into account o ther variables w h ich
serve as proxies fo r the analysis o f th e ir technological conduct and endogenous sk ills .10 T he a im is thus to
apply a k in d o f w e igh tin g o f the com plex ity o f the IC T
inco rp ora ted and thereby get a w a y fro m m ere
dichotom ic counting o f the “ has/has not” type, as w e ll as establishing a qualitative gradient to see how fa r an
enterprise is m oving , firs tly , tow ards the use o f in fo rm atics in existing processes and, secondly, towards the
deliberate use o f the largest possible am ount o f in fo rm ation . T he com plex ity o f the IC T incorporated
allow s some inferences to be m ade on the dynam ics o f
the learn ing process tak ing place in the firm s.Thus, in o rder to analyze the use o f IC T and
id e n tify the possible c ircu la tion o f in fo rm atio n in the
enterprise, indicators w ere designed to take account o f the in fo rm atio n and com m u nication equ ipm ent and infrastructure (hard w are ), the com puter p ro gram m es used (s o ftw a re ),11 and the use and im p o rtance o f the new com m unication tools — especially
the internet, intranet and e -m a il— as means o f in te rnal and external contact, inc lu d in g sales and purchasin g (e -c o m m e rc e ). F o r p ro d u c tio n a c tiv ities , an
appraisal w as m ade o f the com plex ity o f the productio n hardw are and softw are, design softw are, and
softw are fo r p roduction p lann ing and co n tro l.12 As
w e ll as id e n tify in g the existence o f these tools, in
apprais ing the com plex ity o f the d iffu s io n o f IC T , account is also taken o f the p ro po rtion o f the s ta ff
w ith access to them , the purposes they are used fo r ( in
11 As well as the existence o f a server and database engine and the existence and conformation o f an information processing department in the enterprise.12 All this is based on the hypothesis that information and communication technologies are important in all sectors. W hile it is alsoconsidered that the links o f ICT with production are specific to eachsector and have different weights in the corresponding production functions, however, the level o f disaggregation needed to analyze these factors would exceed the capacity o f the sample used.
9 See, among others, Lundvall (2003) and Cimoli and Correa(2003).10 In various studies by the authors (Yoguel, Novick and Marin, 2001; Novick, Yoguel and others, 2002) progress has been made in the construction o f a set o f indicators to measure these aspects.
INFORMATION A ND KNOW LEDGE: THE DIFFUSION OF INFORMATION A ND CO M M UNICATIO N TECHNO LO G IES IN THE A R G ENTINEMANUFACTURING SECTOR • G ABRIEL YO G UEL, MARTA NOVICK, DARÍO MILESI, SON IA RO ITTER A ND JO S É BORELLO

142 C E P A L R E V I E W 8 2 • A P R I L 2 0 0 4
general activ ities , innovation , q ua lity contro l, o rgan iza tio n o f w o rk , tra in in g ) and the type o f linkages they
help to develop (trade, institu tional, etc .). In p articu lar, account is taken, in the case o f the internet, not only o f w h e th er it is used o r not b u t also o f w hether
the enterprise has a w eb page and w h at it is used for.In the case o f the intranet, the p la tfo rm on w h ic h it operates is also considered: in tern a lly w ith in the
enterprise, o r v ia the internet. F in a lly , an ind ica to r
was prepared fo r eva luating the im portance o f e -co m merce.
Endogenous capab ilities — understood as the
potential o f the enterprises to turn the ir generic k n o w ledge into specific know ledge on the basis o f existing
capab ilities and d yn am ic accum ula tio n o f skills , including fo rm a l and in fo rm al learn ing processes fo r
both cod ified and tac it in fo rm ation 13— are determ ined
on the basis o f various elements: firs tly , the innovative
capacity o f the agents, evaluated through an analysis
o f the fo rm a l and in fo rm al research and developm ent efforts m ade;14 secondly, the efforts m ade b y firm s to
IVPrincipal results
1. The diffusion of information and communication technologies in the enterprises studied
The panel analyzed included 24 6 A rgentine industrial enterprises located in the m etropo litan area, Cordoba
and R afae la , w h ic h w ere in terv iew ed betw een July
and O ctober 2002. T he m edian fo r the num ber o f
em ployees and sales turnover o f these firm s in 2001
was 49 persons and 3 m illio n dollars, respectively.17 The sim ple average fo r sales p er em ployee was about
13 See Ernst and Lundvall (1997), Lall (1992) and Yoguel and Boscherini (1996).14 Appraised on the basis o f two indicators which reflect the potential capacity o f the firm ’s human resources to carry out R&D activities, the level o f formal organization o f those activities (R&D teams), and their importance and scope from the point o f view o f the results obtained (percentage o f R&D products incorporated in the last few years).15 The indicator designed for the organization o f work seeks to capture these aspects by taking account o f two elements, one quantitative and the other qualitative: i) the extent o f work in cells or teams, and ii) the degree o f autonomy o f those cells or teams.
ensure process and product quality, as m easured by
com pliance w ith certified standards; and fin a lly , the
m odel used fo r the organ ization o f w o rk , w h ich in flu ences the possibilities fo r the c ircu lation o f in fo rm atio n and the acquisition o f tac it know ledge b y w orkers
in order to im prove the ir skills and m ake progress in
the tw o fields in question. The existence o f teams and
spaces fo r interaction, rather than the assignm ent o f
specific in d iv id u a l jo b responsibilities, makes it possib le to exchange experience and v iew s and increases
the possibility o f the spread o f tac it know ledge am ong
ind iv iduals through observation, im ita tio n and experim entation (N o v ic k , Y oguel and others, 2 0 0 2 ) .15
T he three elem ents in question m ake it possible
to appraise the developm ent and use o f the skills o f the
entire labour force engaged in production activities, quality control and technological developm ent. The
fo rm a l and in fo rm al tra in ing o f w orkers o f d ifferent
levels, as w e ll as the ir q ualification , are o ther key e le ments fo r the achievem ent o f com petitive advantages
(N o v ic k , 1 9 9 9 ).16
115,300 dollars at 2001 prices, w h ic h was s im ilar to
the average fo r A rgentine industry, i f m icro-enterprises are excluded, b u t the m edian was only 6 2 ,50 0 d o llars. The d istribution o f firm s by types o f agents was
also s im ila r to the general structure o f Argentine
industry. Thus, sm all and m edium -sized enterprises
predom inated (6 9 % ), w ith s ign ificantly sm aller p ro portions o f ve ry sm all enterprises (1 8 % ) and large
enterprises (1 3 % ).18 O f the firm s studied, 19 % w ere
w h o lly o r p artia lly fore ign-ow ned. In sectoral terms, the production o f traditional goods such as footw ear,
16 In estimating this element, the following aspects were taken into account: i) the proportion o f human resources involved in these activities, and ii) the proportion of technical personnel among the total number of employees.17 The simple averages for both variables in 2001 were 140 persons and 18 million dollars; these figures were strongly affected by the extreme values registered by some of the firms studied.18 Very small enterprises were considered to be those with a turnover of less than 500,000 dollars at 2001 prices, while small and medium-sized enterprises were those with a turnover of between 500,000 and 20 million dollars and large enterprises were those with sales of over 20 million.
INFORMATION A ND KNOW LEDGE: THE DIFFUSIO N OF INFORMATION A ND CO M M UNICATIO N TECHNO LO G IES IN THE ARG ENTINEM ANUFACTURING SEC TO R • G ABRIEL YOG UEL, MARTA NOVICK, DARÍO MILESI, SON IA RO ITTER A ND JO S É BORELLO

C E P A L R E V I E W 8 2 • A P R I L 2 0 0 4 143
furn iture, basic m etal products and m achinery, etc. predom inated (4 4 % ), w ith lesser proportions o f goods
o f greater technological com plex ity (2 3 % ), products
fo r the autom otive sector (1 7 % ), and com m odities
(1 2 % ). D u rab le goods accounted fo r only 4% .The results o f the survey indicate that the d iffu
sion o f IC T in the enterprises covered by the sample is
considerable in quantitative terms, b u t is seen to be
sign ificantly less im portant w hen evaluated fro m the
poin t o f v ie w o f the com plex ity o f the software and
systems used (tables A .1 to A .6 o f the Statistical A p pen dix ). A lm o st a ll the firm s in the sample made
investm ents in in fo rm ation and com m unication equipm ent and systems b etw een 1999 and 2 001 . The
amounts invo lved in these investments during that period averaged 1 .2% o f annual sales, 7 8 % o f w h ich
was spent on equipm ent and systems fo r the m anagem ent area.
A s noted above, most o f the investments w ere on
m anagem ent and adm inistration too ls,19 m ostly o f a
lo w le v e l o f com plexity, w h ic h had only a lim ited
im pact on the p reva ilin g form s o f m anagem ent, p ro duction and interchange. In spite o f this lo w le v e l o f
com plexity, the g row ing presence o f IC T , m ain ly in
m anagem ent systems, has faced firm s w ith the need to
establish some k in d o f scheme fo r the handling o f such
technologies.I t should be noted that in the course o f the 1990s
there was a great deal o f incorporation o f equipm ent, favoured by the econom ic opening process and the
leve l o f the real exchange rate. Th is incorporation was
not systemic, however. T he shares accounted fo r by
w eb pages and e -m a il are even h igher than in developed countries, b u t this highlights the fac t that, in isolation, these tools are no measure o f com petitiveness
o r endogenous skills.In keeping w ith the investm ents made, most o f
the firm s have a substantial am ount o f equipm ent and
systems w h ic h w ere incorporated in recent years. Thus, 8 7 % o f them have netw orks, m ostly local area
netw orks,20 w h ile a little over h a lf o f them have te le phone lines that provide h igher speeds and com m unication capacity (integrated services d ig ita l netw ork
( IS D N ) lines o r asym m etrical d ig ita l subscriber lines
(A D S L )) . In the m anagem ent area, 7 8 % o f the firm s
have servers, although in m any cases these do not have
a database engine, w h ic h reduces th e ir potential. The
average age o f both the servers and the com puters o f
the firm s in the panel is around three years.W ith regard to the use o f software, the dem and o f
most o f the firm s is quite unsophisticated, consisting
m ain ly o f standardized o ffice autom ation systems
(7 8 % ). O n ly a re la tive ly sm all proportion o f the firm s
(about 2 2 % ) use m ore com plex program m es, such as
systems fo r w o rk in g in groups (c ircu lation o f k n o w ledge) and fo r p rovid ing support fo r decis ion-m aking
at the m iddle and m anagerial levels.In the are o f production, in contrast, the presence
o f inform atics equipm ent and the use o f special softw are is considerably sm aller than in the m anagem ent area. T he most com m on equipm ent, found in 2 3 % o f
the firm s, is fo r program m able log ica l control; it is fo llow ed b y com puterized num erical control, robots, num erical control, autom ated assembly and fittin g
systems, and flex ib le production cells. In m ost cases, this equipm ent operates in isolation, w ith ou t being
integrated through software w ith other areas o f the
f irm . O n ly in design is there extensive d iffus ion o f
systems (such as com puter-aided design, com puter- aided engineering, etc., w h ic h are present in 5 0 % o f
the firm s); the leve l o f d iffus ion o f systems is lo w e r in
planning and control activities (p lann ing o f requirem ents o f m ateria ls , p lan n in g o f m an u fac tu rin g
resources, and com puter-a ided process p lanning), and
is alm ost com pletely absent in the production phase: only 4 % o f the firm s use some system o f com puter- aided m anufacturing.21
In contrast, the new com m unication tools are
w id e ly disseminated, although in m any cases the ir
“rea l” use and even the objectives w h ic h led to the ir
incorporation l im it the ir potential im pact. 5 4 % o f the
firm s in terv iew ed have a w eb site, although in most cases its purpose is not very com plex (p rov id ing institu tional in fo rm ation , p ub lic iz in g products, and sim ply
being present on the w eb). S im ilarly , 9 6 % o f the firm s
have an institu tional e -m a il account, w h ile in 3 7 % o f
the tota l num ber o f firm s, over 7 5 % o f the em ployees
in the m anagem ent and adm inistration areas have personal e -m a il accounts. A considerable num ber o f firm s
(5 7 % ) also have intranets, although in tw o-th irds o f
them these are m erely internal networks that do no
operate v ia the internet, thus lim itin g th e ir possibilities
21 Although it should be noted that in many cases the equipment already has built-in software.
19 This is in keeping with the findings o f the survey on the technological conduct o f Argentine industrial firms (Bisang, Lugones and others, 2003), which identified, within innovation activities, a marked tendency for efforts to be directed towards the management area rather than marketing and production.20 75% o f the firms have local area networks (LANs), while only15% o f the enterprises have wide area networks (WANs).
INFORMATION A ND KNO W LED G E: THE DIFFUSION OF INFORMATION A ND CO M M UNICATIO N TECHNO LO G IES IN THE A R G ENTINEMANUFACTURING SECTOR • G ABRIEL YO G UEL, MARTA NOVICK, DARÍO MILESI, SON IA RO ITTER A ND JO S É BORELLO

144 C E P A L R E V I E W 8 2 • A P R I L 2 0 0 4
in term s o f access and connectivity fo r suppliers and
clients.In this context, the w e ig h t o f such tools in the
f ie ld o f links w ith suppliers and clients is considerable, although very uneven. The m ost frequently used m ed i
u m is e -m a il, b u t the telephone and personal visits still occupy im portant places, thus show ing that personal contacts and face to face dealings cannot be replaced
easily o r com pletely b y the new technologies. The
intranet and internet are o f less im portance in this
fie ld ; th e ir leve l o f use is s im ila r to that o f traditional m ail, w h ic h has now lost m uch o f its fo rm er im p o r
tance. Som ething s im ila r m ay be observed in the re la tions o f firm s w ith institutions such as technology centres, trade associations, technological lia ison units, consultants and universities.
Lastly , e-com m erce is fa ir ly w idespread am ong
the firm s in the panel: 5 % o f them m ake electronic
purchases and sales, 10% only m ake purchases in this
w ay, and another 14% on ly m ake e-sales. Thus, alm ost 3 0 % o f the firm s in the panel m ake some k in d o f e lectronic purchases o r sales. O f the 7 0 % w h ic h do not engage in e-com m erce, 4 2 % are u n fa m ilia r w ith the
possibilities, function ing and regulations regarding e com m erce. In line w ith this, m ost o f the firm s (5 4 % )
w o u ld be u n w illin g to use this too l in the future, w h ile
16% w o u ld only be w illin g to purchase in this way, another 10 % only to m ake e-sales, and the rem aining
2 0 % w o u ld be w illin g to m ake both purchases and
sales.W ith in the analy tica l fram ew o rk fo llo w e d by this
study, the em p irica l evidence collected m akes it possib le to outline a p re lim inary set o f aspects w h ich , in
general term s, are seen as characterizing the process o f
incorporation o f in fo rm ation and com m unication tech
nologies undertaken b y the firm s in the panel: i) the
degree o f incorporation o f these technologies m ay be
deem ed considerable fro m the quantitative po in t o f
v ie w ; i i) the presence o f IC T s is considerably greater
in m anagem ent than in production; i i i ) there is a p redom inance o f IC T tools o f a lo w leve l o f com plexity, aim ed a t objectives w ith lim ite d potential im pact, so
that the w e ig h t o f the process is m uch less in qualita tive term s than quantitatively; and iv ) because o f this, the process o f d iffus ion o f IC T analyzed here is closer
to the m ere m anagem ent and c ircu lation o f in fo rm atio n than to a process w h ic h w i l l enable firm s to
strengthen the generation and c ircu lation o f the k n o w l
edge needed to im prove th e ir capabilities.These general characteristics are observed, h o w
ever, against the background o f a h ig h le v e l o f heterogeneity, w h ic h m ust be taken into account in order to
enhance the debate and m ake it possible to include in
it a ll the nuances that this new phenom enon undoubtedly displays. Consequently, in the next section but one an analysis w i l l be made o f homogeneous clusters
o f firm s, in order to iden tify and sum m arize the m ain
types o f conduct adopted by the firm s in the panel w ith
regard to tw o dim ensions - the use and d iffus ion o f
IC T , and the developm ent o f endogenous capabilities
- and then iden tify the linkages betw een them .
2. Analysis of homogeneous clusters of firms
U sin g a m u lti-d im ens io na l exploratory analysis techn ique — m u ltip le correspondence fa c to r analysis
( M C A )— hom ogeneous clusters o f firm s w ere made
on the basis o f the sim ultaneous consideration o f v a rious characteristics associated w ith the d iffu s io n o f
IC T on the one hand and the developm ent o f endogenous capabilities on the other. M C A m akes it possible
to analyze a ll the associations w h ic h exist betw een
the d iffe ren t form s o f the variab les m ak in g up the data
m a trix and to obta in a set o f classes m ade up o f in d iv iduals hav in g h ig h in tra-group hom ogeneity and
h ig h extra-group heterogeneity. T h is m ethod operates
through reduction o f the num ber o f d im ensions studied fo r the phenom enon in question, thus fo rm in g fa c
to r axes whose determ ination m akes it possible to
concentrate the analysis on those variab les and form s
w h ic h do m ost to exp la in the p ro b lem addressed, thereby g iv in g a m ore m anageable p ic ture o f it
(R oitter, 1991; C riv isq u i, 1993).
U s in g M C A , an analysis was m ade o f hom ogeneous groups, w h ic h m ade it possible to construct d if ferent groups m ade up o f the ind iv idu als closest to
each other on the basis o f the E u c lid ia n distances ca lculated fo r the coordinates o f the ind iv iduals on a ll the fac to r axes.22
Throu gh tw o d iffe ren t statistical exercises, and
using the m ethodology described above, it was possib le to id e n tify a gradient o f situations fo r each o f the
ana ly tica l dim ensions considered in this study. Thus,
22 In order to interpret the results correctly, it must be borne in mindthat while the forms o f the variables associated with a given group indicate that individuals with that characteristic are represented in the group to a (significantly) greater degree than in the sample as a whole, this does not necessarily mean that all the firms in that group display that characteristic.
INFORMATION A ND KNOW LEDGE: THE DIFFUSIO N OF INFORMATION A ND CO M M UNICATIO N TECHNO LO G IES IN THE ARG ENTINEM ANUFACTURING SEC TO R • G ABRIEL YOG UEL, MARTA NOVICK, DARÍO MILESI, SON IA RO ITTER A ND JO S É BORELLO

C E P A L R E V I E W 8 2 • A P R I L 2 0 0 4 145
hom ogeneous groups w ere iden tified w h ic h d iffe r
fro m others according to the degree o f d iffus ion o f
IC T in them (in terms o f both presence and com plex
ity ) and also according to the degree o f developm ent o f endogenous capabilities, so as to subsequently
establish the linkages betw een the tw o dim ensions.T he analysis was carried out on the basis o f the
indicators a lready described, w h ic h m ake possible the
sim ultaneous estim ation o f b o th q uantitative and
q ua lita tive aspects. In b o th cases, the indicators
re flec t not on ly the presence o f a g iven attribute, but also its degree o f com plex ity and its possible con trib u tio n to the generation o f know ledge. F in a lly , both
planes w ere com bin ed in o rd er to eva luate the
hypothesis o f this study.B y d iffe ren tia tin g according to the degree o f d if
fus ion o f IC T , three groups w ere obtained w ith the
fo llo w in g characteristics:i) High level o f diffusion o f ICT. T h is group
accounts fo r 2 8 % o f the firm s in the panel. They
are m arked b y a strong presence and h igh degree
o f in tegration o f m ost o f the in fo rm atio n and
com m unication tools considered. There is a p redom inance o f firm s w ith com plex m anagem ent
softw are, and also a considerable proportion o f
firm s w ith com plex program m es in the production area. T he in fo rm atio n tools are incorporated
on a system ic basis, a im ed at in tegration am ong
the d iffe ren t areas o f the f irm . These firm s m ake
extensive use o f the internet, in tranet and e -m ail.ii) Limited level o f diffusion o f ICT. This group,
m ade up o f 3 6 % o f the firm s, has characteristics
w h ic h are alm ost the opposite o f those o f the p rev ious group. In term s o f the various planes considered, these firm s have the low est re la tive le v e l o f com plex ity . T h ey m ake litt le use o f the
intranet, e -m a il, e -com m erce and the in ternet.23
M o s t o f these firm s do not have a server, and
th e ir com puters are not netw orked. In m anagem ent, the use o f b a s ic -lev e l com pu ter p ro gram m es predom inates, w h ile in production l i t tle use is m ade o f the new tools based on IC T .
iii) Medium level o f diffusion o f ICT. T h is group
accounts fo r the rem ain ing 3 6 % o f the firm s, w h ich do not d isp lay such hom ogeneous characteristics as in the previous tw o groups. In some
23 93% of the firms in this group do not have an intranet, or if they do, it is used by less than 25% o f their employees. In a similar proportion o f firms, less than 25% o f the employees use the internet. In 80% o f cases, e-mail is used by less than half the staff.
respects they are closer to group i), w h ile in o th ers they are m ore s im ila r to group ii). A m o n g
th e ir m a in characteristics is the absence o f p ro duction softw are and hardw are in m ost o f the
firm s , the predom inance o f b as ic -leve l m anagem ent softw are, the presence o f servers and netw orks in m ost o f the firm s, a ve ry h ig h le v e l o f
u tiliza tio n o f e -m a il, b u t an a lm ost com plete
absence o f intranets.W h en the firm s in the panel w ere d ifferentia ted
according to the degree o f developm ent o f endogenous capabilities, a s im ila r statistical exercise l ik e w ise gave three groups:i) High level o f development o f endogenous capa
bilities. This group accounts fo r 3 8 % o f the firm s
in the panel, w h ic h are m arked by the p redo m inance o f h ig h ly -s k ille d hum an resources. The
m ost notable endogenous capabilities w ere: the
considerable presence o f q ua lity contro l systems
throughout the production process, as reflected
in process and p ro du ct s tandard ization ; the
im portance o f cells in the organ ization o f w o rk
(h ig h leve l o f au tonom y),24 and the m ed iu m or
high leve l o f the efforts m ade in the fie ld o f
tra in ing. Furtherm ore, an considerable p roportio n o f the firm s carry out research and developm ent activ ities in the hands o f fo rm a l and/or
in fo rm al team s m ade up o f s ta ff m em bers w o rk ing fu l l o r part tim e in this area. F in a lly , in 5 5 %
o f the firm s “ n ew ” products account fo r a substantial proportion o f th e ir sales.
ii) Low level o f development o f endogenous capabilities. Th is group accounts fo r 4 2 % o f the
firm s in the panel, w ith a lo w average le v e l o f
hum an resources skills. T he p redom inant characteristic o f this group is the absence o f quality
contro l systems and o f research and developm ent teams. W ith regard to hum an resources
m an agem en t, the o rg an iza tio n o f w o rk is
through the in d iv id u a l assignm ent o f jo b responsib ilities, and tra in in g activ ities are scarce o r
non-existent. There is also litt le incorporation o f
new products.i i i ) Intermediate level o f development o f endogenous
capabilities. T h is group consists o f 2 0 % o f the
firm s — and lik e the previous group i i i ) established according to the degree o f d iffus ion o f
IC T — is less hom ogeneous than the previous
24 In 76% o f the cases the workers participate, at least sometimes, in the programming or reprogramming of the equipment they use.
INFORMATION A ND KNOW LEDGE: THE DIFFUSION OF INFORMATION A ND CO M M UNICATIO N TECHNO LO G IES IN THE A R G ENTINEMANUFACTURING SECTOR • G ABRIEL YO G UEL, MARTA NOVICK, DARÍO MILESI, SON IA RO ITTER A ND JO S É BORELLO

146 C E P A L R E V I E W 8 2 • A P R I L 2 0 0 4
tw o groups. Q u a lity contro l is p racticed in 4 0 %
o f the firm s , w h ile in those o f them w h ic h carry
out research and d evelopm ent activ ities , the
s ta ff w o rk in g in this area o n ly do so p art-tim e , in spite o f the im portance o f new products in the
f irm s ’ turnover. W ith regard to hum an resources
m anagem ent, w o rk in cells is a feature o f this
group, b u t the cells have litt le autonom y and the
learn ing processes are therefore lim ite d . Indeed, in h a lf o f the firm s there is no tra in in g o f hum an
resources. T he h ig h le v e l o f qualifica tio ns o f the
s ta ff in a considerable num ber o f these firm s
m arks a strong d ifference, how ever, fro m the
gro up w ith a lo w le v e l o f endogenous
capabilities.
3. Joint analysis
U sin g the tw o sets o f hom ogeneous groups o f firm s
constructed as described above, a jo in t analysis was
m ade w h ic h m akes it possible to id en tify several d if ferent types o f situations (tab le 1).25
O n the one hand, there is a strong re la tion
b etw een the endogenous capabilities developed by
firm s and the degree o f d iffu s io n reached by in fo rm a tio n and com m unication technologies, in keeping
w ith the central hypothesis o f this study.26 A s m ay be
observed, in the group w ith a lo w le v e l o f d iffu s io n o f
IC T , firm s w ith lo w levels o f capabilities are overrepresented, w h ile those w ith h igh levels o f cap ab ilities are under-represented. In contrast, in the group
w ith a h igh le v e l o f d iffus ion o f IC T , firm s w ith lo w
levels o f endogenous capabilities are under-represented, w h ile those w ith h igh levels are over-represented. F in a lly , on ly 2 4 % o f the firm s w ith a m ed ium leve l o f
d iffus ion o f IC T belong to the group w ith an in term ediate le v e l o f endogenous capabilities. In this set o f
firm s, w h ic h represents about h a lf o f the panel, the
hypothesis th a t there is a system ic association
b etw een endogenous capabilities and the le v e l o f d if fus ion o f IC T is con firm ed .27
TABLE 1
Argentina: Distribution of groups of firms by degree of diffusion of information and communication technologies (ICT) and by level of development of endogenous capabilities
A. Diffusion groups, as a percentage o f total number o f firms
Level o f diffusion of ICT
Level o f development o f endogenous capabilitiesa
Total
Low Medium High
Low 59b 18 23b 100Medium 42 24 34 100High 21b 17 62b 100
Total 42 20 38 100
B. Percentages o f total number o f firms in the panel
Level o f diffusion of ICT
Level o f development o f endogenous capabilitiesa
Total
Low Medium High
Low 21 7 8 36Medium 15 8 13 36High 6 5 17 28Total 42 20 38 100
Source: Prepared by the authors on the basis o f the survey on the use and diffusion of information and communication technologies in Argentine m anufacturing carried out by the Institute o f Industry/Institute for the G reater Buenos Aires Conurbation (IDEI/ICO), Universidad de General Sarmiento. a Chi squared test significant at the 1% level. b Z test significant at the 1% level (see footnote 25).
27 In order to contrast the hypothesis that the diffusion o f ICT depends on the level o f endogenous capabilities reached, a linear regression analysis was also made between the two variables, including the size o f the firms as an additional independent variable. In order to estimate the model with the data for the 246 firms studied, a numerical index was used which was constructed on the basis of the sum o f the values assumed for each o f the categories associated with ICT, on the one hand, and with endogenous capabilities on the other. The sales o f the firms in 2001 were used as a proxy variable for their size. As may be seen from table A.6 o f the statistical appendix, there would appear to be a positive relation between the level o f endogenous capabilities and ICT, and also between the size of the firms and the level o f diffusion o f information and communication technologies. Similar results were obtained using an ordered Probit model, taking the level o f diffusion o f ICT as a dependent variable. The foregoing analysis does not make it possible to see what is behind the estimated coefficients, however: that is to say, the variance between cases. It was therefore decided to opt for examining the information by means o f a non-parametric analysis.
25 W hen examining the relation between two qualitative variables we considered on the one hand the chi-squared test in order to contrast the significance o f the association between them, and on the other hand a Z test for the differences o f proportions between each pair o f forms. This latter test contrasts the contribution o f each pair of categories to the chi-squared. A significant relation may be said to exist (over- or under-representation) when the corresponding test has a 10% significance level.26 The value o f 25 obtained for Pearson’s chi squared permits us toreject the hypothesis that there is no association between variables with a 1% significance level.
INFORMATION A ND KNOW LEDGE: THE DIFFUSIO N OF INFORMATION A ND CO M M UNICATIO N TECHNO LO G IES IN THE ARG ENTINEM ANUFACTURING SEC TO R • G ABRIEL YOG UEL, MARTA NOVICK, DARÍO MILESI, SON IA RO ITTER A ND JO S É BORELLO

C E P A L R E V I E W 8 2 • A P R I L 2 0 0 4 147
There are tw o interesting h yb rid cases w here this
hypothesis is not fu lfille d : in 2 8 % o f the firm s the
le v e l o f endogenous capabilities reached was h igher
than the leve l o f d iffus ion o f IC T , and in the rem aining
2 6 % the opposite situation was observed (section B o f
table 1).28B y com bin ing the levels reached in term s o f
endogenous capabilities and d iffus ion o f IC T , fou r
groups m ay be iden tified :29 i) h igh levels o f endogenous capabilities and h ig h levels o f d iffus ion o f IC T ;i i) lo w levels o f endogenous capabilities and lo w le v els o f d iffus ion o f IC T ; i i i ) levels o f endogenous capab ilities h igher than those o f d iffus ion o f IC T ; and iv )
lo w e r levels o f endogenous capabilities than o f d iffu sion o f IC T .
i) High levels o f endogenous capabilities and highlevels levels o f diffusion o f IC T (17% o f thepane!)
T he firm s in this group display m ost o f the a ttrib utes o f “virtuous” groups: h igh levels o f both endogenous capabilities and d iffus ion o f IC T . In this sense, they d iffe r fro m the interm ediate cases — ii i ) and iv )—
in terms o f attributes lin ked w ith in fo rm ation and
com m unication technologies and also w ith endogenous capabilities. W ith regard to the technologies
used, these firm s are m arked ly d iffe rent fro m the rest because o f the ir greater use o f com plex software in the
m anagem ent area (support fo r decis ion-m aking at the
m iddle and h ig her m anagem ent levels) and in that o f
production, as w e ll as in the im portance they attach to
the tra in ing o f th e ir s ta ff in inform atics (table A .7 o f
the statistical appendix). I f w e also take account o f the
h igh leve l o f endogenous capabilities reached by these
firm s, it could be argued that the d iffus ion o f IC T can
be a positive contribu tion in some phases o f the
m etabolism o f know ledge. These phases include both
the conversion o f tac it know ledge into in fo rm ation
and the com bination o f in fo rm ation fro m various
sources into new tac it and cod ified know ledge. In
other words, the h ig h levels o f endogenous capab ilities o f this group re flect the developm ent o f learn ing
processes in vo lv in g b o th cod ified and tac it know ledge
28 If only these two cases are taken into account in the estimation o f the regression model referred to in the previous footnote, the endogenous capabilities variable ceases to be significant for explaining the behaviour o f the diffusion of ICT. Consequently, in these groups qualitative analysis becomes even more important.29 In this analysis, no account is taken of the 8% o f firms with medium levels o f diffusion of ICT and medium levels o f endogenous capabilities.
o f some degree o f com plexity. L ikew ise , in v ie w o f
the im portance assumed by in fo rm ation and com m unication technologies, these w o u ld p erm it connections
both betw een d iffe rent areas w ith in the same f irm and
betw een d iffe rent groups o f firm s and could therefore
act as a veh ic le fo r the c ircu lation o f cod ified k n o w ledge and fo r p rom oting the cod ifica tion o f tac it know ledge generated in the various w o rk in g environ ments.
This group displays a h igh re la tive presence o f
firm s w h ic h have some proportion o f fo re ig n capita l in
the ir ownership and are m edium -sized o r large in
terms o f b oth sales and num ber o f em ployees. I t also
displays a m arked degree o f sectoral specialization, since 6 5 % o f the firm s are concentrated in f iv e sectors
(chem ical products, m otor veh ic le parts, rubber and
plastic products, electrical m achinery and equipm ent, and m edical and m easuring instrum ents).
M o s t o f the firm s in this group have a considerable degree o f openness to the exterior, as reflected in
a h igh export coeffic ien t and the m agnitude o f the ir
im ports o f inputs (table A .7 o f the statistical append ix ). F in a lly , as regards the ir m arket dynam ism , the
considerable w e ig h t o f the firm s whose sales increased
during the 1990s should be noted.
ii) Low levels o f endogenous capabilities and lowlevels o f diffusion o f IC T (21% o f the panel)
The firm s in this group display the predom inant features o f the groups w ith lo w levels o f endogenous
capabilities and lo w levels o f d iffus ion o f IC T . This
means that neither the in fo rm ation they receive and
process nor the developm ent o f learn ing processes
appear to be o f m uch significance. A s regards the
degree o f d iffus ion o f IC T , they are characterized by
the presence o f bas ic-leve l software in the m anagem ent and adm inistrative areas and the absence o f com p le x software in the area o f production. A s fo r the le v els o f endogenous capabilities reached, most o f these
firm s do not have certified quality contro l systems or
research and developm ent teams. T hey also m ake l it tle e ffo rt to tra in th e ir s ta ff and the ir em ployees genera lly have lo w levels o f skills.
In this case, the lo w levels o f endogenous capab ilities g ive grounds fo r assum ing that there are only
feeble learn ing processes and, in v ie w o f the lo w le v els o f d iffus ion o f IC T , on ly very lim ite d cod ification
o f the tac it know ledge w h ic h m ay exist.In this group, dom estic-capital firm s predom inate
w h ic h are sm all in term s o f both sales and num bers o f
INFORMATION A ND KNOW LEDGE: THE DIFFUSION OF INFORMATION A ND CO M M UNICATIO N TECHNO LO G IES IN THE A R G ENTINEMANUFACTURING SECTOR • G ABRIEL YO G UEL, MARTA NOVICK, DARÍO MILESI, SON IA RO ITTER A ND JO S É BORELLO

148 C E P A L R E V I E W 8 2 • A P R I L 2 0 0 4
em ployees. These firm s are agents w ith a ve ry lo w
export coeffic ient, and they purchase fe w im ported
inputs. A lm o st tw o-th irds o f the firm s in this group
had a negative sales perform ance in the 1990s, and this
was reflected even m ore starkly in th e ir em ploym ent figures. They display less specialization, and m ost o f
them carry out activ ities w h ic h are generally less
com plex than those o f the previous group (rubber and
plastic products, m otor veh ic le parts, m etal products, foodstuffs and furniture).
iii) Levels o f endogenous capabilities higher thanthose o f diffusion o f IC T (28% o f the pane!)
M o s t o f the firm s in this group are in a stage o f
th e ir technological trajectory in w h ich , a lthough they
have m ed ium o r h ig h levels o f endogenous capab ilities, they have not y e t reached a h igh le v e l o f d iffus ion
o f IC T .
A ltho ug h this group does not d iffe r m uch fro m
the most v irtuous one in term s o f its levels o f endogenous capabilities, some o f its attributes cause it to be
located in a lo w e r category. A m o n g these are the lesser im portance assigned to quality control systems and
the lo w e r re la tive w e igh t o f training.In v ie w o f the defin ition o f this group, it w ou ld
seem o f interest to explore the various attributes connected w ith the d iffusion o f IC T w h ic h caused this
group to occupy a lo w e r leve l than the most v irtuous
group. F irstly , it is im portant to note that the lo w e r
degree o f developm ent in this respect is not located in
any area in p articu lar (m anagem ent, production o r
com m unication), b u t corresponds to a generalized lag
in the adoption o f this type o f technology.W ith regard to the m anagem ent area, this group
differs fro m group i) in the lo w leve l o f com plex ity o f
the software and equipm ent used,30 the m ore lim ited
use o f its servers, and the lesser im portance attached to
tra in ing in the f ie ld o f inform atics.
The same is true in the production area, w here
there is not only lim ite d use o f this type o f tools but also a lo w leve l o f com plex ity and lack o f integration
w ith the rest o f the f irm . Thus, the num ber o f persons
in d iffe ren t areas w ho interact w ith each o ther is sign ificantly less than in group i). L ikew ise , the degree o f
synergy and proper u tiliza tio n o f the learn ing process
are also m ore lim ited .
F in a lly , i f w e loo k at the characteristics regarding
the use o f IC T as a too l fo r com m unication , it is notew orthy that these firm s assign little im portance to the
use o f the internet, intranet and e -m a il (tab le A .7 o f the
statistical appendix).In term s o f the size o f the enterprises, sm all firm s
predom inate,31 w h ile as regards sectoral specialization
the most im portant branches w ere m o tor veh ic le parts, m etal products, m achinery and equipm ent, rubber, and
chem ical products, w h ic h accounted fo r 6 7 % o f the
production o f the firm s in the group.In this case, the re la tive ly h ig h degree o f devel
opm ent o f endogenous capabilities is reflected in quite
a h igh degree o f generation and c ircu lation o f cod ified
and tac it know ledge. T he shortcomings observed in
terms o f the d iffusion o f IC T do not p erm it the
enhanced circu lation o f this know ledge, however.
iv) Lower levels o f endogenous capabilities than o f diffusion o f information and communication technologies (26% o f the panel)
This group o f firm s is located at a lo w level, because the position they occupy in term s o f the level o f developm ent o f endogenous capabilities is re la tive ly lo w e r than the degree o f d iffusion o f in form ation
and com m unication technologies in them . A s noted at the beginning, the fac t o f having m ade progress in the
incorporation o f these new technologies, even in the
absence o f a p rio r com petitive base, should a t a ll events enable these firm s to occupy a h ig her le v e l than
those registering bo th a lo w leve l o f endogenous capab ilities and lim ite d d iffusion o f IC T . The firm s in this
group have b etter perform ance in the dom estic and
foreign m arkets and a h igher leve l o f d iffusion o f IC T
than a ll the o ther groups except i). Th is is reflected in
general in a greater presence o f servers w ith database
engines; interconnected networks; tra in ing in in fo rmatics; substantial use o f the internet, e -m a il and the
intranet; com plex m anagem ent software; design softw are in the production area w h ic h is integrated w ith
the rest o f the f irm , and, to a lesser extent, integrated
planning and control software. I t should be noted, however, that in these la tter aspects, w h ic h are considered to be o f key im portance fo r defin ing the leve l o f
com plexity attained in the d iffusion o f IC T , there is a
significant distance betw een these firm s and those in
group i).
In term s o f endogenous capabilities, as m ay be
30 There is total predominance o f basic-level office software in thisgroup, which brings it down to a level similar to that o f the least virtuous group in the panel. 31 In 2001 these firms had a sales turnover o f up to US$ 3 million
INFORMATION A ND KNOW LEDGE: THE DIFFUSIO N OF INFORMATION A ND CO M M UNICATIO N TECHNO LO G IES IN THE ARG ENTINEM ANUFACTURING SEC TO R • G ABRIEL YOG UEL, MARTA NOVICK, DARÍO MILESI, SON IA RO ITTER A ND JO S É BORELLO

C E P A L R E V I E W 8 2 • A P R I L 2 0 0 4 149
seen in table A .7 o f the statistical appendix, this group
occupies a position w h ic h is h igher than that o f groupi i) b u t b e lo w that o f groups i) and iii).
In v ie w o f the lo w le v e l o f these capabilities, there is litt le generation o f cod ified and tac it k n o w ledge. In this respect, although the greater im portance
attached to IC T should m ake possible a h igher degree
o f connection betw een the d iffe rent areas and better
c ircu lation o f know ledge, there are lim ita tio ns due to
the shortcom ings in question.A m o n g the structural features w h ic h distinguish
this group fro m the w eakest one is the greater re lative
size o f the firm s, am ong w h ic h m edium -s ized and
large enterprises predom inate. Furtherm ore, this is the
group w ith the greatest sectoral d iversification , the
f iv e m a in activities being chem ical products, electrical m achinery and equipm ent, m achinery and equipm ent, m o tor veh ic le parts and p rin tin g and publishing. A lthough, in v ie w o f the predom inant sectors and sizes
o f enterprises, the leve l o f endogenous capabilities
reached could be expected to be h igher than that actua lly registered, this m ight be expla ined b y questions o f
structural heterogeneity.
VConclusions
In this artic le w e have analyzed the use and d iffus ion
o f IC T in A rgentine industry w ith tw o m a in objectives: to provide an em pirica l m ap o f the use and d iffus ion o f
these technologies in m anufacturing, and to identify
the linkages betw een this d iffus ion and the developm ent o f endogenous capabilities in the enterprises in
question.The study shows that IC T is w id e ly dissem inated
in industrial activ ity and that m ost o f the firm s have
m ade significant investments in those technologies, especially in certa in periods - such as the period o f
con vertib ility - w hen the cost o f com puters and softw are was re la tive ly lo w com pared w ith other goods. B o th the le v e l o f d iffus ion o f IC T and the use m ade o f
these technologies show weaknesses, how ever, w h ich
m ay be sum m arized as fo llow s: generally speaking, the d iffus ion o f these technologies is greater in the
adm inistrative area than in that o f production, and in
both areas there are m any cases o f the use o f re la tive ly unsophisticated tools fo r tasks o f a lo w le v e l o f
com plexity.The evidence assembled shows that, in the firm s
included in the panel, this process is uneven and
incom plete and that m ost o f them are fa r fro m having
applied inform atics in the m ajo r part o f the ir processes and integrated the sources o f in fo rm ation o f the ir
diffe rent areas (production, m arketing, purchasing, etc.). T he leve l o f progress in the outside linkages o f
these firm s is at an even m ore inc ip ien t level. Thus, fo r
exam ple, although m ost o f the firm s have w eb pages, fe w o f them m ake sales e lectron ically o r contact the ir
suppliers b y this means. The study found alm ost no
indications o f m ore com plex actions such as the establishm ent o f networks am ong sm all and m edium -sized
enterprises fo r the exchange o f in fo rm ation o r local or
sectoral cooperation. N o r is there any evidence that the
incorporation o f IC T has led to appreciable changes in
the form s o f organization o f production (w ith in the
plant, o r betw een d iffe rent plants w here a g iven enterprise carries out d iffe ren t processes).32
W ith in these g lobal characteristics, how ever, there is a h ig h degree o f heterogeneity, w h ic h it was
possible to exam ine m ore system atically on the basis
o f an analysis o f groups w h ic h are m ore homogeneous
in term s o f the degree d iffus ion o f IC T . S im ila r heterogeneity was observed in respect o f the uneven
developm ent o f endogenous capabilities.W h e n the classification o f firm s as a function o f
the ir endogenous capabilities is com pared w ith the ir
classification b y degree o f d iffus ion o f IC T , a h igh
degree o f coincidence betw een the tw o groups is
observed. Thus, a little less than 5 0 % o f the firm s are
located at the extremes o f the tw o classifications (h igh
levels o f endogenous capabilities and h ig h levels o f
d iffus ion o f IC T and lo w levels o f capabilities and d if fusion). The g u lf betw een these extrem e groups is very
32 This evidence collected in the case o f Argentina is also partly applicable to other Latin American countries. It also shows the need for caution when interpreting ICT indicators based solely on the development o f web pages, e-mail, intranet and extranet, when these are not supplemented with information on the application o f ICT to the production process and relations with clients and suppliers.
INFORMATION A ND KNOW LEDGE: THE DIFFUSION OF INFORMATION A ND CO M M UNICATIO N TECHNO LO G IES IN THE A R G ENTINEMANUFACTURING SECTOR • G ABRIEL YO G UEL, MARTA NOVICK, DARÍO MILESI, SON IA RO ITTER A ND JO S É BORELLO

150 C E P A L R E V I E W 8 2 • A P R I L 2 0 0 4
significant in both o f the indicators in question. Thus, 6 0 % o f the firm s in the firs t group tra in th e ir s ta ff in
inform atics, w h ile on ly 6 % o f the second group do so, and the percentages are s im ila r fo r the use o f com plex
com puter program m es (6 5 % against 4 % ). These d if ferences h igh ligh t the b ig disparities betw een the
extrem e cases in the survey.W e thus see that in the set o f firm s studied, there
is a ve ry m arked d irect re lation betw een endogenous
capabilities and the degree o f d iffusion o f IC T . A t the
same tim e, how ever, the same data reveal that the
incorporation o f these technologies and th e ir app lications in the m anufacturing firm s analyzed are not only
a consequence o f the endogenous capabilities attained, although those capabilities are a p o w erfu l p red ictor o f
the degree o f d iffus ion o f IC T , fo r the size o f the firm s
is also an im portant variab le , show ing the in d iv is ib ilities that exist in the acquisition o f com puter equipm ent and program m es.
O bviously , the most interesting cases are those
corresponding to the tw o interm ediate groups, w here
the w o rk in g hypothesis is not fu lf ille d : h ig h (lo w ) le v els o f endogenous capabilities and lo w (h igh) levels o f
diffusion o f IC T . The tw o interm ediate groups very
clearly show som ething w h ic h has a lready been noted
in the specialized literature, nam ely, the varied w ays in
w h ic h these technologies are incorporated in firm s and
the d iffe rent rates a t w h ic h firm s introduce inform atics
tools. The existence o f these tw o groups in the sample
suggests that the incorporation o f IC T m ay lag behind
the path a lready trave lled b y the f irm , o r it m ay run
ahead o f th e ir capacity to m ake fu ll use and take fu ll advantage o f the new technologies. Im balances m ay
thus be observed w ith in the firm s w h ic h can act as a
burden o r a new m o tor o f progress in th e ir fo rw ard
path. I t m ay w e ll be im agined that firm s whose
progress in term s o f endogenous capabilities outstrips
th e ir leve l o f incorporation o f IC T could strengthen
th e ir endogenous capabilities by a m ore systemic
incorporation o f in fo rm ation and com m unication tech
nologies.In short, the process o f incorporation o f IC T is
unbalanced and unequal in m any senses: w ith in the
firm s themselves (fo r exam ple, betw een the areas o f
production and m anagem ent), betw een d iffe rent firm s, and betw een sectors o f activity. T he d iffusion process
has advanced along the lines o f least resistance, being
connected w ith structural factors such as the size o f
the firm s and the capabilities they have acquired in the
course o f tim e. T he data obtained gives grounds fo r
in ferring that, in m ost cases, the m ost interesting
potentialities o f IC T (such as the possibility o f p ro m oting internal learn ing processes) are s till only being
explo ited in a very inc ip ien t manner.In line w ith this set o f argum ents, it seems appro
priate to contrast the forego ing conclusions w ith the
recom m endations o f some international experts w ho
specialize in the d ig ita liza tio n o f the operations o f
m anufacturing and services enterprises.A fte r having had some rather unrealistic v iew s on
the im m ediate potential o f IC T , m any o f these experts
are now a good deal m ore cautious in th e ir recom m endations. T hey now say that the incorporation o f
in form ation and com m unication technologies in firm s
should be subject to a jo in t analysis w h ic h also
involves the trading strategies o f the firm s. The degree
o f d ig ita liza tio n o f a f irm cannot be considered in isolation, b u t must also take into account its business
strategy (S ly w o tzk y and M orrison , 2000).
M u c h o f the literature on real cases o f the d iffu sion o f IC T offers elem ents o f interest fo r the matters
addressed in the present study. I t has been stated that the incorporation o f IC T is a process w h ic h runs into
various types o f resistance w ith in firm s and in th e ir
links w ith suppliers and clients. Th is resistance is due
to d ifficu lties o f com m unication betw een the experts
in these fie lds and the persons responsible fo r running
the various areas o f a f irm ; fe a r o f change and o f the
unknow n; and d ifficu lties in choosing technologies. M oreo ver, there is the d ifficu lty o f fin d in g d ig ita l solutions to im prove production processes, w h ic h are less
generic in nature than those developed fo r the adm in istrative and m anagem ent areas. In o rder to incorporate in fo rm ation and com m unication technologies it is
necessary to have a horizon and tim e sequence that depends on the evolu tionary path o f each ind iv idual f irm (S ly w o tzk y and M orrison , 2000; W in d ru m and
de Berranger, 2002).
In conclusion, the data and v iew s presented here
serve to iden tify a set o f questions that m ay u sefu lly be
taken into account in po licy design. F irstly , the system ic incorporation o f in fo rm ation and com m unica
tion technologies cannot be seen as a process that is
independent o f the developm ent o f the endogenous
capabilities o f the firm s involved. Secondly, i t m ust be
borne in m in d that the A rgentine m anufacturing sector, like that o f m any other countries o f the region, is made
up o f ve ry diverse organizations w h ic h have very d iss im ilar possibilities o f incorporating such technologies
in th e ir internal processes and th e ir links w ith suppliers and clients. In this respect, the identification o f
fo u r groups in the jo in t analysis (based on the tw o
INFORMATION A ND KNOW LEDGE: THE DIFFUSIO N OF INFORMATION A ND CO M M UNICATIO N TECHNO LO G IES IN THE ARG ENTINEM ANUFACTURING SEC TO R • G ABRIEL YOG UEL, MARTA NOVICK, DARÍO MILESI, SON IA RO ITTER A ND JO S É BORELLO

C E P A L R E V I E W 8 2 • A P R I L 2 0 0 4 151
analyses o f hom ogeneous groups) clearly shows that there is a lim ite d num ber o f stages o r types o f d iffu sion o f IC T that can be envisaged fo r incorporating
these technologies into A rgentine industry. Th ird ly , policies fo r prom oting the incorporation o f in fo rm a
tio n and com m unication technologies in firm s should
recognize fro m the beg inn ing that such incorporation
is m ore than ju s t a new elem ent to be put on the f irm s ’
balance sheets. I t does not seem reasonable, therefore, to propose isolated policies w h ic h do not take account o f the fac t that the d iffus ion o f these technologies and
the ir e ffective use is a com plex and re la tive ly slow
process.(Original: Spanish)
Statistical appendix
Nature and distribution of informatics equipment
Argentina: General infrastructure and equipment for information and com munication technologies in the management area
Infrastructure and equipment Percentage o f firms
Networks 87Local 75Wide area 15
Integrated services digital network/ 56asymmetrical digital subscriber lineServers 78Servers with a database engine 41Networked printers 79Shared scanners 31Shared plotters 13Shared hard disks 68
TABLE A.2
Software used by firms
Type o f software Percentage o f firms
M anagementO ff-the-shelf 77Complex (CASE tools,CUBO software, Datawarehouse) 13
ProductionManufacturing 4Planning and control 30Design 50
TABLE A.3
Informatics equipment in the production area
Equipment Percentage o f firms
Programmable logical control 23Computerized numerical control 11Robots 8Numerical control 6Assembly and fitting system 4Flexible manufacturing cells 2
TABLE A.4
New communication tools used by firms
Tool Percentage o f firms
Web page 54Internet access 9675% o f staff with internet access 18e-mail 9675% o f staff with personal e-mail accounts 37Intranet 5775% o f staff with access to intranet 28
TABLE A.5
Form of links with other firms and institutions
IForm o f link Percentage o f firms
Total W ith other firms
Withinstitutions
e-mail 95 93 80Telephone 90 87 74Visits 46 38 36Internet 24 22 16Intranet 13 12 3Mail 17 14 10
TABLE A.6
Results of regression analysisa,b
Regression analysis Regression analysisTotal sample o f firms Intermediate groups
A 11.4 (11.9)c 18 (15.1) cB 0.53 (7 .1)c 8.3*10-3 (0.09)C 9.7*10-3 (3 .6)c 2.6*10-2 (3.4) cR2 (adjusted) 0.23 0.06F 35 .0c 5.8 c
a Model: Index o f homogeneous dissemination groups = A + B (index of endogenous capabilities) + C (sales, in millions of dollars).
b Figures in parentheses correspond to t statistic. c t is significant at the 5% level.
Source fo r all tables in this appendix: Prepared by the authors on the basis o f the survey on the use and diffusion o f information and communication technologies in Argentine manufacturing carried out by the Institute o f Industry/Institute for the Greater Buenos Aires Conurbation (IDEI/ICO), Universidad de General Sarmiento.
INFORMATION A ND KNOW LEDGE: THE DIFFUSION OF INFORMATION A ND CO M M UNICATIO N TECHNO LO G IES IN THE A R G ENTINEMANUFACTURING SECTOR • G ABRIEL YO G UEL, MARTA NOVICK, DARÍO MILESI, SON IA RO ITTER A ND JO S É BORELLO

152 C E P A L R E V I E W 8 2 • A P R I L 2 0 0 4
TABLE A .7
Percentage of firms belonging to each of the four groups, by attributes
Attribute High levels ofendogenous capabilities and of diffusion o f ICT
(group i)
Higher levels of endogenous capabilities than o f diffusion o f ICT
(group iii)
Lower levels o f endogenous capabilities
than of diffusion o f ICT
(group iv)
Low levels of endogenous capabilities
and o f diffusion of ICT
(group ii)1. Structural characteristics Sales under 0.5 million oa 15 10 41aSales between 0.5 and 3 million 12a 48a 37 26Sales between 3 and 8 million 29b 17 13 20Sales between 8 and 20 million 33a 9b 23 11Sales over 20 million 26a 11 18 2a
Fewer than 20 employees oa 27 27 39b21 to 50 employees 21 39b 18 2951 to 100 employees 2Sb 19 11 14Over 100 employees 51a 15a 44a 18bForeign direct investment 4oa 18 22 6a
Export Sob 70 75 45aMerger or purchase 42a 21 23 22Do not import inputs 17b 40 26 47bIncreased sales in the 1990s 56 40 66b 39Motor industry 1S 24b 6a 14
2. Endogenous capabilitiesFully implemented quality control system 91a 55 31b 10aExistence o f a research and development team with full-time personnel 44a 36b 16 6a
New products account for over 30% of sales since 1995 5o 56 41 34Operatives programme machines used in their cells, at least sometimes S1a 55 34b 33bMedium or high levels o f trainingefforts (over 40% o f staff involved) 69a 55 31 16aHigh proportion o f technical personnel 67a 54a 20a 18a
3. Diffusion o f IC T Server and database engine 67a 30b 55 24aBackup and UPSc systems 93a 49 70 49Have interconnected network, at least internally 33a 10 27 6a
Complex management software 65a 3a 31 4a
Only basic-level office software 33a 92a 58 92bComplements or contracts in informatics 35b 70b 42 71Training in informatics 6oa 14a 34 6a
Integrated planning and control software 77a 9a 17 10aComplex hardware and software in the production area 47a 18 20 14Does not have design software 2Sa 55 48 77aDesign software integrated in production 42a 5a 20 6b
Low level o f importance o f internet 12a 49 13a 84aHigh level o f importance o f internet 3o 25 31 0a
Low level o f importance o f intranet 35a 78 67 96aHigh level o f importance o f intranet 35a 8 13 0aMedium level o f importance o f e-mail 2a 39 2a 75aHigh level o f importance o f e-mail 9Sa 58 98a 22a
Source: Prepared by the authors on the basis o f the survey on the use and diffusion o f information and communication technologies inArgentine manufacturing carried out by the Institute o f Industry/Institute for the Greater Buenos Aires Conurbation (IDEI/ICO), Universidadde General Sarmiento. a Z test significant at the 5% level. b Z test significant at the 10% level.c Stabilizer designed to protect delicate equipment from surges or interruptions in the electricity supply.
INFORMATION A ND KNOW LEDGE: THE DIFFUSIO N OF INFORMATION A ND CO M M UNICATIO N TECHNO LO G IES IN THE ARG ENTINEM ANUFACTURING SEC TO R • G ABRIEL YOG UEL, MARTA NOVICK, DARÍO MILESI, SON IA RO ITTER A ND JO S É BORELLO

C E P A L R E V I E W 8 2 • A P R I L 2 0 0 4 153
Bibliography
Bisang R., G. Lugones and G. Yoguel (2002): Apertura e innovación en la Argentina, Madrid, Editorial Miño y Dávila.
Bisang, R., G. Lugones and others (2003): Segunda Encuesta Nacional de Innovación y Conducta Tecnológica de las Empresas Argentinas 1998/2001, Buenos Aires, Instituto de Industria, U niversidad N acional de General Sarmiento/Redes/National Institute o f Statistics and Censuses (INDEC).
Castells, M. (1998): L a era de la información: economía, sociedad y cultura, Madrid, Editorial Alianza.
Cim oli, M. and N. C orrea (2002): Trade Openness and Technological Gaps in Latin America: A Low Growth Trap, paper presented at the Conference “Innovation and Growth: New Challenges for the Regions” (Sophia Antipolis, France, 18-19 January).
(2003): Nuevas tecnologías y viejos problemas. ¿Pueden lasTICs reducir la brecha tecnológica y la heterogeneidad estructural?, in F. Boscherini, M. Novick and G. Yoguel (eds.),Nuevas tecnologías de información y comunicación. Los límites de la economía del conocimiento , Buenos Aires, Editorial Miño y Dávila/Universidad Nacional de General Sarmiento.
Cimoli, M. and G. Dosi (1995): Technological paradigms, patterns o f learning and development: an introductory roadmap,Journal o f Evolutionary Economics, vol. 5, No. 3, Heidelberg, Springer-Verlag Heidelberg.
Cimoli, M. and J. Katz (2002): Structural Reforms, Technological Gaps and E conom ic D evelopm ent. A L atin A m erican Perspective, “D esarrollo productivo” series, No. 129, LC/L.1775-P, Santiago, Chile, ECLAC.
Cowan, R., P David and D. Foray (2000): The explicit economics o f knowledge codification and tacitness, Industrial and Corporate Change, vol. 9, No. 2, Oxford, Oxford University Press, June.
Crivisqui, E. (1993): Análisis fac toria l de correspondencias, Asunción , Laboratorio de Informática Social, Universidad Católica de Asunción.
Dosi, G. (1998): Sources, procedures and microeconomic effects o f innovation, Journal o f Economic Literature, vol. 26, No. 3, Nashville, Tennessee, American Economic Association.
Dosi, G., L. Orsenigo and M. Sylos Labini (2002): Technology and the Economy, LEM Papers Series, No. 18, Laboratory o f Economics and Management (LEM), Pisa, Italy, Sant'Anna School o f Advanced Studies.
Dosi, G., K. Pavitt and L. Soete (1990): The Economics o f Technical Change and International Trade, New York, New York University Press.
Ernst, D. and A. Lundvall (1997): Information Technology in the Learning Economy, Challenges fo r Developing Countries, Working Paper No. 97/12, Aalborg, Danish Research Unit for Industrial Dynamics (DRUID).
Johnson, A., T. Moher and others (2002): Augmenting elementary school education with VR, IEEE Computer Graphics and Applications, vol. 22, No. 2, Chicago, University o f Illinois at Chicago, March-April.
Lall, S. (1992): Technological capabilities and industrialization, World Development, vol. 20, No. 2, Amsterdam, Elsevier Science, February.
(2001): Competitiveness, Technology and Skills, Cheltenham,Edward Elgar.
Lugones, G., C. Bianco and others (2003): Indicadores de la sociedad del conocimiento e indicadores de innovación. Vinculaciones e implicancias conceptuales y metodológicas, in F. Boscherini, M. Novick and G. Yoguel (eds.), Nuevas tecnologías de información y comunicación. Los límites de la economía del conocimiento, Buenos Aires, Editorial Miño y Dávila/Universidad Nacional de General Sarmiento.
Lundvall, B. (2003): ¿Por qué la nueva economía es una economía del aprendizaje?, in F. Boscherini, M. Novick and G. Yoguel (eds.), Nuevas tecnologías de información y comunicación. Los límites de la economía del conocimiento , Buenos Aires, Editorial Miño y Dávila/Universidad Nacional de General Sarmiento.
Milesi, D. (2002): Del ajuste macro a la competitividad micro. El caso de las pequeñas y medianas empresas industriales, in R. Bisang, G. Lugones and G. Yoguel, Apertura e innovación en la Argentina , Madrid, Editorial Miño y Dávila.
Nonaka, I. and H. Takeuchi (1999): La organización creadora de conocimiento. Cómo las compañías japonesas crean la dinámica de la innovación, Mexico City, Oxford University Press.
Novick, M. (1999): Experiencias exitosas de capacitación de empresas innovadoras en América Latina y el Caribe, in G. Labarca (coord.), Formación y empresa: el entrenamiento y la capacitación en el proceso de reestructuración productiva , Montevideo, Inter-American Research and Documentation Centre on Vocational Training (CINTERFOR).
Novick, M., G. Yoguel and others (2002): Nuevas configuraciones en el sector automotor argentino. La tensión entre estrategias productivas y comerciales, Revista del CENDES, No. 49, Caracas, Universidad Central de Venezuela.
Ocampo, J.A. (2001): A new look at the development agenda, CEPALReview, No. 74, LC/G.2135-P, Santiago, Chile.
OECD (Organisation for Economic Co-operation and Development) (1995), Information Technology (IT). D iffusion Policies fo r Small and M edium -Sized Enterprises, Paris.
Peirano, F. and C. Bianco (2002): Las TICs vistas desde los sectores de m enores ingresos en Argentina, Chile y Uruguay. Resultados de la aplicación de una metodología de e-readiness y del análisis de las principales políticas en materia de la reducción de la brecha digital, paper presented at the Redes Seminar “Tecnologías de información y comunicación y desarrollo de políticas públicas”, Buenos Aires, Littec/Universidad Nacional de General Sarmiento (UNGS).
Perez, W. and G. Stumpo (2001): Pequeñas y medianas empresas en Am érica Latina y el Caribe, Santiago, Chile, ECLAC/Siglo XXI.
Poma, L. (2000): La producción de conocimiento. Nuevas dinámicas competitivas para el territorio, in F. Boscherini and L. Poma (eds.), Territorio, conocimiento y competitividad de las empresas. E l rol de las instituciones en el espacio global, Madrid, Editorial Miño y Dávila.
Reinert, E. (1996): The role o f technology in the creation o f rich and poor nations: underdevelopment in a Schumpeterian system, in D. Aldcroft and R. Catterall (eds.), Rich Nations, Poor Nations. The Long Run Perspectives, London, Edward Elgar.
Roitter, S. (1991): Análisis factorial de correspondencias múltiples, Cordoba, Universidad Nacional de Córdoba, unpublished.
Rullani, E. (2000): El valor del conocimiento, in F. Boscherini and L. Poma (eds.), Territorio, conocimiento y competitividad de
INFORMATION A ND KNOW LEDGE: THE DIFFUSION OF INFORMATION A ND CO M M UNICATIO N TECHNO LO G IES IN THE A R G ENTINEMANUFACTURING SECTOR • G ABRIEL YO G UEL, MARTA NOVICK, DARÍO MILESI, SON IA RO ITTER A ND JO S É BORELLO

154 C E P A L R E V I E W 8 2 • A P R I L 2 0 0 4
las empresas. El rol de las instituciones en el espacio global, Madrid, Editorial Miño y Dávila.
Slywotzky, A.J., K. Weber and D.J. Morrison (2000): How Digital is Your Business?, New York, Crown Publishing.
Windrum, P. and P. de Berranger (2002): The Adoption of E-business Technology by SMEs, M erit-Infonom ics Research Memorandum series, No. 23, Maastricht, The Netherlands.
Yoguel, G. and F. Boscherini (1996): La capacidad innovativa y el fortalecimiento de la competitividad de las firmas: el caso de las PYMEs exportadoras argentinas, working paper, No. 71, LC/BUE/L. 154, Buenos Aires, ECLAC Office in Buenos Aires, August.
Yoguel, G., M. Neuman and others (1997): Programa de capacitación tecnológica de Pymes industriales, Documento No. 1,
Buenos Aires, Secretaría para la Tecnología, la Ciencia y la Innovación productiva [www.secyt.gov.ar/publica_planplur /anepyme_n.htm].
Yoguel, G., M. Novick and A. Marin (2001): Production Network Linkages, Innovation Processes and Social Management Technologies. A Methodological Approach Applied to the Volkswagen Case in Argentina, Electronic Papers, No. 5, Aalborg, Denmark, Danish Research U nit for Industrial Dynamics (DRUID) www.druid.dk/wp/wp2000.html.
Yoguel, G. and R. Rabetino (2002): Algunas consideraciones generales sobre la incorporación de tecnología en la industria manufacturera argentina, in R. Bisang, G. Lugones and G. Yoguel, Apertura e innovación en la Argentina, Madrid, Editorial Miño y Dávila.
INFORMATION A ND KNOW LEDGE: THE DIFFUSIO N OF INFORMATION A ND CO M M UNICATIO N TECHNO LO G IES IN THE ARG ENTINEM ANUFACTURING SEC TO R • G ABRIEL YOG UEL, MARTA NOVICK, DARÍO MILESI, SON IA RO ITTER A ND JO S É BORELLO

155
F r a n c i s c o A l b u r q u e r q u e
I n s t i t u t e o f E c o n o m i c s a n d
G e o g r a p h y ,
H i g h e r C o u n c i l f o r S c i e n t i f i c
R e s e a r c h , M i n i s t r y o f S c i e n c e a n d
T e c h n o l o g y , S p a i n
f f .a lb u rq u e r q u e @ ie g .c s ic .e s
C E P A L R E V I E W 8 2 • A P R I L 2 0 0 4
Localeconomic development anddecentralization in Latin America
Francisco Alburquerque, in memory o f Gabriel Aghon
T his a r t i c l e d e s c r i b e s t h e w o r k d o n e u n d e r t h e E C L A C / G T Z
p r o j e c t d i r e c t e d u nt i l h i s d e a t h b y G a b r i e l A g h o n f r o m t h e
E C L A C E c o n o m i c D e v e l o p m e n t D i v i s i o n . It s h o w s t h a t t h e
e m e r g e n c e o f l o c a l e c o n o m i c d e v e l o p m e n t i n i t i a t i v e s is n o t o n l y
t h e c o n s e q u e n c e o f t h e d e c e n t r a l i z a t i o n p r o c e s s e s u n d e r w a y in
t h e d i f f e r e n t c o u n t r i e s o f t h e r e g i o n b u t is t h e r e s u l t o f a m o r e
c o m p l e x s e t o f f a c t o r s w h i c h h a v e a r i s e n in t h e l o c a l a r e a s
t h e m s e l v e s a n d h a v e g i v e n r i s e t o t h e m o b i l i z a t i o n a n d a c t i o n o f
p u b l i c a n d p r i v a t e l o c a l a g e n t s . T h e p r o j e c t c a r r i e d o u t a l m o s t
t h i r t y c a s e s t u d i e s in s e v e n c o u n t r i e s o f t h e r e g i o n a n d is o n e o f
t h e m o s t e x t e n s i v e s t u d i e s m a d e s i n c e l o c a l e c o n o m i c
d e v e l o p m e n t i n i t i a t i v e s b e g a n t o b e m a d e in L a t i n A m e r i c a .
156 C E P A L R E V I E W 8 2 • A P R I L 2 0 0 4
ILaying the foundations for the local economic development approach
A s is generally know n, the territo ria l (o r loca l) nature
o f econom ic developm ent has long suffered fro m a situation o f theoretical m arginality. F o r some authors, however, the crisis o f the Fordist mass production
m odel has fac ilita ted the theoretical rediscovery o f
f le x ib le fo rm s o f p ro du ction at the lo c a l leve l, although these have in fact alw ays been present as
form s o f industria liza tion in econom ic history. L oca l
econom ic developm ent should not be seen, then, as a
post-Fordist industria liza tion m odel opposed to the
function ing o f b ig business. In reality, the local econom ic developm ent approach basically stresses the
local values o f identity, d iversity and f le x ib ility w h ich
have existed in the past in form s o f production w h ich
are not based only on large-scale industry but on the
general and local characteristics o f a g iven area.Thus, the m ain cause o f the theoretical m argina l
iza tio n o f the territo ria l o r loca l nature o f econom ic
developm ent is to be found in the s im p lifica tio n o f this
process o f evo lu tion m ade by a large proportion o f
econom ic thinkers b y abandoning the local d im ension
and tak ing as th e ir un it o f analysis the enterprise or
econom ic sector in the abstract, that is to say, separated fro m the ir loca l environm ent. In this w ay, the local
area has been reduced to a u n ifo rm and und ifferentia ted space, and the central analysis o f econom ic developm ent has long been dom inated b y the concept o f
econom ies o f scale w h ic h are internal to the enterprise: an aspect shared b y the m ain lines o f econom ic
thinking.
A n other consequence o f this analy tica l approach
is the reduction o f the concept o f econom ic developm ent to industrial developm ent based on large v e rtica lly integrated enterprises and linked w ith urban izatio n processes. Th is fo rm o f reasoning, w h ic h is still very m uch alive, was m od ified , how ever, in the late
19th century b y A lfre d M ars h a ll (1 8 9 0 ), w ho exam
ined the geographical concentration o f industry and
proposed that the un it fo r the study o f econom ic developm ent should be a locally-based entity. M a rs h a ll’s
theory o f industrial organ ization and his concept o f
organization (w h ic h cannot be reduced solely to busi
ness capacity) thus provide a fundam ental theoretical base fo r the local econom ic developm ent approach, by
restoring the local area as a u n it o f analysis. M a rs h a ll’s
theory o f industrial organ ization thus runs counter to
the neoclassical theory o f industrial location, since the
central ro le p lay by the enterprise in the la tter is
replaced in M a rs h a ll’s theory by the local environm ent and the cluster in w h ic h the enterprise is located. L ikew ise , internal econom ies o f scale linked w ith the
enterprise-based d im ension are now accom panied by
external econom ies generated b y loca l interdependences.
A s w e can see, this approach to industrial organiza tio n is a structural o r systemic statement, since it is
not possible to consider a part o f the system in isolation, ignoring the relations o f interdependence w h ich
exist betw een that part and the w ho le in w h ich it is
integrated. O rgan ization is not ju s t business capacity, but also the interdependence w h ic h exists w ith in the
enterprise, betw een the enterprise and the rest o f the
group o f enterprises o f w h ic h it form s part, and
betw een those tw o aspects and the area in w h ic h the
local system o f enterprises is located. In short, it is not the enterprise alone that competes, but the netw ork
and local area in w h ic h it is located. Consequently, in
the term s expressed by M ars h a ll, the econom ies
achieved in p ro du ction are not ju s t the in ternal economies o f the enterprise considered in isolation; there are also “general external econom ies” (o f the
group o f enterprises o f w h ic h it form s part) and “ local external econom ies” corresponding to the specific
loca l area in w h ic h it is located (S fo rz i, 1999). K n ow ledg e , w h ic h is at the centre o f the d e fin itio n o f
local external econom ies, is the most im portant e le m ent in production and sometim es becomes an asset shared by the local com m unity as a w hole. L ikew ise , local external econom ies also include the existence o f
local linkages w ith aux ilia ry firm s, or the com plem entarity betw een the local labour m arket and production
system. A l l this form s part o f a “ local environm ent”
favourable to the production e ffic iency and com petitiveness o f the local p roduction system.
LO CAL ECO NO M IC DEVELO PM ENT AN D DECENTRALIZATION IN LATIN AM ER IC A • FRANCISCO ALB URQ UERQ UE

C E P A L R E V I E W 8 2 • A P R I L 2 0 0 4 157
L o ca l production systems are thus the local re ferents o r units in w h ic h production econom ies w ith in
firm s m erge w ith local external econom ies; this thereb y goes beyond the analysis b y types o f firm s, as the
im portant th ing is the interaction o f the various local economies. Consequently, as w e ll as the econom ic
relations and production techniques, o ther essential factors fo r local econom ic developm ent are social relations and the developm ent o f a business culture, the fo rm atio n o f associative netw orks am ong local actors, and the creation o f w h a t is now called “ social capita l” (K liksb erg and Tom assini, 2000).
A ltho ug h it w i l l not be possible in this artic le to
analyse in deta il the m ain references and basic contrib utions b eh in d the lo c a l econom ic d eve lo pm en t approach, special m ention m ay be m ade o f the “rediscovery” by B ecattin i (1 9 7 9 ) o f the notion o f “ industri
a l districts” put fo rw ard by A lfre d M ars h a ll (1 8 9 0 ) and
the iden tifica tio n o f the local area as the u n it o f analy
sis instead o f the enterprise in isolation. Since there
has been a f lo w o f d iffe rent contributions w hich , fro m
d iffe rent angles, have been b u ild in g up a m ore integral v ie w o f developm ent w h ic h incorporates the local approach as one o f its m ain sources o f theoretical and
conceptual support.F ro m a m ore pragm atic standpoint, various p ro
posals have been put fo rw ard by the O rgan ization fo r
E conom ic C ooperation and D eve lop m ent (O E C D ,1999), the In ternational L ab o u r O rganisation and, in
particular, the European U n io n on the new p illars o f
local econom ic policy: the prom otion o f ru ra l developm ent and sustainable developm ent. F in a lly , m ention
must be made o f the developm ent o f decentralization
and the re fo rm o f the State and the im p lem entation o f
processes o f m odern ization o f the pub lic adm inistratio n and p o litica l m anagem ent in o rder to achieve
active partic ipation b y society at large in developm ent processes (H aldenw ang, 2000).
IIThe advance of democratization
and decentralization processes
The advance o f the processes o f dem ocratization and
decentralization, w ith a consequent increase in the
functions o f local pub lic adm inistrations, have obliged
those responsible fo r p o litica l and technical policies to
seek approaches and proposals suitable fo r dealing
w ith the g row ing problem s and demands o f the popula tio n (A ffonso , 2 0 0 0 ). Th is has becom e necessary not only because o f the need to provide concrete and
effective responses to the local population as a w hole, b ut also because o f the shortcom ings o r lim ita tions o f
centralist and sectoral policies and o f the o ld assisten- tia lis t approaches in reg ional developm ent and social policy. Thus, local developm ent strategies have been
gain ing currency as an approach w ith a strong pragm atic com ponent, a “ top -dow n” concept, and a m ore
in tegral v is ion o f the d iffe rent facets o r aspects o f
developm ent, w ith a horizontal presentation o f the la tte r w h ich demands that the d iffe rent developm ent policies should have links w ith the local level.
In this sense, it should be recalled that the econom ic crisis w h ic h broke out in the developed countries as fro m the end o f the 1970s had a pronounced
im pact on m any loca l areas, w h ic h suffered a deterio ration in th e ir econom ic and social conditions. In these
circumstances, the measures designed b y the central governm ents w ere generally too generic and ine ffec tive , since the distance and vertica l approach o f the la tte r prevented them fro m tak ing account in them o f the
specific features o f the d iffe rent local p roduction systems. Furtherm ore, the g row ing process o f transnationalization , g loba liza tio n and external openness o f
the economies has been show ing even m ore clearly the
enormous heterogeneity o f the d iffe rent local productio n systems and the ir greater exposure to the demands
o f the current phase o f technological transition and
structural change (A lburquerque, 2000).Som e authors, such as V á z q u e z B arquero
(20 0 0 a ), have described local econom ic developm ent in itia tives as being “ spontaneous” , since they w ere not induced o r prom oted fro m the central leve l o f the
State, w h ich was m ore concerned at that tim e w ith
coping w ith the demands o f m acroeconom ic stability
and the crisis in the trad itional sectors. A n analysis o f
the links betw een the decentra lization processes in
LOCAL ECO NO M IC DEVELO PM ENT A ND DECENTRALIZATION IN LATIN A M ERICA • FRANCISCO A LB URQ UERQ UE

158 C E P A L R E V I E W 8 2 • A P R I L 2 0 0 4
L a tin A m erican countries and the emergence o f local econom ic developm ent in itiatives also shows that the
la tter have been arising because o f the tension caused
by the necessary adaptation to the demands o f the c risis and econom ic restructu ring , in spite o f the
unfavourable context p reva ilin g in the countries o f the
region. A t a ll events, there can be no doubt that the
advance o f decentra lization processes is opening up
m ore room fo r the deploym ent o f local developm ent
in itia tives , w h ile the practical experience and re flec tions on local developm ent strategies represent an
innovative contribu tion w h ic h has encouraged a m ore
in tegra ted v ie w o f d eve lo p m en t its e lf (V á z q u e z
B arquero, 2000b ). A t the same tim e, the greater partic ipa tion o f loca l adm inistrations in econom ic developm ent and the efforts to increase productive em p loym ent have in vo lved a red istribution o f responsibilities
and functions in the econom ic f ie ld am ong the d iffe rent local levels o f the pub lic adm inistration.
T he boost g iven to pub lic -private cooperation
and the pursuit o f strategic consensuses am ong local econom ic and social actors fo r the design o f local developm ent strategies have brought about the ap p lication o f a fo rm o f shared econom ic developm ent w h ic h is not based solely on d irectives fro m the public sector o r s im ply guided b y the free m arket. In this
w ay, the search fo r an interm ediate space betw een the
m arket and the public authorities, that is to say, a space
at the m esoeconom ic level, has served to define a new
w ay o f p o licy -m akin g , and especially o f econom ic
developm ent po licy -m akin g . A l l this has m ade it possible to lin k together d iffe ren t processes in a v irtuous
circle o f interactions betw een the advance o f a more
partic ipative fo rm o f dem ocracy and the decentralization o f responsibilities a t the subnational levels, in
order to ensure the assum ption o f responsibilities, capabilities and resources by local bodies and actors
and thus prom ote loca l developm ent strategies.
IIIThe origin and objectives of local economic
development initiatives in Latin America
O ne o f the m ain conclusions w h ic h m ay be draw n
fro m an analysis o f local econom ic developm ent in itiatives in L a tin A m erica is the inc ip ien t nature and
sm all num ber o f the “best practices” existing in the
region. The analysis does, how ever, reveal some
exam ples w hich , a lthough they cannot be included
am ong the “best practices” , are nevertheless interesting in itia tives because they provide some useful lessons to fu rth er the collective learn ing process in this
fie ld .There is no single cause ly in g at the o rig in o f the
local econom ic developm ent in itiatives im plem ented
in L a tin A m erica . M a n y o f those in itiatives arose as a
reaction to loca l econom ic crisis situations and the
lack o f suitable policies em anating fro m the central leve l o f the State to deal w ith them . The industrial c risis w h ic h gave rise to the “ G ran A B C ” in itia tive in the
state o f Sao Paulo is a good exam ple o f this (Le ite , 2000).
L o c a l econom ic developm ent in itiatives have
also had to tackle econom ic problem s at the m unicipal leve l w h ic h are reflected in g row ing demands b y local
com m unities. A fte r the firs t popular election o f m a y ors in 1988, the m u n ic ipa lity o f Pensilvania, in the
eastern reg ion o f Caldas (C o lo m b ia ), began to p lay an
active role in the prom otion o f loca l econom ic developm ent, w h ile also p rom oting im provem ent o f the
road infrastructure, expansion o f the coverage o f public services, greater access o f the population to health
and education, and the im p lem entation o f program m es
and projects designed to generate source o f em p loym en t th ro u g h support fo r m icro -enterp rises
(M aldonado , 2000b ).In the same w ay, the restoration o f dem ocracy at
the m un ic ipa l and the local leve l in general has been
accom panied b y greater demands fo r the local public
authorities to present concrete program m es and p ro posals to the inhabitants on the substantive issues o f
the developm ent o f p roduction and em ploym ent at the
local level. In some cases, the emergence o f local econom ic developm ent in itiatives has been fac ilita ted by
an in te lligent process o f institu tional deconcentration
prom oted by some centra l-leve l bodies, as in the case
o f the So lidarity and Social Investm ent Fund (F O S IS )
LO CAL ECO NO M IC DEVELO PM ENT AN D DECENTRALIZATION IN LATIN AM ER IC A • FRANCISCO ALB URQ UERQ UE

C E P A L R E V I E W 8 2 • A P R I L 2 0 0 4 159
in C h ile , w here a leading role has been g iven to local team s so that they can act as local developm ent agents
(Caceres and F igueroa, 2000).In B ra z il, the need to fo rm a collective fro n t to
deal w ith the “fisca l w a r” situation acted as a p ow erfu l stim ulus fo r the m unicipalities o f the V a lle M e d io
Paraiba reg ion o f the state o f R io de Janeiro to take an
in itia tive w h ic h culm inated in the creation o f a F orum
o f Secretaries o f P lanning fo r the collective fo rm u la tio n o f measures to be taken at the m un ic ipa l leve l (C oelho, 2000b ). A lso in B raz il, in the state o f A cre,
the M u n ic ip a l Prefecture o f R io Branco prom oted a
project fo r the establishm ent o f an agro-forestry pole
in the rural surroundings o f that city to m eet the needs
o f the settlements o f peasant fam ilies displaced fro m
rural areas b y b ig com m ercia l agricu ltural projects
(C oelho, 2000a ). F in a lly , there is the exam ple o f V i l la
E l Salvador (Peru), w here the in itiatives taken had
the ir o rig in in the plans designed b y the central governm ent to prom ote se lf-bu ild activ ities in the areas o f
housing and urban infrastructure, instead o f the trad itional housing program m es subsidized b y the State
(Benavides and M an riq u e , 2000).There are thus tw o types o f tensions w h ic h incen
tivate local econom ic developm ent in itia tives “fro m
b e lo w ” . O ne is the tension caused by the developm ent o f dem ocracy its e lf and the d irect election o f the o ff icials responsible fo r the d iffe rent loca l levels o f public
adm inistration (m unicipalities , provinces, regions or
states), w h ic h m akes it necessary to m eet the demands
o f the public regarding the basic issues o f production
developm ent and em ploym ent in each loca l area. The
other is the tension caused b y the general s ituation o f
crisis and econom ic restructuring, w h ic h im pels the
actors in the private business sector to incorporate
m odernizing elements and processes o f adaptation to
cope w ith the new demands in the f ie ld o f production
and the h igher levels o f com petition in m arkets. In
add ition to these tw o types o f tensions “fro m b e lo w ”
there is another “top -d ow n ” process corresponding to
the advance o f decentralization and re fo rm o f the State
at the central leve l in the countries o f the region. This
does not ye t have a com plem entary relationship w ith
the a fo rem en tio n ed processes em an atin g “ fro m
b e lo w ” , but it is c lear that the advance in decentralizatio n should be capable o f creating favourable environments fo r the prom otion o f loca l econom ic developm ent in itiatives.
A t a ll events, it is im portant to note that the most advanced decentra lization processes, that is to say, those w h ic h include the d irect election o f a ll levels o f
local representation o f the citizens, fro m the m ayoral to the reg ional level, and w h ic h transfer resources and
decis ion-m aking powers to the subnational governments, are m uch m ore consistent bases fo r the p rom otio n o f loca l econom ic developm ent in itiatives. In the
state o f Jalisco (M e x ic o ), the decentra lization process
d id not stop w ith the transfer o f resources and powers
fo r the im provem ent o f m un ic ipa l m anagem ent but also incorporated a c lear productive dim ension, by
seeking to strengthen the m edium -s ized cities o f the
state and to prom ote trad itional industries and local S M E s. Thus, it is not m erely a question o f fiscal decentralization b u t o f reorganization o f the state by
strengthening its d iffe rent levels o f governm ent and
creating spaces fo r d ialogue, partic ipation and consensus-building am ong the d iffe rent loca l actors (R u iz
D uran , 2000a).In short, am ong the m a in objectives o f loca l eco
nom ic developm ent in itiatives in L a tin A m erica , spec ia l m ention m ay be m ade o f the fo llow in g :• Enhancem ent o f the endogenous resources o f
each local area by seeking to prom ote d iversified
production activities and encouraging the establishm ent o f new local enterprises.
• O rgan ization o f local networks am ong pub lic and
private actors in order to prom ote production and
business innovation in the local area.• Establishm ent o f in te r-m u n ic ip a l consortia in
order to increase the efficacy and effic iency o f
local developm ent activities.• Search fo r new sources o f em p loym ent and
incom e at the local level.• P rom otion o f scientific and technological devel
opm ent activities at the local level.• C reation o f new financ ing instruments to m eet
the needs o f loca l m icro - and sm all enterprises.• Progress beyond the lim ita tions o f the assisten-
tia lis t approach im p lic it in social investm ent funds and anti-poverty program m es.
• Incorporation o f city m arketing policies to p ro m ote system ic local com petitiveness.
• Search fo r strategic accords on environm ental goods and sustainable developm ent, lik e the sustainable developm ent strategy adopted in B uena
Vista, B o liv ia (Salinas, 2000a).
LOCAL ECO NO M IC DEVELO PM ENT A ND DECENTRALIZATION IN LATIN A M ERICA • FRANCISCO A LB URQ UERQ UE

160 C E P A L R E V I E W 8 2 A P R I L 2 0 0 4
IVThe basic elements of local economic development initiatives
A local econom ic developm ent in itia tive is not ju s t a
project w h ic h is successful in a loca l area. I t requires
an institu tionalized consensus am ong the m ost im p o rtant local public and private actors around a com m on
developm ent strategy (Â balos, 2 0 0 0 ). M oreo ver, a
com plex sum o f p rom otional instruments can never
take the place o f the set o f local institutions needed fo r
econom ic developm ent (Fa labella , 2 0 0 0 ). C reating
instrum ents fro m the central leve l w h ich can be used
by the d iffe ren t loca l areas is not the same as im p e llin g
and p rom oting a more im portant role and greater capab ilities o f those areas to m ake b etter use o f th e ir o w n
endogenous resources. Som e o f the cases outlined in
this project, such as those o f C o lom bia (M aldonado, 2 000a ) and M e x ic o (Casalet, 2 0 0 0 ), are quite eloquent in this respect, since they s till re flect a centralized
design o f p rom otional program m es and instrum ents
instead o f the local design o f measures to prom ote
econom ic developm ent.T h is lim ita tio n is accom panied b y a basically
assistentialist approach to m icro - and sm all enterprises in alm ost a ll the countries o f the region, w h ic h still
do not have locally-designed policies fo r the p rom otio n o f these kinds o f enterprises, in spite o f th e ir
num erical im portance, th e ir w idespread presence, and
th e ir im portance fro m the po in t o f v ie w o f generation
o f em p loym ent and incom e. A t the same tim e, the
degree o f preparation and consolidation o f the strategic capabilities o f the m un ic ipa lity and its capacity to
recognize the real econom ic, social and cultural situatio n o f the local area, the capacity fo r m ain tain ing a
dialogue w ith the com m unity, sk ill in p lanning prom otional actions, the capacity to coordinate and lin k up
developm ent actions w ith o ther econom ic, social and
p o litica l agents, and the capacity to present proposals
to other levels o f governm ent and negotiate w ith them
are likew ise key elem ents to p erm it the m unicipalities
to learn how to th in k out the type o f developm ent they
need in o rder to solve critical problem s such as the
lack o f productive em p loym ent and the m odernization
and d iversification o f the local p roduction base.
T he set o f basic elem ents w h ic h define local econom ic developm ent in itia tives and fo rm the fundam ental p illars fo r th e ir support are shown in figure 1.
Basic elements of local economic development initiativesF IG U R E 1
LO CAL ECO NO M IC DEVELO PM ENT AN D DECENTRALIZATION IN LATIN AM ER IC A • FRANCISCO ALB URQ UERQ UE
C E P A L R E V I E W 8 2 • A P R I L 2 0 0 4 161
M a n y o f the local econom ic developm ent in itia tives in
L a tin A m erica have made considerable progress in a
num ber o f the com ponents shown there. The w eak
points o f those in itiatives m ay be iden tified through
the absence o r weakness o f some o f those components.T he firs t th ing that leaps to o ne ’s attention is the
im portance o f the m o b iliza tio n and partic ipation o f the
local actors. This calls fo r the construction o f com m unity social capital, w h ich , in turn, requires the p rom otion o f a p ro -active, enterprising attitude, fa r rem oved
fro m the k in d o f approach w h ic h relies on subsidies. A t the same tim e, a local econom ic developm ent in itia tive requires a pro -active attitude b y local governments (and reg ional authorities in general) to the
developm ent o f p roduction and the generation o f
em ploym ent. Th is means that loca l pub lic authorities
m ust assume new functions that go beyond the ir trad itional roles as providers o f social, urbanistic and env ironm ental services at the local level.
I t m ust be stressed that the reg ional identity, like
social capital, m ust not be understood as assets w h ich
already exist in the area as the result o f the com bination o f p re-existing geographical o r h istorical factors, but as an intang ible asset w h ich can be constructed
loca lly by generating spaces fo r the b u ild in g o f consensuses and confidence am ong actors to tackle the
com m on challenges they share. In this sense, the partic ipation o f the d iffe rent local actors in the discussion
o f loca l problem s greatly assists this process o f construction o f a shared loca l identity and, u ltim ate ly , the
social construction o f the region. The Cooperation
Pact in the state o f C eara (B ra z il), w h ic h was o rig in a lly established as a fo ru m fo r discussions betw een
entrepreneurs and the state governm ent on the most im portant issues fo r loca l society, ended up by being
extended to the rem ain ing sectors o f c iv il society, thus
fo rm in g a n etw ork o f persons, m ovem ents and organizations interested in local developm ent (D o A m ara l F ilh o , 2000).
L ik e w is e , the S trateg ic P la n fo r R a fa e la
(A rgentina ) m ade it possible in 1996 to open up a
space fo r discussion by the w ho le o f loca l society fo r
the d efin itio n in a concerted and partic ipative m anner
o f the w ay the c ity ’s g row th should be p lanned and the
v is io n loca l society had o f the city. A s one o f the p ro jects in this Strategic P lan, late in 1997 the Institute fo r
L o ca l D eve lop m ent T ra in in g and Studies was set up; the purpose o f this m un ic ipa l body is to keep track o f
the changes in and evolu tion o f the local com m unity, w o rk in g to tra in hum an resources and foster a set o f
cultural and socioeconomic conditions favourable to
the developm ent o f the c ity and its region, in order to
strengthen in this w ay the interaction betw een the
State and local society and collaborate in the process
o f developing a new and d iffe rent fo rm o f m unicipal m anagem ent (Costam agna, 2000).
The local econom ic developm ent program m e o f
the m un ic ip a lity o f M e d e llin (C o lo m b ia ), fo r its part, incorporates urban and m etropo litan infrastructure
projects, as w e ll as objectives connected w ith the crea tion o f a new im age o f the city, thus com plem enting
the program m es to support the com petitiveness o f
local sm all and m edium -sized enterprises (Londono,2 0 0 0 ). L ikew ise , the m un ic ip a lity o f Bucaram anga
(C o lo m b ia ) has m ade a decided e ffo rt to participate in
fu rthering the com petitiveness o f the area by p rom oting the c ity o f Bucaram anga as the “Technopolis o f the
A ndes” ; as part o f this pro ject it has opened up concrete spaces fo r action w ith the private sector, the
C h am b er o f C o m m erce , and the D e p a rtm e n t o f
Santander and has prom oted im portant jo in t actions
(Vargas and Prieto , 2000).L o ca l governm ents are not alw ays the initiators
o f loca l econom ic developm ent processes, although in
the m ed ium term the ir presence in them is o f fundam ental im portance fo r establishing the institutions that those in itia tives require. M oreo ver, in dem ocracy they
are the most leg itim ate loca l pub lic authorities responsible fo r ca lling together the d iffe rent local actors and
seeking areas o f pub lic -private consensus to further
local econom ic developm ent. I t is therefore im portant that they should take the lead in fostering such
processes o f m o b iliza tio n and partic ipation o f local actors and fo rm in g teams o f leaders to ensure the continu ity o f the activities undertaken.
The m a in strategic objectives in the fo rm u lation
o f a local econom ic developm ent strategy backed by a
consensus am ong the m ain local actors are to m ake
better use o f the endogenous resources and to d iversify the loca l p roduction base through the incorporation
o f innovations based on h igh quality and d iffe rentia tion o f products and production processes; the incorporation o f m anagem ent innovations, and the in tro duction o f the necessary social and institu tional adaptations. The prom otion o f local m icro - and sm all enterprises and the tra in ing o f hum an resources in line w ith
the innovation needs o f the local p roduction system
are a fundam ental part o f this strategy too.The local supply o f business developm ent servic
es should include the tra in ing o f hum an resources in
line w ith the needs o f the local production systems, b o th in o rd er to m o d ern ize e x is tin g p ro du ction
LOCAL ECO NO M IC DEVELO PM ENT A ND DECENTRALIZATION IN LATIN A M ERICA • FRANCISCO A LB URQ UERQ UE

162 C E P A L R E V I E W 8 2 • A P R I L 2 0 0 4
activities and to incorporate o ther activities w h ich m ay
be v iab le in the im m ediate future. F o r this purpose, it is im portant to have the capability o f keeping track at a ll tim es o f the real and potential needs o f the local enterprises and the characteristics o f the local labour
m arket (Bernales, 2 0 0 0 ). A loca l developm ent strategy
can som etimes be in itia ted through the local coord inatio n o f some sectoral developm ent program m es and
instrum ents w h ich are defined at the central leve l but are to be im plem ented locally. F o r e ffic ien t coord inatio n o f d iffe rent sectoral program m es designed at the
central level, i t is essential that the actions taken
should be guided by the actual dem and, that is to say, by the real needs to be satisfied, w h ic h must be iden tif ie d and p rio ritized b y the local actors.
F in a lly , local econom ic developm ent in itia tives
must be institu tionalized by reaching the necessary
p o litica l and social agreements in the corresponding
local areas. L o ca l pacts w h ic h are above p o litica l party
considerations and enjoy the fu lles t possible partic ipatio n o f local actors should be sought, in order to endow
them w ith the highest possible levels o f stability, regardless o f possible p o litica l changes. The private
business sector needs to be represented in local developm ent institutions in order to avo id the uncertainty
arising fro m frequent changes in the local p o litica l representatives, w h ile the presence o f the pub lic
authorities at the head o f the local developm ent institutions seeks to endow the entire process w ith a lasting
m edium - and lon g-term perspective, w h ich is not alw ays possible w hen only short-term business benefits are sought.
E lec toral disputes and party differences should
not be a llow ed to interfere w ith the im p lem entation o f
the local econom ic developm ent in itia tives agreed
upon by the d iffe ren t social and econom ic actors. The
decision to fo rm a m ixed organization to execute the
agreements on local econom ic po licy and im prove the
com petitiveness o f the c ity o f Córdoba (A rgentina) was based on the conviction that it was necessary to
overcom e the trad itional separation betw een local governm ent and private enterprise (M arian acci, 2000). F o r this purpose, it is essential that the institu tional arrangements fo r such in itiatives should include the
signing o f “ local area pacts” fo r local developm ent that rise above party considerations ( D ’A nnunzio ,20 0 0 ). L o c a l investments fo r developm ent, w hether
tangible o r intangible , need longer lead tim es than
those connected w ith electoral and p o litica l cycles. This is w h y it is so necessary to ca ll upon the local p o litica l and social forces to invo lve them selves in
these in itiatives, so that e lectoral contests, although
perfectly leg itim ate , w i l l not w eaken the processes o f
lo ca l econom ic d eve lo p m en t and g en era tion o f
em ploym ent.
L o c a l econom ic d eve lo pm en t thus calls fo r
decided action by the local public bodies, w h ich
means that this d im ension m ust be incorporated in the
current program m es fo r the strengthening o f local governments. D ecen tra liza tio n cannot be lim ite d solely to im p ro v ing the capacity fo r the e ffic ien t m anagem ent o f the resources transferred to local governments
and m odernizing m un ic ipa l m anagem ent. These tasks
are extrem ely im portant, b u t the m odernization o f
local adm inistrations must also include the ir tra in ing
fo r the ir new role o f prom oters o f loca l econom ic
developm ent, so that, together w ith the private actors
and the rest o f local c iv il society, they can construct the necessary innovative local environm ents fo r the
p rom otion o f production and the developm ent o f the
local structure o f enterprises. The local developm ent strategy o f V il la E l Salvador (P eru ) was centered on
the establishm ent o f an industrial p ark fo r sm all enterprises, as part o f the new population settlement, fo r
w h ich purpose it fostered the provis ion o f com m on
business services and su itab le in frastructu re
(Benavides and M an riq uez , 2 0 0 0 ).
A s part o f th e ir e ffo rt to prom ote local econom ic
developm ent, m unicipalities should also adopt e ff icient organizational practices, in order to m odernize
the ir m anagem ent. To this end, they should undertake
adm inistrative m odern ization program m es and tra in
the ir s ta ff in order to im prove m un ic ipa l m anagem ent. A dopting a strategic approach and an integral conceptio n o f m un ic ipa l p lanning helps to visualize the context o f w h ich the c ity form s part and makes it possible
to incorporate an intersectoral v ie w o f the various
problem s faced, thus going beyond an approach based
only on physical and spatial considerations and v ie w ing urban matters in a ll th e ir social and econom ic
dim ensions. B y investing in pub lic w orks, m u n ic ip a lities g ive th e ir area added econom ic va lue and
enhance the com petitiveness o f the loca l production
base. The urban services provided b y the m u n ic ipa lity
are likew ise linked w ith loca l econom ic com petitiveness, since the quality o f those services increases the
attractiveness o f the area fo r private investm ent. Thus, an im portant function o f m unicipalities is to create the
necessary conditions in term s o f basic infrastructure
and urban developm ent services fo r the private business sector to take on its role as a producer o f goods
and services and a m otor o f the local economy.
LO CAL ECO NO M IC DEVELO PM ENT AN D DECENTRALIZATION IN LATIN AM ER IC A • FRANCISCO ALB URQ UERQ UE

C E P A L R E V I E W 8 2 • A P R I L 2 0 0 4 163
VCriteria for action
1. Construction of the local supply of businessdevelopment services
A crucial question fo r p rom oting local econom ic
developm ent is the construction o f a suitable local supply o f business developm ent services fo r m icro - and sm all enterprises, including services in the fields
o f technological and m arket in fo rm ation , innovation
in the fie lds o f products and production processes, technical and business m anagem ent tra in ing , cooperatio n am ong enterprises, m arketing and quality control, and financ ia l advice. Such services are alw ays hard to
reach fo r m icro - and sm all enterprises located in the
in te rio r o f the country.
I t m ust be borne in m ind, how ever, that in order
to iden tify the underly ing dem and fo r innovation in
the local p roduction systems, m ade up m ain ly o f
m icro - and sm all enterprises, it is necessary to take
pro-active action on the supply side, in order to overcom e the d ifficu lties that this segment o f business
experiences in m ak in g kn o w n the circumstances that affect its p roduction effic iency and com petitiveness.
It is not possible, therefore, to im p lic itly trust that it w i l l be the m icro - and sm all-scale entrepreneurs
themselves w ho w il l g ive tim e ly signals in these
strategic business developm ent services m arkets. E ven
they are not alw ays sufficien tly sure o f the future outloo k fo r th e ir businesses, not do they have the fin an c ia l resources to pay fo r such services. Furtherm ore, the loca l supply o f such services is not organized in
locations close to the clusters o f enterprises. In short, it is necessary to construct that m arket fo r business
factors and developm ent services through in te lligent measures that w i l l b ring about the c lear expression o f
the signals regarding the dem and fo r business services
w h ic h lies b e lo w the surface in the group o f local areas.
In local econom ic developm ent in itia tives, there
is a c lear need fo r a local production developm ent p o licy fo r m icro - and sm all enterprises, in order to ensure
the ir access to business developm ent services. This
means that business prom otion policies cannot be o f a
generic nature, but must incorporate a loca l d im ension. T he quantitative im portance o f the m icro - and
sm all enterprise sector has led to the generic design o f
measures fo r app lication en masse, w ith o u t taking
account o f special econom ic, local, technical o r p ro duction-related features. The d iffe ren t conditions p rev a ilin g w ith in the various sectors shows the need fo r
d iffe rent instruments and special targeting on the
groups to w h ic h they are directed, how ever. The
A rtic les o f A ssociation o f the R egional C ham ber fo r
the G reater A B C A re a ,1 in B raz il, note the fundam en
ta l im portance o f p ro v id ing support fo r m icro - and
sm all enterprises because o f th e ir im portance in terms
o f production, em ploym ent and incom e. In order to
give due attention to this group o f sm all businesses, how ever, a selective local po licy is needed w h ic h p ro motes the strengthening o f the production chains o f
the G reater A B C A rea in particular, instead o f the
usual generic policies w h ic h invo lve a great w aste o f
efforts (L e ite , 2000).In m any countries o f the region, loca l econom ic
developm ent in itiatives are not g iven sufficient support in central governm ent policy, in w h ic h p rio rity is
g iven to com petitive in tegration w ith in the g lo ba liza tio n process, thus p lac ing the internal lin k in g o f local econom ies on a secondary level. N o r have central public policies so fa r attached sufficient im portance to
m icro - and sm all enterprises as the e lem ent w h ich
integrates and strengthens the dom estic m arket, in
spite o f the im portance o f this segm ent o f enterprises
in term s o f em p loym ent and incom e in a ll the coun
tries o f the region.B usiness p ro m o tio n p o lic ies m ust p lace
emphasis on the im portance o f im p lem en tin g specific
program m es to strengthen the business skills o f
w om en, w ho represent a great po tentia l w ith in the
o vera ll group o f m ic ro - and sm all enterprises. In
m any cases, the b order b etw een the w orkshop and the
hom e is quite vague and the conditions o f w o rk and
production inev itab ly a ffec t the fam ily , w h ic h is not only a u n it o f consum ption b ut also o f labour and
production (B enavides and M an riq u e , 2 0 0 0 ). Specific
program m es are therefore needed w h ic h are a im ed at
1 The Greater ABC Area is the name given to the group o f three municipalities south o f Sao Paulo -S ao André, Sao Bernardo do Campo and Sao C aetano- which form one of the most dynamic areas in Brazil.
LOCAL ECO NO M IC DEVELO PM ENT A ND DECENTRALIZATION IN LATIN A M ERICA • FRANCISCO A LB URQ UERQ UE

164 C E P A L R E V I E W 8 2 • A P R I L 2 0 0 4
persons w ho use the ir o w n hom es as places o f
production. Through such program m es, w o m e n can
rece ive techn ica l, artis tic and business guidance
services, as w e ll as in fo rm atio n on legal aspects o f
production, details o f new products, easier access to
the existing lines o f finance, and incentives and
guidance fo r the fo rm atio n o f com m unity workshops
and product m arketing fac ilities .
2. Local development and municipal development
L o ca l developm ent policies are not lim ite d solely to
m unic ipa l developm ent. Som etim es the local area o f
action covers several m u n ic ip a lities w ith s im ila r
econom ic, labour and environm ental characteristics. The frontiers o f loca l p roduction systems therefore do
not necessarily have to coincide w ith the borders o f
the m unicipalities in question. Consequently, i t is
im portant to iden tify the appropriate units fo r action, by preparing special in fo rm ation systems fo r local econom ic developm ent: a task w h ic h the various local in itia tives should undertake sooner rather than later. T he study o f the production linkages and territo ria l location o f enterprises and activities is o f fundam ental im portance fo r fo rm u lating in te lligen t lines o f action
in term s o f local econom ic developm ent. The m ain
objective is to iden tify and understand the production
and m arketing structure o f the activities w h ich are
m ost im portant fo r the local econom y; that is to say, the set o f econom ic relations betw een producers, m arketers and clients, together w ith the necessary
support infrastructures, tra in in g and technological research centres, business services, and a ll the
elements associated w ith the environm ent in w h ich the
various activ ities and enterprises in vo lved in the
d iffe rent local areas are located.T his shows the desirab ility o f addressing the
challenges o f loca l econom ic developm ent jo in tly , through associations o f m unicipalities, and ensuring
in te lligent and coordinated action am ong the d ifferent local pub lic authorities at the m unicipal, p rovinc ia l, regional and central levels. L ikew ise , although this
m ay seem obvious, m u n ic ip a l developm ent must extend not only to the urban centre o f the m u n ic ip a lity, b u t also to the w ho le population o f the m unicipal area. Th is is a m atter o f fundam ental im portance w hen
it is a question o f m eeting the needs o f the population
spread out in peasant com m unities, w ho are o ften
ignored o r excluded fro m developm ent processes
(Zub ieta , 2000).
3. Local economic development: not merelythe development of endogenous resources
In order to prom ote loca l econom ic developm ent, it is
necessary not o n ly to m ake better use o f endogenous
resources but also to take advantage o f the outside
grow th opportunities that m ay exist. T h e im portant th ing is to f in d w ays o f endogenizing the favourable
im pacts o f those external opportunities through a
developm ent strategy defined and agreed upon b y the
various local actors. Thus, loca l econom ic developm ent in itia tives m ust not be seen as closed processes
con fin ed to lo c a l m arkets and using o n ly loca l resources (Benavides, 2000).
S om e loca l developm ent in itia tives lo o k fo r
spaces o f m utual benefits fo r both b ig firm s and the
local systems o f enterprises, b y seeking to prom ote
subcontracting schemes based on q u a lity and cooperatio n am ong firm s. T h is shows the im portance o f starting negotiations to strengthen the econom ic relations
betw een m icro-enterprises and b ig firm s, in order to
go beyond the leve l o f dependent sub-contracting. The
Chihuahua C enter fo r the D eve lop m ent o f Suppliers, in M e x ic o , has persuaded outside agents to adopt a
position o f com m itm ent to the developm ent o f local suppliers. There is a great deal o f potential in this fie ld , since the sm all enterprises o f the reg ion can lin k up
w ith this e ffo rt w ith support fro m the tra in ing and
advisory assistance program m es o f the A utonom ous
U n ivers ity o f C hihuahua, the Autonom ous U n ivers ity
o f C iu dad Juárez, and the C h ihuahua Cam pus o f the
M o n te rre y In s titu te o f Techno logy (R u iz D u rán , 2000b ).
A n o th er fo rm o f partic ipation b y the private secto r is through the granting o f concessions fo r w orks
and services previously provided b y the loca l authorities. Thus, the concessions granted by the m u n ic ip a lity o f R ancagua (C h ile ) fro m 1993 onwards provide fo r
the construction o f infrastructure and urban equipm ent at no cost to the m un icipality , w h ic h thus obtains p rivate resources fo r the execution o f projects o f social value. T he process o f aw ard ing these concessions was
endow ed w ith the necessary transparency b y the adoptio n o f a set o f rules and regulations on the granting o f
concessions (M u ñ o z , 2000).
LO CAL ECO NO M IC DEVELO PM ENT AN D DECENTRALIZATION IN LATIN AM ER IC A • FRANCISCO ALB URQ UERQ UE

C E P A L R E V I E W 8 2 • A P R I L 2 0 0 4 165
4. Access to credit for micro- and small enterprises
O ne o f the aspects w h ic h explains the lack o f f le x ib ility and re la tive uselessness o f the existing instruments
fo r the p rom otion o f p roduction activities has to do
w ith the fac t that since they are m ain ly provided
according to trad itional criteria on the p ro fitab ility o f
the econom ic activ ities thus supported, this rules out m any production units w h ic h do not satisfy the established conditions because they do not have bank guarantees, they have only a sm all annual sales vo lum e, or
they belong to the in fo rm al sector. I t is therefore
im portant to create local funds fo r the developm ent o f
m icro - and sm all enterprises, in order to overcom e
the ir d ifficu lties in ga in ing access to m ed ium - and
lon g-te rm lines o f finance. The C om m unity C red it In s titu tio n (P O R T O S O L ) is p art o f the L o c a l Econom ic D eve lop m ent P la n o f the city o f Porto
A legre (B ra z il). Th is is an institu tion w h ic h was pro posed by the Prefecture o f the c ity b u t has been fo rm ulated and executed in co llaboration w ith o ther p ri- vate-sector local econom ic and social agents (C oelho, 2000a ). Such a system o f technical assistance and
tra in ing , together w ith the p rovis ion o f lines o f credit, is o f fundam ental im portance fo r consolidating and
expanding projects b y sm all producers w h ic h are
g iven financ ia l aid.
5. Promoting association and cooperation among micro- and small enterprises
T here are m any d ifficu lties w h ic h h inder the fu ll
invo lvem ent o f the private business sector in local econom ic developm ent in itia tives, such as the d iffe rence in interests, the sm all size o f m ost local enterprises, and the unequal le v e l o f representation o f the
re levant business organizations. L ikew ise , the diverse
activities carried on b y these organizations and the ir
sectoral approach, together w ith the ir trad itional m istrust o f local governm ents, also lim it the ir partic ipatio n in projects fo r pub lic -private cooperation at the
local level. Consequently, in order to achieve adequate
incorporation o f the business sector in local econom ic
developm ent in itia tives , i t is necessary to strengthen
the institu tional arrangements fo r the representation o f
trade and business associations and support changes in
these bodies in at least tw o k ey aspects: the transition
fro m a sectoral v ie w to one based on the production
linkages that exist, and the replacem ent o f th e ir usual lobbying approach by one that seeks to support and
prom ote local production systems.In order fo r the producers’ associations to change,
they must b eg in to support the firm s they represent in
matters such as technological developm ent, m arket in fo rm ation , etc. A t the same tim e, they must prepare
themselves to take part, together w ith the local governments, in the d e fin itio n o f m a jo r reg ional develop
m ent objectives and projects. Som etim es the situation
is quite precarious in this respect, as there is not even
yet a perm anent means fo r the in ter-institu tional coord ination o f the actors. In this case, the im m ediate challenges are to prom ote encounters w ith the organized
producers to discuss local econom ic prom otion and
assume responsibilities fo r it; to m ake producers m ore
aw are o f p ro fitab le activities, and to provide jo in t support fo r the study o f m arketing possibilities that can
m ake local econom ic in itia tives v iab le .
6. The need to link the regional universities and scientific and technological research centres with the local production systems
T he trad itional generalist approach o f universities has
been overtaken b y new developm ents, lik e so m any
trad itional form s o f transm ission o f know ledge. The
need to tra in hum an resources capable o f asking them selves good questions and not ju s t m e m o riz in g
answers that are already w ritten dow n is increasingly
obvious, in v ie w o f the rap id pace o f change in the
w o rld o f today. L ikew ise , m ore integrated form s o f
teaching are required. Th is also brings into question
the content o f m any study plans, to say nothing o f the
excessive attachm ent o f m any o f those plans to outw o rn v iew s and the ir in ab ility o r unw illingness to
adapt to the new realities. A bove a ll, it is necessary to
overcom e as soon as possible the disparity betw een
the supply o f tra in ing offered b y the universities and
tra in ing centres and the innovation needs o f the v a r ious local production systems. F o r this purpose, it is
essential fo r the educational, university and scientific
and technological research bodies to p lay an active
p art in lo c a l econom ic d eve lo pm en t in itia tiv e s . Through the decided action o f the local actors it w i l l be possible to b u ild links betw een the supply o f
know ledge and its end-users o r o ther sources o f
dem and in the d iffe rent local p roduction systems.
LOCAL ECO NO M IC DEVELO PM ENT A ND DECENTRALIZATION IN LATIN A M ERICA • FRANCISCO A LB URQ UERQ UE

166 C E P A L R E V I E W 8 2 • A P R I L 2 0 0 4
In order to achieve a h igher leve l o f com plex ity
and diversity in the local production system and, in
particular, to tra in peasants in m anagem ent and product m arketing techniques, the in itia tive launched by
the province o f E l L oa , in C h ile , sought the collaboratio n o f the universities in the northern reg ion o f the
country, and they began to incorporate areas o f tra in ing that w i l l m ake it possible to achieve the econom ic
sustainability o f the various peasant production p ro jects -p ro d u c tio n o f goat cheese, fo r e x a m p le - by
exploring sales channels and supply strategies both
inside and outside the reg ion (Salinas, 2000b ). In
C olom bia , one o f the m a in aspects responsible fo r the
restructuring o f the Industria l U n ive rs ity o f Santander
was the desire to establish closer links betw een that ins titu tio n and the production sector o f the c ity
through the developm ent o f concrete projects in v a r ious areas, such as the feas ib ility studies fo r the crea tio n o f the “ C o rp o rac ió n B u caram an ga
Em prendedora” incubator fo r technology-based enterprises, w h ic h was indeed established la ter (Vargas and
Prieto , 2000).
7. Basic infrastructure endowment for local economic development
The provis ion o f basic infrastructure in accordance
w ith local econom ic developm ent needs is v ita lly necessary, because som etimes the existing infrastructure
corresponds alm ost entire ly to the needs o f b ig firm s, and this does not alw ays ensure the necessary in te rconnection o f the local p roduction systems, resulting
in inadequate links am ong the areas o f p roduction and
betw een them and the m a in d istribution and m arketing
centres. In C h ile , fo r exam ple, although R oute 5, w h ic h runs through the A raucania reg ion fro m north to
south, is the com m unications backbone o f the region, i t only provides w eak in ternal interconnections, resulting as noted above in inadequate links am ong the areas
o f production and betw een them and the m ain d is tri
bu tion and m arketing centres (Bernales, 2 0 0 0 ).In Ilo (Peru), fo r its part, the m unicipality has
obtained resources fro m the central governm ent to channel the waters o f the river Osmare to the w ater treatment plant; it has negotiated w ith the O ffice o f the President o f the Republic the provision o f an adequate supply o f
w ater to the upper part o f the city, where the Industrial Park is located but w hich suffered fro m w ater shortage
and low w ater pressure; and it has made substantial
investments in the asphalting o f the streets o f the port and the construction o f a land transport term inal, in order
to facilitate transport and com merce (Benavides, 2000).
8. The adaptation of the legal and juridical frameworks for the promotion of local economic development, and the need to incorporate follow-up and evaluation mechanisms
W h e n designing and im p le m e n tin g lo c a l econom ic
deve lo pm en t p o lic ies , i t is necessary to c la rify the
ro le o f the centra l govern m en t in the specific context o f this type o f in itia tives : i t m ust not o n ly prom ote
such in itia tiv e s by g iv in g a dec ided boost to decentra liz a tio n b u t m ust also adapt the necessary ju r id i cal, le g a l and regu la tory fra m e w o rk fo r the p ro m o tio n o f lo ca l econom ic developm ent. So far, h o w e v er, lo c a l econom ic deve lo pm en t in itia tiv e s have run
in to m any obstacles in these fie ld s , w h ic h reflects
the lack o f congruence b etw een th e m and the p r io r ity concerns o f centra l governm ents, w h ic h s till do
not seem to attach su ffic ien t im portance to them . “P rod uction support” is som etim es equated w ith the
execu tio n o f in fras tru c tu ra l w orks in the areas o f
basic sanitation, u rban ism , roads and h ighw ays , i r r i
gation , hea lth o r education, b u t u sually w ith o u t
in c lu d in g the construction o f m arkets fo r strategic
factors and services fo r the d eve lo pm en t o f m ic ro -
and sm all enterprises in the various lo ca l p ro du ction
systems.I t is hard to o b ta in finance fo r in s titu tio n a l
investm ents o f an in tang ib le nature, such as the cons truction o f n e tw orks o f lo c a l actors, in L a t in
A m erica : the c rite ria d e fin in g the a c tiv ities that can
be fin an ced b y the ex is tin g funds g ive p rio r ity to
tan g ib le investm ents o f a social nature and relegate
to a m in o r le v e l those connected w ith the construct io n o f in n o v a tiv e lo ca l environm ents. I t m ust be
em phasized tha t today this k in d o f in tan g ib le in ves tm ent is ju s t as im p o rtan t as investm ent in roads o r
te lecom m unications, since o ve ra ll i t m akes i t possib le to estab lish the m a in conditions needed fo r the
ach ievem ent o f system ic lo ca l com petitiveness. In
some cases, the lim ita tio n s are due to an unsuitable
design im posed fro m outside, w ith an essentia lly
assistentialist approach, b u t in others they are due to
the fa ilu re to adapt the ju r id ic a l fram ew o rks o f the
countries to current needs, thus p reven ting the co p artic ip a tio n o f the lo ca l p u b lic a d m in is tra tio n and
LO CAL ECO NO M IC DEVELO PM ENT AN D DECENTRALIZATION IN LATIN AM ER IC A • FRANCISCO ALB URQ UERQ UE

C E P A L R E V I E W 8 2 • A P R I L 2 0 0 4 167
the private business sector in the creation of mixed local economic development institutions.
It should also be noted that all local economic development initiatives need permanent evaluation mechanisms. The indicators of the success of such initiatives are not only quantitative, however. Equally necessary are indicators on the construction of the social and institutional capital needed by those initiatives, which provide a better understanding of the technical, social, institutional, political and cultural dimensions of local development. Sometimes, establishing such qualitative indicators seems to present a problem for researchers, but it is perfectly possible to measure these qualitative phenomena one way or another: for example, through the number of local consensus-building bodies which have been set up and consolidated, the degree of participation of those who take part in them, the resources contributed by the various local actors to those bodies, etc.
The degree of public-private involvement in local economic development initiatives, both in the formulation of projects and in their execution, is a good indicator of the success of such initiatives. Another important indicator in local economic development initiatives is the creation of institutions that place the existing public-private agreements on a formal basis. If it is desired to promote local economic development, it is necessary to join wills, stimulate dialogues, build public and institutional agendas, construct local networks, and assume and share responsibilities. Thus, local economic promotion depends not only on the attainment of indicators of economic efficiency, but also on vital investment in the social and institutional capital needed to ensure the success of these processes.
9. E ff ic ie n t c o o rd in a tio n a m o n g in s titu t io n s
As already noted, many local economic development initiatives have problems in achieving effective and efficient coordination among the different levels of institutions (central, provincial and local) of the public administration and among the different sectoral ministries or bodies. However, the excessive distances that sometimes exist between the capital city where the regional (departmental or state) government is located and the different municipalities could be mitigated through more active behaviour on the part of the intermediate levels (provinces
or micro-regions). As shown in the case study on Rancagua (Chile), the existing set of bodies or services may not achieve fully coordinated action at the local level because it is based on a sectoral and centralist design. Its local institutional linkages must therefore be strengthened in order to increase its efficacy and efficiency. Likewise, the relations between the central and municipal levels may suffer from insufficient coordination of measures to promote production, thus causing duplication of efforts and resources (Muñoz, 2000).
There is also a need to overcome the system of dispersed action by non-governmental or international cooperation organizations, mostly based on an assistentialist approach. Local economic development is not just social or solidary development. It is also a question of promoting the introduction of technological, management, social and institutional innovations in the local production systems, in order to generate suitable conditions for the viable and sustained creation of employment and income. Priority attention to the needs of micro- and small enterprises and the strengthening of local governments for the promotion of local economic development must therefore be incorporated in the development strategies of the different local areas, in order to obtain more consistent results than those achieved through praiseworthy but excessively isolated efforts. At the local level, therefore, there must be institutions capable of coordinating the dispersed actions of NGOs and international cooperation bodies.
10. T h e n e e d fo r c o m p le m e n ta r ity b e tw e e n
s o c ia l in v e s tm e n t fu n d s and re s o u rc e s fo r
th e p ro m o tio n o f lo ca l e c o n o m ic
d e v e lo p m e n t
Finally, it should be noted that social investment funds and investments to promote production are complementary, and it is a mistake to think that it is only necessary to think in terms of the latter when social needs have been taken care of. As a peasant woman who was once a municipal councillor in Irupana (Bolivia) said: “It is no use building local heath centres if we have no money to maintain our families” (Zubieta, 2000). It is indeed little use investing in rural health facilities or schools if the inhabitants have to emigrate to find a job. Paying attention to social investments without
LOCAL ECO NO M IC DEVELO PM ENT A ND DECENTRALIZATION IN LATIN A M ERICA • FRANCISCO A LB URQ UERQ UE

168 C E P A L R E V I E W 8 2 • A P R I L 2 0 0 4
simultaneously incorporating a local economic development approach is nonsensical. Both these things must be addressed in an integrated manner, as many social investments (such as those in health, education and housing, for example) are also investments in development: raising the skills of the human resources is crucial in any development strategy, and even more so in the present “knowledge society”.
Consequently, social policies cannot be considered apart from development policies. Decentralized bodies generally show considerable “know-how” in their handling of social development instruments, but much less in the field of the promotion of production.
The absence of funds for the promotion of local economic development initiatives which are complementary to social investment funds is thus a serious shortcoming in Latin America, in contrast with the situation in the developed countries. In this respect, it would be desirable for the multilateral organizations which have an influence in Latin America and the Caribbean to consider the possibility of creating funds to promote local development
initiatives - like the structural funds in the European Union - in order to make up for the limitations of the assistentialist approach of the social investment funds in Latin America.
In this sense, it is important to emphasize that local economic development is an alternative approach to that based on assistentialist policies to overcome poverty, and it seeks to influence the generation of employment and income by improving the productivity and competitiveness of the various local production systems. This involves progressing from an assistentialist design to one based on economic development and from a sectoral view to one of a more integrated and horizontal nature, according to the characteristics, actors and social capital of each local area. It is in this local area that the demand for the modernization of the existing structure of enterprises is defined, and it is on the basis of this demand that the appropriate supply of innovation services and technical and business training for the promotion of local production must be built up.
(Original: Spanish)
Bibliography
Ábalos, J.A. (2000): El fomento al desarrollo productivo local: orientaciones, actores, estructuras y acciones. La situación en Chile en los noventa, LC/R.1976, Santiago, Chile, Economic Commission for Latin America and the Caribbean (ECLAC), February.
Affonso, Rui de Britto Alvares (2000): Descentraliza9áo, desen- volvimento local e crise da Federa9áo no Brasil, LC/R.1975, Santiago, Chile, Economic Commission for Latin America and the Caribbean (ECLAC).
Aghón, G., F. Alburquerque and P. Cortés (2001): Desarrollo económico local y descentralización en América Latina: un análisis comparativo, LC/L.1549, Santiago, Chile, Economic Commission for Latin America and the Caribbean (ECLAC).
Alburquerque, F. (2000): Las agencias de desarrollo regional y la prom oción del desarrollo local en el Estado español, LC/R.1973, Santiago, Chile, Economic Commission for Latin America and the Caribbean (ECLAC).
Becattini, G. (1979): Dal settore industriale al distreto industriale: alcune considerazione sull unita di indagine dell’economia industriale, Rivista di Economia e Politica Industriale, No. 1.
Benavides, M. (2000): Estudio de caso a nivel local: el Programa Municipal de Desarrollo Empresarial (PROMDE) y la experiencia de la M unicipalidad de Ilo, Perú, LC/R.2015, Santiago, Chile, Economic Commission for Latin America and the Caribbean (ECLAC).
Benavides, M. and G. Manrique (2000): Parque industrial del distrito Villa El Salvador: una iniciativa para el desarrollo económico local en Perú, LC/R.2016, Santiago, Chile, Economic Commission for Latin America and the Caribbean (ECLAC).
Bernales, O. (2000): El Programa Red de Equipos Municipales de
Gestión Estratégica (EMGES): una experiencia de asociativi- dad para el desarrollo de las comunas de Angol, Renaico, Collipulli y Ercilla, IX Región de la Araucanía, Chile, LC/R.1945, Santiago, Chile, Economic Commission for Latin America and the Caribbean (ECLAC).
Cáceres, L. and N. Figueroa (2000): Sistematización Ranquil, Chile: una experiencia sobre la generación de condiciones para el desarrollo económico local, LC/R.2019, Santiago, Chile, Economic Commission for Latin America and the Caribbean (ECLAC).
Casalet, M. (2000): Descentralización y desarrollo económico local: una visión general del caso de México, LC/R.1974, Santiago, Chile, Economic Commission for Latin America and the Caribbean (ECLAC).
Coelho, F. Dias (2000a): Desenvolvimento económico local no Brasil: as experiencias recentes num contexto de descentral- iza9áo, LC/R.1972, Santiago, Chile, Economic Commission for Latin America and the Caribbean (ECLAC).
______ (2000b): Consórcios regionais de desenvolvimento: os m ercados regionais no Estado do Rio de Janeiro, LC/R.1982, Santiago, Chile, Economic Commission for Latin America and the Caribbean (ECLAC).
Costamagna, P (2000): La articulación y las interacciones entre instituciones: la iniciativa de desarrollo económico local de Rafaela, Argentina, LC/R.2011, Santiago, Chile, Economic Commission for Latin America and the Caribbean (ECLAC).
D 'Annunzio, M. C. (2000): Iniciativa de desarrollo económico local. La articulación y las interacciones entre instituciones: el caso de Tandil, Argentina, LC/R.2003, Santiago, Chile, Economic Commission for Latin America and the Caribbean (ECLAC).
LO CAL ECO NO M IC DEVELO PM ENT AN D DECENTRALIZATION IN LATIN AM ER IC A • FRANCISCO ALB URQ UERQ UE

C E P A L R E V I E W 8 2 • A P R I L 2 0 0 4 169
Do Amaral Filho, J. (2000): Desenvolvimento local e descentraliza- 9áo na América Latina: el caso del Estado de Ceará, Brasil, LC/R.2012, Santiago, Chile, Economic Commission for Latin America and the Caribbean (ECLAC).
Falabella, G. (2000): Los cien Chile: más allá del país promedio. Estudio exploratorio, LC/R.2020, Santiago, Chile, Economic Commission for Latin America and the Caribbean (ECLAC).
Haldenwang, C. von (2000): Nuevos conceptos de la política regional de desarrollo en Alemania: aportes para la discusión latinoam ericana, LC/R. 1965, Santiago, Chile, Economic Commission for Latin America and the Caribbean (ECLAC).
Kliksberg, B. and L. Tomassini (eds.) (2000): Capital social y cultura: claves estratégicas para el desarrollo, Buenos Aires, Fondo de Cultura Económica.
Leite, M. de Paula (2000): Desenvolvimento económico local e descentraliza9áo na América Latina: a experiencia da Cámara regional do Grande ABC no Brasil, LC/R. 1980, Santiago, Chile, Economic Commission for Latin America and the Caribbean (ECLAC).
Londoño, C. A. (2000): La gestión del desarrollo en Antioquia, Colom bia, LC /R .2018, Santiago, Chile, Economic Commission for Latin America and the Caribbean (ECLAC).
Maldonado, A. (2000a): Descentralización y desarrollo económico local. Una visión general del caso de Colombia, LC/R.1968, Santiago, Chile, Economic Commission for Latin America and the Caribbean (ECLAC).
_______ (2000b): La experiencia de desarrollo económico local delmunicipio de Pensilvania (Colombia), LC/R.1979, Santiago, Chile, Economic Commission for Latin America and the Caribbean (ECLAC).
Marianacci, G. (2000): Descentralización y desarrollo económico local: estudio de caso de la ciudad de Córdoba, Argentina, LC/R.2010, Santiago, Chile, Economic Commission for Latin America and the Caribbean (ECLAC).
Marshall, A. (1963): Principios de economía, Madrid, Aguilar. Published originally in 1890.
Muñoz Villalobos, C. (2000): La experiencia de desarrollo económico local en el municipio de Rancagua: Programa Rancagua Emprende, Sexta Región, Chile, LC/R.1986, Santiago, Chile, Economic Commission for Latin America and the Caribbean (ECLAC).
OECD (Organisation for Economic Co-operation and Development)
(1999): Redes de empresas y desarrollo local. Programa de Empleo y Desarrollo Económico Locales (LEED), Paris.
Ruiz Durán, C. (2000a): Esquema de regionalización y desarrollo local en Jalisco, México: el paradigma de una descentralización fundam entada en el fortalecim iento productivo, LC/R.2014, Santiago, Chile, Economic Commission for Latin America and the Caribbean (ECLAC).
_______ (2000b): El paradigma de desarrollo regional basado en lacooperación público-privada: el caso de Chihuahua, México, LC/R.2013, Santiago, Chile, Economic Commission for Latin America and the Caribbean (ECLAC).
Salinas, Jorge (2000a): Desarrollo turístico en el municipio de Buena Vista, Santa Cruz, Bolivia: desafíos y opciones para im pulsar un proyecto de desarrollo local, LC /R .2036, Santiago, Chile, Economic Commission for Latin America and the Caribbean (ECLAC).
_______ (2000b): Concertación de actores territoriales para el impulso del desarrollo productivo de la provincia del Loa, región de Antofagasta, Chile, LC/R. 1988, Santiago, Chile, Economic Commission for Latin America and the Caribbean (ECLAC).
Sforzi, F. (1999): La teoría marshalliana para explicar el desarrollo local, in F. Rodríguez (ed.), Manual de desarrollo local, Asturias, Editorial Gijón.
Vargas, C. and R. Prieto (2000): Alianza del sector público, sector privado y academia para el desarrollo productivo y la com- petitividad de Bucaram anga, Colom bia, LC /R .2017, Santiago, Chile, Economic Commission for Latin America and the Caribbean (ECLAC).
Vázquez Barquero, A. (2000a): Desarrollo económico local y descentralización: aproximación a un marco conceptual, LC/R.1964, Santiago, Chile, Economic Commission for Latin America and the Caribbean (ECLAC).
(2000b): La política de desarrollo local en Italia: instrumentos y experiencias, LC/R.1978, Santiago, Chile, Economic Commission for Latin America and the Caribbean (ECLAC).
Zubieta, Javier (2000): Estudios de caso a nivel local: elementos para el desarrollo del municipio de Irupana, la experiencia de la Corporación Agrícola Campesina y el proceso participativo de elaboración del Plan Operativo Anual, LC/R.2037, Santiago, Chile, Economic Commission for Latin America and the Caribbean (ECLAC).
LOCAL ECO NO M IC DEVELO PM ENT A ND DECENTRALIZATION IN LATIN A M ERICA • FRANCISCO A LB URQ UERQ UE


171
R o s a l ía C o r t é s
R e s e a r c h P r o f e s s o r
f rcortes@ fiberte l.com .ar
F e r n a n d o G r o i s m a n
G u e s t R e s e a r c h F e l lo w
f fgroism an@ tutopia .com
L a t in A m e r i c a n F a c u l t y
o f S o c ia l S c i e n c e s
( E c o n o m i c s a n d T e c h n o l o g y
S e c t i o n ) a n d
N a t i o n a l C o u n c i l f o r S c i e n t i f i c
a n d T e c h n o l o g i c a l R e s e a r c h
( F L A C S O - C O N I C E T ) , A r g e n t i n a
C E P A L R E V I E W 8 2 • A P R I L 2 0 0 4
Migrations, the labour market and povertyin Greater Buenos Aires
Rosalía Cortés and Fernando Groisman
T his s t u d y a n a l y s e s t h e l a b o u r b e h a v i o u r o f t w o s e g m e n t s o f
m i g r a n t s - o n e c o m i n g f r o m t h e p r o v i n c i a l a r ea s o f A r g e n t i n a a nd
t h e o t h e r f r o m n e i g h b o u r i n g c o u n t r i e s - in G r e a t e r B u e n o s Ai res
d u r i n g t h e 1 9 9 0 s . T h e i r l a b o u r t r a j e c t o r i e s w e r e d i f f e r en t : t h e e c o
n o m i c a c t i v i t y o f t h e m i g r a n t s f r o m n e i g h b o u r i n g c o u n t r i e s
i n c r e a s e d , b u t t h e r e w a s an e x p a n s i o n in t h e p r o p o r t i o n o f i n t e r na l
m i g r a n t s in t h e " n o t w o r k i n g " c a t e g o r y . A p r o c e s s o f r e p l a c e m e n t o f
i n te rn a l m i g r a n t s w i t h m i g r a n t s f r o m n e i g h b o u r i n g c o u n t r i e s t o o k
p la ce : t h e l a t te r w o r k e d in p r e c a r i o u s , p o o r l y - p a i d o c c u p a t i o n s ,
w h i l e t h e i n t er na l m i g r a n t s s w e l l e d t h e r a n k s o f t h e " s t r u c t u r a l p o o r " :
p e r s o n s w i t h no t r a d e , o n l y o c c a s i o n a l e m p l o y m e n t , a nd f e w p o s s i
b i l i t i es o f i m p r o v i n g t he i r s i t u a t i o n in t h e n ea r f u t ure .

172 C E P A L R E V I E W 8 2 • A P R I L 2 0 0 4
IIntroduction
This study analyses the differences that occurred in the course of the 1990s in the labour situation of recent internal migrants and migrants from neighbouring countries (hereinafter also referred to as “cross-border migrants”) who arrived in Greater Buenos Aires during that period.1 In that decade, the low fixed exchange rate attracted migrants from Chile, Paraguay, Uruguay, Bolivia and latterly Peru, even in the years of recession, which represented a difference from the behaviour of internal migration flows.
From the mid-1970s and during the following decade -that of the debt crisis- the stagnation of the product and of the demand for labour had caused a slowing-down in the growth rates of the labour force, employment and income. The recessionary context affected the rate of internal and international migrations to the metropolitan area, which fell below their historical levels between 1975 and 1980 because of the return of migrants to their provinces or countries of origin.2
The international migrants from neighbouring countries who arrived in Greater Buenos Aires had historically shared a number of common characteristics with migrants from provinces in the interior of Argentina. With low levels of education and skills, they mostly entered the informal sector of the labour market, with working conditions and wages that were lower than those of the native population (locally- born citizens or long-time residents). Consequently, they were more vulnerable than the native population
to cyclical swings in the economy and employment.3In the 1990s, however, the behaviour of internal
and cross-border migrants to Greater Buenos Aires took on different features from those prevailing in the previous period. During the short period from 1991 to 1993, the growth rates of the product, labour supply and employment all coincided, and in those years the recovery of the economy and the increase in the demand for labour became a factor of attraction for internal migrants, while the overvaluation and stability of the local currency also attracted migrants from neighbouring countries. After the crisis in 1995 and during the period of expansion between 1996 and 1999, however, there was a decline in the demand for labour in the most traditional sectors in which those migrants sought work, and this affected the level of internal migrations. Migrations from neighbouring countries behaved differently, however: the fixed exchange rate lasted until the end of 2001 and served as an incentive for migration from other countries of the region.
In addition to this reduction in internal migration flows and the maintenance of those from neighbouring countries, some differences also began to emerge in the composition and employment status of recent migrants in both groups.4 Firstly, whereas in the 1970s and 1980s both groups had similar levels. of education, in the 1990s the cross-border migrants -especially the women- had higher levels of education than those of the internal migrants. Secondly, the labour trajectories of the two groups started to draw apart. The severe crisis in 1995 caused a contraction in labour demand in the construction, domestic service and manufacturing sectors, which became net expul sors of labour.5 This gave rise to an increase in open unemployment in both groups of recent migrants, but
The authors wish to express their thanks for the valuable com ments o f an anonymous referee.1 In this paper, “migrants from neighbouring countries” refers to foreigners from Chile, Paraguay, Uruguay, Bolivia, Brazil and also, in the 1990s, Peru, while “internal m igrants” means those coming from Argentine provinces in the interior o f the country. The provinces from which such migrants came were mainly Santiago del Estero, Corrientes, Chaco, Entre Ríos, Tucumán, Salta and Jujuy. Table A.1 o f the Appendix shows the relative proportions o f internal migrants and those from neighbouring countries, by province or country o f origin.2The migration rate went down from 2.3 per thousand in the 19701975 period to -1 .6 per thousand in 1975-1980 (CELADE, 1998), and there was also a decline in the proportions o f migrants from other provinces (from 8% to 6%) and from neighbouring countries (from 0.9% to 0.5%) in the total population (INDEC, 1980).
3 Between 1978 and 1982, for example, unemployment in the m etropolitan area o f Buenos Aires - “Greater Buenos Aires” - affected migrants more than natives (Cortés, 1985).4 The analysis o f the behaviour o f recent cross-border and internal migrants is limited to those migrants arriving in the area in the last ten years, according to the respective m easurem ents o f the Permanent Household Surveys. The source o f the information is described in the Appendix.5 The nationwide unemployment rate in construction rose from 14% in 1993 to 31% in 1995, subsequently never falling below 23%
MIGRATIONS, THE LABOUR MARKET A ND PO VERTY IN G REATER BUENO S A IR E S • RO SALÍA C O RTÉS A ND FERNAN DO G ROISM AN
C E P A L R E V I E W 8 2 • A P R I L 2 0 0 4 173
among the internal migrants there was also an increase in the proportion of inactive persons - those in the “not working nor looking for work” category - which was probably a factor in the slackening in migration flows and - this is speculation, since there are no data that prove or disprove it - an increase in the rate of departure from the metropolitan area.
After the brief period of economic expansion which ended in 1994, and as from the 1995 recession, the decline in the proportion of internal migrants in the area in question would appear to indicate that open unemployment acted as a factor that discouraged internal migration to the area. In contrast, the overvaluation of the local currency exchange rate continued to attract migrants from neighbouring countries (including Peru). The decline in employment in the branches
which traditionally employed migrant labour was a factor in the reduction of the proportion of internal migrants, while there was an increase in the relative proportion of cross-border migrants, who finally lasted longer in these jobs. This situation of high unemployment and relative abundance of cross-border migrant labour favoured the spread of precarious working conditions in this segment; recent cross-border migrant workers formed a segment marked by low-quality working conditions: lack of social protection, long hours and low wages. The internal migrants, for their part, without a trade or engaged in only casual employment, with few possibilities of improving their situation in the near future, swelled the hard core of unemployed likely to sink into structural poverty.
IIMigrations and the labour market in Argentina
1. T h e d e b a te in th e 1980s and 1990s
The studies carried out between the late 1970s and the 1990s all identify internal and cross-border migrants as one of the segments most vulnerable to economic swings. They do not coincide, however, in their interpretation of the characteristics of the labour market or the role of migrants in it. According to one line of research, up to the 1980s Argentina suffered from a shortage of unskilled labour and that the rate of economic growth was sufficient to ensure that the migrants were absorbed and integrated into the urban labour market (Marmora, 1977). Other interpretations more in line with the thinking of Lewis, however (Marshall, 1977), argued that the local labour market was marked by sluggish growth in the demand for unskilled labour and the existence of a segment of surplus workers. According to this argument, the demand for migrants suffered from the same sluggishness: migrants were not required by the host economy, since they were the result of processes of expulsion from the
economies of origin and therefore entered occupations outside the formal labour market. According to this view, the growth rate of manufacturing and the urbanization process played a central role in the variations in the volume of migrations as well as in the way migrants entered the labour force in the metropolitan area. Some authors (Marshall, 1977; Marshall and Orlanski, 1983) described from this perspective how in the 1960s, as a result of technological modernization, the concentrated segment of industry had ceased to require unskilled labour, so that migrants had to work in construction and small-scale industry.
In the late 1980s, studies on poverty included the migration dimension; thus, one study on the links between migration and poverty found evidence that in Greater Buenos Aires, in 1988, the incidence of poverty among recent migrants was higher among cross-border migrants than among internal migrants (Maguid, 1990, p. 25). It was also argued in that study that the educational level of recent cross-border migrants was lower than that of internal migrants: findings which differ from those given in the present study.6
6 The study by Maguid (1990) was based on 1990 data from the“Investigación sobre Pobreza en Argentina” (IPA) project, but if the Permanent Household Surveys are used as the data source, in 1980 there was no difference between the educational levels o f recent cross-border and internal migrants.
(Ministry o f Labour, www.observatorio.net). In Greater Buenos Aires, the unemployment rate in domestic service fluctuated around 17% from 1995 on, according to data from the Perm anent Household Survey carried out by the National Institute o f Statisticsand Censuses (INDEC).
MIGRATIONS, THE LABOUR MARKET A ND PO VERTY IN G REATER BUENO S A IRES • RO SALÍA C O RTÉS A ND FERNANDO G ROISM AN

174 C E P A L R E V I E W 8 2 • A P R I L 2 0 0 4
The debate on the enforcement of population laws and regulations during the 1990s -both with regard to the amnesty and bilateral agreements and the decrees on the expulsion of illegal aliens- revived interest in the relation between migrations and the labour market. The public debate revolved around the role of cross-border migrations in the increased unemployment rate, and there were heated discussions about the extent to which cross-border migrants were competing with local residents for jobs: in other words, about how far they could be “blamed” for the high rate of unemployment.
There were two particularly outstanding subjects of discussion: the rate of migrations from neighbouring countries in the 1990s and the way these migrants entered the labour force. With regard to the first of these questions, Lattes (1997) questioned the demographic projections predicting zero migration balances by the year 2015, since according to his estimates there had been no interruption in the volume of crossborder migrations.7 He also argued that both the active population and the rates of participation in economic activity increased during the 1990s as a result of migrations, natural growth and other factors such as the greater propensity of women to participate in the labour force. Maguid (2001), in contrast, minimized the role of the low fixed exchange rate as an incentive for cross-border migration and claimed that in the first half of the 1990s the contraction in the demand for labour of itself reduced cross-border migration.
With regard to the way migrants entered the labour force, a by no means negligible proportion of local authors put forward the hypothesis that the crossborder and internal segments of recent migration flows did not compete for jobs: on the contrary, there was rather some degree of “complementation” or “absence of competition” between them (Marmora, 1994). This view was maintained, for example, by authors such as Maguid (1995) and Benencia and Gazotti (1995), who claimed that the contribution of cross-border migration to open unemployment in the metropolitan area has been negligible. Montoya and Perticara (1995) came to the same conclusion, although they did wonder how far this could be extended to all internal migrants, since in their view internal migrants from the relatively less developed provinces might have
affected the level of unemployment.Marshall (2000), in contrast, argued that there
were grounds for maintaining that cross-border migrants did compete -marginally- with other recent migrants for the same kind of jobs. Revising the views they expressed in 1995, in subsequent studies Benencia (2000) and Maguid (2001) accept the possibility that there may have been some degree of competition between recent cross-border migrants and internal migrants in the metropolitan area. Maguid (2001) considers that the impact of migrations from neighbouring countries on the local labour market depended on the level of economic activity. Maintaining his view that there was a shortage of unskilled labour in the urban labour market in Argentina, he argues that in periods when there was a sustained demand for labour, such as during the import substitution industrialization era, native citizens rejected low-quality jobs. In his revised view, he holds that in the 1990s the decline in the manufacturing product, plus other changes, reduced the level of demand for labour, thereby causing native citizens to be “willing to work in jobs that they previously rejected” (Maguid, 2001, p.67). He consequently accepts that the new recessionary context may have led to competition between migrants and native citizens in the construction and domestic service sectors and may also have led to a reversal of cross-border migration flows. He accepts, however, that “there is no reliableinformation that shows whether immigration hasdeclined or there has been a process of substitution between new migrants and older ones returning to their countries of origin” (Maguid, 2001, p.65). From the standpoint taken in the present article, this analysis attaches excessive importance to voluntary decisions by the native and internal migrant population not to compete with cross-border migrants, while failing to give due weight to the role of the demand for labour in the distribution of jobs.
In the present article, it is considered that in the 1990s the flow of cross-border migrants continued,8 and that during the expansionary phases of the economic cycle the employment of cross-border migrants grew more rapidly than that of internal migrants, pre
8 Between 1993 and 2001 the recent migrant population (with tenor fewer years o f residence) in the Buenos Aires metropolitan area went down from 141,093 to 105,017 (25%), while the number o f cross-border migrants increased from 230,504 to 265,852 (15%), according to the Permanent Household Surveys. The employed population o f internal migrants went down from 1,061,388 to 933,027 (12%).
7 In Lattes (1997) the migration flows were estimated by using data for 1991-1996 from the Permanent Household Surveys, brought into line with those from the 1991 Population and Housing Census.
MIGRATIONS, THE LABOUR MARKET A ND PO VERTY IN G REATER BUENO S AIRES RO SALÍA CO RTÉS AN D FERNANDO GRO ISM AN

C E P A L R E V I E W 8 2 • A P R I L 2 0 0 4 175
cisely in the same branches of activity in which the latter were mainly concentrated. In contrast, although during recessions there were dismissals of both types of migrants from the construction and domestic service sectors, when the economy recovered only the employment of cross-border migrants grew in these two sectors; not that of internal migrants.9
The differences in the levels of qualifications, which favoured the cross-border migrants, and the acceptance by the latter of low wages and long hours, made it more attractive to hire this type of migrant. As from 1995, there was a decline in internal migrations to the area; the high levels of unemployment prevailing there probably caused migrations to other urban centres, open unemployment, a feeling of discouragement and sporadic participation in the labour force:i.e., various different aspects of a growing process of abandonment of the world of work.
This suggests that there was a process in which workers in the construction and domestic service sectors who were recent internal migrants were replaced by recent cross-border migrants. In addition to the processes of exclusion from the labour market there were other problems which, together, affected recent internal migrants more severely. This group would appear to have been concealing, in the course of the last ten years, a sector not recorded in the statistics and hidden behind a situation of inactivity, which could be called the “relatively excluded” sector. Although the information currently available does not provide sufficient evidence to confirm this tendency, this matter warrants more investigation in the future.
2. T h e re g u la to ry fra m e w o rk
The Buenos Aires metropolitan area was a centre of attraction for internal and international migrations from the 1930s up to the mid-1970s. The slackening in migrations increased the proportion of native citizens and reduced the weight of migrants in the population
9 After the drop in the proportion o f recent cross-border and internal migrants employed in the construction sector between 1994 and 1995, in 1996 the proportion o f internal migrants continued to fall, whereas the proportion o f cross-border migrants increased. Thus, the latter accounted for 40% of the total in 1995, 53% in 1996, 57% in 1997 and 58% in 1998 (calculations by the authors on the basis o f data from the Permanent Household Surveys).
of this area.10 Cross-border migration nevertheless continued to be concentrated there, however,11 and this pattern of geographical distribution continued in the 1990s: Greater Buenos Aires accounted for 70% of the cross-border migrants residing in urban areas, 75% of the cross-border migrants with jobs who arrived over the last ten years, and 78% of those who arrived during the last five years.12
During the years of military rule (1976-1983), the legislation on migrations was predominantly restrictive. In 1981 the General Law on Migrations and the Promotion of Immigration was adopted, with the aim of exclusively promoting “the immigration of foreigners whose cultural characteristics permit their appropriate integration” and discouraging immigration from neighbouring countries.13 An important point in this law was the imposition of restrictions on the employment of transient and temporary residents: both they and the employers who opted to hire them had to comply with a number of requirements. From this point on, and even after the beginning of the democratic phase, the legislation did not follow a single line: while some decrees restricted migration flows, some amnesties were also decreed, as for example that in 1984. In 1985 (decree 828/85), restrictions were once more imposed on migration - further intensified in 1987 with the regulation of entry permits, which made it difficult to take out legal residence - and stricter controls were applied to migration, although in the 1990s more permissive bilateral agreements on the entry of nationals of neighbouring countries. The regulatory framework did not play an ongoing dissuasive role with regard to the decision to migrate or to employ migrants, however, since effective controls were not always put into effect to enforce compliance with the restrictive legislation. This lack of controls made it possible to use cross-border migrant labour, which in any case took place outside the law.
10 In the metropolitan area, between the 1980 and 1991 censuses, the proportion o f non-neighbouring international migrants in the population went down from 4.4% to 2.5%, while that o f internal migrants went down from 22.6% to 19.5%. The proportion o f nonmigrants, however, rose from 70.6% to 75.5% (INDEC, 1991).11 In the City o f Buenos Aires, between 1980 and 1991, the proportion o f cross-border migrants increased from 2.9% to 3.9% and remained unchanged in the 19 sections covering the Buenos Aires conurbation (INDEC, 1991).12 Estimates by the authors, based on data from the Permanent Household Surveys.13 Text o f the General Law on M igrations and the Promotion of Immigration, No. 22439/1981. See CELS (2000) and Novick (2001).
MIGRATIONS, THE LABOUR M ARKET A ND PO VERTY IN GREATER BUENO S A IR E S • RO SALÍA C O RTÉS A ND FERNAN DO G ROISM AN

176 C E P A L R E V I E W 8 2 • A P R I L 2 0 0 4
This situation of illegality was a contributory factor in causing workers from neighbouring countries to accept precarious working conditions (lack of pensions, heavier workloads, lack of access to trade union representation, etc.), and although in strictly legal terms there were no obstacles to them bringing labour- related legal proceedings, their nationality may well have deterred workers from initiating such proceed- ings.14 These difficulties in gaining access to justice, together with the rising unemployment, created suitable conditions for the spread of the use of cross-bor
der labour under increasingly substandard conditions. The increase in non-labour production costs (energy, communications, transport) encouraged firms to use strategies aimed at reducing the labour component of costs, as for example by hiring migrant workers, and the hiring of cross-border migrants made more sense than hiring internal migrants, because on the one hand their skills were in no way inferior to those of the latter, and on the other hand they formed a labour force which was very easily disciplined.
IIIInternal and cross-border migrants in the 1990s
1. A c tiv ity , e m p lo y m e n t and u n e m p lo y m e n t
Between 1993 and 2000, the variations in cross-border migration flows, as a proportion of both the total and the active population, were positively linked with the evolution of overall GDP and, in particular, that of the sectors in which recent cross-border migrants were concentrated. In the case of internal migrants, in contrast, the link between migration and the product was negative (table 1). The demand for labour in the economic sectors where migrants were typically employed, which was more clearly directed towards cross-border migrants, was one of the factors which led to changes in the composition of both the total and the active population. The weight of the migratory groups of different origins in the population changed during those years: the proportion of internal migrants went down slightly, but that of cross-border migrants showed an upward trend (table 2). The economically active population also changed in the same direction, since the proportion of internal migrants went down, while that of cross-border migrants increased slightly (table 3).
The direction of these changes is also reflected in the different growth rates of the economically active population, the employed population, and the unemployed. The percentage of economically active internal migrants ceased to grow, while the proportion of
employed persons fell in this segment and the percentage of unemployed rose. In contrast, the percentages of economically active persons, employed persons and unemployed all rose among the cross-border migrants. The factor marking the greatest difference between the two types of migrants was that employment only rose among the cross-border migrants (table 4 and figure A.1 of the appendix).
A breakdown of the variations in the size of the sub-populations of employed and unemployed (table 5) shows that between 1993 and 1995 cross-border migrants played a more important role than internal migrants and even than native local citizens in the variation in the level of employment. If we analyze the other periods we see that although the most important contribution was that of non-migrants, the contribution of cross-border migrants to employment and the economically active population was greater than that of internal migrants. In all periods the latter contributed more than the others to urban unemployment. Table 4 suggests that in periods of recession recent internal and cross-border migrants lost their jobs more frequently than native local citizens, with the loss being even more marked in the case of recent internal migrants. The latter class of migrants had no effect on the levels of employment or activity, but they did help to explain the variations in unemployment in different periods.
14 Interview with Dr. Pedro I. Galin, consultant on labour matters, Buenos Aires, 4 October 2002.
MIGRATIONS, THE LABOUR MARKET A ND PO VERTY IN G REATER BUENO S A IR E S • RO SALÍA C O RTÉS A ND FERNAN DO G ROISM AN

C E P A L R E V I E W 8 2 • A P R I L 2 0 0 4 177
TABLE 1
Argentina: Coefficients o f correlation between the gross domestic product and migration
1993-2000 GDP Manufacturing Construction Services CommercePopulation groups by migratory origin GDP GDPa GDPb GDPc
Internal migrants/total population -0.13 -0.10 -0.36 -0.16 -0.5Recent internal migrants/total population -0.53 -0.50 -0.63 -0.55 -0.42Cross-border migrants/total population 0.90 0.71 0.69 0.93 0.67Recent cross-border migrants/total population 0.49 0.26 0.68 0.60 0.19Internal migrants/economically active population 0.06 0.13 -0.16 -0.06 0.19Recent internal migrants/economically active population -0.60 -0.54 -0.63 -0.62 -0.45Cross-border migrants/economically active population 0.82 0.61 0.59 0.89 0.55Recent cross-border migrants/economically active population 0.34 0.05 0.19 0.47 -0.03
Source: Prepared by the authors on the basis o f data in absolute values on the gross domestic product, at current prices, provided by the Ministry o f the Economy (base year 1993), and data in absolute values from the October figures o f the Permanent Household Census for Greater Buenos Aires.a In the case o f the construction sector, the coefficients o f correlation were calculated for the 1993-1999 period in order to avoid the skew caused by the marked fall in activity in this sector in 2000. Whereas the tequila crisis caused a fall o f 6% in the construction GDP in 19941995, the recession between 1999 and 2000 caused a contraction o f -13%.b Includes social, community and personal services; excludes education, health and public administration. c W holesale and retail trade and repairs.
TABLE 2
Greater Buenos Aires: Composition of population by migratory status(Percentages)
Year Totalpopulation
Total nonmigrant
population
Total internal migrant
population
Total crossborder migrant
population
Total international migrant population
o f other origins
1993 100 73.4 18.1 3.8 4.71994 100 72.9 19.1 3.6 4.41995 100 72.8 18.8 4.0 4.41996 100 72.5 19.0 4.2 4.21997 100 73.4 18.2 4.5 3.91998 100 74.7 17.5 4.6 3.21999 100 75.3 16.9 4.7 3.12000 100 76.0 16.8 4.3 2.92001 100 75.8 17.0 4.6 2.6
Source: Permanent Household Survey.
TABLE 3
Greater Buenos Aires: Composition of economically active population by migratory status, 1993-2001(Percentages)
Year Total economically active
population (EAP)
Non-migrantEAP
Internalmigrant
EAP
Cross-border International migrant migrant EAP
EAP from other origins
1993 100 67.1 24.0 5.4 3.51994 100 66.8 25.0 5.0 3.11995 100 65.8 24.9 5.8 3.51996 100 66.6 24.5 5.8 3.11997 100 67.4 23.4 6.2 3.01998 100 68.5 22.8 6.2 2.51999 100 69.5 21.6 6.5 2.42000 100 70.8 21.0 6.1 2.22001 100 71.1 21.0 6.2 1.6
Source: Permanent Household Survey, figures for October, Greater Buenos Aires.
MIGRATIONS, THE LABOUR M ARKET A ND PO VERTY IN GREATER BUENO S A IR E S • RO SALÍA C O RTÉS A ND FERNAN DO G ROISM AN

178 C E P A L R E V I E W 8 2 • A P R I L 2 0 0 4
TABLE 4
Greater Buenos Aires: Annual average rates of variation in the total, active, employed and unemployed population, 1993-2001(Percentages)
Population N on Internal Cross-border Other Totalmigrants migrants migrants international migrants
Total population 1.93 0.75 4.00 -5.76 1.52Economically activepopulation 2.52 0.10 3.47 -7.57 1.75Employedpopulation 1.23 -1.60 1.80 -8.69 0.32Unemployedpopulation 10.97 10.67 11.79 15.20 10.97
Source: Permanent Household Survey, figures for October, Greater Buenos Aires.
TABLE 5
Greater Buenos Aires: Breakdown of increases in sub-populations, by migratory status, in selected periods(Percentages)
Period Non- Internal Cross-border Other Totalamigrants migrants migrants international migrants
Total population
1995-1993 45 44 11 1001997-1993 63 18 19 1002001-1993 83 8 10 100
Economically active population
1995-1993 37 45 14 3 1001997-1993 69 15 15 1002001-1993 89 1 10 100
Employed population
1995-1993 100 1001997-1993 68 32 1002001-1993 89 11 100
Unemployed population
1995-1993 64 26 7 3 1001997-1993 65 25 5 4 1002001-1993 69 23 8 1 100
Source: Permanent Household Survey, figures for October, Greater Buenos Aires. a The totals do not include cases in which the migratory status was not reported.
In the 1990s, there was an expansion in the rates of activity and of unemployment in the total population of Greater Buenos Aires. In order to estimate the extent to which variations in the volume of the labour supply affected the rates of unemployment in the different subpopulations, we carried out the following exercise. We calculated the value reached by the unemployment rate between 1993 and 2000 with a constant activity rate and then compared the result with the unemployment rate actually observed (real unemployment rate); the resulting coefficient was taken as a proxy for the net effect of the demand for labour, which indicates the portion of unemployment caused by the elimination of jobs. As may be seen from table 6, the net effect of the
demand for labour differs between population groups according to sex and migratory origin.
For the labour force as a whole, the variations in the rate of participation had rather more weight than the elimination of jobs in the increase in unemployment (3.1 percentage points and 2.2 points, respectively). The groups of different migratory origin behaved differently, however.i) Non-migrants. The general tendency was more
marked in the case of women than of men. Among women, it was the expansion in the rate of participation which affected the unemployment rate, whereas among men, both factors contributed equally to the increase in unemployment.
MIGRATIONS, THE LABOUR MARKET A ND PO VERTY IN G REATER BUENO S A IR E S • RO SALÍA C O RTÉS A ND FERNAN DO G ROISM AN

C E P A L R E V I E W 8 2 • A P R I L 2 0 0 4 179
ii) Internal migrants. Men were marked by a fall in migrants was due in equal extents to the elimina- the activity rate: a factor which helped to soften tion of jobs and the increase in the labour supply. the increase that would otherwise have been reg- iii) Cross-border migrants. Female cross-border istered by the unemployment rate as a result of migrants increased their participation rate, but the elimination of jobs. Thus, in the case of men, if increase in the employment rate was even greater, this fall in the activity rate had not taken place the which was why unemployment went down among unemployment rate of this group would have risen them. In the case of male cross-border migrants, by more than 12 percentage points. In contrast, the the elimination of jobs was the most decisive fac- increase in unemployment among female internal tor in the increase in unemployment.
TABLE 6
Greater Buenos Aires: Changes in unemployment, by migratory status(Percentages)
Population, by Unemployment Unemployment Employment Activity Difference between 1993migratory status rates rate, 1993 rate, 2000 effect effect and 2000 unemployment
Total active population 9.6 14.9 2.2 3.1 5.3Non-migrants 10.2 14.8 -0.3 4.9 4.6
Men 8.0 12.6 2.5 2.0 4.6Women 13.7 18.0 -5.4 9.7 4.3
Internal migrants 8.3 16.0 9.5 -1.7 7.8Men 7.4 14.7 12.5 -5.3 7.3Women 9.6 17.9 4.2 4.1 8.4
Cross-border migrants 12.1 14.4 0.5 1.9 2.3Men 11.7 17.6 5.8 0.1 5.9Women 12.6 10.3 -4.7 2.3 -2.4
Source: Permanent Household Survey, October figures, Greater Buenos Aires.
TABLE 7
Greater Buenos Aires: Recalculation of activity and unemployment rates(Percentages)
A. Activity rate
Non migrants Internal migrants Cross-border migrants Total Percentage differencewith respect to observed rate
1993 39.5 57.3 62.2 43.31996 41.1 57.7 61.2 44.92001 41.4 54.4 59.7 44.11996a 44.8 -0.061996b 44.6 -0.222001a 44.0 -0.112001b 44.0 -0.11
B. Unemployment rate
Non migrants Internal migrants Cross-border migrants Total Percentage differencewith respect to observed rate1993
1993 10.2 8.3 12.1 9.61996 19.1 19.3 19.3 18.82001 18.8 20.0 22.8 19.31996c 18.5 -0.41996d 17.6 -1.22001c 18.7 -0.62001d 17.9 -1.4
Source: Permanent Household Survey, October figures, Greater Buenos Aires.a New rate, assuming there were no new cross-border migrants since 1993. The total number and number o f active cross-border migrants
would be the same as in 1993. b New rate, without recent cross-border migrants.c New rate, assuming that unemployment among cross-border migrants was the same as in 1993.d New rate, without unemployed and employed recent cross-border migrants, with redistribution o f jobs.
MIGRATIONS, THE LABOUR MARKET A ND PO VERTY IN G REATER BUENO S A IRES • RO SALÍA C O RTÉS A ND FERNANDO G ROISM AN

180 C E P A L R E V I E W 8 2 • A P R I L 2 0 0 4
Table 7 gives an estimate of the effect of crossborder migration on overall activity and unemployment rates. Both rates were recalculated according to the assumption that there had been no increase in cross-border migration since 1993, and even that there had been no entry of migrants at all in the last ten years. The differences registered are only slight. Thus, although the sign is of the expected type (reduction in both rates), because of the relatively minor weight of cross-border migrants in relation to the rest of the groups, the proportion by which those rates went down is only marginal: the activity rate goes down by less than one percentage point, while the open unemployment rate goes down by a little more than that value (in both cases, according to the most restrictive assumption).
An estimate was also made of the impact of migrations on the tendencies that might be expected in the rates of activity, employment and unemployment according to the behaviour registered during the 1990s. Through ordinary least squares linear regression analysis, the proportions of internal and crossborder migrants in the labour supply and the employed population were taken as independent variables, and the above-mentioned rates of activity, employment and unemployment were taken as dependent variables (tables A.1, A.2 and A.3 of the appendix).15 The regression analysis showed that cross-border migrations affected almost exclusively unskilled young people, but not the other age groups or the groups with higher levels of education (for example, the employment rate of persons under 30 with incomplete secondary education goes down as a result of the presence of recent cross-border migrants in the labour supply).
To sum up, the tables indicate that there was a halt in internal migrations but not in those from neighbouring countries, and this affected the relative weights of the two groups in the active population. The volume of migrants was not enough, however, to affect the rates of activity, employment or unemployment. In addition, there was an increase in the economic activity of non-migrant female natives, female internal migrants, and female migrants from neighbouring countries, but the losses of jobs were concentrated solely among female internal migrants. In the case of men, there was a decline in the proportion of
15 In order to have enough observations, the M ay and October figures o f the Permanent Household Survey for the period fromOctober 1993 to May 2002 were used.
employed persons in all three groups, but the biggest decline was among male internal migrants.
2. O c c u p a tio n a l b reakdo w n
In order to make a breakdown of the occupational sectors in which migrants work we formed a data pool by adding together the October figures from the Permanent Household Surveys for 1993, 1995, 1997, 1999 and 2001. This made it possible to increase the number of cases in order to permit their analysis, assuming that the groups maintained common features throughout the period.16
In the 1990s, the patterns of sectoral occupation of employed migrants - both cross-border and internal - settling in the Greater Buenos Aires area had not changed substantially from the previously prevailing trends. Migrants in general (regardless of when they arrived) continued to be concentrated in construction, domestic service and the textile sector, although those from neighbouring countries had greater weight in that decade. Thus, these three sectors accounted for 46.4% of recent cross-border migrants and 32.3% of recent internal migrants; if their date of arrival is not taken into account, there was a higher relative proportion of cross-border than of internal migrants in those activities: 57.6% and 27%, respectively.
During the economic growth stage - up to 1995 - cross-border migrants continued to be in demand due to the growth o f the typical urban economic sectors, but this was not so in the case o f internal migrants; in the stage o f recession, however, when construction and manufacturing became net expellers o f labour, both groups o f migrants were affected by the decline in the demand for labour.
Cross-border migrants occupied jobs previously occupied by internal migrants, in unregistered wage- earning jobs in construction and in domestic service, and to a lesser extent in the garment and leather and footwear industries, while internal migrants resorted more often to own-account activities.
16 See the second paragraph o f the appendix.
MIGRATIONS, THE LABOUR MARKET A ND PO VERTY IN G REATER BUENO S AIRES RO SALÍA CO RTÉS AN D FERNANDO GRO ISM AN

C E P A L R E V I E W 8 2 • A P R I L 2 0 0 4 181
TABLE 8
Greater Buenos Aires: Composition of recent migrants employed in the construction sector, by migratory origin, 1993 to 2001(Percentages)
Year Recent Recent internal cross-border migrants migrants
Total
1993 58.5 41.5 100
1995 45.7 54.3 100
1997 33.1 66.9 100
1999 6.9 93.1 100
2001 19.7 80.3 100
Source: Prepared by the authors on the basis o f the October figures o f the Permanent Household Census.
TABLE 9
Greater Buenos Aires: Composition of recent migrants employed in domestic service, by migratory origin, 1993 to 2001(Percentages)
Year Recentinternalmigrants
Recentcross-border
migrantsTotal
1993 45 55 100
1995 41.5 58.5 100
1997 21 79 100
1999 29.1 70.9 100
2001 8.9 91.1 100
Source: Prepared by the authors on the basis o f the October figures o f the Permanent Household Census.
TABLE 10
Greater Buenos Aires: Breakdown of recent internal and cross-border migrants, by sector of activity(Percentages)
Sex Sector Migrants
Internal Cross-border
Total
Men Manufacturing
Construction
Others
Total
27.3 28.5
10.7 36.4
62.0 35.1
100.0 100.0
27.8
19.2
53.0
100.0
Women Manufacturing
Domestic service
Others
Total
10.8 12.0
40.4 63.8
48.8 24.2
100.0 100.0
11.3
50.7
38.0
100.0
Source: Pooled data from the Perm anent Household Survey (October figures) for Greater Buenos Aires, for 1993, 1995, 1997, 1999 and 2001.
Among men, 36.4% of recent cross-border migrants and 10.7% of recent internal migrants were employed in construction, while among women, 63.8% of cross-border migrants worked in domestic service, compared with 40.4% of female internal migrants.17
Although there is a historical continuity in the proportion of wage-earners in the two groups, it is clear that in the 1990s the wage-earning jobs in the typical economic sectors of construction and domestic service went more to the cross-border migrants (77% and 51%, respectively). In the case of women in domestic service, the same tendency is observed, with proportions of (female) wage-earners of 84% and 76%.
The incidence of precarious employment - jobs not registered with the authorities - was higher among the cross-border migrants: only 26% of cross-border wage-earners worked in jobs protected by social security, 60.2% were not registered, and the remainder enjoyed some partial benefits; among the internal migrants, in contrast, the standards of labour protection, although low, were somewhat higher than those of the cross-border migrants (table 13).
TABLE 11
Greater Buenos Aires: Composition of recent migrant wage-earners, by migratory origin, 1993 and 2001(Percentages)
Wage-earners Internal Cross-border Total
1993 64.6 35.4 1002001 61.6 38.4 100
Source: Prepared by the authors on the basis o f data from the Permanent Household Survey (October figures) for Greater Buenos Aires.
17 According to the pooled data, in the 1993-2001 period the proportion o f recent cross-border migrants among the total employed was o f the order o f 2.4%, while the proportion o f recent internal migrants was around 2.6%. In view o f the historical over-representation o f these groups in construction and domestic service, a comparison by sectors is in order. Thus, 45% of those employed in domestic service were internal migrants 13% were cross-border migrants, and 41% were non-migrants, but when the comparison is restricted to the recent migrants group (up to ten years), the proportion o f cross-border migrants rises to 48% and that o f internal migrants goes down to 40%. In construction, internal migrants accounted for 35% o f those employed, non-migrants for 47%, and cross-border migrants for 16%, but once again, i f only the migrants with up to ten years’ residence are taken into account, the cross-border migrants rise to 49%, the internal migrants go down to 29%, and non-migrants (persons born in the province o f Buenos Aires who moved to metropolitan Buenos Aires) go down to 21%. Source: pooled data from the Permanent Household Survey.
MIGRATIONS, THE LABOUR M ARKET A ND PO VERTY IN GREATER BUENO S A IR E S • RO SALÍA C O RTÉS A ND FERNAN DO G ROISM AN

182 C E P A L R E V I E W 8 2 • A P R I L 2 0 0 4
Greater Buenos Aires: Composition of recent migrants, by origin and occupational category, in two branches of activity(Percentages)
Branch Occupationalcategory Internal
Migrants
Cross-border
Total
Construction Employer 2.2 0.8Own-account work 46.5 22.8 31.6W age-earner 51.3 77.2 67.6Total 100.0 100.0 100.0
Domestic service Own-account work 23.8 16.1 19.5W age-earner 76.2 83.9 80.5Total 100.0 100.0 100.0
Source: Pooled data from the Permanent Household Survey (October figures) for Greater Buenos Aires, for 1993, 1995, 1997, 1999 and 2001.
Greater Buenos Aires: Labour benefits received by wage-earners, according to migratory status(Percentages)
Extent o f labour benefits
Wage-earners Total
Recent internal migrants
Recent cross-border migrants
All benefits 55.3 26.1 44.5No benefits 31.9 60.2 42.3Some benefits 12.8 13.7 13.2
Total 100.0 100.0 100.0
Source: Pooled data from the Permanent Household Survey (October figures) for Greater Buenos Aires, for 1993, 1995, 1997, 1999 and 2001.
3. E d u c a tio n a l level and in c o m e
The differences in educational level between cross-border and internal migrants were not evident among the total number of employed persons, but they were observable among those employed in domestic service and construction. Thus, among women working in
domestic service, the proportion who had completed their secondary education was higher among cross-border than among internal migrants, while among men working in the construction sector, the educational level of migrants from the provinces of the interior was lower than that of cross-border migrants, although the difference was less marked than in the case of women (table 14).
MIGRATIONS, THE LABOUR MARKET A ND PO VERTY IN G REATER BUENO S A IR E S • RO SALÍA C O RTÉS A ND FERNAN DO G ROISM AN

C E P A L R E V I E W 8 2 • A P R I L 2 0 0 4 183
TABLE 14
Greater Buenos Aires: Composition of employed migrants (total and in two branches of activity), by educational level(Percentages)
Educational
level Internal
Migrants
Cross-border
Total
Employed persons, total Complete secondary education 34.6 34.6 34.6
Incomplete secondary education 65.4 65.4 65.4
Total 100.0 100.0 100.0
Employed persons (men) Complete secondary education 32.3 30.5 31.7
Incomplete secondary education 67.7 69.5 68.3
Total 100.0 100.0 100.0
Employed persons (women) Complete secondary education 38.5 39.1 38.7
Incomplete secondary education 61.5 60.9 61.3
Total 100.0 100.0 100.0
Domestic service (total) Complete secondary education 8.9 34.6 23.1
Incomplete secondary education 91.1 65.4 76.9
Total 100.0 100.0 100.0
Construction (total) Complete secondary education 10.1 6.4
Incomplete secondary education 100.0 89.9 93.6
Total 100.0 100.0 100.0
Source: Pooled data from the Permanent Household Survey (October figures) for Greater Buenos Aires, for 1993, 1995, 1997, 1999 and 2001.
TABLE 15
Greater Buenos Aires: Structure of educational level of recent employed migrants, by place of origin(Percentages)
Educational level Bolivia Paraguay Peru Uruguay Total
Incomplete
secondary
education 70.8 88.7 21.1 64.3 65
Complete
secondary
education 29.2 11.3 78.9 35.7 35
Total 100.0 100.0 100.0 100.0 100.0
Educational level Corrientes Chaco Entre Ríos Santiago Tucumán Total
Incomplete
secondary
education 67.6 79.6 56.8 87.6 82.8 70
Complete
secondary
education 32.4 20.4 43.2 12.4 17.2 30
Total 100.0 100.0 100.0 100.0 100.0 100.0
Source: Pooled data from the Permanent Household Survey (October figures) for Greater Buenos Aires, for 1993, 1995, 1997, 1999 and 2001.
MIGRATIONS, THE LABOUR MARKET A ND PO VERTY IN G REATER BUENO S A IRES • RO SALÍA C O RTÉS A ND FERNANDO G ROISM AN

184 C E P A L R E V I E W 8 2 • A P R I L 2 0 0 4
In the 1990s, cross-border migrants continued to show characteristics which were similar to those they had displayed in the previous two decades and which they shared with internal migrants: low levels of education and skills. The change which took place in the 1990s was that there was a visible deterioration in the educational levels of internal migrants compared with those from neighbouring countries.
Internal migrants mostly came from provinces where the levels of dropping-out, repetition and high age-for-grade in secondary education were markedly higher than in the other provinces, and especially the metropolitan area. Rather than an improvement in the levels of skills of cross-border migrants, what was observed was a relative decline in the levels of skills of native migrants arriving in Greater Buenos Aires from the 1980s on (data from the Federal Education Network of the Ministry of Education).
To some extent, cross-border migrants were more favourably placed as a source of labour for the branches of activity in which recent migrant workers have traditionally found employment: construction and
domestic service. With levels of education that were comparable with and in some cases superior to internal migrants, and willing to accept more flexible wages and working conditions, they were in greater demand by employers than the latter. This is one possible explanation for the differential impact of the crisis on cross-border and internal migrants.
Throughout the period studied, cross-border migrants worked under less favourable conditions. Their monthly income was consistently below that of internal migrants, whether wage-earning or not, and their working hours were longer (table 16). Indeed, the total number of hours worked by cross-border migrants was gradually rising, even when the demand for labour was falling, whereas the total number of hours worked by internal migrants was going down, particularly in construction and domestic service, reflecting the decline in demand for this segment. The real income of cross-border migrants was consistently below the general average and that of internal migrants (figures 1 and 2).
Greater Buenos Aires: Coefficients of hourly income, monthly income and hours worked by cross-border migrants, with respect to the corresponding values for recent internal migrants
Cross-border migrants Working conditions 1993 1994 1995 1996 1997 1998 1999 2000 2001
Total Hourly income 0.86 0.80 0.69 0.77 0.77 0.91 0.70 0.81 0.77Monthly income 0.89 0.80 0.77 0.74 0.91 0.91 0.72 0.90 0.81Hours worked 1.02 1.00 1.06 0.93 1.14 1.00 1.07 1.06 1.10
Wage-earners Hourly income 0.85 0.85 0.70 0.83 0.73 0.93 0.72 0.85 0.77Monthly income 0.89 0.79 0.77 0.73 0.89 0.91 0.78 0.89 0.83Hours worked 1.04 0.96 1.04 0.93 1.17 0.98 1.15 1.05 1.11
Source: Permanent Household Survey, October figures, Greater Buenos Aires.
120
I «
SO
«1
40
20
0
Evolution of real hourly income of wage- earners, according to whether internal or cross-border migrants (1993=100)
IrucrruJ fu ignari r.-;
C r w s s - b c m J ç r m i i r cinb-
« i » i V k t t u l J-. rTiJiíc
-------- *--------■— ----i-------- 1--------■-------- 1------- T-------->---------lm j i m m * im ]W? low 2000 :ooi
Source: Permanent Household Survey, October figures, Greater Buenos Aires.
40
ÎO
Evolution of real monthly income of wage- earners, according to whether internal or cross-border migrants (1993=100)
r n l f n a l in ij iT m lj Oii'i- lhirOir migrants- ■ - f i l l lh h l
m i l s * h i w s i m l w t t w s 2 0 0 1
Source: Permanent Household Survey, October figures, Greater Buenos Aires.
TABLE 16
FIG U R E 1 FIG U R E 2
MIGRATIONS, THE LABOUR MARKET A ND PO VERTY IN G REATER BUENO S A IR E S • RO SALÍA C O RTÉS A ND FERNAN DO G ROISM AN

C E P A L R E V I E W 8 2 • A P R I L 2 0 0 4 185
IVConclusions
The economic and labour market changes which took place in the 1990s affected the rates of migration to Greater Buenos Aires; throughout the decade, crossborder migration continued, whereas internal migration tended to diminish. The hypothesis that internal migrants may have returned home or withdrawn as a result of the decline in the demand for labour is worth investigating.
The changes in the form of insertion of internal migrants in the labour market were caused by the demand for labour, which, especially in the construction and domestic service sectors, gave preference to the incorporation of segments of the labour force with fewer demands for social protection in precarious jobs, under unfavourable working conditions and at low wages. As there had also been changes in the composition of the labour supply -a slight improvement in the educational level of cross-border migrants with respect to that of internal migrants- demand was reoriented towards the former. In the literature on migrations in the case of Argentina, several authors have put forward an explanation based on labour supply factors: thus, the hypothesis which holds that there was no competition between cross-border and internal migrants, and that the latter were not willing to accept those kinds of jobs, refers above all to the decades before the 1990s. As from the beginning of the 1990s, they argue, the rise in unemployment in the metropolitan area and the elimination of jobs may have caused competition between the two groups of workers. The role of demand in the competition between these two migrant segments does not appear to have been fully analyzed, however. In the present study, we consider that the most important factor has been the reorientation of the demand for labour because of the changes in the composition of the migrant flows: the rise in the educational level of cross-border migrants and the decline in that of internal migrants. This process led to the displacement of recent internal migrants from the sectors in which migrants typically work: there was a decline in the activity rate of internal migrants, which could well be a sign of discouragement, while the
activity rate of cross-border migrants rose, although unemployment affected both groups. The cross-border migrants who were still employed took jobs with long hours and low hourly wages. Employment in the construction sector fell, and although in the domestic service sector the fall was not as great, in both sectors there was an increase in the proportion of cross-border migrants.
The increase in unemployment since the mid- 1980s has undoubtedly been a factor in the formation of a hard core of unemployed who have not been able to re-enter the labour force in the successive periods of economic reactivation. In diagnostic studies on the social situation in the metropolitan area, however, the size and extent of this hard core of unemployed -and hence of structural poverty- has often been minimized.
Our argument -which requires more detailed research- suggests that the above changes affected the composition of this sector of structural poverty and unemployment. In the 1970s and 1980s, structural poverty was associated with both migrant segments -internal and cross-border- although the incidence of poverty was greater among cross-border migrants. In the 1990s, however, the degree of unemployment and the persistence of poverty were more clearly limited to the internal migrant sector. Internal migrants were more likely to suffer situations of severe social privation, representing the first step towards exclusion. This is not a recent process, but rather a new pattern of distribution of access to income-generating activities which facilitated the reproduction of the “poverty trap”. The replacement of under-privileged segments in the labour market deprives those thus displaced of possibilities of entering that market again and, in general, obtaining income.
This process has been building up a new social setting in which there are increasingly marked divisions between those holding precarious jobs and those who are unemployed and are simply no longer taken into account for employment.
MIGRATIONS, THE LABOUR MARKET A ND PO VERTY IN G REATER BUENO S A IRES • RO SALÍA C O RTÉS A ND FERNANDO G ROISM AN

186 C E P A L R E V I E W 8 2 • A P R I L 2 0 0 4
Appendix
Characteristics o f the Permanent Household Survey carried out by the National Institute o f Statistics and Censuses (INDEC).This survey is carried out on the basis of a set of samples from the main urban agglomerations in the country, representing approximately 70% of the national urban population. The population of Greater Buenos Aires, which comprises the city of Buenos Aires and 19 areas of the Buenos Aires conurbation, represents 30% of the total population of the country and approximately 40% of the total urban population. The data
are collected twice a year, in May and October, and the units of observation are households. The household survey of Greater Buenos Aires represents 100% of the population of that agglomeration. The information collected corresponds to characteristics of the households and the individuals in them. The first characteristics include in particular the size and composition of the household and the characteristics of the dwelling, while the second set of characteristics includes demographic, labour, income, educational and migration variables.
Greater Buenos Aires: Composition of recent resident migrants, by place of origin(Percentages)
October 1993 October 2000
Province Recent internal or country migrant
Recentcross-border
migrant
Recent internal migrant
Recentcross-border
migrant
Corrientes 13.6 8.4Chaco 16.2 9.2Entre Ríos 6.9 7.5Santiago 11.0 9.9Tucumán 7.7 7.8Misiones 11.4 21.7Other provincialmigrants 33.2 35.5
Total, provincial migrants 100.0 100.0
Bolivia 15.5 16.5Paraguay 42.6 42.4Peru 5.7 27.4Uruguay 27.2 7.4Others 9.0 6.3
Total, cross-border migrants 100.0 100.0
Source: Permanent Household Survey.
MIGRATIONS, THE LABOUR MARKET A ND PO VERTY IN G REATER BUENO S AIRES RO SALÍA CO RTÉS AN D FERNANDO GRO ISM AN

C E P A L R E V I E W 8 2 • A P R I L 2 0 0 4 187
FIG U R E A.1
FIG U R E A.2
Greater Buenos Aires: Evolution of the employed population, by migratory status(Index, 1993=100)
Source: Permanent Household Survey, October figures, Greater Buenos Aires.
Greater Buenos Aires: 90% confidence intervals of rates of open unemployment of male cross-border and internal migrants8
Source: Permanent Household Survey, October figures, Greater Buenos Aires. a MCM = Male cross-border migrants. MIM = Male internal migrants.
MIGRATIONS, THE LABOUR M ARKET A ND PO VERTY IN GREATER BUENO S A IR E S • RO SALÍA C O RTÉS A ND FERNAN DO G ROISM AN

188 C E P A L R E V I E W 8 2 A P R I L 2 0 0 4
F IG U R E A .3
Greater Buenos Aires: 90% confidence intervals of rates of open unemployment of female cross-border and internal migrants3
Source: Permanent Household Survey, October figures, Greater Buenos Aires. a FCM = Female cross-border migrants. FIM = Female internal migrants.
Greater Buenos Aires: Ordinary least squares linear regression analysis3Independent variable: Rate o f participation o f recent cross-border migrants in the economically active population (EAP)
Dependent variables:
(1) Rate o f employment o f young recent internal migrants without complete secondary education(2) Rate o f employment o f young non-recent internal migrants without complete secondary education(3) Rate o f employment o f young recent cross-border migrants without complete secondary education(4) Rate o f employment o f older non-migrants without complete secondary education(5) Activity rate o f young non-migrants w ithout complete secondary education(6) Activity rate o f young cross-border migrants w ithout complete secondary education(7) Activity rate o f older non-recent cross-border migrants w ithout complete secondary education
Independentvariable
Dependentvariable
( 1)
Dependentvariable
(2)
Dependentvariable
(3)
Dependentvariable
(4)
Dependentvariable
(5)
Dependentvariable
(6)
Dependentvariable
(7)
Participation o f recent cross-border -13.537 11.241 -21.103 4.654 -9.867 -17.181 13.106migrants in EAP (7.942) (6.378)b (10.167)b (2.229)b (3.885)c (8.030)c (5.523)c
R2 0.154 0.163 0.212 0.214 0.287 0.222 0.260
Num ber o f observations: 18
Source: Prepared by the authors on the basis o f May and October figures for Greater Buenos Aires from October 1993 to May 2002. a The figures in parentheses correspond to the standard error. The age groups were as follows: young (between 16 and 29), adult (between 30
and 44), older (over 45). b Significant at 10%. c Significant at 5%.
MIGRATIONS, THE LABOUR MARKET A ND PO VERTY IN G REATER BUENO S AIRES RO SALÍA CO RTÉS AN D FERNANDO GRO ISM AN

C E P A L R E V I E W 8 2 • A P R I L 2 0 0 4 189
TABLE A.3
Greater Buenos Aires: Ordinary least squares linear regression analysis'Independent variable: Rate ofparticipation o f recent cross-border migrants in the employed population
D ependent variables:(1) Rate o f employment o f young recent internal migrants without complete secondary education(2) Rate o f employment o f young non-recent internal migrants without complete secondary education(3) Rate o f employment o f adult non-recent internal migrants without complete secondary education(4) Rate o f employment o f older non-migrants without complete secondary education(5) Activity rate o f young recent cross-border migrants without complete secondary education
Independent Dependent Dependent Dependent Dependent Dependentvariable variable variable variable variable variable
( i) (2) (3) (4) (5)
Percentage o f recentcross-border migrants in total -11.170 11.988 7.299 3.911 -18.648employed population (7.861) (6.031)b (4.285) (2.224)b (7.463)c
R2 0.112 0.198 0.154 0.162 0.281
Num ber o f observations: 18
Source: Prepared by the authors on the basis o f M ay and October figures for Greater Buenos Aires from October 1993 to M ay 2002. a The figures in parentheses correspond to the standard error. The age groups were as follows: young (between 16 and 29), adult (between 30
and 44), older (over 45). b Significant at 10%. c Significant at 5%.
Pooling o f survey data
The methodological strategy chosen for this part of the study, which consists of forming a pool of survey data, makes it possible to carry out tabulations at a higher level of disaggregation than that which is usual for working on the figures obtained separately in each compilation of data by the Permanent Household Survey (i.e., each “wave” of data), without causing the results of this operation to lose their significance. The assumption on which the use of this procedure is based is that the 1990s was homogeneous in terms of incentives and disincentives and that the changes that could occur in each period are only small and therefore do not alter the final balance. The pooling of data was carried out using the October figures for 1993, 1995, 1997, 1999 and 2001, and between each of them there was a complete rotation of the households responding, thus
avoiding the overlapping of data corresponding to the same individuals.
Migrations from neighbouring countries have traditionally represented only a small proportion of the total population: 2.4% up to 1980 and 2.5% in 1991. The flow of migrants from neighbouring countries, which had grown in the first half of the 1970s, slackened between 1975 and 1980.
Total population growth in Argentina has shown a downward trend: the average annual rates in the 1970s, 1980s and 1990s were 1.8%, 1.6% and 1%, respectively (INDEC, 1970, 1980 and 1991 censuses).18 As international migrations from non-neighbouring countries went down, the proportion of migrants from neighbouring countries in total migration has increased, amounting to 52% in 1991 (INDEC, 1991).
(Original: Spanish)
18 For the period from 1991 to 2001, the rate o f variation has been estimated on the basis o f preliminary data from the 2001 National Population Census.
MIGRATIONS, THE LABOUR M ARKET A ND PO VERTY IN GREATER BUENO S A IR E S • RO SALÍA C O RTÉS A ND FERNAN DO G ROISM AN

190 C E P A L R E V I E W 8 2 • A P R I L 2 0 0 4
Bibliography
Benencia, R. (2000): Argentina: la problemática social de la m igración limítrofe, Comercio exterior, vol. 50, No. 3, Mexico City, Banco Nacional de Comercio Exterior (BANCOMEXT).
Benencia, R. and A. Gazotti (1995): M igración limítrofe y empleo: precisiones e interrogantes, Estudios migratorios latinoamericanos, vol. 10, No. 31, Buenos Aires, Centro de Estudios M igratorios Latinoamericanos (CEMLA).
CELADE (1998): Latin America: population projections, 19702050, Demographic Bulletin, No. 62, LC/DEM /G. 180, Santiago, Chile.
CELS (Center for Legal and Social Studies) (1998): Informe anual, Buenos Aires.
(2000): Informe anual, Buenos Aires.Cortés, R. (1985): Cambios en el mercado de trabajo urbano en
la Argentina: 1974-1983, “Docum entos e Informes de Investigación” series, No. 14, Buenos Aires, Latin American Faculty o f Social Sciences (FLACSO).
INDEC (National Institute o f Statistics and Censuses) (1980): Censo Nacional de Población, 1980, Buenos Aires.
(1991): Censo Nacional de Población, 1991, Buenos Aires.______ (various years): Encuesta Permanente de Hogares, Buenos
Aires.Lattes, A. (1997): La dinámica demográfica y la migración en la
evolución reciente de la actividad económica en el Area Metropolitana de Buenos Aires, Buenos Aires, unpublished.
Maguid, A. (1990): Argentina: migración y pobreza durante la década del 80, Buenos Aires, National Council for Scientific nd Technical Research (CONICET).
(1995): Migrantes limítrofes en Argentina: su inserción eimpacto en el mercado de trabajo, Estudios del trabajo, No. 10, Buenos Aires, Asociación Argentina de Especialistas en Estudios del Trabajo (ASET).
MIGRATIONS, THE LABOUR MARKET A ND PO VERTY IN G REATER BUENO S AIRES • RO SALÍA CO RTÉS AN D FERNANDO GRO ISM AN
_______(2001): El chivo expiatorio. Problemas de empleo,Encrucijadas, vol. 1, No. 7, Buenos Aires, University o f Buenos Aires.
Mármora, L. (1977): Política e investigación en el proceso de planificación migratoria, Santiago, Chile, Programme o f Social R esearch on Population in Latin A m erica (PISPAL)/ Population Division (CELADE).
(1994): Desarrollo sostenido y políticas migratorias: sutratamiento en los espacios latinoamericanos de integración, Revista de la OIM sobre Migraciones en América Latina, vol. 12, No. 1, Santiago, Chile, Center for Inform ation on M igrations in Latin America (CIMAL).
Marshall, A. (1977): Inmigración, demanda de fuerza de trabajo y estructura ocupacional en el área metropolitana argentina, Desarrollo económico, vol. 17, No. 65, Buenos Aires, Institute o f Economic and Social Development (IDES).
(2000): Política inmigratoria y el mercado de trabajo,Memorias de las IV Jornadas Argentinas de Estudios de Población, Resistencia, Chaco.
Marshall, A. and D. Orlansky (1983): Inmigración de países limítrofes y demanda de mano de obra en la Argentina, 1940-1980, Desarrollo económico, vol. 23, No. 89, Buenos Aires, Institute o f Economic and Social Development (IDES).
Montoya, S. and M. Perticara (1995): Los migrantes de países limítrofes en los mercados de trabajo urbanos, Estudios, No. 75, Córdoba, Instituto de Estudios Económicos sobre la Realidad Argentina y Latinoamericana (IEERAL), October- December.
Novick, S. (2001): U n país ¿receptor? Políticas m igratorias nacionales, Encrucijadas, vol. 1, No. 7, Buenos Aires, University o f Buenos Aires.

191
B e n j a m í n D a v i s
E c o n o m i s t ,
U n i t e d N a t i o n s F o o d a n d
A g r i c u l t u r e O r g a n i z a t i o n / E S A
/ ben jam in .davis@ fao .org
S u d h a n s h u H a n d a
A s s o c i a t e P r o f e s s o r ,
D e p a r t m e n t o f P u b l i c P o l i c y ,
U n i v e r s i t y o f N o r t h C a r o l i n a
/ shanda@ m ail.unc.edu
H u m b e r t o S o t o
R e s e a r c h A s s o c i a t e ,
D e p a r t m e n t o f E c o n o m i c s ,
U n i v e r s i d a d I b e r o a m e r i c a n a ,
M e x i c o C i t y
/ hum berto .soto@ uia.m x
C E P A L R E V I E W 8 2 • A P R I L 2 0 0 4
Households, poverty and policy in times of crisis.Mexico, 1992-1996
Benjamín Davis, Sudhanshu Handa and Humbert
m. - J e f o r a t h e 1 9 9 5 cr is i s , M e x i c o had r e g i s t e r e d o v e r a d e c a d e o f
i m p r o v e m e n t s in h u m a n d e v e l o p m e n t i n d i c a t o r s . U s i n g
d e c o m p o s i t i o n t e c h n i q u e s , t h is p a p e r m e a s u r e s t h e b e n e f i t s o f
t h o s e i m p r o v e m e n t s in t e r m s o f a l l o w i n g h o u s e h o l d s t o c o p e w i t h
t h a t cr i s i s . T h e d e c l i n e in c o n s u m p t i o n b e t w e e n 1 9 9 4 a n d 1 9 9 6 is
a m p l y e x p l a i n e d b y t h e r e d u c t i o n in t h e r e t u r n s t o h o u s e h o l d
c h a r a c t e r i s t i c s , w i t h t h e c h a n g e s in t h o s e c h a r a c t e r i s t i c s s e r v i n g to
r e d u c e t h e n e g a t i v e i m p a c t o f t h e c r i s i s . H a d h o u s e h o l d
c h a r a c t e r i s t i c s r e m a i n e d at t h e i r 1 9 9 2 leve ls , rura l p o v e r t y in 1 9 9 6
w o u l d h a v e b e e n 4 8 % h i g h e r t h a n o b s e r v e d . T h e r e su l t s o f o u r
s i m u l a t i o n s h o w t h a t had t h e P R O G R E S A p r o g r a m m e b e e n in p l a c e
d u r i n g t h e cr i s i s , t h e rura l p o v e r t y g a p a n d t h e s q u a r e d p o v e r t y g a p
w o u l d h av e b e e n r e d u c e d . T h e c o n c l u s i o n is t h a t s o c i a l p r o g r a m m e s
t h a t f o c u s on l o ng t e r m d e v e l o p m e n t c a n a l so p e r f o r m an i m p o r t a n t
s a f e t y n e t f u n c t i o n d u r i n g a m a c r o e c o n o m i c cr i s is .

192 C E P A L R E V I E W 8 2 • A P R I L 2 0 0 4
IIntroduction
In 1995 Mexico sustained one of its worst economic crises in recent history, with per capita GDP falling by 9% and real wages by 25%. Yet this crisis was preceded by over a decade of growth in social and economic indicators and important changes in the structure of the economy. On the eve of the crisis, Mexico was clearly a different society than 10 years earlier. How did these long-term changes in Mexican society influence the ability of Mexican households to withstand the crisis and, ultimately, to recover from it? In answering this question, we return to the core issue of ‘growth versus development’ which has preoccupied the development community since the early 1980s. During the five years before the peso crisis, Mexico’s GDP increased by an average of 3% per year, but even more importantly, this period of growth was accompanied by an even longer period of development, as manifested by reductions in infant mortality and increased access to education, as well as structural changes in the economy. Our goal is to quantify the impact of this ‘development’ in ameliorating the negative consequences of the macro crisis of 1995. By doing so, we contribute to the state of knowledge on the trade-offs involved in pursuing development strategies that focus on narrowly defined economic growth, in contrast with strategies that pursue growth and development objectives together.
The paper begins with a description of the
Mexican crisis and a review of the country’s performance in terms of poverty, growth and social indicators. We then analyze the behavioral response of households to the macroeconomic shock of 1995. This is followed by a decomposition, using standard techniques, of the changes in consumption between 1992, 1994 and 1996, distinguishing between changes due to differences in the environment and institutions, and changes due to differences in the characteristics of households. Finally, we explore the role that social programmes can play in mitigating and alleviating poverty during macroeconomic crises, using two of Mexico’s larger social programmes as our examples _ the Direct Support Programme for Rural Areas (PROCAMPO) and the Education, Health and Food Programme (PROGRESA), now called the “Oportunidades” programme.
Our analysis is based on household data from three successive (1992, 1994, and 1996) National Income and Expenditure Surveys (ENIGH) carried out by the Mexican government’s statistical institute, INEGI (National Institute of Statistics, Geography and Information Processing). These are not panel data surveys but rather repeated cross-sectional surveys which cover all forms of income and expenditures. The 1994 survey was carried out prior to the crisis, so that the impact of this exogenous shock can be captured by comparing the 1994 and 1996 surveys.
The authors wish to express their gratitude for the valuable observations o f M arco Stampini, Gabriel Demombynes, Daniel Hérnandez, Oscar Altimir, and an anonymous referee. We also wish to thank Emm anuel Skoufias for helping to construct the consumption aggregates and Susan Parker for the information provided. We also wish to pay tribute to José Gómez de Léon (1946-2000), who made some observations on an earlier version o f this study and with whom we had the honour o f working on the PROGRESA programme.
HO USEHO LDS, P O V E R TY A N D POLICY IN TIM ES OF CRISIS. MEXICO, 1992-1996 • BENJAMIN DAVIS, SUDHA NSH U H A N D A A N D HUM BERTO SOTO

C E P A L R E V I E W 8 2 • A P R I L 2 0 0 4 193
iiEconomic reform and crisis
During the presidency of Carlos Salinas de Gortari (1988-1994), Mexico embarked upon a programme of structural economic reforms. These reforms were a response to the series of economic crises that had hit the Mexican economy since 1976, as well as to the import substitution development strategy that had been followed in Mexico in previous decades. The government signed the General Agreement on Tariffs and Trade (GATT); entered into the North American Free Trade Agreement (NAFTA) with Canada and the United States; privatized most State enterprises; initiated changes in the system of land ownership in the ejido (land reform) sector through the reform of Article 27 of the Constitution, affecting over half of Mexican territory; and modified the role of the State in credit, marketing, and other support services to agriculture.
An overvalued exchange rate and reliance on volatile short-term foreign investment led to a severe foreign exchange crisis during the first year of the Administration of President Ernesto Zedillo (19942000). The crisis resulted in a heavy devaluation
(120% between December 1994 and March 1995), high levels of inflation and skyrocketing real interest rates, and macroeconomic instability through 1996. Real GDP dropped over 6% in 1995 (8.6% in per capita terms), as the economy entered a severe repression. By the next year, the economy had bounced back with 5% growth (almost 3% in per capita terms). Despite the rebounding economy, however, average daily real wages dropped 24% between 1994 and 1996 (after having risen 21% between 1992 and 1994), and remained essentially the same in 1997 (Banco de México, 1999; INEGI, 1999).
The crisis had a more severe effect on wage income than non-wage income, which resulted in urban areas being harder hit by the ensuing fall in consumption. While monthly per capita consumption fell in rural areas by 4%, it fell by a stunning 27% in urban areas between 1994 and 1996. The concomitant increases in extreme and moderate poverty rates were more than three times higher in urban areas then rural areas. We discuss these changes in more detail below.
Mexico: Poverty incidence, by relative poverty line, 1992, 1994 and 1996
National Urban Rural
1992 1994 1996 1992 1994 1996 1992 1994 1996
M onthly p e r capita consumption(1994 pesos) 650 709 535 772 843 617 265 278 266
Percentage o f households in povertyOverall poor 28 25 31 29 25 36 31 25 28
Extremely poor 12 10 13 12 10 16 15 10 12Moderately poor 16 15 18 16 15 20 16 15 16
Source: Prepared by the authors on the basis o f the National Household Income and Expenditure Surveys (ENIGH) for 1992, 1994 and 1996.
Mexico: Percentage change in incidence of poverty, by relative poverty line, 1992, 1994 and 1996
National Urban Rural
1992-94 1994-96 1992-94 1994-96 1992-94 1994-96
Monthly per capita consumption (1994 pesos) Percentage o f households in poverty
9 -25 9 -27 5 -4
Percentage o f households in povertyOverall poor -11 23 -13 43 -20 13
Extremely poor -18 27 -18 61 -35 21Moderately poor -5 21 -9 31 -5 8
Source: Prepared by the authors on the basis o f the National Household Income and Expenditure Surveys (ENIGH) for 1992, 1994 and 1996.
TABLE 1
TABLE 2
HO USEHO LDS, PO VERTY A N D POLICY IN T IM ES OF CRISIS. MEXICO, 1992-1996 BENJAM IN DAVIS, SUDHANSHU H A N D A A N D HUM BERTO SOTO

194 C E P A L R E V I E W 8 2 • A P R I L 2 0 0 4
The government found it difficult to protect those affected by the crisis, due to fiscal constraints. Between 1994 and 1995, government social spending dropped 12% in real terms (Lustig and Székely, 1998), though some emergency safety net programmes, such as temporary work programmes, were enacted. Instead, the government tightened monetary and fiscal policies and continued the structural adjustment of the economy.
1. L o n g -te rm tre n d s o f s o c ia l in d ica to rs
Mexico has made tremendous progress over the last few decades in terms of improving the wealth and living standards of its population. Since 1950, real per capita GDP has almost doubled, the proportion of illiterate adults has fallen from 45% to 11%, and the proportion of adults completing primary school has risen from 10% to 70%. Infant mortality has fallen from 178 out of 1000 live births in 1930 to 30.5 in 1995, and over the same period child mortality has fallen from 156 per 1000 to 4.4 per thousand. By 1997, over 85% of the population had access to potable water (CONAPO, 1997).
The overall improvement in social and demographic indicators masks significant regional variations, however. Men residing in Oaxaca, for example, on average live 4.7 years less than in Nuevo León (CONAPO, 1997). Similarly, the rates of infant mortality in Oaxaca, Chiapas and Guerrero are more than double that of Mexico City, Nuevo León and Baja California. Confounding the national trend, the rate of child mortality in Guerrero has actually increased from 36.7 per thousand in 1992 to 63.8 per thousand
in 1997. Similar large differences in rates are found when comparing urban and rural areas and when taking into account the age or educational status of the mother (Programa Nacional de Acción a favor de la Infancia, 1998).
While overall adult illiteracy stood at 11% in 1997, the figure varied from less than 4% in Mexico City and Nuevo León to over 20% in Chiapas, Guerrero, and Oaxaca. The proportion of residents with access to potable water in that year ranged from 99% in Sonora to less than 70% in Veracruz, Guerrero, Tabasco, Chiapas and Oaxaca. Similarly, while 99% of residents of Colima had access to sewerage services, less than 50% had such access in Yucatán, Guerrero and Oaxaca (Programa Nacional de Acción a favor de la Infancia, 1998).
Poverty rates, not surprisingly, have followed similar trends. Lustig and Székely (1998) reviewed estimates of poverty rates made by a collection of researchers for the 1960s and 1970s, and while most disagreed on the levels of poverty, all found that poverty rates dropped over this period. Hernández Laos (1990) found that extreme poverty fell from 70% in 1963 to 34% in 1977, while Székely (1998) found a drop from 30% to 18% over the same period.
According to Lustig and Székely (1998), both extreme and moderate poverty, as well as inequality, increased between 1984 and 1989. Little change in national poverty and inequality indicators was found between 1989 and 1994. Again, however, these national figures mask regional variations, as the southern region showed a large increase in the number of poor. As shown in their study and in our data below, poverty is particularly concentrated in the southern region of Mexico.
IIIThe changing characteristics of the poor, 1992 to 1996
Our hypothesis is that the nature of the 1994-1995 crisis led to a change in the characteristics of households living in poverty, as determined by a consumption- based welfare measure. Given the sharp impact of the crisis on interest rates and real wages, we would expect middle and working class households to have
the sharpest drops in consumption levels. The ranks of the poor would thus be enlarged through the addition of households with relatively higher levels of education, an older demographic structure, and other indicators of greater long-term well-being. We find that while on average the characteristics of the poor evolve
HO USEHO LDS, PO VERTY A N D POLICY IN TIM ES OF CRISIS. MEXICO, 1992-1996 • BENJAMIN DAVIS, SUDHA NSH U HANDA A N D HUM BERTO SOTO

C E P A L R E V I E W 8 2 • A P R I L 2 0 0 4 195
as hypothesized, at the margin these same characteristics, such as household education levels, play an even greater role in reducing the probability of a family falling into poverty.
1. T h e in c re as e in p ov e rty
Using consumption as the basic welfare measure will almost invariably lead to the conclusion that the proportion of households living in poverty in Mexico increased between 1994 and 1996, given the drop in per capita consumption observed over this period. Wide divergences exist, however, among government and international agencies as to the appropriate poverty line, consequently leading to widely varying estimates as to the number of poor in Mexico.1 Since our objective is to analyze changes in consumption and poverty between 1992 and 1996, and not to enter into the debate as to the precise number of poor in Mexico, we have chosen as poverty lines, for the purposes of this study, the consumption level corresponding to the 10th percentile in 1994 as the extreme poverty line, and the consumption level corresponding to the 25th percentile in 1994 as the moderate poverty line.
Using constant 1994 prices, we can compare changes in the index of the number of poor across time, and these are reported in tables 1 and 2. Under our definition, 1994 (prior to the shock) appears to have been a positive year in terms of poverty reduction. In both urban and rural areas, the average monthly per capita level of consumption increased between 1992 and 1994, while the proportion of households under the poverty line fell. These gains, however, were more than wiped out between 1994 and 1996, particularly in urban areas, as we mentioned earlier. The proportion of urban households in extreme poverty increased over 60% and the proportion in moderate poverty increased 30%.
2. P o v e rty p ro files
Table 3 shows the mean values for a variety of household characteristics by year, location, and poverty status. Here we find evidence for our hypothesis that the crisis hit relatively better-off families, resulting in a change in the overall characteristics of poor households. Thus, we find an improvement in the characteristics of extremely and moderately poor households, particularly from 1994 to 1996. The urban poor are increasingly better educated, have higher levels of ownership of consumer durables such as stereos, refrigerators and VCRs, have fewer small children, and there is a lower proportion of households with dirt floors. Likewise, in 1996 the rural poor show greater ownership of consumer durables, a lower proportion of households with dirt floors, and an improvement in levels of education among family members.
Probit equations were estimated to determine the probability of a household being poor (combining extreme and moderate poverty) for all three years, by urban and rural areas. The results are presented in tables 4 and 5. We find that while the average effects reflect the changing overall characteristics of the poor, at the margin in 1996 higher levels of education, for example, had an even stronger effect on reducing the probability of living in poverty. Similarly, while poor households, particularly those in urban areas, on average have increasingly fewer children over time, additional children and adolescents significantly increased the probability of living in poverty in 1996.
The role played by labour activities remained relatively constant: in both urban and rural areas non- agricultural wage labour was associated with a lower probability of living in poverty, while the opposite was true for agricultural wage labour. The sign for selfemployment activities switched between years, however: for urban households, in 1992 and 1996 selfemployment was associated with a high probability of living in poverty, while the reverse was true for 1994. Overall, the results for 1996 show that younger families with greater numbers of children and adolescents, with lower levels of education among both household heads and non-heads, and living in the Pacific South (and for urban households in the Gulf region as well) were much more likely to fall into poverty.
1 W hile estimates o f the incidence o f poverty vary, in general the trends over time are similar: falling poverty rates until 1994, with a spike upward in 1996 due to the crisis, followed by a gradual decline. See, for example, ECLAC (2002).
HO USEHO LDS, PO VERTY A N D POLICY IN T IM ES OF CRISIS. MEXICO, 1992-1996 BENJAM IN DAVIS, SUDHANSHU H A N D A A N D HUM BERTO SOTO

196 C E P A L R E V I E W 8 2 • A P R I L 2 0 0 4
Mexico: Characteristics of poor households in urban and rural areas, 1992, 1994 and 1996
TABLE 3
Extremely poor Moderately poor Non poor
1992 1994 1996 1992 1994 1996 1992 1994 1996
Urban areasNum ber o f members without primary education 1.14 1.21 0.95 0.71 0.86 0.57 0.32 0.32 0.24Num ber o f members with primary education 0.81 0.71 0.83 0.75 0.84 0.61 0.46 0.43 0.35Num ber o f members with secondary or technical education 0.55 0.45 0.68 0.73 0.75 0.90 0.85 0.90 0.88Num ber o f members with higher education 0.03 0.02 0.03 0.05 0.04 0.09 0.24 0.25 0.30Num ber o f family members aged 0 to 4 0.95 1.05 0.94 0.65 0.80 0.58 0.39 0.39 0.35Share o f households with stereo 0.23 0.14 0.20 0.27 0.21 0.33 0.57 0.52 0.51Share o f households with VCR 0.09 0.10 0.11 0.20 0.22 0.25 0.50 0.51 0.50Share o f households with refrigerator 0.28 0.32 0.42 0.56 0.57 0.68 0.85 0.85 0.87Share o f households with dirt floor 0.28 0.26 0.21 0.13 0.13 0.07 0.03 0.03 0.02
Num ber o f observations 704 722 1 404 950 1 081 1 721 4 116 5 405 5 610
Rural areasNum ber o f members without primary education 1.65 1.62 1.70 1.45 1.44 1.36 0.98 0.96 0.80Num ber o f members with primary education 0.39 0.59 0.67 0.56 0.60 0.72 0.59 0.57 0.57Num ber o f members with secondary or technical education 0.08 0.13 0.16 0.20 0.17 0.27 0.38 0.37 0.47Num ber o f members with higher education 0.00 0.00 0.00 0.00 0.00 0.00 0.01 0.02 0.03Num ber o f family members aged 0 to 4 1.38 1.36 1.47 0.98 0.95 0.99 0.59 0.56 0.53Share o f households with stereo 0.01 0.02 0.04 0.06 0.05 0.12 0.15 0.15 0.17Share o f households with VCR 0.00 0.02 0.01 0.02 0.02 0.04 0.10 0.11 0.13Share o f households with refrigerator 0.02 0.04 0.05 0.11 0.10 0.17 0.34 0.36 0.42Share o f households with dirt floor 0.76 0.75 0.69 0.66 0.53 0.48 0.34 0.28 0.25
Num ber o f observations 605 482 539 620 721 723 2 712 3 604 3 191
Source: Prepared by the authors on the basis o f the National Household Income and Expenditure Surveys (ENIGH) for 1992. 1994 and 1996.
HO USEHO LDS, P O V E R TY A N D POLICY IN TIM ES OF CRISIS. MEXICO, 1992-1996 • BENJAMIN DAVIS, SUDHA NSH U H A N D A A N D HUM BERTO SOTO

C E P A L R E V I E W 8 2 • A P R I L 2 0 0 4 197
Mexico: Probit estimate of probability o f living in poverty (extreme and moderate combined), urban households, 1992, 1994 and 1996a
TABLE 4
1992 1994 1996
coeff P>|z| coeff P>|z| coeff P>|z|
Age o f head in years 0.001 0.40 -0.001 0.43 -0.002 0.02**Female head o f household 0.001 0.98 -0.026 0.11 -0.011 0.61Ln (household size) 0.296 0 .00*** 0.137 0 .00*** 0.181 0.00***Head has some primary education -0.089 0 .00*** -0.078 0 .00*** -0.119 0.00***Head has complete primary education 0.139 0 .00*** -0.124 0 .00*** -0.227 0 .00***Head has some secondary education -0.182 0 .00*** -0.171 0 .00*** -0.288 0.00***Head has some vocational or technical education 0.209 0 .00*** -0.183 0 .00*** -0.334 0 .00***Head has some higher education -0.265 0 .00*** -0.234 0 .00*** -0.407 0.00***No. o f members without primary education -0.011 0.48 0.056 0 .00*** 0.080 0.00***No. o f members with complete primary education 0.041 0 .01*** 0.008 0.51 0.022 0.18No. o f members with secondary or technical education -0.088 0 .00*** -0.053 0 .00*** -0.062 0 .00***No. o f members with some higher education -0.152 0 .00*** -0.114 0 .00*** -0.172 0.00***Dependency ratio o f households'3 0.353 0 .00*** 0.064 0.13 0.215 0.00***No. o f household members aged 0-4 0.043 0 .00*** 0.075 0 .00*** 0.121 0.00***No. o f household members aged 5-10 0.010 0.38 0.058 0 .00*** 0.087 0.00***No. o f male household members aged 11-14 0.011 0.47 0.044 0 .00*** 0.089 0.00***No. o f female household members aged 11-14 -0.008 0.58 0.027 0.03** 0.105 0.00***No. o f male household members aged 15-19 0.067 0 .00*** 0.030 0 .02** 0.096 0.00***No. o f female household members aged 15-19 0.060 0 .00*** 0.053 0 .00*** 0.075 0.00***No. o f male household members aged 20-34 0.047 0 .00*** 0.020 0.05** 0.058 0.00***No. o f female household members aged 20-34 0.037 0 .00*** 0.003 0.75 0.031 0.02**No. o f male household members aged 55 or more 0.029 0.18 -0.007 0.66 0.014 0.53No. o f female household members aged 55 or more 0.039 0.04** -0.016 0.26 0.029 0.11No. o f non-agricultural wage earners -0.007 0.54 -0.027 0 .01*** -0.032 0.02**No. o f agricultural wage earners 0.064 0 .01*** 0.080 0 .00*** 0.062 0.03**No. o f self-employed 0.051 0 .00*** -0.031 0 .01*** 0.029 0.07*No. o f own farm workers 0.019 0.33 -0.010 0.45 -0.058 0.00***Own house -0.076 0 .00*** -0.053 0 .00*** -0.054 0.01***Rented house -0.134 0 .00*** -0.082 0 .00*** -0.140 0.00***Head o f family works in agricultural sector 0.129 0 .00*** 0.063 0 .02** 0.138 0.00***Head o f family works in manufacturing 0.051 0.05** -0.026 0.18 0.105 0.00***Head o f family works in transport/utilities/commerce 0.033 0.14 -0.010 0.56 0.093 0 .00***Head o f family works in government or defence sector 0.032 0.28 -0.038 0.08* 0.032 0.27Head works in services sector 0.028 0.27 -0.022 0.23 0.109 0.00***North -0.111 0 .00*** -0.051 0 .02** -0.064 0.01***Pacific North -0.155 0 .00*** -0.110 0 .00*** -0.162 0.00***Central -0.059 0 .01*** -0.043 0.04** -0.049 0.03**G ulf -0.101 0 .00*** -0.014 0.53 0.017 0.52Urban metropolitan area -0.191 0 .00*** -0.142 0 .00*** -0.148 0.00***
Num ber o f observations 5 723 7 145 8 678
Source: Prepared by the authors on the basis o f the National Household Income and Expenditure Surveys (ENIGH) for 1992. 1994 and 1996. a Coefficients are marginal probabilities derived from Probit coefficients. “No education” is the excluded category for head’s education. *** significant at 1%.** significant at 5%.* significant at 10%.b Dependency rate o f households corresponds to the ratio o f the number o f employed persons in the household to the total number o f persons in the household.
HO USEHO LDS, PO VERTY A N D POLICY IN T IM ES OF CRISIS. MEXICO, 1992-1996 BENJAM IN DAVIS, SUDHANSHU H A N D A A N D HUM BERTO SOTO

198 C E P A L R E V I E W 8 2 • A P R I L 2 0 0 4
TABLE 5
Mexico: Probit estimate of probability of living in poverty (extreme and moderate combined), rural households, 1992, 1994 and 1996a
1992 1994 1996
coeff P>|z| coeff P>|z| coeff P>|z|
Age o f head in years 0.000 0.90 -0.001 0.19 -0.002 0.03**Female head o f household 0.018 0.S9 0.034 0.17 0 .00S 0 .8SLn (household size) 0.201 0.00*** 0.207 0.00** 0.111 0 .02**Head has some primary education -0.094 0 .00*** -0.042 0.00*** -0.031 0.06Head has complete primary education -0.131 0 .00*** -0.084 0.00*** -0.099 0 .00***Head has some secondary or some higher education -0.178 0 .00*** -0.121 0.00*** -0.146 0 .00***No. o f members without primary education 0.001 0.94 0.14 0.2S 0.037 0 .02**No. o f members with complete primary education -0.068 0 .00** -0.023 0.07* -0.027 0.10No. o f members with secondary or technical education -0.081 0 .00*** -0.068 0.00*** -0.080 0 .00***No. o f members with some higher education -0.189 0.03 -0.170 0.02 -0.339 0 .01***Dependency ratio o f households'1 0.243 0.00*** 0.039 0.46 0.209 0 .00***No. o f household members aged 0-4 0.042 0.00*** 0.038 0.00*** 0.08S 0 .00***No. o f household members aged 5-10 0.031 0.01*** 0.021 0.01*** 0.0S7 0 .00***No. o f male household members aged 11-14 -0.014 0.3S 0.016 0. 1S 0.030 0.04**No. o f female household members aged 11-14 0.023 0.13 0.013 0.2S 0.030 0.04**No. o f male household members aged 15-19 0.014 0.47 0.009 0.S4 0.044 0 .02**No. o f female household members aged 15-19 0.017 0.38 -0.020 0.18 0.031 0.08*No. o f male household members aged 20-34 0.009 0 .S6 0.018 0.12 0.028 0 .0S**No. o f female household members aged 20-34 0.002 0.92 -0.010 0.38 0.010 0 .S1No. o f male household members aged 55 or more -0.017 0.47 -0.007 0.66 0 .00S 0.83No. o f female household members aged 55 or more 0.027 0.21 0.010 0.S1 0.004 0.84No. o f non-agricultural wage earners -0.009 0.S3 -0.062 0.00*** -0.044 0 .00***No. o f agricultural wage earners 0.028 0 .02** 0.008 0.S1 0.027 0.04**No. o f self-employed 0.071 0.00*** -0.002 0.89 0.006 0.69No. o f own farm workers 0.028 0.03** -0.003 0.79 0.003 0.79Own house 0.011 0.63 0.034 0.04 0.066 0 .00***Rented house -0.076 0.30 -0.079 0.18 -0.037 0 .S6Head o f family works in agricultural sector 0.070 0 .02** 0.002 0.92 0.019 0.48Head o f family works in manufacturing 0.029 0 .S0 -0.001 0.97 -0.012 0.74Head o f family works in transport/utilities/commerce -0.041 0.22 -0.071 0.00*** -0.031 0.31Head o f family works in government or defence sector -0.037 0 .S0 -0.072 0.0S** -0.069 0.11Head works in services sector -0.03S 0.43 -0.074 0.01*** -0.007 0.86North -0.063 0.00*** -0.079 0.00*** -0.109 0 .00***Pacific North -0.121 0.00*** -0.083 0.00*** -0.123 0 .00***Central -0.061 0.00*** -0.041 0.01*** -0 .0S0 0 .01***G ulf -0.074 0.00*** -0.008 0.66 -0.03S 0.07*
Num ber o f observations 3 927 4 801 4 438
Source: Prepared by the authors on the basis o f the National Household Income and Expenditure Surveys (ENIGH) for 1992, 1994 and 1996. a Coefficients are marginal probabilities derived from Probit coefficients. “No education” is the excluded category for head’s education. *** significant at 1%.** significant at 5%.* significant at 10%.b Dependency rate o f households corresponds to the ratio o f the number o f employed persons in the household to the total number o f per
sons in the household.
HO USEHO LDS. P O V E R TY A N D POLICY IN TIM ES OF CRISIS. MEXICO. 1992-1996 • BENJAMIN DAVIS. SUDHA NSH U H A N D A A N D HUM BERTO SOTO

C E P A L R E V I E W 8 2 • A P R I L 2 0 0 4 199
IVBehavioral responses to the crisis
In order to understand h ow households adjusted during the 1995 crisis, w e explored w hether sign ificant changes in food and general consum ption patterns
occurred during the period studied. W e also analyzed
school enrolm ent rates to see i f households system atica lly rem oved child ren fro m school to help w ith short
term incom e earning activities.
1. C o n s u m p tio n p atte rn s
Consum ption patterns w ere explored in fo u r d ifferent w ays, each exp lo iting the details o f the E N IG H con
sum ption questionnaire. W e firs t analyzed changes in
expenditure shares in m ajo r consum ption groups to
see w hether there was sign ificant consum ption sw itching am ong expenditure groups in response to the overa ll decline in w e lfa re in 1995. N e x t w e calculated the
incom e effects fo r budget shares, using E n ge l curve
regression equations. W e then repeated these tw o exercises considering only food budget shares.
The E ngel curve regression equations are based
on the W o rk ing -Leser functional fo rm w here the budget share is regressed against log tota l per capita expenditure, log o f household size, the num ber o f people in
each o f 12 sex-specific age groups, and the sex, schooling and age o f the household head:2
w i= a + b¡*ln (x/n) + b 2* ln (n ) + b 3* D + b 4*H + u [1]
w here Wi is the ith budget share, x is to ta l household
expenditure, n is household size, D is a vecto r o f 12
dem ographic variables, H is a vecto r o f household
head characteristics, and a and bi are parameters to be
estimated. In this fo rm , positive values o f b indicate
luxury goods, and negative values necessities.W e beg in our discussion o f consum ption patterns
w ith the proportion o f the o vera ll consum ption bundle
allocated to 10 d ifferent groups, shown in percentage
terms fo r the three survey years in table 6, w h ich also
shows the budget shares fo r the bottom quintile o f the
per capita expenditure d istribution fo r each year. The
same pattern o f consum ption sw itch ing was observed
fo r urban and rural areas betw een 1994 and 1996. The
food share rose by roughly f iv e percentage points in
the y e a r a fte r the crisis, w h ile the shares devoted to
housing, alcohol and dom estic goods (fu rn itu re , app liances, etc.) fe ll. There was also a sm all decline in the
budget shares o f clo th ing in both urban and rural areas. A w orry in g trend is the decline in the share o f educatio n betw een 1994 and 1996. In rural areas the share o f
the budget devoted to educational expenses was over
5 0 % less in 1996, and in urban areas the drop was
approxim ately 25% .A m o n g the poorest qu intile , as m ight be expect
ed, the o vera ll share devoted to foo d is higher, and the
changes in the shares betw een 1994 and 1996 m irro r
those found in the fu ll sample. The foo d share rose by
seven percentage points in rural areas (fiv e in urban), w ith declines in the a lcohol, housing, and dom estic
budget shares. The w orry in g decline in allocations to
education is especially large in this sub-sam ple, w ith
drops equ ivalent to 7 0 % (ru ra l) and 5 0 % (urban) re la tive to the 1994 levels.
Table 7 shows the coeffic ien t o f log p er capita
expenditure calculated fro m equation [1]. B o th the
rural and urban estimates o f incom e effects show that foo d and housing are unam biguously necessities, w h ile education, health and hygiene, transportation, dom estic item s, and transfers out are unam biguously
luxuries. The coeffic ien t fo r food rose s ign ificantly (in
absolute value) in 1996, as expected, w h ile the c o e fficients fo r transportation, clothing, and health also rose
in 1996, ind icating that they becam e m ore o f a luxury
good. H ousing becam e m ore ‘luxu rio us ’ in 1996 in
both urban and rural areas, w h ile in rural areas the
ju m p betw een 1994 and 1996 fo r transportation and
com m unication and fo r c lothing was especially large.
2 See Deaton and Muellbauer (1980) for a discussion o f this functional form.
HO USEHO LDS. PO VERTY A N D POLICY IN T IM ES OF CRISIS. MEXICO. 1992-1996 BENJAM IN DAVIS. SUDHANSHU H A N D A A N D HUM BERTO SOTO

200 C E P A L R E V I E W 8 2 • A P R I L 2 0 0 4
TABLE 6
Mexico: Mean household budget shares of various expenditure categories, rural and urban areas(Percentages)
Total population Bottom quintile
1992 1994 199ó 1992 1994 199ó
Rural areasFood 4ó 42 47 51 47 54Alcohol and tobacco 0 3 0 0 1 0Housing 17 23 22 18 27 25Transport and communication 7 7 7 3 4 3Health and personal hygiene ó 7 8 4 5 5Clothing and footwear 8 5 5 10 5 4Education 2 3 1 2 3 1Domestic items 9 8 7 8 7 óTransfers out 1 1 1 0 0 0Other 5 1 2 4 0 2
Num ber o f observations 3 911 4 797 4 442 óó5 823 814
Urban areasFood 35 32 3ó 44 42 4óAlcohol and tobacco 0 2 0 0 1 0Housing 22 28 2ó 20 2ó 24Transport and communication 8 9 10 ó 7 8Health and personal hygiene ó 7 8 ó 7 7Clothing and footwear 5 5 4 ó 4 4Education 5 5 4 5 5 2Domestic items 9 7 ó 8 7 óTransfers out 2 1 1 0 0 0Other 8 3 4 ó 1 3
Num ber o f observations 5 739 7 199 8 709 1 193 1 491 1 979
Source: Prepared by the authors on the basis o f the National Household Income and Expenditure Surveys (ENIGH) for 1992, 1994 and 1996.
The income elasticity for food is lower in urban areas, as is the elasticity of transport and health and personal hygiene. However, all these elasticities increased in absolute terms between 1994 and 1996. One important difference between rural and urban areas is that the income elasticity of education is much larger (almost double) in urban areas. Hence educational expenditures are more sensitive to income in urban than in rural areas in Mexico.
Table 8 shows the mean values of food budget shares over the three time periods under study. There is less switching among food groups than between food and the other broad groups, but some basic patterns emerge. Over 40% of the food budget in rural areas is devoted to cereals and to fruits, vegetables and legumes, and in the bottom quintile these groups account for around 60% of the food budget. During the crisis, households generally responded by increasing the share allocated to cereals and dairy products and reducing expenditures on meat and fish and ‘other’ foods.
The same shift is observed in urban areas, although here cereals rank only fourth in importance in the food budget, while meat and fish and ‘food eaten out’ are the two largest food groups, accounting for over 40% of the entire food budget. Urban households in the bottom quintile have food consumption patterns more similar to those of the rural population as a whole, with over 40% of the budget dedicated to cereals and to vegetables, fruits and legumes.
Table 9 gives estimates of the income elasticities for each food group by year and region, using equation [1]. For both urban and rural areas, cereals, vegetables, and other foods were unambiguous necessities, while food eaten out was a luxury. However, meat and fish were a luxury in rural areas only, while dairy products were a necessity in urban areas. Between 1994 and 1996, income elasticities increased (in absolute terms) for cereals and vegetables (i.e., they became more of a necessity), while other foods become more of a luxury (income elasticity increased). Surprisingly, the income elasticity for food eaten out declined in 1996.
HO USEHO LDS. PO VERTY A N D POLICY IN TIM ES OF CRISIS. MEXICO. 1992-1996 • BENJAMIN DAVIS. SUDHA NSH U HANDA A N D HUM BERTO SOTO

C E P A L R E V I E W 8 2 • A P R I L 2 0 0 4 201
TABLE 7
Mexico: Income effects for full household budget shares'
1992 1994 1996
Rural areas
Food -4.07 -S.73 -6.SS(9.82) (1S.87) (16.24)
Alcohol and tobacco 0.06 2.14 0 .0S(1.09) ( 10.S2) (0.92)
Housing -3.3S -6.9S -S.43(12.18) (22.33) (17.74)
Transport and communication 3.73 1.94 3.66(17.16) (9.66) (17.SS)
Health and personal hygiene 2.18 2.S0 3.31(10.81) (11.S4) (1S.40)
Clothing and footwear -1.48 0.S1 0.92(7.77) (3.61) (6.89)
Education 0.4S 0.69 0.68(3.9S) (S.80) (9.13)
Domestic items 1.2S 1.76 0.S3(S.4S) (9.22) (3.70)
Transfers out 0.96 2.11 1.83(9.98) (16.19) (14.S7)
Other 0.28 1.04 1.01(2.23) (11.40) (7.6S)
Urban areas
Food -8.04 -8.6S -9.26(27.82) (37.21) (38.3S)
Alcohol and tobacco 0.04 1.12 -0.01(1.S4) (8.0S) (0 .2S)
Housing -1.30 -2.99 -1.S6(S.07) (11.09) (6.7S)
Transport and communication 1.16 0.81 1.19(7.36) (S.82) (8.44)
Health and personal hygiene 1.12 1.78 2.41(8.42) (10.87) ( 1S.6S)
Clothing and footwear 0.38 0.22 0.61(3.60) (2.43) (7.78)
Education 1.30 1.7S 1.94(8.4S) (11.96) (17.96)
Domestic items 2.09 1.69 0 .6S(11.S4) (11.38) (6.73)
Transfers out 1.89 1.30 1.36(17.93) (14.41) (16.37)
Other 1.37 2.96 2.66(8.46) (27.26) (23.18)
Source: Prepared by the authors on the basis o f the National Household Income and Expenditure Surveys (ENIGH) for 1992, 1994 and 1996. a Figures correspond to coefficients for log per capita expenditure derived from Engel curve estimates using equation [1] in the text. i-statis
tics are shown in parenthesis below coefficients. Negative coefficients imply necessities, positive coefficients imply luxury items.
2. S c h o o l e n ro lm e n t
The ENIGH data set provides very little information on individual welfare outcomes such as health or nutrition. Information on educational attainment, however, including current school enrolment, provides an additional insight into the possible coping
strategies of Mexican households. In general, enrolment rates are high (90%) until the end of primary school, and begin to fall around age 11. We therefore focus on children 12-15 years old, analyzing enrolment patterns to see if the 1995 crisis had any significant impact on possible long-term development through declines in school enrolment rates.
HO USEHO LDS. PO VERTY A N D POLICY IN T IM ES OF CRISIS. MEXICO. 1992-1996 BENJAM IN DAVIS. SUDHANSHU H A N D A A N D HUM BERTO SOTO

202 C E P A L R E V I E W 8 2 • A P R I L 2 0 0 4
Mexico: Mean shares of different expenditure items in household food budget(Percentages)
TABLE 8
Total population Bottom quintile
1992 1994 1996 1992 1994 1996
Rural areasCereals 24 23 24 34 31 34Meat and fish 14 16 15 8 12 10Dairy products 14 14 15 13 13 12Vegetables, fruits and legumes 24 21 21 32 27 27Food preparation 2 2 1 1 1 1Food eaten out 11 11 12 2 2 4Other food 11 13 12 11 14 12
Num ber o f observations 3 911 4 797 4 442 665 823 814
Urban areasCereals 13 13 15 21 20 23Meat and fish 23 23 21 22 22 18Dairy products 15 15 17 17 17 19Vegetables, fruits and legumes 16 15 16 21 20 20Food preparation 4 4 3 3 2 3Food eaten out 21 21 19 8 8 8Other food 8 9 8 9 9 9
Num ber o f observations 5 739 7 199 8 709 1 193 1 491 1 979
Source: Prepared by the authors on the basis o f the National Household Income and Expenditure Surveys (ENIGH) for 1992, 1994 and 1996.
Table 10 shows mean enrolment rates by region and sex of child, for the full sample of children as well as for children residing in households in the bottom quintile of the per capita expenditure distribution in each year. In general, urban rates are higher than rural rates, and male rates higher than female ones. The role of income seems to be stronger in urban areas, a finding that is consistent with the higher income elasticities for education expenses in urban areas referred to above. The gap between the full sample and the bottom quintile was larger in urban areas (20 percentage points for girls) than in rural ones (where the male- female difference was never larger than 10 percentage points), and this gap increased in 1996. Male enrolment rates remained stable in both urban and rural areas, although there was a small decline after the crisis. According to table 10, the group that suffered most in terms of enrolment was girls in the bottom quintile in urban areas, whose enrolment rate dropped by 14 percentage points between 1994 and 1996, and was actually lower in 1996 (46%) than at the beginning of the study period (61%).
This result is confirmed within a multivariate framework. We stacked the three years of survey data and estimated a Probit equation for the probability of being enrolled in school during the survey. Control variables used in this exercise included age and sex of
the child, education and sex of the household head, log per capita household expenditure, and survey year. We included a dummy variable equal to 1 if the child was a female from the bottom quintile in 1996. The coefficient of this variable was significant in urban areas, and when evaluated in terms of the means indicated that girls from the poorest families had enrolment rates that were seven percentage points lower than other children in the survey. In rural areas this coefficient was not significant.3
As in the case of the analysis conducted earlier for consumption patterns, we estimated Probit models for the determinants of enrolment separately for each year (and by region) in order to understand how these determinants may have changed following the economic crisis of 1995. The control variables were those mentioned above (minus the survey year dummies), although for rural areas we had to aggregate the dummy variables for educational level of the head of household due to the small cell sizes.
The Probit marginal probabilities derived from the underlying coefficient estimates are presented in table 11. We were particularly interested in the pattern of ‘income effects’ over time, as well as male-female differences. As was to be expected, the ‘income effect’
3 Results available from the authors upon request.
HO USEHO LDS. PO VERTY A N D POLICY IN TIM ES OF CRISIS. MEXICO. 1992-1996 • BENJAMIN DAVIS. SUDHA NSH U HANDA A N D HUM BERTO SOTO
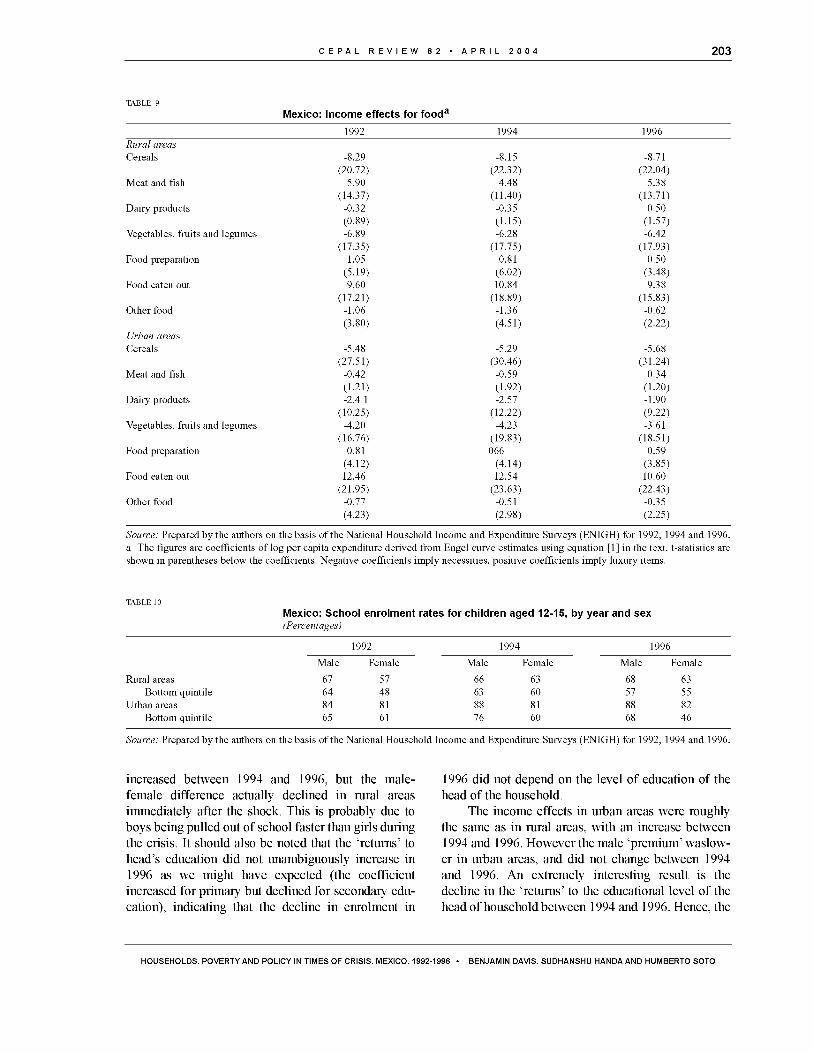
C E P A L R E V I E W 8 2 • A P R I L 2 0 0 4 203
TABLE 9
Mexico: Income effects for fooda
1992 1994 1996R ural areasCereals -8.29 -8.1S -8.71
(20.72) (22.32) (22.04)Meat and fish S.90 4.48 S.38
(14.37) (11.40) (13.71)Dairy products -0.32 -0.3S 0 .S0
(0.89) ( 1.1S) (1.S7)Vegetables. fruits and legumes -6.89 -6.28 -6.42
(17.3S) (17.7S) (17.93)Food preparation 1.0S 0.81 0 .S0
(S.19) (6.02) (3.48)Food eaten out 9.60 10.84 9.38
(17.21) (18.89) (1S.83)Other food -1.06 -1.36 -0.62
(3.80) (4.S1) (2 .22)Urban areasCereals -S.48 -S.29 -S.68
(27.S1) (30.46) (31.24)Meat and fish -0.42 -0.S9 0.34
( 1.21) (1.92) ( 1.20)Dairy products -2.4 1 -2.S7 -1.90
( 10.2S) ( 12.22) (9.22)Vegetables. fruits and legumes -4.20 -4.23 -3.61
(16.76) (19.83) (18.S1)Food preparation 0.81 066 0.S9
(4.12) (4.14) (3.8S)Food eaten out 12.46 12.S4 10.60
(21.9S) (23.63) (22.43)Other food -0.77 -0 .S1 -0.3S
(4.23) (2.98) (2 .2S)
Source: Prepared by the authors on the basis o f the National Household Income and Expenditure Surveys (ENIGH) for 1992, 1994 and 1996. a The figures are coefficients o f log per capita expenditure derived from Engel curve estimates using equation [1] in the text. t-statistics are shown in parentheses below the coefficients. Negative coefficients im ply necessities, positive coefficients imply luxury items.
TABLE 10
Mexico: School enrolment rates for children aged 12-15, by year and sex(Percentages)
1992 1994 1996
Male Female Male Female Male Female
Rural areas 67 S7 66 63 68 63Bottom quintile 64 48 63 60 S7 SS
Urban areas 84 81 88 81 88 82Bottom quintile 6S 61 76 60 68 46
Source: Prepared by the authors on the basis o f the National Household Income and Expenditure Surveys (ENIGH) for 1992, 1994 and 1996.
increased between 1994 and 1996, but the male- female difference actually declined in rural areas immediately after the shock. This is probably due to boys being pulled out of school faster than girls during the crisis. It should also be noted that the ‘returns’ to head’s education did not unambiguously increase in 1996 as we might have expected (the coefficient increased for primary but declined for secondary education), indicating that the decline in enrolment in
1996 did not depend on the level of education of the head of the household.
The income effects in urban areas were roughly the same as in rural areas, with an increase between 1994 and 1996. However the male ‘premium’ waslow- er in urban areas, and did not change between 1994 and 1996. An extremely interesting result is the decline in the ‘returns’ to the educational level of the head of household between 1994 and 1996. Hence, the
HO USEHO LDS. PO VERTY A N D POLICY IN T IM ES OF CRISIS. MEXICO. 1992-1996 BENJAM IN DAVIS. SUDHANSHU H A N D A A N D HUM BERTO SOTO

204 C E P A L R E V I E W 8 2 • A P R I L 2 0 0 4
drops in enrolment in the aftermath of the shock were systematically related to the head’s education, but in a way opposite to what we would expect. However, the rate of dropouts was related to overall household well
being (as measured by per capita expenditure), with poorer households more likely to have lower enrolment rates in 1996 compared with 1994.
TABLE 11
Mexico: Probit estimates of determinants of school enrolment of children between 12 and 15 a
( 1) (2) (3)
1992 1994 199ó
Rural areasLog per capita expenditure 0.074 0.097 0.114
(4.57) (ó.27) (ó.98)Male child 0.090 0.082 0.055
(4.22) (4.28) (2.83)Age 13 -0.135 -0.231 -0.149
(4.33) (7.74) (4.92)Age 14 -0.282 -0.354 -0.274
(9.17) ( 12.0ó) (9.17)Age 15 -0.484 -0.511 -0.470
(15.ó9) (17.41) (15.47)Head o f household is female -0.03ó -0.082 0.008
(0.83) (2.30) (0.21)Head has incomplete primary education 0.055 0.020 0.034
(2.28) (0.94) (1.44)Head has complete primary education 0.152 0.07ó 0.111
(4.51) (2.49) (3.85)Head has some secondary education 0.272 0.183 0.145
(5.45) (4.01) (3.41)
Num ber o f observations 2 22ó 2 ó32 2 417
Urban areasLog per capita expenditure 0.083 0.080 0.092
(7.4ó) (8.23) (9.91)Male child 0.034 0.048 0.048
(2 .ó1) (4.09) (4.49)Age 13 -0.111 -0.093 0.0ó8
(4.44) (4.12) (3.4ó)Age 14 -0.1ó3 -0.17ó -0.175
(ó.54) (7.75) (8.48)Age 15 -0.343 -0.339 -0.272
(13.00) (13.33) (12.33)Head o f household is female -0.0ó3 -0.029 -0.022
(3.11) (1.ó7) (1.40)Head has incomplete primary education 0 .0ó0 0.052 0.024
(3.50) (3.45) (1.58)Head has complete primary education 0.119 0.087 0.0ó5
(7.08) (5.72) (4.23)Head has some secondary education 0.118 0.121 0.080
(ó.ó0) (7.48) (4.84)Head has some technical or vocational education 0.101 0.105 0.104
(4.1ó) (4.72) (5.02)Head has some higher education 0 .10ó 0.094 0.07ó
(4.14) (4.12) (3.43)
Num ber o f observations 2 ó58 3 12ó 3 554
Source: Prepared by the authors on the basis o f the National Household Income and Expenditure Surveys (ENIGH) for 1992, 1994 and 1996. a Absolute value o f z-statistics is given in parentheses. Coefficients are marginal probabilities derived from Probit coefficients. “No education” is the excluded category for head’s education.
HO USEHO LDS. PO VERTY A N D POLICY IN TIM ES OF CRISIS. MEXICO. 1992-1996 • BENJAMIN DAVIS. SUDHA NSH U HANDA A N D HUM BERTO SOTO

C E P A L R E V I E W 8 2 • A P R I L 2 0 0 4 205
VDecomposition
The sharp fall in private consumption after the crisis came just after a period of economic expansion and strong growth in consumption. Within a longer-term perspective, the crisis also occurred after almost two decades of increasing human capital indicators such as educational attainment and health status, with corresponding declines in poverty rates. On the eve of the crisis, Mexico was clearly a very different society from what it had been 15 years before, in terms of the characteristics of its people and the structure of its economy, and yet almost overnight, private consumption and poverty fell back to levels of 15 years earlier. How did the evolution of the characteristics of Mexican households affect their capacity to absorb the economic shock of 1995 and, subsequently, to recover? In this section we use decomposition techniques to try and understand the role that structural changes related to long-term development (such as changes in the economy and human capital expansion) play in times of economic crisis, and the specific characteristics of households that were associated with the decline in welfare during the crisis.
For each of our three survey years, we relate household per capita consumption (in log form) to a set of household characteristics that we divide into seven groups:logCi = a + P 1*MISC + P2*HE + P3*NHE + P4*DEMO +
P5*EMPL + P6*HOUSE + P7*SECTOR + u i [2]
where:MISC is a set of miscellaneous variables including
log of family size, and the sex and age of the household head.
HE refers to the head’s education, and is measured by a set of nine dummy variables indicating different levels of attained schooling.
NHE is the educational level of persons who are not heads of household, measured by the number of household members in four different schooling levels.
DEMO4 is the number of people in each of 10 different sex-specific age groups, plus the depend-
4 The number o f males and females age 36-50 is actually not included in the regressions. because these numbers are highly correlated with the number o f non-head adults in the four educational groups and the number o f adults in the four employment states.
analysis
ency ratio of the household.EMPL is the number of people employed respective
ly in agricultural wage labour, non-agricultur
al wage labour, self employed, and family employment.
HOUSE is captured by two dummy variables indicating whether the household owns or rents the house it lives in (other types of tenancy is the excluded category).
SECTOR is the sector of employment of the household head.
In equation [2], a and P are the parameters to be estimated and Ui is a random error term. Equation [2] is estimated for the households, separately by year and by urban and rural. Using urban and rural estimates from adjacent years, we decompose the change in consumption between the years into the proportion due to changes in the mean level of household characteristics, and the proportion due to differences in the ‘returns’ to these characteristics —the b e ta values— strictly according to the technique first pioneered by Ronald Oaxaca (1973 and 1998). Thus, for example, the decomposition for the period between 1992 and 1994, using 1992 as the base year, can be written as follows:
A C o n = C o n 92 - C o n 94 = (C 92 - C 94 ) + X 94
* (@92 - P 94 ) +p 92*( X92 - XX94) [3]
where C o n is (log of) per capita consumption, C i is the constant term in the regression for time period i , X i is the mean characteristics of households in time period i , and ¡5i is the coefficient vector for the regression from time period i . Equation [3] states that the change in consumption between time periods 0 and 1 can be decomposed into three components. The first is the difference in the estimated constant term between the two time periods. The second is the difference in coefficients (or b e ta s ) between the two time periods, or the ‘returns’ to household characteristics. The third is the difference in characteristics of households between the two periods, or the change in endowments. Since the
HO USEHO LDS. PO VERTY A N D POLICY IN T IM ES OF CRISIS. MEXICO. 1992-1996 BENJAM IN DAVIS. SUDHANSHU HANDA A N D HUM BERTO SOTO

206 C E P A L R E V I E W 8 2 • A P R I L 2 0 0 4
values fo r the second period are subtracted fro m those
fo r the in it ia l period , an increase in consum ption
betw een the tw o periods w i l l be reflected in a negative
varia tio n in consum ption on the le ft hand side o f equa
tio n [3]. A s w e shall see, this is w hat happened
betw een 1992 and 1994. L ikew ise , a reduction in con
sum ption w i l l be reflected in a positive va ria tio n on
the le ft hand side o f equation [3 ], as occurred betw een
1994 and 1996.
T rad itionally , this decom position technique has
been used to analyse m ale -fem ale w age differentials; in that context, the portion o f the w age d iffe ren tia l that is due to d ifferences in betas (o r returns to characteristics) is a measure o f the unequal treatm ent that m en
and w o m en receive in the labour m arket. In the present study, w e are com paring differences in consum ptio n over tim e, hence differences in betas can be in te rpreted as differences in the environm ent betw een the
tw o tim e periods, w h ic h lead to d iffe rent returns to
characteristics such as the education and sector o f
em ploym ent o f the household head, fo r exam ple. Furtherm ore, w h ile w e w i l l re fe r to changes in the X
variables as changes in household characteristics, i t is
im portant to note that some o f these changes are
endogenous in the short run, as households m ay split or jo in in response to econom ic crisis, o r household
heads m ay change sectors o f em ploym ent. T he set o f
variables most lik e ly to be exogenous in the short run
is that describing the education o f the household head
and other adult household m em bers, and since these
are a d irect measure o f hum an capital, w e w il l pay
particu lar attention to the contribu tion o f these v a r i
ables to changes in o vera ll household consum ption.W ith in this fram ew o rk , w e develop a num ber o f
hypotheses and p r io r assum ptions re g ard in g the
sources and m agnitude o f consum ption changes
betw een 1992 and 1994 and 1994 and 1996. F irst, w e
expect that changes in betas w i l l exp la in most o f the
changes in consum ption, because the X variables w e
use tend not to m ove drastically in the short run, and
our tim e fram e is only fo u r years. H o w ever, because o f
the econom ic crisis, w e expect that a larger proportion
o f the changes in consum ption betw een 1994 and 1996
w il l be expla ined b y changes in betas, com pared w ith
the 199 2 -1 9 9 4 period.
Second, as m entioned earlier, the 1995 crisis was
preceded by a lengthy period o f expansion o f hum an
capital, as w e ll as econom ic restructuring. I f these
changes in the characteristics o f the M e x ic a n populatio n led to increases in consum ption, then our decom positions should show changes in X characteristics
lea d in g to increases in con sum ption o v e r tim e , although the m agnitude o f these increases w i l l be
sm all since our tim e period is only fo u r years.In add ition to these m a in hypotheses, the decom
position analysis perm its us to see w h ic h group o f
household characteristics contributed the m ost to the
decline (o r rise) in consum ption during the period
under study. F in a lly , w e can use the estim ated co e fficients fo r 1996, along w ith the X characteristics fo r
1992, to sim ulate and quantify the role o f structural changes that are part o f the lon g -term developm ent process, as m easured by the p ro file o f the X variables, in m itiga ting the adverse consequences o f m acroeconom ic shocks.
Table 12 presents the results o f the decom positio n analysis fo r both ru ra l and urban areas fo r the tw o
adjacent tim e periods.5 In each case, consum ption in
the in itia l period is used as the base. B etw een 1992
and 1994 consum ption increased, so the differences
are negative, w h ile betw een 1994 and 1996 consum p
tio n decreased, so the differences are positive. The
results indicate that betw een 1992 and 1994, 9 5 % o f
the increase in consum ption was due to change in
returns to household characteristics (inc lud ing the
constant term ) w h ile 5 % w ere due to im provem ents in
these characteristics. B etw een 1994 and 1996, h ow ever, changes in returns accounted fo r 1 06% o f the
decline in consum ption, w h ile im provem ent in X char
acteristics actually led to a 6 % increase in consum ption. T he results fo r urban areas te ll the same story. Changes in betas accounted fo r a larger part o f the
change in consum ption in the la tter period (1 9 9 4
1996) re la tive to the fo rm e r period, and changes in X characteristics actually led to im provem ents in households’ ab ility to generate consum ption, particu larly
betw een 1994 and 1996.
5 Results available from the authors upon request.
HO USEHO LDS. PO VERTY A N D POLICY IN TIM ES OF CRISIS. MEXICO. 1992-1996 • BENJAMIN DAVIS. SUDHA NSH U H A N D A A N D HUM BERTO SOTO

C E P A L R E V I E W 8 2 • A P R I L 2 0 0 4 207
TABLE 12
Mexico: Consumption variation decomposition(Percentage variation)
1992-1994 1994-1996
ß X ß X
R ural areasOther -15.30 -1.29* -18.78 -0.53*Head’s education -0.78 -0 .20* 4.13 -2.60*Non-head’s education 8.30 -0.89* 4.68 -1.27*Demographic factors -18.00 -2.44* 14.20 -0.39*Employment -15.90 -0 .86* 8.40 -1.18*Housing 12.04 0.07* -1.30 0.34*Sector -11.38 0 .21* -3.29 -0 .22*Constant -53.62 97.80
Total -94.64 -5.40 105.84 -5.85
Urban areasOther 17.31 0 .00* 7.05 -1.40*Head’s education 1.83 0.34* -1.14 -2.24*Non-head’s education 10.50 0.60* -7.00 -0.75*Demographic factors -29.83 -0.57* 8.07 -0.34*Employment -20.36 -0.26* 9.19 0.33*Housing 11.67 0 .21* -5.03 -0.08*Sector -5.28 0 .01* 6.45 -0.07*Constant -86.02 86.96
Total -100.18 0.33 104.55 -4.55
Source: Prepared by the authors on the basis o f the National Household Income and Expenditure Surveys (ENIGH) for 1992, 1994 and 1996. * Joint significance at 1% level.
TABLE 13
Mexico: Decomposition of consumption variation, by region(Percentage variation)
North North Central G ulf Pacific UrbanPacific South Metropolitan area
ß X P X ß X ß Xß X P X P
1992-1994Other 17,31 0 ,00* -35,07 0,44* 1,02
*o' 30,05 -0,53* -32,68 -10,04* -51,44 -0,13*Head’s education 1,83 0,34* -7,89 3,19* 0,02 0,29* -2,01 1,03* 7,28 -3,16* -16,58 -2,08Non-head’s education 10,50 0,60* 13,62 -1,78* 17,91 -1,22* -17,14 -0,72* 13,74 1,43* 14,35 -0,95*Demographic factors -29,83 0,57* -7,43 -1,10* -31,48 -1,0l* -27,16 -0,94* -11,09 -1,84* -0,43 -0,40*Employment -20,36 0,26* 4,87 -0,07* -26,43 0 ,20* -26,31 1,18* -10,52 -0,36* -3,35 0,11Housing 11,67
*o' 10,49 -0,27 19,95
*VOo' 29,30 1,52* 3,73 -0,15 11,71 O o *
Sector -5,28 o o * -14,71
*VOo' -0,85
*o' -1,25 1,95* -10,24 -2,93* 6,34 O o *
Constant -86,02 -64,52 -79,61 -88,96 -43,08 -57,19
Total -100,18 0,33 -100,64 1,04 -99,47 -0,51 -103,48 3,49 -82,86 -17,05 -96,59 -3,43
1994-1996Other -23,81 -0,84* -24,08 -0,41* -5,67 -2 ,12* -22,92 -2,91* 24,76 2,89* 1,10 -3,82*Head’s education 15,58 -3,93* 9,64 -4,17* -0,83 -2,92* 4,44 -8,18* -5,79 0,57* 9,33 0,42*Non-head’s education 9,50 -0,40* 14,23 0,29* -8,56 -1,29* 4,91 -0,14* -18,37 -1,41* -0,68 -0,34Demographic factors 14,45 0,18* 1,93 0,32* 13,90 -0, 42* 34,99 -0,62* 13,84 1,90* -4,81 -0,97*Employment -1,02 -0,41* -0,11 0 ,12* 11,58 0 ,11* 30,67
*VOo' 17,52 0 ,20* 5,98 -0,18Housing 2,63 -0,25* -4,34 O o 'M * -5,60 -0,53* -5,79 -0,36* -12,22 0,45* -5,57 -0,13*Sector 10,29 -0,83* 15,40 0,37* 0,19 -0,42* 7,38 -2,02* 2,01 0,14* 0,23 -0,26Constant 78,85 90,76 102,58 59,94 78,69 99,69
Total 106,47 -6,48 103,43 -3,43 107,59 -7,59 113,62 -13,62 96,42 3,60 105,27 -5,28
Source: Prepared by the authors on the basis o f the National Household Income and Expenditure Surveys (ENIGH) for 1992, 1994 and 1996. * Joint significance at the 1% level
HO USEHO LDS. PO VERTY A N D POLICY IN T IM ES OF CRISIS. MEXICO. 1992-1996 BENJAM IN DAVIS. SUDHANSHU H A N D A A N D HUM BERTO SOTO

208 C E P A L R E V I E W 8 2 • A P R I L 2 0 0 4
TABLE 14
Mexico: Simulated percentage changes in poverty indicators, using the 1992 household characteristics3
Indicator Rural areas Urban areas
Mean consumption -14 -8Headcount 48 25Poverty gap 45 33Squared poverty gap 45 36
Source: Prepared by the authors on the basis o f the National Household Income and Expenditure Surveys (ENIGH) for 1992, 1994 and 1996. 3 Simulations compare changes between P 96X96 and P96X92.
The precise characteristics that contribute to positive consum ption changes vary across tim e periods
and betw een urban and rural areas. In rural areas, household dem ographics accounted fo r the m ajo rity o f
the increase in consum ption am ong X variables in the
fo rm er period, w h ile in the la tter period the most im portant contributions came fro m the education o f
heads (2 .6 0 % ) and non-heads (1 .2 7 % ). In urban areas
in the la tter period, positive contributions to consum ptio n came fro m heads’ education (2 .2 4 % ) and the
“m iscellaneous” category (1 .4 0 % ), specifically household size. O f course, the m ajo rity o f the change in consum ption derives fro m changes in the returns to these
characteristics. In the 199 2 -1 9 9 4 period , large changes
in the returns to type o f em ploym ent and dem ographic com position s ign ificantly im proved household consum ption, and it was precisely the decline in the
returns to these tw o characteristics that led to the sign ificant decline in consum ption during the crisis.
T here is sign ificant reg ional va ria tio n in levels o f
econom ic developm ent in M e x ic o , and it is possible
that d ifferent regions w ere affected d iffe rently by the
1995 crisis. To assess this hypothesis, w e d iv ided the
country into six regions6 and repeated the decom positio n analysis by region. The results are presented by
tim e period in table 13.In every reg ion w ithou t exception, the portion o f
the change in consum ption due to changes in betas
was larger in the crisis period (1 9 9 4 -1 9 9 6 ). Further
m ore, in this same period, every reg ion except fo r the
P acific South showed changes in X characteristics that served to increase consum ption fro m 1994 to 1996,
thus reducing o r m itiga ting the negative im pact o f
change in returns to these characteristics. These posi-
6 The regions were defined as follows: N orth (Coahuila. Chihuahua. Durango. Nuevo León. San Luis Potosí. Tamaulipas. Zacatecas). Pacific-N orth (Baja C alifornia N orte and Sur. Nayarit.Sinaloa. Sonora). Central (Aguascalientes. Guanajuato Hidalgo. Jalisco. Mexico. Michoacan. Morelos. Puebla. Queretaro. Tlaxcala). G ulf (Campeche. Quintana Roo. Tabasco. Veracruz
tive endow m ent effects w ere particu larly large in the
G u lf (1 3 .6 % ) and C entral regions (7 .6 % ). In both
cases, the sources o f im provem ent came fro m the education o f the head and the m iscellaneous category
(particu larly household size). W ith regard to returns, the pattern was som ew hat m ixed across regions, although fluctuations in the returns to em ploym ent type, dem ographic com position, and ‘others’ w ere key
factors in the decline in consum ption after the crisis. It
is interesting to note that during the crisis period, the
proportion o f the w e lfa re decline due to changes in
returns was low est in the P acific South (9 6 .4 % ) and
the G u lf (1 0 3 .4 % ), ind icating that the im pact o f the
crisis on the econom ic environm ent was least in these
tw o areas re la tive to the rest o f the country.W h a t w o u ld the im pact o f the crisis have been i f
M e x ic o had not rea lized any changes in structural characteristics betw een 1992 and 1996? To answer
this question, w e app lied the characteristics o f households in 1992 to the returns these characteristics p ro v ided in 1996, using the estim ated coefficients fro m
the 1996 regression function (hence w e calculated
P 96X 92 ). The resulting m ean predicted leve l o f con
sum ption is 14% lo w e r in rural areas than actual consum ption reported in 1996. F o r urban areas the corre
sponding decline in m ean consum ption is 8% . Table
14 presents these sim ulated changes, as w e ll as those
fo r a set o f com m only used poverty indicators. In both
regions, poverty rates w o u ld have been substantially
h igher in 1996 had there been no changes in the ve c
to r o f X characteristics o f households. The im pact o f
the im provem ent in these characteristics is especially
large in rural areas.7A n other approach to m easuring the influence o f
structural factors associated w ith econom ic developm ent w o u ld be to sim ulate the im pact o f the crisis had
Yucatán). Pacific South (Colima. Guerrero. Oaxaca. Chiapas). and Metropolitan (Mexico City and Guadalajara).7 A similar analysis was done using data from 1989 and 1996. with similar results. These are available from the authors upon request.
HO USEHO LDS. P O V E R TY A N D POLICY IN TIM ES OF CRISIS. MEXICO. 1992-1996 • BENJAMIN DAVIS. SUDHA NSH U H A N D A A N D HUM BERTO SOTO

C E P A L R E V I E W 8 2 A P R I L 2 0 0 4 209
it occurred in 1992. This amounts to comparing P 96 X 92 not with actual consumption in 1996, but with actual consumption in 1992. Using this approach, mean predicted consumption is 26% lower in rural areas and 36% lower in urban areas, compared to actu
al consumption in 1992.8 Using either approach, the results indicate that structural changes associated with the development process can play an important role in mitigating the adverse impact of economic crisis on household welfare.
VIThe role of public programmes
In this section we evaluate the degree to which two of Mexico’s largest social programmes, PROCAMPO and PROGRESA, mitigated (or could have mitigated, in the case of PROGRESA) the adverse effects of the macroeconomic crisis in 1995. PROCAMPO is a programme providing a cash transfer to farmers who had cultivated any one of nine staple crops during the 1991-1993 agricultural seasons. The stated objective of this programme, which was established in 1994, is to compensate for the expected negative impact of NAFTA on the producers of these crops, and the programme is to be phased out after 15 years. Uniform payments are provided on a per-hectare basis and are decoupled from current land use. Payments were to remain constant in real terms for the first 10 years of the programme, then phase out over the remaining five years. In fact, however, the real value of payments fell 35% between the inception of the programme in 1994 and 1996. Only in 2001 did payments per hectare, as well as total PROCAMPO expenditures, reach the original 1994 levels in real terms. The per-hectare payment in 2002 was set at 875 Mexican pesos, or US$ 90. PROCAMPO reaches almost three million producers each year. Of the almost 14 million hectares covered each year, approximately 79% are rainfed (Fox, 2002). The programme had a budget of US$ 1.24 billion for fiscal year 2002, which represented 60% of the Ministry of Agriculture’s total budget (PROCAMPO, 2002). Since the PROCAMPO benefits are distributed on a per-hectare basis, larger farms tend to get higher total transfers. Overall payments are regressively distributed; the 45% of producers with farms smaller that 5 hectares receive only 10% of total PROCAMPO transfers (SAGAR, 1998). Payments are progressively distributed on per-hectare basis, however, as they are uniform per hectare and are thus unrelated to yields achieved and whether households were selling basic crops before NAFTA.
PROGRESA, on the other hand, which is the Mexican government’s premier poverty alleviation programme, provides cash transfers to very poor rural households provided they comply with a complex set of ‘responsibilities’. These include ensuring that children are enrolled in school and maintain 85% attendance, that children and adults receive regular preventive health check-ups and vaccinations, and that mothers of beneficiary families attend a monthly health talk. In return for compliance, families receive cash payments depending on the number of children attending school and the level of schooling they have attained. For example, in 1998 children in grades 3-6 received from US$ 7-12 depending on their level. Middle school students received US$ 20-23 per month, with payments somewhat higher for girls relative to boys. In addition to these educational subsidies, each student received a package of school supplies twice a year, and the family received a monthly income supplement of approximately US$ 10. Since 1997, these payments have increased in real terms by 47%. As of the end of 1998, over 1.9 million households were receiving PROGRESA benefits, requiring a total expenditure of approximately US$ 900 million. When the Fox administration took office in 2001, PROGRESA changed its name to “Oportunidades” and expanded its operations to urban and semi-urban areas. By 2002, the PROGRESA budget had reached US$ 1.9 billion, covering almost three million rural families and over 1.2 million urban and semi-urban families (Fox, 2002).
Once again. these results are available from the authors.8
HO USEHO LDS. PO VERTY A N D POLICY IN T IM ES OF CRISIS. MEXICO. 1992-1996 BENJAM IN DAVIS. SUDHANSHU H A N D A A N D HUM BERTO SOTO

210 C E P A L R E V I E W 8 2 • A P R I L 2 0 0 4
1. D ire c t S u p p o rt P ro g ra m m e fo r R u ra l A rea s
(P R O C A M P O )
The 1996 round of household income and expenditure surverys (ENIGH) collected information on the monetary value of PROCAMPO benefits received by rural households. In the rural sample, 16% of households reported receiving PROCAMPO money, and among these recipients the mean level of benefits was 402 Mexican pesos per quarter, while actual monthly per capita expenditure among this same group was 604 Mexican pesos. Did PROCAMPO play an important role in mitigating the effect of the crisis among the rural population?
To answer this question, we first estimated the relationship between PROCAMPO benefits and household consumption by including the monetary
value of PROCAMPO benefits in our consumption regression for 1996. The estimated coefficient of this variable was 0.0002, with a t-value of 7. Using these estimates, we predicted mean consumption as well as three poverty indicators (number of poor, poverty gap, and squared gap) using a relative poverty line set at the 25th percentile of consumption in 1994. We then set the value of PROCAMPO transfers to 0 and simulated the new values for these four measures of well-being. The percentage change in these indicators is reported in column (1) of table 15. Without PROCAMPO, mean consumption in 1996 would have been 1.5% lower, and all the poverty indicators would have been higher. For example, the number of poor would have been 5.1% higher, while the squared poverty gap, which gives more weight to the welfare of the poorest, would have increased by 5.7%.
Mexico: Simulated impact of social programmes on rural poverty indicators, 1996(Percentage variation)
Indicator If PROCAMPO
had not existed
If PROGRESA had existed
Phase 1 & 2 Phase 1- 4 All phases
Mean consumption -1.5 0.2 0.8 1.1Headcount 5.1 -1.1 -6.8 -8.8Poverty gap 4.8 -3.2 -13.2 -17.1Squared poverty gap 5.7 -3.9 -17.5 -22.5
Source: Prepared by the authors on the basis o f the National Household Income and Expenditure Surveys (ENIGH) for 1992, 1994 and 1996.
2. E d u c a tio n , H e a lth and F o o d P ro g ra m m e(P R O G R E S A )
Our analysis of the potential poverty-reducing impact of PROGRESA was more complicated, because PROGRESA only began distributing benefits at the end of 1997. In this case we ask the question “what would the impact on poverty have been had PROGRESA begun distributing benefits in 1996?”.
We must go through several steps in order to answer this question. Since there is of course no information on PROGRESA benefits in the 1996 data, we first established the marginal propensity to consume out of cash income by including total per capita household income in our consumption equation for 1996. The coefficient of (log of) per capita income was 0.39, with a t-value of 46. Based on this parameter, we then increased household cash income by the amount of benefits the household would have received had PRO- GRESAbeen functioning in 1996.
We decided which households should be assigned PROGRESA benefits by using PROGRESA’s own targeting mechanism. First, each household in the rural ENIGH sample was designated as poor or non-poor, using the exact discriminant analysis model that PROGRESA uses to select beneficiary households.9 Next, we compared each locality in the ENIGH sample to the PROGRESA data base to see which localities were eventually incorporated into PROGRESA, and during which phase they were incorporated. Using this method we were able to identify which households in the 1996 ENIGH sample later became PROGRESA beneficiaries, and when. Based on this method, we found that 55% of rural households in the 1996 ENIGH were later incorporated into PROGRESA. Of these future beneficiaries, 15% were incorporated in the first two phases of PROGRESA, and 70% were incorporated by the fourth phase.
9 See Skoufias. Davis. and de la Vega. 2001. for a description o f this process.
HO USEHO LDS. P O V E R TY A N D POLICY IN TIM ES OF CRISIS. MEXICO. 1992-1996 • BENJAMIN DAVIS. SUDHA NSH U H A N D A A N D HUM BERTO SOTO

C E P A L R E V I E W 8 2 • A P R I L 2 0 0 4 211
For each of these future beneficiary households, we calculated the potential transfer they would receive based on the age, sex, school enrolment status and grade attainment of their children. The monetary value of the school supply package (útiles) was also included in this assessment. Using these potential transfer amounts and the marginal propensity to consume out of cash income, we simulated percentage changes in welfare indicators based on varying assumptions on the extent of PROGRESA coverage in 1996. These results are shown in the last three columns of table 15.
The first assumption we simulated was that by the end of 1996, only the first two phases of PROGRESA had been completed. This is probably the most realistic assumption, given the timing of the macroeconomic shock and the complexity involved in setting up PROGRESA. In this scenario, the number of poor would have decreased by 1.1%, and the squared poverty gap would have decreased by 3.9%. If phase four of PROGRESA had been completed by the
end of 1996, the incidence of poverty would have declined by 6.8%, the poverty gap by 13%, and the squared poverty gap by 17.5%. If PROGRESA had been completely implemented, the decline in poverty indicators would have been even greater (8.8% in the case of incidence, 17% for the poverty gap, and 22.5% for the squared poverty gap).10 Although this last assumption is unrealistic for 1996, it allows juxtaposition of similar PROCAMPO/PROGRESA total budget figures, and thus a comparison of peso for peso poverty impact. It also provides us with an idea of the extent to which the current PROGRESA programme would serve as a safety net in the case of a macroeconomic crisis such as that of 1995. Note also that PROGRESA has a larger impact than PROCAMPO on the poverty gap and the severity of poverty. This is because PROGRESA is targeted towards the poorest rural families.
V IIConclusions and
In this paper we have explored the interrelated factors of policy, structural change and household behaviour around the period of the severe economic crisis of 1995 in Mexico. The results stress the importance of both medium-term development goals and short-term social safety nets in mitigating the negative impact of a macroeconomic shock. We find first a significant and expected response on the part of poor households to a fall in income. Households increased the share of food consumption, and within food consumption, of cereals and fruits and vegetables. Differences in the composition of the food basket between urban and rural households have implications for food price policy. The rural basket is dominated by cereals and vegetables, fruits and legumes, while the urban basket is dominated by meats and fish, and food eaten out. However, the food consumption patterns of the urban poorest (bottom quintile) resemble that of rural households, but not of poor rural households.
Second, we find that the aftermath of the economic crisis led to lower enrolment rates, particularly for poor urban girls. These changes are worrying in that they represent possible long-term costs of the crisis. The fall in enrolment rates was related to house-
policy implications
hold income for both urban and rural households. Higher levels of household income increased the probability of enrolment.
Third, on the eve of the 1995 peso crisis, Mexico had experienced five years of growth, accompanied by economic restructuring, increases in social indicators, and declines in poverty. The decomposition analysis presented in this paper suggests that changes in the characteristics of the economy and of households between 1992 and 1996 helped to mitigate the impact of the crisis. Simulations show that poverty would have been significantly higher during the crisis without these changes. These results imply that economic strategies focusing purely on growth, without ensuring medium-term development (such as access to education), can be very costly, especially in times of macroeconomic crisis.
Finally, the results from this study also provide some lessons on programme design and impact.
10 The actual levels o f the predicted poverty gap and squared poverty gap are low in 1996, since the predictions using the ordinary least squares method over-predict smaller values o f the dependent variable and under-predict larger values.
HO USEHO LDS. PO VERTY A N D POLICY IN T IM ES OF CRISIS. MEXICO. 1992-1996 BENJAM IN DAVIS. SUDHANSHU H A N D A A N D HUM BERTO SOTO
212 C E P A L R E V I E W 8 2 • A P R I L 2 0 0 4
Mexico’s PROGRESA programme, although designed to stimulate investment in the long-run human capital of the poorest, could play an important safety net function during a macro economic crisis. Simulations show that had PROGRESA been operating in 1996, the severity of poverty and the squared poverty gap would have been significantly lower than the levels registered in that year. This is an important result for other Latin American countries considering or imple
menting demand- side interventions to raise the human capital of the very poorest, such as Nicaragua, Honduras, and Brazil. However, the key to success will depend on accurate targeting mechanisms that ensure that such programmes really do favour the very poorest.
(Original: English)
Bibliography
Banco de México (1999): http://www.banxico.org.mx, November.CONAPO (Consejo Nacional de Población) (1997): La situación
demográfica de México, Mexico City.Deaton, A. and J. Muellbauer (1996): Economics and Consumer
Behavior, Cambridge, Cambridge Univer-sity Press.ECLAC (Econom ic Com m ission for Latin Am erica and the
Caribbean) (2002): Social Panorama of Latin America, 20012002, LC/G.2183-P, Santiago, Chile, October. United Nations publication, Sales No. E.02.II.G.65.
Fox, V. (2002): Informe de gobierno, 2002, Mexico City, September. http://inform e.presidencia.gob.m x/Inform es/2002Fox2/web- site/cfm/index.cfm.
Hernández-Laos, E. (1990): M edición de la intensidad de la pobreza y de la pobreza extrema en México, Investigación económica, vol. 49, No. 191, Mexico, City, N ational Autonomous University o f Mexico.
INEGI (Nacional Institute o f Statistics, Geography and Information) (1999): http://www.inegi.gob.mx/inegi/default.asp, November.
Lusting, N. and M. Székely (1998): México: evolución económica, pobreza, y desigualdad, in E. Ganuza, L. Taylor and S. Morley (eds.), Política macroeconómica y pobreza en América Latina y el Caribe, Madrid, Mundi-Prensa.
Oaxaca, R. (1973): Male-female wage differentials in urban labor m arkets, International Economic Review, vol. 14, Philadelphia, University o f Pennsylvania.
(1998): On discrimination and the decomposition o f wagedifferentials, Journal of Econometrics, vol. 61, No. 3, Amsterdam, Elsevier Science.
PROCAMPO (Programa de Apoyos Directos al Campo) (2002): Resultados principales del 3er trimestre del año fiscal 2002, October [www.procampo.gob.mx].
Programa Nacional de Acción a favor de la Infancia, 1995-2000 (1998): Evaluación 1998, Mexico City, Comisión Nacional de Acción a favor de la Infancia.
SAGAR (Secretaría de Agricultura, Ganadería y Desarrollo Rural) (1998): PROCAMPO, 1994-1998, Claridades agropecuarias, No. 64, Mexico City, December.
Skoufias, E., B. Davis and S. de la Vega (2001): Targeting the poor in Mexico: an evaluation o f the selection o f households into PROGRESA, World Development, vol. 29, No. 10, Amsterdam, Elsevier Science.
Székely, M. (1998): The Economics of Poverty, Inequality, and Wealth Accumulation in Mexico, London, Macmillan/St. Antony’s College.
HO USEHO LDS. P O V E R TY A N D POLICY IN TIM ES OF CRISIS. MEXICO. 1992-1996 • BENJAMIN DAVIS. SUDHA NSH U H A N D A A N D HUM BERTO SOTO

CEPAL REVIEW ON THE INTERNETwww.cepal.clwww.cepal.org
www.eclac.clwww.eclac.org

R E V I S T A d e l a
C E P A L
S olic itud de suscripción y/o e jem plares atrasados
□ Suscripción por tres núm eros
□ Suscripción por seis números ..
□ E jem plares s u e lto s .......................
Nombre: ..................................................
Domicilio: ................................................
Código y ciudad: ..................................
P a ís :......................................................... FAX: Tel.: .......................
E -M a il: ........................................................................
Adjunto cheque (*) del B a n c o ............................................................... N ° ..........................................................
por valor de $ / U S $ ...................................(Para exterior: s o b r e p la z a USANo enviar giros postales).
(*) A g ra d e c e re m o s e m i t i r e l c h e q u e a n o m b re d e U N -EC LAC .
Q Favor cargar tarjeta de crédito Q Diners Q MasterCard Q Visa
Nombre que aparece en la ta r je ta : ...................................................... N ú m e ro :......................................
F irm a :............................
Fecha de vencimiento:
Los precios de subscripción anual vigentes son de US$30. El precio por ejemplar suelto es de US$15 incluidos los gastos de envío. El precio de suscripción por dos años es de US$50.
^ _______________________________
Publicaciones de la CEPALCOMISIÓN ECONÓMICA PARA AMÉRICA LATINA
Y EL CARIBE Casilla 179-D - Santiago de Chile
[email protected] Fax (562) 210-2069
C E P A L
R E V I E W
□ Subscription for three issues .
□ Subscription for six issues . ..
□ Single is s u e s ............................
Name: ..................................................
Address: ...............................................
C ity and postal code: ...................
Country: .............................................
R equest for subscrip tion
and/or back issues
FAX: Telephone: . .
E-Mail: ...........................................................................
I enclose cheque (*) No................................................. drawn on the following bank: ..............................
in the amount o f $ / U S $ ........................................................ (For requests originating outside Chile, the
cheque must be drawn on a U n i t e d S t a t e s b a h D o n o t send money orders).
(*) T h e c h e q u e s h o u ld b e m ade p a y a b le t o UN-ECLAC
□ Please charge my credit Card □ Diners □ MasterCard □ Visa
Name as appears on c a r d : ................................................. N um ber:........................................................
Signature: ..........................................................................
E xp ira tio n :........................................................................
Annual subscription costs are US$35. The price of single issues is US$15, shipping costs included. The cost of a two-year subscription is US$60.
ECLAC publicationsECONOMIC COMMISSION FOR LATIN AMERICA
AND THE CARIBBEAN Casilla 179-D - Santiago, CHILE
[email protected] Fax (562) 210-2069

C E P A L R E V I E W 8 2 217
Recent ECLAC publications
P e r io d ic a l in s titu t io n a l rep orts
P relim inary overview o f the econom ies o f Latin A m erica and the
C aribbean 2003, LC/G.2223-P, U nited N ations publication , Sales No.
E.03.II.G.186, ECLAC, Santiago, Chile, D ecem ber 2003.
The economies o f Latin America and the Caribbean as a whole grew by 1.5%
in 2003. This contrasts favourably with the 0.4% reduction in GDP registered
in 2002. The recovery was not strong enough to m ake up for the stagnation of
recent years, how ever, and per capita GDP is still 1.5% low er than in 1997.
Gross capital form ation has been virtually fla t this year and stands at a level
12.5% lower than five years ago. The upturn in economic activity generated a
sligh t increase in the em ploym ent rate. U nem ploym ent rem ains h igh at
10.7%, however, and poverty has spread to encompass almost 44% o f the pop
u la tion o f the region. The m ore buoyant econom ic perform ance o f Latin
A m erica and the Caribbean has been associated w ith the international eco
nomic situation, w hich has brightened w ith the recovery in the U nited States
and Japan and the grow th o f China.
The prices o f com m odities exported by the region rose by 15.9%, but
the variation in the total export price index, w hich includes m anufactures, was
lower (2.8%). Despite a 1.5% rise in im port prices, this reactivation has been
sufficient to halt the 3.3% deterioration in the term s o f trade experienced
betw een 1998 and 2002. The com bination o f volum es and prices has m ade
exports the m ost dynam ic factor o f demand. A record trade surplus (U S$ 41
billion) was recorded in 2003. The buoyancy o f exports was fairly widespread
_ o f the order o f 5% for Central Am erica, the A ndean Com m unity and Chile
and three tim es as h igh fo r M ERCO SU R. M exico’s non-oil exports, on the
other hand, stagnated. The trade surplus contributed to an alm ost unp rece
dented result in the region’s current account: a U S$ 6 billion surplus.
Capital flow s did not behave negatively, as they did in 2002.
A utonom ous capital m ovem ents w ere practically neutral, w ith the U S$ 3.5
billion in inflows com paring favourably w ith the outflows o f U S$ 14 billion
recorded last year. In 2003, the countries o f the region w ere able to access
funds at an average cost o f 9.6% , w hich is 300 basis points less than 12
m onths earlier. N evertheless, foreign investm ent has been on the decline.
Latin A m erica and the Caribbean received nearly U S$ 22 billion in com pen
satory funds, w ith alm ost h a lf o f tha t sum com ing from the International
M onetary Fund.
This international environm ent provided a more favourable fram ework
for the design o f national economic policies. Fiscal and monetary instruments
once again failed to produce the hoped-for countercyclical effects, however.
The reg ion’s fiscal policy has been d irected tow ards increasing the govern
m en t’s prim ary surplus, even though econom ic grow th has been slow. The
reg ion’s prim ary balance has risen by alm ost one percentage point, moving
from a deficit o f 0.3% of GDP to a surplus o f 0.6%.
In term s o f the direction o f m onetary policy, the coun tries’ central
banks focused on controlling inflationary pressures. To achieve this, they ini
tially raised rates and restricted liquidity. O nce inflation started to subside,
they induced a decline in interest rates, taking a m ore active stance in an effort
to reverse the cycle.
M ost countries have estab lished and consolidated m ore flexible
exchange-rate regim es and have been phasing ou t restric tions on foreign-
exchange operations. By the end o f the first 10 m onths o f the year, the aver
age exchange-rate index for the region showed a slight depreciation (2.6% )
com pared w ith the end o f 2002.
The design and application o f various fiscal and monetary instruments
made possible, among other things, a decline in inflation. In 2003, prices rose
by 8.5%: four percentage points less than the year before.
Bearing in m ind the external situation and domestic economic trends,
the prospects for 2004 are for a continuation o f the upsw ing that began this
year. E conom ic activity is expected to clim b to an average grow th rate o f
3.5% for the region, w hich is w ell above the average for the last five years.
The region is estimated to have achieved a year-on-year grow th rate o f around
2.5% in the fourth quarter, and its m ore robust performance in the second half
o f 2003 w ill pave the way for the expansion o f its economy in 2004.
O th er p u b lica tio n s
Traffic congestion: the problem and how to deal w ith it, “Cuadernos de la
CEPAL” series, No.87, LC/G.2199-P, U nited N ations publication, Sales No.
E.03.II.G .88, ECLAC, Santiago, Chile, July 2003, 187 pages.
Traffic congestion has such severe effects in both the short and long term s
that multidisciplinary efforts to design appropriate policies and m easures are
called for to keep it under control. There are no easy solutions, but all the evi
dence points to the need for a package made up o f both supply- and demand-
side m easures in order to rationalize the use o f public roadways.
Keeping traffic congestion under control is one com ponent o f a long
term strategic vision o f how to allow cities to develop in a way that reconciles
the pressing need for mobility, grow th and com petitiveness w ith the sustain
ability o f urban areas and the quality o f their inhabitants’ lives. This complex
challenge dem ands a high level o f professional skill and leadership on the part
o f urban planning and transport authorities, com bined w ith ongoing efforts
by all the stakeholders involved.
This book discusses the tools that can be used in tackling this crucial
issue, som e o f w hich are m ore effective and/or m ore readily accepted than
others. I f these tools can be put to use with the active support o f the local pop
ulation, they may w ell enable the region to find solutions for this increasingly
serious problem.
La ciudad inclusiva en los países en vías de desarrollo (The inclusive city
in developing countries), “Cuadernos de la CEPA L” series, No. 88,
LC/G.2210-P, U nited Nations publication, Sales No. S.03.II.G.146, ECLAC,
Santiago, Chile, N ovem ber 2003, 313 pages.
In order to address the challenges encountered in the p repara tion o f urban
developm ent and housing policies in Latin A m erica and the Caribbean, the
A P R I L 2 0 0 4

218 C E P A L R E V I E W 8 2 • A P R I L 2 0 0 4
pro ject “U rban m anagem ent fo r sustainable developm ent: instrum ents and
strategies” (Spanish acronym : GUDS), financed by the Italian G overnm ent
and carried out by the ECLA C D ivision o f Sustainable D evelopm ent and
H um an Settlem ents, prom oted various program m es and in itia tives for the
training o f professionals and technicians in the hum an settlem ents field.
Through these training activities, the project has sought to update and
perfec t the know ledge and skills o f professionals w orking in the fie ld o f
hum an habitat issues, as w ell as to provide som e additional urban m anage
m ent instrum ents for use in the design and im plem entation o f public urban
developm ent strategies and policies. The aim has been to prepare profession
als to head or form part o f teams responsible for prom oting, com missioning,
preparing or supervising the preparation o f urban and territorial development
plans and implementing urban m anagem ent instrum ents and strategies.
In term s o f the content o f the project, em phasis has been placed on a
form o f train ing w hich em braces both instrum ents and strategies and their
theoretical and m ethodological content. In order to provide Latin A m erican
and Caribbean students with theoretical support m aterial that reflects the lat
est advances regard ing im portant urban issues, it w as therefore decided to
translate into Spanish the book entitled “The inclusive city”, originally com
piled in Italian by M arcello Balvo. This book seeks to m ake a m uch-needed
system atization o f the issues o f the city, its m anagem ent, and its key ro le in
the processes o f territorial change and growth, and thus represents a very valu
able contribution to training.
The issues analysed in this book include the challenges o f urban devel
opment, the efficient city, urban poverty, decentralized urban management, land
ownership, historical centres, urban services, mobility, sustainable urban devel
opment, safety and security, the gender dimension, and urban vulnerability.
M ercados de tierras agrícolas en Am érica Latina y el C aribe (Agricultural
land m arkets in Latin A m erica and the Caribbean), “L ibros de la CEPA L”
series, No. 74 (LC /G .2202-P), U nited N ations publication, Sales No.
S.03.II.G.99, ECLAC, Santiago, Chile, July 2003, 452 pages.
This book, w hich form s part o f a jo in t p ro jec t by ECLA C and the G erm an
Technical Cooperation Society (GTZ), seeks to determine, through a series of
theoretical essays and case studies, how far the developm ent o f land markets
can facilitate the access to land o f the poorest peasants and sm allholders o f
Latin A m erica and the Caribbean, w ith the dual aim o f progressing tow ards
m ore equitable distribution o f this resource and raising agricultural produc
tion and productivity. The findings o f the relevant studies, w hich lasted over
four years (1997-2000), are in line w ith those o f other studies, likewise spon
sored by ECLAC and GTZ, on the effect that liberalizing reforms have had at
various levels o f the economic structure o f the countries o f the region, espe
cially in the labour, financial and technological spheres.
The general conclusion o f these latest studies is that the effects o f m ar
ket liberalization have not always been in consonance w ith the hopes o f the
prom oters o f such policies: liberalization o f the labour market, for example,
has had unsatisfactory results in term s o f its failure to reduce unem ploym ent
and inform al-sector em ployment; the free play o f financial markets has result
ed in still greater concentration o f resources and even g reater difficulties o f
the weakest agents in gaining access to credit, and finally, the privatization of
research and o f the application and dissemination o f technology has generally
likewise left out these same under-privileged sectors.
A lthough they have not as y e t reached definitive conclusions, the stud
ies docum ented in this book appear to po in t in the sam e d irection . F irstly ,
there are still many elements lacking in the region for land markets to become
formally established as such, and even in the very few cases where such m ar
kets can be said to be fully operative, there are other elem ents w hose pres
ence prevents the m arket from acting as an effective mechanism for reallocat
ing land m ore equitably: thus, the extrem e degree o f poverty affecting m ost
peasants, together w ith the unequal distribution o f power, know ledge and edu
cation and the m any flaw s in institu tional, legal and jurid ica l system s, are
probably the factors m ost responsible for the inability displayed by land m ar
kets to fulfill the aspirations o f social equity and productive efficiency.
Finally, the studies reported in th is book identify the spheres w here
deeper research is necessary to see w hat other m echanism s should be estab
lished and w hat other m easures should be taken to lay the bases fo r Latin
A merican and Caribbean agriculture to operate m ore fairly and fruitfully. For
the m om ent, it cannot be concluded either tha t land m arkets are the key to
the im provem ent o f the agriculture o f the reg ion or tha t their shortcom ings
are so serious that they m ust be ruled out in this respect. The m ost likely con
clusion - and this is the ultim ate point o f the book - is that the solution lies in
the direction o f the form ulation and im plem entation o f com plem entary m ech
anisms w hose nature, scope and status are precisely the aspects that m ust be
determined in future studies.
G estión urbana para el desarrollo sostenib le en A m érica L atina y el
C aribe (U rban m anagem ent for sustainable developm ent in Latin A m erica
and the Caribbean), “L ibros de la CEPA L” series, No. 75 (LC/G .2203-P),
U nited N ations publication , Sales No. S .03.II.G .113, ECLA C, Santiago,
Chile, O ctober 2003, 252 pages.
T he form ulation and application o f developm ent policies in Latin
A m erica and the Caribbean is a process w hich has to take p lace in the space
between two forces that are shaping the w orld o f today: global forces, such as
the constant and grow ing econom ic, cultural and political integration o f the
countries o f the world, and local forces, such as the tendency tow ards higher
degrees o f self-determination and o f the delegation o f pow er and responsibili
ties to sub-national com m unities and localities. A ll this is taking p lace in a
context o f sharp contrasts between grow th and recession, equity and inequali
ty, exclusion and integration, and poverty and wealth.
T he apparent unsustainability o f the cities, w ith the ir daily state o f
chaos, is reflected in dem ands for developm ent options for the local habitat
w hich have to be analysed day by day in the ligh t o f the m ost variab le and
com plex realities. Poverty is heterogeneous in term s o f its characteristics and
the severity o f its incidence. Vulnerability increasingly affects ever broader
social groups living in urban areas, w hile inequality and lack o f access to the
benefits o f development continue to spread.
A t the sam e tim e, the available goods and services and the ir quality
and quantity are grow ing, com m unications technologies are spreading, and
productivity is rising in m any sectors o f the econom y. The m echanism s for
the m anagem ent o f public services are being im proved, and there is increas
ing com m unity partic ipation in and identification w ith the challenges and
responsibilities o f development.
R E C E N T E C L A C P U B L IC A T IO N S

C E P A L R E V I E W 8 2 • A P R I L 2 0 0 4 219
This book aims to prom ote reflection on hum an settlem ents m anage
m ent and its links with sustainable development in the region, its significance,
and its projection or vision in term s o f program m es. It seeks to contribute to
the design o f institu tional, m ethodological and financial instrum ents that
could substan tially im prove m anagem ent o f the hab ita t a t the national and
sub-national level in three subject areas: m easures to deal w ith urban poverty,
the m anagem ent o f public services, and the recovery o f central areas.
C hapter I, “The city and developm ent in Latin A m erica and the
Caribbean”, analyses the urban developm ent process as a m anifestation and
product o f economic developm ent, identifies the city as the space for hum an
development, and highlights the links between cities and globalization. It also
highlights the role of cities as a factor in economic productivity and an instru
m ent for the trade and financial insertion o f the countries o f the region in the
global econom y. In addition, it analyses urban sustainability as the relation
between habitability and functionality and refers to the changes and transfor
mations needed in order to im prove governance as it relates to urban policies,
program mes and projects.
Chapter II, “The new urban m anagem ent”, describes the current situa
tion o f the cities of Latin A m erica and the Caribbean and their forms o f m an
agement, in the light of two phenom ena: the high rates o f urbanization o f the
population, and the globalization process. It also analyses territorial develop
m ent trends and makes some proposals for the m anagem ent o f cities based on
changes in the present forms of urban and territorial management.
Chapter III, “Poverty and the city in Latin A m erica and the
Caribbean”, m akes a selective review o f various aspects that m ust be consid
ered in the design of policies and program m es for helping to overcom e pover
ty ; analyses the ways in w hich urban poverty is expressed in term s o f exclu
sion, segregation and inform ality; and offers a program m e-oriented view with
respect to national and local policies (econom ic, social and environm ental),
as reflected in an agenda that takes account o f a num ber o f factors: land use,
services, housing, public areas, and em ploym ent and income.
Chapter IV, “Public services m anagem ent in Latin A m erica and the
C aribbean”, m akes an analysis o f approaches and practices in the region as
regards the provision o f public services. It reviews urban m anagem ent strate
gies and instruments connected with the provision o f public services and sug
gests new forms o f m anagem ent in a context o f closer public-private links. It
also m akes a system atic analysis tha t perm its the com parison o f different
form s o f m anagem ent and em phasizes the value o f approaching the provision
o f public services as a factor in greater urban equity and inclusion.
Finally, chapter V, “Recovery o f central areas” , exam ines the charac
teristics o f central urban areas as regards the ir po tentia l fo r undergoing
processes o f urban change and conservation from the standpoint o f the p ro
m otion o f local economic developm ent and social inclusion and integration.
It also analyses the policies and program m e lines tha t m ust be taken into
account w hen undertaking, as part o f citywide projects, planning and training
activities and the integral m anagem ent o f central areas o f cities.
R E C E N T E C L A C P U B L IC A T IO N S

ECLACpublications
ECONOMIC COMMISSION FOR LATIN AMERICA
AND THE CARIBBEAN Casilla 179-D Santiago, Chile
Publications may be accessed at: www.eclac.cl/publicaciones
CEPAL Review
CEPAL Review first a p p e a re d in 1 9 7 6 a s part o f the Publications P ro g ra m m e o f the Ec o n o m ic C o m m is s io n for Latin A m e ric a and the Caribbean, its aim being to m ake a contribution to the study of the economic a nd social d evelop m e nt problem s o f the region. T h e vie w s e xpressed in signed articles, including those b y Secretariat staff m e m be rs, are those of the authors and therefore do not necessarily reflect the point o f vie w of the O rganizatio n.
CEPAL Review is published in Spanish and English versions three times a ye a r.
A n n u al subscription costs for 2005 are U S $ 30 for the Spanish version and U S $ 35 for the En glish version . T h e price o f single issues is U S $ 15 in both cases.
T h e cost of a tw o-year subscription (2005-2006) is U S $ 50 for Spanish- language version and U S $ 60 for English.
Revista de la C E P A L , núm ero extraordinario: C E P A L C I N C U E N T A A Ñ O S , reflexiones sobre Am é rica Latina y el Caribe, 19 9 8 , 3 76 p. (out o f stock).
Annual reportsIssues for previous years also available
• Panorama social de América Latina, 2002-2003, 348 p.Social panorama of Latin America, 2002-2003, 3 40 p.
• Balance preliminar de las economías de América Latina y el Caribe, 2004, 16 9 p.Preliminary overview ofthe economies of Latin America and the Caribbean, 2004, 1 6 8 p.
• Estudio económico de América Latina y el Caribe 2003-2004, 358 p.Economic survey of Latin America and the Caribbean 20032004, 336 p.
• Anuario estadístico de América Latina y el Caribe / Statistical yearbookforLatin America and the Caribbean (bilingüe). 2003, 636 p.
• La inversión extranjera en América Latina y el Caribe, 20 0 3, 1 4 6 p. Foreign investment of Latin America and the Caribbean,20 0 3 , 1 4 6 p.
• Panorama de la inserción internacional de América Latina y el Caribe, 2002-2003, 240 p.Latin America and the Caribbean in the world economy,2002-2003, 238 p.
Libros de la CEPAL
80 Gobernabilidad e integración financiera: ámbito global y regional, 2004, Jo s é An ton io O c a m p o and A n d ra s Uthoff (compilers), 2 78 p.
79 Etnicidad y ciudadanía en América Latina. La acción colectiva de los pueblos indígenas, 2 0 0 4 , Á lv a ro Bello, 2 2 2 p.
78 Los transgénicos en América Latina y el Caribe: un debate abierto, 2 0 0 4 , 4 1 6 p.
7 7 Una década de desarrollo social en América Latina 1990-1999, 2 0 0 4 , 300 p.
7 7 A decade ofsocial development in Latin America 1990-1999,2 0 0 4 , 308 p.
7 7 Une décennie de développment social en Amérique latine 19901999, 200 4, 300 p.
76 A decade of light and shadow. Latin America and the Caribbean in the 1990s, 2 0 0 3 , 366 p.
76 Une décennie d'ombres et de lumières. L'Amérique latine et les Caraïbes dans les années 90, 2 0 0 3 , 40 1 p.
75 Gestión urbana para el desarrollo sostenible en América Latina y el Caribe, Ricardo Jo rd án and Daniela Simioni (compilers), 2003, 264 p.
74 Mercados de tierras agrícolas en América Latina y el Caribe: una realidad incompleta, Pe dro Tejo (compiler), 2003, 4 1 6 p.
73 Contaminación atmosférica yconciencia ciudadana, 2003. Daniela Sim ioni (com pilera), 260 p.
72 Los caminos hacia una sociedad de la información en América Latina y el Caribe, 2 0 0 3 , 1 3 9 p.
72 Road maps towards an information society in Latin America and the Caribbean, 2 0 0 3 , 1 3 0 p.
71 Capttal social y reducción de la pobreza en América Latina yel Caribe. En busca de un nuevo paradigma, 2003, Raúl Atria a n d Marcelo Siles (compilers), C EP A L /M ic h ig a n State University, 590 p.
70 Hacia el objetivo del milenio de reducir la pobreza en América Latina y el Caribe, 2 0 0 2 , 80 p.
70 Meeting the millennium poverty reduction targets in Latin America and the Caribbean, 20 0 2, E C L A C / I P E A / U N D P , 7 0 p.
70 L 'objectifdu millénaire de réduire la pauvreté en Amérique Latine et les Caraïbes, 2 0 0 2 , 85 p.
70 Rumo ao objetivo do milenio de reduzir a pobreza na América Latina e o Caribe, 2 0 0 2 , 81 p.
69 El capitalsocial campesino en la gestión del desarrollo rural. Diadas, equipos, puentes yescaleras, 2002, Jo h n Durston, 15 6 p.
68 La sostenibliidaddeldesarrollo en América Latina yelCanbe: desafíos yoportunidades, 2 0 0 2 , 251 p.
68 The sustainability of development in Latin America and the Caribbean: challenges and opportunities, 2 0 0 2 , 2 48 p.

67 Growth with stability, financing for development in the new international context, 2 0 0 2 , 2 4 8 p.
Recent co-publicationsO n occa sio n E C L A C c o nclude s a gre e m e n ts for the co-publication o f texts that m a y be of special interest to other international organizations or to publishing h o u s e s . In the latter c a s e , the publishing ho us e s h a ve exclusive sales and distribution rights.
Pequeñas y medianas empresas y eficiencia colectiva. Estudios de caso en América Latina, M a rc o D in i a n d G io v a n n i S tu m p o (co o rdin ad o re s), C E P A L / S i g l o X X I .
En búsqueda de efectividad, eficiencia y equidad: las políticas del mercado de trabajo y los instrumentos de su evaluación, Jü rg e n W eller (c o m pile r), C E P A L / L O M .
América Latina en la era global, J o s é A n to n io O c a m p o y J u a n Martin (co o rdin a d o re s), C E P A L / A lfa o m e g a . El desarrollo económico en los albores del siglo XXI, J o s é A n to n io O c a m p o (editor), C E P A L / A lfa o m e ga .
Los recursos del desarrollo. L e c c io n e s d e se is a g lo m e ra c io n e s agro industriales en A m é ric a La tin a , C arlo s G u a ip a tín (com piler), C E P A L / A lfa o m e g a .
Medir la economía de los países según el sistema de cuentas nacionales, M ichel S é ru zie r, C E P A L / A l fa o m e g a , 2 0 0 3 .
Globalization and Development. A Latin American and Caribbean Perspective, Ed ite d b y J o s é A n to n io O c a m p o a n d J u a n M a rtin , C E P A L / A lfa o m e g a , 2003.
Globalización y desarrollo. Una reflexión desde América Latina y el Caribe, J o s é A n to n io O c a m p o and J u a n Martin (editors), C E P A L / A lfa o m e g a , 2003.
Autonomía o ciudadanía incompleta. El Pueblo Mapuche en Chile y Argentina, Isabel H e r n á n d e z, C E P A L / P e h u é n , 2 0 0 3 .
Reformas económicas y formación. G u ille rm o La b a rc a (co ordinador), C E P A L / G T Z / O I T - C I N T E R F O R , 2 0 0 3 .
El desarrollo de complejos forestales en América Latina, Néstor Bercovich y J o r g e K a tz (editors), C E P A L / A lfa o m e g a , 2003
Territorio y competividad en la agroindustria en México. Condiciones y propuestas de política para los clusters del limón mexicano en Colima y la piña en Veracruz, E n riq u e Dusse l Pe te rs , C E P A L P l a z a y V a ld é s , 2002
Capital social rural. Experiencias de México yCentroamérica, Margarita F lo re s y F e r n a n d o R e llo , C E P A L / P l a z a y V a ld é s , 2 0 0 2 .
Eqüidade, desenvolvimento e cidadania, J o s é A n to n io O c a m p o , C E P A L / C a m p u s , 2 0 0 2.
Crescimento, emprego e eqüidade; O Impacto das Reformas Económicas na América Latina e Caribe, B arba ra Stallings and W ilso n P e re s , C E P A L / C a m p u s , 2 0 0 2 .
Crescer com Estabilidade, O financiamento do desenvolvimento no novo contexto internacional, J o s é A n to n io O c a m p o , C E P A L / C a m p u s , 2002.
Pequeñas y medianas empresas industriales en América Latina y el Caribe, W ils o n P e r e s a nd G io v a n n i S tu m p o (coordinators), C E P A L / S ig lo X X I , M é xic o .
Aglomeraciones mineras y desarrollo local en América Latina, R u d o lf M . B uitelaar (co m pile r), C E P A L / A lfa o m e g a , C o lo m b ia , 2 0 0 2 .
Panorama de la agricultura en América Latina y el Caribe 1990-2000 / Survey of Agriculture in Latin America and the Caribbean 1990-2000, C E P A L / I I C A , 2 0 0 2 .
Cuadernos de la CEPAL
90 Los sistemas de pensiones en América Latina: un análisis de género, 2 0 0 4 , Fla via M arc o (co ordinadora), 2 7 0 p.
89 Energía y desarrollo sustentable en América Latina y el Caribe.G u ía para la form ulación d e políticas ene rg éticas, 20 0 3 , 2 40 p.
88 La ciudad inclusiva, M arcello B a lb o , R ic a rd o Jo rd á n a n d D an iela Sim ioni (com pilers), C E P A L / C o o p e r a z io n e Italiana, 20 0 3 , 322 p.
87 Traffic congestion. The problem and howto deal with it, 2004 A lbe rto Bull (com piler), 19 8 p.
87 Congestión de tránstto. El problema y cómo enfrentarlo, 20 0 3 , Albe rto Bull (compiler), 1 1 4 p.
Cuadernos Estadísticos de la CEPAL30 Clasificaciones estadísticas internacionales incorporadas en el
banco de datos del comercio exterior de América Latina y el Caribe de la CEPAL, 2 0 0 4 , 308 p.
29 América Latina y el Caribe: series estadísticas sobre comercio de servicios 1980-2001, 20 0 3 , 15 0 p.
Estudios e Informes de la CEPAL95 México: la industria maquiladora, 1 9 9 6 , 2 3 7 p.94 Innovación en tecnologías y sistemas de gestión ambientales en
empresas líderes latinoamericanas, 1 9 9 5 , 206 p. (out o f stock)93 Comercio internacionalymedio ambiente. La discusión actual, 1995,
1 1 2 p. (out o f stock)92 Reestructuración y desarrollo productivo: desafío y potencial para
los años noventa, 1 9 9 4 , 10 8 p.91 Las empresas transnacionales de una economía en transición: la
experiencia argentina en los años ochenta, 1 9 9 5 , 19 3 p.90 El papel de las empresas transnacionales en la reestructuración
industrial de Colombia: una síntesis, 1 9 9 3 , 1 3 1 p.
Serie INFOPLAN: Temas Especiales del Desarrollo
13 Políticas sociales: resúmenes de documentos II, 1 9 9 7 , 80 p.12 Gestión de la información: reseñas de documentos, 19 9 6 , 15 2 p.11 Modernización delEstado: resúmenesde documentos, 1995, 75 p.1 0 Políticas sociales: resúmenes de documentos, 1 9 9 5 , 95 p.
9 MERCOSUR: resúmenes de documentos, 1 9 9 3 , 2 1 9 p.8 Reseñas de documentos sobre desarrollo ambientalmente
sustentable, 1 9 9 2 , 2 1 7 p. (out o f stock)7 Documentos sobre privatización con énfasis en América Latina,
1 9 9 1 , 82 p.

Boletín demográfico/Demographic Bulletin (bilingual)
Bilingual publication (Spanish and English) proving u p -to -d a te estimates and projections o f the populations o f the Latin A m e ric a n a nd C aribbea n countries. A ls o includes various dem ographic indicators o f interest such as fertility and m ortality rates, life e x p e c ta n c y , m e a s u re s o f population distribution, etc.
Publishe d since 1 9 6 8 , the Bulletin a pp e ars twice a y e a r in J a n u a ry and Ju ly .
A n n u a l S u b s c rip tio n : U S $ 2 0 .0 0 P e r issu e : U S $ 1 5 .0 0
Notas de población
Sp ecializedjournal which publishes articles and reports on recent studies o f d e m o g ra p h ic d y n a m ic s in the re g io n , in S p a n is h with a b stra c ts in S p a n is h a n d E n g lis h . A ls o includes info rm a tio n o n scientific and professional activities in the field o f population.
Pu b lis h e d sin ce 1 9 7 3 , th e jo u rn a l a p p e a rs tw ice a y e a r in J u n e and Decem ber.
A n n u a l S u b s c rip tio n : U S $ 2 0 .0 0 P e r issu e : U S $ 1 2 .0 0
Series de la CEPAL
C om ercio internacional Desarrollo productivo Es tu d io s estadísticos y prospectivos E s tu d io s y p e rs p e ctivas :
— B og otá— B u e n o s A ire s— M é x ic o
Financiam iento del desarrollo Inform ación y desarrollo Inform es y e studio s especiales M a c ro e c o n o m ía del desarrollo M a n u ale sM e dio a m biente y desarrollo Po blac ió n y desarrollo Políticas socialesRec u rso s naturales e infraestructura S e m in ario s y conferencias
A c o m p le te l i s t i n g i s a v a i l a b l e a t : w w w . e c l a c . c l / p u b l i c
doL Wkll |+ 1 ««><a I
U5U ^ lJ ^ \ . (JUII , L J ^ j ^ ;>J l ^ oLSLl ^ ïjundl ^Sfl o b j- - ^ > J ^ l
• ^-r^r j 9 j £-r ' r»-—** • r»-4 1 : J! ^ U-*4 J—4 "
« ása m & o
HOW TO OBTAIN UNITED NATIONS PUBLICATIONSU n ited N atio n s p u b lica tio n s m ay be o b ta in ed fro m b o o k s to re s and d is tr ib u to rs th ro u g h o u t the w orld . C on su lt y o u r bo o k s to re o r w rite to: U n ited N atio n s, S ales S ection , N ew Y o rk o r G eneva.
COMMENT SE PROCURER LES PUBLICATIONS DES NATIONS UNIESL es p u b lica tio n s des N a tio n s U n ies sont en v en te dans les lib ra ir ie s e t les ag en ces d ép o s ita ire s du m o n d e e n tie r . In fo rm ez -v o u s au p rè s de v o tre lib ra ire ou a d re s sez -v o u s à : N a tions U n ies , S ection des v en tes , N ew Y o rk ou G en èv e .
KAK nOJIYHHTb H3£AH Hfl OPTAHH3AUHH OEUE/DiHEHHblX HALJMHM3naHH5i O p r a m m u H H O ô'bennH eH H bix H a u n ñ m o > k h o KyriHTb b k h h j k h b ix M ara3H H ax h areHTCTBax b o Bcex pañO H ax M upa. H aB O flrrre cnpaBKH 06 H3aaHH«x b Bam eM k h h > k h o m M a ra 3HHe h j ih nm iiH T e n o a n p e c y : O p ra H to a m i i i O ôteziH H eH H bix H a n n n , C e x itn a n o npona>K e H3ztaHHH, H b io -H o p K h j ih )K eH eBa.
COMO CONSEGUIR PUBLICACIONES DE LAS NACIONES UNIDASL as p u b licac io n es de las N ac io n es U n id as es tán en v en ta en lib re r ía s y ca sas d is tr ib u id o ra s en to d as p artes del m u n d o . C o n su lte a su lib re ro o d iríja se a: N ac io n es U n id as , S ecc ión de V en ta s, N u ev a Y o rk o G in eb ra .
Las publicaciones de la Comisión Económica para América Latina y el Caribe (CEPAL) y las del Instituto Latinoamericano y del Caribe de Planificación Económica y Social (ILPES) se pueden adquirir a los distribuidores locales o directamente a través de:
Publicaciones de las Naciones Unidas Sección de Ventas - DC-2-0853 Fax (212)963-3489 E-mail: [email protected] Nueva York, NY, 10017 Estados Unidos de América
Publicaciones de las Naciones Unidas Sección de Ventas, Fax (22)917-0027 Palais des Nations 1211 Ginebra 10, Suiza
Unidad de Distribución CEPAL - Casilla 179-D
Fax (562)208-1946 E-mail: [email protected]
Santiago de Chile
Publications of the Economic Commission for Latin America and the Caribbean (ECLAC) and those of the Latin American and the Caribbean Institute for Economic and Social Planning (ILPES) can be ordered from your local distributor or directly through:
United Nations Publications Sales Sections, DC-2-0853 Fax (212)963-3489 E-mail: [email protected] New York, NY, 10017 USA
United Nations Publications Sales Sections, Fax (22)917-0027 Palais des Nations 1211 Geneve 10, Switzerland
Distribution Unit CEPAL - Casilla 179-D
Fax (562)208-1946 E-mail: [email protected]
Santiago, Chile