Jaume Gasia Mercè - TDX (Tesis Doctorals en Xarxa)
318
Technological requirements in latent heat thermal energy storage systems: Study of the partial load operating conditions and the dynamic melting enhancement technique Jaume Gasia Mercè http://hdl.handle.net/10803/664963 ADVERTIMENT. L'accés als continguts d'aquesta tesi doctoral i la seva utilització ha de respectar els drets de la persona autora. Pot ser utilitzada per a consulta o estudi personal, així com en activitats o materials d'investigació i docència en els termes establerts a l'art. 32 del Text Refós de la Llei de Propietat Intel·lectual (RDL 1/1996). Per altres utilitzacions es requereix l'autorització prèvia i expressa de la persona autora. En qualsevol cas, en la utilització dels seus continguts caldrà indicar de forma clara el nom i cognoms de la persona autora i el títol de la tesi doctoral. No s'autoritza la seva reproducció o altres formes d'explotació efectuades amb finalitats de lucre ni la seva comunicació pública des d'un lloc aliè al servei TDX. Tampoc s'autoritza la presentació del seu contingut en una finestra o marc aliè a TDX (framing). Aquesta reserva de drets afecta tant als continguts de la tesi com als seus resums i índexs. ADVERTENCIA. El acceso a los contenidos de esta tesis doctoral y su utilización debe respetar los derechos de la persona autora. Puede ser utilizada para consulta o estudio personal, así como en actividades o materiales de investigación y docencia en los términos establecidos en el art. 32 del Texto Refundido de la Ley de Propiedad Intelectual (RDL 1/1996). Para otros usos se requiere la autorización previa y expresa de la persona autora. En cualquier caso, en la utilización de sus contenidos se deberá indicar de forma clara el nombre y apellidos de la persona autora y el título de la tesis doctoral. No se autoriza su reproducción u otras formas de explotación efectuadas con fines lucrativos ni su comunicación pública desde un sitio ajeno al servicio TDR. Tampoco se autoriza la presentación de su contenido en una ventana o marco ajeno a TDR (framing). Esta reserva de derechos afecta tanto al contenido de la tesis como a sus resúmenes e índices. WARNING. Access to the contents of this doctoral thesis and its use must respect the rights of the author. It can be used for reference or private study, as well as research and learning activities or materials in the terms established by the 32nd article of the Spanish Consolidated Copyright Act (RDL 1/1996). Express and previous authorization of the author is required for any other uses. In any case, when using its content, full name of the author and title of the thesis must be clearly indicated. Reproduction or other forms of for profit use or public communication from outside TDX service is not allowed. Presentation of its content in a window or frame external to TDX (framing) is not authorized either. These rights affect both the content of the thesis and its abstracts and indexes.
-
Upload
khangminh22 -
Category
Documents
-
view
3 -
download
0
Transcript of Jaume Gasia Mercè - TDX (Tesis Doctorals en Xarxa)

Technological requirements in latent heat thermal energy storage systems: Study of the partial load
operating conditions and the dynamic melting enhancement technique
Jaume Gasia Mercè
http://hdl.handle.net/10803/664963
ADVERTIMENT. L'accés als continguts d'aquesta tesi doctoral i la seva utilització ha de respectar els drets de la persona autora. Pot ser utilitzada per a consulta o estudi personal, així com en activitats o materials d'investigació i docència en els termes establerts a l'art. 32 del Text Refós de la Llei de Propietat Intel·lectual (RDL 1/1996). Per altres utilitzacions es requereix l'autorització prèvia i expressa de la persona autora. En qualsevol cas, en la utilització dels seus continguts caldrà indicar de forma clara el nom i cognoms de la persona autora i el títol de la tesi doctoral. No s'autoritza la seva reproducció o altres formes d'explotació efectuades amb finalitats de lucre ni la seva comunicació pública des d'un lloc aliè al servei TDX. Tampoc s'autoritza la presentació del seu contingut en una finestra o marc aliè a TDX (framing). Aquesta reserva de drets afecta tant als continguts de la tesi com als seus resums i índexs.
ADVERTENCIA. El acceso a los contenidos de esta tesis doctoral y su utilización debe respetar los derechos de la persona autora. Puede ser utilizada para consulta o estudio personal, así como en actividades o materiales de investigación y docencia en los términos establecidos en el art. 32 del Texto Refundido de la Ley de Propiedad Intelectual (RDL 1/1996). Para otros usos se requiere la autorización previa y expresa de la persona autora. En cualquier caso, en la utilización de sus contenidos se deberá indicar de forma clara el nombre y apellidos de la persona autora y el título de la tesis doctoral. No se autoriza su reproducción u otras formas de explotación efectuadas con fines lucrativos ni su comunicación pública desde un sitio ajeno al servicio TDR. Tampoco se autoriza la presentación de su contenido en una ventana o marco ajeno a TDR (framing). Esta reserva de derechos afecta tanto al contenido de la tesis como a sus resúmenes e índices.
WARNING. Access to the contents of this doctoral thesis and its use must respect the rights of the author. It can be used for reference or private study, as well as research and learning activities or materials in the terms established by the 32nd article of the Spanish Consolidated Copyright Act (RDL 1/1996). Express and previous authorization of the author is required for any other uses. In any case, when using its content, full name of the author and title of the thesis must be clearly indicated. Reproduction or other forms of for profit use or public communication from outside TDX service is not allowed. Presentation of its content in a window or frame external to TDX (framing) is not authorized either. These rights affect both the content of the thesis and its abstracts and indexes.
TESI DOCTORAL
Technological requirements in latent heat thermal energy storage systems: Study of the partial load
operating conditions and the dynamic melting enhancement technique
Jaume Gasia Mercè
Memòria presentada per optar al grau de Doctor per la Universitat de Lleida Programa de Doctorat en Informàtica i Enginyeria Industrial
Directors Prof. Dr. Luisa F. Cabeza (Universitat de Lleida, Spain)
Dr. Steven Tay (University of Newcastle, United Kingdom)
2018

ii
This page intentionally left blank

iii
Departament d’Informàtica i Enginyeria Industrial
Escola Politècnica Superior
Universitat de Lleida
Technological requirements in latent heat thermal energy storage
systems: Study of the partial load operating conditions and the
dynamic melting enhancement technique
Memòria presentada per optar al grau de Doctor per la Universitat de Lleida redactada segons els
criteris establerts en l’Acord núm. 67/2014 de la Junta de Govern del 10 d’abril de 2014 per la
presentació de la tesis doctoral en format d’articles.
Programa de doctorat: Enginyeria i Tecnologies de la Informació
Directors de la Tesis: Dra. Luisa F. Cabeza i Dr. Steven Tay
La Dra. Luisa F. Cabeza, catedràtica de l’Escola Politècnica Superior de la Universitat de Lleida
i el Dr. Steven Tay, professor a temps complert de la University of Newcastle.
CERTIFIQUEN:
Que la memòria “Technological requirements in latent heat thermal energy storage systems:
Study of the partial load operating conditions and the dynamic melting enhancement technique”
presentada per Jaume Gasia Mercè per optar al grau de Doctor s’ha realitzat sota la seva
supervisió.
Lleida, Juny 2018
iv
Acknowledgements
Acknowledgements
Acknowledgements
AcknowledgementsAcknowledgements
In the first place, I would like to thank the two supervisors of my PhD thesis, Prof. Luisa F.
Cabeza and Dr. N.H. Steven Tay, not only for the opportunity they gave me to immerse myself
into the exciting world of research but also for their wise guidance, knowledge and
encouragement I received throughout the sinuous path of the doctorate.
I would like to thank all the funding received to carry out this PhD thesis. To the Spanish
Government (ENE2011-22722, ULLE10-4E-1305 and ENE2015-64117-C5-1-R
(MINECO/FEDER)). To the European Commission Seventh Framework Programme (FP/2007-
2013) under Grant agreement Nº PIRSES-GA-2013-610692 (INNOSTORAGE) and to the
European Union’s Horizon 2020 research and innovation programme under grant agreement No
657466 (INPATH-TES). To the Catalan Government for the quality accreditation given to the
research group I belong to (2014 SGR 123 and 2017 SGR 1537), for the quality accreditation
TECNIO, and for the PhD fellowship given to the me (2016FI_B 0004700092, 2017FI_B1
00092, 2018FI_B2 00100)). To Abengoa Solar New Technologies for the resources on the
experimental facility at the University of Lleida. To the South Australian Department of State
Development who funded part of the research carried out at the University of South Australia
through the Premier's Research Industry Fund - International Research Grant Program (IRGP
33). To the Societat Econòmica d'Amics del País (SEBAP) for the award to promote research in
an abroad institution, which allowed me doing a research stay at the Dalhousie University. And
finally, to the Canadian Foundation for Innovation (CFI) for its financial assistance towards the
infrastructure I used in the research done in at Dalhousie University.

v
Acknowledgements
I would also like to wish my gratitude to the supervisors in my two research stays abroad:
To Prof. Dr. Frank Bruno and Dr. Martin Belusko from Barbara Hardy Institute, University
of South Australia, Adelaide (Australia).
To Dr. Dominic Groulx from the Lab of Applied MultiPhase Thermal Engineering
(LAMTE), Dalhousie University, Halifax (Canada).
Special mention should be given to all my colleagues from GREA research group (today
GREiA) and the good atmosphere created within it, who helped me during my research and
during the tougher moments from the very first day. Especially to those with whom I shared the
pilot plant periodically gifts.
Thanks to the old and news friends, with whom I spent time and experiences, and shared laughs
and concerns.
Last but not least, my sincere gratitude to my parents, sister and Laura, for being by my side in
the good and bad moments, and for the talks, laughs, tears and love that we shared, and we are
going to share.

vi
Summary/Resum/Resumen
Summary
The use of energy from renewable sources is important in the fight against climate change.
However, the intermittence of their sources and the constant mismatch between supply and
demand hamper the global use of this energy. Therefore, thermal energy storage (TES)
technologies become crucial in order to overcome the aforementioned disadvantages. Systems
based on this technology must meet various requirements in order to be competitive at all levels.
Among the different requirements, this PhD thesis is framed in the study of the technological
ones, and more specifically, in two areas of research within these requirements. On the one hand,
this PhD thesis focuses on the study of the partial load operating conditions in a mid-temperature
range latent heat TES system (100 ºC < T < 150 ºC) in order to optimize its operation strategy.
These operating conditions are generated from discontinuous energy supplies or from controlled
interruptions of continuous energy supplies, causing the TES systems not being fully
charged/discharged and therefore, resulting in incomplete phase change processes. Results from
experimentation allowed quantifying the effect of partially charging a latent heat TES system in
its subsequent processes of storage and discharge, as well as quantifying the effect of the storage
period duration in the same processes. On the other hand, this PhD thesis also centres its
attention on the study of the dynamic melting concept in a low-temperature range latent heat
TES system (-10 < T <10ºC) to enhance the heat transfer between the heat transfer fluid and the
TES material. Dynamic melting consists of recirculating the liquid fraction of this material
during its phase change process by means of an external mechanical device. The experimental
and numerical results allowed quantifying the influence of the flow arrangement, of the fluid
velocity, and the heat gains of the system on the behaviour of the TES system from the thermal
and fluid dynamics points of view.
vii
Summary/Resum/Resumen
Resum
L’ús d’energia provinent de fonts renovables és important en la lluita contra el canvi climàtic.
Tanmateix, la intermitència de les seves fonts i el constant desajust entre l'oferta i la demanda
dificulten l’ús global d’aquesta energia. Per tant, les tecnologies d'emmagatzematge d'energia tèrmica
(EET) esdevenen cabdals per tal de superar aquests inconvenients. Els sistemes basats en aquesta
tecnologia han de complir diversos requisits per tal de ser competitius en tots els nivells. D’entre tots
els requisits, la present tesi doctoral està emmarcada en l'estudi dels tecnològics, i més concretament,
en dos àmbits d'investigació. Per una banda, aquesta tesi doctoral se centra en l'estudi de les
condicions d’operació a càrrega parcial d’un sistema d’EET per calor latent amb l’objectiu
d’optimitzar la seva estratègia de funcionament en un rang de temperatura comprès entre els 100 ºC i
els 150 ºC. Aquestes condicions d’operació es generen quan les fonts d’energia no subministren un
flux energètic constant o quan, de forma controlada, s’interromp el subministrament d’energia que té
un flux energètic constant, provocant que els sistemes d’EET no estiguin totalment
carregats/descarregats i per tant, canvis de fase incomplerts. Els resultats experimentals han permès
quantificar l'efecte que té carregar parcialment un sistema d’EET per calor latent en els posteriors
processos d'emmagatzematge i descàrrega, així com quantificar l'efecte de la durada del període
d'emmagatzematge en els mateixos processos. D'altra banda, aquesta tesi doctoral també se centra en
l'estudi del concepte de fusió dinàmica en un sistema d’EET per calor latent de baixa temperatura (-
10<T<10ºC) amb l’objectiu de millorar la transferència de calor entre el fluid caloportador i el
material d’emmagatzematge tèrmic. La fusió dinàmica consisteix en la recirculació de la fracció
líquida d’aquest material durant el seu procés de canvi de fase mitjançant un dispositiu mecànic
extern. Els resultats experimentals i numèrics han permès quantificar la influència de la configuració
del flux, de la velocitat de recirculació i dels guanys tèrmics del sistema, en el comportament del
sistema d’EET des dels punts de vista tèrmics i de dinàmica de fluids.
viii
Summary/Resum/Resumen
Resumen
El uso de energía proveniente de fuentes renovables es importante en la lucha contra el cambio
climático. Sin embargo, la intermitencia de sus fuentes y el constante desajuste entre la oferta y la
demanda dificultan el uso global de esta energía. Por lo tanto, las tecnologías de almacenamiento de
energía térmica (AET) se convierten en primordiales para superar estos inconvenientes. Los sistemas
basados en esta tecnología deben cumplir varios requisitos para ser competitivos a todos los niveles.
De entre todos los requisitos, la presente tesis doctoral está enmarcada en el estudio de los
tecnológicos, y más concretamente, en dos ámbitos de investigación. Por un lado, esta tesis doctoral
se centra en el estudio de las condiciones de operación a carga parcial de un sistema de AET por
calor latente con el objetivo de optimizar su estrategia de funcionamiento en un rango de temperatura
comprendido entre los 100 ºC y los 150 ºC. Estas condiciones de operación se generan cuando las
fuentes de energía no suministran un flujo energético constante o cuando, de forma controlada, se
interrumpe el suministro de energía que tiene un flujo energético constante, provocando que los
sistemas de AET no estén totalmente cargados/descargados y, por consiguiente, cambios de fase
incompletos. Los resultados experimentales han permitido cuantificar el efecto que tiene cargar
parcialmente un sistema de AET por calor latente en los posteriores procesos de almacenamiento y
descarga, así como cuantificar el efecto de la duración del periodo de almacenamiento en los mismos
procesos. Por otra parte, esta tesis doctoral también se centra en el estudio del concepto de fusión
dinámica en un sistema de AET por calor latente de baja temperatura (-10<T<10ºC) con el objetivo
de mejorar la transferencia de calor entre el fluido caloportador y el material de almacenamiento
térmico. La fusión dinámica consiste en la recirculación de la fracción líquida de este material
durante su proceso de cambio de fase mediante un dispositivo mecánico externo. Los resultados
experimentales y numéricos han permitido cuantificar la influencia de la configuración del flujo, de
la velocidad de recirculación y de las ganancias térmicas del sistema, en el comportamiento del
sistema de AET desde los puntos de vista térmicos y de dinámica de fluidos.

ix
Table of contents
Table of contents
List of figures…………………...……………………………………………………….. xii
List of tables…………………...………………..………………………………………. xv
1 Introduction, objectives and PhD thesis structure……………………….…….. 1
1.1 Introduction…………….………………………………………………..…... 1
1.1.1 Background…..………………………………………...………....... 1
1.1.2 Thermal energy storage………………………......………………... 5
1.2 Objectives…………………………………………………………………… 11
1.3 PhD thesis structure………………………………….………….....………... 12
2 Review on system and materials requirements for high temperature thermal
energy storage………………………………...……………………………..……. 14
2.1 Introduction………………………………..…………………………….…... 14
2.2 Paper 1. Review on system and materials requirements for high temperature
thermal energy storage. Part 1: General requirements…………………...….. 15
2.2.1 Contribution to the state-of-the-art…………………………..…….. 15
2.2.2 Contribution of the candidate………………....……………..…….. 17
2.2.3 Journal paper……………………….....…………………..………... 17
2.3 Paper 2. Materials and system requirements of high temperature thermal
energy storage systems: A review. Part 2: Thermal conductivity
enhancement techniques.................................................................................. 18
x
Table of contents
2.3.1 Contribution to the state-of-the-art………………..……………….. 18
2.3.2 Contribution of the candidate………..…………..……….….…….. 21
2.3.3 Journal paper…………………………………………………...…... 22
3 Partial load operating conditions for thermal energy storage management..... 23
3.1 Introduction……………………………..…………………….……………... 23
3.2 Experimental set-up…………………………………..………………........... 26
3.3 Paper 3. Phase change material selection for thermal processes working
under partial load operating conditions in the temperature range between
120 and 200 °C................................................................................................. 30
3.3.1 Contribution to the state-of-the-art…………………………..…….. 30
3.3.2 Contribution of the candidate………………..…………………….. 31
3.3.3 Journal paper……………………………………......…….………... 33
3.4 Selected phase change material: High density polyethylene (HDPE)……..... 34
3.5 Paper 4. Use of partial load operating conditions for latent thermal energy
storage management………….……..……………………………………….. 38
3.5.1 Contribution to the state-of-the-art……………......……………….. 38
3.5.2 Contribution of the candidate………………..……..……..……….. 41
3.5.3 Journal paper………………..…..………………...………………... 41
3.6 Paper 5. Influence of the storage period between charge and discharge in a
latent heat thermal energy storage system working under partial load
operating conditions......................................................................................... 42
3.6.1 Contribution to the state-of-the-art……………..………………….. 42
3.6.2 Contribution of the candidate……..…………..………………..….. 43
3.6.3 Journal paper…………..……..………………………………...…... 44
4 Dynamic melting as a heat transfer enhancement technique……………....….. 46
4.1 Introduction……..………….………………………………………………... 46

xi
Table of contents
4.2 Working principle of dynamic melting……………………………...………. 48
4.3 Paper 6: Experimental investigation of the effect of dynamic melting in a
cylindrical shell-and-tube heat exchanger using water as PCM…………...... 50
4.3.1 Experimental set-up………..………..………..……………………. 50
4.3.2 Contribution to the state-of-the-art…………………..…………….. 52
4.4.3 Contribution of the candidate………..………………..…..…..….... 55
4.3.4 Journal paper…………………..……………………..…………...... 55
4.4 Paper 7: Numerical study of dynamic melting enhancement in a latent heat
thermal energy storage system…………………………..………….……….. 56
4.4.1 Numerical model………………………….………………..………. 56
0
Contribution to the state-of-the-art……………………………..….. 60
4.4.3 Contribution of the candidate…………………..………………….. 62
4.4.4 Journal paper……………………………………………...………... 63
5 Conclusions and future work…………………………………..…....……….….. 64
Other research activities………………………………..……………….…………..….. 69
References..…………………………………………...…….…….……………..………. 77
Annexes..………………………………………………...……….……………..……….. 84

xii
List of figures
List of figures
Figure 1.1 (a) Worldwide total energy consumption. (b) Breakdown by energy
(2016): Oil 32%, coal 27%, gas 21%, biomass 11%, electricity 9% [2]....... 2
Figure 1.2 Estimated renewable energy share of total final energy consumption, 2015
[5]................................................................................................................... 3
Figure 1.3 Evolution of the storage facilities accumulated rated power at worldwide
scale: (a) Including pumped hydro storage; (b) Excluding pumped hydro
storage. Adapted from [8].............................................................................. 4
Figure 1.4 Energy flow diagram in a TES process......................................................... 6
Figure 1.5 Thermal energy storage technologies............................................................ 6
Figure 1.6 Classification of phase change materials. Based on [18].............................. 7
Figure 1.7 Scheme of the PhD thesis structure. ............................................................. 13
Figure 2.1 Thermal conductivity enhancement techniques for high temperature
purposes......................................................................................................... 19
Figure 3.1 (a) Hysteresis and subcooling in a PCM melting and solidification
process. (b) Scenarios for modelling the transition between heating and
cooling in a partially melted PCM. Based on [42]........................................ 25
Figure 3.2 Pilot plant facility available at the University of Lleida which was used to
experimentally test the partial load operating conditions for TES
management................................................................................................... 26

xiii
List of figures
Figure 3.3 TES system used of the experimental setup: (a) Overview of the TES
system; (b) PCM distribution within the TES system; (c) PCM
temperature sensors of the main part; (d) Inlet and outlet HTF temperature
sensors, and PCM temperature sensors of the corner and central parts....... 28
Figure 3.4 HDPE Fourier transform infrared (FT-IR) spectroscopy after 0, 10 and
100 cycles...................................................................................................... 35
Figure 3.5 HDPE results from the DSC analyses [55] following the PCM standard
methodology [53]. (a) HDPE enthalpy-temperature curve; (b) specific
heat-temperature curve.................................................................................. 36
Figure 3.6 Overview of the HDPE inside the storage tank: (a) melted and (b)
solidified........................................................................................................ 37
Figure 3.7 (a) 30-min averaged HTF heat transfer rate evolution during the
discharging processes; (b) HTF heat transfer rate evolution during the
discharging processes when the PCM accumulated energy reached RAE
58%. Notice that 0 in the “x” axis means the moment when the different
study cases achieved this value, and not the beginning of the discharging
process........................................................................................................... 40
Figure 3.8 Figure 3.8. PCM temperature evolution during a storage period of 120
min: (a) RAE 58%; (b) RAE 73%; (c) RAE 83%; (d) RAE 97%................. 43
Figure 3.9 Evolution of the HTF heat transfer rate during the discharging processes
for different storage periods (∆tST=25 min, 60 min, and 120 min) and
preceded by charging processes at different energy levels: (a) RAE 58%;
(b) RAE 73%; (c) RAE 83%; (d) RAE 97%................................................. 44
Figure 4.1 Schematic diagram of the working principle of the dynamic melting
concept, where dark grey is the solid PCM and light grey is the liquid
PCM. (a) to (d) follows the chronological order to completely melt a
PCM. Note that the schematic diagram presented in this figure is set to
one of the four possible HTF/PCM flow configurations............................... 49
Figure 4.2 (a) Schematic view and (b) real view of the experimental set-up used to 51

xiv
List of figures
perform the experimental study.....................................................................
Figure 4.3 HTF-PCM heat exchanger used to perform the experimental study: (a)
Bottom view; (b) Front view of the upper part; (c) Front view of the
bottom part; (d) HTF and PCM recirculation loop description..................... 52
Figure 4.4 Schematic view of the HTF-PCM heat exchanger used to perform the
experimental study: Dimensions and location of the temperature
sensors........................................................................................................... 53
Figure 4.5 Evolution of the (a) local effectiveness and (b) HTF heat transfer rate
during the discharging process for an HTF flow rate of 1 l/min with and
without the influence of the dynamic melting............................................... 54
Figure 4.6 Two-dimensional Cartesian model used to carry out the numerical
investigation of the dynamic melting enhancement technique...................... 56
Figure 4.7 Results of the melting fraction for an average HTF velocity of 0.05 m/s
for the mesh convergence study.................................................................... 58
Figure 4.8 Mesh used in the numerical study…………………………..……….…...... 59

xv
List of tables
List of tables
Table 1.1 Main requirements for selecting the suitable materials and systems
focused on high temperature TES. The requirements which have an *
correspond only to latent heat energy storage [19]........................................ 8
Table 2.1 Main characteristics of the heat transfer enhancement techniques within
the PCM......................................................................................................... 20
Table 3.1 Location of the different temperature sensors within the storage tank.......... 28
Table 3.2 Potential thermal energy processes which can operate under partial load
operation conditions within the temperature range between 120 and 200
°C. Based on Gasia et al. [19]........................................................................ 30
Table 3.3 Summary of the characterization of the sixteen PCM under study............... 32
Table 3.4 Evolution of the melting and solidification enthalpies and temperatures of
HDPE after 0, 10 and 100 cycles................................................................... 35
Table 3.5 Summary of the main thermophysical properties of HDPE.......................... 37
Table 4.1 Summary of the main results obtained in the experimental study................. 54
Table 4.2 Mesh convergence study parameters…………....................................……. 58
Table 4.3 Parameters of the mesh selected in this study………................................... 59
Table 4.4 Summary of the results obtained for the different simulations carried out
in the present study........................................................................................ 61

xvi
This page intentionally left blank

1
1. Introduction, objectives and PhD thesis structure
Chapter 1
Introduction, objectives and PhD thesis structure
1.1 Introduction 1.1.1 Background
Human beings are facing the effects of climate-related changes due to an increase in the global
mean temperature. Longer periods of drought and the increase of heavier tropical storms are
some of the most notorious effects already affecting several regions worldwide [1]. The scientific
community [2] points out that the main cause of climate change is the constant and uninterrupted
rise that the worldwide energy consumption has experienced in the last decades (Figure 1.1).
From the beginning of the current century, worldwide energy consumption has been accounted to
have increased 38.6%, from a value of 9748 Mtoe in 2000 to a value of 13509 Mtoe in 2016.
This evolution has been mainly influenced by the dramatic growth of the energy consumption of
the countries located in the Asian region, which have doubled the need of energy resources as a
result of the economic development of the region and the installation of offshore industries from
Europe and North America. These two regions, which have been the heaviest worldwide energy
consumers during decades, experienced a decrease of 2% in the same time interval.

2
1. Introduction, objectives and PhD thesis structure
(a) (b)
Figure 1.1. (a) Worldwide total energy consumption. (b) Breakdown by energy (2016): Oil 32%, coal
27%, gas 21%, biomass 11%, electricity 9% [2].
According to the Inter-governmental Panel on Climate Change (IPPC), only the ability of society
to adapt to, or to mitigate, the climate change might help reducing its long-term effects, i.e. more
extreme weather conditions, higher human mortality and poverty rates, and greater risk of
collapsing of some ecosystems [3]. In order to minimize such effects, the Paris Climate
Agreement was approved and adopted within the United Nations Framework Convention on
climate Change (UNFCCC) in December 2015 [4]. This agreement was ratified by 168
UNFCCC members (as of October 2017) and its main objectives are included in the second
article:
- Holding the increase in the global average temperature to well below 2°C above pre-
industrial levels and pursuing efforts to limit the temperature increase to 1.5°C above
pre-industrial levels, recognizing that this would significantly reduce the risks and
impacts of climate change;
- Increasing the ability to adapt to the adverse impacts of climate change and foster
climate resilience and low greenhouse gas emissions development, in a manner that does
not threaten food production;
- Making finance flows consistent with a pathway towards low greenhouse gas emissions
and climate-resilient development.

3
1. Introduction, objectives and PhD thesis structure
The use of renewable energies has been found as one of the key technologies which might help
mitigating the climate change and shifting towards a new energy system and society model.
Renewable energies present a footprint that is much lower than traditional energy sources.
Moreover, they are employing around 9.8 million people worldwide, with the perspectives of
increasing this number [5]. According to the Renewable Energy Policy Network for the 21st
Century [5], the estimated renewable energy share of total energy consumption in 2015 was less
than 20% (Figure 1.2), which indicates that a considerable effort is required to successfully
change from conventional to renewable energy supplies. However, the dependence on the
weather conditions and the mismatch between energy demand and supply are the two main
drawbacks that slow down this change. Thus, storage technologies are indispensable at any
installation coupled to a renewable energy technology since they help overcoming these main
constraints [6,7]. During the last decade, the global capacity of facilities with storage
technologies, installed or under construction, showed an increase of 51%, reaching the value of
172.5 GW as of 2017 (Figure 1.3). This evolution shows that storage technologies are starting to
become important in the energy management of most of the countries worldwide. The dominant
technology is the pumped hydro storage, with a share of 96.2%, followed by the thermal storage
and electro-chemical, with a share of 1.7% and 1.2%, respectively. The reason lies on the fact
that hydro infrastructures are not only useful for storage purposes, but also for electricity
generation and water management.
Figure 1.2. Estimated renewable energy share of total final energy consumption, 2015 [5].

4
1. Introduction, objectives and PhD thesis structure
(a)
(b)
Figure 1.3. Evolution of the storage facilities accumulated rated power at worldwide scale: (a) Including
pumped hydro storage; (b) Excluding pumped hydro storage. Adapted from [8].

5
1. Introduction, objectives and PhD thesis structure
1.1.2 Thermal energy storage 1.1.2.1 Overview
Thermal energy storage (TES) is a technology that allows storing thermal energy for use at a
different time from generation. The evolution during the period 2007-2017 of the accumulated
rated power of facilities coupled to TES technologies, during the last decade, showed an increase
of 2.99 GW , for a rated power of 3.01 GW as of 2017 (167 times higher than 2007) (Figure
1.3b). Despite this dramatic increase, TES technologies are still not in their mature stage and
their integration to the global energy system strongly depends on the support of policy makers
and private investors in the research, development, and innovation (R&D&I) processes. Hence,
favourable regulatory treatments would encourage higher investment at all stages of the R&D&I
processes, from basic and applied research to the commercialization of the technology and, as a
consequence, to accomplish the UNFCCC agreements. The International Energy Agency (IEA)
established some recommendations for policy makers with the aim of guiding them on achieving
these agreements [9]:
Governments should develop a vision for a sustainable energy future that addresses
multiple energy policy challenges and tracks progress towards stated objectives.
International collaboration needs to be enhanced to achieve global objectives.
Policy support for technology should be accelerated at all stages of the innovation cycle.
Policy, finance and market mechanisms must be adapted to support new business models
enabled by the changing technology landscape.
Policy makers should develop a better understanding of opportunities and challenges
that arise from increasing digitalization in the energy sector.
The basic principle of TES is the storage of energy from a heat supply to be further used when it
is needed, usually through an intermediate heat transfer fluid (HTF). Hence, the energy flow
diagram of any TES process contains three steps: charge, storage, and discharge (Figure 1.4).
During the process of charging, the thermal energy is transferred from an outer source to the TES
system. This heat transfer takes place when there is an excess of thermal energy and/or when the
price of performing this process is low enough to be economically feasible. During the storage

6
1. Introduction, objectives and PhD thesis structure
process, the energy is stored in the TES system for a certain period of time (from minutes to
months), which mainly depends on the TES system itself and on the energy demand. Finally,
during the discharging process, the energy is transferred from the TES system to an external
application.
Figure 1.4. Energy flow diagram in a TES process.
1.1.2.2 Thermal energy storage technologies
Some research has been conducted regarding TES in the last decades, which is summarized in
different books [6,10,11] and journal papers [12-16]. Three major technologies for TES are
identified: sensible heat, latent heat, and chemical and sorption reactions [6] (Figure 1.5).
Figure 1.5. Thermal energy storage technologies.
The energy stored in sensible heat TES is related to the increase of the storage medium
temperature. Hence, the amount of energy is proportional to the mass, heat capacity, and the

7
1. Introduction, objectives and PhD thesis structure
temperature variation of the storage medium. Sensible heat storage is by far the most common
method for heat storage [6], and the most commonly used storage materials are water, concrete,
rock beds, bricks and soils [17]. In latent heat TES, the energy is stored when the storage
material undergoes phase change. Unlike sensible heat storage, the process is nearly isothermal,
which means that the energy is stored due to the molecular restructuration that takes place within
the transition from one phase to the other. Thus, the amount of energy is proportional to the mass
and phase change enthalpy of the storage medium. The most widely used and studied phase
change transition is the solid-liquid one. The materials which undergo solid-liquid phase change
are known as phase change materials (PCMs), and they are usually classified into organics,
inorganics, and eutectics [6] (Figure 1.6).
Figure 1.6. Classification of phase change materials. Based on [18].
Finally, the energy storage based on sorption and chemical reactions (usually known as
thermochemical energy storage) consists of reversible physical and chemical processes or
reactions involving two substances, usually known as thermochemical materials (TCMs). This

8
1. Introduction, objectives and PhD thesis structure
means that the heat released resulted from the dissociation process can be recovered if a
synthesis reaction takes place.
1.1.2.3 Thermal energy storage requirements
TES systems are starting to penetrate into the market. However, it can be considered that TES
technology is still in a non-mature stage, and therefore it requires a higher intensity in research.
Table 1.1 summarizes the requirements that a TES system should fulfil for an optimum
performance.
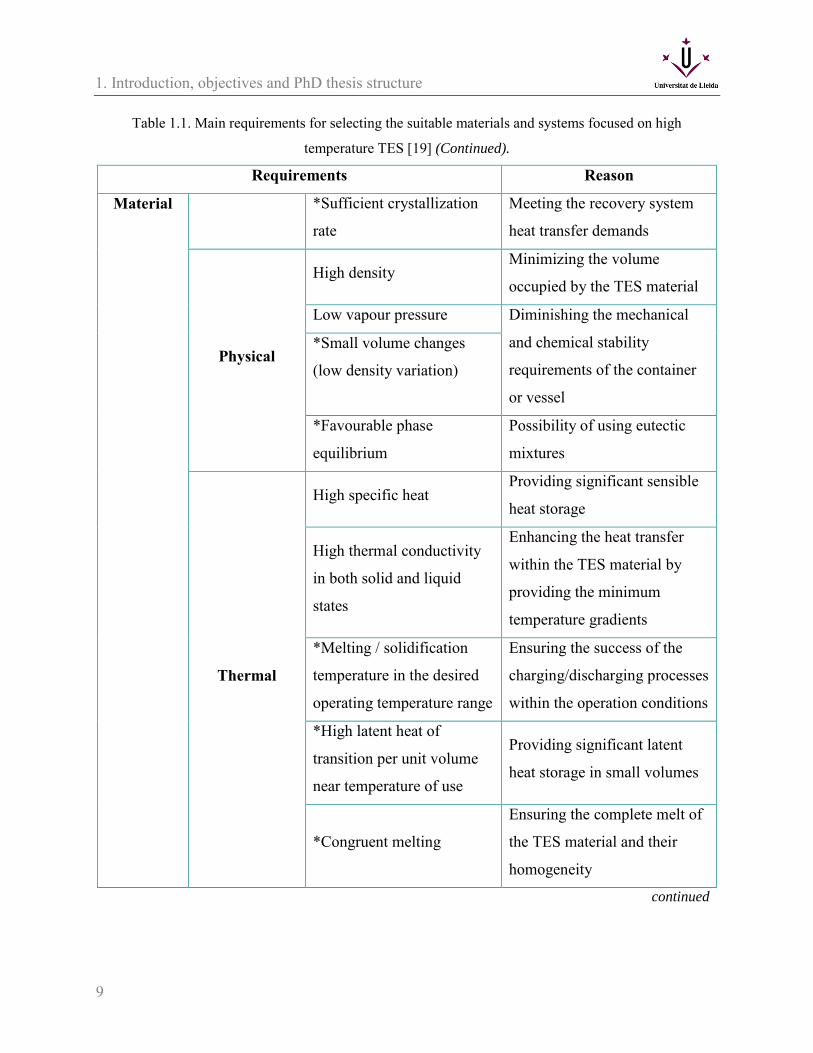
Table 1.1. Main requirements for selecting the suitable materials and systems focused on high
temperature TES. The requirements which have an * correspond only to latent heat energy storage [19].
Requirements Reason
Material
Chemical
Long-term chemical
stability
Keeping the initial
thermochemical properties
along the cycling periods No chemical decomposition
Compatibility with
container materials and low
reactivity to heat transfer
fluids (HTFs)
Ensuring long lifetime of the
container and the surrounding
materials in case of leakage
No fire and explosion
hazard Ensuring workplace safety
No toxicity Ensuring handling safety
*No phase separation /
Incongruent melting
Avoiding changes on the melt
stoichiometric composition
Kinetic *Small or no subcooling
Having the same melting/
solidification temperature and
avoiding heat release
problems
continued
9
1. Introduction, objectives and PhD thesis structure
Table 1.1. Main requirements for selecting the suitable materials and systems focused on high
temperature TES [19] (Continued).
Requirements Reason
Material
*Sufficient crystallization
rate
Meeting the recovery system
heat transfer demands
Physical
High density Minimizing the volume
occupied by the TES material
Low vapour pressure Diminishing the mechanical
and chemical stability
requirements of the container
or vessel
*Small volume changes
(low density variation)
*Favourable phase
equilibrium
Possibility of using eutectic
mixtures
Thermal
High specific heat Providing significant sensible
heat storage
High thermal conductivity
in both solid and liquid
states
Enhancing the heat transfer
within the TES material by
providing the minimum
temperature gradients
*Melting / solidification
temperature in the desired
operating temperature range
Ensuring the success of the
charging/discharging processes
within the operation conditions
*High latent heat of
transition per unit volume
near temperature of use
Providing significant latent
heat storage in small volumes
*Congruent melting
Ensuring the complete melt of
the TES material and their
homogeneity
continued
10
1. Introduction, objectives and PhD thesis structure
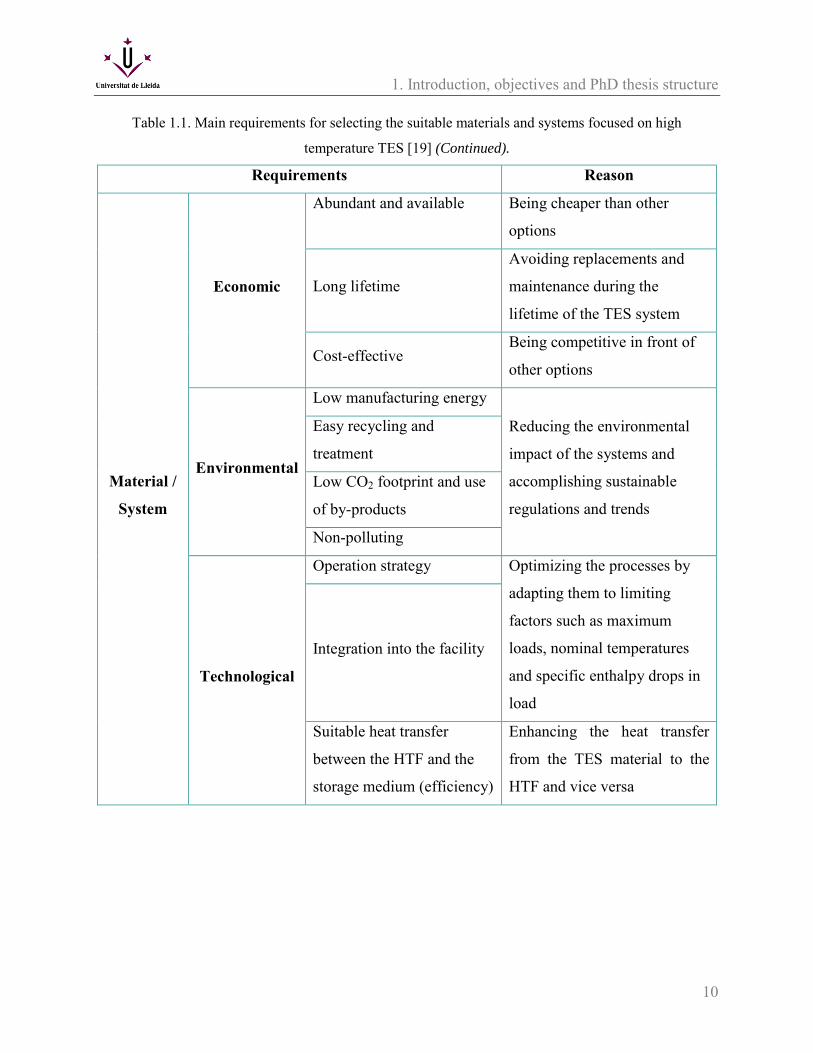
Table 1.1. Main requirements for selecting the suitable materials and systems focused on high
temperature TES [19] (Continued).
Requirements Reason
Material /
System
Economic
Abundant and available Being cheaper than other
options
Long lifetime
Avoiding replacements and
maintenance during the
lifetime of the TES system
Cost-effective Being competitive in front of
other options
Environmental
Low manufacturing energy
Reducing the environmental
impact of the systems and
accomplishing sustainable
regulations and trends
Easy recycling and
treatment
Low CO2 footprint and use
of by-products
Non-polluting
Technological
Operation strategy Optimizing the processes by
adapting them to limiting
factors such as maximum
loads, nominal temperatures
and specific enthalpy drops in
load
Integration into the facility
Suitable heat transfer
between the HTF and the
storage medium (efficiency)
Enhancing the heat transfer
from the TES material to the
HTF and vice versa
11
1. Introduction, objectives and PhD thesis structure
1.2 Objectives
Among the different requirements that a latent heat TES system should fulfil to be a competitive
technology and therefore, to be able to penetrate the energy market, the present PhD thesis is
focused on the study of the technological requirements. The reason lies on the fact that despite
knowing that these requirements have an important impact in the design and the economics of
the TES system, they are not usually analysed in literature. A good operational strategy and
integration of TES systems into the energy processes by adapting them to limiting factors such as
maximum loads, nominal temperatures and specific enthalpy drops are essential to help
optimizing such processes and increasing both the environmental and economic benefits.
Similarly, maximizing the heat transfer between the HTF and the TES material might contribute
to enhance the overall TES system efficiency.
Therefore, the research presented in this PhD thesis is focused on two areas. First of all, the study
of the partial load operating conditions in a mid-temperature range latent heat TES system in
order to optimize its operational strategy. This research studies the effect of partially charging a
latent heat TES system in its charging, storage, and discharging processes. On the other hand, the
second area of research of this PhD thesis presents as a focal point the study of the dynamic
melting in a low-temperature range latent heat TES system in order to enhance the heat transfer
between the HTF and the TES material. This research studies the influence of the dynamic
melting on the thermal and fluid dynamic behaviour of the TES material.
To get all the information required to fulfil the objectives of this PhD, experimental and
numerical research were carried out in different facilities. The initial aim of this PhD was to
carry out the research in the high temperature range (>150 ºC). However, due to different
technical issues with the experimental facilities, it was redesigned to be carried out on the mid-
low temperature range (<150 ºC).
12
1. Introduction, objectives and PhD thesis structure
1.3 PhD thesis structure
The present PhD thesis is based on seven papers, of which five papers have already been
published in SCI journals while two have been submitted.
This PhD thesis is divided into five chapters as shown in the scheme of the structure of the PhD
presented in Figure 1.7. Chapter 1 starts with an introduction to the current energy consumption
trends and the need for TES technologies, followed by the presentation of the main objectives
and the structure of this PhD thesis. Chapter 2 presents a review of the main requirements that
TES materials and systems should fulfil for an optimum performance. This chapter includes
Paper 1 and Paper 2, which review the different research works focused on studying these
requirements and how to improve them for high temperature applications. Chapter 3 and Chapter
4 arouse from needs detected during the elaboration of Chapter 2. Hence, Chapter 3 focuses on
studying the partial load operating conditions as a thermal management tool, taking advantage of
the pilot plant facility that the GREiA research group has at the University of Lleida. Papers 3 to
5 present the research carried out within the frame of this chapter. The centre of attention of
Chapter 4 is the study of the dynamic melting concept as a heat transfer enhancement technique
between the TES material and the HTF, which was carried out during the two research stays that
the PhD candidate did during his candidature. Paper 6 and Paper 7 present the research
performed within the framework of this chapter. Finally, Chapter 5 embraces the main
conclusions of this PhD thesis and the recommendations for future work. All the papers included
in the contents of this thesis are attached in the annexes in the journals format.

13
1. Introduction, objectives and PhD thesis structure
Figure 1.7. Scheme of the PhD thesis structure.

14
2. Review on system and materials requirements for high temperature thermal energy storage
Chapter 2
Review on system and materials requirements for
high temperature thermal energy storage
2.1. Introduction
TES has been widely studied at different temperature ranges for different applications, such as
heating and cooling [20,21], transportation [22], thermal protection [23], industrial waste heat
recovery [24], and solar energy power generation [25]. However, few studies have been done on
gathering and identifying in a same paper the main requirements that a TES system should
accomplish from the material and system point of view. In the early eighties, Abhat [26] did a
first attempt to determine the most important characteristics of PCM. In this case, the authors
only focused on the material point of view analysing the thermodynamic, chemical, and
economic characteristics. Zalba et al. [12], updated the work carried out by Abhat [26] and
provided details of the research carried out on latent heat TES until 2003. Despite slightly
modifying the nomenclature, they summarized the same characteristics. Dinçen and Rosen [10]
and Mehling and Cabeza [6] analysed the latent heat technology and suggested two more
characteristics that should be taken into account, the technical and the environmental ones.
From reviewing different studies, it was observed that there was a lack of data analysing TES
from both the systems and materials points of view, and summarizing all this research in a single
15
2. Review on system and materials requirements for high temperature thermal energy storage
document. Therefore, in the present study, the requirements that sensible and latent TES
materials and systems working at temperatures higher than 150 ºC should fulfil for an optimum
performance were reviewed and classified (Table 1.1). Moreover, the studies which were carried
out with the aim of achieving such optimization were reviewed and analysed, and the main
findings and enhancements were presented.
Due to the wide scope of the information reviewed, the work was divided into two parts. The
first part (Paper 1) shows the general requirements, with the exception of the thermal
conductivity, which is found in the second part (Paper 2).
2.2. Paper 1. Review on system and materials requirements for
high temperature thermal energy storage. Part 1: General
requirements 2.2.1. Contribution to the state-of-the-art
The main contribution to the state-of-the-art of the first part of this review is a complete review
of the literature which studied the chemical, kinetic, physical, thermal, economic, environmental,
and technological requirements of sensible and latent TES materials and systems working at
temperatures higher than 150 °C.
Regarding the chemical requirements, it was found that the chemical stability is a requirement
which is practically not studied. Only five PCMs and alloys were evaluated being galacticol the
PCM with better results. The compatibility between the PCM and the TES container has been
widely studied, but the lack of a standard procedure in literature (metal weight/gain losses,
corrosion rates, etc.) complicates the comparison between studies. The material safety is
commonly checked on the materials safety data sheets or other security standards such as the
National Fire Protection Association (NFPA) 704. Finally, the phase segregation is mainly
addressed by the use of encapsulation made of high temperature resistant materials, such as
metals.

16
2. Review on system and materials requirements for high temperature thermal energy storage
With reference to the kinetic requirements, small or no subcooling during the solidification and
sufficient crystallization rate is desired. Despite the fact that the use of nucleating agents is found
to reduce the subcooling, some studies showed that this effect is size-dependent, which is
enhanced by the irregularities in the storage tank and the presence of not-fully melted PCM
before starting the solidification process.
In relation to the physical requirements, no remarkable studies were found.
On the contrary, regarding the thermal requirements, lots of research was conducted to increase
the thermal conductivity (fully detailed in the second part of this review) and specific heat in
both solid and liquid phases. Despite the fact that no increase of the specific heat was found in
water-based and organic-based nanomaterials if compared to pure materials, increases up to 30%
were found in molten salt-based nanomaterials. Shin and Banerjee [27] stated that such increase
was due to the fractal-like nanostructure of the molten salt-based nanomaterials.
The economic requirement studies available in the literature were mainly focused on parabolic
trough concentrated solar power (CSP) plants. Results showed, on the one hand, that the TES
system is responsible for up to 15% of the capital expenditures (CAPEX) breakdown, and on the
other hand, that the annual number of storage cycles is the parameter with the highest impact on
the cost effectiveness. Moreover, results showed that the implementation of TES allows
increasing the annual capacity but turns of with an increase of the total plant capital costs.
Regarding environmental requirements, three tools were used to identify the environmental
affection of TES systems: the carbon or CO2 footprint, the life cycle assessment (LCA), and the
cumulative energy demand. The main conclusion was that TES systems reduce greenhouse gases
emissions but increase the environmental impact because of the usage of more materials and
land. Furthermore, when TES is evaluated and compared to conventional systems from a
material point of view, its benefits are not significant (with the exception of by-products).
However, when the comparison is done at system level, the benefits of using TES in terms of
reduction of CO2 emissions, and energy and water consumption are more noticeable.

17
2. Review on system and materials requirements for high temperature thermal energy storage
Finally, the use of multiple PCMs configuration and the dynamic melting concept were found to
be good options to optimize the technological requirements, which also include the integration of
the TES material into the facility, the operation strategy of the facilities, and the good transfer
between the HTF and the TES material.
2.2.2. Contribution of the candidate
Jaume Gasia proposed and conceived the structure of the review; Jaume Gasia also proposed a
list of references to review, which was further extended by the co-authors; all co-authors
collaborated on the interpretation of the results and on the preparation of the manuscript, as well
as responding to reviewers queries.
2.2.3. Journal paper
The scientific contribution from the present research work was published in the Renewable and
Sustainable Energy Reviews journal in 2017.
Reference: Gasia J, Miró L, Cabeza LF. Review on system and materials requirements for high
temperature thermal energy storage. Part 1: General requirements. Renewable and Sustainable
Energy Reviews 2017;75;1320–1338. DOI: 10.1016/j.rser.2016.11.11

18
2. Review on system and materials requirements for high temperature thermal energy storage
2.3. Paper 2. Materials and system requirements of high
temperature thermal energy storage systems: A review. Part 2:
Thermal conductivity enhancement techniques 2.3.1. Contribution to the state-of-the-art
The main contribution of the second part of this review to the state-of-the-art is a complete
review of the literature which studied the thermal conductivity enhancement techniques at
temperatures higher than 150 °C.
Available TES materials have very low thermal conductivity (fatty acids: ~0.15 W/m·K;
paraffins: ~0.20 W/m·K; salts: ~0.6 W/m·K) [6]. As a consequence, the heat transfer rates
between the TES material and the medium which transports the energy from/to the heat
source/sink, usually a HTF, become low. In order to overcome this drawback, the approaches
and techniques which have been studied, by increasing the thermal conductivity of the TES

19
2. Review on system and materials requirements for high temperature thermal energy storage
material, but also by improving the effective thermal conductivity between the HTF and the TES
medium, were also reviewed (Figure 2.1).
Figure 2.1. Thermal conductivity enhancement techniques for high temperature purposes.
The enhancement of the effective thermal conductivity between the HTF and the TES medium
has mainly been addressed by adding extended surfaces such as fins or heat pipes. As a result,
higher heat transfer rates are achieved since a higher quantity of TES medium is in contact with a
higher/lower temperature surface. In the case of the addition of fins, the heat transfer
enhancement depends on the number of fins, thickness, geometry, material, and distance between
them. In the case of addition of heat pipes, the heat transfer enhancement depends on their
orientation, HTF flow rate, module length, condenser and evaporator section tube lengths, and
the vapour core radius. However, two main drawbacks need to be faced, the increase of costs and
the decrease of the packing factor. On the contrary, the enhancement of the effective thermal
conductivity within the TES materials has been addressed by combining them with highly
conductive materials such as graphite, metal foams, and nanomaterials. Table 2.1 reviews the
parameters which have an influence on the heat transfer enhancement for the three different
techniques, as well as the main disadvantages reported.
20
2. Review on system and materials requirements for high temperature thermal energy storage
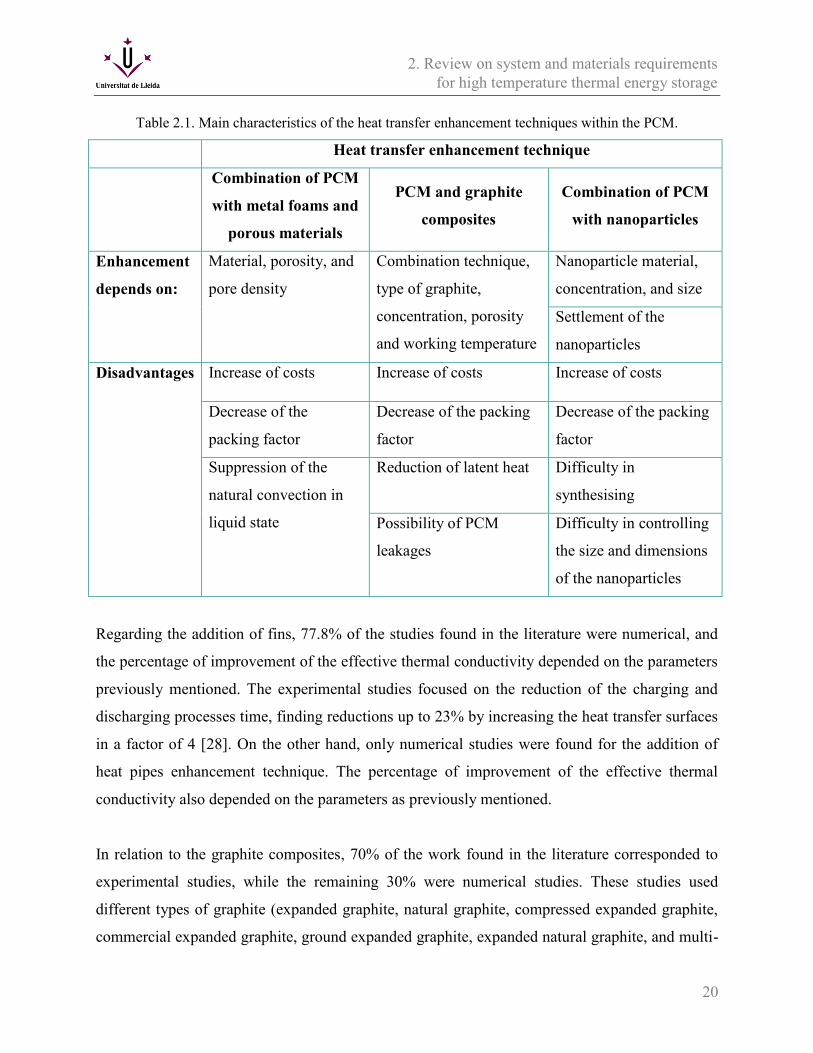
Table 2.1. Main characteristics of the heat transfer enhancement techniques within the PCM.
Heat transfer enhancement technique
Combination of PCM
with metal foams and
porous materials
PCM and graphite
composites
Combination of PCM
with nanoparticles
Enhancement
depends on:
Material, porosity, and
pore density
Combination technique,
type of graphite,
concentration, porosity
and working temperature
Nanoparticle material,
concentration, and size
Settlement of the
nanoparticles
Disadvantages Increase of costs Increase of costs Increase of costs
Decrease of the
packing factor
Decrease of the packing
factor
Decrease of the packing
factor
Suppression of the
natural convection in
liquid state
Reduction of latent heat Difficulty in
synthesising
Possibility of PCM
leakages
Difficulty in controlling
the size and dimensions
of the nanoparticles
Regarding the addition of fins, 77.8% of the studies found in the literature were numerical, and
the percentage of improvement of the effective thermal conductivity depended on the parameters
previously mentioned. The experimental studies focused on the reduction of the charging and
discharging processes time, finding reductions up to 23% by increasing the heat transfer surfaces
in a factor of 4 [28]. On the other hand, only numerical studies were found for the addition of
heat pipes enhancement technique. The percentage of improvement of the effective thermal
conductivity also depended on the parameters as previously mentioned.
In relation to the graphite composites, 70% of the work found in the literature corresponded to
experimental studies, while the remaining 30% were numerical studies. These studies used
different types of graphite (expanded graphite, natural graphite, compressed expanded graphite,
commercial expanded graphite, ground expanded graphite, expanded natural graphite, and multi-

21
2. Review on system and materials requirements for high temperature thermal energy storage
walled carbon nanotubes), different methods of synthesis (compression, infiltration,
impregnation, and dispersion), and different concentrations. It was found that heat transfer
enhancements were increased to a factor of 100 by using a KNO3 + NaNO3 mixture combined
with 15 wt% expanded natural graphite treated with sulphuric acid through the cold compression
method [29]. However, a reduction in the natural convection was observed in the liquid state.
With reference to the metal foams composites, only six studies were found where copper was the
most used porous material and NaNO3 the most improved TES material. Experimental results
showed enhancements in a factor of up to 2.5 of the heat transfer rates in the solid region [30].
However, this technique does not increase the effective thermal conductivity on the liquid state
as a result of the reduction of the natural convection.
Finally, the addition of nanoparticles was found to be a research field which is growing in
interest among the scientific community. 82% of the research work studied was found to be
experimental, and the remaining 18% to be numerical. In these studies, the material, size and
concentration of the nanoparticles were the three main parameters which were evaluated, mainly
focused on improving the most common TES materials used in solar plants. Experimental results
found enhancements up to 61 % in a SO2-Aluminate cement nanomaterial using 3 wt% of 50 nm
particles [31].
2.3.2. Contribution of the candidate
Jaume Gasia proposed and conceived the structure of the review; Jaume Gasia also proposed a
list of references to review, which was further extended by the co-authors; all co-authors
collaborated on the interpretation of the results and on the preparation of the manuscript, as well
as responding to reviewers queries.

22
2. Review on system and materials requirements for high temperature thermal energy storage
2.3.3. Journal paper
The scientific contribution from the present research work was published in the Renewable and
Sustainable Energy Reviews journal in 2016.
Reference: Gasia J, Miró L, Cabeza LF. Materials and system requirements of high temperature
thermal energy storage systems: A review. Part 2: Thermal conductivity enhancement
techniques, Renewable and Sustainable Energy Reviews 2016;60;1584-1601. DOI:
10.1016/j.rser.2016.03.019
23
3. Partial load operating conditions for thermal energy storage management
Chapter 3
Partial load operating conditions for thermal
energy storage management
3.1. Introduction
Renewable and industrial waste heat energy sources do not always provide a continuous energy
supply, and when they do it, the charging process of the TES system can be adapted according to
the final demand and the storage design. These conditions are known as partial load operating
conditions, and they might have an effect on the final performance of the TES systems and on
the thermal processes attached to them. For example, in latent heat TES systems, working under
partial load operating conditions might lead to the PCM to be not fully melted, or solidified, at
the end of their respective charging, or discharging processes. Thus, understanding the influence
of partial load operating conditions on both processes can help designers to better support
thermal storage sizing decisions, and manufacturers to take into account the greater level of
complexity when dealing with latent heat TES systems. The reason lies on the fact that geometry
plays a much more important role as compared with sensible TES systems in terms of avoiding
possible dead zones, or the greater relevance of the distance between the heat exchanger surfaces
and the PCM to permit higher heat transfer rates during the melting-solidifying processes, etc.
[32].

24
3. Partial load operating conditions for thermal energy storage management
3. Partial load operating conditions for thermal energy storage management
3. Partial load operating conditions for thermal energy storage management
3. Partial load operating conditions for thermal energy storage management
3. Partial load operating conditions for thermal energy storage management
3. Partial load operating conditions for thermal energy storage management
3. Partial load operating conditions for thermal energy storage management
3. Partial load operating conditions for thermal energy storage management
3. Partial load operating conditions for thermal energy storage management
3. Partial load operating conditions for
The PCM selection is a crucial step that should be carried out to ensure that the latent heat TES
systems working under partial load operating conditions are able to last for a long period at high
performance. It is not always easy to identify all critical parameters and the necessary
requirements are often in conflict with each other [33]. Previous research was conducted on
performing a selection and characterization of liquid crystals [34], sugar alcohols and eutectic
blends [35], and other different PCM family groups [36,37]. Researchers focused on the study of
the thermal cycling and stability, thermal physical and rheological properties, and the health
hazard of the different PCMs under evaluation. One of the conclusions pointed out by
researchers was the need for further investigations under real operating conditions. This
approach was dealt in the present PhD thesis during the selection procedure of the PCM that was
used to carry out the experimental research.
The influence of the partial load operating conditions in latent heat TES systems was previously
studied by some authors [38-45]. The vast majority of PCMs present hysteresis [6] and therefore,
they present different enthalpy-temperature curves for the heating (melting) and cooling
(solidification) processes (Figure 3.1a). Consequently, the transition between heating and cooling
in latent TES systems working under partial load operating conditions requires special attention,
and this will help to avoid accuracy problems in the system performance analysis [46].
Nowadays, the way of addressing this transition when a PCM has not fully undergone phase still
remains uncertain despite the fact that four different methodologies were proposed. The first
methodology proposes switching from one curve to the other with a slope that is identical to the
slope of the sensible region at which the process should finish [38] (points a-c-f in Figure 3.1b).
Thus, it reduces the possibility of having a discontinuity at the enthalpy curve when the transition
takes place at the end of the phase change. The second methodology consists of instantaneous
switches between both curves, which means that the transition from one curve to the other has no
equivalent slope, but it takes place horizontally [39] (points a-c’-f in Figure 3.1b). The third
methodology proposes staying at the same curve than in the precedent process, so there is no
change between curves unless the phase change is completed [40] (points a-d-f in Figure 3.1b).
Finally, the fourth methodology proposes switching to a curve placed between the cooling and
25
3. Partial load operating conditions for thermal energy storage management
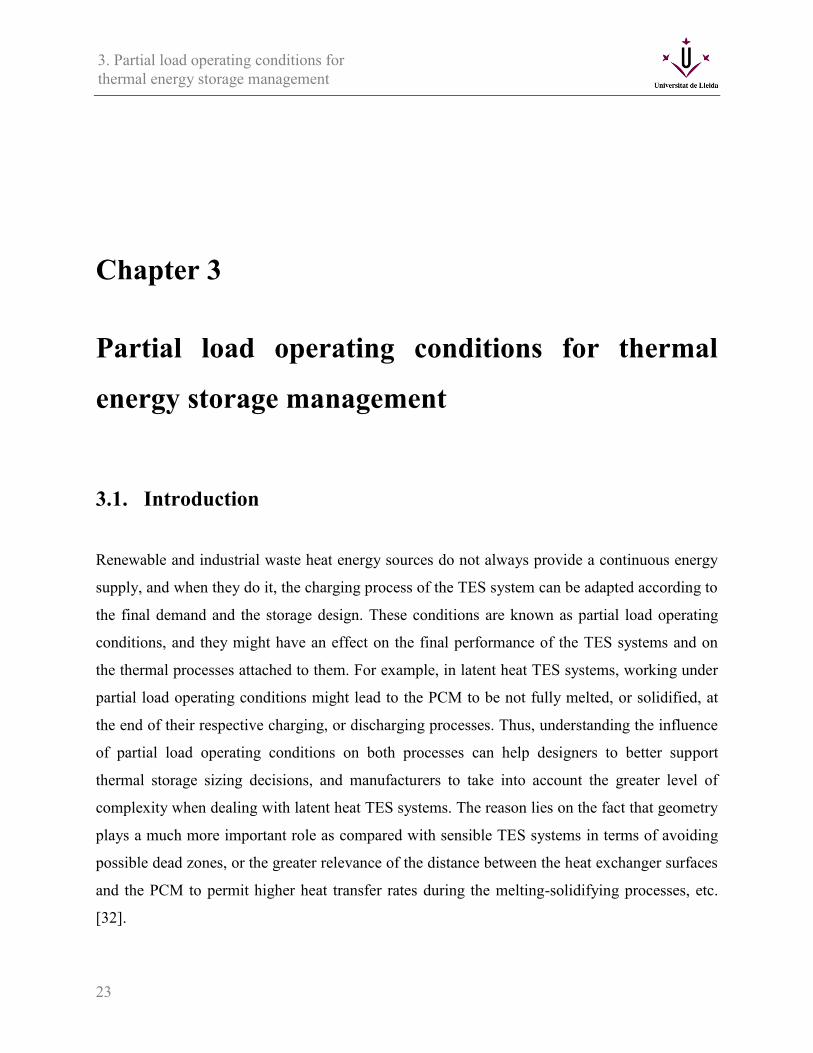
heating curves, whose position and slope depends on TES system operating conditions and if the
interruption takes place during the heating or cooling [41] (points a-b-e-f in Figure 3.1b).
(a) (b)
Figure 3.1. (a) Hysteresis and subcooling in a PCM melting and solidification process. (b) Scenarios for
modelling the transition between heating and cooling in a partially melted PCM. Based on [42].
Different conclusions arouse from the research studies that analysed the influence of the partial
load operating conditions [41-46]. First, the processes that had an incomplete PCM melting or
solidification presented worse results than the processes that had a complete PCM melting or
solidification. The reason lies on the fact that the characteristic latent heat of these processes was
not fully used. Second, the degree of subcooling of some PCMs decreased in the solidification
process that had an incomplete melting process. When a melting process was interrupted before
it was completed, a certain percentage of PCM was either in the solid state or in transition, and
therefore, some particles of crystal remained in the system, which acted as nucleating agents.
Third, the hysteresis between heating and cooling was reduced in comparison to complete phase
change processes for analogous reasoning. Lastly, the PCM phase change temperatures presented
slight variations, which is clearly related to the variation of the hysteresis curve. However, most
of the authors commented that there is a lack of experimental studies evaluating this topic and
therefore, further works are required to validate the previous statements.
Another important aspect in partially charged/discharged latent TES systems is the proper
evaluation of the storage periods (also known as stand-by periods) between charge and
discharge. The reason lies on the fact that the thermal distribution at the end of the preceding

26
3. Partial load operating conditions for thermal energy storage management
3. Partial load operating conditions for thermal energy storage management
3. Partial load operating conditions for thermal energy storage management
3. Partial load operating conditions for thermal energy storage management
3. Partial load operating conditions for thermal energy storage management
3. Partial load operating conditions for thermal energy storage management
3. Partial load operating conditions for thermal energy storage management
3. Partial load operating conditions for thermal energy storage management
3. Partial load operating conditions for thermal energy storage management
3. Partial load operating conditions for
process (either charge or discharge) may be different from the thermal distribution at the
beginning of the subsequent process, and it is usually not considered [47-50].
3.2. Experimental set-up
A pilot plant facility at the University of Lleida was used to carry out the experimentation
(Figure 3.2). This facility contains three characteristic systems that allow simulating a TES
system coupled to a real thermal process. Firstly, a commercial 24 kWe electrical heater supplied
by Pirobloc which heats up the HTF (silicon fluid Syltherm 800 [51]) acting as the heating
energy source during a charging process. Secondly, a 20 kWth air-HTF heat exchanger, designed
and built at the University of Lleida, which cools down the HTF acting as the heat sink during
the discharging process. Finally, a latent heat TES system to store the PCM. These three systems
are linked through a stainless steel 304 L piping which distributes the HTF within a flow rate
range between 0.3 and 3 m3/h. Moreover, the piping is also insulated with rock wool in order to
minimize the heat losses to the surroundings.
Figure 3.2. Pilot plant facility available at the University of Lleida which was used to experimentally test
the partial load operating conditions for TES management.

27
3. Partial load operating conditions for thermal energy storage management
The latent heat TES systems consists of a stainless steel 304L storage tank based on the shell-
and-tube heat exchanger concept. Its design is based on a rectangular prism shaped vessel (0.53
m x 0.27 m x 1.27 m), where the PCM is located, with a tubes bundle inside containing seven
rows of seven tubes distributed in square pitch (Figure 3.3a). The tubes are bended in U-shape,
the distance between tubes centre is 30 mm and all the tubes are connected in the same side of
the vessel to two different manifolds which distribute and collect the HTF. With the aim of
reducing the heat losses, 450 mm of Foamglass® are installed under the storage and 240 mm of
rock wool are installed on the lateral walls and on the cover of the storage tank.
The capacity of the TES system is 0.154 m3 and 99.5 kg of PCM are distributed within the vessel
as shown in Figure 3.3b. 79% of the PCM is located in the main part, where the tube bundle is,
14% of the PCM is located in the central part, and the remaining 7% is located in the corners.
Different Pt-100 1/5 DIN class B temperature sensors with an accuracy of ± 0.3 ºC are located at
different regions of the latent TES for the monitoring and acquisition of the HTF and PCM
temperatures. The details of the sensor locations are:
Two sensors are located at the inlet and outlet of the HTF tubes bundle to measure the HTF
inlet and outlet temperatures (THTF.IN and THTF.OUT in Figure 3.3d)
Thirty-one sensors are located within the TES system to measure the PCM temperature.
Nineteen of these sensors are located in the main part (from TPCM.1 to TPCM.15 in Figure
3.3c), six sensors in the corner part close to the U bend (from Tc.1 to Tc.6 in Figure 3.3d),
and six in the central part (from Tin.1 to Tin.6 in Figure 3.3d).
Six additional sensors are placed on the walls of the vessel and on the walls of the
insulation to evaluate the heat losses to the surroundings.
Each PCM temperature sensor is associated to a control volume, which is defined as the theoretical
volume of PCM in which the value of the temperature sensor is approximately representative. Table
3.1 presents the location and length of the different temperature sensors.

28
3. Partial load operating conditions for thermal energy storage management
3. Partial load operating conditions for thermal energy storage management
3. Partial load operating conditions for thermal energy storage management
3. Partial load operating conditions for thermal energy storage management
3. Partial load operating conditions for thermal energy storage management
3. Partial load operating conditions for thermal energy storage management
3. Partial load operating conditions for thermal energy storage management
3. Partial load operating conditions for thermal energy storage management
3. Partial load operating conditions for thermal energy storage management
3. Partial load operating conditions for
(a) (b)
(c) (d)
Figure 3.3. TES system used of the experimental setup: (a) Overview of the TES system; (b) PCM
distribution within the TES system; (c) PCM temperature sensors of the main part; (d) Inlet and outlet
HTF temperature sensors, and PCM temperature sensors of the corner and central parts.
Table 3.1. Location of the different temperature sensors within the storage tank.
Probe Units x y z Sensor
length
Main
part
TPCM 1 [mm] 78 0 31 35
TPCM 2 [mm] 78 0 126 114
TPCM 2.1 [mm] 38 0 126 35
TPCM 2.2 [mm] 118 0 126 194
TPCM 3 [mm] 78 0 190 194
TPCM 4 [mm] 78 527.5 31 114
TPCM 5 [mm] 78 527.5 126 114
TPCM 6 [mm] 78 527.5 190 114
continued
x y
z
(0,0,0) (0,0,0)

29
3. Partial load operating conditions for thermal energy storage management
Table 3.1. Location of the different temperature sensors within the storage tank (Continued).
Probe Units x y z Sensor
length
Main
part
TPCM 7 [mm] 652 0 31 114
TPCM 8 [mm] 652 0 126 114
TPCM 9 [mm] 652 0 190 114
TPCM 10 [mm] 652 527.5 31 35
TPCM 11 [mm] 652 527.5 126 114
TPCM 11.1 [mm] 612 527.5 126 35
TPCM 11.2 [mm] 692 527.5 126 194
TPCM 12 [mm] 652 527.5 190 194
TPCM 13 [mm] 1273 264 31 35
TPCM 14 [mm] 1273 264 126 114
TPCM 15 [mm] 1273 264 190 194
Central
part
Tin 1 [mm] 532.2 0 31.1 235
Tin 2 [mm] 532.2 0 94.6 252
Tin 3 [mm] 532.2 0 189.9 235
Tin 4 [mm] 532.2 527.5 31.1 235
Tin 5 [mm] 532.2 527.5 94.6 252
Tin 6 [mm] 532.2 527.5 189.9 235
Corners
Tc 1 [mm] 1227.2 0 31.9 22
Tc 2 [mm] 1227.2 0 134.4 73
Tc 3 [mm] 1227.2 0 236.9 22
Tc 4 [mm] 1227.2 527.5 31.9 22
Tc 5 [mm] 1227.2 527.5 134.4 73
Tc 6 [mm] 1227.2 527.5 236.9 150
The HTF flow rate is measured using a FUJI FCX-A2 V5 series transmitter with an accuracy of ±
23.7 l/h. Temperature and flow rate sensors are connected to a DL01 from STEP data acquisition
system, which controls, measures and records the information at a time interval of 60 s.

30
3. Partial load operating conditions for thermal energy storage management
3. Partial load operating conditions for thermal energy storage management
3. Partial load operating conditions for thermal energy storage management
3. Partial load operating conditions for thermal energy storage management
3. Partial load operating conditions for thermal energy storage management
3. Partial load operating conditions for thermal energy storage management
3. Partial load operating conditions for thermal energy storage management
3. Partial load operating conditions for thermal energy storage management
3. Partial load operating conditions for thermal energy storage management
3. Partial load operating conditions for
3.3. Paper 3. Phase change material selection for thermal processes
working under partial load operating conditions in the
temperature range between 120 and 200 °C 3.3.1. Contribution to the state-of-the-art
In the present study, the authors performed a PCM selection under real operating conditions.
Sixteen different PCMs with phase change temperatures range between 120 and 200 °C were
evaluated from the thermal and cycling stability, as well as from the health hazard point of view,
with the aim of selecting a suitable PCM that would be further used in a pilot plant experimental
setup working under partial load operating conditions.
The selection of the temperature range between 120 and 200 ºC lied on the fact that thermal
energy processes with a higher possibility to make the TES system working under partial load
operating conditions are within this range (Table 3.2).
Table 3.2. Potential thermal energy processes which can operate under partial load operation conditions
within the temperature range between 120 and 200 °C. Based on Gasia et al. [19].
Thermal process Range of temperatures
Absorption refrigeration From 80 to 230 °C
Adsorption refrigeration From −60 to 350 °C
Transportation exhaust heat recovery From 55 to 800 °C
Solar cooling From 60 to 250 °C
Industrial waste heat recovery From 30 to 1600 °C
The main contribution to the state-of-the-art is the characterization of sixteen different PCMs
with phase change temperatures within the temperature range of 120 and 200 °C, considering the
thermal and cycling stability, and the health hazard. The novelty of this work is the increase of
the number of cycles up to one hundred, the performance of the cycling tests under no controlled
atmosphere and with higher samples mass, and the modification of the health hazard study.

31
3. Partial load operating conditions for thermal energy storage management
This paper shows that from the health hazard point of view, high density polyethylene (HDPE)
was the safest PCM among the sixteen evaluated (Table 3.3). Other six PCMs (Sebacic acid,
dimethyl terephthalate, d-mannitol, adipic acid, benzanilide, dulcitol) were also found to be
suitable to be selected for latent heat TES purposes but specific safety measures should be taken
into account. Finally, the remaining eight PCMs were found to be dangerous and their use should
be either avoided or used under high safety measures.
From the thermal stability point of view it was found that only five PCMs, potassium thiocynate,
HDPE, dulcitol, adipic acid, and d-mannitol, were suitable for TES processes with temperatures
of 200 ºC or higher (Table 3.3). The remaining eleven PCMs showed a maximum thermal-stable
temperature between 118 ºC and 196 ºC, and therefore their suitability depends on the fact that
the heating temperature does not exceed their maximum thermal-stable temperature. Finally,
from the cycling stability point of view, it was found that the phase change temperatures and
enthalpies of seven PCMs, benzamide, HDPE, dimethyl terephthalate, adipic acid, potassium
thiocynate, and benzanilide remained almost constant after 100 cycles. Moreover, the previous
PCMs together with phtalic anhydride, hydroquinone, and sebacic acid presented no, or a certain
level, of chemical degradation.
Table 3.3 summarizes the characterization of the sixteen PCMs under study. Hence, results from
this characterization showed that HDPE and adipic acid were the two most suitable PCMs to be
used in an experimental evaluation of the partial load operating conditions.
3.3.2. Contribution of the candidate
Jaume Gasia, Aran Solé and Luisa F. Cabeza conceived and designed the study; Marc Martin
and Camila Barreneche performed the experiments at the laboratory; all co-authors collaborated
on the interpretation of the results and on the preparation of the manuscript, as well as
responding to reviewers queries.

32
3. Partial load operating conditions for thermal energy storage management
3. Partial load operating conditions for thermal energy storage management
3. Partial load operating conditions for thermal energy storage management
3. Partial load operating conditions for thermal energy storage management
3. Partial load operating conditions for thermal energy storage management
3. Partial load operating conditions for thermal energy storage management
3. Partial load operating conditions for thermal energy storage management
3. Partial load operating conditions for thermal energy storage management
3. Partial load operating conditions for thermal energy storage management
3. Partial load operating conditions for
Table 3.3. Summary of the characterization of the sixteen PCM under study.
Material Health
hazard
Cycling stability
(after 100 cycles)
Thermal
stability
Suitable
material
Phase
change
enthalpy
loss (%)
Chemical
degradation
Maximum
thermal-
stable
temperature
Benzoic acid 2 100 ++ 121 No
Benzamide 2 14 ++ 138 No
HDPE 0 12 + 309 Yes
Sebacic acid 1 63 ++ 118 No
Phtalic anhydride 3 6 + 129 No
Maleic acid 3 ** ++ 141 No
Urea 2 ** ++ 148 No
Dimethyl terephthalate 1 2 + 128 No
D-mannitol 1 61 ++ 259 No
Adipic acid 1 7 - 203 Yes
Salycilic acid 2 ** ++ 133 No
Potassium thiocynate 3 13 + 540 No
Hydroquinnone 2 62 ++ 157 No
Benzanilide 1 2*** - 196 No
Dulcitol 1 100 ++ 293 No
2,2-bis(hydroxylmethyl)
propionic acid (DMPA) * ** ++ 190 No
a Chemical degradation: - no degradation, + no remarkable degradation, ++ remarkable degradation / *
NFPA 704 health hazard division (blue) has not been found in the literature. / ** The material does not
show phase change under analysis conditions. / *** The material presents remarkable differences between
solidification and melting temperatures at lab scale
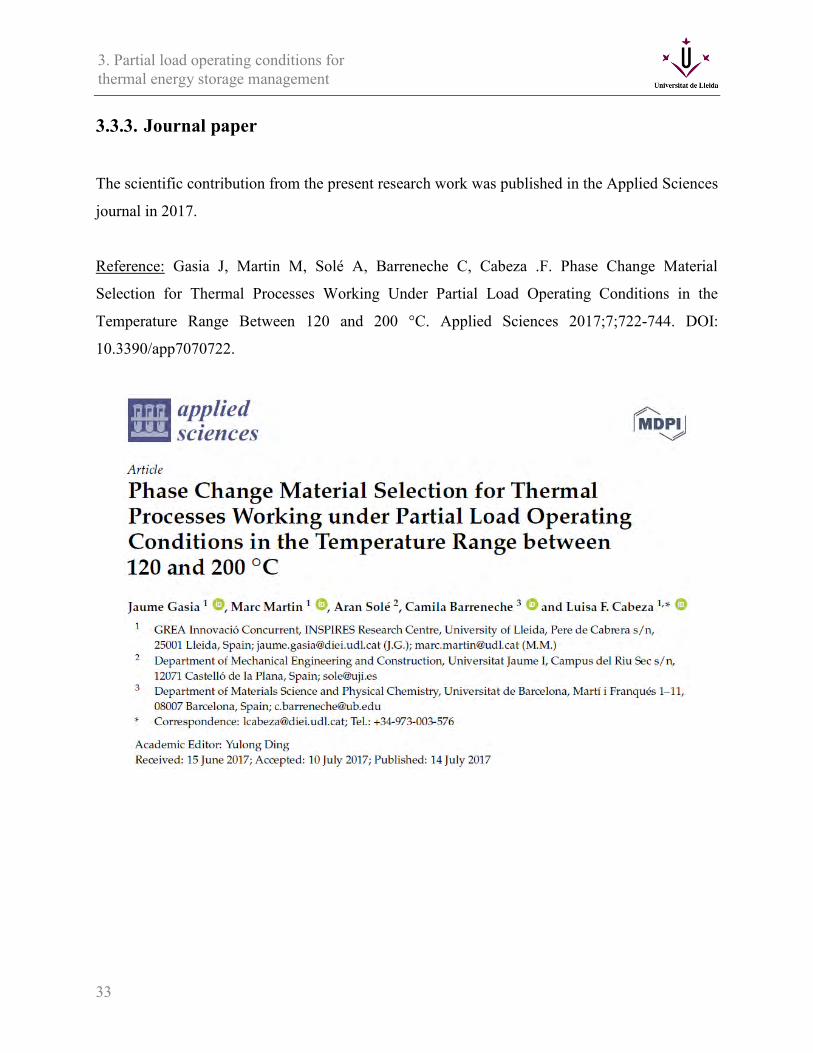
33
3. Partial load operating conditions for thermal energy storage management
3.3.3. Journal paper
The scientific contribution from the present research work was published in the Applied Sciences
journal in 2017.
Reference: Gasia J, Martin M, Solé A, Barreneche C, Cabeza .F. Phase Change Material
Selection for Thermal Processes Working Under Partial Load Operating Conditions in the
Temperature Range Between 120 and 200 °C. Applied Sciences 2017;7;722-744. DOI:
10.3390/app7070722.

34
3. Partial load operating conditions for thermal energy storage management
3. Partial load operating conditions for thermal energy storage management
3. Partial load operating conditions for thermal energy storage management
3. Partial load operating conditions for thermal energy storage management
3. Partial load operating conditions for thermal energy storage management
3. Partial load operating conditions for thermal energy storage management
3. Partial load operating conditions for thermal energy storage management
3. Partial load operating conditions for thermal energy storage management
3. Partial load operating conditions for thermal energy storage management
3. Partial load operating conditions for
3.4. Selected phase change material: High density polyethylene
(HDPE)
Before performing the experimental evaluation of the partial load operating conditions in the
latent heat TES system located at the University of Lleida, the authors selected HDPE as PCM,
after analysing the conclusions from the material selection analysis done in the previous study.
The main reasons were its suitable thermophysical properties and the fact that this PCM
presented a melting range large enough to evaluate the partial load operating conditions. The
most important HDPE results from this analysis are summarized below:
Health hazard
According to the NFPA 704 standard, the health hazard was zero. This value was further
specified with the globally harmonized system (GHS) of classification and labelling of
chemicals, which stated that HDPE was a non-hazardous material.
Thermal stability
The maximum thermal-stable temperature of the HDPE, which is defined as the
temperature needed by the material to lose 1.5 wt.% of its composition, is 309 ºC and its
final degradation temperature, which is defined as the temperature achieved when the
thermal-degradation process is finished, is 540 ºC.
Cycling stability
Thermophysical characterization
The results of the HDPE thermophysical characterization are shown in Table 3.4,
where it can be observed that its phase change temperature experienced
practically no variation, while its phase change enthalpy showed a variation lower
than 13% after 100 cycles.
35
3. Partial load operating conditions for thermal energy storage management
Table 3.4. Evolution of the melting and solidification enthalpies and temperatures of HDPE after
0, 10 and 100 cycles.
Cycles ∆Hfusion
[kJ/kg]
∆Hsolidification
[kJ/kg]
Tfusion
[ºC]
Tsolidification
[ºC]
0 137.78 130.65 126.98 119.93
10 130.42 124.27 127.45 119.35
100 120.59 115.46 126.45 119.38
Chemical characterization
The results of the HDPE chemical characterization are shown in Figure 3.4. It can
be seen that this PCM showed practically no variation after 100 cycles.
Figure 3.4. HDPE Fourier transform infrared (FT-IR) spectroscopy after 0, 10 and 100 cycles.
The material selection study, whose results are presented in the previous section, was performed
with a high quality grade PCM. However, the PCM selected to perform the experimental study at
the pilot plant facility was the commercial HDPE PEAD ALCUDIA 6020L, supplied by
REPSOL [52] with a price, in February 2017, of 1.95 €/kg. It consists of a monomodal
homopolymer with a medium molecular weight, and it is mainly used for the manufacturing, by
extrusion-blowing, of bottles for sterilized and pasteurized milk.

36
3. Partial load operating conditions for thermal energy storage management
3. Partial load operating conditions for thermal energy storage management
3. Partial load operating conditions for thermal energy storage management
3. Partial load operating conditions for thermal energy storage management
3. Partial load operating conditions for thermal energy storage management
3. Partial load operating conditions for thermal energy storage management
3. Partial load operating conditions for thermal energy storage management
3. Partial load operating conditions for thermal energy storage management
3. Partial load operating conditions for thermal energy storage management
3. Partial load operating conditions for
A new study by means of differential scanning calorimetry (DSC) analysis was performed to
thermally characterize the new commercial HDPE. Enthalpy-temperature and specific heat-
temperature curves were obtained following the standard methodology presented in the IEA SHC
Task 42 / ECES Annex 29 [53]. Results from the DSC analyses showed that the melting process
of HDPE takes place between 124 °C and 134 °C, with a peak at 127 °C, and that the
solidification phase change is ranged between 126 ºC and 114 ºC, with a peak at 119 ºC (Figure
3.5). Furthermore, a summary of the main thermophysical properties of commercial HDPE is
shown in Table 3.5.
Figure 3.6 shows the state of the selected PCM after a charging process (melting), and after the
discharging process (solidification). The presence of air bubbles was found during the melting
process due to the release of air that was embedded when the PCM was in solid state. The high
viscosity of the HDPE makes the air to scape at a very low velocity, and therefore, the creation
and visualization of these air bubbles. This behaviour is consistent with the one reported in
Zauner et al. [54]. HDPE presents a density variation of around 18 % between the liquid and the
solid phases. This high variation caused the HTF tubes to be bended (Figure 3.6a) and the
creation of air gaps at the areas where the solid PCM was in contact with the metallic shell of the
TES system (Figure 3.6b)
(a) (b)
Figure 3.5. HDPE results from the DSC analyses [55] following the PCM standard methodology [53]. (a)
HDPE enthalpy-temperature curve; (b) specific heat-temperature curve.

37
3. Partial load operating conditions for thermal energy storage management
(a) (b)
Figure 3.6. Overview of the HDPE inside the storage tank: (a) melted and (b) solidified.
Table 3.5. Summary of the main thermophysical properties of HDPE.
Parameter Value Ref.
Melting temperature Tm 124 – 134 ºC [55]
Solidification temperature Ts 126 – 114 ºC [55]
Melting enthalpy ∆Hm 137.8 kJ/kg [55]
Solidification enthalpy ∆Hs 130.7 kJ/kg [55]
Specific heat Cp @100 ºC 2.4 – 2.8 kJ/kg·K [55-56]
@150 ºC 2.3 – 2.7 kJ/kg·K [55-56]
Density ρ @100 ºC 990 kg/m3 [52]
@150 ºC 786 kg/m3 [55]
Thermal conductivity λ @100 ºC
0.35 – 0.38
W/m·K [54,56]
@150 ºC 0.19 W/m·K [54]
Subcooling ∆Tsub No subcooling was detected [55]

38
3. Partial load operating conditions for thermal energy storage management
3. Partial load operating conditions for thermal energy storage management
3. Partial load operating conditions for thermal energy storage management
3. Partial load operating conditions for thermal energy storage management
3. Partial load operating conditions for thermal energy storage management
3. Partial load operating conditions for thermal energy storage management
3. Partial load operating conditions for thermal energy storage management
3. Partial load operating conditions for thermal energy storage management
3. Partial load operating conditions for thermal energy storage management
3. Partial load operating conditions for
3.5. Paper 4. Use of partial load operating conditions for latent
thermal energy storage management 3.5.1. Contribution to the state-of-the-art
The main contribution to the state-of-the-art is the evaluation and quantification of the effects of
working under partial load operating conditions during the charging process on its consecutive
discharging process. A key performance indicator (KPI) known as ratio of accumulated energy
(RAE) was defined to characterize the percentage of charge. It is calculated based on the amount
of energy accumulated in the PCM at a certain time interval in front of the theoretical maximum
energy that can be stored by the PCM. Five different RAE are studied, 58%, 73%, 83%, 92%,
and 97% (baseline case), with the aim of determining how the reduction of both the charging
process time (advantage) and the energy stored (disadvantage), influence on the discharging
process.
This paper presents the procedure to determine the five values of RAE which were used and
studied in the current study. The procedure consisted of performing a 24-hour charging process
and evaluating the time needed to achieve different percentages of charge. From this process, it
was observed that the time evolution for the first 55% of charge followed a linear profile with an
approximate slope of 0.655 minutes per percentage of RAE, which indicates that a high amount
energy was stored in the TES system as a result of the melting process. During the following
period, which continued up to a value of RAE of 70%, the evolution of time also showed a linear
profile but with a slope of 2.7 times steeper than the previous one, indicating that the time
needed to increase the same percentage of RAE was higher, since a big amount of PCM was
melted or almost melted. Finally, the remaining charging period followed a non-linear profile
because the energy absorbed by the TES system was focused on melting the PCM located in the
corners and on increasing the temperature of the already liquid PCM. Therefore, the authors
selected values of RAE located on the last two periods of charge, which are more likely to occur
in real facilities.

39
3. Partial load operating conditions for thermal energy storage management
Results showed that working under partial load operating conditions reduced the charging
process time. When the TES system was charged at the RAE presented above, a reduction
between 68.8% and 97.2% was observed if compared to the baseline case. In real facilities, this
aspect is beneficial since a higher number of cycles can be performed. However, the energy
accumulated in the TES system for the same RAE was reduced between 5.2% and 40.2%, which
indicates that working under partial load operating conditions has an impact on the discharging
process.
During the evaluation of the discharging process, it was observed that the behaviour of the TES
system was indeed affected by the percentage of charge. From the temperatures point of view,
higher PCM temperatures were observed for the study cases with a higher RAE during the whole
process, no matter where the PCM was located. Moreover, more uniform PCM temperatures
within the TES system were also observed at the beginning of the discharge. The influence of
this uniformity specially affected the PCM located at the corners of the TES system. In the
baseline case, no remarkable effects were observed since the temperature was practically
homogeneous within the whole system. However, for the other study cases, a higher temperature
difference between the main parts and the corners was detected. Moreover, the PCM located in
the corner kept increasing its temperature during the first 90 minutes of discharge, since the
energy transferred from the PCM located at the main part was higher than the energy lost
through the walls.
From the heat transfer point of view, the experimentation presented in this study showed the
same tendency than before and, when the different study cases were compared against the
baseline case, results were observed to be worse. During the first 30 min of discharge, the case
studies RAE 73%, 83%, and 92% presented a variation lower than 10% (Figure 3.7a). During the
following 30 min, only the studies RAE 73% and 83% presented such variation. In addition,
when the PCM energy level during the discharge reached the same value than the PCM energy
available at the beginning of the discharge with RAE 58%, the heat transfer rate showed different
values for the different study cases (Figure 3.7b). This fact also indicates the influence on the

40
3. Partial load operating conditions for thermal energy storage management
3. Partial load operating conditions for thermal energy storage management
3. Partial load operating conditions for thermal energy storage management
3. Partial load operating conditions for thermal energy storage management
3. Partial load operating conditions for thermal energy storage management
3. Partial load operating conditions for thermal energy storage management
3. Partial load operating conditions for thermal energy storage management
3. Partial load operating conditions for thermal energy storage management
3. Partial load operating conditions for thermal energy storage management
3. Partial load operating conditions for
heat transfer rates of the PCM temperature distribution within the TES system during the
discharging process
Therefore, it can be concluded that if the TES system is required to supply thermal energy for a
short period of time, the penalization of working under partial load operating conditions during
the charging process is widely overcame by the charge time reductions.
(a)
(b)
Figure 3.7. (a) 30-min averaged HTF heat transfer rate evolution during the discharging processes; (b)
HTF heat transfer rate evolution during the discharging processes when the PCM accumulated energy
reached RAE 58%. Notice that 0 in the “x” axis means the moment when the different study cases
achieved this value, and not the beginning of the discharging process.
41
3. Partial load operating conditions for thermal energy storage management
3.5.2. Contribution of the candidate
Jaume Gasia, Alvaro de Gracia and Luisa F. Cabeza conceived and designed the study; Jaume
Gasia and Gerard Peiró performed the experimentation at the pilot plant facility; all co-authors
collaborated on the interpretation of the results and on the preparation of the manuscript, as well
as responding to reviewers queries.
3.5.3. Journal paper
The scientific contribution from the present research work was published in the Applied Energy
journal in 2018.
Reference: Gasia J, de Gracia A, Peiró G, Arena S, Cau G, Cabeza L.F. Use of partial load
operating conditions for latent thermal energy storage management. Applied energy
2018;2016;234-242. DOI: 10.1016/j.apenergy.2018.02.061.
42
3. Partial load operating conditions for thermal energy storage management
3. Partial load operating conditions for thermal energy storage management
3. Partial load operating conditions for thermal energy storage management
3. Partial load operating conditions for thermal energy storage management
3. Partial load operating conditions for thermal energy storage management
3. Partial load operating conditions for thermal energy storage management
3. Partial load operating conditions for thermal energy storage management
3. Partial load operating conditions for thermal energy storage management
3. Partial load operating conditions for thermal energy storage management
3. Partial load operating conditions for
3.6. Paper 5. Influence of the storage period between charge and
discharge in a latent heat thermal energy storage system
working under partial load operating conditions 3.6.1. Contribution to the state-of-the-art
The main contribution to the state-of-the-art is the evaluation of the influence of the storage
period (also known as stand-by period) in a latent heat TES system working under partial load
operating conditions during the discharging process. The present work investigated three
different periods of storage (25 min, 60 min, and 120 min) and four partial and full charging
processes (RAE 58%, RAE 73%, RAE 83%, and RAE 97%), which were obtained from the
study presented in Section 3.5. This evaluation was focused not only on the storage period but
also on its subsequent discharging process.
It was found that the behaviour of the latent heat TES system during the storage process
depended largely on the RAE of the previous charging process. When the TES system was
partially charged (RAE 58%, RAE 73%, RAE 83%) the energy level of the PCM located at the
main region at the beginning of the storage period was higher than the PCM located at the central
region and corners. This is due to the low PCM thermal conductivity and the TES system
geometry. Hence, the length of the storage period influenced the level of homogenization and the
variation of the thermal conditions between the end of the charging process and the beginning of
the discharging process (Figure 3.8). On the contrary, when the TES system was fully charged
(RAE 97%), the PCM temperature was almost homogeneous and the heat losses played a more
important role. Therefore, the duration of the storage period mainly influenced the energy lost by
the PCM and the homogenization within the storage tank.
The behaviour of the latent heat TES system during the discharging process was evaluated based
on the temperature and the heat transfer. Results showed that the effect of the duration of the
storage period is practically insignificant and it could only be observed during the first 30 min of

43
3. Partial load operating conditions for thermal energy storage management
discharge (Figure 3.9). The higher influence could be observed when the RAE was intermediate
(RAE 73%), and not that important for lower (RAE 58%) or higher values (RAE 97%).
(a) (b)
(c) (d)
Figure 3.8. PCM temperature evolution during a storage period of 120 min: (a) RAE 58%; (b) RAE 73%;
(c) RAE 83%; (d) RAE 97%.
3.6.2. Contribution of the candidate
All co-authors conceived and designed the study; Jaume Gasia performed the experimentation at
the pilot plant facility; all co-authors collaborated on the interpretation of the results and on the
preparation of the manuscript, as well as responding to reviewers queries.

44
3. Partial load operating conditions for thermal energy storage management
3. Partial load operating conditions for thermal energy storage management
3. Partial load operating conditions for thermal energy storage management
3. Partial load operating conditions for thermal energy storage management
3. Partial load operating conditions for thermal energy storage management
3. Partial load operating conditions for thermal energy storage management
3. Partial load operating conditions for thermal energy storage management
3. Partial load operating conditions for thermal energy storage management
3. Partial load operating conditions for thermal energy storage management
3. Partial load operating conditions for
(a) (b)
(c) (d)
Figure 3.9. Evolution of the HTF heat transfer rate during the discharging processes for different storage
periods (∆tST=25 min, 60 min, and 120 min) and preceded by charging processes at different energy
levels: (a) RAE 58%; (b) RAE 73%; (c) RAE 83%; (d) RAE 97%.
3.6.3. Journal paper
The scientific contribution from the present research work was published in the Applied Energy
journal in 2018.
Reference: Gasia J, de Gracia A, Zsembinszki G, Cabeza LF. Influence of the storage period
between charge and discharge in a latent heat thermal energy storage system working under
partial load operating conditions. Applied Energy;2019;235;1389–1399. DOI:
10.1016/j.apenergy.2018.11.041

45
3. Partial load operating conditions for thermal energy storage management
46
4. Dynamic melting as a heat transfer enhancement technique
Chapter 4
Dynamic melting as a heat transfer enhancement
technique
4.1. Introduction
Current cost-effective PCMs present very low thermal conductivity coefficients, which
significantly reduce the heat transfer to, from, or within these materials [6]. Consequently, this
drawback hinders the technical viability of latent heat TES systems. The scientific community
tried, during the last decades, to increase the heat transfer rates by adding extended surfaces
[57,58] and combining the PCM with materials which have high thermal conductivity values
[59-61]. Despite being effective enhancement techniques, they decrease the energy storage
capacity and the packing factor of the system.
Recent research was conducted on the study of non-invasive heat transfer enhancement
techniques, which can potentially overcome the above-commented disadvantages by moving or
agitating the PCM during the phase change process [62,63]. These enhancement techniques are
divided into four main categories: PCM slurries [64], direct-contact PCM systems [65,66], close-
contact melting [67,68], and dynamic PCM systems [69-73]. PCM slurries are a mixture of an
HTF and microcapsules of PCM. The advantage of this technique is that it allows the avoidance
of intermediate materials, such as metal tubes, which reduces the thermal resistance, and allows

47
4. Dynamic melting as a heat transfer enhancement technique increasing the storage capacity as a result of the specific heat increase associated to the PCM
microcapsules. However, PCM slurries have higher viscosity than the pure HTF, which leads to
an increase of the pump consumption and a decrease of the heat transfer [64]. Direct-contact
systems allow mixing the HTF and the PCM with no need of intermediate materials. This
permits increasing the heat transfer rate of the system and reducing the heat losses. However,
both HTF and PCM must be perfectly selected to ensure a proper phase separation [65,66], lower
pressure losses, and a low volumetric expansion of the PCM during phase change. Close-contact
melting bases its working principle on avoiding the attachment of solid PCM on the cold
surfaces of the TES system and allowing motion of the solid PCM [67,68]. This is done by
creating a thin liquid PCM layer on the wall as a result of setting on it a temperature with a value
higher than the PCM melting temperature. Finally, the working principle of dynamic PCM
systems is the movement or agitation of the PCM during the phase change process with an
external mechanical force [69-73]. Hence, higher heat transfer rates during longer periods, as
well as the avoidance of phase segregation, are the main advantages of this technique, while the
main disadvantage is the increase of the electrical energy consumption required to move or
agitate the PCM.
Dynamic PCM systems developed so far can be divided into four categories: TES systems
associated to ultrasonic vibrations [69], double screw heat exchanger [70], PCM flux concept
[71], and the dynamic melting concept [72,73]. The implementation of ultrasonic vibrations to
the TES system allows enhancing the heat transfer due to the combination of cavitation, acoustic
streaming, and thermally oscillating flow initiated by the ultrasonic vibration. The double screw
heat exchanger consists of a heat exchanger which has an internally helicoidally heat transfer
surface that is continuously rotating and moving the PCM during the phase change. The principle
of the PCM flux concept is a transportation line that moves PCM encapsulated plates parallel to a
heat transfer surface. Finally, the dynamic melting concept consists of recirculating liquid PCM
during the melting process with an external device, which is used to control the PCM flow rate
and the heat transfer rate.

48
4. Dynamic melting as a heat transfer enhancement technique
This last technique, the dynamic melting concept, was the object of study of the this PhD thesis,
continuing the work of Tay et al. [72,73]. The aim of the present work was to investigate and
demonstrate, experimentally and numerically, the benefits of the dynamic melting concept in a
latent heat TES system. Indeed, the TES system thermal behaviour was studied under the
influence of different flow arrangements, different HTF and PCM velocities, and different heat
gains in the PCM recirculation loop, as well as an explanation of the PCM fluid dynamics
behaviour was proposed.
4.2. Working principle of dynamic melting
The working principle of the dynamic melting concept follows the schematic diagram shown in
Figure 4.1. There is a HTF loop, which recirculates the HTF with an external pump, and whose
objective is to absorb, or release, energy from, or to, the PCM. There is also a PCM loop, which
recirculates the liquid PCM with a second external pump with the aim of increasing the
dominance of the convection heat transfer mechanism. These external pumps are used to control
the fluid flow rates and therefore the heat transfer rates between them.
The first stage of the dynamic melting process takes place when the latent heat TES system is
homogeneous at the initial temperature of discharge for low temperature PCMs (T<10 ºC) or at
the initial temperature of charge for mid-high temperature PCMs (T>10 ºC), where the PCM is
fully solidified (Figure 4.1a). At that point, the HTF, at a higher temperature than the PCM
melting temperature, is set to flow through the latent heat TES system releasing energy to the
PCM, which starts to melt (Figure 4.1b). Conduction is the dominant heat transfer mechanism at
the beginning of the process, but as soon as the melting front starts to move away from the heat
transfer surface and the thickness of the PCM liquid layer starts to increase, the heat transfer
switches from pure conduction dominance to a combination of conduction and natural
convection. At some point of the process, the melting front reaches the inlet and outlet of the
PCM loop, which makes the liquid fraction of PCM being able to be recirculated (Figure 4.1c).
Consequently, the PCM recirculation pump is switched on and the liquid PCM is sucked from
one end of the TES system and poured to the other end, situation that depends on the flow

49
4. Dynamic melting as a heat transfer enhancement technique configuration. The liquid PCM recirculation makes forced convection to become the dominant
heat transfer mechanism, which increases the heat transfer rate and reduces the duration of the
process when compared to the same process without the implementation of the dynamic melting
concept (Figure 4.1d).
(a) (b)
(c) (d) Figure 4.1. Schematic diagram of the working principle of the dynamic melting concept, where dark grey
is the solid PCM and light grey is the liquid PCM. (a) to (d) follows the chronological order to completely
melt a PCM. Note that the schematic diagram presented in this figure is set to one of the four possible
HTF/PCM flow configurations.
50
4. Dynamic melting as a heat transfer enhancement technique
4.3. Paper 6: Experimental investigation of the effect of dynamic
melting in a cylindrical shell-and-tube heat exchanger using
water as PCM 4.3.1. Experimental set-up
The experimental evaluation of the dynamic melting enhancement technique was carried out in
an experimental set-up located at the University of South Australia using water as PCM and a
potassium formate/water solution as HTF.
Figure 4.2 shows the schematic diagrams and actual setup of the experimental facility. It was
mainly composed of (1) a 400 l cold HTF tank coupled to a refrigeration unit; (2) a 25 l hot HTF
tank coupled to an electrical heater and a temperature controller; (3) two Keg King MK II
magnetic drive pumps, responsible for the recirculation of the HTF and the liquid PCM; (4) two
three-way valves, which were basically used to switch between the charging and discharging
process; (5) two pin valves, which were used to adjust the flow rates of the HTF and the PCM;
(6) a data acquisition unit connected to a personal computer which acquires and records the data
at time intervals of 5 s for further processing; and finally, (7) an HTF-PCM heat exchanger. The
heat exchanger was based on the shell-and-tube concept, with the HTF vertically flowing
through the inner stainless steel tube, and with the PCM placed in the annulus between the inner
stainless steel tube and the outer polycarbonate tube. A detailed view showing the different
components of the heat exchanger which characterizes the dynamic melting concept can be seen
in Figure 4.3.
Five four-wire resistance temperature detectors (RTDs) with an error of ±0.1 ºC were placed
inside the PCM at axial distances of 115 mm, 246 mm, 486 mm, 726 mm, and 861 mm from the
bottom of the heat exchanger and at radial distances of 17.7 mm and 40 mm (Figure 4.4). Four
more RTDs were placed at the inlet and outlet of both the HTF and the PCM recirculation loop
to obtain accurate temperature measurements of the HTF and the liquid PCM during the dynamic
melting process.

51
4. Dynamic melting as a heat transfer enhancement technique
(a)
(b) Figure 4.2. (a) Schematic view and (b) real view of the experimental set-up used to perform the
experimental study.
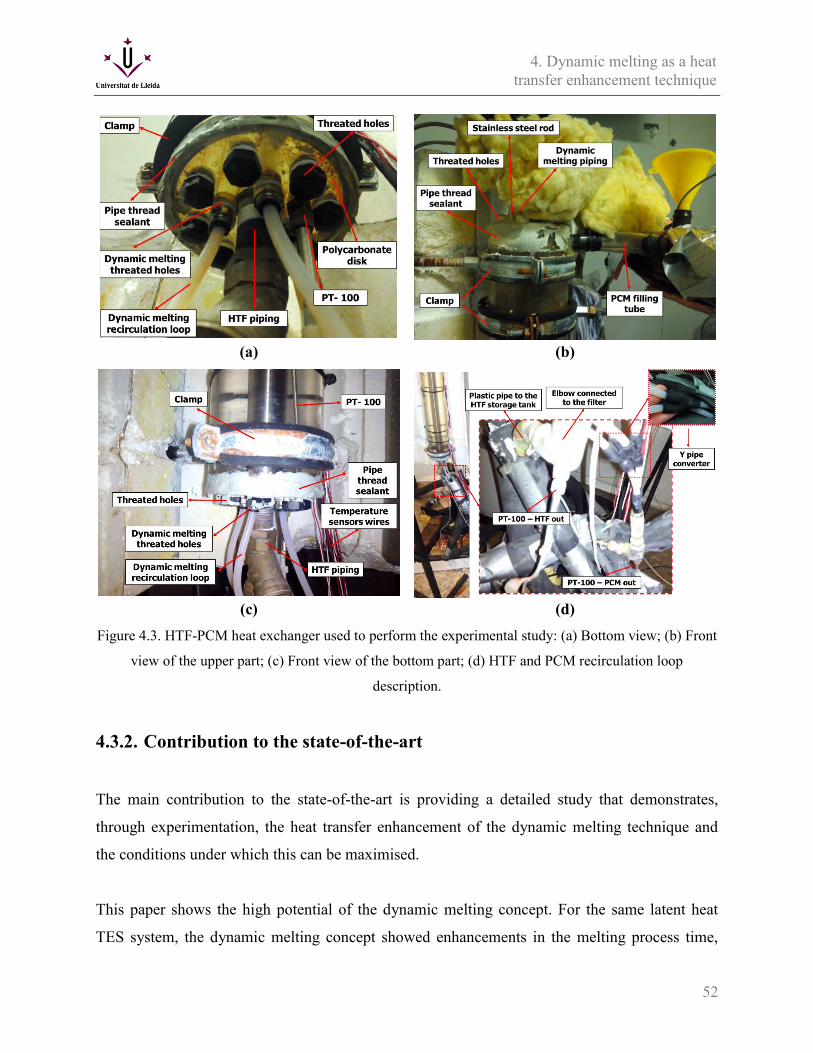
52
4. Dynamic melting as a heat transfer enhancement technique
(a) (b)
(c) (d) Figure 4.3. HTF-PCM heat exchanger used to perform the experimental study: (a) Bottom view; (b) Front
view of the upper part; (c) Front view of the bottom part; (d) HTF and PCM recirculation loop
description.
4.3.2. Contribution to the state-of-the-art
The main contribution to the state-of-the-art is providing a detailed study that demonstrates,
through experimentation, the heat transfer enhancement of the dynamic melting technique and
the conditions under which this can be maximised.
This paper shows the high potential of the dynamic melting concept. For the same latent heat
TES system, the dynamic melting concept showed enhancements in the melting process time,
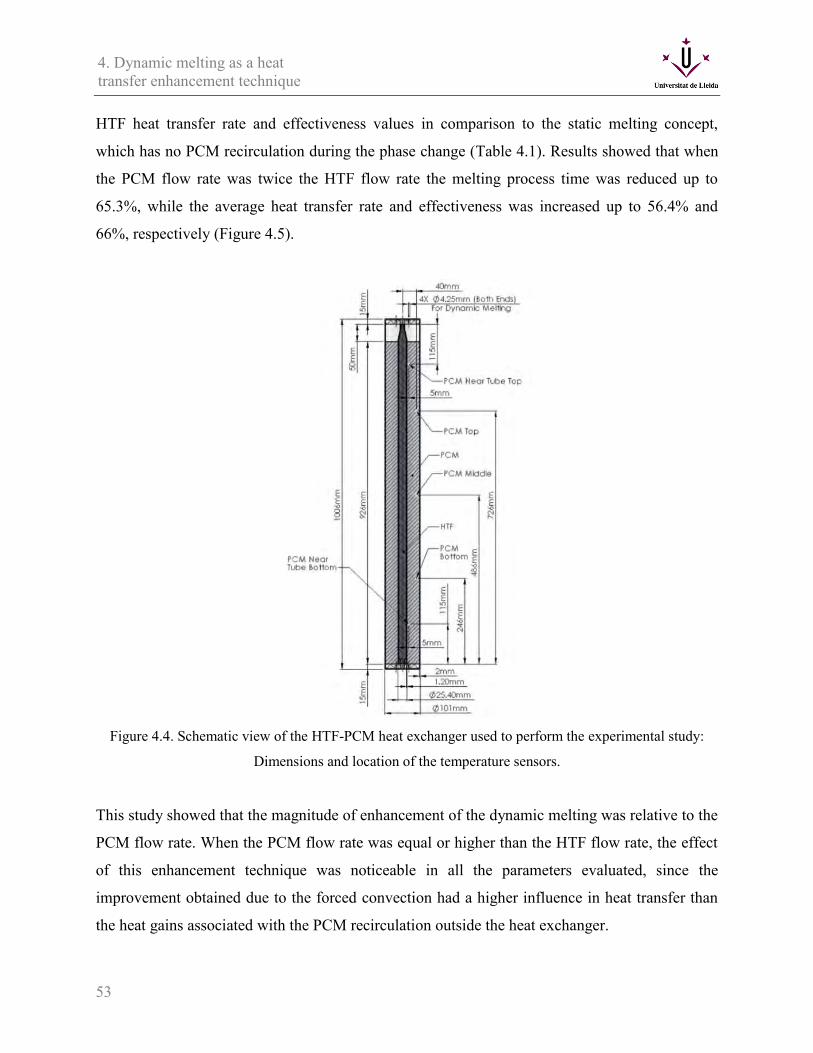
53
4. Dynamic melting as a heat transfer enhancement technique HTF heat transfer rate and effectiveness values in comparison to the static melting concept,
which has no PCM recirculation during the phase change (Table 4.1). Results showed that when
the PCM flow rate was twice the HTF flow rate the melting process time was reduced up to
65.3%, while the average heat transfer rate and effectiveness was increased up to 56.4% and
66%, respectively (Figure 4.5).
Figure 4.4. Schematic view of the HTF-PCM heat exchanger used to perform the experimental study:
Dimensions and location of the temperature sensors.
This study showed that the magnitude of enhancement of the dynamic melting was relative to the
PCM flow rate. When the PCM flow rate was equal or higher than the HTF flow rate, the effect
of this enhancement technique was noticeable in all the parameters evaluated, since the
improvement obtained due to the forced convection had a higher influence in heat transfer than
the heat gains associated with the PCM recirculation outside the heat exchanger.

54
4. Dynamic melting as a heat transfer enhancement technique
Moreover, it was found that during the phase change process, the profiles of the PCM
temperatures (stratification) depended on the PCM flow rate, as a result of an equilibrium
between the buoyancy forces and the induced forced convection.
Finally, the heat gains due to the recirculation of the liquid PCM outside the heat exchanger
played an important role on the enhancements since they increased the average temperature of
the PCM, reducing the energy that could be recovered from the system, the heat transfer rates
and the effectiveness. Hence, if the heat gains were reduced, the enhancement would be higher,
as the HTF would be the only heat source supplied to the PCM.
Table 4.1. Summary of the main results obtained in the experimental study.
PCM
flow rate
Change in melting
process time
Average
QHTF
Change in average
effectiveness
0 - - -
0.5 l/min 47.4 % 18.5 % -4.5 %
1 l/min 47.8 % 26.3 % 24.7 %
2 l/min 65.3 % 66.0 % 56.4 %
(a) (b) Figure 4.5. Evolution of the (a) local effectiveness and (b) HTF heat transfer rate during the discharging
process for an HTF flow rate of 1 l/min with and without the influence of the dynamic melting.

55
4. Dynamic melting as a heat transfer enhancement technique
4.3.3. Contribution of the candidate
Jaume Gasia, Steven Tay, Martin Belusko, and Frank Bruno conceived and designed the study.
Jaume Gasia performed the experimentation, data treatment, and analysis of the tests; all co-
authors collaborated in the interpretation of the results and in the preparation of the manuscript
as well as during the reviewers queries.
4.3.4. Journal paper
The scientific contribution from the present research study was published in the journal Applied
Energy in 2017.
Reference: Gasia J, Tay NHS, Belusko M, Cabeza LF, Bruno F. Experimental investigation of
the effect of dynamic melting in a cylindrical shell-and-tube heat exchanger using water as PCM.
Applied Energy 2017;185:136–145. DOI: 10.1016/j.apenergy.2016.10.042

56
4. Dynamic melting as a heat transfer enhancement technique
4.4. Paper 7: Numerical study of dynamic melting enhancement in
a latent heat thermal energy storage system 4.4.1. Numerical model
The numerical evaluation of the dynamic melting enhancement technique was carried out at
Dalhousie University. A finite element model using COMSOL Multiphysics was used. It
consisted of a two-dimensional Cartesian geometry that represented an HTF duct, an
intermediate wall, and the PCM enclosure (Figure 4.6). All three domains have a height of 100
mm. The HTF duct has a width of 9 mm, the intermediate wall has a width of 1 mm, and the
PCM enclosure has a width of 30 mm. In this enclosure, two small ducts of 2 mm width are
attached to the HTF intermediate wall to simulate the inlet and outlet of the PCM recirculation
loop during the dynamic melting process.
Figure 4.6. Two-dimensional Cartesian model used to carry out the numerical investigation of the
dynamic melting enhancement technique.
The thermophysical properties of the HTF (potassium formate and water solution), intermediate
wall (stainless steel), and PCM (water) implemented in the numerical model were obtained from

57
4. Dynamic melting as a heat transfer enhancement technique the experimental study detailed in Section 4.3. The thermal and fluid dynamics behaviour of the
HTF and the PCM were simulated through the Navier-Stokes equations. The PCM was treated as
a liquid regardless whether it was in a liquid or solid state, and some extra functions were added
to avoid material movement when it was below its melting temperature using the heat capacity-
porosity method [74]. Finally, the heat transfer through the intermediate wall was simulated
considering only conduction in solid domains.
A mesh convergence study was carried out to determine the element size required for a mesh
independent solution [75]. This step is important since the accuracy of the results obtained in any
simulation is strongly related to the mesh size. The aim of this study was ensuring that the error
associated to the selected mesh was within an accepted tolerance level. In the present study, the
tolerance was set to be 10% in the melting fraction as compared to the extremely fine mesh
study. The PhD candidate would like to clarify that the objective of this study was not to find the
most accurate results, since there is no experimental result to be validated, but it is meant to
evaluate the influence of different parameters of the dynamic melting concept following the
work presented in Section 4.3.
Nine different configurations were considered based on the predefined physics-controlled mesh
types provided by COMSOL as shown in Table 4.2. For this study, the HTF inlet velocity of
0.05 m/s was used with no PCM recirculation. Figure 4.7 shows the results of the melting
fraction obtained during the first 2.5 hours of simulation. The reduction of the mesh size
increases the number of elements in the PCM domain, thus reducing the melting speed (slower
increase of the melting fraction). As observed by Kabbara et al. [74], the mesh size plays an
insignificant role in the earlier stages of the simulation because of the dominance of the
conduction heat transfer mechanism. However, as soon as convection starts, the mesh size
significantly influences the behaviour of the system. In larger mesh size configurations,
unphysical oscillations of temperatures are normally simulated inaccurately. As the mesh size
decreases, the temperature behaviour is smoother, and the local phase change appears at a
temperature much closer to the actual melting temperature of the PCM.
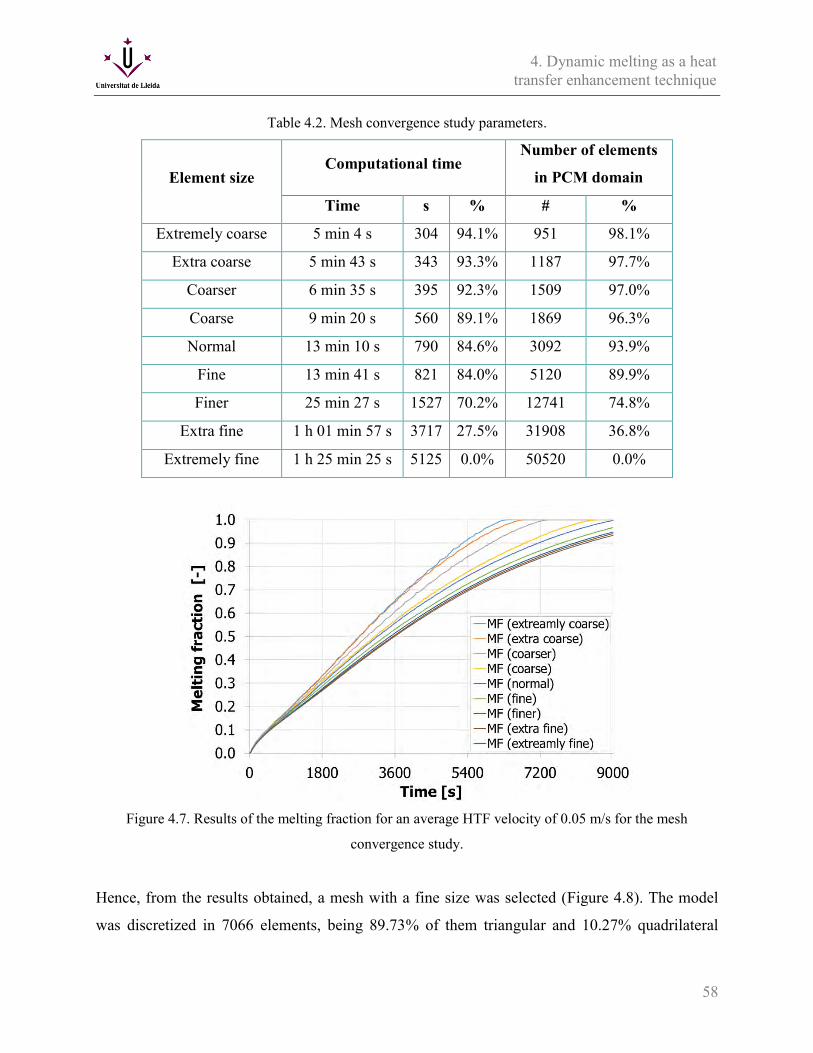
58
4. Dynamic melting as a heat transfer enhancement technique
Table 4.2. Mesh convergence study parameters.
Element size Computational time
Number of elements
in PCM domain
Time s % # %
Extremely coarse 5 min 4 s 304 94.1% 951 98.1%
Extra coarse 5 min 43 s 343 93.3% 1187 97.7%
Coarser 6 min 35 s 395 92.3% 1509 97.0%
Coarse 9 min 20 s 560 89.1% 1869 96.3%
Normal 13 min 10 s 790 84.6% 3092 93.9%
Fine 13 min 41 s 821 84.0% 5120 89.9%
Finer 25 min 27 s 1527 70.2% 12741 74.8%
Extra fine 1 h 01 min 57 s 3717 27.5% 31908 36.8%
Extremely fine 1 h 25 min 25 s 5125 0.0% 50520 0.0%
Figure 4.7. Results of the melting fraction for an average HTF velocity of 0.05 m/s for the mesh
convergence study.
Hence, from the results obtained, a mesh with a fine size was selected (Figure 4.8). The model
was discretized in 7066 elements, being 89.73% of them triangular and 10.27% quadrilateral
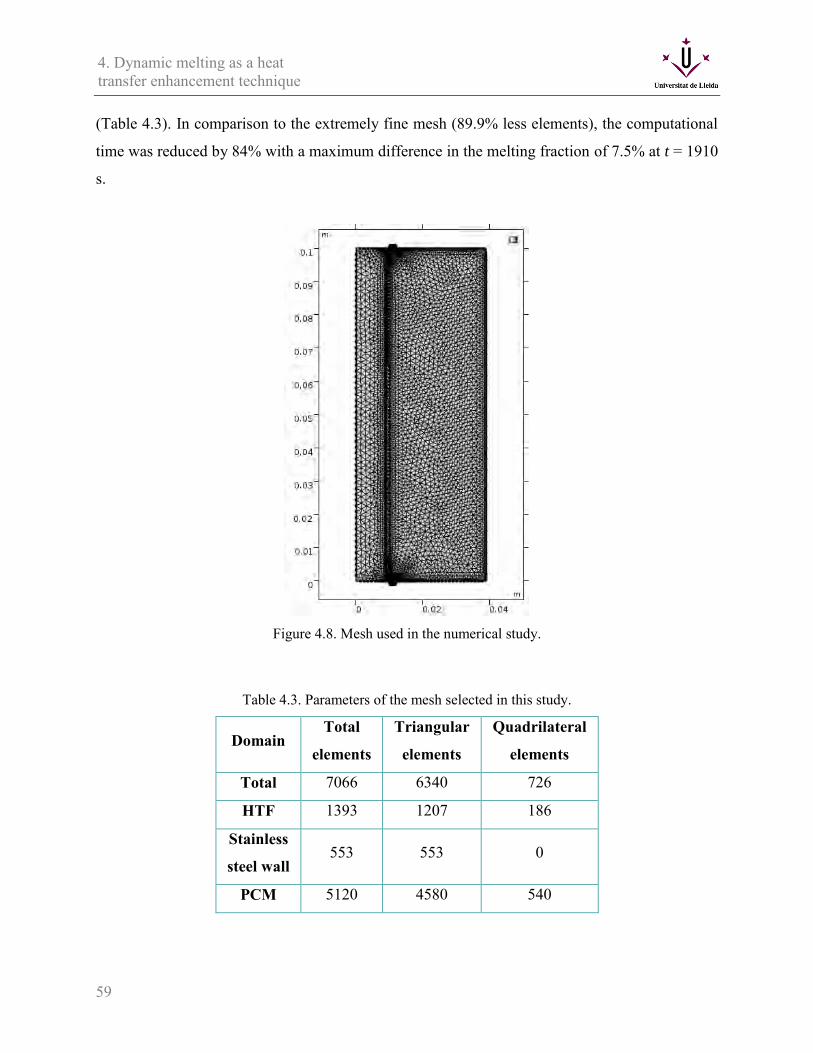
59
4. Dynamic melting as a heat transfer enhancement technique (Table 4.3). In comparison to the extremely fine mesh (89.9% less elements), the computational
time was reduced by 84% with a maximum difference in the melting fraction of 7.5% at t = 1910
s.
Figure 4.8. Mesh used in the numerical study.
Table 4.3. Parameters of the mesh selected in this study.
Domain Total
elements
Triangular
elements
Quadrilateral
elements
Total 7066 6340 726
HTF 1393 1207 186
Stainless
steel wall 553 553 0
PCM 5120 4580 540

60
4. Dynamic melting as a heat transfer enhancement technique
4.4.2. Contribution to the state-of-the-art
The main contribution to the state-of-the-art is providing a detailed study that demonstrates,
through numerical simulations, the heat transfer enhancement of the dynamic melting concept in
a latent heat TES system, and the conditions under which this technique can be maximised.
Fourteen case studies were studied, with the HTF flowing from top to bottom, to evaluate the
effect of the PCM flow direction, the heat gains in the PCM recirculation loop, and the PCM and
HTF inlet velocities.
The main results of the research carried out in the present work are summarized in Table 4.4.
Identically to the work carried out in the experimental study, the dynamic melting enhancement
technique in the numerical model showed dramatic enhancements in comparison to the case with
static melting.
The study of the PCM flow direction showed that higher heat transfer rates and shorter PCM
melting processes were obtained when the PCM was recirculated from top to bottom (parallel to
the HTF flow) instead of being recirculated from bottom to top. One reason is the irregular shape
of the melting front when the PCM recirculation is activated (wider on the top and thicker on the
bottom). The second reason is the temperature difference between the PCM and the HTF. Hence,
the PCM flow direction influenced on the PCM pressure gradients, fluid streamlines, and
temperature gradients generated in the PCM enclosure, and therefore on the heat transfer rates.
The study of the influence of the PCM velocities showed that higher heat transfer rates and
shorter PCM melting processes were obtained when the PCM was recirculated at higher
velocities. Since the PCM fluid flow was laminar, and thus the heat transfer coefficient was
considered to be constant, the enhancements were mainly due to the temperature gradients
between the HTF and the PCM. At higher PCM velocities, lower PCM temperature variations
between the inlet and the outlet of the PCM recirculation loop were observed. Hence, the
temperature difference between HTF and PCM remained higher, which enhanced the heat
transfer rates and the melting process period. Furthermore, the present work helped to detect two
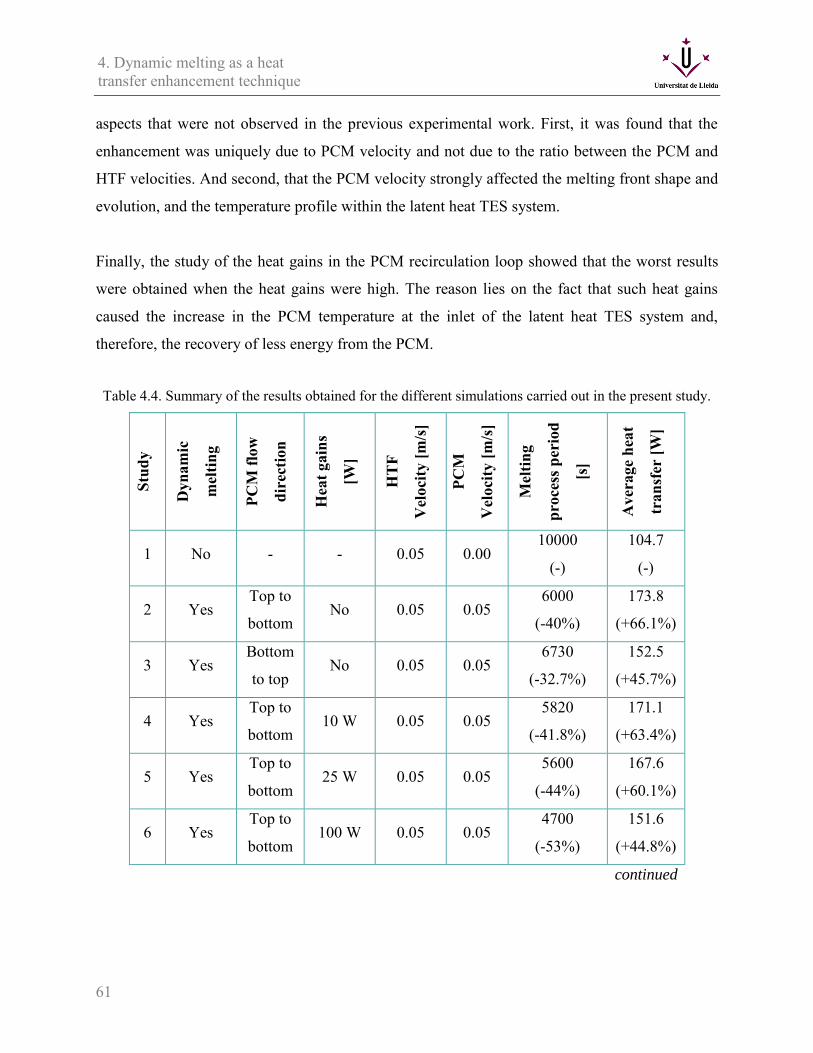
61
4. Dynamic melting as a heat transfer enhancement technique aspects that were not observed in the previous experimental work. First, it was found that the
enhancement was uniquely due to PCM velocity and not due to the ratio between the PCM and
HTF velocities. And second, that the PCM velocity strongly affected the melting front shape and
evolution, and the temperature profile within the latent heat TES system.
Finally, the study of the heat gains in the PCM recirculation loop showed that the worst results
were obtained when the heat gains were high. The reason lies on the fact that such heat gains
caused the increase in the PCM temperature at the inlet of the latent heat TES system and,
therefore, the recovery of less energy from the PCM.
Table 4.4. Summary of the results obtained for the different simulations carried out in the present study.
Stud
y
Dyn
amic
mel
ting
PCM
flow
dire
ctio
n
Hea
t gai
ns
[W]
HT
F
Vel
ocity
[m/s
]
PCM
Vel
ocity
[m/s
]
Mel
ting
proc
ess p
erio
d
[s]
Ave
rage
hea
t
tran
sfer
[W]
1 No - - 0.05 0.00 10000
(-)
104.7
(-)
2 Yes Top to
bottom No 0.05 0.05
6000
(-40%)
173.8
(+66.1%)
3 Yes Bottom
to top No 0.05 0.05
6730
(-32.7%)
152.5
(+45.7%)
4 Yes Top to
bottom 10 W 0.05 0.05
5820
(-41.8%)
171.1
(+63.4%)
5 Yes Top to
bottom 25 W 0.05 0.05
5600
(-44%)
167.6
(+60.1%)
6 Yes Top to
bottom 100 W 0.05 0.05
4700
(-53%)
151.6
(+44.8%)
continued

62
4. Dynamic melting as a heat transfer enhancement technique
Table 4.4. Summary of the results obtained for the different simulations carried out in the present study.
(Continued) St
udy
Dyn
amic
mel
ting
PCM
flow
dire
ctio
n
Hea
t gai
ns
[W]
HT
F
Vel
ocity
[m/s
]
PCM
Vel
ocity
[m/s
]
Mel
ting
proc
ess p
erio
d
[s]
Ave
rage
hea
t
tran
sfer
[W]
7 Yes Top to
bottom No 0.05 0.025
6910
(-30.9%)
150
(+43.3%)
8 Yes Top to
bottom No 0.05 0.10
5120
(-48.8%)
200.3
(+91.3%)
9 Yes Top to
bottom No 0.05 0.20
4560
(-54.4%)
220.7
(+110.8
%)
10 No - - 0.025 0.00 10800
(-)
96.4
(-)
11 Yes Top to
bottom No 0.025 0.0125
7940
(-26.6%)
129.5
(+34.3%)
12 Yes Top to
bottom No 0.025 0.025
7300
(-32.4%)
140.5
(+45.7%)
13 Yes Top to
bottom No 0.025 0.05
6310
(-41.6%)
163.3
(+69.4%)
14 Yes Top to
bottom No 0.025 0.10
5530
(-48.8%)
184.1
(+91.0%)
4.4.3. Contribution of the candidate
Jaume Gasia and Dominic Groulx conceived and designed the study. Jaume Gasia performed the
simulations, data treatment, and analysis of the results; all co-authors collaborated in the
interpretation of the results and in the preparation of the manuscript.
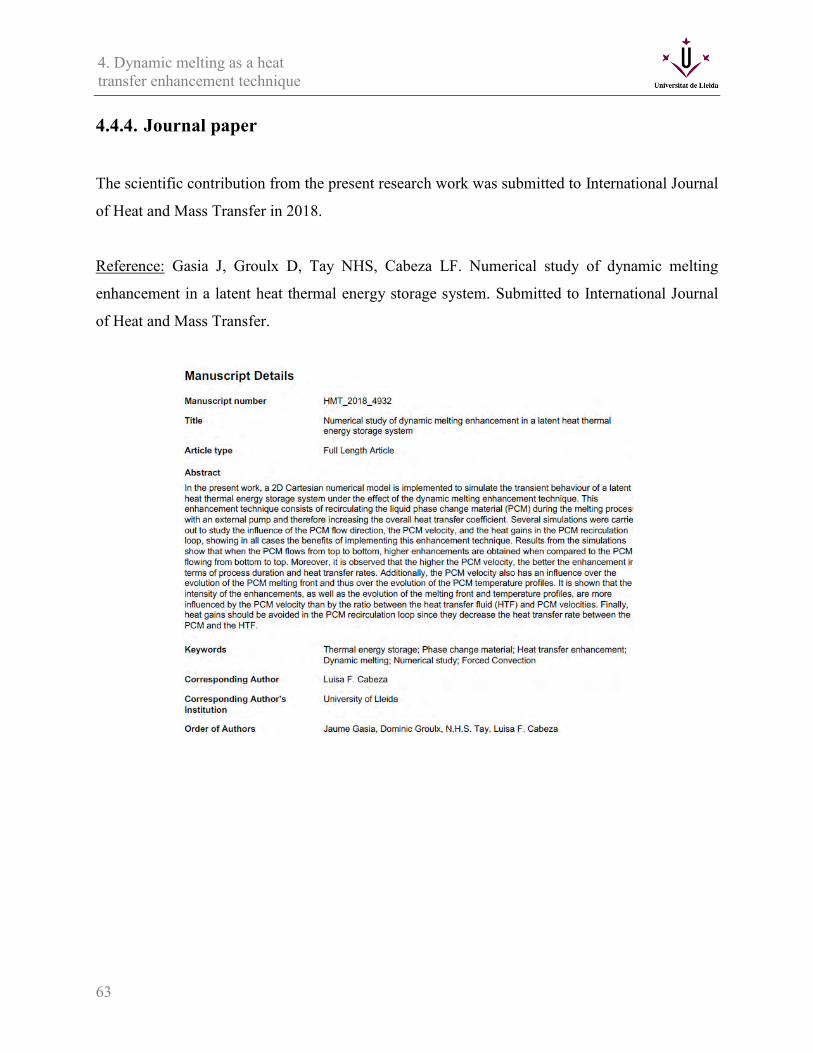
63
4. Dynamic melting as a heat transfer enhancement technique
4.4.4. Journal paper
The scientific contribution from the present research work was submitted to International Journal
of Heat and Mass Transfer in 2018.
Reference: Gasia J, Groulx D, Tay NHS, Cabeza LF. Numerical study of dynamic melting
enhancement in a latent heat thermal energy storage system. Submitted to International Journal
of Heat and Mass Transfer.

64
5. Conclusions and future work
Chapter 5
Conclusions and future work
5.1. Conclusions
This PhD thesis contributed to broaden the knowledge of two of the technological requirements
that any latent heat TES systems should fulfil to be a competitive technology. A good operational
strategy can be achieved by integrating the TES system into the energy processes through
adapting it to limiting operational factors. This first area of research was investigated by means
of analysing the effects of the partial load operating conditions on the charging and discharging
processes. The other technological requirement studied in this PhD thesis was the maximization
of the heat transfer between the HTF and the TES. This second area of research was focused on
the analysis of the dynamic melting.
The main accomplishments of this PhD are shown below:
A complete review of the literature which studied the seven main requirements of
sensible and latent TES materials and systems (chemical, kinetic, physical, thermal,
economic, environmental, and technological) was performed.
An experimental analysis on the effects of the partial load operating conditions combined
with different storage periods on the behaviour of a latent heat TES system was carried
out.

65
5. Conclusions and future work
A numerical and experimental analysis on the dynamic melting heat transfer
enhancement technique in a latent heat TES system. Identification of the parameters
which have a higher impact on its behaviour was also conducted.
The state-of-the-art of the main requirements that any sensible and latent heat TES material and
system should fulfil for an optimum performance was presented in two publications (Papers 1
and 2). The main conclusions drawn from this literature review are:
There is a lack of data in analysing TES from both the system and material points of
view, since the previous studies only focus on single requirements.
More than 200 studies were reviewed, however comparison between studies was difficult
due to the lack of standards and performance indicators which homogenise the main
parameters in TES applications.
Most of the studies focused on the thermal requirements, which mainly dealt with the
enhancement of the thermal conductivity and specific heat of the TES material.
Technological requirements, including the integration of the TES material into the
facility, the operation strategy of the facilities, and the good heat transfer between the
HTF and the TES material, are not usually considered in the literature. However, these
requirements are known to have an important impact in the design and the economics of
the TES systems.
No study regarding the TES material integration into the facility and the operation
strategy of the facilities was found.
The analysis of the effects of the partial load operating conditions combined with different
storage periods on the behaviour of a latent heat TES produced three publications (Papers 3, 4,
and 5). Paper 3 presents the results of the material selection performed to determine the suitable
PCM to be used in the experimental evaluation of the partial load operating conditions, while
Paper 4 and Paper 5 present the experimental evaluation of the partial load operating conditions
in a latent heat TES system. The main findings arisen from this study can be summarized as
follows:

66
5. Conclusions and future work
Sixteen different PCMs with phase change temperatures range between 120 and 200 °C
were evaluated from the thermal and cycling stability, as well as from the health hazard
point of view. Among the different PCM, high density polyethylene (HDPE) and adipic
acid showed the most suitable behaviour.
HDPE was finally selected because of its suitable thermophysical properties and because
it presented a melting range large enough to evaluate the partial load operating
conditions.
A key performance indicator (KPI) known as ratio of accumulated energy (RAE) was
defined to characterize the percentage of charge. Five different RAE were studied: RAE
58%, RAE 73%, RAE 83%, RAE 92%, and RAE 97% (baseline case).
The present work also investigated the influence of three different periods of storage: 25
min, 60 min, and 120 min.
Working under partial load operating conditions allowed reducing the charging process
time if compared to the baseline case, which is beneficial for the thermal process
associated to the TES system. However, it also reduced the energy accumulated during
the charging process if compared to the baseline case, which is a drawback for the
thermal process coupled to the TES system.
The behaviour of the latent heat TES system during the storage and discharging processes
depended largely on the RAE of the previous charging process.
The length of the storage period influenced the level of homogenization and the variation
of the thermal conditions between the end of the charging process and the beginning of
the discharging process. However, the effect of the duration of the storage period (up to
120 min) practically does not modify the heat transfer rates if compared with the
minimum storage period.
For a specific storage period, more uniform PCM temperatures within the TES system
were observed at the beginning of the discharge in the study cases with a higher RAE.
Moreover, higher PCM temperatures during the whole discharge process were also
observed in the study cases with a higher RAE. The influence of this uniformity specially
affected the PCM located at the corners of the TES system.
67
5. Conclusions and future work
If the TES system is required to supply thermal energy for a short period of time (up to
30 min), the penalization of working under partial load operating conditions during the
charging process is widely overcome by the charge time reduction.
Finally, regarding the analysis of the dynamic melting concept in a latent heat TES system
showed that the work presented in this PhD thesis increased the knowledge in the field of PCM
dynamic systems. Experimental (Paper 6) and numerical (Paper 7) studies were performed. The
main conclusions of this research are listed below:
Dynamic melting was proven to be a successful heat transfer enhancement technique
between the HTF and the PCM in comparison with the static melting concept. For the
same TES system, dynamic melting has showed enhancements in the melting process
period, HTF heat transfer rate, and effectiveness.
The degree of improvement of dynamic melting is influenced by the flow direction
and velocity of the liquid PCM, and the heat gains in the PCM recirculation loop.
The temperature distribution of the PCM inside the TES system was found to depend
on the PCM flow rates and PCM flow directions.
For low-temperature TES systems, heat gains due to the recirculation of the liquid
PCM outside the TES system played an important role in the enhancement, since they
increase the average temperature of the PCM. Hence, if heat gains are reduced, the
enhancement is higher, as the HTF is the only heat source supplied to the PCM.
5.2. Future work
The research presented in this PhD thesis provides important information to increase the knowledge
in the field of technological requirements for TES systems. Although much work has been conducted
in the two main areas of research proposed which have produced many outcomes as stated in this
PhD thesis, further work is needed to be able to fully explore this research. Hence, this section aims
at presenting different recommendations for future works on the topics on partial load operating
conditions for thermal energy storage management and dynamic melting as a heat transfer
enhancement technique.

68
5. Conclusions and future work
5.2.1. Partial load operating conditions for thermal energy storage
management
Most of the PCMs available to be tested present hysteresis and therefore, different enthalpy-
temperature curves for the heating (melting) and cooling (solidification) processes are observed.
However, there is a lack of agreement on how to treat the transition between heating and cooling
when these processes are interrupted as a result of the partial load operating conditions where the
PCM has not fully undergone phase change. Thus, a numerical study validated with experimental
results can be conducted to define the methodology for such transition.
In the experimentation presented in this PhD thesis, storage periods of up to 120 min were studied.
Hence, a study evaluating longer storage periods will help to determine their influence on the
discharging process.
5.2.2. Dynamic melting as a heat transfer enhancement technique
The experimental and numerical studies in the present thesis showcase the potential of this heat
transfer enhancement technique by increasing the heat transfer rate and reducing the duration of
the melting process. However, only water was tested as PCM and only under a vertical
configuration. Therefore, the study of this technique in TES systems under a horizontal
configuration would increase the knowledge of this field. Moreover, the use of other PCMs with
a higher melting temperature will help in the analysis on the influence of heat losses on mid
high-temperature TES systems. The different thermophysical properties of the PCMs should also
be evaluated to determine whether it affects the degree of enhancement.
The overall performance of the TES system can be better evaluated and optimized if a thermal
control system, which monitors the flow rate according to the energy supply, the storage state,
and the energy demand is utilised.

69
Other research activities
Other research activities
Other journal publications
The PhD candidate carried out other scientific research besides the one presented in this thesis
during the execution of his PhD. The resulting publications are listed below:
1. Romaní J, Gasia J, Solé A, Taksu H, Cabeza LF, Kato Y. Evaluation of energy density as
performance indicator for thermal energy storage at material and system levels. Applied
Energy 2019;235;954-962.
2. Gibb D, Johnson M, Romaní J, Gasia J, Cabeza LF, Seitz A. Process integration of thermal
energy storage systems – Evaluation methodology and case studies. Applied Energy
2018;230;750-760.
3. Arena S, Casti E, Gasia J, Cabeza LF, Cau G. Numerical analysis of a latent heat thermal
energy storage system under partial load operating conditions. Renewable Energy. In Press.
4. Peiró G, Prieto C, Gasia J, Jové A, Miró L, Cabeza LF. Two-tank molten salts thermal
energy storage system for solar power plants at pilot plant scale: Lessons learnt and
recommendations for its design, start-up and operation. Renewable Energy 2018;121;236-
248.
5. Gasia J, Diriken J, Bourke M, Van Bael J, Cabeza LF. Comparative study of the thermal
performance of four different shell-and-tube heat exchangers used as latent heat thermal
energy storage systems. Renewable Energy 2017;114;934-944.
6. Peiró G, Gasia J, Miró L, Prieto C, Cabeza LF. Influence of the heat transfer fluid in a CSP
plant molten salts charging process. Renewable Energy 2017;113;148-158.
70
Other research activities
7. Miró L, Gasia J, Cabeza LF. Thermal energy storage (TES) for industrial waste heat (IWH)
recovery: A review. Applied Energy 2016;179;284-301.
8. Gasia J, Miró L, de Gracia A, Barreneche C, Cabeza LF. Experimental evaluation of a
paraffin as phase change material for thermal energy storage in laboratory equipment and in a
shell-and-tube heat exchanger. Applied Sciences 2016;6(4);112. DOI: 10.3390/app6040112
9. Peiró G, Gasia J, Miró, L, Prieto C, Cabeza LF. Experimental analysis of charging and
discharging processes, with parallel and counter flow arrangements, in a molten salts high
temperature pilot plant scale setup. Applied Energy 2016;178;394-403.
10. Peiró G, Gasia J, Miró L, Cabeza LF. Experimental evaluation at pilot plant scale of
multiple PCMs (cascaded) vs. single PCM configuration for thermal energy storage.
Renewable Energy 2015;83;729-736.
11. Gasia J, Gutierrez A, Peiró G, Miró L, Grageda M, Ushak S, Cabeza LF. Thermal
performance evaluation of bischofite at pilot plant scale. Applied Energy 2015;155;826-833.
Contributions to international conferences
The PhD candidate contributed to some international conferences:
1. Romaní J, Gasia J, Kato Y, Cabeza LF. Energy density as a key performance indicator for
thermal energy storage systems: From material to system level. ENERSTOCK 2018 - The
14th International Conference on Energy Storage, Adana (Turkey).
2. Gasia J, Peiró G, de Gracia A, Cabeza LF. Influence of intermittency of the energy supply
on the discharging process of TES systems. An experimental study. ENERSTOCK 2018 -
The 14th International Conference on Energy Storage, Adana (Turkey).
3. Arena S, Casti E, Gasia J, Cabeza LF, Cau G. Numerical simulation of a finned-tube LHTES
system: Influence of the mushy zone constant on the phase change behaviour. ATI 2017 -
72nd Conference of the Italian Thermal Machines Engineering Association, Lecce (Italy)
4. Gasia J, Martin M, Solé A, de Gracia A, Arena S, Cabeza LF. Partial loads as thermal
energy storage enhancement strategy. CNIT 2017 - 10 Congreso Internacional de Ingeniería
Temodinámica, Lleida (Spain).

71
Other research activities 5. Peiró G, Gasia J, Miró L, Prieto C, Cabeza LF. Experimental comparison between two
different HTF operating in a Two-tank molten salts plate heat exchanger charging process.
CNIT 2017 - 10 Congreso Internacional de Ingeniería Temodinámica, Lleida (Spain).
6. Gasia J, Miró L, Peiró G, Prieto C, Cabeza LF. Use of pilot plant scale facilities as key
factor for an optimal design and operation of commercial CSP plants with TES systems.
IRES 2017 - 11th International Renewable Energy Storage Conference, Düsseldorf
(Germany).
7. Peiró G, Gasia J, Miró L, Prieto C, Cabeza LF. Importance of thermal energy storage pilot
plant facilities for solar energy applications. EuroSun 2016 - International Conference of
Solar Energy and Buldings, Palma de Mallorca (Spain).
8. Cabeza LF, Prieto C, Miró L, Gasia J, Peiró G. Design and start-up of two pilot plants for
molten salts storage testing. ASME 2016 - 10th International Conference on Energy
Sustainability, Charlotte (United States of America).
9. Gasia J, Diriken J, Bourke M, Van Bael J, Cabeza LF. MERITS project: a comparative study
of shell-and-tube heat exchangers for domestic hot water (DHW) and industrial waste heat
(IWH). INNOSTORAGE - Advances in Thermal Energy Storage 2016, Beer Sheva (Israel).
10. Gasia J, Tay NHS, Belusko M, Cabeza LF, Bruno F. Dynamic melting of PCM: An
experimental evaluation. INNOSTORAGE - Advances in Thermal Energy Storage 2016,
Beer Sheva (Israel).
11. Cabeza LF, Prieto C, Solé A, Miró L, Gasia J, Fernández A.I. Pilot plant for molten salts
testing: an example on how research helps commercialization. SolarPACES 2015.
Concentrating Solar Power and Chemical Energy Systems, Cape Town (South Africa).
12. Gasia J, Peiró G, Miró L, Cabeza LF. Multiple PCMs (cascaded) configuration: An
experimental study at pilot plant scale. GREENSTOCK 2015 - The 13th International
Conference on Energy Storage, Beijing (China).
13. Gasia J, Gutierrez A, Miró L, Peiró G, Ushak S, Cabeza LF. Analysis of bischofite as phase
change material (PCM) at pilot plant scale. GREENSTOCK 2015 - The 13th International
Conference on Energy Storage, Beijing (China).

72
Other research activities
14. Gasia J, Miró L, Cabeza LF. Análisis experimental de la parafina RT-58 como material de
cambio de fase (PCM) para agua caliente sanitaria (ACS) y recuperación de calor residual. 9º
Congreso Nacional de Ingeniería Termodinámica - 9CNIT 2015, Cartagena (Spain).
15. Gasia J, Miró L, Peiró G, Barreneche C, Cabeza LF Thermal behavior analysis of paraffin
RT-58 at both laboratory and pilot plant scale. ICAE 2015 - The 7th International Conference
on Applied Energy, Abu Dhabi (United Arab Emirates)
16. Gasia J, Gutierrez A, Miró L, Peiró G, Ushak S, Cabeza LF. Bischofite as phase change
material (PCM) for thermal energy storage (TES) applications. EuroSun 2014 - International
Conference of Solar Energy and Buldings, Aix-les-Bains (France).
17. Gasia J, Miró L, Tarragona J, Martorell I, Solé A, Cabeza LF. Experimental analysis of RT-
58 as phase change material (PCM) for domestic hot water (DHW) applications. EuroSun
2014 - International Conference of Solar Energy and Buldings, Aix-les-Bains (France).
18. Gasia J, Miró L, Solé A, Martorell I, Kelly M, Bauer B, Van Bael J, Diriken J, Griffiths P,
Redpath D, Cabeza LF. MERITS Project: A comparative study of four different PCM energy
storage systems for domestic hot water (DHW) applications. Eurotherm Seminar #99 -
Advances in Thermal Energy Storage 2014, Lleida (Spain).
International meetings
The PhD candidate also contributed to IEA-Annex 30 international meetings:
1. Gasia J, Romaní J, Cabeza LF. Definition of analysis level for thermal energy storage (TES).
ECES-IEA Annex 30 - Seventh meeting 2018, Cologne (Germany).
2. Gasia J, Romaní J, Cabeza LF. Definitions of technical parameters for thermal energy
storage (TES). ECES-IEA Annex 30 - Seventh meeting 2018, Cologne (Germany).
3. Romaní J, Gasia J, Cabeza LF. Subtask 2- KPI definitions. ECES-IEA Annex 30 - Sixth
meeting 2018, Frankfurt (Germany).
4. Romaní J, Gasia J, Cabeza LF. Subtask 2- Material Energy Density (EDmat) benchmarking.
ECES-IEA Annex 30 - Fourth meeting 2017, Lleida (Spain).
5. Gasia J, Romaní J, Cabeza LF. Subtask 2 - Technical parameters. ECES-IEA Annex 30 -
Fourth meeting 2017, Lleida (Spain).

73
Other research activities 6. Romaní J, Gasia J, Cabeza LF. Subtask 5: Module storage capacity and energy density.
ECES-IEA Annex 30 - Fourth meeting 2017, Lleida (Spain).
7. Gasia J, Romaní J, Cabeza LF. Overview of TES Activities in Spain. ECES-IEA Annex 30 -
Fourth meeting 2017, Lleida (Spain).
8. Gasia J, Romaní J, Peiró G, Miró L, Prieto C, Cabeza, LF. Operation characteristics of
molten salts for CSP plants. ECES IA-IEA Annex 30 Workshop, Tokyo (Japan), ECES-IEA
Annex 30 – Third meeting 2016, Tokyo (Japan).
9. Gasia J, Romaní J, Cabeza LF. Subtask 5- Key performance indicators (KPI) definitions.
ECES-IEA Annex 30 - Third meeting 2016, Tokyo (Japan).
10. Romaní J, Gasia J, Cabeza LF. Subtask 3- Key performance indicators (KPI) for thermal
energy storage (TES). ECES-IEA Annex 30 - Second meeting 2016, Frankfurt (Germany).
11. Gasia J, Romaní J, Peiró G, Miró L, Prieto C, Cabeza, LF. High temperature TES pilot
plant: Experimental research and lessons learnt. ECES-IEA Annex 30 – Third meeting 2016,
Tokyo (Japan).
Scientific foreign-exchange
The PhD candidate did two stays abroad during the development of this PhD thesis.
University of South Australia (Adelaide, Australia)
The first research stay done by the PhD candidate was carried out at the Barbara Hardy institute,
a research group from the University of South Australia. The exchange was possible thanks to
the mobility project INNOSTORAGE. In this research stay, the PhD candidate worked on the
dynamic melting concept, performing the experimentation which is presented within the
framework of this PhD thesis.
74
Other research activities
Dalhousie University (Halifax, Canada)
The second research stay done by the PhD candidate was carried out at the Lab of Applied
Multiphase Thermal Engineering (LAMTE), a research group from the Dalhousie University.
The exchange was possible thanks to the award to promote research in an abroad institution
from SEBAP. In this research stay, the PhD candidate worked on the dynamic melting concept,
performing the numerical study which is presented within the framework of this PhD thesis
Others activities
Book chapters participation
Gasia J, Miró L, de Gracia A, Cabeza LF. High-temperature thermal storage systems using
phase change materials. Static Concept at University of Lleida. Academic Press Elsevier Ltd.
United States of America, 2018.
Palomba V, Gasia J, Romaní J, Frazzica A, Cabeza LF. Experimental methods for the
characterization of systems for thermal energy storage: Definition of performance indicators,
Springer books, Springer-Verlag. Germany, In press.
Gasia J, Miró L, de Gracia A, Cabeza LF. Static Concept at University of Lleida. In High-
temperature thermal storage systems using phase change materials. United States of America:
Academic Press Elsevier Ltd, 2017.
Projects participation
Innovative compact hybrid storage systems for low energy buildings (HYBUILD). European
Union's Horizon 2020 research and innovation programme under grant agreement n° 768824,
2017-2021.
Quantificació del calor residual i la demanda de calor al polígon industrial de Sant Vicenç.
Codi CTT S16073, 2017.

75
Other research activities Identificación de barreras y oportunidades sostenibles en los materiales y aplicaciones del
almacenamiento de energía térmica (SOPPORTES). Ministerio de Ciencia e Innovación,
ENE2015-64117-C5-1-R, 2016-2018.
Use of innovative thermal energy storage for marked energy savings and significant lowering
of CO2 emissions (INNOSTORAGE). European Commission Seventh Framework
Programme (FP/2007-2013), Nº PIRSES-GA-2013-610692, 2013-2017.
More effective use of renewables including compact seasonal thermal energy storage
(MERITS). European Commission Seventh Framework Programme (FP/2007-2013), Nº
ENER/FP7/295983, 2012-2016
PhD on Innovation Pathways for TES (INPATH-TES). European Union's Horizon 2020
research and innovation programme under grant agreement No 657466, 2015-2018.
Organizing committee participation
Eurotherm Seminar nº 112 – Advances in thermal energy storage 2019. Lleida, Spain.
Eurotherm Seminar nº 99 – Thermal energy storage and transportation: materials, systems
and applications 2014. Lleida, Spain.
10 Congreso Nacional Ingeniería Termodinámica (CNIT) 2017. Lleida, Spain.
INNOSTORAGE Third Training School - Experimental Apparatus for Measurement 2018.
Lleida, Spain.
Experts network participation
Annex 30: Thermal energy storage for cost-effective energy management and CO2
mitigation. International Energy Agency implementing agreement Energy Conservation
through Energy Storage (ECES).

76
Other research activities
Patents
Angel G. Fernandez, Mauro Henriquez, Abdiel Mallco, Carlos Soto, Jaume Gasia, Luisa
F. Cabeza. Sistema semi-industrial y método para la evaluación de la corrosión dinámica
y la evaluación de mezclas de sales fundidas, INAPI – Chile Patent, No. 1674-2017, 09-
02-2017.
77
References
References
1. National Aeronautics and Space Administration (NASA). Global Climate Change: Vital Signs
of the Planet. The consequence of climate change. https://climate.nasa.gov/effects/. Last
accessed: 28/05/2018.
2. Enerdata. Global Energy Statistical Yearbook 2017. https://yearbook.enerdata.net/total-
energy/world-consumption-statistics.html. Last accessed: 28/05/2018.
3. Intergovernmental Panel on Climate Change (IPPC). Climate Change 2014: Synthesis Report.
Contribution of Working Groups I, II and III to the Fifth Assessment Report of the
Intergovernmental Panel on Climate Change. Switzerland, 2014.
4. United Nations / Framework Convention on Climate Change. Adoption of the Paris Agreement.
21st Conference of the Parties. France, 2015.
5. Renewable Energy Policy Network for the 21st century (REN21). Advancing the global
renewable energy transition. http://www.ren21.net/wp-
content/uploads/2017/06/GSR2017_Highlights_FINAL.pdf. Last accessed: 28/05/2018.
6. Mehling H, Cabeza LF. Heat and cold storage with PCM. An up to date introduction into basics
and applications. Springer-Verlag. Germany, 2008.
7. Liu C, Li F, Lai-Peng M, Cheng HM. Advanced materials for energy storage. Advanced
materials 2010;22(8);28-62.
8. United States Department of Energy (DOE) - Office of Electricity Delivery & Energy
Reliability. DOE global energy storage database. https://www.energystorageexchange.org/. Last
accessed: 28/05/2018.
9. International Energy Agency (IEA) Publications. Energy Technology Perspectives 2017.
Catalysing Energy Technology Transformations. France, 2017.
10. Dinçer I, Rosen MA. Thermal energy storage. Systems and applications. John Wiley & Sons.
United Kingdom, 2011.

78
References
11. Cabeza LF. Advances in thermal energy storage systems. Methods and applications. Woodhead
Publishing. United Kingdom, 2015.
12. Zalba B, Marın JM, Cabeza LF, Mehling H. Review on thermal energy storage with phase
change: materials, heat transfer analysis and applications. Applied Thermal Engineering
2003;23:251-283.
13. Sharma A, Tyagi, VV, Chen CR, Buddhi D. Review on thermal energy storage with phase
change materials and applications. Renewable and Sustainable Energy Reviews 2009;13(2);318-
345.
14. Gil A, Medrano M, Martorell I, Lázaro A, Dolado P, Zalba B, Cabeza LF. State of the art on
high temperature thermal energy storage for power generation. Part 1-Concepts, materials and
modellization. Renewable and Sustainable Energy Reviews 2010;14(1);31-55.
15. Tatsidjodoung P, Le Pierrès N, Luo L. A review of potential materials for thermal energy
storage in building applications. Renewable and Sustainable Energy Reviews 2013;18;327-349.
16. Yu N, Wang, RZ, Wang LW. Sorption thermal storage for solar energy. Progress in Energy and
Combustion Science 2013;39(5);489-514.
17. Fernandez AI, Martínez M, Segarra M, Martorell I, Cabeza LF. Selection of materials with
potential in sensible thermal energy storage. Solar Energy Materials and Solar Cells 2010;
94;1723-1729.
18. Palomba V. Thermal energy storage systems for low-grade heat applications: Design and
experimental testing of lab-scale prototypes. PhD dissertation, Department Engineering,
University of Messina. Italy, 2017.
19. Gasia J, Miró L, Cabeza LF. Review on system and materials requirements for high temperature
thermal energy storage. Part 1: General requirements. Renewable and Sustainable Energy
Reviews 2017;75;1320–1338.
20. Oró E, de Gracia A, Castell A, Farid MM, Cabeza LF. Review on phase change materials
(PCMs) for cold thermal energy storage applications. Applied Energy 2012;99;513-533.
21. Cabeza LF, Castell A, Barreneche C, de Gracia A, Fernández AI. Materials used as PCM in
thermal energy storage in buildings: A review. Renewable and Sustainable Energy Reviews
2011;15:1675-1695.
22. Jankowski NR, McCluskey FP. A review of phase change materials for vehicle component
thermal buffering. Applied Energy 2014;113:1525-1561.
79
References 23. Kandasamy R, Wang XQ, Mujumdar AS. Application of phase change materials in thermal
management of electronics. Applied Thermal Engineering 2007;27:2822-2832.
24. Miró L, Gasia J, Cabeza LF. Thermal energy storage (TES) for industrial waste heat (IWH)
recovery: A review. Applied Energy 2016;179;284-301.
25. Kenisarin M, Mahkamov K. Solar energy storage using phase change materials. Renewable and
Sustainable Energy Reviews 2007;11:1913-1965.
26. Abhat A. Low temperature latent heat thermal energy storage: Heat storage materials. Solar
Energy 1983;30:313-332.
27. Shin D, Banerjee D. Enhancement of heat capacity of molten salt eutectics using inorganic
nanoparticles for solar thermal energy applications. John Wiley & Sons. United Kingdom, 2011.
28. Gil A, Oró E, Miró L, Peiró G, Ruiz Á, Salmerón JM, Cabeza LF. Experimental analysis of
hydroquinone used as phase change material (PCM) to be applied in solar cooling refrigeration.
International Journal of Refrigeration 2014;39:95–103.
29. Zhao YJ, Wang RZ, Wang LW, Yu N. Development of highly conductive KNO3/NaNO3
composite for TES (thermal energy storage). Energy 2014;70:272–277.
30. Wu ZG, Zhao CY. Experimental investigations of porous materials in high temperature thermal
energy storage systems. Solar Energy 2011;85;1371–1380.
31. Shi Y, Yuan HW, Xu ZZ, Lu CH, Ni YR, Dong Y. Thermal and Mechanical Properties of
Aluminate Cementitious Functional Materials Enriched with Nano-SiO2 for Thermal Energy
Storage. Advanced Materials Research 2014;887-888;77–80.
32. Gasia J, Miró L, de Gracia A, Barreneche C, Cabeza L.F. Experimental evaluation of a paraffin
as phase change material for thermal energy storage in laboratory equipment and in a shell-and-
tube heat exchanger. Applied Sciences 2016;6(4);112-124. DOI: 10.3390/app6040112
33. Gasia J, Miró L, Cabeza LF. Materials and system requirements of high temperature thermal
energy storage systems: A review. Part 1: General requirements. Renewable and Sustainable
Energy Reviews 2017;75;1320–1601.
34. Bayón R, Coco S, Barcenilla M, Espinet P, Imbuluzqueta G. Feasibility of Storing Latent Heat
with Liquid Crystals. Proof of Concept at Lab Scale. Applied Sciences 2016;6;120.
35. Palomo del Barrio E, Godin A, Duquesne M, Daranlot J, Jolly J, Alshaer W, Kouadio T,
Sommier A. Characterization of different sugar alcohols as phase change materials for thermal
energy storage applications. Solar Energy Materials and Solar Cells 2017;159;560–569.

80
References
36. Haillot D, Bauer T, Kröner U, Tamme R. Thermal analysis of phase change materials in the
temperature range 120–150 °C. Thermochimica Acta 2011;513;49–59.
37. Miró L, Barreneche C, Ferrer G, Solé A, Martorell I, Cabeza LF. Health hazard, cycling and
thermal stability as key parameters when selecting a suitable phase change material (PCM).
Thermochimica Acta 2016;627–629;39–47.
38. Bony J, Citherlet S. Numerical model and experimental validation of heat storage with phase
change materials. Energy Buildings 2007;39;1065–1072.
39. Rose J, Lahme A, Christensen NU, Heiselberg P, Hansen M, Grau K. Numerical method for
calculating latent heat storage in constructions containing phase change material. 11th
Conference of the International Building Performance Simulation Association 2009. Glasgow,
United Kingdom.
40. Chandrasekharan R, Lee ES, Fisher DE, Deokar PS. An enhanced simulation model for building
envelopes with phase change materials. ASHRAE Transcriptions 2013;119.
41. Delcroix B. Modelling of Thermal Mass Energy Storage in Buildings with Phase Change
Materials. PhD dissertation, Department of Mechanical Engineering, École Polytechnique de
Montréal. Canada, 2015.
42. D’Avignon K, Kummert M. Experimental assessment of a phase change material storage tank.
Applied Thermal Engineering 2016;99;880–891.
43. Palomba V, Brancato V, Frazzica A. Experimental investigation of a latent heat storage for solar
cooling applications. Applied Energy 2017;199;347-358.
44. Bédécarrats JP, Castaing-Lasvignottes J, Strub F, Dumas JP. Study of a phase change energy
storage using spherical capsules. Part I: Experimental results. Energy Conversion and
Management 2009;50;2527–2536.
45. Bédécarrats JP, Castaing-Lasvignottes J, Strub F, Dumas JP. Study of a phase change energy
storage using spherical capsules. Part II: Numerical modelling. Energy Conversion and
Management 2009;50;2537–2546.
46. Kuznik F, Virgone J. Experimental investigation of wallboard containing phase change material:
Data for validation of numerical modelling. Energy and Buildings 2009;41(5);561-570.
47. Toksoy M, Ilken Z. The effects of phase change during the stand-by period in latent heat energy
storage systems. Solar Energy 1991;47(2);69-73.

81
References 48. Bejarano G, Suffo JJ, Vargas M, Ortega MG. Novel scheme for a PCM-based cold energy
storage system. Design, modelling, and simulation. Applied Thermal Engineering
2018;132;256–274.
49. Jegadheeswaran S, Pohekar SD, Kousksou T. Exergy based performance evaluation of latent
heat thermal storage system: A review. Renewable and Sustainable Energy Reviews
2010;14;2580–2595.
50. Hirano S. Performance of supercooled thermal energy storage unit. 1st International Energy
Conversion Engineering Conference 2003. Portsmouth, United States of America.
51. Dow Chemical Company. SYLTHERM 800 technical data.
http://www.dow.com/heattrans/products/synthetic/syltherm.htm. Last accessed: 28/05/2018.
52. REPSOL Chemicals. Repsol Alcudia 6020L Data sheet.
https://portalquimica.repsol.com/ccrz__CCPage?pageKey=detail&id=a1xb0000001GyjHAAS&
cclcl=en_US. Last accessed: 28/05/2018.
53. Gschwander S, Haussmann T, Hagelstein G, Sole A, Diarce G, Hohenauer W, Lager D,
Rathgeber C, Hennemann P, Lazaro A, Mehling H. Standard to determine the heat storage
capacity of PCM using hf-DSC with constant heating/cooling rate (dynamic mode), DSC 4229
PCM Standard. A technical report of subtask A2.1 of IEA SHC 42 / ECES Annex 29, 2015.
54. Zauner C, Hengstberger F, Etzel M, Lager D, Hofmann R, Walter H. Experimental
characterization and simulation of a fin-tube latent heat storage using high density polyethylene
as PCM. Applied Energy 2016;179;237–246.
55. Gasia J, de Gracia A, Peiró G, Arena S, Cau G, Cabeza LF. Use of partial load operating
conditions for latent thermal energy storage management. Applied Energy 2018;216;234-242.
56. Yang C, Navarro ME, Zhao B, Leng G, Xu G, Wang L, Jin Y, Ding Y. Thermal conductivity
enhancement of recycled high density polyethylene as a storage media for latent heat thermal
energy storage. Solar Energy Materials and Solar Cells 2016;15;103-110.
57. Al-Abidi AA, Mat S, Sopian K, Sulaiman MY, Mohammad AT. Internal and external fin heat
transfer enhancement technique for latent heat thermal energy storage in triplex tube heat
exchangers. Applied Thermal Engineering 2013;53(1);147-156.
58. Nithyanandam K, Pitchumani R. Analysis and optimization of a latent thermal energy storage
system with embedded heat pipes. International Journal Of Heat and Mass Transfer
2011;54:4596–4610.

82
References
59. Sanusi O, Warzoha R, Fleischer AS. Energy storage and solidification of paraffin phase change
material embedded with graphite nanofibers. International Journal of Heat and Mass Transfer
2011;54:4429–4436.
60. Tong X, Khan JA, Ruhulamin M. Enhancement of heat transfer by inserting a metal matrix into
a phase change material. Numerical heat transfer, Part A: Applications. An International Journal
of Computation and Methodology 1996;30:125–141.
61. Khodadadi J, Fan L, Babaei H. Thermal conductivity enhancement of nanostructure-based
colloidal suspensions utilized as phase change materials for thermal energy storage: A review.
Renewable and Sustainable Energy Reviews 2013;24:418–444.
62. Tay NHS, Cabeza LF. High temperature thermal storage systems using phase change materials.
Academic Press El Sevier 2018. ISBN: 978-0-12-805323-2.
63. Tay NHS, Liu M, Belusko M, Bruno F. Review on transportable phase change material in
thermal energy storage systems. Renewable and Sustainable Energy Reviews 2017;75:264-277.
64. Delgado M, Lázaro A, Peñalosa C, Mazo J, Zalba B. Analysis of the physical stability of PCM
slurries. International Journal of Refrigeration 2013;36:1648-1656.
65. Wang W, Guo S, Li H, Yan J, Zhao J, Li X, Ding J. Experimental study on the direct/indirect
contact energy storage container in mobilized thermal energy system (M-TES). Applied Energy
2014;119;181–189
66. Nomura T, Tsubota M, Oya T, Okinaka N, Akiyama T. Heat release performance of direct-
contact heat exchanger with erythritol as phase change material. Applied Thermal Engineering
2013;61:28-35.
67. Bareiss M, Beer H. An analytical solution of the heat transfer process during melting of an
unfixed solid phase change material inside a horizontal tube. International Journal of Heat and
Mass Transfer 1984;27;739-746.
68. Kozak Y, Rozenfeld T, Ziskind G. Close-contact melting in vertical annular enclosures with a
non-isothermal base: Theoretical modeling and application to thermal storage. International
Journal of Heat and Mass Transfer 2014;72;114-127.
69. Oh YK, Park SH, Cho YI. A study of the effect of ultrasonic vibrations on phase-change heat
transfer. International Journal of Heat and Mass Transfer 2002;45:4631-4641.
70. Zipf V, Neuhäuser A, Willert D, Nitz P, Gschwander S, Platzer W. High temperature latent heat
storage with a screw heat exchanger: Design of prototype. Applied Energy 2013;109:462–469.
83
References 71. Pointner H, Steinmann WD, Eck M. Introduction of the PCM Flux Concept for Latent Heat
Storage. Energy Procedia 2014;57:643–652.
72. Tay NHS, Bruno F, Belusko M. Experimental investigation of dynamic melting in a tube-in-
tank PCM system. Applied Energy 2013;104:137–148.
73. Tay NHS, Belusko M, Liu M, Bruno F. Investigation of the effect of dynamic melting in a tube-
in-tank PCM system using a CFD model. Applied Energy 2015;137:738–747.
74. Kabbara M, Kheirabadi AC, Groulx D. Numerical Modelling of Natural Convection Driven
Melting for an Inclined/Finned Rectangular Enclosure. ASME Conference 2017. Washington,
United States of America.
75. COMSOL Inc. How to Implement a Mesh Refinement Study.
https://www.comsol.com/blogs/how-to-implement-mesh-refinement-study. Last accessed:
28/05/2018.

84
Annexes
Annexes: Journal papers
1
Review on system and materials requirements for high
temperature thermal energy storage. Part 1: General
requirements
Jaume Gasia, Laia Miró, Luisa F. Cabeza*
GREA Innovació concurrent, Edifici CREA, Universitat de Lleida, Pere de Cabrera s/n, 25001-
Lleida (Spain) * Corresponding author: Phone: +34-973-003576, fax: +34-973-003575, e-mail: [email protected]
Abstract
High temperature thermal energy storage offers a huge energy saving potential in industrial
applications such as solar energy, automotive, heating and cooling, and industrial waste heat
recovery. However, certain requirements need to be faced in order to ensure an optimal
performance, and to further achieve widespread deployment. In the present review, these
requirements are identified for high temperature (> 150 ºC) thermal energy storage systems and
materials (both sensible and latent), and the scientific studies carried out meeting them are
reviewed. Currently, there is a lack of data in the literature analysing thermal energy storage
from both the systems and materials point of view. In the part 1 of this review more than 25
requirements have been found and classified into chemical, kinetic, physical and thermal (from
the material point of view), and environmental, economic and technologic (form both the
material and system point of view). The enhancements focused on the thermal conductivity are
addressed in the Part 2 of this review due to their research significance and extension.
Key-words: Thermal energy storage, High temperature, Enhancement, Phase change material,
system, requirements.

2
Table of abbreviations
BM Base material
ACW Asbestos containing wastes
CAPEX Capital investment costs
CED Cumulative energy demand
CO2-eq Equivalent CO2 emissions
CSP Concentrated solar power
DSC Differential scanning calorimeter
ECES Energy conservation through energy storage
FA Fly ashes
FT-IR Infrared spectroscopy
GHG Greenhouse gases
GWP Global warming potential
h Heat storage capacity
HTF Heat transfer fluid
IACW Intertized asbestos containing wastes
IEA International Energy Agency
IP Impact points
LCA Life cycle assessment
MDSC Modulated differential scanning calorimeter
MWCNT Multi-walled carbon nanotubes
NFPA National fire protection association
OPEX Operation and maintenance costs
PCM Phase change material
PT Parabolic trough
SM Stirring method
ST Solar tower
SWCNT Single walled carbon nanotubes
TES Thermal energy storage
Tm Temperature of fusion
TSSM Two-step solution method
XR X-ray powder diffraction

3
1. Introduction
Current trends in energy supply and demand are economically, environmentally and socially
unsustainable since energy-related emissions of carbon dioxide are expected to be doubled by
2050 and fossil energy demand is expected to be increased over the security of supplies [1]. The
International Energy Agency (IEA) recognizes energy storage technologies as a tool to support
energy security and climate change goals by helping to integrate electricity and heat systems.
Among the different energy storage technologies, thermal energy storage (TES) is an effective
technique that has become a key factor on improving the efficiency of different energy systems
due to the versatility in correcting the mismatch between the energy demand and supply, and by
allowing the development and implementation of renewable energies. A clear example is TES in
solar power plants, where the excess of solar energy during the Sun-light period, is stored to be
further released during the periods when the solar energy is needed but not available, such as
cloudy or night-time periods.
There are basically three main techniques for TES: sensible, latent and thermochemical, being
the first two the most studied and developed by the researchers. In sensible heat storage, the
storing (or releasing) of thermal energy is linked to the temperature rising (or dropping) without
undergoing phase change, as a consequence of a change in the internal energy of the TES
material. In latent heat storage, the media stores (or releases) the thermal energy when it
undergoes phase change. Unlike sensible heat storage, latent heat storage has higher storage
density because the phase-transition enthalpy is much higher (usually more than 50-100 times)
[2]. Since the process is nearly isothermal, which means that the temperature barely increases
(or decreases), all the energy stored comes from the molecular restructuration that takes place
within the transition from one phase to the other. Finally, in thermochemical heat storage the
energy is stored (or released) after a reversible chemical reaction between two substances. It
means that once the heat is released due to a dissociation of a chemical product, it can be
recovered in almost its totality when the synthesis reaction takes place.
TES can be implemented in many different sectors and applications. Table 1 summarizes the
most known and studied TES storage applications for a range that comprises low and high
temperature (from -269 ºC to around 1600 ºC).

4
Table 1. Review of the potential TES storage applications and sectors, as well as their range of working
temperatures.
Sector and pplication Range of temperatures Reference
1. Heating and cooling From -40 ºC to 350 ºC
1.1. Cold production From -40 ºC to -10 ºC [2,3]
1.2. Space heating and cooling of buildings From 18 ºC to 28 ºC [4,5]
1.3. Heating and cooling of water From 29 ºC to 80 ºC [4,6]
1.4. Absorption refrigeration From 80 ºC to 230 ºC [7]
1.5. Adsorption refrigeration From -60 ºC to 350 ºC [8]
2. Transportation From -50 ºC to 800 ºC
2.1. Cabin heating and refrigeration From -50 ºC to 70 ºC [9,10]
2.2. Battery and electronic protection From 30 ºC to 80 ºC [9,10]
2.3. Exhaust heat recovery From 55 ºC to 800 ºC [9,10]
3. Thermal protection From -269 ºC to 130 ºC
3.1. Electronic devices thermal protection From 25 ºC to 45 ºC [11]
3.2. Chips thermal protection From 85 ºC to 120 ºC [12]
3.3. Data centers thermal protection From 5 ºC to 45 ºC [13]
3.4. Spacecraft electronics thermal protection From -269 ºC to 130 ºC [14]
3.5. Food thermal protection From -30 ºC to 121 ºC [15]
3.6. Biomedical applications From -30 ºC to 22 ºC [16]
4. Industry From 60 ºC to 260 ºC [17,18]
5. Solar energy From 20 ºC to 565 ºC
5.1. Solar cooling From 60 ºC to 250 ºC [19,20]
5.2. Solar energy storage From 20 ºC to 150 ºC [20]
5.3. Solar power plants From 250 ºC to 565 ºC [21,22]
6. Desalination From 40 ºC to 120 ºC [23,24]
7. Industrial waste heat recovery From 30 ºC to 1600 ºC [25,26]
TES has been of high interest for the researchers in the last decade and therefore many papers
can be found in the literature dealing this topic, especially at mid-low temperatures (below 150
ºC). For example, Zalba et al. [27] reviewed and classified phase change materials (PCM) from
-33 ºC on and described some of their main applications. Pielichowska and Pielichowski [22]
updated this review including sensible materials. At higher temperatures the number of
publications is considerably fewer. Liu et al. [28] focused their review on PCM and possible
thermal performance enhancement techniques at temperatures higher than 300 ºC. Over the
same temperature range worked Cárdenas and León [29] and Fernandes et al. [30], who defined

5
a suitable material selection and procedure, defined different applications for power generation,
and reviewed some enhancement techniques focused on different thermophyisical properties.
Although most of these reviews mentioned some of the requirements presented in Table 2, none
of them organized the information in a way that addresses each of the requirements in order to
help the final user to identify the right TES material, technology, system and/or enhancement
technique.
Table 2 classifies the different requirements that, according to the literature, TES materials and
systems should accomplish for an optimum thermal, physical, kinetic, chemical, economical,
technological, and environmental performance.
Table 2. Main requirements for selecting the suitable materials and systems focused on high temperature
TES. The requirements which have an * correspond only to latent storage. Based on [27,31-33].
Requirements Reason
Mate
rial
Chemical
Long-term chemical stability Keeping the initial thermochemical
properties along the cycling periods No chemical decomposition Compatibility with container materials and low reactivity to heat transfer fluids (HTFs)
Ensuring long lifetime of the container and the surrounding materials in case of leakage
No fire and explosion hazard
Ensuring workplace safety
No toxicity Ensuring handling safety *No phase separation / Incongruent melting
Avoiding changes on the stoichiometric composition of melt
Kinetic
*Small or no subcooling Having the same melting/solidification temperature and avoiding heat release problems
*Sufficient crystallization rate
Meeting the recovery system heat transfer demands
Physical
High density Minimizing the volume occupied by the TES material
Low vapour pressure Diminishing the mechanical and chemical stability requirements of the container or vessel
*Small volume changes (low density variation) *Favourable phase equilibrium
Possibility of using eutectic mixtures
Thermal
High specific heat Providing significant sensible heat storage
High thermal conductivity in both solid and liquid states
Enhancing the heat transfer within the TES material by providing the minimum temperature gradients
*Melting / solidification temperature in the desired operating temperature range
Ensuring the success of the charging and discharging processes within the operation conditions

6
*High latent heat of transition per unit volume near temperature of use
Providing significant latent heat storage in small volumes
*Congruent melting Ensuring the complete melt of the TES material and their homogeneity
Mate
rial/
Syst
em
Economic
Abundant and available Being cheaper than other options
Large lifetime Avoiding replacements and maintenance during the lifetime of the TES system
Cost effective Being competitive in front other options
Environmental
Low manufacturing energy
Reducing the environmental impact of the systems and accomplishing sustainable regulations and trends
Easy recycling and treatment Low CO2 footprint and use of by-products Non-polluting
Technological
Operation strategy Optimizing the processes by adapting them to limiting factors such as maximum loads, nominal temperatures and specific enthalpy drops in load
Integration into the facility
Suitable heat transfer between the HTF and the storage medium (efficiency)
Enhancing the heat transfer from the TES material to the HTF and vice versa
The main objective of the present paper is to identify the main requirements that a TES system
(sensible or latent) should accomplish at high temperature (> 150 ºC) from the material and
system point of view, and reviewing the literature available on this topic in order to find the
research niches which can allow the researchers conducting their investigation.
This is the first review considering such a wide scope and therefore the authors have divided it
into two parts. The first part consists of a revision of all the general requirements that a TES
system should fulfil in order to be considered optimal (chemical, economic, environmental,
kinetic, physical, technological, and thermal). The second part [34] is mainly focused on the
study of the thermal conductivity enhancement techniques between the HTF and the TES
material, by adding extended surfaces, and enhancing the thermal conductivity of the material
itself, by combining it with highly conductive materials.

7
2. Material requirements
2.1 Addressing chemical requirements
Chemical requirements are very similar for sensible and latent heat storage materials (Table 2).
Candidate materials should have long-term chemical stability, no chemical decomposition,
should be compatible with the container materials and the HTF, non-toxic and non-flammable,
and they should present no phase segregation.
Any material is suitable for TES applications if it is chemically stable and does not degrade
after a number of repeated heating and cooling cycles, which means that it keeps almost the
same thermochemical properties than the beginning. Many authors reported the results from
their cycling tests in which the chemical stability was checked. Ferrer et al. [35] reviewed the
methodologies used to assess the cyclability of TES materials. They identified that the infrared
spectroscopy (FT-IR) analysis is the most widely technique used to study the chemical stability.
In addition, they also identified the parameters that need to be considered when performing
those tests: cycling equipment, characterization technique after the test, number of cycles, and
heating rate. Only four studies regarding high temperature TES materials have been found. Solé
et al. [36] studied the chemical stability of three high temperature sugar alcohols (d-mannitol
[Tm = 166 - 176.9 °C], myo-inositol [Tm = 224 - 227 °C] and galacticol [Tm = 187 - 188.5 °C])
using differential scanning calorimeter (DSC) and FT-IR analyses. Results showed a poor
stability of galacticol and d-mannitol and a good stability of myo-inositol. Moreover, it was
observed that the contact of the TES materials with oxygen was a variable that affected the
results of the study. Therefore, a TES system including these materials should be in an inert
atmosphere or in vacuum. Similarly, John et al. [37] studied the effect of the upper cycle
temperature on the thermal behaviour of galactitol in bulk thermal cycling for solar cookers.
They observed the same poor stability results than Solé et al. [36] and concluded that this TES
material is not suitable for the application proposed. Paul et al. [38] studied the chemical
stability of a eutectic mixture at a 30:70 molar ratio of galactitol and mannitol (Tm = 153 ºC) via
DSC, X-ray powder diffraction (XR) and FT-IR spectroscopy analyses. Those techniques
confirmed that the combination of mannitol and galacticol showed good cyclic, thermal and
chemical stability compared to its individual components under nitrogen or air atmospheres.
Finally, Sun et al. [39] cycled 1000 times an aluminium-magnesium-zinc alloy (Tm = 450 ºC).
Results showed a good stability of the alloy as it showed an 11% of loss on the heat storage
capacity and a variation of 0.7 % on the melting temperature.
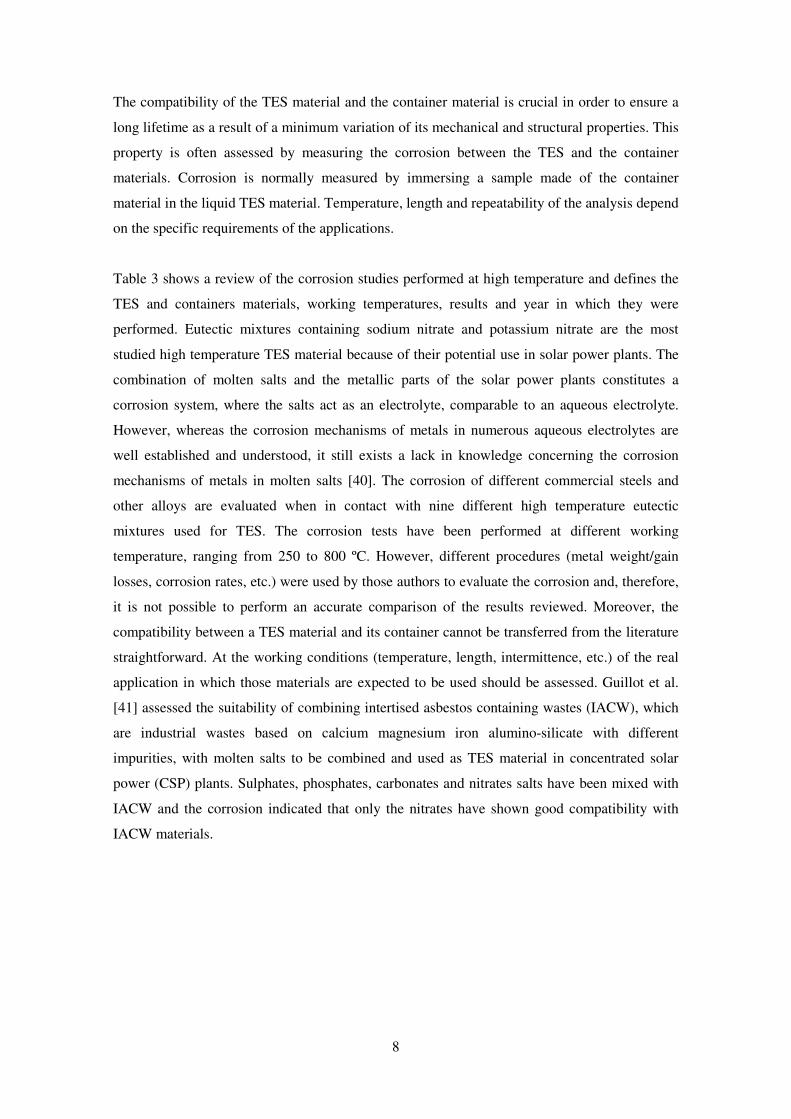
8
The compatibility of the TES material and the container material is crucial in order to ensure a
long lifetime as a result of a minimum variation of its mechanical and structural properties. This
property is often assessed by measuring the corrosion between the TES and the container
materials. Corrosion is normally measured by immersing a sample made of the container
material in the liquid TES material. Temperature, length and repeatability of the analysis depend
on the specific requirements of the applications.
Table 3 shows a review of the corrosion studies performed at high temperature and defines the
TES and containers materials, working temperatures, results and year in which they were
performed. Eutectic mixtures containing sodium nitrate and potassium nitrate are the most
studied high temperature TES material because of their potential use in solar power plants. The
combination of molten salts and the metallic parts of the solar power plants constitutes a
corrosion system, where the salts act as an electrolyte, comparable to an aqueous electrolyte.
However, whereas the corrosion mechanisms of metals in numerous aqueous electrolytes are
well established and understood, it still exists a lack in knowledge concerning the corrosion
mechanisms of metals in molten salts [40]. The corrosion of different commercial steels and
other alloys are evaluated when in contact with nine different high temperature eutectic
mixtures used for TES. The corrosion tests have been performed at different working
temperature, ranging from 250 to 800 ºC. However, different procedures (metal weight/gain
losses, corrosion rates, etc.) were used by those authors to evaluate the corrosion and, therefore,
it is not possible to perform an accurate comparison of the results reviewed. Moreover, the
compatibility between a TES material and its container cannot be transferred from the literature
straightforward. At the working conditions (temperature, length, intermittence, etc.) of the real
application in which those materials are expected to be used should be assessed. Guillot et al.
[41] assessed the suitability of combining intertised asbestos containing wastes (IACW), which
are industrial wastes based on calcium magnesium iron alumino-silicate with different
impurities, with molten salts to be combined and used as TES material in concentrated solar
power (CSP) plants. Sulphates, phosphates, carbonates and nitrates salts have been mixed with
IACW and the corrosion indicated that only the nitrates have shown good compatibility with
IACW materials.

9
Table 3. Review of the studies concerning the chemical requirements at high temperature in terms of compatibility between the container and the TES material.
Study case
TES material (wt %)
Container material Working
temperature Results Year Reference
1 (HITEC)
NaNO2 + NaNO3 + KNO3 (40 % + 7 % + 53 %)
Steel
A516 390 ºC Mass gain = 0.35 mg/cm2 2015 Fernandez et al. [42] T11 390 ºC Mass gain = 0.35 mg/cm2
T22 390 ºC Mass gain = 0.35 mg/cm2 321 530 ºC ≈ 0.02 mm/a 2015 Federsel et al. [43]
Other alloys Inconel 600 530 ºC ≈ 0.02 mm/a 2015 Federsel et al. [43]
AISI 430 390 ºC < 0.1 mg/cm2 2015 Fernandez et al. [44] T22 390 ºC 0.00044 µm/h
A1 390 ºC 0.00075 µm/h SS316 550 ºC > 1 mg/cm2
2004 Goods and Bradshaw
[45] A36 550 ºC <0.5 mg/cm2
SS304 390 ºC <0.1 mg/cm2 2015 Fernandez et al. [44]
550 ºC < 3 mg/cm2 2004 Goods and Bradshaw
[45]
3 KNO3 + NaNO3
(50 % + 50 %) Other alloys
Inconel
677 ºC
3.05-4.83 mm/a
1985 Slusser et al. [46]
Hastelloy 3.30-10.41 mm/a Alloy 4.32 mm/a RA 6.86 mm/a
Incoloy 10.67 mm/a Haynes 17.53-21.08 mm/a Nitronic 21.33-29.72 mm/a Nicofer 43.18 mm/a
Ni 81.79 mm/a
4
(Molten salts) NaNO3 + KNO3 (60 % + 40 %)
Steel
SS304
390 ºC < 0.05 mg/cm2 2014 Fernandez et al. [47,48]
550 ºC 0.0062 µm/h
570 ºC 4-10 mg/cm2 2004 Goods and Bradshaw
[45] T11 390 ºC 2.75 mg/cm2 2014 Fernandez et al. [49]
T22 390 ºC 0.0081 µm/h 2014 Fernandez et al. [48]
550 ºC 2.25 mg/cm2 Fernandez et al. [50] OC-4 390 ºC Excellent behaviour 2014 Fernandez et al. [47] A1 390 ºC 0.1108 µm/h 2014 Fernandez et al. [48]

10
A36 316 ºC 1-2.5 mg/cm2 2004 Goods and Bradshaw
[45]
AISI SS430 390 ºC 0 mg/cm2 2014 Fernandez et al. [50]
550 ºC 0.1321 µm/h Fernandez et al. [48] P91 600 ºC Scale thickness = 1330 µm 2016 Dorcheh et al. [51] X20 600 ºC Scale thickness = 450 µm 2016 Dorcheh et al. [51]
SS316 570 ºC 5-8 mg/cm2 2004
Goods and Bradshaw [45]
600 ºC Scale thickness = 18 µm 2016 Dorcheh et al. [51] 316Ti 565 ºC ≈ 0.5 % weight loss 2015 Federsel et al. [43]
SS347H 600 ºC Scale thickness = 18 µm 2016 Dorcheh et al. [51]
SS321
400 ºC Descaled loss = 0.27 mg/cm2 2014 Kruizenga and Gill [52] 500 ºC Descaled loss = 1.98 mg/cm2 2014 Kruizenga and Gill [52] 565 ºC ≈ 0.2 % weight loss 2015 Federsel et al. [43] 680 ºC Descaled loss = 42.77 mg/cm2 2014 Kruizenga and Gill [52]
SS347 400 ºC Descaled loss = 0.2 mg/cm2 2014 Kruizenga and Gill [52] 500 ºC Descaled loss = 1.28 mg/cm2 2014 Kruizenga and Gill [52] 680 ºC Descaled loss = 42.05 mg/cm2 2014 Kruizenga and Gill [52]
Other alloys
HA230 600 ºC Metal losses of 23.6 µm/a 2014 McConohy and
Kruizenga [53]
680 ºC Metal losses of 688 µm/a 2014 McConohy and Kruizenga [53]
In625
600 ºC Scale thickness = 9 µm 2016 Dorcheh et al. [51]
600 ºC Metal losses of 16.8 µm/a 2014 McConohy and Kruizenga [53]
680 ºC Metal losses of 594 µm/a. 2014 McConohy and Kruizenga [53]
Incoloy Alloy 800 550-670 ºC Oxide scales higher than 15 µm 1981 Goods [54]
5
LiNO3 + NaNO3 + KNO3
(30 % + 18 % + 52 %) Steel
SB450 550 ºC n.a.
2015 Cheng et al. [55] T22 550 ºC
n.a. T5 550 ºC T9 550 ºC
X20 550 ºC

11
6 Molten salts with NaCl additives
Stainless steel 304 570 ºC 7-10 mg/cm2 2004 Goods and Bradshaw
[45] 316 570 ºC 5-6 mg/cm2 Carbon steel A36 316 ºC 2-3 mg/cm2
7
(FLiNaK) LiF + NaF + KF
(46.5 % + 11.5 % + 42 %) Steel
SS316L
650 ºC
19.65 mm/a
2014 Sona et al. [56]
SS317L 17.82 mm/a Inconel-625 23.70 mm/a
Incoloy-800H 39.30 mm/a Hasteloy-B 3.02 mm/a
Ni-201 0.94 mm/a
8 NaCl + KCl (50 % + 50 %)
Fe-Cr alloy n.a. 670 ºC n.a. 2005 Li et al. [57] Fe-Al alloy
Ni-Al alloy
Steel 316L
670 ºC n.a. 2010 Abramov et al. [58] 316Ti 321
9 NaCl + KCl + ZnCl2 (13.4 % + 33.7 + 52.9 %)
Hastelloy C-276
500 ºC Corrosion rate < 20 µm/a
2015 Vignarooban et al. [59]
800 ºC Corrosion rate 40 µm/a
C-22 250 ºC Corrosion rate < 20 µm/a 500 ºC Corrosion rate 40 µm/a
Stainless steel 304 250 ºC Corrosion rate 20 µm/a 500 ºC Corrosion rate 380 µm/a
n.a: not available

12
In order to facilitate the handling and the safe use of the TES material, no hazardous materials
are preferable. Therefore toxic or flammable TES materials should be avoided. However, most
of the authors have focused only on the thermal behaviour properties when selecting TES
materials without taking into account those parameters. Miró et al. [60] proposed health hazard
as a part of a new methodology to select the suitable TES materials. Moreover, a case study
considering five high temperature PCMs (salicylic acid, benzanilide, d-mannitol, hydroquinone,
and potassium thiocyanate) was presented. The degree of health hazard of a material is based on
the form or condition of the material and on its inherent properties. It is provided by the
manufacturer in the material safety data sheets or by different standard associations which have
developed tools to indicate the health, flammability, reactivity and special hazards for many
common chemicals [60]. Results showed that potassium thiocyanate was the most dangerous
TES materials within the selected ones and its short exposure could cause serious temporary or
moderate residual injuries. TES material with health hazard values above 3 (according to the
National fire protection association (NFPA) 704 standard in a scale from 0 to 4) should be
discarded. However, if a specific application requires it, its use must be always under the
established safety measures. In Table 4, the health hazard rating of the different materials
studied are presented. Regarding to the flammability, Gallegos and Yu [61] proposed TES as
and insulation medium in high temperatures systems when the heat flux presented values up to
80-84 kW·m-2 from flashover conditions in a firefighting environment. Among the proposed
candidates, they analysed dulcitol and d-mannitol. Results showed that the molecular structure
of sugar alcohols has tremendous impacts in terms of melting and boiling point and therefore in
flammability.
Table 4. Health hazard rating of some TES materials based on the NFPA 704 standard [60].
Health hazard rating
Salicylic acid ½
Benzanilide 1
d-mannitol 1
Hydroquinone 2
Potassium thiocyanate 3
Phase segregation (or phase separation) is the macroscopic separation of the phases in a PCM.
When that occurs, PCM shows a significantly lower capacity to store heat [33]. According to
Zhao [62], encapsulation can help to mitigate not only phase segregation during thermal cycling
but also problems like low thermal conductivity and subcooling. Moreover, it protects the TES
material from exposure and potential corrosion with HTF. Therefore, the encapsulation material
should also be compatible with the TES material. Metals are the best candidates for

13
encapsulation at high temperature due to their properties such as strength, thermal conductivity,
wear resistance, excellent workability and ductility [62,63]. However, the use of shells and their
characteristics are strongly determined by the volumetric expansion of the material and the
pressure increase during the melting process [64]. In order to avoid problems such as chemical
corrosion and thermal stress, the use of ceramic shells is starting to gain relevance [65]. A more
detailed review on shell materials used in the encapsulation of TES materials for high
temperature is presented in Jacob and Bruno [66].
2.2 Addressing kinetic requirements
The kinetic requirements identified in this review include small or no subcooling during the
solidification in order to have the similar temperatures in both the melting and the solidification
processes and therefore avoiding heat release problems, and sufficient crystallization rate in
order to meet the recovery system heat transfer demands. These two requirements are referred
only to latent heat storage systems [67].
In the literature, only research work discussing the subcooling effect is found. This effect, also
known as supercooling or undercooling [33], refers to a solidification process which does not
start immediately upon cooling below the melting temperature, but starts the crystallization only
after a temperature well below the melting temperature (Fig. 1). It appears mostly in inorganic
PCM.
Fig. 1. Effect of subcooling on heat storage. Left: little subcooling and nucleation, right:
severe subcooling without nucleation [33].
The most common approach to eliminate the subcooling effect is the addition of additives, also
known as nucleating agents, into the TES material in order to cause heterogeneous nucleation.
Most of the nucleating agents are materials with a similar crystal structure than the solid TES
material, which allows the solid phase of the TES material to grow on their surface but with

14
higher melting temperature to avoid deactivation when the TES material is melted. The main
problem of this solution is that similar crystal structures usually means similar melting
temperatures.
Very little research has been carried out regarding kinetics at high temperature. For example,
Sari et al. [68] reduced the subcooling of galacticol (Tm = 187.4 °C) by preparing galactitol
hexastearate and galactitol hexapalmitate as a novel solid–liquid TES material by means of
esterification reaction of the TES material with palmitic acid and stearic acid. However, this
mixture leaded to a TES material with a melting temperature of around 40 °C. Paul et al. [38]
studied the effect of adding up to 0.5 wt.% of different nucleating agents (graphite and silver
iodide) into an eutectic mixture at a 30:70 molar ratio of galactitol and mannitol (Tm = 153 ºC).
They observed that the nucleation agents reduced subcooling around 10 ºC. Other studies
observed that the size of the sample is an important parameter when determining the subcooling
effect [69-71]. Rathgeber et al. [69] selected nine TES materials for combined DSC and T-
history measurements. From these materials, hydroquinone was the only one at high
temperature. Using both DSC and T-history for the determination of enthalpy curves, the
dependence of this curve on the sample size and on the temperature profile applied could be
analysed and a reduction of around 13 ºC in the subcooling effect was observed. Gil et al. [70]
tested at both laboratory and pilot plant scales two TES materials candidates for solar
refrigeration applications (hydroquinone and d-mannitol). They realized that d-mannitol showed
subcooling in both scales while hydroquinone showed subcooling only at laboratory scale. Later
on, both materials were also analysed with the T-History method [71], verifying that the effect
of subcooling was volume-dependent.
2.3 Addressing physical requirements
Regarding the physical requirements, TES materials should have high density in order to
decrease the space needed to store the same amount of heat. In addition, low vapour pressure
and low density variation between phases are needed to diminish the mechanical and chemical
stability requirements of the container. Finally, and specifically for TES materials working in
their latent phase, favourable phase equilibrium is required.
Despite the fact that these parameters are very important when designing the TES container or
the encapsulation for the TES material, there is a paucity of literature on this requirement at
high temperature. Regarding the low density variation, Archiblod et al. [71] and Solomon et al.
[73] considered the thermal expansion coefficient of sodium nitrate (Tm = 306.8 °C) and the
effect of an internal air void when evaluating its thermal performance within a metallic spherical

15
shell. They highlighted that the salt quantity inside the sell should be carefully calculated to
guarantee the internal pressure. Moreover, they found that the shape of the melting front and the
rate at which it moves is affected by the location of the internal air void. Hennemann et al. [74]
studied the physical laws limiting the heat of fusion and the usability of TES material in
applications, and an exhaustive study of entropy was done regarding expansional, positional,
orientational, conformational and electronic contribution of entropy. They concluded that
disregarding molecules with molecular weights less than 70 g/mol, the limiting theoretical
entropy value set by physical and chemical constrains was 1.0 J/(g·K).
2.4 Addressing thermal requirements
It is a fact that most of the materials used for TES purposes have poor thermal characteristics
and therefore enhancement techniques addressing these requirements need to be performed. As
Table 2 shows, there are five main thermal requirements that TES materials should meet in
order to optimize the processes in which they are planned to be implemented. If the thermal
storage is requested to occur in the latent phase, TES materials must have their phase change
temperature in the desired operating temperature range in order to increase the potential of the
system. Moreover, high latent heat of transition per unit volume near the temperature of use is
also desired in order to provide significant latent heat storage with small volumes and therefore,
obtaining lower operation costs due to the optimization of the storage container. The last
thermal requirement regarding the use of the latent phase is the utilization of a TES material
with congruent melting in order to ensure that it completely changes of phase and therefore,
both solid and liquid phases remain homogeneous. These three parameters can be evaluated
with commercial devices.
On the contrary, most of TES materials employed for high temperature purposes are used in
their sensible phases. Hence, laboratory analyses should be performed in order to determine the
proper thermal properties and optimize them within the desired operation temperature range.
The first requirement is that the TES material should have high thermal conductivity at both
solid and liquid states. This requirement, which has received a high interest from the
researchers, is fully reviewed and developed in the second part of this review [34]. The second
requirement is that the TES material should have high specific heat to provide significant
sensible heat storage. Normally, TES materials used for high temperature purposes have low
specific heat. The most widely used technique to enhance this property is the dispersion of
nanoparticles within the TES material. As mentioned in the second part of this review [34], the
material composed by nanoparticles dispersed within a base material (BM) is usually presented
as nanofluid, when the BM is in the liquid state, or nanocomposite, when the BM is in the solid

16
state. Both nanofluids and nanocomposites can be obtained from two different synthesis
methods [75] (Fig. 2): the two-step solution method (TSSM) or liquid solution method [76] and
the stirring method (SM) [77].
(a)
(b)
Fig. 2. Obtainment of nanomaterials at high temperature: (a) Schematic diagram of preparation of the two
step solution method [76]. (b) Schematic diagram of preparation of the stirring dispersion method [77].
Despite the fact that this enhancement technique for high temperature purposes is still in the
early stages of research, several studies have been carried out since 2011. Controversial results
were found on these studies. It has been observed that while in the water-based and organic-
based nanomaterials an increase on the specific heat was not achieved if compared to the pure
material (following the traditional thermal equilibrium model) [78], in the molten salt-based
nanomaterials an increase of the specific heat was observed. Shin and Banerjee [76] proposed
three mechanisms to help to understand these anomalous enhancements: low vibration
frequency, interfacial interaction and higher mean free path (Fig. 3). Shin and Banerjee [79]
went a step further and detailed why the molten salts nanofluids do not follow the conventional
effective specific heat model based on thermal equilibrium, but followed a more complex one.
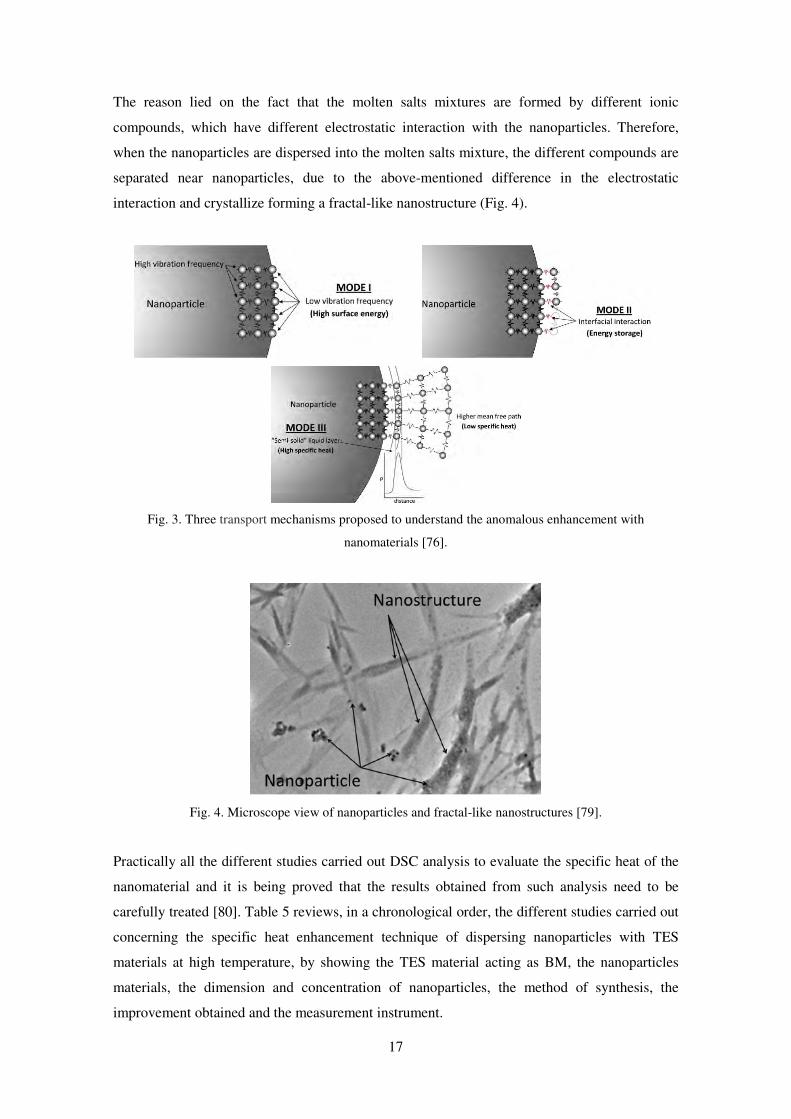
17
The reason lied on the fact that the molten salts mixtures are formed by different ionic
compounds, which have different electrostatic interaction with the nanoparticles. Therefore,
when the nanoparticles are dispersed into the molten salts mixture, the different compounds are
separated near nanoparticles, due to the above-mentioned difference in the electrostatic
interaction and crystallize forming a fractal-like nanostructure (Fig. 4).
Fig. 3. Three transport mechanisms proposed to understand the anomalous enhancement with
nanomaterials [76].
Fig. 4. Microscope view of nanoparticles and fractal-like nanostructures [79].
Practically all the different studies carried out DSC analysis to evaluate the specific heat of the
nanomaterial and it is being proved that the results obtained from such analysis need to be
carefully treated [80]. Table 5 reviews, in a chronological order, the different studies carried out
concerning the specific heat enhancement technique of dispersing nanoparticles with TES
materials at high temperature, by showing the TES material acting as BM, the nanoparticles
materials, the dimension and concentration of nanoparticles, the method of synthesis, the
improvement obtained and the measurement instrument.

18
Regarding these experimental studies, the two TES material which have been selected the most
as base materials to test the specific heat enhancement because of the dispersion of
nanoparticles heat have been the eutectic mixtures of sodium nitrates and potassium nitrates,
and the eutectic mixtures of lithium carbonates and potassium carbonates. The different authors
have studied the influence of the concentration of nanoparticles (from 0.5 to 4.6 wt %)
[75,77,81,82,84-87,89], of the influence of the nanoparticles material (mica, SiO2, Al2O3, TiO2,
SiO2-Al2O, carbon nanotubes, graphene and fullerene C60 (Fig. 5)) [82,86,87], and of the
influence of the particle size (5, 10, 30 and 60 nm) [83,84,88]. The lack of standards for the
preparation, the measurement and the evaluation of the results, as well as the lack of knowledge
of the behaviour of the composite at nano-scale, generates an elevated uncertainty which
currently makes very difficult the exercise of obtaining proper conclusions. However, Table 5
shows that the highest specific heat enhancement was achieved with a nanoparticle
concentration of 1 wt.%. Regarding the particle size, there is no significant variation in the
specific heat enhancement. Therefore, the fact of having the nanoparticles well-dispersed within
the BM rather than agglomerated might be one of the parameters responsible of such
enhancement. Ho and Pan [77] obtained the minimum concentration value at which
nanoparticles starts to aggregate and it turned to be 0.016 wt.%. Therefore, a standardization of
the preparation and evaluation of both the nanomaterial and the results, as well as, studies with
samples containing masses higher than the studied at laboratory scale, should be considered.
Fig. 5. Carbon nanostructures obtained by SEM analysis [87].
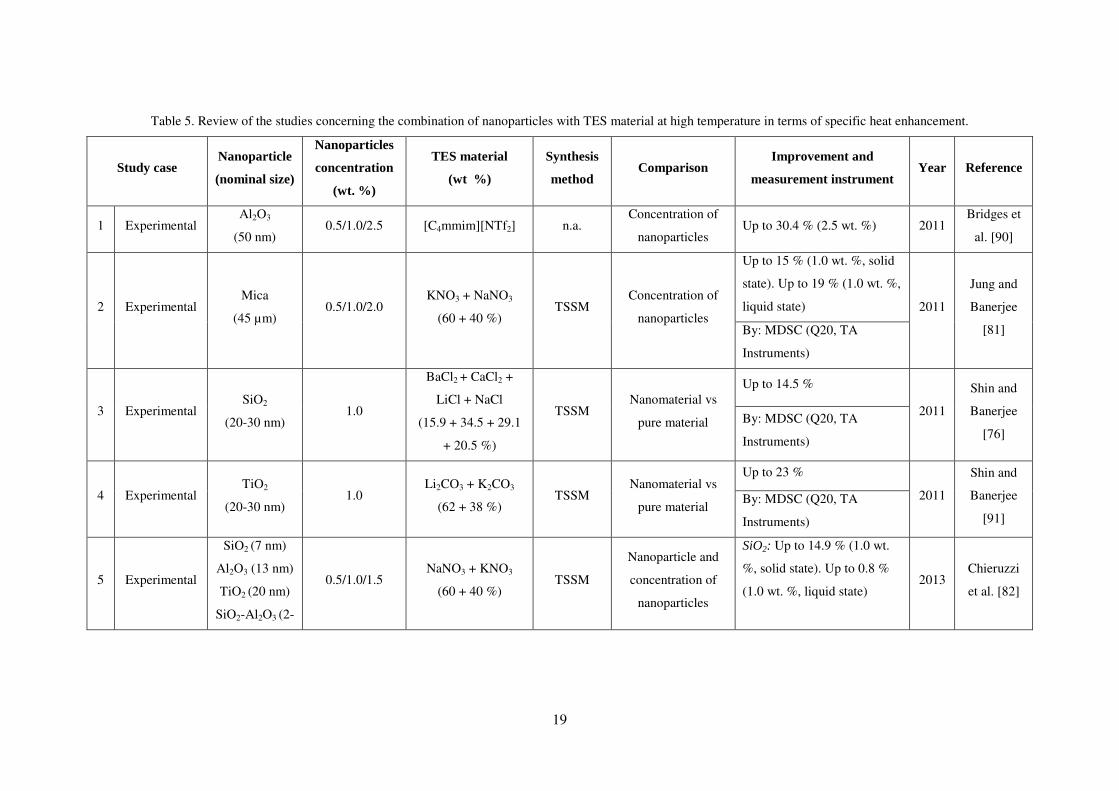
19
Table 5. Review of the studies concerning the combination of nanoparticles with TES material at high temperature in terms of specific heat enhancement.
Study case Nanoparticle
(nominal size)
Nanoparticles
concentration
(wt. %)
TES material
(wt %)
Synthesis
method Comparison
Improvement and
measurement instrument Year Reference
1 Experimental Al2O3
(50 nm) 0.5/1.0/2.5 [C4mmim][NTf2] n.a.
Concentration of
nanoparticles Up to 30.4 % (2.5 wt. %) 2011
Bridges et
al. [90]
2 Experimental Mica
(45 µm) 0.5/1.0/2.0
KNO3 + NaNO3
(60 + 40 %) TSSM
Concentration of
nanoparticles
Up to 15 % (1.0 wt. %, solid
state). Up to 19 % (1.0 wt. %,
liquid state) 2011
Jung and
Banerjee
[81] By: MDSC (Q20, TA
Instruments)
3 Experimental SiO2
(20-30 nm) 1.0
BaCl2 + CaCl2 +
LiCl + NaCl
(15.9 + 34.5 + 29.1
+ 20.5 %)
TSSM Nanomaterial vs
pure material
Up to 14.5 %
2011
Shin and
Banerjee
[76] By: MDSC (Q20, TA
Instruments)
4 Experimental TiO2
(20-30 nm) 1.0
Li2CO3 + K2CO3
(62 + 38 %) TSSM
Nanomaterial vs
pure material
Up to 23 %
2011
Shin and
Banerjee
[91]
By: MDSC (Q20, TA
Instruments)
5 Experimental
SiO2 (7 nm)
Al2O3 (13 nm)
TiO2 (20 nm)
SiO2-Al2O3 (2-
0.5/1.0/1.5 NaNO3 + KNO3
(60 + 40 %) TSSM
Nanoparticle and
concentration of
nanoparticles
SiO2: Up to 14.9 % (1.0 wt.
%, solid state). Up to 0.8 %
(1.0 wt. %, liquid state)
2013 Chieruzzi
et al. [82]

20
200 nm) Al2O3: Up to 19.9 % (1.0 wt
%, solid state). Up to 5.9 %
(1.0 wt. %, liquid state)
TiO2: No enhancement
observed
SiO2-Al2O3: Up to 57.7 %
(1.0 wt. %, solid state). Up to
22.5 % (1.0 wt. %, liquid
state)
By: Mettler-Toledo DSC
822E/400
6 Experimental
SiO2
(5/10/30/60
nm)
1.0 NaNO3 + KNO3
(60 + 40 %) TSSM
Size of
nanoparticles
Up to 10 % (1.0 wt. %, 60nm,
solid state). Up to 28 % (1.0
wt. %, 60nm, liquid state) 2013 Dudda and
Shin [83] By: MDSC (Q20, TA
Instruments)
7 Experimental Al2O3
(13/90 nm) 0.9/2.7/4.6
NaNO3 + KNO3
(60 + 40 %) TSSM
Concentration of
nanoparticles and
particle size
No enhancement observed
2013 Lu and
Huang [84] By: MDSC (Q20, TA
Instruments)
8 Experimental SiO2
(2-20 nm) 1.5
Li2CO3 + K2CO3
(62 + 38 %) TSSM
Nanomaterial vs
pure material
Up to 54 % (solid state). Up
to 124 % (liquid state) 2013
Shin and
Banerjee

21
By: MDSC (Q20, TA
Instruments)
[92]
9 Experimental
SiO2
(5/10/30/60
nm)
1.0 Li2CO3 + K2CO3
(62 + 38 %) TSSM
Size of
nanoparticles
Up to 28 % (60 nm, solid
state). Up to 26 % (60nm,
liquid state) 2013
Tiznobaik
and Shin
[93] By: MDSC (Q20, TA
Instruments)
10 Experimental SiO2
(12 nm) 0.5/1.0/1.5/2.0
NaNO3 + KNO3
(60 + 40 %) TSSM
Concentration of
nanoparticles
Up to 25 % (1.0 wt. %).
2014
Andreu-
Cabedo
[75]
By: Mettler-Toledo DSC
822E/400
11 Experimental Al2O3
(<50 nm)
0.016/0.063/0.1
25/0.25/0.5/1.0/
2.0
KNO3 + NaNO2 +
NaNO3
(53+ 40 + 7 %)
SM Concentration of
nanoparticles
Up to 19.9 % (0.063 wt. %)
2014 Ho and Pan
[77] By: Perkin Elmer/DSC 7
12 Experimental Sn/SiO2
(100 nm) 1.0/3.0/5.0
KNO3 + NaNO3
(40 + 60 %)
KNO3 + NaNO2 +
NaNO3
(53 + 40 + 7 %)
n.a. Concentration of
nanoparticles
KNO3+NaNO3: Up to 36.3 %
(5.0 wt. %).
2014 Lai et al.
[89]
KNO3+NaNO2+NaNO3: Up
to 30.1 % (5.0 wt. %).
By: Mettler-Toledo DSC
822E/400
13 Experimental SiO2
(60 nm) 1.0
LiNO3 + NaNO3 +
KNO3
(38 + 15 + 47 %)
TSSM Nanomaterial vs
pure material
Up to 33 %
2014 Seo and
Shin [94] By: MDSC (Q20, TA
Instruments)
14 Experimental Al2O3 1.0 Li2CO3 + K2CO3 TSSM Nanomaterial vs Up to 33 % 2014 Shin and

22
(60 nm) (62 + 38 %) pure material By: MDSC (Q20, TA
Instruments)
Banerjee
[95]
15 Experimental
MWCNT
(10-30 nm x
1.5µm)
1.0 Li2CO3 + K2CO3
(62 + 38 %) TSSM
Nanomaterial vs
pure material
Up to 16 % (solid state). Up
to 21 % (liquid state) 2014
Jo and
Banerjee
[96] By: MDSC (Q20, TA
Instruments)
16 Experimental SiO2 1.0 Li2CO3 + K2CO3
(62 + 38 %) TSSM
Nanomaterial vs
pure material
Up to 15 % (solid state)
2015
Shin and
Banerjee
[97]
By: MDSC (Q20, TA
Instruments)
17 Experimental Al2O3
(40 nm)
0.125/0.25/0.5/0
.75/1.0/1.5/2.0
NaNO3 + KNO3
(60 + 40 %) TSSM
Concentration of
nanoparticles
Up to 30.6 % (0.78 wt. %)
2015 Schuller et
al. [85] By: MDSC (Q20, TA
Instruments)
18 Experimental
SWCNT (5-20
nm x 1-5 µm)
MWCNT (10-
50 nm x 0.5-1
µm)
Graphene (10-
20 nm x 1-5
µm)
Fullerene C60
(0.5-2 µm)
0.1/0.5/1.0/1.5/2
.5
Li2CO3 + K2CO3
(62 + 38 mol %) TSSM
Nanoparticle and
concentration of
nanoparticles
SWCNT: Up to 18.7 % (1.5
wt. %, solid state). Up to 14.4
% (1.5 wt%, liquid state)
2015 Tao et al.
[87]
MWCNT: Up to 12.4 % (1.5
wt. %, solid state). Up to
14.52 % (1.5 wt. %, liquid
state)
Graphene: Up to 16.8 % (1.5
wt. %, solid state). Up to
18.57 % (1.5 wt. %, liquid
state)

23
C60: Up to 13.47 % (2.5 wt.
%, solid state). Up to 12.05 %
(2.5 wt. %, liquid state)
By: n.a.
19 Experimental
SiO2 (7 nm)
Al2O3 (13 nm)
SiO2-Al2O3 (2-
200 nm)
1.0 KNO3 TSSM Nanoparticle
SiO2: Up to 9.5 % (solid
state). Up to 6.1 % (liquid
state)
2015 Chieruzzi
et al. [86]
Al2O3: No enhancement
observed
SiO2-Al2O3: Up to 4.7 %
(solid state). No enhancement
observed in the liquid state
By: Mettler-Toledo DSC
822E/400
20 Experimental
SiO2
(5/10/30/60
nm)
1.0
LiNO3 + NaNO3 +
KNO3
(38 + 15 + 47 %)
TSSM Size of
nanoparticles
Up to 16 % (10 and 30 nm)
2016 Seo and
Shin [88] By: MDSC (Q20, TA
Instruments)
21 Experimental SiO2
(30 nm) 1.0
NaNO3 + KNO3 +
Ca(NO3)2
(49 + 30 + 21 %)
TSSM Nanomaterial vs
pure material
Up to 19 %
2016
Devaradjan
e and Shin
[98] By: MDSC (Q20, TA
Instruments)
MDSC: Modulated differential scanning calorimeter / SWCNT: Single walled carbon nanotubes / MWCNT: Multi-walled carbon nanotubes /TSSM: Two-step solution method /
SM: Stirring method

24
3. System requirements
3.1 Addressing economic requirements
A common problem in the current research field is that TES is mainly focused on the analysis of
the intrinsic properties of the materials and its enhancement techniques and the system
requirements (Economy, technology and environment) are sometimes ignored. The economic
feasibility of a TES system is assessed taking into account parameters like abundance and
availability of the TES material, large lifetime of the components and cost effectiveness.
Most of the economic analyses are focused on CSP facilities as they are one of the most
developed technologies at the high temperature range. More than 80% of CSP plants which are
already built or under construction are based on the parabolic trough technology [106]. Hence,
practically all the information regarding economic aspects refers to this technology. CSP
facilities costs are mainly divided in three categories: capital investment costs (CAPEX),
operation and maintenance costs (OPEX) and financing costs [107]. It is very difficult to obtain
feasible and real values, since very few information is currently available because of
confidentiality. Table 6 shows the breakdown of the CAPEX costs of two proposed 100 MW
CSP plants in South Africa. The first one corresponds to a parabolic through CSP plant with
13.4 h of storage and estimated total CAPEX costs of 914 million USD, while the second one
corresponds to a solar tower CSP plant with 15 h of TES and estimated total CAPEX costs of
978 million USD. In both cases the most economic-intensive part is the solar and heliostat field,
representing one third of the total investment. From this cost, the elements made of steel and the
mirrors are the largest contributors. On the other hand, the TES system represents 10-15 % of
the total cost, being the TES material and the storage tanks the largest contributors. OPEX costs
include the replacement costs of the damaged and broken elements of the plant, the water costs
for mirror washing, and insurance among others, and have values between 0.020 and 0.036
USD/kWh for parabolic trough CSP plants, and around 65 USD/kW/year for solar tower CSP
plants [106]. Finally, the authors of the study reviewed potential CSP cost reduction potentials
and identified the following potential innovations: new HTFs, new storage materials, new
mirror material and new collector concepts.
Table 6. Breakdown of the CAPEX of two proposed 100 MW CSP plants in South Africa [107].
Section CAPEX breakdown
Parabolic trough CSP Solar tower CSP
Solar field / Heliostat field 35 % 33 %

25
Site preparation n.a. 4 %
Tower n.a. 2 %
Receiver system n.a. 15 %
Owner’s costs 5 % 5 %
Contingencies 8 % 8 %
Engineering 7 % 6 %
Balance of plant 6 % 6 %
Power block 17 % 11 %
TES system 15 % 10 %
HTF system 7 % -
Wagner and Rubin [109] combined the cost with the performance and the profit of a 110-MW
parabolic trough CSP plant operating with a TES system, with and without natural gas-fired
backup system. The use of TES was found to increase the annual capacity factor and the total
plant capital costs but decreased the annual operation and maintenance costs. Nithyanandam and
Pitchumani [110] studied, in terms of cost and performance, two different TES systems types
(encapsulated PCM and embedded heat pipes) integrated in tower CSP plants, and compared
them with the results of a two-tank molten salt storage system. Results showed that the costs of
integrating the two-tank molten salt storage system is at least 1.12 ¢€/kWh and 0.71 ¢€/kWh
higher compared to encapsulated PCM and embedded heat pipes systems, respectively.
Regarding to other types of TES systems, Rathgeber et al. [111] evaluated the storage capacity
costs (€·kWh-1) of different TES systems from the participants institutions at Energy
conservation through energy storage (ECES) Annex 29 via top-down and bottom-up
approaches. Some of the systems presented work at high temperature. Results showed that the
annual number of storage cycles has the largest influence on the cost effectiveness.
3.2 Addressing environmental requirements
As environmental awareness increases, industries and businesses are assessing how their
activities affect to the environment. Table 2 lists the environmental requirements for a whole
TES system (TES material, container, piping system, insulation, etc.). These requirements aim
to reduce the environmental impact of the TES systems and to accomplish sustainable
regulations and trends. Therefore it is desirable to have a low manufacturing energy demand, to
demand an easy recycling and treatment, and to use non-polluting and low CO2 footprint
materials. These requirements can be assessed by performing environmental analyses and/or
using by-products or industrial wastes as alternative TES materials.

26
Regarding the environmental analysis, three main tools have been found focused on identifying
the environmental affection of those systems: the carbon or CO2 footprint, the life cycle
assessment (LCA), and the cumulative energy demand (CED). The CO2 footprint measures the
greenhouse gases (GHG) emissions over the whole life of a product from the extraction of raw
materials and manufacturing right through to its use and final re-use, recycling or disposal
[112]. It considers direct emissions, which are emissions from sources that are owned or
controlled by the reporting entity, and indirect emissions, which are emissions that are a
consequence of the activities of the reporting entity, but occur at sources owned or controlled by
another entity. In fact, the CO2 footprint is a simplification of the LCA analysis, and instead of
considering all the impact categories a LCA (Table 7), it only considers the global warming
impact category. LCA analyses the impact of a product from the extraction, through
manufacturing, transportation and use, to its disposal. LCA divides the environmental burdens
analysis into three different damage categories: human health, ecosystem quality and resources.
Finally, the CED considers direct and indirect energy use throughout the life cycle, including
the energy consumed during the extraction, manufacturing and disposal of the raw and auxiliary
materials [113].
Table 7. Main impact categories of LCA classified by scale impact and their quantification, based on
[114].
Impact category Quantification
Global impact
Global warming CO2-Eq
Resource depletion Quantityresourceused
Quantityleftinreserve
Ozone depletion CFC-11 equivalents
Regional impact Smog Ethane equivalents
Acidification Hydrogen ion equivalents
Local impact
Eutrophication PO4 equivalents
Human toxicity LC50 equivalents
Ecotoxicity LC50 equivalents
Land use Mass of solid waste
Water use Quantitywaterused
Quantityleftinreserve
The environmental analyses found in the literature are classified in this review depending on the
boundaries of the study. First, only the TES material. Afterwards, the TES system (it includes
27
the HTF, the container material and the insulation). Finally, the whole facility (it includes the
TES system and the heating and cooling systems).
Considering only the TES material, Khare et al. [115] identified some sensible heat storage
materials to work from 500 ºC on and calculated their environmental affection during the
different life cycle stages. Among all the materials studied, they observed that high alumina
concrete was the less energy requiring material and with the lower values of CO2 production as
a consequence of little material processing and local transport. López-Sabirón et al. [116]
performed an LCA to determine whether the energy savings of conventional fuels during the
operation stage were large enough to balance the environmental impact of four different latent
TES system (used to recover thermal energy in a temperature range from 300 ºC to 400 ºC)
from its manufacture to its disposal. Results showed a reduction in the overall impacts by the
use of TES. Besides, they also calculated the carbon footprint of the main integrating
components of these TES system. They observed that the HTF is the lowest contributor while
the steel and the PCM are the highest contributors. In another study, López-Sabirón et al. [117]
evaluated a TES system with PCM including the manufacture, use and end-of-life stages. They
observed that changing the materials in the manufacture of the TES, raising the material
recovery ratios, and selecting the proper HTF, can increase the positive impact of the end-of-life
stage.
Regarding both the material and system, Oró et al. [118] compared the LCA of three different
TES systems for solar power plants: sensible heat storage (concrete and molten salts) both in
solid and liquid thermal storage media and latent heat storage (molten salts). They concluded
that the system containing sensible liquid thermal storage media was the one with higher
environmental impact. The same systems were analysed by Miró et al. [119], who besides
accounted their CED. In this case, results showed that the latent system was the one accounting
for more embodied energy. Recently, Lalau et al. [120] compared the environmental impacts of
a thermocline TES system using Cofalit as the filler material to a conventional two-tank molten
salt TES system. The authors used the global warming potential (GWP), CED and water
indicators to calculate the Cofalit manufacturing impact. They identified a reduction in
comparison with the two-tank molten salt storage of 40 % for the GWP, 30 % for the CED and
60 % for water. Moreover, the advantages of using Cofalit are its availability and its high
working temperature (up to 1000 ºC).
Finally, from the point of view of the whole facility, Klein [121] analysed the water
consumption, land use, and life cycle GHG emissions of different backup cooling options (wet
and dry cooling combined with fossil fuels or molten salts TES) by applying a multi-criteria

28
decision analysis to a 1 MWh parabolic trough CSP plant. In this study, the authors suggested a
preference for the TES backup. In another study, Klein and Rubin [122], applied an LCA
analysis to the same CSP plant than Klein [121] and considered also different backup systems.
They concluded that facilities with TES have less GHG emissions than plants using natural gas
as backup system but higher land use. Lechón et al. [123] performed an LCA analysis of two
solar thermal plants located in Spain using molten salts as TES material: one with the solar
tower technology (17 MW) and the other with the parabolic trough technology (50 MW). They
accounted for 634 kt of CO2 savings if thermal power objectives for Spain were accomplished.
Giuliano et al. [124] accounted and compared the CO2 emissions of five 30 MW solar-hybrid
plants (with and without molten salts as storage system) to a conventional fossil-fired driven
plant. Results showed that larger solar fields and the integration of TES reduced the CO2
emissions up to 68% if compared to the fossil-fired combined cycle. Whitaker et al. [125]
analysed the GHG emissions, water consumption and CED of a 106 MW solar tower CSP plant.
They compared the origin of the TES material (mined or synthetic) and the configuration of the
storage system (two-tank or thermocline). They concluded that the use of synthetic salts
increased the cumulative energy demand and the switching from two-tank to thermocline
configuration was insignificant regarding all the environmental parameters. The same
environmental analysis was used by Burkhardt et al. [126] in a parabolic trough CSP plant (103
MW). In this case, the same conclusion than Burkhardt et al. [126] was achieved regarding the
origin of the TES material. In addition, the authors found a 7 % of GHG emissions reduction
when using thermocline instead of two-tank configuration.
Table 8 shows the different studies found in the literature concerning the environmental analysis
at high temperature. It is classified according to the TES material and ordered chronologically.
Besides, the type of environmental analysis performed and the software and database used are
also listed. It can be seen that there is a lack of environmental analysis in systems containing
TES materials, since only twelve cases have been found in the literature. Among them, molten
salts are the most studied TES material in the high temperature range considered in this article
(> 150 ºC). Other materials studied are sodium nitrate, high temperature concrete, ferrous
metals, alumina, high alumina concrete, graphite, magnesia and silicon carbide. In order to
perform the different environmental analyses, EcoInvent and SimaPro are the most used
software. Regarding to the parameters analysed, LCA and CO2 footprint are the ones which
have been calculated more often. Generally, when TES is evaluated and compared to
conventional systems from a material point of view, its benefits are not significant. However,
when the comparison is done at system level and at higher scale, the benefits of introducing
TES, such as a reduction of CO2 emissions, and energy and water consumption, are more
noticeable. On the contrary, the main disadvantage is the land use.

29
Table 8. Review of the studies concerning the environmental analysis at high temperature.
Study
case Boundary TES material Parameter analysed
Software /
Database used Results Year Reference
1 Facility Molten salts LCA SIMAPRO ST: 9.49 g CO2-eq/kWh
PT: 14.60 g CO2-eq/kWh 2008
Lechón et al.
[123]
2 Facility Molten salts CO2 emissions
reduction n.a.
ST: 0.062-0.414 kg CO2-eq/kWh
PT: 0.098-0.482 kg CO2-eq/kWh 2011
Giuliano et
al. [124]
3 Facility Molten salts
CO2 footprint SIMAPRO
EcoInvent
database
5.01-5.21 g CO2 eq/kWh
2011 Burkhardt et
al. [126] Water consumption 0.19 L/kWh
CED 0.07 MJ/kWh
4 Material
and system
Molten salts (sensible)
LCA Eco-Indicator 99
3376 IP
2012 Oró et al.
[118] Molten salts (latent) 1270 IP
High temperature concrete 279 IP
5 Material
Magnesium
Aluminium
Zinc
Al+Si (88+12 wt %)
Al+Mg+Zn (60+34+6 wt %)
Energy consumption
CO2 footprint
CES
EcoAuditTM
Energy and CO2 production for the
alloy 88Al–12Si being the lowest,
followed by aluminium
2013 Khare et al.
[115]
6 Facility Molten salts
Water consumption
SIMAPRO
0.73-5 L/kWh
2013 Klein [121] Land use 240-286 m2/GWh
CO2 footprint 49-73 g CO2-eq/kWh

30
7 Facility Molten salts
Water consumption
n.a.
2.3-2.4 L/kWh
2013 Klein and
Rubin [122] Land use n.a.
CO2 footprint 0.33-0.34 kg CO2-eq/kWh
8 Facility Mined and synthetically
derived molten salts
CO2 footprint SIMAPRO
EcoInvent
database
The use of synthetic salts increase CO2
footprint 12%, CED by 7%, and water
consumption by 4% compared to
mined salts
2013 Whitaker et
al. [125] Water consumption
CED
9 Material
KNO3
NaOH
K2CO3 +Na2CO3+Li2CO3
(35+33+32 wt %)
LiOH+KOH (40+60 wt %)
CO2 footprint
EcoInvent
database
Simapro
LiOH/KOH benefits -8 to -18 ton CO2
eq in comparison with other cases 2014
López-
Sabirón et al.
[116]
10 Material Sodium nitrate LCA
SIMAPRO
CML 2001
Eco-Indicator 99
n.a. 2014
López-
Sabirón et al.
[117]
11 Material
and system
Molten salts (sensible)
CED EcoInvent
database
125 TJ
2015 Miró et al.
[119] Molten salts (latent) 257 TJ
High temperature concrete 17 TJ
12 Material
and system Cofalit
GWP
CML 2001
2.4 kg CO2-eq/kWh
2016 Lalau et al.
[120] CED 0.046 MJ/kWh
Water consumption 0.058 L/kWh
LCA: Life cycle assessment / CED: Cumulative energy demand / GWP: Global warming potential / ST: Solar tower / PT: Parabolic trough / CO2-eq: Equivalent CO2
emissions / IP: Impact points

31
Regarding the use of by-products and industrial wastes to reduce environmental impact of TES
systems, researchers have proposed the use of waste materials and by-products from different
industries as TES materials in order to reduce the environmental impact of the facilities which
contains a TES system [127]. The use of these materials reduces significantly the environmental
impact if compared to other manufactured products as they avoid both extraction of raw
materials and manufacturing life cycle stages. Moreover, if these materials do not need any
further treatment, they are considerably cheaper. Some examples of by-products and waste
materials candidates for high temperature TES purposes are: Intertized asbestos containing
wastes (ACW), fly ashes (FA), by-products from the salt and metal industry and municipal
wastes.
Several authors [128-131] studied the recycled industrial ceramics made of ACW. Results
showed that this material presented no hazard, no environmental impact, good thermophysical
properties and very low investment cost. Meffre et al. [132] studied and characterized FA as
TES material. FA are micron-size particles present in gaseous effluents produced by industrial
combustions in facilities such as coal fired power plants or municipal solid wastes incinerators.
They are mainly composed of SiO2, Al2O3 and CaO and its waste treatment is also generally
performed by plasma torch processing [133]. Results from the characterization showed good
thermophysical properties for sensible TES storage and an energy payback of the plasma torch
waste treatment of 7.4 months for CSP applications. By-products from the salt industry were
studied by Miró et al. [134] and Ushak et al. [135]. The authors performed thermophysical and
morphological characterisation at laboratory scale, and evaluated their performance at pilot
plant scale. It was found that this by-product had high potential for commercial TES up to a
temperature of 200 ºC but corrosion should be previously solved. The steel industry produces
different types of by-products (referred as slags) depending on the furnace technology used.
Thermo-physical properties of ferrous slag [139-142] indicate very appropriate values for the
use of this material in sensible thermal energy storage up to temperatures of 1200 ºC. Finally,
some authors proposed mixtures of wastes and TES materials. For example, Ozger et al. [137]
proposed nylon fibres from post-consumer textile carpet waste for fibre-reinforced concrete as
candidate for high temperature sensible heat storage up to 450 ºC, and Navarro et al. [138]
proposed by-products from the copper industry to be mixed with cement.
Table 9 lists the by-products which have been currently studied by different researchers and the
temperature at which they have been tested. However, researchers do not only focus on by-
products because of their environmental advantages but also focus on these products from the
economical point of view, since they are usually cheaper than current TES materials.

32
Table 9. Summary of the studies concerning the environmental requirements at high temperature in terms
of potential by-products and waste materials candidates for TES purposes.
Study
Case By-product
Temperature
range analysed Year Reference
1 Asbestos containing wastes
(ACW) Up to 1000 ºC 2000-2014
Py et al. [128]
Kere et al. [129]
Gualtieri and Tartaglia
[130]
Calvet et al. [131]
2 Fly ashes (FA) Up to 1100 ºC 2011-2012 Meffre et al. [132]
3 NaCl from salt industry 100-200 ºC 2014 Miró et al. [134]
4 Astrakanite from salt industry 570-680 ºC 2014 Ushak et al. [135]
5 Ferrous slag from metal
industry Up to 1200 ºC 2011-2014
Gil et al. [139]
Ortega et al. [140,141]
Mills [142]
3.3 Addressing technological requirements
Technological requirements, which include the integration of the TES material into the facility,
the operation strategy of the facilities, and the good transfer between the HTF and the TES
material, are not usually considered in the literature, even though these requirements are known
to have an incidence in the design and the economics of the system. The integration of the TES
material into the facility can help TES systems to be considered as substitutes of conventional
fossil-fuel technologies. A good operation strategy can considerably enhance the overall TES
system heat transfer efficiency, which is closely linked to the requirement of good heat transfer
between the HTF and the TES material. Finally, the most important operation strategies
containing TES at high temperature are the multiple PCMs configuration and the forced
movement of the TES material while undergoing phase change.
Multiple PCMs configuration, also referred as cascaded or multistage configuration, is a TES
system configuration where different PCMs (with different melting temperatures and
enthalpies) are arranged in series. This configuration aims to increase low storage capacities in
the single PCM due to the poor PCM thermal conductivities. As it can be observed in Fig. 6, the
optimum arrangement for a multiple PCM system is obtained by placing the PCMs in a
decreasing order of their melting temperatures (Tm) and in an increasing order of their heat
storage capacities (h) in the HTF flow direction during the charging process, and the other way
around during the discharging process [143]. The advantages of this arrangement are the

33
increase of the heat transfer rate during charging and discharging, especially in the latent part,
the uniform and higher outlet HTF temperature for a longer period during charging and
discharging process, the faster charging and discharging process, the increase of exergy
efficiency and the increase of average effectiveness.
Fig. 6. Optimum arrangement of a multiple PCM system [143].
Hence, in order to achieve the greatest performance improvement, researchers need to study the
thermophysical properties of the candidate PCMs with the aim of not selecting them arbitrarily
but select the suitable combination and with the proper dimensions for the desired application.
Tao et al. [144] performed an optimization of the PCM temperatures for a two-stage PCM
storage unit using the entransy theory and Li et al. [145] optimized the geometrical parameters
of their proposed storage unit.
In the literature, few multiple PCMs configuration within the high temperature range are found.
Gong and Mujumdar [146] used five PCM in the range 667 – 867 ºC, Cui et al. [147] three
PCM in the range 717 – 779 ºC, Michels and Pitz-Paal [148] used three PCM in the range 306 –
335 ºC, Seeniraj and Lakshmi Narasimhan [149] used five PCM in the range 873 – 767 ºC,
Shagbard et al. [150] used three PCM in the range 318 – 370 ºC, Li et al. [145] used three PCM
in the range 397 – 710 ºC, Tao et al. [144] used two PCM in the range 746 – 767 ºC, Wang et al.
[151] used three PCM in the range 390 – 485 ºC and finally Peiró et al. [143] used two PCM in
the range 158.5 – 168.5 ºC. Most of them are numerical studies [144-147,149-151] and only two
experimental cases have been found [143,148].
Table 10 summarizes the characteristics of the multiple PCM configuration analysis found in
the literature and their improvement versus single PCM configuration.

34
Table 10. Review of the studies concerning the technological requirements at high temperature in terms of numerical and experimental analysis of cascaded PCM
configurations.
Study case Heat exchanger
design Number of PCM
TES materials (mol%) and
order in which they are
placed
Melting
temperature
Improvement vs single
configuration Year Reference
1 Numerical Single pass shell and
tube 5
1. n.a. 1. 867 ºC
More uniform HTF outlet
temperature 1995
Gong and
Mujumdar
[146]
2. n.a. 2. 817 ºC 3. LiF + CaF2
(80.5 + 19.5 %) 3. 767 ºC
4. n.a. 4. 717 ºC 5. n.a. 5. 667 ºC
2 Numerical Single pass shell and
tube 3
1. n.a. 1. 779 ºC Reduction of the HTF outlet
temperature variations
Energy rate enhancement
2003 Cui et al.
[147] 2. LiF + CaF2
(80.5 + 19.5 %) 2. 767 ºC
3. n.a. 3. 717 ºC
3 Experimental Single pass shell and
tube 3
1. KNO3 1. 335 ºC Reduction of the HTF outlet
temperature variations
Energy rate enhancement
2007
Michels
and Pitz-
Paal [148]
2. KNO3 + KCl (95.5 + 4.5 %)
2. 320 ºC
3. NaNO3 3. 306 ºC
4 Numerical Single pass shell and
tube 5
1. LiF + CaF2
(80.5 + 19.5 %) 1. 767 ºC
Reduction of the HTF outlet
temperature variations
Energy rate enhancement
2008 Seeniraj et
al. [149]
2. Eutectic mixture LiF-MgF2
2. 736 ºC
3. n.a. 3. 700 ºC
4. n.a. 4. 650 ºC
5. n.a. 5. 600 ºC
5 Numerical
Rectangular
container with HTF
flow channels
3
1. NaOH + NaCl (73.3 + 26.7 %)
1. 370 ºC Increase 10 % exergy
recovery 2012
Shagbard et
al. [150] 2. KCl + MnCl2 + NaCl (22.9 + 60.6 + 16.5 %)
2. 350 ºC

35
located at the top
and bottom 3. NaOH + NaCl + Na2CO3 (65.2 + 20 + 14.8 %)
3. 318 ºC
6 Numerical Single pass shell and
tube 3
1. K2CO3 + Na2CO3 (51 + 49 %)
1. 710 ºC No comparison with single
configuration has been done
in this study
2013 Li et al.
[145] 2. Li2CO3 + NaCO3 + K2CO3 (20 + 60 + 20 %)
2. 550 ºC
3. Li2CO3 + NaCO3 + K2CO3 (32 + 33 + 35 %)
3. 397 ºC
7 Numerical Single pass shell and
tube 2
1. LiF + CaF2 (80.5 + 19.5 %)
1. 767 ºC Energy rate enhancement
Reduction of the entransy
dissipation rate
2014 Tao et al.
[144] 2. LiF + MgF2 (67 + 33 %)
2. 746 ºC
8 Experimental Multiple pass shell
and tube 2
1. Hidroquinone 1. 168.5 ºC Higher uniformity on the
outlet HTF temperature
Effectiveness enhancement
of 19.36 %
2015 Peiró et al.
[143] 2. D-mannitol 2. 158.5 ºC
9 Numerical Zig zag
configuration 3
1. n.a. 1. 450, 460, 470,
480, 485 ºC Intensification of the
charging process 2015
Wang et al.
[151] 2. n.a. 2. 440 ºC
3. n.a. 3. 395, 400, 410,
420, 430 ºC

36
Despite the fact that very little investigation has been carried out at high temperature, a novel
heat transfer enhancement technique between the TES material and the HTF is included in this
review, which is known as forced movement of the TES material while undergoing phase
change. Three different concepts are currently dealing with this technique: dynamic melting
[152,153], screw heat exchanger [154] and PCM flux [155] (Fig. 7). They mainly consist of
moving the TES material during the phase change processes with an external force (transport
mechanism or pump). As a consequence, there is a dominance of the forced convection heat
transfer mechanism during the melting process, which increases the overall heat transfer
coefficient and therefore, the heat transfer between the HTF and the TES material. During the
solidification process, this technique continuously avoids the presence of a solid layer around
the heat transfer surface by removing it, which decreases the thermal resistance of the material.
Three main advantages can be identified in this enhancement technique: first, the heat transfer
can be controlled by adjusting the HTF and PCM velocities; second, the phase segregation can
be prevented because of the forced movement; third, the packing factor, which is the ratio
between the volume of PCM and the volume of the TES container, is maintained constant.
(a) (b)
(c) (d)
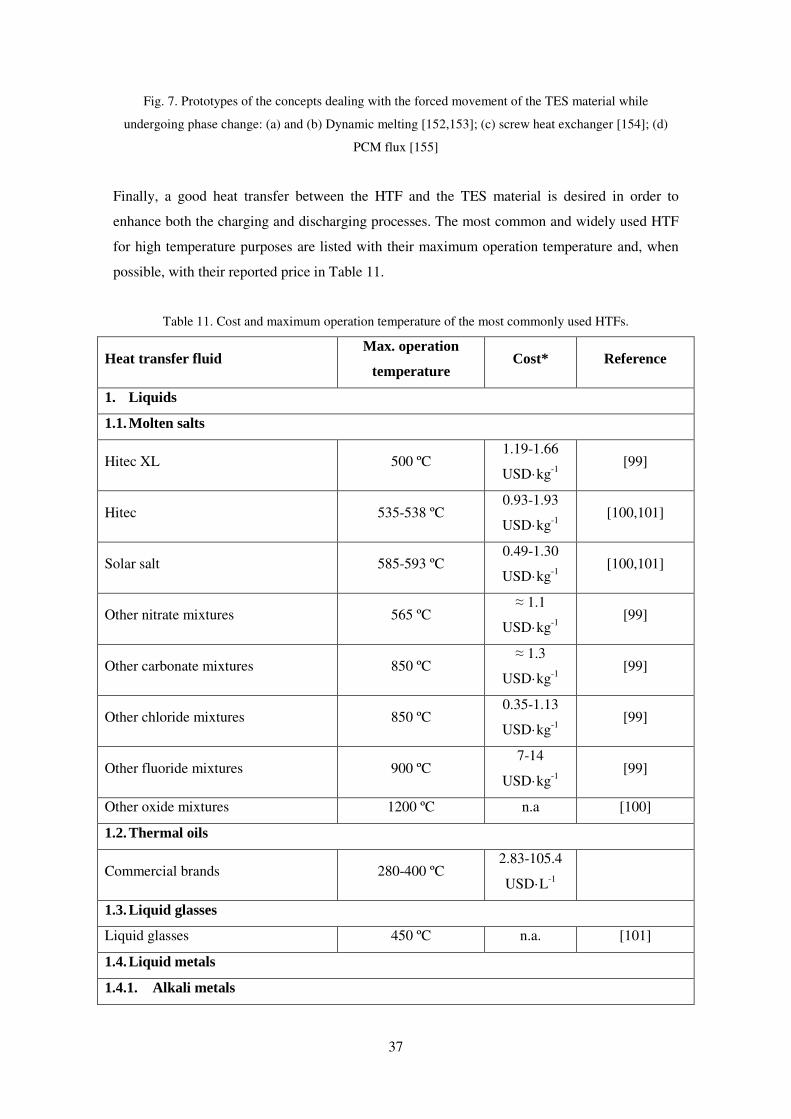
37
Fig. 7. Prototypes of the concepts dealing with the forced movement of the TES material while
undergoing phase change: (a) and (b) Dynamic melting [152,153]; (c) screw heat exchanger [154]; (d)
PCM flux [155]
Finally, a good heat transfer between the HTF and the TES material is desired in order to
enhance both the charging and discharging processes. The most common and widely used HTF
for high temperature purposes are listed with their maximum operation temperature and, when
possible, with their reported price in Table 11.
Table 11. Cost and maximum operation temperature of the most commonly used HTFs.
Heat transfer fluid Max. operation
temperature Cost* Reference
1. Liquids
1.1. Molten salts
Hitec XL 500 ºC 1.19-1.66
USD·kg-1 [99]
Hitec 535-538 ºC 0.93-1.93
USD·kg-1 [100,101]
Solar salt 585-593 ºC 0.49-1.30
USD·kg-1 [100,101]
Other nitrate mixtures 565 ºC ≈ 1.1
USD·kg-1 [99]
Other carbonate mixtures 850 ºC ≈ 1.3
USD·kg-1 [99]
Other chloride mixtures 850 ºC 0.35-1.13
USD·kg-1 [99]
Other fluoride mixtures 900 ºC 7-14
USD·kg-1 [99]
Other oxide mixtures 1200 ºC n.a [100]
1.2. Thermal oils
Commercial brands 280-400 ºC 2.83-105.4
USD·L-1
1.3. Liquid glasses
Liquid glasses 450 ºC n.a. [101]
1.4. Liquid metals
1.4.1. Alkali metals

38
NaK (22.2 wt. % Na + 77.8 wt. % K) 785 ºC 2 USD·kg-1 [102]
K 766 ºC 2 USD·kg-1 [102]
Na 873-883 ºC 2 USD·kg-1 [99-101]
Li 1342 ºC 60 USD·kg-1 [102]
1.4.2. Heavy metals
Lead-bismuth eutectic allow (LBE)
(44.5 wt. % Pb + 55.5 wt. % Bi) 1533-1670 ºC 13 USD·kg-1 [99,101,102]
Pb 1743 ºC 2 USD·kg-1 [102]
Bi 1670 ºC 22 USD·kg-1 [102]
1.4.3. Fusible metals
Ga 2237 ºC 600
USD·kg-1 [102]
In 2072 ºC 500
USD·kg-1 [102]
Sn 2687 ºC 25 USD·kg-1 [102]
2. Supercritical fluids
Supercritical H2O 620 ºC n.a. [101]
Supercritical C2O 850 ºC n.a. [101]
3. Gases
Superheated steam 600 ºC 0 [101]
Compressed air 800 °C 0 [100]
*Commercial cost at May 2015 without shipping fees
Two research groups studied how to improve the thermal conductivity of commercial HTF in
order to increase the heat transfer rates between HTFs and TES materials. Cingarapu et al. [103]
dispersed 5 vol.% of core/shell silica encapsulated tin (Sn/SiO2) nanoparticles in Therminol66,
obtaining an enhancement of 11 %. Torres-Mendieta et al. [104] dispersed spherical gold
nanoparticles in Therminol VP-1 and obtained an enhancement of 4 %. Other authors have also
proposed the lead-bismuth eutectic alloy PbBi and molten tin [102], and dense particle
suspension (DPS) fluidized with air [105] for candidates as HTF.
4. Conclusions
In the part 1 of this article, the requirements that TES materials and TES system should
accomplish for an optimal performance and a widespread deployment are reviewed. High
temperature is considered above 150 ºC and only latent and sensible TES are studied. These

39
requirements are divided depending if they are focused on the TES material or on both the TES
material and system. Requirements focused on the TES material are grouped into chemical,
physical and thermal while the requirements focused on the TES material and systems are
grouped into environmental, economic and technologic. Part 2 of this article presents a review
of the numerical and experimental studies focused on the different thermal conductivity
enhancement techniques in the high temperature range.
The most studied topics regarding the different requirements reviewed are:
� Materials requirements
The full characterization of the TES material is very important to assess its suitability
for a TES application.
o Chemical
This is the most studied requirement regarding the TES material. Long-term
stability, compatibility between TES materials and their surrounding
components (especially for solar salts and metals used in solar power plants),
phase segregation and handling and safe use of the materials are assessed in the
literature.
o Kinetic
Few studies have been found regarding the identification of the subcooling
effect dealing with galacticol, hydroquinone and d-mannitol.
o Physical
Thermal expansion coefficient is found to be basic for design purposes.
Therefore, the TES material quantity inside the TES container and/or shell
capsule should be carefully calculated to guarantee the internal pressure and
avoid leakages.
o Thermal
The main thermal requirement is the enhancement of the thermal conductivity,
which is widely reviewed in Part 2 of this review. Regarding the rest of
requirements, increasing the specific heat by including nanoparticles is the most
attractive research topic.
� Material and system requirements
These requirements are not directly related to the TES material but are basic for the
design of the facility.
o Economic
Most of economic analyses are focused on CSP facilities and the capital
investment costs (CAPEX), operation and maintenance costs (OPEX) and

40
financing costs are studied. Moreover, the annual number of storage cycles has
the largest influence on the cost effectiveness.
o Environmental
Carbon footprint, Life Cycle Assessment and Cumulative Energy Demand
analyses have been developed at three different scales (TES material, TES
system and the whole facility). Most of them consider solar power plants.
Moreover, the use of by-products or industrial wastes has been assessed.
o Technological
Multiple PCMs configuration and the forced movement of the TES material
while undergoing phase change dynamic melting systems have been proposed
by the researchers as important strategies for maximizing the heat transfer
between the HTF and the TES material.
Acknowledgments
The work is partially funded by the Spanish government (ENE2015-64117-C5-1-R, ENE2011-
22722 and ULLE10-4E-1305). The authors would like to thank the Catalan Government for the
quality accreditation given to their research group GREA (2014 SGR 123). This project has
received funding from the European Commission Seventh Framework Programme (FP/2007-
2013) under Grant agreement NºPIRSES-GA-2013-610692 (INNOSTORAGE) and from the
European Union’s Horizon 2020 research and innovation programme under grant agreement No
657466 (INPATH-TES). Laia Miró would like to thank the Spanish Government for her
research fellowship (BES-2012-051861). Jaume Gasia would like to thank the Departament
d'Universitats, Recerca i Societat de la Informació de la Generalitat de Catalunya for his
research fellowship (2016FI_B 00047).
References
1. Internation Energy Agency. Technology Roadmap: Energy storage 2014. 2. Wongsuwan W, Kumar S, Neveu P, Meunier F. A review of chemical heat pump
technology and applications. Appl Therm Eng 2001;21:1489–519. doi:10.1016/S1359-4311(01)00022-9.
3. Meunier F. Solid sorption: An alternative to CFCs. Heat Recovery Syst CHP 1993;13:289–95. doi:10.1016/0890-4332(93)90051-V.
4. Cabeza LF, Castell A, Barreneche C, de Gracia A, Fernández AI. Materials used as PCM in thermal energy storage in buildings: A review. Renew Sustain Energy Rev 2011;15:1675–95. doi:10.1016/j.rser.2010.11.018.
5. Zhang Y, Zhou G, Lin K, Zhang Q, Di H. Application of latent heat thermal energy storage in buildings: State-of-the-art and outlook. Build Environ 2007;42:2197–209. doi:10.1016/j.buildenv.2006.07.023.
41
6. Mazman M, Cabeza LF, Mehling H, Nogues M, Evliya H, Paksoy HÖ. Utilization of phase change materials in solar domestic hot water systems. Renew Energy 2009;34:1639–43. doi:10.1016/j.renene.2008.10.016.
7. Srikhirin P, Aphornratana S, Chungpaibulpatana S. A review of absorption refrigeration technologies. Renew Sustain Energy Rev 2001;5:343–72. doi:10.1016/S1364-0321(01)00003-X.
8. Demir H, Mobedi M, Ülkü S. A review on adsorption heat pump: Problems and solutions. Renew Sustain Energy Rev 2008;12:2381–403. doi:10.1016/j.rser.2007.06.005.
9. Johnson RW, Evans JL, Jacobsen P, Thompson JR, Christopher M. The changing automotive environment: high-temperature electronics. IEEE Trans Electron Packag Manuf 2004;27:164–76. doi:10.1109/TEPM.2004.843109.
10. Jankowski NR, McCluskey FP. A review of phase change materials for vehicle component thermal buffering. Appl Energy 2014;113:1525–61. doi:10.1016/j.apenergy.2013.08.026.
11. Patapoutian A, Peier AM, Story GM, Viswanath V. ThermoTRP channels and beyond: mechanisms of temperature sensation. Nat Rev Neurosci 2003;4:529–39. doi:10.1038/nrn1141.
12. Kandasamy R, Wang X-Q, Mujumdar AS. Application of phase change materials in thermal management of electronics. Appl Therm Eng 2007;27:2822–32. doi:10.1016/j.applthermaleng.2006.12.013.
13. ASHRAE Technical Committee (TC) 9.9. 2011 Thermal Guidelines for Data Processing Environments – Expanded Data Center Classes and Usage Guidance 2011.
14. Larson WJ, Wertz JR, editors. Space Mission Analysis and Design. 3rd edition. El Segundo, Calif. : Dordrecht ; Boston: Microcosm; 1999.
15. Dincer I. Heat Transfer In Food Cooling Applications. CRC Press; 1997. 16. Mondieig D, Rajabalee F, Laprie A, Oonk HAJ, Calvet T, Angel Cuevas-Diarte M.
Protection of temperature sensitive biomedical products using molecular alloys as phase change material. Transfus Apher Sci 2003;28:143–8. doi:10.1016/S1473-0502(03)00016-8.
17. Kalogirou S. The potential of solar industrial process heat applications. Appl Energy 2003;76:337–61. doi:10.1016/S0306-2619(02)00176-9.
18. Schweiger H, Mendes JF, Benz N, Hennecke K, Prieto G, Cusí M, et al. The potential of solar heat in industrial processes. State of the art review for Spain and Portugal. ISES-Eur. Sol. Congr., Copenhagen, Denmark: 2000.
19. Pintaldi S, Perfumo C, Sethuvenkatraman S, White S, Rosengarten G. A review of thermal energy storage technologies and control approaches for solar cooling. Renew Sustain Energy Rev 2015;41:975–95. doi:10.1016/j.rser.2014.08.062.
20. Kenisarin M, Mahkamov K. Solar energy storage using phase change materials. Renew Sustain Energy Rev 2007;11:1913–65. doi:10.1016/j.rser.2006.05.005.
21. Medrano M, Gil A, Martorell I, Potau X, Cabeza LF. State of the art on high-temperature thermal energy storage for power generation. Part 2—Case studies. Renew Sustain Energy Rev 2010;14:56–72. doi:10.1016/j.rser.2009.07.036.
22. Pielichowska K, Pielichowski K. Phase change materials for thermal energy storage. Prog Mater Sci 2014;65:67–123. doi:10.1016/j.pmatsci.2014.03.005.
23. Gude VG. Energy storage for desalination processes powered by renewable energy and waste heat sources. Appl Energy 2015;137:877–98. doi:10.1016/j.apenergy.2014.06.061.
24. Gude VG, Nirmalakhandan N, Deng S. Renewable and sustainable approaches for desalination. Renew Sustain Energy Rev 2010;14:2641–54. doi:10.1016/j.rser.2010.06.008.
25. Nomura T, Okinaka N, Akiyama T. Technology of Latent Heat Storage for High Temperature Application: A Review. ISIJ Int 2010;50:1229–39. doi:10.2355/isijinternational.50.1229.

42
26. Brückner S, Liu S, Miró L, Radspieler M, Cabeza LF, Lävemann E. Industrial waste heat recovery technologies: An economic analysis of heat transformation technologies. Appl Energy 2015;151:157–67. doi:10.1016/j.apenergy.2015.01.147.
27. Zalba B, Marı n JM, Cabeza LF, Mehling H. Review on thermal energy storage with phase change: materials, heat transfer analysis and applications. Appl Therm Eng 2003;23:251–83. doi:10.1016/S1359-4311(02)00192-8.
28. Liu M, Saman W, Bruno F. Review on storage materials and thermal performance enhancement techniques for high temperature phase change thermal storage systems. Renew Sustain Energy Rev 2012;16:2118–32. doi:10.1016/j.rser.2012.01.020.
29. Cárdenas B, León N. Latent Heat Based High Temperature Solar Thermal Energy Storage for Power Generation. Energy Procedia 2014;57:580–9. doi:10.1016/j.egypro.2014.10.212.
30. Fernandes D, Pitié F, Cáceres G, Baeyens J. Thermal energy storage: “How previous findings determine current research priorities.” Energy 2012;39:246–57. doi:10.1016/j.energy.2012.01.024.
31. Abhat A. Low temperature latent heat thermal energy storage: Heat storage materials. Sol Energy 1983;30:313–32. doi:10.1016/0038-092X(83)90186-X.
32. Dincer I, Rosen MA. Thermal Energy Storage: Systems and Applications. 2 edition. Hoboken, N.J: Wiley; 2010.
33. Mehling H, Cabeza LF. Heat and cold storage with PCM: An up to date introduction into basics and applications. Springer Science & Business Media; 2008.
34. Gasia J, Miró L, Cabeza LF. Materials and system requirements of high temperature thermal energy storage systems: A review. Part 2: Thermal conductivity enhancement techniques. Renew Sustain Energy Rev 2016;60:1584–601. doi:10.1016/j.rser.2016.03.019.
35. Ferrer G, Solé A, Barreneche C, Martorell I, Cabeza LF. Corrosion of metal containers for use in PCM energy storage. Renew Energy 2015;76:465–9. doi:10.1016/j.renene.2014.11.036.
36. Solé A, Neumann H, Niedermaier S, Martorell I, Schossig P, Cabeza LF. Stability of sugar alcohols as PCM for thermal energy storage. Sol Energy Mater Sol Cells 2014;126:125–34. doi:10.1016/j.solmat.2014.03.020.
37. John G, König-Haagen A, King’Ondu CK, Brüggemann D, Nkhonjera L. Galactitol as phase change material for latent heat storage of solar cookers: Investigating thermal behavior in bulk cycling. Sol Energy 2015;119:415–21. doi:10.1016/j.solener.2015.07.003
38. Paul A, Shi L, Bielawski CW. A eutectic mixture of galactitol and mannitol as a phase change material for latent heat storage. Energy Convers Manag 2015;103:139–46. doi:10.1016/j.enconman.2015.06.013.
39. Sun JQ, Zhang RY, Liu ZP, Lu GH. Thermal reliability test of Al–34%Mg–6%Zn alloy as latent heat storage material and corrosion of metal with respect to thermal cycling. Energy Convers Manag 2007;48:619–24. doi:10.1016/j.enconman.2006.05.017.
40. Bauer T, Pfleger N, Breidenbach N, Eck M, Laing D, Kaesche S. Material aspects of Solar Salt for sensible heat storage. Appl Energy 2013;111:1114–9. doi:10.1016/j.apenergy.2013.04.072.
41. Guillot S, Faik A, Rakhmatullin A, Lambert J, Veron E, Echegut P, et al. Corrosion effects between molten salts and thermal storage material for concentrated solar power plants. Appl Energy 2012;94:174–81. doi:10.1016/j.apenergy.2011.12.057.
42. Fernández AG, Cortes M, Fuentealba E, Pérez FJ. Corrosion properties of a ternary nitrate/nitrite molten salt in concentrated solar technology. Renew Energy 2015;80:177–83. doi:10.1016/j.renene.2015.01.072.
43. Federsel K, Wortmann J, Ladenberger M. High-temperature and Corrosion Behavior of Nitrate Nitrite Molten Salt Mixtures Regarding their Application in Concentrating Solar Power Plants. Energy Procedia 2015;69:618–25. doi:10.1016/j.egypro.2015.03.071.
44. Fernández AG, Galleguillos H, Fuentealba E, Pérez FJ. Corrosion of stainless steels and low-Cr steel in molten Ca(NO3)2–NaNO3–KNO3 eutectic salt for direct energy storage
43
in CSP plants. Sol Energy Mater Sol Cells 2015;141:7–13. doi:10.1016/j.solmat.2015.05.004.
45. Goods SH, Bradshaw RW. Corrosion of stainless steels and carbon steel by molten mixtures of commercial nitrate salts. J Mater Eng Perform 2004;13:78–87. doi:10.1361/10599490417542.
46. Slusser JW, Titcomb JB, Heffelfinger MT, Dunbobbin BR. Corrosion in Molten Nitrate-Nitrite Salts. Jom 1985;37:24–7. doi:10.1007/bf03259692
47. Fernández AG, Rey A, Lasanta I, Mato S, Brady MP, Pérez FJ. Corrosion of alumina-forming austenitic steel in molten nitrate salts by gravimetric analysis and impedance spectroscopy. Mater Corros 2014;65:267–75. doi:10.1002/maco.201307422.
48. Fernández AG, Galleguillos H, Pérez FJ. Thermal influence in corrosion properties of Chilean solar nitrates. Sol Energy 2014;109:125–34. doi:10.1016/j.solener.2014.07.027.
49. Fernández A, Grágeda M, Galleguillos H. Impurity Influence in Physico-chemical and Corrosion Properties of Chilean Solar Nitrates. Energ Proced 2014;49:607–16. doi:10.1016/j.egypro.2014.03.066.
50. Fernández AG, Lasanta MI, Pérez FJ. Molten Salt Corrosion of Stainless Steels and Low-Cr Steel in CSP Plants. Oxid Met 2012;78:329–48. doi:10.1007/s11085-012-9310-x.
51. Dorcheh AS, Durham RN, Galetz MC. Corrosion behavior of stainless and low-chromium steels and IN625 in molten nitrate salts at 600°C. Sol Energy Mater Sol Cells 2016;144:109–16. doi:10.1016/j.solmat.2015.08.011.
52. Kruizenga A, Gill D. Corrosion of Iron Stainless Steels in Molten Nitrate Salt. Energy Procedia 2014;49:878–87. doi:10.1016/j.egypro.2014.03.095.
53. McConohy G, Kruizenga A. Molten nitrate salts at 600 and 680 °C: Thermophysical property changes and corrosion of high-temperature nickel alloys. Sol Energy 2014;103:242–52. doi:10.1016/j.solener.2014.01.028.
54. Goods SH. Creep and the corrosion characteristics of Incoloy Alloy 800 in molten nitrate salts. J Mater Energy Syst 1981;3:43–50. doi:10.1007/BF02833528.
55. Cheng W-J, Chen D-J, Wang C-J. High-temperature corrosion of Cr–Mo steel in molten LiNO3–NaNO3–KNO3 eutectic salt for thermal energy storage. Sol Energy Mater Sol Cells 2015;132:563–9. doi:10.1016/j.solmat.2014.10.007.
56. Sona CS, Gajbhiye BD, Hule PV, Patwardhan AW, Mathpati CS, Borgohain A, et al. High temperature corrosion studies in molten salt-FLiNaK. Corros Eng Sci Technol 2013;49:287–95. doi:10.1179/1743278213Y.0000000135.
57. Li Y, Spiegel M, Shimada S. Corrosion behaviour of various model alloys with NaCl–KCl coating. Mater Chem Phys 2005;93:217–23. doi:10.1016/j.matchemphys.2005.03.015.
58. Abramov AV, Polovov IB, Volkovich VA, Rebrin OI, Griffiths TR, May I, et al. Spectroelectrochemical Study of Stainless Steel Corrosion in NaCl-KCl Melt. ECS Trans 2010;33:277-85. doi:10.1149/1.3484785.
59. Vignarooban K, Xu X, Wang K, Molina E, Li P, Gervasio D, et al. Vapor pressure and corrosivity of ternary metal-chloride molten-salt based heat transfer fluids for use in concentrating solar power systems. Appl Energ 2015;159:206–13. doi:10.1016/j.apenergy.2015.08.131.
60. Miró L, Barreneche C, Ferrer G, Solé A, Martorell I, Cabeza LF. Health hazard, cycling and thermal stability as key parameters when selecting a suitable phase change material (PCM). Thermochim Acta 2016;627-629:39–47. doi:10.1016/j.tca.2016.01.014.
61. Gallegos MA, Yu W. Thermal performance and flammability of phase change material for medium and elevated temperatures for textile application. J Therm Anal Calorim 2014;117:9–17. doi:10.1007/s10973-013-3411-x.
62. Zhao W. Characterization of Encapsulated Phase Change Materials for Thermal Energy Storage. Lehigh University, 2013.
63. Nath R. Encapsulation of High Temperature Phase Change Materials for Thermal Energy Storage. Grad Theses Diss 2012.

44
64. Pitié F, Zhao CY, Cáceres G. Thermo-mechanical analysis of ceramic encapsulated phase-change-material (PCM) particles. Energy Environ Sci 2011;4:2117–24. doi:10.1039/C0EE00672F.
65. Fukahori R, Nomura T, Zhu C, Sheng N, Okinaka N, Akiyama T. Macro-encapsulation of metallic phase change material using cylindrical-type ceramic containers for high-temperature thermal energy storage. Appl Energ 2016;170:324–8. doi:10.1016/j.apenergy.2016.02.106.
66. Jacob R, Bruno F. Review on shell materials used in the encapsulation of phase change materials for high temperature thermal energy storage. Renew Sust Energ Rev 2015;48:79–87. doi:10.1016/j.rser.2015.03.038
67. Legay M, Gondrexon N, Le Person S, Boldo P, Bontemps A. Enhancement of Heat Transfer by Ultrasound: Review and Recent Advances. Int J Chem Eng 2011;2011:e670108. doi:10.1155/2011/670108.
68. Sarı A, Biçer A, Lafçı Ö, Ceylan M. Galactitol hexa stearate and galactitol hexa palmitate as novel solid–liquid phase change materials for thermal energy storage. Sol Energy 2011;85:2061–71. doi:10.1016/j.solener.2011.05.014.
69. Rathgeber C, Miró L, Cabeza LF, Hiebler S. Measurement of enthalpy curves of phase change materials via DSC and T-History: When are both methods needed to estimate the behaviour of the bulk material in applications? Thermochim Acta 2014;596:79–88. doi:10.1016/j.tca.2014.09.022.
70. Gil A, Oró E, Peiró G, Álvarez S, Cabeza LF. Material selection and testing for thermal energy storage in solar cooling. Renew Energy 2013;57:366–71. doi:10.1016/j.renene.2013.02.008.
71. Rathgeber C, Schmit H, Miró L, Cabeza LF, Gutierrez A, Ushak S. Analyisis of subcooling of phase change materials with increased sample size - Comparison of measurements via DSC, T-History and at pilot plant scale. 13h Int. Conf. Therm. Energy Storage, Beijing, China: 2015.
72. Archibold AR, Gonzalez-Aguilar J, Rahman MM, Yogi Goswami D, Romero M, Stefanakos EK. The melting process of storage materials with relatively high phase change temperatures in partially filled spherical shells. Appl Energy 2014;116:243–52. doi:10.1016/j.apenergy.2013.11.048.
73. Solomon L, Elmozughi, Oztekin A. Effect of Internal Void Placement on Heat Transfer Performance – Encapsulated Phase Change material for Energy Storage. Renew Energy 2015;78:438–47. doi:10.1016/j.renene.2015.01.035.
74. Hennemann P, Hiebler S, Hauer A. Physical limitations to the usage of PCM - A theoretical approach. 13h Int. Conf. Therm. Energy Storage, Beijing, Xina: 2015.
75. Andreu-Cabedo P, Mondragon R, Hernandez L, Martinez-Cuenca R, Cabedo L, Julia JE. Increment of specific heat capacity of solar salt with SiO2 nanoparticles. Nanoscale Res Lett 2014;9:582. doi:10.1186/1556-276X-9-582.
76. Shin D, Banerjee D. Enhancement of specific heat capacity of high-temperature silica-nanofluids synthesized in alkali chloride salt eutectics for solar thermal-energy storage applications. Int J Heat Mass Transf 2011;54:1064–70. doi:10.1016/j.ijheatmasstransfer.2010.11.017.
77. Ho MX, Pan C. Optimal concentration of alumina nanoparticles in molten Hitec salt to maximize its specific heat capacity. Int J Heat Mass Transf 2014;70:174–84. doi:10.1016/j.ijheatmasstransfer.2013.10.078.
78. Shahrul IM, Mahbubul IM, Khaleduzzaman SS, Saidur R, Sabri MFM. A comparative review on the specific heat of nanofluids for energy perspective. Renew Sustain Energy Rev 2014;38:88–98. doi:10.1016/j.rser.2014.05.081.
79. Shin D, Banerjee D. Enhancement of Heat Capacity of Molten Salt Eutectics using Inorganic Nanoparticles for Solar Thermal Energy Applications. In: Kriven WM, Gyekenyesi AL, Wang J, Widjaja S, Singh D, editors. Dev. Strateg. Mater. Comput. Des. II, John Wiley & Sons, Inc.; 2011, p. 119–26.

45
80. Lazaro A, Peñalosa C, Solé A, Diarce G, Haussmann T, Fois M, et al. Intercomparative tests on phase change materials characterisation with differential scanning calorimeter. Appl Energy 2013;109:415–20. doi:10.1016/j.apenergy.2012.11.045.
81. Jung S, Banerjee D. Enhancement of Heat Capacity of Nitrate Salts using Mica Nanoparticles. In: Kriven WM, Gyekenyesi AL, Wang J, Widjaja S, Singh D, editors. Dev. Strateg. Mater. Comput. Des. II, John Wiley & Sons, Inc.; 2011, p. 127–37.
82. Chieruzzi M, Cerritelli GF, Miliozzi A, Kenny JM. Effect of nanoparticles on heat capacity of nanofluids based on molten salts as PCM for thermal energy storage. Nanoscale Res Lett 2013;8:448. doi:10.1186/1556-276X-8-448.
83. Dudda B, Shin D. Effect of nanoparticle dispersion on specific heat capacity of a binary nitrate salt eutectic for concentrated solar power applications. Int J Therm Sci 2013;69:37–42. doi:10.1016/j.ijthermalsci.2013.02.003.
84. Lu M-C, Huang C-H. Specific heat capacity of molten salt-based alumina nanofluid. Nanoscale Res Lett 2013;8:292. doi:10.1186/1556-276X-8-292.
85. Schuller M, Shao Q, Lalk T. Experimental investigation of the specific heat of a nitrate–alumina nanofluid for solar thermal energy storage systems. Int J Therm Sci 2015;91:142–5. doi:10.1016/j.ijthermalsci.2015.01.012.
86. Chieruzzi M, Miliozzi A, Crescenzi T, Torre L, Kenny JM. A New Phase Change Material Based on Potassium Nitrate with Silica and Alumina Nanoparticles for Thermal Energy Storage. Nanoscale Res Lett Nanoscale Research Letters 2015;10. doi:10.1186/s11671-015-0984-2.
87. Tao YB, Lin CH, He YL. Preparation and thermal properties characterization of carbonate salt/carbon nanomaterial composite phase change material. Energy Convers Manag 2015;97:103–10. doi:10.1016/j.enconman.2015.03.051.
88. Seo J, Shin D. Size effect of nanoparticle on specific heat in a ternary nitrate (LiNO3–NaNO3–KNO3) salt eutectic for thermal energy storage. Applied Thermal Engineering 2016;102:144–8. doi:10.1016/j.applthermaleng.2016.03.134.
89. Lai C-C, Chang W-C, Hu W-L, Wang ZM, Lu M-C, Chueh Y-L. A solar-thermal energy harvesting scheme: enhanced heat capacity of molten HITEC salt mixed with Sn/SiOx core–shell nanoparticles. Nanoscale 2014;6:4555–9. doi:10.1039/C3NR06810B.
90. Bridges NJ, Visser AE, Fox EB. Potential of nanoparticle enhanced ionic liquids (NEILs) as advanced heat-transfer fluids. Energy Fuels 2011;25:4862–4.
91. Shin D, Banerjee D. Experimental Investigation of Molten Salt Nanofluid for Solar Thermal Energy Application 2011:T30024–T30024. doi:10.1115/AJTEC2011-44375.
92. Shin D, Banerjee D. Enhanced Specific Heat Capacity of Nanomaterials Synthesized by Dispersing Silica Nanoparticles in Eutectic Mixtures. J Heat Transf 2013;135:032801–032801. doi:10.1115/1.4005163.
93. Tiznobaik H, Shin D. Enhanced specific heat capacity of high-temperature molten salt-based nanofluids. Int J Heat Mass Transf 2013;57:542–8. doi:10.1016/j.ijheatmasstransfer.2012.10.062.
94. Seo J, Shin D. Enhancement of specific heat of ternary nitrate (LiNO3-NaNO3-KNO3) salt by doping with SiO2 nanoparticles for solar thermal energy storage. IET Micro Nano Lett 2014;9:817–20. doi:10.1049/mnl.2014.0407.
95. Shin D, Banerjee D. Specific heat of nanofluids synthesized by dispersing alumina nanoparticles in alkali salt eutectic. Int J Heat Mass Transf 2014;74:210–4. doi:10.1016/j.ijheatmasstransfer.2014.02.066.
96. Jo B, Banerjee D. Effect of Dispersion Homogeneity on Specific Heat Capacity Enhancement of Molten Salt Nanomaterials Using Carbon Nanotubes. J Sol Energy Eng 2014;137:011011–011011. doi:10.1115/1.4028144.
97. Shin D, Banerjee D. Enhanced thermal properties of SiO2 nanocomposite for solar thermal energy storage applications. Int J Heat Mass Transf 2015;84:898–902. doi:10.1016/j.ijheatmasstransfer.2015.01.100.

46
98. Devaradjane R, Shin D. Nanoparticle Dispersions on Ternary Nitrate Salts for Heat Transfer Fluid Applications in Solar Thermal Power. J Heat Transfer Journal Of Heat Transfer 2016;138:051901. doi:10.1115/1.4030903
99. Vignarooban K, Xu X, Arvay A, Hsu K, Kannan AM. Heat transfer fluids for concentrating solar power systems – A review. Appl Energy 2015;146:383–96. doi:10.1016/j.apenergy.2015.01.125.
100. Liu M, Belusko M, Steven Tay NH, Bruno F. Impact of the heat transfer fluid in a flat plate phase change thermal storage unit for concentrated solar tower plants. Sol Energy 2014;101:220–31. doi:10.1016/j.solener.2013.12.030.
101. Heller L. Literature Review on Heat Transfer Fluids and Thermal Energy Storage Systems in CSP Plants. STERG Report 2013.
102. Pacio J, Wetzel T. Assessment of liquid metal technology status and research paths for their use as efficient heat transfer fluids in solar central receiver systems. Sol Energy 2013;93:11–22. doi:10.1016/j.solener.2013.03.025.
103. Cingarapu S, Singh D, Timofeeva EV, Moravek MR. Nanofluids with encapsulated tin nanoparticles for advanced heat transfer and thermal energy storage. Int J Energy Res 2014;38:51–9. doi:10.1002/er.3041.
104. Torres-Mendieta R, Mondragón R, Juliá E, Mendoza-Yero O, Cordoncillo E, Lancis J, et al. Fabrication of gold nanoparticles in Therminol VP-1 by laser ablation and fragmentation with fs pulses. Laser Phys Lett Laser Physics Letters 2014;11:126001. doi:10.1088/1612-2011/11/12/126001
105. Boissiere B, Ansart R, Gauthier D, Flamant G, Hemati M. Experimental hydrodynamic study of gas-particle dense suspension upward flow for application as new heat transfer and storage fluid. Can J Chem Eng 2015;93:317–30. doi:10.1002/cjce.22087
106. International Renewable Energy Agency. Renewable energy technologies: Cost analysis series. Volume 1: Power Sector. Issue 2/5 Concentrating solar power 2012.
107. Internation Energy Agency. Technology Roadmap: Concentrating solar power 2010.
108. Fichtner GmbH & Co. Technology Assessment of CSP Technologies for a Site Specific Project in South Africa Final Report, The World Bank and ESMAP, Washington D.C. 2010.
109. Wagner SJ, Rubin ES. Economic implications of thermal energy storage for concentrated solar thermal power. Renew Energy 2014;61:81–95. doi:10.1016/j.renene.2012.08.013.
110. Nithyanandam K, Pitchumani R. Cost and performance analysis of concentrating solar power systems with integrated latent thermal energy storage. Energy 2014;64:793–810. doi:10.1016/j.energy.2013.10.095.
111. Rathgeber C, Hiebler S, Lävemann E, Hauer A. Economic Evaluation of Thermal Energy Storages via Top-down and Bottom-up Approach. 13h Int. Conf. Therm. Energy Storage, Beijing, China: 2015.
112. Carbon Trust. Carbon footprinting guide 2015. http://www.carbontrust.com/resources/guides/carbon-footprinting-and-reporting/carbon-footprinting.
113. Hirschier R, Weidema B. Implementation of Life Cycle Impact Assessment Methods. ecoinvent report No. 3, v2.2 2010.
114. IHOBE, Sociedad Pública de Gestión Ambiental. Análisis de ciclo de vida y huella de carbono. Dos maneras de medir el impacto ambiental de un producto. 2009.
115. Khare S, Dell’Amico M, Knight C, McGarry S. Selection of materials for high temperature sensible energy storage. Sol Energy Mater Sol Cells 2013;115:114–22. doi:10.1016/j.solmat.2013.03.009.
116. López-Sabirón AM, Royo P, Ferreira VJ, Aranda-Usón A, Ferreira G. Carbon footprint of a thermal energy storage system using phase change materials for industrial energy recovery to reduce the fossil fuel consumption. Appl Energy 2014;135:616–24. doi:10.1016/j.apenergy.2014.08.038.

47
117. López-Sabirón AM, Aranda-Usón A, Mainar-Toledo MD, Ferreira VJ, Ferreira G. Environmental profile of latent energy storage materials applied to industrial systems. Sci Total Environ 2014;473–474:565–75. doi:10.1016/j.scitotenv.2013.12.013.
118. Oró E, Gil A, de Gracia A, Boer D, Cabeza LF. Comparative life cycle assessment of thermal energy storage systems for solar power plants. Renew Energy 2012;44:166–73. doi:10.1016/j.renene.2012.01.008.
119. Miró L, Oró E, Boer D, Cabeza LF. Embodied energy in thermal energy storage (TES) systems for high temperature applications. Appl Energy 2015;137:793–9. doi:10.1016/j.apenergy.2014.06.062.
120. Lalau Y, Py X, Meffre A, Olives R. Comparative LCA Between Current and Alternative Waste-Based TES for CSP. Waste Biomass Valor Waste And Biomass Valorization 2016. doi:10.1007/s12649-016-9549-6.
121. Klein SJW. Multi-Criteria Decision Analysis of Concentrated Solar Power with Thermal Energy Storage and Dry Cooling. Environ Sci Technol 2013;47:13925–33. doi:10.1021/es403553u.
122. Klein SJW, Rubin ES. Life cycle assessment of greenhouse gas emissions, water and land use for concentrated solar power plants with different energy backup systems. Energy Policy 2013;63:935–50. doi:10.1016/j.enpol.2013.08.057.
123. Lechón Y, de la Rúa C, Sáez R. Life Cycle Environmental Impacts of Electricity Production by Solarthermal Power Plants in Spain. J Sol Energy Eng 2008;130:021012–021012. doi:10.1115/1.2888754.
124. Giuliano S, Buck R, Eguiguren S. Analysis of Solar-Thermal Power Plants With Thermal Energy Storage and Solar-Hybrid Operation Strategy. J Sol Energy Eng 2011;133:031007–031007. doi:10.1115/1.4004246.
125. Whitaker MB, Heath GA, Burkhardt JJ, Turchi CS. Life Cycle Assessment of a Power Tower Concentrating Solar Plant and the Impacts of Key Design Alternatives. Environ Sci Technol 2013;47:5896–903. doi:10.1021/es400821x.
126. Burkhardt JJ, Heath GA, Turchi CS. Life Cycle Assessment of a Parabolic Trough Concentrating Solar Power Plant and the Impacts of Key Design Alternatives. Environ Sci Technol 2011;45:2457–64. doi:10.1021/es1033266.
127. Gutierrez A, Miró L, Gil A, Rodríguez-Aseguinolaza J, Barreneche C, Calvet N, et al. Advances in the valorization of waste and by-product materials as thermal energy storage (TES) materials. Renew Sustain Energy Rev 2016;59:763–83. doi:10.1016/j.rser.2015.12.071.
128. Py X, Calvet N, Olives R, Meffre A, Echegut P, Bessada C, et al. Recycled Material for Sensible Heat Based Thermal Energy Storage to be Used in Concentrated Solar Thermal Power Plants. J Sol Energy Eng 2011;133:031008–031008. doi:10.1115/1.4004267.
129. Kere A, Sadiki N, Py X, Goetz V. Applicability of thermal energy storage recycled ceramics to high temperature and compressed air operating conditions. Energy Convers Manag 2014;88:113–9. doi:10.1016/j.enconman.2014.08.008.
130. Gualtieri AF, Tartaglia A. Thermal decomposition of asbestos and recycling in traditional ceramics. J Eur Ceram Soc 2000;20:1409–18. doi:10.1016/S0955-2219(99)00290-3.
131. Calvet N, Gomez JC, Faik A, Roddatis VV, Meffre A, Glatzmaier GC, et al. Compatibility of a post-industrial ceramic with nitrate molten salts for use as filler material in a thermocline storage system. Appl Energy 2013;109:387–93. doi:10.1016/j.apenergy.2012.12.078.
132. Meffre A, Py X, Olives R, Bessada C, Veron E, Echegut P. High-Temperature Sensible Heat-Based Thermal Energy Storage Materials Made of Vitrified MSWI Fly Ashes. Waste Biomass Valor Waste And Biomass Valorization 2015;6:1003–14. doi:10.1007/s12649-015-9409-9.
133. Faik A, Guillot S, Lambert J, Véron E, Ory S, Bessada C, et al. Thermal storage material from inertized wastes: Evolution of structural and radiative properties with temperature. Sol Energy 2012;86:139–46. doi:10.1016/j.solener.2011.09.014.
48
134. Miró L, Navarro ME, Suresh P, Gil A, Fernández AI, Cabeza LF. Experimental characterization of a solid industrial by-product as material for high temperature sensible thermal energy storage (TES). Appl Energy 2014;113:1261–8. doi:10.1016/j.apenergy.2013.08.082.
135. Ushak S, Gutierrez A, Flores E, Galleguillos H, Grageda M. Development of Thermal Energy Storage Materials from Waste-process Salts. Energy Procedia 2014;57:627–32. doi:10.1016/j.egypro.2014.10.217.
136. Calvet N, Dejean G, Unamunzaga L, Py X. Waste From Metallurgic Industry: A Sustainable High-Temperature Thermal Energy Storage Material for Concentrated Solar Power 2013:V001T03A012. doi:10.1115/ES2013-18333.
137. Ozger OB, Girardi F, Giannuzzi GM, Salomoni VA, Majorana CE, Fambri L, et al. Effect of nylon fibres on mechanical and thermal properties of hardened concrete for energy storage systems. Mater Des 2013;51:989–97. doi:10.1016/j.matdes.2013.04.085.
138. Navarro ME, Martínez M, Gil A, Fernández AI, Cabeza LF, Olives R, et al. Selection and characterization of recycled materials for sensible thermal energy storage. Sol Energy Mater Sol Cells 2012;107:131–5. doi:10.1016/j.solmat.2012.07.032.
139. Gil A, Olives R, Faure R, Tessier-Doyen, Huger M. Thermomechanical characterization of recycled high temperature thermal energy storage material. Adv. Therm. Energy Storage Technol., Lleida, Spain: 2014.
140. Ortega I, Faik A, Gil A, Rodriguez-Aseguinolaza J, D’Aguanno B. Thermo-physical properties of a Steel-making by-product to be used as thermal energy storage material in a packed-bed system. Conc. Sol. Power Chem. Energy Syst., Beijing, China: 2014.
141. Ortega I, Rodriguez-Aseguinolaza J, Gil A, Faik A, D’Aguanno B. New thermal energy storage materials from industrial wastes: compatibility of Steel slags with the most common heat transfer fluids. Int. Conf. Energy Sustain., Boston, USA: 2012.
142. Mills K. The estimation of slag properties, Cradle of Humankind, South Africa: 2011.
143. Peiró G, Gasia J, Miró L, Cabeza LF. Experimental evaluation at pilot plant scale of multiple PCMs (cascaded) vs. single PCM configuration for thermal energy storage. Renew Energy 2015;83:729–36. doi:10.1016/j.renene.2015.05.029.
144. Tao YB, He YL, Liu YK, Tao WQ. Performance optimization of two-stage latent heat storage unit based on entransy theory. Int J Heat Mass Transf 2014;77:695–703. doi:10.1016/j.ijheatmasstransfer.2014.05.049.
145. Li YQ, He YL, Song HJ, Xu C, Wang WW. Numerical analysis and parameters optimization of shell-and-tube heat storage unit using three phase change materials. Renew Energy 2013;59:92–9. doi:10.1016/j.renene.2013.03.022.
146. Gong Z-X, Mujumdar AS. A New Solar Receiver Thermal Store for Space-Based Activities Using Multiple Composite Phase-Change Materials. J Sol Energy Eng 1995;117:215–20. doi:10.1115/1.2847798.
147. Cui H, Yuan X, Hou X. Thermal performance analysis for a heat receiver using multiple phase change materials. Appl Therm Eng 2003;23:2353–61. doi:10.1016/S1359-4311(03)00210-2.
148. Michels H, Pitz-Paal R. Cascaded latent heat storage for parabolic trough solar power plants. Sol Energy 2007;81:829–37. doi:10.1016/j.solener.2006.09.008.
149. Seeniraj RV, Lakshmi Narasimhan N. Performance enhancement of a solar dynamic LHTS module having both fins and multiple PCMs. Sol Energy 2008;82:535–42. doi:10.1016/j.solener.2007.11.001.
150. Shabgard H, Robak CW, Bergman TL, Faghri A. Heat transfer and exergy analysis of cascaded latent heat storage with gravity-assisted heat pipes for concentrating solar power applications. Sol Energy 2012;86:816–30. doi:10.1016/j.solener.2011.12.008.
151. Wang P, Wang X, Huang Y, Li C, Peng Z, Ding Y. Thermal energy charging behaviour of a heat exchange device with a zigzag plate configuration containing multi-
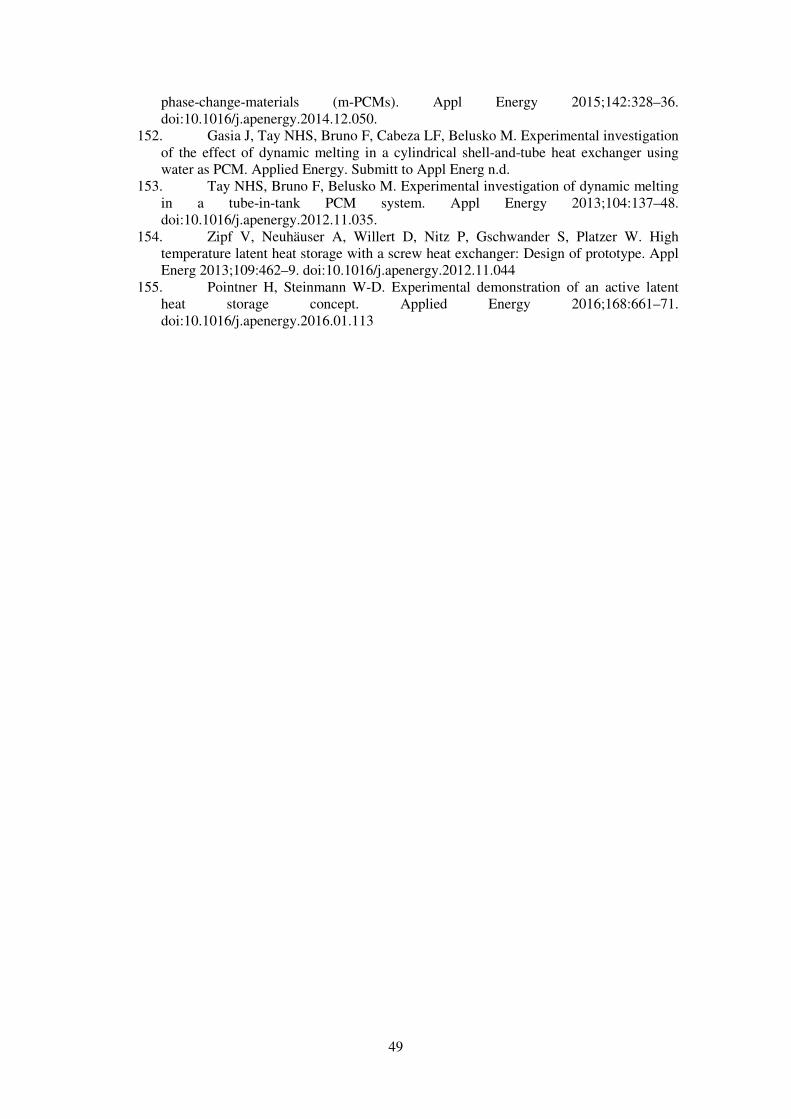
49
phase-change-materials (m-PCMs). Appl Energy 2015;142:328–36. doi:10.1016/j.apenergy.2014.12.050.
152. Gasia J, Tay NHS, Bruno F, Cabeza LF, Belusko M. Experimental investigation of the effect of dynamic melting in a cylindrical shell-and-tube heat exchanger using water as PCM. Applied Energy. Submitt to Appl Energ n.d.
153. Tay NHS, Bruno F, Belusko M. Experimental investigation of dynamic melting in a tube-in-tank PCM system. Appl Energy 2013;104:137–48. doi:10.1016/j.apenergy.2012.11.035.
154. Zipf V, Neuhäuser A, Willert D, Nitz P, Gschwander S, Platzer W. High temperature latent heat storage with a screw heat exchanger: Design of prototype. Appl Energ 2013;109:462–9. doi:10.1016/j.apenergy.2012.11.044
155. Pointner H, Steinmann W-D. Experimental demonstration of an active latent heat storage concept. Applied Energy 2016;168:661–71. doi:10.1016/j.apenergy.2016.01.113

1
Materials and system requirements of high temperature
thermal energy storage systems: A review. Part 2: Thermal
conductivity enhancement techniques.
Jaume Gasia, Laia Miró, Luisa F. Cabeza*
GREA Innovació concurrent, Edifici CREA, Universitat de Lleida, Pere de Cabrera s/n, 25001-
Lleida (Spain). * Corresponding author: Phone: +34-973-003576, fax: +34-973-003575, e-mail: [email protected]
Abstract
This review is focused on the study of the requirement of high thermal conductivity of thermal
energy storage (TES) materials and the techniques used to enhance it as this is one of the main
obstacles to achieve full deployment of TES systems. Numerical and experimental studies
involving different thermal conductivity enhancement techniques at high temperature (> 150 ºC)
are reviewed and classified. This article complements Part 1, which reviews the different
requirements that TES materials and systems should consider for being used for high
temperature purposes and the approaches to satisfy them. The enhancements identified for this
temperature range are the addition of extended surfaces like fins or heat pipes and the
combination of highly conductive materials with TES material like graphite or metal foam
composites and nanomaterials. Moreover the techniques presented are classified and discussed
taking into account their research evolution in terms of maturity and publications.
Key-words: Thermal energy storage, High temperature, Thermal enhancement techniques,
Thermal conductivity, Nanoparticles, Technology Readiness Level.

2
1. Introduction
Part 1 of this review [1] lists more than 25 different requirements that thermal energy storage
(TES) materials (both sensible and latent) and TES systems should consider for being used for
high temperature purposes (> 150 ºC) and it analyses the different literature approaches
presented in previous studies to achieve such requirements. These requirements have been
classified into chemical, kinetic, physical and thermal for the material point of view; and
environmental, economic and technologic for the system point of view. Within all the
requirements listed, this second part of the review is focused on the study of the requirement for
high thermal conductivity of TES materials, being the one that has drawn more attention in the
scientific community, and the techniques used to enhance their usually low values.
In a TES system, thermal energy needs to be transferred in the first place from an outer energy
source to the TES material to be later on transferred from the TES material to an outer
application. This transition needs to be done within a specific period of time and under different
heat transfer mechanisms: conduction, convection or both. For instance, in a latent charging
process, the TES material undergoes phase change as the heat transfer fluid (HTF) transfers heat
to it, causing the melting front to move away from the heat transfer surface and, as a
consequence, the solid layer of the material decreases while the thickness of the liquid layer
increases. During all the process conduction is present. However, the higher presence of liquid
state leads a higher presence of density gradients, which added to the fact that the thermal
conductivity is lower in the liquid state than in the solid state, causes the convection to become
dominant and the conduction negligible [2]. During the latent discharging process, or
solidification, conduction becomes the dominant heat transfer mechanism since a layer of solid
material is created at the very beginning around the heat transfer surface, reducing the effect of
convection to become almost negligible. Therefore, materials with low thermal conductivity
coefficients, which mean high thermal resistance and slow charging and discharging rates,
drastically decrease the thermal performance of TES and limit possible large-scale applications.
It is a fact that most of the commercial TES materials that are currently available at the market
have intolerably low thermal conductivity values (0.2–1 W/(m·K)), allowing the researchers to
try to make up for such poor values by proposing heat transfer enhancement techniques, not
only for improving the TES material itself but also for improving the effective thermal
conductivity between the HTF and the TES material, which in some cases turn to be the same
material.

3
Before introducing any external enhancer to the TES system, the researchers have to bear in
mind in which physical state the TES material is going to be used, whether the liquid phase, the
solid phase or both, since their introduction can enhance the thermal performance of one state
but can decrease the thermal performance of the other state. Hence, a previous study or
discussion should be done in order to know the advantages and disadvantages of the thermal
conductivity enhancement technique which is desired to be used.
The aim of the present study is to review the thermal conductivity enhancement techniques used
in high temperature TES systems and materials for both enhancing the effective thermal
conductivity between the HTF and the TES material by adding extended surfaces, and
enhancing the thermal conductivity of the material itself by combining it with highly conductive
materials (Fig. 1).
Fig. 1. Thermal conductivity enhancement techniques for high temperature purposes.
2. Addition of extended surfaces
The most and widely studied thermal conductivity enhancement technique in the different
temperature ranges is the extended surfaces. This technique consists of increasing the heat
transfer surface between the HTF and the TES material by arranging fins or heated pipes on the
HTF tubes embedded in the TES system. This technique leads to an increase of the effective
thermal conductivity as it diminishes the distance between the storage material and the HTF,
and reduces the thermal resistance between the HTF and the TES material. However, two main
drawbacks are associated to this technique: on the one hand the increase of costs due to the
increase of the extended surfaces material and on the other hand the decreasing of the packing

4
factor of the TES system, which is the ratio that defines the percentage of volume of TES
material in front of the total volume of the storage container, due to the increase of the volume
occupied by the extended surfaces.
Despite the fact that not many experimentation at high temperature has been carried out, the
criteria that should be borne in mind when designing a TES system with the extended surfaces
enhancement technique is the same than the used at lower temperatures: HTF pipe dimensions,
material of the extended surfaces, geometry of the extended surfaces, arrangement of the
extended surfaces, good interaction between the TES material, the HTF and the material of the
extended surfaces and finally the boundary conditions of the TES system.
The two main enhancement techniques regarding the extended surfaces which have been studied
by different researchers are the addition of fins and the addition of heated pipes.
2.1 Addition of fins
Concerning to the addition of fins, first references lead us to Zhang et al. [3] who numerically
studied the heat transfer enhancement in a latent heat TES (LHTES) system by using an
internally finned tube. A comparison with a plain tube, in terms of the melting volume factor,
was performed, concluding that this factor could be significantly increased by increasing the
thickness, height and number of fins for a HTF with low thermal conductivity and low Reynolds
numbers.
Seeniraj et al. [4] numerically studied the improvement in terms of temperature, melting front
location and thermal energy stored of an externally finned tube in a space based LHTES unit for
solar dynamic power generation. An enhancement of the performance by increasing the number
of fins for a given set of geometrical parameters and depending on the thermophysical
properties of the tube material and the HTF-TES material combination was observed.
Khaled [5] numerically proposed a variation of the fin enhancement technique called hairy fin
system, which consists of a primary rectangular fin with a large number of slender secondary
rods attached on its surface (Fig. 2). This technique increased the heat transfer, if compared to a
rectangular fin, with low secondary fins diameter and high secondary thermal conductivity.

5
Fig. 2. Schematic diagram of the hairy fin system [5].
Guo and Zhang [6], Jung and Boo [7] and Tiari et al. [8] numerically studied how the addition
of aluminum fins and the variation of different geometric and thermal parameters affected the
heat transfer enhancement during the discharging process in a LHTES. Results showed that the
magnitude of the enhancement was dependent on the geometry of the fins, fins spacing, HTF
tube radius, boundary conditions and thermal conductivity values of the TES material.
The German Aerospace Center (DLR) theoretically proposed and experimentally developed
different designs concerning both embedded and finned tubes enhancement techniques, for solar
thermal power generation and high temperature process heat [9-11]. Eutectic mixtures of KNO3,
NaNO2 and NaNO3 were selected as base materials and materials such as graphite, aluminum,
stainless steel and carbon steel were considered for fins. Results showed that a decreasing on the
number of tubes could be achieved if the thermal conductivity of the TES material was
increased and a reduction of the charging process time if graphite was used as fin material for
applications up to 250 °C and aluminum for higher temperatures applications (Fig. 3).
Fig. 3. (a) Effect of thermal conductivity on the number of required pipes [10]. (b) Effect of material fins
on the process of charging [11].

6
Tao et al. [12] numerically studied the behavior of three geometrically different fins
enhancement techniques (dimpled, cone-fined and helically-fined) in terms of TES material
melting rate, solid–liquid interface, TES capacity, TES efficiency and HTF outlet temperature
for a dish solar thermal power generation system. Results showed that all three enhanced tubes
could effectively improve the thermal performance of the system, being the helically-finned
tube the one with better results (Fig. 4).
Fig. 4. Effects of the fins enhancement techniques on the heat storage efficiency [12].
Gil et al. [13] developed an experimental study at pilot plant scale with a finned shell-and-tubes
heat exchanger. It consisted of a high temperature TES system for solar cooling applications and
analyzed two similar storage tanks based on shell-and-tubes heat exchanger configuration with
the only difference that one of them incorporated 196 squared fins on the tubes bundle. Results
showed a decrease in the melting/solidification periods and higher heat transfer rates for partial
charging and discharging processes in the tank with fins.
(a)
(b)
Fig. 5. (a) Storage TES system without fins. (b) Storage TES system with fins used in the experimentation
[13].

7
2.2 Addition of heat pipes
Embedded heat pipes, also referred in different studies as thermosyphons, are gaining relevance
as a heat transfer enhancement technique due to their high effective thermal conductivity that
facilitates the heat transfer from the TES material to the HTF and vice versa. This system
consists of several small closed tubes which are attached to the main pipe and whose inside is
filled with a working fluid which undergo liquid-vapor phase change at the ends of such heat
pipes, called evaporator and condenser sections. That allows the thermal performance
enhancement in the heat transfer (Fig. 6).
Fig. 6. Embedded heat pipe scheme [14].
Regarding this technique, only numerical studies have been performed [14-19]. Shabgard et al.
[14] and Nithyanandam and Pitchumani [16,17] developed a thermal network model to analyze
a heat transfer in a high temperature LHTES unit with different arrangements of embedded heat
pipes for solar thermal electricity generation evaluating the effect of HTF flow direction and the
number of heated pipes among others (Fig. 7). Results showed a reduction of the thermal
resistance of the unit as well as well as a relation between the effectiveness of the heat pipes and
the variation on several HTF parameters: higher HTF mass flow rate and tube diameter implied
lower effectiveness of the heat pipes and vice versa. A similar study was carried out by Khalifa
et al. [18], whose simulated results showed that the energy extracted after 4 h by a finned heat
pipe was 86% higher than that of a bare one.

8
Fig. 7. Two LHTES units: (a) the TES material surrounds the HTF tubes, (b) the HTF passes over tubes
containing TES material [14].
Finally, Robak et al. [19] theoretically and numerically studied, in economic terms, the
incorporation of thermosyphons in a large scale LHTES system for commercial collector solar
plants (CSP) and compared the results with a two-tank sensible heat TES (SHTES). Results
showed the economic competitiveness of such system, with a reduction of 15% in the capital
costs.
Table 1 and Table 2 review, in a chronological order, the different studies carried out at high
temperature concerning the extended surfaces enhancement techniques, showing the
enhancement technique used, the study case, the main characteristics of the TES system, the
comparison performed and the improvement observed.

9
Table 1. Review of the studies concerning the extended surfaces techniques at high temperature in terms of thermal conductivity enhancement. Case 1: Addition of fins.
Technique System
geometry
Study
case
TES
material
Pipes/Fins
material
HTF
material Comparison Improvement Year Reference
1
Internally
finned tube –
Single
longitudinal
fin
Annular
shell Numerical n.a. n.a. n.a.
Finned – plain
tubed
Percentage of
improvement
depending on height
and width of the fins
1996 Zhang and
Faghri [3]
2
Externally
finned tube –
Multiple fins
Shell-and-
tubes Numerical LiF/MgF2 n.a. n.a.
Finned – plain
tubed
Percentage of
improvement
depending on number
of fins for a given set
of geometrical
parameters
2002 Seeniraj et
al. [4]
3 Hairy fin
system
Heated
surface Numerical n.a n.a. n.a.
Hairy fins –
Rectangular
fins
Higher improvement if
secondary fins
diameter decreases
2007 Khaled [5]
4
Externally
finned tube –
Multiple fins
Shell-and-
tubes Numerical KNO3/NaNO3 Aluminium n.a
Finned – plain
tubed
Percentage of
improvement
depending on
geometry of fins
2008 Guo and
Zhang [6]
5 Finned tube Shell-and-
tubes Theoretical n.a n.a n.a n.a
Reduction of number
of pipes 2008
Tamme et
al. [10]
6 Externally Storage tank Theoretical & KNO3/NaNO2/KaNO3 Graphite Thermal oil Finned – plain Depending on the 2009 Laing et al.

10
finned tube experimental KNO3/NaNO3
NaNO3
Aluminum
Stainless
steel
Carbon steel
Steam tube shape and materials of
the fins
[11]
7 Externally
finned tube
Shell-and-
tubes Numerical LiF/CaF2 n.a He/Xe
Smooth (S)
Dimpled (D)
Cone-finned
(CF)
Helically-
finned (HF)
Reduction on the
melting time of 19.9%
(D), 26.9 % (CF) and
30.7 % (HF)
2012 Tao et al.
[12]
8
Externally
finned tube –
multiple fins
Shell-and-
tubes Experimental Hydroquinone
Stainless
steel Therminol
Finned – plain
tube
Charging/discharging
time enhancement 2014
Gil et al.
[13]
9 Externally
finned tube n.a. Numerical KNO3 Nickel n.a.
Geometrical
parameters
Percentage of
improvement
depending on number
of fins and geometrical
parameters
2015 Tiari et al.
[8]
n.a: not available

11

12
Table 2. Review of the studies concerning the extended surfaces techniques at high temperature in terms of thermal conductivity enhancement. Case 2: Addition of heat
pipes.
Technique System
geometry
Study
case
TES
material
Pipes/Fins
material
HTF
material Comparison Improvement Year Reference
1 Embedded
heat pipes
Shell-and-
tubes Numerical KNO3
Stainless
steel Therminol
Distribution
TES
material/HTF
and orientation
of heat pipes
Depending on the
influence of the
number of heat pipes
and HTF flow
direction
2010
Shabgard
and
Bergman
[14]
2 Embedded
heat pipes
Shell-and-
tubes Numerical KNO3
Stainless
steel Therminol
Orientation of
heat pipes
Depending on HTF
mass flow rate, module
length, tube length of
the condenser section,
length of the
evaporator section and
the vapor core radius
2011
Nithyanand
am and
Pitchumani
[16]
3 Embedded
heat pipes n.a. Numerical
NaNO3
NaOH/NaCl/Na2CO3
KNO3
LiCl/KCl
KOH
MgCl2/KCl/NaCl
Carbon steel
Therminol
Diphenyl
Naphthalene
potassium
Sensible/Latent
15% reduction in
capital in latent over
sensible
2011 Robak et al.
[19]
4 Embedded
heat pipes
Shell-and-
tubes Numerical KNO3
Stainless
steel Therminol
Different
arrangements
Higher effectiveness
for 4 thermosyphons 2013
Nithyanand
am and

13
of
thermosyphons
Pitchumani
[17]
5 Finned heat
pipes
Shell-and-
tubes Numerical n.a n.a n.a
Finned – plain
tube
With 4 fins:
energy extracted:86%
at the same time
heat pipes
effectiveness: 24%
2014 Khalifa et
al. [18]
6 Finned heat
pipes
Shell-and-
tubes Numerical KNO3
Stainless
steel
Superheated
vapour
Finned – plain
tube
Percentage of
improvement
depending on number
of fins and geometrical
parameters
2014 Jung and
Boo [7]
n.a: not available
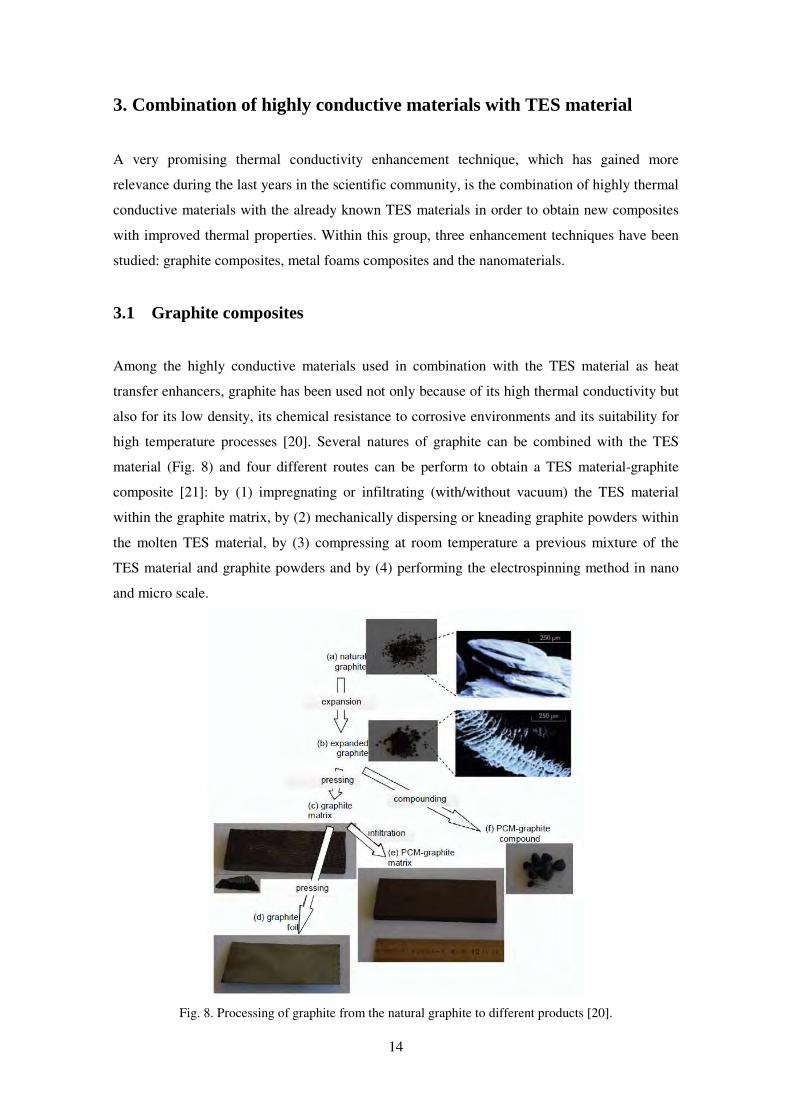
14
3. Combination of highly conductive materials with TES material
A very promising thermal conductivity enhancement technique, which has gained more
relevance during the last years in the scientific community, is the combination of highly thermal
conductive materials with the already known TES materials in order to obtain new composites
with improved thermal properties. Within this group, three enhancement techniques have been
studied: graphite composites, metal foams composites and the nanomaterials.
3.1 Graphite composites
Among the highly conductive materials used in combination with the TES material as heat
transfer enhancers, graphite has been used not only because of its high thermal conductivity but
also for its low density, its chemical resistance to corrosive environments and its suitability for
high temperature processes [20]. Several natures of graphite can be combined with the TES
material (Fig. 8) and four different routes can be perform to obtain a TES material-graphite
composite [21]: by (1) impregnating or infiltrating (with/without vacuum) the TES material
within the graphite matrix, by (2) mechanically dispersing or kneading graphite powders within
the molten TES material, by (3) compressing at room temperature a previous mixture of the
TES material and graphite powders and by (4) performing the electrospinning method in nano
and micro scale.
Fig. 8. Processing of graphite from the natural graphite to different products [20].

15
Impregnation, infiltration and compression are found to have higher enhancement performance
than dispersion due to the fact that in these three processes graphite particles are always
connected between them forming a highly thermal conductive and interconnected network while
in the dispersion process graphite microstructures are formed but are not fully connected.
Moreover, graphite particles parameters such as shape, concentration, distribution and
orientation within the compound are extremely important to accurately calculate the average
thermal conductivity of the graphite composite. However, average thermal conductivity is not
the only criteria to determine the optimum composite preparation route. It has also to bear in
mind economics and porosity, which are closely linked to the storage density. This last property
is often not keep primordial during the obtaining process of the composite and can lead to a
significantly reduction in the latent heat value if it is too low and to a reduction on the capillarity
force and therefore leakage of liquid TES material if it is too high [20,22]. Several experimental
and numerical investigations have been carried out studying the graphite as thermal conductivity
enhancer and the ones available up to mid-2015 are explained below.
From the experimental point of view, the first attempt to study graphite composites at high
temperature was carried out by Do Couto et al. [23], who tested the behavior of KNO3/NaNO3-
expanded graphite (EG) and KNO3/LiNO3-EG composites obtained by two different elaboration
routes: compression and infiltration. Results showed that compressed composites had an
enhancement in a factor up to 10 and infiltrated composites presented a thermal conductivity
enhancement lower than the previous route but accentuated in the direction parallel to its
layered structure.
Bauer et al. [24] focused on the enhancement of KNO3/NaNO3 by studying the effect of adding
natural graphite (NG) and compressed expanded graphite (CEG) with the infiltration route and
adding commercial EG (CFG 500) with the compression route varying the graphite
concentration and orientation. Results showed an enhancement of the thermal conductivity in
the range from 3 to 30 times if compared to the single TES material. Moreover, it was observed
that the thermal conductivity of the composites prepared by compression strongly depended on
their graphite concentration (the higher the graphite concentration, the higher the conductivity),
on the temperature (the higher the temperature, the lower the conductivity) and on the
orientation and the thermal conductivity of the composites prepared by infiltration reached high
conductivities with small graphite concentration.
Several studies, under the framework of the European project DISTOR, numerically and
experimentally tested at both laboratory and industrial scales the behavior of graphite-

16
NaNO3/KNO3 composites for solar thermal power plants using direct solar steam generation
[9,10,[25,26]. Different types of graphite (NG, EG and ground EG) and three different
elaboration routes (dispersion, infiltration and cold compression) were studied. Results showed
an enhancement on the thermal conductivity in a factor between 10 and 31. The percentage of
enhancement was found to be dependent on the graphite particle size, the working temperature
and elaboration route, (Fig. 9). Regarding to this last parameter, important constrains were
observed: infiltration was found to be inefficient, dispersion composites presented isotropic
properties and thermal conductivity intensification and cold compressed composites presented
highly anisotropic properties and strong intensification in thermal conductivity as well as
important salt leakages.
(a)
(b)
(c)
Fig. 9. Variation of the NaNO3/KNO3-graphite composites thermal conductivity: (a) Depending on the
temperature and the graphite type: ( ) Graphite flakes I, ( ) Graphite flakes II, (○) Natural graphite, (●)
Expanded graphite powder [26]; (b) Depending on the graphite percentage [9]; (b) Depending on the
graphite percentage and elaboration route at 200 ºC [10].
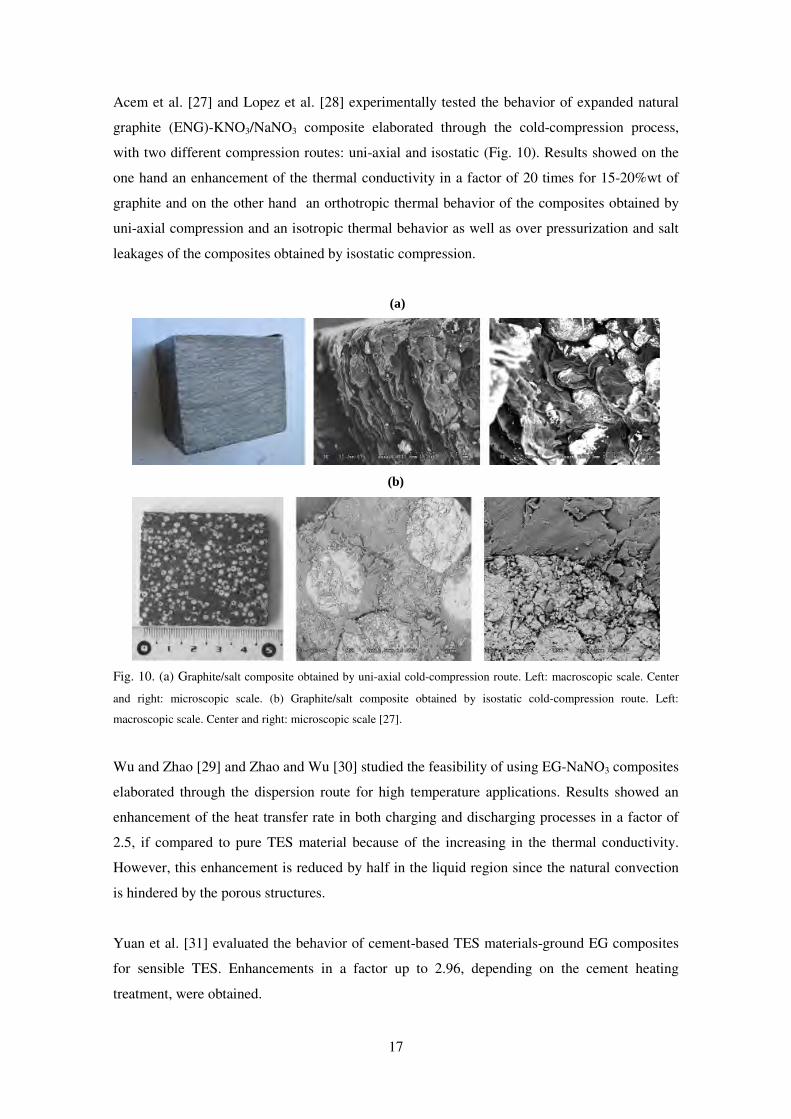
17
Acem et al. [27] and Lopez et al. [28] experimentally tested the behavior of expanded natural
graphite (ENG)-KNO3/NaNO3 composite elaborated through the cold-compression process,
with two different compression routes: uni-axial and isostatic (Fig. 10). Results showed on the
one hand an enhancement of the thermal conductivity in a factor of 20 times for 15-20%wt of
graphite and on the other hand an orthotropic thermal behavior of the composites obtained by
uni-axial compression and an isotropic thermal behavior as well as over pressurization and salt
leakages of the composites obtained by isostatic compression.
(a)
(b)
Fig. 10. (a) Graphite/salt composite obtained by uni-axial cold-compression route. Left: macroscopic scale. Center
and right: microscopic scale. (b) Graphite/salt composite obtained by isostatic cold-compression route. Left:
macroscopic scale. Center and right: microscopic scale [27].
Wu and Zhao [29] and Zhao and Wu [30] studied the feasibility of using EG-NaNO3 composites
elaborated through the dispersion route for high temperature applications. Results showed an
enhancement of the heat transfer rate in both charging and discharging processes in a factor of
2.5, if compared to pure TES material because of the increasing in the thermal conductivity.
However, this enhancement is reduced by half in the liquid region since the natural convection
is hindered by the porous structures.
Yuan et al. [31] evaluated the behavior of cement-based TES materials-ground EG composites
for sensible TES. Enhancements in a factor up to 2.96, depending on the cement heating
treatment, were obtained.

18
Li and Zhang [32] studied the behavior of the NaNO3/LiNO3-EG composite elaborated through
the dispersion route. Results showed a dependence of the thermal conductivity to the graphite
concentration. Thermal conductivity enhancement values up to a factor of 10 could be achieved
despite the fact that the effective latent heat was found to be reduced and the thermal stability
was also found to have worse behavior.
Xiao et al. [33] studied the thermal performance of pure NaNO3, KNO3 and KNO3/NaNO3 as
well as the composites made of such materials with various dispersed EG mass concentrations.
Results showed an enhancement on the thermal conductivity in a 40 % depending on the EG
mass concentration. Moreover, a variance on the melting/freezing temperatures of the
composites was observed if compared with those of pure nitrates.
Huang et al. [34] studied the thermal behavior of EG- LiNO3/KCl composites elaborated
through the dispersion route. Results showed a thermal conductivity enhancement of the
composites if compared with the eutectic LiNO3/KCl in a factor range of 1.85–7.56, depending
on the EG mass concentration and the apparent density of the composite, as well as a reduction
on the heat storage period caused by the reduction of the phase change latent heat of the
composite material.
Xiao et al. [35] reported a method to prepare NaNO3/KNO3-EG composites through the
dispersion route with the addition of ultrasonic waves. Ultrasounds played the role of breaking
EG into nanoscale slices and dispersing them into the nitrates. Results showed on one hand a
good dispersion and a homogeneous distribution of the stripped graphite flakes within the
composite and on the other hand no chemical reaction after the ultrasounds. Moreover, thermal
conductivity enhancements in a factor of up to 2 and a latent heat reduction of 11% were
observed.
Zhao et al. [36] studied the behavior of expanded natural graphite treated with sulfuric acid
(ENG-TSA)-KNO3/NaNO3 composites in terms of anisotropic thermal conductivity, phase
transition properties, thermal stability and micro structures. Results showed an enormous
thermal conductivity enhancement, with values up to a factor of 110, a slight decrease in latent
heat and no remarkable variation in the melting point. On the other hand, when the density of
composite TES material and the salt mass fraction were high, problems with leakage of salt
were found.

19
Zhong et al. [37] evaluated three different types of binary molten salts (LiNO3/KCl,
LiNO3/NaNO3 and LiNO3/NaCl)-EG composites synthesized through the impregnation route.
On one hand, results showed a thermal conductivity enhancement if compared to the pure
eutectic mixture and on the other hand it was observed that these composites showed higher
homogeneity and greater thermal stability (without loss of their morphologies and crystalline
structures) in comparison to other salt-EG composites synthesized through infiltration or
compression routes.
From the modelling and simulation point of view, Lafdi et al. [22] numerically studied and
predicted the thermal performance of graphite foams infiltrated with TES materials for space
TES applications. Results showed an improvement in a factor of 8 in the average value of the
output power delivered to the working fluid as a result of the enhancement of the composite
thermal conductivity.
Lopez et al. [28] studied the melting and solidification process in a KNO3/NaNO3-EG
composite elaborated through the compression process. Results showed that during the melting
process, the TES material volume expansion is constrained by the graphite creating an over
pressurization that increases the melting point of TES material and decreases its latent heat. To
avoid this problem, the authors identified the need to perform the following actions without
reducing the effective thermal conductivity: reduce the pore-wall rigidity, increase the pore
walls and/or increase the pores connectivity.
Kim et al. [38] and Zhao et al. [39] numerically studied the use of graphite foam-MgCl2
composite in a LHTES system, consisting of a tank filled with a TES material and pipes
carrying a heat transfer fluid simulating a CSP plant. Results showed that the thermal
conductivity enhancement of the composite not only could improve the exergy efficiency in the
system but also it could reduce the number of pipes of the system in a factor of 13.5 and
therefore a huge reduction on the investment costs.
3.2 Metal foams composites
The concept of metal foam, also referred as cellular metals, porous metals, foamed metal and
metallic foam [40], consists of a highly metallic porous material (solid metal containing a large
volume fraction of gas pores) which is combined with TES materials. Two different types of
foams can be differentiated depending on the pores characteristics: close-cell metallic foam if
the pores are sealed or open-cell metallic foams if the pores form an interconnected network
[41].

20
The concept of metal foams has been widely studied during the last decades in the automotive,
aerospace, medical, environment, chemical, metallurgy, structural and mechanical engineering
industries but it is currently starting to emerge as a promising thermal conductivity enhancement
technique, not only because of its good intrinsic thermomechanical properties (mainly high
thermal conductivity and good behavior at high temperature), but also because of the high
versatility in the control of variables such as lightness, pore distribution, permeability, specific
surface area to volume ratio and capillarity [42].
Focusing on metal foams as thermal conductivity enhancers, it has been found that very few
studies have been carried out at high temperature. Chen et al. [41] reviewed the research
progress of TES materials embedded with metal foams and studied the effects of introducing
this enhancer on the conduction, convection and phase change heat transfer process of the
composite. They observed on the one hand that metal foams composites have higher effective
thermal conductivity and thus they could improve the uniformity of the temperature distribution
but on the other hand, the presence of the metal foam reduce drastically the natural convection,
for analogous reasoning than in the graphite composites, warning the researchers to consider the
effects of porosity and pore size on both the conduction and convection heat transfer.
Wu and Zhao [29] and Zhao and Wu [30] experimentally tested the feasibility of using NaNO3
embedded with copper and steel alloy metal foams (Fig. 11) (varying the porosity and pore
density in cylindrical containers in order to enhance the heat transfer performance of the pure
TES material. Results showed that the heat transfer rate could be enhanced by 2.5 times if
compared to the pure NaNO3 in the heating process from 250–300 °C. However, when this
process took place in the liquid region, the heat transfer rate was reduced by half because of the
suppression of the natural convection by the porous structures.
Fig. 11. Microscopical structure of a metal foam [29].

21
Zhang et al. [43] experimentally and numerically investigated the thermal enhancement of the
eutectic mixture KNO3/NaNO3 by combining it with two different metal foams (copper and
nickel foams). It was observed that during the charging process the presence of the metal foams
weakened the influence of the natural convection and therefore limited the process. However, in
the discharging process, where the conduction is the dominant mechanism, the presence of
copper and nickel foams enhanced the process in 28.8% and 19.3% respectively.
Li and Wu [44] numerically investigated the thermal behavior of NaNO3 inside porous copper
matrix depending on porosity and pore density of the metal foam. Results showed a heat transfer
coefficient enhancement in the solid state with values up to 28.1 times by heat conduction and
an enhancement in the liquid state with values up to 3.1 times by the combination of natural
convection and heat conduction. As a result, not only both the melting and the solidification
processes are shortened but also the time differences between them were greatly shortened to
harmonize the heating and cooling rates.
Yang et al. [45,46] numerically studied the influence of varying the porosity and pore density in
the enhancement of a copper metal foam composite. In the first study [45], a sandwich structure
with fins and copper metal foam imbedded in NaNO3 was used to evaluate the flow and heat
transfer behavior. Results showed a significant improvement in the heat transfer performance.
Moreover it was observed that when the porosity of the metal foam is decreased, the phase
change period can be substantially shortened, while the effect of the pore density is not notable.
In the second study [46], a KNO3- copper metal foam composite was used. Results showed an
improvement in the charging process performance up to 24.2 % by increasing linearly the
porosity from the bottom to the top.
3.3 Nanomaterials
In the literature, the material composed by nanometer-sized particles (nanoparticles) and a base
material (BM) is usually presented as nanofluid [47], when the BM is in the liquid state, or
nanocomposite, when the BM is in the solid state [48]. However, in this review both concepts
will be presented as nanomaterial to facilitate the understanding of the article.
The advance of technology has allowed the researchers to obtain smaller structures and take
advantage of them in order to enhance the thermal properties of the actual TES materials.
Previous studies have presented the advantages and disadvantages of nanomaterials if compared
to pure materials [49-55]. Among the advantages, it can be found (1) higher thermal capacity,
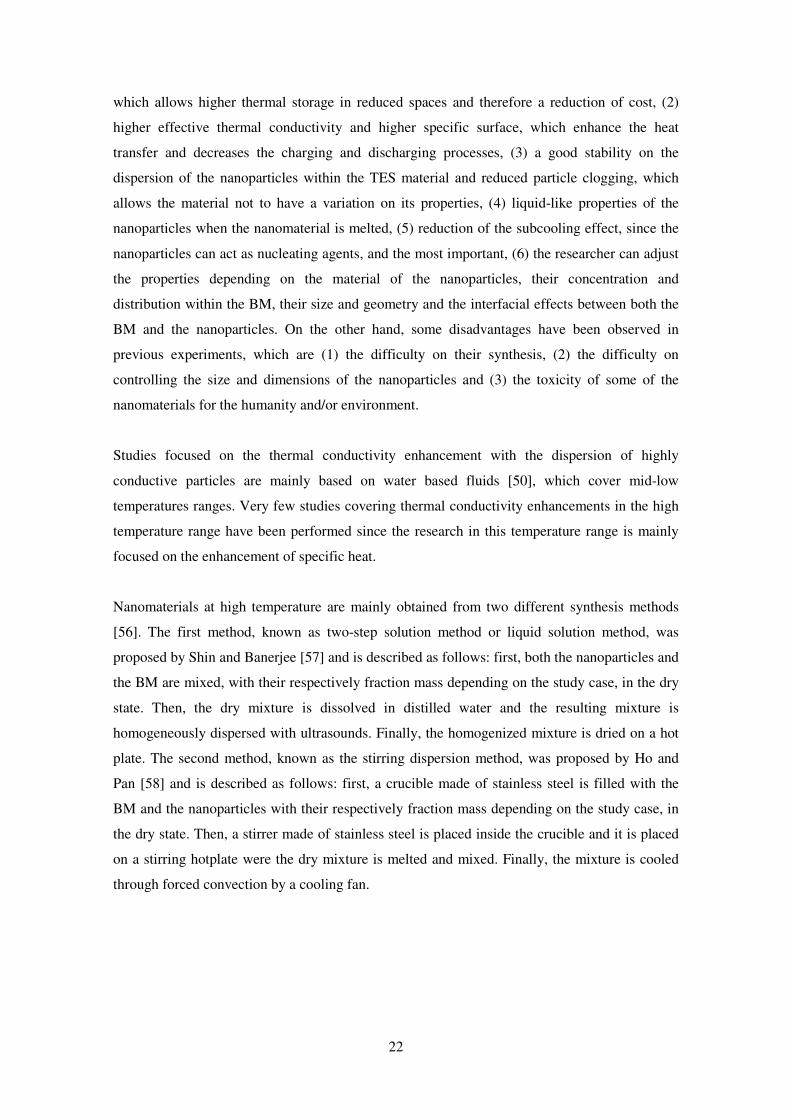
22
which allows higher thermal storage in reduced spaces and therefore a reduction of cost, (2)
higher effective thermal conductivity and higher specific surface, which enhance the heat
transfer and decreases the charging and discharging processes, (3) a good stability on the
dispersion of the nanoparticles within the TES material and reduced particle clogging, which
allows the material not to have a variation on its properties, (4) liquid-like properties of the
nanoparticles when the nanomaterial is melted, (5) reduction of the subcooling effect, since the
nanoparticles can act as nucleating agents, and the most important, (6) the researcher can adjust
the properties depending on the material of the nanoparticles, their concentration and
distribution within the BM, their size and geometry and the interfacial effects between both the
BM and the nanoparticles. On the other hand, some disadvantages have been observed in
previous experiments, which are (1) the difficulty on their synthesis, (2) the difficulty on
controlling the size and dimensions of the nanoparticles and (3) the toxicity of some of the
nanomaterials for the humanity and/or environment.
Studies focused on the thermal conductivity enhancement with the dispersion of highly
conductive particles are mainly based on water based fluids [50], which cover mid-low
temperatures ranges. Very few studies covering thermal conductivity enhancements in the high
temperature range have been performed since the research in this temperature range is mainly
focused on the enhancement of specific heat.
Nanomaterials at high temperature are mainly obtained from two different synthesis methods
[56]. The first method, known as two-step solution method or liquid solution method, was
proposed by Shin and Banerjee [57] and is described as follows: first, both the nanoparticles and
the BM are mixed, with their respectively fraction mass depending on the study case, in the dry
state. Then, the dry mixture is dissolved in distilled water and the resulting mixture is
homogeneously dispersed with ultrasounds. Finally, the homogenized mixture is dried on a hot
plate. The second method, known as the stirring dispersion method, was proposed by Ho and
Pan [58] and is described as follows: first, a crucible made of stainless steel is filled with the
BM and the nanoparticles with their respectively fraction mass depending on the study case, in
the dry state. Then, a stirrer made of stainless steel is placed inside the crucible and it is placed
on a stirring hotplate were the dry mixture is melted and mixed. Finally, the mixture is cooled
through forced convection by a cooling fan.
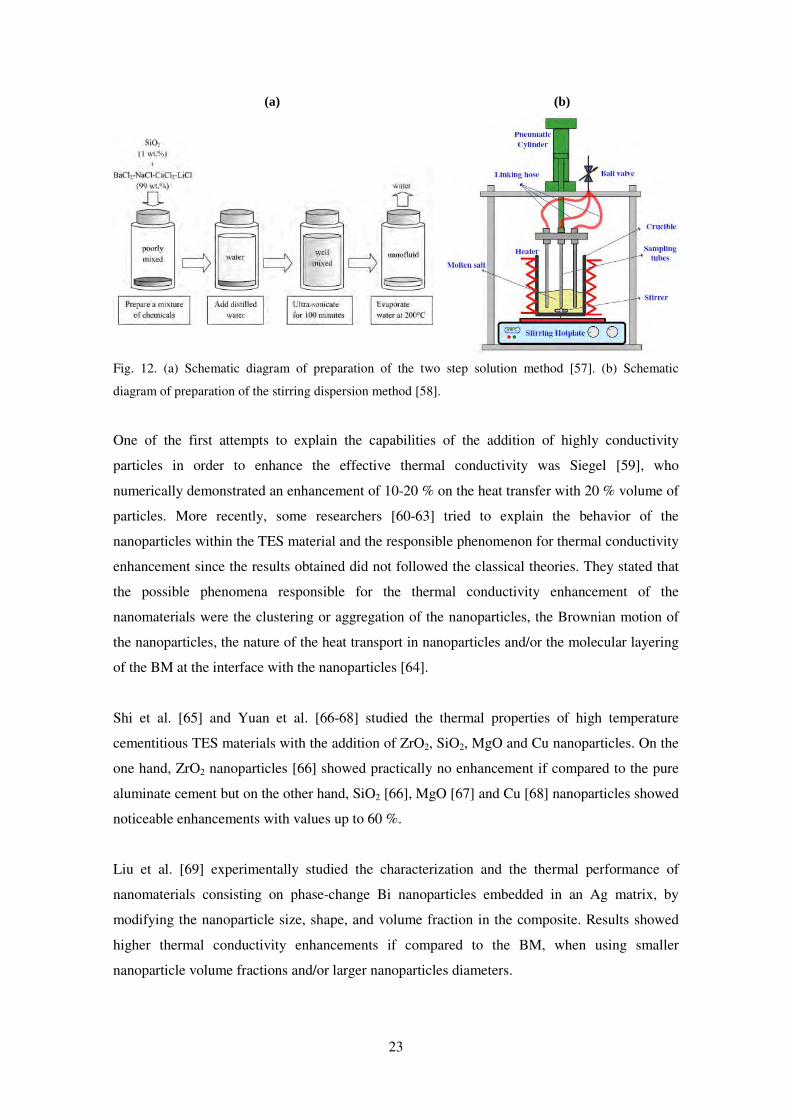
23
(a)
(b)
Fig. 12. (a) Schematic diagram of preparation of the two step solution method [57]. (b) Schematic
diagram of preparation of the stirring dispersion method [58].
One of the first attempts to explain the capabilities of the addition of highly conductivity
particles in order to enhance the effective thermal conductivity was Siegel [59], who
numerically demonstrated an enhancement of 10-20 % on the heat transfer with 20 % volume of
particles. More recently, some researchers [60-63] tried to explain the behavior of the
nanoparticles within the TES material and the responsible phenomenon for thermal conductivity
enhancement since the results obtained did not followed the classical theories. They stated that
the possible phenomena responsible for the thermal conductivity enhancement of the
nanomaterials were the clustering or aggregation of the nanoparticles, the Brownian motion of
the nanoparticles, the nature of the heat transport in nanoparticles and/or the molecular layering
of the BM at the interface with the nanoparticles [64].
Shi et al. [65] and Yuan et al. [66-68] studied the thermal properties of high temperature
cementitious TES materials with the addition of ZrO2, SiO2, MgO and Cu nanoparticles. On the
one hand, ZrO2 nanoparticles [66] showed practically no enhancement if compared to the pure
aluminate cement but on the other hand, SiO2 [66], MgO [67] and Cu [68] nanoparticles showed
noticeable enhancements with values up to 60 %.
Liu et al. [69] experimentally studied the characterization and the thermal performance of
nanomaterials consisting on phase-change Bi nanoparticles embedded in an Ag matrix, by
modifying the nanoparticle size, shape, and volume fraction in the composite. Results showed
higher thermal conductivity enhancements if compared to the BM, when using smaller
nanoparticle volume fractions and/or larger nanoparticles diameters.
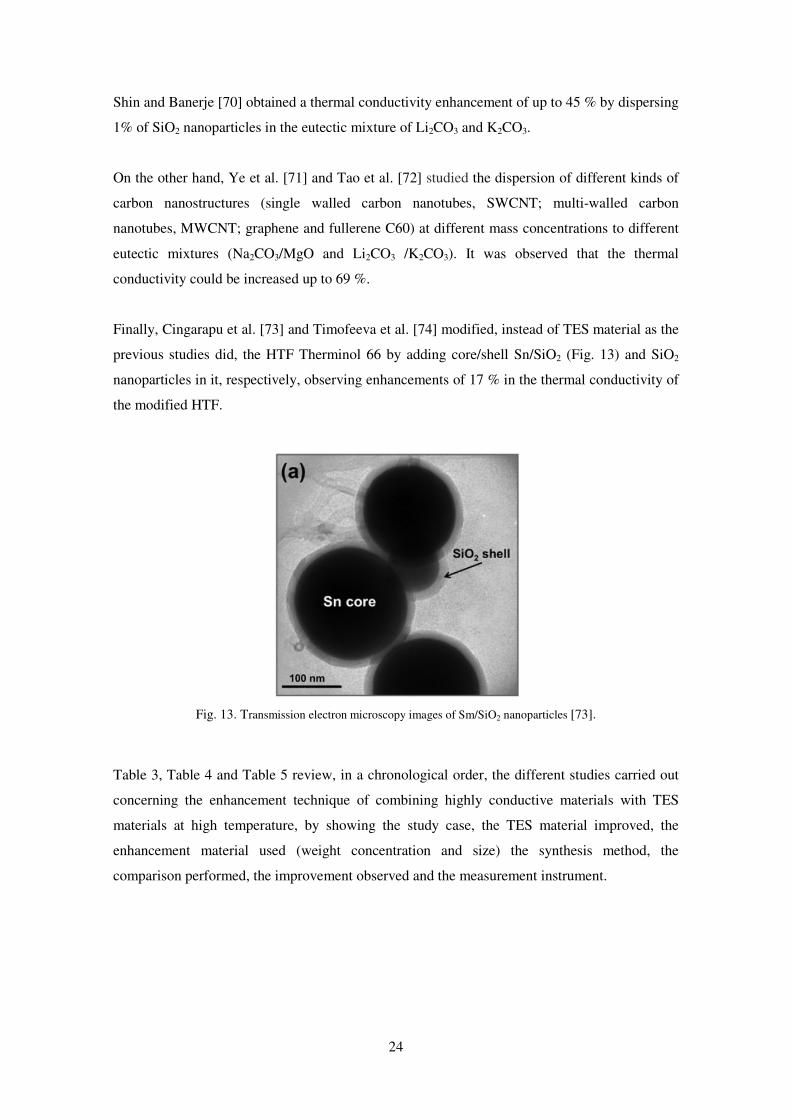
24
Shin and Banerje [70] obtained a thermal conductivity enhancement of up to 45 % by dispersing
1% of SiO2 nanoparticles in the eutectic mixture of Li2CO3 and K2CO3.
On the other hand, Ye et al. [71] and Tao et al. [72] studied the dispersion of different kinds of
carbon nanostructures (single walled carbon nanotubes, SWCNT; multi-walled carbon
nanotubes, MWCNT; graphene and fullerene C60) at different mass concentrations to different
eutectic mixtures (Na2CO3/MgO and Li2CO3 /K2CO3). It was observed that the thermal
conductivity could be increased up to 69 %.
Finally, Cingarapu et al. [73] and Timofeeva et al. [74] modified, instead of TES material as the
previous studies did, the HTF Therminol 66 by adding core/shell Sn/SiO2 (Fig. 13) and SiO2
nanoparticles in it, respectively, observing enhancements of 17 % in the thermal conductivity of
the modified HTF.
Fig. 13. Transmission electron microscopy images of Sm/SiO2 nanoparticles [73].
Table 3, Table 4 and Table 5 review, in a chronological order, the different studies carried out
concerning the enhancement technique of combining highly conductive materials with TES
materials at high temperature, by showing the study case, the TES material improved, the
enhancement material used (weight concentration and size) the synthesis method, the
comparison performed, the improvement observed and the measurement instrument.

25
Table 3. Review of the studies concerning the combination of highly conductive material with TES material at high temperature. Case 3: Graphite composites.
Study case Graphite type
1
(nominal size)
Concentration
(wt%) TES material
Method of
synthesis Comparison
Improvement and
measurement
instrument2
Year Reference
1 Experimental EG (n.a) 15
KNO3 + NaNO3
(54 + 46 wt%)
KNO3 + LiNO3
(68 + 32 wt%)
Compression
Infiltration
Different graphite
composites
(different routes) vs.
pure TES materials
Up to a factor of 10 (15
wt%, compression,
KNO3-NaNO3)
Up to a factor higher
than 10 (15 wt%,
compression, LiNO3-
NaNO3)
By: TCCT
2005 Do Couto
et al. [23]
2 Experimental
NG (n.a)
CEG (n.a)
CFG 500 (n.a)
5/10/20/30 KNO3 + NaNO3
(n.a. wt%)
Compression
Infiltration
Different graphite
composites
(different routes,
graphite types and
concentrations) vs.
pure TES materials
Up to a factor of 30 (30
wt%, compression)
By: LFA457 (Netzsch
Gertebau)
2006 Bauer et al.
[24]
3 Numerical Graphite foam
(n.a.) n.a.
LiF–CaF2
(n.a. %) n.a.
Graphite composites
vs pure TES material
Output power delivered:
Up to 800 % 2008
Lafdi et al.
[22]
4 Experimental
NG (400 µm)
EG (n.a.)
GEG (50-500 µm)
7/10/20/30 KNO3-NaNO3
(n.a. %)
Dispersion
Infiltration
Cold
compression
Different graphite
composites
(different routes,
graphite types and
Up to a factor of 31 (20
wt%, compression)
Up to a factor of 10 (7
wt%, dispersion)
2008 Pincemin et
al. [25]
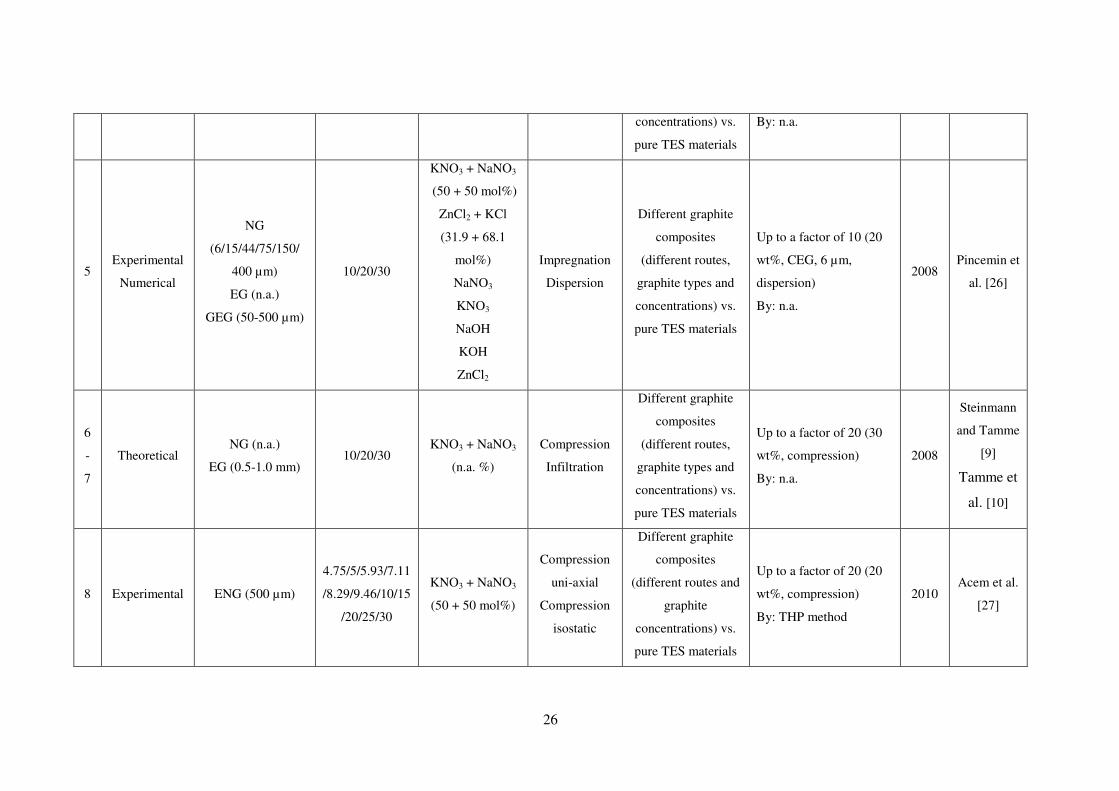
26
concentrations) vs.
pure TES materials
By: n.a.
5 Experimental
Numerical
NG
(6/15/44/75/150/
400 µm)
EG (n.a.)
GEG (50-500 µm)
10/20/30
KNO3 + NaNO3
(50 + 50 mol%)
ZnCl2 + KCl
(31.9 + 68.1
mol%)
NaNO3
KNO3
NaOH
KOH
ZnCl2
Impregnation
Dispersion
Different graphite
composites
(different routes,
graphite types and
concentrations) vs.
pure TES materials
Up to a factor of 10 (20
wt%, CEG, 6 µm,
dispersion)
By: n.a.
2008 Pincemin et
al. [26]
6
-
7
Theoretical NG (n.a.)
EG (0.5-1.0 mm) 10/20/30
KNO3 + NaNO3
(n.a. %)
Compression
Infiltration
Different graphite
composites
(different routes,
graphite types and
concentrations) vs.
pure TES materials
Up to a factor of 20 (30
wt%, compression)
By: n.a.
2008
Steinmann
and Tamme
[9]
Tamme et
al. [10]
8 Experimental ENG (500 µm)
4.75/5/5.93/7.11
/8.29/9.46/10/15
/20/25/30
KNO3 + NaNO3
(50 + 50 mol%)
Compression
uni-axial
Compression
isostatic
Different graphite
composites
(different routes and
graphite
concentrations) vs.
pure TES materials
Up to a factor of 20 (20
wt%, compression)
By: THP method
2010 Acem et al.
[27]
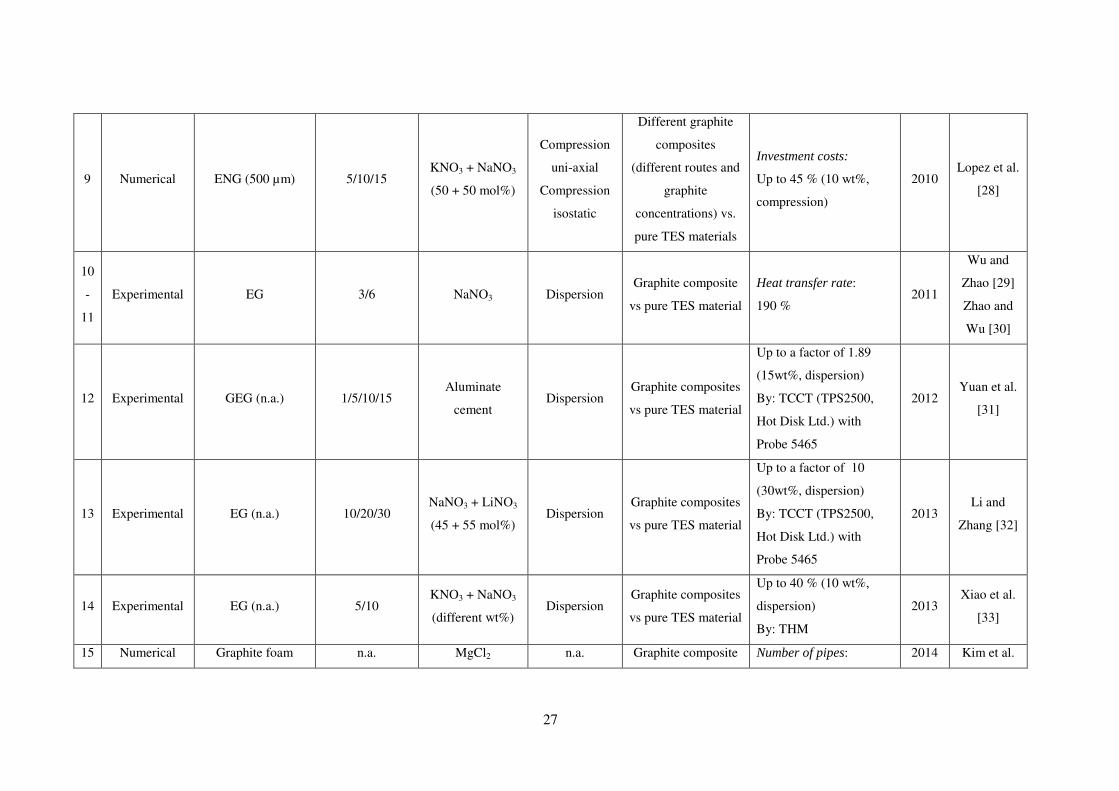
27
9 Numerical ENG (500 µm) 5/10/15 KNO3 + NaNO3
(50 + 50 mol%)
Compression
uni-axial
Compression
isostatic
Different graphite
composites
(different routes and
graphite
concentrations) vs.
pure TES materials
Investment costs:
Up to 45 % (10 wt%,
compression)
2010 Lopez et al.
[28]
10
-
11
Experimental EG 3/6 NaNO3 Dispersion Graphite composite
vs pure TES material
Heat transfer rate:
190 % 2011
Wu and
Zhao [29]
Zhao and
Wu [30]
12 Experimental GEG (n.a.) 1/5/10/15 Aluminate
cement Dispersion
Graphite composites
vs pure TES material
Up to a factor of 1.89
(15wt%, dispersion)
By: TCCT (TPS2500,
Hot Disk Ltd.) with
Probe 5465
2012 Yuan et al.
[31]
13 Experimental EG (n.a.) 10/20/30 NaNO3 + LiNO3
(45 + 55 mol%) Dispersion
Graphite composites
vs pure TES material
Up to a factor of 10
(30wt%, dispersion)
By: TCCT (TPS2500,
Hot Disk Ltd.) with
Probe 5465
2013 Li and
Zhang [32]
14 Experimental EG (n.a.) 5/10 KNO3 + NaNO3
(different wt%) Dispersion
Graphite composites
vs pure TES material
Up to 40 % (10 wt%,
dispersion)
By: THM
2013 Xiao et al.
[33]
15 Numerical Graphite foam n.a. MgCl2 n.a. Graphite composite Number of pipes: 2014 Kim et al.
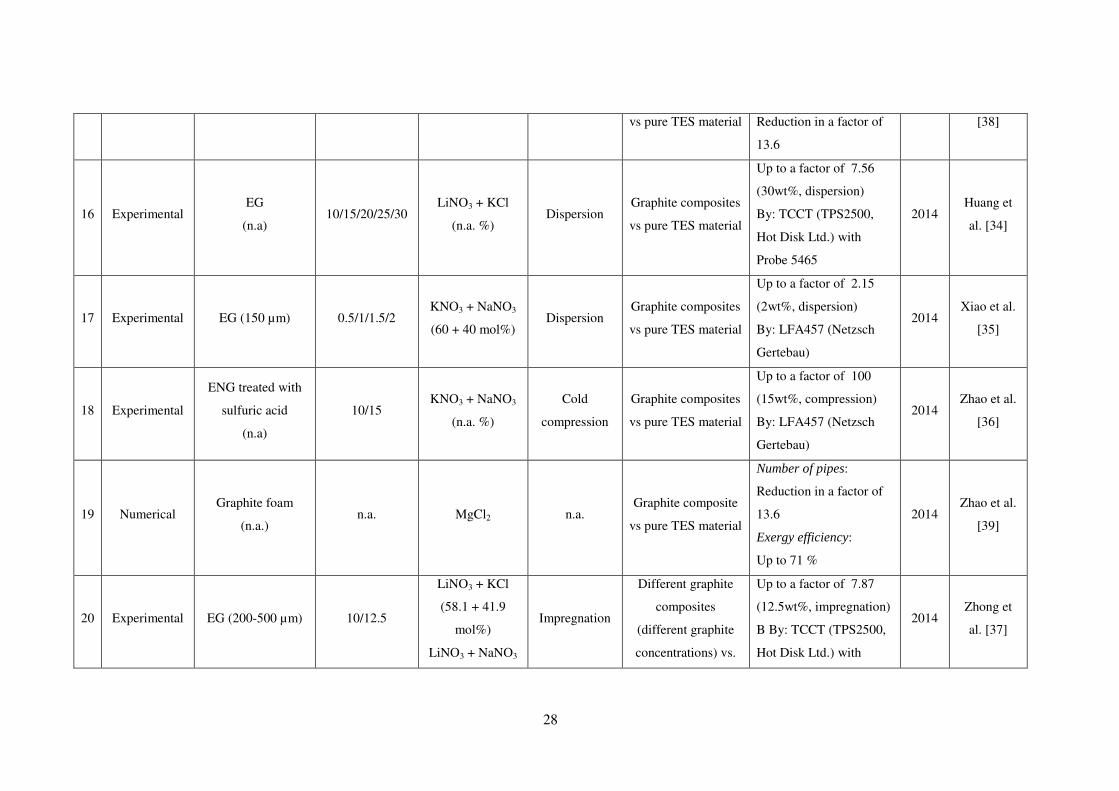
28
vs pure TES material Reduction in a factor of
13.6
[38]
16 Experimental EG
(n.a) 10/15/20/25/30
LiNO3 + KCl
(n.a. %) Dispersion
Graphite composites
vs pure TES material
Up to a factor of 7.56
(30wt%, dispersion)
By: TCCT (TPS2500,
Hot Disk Ltd.) with
Probe 5465
2014 Huang et
al. [34]
17 Experimental EG (150 µm) 0.5/1/1.5/2 KNO3 + NaNO3
(60 + 40 mol%) Dispersion
Graphite composites
vs pure TES material
Up to a factor of 2.15
(2wt%, dispersion)
By: LFA457 (Netzsch
Gertebau)
2014 Xiao et al.
[35]
18 Experimental
ENG treated with
sulfuric acid
(n.a)
10/15 KNO3 + NaNO3
(n.a. %)
Cold
compression
Graphite composites
vs pure TES material
Up to a factor of 100
(15wt%, compression)
By: LFA457 (Netzsch
Gertebau)
2014 Zhao et al.
[36]
19 Numerical Graphite foam
(n.a.) n.a. MgCl2 n.a.
Graphite composite
vs pure TES material
Number of pipes:
Reduction in a factor of
13.6
Exergy efficiency:
Up to 71 %
2014 Zhao et al.
[39]
20 Experimental EG (200-500 µm) 10/12.5
LiNO3 + KCl
(58.1 + 41.9
mol%)
LiNO3 + NaNO3
Impregnation
Different graphite
composites
(different graphite
concentrations) vs.
Up to a factor of 7.87
(12.5wt%, impregnation)
B By: TCCT (TPS2500,
Hot Disk Ltd.) with
2014 Zhong et
al. [37]
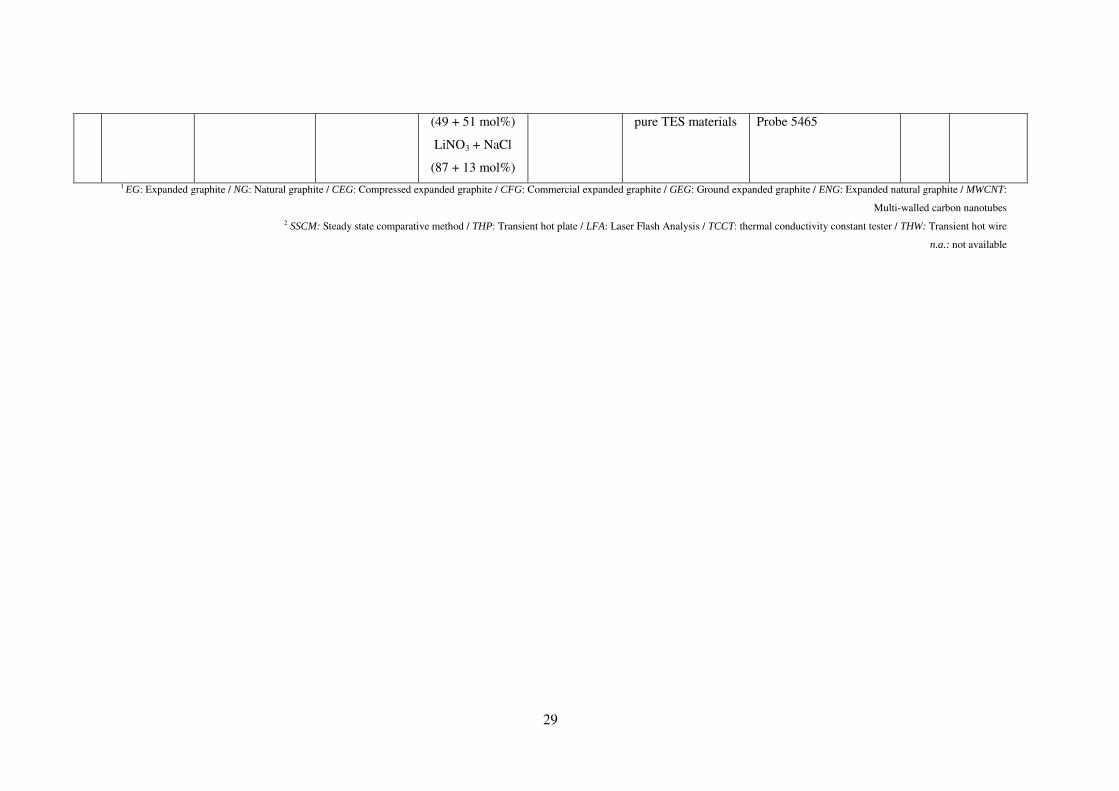
29
(49 + 51 mol%)
LiNO3 + NaCl
(87 + 13 mol%)
pure TES materials Probe 5465
1 EG: Expanded graphite / NG: Natural graphite / CEG: Compressed expanded graphite / CFG: Commercial expanded graphite / GEG: Ground expanded graphite / ENG: Expanded natural graphite / MWCNT:
Multi-walled carbon nanotubes
2 SSCM: Steady state comparative method / THP: Transient hot plate / LFA: Laser Flash Analysis / TCCT: thermal conductivity constant tester / THW: Transient hot wire
n.a.: not available
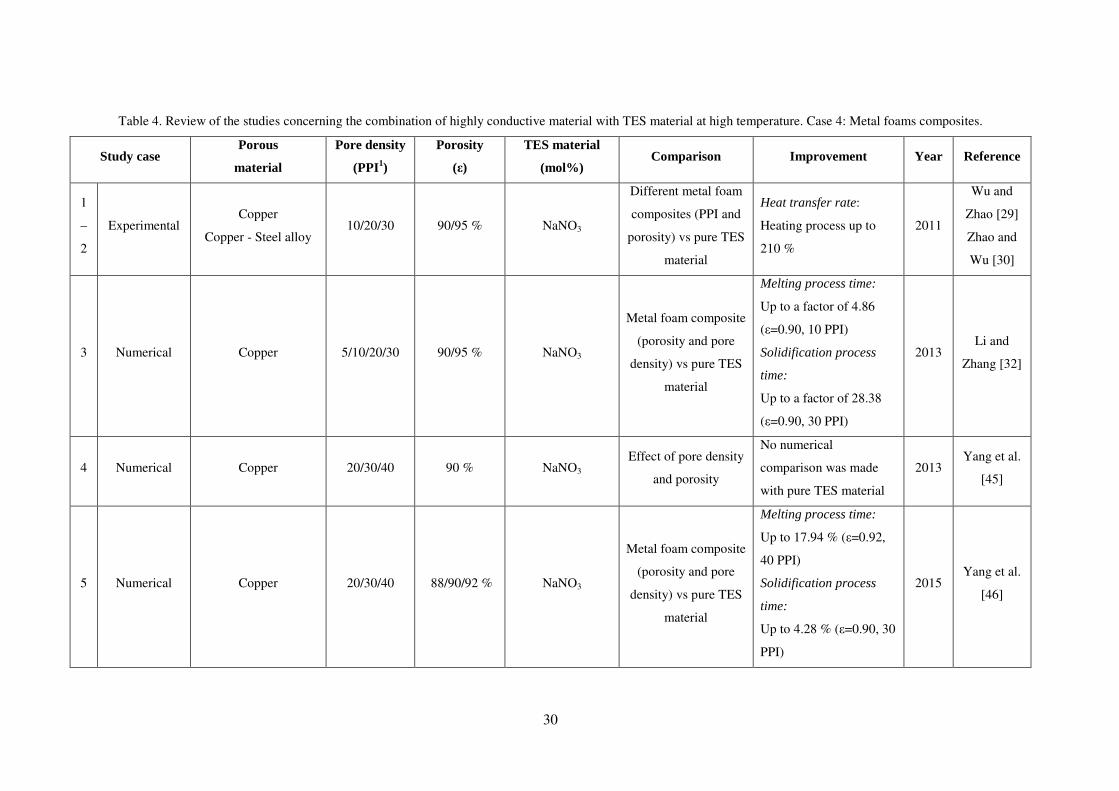
30
Table 4. Review of the studies concerning the combination of highly conductive material with TES material at high temperature. Case 4: Metal foams composites.
Study case Porous
material
Pore density
(PPI1)
Porosity
(ε)
TES material
(mol%) Comparison Improvement Year Reference
1
–
2
Experimental Copper
Copper - Steel alloy 10/20/30 90/95 % NaNO3
Different metal foam
composites (PPI and
porosity) vs pure TES
material
Heat transfer rate:
Heating process up to
210 %
2011
Wu and
Zhao [29]
Zhao and
Wu [30]
3 Numerical Copper 5/10/20/30 90/95 % NaNO3
Metal foam composite
(porosity and pore
density) vs pure TES
material
Melting process time:
Up to a factor of 4.86
(ε=0.90, 10 PPI)
Solidification process
time:
Up to a factor of 28.38
(ε=0.90, 30 PPI)
2013 Li and
Zhang [32]
4 Numerical Copper 20/30/40 90 % NaNO3
Effect of pore density
and porosity
No numerical
comparison was made
with pure TES material
2013 Yang et al.
[45]
5 Numerical Copper 20/30/40 88/90/92 % NaNO3
Metal foam composite
(porosity and pore
density) vs pure TES
material
Melting process time:
Up to 17.94 % (ε=0.92,
40 PPI)
Solidification process
time:
Up to 4.28 % (ε=0.90, 30
PPI)
2015 Yang et al.
[46]

31
6 Experimental
Numerical
Copper
Nickel 10 96.5/97.5 %
KNO3 + NaNO3
(50 + 50 %)
Different metal foam
composites (material)
vs pure TES material
Solidification process
time (Copper):
Up to 28.8 % (ε=0.96, 10
PPI)
Solidification process
time (Nickel):
Up to 19.3 % (ε=0.97, 10
PPI)
2015 Zhang et al.
[43]
1 PPI: Pore number per inch

32
Table 5. Review of the studies concerning the combination of highly conductive material with TES material at high temperature. Case 5: Nanomaterials.
Study case Nanoparticles
(nominal size)
Concentration
(wt%)
TES material
(mol%)
Method of
synthesis Comparison
Improvement and
measurement instrument1 Year Reference
1 Numerical n.a. 20/60 Molten salts n.a. Concentration of
nanoparticles
Heat transfer rate:
Solidification process up to
20 %
1977 Siegel
[59]
2 Experimental SiO2
(15 nm) 1.2/3.6/5.0/7.0 Therminol 66
Two-step
solution method
Concentration of
nanoparticles
Up to 17.1 % (7.0 wt%, at
25 ºC)
By: THW (Model KD2pro,
Decagon Devices, Inc.)
2011
Timofeev
a et al.
[74]
3 Experimental ZrO2
(20 nm)
1.0/2.0/3.0/4.0/5
.0 Aluminate cement Normal mixture
Concentration of
nanoparticles
Practically no enhancement
By: TCCT (TPS2500, Hot
Disk Ltd.) with Probe 5465
2013 Yuan et
al. [66]
4 Experimental Sn/SiO2
(50-100 nm)
1.0/2.0/3.0/4.0/5
.0 Therminol 66
Two-step
solution method
Concentration of
nanoparticles
Up to 17.1 % (5.0 wt%)
By: THW (Model KD2pro,
Decagon Devices, Inc.)
2014 Cingarapu
et al. [73]
5 Experimental SiO2
(50 nm)
1.0/2.0/3.0/4.0/5
.0 Aluminate cement
Similar to
stirring method
Concentration of
nanoparticles
Up to 61 % (3.0 wt%)
By: TCCT (TPS2500, Hot
Disk Ltd.) with Probe 5465
2014 Shi et al.
[65]
6 Experimental MWCNT
(11 nm x 10 µm) 0.1/0.2/0.3/0.5
Na2CO3 + MgO
(40 + 60 %, 50 + 50 %,
60 + 40 %, 80 + 20 %)
Normal mixture Concentration of
nanoparticles
Up to 69 % (0.5 wt%)
By: UNITHERMTM model
2022 (Anter Corporation)
2014 Ye et al.
[71]
7 Experimental MgO
(50 nm) 2.0/3.0/4.0/10.0 Aluminate cement Normal mixture
Concentration of
nanoparticles and
Up to 35.4 % (1 wt%, 350
ºC) 2014
Yuan et
al. [67]

33
temperature
effect
Up to 23.6 % (1 wt%, 350
ºC)
By: TCCT (TPS2500, Hot
Disk Ltd.) with Probe 5465
8 Experimental
Bi
(8.1/9.8/13.2/14.9
nm)
2.0/5.0/10.0 Ag Normal mixture
Concentration of
nanoparticles and
nanoparticle size
Decrease if concentration
increases
By: n.a.
2015 Liu et al.
[69]
9 Experimental SiO2
(10-30 nm) 1.0
Li2CO3 + K2CO3
(62 + 38 %)
Two-step
solution method
Nanomaterial vs
pure material
Up to 47 % (1 wt%, 150 ºC)
Up to 36 % (1 wt%, 250 ºC)
Up to 37 % (1 wt%, 350 ºC)
By: LFA 447 Nanoflash (Netzsch Instruments N.A. LLC.).
2015
Shin and
Banerjee
[70]
10 Experimental
SWCNT (5-20 nm
x 1-5 µm)
MWCNT (10-50
nm x 0.5-1 µm)
Graphene (10-20
nm x 1-5 µm)
Fullerene C60 (0.5-2
µm)
0.1/0.5/1.0/1.5/2
.5
Li2CO3 + K2CO3
(62 + 38 mol%)
Two-step
solution method
Type of
nanoparticles and
concentration of
nanoparticles
SWCNT: Up to 56.98 % (1.5
wt%)
MWCNT: Up to 50.05 %
(1.5 wt%).
Graphene: Up to 27.77 %
(2.5 wt%)
C60: Up to -31.85 % (2.5
wt%)
By: LFA
2015 Tao et al.
[72]
11 Experimental Cu powder 1.0/5.0/10.0/15.
0 Aluminate cement Normal mixture
Concentration of
nanoparticles and
temperature
Up to 24 % (15 wt%, 105
ºC)
Up to 50 % (15 wt%, 350
2015 Yuan et
al. [68]

34
effect ºC)
Up to 51 % (15 wt%, 900
ºC)
By: TCCT (TPS2500, Hot
Disk Ltd.) with Probe 5465 1 EG: Expanded graphite / NG: Natural graphite / CEG: Compressed expanded graphite / CFG: Commercial expanded graphite / GEG: Ground expanded graphite / ENG: Expanded natural graphite / MWCNT:
Multi-walled carbon nanotubes / SWCNT: Single -walled carbon nanotubes 2 THW: Transient hot wire / TCCT: thermal conductivity constant tester / LFA: Laser Flash Analysis
n.a.: not available

35
4. Overview of the enhancement techniques research evolution
The Technology Readiness Level (TRL) of the five enhancement techniques reviewed in the
present study are presented as well as the temporal evolution of the publications related to them.
The main objective of this classification is to give an overview about how the maturity of the
enhancement techniques is in order to describe recent trends in this field and to identify a niche
of research.
TRL is a measurement system used on the one hand to assess the maturity of evolving
technologies during their development and early operations and on the other hand to compare
technologies [75]. This scale classifies the maturity of a technology in nine levels, from the
basic research until its commercial application (Table 6).
Table 6. Technology readiness levels summary. Based on: [76,77].
Level Definition
TRL 1 Basic principles observed
TRL 2 Technology concept formulated
TRL 3 Experimental proof of concept at lab scale
TRL 4 Technology validated in small-scale
TRL 5 Development at real-scale
TRL 6 System prototype demonstration in simulated operational environment
TRL 7 System prototype demonstration in real operational environment
TRL 8 System complete and qualified, first commercial prototype
TRL 9 Commercial application
As it can be observed in Table 7, the 40.4 % and the 53.8 % of the studies reviewed are in a
TRL 2 and TRL 3, respectively, which means that more than the 94 % of the work carried out
so far is still in the very early stages. The promising aspects of each thermal enhancement
techniques have been detected and observed. Moreover, active research and development has
gained relevance and the governments have been started to fund projects related with numerical
and laboratory scale experimentation in order to validate the analytical predictions. Only the 6
% of the experimentation has been carried out at a scale higher than the laboratory. Therefore,
since the benefits of implementing the thermal conductivity enhancement techniques have been
already proved, the next step is to test them at higher scale in order to validate the results
obtained numerically and at laboratory scale.
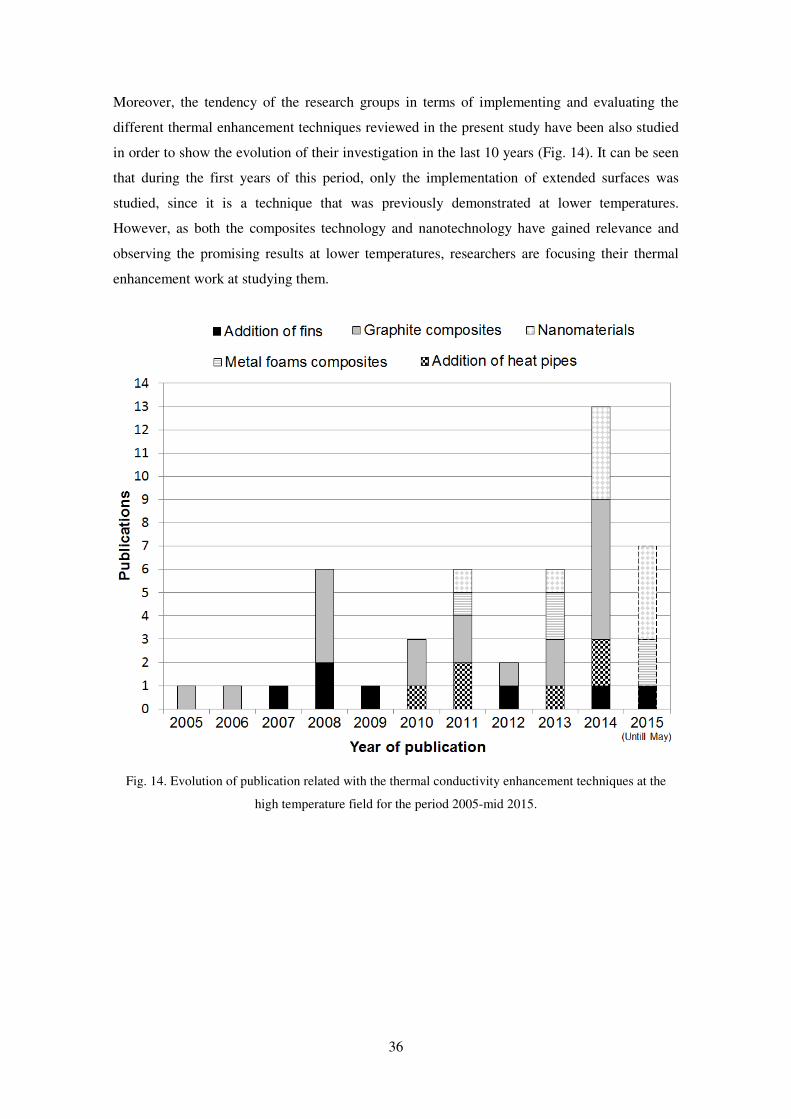
36
Moreover, the tendency of the research groups in terms of implementing and evaluating the
different thermal enhancement techniques reviewed in the present study have been also studied
in order to show the evolution of their investigation in the last 10 years (Fig. 14). It can be seen
that during the first years of this period, only the implementation of extended surfaces was
studied, since it is a technique that was previously demonstrated at lower temperatures.
However, as both the composites technology and nanotechnology have gained relevance and
observing the promising results at lower temperatures, researchers are focusing their thermal
enhancement work at studying them.
Fig. 14. Evolution of publication related with the thermal conductivity enhancement techniques at the
high temperature field for the period 2005-mid 2015.
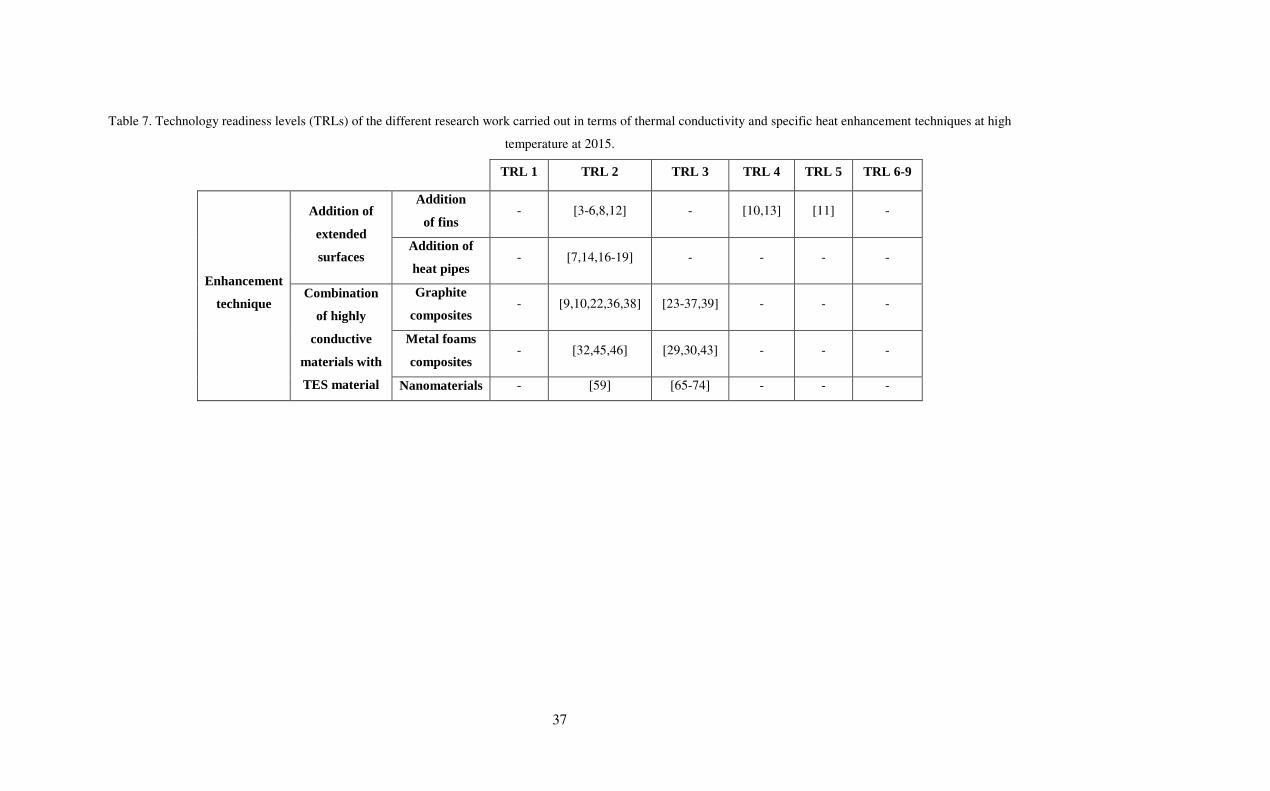
37
Table 7. Technology readiness levels (TRLs) of the different research work carried out in terms of thermal conductivity and specific heat enhancement techniques at high
temperature at 2015.
TRL 1 TRL 2 TRL 3 TRL 4 TRL 5 TRL 6-9
Enhancement
technique
Addition of
extended
surfaces
Addition
of fins - [3-6,8,12] - [10,13] [11] -
Addition of
heat pipes - [7,14,16-19] - - - -
Combination
of highly
conductive
materials with
TES material
Graphite
composites - [9,10,22,36,38] [23-37,39] - - -
Metal foams
composites - [32,45,46] [29,30,43] - - -
Nanomaterials - [59] [65-74] - - -

38
5. Conclusions
One of the main obstacles that hinder the fully development and implementation of TES
systems is the low thermal conductivity values that most of the currently commercial TES
materials have. The present paper presents an exhaustive review of the numerical and
experimental studies, involving the different thermal conductivity enhancement techniques,
developed at the high temperature field (> 150 ºC). Notice that Part 1 of this article identifies
and reviews more than 25 different requirements that TES materials and systems should
consider for being used at those temperatures and the approaches to achieve them. The research
is focused on the literature available on scientific journals until mid-2015 and the authors would
like to apology if any paper has been neglected since the present paper does not claim about its
exhaustiveness in the high temperature field.
The main conclusion regarding the different enhancement techniques are:
� Extended surfaces
The addition of extended surfaces is the most and widely studied thermal conductivity
enhancement techniques in the low temperature range (<150 ºC). Therefore, since its
enhancement has been demonstrated, only little research has been carried out at high
temperature.
- Addition of fins
It has been numerically and experimentally demonstrated the thermal performance
improvement of this technique. Among all materials tested at high temperature,
aluminum is preferred as fin material and the geometry of the fin is a key factor on
the percentage of improvement. However, two main drawbacks have been
observed, which are the increase of costs and the decrease of the packing factor.
- Addition of heat pipes
This technique has been only numerically studied at high temperature. Different
parameters have been simulated and evaluated and in all the research work carried
out, promising results were obtained.
� Combination of highly conductive materials with TES material
The combination of highly thermal conductive materials with the already known TES
materials in order to obtain new materials with improved thermal properties is gaining
relevance every year.
- Graphite composites
Graphite is considered a good thermal conductivity enhancer not only because of its
high thermal conductivity but also for its low density, its chemical resistance to
39
corrosive environments and its suitability for high temperature processes. Among
the different graphite composites elaboration routes, impregnation and compression
are found to have a high enhancement performance. Experimental results showed
that the effective thermal conductivity of the composite strongly depends on the
graphite fraction of the composite, the temperature and on the graphite particles size
and orientation. However, a reduction on the natural convection has been observed
in the liquid state.
- Metal foams composites
Metal foams are promising thermal conductivity enhancers not only because of its
good intrinsic thermomechanical properties, but also because of variables such as
lightness, pore distribution, permeability, specific surface area to volume ratio and
capillarity that can be controlled by the researchers. Very little experimentation has
been carried at high temperature but results showed an increase of the thermal
conductivity on the solid state and solidification process but no increase of the
thermal conductivity on the liquid state and melting process due to the fact that the
presence of metal foam reduce drastically the natural convection
- Nanomaterials
The dispersion of nanoparticles within a TES material is the most promising
enhancement technique for its implementation at industrial scale due to their
advantages such as high thermal capacity, high effective thermal conductivity and
specific surface, good stability on the dispersion of the nanoparticles within the TES
material and reduced particle clogging, reduction of the subcooling effect and the
most important, the researcher can adjust the properties depending on the material
of the nanoparticles. Therefore, all the work done is focused on improving the most
common TES materials used in solar plants. Results showed good and promising
enhancement in thermal conductivity values.
Finally, the authors would like the readers to be critical with the results collected in the present
review, since the lack of international standards or agreements in the expert community for
evaluating the thermal properties of TES materials makes difficult to properly discuss and
compare the results.
Acknowledgments
The work is partially funded by the Spanish government (ENE2011-22722 and ULLE10-4E-
1305). The authors would like to thank the Catalan Government for the quality accreditation

40
given to their research group GREA (2014 SGR 123). The research leading to these results has
received funding from the European Union's Seventh Framework Programme (FP7/2007-2013)
under grant agreement n° PIRSES-GA-2013-610692 (INNOSTORAGE). Laia Miró would like
to thank the Spanish Government for her research fellowship (BES-2012-051861).
References
[1] Gasia J, Miró L, Cabeza LF. Materials and system requirements of high temperature thermal energy storage systems: A review. Part 1: General requirements 2015; in press.
[2] Jegadheeswaran S, Pohekar SD. Performance enhancement in latent heat thermal storage system: A review. Renew Sustain Energy Rev 2009;13:2225–44. doi:10.1016/j.rser.2009.06.024.
[3] Zhang Y, Faghri A. Heat transfer enhancement in latent heat thermal energy storage system by using the internally finned tube. Int J Heat Mass Transf 1996;39:3165–73. doi:10.1016/0017-9310(95)00402-5.
[4] Seeniraj RV, Velraj R, Narasimhan NL. Thermal analysis of a finned-tube LHTS module for a solar dynamic power system. Heat Mass Transf 2002;38:409–17. doi:10.1007/s002310100268.
[5] Khaled A-RA. Heat transfer enhancement in hairy fin systems. Appl Therm Eng 2007;27:250–7. doi:10.1016/j.applthermaleng.2006.04.012.
[6] Guo C, Zhang W. Numerical simulation and parametric study on new type of high temperature latent heat thermal energy storage system. Energy Convers Manag 2008;49:919–27. doi:10.1016/j.enconman.2007.10.025.
[7] Jung EG, Boo JH. Thermal analytical model of latent thermal storage with heat pipe heat exchanger for concentrated solar power. Sol Energy 2014;102:318–32. doi:10.1016/j.solener.2013.11.008.
[8] Tiari S, Qiu S, Mahdavi M. Numerical study of finned heat pipe-assisted thermal energy storage system with high temperature phase change material. Energy Convers Manag 2015;89:833–42. doi:10.1016/j.enconman.2014.10.053.
[9] Steinmann W-D, Tamme R. Latent Heat Storage for Solar Steam Systems. J Sol Energy Eng 2008;130:5. doi:10.1115/1.2804624.
[10] Tamme R, Bauer T, Buschle J, Laing D, Muller-Steinhagen H, Steinmann W-D. Latent heat storage above 120°C for applications in the industrial process heat sector and solar power generation. Int J Energy Res 2008;32:264–71. doi:0.1002/er.1346.
[11] Laing D, Bauer T, Steinmann W-D, Lehmann D. Advanced high temperature latent heat storage system – design and test results. 11th Int. Conf. Therm. Energy Storage, Stockholm: 2009.
[12] Tao YB, He YL, Qu ZG. Numerical study on performance of molten salt phase change thermal energy storage system with enhanced tubes. Sol Energy 2012;86:1155–63. doi:10.1016/j.solener.2012.01.004.
[13] Gil A, Oró E, Miró L, Peiró G, Ruiz Á, Salmerón JM, et al. Experimental analysis of hydroquinone used as phase change material (PCM) to be applied in solar cooling refrigeration. Int J Refrig 2014;39:95–103. doi:10.1016/j.ijrefrig.2013.05.013.
[14] Shabgard H, Bergman TL, Sharifi N, Faghri A. High temperature latent heat thermal energy storage using heat pipes. Int J Heat Mass Transf 2010;53:2979–88. doi:10.1016/j.ijheatmasstransfer.2010.03.035.
[15] Siddique M, Khaled A-RA, Abdulhafiz NI, Boukhary AY. Recent Advances in Heat Transfer Enhancements: A Review Report. Int J Chem Eng 2010;2010:1–29. doi:10.1155/2010/106461.
[16] Nithyanandam K, Pitchumani R. Analysis and optimization of a latent thermal energy storage system with embedded heat pipes. Int J Heat Mass Transf 2011;54:4596–610. doi:10.1016/j.ijheatmasstransfer.2011.06.018.

41
[17] Nithyanandam K, Pitchumani R. Thermal energy storage with heat transfer augmentation using thermosyphons. Int J Heat Mass Transf 2013;67:281–94. doi:10.1016/j.ijheatmasstransfer.2013.08.007.
[18] Khalifa A, Tan L, Date A, Akbarzadeh A. A numerical and experimental study of solidification around axially finned heat pipes for high temperature latent heat thermal energy storage units. Appl Therm Eng 2014;70:609–19. doi:10.1016/j.applthermaleng.2014.05.080.
[19] Robak CW, Bergman TL, Faghri A. Economic evaluation of latent heat thermal energy storage using embedded thermosyphons for concentrating solar power applications. Sol Energy 2011;85:2461–73. doi:10.1016/j.solener.2011.07.006.
[20] Mehling H, Cabeza LF. Heat and cold storage with PCM. Berlin, Heidelberg: Springer Berlin Heidelberg; 2008.
[21] Nomura T, Okinaka N, Akiyama T. Technology of Latent Heat Storage for High Temperature Application: A Review. ISIJ Int 2010;50:1229–39. doi:10.2355/isijinternational.50.1229.
[22] Lafdi K, Mesalhy O, Elgafy A. Graphite foams infiltrated with phase change materials as alternative materials for space and terrestrial thermal energy storage applications. Carbon 2008;46:159–68. doi:10.1016/j.carbon.2007.11.003.
[23] Do Couto K., Tamme R, Müller-Steinhagen H. PCM-Graphite storage materials for the temperature range 100-300°C, Yverdon-Les-Bains, Schweiz: 2005.
[24] Bauer T, Tamme R, Christ M, Öttinger O. PCM-Graphite Composites for High Temperature Thermal Energy Storage. Tenth Int. Conf. Therm. Energy Storage, Pomona, NJ (USA): 2006.
[25] Pincemin S, Py X, Olives R, Christ M, Oettinger O. Elaboration of Conductive Thermal Storage Composites Made of Phase Change Materials and Graphite for Solar Plant. J Sol Energy Eng 2007;130:011005–011005. doi:10.1115/1.2804620.
[26] Pincemin S, Olives R, Py X, Christ M. Highly conductive composites made of phase change materials and graphite for thermal storage. Sol Energy Mater Sol Cells 2008;92:603–13. doi:10.1016/j.solmat.2007.11.010.
[27] Acem Z, Lopez J, Palomo Del Barrio E. KNO3/NaNO3 – Graphite materials for thermal energy storage at high temperature: Part I. – Elaboration methods and thermal properties. Appl Therm Eng 2010;30:1580–5. doi:10.1016/j.applthermaleng.2010.03.013.
[28] Lopez J, Caceres G, Palomo Del Barrio E, Jomaa W. Confined melting in deformable porous media: A first attempt to explain the graphite/salt composites behaviour. Int J Heat Mass Transf 2010;53:1195–207. doi:10.1016/j.ijheatmasstransfer.2009.10.025.
[29] Wu ZG, Zhao CY. Experimental investigations of porous materials in high temperature thermal energy storage systems. Sol Energy 2011;85:1371–80. doi:10.1016/j.solener.2011.03.021.
[30] Zhao CY, Wu ZG. Heat transfer enhancement of high temperature thermal energy storage using metal foams and expanded graphite. Sol Energy Mater Sol Cells 2011;95:636–43. doi:10.1016/j.solmat.2010.09.032.
[31] Yuan H-W, Lu C-H, Xu Z-Z, Ni Y-R, Lan X-H. Mechanical and thermal properties of cement composite graphite for solar thermal storage materials. Sol Energy 2012;86:3227–33. doi:10.1016/j.solener.2012.08.011.
[32] Li Y-F, Zhang D. Study on high-temperature phase change composites of NaNO3-LiNO3/expanded graphite by saturated water solution method. J Funct Mater 2013;44:1451–6.
[33] Xiao X, Zhang P, Li M. Thermal characterization of nitrates and nitrates/expanded graphite mixture phase change materials for solar energy storage. Energy Convers Manag 2013;73:86–94. doi:10.1016/j.enconman.2013.04.007.
[34] Huang Z, Gao X, Xu T, Fang Y, Zhang Z. Thermal property measurement and heat storage analysis of LiNO3/KCl – expanded graphite composite phase change material. Appl Energy 2014;115:265–71. doi:10.1016/j.apenergy.2013.11.019.

42
[35] Xiao J, Huang J, Zhu P, Wang C, Li X. Preparation, characterization and thermal properties of binary nitrate salts/expanded graphite as composite phase change material. Thermochim Acta 2014;587:52–8. doi:10.1016/j.tca.2014.04.021.
[36] Zhao YJ, Wang RZ, Wang LW, Yu N. Development of highly conductive KNO3/NaNO3 composite for TES (thermal energy storage). Energy 2014;70:272–7. doi:10.1016/j.energy.2014.03.127.
[37] Zhong L, Zhang X, Luan Y, Wang G, Feng Y, Feng D. Preparation and thermal properties of porous heterogeneous composite phase change materials based on molten salts/expanded graphite. Sol Energy 2014;107:63–73. doi:10.1016/j.solener.2014.05.019.
[38] Kim T, France DM, Yu W, Zhao W, Singh D. Heat transfer analysis of a latent heat thermal energy storage system using graphite foam for concentrated solar power. Sol Energy 2014;103:438–47. doi:10.1016/j.solener.2014.02.038.
[39] Zhao W, France DM, Yu W, Kim T, Singh D. Phase change material with graphite foam for applications in high-temperature latent heat storage systems of concentrated solar power plants. Renew Energy 2014;69:134–46. doi:10.1016/j.renene.2014.03.031.
[40] Lefebvre L-P, Banhart J, Dunand DC. Porous Metals and Metallic Foams: Current Status and Recent Developments. Adv Eng Mater 2008;10:775–87. doi:10.1002/adem.200800241.
[41] Chen J, Yang D, Jiang J, Ma A, Song D. Research Progress of Phase Change Materials (PCMs) Embedded with Metal Foam (a Review). Procedia Mater Sci 2014;4:389–94. doi:10.1016/j.mspro.2014.07.579.
[42] Yuan W, Tang Y, Yang X, Wan Z. Porous metal materials for polymer electrolyte membrane fuel cells – A review. Appl Energy 2012;94:309–29. doi:10.1016/j.apenergy.2012.01.073.
[43] Zhang P, Xiao X, Meng ZN, Li M. Heat transfer characteristics of a molten-salt thermal energy storage unit with and without heat transfer enhancement. Appl Energy 2015;137:758–72. doi:10.1016/j.apenergy.2014.10.004.
[44] Li Z, Wu Z-G. Numerical study on the thermal behavior of phase change materials (PCMs) embedded in porous metal matrix. Sol Energy 2014;99:172–84. doi:10.1016/j.solener.2013.11.017.
[45] Yang J, Du X, Yang L, Yang Y. Numerical analysis on the thermal behavior of high temperature latent heat thermal energy storage system. Sol Energy 2013;98, Part C:543–52. doi:10.1016/j.solener.2013.10.028.
[46] Yang J, Yang L, Xu C, Du X. Numerical analysis on thermal behavior of solid–liquid phase change within copper foam with varying porosity. Int J Heat Mass Transf 2015;84:1008–18. doi:10.1016/j.ijheatmasstransfer.2015.01.088.
[47] Choi SU., Eastman JA. Enhancing thermal conductivity of fluids with nanoparticles. Nternational Mech. Eng. Congr. Exhib., San Francisco, CA (United States): 1995.
[48] Al-Kayiem HH, Lin SC, Lukmon A. Review on nanomaterials for thermal energy storage technologies. Nanosci Nanotechnol-Asia 2013;3:60–71.
[49] Puliti G, Paolucci S, Sen M. Nanofluids and Their Properties. Appl Mech Rev 2011;64:1–24. doi:10.1115/1.4005492.
[50] Khanafer K, Vafai K. Chapter Five - Applications of Nanomaterials in Solar Energy and Desalination Sectors. In: Ephraim M. Sparrow YIC, John P. Abraham and John M. Gorman, editor. Adv. Heat Transf., vol. 45, Elsevier; 2013, p. 303–29.
[51] Khodadadi JM, Fan L, Babaei H. Thermal conductivity enhancement of nanostructure-based colloidal suspensions utilized as phase change materials for thermal energy storage: A review. Renew Sustain Energy Rev 2013;24:418–44. doi:10.1016/j.rser.2013.03.031.
[52] Xuan Y, Li Q. Heat transfer enhancement of nanofluids. Int J Heat Fluid Flow 2000;21:58–64. doi:10.1016/S0142-727X(99)00067-3.
[53] Saidur R, Leong KY, Mohammad HA. A review on applications and challenges of nanofluids. Renew Sustain Energy Rev 2011;15:1646–68. doi:10.1016/j.rser.2010.11.035.
[54] Raam Dheep G, Sreekumar A. Influence of nanomaterials on properties of latent heat solar thermal energy storage materials – A review. Energy Convers Manag 2014;83:133–48. doi:10.1016/j.enconman.2014.03.058.

43
[55] Kibria MA, Anisur MR, Mahfuz MH, Saidur R, Metselaar IHSC. A review on thermophysical properties of nanoparticle dispersed phase change materials. Energy Convers Manag 2015;95:69–89. doi:10.1016/j.enconman.2015.02.028.
[56] Andreu-Cabedo P, Mondragon R, Hernandez L, Martinez-Cuenca R, Cabedo L, Julia JE. Increment of specific heat capacity of solar salt with SiO2 nanoparticles. Nanoscale Res Lett 2014;9:1–11. doi:10.1186/1556-276X-9-582.
[57] Shin D, Banerjee D. Enhancement of specific heat capacity of high-temperature silica-nanofluids synthesized in alkali chloride salt eutectics for solar thermal-energy storage applications. Int J Heat Mass Transf 2011;54:1064–70. doi:10.1016/j.ijheatmasstransfer.2010.11.017.
[58] Ho MX, Pan C. Optimal concentration of alumina nanoparticles in molten Hitec salt to maximize its specific heat capacity. Int J Heat Mass Transf 2014;70:174–84. doi:10.1016/j.ijheatmasstransfer.2013.10.078.
[59] Siegel R. Solidification of low conductivity material containing dispersed high conductivity particles. Int J Heat Mass Transf 1977;20:1087–9. doi:10.1016/0017-9310(77)90195-8.
[60] Keblinski P, Phillpot SR, Choi SUS, Eastman JA. Mechanisms of heat flow in suspensions of nano-sized particles (nanofluids). Int J Heat Mass Transf 2002;45:855–63. doi:10.1016/S0017-9310(01)00175-2.
[61] Koo J, Kleinstreuer C. A new thermal conductivity model for nanofluids. J Nanoparticle Res 2005;6:577–88. doi:10.1007/s11051-004-3170-5.
[62] Jang SP, Choi SUS. Role of Brownian motion in the enhanced thermal conductivity of nanofluids. Appl Phys Lett 2004;84:4316–8. doi:10.1063/1.1756684.
[63] Yu W, France DM, Routbort JL, Choi SUS. Review and Comparison of Nanofluid Thermal Conductivity and Heat Transfer Enhancements. Heat Transf Eng 2008;29:432–60. doi:10.1080/01457630701850851.
[64] Dudda B, Shin D. Effect of nanoparticle dispersion on specific heat capacity of a binary nitrate salt eutectic for concentrated solar power applications. Int J Therm Sci 2013;69:37–42. doi:10.1016/j.ijthermalsci.2013.02.003.
[65] Shi Y, Yuan HW, Xu ZZ, Lu CH, Ni YR, Dong Y. Thermal and Mechanical Properties of Aluminate Cementitious Functional Materials Enriched with Nano-SiO2 for Thermal Energy Storage. Adv Mater Res 2014;887-888:77–80. doi:10.4028/www.scientific.net/AMR.887-888.77.
[66] Yuan H, Shi Y, Xu Z, Lu C, Ni Y, Lan X. Influence of nano-ZrO2 on the mechanical and thermal properties of high temperature cementitious thermal energy storage materials. Constr Build Mater 2013;48:6–10. doi:10.1016/j.conbuildmat.2013.06.088.
[67] Yuan H, Shi Y, Xu Z, Lu C, Ni Y, Lan X. Effect of nano-MgO on thermal and mechanical properties of aluminate cement composite thermal energy storage materials. Ceram Int 2014;40:4811–7. doi:10.1016/j.ceramint.2013.09.030.
[68] Yuan H, Shi Y, Lu C, Xu Z, Ni Y, Lan X. Enhanced performance of high temperature aluminate cementitious materials incorporated with Cu powders for thermal energy storage. Cem Concr Compos 2015;55:139–44. doi:10.1016/j.cemconcomp.2014.08.006.
[69] Liu M, Ma Y, Wu H, Wang RY. Metal matrix-metal nanoparticle composites with tunable melting temperature and high thermal conductivity for phase-change thermal storage. ACS Nano 2015;9:1341–51. doi:10.1021/nn505328j.
[70] Shin D, Banerjee D. Enhanced thermal properties of SiO2 nanocomposite for solar thermal energy storage applications. Int J Heat Mass Transf 2015;84:898–902. doi:10.1016/j.ijheatmasstransfer.2015.01.100.
[71] Ye F, Ge Z, Ding Y, Yang J. Multi-walled carbon nanotubes added to Na2CO3/MgO composites for thermal energy storage. Particuology 2014;15:56–60. doi:10.1016/j.partic.2013.05.001.
[72] Tao YB, Lin CH, He YL. Preparation and thermal properties characterization of carbonate salt/carbon nanomaterial composite phase change material. Energy Convers Manag 2015;97:103–10. doi:10.1016/j.enconman.2015.03.051.

44
[73] Cingarapu S, Singh D, Timofeeva EV, Moravek MR. Nanofluids with encapsulated tin nanoparticles for advanced heat transfer and thermal energy storage. Int J Energy Res 2014;38:51–9. doi:10.1002/er.3041.
[74] Timofeeva EV, Moravek MR, Singh D. Improving the heat transfer efficiency of synthetic oil with silica nanoparticles. J Colloid Interface Sci 2011;364:71–9. doi:10.1016/j.jcis.2011.08.004.
[75] Mankins JC. Technology readiness levels. NASA 1995. http://www.hq.nasa.gov/office/codeq/trl/trl.pdf (accessed March 31, 2015).
[76] European Comission. Technology readiness levels (TRL). Horiz 2020 – WORK Programme 2014 - 2015 Gen Annex 2014. http://ec.europa.eu/research/participants/data/ref/h2020/wp/2014_2015/annexes/h2020-wp1415-annex-g-trl_en.pdf (accessed March 31, 2015).
[77] Ibáñez JM. Niveles de madurez de la tecnología. Technology readiness levels. TRLs. Una introducción. Minist Indústria Energ Tur 2014. http://www.minetur.gob.es/Publicaciones/Publicacionesperiodicas/EconomiaIndustrial/RevistaEconomiaIndustrial/393/NOTAS.pdf (accessed March 31, 2015).

Appl. Sci. 2017, 7, x; doi: FOR PEER REVIEW www.mdpi.com/journal/applsci
Article
Phase Change Material Selection for Thermal Processes Working Under Partial Loads Operating Conditions in the Temperature Range Between 120 and 200 °C
Jaume Gasia 1, Marc Martin 1, Aran Solé 2, Camila Barreneche 3 and Luisa F. Cabeza 1,*
1 GREA Innovació concurrent, INSPIRES Research Centre, University of Lleida, Pere de Cabrera s/n, 25001, Lleida, Spain
2 Department of Mechanical Engineering and Construction, Universitat Jaume I, Campus del Riu Sec s/n, 12071 Castelló de la Plana, Spain
3 Department of Materials Science and Physical Chemistry, Universitat de Barcelona, Martí i Franqués 1-11, Barcelona, Spain
* Correspondence: [email protected]; Tel: +34 973003576
Academic Editor: name Received: date; Accepted: date; Published: date
Abstract: In some processes, latent heat thermal energy storage (TES) systems might work under partial loads operating conditions (the available thermal energy source is discontinuous or not enough to completely charge the phase change material (PCM)). Therefore, there is a need to study how these conditions affect the discharge process and to design a control strategy that can benefit the user of these systems. The aim of this paper is to show and perform at laboratory scale the selection of a PCM, with a phase change temperature between 120 and 200 ºC, which will be further used in an experimental facility. Beyond the typical PCM properties, the PCMs are here studied from the cycling and thermal stability point of view, as well as from the health hazard point of view. After 100 melting and freezing cycles, seven candidates out of the sixteen present a suitable cycling stability behaviour and five of them show a maximum thermal-stable temperature higher than 200 ºC. Two final candidates for partial loads approach are found in this temperature range, named high density polyethylene (HDPE) and adipic acid.
Keywords: thermal energy storage (TES); phase change material (PCM); partial load; thermal stability; cycling stability; health hazard; application
1. Introduction
Latent heat thermal energy storage (TES) using phase change materials (PCM) is an effective way of storing thermal energy because of its high energy storage density and the nearly isothermal melting and solidification processes at the phase change transition temperature of the PCM [1]. Many PCM have been proposed in the literature for different temperature ranges, being the phase change temperature and phase change enthalpy the main parameters provided by the authors [1–3]. However, the PCM should fulfil several other requirements besides the two above-mentioned ones. Gasia et al. [4] summarized the main requirements for selecting proper TES materials and systems by classifying them into chemical, kinetic, physical, thermal, economic, environmental, and technological. Therefore, the selection procedure of a PCM becomes a crucial step for an optimum operation of the thermal process and the latent heat TES system. The critical parameters and necessary requirements for a specific process are not always easy to identify and are often in conflict with each other.
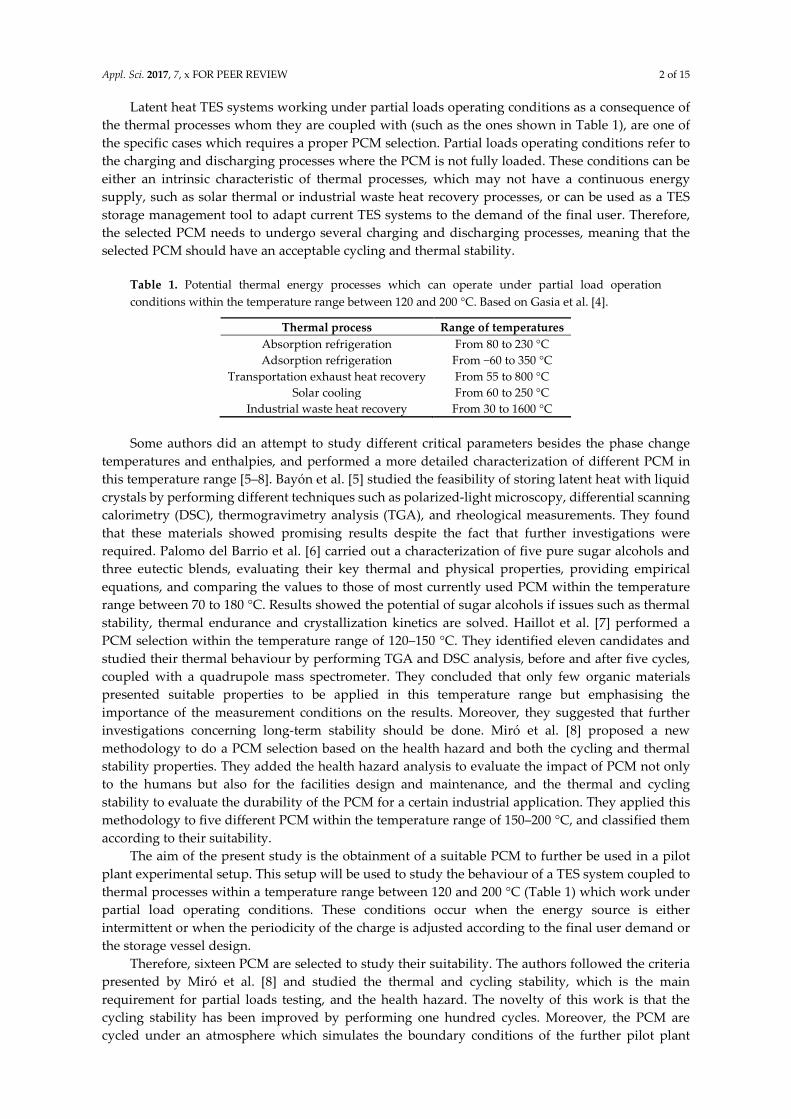
Appl. Sci. 2017, 7, x FOR PEER REVIEW 2 of 15
Latent heat TES systems working under partial loads operating conditions as a consequence of the thermal processes whom they are coupled with (such as the ones shown in Table 1), are one of the specific cases which requires a proper PCM selection. Partial loads operating conditions refer to the charging and discharging processes where the PCM is not fully loaded. These conditions can be either an intrinsic characteristic of thermal processes, which may not have a continuous energy supply, such as solar thermal or industrial waste heat recovery processes, or can be used as a TES storage management tool to adapt current TES systems to the demand of the final user. Therefore, the selected PCM needs to undergo several charging and discharging processes, meaning that the selected PCM should have an acceptable cycling and thermal stability.
Table 1. Potential thermal energy processes which can operate under partial load operation conditions within the temperature range between 120 and 200 °C. Based on Gasia et al. [4].
Thermal process Range of temperatures
Absorption refrigeration From 80 to 230 °C Adsorption refrigeration From −60 to 350 °C
Transportation exhaust heat recovery From 55 to 800 °C Solar cooling From 60 to 250 °C
Industrial waste heat recovery From 30 to 1600 °C
Some authors did an attempt to study different critical parameters besides the phase change temperatures and enthalpies, and performed a more detailed characterization of different PCM in this temperature range [5–8]. Bayón et al. [5] studied the feasibility of storing latent heat with liquid crystals by performing different techniques such as polarized-light microscopy, differential scanning calorimetry (DSC), thermogravimetry analysis (TGA), and rheological measurements. They found that these materials showed promising results despite the fact that further investigations were required. Palomo del Barrio et al. [6] carried out a characterization of five pure sugar alcohols and three eutectic blends, evaluating their key thermal and physical properties, providing empirical equations, and comparing the values to those of most currently used PCM within the temperature range between 70 to 180 °C. Results showed the potential of sugar alcohols if issues such as thermal stability, thermal endurance and crystallization kinetics are solved. Haillot et al. [7] performed a PCM selection within the temperature range of 120–150 °C. They identified eleven candidates and studied their thermal behaviour by performing TGA and DSC analysis, before and after five cycles, coupled with a quadrupole mass spectrometer. They concluded that only few organic materials presented suitable properties to be applied in this temperature range but emphasising the importance of the measurement conditions on the results. Moreover, they suggested that further investigations concerning long-term stability should be done. Miró et al. [8] proposed a new methodology to do a PCM selection based on the health hazard and both the cycling and thermal stability properties. They added the health hazard analysis to evaluate the impact of PCM not only to the humans but also for the facilities design and maintenance, and the thermal and cycling stability to evaluate the durability of the PCM for a certain industrial application. They applied this methodology to five different PCM within the temperature range of 150–200 °C, and classified them according to their suitability.
The aim of the present study is the obtainment of a suitable PCM to further be used in a pilot plant experimental setup. This setup will be used to study the behaviour of a TES system coupled to thermal processes within a temperature range between 120 and 200 °C (Table 1) which work under partial load operating conditions. These conditions occur when the energy source is either intermittent or when the periodicity of the charge is adjusted according to the final user demand or the storage vessel design.
Therefore, sixteen PCM are selected to study their suitability. The authors followed the criteria presented by Miró et al. [8] and studied the thermal and cycling stability, which is the main requirement for partial loads testing, and the health hazard. The novelty of this work is that the cycling stability has been improved by performing one hundred cycles. Moreover, the PCM are cycled under an atmosphere which simulates the boundary conditions of the further pilot plant

Appl. Sci. 2017, 7, x FOR PEER REVIEW 3 of 15
experimental setup testing and using a higher sample mass. Finally, the study of the health hazard has been extended by using an additional standard classification.
2. Materials Description
Based in the actual literature [2,7,9-13], the authors made a review of potential PCM in the temperature range between 120 and 200 °C. Taking into account that the present study is aimed at selecting a candidate for further tests at pilot plant scale, some materials have been disregarded from the very beginning. For instance, salt hydrates usually present phase separation and are corrosive [9] and mixtures and metals might not be compatible with the heat exchanger material [10]. Sixteen different PCM were selected and characterized in this paper, based on their cited thermophysical properties. These materials are listed in Table 2 along with their main thermophysical properties from the literature and their manufacturer information.
Table 2. PCM candidates for thermal energy storage processes working under partial loads operating conditions within a temperature range between 120 and 200 °C.
Nº Material Material type
Thermophysical properties Manufacturer
information
Phase change
temperature (°C)
Phase change
enthalpy (kJ/kg) Manufacturer Purity
(%) Value Ref. Value Ref.
1 Benzoic acid Aromatic
hydrocarbon 121–123 [13] 114–147 [13]
PanReac AppliChem
> 99.5
2 Benzamide Aromatic
hydrocarbon 124–127 [13] 169 [13] Alfa Aesar > 98
3 High density
polyethylene (HDPE) Polymeric
hydrocarbon 130 [13] 211–233 [13] Alfa Aesar n.a.
4 Sebacic acid Dicarboxylic acid 130–134 [13] 228 [13] Alfa Aesar > 98
5 Phtalic anhydride Dicarboxylic acid
anhydride 131 [13] 159 [13] Alfa Aesar 99
6 Maleic acid Dicarboxylic acid 131–140 [13] 235 [13] PanReac
AppliChem > 99
7 Urea Organic compound 133–135 [13] 170–258 [13] PanReac
AppliChem > 99
8 Dimethyl terephthalate Aromatic
hydrocarbon 142 [13] 170 [13] Alfa Aesar 99
9 D-mannitol Sugar alcohol 150 [11] 224–234 [11] Sigma-Aldrich 98 10 Adipic acid Dicarboxylic acid 150–152 [9] 213–260 [9] Sigma-Aldrich > 99.5 11 Salycilic acid phenolic acid 157–159 [2] 199 [2] Sigma-Aldrich > 99 12 Potassium thiocynate Inorganic salt 157–177 [12] 112–114 [12] Sigma-Aldrich > 99
13 Hydroquinnone Aromatic
hydrocarbon 160–173 [12] 179–235 [12] Sigma-Aldrich > 99
14 Benzanilide Amide 161 [12] 129–139 [12] Sigma-Aldrich 98 15 Dulcitol Sugar alcohol 167–185 [9,13] 246–257 [9,13] Sigma-Aldrich 99
16 2,2-Bis(hydroxymethyl) propionic acid (DMPA)
Carboxylic acid 185 [7] 289 [7] Sigma-Aldrich 98
3. Methodology
The PCM characterization presented in this study followed the methodology proposed by Miró et al. [8], which studied and analysed the PCM from three different approaches: health hazard, thermal stability, and cycling stability. In the present case, these analyses were done in parallel to fully characterize the materials and to give to the scientific community the data from all PCM evaluated [14].
3.1. Health Hazard
The health hazard is studied to detect potential environmental and personal risks of the selected PCM for the specific application in which it is wanted to be implemented. Therefore, results from the
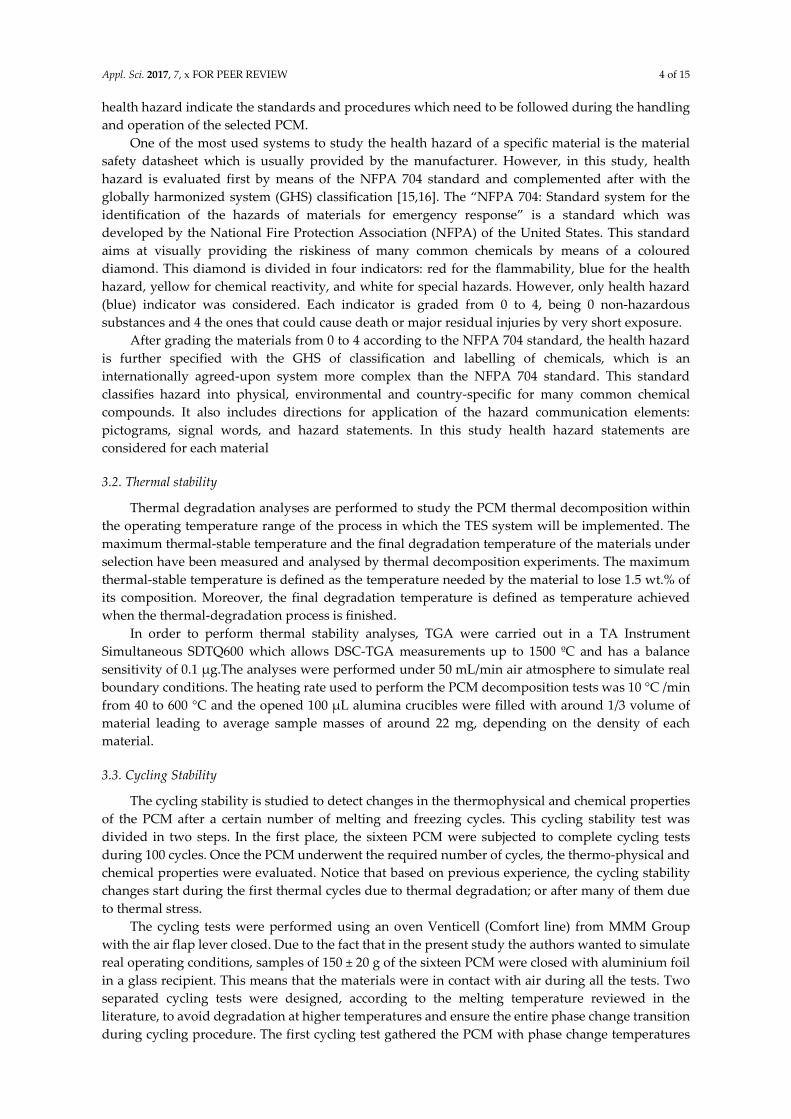
Appl. Sci. 2017, 7, x FOR PEER REVIEW 4 of 15
health hazard indicate the standards and procedures which need to be followed during the handling and operation of the selected PCM.
One of the most used systems to study the health hazard of a specific material is the material safety datasheet which is usually provided by the manufacturer. However, in this study, health hazard is evaluated first by means of the NFPA 704 standard and complemented after with the globally harmonized system (GHS) classification [15,16]. The “NFPA 704: Standard system for the identification of the hazards of materials for emergency response” is a standard which was developed by the National Fire Protection Association (NFPA) of the United States. This standard aims at visually providing the riskiness of many common chemicals by means of a coloured diamond. This diamond is divided in four indicators: red for the flammability, blue for the health hazard, yellow for chemical reactivity, and white for special hazards. However, only health hazard (blue) indicator was considered. Each indicator is graded from 0 to 4, being 0 non-hazardous substances and 4 the ones that could cause death or major residual injuries by very short exposure.
After grading the materials from 0 to 4 according to the NFPA 704 standard, the health hazard is further specified with the GHS of classification and labelling of chemicals, which is an internationally agreed-upon system more complex than the NFPA 704 standard. This standard classifies hazard into physical, environmental and country-specific for many common chemical compounds. It also includes directions for application of the hazard communication elements: pictograms, signal words, and hazard statements. In this study health hazard statements are considered for each material
3.2. Thermal stability
Thermal degradation analyses are performed to study the PCM thermal decomposition within the operating temperature range of the process in which the TES system will be implemented. The maximum thermal-stable temperature and the final degradation temperature of the materials under selection have been measured and analysed by thermal decomposition experiments. The maximum thermal-stable temperature is defined as the temperature needed by the material to lose 1.5 wt.% of its composition. Moreover, the final degradation temperature is defined as temperature achieved when the thermal-degradation process is finished.
In order to perform thermal stability analyses, TGA were carried out in a TA Instrument Simultaneous SDTQ600 which allows DSC-TGA measurements up to 1500 ºC and has a balance sensitivity of 0.1 µg.The analyses were performed under 50 mL/min air atmosphere to simulate real boundary conditions. The heating rate used to perform the PCM decomposition tests was 10 °C /min from 40 to 600 °C and the opened 100 µL alumina crucibles were filled with around 1/3 volume of material leading to average sample masses of around 22 mg, depending on the density of each material.
3.3. Cycling Stability
The cycling stability is studied to detect changes in the thermophysical and chemical properties of the PCM after a certain number of melting and freezing cycles. This cycling stability test was divided in two steps. In the first place, the sixteen PCM were subjected to complete cycling tests during 100 cycles. Once the PCM underwent the required number of cycles, the thermo-physical and chemical properties were evaluated. Notice that based on previous experience, the cycling stability changes start during the first thermal cycles due to thermal degradation; or after many of them due to thermal stress.
The cycling tests were performed using an oven Venticell (Comfort line) from MMM Group with the air flap lever closed. Due to the fact that in the present study the authors wanted to simulate real operating conditions, samples of 150 ± 20 g of the sixteen PCM were closed with aluminium foil in a glass recipient. This means that the materials were in contact with air during all the tests. Two separated cycling tests were designed, according to the melting temperature reviewed in the literature, to avoid degradation at higher temperatures and ensure the entire phase change transition during cycling procedure. The first cycling test gathered the PCM with phase change temperatures

Appl. Sci. 2017, 7, x FOR PEER REVIEW 5 of 15
between 90 and 150 °C: sebacic acid, HDPE, benzoic acid, phtalic anhydride, urea, benzamide, maleic acid, and dimethyl terephthalate. The second cycling test gathered the PCM with phase change temperatures between 150 and 200 °C: adipic acid, DMPA, d-mannitol, benzanilide, potassium thiocynate, dulcitol, hydroquinone, and salycilic acid. A dynamic cycling method was established for both tests at a constant heating and cooling rate of 3.2 °C/min
In order to evaluate the cycling stability and quantify the variation of the thermophysical and chemical properties of all the PCM, three different measurement points were established: • Measurement 1: 0 cycle • Measurement 2: 10th cycle • Measurement 3: 100th cycle
The thermophysical properties studied in this paper were the phase change temperature and phase change enthalpy. These properties were evaluated using a DSC 822e from Mettler Toledo under nitrogen atmosphere, which has an uncertainty of ± 0.1 °C for temperatures and ±3 kJ·kg-1 for enthalpies. The methodology followed a two-cycle program. A first melting and solidification cycle at 10 °C/min rate was performed to ensure good contact with crucible base. The second cycle was performed at 0.5 °C/min rate and the mean values of temperature and enthalpy was calculated with it. Two temperature ranges were evaluated following the same criteria than in the cycling tests. On one hand, a temperature program which ranged from 90 to 150 °C for the PCM with a melting temperature lower than 150 °C. On the other hand, a temperature program which ranged from 150 to 200 °C for the remaining PCM. Three samples of each material which were located in 40 µl aluminium crucibles (maximum filled with two thirds of their volume, with an average sample mass of 10 mg, to avoid oxidation and taking into account volume expansion), were analysed to ensure repeatability of the tests.
The chemical characterization was carried out using a Fourier transform infrared (FT-IR) spectroscopy with attenuated total reflectance (ATR), which analyses the PCM chemical degradation caused by thermal cycling. The advantage of ATR is the possibility of obtaining the spectra directly from the sample, without any specific sample preparation. The partial or total disappearance of the characteristic peaks and/or the appearance of new peaks can indicate that the material is being oxidized or degraded. This analysis was carried out with a Spectrum Two™ from perking Elmer, which allows analysing substances at solid and liquid state. It was optimized by a wavelength range between 4000 and 350 cm-1 and its standard spectral resolution is 0.5 cm-1 accounting for four infrared scans for each analysis and the data recorded is the mean of them. Its functionality is based on the characteristic wave numbers at which the molecules vibrate in infrared frequencies.
4. Results
4.1. Health Hazard
Table 3 shows the health hazard rating from both the NFPA 704 standard and GHS statements of the materials under study. As explained above, the NFPA 704 standard rates the relationship between hazard and exposure, while the GHS specifies the damages that the material can cause.
A wide variety of health hazard ranging from 0 to 3 is observed. Among the sixteen materials which have been evaluated, HDPE showed the lowest health hazard value in the NFPA 704 standard, meaning that it is non-hazardous under any concept. Six other materials showed a health hazard rate of 1. According to the GHS statement, these materials may cause irritation or can be hazardous at long exposure. Therefore, they are also suitable to be selected but safety measures should be taken into account when using them [8]. The other eight materials present higher values in the NFPA 704 standard and are suggested to be discarded. Nonetheless, if a specific application requires the use of any of these materials, the use of the established safety measures are compulsory to avoid serious damages.
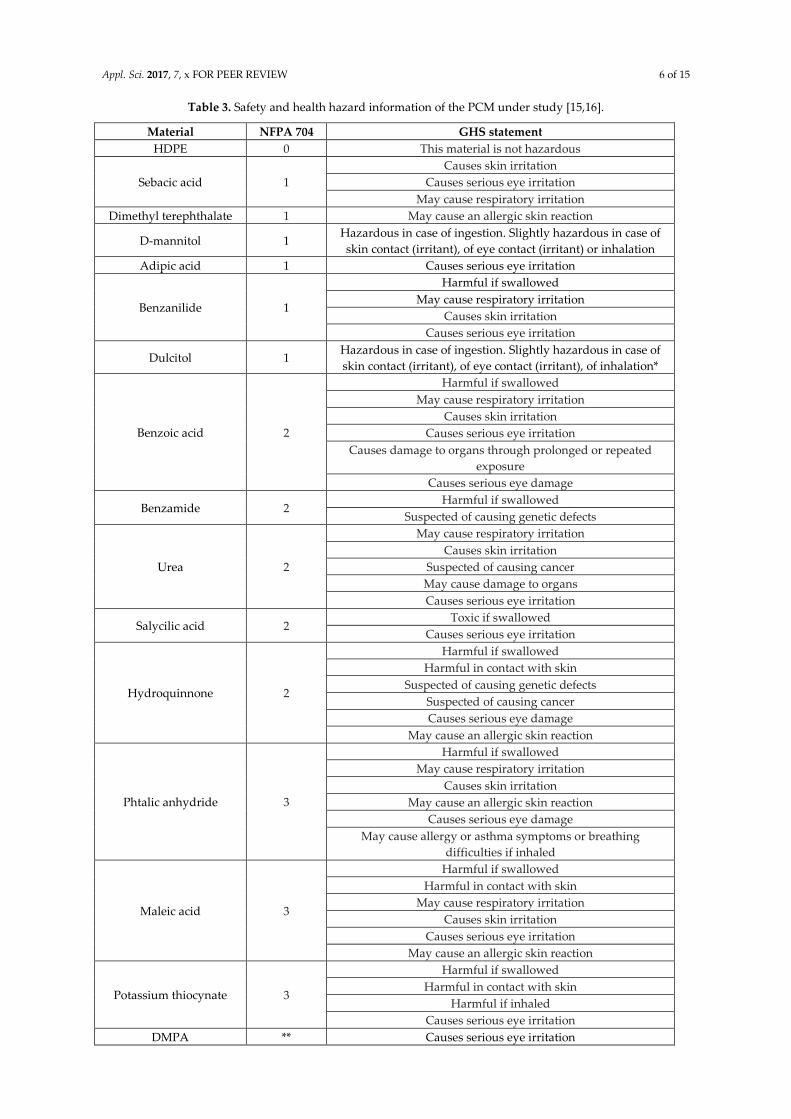
Appl. Sci. 2017, 7, x FOR PEER REVIEW 6 of 15
Table 3. Safety and health hazard information of the PCM under study [15,16].
Material NFPA 704 GHS statement
HDPE 0 This material is not hazardous
Sebacic acid 1 Causes skin irritation
Causes serious eye irritation May cause respiratory irritation
Dimethyl terephthalate 1 May cause an allergic skin reaction
D-mannitol 1 Hazardous in case of ingestion. Slightly hazardous in case of skin contact (irritant), of eye contact (irritant) or inhalation
Adipic acid 1 Causes serious eye irritation
Benzanilide 1
Harmful if swallowed May cause respiratory irritation
Causes skin irritation Causes serious eye irritation
Dulcitol 1 Hazardous in case of ingestion. Slightly hazardous in case of skin contact (irritant), of eye contact (irritant), of inhalation*
Benzoic acid 2
Harmful if swallowed May cause respiratory irritation
Causes skin irritation Causes serious eye irritation
Causes damage to organs through prolonged or repeated exposure
Causes serious eye damage
Benzamide 2 Harmful if swallowed
Suspected of causing genetic defects
Urea 2
May cause respiratory irritation Causes skin irritation
Suspected of causing cancer May cause damage to organs Causes serious eye irritation
Salycilic acid 2 Toxic if swallowed
Causes serious eye irritation
Hydroquinnone 2
Harmful if swallowed Harmful in contact with skin
Suspected of causing genetic defects Suspected of causing cancer Causes serious eye damage
May cause an allergic skin reaction
Phtalic anhydride 3
Harmful if swallowed May cause respiratory irritation
Causes skin irritation May cause an allergic skin reaction
Causes serious eye damage May cause allergy or asthma symptoms or breathing
difficulties if inhaled
Maleic acid 3
Harmful if swallowed Harmful in contact with skin
May cause respiratory irritation Causes skin irritation
Causes serious eye irritation May cause an allergic skin reaction
Potassium thiocynate 3
Harmful if swallowed Harmful in contact with skin
Harmful if inhaled Causes serious eye irritation
DMPA ** Causes serious eye irritation
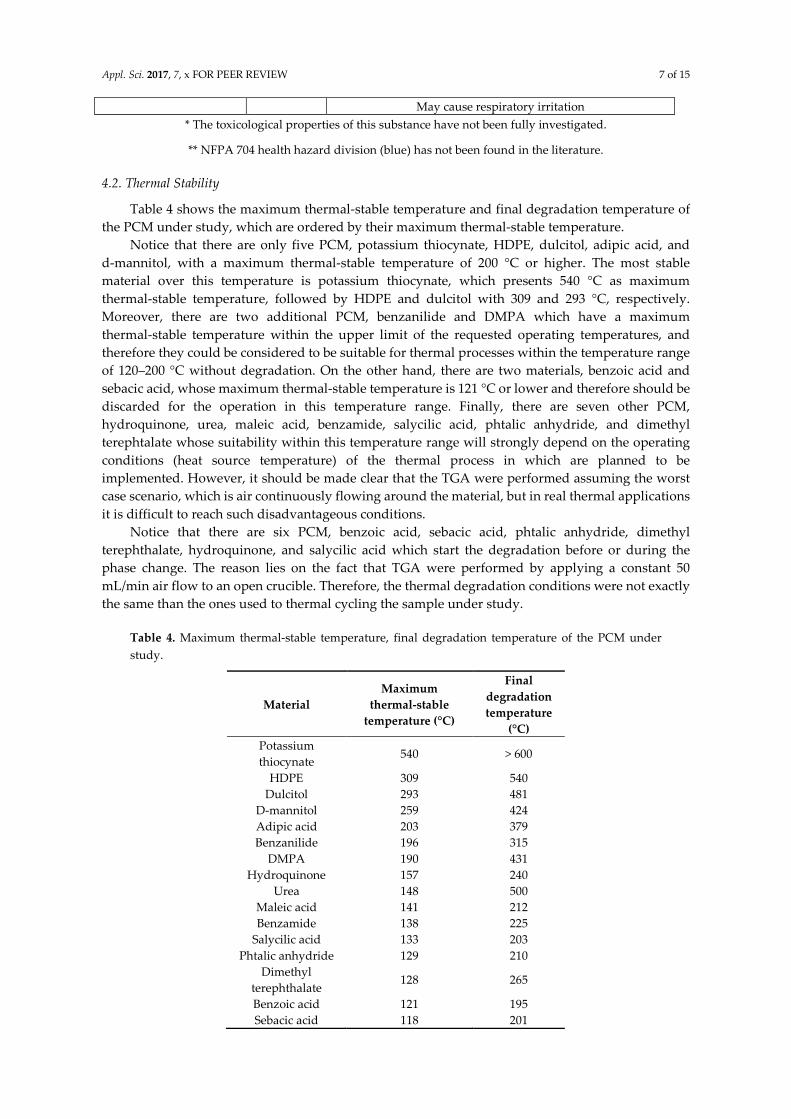
Appl. Sci. 2017, 7, x FOR PEER REVIEW 7 of 15
May cause respiratory irritation * The toxicological properties of this substance have not been fully investigated.
** NFPA 704 health hazard division (blue) has not been found in the literature.
4.2. Thermal Stability
Table 4 shows the maximum thermal-stable temperature and final degradation temperature of the PCM under study, which are ordered by their maximum thermal-stable temperature.
Notice that there are only five PCM, potassium thiocynate, HDPE, dulcitol, adipic acid, and d-mannitol, with a maximum thermal-stable temperature of 200 °C or higher. The most stable material over this temperature is potassium thiocynate, which presents 540 °C as maximum thermal-stable temperature, followed by HDPE and dulcitol with 309 and 293 °C, respectively. Moreover, there are two additional PCM, benzanilide and DMPA which have a maximum thermal-stable temperature within the upper limit of the requested operating temperatures, and therefore they could be considered to be suitable for thermal processes within the temperature range of 120–200 °C without degradation. On the other hand, there are two materials, benzoic acid and sebacic acid, whose maximum thermal-stable temperature is 121 °C or lower and therefore should be discarded for the operation in this temperature range. Finally, there are seven other PCM, hydroquinone, urea, maleic acid, benzamide, salycilic acid, phtalic anhydride, and dimethyl terephtalate whose suitability within this temperature range will strongly depend on the operating conditions (heat source temperature) of the thermal process in which are planned to be implemented. However, it should be made clear that the TGA were performed assuming the worst case scenario, which is air continuously flowing around the material, but in real thermal applications it is difficult to reach such disadvantageous conditions.
Notice that there are six PCM, benzoic acid, sebacic acid, phtalic anhydride, dimethyl terephthalate, hydroquinone, and salycilic acid which start the degradation before or during the phase change. The reason lies on the fact that TGA were performed by applying a constant 50 mL/min air flow to an open crucible. Therefore, the thermal degradation conditions were not exactly the same than the ones used to thermal cycling the sample under study.
Table 4. Maximum thermal-stable temperature, final degradation temperature of the PCM under study.
Material
Maximum
thermal-stable
temperature (°C)
Final
degradation
temperature
(°C)
Potassium thiocynate
540 > 600
HDPE 309 540 Dulcitol 293 481
D-mannitol 259 424 Adipic acid 203 379 Benzanilide 196 315
DMPA 190 431 Hydroquinone 157 240
Urea 148 500 Maleic acid 141 212 Benzamide 138 225
Salycilic acid 133 203 Phtalic anhydride 129 210
Dimethyl terephthalate
128 265
Benzoic acid 121 195 Sebacic acid 118 201

Appl. Sci. 2017, 7, x FOR PEER REVIEW 8 of 15
4.3. Cycling stability
In this section, the variation of the thermophysical properties (phase change temperatures and enthalpies) and the variation of the chemical properties of the studied PCM are presented. In this section only the most representative results are shown for a better comprehension of the reader.
4.3.1. Thermophysical Characterization (Phase Change Temperature and Enthalpy)
DSC results show that four out of the sixteen evaluated PCM did not show solidification under described conditions during the first cycle and, as a consequence, they cannot be considered for latent heat TES purposes. These PCM are maleic acid, DMPA, salicylic acid, and urea. Hence, from the thermophysical characterization point of view, only twelve out of the sixteen materials can be considered for latent heat storage units purposes. Errors of 10% for melting enthalpy and a 5% for melting temperature are stated as acceptable for the DSC measurements and are represented in the graphics with error bars [17].
Figure 1 shows the evolution of the phase change temperature (melting (a) and solidification (b)) of the twelve PCM which presented suitable thermal results at the initial stages of the thermophysical characterization after 0, 10 and 100 cycles. It is important to highlight that at the zero cycle some PCM showed remarkable differences between melting and solidification temperatures, like benzamide, benzanilide, d-mannitol, and dulcitol. After 10 cycles, benzoic acid did not show phase change under analysis conditions, and the remaining materials presented variations lower than 6.5%, being d-mannitol and hydroquinone the PCM which had a higher variation on the solidification temperature, with values of 6.2% and 6.1%, respectively. After 100 cycles, dulcitol and hydroquinone did not show phase change under analysis conditions. Moreover, sebacic acid and d-mannitol showed a decrease in their phase change temperatures in comparison to their initial values, especially in the solidification temperature, with values of 14.3% and 19.5%, respectively. Hence, from d-mannitol and sebacic acid results it can be seen that the modification in phase change temperature and latent heat with increasing number of cycles is noteworthy (more than 20% in the case of latent heat). On the other hand, the thermophysical properties of benzamide, HDPE, dimethyl terephthalate, adipic acid, potassium thiocynate, and benzanilide remained almost constant during whole cycling tests. However, after 100 cycles d-mannitol, benzamide and benzanilide showed important temperature differences between solidification and melting processes. The evolution of the melting and solidification enthalpies after 0, 10 and 100 cycles of the twelve PCM which presented suitable results at the initial stages of the thermophysical characterization is presented in Figure 2 (a) and (b), respectively. At the initial stage, a wide range of enthalpies values were observed, from a minimum value of 100–120 kJ/kg for the benzoic acid, to values up to 400 kJ/kg for dulcitol. The remaining PCM showed phase change enthalpies ranged between 120 and 280 kJ/kg. Results after 100 cycles showed that melting enthalpies of benzamide, HDPE, dimethyl terphthalate, adipic acid, potassium thiocynate, phtalic anhydride and benzanilide presented variations lower than 15%.
From the phase change temperature and enthalpy point of view, six PCM, benzamide, HDPE, dimethyl terphthalate, adipic acid, potassium thiocynate, phtalic anhydride and benzanilide, present values which are suitable for partial loads operation conditions in latent heat TES systems. The variations on these parameters observed along thermal cycles might be due to the degradation of the chemical structure of the PCM with increasing number of cycles [18]. Hence, the material could not form the first crystal during the solidification process of the thermal cycling and hysteresis phenomena took place. Throughout a considerable number of phase change transition processes new compounds were formed, which may have different latent heat than that of the fresh PCM. In order to deeply analyse the described phenomena, infrared (FT-IR) spectroscopy was carried out.
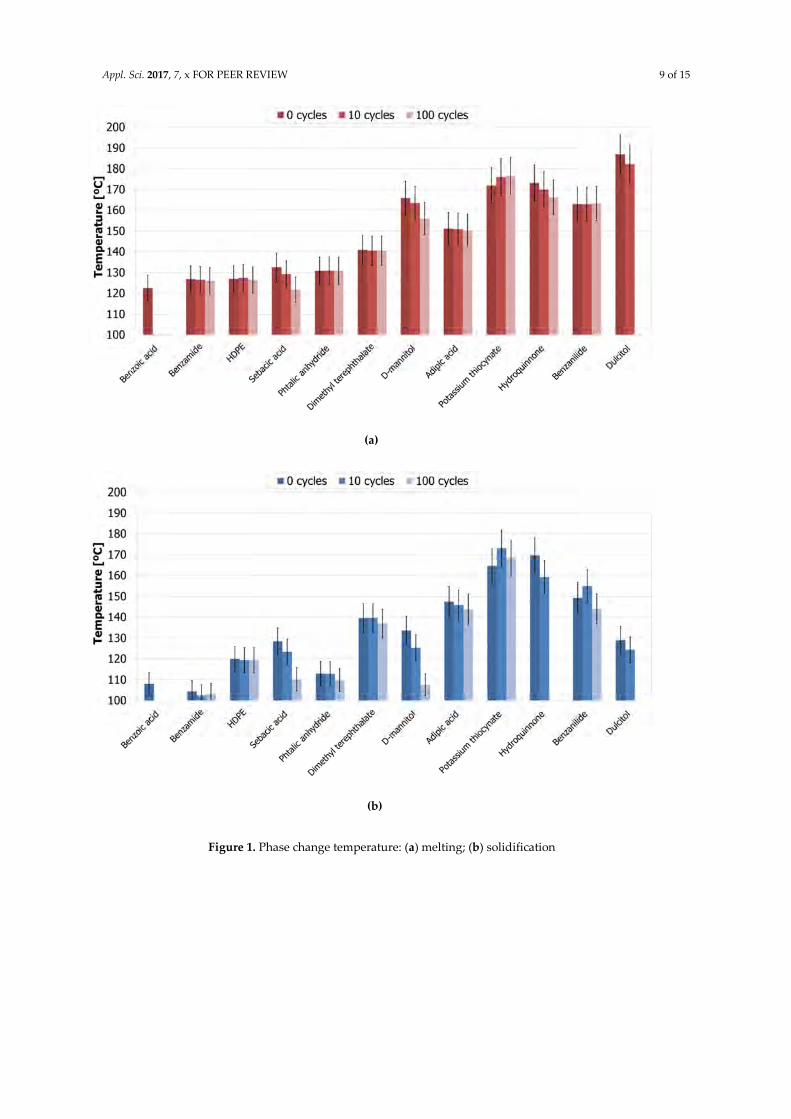
Appl. Sci. 2017, 7, x FOR PEER REVIEW 9 of 15
(a)
(b)
Figure 1. Phase change temperature: (a) melting; (b) solidification

Appl. Sci. 2017, 7, x FOR PEER REVIEW 10 of 15
(a)
(b)
Figure 2. Phase change enthalpy: (a) melting; (b) solidification
4.3.2. Chemical Characterization
In order to simplify the analysis for chemical degradation, two peaks of each material are considered as characteristic peaks. The first peak considered is contained in the region known as fingerprint region (1500 to 500 cm-1) and the second peak is contained in the high-wavenumber region (4000 to 1500 cm-1).
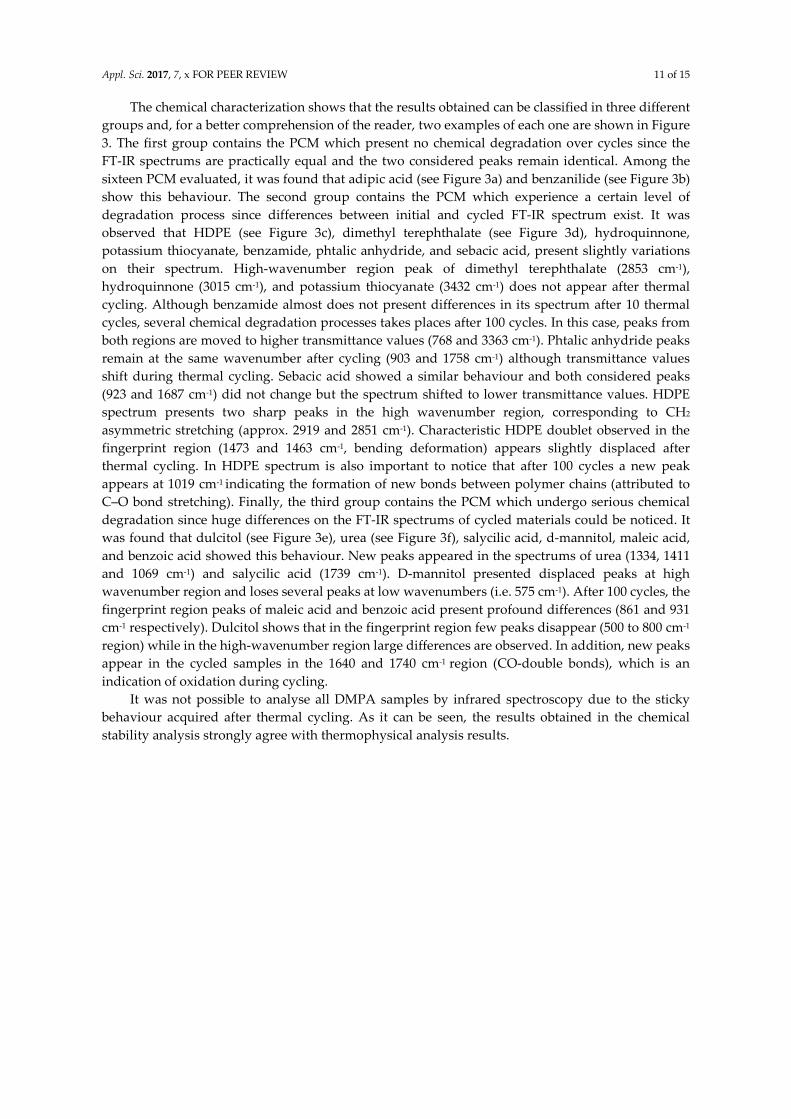
Appl. Sci. 2017, 7, x FOR PEER REVIEW 11 of 15
The chemical characterization shows that the results obtained can be classified in three different groups and, for a better comprehension of the reader, two examples of each one are shown in Figure 3. The first group contains the PCM which present no chemical degradation over cycles since the FT-IR spectrums are practically equal and the two considered peaks remain identical. Among the sixteen PCM evaluated, it was found that adipic acid (see Figure 3a) and benzanilide (see Figure 3b) show this behaviour. The second group contains the PCM which experience a certain level of degradation process since differences between initial and cycled FT-IR spectrum exist. It was observed that HDPE (see Figure 3c), dimethyl terephthalate (see Figure 3d), hydroquinnone, potassium thiocyanate, benzamide, phtalic anhydride, and sebacic acid, present slightly variations on their spectrum. High-wavenumber region peak of dimethyl terephthalate (2853 cm-1), hydroquinnone (3015 cm-1), and potassium thiocyanate (3432 cm-1) does not appear after thermal cycling. Although benzamide almost does not present differences in its spectrum after 10 thermal cycles, several chemical degradation processes takes places after 100 cycles. In this case, peaks from both regions are moved to higher transmittance values (768 and 3363 cm-1). Phtalic anhydride peaks remain at the same wavenumber after cycling (903 and 1758 cm-1) although transmittance values shift during thermal cycling. Sebacic acid showed a similar behaviour and both considered peaks (923 and 1687 cm-1) did not change but the spectrum shifted to lower transmittance values. HDPE spectrum presents two sharp peaks in the high wavenumber region, corresponding to CH2 asymmetric stretching (approx. 2919 and 2851 cm-1). Characteristic HDPE doublet observed in the fingerprint region (1473 and 1463 cm-1, bending deformation) appears slightly displaced after thermal cycling. In HDPE spectrum is also important to notice that after 100 cycles a new peak appears at 1019 cm-1 indicating the formation of new bonds between polymer chains (attributed to C–O bond stretching). Finally, the third group contains the PCM which undergo serious chemical degradation since huge differences on the FT-IR spectrums of cycled materials could be noticed. It was found that dulcitol (see Figure 3e), urea (see Figure 3f), salycilic acid, d-mannitol, maleic acid, and benzoic acid showed this behaviour. New peaks appeared in the spectrums of urea (1334, 1411 and 1069 cm-1) and salycilic acid (1739 cm-1). D-mannitol presented displaced peaks at high wavenumber region and loses several peaks at low wavenumbers (i.e. 575 cm-1). After 100 cycles, the fingerprint region peaks of maleic acid and benzoic acid present profound differences (861 and 931 cm-1 respectively). Dulcitol shows that in the fingerprint region few peaks disappear (500 to 800 cm-1 region) while in the high-wavenumber region large differences are observed. In addition, new peaks appear in the cycled samples in the 1640 and 1740 cm-1 region (CO-double bonds), which is an indication of oxidation during cycling.
It was not possible to analyse all DMPA samples by infrared spectroscopy due to the sticky behaviour acquired after thermal cycling. As it can be seen, the results obtained in the chemical stability analysis strongly agree with thermophysical analysis results.

Appl. Sci. 2017, 7, x FOR PEER REVIEW 12 of 15
(a) (b)
(c) (d)
(e) (f)
Figure 3. FT-IR spectroscopy results: (a) Adipic acid; (b) Benzanilide; (c) HDPE; (d) Dimethyl terephthalate; (e) Dulcitol; (f) Urea.
5. General Discussion
Taking into account the thermophysical characterization from the cycling stability tests results, only dimethyl terephthalate, benzanilide, potassium thiocyanate, HDPE, benzamide, phtalic anhydride, and adipic acid showed a suitable stability after 100 cycles. However, benzamide and benzanilide presented remarkable differences between solidification and melting temperatures at lab scale. Therefore, these two candidates might be interesting to be tested at higher scale to study this phenomena since the difference between solidification and melting temperatures and subcooling of PCM are mass dependent [17]. From this first filter, and taking into account the chemical characterization, it was seen that adipic acid showed the same chemical spectra after cycling tests, while HDPE, potassium thiocyanate, and dimethyl terephthalate do not experiment important chemical degradation but the appearance or disappearance of some peaks. Moreover, from the health hazard point of view, potassium thiocynate should be disregarded due to its high

Appl. Sci. 2017, 7, x FOR PEER REVIEW 13 of 15
hazard value according to the methodology explained. Adipic acid and dimethyl terephthalate present a low health hazard value whereas HDPE appears to be hazardless, being easy to handle and not presenting any hazardous GHS statement. Finally, bearing in mind the thermal stability tests, only HDPE and adipic acid would be suitable PCM for thermal processes working under partial loads operating conditions in the temperature range between 120 and 200 °C.
A summary of the results of the deep experimental characterization of the sixteen PCM in the temperature range between 120 and 200 °C is provided in Table 5.
Table 5. Summary of the characterization of the sixteen PCM under study
Material Health
hazard
Cycling stability (after 100 cycles) Thermal
stability Suitable
material for
partial loads
applications
Phase change
enthalpy loss
(%)
Chemical
degradationa
Maximum
thermal-stable
temperature
Benzoic acid 2 100 ++ 121 No Benzamide 2 14 ++ 138 No
High density polyethylene (HDPE)
0 12 + 309 Yes
Sebacic acid 1 63 ++ 118 No Phtalic anhydride 3 6 + 129 No
Maleic acid 3 ** ++ 141 No Urea 2 ** ++ 148 No
Dimethyl terephthalate 1 2 + 128 No D-mannitol 1 61 ++ 259 No Adipic acid 1 7 - 203 Yes
Salycilic acid 2 ** ++ 133 No Potassium thiocynate 3 13 + 540 No
Hydroquinnone 2 62 ++ 157 No Benzanilide 1 2*** - 196 No
Dulcitol 1 100 ++ 293 No 2,2-Bis(hydroxymethyl) propionic acid (DMPA)
* ** ++ 190 No
a Chemical degradation: - no degradation, + no remarkable degradation, ++ remarkable degradation * NFPA 704 health hazard division (blue) has not been found in the literature.
** The material does not show phase change under analysis conditions. *** The material presents remarkable differences between solidification and melting temperatures at lab scale
6. Conclusions
The selection of a PCM to be implemented in thermal processes working under partial loads operating conditions in a temperature range between 120–200 °C was successfully performed. Sixteen PCM were preselected for this study. The selection procedure followed a methodology which studied the health hazard, cycling stability and thermal stability of the PCM in the mentioned range. In this study, the cycling stability tests were performed at higher sample mass (150 ± 20 g) than in previous studies and under real atmospheric conditions which can hinder the PCM performance in some cases due to oxygen presence [11].
Considering the results obtained, adipic acid and high density polyethylene (HDPE) are suitable options. Both of them do not lose more than 12% of its thermal storage capacity after 100 cycles, do not show significant changes in their chemical structure and present low hazardous values, and their degradation starts at temperatures higher than 200 °C.
Commodity polymers such as HDPE are cheap plastics to produce. In an industrial application price is proved to be one of the most important aspects in the material selection process [10]. Based on price and health hazard, HDPE is the material selected for application between 120 and 200 °C. Further research on studying different partial loads profiles at pilot plant scale implementing HDPE will be performed.

Appl. Sci. 2017, 7, x FOR PEER REVIEW 14 of 15
Acknowledgments: The work was partially funded by the Spanish government (ENE2015-64117-C5-1-R (MINECO/FEDER)). The authors would like to thank the Catalan Government for the quality accreditation given to their research group GREA and DIOPMA (2014 SGR 123, 2014 SGR 1543). GREA and DIOPMA are certified agents TECNIO in the category of technology developers from the Government of Catalonia. This project has received funding from the European Commission Seventh Framework Programme (FP/2007-2013) under Grant agreement Nº PIRSES-GA-2013-610692 (INNOSTORAGE) and from the European Union’s Horizon 2020 research and innovation programme under grant agreement No 657466 (INPATH-TES). Jaume Gasia would like to thank the Departament d'Universitats, Recerca i Societat de la Informació de la Generalitat de Catalunya for his research fellowship (2017 FI_B1 00092). Dr. Camila Barreneche and Dr. Aran Solé would like to thank Ministerio de Economía y Competitividad de España for Grant Juan de la Cierva FJCI-2014-22886 and FJCI-2015-25741, respectively.
Author Contributions: Jaume Gasia, Aran Solé and Luisa F. Cabeza conceived and designed the study; Marc Martin and Camila Barreneche performed the experiments at the laboratory; all the coauthors collaborated on the interpretation of the results and on the preparation of the manuscript.
Conflicts of Interest: The authors declare no conflict of interest.
References
1. B. Zalba, M.A. Marın José, L.F. Cabeza, H. Mehling, Review on thermal energy storage with phase change: materials, heat transfer analysis and applications, Applied Thermal Engineering 23 (2003) 251–283.
2. A. Sharma, V.V. Tyagi, C.R. Chen, D. Buddhi, Review on thermal energy storage with phase change materials and applications, Renewable and Sustainable Energy Reviews 13 (2009) 318–345
3. S.M. Hasnain, Review on sustainable thermal energy storage technologies, Part I: heat storage materials and techniques, Energy Conversion and Management 39 (1998) 1127–1138
4. J. Gasia, L. Miró, L.F. Cabeza, Materials and system requirements of high temperature thermal energy storage systems: A review. Part 1: General requirements, Renewable and Sustainable Energy Reviews 75 (2017) 1320–1601.
5. R. Bayón, S. Coco, M. Barcenilla, P. Espinet, and G. Imbuluzqueta, Feasibility of Storing Latent Heat with Liquid Crystals. Proof of Concept at Lab Scale, Applied Sciences 6 (2016) 120.
6. E. Palomo del Barrio, A. Godin, M. Duquesne, J. Daranlot, J. Jolly, W. Alshaer, T. Kouadio, A. Sommier, Characterization of different sugar alcohols as phase change materials for thermal energy storage applications, Solar Energy Materials and Solar Cells 159 (2017) 560–569.
7. D. Haillot, T. Bauer, U. Kröner, and R. Tamme, Thermal analysis of phase change materials in the temperature range 120–150 °C, Thermochimica Acta 513 (2011) 49–59.
8. L. Miró, C. Barreneche, G. Ferrer, A. Solé, I. Martorell, and L. F. Cabeza, Health hazard, cycling and thermal stability as key parameters when selecting a suitable phase change material (PCM), Thermochimica Acta, 627–629 (2016) 39–47.
9. J. Buschle, W.D. Steinmann, R. Tamme, Latent heat storage for process heat applications. 10th International Conference on Thermal Energy Storage ECOSTOCK, Atlantic City (2006).
10. H. Ge, H. Li, S. Mei, and J. Liu, Low melting point liquid metal as a new class of phase change material : An emerging frontier in energy area, Renewable and Sustainable Energy Reviews, vol. 21, pp. 331–346, 2013.
11. A. Solé, H. Neumann, S. Niedermaier, I. Martorell, P. Schossig, L. F. Cabeza. Stability of sugar alcohols as PCM for thermal energy storage, Solar Energy Materials & Solar Cells 126 (2014) 125–134.
12. E. Oró, A. Gil, L. Miró, G. Peiró, S. Álvarez, and L. F. Cabeza, Thermal energy storage implementation using phase change materials for solar cooling and refrigeration applications, Energy Procedia 30 (2012) 947–956.
13. J. Waschull, R. Müller, and S. Römer, Investigation of phase change materials for elevated temperatures. 11th International Conference on Thermal Energy Storage EFFSTOCK, Stockholm (2009)
14. J. Gasia, M. Martin, A. Solé, C. Barreneche, L. F. Cabeza, , Dataset on thermal and cycling stability tests of phase change materials within 120 - 200 ºC temperature range, Submitted to Data in brief (2017).
15. https://www.sciencelab.com (accessed 16/01/2017) 16. http://pubchem.ncbi.nlm.nih.gov/compound (accessed 16/01/2017)

Appl. Sci. 2017, 7, x FOR PEER REVIEW 15 of 15
17. C. Rathgeber, L. Miró, L.F. Cabeza, S. Hiebler, Measurement of enthalpy curves of phase change materials via DSC and T-History: when are both methods needed to estimate the behaviour of the bulk material in applications. Thermochim. Acta 596 (2014) 79–88.
18. S.D. Sharma, Latent heat storage materials and systems: a review, International Journal of Green Energy 2 (2005) 1–56.
© 2017 by the authors. Submitted for possible open access publication under the terms and conditions of the Creative Commons Attribution (CC BY) license (http://creativecommons.org/licenses/by/4.0/).

1
Use of partial load operating conditions for latent thermal
energy storage management
Jaume Gasia1, Alvaro de Gracia2, Gerard Peiró1, Simone Arena3, Giorgio Cau3, Luisa F.
Cabeza1,*
1 GREA Innovació Concurrent, INSPIRES Research Centre, University of Lleida, Pere de Cabrera s/n,
25001, Lleida, Spain 2 Departament d’Enginyeria Mecanica, Universitat Rovira i Virgili, Av. Paisos Catalans 26, 43007
Tarragona, Spain. 3 Dept. of Mechanical, Chemical and Materials Engineering, University of Cagliari, Via Marengo 2,
09123, Cagliari, Italy
*Corresponding author: Tel: +34.973.00.35.76. Email: [email protected]
Abstract
A proper management of thermal energy storage (TES) charging and discharging processes
allows the final users to optimize the performance of TES systems. In this paper, an
experimental research is carried out to study how the percentage of charge in a latent heat TES
system (partial load operating conditions) influences the discharge process. Several charging
and discharging processes were performed at a constant heat transfer fluid (HTF) mass flow rate
of 0.5 kg/s and temperature of 155 ºC and 105 ºC, respectively. High density polyethylene
(HDPE) with a total mass of 99.5 kg was used as phase change material (PCM) in a 0.154 m3
storage tank based on the shell-and-tube heat exchanger concept. Five different percentages of
charge have been studied: 58 %, 73 %, 83 %, 92 %, and 97 % (baseline test). Results showed
that by modifying the percentage of charge, the time required for the charging process was
reduced between 97.2 % and 68.8 % in comparison to the baseline case. However, the energy
accumulated was only reduced a maximum of 35.1 % and a minimum of 5.2 %, while the heat
transfer rates during the first 60 minutes of discharge were reduced a maximum of 45.8 % and a
minimum of 6 %. Therefore, partially charging the TES system not lower than 85% of its
maximum energy capacity becomes a good option if the final application accepts a maximum
decrease of discharging heat transfer rates of 10% if compared to the fully charged system.
Keywords: Thermal energy storage; Latent heat; Phase change material; Partial load; Thermal
management.

2
Nomenclature
Cp Specific heat, J/kg·ºC
E Energy, J
m Mass, kg
�� Mass flow rate, kg/s
R Function which depends on the measured parameters
t Time, s
T Temperature, ºC
w Uncertainties which are associated to the independent parameters
W Estimated uncertainty in the final result, value-dependent
x Independent measured parameters
Greek symbols
∆ℎ(�) Enthalpy variation (sensible and latent), kJ/kg
∆� Temperature variation, ºC
Subscripts
i Instant
in Inlet
max Maximum
n Control volume
out Outlet
pr Process
Abbreviations
DSC Differential scanning calorimeter
HDPE High density polyethylene
HTF Heat transfer fluid
HTR Heat transfer rate
PCM Phase change material
RAE Ratio of accumulated energy
TES Thermal energy storage
TGA Thermogravimetry analysis

3
1 Introduction
Storage technologies, such as thermal energy storage (TES) technologies, have become an
indispensable component at any installation coupled to a renewable energy system since they
help overcoming the dependence on the weather conditions and the mismatch between energy
demands and supplies [1]. A TES cycling process consists of storing the energy when it is
available or cheap, but not needed, to further release it when it is demanded and not available or
more expensive, with the aim of increasing the efficiency of the thermal process. There are
some energy supply sources which are known to be intermittent (i.e. solar energy and industrial
waste heat recovery systems) which they might not give a continuous energy supply.
Furthermore, if the energy source is able to provide a continuous heat supply, the periodicity of
the charge can be adjusted depending on the final demand and the tank design, which is
normally not optimized. All these conditions are known as partial load operating conditions and
might lead to a TES material which is partially charged and, as a consequence, affect the TES
discharging process, especially if the TES material is a phase change material (PCM).
Some of the research work done to study the effect of partial load operating conditions was
focused on numerically studying and optimizing the size of sensible cold storage systems for
cooling purposes by comparing full storage and partial storage strategies to conventional
systems [2-7]. According to Dincer [8], the full storage strategy shifts the entire peak cooling
load to off-peak hours, while the partial load strategy is used to either level the load or limit the
demand, since the cooling load is partially met by the cooling source and partially met by the
storage system. Sebzali et al. [2] studied the effects of using partial and full loads strategies on
the TES and chiller size, the reduction of electrical peak demand and the reduction of the energy
consumption of a chiller for a clinic building in Kuwait. They found that full storage operation
allows larger electrical peak reduction and chiller and storage capacities, while it presents the
higher energy consumption. Rahman et al. [3] analysed partial and full TES storage scenarios in
a subtropical climate building. Results showed that in both cases more than 50 % of the cooling
electricity cost was saved when compared with the conventional system. Macphee and Dincer
[4] studied the effect of partial and full storage strategies in the energy and exergy efficiencies
of four different types of ice storage techniques for space cooling. They found that both
efficiencies were always lower in partial storage systems. Hasnain et al. [5] showed that
incorporating partial ice storage systems in Saudi Arabian office buildings reduced the peak
electrical power demand and peak cooling load in the up to 20% and up to 40%, respectively.
Similarly, Habeebullah [6] performed this analysis for a Saudi Arabian mosque. The author
concluded that partial load operating strategies were not economically attractive if compared to
full load or conventional systems. Boonnasa and Namprakai [7] performed an optimization of

4
the payback period for a full load and three different partial load scenarios. They found that
partial load scenarios show good economic results as well as manageability and flexibility.
On the other side, literature review showed that some research was also performed to study the
influence of partial load operating conditions in latent heat TES systems [9-20]. It is known that
when a PCM goes through consecutive melting and solidification processes, it might show
specific effects such as hysteresis and/or subcooling. Hence, it might follow different enthalpy-
temperature curves for each process (Figure 1a). These effects bring new challenges when
numerical models need to evaluate the transition between heating and cooling in TES systems
working under partial load operating conditions, since the PCM might have not completely
undergone phase change when the following process starts. Four methodologies were found in
the literature defining how to address this transition. The first methodology, which was
proposed by Bony and Citherlet [9], suggests switching from the heating to the cooling curves,
or the other way around, with the same slope than the specific heat curve in the sensible region
(points a-c-f in Figure 1b). The second methodology, which was proposed by Rose et al. [10],
has the same principle than the first methodology but the transition takes place with no
equivalent slope (points a-c’-f in Figure 1b). The third methodology, which was proposed by
Chandrasekharan et al. [11], suggests staying at the same curve without considering the other
curve (points a-d-f in Figure 1b). Finally, the fourth methodology was obtained in an
experimental PCM-equipped wall by Delcroix [12]. He observed that the curve was placed
between the cooling and heating curves at a distance and with a slope which depended on the
TES system operating conditions (points a-b-e-f in Figure 1b). Palomba et al. [13]
experimentally evaluated three short consecutive charging and discharging processes in a latent
heat TES system for solar cooling purposes to study the effect of starting a new process without
fully melting/solidifying the PCM. They observed that better results could be obtained with
longer processes, mainly in the first discharge/charge. Chiu et al. [14] performed a techno-
economic optimization of a mobile-TES system in which one of the parameters was the storage
level with varying charge/discharge time. Results showed in a monthly base the optimal charge
and discharge storage level which provided the maximum economic benefits. Nithyanandam et
al. [15] and Zhao et al. [16] numerically analysed the behaviour of packed bed TES systems
(with and without encapsulated PCM) under partial load operating conditions in a concentrating
solar power plant. Results showed that when the TES system repeatedly worked under partial
load conditions, the PCM phase change rate might be limited and the effective storage capacity
might be decreased with time. Bedecarrats et al. [17,18] experimentally and numerically
investigated the effect of partially discharge a TES system on the following charging process.
They observed that the charge mode was relatively shorter and that the subcooling effect
practically disappeared. Avignon and Kummert [19] experimentally analysed the effect of
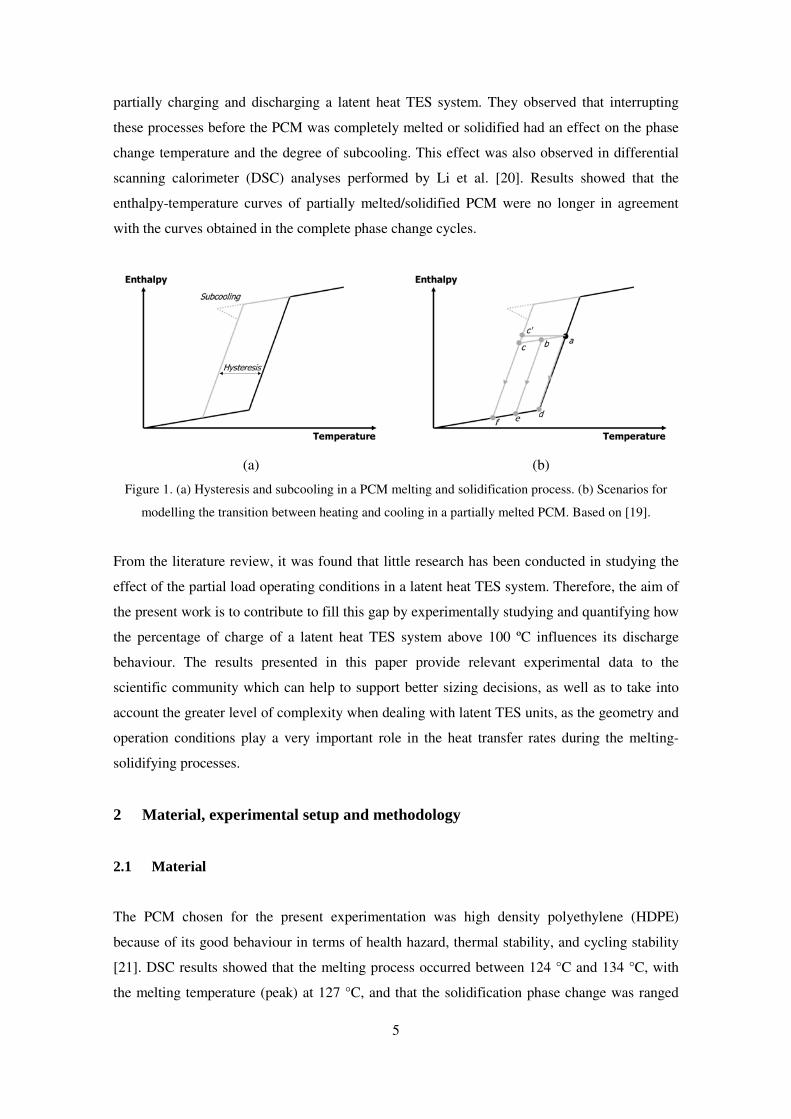
5
partially charging and discharging a latent heat TES system. They observed that interrupting
these processes before the PCM was completely melted or solidified had an effect on the phase
change temperature and the degree of subcooling. This effect was also observed in differential
scanning calorimeter (DSC) analyses performed by Li et al. [20]. Results showed that the
enthalpy-temperature curves of partially melted/solidified PCM were no longer in agreement
with the curves obtained in the complete phase change cycles.
(a) (b)
Figure 1. (a) Hysteresis and subcooling in a PCM melting and solidification process. (b) Scenarios for
modelling the transition between heating and cooling in a partially melted PCM. Based on [19].
From the literature review, it was found that little research has been conducted in studying the
effect of the partial load operating conditions in a latent heat TES system. Therefore, the aim of
the present work is to contribute to fill this gap by experimentally studying and quantifying how
the percentage of charge of a latent heat TES system above 100 ºC influences its discharge
behaviour. The results presented in this paper provide relevant experimental data to the
scientific community which can help to support better sizing decisions, as well as to take into
account the greater level of complexity when dealing with latent TES units, as the geometry and
operation conditions play a very important role in the heat transfer rates during the melting-
solidifying processes.
2 Material, experimental setup and methodology
2.1 Material
The PCM chosen for the present experimentation was high density polyethylene (HDPE)
because of its good behaviour in terms of health hazard, thermal stability, and cycling stability
[21]. DSC results showed that the melting process occurred between 124 °C and 134 °C, with
the melting temperature (peak) at 127 °C, and that the solidification phase change was ranged

6
between 126 ºC and 114 ºC, with the solidification temperature (peak) at 119 ºC (Figure 2). The
methodology used to obtain the enthalpy-temperature and specific heat-temperature curves
followed the standard presented in the IEA SHC Task 42 / ECES Annex 29 [22].
(a) (b)
Figure 2. High density polyethylene enthalpy-temperature (a) and specific heat-temperature curves (b)
following the PCM standard methodology [22].
2.2 Experimental setup
The experimentation presented in this paper was carried out at the pilot plant facility available at
the University of Lleida, which is integrated by three main parts: the heating system, the cooling
system, and the storage system. The heating system, which simulates the energy source during
the charging process (i.e. solar field, waste heat stream...), consists of a 24 kWe electrical heater.
The cooling system, which simulates the energy consumption, consists of a 20 kWth cross flow
air-HTF heat exchanger. Finally, the storage system consists of a stainless steel 304 L storage
tank based on the shell-and-tube heat exchanger concept. This design consists of a rectangular
prism shaped vessel (0.53 x 0.27 x 1.27 m), where the PCM is located, with a tubes bundle
inside containing 49 tubes distributed in square pitch and bended in U-shape, with an average
length of 2.49 m (Figure 3a). The capacity of the storage tank is 0.154 m3 and 99.5 kg of PCM
are distributed as shown in Figure 1b: 79% of the PCM is located in the so-called main part,
which surrounds the tubes bundle, 14% of the PCM is located in the central part, and finally the
remaining 7% is located in the corners. Two Pt-100 1/5 DIN class B temperature sensors,
located at the inlet and outlet of the HTF tubes bundle, were used to measure the HTF inlet and
outlet temperature (THTF.IN and THTF.OUT in Figure 3d) and thirty-one Pt-100 1/5 DIN class B
temperature sensors were installed in the storage tank to measure the PCM temperature.
Nineteen of these sensors were located in the main part (from TPCM.1 to TPCM.15 in Figure 3c), six
sensors in the corner part close to the U bend (from Tc.1 to Tc.6 in Figure 3d), and six in the
central part (from Tin.1 to Tin.6 in Figure 3d). Each temperature sensor was associated to a control

7
volume, which is defined as the theoretical volume of PCM in which the value of the temperature
sensor could be stated as representative. Six additional Pt-100 1/5 DIN class B were placed on the
walls of the storage tank and of the insulation to evaluate the heat losses to the surroundings.
The HTF flow rate was measured using a FUJI FCX-A2 V5 series transmitter. Temperature and
flow rate sensors were connected to a data acquisition system, which controls, measures and records
the information at a time interval of 60 s.
The three above-explained systems are linked through a stainless steel 304 L piping system
which distributes the HTF (silicon fluid Syltherm 800) within a flow rate range between 0.3 and
3 m3/h. The piping system is insulated with rock wool in order to minimize the heat losses to the
surroundings.
(a) (b)
(c) (d)
Figure 3. TES system used of the experimental setup: (a) Overview of the TES system; (b) PCM
distribution within the TES system; (c) PCM temperature sensors of the main part; (d) Inlet and outlet
HTF temperature sensors, and PCM temperature sensors of the corner and central parts.
2.3 Theory and calculation
This section presents the main equations used to describe the experimental results presented in
the results and discussion section. The energy stored, or released, by the PCM during the

8
charging or discharging process, respectively, is calculated as given in Eq. 1. Since HDPE
presents hysteresis, the methodology used to study the enthalpy variation under partial load
operating conditions followed the one proposed by Chandrasekharan et al. [11], who suggests
staying at the same curve without considering the other curve.
�� = ��,� ·���
���
��
���∆ℎ(�)�,(�,���)
(1)
The heat transfer rate of the HTF during the charging or discharging process is calculated using
Eq. 2:
����� = �� ��� · ����� · (∆����.��� !�)���
���
(2)
Finally, the ratio of accumulated energy (RAE), which is the amount of energy accumulated in
the PCM at a certain time interval in front of the theoretical maximum energy that can be stored
by the PCM is calculated using Eq. 3. The theoretical maximum energy stored was obtained by
multiplying the enthalpy variation of the PCM, whose values were acquired from the DSC
enthalpy-temperature curves, by the total amount of material used in this experimentation, as
described in Eq. 1. In this case, the theoretical maximum energy accumulated by 99.5 kg of
HDPE within the temperature range of 105 ºC and 155 ºC is 10.08 kWh. Similarly, the
maximum energy stored by the metal parts of the TES system is 1.29 kWh, which is obtained by
multiplying their mass by the specific heat of the stainless steel, and by the temperature
difference between the initial state and the final state.
"#� = ��.���.$%& (3)
2.4 Methodology
The experimentation presented in this paper consisted of five different charging and discharging
tests with the aim of evaluating the effect of partially charging the PCM (partial load operating
conditions) on the discharging process (see Table 1). All the processes were carried out using
the same parameters, and at least five repetitions of each one were performed to ensure
repeatability. Table 1 shows the operating conditions of the partial load charging processes,
evaluated by the RAE, and the time needed to reach them. In order to determine the time needed
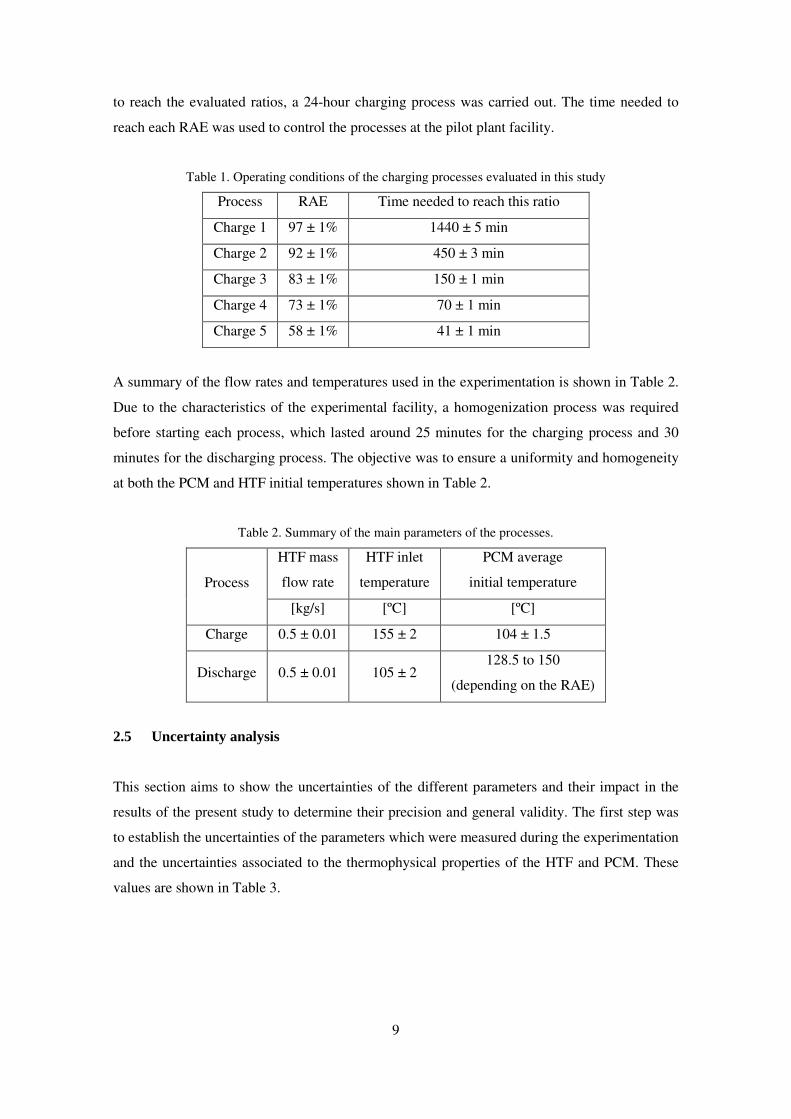
9
to reach the evaluated ratios, a 24-hour charging process was carried out. The time needed to
reach each RAE was used to control the processes at the pilot plant facility.
Table 1. Operating conditions of the charging processes evaluated in this study
Process RAE Time needed to reach this ratio
Charge 1 97 ± 1% 1440 ± 5 min
Charge 2 92 ± 1% 450 ± 3 min
Charge 3 83 ± 1% 150 ± 1 min
Charge 4 73 ± 1% 70 ± 1 min
Charge 5 58 ± 1% 41 ± 1 min
A summary of the flow rates and temperatures used in the experimentation is shown in Table 2.
Due to the characteristics of the experimental facility, a homogenization process was required
before starting each process, which lasted around 25 minutes for the charging process and 30
minutes for the discharging process. The objective was to ensure a uniformity and homogeneity
at both the PCM and HTF initial temperatures shown in Table 2.
Table 2. Summary of the main parameters of the processes.
Process
HTF mass
flow rate
HTF inlet
temperature
PCM average
initial temperature
[kg/s] [ºC] [ºC]
Charge 0.5 ± 0.01 155 ± 2 104 ± 1.5
Discharge 0.5 ± 0.01 105 ± 2 128.5 to 150
(depending on the RAE)
2.5 Uncertainty analysis
This section aims to show the uncertainties of the different parameters and their impact in the
results of the present study to determine their precision and general validity. The first step was
to establish the uncertainties of the parameters which were measured during the experimentation
and the uncertainties associated to the thermophysical properties of the HTF and PCM. These
values are shown in Table 3.
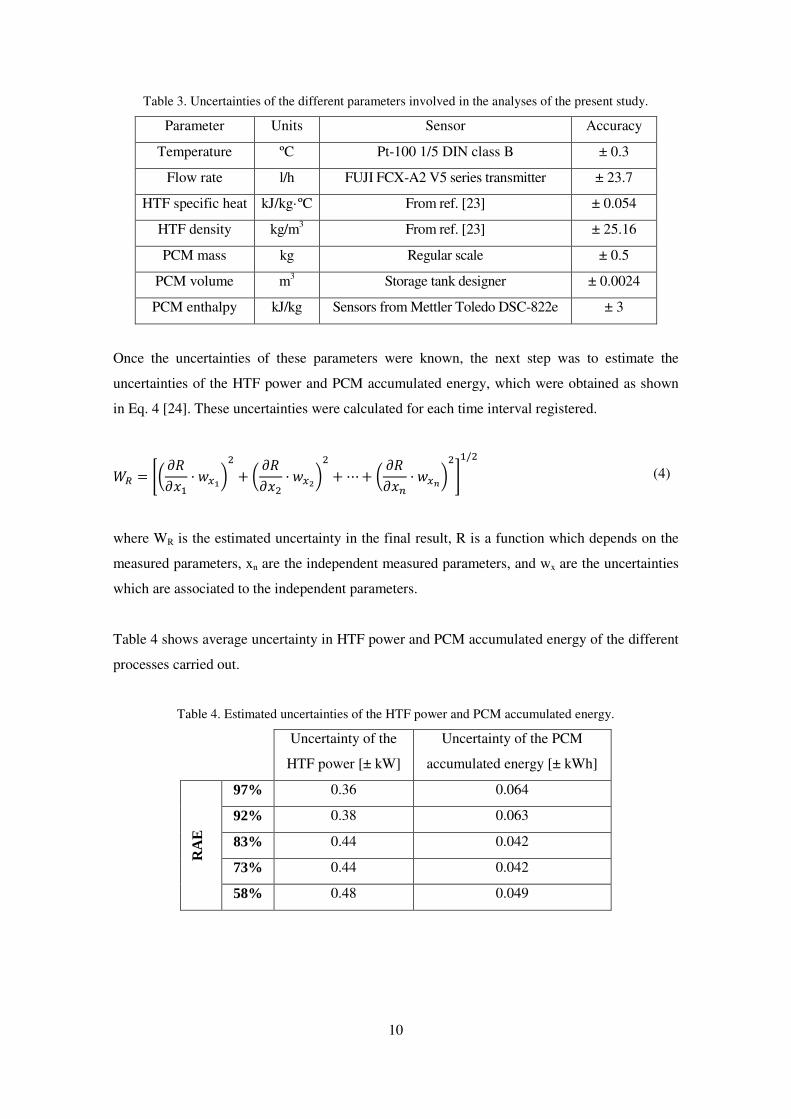
10
Table 3. Uncertainties of the different parameters involved in the analyses of the present study.
Parameter Units Sensor Accuracy
Temperature ºC Pt-100 1/5 DIN class B ± 0.3
Flow rate l/h FUJI FCX-A2 V5 series transmitter ± 23.7
HTF specific heat kJ/kg·ºC From ref. [23] ± 0.054
HTF density kg/m3 From ref. [23] ± 25.16
PCM mass kg Regular scale ± 0.5
PCM volume m3 Storage tank designer ± 0.0024
PCM enthalpy kJ/kg Sensors from Mettler Toledo DSC-822e ± 3
Once the uncertainties of these parameters were known, the next step was to estimate the
uncertainties of the HTF power and PCM accumulated energy, which were obtained as shown
in Eq. 4 [24]. These uncertainties were calculated for each time interval registered.
'( = )*+"+,� · -&./� + * +"+,� · -&1/
� +⋯+ * +"+,� · -&3/�4�/�
(4)
where WR is the estimated uncertainty in the final result, R is a function which depends on the
measured parameters, xn are the independent measured parameters, and wx are the uncertainties
which are associated to the independent parameters.
Table 4 shows average uncertainty in HTF power and PCM accumulated energy of the different
processes carried out.
Table 4. Estimated uncertainties of the HTF power and PCM accumulated energy.
Uncertainty of the
HTF power [± kW]
Uncertainty of the PCM
accumulated energy [± kWh]
RA
E
97% 0.36 0.064
92% 0.38 0.063
83% 0.44 0.042
73% 0.44 0.042
58% 0.48 0.049
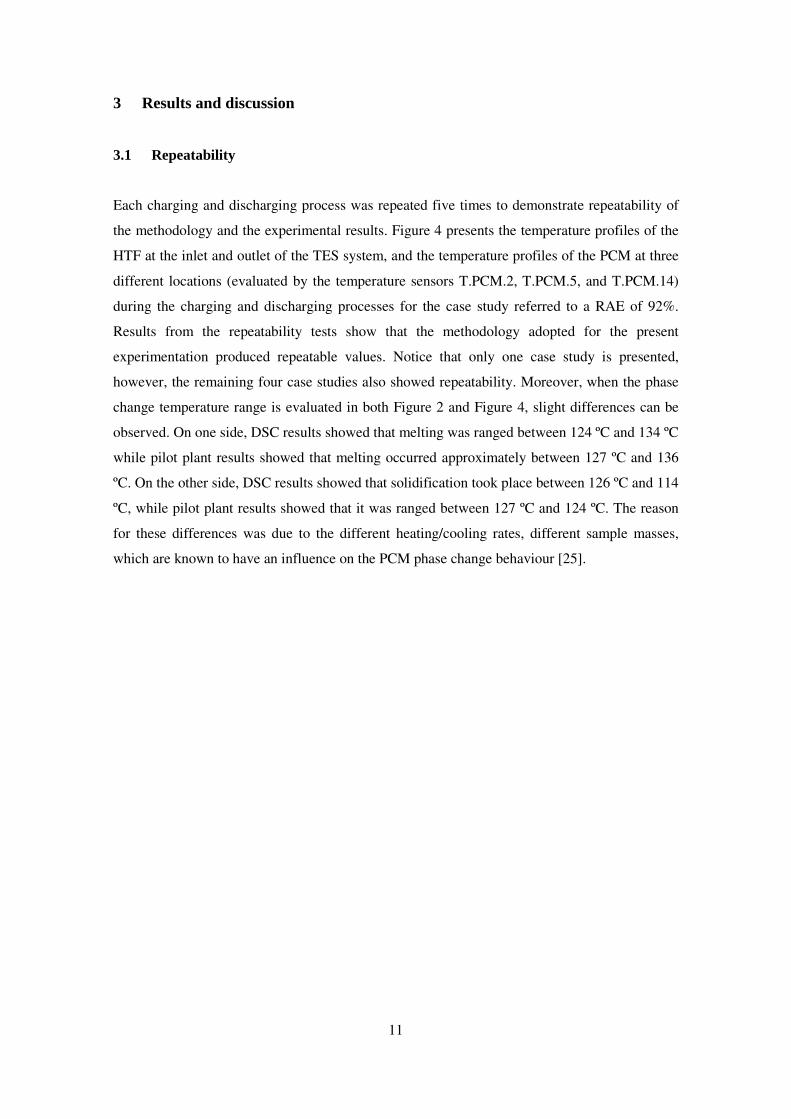
11
3 Results and discussion
3.1 Repeatability
Each charging and discharging process was repeated five times to demonstrate repeatability of
the methodology and the experimental results. Figure 4 presents the temperature profiles of the
HTF at the inlet and outlet of the TES system, and the temperature profiles of the PCM at three
different locations (evaluated by the temperature sensors T.PCM.2, T.PCM.5, and T.PCM.14)
during the charging and discharging processes for the case study referred to a RAE of 92%.
Results from the repeatability tests show that the methodology adopted for the present
experimentation produced repeatable values. Notice that only one case study is presented,
however, the remaining four case studies also showed repeatability. Moreover, when the phase
change temperature range is evaluated in both Figure 2 and Figure 4, slight differences can be
observed. On one side, DSC results showed that melting was ranged between 124 ºC and 134 ºC
while pilot plant results showed that melting occurred approximately between 127 ºC and 136
ºC. On the other side, DSC results showed that solidification took place between 126 ºC and 114
ºC, while pilot plant results showed that it was ranged between 127 ºC and 124 ºC. The reason
for these differences was due to the different heating/cooling rates, different sample masses,
which are known to have an influence on the PCM phase change behaviour [25].

12
(a) (b)
(c) (d)
Figure 4. Repeatability tests for the study case of a RAE of 92%: (a) HTF inlet and outlet temperatures
during the charging process; (b) PCM temperature at three different locations (evaluated by the
temperature sensors T.PCM.2, T.PCM.5, and T.PCM.14) during the charging process; (c) HTF inlet and
outlet temperatures during the discharging process; (d) PCM temperature at three different locations
(evaluated by the temperature sensors T.PCM.2, T.PCM.5, and T.PCM.14) during the discharging
process.
3.2 Charging process
Figure 5 shows the evolution of the time of charge (left axis) and the evolution of the average
temperatures of the PCM at the main, corner, and central part of the TES system (right axis) for
the different percentages of RAE. These results were used to determine the five case studies
presented in this paper. Notice that the profile of the time showed a linear evolution until the
RAE achieved the value of 55%. From this value to a value of RAE of 70%, the time profile
also showed a linear evolution but with a different slope, which indicates that the time needed to
increase the RAE is increased. Finally, from the value of RAE of 70% up to the maximum
achievable RAE (in the present study this value was 97% after 24 h, which was limited because
of the current geometrical design of the TES system and the existing heat losses), the time
profile showed a non-linear evolution, since the efforts were focused on melting the PCM
located on the corner part and on increasing the temperature of the already liquid PCM.

13
A more detailed profile time study is shown in Figure 6. This figure shows the time needed to
increase 5% the value of the RAE during the charging process (notice that the primary and
secondary y-axes are in a log-2 scale). It can be observed that for the first period (from 0% to
55%) the time needed was five minutes or less. Specifically, it can be seen that the time to store
the initial 5% of energy was slightly higher than the time needed to increase the following 5%
until a RAE of 55%. The reason is due to two factors. On one hand, during the first six minutes
of charge, the heat transfer gradually increases from 0 to its maximum, as seen in Figure 7, and
as a consequence, the energy transferred in this period is lower. On the other hand, part of this
energy is absorbed initially by the metal of the tubes bundle and afterwards by the PCM located
around it in terms of sensible energy. After the first 5%, it takes between two and four minutes
to increase 5% until the ratio of energy accumulated (RAE) is 55%. On the other hand, in the
second period (from 55% to 70%) the required time was at least nine minutes. Finally, the time
needed to increase 5% the RAE in the third period (from 70% to 97%) increased exponentially.
As explained above, the main reason for this behaviour is that when the RAE achieved the value
of 70% the PCM located at the main and central parts was already melted. Therefore, the
biggest amount of energy from the HTF was focused on increasing the temperature and melting
the PCM located at the corner part. The existing distance between the corners and the HTF
tubes bundle, and the low thermal gradient between the PCM and the HTF induced low heat
transfer rates and a reduction in the power of energy absorbed by the PCM. The existence of this
non-linear profile from the RAE of 70% shows the potential of using partial load operating
conditions when a fast charging process needs to be performed, mainly because of the heating
source availability.
If the different case studies are compared to the baseline case study (RAE 97%), different
reductions on the energy accumulated at the end of the charging process and the time needed to
reach these levels are observed. In the case study of RAE 92%, a reduction of 5.2% of the
accumulated energy, which causes a time reduction of 68.8% on the charging period. This
variation on the charging time is even increased in the other case studies. If the accumulated
energy is reduced 14.4% (RAE 83%), 24.7% (RAE 73%), and 40.2% (RAE 58%), the period of
time needed to reach these levels is reduced 89.6%, 95.1%, and 97.2%, respectively (Table 5).
Focusing again on the temperature profiles shown in Figure 5, it can be seen that the baseline
study case (cross mark) shows always higher temperature in the three different regions than the
other case studies as a result of the higher amount of accumulated energy. Looking at the PCM
distribution in the TES system, it can be seen that the average temperature of the PCM located
in the main part at the end of the charging process, in comparison to the baseline case study, has

14
a temperature variation which goes from 12.8% in the case of RAE 58% (round mark) to a
difference of only 0.4% in the case of RAE 92% (rhombus mark). Observing the PCM located
in the central part, the temperature variation compared to the baseline study case goes from the
19.8% in the case of RAE 58% to 3.5% in the case of RAE 92%. Finally, the PCM located in
the corners of the TES system, shows a higher temperature variation, from 25.4% in the study
case of RAE 58% to 6.5% in the case of RAE 92%. These results show that, if compared to the
baseline study case, the PCM located at the main part presents a lower temperature variation
than the PCM located in both the central and corner parts. The reason lies on the fact that this
PCM surrounds the HTF tubes bundle and therefore it received first the heat released by the
HTF and it increased faster its temperature. Moreover, Figure 5 shows that the PCM located in
the corners of the TES system did not fully melt. This was mainly caused by a non-optimized
design of the TES system, which creates dead zones. Hence, the effect of the heat losses was
higher than the effect of the heat transfer from the HTF.
Figure 7 presents the evolution of the HTF heat transfer rate during the charging process of the
five study cases. These profiles are limited to 180 minutes for a better visualization. As
expected, the heat transfer rates are practically the same for the different studies until they are
stopped, and the slight variations are due to the small variations on the initial conditions and
mass flow rates. These profiles show an exponential behaviour with significantly higher values
during the first 10 minutes of process, when the heat is mainly transferred to the metal tubes
bundle, and therefore rapidly increases its temperature, and when the thermal gradient between
the HTF and the PCM is maximum. Afterwards, while the PCM increases its temperature, the
values of the heat transfer exponentially decrease until minimum values. At this moment, the
heat transfer is focused on increasing the temperature of the PCM located at the corners and the
central part of the tank.
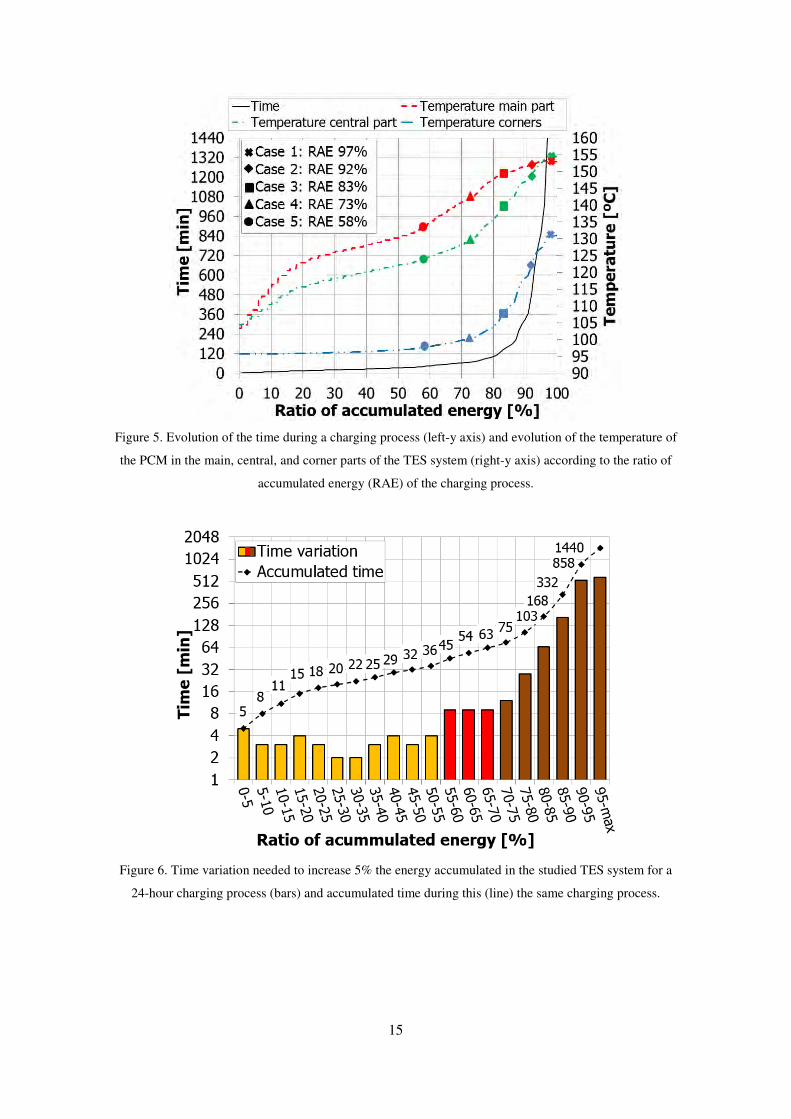
15
Figure 5. Evolution of the time during a charging process (left-y axis) and evolution of the temperature of
the PCM in the main, central, and corner parts of the TES system (right-y axis) according to the ratio of
accumulated energy (RAE) of the charging process.
Figure 6. Time variation needed to increase 5% the energy accumulated in the studied TES system for a
24-hour charging process (bars) and accumulated time during this (line) the same charging process.

16
Figure 7. Evolution of the HTF heat transfer rate during the charging processes of the five study cases
presented in this study.
3.3 Discharging process
In order to study the influence that the RAE during the charging process has on the discharging
process, the authors decided to analyse the temperatures and heat transfer rates. Figure 8 shows
the evolution of the PCM temperature during the discharging process at the three characteristic
locations of the storage tank, as well as the weighted average temperature of the whole PCM,
for the five case studies. For the whole discharging processes, higher temperatures were
observed for the study cases with a higher RAE, no matter where the PCM was located.
However, an interesting phenomenon could be observed in the PCM located at the corners
(Figure 8d). During the first 40-90 minutes of the discharging process, depending on the RAE
during the charging process, the average temperature of the PCM slightly increased since the
energy transferred from the PCM located at the main part was higher than the energy lost
through the walls. After this period, the PCM temperature started to decrease for opposite
reasoning.

17
(a) (b)
(c) (d)
Figure 8. Evolution of the weighted average PCM during the discharging process: (a) All control
volumes; (b) Control volumes located at the main part; (c) Control volumes located at the central part; (d)
Control volumes located at the corners.
The evolution of the HTF temperature at the outlet of the HTF tubes bundle for the different
RAE is presented in Figure 9. Notice that only the first 180 minutes are presented for a better
comprehension of the readers since the values for longer periods of time present an asymptotic
trend. Results in Figure 9 show that the HTF outlet temperature during the discharging process
is clearly affected by the percentage of charge. It is observed that the outlet HTF temperature
decreased as the RAE during the charge decreased and the variations in comparison to the
baseline study case were higher when the RAE during the charge were 73% and 58%. Due to
the fact that both the inlet HTF temperature and mass flow rate were kept almost constant along
the different discharging processes, the heat transfer rates were also affected similarly than the
outlet HTF temperature as shown in Figure 10. Figure 11 goes a step further and numerically
quantifies the average values of the heat transfer rates every 30 min from the beginning to the
minute 180. Results show that during the first 30 minutes the heat transfer rates of all the case
studies, except for the case study RAE 58%, presented a variation, compared to the baseline
case, lower than 10% (Table 5). During the next 30 minutes only the RAE 92% and RAE 83%
kept average heat transfer rates with a variation, compared to the baseline case, lower than 10
%. From this period on, all the case studies presented variations higher than 10%. Therefore, it
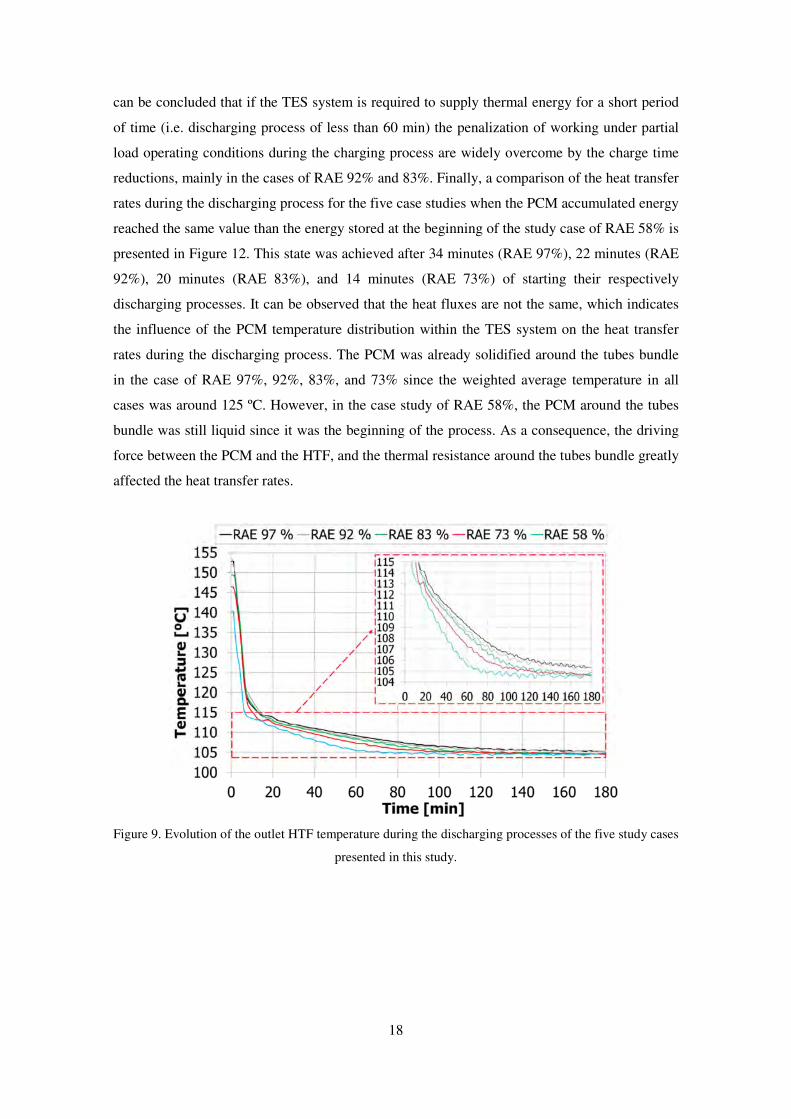
18
can be concluded that if the TES system is required to supply thermal energy for a short period
of time (i.e. discharging process of less than 60 min) the penalization of working under partial
load operating conditions during the charging process are widely overcome by the charge time
reductions, mainly in the cases of RAE 92% and 83%. Finally, a comparison of the heat transfer
rates during the discharging process for the five case studies when the PCM accumulated energy
reached the same value than the energy stored at the beginning of the study case of RAE 58% is
presented in Figure 12. This state was achieved after 34 minutes (RAE 97%), 22 minutes (RAE
92%), 20 minutes (RAE 83%), and 14 minutes (RAE 73%) of starting their respectively
discharging processes. It can be observed that the heat fluxes are not the same, which indicates
the influence of the PCM temperature distribution within the TES system on the heat transfer
rates during the discharging process. The PCM was already solidified around the tubes bundle
in the case of RAE 97%, 92%, 83%, and 73% since the weighted average temperature in all
cases was around 125 ºC. However, in the case study of RAE 58%, the PCM around the tubes
bundle was still liquid since it was the beginning of the process. As a consequence, the driving
force between the PCM and the HTF, and the thermal resistance around the tubes bundle greatly
affected the heat transfer rates.
Figure 9. Evolution of the outlet HTF temperature during the discharging processes of the five study cases
presented in this study.
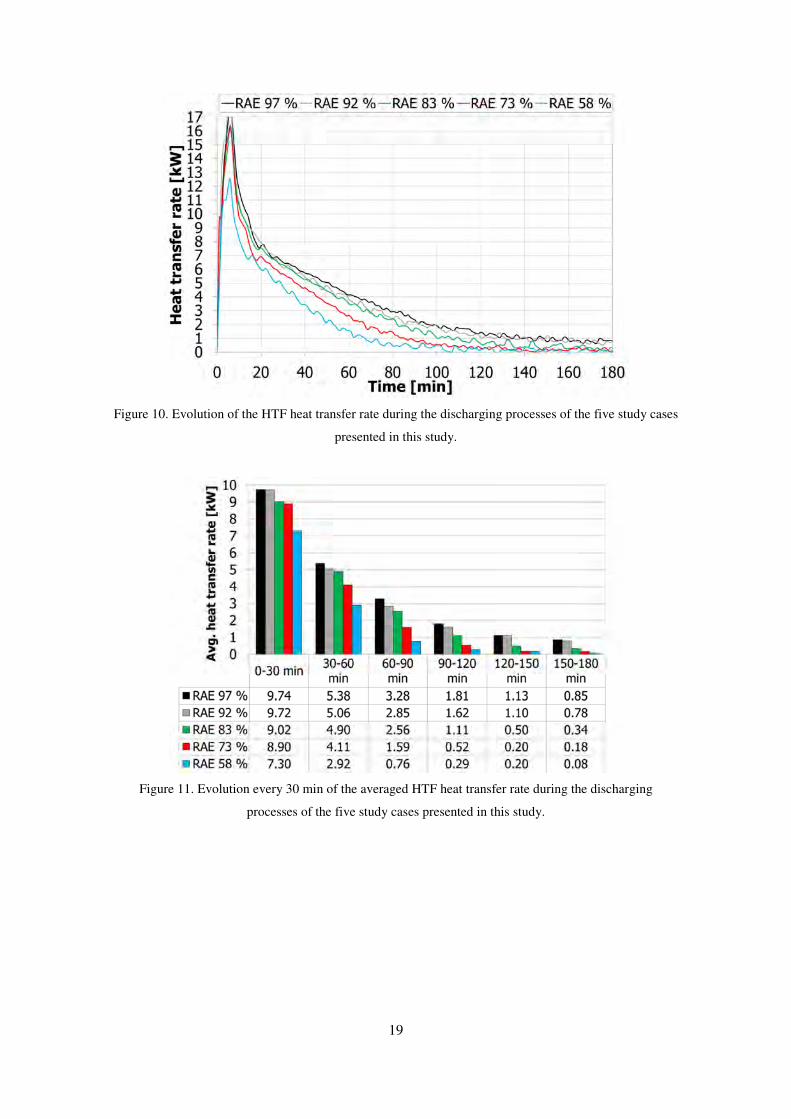
19
Figure 10. Evolution of the HTF heat transfer rate during the discharging processes of the five study cases
presented in this study.
Figure 11. Evolution every 30 min of the averaged HTF heat transfer rate during the discharging
processes of the five study cases presented in this study.

20
Figure 12. Evolution of the HTF heat transfer rate during the discharging processes of the five study cases
when the accumulated energy is 58%. Notice that 0 in the “x” axis means the moment when the different
study cases achieved this value, and not the beginning of the discharging process.
Table 5. Summary of the variation of the main results discussed in the present paper compared to the
baseline case (RAE 97 %).
Charge Discharge
∆
RAE
∆
Process
time
∆
Average
HTR*
0-30
min
∆
Average
HTR
30-60
min
∆
Average
HTR
60-90
min
∆
Average
HTR
90-120
min
∆
Average
HTR
120-150
min
∆
Average
HTR
150-180
min
RA
E
97
% - - - - - - - -
92
%
5.2
% 68.8 % 0.3% 6.0% 13.3% 10.7% 2.7% 7.9%
83
%
14.4
% 89.6 % 7.4% 9.0% 22.1% 38.5% 55.8% 59.8%
73
%
24.7
% 95.1 % 8.7% 23.7% 51.5% 71.3% 82.3% 78.4%
58
%
40.2
% 97.2 % 25.0% 45.8% 76.8% 84.2% 82.3% 91.0%
*HTR: Heat transfer rate

21
4 Conclusions
The work presented in this paper studies how the fact of partially charging a latent heat TES
system influences the discharging process (partial load operating conditions). Five different
percentages of charge were studied and discussed, which were determined with a 24-hour
charging process. The parameter ratio of accumulated energy (RAE) was defined to evaluate the
partial load charging processes. This ratio defines the PCM accumulated energy at a certain time
interval in front of the theoretical maximum energy stored by the PCM. The five case studies
were RAE 97 %, RAE 92 %, RAE 83 %, RAE 73 %, and RAE 58 %, being the first one the
baseline case.
The experimental results showed that during the charging process, the evolution of the time
according to the RAE presented three different profiles. From the beginning to a RAE of 55%,
the profile of the time showed a linear evolution. After this value to a RAE of 70%, the time
profile also showed a linear evolution but with a different slope. Finally, from the value of RAE
of 70% up to the maximum achievable RAE (97%) the time profile showed a non-linear
evolution. Moreover, it was observed that in comparisons to the baseline case, by reducing the
RAE between 5.2% and 40.2%, the charging process time could be reduced between 68.8 % and
97.2%. Therefore, in terms of time, working under partial load operating conditions is
beneficial. However, during the discharging process partial load operating conditions penalize
the heat transfer rate. Before the first hour of discharge, only the case studies of RAE 92% and
83% showed heat transfer rates values which were 10% lower than the baseline case, and after
the first hour all the case studies present a reduction on the heat transfer rates in comparison to
the baseline case higher than 10%. Therefore, if the TES system works under partial load
operating conditions during the charging process for a RAE higher than 83%, it is able to supply
heat transfer rates during the first 60 min of the discharging process with variations lower than
10% compared to the baseline case, but with significant time reductions in the charging process
of more than 89%.
Finally, it has to be pointed out that the results presented in this paper are strongly affected by
the particular geometry of the system, which presents two dead zones (at the corners) that
cannot be effectively used. Different geometries, with different distribution of tubes or different
container shapes, could yield different results.

22
Acknowledgements
The work was partially funded by the Spanish government (ENE2015-64117-C5-1-R
(MINECO/FEDER), ENE2015-64117-C5-3-R (MINECO/FEDER), and ULLE10-4E-1305).
The authors would like to thank the Catalan Government for the quality accreditation given to
their research group (2014 SGR 123). GREA is certified agent TECNIO in the category of
technology developers from the Government of Catalonia. This project has received funding
from the European Commission Seventh Framework Programme (FP/2007-2013) under Grant
agreement Nº PIRSES-GA-2013-610692 (INNOSTORAGE) and from the European Union’s
Horizon 2020 research and innovation programme under grant agreement No 657466
(INPATH-TES). Jaume Gasia would like to thank the Departament d'Universitats, Recerca i
Societat de la Informació de la Generalitat de Catalunya for his research fellowship (2017
FI_B1 00092). Alvaro de Gracia would like to thank Ministerio de Economia y Competitividad
de España for Grant Juan de la Cierva, FJCI-2014-19940. Simone Arena would like to thank the
Department of Mechanical, Chemical and Materials Engineering of the University of Cagliari
for funding his research grant.
References
1. H. Mehling, LF. Cabeza, Heat and cold storage with PCM. An up to date introduction into
basics and applications. Berlin, Germany. Springer-Verlag 2008. ISBN: 979-3-540-68556-
2.
2. M. Sebzali, P. Rubini, Analysis of ice cool thermal storage for a clinic building in Kuwait,
Energy Conversion and Management 47 (2006) 3417–3434.
3. M. Rahman, M. Rasul, M. Khan, Feasibility of thermal energy storage systems in an
institutional building in subtropical climates in Australia, Applied Thermal Engineering 31
(2011) 2943–2950.
4. D. Macphee, I. Dincer, Performance assessment of some ice TES systems, International
Journal of Thermal Sciences 48 (2009) 2288–2299.
5. SM. Hasnain, SH. Alawaji, AM. Al-Ibrahim, MS. Smiai, Prospects of cool thermal storage
utilization in Saudi Arabia, Energy Conversion and Management 41 (2000) 1829–1839.
6. BA. Habeebullah, Economic feasibility of thermal energy storage systems, Energy and
buildings 39 (2007) 355–363.
7. S. Boonnasa, P. Namprakai, The chilled water storage analysis for a university building
cooling system, Applied Thermal Engineering 30 (2010) 1396–1408.
8. I. Dincer, On thermal energy storage systems and applications in buildings, Energy and
Buildings 34 (2002) 377–388.
23
9. Bony, S. Citherlet, Numerical model and experimental validation of heat storage with
phase change materials, Energy Buildings 39 (2007) 1065–1072.
10. J. Rose, A. Lahme, N.U. Christensen, P. Heiselberg, M. Hansen, K. Grau. Numerical
method for calculating latent heat storage in constructions containing phase change
material. In Proceedings of Building Simulation 2009: 11th Conference of the International
Building Performance Simulation Association, 400–407. Glasgow, Scotland, GBR, July
27–30.
11. R. Chandrasekharan, E.S. Lee, D.E. Fisher, P.S. Deokar. An enhanced simulation model
for building envelopes with phase change materials, ASHRAE Trans, 119 (2013).
12. B. Delcroix. Modelling of Thermal Mass Energy Storage in Buildings with Phase Change
Materials. PhD dissertation, Department of Mechanical Engineering, École Polytechnique
de Montréal, Montréal, QC, Canada (2015).
13. V. Palomba, V. Brancato, A. Frazzica. Experimental investigation of a latent heat storage
for solar cooling applications Applied Energy 199 (2017) 347-358.
14. JN. Chiu, J. Castro Flores, V. Martin, B. Lacarrière, Industrial surplus heat transportation
for use in district heating, Energy, 110 (2016) 139–147.
15. K. Nithyanandam, R. Pitchumani, A. Mathur, Analysis of a latent thermocline storage
system with encapsulated phase change materials for concentrating solar power, Applied
Energy 113 (2014) 1446–1460.
16. B. Zhao, M. Cheng, C. Liu, Z. Dai, Cyclic thermal characterization of a molten-salt
packed-bed thermal energy storage for concentrating solar power, Applied Energy 195
(2017) 761-773.
17. J.P. Bédécarrats, J. Castaing-Lasvignottes, F. Strub, J.P. Dumas. Study of a phase change
energy storage using spherical capsules. Part I: Experimental results. Energy Conversion
and Management 50 (2009) 2527–2536.
18. J.P. Bédécarrats, J. Castaing-Lasvignottes, F. Strub, J.P. Dumas. Study of a phase change
energy storage using spherical capsules. Part II: Numerical modelling. Energy Conversion
and Management 50 (2009) 2537–2546.
19. K. D’Avignon, M. Kummert. Experimental assessment of a phase change material storage
tank. Applied Thermal Engineering 99 (2016) 880–891.
20. L. Li, H. Yu, X. Wang, S. Zheng. Thermal analysis of melting and freezing processes of
phase change materials (PCMs) based on dynamic DSC test. Energy and Buildings 130
(2016) 388–396.
21. J. Gasia, M. Martin, A. Solé, C. Barreneche, LF. Cabeza, Phase change material selection
for thermal processes working under partial load operating conditions in the temperature
range between 120 ºC and 200 ºC, Applied Sciences 7 (2017) 722.

24
22. S. Gschwander, T. Haussmann, G. Hagelstein, A.Sole, G. Diarce, W. Hohenauer, D.
Lager, C. Rathgeber, P. Hennemann, A. Lazaro, H. Mehling. Standard to determine the
heat storage capacity of PCM using hf-DSC with constant heating/cooling rate (dynamic
mode), DSC 4229 PCM Standard. A technical report of subtask A2.1 of IEA SHC 42 /
ECES Annex 29 (2015).
23. H. Benoit, D. Spreafico, D. Gauthier, G. Flamant, Review of heat transfer fluid in tube –
receivers used in concentrating solar thermal systems: Properties and heat transfer
coefficients, Renewable Sustainable Energy Reviews 55 (2016) 298–315.
24. J.P. Holman, Experimental Methods for Engineers, eight ed. McGrawHill, Newyork
(2012).
25. H. Mehling, C. Barreneche, A. Solé, L.F. Cabeza. The connection between the heat storage
capability of PCM as a material property and their performance in real scale applications.
Journal of Energy Storage 13 (2017) 35–39.

1
Influence of the storage period between charge and discharge
in a latent heat thermal energy storage system working under
partial load operating conditions
Jaume Gasia1, Alvaro de Gracia1,2, Gabriel Zsembinszki1, Luisa F. Cabeza1,*
1GREiA Research Group, INSPIRES Research Centre, Universitat de Lleida, Pere de Cabrera
s/n, 25001-Lleida, Spain 2CIRIAF – Interuniversity Research Centre on Pollution and Environment “Mauro Felli”, Via
Duranti 63, 06125-Perugia, Italy
*Corresponding author: Tel: +34.973.00.35.76. Email: [email protected]
Abstract
The supply intermittency of energy sources like solar energy or industrial waste heat should be
properly addressed when studying latent heat thermal energy storage (TES) systems, since it
might cause an incomplete melting/solidification of phase change materials (PCM). In the
present paper, and experimental study was performed to analyse the storage period (also known
as stand-by period) in a latent heat TES system working under partial load operating conditions
and the effect of its duration on the subsequent discharging process. In the experimental set-up,
99.5 kg of high density polyethylene (HDPE) was used as PCM in a 0.154 m3 storage tank
based on the shell-and-tube heat exchanger concept. Four different percentages of charge were
evaluated: 58%, 73%, 83% (partial charge), and 97% (full charge). Each charging level was
followed by three different periods of storage: 25 min, 60 min, and 120 min. The fact of
working at different levels of charge caused that in some regions of the TES system the PCM
was not completely melted. Thus, at the end of the charging process different levels of thermal
homogenisation were observed. However, during the storage period, the PCM temperature
showed a tendency to homogenisation, which was influenced by the energy distribution within
the PCM, the heat losses, and the duration of the storage period. Focusing on the discharging
period, it was observed that the duration of the storage period slightly affected the temperature
and heat transfer profiles, causing the main differences of performance during the first 30 min of
process.
Keywords: Thermal energy storage; Phase change material; Partial loads; Incomplete melting;
Storage period; Stand-by period.

2
Nomenclature
Cp Specific heat, J/kg·K
E Energy, J or kWh
h Enthalpy, J/kg or kWh/kg
m Mass, kg
�� Mass flow rate, kg/s
R Function that depends on the measured parameters
t Time, s
T Temperature, ºC
V Volume, m3
w Uncertainties associated to the independent parameters
W Estimated uncertainty in the final result
x Independent measured variables
� Density, kg/m3
λ Thermal conductivity, W/m·K
Subscripts
c Corner
ch Charge
dch
fs
Discharge
Final time of the storage process
i Instant
in
is
ins
loss
Central part of the storage tank when it refers to the PCM
Inlet of the storage tank when it refers to the HTF
Initial time of the storage process
Insulation
Losses
m Melting
n Control volume
out Outlet of the storage tank
pr Process
s Solidification
st
tank
Storage
Metal parts of the storage tank
sub Subcooling

3
Abbreviations
DSC Differential scanning calorimeter
HDPE High density polyethylene
HTF Heat transfer fluid
HTR Heat transfer rate
MF Melt fraction
PCM Phase change material
RAE Ratio of accumulated energy
TES Thermal energy storage

4
1 Introduction
Reducing greenhouse gases emissions and therefore, fighting against climate change, which is
responsible of several catastrophes around the world, implies shifting towards a more
sustainable society. This means that households, industries, governments, etc. must find an
equilibrium between economic prosperity, technological competitiveness, and environment
benefits. Two of the easiest actions which can be carried out to achieve such equilibrium are the
deployment of renewable energies and the reuse of wastes. From the thermal energy point of
view, the main targets for this deployment are solar energy and industrial waste heat (IWH) use,
due to their high availability and energy potential [1,2]. However, they have a major drawback
which limits their harnessing, the intermittency in their thermal energy supply. As a
consequence, mismatches between energy supply and demand might occur and therefore, the
thermal process associated to them might be forced to work under partial load operating
conditions.
Thermal energy storage (TES) is a key technology that can address the intermittency of both
solar energy and IWH and thus, helping to the reliability of the system. Moreover, TES allows
increasing the facility generation capacity by taking advantage of the thermal energy excess
during low-demand periods, and increasing the versatility of the system by levelling peak load
demand periods and achieving off-peak consumption [3]. The basic principle of TES is the
storage of energy from a heat supply to be further used by a heat sink, usually through an
intermediate heat transfer fluid (HTF). A full TES cycle involves the processes of charge,
storage, and discharge. Thus, the heat obtained from the TES system during the discharging
process not only depends on how the energy was supplied into the system during the charging
process, but also depends on the behaviour of the TES system during the storage process.
Among the different TES technologies, latent heat TES is considered one of the most promising
due to its high energy density [4]. For example, during the phase change of 1 kg of ice, about
334 kJ of energy can be stored. On the contrary, if the same amount of energy is required to be
stored in the sensible form, the water storage system would require a temperature gradient of 79
ºC, which can cause problems with heat losses, stratification control, etc. [5]. Several studies
were carried out in order to optimize and maximize the operation of latent heat TES systems,
focusing on evaluating the influence of the HTF mass flow rate, HTF inlet temperature, PCM
melting temperature, number of PCM in multiple PCM configurations, PCM effective thermal
conductivity, TES system dimension, sensible heating, and subcooling [6]. However, the gross
majority of those studies did not take into account two important considerations. On one hand,
the storage period between the charging and discharging processes, since these studies are
mainly focused on the charge and discharge, either as separate processes or as continuous
5
processes [7,8]. On the other hand, working under partial load operating conditions, which
might lead the PCM to be partially charged/discharged and, as a consequence, to not fully
undergo phase change [9]. Thus, the aim of this paper is to study if the variation of the duration
of the storage period (also known as stand-by period) in a latent heat TES system which has
been previously partially or totally charged has any influence on the subsequent discharging
process.
For the storage process it is important to be properly evaluated since the thermal distribution at
the end of the preceding process (either charge or discharge) may be different than the thermal
distribution at the beginning of the subsequent process, especially in partially
charged/discharged latent TES systems. To the best of the authors knowledge, only four studies
did an attempt to evaluate the storage process after interrupting a charging/discharging process.
Toksoy and Ilken [10] observed, with a mathematical model, that in a storage process which
followed an interrupted freezing process, the phase change process continued until the
temperature distribution in the whole system became uniform. Similarly, Bejarano et al. [11]
performed a series of partial charging/discharging operations with a short storage period.
Results showed that during the storage period the PCM continued storing/releasing energy
because of the thermal inertia of the intermediate fluid. Hence, it is important that both, the
temperature distribution due to the temperature gradient within the TES material and the heat
losses to the surroundings, are properly taken into account during the storage period. Following
this idea, Jegadheeswaran et al. [12] stated that the storage period required in a TES system has
a high influence on its final thermo-economic analysis results. Another study carried out by
Hirano [13] evaluated the behaviour of a latent heat TES system, after being fully charged,
under three different storage periods (36 h, 7 days, and 2 months). They observed that after two-
month-period storage, about 40% of the input energy was lost and 10% of it was due to the
cooling operation for nucleation. Moreover, they observed that the temperature of the storage
tank showed a tendency to homogenise to the ambient temperature, as a result of the heat losses.
It has to be mentioned that most of the research which studied the temperature distribution and
heat losses within a TES system were mainly focused on sensible TES materials, such as packed
beds [14], water [15] or molten salts [17].
As mentioned above, partial load operating conditions are very likely to happen in real thermal
processes where PCMs are used and, therefore, incomplete melting and/or freezing cases may
still occur. This is even more sensitive in PCM which present specific effects such as hysteresis
and/or subcooling [17,18]. There is currently no consensus on how to address in numerical
models the transition between heating and cooling in TES systems working under partial load
operating conditions from the enthalpy-temperature curve point of view. Four different

6
methodologies are currently available in the literature defining how to model such transition in a
partially melted/solidified PCM [19-22], highlighting the need for experimental studies which
shed light on the matter and define the proper methodology of modelling. The first [19] and
second [20] methodologies state that one can change from one curve to the other. The only
difference is the slope of the change, either parallel to the curve in the sensible region [19] or
without [20]. The third methodology [21] suggests to remain in the same curve. Finally, the
fourth methodology [22] states that the curve is placed between the cooling and heating curves.
Differential scanning calorimeter (DSC) analyses carried out by Li et al. [23] showed that the
peak in melting process gradually decreased in incomplete phase change processes, and that the
relationship of heat flow with temperature also showed a different behaviour. Bedecarrats et al.
[24] and Avignon and Kummert [25] experimentally observed that interrupting heating/cooling
processes before the PCM was completely melted or solidified also had an effect on the phase
change temperature and on the degree of subcooling. Palomba et al. [26] noticed that the level
of charge, or discharge, in incomplete phase change processes influenced their subsequent
processes. Finally, in a previous study carried out by Gasia et al. [27], five percentage of charge
(58%, 73%, 83%, 92%, and 97%) and their influence on the discharging process were evaluated
in a latent heat TES system. Results from the experimentation showed that partially charging the
TES system above 85% of its maximum energy capacity becomes a good option if the final
application accepts a maximum decrease of discharging heat transfer rates of 10% if compared
to the fully charged system.
From the literature review, it is observed that there is still a lack of experimental results which
evaluate the effect of the storage period duration in cyclic processes working under partial load
operating conditions. Therefore, continuing the previous work [27], this paper analyses the
influence that the duration of different storage periods (25 min, 60 min, and 120 min) after
partially charged (charging levels of 58%, 73%, and 83%) and fully charged processes has on
the same storage periods and on their subsequent discharging processes.
2 Materials and method
2.1 Materials
High density polyethylene (HDPE) was the PCM used in this experimentation. Table 1 and
Figure 1 summarize the main thermophysical properties of HDPE. Moreover, pilot plant
analyses carried out in a previous study by Gasia et al. [27] showed that the melting process
occurred between 127 °C and 136 °C and that the solidification occurred between 127 ºC and
124 ºC [27], in accordance to what it was observed in Rathgeber et al. [31].

7
Table 1. Summary of the main thermo-physical properties of HDPE.
Parameter Value Ref.
Melting temperature Tm 124 – 134 ºC [27]
Solidification temperature Ts 126 – 124 ºC [27]
Melting enthalpy ∆Hm 137.8 kJ/kg [27]
Solidification enthalpy ∆Hs 130.7 kJ/kg [27]
Specific heat Cp @100 ºC 2.4 – 2.8 kJ/kg·K [27-29]
@150 ºC 2.3 – 2.7 kJ/kg·K [27-29]
Density ρ @100 ºC 990 kg/m3 [30]
@150 ºC 786 kg/m3 [27]
Thermal conductivity λ @100 ºC 0.35 – 0.38 W/m·K [28,29]
@150 ºC 0.19 W/m·K [28]
Subcooling ∆Tsub No subcooling was detected [27]
(a) (b)
Figure 1. High density polyethylene enthalpy-temperature (a) and specific heat-temperature curves (b)
[27].
2.2 Experimental set-up
This study was performed at the pilot plant facility available at the University of Lleida, whose
high versatility allows testing and characterizing sensible and latent heat TES systems up to 400
ºC [27,32]. The storage system was a 0.154 m3 tank based on the shell-and-tube exchanger
concept (Figure 2a) whose lateral walls and cover were insulated with 240 mm of rock wool
(90.4 kg) and whose bottom region was insulated with 450 mm of foam glass (91.4 kg). It
contained 99.5 kg of HDPE distributed within the tank in three representative regions as shown
in Figure 2b: 79% of the PCM was placed around the tubes bundle (main part), 14% of the PCM

8
was placed in the region between the tubes bundle (central part), and the remaining 7% was
located in the corners. With the aim of monitoring the behaviour of the latent heat system
several Pt-100 1/5 DIN class B temperature sensors were installed. Thirty-one of them were
installed in the three representative regions of the storage tank (Figure 2c and Figure 2d). Each
sensor was associated to a PCM control volume, which allowed a better monitoring and analysis
of the PCM behaviour. Two temperature sensors were located at the inlet and outlet of the HTF
tubes bundle to measure the HTF temperature (Figure 2d). Finally, six temperature sensors were
placed on the walls of the storage tank and on the walls of the insulation to evaluate the energy
accumulated by the tank and by the insulation, as well as to evaluate the heat losses to the
surroundings.
(a) (b)
(c) (d)
Figure 2. TES system used in the experimental setup: (a) Overview of the TES system; (b) PCM
distribution within the TES system; (c) PCM temperature sensors of the main part; (d) Inlet and outlet
HTF temperature sensors, and PCM temperature sensors of the corner and central parts [27].
2.3 Methodology
The experimentation consisted of twelve complete cycles (Table 2). These cycles presented
three stages, as shown in Figure 3. The first stage was the charging process. In this stage, the
PCM was initially at a homogeneous average temperature of 105 ± 1 ºC and the HTF entered
the TES system at a temperature of 155 ± 2 ºC and a mass flow rate of 0.5 ± 0.01 kg/s. Four

9
different charging levels were evaluated, following the previous study carried out by Gasia et al.
[27]. Hence, the charging processes were stopped after a period of time (∆tCH) which depended
on the ratio of accumulated energy (RAE). This performance indicator defines the amount of
energy accumulated in the PCM at a certain time interval in front of the theoretical maximum
energy that can be stored by the PCM if fully charged. Therefore, the charging time was: 41 ± 1
min (RAE 58%), 70 ± 1 min (RAE 73%), 150 ± 1 min (RAE 83%), and 1440 ± 5 min (RAE
97%). These processes were followed by a storage period, in which no HTF recirculation within
the storage tank took place. The duration of this period (∆tST) was a parameter defined by the
authors of the current study. Three different storage periods were evaluated: 25 ± 1 min, 60 min
± 1 min, and 120 ± 1 min. Authors tried to represent potential storage periods in processes
working under partial load operating conditions, such as industrial and solar processes, which
might need the heat from the latent heat TES system even though they are not completely
charged. It should also be mentioned that 25 min was the minimum storage period required to
carry out the change from charge to discharge, and vice versa, since it is the minimum time
needed by the experimental facility to achieve the set-point temperatures in each process.
Finally, the third stage of the cycle was the discharging process, where the energy stored in the
system is recovered by recirculating HTF at an average temperature of 105 ± 2 ºC and a mass
flow rate of 0.5 ± 0.01 kg/s. In that case, the process was finished when the PCM reached steady
conditions. Each of the twelve whole charging-storage-discharging cycle carried out in the
present study was repeated three times to demonstrate repeatability of the methodology and the
experimental results, ending up with the realization of thirty-six complete cycles.
Table 2. Set of experiments carried out in this study.
Experiment RAE ∆tST Experiment RAE ∆tST
1 97% 25 ± 1 min 7 73% 25 ± 1 min
2 97% 60 ± 1 min 8 73% 60 ± 1 min
3 97% 120 ± 1min 9 73% 120 ± 1min
4 83% 25 ± 1 min 10 58% 25 ± 1 min
5 83% 60 ± 1 min 11 58% 60 ± 1 min
6 83% 120 ± 1min 12 58% 120 ± 1min

10
Figure 3. Stages of a complete charging/discharging cycle.
2.4 Theory and calculation
This section presents the equations used to obtain the results presented in the results and
discussion section. The PCM weighted average temperature, according to the three
representative regions of the storage tank (Figure 2b), was calculated as shown in Eq. 1:
����.��,� � ∑ ����,� � ����,�,������ � ∑ ���,� � ���,�,����� � ∑ ��,� � ��,�,������������� � ��
(1)
The variations of the energy levels of PCM, HTF, metal parts of the storage tank, and insulation
were calculated as given in Eq. 2, Eq. 3, Eq. 4, and Eq. 5, respectively:
∆����.�� � ∑ ����,������ ∆��� �,!"#�" � ∆����.$��� � ∆����.�� � ∆����.� (2)
∆�%�& � �%�& � '%�& � ()%�& � ∆�%�&,*+,-+ (3)
∆�./01 � �./01 � ()./01 � ∆�./01,*+,-+ (4)
∆�-0+ � �-0+ � ()-0+ � ∆�-0+,*+,-+ (5)
Finally, the energy lost during the process was calculated through an energy balance, as shown
in Eq. 6:
∆�23++ � ,�∆�4(5..3./2 �∆�%�& �∆�./01 �∆�-0+ (6)

11
The HTF heat transfer rate at time “i” during the discharging processes that follows a storage
period was calculated by means of Eq. 7:
6� %�&,78�,- � �� %�&,- � ()%�&,- � ∆�%�&,-0,39.,- (7)
2.5 Uncertainty analysis
An uncertainty analysis of the HTF heat transfer rate and the PCM accumulated energy of
different charging and discharging processes was carried out in a previous study [27] to
determine the precision and general validity of such results. In this paper, the uncertainty
analysis is extended to include the storage period between a (partial) charge and the subsequent
discharge of the latent heat TES system. Furthermore, the present analysis also includes an
uncertainty analysis related to the energy variations in the HTF, the metal parts of the tank, the
insulation, and the heat losses (for the storage period).
Two types of uncertainties may be distinguished in the analysis (Table 3): uncertainties
associated to experimentation and uncertainties associated to the thermos-physical properties of
the HTF, PCM, metal parts of the tank, and insulation.
Table 3. Uncertainties of the different parameters involved in the analyses.
Parameter Units Source Accuracy
Temperature ºC Pt-100 1/5 DIN class B ± 0.2
HTF flow rate l/h FUJI FCX-A2 V5 series transmitter ± 23.7
HTF specific heat kJ/kg·ºC From ref. [33] ± 0.054
HTF density kg/m3 From ref. [33] ± 25.16
HTF volume % Estimated ± 3
PCM mass kg Regular scale ± 0.28
PCM volume m3 From manufacturer ± 0.0024
PCM enthalpy kJ/kg Sensors from Mettler Toledo DSC-822e ± 3
Insulation mass % From manufacturer ± 3
Insulation specific heat % From manufacturer ± 3
Metal parts volume % From manufacturer ± 3
Metal parts specific heat % From manufacturer ± 3
Metal parts density % From manufacturer ± 3
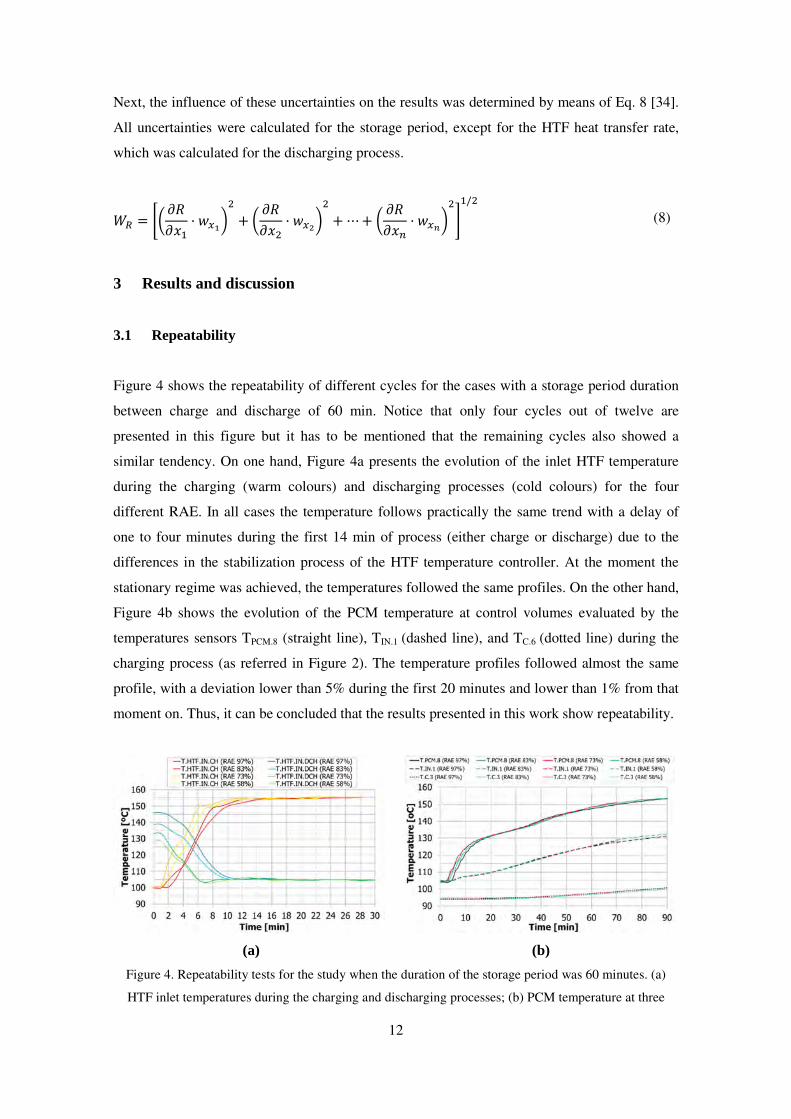
12
Next, the influence of these uncertainties on the results was determined by means of Eq. 8 [34].
All uncertainties were calculated for the storage period, except for the HTF heat transfer rate,
which was calculated for the discharging process.
:; � <=>?>@� � ABCD
� � = >?>@� � ABED
� � ⋯� = >?>@� � ABGD
�H�/�
(8)
3 Results and discussion
3.1 Repeatability
Figure 4 shows the repeatability of different cycles for the cases with a storage period duration
between charge and discharge of 60 min. Notice that only four cycles out of twelve are
presented in this figure but it has to be mentioned that the remaining cycles also showed a
similar tendency. On one hand, Figure 4a presents the evolution of the inlet HTF temperature
during the charging (warm colours) and discharging processes (cold colours) for the four
different RAE. In all cases the temperature follows practically the same trend with a delay of
one to four minutes during the first 14 min of process (either charge or discharge) due to the
differences in the stabilization process of the HTF temperature controller. At the moment the
stationary regime was achieved, the temperatures followed the same profiles. On the other hand,
Figure 4b shows the evolution of the PCM temperature at control volumes evaluated by the
temperatures sensors TPCM.8 (straight line), TIN.1 (dashed line), and TC.6 (dotted line) during the
charging process (as referred in Figure 2). The temperature profiles followed almost the same
profile, with a deviation lower than 5% during the first 20 minutes and lower than 1% from that
moment on. Thus, it can be concluded that the results presented in this work show repeatability.
(a) (b)
Figure 4. Repeatability tests for the study when the duration of the storage period was 60 minutes. (a)
HTF inlet temperatures during the charging and discharging processes; (b) PCM temperature at three

13
different locations (evaluated by the temperature sensors TPCM.8, TIN.1, and TC.3) during the charging
process
3.2 Storage process
Figure 5 shows the PCM temperature evolution of different control volumes in the three main
regions of the storage tank during a storage period of 120 min for the four different tested RAE.
Notice that due to the repeatability of results shown in the previous section, the PCM
temperature evolution during the storage periods of 25 and 60 min can be analysed in the same
figure. Moreover, the variation of the PCM average temperature and energy accumulated in the
different regions of the tank, as well as the energy variation in the metal parts of the storage tank
and in the insulation, and the heat losses are summarized from Table 4 to Table 7. Each table
shows the results for each of the four RAE evaluated during the charging process.
It can be observed that when the charging process was stopped at a RAE 58% (Figure 5a) and
the storage period started, the temperature of the PCM inside the tank was not homogeneous.
The PCM located in the main region (straight line) was at a higher temperature than the PCM
located in the central region (dashed line) and corners (dotted line). Furthermore, within the
same regions, differences can be observed. The reason lies on the low thermal conductivity of
HDPE (<0.4 W/m·K at the temperature range evaluated [28]), the geometry of the storage tank,
and the level of charge. However, as the storage period keeps going, two different phases can be
observed. On one hand, during the first 10 min there was an increasing of temperatures on
practically all PCM control volumes because of the thermal inertia of the HTF and the metal
parts of the storage tank. This turned out into an increase of the energy available to be
transferred to the PCM, which was at a lower temperature. On the other hand, from that moment
on, a clear tendency to homogenization of temperatures, and therefore of the energy level, was
observed. Energy from the PCM located at the main region was transferred to the PCM located
at the central region and corners but also to insulation and lost to the environment (Table 4).
During 120 min of storage, the average temperature of the PCM located at the main region
decreased 5.5 ºC, while the average temperature of the PCM located at the central region and
corners increased 0.4 ºC and 9.1 ºC, respectively. Moreover, the PCM that was under phase
change at beginning of the storage showed temperature variations within the melting
temperature range during the storage process, indicating that the melting front suffered a
modification during the process, whose extend could not be quantified because of the current
set-up acquisition methodology.
14
For shorter periods of storage, a similar tendency was observed, being the variation of
temperature and energy levels between the end of the charging process and the beginning of the
discharging process smaller than the variation over the storage periods of 120 min. Focusing on
the PCM distribution within the tank, it can be seen that the material located in the main region
losses less energy to its surrounding, or even it is still absorbing energy at lower RAE, as a
result of the above-mentioned influence of the thermal inertia of the HTF and the metal parts of
the tank. This is translated to a less energy absorbed by the PCM in the corners, and therefore to
a practically negligible temperature variation. Focusing on the energy released by the metal
parts of the storage tank and by the HTF, it can be observed that shorter storage periods meant
lower energy released to the PCM, and of course, lower heat losses to the surroundings. Finally,
despite observing a decrease of the PCM weighted average temperature during the storage
process, the variation of PCM energy did not show the same tendency, but it showed an
increase. This reflects the influence of the sensible region on the temperature behaviour while
the energy variation was mainly influenced by the latent region.
When the RAE was increased (Figure 5b-5d and Table 5 to Table 7) some differences could be
observed if compared to the process with a RAE 58% (Figure 5a). For the RAE 73% and the
RAE 83%, a higher decrease of temperatures in the PCM located at the main and central regions
and a higher increase of temperature in the PCM located in the corners was observed. However,
it can be seen that at RAE 73% there was a change of tendency, and from this point on, the
increase of temperature of the PCM located in the corners starts to be lower due to the increase
of heat losses. Identically to temperatures, the PCM energy level showed a decrease in the main
and central regions and an increase in the corners. Moreover, there was a lower heat transfer
from the HTF and metal parts of the storage tank to the PCM due to the fact that there were
lower temperature gradients between the PCM and these two components. Finally, the
behaviour of the TES system during the storage period which was previously fully charged
(RAE 97%) deserves a separate mention. Notice that at the beginning of the storage process,
there was an almost homogeneous temperature of the PCM at the inlet HTF temperature. The
PCM temperature remained practically at the same homogeneous temperature during the whole
period, with a temperature variation of 1.6 ºC after 120 min of storage. The high
homogenization existing within the storage tank caused that the variation on the energy level
was mainly due to heat losses.

15
(a)
(b)
(c)

16
(d)
Figure 5. PCM temperature evolution during a storage period of 120 min: (a) RAE 58%; (b) RAE 73%;
(c) RAE 83%; (d) RAE 97%. Due to the repeatability of the methodology and the experimental results,
the evolution of the PCM temperature during the storage periods of 60 min and 25 min can be also
observed in the same figures.
Table 4. Summary of the most important results during the storage process for a RAE 58%.
Parameter* Units Storage period (∆tST)
25 min 60 min 120 min
Temperature variation of the whole PCM
∆TPCM.total [ºC] - 0.33
(- 0.3%) - 0.22
(- 0.2%) - 2.95
(- 2.3%) Temperature variation of the
PCM located in the main region ∆TPCM [ºC]
- 0.83 (- 0.6%)
- 0.78 (- 0.6%)
- 5.45 (- 4.0%)
Temperature variation of the PCM located in the central
region ∆TIN [ºC]
- 0.09 (- 0.1%)
+ 0.86 (+ 0.7%)
+ 0.41 (+ 0.3%)
Temperature variation of the PCM located in the corners
∆TC [ºC] + 2.28
(+ 2.4%) + 2.35
(+ 2.4%) + 9.09
(+ 9.5%) Energy variation of the whole
PCM ∆EPCM.total [kWh]
+ 0.156 (+ 2.2%)
+ 0.049 (+ 0.7%)
- 0.250 (- 3.6%)
Energy variation of the PCM located in the main region
∆EPCM [kWh] + 0.275
(+ 4.4%) + 0.079
(+ 1.3%) - 0.240
(- 3.8%) Energy variation of the PCM located in the central region
∆EIN [kWh] - 0.130
(- 17.3%) - 0.059
(- 9.1%) - 0.062
(- 9.4%) Energy variation of the PCM
located in the corners ∆EC [kWh]
+ 0.012 (+36.3%)
+ 0.029 (+89.9%)
+ 0.052 (+ 164.2%)
Energy variation of the HTF ∆EHTF [kWh] - 0.070
(- 6.0%) - 0.138
(- 11.7%) - 0.182
(- 15.4%) Energy variation of the metal
parts of the storage tank ∆Etank [kWh]
- 0.083 (- 2.4%)
- 0.187 (- 5.4%)
- 0.262 (- 7.5%)
Energy variation of the insulation ∆Eins [kWh] + 0.084
(+ 3.6%) + 0.124
(+ 5.3%) + 0.200
(+ 8.4%)
Heat losses ∆Eloss [kWh] - 0.087
(- 0.6%) + 0.152
(+ 1.1%) + 0.493
(+ 3.5%) *The percentage between parentheses shows the percentage variation during the storage process
compared to the value at the end of the charging process.
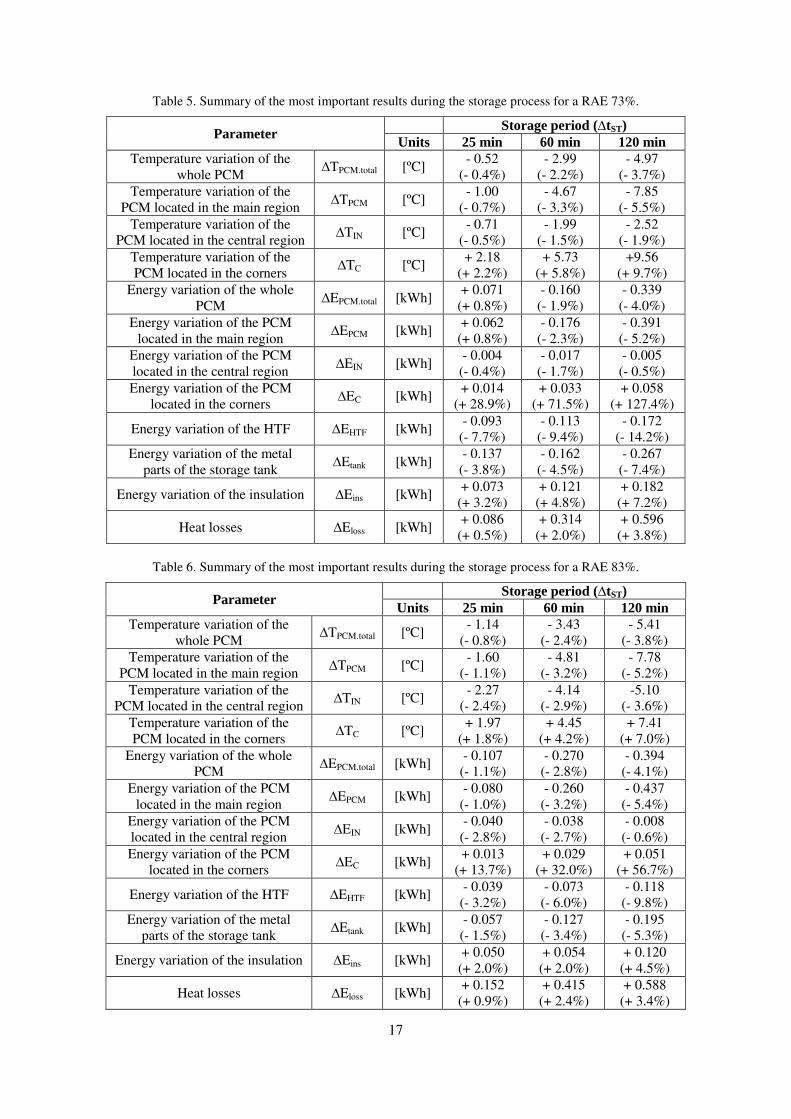
17
Table 5. Summary of the most important results during the storage process for a RAE 73%.
Parameter Storage period (∆tST)
Units 25 min 60 min 120 min
Temperature variation of the whole PCM
∆TPCM.total [ºC] - 0.52
(- 0.4%) - 2.99
(- 2.2%) - 4.97
(- 3.7%) Temperature variation of the
PCM located in the main region ∆TPCM [ºC]
- 1.00 (- 0.7%)
- 4.67 (- 3.3%)
- 7.85 (- 5.5%)
Temperature variation of the PCM located in the central region
∆TIN [ºC] - 0.71
(- 0.5%) - 1.99
(- 1.5%) - 2.52
(- 1.9%) Temperature variation of the PCM located in the corners
∆TC [ºC] + 2.18
(+ 2.2%) + 5.73
(+ 5.8%) +9.56
(+ 9.7%) Energy variation of the whole
PCM ∆EPCM.total [kWh]
+ 0.071 (+ 0.8%)
- 0.160 (- 1.9%)
- 0.339 (- 4.0%)
Energy variation of the PCM located in the main region
∆EPCM [kWh] + 0.062
(+ 0.8%) - 0.176
(- 2.3%) - 0.391
(- 5.2%) Energy variation of the PCM located in the central region
∆EIN [kWh] - 0.004
(- 0.4%) - 0.017
(- 1.7%) - 0.005
(- 0.5%) Energy variation of the PCM
located in the corners ∆EC [kWh]
+ 0.014 (+ 28.9%)
+ 0.033 (+ 71.5%)
+ 0.058 (+ 127.4%)
Energy variation of the HTF ∆EHTF [kWh] - 0.093
(- 7.7%) - 0.113
(- 9.4%) - 0.172
(- 14.2%) Energy variation of the metal
parts of the storage tank ∆Etank [kWh]
- 0.137 (- 3.8%)
- 0.162 (- 4.5%)
- 0.267 (- 7.4%)
Energy variation of the insulation ∆Eins [kWh] + 0.073
(+ 3.2%) + 0.121
(+ 4.8%) + 0.182
(+ 7.2%)
Heat losses ∆Eloss [kWh] + 0.086
(+ 0.5%) + 0.314
(+ 2.0%) + 0.596
(+ 3.8%)
Table 6. Summary of the most important results during the storage process for a RAE 83%.
Parameter Storage period (∆tST)
Units 25 min 60 min 120 min
Temperature variation of the whole PCM
∆TPCM.total [ºC] - 1.14
(- 0.8%) - 3.43
(- 2.4%) - 5.41
(- 3.8%) Temperature variation of the
PCM located in the main region ∆TPCM [ºC]
- 1.60 (- 1.1%)
- 4.81 (- 3.2%)
- 7.78 (- 5.2%)
Temperature variation of the PCM located in the central region
∆TIN [ºC] - 2.27
(- 2.4%) - 4.14
(- 2.9%) -5.10
(- 3.6%) Temperature variation of the PCM located in the corners
∆TC [ºC] + 1.97
(+ 1.8%) + 4.45
(+ 4.2%) + 7.41
(+ 7.0%) Energy variation of the whole
PCM ∆EPCM.total [kWh]
- 0.107 (- 1.1%)
- 0.270 (- 2.8%)
- 0.394 (- 4.1%)
Energy variation of the PCM located in the main region
∆EPCM [kWh] - 0.080
(- 1.0%) - 0.260
(- 3.2%) - 0.437
(- 5.4%) Energy variation of the PCM located in the central region
∆EIN [kWh] - 0.040
(- 2.8%) - 0.038
(- 2.7%) - 0.008
(- 0.6%) Energy variation of the PCM
located in the corners ∆EC [kWh]
+ 0.013 (+ 13.7%)
+ 0.029 (+ 32.0%)
+ 0.051 (+ 56.7%)
Energy variation of the HTF ∆EHTF [kWh] - 0.039
(- 3.2%) - 0.073
(- 6.0%) - 0.118
(- 9.8%) Energy variation of the metal
parts of the storage tank ∆Etank [kWh]
- 0.057 (- 1.5%)
- 0.127 (- 3.4%)
- 0.195 (- 5.3%)
Energy variation of the insulation ∆Eins [kWh] + 0.050
(+ 2.0%) + 0.054
(+ 2.0%) + 0.120
(+ 4.5%)
Heat losses ∆Eloss [kWh] + 0.152
(+ 0.9%) + 0.415
(+ 2.4%) + 0.588
(+ 3.4%)

18
Table 7. Summary of the most important results during the storage process for a RAE 97%.
Parameter Storage period (∆tST)
Units 25 min 60 min 120 min
Temperature variation of the whole PCM
∆TPCM.total [ºC] - 0.06
(- 0.0%) - 0.75
(- 0.5%) - 1.60
(- 1.1%) Temperature variation of the
PCM located in the main region ∆TPCM [ºC]
- 0.09 (- 0.1%)
-0.97 (- 0.6%)
- 2.05 (- 1.3%)
Temperature variation of the PCM located in the central region
∆TIN [ºC] - 0.09
(- 0.1%) - 0.40
(- 0.3%) - 0.90
(- 0.6%) Temperature variation of the PCM located in the corners
∆TC [ºC] + 0.17
(+ 0.1%) + 0.24
(+ 0.2%) + 0.57
(+ 0.4%) Energy variation of the whole
PCM ∆EPCM.total [kWh]
- 0.013 (- 0.1%)
- 0.048 (- 0.4%)
- 0.095 (- 0.9%)
Energy variation of the PCM located in the main region
∆EPCM [kWh] - 0.016
(- 0.2%) - 0.054
(- 0.6%) - 0.124
(- 1.4%) Energy variation of the PCM located in the central region
∆EIN [kWh] - 0.002
(- 0.1%) - 0.004
(- 0.2%) - 0.010
(- 0.6%) Energy variation of the PCM
located in the corners ∆EC [kWh]
+ 0.005 (+ 1.0%)
+ 0.010 (+ 2.2%)
+ 0.039 (+ 8.7%)
Energy variation of the HTF ∆EHTF [kWh] - 0.016
(- 1.3%) - 0.027
(- 2.3%) - 0.043
(- 3.6%) Energy variation of the metal
parts of the storage tank ∆Etank [kWh]
- 0.031 (- 0.8%)
- 0.057 (- 1.5%)
- 0.099 (- 2.5%)
Energy variation of the insulation ∆Eins [kWh] - 0.009
(- 0.3%) - 0.024
(- 0.8%) - 0.032
(- 1.0%)
Heat losses ∆Eloss [kWh] + 0.069
(+ 0.4%) + 0.156
(+ 0.8%) + 0.270
(+ 1.4%) 3.3 Discharging process
The influence of the storage period on the discharge process was evaluated from thermal and
heat transfer rates points of view. Figure 6 shows the temperature evolution of the weighted
average temperature of the PCM located in the three characteristic regions of the storage tank
(Figure 2b), during the first 180 min of discharge. The first thing it can be observed is that the
temperature profiles showed higher values when the previous charging processes were
performed at higher RAE. This picture was the same in all three regions of the storage tank and
independently of the storage period duration. The second thing that can be observed is that
slight variations could be observed on the temperature profiles when the RAE was kept constant
and only the storage period was modified. However, the influence of the storage period length is
analysed in each region of the storage tank separately. If considering PCM located in the main
region (Figure 6a), it can be seen that the discharging processes which were preceded by short
storage periods (no matter which RAE was) presented higher average temperature values until
one point (i.e: t=40 min in RAE 58% or t=80 min in RAE 73%), where this tendency is
reversed. The instant where the change of tendency took place depended on the RAE of the
previous charging period, being faster for lower RAE. The PCM located in the central region
(Figure 6b) showed a similar temperature evolution than the previous case, but with slightly
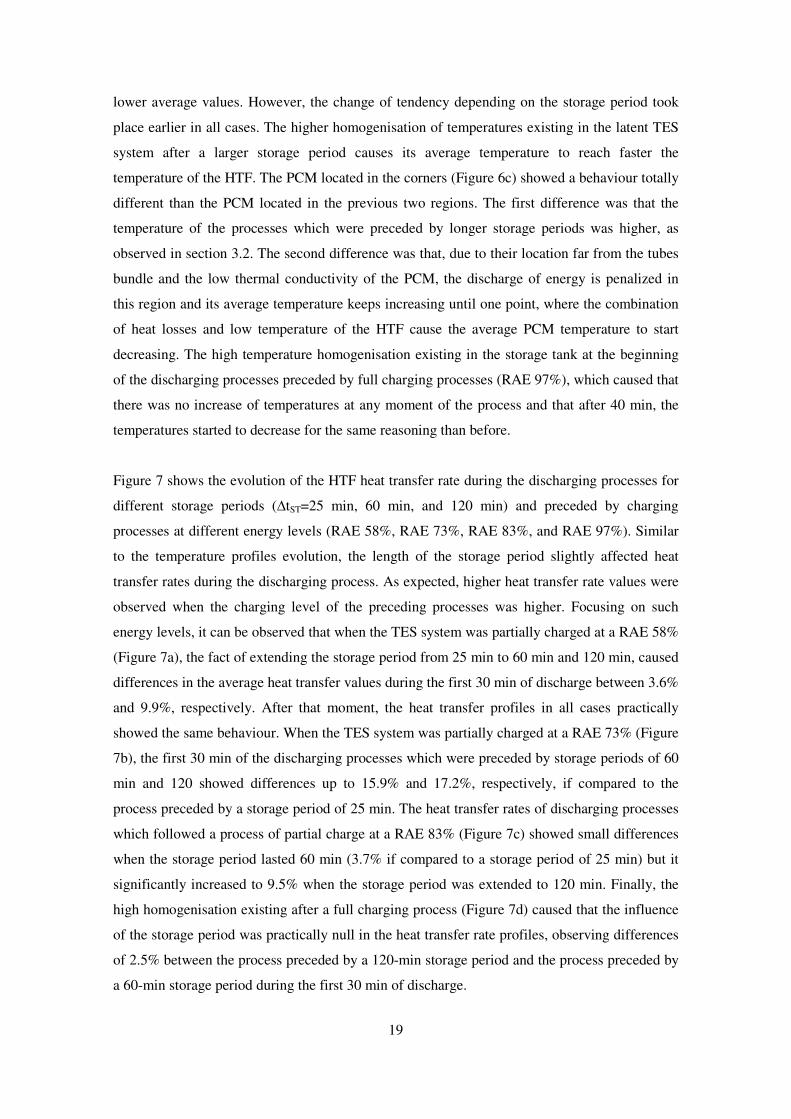
19
lower average values. However, the change of tendency depending on the storage period took
place earlier in all cases. The higher homogenisation of temperatures existing in the latent TES
system after a larger storage period causes its average temperature to reach faster the
temperature of the HTF. The PCM located in the corners (Figure 6c) showed a behaviour totally
different than the PCM located in the previous two regions. The first difference was that the
temperature of the processes which were preceded by longer storage periods was higher, as
observed in section 3.2. The second difference was that, due to their location far from the tubes
bundle and the low thermal conductivity of the PCM, the discharge of energy is penalized in
this region and its average temperature keeps increasing until one point, where the combination
of heat losses and low temperature of the HTF cause the average PCM temperature to start
decreasing. The high temperature homogenisation existing in the storage tank at the beginning
of the discharging processes preceded by full charging processes (RAE 97%), which caused that
there was no increase of temperatures at any moment of the process and that after 40 min, the
temperatures started to decrease for the same reasoning than before.
Figure 7 shows the evolution of the HTF heat transfer rate during the discharging processes for
different storage periods (∆tST=25 min, 60 min, and 120 min) and preceded by charging
processes at different energy levels (RAE 58%, RAE 73%, RAE 83%, and RAE 97%). Similar
to the temperature profiles evolution, the length of the storage period slightly affected heat
transfer rates during the discharging process. As expected, higher heat transfer rate values were
observed when the charging level of the preceding processes was higher. Focusing on such
energy levels, it can be observed that when the TES system was partially charged at a RAE 58%
(Figure 7a), the fact of extending the storage period from 25 min to 60 min and 120 min, caused
differences in the average heat transfer values during the first 30 min of discharge between 3.6%
and 9.9%, respectively. After that moment, the heat transfer profiles in all cases practically
showed the same behaviour. When the TES system was partially charged at a RAE 73% (Figure
7b), the first 30 min of the discharging processes which were preceded by storage periods of 60
min and 120 showed differences up to 15.9% and 17.2%, respectively, if compared to the
process preceded by a storage period of 25 min. The heat transfer rates of discharging processes
which followed a process of partial charge at a RAE 83% (Figure 7c) showed small differences
when the storage period lasted 60 min (3.7% if compared to a storage period of 25 min) but it
significantly increased to 9.5% when the storage period was extended to 120 min. Finally, the
high homogenisation existing after a full charging process (Figure 7d) caused that the influence
of the storage period was practically null in the heat transfer rate profiles, observing differences
of 2.5% between the process preceded by a 120-min storage period and the process preceded by
a 60-min storage period during the first 30 min of discharge.

20
(a)
(b)
(c)
Figure 6. Evolution, during the discharge, of the weighted average temperature of the PCM located in the main region (a), in the central region (b), and in the corners (c) for different periods of storage: 25 min, 60
min, and 120 min

21
(a) (b)
(c) (d)
Figure 7. Evolution of the HTF heat transfer rate during the discharging processes for different storage
periods (∆tST=25 min, 60 min, and 120 min) and preceded by charging processes at different energy
levels: (a) RAE 58%; (b) RAE 73%; (c) RAE 83%; (d) RAE 97%.
3.4 Uncertainty analysis results
To get an insight on the importance of the uncertainties in the results presented in this study,
Table 8 shows the results of the uncertainty analysis calculated for the case in which the tank
was charged up to RAE 83%, and the storage period was 60 minutes. This case was selected
since the authors considered it could give more representative values. The values of the HTF
power uncertainty refer to the average value of 6� %�&,78� over the first 30 minutes of discharge.

22
Table 8. Summary of the uncertainty analysis results, for a RAE 83% and a storage period of 60 minutes.
Parameter Units Value*
Temperature variation of the whole PCM
∆TPCM.total [ºC] ± 0.05
(± 1.5%) Temperature variation of the
PCM located in the main region ∆TPCM [ºC]
± 0.07 (± 1.4%)
Temperature variation of the PCM located in the central
region ∆TIN [ºC]
± 0.10 (± 2.4%)
Temperature variation of the PCM located in the corners
∆TC [ºC] ± 0.10
(+ 2.3%) Energy variation of the whole
PCM ∆EPCM.total [kWh]
± 0.028 (± 10.2%)
Energy variation of the PCM located in the main region
∆EPCM [kWh] ± 0.026
(± 10.1%) Energy variation of the PCM located in the central region
∆EIN [kWh] ± 0.008
(± 20.6%) Energy variation of the PCM
located in the corners ∆EC [kWh]
± 0.004 (± 13.3%)
Energy variation of the HTF ∆EHTF [kWh] ± 0.004
(± 5.5%) Energy variation of the metal
parts of the storage tank ∆Etank [kWh]
± 0.013 (± 10.0%)
Energy variation of the insulation ∆Eins [kWh] ± 0.038
(± 70.2%)
Heat losses ∆Eloss [kWh] ± 0.049
(± 11.8%)
HTF heat transfer rate 6� %�&,78� [kW] ± 0.54
(± 6.1%) * The percentage between parentheses shows the relative uncertainty in relation to the value of the
parameter during the process.
Table 6 shows that the errors associated to the PCM temperature measurements are small
compared to the PCM temperature variations in the different regions of the tank. The errors
associated to the variations of the energy stored in the PCM are relatively high, but still much
lower than the corresponding variations during the storage period. The highest relative
uncertainty of the PCM energy variations corresponds to the central part of the tank (∆EPCM.in).
The uncertainty of the energy variations of the HTF are in between the uncertainties of the PCM
temperature and PCM energy, while the uncertainties of the metal parts of the storage tank and
of the heat losses are comparable to that of the PCM energy. The only variable that has a
relatively high uncertainty is the variation of the energy stored in the insulation. Thus, one has
to pay more attention to the correct quantification of this variable. Finally, the uncertainty
associated to the average HTF power during the first 30 minutes of discharge is also relatively
low; nevertheless, they are comparable with the results obtained regarding the variation of the
average HTF power with respect to the case in which the storage period was 25 minutes.

23
4 Conclusions
The experimental research presented in this paper aims at studying the influence of the duration
of the storage period in a latent heat TES system which was partially charged on its subsequent
discharging process. Three different storage periods were evaluated (25 min, 60 min, and 120
min), which followed charging processes which were charged at different energy levels (58%,
73%, 83% (partial charge), and 97% (full charge)).
Results showed that during the storage periods which followed partially charged processes there
was an energy homogenization process not only as a result of the temperature gradients existing
within the different regions of the storage tank, but also as a result of the heat losses to the
surroundings. When the storage period was increased, higher energy transference from the main
region to the corners was observed. Due to the geometry of the TES system, it was desired that
the energy was contained in the main region rather than in the corners, where the energy is more
difficult to recover from. Moreover, heat losses were also increased no matter the value of the
RAE. Therefore, the length of the storage period which follows an incomplete charge has an
influence on the modification of the discharging process initial map. This is important for
numerical models, since they usually consider at the beginning of the discharge the same map
than the existing at the end of the charge.
During the discharging process, it was observed that the length of the storage period had a
higher influence when the RAE was intermediate (RAE 73%), and not that important for lower
(RAE 58%) or higher values (RAE 97%). However, it can be stated that this effect is not very
significant, and it only can be observed during the first 30 min of discharge as a result of the
temperature at which the discharging process starts.
Acknowledgements
This work was partially funded by the Ministerio de Economía y Competitividad de España
(ENE2015-64117-C5-1-R (MINECO/FEDER) and ENE2015-64117-C5-3-R
(MINECO/FEDER)). The authors would like to thank the Catalan Government for the quality
accreditation given to their research group (2017 SGR 1537). GREA is certified agent TECNIO
in the category of technology developers from the Government of Catalonia. Jaume Gasia
would like to thank the Departament d'Universitats, Recerca i Societat de la Informació de la
Generalitat de Catalunya for his research fellowship (2018 FI_B2 00100). Dr. Alvaro de Gracia
has received funding from the European Union's Horizon 2020 research and innovation
programme under the Marie Sklodowska-Curie grant agreement No 712949.

24
References
1. A. Gil, M. Medrano, I. Martorell, A. Lázaro, P. Dolado, B. Zalba, L.F. Cabeza, State of the
art on high temperature thermal energy storage for power generation. Part 1—Concepts,
materials and modellization, Renewable and Sustainable Energy Reviews 14(1) (2010) 31-
55.
2. S. Brückner, S. Liu, L. Miró, M. Radspieler, L.F. Cabeza, E. Lävemann, Industrial waste
heat recovery technologies: An economic analysis of heat transformation technologies,
Applied Energy 151 (2015) 157-167.
3. I. Dincer, M.A. Rosen, Thermal energy storage: systems and applications, Second edition.,
Chichester: John Wiley & Sons (2010). ISBN: 978-0-470-74706-3.
4. H. Mehling, LF. Cabeza, Heat and cold storage with PCM. An up to date introduction into
basics and applications. Berlin, Germany. Springer-Verlag 2008. ISBN: 979-3-540-68556-
2.
5. D. Macphee, I. Dincer, Performance assessment of some ice TES systems, International
Journal of Thermal Sciences 48 (2009) 2288–2299.
6. G. Li, Energy and exergy performance assessments for latent heat thermal energy storage
systems, Renewable and Sustainable Energy Reviews 51 (2015) 926–954.
7. H. El-Dessouky, F. Al-Juwayhel, Effectiveness of a thermal energy storage system using
phase-change materials, Energy Conversion and Management 38(6) (1997) 601-617.
8. F. Agyenim, P. Eames, M. Smyth, Heat transfer enhancement in medium temperature
thermal energy storage system using a multitube heat transfer array, Renewable Energy
35(1) (2010) 198-207.
9. L. Li, H. Yu, X. Wang, S. Zheng. Thermal analysis of melting and freezing processes of
phase change materials (PCMs) based on dynamic DSC test. Energy and Buildings 130
(2016) 388–396.
10. M. Toksoy, Z. Ilken, The effects of phase change during the stand-by period in latent heat
energy storage systems, Solar Energy 47(2) (1991) 69-73.
11. G. Bejarano, J.J. Suffo, M. Vargas, M.G. Ortega, Novel scheme for a PCM-based cold
energy storage system. Design, modelling, and simulation, Applied Thermal Engineering
132 (2018) 256–274.
12. S. Jegadheeswaran, S.D. Pohekar, T. Kousksou, Exergy based performance evaluation of
latent heat thermal storage system: A review, Renewable and Sustainable Energy Reviews
14 (2010) 2580–2595.
13. S. Hirano, Performance of supercooled thermal energy storage unit. 1st International Energy
Conversion Engineering Conference, USA (2003).

25
14. H. Singh, R.P. Saini, J.S. Saini, A review on packed bed solar energy storage systems,
Renewable and Sustainable Energy Reviews 14(3) (2010) 1059-1069.
15. Y.M. Han, R.Z. Wang, Y.J. Dai, Thermal stratification within the water tank, Renewable
and Sustainable Energy Reviews 13(5) (2009) 1014-1026.
16. C. Prieto, L. Miró, G. Peiró, E. Oró, A. Gil, L.F. Cabeza, Temperature distribution and heat
losses in molten salts tanks for CSP plants, Solar Energy 135 (2016) 518-526.
17. F. Kuznik, J. Virgone, Experimental investigation of wallboard containing phase change
material: Data for validation of numerical modelling, Energy and Buildings 41 (2009) 561–
570.
18. X. Jin, H. Hu, X. Shi, X. Zhang, Energy asymmetry in melting and solidifying processes of
PCM, Energy Conversion and Management 106 (2015) 608–614.
19. Bony, S. Citherlet, Numerical model and experimental validation of heat storage with phase
change materials, Energy Buildings 39 (2007) 1065–1072.
20. J. Rose, A. Lahme, N.U. Christensen, P. Heiselberg, M. Hansen, K. Grau. Numerical
method for calculating latent heat storage in constructions containing phase change
material. In Proceedings of Building Simulation 2009: 11th Conference of the International
Building Performance Simulation Association, 400–407. Glasgow, Scotland, GBR, July 27–
30.
21. R. Chandrasekharan, E.S. Lee, D.E. Fisher, P.S. Deokar. An enhanced simulation model for
building envelopes with phase change materials, ASHRAE Trans, 119 (2013).
22. B. Delcroix. Modelling of Thermal Mass Energy Storage in Buildings with Phase Change
Materials. PhD dissertation, Department of Mechanical Engineering, École Polytechnique
de Montréal, Montréal, QC, Canada (2015).
23. L. Li, H. Yu, X. Wang, S. Zheng. Thermal analysis of melting and freezing processes of
phase change materials (PCMs) based on dynamic DSC test. Energy and Buildings 130
(2016) 388–396.
24. J.P. Bédécarrats, J. Castaing-Lasvignottes, F. Strub, J.P. Dumas. Study of a phase change
energy storage using spherical capsules. Part I: Experimental results. Energy Conversion
and Management 50 (2009) 2527–2536.
25. K. D’Avignon, M. Kummert. Experimental assessment of a phase change material storage
tank. Applied Thermal Engineering 99 (2016) 880–891.
26. V. Palomba, V. Brancato, A. Frazzica. Experimental investigation of a latent heat storage
for solar cooling applications Applied Energy 199 (2017) 347-358.
27. J. Gasia, A. de Gracia, G. Peiró, S. Arena, G. Cau, L.F. Cabeza, Use of partial load
operating conditions for latent thermal energy storage management, Applied Energy 216
(2018) 234-242.
26
28. C. Zauner, F. Hengstberger, M. Etzel, D. Lager, R. Hofmann, H. Walter, Experimental
characterization and simulation of a fin-tube latent heat storage using high density
polyethylene as PCM, Applied Energy 179 (2016) 237-246.
29. C. Yang, M.E. Navarro, B. Zhao, G. Leng, G. Xu, L. Wang, Y. Jin, Y. Ding. Thermal
conductivity enhancement of recycled high density polyethylene as a storage media for
latent heat thermal energy storage, Solar Energy Materials and Solar Cells 152 (2016) 103-
110
30. Repsol Alcudia 6020L Data sheet. REPSOL Chemicals. <
https://portalquimica.repsol.com/ccrz__CCPage?pageKey=detail&id=a1xb0000001GyjHA
AS&cclcl=en_US> (last accessed on 05/01/2018).
31. C. Rathgeber, H. Schmit, L. Miró, L.F Cabeza, A. Gutierrez, S.N Ushak, S. Hiebler.
Enthalpy-temperature plots to compare calorimetric measurements of phase change
materials at different sample scales. Journal of Energy Storage 15 (2018) 32-38.
32. G. Peiró, C. Prieto, J. Gasia, A. Jové, L. Miró, L.F. Cabeza, Two-tank molten salts thermal
energy storage system for solar power plants at pilot plant scale: lessons learnt and
recommendations for its design, start-up and operation, Renewable energy 121 (2018) 236-
248.
33. H. Benoit, D. Spreafico, D. Gauthier, G. Flamant, Review of heat transfer fluid in tube –
receivers used in concentrating solar thermal systems: Properties and heat transfer
coefficients, Renewable Sustainable Energy Reviews 55 (2016) 298–315.
34. J.P. Holman, Experimental Methods for Engineers, eight ed. McGrawHill, Newyork (2012).
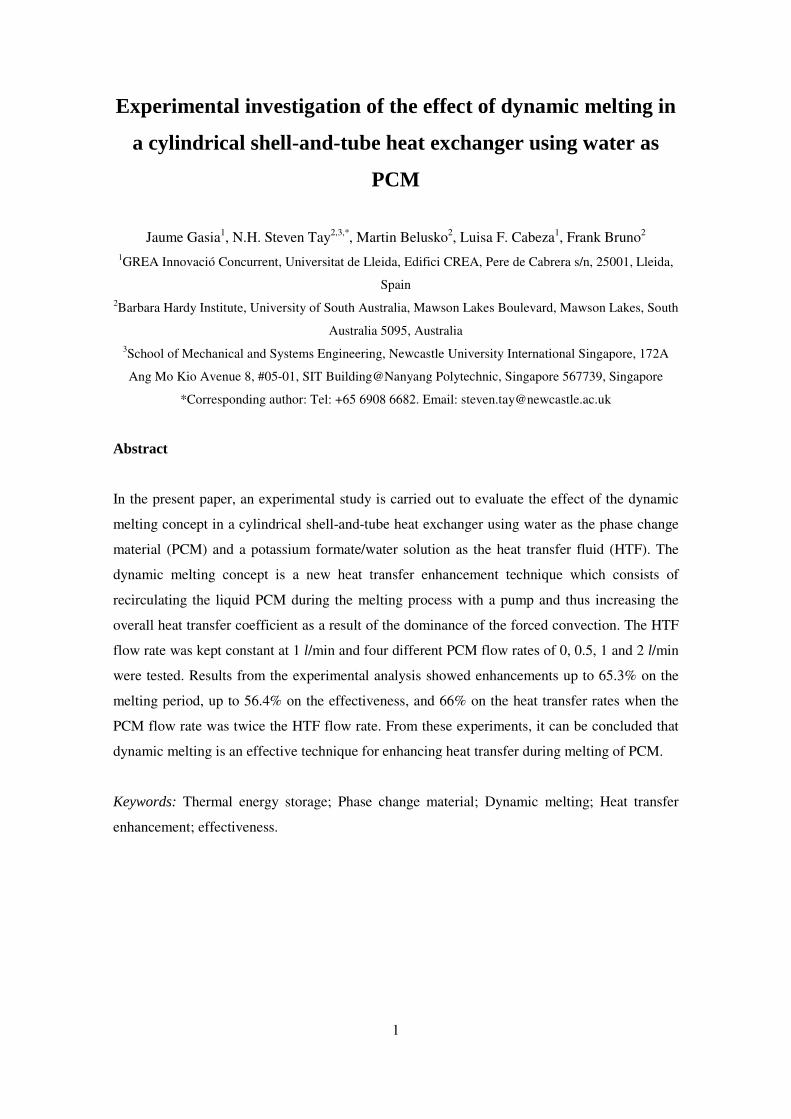
1
Experimental investigation of the effect of dynamic melting in
a cylindrical shell-and-tube heat exchanger using water as
PCM
Jaume Gasia1, N.H. Steven Tay2,3,*, Martin Belusko2, Luisa F. Cabeza1, Frank Bruno2 1GREA Innovació Concurrent, Universitat de Lleida, Edifici CREA, Pere de Cabrera s/n, 25001, Lleida,
Spain 2Barbara Hardy Institute, University of South Australia, Mawson Lakes Boulevard, Mawson Lakes, South
Australia 5095, Australia 3School of Mechanical and Systems Engineering, Newcastle University International Singapore, 172A
Ang Mo Kio Avenue 8, #05-01, SIT Building@Nanyang Polytechnic, Singapore 567739, Singapore
*Corresponding author: Tel: +65 6908 6682. Email: [email protected]
Abstract
In the present paper, an experimental study is carried out to evaluate the effect of the dynamic
melting concept in a cylindrical shell-and-tube heat exchanger using water as the phase change
material (PCM) and a potassium formate/water solution as the heat transfer fluid (HTF). The
dynamic melting concept is a new heat transfer enhancement technique which consists of
recirculating the liquid PCM during the melting process with a pump and thus increasing the
overall heat transfer coefficient as a result of the dominance of the forced convection. The HTF
flow rate was kept constant at 1 l/min and four different PCM flow rates of 0, 0.5, 1 and 2 l/min
were tested. Results from the experimental analysis showed enhancements up to 65.3% on the
melting period, up to 56.4% on the effectiveness, and 66% on the heat transfer rates when the
PCM flow rate was twice the HTF flow rate. From these experiments, it can be concluded that
dynamic melting is an effective technique for enhancing heat transfer during melting of PCM.
Keywords: Thermal energy storage; Phase change material; Dynamic melting; Heat transfer
enhancement; effectiveness.

2
Nomenclature
Dimensional variables
A Area (m2)
�� Specific heat (J/kg·K)
� Energy (J)
�� Mass flow rate (kg/s)
�� Heat transfer rate (W)
� Radial dimension of the HTF tube (m)
� Temperature (ºC)
� Volumetric flow rate (m3/s)
Greek symbols
Convection coefficient (W/m2·K)
� Error of the energy balance (-)
� Local effectiveness (-)
Efficiency (-)
� Thermal conductivity (W/m·K)
� Density (kg/m3)
Subscripts
1 HTF tube
2 Inner face of the heat exchanger
3 Outer face of the heat exchanger
4 Outer face of the insulation
��� Ambient
c Cross-sectional
�� Inlet of the heat exchanger
��� Insulation
��� Heat exchanger
��. ���� Heat gains as a result of the external recirculation of the liquid PCM
��. � Heat gains as a result of the boundary conditions
��! Heat transfer fluid
L Losses
m Melting
"#��. �$�#. �%# Average near the HTF pipe
�$& Outlet of the heat exchanger

3
p Pump
PC Phase change
' ( Phase change material
ps Power station
theor Theoretical
1 Introduction
It is well understood that the implementation of energy storage technologies is an effective
method to help to correct the mismatch between the energy demand and supply. Among the
different energy storage technologies, latent heat thermal energy storage (LHTES) systems have
gained relevance during the last decades because of their high energy storage densities and
almost isothermal operating conditions [1].
In LHTES systems, the process of energy storage involves absorbing (charging) and releasing
(discharging) thermal energy. During these processes, the phase change material (PCM) stores
and releases thermal energy when changing from a solid to a liquid. In low temperature storage
applications (cold storage), charging involves freezing while discharging involves melting.
During the charging process, the PCM solid front moves away from the heat transfer surface
and the thickness of the PCM solid layer increases. This makes conduction the dominant heat
transfer mechanism. During the discharge process, the PCM starts melting around the heat
transfer surface. The melting front moves away from the heat transfer surface and the thickness
of the PCM liquid layer increases. Thus, natural convection becomes the heat transfer
mechanism. In both cases the thermal resistance increases, reducing the effectiveness of heat
transfer.
The low thermal conductivity coefficients of currently-available cost-effective PCMs cause the
thermal resistance to be high, so it reduces the heat transfer during the charging processes [2].
To overcome this drawback and to improve the thermal performance of the thermal energy
storage system, heat transfer enhancement techniques are required. Some of these techniques
consist of adding extended surfaces, such as fins [3,4] and heat pipes [5,6], and combining the
PCM with highly conductive materials, such as carbon-based elements [2,7] metallic particles
elements [8,9] and nanoparticles [10,11]. They have been found to be very effective, but adding
external elements to improve the thermal conductivity causes a decrease in the energy storage
capacity, a decrease in the compactness factor, which is the ratio that takes into account the
volume of PCM per volume of LHTES unit, and an increase in the final cost of the system.
Collectively, the research above involves static solutions in which components are added to the

4
PCM. A limited but growing area of interest is through the use of dynamic means to enhance
heat transfer, which can potentially overcome the disadvantages of the static concepts.
Dynamic systems involve the PCM moving during the phase change process. These concepts
include PCM slurries, direct-contact PCM systems, and dynamic PCM systems.
PCM slurries are a mixture of a heat transfer fluid (HTF) and microcapsules of PCM (e.g. a
mixture of water and microencapsulated PCM) without the need of intermediate materials like
tubes or encapsulations. They can be treated as a homogeneous medium which exhibits fluid-
like properties and eliminates the heat losses associated with the heat transfer between the HTF
and the PCM. Previous studies [12,13] showed that if the concentration of microcapsules is
increased, both the storage capacity and the viscosity increase. While the increase of storage
capacity is desired, the increase of viscosity should be avoided, since it leads to an increase of
the pump consumption and a decrease of the heat transfer. Delgado et al. [12] observed that with
PCM concentrations higher than 20 % the disadvantages associated with the increase in
viscosity have a higher influence than the advantages associated with the increase of the specific
heat. These concentrations deliver a significant reduction in compactness ratio.
In direct-contact PCM systems, the PCM is mixed directly with the HTF without an
intermediate material, which allows the system to supply high heat transfer rates and
effectiveness values [14,15]. Furthermore, by eliminating the intermediate material, the heat
losses associated with the heat transfer between the HTF and the PCM are reduced. However,
the PCM needs to be non-soluble in the HTF and the difference between the densities of both
materials should be large enough to ensure a proper phase separation. The main disadvantages
of these systems are the pressure losses, volumetric expansion of the PCM during phase change,
which reduce the compactness factor, and that enhancements are obtained only when the HTF
flows uniformly through the PCM [16].
In dynamic PCM systems, the PCM is moved while undergoing phase change with an external
mechanical force [17-20]. This results in minimising the thermal resistance between the PCM
and the heat transfer fluid since forced convection becomes the dominant heat transfer
mechanism. Three main advantages are associated with this heat transfer enhancement
technique. First, a higher heat transfer rate can be maintained for a longer period during phase
change. Second, the continuous movement of PCM may avoid phase segregation. Third, the
compactness factor of the storage tank is kept constant since no external elements are introduced
inside the LHTES unit. The main disadvantage of this enhancement technique is the increase of
the electrical energy consumption required in moving the PCM.

5
In recent times, only three studies have investigated the benefits of actively moving the PCM to
improve the heat transfer: screw heat exchanger, PCM flux, and dynamic melting. Zipf et al.
[17] presented a study based on the main principles of the screw heat exchanger design and
construction. This concept consists of a heat exchanger which has an internally helicoidally heat
transfer surface that is continuously moving. It transports the PCM during both melting and
solidification processes, from a PCM storage tank, which is located at one end of the heat
exchanger and where the PCM is in one state, to another PCM storage tank, which is located at
the other end of the heat exchanger and where the PCM is stored in the other state. Pointner et
al. [18] presented the PCM flux concept, which consists of a transportation line that moves
PCM plates parallel to a heat transfer surface. Finally, the dynamic melting concept was
experimentally and numerically investigated by Tay et al. [19,20]. This concept consists of
externally recirculating the liquid PCM with a pump during the melting process. Initially, Tay et
al. [19] designed and constructed a coil-in-tank LHTES system with two pre-melt tubes which
created the pre-melt paths to allow dynamic melting. Results showed an improvement of up to
89 % in the average effectiveness and up to 30 % decrease in the melting period. In order to
develop a more detailed understanding of this concept, Tay et al. [20] numerically studied the
effect of both HTF and PCM mass flow rates and direction (parallel and counter-flow) for the
dynamic melting enhancement technique around a single tube. Results showed that the counter-
flow direction delivered lower phase change periods than the parallel-flow direction. It was also
found that when the flow rates of the PCM were equal or higher than the HTF, better results
were obtained in terms of effectiveness and phase change periods. This study was conducted
ignoring natural convection, and therefore an experimental study is warranted to confirm these
results.
There is currently no detailed experimental study which has investigated the impact of the
amount of dynamic melting on the heat transfer rate through the PCM. Furthermore, no research
has investigated the associated pumping power needed to achieve dynamic melting. Hence, the
objective of this article is to fill this knowledge gap, since it represents the first experimental
parametric study in the literature which demonstrates, through experimentation, the heat transfer
enhancement of the dynamic melting enhancement technique and the conditions under which
this can be maximised. From this work, the pumping power and therefore the overall benefit of
dynamic melting can be established. The originality of this work lies in the fact that it
contributes to the field of enhancing heat transfer within PCMs through dynamic mechanisms
and it will contribute to the knowledge of these techniques by experimentally verifying the
conditions by which dynamic melting can dramatically increase heat transfer.

6
2 Experimental study
2.1 Experimental set-up
A schematic view of the experimental set-up is shown in Fig. 1. It is composed of the following
components: (1) a shell-and-tube heat exchanger; (2) a cold HTF tank, which stored and cooled
400 l of HTF with a refrigeration unit; (3) a hot HTF tank containing 25 l of HTF, which was
stored and maintained at the desired discharging temperature with an electrical heater and a
temperature controller; (4) two Keg King MK II magnetic drive pumps, which recirculated the
HTF and the liquid PCM; (5) two three-way valves, which were used to change the direction of
the HTF so as to switch between charging and discharging processes; (6) two pin valves, which
were used to adjust the flow rates of the HTF and the PCM; and finally, (7) a data acquisition
unit connected to a personal computer (PC) for data analysis. All the components which were
likely to exchange heat with the surroundings were insulated with 95 mm of expanded
polystyrene.
Fig. 1. Schematic view of the experimental set-up used to perform the present work.
The heat exchanger is based on the shell-and-tube concept. It composed of two concentric tubes,
with the HTF flowing vertically through the inner tube and with the PCM placed in the annulus
region between the two tubes (Fig. 2). The inner tube is made of stainless steel and has an outer
diameter of 25.4 mm. The outer tube, or shell, is made of clear polycarbonate, which allows
visual inspection of the heat exchanger. It has a length of 1006 mm, with inner and outer

7
diameters of 94 mm and 100.6 mm, respectively. The HTF used was a potassium formate and
water solution, which has an operating temperature range of -50 ºC to 218 ºC. This solution is a
low temperature HTF with lower viscosity than glycol, and therefore requires less pumping
energy. Table 1 shows its main thermophysical properties.
Table 1. Thermophysical properties of the HTF used in the present study
Property @ -10 ºC @ 10 ºC
Viscosity [mPa·s] 5.99 3.80
Thermal conductivity [W/m·K] 0.475 0.495
Specific heat [kJ/kg·K] 2.64 2.68
Density [kg/m3] 1356 1345
Water was used as the PCM to eliminate the errors associated with latent energy measurement.
It was placed in the annulus space between the metallic tube and the plastic shell, to a height of
926 mm, leaving 50 mm height of air for volumetric expansion. Different temperature sensors,
as shown in Fig. 2, determined the thermal behaviour of the system during the experiment. Five
four-wire resistance temperature detectors (RTDs) with an error of ±0.1 °C were placed inside
the PCM at axial distances of 115 mm, 246 mm, 486 mm, 726 mm, and 861 mm from the
bottom of the heat exchanger and at radial distances of 17.7 mm and 40 mm. Four more RTDs
were placed at the inlet and outlet of both the HTF and the PCM recirculation loop to obtain
accurate temperature measurements of the HTF and the liquid PCM during the dynamic melting
process. Two rotary piston flow meters with an error of ±2% were used to measure both the
HTF and the liquid PCM flow rates. All RTDs and flow meters were connected to a data
acquisition system. Commercial software was used to acquire and record the data at time
intervals of 5 s in a database format on the PC for further processing. The sensors and flow
meters were calibrated with the data acquisition system so that the errors were minimised.

8
Fig. 2. Schematic view of the shell-and-tube heat exchanger. Dimensions and location of the temperature
sensors.
2.2 Methodology
2.2.1 Experimental procedure
The experiments consisted of different charging (freezing) and discharging (melting) processes
at a temperature range between -7.5 ºC and 10 ºC. The HTF flow rate was set at a constant value
of 1 l/min for all the experiments and the PCM flow rates were modified to 0.5, 1 and 2 l/min. A
baseline test was also conducted without any PCM flow.
For each test, the PCM was frozen to achieve the same initial conditions. The HTF was set at
the temperature of -7.5 ºC and it was circulated through the inner tube from the top to the
bottom until all the temperature sensors inside the PCM were recording the same temperature of
-4 ±1 ºC. Subsequently, the discharging processes were performed. Three different repetitions
for each test were carried out to ensure repeatability. They were conducted by circulating the
HTF at a temperature of 10 ºC through the inner tube from the top to the bottom until the PCM
reached the HTF temperature. As for the discharging processes with dynamic melting, the start

9
of the tests was the same as the baseline test. The pump of the PCM loop was activated when
the PCM temperature near the HTF tube (PCM Near Tube Top and PCM Near Tube Bottom)
reached 5 ±0.5 ºC. It was experimentally proven that this temperature was the threshold for a
liquid path to be created. The start of the dynamic melting process represents a variable in the
impact of such a technique on the results overall effectiveness. The recirculation of the liquid
PCM was then conducted by pumping it from the bottom of the heat exchanger and returning it
to the top, such that the PCM flow was in parallel to the HTF. It was possible to have the liquid
PCM flowing in the opposite direction. However, this was not practical in this rig as the liquid
level drops during melting and this would cavitate the pump. This research applied parallel flow
as it was found to be effective in previous research conducted by Tay et al. [20]
2.2.2 Calculation procedure
The energy absorbed by the PCM during the discharging process is equal to the summation of
the energy which is actually recovered by the HTF (�)*+), the heat gains because of the
boundary conditions (�),.-.), and the heat gains due to external recirculation of the liquid PCM
(�),./001). This parameter is defined in Eq. 1:
�2.3 = �)*+ + �),.-. + �),./001 = 6 (��)*+ + ��),.-. + ��),./001) · :&;<=
(1)
The HTF heat transfer rate (��)*+) is calculated using Eq. 2:
��)*+ = �� )*+ · ��)*+ · (�)*+.>? − �)*+.0A;) (2)
where �� )*+ is the mass flow rate of the HTF, ��)*+ is the specific heat of the HTF, and
(�)*+.>? − �)*+.0A;) is the temperature difference of the HTF between the inlet and the outlet of
the heat exchanger.
The heat transfer rate of the heat gains because of the boundary conditions (��),.-.) is defined
in Eq. 3:
��),.-. = �2.3.BCDE.*AFC.DGC − �DHFln(�L �M)⁄2 · O · �2.3 + ln(�P �L)⁄2 · O · �)QR +ln(�S �P)⁄2 · O · �>?T +
12 · O · �S · D>E (3)

10
where, �2.3.BCDE.*AFC.DGC is the average temperature of the PCM near the HTF tube,�DHF is the
ambient temperature, �M,�L,�P, and �S are the radial dimension of the HTF tube, inner face of
the shell, outer face of the shell, and outer face of the insulation, respectively. �2.3,�)QR, and
�>?T are the thermal conductivities of the PCM, polycarbonate and insulation, respectively, and
D>E is the air convection coefficient. In order to facilitate the calculation of this parameter, it
was assumed that it consists of a one dimensional process, conduction is the only heat transfer
mechanism in the PCM, and with insulation the convection has a negligible impact.
Finally, the heat transfer rate of the heat gains due to external recirculation of the liquid PCM
are mainly caused by two factors. First, the heat introduced by the recirculation pump as a result
of its internal mechanical losses, and second, the heat absorbed along the PCM recirculation
loop through the insulated piping. This parameter is calculated as shown in Eq. 4:
��),./001 = �� 2.3 · ��2.3 · (�2.3.>? − �2.3.0A;) (4)
where �� 2.3 is the mass flow rate of the PCM liquid fraction, ��2.3 is the specific heat of the
liquid PCM, and (�2.3.>? − �2.3.0A;) is the temperature difference of the liquid PCM between
the inlet and the outlet of the heat exchanger.
The heat introduced by the recirculation pump ('U) determines the influence of the pump in the
PCM heating rate. This value is calculated as shown in Eq. 5:
'U = ∆' · �2.3 1 · 1T (5)
where ∆' is the pressure drop of the PCM liquid fraction in the PCM recirculation loop,
evaluated with the Darcy-Weisbach equation (Eq. 6). �2.3 is the volumetric flow rate of the
liquid PCM during the dynamic melting. Pump efficiency ( 1) and power station efficiency
( 1T) were fixed at 0.5 and 0.3, respectively.
∆' = W · XY:Z · [�� 2.3L
2 · �2.3 · \]L^ (6)
where f is the friction factor, L is the length of the PCM recirculation loop, d is the inner tube
diameter, Ac is the cross-sectional area of the annulus between the HTF tube and the shell, m�

11
the mass flow rate of the liquid PCM in the PCM recirculation loop and� is the density of the
liquid PCM. The entrance and exit losses are ignored as these are negligible.
Local effectiveness, as described in Eq. 7, is the ratio of the actual heat transfer and the
theoretical maximum heat transfer that can be discharged at any point in time over the phase
change period [21]. Therefore, the maximum values of effectiveness are obtained when the HTF
exits at temperatures close to the PCM phase change temperature.
� = ��C`1CE>HC?;��;aC0E>] = �)*+.>? − �)*+.0A;�)*+.>? − �2.3.H (7)
In order to validate the results, the error from the energy balance is calculated as shown in Eq. 8:
� = �2.3.2. − �;aC0E.2.�;aC0E.2. (8)
where �2.3.2. is the energy absorbed during the phase change process from the energy balance
shown in Eq.1, and �;aC0E.2. is the theoretical energy absorbed. This last parameter is
calculated multiplying the PCM mass and the PCM heat of fusion. Sensible energy is ignored
since it only represents 13.5 % of the energy stored in the PCM
3 Results and discussion
Fig. 3 to Fig. 6 present the temperature evolution of the PCM and the inlets and outlets of the
HTF and PCM during the discharging process for four different PCM flow rates. The PCM
temperature evolution along the discharging process allows the influence of the dynamic
melting on the phase change process to be studied.
Fig. 3 shows the temperature distribution for the baseline test with the HTF flow rate of 1 l/min
and the PCM flow rate of 0 l/min. In this figure, three different states of the test can be clearly
observed. The first one is the solid sensible region, where the top, middle and bottom PCM
temperatures showed a nearly homogeneous increase, from the initial discharging conditions to
the phase change temperature. This behaviour shows that conduction is the main heat transfer
mechanism and gravity has no effect on the solid PCM. Once the PCM reached the phase
change temperature (0.11 h), it moved to the latent heat transfer region. After 0.3 h, a melted
path started to be formed around the HTF tube since the PCM temperature sensors located near
the outer surface of the HTF tube (PCM Near Tube Top and PCM Near Tube Bottom) showed

12
that the temperatures were higher than zero. The separation of ice from different surfaces of the
inner and outer tubes played an important role in the PCM temperature distribution. This was
consistent with López-Navarro et al. [22]. While the PCM Near Tube Bottom thermocouple
showed a gradual increase during the melting process, the PCM Near Tube Top showed
different peaks along the melting process. Since water has a lower density in the solid state than
in liquid state (unlike most of the other PCMs), once the ice was detached from the surfaces of
the heat exchanger, it floated and remained around the upper PCM temperature sensors. As a
consequence, its temperature decreased sharply until it was melted, showing different bumps in
the PCM Near Tube Top thermocouple. Because of this phenomenon the upper region of the
PCM was kept in the latent region for a longer time than the lower region. This result is unlikely
to have occurred without the impact of buoyancy. Since the HTF flows from top to bottom,
consistent with Tay et al. [20], the upper section should complete melting before the lower
sections. Finally, after 12.4 h it can be considered that the PCM entered the liquid sensible
region, and therefore the melting process lasted 12.3 h. In the liquid sensible region, the PCM
temperature behaviour followed a different pattern than the one observed in the latent region,
showing a temperature stratification mainly influenced by the HTF flow arrangement and the
effect of natural convection. When the PCM was in a liquid state, the heat transfer was mainly
conducted by natural convection, which created an internal recirculation due to the buoyancy
forces. These forces are induced by the density gradients as a result of the temperature
differences [23]. Notice that during the liquid sensible region, there was a sharp decrease in the
PCM Near Tube Top temperature sensor. This result can be attributed to a small piece of ice
attached to the top layers of the heat exchanger that were broken up towards the end of the
process and floated on top of the liquid PCM.
Fig. 3. Temperature evolution of the heat transfer fluid (HTF) and the phase change material (PCM) of
the baseline test. Experiment set at an average HTF flow rate of 1 l/min and a PCM flow rate of 0 l/min.

13
Fig. 4 to Fig. 6 show the temperature distribution for a HTF flow rate of 1 l/min and PCM flow
rates of 0.5, 1 and 2 l/min, respectively. In all these experiments, the behaviour of the PCM
before starting the dynamic melting process was similar to the baseline test, confirming that the
experimental results are directly comparable. The phase change of all three experiments started
at 0.12 ±0.02 h after the beginning of the melting process, and the dynamic melting processes
started 0.7 ±0.05 h after the start of the discharging processes. Despite the variation in the start
of dynamic melting processes, it has a small effect on the results of dynamic melting, especially
on the overall effectiveness, as observed in the following sections. When the PCM recirculation
pump was switched on, a sharp variation in the temperature of recirculated PCM (PCM in and
PCM out) was observed. Before starting the dynamic melting processes, the PCM located inside
the PCM recirculation loop was at a temperature close to the ambient one as a result of being
located outside the heat exchanger zone, although insulated from the surroundings. Immediately
after starting the dynamic melting process, these temperatures decreased as the PCM was
recirculated. The sensors PCM Near Tube Top and PCM Near Tube Bottom also showed a sharp
variation for analogous reasoning. Once the dynamic melting processes started, the inlet and
outlet temperatures of the HTF remained relatively constant throughout the phase change period
for 0.5 l/min and decreased at higher PCM flow rates. This decrease is indicative of the
improved heat transfer to the HTF, as the PCM could absorb more energy than that applied to
the HTF from the heat source. It was observed that, when the PCM flow rate was equal or
higher than the HTF flow rate, the temperature differences between the inlet and outlet HTF
increased due to the decreasing outlet HTF temperature, as predicted by Tay et al. [20]. The
reason is because for PCM flow rates lower than HTF flow rates, the heat gains associated with
the recirculation outside the heat exchanger of the liquid PCM has a higher influence in heat
transfer than the enhancement obtained as a result of the forced convection. Hence, the
enhancement obtained as a consequence of the increase in the overall heat transfer coefficient
was compensated or even overcome for the PCM temperature increase as a result of the heat
gains.
The PCM temperature profiles during the dynamic melting processes in the latent region varied
significantly depending on the PCM flow rates. When the PCM flow rate was equal or lower
than the HTF flow rate, the phase change within the heat exchanger followed the following
pattern, with the order of melting being the top, middle and then the bottom section consistent
with the baseline case. When the PCM flow rate was higher than the HTF flow rate, the melting
process of the PCM followed a different pattern, and started from the middle, followed by the
top and ended at the bottom of the heat exchanger. For the first case, during melting, buoyancy
in the PCM maintained the warm liquid near the top and therefore this section melted first. With

14
a high level of forced flow, this buoyancy was overpowered and therefore the PCM liquid was
further mixed, changing which section melted first. At the end of the melting process, the
remaining ice located at the bottom region of the heat exchanger was detached from the surface
of the heat exchanger and raised to the top of the PCM column reducing top temperatures.
From this study, it can be observed that the phase change duration was reduced as the PCM
flow rate increased since the overall heat transfer coefficient was increased. Moreover, the
temperature difference in the PCM recirculation loop shows that heat was being transferred to
the PCM as it was pumped and this heat did contribute to the melting process and therefore
influenced the decreasing of the melting time. Hence, as a result of recirculating the liquid
PCM, the melting processes with a flow rate of 0.5, 1 and 2 l/min were completed after 6.61,
6.55 and 4.26 h, respectively, representing the melting processes to be 47.4%, 47.8% and 65.3%
faster than the baseline test.
Fig. 4. Temperature evolution of the HTF and the PCM in a discharging process with dynamic melting.
Experiment set at an average HTF flow rate of 1 l/min and a PCM flow rate of 0.5 l/min.
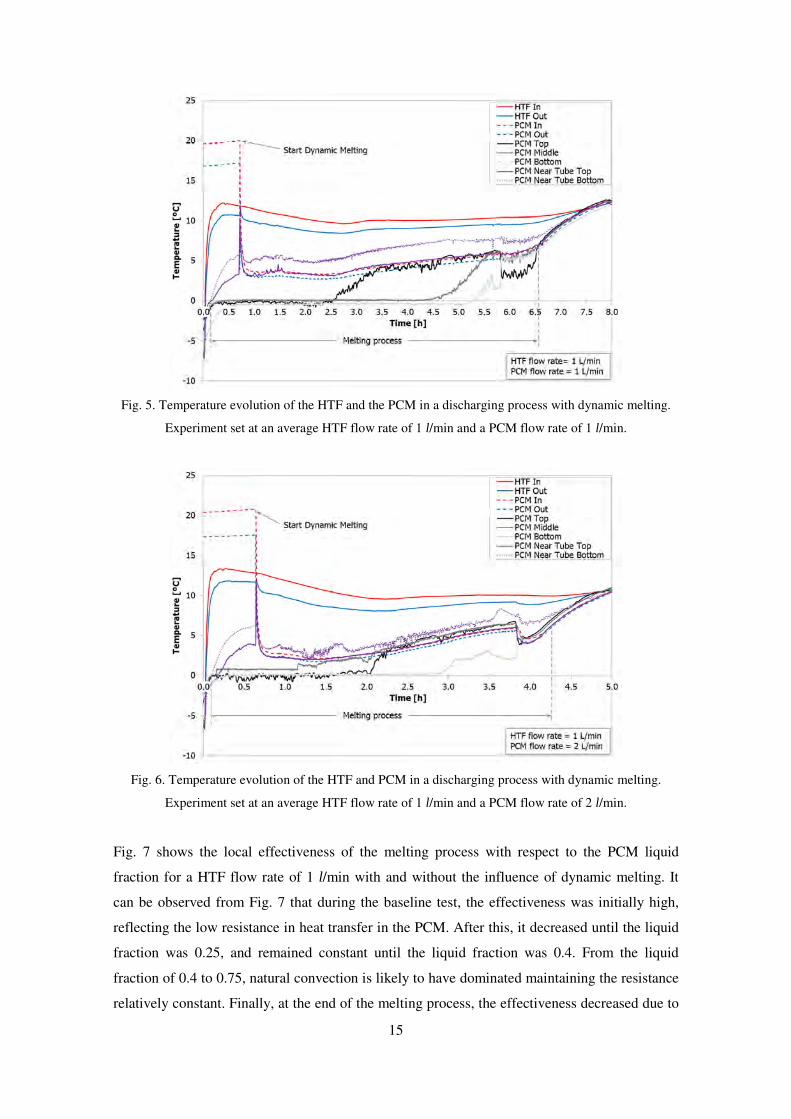
15
Fig. 5. Temperature evolution of the HTF and the PCM in a discharging process with dynamic melting.
Experiment set at an average HTF flow rate of 1 l/min and a PCM flow rate of 1 l/min.
Fig. 6. Temperature evolution of the HTF and PCM in a discharging process with dynamic melting.
Experiment set at an average HTF flow rate of 1 l/min and a PCM flow rate of 2 l/min.
Fig. 7 shows the local effectiveness of the melting process with respect to the PCM liquid
fraction for a HTF flow rate of 1 l/min with and without the influence of dynamic melting. It
can be observed from Fig. 7 that during the baseline test, the effectiveness was initially high,
reflecting the low resistance in heat transfer in the PCM. After this, it decreased until the liquid
fraction was 0.25, and remained constant until the liquid fraction was 0.4. From the liquid
fraction of 0.4 to 0.75, natural convection is likely to have dominated maintaining the resistance
relatively constant. Finally, at the end of the melting process, the effectiveness decreased due to

16
a loss of heat transfer area as the phase front decreased rapidly. The average effectiveness value
during the baseline test was 0.088.
During the other processes, all three effectiveness profiles before the beginning of the dynamic
melting process were tracking below the baseline test profile. The differences were mainly due
to slightly different boundary conditions and experimental errors. The three dynamic melting
processes started at a liquid fraction of 0.095 ±0.005. Once dynamic melting was initiated, the
effectiveness experienced a rapid decrease followed by a sharp increase. The sudden decrease
was caused by the mixing of the PCM in the PCM recirculation loop which was at ambient
temperature. Before the dynamic melting was activated, the liquid PCM was stratified both in
the radial and axial directions: the liquid PCM located nearer the HTF tube was hotter than
liquid PCM located nearer to the solid PCM, and the liquid PCM located at the top of the heat
exchanger was hotter than liquid PCM located at the bottom. Therefore, when the PCM
recirculation pump was switched on, the hotter liquid PCM located at the top and in the PCM
recirculation loop passed through the entire outer wall of the HTF tube, causing the outlet HTF
temperature to increase sharply and therefore a sharp decrease in the effectiveness. Very
quickly, the liquid PCM was mixed due to the recirculation, which induced the temperature of
the PCM to drop. As a consequence, the HTF outlet temperature sharply decreased, which
caused a sharp increase in the effectiveness. When the liquid fraction was around 0.9, the
effectiveness showed again a sudden increase. This is because a small block of ice remaining at
the top of the tube would fall into the liquid PCM and cool the HTF. This small block was
attached to the shell of the heat exchanger and as the PCM melted, the volume of the PCM
reduced, leaving this block above the liquid level.
The magnitude of enhancement of the dynamic melting was related to the PCM flow rate.
Dynamic melting showed enhancement when the PCM flow rate was equal to or higher than the
HTF flow rate, which is consistent with what was determined in Tay et al. [20]. The
effectiveness was based on how close the HTF outlet temperature was to the PCM melting
temperature. The PCM recirculation loop was adding heat to the PCM and the impact of this
was to increase the HTF outlet temperature as it physically pumped warmer PCM in parallel to
the tube and it increased the HTF outlet temperature, as observed in Table 2. Hence, it was
found that the measured effectiveness was, in fact, an underestimated value since if the heat
gains would not have existed the effectiveness would have been higher. The average
effectiveness values during the melting process with PCM flow rates of 1 and 2 l/min were
0.109 and 0.137, respectively, which were 24.7% and 56.4% higher than the value obtained in
the baseline test.
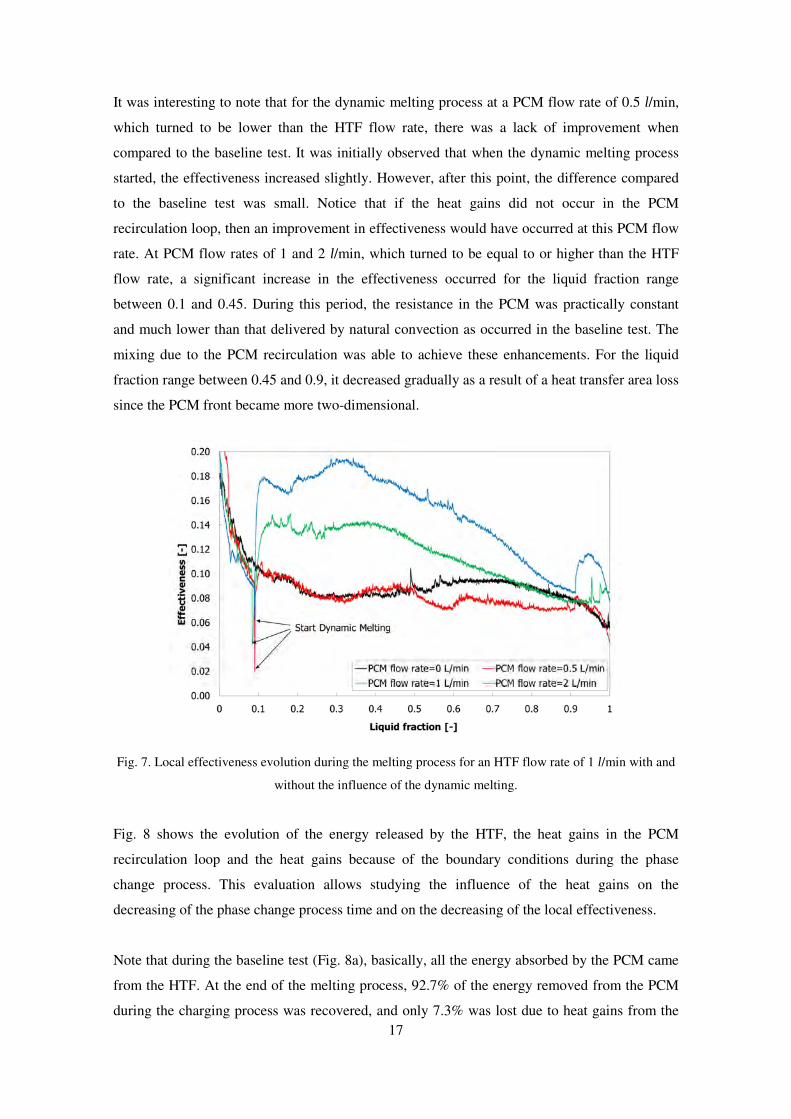
17
It was interesting to note that for the dynamic melting process at a PCM flow rate of 0.5 l/min,
which turned to be lower than the HTF flow rate, there was a lack of improvement when
compared to the baseline test. It was initially observed that when the dynamic melting process
started, the effectiveness increased slightly. However, after this point, the difference compared
to the baseline test was small. Notice that if the heat gains did not occur in the PCM
recirculation loop, then an improvement in effectiveness would have occurred at this PCM flow
rate. At PCM flow rates of 1 and 2 l/min, which turned to be equal to or higher than the HTF
flow rate, a significant increase in the effectiveness occurred for the liquid fraction range
between 0.1 and 0.45. During this period, the resistance in the PCM was practically constant
and much lower than that delivered by natural convection as occurred in the baseline test. The
mixing due to the PCM recirculation was able to achieve these enhancements. For the liquid
fraction range between 0.45 and 0.9, it decreased gradually as a result of a heat transfer area loss
since the PCM front became more two-dimensional.
Fig. 7. Local effectiveness evolution during the melting process for an HTF flow rate of 1 l/min with and
without the influence of the dynamic melting.
Fig. 8 shows the evolution of the energy released by the HTF, the heat gains in the PCM
recirculation loop and the heat gains because of the boundary conditions during the phase
change process. This evaluation allows studying the influence of the heat gains on the
decreasing of the phase change process time and on the decreasing of the local effectiveness.
Note that during the baseline test (Fig. 8a), basically, all the energy absorbed by the PCM came
from the HTF. At the end of the melting process, 92.7% of the energy removed from the PCM
during the charging process was recovered, and only 7.3% was lost due to heat gains from the

18
surroundings. During the processes where the dynamic melting enhancement technique was
implemented (from Fig. 8b to Fig. 8d), heat gains due to the recirculation of the liquid PCM
outside the heat exchanger reduced the melting time. The energy absorbed by the PCM because
of these heat gains was 32.6 ±0.9% of the energy stored during the charging processes, while
the energy absorbed by the PCM from the surroundings represented the 3.5 ±0.3%. As a result
of the heat gains, the PCM temperature was increased and therefore a reduction in the phase
change period was obtained. Notice that the error from the energy balance of the
experimentation carried out (Table 2) is less than the 11%, which shows that the results are
validated.
(a) (b)
(c) (d)
Fig. 8. Evolution of the energy absorbed by the HTF (straight full coloured bar), the heat gains because of
the liquid PCM recirculation (white bar), and the heat gains because of the boundary conditions (dotted
coloured bar) during the melting process for an HTF flow rate of 1 l/min. (a) Baseline test: PCM flow rate
of 0 l/min; (b) dynamic melting: PCM flow rate of 0.5 l/min; (c) dynamic melting: PCM flow rate of 1
l/min; (d) dynamic melting: PCM flow rate of 2 l/min
Fig. 9 shows the change of the heat transfer rate of the HTF during the discharging process, with
and without the influence of dynamic melting. Clearly, the impact of dynamic melting is to
dramatically increase the heat transfer rate to the HTF. The average heat transfer value of the
HTF during the baseline test was 49.1 W, while the average heat transfer value of the HTF
during the dynamic melting for flow rates of 0.5, 1 and 2 l/min were 58.2 W, 62.1 W and 81.6

19
W, respectively. If compared to the baseline test, it represented an enhancement of 18.5, 26.3
and 66 %, respectively. Moreover, it was found that the heat transfer rates of the PCM
recirculation loop were 32.9, 37.3 and 48.9 W, respectively. Therefore, if the heat gains were
minimized, the heat transfer rate from the HTF would have been even higher, as the HTF would
have been the only heat source melting the PCM. Furthermore, the influence of the pump in the
PCM rate was found to be very small if compared to the average increase in the heat transfer
rate from the dynamic melting. Values from the calculation showed that the heat introduced by
the PCM recirculation pump during the dynamic melting for flow rates of 0.5, 1 and 2 l/min
were 4.25·10-5 W, 1.67·10-5 W, and 1.09·10-2 W, respectively. The pumping power was
determined by calculating the pressure drop through the annulus surrounding the tube at each
melt fraction, and subsequently determining the average pumping power over the entire melting
process. Given the pumping power is small, the additional capital cost to the system is likely to
be small as well.
Fig. 9. Evolution of the HTF heat transfer rate during the discharging process for an HTF flow rate of 1
l/min with and without the influence of the dynamic melting.
Finally, Table 2 and Table 3 summarize the results obtained during the experiments and show
the enhancements of the dynamic melting.

20
Table 2. Summary of the results obtained for the different experiments carried out.
PCM
flow
rate
Melting
process
time
Dynamic
melting
process
start
Average
T.PCM.in
Average
T.PCM.out EHTF EHG.BC EHG.loop EPCM
Average ��)*+
Average ��),.-.
Average ��),./001
Average ��2.3
Average 'U
Average
effectiveness
Energy
balance
error
l/min] [h] [h] [ºC] [ºC] [kWh] [kWh] [kWh] [kWh] [W] [W] [W] [W] [W] [-] [%] Experimentation without dynamic melting
0 12.3 - - - 0.62
(92.7%) 0.05
(7.3%) -
0.67 (100%)
49.14 3.89 - 53.03 - 0.09 9
Experimentation with dynamic melting
0.5 6.61 0.71 5.66 4.58 0.40
(64.5%) 0.02
(3.8%) 0.19
(31.7%) 0.61
(100%) 58.22 3.47 32.87 94.56 4.25·10-5 0.08 3
1 6.55 0.72 4.57 3.97 0.42
(62.7%) 0.03
(3.8%) 0.23
(33.5%) 0.68
(100%) 62.07 3.75 37.30 103.12 6.80·10-4 0.14 11
2 4.26 0.65 3.80 3.43 0.36
(64.0%) 0.02
(3.2%) 0.18
(32.8%) 0.56
(100%) 81.56 3.99 48.90 134.45 1.09·10-2 0.14 8
Table 3. Comparison of the dynamic melting enhancements.
PCM
flow rate
Change in
melting
process time
Average
QHTF
Change in
average
effectiveness 0 - - -
0.5 47.4 % 18.5 % -4.5 % 1 47.8 % 26.3 % 24.7 % 2 65.3 % 66.0 % 56.4 %

21
4 Conclusions
A heat transfer enhancement technique known as dynamic melting has been experimentally
tested in a cylindrical shell-and-tube heat exchanger using water as PCM. This enhancement
technique consists of externally recirculating the liquid PCM during the melting process using
an external pump, thereby increasing the overall heat transfer coefficient. Different experiments
were carried out with a constant HTF flow rate of 1 l/min and varying PCM flow rates: 0, 0.5, 1
and 2 l/min. Only the parallel flow arrangement has been studied.
The experimental results showed that the phase change processes with the dynamic melting
technique were 47.4%, 47.8% and 65.3% faster than the baseline test for flow rates of 0.5, 1 and
2 l/min, respectively. However, this enhancement was not only due to the increase in the overall
heat transfer coefficient because of the forced convection, it was also due to the heat gains from
the PCM recirculation loop. These heat gains increased the PCM temperature and represented
the 32.5 ±1% of the energy stored during the charging processes, which decreased the energy
capacity of the LHTES unit. As for the effectiveness, the implementation of the dynamic
melting technique only showed an enhancement when the PCM flow rate was equal or higher
than the HTF flow rate due to the influence of the heat gains. During the dynamic melting
processes with PCM flow rates of 1 and 2 l/min, the average effectiveness was respectively
24.7% and 56.4% higher than the effectiveness of the baseline test. In terms of heat transfer
rates, dynamic melting represented an enhancement of 18.5%, 26.3% and 66% for flow rates of
0.5, 1 and 2 l/min, respectively. However, these heat gains are a characteristic of the
experiments and not what can be expected in a real application. Hence, if the heat gains did not
exist the effectiveness would be higher. An analysis of the pumping power associated with
dynamic melting was shown to be negligible relative to the heat transfer improvements.
Acknowledgements
The authors acknowledge the South Australian Department of State Development who have
funded this research through the Premier's Research Industry Fund - International Research
Grant Program (IRGP 33). This project has received funding from the European Commission
Seventh Framework Programme (FP/2007-2013) under Grant agreement Nº PIRSES-GA-2013-
610692 (INNOSTORAGE) and from the European Union’s Horizon 2020 research and
innovation programme under grant agreement No 657466 (INPATH-TES). Jaume Gasia
would like to thank the Departament d'Universitats, Recerca i Societat de la Informació de la
Generalitat de Catalunya for his research fellowship (2016FI_B 00047). The work is partially

22
funded by the Spanish government (ENE2015-64117-C5-1-R). The authors at the University of
Lleida would like to thank the Catalan Government for the quality accreditation given to their
research group GREA (2014 SGR 123).
References
1. Zalba B, Marın José Ma, Cabeza LF, Mehling H. Review on thermal energy storage with
phase change: materials, heat transfer analysis and applications. Applied Thermal
Engineering 2003;23:251–83. doi:10.1016/s1359-4311(02)00192-8.
2. Cabeza L, Mehling H, Hiebler S, Ziegler F. Heat transfer enhancement in water when used
as PCM in thermal energy storage. Applied Thermal Engineering 2002;22:1141–51.
doi:10.1016/s1359-4311(02)00035-2.
3. Al-Abidi AA, Mat S, Sopian K, Sulaiman MY, Mohammad AT. Internal and external fin
heat transfer enhancement technique for latent heat thermal energy storage in triplex tube
heat exchangers. Applied Thermal Engineering 2013;53(1):147-56.
doi:10.1016/j.applthermaleng.2013.01.011
4. Gil A, Oró E, Miró L, Peiró G, Ruiz Á, Salmerón JM, et al. Experimental analysis of
hydroquinone used as phase change material (PCM) to be applied in solar cooling
refrigeration. International Journal Of Refrigeration 2014;39:95–103.
doi:10.1016/j.ijrefrig.2013.05.013.
5. Nithyanandam K, Pitchumani R. Analysis and optimization of a latent thermal energy
storage system with embedded heat pipes. International Journal Of Heat and Mass Transfer
2011;54:4596–610. doi:10.1016/j.ijheatmasstransfer.2011.06.018.
6. Shabgard H, Bergman T, Sharifi N, Faghri A. High temperature latent heat thermal energy
storage using heat pipes. International Journal Of Heat and Mass Transfer 2010;53:2979–
88. doi:10.1016/j.ijheatmasstransfer.2010.03.035.
7. Sanusi O, Warzoha R, Fleischer AS. Energy storage and solidification of paraffin phase
change material embedded with graphite nanofibers. International Journal of Heat and Mass
Transfer 2011;54:4429–36. doi:10.1016/j.ijheatmasstransfer.2011.04.046.
8. Tong X, Khan JA, Ruhulamin M. Enhancement Of Heat Transfer By Inserting A Metal
Matrix Into A Phase Change Material. Numerical Heat Transfer, Part A: Applications
1996;30:125–41. doi:10.1080/10407789608913832.
9. Liu M, Ma Y, Wu H, Wang RY. Metal Matrix–Metal Nanoparticle Composites with
Tunable Melting Temperature and High Thermal Conductivity for Phase-Change Thermal
Storage. ACS Nano 2015;9:1341–51. doi:10.1021/nn505328j.
10. Khodadadi J, Fan L, Babaei H. Thermal conductivity enhancement of nanostructure-based
colloidal suspensions utilized as phase change materials for thermal energy storage: A

23
review. Renewable And Sustainable Energy Reviews 2013;24:418–44.
doi:10.1016/j.rser.2013.03.031.
11. Angayarkanni S, Philip J. Review on thermal properties of nanofluids: Recent
developments. Advances in Colloid and Interface Science 2015;225:146–76.
doi:10.1016/j.cis.2015.08.014.
12. Delgado M, Lázaro A, Peñalosa C, Mazo J, Zalba B. Analysis of the physical stability of
PCM slurries. International Journal of Refrigeration 2013;36:1648-1656 doi:
10.1016/j.ijrefrig.2013.04.020.
13. Huang L, Petermann M, Doetsch C. Evaluation of paraffin/water emulsion as a phase
change slurry for cooling applications. Energy. 2009;34:1145-1155
doi:10.1016/j.egypro.2014.12.397.
14. Wang W, Guo S, Li H, Yan J, Zhao J, Li X, Ding J. Experimental study on the
direct/indirect contact energy storage container in mobilized thermal energy system (M-
TES). Applied Energy 2014;119:181-189. doi:10.1016/j.apenergy.2013.12.058.
15. Guo S, Zhao J, Wang W, Jin G, Wang X, An Q, Gao W. Experimental study on solving the
blocking for the direct contact mobilized thermal energy storage container. Applied
Thermal Engineering 2015;78:556-564. doi:10.1016/j.applthermaleng.2014.12.008.
16. Nomura T, Tsubota M, Oya T, Okinaka N, Akiyama T. Heat release performance of direct-
contact heat exchanger with erythritol as phase change material. Applied Thermal
Engineering 2013;61:28-35. doi:10.1016/j.applthermaleng.2013.07.024
17. Zipf V, Neuhäuser A, Willert D, Nitz P, Gschwander S, Platzer W. High temperature latent
heat storage with a screw heat exchanger: Design of prototype. Applied Energy
2013;109:462–9. doi:10.1016/j.apenergy.2012.11.044.
18. Pointner H, Steinmann W-D, Eck M. Introduction of the PCM Flux Concept for Latent Heat
Storage. Energy Procedia 2014;57:643–52. doi:10.1016/j.egypro.2014.10.219.
19. Tay N, Bruno F, Belusko M. Experimental investigation of dynamic melting in a tube-in-
tank PCM system. Applied Energy 2013;104:137–48. doi:10.1016/j.apenergy.2012.11.035.
20. Tay N, Belusko M, Liu M, Bruno F. Investigation of the effect of dynamic melting in a
tube-in-tank PCM system using a CFD model. Applied Energy 2015;137:738–47.
doi:10.1016/j.apenergy.2014.06.060.
21. Tay N, Belusko M, Bruno F. An effectiveness-NTU technique for characterising tube-in-
tank phase change thermal energy storage systems. Applied Energy 2012;91:309–19.
doi:10.1016/j.apenergy.2011.09.039.
22. López-Navarro A, Biosca-Taronger J, Torregrosa-Jaime B, Corberán J, Bote-García J, Payá
J. Experimental investigations on the influence of ice floating in an internal melt ice-on-coil
tank. Energy And Buildings 2013;57:20–5. doi:10.1016/j.enbuild.2012.10.040.

24
23. Akgün M, Aydın O, Kaygusuz K. Experimental study on melting/solidification
characteristics of a paraffin as PCM. Energy Conversion And Management 2007;48:669–
78. doi:10.1016/j.enconman.2006.05.014.

1
Numerical study of dynamic melting enhancement in a latent
heat thermal energy storage system
Jaume Gasia1, Dominic Groulx2, N.H. Steven Tay3, Luisa F. Cabeza1,* 1 GREiA Research Group, INSPIRES Research Centre, University of Lleida, Pere de Cabrera
s/n, 25001-Lleida, Spain 2 Dept. of Mechanical Engineering, Dalhousie University, Halifax, NS, Canada
3 Newcastle Research & Innovation Institute Pte Ltd, Newcastle University in Singapore, 80
Jurong East Street 21 #05-04, The Devan Nair Institute For Employment and Employability,
Singapore 609607, Singapore
*Corresponding author: Tel: +34.973.00.35.76. Email: [email protected]
Abstract
In the present work, a 2D Cartesian numerical model is implemented to simulate the transient
behaviour of a latent heat thermal energy storage system under the effect of the dynamic
melting enhancement technique. This enhancement technique consists of recirculating the liquid
phase change material (PCM) during the melting process with an external pump and therefore
increasing the overall heat transfer coefficient. Several simulations were carried out to study the
influence of the PCM flow direction, the PCM velocity, and the heat gains in the PCM
recirculation loop, showing in all cases the benefits of implementing this enhancement
technique. Results from the simulations show that when the PCM flows from top to bottom,
higher enhancements are obtained when compared to the PCM flowing from bottom to top.
Moreover, it is observed that the higher the PCM velocity, the better the enhancement in terms
of process duration and heat transfer rates. Additionally, the PCM velocity also has an influence
over the evolution of the PCM melting front and thus over the evolution of the PCM
temperature profiles. It is shown that the intensity of the enhancements, as well as the evolution
of the melting front and temperature profiles, are more influenced by the PCM velocity than by
the ratio between the heat transfer fluid (HTF) and PCM velocities. Finally, heat gains should be
avoided in the PCM recirculation loop since they decrease the heat transfer rate between the
PCM and the HTF.
Keywords: Thermal energy storage; Phase change material; Heat transfer enhancement;
Dynamic melting; Numerical study; Forced Convection.

2
1. Introduction
Latent heat thermal energy storage (LHTES) systems have been widely studied during the last
decades because of their high energy storage densities and almost isothermal operating
characteristic, which allow improving the thermal performance of the energy system they are
coupled to [1]. However, the low thermal conductivity of the most extensively studied phase
change materials (PCMs) hinders the full implementation of these systems for daily life
applications. Different authors reviewed the research which has been carried out regarding the
implementation of heat transfer enhancement techniques, such as adding highly conductive
extended surfaces and combining highly conductive materials with the PCM, in order to
overcome the low thermal conductivity problem and increase the overall heat transfer rates in
and out of LHTES systems [2-4]. Even though these techniques are found to be very effective in
terms of heat transfer enhancement, they are invasive, since a lower quantity of PCM can be
placed within the LHTES system. As a consequence, there is a decrease in the packing factor
and in the energy storage capacity. In order to overcome these disadvantages, other authors
focused on studying non-invasive heat transfer enhancement such as dynamic PCM systems
[5,6].
The working principle of dynamic PCM systems is the movement or agitation of the PCM
during the phase change process. They can be categorized into five different groups. The first
technique is the implementation of ultrasonic vibration in the LHTES system with the
enhancements mainly due to the combination of cavitation, acoustic streaming, and thermally
oscillating flow initiated by the ultrasonic vibration [7-11]. Oh et al. [7] experimentally
investigated it during the melting process. They observed that they could accelerate the melting
process up to 2.5 times if compared to the rate of natural melting. Other authors experimentally
and numerically investigated the implementation of this technique during the solidification
process [8-11]. They focused on preventing the adhesion of the PCM solid layers to the cooling
wall and on the generation of solid PCM slurries in subcooled liquid PCM, obtaining better
results because of the longer absence of these solid layers.
The second technique, known as close contact melting, bases its working principle on avoiding
the attachment of solid PCM on the cold surfaces of the TES system and allowing motion of the
solid PCM [12-14]. This is done by creating a thin liquid PCM layer on the wall as a result of
setting on it a temperature with a value higher than the PCM melting temperature. Experimental
and numerical studies showed a heat transfer rate enhancement and therefore, a melting time
reduction. The third technique is known as double screw heat exchanger and consists of
transporting the PCM within a constantly moving helicoidally heat transfer surface of a heat
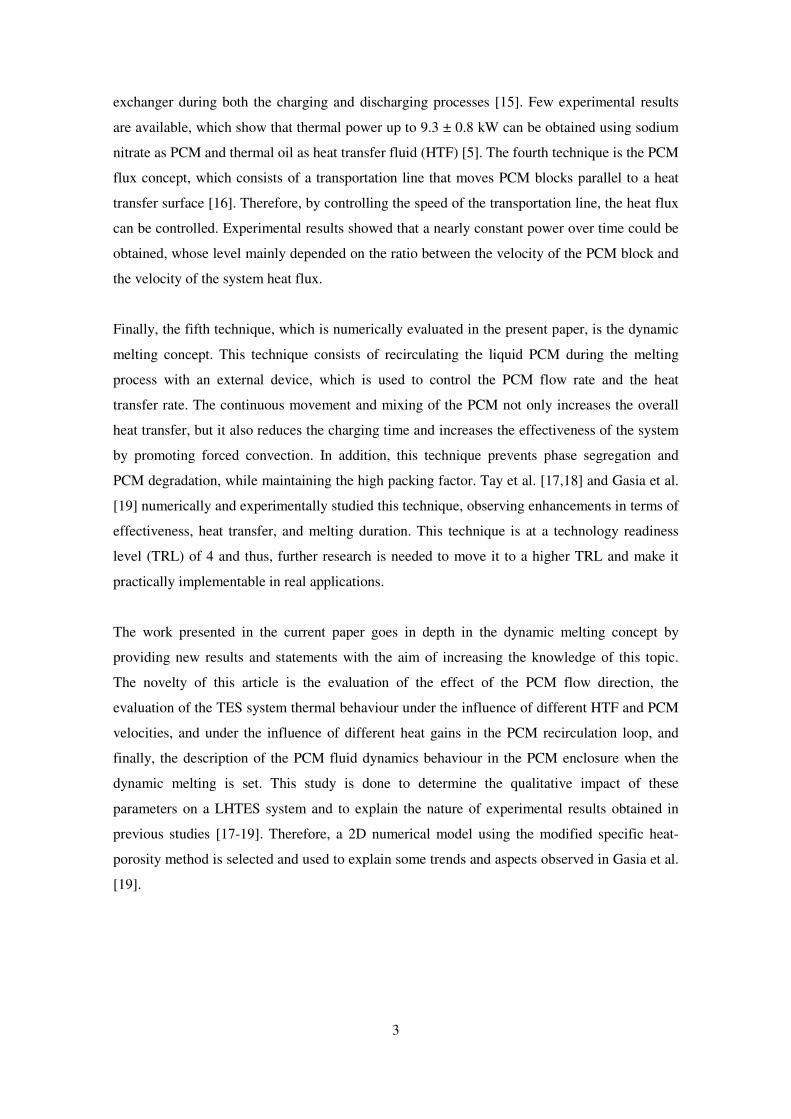
3
exchanger during both the charging and discharging processes [15]. Few experimental results
are available, which show that thermal power up to 9.3 ± 0.8 kW can be obtained using sodium
nitrate as PCM and thermal oil as heat transfer fluid (HTF) [5]. The fourth technique is the PCM
flux concept, which consists of a transportation line that moves PCM blocks parallel to a heat
transfer surface [16]. Therefore, by controlling the speed of the transportation line, the heat flux
can be controlled. Experimental results showed that a nearly constant power over time could be
obtained, whose level mainly depended on the ratio between the velocity of the PCM block and
the velocity of the system heat flux.
Finally, the fifth technique, which is numerically evaluated in the present paper, is the dynamic
melting concept. This technique consists of recirculating the liquid PCM during the melting
process with an external device, which is used to control the PCM flow rate and the heat
transfer rate. The continuous movement and mixing of the PCM not only increases the overall
heat transfer, but it also reduces the charging time and increases the effectiveness of the system
by promoting forced convection. In addition, this technique prevents phase segregation and
PCM degradation, while maintaining the high packing factor. Tay et al. [17,18] and Gasia et al.
[19] numerically and experimentally studied this technique, observing enhancements in terms of
effectiveness, heat transfer, and melting duration. This technique is at a technology readiness
level (TRL) of 4 and thus, further research is needed to move it to a higher TRL and make it
practically implementable in real applications.
The work presented in the current paper goes in depth in the dynamic melting concept by
providing new results and statements with the aim of increasing the knowledge of this topic.
The novelty of this article is the evaluation of the effect of the PCM flow direction, the
evaluation of the TES system thermal behaviour under the influence of different HTF and PCM
velocities, and under the influence of different heat gains in the PCM recirculation loop, and
finally, the description of the PCM fluid dynamics behaviour in the PCM enclosure when the
dynamic melting is set. This study is done to determine the qualitative impact of these
parameters on a LHTES system and to explain the nature of experimental results obtained in
previous studies [17-19]. Therefore, a 2D numerical model using the modified specific heat-
porosity method is selected and used to explain some trends and aspects observed in Gasia et al.
[19].

4
2. Numerical and physical model
2.1. Geometry and boundary conditions
The 2D Cartesian geometry used to carry out the numerical study is shown in Figure 1. The
choice of a 2D model instead of a 3D lies on the computational and convergence cost of this last
one, and to facilitate the explanation of the thermodynamics and fluid dynamics of the PCM
under the effect of dynamic melting. Hence, this study is not a recreation of the experimentation
shown in Gasia et al. [19], but it is a study on its own to look at overarching behaviours. The
geometry shown in Figure 1 represents, from left to right, the HTF duct, the intermediate wall,
and the PCM enclosure. The HTF duct, through which the HTF flows, has a height of 100 mm
and a width of 9 mm. The intermediate wall, which is made of stainless steel and separates the
HTF and the PCM, has a height of 100 mm and a width of 1 mm. Finally, the PCM enclosure,
which is the cavity where the PCM is located, has a height of 100 mm and a width of 30 mm. In
this cavity, two small ducts of 2 mm width are attached at 0 mm to the HTF intermediate wall to
simulate the inlet and outlet of the PCM recirculation loop during the dynamic melting process.
In a LHTES system using the dynamic melting enhancement technique, the PCM recirculation
loop is the external pipe connected to a recirculation pump which is used to move the liquid
PCM. Thus, the inlet of this loop is where the liquid PCM enters the LHTES system and the
outlet is, where the liquid PCM leaves the LHTES system.
The initial and boundary conditions are the followings:
• Only the melting process is evaluated.
• The initial temperature of the entire system is set at T0 = 268.15 K to ensure that the
PCM is fully solidified and with the same value than in the previous experimental work
[19].
• When the discharging process starts, the HTF flows downwards from the top of the
HTF duct at velocity VHTF. During the first 10 s, the HTF progressively increases from
the initial system temperature T0 to a constant final inlet temperature Tin = 283.15 K in
order to avoid divergences during the simulation.
• Only half of the system is considered since there is symmetry with respect of the
vertical symmetry line existing in the HTF duct (Figure 1).
• All the outside walls are thermally insulated, with the exception of the inlet and outlet
of the PCM recirculation loop during the performance of the dynamic melting process.
• No-slip conditions are set on the surfaces of the system, with the exception of the
vertical symmetry line in the HTF duct.
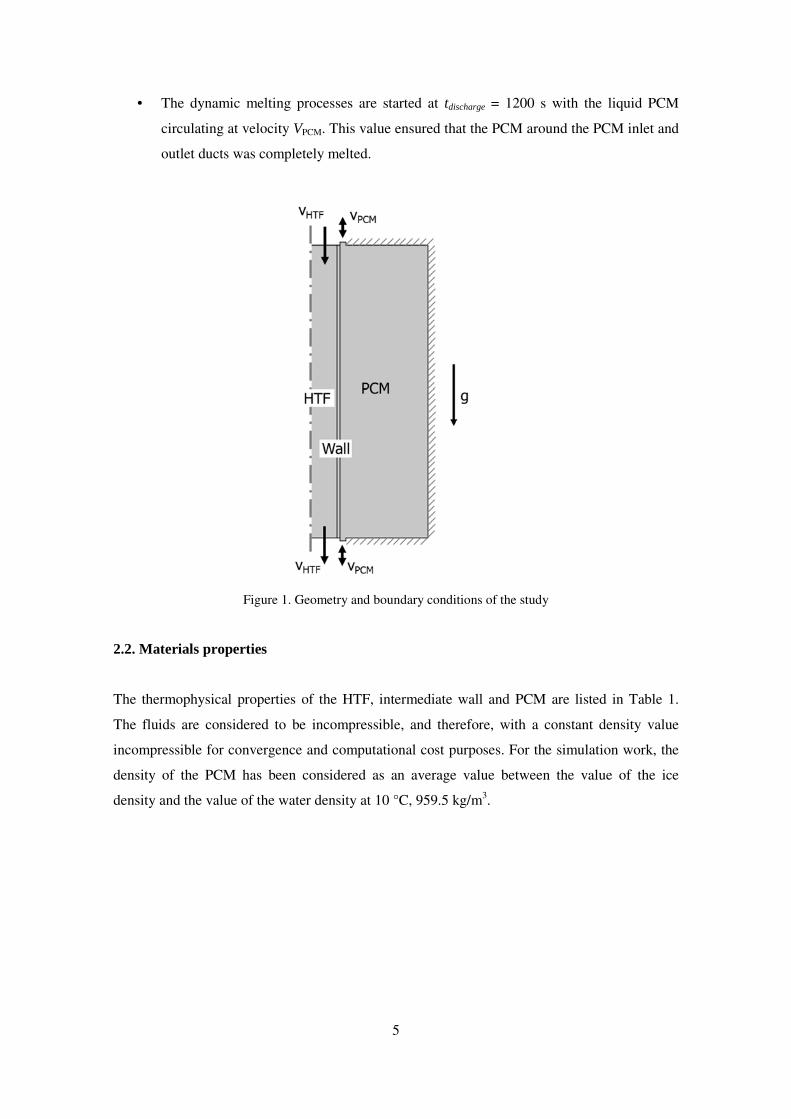
5
• The dynamic melting processes are started at tdischarge = 1200 s with the liquid PCM
circulating at velocity VPCM. This value ensured that the PCM around the PCM inlet and
outlet ducts was completely melted.
Figure 1. Geometry and boundary conditions of the study
2.2. Materials properties
The thermophysical properties of the HTF, intermediate wall and PCM are listed in Table 1.
The fluids are considered to be incompressible, and therefore, with a constant density value
incompressible for convergence and computational cost purposes. For the simulation work, the
density of the PCM has been considered as an average value between the value of the ice
density and the value of the water density at 10 °C, 959.5 kg/m3.

6
Table 1. Thermophysical properties of simulated materials.
Properties Units PCM
[20]
Intermediate
wall [21]
HTF
[19]
Material - Water AISI 4340
steel alloy
Potassium formate
and water solution
Melting temperature (Tm) K 273.15 - -
Phase change
temperature range (∆Tm) K 2 - -
Latent heat (Lf) J/kg 3.34·105 - -
Coefficient of expansion (β) 1/K 8·10-4 - -
Thermal
conductivity
solid state (ks) W/m·K 2.30 44.5 -
liquid state (kl) W/m·K 0.56 - 0.485
Density solid state (ρs) kg/m3 919 7850 -
liquid state (ρl) kg/m3 1000 - 1351
Specific
heat
solid state (cp,s) kJ/kg·K 2.027 0.475 -
liquid state (cp,l) kJ/kg·K 4.186 - 2.661
Dynamic
viscosity liquid state (µl) mPa·s 1.52 - 4.7
2.3. Numerical model
The numerical model used in this study is based on the well-studied and validated modified heat
capacity – porosity method. The modified heat capacity accounts for the latent heat present
during phase change while the porosity component of the model deals with the impact of natural
convection in the liquid melt.
The physical processes which occur on each element of the system are explained below:
1. Heat transfer fluid
The fluid dynamic behaviour of the HTF was simulated through the Navier-Stokes
equations, which consist of time-dependent equations to solve for mass, momentum and
energy conservation. Both the mass and the momentum conservation equations were solved
simultaneously. The heat transfer between the HTF and the intermediate walls occurs by
convection, which is introduced in the material derivative term of the energy conservation
equation from the velocities obtained in the mass and momentum conservation equations.
These governing equations, assuming fluid incompressibility, take the following forms:
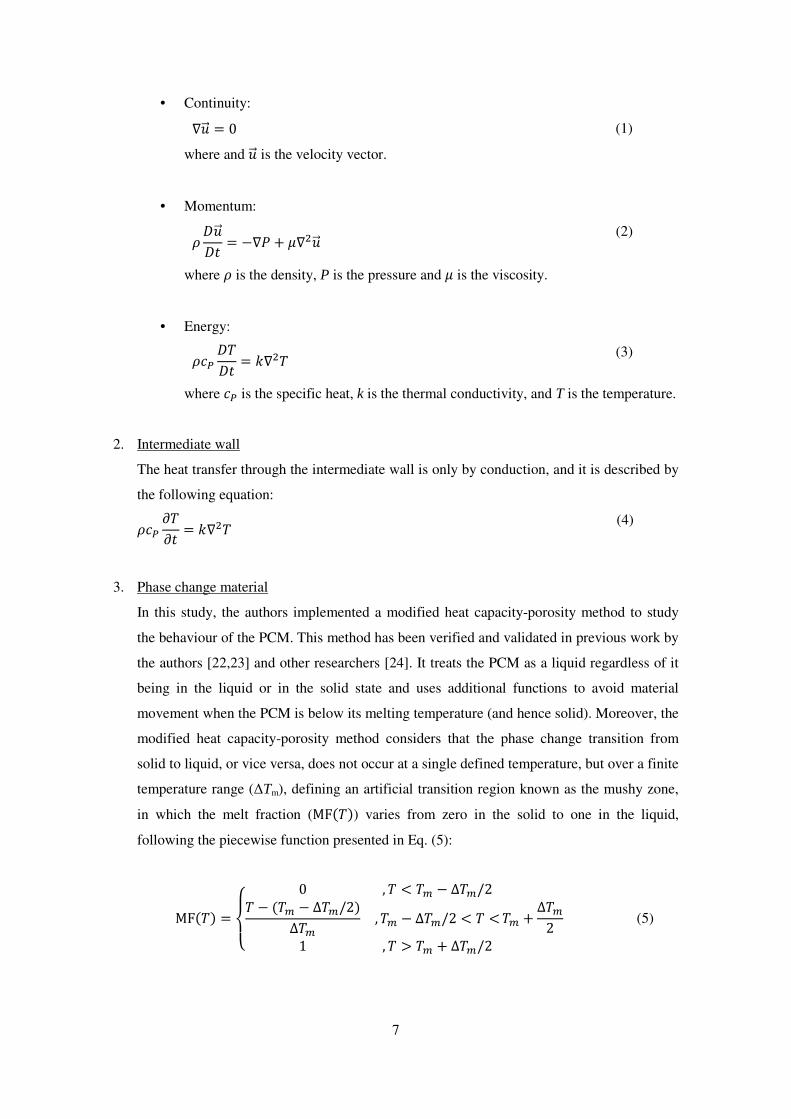
7
• Continuity:
∇��� = 0 (1)
where and ��� is the velocity vector.
• Momentum:
������ = −∇� + ∇���� (2)
where � is the density, P is the pressure and is the viscosity.
• Energy:
��� ��� = �∇�� (3)
where �� is the specific heat, k is the thermal conductivity, and T is the temperature.
2. Intermediate wall
The heat transfer through the intermediate wall is only by conduction, and it is described by
the following equation:
��� ��� = �∇�� (4)
3. Phase change material
In this study, the authors implemented a modified heat capacity-porosity method to study
the behaviour of the PCM. This method has been verified and validated in previous work by
the authors [22,23] and other researchers [24]. It treats the PCM as a liquid regardless of it
being in the liquid or in the solid state and uses additional functions to avoid material
movement when the PCM is below its melting temperature (and hence solid). Moreover, the
modified heat capacity-porosity method considers that the phase change transition from
solid to liquid, or vice versa, does not occur at a single defined temperature, but over a finite
temperature range (∆Tm), defining an artificial transition region known as the mushy zone,
in which the melt fraction (MF���) varies from zero in the solid to one in the liquid,
following the piecewise function presented in Eq. (5):
MF��� =��� 0 , � < �� − Δ��/2� − ��� − Δ��/2�Δ�� , �� − Δ��/2 < � <
1 , � > �� + ��/2�� + ��2 (5)

8
The porosity part of the method models the fluid flow within the mushy zone as a flow
through a porous medium, modifying the velocity of the fluid through the mushy zone from
zero in the solid to the natural convection velocity in the liquid phase [25]. A phase change
temperature range (∆Tm) of 2 ºC was selected as a compromise between simulation time,
mesh size, and accuracy of results [24].
The governing equations are the Navier-Stokes equations, which assume incompressibility
with variable viscosity:
• Continuity conservation is expressed using Eq. (1).
• Momentum:
T
the PCM always being considered a liquid in this method, the Navier-Stokes
equations will calculate liquid velocities at every point in the PCM, even in the
solid state. In order to speed up calculations and to avoid potential divergences
during the simulation, a source term ($�%) is added to the momentum conservation
equation (Eq. 7).
w
where $��� is the Carman-Kozeny function defined by Eq. (8). It acts as a damping
function as explained by Voller and Prakash [27]: When the PCM is liquid, the
Carman-Koseny function takes a zero value and the momentum equation is not
altered. When the PCM is in the mushy zone close to the liquid region, the Carman-
Koseny function starts to take important values and the source term $�% starts to
dominate the transient, convective, and diffusive terms. On the contrary, when the
PCM is in the mushy zone close to the solid region, the Carman-Koseny function
takes large values and the source term $�% dominate all other terms in the
momentum equation, forcing the PCM velocity to values close to zero. Finally, in
the solid region, and for analogous reasoning, the PCM velocities are zero.
$��� = &�'() *1 − MF���+�MF���, + - (8)
������ = −∇� + ∇���� + $�% + ./ (6)
$�% = −$��� ∙ ��� (7)

9
where &�'() is the mushy-zone constant, a parameter that controls the degree of
penetration of the convection field into the mushy region [25]. Different studies
have been done to understand the effect of the parameter of &�'() [22,25-28],
where values for Amush ranging from 103 to 1010 have been used. No consensus has
been found for the right value to take since it appears to depend on the code and
software used, the actual process studied, and the geometry looked at. Lately, using
the same method and the same software, the authors have found that values of 104
provide the most accurate results when actually comparing the progression of the
melting interface in a 2D rectangular enclosure heated from one side to
experimental results [22]. This recent work provides great confidence in the
selection of Amush for use in this geometry and using this software. Therefore, in the
present study, Amush takes a value of 104.- is an arbitrary constant which takes a
value of 10-3 to avoid division by zero when the PCM is in solid state.
Furthermore, .�/ is a volume force which is added to the momentum conservation
equation to account for the buoyancy force that gives rise to natural convection in
the liquid phase. It is modelled through the Boussinesq approximation as follows:
w
where �1 is the reference density which is taken to be the density of the liquid PCM
at the melting temperature, 2 is the thermal expansion coefficient, g is the gravity
acceleration, and �1 is the reference temperature which is taken to be the melting
temperature.
Moreover, in order to better describe the velocity profile and to improve the time of
convergence, some studies showed that the viscosity has to be defined as a
temperature dependent fluid viscosity through the Carman-Kozeny term $��� as
shown in Eq. (10) [24,29]. By implementing this modification, the modified
viscosity takes the material liquid viscosity ( 3) value when the temperature is
higher than �� + ��/2, it takes extremely large values when the temperature is
lower than �� − Δ��/2, and therefore forcing the material to behave as a solid, and
it damps following the profile given by the Carman-Koseny term $��� within the
mushy region, from large values in the solid state to the liquid viscosity value to the
liquid state.
.�/ = �124�� − �1� (9)
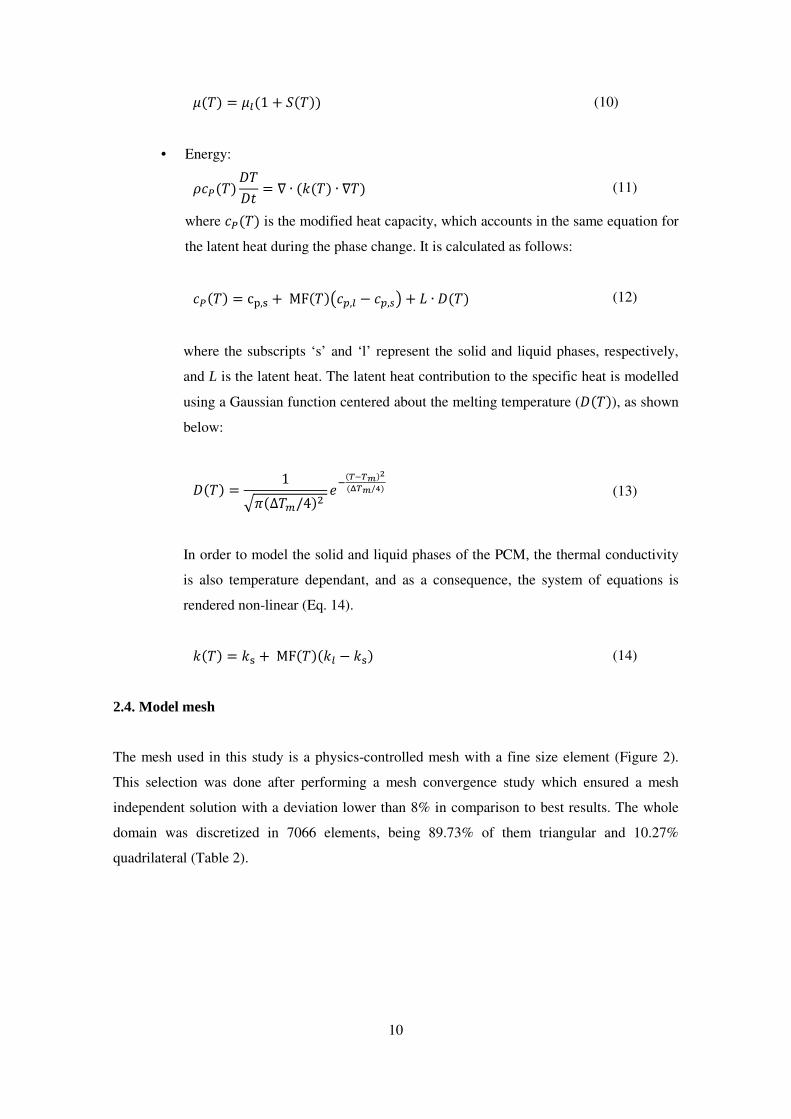
10
��� = 3�1 + $���� (10)
• Energy:
��������� = ∇ ∙ ����� ∙ ∇�� (11)
where ����� is the modified heat capacity, which accounts in the same equation for
the latent heat during the phase change. It is calculated as follows:
����� = c6,7 + MF���*�8,3 − �8,(+ + 9 ∙ ���� (12)
where the subscripts ‘s’ and ‘l’ represent the solid and liquid phases, respectively,
and L is the latent heat. The latent heat contribution to the specific heat is modelled
using a Gaussian function centered about the melting temperature (����), as shown
below:
���� = 1:;���/4�� =
>�?@?A�B�C?A/D� (13)
In order to model the solid and liquid phases of the PCM, the thermal conductivity
is also temperature dependant, and as a consequence, the system of equations is
rendered non-linear (Eq. 14).
���� = �7 + MF�����3 − �7� (14)
2.4. Model mesh
The mesh used in this study is a physics-controlled mesh with a fine size element (Figure 2).
This selection was done after performing a mesh convergence study which ensured a mesh
independent solution with a deviation lower than 8% in comparison to best results. The whole
domain was discretized in 7066 elements, being 89.73% of them triangular and 10.27%
quadrilateral (Table 2).

11
Figure 2. Mesh used in this study
Table 2. Parameters of the mesh selected in this study
Domain Total
elements
Triangular
elements
Quadrilateral
elements
Total 7066 6340 726
HTF 1393 1207 186
Stainless
steel
wall
553 553 0
PCM 5120 4580 540
2.5. Numerical study
The numerical study consisted of the 14 simulations which are summarized in Table 3. These
simulations were ran in COMSOL Multiphysics 5.3 on an Intel Xeon 16 Core processor (2.40
GHz) with 128 GB of RAM. The studies evaluated the effect of the dynamic melting
enhancement technique for different PCM flow directions, different heat gains in the PCM
recirculation loop, and different PCM and HTF inlet velocities. Thus, to properly evaluate the
temperatures over time, several monitor points were added in the PCM enclosure and in the
HTF duct (Figure 3).
Figure 3. Monitor points used to measure the PCM temperature

12
Table 3. Simulations carried out in the present numerical study
Case
stu
dy
Dyn
am
ic
mel
tin
g
HT
F f
low
dir
ecti
on
PC
M f
low
dir
ecti
on
Hea
t gain
s [W
]
HT
F
Vel
oci
ty [
m/s
]
PC
M
Vel
oci
ty [
m/s
]
1 No Top to bottom - - 0.05 0.00
2 Yes Top to bottom Top to bottom No 0.05 0.05
3 Yes Top to bottom Bottom to top No 0.05 0.05
4 Yes Top to bottom Top to bottom 10 W 0.05 0.05
5 Yes Top to bottom Top to bottom 25 W 0.05 0.05
6 Yes Top to bottom Top to bottom 100 W 0.05 0.05
7 Yes Top to bottom Top to bottom No 0.05 0.025
8 Yes Top to bottom Top to bottom No 0.05 0.10
9 Yes Top to bottom Top to bottom No 0.05 0.20
10 No Top to bottom - - 0.025 0.00
11 Yes Top to bottom Top to bottom No 0.025 0.0125
12 Yes Top to bottom Top to bottom No 0.025 0.025
13 Yes Top to bottom Top to bottom No 0.025 0.05
14 Yes Top to bottom Top to bottom No 0.025 0.10
2.6. Calculation procedure
The melt fraction (MF) is the portion of PCM which is in liquid state in a domain at a given
time. In a 2D Cartesian model, it is defined as the surface integral of all PCM elements with a
temperature higher than the upper temperature of the melting range, divided by the total area of
all elements (Eq. 15).
MF = ∬&F=GHIℎ�� > ��� + ∆�/2� ∙ LM ∙ LN&OPO (15)
The heat transfer rate (QRSTU) of the HTF is obtained as Eq (16) shows:
QRSTU = VR STU ∙ WXSTU ∙ ��STU.Z[ − �STU.P'O� (16)
where VR STU is the HTF mass flow rate, WXSTU is the specific heat, THTF.in is the temperature at
the inlet of the duct, and THTF.out is the temperature at the outlet of the duct. Note that both HTF
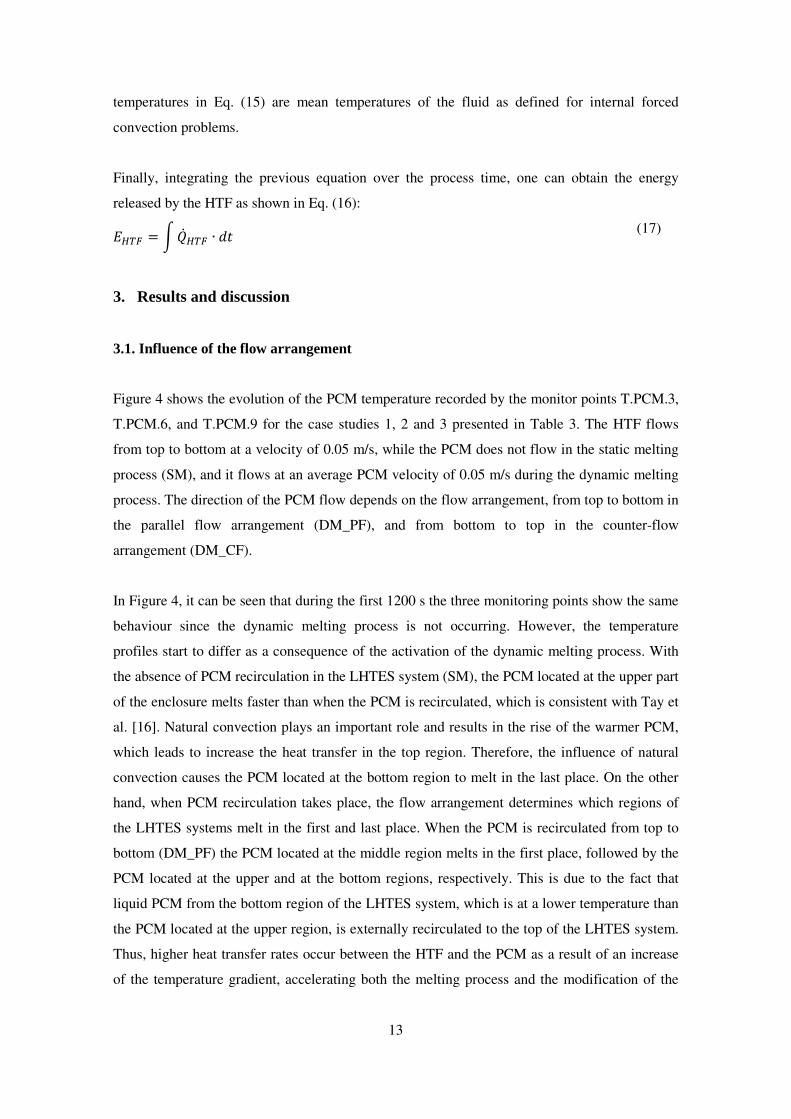
13
temperatures in Eq. (15) are mean temperatures of the fluid as defined for internal forced
convection problems.
Finally, integrating the previous equation over the process time, one can obtain the energy
released by the HTF as shown in Eq. (16):
\STU = ]QRSTU ∙ L (17)
3. Results and discussion
3.1. Influence of the flow arrangement
Figure 4 shows the evolution of the PCM temperature recorded by the monitor points T.PCM.3,
T.PCM.6, and T.PCM.9 for the case studies 1, 2 and 3 presented in Table 3. The HTF flows
from top to bottom at a velocity of 0.05 m/s, while the PCM does not flow in the static melting
process (SM), and it flows at an average PCM velocity of 0.05 m/s during the dynamic melting
process. The direction of the PCM flow depends on the flow arrangement, from top to bottom in
the parallel flow arrangement (DM_PF), and from bottom to top in the counter-flow
arrangement (DM_CF).
In Figure 4, it can be seen that during the first 1200 s the three monitoring points show the same
behaviour since the dynamic melting process is not occurring. However, the temperature
profiles start to differ as a consequence of the activation of the dynamic melting process. With
the absence of PCM recirculation in the LHTES system (SM), the PCM located at the upper part
of the enclosure melts faster than when the PCM is recirculated, which is consistent with Tay et
al. [16]. Natural convection plays an important role and results in the rise of the warmer PCM,
which leads to increase the heat transfer in the top region. Therefore, the influence of natural
convection causes the PCM located at the bottom region to melt in the last place. On the other
hand, when PCM recirculation takes place, the flow arrangement determines which regions of
the LHTES systems melt in the first and last place. When the PCM is recirculated from top to
bottom (DM_PF) the PCM located at the middle region melts in the first place, followed by the
PCM located at the upper and at the bottom regions, respectively. This is due to the fact that
liquid PCM from the bottom region of the LHTES system, which is at a lower temperature than
the PCM located at the upper region, is externally recirculated to the top of the LHTES system.
Thus, higher heat transfer rates occur between the HTF and the PCM as a result of an increase
of the temperature gradient, accelerating both the melting process and the modification of the

14
melting front shape. On the contrary, when the PCM flows from bottom to top (DM_CF), the
PCM melts following the same pattern than the case with no PCM recirculation.
Figure 5 presents the evolution of the melting front at different moments of the discharging
process. It is found that this result differs from the one observed by Gasia et al. [19], who
experimentally studied the same phenomenon. In that study, the authors observed that the solid
pieces of ice which were detached from the system surfaces, floated and remained around the
upper portion for a long period of time and, as a consequence, affected to the temperature
distribution. The impact of the floating ice was not implemented in this numerical model for
computational reasons, which explains this difference. As the melting process goes on, the
influence of the PCM recirculation was observed in the PCM temperature (Figure 4), the
evolution of the melting front (Figure 5), and the velocity profiles (Figure 6).
When the dynamic melting process is activated (tdischarge=1200 s) the melting front presents an
irregular shape, no matter which flow arrangement is set (Figure 5). Therefore, the liquid PCM
flow channel inside the enclosure does not present a homogeneous cross-sectional area. The
liquid PCM flow channel is defined as the section of liquid PCM limited by solid walls, which
in the current study are the HTF intermediate wall and the melting front. In the upper region, the
melting front is found halfway in the PCM enclosure, while in the bottom region the melting
front is found very close to the duct of PCM recirculation loop. This situation causes that when
the PCM is recirculated from top to bottom (DM_PF), the PCM initially follows the theoretical
linear path that connects the inlet and outlet of the PCM recirculation loop. Continuously, it
gradually diverges towards the outer wall of the LHTES system, modifying the melting front
shape as seen in Figure 5 (b). This is due to the sudden expansion that suffers the liquid PCM
when it enters the top of the LHTES system, which has a large cross-sectional area, coming
from the PCM recirculation loop, which has a lower cross-sectional area. This effect is
increased by the existence of a sharp 90º turn in this section of the LHTES system that makes
the liquid PCM flow streamline to separate from the wall and to take the above-mentioned
diverging pattern towards the external wall of the LHTES system (Figure 6) and, as a
consequence, to hit the PCM melting front further downstream at a distance which depends on
the Reynolds number [30-32]. Moreover, as a result of this sudden expansion, the PCM is
decelerated and it suffers an increase in its pressure, creating a pressure difference between the
regions with different cross-sectional areas in the direction of the flow. Furthermore, the liquid
PCM located in the right-top corner region, which is out of direct influence of the PCM flow
streamline, suffers a reverse recirculation since its low kinematic energy cannot overcome the
adverse pressure increase created in the direction of the flow streamline (Figure 6). A similar
behaviour is observed in the liquid PCM located in the region close to the HTF intermediate

15
wall. The adverse pressure gradient generated in the enclosure causes a detachment of the liquid
PCM flow streamline from the surface of the HTF wall, and a further reattachment to the wall at
a certain distance downstream, which also depends on the Reynolds number [30-32]. As a
result, a reverse recirculation zone is generated within the space between both detachment and
reattachment points, for analogous reasoning.
When the PCM is recirculated from bottom to top (DM_CF), the previous behaviour is not
observed anymore, and the PCM follows during the whole process the theoretical linear path
which connects the inlet and outlet of the PCM recirculation loop. At the beginning of the
dynamic melting process, the liquid PCM flow channel at the bottom region of the LHTES
system has a cross-sectional area which is almost identical to the cross-sectional area of the
PCM recirculation loop inlet. This characteristic does not allow a sudden expansion of the
incoming liquid PCM as seen before. However, the cross-sectional area of the liquid PCM flow
channel gradually increases as it moves upwards the enclosure because of the effect of the
natural convection on the early stages of the process, becoming more remarkable at the upper
region. Furthermore, the sudden and sharp contraction that the liquid PCM suffers at the top
region when it leaves the LHTES system creates a recirculation zone between the outlet of the
PCM recirculation loop and the melting front due to the pressure gradients which are generated
(Figure 6). As the process continues, the region of liquid PCM which is not directly influenced
by the liquid PCM flow streamline is affected by the effects of the natural convection. Thus, it
results into a temperature profile and melting front evolution similar to the evolution observed
when the process has no PCM recirculation, but with a faster response, confirming the benefits
of forced convection.

16
Figure 4. Temperature of the PCM at the upper-right corner (T.PCM.3), centre-right side (T.PCM.6), and
bottom-right corner (T.PCM.9) of the LHTES system. Influence of the PCM flow arrangement for an
HTF flowing from top to bottom at an average velocity of 0.05 m/s: No dynamic melting (SM), PCM
flowing from top to bottom (DM_PF), PCM flowing from bottom to top (DM_CF).
(a) (b) (c)
Figure 5. Melting front at t=1200 s, t=1800 s, t=3600 s, and t=5400 s. Influence of the PCM flow
arrangement for an HTF flowing from top to bottom at an average velocity of 0.05 m/s: No dynamic
melting (SM), PCM flowing from top to bottom (DM_PF), PCM flowing from bottom to top (DM_CF).

17
tdischarge = 1800 s tdischarge = 3600 s tdischarge = 5400 s
SM
DM
_P
F
HT
F H
TF
Recirculation
zones

18
DM
_C
F
Figure 6. Velocity profiles at t=1800 s, t=3600 s, and t=5400 s. Influence of the PCM flow arrangement
for an HTF flowing from top to bottom at an average velocity of 0.05 m/s: No dynamic melting (SM),
PCM flowing from top to bottom (DM_PF), PCM flowing from bottom to top (DM_CF). The white line
represents the boundary where the PCM is at the melting temperature.
The influence of the PCM recirculation can be easily observed in the evolution of the heat
transfer rate (Figure 7) and the melting fraction (Figure 8) profiles. Notice that when the
dynamic melting process is activated (tdischarge = 1200 s), differences are observed in the three
cases studied. The average value of the heat transfer rate during the discharge is 104.7 W when
there is no PCM recirculation (SM). The heat transfer rate is increased to 173.8 W (+ 66.1%)
when the PCM flow from top to bottom (DM_PF), while the heat transfer rate becomes 152.5
W (+45.7%) when the PCM flows from bottom to top (DM_CF). These results indicate that the
recirculation of the liquid PCM increases the heat transfer rates in comparison to the case with
no PCM recirculation. When the PCM is recirculated from top to bottom, the colder liquid PCM
is sucked from the bottom region of the system and poured to the top region, which makes the
temperature gradient between the inlets of the HTF and the PCM higher than when the PCM is
recirculated from bottom to top. In such case, warmer PCM from the top is externally pumped
to the bottom, allowing the colder water from the bottom to internally flow towards the upper
region of the system but at a higher average temperature. The presence of higher values of heat
transfer rates leads to the melting process finishing 40% earlier in the parallel flow arrangement
(tMF=1 = 6000 s) and 32.7% earlier in the counter flow arrangement (t MF=1 = 6730 s) when
compared to the case with no PCM recirculation (tMF=1 = 10000 s).
HT
F Recirculation
zone
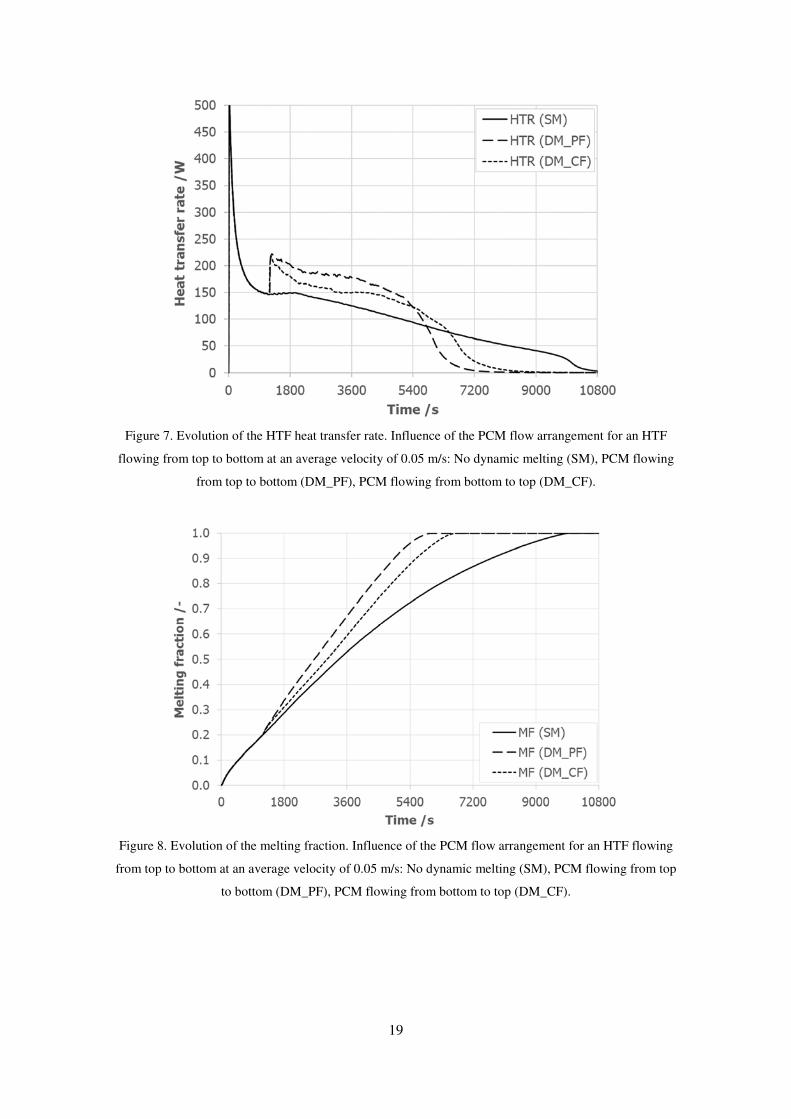
19
Figure 7. Evolution of the HTF heat transfer rate. Influence of the PCM flow arrangement for an HTF
flowing from top to bottom at an average velocity of 0.05 m/s: No dynamic melting (SM), PCM flowing
from top to bottom (DM_PF), PCM flowing from bottom to top (DM_CF).
Figure 8. Evolution of the melting fraction. Influence of the PCM flow arrangement for an HTF flowing
from top to bottom at an average velocity of 0.05 m/s: No dynamic melting (SM), PCM flowing from top
to bottom (DM_PF), PCM flowing from bottom to top (DM_CF).

20
3.2. Influence of the PCM velocity
Having determined that recirculating the liquid PCM from top to bottom provides an added heat
transfer rate, the following step is to study the influence of the PCM velocity in the recirculation
loop on the heat transfer and energy storage behaviour (case studies 1, 2, 7, 8, and 9 presented in
Table 3). Moreover, the authors also investigated the possible relationship between the
enhancements observed because of the dynamic melting and the ratio between the HTF and
PCM velocities as stated by Tay et al. [16] and Gasia et al. [19] from previous experimental
studies.
Figure 9 displays the evolution of the melting fraction for an average HTF velocity of 0.05 m/s
and different PCM velocities, both fluids flowing from top to bottom. It can be observed that
increasing the value of the average PCM velocity translates to a decrease of the time needed to
fully melt the entire PCM inside the LHTES system. Results from the simulations shows that
when the PCM velocity is set to be half of the HTF velocity (i.e vPCM = 0.025 m/s), the time
needed to entirely melt the PCM is 6910 s, which represents a reduction of 30.9% as compared
to the case with no PCM recirculation (tSM.MF=1 = 10000 s). If the PCM velocity is increased, the
time needed to fully melt the PCM is 6000 s (vPCM = 0.05 m/s), 5120 s (vPCM = 0.1 m/s), and
4560 s (vPCM = 0.2 m/s), which represents a reduction of 40%, 48.8%, and 54.4% as compared to
the case with no PCM recirculation, respectively. The reduction of the melting period is due to
the increase in heat transfer rates between the HTF and the PCM, as shown in Figure 10. Notice
that when the PCM velocities are increased, both the peak and average values of the heat
transfer rates are increased. Results from simulations show that when the PCM velocities are
0.025 m/s, 0.05 m/s, 0.1 m/s, and 0.2 m/s, the average heat transfer values are 150 W, 173.8 W,
200.3 W, and 220.7 W, respectively. Hence, if compared to the case with no PCM recirculation,
the enhancements are 43.3%, 66.1%, 91.3%, and 110.8%, respectively. When the PCM velocity
is higher, the liquid PCM temperature does not change as much within between the inlet and the
outlet of the PCM recirculation loop. Thus, the temperature difference between HTF and PCM
stays higher, since lower temperature PCM from the bottom region of the LHTES system is
pumped to the top, and as a consequence it increases the heat transfer. Moreover, since the HTF
flow is laminar, the heat transfer coefficient is constant, and the heat transfer rate mainly
depends on the temperature gradients between the HTF and the PCM.

21
Figure 9. Evolution of the melting fraction. Influence of the liquid PCM velocity for an average HTF
velocity of 0.05 m/s. Both PCM and HTF flow from top to bottom.
Figure 10. Evolution of the HTF heat transfer rate. Influence of the liquid PCM velocity for an average
HTF velocity of 0.05 m/s. Both PCM and HTF flow from top to bottom.
The results from the simulation also show a different behaviour in the evolution of temperature
profiles of the PCM located at the right side of the LHTES system (Figure 11) and the evolution
of the melting front (Figure 12) depending on the PCM velocity. Notice that when the PCM
velocity is 0 m/s or 0.025 m/s the PCM located at the upper-right corner increases its
temperature faster than the PCM located at centre-right side and the bottom-right corner. When
the PCM velocity is 0.05 m/s or 0.1 m/s, the PCM located at the centre-right region melts faster
than the PCM located at the upper- and bottom-right corners. Finally, when the PCM velocity is
0.2 m/s, the PCM located at the bottom-right corner increases its temperature faster than the

22
PCM located at the upper- and centre-right regions. It is observed that the size and structure of
the two recirculation zones above-mentioned (the one generated at the intermediate wall and the
one generated in the upper region of the LHTES system as a result of the sharp corner) is
strongly dependant on the PCM velocity, consistent with [30-32]. For lower velocities, the
pressure gradients generated by the sudden expansion cause the liquid PCM streamline to move
towards the upper region of the external wall of the LHTES. As a result, the detachment point
from the intermediate wall is located at the upper region of the LHTES system and therefore big
recirculation zones are created on this wall, while the recirculation zone generated at the upper
regions decrease its size. On the other hand, for higher velocities, the liquid PCM streamline is
attached to the wall for a longer length and the detachment point is located downwards. Thus,
the recirculation zone generated on the wall has a smaller size while the other one increases its
size. These results are consistent with the experimental results obtained in Gasia et al. [19],
where a similar behaviour on the temperature profiles were observed.
Figure 11. Temperature of the PCM at the upper-right corner (T.PCM.3), centre-right side (T.PCM.6),
and bottom-right corner (T.PCM.9) of the LHTES system. Influence of the PCM velocity for an average
HTF velocity of 0.05 m/s. Both PCM and HTF flow from top to bottom.

23
(a) (b) (c)
(d) (e)
Figure 12. Melting front at t=1200 s, t=1800 s, t=3600 s, and t=5400 s. Influence of the PCM velocity for
an average HTF velocity of 0.05 m/s: (a) vPCM=0, (b) vPCM=0.025 m/s, (c) vPCM=0.05 m/s, (d) vPCM=0.10
m/s, and (e) vPCM=0.20 m/s. Both PCM and HTF flow from top to bottom.
The influence of the ratio between the PCM and the HTF velocities (vPCM / vHTF) is also studied
to evaluate if the dynamic melting enhancement is influenced by this ratio, or it is uniquely
influenced by the PCM velocity (Case studies 10, 11, 12, 13, and 14 presented in Table 3).
Hence, the average HTF velocity was reduced to 0.025 m/s while the ratio between both
velocities was the same than in the previous case study (vPCM /vHTF = 0, 0.5, 2, and 4. Hence, the
new PCM velocities are: vPCM= 0, 0.0125, 0.025, 0.5, and 0.1 m/s, respectively). Figure 13

24
shows the evolution of the melting front at different moments of the process for the five above-
mentioned PCM velocities. As compared to the previous case study (Figure 12), it can be
observed that for the same PCM velocity, the melting front follows practically the same pattern
over time (i.e. Figure 12(b) and Figure 13(c), Figure 12(c) and Figure 13(d), Figure 12(d) and
Figure 13(e)). The only difference is that the melting front profile has slightly moved more
towards the right border of the enclosure when the HTF velocity is higher (vHTF=0.5 m/s). The
reason lies on the fact that with lower HTF velocities, the heat transfer rates are lower and
therefore, lower quantity of PCM is melted (Figure 14. Thus, it can be concluded that in absence
of heat gains in the LHTES system, the enhancement obtained by the implementation of the
dynamic melting concept is uniquely due to the PCM velocity. Hence, there is no threshold in
the ratio between the PCM and HTF velocities below which there is no enhancement in terms of
heat transfer, opposite to what it was stated in Tay et al. [16] and Gasia et al. [19].
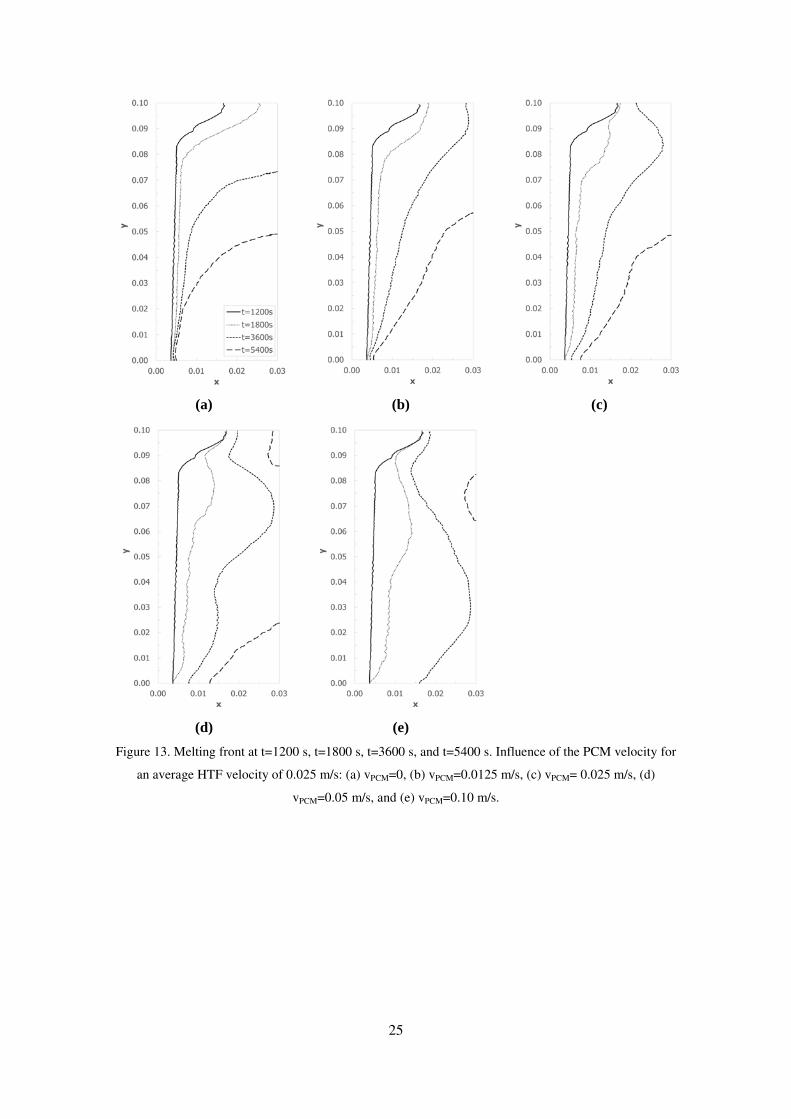
25
(a) (b) (c)
(d) (e)
Figure 13. Melting front at t=1200 s, t=1800 s, t=3600 s, and t=5400 s. Influence of the PCM velocity for
an average HTF velocity of 0.025 m/s: (a) vPCM=0, (b) vPCM=0.0125 m/s, (c) vPCM= 0.025 m/s, (d)
vPCM=0.05 m/s, and (e) vPCM=0.10 m/s.

26
Figure 14. Evolution of the HTF heat transfer rate. Influence of the liquid PCM velocity for an average
HTF velocity of 0.025 m/s.
3.3. Influence of heat gains in the dynamic melting loop
This section aims to show the influence on the LHTES system thermal behaviour of the heat
gains from the PCM recirculation loop. The goal of cooling down the HTF in the LHTES
system for refrigeration purposes is to obtain a colder temperature at the outlet of the HTF duct.
Hence, heat gains in the PCM recirculation loop makes the PCM temperature increase faster and
therefore, reduces the amount of “cold” which can be obtained from the PCM. These heat gains
can be generated by two factors. The first factor is due to poor insulation of the PCM
recirculation piping, which causes the PCM to absorb energy from the environment. The second
factor is by the mechanical losses of the PCM recirculation pump, which increases the internal
energy of the liquid PCM. As a result of these heat gains, the PCM increases its temperature and
modifies the LHTES system behaviour.
In the present study, five different cases are compared and discussed (Case studies 1, 2, 4, 5,
and 6 presented in Table 3). First, a static melting process with the HTF flowing from top to
bottom at a constant velocity of vHTF = 0.05 m/s without the effect of the dynamic melting
(DM). Second, a dynamic melting process with the same HTF flow arrangement, and the liquid
PCM flowing from top to bottom at a constant velocity of vPCM = 0.05 m/s without heat gains
(DM_PF). Finally, the same dynamic melting processes with heat gains on the PCM
recirculation loop of 10 W, 25 W, and 100 W (DM_PF_10W, DM_PF_25W, DM_PF_100W,
respectively).

27
Results from the simulations show that the increase on the inlet temperature of the PCM at the
top of the LHTES system, as a result of the heat gains in the recirculation loop, causes the PCM
to melt faster than with absence of heat gains (Figure 15). Indeed, the time needed to fully melt
the PCM when the heat gains are 10 W, 25 W, and 100 W are 5820 s, 5600 s, and 4700 s,
respectively, in comparison to the 6000 s needed when no heat gains are being absorbed by the
PCM. Therefore, the melting process is affected, and the time needed to complete it is reduced
up to 21.7% if there are constant heat gains of 100 W. However, this reduction is not beneficial
as it can be seen in Figure 16 and Figure 17. The fact of increasing the inlet PCM temperature
directly affects the heat transfer between the HTF and the PCM, therefore the heat released by
the HTF during the melting process. As observed in section 3.1, the fact of recirculating colder
PCM from the lower regions of the LHTES system to its upper regions dramatically increases
the heat transfer. However, if warmer PCM is pumped to the LHTES system, the temperature
gradient between the HTF and the PCM is decreased, and so does the heat transfer. Results from
the simulation show that the average heat transfer rate from the beginning of the process until
the PCM is fully melted is 171.1 W, 167.6 W, and 151.6 W, when the heat gains are 10 W, 25
W, and 100 W, respectively. This means a reduction of up to 12.8% as compared to the dynamic
melting process without heat gains. Moreover, there is one point at which the HTF stops
releasing energy to the PCM and starts absorbing energy from the PCM (heat transfer = 0 W).
At this point, the LHTES system becomes worthless as cold LHTES system and it should be
stopped. Finally, the melting front is also affected by the heat gains (Figure 18) in a similar way
than the melting fraction. Despite the fact that its profile is not being modified like it is observed
in the previous sections, it moves along faster as the heat gains are higher.

28
Figure 15. Evolution of the melting fraction. Influence of the heat gains in the PCM recirculation loop for
the HTF and PCM flowing from top to bottom at an average velocity of 0.05 m/s.
Figure 16. Evolution of the HTF heat transfer rate. Influence of the heat gains in the PCM recirculation
loop for the HTF and PCM flowing from top to bottom at an average velocity of 0.05 m/s.

29
Figure 17. Evolution of the accumulated energy released by the HTF during the melting process.
Influence of the heat gains in the PCM recirculation loop for the HTF and PCM flowing from top to
bottom at an average velocity of 0.05 m/s.

30
(a) (b) (c)
(d) (e)
Figure 18. Melting front at t=1200 s, t=1800 s, t=3600 s, and t=5400 s. Influence of the heat gains in the
PCM recirculation loop for the HTF and PCM flowing from top to bottom at an average velocity of 0.05
m/s: (a) Heat gains=0W (vPCM=0 m/s), (b) Heat gains=0W, (c) Heat gains=10W, (d) Heat gains=25W,
and (e) Heat gains=100W.
3.4. Summary of the results
Finally, Table 4 summarizes the main results obtained for the 14 simulations carried out in the
present work.

31
Table 4. Summary of the results obtained for the different simulations carried out in the present work. The
percentage difference in comparison to the two cases with no PCM recirculation are shown in brackets. S
tud
y
Dyn
am
ic
mel
tin
g
HT
F f
low
dir
ecti
on
PC
M f
low
dir
ecti
on
Hea
t gain
s [W
]
HT
F
Vel
oci
ty [
m/s
]
PC
M
Vel
oci
ty [
m/s
]
Mel
tin
g p
roce
ss
per
iod
[s]
Aver
age
hea
t
tran
sfer
[W
]
1 No Top to
bottom - - 0.05 0.00
10000
(-)
104.7
(-)
2 Yes Top to
bottom
Top to
bottom No 0.05 0.05
6000
(-40%)
173.8
(+66.1%)
3 Yes Top to
bottom
Bottom
to top No 0.05 0.05
6730
(-32.7%)
152.5
(+45.7%)
4 Yes Top to
bottom
Top to
bottom 10 W 0.05 0.05
5820
(-41.8%)
171.1
(+63.4%)
5 Yes Top to
bottom
Top to
bottom 25 W 0.05 0.05
5600
(-44%)
167.6
(+60.1%)
6 Yes Top to
bottom
Top to
bottom 100 W 0.05 0.05
4700
(-53%)
151.6
(+44.8%)
7 Yes Top to
bottom
Top to
bottom No 0.05 0.025
6910
(-30.9%)
150
(+43.3%)
8 Yes Top to
bottom
Top to
bottom No 0.05 0.10
5120
(-48.8%)
200.3
(+91.3%)
9 Yes Top to
bottom
Top to
bottom No 0.05 0.20
4560
(-54.4%)
220.7
(+110.8%)
10 No Top to
bottom - - 0.025 0.00
10800
(-)
96.4
(-)
11 Yes Top to
bottom
Top to
bottom No 0.025 0.0125
7940
(-26.6%)
129.5
(+34.3%)
12 Yes Top to
bottom
Top to
bottom No 0.025 0.025
7300
(-32.4%)
140.5
(+45.7%)
13 Yes Top to
bottom
Top to
bottom No 0.025 0.05
6310
(-41.6%)
163.3
(+69.4%)
14 Yes Top to
bottom
Top to
bottom No 0.025 0.10
5530
(-48.8%)
184.1
(+91.0%)

32
4. Conclusions
This work presents a numerical study focused on studying the influence of the dynamic melting
concept in a two-dimensional Cartesian LHTES system, with the HTF flowing from top to
bottom at 0.05 m/s and the PCM is stored in a rectangular enclosure. Dynamic melting is an
enhancement technique which consists of recirculating the liquid PCM during the melting
process with an external device and therefore, increasing the overall heat transfer coefficient.
Fourteen different simulations were carried out with the aim of studying the influence of the
PCM flow direction, the PCM velocity, and the heat gains in the PCM recirculation loop.
The study of the influence of the PCM flow direction shows that when the PCM is recirculated
from top to bottom, which means parallel to the HTF flow direction, higher heat transfer rates
and lower melting process periods are obtained than when the PCM is recirculated from bottom
to top. Results from the simulations showed that heat transfer rates, in comparison to the case
with no recirculation are 66.1% and 45.7% higher, respectively, while the melting process
periods are 40% and 32.7% lower, respectively. Moreover, different melting front and
temperature profiles are observed in each scenario. On the other hand, the study of the influence
of the PCM velocity shows that the higher the velocity the higher the heat transfer rates and the
lower the melting process periods. Specifically, with PCM velocity between 0.025 m/s and 0.20
m/s, results showed enhancement in the heat transfer rates between 43.3% and 110.8%, while
reduction in the melting process periods between 30.9% and 54.4%, respectively. Additionally,
two other issues were observed in this study First, that the enhancement was uniquely due to
PCM velocity, and not to the ratio between the PCM and HTF velocities and second, that the
PCM velocity strongly affected the melting fronts and temperature profiles within the LHTES
system. The previous studies were carried out with the absence of heat gains in the PCM
recirculation loop, which causes the increase of the PCM temperature at the inlet of the LHTES
system. The increase of the heat gains is translated to a decrease of the average heat transfer
rates and a decrease of the melting process periods. Results showed a difference of 21.3% in the
heat transfer rate between the case study with absence of heat gains and the case study with
constant heat gains of 100 W. Moreover, it is observed that there is one point that the HTF stops
releasing energy to the PCM and it starts absorbing energy, as a result of the PCM temperature
increase.

33
Acknowledgements
The work was partially funded by the Spanish government (ENE2015-64117-C5-1-R
(MINECO/FEDER)). The authors would like to thank the Catalan Government for the quality
accreditation given to their research group (2017 SGR 1537). GREA is certified agent TECNIO
in the category of technology developers from the Government of Catalonia. Jaume Gasia
would like to thank the Departament d'Universitats, Recerca i Societat de la Informació de la
Generalitat de Catalunya for his research fellowship (2017 FI_B1 00092) and the Societat
Econòmica Barcelonesa d'Amics del País (SEBAP) for his research mobility scholarship. The
Dalhousie Researchers would like to thank the Canadian Foundation for Innovation (CFI) for
their financial assistance towards the infrastructure used in this project.
References
1. Mehling H, Cabeza LF. Heat and cold storage with PCM. An up to date introduction into
basics and applications. Berlin, Germany: Springer-Verlag 2008. ISBN: 979-3-540-68556-
2.
2. Fan L, Khodadadi JM. Thermal conductivity enhancement of phase change materials for
thermal energy storage: A review, Renewable and Sustainable Energy Reviews
2011;15(1):24-46.
3. Jegadheeswaran S, Pohekar SD. Performance enhancement in latent heat thermal storage
system: A review, Renewable and Sustainable Energy Reviews 2009;13(9) 2225-2244.
4. Gasia J, Miró L, Cabeza LF. Materials and system requirements of high temperature
thermal energy storagesystems: A review. Part 2: Thermal conductivity enhancement
techniques, Renewable and Sustainable Energy Reviews 2016;60:1584-1601.
5. Tay NHS, Cabeza LF. High temperature thermal storage systems using phase change
materials. Academic Press El Sevier 2018. ISBN: 978-0-12-805323-2.
6. Tay NHS, Liu M, Belusko M, Bruno F. Review on transportable phase change material in
thermal energy storage systems. Renewable and Sustainable Energy Reviews
2017;75:264-277.
7. Oh YK, Park SH, Cho YI. A study of the effect of ultrasonic vibrations on phase-change
heat transfer. International Journal of Heat and Mass Transfer 2002;45:4631-4641.
8. Zhang XJ, Qiu LM, Zhang P, Liu L, Gan ZH. Performance improvement of vertical ice
slurry generator by using bubbling device. Energy Conversion and Management
2008;49:83-88.

34
9. Vadasz JJ, Meyer JP, Govender S, Ziskind G. Experimental study of vibration effects on
heat transfer during solidification of paraffin in a spherical shell. Experimental Heat
Transfer 2016;29(3);285-298.
10. Hu F, Sun D, Gao W, Zhang Z, Zeng X, Han Z. Effects of pre-existing bubbles on ice
nucleation and crystallization during ultrasound-assisted freezing of water and sucrose
solution Innovative Food Science and Emerging Technologies 2013;20:161-166.
11. Mohamed MM. Solidification of phase change material on vertical cylindrical surface in
holdup air bubbles. International Journal of Refrigeration 2005;28:403-411.
12. Study of the effect of convection on close contact melting of high Prandtl number
substances. International Journal of Thermal Sciences 2007;46(3);213-220.
13. Bareiss M, Beer H. An analytical solution of the heat transfer process during melting of an
unfixed solid phase change material inside a horizontal tube. International Journal of Heat
and Mass Transfer 1984;27;739-746.
14. Kozak Y, Rozenfeld T, Ziskind G. Close-contact melting in vertical annular enclosures
with a non-isothermal base: Theoretical modeling and application to thermal storage.
International Journal of Heat and Mass Transfer 2014;72;114-127.
15. Zipf V, Neuhäuser A, Willert D, Nitz P, Gschwander S, Platzer W. High temperature
latent heat storage with a screw heat exchanger: design of prototype. Applied Energy
2013;109:462-69.
16. Pointner H. Entwicklung und Demonstration eines Phasenwechselspeichers mit Trennung
von Leistung und kapazität. Doctoral dissertation. Stutgart University, Germany 2016.
17. Tay NHS, Belusko M, Liu M, Bruno F. Investigation of the effect of dynamic melting in a
tube-in-tank PCM system using a CFD model. Applied Energy 2015;137:738-47.
18. Tay NHS, Bruno F, Belusko M. Experimental investigation of dynamic melting in a tube-
intank PCM system. Applied Energy 2013;104:137-48.
19. Gasia J, Tay NHS, Belusko M, Cabeza LF, Bruno, F. Experimental investigation of the
effect of dynamic melting in a cylindrical shell-and-tube heat exchanger using water as
PCM. Applied Energy 2017;185:136-145.
20. Incropera FP, and David P. DeWitt. Fundamentals of Heat and Mass Transfer. New York,
USA: J. Wiley, 2002. ISBN: 0-471-3060-3.
21. Mat web. Properties of AISI 4340 Steel, annealed, 25 mm round.
http://www.matweb.com/search/datasheet.aspx?matguid=fd1b43a97a8a44129b32b9de0d7
d6c1a&ckck=1. Last accessed: 10/07/2018
22. Kheirabadi AC, Groulx D. Simulating phase change heat transfer using COMSOL and
FLUENT: Effect of the Mushy-Zone constant. Computational Thermal Sciences
2015;7(5-6);427-440.

35
23. Kabbara M, Kheirabadi AC, Groulx D. Numerical modelling of natural convection driven
melting for an inclined/finned rectangular enclosure. Proceedings of the ASME 2016
Summer Heat Transfer Conference, Washington, USA.
24. Biwole PH, Eclache P, Kuznik F. Phase-change materials to improve solar panel's
performance. Energy and Buildings 2013;62;59-67.
25. Brent AD, Voller VR, Reid KJ. Enthalpy-porosity technique for modeling convection-
diffusion phase change: application to the melting of a pure metal. Numerical Heat
Transfer 1988;13(3);297-318.
26. Hameter M, Walter H. Influence of the Mushy Zone Constant on the Numerical
Simulation of the Melting and Solidification Process of Phase Change Materials.
Computer Aided Chemical Engineering 2016;38;439-444
27. Voller VR., Prakash C. A fixed grid numerical modelling methodology for convection-
diffusion mushy region phase-change problems. International Journal of Heat and Mass
Transfer 1987;30 1709-1719.
28. Kumar M, Jaya Krishna D. Influence of Mushy Zone Constant on Thermohydraulics of a
PCM. Energy Procedia 2017;109;314-332.
29. Danaila I, Moglan R, Hecht F, Le Masson S. A Newton method with adaptive finite
elements for solving phase-change problems with natural convection, Journal of
Computational Physics 2014:274:826-840.
30. Armaly BF, Durst F, Pereira JCF, Schonung B. Experimental and theoretical investigation
of backward-facing step flow. Journal of Fluid Mechanics 1983:127:473-496
31. Lima RC, Andrade CR, Zaparoli EL. Numerical study of three recirculation zones in the
unilateral sudden expansion flow. International Communications in Heat and Mass
Transfer 2008:35(9):1053-1060.
32. Roul M, Sukanta KD. Two‐phase pressure drop caused by sudden flow area
contraction/expansion in small circular pipes. International Journal for Numerical
Methods in Fluids 2011:66(11):1420-1446