
Making biosignals available - TDX (Tesis Doctorals en Xarxa)
Upload
khangminh22Category
view
0download
0
ii
“thesis” — 2014/9/8 — 10:58 — page i — #1 ii
ii
ii
Positive selection in humans: fromsingle genes to interaction maps
Pierre Luisi
TESI DOCTORAL UPF / ANY 2014
DIRECTORS DE LA TESI
Jaume Bertranpetit and Hafid LaayouniDepartament of Experimental and Health Sciences

ii
“thesis” — 2014/9/8 — 10:58 — page ii — #2 ii
ii
ii

ii
“thesis” — 2014/9/8 — 10:58 — page iii — #3 ii
ii
ii
For my family. . .
iii

ii
“thesis” — 2014/9/8 — 10:58 — page iv — #4 ii
ii
ii

ii
“thesis” — 2014/9/8 — 10:58 — page v — #5 ii
ii
ii
You find the world is a very puzzlingplace and if you are willing to bepuzzled, you can learn. [...] Learningcomes from asking ”Why do thingswork like that, not some other way?”
Is the man who is tall happy?An Animated Conversation with Noam Chomsky
Documentary by Michel GondryNOAM CHOMSKY
v

ii
“thesis” — 2014/9/8 — 10:58 — page vi — #6 ii
ii
ii

ii
“thesis” — 2014/9/8 — 10:58 — page vii — #7 ii
ii
ii
Acknowledgments
OH! I get by with a little help from myfriends.
Sgt pepper’s lonely hearts club bandTHE BEATLES
I wished the moment to acknowledge all the people who supported me toaccomplish my PhD would never come. Finalizing my thesis feels likethe end of an incredible period, rather than an achievement. The time Ihave spent in Barcelona, including at the IBE, has been really amazing.I had a lot of pleasure and I have grown both scientifically and person-ally during those last years. I owe it to all the incredible people I haveinteracted with, and it would be difficult to exhaustively thank everyonesufficiently.
First of all, I wish to naturally thank my supervisors. Jaume and Hafidyou have been supportive in so many ways. You made working with youso easy. I really appreciate everything you have done to make my lifeeasier in Barcelona. From the extra beginning you proved that humanelyyou care about your students. Hafid, you helped me to set up in Barcelonawhen the first wage lasted to come, then you always offered your supportwhen I had some uneasy moments to go through. Jaume, you tried to finda solution so that my partner at that time could stay in Barcelona. I amsure not that all the supervisors would do what you both did. I am verythankful for that. More importantly for this thesis, I learnt a lot from yoursupervision. You both have been very patient when I lost faith in someprojects. You accepted my directness when I was beset by impatienceand desperation. You took time to listen to all of my doubts and worries.Especially you Hafid, you supported me to answer those doubts and findsolutions when I felt a project was blocked or even not worth to follow.Jaume, I really enjoyed learning from your vision of science, always try-ing to put our scientific activities within a bigger biological frame, alwaysanticipating the knowledge and technical outbreaks to come. I also really
vii

ii
“thesis” — 2014/9/8 — 10:58 — page viii — #8 ii
ii
ii
wish to thank both of you for all the freedom you gave me to follow someprojects with co-workers outside the IBE. I have learnt a lot during thisPhD, both from the independence I had and directly from yourselves. Icould not expect better supervisors, and I feel ready to keep on in my sci-entific career thanks to all what I have learnt under your supervision.I would like to thank former and present members of the EvolutionarySystem Biology Group led by Jaume Bertranpetit for their scientific sup-port and their kindness during those years. Thank to the ones who sharedmy office, Gio, Ludo, Brandon, Marc and Bego, for standing all my —or-ganized — chaos and my overflowing energy in front of the bright screen.I wish to thank the “Boosting team”, Gio, Marc and Johannes for this veryinteresting project. It really boosted my learning process!I also have to thank everybody in BioEvo. Working there has been amaz-ing. A special thank goes to Txema, Jordi and Angel for this very robustcluster you have put together and you manage efficiently, it makes ourwork so easier. Thanks to Arcadi, Diego and David for the useful com-ments on the interactome paper. Thanks Ferran for your tips on the Post-doc positions.
I want to thank people outside the IBE with whom I have worked. First,I naturally have to thanks David Alvarez-Ponce. I started my PhD whileyou were finishing yours, you are now Assistant Professor at the Univer-sity of Nevada, USA. You have moved forward quite fast and I have learnta lot from your rigour. Your contribution in the papers we co-signed isamazing and made them of much higher quality, as much for the contentas for the style. Thanks Mario Fares for your contribution in the interac-tome paper.I would like to thanks members of Anna Di Rienzo lab for their welcomeat the University of Chicago back in 2012. I would also like to thankOscar Lao at Erasmus MC University, Rotterdam, the Netherlands, forthe exciting on-going project on selection on standing variants, as well asTom Gilbert at the Centre for GeoGenetics, Copenhagen, Denmark, forthe invitation to Copenhagen and for having trusted in me for the promis-ing project on ancientDNA.
viii

ii
“thesis” — 2014/9/8 — 10:58 — page ix — #9 ii
ii
ii
Last of the people I have been working with, but not least, I am verythankful to Audrey, Emmanuelle and Blandine for including me in yourprojects on pharmacogenetics. I especially have a thought to Blandinefor all the hours trying to solve some issues by chat. Your thesis has beenfraught with difficulties, but your forceful personality allowed you to keepon. I admire you for that. Thanks you Audrey for all those years workingtogether. It is such a pleasure to work with someone like you. Thanks forhaving trusted in me while I was still a bachelor student, for all advices inmy career, all the invitations to Paris and the on-going projects with theUMR-216. Thanks for having brought me to know this research unit, andthanks for having suggested me as a workshop facilitator at the Univer-sity of Ghana. I am sure our collaboration is just at its beginning and I amlooking forward to working with you on future projects. Thanks Laurefor the wonderful work you have done on the HLA-G study.
Gracias a la banda del Tupper//Taper/Toper/Taper/Tuper club por todosestos magnıficos almuerzos compartiendo comida. Cada dıa, el almuerzofue una experiencia increıble. Estoy muy orgulloso de ser parte de este ex-perimento social, donde el grupo vale, donde el individualismo no tienelugar. Aunque al principio eran todos companeros de trabajo nada mas(dedicatoria a Marıa!), hemos crecido una amistad muy fuerte y me sientomuy cercano a todos los miembros, sean pasados o presentes. Hemostenido momentos bien divertidos almorzando en esta terraza pero tambienafuera del PRBB! Gracias a (por orden alfabetico, ası no hay celos posi-bles... se que todos son un poco susceptibles) Alicia, Diego, Elena, Fede,Johannes, Juan, Katharina, Ilaria, Lara, Lisa, Marc, Marco, Marıa, Miruna,Nino y Vero. Les deseo seguir ası mucho tiempo, no sin envidia. Para citara un miembro (le dejare el beneficio del anonimato): “El taperclub es lomejor que me ha pasado en el doctorado... by far!”. Prometo que cuandoeste de visita en Barcelona les cocinare mi especialidad, una leyenda delexito culinario: los mıticos pulpitos!Quiero agradecer especialmente a Diego por todas las horas escuchandomis pajas mentales, hablando de las tuyas y sobre todo por el apoyo encualquier situacıon; a Elena (y Marc seu) por —entre muchas mas cosas
ix

ii
“thesis” — 2014/9/8 — 10:58 — page x — #10 ii
ii
ii
— Granada y por dejarme dormir en su sofa tantas veces; a Marc y Marıa,ası como a Diego (y Abril), por la ayuda cuando estaba buscando hogar(para variar); a Nino por las horas de palas en la playa y por Sicilia. Gra-cias Marc (apareces demasiado en estos agradecimientos, eh!) por todaslas pausas “cigarouuu”. Hemos sublimado nuestro espıritu crıtico sobrenuestros proyectos, ciencia y polıtica. Solo para estas pausas, valio lapena empezar a fumar tan tarde... Ahora que me voy, lo puedo dejar!Gracias a los Anomalocaris por este ano en la liga de basket, especial-mente a Diego, Ignasi y Javi. Me la pase muy bien. Ojala volvamos ajugar juntos pronto. Gracias a todos los locos que ”madrugan” para jugarun partido de futbol antes del “curo” una vez a la semana, a los del IMIMy del CRG por los partidos semanales de basket, a todos que bajan a jugara beachvolley en el verano y a Javi por los demasiados pocos partidos detenis.
Quiero agradecer a la gente con quien me ha encantando vivir estos anos.Karla, por esos anos felices juntos, gracias por haber probado tanto paraque funcionara nuestra historia. Ası va la vida, suerte en tu nuevo camino.Gracias a Tania y Martha por haber conseguido hacerme sentir en casadesde el primer dıa. Se me hace difıcil marchar de Barcelona tambienporque me encanta vivir con ustedes dos, mamasitas!Gracias Nata, el ano que hemos coincidido en Barcelona fue genial. Nosvemos en Peru prontito.
Je veux aussi remercier MG Gold pour cette fameuse chanson dont jetairai le titre... Merci aux loustiques, mes amis de longue date, vous mepermettez de me vider la tete regulierement. Merci donc Alex, Bestion,Banette, Guyves, Laurent, Manu, Mehdi, Mehdi (l’autre), Nico, Seb etZig pour les moments intenses que l’on passe a chaque rencontre.
Enfin, je veux remercier le clan Luisi! Je sais la chance que j’ai de fairepartie d’une telle famille, une famille soudee et ou les choix des uns etdes autres sont respectes. Merci Anne et Michel pour tout le soutien que
x

ii
“thesis” — 2014/9/8 — 10:58 — page xi — #11 ii
ii
ii
vous m’avez toujours apporte et pour votre amour. Je suis vraiment fierde l’education que voue nous avez inculquee et de me sentir si prochede vous. Merci Gates et Titou pour les bons moments que l’on passeensemble. C’est assez malheureux qu’ils soient si peu frequents, mais jepense a vous! Merci a Grand-Pere et Grand-Mere pour tout l’amour quevous nous avez donne.
Encore merci a tous!Thanks again to everyone!Otra vez, gracias a todos!
Pierre Luisi Barcelona, Spain Septembre 6, 2014
This research was supported by a Ph.D. fellowship from ”Accion Es-trategica de Salud, en el marco del Plan Nacional de Investigacion Cientıfica,Desarrollo e Innovacion Tecnologica 2008–2011” from Instituto de SaludCarlos III.
xi

ii
“thesis” — 2014/9/8 — 10:58 — page xii — #12 ii
ii
ii
ii
“thesis” — 2014/9/8 — 10:58 — page xiii — #13 ii
ii
ii
Abstract
From Darwin’s Origin of the Species to the recent wealth in genomic data,many biologists have focused their research on understanding how naturalselection has shaped the variability among and within species. Althoughtheoretical and empirical advances have been remarkable, most biologicalmechanisms underlying the molecular basis of human adaptation remainto be elucidated. The selectionist view of adaptation accounted for thebias towards independent gene evolution. Most published studies aimingat detecting positive selection using either polymorphism or divergencedata have been performed using a gene-candidate or a genome-wide scanapproach, as described in the two first articles presented here. However,gene evolution is largely influenced by the biological context in whichthe encoded protein performs its intrinsic function(s). The phenotype, notthe genotype, is at the interface with natural selection. Thus, in orderto understand gene evolution, and particularly when considering adaptiveselection, it is crucial to reduce the gap between genotype and pheno-type. Genes and proteins do not act in isolation, but rather interact onewith others in order to perform a given biological function. Therefore,when studying natural selection at molecular level one promising frame-work is to consider gene networks, as described in the two last articles ofthe present thesis. Analyses of gene networks describing the Insulin/TORtransduction signalling cascade and the whole protein-protein physical in-teraction map hold very striking results. Namely, genes acting at the coreof both networks, thus having either more effect on a given phenotype ormore pleiotropic effects within the organism, are more likely to be tar-geted by recent positive selection, as inferred using polymorphism data.
xiii

ii
“thesis” — 2014/9/8 — 10:58 — page xiv — #14 ii
ii
ii
ii
“thesis” — 2014/9/8 — 10:58 — page xv — #15 ii
ii
ii
Resumen
Desde el “Origen de las Especies” de Darwin a la reciente revoluciongenomica, muchos biologos han centrado su investigacion en la compren-sion de como la seleccion natural ha dado forma a la variabilidad entre ydentro de las especies. Aunque, los avances teoricos y empıricos han sidonotables, la mayorıa de los mecanismos biologicos que subyacen a las ba-ses moleculares de la adaptacion biologica aun no estan suficientementeesclarecidos. La vision seleccionista de adaptacion marco el sesgo de losestudios evolutivos hacia el analisis de genes individuales. La mayorıade estudios publicados destinados a la deteccion de la seleccion positivautilizando datos de polimorfismo o de divergencia se han realizado uti-lizando un gen candidato o un enfoque de exploracion genomica, comose describe en los dos primeros artıculos presentados en la presente tesis.Sin embargo, la evolucion de genes esta muy condicionada por el con-texto biologico en el que cada gen realiza su funcion intrınseca, siendoel fenotipo, y no el genotipo, su materia primaria. Por lo tanto, a fin decomprender la evolucion de genes, y en particular cuando se considera laevolucion adaptativa, es crucial reducir la brecha entre el genotipo y elfenotipo. Los genes y las proteınas no actuan de manera aislada, sino queinteractuan entre sı con el fin de realizar una funcion biologica determi-nada. Por lo tanto, un marco prometedor al estudiar la seleccion naturala nivel molecular seria considerar las redes de genes, como se describeen los dos ultimos artıculos de la presente tesis. Los analisis de los da-tos de polimorfismo genetico, tanto de los genes que componen la vıa dela insulina, como de los todos los genes descritos en los mapas fısicosde interaccion proteına-proteına tienen resultados muy sorprendentes: losgenes que actuan en el nucleo de ambas redes, teniendo ası mas efec-to sobre un determinado fenotipo o mas efectos pleotropicos dentro delorganismo, tienen mas probabilidades de ser el blanco de la seleccion po-sitiva reciente.
xv

ii
“thesis” — 2014/9/8 — 10:58 — page xvi — #16 ii
ii
ii

ii
“thesis” — 2014/9/8 — 10:58 — page xvii — #17 ii
ii
ii
Resum
Des del ”Origen de les Especies”de Darwin fins a la recent revoluciogenomica, molts biolegs han centrat la seva investigacio a la compren-sio de com la seleccio natural ha donat forma a la variabilitat existententre i dins de les especies. Tot i que els avencos teorics i experimentalshan estat notables, la majoria dels mecanismes biologics subjacents a lesbases moleculars de la adaptacio biologica no estan prou aclarits.Els estudis evolutius per entendre l’adaptacio estan esbiaixats cap a lacomprensio de l’accio de gens individuals. La majoria d’estudis publicatsdestinats a la deteccio de la seleccio positiva (adaptativa) utilitzant dadesde polimorfisme o de divergencia, s’han realitzat utilitzant o be gens can-didats o be un enfocament d’escaneig de tot el genoma, tal com es descriuen els dos primers articles presentats en aquesta tesi.No obstant aixo, l’evolucio de gens esta molt condicionat pel context bi-ologic en el qual la proteına codificada per cada gen realitza la seva propiafuncio. El fenotip, no el genotip, es a la interfıcie directa amb la seleccionatural. Per tant, per tal per entendre l’evolucio dels gens, i en particu-lar quan es considera la seleccio adaptativa, es crucial reduir la separacioentre el genotip i el fenotip. Els gens i les proteınes no actuen de maneraaıllada, sino que interactuen uns amb altres per tal de realitzar una funciobiologica determinada. Per tant, per l’estudi de la seleccio natural a nivellmolecular, un marc prometedor es considerar les xarxes de gens, tal comes descriu en els dos ultims articles de la present tesi.Les analisis de la xarxa de gens que descriuen la cascada de transducciode senyals de la insulina/TOR i del conjunt total del mapa d’interaccionsfısiques proteına-proteına en humans tenen resultats molt sorprenents. Defet, els gens que actuen en el nucli de totes dues xarxes (i que per tant te-nen mes impacte en un determinat fenotip i mes efectes pleiotropics dinsde l’organisme), tenen mes probabilitats de ser la diana de la selecciopositiva recent que no pas els gens amb menys interaccions.
xvii

ii
“thesis” — 2014/9/8 — 10:58 — page xviii — #18 ii
ii
ii

ii
“thesis” — 2014/9/8 — 10:58 — page xix — #19 ii
ii
ii
PREFACE
Most achievements in science are to acertain degree group efforts.
Speech at the Nobel Banquet inStockholm, December 10, 1960
WILLARD LIBBY
In 1859, with his masterpiece The Origin of the Species Charles R. Dar-win laid the cornerstone of evolutionary biology. Nevertheless, it is notuntil the 1920s that the field properly began with the visionary work fromfew theoreticians. Indeed, at that time and in the following decades,Ronald R. Fisher, Sewall Wright and J. B. S Haldane developed the mod-ern evolutionary synthesis through the formulation of the mathematicalbackground for population genetics. Since then, this field has been longlasting. The insights from population genetics into evolutionary biologyare extraordinary. To broaden the understanding on the main evolutiveforces at play, cross-talks between theoretical development and empir-ical observations have proved to be essential. During almost one cen-tury of population genetics and evolutionary biology, lively discussionshave been frequently rekindled thanks to many empirical and theoreticalbreakthroughs. In the last few years, evolutionary biology and popula-tion genetics have been living a very exciting moment. Indeed, with theadvent of high-throughput technologies to produce large amount of datawith increasing confidence, the so-called “-omics” era could begin. Greatamount of data from genomics, interactomics, metabolomics, transcrip-
xix

ii
“thesis” — 2014/9/8 — 10:58 — page xx — #20 ii
ii
ii
tomics, epigenomics, etc., are now available. Such wealth in data mayseem overwhelming and much effort is still required to process and fullyunderstand it. Although this is challenging, biology is now moving from atraditionally reductionist view and we are more and more able to considermany layers of complexity to answer many interesting biological issuesand interrogate and/or improve the models traditionally used. Particularly,evolutionary biology is now on the path to leave behind the gene-centricview which led the field for many years, as more information on the genefunction and context can be included to attempt to bridge the gap betweengenotype and phenotype.
Considering the biological pathways in which genes participate is oneof the emerging frameworks for evolutionary biology studies. Very fewstudies on how natural selection acts within gene networks have beenpublished to date. Specifically, the impact of positive selection acrossgene networks has been overlooked. The present thesis introduces thefirst study of the relationship between gene adaptive evolution and theposition occupied by the protein it encodes in a given functional pathway.Then, it focuses on a study at much larger scale which demonstrates howchallenging it is to fully understand the molecular mechanisms drivingadaptive evolution.
The kind of analyses presented in this thesis deeply rely on an accuraterepresentation of the interactions among proteins. However, althoughtechnical and technological efforts have been made to produce such anamount of data, it remains a relatively significant number of errors. Whenstudying small-scale networks, such as those representing specific biolog-ical pathways, the errors can be addressed retrieving information from theliterature. Therefore, earlier efforts by many researchers makes possibletechnical and technological progresses to improve each day the accuracyof the produced data. A special thought also goes to all the persons whomanually curate the databases by retrieving information from decades ofefforts in biochemistry and molecular biology. The modest contributionto the field of evolutionary biology presented in this thesis would not havebeen possible without all this people.
xx

ii
“thesis” — 2014/9/8 — 10:58 — page xxi — #21 ii
ii
ii
Contents
PREFACE xix
Abbreviations xxv
List of figures xxviii
List of tables xxix
I Introduction 1
1 BACKGROUND 31.1 The rise of Homo Sapiens and its history. . . . . . . . . 31.2 Human genetic variation. . . . . . . . . . . . . . . . . . 6
1.2.1 Types of genetic variation. . . . . . . . . . . . . 61.2.2 Available polymorphism data. . . . . . . . . . . 10
1.3 What determines genetic diversity levels within species? 131.3.1 Natural selection in action. . . . . . . . . . . . . 141.3.2 The neutral theory: the role of genetic drift in
evolution. . . . . . . . . . . . . . . . . . . . . . 191.4 Statistical approaches to identifying signals of positive se-
lection. . . . . . . . . . . . . . . . . . . . . . . . . . . 241.4.1 Using divergence data. . . . . . . . . . . . . . . 251.4.2 Using polymorphism data. . . . . . . . . . . . . 29
xxi

ii
“thesis” — 2014/9/8 — 10:58 — page xxii — #22 ii
ii
ii
1.5 Practical challenges in detecting positive selection usingpolymorphism data. . . . . . . . . . . . . . . . . . . . . 351.5.1 Distortions due to ascertainment bias. . . . . . . 371.5.2 The confounding factor of background selection. 401.5.3 Demography can mimic positive selection. . . . 421.5.4 Has a region of interest evolved under positive se-
lection? . . . . . . . . . . . . . . . . . . . . . . 431.5.5 Selection not only by hard sweep. . . . . . . . . 561.5.6 From putative advantageous mutation to the in-
creased fitness. . . . . . . . . . . . . . . . . . . 651.6 Current knowledge on positive selection in the human
genome. . . . . . . . . . . . . . . . . . . . . . . . . . . 701.6.1 Candidate gene studies of positive selection. . . . 701.6.2 Genome-wide scans for positive selection. . . . . 711.6.3 Insights from published studies of positive selec-
tion in humans. . . . . . . . . . . . . . . . . . . 741.7 The network framework. . . . . . . . . . . . . . . . . . 83
1.7.1 Interest of biological networks to understand nat-ural selection. . . . . . . . . . . . . . . . . . . . 83
1.7.2 Biological pathways and their representation asnetworks. . . . . . . . . . . . . . . . . . . . . . 85
1.8 Evolutionary patterns within biological networks. . . . . 911.8.1 Evolutionary analysis of small-scale networks. . 921.8.2 Evolutionary analysis of large-scale networks. . . 94
2 OBJECTIVES 1052.1 Study the impact of positive selection on a candidate gene. 1062.2 Scan the genome for positive selection. . . . . . . . . . . 1072.3 Distribution of selective events within a small-scale protein-
protein interaction map. . . . . . . . . . . . . . . . . . . 1072.4 Distribution of selective events within a large-scale protein-
protein interaction map. . . . . . . . . . . . . . . . . . . 108
xxii

ii
“thesis” — 2014/9/8 — 10:58 — page xxiii — #23 ii
ii
ii
II Results 111
3 STUDY THE IMPACT OF POSITIVE SELECTION ON ACANDIDATE GENE. 113
4 SCAN THE GENOME FOR POSITIVE SELECTION. 129
5 DISTRIBUTION OF SELECTIVE EVENTS WITHIN A SMALL-SCALE PROTEIN-PROTEIN INTERACTION MAP. 137
6 DISTRIBUTION OF SELECTIVE EVENTS WITHIN A LARGE-SCALE PROTEIN-PROTEIN INTERACTION MAP. 153
III Discussion 187
7 DISCUSSION 1897.1 General remarks on the four studies described. . . . . . . 190
7.1.1 Single gene studies. . . . . . . . . . . . . . . . . 1907.1.2 Network-level analyses. . . . . . . . . . . . . . 194
7.2 Evolutionary system biology is dead! Long life to evolu-tionary system biology! . . . . . . . . . . . . . . . . . . 2047.2.1 Insights from network-level analyses: Is the glass
half-full or half-empty? . . . . . . . . . . . . . . 2047.2.2 Other mechanisms at stake: lessons from protein
evolutionary rates. . . . . . . . . . . . . . . . . 2087.2.3 Perspectives in evolutionary system biology. . . . 212
8 CONCLUSIONS 219
IV Appendix 221
LIST OF PUBLICATIONS 223
SUPPLEMENTARY MATERIALS. 227
xxiii

ii
“thesis” — 2014/9/8 — 10:58 — page xxiv — #24 ii
ii
ii
A MACHINE-LEARNING FRAMEWORK TO DETECT ANDCLASSIFY HARD SELECTIVE SWEEPS IN HUMAN POP-ULATIONS. 257
Bibliography 301
xxiv

ii
“thesis” — 2014/9/8 — 10:58 — page xxv — #25 ii
ii
ii
Abbreviations
AVK : Anti Vitamine KBp : Base pairBGS : Background SelectionCEU : European ancestry population from UtahCHB : Han Chinese population from BeijingCDS : Coding SequenceCCDS : Conserved Coding SequenceCNV : Copy Number VariantCMS : Composite Multiple ScoreDAF : Derived Allele FrequencyEHH : Extended Haplotype HomozygosityENCODE : Encyclopedia of DNA ElementseQTL : expression Quantitative Trail LocusFAF : Final Allele FrequencyFDR : False Discovery RateFGM : Fisher’s Gemotric Model of AdaptationFPR : False Positive RateGWAS : Genome-Wide Association StudyiHS : integrated Haplotype ScoreIS : Individual SiteJPT : Japanese population from TokyoKb : KilobaseKYA : Thousand Years AgoKEGG: Kyoto Encyclopedia of Genes and Genomes
xxv

ii
“thesis” — 2014/9/8 — 10:58 — page xxvi — #26 ii
ii
ii
HGDP : Human Genome Diversity PanelHPRD : Human Protein Reference DatabaseIT pahway : Insulin/TOR transduction pathwayLD : Linkage DisequilibriumLRH : Long Range HaplotypeMAF : Minor Allele FrequencyMAPK : Mitogen Activated Protein KinaseMb : MegabaseMCMC : Markov Chain Monte CarloMK test : McDonald-Kreitman testMRCA : Most Recent Common AncestormRNA : messenger RNAMYA : Million Years AgomtDNA : mitochondrial DNANGS : Next-Generation SequencingPANTHER : Protein Analysis Through Evolutionary RelationshipsPIN : Protein-protein Interaction NetworkPPI : Physical Protein-protein InteractionPS : Pooled SitesQTL : Quantitative Trait LocusSFS : Site Frequency SpectrumSNP : Single Nucleotide PolymorphismSNV : Single Nucleotide VariantSV : Structural VariantSVM : Support Vector MachineTF : Transcription FactorTLR : Toll-Like ReceptorUTR : Untranslated RegionXP-EHH : Cross-population Extended Haplotype HomozygosityY2H : Yeast 2-HybridsYRI : Yoruba population from Nigeria
xxvi

ii
“thesis” — 2014/9/8 — 10:58 — page xxvii — #27 ii
ii
ii
List of Figures
1.1 A map of prehistoric diaspora of modern humans . . . . 51.2 A model describing the Out-of-Africa . . . . . . . . . . 71.3 Types of genetic variation . . . . . . . . . . . . . . . . . 91.4 The different modes of natural selection . . . . . . . . . 171.5 genetic drift in a finite population. . . . . . . . . . . . . 191.6 Simulated allele frequency trajectories under genetic drift. 211.7 Sequence divergence among different site classes. . . . . 221.8 Time scales for the signature of selection. . . . . . . . . 261.9 Molecular patterns in genomic region suffering selective
sweep. . . . . . . . . . . . . . . . . . . . . . . . . . . . 301.10 Extended Haplotype Homozygosity decay. . . . . . . . . 321.11 Site Frequency Spectrum under different evolutionary mod-
els. . . . . . . . . . . . . . . . . . . . . . . . . . . . . . 341.12 Ascertainment Bias in HapMap populations. . . . . . . . 381.13 Background Selection and molecular diversity. . . . . . . 411.14 Coalescence. . . . . . . . . . . . . . . . . . . . . . . . 471.15 Outlier approach. . . . . . . . . . . . . . . . . . . . . . 501.16 The DH test. . . . . . . . . . . . . . . . . . . . . . . . 531.17 Selection on standing variant. . . . . . . . . . . . . . . . 581.18 Selection on recurrent mutation. . . . . . . . . . . . . . 591.19 Polygenic adaptation. . . . . . . . . . . . . . . . . . . . 601.20 Example of SNP detected by BayENV . . . . . . . . . . 621.21 There is no strong differentiation between close populations. 631.22 Covariance of genotype and phenotype. . . . . . . . . . 66
xxvii
ii
“thesis” — 2014/9/8 — 10:58 — page xxviii — #28 ii
ii
ii
1.23 An integrative approach. . . . . . . . . . . . . . . . . . 681.24 A map of signals of positive selection from 10 genome-
wide scans. . . . . . . . . . . . . . . . . . . . . . . . . 751.25 Mean genetic value QX for several phenotypes. . . . . . 781.26 Gene expression drives local adaptation in humans. . . . 811.27 Most human recent positive selection occurs in regulatory
sequences. . . . . . . . . . . . . . . . . . . . . . . . . . 821.28 Cross-talks among different pathways. . . . . . . . . . . 901.29 Fisher’s geometric model of adaptation. . . . . . . . . . 911.30 Events of positive selection are more likely to occur at
the periphery of the Physical Protein-protein InteractionNetwork. . . . . . . . . . . . . . . . . . . . . . . . . . 98
1.31 MULTINET: a meta-network integrating different typesof large-scale networks. . . . . . . . . . . . . . . . . . . 102
7.1 Visual inspection of signal of positive selection for the ITpathway genes. . . . . . . . . . . . . . . . . . . . . . . 198
7.2 Bridge the gap between genotype and phenotype. . . . . 2057.3 Integration of physical interaction maps into a model of
genotype-phenotype-fitness map. . . . . . . . . . . . . . 2097.4 Interindependance between gene features that affect evo-
lutionary constraint. . . . . . . . . . . . . . . . . . . . . 2107.5 Metabolic flux is a determinant of the evolutionary rates
of enzyme-encoding genes in human erythrocytes. . . . . 216
xxviii

ii
“thesis” — 2014/9/8 — 10:58 — page xxix — #29 ii
ii
ii
List of Tables
1.1 Statistics implemented by Pybus et al. (2014) . . . . . . 361.2 Different demographic processes. . . . . . . . . . . . . . 451.3 Examples of positively selected genes supported by func-
tional evidence. . . . . . . . . . . . . . . . . . . . . . . 691.4 Elements and their interactions within the different types
of biological networks. . . . . . . . . . . . . . . . . . . 87
xxix

ii
“thesis” — 2014/9/8 — 10:58 — page xxx — #30 ii
ii
ii

ii
“thesis” — 2014/9/8 — 10:58 — page 1 — #31 ii
ii
ii
Part I
Introduction
1

ii
“thesis” — 2014/9/8 — 10:58 — page 2 — #32 ii
ii
ii

ii
“thesis” — 2014/9/8 — 10:58 — page 3 — #33 ii
ii
ii
Chapter 1
BACKGROUND
Nothing in biology makes sense exceptin the light of evolution.
THEODOSIUS DOBZHANSKY
Darwin would have loved DNA.
LINDELL BROMHAM
1.1 The rise of Homo Sapiens and its history.
Modern human lineage (Homo Sapiens) diverged from its closer livingrelative, the chimpanzee, about six million years ago (6 MYA). During allthose years, many different ancient hominin lineages appeared and dis-appeared, some of them being ancestors of modern humans [1]. Modernhumans emerged some 200 thousand years ago (200 KYA) somewherein Africa. The oldest fossil that has been classified as being the remainof a modern human was found in Ethiopia and dates to about 195 KYA[2]. The relationship and boundaries among the hominin lineages remain
3
ii
“thesis” — 2014/9/8 — 10:58 — page 4 — #34 ii
ii
ii
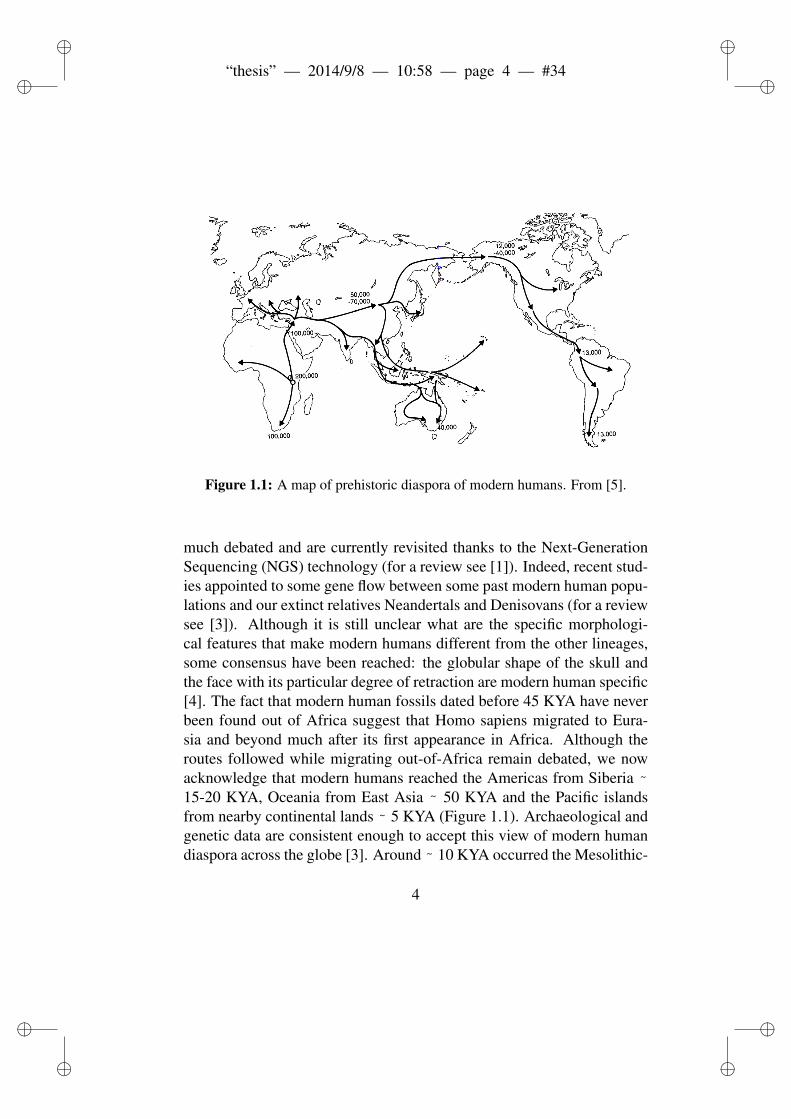
Figure 1.1: A map of prehistoric diaspora of modern humans. From [5].
much debated and are currently revisited thanks to the Next-GenerationSequencing (NGS) technology (for a review see [1]). Indeed, recent stud-ies appointed to some gene flow between some past modern human popu-lations and our extinct relatives Neandertals and Denisovans (for a reviewsee [3]). Although it is still unclear what are the specific morphologi-cal features that make modern humans different from the other lineages,some consensus have been reached: the globular shape of the skull andthe face with its particular degree of retraction are modern human specific[4]. The fact that modern human fossils dated before 45 KYA have neverbeen found out of Africa suggest that Homo sapiens migrated to Eura-sia and beyond much after its first appearance in Africa. Although theroutes followed while migrating out-of-Africa remain debated, we nowacknowledge that modern humans reached the Americas from Siberia ˜15-20 KYA, Oceania from East Asia ˜ 50 KYA and the Pacific islandsfrom nearby continental lands ˜ 5 KYA (Figure 1.1). Archaeological andgenetic data are consistent enough to accept this view of modern humandiaspora across the globe [3]. Around ˜ 10 KYA occurred the Mesolithic-
4
ii
“thesis” — 2014/9/8 — 10:58 — page 5 — #35 ii
ii
ii
Neolithic transition during which agricultural life-style appeared indepen-dently in several regions across the globe. This dramatic change from no-madic hunter-gatherer communities to more sedentary agriculturist onesallowed a dramatic expansions of human populations and cultural andsocial revolution with extensive technological improvements. Much ef-fort have been put into building demographic models to explain both thehuman expansion over different time-scales, and genetic data have madepossible to test them. By looking at genetic diversity and reconstructinggenetic phylogenies, we can infer the root (i.e. the common ancestor) ofour lineages and thus, trace back our origin. Maternal or paternal specificmarkers, namely markers located on mitochondrial DNA (mtDNA) andY-chromosome were the most used because besides being sex-specific,and thus having a simple mode of inheritance, are also non-recombinant,facilitating the analyses. The out-of-Africa hypothesis have been con-firmed because the human genetic diversity decrease with distance fromAfrica and populations out-of-Africa also present unique variants thoughtto be gained after their migration.The recent wealth in genetic diversity data and the unprecedented powerof computational modeling approaches allowed an increase power to inferthe history of the human populations. Those demographic models includeseveral past demographic events which are responsible for the observedvariation patterns and genetic diversity in the current human populationacross the globe. We can distinguish among two families. The first kindof models considers that the human expansion occurred through severalfounding events, where an initial population increases in size and, in turn,a subset of individuals found a subsequent population and so on and soforth [6–9]. The second class of models assumes a single out-of-Africaevent to Europe and Asia with subsequent population bottlenecks and ex-pansions. They also include migration among populations that can varyacross time. Most of these models only consider three populations rep-resenting African, European and Asian continents and, therefore, are ob-viously quite simplistic. However, they describe sufficiently past humandemography for many purposes in genetic studies focusing on populationsfrom these three continents. The most used model of this kind has been so
5
ii
“thesis” — 2014/9/8 — 10:58 — page 6 — #36 ii
ii
ii
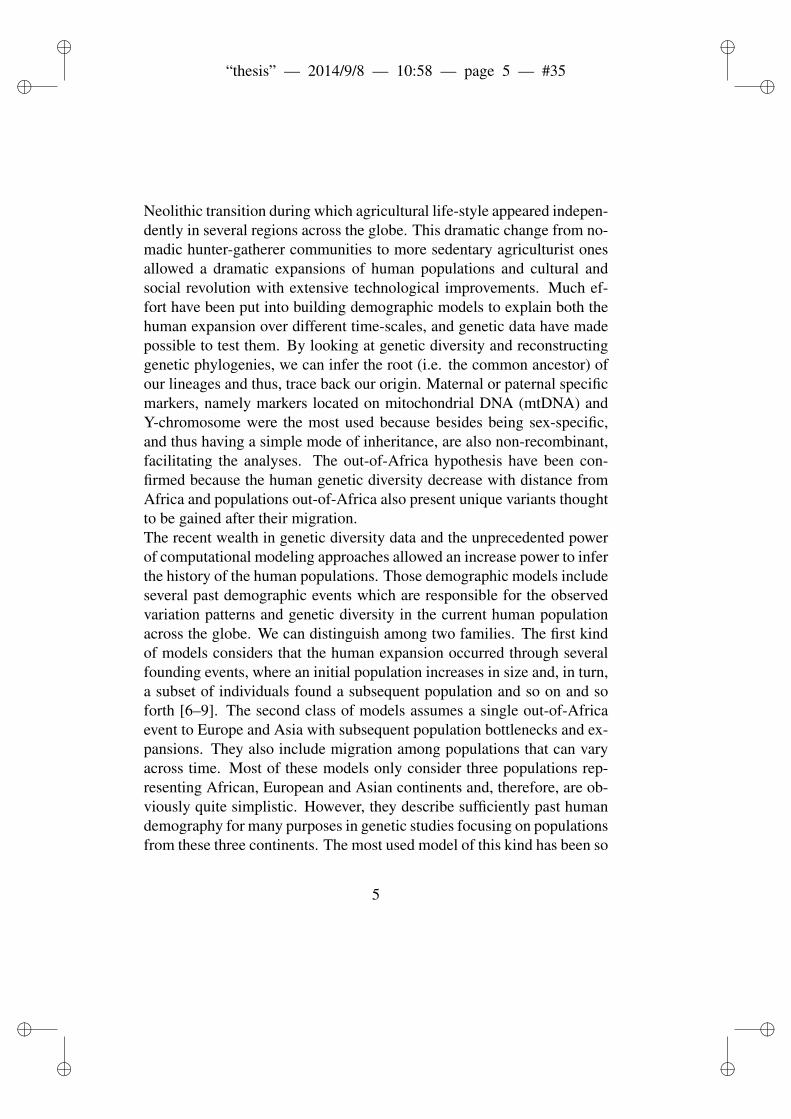
Figure 1.2: A model describing the modern human expansion with one singleout-of-Africa events. From [10].
far the one calibrating on HapMap III genotype data (www.hapmap.org)using COSI coalescent simulator [10] and shown in Figure 1.2. Recentlyother models with more complex demographic histories or more popula-tions have been implemented (e.g. in [11, 12]) as described in Section1.5.3.
1.2 Human genetic variation.
1.2.1 Types of genetic variation.
Although the genetic differences among two individuals has consequenceson the phenotypic variability, the genetic contribution to phenotypes hasnot been fully established and it is one of the main challenges in the21st century. Even though the phenotypic variability among individu-
6

ii
“thesis” — 2014/9/8 — 10:58 — page 7 — #37 ii
ii
ii
als seems important, any randomly pair of individuals in the world haveon average only 0.1% sequence difference. This means that two humangenomes share 99.9% of their variants. Recent available sequencing ofhuman DNA provided a detailled description of the variants segregat-ing in the genome of healthy individuals. Among the variants, there aresubstitutions and insertions/deletions, and they can be divided into threecategories (Figure 1.3) according to their corresponding number of basepairs (bps): (1) structural variants (SVs) encompassing from few kilo-bases (> 10Kb) to few megabase, including large deletions and inser-tions, inversions, macrosatellites and Copy Number Variants (CNVs); (2)SVs encompassing few hundreds of base pairs such as medium sized in-sertions and deletions and minisatellites (repeats of 10-100 bps); and (3)variants of few bps such as small insertions and deletions, microsatel-lites (repeats of 2-6 bps) and single base pair substitutions, called SingleNucleotide Variants (SNVs) or traditionally Single Nucleotide Polymor-phism (SNPs).In the present thesis, most analyses have been performed using SNVswhich are the most common and the most studied type of variation in thehuman genome. Single nucleotide polymorphisms are divided into twokinds. The transitions substitute either a pyrimidine to another pyrimi-dine (C to T or T to C) or a purine to another purine (A to G or G toA) while the transversions substitute a purine for a pyrimidine, or vice-versa. It has been observed 2-fold enrichment of segregating transitionsas compared to transversions. The potential explanation would be thatone purine (or pyrimidine) can be altered to the other purine (or pyrimi-dine), while it is impossible to chemically alter a purine to a pyrimidine(and vice versa). Another explanation could be that enzymes involved inDNA replication and correction are not able to correct transitions as wellas transversions. The mutation rate can be estimated through comparativegenomics (phylogenetic estimation), analysis of the frequency of new dis-ease loci in human populations (direct estimation) or using biochemicalknowledge of the DNA replication process (biochemical method). De-pending on the studies, the mutation rate differ but has been estimated tobe of the order of 10-8 per base per generation [9, 13, 14]. The mutation
7
ii
“thesis” — 2014/9/8 — 10:58 — page 8 — #38 ii
ii
ii
rate varies across the genome. For example, the CpG dinucleotide is amutation hotspot, with a mutation rate ˜ 10-fold higher than other basepairs and with a strong tendency to mutate to TpG or CpA because of thehigher rate for transition than for transversion.Beyond the genotypes, one can study the haplotypic variability. Haplo-types are the combinations of alleles that are inherited together becausethey are carried by the same chunk of the chromosome which has not beencut by any recombination event during meosis. Two loci are in linkagedisequilibrium (LD) if there is a specific combination of their alleles thatare observed on the same haplotype more often than expected at random.Knowing the haplotypes provide valuable information about ancestry andinheritance to perform evolutionary studies. Estimating haplotypes exper-imentally appears to be harsh, time-consuming and quite expensive. Asa consequence, many computational algorithms have been implementedto infer the haplotypes from genotypes. Those algorithms are mainlyMarkov Chain Monte Carlo (MCMC) methods within a Bayesian frame-work [15]. Mutation at genotypic level is obviously responsible for cre-ating new haplotypes. However, recombination is the main force drivinghaplotypic diversity. Recombination rates are not uniformly distributedalong the genome: there are recombination hotspots. Therefore, alleliccombinations are shaped in a haplotype-block manner. Recombinationhotspots are differently distributed in the genome according to the popula-tion, hence, recombination events are responsible for haplotypic diversityamong populations [16]. Finally, gene conversion (non reciprocal transferof genetic variants from one chromosome to the other), where one alleledoes not change whereas the other one converts to the same state as theunchanged allele, is also responsible for haplotypic variability.
1.2.2 Available polymorphism data.
The first draft of the human genome was released in 2001 thanks to two in-dependent sequencing efforts [17, 18]. This draft, as well as the followingones, does not consist in the sequence of the human genome. Indeed, it
8

ii
“thesis” — 2014/9/8 — 10:58 — page 9 — #39 ii
ii
ii
Figure 1.3: Types of genetic variation. Different genetic variations segregatingin a genome and classified according to their size in base pairs.
has been retrieved from a mosaic of many different genomes from differ-ent individual sequences. During the assembly of the first human genome,around 4 Millions SNVs were discovered. Those SNVs, represents singlenucleotide differences among the individuals used for the assembly.Since then, several project provided public access to genotype data fromsamples in worldwide populations. The work described in the presentthesis has been mostly performed on three main databases. A brief de-scription of each as well as their own strengths and drawbacks is thenrequired.
Human Genome Diversity Panel.The Human Genome Diversity Project (HGDP), led by Luca Cavalli-
Sforza and Allan Wilson, began in 1991. This project aimed at collecting,analyzing and making available a broad set of human samples all aroundthe globe . In 2002, a panel (called HGDP with now the P standing forPanel instead of Project) made available 1,064 cell lines from individualsfrom 51 populations representing the seven main geographic areas (Sub-
9

ii
“thesis” — 2014/9/8 — 10:58 — page 10 — #40 ii
ii
ii
Saharan Africa, Middle-East and North Africa, Europe, Central-SouthAsia, East Asia, Oceania and America) [19]. In 2008, Li et al. geno-typed 1,043 of those individuals distributed across 51 populations, on theIllumina HumanHap650K Beadchips. This array include 650 thousandsmarkers chosen to maximize tagging of additional common SNPs that arein LD with the genotyped SNPs. Those markers were described to tag inEuropean, Asian and African samples more than 90%, 88% and 67% ofSNPs with Minor Allele Frequency (MAF) above 5%, respectively. Themain drawback of this data results from the type of markers included. In-deed, Li et al. (2008) [9] reported a bias towards highest heterozygosityin Europe, with heterozygosity level being lower in Middle-East, Central-South Asia and three hunter-gatherers groups in Africa and followed byEast Asia. This bias, known as ascertainment bias, is the systemic dis-torsion of the allele frequency spectrum due to a a priori discovery ofthe polymorphism segregating in a reduced sample. Thus, when geno-typing individuals from other populations, especially isolated by distancefrom the ascertainment sample, one most certainly does not catch all thegenetic variation (more on ascertainment bias in 1.5.1).
International HapMap Project.In 2003 started the International HapMap Project. This project aimed
at developping a variant map of the human genome to describe the com-mon patterns of genetic variation. During the Phase I and II, ˜ 3.1 Mil-lion SNPs have been genotyped in 270 individuals from three differentpopulations [20]. The samples were retrieved in a Yoruba (YRI) popula-tion in Nigeria, an European ancestry population in Utah, USA (CEU), aHan Chinese population in Beijing and Japanese from Tokyo (CHB+JPT).There were different technologies used to discover new SNPs and typethem in the three samples. In these two phases the ascertainment schemeis therefore difficult to assess since it depends on the genotyping tech-nology. For the Phase III of the project, the number of sampled popu-lations has been increased up to 14. However, this phase does not pro-vide as much variants as in the first two phases. Indeed, the samples were
10
ii
“thesis” — 2014/9/8 — 10:58 — page 11 — #41 ii
ii
ii
genotyped only on Affymetrix Genome-Wide Human SNP Array 6.0 withhowever an easier ascertainment scheme to assess. This chip also includestag-SNPs, i.e. SNPs that catch the variation in the surrounding regions be-cause they are in LD with ungenotyped variants. As for HGDP, Hapmapdata mostly captures common variation since it provides the genotypesfor SNPs segregating with a MAF > 5%. Moreover, HapMap projectreleased accurate genetic map (giving information on the past recombi-nation events across the genome) and a wealth of information about thepatterns of LD in human populations.
1000 Genomes Project.Following the HapMap project, the 1000 Genomes Project provided moreinsight into the human variation [21]. Making profit of the emergence ofNGS technologies, the 1000 Genomes project aims to provide a catalog ofhuman genomic variation by sequencing ˜ 2,500 individuals in 27 popu-lations. Now, with the Phase I release, already over 1000 individuals havebeen sequenced and ˜ 41 Millions SNVs have been discovered using bothwhole-genome sequencing at low coverage (2-6 X) and limited targetedexon sequencing at higher coverage (50-100 X). They describe 98% vari-ants (both SNVs and indels) segregating with a MAF > 1% in a givenpopulation. They also implemented in silico genome-wide phasing andimputation, meaning that the haplotypes are provided and ungenotypedSNVs have been inferred. The data also describes detectable Copy Num-ber Variants (CNVs). So far, this is the most detailed catalog of humanvariation available. However, one must note that the coverage used forsequencing strongly affect the power to detect rare variants, thereby, theallele frequency spectrum observed for exonic regions will be differentthan for the rest of the genome.
11
ii
“thesis” — 2014/9/8 — 10:58 — page 12 — #42 ii
ii
ii
1.3 What determines genetic diversity levels withinspecies?
One main goal in studying species evolution is to determine which are theforces producing and maintaining genetic diversity in natural populations.Such knowledge contributed to the development of the neutral theory ofmolecular evolution which has mostly been attributed to the work of Mo-too Kimura [22] in the 50s and 60s. The neutral theory of molecular evo-lution may in turn be used as the null hypothesis for many evolutionaryanalyses in order to assess whether a population have evolved under nat-ural selection accounting for some specific molecular patterns observedthroughout the genome [23–25]. The Hardy-Weinberg principle [26, 27]which describes the conditions a sexual population has to meet to be atequilibrium gives straight forward insights into the evolutionary forces inaction. The so-called Hardy-Weinberg equilibrium states that allele fre-quency will remain equal across generations if the following criteria arefulfilled (1) diploidy and individuals can only reproduce through sexualmating; (2) generations are non overlapping; (3) allele frequencies areequal in both sexes; (4) there is no mutation; (5) the population is pan-mixic (individuals mate randomly); (6) there is no migration from or toanother population; (7) the size of the population is infinitely large, and(8) natural selection is not active.Since we are interested in human evolution, diploidy and sexual matingare met in any cases. It is complicated to infer the influence of the absenceoverlapping generations, but we will consider this criteria as granted. Theallele frequency equality among sex is not guaranteed, especially for sex-ual chromosomes and, for this reason, many genetic studies focus eitheron sexual or autosomal chromosomes separately. Mutation is a rare pro-cess: it has been estimated that the average single nucleotide substitutionis in the order of 10-8 per base per generation [9, 13, 14]. However, thoserare changes accumulate across generations and are the raw material forevolution to occur. Therefore, mutation can not be discarded when study-ing evolution but it is often assume that this mechanism does not account
12
ii
“thesis” — 2014/9/8 — 10:58 — page 13 — #43 ii
ii
ii
for observed genetic differences among genomic regions, and thereby itsrate is considered to be uniform across the genome although it is not (e.g.see [28]). Panmixia condition relies on the absence of any mating restric-tions among the individuals so that they can mate randomly. Specific envi-ronmental, behavioural, hereditary or social interactions may account forpopulation structure and, thus, prevent random mating. Moreover, the ab-sence of migration from one population to the studied one guarantees nonew allele supply in the gene pool. Finally, violation of the last two con-ditions regarding population size and absence of natural selection are themost studied by evolutionary biologists. If a population has an infinitelylarge size, the random sampling of the alleles from one generation’s genepool to be passed to the next one is unbiased: the alleles present at onegeneration are a representative sample of the alleles at the previous one.The main contribution of the neutral theory of molecular evolution wasto describe how, in finite populations, this random allele sampling fromone generation to the next one leads to a significant fluctuation in allelefrequencies across generations, a phenomena well-known as genetic driftand discussed in 1.3.2. On the other hand, if one allele is evolving undernatural selection, that is its odds to segregate through generations is loweror higher than for the other alleles, its frequency will decrease or increase.We will discuss the different modes of natural selection in 1.3.1.
1.3.1 Natural selection in action.
This preservation of favorablevariations and the rejection of injuriousvariations, I call Natural Selection.
On the origin of species by means ofNatural Selection, or the preservation
of favoured races in the struggle for lifeCHARLES R. DARWIN
As stated in the quotation above, (Darwinian) natural selection targets
13

ii
“thesis” — 2014/9/8 — 10:58 — page 14 — #44 ii
ii
ii
a heritable trait that provides greater or lower chances for an organismto reproduce, and/or to survive, in a given environment. This evolution-ary process is therefore directional: while an allele responsible for anyadvantageous trait will be selected for and, thus, increase in frequency inthe population, an allele encoding a prejudicial phenotype will be selectedagainst and purged from the population. This concept, introduced in 1858simultaneously by Charles R. Darwin and Alfred R. Wallace [29, 30], hasbeen at the core of the study of evolution and biological research. How-ever, since then there has been passionate debate concerning its relativeimportance among other evolutionary processes, the prevalence of adap-tive traits and how they are originated in natural populations. For naturalselection to be effective, Darwin suggested that a population must presentthree features. First, as mentioned in the title of the book presenting histheory, individuals within a population must “struggle for life”, meaningthat more individuals are born than the number that can actually survivein the population. Second, individuals should vary in their ability to re-produce (or survive until reproductive age), so that only the fittest oneswould be more likely to have offspring, and thus, to transmit their charac-teristics to the next generation. A concept that the liberal theorist, AlbertSpencer, interpreted as the ”survival of the fittest”. Although this expres-sion was then used by Charles Darwin himself in latter versions of TheOrigin of the Species, it does not accurately describe the process of nat-ural selection which acts on reproductive differences among individuals.Third, the variation in reproductive success must be heritable. Darwincould demonstrate the existence in natural population of the two first re-quirements. However, he was unfortunately unaware of Gregor Mendel’swork on the law of inheritance and could not provide any suitable modelof inheritance. Alternatively, he suggested a blending inheritance modelin which the offspring is a fusion of its parent’s characters. This modelwas not suitable for his theory because such blending inheritance wouldremove quickly any variability in the population, avoiding natural selec-tion to act. The absence of a suitable model of inheritance prejudicedthe natural selection theory and brought controversy in the field. We hadto wait until the 20th century, for Mendel’s work to be broadly known.
14

ii
“thesis” — 2014/9/8 — 10:58 — page 15 — #45 ii
ii
ii
Figure 1.4: The different modes of natural selection. From [31].
Along with the Hardy-Weinberg principle, Mendel’s law of inheritancecould finally provided the missing link in Darwin’s theory: variabilitycan be maintained in the population when random mating occurs in asufficiently large population. On the other hand, when mating is not ran-dom anymore and the fitness of the individuals is not the same, naturalselection occurs leading to a reduction in variability, just as predicted byDarwin.
Consequently, at the dawn of the 20th century, natural selection beganto be fully accepted by biologists and several theorists gave birth to themodern synthesis of evolutionary theory, also referred as neo-Darwinism.Notably, John D. S. Haldane, Ronald A. Fisher and Sewall Wright beganimpressive theoretical work considered as the founding principles of pop-ulation genetics. In their extensive work, they demonstrated how naturalselection on a phenotype induced by a single or multiple loci could result
15

ii
“thesis” — 2014/9/8 — 10:58 — page 16 — #46 ii
ii
ii
in rapid changes in loci frequency within a population, leading in turn tothe phenotype evolution [32–35]. In this setting background paradigm,phenotype is placed as the target of natural selection. This theoreticalbackground led to the selectionist view in which natural selection is con-sidered by far the main mechanism of evolutive changes in a population.Natural selection is a generic name which accounts for four different evo-lutionary processes: sexual, purifying, positive and balancing selection.Sexual selection is a mode in which random mating does not occur dueto the choice of the reproductive partners based on some specific pheno-types. The three other modes are related to the odds of an individual tosurvive until reproduction and to reproduce. Therefore, sexual selectionis not to be considered together with the three others: the reason why anallele encoding the phenotype targeted by the different modes of selec-tion is selected for or against differs. The following will focuses on thedescription of natural selection where environment represents the mainselective force, and, sexual selection will not be considered.
1. Purifying selection (Figure 1.4a.), also referred as negative selec-tion or stabilizing selection, is the evolutionary process by whichdeleterious mutations are removed from the population’s geneticpool. It ensures that organisms remain well-fitted to their envi-ronment and prevents from the spread of any damaging mutationsacross generations. It is considered as the most effective type ofselection because mutations with a functional consequence seem tobe more likely to decrease than to increase the fitness. Thus, purify-ing selection is believed to be widespread in functionally importantgenes or regulatory elements.
2. Positive selection (Figure 1.4b.), also referred as Darwinian selec-tion or adaptive selection has been considered one of the most im-portant driving forces for phenotypic variability among species orpopulations. The concept is straightforward: any beneficial muta-tion will increase in frequency in the population, thus allowing theadaptation of individuals to new environments.
3. Balancing selection (Figure 1.4c.) sustains the segregation of dif-
16
ii
“thesis” — 2014/9/8 — 10:58 — page 17 — #47 ii
ii
ii
ferent alleles in a population. In opposition to positive and negativeselection, this mode of selection avoids alleles to reach fixation, andthereby, favors genetic diversity. Alleles under balancing selectioncannot be strictly classified as deleterious or beneficial to the envi-ronment since it would depend on other factors. Indeed, four mainprocesses can lead to an excess of polymorphisms. First the over-dominance, i.e. when the heterozygote genotype is the fittest. Sec-ond, frequency-dependent selection, i.e. when an allele becomesdeleterious or beneficial depending on its frequency in the popula-tion. Third, fluctuating selection, i.e. when selection coefficientsvary over time and/or space. Fourth, pleiotropy when the selectivevariant affects multiple traits with different effects.
1.3.2 The neutral theory: the role of genetic drift in evo-lution.
This neutral theory claims that theoverwhelming majority of evolutionarychanges at the molecular level are notcaused by selection acting onadvantageous mutants, but by randomfixation of selectively neutral or verynearly neutral mutants through thecumulative effect of sampling drift (dueto finite population number) undercontinued input of new mutations.
The neutral theory of molecularevolution: A review of recent evidence
MOTOO KIMURA
Since its introduction at the beginning of the 20th century, the modernsynthesis of evolutionary theory and its selectionist view was each timemore popular until the 1970s. However, it was based on pioneer work
17

ii
“thesis” — 2014/9/8 — 10:58 — page 18 — #48 ii
ii
ii
Figure 1.5: Genetic drift in a finite population. Different coloured circles rep-resent different alleles. Lines represent the transmission of an allele from onegeneration to next one. Genetic drift drives increases and decreases in allelefrequencies by random sampling of the parental alleles to the offsprings.
from Wright, Fisher and Haldane who also considered an other sourceof variability within and among populations: a stochastic selectively neu-tral process in opposition to the deterministic evolution through naturalselection. One of the strongest assumption in Hardy Weinberg principleis certainly the infinite population size, particularly for humans. Indeed,as briefly described in 1.1, modern human expansion has likely occurredthrough several founding events and the human populations suffered sev-eral bottleneck. The effective population size, Ne [36], a measure of theconstant size for an idealized population that represents the past historyof the population of interest, it is relatively small in humans. Indeed, ithas been estimated that Ne is ˜ 10,000, a quite striking number if com-pared to the more than 7 billions individuals peopling the world nowa-days. Introduced by Sewall Wright in 1931, the effective population sizerepresents the harmonic mean of population sizes among generations, andthus, allows to describe the amount of genetic drift a population has suf-fered. As stressed before, genetic drift, is the allele frequency fluctuationacross generations due to random sampling of the gametes from one gen-eration to engender the next one (Figure 1.5). The Wright-Fisher model[33, 36] was the first proposed to explain the diffusion of allele within a
18
ii
“thesis” — 2014/9/8 — 10:58 — page 19 — #49 ii
ii
ii
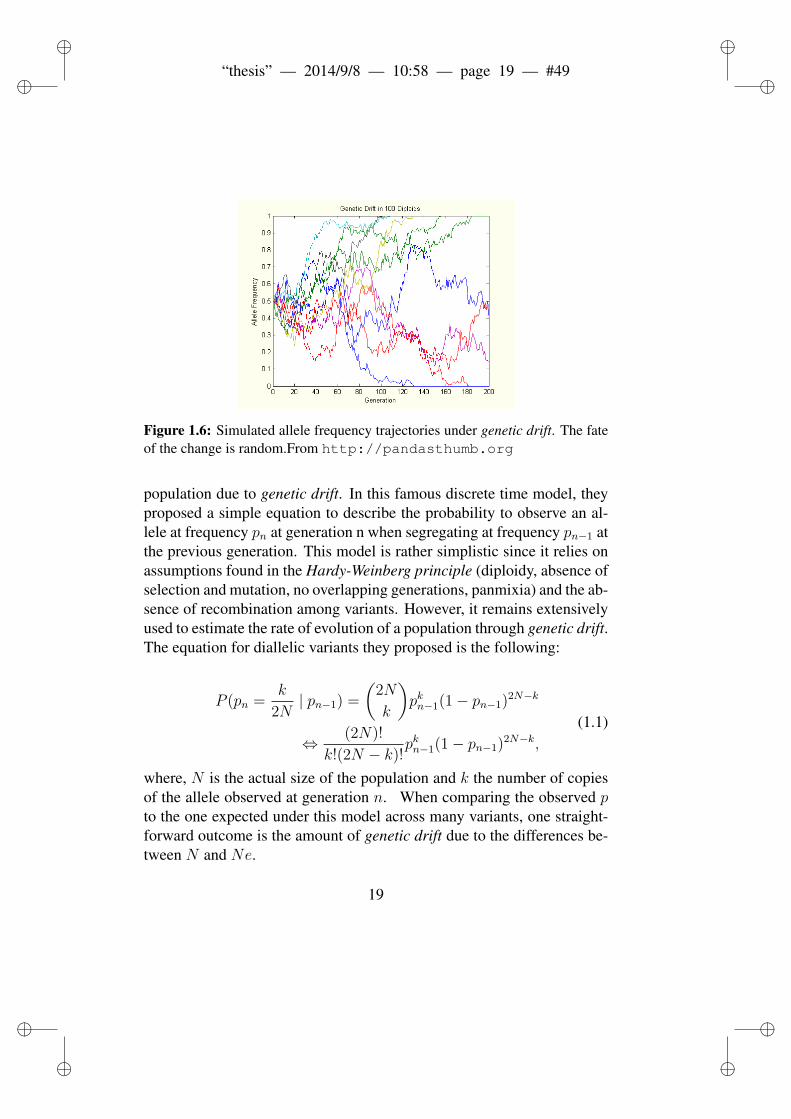
Figure 1.6: Simulated allele frequency trajectories under genetic drift. The fateof the change is random.From http://pandasthumb.org
population due to genetic drift. In this famous discrete time model, theyproposed a simple equation to describe the probability to observe an al-lele at frequency pn at generation n when segregating at frequency pn−1 atthe previous generation. This model is rather simplistic since it relies onassumptions found in the Hardy-Weinberg principle (diploidy, absence ofselection and mutation, no overlapping generations, panmixia) and the ab-sence of recombination among variants. However, it remains extensivelyused to estimate the rate of evolution of a population through genetic drift.The equation for diallelic variants they proposed is the following:
P (pn =k
2N| pn−1) =
(2N
k
)pkn−1(1− pn−1)2N−k
⇔ (2N)!
k!(2N − k)!pkn−1(1− pn−1)2N−k,
(1.1)
where, N is the actual size of the population and k the number of copiesof the allele observed at generation n. When comparing the observed pto the one expected under this model across many variants, one straight-forward outcome is the amount of genetic drift due to the differences be-tween N and Ne.
19

ii
“thesis” — 2014/9/8 — 10:58 — page 20 — #50 ii
ii
ii
Figure 1.7: Sequence divergence among different site classes. Less changes areobserved at non-synonymous sites than at site with no or little effect on proteinfunction. From [37].
However, until the 1960s. The predominant view in evolutionary biol-ogy was that natural selection is playing the dominant role in explainingthe observed gene pool. According to this view, the differences betweenspecies were assumed to occur mostly from advantageous mutations thathad been fixed by positive selection (Section 1.3.1). On the other hand,the observed relatively important amount of polymorphism within popu-lations, was explained by the action of balancing selection (Section 1.3.1)or by a transient change towards fixation of the advantageous alleles.Hence, neutral (non adaptive) processes were overlooked because of theirassumed little contribution. Based on the recent view of large amountsof polymorphism, Kimura challenged the selectionist theory in the late1960s. Indeed, Kimura observed that genetic variability was more fre-quent than expected and, proposed his now recognized neutral theory ofmolecular evolution [23]. The main claim in his theory was that most ge-netic variants observed in a population are neutral, i.e. has no phenotypiceffect for the individuals carrying them. Thus, the observed amount of di-
20
ii
“thesis” — 2014/9/8 — 10:58 — page 21 — #51 ii
ii
ii
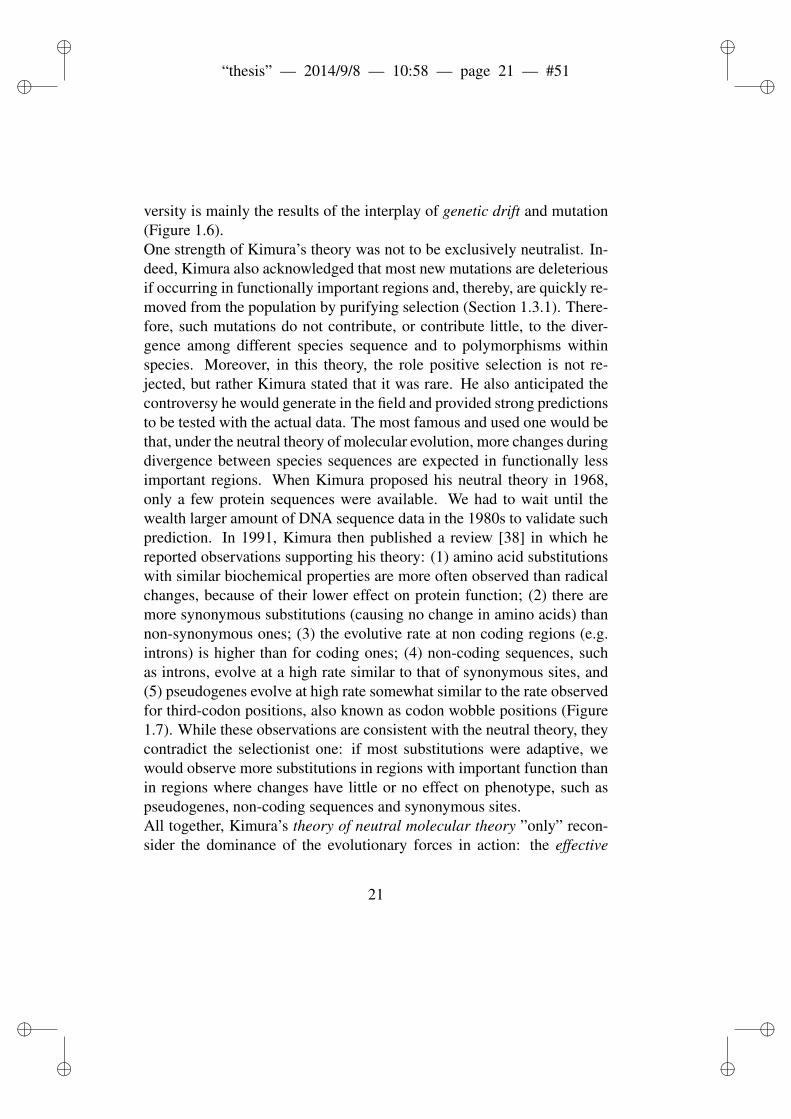
versity is mainly the results of the interplay of genetic drift and mutation(Figure 1.6).One strength of Kimura’s theory was not to be exclusively neutralist. In-deed, Kimura also acknowledged that most new mutations are deleteriousif occurring in functionally important regions and, thereby, are quickly re-moved from the population by purifying selection (Section 1.3.1). There-fore, such mutations do not contribute, or contribute little, to the diver-gence among different species sequence and to polymorphisms withinspecies. Moreover, in this theory, the role positive selection is not re-jected, but rather Kimura stated that it was rare. He also anticipated thecontroversy he would generate in the field and provided strong predictionsto be tested with the actual data. The most famous and used one would bethat, under the neutral theory of molecular evolution, more changes duringdivergence between species sequences are expected in functionally lessimportant regions. When Kimura proposed his neutral theory in 1968,only a few protein sequences were available. We had to wait until thewealth larger amount of DNA sequence data in the 1980s to validate suchprediction. In 1991, Kimura then published a review [38] in which hereported observations supporting his theory: (1) amino acid substitutionswith similar biochemical properties are more often observed than radicalchanges, because of their lower effect on protein function; (2) there aremore synonymous substitutions (causing no change in amino acids) thannon-synonymous ones; (3) the evolutive rate at non coding regions (e.g.introns) is higher than for coding ones; (4) non-coding sequences, suchas introns, evolve at a high rate similar to that of synonymous sites, and(5) pseudogenes evolve at high rate somewhat similar to the rate observedfor third-codon positions, also known as codon wobble positions (Figure1.7). While these observations are consistent with the neutral theory, theycontradict the selectionist one: if most substitutions were adaptive, wewould observe more substitutions in regions with important function thanin regions where changes have little or no effect on phenotype, such aspseudogenes, non-coding sequences and synonymous sites.All together, Kimura’s theory of neutral molecular theory ”only” recon-sider the dominance of the evolutionary forces in action: the effective
21

ii
“thesis” — 2014/9/8 — 10:58 — page 22 — #52 ii
ii
ii
population size does matter. In order to conclude the action of selectionat a given locus, one must reject the null hypothesis which states that themolecular patterns observed around this locus are the result of geneticdrift. A new theoretical background to detect the action of alternativeevolutionary processes disrupting neutral evolution was born! [23–25]
1.4 Statistical approaches to identifying signalsof positive selection.
As introduced in Section 1.3.1, positive selection at the genomic level isthe process through which an allele that determine an advantageous traitwill increase rapidly in frequency, potentially until it reaches fixation. Theallele frequency trajectory in the population through the action of positiveselection depends on two main factors: the strength of the selective pres-sure and the number of generations since it started. The strength of pos-itive selection is measured by the selection coefficient, s, defined as theincreased percentage of offspring that the individual carrying the advanta-geous genotype at each generation, compared to individuals with alterna-tive genotypes. A higher selection coefficient involves the advantageousallele to increase quicker in frequency, and thereby, to reach fixation in ashorter time. On the other hand, the speed of the increase tends to declinewith the frequency of the advantageous allele in the population: the selec-tion coefficient relates the relative advantage of individuals carrying theadvantageous genotype compared to all the others. As a consequence, theallele frequency trajectory is non-linear but rather depends on the numberof generations since the allele began to increase in frequency through theaction of positive selection.The allele frequency shift comes with some typical molecular footprintsused to detect selective events in the genome. Usually, we distinguishbetween two method families according to the kind of data analysed.
22
ii
“thesis” — 2014/9/8 — 10:58 — page 23 — #53 ii
ii
ii
1. Using divergence data, i.e. sequences from different species, onecan identify substitutions in the genome that are different across thespecies due to a past selective events that contributed to the speciesdivergences.
2. Using polymorphism data, i.e. sequence or genotype data fromdifferent populations within a same species, one can explore thenucleotidic and haplotypic diversity within and among populations.
The different molecular patterns left by a selective event are not main-tained forever in the genome, and those footprints allow to infer how manygenerations have past since the selective events occurred. (Figure 1.8).
1.4.1 Using divergence data.
Estimating molecular evolutionary rates.Using divergence data, the calculation of the ratio dN/dS (referred to
as ω) is the most commonly used method for determining the nature ofthe selective forces acting on a protein-coding gene. For that purposeusing the orthologous sequences for several species, dN is the rate of nu-cleotide substitutions that have occurred per nonsynonymous site in thesequence while dS is the rate of substitutions per synonymous site. Basedon the assumption that synonymous substitutions are largely neutral, inopposition to non-synonymous ones (see Section 1.3.2), the ratio of sub-stitution rates between these two site classes is then taken as an indicatorof the strength of non-neutral selective forces acting on the gene dur-ing the species evolution since their divergence. When dN/dS = 1, thegene is said to have evolved neutrally, while dN/dS < 1 is seen as thefootprint of purifying selection constraining the gene evolution becausenon-synonymous substitutions have been removed from the population ata greater rate than synonymous substitutions. On the other hand, dN/dS> 1 would imply that positive selection has occurred, with more fixednon-synonymous substitutions than expected under neutral evolution (asinferred by the rate of synonymous substitution).
23

ii
“thesis” — 2014/9/8 — 10:58 — page 24 — #54 ii
ii
ii
Figure 1.8: Time scales for the signature of selection. The signatures of selec-tion persist over different time-scales. From [39].
Different methods have been implemented to estimate the dN/dS . Theearly ones, such as the one by Nei and Gojobori (1986) [40], rely on abasic counting. Although rather simple, they illustrate well the spirit ofthe methods. At each codon, the numbers of synonymous and nonsyn-onymous sites are calculated. For each position, i, in a codon, the fractionfi of observed synonymous changes is computed; the numbers of synony-mous (s) and nonsynonymous sites (n) are then obtained by s =
∑3i=1 fi
and n = 3 − s. The total number of synonymous (S) and nonsynony-mous (N ) sites in a sequence are the sum of s and n, respectively, acrossthe whole sequence, i.e. the whole set of codons. The number of syn-onymous (sd) and nonsynonymous changes (nd) per codon between twosequences are then counted. At this step, multiple mutational paths be-tween two codons are considered equally likely, thus, the resulting countsis computed as the average between all possible paths. The sum of thesecounts give the total number of synonymous (Sd) and nonsynonymous(Nd) changes across the sequence. ps = Sd/S and pn = Nd/N are used
24
ii
“thesis” — 2014/9/8 — 10:58 — page 25 — #55 ii
ii
ii
as an estimation of the proportions of synonymous (pS) and nonsynony-mous (pN ) differences,respectively. Finally, the rate of synonymous sub-stitutions (dS) and nonsynonymous substitutions (dN ) can be computedfollowing the formula 1.2 [41]:
d = −3
4loge
(1− 4
3p
)(1.2)
where p is either pS or pN . More recent methods also include more pa-rameters to account for differences among different types of substitu-tions. For example, transversion changes do not occur as frequently astransition (transition/tranversion rate bias) and there are different chem-ical property differences among amino acids. The number of sequencesanalyzed has increased a lot since 1986, and therefore several statisticalapproaches have been suggested to estimate more efficiently dN and dS ,such as Markov-process model [42] and Bayesian approach [43].
Tests of adaptive selection.A gene can be overall constrained in its evolution while some specific
codons being evolving under positive selection. As a consequence, suchapproach requires a very strong trend of positive selection to produce avalue greater than one. Therefore, several tests for positive selection atspecific codon sites, instead of working at the gene-level, using diver-gence data have been suggested. They can be divided into two main fam-ilies of tests: the individual site (IS) and the pooled site (PS) tests. Thefirst IS method was proposed in 1999 [44] and relies on the constructionof a phylogenetic tree in order to count the total number of synonymousand nonsynonymous substitutions across all branches of the tree. A signalof positive selection at a given codon would then be a significantly greaternumber of nonsynonymous than the number of synonymous substitutions.Improvements came from both likelihood and Bayesian-based implemen-tation of this framework [45–47]. On the other hand, the PS methods relyon nested models in order to perform likelihood-ratio tests between the
25

ii
“thesis” — 2014/9/8 — 10:58 — page 26 — #56 ii
ii
ii
null model where all sequence alignments are assumed to present eithera dN/dS < 1 or dN/dS = 1 (i.e. sites are either evolving neutrally orunder purifying selection, respectively) and the alternative model whereanother site class is considered (namely some sites are fit by the model tohave evolve under positive selection, that is with a dN/dS > 1) [48, 49].For example, one of the most used test compares models M7a and M8.The M7a model estimates the likelihood of the sequence alignment to fitseven site classes, one with dN/dS = 1 and six with dN/dS < 1, with aβ distribution to model the dN/dS values for the sites. Next, the samedata is fitted to the M8 model which considers one more site class allow-ing dN/dS > 1. Finally, a likelihood ratio between the best likelihoodsunder each model allows to test whether adding putative positive selec-tion to the model explain better the data [48, 49]. Further methods usinga Bayesian framework can also be used to test a posteriori which are thespecific codons that have been targeted by positive selection [48–50].As mentionned before, the main advantage of these codon-specific testsover the simple calculation of dN/dS at gene level, is that they take intoaccount that individual sites to evolve at different rates. Nevertheless,these methods remain generally little sensitive to detect positive selection[51]. A particular concern is that they require sustained strong events ofpositive selection while those may be rare during evolution and the com-mon case seems to be brief episodes of selection. Consequently, in orderto detect such episodic adaptive events, several methods have been devel-oped in which evolutionary rates can vary not only between codons butalso between phylogenetic branches [52–54]. These methods are moresensitive to detect positive selection [54, 55].
1.4.2 Using polymorphism data.
In 1974, Maynard Smith and Haigh [56] proposed a model to explain themolecular mechanisms at play when positive selection acts on a variant.In this model, now referred as the hard sweep model, they described thephenomena of genetic hitchhiking which results from positive selection
26
ii
“thesis” — 2014/9/8 — 10:58 — page 27 — #57 ii
ii
ii
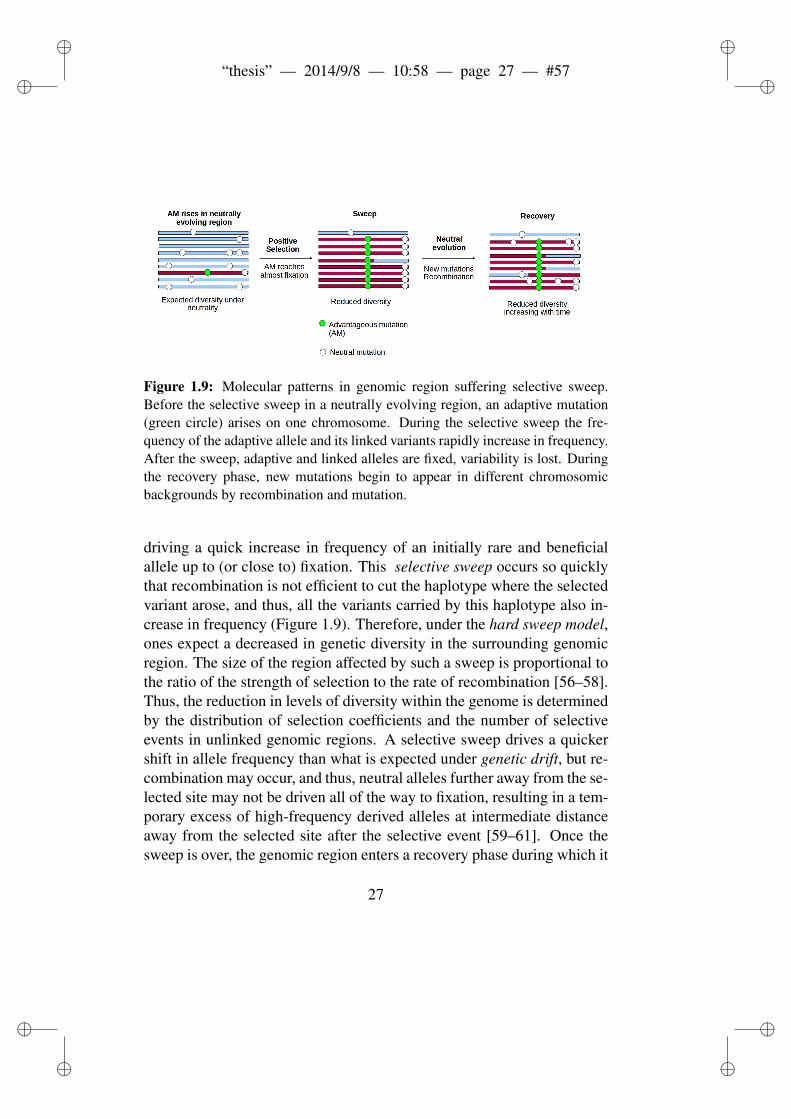
Figure 1.9: Molecular patterns in genomic region suffering selective sweep.Before the selective sweep in a neutrally evolving region, an adaptive mutation(green circle) arises on one chromosome. During the selective sweep the fre-quency of the adaptive allele and its linked variants rapidly increase in frequency.After the sweep, adaptive and linked alleles are fixed, variability is lost. Duringthe recovery phase, new mutations begin to appear in different chromosomicbackgrounds by recombination and mutation.
driving a quick increase in frequency of an initially rare and beneficialallele up to (or close to) fixation. This selective sweep occurs so quicklythat recombination is not efficient to cut the haplotype where the selectedvariant arose, and thus, all the variants carried by this haplotype also in-crease in frequency (Figure 1.9). Therefore, under the hard sweep model,ones expect a decreased in genetic diversity in the surrounding genomicregion. The size of the region affected by such a sweep is proportional tothe ratio of the strength of selection to the rate of recombination [56–58].Thus, the reduction in levels of diversity within the genome is determinedby the distribution of selection coefficients and the number of selectiveevents in unlinked genomic regions. A selective sweep drives a quickershift in allele frequency than what is expected under genetic drift, but re-combination may occur, and thus, neutral alleles further away from the se-lected site may not be driven all of the way to fixation, resulting in a tem-porary excess of high-frequency derived alleles at intermediate distanceaway from the selected site after the selective event [59–61]. Once thesweep is over, the genomic region enters a recovery phase during which it
27
ii
“thesis” — 2014/9/8 — 10:58 — page 28 — #58 ii
ii
ii
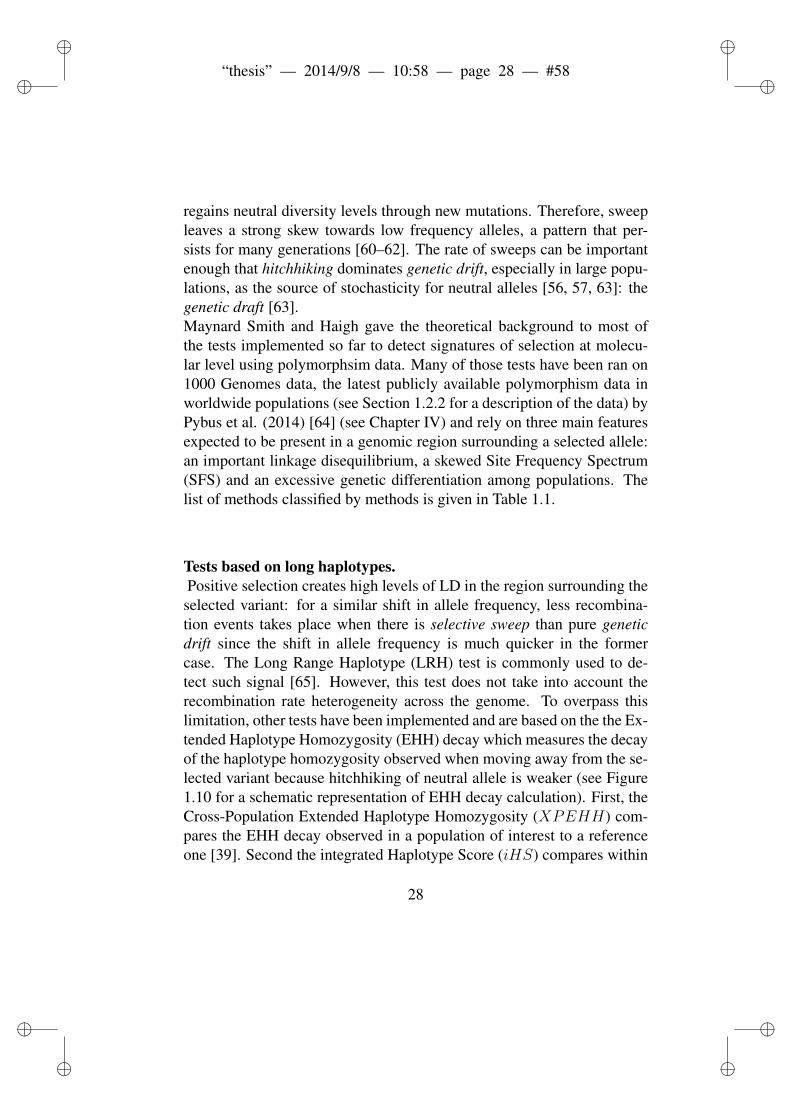
regains neutral diversity levels through new mutations. Therefore, sweepleaves a strong skew towards low frequency alleles, a pattern that per-sists for many generations [60–62]. The rate of sweeps can be importantenough that hitchhiking dominates genetic drift, especially in large popu-lations, as the source of stochasticity for neutral alleles [56, 57, 63]: thegenetic draft [63].Maynard Smith and Haigh gave the theoretical background to most ofthe tests implemented so far to detect signatures of selection at molecu-lar level using polymorphsim data. Many of those tests have been ran on1000 Genomes data, the latest publicly available polymorphism data inworldwide populations (see Section 1.2.2 for a description of the data) byPybus et al. (2014) [64] (see Chapter IV) and rely on three main featuresexpected to be present in a genomic region surrounding a selected allele:an important linkage disequilibrium, a skewed Site Frequency Spectrum(SFS) and an excessive genetic differentiation among populations. Thelist of methods classified by methods is given in Table 1.1.
Tests based on long haplotypes.Positive selection creates high levels of LD in the region surrounding theselected variant: for a similar shift in allele frequency, less recombina-tion events takes place when there is selective sweep than pure geneticdrift since the shift in allele frequency is much quicker in the formercase. The Long Range Haplotype (LRH) test is commonly used to de-tect such signal [65]. However, this test does not take into account therecombination rate heterogeneity across the genome. To overpass thislimitation, other tests have been implemented and are based on the the Ex-tended Haplotype Homozygosity (EHH) decay which measures the decayof the haplotype homozygosity observed when moving away from the se-lected variant because hitchhiking of neutral allele is weaker (see Figure1.10 for a schematic representation of EHH decay calculation). First, theCross-Population Extended Haplotype Homozygosity (XPEHH) com-pares the EHH decay observed in a population of interest to a referenceone [39]. Second the integrated Haplotype Score (iHS) compares within
28
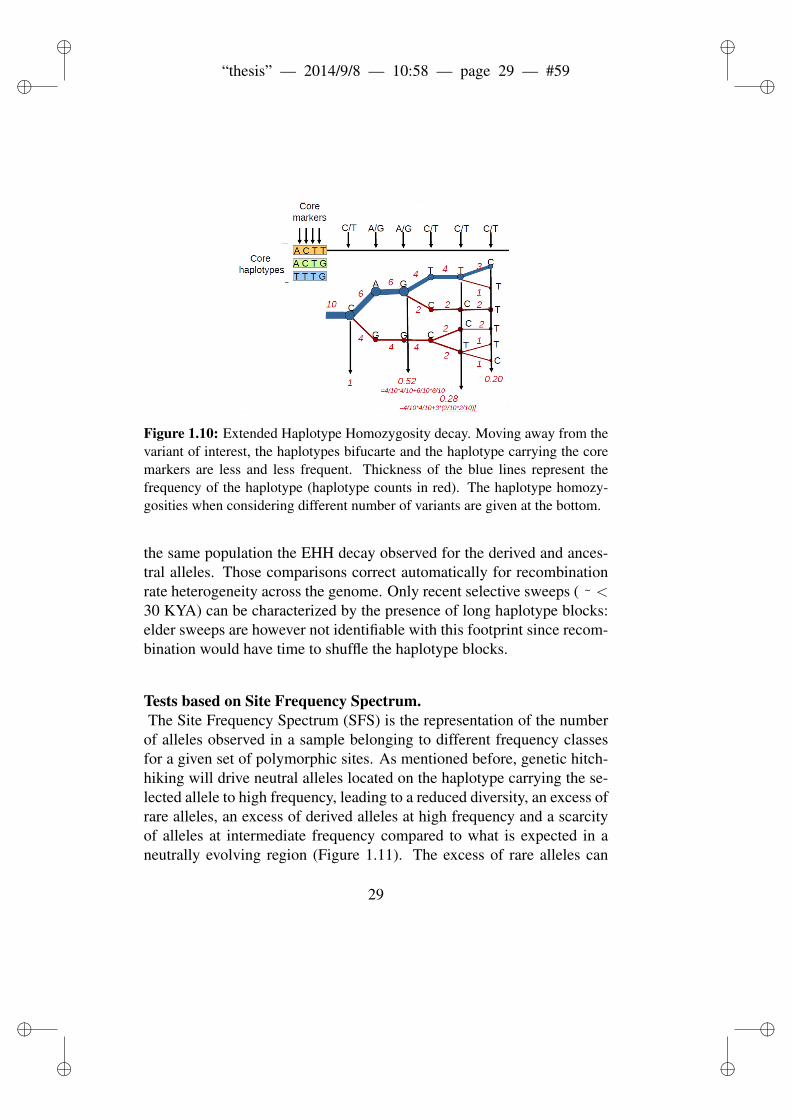
ii
“thesis” — 2014/9/8 — 10:58 — page 29 — #59 ii
ii
ii
Figure 1.10: Extended Haplotype Homozygosity decay. Moving away from thevariant of interest, the haplotypes bifucarte and the haplotype carrying the coremarkers are less and less frequent. Thickness of the blue lines represent thefrequency of the haplotype (haplotype counts in red). The haplotype homozy-gosities when considering different number of variants are given at the bottom.
the same population the EHH decay observed for the derived and ances-tral alleles. Those comparisons correct automatically for recombinationrate heterogeneity across the genome. Only recent selective sweeps ( ˜ <30 KYA) can be characterized by the presence of long haplotype blocks:elder sweeps are however not identifiable with this footprint since recom-bination would have time to shuffle the haplotype blocks.
Tests based on Site Frequency Spectrum.The Site Frequency Spectrum (SFS) is the representation of the number
of alleles observed in a sample belonging to different frequency classesfor a given set of polymorphic sites. As mentioned before, genetic hitch-hiking will drive neutral alleles located on the haplotype carrying the se-lected allele to high frequency, leading to a reduced diversity, an excess ofrare alleles, an excess of derived alleles at high frequency and a scarcityof alleles at intermediate frequency compared to what is expected in aneutrally evolving region (Figure 1.11). The excess of rare alleles can
29

ii
“thesis” — 2014/9/8 — 10:58 — page 30 — #60 ii
ii
ii
be formally tested by the famous Tajima’s D [66] and persists for a longtime (up to ˜ 250 KYA) during the recovery phase. Moreover, if ancestralstate of the variants is available, one can also test for the expected excessof high frequency derived allele (Figure 1.11), with tests such as Fay andWu’s H [59]. This specific excess vanishes more rapidly as recombinationrelieves neutral variants to evolve under pure genetic drift. This patternscan be detected it up to ˜ 80 KYA after the sweep occured.
Tests based on genetic differentiation.When a population faces a new environment, positive selection may act
on mutations that help the individual to better adapt to this new envi-ronment. Therefore, to detect the alleles responsible of local adaptation,i.e. that has not occured in all the populations, one approach is to studygenetic differentiation among populations. Traditionally the most usedstatistics is the fixation index, FST , first introduced by Wright and de-clined into different versions. Using Cockerham and Weir’s formula, FSTcan be viewed as the the proportion of genetic diversity due to allele fre-quency differences among populations:
FST =σ2a
σ2w + σ2
b + σ2a
(1.3)
where σ2w, σ2
a and σ2b are the intra-individual, inter-population and within
population inter-individual variances, respectively.FST ranges from 0 to 1, with 0 when there is no differentiation (completepanmixia) and 1 indicating complete differentiation of the populations.Although, high FST can putatively be attributed to the action of posi-tive selection in one population, this approach is often criticised becauseof its sensitivity to population structure, demographic history, ascertain-ment bias and minor allele frequency (for a review see [82]). The ∆DAFscore (the differences of derived allele frequency between one populationand a reference) is another genetic differentiation index which suffers thesame limitation. However, the use of the derived allele state allows toidentify the population where positive selection occurred. Further meth-
30

ii
“thesis” — 2014/9/8 — 10:58 — page 31 — #61 ii
ii
ii
Figure 1.11: Site Frequency Spectrum (SFS) under different evolutionary mod-els. The Unfolded SFS represents the number of derived alleles observed withindifferent frequency classes. A region that have evolved under positive selectionpresents an excess of rare variant and of derived alleles at high frequency is ex-pected (sweep in red). During the recovery phase, the former pattern will remaindue to new mutations arising in the region while the later is lost more rapidly.Based on coalescent simulations of 100Kb regions (from Pybus et al. 2014) withno selection (3000 neutral replicates in blue) and with a recent selective sweepin an European population driving an advantageous up to fixation (300 selec-tive sweep replicates in red) using COSI with demographic model calibrated bySchaffner et al. (2005) [10].
31

ii
“thesis” — 2014/9/8 — 10:58 — page 32 — #62 ii
ii
ii
ods using genetic differentiation pattern have been developed. For ex-ample, the Cross-Population Composite Likelihood Ratio test (XPCLR)implemented by Chen et al. (2010) [79] relies on a null model of ge-netic drift and an alternative one with selective sweep and makes profit ofthe genomic context around the selected allele to detect genomic regionswith long chunks being differentiated among populations due to hitchhik-ing, making this method more robust to demography than individual SNPbased methods, such as FST and ∆DAF .
1.5 Practical challenges in detecting positive se-lection using polymorphism data.
The work presented in this thesis mostly focuses on the impact of positiveselection in the human genome at the intraspecific level, and, as a con-sequence, the analyses have mostly been performed using polymorphismdata. Therefore, it seems interesting to describe some challenges poten-tially met when detecting positive selection using polymorphism data andapproaches to overcome them. First, looking for the different genomicfootprints left by positive selection can result difficult in the genotypedata used (1.5.1). Second, those footprints may also result from othermechanisms (1.5.2 and 1.5.3) and are specific to the hard sweep modelwhile other modes of adaptation leave much subtle signals at molecularlevel (1.5.5).
32
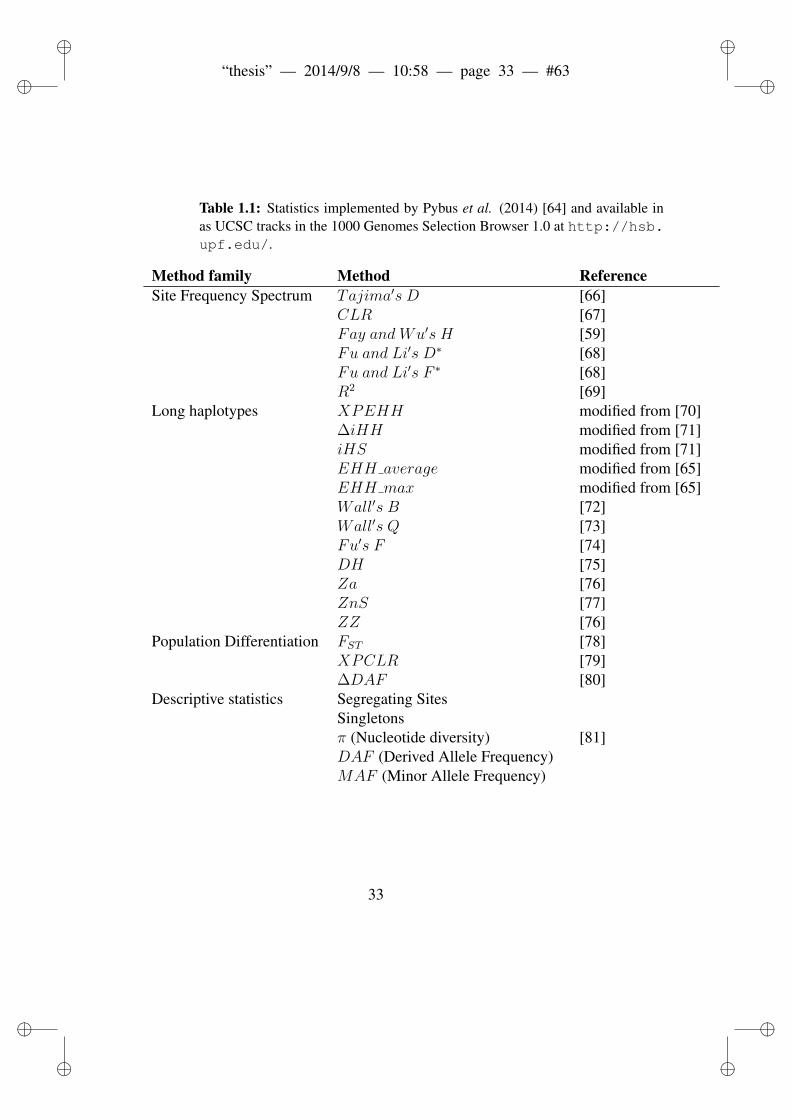
ii
“thesis” — 2014/9/8 — 10:58 — page 33 — #63 ii
ii
ii
Table 1.1: Statistics implemented by Pybus et al. (2014) [64] and available inas UCSC tracks in the 1000 Genomes Selection Browser 1.0 at http://hsb.upf.edu/.
Method family Method ReferenceSite Frequency Spectrum Tajima′s D [66]
CLR [67]Fay and Wu′s H [59]Fu and Li′s D∗ [68]Fu and Li′s F ∗ [68]R2 [69]
Long haplotypes XPEHH modified from [70]∆iHH modified from [71]iHS modified from [71]EHH average modified from [65]EHH max modified from [65]Wall′s B [72]Wall′s Q [73]Fu′s F [74]DH [75]Za [76]ZnS [77]ZZ [76]
Population Differentiation FST [78]XPCLR [79]∆DAF [80]
Descriptive statistics Segregating SitesSingletonsπ (Nucleotide diversity) [81]DAF (Derived Allele Frequency)MAF (Minor Allele Frequency)
33

ii
“thesis” — 2014/9/8 — 10:58 — page 34 — #64 ii
ii
ii
1.5.1 Distortions due to ascertainment bias.
As mentioned in Section 1.2.2, most genotype data used to study popula-tion diversity present relatively important ascertainment bias. The ascer-tainment bias is an intrinsic feature of genotyping technologies which arestill extensively used because they are simpler, cheaper and much fasterthan sequencing approaches. The ascertainment bias results from the apriori selection of the SNPs to be genotyped. Therefore, the genotypeinformation in the population of interest will not be produced for all thesegregating sites but only for the ones present in the so-called discoverysample which generally has reduced size. Hence, the ascertained SNPsare likely to segregate in the population at intermediate or high frequen-cies (Figure 1.12) since the probability to identify a SNP is a function ofits frequency, and as a consequence, common SNPs are easier to detectthan rare ones.
Furthermore, ascertainment bias can also be caused by a selection ofSNP in a discovery sample that does not represent the studied populationin term of genetic variability. For example, many arrays used SNPs dis-covered in European samples but then are used to genotype populationsworldwide in which SNPs on the array are not polymorphic. Moreover,populations do not share all the variation: there are private SNPs segre-gating, i.e. SNPs not shared with other populations [85]. Usually, theSNPs for new designed arrays are selected from public database such asHapMap (www.hapmap.org) which in turn present an ascertainment biasof their own.Usually, SNPs are selected to be genotyped in a population of interest withsome of the following criteria: (1) having a MAF above a given thresh-old, usually relatively high in discovery samples representing either one orseveral populations of interest; (2) select one SNP every a given numberof base pairs; (3) select many SNPs in targeted regions. The criteria usedaffect the ascertainment bias, and it is difficult to asses a posteriori itsextent when using genotyping array designed by others. However, recentefforts have been made to design genotyping array with reduced ascer-tainment bias. For example, Illumina made available the Omni Family of
34

ii
“thesis” — 2014/9/8 — 10:58 — page 35 — #65 ii
ii
ii
Figure 1.12: Ascertainment Bias in HapMap populations. New SNPs were dis-covered by Wall et al. [84] through sequencing of 40 intergenic regions in 90individuals from 6 different ethnic groups. The figure shows the number of SNPsin the HapMap data (green) compared with the number of SNPs that were dis-covered by resequencing and that were not present in the HapMap data (orange),categorized by derived allele frequency. It can be seen that the HapMap data havegreater SNP ascertainment bias for African than for European or Asian popula-tions. In particular, African populations have many low-frequency alleles thatare not well represented. From [83].
35

ii
“thesis” — 2014/9/8 — 10:58 — page 36 — #66 ii
ii
ii
Microarrays which include up to five million markers per sample and ex-tensive coverage of new variants identified by the 1000 Genomes Project,i.e. SNPs discovered through NGS in samples from worldwide popula-tions. Moreover Patterson et al. designed the Affymetrix Human Originsarray with clearly documented ascertainment specifically for populationgenetics study [86].The ascertainment bias has a direct effect on many statistics to detect pos-itive selection using polymorphism data [87]. First, and the most straight-forward, SFS-based statistics are distorted by the artefactual excess ofcommon variants in genotyping arrays. Second, the tests based on ge-netic differentiation, such as the FST index, rely on a measure of geneticvariance within and among the populations. Hence, if the SNPs geno-typed within different populations present different ascertainment bias,the distribution of the index of genetic differentiation will be distorted. Inthe first decade of this century, much effort have been made to implementother methods less sensitive to the ascertainment bias with the develop-ment of haplotype-based statistics [39, 71]. However, such methods relyon an accurate estimate of LD patterns within a genomic region for thepopulation of interest in order to infer whether there is a particularly EHH[88]. If the genotyping array only contains common variants and partic-ularly chosen to tag the variability from another population, the observedLD patterns in the studied population are unlikely to be representative ofthe real ones. For example, for HGDP data (Section 1.2.2), in Africanpopulations for which the genotyped SNPs tag only 67% of SNPs withMinor Allele Frequency (MAF) above 5%, the power to detect positiveselection is lower than for European where 90% of such SNPs are tagged.On the other hand, it has been proved that haplotype diversity is morerepresentative than individual SNP heterozygosity in the HGDP data [16],suggesting that the ascertainment schemes affect more individual variantsthan haplotypes.Nowadays, more and more studies obtain genotype information throughNGS which does not suffer any ascertainment bias. However, the SFSis highly dependent on the coverage (the read depth) used for sequenc-ing. Indeed, the power to detect rare variants increase with coverage [21].
36
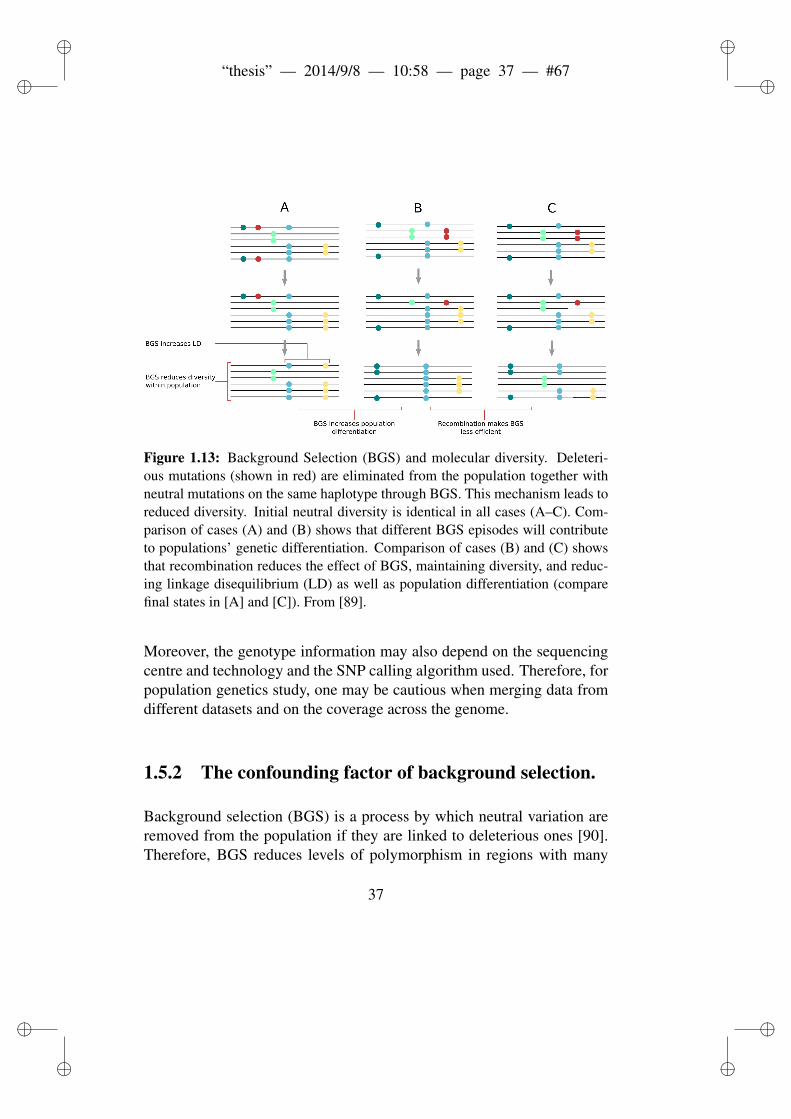
ii
“thesis” — 2014/9/8 — 10:58 — page 37 — #67 ii
ii
ii
Figure 1.13: Background Selection (BGS) and molecular diversity. Deleteri-ous mutations (shown in red) are eliminated from the population together withneutral mutations on the same haplotype through BGS. This mechanism leads toreduced diversity. Initial neutral diversity is identical in all cases (A–C). Com-parison of cases (A) and (B) shows that different BGS episodes will contributeto populations’ genetic differentiation. Comparison of cases (B) and (C) showsthat recombination reduces the effect of BGS, maintaining diversity, and reduc-ing linkage disequilibrium (LD) as well as population differentiation (comparefinal states in [A] and [C]). From [89].
Moreover, the genotype information may also depend on the sequencingcentre and technology and the SNP calling algorithm used. Therefore, forpopulation genetics study, one may be cautious when merging data fromdifferent datasets and on the coverage across the genome.
1.5.2 The confounding factor of background selection.
Background selection (BGS) is a process by which neutral variation areremoved from the population if they are linked to deleterious ones [90].Therefore, BGS reduces levels of polymorphism in regions with many
37

ii
“thesis” — 2014/9/8 — 10:58 — page 38 — #68 ii
ii
ii
functional elements and low recombinations (Figure 1.13). The lowerlevel of polymorphisms in extended region is often attributed to the actionof positive selection because it is a molecular pattern expected under thehard sweep model. It is consequently important to correct for BGS, andone straightforward approach when analyzing protein-coding regions is tolook for lower levels of neutral variation near functional substitutions, i.e.at functional sites where a mutation was fixed in a set of species, whichis the clearest genomic evidence for positive selection while not beingexpected under BGS. However, this approach is biased towards protein-coding regions and would just detect events of positive selection acting onmutations with a priori known function. An alternative to this approach,would be to correct for several genomic variables that correlate with BGS,such as levels of recombination rate and functional constraint. Measuringfunctional constraint is not straightforward but one can use the density ofcoding sequences (CDS), density of conserved coding sequences (CCDS)and conserved non-coding sequences, as well as the density of untrans-lated regions (UTRs). Moreover, Enard et al. recently found that GCcontent have a strong influence on levels of neutral diversity [91]. Al-though BGS has been seen as mimicking positive selection a molecularlevel since the article by Charlesworth et al. in 1993 [90], it has beenproved that tests based on LD (namely XPEHH [39] and iHS [71]) areinsensitive to BGS [91, 92], and therefore, their extreme deviations maydirectly be attributed to recent hard sweeps.
1.5.3 Demography can mimic positive selection.
As described in Section 1.3, many mechanisms can affect the genetic di-versity in population or species, among which several demographic pro-cesses can lead to molecular patterns expected under a positive selectionscenario (Table 1.2).
38
ii
“thesis” — 2014/9/8 — 10:58 — page 39 — #69 ii
ii
ii
Migration and structure.The neutral model assumes that any cross-gender individual pair has the
same probability to reproduce in the population. However, there may bepopulation subdivision due to geographic distance, social, linguistic oreconomical barriers (e.g. in India with the caste system). Those barri-ers to random mating are likely not to be absolute, and a number of mi-grants can move between subpopulations at each generation. When thereis a population subdivision one is not aware of, and thus panmixia is im-properly assumed, the genetic variability is higher than expected with anexcess of variants at intermediate frequency. On the other hand, if thereare migration from an external population to the studied population, anhigher variability with an excess of rare variants is expected.
Population expansion.During population expansion, a new generation has a greater number of
individuals than the previous one. Well-described population expansionevents occurred after the Neolithic transition. One possible explanation isthat the agriculturist way of life may have provided a more reliable modeof subsistence and allowed settlements to increase in size. A populationwith expansion will show an excess of singletons and mutations at lowfrequency compared to a population with constant size due recent mu-tations which have not increased in frequency through genetic drift andremain almost individual specific [93]. This also implies a lower geneticvariability than expected for the population size.
Population bottleneck.A bottleneck is the phenomena through which population size decreasesall the sudden, followed by a recovery or even an increase of the orig-inal population size in a few generations. One striking example is theBlack Death plague faced by Asian and European populations in the 14th
century. Plague is thought to be responsible responsible several large epi-demics with death rates of up to 30–50% of the European population andlingering thereafter in Europe for several centuries [94]. Many alleles
39
ii
“thesis” — 2014/9/8 — 10:58 — page 40 — #70 ii
ii
ii
from the original population, mostly at low frequency, will disappear dur-ing the decreasing size phase, thus reducing the genetic variability. Dur-ing the recovery phase, as for population expansion, an excess of rarevariant will arise.
Founder effect.A founder effect when a small subpopulation leaves its former habitat to
establish a new one. This can be seen as a particular case of bottleneck.It is likely how modern humans colonized geographic areas out-of-Africa[95]. One more recent example would be colonization of Quebec, Canadaaround 400 years ago by about 8,500 French settlers. Such event allowsvariants to rapidly reach fixation through pure genetic drift, a phenomenacalled gene surfing [96], which mimics genetic hitchhiking.
1.5.4 Has a region of interest evolved under positive se-lection?
One major challenge while assessing whether a region of interest hasevolved under the action of positive selection is certainly to circumventthe confounding factors of both past demographic processes and of the as-certainment bias of the data. For that purpose, one can compute the statis-tic from some method designed to detect footprints of positive selection(see Section 1.4.2) and estimate its significance by comparison to a ref-erence distribution. This reference distribution must reflect the expectedscore under selectively neutral evolution with the data used. Indeed, val-ues of statistics are relative to the studied population and to the kind ofdata analyzed, rather than absolute. There are two main approaches toobtain such reference distribution: the outlier approach and the use ofsimulations.
40
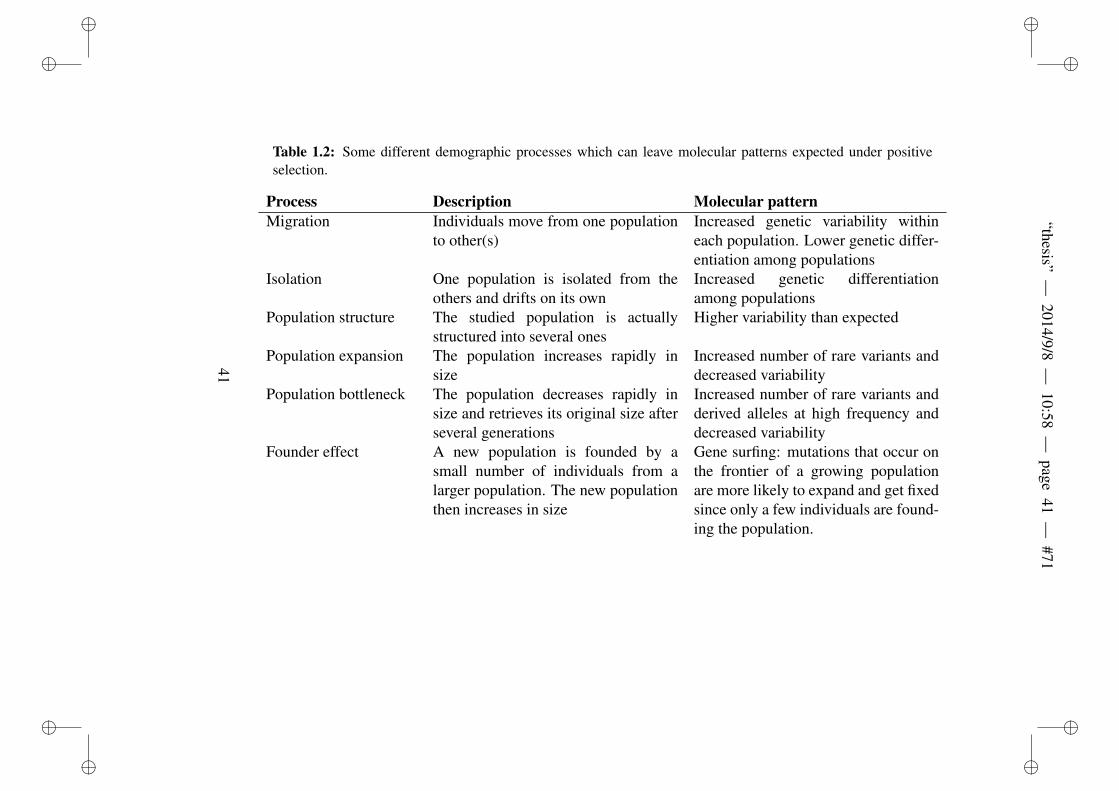
ii
“thesis”—
2014/9/8—
10:58—
page41
—#71
ii
ii
ii
Table 1.2: Some different demographic processes which can leave molecular patterns expected under positiveselection.
Process Description Molecular patternMigration Individuals move from one population
to other(s)Increased genetic variability withineach population. Lower genetic differ-entiation among populations
Isolation One population is isolated from theothers and drifts on its own
Increased genetic differentiationamong populations
Population structure The studied population is actuallystructured into several ones
Higher variability than expected
Population expansion The population increases rapidly insize
Increased number of rare variants anddecreased variability
Population bottleneck The population decreases rapidly insize and retrieves its original size afterseveral generations
Increased number of rare variants andderived alleles at high frequency anddecreased variability
Founder effect A new population is founded by asmall number of individuals from alarger population. The new populationthen increases in size
Gene surfing: mutations that occur onthe frontier of a growing populationare more likely to expand and get fixedsince only a few individuals are found-ing the population.
41

ii
“thesis” — 2014/9/8 — 10:58 — page 42 — #72 ii
ii
ii
Using simulations accounting for demography.Since the development of coalescence theory [97–99] (described below)
and the recent wealth in computational capacity, simulations became apowerful approach in population genetics. It is now possible to gener-ate large independent data sets fitting the real data for several featuresaccurately assessed through simulations of genetic data that mimic pop-ulation demographics and evolution. Those data sets are, in turn, usedto assess the statistical significance of empirical data. Particularly, onecan simulate sets of genetic data under a neutral model and appropriatedemographic parameters to infer what the empirical data would look likewithout the action of positive selection, and then a significance thresholdat a given false positive rate (FPR) can be estimated using the distributionof the simulated neutral data. In this case, any putative bias from empiri-cal data are eliminated. Furthermore, if one is interested in evaluating thereliability of the estimated threshold, simulations incorporating selectiveevents to the neutral model can be ran in order to infer the power of theapproach.
The simulation software that have been implemented so far can be di-vided into the ones relying on coalescent theory and the ones based onforward simulation. Coalescent simulation is the first widely approachthat has been used to simulate genetic data at the sequence level and,as the name suggest, is based on coalescent theory first introduced byJohn Kingman in 1982 [98]. It relies on a backward model describing thecharacteristics of the joining of lineages back in time to the most recentcommon ancestor (MRCA) as showed in Figure 1.14. It represents thetheoretical background for most of neutral genetic models, as well as theestimation of many population genetic parameters. If a population has aneffective size of Ne, the probability that two lineages, i.e. gene copies,are derived from the same parent in the previous generation, i.e. coalesce,is 1/2Ne. The coalescence time of the lineages sampled for the studyin previous generation follows a geometric distribution with mean 2Ne.Therefore, if there are p lineages at a given generation, the probabilitythat two coalesce at the previous generation, thus reducing the numberof copies to p − 1 is p(p − 1)/4Ne, and the expectation time that any
42

ii
“thesis” — 2014/9/8 — 10:58 — page 43 — #73 ii
ii
ii
Figure 1.14: Coalescence. a. The complete genealogy for a population of tenhaploid individuals is shown. In coalescence theory, diploid individuals are con-sidered as two independent haploid ones. Here a sample size of three haploidindividuals is considered, and their ancestries back to a single common ances-tor are shown with the black lines. b. The subgenealogy for the three sampledhaploid individuals. Coalescence needs to keep track of the times between coa-lescence events and the topology. From [100].
43

ii
“thesis” — 2014/9/8 — 10:58 — page 44 — #74 ii
ii
ii
pair of lineages coalesces is 4Ne/p(p − 1). From those simple equa-tions, the main conclusions of coalescence theory are : (1) while the rateof coalescence (p(p − 1)/4Ne) increases with the sample size (p), it de-creases with the effective population size (Ne); (2) time to coalescenceincreases when the process moves towards the MRCA; and (3) the proba-bility of the MRCA of the samples being the same as of the population is(p−1)/(p+ 1), and thus, even small sample sizes have a high probabilityof including the MRCA. The coalescence theory provides computationalefficiency and several coalescence simulation software have been imple-mented, such as FastCoal [101], CoaSim [102], SelSim [103], cosi [10],ms [104] and msms [12].For many of the underlying coalescent models, parameters have been cal-ibrated to fit empirical data in order to retrieve the past demographic his-tory of human populations. For example, Schaffner et al. used HapMapIIIdata to infer the demographic history of three populations (see Figure 1.2)through the calibration of their model to make the simulated data matchempirical data for pairwise FST values, LD decay (how LD for pairwiseSNPs decreases with physical distance in the genome) and SFS [10]. Fur-ther implementations used more complex empirical data features, such asthe joint SFS across populations [105]. Those programs allow to simulategenomic regions spanning few megabases in hundreds of samples with-out important computational costs in term of time and resource. This isparticularly useful to compute large simulated distribution of the statis-tics of interest and, thereby, estimate the statistical significance for thestudied genomic region. However, coalescent simulations present severallimitations. The most important one is limited accuracy in simulating thenumber recombination and gene conversion events, as well as the levelof recombination patterns that is possible to include in the model. Asa consequence, when a realistic recombination map is incorporated intothe model one, only few megabases can be simulated with an increasedcomputational cost. Otherwise, with a simplistic recombination map, thesimulated genomic regions can be longer but the model is likely not tobe accurate. Another traditional issue with coalescent simulations is theincorporation of selective events. Although efforts have been made to cir-
44
ii
“thesis” — 2014/9/8 — 10:58 — page 45 — #75 ii
ii
ii
cumvent this limitation, e.g. see [12, 103, 106], usually it is at the cost ofover-simplifying other aspects of the model, such as recombination map,population changes, sample size and length of the simulated genomic re-gions.To circumvent the limitation faced by coalescent simulations, the forwardsimulation approach has been explored as an alternative. Genomic data issimulated forward in time from an ancestral status, allowing much moreflexibility to the model. Then, complex recombination patterns and othergenomic features (gene content, background selection) can be considered,for example see SFS CODE [107]. The demographic processes includedin the model can also present a much higher layer of complexity (see[108, 109]). However, such approach requires the simulation of the wholepopulation and, therefore, is very computationally expensive, preventingits use for generating large data sets. If one is interested in obtaining aneutral model for human demography, Excoffier and colleagues imple-mented a coalescent model, fastsimcoal2, which allows a high level ofdemographic complexity, with serial founder effects, range expansionsand admixture among populations [11]. This model overpasses forwardsimulation models such as dadi which is the reference in the field [11].As mentioned above, the models are calibrated to make the simulated datafitting the empirical data. Therefore, when the empirical data contains as-certainment bias, it is important to either correct for it [110] or to take intoaccount in the estimation procedure [111, 112]. However, it is not an easytask and the calibrated model can inaccurately reflect past demography(but see [11]). In addition, most models also rely on a priori assumptionson demographic events and therefore accurate models are available for areduced numbers of well-studied populations.
Outlier approach.As mentioned before, constructing a neutral model using simulation is
computational expensive and the model does likely not incorporate all thelayers of demographic and genomic complexity. One may prefer to usethe outlier approach: an empirical distribution of the statistics to detectpositive selection is built from a large number of loci across the genome.
45

ii
“thesis” — 2014/9/8 — 10:58 — page 46 — #76 ii
ii
ii
Figure 1.15: Outlier Approach. A typical study design based on outlier ap-proach. From many sampled loci for which a statistic designed to detect positiveselection have been calculated (1) are used to build an empirical distribution (2).Then, for the position of some loci of interest within the distribution is observedto infer the empirical significance (3). From [113].
46

ii
“thesis” — 2014/9/8 — 10:58 — page 47 — #77 ii
ii
ii
The loci located in the extreme tail(s) of the distribution, i.e. outliers, arethen considered as possible targets of positive selection (Figure 1.15). Theassumption behind this framework is that demography affects stochasti-cally the whole genome in the same overall way, while positive selection,a deterministic process, affects only a few loci, and thereby, does not dis-tort the distribution. Moreover, such approach allows to correct for ascer-tainment bias, as well as the confounding effect of background selectionif the reference loci are accurately sampled. However, the genome can beseen as a mosaic of several chunks, each with its own history. Although,if the population definition is accurate, the chunk demographies may bevery similar, some specific genomic regions may have extreme molecularpatterns that mimic positive selection and would be inaccurately identi-fied as having under positive selection, i.e. there would be false positives[114]. This seems to be particularly the case when positive selection tar-gets recessive rather than co-dominant allele, when it acts on a standingvariant rather than on a newly arose mutation (more on standing variantsbelow) and when a population bottleneck occurred [115]. Another diffi-culty of the outlier approach is the arbitrary threshold used to consider ascores as significance. Indeed, setting such threshold requires to define apriori which is the proportion of the genome expected to be under positiveselection. For example, if the 5% more extreme scores are considered asbeing under putative positive selection, the underlying assumption is that5% of the genome is expected to be so. However, there is no accurateestimate of such proportion and it remains the main question assessedby people studying positive selection. Finally, the outlier approach onlyidentifies the most extreme case of positive selection, and many of theselected alleles with a relatively low selective coefficient are likely to befalse negatives.
Combination of different tests.Assessing statistical significance for a given score through either sim-
ulations or the outlier approach is a required step to contrast whether agenomic region has been evolving under positive selection. However, itis very delicate to make sure that a significant score is not actually a false
47

ii
“thesis” — 2014/9/8 — 10:58 — page 48 — #78 ii
ii
ii
positive and, when using only a single method it always remains a sub-stantial doubt when concluding that a locus of interest has been targetedby positive selection. To reduce the risk of false positive, it is wise touse different methods developed to detect the impact of positive selectionat molecular level. Particularly, one may use methods based on differ-ent kinds of molecular footprints left by a selective sweep (SFS, LD andgenetic differentiation). This way, the false discovery rate is likely to bereduced: the false positives from individual methods are unlikely to over-lap, since each method are sensitive to different demographic processes.Zeng et al. implemented two compound tests, DH [116] and DHEW[117], which combine different SFS-based methods: Fay and Wu’s H[59] and Tajima’s D [66] for the formerDH [116], and adding the Ewens-Watterson test [118] for the latter. Focusing on DH , the underlying ideais that Fay and Wu’s H and Tajima’s D are sensitive to population bottle-neck and expansion, respectively [116], but each is insensitive to the otherdemographic process. Thus, combining the two tests is robust to both de-mographic processes. The idea is very simple, using neutral simulation,one set a join threshold of significance for both tests for a given FPR. Af-terwards, if a region of interest is significant for both tests, it is identifiedat being targeted by positive (Figure 1.16). However the original methodrelies on neutral simulations with rather simplistic demography using ms[104]. One can use the framework suggested by Zeng et al. under an out-lier approach as in Luisi et al. (2014) (see Chapter 6) by computing Fayand Wu’s H and Tajima’s D in a large number of genomic regions to makethe reference distribution and estimate the join threshold of significance.
A more simplistic manner is to use any combination test, i.e. a test thatcombine individual test P-values, such as the Fisher combination’s test:
ZF = −2K∑i=1
log(Pi) (1.4)
where Pi is the P-value associated to the score of the ith test.
48
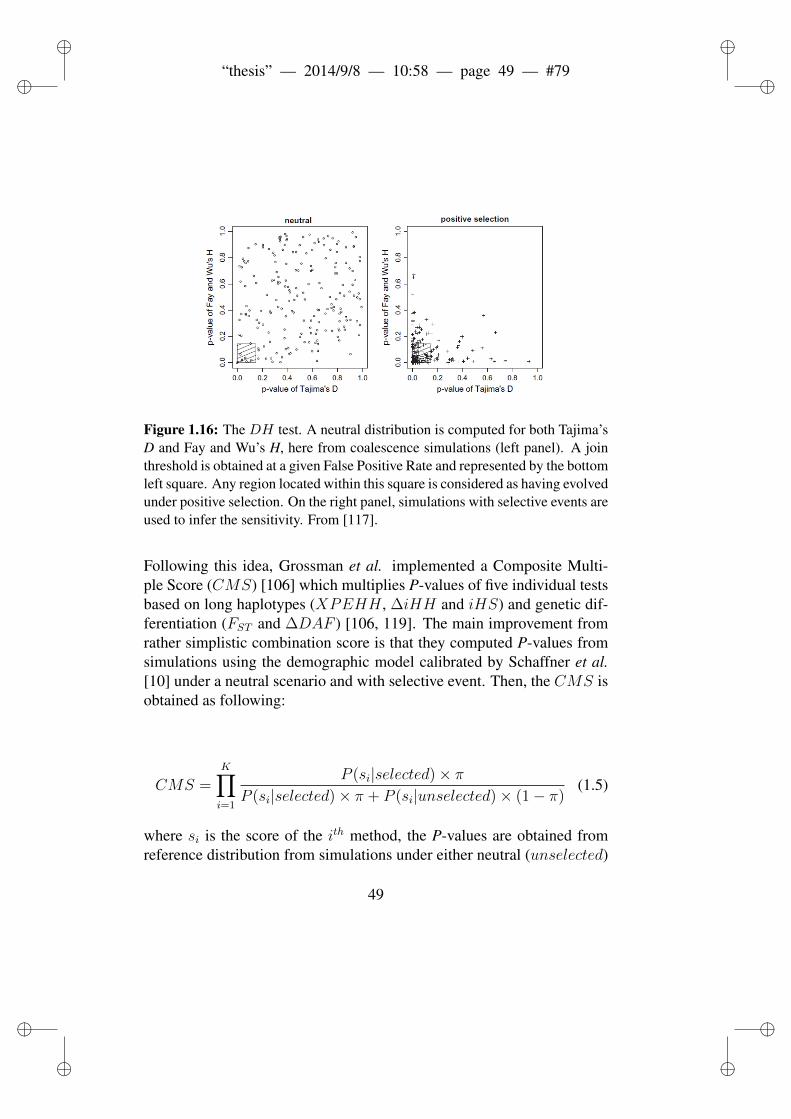
ii
“thesis” — 2014/9/8 — 10:58 — page 49 — #79 ii
ii
ii
Figure 1.16: The DH test. A neutral distribution is computed for both Tajima’sD and Fay and Wu’s H, here from coalescence simulations (left panel). A jointhreshold is obtained at a given False Positive Rate and represented by the bottomleft square. Any region located within this square is considered as having evolvedunder positive selection. On the right panel, simulations with selective events areused to infer the sensitivity. From [117].
Following this idea, Grossman et al. implemented a Composite Multi-ple Score (CMS) [106] which multiplies P-values of five individual testsbased on long haplotypes (XPEHH , ∆iHH and iHS) and genetic dif-ferentiation (FST and ∆DAF ) [106, 119]. The main improvement fromrather simplistic combination score is that they computed P-values fromsimulations using the demographic model calibrated by Schaffner et al.[10] under a neutral scenario and with selective event. Then, the CMS isobtained as following:
CMS =K∏i=1
P (si|selected)× πP (si|selected)× π + P (si|unselected)× (1− π)
(1.5)
where si is the score of the ith method, the P-values are obtained fromreference distribution from simulations under either neutral (unselected)
49
ii
“thesis” — 2014/9/8 — 10:58 — page 50 — #80 ii
ii
ii
or selective (selected) scenarios and π is the uniform prior probability ofselection.The combination tests and CMS can not use any kind of tests since theyrely on the assumption of the independence among tests. Moreover, theyattribute to each test the same contribution to the combined score. In Py-bus et al. (submitted; see Chapter IV), an alternative framework, Boost-ing, to incorporate the information from different methods. Based onBoosting functions [120], this framework allows to detect and classify se-lective events. Boosting is a Support Vector Machine (SVM) [121] whichis trained on simulated data to estimate the best regression function ofscores from different individual methods to distinguish between two sce-nario. Making profit of a neutral model with demography [10] to which aselective sweep scenario can be incorporated (as in [106]), thousands ofgenomic regions have been simulated under a selectively neutral scenarioand 45 selective ones (Figure 1 in Chapter IV). Then, two boosting func-tions have been trained to distinguish among those scenarios, namely, (1)evolution under either pure genetic drift or with partial selective sweep(where the selected mutation reaches a final allele frequency -FAF- of0.2 and 0.4); (2) evolution with incomplete selective sweep (FAF = 0.6or 0.8); and (3) evolution with complete sweep. Two further boostingfunctions have been also built to further classified regions evolving undercomplete and incomplete sweep as recent or ancient sweep (as defined inFigure 1 in Chapter IV). Those functions are included in a classificationtree as shown in Figure 5 in Chapter IV. Such framework allow to com-bine different tests, although relatively correlated, but more interestingly,to classify the mode of positive selection for for the detected selectiveevents. A look at the standardized coefficients for each coefficient givevaluable insight on the methods that contribute the most to distinguishbetween two given scenarios, and thus, on their performance to detecta given selective event (Figure 6 in Chapter IV). Moreover, the boostingcoefficients are quite similar for the three populations considered (namelyYRI, CEU and CHB), and thus seems quite robust to demography.
On one hand there are clear evidences of morphological and physiolog-
50
ii
“thesis” — 2014/9/8 — 10:58 — page 51 — #81 ii
ii
ii
ical adaptations in modern human populations, such as pigmentation forsolar radiation, body size for thermal condition, blood flow and oxygendelivery for high altitude. On the other hand, there are few examplesof fixed, or almost fixed, genetic differences among populations and/orvalidated cases of adaptive mutations (see Section 1.6 for an overview).This striking inconsistency between the number of known phenotypic andgenotypic adaptive examples, may be explained by the reduced vision ofthe action of positive selection that have been followed until recently. In-deed, until now, most studies of natural selection relied on the hard sweepmodel (see Section 1.4.2) since they make use of methods designed todetect molecular patterns expected to remain in the genome after sucha sweep. In order to have a complete vision of adaptation and the ge-nomic processes allowing it, it is also important to consider other modesof positive selection. Those alternative events of positive selection do notleave the same molecular footprints as expected after a hard sweep, andtheoretical development is still required. Particularly, the two followingalternative mode of positive selection have been recently studied after be-ing overlooked for many decades [122].
Soft sweep.Recently, works at both empirical [123–127] and theoretical [128–132]
point to the importance of soft sweeps which can occur through two dif-ferent modes of adaptation:
1. Selection on standing variants which, in opposition to a hardsweep, does not rely on the appearance of an advantageous mu-tation to arise in the population, but rather targets a variant alreadysegregating at relatively important frequency when a change of en-vironment occurs. (Figure 1.17).
2. Selection on recurrent mutations where, the derived allele whichis advantageous arise in the population several time independently,as a result of recurrent mutation or gene flow from another popula-tion. All copy of the derived allele increase in frequency until theallele reaches fixation. If, all copies of the derived allele have a
51

ii
“thesis” — 2014/9/8 — 10:58 — page 52 — #82 ii
ii
ii
similar selective coefficient (because the genetic background doesnot have affect it through, for example, intragenic epistatis), nonewould fix during the selective event (Figure 1.18).
In both cases different copies of the selected allele may belong to differ-ent haplotypes: in the former case because it was already segregating ondifferent haplotypes before the selective event, while in the latter, becauseit arise on different haplotypes. Anyway, in both cases tests based on longhaplotypes are not suited to detect such mode of adaptation. However, ifthe selective pressure is population specific, and thus the selective eventoccurred in a given population, methods based on genetic differentiationmay be able to detect it. In addition, other haplotype patterns, beyond theEHH, are informative (see below).
1.5.5 Selection not only by hard sweep.
Polygenic adaptation.Recent genome-wide association studies (GWASs) comfort the view of
classic quantitative genetics that many phenotypes are encoded by sev-eral dozens, hundreds or even thousand, rather than an unique one [133].This drastically contrasts with the reduced vision of positive selectionacting on a single advantageous mutation to drive phenotypic adaptation.Therefore, more focus on polygenic adaptation is required. Such mode ofadaptation would drive simultaneously a limited shift in allele frequencyat several variants located in different genomic regions and with smalleffect on fitness (Figure 1.19). Such shift are extremely difficult to distin-guish from pure genetic drift.
Recent methodological advances in detecting alternative sweep sce-narios.As appearing in Figures 1.19, 1.18 and 1.17, the molecular patterns ex-
pected to be left by soft sweeps and polygenic adaptation are not as evi-dent as the ones left by hard sweeps. Therefore, there is still an evidentscarcity in methods designed to detect such selective events at the genetic
52

ii
“thesis” — 2014/9/8 — 10:58 — page 53 — #83 ii
ii
ii
Figure 1.17: Selection on standing variant. The variant is already segregatingin the population and becomes advantageous and increases in frequency until itreaches fixation, or almost fixation.From [134].
Figure 1.18: Selection on recurrent mutation. Considering the schema ofWright-Fisher model. Circles represent individuals, the different patterns in-dicate independent ancestral haplotypes. The beneficial allele B (dark gray indi-viduals) substitutes the ancestral b allele (white). The B allele arises three timesby independent mutation; individuals then change their color from white to graybut keep their haplotype pattern. The zoom into a single time step shows how re-production and mutation are separated. Directly after fixation (time 0), we take asample of size three (K, L, M) that contains descendants from the first (L, M) andthe second (K) mutational origins of B. The right panel shows DNA fragmentsof the sampled individuals. The vertical ticks represent neutral polymorphisms.Individuals L and M share a recent ancestor and are identical in this region of thegenome. Individual K carries a different ancestral haplotype. From [131].
53

ii
“thesis” — 2014/9/8 — 10:58 — page 54 — #84 ii
ii
ii
Figure 1.19: Polygenic adaptation. Before the selective event, advantageousalleles located in different genomic regions may already segregate in the popu-lation at different frequencies (upper panel). During the selective event they allincrease slightly in frequency. The shifts in allele frequency would depend onthe variant effect on fitness (lower panel). From [122].
level. However, ongoing methodological development is in progress.First, some already existing methods can be used to detect soft sweeps.Indeed, as mentioned above, if the selective pressure is population spe-cific a locus-based statistics of genetic differentiation, e.g. FST [78], maybe powerful provided the variant is segregating at low frequency in thereference populations. Furthermore, iHS [71] shows good sensitivitywhen positive selection acts on a standing variant that was still segre-gating at low frequency before the selective event [135]. Two other meth-ods relying on specific haplotypic patterns have been recently developed[135, 136]. First, nSL [135] is based on the comparison between EHH forderived and ancestral alleles, as for iHS, but also takes into account thelength of the segment of haplotype homozygosity between a pair of hap-lotypes. Besides showing greater power than iHS for scenarios where theadvantageous allele was already presents in the population at frequency> 3%, it does not need any genetic map and it is robust to recombina-tion rate and mutation rate. Second, the H12 and H2/H1 statistics [136]also rely on homozygosity of multiple haplotypes. H12 use the combinedfrequency of the first and second most frequent haplotypes observed in agenomic region as following:
H12 = (p1 + p2)2 +
∑i>2
pi2 (1.6)
54
ii
“thesis” — 2014/9/8 — 10:58 — page 55 — #85 ii
ii
ii
where pi is the frequency of the ith most common haplotype in the sam-ple.The H12 has power to detect hard sweeps and - not so- soft sweeps, i.e.when the starting frequency is below 0.1%. In order to distinguish be-tween those two scenario Garud et al. further developped the H2/H1statistics [136]:
H2/H1 =
∑i>2 pi
2∑i=1 pi
2(1.7)
where pi is the frequency of the ith most common haplotype in the sam-ple.H1 and H2 are expected to be higher and lower under hard sweep thanunder soft sweep scenario, respectively. Therefore H2/H1 increases withthe softness of the sweep, i.e. the number of haplotypes on which theadvantageous mutation is segregating previous to the selective event.Those two recent methods demonstrate that accurate theoretical imple-mentation allows to detect soft sweeps although the molecular patternsare more difficult to recognize. Further effort is required to increase thepower to detect even softer sweeps. However, the reduced shift in al-lele frequency expected under polygenic adaptation leave very weak foot-prints in the genome. Hence, although it could be argued that increasingthe sample size would increase the power, implementing methods usingonly genetic information seems a loosing battle. For this reason, the fewmethods proposed until now, include other kind of information. First, theBayENV [137, 138] method uses environmental variables. Indeed, itis based on the correlation between allele frequency and an environmen-tal variable observed at many populations. It provides a Bayes Factorfor each studied locus which is the ratio between two Bayesian posteriorprobabilities:
1. Under the null (neutral) model, the correlation we observe in allelefrequencies between different populations is just explained by de-mographic factors (basically genetic drift, migration and populationsize changes)
2. Under the model where a specific environmental variable has been
55

ii
“thesis” — 2014/9/8 — 10:58 — page 56 — #86 ii
ii
ii
a selective pressure in one(s) population(s) and then may have im-balanced the allele frequency spectrum across the populations.
Therefore, this method is detecting variants that shifted similarly in allelefrequency in populations facing the same environmental pressure com-pared to their neighbouring populations (Figure 1.20). Such parallel se-lection, recently theoretically analysed by Ralph and Coop [139], is morelikely to occur on rather ancient variants that are shared among world-wide populations. Note that the signal is driven by the consistency ofthe shift in allele frequency across populations rather than by its am-plitude. Such method corrects for population structure and therefore isless sensitive to demography than a simple correlation analysis. Indeed,the genetic differentiation among populations is directly related to theirgeographic distance (Figure 1.21) due to the isolation by distance phe-nomena. However, retrieving environmental variables from many popu-lations may be challenging, especially because it relies on representativegeo-localization. Another approach was suggested by Mendizabal et al.[141] in order to include phenotypic information rather than the selectivepressure. More precisely, the authors have analysed the covariance be-tween allele frequencies and height measurement to detect genetic vari-ants allowing Pygmy adaptation to the rainforest climate through reducedsize for thermo regulation purposes (the Bergmann’s rule) as shown inFigure 1.22. Such approach would requires extensive phenotypical mea-surements but the authors implemented a permutation procedure allowingto only use the average and variance of the phenotype of interest from lit-erature. This method can be describe as a method to detect advantageousvariants only if one acknowledges that the phenotype under study arosefrom an adaptive process.H. Allen Orr also suggested a sign test [142], to test whether the observednumber of plus (or minus) alleles at Quantitative Trait Loci (QTLs) isdifferent in two groups of individuals with different phenotype, insteadof being similar as expected under pure genetic drift. The Orr’s sign testhas recently been used for expression QTLs (eQTLs). Even if each eQTLhas low effect on phenotype, the accumulation of alleles increasing (ordecreasing) the phenotype points to polygenic adaptation. Similarly, an
56
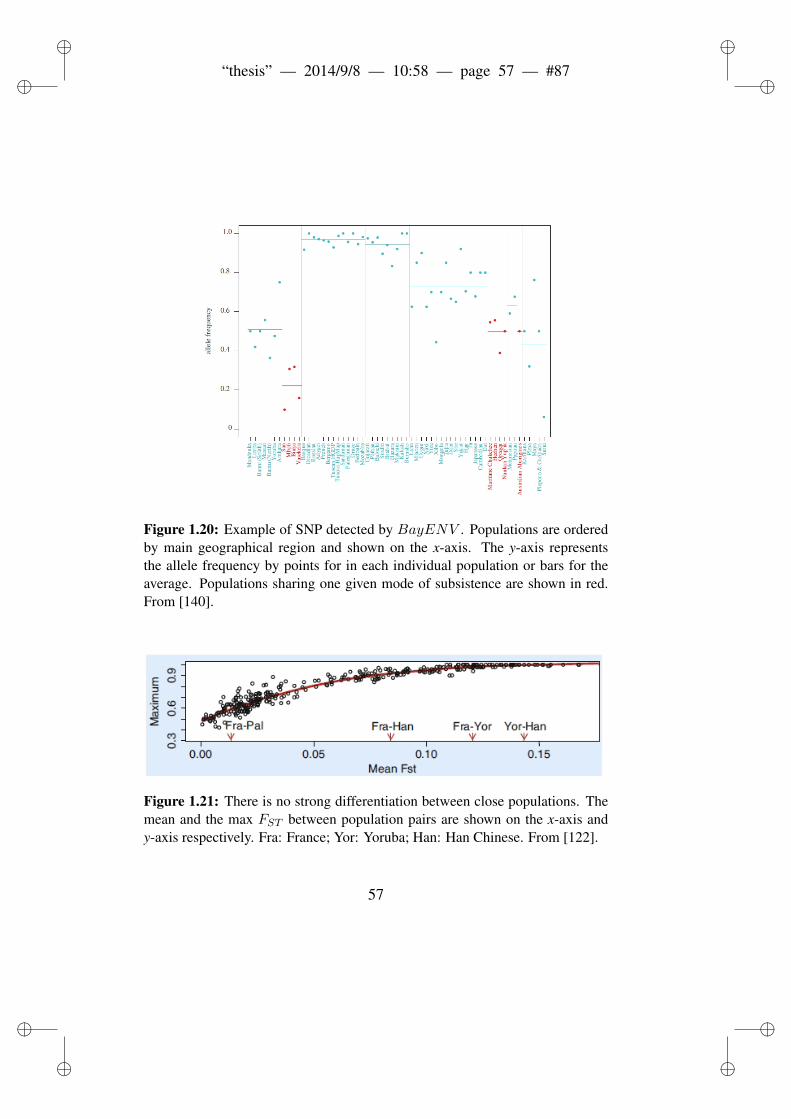
ii
“thesis” — 2014/9/8 — 10:58 — page 57 — #87 ii
ii
ii
Figure 1.20: Example of SNP detected by BayENV . Populations are orderedby main geographical region and shown on the x-axis. The y-axis representsthe allele frequency by points for in each individual population or bars for theaverage. Populations sharing one given mode of subsistence are shown in red.From [140].
Figure 1.21: There is no strong differentiation between close populations. Themean and the max FST between population pairs are shown on the x-axis andy-axis respectively. Fra: France; Yor: Yoruba; Han: Han Chinese. From [122].
57

ii
“thesis” — 2014/9/8 — 10:58 — page 58 — #88 ii
ii
ii
alternative is to use a set of SNPs associated with a given phenotype, e.g.height in European populations [143], and show a systematic allele fre-quency differences between populations with different phenotypic valuesthat better fits a model of adaptive evolution than genetic drift. Finally,Berg and Coop [144] have implemented a test using the mean additivegenetic value, QX , estimated from the additive effect size of loci associ-ated to a given phenotype (GWAS loci). The test is an extension of theBayENV method and contrasts whether the genetic value (instead of theallele frequency) covariates with a given environmental variable. Theyfurther developed a generalization of the QST/FST comparison [145].The QST/FST test of neutrality contrasts whether there is an excess ofquantitative trait differentiation (as measure by the QST index) comparedto the genetic differentiation among populations (as measured in a largeset of loci by the FST index), to identity traits that have evolved adaptively.In their implementation Berg and Coop use the estimated QX instead ofQST .The theoretical development to identify variants with small effect on fit-ness but at the basis of phenotypical adaptation through polygenic adap-tation is progressing. However, most of the methods rely on GWAS loci,and as a consequence, are still limited. Indeed, first they assume that theassociated loci act in a strictly additive manner, putting aside the putativedominance or epistatis among them. Second, GWAS loci are unlikely tobe the causal ones, but rather tag them; therefore, since the LD patternsare variable among population, the GWAS loci may not be a good proxyof the causal one in all the studied populations. Third, the genetic valuesare relatively accurate when calculated in a population where the associ-ation studies were performed, but the GWAS loci may not be portable toany genetic background, i.e. in any populations.
1.5.6 From putative advantageous mutation to the in-creased fitness.
Most studies set as a goal the identification of the advantageous mutation.This goal can be reach if, at least, the four following steps are completed
58

ii
“thesis” — 2014/9/8 — 10:58 — page 59 — #89 ii
ii
ii
Figure 1.22: Covariance of genotype and phenotype. Covariance of allele fre-quency and height for a given SNP. From [141].
(Figure 1.23).1. Identify candidate adaptive loci. The main issue is to disentangle
whether a statistic for detecting positive selection is extreme at aloci because of the impact of positive selection or alternative pro-cesses aforementioned.
2. Identify the underlying functional variant. For that purpose, onemust get rid of the strong LD within a genomic region which hasfaced hitchhiking in order to pinpoint the variant targeted by posi-tive selection.
3. Quantify the phenotypic consequences of the candidate adap-tive allele by performing experimentsin vivo with model organism(mouse, zebrafish, etc...), in vitro using call cultures, or genotype-phenotype association studies. An alternative is to use the wealthof functional public database to retrieve such information from theliterature.
59
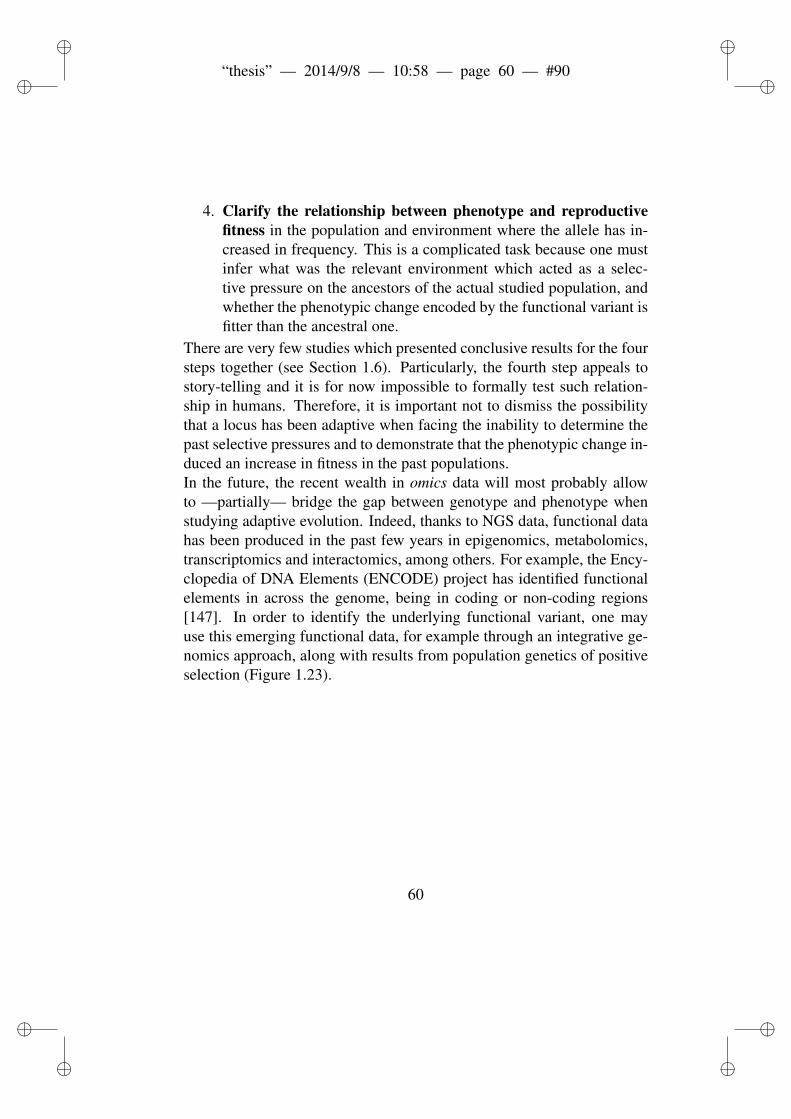
ii
“thesis” — 2014/9/8 — 10:58 — page 60 — #90 ii
ii
ii
4. Clarify the relationship between phenotype and reproductivefitness in the population and environment where the allele has in-creased in frequency. This is a complicated task because one mustinfer what was the relevant environment which acted as a selec-tive pressure on the ancestors of the actual studied population, andwhether the phenotypic change encoded by the functional variant isfitter than the ancestral one.
There are very few studies which presented conclusive results for the foursteps together (see Section 1.6). Particularly, the fourth step appeals tostory-telling and it is for now impossible to formally test such relation-ship in humans. Therefore, it is important not to dismiss the possibilitythat a locus has been adaptive when facing the inability to determine thepast selective pressures and to demonstrate that the phenotypic change in-duced an increase in fitness in the past populations.In the future, the recent wealth in omics data will most probably allowto —partially— bridge the gap between genotype and phenotype whenstudying adaptive evolution. Indeed, thanks to NGS data, functional datahas been produced in the past few years in epigenomics, metabolomics,transcriptomics and interactomics, among others. For example, the Ency-clopedia of DNA Elements (ENCODE) project has identified functionalelements in across the genome, being in coding or non-coding regions[147]. In order to identify the underlying functional variant, one mayuse this emerging functional data, for example through an integrative ge-nomics approach, along with results from population genetics of positiveselection (Figure 1.23).
60
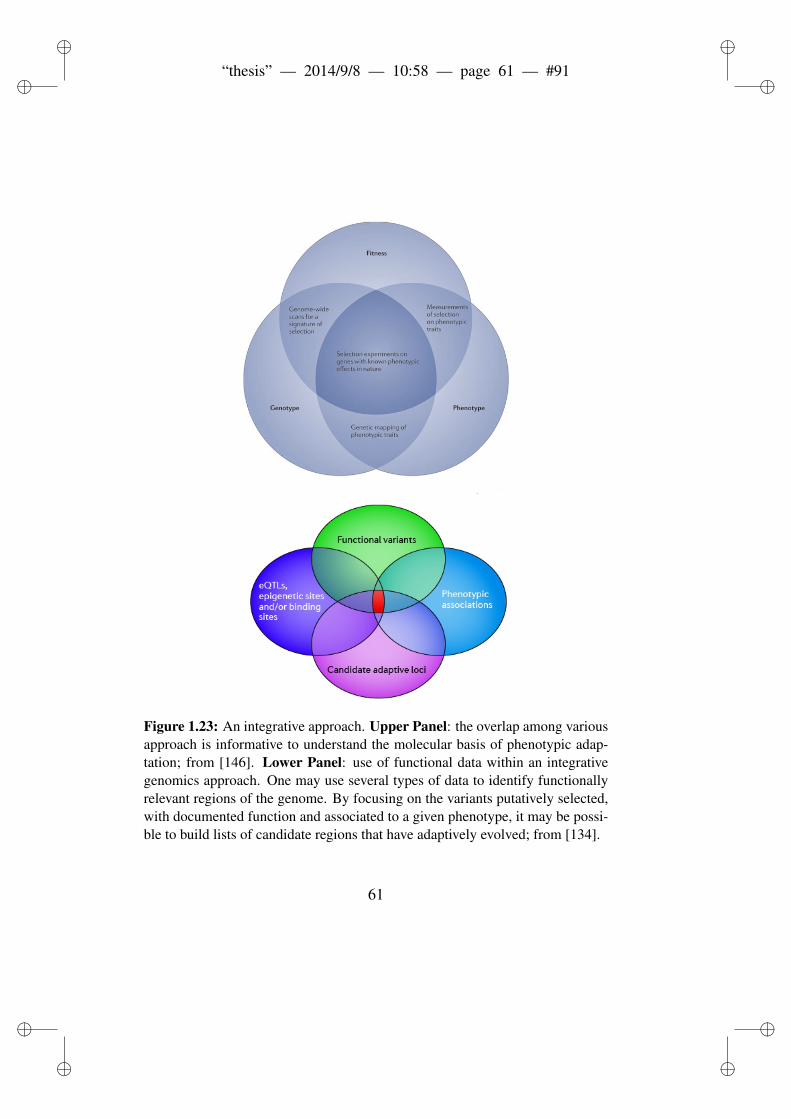
ii
“thesis” — 2014/9/8 — 10:58 — page 61 — #91 ii
ii
ii
Figure 1.23: An integrative approach. Upper Panel: the overlap among variousapproach is informative to understand the molecular basis of phenotypic adap-tation; from [146]. Lower Panel: use of functional data within an integrativegenomics approach. One may use several types of data to identify functionallyrelevant regions of the genome. By focusing on the variants putatively selected,with documented function and associated to a given phenotype, it may be possi-ble to build lists of candidate regions that have adaptively evolved; from [134].
61
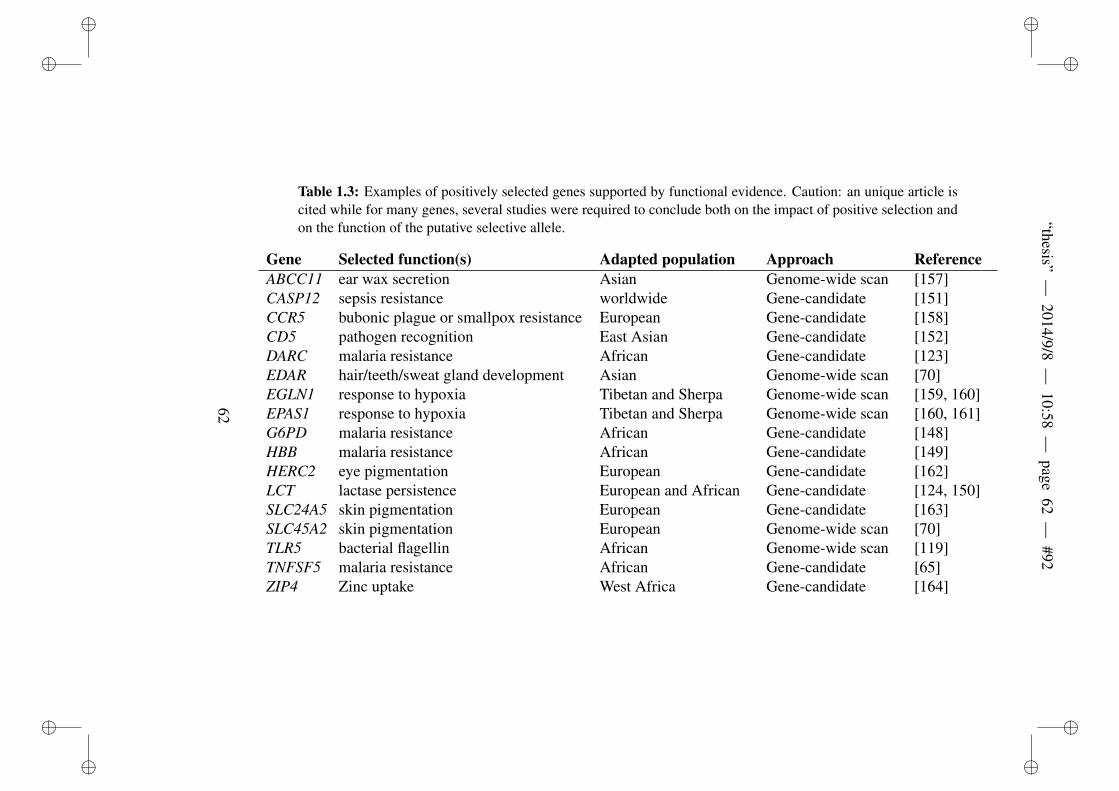
ii
“thesis”—
2014/9/8—
10:58—
page62
—#92
ii
ii
ii
Table 1.3: Examples of positively selected genes supported by functional evidence. Caution: an unique article iscited while for many genes, several studies were required to conclude both on the impact of positive selection andon the function of the putative selective allele.
Gene Selected function(s) Adapted population Approach ReferenceABCC11 ear wax secretion Asian Genome-wide scan [157]CASP12 sepsis resistance worldwide Gene-candidate [151]CCR5 bubonic plague or smallpox resistance European Gene-candidate [158]CD5 pathogen recognition East Asian Gene-candidate [152]DARC malaria resistance African Gene-candidate [123]EDAR hair/teeth/sweat gland development Asian Genome-wide scan [70]EGLN1 response to hypoxia Tibetan and Sherpa Genome-wide scan [159, 160]EPAS1 response to hypoxia Tibetan and Sherpa Genome-wide scan [160, 161]G6PD malaria resistance African Gene-candidate [148]HBB malaria resistance African Gene-candidate [149]HERC2 eye pigmentation European Gene-candidate [162]LCT lactase persistence European and African Gene-candidate [124, 150]SLC24A5 skin pigmentation European Gene-candidate [163]SLC45A2 skin pigmentation European Genome-wide scan [70]TLR5 bacterial flagellin African Genome-wide scan [119]TNFSF5 malaria resistance African Gene-candidate [65]ZIP4 Zinc uptake West Africa Gene-candidate [164]
62

ii
“thesis” — 2014/9/8 — 10:58 — page 63 — #93 ii
ii
ii
1.6 Current knowledge on positive selection inthe human genome.
The previous section (1.5) makes emphasis on the practical challengesto (1) detect positive selection in the genome, (2) confirm which arethe adaptive loci, and (3) to link the genotype to the phenotype. Al-though, such challenges are numerous and have avoided to reach a com-plete knowledge of the past human adaptation, there have been severalstriking successes since the advent of the genomic area one decade ago(Table 1.3). Studies of the impact of positive selection can be divided intothe ones focusing on candidate genes and the genome-wide scans.
1.6.1 Candidate gene studies of positive selection.
Candidate gene studies focussing on a gene are driven by an a priori hy-pothesis on the implication of a gene in a putatively adaptive phenotype.Before the recent wealth in genomic data, they used to be the most pe-formed analyses of positive selection. They allowed to understand theimpact of positive selection on specific genomic regions, to identify can-didate adaptive loci and provided informative insights into the molecularbasis of phenotypic adaptation across human populations. For example,several genes have been identified to have been targeted by positive selec-tion with supporting functional evidence for the candidate adaptive locusand a link to a phenotype change conferring a fitness increase (Table 1.3):G6PD, DARC, TNFS5, HBB which provide malaria resistance in Africa[65, 123, 148, 149]; LCT proffering lactose resistance in population withherder ancestors in Europe [150] or Africa [124] ; CASP12 increasing re-sistance to sepsis [151]; and CD5 allowing better pathogen recognition[152].Although the aforementioned successes in detecting variants that havebeen selected for, the candidate-gene approach suffers from the three fol-lowing main drawback.
1. An a priori hypothesis is required about which genes have been
63

ii
“thesis” — 2014/9/8 — 10:58 — page 64 — #94 ii
ii
ii
under positive selection, as well as a knowledge of the relationshipbetween genotype and phenotype. Candidate-gene approach aimsto pinpoint the functional variant, but the goal is rarely reached.Furthermore, when the function of the adaptive allele is established,it is difficult to stress how it confers a selective advantage to itscarriers.
2. When there is prior insights on the genes that could have been in-volved in phenotypic adaptation, the adaptive variant can be locatedfar away from the region spanning the gene, rather being withinthe coding or flanking region. In that case, if there is no previousknowledge on the gene regulatory regions, it would be impossibleto detect the adaptive locus within a gene-candidate framework.
3. There is, in general, no sufficient biological knowledge on the molec-ular basis of adaptative phenotype (or even of diseases) across thegenome to make good a priori hypothesis of the underlying molec-ular bases of traits. Thus, candidate-gene approach is reduced to thestudy of annotated genes encoding relatively simple phenotypes.
For those reasons, with the recent wealth of polymorphism data, an alter-native approach have been also used: the genome-wide scan approach.
1.6.2 Genome-wide scans for positive selection.
During the last decade, impressive technological progresses have beenmade to obtain genomic data from high-throughput genotyping arrays toNGS, leading to a bulk of genotype data to perform population geneticsanalyses. Now, large catalogs of genetic variability in worldwide humanpopulations are publicly available (see Section 1.2.2) allowing to studythe impact of natural selection on our genome. For that reason, a largenumber of genome-wide scans of positive selection in different popula-tions has been published in the last years (reviewed in [113, 133, 134]).Such top-down approach, with no a priori hypothesis on the adaptive phe-notype, allowed to overcome the limitations of candidate-gene studies.The first genome-wide scan for positive selection in human populations
64
ii
“thesis” — 2014/9/8 — 10:58 — page 65 — #95 ii
ii
ii
was performed by Akey et al. in 2002 [153] and was followed by morethan 20 other ones. Since 2002, the number of individuals and markersavailable increased consequently (see Section 1.2.2), and theoretical de-velopment allowed the implementation of several new methods for bothhard sweep and alternative modes of positive selection (see Sections 1.4.2and 1.5.5). The multiplication of the data and statistical methods to detectpositive selection, obviously engendered a multiplication of the genomicregions that have putatively evolved in at least a population. Already in2009, more than 5,000 regions in the genome spanning a total of 400Mband encompassing more than 4,000 protein-coding genes were reportedin a review of 21 genome-wide scans published at that time [113]. Those21 scans used methods designed to detect the molecular patterns left bya hard sweep. They also relied on the outlier approach and, therefore,established a priori an expected proportion of the genome under positiveselection in the studied populations, likely leading to an important falsepositive rate. Indeed, in his review [113], Joshua Akey looked at the over-lap of the genomic regions reported by 10 studies using the same data, butdifferent statistics. Strikingly, only 14.1%, 5.3% and 2.5% of the overallregions were reported in two, three or four studies, respectively (Figure1.24). Besides the FPR issue, it is clear that those genome-wide scans canalso miss some real event of selection as suggested by the fact both G6PDand DARC have never been reported by such studies.Although the overlap among individual scans is low, more than 700 re-gions have been identified encompassing previous candidate adaptive lociand new well-supported ones (Table 1.3). Moreover, it appears that mostsignals of putative positive selection are not shared among populationsfrom different geographic regions (for example see [71, 154]). This is ex-pected when considering that the scans mostly relied on the hard sweepmodel, and therefore detected advantageous mutation that appears in thepopulation just before being selected for. Indeed, geographically distantpopulation present different genetic background and have to adapt to veryheterogeneous environmental conditions.Genome-wide scans allow to build maps of putative signals of positiveselection and will still give great insights on how natural selection has
65
ii
“thesis” — 2014/9/8 — 10:58 — page 66 — #96 ii
ii
ii
shaped the human genome. They will also keep on helping the discov-ery of functional elements. However, it remains challenging to extractthe relevant information in the bulk of signals of positive selection fromgenome-wide scans in order to understand how human population reallyevolved and what is at the molecular basis of phenotypic adaptation. In-deed, although the genome-wide approach circumvents some limitationof the gene-candidate, it presents its own ones.
1. Large scale studies do not allow to extensively control for manylayers of complexity. Indeed, in opposition to gene-candidate ap-proach, performing a genome-wide scan it is extremely difficult tobuild an accurate model including both demographic and genomicprocesses to describe the evolution of a specific genomic region orto investigate in depth the molecular mechanisms affecting the ge-netic variability. Therefore, most scans rely on outlier approach,and as mentioned before, only detect the most extreme cases ofpositive selection as well as suffering a likely important FPR [115].As already mentionned, one solution to reduce the FPR, is to relyon different scans performed with different methods and/or on dif-ferent populations.
2. Regions reported by genome-wide scans are usually large, spanninghundreds of kilobases and containing several contiguous genes andregulatory regions. On the other hand, sometimes signals can belocated in intergenic regions where no function has been reportedyet. Therefore, it is often difficult to follow-up the signals to iden-tify the selected variant and the phenotype putatively increasing thefitness.
3. For most genes, it requires a quite important amount of specula-tive discussion (story-telling) to state which could be the adaptivephenotype.
For those reasons, most genome-wide scans focus on a very reduced sig-nals of putative selection based on biological information for a follow-upanalysis. This practice is often referred as cherry picking. Hence, mostof the signals already reported remain to be explained. The recent scan
66

ii
“thesis” — 2014/9/8 — 10:58 — page 67 — #97 ii
ii
ii
performed by Grossman et al. [119] set up new standards to overcomethe aforementioned limitations and represents an important step towardthe identification of putative adaptive variants as well as the underlyingphenotypes increasing the fitness. This study rely on several progresses:(1) they used the CMS which allows to pinpoint more accurately the se-lected variant ([106]; see Section 1.5.4); (2) they performed their analysison the 1,000 Genomes Project Pilot 1 data [155]; and (3) they analysed theputative phenotypic implications of the selective variants by interrogatingthe ENCODE database [147] as well as the GWAS catalog [156].
1.6.3 Insights from published studies of positive selec-tion in humans.
All the studies aforementioned allowed the identification of putative adap-tive loci, but also provide interesting insights on more general questionson the nature of the genomic regions that have been preferentially tar-geted by positive selection in human populations. Thus, they allow tounderstand what are the phenotypic differences among populations andspecies that are induced from adaptation to new environments and whichwere the underlying biological functions at play.
Functional categories for the selected protein-coding gene.
A functional enrichment analysis is almost always performed after a genome-wide scan for positive selection. Such analysis basically tests whether theset of variants located within the regions with a signal of positive selec-tion is enriched in a given biological process or functional pathway. Inother words, it contrasts whether there are more of those variants belong-ing to a given functional class or pathway than expected by chance fromthe background list of loci included in the study. To perform a functionalenrichment analysis, one may use one of the following databases.
1. Geno Ontology [165] groups genes according the the features ofthe gene product. There are three main domains: (1) cellular com-
67
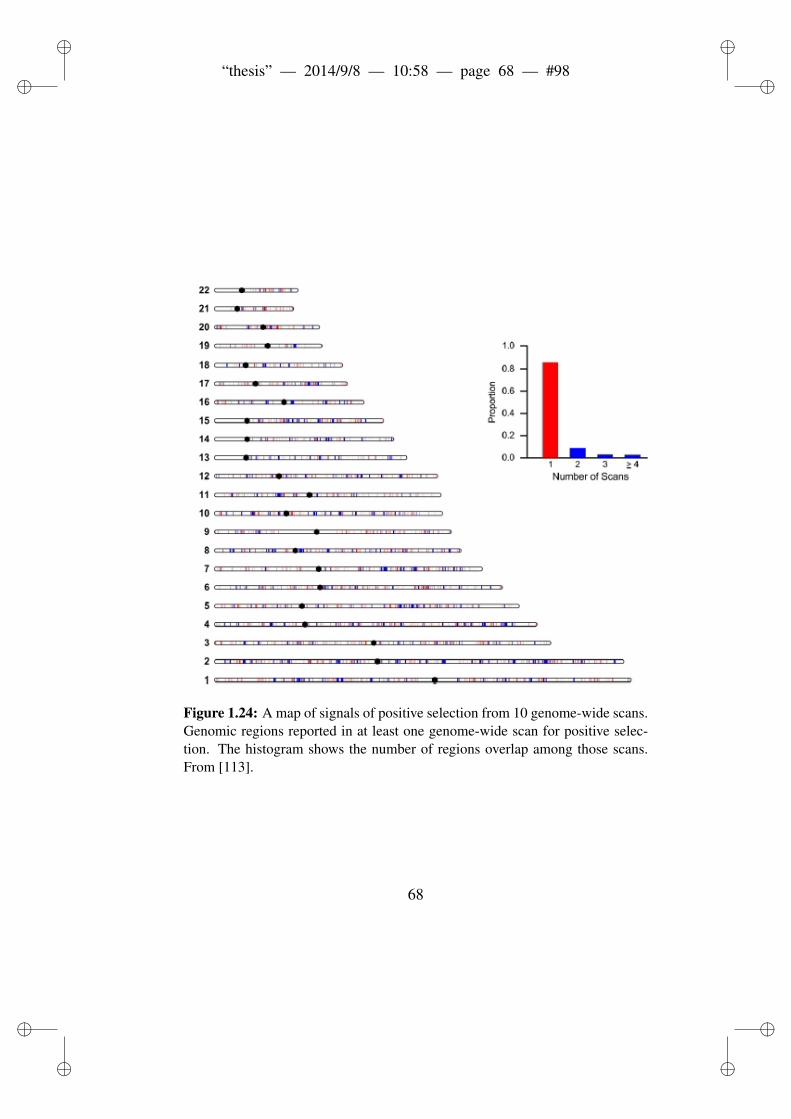
ii
“thesis” — 2014/9/8 — 10:58 — page 68 — #98 ii
ii
ii
Figure 1.24: A map of signals of positive selection from 10 genome-wide scans.Genomic regions reported in at least one genome-wide scan for positive selec-tion. The histogram shows the number of regions overlap among those scans.From [113].
68

ii
“thesis” — 2014/9/8 — 10:58 — page 69 — #99 ii
ii
ii
ponent, i.e. the parts of the cell or its extracellular environmentwhere the gene product is active; (2) molecular function, i.e. theelemental activities of the gene product at the molecular level (e.g.binding, catalysis, etc...); and (3) biological process, i.e. operationsand sets of molecular events with a defined beginning and end andpertinent to the functioning of integrated living units.
2. PANTHER (Protein Analysis Through Evolutionary Relationships)[166] relies on annotation fron Gene Ontology among others andclassifies proteins (and the encoding genes) according to either: (1)family, i.e. groups of evolutionarily related proteins; and subfamily(related proteins that also have the same function); (2) molecularfunction of the protein by itself or with directly interacting proteinsat a biochemical level; (3) biological process, i.e. the function of theprotein in the context of a larger network of proteins that interact toaccomplish a process at the level of the cell or organism, e.g. mito-sis; or (4) pathway which also explicitly specifies the relationshipsbetween the interacting molecules.
3. KEGG (Kyoto Encyclopedia of Genes and Genomes) [167] is acollection of manually curated databases dealing with genomes, bi-ological pathways, diseases, drugs, and chemical substances.
4. Reactome Pathway Database [168] contains curated functionalpathway annotations that cover a diverse set of topics in molecularand cellular biology.
Genome-wide scans of positive selection using polymorphism data in hu-man populations pointed to different categories enriched for gene thathave evolved under a selective scenario: skin pigmentation, immunity,hair density and sweat gland, etc. [114]. Scans based on comparative ge-nomics have revealed categories such as immunity and pathogen defenceor sensory perception [169, 170].However, functional enrichment analyses using such databases are biasedtoward protein-coding gene. In addition, they assume that all the genesare independent and that there is no interaction among them and do not at-tribute any weight according to the gene importance within a pathway or
69
ii
“thesis” — 2014/9/8 — 10:58 — page 70 — #100 ii
ii
ii
a functional category. Although functional enrichment analysis has shedlight on important functions and pathways being preferentially targetedby positive selection, it does not provide a formal test for selection actingon a function. The current approach commonly used for large genome-wide analysis of positive selection is to detect signals at individual genesor regions. However, selected loci are just at the molecular basis of pos-itive selection acting at phenotypic level. Thus, single mutations rarelyact in isolation to improve a function or to contribute to the acquisitionof new ones. To overcome those limitations, Serra et al. created a newmethod called the Gene Set Selection Analysis (GSSA) to detect signif-icant differences in scores of natural selection over functionally relatedgenes [171]. The method was applied genome-wide to coding regions offive mammals. But it still has never been used to interrogate non-codingelements or for polymorphism data.
Complex adaptive traits.The studies listed above describe the first intents to move from individualgenes to the biological modules they belong to. These studies start fromindividual genes or loci to then integrate the information on functionalmodules. The idea behind is that, except for Mendelian traits, many lociwill be involved in phenotypic adaptation. This implies that polygenicadaptation is likely to be the main adaptive force acting on the humangenome. First, Daub et al. used a gene-set enrichment test based on theof FST statistics (SUMSTAT ) to functional pathways or gene sets en-riched in differentiated loci among populations [172]. They found thatmost of the pathways enriched in such loci are more or less directly in-volved in the immune response. This result confirms the general ideathat response to pathogens have been a major selective pressure for hu-man populations (for two reviews see [31, 173]). They also observed ev-idences for epistatic interactions between members of the same pathway.A genome-wide scan although detected several signals of selection forgenes involved in the hypoxia-inducible factor 1 (HIF1) pathway whichis involved in physiological response to hypoxic conditions [159].In order to move towards such mode of adaptation, several studies used
70
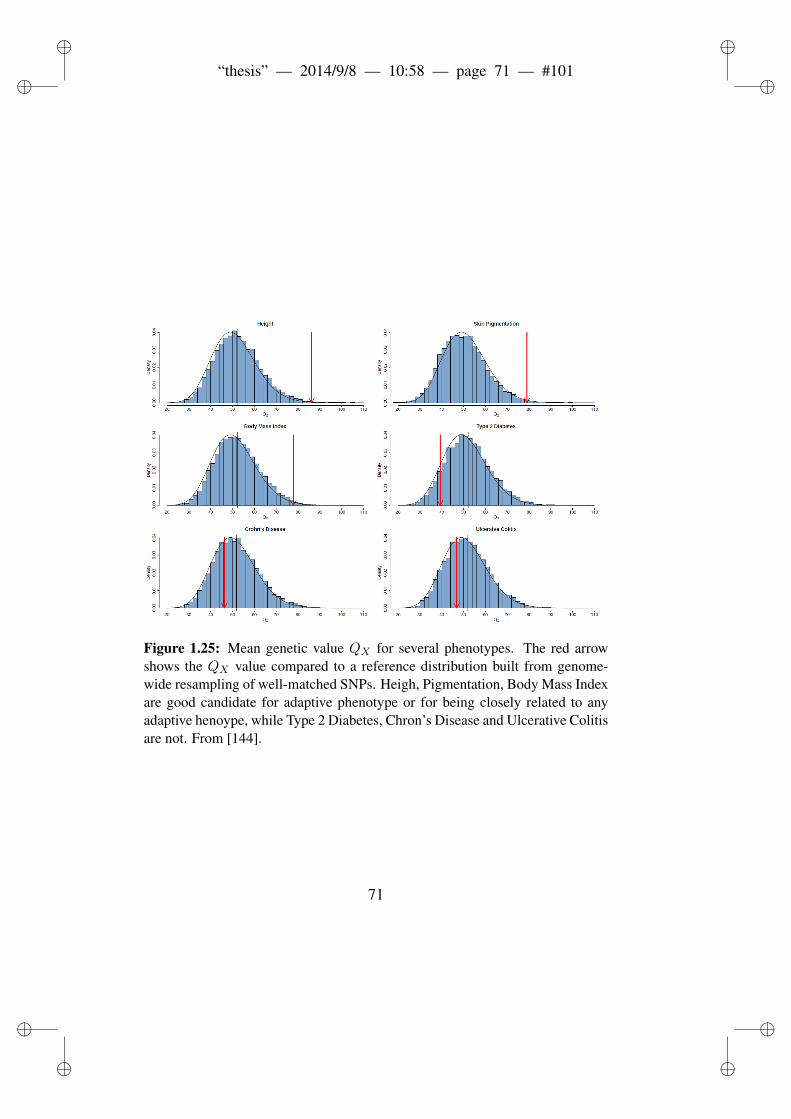
ii
“thesis” — 2014/9/8 — 10:58 — page 71 — #101 ii
ii
ii
Figure 1.25: Mean genetic value QX for several phenotypes. The red arrowshows the QX value compared to a reference distribution built from genome-wide resampling of well-matched SNPs. Heigh, Pigmentation, Body Mass Indexare good candidate for adaptive phenotype or for being closely related to anyadaptive henoype, while Type 2 Diabetes, Chron’s Disease and Ulcerative Colitisare not. From [144].
71

ii
“thesis” — 2014/9/8 — 10:58 — page 72 — #102 ii
ii
ii
methods better suited to study small shift in allele frequency [140, 174,175] (see Section 1.5.5). Looking at covariation of diet, subsistence orecoregion, Hancock et al. found that pathways involved in starch and su-crose metabolism are enriched in signals of polygenic adaptation to a dietrich in roots and tubers, as well as an over-representation of signals asso-ciated to polar climate in genes involved in energy metabolism pathways[140]. Applying the same method with other environmental variables,they also described an enrichment of signals in gene sets related to UVradiation, infection and immunity. On the other hand , Fumagalli et al.,using a similar method, showed that local adaptation has been driven bythe diversity of the local pathogenic environment while climate played arelatively minor role [174].Berg and Coop, using the mean additive genetic value (QX , describedin Section 1.5.5) described several complex traits likely or not to haveevolved through the action of polygenic adaptation [144] as showed inFigure 1.25.
The importance of regulatory elements.Although the method proposed by Berg and Coop [144] is limited be-
cause of relying on GWAS loci and the problem of portability amongpopulations, it is representative of a major shift in the field. Indeed, itis more and more recognized that focusing only on protein-coding ele-ments is not enough to understand adaptive evolution in humans. Indeed,although protein-coding sequence are very well annotated, they only rep-resent around 1.2% of the human genome. Furthermore, the importantsimilarity between humans and chimpanzees in their protein-coding genesequences can not explain the observed phenotypic differences. In 1975,King and Wilson [176] suggested that differences in gene regulation maylargely account for those phenotypic differences among species but alsopopulations. Since 1975, the relative contribution of variants locatedwithin protein-coding genes and regulatory regions has been debated.One evidence from the functionality of non protein-coding regions is theamount of conservation among species across the genome. Indeed, 5% ofthe genome has been estimated to have been largely conserved since the
72

ii
“thesis” — 2014/9/8 — 10:58 — page 73 — #103 ii
ii
ii
MRCA of mouse and human through the action of purifying selection.Hence, this conserved proportion of the genome is likely to be somehowfunctional [177]. Since this proportion is higher than the proportion ofprotein-coding sequences in the genome, a large fraction of the elementswith relevant biological function is non-coding.Until recently, very few evidence has been provided on the adaptive roleof non-coding elements because of technical limitations. On one hand,the annotation outside the genes had been lacking, therefore, it is diffi-cult to distinguish any functional evidence to any putatively adaptive lo-cus. On the other hand, comparative genomics studies, which rely on thecomparison of the rate of substitution on functional versus non functionalelements struggle to find any equivalent to the non-synonymous and syn-onymous changes classification. However in the recent years, a group ofevidences pointed to the role of regulatory elements in adaptive evolu-tion. Using as reference putatively neutral elements the variants locatedin ancestral repeats and pseudogenes, Haygood et al. found an impor-tant amount of promoter regions with signatures of positive selection inthe human and chimpanzee lineages [179]. Strikingly, they found an en-richment of signals of selection in promoters related to nervous-systemfunctions. Recent population genetics studies also point to the same di-rection. First, Kadaravalli e al. using a genome-wide set of eQTLs tointerrogate for positive selection using iHS [71], found that SNPs show-ing signals of selection are more likely than random SNPs to be associatedwith gene expression levels in cis [180]. Second, with a similar study de-sign but taking advantage of the recent wealth in eQTL databases and therecently published ENCODE project [147], as well as using BayENVscores for polygenic adaptation ( [137, 138]; see Section 1.5.5), Fraserprovided the first genome-scale support for the hypothesis that changesin gene expression have driven human adaptation [178] shown in Figure1.26. Third, Enard et al. observed a greater correlation of the observedsignatures of positive selection (as inferred by iHS [71], XPEHH [70]and CLR [67] and correcting for background selection) with the presenceof regulatory sequences from ENCODE [147] than with the amino acidsubstitutions (Figure 1.27) [91].
73
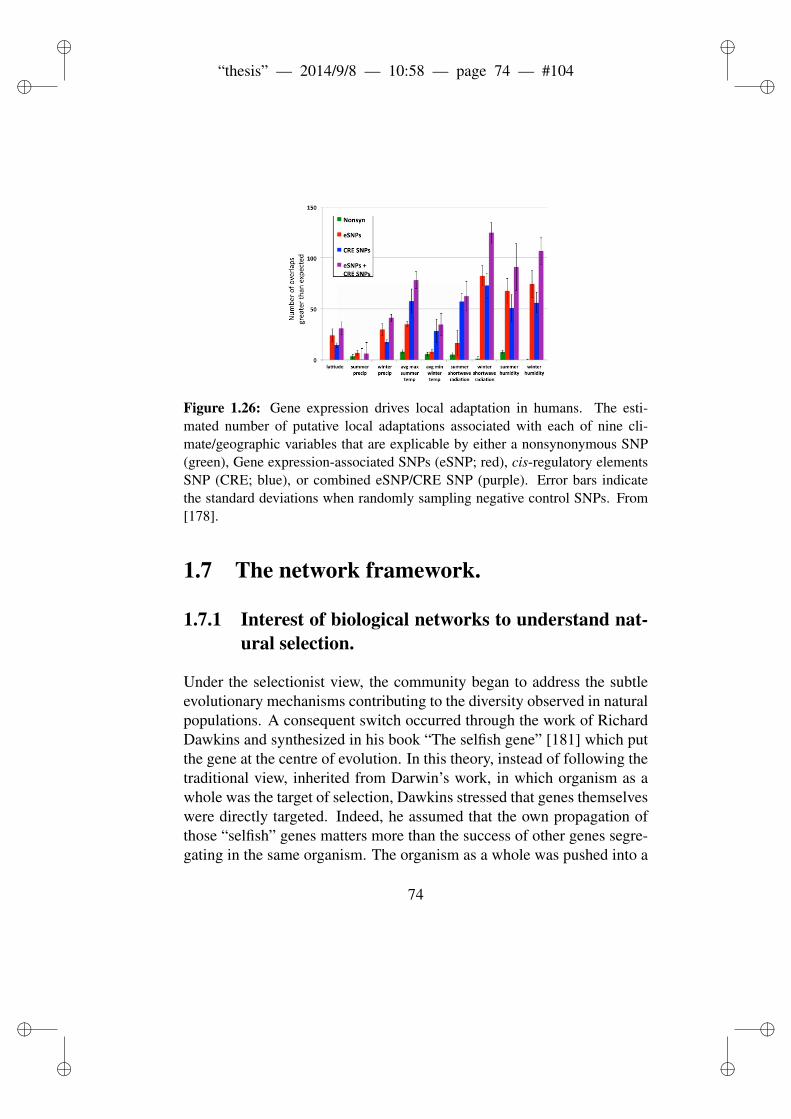
ii
“thesis” — 2014/9/8 — 10:58 — page 74 — #104 ii
ii
ii
Figure 1.26: Gene expression drives local adaptation in humans. The esti-mated number of putative local adaptations associated with each of nine cli-mate/geographic variables that are explicable by either a nonsynonymous SNP(green), Gene expression-associated SNPs (eSNP; red), cis-regulatory elementsSNP (CRE; blue), or combined eSNP/CRE SNP (purple). Error bars indicatethe standard deviations when randomly sampling negative control SNPs. From[178].
1.7 The network framework.
1.7.1 Interest of biological networks to understand nat-ural selection.
Under the selectionist view, the community began to address the subtleevolutionary mechanisms contributing to the diversity observed in naturalpopulations. A consequent switch occurred through the work of RichardDawkins and synthesized in his book “The selfish gene” [181] which putthe gene at the centre of evolution. In this theory, instead of following thetraditional view, inherited from Darwin’s work, in which organism as awhole was the target of selection, Dawkins stressed that genes themselveswere directly targeted. Indeed, he assumed that the own propagation ofthose “selfish” genes matters more than the success of other genes segre-gating in the same organism. The organism as a whole was pushed into a
74

ii
“thesis” — 2014/9/8 — 10:58 — page 75 — #105 ii
ii
ii
Figure 1.27: Most human recent positive selection occurs in regulatory se-quences. The filled circles and squares show the correlation coefficients of theabsolute values of iHS with the density of regulatory and coding sequence den-sity, respectively, controlling for recombination and average pairwise diversity(covariate of BGS). The open circles and squares show partial correlations. From[91].
position of secondary importance: its function is merely a “survival ma-chine” for the genes to segregate [181]. Under this view, the biologicalrole of altruism could be explained: alleles promoting altruist behaviourmay allow their own survival by helping their fellows to survive, beingin the same host organism or in a close related one. Moreover, this the-ory struck a chord in the genetics community, since it could also justifywhy some genes extensively replicate even to the detriment of the organ-ism. Although Dawkins’ view of natural selection remains wide-spread,it presents different caveats, most formulated by Stephen J. Gould andErnst Mayr. Especially, genes are not directly exposed to the environ-ment, and only the phenotype not the genotype interfaces with naturalselection: the survival of the organism only depends on the viable pheno-type resulting from the genes function. The selection at the genome levelis only a consequence on the selective pressures endorsed by the pheno-type. Moreover, most of the phenotypes result from the joined action ofseveral genes: the phenotypic effect of one gene deeply depends on the
75

ii
“thesis” — 2014/9/8 — 10:58 — page 76 — #106 ii
ii
ii
genetic background in which it segregates. This mechanism, called epis-tasis between mutations within and among genes. Inter-genes epistasis,which can be viewed as complex interactions, can not be assessed by thegene-centric view proposed by Dawkins. Epistasis is said to be positive(or synergetic) when a combination of mutations has more effect on thefitness than the additive effect of individual mutations. On the other hand,negative (or antagonistic) epistasis occurs when interacting mutations in-duce a lower fitness effect than expected by adding the individual effectof each mutation. Finally, sign epistasis describes the inversion in fit-ness effect of a mutation when in the presence of another mutation. Thephenotype is encoded through the effects of several genes in a non-linearway, and it is the prime target of natural selection. Hence, one expectsto observed (1) that the interacting partners of a protein would affect theevolution of the gene encoding it; and (2) evolutionary patterns within thebiological systems.There is now a body of evidences showing the prevalence of epistastisemerging from biological systems [182, 183]. Particularly, Dobzhansky-Muller incompatibilities, also known as compensatory mutations havebeen describe to be a relevant mechanism driving protein evolution [184].This phenomena is an extreme case of sign epistasis, when two delete-rious mutations are beneficial when segregating together (reciprocal signepistasis). Moreover, genes encoding interacting proteins tend to exhibitcorrelated evolutionary histories (for review, see [185]). Indeed, suchgenes tend to duplicate almost simultaneously [186, 187] and to evolve atrelatively similar rates [188–193]. Such co-evolution of genes may resultfrom the co-evolutionary dynamics of the proteins they encode, for exam-ple when the deleterious effect of mutations in a protein is compensatedby other mutations in interacting proteins. Other factors might also drivesuch coevolution : similar expression levels and/or function of interactingproteins [194, 195]. All together, it is now accepted that interacting part-ners of a protein affect the evolution of the gene encoding it.Therefore, the consideration of biological systems in which proteins in-teract to accomplish a given function may be informative to understandgene evolution, and one would expect some evolutionary patterns within
76
ii
“thesis” — 2014/9/8 — 10:58 — page 77 — #107 ii
ii
ii
those systems. Indeed, the interacting genes have uneven importance onthe function of the biological system, and since natural selection acts onthis function, its impact on genes is expected to differ from gene to gene.A straightforward way to study an interacting system of proteins is to rep-resent it through a network. The present thesis focuses on this networkframework, and before reviewing the studies trying to relate the action ofnatural selection -either positive or purifying- on genes to their positionand role in the functional networks, a brief description of the methodol-ogy adopted is required.
1.7.2 Biological pathways and their representation as net-works.
It is an essential characteristic ofexperimentation that it is carried outwith limited resources, and an essentialpart of the subject of experimentaldesign to ascertain how these should bebest applied; or, in particular, to whichcauses of disturbance care should begiven, and which ought to bedeliberately ignored.
The Design of ExperimentsSIR RONALD A. FISHER
Three main types of biological networks.The biological networks are key systems that describe the basic mecha-
nisms that govern life and functioning of the cell. Genes and their prod-ucts, i.e. proteins, interact in several ways. The global function of thecell, or even the organism, is led by all the different interactions occur-ring simultaneously. However, each interaction type is driven by differentmechanisms and, thus, operate under different constraints. Treating thosedifferent types of interactions separately may be an useful simplification.
77

ii
“thesis” — 2014/9/8 — 10:58 — page 78 — #108 ii
ii
ii
Indeed, the present knowledge of molecular biology is too limited to allowan ideal integration of all the active elements in the cell into a single bio-logical system, and trying to describe all the complexity of all the cellularinteractions is not feasible yet. One would prefer to focus on a specificaspect of the interactions in order to study its own properties.Therefore, biological networks can be divided into three main familiesaccording to the type of interactions at stake:
1. Gene regulatory networks govern the expression levels of mes-senger RNA (mRNA) and proteins in the cell. They are composedof several DNA sequences which interact with each other -and withother molecules- indirectly in the cell. The main elements of thosenetworks are the transcription factors (TFs), which turn on or downthe transcription of other genes by binding to their promoter regionat the start (in 3’) or at the end (in 5’) region. In multicellular organ-isms, different cells perform different functions with the same ge-nomic information thanks to the control of the genes that are turnedon and expressed. Gene regulatory networks are the main driversof such control of the cell function.
2. Signal transduction networks are activated when an extracellu-lar signaling molecule binds a specific receptor located either onthe cell surface or inside the cell. The activation of the recep-tor, in turn triggers a chain of biochemical events inside the cell,creating a response to the signal and, thus performing a given bi-ological function. Signal transduction networks are mainly com-posed by physical protein-protein interactions (PPIs) : phosphory-lation which activates the function of the protein by transferring aphosphate group to a protein, dephosphorylation, proteins bindingthrough their binding sites to be functional together, sometimes ag-gregating as protein complex. The proteins involved in those trans-duction cascades can be active inside or outside the cell, and can beclassified according to their function as defined by their domains.
3. Metabolic networks represent a series of chemical reactions, cat-alyzed by enzymes, to transform an initial molecule to form another
78

ii
“thesis” — 2014/9/8 — 10:58 — page 79 — #109 ii
ii
ii
product. During the metabolic reaction chain are produced metabo-lites, which are the product of a given reaction and the substrate ofthe following one. Enzymes are the active elements of metabolicnetworks and are linked by the metabolites shared between the re-action they catalyse.
.
Topological representation of biological networks.Graph theory provides useful tools to describe the structure of the bio-
logical networks. A network is made of nodes (active elements) relatedone with the others by edges (interactions). Table 1.4 shows the nature ofthe nodes and edges depending on the three kind of biological networks.
Table 1.4: Elements and their interactions within the different types of biolog-ical networks. A simplistic overview of the active elements (nodes) and theirinteractions (edges) composing three different types of biological networks
Nodes EdgesMetabolic Network Enzymes Shared MetabolitesSignal tranduction Pathways Proteins Physical InteractionsGene Regulatory Network Transcription Factors Regulatory Relationships
Graphs theory allows to compute several descriptive statistics represent-ing the topology of a given network, in order to discriminate the elementscomposing it. Particularly, there are a body of measures to describe thecentrality of each element. The three most widely use are :
1. Degree centrality (or connectivity) is the number of edges of anode. Within a biological network, it is the number of interactionsa given protein participate to.
2. Betweenness centrality is the number of shortest paths that pass
79

ii
“thesis” — 2014/9/8 — 10:58 — page 80 — #110 ii
ii
ii
through a node [196]:
cB(v) =∑s,t∈N
σ(s, t|v)
σ(s, t)(1.8)
, where v is the node of interest, s and t are two other nodes in thenetwork N, σ(s, t) is the total number of shortest paths betweens and t (minimal sequences of nodes that connect s and t), andσ(s, t|v) is the total number of shortest paths between s and t thatpass through v. Nodes acting as information bridges will be as-signed a high betweenness centrality measure.
3. Closeness centrality is the reciprocal of the sum of the shortestpath distances between a node and all the other nodes in the network[196]:
cC(v) =n− 1∑n
u=1 d(v, u)(1.9)
where n is the number of nodes in the network and d(v, u) is theshortest path distance between nodes v and u. Notably, high valuesof closeness should indicate that all other nodes are in proximity tonode v. In contrast, low values of closeness should indicate that allother nodes are distant from node v.
An important assumption.When studying evolution of genes involved in a biological network, one
obvious assumption is the fact that network topology is fixed. While itis conceivable to think that network structure might affect and constrainthe possibilities of evolution of individual genes having a role in the net-work, in turn, the evolution of individual genes changes the network itselfby adding and removing nodes and edges as a consequence of their ownevolution. However, even if the influence presumably goes in both direc-tions, the rate of link dynamics (gain and loss of edges) is estimated to bemuch slower than the rate of protein sequence evolution [197]. This keepsdown the magnitude of the effect of the assumption of fixed topology andmakes it of practical use to study the influence of network structure ongenes’ evolution.
80
ii
“thesis” — 2014/9/8 — 10:58 — page 81 — #111 ii
ii
ii
Two different biological scales for evolutionary network analsyses.The studies of the patterns of molecular evolution within biological net-
works can be divided into two lines of investigation distinguished by thebiological scale considered (Figure 1.28):
1. Small-scale network which represents a particular biochemical sys-tem of interest in order to gain insight into its specific evolutionaryhistories. This approach focus on the coordinate effect among genesperforming a given biological function. In that case, succesivefunctions are determined on the basis of well established molecularknowledge on the process. Then, one studies the impact of naturalselection on the gene evolution integrating information on the play-ers at succesive steps interacting together across a given biologicalnetwork describing such small and well annotated pathways. Al-though, such small-scale approach is interesting in the sense that itfocuses on a specific biological function, which is, again, the primetarget of natural selection, it considers that the biological system istotally isolated from the others in the organism.
2. Large-scale network which considers the complete set of interac-tions of a kind comprised by the organism, in order to detect univer-sal patterns of evolution. Such scale allows to incorporate the infor-mation on cross-talks among pathways and gene pleitropy (whena gene influences multiple, seemingly unrelated biological func-tions). Taking the pleotropic effect of a gene is of significant im-portance when considering gene evolution, as predicted by RonaldFisher [33] in its geometric model of adaptation (Figure 1.29). Nev-ertheless, using such large-scale networks present its own draw-backs: the information on the interactions may be incomplete andcontain a relatively important amount of errors since it is mainlygenerated from high-throughput analyses. The large-scale networkscan also be divided according to the type of interactions considered:the metabolome describes all the metabolic interactions among en-zymes, the interactome is the whole Physical Protein-protein Inter-action map (PPI) and the whole regulatory network. In any case,the retrieved network is fully dependent on how the full set of data
81

ii
“thesis” — 2014/9/8 — 10:58 — page 82 — #112 ii
ii
ii
was obtained, and thus, is technology dependent.Moreover, Khurana et al. integrates the diverse modes of gene interac-tions to create a unified biological network called MULTINET [200].Despite the extreme differences in scope when using different networkscales, the network representation use the same descriptive measures men-tioned above.
1.8 Evolutionary patterns within biological net-works.
The evolution of biological networks is two-fold. First, the addition, re-moval and/or change of elements and their connections account for vari-ation of network structure across time. Second, the elements are them-selves evolving entities. If the network structure evolves at slow pace, itcan be freeze to interrogate what is its impact on the evolutionary historyof its elements. Does network structure constrain the evolution (purifyingselection) of specific elements; does it incite innovations to arise (positiveselection) at particular positions within the network?Below, an overview of the studies that have investigated how biologicalnetwork topology and structure may drive natural selection. The resultsof those studies will be described according to the scale of the biologicalnetworks (either small or large scale; see Section 1.7.2), the mode of nat-ural selection studied (either purifying or positive) and the approach usedto detect it (using either polymorphism or divergence data).
1.8.1 Evolutionary analysis of small-scale networks.
Inter-specific analysis of small-scale networks.The anthocyanin biosynthetic pathway was the first biological network
studied within the scope considered in this thesis. The authors used di-vergence data from three plant species to infer the evolutionary rate ofthe 6 genes involved in this metabolic pathway [201]. In the following
82

ii
“thesis” — 2014/9/8 — 10:58 — page 83 — #113 ii
ii
ii
Figure 1.28: Cross-talks among different pathways. A gene’s position in a net-work influences its effects on a target phenotype and on other traits. Circularnode sizes are proportional to the gene’s effect on the selected phenotype; theintensity of red colouration is proportional to effects on other traits (where nocolour indicates no effect on other traits). Square nodes have no effect on the tar-get phenotype owing to the directionality of the network, but they may influenceother phenotypes. Small black circles indicate the directions of the interactionsin the network; modes of interaction are not specified. From [198].
83

ii
“thesis” — 2014/9/8 — 10:58 — page 84 — #114 ii
ii
ii
Figure 1.29: Fisher’s geometric model of adaptation. In its geometric modelof adaptation [33], Fisher showed that the probability, Pa(x), that a mutationwith a phenotypic effect r, is favourable is 1 − Φ(x), where Φ(x) representsthe cumulative distribution function of a standard normal random variable, andx = r ×
√n2z , where n is the number of traits -or biological functions- the
mutation participates to and z is the distance to the optimum. From [199].
years, other metabolic [202–206] and signaling pathways [207–212] havebeen analysed using divergence data. All of them are composed of a smallnumber of genes functionally related, with the the role of each within thesystem well established. Such knowledge retrieved from biochemical re-search allows to construct accurately the network structure.In many of these studies, it has been observed that upstream genes in thepathway tend to be more constrained in their evolution -through the ac-tion of purifying selection- than downstream genes [201, 203, 205, 207,213, 214]. A possible reason for this pattern would be that upstreamgenes are more constraint in their evolution because they are likely tohave more pleitropic effect than those downstream. Indeed, since they aremore likely to be above some branching points in the pathway, they areinvolved in the synthesis of more products than downstream genes [201].Nevertheless, this gradient of decreasing purifying selection along a path-way has not always been found. First, Yang et al. did not identify any sig-nificant evidence for such relationship in the gibberilin metabolic biosyn-thetic pathway [204]. Second, the opposite trend has been reported forthe insulin/TOR transduction signaling pathway in Drosophila [208] andvertebrates [209], as well as in the N-glycosylation pathway in primates
84

ii
“thesis” — 2014/9/8 — 10:58 — page 85 — #115 ii
ii
ii
[206]. Ramsay et al. introduced another measure which weights the posi-tion of a genes in relation to pathway branch points. This measure, calledthe “Pathway Pleiotropy Index”, counts groups of enzymes between path-way branch points and enzymes between two consecutive branch pointsare given the same position [205]. In the plant terpenoid biosynthesispathway, composed of 40 genes, this measures positively correlates withevolutionary rates, as estimated comparing angiosperms sequences of fiveplant species, better than simple pathway position. This result points thesignificant effect of pleitropy on evolutionary rates [205]. Two other stud-ies suggest that branch points in metabolic pathways play a relevant roleand are critical to evolution: branch points are under stronger purifyingselection [204] and more likely to be targeted by positive selection[202].The impact on metabolic flux of branching points may account for theseresults [215, 216].Other studies used centrality measure to assess the importance of a genewithin a biological network [210–212], all describing that central genesin the network are more constrained in their evolution, as inferred fromdivergence data, than genes acting at the periphery.
Intra-specific analysis of small-scale networks.Until the last three years, very few was known on the relationship be-
tween the impact of natural selection on a gene, as inferred using poly-morphism data, and the position it occupies in a biological network. Twoearly studies indicate that genes that act at metabolic pathway branchpoints are targets of positive selection [217, 218]. An analysis of six genesin the Arabidopsis floral developmental pathway suggests that four down-stream TF genes have evolved neutrally, while the two earliest-actinggenes included in the study present a significant reduction in silent sitenucleotide variation consistent with a recent selective sweep [219]. Nev-ertheless, they did not consider the biological network as a whole, butrather focus on a group of genes with relevant function within it.Moreover, a study of polymorphism data for the D. melanogaster speciesconfirmed the gradient of the levels of purifying selection along the in-sulin/TOR transduction signaling pathway found using divergence data
85

ii
“thesis” — 2014/9/8 — 10:58 — page 86 — #116 ii
ii
ii
from either Drosophila [208] or vertebrate [209] species. Indeed, at intra-specific level, the downstream genes being the most constrained in thepathway [220]. Finally, Casals et al. constructed the innate immunityinteraction network to infer the action of both positive and purifying se-lection using polymorphism data [221]. Although this network does notrepresent a biological pathway performing a specific function within thecell, it is informative on the relationship between gene centrality and theimpact of natural selection. Indeed, they also found that at intra-specificlevel, selective constraint is greater for gene acting at the core of the net-work while adaptation (balancing and positive selection) mostly occurredat particular positions at the network edges. When the article presentedin this thesis in Chapter 5 was published, the study by Casals et al. [221]seems to be the only one on the distribution of adaptive selection acrossan network of interacting genes using polymorphism data. Since, severalarticles have been published and are discussed in Chapter 7.
1.8.2 Evolutionary analysis of large-scale networks.
Protein interaction network.Since the development of the yeast two-hybrid technique, high through-
put determinations of physical interactions among proteins allowed to re-trieve an important amount of information on the whole map of PhysicalProtein-protein Interactions (PPIs) occurring in a given organism, alsoreferred to as Interactome, or Protein Interaction Network (PIN). It hasbeen observed that the PIN is organized following a scale-free model[222, 223]: the connectivity (or degree) follows a power-law distribution.Thus, the probability, P (k), of a gene to be involved in k interactions isproportional to k−γ , where γ is the degree exponent which determinesimportant features of the network. The lower γ, the more important therole of the hubs, i.e. the highly connected elements in the network. Thediscovery of this PINs feature for many organism, brought to attention therole and importance of node connectivity. Does the topology itself confersome properties to the system? What are its functional implications incase of the PPI networks? Since the scale-free organization has emerged
86
ii
“thesis” — 2014/9/8 — 10:58 — page 87 — #117 ii
ii
ii
independently in many biological networks, it suggests that such topol-ogy is able to arise from a self-organizing process through the influenceor as the result of selective mechanisms. Several studies have studied thebiological characteristics of the hubs in order to better understand the pu-tative function(s) of these highly connected elements. Genes encodingproteins acting as hubs in the PIN may have some special features, suchas being indispensable for the cell to correctly carry its functions. In otherword, if a gene encoding such proteins is removed from the system, couldthe organism survive? To answer this question the relation between con-nectivity and other gene features related to fitness have been addressed.
1. Connectivity and Indispensability. To estimate the indispens-ability of a gene, one way is to knock-out it in a model organ-ism and observe whether the gene deletion is lethal. Such exper-iments in yeast revealed that that highly connected proteins arethree times more likely to be indispensable than less-connectedones [224, 225]. Thus, gene indispensability is due to the positionwithin the PIN occupied by the protein it encodes, most likely be-cause when hub proteins are removed the network would be quicklydisrupted while it would tolerate the absence of a protein with fewinteractions.
2. Connectivity and evolutive constraint. The patterns describedabove suggest an obvious expectation: since the removal of highlyconnected proteins is lethal, any impairing mutation appearing inthe underlying gene must be purged by purifying selection. Sev-eral studies testing this hypothesis have been published during thelast decade. First, Fraser et al. reported a negative correlation be-tween connectivity and evolutionary rate using divergence data ofS.cerevisiae species [188]. Hence, proteins interacting with manyothers evolve more slowly than less connected ones. Two differentexplanations can arise from such observations: highly connectedprotein may (1) have a greater effect on fitness (see the mutationalrobustness hypothesis introduced by Jeong et al. [224]); (2) bemore pleitropic since they have a larger proportion of their struc-ture involved in their different functions and thus may be under an
87
ii
“thesis” — 2014/9/8 — 10:58 — page 88 — #118 ii
ii
ii
overall higher constraint. Performing a partial correlation analysis,the authors concluded the second choice is more likely : centralproteins have a higher proportion of the protein structure involvedin its functions. The correlation between evolutionary rates andconnectivity is not fully accepted. Indeed, although some alterna-tive studies point to the same direction [225], it has not been fullyvalidated by other studies using different data to describe the PINas well as other methodology to estimate the rate of gene evolu-tion [226, 227]. The difficulties to confirm such tendency broughtlight on the accuracy of the networks’ reconstruction associatedwith the technology used [228]. Furthermore, Bloom and Adamiused different PINs from different data sets and estimate for eachthe relationship between connectivity [227]. They deduced that thecorrelation between connectivity and evolutionary rates might justbe a by-product of highly connected genes being highly expressed[227, 229]. Indeed, high protein expression level induces a con-straint of the substitution rate in protein sequences [230]. A lessonfrom this debate would be the importance of considering other ge-nomic determinants that influence the gene evolution, before con-cluding on a putative relationship between the rate of evolution andgene centrality. For instance, a study of different PINs in yeastyields inconsistent conclusions, even when correcting for the con-founding factor of expression level [231]. All together, although thenegative correlation between evolutionary rate and gene connectiv-ity seems to be widely accepted, the evidences remain controver-sial.
3. Evolutionary rate and other centrality measures. Beyond con-nectivity, betweenness and closeness centrality (see Section 1.7.2),other measures have been used to interrogate the putative relation-ship between gene centrality and three different eukaryotic PINs[232]. The authors reported that dN negatively correlate with be-tweenness while dN/dS correlate with centrality, independently ofthe measure used. Although closeness and betweenness are largelycorrelated to degree (connectivity), they are informative measure to
88

ii
“thesis” — 2014/9/8 — 10:58 — page 89 — #119 ii
ii
ii
take into account the global network context by considering pro-teins beyond the directly interacting partners. Proteins with highercentrality measure likely play a relevant role in the cross-talks be-tween different parts of the network, and thus, have an importantpleitropic effect accounting for the selective constraint acting onthem. In order to estimate the relative importance of a proteinwithin the network, one can also consider its participation and posi-tion in relation to module. Modules are groups of highly connectedgenes which, together, perform a given function. Under this scope,in S. cerevisiae, the evolutionary rate (dN/dS) has been describedto be lower for local hubs, that is highly connected genes with inter-actions essentially within modules than for global hubs, i.e. whichconnect different modules [233]. This observation suggests thatmodules are quite conserved while their co-action is more likely tobe targeted by positive selection.
4. Positive Selection in Protein-Interaction Networks. The fractionof genes that shows this signature of positive selection is generallysmall. However studying the genes that have evolved under puta-tive positive selection is informative because they are the molecularbasis of new phenotypic adaptations. A study of the distributionof the events of positive selection within the human PIN [234] us-ing divergence data from human and chimpanzee species, using thedN/dS based likelihood ratio test (see Section 1.4.1), demonstratethat they are more likely to occur at the periphery of the PIN (Fig-ure 1.30). The authors claimed that the periphery corresponds tothe physical periphery of the cell. This article of the distribution ofevents of selection within a PIN seems to be the only one precedingthe study presented in Chapter 6 which has been carried using bothpolymorphism data in human populations and divergence data inmammals and analyzing both positive and purifying selection.
89

ii
“thesis” — 2014/9/8 — 10:58 — page 90 — #120 ii
ii
ii
Figure 1.30: Events of positive selection are more likely to occur at the periph-ery of the Physical Protein-protein Interaction Network. (A) The gene likelihoodto be positively selected and betweenness centrality are represented along they and x-axes, respectively (Spearman’s correlation coefficient, ρ, = 0.06; P =1.2e-06). Dark red and light red points for genes likely to be under positive se-lection with high and low likelihood, respectively, while yellow points representgenes that has not evolved under positive selection. (B) The gene dN/dS scoreand betweenness centrality are represented along the y and x-axes, respectively(Spearman’s correlation coefficient, ρ, = 0.06; P = 1.2e-06) (C Upper) Between-ness centrality of genes under positive selection vs all other genes. (C Lower)Betweenness centrality of genes with a high ratio of nonsynonymous to synony-mous SNPs (pN/pS) vs. genes with a low pN/pS . From [234].
90

ii
“thesis” — 2014/9/8 — 10:58 — page 91 — #121 ii
ii
ii
Metabolic interaction networks.Knowledge on metabolic reactions in model organisms has been drawn
from decades of biochemical research and its integration with the cur-rently available whole-genome information is allowing the reconstruc-tion of a single organism-scale metabolic network [235–237] which in-tegrates the whole metabolic machinery of an organism. Based on thehuge amount of knowledge on the biochemistry of the involved processes,metabolic networks result to present much better annotation of the func-tions and role within the global process for the elements composing it.Therefore, interpret the phenotype from the the genotype happens to beeasier.In metabolic networks, there is the information about reactions, enzymesand metabolites. Because of this coupled information about the reactions,the enzymes catalyzing them and their substrates and products, differentgraph representation can be adopted. Each representation captures differ-ent aspect of the metabolism machinery and, thus, gives a different focusto the analysis. Two main representations arise [238]: the substrate graph,in which the substrates are the nodes and edges their co-occurrence in thesame reaction; and the reaction graph, in which nodes represent reactionsand edges indicate shared compounds.
1. Metabolic network organization. Using the substrate graph, thosenetworks appear to (1) follow the scale-free organization [224, 239];(2) be hierarchical [240]; and (3) be organized according the thesmall-world property [238, 239]. This latter property implies thatmost pairs of nodes (substrates) can be connected through a rela-tively short path of reactions, thus, conferring an advantage to thesystem by enabling it a quick recover of the required concentrationof metabolites after perturbations.
2. Evolutionary Rates and Centrality Measures. The reaction graph,where the genes encoding the enzymes are the nodes is more in-formative to study the distribution of the impact of natural selec-tion across the network. This representation has been used for thestudies described below. In the E. coli metabolic network, no sig-nificant relationship has been found between connectivity and the
91

ii
“thesis” — 2014/9/8 — 10:58 — page 92 — #122 ii
ii
ii
evolutionary rate, measured with the dN score [241]. On the otherhand, for Drosophila and yeast, the dN/dS score is negatively cor-related with connectivity. This points to the same direction thanstudies which describe in the same networks that highly connectedgenes evolve at slower rates, most likely due to the action of pu-rifying selection [242, 243]. Moreover, this relationship happensto be stronger with global centrality measure, such as betweenness[244]. To date, it seems that there is no published analysis carriedout with polymorphism data (at intraspecific level) to describe thedistribution of natural selection throughout the metabolic network.
Gene regutory networks.Transcription Factors (TFs) regulate the expression of their targets (whichcan also encode TFs). The gene regulatory network (or TF network) en-codes those regulatory relationships. Although in other networks the in-teractions are undirected, the gene regulatory network is composed ofdirected edges (or arcs) connecting each TF to its targets. For directedgraphs, connectivity can be divided into two components: the in-degreeand out-degree which are the number of incoming edges upon a node andthe number of outgoing edges from a node, respectively.Available network reconstructions may be incomplete since TF-target as-sociations are highly context dependent [245], and it is experimentallypossible to only test a few of them. Therefore, one can argue that thegene regulatory networks that have been retrieved to date are largely in-complete. Nevertheless, different large scale compilations of gene regula-tory networks are now available and can be used as a proxy of the wholenetwork to study its topological architecture and evolution [246, 247]. Inyeast (S. cerevisiae), gene regulatory networks are organized into a hi-erarchical structure and follow the scale-free model [248] in which fewTFs are at the top and are not regulated by others. Gerstein et al. de-scribed a hierarchical human gene regulatory network derived from EN-CODE data with a bow-tie structure, with middle level elements havingthe most information flow bottlenecks [249]. Moreover, Rodriguez-Casoet al. also observed that the human gene regulatory network shows the
92
ii
“thesis” — 2014/9/8 — 10:58 — page 93 — #123 ii
ii
ii
properties of a scall-free and small-world network [247]. The upstreamTFs of gene regulatory network are usually activated through a signaltransduction pathway in response to an extra-cellular stimuli.
1. Evolutionary rates and centrality measures. TF hubs in the yeastTF network do not exhibit lower evolutive rates than other elements[250, 251] suggesting that TF connectivity does not affect its selec-tive constraint. However, another study on a bigger dataset founda significant correlation between the rate of protein evolution andcentrality with central TFs evolving faster [252]. The authors alsoclaimed that the higher rate of divergence among central TFs couldbe due to the action of positive selection because of their role incontrolling information flow. On the other hand, the opposite trendwas described in the human regulatory network : more connectedelements of the network are more constrained (as inferred by theSNP density in the genes encoding it and the dN/dS rate) [249].Hence, the effect of TFs position in the gene regulatory network onthe evolution of genes encoding them remains to be elucidated, andfurther studies are needed.
2. Gene co-expression networks. Analysing co-expression networksis also informative to understand gene regulation. In such net-works, two genes are linked if they are co-expressed in the same tis-sues and conditions. The human co-expression network, retrievedfrom tissue-specific expression profiles, exhibits scale-free prop-erties [253]. This implies evolutionary self-organization throughpreferential node attachment. The authors also observed that geneswith many co-expressed partners, i.e. the hubs, evolve more slowlyon average than genes than others, as well as similar evolutive ratesfor co-expressed genes.
Integration of different types of large-scale networks within a meta-network.Khurana et al. integrated the diverse modes of gene interactions (regula-
tory, genetic, phosphorylation, signaling, metabolic and physical protein-
93

ii
“thesis” — 2014/9/8 — 10:58 — page 94 — #124 ii
ii
ii
Figure 1.31: MULTINET: a meta-network integrating different types of large-scale networks. The edges of the MULTINET are shown in grey (only the in-teractions of genes that are involved in more than one network are shown). (A)Nodes corresponding to loss-of-function tolerant and essential genes are shownin blue and red respectively. Size of the nodes reflects the degree centrality ofthe gene within MULTINET. Essential and loss-of-function tolerant genes tendto be at the centre and the periphery of the network, respectively. (B) Nodescorresponding to loss-of-function tolerant and essential genes are shown in or-ange and green respectively. Size of the nodes reflects the number of networksthe gene is involved in. Essential and loss-of-function tolerant genes genes tendto be involved in more and less networks, respectively. Moreover, most loss-of-function tolerant genes are not involved in any network and are not present in theMILTINET. From [200].
94

ii
“thesis” — 2014/9/8 — 10:58 — page 95 — #125 ii
ii
ii
protein interactions) in order to create an unified biological network inhumans called MULTINET (Figure 1.31) [200]. Although such meta-network is likely to suffer a large number of errors, it is a step forwardsto the integration of many layers of complexity in the functioning of theorganism. Indeed, different pathways and networks interact one with theothers in a complex dynamical way. For instance, a signal transductionpathway can respond to a stimuli to active a gene regulatory networkwhich to turn on the expression of enzymes involved in some metabolicreactions. The authors then studied how natural selection acts within eachindividual network as well as in the MULTINET. First, when evolutiveconstraint was estimated by the dN/dS ratio using human and chimpanzeesequences, they found that dN/dS values are negatively correlated withtheir degree centralities in all networks. This shows that highly connectedgenes tend to be under stronger purifying selection constraints over longevolutionary time-scale. Then, they analysed polymorphism data fromthree human populations [155], and calculated the average heterozygos-ity for missense SNPs for each gene. They observed a significant neg-ative correlation between MULTINET connectivity and heterozygosity,suggesting that more variation has been allowed to arise at the peripheryof the network. Such trend was not observed when analysing synonymoussites. The higher selective constraint in human populations for gene act-ing at the core of the MULTINET may account for those results.Based on this MULTINET and other features (such as selective constraint,participation to the diferrent networks, etc...) of loss-of-function tolerantgenes (as defined in [254]) and essential genes (as defined in [255]), theyimplemented a computational model to predict global perturbation causedby deleterious mutations in all genes with good accuracy (Figure 1.31)[200].
95

ii
“thesis” — 2014/9/8 — 10:58 — page 96 — #126 ii
ii
ii

ii
“thesis” — 2014/9/8 — 10:58 — page 97 — #127 ii
ii
ii
Chapter 2
OBJECTIVES
This work aimed at broadening our knowledge on selective events at themolecular level, using mostly polymorphsim data. The action of posi-tive selection on advantageous genetic variants is at the molecular basisof phenotypic adaptation of a population to a given environment. How-ever, genes and proteins rarely act in isolation, and, therefore they haveto be considered within networks describing the interactions occurringamong them. Thus, working within a network framework allows to reducethe gap between genotype and phenotype but has been overlooked whilestudying adaptation. First, positive selection has been detected at gene-level using either candidate-gene (Section 2.1) or genome-scan (Section2.2) approaches. Then, an analysis of a small-scale gene-network repre-senting a specific transduction signalling pathway has been performed inorder to illustrate how the information on protein-protein interactions canbe useful to understand how adaptation occurs at biological pathway level(Section 2.3). Finally, a study was carried out to describe the distributionof positive selection throughout the whole protein-protein interaction mapto implicitly consider a much larger biological scale taking into accountcross-talks among pathways and gene pleitropy (Section 2.4).
97

ii
“thesis” — 2014/9/8 — 10:58 — page 98 — #128 ii
ii
ii
2.1 Study the impact of positive selection on acandidate gene.
VKORC1 enzyme is the direct pharmacologic target of oral anticoagu-lants of antivitamin K type (AVK), such as wafarin and acenocoumarol.These drugs are widely prescribed and the dose recommended vary sub-stantially among individuals according to their genetic composition (e.g.see [256] for warfarin). The enzyme is encoded by VKORC1 gene. Sev-eral genome-wide scans suggest that positive selection was the main forcedriving the evolution of the 450 Kb region encompassing this gene [257–260]. Furthermore, while interrogating the patterns of genetic differentia-tion of four loci associated with warfarin dose requirement in HGDP [19],Ross et al. showed an extensive geographic differentiation at the site lo-cated within VKORC1 [261]. They revealed that the high frequency of thederived allele in East Asians population accounted for such high geneticdifferentiation. Moreover, they observed molecular patterns suggestingthe past action of positive selection in CHB+JPT population as measuredby several methods applied to Hapmap data [20]. Chapter 3 describesa follow-up study on HGDP with extra genotyped SNPs to increase thevariant density to interrogate in VKORC1. This study allowed to concludethat the signal of selection is restricted to East Asia and shared among allEast Asian populations. Moreover, the gene targeted by selection couldbe either VKORC1 or another gene located in the 45 kb region covered bythe selective sweep signal identified in East Asia.This study provides an explicit example of the difficulties to pinpoint thetarget of positive selection. Some a priori information on VKORC1 func-tion and on the selective pressure allowed to start with an a priori hypoth-esis on the adaptive phenotype: large geographic differences in dietaryvitamin K intake, especially in vitamin K2, is well-documented; and thehighest plasma levels of vitamin K are found in Asian populations. Al-though the differences in AVK sensibility could be a direct consequenceof adaptation of East Asian populations to their diet, it remains impossibleto conclude which variant drove the signal without performing functionalanalysis for the several genes hitchhiked by the selective sweep.
98

ii
“thesis” — 2014/9/8 — 10:58 — page 99 — #129 ii
ii
ii
2.2 Scan the genome for positive selection.
While Chapter 3 focuses on a gene-candidate study, Chapter 4 describesa genome-wide scan. For this project, specific populations with knownrecent history were selected to detect signals of positive selection sharedby populations with different ancestry but that have lived within the sameenvironment. Namely, three populations were analysed: (1) one with Eu-ropean ancestry from Romania; (2) a Rroma/Gypsie one which has alsolived in Romania for the last thousand years; and (3) a Northwest Indianone. The Rroma/Gypsie population migrated from Northwest India toEurope one thousand years ago [141]. Therefore, Rroma/Gypsie and Ro-manian populations may have adapted to the European environment withtheir different genetic background. Particularly, the last thousand yearEuropean history has been affected by severe epidemic events (plague, in-fluenza, smallpox, etc.) which may have been severe selective pressuresfor the immune system. Using the Illumina Immunochip array [262],several tests for positive selection in the three populations have been per-formed and signals from the same genomic region in Rroma/Gypsies andRomanians, but absent in Northindians were identified.Chapter 4 gives an interesting example of the genome-wide scan ap-proach. Several signals of putative interest were identified, and a strik-ing one was picked for follow-up studies. Indeed, the molecular patternsobserved at Toll-like receptor 1 (TLR1/TLR6/TLR10) suggested that pos-itive selection was the main evolutive force acting on it in Rroma/Gypsiesand Romanians. Functional analyses pointed to its role as a pattern recog-nition pathway of Yersinia pestis, the vector of plague.
2.3 Distribution of selective events within a small-scale protein-protein interaction map.
In order to understand the evolution of genes, it is informative to bridgethe gap between genotype and phenotype. For that purpose, one may takeinto account the interaction networks they are involved in. A network-
99
ii
“thesis” — 2014/9/8 — 10:58 — page 100 — #130 ii
ii
ii
level and population genetics analysis of the Insulin/TOR transductionpathway (IT pathway) is presented in Chapter 5. This study was the firstone to describe how recent positive selection, as inferred using polymor-phism data, distributes within an interaction network. Indeed previousworks focused either on the distribution of purifying selection or on posi-tive selection at much larger evolutionary time-scale using a comparativegenomics approach.It was observed that the most central elements in the pathway have beenmore targeted by positive selection than other genes. This result con-trasts to previous observations in the whole human interactome wherepositive selection was inferred since the divergence between human andchimpanzee [234]. This indicates that the IT pathway structure affects theimpact of positive selection on genes composing it. Therefore, consid-ering the topology of a network representing a given pathway seems toprovide important insights on how local adaptation to new environmentsoccurs to efficiently tune a biological function. Further analyses of dif-ferent pathways are needed to contrast whether this is a general patternshared among many pathways, or whether it is specific to the IT pathway.
2.4 Distribution of selective events within a large-scale protein-protein interaction map.
As mentioned in Section 1.7, studies of interaction networks can be per-formed at either small or large scale. Small-scale analyses present thecaveat of not taking into account the cross-talks among different pathwaysand of the artificial delimitation of a specific pathway. The pleitropic ef-fect of the genes is very likely to be an important feature affecting geneevolution, and particularly its likelihood to be targeted by positive selec-tion, as formulated by Ronald A. Fisher [33]. Chapter 6 illustrates a studyof the distribution of positive selection within the human protein–proteininteraction network (PIN), also referred as Interactome. This large-scalenetwork is a fair representation of all the physical interactions occurringamong proteins in the human organism. In a previous study, Kim et al.
100
ii
“thesis” — 2014/9/8 — 10:58 — page 101 — #131 ii
ii
ii
estimated the likelihood of a gene to be targeted by positive selectionthrough a comparative genomics approach of Human and Chimpanzeesequences [234]. The authors observed that positive selection concen-trates at the PIN periphery. The study described in Chapter 6 used bothpolymorphism data in human populations and divergence data from 10mammal species to estimate the impact of positive selection at small andlarge evolutionary time-scales, respectively. It was observed that signa-tures of recent positive selection are more prone to target genes with highnumber of interactions while at large evolutionary scale the results werein the opposite direction, with more selective events detected at low con-nected nodes.These results show that signals of positive selection at different evolu-tionary time-scales are distributed in different parts of the interactome.It seems that innovations have a molecular basis with variants in geneswith more pleiotropic effects, more indispensable and in general are re-sponsible for strong changes as a result of a mutation. More layers ofcomplexity must be considered to fully understand those results and willbe discussed in Chapter 7.
101

ii
“thesis” — 2014/9/8 — 10:58 — page 102 — #132 ii
ii
ii

ii
“thesis” — 2014/9/8 — 10:58 — page 103 — #133 ii
ii
ii
Part II
Results
103

ii
“thesis” — 2014/9/8 — 10:58 — page 104 — #134 ii
ii
ii

ii
“thesis” — 2014/9/8 — 10:58 — page 105 — #135 ii
ii
ii
Chapter 3
STUDY THE IMPACT OFPOSITIVE SELECTION ON ACANDIDATE GENE.
Blandine Patillon, Pierre Luisi, Helene Blanche, Etienne Patin, HowardM. Cann, Emmanunelle Genin, Audrey SabbaghPublished [263]
105
Patillon B, Luisi P, Blanché H, Patin E, Cann HM, Génin E, Sabbagh A. Positive selection in the chromosome 16 VKORC1 genomic region has contributed to the variability of anticoagulant response in humans. PLoS One. 2012;7(12):e53049. doi: 10.1371/journal.pone.0053049.

ii
“thesis” — 2014/9/8 — 10:58 — page 106 — #136 ii
ii
ii
ii
“thesis” — 2014/9/8 — 10:58 — page 107 — #137 ii
ii
ii
Positive Selection in the Chromosome 16 VKORC1Genomic Region Has Contributed to the Variability ofAnticoagulant Response in HumansBlandine Patillon1,2*., Pierre Luisi3., Helene Blanche4, Etienne Patin5, Howard M. Cann4,
Emmanuelle Genin1", Audrey Sabbagh6"
1 Inserm UMRS-946, Genetic Variability and Human Diseases, Institut Universitaire d’Hematologie, Universite Paris Diderot, Paris, France, 2 Universite Paris Sud, Kremlin-
Bicetre, France, 3 Institute of Evolutionary Biology, CEXS-UPF-PRBB, Catalonia, Barcelona, Spain, 4 Fondation Jean-Dausset-CEPH, Paris, France, 5 Human Evolutionary
Genetics, CNRS URA3012, Institut Pasteur, Paris, France, 6 UMR IRD 216, Universite Paris Descartes, Paris, France
Abstract
VKORC1 (vitamin K epoxide reductase complex subunit 1, 16p11.2) is the main genetic determinant of human response tooral anticoagulants of antivitamin K type (AVK). This gene was recently suggested to be a putative target of positiveselection in East Asian populations. In this study, we genotyped the HGDP-CEPH Panel for six VKORC1 SNPs and downloadedchromosome 16 genotypes from the HGDP-CEPH database in order to characterize the geographic distribution of footprintsof positive selection within and around this locus. A unique VKORC1 haplotype carrying the promoter mutation associatedwith AVK sensitivity showed especially high frequencies in all the 17 HGDP-CEPH East Asian population samples. VKORC1and 24 neighboring genes were found to lie in a 505 kb region of strong linkage disequilibrium in these populations.Patterns of allele frequency differentiation and haplotype structure suggest that this genomic region has been submitted toa near complete selective sweep in all East Asian populations and only in this geographic area. The most extreme scores ofthe different selection tests are found within a smaller 45 kb region that contains VKORC1 and three other genes (BCKDK,MYST1 (KAT8), and PRSS8) with different functions. Because of the strong linkage disequilibrium, it is not possible todetermine if VKORC1 or one of the three other genes is the target of this strong positive selection that could explainpresent-day differences among human populations in AVK dose requirement. Our results show that the extended regionsurrounding a presumable single target of positive selection should be analyzed for genetic variation in a wide range ofgenetically diverse populations in order to account for other neighboring and confounding selective events and thehitchhiking effect.
Citation: Patillon B, Luisi P, Blanche H, Patin E, Cann HM, et al. (2012) Positive Selection in the Chromosome 16 VKORC1 Genomic Region Has Contributed to theVariability of Anticoagulant Response in Humans. PLoS ONE 7(12): e53049. doi:10.1371/journal.pone.0053049
Editor: Yury E. Khudyakov, Centers for Disease Control and Prevention, United States of America
Received September 20, 2012; Accepted November 23, 2012; Published December 28, 2012
Copyright: � 2012 Patillon et al. This is an open-access article distributed under the terms of the Creative Commons Attribution License, which permitsunrestricted use, distribution, and reproduction in any medium, provided the original author and source are credited.
Funding: This work was supported by the Spanish National Institute for Bioinformatics (www.inab.org). PL is supported by a PhD fellowship from ‘‘AccionEstrategica de Salud, en el Marco del Plan Nacional de Investigacion Cientıfica, Desarrollo e Innovacion Tecnologica 2008–2011’’ from Instituto de Salud Carlos III.BP is supported by a PhD fellowship from the doctoral program in Public Health (ED420: www.ed-sante-publique.u-psud.fr) from Paris Sud University. The fundershad no role in study design, data collection and analysis, decision to publish, or preparation of the manuscript.
Competing Interests: The authors have declared that no competing interests exist.
* E-mail: [email protected]
. These authors contributed equally to this work.
" These authors also contributed equally to this work.
Introduction
Oral anticoagulants of antivitamin K type (AVK) 2 such as
warfarin and acenocoumarol 2 are widely prescribed drugs for
the prevention and treatment of arterial and venous thromboem-
bolic disorders [1,2]. They exert their anticoagulant effect by
inhibiting the vitamin K 2,3-epoxide reductase complex 1
(VKORC1). Besides well-known physiopathological and environ-
mental factors, including age, sex, body mass index, disease states,
co-medications and diet, genetic factors have been identified as
major determinants of AVK dose variability [3]. Candidate-gene
and genome-wide association studies have identified four main
genes 2 CYP2C9, CYP4F2, CYP2C18 and VKORC12 which
explain together between 28.2% and 43.5% of the AVK dose
variance [3,4,5,6,7]. CYP2C9, CYP4F2 and CYP2C18 encode
proteins involved in the hepatic metabolism of AVK [8,9,10].
VKORC1 encodes the VKORC1 enzyme, which is the direct
pharmacologic target of AVK [11,12]. Differences in the
worldwide distribution of the most important polymorphisms
influencing AVK dosing are likely to underlie the wide interethnic
variability in AVK dose requirements: current population-based
trends in warfarin dosing, as reported by the International
Warfarin Pharmacogenetics Consortium, indicate a mean weekly
dose of 21 mg in Asians, 31.5 mg in Europeans and 40 mg in
individuals of African ancestry [13].
Recently, Ross et al. [14] documented the distribution of four
functional variants located in the three main genes known to
influence AVK dose requirement 2 rs9923231 (VKORC1),
rs1799853 and rs1057910 (CYP2C9), and rs2108622 (CYP4F2) 2
in a large set of samples from the Human Genome Diversity
Project - Centre d’Etude du Polymorphisme Humain (HGDP-
PLOS ONE | www.plosone.org 1 December 2012 | Volume 7 | Issue 12 | e53049

ii
“thesis” — 2014/9/8 — 10:58 — page 108 — #138 ii
ii
ii
CEPH) Panel, representing 52 world populations [15]. They
observed a pattern of genetic differentiation among human
populations for the VKORC1 single nucleotide polymorphism
(SNP) rs9923231. They applied three formal tests of positive
selection to the VKORC1 gene 2 the locus-specific branch length
(LSBL) test [16], the log of the ratio of heterozygosities (lnRH) test
[17], and Tajima’s D [18] 2 using genome-wide data available for
the West African, European and East Asian HapMap samples
[19]. The tests yielded significant results in the East Asian sample.
Interestingly, the rs9923231 SNP (g.-1639G.A), which was found
to be a putative target of positive selection [14], is the main genetic
determinant of AVK dose requirement and can alone explain
between 25% to 30% of the dose variance among patients
[4,5,6,7]. This SNP, located in the promoter region, alters a
VKORC1 transcription factor binding site, leading to lower protein
expression [20]. By decreasing VKORC1 activity, the derived -
1639A allele thus confers an increased AVK sensitivity phenotype
and patients carrying one and two -1639A alleles require on
average respectively 25% and 50% lower daily warfarin doses than
-1639G homozygous carriers to obtain the same anticoagulant
effect [21,22]. Understanding the processes of local adaption that
may result in high levels of population differentiation and
important interethnic differences in the required AVK dose is
thus of particular relevance.
During these last few years, newer methods than those proposed
by Ross et al. have been developed to detect the molecular
footprints of positive selection. These methods are particularly well
suited to detect classical signatures of selective sweeps, i.e. when a
new advantageous mutation spreads rapidly to fixation in
particular populations (the so-called ‘hard sweep’ model) [23].
Such a selective sweep occurs too quickly to leave enough time for
recombination events to break down the linkage disequilibrium
(LD), leading to a similar increase in frequency of alleles at nearby
variants. Therefore, the pattern of genetic variation in the genomic
region surrounding the selected allele may differ among popula-
tions [24], and the selected allele is expected to be carried by a
long and frequent haplotype only in those populations that
experienced the local adaptive event [25]. Signals of positive
selection can thus be detected by looking for an increased genetic
differentiation among populations (using methods such as FST [26]
and the Cross-Population Composite Likelihood Ratio (XP-CLR)
test [24]), and an extended haplotype homozygosity (EHH) at the
putatively selected locus (using methods such as the Cross-
Population Extended Haplotype Homozygosity (XP-EHH) test
[27] and the integrated Haplotype Score (iHS) [28]). These
methods have proved to be powerful and largely complementary
to detect and localize a selective sweep, and are more robust to
ascertainment bias in SNP discovery than methods based on the
allele frequency spectrum such as the Tajima’s D used by Ross
et al. [14,29].
In this study, we investigated whether and how positive selection
has acted on the VKORC1 gene locus using these complementary
analytic methods. Our first objective was to determine (1) if the
selective sweep is restricted to East Asia or if it is detected in other
geographic regions, in particular Central South Asia and America,
which are geographically close to East Asia, and (2) if it occurred in
all East Asian populations or only in a few of them. Thus, we
genotyped six VKORC1 SNPs in the HGDP-CEPH Panel [30]
which covers a much wider range of world populations – including
17 populations from East Asia – than the HapMap Panel in which
positive selection at the VKORC1 locus was initially evidenced.
Furthermore, by expanding the analysis to a 2 Mb region
encompassing the VKORC1 gene, we sought to determine if the
selective sweep identified around VKORC1 was due to positive
selection directly acting on this gene, or if it was caused by positive
selection at a nearby linked gene resulting in genetic hitchhiking
[23]. Finally, we discuss combining different methods for
uncovering distinct selection signatures, in order to both increase
power to detect a selective signal and precisely define its genomic
location. We address the difficulty, even with such detailed
analyses, in identifying the specific target of selection.
Results
VKORC1 Haplotype StudyA haplotype study of the 4.1 kb VKORC1 gene was carried out
with seven VKORC1 SNPs genotyped in the 52 HGDP-CEPH
population samples (Figure 1A). Haplotypes were reconstructed
from these SNPs. Seven of these haplotypes had a frequency above
1% in at least one geographic region and were labeled H1 to H7
according to their frequency at the global level (Figure 1B). Four
haplotypes are found in at least five geographic regions and only
two are shared among all regions. The highest and lowest
haplotype diversity values are observed in Sub-Saharan Africa
(0.7560.02) and East Asia (0.1960.02), respectively. Most
individuals carrying the ancestral haplotype (H6), i.e. the haplotype
carrying the ancestral allele at each SNP, are from Sub-Saharan
Africa (Figure 1B and Figure S1). Interestingly, the -1639A allele
(rs9923231) conferring the increased sensitivity to AVK is carried
by a unique haplotype (H1). This haplotype associated with AVK
sensitivity is the most frequent at the worldwide level (49.7%) and
shows an extremely high differentiation among geographic regions
(Figure 1B). While rare in Sub-Saharan Africa (4.4%), it is found at
intermediate frequencies in the Middle East, Europe, Central
South Asia, Oceania and America (from 27.8% to 51.2%), and is
largely predominant in East Asia (89.6%). The prevalence of H1
tends to be high in all of the 17 East Asian population samples
investigated, ranging from 75% in She to 100% in Oroqen (Figure
S1). However, the sample size is small for most of them, with 10 or
less individuals.
The median-joining haplotype network describes the mutational
relationships between the different VKORC1 haplotypes inferred
(Figure 1C). Haplotype H1 differs from the others by two
nucleotide substitutions at the functional rs9923231 SNP and at
the rs9934438 SNP, which are found in complete LD in all
geographic regions (D’ = 1 and r2 = 1, Figure S2).
Detection of Signatures of Positive SelectionTo support the hypothesis that positive selection has played a
role in shaping patterns of genetic variation at VKORC1, four
complementary methods were applied to detect signatures of
selective sweeps in the genome. FST and XP-CLR are both based
on allele frequency differentiation, whereas XP-EHH and iHS are
based on haplotype structure. Scores for the four test statistics were
computed at both the regional and population levels for the seven
VKORC1 SNPs and for some other available SNPs [15]
representing the expected neutral genomic background. For each
score, a p-value was derived from the empirical distribution
obtained from the genomic background (cf. Material and
Methods). We considered as significant any p-value below 0.05.
The results of the four tests are presented in Table 1 and Table 2.
At the global level, when we evaluated the level of genetic
differentiation among the seven HGDP-CEPH Panel geographic
regions, an atypical pattern of genetic differentiation was detected
for four VKORC1 SNPs: rs2359612, rs8050894, rs9934438 and
rs9923231 (p,0.05). The functional rs9923231 polymorphism and
the rs9934438 SNP, in complete LD with each other, displayed
FST values falling above the 99th percentile of the empirical
Positive Selection Shaped Human AVK Sensitivity
PLOS ONE | www.plosone.org 2 December 2012 | Volume 7 | Issue 12 | e53049
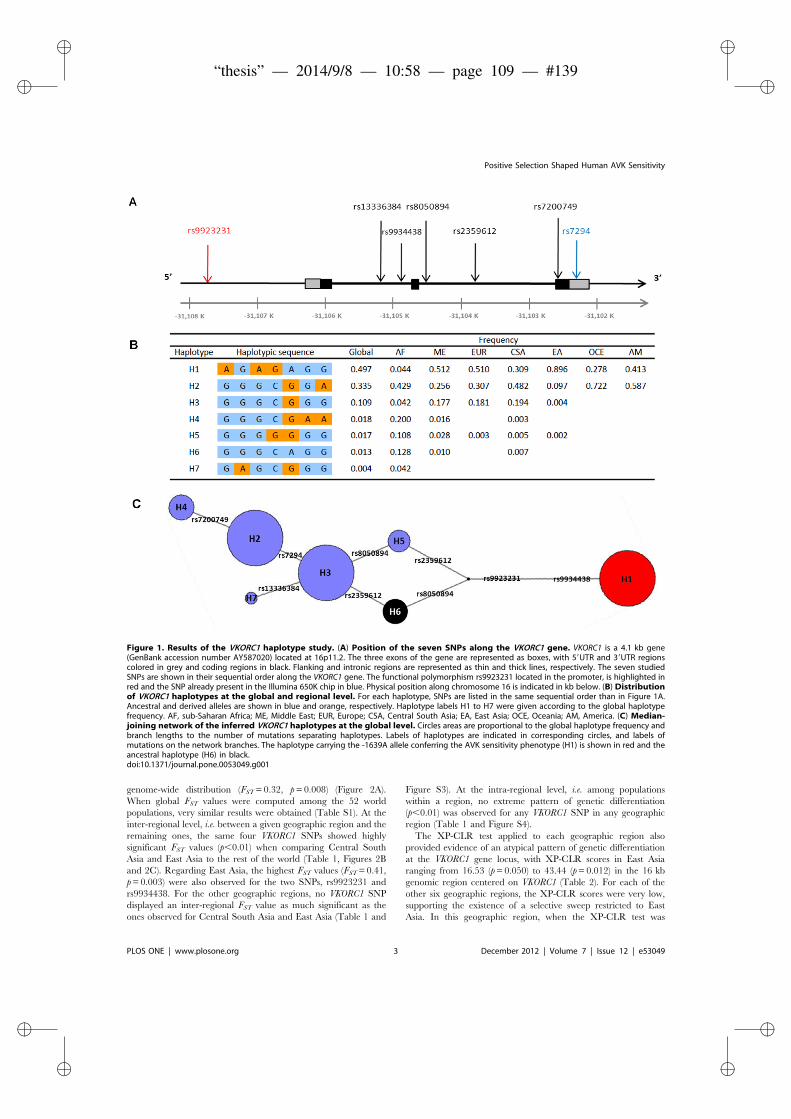
ii
“thesis” — 2014/9/8 — 10:58 — page 109 — #139 ii
ii
ii
genome-wide distribution (FST = 0.32, p = 0.008) (Figure 2A).
When global FST values were computed among the 52 world
populations, very similar results were obtained (Table S1). At the
inter-regional level, i.e. between a given geographic region and the
remaining ones, the same four VKORC1 SNPs showed highly
significant FST values (p,0.01) when comparing Central South
Asia and East Asia to the rest of the world (Table 1, Figures 2B
and 2C). Regarding East Asia, the highest FST values (FST = 0.41,
p = 0.003) were also observed for the two SNPs, rs9923231 and
rs9934438. For the other geographic regions, no VKORC1 SNP
displayed an inter-regional FST value as much significant as the
ones observed for Central South Asia and East Asia (Table 1 and
Figure S3). At the intra-regional level, i.e. among populations
within a region, no extreme pattern of genetic differentiation
(p,0.01) was observed for any VKORC1 SNP in any geographic
region (Table 1 and Figure S4).
The XP-CLR test applied to each geographic region also
provided evidence of an atypical pattern of genetic differentiation
at the VKORC1 gene locus, with XP-CLR scores in East Asia
ranging from 16.53 (p = 0.050) to 43.44 (p = 0.012) in the 16 kb
genomic region centered on VKORC1 (Table 2). For each of the
other six geographic regions, the XP-CLR scores were very low,
supporting the existence of a selective sweep restricted to East
Asia. In this geographic region, when the XP-CLR test was
Figure 1. Results of the VKORC1 haplotype study. (A) Position of the seven SNPs along the VKORC1 gene. VKORC1 is a 4.1 kb gene(GenBank accession number AY587020) located at 16p11.2. The three exons of the gene are represented as boxes, with 59UTR and 39UTR regionscolored in grey and coding regions in black. Flanking and intronic regions are represented as thin and thick lines, respectively. The seven studiedSNPs are shown in their sequential order along the VKORC1 gene. The functional polymorphism rs9923231 located in the promoter, is highlighted inred and the SNP already present in the Illumina 650K chip in blue. Physical position along chromosome 16 is indicated in kb below. (B) Distributionof VKORC1 haplotypes at the global and regional level. For each haplotype, SNPs are listed in the same sequential order than in Figure 1A.Ancestral and derived alleles are shown in blue and orange, respectively. Haplotype labels H1 to H7 were given according to the global haplotypefrequency. AF, sub-Saharan Africa; ME, Middle East; EUR, Europe; CSA, Central South Asia; EA, East Asia; OCE, Oceania; AM, America. (C) Median-joining network of the inferred VKORC1 haplotypes at the global level. Circles areas are proportional to the global haplotype frequency andbranch lengths to the number of mutations separating haplotypes. Labels of haplotypes are indicated in corresponding circles, and labels ofmutations on the network branches. The haplotype carrying the -1639A allele conferring the AVK sensitivity phenotype (H1) is shown in red and theancestral haplotype (H6) in black.doi:10.1371/journal.pone.0053049.g001
Positive Selection Shaped Human AVK Sensitivity
PLOS ONE | www.plosone.org 3 December 2012 | Volume 7 | Issue 12 | e53049
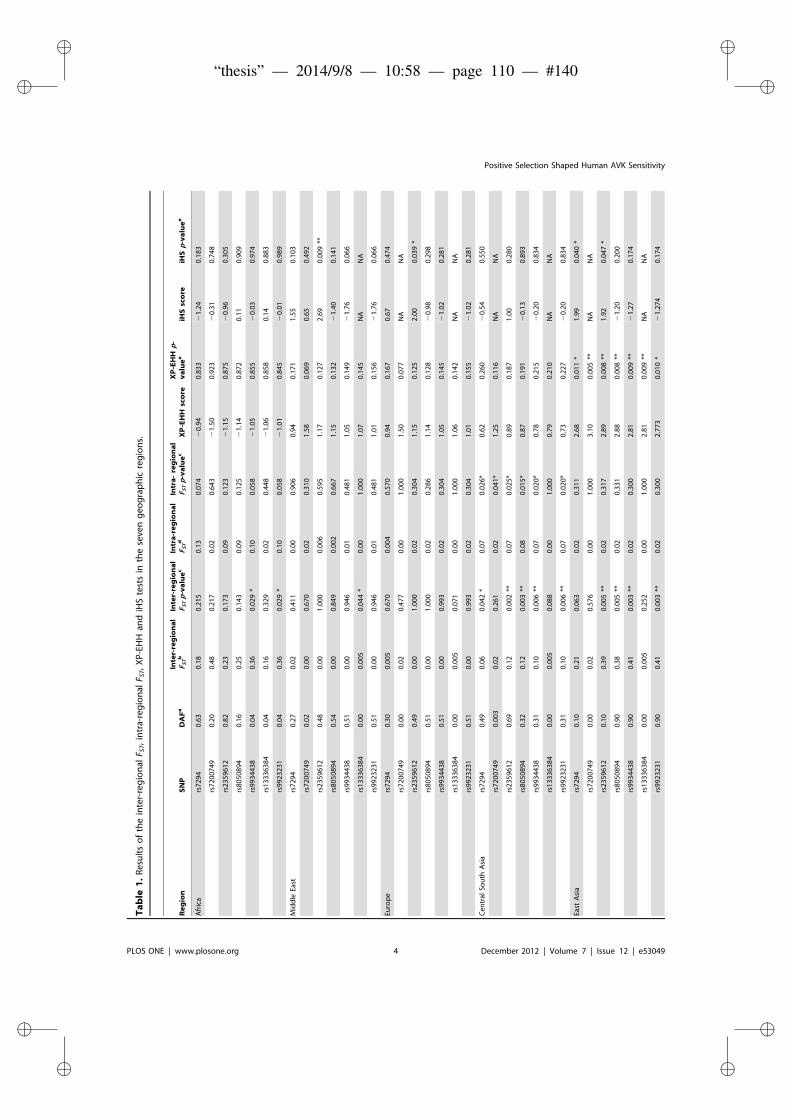
ii
“thesis” — 2014/9/8 — 10:58 — page 110 — #140 ii
ii
ii
Ta
ble
1.
Re
sult
so
fth
ein
ter-
reg
ion
alF S
T,
intr
a-re
gio
nal
F ST,
XP
-EH
Han
diH
Ste
sts
inth
ese
ven
ge
og
rap
hic
reg
ion
s.
Re
gio
nS
NP
DA
Fa
Inte
r-re
gio
na
lF S
Tb
Inte
r-re
gio
na
lF S
Tp
-va
lue
cIn
tra
-re
gio
na
lF S
Td
Intr
a-
reg
ion
al
F ST
p-v
alu
ec
XP
-EH
Hsc
ore
XP
-EH
Hp
-v
alu
ee
iHS
sco
reiH
Sp
-va
lue
e
Afr
ica
rs7
29
40
.63
0.1
80
.21
50
.13
0.0
74
20
.94
0.8
33
21
.24
0.1
83
rs7
20
07
49
0.2
00
.48
0.2
17
0.0
20
.64
32
1.5
00
.92
32
0.3
10
.74
8
rs2
35
96
12
0.8
20
.23
0.1
73
0.0
90
.12
32
1.1
50
.87
52
0.9
60
.30
5
rs8
05
08
94
0.1
60
.25
0.1
43
0.0
90
.12
52
1.1
40
.87
20
.11
0.9
09
rs9
93
44
38
0.0
40
.36
0.0
29
*0
.10
0.0
58
21
.05
0.8
55
20
.03
0.9
74
rs1
33
36
38
40
.04
0.1
60
.32
90
.02
0.4
48
21
.06
0.8
58
0.1
40
.88
3
rs9
92
32
31
0.0
40
.36
0.0
29
*0
.10
0.0
58
21
.01
0.8
45
20
.01
0.9
89
Mid
dle
East
rs7
29
40
.27
0.0
20
.41
10
.00
0.9
06
0.9
40
.17
11
.55
0.1
03
rs7
20
07
49
0.0
20
.00
0.6
70
0.0
20
.31
01
.58
0.0
69
0.6
50
.49
2
rs2
35
96
12
0.4
80
.00
1.0
00
0.0
06
0.5
95
1.1
70
.12
72
.69
0.0
09
**
rs8
05
08
94
0.5
40
.00
0.8
49
0.0
02
0.6
67
1.1
50
.13
22
1.4
00
.14
1
rs9
93
44
38
0.5
10
.00
0.9
46
0.0
10
.48
11
.05
0.1
49
21
.76
0.0
66
rs1
33
36
38
40
.00
0.0
05
0.0
44
*0
.00
1.0
00
1.0
70
.14
5N
AN
A
rs9
92
32
31
0.5
10
.00
0.9
46
0.0
10
.48
11
.01
0.1
56
21
.76
0.0
66
Euro
pe
rs7
29
40
.30
0.0
05
0.6
70
0.0
04
0.5
70
0.9
40
.16
70
.67
0.4
74
rs7
20
07
49
0.0
00
.02
0.4
77
0.0
01
.00
01
.50
0.0
77
NA
NA
rs2
35
96
12
0.4
90
.00
1.0
00
0.0
20
.30
41
.15
0.1
25
2.0
00
.03
9*
rs8
05
08
94
0.5
10
.00
1.0
00
0.0
20
.28
61
.14
0.1
28
20
.98
0.2
98
rs9
93
44
38
0.5
10
.00
0.9
93
0.0
20
.30
41
.05
0.1
45
21
.02
0.2
81
rs1
33
36
38
40
.00
0.0
05
0.0
71
0.0
01
.00
01
.06
0.1
42
NA
NA
rs9
92
32
31
0.5
10
.00
0.9
93
0.0
20
.30
41
.01
0.1
55
21
.02
0.2
81
Ce
ntr
alSo
uth
Asi
ars
72
94
0.4
90
.06
0.0
42
*0
.07
0.0
26
*0
.62
0.2
60
20
.54
0.5
50
rs7
20
07
49
0.0
03
0.0
20
.26
10
.02
0.0
41
*1
.25
0.1
16
NA
NA
rs2
35
96
12
0.6
90
.12
0.0
02
**0
.07
0.0
25
*0
.89
0.1
87
1.0
00
.28
0
rs8
05
08
94
0.3
20
.12
0.0
03
**0
.08
0.0
15
*0
.87
0.1
91
20
.13
0.8
93
rs9
93
44
38
0.3
10
.10
0.0
06
**0
.07
0.0
20
*0
.78
0.2
15
20
.20
0.8
34
rs1
33
36
38
40
.00
0.0
05
0.0
88
0.0
01
.00
00
.79
0.2
10
NA
NA
rs9
92
32
31
0.3
10
.10
0.0
06
**0
.07
0.0
20
*0
.73
0.2
27
20
.20
0.8
34
East
Asi
ars
72
94
0.1
00
.21
0.0
63
0.0
20
.31
12
.68
0.0
11
*1
.99
0.0
40
*
rs7
20
07
49
0.0
00
.02
0.5
76
0.0
01
.00
03
.10
0.0
05
**N
AN
A
rs2
35
96
12
0.1
00
.39
0.0
05
**0
.02
0.3
17
2.8
90
.00
8**
1.9
20
.04
7*
rs8
05
08
94
0.9
00
.38
0.0
05
**0
.02
0.3
31
2.8
80
.00
8**
21
.20
0.2
00
rs9
93
44
38
0.9
00
.41
0.0
03
**0
.02
0.3
00
2.8
10
.00
9**
21
.27
0.1
74
rs1
33
36
38
40
.00
0.0
05
0.2
52
0.0
01
.00
02
.81
0.0
09
**N
AN
A
rs9
92
32
31
0.9
00
.41
0.0
03
**0
.02
0.3
00
2.7
73
0.0
10
*2
1.2
74
0.1
74
Positive Selection Shaped Human AVK Sensitivity
PLOS ONE | www.plosone.org 4 December 2012 | Volume 7 | Issue 12 | e53049

ii
“thesis” — 2014/9/8 — 10:58 — page 111 — #141 ii
ii
ii
Ta
ble
1.
Co
nt.
Re
gio
nS
NP
DA
Fa
Inte
r-re
gio
na
lF S
Tb
Inte
r-re
gio
na
lF S
Tp
-va
lue
cIn
tra
-re
gio
na
lF S
Td
Intr
a-
reg
ion
al
F ST
p-v
alu
ec
XP
-EH
Hsc
ore
XP
-EH
Hp
-v
alu
ee
iHS
sco
reiH
Sp
-va
lue
e
Oce
ania
rs7
29
40
.72
0.2
30
.09
00
.00
0.7
71
0.0
30
.45
60
.05
0.9
61
rs7
20
07
49
0.0
00
.00
50
.40
10
.00
1.0
00
0.5
10
.28
5N
AN
A
rs2
35
96
12
0.7
20
.09
0.4
04
0.0
00
.77
10
.32
0.3
46
0.0
50
.96
1
rs8
05
08
94
0.2
50
.12
0.3
27
0.0
20
.53
00
.29
0.3
55
0.5
00
.58
4
rs9
93
44
38
0.2
80
.08
0.4
38
0.0
00
.74
90
.20
0.3
88
0.5
00
.58
4
rs1
33
36
38
40
.00
0.0
09
0.0
14
*0
.00
1.0
00
0.2
10
.38
4N
AN
A
rs9
92
32
31
0.2
80
.08
0.4
38
0.0
00
.74
90
.16
0.4
04
0.5
00
.58
4
Am
eri
cars
72
94
0.5
80
.11
0.3
20
0.1
70
.19
50
.76
0.2
07
NA
NA
rs7
20
07
49
0.0
00
.01
0.5
53
0.0
01
.00
01
.15
0.1
25
NA
NA
rs2
35
96
12
0.5
90
.02
0.6
74
0.1
70
.19
00
.96
0.1
62
NA
NA
rs8
05
08
94
0.4
10
.02
0.6
67
0.1
70
.19
00
.95
0.1
63
NA
NA
rs9
93
44
38
0.4
10
.01
0.7
43
0.1
70
.19
00
.88
0.1
78
NA
NA
rs1
33
36
38
40
.00
0.0
06
0.0
13
*0
.00
1.0
00
0.8
90
.17
6N
AN
A
rs9
92
32
31
0.4
10
.01
0.7
43
0.1
70
.19
00
.85
0.1
85
NA
NA
aD
eri
ved
alle
lefr
eq
ue
ncy
est
imat
ed
atth
eg
lob
alle
vel.
bF S
Te
stim
ate
dat
the
inte
r-re
gio
nal
leve
l,i.e
.b
etw
ee
na
giv
en
ge
og
rap
hic
reg
ion
and
the
rem
ain
ing
on
es.
cP
-val
ue
sar
ed
eri
ved
fro
mth
eg
en
om
e-w
ide
em
pir
ical
dis
trib
uti
on
of
F ST
valu
es.
dF S
Te
stim
ate
dat
the
intr
a-re
gio
nal
leve
l,i.e
.am
on
gp
op
ula
tio
ns
wit
hin
are
gio
n.
eP
-val
ue
sar
ed
eri
ved
fro
mth
ee
mp
iric
ald
istr
ibu
tio
no
fth
eiH
San
dX
P-E
HH
sco
res
alo
ng
the
chro
mo
som
e1
6.
*p,
0.0
5;
**p
,0
.01
;**
*p
,0
.00
5.
NA
:N
ot
Ap
plic
able
(fo
riH
S:w
he
na
gap
.2
00
kbb
etw
ee
nsu
cce
ssiv
eSN
Ps
isfo
un
din
the
reg
ion
inth
ere
gio
nd
elim
ite
db
yth
eSN
Ps
wh
ere
the
EHH
valu
ed
rop
sb
elo
w0
.05
aro
un
dth
eco
reSN
P).
do
i:10
.13
71
/jo
urn
al.p
on
e.0
05
30
49
.t0
01
Positive Selection Shaped Human AVK Sensitivity
PLOS ONE | www.plosone.org 5 December 2012 | Volume 7 | Issue 12 | e53049
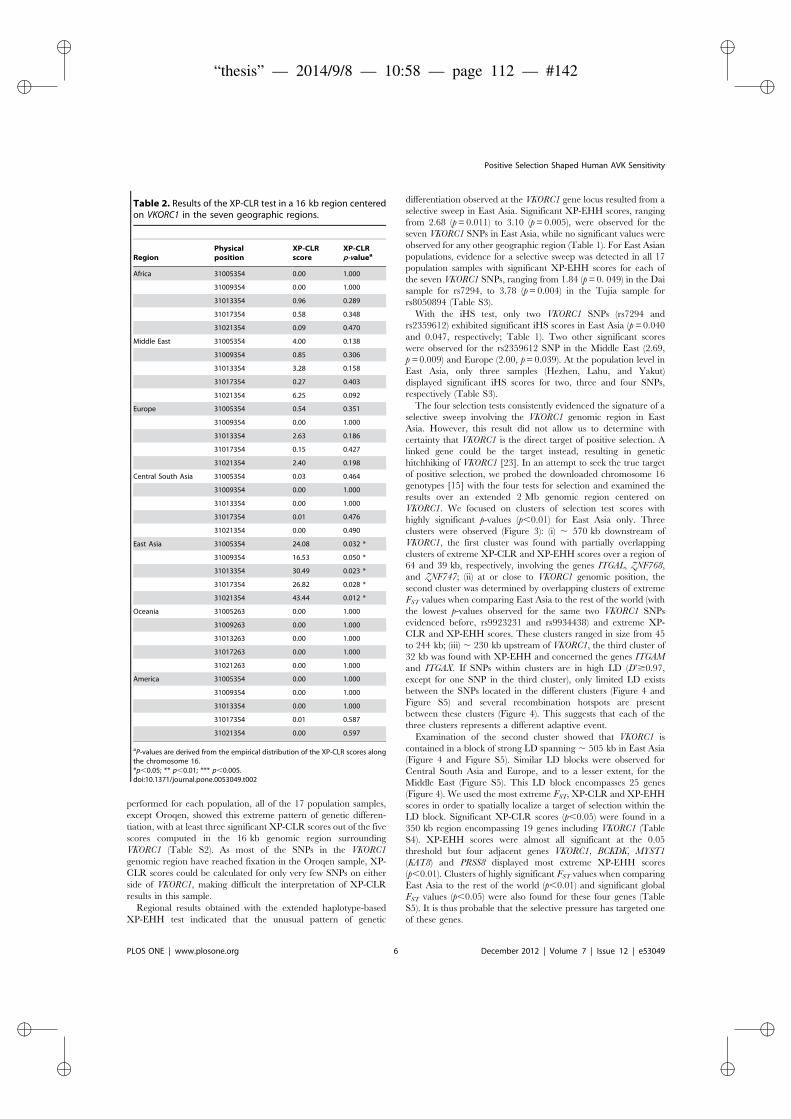
ii
“thesis” — 2014/9/8 — 10:58 — page 112 — #142 ii
ii
ii
performed for each population, all of the 17 population samples,
except Oroqen, showed this extreme pattern of genetic differen-
tiation, with at least three significant XP-CLR scores out of the five
scores computed in the 16 kb genomic region surrounding
VKORC1 (Table S2). As most of the SNPs in the VKORC1
genomic region have reached fixation in the Oroqen sample, XP-
CLR scores could be calculated for only very few SNPs on either
side of VKORC1, making difficult the interpretation of XP-CLR
results in this sample.
Regional results obtained with the extended haplotype-based
XP-EHH test indicated that the unusual pattern of genetic
differentiation observed at the VKORC1 gene locus resulted from a
selective sweep in East Asia. Significant XP-EHH scores, ranging
from 2.68 (p = 0.011) to 3.10 (p = 0.005), were observed for the
seven VKORC1 SNPs in East Asia, while no significant values were
observed for any other geographic region (Table 1). For East Asian
populations, evidence for a selective sweep was detected in all 17
population samples with significant XP-EHH scores for each of
the seven VKORC1 SNPs, ranging from 1.84 (p = 0. 049) in the Dai
sample for rs7294, to 3.78 (p = 0.004) in the Tujia sample for
rs8050894 (Table S3).
With the iHS test, only two VKORC1 SNPs (rs7294 and
rs2359612) exhibited significant iHS scores in East Asia (p = 0.040
and 0.047, respectively; Table 1). Two other significant scores
were observed for the rs2359612 SNP in the Middle East (2.69,
p = 0.009) and Europe (2.00, p = 0.039). At the population level in
East Asia, only three samples (Hezhen, Lahu, and Yakut)
displayed significant iHS scores for two, three and four SNPs,
respectively (Table S3).
The four selection tests consistently evidenced the signature of a
selective sweep involving the VKORC1 genomic region in East
Asia. However, this result did not allow us to determine with
certainty that VKORC1 is the direct target of positive selection. A
linked gene could be the target instead, resulting in genetic
hitchhiking of VKORC1 [23]. In an attempt to seek the true target
of positive selection, we probed the downloaded chromosome 16
genotypes [15] with the four tests for selection and examined the
results over an extended 2 Mb genomic region centered on
VKORC1. We focused on clusters of selection test scores with
highly significant p-values (p,0.01) for East Asia only. Three
clusters were observed (Figure 3): (i) , 570 kb downstream of
VKORC1, the first cluster was found with partially overlapping
clusters of extreme XP-CLR and XP-EHH scores over a region of
64 and 39 kb, respectively, involving the genes ITGAL, ZNF768,
and ZNF747; (ii) at or close to VKORC1 genomic position, the
second cluster was determined by overlapping clusters of extreme
FST values when comparing East Asia to the rest of the world (with
the lowest p-values observed for the same two VKORC1 SNPs
evidenced before, rs9923231 and rs9934438) and extreme XP-
CLR and XP-EHH scores. These clusters ranged in size from 45
to 244 kb; (iii) , 230 kb upstream of VKORC1, the third cluster of
32 kb was found with XP-EHH and concerned the genes ITGAM
and ITGAX. If SNPs within clusters are in high LD (D’$0.97,
except for one SNP in the third cluster), only limited LD exists
between the SNPs located in the different clusters (Figure 4 and
Figure S5) and several recombination hotspots are present
between these clusters (Figure 4). This suggests that each of the
three clusters represents a different adaptive event.
Examination of the second cluster showed that VKORC1 is
contained in a block of strong LD spanning , 505 kb in East Asia
(Figure 4 and Figure S5). Similar LD blocks were observed for
Central South Asia and Europe, and to a lesser extent, for the
Middle East (Figure S5). This LD block encompasses 25 genes
(Figure 4). We used the most extreme FST, XP-CLR and XP-EHH
scores in order to spatially localize a target of selection within the
LD block. Significant XP-CLR scores (p,0.05) were found in a
350 kb region encompassing 19 genes including VKORC1 (Table
S4). XP-EHH scores were almost all significant at the 0.05
threshold but four adjacent genes VKORC1, BCKDK, MYST1
(KAT8) and PRSS8 displayed most extreme XP-EHH scores
(p,0.01). Clusters of highly significant FST values when comparing
East Asia to the rest of the world (p,0.01) and significant global
FST values (p,0.05) were also found for these four genes (Table
S5). It is thus probable that the selective pressure has targeted one
of these genes.
Table 2. Results of the XP-CLR test in a 16 kb region centeredon VKORC1 in the seven geographic regions.
RegionPhysicalposition
XP-CLRscore
XP-CLRp-valuea
Africa 31005354 0.00 1.000
31009354 0.00 1.000
31013354 0.96 0.289
31017354 0.58 0.348
31021354 0.09 0.470
Middle East 31005354 4.00 0.138
31009354 0.85 0.306
31013354 3.28 0.158
31017354 0.27 0.403
31021354 6.25 0.092
Europe 31005354 0.54 0.351
31009354 0.00 1.000
31013354 2.63 0.186
31017354 0.15 0.427
31021354 2.40 0.198
Central South Asia 31005354 0.03 0.464
31009354 0.00 1.000
31013354 0.00 1.000
31017354 0.01 0.476
31021354 0.00 0.490
East Asia 31005354 24.08 0.032 *
31009354 16.53 0.050 *
31013354 30.49 0.023 *
31017354 26.82 0.028 *
31021354 43.44 0.012 *
Oceania 31005263 0.00 1.000
31009263 0.00 1.000
31013263 0.00 1.000
31017263 0.00 1.000
31021263 0.00 1.000
America 31005354 0.00 1.000
31009354 0.00 1.000
31013354 0.00 1.000
31017354 0.01 0.587
31021354 0.00 0.597
aP-values are derived from the empirical distribution of the XP-CLR scores alongthe chromosome 16.*p,0.05; ** p,0.01; *** p,0.005.doi:10.1371/journal.pone.0053049.t002
Positive Selection Shaped Human AVK Sensitivity
PLOS ONE | www.plosone.org 6 December 2012 | Volume 7 | Issue 12 | e53049
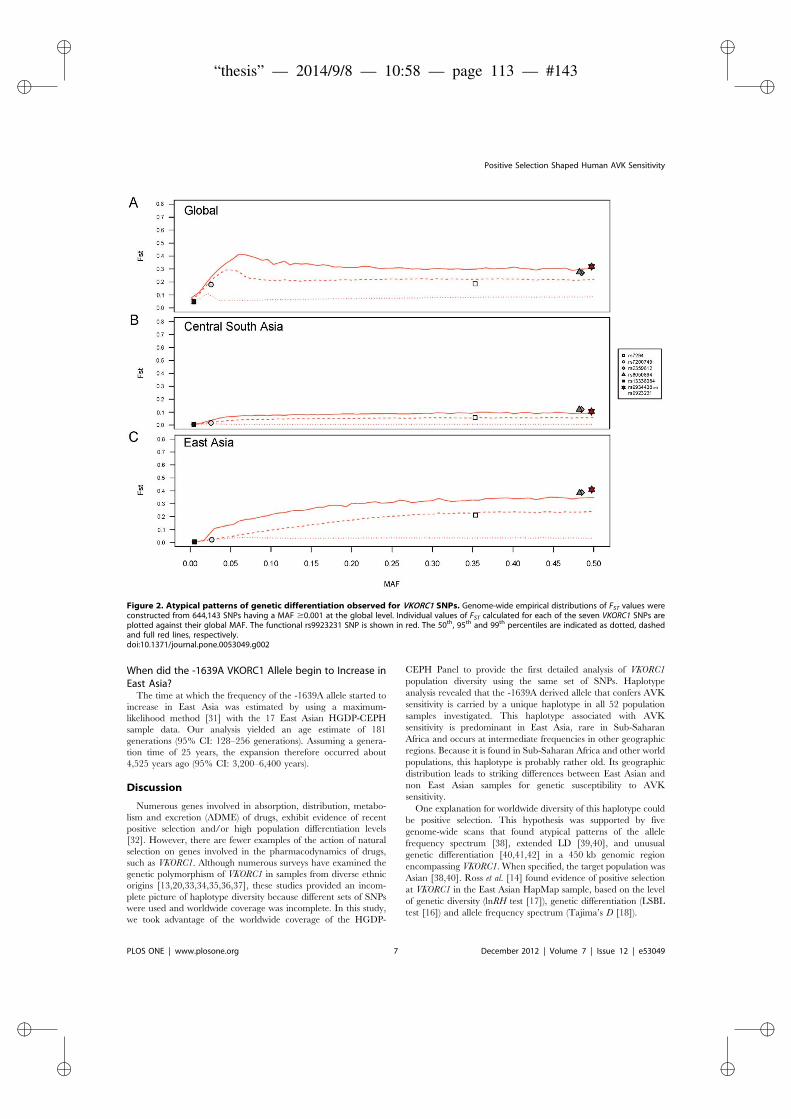
ii
“thesis” — 2014/9/8 — 10:58 — page 113 — #143 ii
ii
ii
When did the -1639A VKORC1 Allele begin to Increase inEast Asia?
The time at which the frequency of the -1639A allele started to
increase in East Asia was estimated by using a maximum-
likelihood method [31] with the 17 East Asian HGDP-CEPH
sample data. Our analysis yielded an age estimate of 181
generations (95% CI: 128–256 generations). Assuming a genera-
tion time of 25 years, the expansion therefore occurred about
4,525 years ago (95% CI: 3,200–6,400 years).
Discussion
Numerous genes involved in absorption, distribution, metabo-
lism and excretion (ADME) of drugs, exhibit evidence of recent
positive selection and/or high population differentiation levels
[32]. However, there are fewer examples of the action of natural
selection on genes involved in the pharmacodynamics of drugs,
such as VKORC1. Although numerous surveys have examined the
genetic polymorphism of VKORC1 in samples from diverse ethnic
origins [13,20,33,34,35,36,37], these studies provided an incom-
plete picture of haplotype diversity because different sets of SNPs
were used and worldwide coverage was incomplete. In this study,
we took advantage of the worldwide coverage of the HGDP-
CEPH Panel to provide the first detailed analysis of VKORC1
population diversity using the same set of SNPs. Haplotype
analysis revealed that the -1639A derived allele that confers AVK
sensitivity is carried by a unique haplotype in all 52 population
samples investigated. This haplotype associated with AVK
sensitivity is predominant in East Asia, rare in Sub-Saharan
Africa and occurs at intermediate frequencies in other geographic
regions. Because it is found in Sub-Saharan Africa and other world
populations, this haplotype is probably rather old. Its geographic
distribution leads to striking differences between East Asian and
non East Asian samples for genetic susceptibility to AVK
sensitivity.
One explanation for worldwide diversity of this haplotype could
be positive selection. This hypothesis was supported by five
genome-wide scans that found atypical patterns of the allele
frequency spectrum [38], extended LD [39,40], and unusual
genetic differentiation [40,41,42] in a 450 kb genomic region
encompassing VKORC1. When specified, the target population was
Asian [38,40]. Ross et al. [14] found evidence of positive selection
at VKORC1 in the East Asian HapMap sample, based on the level
of genetic diversity (lnRH test [17]), genetic differentiation (LSBL
test [16]) and allele frequency spectrum (Tajima’s D [18]).
Figure 2. Atypical patterns of genetic differentiation observed for VKORC1 SNPs. Genome-wide empirical distributions of FST values wereconstructed from 644,143 SNPs having a MAF $0.001 at the global level. Individual values of FST calculated for each of the seven VKORC1 SNPs areplotted against their global MAF. The functional rs9923231 SNP is shown in red. The 50th, 95th and 99th percentiles are indicated as dotted, dashedand full red lines, respectively.doi:10.1371/journal.pone.0053049.g002
Positive Selection Shaped Human AVK Sensitivity
PLOS ONE | www.plosone.org 7 December 2012 | Volume 7 | Issue 12 | e53049

ii
“thesis” — 2014/9/8 — 10:58 — page 114 — #144 ii
ii
ii
In this study, we provided compelling evidence of positive
selection at the VKORC1 gene locus in East Asia and only in this
geographic region. A footprint of natural selection was found in
each of the widely distributed 17 HGDP-CEPH East Asian
population samples. By using four different tests of positive
selection and by assessing significance at a given locus on the basis
of an empirical distribution derived from the genomic background,
we believe we can be confident that positive selection, rather than
demographic forces, accounts for the data presented here. Indeed,
it is well known that large allele frequency differences between
populations are not infallible proofs of positive selection: these can
also result from genetic drift, migration and other neutral
demographic processes [43,44]. This might be the explanation
for the significant inter-regional FST values observed in Central
South Asia (Table 1 and Figure 2B).
Because the XP-EHH test is designed to detect fixation events
that are relatively young (, 30,000 years) [27], the selective event
we have detected is likely to be rather recent. This is indeed
supported by an age estimate of 4,525 years (95% CI: 3,200–6,400
years) for the time at which the VKORC1 -1639A allele started to
increase in frequency in East Asia. The poor performance of the
iHS test that detected only very few signals of positive selection in
this study could have been predicted since its power to detect
selective sweeps involving alleles near fixation is known to be low
[28,45]. By contrast, XP-EHH and XP-CLR perform better when
the allele targeted by selection is near fixation and indeed showed
strong evidence of a selective sweep in this study [24,27].
In an attempt to determine if the VKORC1 gene has been the
direct target of positive selection or if it reflects genetic hitchhiking
[23], we extended our analysis to a 2 Mb region surrounding the
VKORC1 gene (Figure 3). Apart from the highly significant
footprint of positive selection localized in the VKORC1 region,
two other significant signals, at , 570 kb downstream and ,230 kb upstream of VKORC1, were detected with XP-CLR and/or
XP-EHH in East Asia. These two regions contains genes that
belong to the same integrin family – specifically to the CD11 gene
cluster: ITGAL downstream, and adjoining genes ITGAM and
ITGAX upstream – involved in immune functions and being thus
good candidates for positive selection [46,47,48]. However, since
SNPs located in these integrin genes show limited LD with those of
VKORC1, a single adaptive event is unlikely. Apart from East Asia,
the ITGAL region showed signals of positive selection in other
Figure 3. Distribution of –log10 (p-values) for four selection tests across a 2 Mb region centered on VKORC1. A black vertical lineindicates the physical position of VKORC1 on chromosome 16. Horizontal red dotted and dashed lines show 0.05 and 0.01 chromosome-widesignificance levels, respectively. The selection tests (inter-regional FST, XP-CLR, XP-EHH and iHS, respectively) were separately applied in each of theseven geographic regions.doi:10.1371/journal.pone.0053049.g003
Positive Selection Shaped Human AVK Sensitivity
PLOS ONE | www.plosone.org 8 December 2012 | Volume 7 | Issue 12 | e53049
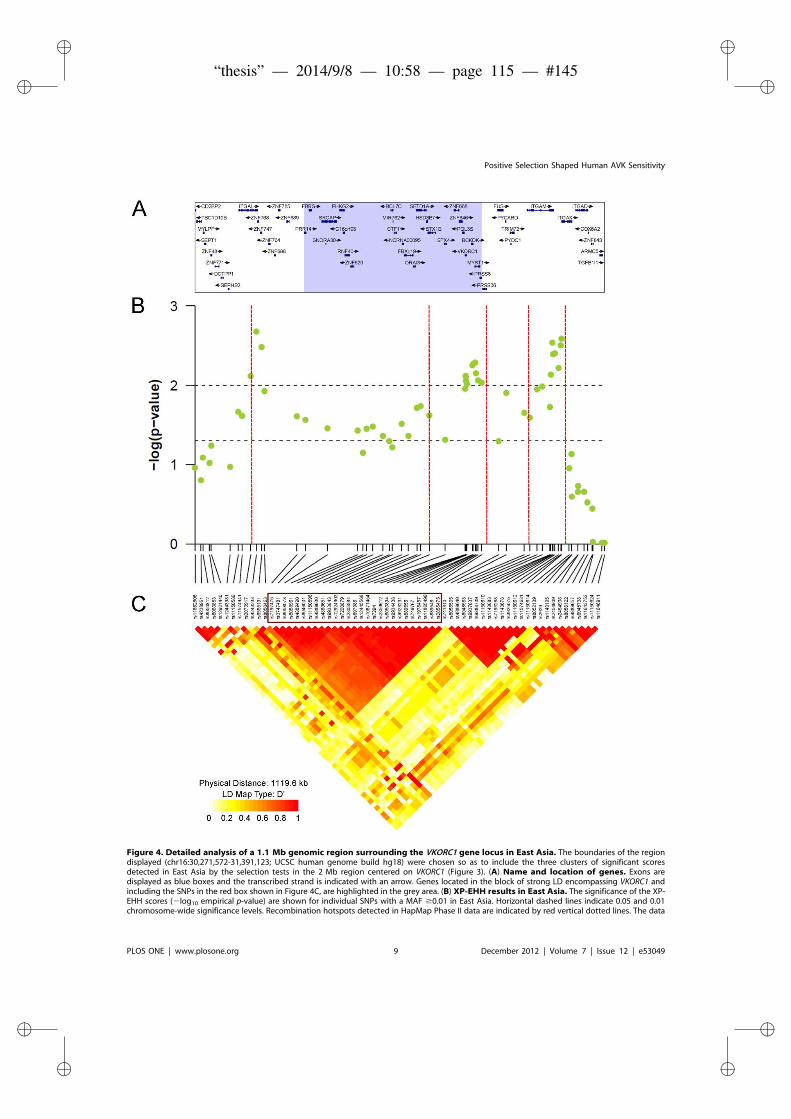
ii
“thesis” — 2014/9/8 — 10:58 — page 115 — #145 ii
ii
ii
Figure 4. Detailed analysis of a 1.1 Mb genomic region surrounding the VKORC1 gene locus in East Asia. The boundaries of the regiondisplayed (chr16:30,271,572-31,391,123; UCSC human genome build hg18) were chosen so as to include the three clusters of significant scoresdetected in East Asia by the selection tests in the 2 Mb region centered on VKORC1 (Figure 3). (A) Name and location of genes. Exons aredisplayed as blue boxes and the transcribed strand is indicated with an arrow. Genes located in the block of strong LD encompassing VKORC1 andincluding the SNPs in the red box shown in Figure 4C, are highlighted in the grey area. (B) XP-EHH results in East Asia. The significance of the XP-EHH scores (2log10 empirical p-value) are shown for individual SNPs with a MAF $0.01 in East Asia. Horizontal dashed lines indicate 0.05 and 0.01chromosome-wide significance levels. Recombination hotspots detected in HapMap Phase II data are indicated by red vertical dotted lines. The data
Positive Selection Shaped Human AVK Sensitivity
PLOS ONE | www.plosone.org 9 December 2012 | Volume 7 | Issue 12 | e53049
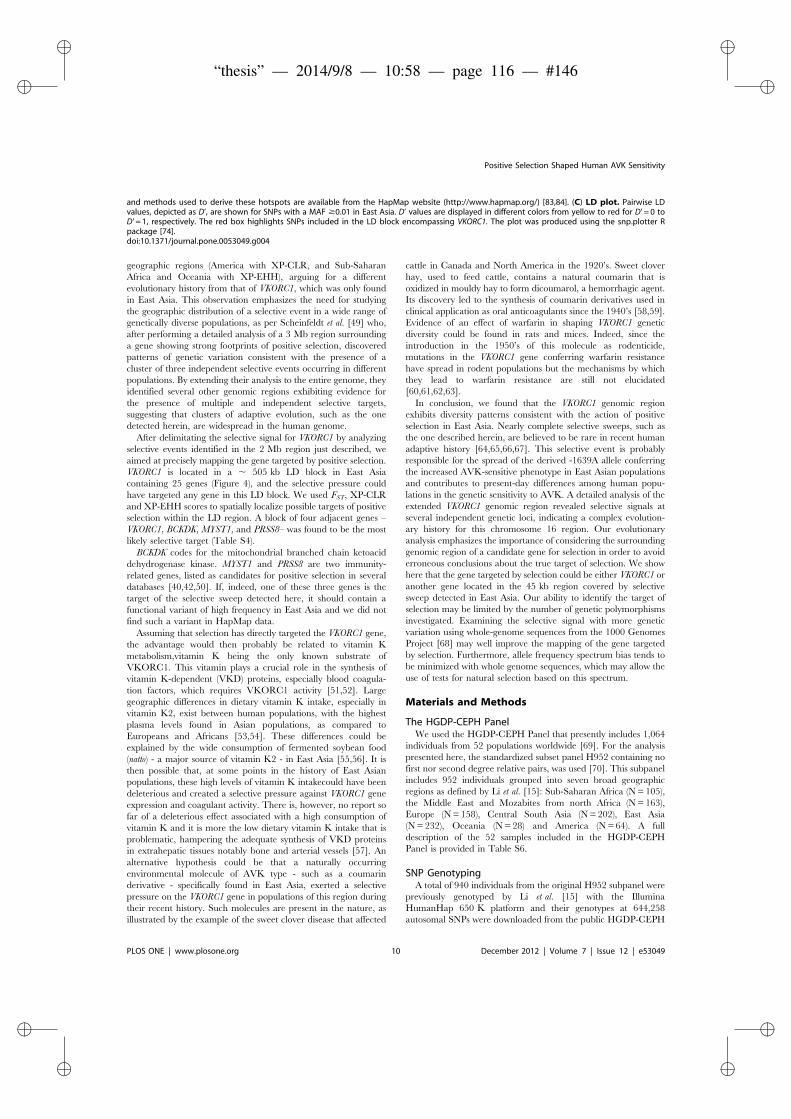
ii
“thesis” — 2014/9/8 — 10:58 — page 116 — #146 ii
ii
ii
geographic regions (America with XP-CLR, and Sub-Saharan
Africa and Oceania with XP-EHH), arguing for a different
evolutionary history from that of VKORC1, which was only found
in East Asia. This observation emphasizes the need for studying
the geographic distribution of a selective event in a wide range of
genetically diverse populations, as per Scheinfeldt et al. [49] who,
after performing a detailed analysis of a 3 Mb region surrounding
a gene showing strong footprints of positive selection, discovered
patterns of genetic variation consistent with the presence of a
cluster of three independent selective events occurring in different
populations. By extending their analysis to the entire genome, they
identified several other genomic regions exhibiting evidence for
the presence of multiple and independent selective targets,
suggesting that clusters of adaptive evolution, such as the one
detected herein, are widespread in the human genome.
After delimitating the selective signal for VKORC1 by analyzing
selective events identified in the 2 Mb region just described, we
aimed at precisely mapping the gene targeted by positive selection.
VKORC1 is located in a , 505 kb LD block in East Asia
containing 25 genes (Figure 4), and the selective pressure could
have targeted any gene in this LD block. We used FST, XP-CLR
and XP-EHH scores to spatially localize possible targets of positive
selection within the LD region. A block of four adjacent genes –
VKORC1, BCKDK, MYST1, and PRSS8– was found to be the most
likely selective target (Table S4).
BCKDK codes for the mitochondrial branched chain ketoacid
dehydrogenase kinase. MYST1 and PRSS8 are two immunity-
related genes, listed as candidates for positive selection in several
databases [40,42,50]. If, indeed, one of these three genes is the
target of the selective sweep detected here, it should contain a
functional variant of high frequency in East Asia and we did not
find such a variant in HapMap data.
Assuming that selection has directly targeted the VKORC1 gene,
the advantage would then probably be related to vitamin K
metabolism,vitamin K being the only known substrate of
VKORC1. This vitamin plays a crucial role in the synthesis of
vitamin K-dependent (VKD) proteins, especially blood coagula-
tion factors, which requires VKORC1 activity [51,52]. Large
geographic differences in dietary vitamin K intake, especially in
vitamin K2, exist between human populations, with the highest
plasma levels found in Asian populations, as compared to
Europeans and Africans [53,54]. These differences could be
explained by the wide consumption of fermented soybean food
(natto) - a major source of vitamin K2 - in East Asia [55,56]. It is
then possible that, at some points in the history of East Asian
populations, these high levels of vitamin K intakecould have been
deleterious and created a selective pressure against VKORC1 gene
expression and coagulant activity. There is, however, no report so
far of a deleterious effect associated with a high consumption of
vitamin K and it is more the low dietary vitamin K intake that is
problematic, hampering the adequate synthesis of VKD proteins
in extrahepatic tissues notably bone and arterial vessels [57]. An
alternative hypothesis could be that a naturally occurring
environmental molecule of AVK type - such as a coumarin
derivative - specifically found in East Asia, exerted a selective
pressure on the VKORC1 gene in populations of this region during
their recent history. Such molecules are present in the nature, as
illustrated by the example of the sweet clover disease that affected
cattle in Canada and North America in the 1920’s. Sweet clover
hay, used to feed cattle, contains a natural coumarin that is
oxidized in mouldy hay to form dicoumarol, a hemorrhagic agent.
Its discovery led to the synthesis of coumarin derivatives used in
clinical application as oral anticoagulants since the 1940’s [58,59].
Evidence of an effect of warfarin in shaping VKORC1 genetic
diversity could be found in rats and mices. Indeed, since the
introduction in the 1950’s of this molecule as rodenticide,
mutations in the VKORC1 gene conferring warfarin resistance
have spread in rodent populations but the mechanisms by which
they lead to warfarin resistance are still not elucidated
[60,61,62,63].
In conclusion, we found that the VKORC1 genomic region
exhibits diversity patterns consistent with the action of positive
selection in East Asia. Nearly complete selective sweeps, such as
the one described herein, are believed to be rare in recent human
adaptive history [64,65,66,67]. This selective event is probably
responsible for the spread of the derived -1639A allele conferring
the increased AVK-sensitive phenotype in East Asian populations
and contributes to present-day differences among human popu-
lations in the genetic sensitivity to AVK. A detailed analysis of the
extended VKORC1 genomic region revealed selective signals at
several independent genetic loci, indicating a complex evolution-
ary history for this chromosome 16 region. Our evolutionary
analysis emphasizes the importance of considering the surrounding
genomic region of a candidate gene for selection in order to avoid
erroneous conclusions about the true target of selection. We show
here that the gene targeted by selection could be either VKORC1 or
another gene located in the 45 kb region covered by selective
sweep detected in East Asia. Our ability to identify the target of
selection may be limited by the number of genetic polymorphisms
investigated. Examining the selective signal with more genetic
variation using whole-genome sequences from the 1000 Genomes
Project [68] may well improve the mapping of the gene targeted
by selection. Furthermore, allele frequency spectrum bias tends to
be minimized with whole genome sequences, which may allow the
use of tests for natural selection based on this spectrum.
Materials and Methods
The HGDP-CEPH PanelWe used the HGDP-CEPH Panel that presently includes 1,064
individuals from 52 populations worldwide [69]. For the analysis
presented here, the standardized subset panel H952 containing no
first nor second degree relative pairs, was used [70]. This subpanel
includes 952 individuals grouped into seven broad geographic
regions as defined by Li et al. [15]: Sub-Saharan Africa (N = 105),
the Middle East and Mozabites from north Africa (N = 163),
Europe (N = 158), Central South Asia (N = 202), East Asia
(N = 232), Oceania (N = 28) and America (N = 64). A full
description of the 52 samples included in the HGDP-CEPH
Panel is provided in Table S6.
SNP GenotypingA total of 940 individuals from the original H952 subpanel were
previously genotyped by Li et al. [15] with the Illumina
HumanHap 650 K platform and their genotypes at 644,258
autosomal SNPs were downloaded from the public HGDP-CEPH
and methods used to derive these hotspots are available from the HapMap website (http://www.hapmap.org/) [83,84]. (C) LD plot. Pairwise LDvalues, depicted as D’, are shown for SNPs with a MAF $0.01 in East Asia. D’ values are displayed in different colors from yellow to red for D’ = 0 toD’ = 1, respectively. The red box highlights SNPs included in the LD block encompassing VKORC1. The plot was produced using the snp.plotter Rpackage [74].doi:10.1371/journal.pone.0053049.g004
Positive Selection Shaped Human AVK Sensitivity
PLOS ONE | www.plosone.org 10 December 2012 | Volume 7 | Issue 12 | e53049

ii
“thesis” — 2014/9/8 — 10:58 — page 117 — #147 ii
ii
ii
database (http://www.cephb.fr/en/hgdp/). Only one SNP
(rs7294) from this dataset is located in the VKORC1 gene. We
additionally genotyped six SNPs in VKORC1 in the 940
individuals, using the TaqManH SNP Genotyping Assay-by-
Design method in 5 ml reaction volumes according to the
manufacturer’s protocol (Applied Biosystems, Foster City, CA):
rs9923231 (g.-1639G.A) located in the promoter region,
rs13336384 and rs9934438 in the first intron, rs2359612 and
rs8050894 in the second intron, and rs7200749 in the third exon
(Figure 1A). Missing genotype rates varied from 0.5% to 2.2% for
SNPs rs7200749 and rs9934438, respectively. Since the two SNPs
rs9923231 and rs9934438 were found in complete LD in the seven
geographic regions (Figure S2), we were able to impute the missing
genotypes of a given SNP using available information from the
other, leading to a total of 0.96% missing genotypes for these two
SNPs. No significant deviations from the Hardy-Weinberg
proportions were observed for any VKORC1 SNP in any of the
52 population samples at the 0.01 significance level (data not
shown). Allele frequency distributions of the seven VKORC1 SNPs
in the 52 population samples are shown in Figure S6.
Statistical AnalysisVKORC1 haplotype study. To investigate the worldwide
diversity of the VKORC1 gene, we conducted a haplotype study
using the seven genotyped SNPs. A total of 931 individuals with
less than three missing genotypes were included in the haplotype
reconstruction. For each geographic region, haplotype frequencies
were estimated with the Bayesian statistical method implemented
in Phase v2.1 [71] using defaults parameters. To avoid the
convergence of the algorithm to a local maximum, we ran it 10
times with different random seeds and kept the output from the
run with the best average value. The worldwide haplotype
frequencies were then calculated as the weighted average of the
frequencies estimated in each of the seven geographic regions.
Similar results were obtained when a single pooled sample of all
individuals was considered in the haplotype frequency estimation
(data not shown). Since information on ancestral allele state is
required to distinguish between ancestral and derived haplotypes,
we used the snp131OrthoPt2Pa2Rm2.txt file downloaded from
the UCSC genome browser (http://genome.ucsc.edu/) which
provides the orthologous alleles in chimpanzee, orangutan and
rhesus macaque. For each SNP, the allele shared by the three
species was identified as the ancestral allele. Haplotype networks
were drawn with the Network v4.5.1.6 software (http://www.
fluxus-engineering.com/), using the median-joining algorithm
which builds the minimum spanning network from the given
haplotypes by favoring short connections [72]. LD analyses were
performed with Haploview v4.1 [73] and the snp.plotter R
package [74], using Lewontin’s disequilibrium coefficient D’ [75]
and the correlation coefficient r2 [76].
Detection of Signatures of Positive SelectionTo explore whether VKORC1 has evolved under positive
selection in humans, we looked for two distinct genetic patterns
of a selective sweep that are expected to remain detectable in the
genome over different time scales after the action of natural
selection: (i) an important genetic differentiation among popula-
tions nearby the locus of interest, and (ii) the presence of unusually
frequent and long haplotypes in the surrounding genomic region.
For each method, we used an outlier approach to calculate the p-
values of the computed scores. Under this approach, an empirical
distribution is constructed using other SNPs in the genome that
are assumed to be neutral and to represent the genomic
background under neutrality. An empirical p-value is computed
that corresponds to the proportion of values from the empirical
distribution that are higher than the value observed at the locus of
interest. If the value obtained for the SNP of interest is greater
than the 95th percentile (p,0.05) of the empirical distribution,
positive selection is invoked. For that purpose, we used the
empirical distributions obtained from the scores calculated either
on a genome-wide (all autosomal chromosomes) or chromosome-
wide (chromosome 16, where VKORC1 is located) basis.
First, we used two statistics, FST and XP-CLR, which measure
the genetic differentiation among human populations [24,26].
These methods are able to detect selective sweeps that have
occurred up to 75,000 years ago [77]. The fixation index FST [78]
quantifies the proportion of genetic variance explained by allele
frequency differences among populations. FST ranges from 0 (for
genetically identical populations) to 1 (for completely differentiated
populations). We calculated FST values using the BioPerl module
PopGen [79] for each autosomal SNP with a minor allele
frequency (MAF) $1023 (644,143 SNPs) at three different levels:
(i) global level (either among the seven HGDP-CEPH Panel
geographic regions or among the 52 Panel populations), (ii) inter-
regional level (each geographic region versus the remaining ones),
and (iii) intra-regional level (among populations within a region).
Since FST strongly correlates with heterozygosity [41,80,81],
empirical p-values were calculated within bins of 10,000 SNPs
grouped according to MAF. The resulting distributions represent
the average genetic differentiation of human populations corrected
for heterozygosity.
We next applied the XP-CLR test [24] which identifies selective
sweeps in a population by detecting significant genetic differen-
tiation in an extended genomic region of interest as compared to a
reference population. This method presents both the advantages of
being robust to ascertainment bias and of not requiring any
information on haplotypes, thus avoiding errors of haplotype
estimation from genotype data. XP-CLR scores were computed at
regularly spaced grid points (every 4 kb) across chromosome 16
using the genotypes from SNPs within overlapping windows of
0.1 cM around each grid point. To account for different SNP
densities among genomic regions, we restricted to 200 the
maximal number of SNPs used to compute a XP-CLR score
within the 0.1 cM genomic region, by removing excess SNPs at
random. We applied this method by considering all SNPs with a
MAF $1023 on chromosome 16 at both the regional and
population levels (17,729 SNPs). P-values were calculated from the
empirical distribution of the collected scores obtained with these
SNPs. XP-CLR requires the definition of a reference population:
the Sub-Saharan African samples were used as a reference for non
Sub-Saharan African regions, and the European samples as a
reference for Sub-Saharan Africa. For the analyses performed at
the population level, we defined the Yoruba as the reference for
non Sub-Saharan African samples, and the French for Sub-
Saharan African samples.
The second class of methods that we used is based on EHH, i.e.
the sharing of identical alleles across relatively long distances by
most haplotypes in population samples [25]. In brief, the EHH is
computed for a given SNP (the core SNP) of a sequence being
interrogated for a selective sweep. In the absence of a selective
sweep, recombination events break down haplotypes relatively
rapidly with time and with increasing distance from the core SNP.
In the case of a selective sweep, LD tends to maintain the
haplotype carrying the selected allele, and the relative frequency of
this (favored) haplotype will increase with time leading to so-called
EHH. Integration of genetic distance in both directions from the
core SNP can be used to discriminate between selected and non-
selected alleles, and be applied to ancestral and derived alleles.
Positive Selection Shaped Human AVK Sensitivity
PLOS ONE | www.plosone.org 11 December 2012 | Volume 7 | Issue 12 | e53049
ii
“thesis” — 2014/9/8 — 10:58 — page 118 — #148 ii
ii
ii
Analytic methods based on EHH are able to detect recent selective
sweeps (i.e. those occurring less than 30,000 years ago [77]). Such
analyses require haplotype data. We used fastPHASE v1.3.0 EM
algorithm [82] to infer haplotypes with chromosome 16 SNPs for
individuals from each geographic region. For each region, the K-
selection procedure was first run several times in order to define
the optimal number of clusters of similar haplotypes by minimizing
chance error rates. Ultimately, phase was determined with K = 6
for Oceania, K = 14 for Europe and Central-South Asia and
K = 12 for the remaining regions. Using these values, the EM
algorithm was then run with 20 random starts and 25 iterations.
Once haplotypes were reconstructed, we computed the XP-
EHH statistic [27] that compares the integrated EHH
computed in a test population versus that of a reference
population. Therefore, this method detects a sweep in which
the selected allele has risen to near fixation in one population
but remains polymorphic in the other. XP-EHH scores were
computed using the same parameters as those described in
Sabeti et al. (2007). Reference populations were defined as for
XP-CLR.
We finally applied the iHS [28] that compares the rate of EHH
decay observed for both the derived and ancestral allele at the core
SNP. An extremely positive or negative value at the core SNP
provides evidence of positive selection with unusually long
haplotypes carrying the ancestral or the derived allele, respectively.
The raw iHS scores were computed using the iHS option
implemented in the WHAMM software developed by Voight
et al. (2006). The scores were standardized to have null mean and
unit variance in 5% bins of the derived allele frequency at the core
SNP. Information on ancestral allele state was obtained from the
snp131OrthoPt2Pa2Rm2.txt file downloaded from the UCSC
website. We were unable to determine with certainty the ancestral
allele status of 111 SNPs on chromosome 16 and we removed
them from the analysis.
XP-EHH and iHS scores were calculated for all available SNPs
on chromosome 16 (19,733 and 19,622, respectively) at both the
regional and population levels. The resulting distributions were
used to calculate empirical p-values.
The genetic map used for applying XP-CLR, XP-EHH and
iHS was retrieved from release 22, build 36 of HapMap (www.
hapmap.org).
Age of the Expansion of the -1639A VKORC1 Allele in EastAsia
We inferred the age at which the -1639A allele started to
increase in frequency in East Asia by estimating the age of the
most recent common ancestor carrying this allele in East Asia
using the likelihood-based method implemented in the Estiage
program [31]. This method assumes that all individuals derive
from a common ancestor who introduced the mutation n
generations ago. Estimation of n is based on the length of the
haplotype shared by the individuals, which is estimated
through the identification of recombination events on the
ancestral haplotype by taking into account allele frequencies
and recombination rates. We estimated n using only one
haplotype per East Asian population sample (i.e., 17 haplo-
types). For each population, this one haplotype was construct-
ed by taking at each locus over a 6 Mb region the allele the
most frequently seen in individuals from the population
carrying the -1639A allele. A mutation rate of 1026 per
individual and per generation, and a 25-year generation time
were assumed.
Supporting Information
Figure S1 Distribution of VKORC1 haplotypes in the 52HGDP-CEPH samples. The haplotype carrying the -1639A
allele (H1) is represented in red and the ancestral haplotype (H6) in
black.
(TIF)
Figure S2 Pairwise LD between the seven VKORC1SNPs at the regional and global level. Red squares indicate
statistically significant (logarithm of odds .2) LD between the pair
of SNPs, as measured by the D’ statistic [75] with the Haploview
software [73]; darker colors of red indicate higher values of D’, up
to a maximum of 1. White squares indicate pairwise D’ values of
,1 with no statistically significant evidence of LD. Blue squares
indicate pairwise D’ values of 1 but without statistical significance.
(TIF)
Figure S3 Genome-wide empirical distributions ofinter-regional FST values against MAF in the sevengeographic regions. Empirical distributions of FST were
constructed by calculating an FST value for 644,413 SNPs having
a MAF $0.001 at the global level. Individual values of FST
calculated for each of the seven VKORC1 SNPs are plotted against
their global MAF. The functional rs9923231 SNP is shown in red.
The 50th, 95th and 99th percentiles are indicated as dotted, dashed
and full red lines, respectively.
(TIFF)
Figure S4 Genome-wide empirical distributions of in-tra-regional FST values against MAF in the sevengeographic regions. Empirical distributions of FST were
constructed by calculating an FST value for all SNPs having a
MAF $0.001 at the intra-regional level. Individual values of FST
calculated for each of the seven VKORC1 SNPs are plotted against
the regional MAF. The functional rs9923231 SNP is shown in red.
The 50th, 95th and 99th percentiles are indicated as dotted, dashed
and full red lines, respectively.
(TIFF)
Figure S5 LD patterns over a 2 Mb region centered onVKORC1 in the seven geographic regions. Pairwise LD,
depicted as D’, is shown for SNPs with a MAF $0.05 at the global
level. D’ values are displayed in different colors from yellow to red
for D’ = 0 to D’ = 1, respectively. The plot was produced using the
snp.plotter R package [74]. The vertical dashed lines delineate
VKORC1 gene position.
(TIF)
Figure S6 Allele frequency distribution of the sevenVKORC1 SNPs in the 52 HGDP-CEPH samples: rs9923231
(A), rs13336384, (B) rs9934438 (C), rs8050894 (D), rs2359612
(E), rs7200749 (F) and rs7294 (G). The derived and ancestral
alleles are represented in orange and blue, respectively.
(TIF)
Table S1 Global FST values among populations and among
regions for the seven VKORC1 SNPs.
(XLS)
Table S2 Results of the XP-CLR test in a 16 kb region centered
on VKORC1 in the 52 HGDP-CEPH samples.
(XLS)
Table S3 Results of the XP-EHH and iHS tests in the 52
HGDP-CEPH samples.
(XLS)
Positive Selection Shaped Human AVK Sensitivity
PLOS ONE | www.plosone.org 12 December 2012 | Volume 7 | Issue 12 | e53049

ii
“thesis” — 2014/9/8 — 10:58 — page 119 — #149 ii
ii
ii
Table S4 Results of the XP-CLR test in the , 500 kb genomic
region of the LD block encompassing VKORC1 in East Asia.
(XLS)
Table S5 Results of the XP-EHH, iHS tests, inter-regional FST
and global FST for all SNPs located in the linkage disequilibrium
block encompassing VKORC1 in East Asia.
(XLS)
Table S6 Description of the 52 HGDP-CEPH samples grouped
into seven main geographic regions.
(XLS)
Acknowledgments
PL thanks Txema Heredia, Angel Carreno and Jordi Rambla for
computational support. BP thanks Steven Gazal for his valuable assistance
in writing scripts, Quentin Vincent for his advices on the datation protocol,
and Marie-Claude Babron and Remi Kazma for their helpful comments
on the manuscript.
Author Contributions
Conceived and designed the experiments: EG AS. Performed the
experiments: BP PL HB. Analyzed the data: BP PL EG AS. Contributed
reagents/materials/analysis tools: HB EP HMC. Wrote the paper: BP PL
EP HMC EG AS.
References
1. Hirsh J, Dalen JE, Anderson DR, Poller L, Bussey H, et al. (1998) Oral
anticoagulants: mechanism of action, clinical effectiveness, and optimaltherapeutic range. Chest 114: 445S–469S.
2. Hyers TM, Agnelli G, Hull RD, Weg JG, Morris TA, et al. (1998)
Antithrombotic therapy for venous thromboembolic disease. Chest 114: 561S–578S.
3. D’Andrea G, D’Ambrosio R, Margaglione M (2008) Oral anticoagulants:
Pharmacogenetics Relationship between genetic and non-genetic factors. Blood
Rev 22: 127–140.
4. Cooper GM, Johnson JA, Langaee TY, Feng H, Stanaway IB, et al. (2008) Agenome-wide scan for common genetic variants with a large influence on
warfarin maintenance dose. Blood 112: 1022–1027.
5. Takeuchi F, McGinnis R, Bourgeois S, Barnes C, Eriksson N, et al. (2009) Agenome-wide association study confirms VKORC1, CYP2C9, and CYP4F2 as
principal genetic determinants of warfarin dose. PLoS Genet 5: e1000433.
6. Teichert M, Eijgelsheim M, Rivadeneira F, Uitterlinden AG, van Schaik RH, et
al. (2009) A genome-wide association study of acenocoumarol maintenancedosage. Hum Mol Genet 18: 3758–3768.
7. Cha PC, Mushiroda T, Takahashi A, Kubo M, Minami S, et al. (2010) Genome-
wide association study identifies genetic determinants of warfarin responsivenessfor Japanese. Hum Mol Genet 19: 4735–4744.
8. Goldstein JA, de Morais SM (1994) Biochemistry and molecular biology of the
human CYP2C subfamily. Pharmacogenetics 4: 285–299.
9. Stec DE, Roman RJ, Flasch A, Rieder MJ (2007) Functional polymorphism in
human CYP4F2 decreases 20-HETE production. Physiol Genomics 30: 74–81.
10. Bardowell SA, Stec DE, Parker RS (2010) Common variants of cytochromeP450 4F2 exhibit altered vitamin E-{omega}-hydroxylase specific activity. J Nutr
140: 1901–1906.
11. Li T, Chang CY, Jin DY, Lin PJ, Khvorova A, et al. (2004) Identification of thegene for vitamin K epoxide reductase. Nature 427: 541–544.
12. Rost S, Fregin A, Ivaskevicius V, Conzelmann E, Hortnagel K, et al. (2004)
Mutations in VKORC1 cause warfarin resistance and multiple coagulation
factor deficiency type 2. Nature 427: 537–541.
13. Limdi NA, Wadelius M, Cavallari L, Eriksson N, Crawford DC, et al. (2010)Warfarin pharmacogenetics: a single VKORC1 polymorphism is predictive of
dose across 3 racial groups. Blood 115: 3827–3834.
14. Ross KA, Bigham AW, Edwards M, Gozdzik A, Suarez-Kurtz G, et al. (2010)Worldwide allele frequency distribution of four polymorphisms associated with
warfarin dose requirements. J Hum Genet 55: 582–589.
15. Li JZ, Absher DM, Tang H, Southwick AM, Casto AM, et al. (2008) Worldwide
human relationships inferred from genome-wide patterns of variation. Science319: 1100–1104.
16. Shriver MD, Kennedy GC, Parra EJ, Lawson HA, Sonpar V, et al. (2004) The
genomic distribution of population substructure in four populations using 8,525autosomal SNPs. Hum Genomics 1: 274–286.
17. Storz JF, Payseur BA, Nachman MW (2004) Genome scans of DNA variability
in humans reveal evidence for selective sweeps outside of Africa. Mol Biol Evol
21: 1800–1811.
18. Tajima F (1989) Statistical method for testing the neutral mutation hypothesis byDNA polymorphism. Genetics 123: 585–595.
19. Frazer KA, Ballinger DG, Cox DR, Hinds DA, Stuve LL, et al. (2007) A second
generation human haplotype map of over 3.1 million SNPs. Nature 449: 851–861.
20. Rieder MJ, Reiner AP, Gage BF, Nickerson DA, Eby CS, et al. (2005) Effect of
VKORC1 haplotypes on transcriptional regulation and warfarin dose.
N Engl J Med 352: 2285–2293.
21. Wu AH, Wang P, Smith A, Haller C, Drake K, et al. (2008) Dosing algorithmfor warfarin using CYP2C9 and VKORC1 genotyping from a multi-ethnic
population: comparison with other equations. Pharmacogenomics 9: 169–178.
22. Yang L, Ge W, Yu F, Zhu H (2010) Impact of VKORC1 gene polymorphismon interindividual and interethnic warfarin dosage requirement–a systematic
review and meta analysis. Thromb Res 125: e159–166.
23. Smith JM, Haigh J (1974) The hitch-hiking effect of a favourable gene. Genet
Res 23: 23–35.
24. Chen H, Patterson N, Reich D (2010) Population differentiation as a test for
selective sweeps. Genome Res 20: 393–402.
25. Sabeti PC, Reich DE, Higgins JM, Levine HZ, Richter DJ, et al. (2002)Detecting recent positive selection in the human genome from haplotype
structure. Nature 419: 832–837.
26. Weir BS, Hill WG (2002) Estimating F-statistics. Annu Rev Genet 36: 721–750.
27. Sabeti PC, Varilly P, Fry B, Lohmueller J, Hostetter E, et al. (2007) Genome-wide detection and characterization of positive selection in human populations.
Nature 449: 913–918.
28. Voight BF, Kudaravalli S, Wen X, Pritchard JK (2006) A map of recent positive
selection in the human genome. PLoS Biol 4: e72.
29. Clark AG, Hubisz MJ, Bustamante CD, Williamson SH, Nielsen R (2005)Ascertainment bias in studies of human genome-wide polymorphism. Genome
Res 15: 1496–1502.
30. Cann HM, de Toma C, Cazes L, Legrand MF, Morel V, et al. (2002) A humangenome diversity cell line panel. Science 296: 261–262.
31. Genin E, Tullio-Pelet A, Begeot F, Lyonnet S, Abel L (2004) Estimating the age
of rare disease mutations: the example of Triple-A syndrome. J Med Genet 41:
445–449.
32. Li J, Zhang L, Zhou H, Stoneking M, Tang K (2011) Global patterns of geneticdiversity and signals of natural selection for human ADME genes. Hum Mol
Genet 20: 528–540.
33. Marsh S, King CR, Porche-Sorbet RM, Scott-Horton TJ, Eby CS (2006)Population variation in VKORC1 haplotype structure. J Thromb Haemost 4:
473–474.
34. Limdi NA, Beasley TM, Crowley MR, Goldstein JA, Rieder MJ, et al. (2008)
VKORC1 polymorphisms, haplotypes and haplotype groups on warfarin doseamong African-Americans and European-Americans. Pharmacogenomics 9:
1445–1458.
35. Schwarz UI, Ritchie MD, Bradford Y, Li C, Dudek SM, et al. (2008) Geneticdeterminants of response to warfarin during initial anticoagulation. N Engl J Med
358: 999–1008.
36. Geisen C, Watzka M, Sittinger K, Steffens M, Daugela L, et al. (2005)
VKORC1 haplotypes and their impact on the inter-individual and inter-ethnicalvariability of oral anticoagulation. Thromb Haemost 94: 773–779.
37. Bodin L, Verstuyft C, Tregouet DA, Robert A, Dubert L, et al. (2005)
Cytochrome P450 2C9 (CYP2C9) and vitamin K epoxide reductase (VKORC1)genotypes as determinants of acenocoumarol sensitivity. Blood 106: 135–140.
38. Carlson CS, Thomas DJ, Eberle MA, Swanson JE, Livingston RJ, et al. (2005)
Genomic regions exhibiting positive selection identified from dense genotype
data. Genome Res 15: 1553–1565.
39. Wang ET, Kodama G, Baldi P, Moyzis RK (2006) Global landscape of recentinferred Darwinian selection for Homo sapiens. Proc Natl Acad Sci U S A 103:
135–140.
40. Teo YY, Sim X, Ong RT, Tan AK, Chen J, et al. (2009) Singapore GenomeVariation Project: a haplotype map of three Southeast Asian populations.
Genome Res 19: 2154–2162.
41. Barreiro LB, Laval G, Quach H, Patin E, Quintana-Murci L (2008) Natural
selection has driven population differentiation in modern humans. Nat Genet40: 340–345.
42. Akey JM (2009) Constructing genomic maps of positive selection in humans:
where do we go from here? Genome Res 19: 711–722.
43. Xue Y, Zhang X, Huang N, Daly A, Gillson CJ, et al. (2009) Populationdifferentiation as an indicator of recent positive selection in humans: an
empirical evaluation. Genetics 183: 1065–1077.
44. Hofer T, Ray N, Wegmann D, Excoffier L (2009) Large allele frequency
differences between human continental groups are more likely to have occurredby drift during range expansions than by selection. Ann Hum Genet 73: 95–108.
45. Pickrell JK, Coop G, Novembre J, Kudaravalli S, Li JZ, et al. (2009) Signals of
recent positive selection in a worldwide sample of human populations. GenomeRes 19: 826–837.
46. Nath SK, Han S, Kim-Howard X, Kelly JA, Viswanathan P, et al. (2008) A
nonsynonymous functional variant in integrin-alpha(M) (encoded by ITGAM) is
associated with systemic lupus erythematosus. Nat Genet 40: 152–154.
Positive Selection Shaped Human AVK Sensitivity
PLOS ONE | www.plosone.org 13 December 2012 | Volume 7 | Issue 12 | e53049

ii
“thesis” — 2014/9/8 — 10:58 — page 120 — #150 ii
ii
ii
47. Hom G, Graham RR, Modrek B, Taylor KE, Ortmann W, et al. (2008)
Association of systemic lupus erythematosus with C8orf13-BLK and ITGAM-
ITGAX. N Engl J Med 358: 900–909.
48. Jarvinen TM, Hellquist A, Koskenmies S, Einarsdottir E, Panelius J, et al. (2010)
Polymorphisms of the ITGAM gene confer higher risk of discoid cutaneous than
of systemic lupus erythematosus. PLoS One 5: e14212.
49. Scheinfeldt LB, Biswas S, Madeoy J, Connelly CF, Akey JM (2011) Clusters of
adaptive evolution in the human genome. Front Genet 2: 50.
50. Barreiro LB, Quintana-Murci L (2010) From evolutionary genetics to human
immunology: how selection shapes host defence genes. Nat Rev Genet 11: 17–
30.
51. Suttie JW (1985) Vitamin K-dependent carboxylase. Annu Rev Biochem 54:
459–477.
52. Oldenburg J, Marinova M, Muller-Reible C, Watzka M (2008) The vitamin K
cycle. Vitam Horm 78: 35–62.
53. Yan L, Zhou B, Greenberg D, Wang L, Nigdikar S, et al. (2004) Vitamin K
status of older individuals in northern China is superior to that of older
individuals in the UK. Br J Nutr 92: 939–945.
54. Beavan SR, Prentice A, Stirling DM, Dibba B, Yan L, et al. (2005) Ethnic
differences in osteocalcin gamma-carboxylation, plasma phylloquinone (vitamin
K1) and apolipoprotein E genotype. Eur J Clin Nutr 59: 72–81.
55. Kaneki M, Hodges SJ, Hosoi T, Fujiwara S, Lyons A, et al. (2001) Japanese
fermented soybean food as the major determinant of the large geographic
difference in circulating levels of vitamin K2: possible implications for hip-
fracture risk. Nutrition 17: 315–321.
56. Fujita Y, Iki M, Tamaki J, Kouda K, Yura A, et al. (2011) Association between
vitamin K intake from fermented soybeans, natto, and bone mineral density in
elderly Japanese men: the Fujiwara-kyo Osteoporosis Risk in Men (FORMEN)
study. Osteoporos Int.
57. Vermeer C, Shearer MJ, Zittermann A, Bolton-Smith C, Szulc P, et al. (2004)
Beyond deficiency: potential benefits of increased intakes of vitamin K for bone
and vascular health. Eur J Nutr 43: 325–335.
58. Wardrop D, Keeling D (2008) The story of the discovery of heparin and
warfarin. Br J Haematol 141: 757–763.
59. Mueller RL, Scheidt S (1994) History of drugs for thrombotic disease. Discovery,
development, and directions for the future. Circulation 89: 432–449.
60. Kohn MH, Pelz HJ, Wayne RK (2000) Natural selection mapping of the
warfarin-resistance gene. Proc Natl Acad Sci U S A 97: 7911–7915.
61. Kohn MH, Pelz HJ, Wayne RK (2003) Locus-specific genetic differentiation at
Rw among warfarin-resistant rat (Rattus norvegicus) populations. Genetics 164:
1055–1070.
62. Diaz JC, Song Y, Moore A, Borchert JN, Kohn MH (2010) Analysis of vkorc1
polymorphisms in Norway rats using the roof rat as outgroup. BMC Genet 11:
43.
63. Song Y, Endepols S, Klemann N, Richter D, Matuschka FR, et al. (2011)
Adaptive introgression of anticoagulant rodent poison resistance by hybridiza-
tion between old world mice. Curr Biol 21: 1296–1301.
64. Hernandez RD, Kelley JL, Elyashiv E, Melton SC, Auton A, et al. (2011) Classic
selective sweeps were rare in recent human evolution. Science 331: 920–924.65. Pritchard JK, Di Rienzo A (2010) Adaptation - not by sweeps alone. Nat Rev
Genet 11: 665–667.
66. Pritchard JK, Pickrell JK, Coop G (2010) The genetics of human adaptation:hard sweeps, soft sweeps, and polygenic adaptation. Curr Biol 20: R208–215.
67. Coop G, Pickrell JK, Novembre J, Kudaravalli S, Li J, et al. (2009) The role ofgeography in human adaptation. PLoS Genet 5: e1000500.
68. Consortium TGP (2010) A map of human genome variation from population-
scale sequencing. Nature 467: 1061–1073.69. Cann HM (1998) Human genome diversity. C R Acad Sci III 321: 443–446.
70. Rosenberg NA (2006) Standardized subsets of the HGDP-CEPH HumanGenome Diversity Cell Line Panel, accounting for atypical and duplicated
samples and pairs of close relatives. Ann Hum Genet 70: 841–847.71. Stephens M, Donnelly P (2003) A comparison of bayesian methods for haplotype
reconstruction from population genotype data. Am J Hum Genet 73: 1162–
1169.72. Bandelt HJ, Forster P, Rohl A (1999) Median-joining networks for inferring
intraspecific phylogenies. Mol Biol Evol 16: 37–48.73. Barrett JC, Fry B, Maller J, Daly MJ (2005) Haploview: analysis and
visualization of LD and haplotype maps. Bioinformatics 21: 263–265.
74. Luna A, Nicodemus KK (2007) snp.plotter: an R-based SNP/haplotypeassociation and linkage disequilibrium plotting package. Bioinformatics 23:
774–776.75. Lewontin RC (1964) The Interaction of Selection and Linkage. I. General
Considerations; Heterotic Models. Genetics 49: 49–67.76. Hill WG, Robertson A (1968) Linkage disequilibrium in finite populations
Theoretical and Applied Genetics 38: 226–231.
77. Sabeti PC, Schaffner SF, Fry B, Lohmueller J, Varilly P, et al. (2006) Positivenatural selection in the human lineage. Science 312: 1614–1620.
78. Wright S (1951) The genetical structure of populations. Annals of Eugenics 15323–354.
79. Stajich JE, Block D, Boulez K, Brenner SE, Chervitz SA, et al. (2002) The
Bioperl toolkit: Perl modules for the life sciences. Genome Res 12: 1611–1618.80. Beaumont MA, Nichols RA (1996) Evaluating loci for use in the genetic analysis
of population structure. The Royal Society 263: 1619–1626.81. Gardner M, Bertranpetit J, Comas D (2008) Worldwide genetic variation in
dopamine and serotonin pathway genes: implications for association studies.Am J Med Genet B Neuropsychiatr Genet 147B: 1070–1075.
82. Scheet P, Stephens M (2006) A fast and flexible statistical model for large-scale
population genotype data: applications to inferring missing genotypes andhaplotypic phase. Am J Hum Genet 78: 629–644.
83. McVean GA, Myers SR, Hunt S, Deloukas P, Bentley DR, et al. (2004) Thefine-scale structure of recombination rate variation in the human genome.
Science 304: 581–584.
84. Winckler W, Myers SR, Richter DJ, Onofrio RC, McDonald GJ, et al. (2005)Comparison of fine-scale recombination rates in humans and chimpanzees.
Science 308: 107–111.
Positive Selection Shaped Human AVK Sensitivity
PLOS ONE | www.plosone.org 14 December 2012 | Volume 7 | Issue 12 | e53049

ii
“thesis” — 2014/9/8 — 10:58 — page 121 — #151 ii
ii
ii
Chapter 4
SCAN THE GENOME FORPOSITIVE SELECTION.
Hafid Laayouni, Marije Oosting, Pierre Luisi, Mihai Ioana Santos Alonso,Isis Ricano-Ponce, Gosia Trynka, Alexandra Zhernakova, Theo S. Plantinga,Shih-Chin Cheng, Jos W. M. van der Meer Radu Popp, Ajit Sood, B. K.Thelma, Cisca Wijmenga, Leo A. B. Joosten, Jaume Bertranpetit, andMihai G. NeteaPublished [264]
121
Laayouni H, Oosting M, Luisi P, Ioana M, Alonso S, Ricaño-Ponce I, Trynka G, Zhernakova A, Plantinga TS, Cheng SC, van der Meer JW, Popp R, Sood A, Thelma BK, Wijmenga C, Joosten LA, Bertranpetit J, Netea MG. Convergent evolution in European and Rroma populations reveals pressure exerted by plague on Toll-like receptors. Proc Natl Acad Sci U S A. 2014 Feb 18;111(7):2668-73. doi: 10.1073/pnas.1317723111.

ii
“thesis” — 2014/9/8 — 10:58 — page 122 — #152 ii
ii
ii

ii
“thesis” — 2014/9/8 — 10:58 — page 129 — #159 ii
ii
ii
Chapter 5
DISTRIBUTION OFSELECTIVE EVENTSWITHIN A SMALL-SCALEPROTEIN-PROTEININTERACTION MAP.
Pierre Luisi, David Alvarez-Ponce, Giovanni Marco Dall’Olio, MartinSikora, Jaume Bertranpetit, and Hafid LaayouniPublished [265]
129
Luisi P, Alvarez-Ponce D, Dall'Olio GM, Sikora M, Bertranpetit J, Laayouni H. Network-level and population genetics analysis of the insulin/TOR signaltransduction pathway across human populations. Mol Biol Evol. 2012 ;29(5):1379-92. doi: 10.1093/molbev/msr298.

ii
“thesis” — 2014/9/8 — 10:58 — page 130 — #160 ii
ii
ii

ii
“thesis” — 2014/9/8 — 10:58 — page 145 — #175 ii
ii
ii
Chapter 6
DISTRIBUTION OFSELECTIVE EVENTSWITHIN A LARGE-SCALEPROTEIN-PROTEININTERACTION MAP.
Pierre Luisi, David Alvarez-Ponce, Marc Pybus, Mario A. Fares, JaumeBertranpetit, and Hafid LaayouniSubmitted
145

ii
“thesis” — 2014/9/8 — 10:58 — page 146 — #176 ii
ii
ii
ii
“thesis” — 2014/9/8 — 10:58 — page 147 — #177 ii
ii
ii
RESEARCH ARTICLE
Recent Positive Selection Has Acted On Genes Encoding Proteins With More Interactions Within the Whole Human Interactome
Pierre Luisi1†, David Alvarez-Ponce2,3†, Marc Pybus1, Mario A. Fares2,4, Jaume Bertranpetit1*
and Hafid Laayouni1,5*.
(† These authors contributed equally to this work)
1Institute of Evolutionary Biology (Universitat Pompeu Fabra-CSIC), CEXS-UPF-PRBB,
Barcelona, Catalonia, Spain.
2Integrative Systems Biology Group, Instituto de Biología Molecular y Celular de Plantas,
Consejo Superior de Investigaciones Científicas (CSIC)-Universidad Politécnica de Valencia
(UPV), Valencia, Spain.
3Current address: Biology Department, University of Nevada, Reno, NV, USA.
4Smurfit Institute of Genetics, University of Dublin, Trinity College, Dublin, Ireland.
5Departament de Genètica i de Microbiologia, Grup de Biologia Evolutiva (GBE), Universitat
Autonòma de Barcelona, Bellaterra (Barcelona), Spain
* Authors for correspondence.
Pierre Luisi:
IBE, Institut de Biologia Evolutiva (UPF-CSIC)
CEXS-Universitat Pompeu Fabra-PRBB
Doctor Aiguader 88
08003 Barcelona, Catalonia, Spain
email: [email protected]
David Alvarez-Ponce:
Instituto de Biología Molecular y Celular de Plantas (Consejo Superior de Investigaciones
Científicas-Universidad Politécnica de Valencia)
Ingeniero Fausto Elio s/n
46022 Valencia, Spain
Biology Department,
University of Nevada, Reno

ii
“thesis” — 2014/9/8 — 10:58 — page 148 — #178 ii
ii
ii
Max Fleischmann Agriculture Building
1664 N. Virginia Street
Reno, NV 89557-0314
email: [email protected]
Marc Pybus:
IBE, Institut de Biologia Evolutiva (UPF-CSIC)
CEXS-Universitat Pompeu Fabra-PRBB
Doctor Aiguader 88
08003 Barcelona, Catalonia, Spain
email: [email protected]
Mario A. Fares:
Instituto de Biología Molecular y Celular de Plantas (Consejo Superior de Investigaciones
Científicas-Universidad Politécnica de Valencia)
Ingeniero Fausto Elio s/n
46022 Valencia, Spain
Smurfit Institute of Genetics,
University of Dublin,
Trinity College,
2 College Green
Dublin 2, Ireland
email: [email protected]
Hafid Laayouni:
IBE, Institut de Biologia Evolutiva (UPF-CSIC)
CEXS-Universitat Pompeu Fabra-PRBB
Doctor Aiguader 88
08003 Barcelona, Catalonia, Spain
Departament de Genètica i de Microbiologia
Facultat de Biociències, Edifici Cn
Universitat Autònoma de Barcelona
08193 Bellaterra, Catalonia, Spain
email: [email protected]

ii
“thesis” — 2014/9/8 — 10:58 — page 149 — #179 ii
ii
ii
Jaume Bertranpetit:
IBE, Institut de Biologia Evolutiva (UPF-CSIC)
CEXS-Universitat Pompeu Fabra-PRBB
Doctor Aiguader 88
08003 Barcelona, Catalonia, Spain
email: [email protected]

ii
“thesis” — 2014/9/8 — 10:58 — page 150 — #180 ii
ii
ii
ABSTRACT
Genes vary in their likelihood to undergo adaptive evolution. The genomic factors that
determine adaptability, however, remain poorly understood. Genes function in the context of
molecular networks, with some occupying more important positions than others and thus
being likely to be under stronger selective pressures. However, how positive selection
distributes across the different parts of molecular networks is still not fully understood. Here,
we inferred positive selection using comparative genomics and population genetics
approaches through the comparison of 10 mammalian and 270 human genomes, respectively.
In agreement with previous results, we found that genes with lower network centralities are
more likely to evolve under positive selection (as inferred from divergence data). Surprisingly,
polymorphism data yields results in the opposite direction than divergence data: genes with
higher centralities are more likely to have been targeted by recent positive selection during
recent human evolution. Our results indicate that the relationship between centrality and the
impact of adaptive evolution highly depends on the mode of positive selection and/or the
evolutionary time-scale. Most likely, network adaptation occurs through intra-specific
adaptive leaps affecting key network genes, followed by fine-tuning adaptations in less
important network regions.
Keywords
Physical protein interaction, Protein interaction network, Natural selection, Positive selection,
Mammals, Humans
ii
“thesis” — 2014/9/8 — 10:58 — page 151 — #181 ii
ii
ii
BACKGROUND
In recent years, the availability of large-scale network and genomic datasets has
allowed researchers to study the relationship between the position of proteins within
molecular networks and their patterns of molecular evolution (Cork & Purugganan 2004;
Wagner 2012). These studies have shown that the strength of purifying selection acting on
individual genes is affected by the position that their encoded products occupy in molecular
networks. Indeed, genes acting at the centre of protein-protein interaction networks (PINs)
and metabolic networks (i.e., genes coding for proteins with many interactions or
connections) evolve under higher levels of purifying selection than those acting at the network
periphery (Alvarez-Ponce & Fares 2012; Alvarez-Ponce 2012; Fraser et al. 2002; Hahn &
Kern 2005; Vitkup et al. 2006) (but see (Hahn et al. 2004; Jordan et al. 2003)) . Furthermore,
interacting proteins evolve at similar rates, probably as a result of molecular coevolution
(Agrafioti et al. 2005; Codoñer & Fares 2008; Cui et al. 2009; Fraser et al. 2002; Lovell &
Robertson 2010; Pérez-Bercoff et al. 2013).
Less well understood, however, is how adaptive events distribute across molecular
pathways and networks. Some evidence supports that adaptive events tend to occur in less
centrally located regions of gene networks. In an early study using two genomes, the human
and chimpanzee genomes, Kim et al. found that positive selection often targeted genes acting
at the periphery of the PIN (Kim et al. 2007). Powerful detection of positive selection
requires, nevertheless, comparing many genomes (Anisimova et al. 2002; Kosiol et al. 2008),
making it appropriate to re-evaluate this trend in light of the currently available mammalian
genomes.
In addition, some recent population genetics studies appear to contradict the notion
that positive selection targets preferentially the periphery of molecular networks. Indeed,
positive selection often targets genes acting at the most “influential” positions of these
pathways, including the most entral genes in the human insulin/mTOR pathway (Luisi et al.
2012), genes acting at bifurcation points of the human N-glycosylation pathway (Dall’Olio et
al. 2012) and the Drosophila pathways involved in glucose metabolism (Flowers et al. 2007),
and the gene encoding the first enzyme of the Arabidopsis glucosinolate pathway (Olson-
Manning et al. 2013). Simulation studies also indicate that adaptation preferentially targets
genes acting at the upstream and branch-point parts of pathways, at least when the system is
far from the fitness optimum (Rausher 2012; Wright & Rausher 2010). Proteins occupying
these key network positions are expected to exert strong influence over the pathway function,
and thus on the associated phenotypes and organism’s fitness (Olson-Manning et al. 2013;

ii
“thesis” — 2014/9/8 — 10:58 — page 152 — #182 ii
ii
ii
Rausher 2012; Wright & Rausher 2010). Therefore, positive selection on genes encoding such
proteins may lead to rapid adaptation.
Here, we make use of the unprecedented wealth of genomic (Kersey et al. 2012; The
1000 Genomes Project Consortium 2012) and interactomic data (Stark et al. 2011), to
ascertain what parts of the human protein–protein interaction network were affected by
positive selection, using both comparative genomics and population genetics approaches. We
found that positive selection, as inferred from divergence data, preferentially targets genes
acting at more peripheral positions in the network, in agreement with previous observations
(Kim et al. 2007). Conversely, genes with signatures of recent positive selection, identified
considering polymorphism data, occupy more central parts of the network. We discuss on the
apparently contradictory results from divergence and polymorphism data and propose, for the
first time, an evolutionary scenario reconciling both patterns.

ii
“thesis” — 2014/9/8 — 10:58 — page 153 — #183 ii
ii
ii
MATERIAL AND METHODS
Reconstructing the Human Protein–Protein Interaction Network
The human protein–protein interaction network (PIN) was reconstructed from the
interactions available from the BioGRID database version 3.1.81 (Stark et al. 2011). Only
non-redundant physical interactions were considered to calculate centrality measures. We
removed from our analysis proteins without an Ensembl ID as well as Ubiquitin C (encoded
by the gene with Ensembl ID ENSG00000150991), which has an outlier degree centrality.
Detecting Natural Selection Events from 10 Mammalian Genomes
In order to infer events of positive selection that have occurred during mammals
evolution we used sequence data for a set of mammals, enriched in primates. The analysis was
restricted to 10 high-coverage genomes: human, chimpanzee, gorilla, orang-utan, macaque,
mouse, rat, cow, dog, and opossum. The platypus genome was not included in the analysis, as
the currently available assembly is highly fragmented, making gene annotation difficult. Also
excluded were non-mammalian genomes, in order to avoid the problem of saturation of
synonymous sites (Smith & Smith 1996), and to maximize the number of genes with 1:1
orthologs in all studied genomes.
All protein and coding (CDS) sequences for the selected genomes were obtained from
Ensembl release 62 (Kersey et al. 2012). For each of the 9,041 human protein-coding genes
represented in the PIN, we searched the 9 non-human genomes for 1:1 orthologs using the
best reciprocal BLAST approach. First, we selected the longest protein (or, in the case of
multiple proteins sharing the maximal length, that classified as the canonical isoform), and
used it as query in a BLASTP search against each of the non-human proteomes. Second, for
the best hits in each proteome, we performed a BLASTP search against the human proteome.
If the hit obtained in the second search was the original human protein, then it was considered
to be a 1:1 ortholog. Only human genes with 1:1 orthologs in all 9 non-human genomes were
used in subsequent analyses (in total, 5,916 genes met this criterion).
Each group of orthologous proteins was aligned using ProbCons 1.12 (Do et al. 2005).
Because tests of positive selection are sensitive to sequencing, annotation and alignment
errors (Scheinfeldt et al. 2009; Talavera & Castresana 2007), we used highly stringent criteria
to filter our alignments. First, unreliably aligned regions were removed using Gblocks version

ii
“thesis” — 2014/9/8 — 10:58 — page 154 — #184 ii
ii
ii
0.91b (Talavera & Castresana 2007), with default parameters. Additionally, we used an ad-
hoc filtering procedure in order to remove annotation errors, including the following steps: (1)
identification of unique amino acid replacement (i.e., amino acids that are unique to a given
species in a certain alignment column); (2) identification of alignment regions with a very
high incidence of unique substitutions in the same species; in particular, we used a sliding
window approach to identify regions of 15 amino acids containing 10 or more unique
substitutions in the same sequence, as well as regions of 5 amino acids containing 5 unique
substitutions in the same sequence; these patterns are unlikely to represent true divergence
between species, provided that the species included in the current analysis are relatively
closely related; and (3) removal of these alignment regions. These procedures resulted in the
removal of 35.5% of amino acid positions. The resulting filtered protein alignments were used
to guide the alignment of the corresponding CDSs.
We evaluated the impact of both purifying and positive selection on each orthologous
group using the program codeml from the package PAML 4.4 (Yang et al. 2005). For each
CDS alignment, three different evolutionary models (M0, M7 and M8) were fitted. First, for
each gene, an overall ω estimate was obtained from the M0 model, which assumes a
homogeneous ω for all branches in the tree and all codons in the alignment. This score was
used as a proxy of the impact of purifying selection. Second, in order to infer the action of
positive selection, we applied the M7 vs. M8 test (Nielsen & Yang 1998). The M7 model
assumes that codons' ω values follow a beta distribution, limited to the interval (0, 1), whereas
model M8 allows for an additional class of codons with ω > 1. The likelihood ratio test was
used to contrast whether model M8 fits the data significantly better than model M7. Twice the
difference between the log-likelihoods of both nested models, [2Δℓ = 2 × (ℓM8 – ℓM7),
where ℓii is the log-likelihood of the observed data under model i], is assumed to follow a χ2
distribution with two degrees of freedom. In order to avoid the problem of local optima, for
each gene each model was fitted three times, using different starting ω values (0.04, 0.4 and
4), and the computation with the highest likelihood was retained. The commonly accepted tree
topology was used.
In order to discard potential alignment errors, not detected by our stringent filtering,
the alignments corresponding to genes with P < 0.1 in the likelihood ratio test for positive
selection were inspected visually. Alignment regions containing evident errors were manually
ii
“thesis” — 2014/9/8 — 10:58 — page 155 — #185 ii
ii
ii
removed using BioEdit v7.0.5.2 (Hall 1999), and analyses of positive selection were re-run.
This process was iterated until no further errors were detected in the alignments
corresponding to genes with putative signatures of positive selection. We obtained a total of
554 genes with putative signatures of positive selection (divPSGs; P < 0.05).
Detecting Natural Selection from 1000 Human Genomes
We obtained phased genotypes from low-coverage data of the phase I of the 1000
Genomes Project (The 1000 Genomes Project Consortium 2012), which makes available data
for over 36 millions Single Nucleotide Variants (SNVs) for 1,092 individuals sampled from
14 populations worldwide. We used a subset of 270 individuals from YRI, CEU and CHB
populations.
For each of the 9,041 genes contained in the PIN, we analysed the genomic region
corresponding to the transcript spanning the longest chromosome region. Gene coordinates
were obtained from release 37 of the human genome at NCBI (Flicek et al. 2010). We
removed 365 genes located at sex chromosomes because some of the methods used to detect
signals of positive selection have been devised for autosomal regions, or provide results that
cannot be compared between autosomal and sex chromosomes. In order to increase the
statistical power in the detection of positive selection, we removed from the analyses 96 genes
with less than 10 SNVs annotated in the 1000 genomes.
We used the genetic map provided by the 1000 Genomes Consortium. Ancestral states
inferred from comparison with orthologous sequences in the chimpanzee and rhesus macaque
genomes were obtained from the UCSC Genome Bioinformatics Site (Karolchik et al. 2009)
(http://genome.ucsc.edu/; table ‘‘snp128OrthoPanTro2RheMac2’’).
Retained genes (a total of 8,580), have a length ranging from 0.414 to 2,305 Kb (mean
= 61.70 Kb; median = 25.95 Kb) and are covered by a total of 6,815,879 SNVs. The number
of SNVs located in a gene ranges from 10 (28 genes) to 45,577 with a mean of 794.4 and a
median of 312.
To identify the genes belonging to the PIN that have evolved under positive selection
during human evolution, we applied three different tests: (i) the Cross-Population Composite
Likelihood Ratio method (Chen et al. 2010) (XP-CLR), based on the multi-locus allele
frequency differentiation between two populations, (ii) the integrated Haplotype Score
ii
“thesis” — 2014/9/8 — 10:58 — page 156 — #186 ii
ii
ii
(Voight et al. 2006) (iHS), which aims to detect extended haplotype homozygosity from the
local haplotype structure, and (iii) DH (Zeng et al. 2007), based on the excess of rare variants,
which combines Tajima’s D (Tajima 1989) and Fay and Wu's H (Fay & Wu 2000). Those tests
are designed assuming the hard sweep model which states that a new advantageous mutation
arises in the population and rapidly increases in frequency hitchhiking the surrounding neutral
variants located on the same haplotype.
We computed a raw iHS for each SNV with ancestral state information following the
method proposed by Voight et al. (2006). We used the script available at
http://hgdp.uchicago.edu/Software/, which we slightly modified in order to speed up
computation times; thresholds for Extended Haplotype Homozygosity (EHH) decay were
modified from 0.25 to 0.15 and we used a size for the analysed region of 0.2 Mb (original
size: 2.5 Mb). Using coalescent simulations (COSI) (Schaffner et al. 2005) we validated that
these changes do not affect sensitivity and specificity of the method (data not shown).
Standardized iHS scores were obtained by grouping SNVs into 20 bins separated by a derived
allele frequency of 0.05, subtracting the mean, and dividing by the standard deviation for all
SNVs in the same bin as in Voight et al. (2006). Extreme positive or negative values indicate
high extended haplotype homozygosity of haplotypes carrying the ancestral or derived allele,
respectively. Hence, we consider both extreme positive or negative iHS as potential signatures
of positive selection. We integrated the |iHS| scores observed at each gene of interest into a
gene-level summary statistic using the mean.
The XP-CLR method aims at detecting important genetic differentiation in an
extended genomic region in comparison with a reference population. This method provides a
good localization of the position of the selected variant (Chen et al. 2010). XP-CLR scores
were computed at regularly spaced grid points (every 2 Kb) using the information from SNVs
within a flanking window of 0.2 cM. To account for different SNV densities among genomic
regions, we restricted to 200 the maximal number of SNVs used to calculate a XP-CLR score
within each window, by randomly removing SNVs in excess. We integrated the XP-CLR
scores observed at each gene of interest into a gene-level summary statistic using the mean.
Extreme iHS and XP-CLR scores could also be attributable to the action of non-
selective events such as demographic changes and genetic drift. However, these selectively
neutral events act randomly on the genome, in contrast with positive selection, which targets
ii
“thesis” — 2014/9/8 — 10:58 — page 157 — #187 ii
ii
ii
specific genes. Therefore, we adopted an outlier approach to infer the action of positive
selection on PIN genes (Kelley et al. 2006; Teshima et al. 2006): we evaluated the
significance of the scores for each gene by taking into account the whole genome context. For
that purpose, we used a genomic gene-level background containing all annotated genes that
were distant one from each other and from the 8,580 genes included in the analysis, by at least
5 Kb and contained at least 10 SNVs. The complete background gene set obtained thus
includes 13,388 genomic regions and 8,431,716 SNVs. For each of these background
genomic regions, we computed the mean summary statistics based on iHS and XP-CLR and
then obtained gene-level empirical distributions. Empirical P-values associated to iHS and
XP-CLR for PIN genes were obtained using these distributions.
For each gene, using the SNVs with ancestral state information, we also computed
Tajima's D, Fay and Wu's H and DH, using a program kindly provided by Kai Zeng. For each
gene, the DH P-value was obtained as in (Zeng et al. 2007) from Tajima's D and Fay and Wu's
H by a bivariate comparison to their neutral distributions. However, instead of using 10,000
replicates of coalescent simulations to build these neutral distributions as in the original
article, we used the 13,388 genomic regions described before in order to better take into
account demographic forces that acted on the studied populations.
In order to summarize the results of the three different tests, we combined the gene-
level empirical P-values obtained as described above using the Fisher combination test:
Z F=−2 log∑i=1
i=3
Pi ,
where Pi are the empirical P-values obtained from the three tests. Thus, for each gene we
obtained a unique ZF score, which follows a χ2 distribution with 6 degrees of freedom. This
combination requires independence of the three combined P-values. We confirmed that this
assumption is appropriate to our data (Supplementary Figure 1). We invoked positive
selection if the P-value associated to the ZF score was below 5%. Therefore, we obtained 4
lists of genes with putative signatures of positive selection inferred from polymorphism data
(polyPSGs): 3 populations + global level.
The major limitation of the methods implemented to detect positive selection using
polymorphism data is that demographic events, such as population growth, bottleneck, and/or
subdivision, can mimic patterns similar to those produced by selection. However, the outlier

ii
“thesis” — 2014/9/8 — 10:58 — page 158 — #188 ii
ii
ii
approach framework that we implemented and which combines three tests that consider three
different molecular patterns (namely genetic differentiation, site frequency spectrum and
linkage disequilibrium) is very likely to overcome this issue.
In order to estimate the strength of purifying selection acting on the genes involved in
the PIN we calculated the average Derived Allele Frequency (DAF) among the 270
individuals belonging to YRI, CEU and CHB populations (The 1000 Genomes Project
Consortium 2012).
Determining Fitness Effect of Genes
Using data from the Mouse Genome Database “MRK_Ensembl_Pheno.rpt” (Bult et al.
2008) (file downloaded on 7 October 2010), we classified genes as essential and non-essential
when described to be lethal and viable when knocked out in mice, respectively. We retrieved
such information for 3,994 genes represented in the PIN.
We also used the functional indispensability score (Khurana et al. 2013) estimated
from functional and evolutionary properties. This score shows great performance to
distinguish between essential genes (those showing clinical features of death before puberty
or infertility when Loss-of-Function –LoF– mutations occur (Liao & Zhang 2008)) and LoF-
tolerant genes (those observed to contain homozygous LoF mutations in at least one
individual in the 1000 Genomes Pilot Data (MacArthur et al. 2012)). We obtained the
functional indispensability score for 8,816 genes involved in the PIN.
ii
“thesis” — 2014/9/8 — 10:58 — page 159 — #189 ii
ii
ii
RESULTS
Positive selection inferred from divergence data and gene centrality in the human
protein-protein interaction network
We used 10 mammalian genomes (Kersey et al. 2012) to infer events of positive
selection that took place within the last ~165 million years. The test used in this study looks
for a non-synonymous to synonymous divergence ratio (ω = dN/dS) higher than 1 at a subset of
codons (Nielsen & Yang 1998). It provides a positive selection likelihood score, termed 2Δℓ
(see Methods), that is proportional to the likelihood of positive selection. We identified a total
of 554 putative positively selected genes (divPSGs; those with P < 0.05).
We measured the difference in the mean degree (number of protein-protein
interactions, or number of proteins with which a protein interacts) between divPSGs and the
other genes in the network (non-divPSGs), and tested whether this difference was expected at
random through 10,000 random permutations of the two groups containing divPSGs and non-
divPSGs. We observed that divPSGs encode proteins with a lower significantly lower degree
than non-divPSGs (permutation test: P = 0.0067; Figure 1A; Supplementary Table 1). Indeed,
divPSGs and non-divPSGs encode proteins with, on average, 7.578 and 9.122 interactions,
respectively, i.e. the degree for divPSGs is 17% lower than the one observed for non-
divPSGs. The magnitude of this difference is similar to previous observations (Kim et al.
2007).
We next observed that log-likelihood increments (2Δℓ scores) from the positive
selection test exhibit a significant negative correlation with proteins’ degrees (Spearman's
rank correlation coefficient, ρ = −0.0490; P = 0.0002; Table 1), indicating that central genes
are less likely to be under positive selection. Finally, when proteins were binned into four
degree classes (low, medium-low, medium-high and high degree), we observed a continuous
decrease in their positive selection likelihood scores (2Δℓ) (Figure 2D; Table 1). Indeed, the
non-parametric Analysis Of Variance (ANOVA) F-test is significant (P = 0.0101), and there is
a trend towards higher 2Δℓ scores in the lower degree groups (linear trend test on ranks; P =
0.0014). Taken together, our observations indicate that adaptation (as inferred from
divergence data) more frequently occurs at the less connected proteins of the human
interactome, consistent with previous observations (Kim et al. 2007).
Positive selection inferred from polymorphism data and gene centrality in the human
protein-protein interaction network

ii
“thesis” — 2014/9/8 — 10:58 — page 160 — #190 ii
ii
ii
We inferred recent events of positive selection in humans using genomic data from
three different populations of West African, Northern European and East Asian ancestry (YRI,
CEU and CHB, respectively). We used a Fisher's combination (ZF score) of three tests of
positive selection assuming the hard sweep model: XP-CLR (Chen et al. 2010), iHS (Voight
et al. 2006) and DH (Zeng et al. 2007) (see Material and Methods). Assuming that ZF follows
a χ2 distribution with 6 degrees of freedom, we identified putative positive selection genes
(polyPSGs).
We measured the difference in the mean degree between these genes and genes
without evidences of having evolved under positive selection (non-polyPSGs) (Figure 1A;
Supplementary Table 1). When all populations were analysed together (global analysis), we
observed a statistically significant higher degree for genes with signatures of positive
selection (permutation test: P = 0.0254). Indeed, polyPSGs and non-polyPSGs encode
proteins with, on average, 9.637 and 8.107 interactions, respectively, i.e. the degree for
polyPSGs is 19% higher than the one observed for non-polyPSGs. The magnitude of this
difference is similar to what has been observed at inter-specific level yet in the other direction.
When the three populations were considered separately, polyPSGs were always more
connected than non-polyPSGs, although the test was significant only for YRI (Supplementary
Table 1).
ZF scores and network degrees exhibit a significant positive correlation for all three
populations (Table 1). Finally, comparison of ZF scores for the four degree groups (low,
medium-low, medium-high and high degree) using a non-parametric ANOVA showed
significant differences in all three populations, as a result of higher ZF scores at the highest
degree groups, according to a linear trend test on ranks (Figure 2A–C; Table 1). These results
were reproduced using the three positive selection statistics separately (DH, iHS and XP-CLR
in all populations, except XP-CLR in CEU and CHB), and also using the Composite of
Multiple Signals method (CMS) (Grossman et al. 2013, 2010) (Supplementary Note;
Supplementary Figure 2; Supplementary Table 2). Furthermore, the observed trends remain
significant when removing the putative effect of linkage disequilibrium among genes by using
a subset of unlinked genes (see Supplementary Note; Supplementary Figure 3; Supplementary
Table 3).
These analyses indicate that genes encoding proteins with a greater number of
interactions in the human PIN are more likely to present signals of recent selective sweeps
than those acting at more peripheral positions.

ii
“thesis” — 2014/9/8 — 10:58 — page 161 — #191 ii
ii
ii
Correcting for several putative confounding factors and validations
A number of factors correlate with both network centrality and the likelihood of
observing positive selection, and might thus be confounding our observations. In order to
discard this possibility, we conducted a number of validations.
In agreement with previous results (Alvarez-Ponce & Fares 2012; Alvarez-Ponce
2012; Fraser et al. 2002; Hahn & Kern 2005; Vitkup et al. 2006), we observed that purifying
selection is stronger in genes acting at the centre of the human PIN than at those acting at the
periphery, regardless of whether it was measured from the ω ratio or the derived allele
frequency (Figure 2E–F, Table 1, Supplementary Table). Purifying selection, through
background selection (BGS), can produce signatures that can be confounded with positive
selection by tests based on DNA polymorphism (Charlesworth et al. 1993), thus raising the
possibility that our results could be a by-product of the distribution of purifying selection
across the network. This effect, however, is unlikely to have affected our network-level
analyses, given that we combined the results of different positive selection tests. Indeed,
multivariate analyses confirmed that the relationship between network degree and positive
selection was independent of purifying selection (Supplementary Note; Supplementary
Figures 9–10; Supplementary Tables 6–7).
Factors such as gene expression level and breadth (tissue specificity), and the length of
the encoded proteins, correlate with both network centralities and the likelihood of detecting
positive selection (Duret & Mouchiroud 2000; Pál et al. 2006; Subramanian & Kumar 2004)
and thus could also represent confounding factors. However, the relationship between
network degree and all metrics of positive selection (2Δl and ZF) and purifying selection (ω
and DAF) considered in this study remains unaltered when controlling for these parameters
(Table 1; Supplementary Note; Supplementary Figure 4).
Our results might also be biased by the incompleteness and low quality of available
interactomic data. However, similar results were obtained when a high-quality sub-network of
BioGRID (Stark et al. 2011), or the Human Protein Reference Database (Keshava Prasad et
al. 2009), were analysed (see Supplementary Note; Supplementary Figures 5–6;
Supplementary Table 4), indicating that our observations are not a by-product of the quality of
network data.
In addition to degree, which is a local measure of network centrality, we used two
additional centrality measures that take into account the global position of proteins within the
network: betweenness (the number of shortest paths between other proteins passing through a
protein), and closeness (the inverse of the average distance to all other proteins in the

ii
“thesis” — 2014/9/8 — 10:58 — page 162 — #192 ii
ii
ii
network). Similar trends to those observed when using degree were observed in both cases
(see Supplementary Note; Supplementary Figures 7–8; Supplementary Table 5).
Gene essentiality and impact of positive selection
To explore whether genes putatively under recent positive selection in our data set (i.e.
affected by a hard sweep during recent human evolution) have important fitness effects, we
classified the genes under study as viable or lethal using information from The Mouse
Genome Database (Bult et al. 2008). Lethal genes present a significantly higher degree than
viable genes (Mann-Whitney test; P < 0.0001; Table 2), in agreement with previous results
(Fraser et al. 2002; Iyer et al. 2013; Jeong & Albert 2000). This demonstrates that, as
expected, the phenotypic effect of a gene is highly associated with its position within the PIN
(for a review, see (Olson-Manning et al. 2012)). We next compared the scores of positive
selection on the PIN genes between the two groups (Table 2; Figure 3). As expected, lethal
genes have significantly lower DAF and ω scores (Mann-Whitney test, P < 0.0001),
indicating that they evolve under higher selective constraints. Moreover, they are more likely
to be targeted by recent positive selection, since they exhibit significantly higher positive
selection scores in the three human populations (Mann-Whitney test; P = 0.0047 in YRI, P =
0.0009 in CEU and P = 0.0248 in CHB). This indicates that recent positive selection targets
genes with the highest effects on fitness. However, during mammal evolution, positive
selection is more likely to act on viable genes: 2Δℓ scores are significantly higher for viable
than for lethal genes (Mann-Whitney test; P < 0.0001). Similar results were obtained when
using the “functional indispensability” score attributed to a specific gene according to its
functional and evolutionary properties (Khurana et al. 2013) (Table 2).

ii
“thesis” — 2014/9/8 — 10:58 — page 163 — #193 ii
ii
ii
DISCUSSION
The results presented here indicate that signatures of positive selection identified
following two different methodological frameworks concentrate on different parts of the
human PIN: when interrogating mammal divergence data, we observe that positive selection
had a greater impact on genes with a lower network centrality, whereas recent, human-specific
positive selection (as inferred from polymorphism data) has targeted preferentially genes
occupying more central positions in the network. These patterns are independent of several
potentially confounding factors.
The signatures of adaptation detected in this study through either a comparative
genomics or population genetics approach might correspond to different kinds of changes at
the sequence level, a problem with no obvious solution. The maximum-likelihood test used to
detect positive selection using divergence data is powerful only in situations in which the
gene has experienced recurrent selection events at the coding sequence; adaptation at
regulatory sites, however, cannot be detected using this method. Therefore, positive selection
during mammal evolution, as inferred here, should be viewed as sequence adaptations that
alter the function of proteins recurrently across the mammalian phylogeny. Signatures
detected in a genomic region using re-sequencing data, on the contrary, can correspond to
unique selective sweeps (not necessarily recurrent) that occurred recently, either at the studied
region or at a linked one (e.g., promoters and other regulatory regions). Thus, the putative
signals of recent positive selection can be the result of variants that alter protein sequence, but
are perhaps more likely to correspond to cis-regulatory variants, whose role in recent human
evolution seems to have been pivotal (Enard et al. 2014; Fraser 2013). Since protein-coding
genes are particularly constrained at the core of the interactome, their regulatory regions may
provide the necessary pool of variation for adaptation. Therefore, recent positive selection
events detected using polymorphism data are likely to correspond to adaptation through
changes in expression patterns (gene expression level or regulation), while selective events
detected through divergence analysis may mostly correspond to changes in protein function.
The higher centrality of essential genes suggests that the centre of the network may
roughly correspond to the most important, influential and pleiotropic genes of the system.
Certain evolutionary mechanisms may promote a higher adaptability at the centre of the
network where the effects of genes on fitness are important, whereas others may promote a
higher incidence of positive selection at the periphery. On the one hand, in the 1930s, Ronald
Fisher formulated the hypothesis that mutations with large effects on phenotype, such as those
with highly pleiotropic effects, should often be deleterious (Fisher 1930; Orr 2005). In

ii
“thesis” — 2014/9/8 — 10:58 — page 164 — #194 ii
ii
ii
agreement with this hypothesis, purifying selection is stronger on genes acting at the centre of
molecular networks (Fraser et al. 2002; Hahn & Kern 2005; Vitkup et al. 2006; Alvarez-Ponce
& Fares 2012; Alvarez-Ponce 2012) (but see (Hahn & Kern 2005; Jordan et al. 2003)), a
pattern that we have confirmed analysing both divergence and polymorphism data. Since
purifying selection quickly removes a high fraction of new mutations at these genes, one
would expect positive selection to rarely act on them because of their reduced variability
(Olson-Manning et al. 2012). Therefore, we may expect positive selection to target more
frequently the periphery of the network. On the other hand, the action of positive selection at
genes occupying the centre of the network is not to be discarded. Indeed, signatures of
positive selection are frequent at genes occupying relatively important positions in a number
of metabolic and signal transduction pathways (Dall’Olio et al. 2012; Luisi et al. 2012;
Flowers et al. 2007; Olson-Manning et al. 2013).
Simulation analyses of hypothetical metabolic pathways have shown that, when
pathways are far from the fitness optimum, positive selection first targets enzymes lying at the
upstream part, and at the branch points of the pathway, which exert greater control over
metabolic flux. In turn, when the system approaches its optimum, positive selection tends to
concentrate on enzymes with less flux control, and purifying selection constrains the
evolution of upstream and branch-point enzymes (Rausher 2012; Wright & Rausher 2010).
These observations match the expected pattern of diminishing returns, first proposed by
Ronald Fisher in his Geometric Model of Adaptation (Fisher 1930) (FGM) which states that
selection tends to act progressively more often on mutations with smaller phenotypic effects
as populations approach a peak in the adaptive landscape. A mutation's effect is measured as a
function of both its effect on a given trait and the numbers of phenotypes that are jointly
modified by the mutation (pleiotropic effect) (Fisher 1930; Orr 2005), and theoretical
development is undergoing in order to relate the FGM to information on protein-protein
interaction networks (e.g. see (Martin 2014)). According to the FGM, events of selection are
more likely to be observed on mutations with small phenotypic effects (following a geometric
distribution), whereas positive selection on mutations with large effects is most likely to occur
during the first steps of adaptation.
The results described in the present study can be understood according to both the
FGM and the different kinds of advantageous changes detected at the sequence level. Indeed,
when focusing at large evolutionary time-scale, i.e. during mammal evolution, we are
studying the whole process of adaptation acting exclusively on protein-coding genes that
made the species overall fit. Therefore, according to the geometric distribution of the
probability of a mutation to be favourable, it is more likely to detect events of adaptation

ii
“thesis” — 2014/9/8 — 10:58 — page 165 — #195 ii
ii
ii
acting on genes with lower effect on fitness, that is genes encoding proteins with less
interacting partners. On the other hand, when focussing at much shorter evolutionary time-
scale, i.e. during recent human evolution, we are studying the recent adaptation of human
populations to a wide range of new environments (e.g. the Mesolithic-Neolithic transition, the
human diaspora across the world, etc.). We speculate here that events of strong recent positive
selection, as inferred from polymorphism data assuming the hard sweep model, mainly
targeted cis-regulatory regions of genes with important effects on fitness in order to efficiently
tune some specific phenotypes without affecting the whole protein interaction map.
In summary, even though the interactome is a raw simplification of the processes that
take place within the cell, it contains valuable information on the relative role of the many
gene products that interact to sustain life. The position occupied by a protein within an
interaction network provides useful information –albeit incomplete– on the phenotypic effects
of mutations arising at the encoding gene. Interestingly, we have shown that using this
information can also help to better understand the impact of positive selection acting on
protein-coding genes and their cis-regulatory region. Although network centrality used alone
remains a modest predictor of the impact of positive selection, it could be included in an
integrative biology approach to shed light on adaptive processes acting on the genome. The
present study also underscores the fact that the relationship between positive selection and
network position is more complex than previously recognised, when positive selection was
suggested to mostly act at the network periphery. Indeed, the discovery of the rules governing
network evolution may shed light on the dynamics of the evolutionary processes driven by
selection. Notably, the distribution of selective events in a large-scale protein-protein
interaction network described in the present study, which relies on extensive sequence data,
can be understood in the light of the Fisher's Geometric Model of Adaptation. Particularly,
results presented here show that the prime matter for innovation is also to be found in genes,
or in their cis-regulatory region, encoding proteins with high network centrality, meaning that
they have more pleiotropic effects, are more indispensable and in general are at the basis of
strong changes as a result of mutations during the initial high-risk high-gain phase of the
adaptation process.

ii
“thesis” — 2014/9/8 — 10:58 — page 166 — #196 ii
ii
ii
ACKNOWLEDGEMENTS
We thankfully acknowledge valuable discussion and corrections from Diego A.
Hartasanchez, David A. Hughes and Arcadi Navarro. We thank the National Institute of
Bioinformatics (http://www.inab.org) for computational support. This work was funded by the
“Ministerio de Ciencia y Tecnología” (Spain) [grant BFU2010-19443; subprogram BMC],
and the “Direcció General de Recerca, Generalitat de Catalunya (Grup de Recerca Consolidat
2009 SGR 1101)” awarded to JB. PL is supported by a Ph.D. fellowship from “Acción
Estratégica de Salud, en el marco del Plan Nacional de Investigación Científica, Desarrollo e
Innovación Tecnológica 2008–2011” from Instituto de Salud Carlos III. D.A.-P. is a “Juan de
la Cierva” fellow from the “Ministerio de Economía y Competitividad” (Spain) [JCI-2011-
11089]. MAF is supported by a Principal Investigator grant from Science Foundation Ireland
(12/IP/1673) and a project from the “Ministerio de Economía y Competitividad” [grant
number BFU2012-36346].

ii
“thesis” — 2014/9/8 — 10:58 — page 167 — #197 ii
ii
ii
REFERENCES
Agrafioti I et al. 2005. Comparative analysis of the Saccharomyces cerevisiae and
Caenorhabditis elegans protein interaction networks. BMC Evol. Biol. 5:23.
Alvarez-Ponce D. 2012. The relationship between the hierarchical position of proteins in the
human signal transduction network and their rate of evolution. BMC Evol. Biol. 12:192.
Alvarez-Ponce D, Fares M a. 2012. Evolutionary rate and duplicability in the Arabidopsis
thaliana protein-protein interaction network. Genome Biol. Evol. 4:1263–74.
Anisimova M, Bielawski JP, Yang Z. 2002. Accuracy and power of the likelihood ratio test in
detecting adaptive molecular evolution. Mol. Biol. Evol. 18:1585–1592.
Bult CJ, Eppig JT, Kadin J a, Richardson JE, Blake J a. 2008. The Mouse Genome Database
(MGD): mouse biology and model systems. Nucleic Acids Res. 36:D724–8.
Charlesworth B, Morgan MT, Charlesworth D. 1993. The effect of deleterious mutations on
neutral molecular variation. Genetics. 134:1289–303.
Chen H, Patterson N, Reich D. 2010. Population differentiation as a test for selective sweeps.
Genome Res. 20:393–402.
Codoñer FM, Fares MA. 2008. Why Should We Care About Molecular Coevolution ?
Bioinformatics. 4:29–38.
Cork JM, Purugganan MD. 2004. The evolution of molecular genetic pathways and networks.
Bioessays. 26:479–84.
Cui Q, Purisima E, Wang E. 2009. Protein evolution on a human signaling network. BMC
Syst. Biol. 3:21.
Dall’Olio GM et al. 2012. Distribution of events of positive selection and population
differentiation in a metabolic pathway: the case of asparagine N-glycosylation. BMC Evol.
Biol. 12:98.
Do CB, Mahabhashyam MSP, Brudno M, Batzoglou S. 2005. ProbCons: Probabilistic
consistency-based multiple sequence alignment. Genome Res. 15:330–40.
Duret L, Mouchiroud D. 2000. Determinants of substitution rates in mammalian genes:
expression pattern affects selection intensity but not mutation rate. Mol. Biol. Evol. 17:68–74.
Enard D, Messer PW, Petrov D a. 2014. Genome-wide signals of positive selection in human
evolution. Genome Res. 24:885–895.

ii
“thesis” — 2014/9/8 — 10:58 — page 168 — #198 ii
ii
ii
Fay JC, Wu CI. 2000. Hitchhiking under positive Darwinian selection. Genetics. 155:1405–
13.
Fisher RA. 1930. The Genetical Theory of Natural Selection. Clarendon . Oxford.
Fisher RA. 1930. The Genetical Theory of Natural Selection. Oxford Univ Press: Oxford.
Flicek P et al. 2010. Ensembl’s 10th year. Nucleic Acids Res. 38:D557–62.
Flowers JM et al. 2007. Adaptive evolution of metabolic pathways in Drosophila. Mol. Biol.
Evol. 24:1347–54.
Fraser HB. 2013. Gene expression drives local adaptation in humans. Genome Res. 23:1089–
96.
Fraser HB, Hirsh AE, Steinmetz LM, Scharfe C, Feldman MW. 2002. Evolutionary Rate in
the Protein Interaction Network. Science. 296:750–752.
Grossman SR et al. 2010. A Composite of Multiple Signals Distinguishes Causal Variants in
Regions of Positive Selection. Science (80-. ). 327:883–886.
Grossman SR et al. 2013. Identifying recent adaptations in large-scale genomic data. Cell.
152:703–13.
Hahn MW, Conant GC, Wagner A. 2004. Molecular evolution in large genetic networks: does
connectivity equal constraint? J. Mol. Evol. 58:203–211.
Hahn MW, Kern AD. 2005. Comparative genomics of centrality and essentiality in three
eukaryotic protein-interaction networks. Mol. Biol. Evol. 22:803–806.
Hall TA. 1999. BioEdit: a user-friendly biological sequence alignment editor and analysis
program for Windows 95/98/NT. Nucleric Acids Symp. Ser. 41:95–98.
Iyer S, Killingback T, Sundaram B, Wang Z. 2013. Attack robustness and centrality of
complex networks. PLoS One. 8:e59613.
Jeong H, Albert R. 2000. The large-scale organization of metabolic networks. Nature.
407:651–654.
Jordan IK, Wolf Y, Koonin E. 2003. No simple dependence between protein evolution rate
and the number of protein-protein interactions: only the most prolific interactors tend to
evolve slowly. BMC Evol. Biol. 3:1.
Karolchik D, Hinrichs AS, Kent WJ. 2009. The UCSC Genome Browser. Curr. Protoc.
Bioinforma. Chapter1:Unit1:4.

ii
“thesis” — 2014/9/8 — 10:58 — page 169 — #199 ii
ii
ii
Kelley JL, Madeoy J, Calhoun JC, Swanson W, Akey JM. 2006. Genomic signatures of
positive selection in humans and the limits of outlier approaches. Genome Res. 16:980–9.
Kersey PJ et al. 2012. Ensembl Genomes: an integrative resource for genome-scale data from
non-vertebrate species. Nucleic Acids Res. 40:D91–7.
Keshava Prasad TS et al. 2009. Human Protein Reference Database--2009 update. Nucleic
Acids Res. 37:D767–72.
Khurana E, Fu Y, Chen J, Gerstein M. 2013. Interpretation of Genomic Variants Using a
Unified Biological Network Approach. PLoS Comput. Biol. 9.
Kim PM, Korbel JO, Gerstein MB. 2007. Positive selection at the protein network periphery:
evaluation in terms of structural constraints and cellular context. Proc. Natl. Acad. Sci.
104:20274–20279.
Kosiol C et al. 2008. Patterns of positive selection in six Mammalian genomes. PLoS Genet.
4:e1000144.
Liao B, Zhang J. 2008. Null mutations in human and mouse orthologs frequently result in
different phenotypes. Proc. Natl. Acadamy Sci. 105:6987–6992.
Lovell SC, Robertson DL. 2010. An integrated view of molecular coevolution in protein-
protein interactions. Mol. Biol. Evol. 27:2567–75.
Luisi P et al. 2012. Network-level and population genetics analysis of the insulin/TOR signal
transduction pathway across human populations. Mol. Biol. Evol. 29:1379–92.
MacArthur DG et al. 2012. A systematic survey of loss-of-function variants in human protein-
coding genes. Science. 335:823–828.
Martin G. 2014. Fisher’s Geometrical Model Emerges as a Property of Complex Integrated
Phenotypic Networks. Genetics. 197:237–55.
Nielsen R, Yang Z. 1998. Likelihood models for detecting positively selected amino acid sites
and applications to the HIV-1 envelope gene. Genetics. 148:929–936.
Olson-Manning CF, Lee C-R, Rausher MD, Mitchell-Olds T. 2013. Evolution of flux control
in the glucosinolate pathway in Arabidopsis thaliana. Mol. Biol. Evol. 30:14–23.
Olson-Manning CF, Wagner MR, Mitchell-Olds T. 2012. Adaptive evolution: evaluating
empirical support for theoretical predictions. Nat. Rev. Genet. 13:867–77.
Orr HA. 2005. The genetic theory of adaptation: a brief history. Nat. Rev. Genet. 6:119–27.

ii
“thesis” — 2014/9/8 — 10:58 — page 170 — #200 ii
ii
ii
Pál C, Papp B, Lercher MJ. 2006. An integrated view of protein evolution. Nat. Rev. Genet.
7:337–48.
Pérez-Bercoff Å, Hudson CM, Conant GC. 2013. A conserved mammalian protein interaction
network. PLoS One. 8:e52581.
Rausher MD. 2012. The evolution of genes in branched metabolic pathways. Evolution.
67:34–48.
Schaffner SF et al. 2005. Calibrating a coalescent simulation of human genome sequence
variation. Genome Res. 15:1576–183.
Scheinfeldt LB et al. 2009. Population genomic analysis of ALMS1 in humans reveals a
surprisingly complex evolutionary history. Mol. Biol. Evol. 26:1357–67.
Smith JM, Smith NH. 1996. Synonymous nucleotide divergence: what is “saturation”?
Genetics. 142:1033–6.
Stark C et al. 2011. The BioGRID Interaction Database: 2011 update. Nucleic Acids Res.
39:D698–704.
Subramanian S, Kumar S. 2004. Gene expression intensity shapes evolutionary rates of the
proteins encoded by the vertebrate genome. Genetics. 168:373–81.
Tajima F. 1989. Statistical method for testing the neutral mutation hypothesis by DNA
polymorphism. Genetics. 123:585–95.
Talavera G, Castresana J. 2007. Improvement of phylogenies after removing divergent and
ambiguously aligned blocks from protein sequence alignments. Syst. Biol. 56:564–77.
Teshima KM, Coop G, Przeworski M. 2006. How reliable are empirical genomic scans for
selective sweeps? Genome Res. 16:702–712.
The 1000 Genomes Project Consortium. 2012. An integrated map of genetic variation from
1,092 human genomes. Nature. 491:56–65.
Vitkup D, Kharchenko P, Wagner A. 2006. Influence of metabolic network structure and
function on enzyme evolution. Genome Biol. 7:R39.
Voight BF, Kudaravalli S, Wen X, Pritchard JK. 2006. A map of recent positive selection in
the human genome. PLoS Biol. 4:e72.
Wagner A. 2012. Metabolic networks and their evolution. Adv. Med. Biol. 751:29–51.

ii
“thesis” — 2014/9/8 — 10:58 — page 171 — #201 ii
ii
ii
Wright KM, Rausher MD. 2010. The evolution of control and distribution of adaptive
mutations in a metabolic pathway. Genetics. 184:483–502.
Yang Z, Wong WSW, Nielsen R. 2005. Bayes empirical Bayes inference of amino acid sites
under positive selection. Mol. Biol. Evol. 22:1107–1118.
Zeng K, Shi S, Wu C-I. 2007. Compound tests for the detection of hitchhiking under positive
selection. Mol. Biol. Evol. 24:1898–908.
ii
“thesis” — 2014/9/8 — 10:58 — page 172 — #202 ii
ii
ii
FIGURE LEGENDS
Figure 1. Distribution of genes with putative signatures of positive selection within the
Protein–Protein Interaction Network. ZF and 2Δℓ were used to estimate the likelihood of
having evolved under positive selection in human populations and in mammals, respectively.
A. Average degrees (number of interactions) for genes with and without signatures of positive
selection. We represent the mean of centrality measure ± one standard error for the genes with
a putative signal of positive selection (in red) and the other genes (in blue). The significance
of the differences between the mean of both groups was assessed through 10,000
permutations. Asterisks represent significant differences. *: P < 0.05; **: P < 0.01;. B.
Human protein–protein interaction network with genes with signatures of positive selection
according to divergence data (P < 0.05 estimated from 2Δℓ) represented in red. C. Human
protein–protein interaction network with genes with signatures of positive selection according
to polymorphism data represented in red.
Figure 2. Impact of natural selection among groups of genes divided according to degree
quartiles. Genes were divided into four groups according to the degree quartiles. The median
positive selection score ± one median absolute deviation for each group is represented in the
y-axis. ZF and 2Δℓ scores were used to estimate the likelihood of positive selection in human
populations and in mammals, respectively. DAF and ω were used to estimate the impact of
purifying selection in human populations and in mammals, respectively. A non parametric
ANOVA analysis was performed to contrast whether the medians of the scores are equal
across the groups. A trend test on ranks was also carried out to test for a linear relationship
between the four groups (encoded from 1 to 4) and natural selection scores. A Tukey's
honestly significant difference test was further applied to test for all pairwise differences.
Significantly different pairs are marked with asterisks according to the level of significance.
*: P < 0.05; **: P < 0.01; ***: P < 0.001.
Figure 3. Comparison of the impact of natural selection between essential and non-
essential genes. We performed a Mann-Whitney test to compare the positive selection scores
between genes that are lethal (essential, in red) and viable (non essential, in blue) when
knocked out in mice (data from the Mouse Genome Database (Bult et al. 2008);

ii
“thesis” — 2014/9/8 — 10:58 — page 173 — #203 ii
ii
ii
“MRK_Ensembl_Pheno.rpt” file downloaded on 7 October 2010). ZF and 2Δℓ scores were
used to estimate the likelihood of positive selection in human populations and in mammals,
respectively. DAF and ω were used to estimate the impact of purifying selection in human
populations and in mammals, respectively. In order to put all the scores within the same scale
the mean standardized scores are plotted (standardized scores were calculated by subtracting
the mean and dividing by the standard deviation). Significant differences between lethal and
viable genes pairs are marked with asterisks. *: P < 0.05; **: P < 0.01; ***: P < 0.001.
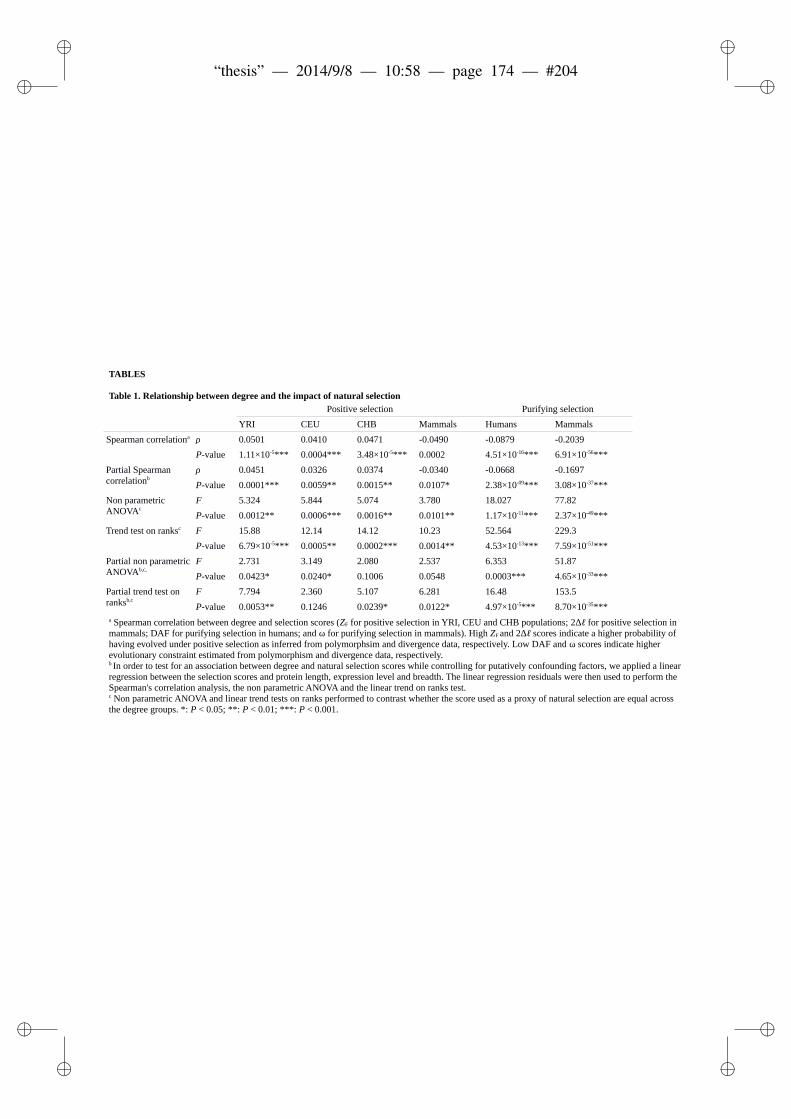
ii
“thesis” — 2014/9/8 — 10:58 — page 174 — #204 ii
ii
ii
TABLES
Table 1. Relationship between degree and the impact of natural selectionPositive selection Purifying selection
YRI CEU CHB Mammals Humans Mammals
Spearman correlationa ρ 0.0501 0.0410 0.0471 -0.0490 -0.0879 -0.2039
P-value 1.11×10⁻⁵*** 0.0004*** 3.48×10⁻⁵*** 0.0002 4.51×10⁻¹⁶*** 6.91×10-56***
Partial Spearman correlationb
ρ 0.0451 0.0326 0.0374 -0.0340 -0.0668 -0.1697
P-value 0.0001*** 0.0059** 0.0015** 0.0107* 2.38×10-09*** 3.08×10-37***
Non parametric ANOVAc
F 5.324 5.844 5.074 3.780 18.027 77.82
P-value 0.0012** 0.0006*** 0.0016** 0.0101** 1.17×10⁻¹¹*** 2.37×10-49***
Trend test on ranksc F 15.88 12.14 14.12 10.23 52.564 229.3
P-value 6.79×10⁻⁵*** 0.0005** 0.0002*** 0.0014** 4.53×10⁻¹³*** 7.59×10-51***
Partial non parametric ANOVAb,c,
F 2.731 3.149 2.080 2.537 6.353 51.87
P-value 0.0423* 0.0240* 0.1006 0.0548 0.0003*** 4.65×10⁻³³***
Partial trend test on ranksb,c
F 7.794 2.360 5.107 6.281 16.48 153.5
P-value 0.0053** 0.1246 0.0239* 0.0122* 4.97×10-5*** 8.70×10⁻³⁵***a Spearman correlation between degree and selection scores (ZF for positive selection in YRI, CEU and CHB populations; 2Δℓ for positive selection in mammals; DAF for purifying selection in humans; and ω for purifying selection in mammals). High ZF and 2Δℓ scores indicate a higher probability of having evolved under positive selection as inferred from polymorphsim and divergence data, respectively. Low DAF and ω scores indicate higher evolutionary constraint estimated from polymorphism and divergence data, respectively.b In order to test for an association between degree and natural selection scores while controlling for putatively confounding factors, we applied a linear regression between the selection scores and protein length, expression level and breadth. The linear regression residuals were then used to perform the Spearman's correlation analysis, the non parametric ANOVA and the linear trend on ranks test.c Non parametric ANOVA and linear trend tests on ranks performed to contrast whether the score used as a proxy of natural selection are equal across the degree groups. *: P < 0.05; **: P < 0.01; ***: P < 0.001.

ii
“thesis” — 2014/9/8 — 10:58 — page 175 — #205 ii
ii
ii
Table 2. Association between gene essentiality and degree and the impact of natural selection
Lethal vs. viable genesa Indispensability scoreb
Mean lethal Mean viable P-value ρ P-value
Degree 14.55 7.048 6.62×10-52*** 0.2311 3.03×10-107***
Positive selection in YRIc
6.419 6.154 0.0047** 0.0473 4.34×10-05***
Positive selection in CEUc
6.754 6.350 0.0009*** 0.0695 2.00×10-09***
Positive selection in CHBc
6.712 6.423 0.0248* 0.0380 0.0010**
Positive selection in mammalsd
1.830 2.270 2.03×10-08*** -0.1157 3.62×10⁻²⁵***
Purifying selection in humanse
0.1041 0.1109 4.66×10-08*** -0.1131 5.14×10⁻²⁵***
Purifying selection in mammalsf
0.0768 0.1160 3.70×10⁻²⁹*** -0.2600 6.67×10-89***
a Mann-Whitney test to compare the degree or the natural selection score between genes that are essential and genes that are not essential, i.e. lethal and viable when knocked out in mice, respectively (data from the Mouse Genome Database (Bult et al. 2008) “MRK_Ensembl_Pheno.rpt” file downloaded on 7 October 2010).b Spearman's correlation analysis to test for the relationship between degree or the natural selection score and the functional indispensability score (Khurana et al. 2013). c,d High ZF and 2Δℓ scores indicate a higher probability of having evolved under positive selection during human and mammal evolution, respectively.e,f Low DAF and ω scores indicate higher selective constraints during human and mammal evolution, respectively.*: P < 0.05; **: P < 0.01; ***: P < 0.001.
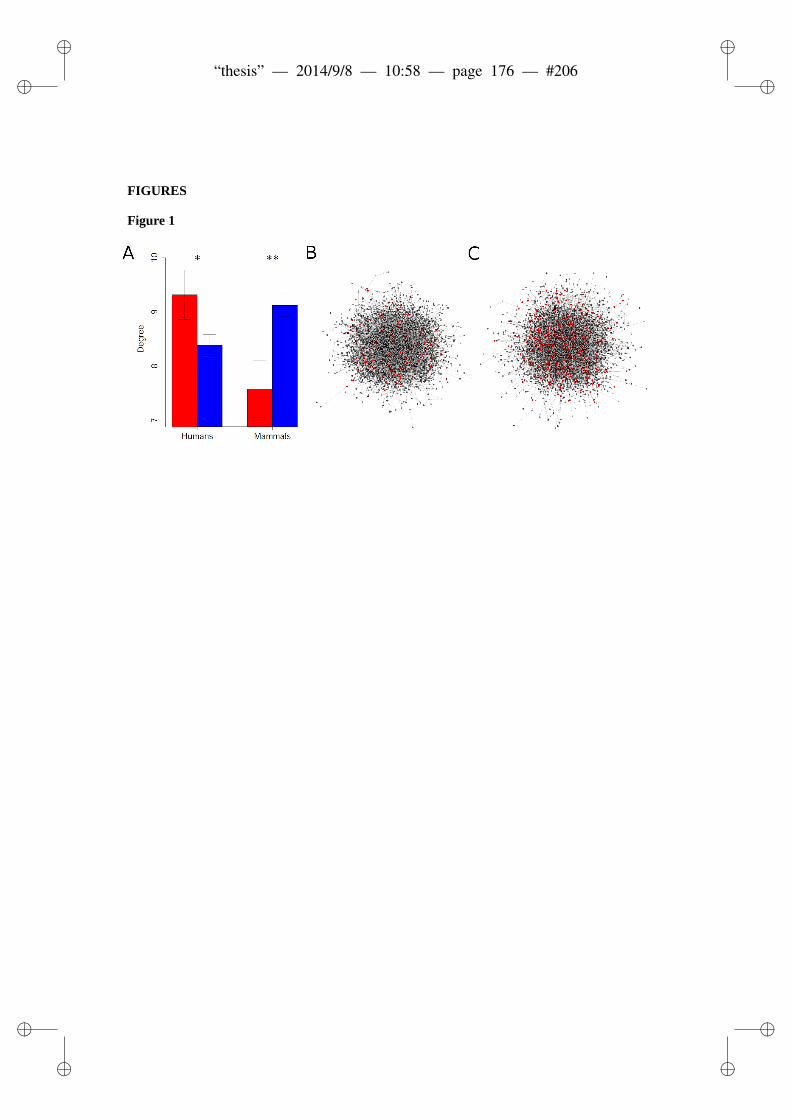
ii
“thesis” — 2014/9/8 — 10:58 — page 176 — #206 ii
ii
ii
FIGURES
Figure 1

ii
“thesis” — 2014/9/8 — 10:58 — page 177 — #207 ii
ii
ii
Figure 2

ii
“thesis” — 2014/9/8 — 10:58 — page 178 — #208 ii
ii
ii
Figure 3

ii
“thesis” — 2014/9/8 — 10:58 — page 179 — #209 ii
ii
ii
Part III
Discussion
179

ii
“thesis” — 2014/9/8 — 10:58 — page 180 — #210 ii
ii
ii

ii
“thesis” — 2014/9/8 — 10:58 — page 181 — #211 ii
ii
ii
Chapter 7
DISCUSSION
Doubt is not a pleasant condition, butcertainty is absurd.
Letter to Frederick II of PrussiaVOLTAIRE
As outlined in the objectives (Chapter 2), the aim of the work presentedin this thesis was to explore how integrating information on gene net-works could shed light on adaptive processes at the molecular level. Forthat purpose, first two gene-level studies have been described: (i) a gene-candidate study to understand the role of positive selection on a regionencompassing a specific gene of interest; and (ii) a genome-wide scanfor positive selection to identify signals of positive selection across thegenome with a functional study to follow-up an outstanding signal thusdetected. These two studies are representative examples of traditionalanalyses performed to understand the impact of adaptive evolution at aparticular genomic region encompassing a protein-coding gene. Then,adaptive evolution of genes was studied within a gene-network frame-work, that is by integrating information on the physical interactions inwhich are involved the encoded proteins. Two gene-network scales havebeen considered: (i) a gene-network representing a specific biologicalpathway, and (ii) one including all the known physical protein-protein in-
181

ii
“thesis” — 2014/9/8 — 10:58 — page 182 — #212 ii
ii
ii
teractions occurring in the organism. These two studies come within thescope of an emerging field which could be designed as evolutionary sys-tem biology. They represent one of the first attempts to describe how theimpact of positive selecion on protein-coding genes is related to biologi-cal network in which are involved the encoded proteins.This chapter will first provide a discussion on the strengths and drawbacksfor each of the four studies. Second, the importance of the network frame-work to study adaptive selection will be discussed. Finally, the underlyingchallenges, and potential perspectives for the evolutionary system biologyfield will be examined.
7.1 General remarks on the four studies de-scribed.
7.1.1 Single gene studies.
As already stressed in Chapter 1, most of the studies of adaptive evolutionat molecular level have focused on its impact on single genes, as in the twoarticles presented in Chapters 3 and 4 which illustrate the gene-candidateand genome-wide scan approaches, respectively.
Gene-candidate approach.The gene-candidate study of the region encompassing VKORC1 gene
shows that detecting the advantageous variant in a region that have un-dergone a selective event is particularly complicated. This study was per-formed using the HGDP genotype data (see Section 1.2.2) and allowedto better localize geographically the selective sweep, namely it occurredonly in East Asian populations and the signal is shared among all thestudied populations in this area. However, it was impossible to preciselypinpoint a putative mutation driving the selective event. A selective sweepleaves an extreme pattern of LD, and, although such molecular pattern isuseful to contrast whether a genomic region evolved adaptively, most of
182

ii
“thesis” — 2014/9/8 — 10:58 — page 183 — #213 ii
ii
ii
the variants within the region exhibit similar scores for the methods usedto detect positive selection. Specifically, an in-depth analysis of the regionencompassing VKORC1 allowed to restrict to 45 Kb the region in whichis located the putative advantageous variant. However, four genes are lo-cated within this 45 Kb region, thus different functional variants are goodcandidates for being the target of positive selection. The genotype datafrom HGDP does not give much precision since the SNPs present on thegenotyping array are tag-SNPs, reducing the variant density for cost pur-poses. Therefore, additional SNPs in the studied region were genotypedto increase the density of the variants to be interrogated. Such effort wasvain, and if more money could have been invested in the study, sequencingthe 45Kb region for the East Asian individuals would have been the bestsolution. Alternatively, one can study the 1000 Genomes re-sequencingdata (see Section 1.2.2) which presents a higher variant density and is freeof ascertainment bias (see Section 1.5.1). Such analysis is presently per-formed in the hope of identifying a single variant with an extreme scorefor several methods to detect positive selection. All together, although thestudy of the region encompassing VKORC1 did not reach its initial goals,it provides very useful insights for follow-up studies. There is no doubtthat the region has evolved under an adaptive regime, and therefore, a par-ticularly variant within those 45 Kb had enough phenotypic relevance tobe selected for in East Asia. Such information might be very useful toanyone with an hypothesis on a phenotype specific to East Asian popu-lations that provided a fitness advantage to the past environment in thisgeographic area, and in which one of the four genes is involved.
Genome-wide scan approachThe study presented in Chapter 4 is a good example of the alternative
to the gene-candidate approach: first the genome is interrogated for posi-tive selection without any a priori assumption on the adaptive phenotype,in order to, in turn, pick a region with a putative signal of selection forwhich an a posteriori assumption can be tested. However, the study de-sign here is unique. Indeed, instead of studying an unique population, ordifferent populations each with an assumed independent history, as usu-
183

ii
“thesis” — 2014/9/8 — 10:58 — page 184 — #214 ii
ii
ii
ally done (e.g. see [70, 71, 119, 154]), here three populations were inter-rogated simultaneously in order to take profit of their history. Namely, theRroma/Gypsie population was of particular interest. This population mi-grated one thousand years ago from North India to the Balkans [141]. Inorder to have a reference population sharing the selective pressures facedby the Rroma/Gypsies after their migration, a population with Europeanancestry from Romania was included. Moreover, a Northwest Indian pop-ulation was used as a reference population sharing most of its history, thussharing most of the genetic background, with the Rroma/Gypsies. Theaim of this study was then to scan the genome for shared signals of pos-itive selection in Rroma/Gypsies and Romanians but absent in NortwestIndians, assuming that such signals must have emerged from the adap-tation to the European environment from different genetic backgrounds.The triangular design of the study allowed then to (1) reduce the FPR inthe signals of positive selection detected in two populations sharing thesame environment; (2) control for genetic drift that occurred before theRroma/Gypsies emigration using the Northwest Indian population, and(3) be able to infer the selective pressures driving the signal, i.e. anyenvironmental variable that appeared in the laste thousand years in Eu-rope and not in Northwest India. The last point is particularly interestingsince in their recent history, European populations faced severe epidemicevents (plague, influenza, smallpox, etc.) arguably exercising importantselective pressures on the immune system. Several genomic regions havebeen identified according to the criteria aforementioned. A particular onewas blindingly obvious to follow-up: a region containing the gene clusterTLR1/TLR6/TLR10 encoding for the Toll-Like Receptors 1, 6 and 10,respectively. This region had already been described to have undergone aselective event in non-African population in a study which, however, didnot include any Central South Asian population [266].The TLR family is recognized as a key family of innate immunity. Afterrecognition of their ligand(s), TLRs transduce the signalling responses toactivate the innate immunity effector mechanisms and the subsequent de-velopment of adaptive immunity (for a review see [267]). In humans, tenmembers compose the TLR family (TLR1-10) [267]). They can be classi-
184

ii
“thesis” — 2014/9/8 — 10:58 — page 185 — #215 ii
ii
ii
fied according to their subcellular distribution: TLR3, TLR7-9 are locatedin intracellular compartments (typically in endosomes) whereas TLR1-2and TLR4-6 are mostly expressed on the cell surface [267]. Intracellu-lar or cell surface TLRs have different kinds of agonists: the intracellularTLRs sense nucleic acid-based agonists, and are typically involved in vi-ral recognition, while the cell surface TLRs detect other products such asglycolipids, lipoleptides and flagellins present in bacteria, parasites andfungi [267]. Although functional roles of TLRs are well described, little isknown for TLR10 which is expressed on cell surface. The study describedhere allowed to broaden our knowledge on this specific gene. Since theTLR1/TLR6/TLR10 gene cluster has undergone convergent positive se-lection (but see below) in two populations with different genetic back-grounds and which have lived for the last thousand years in the same en-vironment, one particular selective pressure from this environment mustbe the driving force. A direct assumption one can make is that Yersiniapestis, the agent of plague, has played such role since plague had be themost devastating epidemics in this specific area at that time. Functionalanalyses allowed to confirm that TLR1, TLR6 and TLR10 contain geneticvariation that modulate Y. pestis-induced immune responses. Namely, Y.pestis is known to induce proinflammatory cytokines (e.g. TNF, IL-1βand IL-6) that are are modulated by specific combination of variants inthe TLR1/TLR6/TLR10 gene cluster. Interestingly, TLR10 receptors in-hibitated the IL-6 induction by IL-1, suggesting that TLR10 may act asan inhibitor of the IL-1 family cytokines. However, the same immunolog-ical analysis yet performed using Y. pseudotuberculosis showed similarresults to that with Y. pestis, suggesting that these TLRs may also respondto other deadly bacteria and other diseases might have been the causes ofthe selective signal observed in this genomic region. However, Y. pseudo-tuberculosis was used because it seems to be the ancestror of Y. pestis andthe observed reaction to Y. pestis was much stronger.In the article, the convergent selective event affecting TLR1/TLR6/TLR10in both European and Rroma/Gypsie populations was suggested. Al-though such parallel adaptation has been proved to be potentially common[139], one may thing that the shared specific molecular pattern observed
185

ii
“thesis” — 2014/9/8 — 10:58 — page 186 — #216 ii
ii
ii
at the TLR1/TLR6/TLR10 and detected in both populations could resultfrom recent admixture between the two populations, i.e. interbreedingbetween the two populations that were isolated until very recently. ”Re-cent” here refers to admixture that would have occurred during or after thecompletion of the selective sweep in one population. Thus, the adaptedpopulation would provided the adaptive variation to the population withwhich it admixed. Such scenario has been observed in Tibetans who area mixture of ancestral populations related to Sherpas and Han Chinese.The ancestral population related to Sherpa was already adapted to the hy-poxic environment due to the high altitude of the Tibetan plateau. Jeonget al. showed that the Tibetans present the same genetic variants thanthe Sherpas in both EGLN1 and EPAS1 genes conferring better fitness tohypoxia, and could demonstrate that migrants from low altitude acquiredthe adaptive alleles from the highlanders [160]. Although such hypothe-sis is evolutionary fascinating, it was not possible to test it on Europeanand Rroma/Gypsie populations. Indeed, the study was performed on theImmunochip which presents a very heterogeneous SNP density across thegenome, thereby preventing one to accurately phase the data to obtain in-formation on haplotype variation from genotypes, while such informationis essential to perform any admixture inference. Although this scenariohas not been tested, this study provides striking results on putative paral-lel adaptation and illustrates how a genome-wide scan for positive selec-tion can allow to point a specific genomic region for follow-up functionalstudy. The functional study, in turn, sheds light on the immune responseto pathogens, and broaden our knowledge on the role played by TLR fam-ily members, particularly the poorly characterized TLR10 gene.
7.1.2 Network-level analyses.
Two analyses of the impact of positive selection in protein-protein in-teraction networks have been presented in Chapters 5 and 6, the formerrepresentative of a particular biological pathway, the later representativeof the whole sets of physical interactions among proteins occurring in thehuman organism. These two biological scales have their own drawbacks
186

ii
“thesis” — 2014/9/8 — 10:58 — page 187 — #217 ii
ii
ii
and advantages.
Pathway-level.In Chapter 5, the distribution of signals of positive selection, as inferred
from human polymorphism data, within the network representing the In-sulin/TOR transduction signalling (IT) pathway has been studied. It wasthe first published study of this kind. Working at the pathway-level allowsgood confidence on the proteins and their interactions since such informa-tion is retrieved from the literature, provided one is able to define biologi-cally relevant boundaries of the studied pathway (see Section 1.8.1 for de-tails). Such direct manual curation of the information allows to considerdifferent kinds of interactions involved in the biological pathway (see Sec-tion 1.7.2). Namely, three types of interactions are participating to the ITpathway: physical protein-protein, metabolic, and transcriptional interac-tions. Network centrality metrics were computed taking into account thedifferent modes of interaction or only the physical protein-protein inter-actions, yet the results pointed towards the same direction in both cases.On the other hand, the completeness of the information on protein inter-actions available in the literature may suffer a bias towards historicallymore studied proteins. Particularly, paralogous copies resulting from re-cent gene duplication events have been difficult to identify given the lowdivergence between the resulting copies, which might have been treatedas a single copy during genome assembly. Therefore, one expects to findmore information in the literature for the original copy than for its par-alogs. To circumvent this issue, the network representing the IT pathwaywas build from genes known to be involved in the pathway according tothe literature or their close paralogs that cluster within these genes in phy-logenetic trees. Genes that are known not to play any role, despite havingparalogs that are actually involved, were excluded. This illustrates howworking at small-biological scale may suffer from interaction ascertain-ment bias because of incomplete knowledge from specific biochemistryexperiments. However, it also illustrates that accurate strategies may existto circumvent such bias.Another issue is the accuracy of the interaction annotation in available
187
ii
“thesis” — 2014/9/8 — 10:58 — page 188 — #218 ii
ii
ii
pathway databases. For example, Dall’Olio et al. manually curated theAsparagine N-linked glycosylation pathway. Although this pathway per-forms one of the most important forms of protein post-translational modi-fication in eukaryotes and is one of the first metabolic pathways describedat a biochemical level, its annotatyion in public databases such as Reac-tome [168] remained poorly accurate, and several correction had to beperformed [268]. The authors advice to use Reactome, rather than otherwidely used databases (e.g. KEGG [167]) as it operates in a open-sourcefashion, encouraging feedback from its users and, thereby making it eas-ier to keep the annotation of this pathway updated with future knowledge[268]. The study of the IT pathway did not suffer such caveat since thenetwork was built directly from the literature instead of relying on anydatabase.Another challenge when studying a specific pathway using polymorphismdata arises from the fact that the genes that are involved may be locatedin either autosomal or sexual chromosome. However, most methods de-signed to detect positive selection exhibit different sensitivity for sexualand autosomal variants. This complicates the comparison of signals ofselection between genes located in sexual and autosomal chromosomes.Usually, while performing a genome-wide scan for positive selection sex-ual and autosomal chromosomes are studied separately. However, whenstudying a specific pathway, genes in sexual chromosomes have to betaken into account somehow to perform a proper network-level analysisof the detected signals of selection. To circumvent this issue, the strat-egy followed in the present study was to simply remove such genes fromthe network-level, yet obviously accounting for them to calculate networkcentrality metrics.When inferring simultaneously the potential impact of positive selectionon many genes, one can not perform an in-depth analysis of the signalsfor each gene such as for single gene studies. A natural way to overpassthis issue is to compute for each gene and each positive selection statisticsa combination score. In this study, since the genotype data used comesfrom the HGDP dataset and thus mainly includes tag-SNPs (see Section1.2.2), the Fisher’s combination test of the empirical P-values for SNPs
188
ii
“thesis” — 2014/9/8 — 10:58 — page 189 — #219 ii
ii
ii
located in a gene (thus assumed to be independent one form the others)was used as a summary statistics. Moreover, since the number of genesin the study remains relatively limited (˜ 70 genes), a visual inspection ofthe signals was still possible as illustrated in Figure 7.1.One advantage inherent of a pathway-level analysis is that one can inte-
grate the information on positive selection on each gene together in orderto contrast whether the studied endophenotype, i.e. the specific biolog-ical function performed by the pathway, has evolved under an adaptiveregime. A hypergeometric test performed in each geographic region rep-resented in the HGDP dataset (see Section 1.2.2) suggests that the trans-duction of Insulin and mTOR protein has been tuned by positive selectionin recent human history in West Eurasia populations. Moreover, the re-sults from the network-level analysis point to the fact that such adaptiveevolution has occurred through specific selective events in genes locatedat central positions in the pathway, thus on genes potentially exerting ahigher influence on the IT pathway function. Other studies describedsimilar results in other pathways, yet the feature considered to define“genes potentially exerting a higher influence” remains somewhat vague(see Section 1.8.1 and further discussion in Section 7.2.1).
Interactome level.In order to gain more insights from the potential of considering network
topology to understand the impact of positive selection on protein-codinggenes, a study at broader scale was performed (Chapter 6). In this study,the whole human interactome was considered, that is, the whole set ofidentified physical protein-protein interactions occurring in the human or-ganism. As already mentioned, such a large-scale study allows to considerthe cross-talks among different biological pathways (provided they in-volve physical interactions), and thereby take into consideration the genepleiotropic effects. Gene pleiotropy has been proposed as a major featurefor the probability of a mutation to be adaptive ([33], Figure 1.29).However, in this study, only one type of interactions was taken into ac-count, and therefore all the interactions at stake were not included. Theinteractome remains a raw simplification of the processes that take place
189

ii
“thesis” — 2014/9/8 — 10:58 — page 190 — #220 ii
ii
ii
Figure 7.1: Visual inspection of signal of positive selection for the IT pathwaygenes. |iHS| scores were calculated and plotted for each SNP within the ge-nomic region containing the gene of interest plus 800 flanking Kb. These plotsallow comparing observations for SNPs nearby the gene and in its surroundingregion. Hence, they provide better visualization of signals of selection. Colourblocks on the bottom represent gene locations. SNPs within the gene are plottedin the same colour as the gene block, whereas SNPs within flanking regions arerepresented in grey. Red lines represent the spline function computed from SNPscores using the smooth.spline function in R (parameters: df=4, spar=0.7).
190

ii
“thesis” — 2014/9/8 — 10:58 — page 191 — #221 ii
ii
ii
within the cell. An arguably more wondering issue is the quality of theinteraction data available to date. Although immense efforts have beenlately made to more accurately identify the physical interactions, the in-formation remains largely imperfect. Indeed, to build such a large-scalenetwork one must mostly rely on results from high-throughput experi-ments. Many screening using high-throughput techniques have been con-ducted in different organisms. Now different databases have curated andcompiled the resulting information in order to provide an as exhaustiveas possible interaction map in those organisms. In the particular case ofthis study, the interaction map was recovered from both yeast-two hybrids(Y2H) and mass spectometry experiments to complete individual focusedstudies available in the litterature [269]. A Y2H experiment follows thefollowing strategy. Two proteins named the bait and prey are coupled totwo halves of a transcription factor and expressed in yeast. A reportergene is activated by the transcription factor when both proteins (prey andbait) are interacting and, thus, are reconstituting the DNA binding andtransvaction domains of the transcription factor. On the one hand, suchexperiments allows the identification of many physical interactions, thusbroadening the knowledge on biological processes to great extent. Thiscould not be possible in individual focused studies. On the other hand,the quality of the data remains poor and one must be fully aware of thisissue. Indeed, several attempts to identify and discard false positives haveshown that the accuracy of the experimental approaches to identify bi-nary protein interactions is underwhelming. For example, a study usinga method designed to computationally assign scores to interactions de-tected through Mass Spectrometry identified an astonishing number offalse positives: the original list of 2,553 interactions was narrowed downto 751 [270]. The same procedure reduced the initial list of 2,000 inter-actions among human mitogen activated protein kinases (MAPKs) downto 641 [271]. The development of more precise procedures is requiredin order to assessing the false negatives (unidentified true binary proteininteractions). The main methodological limitations are: (i) the nature ofthe interactions (whether the interactions are transient or permanent); (ii)the physiological conditions under which such interactions occur; (iii) the
191

ii
“thesis” — 2014/9/8 — 10:58 — page 192 — #222 ii
ii
ii
algorithms utilized for assigning scores during the identification of inter-action complexes; and (iv) the types of proteins identified (e.g. interactionbetween plasma membrane).All together, the currently available datasets have a relatively low qual-ity, being subject to very high false positive and false negative rates, andthus the contained information remains relatively noisy [272–275]. How-ever, the data used in the study presented in this thesis rely on BioGRIDdatabase with dedicated efforts to provide curated information [269]. Thisallowed to perform a second more accurate evaluation of how positiveselection, as inferred from divergence data, is distributed across the in-teractome, in order to validate results presented by Kim et al. [234].Moreover, a strategy to avoid spurious relationship between the impactof positive selection and the interactome topology is to validate it usinginteractomes retrieved from different databases. For that purpose, datafrom the Human Protein Reference Database (HPRD [276]) and the HighQuality subnetwork from BioGrid (containing only interactions from atleast two independent high-throughput experiments or individual focusedstudies; [269]) were also used.Besides the more accurate interaction data used as compared to the studyby Kim et al. [234], the study described in this thesis also relies onthe recent wealth in genomic data allowing a more powerful estimationof the putative impact of positive selection on genes using divergencedata (for details see Chapter 6). This study also dramatically broaden theknowledge on the distribution of selective events across the interactomeby inferring the impact of positive selection using polymorphism data, anunprecedented attempt. Using the recently available re-sequencing datafrom 1000 Genomes Project ([21]; see Section 1.2.2), the impact of posi-tive selection was inferred by combining methods based on the three pat-terns expected in a region that underwent a hard sweep (see Section 1.4.2).One must be careful to the type of data used: the low-coverage (at ˜ 2-6X) data and the exome data (at ˜50-100 X) do not have the same power todetect rare alleles in a population (see Section 1.2.2) and therefore resultsof statistics of positive selection can not be compared if computed on thetwo different sets. A reasonable strategy is therefore to only use the low-
192

ii
“thesis” — 2014/9/8 — 10:58 — page 193 — #223 ii
ii
ii
coverage data which covers the whole genome. Contrary to the HGDPgenotype data used for the IT pathway analysis, 1000 Genomes Projectmade available genotype for a much denser set of SNPs that can not beassumed independent. For this reason the Fisher’s combination test is notsuitable to summarize the scores for a given statistics observed in a givengene, and instead more simple statistics, as the average, were used. Moreinterestingly, the 1000 Genomes Project re-sequencing data contains alarger fraction of rare variants than any genotyping data such as HGDP[16] or HapMap (www.hapmap.org). Therefore, the Site Frequency Spec-trum (SFS) is unbiased, or at least the bias towards common variants isreduced as compared to traditional publicly available genotype data, andSFS-based methods could be applied. Once computed an unique posi-tive selection score for each gene for DH [117], iHS [71] and XPCLR[79], an empirical P-value at gene level was calculated for each gene andstatistics using a genome-wide distribution obtained from ˜ 13,000 genesusing the outlier approach (see Section 1.5.4). To contrast whether a geneunderwent a selective sweep in a given population, a visual inspection ofthe signals in the ˜ 9,000 genes was not possible, and the study relies onlyon the summary statistics and its associated empirical P-value.Another issue arising from using polymorphism data to infer the impactof selection in genes involved in the interactome is the fact that the num-ber of analysed genes is relatively important (˜ 9,000 genes) and there-fore many are located one very close to others. To study the impact ofpositive selection on genes we only used the SNVs located within the ge-nomic region corresponding to the longest transcript. However, it is wellknown that the regions affected by a selective sweep are large, spanninghundreds of kilobases or even megabases and containing many potentialvariants driving the signal. Thus, several adjacent genes may be affectedby an unique event of selection targeting one particular variant. Therefore,some of the genes showing signals of positive selection in our study maybe false positives, even though we do not expect that this bias can affectour network-level analysis, since there is no reason why false positivesshould tend to concentrate in specific parts of the PIN. To confirm thatour study does not suffer from this caveat, we first validated our results
193

ii
“thesis” — 2014/9/8 — 10:58 — page 194 — #224 ii
ii
ii
using the Composite of Multiple Signals (CMS) method [106] calculatedin the YRI, CEU and CHB+JPT populations using the Pilot1 genotypedata from the 1000 Genomes Project [106]. Although this study used theless accurate Pilot1 data, the implemented method presents the strong ad-vantage of more accurately pinpointing a small number of variants withina large genomic region [106]. Thus, using this test we expect to reduce toa great extent the number of falsely detected genes due to genetic hitch-hiking. Our network-level analyses have been confirmed by the use ofCMS and, in fact, the association between the impact of selection andnetwork centrality appears to be stronger. To further confirm that hitch-hiking does not affect the association between the impact of positive se-lection and network centrality, we built a subset of unlinked genes, i.e. notin linkage disequilibrium, for the three populations (YRI, CEU and CHB).For that purpose, in each population, we used the population-specific re-combination rates estimated genome-wide (recombination map providedby the 1000 Genomes Project Pilot 1 [155]) and defined as a recombina-tion hotspot a region where the observed recombination rates was greaterthan 10 times the genome average, i.e. greater than 18.36 cM/Mb, 18.55cM/Mb and 17.61 cM/Mb in YRI, CEU and CHB, respectively. Then,we randomly sampled one PIN gene located between two recombinationhotspots and obtained three subsets of most likely unlinked genes.Relying on the recent wealth in both genomic and interactomic data, thisstudy describes very interesting results. First, it validated the trend al-ready described by Kim et al. that genes acting at the periphery of the hu-man interactome are more likely to have evolved under positive selection(as inferred from divergence data from human and chimp) as describedin Section 1.8.2 and Figure 1.30 [234]. However, when studying the dis-tribution of the putative events of recent positive selection, as inferredfrom human polymorphism data, the opposite trend was observed: morecentral genes are more likely to have been targeted by positive selection.Those results are very interesting and challenge the traditional view thatpositive selection is active at the network periphery. An association withthe Fisher’s Geometric Model of Adaptation is discussed in the article(see Discussion in Chapter 6) and will be further developed in Section
194
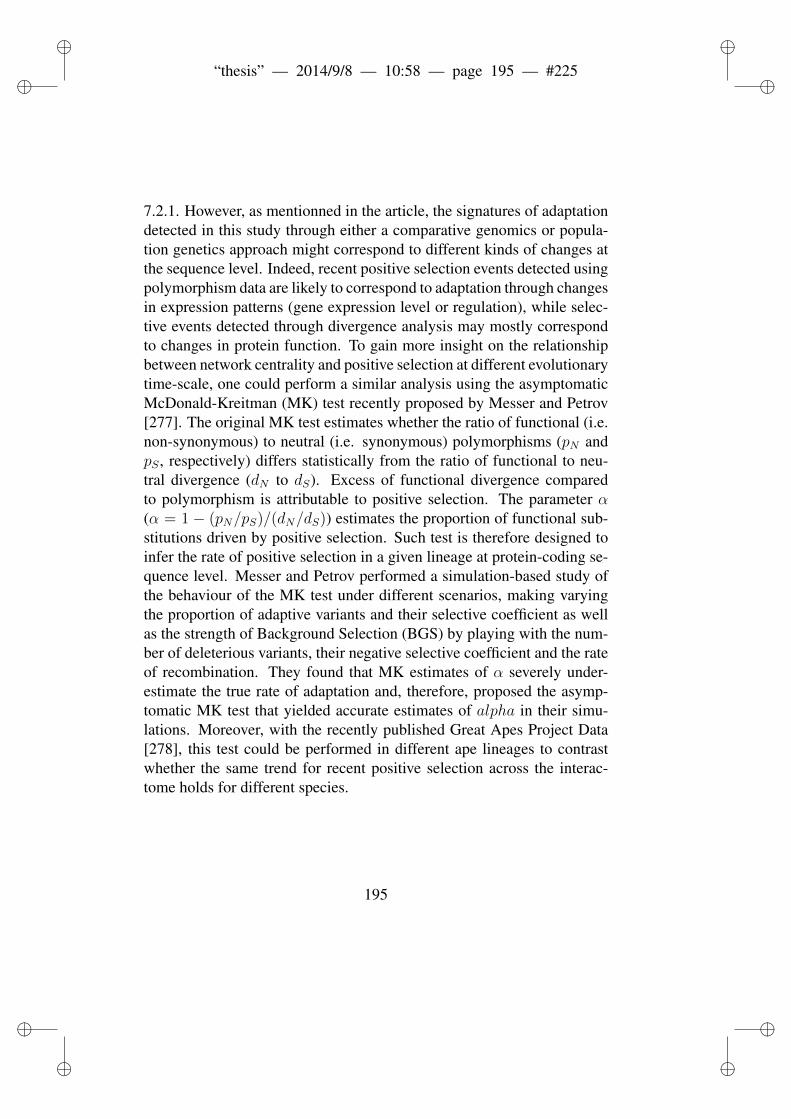
ii
“thesis” — 2014/9/8 — 10:58 — page 195 — #225 ii
ii
ii
7.2.1. However, as mentionned in the article, the signatures of adaptationdetected in this study through either a comparative genomics or popula-tion genetics approach might correspond to different kinds of changes atthe sequence level. Indeed, recent positive selection events detected usingpolymorphism data are likely to correspond to adaptation through changesin expression patterns (gene expression level or regulation), while selec-tive events detected through divergence analysis may mostly correspondto changes in protein function. To gain more insight on the relationshipbetween network centrality and positive selection at different evolutionarytime-scale, one could perform a similar analysis using the asymptomaticMcDonald-Kreitman (MK) test recently proposed by Messer and Petrov[277]. The original MK test estimates whether the ratio of functional (i.e.non-synonymous) to neutral (i.e. synonymous) polymorphisms (pN andpS , respectively) differs statistically from the ratio of functional to neu-tral divergence (dN to dS). Excess of functional divergence comparedto polymorphism is attributable to positive selection. The parameter α(α = 1 − (pN/pS)/(dN/dS)) estimates the proportion of functional sub-stitutions driven by positive selection. Such test is therefore designed toinfer the rate of positive selection in a given lineage at protein-coding se-quence level. Messer and Petrov performed a simulation-based study ofthe behaviour of the MK test under different scenarios, making varyingthe proportion of adaptive variants and their selective coefficient as wellas the strength of Background Selection (BGS) by playing with the num-ber of deleterious variants, their negative selective coefficient and the rateof recombination. They found that MK estimates of α severely under-estimate the true rate of adaptation and, therefore, proposed the asymp-tomatic MK test that yielded accurate estimates of alpha in their simu-lations. Moreover, with the recently published Great Apes Project Data[278], this test could be performed in different ape lineages to contrastwhether the same trend for recent positive selection across the interac-tome holds for different species.
195
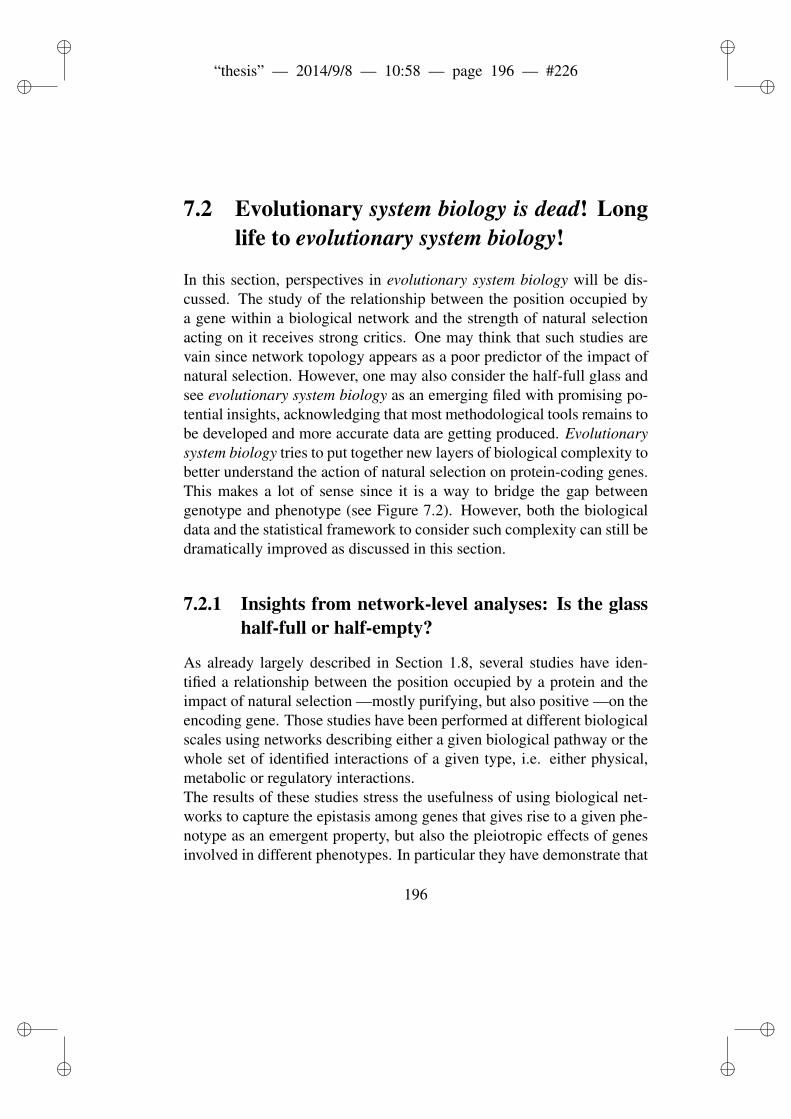
ii
“thesis” — 2014/9/8 — 10:58 — page 196 — #226 ii
ii
ii
7.2 Evolutionary system biology is dead! Longlife to evolutionary system biology!
In this section, perspectives in evolutionary system biology will be dis-cussed. The study of the relationship between the position occupied bya gene within a biological network and the strength of natural selectionacting on it receives strong critics. One may think that such studies arevain since network topology appears as a poor predictor of the impact ofnatural selection. However, one may also consider the half-full glass andsee evolutionary system biology as an emerging filed with promising po-tential insights, acknowledging that most methodological tools remains tobe developed and more accurate data are getting produced. Evolutionarysystem biology tries to put together new layers of biological complexity tobetter understand the action of natural selection on protein-coding genes.This makes a lot of sense since it is a way to bridge the gap betweengenotype and phenotype (see Figure 7.2). However, both the biologicaldata and the statistical framework to consider such complexity can still bedramatically improved as discussed in this section.
7.2.1 Insights from network-level analyses: Is the glasshalf-full or half-empty?
As already largely described in Section 1.8, several studies have iden-tified a relationship between the position occupied by a protein and theimpact of natural selection —mostly purifying, but also positive —on theencoding gene. Those studies have been performed at different biologicalscales using networks describing either a given biological pathway or thewhole set of identified interactions of a given type, i.e. either physical,metabolic or regulatory interactions.The results of these studies stress the usefulness of using biological net-works to capture the epistasis among genes that gives rise to a given phe-notype as an emergent property, but also the pleiotropic effects of genesinvolved in different phenotypes. In particular they have demonstrate that
196
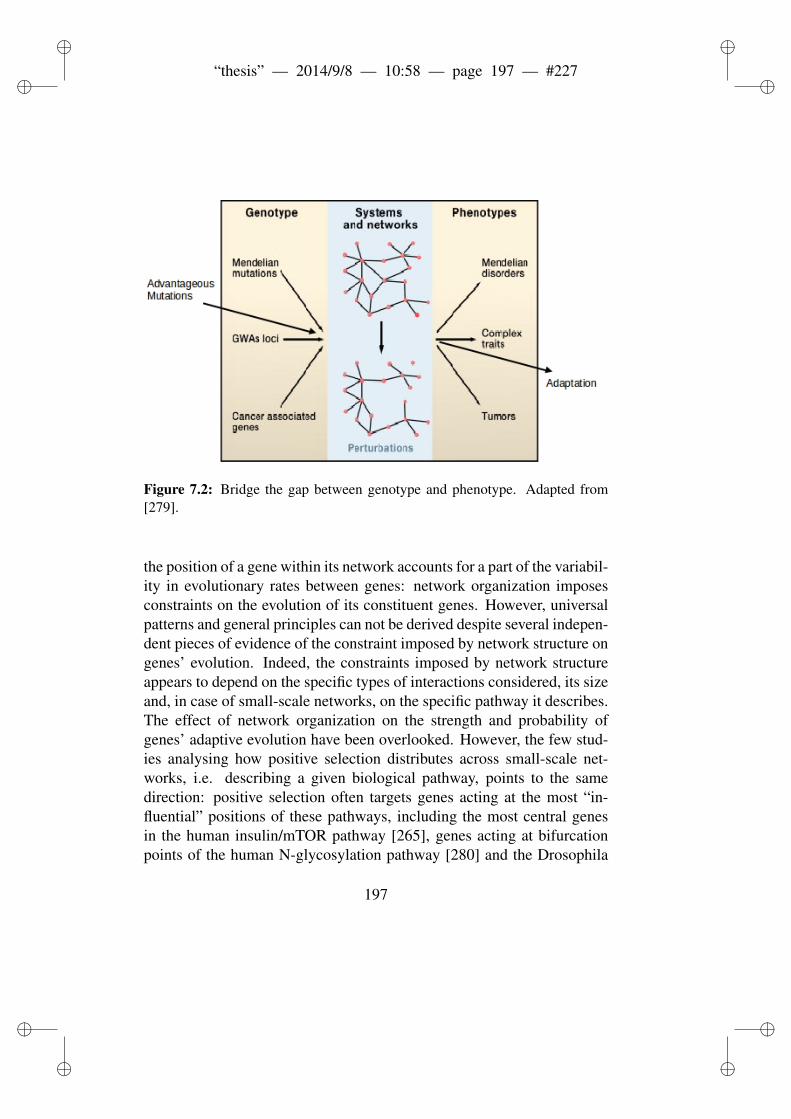
ii
“thesis” — 2014/9/8 — 10:58 — page 197 — #227 ii
ii
ii
Figure 7.2: Bridge the gap between genotype and phenotype. Adapted from[279].
the position of a gene within its network accounts for a part of the variabil-ity in evolutionary rates between genes: network organization imposesconstraints on the evolution of its constituent genes. However, universalpatterns and general principles can not be derived despite several indepen-dent pieces of evidence of the constraint imposed by network structure ongenes’ evolution. Indeed, the constraints imposed by network structureappears to depend on the specific types of interactions considered, its sizeand, in case of small-scale networks, on the specific pathway it describes.The effect of network organization on the strength and probability ofgenes’ adaptive evolution have been overlooked. However, the few stud-ies analysing how positive selection distributes across small-scale net-works, i.e. describing a given biological pathway, points to the samedirection: positive selection often targets genes acting at the most “in-fluential” positions of these pathways, including the most central genesin the human insulin/mTOR pathway [265], genes acting at bifurcationpoints of the human N-glycosylation pathway [280] and the Drosophila
197

ii
“thesis” — 2014/9/8 — 10:58 — page 198 — #228 ii
ii
ii
pathways involved in glucose metabolism [202], and the gene encodingthe first enzyme of the Arabidopsis glucosinolate pathway [216]. Sim-ulation studies also indicate that adaptation preferentially targets genesacting at the upstream and branch-point parts of pathways, at least whenthe system is far from the fitness optimum [281, 282]. Proteins occupyingthese key network positions are expected to exert strong influence over thepathway function, and thus on the associated phenotypes and organism’sfitness [216, 281, 282]. Therefore, positive selection on genes encodingsuch proteins may lead to rapid adaptation. Although all those studiespoint to “influential” genes within a given biological pathway being un-der positive, the gene feature characterizing genes’ “influence” is not uni-versal. As for evolutionary constraint, the relationship between adaptiveevolution and small-scale network structure appears to also depend on thespecific types of interactions considered, its size and the specific pathwayit describes.Only two studies of the distribution of selective events across a large-scale network, namely the interactome, have been published (see Chapter6 and [234]). Although different results at two evolutionary time-scaleshave been observed, a relationship between large-scale network topologyand the impact positive selection appears to exist. The consensus sincethe study by Kim et al. [234] was that events of positive selection oc-cur mostly at the periphery of the interactome. The study presented herechallenges this view and suggests that there is not an universal patternwhich could be applicable at every evolutionary time-scales and/or modeof adaptation. Indeed, it appears that the impact of positive selectionwithin the interactome depends on (1) if only signals at protein-codinglevel can be identified and/or (2) the range of the selective events age oneis able to detect. One possible interpretation with the results presentedin Chapter 6 comes from the Fisher’s Geometric Model of Adaptation(FGM) which predicts when and how likely a mutation of given pheno-type effects is advantageous, that is, it is selected for [33]. The effects onfitness are measured considering the pleiotropic effects —as a funtion ofthe number of phenotypes in which a mutation is involved in —and theeffect on each specific phenotype. The interactome is most likely a good
198
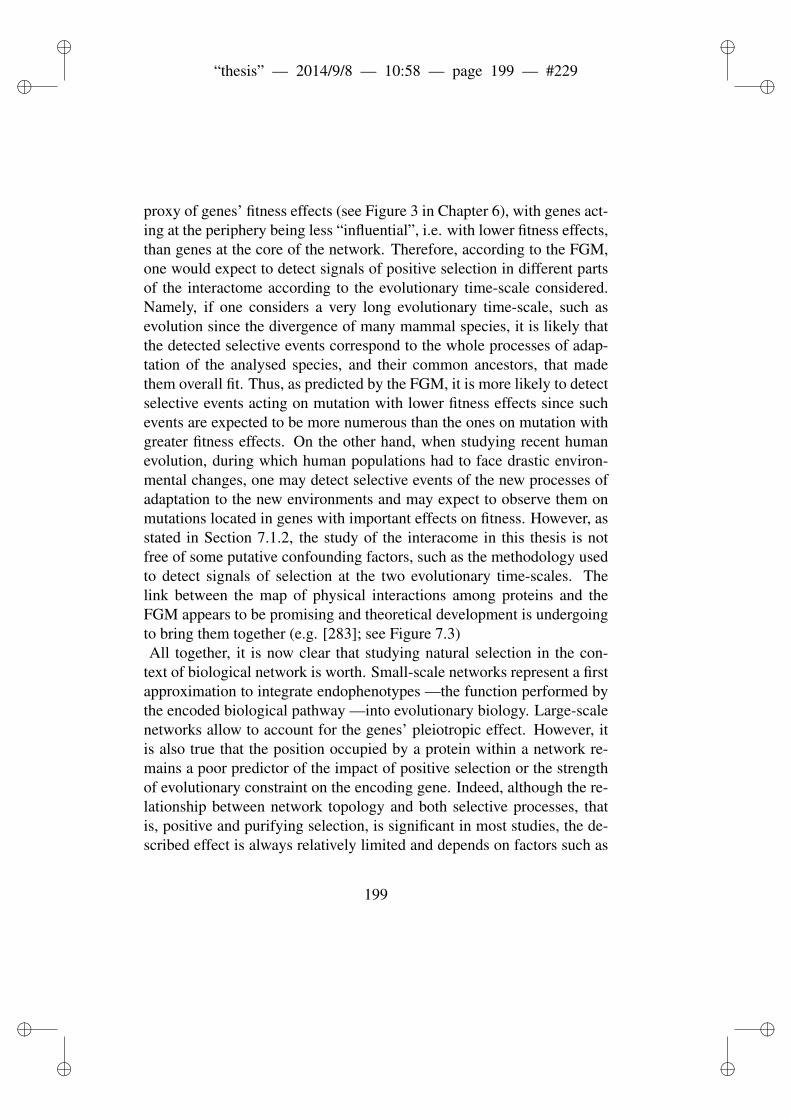
ii
“thesis” — 2014/9/8 — 10:58 — page 199 — #229 ii
ii
ii
proxy of genes’ fitness effects (see Figure 3 in Chapter 6), with genes act-ing at the periphery being less “influential”, i.e. with lower fitness effects,than genes at the core of the network. Therefore, according to the FGM,one would expect to detect signals of positive selection in different partsof the interactome according to the evolutionary time-scale considered.Namely, if one considers a very long evolutionary time-scale, such asevolution since the divergence of many mammal species, it is likely thatthe detected selective events correspond to the whole processes of adap-tation of the analysed species, and their common ancestors, that madethem overall fit. Thus, as predicted by the FGM, it is more likely to detectselective events acting on mutation with lower fitness effects since suchevents are expected to be more numerous than the ones on mutation withgreater fitness effects. On the other hand, when studying recent humanevolution, during which human populations had to face drastic environ-mental changes, one may detect selective events of the new processes ofadaptation to the new environments and may expect to observe them onmutations located in genes with important effects on fitness. However, asstated in Section 7.1.2, the study of the interacome in this thesis is notfree of some putative confounding factors, such as the methodology usedto detect signals of selection at the two evolutionary time-scales. Thelink between the map of physical interactions among proteins and theFGM appears to be promising and theoretical development is undergoingto bring them together (e.g. [283]; see Figure 7.3)All together, it is now clear that studying natural selection in the con-
text of biological network is worth. Small-scale networks represent a firstapproximation to integrate endophenotypes —the function performed bythe encoded biological pathway —into evolutionary biology. Large-scalenetworks allow to account for the genes’ pleiotropic effect. However, itis also true that the position occupied by a protein within a network re-mains a poor predictor of the impact of positive selection or the strengthof evolutionary constraint on the encoding gene. Indeed, although the re-lationship between network topology and both selective processes, thatis, positive and purifying selection, is significant in most studies, the de-scribed effect is always relatively limited and depends on factors such as
199

ii
“thesis” — 2014/9/8 — 10:58 — page 200 — #230 ii
ii
ii
Figure 7.3: Integration of physical interaction maps into a model of genotype-phenotype-fitness map. Schematic representation showing the different levelsof integration assumed in the model, from a single mutation (left) to its effecton the fitness of the whole organism. Each mutation affects a large subset of ptraits (orange ovals) through the interaction network among proteins because oftheir pleiotropic effects. The vector x represents the parent phenotype at all thesetraits. The effect of a mutation (on the offspring’s phenotype) is a random smallperturbation dx. These basic mutational changes diffuse through the network ofinteractions to induce changes at a much smaller set of n key integrative traits(optimized traits; green ovals), which are those under selection, represented bythe vector y. From [283].
200

ii
“thesis” — 2014/9/8 — 10:58 — page 201 — #231 ii
ii
ii
the mode of interaction, the evolutionary time-scale and the biologicalscale considered.
7.2.2 Other mechanisms at stake: lessons from proteinevolutionary rates.
The position occupied by a protein within a biological network accountsfor some phenotypic effects of the encoding gene. However, other genesfeatures also account for their phenotypic effects. Those features are notindependent one from the others and, more interestingly, are also relatedto evolutionary constraint (Figure 7.4). Therefore, those features mayalso be considered when studying adaptive evolution of protein-codinggenes. The literature on the putative gene’s features affecting evolutiveconstraint is abundant: for decades, biologists tried to assess why certainproteins accumulate many mutations, whereas others remain unchangedover long evolutionary periods. The following description is only a briefoverview on this topic and does not pretend to be exhaustive.In 1965, Zuckerkandl and Pauling [285] suggested that the differences in
the rates of evolution of hemoglobin and cytochrome c were attributableto the different levels of selective constraint acting on them. In the follow-ing decade, the neutral theory of molecular evolution stated that proteinswith low functional importance should evolve faster than more importantones (see Section 1.3). It was also proposed that the proportion of aminoacids involved in its function (“functional density”) affects levels of selec-tive constraint [286]: proteins with a low functional density are expectedto be less constrained, thereby to evolve faster. However, although it ap-pears logical that proteins’ rates of evolution are mainly determined bytheir importance and/or functional density, it is difficult to test this hy-pothesis since the measure of these parameters remains experimentallychallenging to assess.The recent emergence of genome-scale datasets allowed to measure animportant number of characteristics for most of the genes in model or-ganisms. In turn, a long list of factors correlating with rates of evolu-tion has been drawn up. Factors more or less related to proteins’ im-
201

ii
“thesis” — 2014/9/8 — 10:58 — page 202 — #232 ii
ii
ii
Figure 7.4: Interindependance between gene features that affect evolutionaryconstraint. PPI, number of protein–protein interactions; τ , range of tissue ex-pression; ω is the dN/dS value. Positive correlations are represented in orange,and negative correlations are represented in blue. The width of the lines is pro-portional to the strength of the correlations. From [284].
202
ii
“thesis” — 2014/9/8 — 10:58 — page 203 — #233 ii
ii
ii
portance and/or functional density appear to be relatively poor predictorsof rates of evolution. These factors are the following: functional cate-gory [193, 243, 287, 288], number of functions [289–291], essentialityfor survival [288, 292, 293] and dispensability measured as the fitness ef-fect upon gene knockout [53, 294–296]. On the other hand, patterns andlevels of gene expression [297, 298] appear to be the strongest determi-nants of levels of selective constraint. Some studies in yeasts describedthat gene expression levels may account for more than 30% of the vari-ability of rates of evolution [299]. Nevertheless, not all analyses reachedthis conclusion and some of them suggested that certain factors aforemen-tioned may be as determinant as expression for selective constraint (e.g.see [300–303]).All together, the prevailing view is that patterns and levels of gene ex-pression are the most important factors affecting evolutionary rates whileother factors have a relatively minor, yet observable, effect. Several stud-ies already described the relationship between the strength of positive se-lection acting on a gene and its expression patterns (e.g. see [170, 297,304, 305]). However, further experimental and theoretical advances arenecessary to better understand the contributions of the different factorsdriving evolutionary rates as well as the probability and the strength ofpositive selection targeting protein-coding genes. Indeed, currently avail-able datasets have a relatively low quality and are being subject to veryhigh false positive and false negative rates [272–275]. Despite the pooraccuracy of those datasets, they allowed to perform a first evaluation of themechanisms affecting the impact of natural selection on protein-codinggenes. Available measures of protein–protein interactions may be partic-ularly noisy, as they are the result on the application of high-throughputtechniques, especially for large-scale networks (see Section 7.1.2). Thiscould result in an under-estimation of the relative effect of the networktopology on the impact of natural selection on protein-coding genes (seeSection 7.1.2). Indeed, a study in which noise levels were equalizedacross 7 putative predictors of dN/dS in yeasts, described a roughly equalcontribution to the variability of evolutionary rates [302]. Therefore, thecritics stating that using biological network topology to better understand
203
ii
“thesis” — 2014/9/8 — 10:58 — page 204 — #234 ii
ii
ii
selective processes is uninformative as compared to other biological fea-tures (e.g. expression patterns and levels) are not receivable since they donot take into account the discrepancy in the accuracy of the available data.
7.2.3 Perspectives in evolutionary system biology.
Consider different modes of adaptive selection.In order to better understand the mechanisms driving natural selection
in a system, it is obviously important to first have a general picture ofits impact on the involved genes and their main regulatory regions. Aslargely discuss in Section 1.3.1, there are three modes of natural selec-tion: purifying, balancing and positive selection. Balancing selection hasbeen overlooked and relating its impact to the position occupied by theencoded proteins in biological network would be informative. Positiveselection is mostly studied assuming the hard sweep model. Consider-ing other modes of positive selection, such as soft sweeps and polygenicadaptation, would be interesting to provide a full picture of the distribu-tion of selective events within biological networks. Actually, the study ofpolygenic adaptation in the context of biological network is necessary forobvious reasons. Moreover, the fact that more selective events have beenobserved in more central genes in the interactome and individual path-ways using polymorphism data (see Chapter 6) is arguably not surprisingsince hard selective sweeps have been detected, that is selective events onmutations with a relatively important selective coefficient. The selectivecoefficient of advantageous mutation is likely to be more important formutations affecting the function or the regulation of central genes whichhave greater effects on fitness.Using methodological tools allowing to infer the action of natural selec-tion on mutations that can affect the regulation of genes may be infor-mative to understand how biological systems evolve through the actionof natural selection. While the action of purifying selection in biologicalsystem has been well studied, it relies on a methodology biased towardscoding regions. Recent efforts have been made to also infer the evolu-tionary constraint in regulatory regions taking as a reference putatively
204
ii
“thesis” — 2014/9/8 — 10:58 — page 205 — #235 ii
ii
ii
neutrally evolving regions as ancestral repeats or pseudogenes (e.g. see[306] for micro RNAs and [307] for transcription factor binding sites)from divergence data. The same direction should be followed to estimatepositive selection using divergence data.
The study of network topology can shed more light on the mecha-nisms driving natural selection.Although the relationship between the impact of natural selection —ei-
ther positive or negative —and network topology is weak, yet measurable,it is worth keeping studying it across many more biological networks.First, at small-scale, the distribution of selective events across biologi-cal pathways has been studied only for very few of them. It is necessaryto broaden the range of studied pathways in this framework in order tobetter understand whether the impact of natural selection on and acrossa pathway varies according to the pathway size (number of proteins andinteractions involved), its linearity (number of branching points), its iso-lation from other pathways, the type of interactions involved, the cellularcompartment in which proteins are active, the tissue specificity of thepathway, etc. However, one must be cautious while performing a sys-tematic analysis of pathways based on database annotation (see Section7.1.2).Second, at large-scale, although purifying selection has been relativelywell studied the three main interaction maps (transcriptome, metabolomeand interactome), more analyses would be informative in other organismsand using networks of increasing accuracy to further validate the view thatcentral genes are more constrained in their evolution. Moreover, the dis-tribution of selective events across such large-scale networks have beenoverlooked and contrasting whether the patterns observed in the interac-tome stand in the metabolome and the transcriptome would be interesting.Before proceeding to such studies, one would rather increase the accu-racy of the large-scale network of interest. For example, the BertranpetitGroup is currently curating manually the human metabolome in collabo-ration with biochemists. Such effort is necessary to reduce the noise and,
205

ii
“thesis” — 2014/9/8 — 10:58 — page 206 — #236 ii
ii
ii
thereby, increase the power of the study. Furthermore, in order to betterconsider the processes that take place within the cell, it would be interest-ing to study networks that encompass all the types of interactions, such asthe MULTINET built by Khurana et al. [200]. Indeed, as illustrated bythe IT pathway (see Chapter 5), different types of interactions are at stakewithin many pathways, mostly the transduction signalling ones. There-fore, considering large-scales networks that include only one type of in-teractions remains a raw simplification of genes epistasis and pleiotropy.Third and last, when studying network topology, one would have to takeinto account the fact that interactions do not have the same importance forthe processes taking place in the organism: (1) interactions happen in dif-ferent compartment of the cell; (2) some are tissue specific while othersoperate within a broad range of cells; (3) proteins may compete one withthe others for the same interacting partners; and (4) interactions are notnecessarily occurring at any time. Therefore, including into the networkstudies more information on the expression patterns, the cell compartmentand the tempo of interactions, could be important. For now, network-levelstudies, such as the ones presented in this thesis, settle for only correctingfor those parameters through multivariate analyses. More insight wouldbe gain if, instead, this information could be used to build subnetworks tostudy individually and to compare.
Include dynamics.Considering the fixed topology of the networks was the first step in evo-
lutionary system biology, and it is clear that it is a huge simplification ofthe protein interaction complexity. Some efforts have been recently madeto include dynamical features into the studied system.First, one can directly rely on measures of dynamical characteristics ofthe involved proteins. For example Colombo et al. studied the relation-ship between metabolic flux and evolutionary rates of enzyme encodinggenes in the human erythrocyte cells [308]. The flux is the movement ofmatter through metabolic networks that are connected by chemical equi-libria, and thus describes the activity of the metabolic network as a wholeusing a single characteristic. They found that genes encoding enzymes
206
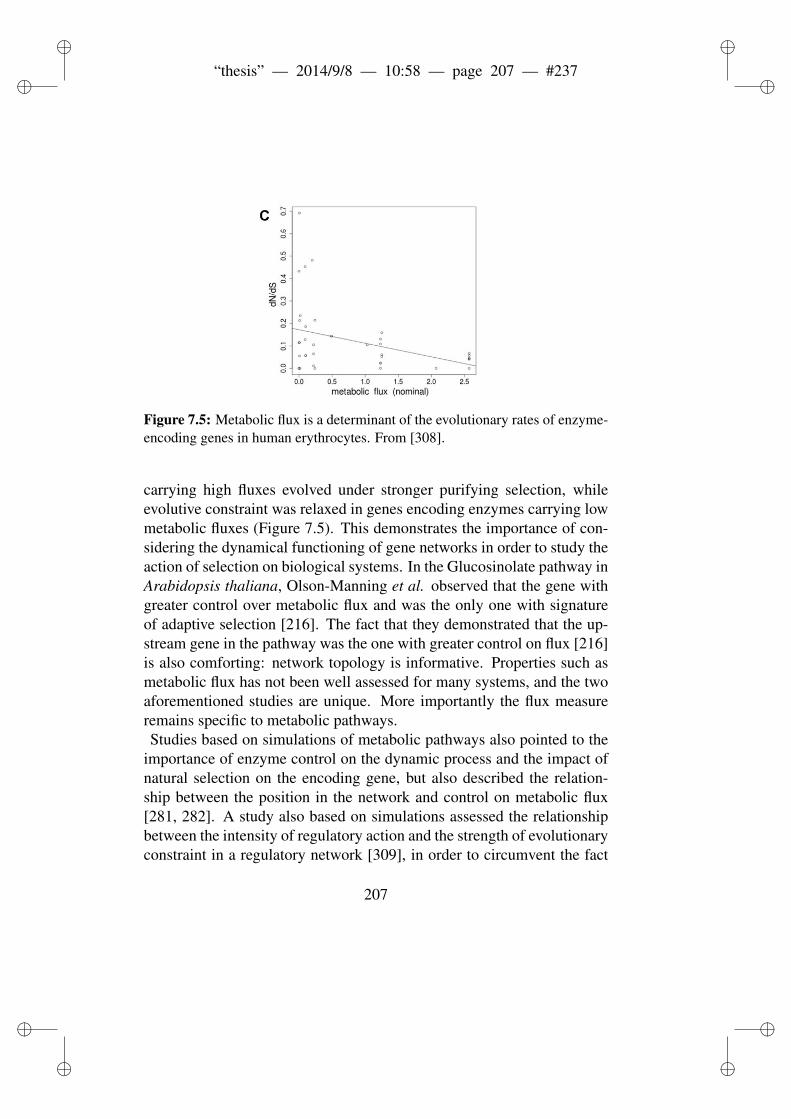
ii
“thesis” — 2014/9/8 — 10:58 — page 207 — #237 ii
ii
ii
Figure 7.5: Metabolic flux is a determinant of the evolutionary rates of enzyme-encoding genes in human erythrocytes. From [308].
carrying high fluxes evolved under stronger purifying selection, whileevolutive constraint was relaxed in genes encoding enzymes carrying lowmetabolic fluxes (Figure 7.5). This demonstrates the importance of con-sidering the dynamical functioning of gene networks in order to study theaction of selection on biological systems. In the Glucosinolate pathway inArabidopsis thaliana, Olson-Manning et al. observed that the gene withgreater control over metabolic flux and was the only one with signatureof adaptive selection [216]. The fact that they demonstrated that the up-stream gene in the pathway was the one with greater control on flux [216]is also comforting: network topology is informative. Properties such asmetabolic flux has not been well assessed for many systems, and the twoaforementioned studies are unique. More importantly the flux measureremains specific to metabolic pathways.Studies based on simulations of metabolic pathways also pointed to the
importance of enzyme control on the dynamic process and the impact ofnatural selection on the encoding gene, but also described the relation-ship between the position in the network and control on metabolic flux[281, 282]. A study also based on simulations assessed the relationshipbetween the intensity of regulatory action and the strength of evolutionaryconstraint in a regulatory network [309], in order to circumvent the fact
207

ii
“thesis” — 2014/9/8 — 10:58 — page 208 — #238 ii
ii
ii
that a gene connected to many loci but only through weak regulation ef-fects is not expected to be strongly exposed to selection since it does notin practice have a strong effect on the expression of the products of thedifferent genes. The authors observed that an increasing intensity of puri-fying selection on the phenotype leads to an increased level of regulationbetween the genes [309]. They also showed that the genes respondingmore strongly to selection within the network were those evolving to-wards stronger regulatory action on the other genes and/or those that arethe less regulated by the other genes [309]. Although those simulationsstudies shed light on how gene influence , i.e. the control exerted by thegene on the output of the system, they represent idealized systems that donot characterize real ones operating in an organism.Less commonly used in the study of evolution are dynamic models ofreal biochemical systems: a mathematical model can be built in order tosimulate known system dynamics. In turn, it can be used as a test of thebreadth of knowledge of a system. This model would include known reac-tions and if the simulations are accurate, it is likely that the mechanismsof the system are well-assessed. Building such models rely on a deepbiochemical knowledge of the interactions at stake in a given biomolec-ular pathway. Invergo and colleagues built a deterministic model of themammalian phototransduction pathway [210]. In such model, reactionsare described by a system of differential equations that track the concen-trations of the various molecules in the system. At any time point in thesimulation, it is possible to calculate the exact concentrations at the nextinstant. Using relevant model parameters as a proxy of dynamic influ-ence, perhaps surprisingly, the authors observed that proteins with greaterpotential to disrupt the system dynamics exhibited a more relaxed evolu-tionary constraint, in the form of higher evolutionary rates (personal com-munication). Such biochemical models are useful to better understand therole exerted by the genes in biological systems, to ,in turn, understand themechanisms affecting the impact of natural selection. However, the pho-totransduction pathway is unique in the sense that it is isolated, involvingspecific proteins. Building such dynamical models for other pathwaysremains challenging.
208
ii
“thesis” — 2014/9/8 — 10:58 — page 209 — #239 ii
ii
ii
Chapter 8
CONCLUSIONS
A major challenge in evolutionary biology is to understand how naturalselection, which acts on phenotypes, shapes the genome, and particularlythe protein-coding genes that contribute to the phenotype. The two firststudies of this thesis illustrates how the impact of adaptive selection canbe detected at the gene-level. However, here genes are considered as inde-pendent entities, while they do not act in isolation but rather interact onewith many others to give rise to the phenotype as an emergent property.This concerted contribution to the phenotypes has to be taken into con-sideration to better understand the mechanisms driving natural selectionat the molecular level. With others, the results from the two last studiespresented in this thesis demonstrate how encoding biological systems intonetworks allows a first approximation that captures the concerted actionof the genes. Those studies show that the position of a gene within itsbiological network allows to understand some of the variability in evolu-tionary rates between genes and the impact of adaptive selection: thoseworks prove that the action of natural selection is somehow circumscribedby network organization.Several independent pieces of evidence derived from studies of differentnetwork types and at different scales did not allow to define universalpatterns and general principles. This could be due to the fact that theconstraints imposed by network topology likely depend on the type of in-
209
ii
“thesis” — 2014/9/8 — 10:58 — page 210 — #240 ii
ii
ii
teraction considered, its size and, for small-scale networks, on the specificsystem, but also on the tempo of the adaptive process.On the other hand, the discrepancy between the observed patterns mayalso come from the poor quality of the interaction maps, particularly fromhigh-throughput experiments allowing to build large-scale networks. Ad-vances in assessing with higher accuracy the interactions taking place inan organism will most likely allow to clarify how network structure hasan impact on gene evolution.Moreover, when natural selection is inferred from divergence or poly-morphism data, that is at two different evolutionary time-scales but alsorelying on different kinds of methods, its relationship with network topol-ogy differs: while interspecific studies point to positive selection beingparticularly active at the periphery of the networks, intraspecific analysesdescribed an enrichment of selective events in highly connected genes.This point needs further inspection in the future.Despite all the difficulties, much knowledge has been and will be derivedfrom considering the topological organization of the networks, providedan increase accuracy of the interaction maps and the integration of newlayers of complexity for both the biological processes and the mode ofnatural selection. Moreover, a deeper understanding might arise from thedynamics and functioning in space and time of the networks, to move be-yond their topology. The evolutionary system biology field has still longyears ahead. However, much experimental work is needed to gather all theinformation to allow the integration of new layers of complexity. At thevery end, evolutionary system biology is likely to contribute significantlyto the understanding of the genetic bases of complex adaptation.
210

ii
“thesis” — 2014/9/8 — 10:58 — page 211 — #241 ii
ii
ii
Part IV
Appendix
211

ii
“thesis” — 2014/9/8 — 10:58 — page 212 — #242 ii
ii
ii

ii
“thesis” — 2014/9/8 — 10:58 — page 213 — #243 ii
ii
ii
LIST OF PUBLICATIONS
Articles Published in Peer-Reviewed Journals1. Mayukh Mondal, Garima Juyal, Pierre Luisi, Hafid Laayouni, Pe-
ter Heutink, Jaume Bertranpetit, Ferran Casals and Thelma BKPopulation and genomic lessons from genetic analysis of two Indianpopulations. Hum Genet. 2014 Jul 1.http://www.ncbi.nlm.nih.gov/pubmed/24980708
2. Vincenza Colonna, Qasim Ayub, Yuan Chen, Luca Pagani, PierreLuisi, Marc Pybus, Yali Xue, Chris Tyler-Smith, The 1000 GenomesProject ConsortiumHuman genomic regions with exceptionally high levels of popula-tion differentiation identified from 911 whole-genome sequences.Genome Biol. 2014 Jun 30; 15(6):R88http://www.ncbi.nlm.nih.gov/pubmed/24980144
3. Hafid Laayouni, Marije Oosting, Pierre Luisi, Mihai Ioana, SantosAlonso, Isis Ricano-Ponce, Gosia Trynka, Alexandra Zhernakova,Theo Plantinga, Shih-Chin Cheng, Jos W.M. van der Meer, ThelmaBK, Radu Popp, Ajit Sood, Cisca Wijmenga, Leo A.B. Joosten,Jaume Bertranpetit and Mihai G. NeteaCommon evolutionary signals in European and Rroma populations:convergent evolution exerted by plague on TLR1/TLR6/TLR10 pat-tern recognition system. Proc Natl Acad Scien U S A. 2014 Feb 18;111(7): 2668-73http://www.ncbi.nlm.nih.gov/pubmed/24550294
213

ii
“thesis” — 2014/9/8 — 10:58 — page 214 — #244 ii
ii
ii
4. Audrey Sabbagh*, Pierre Luisi*, Erick C. Castelli, Laure Gineau,David Courtin, Jacqueline Milet, Juliana D. Massaro, Hafid Laay-ouni, Philippe Moreau, Eduardo A. Donadiand Andre GarciaWorldwide genetic variation at the 3’ untranslated region of theHLA-G gene: balancing selection influencing genetic diversity. GenesImmun. 2013 Dec 19* Equal contributionhttp://www.ncbi.nlm.nih.gov/pubmed/24352166
5. Marc Pybus*, Giovanni M Dall’Olio*, Pierre Luisi*, Manu Uzkudun*,Angel Carreno-Torres, Pavlos Pavlidis, Hafid Laayouni, Jaume Bertran-petit and Johannes Engelken1000 Genomes Selection Browser 1.0: a genome browser dedicatedto signatures of natural selection in modern humans. Nucleic AcidsRes. 2013 Nov 25* Equal contributionhttp://www.ncbi.nlm.nih.gov/pubmed/24275494
6. Blandine Patillon, Pierre Luisi, Audrey Sabbagh and EmmanuelleGeninSignatures Of Recent Positive Selection At The VKORC1 Gene Lo-cus. Genetic epidemiology. 2012;36(2), 170-170
7. Blandine Patillon*, Pierre Luisi*, Helene Blanche, Etienne Patin,Howard M. Cann, Emmanuelle Genin and Audrey SabbaghPositive selection in the chromosome 16 VKORC1 genomic regionhas contributed to the variability of anticoagulant response in hu-mans. PLoS One. 2012;7(12):e53049* Equal contributionhttp://www.ncbi.nlm.nih.gov/pubmed/23285254
8. Giovanni M. Dall’Olio, Hafid Laayouni, Pierre Luisi, Martin Sikora,Ludovica Montanucci and Jaume BertranpetitDistribution of events of positive selection and population differen-tiation in a metabolic pathway: the case of asparagine N-glycosylation.BMC Evol Biol. 2012 Jun 25;12:98http://www.ncbi.nlm.nih.gov/pubmed/22731960
214

ii
“thesis” — 2014/9/8 — 10:58 — page 215 — #245 ii
ii
ii
9. Pierre Luisi, David Alvarez-Ponce, Giovanni M. Dall’Olio, MartinSikora, Jaume Bertranpetit and Hafid LaayouniNetwork-level and population genetics analysis of the insulin/TORsignal transduction pathway across human populations. Mol BiolEvol. 2012 May;29(5):1379-92.http://www.ncbi.nlm.nih.gov/pubmed/22135191
10. Lounes Chikhi, Vitor C. Sousa, Pierre Luisi, Benoıt Goossens andMark A. BeaumontThe confounding effects of population structure, genetic diversityand the sampling scheme on the detection and quantification ofpopulation size changes. Genetics. 2010 Nov;186(3):983-95 http://www.ncbi.nlm.nih.gov/pubmed/20739713
Submitted1. Pierre Luisi*, David Alvarez-Ponce*, Marc Pybus, Mario A. Fares,
Jaume Bertranpetit and Hafid LaayouniRecent positive selection targets the center of the human protein-protein interaction network.* Equal contribution
2. Laure Gineau, Pierre Luisi, Erick C. Castelli, Jacqueline Milet,David Courtin, Blandine Patillon, Hafid Laayouni, Philippe Moreau,Eduardo A. Donadi and Andre GarciaBalancing immunity and tolerance: genetic footprint of natural se-lection in the HLAG 5’ upstream regulatory region.
3. Blandine Patillon, Pierre Luisi, Estella Poloni, Sotiria Boukouvala,Pierre Darlu, Emmanuelle GeninA homogenizing process of selection has maintained an ’ultra-slow’acetylation NAT2 variant in humans.
215

ii
“thesis” — 2014/9/8 — 10:58 — page 216 — #246 ii
ii
ii
In Preparation1. Marc Pybus*, Pierre Luisi*, Giovanni M Dall’Olio*, Manu Uzkudun,
Angel Carreno-Torres, Pavlos Pavlidis, Hafid Laayouni, Jaume Bertran-petit and Johannes EngelkenA machine-learning framework to detect and classify hard selectivesweeps in human populations.* Equal contribution
2. Begona Dobon, Hisham Hassan, Hafid Laayouni, Pierre Luisi,Isis Ricano-Ponce, Alexandra Zhernakova, David Comas, Mihai G.Netea, and Jaume BertranpetitThe genetics of human populations of the Sudanese region: a novelNilotic component in the African landscape and signals of positiveselection in the East-African
216

ii
“thesis” — 2014/9/8 — 10:58 — page 217 — #247 ii
ii
ii
SUPPLEMENTARYMATERIALS.
Study the impact of positive selection on a candi-date gene.The Supplementary Material for the article presented in Chapter 3 [263] isavailable at http://www.plosone.org/article/info\%3Adoi\%2F10.1371\%2Fjournal.pone.0053049#s5.
Scan the genome for positive selection.The Supplementary Material for the article presented in Chapter 4 [264]is available at http://www.pnas.org/content/111/7/2668.long?tab=ds.
Distribution of selective events within a small-scaleprotein-protein interaction map.The Supplementary Material for the article presented in Chapter 5 [265] isavailable at http://mbe.oxfordjournals.org/content/29/5/1379/suppl/DC1.
Distribution of selective events within a large-scaleprotein-protein interaction map.The Supplementary Material for the submitted article presented in Chap-ter 6 is provided below.
217

ii
“thesis” — 2014/9/8 — 10:58 — page 218 — #248 ii
ii
ii
218
ii
“thesis” — 2014/9/8 — 10:58 — page 219 — #249 ii
ii
ii
RESEARCH ARTICLE
Supplementary Information
Recent Positive Selection Has Acted On Genes Encoding Proteins With
More Interactions Within the Whole Human Interactome
Pierre Luisi1†, David Alvarez-Ponce2,3†, Marc Pybus1, Mario A. Fares2,4, Jaume Bertranpetit1* and Hafid Laayouni1,5*.
(† These authors contributed equally to this work)1Institute of Evolutionary Biology (Universitat Pompeu Fabra-CSIC), CEXS-UPF-PRBB, Barcelona, Catalonia, Spain.2Integrative Systems Biology Group, Instituto de Biología Molecular y Celular de Plantas, Consejo Superior de Investigaciones Científicas (CSIC)-Universidad Politécnica de Valencia (UPV), Valencia, Spain.3Current address: Biology Department, University of Nevada, Reno, NV, USA.4Smurfit Institute of Genetics, University of Dublin, Trinity College, Dublin, Ireland.5Departament de Genètica i de Microbiologia, Grup de Biologia Evolutiva (GBE), Universitat Autonòma de Barcelona, Bellaterra (Barcelona), Spain
* Authors for correspondence.
1
ii
“thesis” — 2014/9/8 — 10:58 — page 220 — #250 ii
ii
ii
SUPPLEMENTARY NOTES
Network-Level Analysis Using Different Methods to Detect Positive Selection from
Polymorphism Data
In order to confirm the relationship observed between the position of proteins in the
Protein-Protein Interaction Network (PIN) and intraspecific positive selection, we broadened
the analysis by using separately the three original tests to detect positive selection iHS (Voight
et al. 2006); XP-CLR (Chen et al. 2010) and DH (Zeng et al. 2007) used to compute the
Fisher's combination test score (ZF). We also used the Composite of Multiple Signals (CMS)
method (Grossman et al. 2010) calculated in YRI, CEU and CHB+JPT populations using
Pilot1 genotype data from the 1000 Genomes Project (Grossman et al. 2013). For each gene
we used the average score (for iHS, XP-CLR and CMS) or the −log10(P-value) (for DH) as
summary scores. We then applied a Spearman's correlation analysis between gene degree
(number of interactions), as an estimator of network centrality, and these scores. Moreover,
genes were classified into four groups delimited by their first, second and third degree
quartiles. The median summary scores of the four groups were compared using a non-
parametric ANOVA test. We also applied a linear trend test to contrast whether the putative
differences among groups were due to a trend towards higher summary scores in groups
corresponding to higher degrees (Supplementary Table 2; Supplementary Figure 2).
The Spearman's correlation between the iHS score and degree is positive and
significantly different from 0 in the three populations (P ≤ 0.0014 in all three cases;
Supplementary Table 2). In addition, iHS values are significantly different in the different
groups according to the degree quartiles in all three populations (non-parametric ANOVA; P
≤ 0.0032; Supplementary Table 2; Supplementary Figure 2), and these differences among
groups are due to a clear trend towards higher iHS scores in groups corresponding to higher
degrees (linear trend test on ranks; P ≤ 0.0017; Supplementary Table 2). When using the XP-
CLR score, we did not observe such a clear relationship between degree and the impact of
positive selection. Indeed, although the Spearman's correlation coefficient is positive in the
three populations and significantly different from 0 in YRI and CHB (P equal to 0.0007 and
0.0127, respectively; Supplementary Table 2), the non-parametric ANOVA reaches
significance only in YRI (P = 0.0211), and so does the linear trend test on ranks in YRI and
CEU (P = 0.0028 and P = 0.0236, respectively; Supplementary Table 2; Supplementary
Figure 2). Moreover, we also observe an association between degree and the impact of
2
ii
“thesis” — 2014/9/8 — 10:58 — page 221 — #251 ii
ii
ii
selection as measured by DH. Indeed, the Spearman's correlation coefficient is positive and
significantly different from 0 in the three populations (P ≤ 0.0015; Supplementary Table 2),
and we observed significantly different DH values in different degree groups (non-parametric
ANOVA; P ≤ 0.0222; Supplementary Table 2; Supplementary Figure 2), as well as a
significant linear trend test on ranks in all three populations (P ≤ 0.0027; Supplementary Table
2; Supplementary Figure 2). Finally, using the CMS score, the association appears clearer: we
observe significantly positive Spearman's correlation coefficients in all three populations (P ≤
0.0009; Supplementary Table 2) as well as significant differences in CMS scores among the
degree groups due to a clear tendency towards higher CMS values in groups corresponding to
higher degrees (non-parametric ANOVA, P ≤ 0.0080; linear trend test on ranks P ≤ 0.0016;
Supplementary Table 2; Supplementary Figure 2).
In summary, the observed general tendency of central genes to evolve under recent
positive selection remains significant when positive selection is inferred separately from
different statistics.
Network-Level Analysis for Positive Selection Inferred Using Polymorphism Data in a
Subset of unlinked Genes
To study the impact of positive selection on genes we only used the SNVs located
within the genomic region corresponding to the longest transcript. However, it is well known
that the regions affected by a selective sweep are large, spanning hundreds of kilobases or
even megabases and containing many potential variants driving the signal. Thus, several
adjacent genes may be affected by a unique event of selection targeting one particular variant.
Therefore, some of the genes showing signals of positive selection in our study may be false
positives, even though we do not expect that this bias can affect our network-level analysis,
since there is no reason why false positives should tend to concentrate in specific parts of the
PIN. To confirm that our study does not suffer from this caveat, we first validated our results
using the Composite of Multiple Signals (CMS) method (Grossman et al. 2010) calculated in
the YRI, CEU and CHB+JPT populations using the Pilot1 genotype data from the 1000
Genomes Project (Grossman et al. 2010). Although this study used the less accurate Pilot1
data, the implemented method presents the strong advantage of more accurately pinpointing a
small number of variants within a large genomic region (Grossman et al. 2010). Thus, using
this test we expect to reduce to a great extent the number of falsely detected genes due to
genetic hitch-hiking. Our network-level analyses have been confirmed by the use of CMS
3

ii
“thesis” — 2014/9/8 — 10:58 — page 222 — #252 ii
ii
ii
and, in fact, the association between the impact of selection and network centrality appears to
be stronger (see Supplementary Table 2; Supplementary Figure 2; see previous part of this
supplementary information).
To further confirm that hitch-hiking does not affect the association between the impact
of positive selection and degree, we built a subset of unlinked genes, i.e. not in linkage
disequilibrium, for the three populations (YRI, CEU and CHB). For that purpose, in each
population, we used the population-specific recombination rates estimated genome-wide
(recombination map provided by the 1000 Genomes Project Pilot 1 (The 1000 Genomes
Project Consortium 2010)) and defined as a recombination hotspot a region where the
observed recombination rates was greater than 10 times the genome average, i.e. greater than
18.36 cM/Mb, 18.55 cM/Mb and 17.61 cM/Mb in YRI, CEU and CHB, respectively. Then,
we randomly sampled one PIN gene located between two recombination hotspots. We
obtained three subsets of most likely unlinked genes involved in the PIN containing 2792,
3106 and 3107 genes in YRI, CEU and CHB, respectively.
For each gene we used the ZF score as the likelihood of having been targeted by
positive selection in the human populations, and observed that it is significantly positively
correlated with degree in all three populations (Spearman's correlation analysis; P ≤ 0.0248).
Moreover, when genes were classified into four groups delimited by the first, second and third
degree quartiles, we observed significant differences of summary scores among groups in
CEU and CHB (non-parametric ANOVA test, P equal to 0.0036 and 0.0075, respectively;
Supplementary Table 3; Supplementary Figure 3). Through a linear trend test on ranks, we
concluded that these differences among groups were due to a trend towards higher summary
scores in groups corresponding to higher degrees in these two populations (P ≤ 0.0053;
Supplementary Table 3; Supplementary Figure 3). For YRI, although the non-parametric
ANOVA was not significant (P = 0.2661), the linear trend test on ranks was marginally
significant (P = 0.0482).
Network-Level Analysis Correcting for Putative Confounding Factors
Factors such as gene expression level and breadth (tissues in which a gene is
expressed), and the length of the encoded proteins, correlate with both network centralities
and the likelihood of detecting natural selection, and hence could potentially have an effect on
the observed relationship between the impact of natural selection and the gene centrality in
4

ii
“thesis” — 2014/9/8 — 10:58 — page 223 — #253 ii
ii
ii
the network (Anisimova et al. 2002; Duret & Mouchiroud 2000; Kim et al. 2007; Kosiol et al.
2008; Pál et al. 2006; Subramanian & Kumar 2004). In order to evaluate the effect of these
factors, we applied a linear regression between the scores used as the likelihood of having
been targeted by positive selection during human and mammalian evolution (ZF and 2Δℓ,
respectively), as well as the scores that estimate the strength of purifying selection (DAF and
ω, respectively) and the mentioned putative confounding factors. The linear regression
residuals were then used to perform the correlation analysis in each case. The relationship
between positive selection inferred using polymorphism data and degree remains significant
in all three populations with a Spearman's correlation coefficient, ρ, ranging between 0.0326
(P = 0.0059) in CEU and 0.0451 (P = 0.0001) in YRI (Main text Table 1). Moreover, the non-
parametric ANOVA and trend tests on ranks provide similar results when using the linear
regression residual instead of the ZF score, although P-values tend to be higher (Main text
Table 1; Supplementary Figure 4). Indeed, the non-parametric ANOVA test is significant in
YRI (P = 0.0423) and CEU (P = 0.0240), while it does not reach significance in CHB (P =
0.1006). Moreover, we observe a trend towards higher residuals in groups corresponding to
higher degree (Supplementary Table 3; Supplementary Figure 4). Indeed, in YRI and CHB the
linear trend test on ranks reaches significance (P = 0.0053 and P = 0.0239, respectively).
Taken together, these observations indicate that the association observed between the ZF score
and degree within the PIN cannot be attributed to the three putative confounding factors.
Similarly, the association observed between the impact of positive selection inferred using
divergence data (as estimated by 2Δℓ) and degree remains significant when we correct for the
three putative confounding factors. Indeed, we observed a significant negative Spearman's
partial correlation coefficient (ρ = -0.0340; P = 0.0107). Moreover, although the non-
parametric ANOVA test is not significant (P = 0.0548), the trend test remains significant (P =
0.0122) with lower residuals in groups corresponding to higher degree. Finally, the
relationship between purifying selection and degree also remains significant when using the
residuals of the linear regression of either DAF or ω with protein length, expression level and
expression breadth. Indeed, the correlation tests remain significant (ρ = -0.0668 and -0.1697,
respectively; P < 0.0001 in both cases), as well as the non-parametric ANOVA (P ≤ 0.0003)
and the linear trend tests (P < 0.0001).
5

ii
“thesis” — 2014/9/8 — 10:58 — page 224 — #254 ii
ii
ii
Network-Level Analysis Using Different Protein-Protein Interaction Networks
To validate the association between network position and the impact of positive
selection, analyses were repeated using two additional high-quality networks: a high-quality
(HQ) subnetwork from BioGRID (Stark et al. 2011), in which we retained only interactions
discovered by low-throughput techniques, plus those reported in at least two independent
high-throughput analyses, and the network from the Human Protein Reference Database
(HPRD) (Keshava Prasad et al. 2009), derived from the literature. As in the main analysis, we
calculated the number of interactions in which each protein is involved (degree centrality),
considering the whole set of non-redundant interactions.
For both the HQ and HPRD networks, the Spearman's correlation coefficient between
degree and the recent positive selection ZF scores is positive and significantly different from 0
in all three populations (ρ ≥ 0.0257; P ≤ 0.0294; Supplementary Table 4), except for CHB
when using the HPRD data set (ρ = 0.0229; P=0.0533). Moreover, for the HQ sub-network
the non-parametric ANOVA test is significant in the three populations (P ≤ 0.00950)
(Supplementary Table 4; Supplementary Figure 5). These differences among groups are due to
a trend towards higher ZF scores in groups corresponding to higher degree. Indeed, the linear
trend test on ranks reaches significance in all three populations (P ≤ 0.0027 in the three cases).
When using the HPRD network, although most of the non-parametric ANOVA tests do not
reach significance, the overall pattern also points to higher ZF scores in groups corresponding
to higher degrees: the linear trend test on ranks is significant in YRI and CEU (P equal to
0.0364 and 0.0053, respectively; Supplementary Figure 6; Supplementary Table 4) and
marginally significant in CHB (P = 0.0628).
When studying the association between positive selection as inferred from divergence
data (estimated by 2Δℓ) and degree in the HQ and HPRD networks, we observed a negative
Spearman's correlation coefficient (ρ = -0.0620 and ρ = -0.0577, respectively; P < 0.0001;
Supplementary Table 4). We also observed differences in the 2Δℓ scores among degree groups
(non-parametric ANOVA; P ≤ 0.0011; Supplementary Table 4; Supplementary Figures 5 and
6), with higher 2Δℓ scores in groups corresponding to lower degrees. Indeed, the linear trend
test on ranks reaches significance in both networks (P ≤ 0.0001) . Finally, when studying the
association between purifying selection and degree in both the HQ and HPRD networks, we
observed a significantly negative Spearman's correlation coefficient (ρ ≤ -0.0488; P < 0.0001;
Supplementary Table 4). Moreover, we observed clear differences in both DAF and ω among
6
ii
“thesis” — 2014/9/8 — 10:58 — page 225 — #255 ii
ii
ii
degree groups (non-parametric ANOVA, P ≤ 0.0007), due to a clear tendency towards lower
scores in groups corresponding to higher degrees (linear trend test on ranks; P ≤ 0.0001;
Supplementary Table 4; Supplementary Figures 5 and 6).
Network-Level Analysis Using Different Centrality Measures
We explored whether the association found between the impact of natural selection
and network centrality, as estimated by degree (the number of interactions in which a protein
is involved), was also significant when using other centrality measures. For that purpose, we
calculated two other centrality measures: betweenness (the number of shortest paths between
other proteins passing through a given protein), and closeness (the inverse of the average
distance to all other proteins in the network). The association between the impact of natural
selection and these network centrality measures remains similar, regardless of the centrality
measure considered. Indeed, the Spearman's correlation coefficient between either
betweenness or closeness and ZF, the score used as the likelihood of having been targeted by
positive selection in recent human evolution, is significantly positive in all three populations
(ρ ≥ 0.0295; P ≤ 0.0096; Supplementary Table 5). Moreover, we observed ZF differences
among betweenness groups in the three populations performing a non-parametric ANOVA
(Supplementary Table 5; Supplementary Figure 7), which reaches significance in the three
populations (P ≤ 0.0332; Supplementary Table 5; Supplementary Figure 7). These differences
are due to a clear tendency for higher ZF scores in groups corresponding to higher
betweenness (linear trend test on ranks, P ≤ 0.0157; Supplementary Table 5; Supplementary
Figure 7). When comparing the ZF scores among closeness groups, the non-parametric
ANOVA test reaches significance in YRI and CHB (P = 0.0093 and P = 0.0113, respectively;
Supplementary Table 5; Supplementary Figure 8). These differences among groups are also
due to a trend towards higher ZF scores in groups corresponding to higher closeness. Indeed,
the linear trend test on ranks is significant in all three populations (P ≤ 0.0091; Supplementary
Table 5; Supplementary Figure 8).
When studying the association between positive selection during mammalian
evolution (as estimated by 2Δℓ) and network centrality, using both betweenness and
closeness, we observed a significantly negative Spearman's correlation coefficient (ρ equal to
-0.0645 and -0.0726, respectively; P < 0.0001; Supplementary Table 5). We observed
differences in the 2Δℓ scores among betweenness groups (non-parametric ANOVA, P <
0.0001; Supplementary Table 5; Supplementary Figure 7), and among closeness groups (non-
7
ii
“thesis” — 2014/9/8 — 10:58 — page 226 — #256 ii
ii
ii
parametric ANOVA, P < 0.0001; Supplementary Table 5; Supplementary Figure 8), with a
clear tendency for higher 2Δℓ scores among groups corresponding to lower betweenness or
closeness (linear trend test on ranks , P < 0.0001; Supplementary Table 5; Supplementary
Figures 7-8).
Finally, when studying the association between purifying selection and either
betweenness or closeness, we observed significantly negative Spearman's correlation
coefficients (ρ ≤ -0.0641; P < 0.0001; Supplementary Table 5). Moreover, we observed clear
differences in both DAF and ω values among either betweenness or closeness groups (non-
parametric ANOVA, P < 0.0001; Supplementary Table 5; Supplementary Figures 7 and 8),
due to a clear tendency towards lower scores in groups corresponding to higher centrality
measures (linear trend test on ranks; P < 0.0001; Supplementary Table 5; Supplementary
Figures 7 and 8).
Network-Level Analysis for Positive Selection Inferred Using Polymorphism Data
Correcting for the Action of Purifying Selection
The action of purifying selection on a genomic region can leave some patterns that are
similar to the ones expected under recent positive selection (e.g. an excess of rare variants).
Therefore, we wanted to confirm that the association found between positive selection
estimated from polymorphism data and degree is not a by-product of the already described
association between purifying selection and network centrality. For that purpose, we applied a
linear regression between ZF, the score used as the likelihood of having been targeted by the
impact of recent positive selection in human populations, and ω, which estimates the strength
of purifying selection during mammalian evolution. The linear regression residuals were then
used to perform the analysis. The relationship between positive selection and degree remains
positive in all three populations, with a Spearman's correlation coefficient, ρ, greater than or
equal to 0.0195 (Supplementary Table 6). It is significantly different from 0 in YRI and CHB
(P equal to 0.0020 and 0.0032, respectively). Moreover, the residuals are marginally different
among degree groups (non-parametric ANOVA; P ranging from 0.0371 to 0.0578;
Supplementary Table 6; Supplementary Figure 9). These differences are due to a trend
towards higher residuals in groups corresponding to higher degrees in YRI and CHB (linear
trend test on ranks; P equal to 0.0081 and 0.0100, respectively; Supplementary Table 6;
Supplementary Figure 9). In summary, the observed association between ZF scores and protein
degree cannot be attributed to the association between network centrality and the action of
8
ii
“thesis” — 2014/9/8 — 10:58 — page 227 — #257 ii
ii
ii
purifying selection.
We further confirmed that background selection (BGS), a process that removes neutral
variation linked to deleterious mutations, thus reducing levels of polymorphism in regions of
high functional density and low recombination (Charlesworth et al. 1993), does not confound
the association observed between network centrality and positive selection estimated from
polymorphism data. We estimated the level of BGS acting on each gene using two correlates
of BGS: GC content and recombination rate. Note that we did not take into account the level
of functional constraint because the present study focuses on protein-coding genes. For each
gene, we calculated the average of GC content from the 5-mer table downloaded from the
UCSC browser (Karolchik et al. 2009) (table “gc5Base” downloaded on the 10 th of July,
2013), as well as the average recombination rate from the population-specific recombination
rates estimated genome-wide (recombination map provided by the 1000 Genomes Project
Pilot 1 (The 1000 Genomes Project Consortium 2010)). We then applied a linear regression
between ZF, the score used as the likelihood of having been targeted by positive selection, and
both recombination rate average and GC content average. The linear regression residuals were
then used to perform the analysis. The relationship between positive selection and degree
remains positive in all three populations, with a Spearman's correlation coefficient, ρ, greater
than 0.0369 (Supplementary Table 7) and significantly different from 0 (P ≤ 0.0013).
Moreover, the residuals are different among degree groups in all three populations (non-
parametric ANOVA; P ranging from 0.0017 to 0.0089; Supplementary Table 7;
Supplementary Figure 10), and these differences are due to a trend towards higher residuals in
groups corresponding to higher degree (linear trend test on ranks; P ranging from 0.0007 to
0.0016; Supplementary Table 7; Supplementary Figure 10). Therefore, the association
observed between ZF scores and degree cannot be attributed to the association between
network centrality and the action of BGS.
9

ii
“thesis” — 2014/9/8 — 10:58 — page 228 — #258 ii
ii
ii
References
Anisimova M, Bielawski JP, Yang Z. 2002. Accuracy and power of the likelihood ratio test in detecting adaptive molecular evolution. Mol. Biol. Evol. 18:1585–1592.
Charlesworth B, Morgan MT, Charlesworth D. 1993. The effect of deleterious mutations on neutral molecular variation. Genetics. 134:1289–303.
Chen H, Patterson N, Reich D. 2010. Population differentiation as a test for selective sweeps. Genome Res. 20:393–402.
Duret L, Mouchiroud D. 2000. Determinants of substitution rates in mammalian genes: expression pattern affects selection intensity but not mutation rate. Mol. Biol. Evol. 17:68–74.
Grossman SR et al. 2010. A Composite of Multiple Signals Distinguishes Causal Variants in Regions of Positive Selection. Science. 327:883–886.
Grossman SR et al. 2013. Identifying recent adaptations in large-scale genomic data. Cell. 152:703–13.
Karolchik D, Hinrichs AS, Kent WJ. 2009. The UCSC Genome Browser. Curr. Protoc. Bioinforma. Chapter1:Unit1:4.
Keshava Prasad TS et al. 2009. Human Protein Reference Database--2009 update. Nucleic Acids Res. 37:D767–72.
Kim PM, Korbel JO, Gerstein MB. 2007. Positive selection at the protein network periphery: evaluation in terms of structural constraints and cellular context. Proc. Natl. Acad. Sci. 104:20274–20279.
Kosiol C et al. 2008. Patterns of positive selection in six Mammalian genomes. PLoS Genet. 4:e1000144.
Pál C, Papp B, Lercher MJ. 2006. An integrated view of protein evolution. Nat. Rev. Genet. 7:337–48.
Stark C et al. 2011. The BioGRID Interaction Database: 2011 update. Nucleic Acids Res. 39:D698–704.
Subramanian S, Kumar S. 2004. Gene expression intensity shapes evolutionary rates of the proteins encoded by the vertebrate genome. Genetics. 168:373–81.
The 1000 Genomes Project Consortium. 2010. A map of human genome variation from population-scale sequencing. Nature. 467:1061–1073.
Voight BF, Kudaravalli S, Wen X, Pritchard JK. 2006. A map of recent positive selection in the human genome. PLoS Biol. 4:e72.
Zeng K, Shi S, Wu C-I. 2007. Compound tests for the detection of hitchhiking under positive selection. Mol. Biol. Evol. 24:1898–908.
10
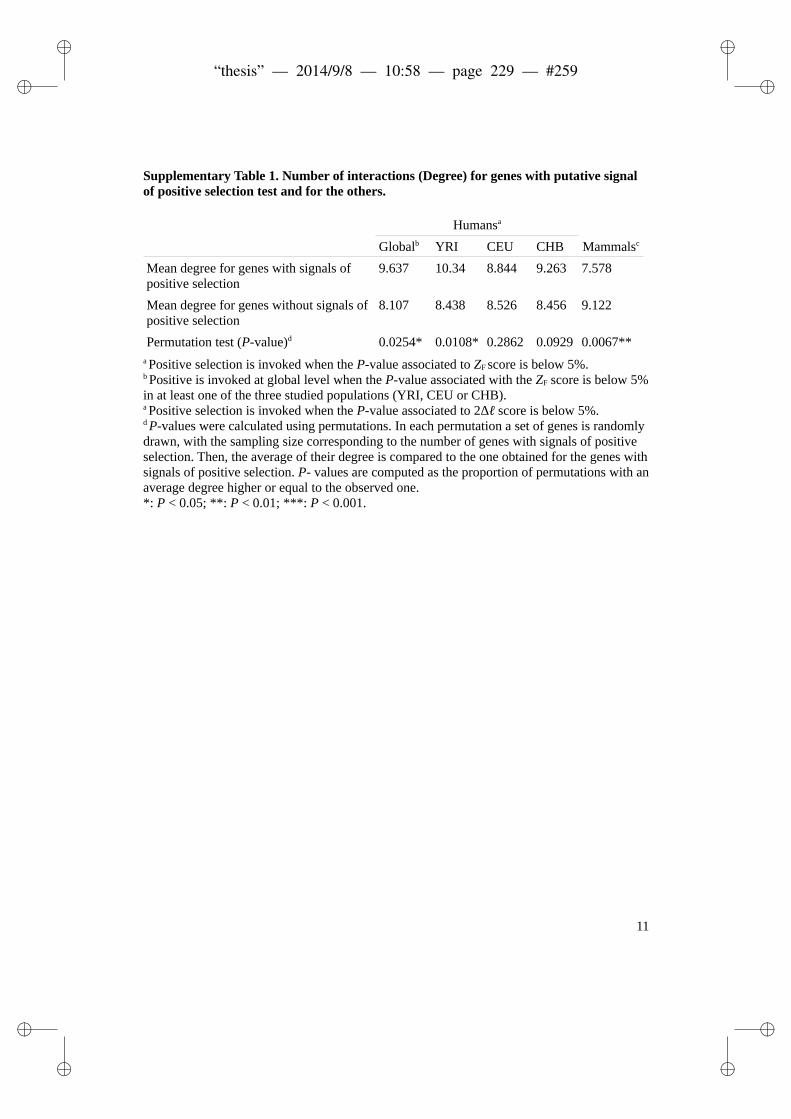
ii
“thesis” — 2014/9/8 — 10:58 — page 229 — #259 ii
ii
ii
Supplementary Table 1. Number of interactions (Degree) for genes with putative signal of positive selection test and for the others.
Humansa
Globalb YRI CEU CHB Mammalsc
Mean degree for genes with signals of positive selection
9.637 10.34 8.844 9.263 7.578
Mean degree for genes without signals of positive selection
8.107 8.438 8.526 8.456 9.122
Permutation test (P-value)d 0.0254* 0.0108* 0.2862 0.0929 0.0067**a Positive selection is invoked when the P-value associated to ZF score is below 5%.b Positive is invoked at global level when the P-value associated with the ZF score is below 5% in at least one of the three studied populations (YRI, CEU or CHB).a Positive selection is invoked when the P-value associated to 2Δℓ score is below 5%.d P-values were calculated using permutations. In each permutation a set of genes is randomly drawn, with the sampling size corresponding to the number of genes with signals of positive selection. Then, the average of their degree is compared to the one obtained for the genes with signals of positive selection. P- values are computed as the proportion of permutations with an average degree higher or equal to the observed one.*: P < 0.05; **: P < 0.01; ***: P < 0.001.
11
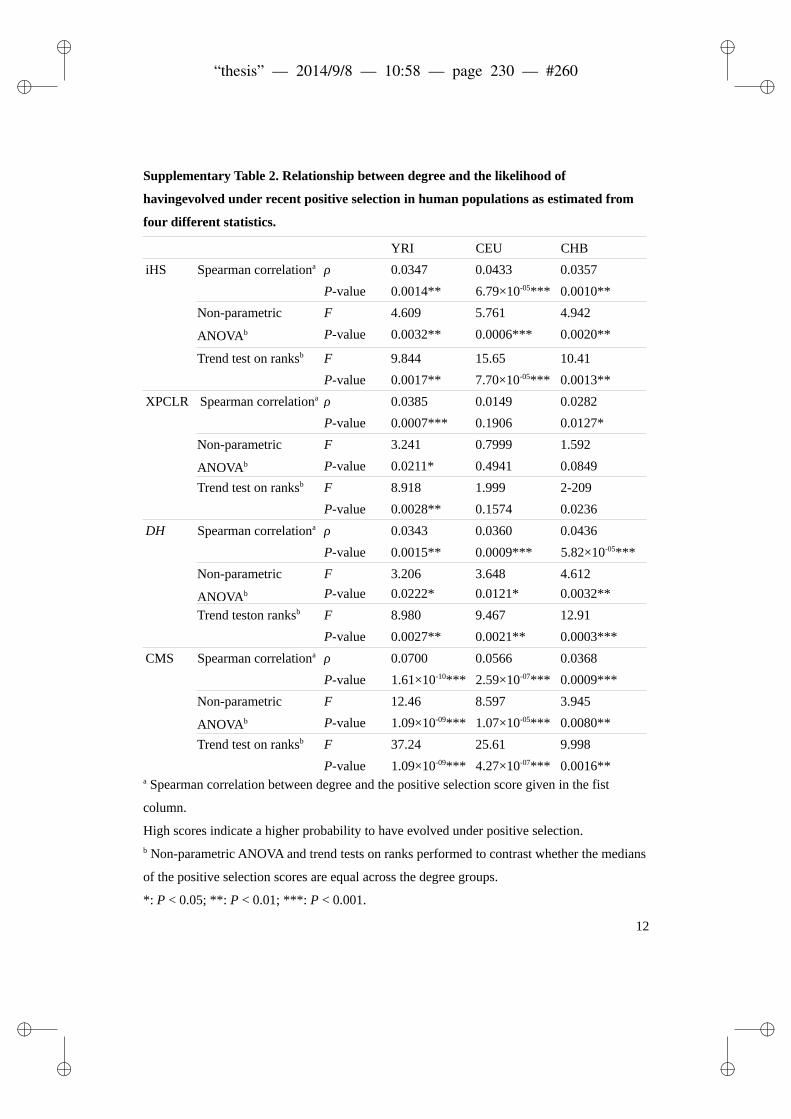
ii
“thesis” — 2014/9/8 — 10:58 — page 230 — #260 ii
ii
ii
Supplementary Table 2. Relationship between degree and the likelihood of
havingevolved under recent positive selection in human populations as estimated from
four different statistics.
YRI CEU CHB
iHS Spearman correlationa ρ 0.0347 0.0433 0.0357
P-value 0.0014** 6.79×10-05*** 0.0010**
Non-parametric
ANOVAb
F 4.609 5.761 4.942
P-value 0.0032** 0.0006*** 0.0020**
Trend test on ranksb F 9.844 15.65 10.41
P-value 0.0017** 7.70×10-05*** 0.0013**
XPCLR Spearman correlationa ρ 0.0385 0.0149 0.0282
P-value 0.0007*** 0.1906 0.0127*
Non-parametric
ANOVAb
F 3.241 0.7999 1.592
P-value 0.0211* 0.4941 0.0849
Trend test on ranksb F 8.918 1.999 2-209
P-value 0.0028** 0.1574 0.0236
DH Spearman correlationa ρ 0.0343 0.0360 0.0436
P-value 0.0015** 0.0009*** 5.82×10-05***
Non-parametric
ANOVAb
F 3.206 3.648 4.612
P-value 0.0222* 0.0121* 0.0032**
Trend teston ranksb F 8.980 9.467 12.91
P-value 0.0027** 0.0021** 0.0003***
CMS Spearman correlationa ρ 0.0700 0.0566 0.0368
P-value 1.61×10⁻¹⁰*** 2.59×10-07*** 0.0009***
Non-parametric
ANOVAb
F 12.46 8.597 3.945
P-value 1.09×10-09*** 1.07×10-05*** 0.0080**
Trend test on ranksb F 37.24 25.61 9.998
P-value 1.09×10-09*** 4.27×10-07*** 0.0016**a Spearman correlation between degree and the positive selection score given in the fist
column.
High scores indicate a higher probability to have evolved under positive selection.b Non-parametric ANOVA and trend tests on ranks performed to contrast whether the medians
of the positive selection scores are equal across the degree groups.
*: P < 0.05; **: P < 0.01; ***: P < 0.001.
12

ii
“thesis” — 2014/9/8 — 10:58 — page 231 — #261 ii
ii
ii
Supplementary Table 3. Relationship between degree and the likelihood of having
evolved under positive selection in human populations using a subset of independent
genes.
YRI CEU CHB
Spearman correlationa ρ 0.0450 0.0600 0.0605
P-value 0.0248* 0.0017** 0.0014**
Non-parametric
ANOVAb
F 1.320 4.521 4.000
P-value 0.2661 0.0036** 0.0075**
Trend test on ranksb F 3.908 8.901 7.791
P-value 0.0482* 0.0029** 0.0053**
We obtained a subset of most likely unlinked genes represented in the network containing
2,792, 3,106 and 3,107 genes in YRI, CEU and CHB, respectively, by randomly sampling one
network gene located between two recombination hotspots (defined as a region where the
observed recombination rates is greater than 10 times the genome recombination rate
average).
a Spearman correlation between degree and ZF in YRI, CEU and CHB.
High ZF scores indicate a higher probability of having evolved under positive selection.b Non-parametric ANOVA and trend tests on ranks performed to contrast whether the medians
of the ZF score are equal across the degree groups (calculated on the whole set of genes).
*: P < 0.05; **: P < 0.01.
13

ii
“thesis” — 2014/9/8 — 10:58 — page 232 — #262 ii
ii
ii
Supplementary Table 4. Relationship between degree and the impact of natural selection using two alternative high-quality protein-protein
interaction networks.
Positive selection Purifying selection
YRI CEU CHB Mammals Humans Mammals
High-Quality
network from
BioGRID
Spearman correlationa ρ 0.0379 0.0420 0.0441 -0.0620 -0.0715 -0.1730
P-value 0.0034** 0.0012** 0.0006*** 2.53×10-05*** 5.82×10-09*** 5.50×10⁻³²***
Non-parametric ANOVAb F 3.819 4.194 4.237 5.363 10.29 45.42
P-value 0.0095** 0.0057** 0.0053** 0.0011** 9.35×10-07*** 6.44×10⁻²⁹***
Trend test on ranksb F 9.492 9.504 8.995 14.91 28.10 131.2
P-value 0.0021** 0.0021** 0.0027** 0.0001*** 1.19×10-07*** 5.39×10⁻³⁰***
Network from
Human Protein
Reference
Database
Spearman correlationa ρ 0.0257 0.0365 0.0229 -0.0577 -0.0488 -0.1353
P-value 0.0294* 0.0021** 0.0533 1.04×10-05*** 6.88×10-06*** 7.97×10⁻²¹***
Non-parametric ANOVAb F 2.223 2.787 1.443 5.733 5.729 27.39
P-value 0.0833 0.0392* 0.2281 0.0006*** 0.0007*** 1.49×10⁻¹⁷***
Trend test on ranksb F 4.380 7.765 3.463 16.90 15.03 80.29
P-value 0.0364* 0.0053** 0.0628 3.99×10-05*** 0.0001 4.56×10⁻¹⁹***a Spearman correlation between degree and selection scores (ZF for positive selection in YRI, CEU and CHB populations; 2Δℓ for positive selection in
mammals; DAF for purifying selection in humans; and ω for purifying selection in mammals). High ZF and 2Δℓ scores indicate a higher probability of
having evolved under positive selection. Low DAF and ω scores indicate higher selective constraint during human and mammalian evolution,
respectively.b Non-parametric ANOVA and trend tests on ranks performed to contrast whether the medians of the natural selection scores are equal across the
degree groups.
*: P-value < 0.05; **: P-value < 0.01; ***: P-value < 0.001.

ii
“thesis” — 2014/9/8 — 10:58 — page 233 — #263 ii
ii
ii
Supplementary Table 5. Relationship between network centrality and the impact of natural selection using betweenness and closeness.
Positive selection Purifying selection
YRI CEU CHB Mammals Humans Mammals
Betweenness Spearman correlationa ρ 0.0295 0.0353 0.0385 -0.0645 -0.0641 -0.1848
P-value 0.0096** 0.0020** 0.0007*** 6.84×10-07*** 3.15×10-09*** 4.92×10-46***
Non-parametric ANOVAb F 3.406 4.445 5.728 11.33 15.29 91.33
P-value 0.0332* 0.0118* 0.0033** 1.23×10-05*** 2.36×10-07*** 8.77×10-40***
Trend test on ranksb F 5.835 8.853 10.69 22.41 30.55 182.0
P-value 0.0157* 0.0029** 0.0011** 2.26×10-06*** 3.34×10-08*** 7.23×10-41***
Closeness Spearman correlationa ρ 0.0413 0.0332 0.0427 -0.0726 -0.0802 -0.1679
P-value 0.0003*** 0.0037** 0.0002*** 2.28×10-08*** 1.25×10⁻¹³*** 3.30×10-38***
Non-parametric ANOVAb F 3.839 2.362 3.698 9.923 16.73 54.87
P-value 0.0093** 0.0693 0.0113* 1.60×10-06*** 7.82×10⁻¹¹*** 5.71×10⁻³⁵***
Trend test on ranksb F 9.702 6.809 10.59 26.40 49.72 153.9
P-value 0.0018** 0.0091** 0.0011** 2.85×10-07*** 1.91×10⁻¹²*** 6.81×10⁻³⁵***a Spearman correlation between degree and natural selection scores (ZF for positive selection in the YRI, CEU and CHB populations; 2Δℓ for positive
selection in mammals; DAF for purifying selection in humans; and ω for purifying selection in mammals). High ZF and 2Δℓ scores indicate a higher
probability of having evolved under positive selection, respectively. Low DAF and ω scores indicate higher selective constraint during human and
mammalian evolution, respectively.b Non-parametric ANOVA and trend tests on ranks performed to contrast whether the medians of the natural selection scores are equal across the
connectivity measure groups. For Betweenness, the 1st and 2nd quartiles were merged due to the uneven distribution of values.
*: P-value < 0.05; **: P-value < 0.01; ***: P-value < 0.001.

ii
“thesis” — 2014/9/8 — 10:58 — page 234 — #264 ii
ii
ii
Supplementary Table 6. Relationship between degree and the impact of recent positive
selection in human populations controlling for ω in mammals.
YRI CEU CHB
Spearman correlationa ρ 0.0432 0.0195 0.0412
P-value 0.0020** 0.1655 0.0032**
Non-parametric ANOVAb F 2.51 2.827 2.499
P-value 0.0569 0.0371* 0.0578
Trend test on ranksb F 7.012 2.032 6.646
P-value 0.0081** 0.1541 0.0100**
In order to test for an association between degree and the impact of positive selection in humans
controlling for ω, we used the ZF as the likelihood of having been targeted by positive selection. We
then applied a linear regression between this score and ω. High ZF values indicate a higher
probability of having evolved under positive selection. Low ω scores indicate higher selective
constraint. The linear regression residuals were then used to perform the Spearman's correlation
analysis, the non-parametric ANOVA and the linear trend test on rank.a Spearman correlation between degree and the residuals.b Non-parametruc ANOVA and trend tests performed to contrast whether the medians of the
residuals across the degree groups.
*: P < 0.05; **: P < 0.01; ***: P < 0.001.

ii
“thesis” — 2014/9/8 — 10:58 — page 235 — #265 ii
ii
ii
Supplementary Table 7. Relationship between degree and the impact of recent positive
selection in human populations controlling for covariates of background selection.
YRI CEU CHB
Spearman correlationa ρ 0.0427 0.0369 0.0428
P-value 0.0002*** 0.0013** 0.0002***
Non-parametric ANOVAb F 3.872 5.043 4.110
P-value 0.0089** 0.0017** 0.0064**
Trend test on ranksb F 11.53 9.947 11.48
P-value 0.0007*** 0.0016** 0.0007***
In order to test for an association between degree and the impact of positive selection in humans
controlling for background selection, we used ZF as the likelihood of having been targeted by
positive selection. We then applied a linear regression between this score and both population-
specific recombination rate average across the gene and GC content average across the gene.
High ZF values indicate a higher probability of having evolved under positive selection.
The linear regression residuals were then used to perform the Spearman's correlation analysis, the
ANOVA and the linear trend test.a Spearman correlation between degree and the residuals.b Non-parametric ANOVA and trend tests performed to contrast whether the medians of the
residuals across the degree groups.
*: P < 0.05; **: P < 0.01; ***: P < 0.001.
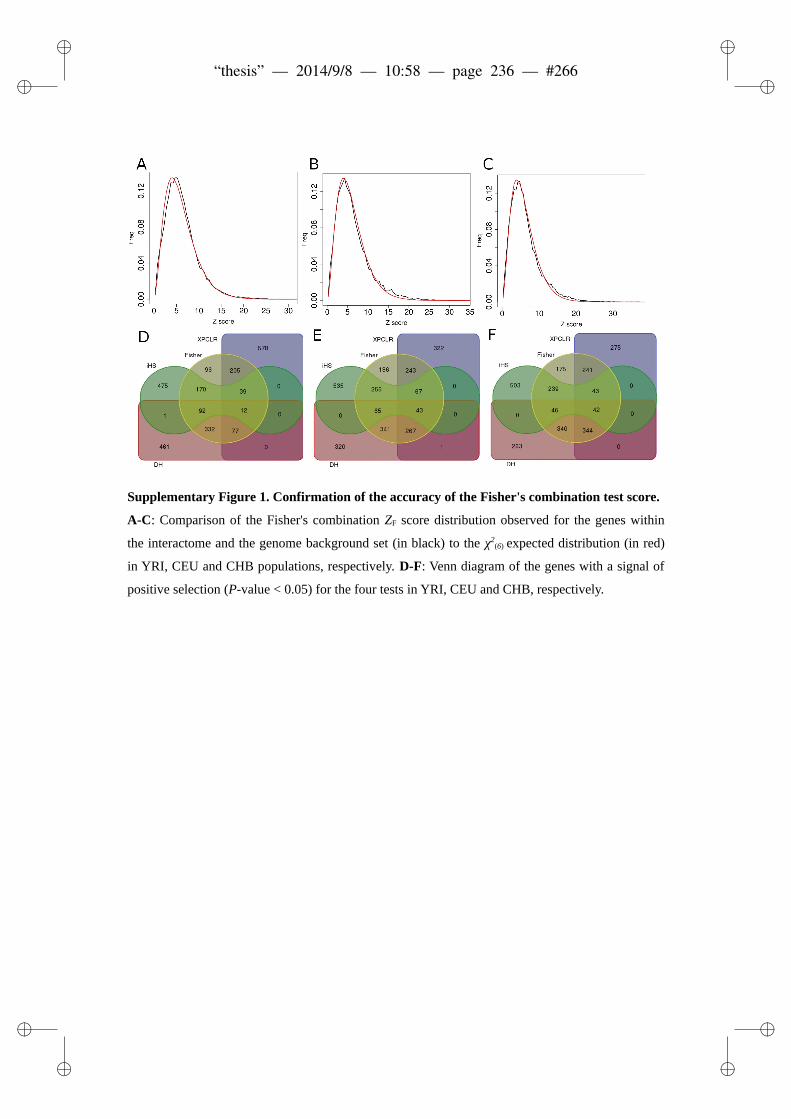
ii
“thesis” — 2014/9/8 — 10:58 — page 236 — #266 ii
ii
ii
Supplementary Figure 1. Confirmation of the accuracy of the Fisher's combination test score.
A-C: Comparison of the Fisher's combination ZF score distribution observed for the genes within
the interactome and the genome background set (in black) to the χ2(6) expected distribution (in red)
in YRI, CEU and CHB populations, respectively. D-F: Venn diagram of the genes with a signal of
positive selection (P-value < 0.05) for the four tests in YRI, CEU and CHB, respectively.

ii
“thesis” — 2014/9/8 — 10:58 — page 237 — #267 ii
ii
ii
Supplementary Figure 2. Impact of positive selection in human populations as measured by
four different tests based on polymorphism data among groups of genes divided according to
the degree quartiles.
Genes were classified into four groups according to the degree quartiles calculated in the network.

ii
“thesis” — 2014/9/8 — 10:58 — page 238 — #268 ii
ii
ii
The median of the positive selection score ± one median absolute deviation within each group is
represented in the y-axis. A non-parametric ANOVA analysis was performed to contrast whether the
medians of the positive selection scores were equal across the groups. A trend test on ranks was also
been carried out to test for a linear relationship between the four quartiles (encoded from 1 to 4) and
natural selection scores. A Tukey's honestly significant difference test was further applied to test for
all pairwise differences. Significantly different pairs are marked with asterisks. *: P < 0.05; **: P <
0.01; ***: P < 0.001.

ii
“thesis” — 2014/9/8 — 10:58 — page 239 — #269 ii
ii
ii
Supplementary Figure 3. Impact of positive selection during recent human evolution among
groups of genes classified according to their degree using a subset of independently evolving
genes.
We obtained a subset of most likely unlinked genes involved in the network containing 2,793, 3,107
and 3,108 genes in YRI, CEU and CHB, respectively, by randomly sampling one network gene
located between two recombination hotspots (defined as a region where the observed recombination
rates is greater than 10 times the genome recombination rate average). Genes were classified into
four groups according to the degree quartiles. The median of the ZF scores ± one median absolute
deviation within each group is represented in the y-axis. A non-parametric ANOVA analysis was
performed to contrast whether the median scores are equal across the groups. A trend test on ranks
was also carried out to test for a linear relationship between the four groups (encoded from 1 to 4)
and natural selection scores. A Tukey's honestly significant difference test was further applied to test
for all pairwise differences. Significantly different pairs are marked with asterisks. *: P < 0.05; **:
P < 0.01; ***: P < 0.001.

ii
“thesis” — 2014/9/8 — 10:58 — page 240 — #270 ii
ii
ii
Supplementary Figure 4. Impact of natural selection among groups of genes classified
according to their degree controlling for confounding factors.
ZF and 2Δℓ were used to estimate the impact of positive selection in human populations and in
mammals, respectively. DAF and ω were used to estimate the impact of purifying selection in
human populations and in mammals, respectively. In order to test for an association between degree
and positive selection scores controlling simultaneously for protein length, expression level and
expression breadth, we applied a linear regression between positive selection scores and these
factors. The linear regression residuals were then used to perform the Spearman's correlation
analysis, the non-parametric ANOVA and the linear trend test on ranks. Genes were classified into
four groups according to the degree quartiles. The median of the residuals ± one median absolute
deviation within each group are represented in the y-axis. A non-parametric ANOVA analysis was
performed to contrast whether the medians of the scores are equal across the groups. A trend test
was carried out to test for a linear relationship between the four groups (encoded from 1 to 4) and
natural selection scores. A Tukey's honestly significant difference test was further applied to test for
all pairwise differences. Significantly different pairs are marked with asterisks. *: P < 0.05; **: P <
0.01; ***: P < 0.001.

ii
“thesis” — 2014/9/8 — 10:58 — page 241 — #271 ii
ii
ii
Supplementary Figure 5. Impact of natural selection among groups of genes classified
according to their degree in the BioGRID high quality network.
Genes were classified into four groups according to the degree quartiles calculated in the network
HQ. The median of the positive selection score used as likelihood of having been targeted by
natural selection ± one median absolute deviation within each group is represented across the y-
axis. ZF and 2Δℓ were used to infer the impact of positive selection in human populations and in
mammals, respectively. DAF and ω were used to estimate the impact of purifying selection in
human populations and in mammals, respectively. A non-parametric ANOVA analysis was been
performed to contrast whether the medians of the scores were equal across the groups. A trend test
on ranks was also carried out to test for a linear relationship between the four groups (encoded from
1 to 4) and natural selection scores. A Tukey's honestly significant difference test was further
applied to test for all pairwise differences. Significantly different pairs are marked with asterisks. *:
P < 0.05; **: P < 0.01; ***: P < 0.001.
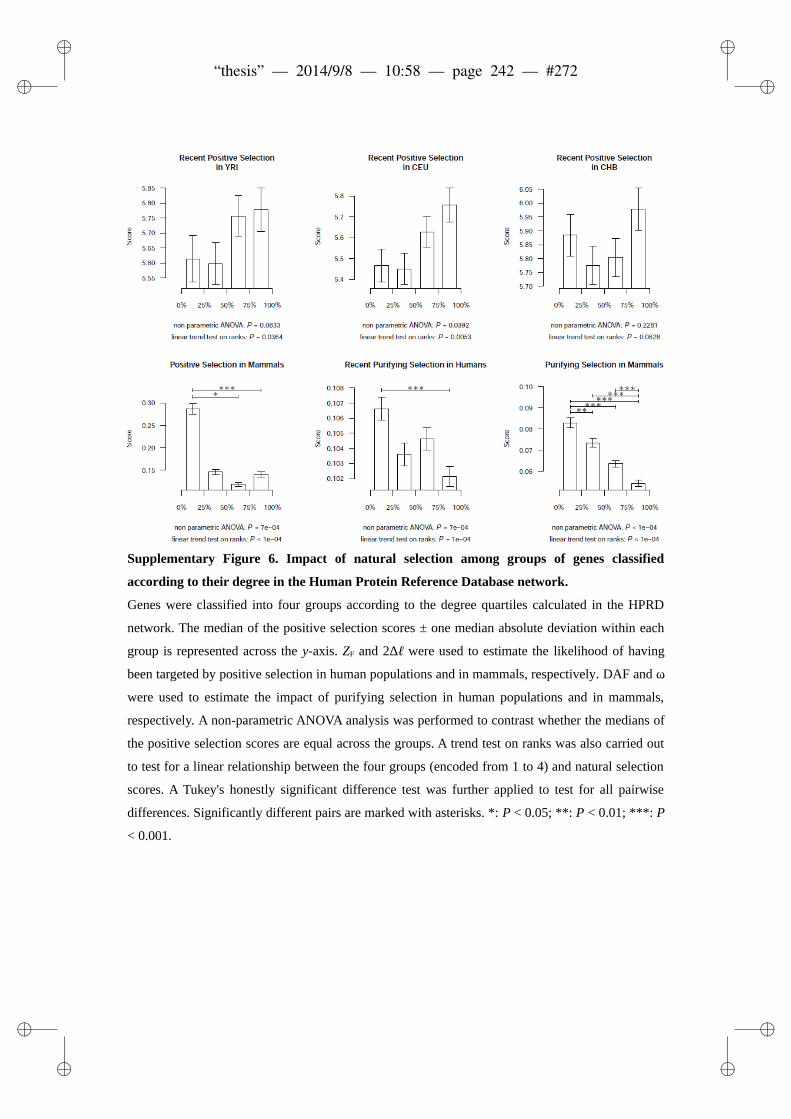
ii
“thesis” — 2014/9/8 — 10:58 — page 242 — #272 ii
ii
ii
Supplementary Figure 6. Impact of natural selection among groups of genes classified
according to their degree in the Human Protein Reference Database network.
Genes were classified into four groups according to the degree quartiles calculated in the HPRD
network. The median of the positive selection scores ± one median absolute deviation within each
group is represented across the y-axis. ZF and 2Δℓ were used to estimate the likelihood of having
been targeted by positive selection in human populations and in mammals, respectively. DAF and ω
were used to estimate the impact of purifying selection in human populations and in mammals,
respectively. A non-parametric ANOVA analysis was performed to contrast whether the medians of
the positive selection scores are equal across the groups. A trend test on ranks was also carried out
to test for a linear relationship between the four groups (encoded from 1 to 4) and natural selection
scores. A Tukey's honestly significant difference test was further applied to test for all pairwise
differences. Significantly different pairs are marked with asterisks. *: P < 0.05; **: P < 0.01; ***: P
< 0.001.
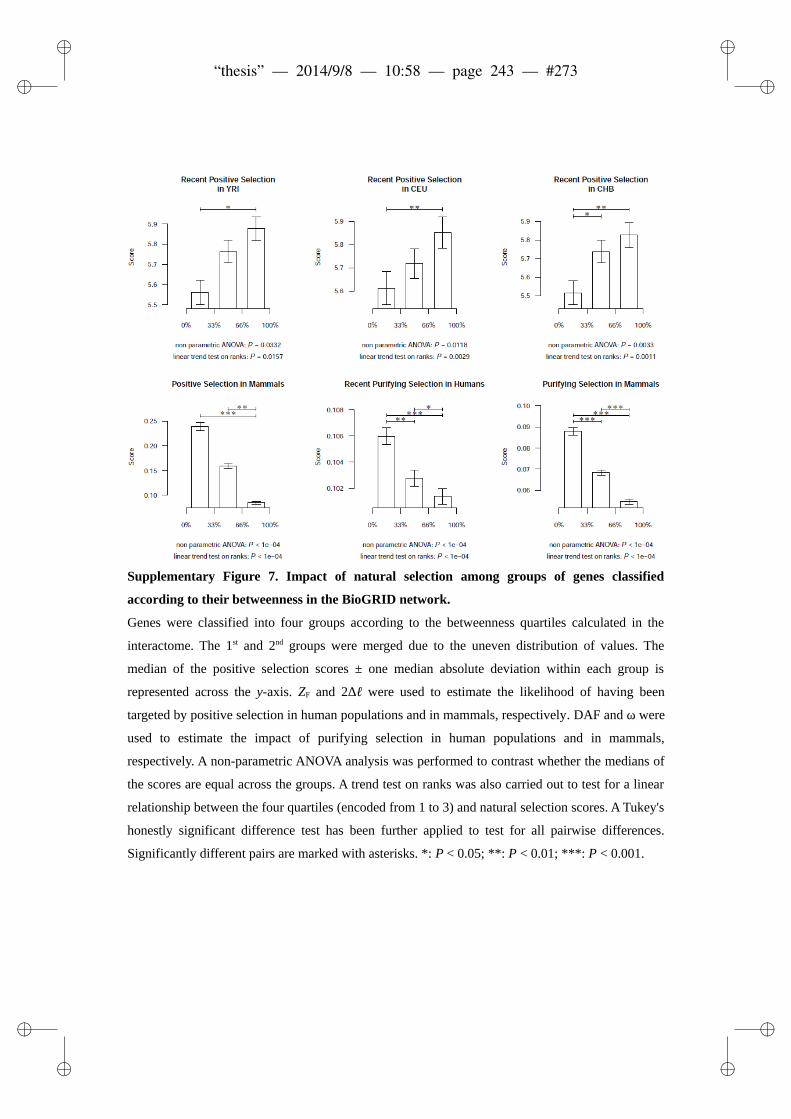
ii
“thesis” — 2014/9/8 — 10:58 — page 243 — #273 ii
ii
ii
Supplementary Figure 7. Impact of natural selection among groups of genes classified
according to their betweenness in the BioGRID network.
Genes were classified into four groups according to the betweenness quartiles calculated in the
interactome. The 1st and 2nd groups were merged due to the uneven distribution of values. The
median of the positive selection scores ± one median absolute deviation within each group is
represented across the y-axis. ZF and 2Δℓ were used to estimate the likelihood of having been
targeted by positive selection in human populations and in mammals, respectively. DAF and ω were
used to estimate the impact of purifying selection in human populations and in mammals,
respectively. A non-parametric ANOVA analysis was performed to contrast whether the medians of
the scores are equal across the groups. A trend test on ranks was also carried out to test for a linear
relationship between the four quartiles (encoded from 1 to 3) and natural selection scores. A Tukey's
honestly significant difference test has been further applied to test for all pairwise differences.
Significantly different pairs are marked with asterisks. *: P < 0.05; **: P < 0.01; ***: P < 0.001.

ii
“thesis” — 2014/9/8 — 10:58 — page 244 — #274 ii
ii
ii
Supplementary Figure 8. Impact of natural selection among groups of genes classified
according to their closeness in the BioGRID network.
Genes were classified into four groups according to the closeness quartiles. The median of the
positive selection scores ± one median absolute deviation within each group is represented across
the y-axis. ZF and 2Δℓ were used to estimate the likelihood of having been targeted by positive
selection in human populations and in mammals, respectively. DAF and ω were used to estimate the
impact of purifying selection in human populations and in mammals, respectively. A non-parametric
ANOVA analysis was performed to contrast whether the medians of the scores are equal across the
groups. A trend test on ranks was also carried out to test for a linear relationship between the four
quartiles (encoded from 1 to 4) and natural selection scores. A Tukey's honestly significant
difference test was further applied to test for all pairwise differences. Significantly different pairs
are marked with asterisks. *: P < 0.05; **: P < 0.01; ***: P < 0.001.
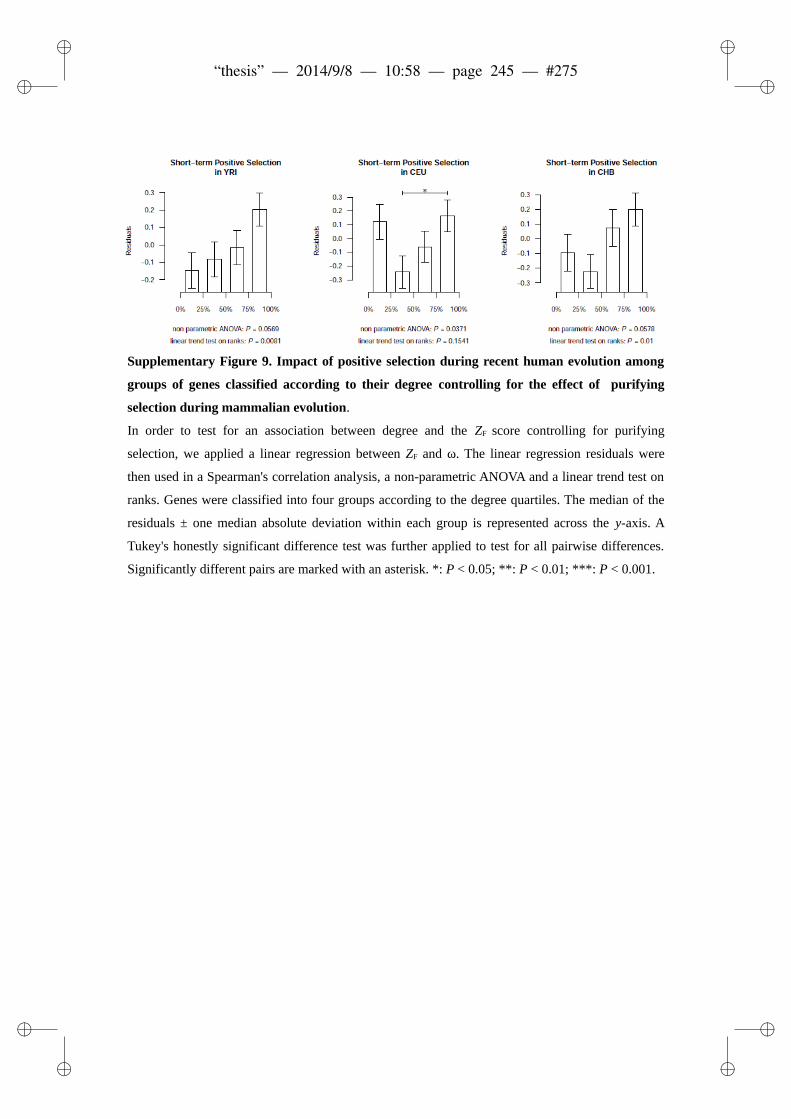
ii
“thesis” — 2014/9/8 — 10:58 — page 245 — #275 ii
ii
ii
Supplementary Figure 9. Impact of positive selection during recent human evolution among
groups of genes classified according to their degree controlling for the effect of purifying
selection during mammalian evolution.
In order to test for an association between degree and the ZF score controlling for purifying
selection, we applied a linear regression between ZF and ω. The linear regression residuals were
then used in a Spearman's correlation analysis, a non-parametric ANOVA and a linear trend test on
ranks. Genes were classified into four groups according to the degree quartiles. The median of the
residuals ± one median absolute deviation within each group is represented across the y-axis. A
Tukey's honestly significant difference test was further applied to test for all pairwise differences.
Significantly different pairs are marked with an asterisk. *: P < 0.05; **: P < 0.01; ***: P < 0.001.
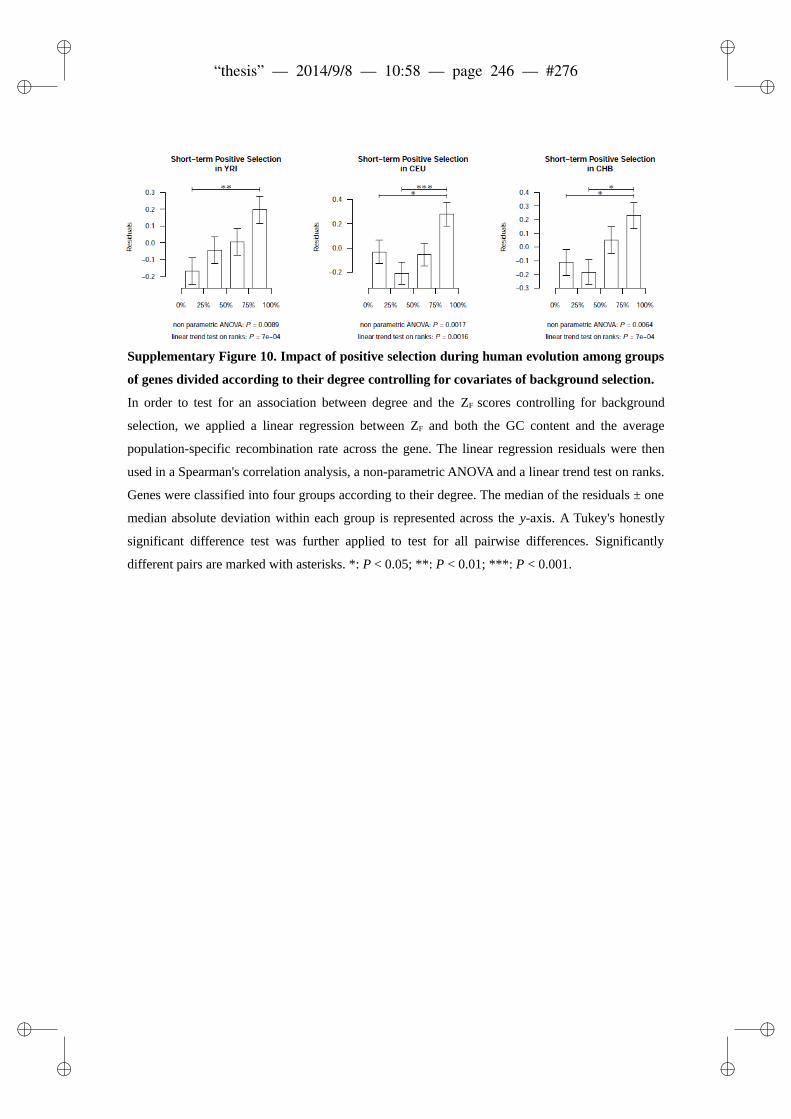
ii
“thesis” — 2014/9/8 — 10:58 — page 246 — #276 ii
ii
ii
Supplementary Figure 10. Impact of positive selection during human evolution among groups
of genes divided according to their degree controlling for covariates of background selection.
In order to test for an association between degree and the ZF scores controlling for background
selection, we applied a linear regression between ZF and both the GC content and the average
population-specific recombination rate across the gene. The linear regression residuals were then
used in a Spearman's correlation analysis, a non-parametric ANOVA and a linear trend test on ranks.
Genes were classified into four groups according to their degree. The median of the residuals ± one
median absolute deviation within each group is represented across the y-axis. A Tukey's honestly
significant difference test was further applied to test for all pairwise differences. Significantly
different pairs are marked with asterisks. *: P < 0.05; **: P < 0.01; ***: P < 0.001.

ii
“thesis” — 2014/9/8 — 10:58 — page 247 — #277 ii
ii
ii
A MACHINE-LEARNINGFRAMEWORK TO DETECTAND CLASSIFY HARDSELECTIVE SWEEPS INHUMAN POPULATIONS.
Marc Pybus, Pierre Luisi, Giovanni Dall’Olio1, Manu Uzkudun, HafidLaayouni, Jaume Bertranpetit, Johannes EngelkenIn Preparation
247

ii
“thesis” — 2014/9/8 — 10:58 — page 248 — #278 ii
ii
ii

ii
“thesis” — 2014/9/8 — 10:58 — page 249 — #279 ii
ii
ii
A Machine-Learning Framework to Detect and Classify
Hard Selective Sweeps in Human Populations
Marc Pybus1,+ , Pierre Luisi1,+, Giovanni Dall’Olio1,2,+ , Manu Uzkudun1 , Hafid Laay-
ouni1 , Jaume Bertranpetit1,*, Johannes Engelken¹,*
¹ Institut de Biologia Evolutiva (UPF-CSIC), Parc de Recerca Biomèdica de Barcelona
(PRBB), Dr Aiguader, 88, 08003, Barcelona, Catalonia, Spain.2 Division of Cancer Studies, King's College of London, London (UK)
+ Those authors contributed equally to this work
* Corresponding authors
Jaume Bertranpetit:
IBE, Institut de Biologia Evolutiva (UPF-CSIC)
CEXS-Universitat Pompeu Fabra-PRBB
Doctor Aiguader 88
08003 Barcelona, Catalonia, Spain
email: [email protected]
Johannes Engelken:
IBE, Institut de Biologia Evolutiva (UPF-CSIC)
CEXS-Universitat Pompeu Fabra-PRBB
Doctor Aiguader 88
08003 Barcelona, Catalonia, Spain
email: [email protected]
Abstract (or Author Summary)
Detecting Darwinian selection in human genomic regions has been a recurrent
topic in human population genetic studies. Over the years, many positive selection
tests have been implemented to highlight specific genomic patterns left by a selec-
tive event when compared to neutral expectations. However, there is little consis-
tency among the regions detected in several genome-wide scans using different
tests: population-specific demographic dynamics, local genomic features or differ-
ent types of selection acting along the genome might explain such discrepancies.
ii
“thesis” — 2014/9/8 — 10:58 — page 250 — #280 ii
ii
ii
We have implemented a machine-learning classification framework that exploits
the combined ability of some positive selection tests to uncover different features
of a given selective sweep (such as completeness and oldness). Our simulation-cali-
brated framework estimates composite scores of several positive selection tests
while controlling for population-specific demographies within a hard sweep model
context. As a result, we increase the sensitivity toward hard selective sweeps while
adding insights about the completeness and oldness of the sweep. Our method also
allows to interpret the relevance of a given positive selection test under specific se-
lection scenarios. We calibrated and applied the method to three reference popula-
tions from The 1000 Genome Project to generate a genome-wide classification map
of hard selective sweeps that can be used to find putative regions under positive
selection in the human lineage. Different genomic patterns arise under specific de-
mographies and different time-spanning hard selective sweeps and, probably, dif-
ferent selection models (soft, balancing). This study is aimed at improving the way
a selective sweep is inferred by taking into account that such differences may exist
and can be used as proxies to understand better how natural selection has shaped
our genome. We found very few signals of hard sweep in the African population
analyzed, putatively appointing to alternative modes of adaptation at stake.
Author Summary (or Abstract)
Almost all the current methods to detect positive selection are designed to detect a
very specific type of selective sweep: the recent strong hard selective sweep. A hy-
pothetical beneficial mutation appears in a population (hard sweep model) and is
increased in frequency until it reaches fixation in a relatively short period of time
(strong selection coefficient). Allele fixation occurs at the present time (recent se-
lective event), leaving no time for mutation and recombination to recover previous
diversity levels and linkage disequilibrium patterns. While this type of sweeps ap-
pears to be common in some animal species (e.g. in some Drosophila species), in
human populations seem to be not so common: few have been detected in Out-of-
Africa populations and almost none have been found in African populations. Selec-
tion on standing variation (soft sweep model), balancing selection or different
types of hard sweeps (such as partial or old sweeps) may have played a bigger role

ii
“thesis” — 2014/9/8 — 10:58 — page 251 — #281 ii
ii
ii
in human evolution. Thus, we have developed a calibrated framework based on re-
alistic simulations that builds composite scores from different positive selection
tests to detect and classify different types of hard selective sweeps. With this new
approach we are able to increase sensitivity toward almost-fixed selective sweeps
and get insights about the relative oldness of a given selection signal. Once vali-
dated, we applied the method to empirical data of three reference populations
from The 1000 Genomes Project to generate a genome-wide classification map of
human hard sweeps. Very few signals were observed in the African population
studied, while our method presents higher sensitivity in this population. In the fu-
ture, our framework implementation could be used to include more types of selec-
tion (soft sweeps, balancing selection) so they could be properly classified and
used to further understand how Darwinian evolution has shaped our genome.
Introduction
Over the last few decades, many different methods to detect positive selection in
genomic regions have been developed. Such methods rely on the different genomic
patterns left by an hypothetical selection event occurring in an idealized human
population: a beneficial de-novo mutation arises and increases its frequency in a
relatively low number of generations until it reaches population fixation at present
times, in what was called the hard sweep model. This process leaves some charac-
teristic patterns in the region surrounding the beneficial allele (selective sweep),
such as skewed site frequency spectrum towards low frequency variants, long link-
age disequilibrium haplotypes and population differentiation. Over the years, meth-
ods aimed at distinguishing such patterns have been developed and the genetic ba-
sis of some examples of human adaptation were confirmed, such as lactase persis-
tence allele [1,2] or malaria resistance gene variants [3–6]. However, most of such
methods usually lack consistency in reporting the same selective events along the
genome [7]. This disagreement might appear due to the specific method capacity
to uncover selection patterns under some local features of a local genomic region
(such as specific recombination maps) or due to specific demographic dynamics of
a given natural population. Thus, during the last decade, special effort was made to
incorporate population-specific demographic models and region-specific recombi-

ii
“thesis” — 2014/9/8 — 10:58 — page 252 — #282 ii
ii
ii
nation maps to approximate the neutral model to more complex scenarios [8].
However, while this approach improved the sensitivity to detect positive selection,
it did not explain the lack concordance between methods. Other hypothesis pointed
that other types of selection acting in the genome might explain such discrepan-
cies, like selection on standing variation and polygenic adaptation [9] or balancing
selection. Recently, a Bayesian method called CMS was developed and trained with
neutral and selection simulations with the aim to integrate the signals of different
positive selection tests in a composite score [10,11]. This Bayesian method com-
bines the common signals shown by different positive selection tests under many
selection scenarios so that the resulting sensitivity to general hard selective
sweeps is increased. Nonetheless, the method did not try to uncover the specific
features of a given selective sweep, such as the extent of completeness (final allele
frequency of the selected allele) or the oldness of a selective event. We hypothesize
that these internal features of the hard sweep model might explain, in part, the ob-
served inconsistency between statistics signals so we can use them to uncover spe-
cific hard sweep features. Here, we applied a similar strategy (combination of neu-
trality scores through a machine-learning algorithm trained with simulations) with
the difference that our framework works by automatically giving more weight to
those tests that perform better at distinguishing between two simulated scenarios.
This approach increases the sensitivity toward hard selective sweeps and uncovers
some specific features of such sweeps. In the framework, we train different boost-
ing models with very specific coalescent simulations to use the resulting regression
functions as classification methods embedded in a hierarchical classification tree.
A boosting algorithm is a widely used machine-learning algorithm that estimates a
linear regression function of different input variables (here, positive selection test
scores) so it maximizes the differences between two competing scenarios (for ex-
ample, neutrality versus selection). Given an empirical genomic region for which
we know their positive selection test scores, our framework sequentially applies
different boosting functions in order to classify it based on the patterns observed
when simulating different selection scenarios. Accordingly, we trained our frame-
work with selection simulations with different final allele frequencies of the se-
lected allele (completeness of a selective sweep) and with different time-spanning
selective events (oldness of a selective sweep). After evaluating our method perfor-
mance through independent simulations we applied it to empirical genome-wide
ii
“thesis” — 2014/9/8 — 10:58 — page 253 — #283 ii
ii
ii
data from The 1000 Genomes Project [12] with the objective of obtaining an im-
proved genome-wide map of positive selection in three reference human popula-
tions. To our knowledge, this is the first genome-wide attempt to build a machine-
learning classification method for hard sweeps in human populations.
A conservative average estimation of 0.47% of the genome exhibiting signals of
hard sweep in the three studied populations suggests that such selective events
were rare during human evolution. Moreover, we detected 13-fold and 15-fold de-
crease of signals in the African population as compared to the European and East
Asian populations, respectively, underlying the fact that adaptive processes may
have been different within and out of Africa.
Materials and Methods
Reference Empirical Dataset
We downloaded genome-wide single nucleotide variant (SNV) data representing
three continental populations -- Yoruba in Ibadan, Nigeria (YRI), Han Chinese in
Beijing, China (CHB) and Utah residents with Northern and Western European
ancestry, USA (CEU) -- from the low-coverage Phase I release (April 2012) of The
1000 Genomes Project [12]. After extracting all polymorphic SNVs we counted
more than 24M segregating sites genome-wide. The SNV data was already phased
by The 1000 Genomes Consortium and its phasing state was kept in other to apply
haplotype-based statistics. We also downloaded both the ancestral allele state
genome and the global genetic map provided by the consortium since this informa-
tion is required by some of the positive selection statistics used.
Coalescent Simulations
Coalescent simulations covered a total of 46 scenarios (45 with selection + 1 neu-
tral) simulating each one of the selected populations (CEU, CHB and YRI) under
population-specific demographic models (Figure 1). Additionally, the same 46 sce-
narios were replicated to obtain an independent dataset that was used for the eval-
uation process. We used the software cosi version 1.2.1 [13] to generate such simu-
ii
“thesis” — 2014/9/8 — 10:58 — page 254 — #284 ii
ii
ii
lations since it includes a tuned human demography for three continental popula-
tions of Northern Europe, Asian and African ancestry (CEU, JPT/CHB, and YRI). In
addition to the neutral scenario, this version of cosi is able to simulate classic se-
lective sweeps (hard sweep model) under specific constraints [10]. Three parame-
ters are required to simulate a hard selective sweep in cosi: selection coefficient,
time when the sweep ends and final allele frequency of the selected allele. We set
up these parameters to build 45 selection scenarios in a similar way to Grossman
et al. 2010 [10]. Cosi does not allow any population effective size change or migra-
tion between populations while selection is occurring. Accordingly, we removed mi-
gration between populations from the provided "best fit" demographic model and
simulated selective sweeps in a period when population effective sizes do not
change in any population (between 10 Kya and 45 Kya). Generation time was set to
25 years, as described in the original paper. In short, nine classes of selective
sweeps were simulated (grouped as Recent, Recent Long and Ancient selective
sweeps) spanning different time periods between 10 Kya and 45 Kya, and for each
class we also simulated five different final allele frequencies (FaF) for the selected
allele (grouped as Complete, Incomplete and Partial selective sweeps). More de-
tails on the demographic and selection parameters used in our simulations are pro-
vided in Supporting Text S1. We also used the hotspot recombination model im-
plemented in the simulation package (recosim) in order to obtain more realistic
linkage disequilibrium patterns: this model incorporates features of recombination
hotspots observed in human populations data instead of a mean genome-wide re-
combination rate. We computed 3000 replicates for the neutral scenario and 100
replicates for each one of the 45 selection scenarios. For each replicate, we simu-
lated regions of 600 Kbp, to allow extended homozygosity statistics to calculate
properly the EHH decay, and 97, 85 and 88 diploid individuals for CEU, CHB and
YRI populations respectively, thus matching the sample size found in the reference
empirical dataset. Note that our demographic model, contrary to Grossman et al.
2010 [10], allowed for the last agricultural population size increase as in the origi-
nal cosi publication. Cosi's 'best fit' demography was designed to produce se-
quence data that match different genome-wide evolutionary statistics distributions
but it does not simulates the site frequency spectrum (SFS) bias towards low-fre-
quency variants found in the low-coverage release of 1000 genomes Phase I [12].
Consequently, we applied a SFS thinning strategy to all simulations and replicates
ii
“thesis” — 2014/9/8 — 10:58 — page 255 — #285 ii
ii
ii
that randomly removed 48% of the singletons present in the all-together popula-
tions site frequency spectrum to adjust simulation data to the SFS found in the ref-
erence empirical dataset. Figure 2 shows the difference in relative site frequency
spectrum of empirical genome-wide data, original neutral simulations and thinned
neutral simulations for each population.
Implemented Positive Selection Tests
In order to detect positive selection in empirical genome-wide and simulated SNV
data we implemented an informatic pipeline including 21 different positive selec-
tion statistics (Table 1) that allowed us to parallelize the analysis in a computer
cluster. Pipeline design and detailed descriptions of the tests can be found in Pybus
et al., 2014 [14]. All the included tests were applied as described in their respec-
tive papers except for XP-EHH and iHS algorithms, which were modified to speed
up the calculations by increasing the EHH threshold from 0.05 to 0.15. Both modi-
fied versions were then verified to report signal of positive selection through simu-
lations. Positive selection tests based on regions, such those based on allele fre-
quency spectrum, were ran applying a sliding window approach, also described in
Pybus et al., 2014 [14]. For the empirical genome-wide data we developed a fur-
ther parallelization strategy which consisted in splitting the genome-wide data in
overlapping regions of 5Mb. Once the regions were analyzed with our 21 positive
selection statistics, their outputs were re-merged seamlessly to retrieve concate-
nated genome-wide results. For the simulation datasets we ran each positive selec-
tion test to the 600 Kbp simulated sequence, although we only used the results
from the central 25 Kbp region to train the algorithm and evaluate the results. For
that purpose, we used the positive selection scores obtained from the central 25
Kbp region containing the selected allele. To get a unique score per region we used
a specific summary statistic to each test so that it maximizes the selective sweep
signal in the central region, as explained below. After the validation process, only
11 positive selection statistics were used to train the machine-learning algorithm
as explained below.
Simulation and Positive Selection Test Validation

ii
“thesis” — 2014/9/8 — 10:58 — page 256 — #286 ii
ii
ii
One important step to use this method in empirical data was to validate all the pos-
itive selection tests we implemented. By comparing statistics’ scores on neutral
and selection simulations we were able to confirm that most of the tests were
showing incremented signals on selective sweep simulations when compared to
neutral ones. This approach confirmed their suitability to report regions under pos-
itive selection in a human demographic context (Figure 3 and Supporting Fig-
ures S2). 'Best fit' demography was fine-tuned to match SFS, Fst and LD decay in
Schaffner et al. 2005 [13]. Having implemented those and more evolutionary statis-
tics we wanted to check that the score distributions at neutral simulations of our
positive selection tests were similar to those found in empirical genome-wide data.
The genome-wide distributions were obtained from analyzing 13,969 autosomal 25
Kbp regions separated by a distance of 200 Kbp each other. We also selected 102
autosomal 25kb regions that have putatively evolved neutrally and dispersed
throughout the genome. Those regions were selected to meet the following crite-
ria: (1) to be a least 100 Kbp away from any known or predicted gene or expressed
sequence tag or region transcribed into mRNA; (2) to be outside any segmental du-
plication or region transcribed into long noncoding RNA or conserved noncoding
element (as defined in Woolfe et al. 2007 [15]); (3) to be distant from each other by
at least 100 Kbp and not in LD each other. By manually checking the score distri-
bution of the positive selection tests implemented in the framework, we confirmed
a good correspondence between empirical and simulated datasets, thus confirming
the suitability of the chosen demographic model. Figure 4 shows distribution
plots, box plots and violin plots for neutral simulations, 1000 genomes genome-
wide data and the neutral subset of 1000 genomes data for dDAF, Tajima's D and
XP-EHH statistics in CEU / EUR population as reference examples. The rest of the
plots for the other statistics and populations can be found in Supporting Figures
S3.
Score combination into window-based summary statistics
Positive selection statistics usually report scores for genomic regions of different
lengths and, in some cases, for individual SNVs. However, a common region size

ii
“thesis” — 2014/9/8 — 10:58 — page 257 — #287 ii
ii
ii
was needed in order to compare and combine different positive selection tests
within the boosting analysis. Accordingly, different region summarizing approaches
were evaluated for each positive selection test. We chose to work with a region of
25 Kbp and considered as summary statistics the maximum, minimum or mean
score across the region. To identify the best of these summary statistics for each
positive selection test, we considered the 25 Kbp window located at the center of
the simulated sequences, thus containing the selected allele. We then performed a
sensitivity vs sensibility analysis comparing neutral simulations to estimate the
false discovery rate to selection simulations with final allele frequencies of 0.8 and
1.0 to estimate the true positive rate. Thus, for each positive selection statistic we
computed three Receiver Operating Characteristic Curves (ROC Curves) and, for
each method, we chose summary statistics showing the highest Area Under the
Curve (AUC) score (Table 3).
The Hierarchical Boosting Framework
We define a boosting function as a linear regression function of positive selection
test scores that can be used as a classification method and that has been estimated
through a boosting algorithm. In our framework, the four different boosting func-
tions are sequentially considered within a hierarchical decision tree implementa-
tion (Figure 5). These boosting functions optimally combine each positive selec-
tion test ability to uncover specific properties of different selective sweeps. In or-
der to estimate the different boosting functions, we grouped the 45+1 simulated
datasets according to some common selective sweep features. After analyzing sev-
eral simulations under different selection parameters we found that the main force
driving statistics' scores was the final allele frequency of the selected allele (Fig-
ure 3). Hence, we decided to create groups of different selection scenarios accord-
ing to the final allele frequency of the selected variant as main property (Complete:
FAF=1.0, Incomplete: FAF=0.8 and 0.6, Partial: FAF=0.4 and 0.2 and Neutral
scenarios) and then, according to the oldness of the simulated sweep (Recent:
sweep ends 10 Kya, Ancient: sweep ends 30 Kya). Having our simulation scenarios
groups defined (Figure 5) and their positive selection test scores calculated, we
ran the machine-learning algorithm to train boosting functions which allowed to

ii
“thesis” — 2014/9/8 — 10:58 — page 258 — #288 ii
ii
ii
classify competing groups of scenarios. To do so we used the positive selection
scores obtained from the central 25 Kbp region containing the selected allele using
an specific summary statistic to each test so that it maximizes the selective sweep
signal in the central region, as explained above (Table 3). Boosting algorithm esti-
mates regression coefficients for input positive selection tests scores from two
competing sets of scenarios (training datasets) so that the resulting regression
score maximizes the differences between the two. This allows to set up a regres-
sion score threshold to, in turn, classify an unknown empirical or simulated ge-
nomic region for which we already know its individual positive selection scores. We
systematically verified coefficient convergence for every estimated boosting func-
tion (Supplementary Figures S8). To circumvent a putative convergence to local
instead of global optimal, and thus, to obtain a more robust regressions, we devel-
oped a bootstrapping strategy which is explained below. Thus, the estimated coeffi-
cients (Figure 6) have an amplitude according to their performance to distinguish
among distinct scenarios. We used the mean coefficient value for each positive se-
lection test to build our boosting functions. Then, using the reference set of simula-
tion replicates at a given step, we calculated the thresholds for estimated regres-
sion scores that were needed to classify the evaluation datasets allowing 1% of
false discovery rate. According to the chosen decision tree scheme, the iterative
classification of a genomic region of interest is done as following:
(1a) if the Complete Boosting score is above the 99th percentile of the distri-
bution of the Complete Boosting scores for the training simulations under Neutral
scenario and Partial and Incomplete sweep scenarios, the region is classified as
Complete Sweep and go to step 2a, otherwise go to step 1b.
(1b) if the Incomplete Boosting score is above the 99th percentile of the dis-
tribution of the Incomplete Boosting scores for the training simulations under Neu-
tral scenario and Partial sweep scenarios, the region is classified as Incomplete
Sweep and go to step 2b, otherwise go to step 1c.
(1c) If not classified at iteration 1a or 1b, the genomic region is left unclassi-
fied and the algorithm stops.
(2a) If the Ancient/Recent Complete Boosting score is above the 99th per-
centile of the distribution of the Ancient/ancient Complete Boosting scores for the
training simulations under Complete Recent scenario the region is classified as An-
cient Complete Sweep, while if it is below the 1th percentile of the distribution of

ii
“thesis” — 2014/9/8 — 10:58 — page 259 — #289 ii
ii
ii
the Ancient/Recent Complete Boosting scores for the training simulations under
Complete Ancient scenario the region is classified as Recent Complete Sweep , oth-
erwise the region remains only classified as Complete Sweep.
(2b) If the Ancient/Recent Incomplete Boosting score is above the 99th per-
centile of the distribution of the Ancient/ancient Incomplete Boosting scores for the
training simulations under Incomplete Recent scenario the region is classified as
Ancient Incomplete Sweep, while if it is below the 1th percentile of the distribu-
tion of the Ancient/Recent Incomplete Boosting scores for the training simulations
under Incomplete Ancient scenario the region is classified as Recent Incomplete
Sweep , otherwise the region remains only classified as Incomplete Sweep.
Two more alternative classification tree configurations were tested but showed
lower performance (Supplementary Text S4).
Boosting Algorithm, Bootstrapping and Quality Control
We have used the boosting algorithm as exactly implemented in Lin et al, 2011
[16]: among different versions of boosting, they chose a logistic regression model
with only one predictor a time as base procedure, thus permitting an easy interpre-
tation of the relevance of each input variable. The loss of function used was the
squared error loss function, as described in the manuscript. Because the boosting
algorithm is predicted to be robust to overfitting we did not use an information-
based iteration stopping criteria: we allowed boosting to iterate enough times until
we observed that regression coefficients reached stable convergence. While testing
different combinations of positive selection tests to build our boosting predictors
we noted that, when highly correlated input variables were used, boosting algo-
rithm never reached coefficient convergence. Thus, once we removed correlated
positive selection statistics, we achieved coefficient convergence in only few hun-
dreds of iterations (Supplementary Figures S8). The boosting algorithm imple-
mentation we used and other relevant functions are available in the R package
mboost [17]. Each boosting was trained with different number of simulations de-
pending on each scenarios different number of replicates (Table 2). We decided to
apply a bootstrapping strategy to evaluate and correct differences in input sizes as
well as to show the robustness of the coefficients estimated. We trained 1000 times

ii
“thesis” — 2014/9/8 — 10:58 — page 260 — #290 ii
ii
ii
each boosting algorithm performing a 90% resampling of input data from each
competing scenarios. To build the final boosting regression function we used the
mean coefficient values from the resampling procedure (Figure 6). All together,
the following quality control analysis was performed to choose the positive selec-
tion statistics to be included in the boosting framework:
1. Comparison of distributions from Neutral simulations with
Genome-wide and Putatively Neutral Real data: a poor match between the
scores distributions of a given test in genome-wide empirical data compared with
neutral or selection simulations was considered as strong reason for excluding
such test from an empirical analysis. We removed Fu's F statistic according to this
criteria (Supporting Figures S3).
2. Correlation among positive selection statistics and with recombi-
nation rate, GC content and read coverage: highly correlated input statistics
had to be removed to facilitate coefficient convergence and avoid overfitting dur-
ing the training process. We analyzed the correlation between statistics and other
variables under neutral, selection and empirical genome-wide data. Purifying se-
lection, through background selection (BGS), can produce signatures that can be
confounded with positive selection by tests based on DNA polymorphism [18]. We
controlled for such the putative confounding effect of BGS using genomic covari-
ates (recombination rate and GC content). Moreover, the power of detecting rare
variants depends on the read coverage [12], making the SFS-based tests putatively
correlated of the sequencing depth. Those putative correlations could bias the final
boosting score regarding local properties of the analyzed region. Figure 9 shows
the correlation analysis between positive selection tests and with recombination in
empirical genome-wide data: Wall's B, Wall's Q, Za, ZnS, R2, Fu & Li's F were
removed following this criteria. Population-specific correlation plots in empirical
and simulated data are shown in Supporting Figures S5.
3. Intrinsic nature of the statistic: cross-population non-directional sta-
tistics show the same signal either selection is happening on the target population
or on the reference one. Fst is a clear example of this, so it can not be used for
training population-specific boosting algorithms. XP-EHH and dDAF are cross-
population directional tests but since boosting algorithm can handle negative and
positive values, all negative values for these two tests were set to zero to avoid

ii
“thesis” — 2014/9/8 — 10:58 — page 261 — #291 ii
ii
ii
confounding signals before the boosting training was applied. XP-CLR is a cross-
population directional test reporting only positive values, so its output did not need
to be modified. Dh statistic was discarded because it is not a positive selection
test.
At the end, 11 positive selection statistics were selected as being suitable for a
combined boosting analysis. Table 4 summarizes the quality control process ap-
plied to all the implemented statistics and its outcome.
Results
Method Performance
Using an independent set of evaluation simulations (same parameters as the train-
ing dataset) we evaluated our framework performance through two methods: its
ability to classify selection scenarios and its sensitivity compared to the positive se-
lection tests used as input variables. To evaluate its classification power we calcu-
lated population-average false and true positive rates for each scenario in the eval-
uation dataset (Table 5 and Table 6). Equivalent population-specific tables are
found in Supporting Text S6. Note that unclassified cases are also taken into ac-
count yet we do not consider them as negative results. Population-averaged, our hi-
erarchical boosting implementation was able to classify the evaluation scenarios
with low false positive rates (5.37%). Many cases were left unclassified (false
negatives, 28.14%), making the hierarchical boosting a conservative method. It
also showed different true positive rates depending on the scenario to classify:
complete sweeps were easier to classify (89.58%) than incomplete sweeps
(43.04%), explained because most of the positive selection tests were imple-
mented to detect hard sweep upon important final allele frequency of the selected
variants. Recent complete sweeps (25.41%) were better classified than ancient
complete sweeps (23.76%). The same pattern was observed with incomplete re-
cent sweeps (18.89%) and incomplete ancient sweeps (11.00%). A selection signal
is expected to be stronger in recent sweeps because the recovery phase have less
time to affect genomic region diversity. When looking at population-specific perfor-
ii
“thesis” — 2014/9/8 — 10:58 — page 262 — #292 ii
ii
ii
mance we noted that hierarchical boosting was performing better in the simulated
African-ancestry population (93.44% for complete and 52.27% for incomplete
sweeps) than in the simulated Out-of-Africa populations (87.64% for complete and
38.97% for incomplete sweeps). On the other hand, we compared independently
the power of each statistic used in our boosting functions and the method itself.
For that purpose we calculated the true positive rate observed among a group of
selective sweep simulations at a given false discovery rate assessed on neutral sim-
ulations alone. We observed an improvement of our method to detect sweeps re-
gardless final allele frequencies (Figure 7, Supporting Text S6). While individual
positive selection statistics may show a comparable sensitivity to Complete and In-
complete boosting functions, like XP-EHH and iHS respectively, our method
showed higher sensitivity at different final allele frequencies overall, probably be-
cause the unifying power of the hierarchical classification scheme. We controlled
for confounding factors and local genomic features that might bias the application
of the method to empirical genome-wide data. To evaluate the robustness of our
method to such features we performed a correlation analysis between the obtained
boosting scores and recombination rate, GC content and read coverage. Neither
feature showed correlation with selected individual positive selection tests or the
hierarchical boosting itself (Supporting Figures S5).
Application to 1000 Genomes Data
We applied our population-specific hierarchical boosting method to the reference
empirical genome-wide data that was used to calibrate the simulations on which
relies the framework. We obtained a list of 25 Kbp widows per population that
were classified according to the different boosting functions described above (Ta-
ble 7). Overall, higher number of windows were classified as Incomplete rather
than Complete. This is expected as complete sweeps should be surrounded by in-
complete signals due to the genetic hitchhiking effect. Yet more windows were
classified as being Recent than Ancient, probably explained because the higher
sensitivity of the positive selection tests towards recent selective events than to old
ones. From a population-specific point of view, much less windows were reported
to be under selection in YRI population than in the CEU and CHB populations. A

ii
“thesis” — 2014/9/8 — 10:58 — page 263 — #293 ii
ii
ii
population average of 0.47% of over 103,000 genome-wide 25 kbp windows were
classified as being either complete or incomplete (CEU:0,6%, CHB:0.8%,
YRI:0,03%). We also observed more windows showing recent rather than ancient
selection signal, as expected (Table 7). However, the number of 25 Kbp windows
showing evidence of selection does not inform about the number of selective
events that happened or are happening along the genome and that are detectable
using this framework. The strength of selection and the recombination hotspot
map of a local region determine how much a selective sweep signal would span for
a given selective event as observed in many cases of positive selection. Thus, we
implemented an algorithm that concatenates consecutive 25 Kbp windows accord-
ing to their proximity, allowing for valley of non-significant scores as long as they
do not contain any recombination hotspot (for details see Supplementary Text
S7). After applying the algorithm we counted 27, 355 and 424 selective events in
YRI, CEU and CHB populations, respectively (Table 8; Supporting Table S9).
Roughly, a 13-fold and 15-fold decrease in the number of selective events was de-
tected in YRI population with respect to CEU and CHB populations, respectively.
Additionally, we classified the selective events according to boosting function
scores showing significance in the genomic region encompassing the selective
sweep signal (Table 8). One satisfying result is the excellent classification of the
selective events detected. Indeed, we observed few signals with any ambiguity for
the Class (Complete or Incomplete): only 10.2% of the identified selective sweeps
in any of the three populations (0%, 7.6% and 12.1% in only YRI, CEU and CHB,
respectively) encompass significant scores for both Complete and Incomplete
Boosting functions (Table 8). Moreover, those ambiguous signals exhibit a much
longer size and lower proportion of significant scores as compared to unambiguous
signals (Supplementary Text 7); hence, most of those signals may actually arise
from different adjacent independent selective events. On the other hand, most of
the selective events could not be assigned to a selective sweep Type (Ancient or
Recent): 59.4% of the identified selective sweeps in any of the three populations
(44.4%, 71.5% and 50.2% in only YRI, CEU and CHB, respectively) could be as-
signed a given Type. This demonstrates the difficulty to asses the oldness of a
sweep. However, we have designed here a very conservative framework for that
purpose, as demonstrated by the very low number of regions with a signal that has

ii
“thesis” — 2014/9/8 — 10:58 — page 264 — #294 ii
ii
ii
been assigned to both Recent and Ancient selective sweep (0%, 0.6%, 2.4% and
1.5% in YRI, CEU, CHB and any of the three populations, respectively). Finally, as
signaled when describing the results for individual 25 Kbp windows, we detected
overall more than twice Recent sweeps than Ancient ones (28.0% and 11.0%,
respectively). However, this trends is clearly driven by selective events in CEU and
CHB, while in YRI we observe a slightly higher number of Ancient selective sweeps
than Recent ones (29.6% and 25.9%, respectively)
We generated UCSC supertracks to easily visualize our hierarchical boosting re-
sults in any UCSC Genome Browser server. Visualizing selective sweeps in a
genome browser helps to properly evaluate their genomic context and allows to in-
terpret their strength and properties to propose putative candidate genes under
positive selection. Figure 8 shows four known examples of selection in the popula-
tions analyzed: LCT and SLC24A5 genes in CEU population, EDAR gene in CHB
and DARC gene in YRI. These supertracks and the raw hierarchical boosting re-
sults can be found in a local implementation of the UCSC Browser of our institute.
We also provide raw scores of the 21 original positive selection tests used in this
project and their estimated p-value under population-specific neutral expectations
(http://hsb.upf.edu/). We did not attempted to speculate about the phenotypic
consequences of the detected selective events because extensive functional analy-
sis are usually needed to do so.

ii
“thesis” — 2014/9/8 — 10:58 — page 265 — #295 ii
ii
ii
Discussion
Interpretation of the Estimated Boosting Functions
In order to properly compare the regression coefficients assigned to each positive
selection statistics within a given boosting function, we standardized them as in
Lin et al. 2011 [16]. We multiplied the estimated coefficients of each test by the
square root of the variance observed in the related statistic distribution across
replicates from both competing scenarios. The standardized coefficient assigned to
a positive selection test in a boosting function (Figure 6) gives some insight on
how well a given test is performing to distinguish between the two competing sce-
narios. We observe that to highlight complete sweeps against the other scenarios
the two most important statistics are, in order of importance, XP-EHH, dDAF, Fu
& Li's D, Omega and CLR. On the other hand, to detect incomplete sweeps, our
boosting functions relied mostly on iHS, XP-CLR and Fay & Hu's H. For recent
complete sweeps, XP-EHH contributed the most along with EHH Average and Fu
& Li's D. Instead, for complete ancient sweeps, dDAF and Tajima's D are the
ones more relevant. Within incomplete sweeps cases, iHS highlights recent selec-
tion patterns while dDAF defines more ancient ones. We observe that all three
populations show very similar boosting function coefficients, indicating that the
method is robust to continental human demography (Figure 6). These results are
also in agreement with the estimated power of each statistic to detect a selective
sweep with a given final allele frequency (Supporting Text S6).
Missing Hard Sweep Signals in Yoruba Population
We report less selective events or regions under selection (13-fold and 15-fold
reduction) in African-ancestry populations (YRI) than Out-of-Africa populations
(CEU and CHB, respectively). A similar pattern was observed in previous works
[19]. In these studies, the authors hypothesize that this lack of hard sweep signals
might be attributed to (i) the SNV ascertainment bias present in the chip-array
data they used in their studies or (ii) the use of positive selection tests with puta-
tively less power in African ancestry populations because particular genomic fea-

ii
“thesis” — 2014/9/8 — 10:58 — page 266 — #296 ii
ii
ii
tures (shorter LD, higher diversity) . They also proposed as an alternative explana-
tion, a scenario in which selection acted on standing variation. The present study is
able to overcome both methodological caveats since (i) it relies on sequencing data
without explicit ascertainment bias to a specific population, and (ii) the hierarchi-
cal boosting framework shows greater power to uncover selective events for
African-ancestry populations than Out-of-Africa populations (EUR and ASN) as
shown in Supporting Text S6. Assuming that there is no biological reason for
African populations to have suffered from less selection pressure than Out-of-Africa
populations, we suggest that this 10-fold difference is likely due to selection acting
on standing variations (soft sweep), rather than de-novo mutations (hard sweep),
segregating in African-ancestry populations and, unfortunately, out of the scope of
our framework. Furthermore, the Out-of-Africa human diaspora likely occurred
through serial founder effects, a specific case of population bottlenecks. Such de-
mographic scenario seems to increase the rates of fixation of favored alleles [20].
This would imply that complete hard sweeps were more frequent Out-of-Africa, as
observed in the present study. Alternatively, Wilson et al. 2014 [21] recently
showed that population bottlenecks can lead a soft sweep to leave molecular foot-
prints expected under the hard sweep model. Indeed, under this specific demo-
graphic scenario, it is likely that only one unique haplotype carrying the standing
favored mutation is sampled. Unfortunately, the coalescent framework used here to
generate training simulations does not allow the implementation of selective sce-
narios on a standing variant. Therefore, we could not assess whether the hard
sweeps signals observed in Out-of-Africa populations are driven by selective sweep
on de-novo or standing mutations, that is by hard or soft sweeps, respectively. Fur-
ther work is necessary to include even more alternative selective scenarios in our
framework implementation. This could provide more insights on the modes of
adaptation at stake and their relative importance during human population evolu-
tion. However, this study already appoints that hard sweeps have definitely not
been common in African populations (or at least in Yoruba studied here), and un-
derlines the dramatic role of demography in understanding human adaptation.
ii
“thesis” — 2014/9/8 — 10:58 — page 267 — #297 ii
ii
ii
References
1. Tishkoff S a, Reed F a, Ranciaro A, Voight BF, Babbitt CC, et al. (2007) Convergent adaptation of human lactase persistence in Africa and Europe. Nat Genet 39: 31–40. Available: http://www.ncbi.nlm.nih.gov/pubmed/17159977.
2. Bersaglieri T, Sabeti PC, Patterson N, Vanderploeg T, SchaffnerSF, et al. (2004) Genetic Signatures of Strong Recent Positive Selection at the Lactase Gene. Am J Hum Genet 74: 1111–1120.
3. Tishkoff S a, Varkonyi R, Cahinhinan N, Abbes S, ArgyropoulosG, et al. (2001) Haplotype diversity and linkage disequilibrium at human G6PD: recent origin of alleles that confer malarial resistance. Science (80- ) 293: 455–462. Available: http://www.ncbi.nlm.nih.gov/pubmed/11423617. Accessed 30 April 2014.
4. Hamblin MT, Di Rienzo a (2000) Detection of the signature of natural selection in humans: evidence from the Duffy blood group locus. Am J Hum Genet 66: 1669–1679. Available: http://www.pubmedcentral.nih.gov/articlerender.fcgi?artid=1378024&tool=pmcentrez&rendertype=abstract.
5. Sabeti P, Usen S, Farhadian S, Jallow M, Doherty T, et al. (2002) CD40L association with protection from severe malaria. Genes Immun 3: 286–291. Available: http://www.ncbi.nlm.nih.gov/pubmed/12140747. Accessed 10May 2014.
6. Ayodo G, Price AL, Keinan A, Ajwang A, Otieno MF, et al. (2007) Combining evidence of natural selection with association analysis increases power to detect malaria-resistance variants. Am J Hum Genet 81: 234–242. doi:10.1086/519221.

ii
“thesis” — 2014/9/8 — 10:58 — page 268 — #298 ii
ii
ii
7. Akey JM (2009) Constructing genomic maps of positive selection in humans: where do we go from here? Genome Res 19: 711–722. Available: http://www.ncbi.nlm.nih.gov/pubmed/19411596. Accessed 29January 2013.
8. Sabeti P, C, Varilly P, Fry B, Lohmueller J, et al. (2007) Genome-wide detection and characterization of positive selection in human populations. Nature 449: 913–918. doi:10.1038/nature06250.
9. Pritchard JK, Pickrell JK, Coop G (2010) The genetics of humanadaptation: hard sweeps, soft sweeps, and polygenic adaptation. Curr Biol 20: R208–15. doi:10.1016/j.cub.2009.11.055.
10. Grossman SR, Shylakhter I, Karlsson EK, Byrne EH, Morales S, et al. (2010) A Composite of Multiple Signals Distinguishes Causal Variants in Regions of Positive Selection. Science (80- ) 327: 883–886.
11. Grossman SR, Andersen KG, Shlyakhter I, Tabrizi S, Winnicki S, et al. (2013) Identifying recent adaptations in large-scale genomic data. Cell 152: 703–713. Available: http://www.ncbi.nlm.nih.gov/pubmed/23415221. Accessed 27February 2013.
12. The 1000 Genomes Project Consortium (2012) An integrated map of genetic variation from 1,092 human genomes. Nature 491: 56–65. Available: http://www.nature.com/nature/journal/v491/n7422/full/nature11632.html. Accessed 2 November 2012.
13. Schaffner SF, Foo C, Gabriel S, Reich D, Daly MJ, et al. (2005)Calibrating a coalescent simulation of human genome sequence variation. Genome Res 15: 1576–183. Available: http://www.ncbi.nlm.nih.gov/pubmed/16251467.

ii
“thesis” — 2014/9/8 — 10:58 — page 269 — #299 ii
ii
ii
14. Pybus M, Dall’Olio GM, Luisi P, Uzkudun M, Carreño-Torres A, et al. (2014) 1000 Genomes Selection Browser 1.0: a genome browser dedicated to signatures of natural selectionin modern humans. Nucleic Acids Res 42: D903–9. Available:http://www.pubmedcentral.nih.gov/articlerender.fcgi?artid=3965045&tool=pmcentrez&rendertype=abstract. Accessed 8 May 2014.
15. Woolfe A, Goode DK, Cooke J, Callaway H, Smith S, et al. (2007) CONDOR: a database resource of developmentally associated conserved non-coding elements. BMC Dev Biol 7: 100. Available: http://www.pubmedcentral.nih.gov/articlerender.fcgi?artid=2020477&tool=pmcentrez&rendertype=abstract. Accessed 15 July 2014.
16. Lin K, Li H, Schlötterer C, Futschik A (2011) Distinguishing positive selection from neutral evolution: boosting the performance of summary statistics. Genetics 187: 229–244. Available: http://www.pubmedcentral.nih.gov/articlerender.fcgi?artid=3018323&tool=pmcentrez&rendertype=abstract. Accessed 15 March 2013.
17. Bühlmann P, Hothorn T (2007) Boosting Algorithms: Regularization, Prediction and Model Fitting. Stat Sci 22: 477–505. Available: http://projecteuclid.org/euclid.ss/1207580163. Accessed 15 July 2014.
18. Charlesworth B, Morgan MT, Charlesworth D (1993) The effect of deleterious mutations on neutral molecular variation. Genetics 134: 1289–1303. Available: http://www.pubmedcentral.nih.gov/articlerender.fcgi?artid=1205596&tool=pmcentrez&rendertype=abstract.

ii
“thesis” — 2014/9/8 — 10:58 — page 270 — #300 ii
ii
ii
19. Granka JM, Henn BM, Gignoux CR, Kidd JM, Bustamante CD,et al. (2012) Limited evidence for classic selective sweeps in African populations. Genetics 192: 1049–1064. Available: http://www.pubmedcentral.nih.gov/articlerender.fcgi?artid=3522151&tool=pmcentrez&rendertype=abstract.
20. Pickrell JK, Coop G, Novembre J, Kudaravalli S, Li JZ, et al. (2009) Signals of recent positive selection in a worldwide sample of human populations. Genome Res 19: 826–837. Available: http://www.ncbi.nlm.nih.gov/pubmed/19307593.
21. Wilson BA, Petrov D, Messer PW (2014) Soft selective sweepsin complex demographic scenarios Corresponding author : bioRxiV: 0–34.
22. Voight BF, Kudaravalli S, Wen X, Pritchard JK (2006) A map ofrecent positive selection in the human genome. PLoS Biol 4: e72.
23. Pavlidis P, Jensen JD, Stephan W (2010) Searching for Footprints of Positive Selection in Whole-genome SNP Data from Non-equilibrium Populations. Genetics 110: 908–922. Available: http://www.ncbi.nlm.nih.gov/pubmed/20407129. Accessed 27 July 2010.
24. Sabeti P, Reich DE, Higgins JM, Levine HZP, Richter DJ, et al. (2002) Detecting recent positive selection in the human genome from haplotype structure. Nature 419: 832–837.
25. Wall JD (1999) Recombination and the power of statistical tests of neutrality. Genet Res 74: 65–79.
26. Wall JD (2000) A comparison of estimators of the population recombination rate. Mol Biol Evol 17: 156–163. Available: http://www.ncbi.nlm.nih.gov/pubmed/10666715.

ii
“thesis” — 2014/9/8 — 10:58 — page 271 — #301 ii
ii
ii
27. Fu YX (1997) Statistical tests of neutrality of mutations against population growth, hitchhiking and background selection. Genetics 147: 915–925. Available: http://www.genetics.org/content/147/2/915.short. Accessed 29 November 2012.
28. Nei M (1987) Molecular Evolutionary Genetics. New York, NY: Columbia University Press.
29. Rozas J, Gullaud M, Blandin G, Aguadé M (2001) DNA variation at the rp49 gene region of Drosophila simulans: evolutionary inferences from an unusual haplotype structure. Genetics 158: 1147–1155. Available: http://www.pubmedcentral.nih.gov/articlerender.fcgi?artid=1461709&tool=pmcentrez&rendertype=abstract.
30. Kelly JK (1997) A Test of Neutrality Based on Interlocu Associations. Genetics 1206: 1197–1206.
31. Tajima F (1989) Statistical method for testing the neutral mutation hypothesis by DNA polymorphism. Genetics 123: 585–595. Available: http://www.pubmedcentral.nih.gov/articlerender.fcgi?artid=1203831&tool=pmcentrez&rendertype=abstract. Accessed 21 November 2012.
32. Weir BS, Cockerham C (1984) Estimating F-statistics for the analysis of population structure. Evolution (N Y) 38: 1358–1370.
33. Hofer T, Ray N, Wegmann D, Excoffier L (2009) Large allele frequency differences between human continental groups are more likely to have occurred by drift during range expansions than by selection. Ann Hum Genet 73: 95–108. Available: http://www.ncbi.nlm.nih.gov/pubmed/19040659. Accessed 28 February 2013.
ii
“thesis” — 2014/9/8 — 10:58 — page 272 — #302 ii
ii
ii
34. Chen H, Patterson N, Reich D (2010) Population differentiation as a test for selective sweeps. Genome Res 20: 393–402. Available: http://www.ncbi.nlm.nih.gov/pubmed/20086244.
35. Nielsen R, Williamson S, Kim Y, Hubisz MJ, Clark AG, et al. (2005) Genomic scans for selective sweeps using SNP data. Genome Res 15: 1566–1575.
36. Fay JC, Wu CI (2000) Hitchhiking under positive Darwinian selection. Genetics 155: 1405–1413. Available: http://www.pubmedcentral.nih.gov/articlerender.fcgi?artid=1461156&tool=pmcentrez&rendertype=abstract. Accessed 29 November 2012.
37. Fu YX, Li WH (1993) Statistical tests of neutrality of mutations. Genetics 133: 693–709. Available: http://www.pubmedcentral.nih.gov/articlerender.fcgi?artid=1208208&tool=pmcentrez&rendertype=abstract.
38. Ramos-Onsins SE, Rozas J (2002) Statistical properties of new neutrality tests against population growth. Mol Biol Evol 19: 2092–2100. Available: http://www.ncbi.nlm.nih.gov/pubmed/12446801.
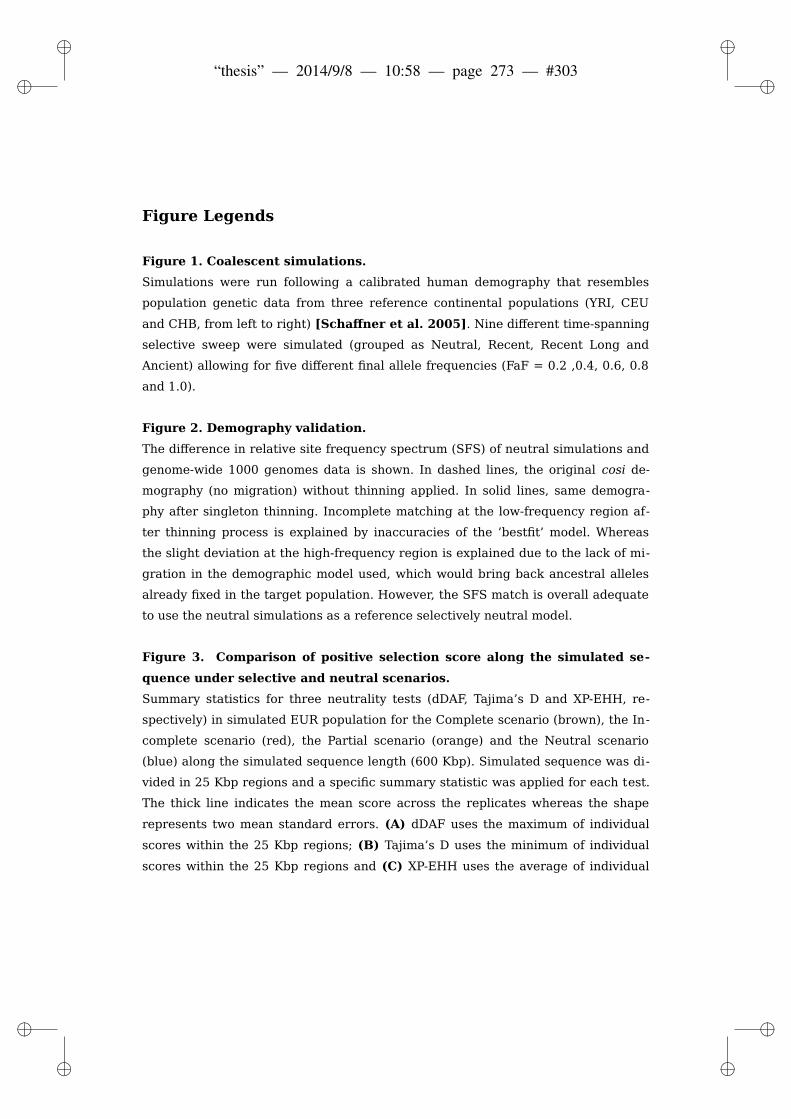
ii
“thesis” — 2014/9/8 — 10:58 — page 273 — #303 ii
ii
ii
Figure Legends
Figure 1. Coalescent simulations.
Simulations were run following a calibrated human demography that resembles
population genetic data from three reference continental populations (YRI, CEU
and CHB, from left to right) [Schaffner et al. 2005]. Nine different time-spanning
selective sweep were simulated (grouped as Neutral, Recent, Recent Long and
Ancient) allowing for five different final allele frequencies (FaF = 0.2 ,0.4, 0.6, 0.8
and 1.0).
Figure 2. Demography validation.
The difference in relative site frequency spectrum (SFS) of neutral simulations and
genome-wide 1000 genomes data is shown. In dashed lines, the original cosi de-
mography (no migration) without thinning applied. In solid lines, same demogra-
phy after singleton thinning. Incomplete matching at the low-frequency region af-
ter thinning process is explained by inaccuracies of the ’bestfit’ model. Whereas
the slight deviation at the high-frequency region is explained due to the lack of mi-
gration in the demographic model used, which would bring back ancestral alleles
already fixed in the target population. However, the SFS match is overall adequate
to use the neutral simulations as a reference selectively neutral model.
Figure 3. Comparison of positive selection score along the simulated se-
quence under selective and neutral scenarios.
Summary statistics for three neutrality tests (dDAF, Tajima’s D and XP-EHH, re-
spectively) in simulated EUR population for the Complete scenario (brown), the In-
complete scenario (red), the Partial scenario (orange) and the Neutral scenario
(blue) along the simulated sequence length (600 Kbp). Simulated sequence was di-
vided in 25 Kbp regions and a specific summary statistic was applied for each test.
The thick line indicates the mean score across the replicates whereas the shape
represents two mean standard errors. (A) dDAF uses the maximum of individual
scores within the 25 Kbp regions; (B) Tajima’s D uses the minimum of individual
scores within the 25 Kbp regions and (C) XP-EHH uses the average of individual

ii
“thesis” — 2014/9/8 — 10:58 — page 274 — #304 ii
ii
ii
scores within the 25 Kbp regions. Population-specific plot for each one of the sta-
tistics implemented can be found in Supporting Figures S2.
Figure 4. Positive selection test and simulation validation.
Distribution plots, box plots and violin plots for dDAF (A-B), Tajima’s D (C-D) and
XP-EHH (E-F) summary scores (Table 3) in neutral simulation data, genome-wide
1000 Genomes data and the neutral subset of 1000 genomes data for EUR / CEU
population. Plots for the rest of the statistics and populations can be found in Sup-
porting Figures S3.
Figure 5. Hierarchical boosting classification tree.
The implemented classification tree was organized in two levels: an unknown ge-
nomic region is firstly classified according to the completeness of the sweep, being
either Complete, Incomplete or Unclassified. In a second step, it is then classified
according to the oldness of the sweep, being Ancient, Recent or Unclassified. The
algorithm can be described as following: (1a) if the Complete Boosting score is
above the 99th percentile of the distribution of the Complete Boosting scores for
the training simulations under Neutral scenario and Partial and Incomplete sweep
scenarios, the region is classified as Complete Sweep and go to step 2a, otherwise
go to step 1b. (1b) if the Incomplete Boosting score is above the 99th percentile of
the distribution of the Incomplete Boosting scores for the training simulations un-
der Neutral scenario and Partial sweep scenarios, the region is classified as Incom-
plete Sweep and go to step 2b, otherwise go to step 1c. (1c) If not classified at iter -
ation 1a or 1b, the genomic region is unclassified and stop. (2a) If the Ancient/Re-
cent Complete Boosting score is above the 99th percentile of the distribution of the
Ancient/ancient Complete Boosting scores for the training simulations under Com-
plete Recent scenario the region is classified as Ancient Complete Sweep, while if
it is below the 1th percentile of the distribution of the Ancient/Recent Complete
Boosting scores for the training simulations under Complete Ancient scenario the
region is classified as Recent Complete Sweep , otherwise the region remains only
classified as Complete Sweep. (2b) If the Ancient/Recent Incomplete Boosting
score is above the 99th percentile of the distribution of the Ancient/ancient Incom-
plete Boosting scores for the training simulations under Incomplete Recent sce-
nario the region is classified as Ancient Incomplete Sweep, while if it is below the

ii
“thesis” — 2014/9/8 — 10:58 — page 275 — #305 ii
ii
ii
1th percentile of the distribution of the Ancient/Recent Incomplete Boosting scores
for the training simulations under Incomplete Ancient scenario the region is classi-
fied as Recent Incomplete Sweep , otherwise the region remains only classified as
Incomplete Sweep.
Figure 6. Standardized coefficients for the three populations and imple-
mented boosting functions.
Estimated coefficients for each population in the four boosting functions used in
the classification tree: Complete (A), Incomplete (B), Complete Recent / Ancient
(C) and Incomplete Recent / Ancient (D). The relevance of the positive selection
statistics to classify the different scenarios is given by the strength of its standard-
ized coefficient.
Figure 7. Sensitivity analysis for Complete and Incomplete Boostings and
other positive selection statistics.
Upper panel: for each method, ROC curves were separately performed for the
different selective scenarios, as defined by the Final Allele Frequency (FaF). For
that purpose, we assessed the thresholds corresponding to a given specificity (false
positive rate across the x-axis) using as a reference the summary statistic distribu-
tion observed for the 25 Kpb central regions of the 3000 replicates for the neutral
scenario; in turn, the sensitivity (true positive rate across the y-axis) was calcu-
lated as the proportion of the summary statistics for the 25 Kpb central regions
across the 600 replicates of the analyzed selective scenario above this threshold.
The line colors appear as described in the lower panel. Lower panel: The Area
Under the Curve (AUC) score for each for each method and selective scenario (as
defined by the FaF). For direct visualization of the performance, we plotted a circle
proportional to the AUC besides the AUC value is provided as well.
Figure 8. Classic examples of positive selection as seen by hierarchical
boosting.
A UCSC supertrack containing our hierarchical boosting results for each target
population was generated: Complete signal is shown in red, Incomplete signal is
shown in orange, Recent signal is shown in blue and Ancient signal is shown in vio-

ii
“thesis” — 2014/9/8 — 10:58 — page 276 — #306 ii
ii
ii
let. The 1% significance thresholds for each boosting were also included. Changing
the supertrack overlaying visualization to ”none” splits the hierarchical boosting
results into individual tracks. (A) Complete Recent sweep signal in the region sur-
rounding LCT in CEU; (B) Complete sweep signal in the region surrounding
SLC24A5 in CEU; (C) Incomplete sweep signal in the region surrounding EDAR in
CHB and (D) Complete Ancient sweep signal in the region surrounding DARC in
YRI. More information about how to interpret the supertracks can be found in our
blog (http://hsb.upf.edu/)

ii
“thesis” — 2014/9/8 — 10:58 — page 277 — #307 ii
ii
ii
Supporting Information
Supporting Text S1. Selection and demographic parameters for cosi simulator.
Supporting Figures S2. Population-specific selection signal plots along the simu-
lated sequence length.
Supporting Figures S3. Distribution plots of positive selection tests in simu-
lated and empirical genome-wide population-specific data.
Supporting Text S4. Testing alternative classification tree configurations.
Supporting Text S5. Population-specific correlation matrices for neutral and
empirical genome-wide data.
Supporting Text S6. Performance analysis for each population-specific hierarchi-
cal boosting.
Supporting Text S7. Estimating the number of selective events detected in 1000
genomes data
Supporting Figures S8. Coefficient convergence for each population-specific
hierarchical boosting.
Supporting Table S9. Regions encompassing putative selective events.

ii
“thesis” — 2014/9/8 — 10:58 — page 278 — #308 ii
ii
ii
Tables
Table 1. Implemented positive selection tests.
Method Family Method Reference Analyzed window size Reporting window
size
Allele Frequency Spectrum Tajima's D [31] 30 Kbp 3 Kbp
CLR [35] variable size 2 Kbp
Fay and Wu's H [36] 30 Kbp 3 Kbp
Fu and Li's F* [37] 30 Kbp 3 Kbp
Fu and Li's D* [37] 30 Kbp 3 Kbp
R² [38] 30 Kbp 3 Kbp
Linkage Disequilibrium XP-EHH modified from [24] variable size SNV-based
diHH modified from [22] variable size SNV-based
iHS modified from [22] variable size SNV-based
Omega [23] variable size 0.1 Kbp
EHH Average modified from [24] 30 Kbp 3 Kbp
Wall's B [25] 30 Kbp 3 Kbp
Wall's Q [26] 30 Kbp 3 Kbp
Fu's F [27] 30 Kbp 3 Kbp
Dh [28] 30 Kbp 3 Kbp
Za [29] 30 Kbp 3 Kbp
ZnS [30] 30 Kbp 3 Kbp
ZZ [29] 30 Kbp 3 Kbp
Population Differentiation Fst (global and pairwise) [32] SNV-specific SNV-based
dDAF [33] SNV-specific SNV-based
XP-CLR [34] 0.1 cM (max. window) 2 Kbp

ii
“thesis” — 2014/9/8 — 10:58 — page 279 — #309 ii
ii
ii
Table 2. Number of replicates used in each boosting analysis.
Boosting Scheme Number of replicates used
Complete* vs Incomplete*+Partial*+Neutral 900 vs 6600
Incomplete* vs Partial*+Neutral 1800 vs 4800
Complete Ancient vs Complete Recent 300 vs 300
Incomplete Ancient vs Incomplete Recent 600 vs 600* Recent, Recent Long and Ancient
Table 3. Selection of the best region summarizing approach for each positive se-
lection test.
Statistic Mean Min / Max Best Approach
dDAF 0.5945 0.9893 (Max) MAX
Fst 0.9052 0.9901 (Max) MAX
XP-CLR 0.7009 0.6990 (Max) MEAN
diHH 0.8220 0.6562 (Max) MEAN
iHS 0.9673 0.8130 (Max) MEAN
XP-EHH 0.9947 0.9839 (Max) MEAN
EHH Average 0.9253 0.8495 (Max) MEAN
Omega 0.7882 0.7983 (Max) MAX
CLR 0.7457 0.7327 (Max) MEAN
Tajima's D 0.9684 0.9735 (Min) MIN
Fu & Li's D* 0.8793 0.8828 (Min) MIN
Fu & Li's F* 0.9541 0.9504 (Min) MEAN
Fay & Wu's H 0.8042 0.7811 (Min) MEAN
R² 0.9689 0.9743 (Min) MIN
Fu's F 0.7734 0.7549 (Min) MEAN
Dh 0.9949 0.9948 (Min) MEAN
Wall's B 0.4879 0.5651 (Max) MAX
Wall's Q 0.4594 0.5354 (Max) MAX
Za 0.4504 0.5301 (Max) MAX
ZnS 0.4401 0.5215 (Max) MAX
ZZ 0.4516 0.5147 (Max) MAXPositive selection test scores were unified for a fixed region size in order to be used in the boosting
analysis. Region size was set to 25 Kbp. Mean, maximum and minimum summary statistics were eval -
uated in EUR simulations.
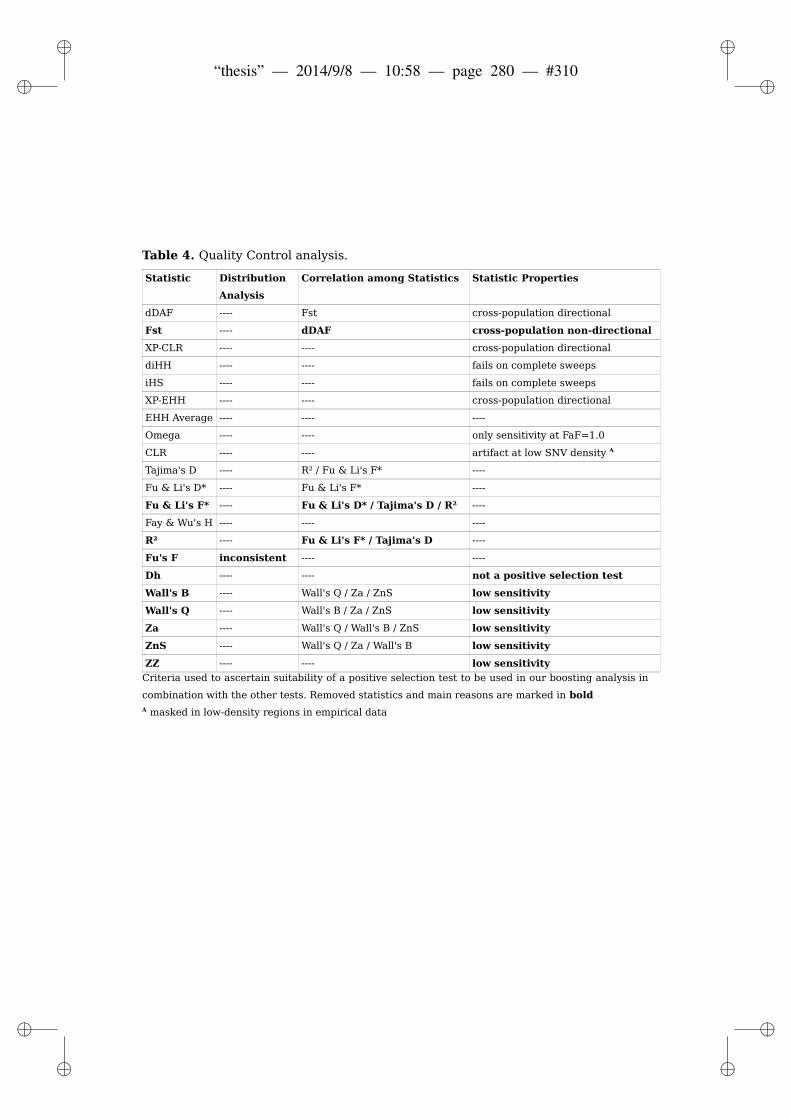
ii
“thesis” — 2014/9/8 — 10:58 — page 280 — #310 ii
ii
ii
Table 4. Quality Control analysis.
Statistic Distribution
Analysis
Correlation among Statistics Statistic Properties
dDAF ---- Fst cross-population directional
Fst ---- dDAF cross-population non-directional
XP-CLR ---- ---- cross-population directional
diHH ---- ---- fails on complete sweeps
iHS ---- ---- fails on complete sweeps
XP-EHH ---- ---- cross-population directional
EHH Average ---- ---- ----
Omega ---- ---- only sensitivity at FaF=1.0
CLR ---- ---- artifact at low SNV density A
Tajima's D ---- R² / Fu & Li's F* ----
Fu & Li's D* ---- Fu & Li's F* ----
Fu & Li's F* ---- Fu & Li's D* / Tajima's D / R² ----
Fay & Wu's H ---- ---- ----
R² ---- Fu & Li's F* / Tajima's D ----
Fu's F inconsistent ---- ----
Dh ---- ---- not a positive selection test
Wall's B ---- Wall's Q / Za / ZnS low sensitivity
Wall's Q ---- Wall's B / Za / ZnS low sensitivity
Za ---- Wall's Q / Wall's B / ZnS low sensitivity
ZnS ---- Wall's Q / Za / Wall's B low sensitivity
ZZ ---- ---- low sensitivity
Criteria used to ascertain suitability of a positive selection test to be used in our boosting analysis in
combination with the other tests. Removed statistics and main reasons are marked in boldA masked in low-density regions in empirical data
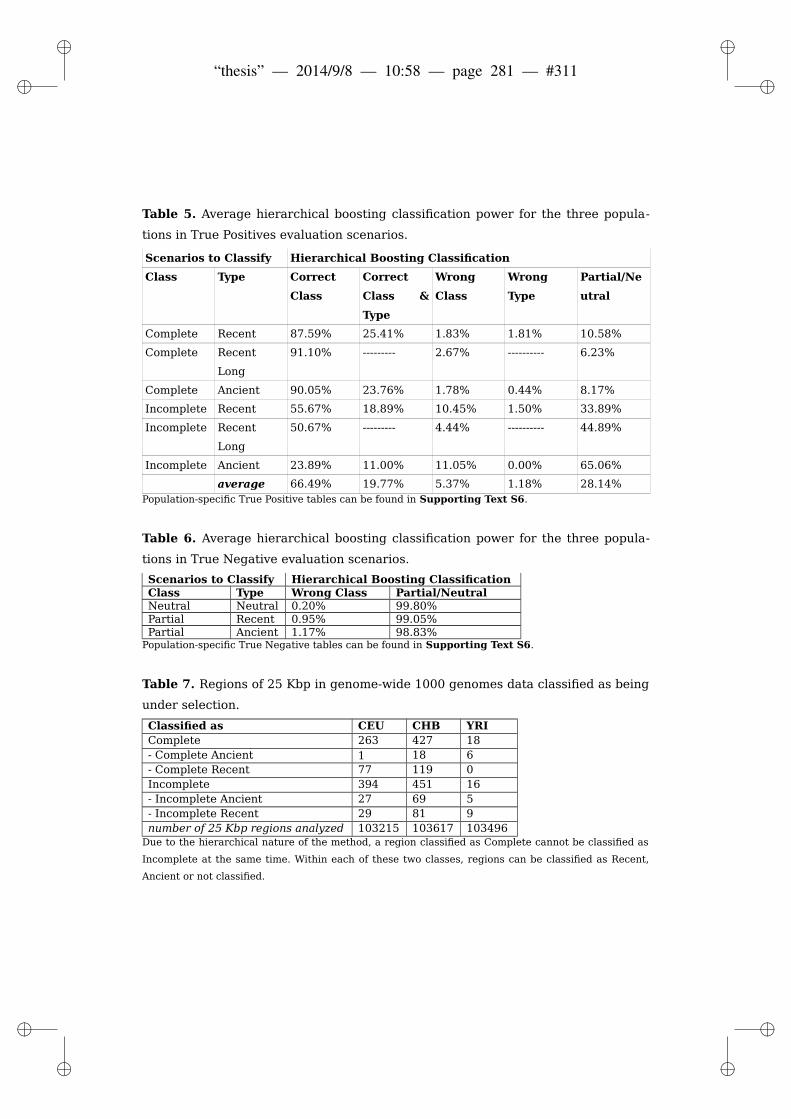
ii
“thesis” — 2014/9/8 — 10:58 — page 281 — #311 ii
ii
ii
Table 5. Average hierarchical boosting classification power for the three popula-
tions in True Positives evaluation scenarios.
Scenarios to Classify Hierarchical Boosting Classification
Class Type Correct
Class
Correct
Class &
Type
Wrong
Class
Wrong
Type
Partial/Ne
utral
Complete Recent 87.59% 25.41% 1.83% 1.81% 10.58%
Complete Recent
Long
91.10% --------- 2.67% ---------- 6.23%
Complete Ancient 90.05% 23.76% 1.78% 0.44% 8.17%
Incomplete Recent 55.67% 18.89% 10.45% 1.50% 33.89%
Incomplete Recent
Long
50.67% --------- 4.44% ---------- 44.89%
Incomplete Ancient 23.89% 11.00% 11.05% 0.00% 65.06%
average 66.49% 19.77% 5.37% 1.18% 28.14%Population-specific True Positive tables can be found in Supporting Text S6.
Table 6. Average hierarchical boosting classification power for the three popula-
tions in True Negative evaluation scenarios.
Scenarios to Classify Hierarchical Boosting ClassificationClass Type Wrong Class Partial/NeutralNeutral Neutral 0.20% 99.80%Partial Recent 0.95% 99.05%Partial Ancient 1.17% 98.83%
Population-specific True Negative tables can be found in Supporting Text S6.
Table 7. Regions of 25 Kbp in genome-wide 1000 genomes data classified as being
under selection.
Classified as CEU CHB YRIComplete 263 427 18- Complete Ancient 1 18 6- Complete Recent 77 119 0Incomplete 394 451 16- Incomplete Ancient 27 69 5- Incomplete Recent 29 81 9number of 25 Kbp regions analyzed 103215 103617 103496
Due to the hierarchical nature of the method, a region classified as Complete cannot be classified as
Incomplete at the same time. Within each of these two classes, regions can be classified as Recent,
Ancient or not classified.

ii
“thesis” — 2014/9/8 — 10:58 — page 282 — #312 ii
ii
ii
Table 8. Classification of the putative selective events detected.
Population Class Ancient Recent Ancient &Recent
Undefined Total Proportion
YRI Complete &Incomplete
0 0 0 0 0 0.000
Complete 4 0 0 10 14 0.519
Incomplete 4 7 0 2 13 0.481
Total 8 7 0 12 27 1.000
Proportion 0.296 0.259 0.000 0.444 1.000 1.000
CEU Complete &Incomplete
3 9 2 13 27 0.076
Complete 1 42 0 76 119 0.335
Incomplete 21 23 0 165 209 0.589
Total 25 74 2 254 355 1.000
Proportion 0.070 0.208 0.006 0.715 1.000 1.000
CHB Complete &Incomplete
10 25 6 14 55 0.130
Complete 8 76 1 98 183 0.432
Incomplete 38 44 3 101 186 0.439
Total 56 145 10 213 424 1.000
Proportion 0.132 0.342 0.024 0.502 1.000 1.000
Globala Complete &Incomplete
13 34 8 27 82 0.0102
Complete 13 118 1 184 316 0.392
Incomplete 63 74 3 268 408 0.506
Total 89 226 12 479 806 1.000
Proportion 0.110 0.280 0.015 0.594 1.000 1.000A putative selective event (as defined in Supporting Text S7) is assigned to a given class , i.e. Com-
plete or Incomplete, when the genomic region encompassing the signal contains 25 Kbp windows
with a significant score only for Complete or Incomplete boosting, respectively. If significant scores
are observed for both Complete and Incomplete Boostings, the selective event is defined as both
Complete & Incomplete. Similarly, the type of the selective event (Ancient or Recent) is assigned
when the genomic region encompassing it only contains 25 Kbp windows with a significant score for
the related boosting, i.e. Ancient/Recent Complete, Ancient/Recent Incomplete boosting or one of the
two, if the selective event was classified as Complete, Incomplete or both, respectively. a Global refers to the analysis overall the three populations.
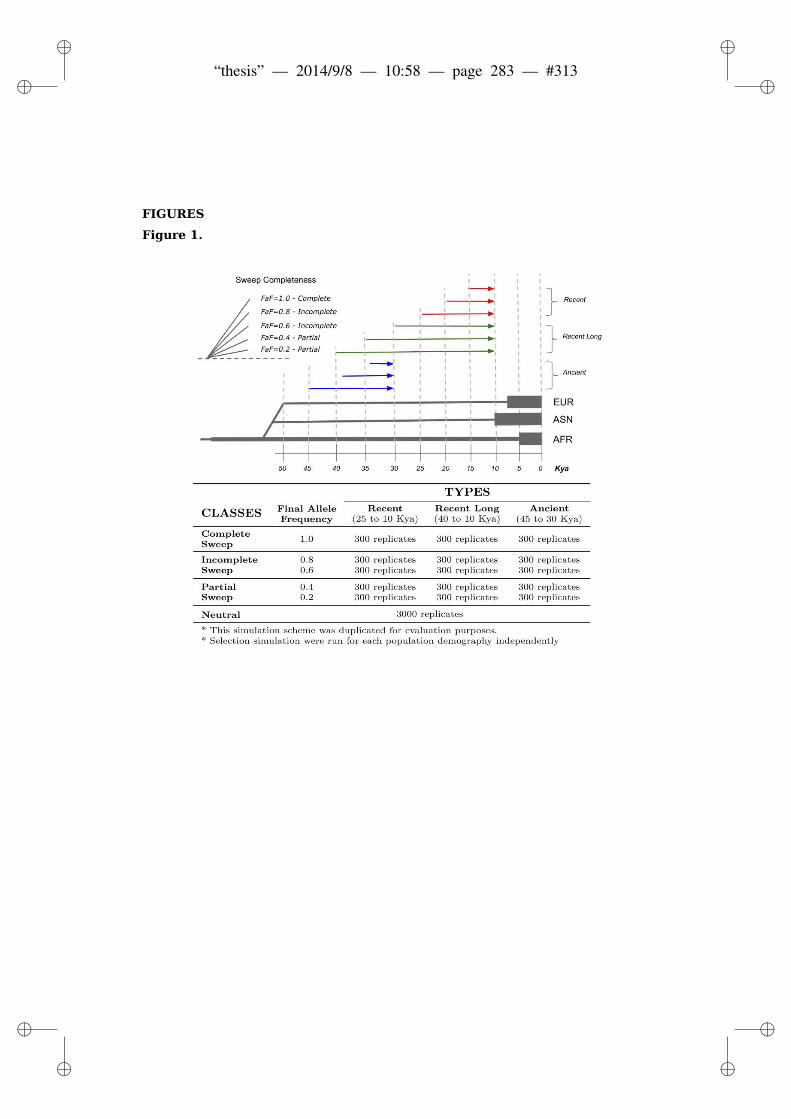
ii
“thesis” — 2014/9/8 — 10:58 — page 283 — #313 ii
ii
ii
FIGURES
Figure 1.
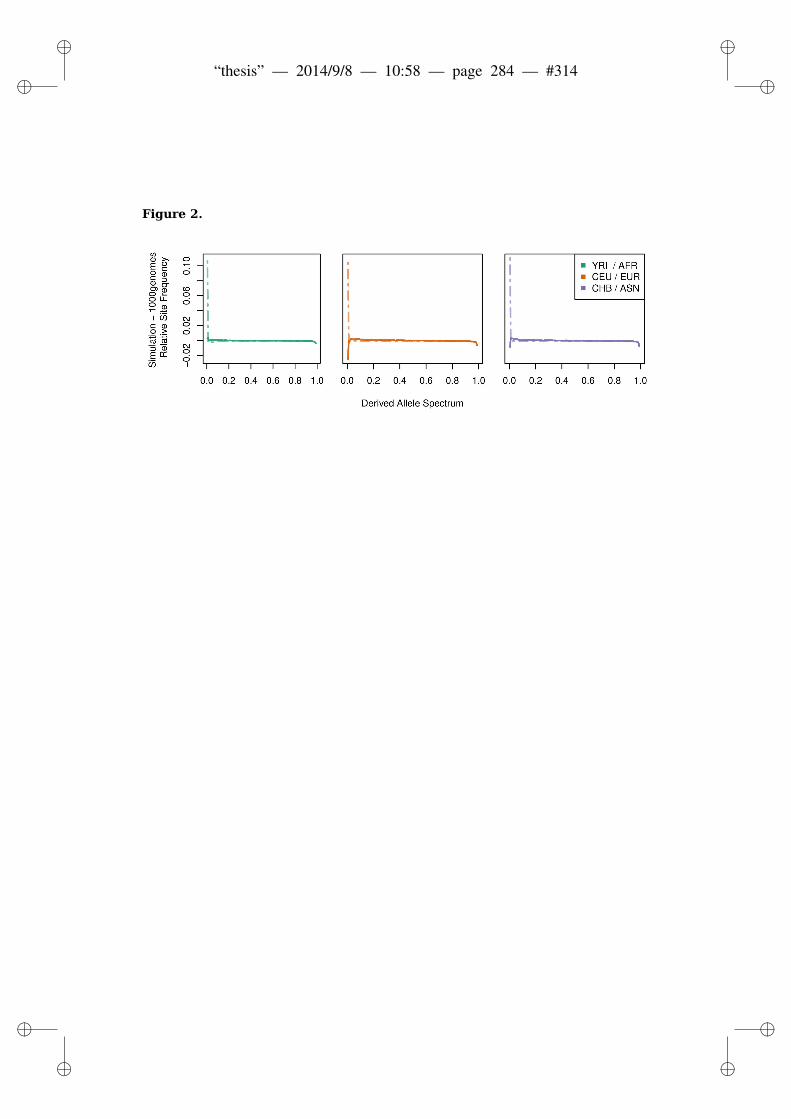
ii
“thesis” — 2014/9/8 — 10:58 — page 284 — #314 ii
ii
ii
Figure 2.

ii
“thesis” — 2014/9/8 — 10:58 — page 285 — #315 ii
ii
ii
Figure 3.

ii
“thesis” — 2014/9/8 — 10:58 — page 286 — #316 ii
ii
ii
Figure 4.

ii
“thesis” — 2014/9/8 — 10:58 — page 287 — #317 ii
ii
ii
Figure 5.
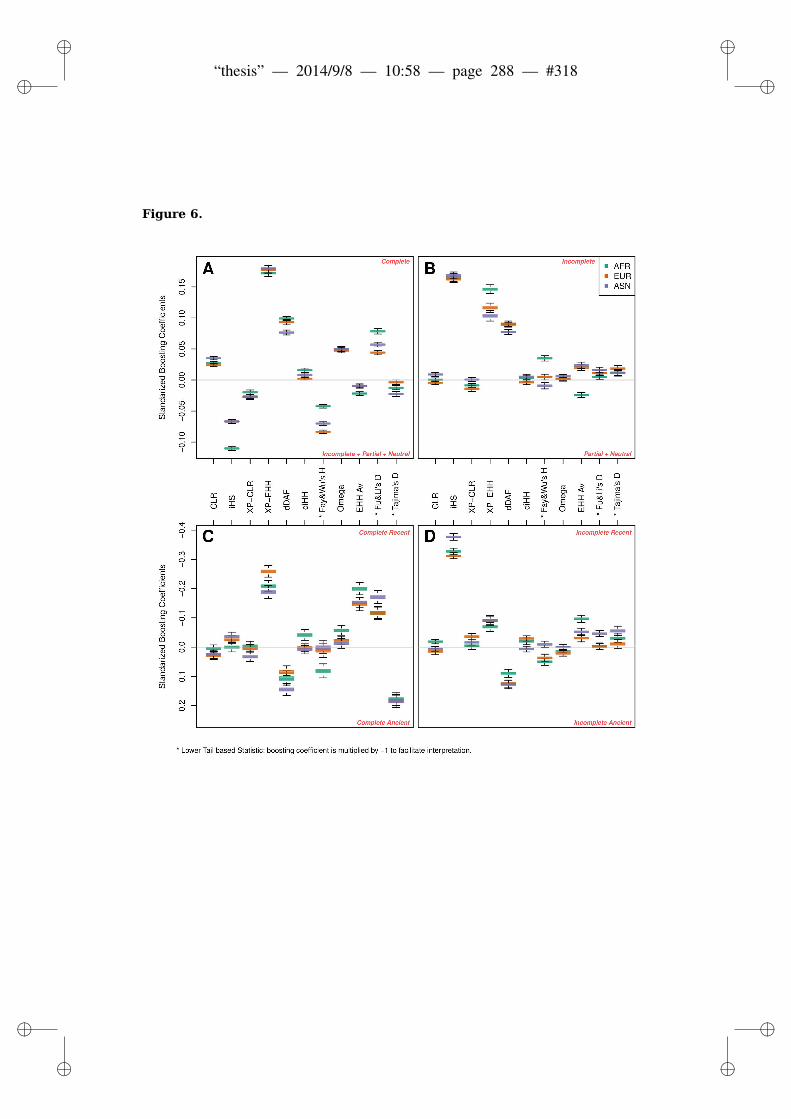
ii
“thesis” — 2014/9/8 — 10:58 — page 288 — #318 ii
ii
ii
Figure 6.

ii
“thesis” — 2014/9/8 — 10:58 — page 289 — #319 ii
ii
ii
Figure 7.

ii
“thesis” — 2014/9/8 — 10:58 — page 290 — #320 ii
ii
ii
Figure 8.

ii
“thesis” — 2014/9/8 — 10:58 — page 291 — #321 ii
ii
ii
Bibliography
[1] Lalueza-Fox C, Gilbert MTP. Paleogenomics of archaic hominins.Current biology : CB. 2011 Dec;21(24):R1002–9.
[2] McDougall I, Brown FH, Fleagle JG. Stratigraphic placementand age of modern humans from Kibish, Ethiopia. Nature.2005;433(February):733–736.
[3] Veeramah KR, Hammer MF. The impact of whole-genome se-quencing on the reconstruction of human population history. Na-ture Reviews Genetics. 2014 Feb;15(3):149–162.
[4] Stringer C. What makes a modern human. Nature.2012;485(7396):33–35.
[5] Nei M, Roychoudhury AK. Evolutionary relationships of humanpopulations. Molecular biology and evolution. 1993;10(5):927–943.
[6] von Cramon-Taubadel N, Lycett SJ. Brief communication: hu-man cranial variation fits iterative founder effect model withAfrican origin. American journal of physical anthropology. 2008May;136(1):108–13.
[7] Liu H, Prugnolle F, Manica A. A Geographically Explicit GeneticModel of Worldwide Human-Settlement History. American jour-nal of human genetics. 2006;79(August):230–237.
291
ii
“thesis” — 2014/9/8 — 10:58 — page 292 — #322 ii
ii
ii
[8] Manica A, Amos W, Balloux F, Hanihara T. The effect of ancientpopulation bottlenecks on human phenotypic variation. Nature.2007 Jul;448(7151):346–8.
[9] Li JZ, Absher DM, Tang H, Southwick AM, Casto AM, Ra-machandran S, et al. Worldwide human relationships inferred fromgenome-wide patterns of variation. Science (New York, NY). 2008Mar;319(5866):1100–4.
[10] Schaffner SF, Foo C, Gabriel S, Reich D, Daly MJ, Altshuler D.Calibrating a coalescent simulation of human genome sequencevariation. Genome research. 2005 Nov;15(11):1576–183.
[11] Excoffier L, Dupanloup I, Huerta-Sanchez E, Sousa VC, Foll M.Robust demographic inference from genomic and SNP data. PLoSgenetics. 2013 Oct;9(10):e1003905.
[12] Ewing G, Hermisson J. MSMS: a coalescent simulation pro-gram including recombination, demographic structure and selec-tion at a single locus. Bioinformatics (Oxford, England). 2010Aug;26(16):2064–5.
[13] Nachman MW, Crowell SL. Estimate of the mutation rate per nu-cleotide in humans. Genetics. 2000 Sep;156(1):297–304.
[14] Conrad DF, Keebler JEM, DePristo Ma, Lindsay SJ, Zhang Y,Casals F, et al. Variation in genome-wide mutation rates within andbetween human families. Nature genetics. 2011 Jul;43(7):712–4.
[15] Stephens M, Donnelly P. A comparison of bayesian methods forhaplotype reconstruction from population genotype data. Ameri-can journal of human genetics. 2003 Nov;73(5):1162–9.
[16] Conrad DF, Jakobsson M, Coop G, Wen X, Wall JD, RosenbergNa, et al. A worldwide survey of haplotype variation and link-age disequilibrium in the human genome. Nature genetics. 2006Nov;38(11):1251–60.
292

ii
“thesis” — 2014/9/8 — 10:58 — page 293 — #323 ii
ii
ii
[17] Lander ES, Linton LM, Birren B, Nusbaum C, Zody MC, Bald-win J, et al. Initial sequencing and analysis of the human genome.Nature. 2001 Feb;409(6822):860–921.
[18] Venter JC, Adams MD, Myers EW, Li PW, Mural RJ, SuttonGG, et al. The sequence of the human genome. Science. 2001Feb;291(5507):1304–51.
[19] Cann H, de Toma C, Cazes L, Legrand M, Morel V, PiouffreL, et al. A human genome diversity cell line panel. Science.2002;12(296(5566)):261–262.
[20] The International Hapmap Consortium. A haplotype map of thehuman genome. Nature. 2005 Oct;437(7063):1299–320.
[21] The 1000 Genomes Project Consortium. An integrated mapof genetic variation from 1,092 human genomes. Nature.2012;491(7422):56–65.
[22] Kimura M. The Neutral Theory of molecular evolution. Cam-bridge: Cambridge University Press; 1983.
[23] Kimura M. Evolutionary Rate at the Molecular Level. Nature.1968;217:624–626.
[24] Kreitman M. The neutral theory is dead. Long live the neutraltheory. BioEssays : news and reviews in molecular, cellular anddevelopmental biology. 1996 Aug;18(8):678–83.
[25] Fay JC, Wu CI. Sequence divergence, functional constraint, andselection in protein evolution. Annual review of genomics and hu-man genetics. 2003 Jan;4:213–35.
[26] Hardy GH. Mendelian Proportions in a Mixed Population. Science.1908;28(706):49–50.
293

ii
“thesis” — 2014/9/8 — 10:58 — page 294 — #324 ii
ii
ii
[27] Weinberg W. Uber den Nachweis der Vererbung beim Menschen.Jahreshefte des Vereins fur vaterlandische Naturkunde in Wurttem-berg. 1908;64:368–382.
[28] Smith NGC, Webster MT, Ellegren H. Deterministic mutationrate variation in the human genome. Genome research. 2002Sep;12(9):1350–6.
[29] Darwin CR, Wallace AR. On the Tendency of Species to formVarieties; and on the Perpetuation of Varieties and Species by Nat-ural Means of Selection. Journal of the Proceedings of the LinneanSociety of London. 1858;3(9):46–50.
[30] Darwin CR. On the Origin of Species by Means of Natural Selec-tion, or the Preservation of Favoured Races in the Struggle for Life.London: John Murray; 1859.
[31] Quintana-murci L, Clark AG. Population genetic tools for dis-secting innate immunity in humans. Nature Reviews Immunology.2013;13(4):280–293.
[32] Fisher RA. The correlation between relatives on the suppositionof Mendelian inheritance. Philosophical Transactions of the RoyalSociety of Edinburgh. 1918;52:399–433.
[33] Fisher RA. The Genetical Theory of Natural Selection. Oxford:Oxford Univ Press; 1930.
[34] Haldane JBS. A Mathematical Theory of Natural and ArtificialSelection. Part I. Transactions of the Cambridge Philosophical So-ciety. 1924;23:19–41.
[35] Wright S. The roles of mutation, inbreeding, crossbreeding andselection in evolution. In: Proceedings of the sixth internationalcongress of genetic. 1932;p. 356–366.
[36] Wright S. Evolution in Mendelian populations. Genetics.1931;16(2):97–159.
294
ii
“thesis” — 2014/9/8 — 10:58 — page 295 — #325 ii
ii
ii
[37] Duret L. Neutral Theory : The Null Hypothesis of Molecular Evo-lution. Nature Education. 2008;1(1):1–6.
[38] Kimura M. The neutral theory of molecular evolution: a review ofrecent evidence. Japanese Journal of Genetics. 1991;66:367–386.
[39] Sabeti PC, Schaffner SF, Fry B, Lohmueller J, Varilly P,Shamovsky O, et al. Positive natural selection in the human lin-eage. Science. 2006;312(5780):1614–1620.
[40] Nei M, Gojobori T. Simple methods for estimating the numbers ofsynonymous and nonsynonymous nucleotide substitutions. Molec-ular Biology and Evolution. 1986 Sep;3(5):418–426.
[41] Jukes TH, Cantor CR. Evolution of protein molecules. In: MunroHN, editor. Mammalian Protein Metabolism. vol. III. New York:Academic Press; 1969. p. 21–132.
[42] Goldman N, Yang Z. A codon-based model of nucleotide substi-tution for protein-coding DNA sequences. Molecular Biology andEvolution. 1994 Sep;11(5):725–736.
[43] Seo TK, Kishino H, Thorne JL. Estimating absolute rates of syn-onymous and nonsynonymous nucleotide substitution in order tocharacterize natural selection and date species divergences. Molec-ular Biology and Evolution. 2004 Jul;21(7):1201–1213.
[44] Suzuki Y, Gojobori T. A method for detecting positive selectionat single amino acid sites. Molecular Biology and Evolution. 1999Oct;16(10):1315–1328.
[45] Suzuki Y. New methods for detecting positive selection at sin-gle amino acid sites. Journal of Molecular Evolution. 2004Jul;59(1):11–19.
[46] Massingham T, Goldman N. Detecting amino acid sites un-der positive selection and purifying selection. Genetics. 2005Mar;169(3):1753–1762.
295

ii
“thesis” — 2014/9/8 — 10:58 — page 296 — #326 ii
ii
ii
[47] Kosakovsky Pond SL, Frost SDW. Not so different after all: a com-parison of methods for detecting amino acid sites under selection.Molecular Biology and Evolution. 2005 May;22(5):1208–1222.
[48] Nielsen R, Yang Z. Likelihood models for detecting positivelyselected amino acid sites and applications to the HIV-1 envelopegene. Genetics. 1998 Mar;148(3):929–936.
[49] Yang Z, Nielsen R, Goldman N, Krabbe Pedersen AM. Codon-substitution models for heterogeneous selection pressure at aminoacid sites. Genetics. 2000;155:431–449.
[50] Yang Z, Wong WSW, Nielsen R. Bayes empirical Bayes inferenceof amino acid sites under positive selection. Molecular Biologyand Evolution. 2005;22(4):1107–1118.
[51] Anisimova M, Bielawski JP, Yang Z. Accuracy and power ofthe likelihood ratio test in detecting adaptive molecular evolution.Molecular Biology and Evolution. 2002;18(6):1585–1592.
[52] Yang Z, Nielsen R. Codon-substitution models for detectingmolecular adaptation at individual sites along specific lineages.Molecular Biology and Evolution. 2002 Jun;19(6):908–917.
[53] Zhang J, Nielsen R, Yang Z. Evaluation of an improved branch-sitelikelihood method for detecting positive selection at the molecularlevel. Molecular Biology and Evolution. 2005 Dec;22(12):2472–2479.
[54] Murrell B, Wertheim JO, Moola S, Weighill T, Scheffler K,Kosakovsky Pond SL. Detecting individual sites subject to episodicdiversifying selection. PLoS Genetics. 2012 Jan;8(7):e1002764.
[55] Yang Z, dos Reis M. Statistical properties of the branch-site testof positive selection. Molecular Biology and Evolution. 2011Mar;28(3):1217–1228.
296

ii
“thesis” — 2014/9/8 — 10:58 — page 297 — #327 ii
ii
ii
[56] Maynard-Smith J, John Haigh. The hitch-hiking effect of afavourable gene. Genetical Research. 1974;23(1):23–35.
[57] Kaplan NL, Hudsont RR, Langle CH. The “Hitchhiking Effect”Revisited. Genetics. 1989;899:887–899.
[58] Barton N. The geometry of adaptation. Nature.1998;395(6704):751–2.
[59] Fay JC, Wu CI. Hitchhiking under positive Darwinian selection.Genetics. 2000 Jul;155(3):1405–13.
[60] Przeworski M. The Signature of Positive Selection at RandomlyChosen Loci. Genetics. 2002;1189:1179–1189.
[61] Kim Y. Allele Frequency Distribution Under Recurrent SelectiveSweeps. Genetics. 2006;1978:1967–1978.
[62] Braverman JM, Hudson RR, Kaplan NL, Langley CH, StephanW. The hitchhiking effect on the site frequency spectrum of DNApolymorphisms. Genetics. 1995 Jun;140(2):783–96.
[63] Gillespie JH. Genetic Drift in an Infinite Population : The Pseudo-hitchhiking Model. Genetics. 2000;155:909–919.
[64] Pybus M, Dall’Olio GM, Luisi P, Uzkudun M, Carreno Torres A,Pavlidis P, et al. 1000 Genomes Selection Browser 1.0: a genomebrowser dedicated to signatures of natural selection in modern hu-mans. Nucleic acids research. 2014 Jan;42(Database issue):D903–9.
[65] Sabeti P, Usen S, Farhadian S, Jallow M, Doherty T, Newport M,et al. CD40L association with protection from severe malaria.Genes and immunity. 2002 Aug;3(5):286–91.
[66] Tajima F. Statistical method for testing the neutral mutation hy-pothesis by DNA polymorphism. Genetics. 1989 Nov;123(3):585–95.
297
ii
“thesis” — 2014/9/8 — 10:58 — page 298 — #328 ii
ii
ii
[67] Nielsen R, Williamson S, Kim Y, Hubisz MJ, Clark AG, Busta-mante C. Genomic scans for selective sweeps using SNP data.Genome Research. 2005;15:1566–1575.
[68] Fu YX, Li WH. Statistical tests of neutrality of mutations. Genet-ics. 1993 Mar;133(3):693–709.
[69] Ramos-Onsins SE, Rozas J. Statistical properties of new neutralitytests against population growth. Molecular biology and evolution.2002 Dec;19(12):2092–100.
[70] Sabeti P, C, Varilly P, Fry B, Lohmueller J, Hostetter E, et al.Genome-wide detection and characterization of positive selectionin human populations. Nature. 2007;449(7164):913–918.
[71] Voight BF, Kudaravalli S, Wen X, Pritchard JK. A map of re-cent positive selection in the human genome. PLoS biology.2006;4(3):e72.
[72] Wall JD. Recombination and the power of statistical tests of neu-trality. Genetical Research. 1999;74:65–79.
[73] Wall JD. A comparison of estimators of the population recombi-nation rate. Molecular biology and evolution. 2000 Jan;17(1):156–63.
[74] Fu YX. Statistical tests of neutrality of mutations against popula-tion growth, hitchhiking and background selection. Genetics. 1997Oct;147(2):915–25.
[75] Nei M. Molecular Evolutionary Genetics. New York, NY:Columbia University Press; 1987.
[76] Rozas J, Gullaud M, Blandin G, Aguade M. DNA variation atthe rp49 gene region of Drosophila simulans: evolutionary in-ferences from an unusual haplotype structure. Genetics. 2001Jul;158(3):1147–55.
298

ii
“thesis” — 2014/9/8 — 10:58 — page 299 — #329 ii
ii
ii
[77] Kelly JK. A Test of Neutrality Based on Interlocu Associations.Genetics. 1997;1206:1197–1206.
[78] Weir BS, Cockerham C. Estimating F-statistics for the analysis ofpopulation structure. Evolution. 1984;38:1358–1370.
[79] Chen H, Patterson N, Reich D. Population differentiation as a testfor selective sweeps. Genome Research. 2010 Mar;20(3):393–402.
[80] Hofer T, Ray N, Wegmann D, Excoffier L. Large allele frequencydifferences between human continental groups are more likely tohave occurred by drift during range expansions than by selection.Annals of human genetics. 2009 Jan;73(1):95–108.
[81] Nei M, Li WH. Mathematical model for studying genetic varia-tion in terms of restriction endonucleases. Proceedings of the Na-tional Academy of Sciences of the United States of America. 1979Oct;76(10):5269–73.
[82] Holsinger KE, Weir BS. Genetics in geographically structured pop-ulations: defining, estimating and interpreting FST. Nature Re-views Genetics. 2009;10(9):639–650.
[83] Teo YY, Small KS, Kwiatkowski DP. Methodological challengesof genome-wide association analysis in Africa. Nature reviews Ge-netics. 2010 Feb;11(2):149–60.
[84] Wall JD, Cox MP, Mendez FL, Woerner A, Severson T, HammerMF. A novel DNA sequence database for analyzing human demo-graphic history. Genome research. 2008 Aug;18(8):1354–61.
[85] Casals F, Bertranpetit J. Human genetic variation, shared and pri-vate. Science (New York, NY). 2012 Jul;337(6090):39–40.
[86] Patterson N, Moorjani P, Luo Y, Mallick S, Rohland N, ZhanY, et al. Ancient admixture in human history. Genetics. 2012Nov;192(3):1065–93.
299

ii
“thesis” — 2014/9/8 — 10:58 — page 300 — #330 ii
ii
ii
[87] Thornton KR, Jensen JD. Controlling the false-positive rate in mul-tilocus genome scans for selection. Genetics. 2007;175(2):737–750.
[88] Granka JM, Henn BM, Gignoux CR, Kidd JM, Bustamante CD,Feldman MW. Limited evidence for classic selective sweeps inAfrican populations. Genetics. 2012 Nov;192(3):1049–64.
[89] Alves I, Sramkova Hanulova A, Foll M, Excoffier L. Genomicdata reveal a complex making of humans. PLoS genetics. 2012Jan;8(7):e1002837.
[90] Charlesworth B, Morgan MT, Charlesworth D. The effect of dele-terious mutations on neutral molecular variation. Genetics. 1993Aug;134(4):1289–303.
[91] Enard D, Messer PW, Petrov Da. Genome-wide signals ofpositive selection in human evolution. Genome research. 2014Mar;24(6):885–895.
[92] Fagny M, Patin E, Enard D, Barreiro LB, Quintana-Murci L, LavalG. Exploring the occurrence of classic selective sweeps in humansusing whole-genome sequencing data sets. Molecular biology andevolution. 2014 Jul;31(7):1850–68.
[93] Keinan A, Clark AG. Recent explosive human population growthhas resulted in an excess of rare genetic variants. Science (NewYork, NY). 2012 May;336(6082):740–3.
[94] McEvedy C. The bubonic plague. Scientific American.1988;258(2):117–23.
[95] Reich DE, Cargill M, Bolk S, Ireland J, Sabeti PC, Richter DJ,et al. Linkage disequilibrium in the human genome. Nature. 2001May;411(6834):199–204.
[96] Hallatschek O, Nelson DR. Gene surfing in expanding populations.Theoretical population biology. 2008 Feb;73(1):158–70.
300

ii
“thesis” — 2014/9/8 — 10:58 — page 301 — #331 ii
ii
ii
[97] Hudson RR. Oxford Surveys in Evolutionary Biology. OxfordUniversity Press; 1991.
[98] Kingman JFC. The coalescent. Stochastic Processes and TheirApplications. 1982;13:235–248.
[99] Wakeley J. Coalescent Theory: An Introduction. Greenwood Vil-lage, Colorado: Roberts & Company Publishers; 2008.
[100] Rosenberg Na, Nordborg M. Genealogical trees, coalescent the-ory and the analysis of genetic polymorphisms. Nature reviewsGenetics. 2002 May;3(5):380–90.
[101] Marjoram P, Wall JD. Fast ”coalescent” simulation. BMC genetics.2006 Jan;7:16.
[102] Mailund T, Schierup MH, Pedersen CNS, Mechlenborg PJM, Mad-sen JN, Schauser L. CoaSim: a flexible environment for simulatinggenetic data under coalescent models. BMC bioinformatics. 2005Jan;6:252.
[103] Spencer CCa, Coop G. SelSim: a program to simulate populationgenetic data with natural selection and recombination. Bioinfor-matics (Oxford, England). 2004 Dec;20(18):3673–5.
[104] Hudson RR. Bioinformatics applications note. Bioinformatics.2002;18(2):337–338.
[105] Gravel S, Henn BM, Gutenkunst RN, Indap AR, Marth GT, ClarkAG, et al. Demographic history and rare allele sharing among hu-man populations. Proceedings of the National Academy of Sci-ences of the United States of America. 2011 Jul;108(29):11983–8.
[106] Grossman SR, Shylakhter I, Karlsson EK, Byrne EH, Morales S,Frieden G, et al. A Composite of Multiple Signals DistinguishesCausal Variants in Regions of Positive Selection. Science. 2010Jan;327(5967):883–886.
301

ii
“thesis” — 2014/9/8 — 10:58 — page 302 — #332 ii
ii
ii
[107] Hernandez RD. A flexible forward simulator for populations sub-ject to selection and demography. Bioinformatics (Oxford, Eng-land). 2008 Dec;24(23):2786–7.
[108] Gutenkunst RN, Hernandez RD, Williamson SH, Bustamante CD.Inferring the joint demographic history of multiple populationsfrom multidimensional SNP frequency data. PLoS genetics. 2009Oct;5(10):e1000695.
[109] Uricchio LH, Hernandez RD. Robust Forward Simulations of Re-current Hitchhiking. Genetics. 2014 Feb;p. 1–33.
[110] Nielsen R, Hubisz MJ, Clark AG. Reconstituting the frequencyspectrum of ascertained single-nucleotide polymorphism data. Ge-netics. 2004;168:2373–2382.
[111] Wollstein A, Lao O, Becker C, Brauer S, Trent RJ, Nurnberg P,et al. Demographic history of Oceania inferred from genome-widedata. Current biology : CB. 2010 Nov;20(22):1983–92.
[112] Pickrell JK, Patterson N, Barbieri C, Berthold F, Gerlach L, Gulde-mann T, et al. The genetic prehistory of southern Africa. Naturecommunications. 2012 Jan;3:1143.
[113] Akey JM. Constructing genomic maps of positive selection inhumans: where do we go from here? Genome research. 2009May;19(5):711–22.
[114] Kelley JL, Madeoy J, Calhoun JC, Swanson W, Akey JM. Genomicsignatures of positive selection in humans and the limits of outlierapproaches. Genome research. 2006 Aug;16(8):980–9.
[115] Teshima KM, Coop G, Przeworski M. How reliable are em-pirical genomic scans for selective sweeps? Genome research.2006;16(6):702–712.
302
ii
“thesis” — 2014/9/8 — 10:58 — page 303 — #333 ii
ii
ii
[116] Zeng K, Fu Yx, Shi S, Wu Ci. Statistical Tests for Detecting Pos-itive Selection by Utilizing High-Frequency Variants. Genetics.2006;174:1431–1439.
[117] Zeng K, Shi S, Wu CI. Compound tests for the detection of hitch-hiking under positive selection. Molecular biology and evolution.2007 Aug;24(8):1898–908.
[118] Watterson Ga. The homozygosity test of neutrality. Genetics. 1978Feb;88(2):405–17.
[119] Grossman SR, Andersen KG, Shlyakhter I, Tabrizi S, Winnicki S,Yen A, et al. Identifying recent adaptations in large-scale genomicdata. Cell. 2013 Feb;152(4):703–13.
[120] Lin K, Li H, Schlotterer C, Futschik A. Distinguishing positive se-lection from neutral evolution: boosting the performance of sum-mary statistics. Genetics. 2011 Jan;187(1):229–44.
[121] Schapire RE. The strength of weak learnability. Machine Learning.1990 Jun;5:197–227.
[122] Pritchard JK, Pickrell JK, Coop G. The genetics of human adapta-tion: hard sweeps, soft sweeps, and polygenic adaptation. Currentbiology : CB. 2010 Feb;20(4):R208–15.
[123] Hamblin MT, Di Rienzo A. Detection of the signature of naturalselection in humans: evidence from the Duffy blood group locus.American journal of human genetics. 2000 May;66(5):1669–79.
[124] Tishkoff Sa, Reed Fa, Ranciaro A, Voight BF, Babbitt CC, Silver-man JS, et al. Convergent adaptation of human lactase persistencein Africa and Europe. Nature genetics. 2007;39(1):31–40.
[125] Colosimo PF, Hosemann KE, Balabhadra S, Villarreal G, DicksonM, Grimwood J, et al. Widespread parallel evolution in stickle-backs by repeated fixation of Ectodysplasin alleles. Science (NewYork, NY). 2005 Mar;307(5717):1928–33.
303

ii
“thesis” — 2014/9/8 — 10:58 — page 304 — #334 ii
ii
ii
[126] Jeong S, Rebeiz M, Andolfatto P, Werner T, True J, CarrollSB. The evolution of gene regulation underlies a morphologi-cal difference between two Drosophila sister species. Cell. 2008Mar;132(5):783–93.
[127] Scheinfeldt LB, Biswas S, Madeoy J, Connelly CF, Schadt EE,Akey JM. Population genomic analysis of ALMS1 in humans re-veals a surprisingly complex evolutionary history. Molecular biol-ogy and evolution. 2009 Jun;26(6):1357–67.
[128] Hermisson J, Pennings PS. Soft sweeps: molecular populationgenetics of adaptation from standing genetic variation. Genetics.2005 Apr;169(4):2335–52.
[129] Innan H, Kim Y. Pattern of polymorphism after strong artifi-cial selection in a domestication event. Proceedings of the Na-tional Academy of Sciences of the United States of America. 2004Jul;101(29):10667–72.
[130] Orr HA, Betancourt AJ. Haldane ’ s Sieve and Adaptation Fromthe Standing Genetic Variation. Genetics. 2001;157:875–884.
[131] Pennings PS, Hermisson J. Soft sweeps II–molecular popula-tion genetics of adaptation from recurrent mutation or migration.Molecular biology and evolution. 2006 May;23(5):1076–84.
[132] Przeworski M, Coop G, Wall JD. The signature of positive selec-tion on standing genetic variation. Evolution; international journalof organic evolution. 2005 Nov;59(11):2312–23.
[133] Fu W, O’Connor TD, Akey JM. Genetic architecture of quanti-tative traits and complex diseases. Current opinion in genetics &development. 2013 Dec;23(6):678–83.
[134] Scheinfeldt LB, Tishkoff Sa. Recent human adaptation: genomicapproaches, interpretation and insights. Nature reviews Genetics.2013 Oct;14(10):692–702.
304

ii
“thesis” — 2014/9/8 — 10:58 — page 305 — #335 ii
ii
ii
[135] Ferrer-Admetlla A, Liang M, Korneliussen T, Nielsen R. Ondetecting incomplete soft or hard selective sweeps using hap-lotype structure. Molecular biology and evolution. 2014May;31(5):1275–91.
[136] Garud NR, Messer PW, Buzbas EO, Petrov DA. Recent selectivesweeps in Drosophila were abundant and primarily soft. arXiv.2014;.
[137] Coop G, Witonsky D, Di Rienzo A, Pritchard JK. Using Environ-mental Correlations to Identify Loci Underlying Local Adaptation.Genetics. 2010 Jun;1423(August):1411–1423.
[138] Gunther T, Coop G. Robust identification of local adaptation fromallele frequencies. 2Genetics. 2013;195(1):205–20.
[139] Ralph PL, Coop G. Parallel Adaptation: One or Many Wavesof Advance of an Advantageous Allele? Genetics. 2010Jul;668(October):647–668.
[140] Hancock AM, Alkorta-Aranburu G, Witonsky DB, Di RienzoA. Adaptations to new environments in humans: the role ofsubtle allele frequency shifts. Philosophical transactions of theRoyal Society of London Series B, Biological sciences. 2010Aug;365(1552):2459–68.
[141] Mendizabal I, Marigorta UM, Lao O, Comas D. Adaptive evolu-tion of loci covarying with the human African Pygmy phenotype.Human genetics. 2012 Aug;131(8):1305–17.
[142] Orr HA. Testing Natural Selection vs. Genetic Drift in Pheno-typic Evolution Using Quantitative Trait Locus Data. Genetics.1998;149:2099–2104.
[143] Turchin M, Chiang CWK, Palmer CD, Sankararaman, Sriram Re-ich D, consortium G, Hirschhorn JN. Evidence of widespread se-lection on standing variation in Europe at height-associated SNPs.Nature Genetics. 2012;44(9):1015–1019.
305

ii
“thesis” — 2014/9/8 — 10:58 — page 306 — #336 ii
ii
ii
[144] Berg JJ, Coop G. The Population Genetic Signature of PolygenicLocal Adaptation. arXiv. 2013;.
[145] Leinonen T, McCairns RJS, O’Hara RB, Merila J. Q(ST)-F(ST)comparisons: evolutionary and ecological insights from genomicheterogeneity. Nature reviews Genetics. 2013 Mar;14(3):179–90.
[146] Barrett RDH, Hoekstra HE. Molecular spandrels: tests ofadaptation at the genetic level. Nature reviews Genetics. 2011Nov;12(11):767–80.
[147] Dunham I, Kundaje A, Aldred SF, Collins PJ, Davis Ca, Doyle F,et al. An integrated encyclopedia of DNA elements in the humangenome. Nature. 2012 Sep;489(7414):57–74.
[148] Tishkoff Sa, Varkonyi R, Cahinhinan N, Abbes S, Argyropoulos G,Destro-Bisol G, et al. Haplotype diversity and linkage disequilib-rium at human G6PD: recent origin of alleles that confer malarialresistance. Science. 2001 Jul;293(5529):455–62.
[149] Ayodo G, Price AL, Keinan A, Ajwang A, Otieno MF, OragoASS, et al. Combining evidence of natural selection with associa-tion analysis increases power to detect malaria-resistance variants.American journal of human genetics. 2007 Aug;81(2):234–242.
[150] Bersaglieri T, Sabeti PC, Patterson N, Vanderploeg T, Schaffner SF,Drake JA, et al. Genetic Signatures of Strong Recent Positive Se-lection at the Lactase Gene. American journal of human genetics.2004;74:1111–1120.
[151] Xue Y, Daly A, Yngvadottir B, Liu M, Coop G, Kim Y, et al.Spread of an Inactive Form of Caspase-12 in Humans Is Due toRecent Positive Selection. American journal of human genetics.2006;78:659–670.
[152] Carnero-Montoro E, Bonet L, Engelken J, Bielig T, Martınez-Florensa M, Lozano F, et al. Evolutionary and functional evidence
306
ii
“thesis” — 2014/9/8 — 10:58 — page 307 — #337 ii
ii
ii
for positive selection at the human CD5 immune receptor gene.Molecular biology and evolution. 2012 Feb;29(2):811–23.
[153] Akey JM, Zhang G, Zhang K, Jin L, Shriver MD. Interrogat-ing a High-Density SNP Map for Signatures of Natural Selection.Genome research. 2002;12:1805–1814.
[154] Pickrell JK, Coop G, Novembre J, Kudaravalli S, Li JZ, Absher D,et al. Signals of recent positive selection in a worldwide sample ofhuman populations. Genome research. 2009;19(5):826–837.
[155] The 1000 Genomes Project Consortium. A map of humangenome variation from population-scale sequencing. Nature. 2010Oct;467(7319):1061–1073.
[156] Hindorff La, Sethupathy P, Junkins Ha, Ramos EM, Mehta JP,Collins FS, et al. Potential etiologic and functional implications ofgenome-wide association loci for human diseases and traits. Pro-ceedings of the National Academy of Sciences of the United Statesof America. 2009 Jun;106(23):9362–7.
[157] Xue Y, Zhang X, Huang N, Daly A, Gillson CJ, Macarthur DG,et al. Population differentiation as an indicator of recent posi-tive selection in humans: an empirical evaluation. Genetics. 2009Nov;183(3):1065–77.
[158] Sabeti PC, Walsh E, Schaffner SF, Varilly P, Fry B, Hutcheson HB,et al. The case for selection at CCR5-Delta32. PLoS biology.2005;3(11):e378.
[159] Simonson TS, Yang Y, Huff CD, Yun H, Qin G, Witherspoon DJ,et al. Genetic evidence for high-altitude adaptation in Tibet. Sci-ence. 2010 Jul;329(5987):72–5.
[160] Jeong C, Alkorta-Aranburu G, Basnyat B, Neupane M, WitonskyDB, Pritchard JK, et al. Admixture facilitates genetic adaptationsto high altitude in Tibet. Nature communications. 2014 Jan;5:3281.
307

ii
“thesis” — 2014/9/8 — 10:58 — page 308 — #338 ii
ii
ii
[161] Beall CM, Cavalleri GL, Deng L, Elston RC, Gao Y, Knight J,et al. Natural selection on EPAS1 ( HIF2 α ) associated with lowhemoglobin concentration in Tibetan highlanders. Proc Natl AcadSci U S A. 2010;107(25):11459–11464.
[162] Wilde S, Timpson A, Kirsanow K, Kaiser E, Kayser M, Un-terlander M, et al. Direct evidence for positive selection of skin,hair, and eye pigmentation in Europeans during the last 5,000 y.Proceedings of the National Academy of Sciences of the UnitedStates of America. 2014 Apr;111(13):4832–7.
[163] Lamason RL, Mohideen MAPK, Mest JR, Wong AC, Norton HL,Aros MC, et al. SLC24A5, a putative cation exchanger, affectspigmentation in zebrafish and humans. Science (New York, NY).2005 Dec;310(5755):1782–6.
[164] Engelken J, Carnero-Montoro E, Pybus M, Andrews GK, Lalueza-Fox C, Comas D, et al. Extreme population differences inthe human zinc transporter ZIP4 (SLC39A4) are explained bypositive selection in Sub-Saharan Africa. PLoS genetics. 2014Feb;10(2):e1004128.
[165] The Gene Ontology Consortium. Gene Ontology : tool for the.Nature genetics. 2000;25:25–29.
[166] Mi H, Muruganujan A, Thomas PD. PANTHER in 2013 : mod-eling the evolution of gene function , and other gene attributes, in the context of phylogenetic trees. Nucleic acids research.2013;41(Database issue):377–386.
[167] Kanehisa M, Goto S. KEGG : Kyoto Encyclopedia of Genes andGenomes. Nucleic acids research. 2000;28(1):27–30.
[168] Croft D, Kelly GO, Wu G, Haw R, Gillespie M, Matthews L, et al.Reactome : a database of reactions , pathways and biological pro-cesses. Nucleic acids research. 2011;39(Database issue):691–697.
308
ii
“thesis” — 2014/9/8 — 10:58 — page 309 — #339 ii
ii
ii
[169] Marques-Bonet T, Ryder Oa, Eichler EE. Sequencing primategenomes: what have we learned? Annual review of genomicsand human genetics. 2009 Jan;10:355–86.
[170] Kosiol C, Vinar T, da Fonseca RR, Hubisz MJ, Bustamante CD,Nielsen R, et al. Patterns of positive selection in six Mammaliangenomes. PLoS genetics. 2008 Jan;4(8):e1000144.
[171] Serra F, Arbiza L, Dopazo J, Dopazo H. Natural selection on func-tional modules, a genome-wide analysis. PLoS Computational Bi-ology. 2011;7(3):e10001093.
[172] Daub JT, Hofer T, Cutivet E, Dupanloup I, Quintana-murci L,Robinson-rechavi M, et al. Evidence for Polygenic Adaptation toPathogens in the Human Genome Article Fast Track. Molecularbiology and evolution. 2013;30(7):1544–1558.
[173] Barreiro LB, Quintana-Murci L. From evolutionary genetics to hu-man immunology: how selection shapes host defence genes. Na-ture reviews Genetics. 2010;11(1):17–30.
[174] Fumagalli M, Sironi M, Pozzoli U, Ferrer-Admetlla A, Ferrer-Admettla A, Pattini L, et al. Signatures of environmen-tal genetic adaptation pinpoint pathogens as the main selec-tive pressure through human evolution. PLoS genetics. 2011Nov;7(11):e1002355.
[175] Hancock AM, Witonsky DB, Alkorta-aranburu G, Beall CM, Suk-ernik R, Utermann G, et al. Adaptations to Climate-Mediated Se-lective Pressures in Humans. PLoS genetics. 2011;7(4):e1001375.
[176] King Mc, Wilson AC. Humans and Chimpanze es. Science.1975;188(4184):107–116.
[177] Siepel A, Bejerano G, Pedersen JS, Hinrichs AS, Hou M, Rosen-bloom K, et al. Evolutionarily conserved elements in verte-brate, insect, worm, and yeast genomes. Genome research. 2005Aug;15(8):1034–50.
309
ii
“thesis” — 2014/9/8 — 10:58 — page 310 — #340 ii
ii
ii
[178] Fraser HB. Gene expression drives local adaptation in humans.Genome research. 2013 Jul;23(7):1089–96.
[179] Haygood R, Fedrigo O, Hanson B, Yokoyama KD, Wray Ga. Pro-moter regions of many neural- and nutrition-related genes have ex-perienced positive selection during human evolution. Nature ge-netics. 2007 Sep;39(9):1140–4.
[180] Kudaravalli S, Veyrieras JB, Stranger BE, Dermitzakis ET,Pritchard JK. Gene expression levels are a target of recent naturalselection in the human genome. Molecular biology and evolution.2009 Mar;26(3):649–58.
[181] Dawkins R. The Selfish Gene. Oxford University Press; 1976.
[182] Lehner B. Molecular mechanisms of epistasis within and betweengenes. Trends in Genetics. 2011;27(8):323–331.
[183] Breen MS, Kemena C, Vlasov PK, Notredame C, Kondrashov FA.Epistasis as the primary factor in molecular evolution. Nature.2012;490(7421):535–538.
[184] Kondrashov AS, Sunyaev S, Kondrashov FA. Dobzhansky –Muller incompatibilities in. Proceedings of the National Acadamyof Sciences. 2002;99(23):14878–14883.
[185] Lovell SC, Robertson DL. An integrated view of molecular co-evolution in protein-protein interactions. Molecular biology andevolution. 2010 Nov;27(11):2567–75.
[186] Fryxell KJ. The coevolution of gene familv trees. Trends in Ge-netics. 1996;12(9):394–369.
[187] Doherty A, Alvarez-Ponce D, McInerney JO. Increased genomesampling reveals a dynamic relationship between gene duplicabil-ity and the structure of the primate protein-protein interaction net-work. Molecular biology and evolution. 2012 Nov;29(11):3563–73.
310

ii
“thesis” — 2014/9/8 — 10:58 — page 311 — #341 ii
ii
ii
[188] Fraser HB, Hirsh AE, Steinmetz LM, Scharfe C, Feldman MW.Evolutionary Rate in the Protein Interaction Network. Science.2002;296(2002):750–752.
[189] Agrafioti I, Swire J, Abbott J, Huntley D, Butcher S, StumpfMPH. Comparative analysis of the Saccharomyces cerevisiae andCaenorhabditis elegans protein interaction networks. BMC evolu-tionary biology. 2005 Jan;5:23.
[190] Lemos B, Bettencourt BR, Meiklejohn CD, Hartl DL. Evolutionof proteins and gene expression levels are coupled in Drosophilaand are independently associated with mRNA abundance, proteinlength, and number of protein-protein interactions. Molecular bi-ology and evolution. 2005 May;22(5):1345–1354.
[191] Cui Q, Purisima E, Wang E. Protein evolution on a human signal-ing network. BMC Systems Biology. 2009;3(1):21.
[192] Clark NL, Aquadro CF. A novel method to detect proteins evolv-ing at correlated rates: identifying new functional relationships be-tween coevolving proteins. Molecular biology and evolution. 2010May;27(5):1152–61.
[193] Alvarez-Ponce D, Fares Ma. Evolutionary rate and duplicabil-ity in the Arabidopsis thaliana protein-protein interaction network.Genome biology and evolution. 2012 Jan;4(12):1263–74.
[194] Wang GZ, Lercher MJ. The Effects of Network Neighbours onProtein Evolution. PLoS ONE. 2011 Apr;6(4):e18288.
[195] Clark NL, Alani E, Aquadro CF. Evolutionary rate covariationreveals shared functionality and coexpression of genes. Genomeresearch. 2012 Apr;22(4):714–20.
[196] Freeman LC. A Set of Measures of Centrality Based on Between-ness. Sociometry. 1977;40(1):35–41.
311
ii
“thesis” — 2014/9/8 — 10:58 — page 312 — #342 ii
ii
ii
[197] Qian W, He X, Chan E, Xu H, Zhang J. Measuring the evolu-tionary rate of protein-protein interaction. Proceedings of the Na-tional Academy of Sciences of the United States of America. 2011May;108(21):8725–8730.
[198] Olson-Manning CF, Wagner MR, Mitchell-Olds T. Adaptive evolu-tion: evaluating empirical support for theoretical predictions. Na-ture reviews Genetics. 2012 Dec;13(12):867–77.
[199] Orr HA. The genetic theory of adaptation: a brief history. Naturereviews Genetics. 2005 Mar;6(2):119–27.
[200] Khurana E, Fu Y, Chen J, Gerstein M. Interpretation of GenomicVariants Using a Unified Biological Network Approach. PLoSComputational Biology. 2013;9(3).
[201] Rausher M, Miller RE, Tiffin P. Patterns of evolutionary rate varia-tion among genes of the anthocyanin biosynthetic pathway. Molec-ular biology and evolution. 1999 Feb;16(2):266–274.
[202] Flowers JM, Sezgin E, Kumagai S, Duvernell DD, Matzkin LM,Schmidt PS, et al. Adaptive evolution of metabolic pathways inDrosophila. Molecular biology and evolution. 2007;24(6):1347–54.
[203] Livingstone K, Anderson S. Patterns of variation in the evolutionof carotenoid biosynthetic pathway enzymes of higher plants. TheJournal of heredity. 2009;100(6):754–761.
[204] Yang Yh, Zhang Fm, Ge S. Evolutionary rate patterns of theGibberellin pathway genes. BMC Evolutionary Biology. 2009Jan;9:206.
[205] Ramsay H, Rieseberg LH, Ritland K. The correlation of evolu-tionary rate with pathway position in plant terpenoid biosynthesis.Molecular Biology and Evolution. 2009;26(5):1045–1053.
312

ii
“thesis” — 2014/9/8 — 10:58 — page 313 — #343 ii
ii
ii
[206] Montanucci L, Laayouni H, Dall’Olio GM, Bertranpetit J. Molec-ular evolution and network-level analysis of the N-glycosylationmetabolic pathway across primates. Molecular biology and evolu-tion. 2011 Jan;28(1):813–823.
[207] Riley RM, Jin W, Gibson G. Contrasting selection pressures oncomponents of the Ras-mediated signal transduction pathway inDrosophila. Molecular Ecology. 2003 May;12(5):1315–1323.
[208] Alvarez-Ponce D, Aguade M, Rozas J. Network-level molecularevolutionary analysis of the insulin/TOR signal transduction path-way across 12 Drosophila genomes. Genome Research. 2009;p.234–242.
[209] Alvarez-Ponce D, Aguade M, Rozas J. Comparative Genomicsof the Vertebrate Insulin / TOR Signal Transduction Pathway :A Network-Level Analysis of. Genome biology and evolution.2011;3:87–101.
[210] Invergo BM, Montanucci L, Laayouni H, Bertranpetit J. A system-level , molecular evolutionary analysis of mammalian phototrans-duction. BMC Evolutionary Biology. 2013;13:52.
[211] Lavagnino N, Serra F, Arbiza L, Dopazo H, Hasson E. Evolution-ary Bioinformatics Evolutionary Genomics of Genes Involved inOlfactory Behavior in the Drosophila melanogaster Species Group.Evolutionary bioinformatics online. 2012;8:89–104.
[212] Fitzpatrick DA, Halloran DMO. Investigating the Relationshipbetween Topology and Evolution in a Dynamic Nematode OdorGenetic Network. International Journal of Evolutionary Biology.2012;2012.
[213] Lu Y, Rausher MD. Evolutionary rate variation in antho-cyanin pathway genes. Molecular biology and evolution. 2003Nov;20(11):1844–53.
313
ii
“thesis” — 2014/9/8 — 10:58 — page 314 — #344 ii
ii
ii
[214] Rausher M, Lu Y, Meyer K. Variation in constraint versus pos-itive selection as an explanation for evolutionary rate variationamong anthocyanin genes. Journal of molecular evolution. 2008Aug;67(2):137–144.
[215] Laportes DC, Walsh K, Koshland DE. The Branch Point Effect.Ultrasensitivity and subsensitivity to metabolic control. Journal ofBiological Chemistry. 1984;259(22):14068–14075.
[216] Olson-Manning CF, Lee CR, Rausher MD, Mitchell-Olds T. Evo-lution of flux control in the glucosinolate pathway in Arabidopsisthaliana. Molecular Biology and Evolution. 2013 Jan;30(1):14–23.
[217] Eanes WF. Analysis of Selection on Enzyme Polymorphisms. An-nual Review of Ecology and Systematics. 1999;30(65):301–26.
[218] Whitt SR, Wilson LM, Tenaillon MI, Gaut BS, Iv ESB. Geneticdiversity and selection in the maize starch pathway. Proceedings ofthe National Academy of Sciences of the United States of America.2002;99(20):12959–12962.
[219] Olsen KM, Womack A, Garrett AR, Suddith JI, Purugganan MD.Contrasting Evolutionary Forces in the Arabidopsis thaliana FloralDevelopmental Pathway. Genetics. 2002;1:1641–1650.
[220] Alvarez-Ponce D, Guirao-Rico S, Orengo DJ, Segarra C, RozasJ, Aguade M. Molecular population genetics of the in-sulin/TOR signal transduction pathway: a network-level analysisin Drosophila melanogaster. Molecular Biology and Evolution.2012 Jan;29(1):123–132.
[221] Casals F, Sikora M, Laayouni H, Montanucci L, Muntasell A,Lazarus R, et al. Genetic adaptation of the antibacterial hu-man innate immunity network. BMC evolutionary biology. 2011Jan;11(1):202.
314
ii
“thesis” — 2014/9/8 — 10:58 — page 315 — #345 ii
ii
ii
[222] Barabasi AL, Oltvai ZN. Network biology: understanding thecell’s functional organization. Nature reviews Genetics. 2004Feb;5(2):101–13.
[223] Yamada T, Bork P. Evolution of biomolecular networks - lessonsfrom metabolic and protein interactions. Nature Reviews Molecu-lar Cell Biology. 2009;10(11):791–803.
[224] Jeong H, Albert R. The large-scale organization of metabolic net-works. Nature. 2000;407(1990):651–654.
[225] Wuchty S. Evolution and topology in the yeast protein interactionnetwork. Genome research. 2004 Jul;14(7):1310–4.
[226] Jordan IK, Wolf Y, Koonin E. No simple dependence between pro-tein evolution rate and the number of protein-protein interactions:only the most prolific interactors tend to evolve slowly. BMC Evo-lutionary Biology. 2003;3(1):1.
[227] Bloom JD, Adami C. Apparent dependence of protein evolutionaryrate on number of sets. BMC Evolutionary Biology. 2003;3:21.
[228] Zhu X, Gerstein M, Snyder M. Getting connected: analysis andprinciples of biological networks. Genes & development. 2007May;21(9):1010–24.
[229] Bloom JD, Adami C. Evolutionary rate depends on numberof protein-protein interactions independently of gene expressionlevel: response. BMC evolutionary biology. 2004 Jun;4:14.
[230] Drummond DA, Raval A, Wilke CO. A single determinant dom-inates the rate of yeast protein evolution. Molecular biology andevolution. 2006 Feb;23(2):327–37.
[231] Fraser H, Hirsh A. Evolutionary rate depends on numberof protein-protein interactions independently of gene expressionlevel. BMC Evolutionary Biology. 2004;4(1):13.
315

ii
“thesis” — 2014/9/8 — 10:58 — page 316 — #346 ii
ii
ii
[232] Hahn MW, Kern AD. Comparative genomics of centrality and es-sentiality in three eukaryotic protein-interaction networks. Molec-ular biology and evolution. 2005 Apr;22(4):803–806.
[233] Fraser HB. Modularity and evolutionary constraint on proteins.Nature genetics. 2005 Apr;37(4):351–2.
[234] Kim PM, Korbel JO, Gerstein MB. Positive selection at the proteinnetwork periphery: evaluation in terms of structural constraints andcellular context. Proceedings of the National Academy of Sciences.2007 Dec;104(51):20274–20279.
[235] Forster J, Famili I, Fu P, Palsson BO, Nielsen J. Genome-Scale Re-construction of the Saccharomyces cerevisiae Metabolic Network.Genome research. 2003;13:244–253.
[236] Duarte NC, Herrga rd MJ, Palsson BO. Reconstruction and vali-dation of Saccharomyces cerevisiae iND750, a fully compartmen-talized genome-scale metabolic model. Genome research. 2004Jul;14(7):1298–309.
[237] Duarte NC, Becker SA, Jamshidi N, Thiele I, Mo ML, Vo TD, et al.Global reconstruction of the human metabolic network based ongenomic and bibliomic data. Proceedings of the National Acadamyof Sciences. 2007;104(6):1777–1782.
[238] Wagner A, Fell DA. The small world inside large metabolic net-works. Proceedings of the Royal Society B: Biological Sciences.2001;268:1803–1810.
[239] Ma H, Zeng Ap. genome data and analysis of their global. Bioin-formatics. 2003;19(2):270–277.
[240] Ravasz E, Somera aL, Mongru Da, Oltvai ZN, Barabasi aL. Hierar-chical organization of modularity in metabolic networks. Science(New York, NY). 2002 Aug;297(5586):1551–5.
316

ii
“thesis” — 2014/9/8 — 10:58 — page 317 — #347 ii
ii
ii
[241] Hahn MW, Conant GC, Wagner A. Molecular evolution in largegenetic networks: does connectivity equal constraint? Journal ofMolecular Evolution. 2004;58(2):203–211.
[242] Vitkup D, Kharchenko P, Wagner A. Influence of metabolic net-work structure and function on enzyme evolution. Genome biol-ogy. 2006;7(5):R39.
[243] Greenberg AJ, Stockwell SR, Clark AG. Evolutionary Constraintand Adaptation in the Metabolic Network of Drosophila. Molecu-lar Biology and Evolution. 2008;25(12):2537–2546.
[244] Lu C, Zhang Z, Leach L, Kearsey MJ, Luo ZW. Impacts of yeastmetabolic network structure on enzyme evolution. Genome biol-ogy. 2007 Jan;8(8):407.
[245] Papp B, Oliver S. Genome-wide analysis of the context-dependence of regulatory networks. Genome Biology. 2005;6:206.
[246] Babu MM, A NML, Aravind L, Gerstein M, Teichmann SA. Struc-ture and evolution of transcriptional regulatory networks. CurrentOpinion in Structural Biology. 2004;14:283–291.
[247] Rodriguez-Caso C, Medina Ma, Sole RV. Topology, tinkering andevolution of the human transcription factor network. The FEBSjournal. 2005 Dec;272(24):6423–34.
[248] Yu H, Gerstein M. Genomic analysis of the hierarchical structureof regulatory networks. Proceedings of the National Acadamy ofSciences. 2006;103:14724–14731.
[249] Gerstein MB, Kundaje A, Hariharan M, Landt SG, Yan KK, ChengC, et al. Architecture of the human regulatory network derivedfrom ENCODE data. Nature. 2012 Sep;489(7414):91–100.
[250] Evangelisti AM, Wagner A. Molecular evolution in the yeast tran-scriptional regulation network. Journal of Experimental Zoology(Mol Dev Evol)2. 2004;302:392–411.
317

ii
“thesis” — 2014/9/8 — 10:58 — page 318 — #348 ii
ii
ii
[251] Wang Y, Franzosa EA, Zhang Xs, Xia Y. Protein evolution inyeast transcription factor subnetworks. Nucleic Acids Research.2010;38(18):5959–5969.
[252] Jovelin R, Phillips PC. Evolutionary rates and centrality in theyeast gene regulatory network. Genome Biology. 2009;10(4):R35.
[253] Jordan IK, Marino Ramırez L, Wolf YI, Koonin EV. Conservationand coevolution in the scale-free human gene coexpression net-work. Molecular biology and evolution. 2004 Nov;21(11):2058–70.
[254] MacArthur DG, Balasubramanian S, Frankish A, Huang N, WalterK, Jostins L, et al. A systematic survey of loss-of-function variantsin human protein-coding genes. Science. 2012;335(6070):823–828.
[255] Liao By, Zhang J. Null mutations in human and mouse orthologsfrequently result in different phenotypes. Proceedings of the Na-tional Acadamy of Sciences. 2008;105(19):6987–6992.
[256] Limdi Na, Wadelius M, Cavallari L, Eriksson N, Crawford DC,Lee MTM, et al. Warfarin pharmacogenetics: a single VKORC1polymorphism is predictive of dose across 3 racial groups. Blood.2010 May;115(18):3827–34.
[257] Carlson CS, Thomas DJ, Eberle MA, Swanson JE, Livingston RJ,Rieder MJ, et al. Genomic regions exhibiting positive selectionidentified from dense genotype data Genomic regions exhibitingpositive selection identified from dense genotype data. GenomeResearch. 2005;15:1553–1565.
[258] Wang ET, Kodama G, Baldi P, Moyzis RK. Global landscape ofrecent inferred Darwinian selection for Homo sapiens. Proceed-ings of the National Academy of Sciences of the United States ofAmerica. 2006;103(1):13–140.
318

ii
“thesis” — 2014/9/8 — 10:58 — page 319 — #349 ii
ii
ii
[259] Teo Yy, Sim X, Ong RTH, Tan AKS, Chen J, Tantoso E, et al.Singapore Genome Variation Project : A haplotype map of threeSoutheast Asian populations Singapore Genome Variation Project: A haplotype map of three Southeast Asian populations. GenomeResearch. 2009;19:2154–2162.
[260] Barreiro LB, Laval G, Quach H, Patin E, Quintana-Murci L. Nat-ural selection has driven population differentiation in modern hu-mans. Nature genetics. 2008;40(3):340–345.
[261] Ross Ka, Bigham AW, Edwards M, Gozdzik A, Suarez-Kurtz G,Parra EJ. Worldwide allele frequency distribution of four poly-morphisms associated with warfarin dose requirements. Journal ofhuman genetics. 2010 Sep;55(9):582–9.
[262] Trynka G, Hunt Ka, Bockett Na, Romanos J, Mistry V, Szperl A,et al. Dense genotyping identifies and localizes multiple commonand rare variant association signals in celiac disease. Nature genet-ics. 2011 Dec;43(12):1193–201.
[263] Patillon B, Luisi P, Blanche H, Patin E, Cann HM, Genin E, et al.Positive Selection in the Chromosome 16 VKORC1 Genomic Re-gion Has Contributed to the Variability of Anticoagulant Responsein Humans. PloS one. 2012 Jan;7(12):e53049.
[264] Laayouni H, Oosting M, Luisi P, Ioana M, Alonso S, Ricano PonceI, et al. Convergent evolution in European and Rroma populationsreveals pressure exerted by plague on Toll-like receptors. Proceed-ings of the National Academy of Sciences of the United States ofAmerica. 2014 Mar;111(7):2668–73.
[265] Luisi P, Alvarez-Ponce D, Dall’Olio GM, Sikora M, BertranpetitJ, Laayouni H. Network-level and population genetics analysis ofthe insulin/TOR signal transduction pathway across human popula-tions. Molecular biology and evolution. 2012 May;29(5):1379–92.
319
ii
“thesis” — 2014/9/8 — 10:58 — page 320 — #350 ii
ii
ii
[266] Barreiro LB, Ben-Ali M, Quach H, Laval G, Patin E, Pickrell JK,et al. Evolutionary dynamics of human Toll-like receptors andtheir different contributions to host defense. PLoS genetics. 2009Jul;5(7):e1000562.
[267] Medzhitov R. Toll-like receptors and innate immunity. Naturereviews Immunology. 2001 Nov;1(2):135–45.
[268] Dall’Olio GM, Jassal B, Montanucci L, Gagneux P, BertranpetitJ, Laayouni H. The annotation of the asparagine N-linked glyco-sylation pathway in the Reactome database. Glycobiology. 2011Nov;21(11):1395–400.
[269] Stark C, Breitkreutz BJ, Chatr-Aryamontri A, Boucher L, OughtredR, Livstone MS, et al. The BioGRID Interaction Database:2011 update. Nucleic acids research. 2011 Jan;39(Databaseissue):D698–704.
[270] Sowa ME, Bennett EJ, Gygi SP, Harper JW. Defining the hu-man deubiquitinating enzyme interaction landscape. Cell. 2009Jul;138(2):389–403.
[271] Bandyopadhyay D, Huan J, Liu J, Prins J, Snoeyink J, Wang W,et al. Functional neighbors: inferring relationships between non-homologous protein families using family-specific packing motifs.IEEE transactions on information technology in biomedicine : apublication of the IEEE Engineering in Medicine and Biology So-ciety. 2010 Sep;14(5):1137–43.
[272] von Mering C, Krause R, Snel B, Cornell M, Oliver SG, Fields S,et al. Comparative assessment of large-scale data sets of protein-protein interactions. Nature. 2002 May;417(6887):399–403.
[273] Bader JS, Chaudhuri A, Rothberg JM, Chant J. Gaining confidencein high-throughput protein interaction networks. Nature biotech-nology. 2004 Jan;22(1):78–85.
320
ii
“thesis” — 2014/9/8 — 10:58 — page 321 — #351 ii
ii
ii
[274] Deeds EJ, Ashenberg O, Shakhnovich EI. A simple physical modelfor scaling in protein-protein interaction networks. Proceedings ofthe National Academy of Sciences of the United States of America.2006 Jan;103(2):311–6.
[275] Kelly WP, Stumpf MPH. Assessing coverage of protein interactiondata using capture-recapture models. Bulletin of mathematical bi-ology. 2012 Feb;74(2):356–74.
[276] Keshava Prasad TS, Goel R, Kandasamy K, Keerthikumar S, Ku-mar S, Mathivanan S, et al. Human Protein Reference Database–2009 update. Nucleic acids research. 2009 Jan;37(Databaseissue):D767–72.
[277] Messer PW, Petrov Da. Frequent adaptation and the McDonald-Kreitman test. Proceedings of the National Academy of Sciences.2013 May;110(21):8615–8620.
[278] Prado-Martinez J, Sudmant PH, Kidd JM, Li H, Kelley JL,Lorente-Galdos B, et al. Great ape genetic diversity and popula-tion history. Nature. 2013 Jul;499(7459):471–5.
[279] Vidal M, Cusick ME, Barabasi AL. Interactome Networks andHuman Disease. Cell. 2011;144(6):986–998.
[280] Dall’Olio GM, Laayouni H, Luisi P, Sikora M, Montanucci L,Bertranpetit J. Distribution of events of positive selection andpopulation differentiation in a metabolic pathway: the case ofasparagine N-glycosylation. BMC evolutionary biology. 2012Jan;12:98.
[281] Rausher MD. The evolution of genes in branched metabolic path-ways. Evolution; international journal of organic evolution. 2012Jan;67(1):34–48.
[282] Wright KM, Rausher MD. The evolution of control and distribu-tion of adaptive mutations in a metabolic pathway. Genetics. 2010Feb;184(2):483–502.
321

ii
“thesis” — 2014/9/8 — 10:58 — page 322 — #352 ii
ii
ii
[283] Martin G. Fisher’s Geometrical Model Emerges as a Propertyof Complex Integrated Phenotypic Networks. Genetics. 2014May;197(1):237–55.
[284] Larracuente AM, Sackton TB, Greenberg AJ, Wong A, Singh ND,Sturgill D, et al. Evolution of protein-coding genes in Drosophila.Trends in genetics. 2008 Mar;24(3):114–23.
[285] Morgan GJ. Emile Zuckerkandl, Linus Pauling, and the molecu-lar evolutionary clock, 1959-1965. Journal of History of Biology.1988;31(2):155–78.
[286] Zuckerkandl E. Evolutionary processes and evolutionary noise atthe molecular level. I. Functional density in proteins. Journal ofMolecular Evolution. 1976;7(3):167–83.
[287] Pal C, Papp B, Hurst LD. Does the Recombination Rate Affect theEfficiency of Purifying Selection ? The Yeast. Molecular biologyand evolution2. 2001;18:2323–2326.
[288] Rocha EPC, Danchin A. An analysis of determinants of aminoacids substitution rates in bacterial proteins. Molecular biologyand evolution. 2004 Jan;21(1):108–16.
[289] Wilson AC, Carlson SS, White TJ. Biochemical evolution. AnnualReview of Biochemistry. 1977;46:573–639.
[290] Salathe M, Ackermann M, Bonhoeffer S. The effect of multifunc-tionality on the rate of evolution in yeast. Molecular biology andevolution. 2006 Apr;23(4):721–2.
[291] Podder S, Mukhopadhyay P, Ghosh TC. Multifunctionality domi-nantly determines the rate of human housekeeping and tissue spe-cific interacting protein evolution. Gene. 2009 Jun;439(1-2):11–6.
[292] Hurst LD, Smith NGC. Do essential genes evolve slowly ? CurrentBiology. 1999;9(14):747–750.
322
ii
“thesis” — 2014/9/8 — 10:58 — page 323 — #353 ii
ii
ii
[293] Jordan IK, Rogozin IB, Wolf YI, Koonin EV. Essential Genes AreMore Evolutionarily Conserved Than Are Nonessential Genes inBacteria. Genome Research. 2002;12:962–968.
[294] Hirsh AE, Fraser HB. Protein dispensability and rate of evolution.Nature. 2001;411:1046–1049.
[295] Yang J, Gu Z, Li WH. Rate of protein evolution versus fitnesseffect of gene deletion. Molecular biology and evolution. 2003May;20(5):772–4.
[296] Wall DP, Hirsh AE, Fraser HB, Kumm J, Giaever G, Eisen MB,et al. Functional genomic analysis of the rates of protein evolution.Proceedings of the National Academy of Sciences of the UnitedStates of America. 2005;102(5483-5488).
[297] Duret L, Mouchiroud D. Determinants of substitution rates inmammalian genes: expression pattern affects selection intensitybut not mutation rate. Molecular biology and evolution. 2000Jan;17(1):68–74.
[298] Pal C, Papp B, Hurst Lawrence D . Letter to the Editor. Genetics.2001;158(1998).
[299] Drummond DA, Bloom JD, Adami C, Wilke CO, Arnold FH. Whyhighly expressed proteins evolve slowly. Proceedings of the Na-tional Academy of Sciences of the United States of Americas.2005;102(40):14338–14343.
[300] Liao BY, Scott NM, Zhang J. Impacts of gene essentiality, ex-pression pattern, and gene compactness on the evolutionary rateof mammalian proteins. Molecular biology and evolution. 2006Nov;23(11):2072–80.
[301] Ingvarsson PK. Gene expression and protein length influencecodon usage and rates of sequence evolution in Populus tremula.Molecular biology and evolution. 2007 Mar;24(3):836–44.
323
ii
“thesis” — 2014/9/8 — 10:58 — page 324 — #354 ii
ii
ii
[302] Plotkin JB, Fraser HB. Assessing the determinants of evolutionaryrates in the presence of noise. Molecular biology and evolution.2007 May;24(5):1113–21.
[303] Alvarez-Ponce D. The relationship between the hierarchical posi-tion of proteins in the human signal transduction network and theirrate of evolution. BMC Evolutionary Biology. 2012;12(1):192.
[304] Pal C, Papp B, Lercher MJ. An integrated view of protein evolu-tion. Nature reviews Genetics. 2006 May;7(5):337–48.
[305] Subramanian S, Kumar S. Gene expression intensity shapes evo-lutionary rates of the proteins encoded by the vertebrate genome.Genetics. 2004 Sep;168(1):373–81.
[306] Quach H, Barreiro LB, Laval G, Zidane N, Patin E, Kidd KK, et al.Signatures of purifying and local positive selection in human miR-NAs. American journal of human genetics. 2009 Mar;84(3):316–27.
[307] Smith JD, McManus KF, Fraser HB. A novel test for selectionon cis-regulatory elements reveals positive and negative selectionacting on mammalian transcriptional enhancers. Molecular biologyand evolution. 2013 Nov;30(11):2509–18.
[308] Colombo M, Laayouni H, Invergo BM, Bertranpetit J, MontanucciL. Metabolic flux is a determinant of the evolutionary rates ofenzyme-encoding genes. Evolution. 2013;68(2):605–613.
[309] Rhone B, Brandenburg JT, Austerlitz F. Impact of selection ongenes involved in regulatory network: a modelling study. Journalof evolutionary biology. 2011 Oct;24(10):2087–98.
324
Copyright © 2022 FDOKUMEN