agj1de1.pdf - TDX (Tesis Doctorals en Xarxa)
195
ADVERTIMENT. Lʼaccés als continguts dʼaquesta tesi doctoral i la seva utilització ha de respectar els drets de la persona autora. Pot ser utilitzada per a consulta o estudi personal, així com en activitats o materials dʼinvestigació i docència en els termes establerts a lʼart. 32 del Text Refós de la Llei de Propietat Intel·lectual (RDL 1/1996). Per altres utilitzacions es requereix lʼautorització prèvia i expressa de la persona autora. En qualsevol cas, en la utilització dels seus continguts caldrà indicar de forma clara el nom i cognoms de la persona autora i el títol de la tesi doctoral. No sʼautoritza la seva reproducció o altres formes dʼexplotació efectuades amb finalitats de lucre ni la seva comunicació pública des dʼun lloc aliè al servei TDX. Tampoc sʼautoritza la presentació del seu contingut en una finestra o marc aliè a TDX (framing). Aquesta reserva de drets afecta tant als continguts de la tesi com als seus resums i índexs. ADVERTENCIA. El acceso a los contenidos de esta tesis doctoral y su utilización debe respetar los derechos de la persona autora. Puede ser utilizada para consulta o estudio personal, así como en actividades o materiales de investigación y docencia en los términos establecidos en el art. 32 del Texto Refundido de la Ley de Propiedad Intelectual (RDL 1/1996). Para otros usos se requiere la autorización previa y expresa de la persona autora. En cualquier caso, en la utilización de sus contenidos se deberá indicar de forma clara el nombre y apellidos de la persona autora y el título de la tesis doctoral. No se autoriza su reproducción u otras formas de explotación efectuadas con fines lucrativos ni su comunicación pública desde un sitio ajeno al servicio TDR. Tampoco se autoriza la presentación de su contenido en una ventana o marco ajeno a TDR (framing). Esta reserva de derechos afecta tanto al contenido de la tesis como a sus resúmenes e índices. WARNING. The access to the contents of this doctoral thesis and its use must respect the rights of the author. It can be used for reference or private study, as well as research and learning activities or materials in the terms established by the 32nd article of the Spanish Consolidated Copyright Act (RDL 1/1996). Express and previous authorization of the author is required for any other uses. In any case, when using its content, full name of the author and title of the thesis must be clearly indicated. Reproduction or other forms of for profit use or public communication from outside TDX service is not allowed. Presentation of its content in a window or frame external to TDX (framing) is not authorized either. These rights affect both the content of the thesis and its abstracts and indexes.
-
Upload
khangminh22 -
Category
Documents
-
view
0 -
download
0
Transcript of agj1de1.pdf - TDX (Tesis Doctorals en Xarxa)
ADVERTIMENT. Lʼaccés als continguts dʼaquesta tesi doctoral i la seva utilització ha de respectar els drets de lapersona autora. Pot ser utilitzada per a consulta o estudi personal, així com en activitats o materials dʼinvestigació idocència en els termes establerts a lʼart. 32 del Text Refós de la Llei de Propietat Intel·lectual (RDL 1/1996). Per altresutilitzacions es requereix lʼautorització prèvia i expressa de la persona autora. En qualsevol cas, en la utilització delsseus continguts caldrà indicar de forma clara el nom i cognoms de la persona autora i el títol de la tesi doctoral. Nosʼautoritza la seva reproducció o altres formes dʼexplotació efectuades amb finalitats de lucre ni la seva comunicaciópública des dʼun lloc aliè al servei TDX. Tampoc sʼautoritza la presentació del seu contingut en una finestra o marc alièa TDX (framing). Aquesta reserva de drets afecta tant als continguts de la tesi com als seus resums i índexs.
ADVERTENCIA. El acceso a los contenidos de esta tesis doctoral y su utilización debe respetar los derechos de lapersona autora. Puede ser utilizada para consulta o estudio personal, así como en actividades o materiales deinvestigación y docencia en los términos establecidos en el art. 32 del Texto Refundido de la Ley de PropiedadIntelectual (RDL 1/1996). Para otros usos se requiere la autorización previa y expresa de la persona autora. Encualquier caso, en la utilización de sus contenidos se deberá indicar de forma clara el nombre y apellidos de la personaautora y el título de la tesis doctoral. No se autoriza su reproducción u otras formas de explotación efectuadas con fineslucrativos ni su comunicación pública desde un sitio ajeno al servicio TDR. Tampoco se autoriza la presentación desu contenido en una ventana o marco ajeno a TDR (framing). Esta reserva de derechos afecta tanto al contenido dela tesis como a sus resúmenes e índices.
WARNING. The access to the contents of this doctoral thesis and its use must respect the rights of the author. It canbe used for reference or private study, as well as research and learning activities or materials in the terms establishedby the 32nd article of the Spanish Consolidated Copyright Act (RDL 1/1996). Express and previous authorization of theauthor is required for any other uses. In any case, when using its content, full name of the author and title of the thesismust be clearly indicated. Reproduction or other forms of for profit use or public communication from outside TDXservice is not allowed. Presentation of its content in a window or frame external to TDX (framing) is not authorized either.These rights affect both the content of the thesis and its abstracts and indexes.
1
Departament de Ciència Animal i dels Aliments
Facultat de Veterinària
LASER COOKING SYSTEM APPLIED TO A
3D FOOD PRINTING DEVICE Memòria presentada per a optar al grau de
Doctor en Ciència dels Aliments
Doctorand:
Alvar Gràcia Julià Departament de Ciència Animal i dels Aliments Universitat Autònoma de Barcelona
Directora i tutora: Director:
Dra. Marta Capellas Puig Dr. Joaquim Rigola Serrano Departament de Ciència Animal i dels Aliments Departament de Màquines i Motors Tèrmics Universitat Autònoma de Barcelona Universitat Politècnica de Catalunya
Bellaterra (Cerdanyola del Vallès), febrer del 2019

2
Aquesta tesi s’ha realitzat mitjançant l’ajut concedit per l’Agència de Gestió d’Ajuts
Universitaris i de Recerca de la Generalitat de Catalunya, en el marc del programa de
Doctorat Industrial entre la Universitat Autònoma de Barcelona i l’empresa 2 Vegan
Natural Machines (2013-DI-063).

3
Als meus pares, Jesús i Joana
A la Bea i als nostres fills Maria i Gerard
4
“Lo que está abajo es como lo que está arriba, y lo que está arriba es como lo que está abajo, para que se obren los milagros de una sola cosa”
“Separa la Tierra del Fuego, y lo sutil de lo grueso, suavemente y con todo cuidado”
Hermes
Au som deu malh, que i a ua lutz,
Qu’i cau guardar los uelhs dessús,
Que’ns cau traucar tot lo segàs,
Tà ns’arrapar, sonque las mans,
Après lo malh, un aute malh,
Après la lutz, ua auta lutz,
Haut, Peiròt, vam caminar,
De cap tà l’immortèla
Nadau

5
AGRAÏMENTS
Després de 5 anys de doctorat i de grans dosis de paciència per part de la Marta Capellas,
de tots els meus companys de Natural Machines i de la família, he pogut completar la
present tesi, que desitjo pugui contribuir a establir la cocció per làser com un nou sistema
per a cuinar aliments de manera eficient i segura.
En primer lloc, vull agrair tot el suport demostrat des del principi i fins el darrer moment
per la Marta Capellas, que m’ha acompanyat en aquesta aventura de la cocció per làser.
Gràcies per la teva direcció i contribució científica, sempre has estat al meu costat en tot
moment. Gràcies per la teva perfecció i la voluntat de fer la feina ben feta. Ja t’ho han dit
abans, ets una gran directora de tesi!
Desitjaria agrair al Quim Rigola el seu consell i dedicació en la modelització matemàtica
de la cocció làser, que ens ha permès anar més enllà del laboratori, i desenvolupar una
eina de simulació capaç d’establir les temperatures de cocció en diferents aliments...sense
usar el termòmetre. Gràcies sempre per la teva bona disposició, criteri científic i bon
humor!
Gràcies a la Begoña Miñarro que em va acompanyar en els primers passos de la tesi i que,
juntament amb la Marta i l’equip de Natural Machines, van demanar l’ajut a l’AGAUR
pel programa de doctorat industrial. I el més important, van creure en mi com a candidat.
Vull agrair especialment al Dr. Eugenio Schillacci per tota la seva contribució en el
disseny i validació de la modelització de la transferència del calor del sistema làser.
Gràcies per la teva valuosa dedicació!
Gràcies als responsables de Natural Machines, Emilio Sepúlveda i Lynette Kucsma, per
l’oportunitat de realitzar aquest doctorat industrial, pels mitjans que m’han proveït per a
dur-lo a terme i, sobretot, per la gran satisfacció d’incorporar a curt termini la cocció per
làser en la Foodini. Aquesta perspectiva és l’objectiu que justifica un doctorat industrial.
I, més enllà del doctorat, gràcies també per permetre continuar formant part del projecte
de NM!
He de donar les gràcies a tots els meus col·legues de NM: Enric, Víctor, Joan, Xavi,
Adri, Alba, Naoufal, Pere, Rosa, Armando, Marta...gràcies a tots per la vostra
6
col·laboració i pels grans moments viscuts en el muntatge de l’equip làser de Foodini.
NM, Foodini i la impressió 3D d’aliments tenen un gran equip!
Gràcies al Víctor Socias i a l’Albert Gil per obrir-me les portes de Laser Project i dur a
terme les primers proves de cocció làser amb els seus equips Epilog. Amb la seva
generositat i bones vibracions es va iniciar l’èxit d’aquest projecte.
Gràcies a la Dra. Montserrat Serra Milà per col·laborar en aquest projecte mitjançant els
tests que es van realitzar amb els equips de Làser Mèdic - Clínica Tres Torres.
Gràcies a tots aquells que m’han ajudat durant les llargues hores del treball experimental
al laboratori, al Marc, la Camila, la Rocío, la Pamela, la Dolo, l’Anthea, la Mirte i la
Judit. Sempre recordaré la vostra inestimable companyia i afany.
Gràcies també a la Montse, pels seus bons consells sobre la cocció de carn i
hamburgueses.
Gràcies a la Sònia, per la seva gran estima i recolzament en el laboratori durant tots aquest
anys.
Gràcies a l’Alícia i a la Idoia, per la seva amistat i suport.
Gràcies a tots els doctorands que m’han precedit i m’han acompanyat, a la Sonia, a
l’Advelí, al Jezer, a la Carol, a la Maria, a l’Alfons, al Johnny, a l’Ulises, al Daniel, a la
Cris, a l’Òscar, a l’Arnau, a l’Ashraf, la Noemí, ...sempre us recordaré.
Gràcies també a tots els professors i tècnics del departament. Gràcies per les converses al
passadís, pel bon humor, gràcies pels milers de “bon dia”, “bon cap de setmana”, “bones
vacances”... i gràcies per fer que el dia a dia sigui més fàcil amb vosaltres.
Gràcies a la Bibi pel seus bons consells i exemple de treball.
Gràcies al Joan Miquel i al Ramon per les grans converses a la planta, durant el temps
que vaig estar treballant amb el primer sistema làser, i de totes les bones hamburgueses
que es van cuinar i menjar.
7
Gràcies també a l’equip de l’AGAUR per la seva col·laboració durant la tesi, amb tots els
retards i les dificultats que es succeeixen en el mon de la innovació tecnològica. El resultat
final, amb una nova aplicació industrial, ha valgut la pena.
I per últim, recordar i agrair el suport a tota la meva família i amics. Als meus pares Jesús
i Joana, i als meus germans Jesús, Lluís i Sergi que sempre pregunten “per quan la
tesi?”...i com a enginyer o tecnòleg sempre responia “...aviat, aviat”. Gràcies per existir!
Doncs finalment ja la tenim aquí.
I l’agraïment més important de tots, per tot el seu amor, alegria , innocència i comprensió
, a la Bea i als meus fills Maria i Gerard. Aquest treball també està dedicat a vosaltres
tres. Bea, gràcies per tot el teu temps i pel recolzament durant les absències d’aquests
darrers temps, que segur ens faran guanyar noves vivències, gràcies per escoltar-me i per
estimar-me. I gràcies a la Maria per animar-me a passar-m’ho bé i gaudir “amb les meves
cosetes i amb les meves maquinetes”. I a tu Gerard per tots els teus somriures i per
recordar-me cada dia que el més important es tornar a casa.
I per últims recordar a aquells amics que ja no estan aquí, aquells que han marxat durant
el període de la tesi, al Roque i al Pablo. Amics, ens retrobem a on sempre neix el sol.

8
Patents related to this thesis:
Patent
Title: Apparatus and method for heating and cooking food using laser beams and
electromagnetic radiation.
Inventors: Alvar Gracia, Emilio Sepulveda.
Assignee: Natural Machines, Inc.
Priority date: 29/09/2014
Applications: EP3200612A4, US20170245682A1, JP2017532520A,
CN107427044A, CA2961394A1, WO2016053681A1.
9
Abstract
An innovative cooking system based on infrared radiation (IR) using a CO2 laser (CO2
IR Laser) has been developed considering that water absorbance of electromagnetic
infrared radiation at CO2 laser wavelength is very high. The new cooking system has been
adapted into a 3D food printer and has been designed with the following requirements: 1)
ability to cook in a delimited area; 2) control of the cooking temperature; 3) physical
dimensions that fit inside the 3D Food Printer; 4) energy consumption below the power
supply limits; 5) software-controlled system; 6) versatility to cook while printing the food
or to cook once the food is printed. In the present study, two CO2 IR Laser cooking
systems have been used and tested. The first CO2 IR Laser cooking system studied was a
laser engraver and cutter equipment in which specific conditions were applied to cook
beef burgers, mashed potatoes bites and pizza dough. After, a new cooking system
adapted to the 3D food printer was developed, consisting of a CO2 laser lamp, a system
of galvo mirrors that direct the laser beam to the cooking area, and a software that allowed
controlling the position and the frequency of movement of galvanometers. With this new
system, a chosen area could be homogenously cooked, due to the rapid movement of the
galvo mirrors. The food products cooked inside the 3D food printer were: beef burgers;
vegetarian patties prepared with legumes, vegetables and egg as main ingredients; and
pizza dough. To demonstrate that cooking had been achieved, food products were cooked
with the CO2 IR laser systems and different traditional cooking systems (flat and barbeque
grills; IR, convection, desk and microwave ovens). Microbiological, physico-chemical
and sensory characteristics of the cooked foods were evaluated. The formation of
polycyclic aromatic hydrocarbons was analyzed in beef burgers and pizzas to evaluate
toxicological safety, and the thermal effect in the count reduction or survival of
Salmonella Typhimurium, Salmonella Senftenberg and Escherichia coli O157:H7
inoculated in beef burgers and vegetarian patties was studied. Microbiological and
toxicological analyses showed that food products cooked with the new CO2 IR Laser
system were as safe as food cooked with traditional methods. Sensory analyses showed
that consumers had the same, or even higher, level of preference for foods cooked with
CO2 IR laser system in comparison with foods cooked with traditional methods. In
addition, a numerical model based on computational fluid dynamics was developed to
simulate the cooking process of beef burgers and vegetarian patties, and it was validated
with experimental data of temperature evolution during the cooking process. The

10
numerical results for temperature evolution given by the model coincide with the
experimental data, except for the first minutes of cooking. The numerical simulation
model is a powerful tool to optimize the cooking process of the CO2 IR Laser system.
Based on the results obtained, future work will be carried out including cooking
experimental studies with foods containing a significantly different composition; the
simulation of the cooking process with different parametric conditions; and nutritional
studies.
11
Resumen
Se ha desarrollado un sistema innovador de cocción de alimentos basado en el
calentamiento por radiación infrarroja (IR) mediante un láser de CO2 (IR Láser CO2)
teniendo en cuenta que el agua posee una elevada capacidad de absorción
electromagnética en la longitud de onda del IR Láser CO2. El sistema de cocción se ha
adaptado en una impresora 3D de alimentos y se ha diseñado con los siguientes
requerimientos: 1) cocción en un área delimitada; 2) capacidad de control de la
temperatura de cocción; 3) las dimensiones físicas de la lámpara de CO2 deben adaptarse
a la impresora 3D de alimentos; 4) el consumo de energía debe ser compatible con la
capacidad de la impresora 3D de alimentos; 5) el sistema debe ser controlado por
software; 6) versatilidad para cocinar mientras se imprime el alimento o después de la
impresión. En el presente estudio se han usado dos sistemas de cocción por IR Láser CO2.
Primero se usó una grabadora y cortadora con IR Láser CO2 en la que se establecieron
unas condiciones específicas que permitieron la cocción de hamburguesas de ternera, puré
de patatas y masas de pizza. Después se desarrolló un nuevo sistema de cocción integrado
en la impresora 3D de alimentos formado por una lámpara láser de CO2, un sistema de
galvos para dirigir el haz láser a la zona de cocción y un software que permitía controlar
la posición y frecuencia del movimiento de los galvanómetros. Con este nuevo sistema
se podía cocinar de manera homogénea un área determinada, debido al rápido movimiento
de los espejos de los galvos. Se cocinaron los siguientes alimentos en el interior de la
impresora 3D de alimentos: hamburguesas de carne de ternera; preparados vegetales tipo
hamburguesas formuladas con legumbres, hortalizas y huevo como ingredientes
principales; y bases de pizza. Para demostrar que la cocción fue adecuada y suficiente, la
cocción mediante IR Láser CO2 se comparó con diferentes sistemas de cocción
tradicionales (plancha, barbacoa y hornos IR, de convección, de suela refractaria y
microondas) y se evaluaron las características microbiológicas, físico-químicas y
sensoriales de los alimentos cocidos. Se analizó la formación de hidrocarburos aromáticos
policíclicos con el fin de evaluar la seguridad toxicológica, y se estudió el efecto térmico
en la eliminación de Salmonella Typhimurium, Salmonella Senftenberg y Escherichia
coli O157:H7 inoculadas en las hamburguesas de ternera y en los preparados vegetales.
Los análisis microbiológicos y toxicológicos demostraron que los alimentos cocinados
con el nuevo sistema IR Láser CO2 son tan seguros como los cocinados con los métodos
convencionales. Los análisis sensoriales indicaron que la preferencia de los consumidores
12
por los alimentos cocidos con IR Láser CO2 fue igual o superior a la preferencia por los
alimentos cocidos con los sistemas convencionales. Además, se desarrolló un modelo
numérico basado en la dinámica computacional de fluidos para simular el proceso de
cocción de las hamburguesas de ternera y los preparados vegetales y se validó con los
resultados experimentales de aumento de temperatura durante el proceso de cocción. Los
resultados numéricos de la evolución de la temperatura coincidieron con los datos
experimentales, excepto durante los primeros minutos de la cocción. El modelo de
simulación numérico se considera una potente herramienta para optimizar el proceso de
cocción del sistema IR Láser CO2. A partir de los resultados obtenidos se abren nuevas
vías de trabajo, que incluyen estudios de cocción con alimentos de composición
sensiblemente diferente a los probados hasta el momento; la simulación del proceso de
cocción con diferentes parámetros y estrategias de cocción; y la realización de estudios
nutricionales.
13
TABLE OF CONTENTS
CHAPTER 1. INTEREST OF THE STUDY, OBJRCTIVES AND WORKING PLAN21 ........................................................................................................................ 21
1.1.INITIAL STATEMENT ........................................................................................ 22
1.2.INTEREST OF THE STUDY ............................................................................... 22
1.3. OBJECTIVES ........................................................................................................ 24
1.3.1. General Objective ........................................................................................................................... 24
1.3.2. Specific objectives ........................................................................................................................... 24
1.4. WORKING PLAN ................................................................................................. 25
CHAPTER 2. INTRODUCTION ............................................................................... 35
2. INTRODUCTION .................................................................................................... 36
1.1.GENERAL ASPECTS ABOUT COOKING ....................................................... 36
1.2. IR HEATING AND COOKING PROCESSES .................................................. 38
1.2.1 Interaction of IR radiation with Food Components ..................................................................... 38
1.2.2. Applications of IR heating in food processing and cooking operations ..................................... 40 1.2.2.1. Drying and dehydration ............................................................................................................ 40 1.2.2.2 Enzyme inactivation ................................................................................................................... 41 1.2.2.3 Pathogen inactivation ................................................................................................................ 41 1.2.2.4. IR cooking processes ................................................................................................................. 42 1.2.2.4.1. IR cooking of meat ................................................................................................................. 43 1.2.2.4.2. IR cooking of vegetables and legumes ................................................................................... 45 1.2.2.4.3. IR cooking of bread ................................................................................................................ 46
1.2.3. IR heat transfer modeling .............................................................................................................. 46
1.2.4. Selective heating by IR radiation .................................................................................................. 49 1.2.4.1. IR Lasers ................................................................................................................................... 50 1.2.4.1.2. CO2 laser ............................................................................................................................... 51 1.2.4.1.3. Laser Cooking ........................................................................................................................ 51
14
CHAPTER 3. MATERIAL AND METHODS .......................................................... 54
3.1. FORMULATION AND PREPARATION OF SAMPLES ................................ 55
3.1.1. Beef Burgers .................................................................................................................................... 55
3.1.2. Mashed potatoes bites .................................................................................................................... 55
3.1.3. Pizza dough ..................................................................................................................................... 55
3.1.4. Vegetarian patties ........................................................................................................................... 55
3.2. COOKING PROCEDURE ................................................................................... 57
3.2.1. Definition of cooking conditions .................................................................................................... 57
3.2.2. Infrared laser cooking .................................................................................................................... 58 3.2.2.1. Epilog equipment ...................................................................................................................... 58 3.2.2.1.1. Beef burgers ........................................................................................................................... 59 3.2.2.1.2. Pizza dough ............................................................................................................................ 59 3.2.2.1.3. Mashed potatoes..................................................................................................................... 60 3.2.2.2. IR laser cooking with Foodini Equipment ................................................................................. 61 3.2.2.2.1. Beef burgers and vegetarian patties ....................................................................................... 64 3.2.2.2.2. Pizza dough ............................................................................................................................ 68
3.2.3. IR oven cooking .............................................................................................................................. 72
3.2.4. Electric barbeque grill ................................................................................................................... 72
3.2.5. Electric flat grill .............................................................................................................................. 73
3.2.6. Deck oven ........................................................................................................................................ 73
3.2.7. Convection oven .............................................................................................................................. 73
3.2.8. Traditional method ......................................................................................................................... 74
3.3. PARAMETERS MEASURED ............................................................................. 74
3.3.1. Cooking loss (%) ............................................................................................................................. 74
3.3.2. Moisture and proximate analyses.................................................................................................. 74
3.3.3. Water activity ................................................................................................................................. 74
3.3.4. Texture analysis .............................................................................................................................. 74 3.3.4.1. Beef burgers .............................................................................................................................. 75 3.3.4.2. Vegetarian patties ..................................................................................................................... 75 3.3.4.3. Pizza dough ............................................................................................................................... 75 3.3.4.4. Mashed potatoes bites ............................................................................................................... 75
15
3.3.5. Differential scanning calorimetry ................................................................................................. 76
3.3.6. Color analysis .................................................................................................................................. 76
3.3.7. Polycyclic aromatic hydrocarbons (PAHs) analysis .................................................................... 76
3.3.8. Sensory evaluation .......................................................................................................................... 77
3.3.9. Microbiological analysis ................................................................................................................. 78 3.3.9.1. Analysis of non-inoculated samples .......................................................................................... 78 3.3.9.2 Inoculated samples ..................................................................................................................... 79 3.3.9.2.1. Bacterial strains and preparation of bacterial cultures ......................................................... 79 3.3.9.2.2. Inoculation ............................................................................................................................. 79 3.3.9.2.3. Microbiological analysis of Salmonella Typhimurium, Salmonella Senftenberg and E. coli 0157:H7. ................................................................................................................................................ 80 3.3.9.2.4. Survival of Salmonella Typhimurium, Salmonella Senftenberg and E. coli 0157:H7 following cooking treatment. .................................................................................................................................. 80
3.3.10. Experimental design and statistical analysis .............................................................................. 81
3.4. NUMERICAL MODEL ........................................................................................ 82
3.4.1. Evolution of the internal temperature and cooking loss in food samples cooked with the CO2 IR Laser Foodini system .......................................................................................................................... 83
3.4.2. Governing equation for food cooking processes .......................................................................... 83
3.4.3. Boundary conditions ...................................................................................................................... 85 3.4.3.1. Top boundary condition ............................................................................................................ 85 3.4.3.2. Lateral boundary condition ....................................................................................................... 86 3.4.3.3. Bottom boundary condition ....................................................................................................... 86
3.4.4. Explanation of the numerical model ............................................................................................. 91 3.4.4.1. Discretization ............................................................................................................................ 91 3.4.4.2. Boundary conditions ................................................................................................................. 91
3.4.5. Physical parameters used for the numerical simulation. ............................................................ 93
3.4.6. Domain, mesh and time step .......................................................................................................... 94
CHAPTER 4. RESULTS ............................................................................................ 96
4.1. PREVIOUS WORK .............................................................................................. 97
4.2. RESULTS OF THE FIRST EXPERIMENTAL STUDY WITH CO2 IR LASER EPILOG EQUIPMENT ................................................................................. 99
4.2.1. Beef burgers .................................................................................................................................... 99 4.2.1.1. Internal cooking temperature .................................................................................................... 99 4.2.1.2. Cooking loss, moisture, proximate analysis and water activity. ............................................... 99 4.2.1.3. Texture analysis ...................................................................................................................... 100
16
4.2.1.4. Color analysis of beef burgers ................................................................................................ 101 4.2.1.5. Images of samples during the cooking process ....................................................................... 102 4.2.1.6. Sensory analysis ...................................................................................................................... 108 4.2.1.7. Microbiological results ........................................................................................................... 110 4.2.1.7.1. Microbiological analysis of non-inoculated samples ........................................................... 110 4.2.1.7.2. Microbiological analysis of inoculated samples. ................................................................. 111 4.2.1.8. Differential scanning calorimetry ........................................................................................... 112
4.2.2. Pizza dough ................................................................................................................................... 114 4.2.2.1. Cooking loss, moisture, proximate analysis and water activity. ............................................. 114 4.2.2.2. Texture analysis ...................................................................................................................... 115 4.2.2.3. Color analysis ......................................................................................................................... 115 4.2.2.4. Images of samples during the cooking process ....................................................................... 118 4.2.2.5. Sensory analysis ...................................................................................................................... 121 4.2.2.6. Differential scanning calorimetry ........................................................................................... 123
4.2.3. Mashed potatoes bites .................................................................................................................. 124 4.2.3.1. Cooking loss, moisture, proximate analysis and water activity .............................................. 124 4.2.3.2. Texture analysis ...................................................................................................................... 125 4.2.3.3. Color analysis ......................................................................................................................... 125 4.2.3.4. Images of samples during the cooking process ....................................................................... 126 4.2.3.5. Sensory analysis ...................................................................................................................... 128
4.3. RESULTS OF THE SECOND EXPERIMENTAL STUDY WITH CO2 IR LASER FOODINI SYSTEM. ..................................................................... 130
4.3.1. Beef burgers .................................................................................................................................. 130
4.3.1.1. COOKING LOSS, MOISTURE, PROXIMATE ANALYSIS AND WATER ACTIVITY .................................................................................................................. 130
4.3.1.2. Texture analysis ...................................................................................................................... 131 4.3.1.3. Color analysis ......................................................................................................................... 132 4.3.1.4. Images of samples during the cooking process ....................................................................... 133 4.3.1.5. Sensory analysis ...................................................................................................................... 135 4.3.1.6. Microbiological results ........................................................................................................... 137 4.3.1.6.1. Microbiological analysis of non-inoculated samples ........................................................... 137 4.3.1.6.2. Microbiological analysis of inoculated samples .................................................................. 137 4.3.3.7. Polycyclic aromatic hydrocarbons analysis ............................................................................ 139 4.3.3.8. Differential scanning calorimetry ........................................................................................... 139
4.3.2. Vegetarian patties ......................................................................................................................... 141 4.3.2.1. Internal cooking temperature .................................................................................................. 141 4.3.2.2. Cooking loss, moisture, proximate analysis and water activity .............................................. 141 4.3.2.3. Texture analysis ...................................................................................................................... 142 4.3.2.4. Color analysis ......................................................................................................................... 142 4.3.2.5. Images of samples during the cooking process ....................................................................... 143 4.3.2.6. Sensory analysis ...................................................................................................................... 147 4.3.2.7. Microbiological results ........................................................................................................... 149 4.3.2.7.1. Microbiological analysis of non-inoculated samples ........................................................... 149 4.3.2.7.2. Microbiological analysis of inoculated samples .................................................................. 149
4.3.3. Pizza dough ................................................................................................................................... 151
17
4.3.3.1. Cooking loss, moisture, proximate analysis and water activity .............................................. 151 4.3.3.2. Texture analysis ...................................................................................................................... 152 4.3.3.3. Color analysis ......................................................................................................................... 152 4.3.3.4. Images of samples during the cooking process ....................................................................... 153 4.3.3.5. Sensory analysis ...................................................................................................................... 157 4.3.3.6. Polycyclic aromatic hydrocarbons analysis ............................................................................ 158 4.3.3.7. Differential scanning calorimetry ........................................................................................... 159
4.4. NUMERICAL SIMULATIONS: RESULTS OF THE MODEL VALIDATION ............................................................................................................ 160
4.4.1. Beef burger .................................................................................................................................... 160
4.4.1. Vegetarian patty ........................................................................................................................... 165
CHAPTER 5. DISCUSSION ..................................................................................... 169
5. DISCUSSION .......................................................................................................... 170
5.2 DISCUSSION OF BEEF BURGER RESULTS ................................................ 177
5.1.1. Cooking methods .......................................................................................................................... 170
5.1.2. Physico-chemical parameters ...................................................................................................... 171
5.1.3. Sensory analysis ............................................................................................................................ 174
5.1.4. Microbiological analyses .............................................................................................................. 176
5.1.5. PAHs analysis ............................................................................................................................... 177
5.2 DISCUSSION OF PIZZA DOUGH RESULTS ................................................. 177
5.3. DISCUSSION OF MASHED POTATOES BITES RESULTS ....................... 179
5.4. DISCUSSION OF VEGETARIAN PATTY RESULTS .................................. 181
5.5. DISCUSSION OF THE NUMERICAL SIMULATION RESULTS .............. 183
CHAPTER 6. CONCLUSION ................................................................................. 185
6. CONCLUSIONS ..................................................................................................... 186
CHAPTER 7. REFERENCES ................................................................................... 187
7. REFERENCES ....................................................................................................... 188

18
Abbreviation Key
3D 3 dimensional
3DFP 3D FOOD PRINTING
IR Infrared
BBQ Barbeque
BGBL Brilliant Green Bile Lactose
CFD Computational Fluid Dynamics
CV Control Volume
FDA Food and Drug Administration
FIR Far Infrared
FSAI Food Safety Authority of Ireland
IR Infrared
MIR Mid Infrared
MPN Most Probable Number
NIR Near Infrared
NM Natural Machines
PAHs Polycyclic Aromatic Hydrocarbons
TSA Tryptone Soya Agar
TSB Tryptone Soya Broth
TPA Texture Profile Analysis
UI/UX User Interface/ User Experience
VRBA Violet Red Bile Agar

Chapter 1. Interest of the study, objectives and working plan
21
CHAPTER 1
INTEREST OF THE STUDY,
OBJECTIVES AND WORKING PLAN
Chapter 1. Interest of the study, objectives and working plan
22
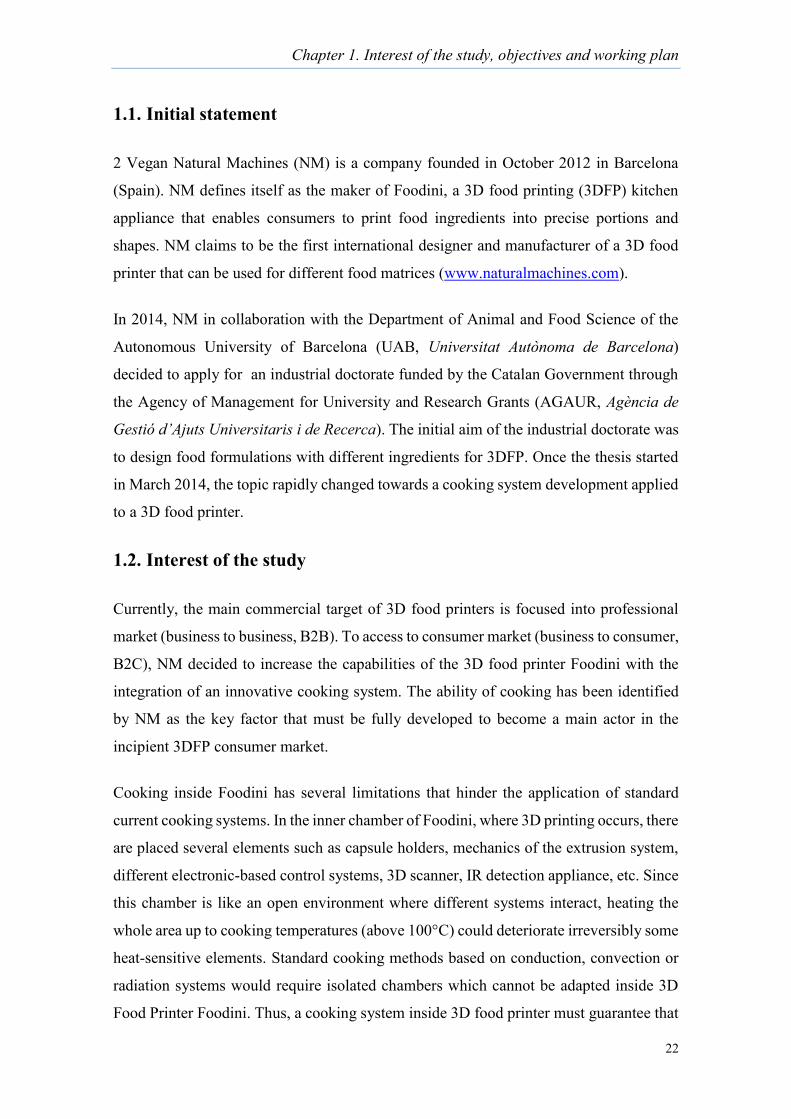
1.1. Initial statement
2 Vegan Natural Machines (NM) is a company founded in October 2012 in Barcelona
(Spain). NM defines itself as the maker of Foodini, a 3D food printing (3DFP) kitchen
appliance that enables consumers to print food ingredients into precise portions and
shapes. NM claims to be the first international designer and manufacturer of a 3D food
printer that can be used for different food matrices (www.naturalmachines.com).
In 2014, NM in collaboration with the Department of Animal and Food Science of the
Autonomous University of Barcelona (UAB, Universitat Autònoma de Barcelona)
decided to apply for an industrial doctorate funded by the Catalan Government through
the Agency of Management for University and Research Grants (AGAUR, Agència de
Gestió d’Ajuts Universitaris i de Recerca). The initial aim of the industrial doctorate was
to design food formulations with different ingredients for 3DFP. Once the thesis started
in March 2014, the topic rapidly changed towards a cooking system development applied
to a 3D food printer.
1.2. Interest of the study
Currently, the main commercial target of 3D food printers is focused into professional
market (business to business, B2B). To access to consumer market (business to consumer,
B2C), NM decided to increase the capabilities of the 3D food printer Foodini with the
integration of an innovative cooking system. The ability of cooking has been identified
by NM as the key factor that must be fully developed to become a main actor in the
incipient 3DFP consumer market.
Cooking inside Foodini has several limitations that hinder the application of standard
current cooking systems. In the inner chamber of Foodini, where 3D printing occurs, there
are placed several elements such as capsule holders, mechanics of the extrusion system,
different electronic-based control systems, 3D scanner, IR detection appliance, etc. Since
this chamber is like an open environment where different systems interact, heating the
whole area up to cooking temperatures (above 100°C) could deteriorate irreversibly some
heat-sensitive elements. Standard cooking methods based on conduction, convection or
radiation systems would require isolated chambers which cannot be adapted inside 3D
Food Printer Foodini. Thus, a cooking system inside 3D food printer must guarantee that
Chapter 1. Interest of the study, objectives and working plan
23
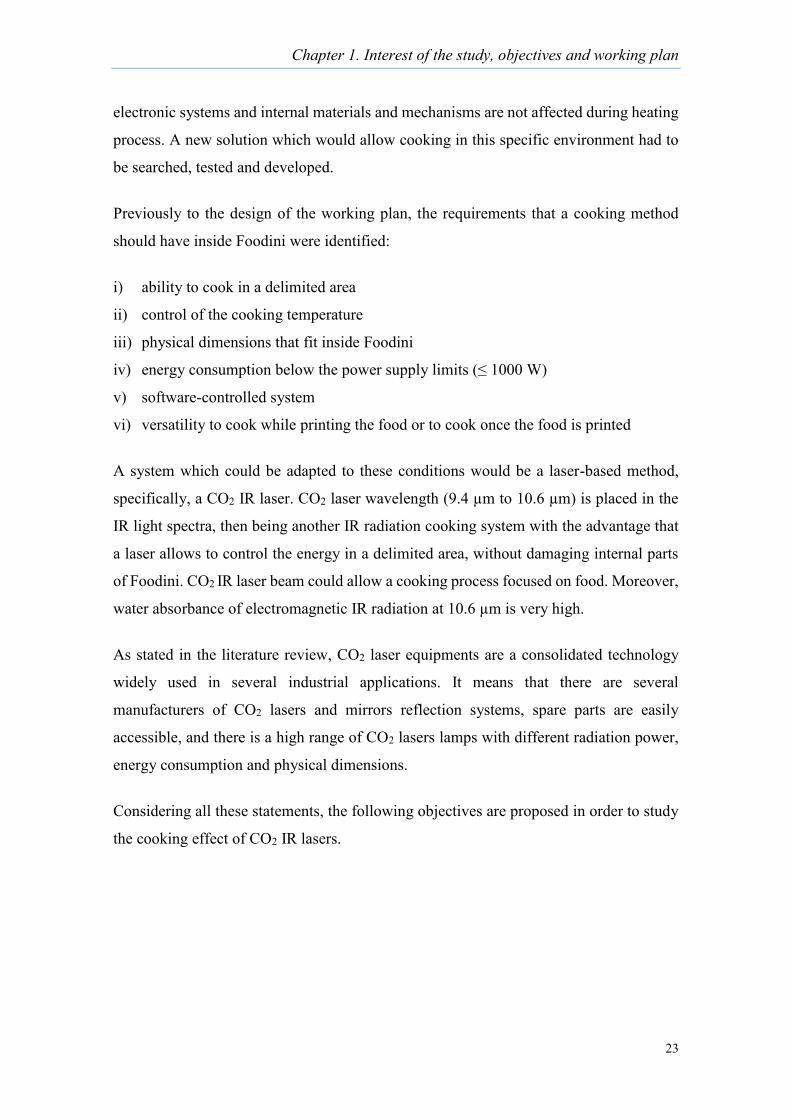
electronic systems and internal materials and mechanisms are not affected during heating
process. A new solution which would allow cooking in this specific environment had to
be searched, tested and developed.
Previously to the design of the working plan, the requirements that a cooking method
should have inside Foodini were identified:
i) ability to cook in a delimited area
ii) control of the cooking temperature
iii) physical dimensions that fit inside Foodini
iv) energy consumption below the power supply limits (≤ 1000 W)
v) software-controlled system
vi) versatility to cook while printing the food or to cook once the food is printed
A system which could be adapted to these conditions would be a laser-based method,
specifically, a CO2 IR laser. CO2 laser wavelength (9.4 µm to 10.6 µm) is placed in the
IR light spectra, then being another IR radiation cooking system with the advantage that
a laser allows to control the energy in a delimited area, without damaging internal parts
of Foodini. CO2 IR laser beam could allow a cooking process focused on food. Moreover,
water absorbance of electromagnetic IR radiation at 10.6 µm is very high.
As stated in the literature review, CO2 laser equipments are a consolidated technology
widely used in several industrial applications. It means that there are several
manufacturers of CO2 lasers and mirrors reflection systems, spare parts are easily
accessible, and there is a high range of CO2 lasers lamps with different radiation power,
energy consumption and physical dimensions.
Considering all these statements, the following objectives are proposed in order to study
the cooking effect of CO2 IR lasers.
Chapter 1. Interest of the study, objectives and working plan
24
1.3. Objectives
1.3.1. General Objective
The general objective of the present work is to study the cooking effect of CO2 IR lasers
on different food matrices and design an innovative cooking system inside a 3D food
printer.
1.3.2. Specific objectives
To achieve the general objective, specific objectives are defined:
To study the cooking effect of different commercial available lasers. To
accomplish this goal, physico-chemical, microbiological, toxicological and
sensory characteristics of several food products cooked with IR laser and standard
cooking methods are compared.
To develop an innovative laser cooking method based on CO2 IR lamp to cook
inside 3D food printer Foodini, and to study and define the cooking conditions for
this new integrated system.
To develop a heat transfer numerical model for CO2 IR laser radiation cooking
system based on ray tracing method.
Chapter 1. Interest of the study, objectives and working plan
25
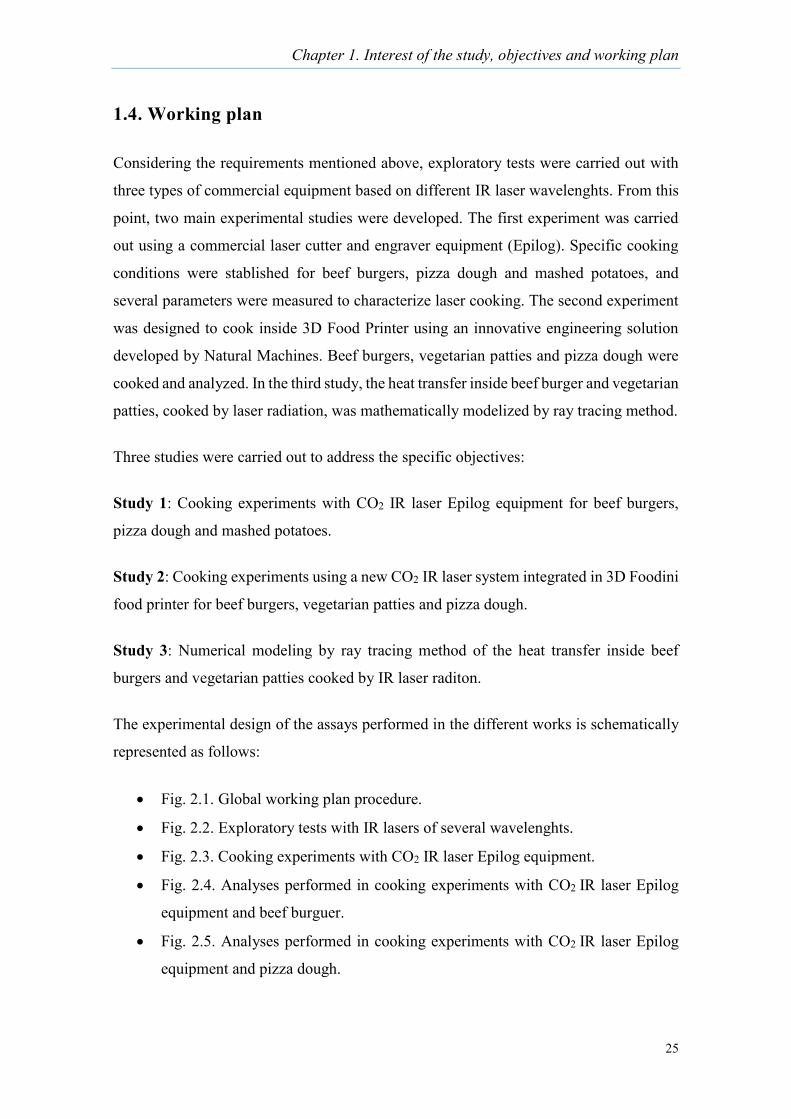
1.4. Working plan
Considering the requirements mentioned above, exploratory tests were carried out with
three types of commercial equipment based on different IR laser wavelenghts. From this
point, two main experimental studies were developed. The first experiment was carried
out using a commercial laser cutter and engraver equipment (Epilog). Specific cooking
conditions were stablished for beef burgers, pizza dough and mashed potatoes, and
several parameters were measured to characterize laser cooking. The second experiment
was designed to cook inside 3D Food Printer using an innovative engineering solution
developed by Natural Machines. Beef burgers, vegetarian patties and pizza dough were
cooked and analyzed. In the third study, the heat transfer inside beef burger and vegetarian
patties, cooked by laser radiation, was mathematically modelized by ray tracing method.
Three studies were carried out to address the specific objectives:
Study 1: Cooking experiments with CO2 IR laser Epilog equipment for beef burgers,
pizza dough and mashed potatoes.
Study 2: Cooking experiments using a new CO2 IR laser system integrated in 3D Foodini
food printer for beef burgers, vegetarian patties and pizza dough.
Study 3: Numerical modeling by ray tracing method of the heat transfer inside beef
burgers and vegetarian patties cooked by IR laser raditon.
The experimental design of the assays performed in the different works is schematically
represented as follows:
Fig. 2.1. Global working plan procedure.
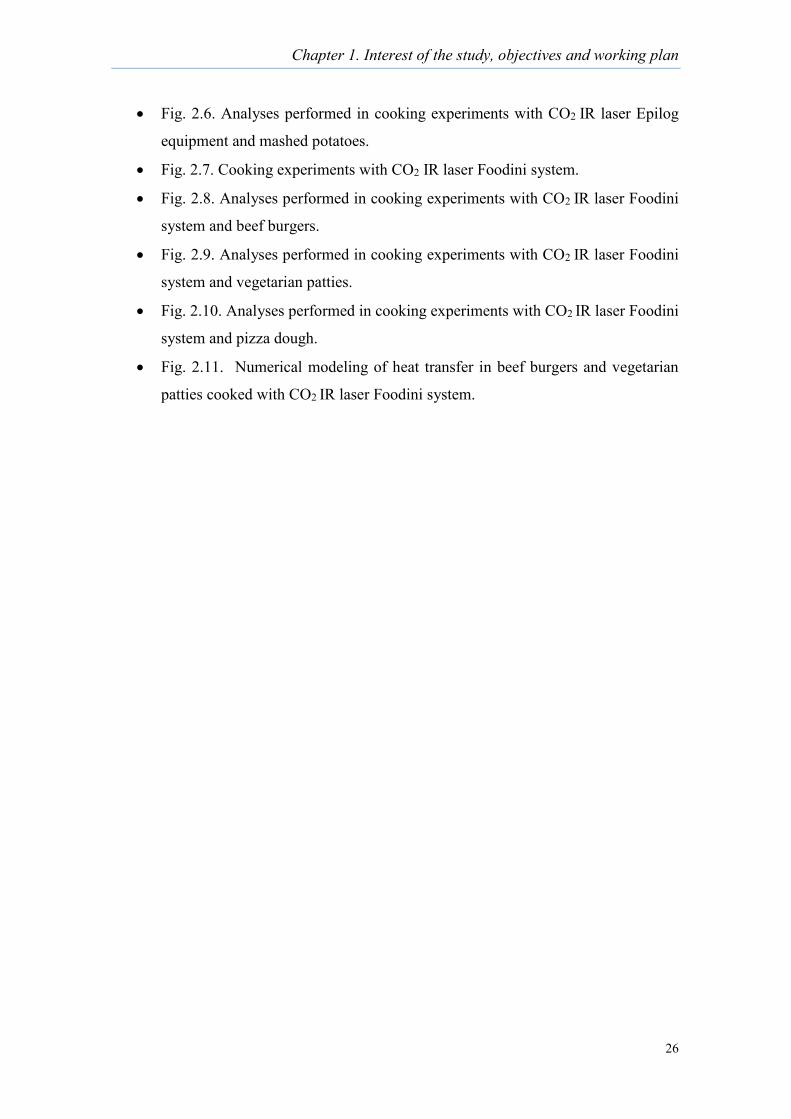
Fig. 2.2. Exploratory tests with IR lasers of several wavelenghts.
Fig. 2.3. Cooking experiments with CO2 IR laser Epilog equipment.
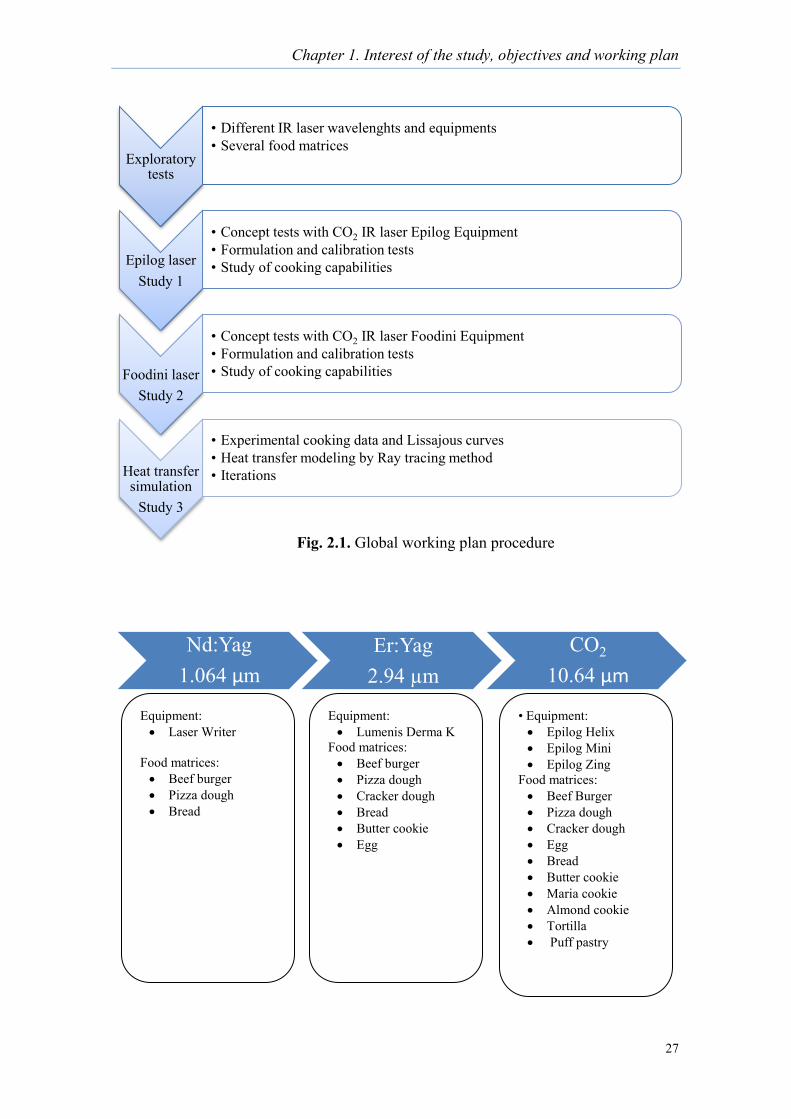
Fig. 2.4. Analyses performed in cooking experiments with CO2 IR laser Epilog
equipment and beef burguer.
Fig. 2.5. Analyses performed in cooking experiments with CO2 IR laser Epilog
equipment and pizza dough.
Chapter 1. Interest of the study, objectives and working plan
26
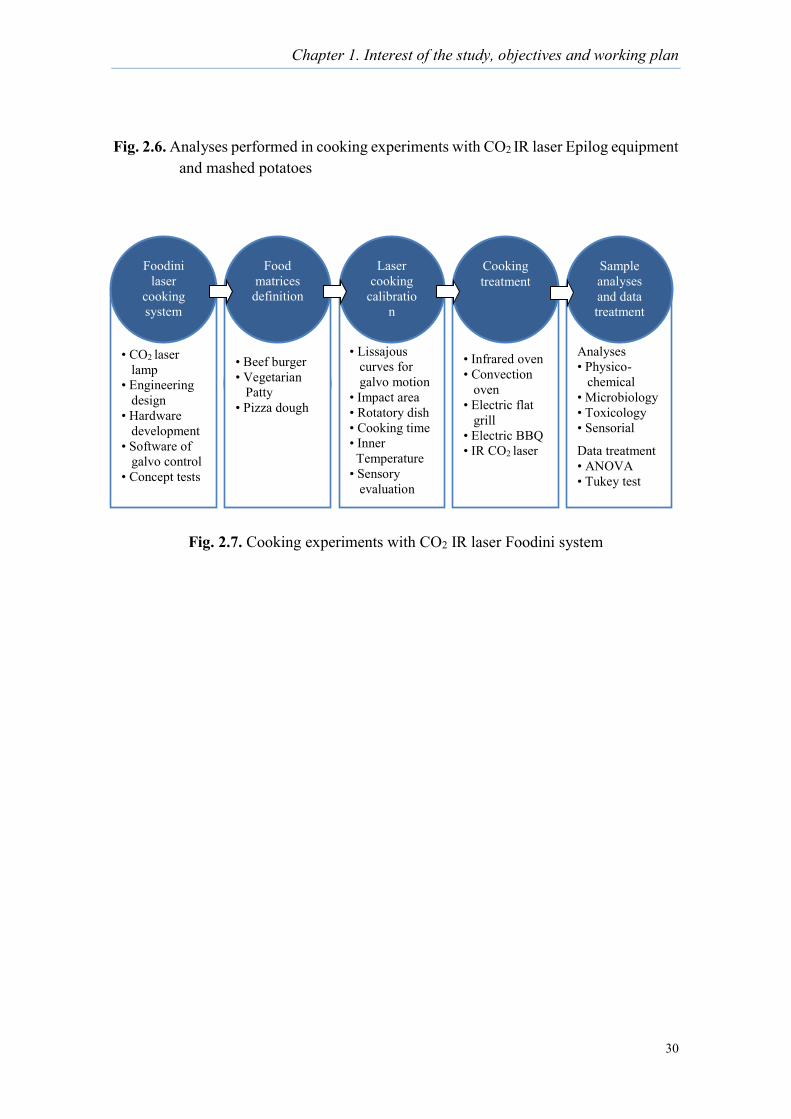
Fig. 2.6. Analyses performed in cooking experiments with CO2 IR laser Epilog
equipment and mashed potatoes.
Fig. 2.7. Cooking experiments with CO2 IR laser Foodini system.
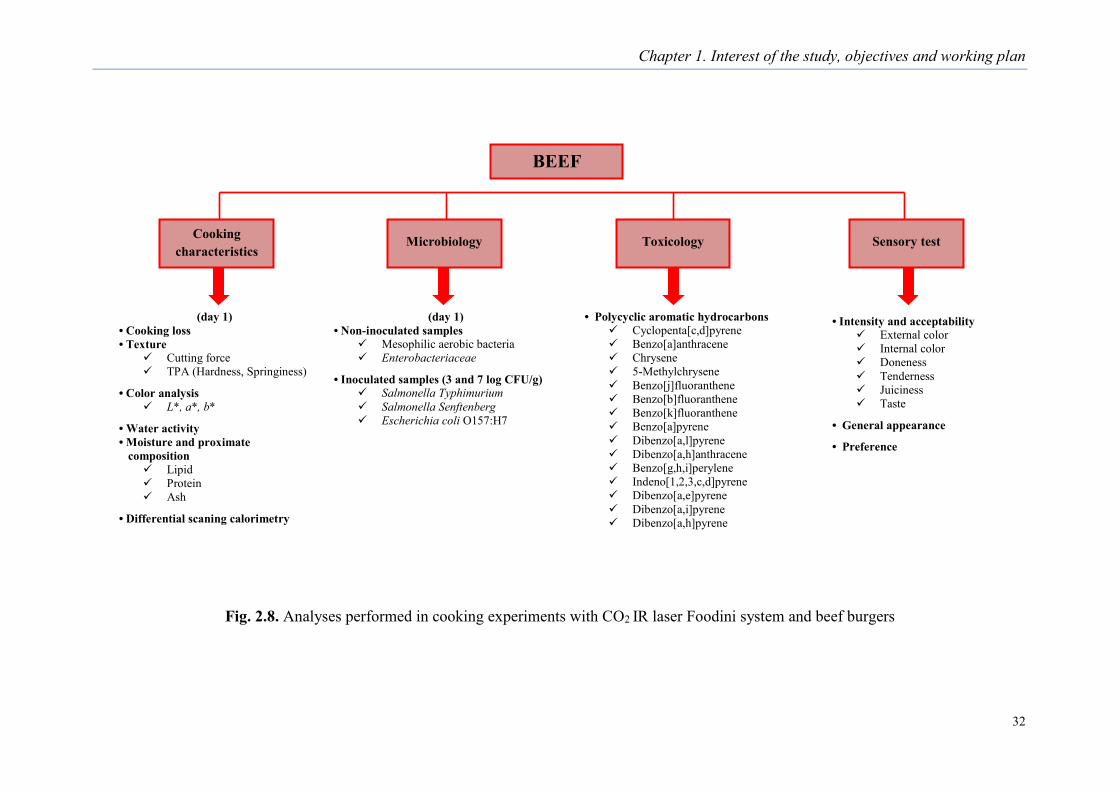
Fig. 2.8. Analyses performed in cooking experiments with CO2 IR laser Foodini
system and beef burgers.
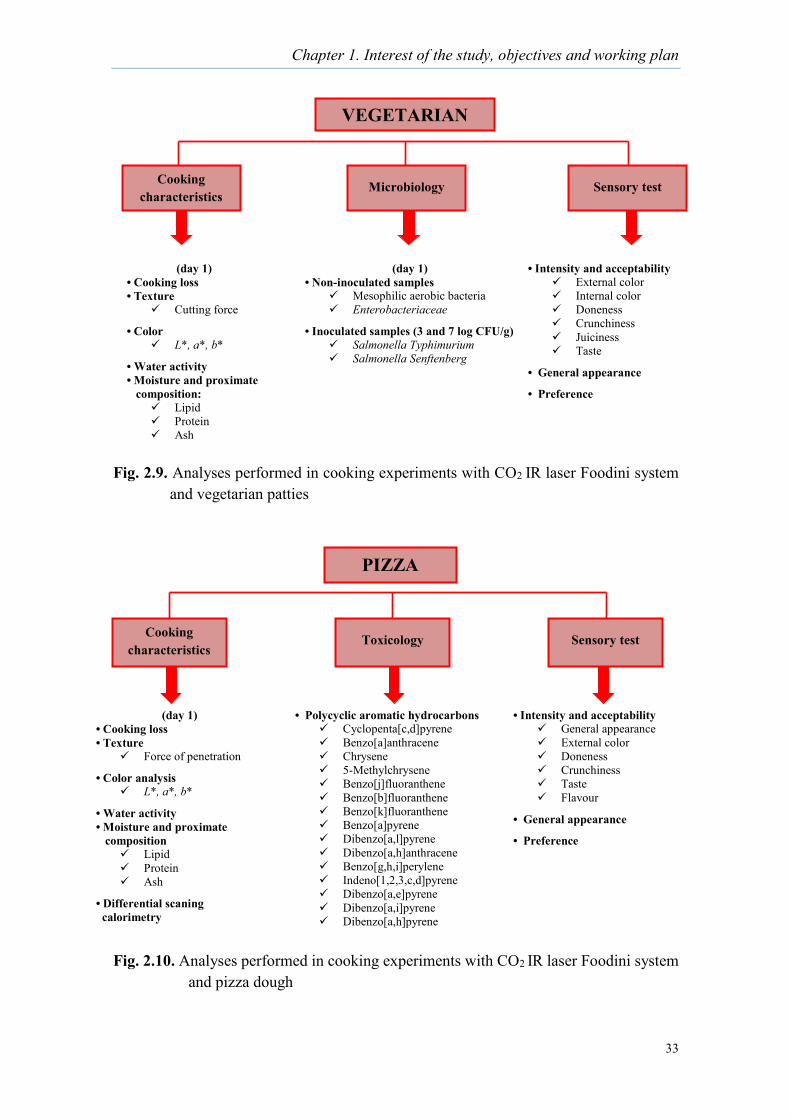
Fig. 2.9. Analyses performed in cooking experiments with CO2 IR laser Foodini
system and vegetarian patties.
Fig. 2.10. Analyses performed in cooking experiments with CO2 IR laser Foodini
system and pizza dough.
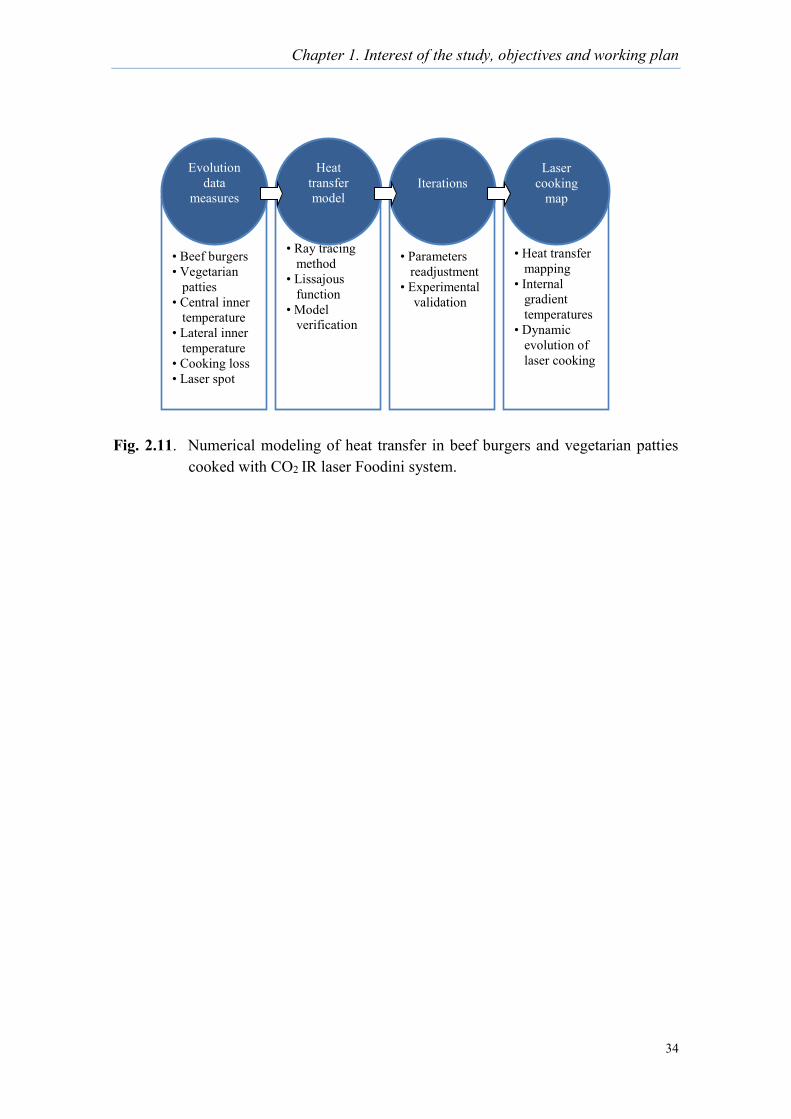
Fig. 2.11. Numerical modeling of heat transfer in beef burgers and vegetarian
patties cooked with CO2 IR laser Foodini system.
Chapter 1. Interest of the study, objectives and working plan
27
Exploratory tests
• Different IR laser wavelenghts and equipments• Several food matrices
Epilog laserStudy 1
• Concept tests with CO2 IR laser Epilog Equipment• Formulation and calibration tests • Study of cooking capabilities
Foodini laserStudy 2
• Concept tests with CO2 IR laser Foodini Equipment• Formulation and calibration tests• Study of cooking capabilities
Heat transfer simulation
Study 3
• Experimental cooking data and Lissajous curves• Heat transfer modeling by Ray tracing method• Iterations
Nd:Yag 1.064 µm
Er:Yag 2.94 µm
CO2
10.64 µm
Equipment: Laser Writer
Food matrices: Beef burger Pizza dough Bread
Equipment: Lumenis Derma K
Food matrices: Beef burger Pizza dough Cracker dough Bread Butter cookie Egg
• Equipment: Epilog Helix Epilog Mini Epilog Zing
Food matrices: Beef Burger Pizza dough Cracker dough Egg Bread Butter cookie Maria cookie Almond cookie Tortilla Puff pastry
Fig. 2.1. Global working plan procedure

Chapter 1. Interest of the study, objectives and working plan
28
• Intensity and acceptability External color Internal color Doneness Tenderness Juiciness Taste
• General appearance • Preference
(day 1) • Cooking loss • Texture
Cutting force TPA: Hardness,
Springiness
• Color L*, a*, b*
• Water activity • Moisture and proximate composition
Lipid Protein Ash
• Differential scaning calorimetry
BEEF BURGER
Cooking characteristics
Microbiology Sensory test
(day 1) • Non-inoculated samples
Mesophilic aerobic bacteria Enterobacteriaceae
• Inoculated samples (3 and 7 log CFU/g) Salmonella Typhimurium Salmonella Senftenberg
Fig. 2.2. Exporatory tests with IR lasers of several wavelenghts
• Epilog Zing
Concept tests with CO2 laser equipmen
t
• Beef burger • Pizza dough • Mashed potato
Food matrices
definition
• Distance • Resolution • Speed • Power • Frequency • Cooking time • Inner Temperature • Sensory evaluation
Laser cooking
calibration
• Infrared oven • Deck oven • Electric flat grill • Electric BBQ • Microwave • IR CO2 laser
Cooking treatment
Analyses • Physico- chemical • Microbiology • Sensory Data treatment • ANOVA • Tukey test
Sample analyses and data treatment
Fig. 2.3. Cooking experiments with CO2 IR laser Epilog equipment
Chapter 1. Interest of the study, objectives and working plan
29
Fig. 2.4. Analyses performed in cooking experiments with CO2 IR laser Epilog equipment and beef burguer
Fig. 2.5. Analyses performed in cooking experiments with CO2 IR laser Epilog equipment and pizza dough
• Intensity and acceptability External color Doneness Crunchiness Taste Flavour
• General appearance
• Preference
(day 1) • Cooking loss • Texture
Force of penetration
• Color L*, a*, b*
• Water activity • Moisture and proximate composition
Lipid Protein Ash
• Differential scaning calorimetry
PIZZA DOUGH
Cooking characteristics
Sensory test
• Intensity and acceptability External color Internal color Hardness Taste Flavour
• General appearance
• Preference
(day 1) • Cooking loss • Texture
Force of compression
• Color L*, a*, b*
• Water activity • Moisture and proximate composition
Lipid Protein Ash
MASHED POTATOES
Cooking characteristics
Sensory test
Chapter 1. Interest of the study, objectives and working plan
30
Fig. 2.6. Analyses performed in cooking experiments with CO2 IR laser Epilog equipment and mashed potatoes
Fig. 2.7. Cooking experiments with CO2 IR laser Foodini system
Food matrices
definition
• Lissajous curves for galvo motion • Impact area • Rotatory dish • Cooking time • Inner Temperature • Sensory evaluation
Laser cooking
calibration
• Infrared oven • Convection oven • Electric flat grill • Electric BBQ • IR CO2 laser
Cooking treatment
Analyses • Physico- chemical • Microbiology • Toxicology • Sensorial
Data treatment • ANOVA • Tukey test
Sample analyses and data treatment
• Beef burger • Vegetarian Patty • Pizza dough
Food matrices
definition
• CO2 laser lamp • Engineering design • Hardware development • Software of galvo control • Concept tests
Foodini laser
cooking system

Chapter 1. Interest of the study, objectives and working plan
31
Chapter 1. Interest of the study, objectives and working plan
32
Fig. 2.8. Analyses performed in cooking experiments with CO2 IR laser Foodini system and beef burgers
• Intensity and acceptability External color Internal color Doneness Tenderness Juiciness Taste
• General appearance
• Preference
(day 1) • Non-inoculated samples
Mesophilic aerobic bacteria Enterobacteriaceae
• Inoculated samples (3 and 7 log CFU/g) Salmonella Typhimurium Salmonella Senftenberg Escherichia coli O157:H7
(day 1) • Cooking loss • Texture
Cutting force TPA (Hardness, Springiness)
• Color analysis L*, a*, b*
• Water activity • Moisture and proximate composition
Lipid Protein Ash
• Differential scaning calorimetry
• Polycyclic aromatic hydrocarbons Cyclopenta[c,d]pyrene Benzo[a]anthracene Chrysene 5-Methylchrysene Benzo[j]fluoranthene Benzo[b]fluoranthene Benzo[k]fluoranthene Benzo[a]pyrene Dibenzo[a,l]pyrene Dibenzo[a,h]anthracene Benzo[g,h,i]perylene Indeno[1,2,3,c,d]pyrene Dibenzo[a,e]pyrene Dibenzo[a,i]pyrene Dibenzo[a,h]pyrene
BEEF BURGER
Cooking characteristics
Toxicology Sensory test Microbiology
Chapter 1. Interest of the study, objectives and working plan
33
Fig. 2.9. Analyses performed in cooking experiments with CO2 IR laser Foodini system and vegetarian patties
Fig. 2.10. Analyses performed in cooking experiments with CO2 IR laser Foodini system and pizza dough
• Intensity and acceptability General appearance External color Doneness Crunchiness Taste Flavour
• General appearance
• Preference
• Polycyclic aromatic hydrocarbons Cyclopenta[c,d]pyrene Benzo[a]anthracene Chrysene 5-Methylchrysene Benzo[j]fluoranthene Benzo[b]fluoranthene Benzo[k]fluoranthene Benzo[a]pyrene Dibenzo[a,l]pyrene Dibenzo[a,h]anthracene Benzo[g,h,i]perylene Indeno[1,2,3,c,d]pyrene Dibenzo[a,e]pyrene Dibenzo[a,i]pyrene Dibenzo[a,h]pyrene
(day 1) • Cooking loss • Texture
Force of penetration
• Color analysis L*, a*, b*
• Water activity • Moisture and proximate composition
Lipid Protein Ash
• Differential scaning calorimetry
PIZZA DOUGH
Cooking characteristics
Toxicology Sensory test
• Intensity and acceptability External color Internal color Doneness Crunchiness Juiciness Taste
• General appearance
• Preference
(day 1) • Cooking loss • Texture
Cutting force
• Color L*, a*, b*
• Water activity • Moisture and proximate composition:
Lipid Protein Ash
(day 1) • Non-inoculated samples
Mesophilic aerobic bacteria Enterobacteriaceae
• Inoculated samples (3 and 7 log CFU/g) Salmonella Typhimurium Salmonella Senftenberg
VEGETARIAN PATTY BURGER
Cooking characteristics
Microbiology Sensory test
Chapter 1. Interest of the study, objectives and working plan
34
Fig. 2.11. Numerical modeling of heat transfer in beef burgers and vegetarian patties cooked with CO2 IR laser Foodini system.
• Parameters readjustment • Experimental validation
Iterations
• Heat transfer mapping • Internal gradient temperatures • Dynamic evolution of laser cooking
Laser cooking
map
• Ray tracing method • Lissajous function • Model verification
Heat transfer model
• Beef burgers • Vegetarian patties • Central inner temperature • Lateral inner temperature • Cooking loss • Laser spot
Evolution data
measures

Chapter 2. Introduction
35
CHAPTER 2
INTRODUCTION
Chapter 2. Introduction
36
2. Introduction
1.1. General aspects about cooking
Cooking is a complex process where different physico-chemical, sensory and
microbiological changes occur in food mainly due to heat application. Toxicological food
safety can be also be influenced by cooking (for example, by formation of benzopyrenes
or acrylamides). Changes induced by cooking can be generated by different processes
including chemical reactions between molecules of food components, water evaporation,
fat melting, loss of lipid-soluble and/or water-soluble proteins, loss of volatile aromatic
lipid compounds, thermal inactivation of pathogens, etc.
Food components are mainly water, carbohydrates, fats, proteins, minerals and vitamins.
Food components are highly influenced by the cooking process.
Water is present in most of food materials. Cooking can change the water concentration
in food products mainly by evaporation and also by dripping. Water loss induces changes
in the texture and sensory attributes, such as, juiciness, crunchiness, etc., thus, increasing
the acceptability of cooked food. High water losses (for example in bakery products)
induces a reduction in the water activity, increasing the shelf-life of products by lowering
the water availability for microbial growth.
Carbohydrates include sugars, starches and fibers. The interaction between heat and the
different types of carbohydrates is very complex and wide. For example, when heated,
starch follows gelatinization which highly influences textural properties of food, and
heating sugars and proteins generates the Maillard reaction, a basic flavor-enhancing and
browning technique, and also acrylamide a potential carcinogenic compound.
Fat includes a wide range of vegetable oils and triglycerides and lipids from animal origin.
Fats can reach temperatures higher than the boiling point of water, and are used to conduct
high heat flux to other ingredients, for example in frying or deep frying treatments. Fats
are often used as ingredients to improve texture or as flavor-enhancers.
Proteins are large biomolecules consisting of one or more long chains of amino acid
residues or polypeptides present mainly in food of animal origin (e. g. meat, fish, milk,
eggs) and vegetable products (e. g. legumes, seeds, mushrooms). For example, when
Chapter 2. Introduction
37
heated, proteins become denatured (unfolded) and, depending on the type of protein, can
form aggregates which can lead to the formation of gels (like egg albumen) or structural
networks (like gluten).
Vitamins and minerals are essential micronutrients. Minerals and vitamins in food
products and vegetables may be decomposed or eluted by cooking process. On the other
hand, bioavailability of some vitamins (thiamin, vitamin B6, niacin, folate,
carotenoids) is increased with cooking by being free from the food microstructure.
Concerning microbiology, cooking processes increases shelf-life of products and
guarantee food safety since prevents many foodborne illnesses related with pathogenic
microorganisms present in raw food. Cooking would kill or inactivate harmful organisms,
such as bacteria, viruses and parasites. The pasteurization or sterilization effect of
cooking depends on combination of temperature and time applied for each type of
pathogen.
Concerning toxicological facts, known potential carcinogenic products like polycyclic
aromatic hydrocarbons (PAHs) or acrylamides are formed at high cooking temperatures
(above 200°C). Grilling, barbecuing and smoking meat and fish could increase levels of
PAHs. Intake of PAHs also could come from cereals, oils and fats treated at high
temperature. Moreover, toasting, grilling or broiling starchy foods, until a toasted crust is
formed, generates significant concentrations of acrylamide. These effects are driven by
the characteristics of each cooking method and the composition of food ingredients
(www.efsa.europa.eu).
Traditional cooking methods include baking, roasting, frying, grilling, barbecuing,
smoking, boiling, steaming and braising. More recent cooking methods have been
industrially developed, for example, microwaving or infrared (IR) cooking. Each method
affects differently the physico-chemical characteristics of foods.
Since the present study is based on an IR system using CO2 wavelength lamps, main
characteristics of IR cooking and its effect on food components and matrices are described
in the next section.
Chapter 2. Introduction
38
1.2. IR heating and cooking processes
Heat transfer occurs through one of these three methods: conduction, convection, and
radiation. In conventional heating, which is usually carried out by an electric resistive
system or by combustion of fuels, heat is generated outside the food to be cooked, and
the heating energy is conveyed to the food matrix by convection of hot air or by thermal
conduction. Electromagnetic methods include ohmic and inductive heating, radio
frequency heating, microwave dielectric heating and IR heating. (Koutchma, 2017).
IR heating provides significant advantages over conventional heating methods, including
reduced heating time, uniform heating, reduced quality losses, versatile, simple, compact
equipment, significant energy saving and provides a high degree of process control. IR
heating has a higher thermal efficiency, faster heating rate and a shorter response time in
comparison to conventional heating systems. Moreover, IR systems give the possibility
of selective heating (Krishnamurty et al., 2008). Because of these benefits, IR radiation
has been widely applied to various thermal preservations operations in the food industry
mainly dehydration and pasteurization, and also for blanching and sterilization
(Koutchma, 2017). IR radiation is also used for different cooking methods, such as
roasting, baking, frying, and broiling.
IR radiation transfers thermal energy in the form of electromagnetic waves. IR radiation
can be classified into 3 regions: near IR (NIR), mid-IR (MIR) and far-IR (FIR),
corresponding to the spectral ranges of 0.75 to 1.4, 1.4 to 3, and 3 to 1000 μm, respectively
(Sakai and Hanzawa, 1994). In general, FIR radiation, like the CO2 laser wavelength (10.6
μm) used in the present work, is advantageous for food processing because most food
components absorb radiative energy in the FIR region (Sandu, 1986). In a food product
exposed to IR radiation (wavelength of 0.78 to 1000 μm), the heat energy delivered on
the surface can be absorbed by different food components.
1.2.1 Interaction of IR radiation with Food Components
The wavelength at which the maximum radiation occurs is determined by the IR emitter
material and by the temperature of the IR heating elements (Koutchma, 2017). As food is
exposed to IR light, the radiation is absorbed, reflected or scattered, but does not behave
as a black-body (which does reflect or scatter IR light) (Birth, 1978). For materials with
Chapter 2. Introduction
39
a rough surface, for example, at NIR wavelength region (λ < 1.25 μm), approximately
50% of the radiation is reflected, whereas less than 10% radiation is reflected at the FIR
wavelength region (Skjoldebrand, 2001). Most organic materials reflect 4% of the total
reflection on the surface, and the rest of the reflection occurs when radiation enters the
food material and scatters (Dagerskog, 1979).
Absorption intensities at different wavelengths differ by food components. When radiant
electromagnetic energy impinges upon a food surface, it may induce changes in the
electronic, vibrational and rotational states of atoms and molecules. The type of
mechanisms for energy absorption determined by the wavelength range of the incident
radiative energy can be categorized: (1) changes in the electronic state correspond to the
wavelength range 0.2 to 0.7 μm (ultraviolet and visible rays), (2) changes in the
vibrational state correspond to wavelength range 2.5 to 1000 μm (FIR), and (3) changes
in the rotational state correspond to wavelengths above 1000 μm (microwaves)
(Decareau, 1985). In general, food substances absorb FIR energy most efficiently through
the mechanism of changes in the molecular vibrational state, which can lead to radiative
heating. The IR absorption spectra of food mixtures are originated by the mechanical
vibrations of molecules or molecular aggregates, due to a very complex phenomenon of
reciprocal overlapping (Halford, 1957).
Water and organic compounds such as proteins, lipids and starches, which are the main
components of food, absorb FIR energy at wavelengths greater than 2.5 μm (Sakai and
Hanzawa, 1994). Sandu (1986) reported that most foods have high transmissivities (low
absorptivities) at λ < 2.5 μm. Amino acids, polypeptides, and proteins reveal two strong
absorption bands localized at 3 to 4 and 6 to 9 μm. On the other hand, lipids show strong
absorption phenomena over the entire IR radiation spectrum with three stronger
absorption bands situated at 3 to 4, 6, and 9 to 10 μm. Carbohydrates yield two strong
absorption bands around at 3 and 7 to 10 μm (Sandu, 1986; Rosenthal, 1992). Hence, the
absorbance of IR radiation on food components is very important for the design of an IR
cooking system and optimization of a thermal process.
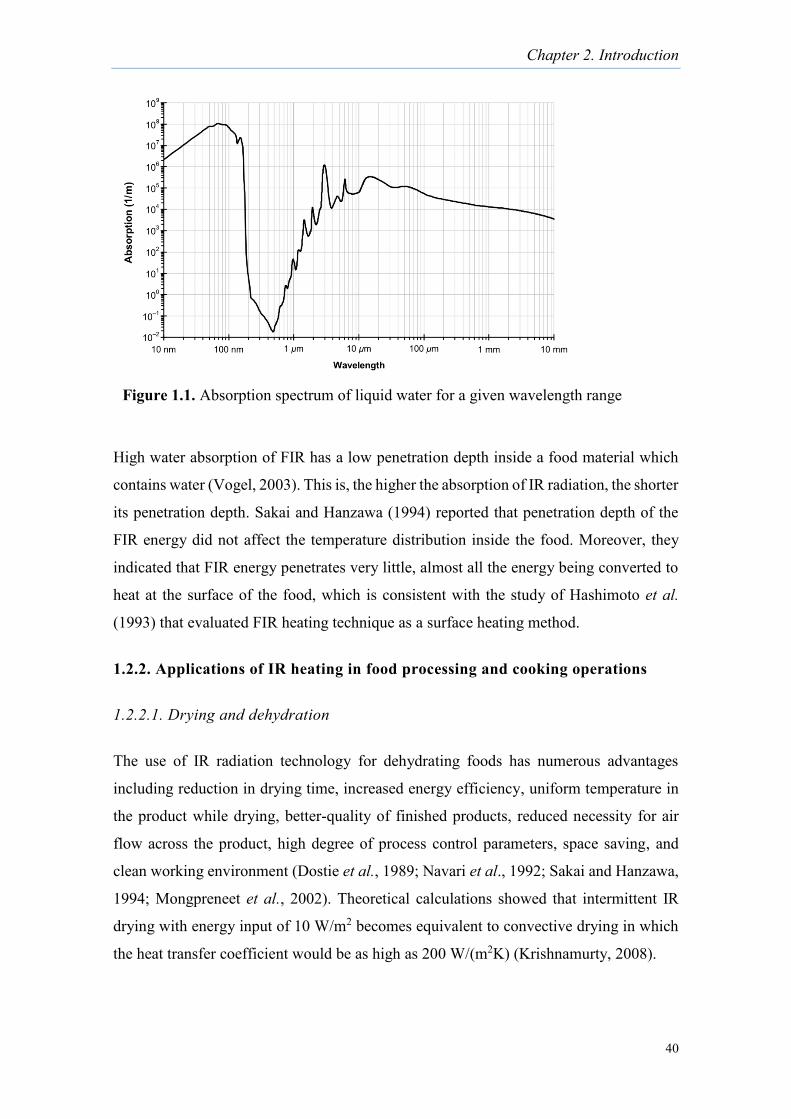
Water effect on absorption of incident radiation is predominant over all the wavelengths.
Figure 1.1. (Kebes, 2008) depicts the water absorption spectrum for a wide range of
wavelengths: ultraviolet, visible, IR and microwaves.
Chapter 2. Introduction
40
High water absorption of FIR has a low penetration depth inside a food material which
contains water (Vogel, 2003). This is, the higher the absorption of IR radiation, the shorter
its penetration depth. Sakai and Hanzawa (1994) reported that penetration depth of the
FIR energy did not affect the temperature distribution inside the food. Moreover, they
indicated that FIR energy penetrates very little, almost all the energy being converted to
heat at the surface of the food, which is consistent with the study of Hashimoto et al.
(1993) that evaluated FIR heating technique as a surface heating method.
1.2.2. Applications of IR heating in food processing and cooking operations
1.2.2.1. Drying and dehydration
The use of IR radiation technology for dehydrating foods has numerous advantages
including reduction in drying time, increased energy efficiency, uniform temperature in
the product while drying, better-quality of finished products, reduced necessity for air
flow across the product, high degree of process control parameters, space saving, and
clean working environment (Dostie et al., 1989; Navari et al., 1992; Sakai and Hanzawa,
1994; Mongpreneet et al., 2002). Theoretical calculations showed that intermittent IR
drying with energy input of 10 W/m2 becomes equivalent to convective drying in which
the heat transfer coefficient would be as high as 200 W/(m2K) (Krishnamurty, 2008).
Figure 1.1. Absorption spectrum of liquid water for a given wavelength range
Chapter 2. Introduction
41
FIR drying operations have been successfully applied for drying of fruit and vegetable
products such as potatoes (Masamura et al., 1988; Afzal and Abe, 1998), sweet potatoes
(Sawai et al., 2004), onions (Mongpreneet et al., 2002; Sharma et al., 2005), kiwifruit
(Fenton and Kennedy, 1998), and apples (Nowak and Levicki, 2004; Togrul, 2005).
Drying of seaweed, vegetables, fish flakes, and pasta is also done in tunnel IR dryers
(Hagen and Drawert, 1986).
IR drying is a fast process and produces heating inside the material being dried, although
its penetrating capacity is limited (Hashimoto et al., 1990; Sakai et al., 1993). Prolonged
exposure of a biological material to IR heat results in swelling and ultimately fracturing
and cracking on the surface of the material (Jones, 1992; Fasina et al., 1997). However,
a combination of intermittent IR heating and continuous convection drying of thick
porous material results in better product quality and energy efficiency (Hashinomoto et
al., 1993). Then, IR radiation can be considered a surface treatment similar to other
radiation technologies. Application of combined electromagnetic radiation and
conventional convective heating is considered to be more efficient than radiation or
convective heating alone, as it gives a synergistic effect (Koutchma, 2017).
1.2.2.2 Enzyme inactivation
FIR has been successfully used to inactivate enzymes in order to preserve the colors of
carrots. Galindo et al. (2005) investigated the application of IR heating of carrot slices
prior to freezing as compared to blanching (hot water and steam) in terms of carrot cell
and tissue damage. Carrot slices heated by FIR radiation contained damaged cells only in
the first half millimeter from the surface and exhibited the texture characteristic of the
raw tissue.
1.2.2.3 Pathogen inactivation
IR heating can be used to inactivate bacteria, spores, yeasts and molds in both liquid and
solid foods. Efficacy of microbial inactivation by IR heating depends on the following
parameters: temperature of food sample, IR power level, peak wavelength (bandwidth of
IR heating source), sample depth, , moisture content, type and physiological state of
microorganism (exponential or stationary growth phase), and type of food material.
Pathogen inactivation inside a food matrix during a cooking process is mainly achieved
Chapter 2. Introduction
42
by thermal mechanisms which damage their intracellular components such as DNA,
RNA, ribosomes, cell envelope and/or cell proteins (Krishnamurty et al., 2009). Tanaka
et al., (2007) demonstrated that IR heating can be used for surface pasteurization of
strawberries without deteriorating their quality. In their studiy, IR heating raised the
internal temperature of strawberries below 50 ◦C while the surface temperature was high
enough to effectively inactivate microorganisms.
According to the results of a USDA study (Huang and Sites, 2008), IR surface
pasteurization was effective to inactivate L. monocytogenes in hot dogs. The hotdogs were
surface inoculated with a cocktail of four strains of L. monocytogenes to average initial
inoculums of 7.32 log CFU/g. On the average, 1.0, 2.1, 3.0 and 5.3 log reduction was
observed after the surface temperature of hotdogs was increased to 70, 75, 80 and 85°C,
respectively. Holding the sample temperature led to additional bacterial inactivation.
With a 3-min holding at 80°C or 2 min at 85°C, at total of 6.4 or 6.7.logs of L.
monocytogenes were inactivated. Since post-process contamination of ready-to-eat meats
primarily occurs on the surface, IR radiation can be used as effective post-lethality
treatment applied for meat processing to ensure final microbial safety (Krishnamurty et
al., 2008).
1.2.2.4. IR cooking processes
The usefulness and versatility of IR heating has also been demonstrated in various food
processing applications: roasting, frying, broiling, heating, cooking meat and meat
products, soy beans, cereal grains, cocoa beans, and nuts.
The two main conventional types of IR radiators used for process heating are electric and
gas-fired heaters. Temperature ranges applied are: 343 to 1100°C for gas and electric IR,
and 1100 to 2200°C for electric IR only. IR temperatures are normally used in the range
of 650 to 1200°C to prevent charring of products. The spectral region suitable for
industrial process heating ranges from 1.17 to 5.4 μm, which corresponds to 260 to
2200°C (Sheridan and Shilton, 1999). Proper emitter and process parameters, have to be
selected for a particular product and process. Electrical IR heaters can be easily installed
and produce a prompt heating rate. For the food heating sector, IR modules are
manufactured in stainless steel and fitted with a wire mesh for mechanical protection. IR
Chapter 2. Introduction
43
emitters can be switched on and off in 1-2 s providing control from any unexpected or
unwanted conveyor belt stoppage. Halogen lamps can also generate IR heating in the
wavelength range of 0.7 to 5 µm. Some halogen ovens feature built-in microwave and
convection oven options. Koutchma (2017) consider that the combinations of IR heating
with microwave and with other conductive and convective heating technologies hold a
great potential in optimizing energy usage and have a high applicability in food
processing.
1.2.2.4.1. IR cooking of meat
When a sample of meat product is cooked by IR radiation, heat transfer from source to
sample, depends on a number of factors: temperature difference between the heater source
and sample surface, source emissivity and wavelength, sample surface absorptivity,
reflection and radiation penetration depth (Sheridan et al., 2002).
Baghe-Khandan & Okos (1981) found that thermal conductivity of lean beef increased
with temperature up to 70°C, followed by a decrease during the denaturation of proteins
and subsequent loss of water. After protein denaturation, the thermal conductivity of beef
again increased with temperature. In the case of meat/fat mixtures, thermal conductivity
also increases with temperature. According to Sheridan and Shilton (1999) the increase
in thermal conductivity is due to the movement of water and melted fat within the meat
product. Although the thermal conductivity of fat is low, it starts to melt at temperature
around 40°C and the movement of the melted fat would carry heat into the interior of the
product. Hence, Heat transfer within a beef patty sample is mainly due to conduction and
diffusion of water and fat.
As the cooking progresses, the moisture content of the surface approaches to zero and the
fat fraction of this zone decreases as some melted fat falls as drip. The surface zone is an
area of high IR radiation absorption/transmission and high heat transfer by
conduction/convection, at the outer of which the surface crust forms (Skjoldebrand, 1979;
Luikov,1975). Skoldejbrand & Olson (1980) defined crust as the portion of the meat
product that has exceeded 100°C during cooking. Initially this happens at the surface, but
as cooking proceeds the >100°C zone moves towards the center. Yildiz et al. (2016) did
not attain 100°C in the surface of meatballs cooked with a FIR source. Sheridan and

Chapter 2. Introduction
44
Shilton (1999) cooked hamburger patties with a MIR and FIR sources. In the case of MIR
source, the samples attained and exceed this temperature and crust was formed.
Moreover, as the water content of the surface is reduced, the surface contains more air-
filled interstices that have an insulating effect. Perez and Calvelo (1984) found that the
thermal conductivity of a crust fell from a value of 0.49 W/m·K for raw meat, almost to
0.14 W/m·K, for a cooked meat with low residual water content.
The effects of IR cooking on the characteristics of meat products have been studied by
several authors. The quality of beef produced by IR dehydration was similar to
conventionally heated beef as indicated by surface appearance and taste tests (Burgheimer
et al., 1971).
Muriana et al. (2004) showed that deli turkey treated with IR heating had a more
appealing brown color and roasted appearance, in addition to the pasteurizing effect on
the surface.
Khan and Vandermey (1985) prepared ground beef patties by IR broiling in a
conveyorized broiler. The cooking time was reduced compared to conventional gas
heating. In addition, it was found that IR-broiled ground beef patties did not undergo any
adverse effects on cooking conditions and quality (number of samples cooked/min, %
shrinkage, cooking time) compared with conventional gas broiling method. Sensory
evaluation of ground beef patties treated by IR heating and gas broiling in terms of flavor,
texture, juiciness and overall acceptability showed no significant difference between both
treatments. However, the general appearance was rated better in gas-broiled patties than
in IR-broiled patties.
Sheridan and Shilton (1999) evaluated the efficacy of cooking beef burger patties using
IR sources at a maximum wavelength of 2.7 μm (MIR) and at a maximum wavelength of
4.0 μm (FIR). They observed that the target core temperatures were achieved more rapidly
as the fat content of samples increased. Moreover, with FIR radiation source, the target
core temperature of beef patty was achieved at lower surface temperature, with less
surface drying and charring. This study also concludes that FIR radiation heaters are more
energy efficient for meat cooking in comparison with MIR heaters. In a later study, the
same authors studied the effect on the yield of beef burger patties cooked with FIR. They
Chapter 2. Introduction
45
observed that water-based cooking loss was mostly due to vaporization whereas fat-based
cooking loss was almost exclusively due to drip. Moreover, they observed that the surface
zone was less thick in low-fat burgers than in high-fat burgers and suggested that greater
surface water availability in low-fat burgers would kept temperature close to 100°C for
longer and delay crust formation (Sheridan and Shilton, 2002).
1.2.2.4.2. IR cooking of vegetables and legumes
The effect of IR cooking has been studied on several plant foods different points of view.
Hashimoto et al. (1990, 1994) studied the penetration of FIR energy into sweet potato
and found that FIR radiation absorbed by the vegetable model was decreased to 1% of
the initial values at a depth of 0.26 to 0.36 mm below the surface, whereas NIR showed
a similar reduction at a depth of 0.38 to 2.54 mm. Chua and Chou (2005) studied the
application of IR radiation in potato and carrot by slowly increasing the power, with short
cooling between power levels, finding that it resulted in less color degradation than with
intermittent IR heating. Reductions in overall color change of 37.6 and 18.1% were
obtained for potato and carrot, respectively. Galindo et al. (2005) also studied the effect
of IR heating on carrots. IR treatment caused less damage to the tissue than blanching, as
observed by lower relative electrolyte leakage values and microscopic observations,
while effectively inactivated the enzymes on carrot surface. Moreover, IR-treated carrots
had higher tissue strength than those blanched with mild hot water.
Mongpreneet et al. (2002) found that chlorophyll content of dehydrated onions treated by
IR increased with an increase in irradiation power. Gabel et al. (2006) observed that
pungency of onions decreased with reduction in moisture after an IR radiation treatment.
Regarding the effect IR treatment duration, they concluded that long IR heat treatments
may darken the color of onion due to browning.
Abdul-Kadir et al. (1990) evaluated the effect of IR heating on pinto beans (Phaseolus
vulgaris) heated to 99 and 107 °C. IR-heating improved rehydration rate and degree of
swelling of pinto beans; however, cooking time of pinto beans significantly increased.
McCurdy (1992) observed that bitterness and protein solubility of peas were reduced after
IR heat treatment. Arntfield et al. (2001) found that IR heat-treated lentils were darker
than raw lentils. Moreover, cell walls of lentils were less susceptible to fracture after IR
Chapter 2. Introduction
46
heat treatment, although they had a more open microstructure that enhanced their
rehydration characteristics.
1.2.2.4.3. IR cooking of bread
Some authors have compared the use of different wavelengths or IR radiation to cook
doughs. Sakai and Hanzawa (1994) discussed the effects of NIR and FIR heaters on crust
formation and color development at the surfaces of white bread and wheat flour. NIR
heater led to a greater heat penetration into food samples, resulting in formation of
relatively wet crust layers, compared to dry layers formed by FIR heaters. However, the
rate of color development caused by FIR heaters was greater than the caused by NIR
heaters, due to a more rapid heating rate on the surface. Nevertheless, Lentz et al. (1995)
stated that, for bread dough, unless the emitting wavelength is restricted to the wavelength
best absorbed, heating will be very inefficient, resulting in excessing heating of the
surface and poor heating of the interior. Excessive surface heating, in the absence of
corresponding heat removal to the interior, will give rise to crust formation, inhibiting
heat transfer.
Olsson et al. (2005) studied the effect of IR heating followed by air jet impingement on
crust formation of par-baked baguettes. Combination of IR heating and jet impingement
resulted in rapid drying and enhanced color development, compared to conventional oven
treatment. Though the water loss rate increased due to the high heat transfer rate, the total
water loss was reduced because of shorter heating time and, in general, IR treatment time
enabled the formation of a thinner crust.
According to Koutchma (2017), further studies have to be done to obtain a detailed insight
into the theoretical explanation of IR effects, especially regarding its interaction with food
components, changes in taste and flavor compounds and living organisms.
1.2.3. IR heat transfer modeling
IR heat transfer modeling inside food has been widely researched due to the complexity
of optical characteristics, radiative energy extinction and combined conductive and/or
convective heat transfer phenomena.
Chapter 2. Introduction
47
In general, numerical methods applied to solve the set of equations are: finite elements,
finite difference, and the control volume method (Turner and Perre, 1996). Diffusion
characteristics in relation with radiation intensity and thickness of a given food volume
have been studied using the finite element method to explain the phenomenon of heat
transfer inside food systems under FIR radiation.
Dagerskog (1979) created a model that successfully predicted the experimentally
measured temperature distribution of beef slices during IR frying. The model was based
on combined IR radiation and convection heating. Heat conduction equation was solved
numerically using the finite difference method. The infinitesimal differentials were
replaced by differences of finite size and the degree of accuracy of the representation was
determined by the step size of these differences.
Sakai and Hanzawa (1994) assumed that most FIR radiation energy would be absorbed
at the surface of a food system due to the predominant energy absorption of water. Then,
energy would be transported by heat conduction inside the food sample. Based on this
assumption, a governing equation and boundary conditions to explain heat transfer
derived from energy balance in a food system were solved using Galerkin’s finite element
method. The measured temperature distribution in samples was in good agreement with
model predictions, permitting control of the surface temperature to retain food properties
without overtreatment.
Abe and Afzal (1997) investigated four mathematical drying models: exponential model,
Page model, diffusion model based on spherical grain shape, and an approximation of the
diffusion model to address the thin-layer IR drying characteristics of rough rice. They
found the Page model as most satisfactory for describing thin-layer IR radiation drying
of rough rice. Das et al. (2004) also reported that the Page model adequately fitted the
experimental drying data while studying the drying characteristics of high-moisture
paddy rice.
Afzal and Abe (1998) studied the effect of radiation intensity and thickness of slab on the
moisture diffusion characteristics of potato during FIR drying applying a model fitting
procedure to the experimental drying data to determine the diffusion coefficients. The
diffusivity was found to vary with radiation intensity and the thickness of slab. The
radiation energy driving internal moisture movement during FIR drying of a potato,

Chapter 2. Introduction
48
induced the activation energy for diffusion inversely proportional to thickness of the
given volume of the sample (Afzal and Abe, 1998).
Ranjan et al. (2002) developed a 3-dimensional control volume formulation for the
solution of a set of 3-way coupled heat, moisture transfer, and pressure equations with an
IR source term. The solution procedure uses a fully implicit time-stepping scheme to
simulate the drying of potato during IR heating in 3-dimensional Cartesian coordinates.
Simulation indicated that the 3-way coupled model predicted the temperature and
moisture contents better than the 2-way coupled heat and mass transfer model. The overall
predictions agreed well with the available experimental data and demonstrated a good
potential for application in grain and food drying.
The variation of moisture ratio with time during IR drying of apple could be described by
the model developed by Midilli et al. (2002). Sixty-six different model equations relating
the temperature and time dependence of IR drying of apple were derived, having the
highest efficiency the model derived from modified Page II. Moreover, a single equation
was derived to predict the moisture ratio change during IR drying (0 to 240 min) of apple
in the temperature range of 50 to 80°C. Togrul (2005) investigated IR drying of apple,
including combined effects of drying time and temperature to create new suitable models.
Ten different drying models (Newton, Page, modified Page, Wang and Singh, Henderson
and Pabis, logarithmic, diffusion approach, simplified Ficks diffusion [SFFD] equation,
modified Page equation-II, and Midilli equation) were developed and validated.
FIR radiation simulations with convection–diffusion air flow and heat transfer
simulations were combined to investigate the suitability of IR radiation for surface
decontamination in strawberries (Tanaka et al., 2007). The model was a powerful tool to
evaluate in a fast and comprehensive way complex heating configurations including
radiation, convection, and conduction phenomena. Computations were validated against
measurements with a thermographic camera. FIR heating obtained more uniform surface
heating than air convection heating, with a maximum temperature well below the critical
limit of about 50 °C.
Shilton et al. (2002) developed a model based on heat and mass transfer during the
cooking of beef patties by long wavelength FIR source. A one-dimensional model based
on an infinite slab was described and the model was solved using the finite difference
Chapter 2. Introduction
49
technique. The results obtained from the model were compared to experimental results
over a range of fat content from 0% to 30%. Heat transfer results for the 0% fat content,
using a conduction model, showed very good agreement with the experimental data. By
including a term to account for internal fat and moisture convection in the beef patties
during cooking, the heat transfer process could be predicted for fat contents ranging from
10% to 30% fat. A diffusion coefficient based on temperature and moisture was applied
for the prediction of the evaporative mass losses. The model showed a very good
agreement with the experimental data.
Sargolzaei et al. (2010) developed a model for an unsteady-state heat transfer in
hamburger cooking process using one dimensional finite difference and three dimensional
computational fluid dynamic (CFD) models. A double-side cooking system was designed
to study the effect of pressure and oven temperature on the cooking process. Applying
pressure to hamburger increased the contact area of hamburger with the heating plate
increased the heat transfer rate to the hamburger, caused weight loss due to water
evaporation and decreased cooking time. CFD predicted results fitted better the
experimental results than the finite difference ones.
1.2.4. Selective heating by IR radiation
In practice, IR sources emit radiation covering a wide range of wavelengths. Nevertheless,
there are systems which can control or filter radiation within a specific spectral range
using optical band pass filters. This controlled radiation can stimulate the maximum
optical response of the target (e.g., food component, microorganism) when the emission
band of IR and the peak absorbance band of the target material are identical. IR radiation
for selective heating of foods could be very useful for a wide range of potential process
applications. Hence, it is considered a challenge to control or filter the spectral
distribution to obtain a specific bandwidth and IR sources that emit with a specific
wavelength should be considered for optimization of the heating process.
There is not much literature on selective heating using IR radiation in foods. Few attempts
have been made to study selective IR bandwidth or wavelength in the food industry. Jun
(2002) developed a novel selective FIR heating system for soy protein and glucose. The
system used band pass filter that selected the specific wavelengths that were emitted
according to the specific absorptivity of each food powder. Soy protein was heated about
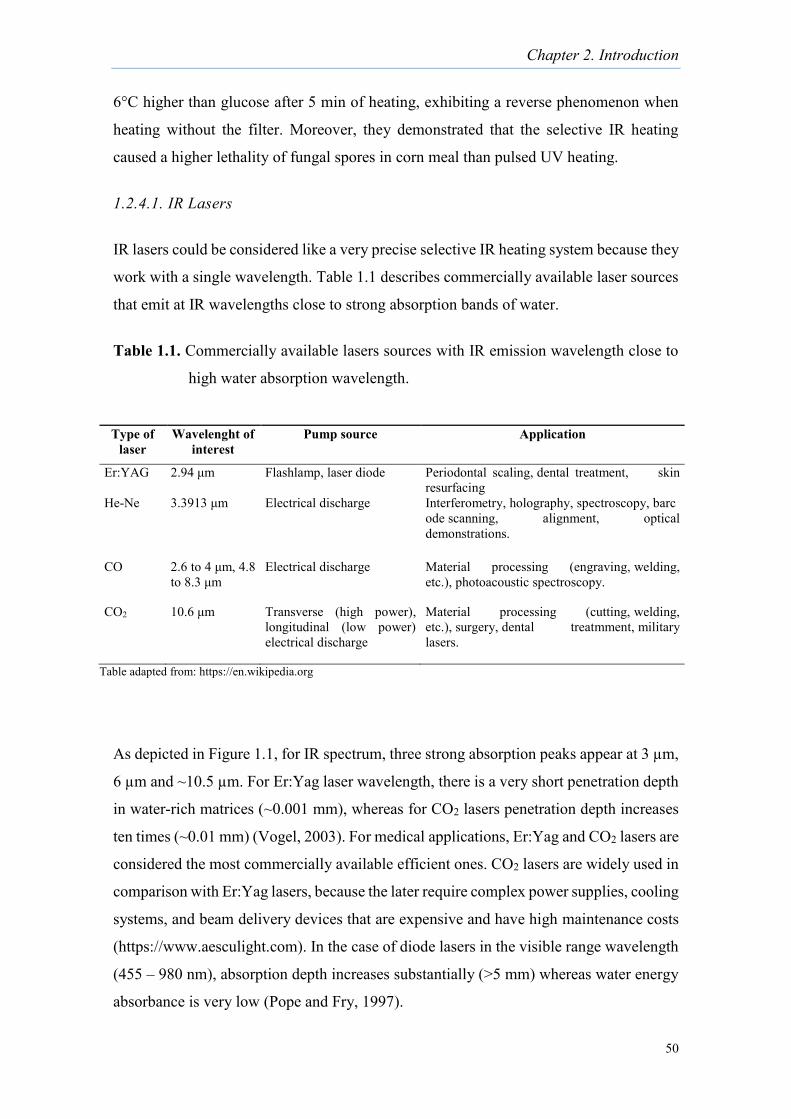
Chapter 2. Introduction
50
6°C higher than glucose after 5 min of heating, exhibiting a reverse phenomenon when
heating without the filter. Moreover, they demonstrated that the selective IR heating
caused a higher lethality of fungal spores in corn meal than pulsed UV heating.
1.2.4.1. IR Lasers
IR lasers could be considered like a very precise selective IR heating system because they
work with a single wavelength. Table 1.1 describes commercially available laser sources
that emit at IR wavelengths close to strong absorption bands of water.
Table 1.1. Commercially available lasers sources with IR emission wavelength close to
high water absorption wavelength.
As depicted in Figure 1.1, for IR spectrum, three strong absorption peaks appear at 3 µm,
6 µm and ~10.5 µm. For Er:Yag laser wavelength, there is a very short penetration depth
in water-rich matrices (~0.001 mm), whereas for CO2 lasers penetration depth increases
ten times (~0.01 mm) (Vogel, 2003). For medical applications, Er:Yag and CO2 lasers are
considered the most commercially available efficient ones. CO2 lasers are widely used in
comparison with Er:Yag lasers, because the later require complex power supplies, cooling
systems, and beam delivery devices that are expensive and have high maintenance costs
(https://www.aesculight.com). In the case of diode lasers in the visible range wavelength
(455 – 980 nm), absorption depth increases substantially (>5 mm) whereas water energy
absorbance is very low (Pope and Fry, 1997).
Type of laser
Wavelenght of interest
Pump source Application
Er:YAG 2.94 μm Flashlamp, laser diode Periodontal scaling, dental treatment, skin resurfacing
He-Ne 3.3913 μm Electrical discharge Interferometry, holography, spectroscopy, barcode scanning, alignment, optical demonstrations.
CO 2.6 to 4 μm, 4.8 to 8.3 μm
Electrical discharge Material processing (engraving, welding, etc.), photoacoustic spectroscopy.
CO2 10.6 μm Transverse (high power), longitudinal (low power) electrical discharge
Material processing (cutting, welding, etc.), surgery, dental treatmment, military lasers.
Table adapted from: https://en.wikipedia.org
Chapter 2. Introduction
51
1.2.4.1.2. CO2 laser
The CO2 laser is a molecular gas laser based on a gas mixture as the gain medium, which
contains carbon dioxide (CO2), helium (He), nitrogen (N2), and possibly some hydrogen
(H2), water vapor and/or xenon (Xe). Such a laser is electrically pumped via a gas
discharge, which can be operated with DC current, with AC current (e.g. 20–50 kHz) or
in the radio frequency domain. N2 molecules are excited by the discharge into
a metastable vibrational level and transfer their excitation energy to the CO2 molecules
when colliding with them. Other constituents such as H2 or water vapor can help
(particularly in sealed-tube lasers) to reoxidize CO formed in the discharge to CO2 (Patel,
1964).
CO2 lasers have a wide range of commercially available powers, combined with a
reasonable cost and a large variety of specialized equipment and, moreover, they are also
quite efficient: the ratio of output power to pump power can be as large as 20%. The
CO2 laser produces a beam of IR light with the principal wavelength bands centering
between 9.4 and 10.6 μm (www.laserproject.es).
CO2 lasers are frequently used in industrial applications for cutting and welding, whereas
lower power level lasers are used for engraving and marking of different material. CO2
lasers are also used in the additive manufacturing process of selective laser sintering.
(https://www.rp-photonics.com)
CO2 laser (10.6 μm) is considered the most suitable for soft tissue procedures in human
and animal medical treatments, as compared to other laser wavelengths. Soft tissue
treatments include cutting and hemostasis which are achieved photo-thermally heating).
The advantages of using CO2 lasers include less bleeding, shorter surgery time, less risk
of infection, and less post operations swelling. Medical areas of application
include gynecology, dentistry, oral and maxillofacial surgery, and many others. CO2
lasers have become versatile and useful in surgical procedures since water, which is
present in a high concentration in most biological tissues, highly absorbs their frequency
radiation (Fisher, 1993; Vogel, 2003).
1.2.4.1.3. Laser Cooking
Chapter 2. Introduction
52
Several patents have described systems to use lasers in conjunction with cooking or as a
cooking system:
- Kiyoshi (1998) patented a laser cooking device system, and described how to improve
thermal efficiency by using laser beams as a cooking means. This system device did not
heat the food directly with a laser and it employed a laser oscillator to heat the bottom of
a cooker.
- Hideki (2002) patented a food cooking apparatus System. They described a microwave
oven with a semiconductor laser irradiation unit which irradiated a laser beam having a
specific wavelength (0.8 µm and 1.5 µm) onto foodstuffs accommodated in a cooking
chamber.
- Muchnik (2008) patented an apparatus and method for cooking food directly with a CO2
laser. The laser beam was directed at a beam splitter, which split the laser beam in half;
mirrors were used to focus the beam to either side of the food. The split beam reached a
higher temperature than most types of lasers.
- Singh (2013), described a method and apparatus for plasma assisted laser cooking of
food products. This system applied energy with a laser emitter very close to the food
product. The application of the energy could be controlled according to a profile to
generate plasma inside and around the food product during cooking, and it could be
adjusted according to the feedback from the controlled application of energy to the food
product.
Recently, Butingler et al. (2018) studied the gelatinization of starch in dough using a blue
diode laser, which operates at 445 nm, by adjusting the water content of the dough (50-
70%) and the exposure pattern of the laser. They applied a ring-shaped cooking pattern
of 5mm diameter, 120 repetitions, 4000mm/min speed, and 2W laser power. Their results
showed that high internal temperatures were achieved in laser-treated dough samples with
greater water content: dough with 70% water content (106.7°C) was >20% warmer than
dough with 50% water content (87°C). The correlation between dough temperature and
the amount of water content was attributed to the low absorbance of water at 445 nm,
resulting in greater heat penetration depth in the dough with the highest amount of water
(70%). Surface burning was observed on the dryer dough (50% water) that also limited
the depth penetration of laser. The authors concluded that further processing with an IR
laser is required to achieve optimal browning.
Chapter 2. Introduction
53
CO2 IR laser cooking could be considered an innovative IR-based cooking technique and,
to the best of our knowledge, a specific cooking system based on CO2 wavelength sources
and their effects on physico-chemical, microbiological, toxicological and sensory aspects
for different food matrices have not been studied or reported yet.
Chapter 3. Material and Methods
54
CHAPTER 3
MATERIALS AND METHODS
Chapter 3. Material and Methods
55
3.1. Formulation and preparation of samples
3.1.1. Beef Burgers
Ingredients used for burger preparations were: raw minced beef meat 98.26% (w/w) (Bon
Area, Grup Alimentari Guissona, Guissona, Spain), iodized refined salt 1.5% (w/w) (Sal
Costa, Barcelona, Spain) and ground black pepper 0.24% (w/w) (Jesús Navarro S.A.,
Novelda, Spain). Ingredients were manually mixed and molded using a 78 mm diameter
circular mold, with 11±1 mm height. Each burger weighted 50±1 g. Once prepared,
burgers were kept at 4°C in plastic containers in order to avoid bacterial growth and to
standardize initial cooking temperature. Burgers were cooked the same day of
preparation.
3.1.2. Mashed potatoes bites
Ingredients used for mashed potatoes were: water 56.99% (w/w), half-skimmed milk
28.16% (w/w) (ATO Natura, Llet ATO S.L., Barcelona), dehydrated mashed potatoes
14.62% (w/w) (Maggi®, Nestlé España, S.A., Esplugues de Llobregat, Spain), and
iodized refined salt 0,23% (w/w) (Sal Costa). Ingredients were mixed together using a
mixer (Thermomix 21/2-1, Vorwerk Elektrowerke GmbH & Co., Wuppertal, Germany).
Each sample weighed 11±1 g and was prepared using a 47 mm diameter circular mold,
with 5 mm height. Once prepared, they were immediately cooked.
3.1.3. Pizza dough
Ready-to-use fresh pizza doughs (Finissima and Tradizionale, Buitoni®, Nestlé España,
S.A.) were used. Samples were prepared using circular molds as cutters. Finissima pizza
dough samples were prepared using a 60 mm diameter circular mold and their average
height was 3 ± 1 mm. Tradizionale pizza dough samples were cut using a 100 mm
diameter circular mold and their average height was 5 ± 1 mm. Pizza dough samples were
immediately cooked after preparation.
3.1.4. Vegetarian patties
Ingredients used for vegetarian patties preparations with egg were: cooked chickpeas
(Acico S.A., Elorrio, Spain), cooked brown lentils (Acico S.A.), fresh red onions (Hortus
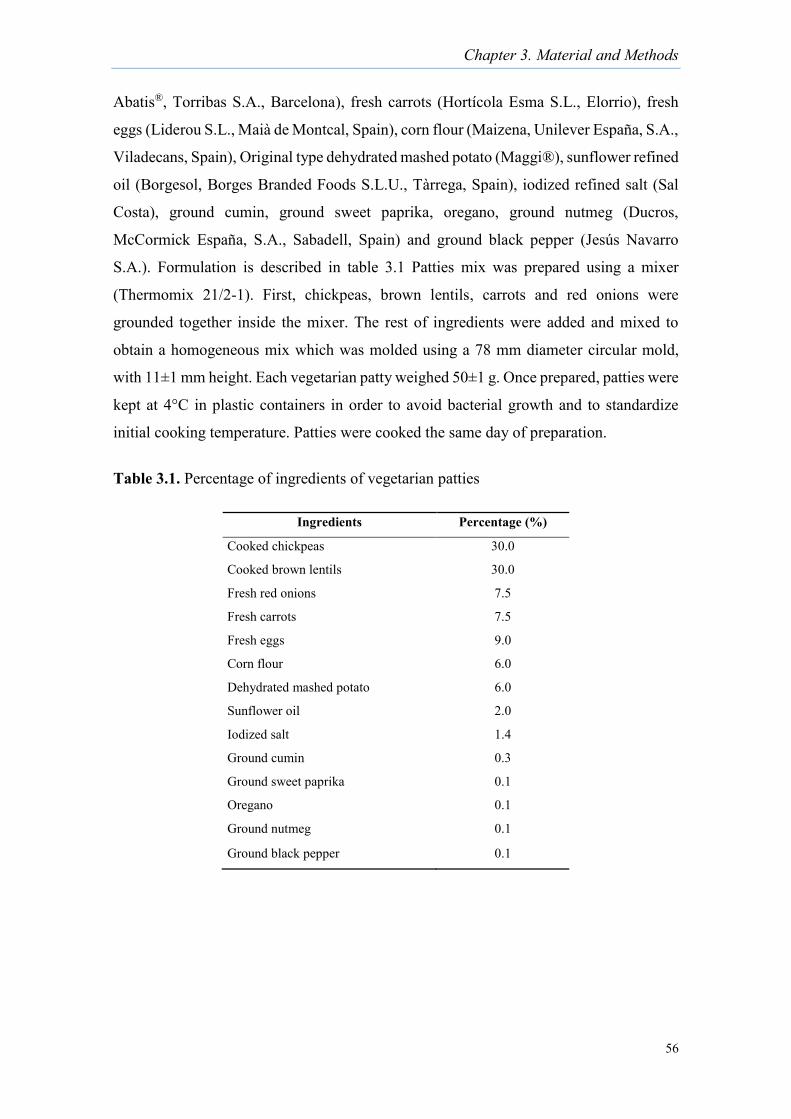
Chapter 3. Material and Methods
56
Abatis®, Torribas S.A., Barcelona), fresh carrots (Hortícola Esma S.L., Elorrio), fresh
eggs (Liderou S.L., Maià de Montcal, Spain), corn flour (Maizena, Unilever España, S.A.,
Viladecans, Spain), Original type dehydrated mashed potato (Maggi®), sunflower refined
oil (Borgesol, Borges Branded Foods S.L.U., Tàrrega, Spain), iodized refined salt (Sal
Costa), ground cumin, ground sweet paprika, oregano, ground nutmeg (Ducros,
McCormick España, S.A., Sabadell, Spain) and ground black pepper (Jesús Navarro
S.A.). Formulation is described in table 3.1 Patties mix was prepared using a mixer
(Thermomix 21/2-1). First, chickpeas, brown lentils, carrots and red onions were
grounded together inside the mixer. The rest of ingredients were added and mixed to
obtain a homogeneous mix which was molded using a 78 mm diameter circular mold,
with 11±1 mm height. Each vegetarian patty weighed 50±1 g. Once prepared, patties were
kept at 4°C in plastic containers in order to avoid bacterial growth and to standardize
initial cooking temperature. Patties were cooked the same day of preparation.
Table 3.1. Percentage of ingredients of vegetarian patties
Ingredients Percentage (%)
Cooked chickpeas 30.0
Cooked brown lentils 30.0
Fresh red onions 7.5
Fresh carrots 7.5
Fresh eggs 9.0
Corn flour 6.0
Dehydrated mashed potato 6.0
Sunflower oil 2.0
Iodized salt 1.4
Ground cumin 0.3
Ground sweet paprika 0.1
Oregano 0.1
Ground nutmeg 0.1
Ground black pepper 0.1
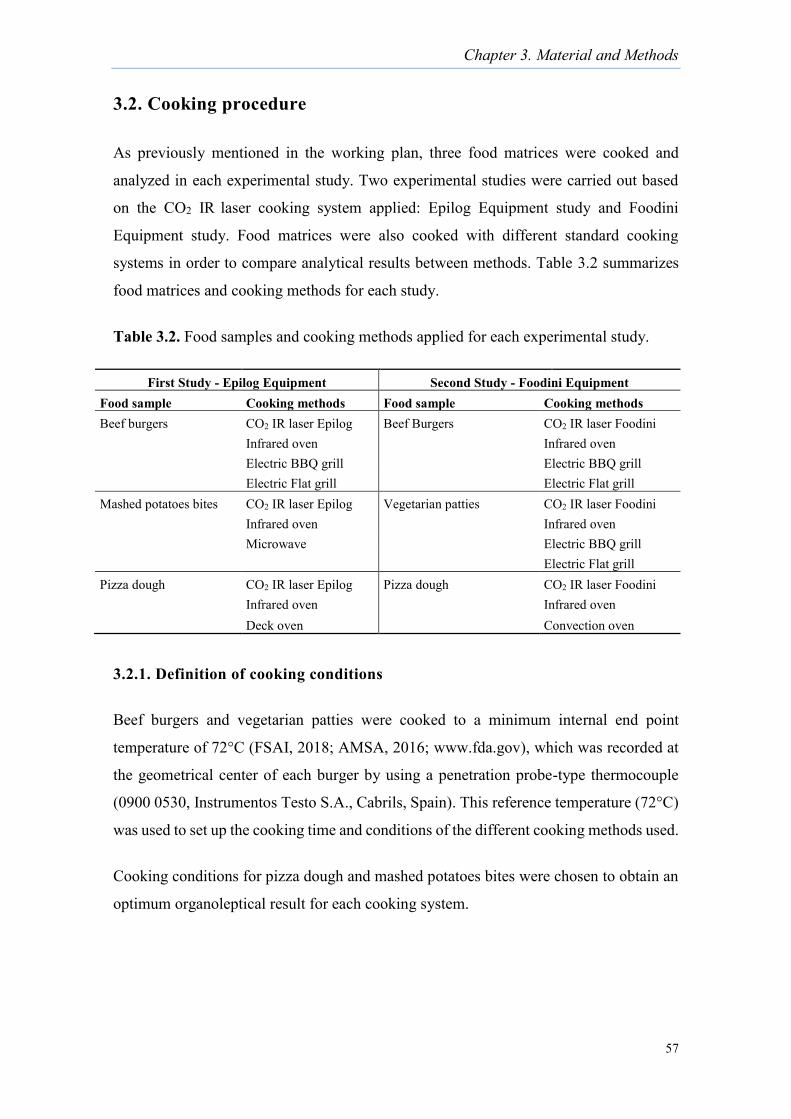
Chapter 3. Material and Methods
57
3.2. Cooking procedure
As previously mentioned in the working plan, three food matrices were cooked and
analyzed in each experimental study. Two experimental studies were carried out based
on the CO2 IR laser cooking system applied: Epilog Equipment study and Foodini
Equipment study. Food matrices were also cooked with different standard cooking
systems in order to compare analytical results between methods. Table 3.2 summarizes
food matrices and cooking methods for each study.
Table 3.2. Food samples and cooking methods applied for each experimental study.
3.2.1. Definition of cooking conditions
Beef burgers and vegetarian patties were cooked to a minimum internal end point
temperature of 72°C (FSAI, 2018; AMSA, 2016; www.fda.gov), which was recorded at
the geometrical center of each burger by using a penetration probe-type thermocouple
(0900 0530, Instrumentos Testo S.A., Cabrils, Spain). This reference temperature (72°C)
was used to set up the cooking time and conditions of the different cooking methods used.
Cooking conditions for pizza dough and mashed potatoes bites were chosen to obtain an
optimum organoleptical result for each cooking system.
First Study - Epilog Equipment Second Study - Foodini Equipment
Food sample Cooking methods Food sample Cooking methods Beef burgers CO2 IR laser Epilog Beef Burgers CO2 IR laser Foodini
Infrared oven Infrared oven
Electric BBQ grill Electric BBQ grill Electric Flat grill Electric Flat grill Mashed potatoes bites CO2 IR laser Epilog Vegetarian patties CO2 IR laser Foodini
Infrared oven Infrared oven
Microwave Electric BBQ grill Electric Flat grill Pizza dough CO2 IR laser Epilog Pizza dough CO2 IR laser Foodini
Infrared oven Infrared oven Deck oven Convection oven
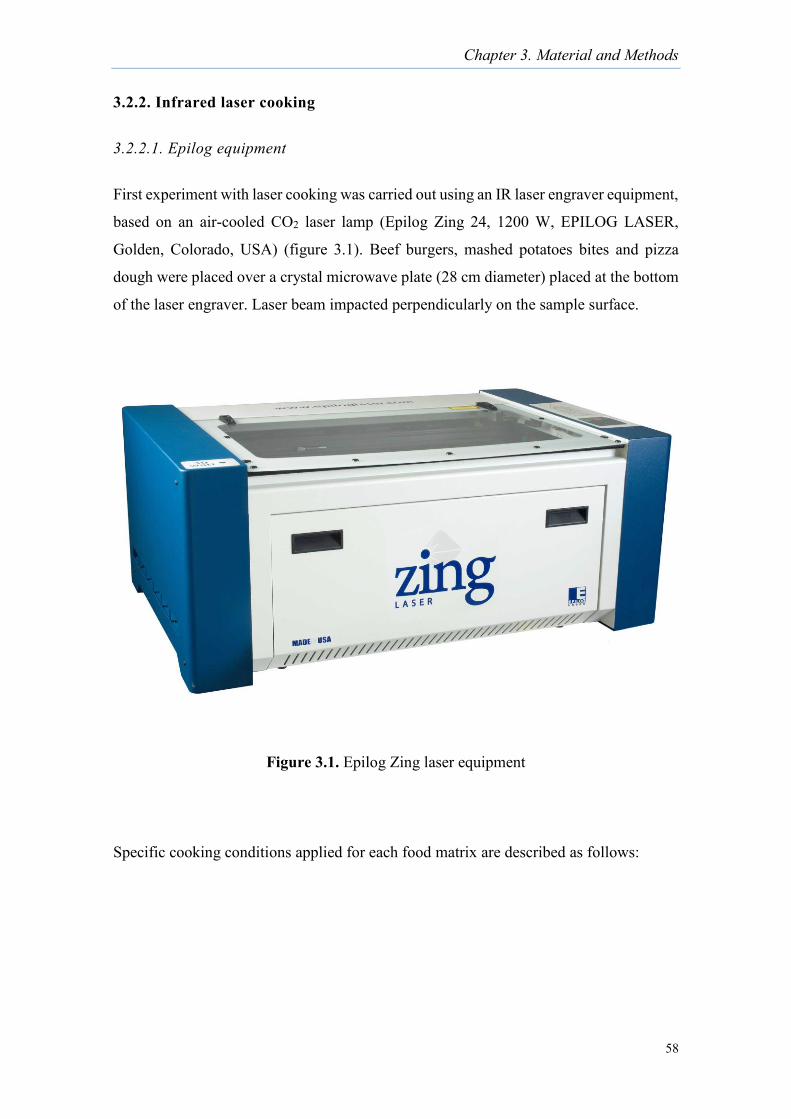
Chapter 3. Material and Methods
58
3.2.2. Infrared laser cooking
3.2.2.1. Epilog equipment
First experiment with laser cooking was carried out using an IR laser engraver equipment,
based on an air-cooled CO2 laser lamp (Epilog Zing 24, 1200 W, EPILOG LASER,
Golden, Colorado, USA) (figure 3.1). Beef burgers, mashed potatoes bites and pizza
dough were placed over a crystal microwave plate (28 cm diameter) placed at the bottom
of the laser engraver. Laser beam impacted perpendicularly on the sample surface.
Figure 3.1. Epilog Zing laser equipment
Specific cooking conditions applied for each food matrix are described as follows:
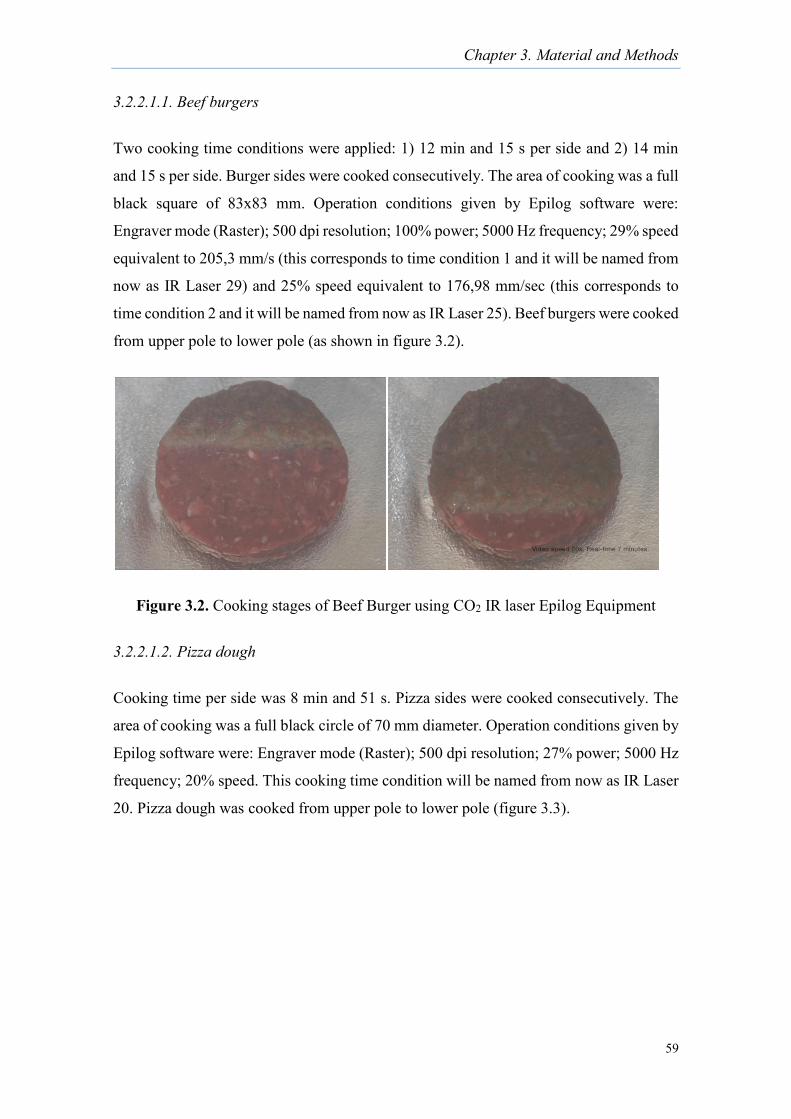
Chapter 3. Material and Methods
59
3.2.2.1.1. Beef burgers
Two cooking time conditions were applied: 1) 12 min and 15 s per side and 2) 14 min
and 15 s per side. Burger sides were cooked consecutively. The area of cooking was a full
black square of 83x83 mm. Operation conditions given by Epilog software were:
Engraver mode (Raster); 500 dpi resolution; 100% power; 5000 Hz frequency; 29% speed
equivalent to 205,3 mm/s (this corresponds to time condition 1 and it will be named from
now as IR Laser 29) and 25% speed equivalent to 176,98 mm/sec (this corresponds to
time condition 2 and it will be named from now as IR Laser 25). Beef burgers were cooked
from upper pole to lower pole (as shown in figure 3.2).
Figure 3.2. Cooking stages of Beef Burger using CO2 IR laser Epilog Equipment
3.2.2.1.2. Pizza dough
Cooking time per side was 8 min and 51 s. Pizza sides were cooked consecutively. The
area of cooking was a full black circle of 70 mm diameter. Operation conditions given by
Epilog software were: Engraver mode (Raster); 500 dpi resolution; 27% power; 5000 Hz
frequency; 20% speed. This cooking time condition will be named from now as IR Laser
20. Pizza dough was cooked from upper pole to lower pole (figure 3.3).
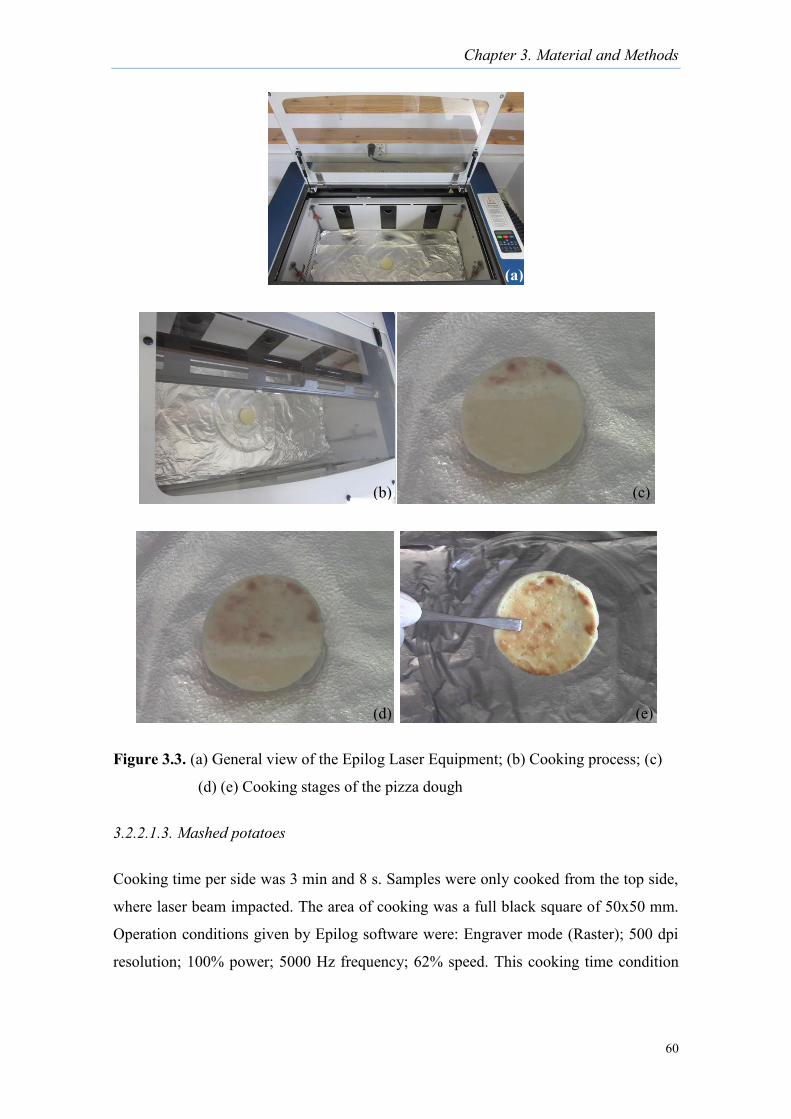
Chapter 3. Material and Methods
60
Figure 3.3. (a) General view of the Epilog Laser Equipment; (b) Cooking process; (c)
(d) (e) Cooking stages of the pizza dough
3.2.2.1.3. Mashed potatoes
Cooking time per side was 3 min and 8 s. Samples were only cooked from the top side,
where laser beam impacted. The area of cooking was a full black square of 50x50 mm.
Operation conditions given by Epilog software were: Engraver mode (Raster); 500 dpi
resolution; 100% power; 5000 Hz frequency; 62% speed. This cooking time condition
(a)
(b) (c)
(d) (e)
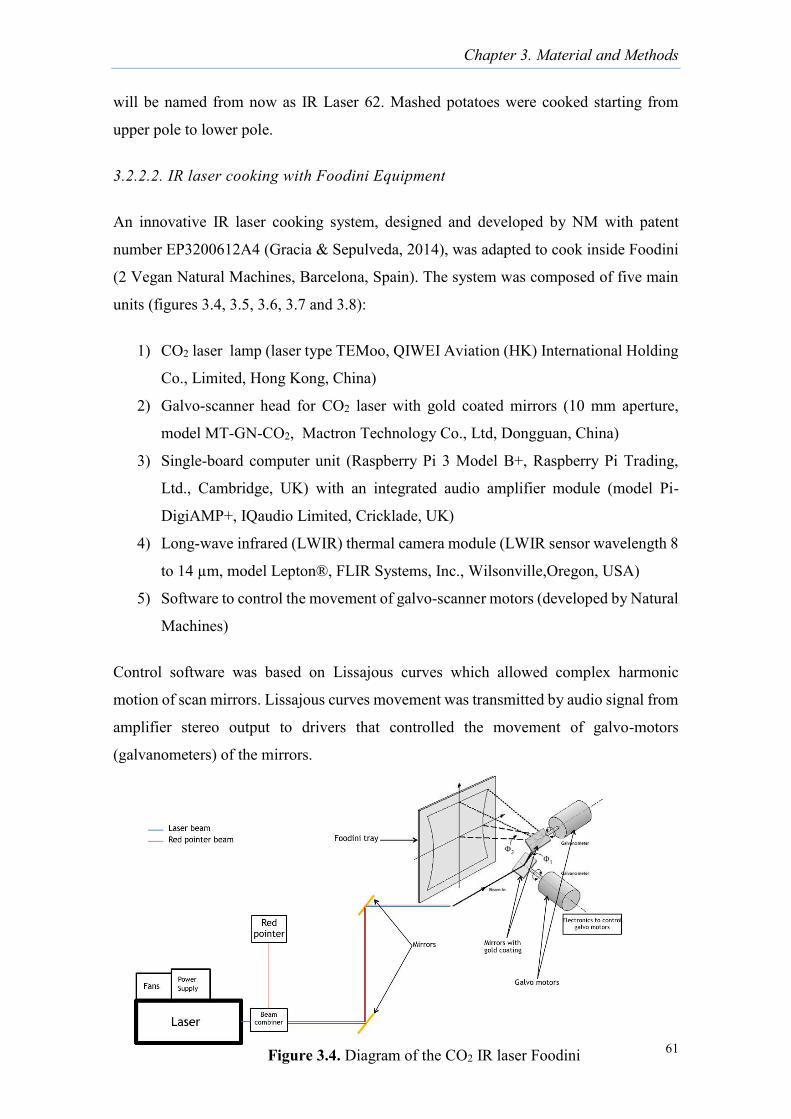
Chapter 3. Material and Methods
61
will be named from now as IR Laser 62. Mashed potatoes were cooked starting from
upper pole to lower pole.
3.2.2.2. IR laser cooking with Foodini Equipment
An innovative IR laser cooking system, designed and developed by NM with patent
number EP3200612A4 (Gracia & Sepulveda, 2014), was adapted to cook inside Foodini
(2 Vegan Natural Machines, Barcelona, Spain). The system was composed of five main
units (figures 3.4, 3.5, 3.6, 3.7 and 3.8):
1) CO2 laser lamp (laser type TEMoo, QIWEI Aviation (HK) International Holding
Co., Limited, Hong Kong, China)
2) Galvo-scanner head for CO2 laser with gold coated mirrors (10 mm aperture,
model MT-GN-CO2, Mactron Technology Co., Ltd, Dongguan, China)
3) Single-board computer unit (Raspberry Pi 3 Model B+, Raspberry Pi Trading,
Ltd., Cambridge, UK) with an integrated audio amplifier module (model Pi-
DigiAMP+, IQaudio Limited, Cricklade, UK)
4) Long-wave infrared (LWIR) thermal camera module (LWIR sensor wavelength 8
to 14 µm, model Lepton®, FLIR Systems, Inc., Wilsonville,Oregon, USA)
5) Software to control the movement of galvo-scanner motors (developed by Natural
Machines)
Control software was based on Lissajous curves which allowed complex harmonic
motion of scan mirrors. Lissajous curves movement was transmitted by audio signal from
amplifier stereo output to drivers that controlled the movement of galvo-motors
(galvanometers) of the mirrors.
Figure 3.4. Diagram of the CO2 IR laser Foodini Equipment
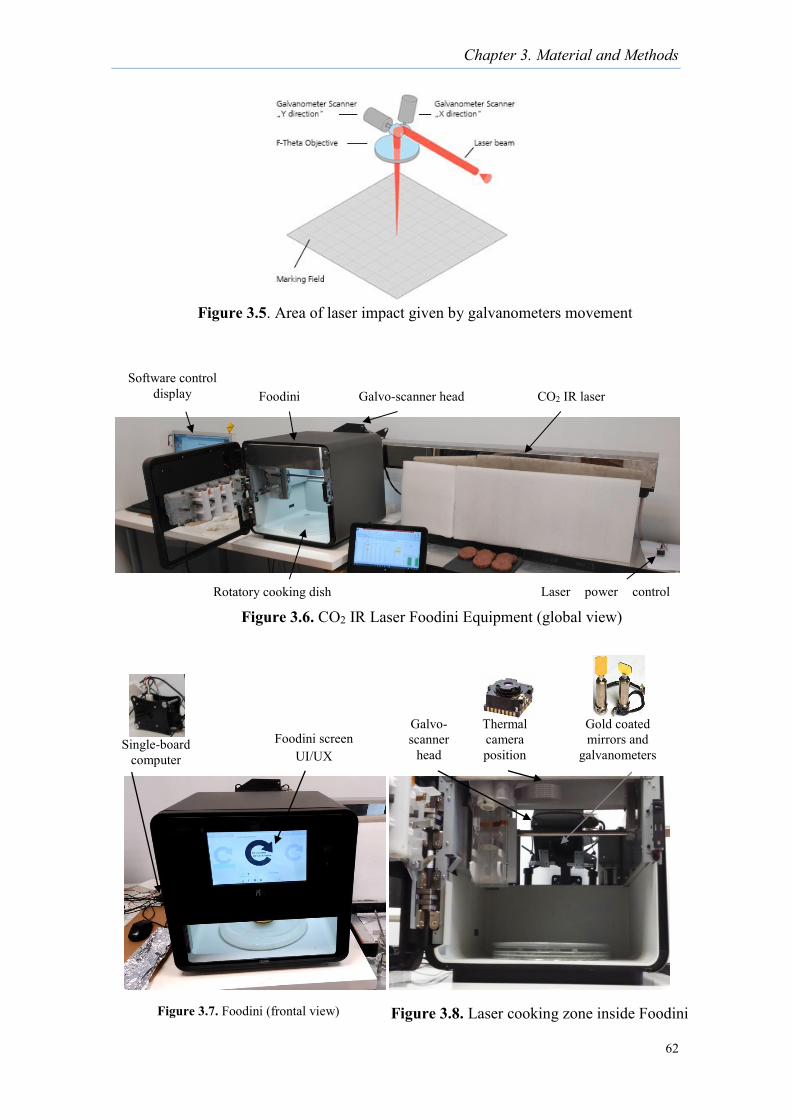
Chapter 3. Material and Methods
62
CO2 IR laser Galvo-scanner head Foodini
Rotatory cooking dish Laser power control pote
Software control display
Single-board computer
Galvo- scanner
head
Gold coated mirrors and
galvanometers Foodini screen
UI/UX
Thermal camera position
Figure 3.6. CO2 IR Laser Foodini Equipment (global view)
Figure 3.5. Area of laser impact given by galvanometers movement
Figure 3.7. Foodini (frontal view) Figure 3.8. Laser cooking zone inside Foodini
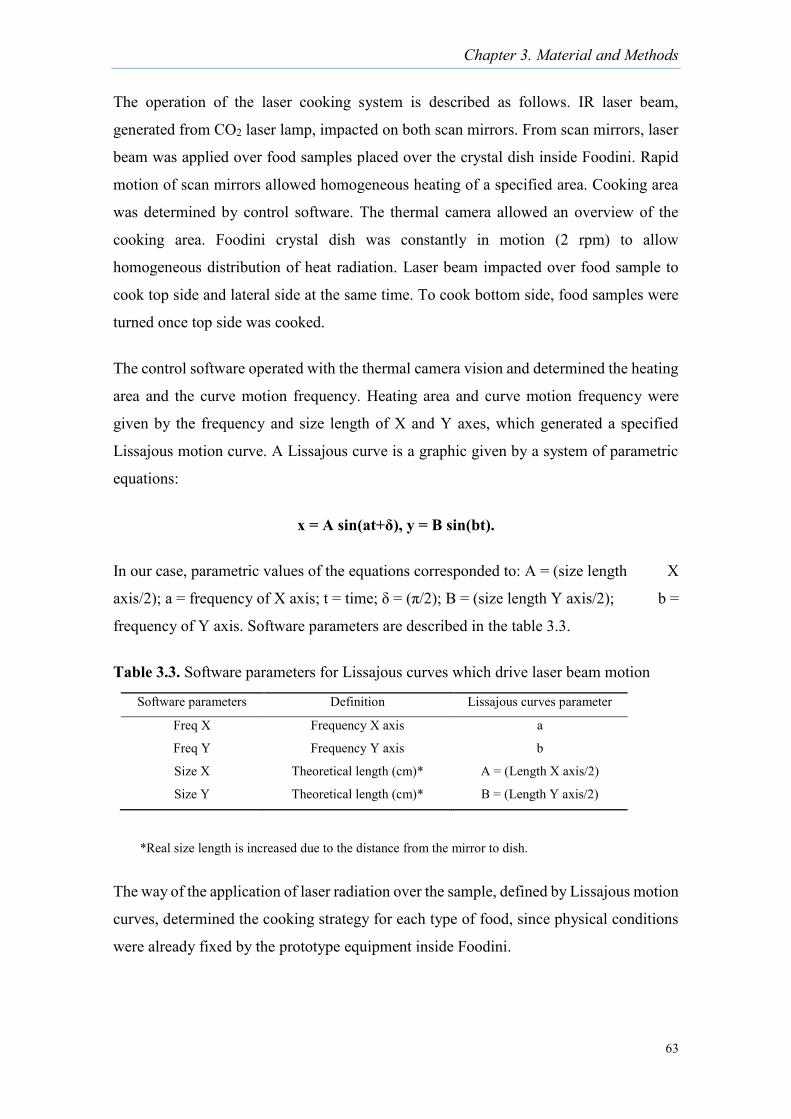
Chapter 3. Material and Methods
63
The operation of the laser cooking system is described as follows. IR laser beam,
generated from CO2 laser lamp, impacted on both scan mirrors. From scan mirrors, laser
beam was applied over food samples placed over the crystal dish inside Foodini. Rapid
motion of scan mirrors allowed homogeneous heating of a specified area. Cooking area
was determined by control software. The thermal camera allowed an overview of the
cooking area. Foodini crystal dish was constantly in motion (2 rpm) to allow
homogeneous distribution of heat radiation. Laser beam impacted over food sample to
cook top side and lateral side at the same time. To cook bottom side, food samples were
turned once top side was cooked.
The control software operated with the thermal camera vision and determined the heating
area and the curve motion frequency. Heating area and curve motion frequency were
given by the frequency and size length of X and Y axes, which generated a specified
Lissajous motion curve. A Lissajous curve is a graphic given by a system of parametric
equations:
x = A sin(at+δ), y = B sin(bt).
In our case, parametric values of the equations corresponded to: A = (size length X
axis/2); a = frequency of X axis; t = time; δ = (π/2); B = (size length Y axis/2); b =
frequency of Y axis. Software parameters are described in the table 3.3.
Table 3.3. Software parameters for Lissajous curves which drive laser beam motion
*Real size length is increased due to the distance from the mirror to dish.
The way of the application of laser radiation over the sample, defined by Lissajous motion
curves, determined the cooking strategy for each type of food, since physical conditions
were already fixed by the prototype equipment inside Foodini.
Software parameters Definition Lissajous curves parameter
Freq X Frequency X axis a
Freq Y Frequency Y axis b
Size X Theoretical length (cm)* A = (Length X axis/2)
Size Y Theoretical length (cm)* B = (Length Y axis/2)
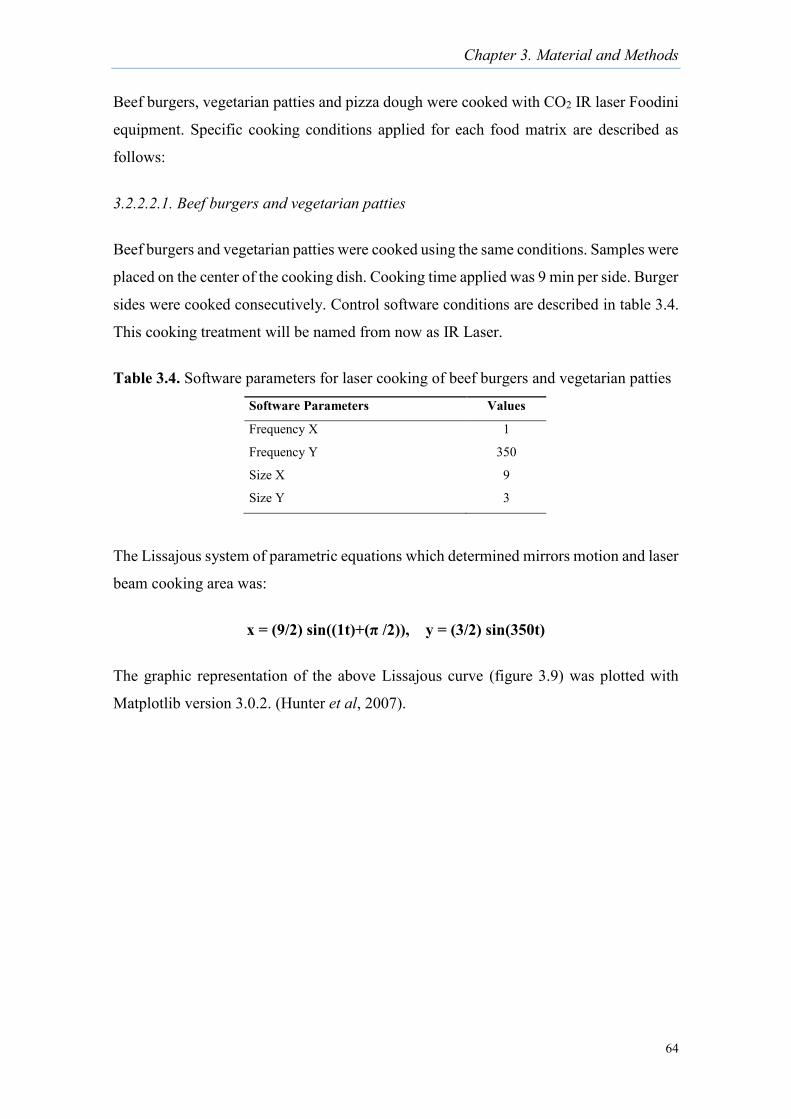
Chapter 3. Material and Methods
64
Beef burgers, vegetarian patties and pizza dough were cooked with CO2 IR laser Foodini
equipment. Specific cooking conditions applied for each food matrix are described as
follows:
3.2.2.2.1. Beef burgers and vegetarian patties
Beef burgers and vegetarian patties were cooked using the same conditions. Samples were
placed on the center of the cooking dish. Cooking time applied was 9 min per side. Burger
sides were cooked consecutively. Control software conditions are described in table 3.4.
This cooking treatment will be named from now as IR Laser.
Table 3.4. Software parameters for laser cooking of beef burgers and vegetarian patties
The Lissajous system of parametric equations which determined mirrors motion and laser
beam cooking area was:
x = (9/2) sin((1t)+(π /2)), y = (3/2) sin(350t)
The graphic representation of the above Lissajous curve (figure 3.9) was plotted with
Matplotlib version 3.0.2. (Hunter et al, 2007).
Software Parameters Values
Frequency X 1
Frequency Y 350
Size X 9
Size Y 3
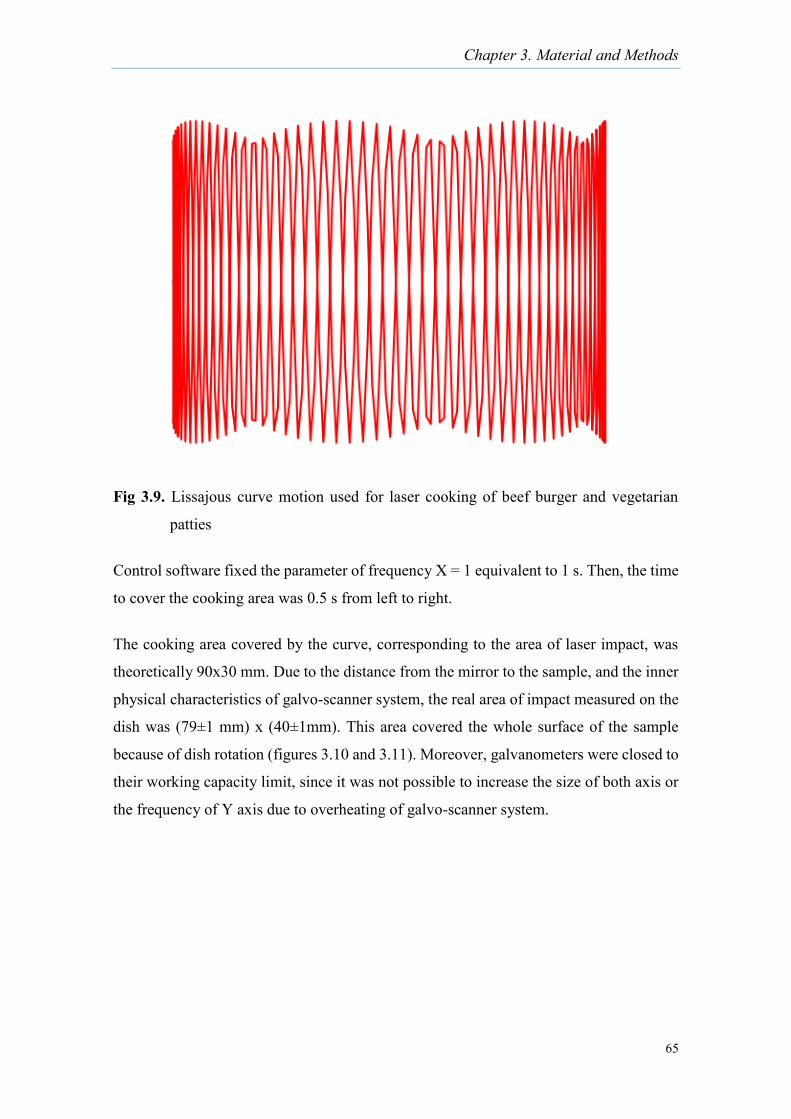
Chapter 3. Material and Methods
65
Fig 3.9. Lissajous curve motion used for laser cooking of beef burger and vegetarian
patties
Control software fixed the parameter of frequency X = 1 equivalent to 1 s. Then, the time
to cover the cooking area was 0.5 s from left to right.
The cooking area covered by the curve, corresponding to the area of laser impact, was
theoretically 90x30 mm. Due to the distance from the mirror to the sample, and the inner
physical characteristics of galvo-scanner system, the real area of impact measured on the
dish was (79±1 mm) x (40±1mm). This area covered the whole surface of the sample
because of dish rotation (figures 3.10 and 3.11). Moreover, galvanometers were closed to
their working capacity limit, since it was not possible to increase the size of both axis or
the frequency of Y axis due to overheating of galvo-scanner system.
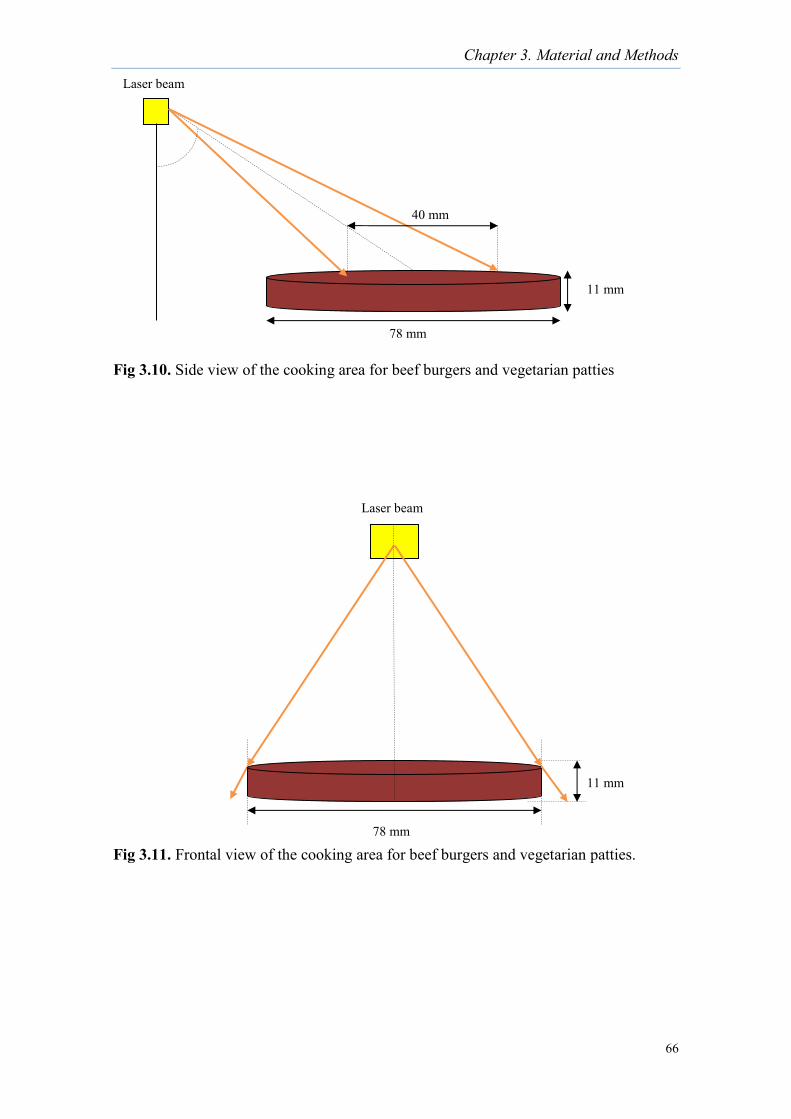
Chapter 3. Material and Methods
66
Fig 3.10. Side view of the cooking area for beef burgers and vegetarian patties
Fig 3.11. Frontal view of the cooking area for beef burgers and vegetarian patties.
Laser beam
78 mm
11 mm
Laser beam
40 mm
78 mm
11 mm
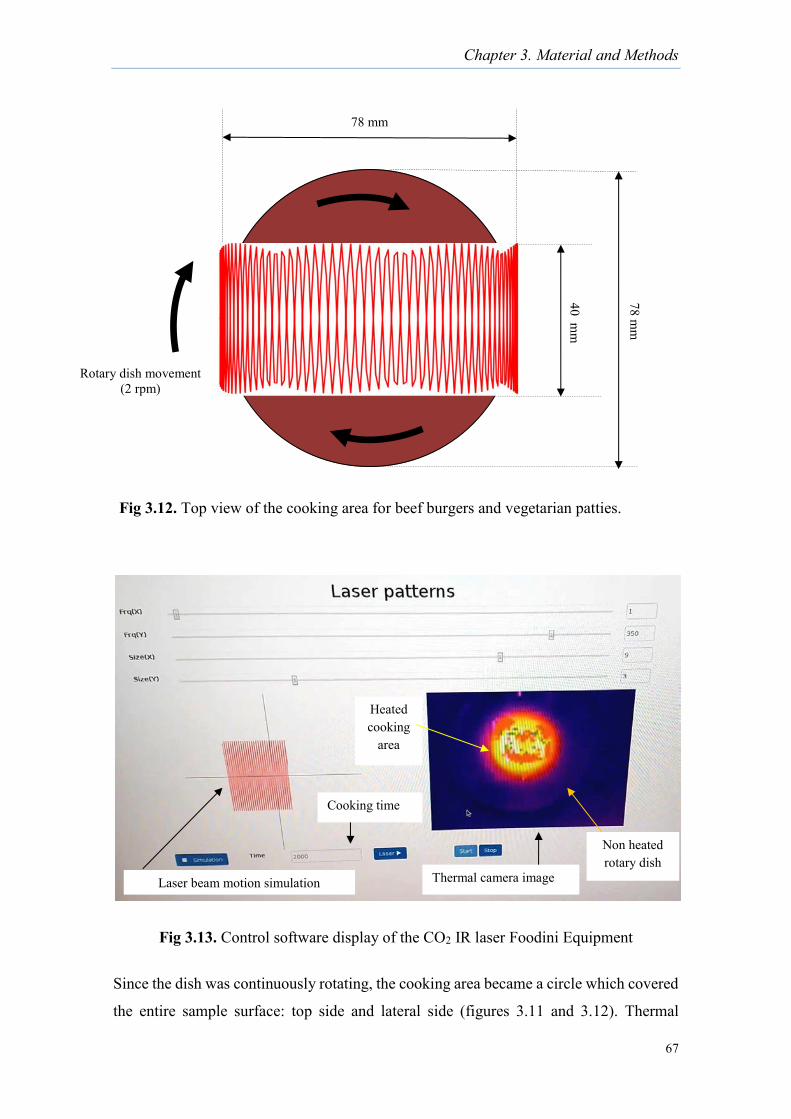
Chapter 3. Material and Methods
67
Fig 3.13. Control software display of the CO2 IR laser Foodini Equipment
Since the dish was continuously rotating, the cooking area became a circle which covered
the entire sample surface: top side and lateral side (figures 3.11 and 3.12). Thermal
Thermal camera image
Non heated rotary dish
Heated cooking
area
Cooking time
Laser beam motion simulation
Fig 3.12. Top view of the cooking area for beef burgers and vegetarian patties.
78 mm
78 mm
40 mm
Rotary dish movement
(2 rpm)
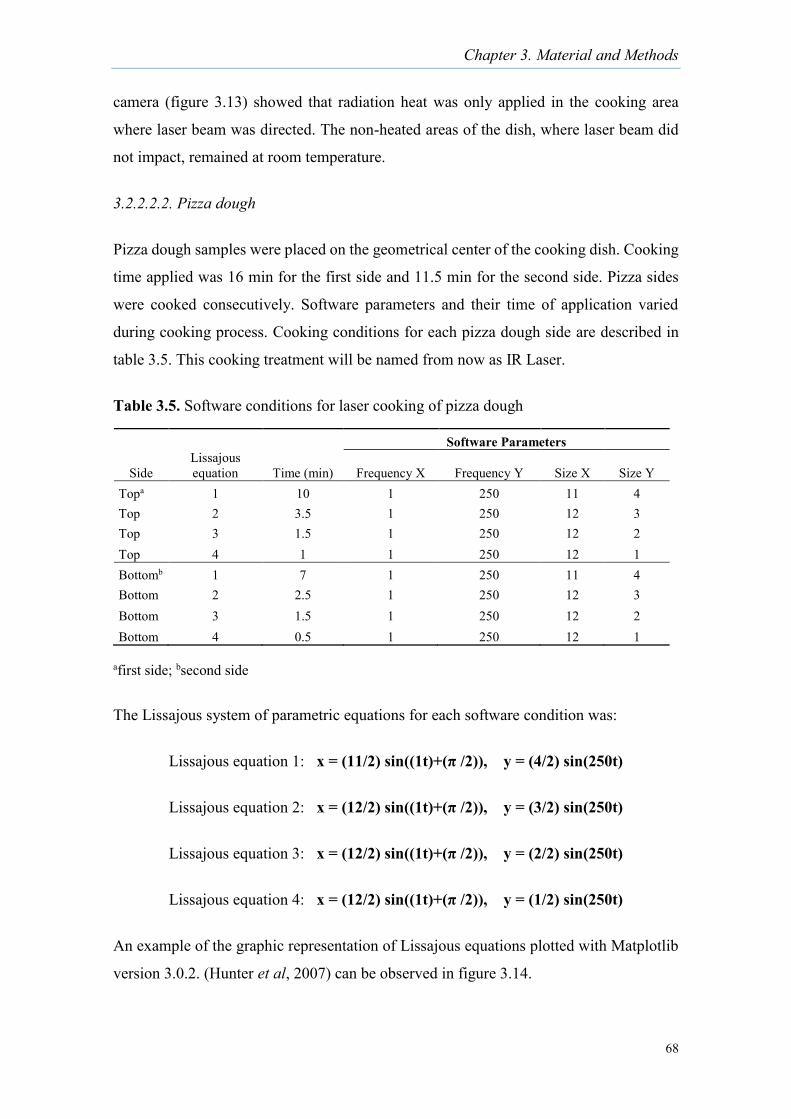
Chapter 3. Material and Methods
68
camera (figure 3.13) showed that radiation heat was only applied in the cooking area
where laser beam was directed. The non-heated areas of the dish, where laser beam did
not impact, remained at room temperature.
3.2.2.2.2. Pizza dough
Pizza dough samples were placed on the geometrical center of the cooking dish. Cooking
time applied was 16 min for the first side and 11.5 min for the second side. Pizza sides
were cooked consecutively. Software parameters and their time of application varied
during cooking process. Cooking conditions for each pizza dough side are described in
table 3.5. This cooking treatment will be named from now as IR Laser.
Table 3.5. Software conditions for laser cooking of pizza dough
afirst side; bsecond side
The Lissajous system of parametric equations for each software condition was:
Lissajous equation 1: x = (11/2) sin((1t)+(π /2)), y = (4/2) sin(250t)
Lissajous equation 2: x = (12/2) sin((1t)+(π /2)), y = (3/2) sin(250t)
Lissajous equation 3: x = (12/2) sin((1t)+(π /2)), y = (2/2) sin(250t)
Lissajous equation 4: x = (12/2) sin((1t)+(π /2)), y = (1/2) sin(250t)
An example of the graphic representation of Lissajous equations plotted with Matplotlib
version 3.0.2. (Hunter et al, 2007) can be observed in figure 3.14.
Software Parameters
Side Lissajous equation Time (min) Frequency X Frequency Y Size X Size Y
Topa 1 10 1 250 11 4 Top 2 3.5 1 250 12 3 Top 3 1.5 1 250 12 2 Top 4 1 1 250 12 1 Bottomb 1 7 1 250 11 4 Bottom 2 2.5 1 250 12 3 Bottom 3 1.5 1 250 12 2 Bottom 4 0.5 1 250 12 1
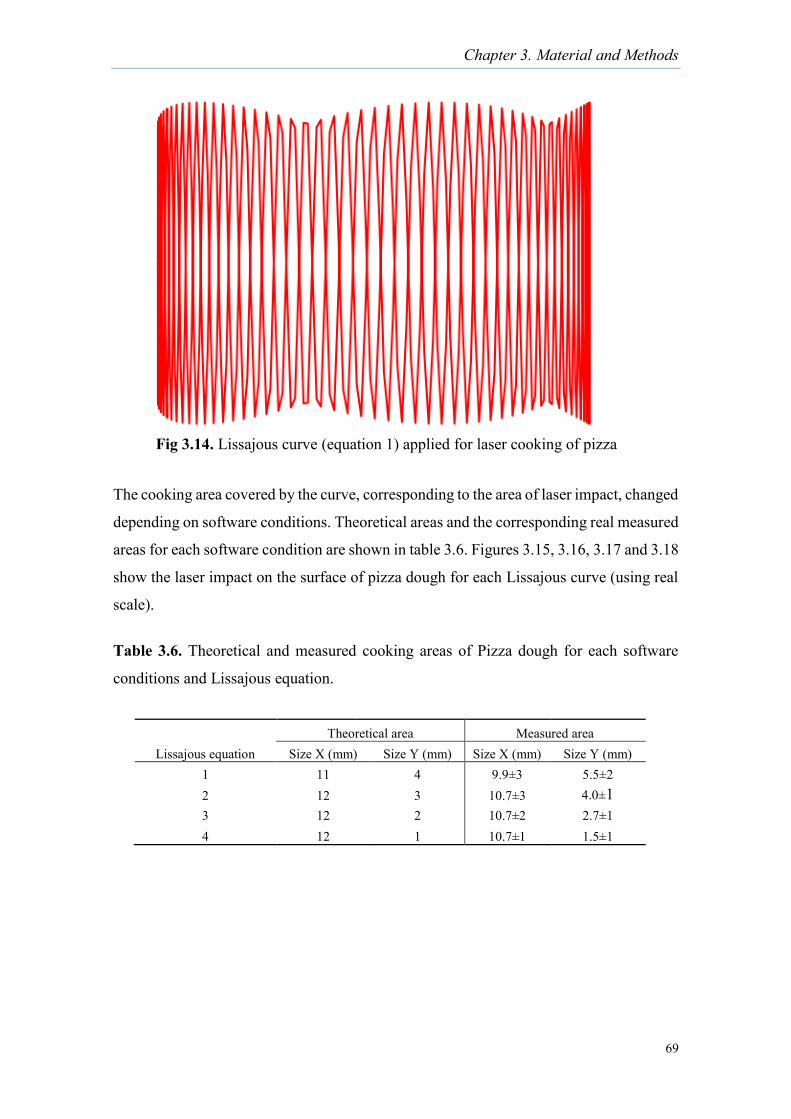
Chapter 3. Material and Methods
69
The cooking area covered by the curve, corresponding to the area of laser impact, changed
depending on software conditions. Theoretical areas and the corresponding real measured
areas for each software condition are shown in table 3.6. Figures 3.15, 3.16, 3.17 and 3.18
show the laser impact on the surface of pizza dough for each Lissajous curve (using real
scale).
Table 3.6. Theoretical and measured cooking areas of Pizza dough for each software
conditions and Lissajous equation.
Fig 3.14. Lissajous curve (equation 1) applied for laser cooking of pizza
dough.
Theoretical area Measured area Lissajous equation Size X (mm) Size Y (mm) Size X (mm) Size Y (mm)
1 11 4 9.9±3 5.5±2 2 12 3 10.7±3 4.0±1 3 12 2 10.7±2 2.7±1 4 12 1 10.7±1 1.5±1
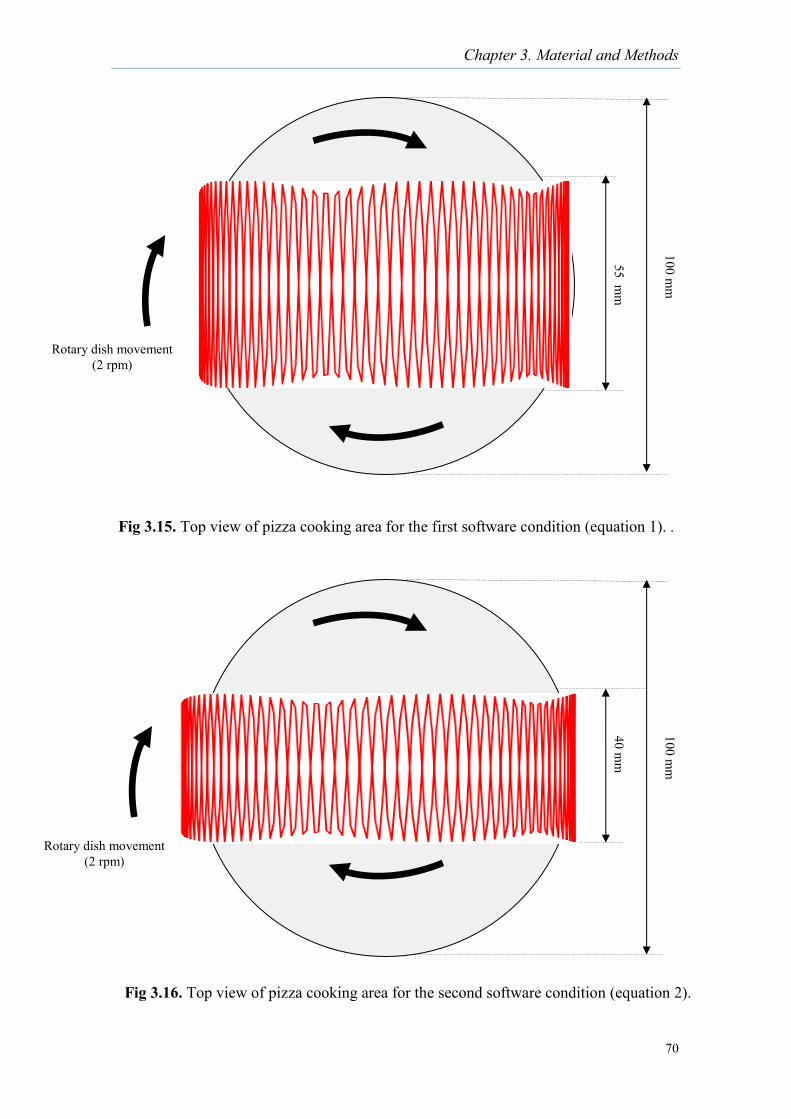
Chapter 3. Material and Methods
70
100 mm
55 mm
Fig 3.16. Top view of pizza cooking area for the second software condition (equation 2).
100 mm
40 mm
Rotary dish movement (2 rpm)
Rotary dish movement (2 rpm)
Fig 3.15. Top view of pizza cooking area for the first software condition (equation 1). .
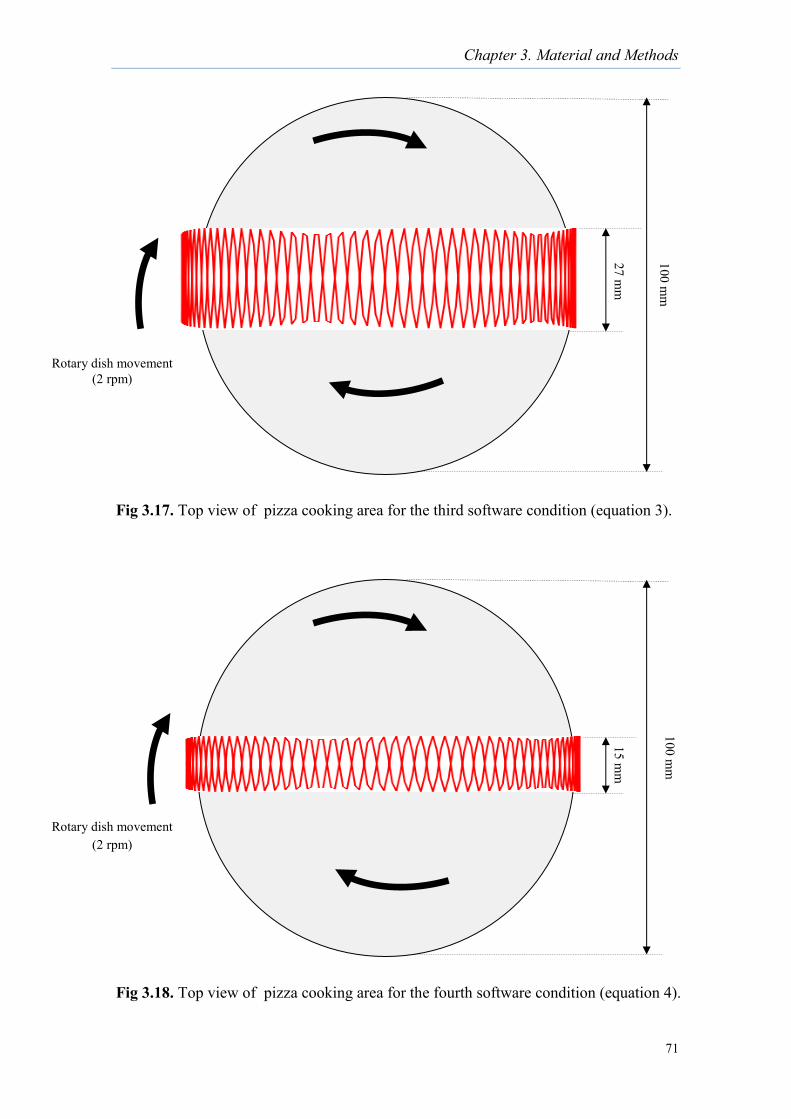
Chapter 3. Material and Methods
71
Fig 3.17. Top view of pizza cooking area for the third software condition (equation 3).
100 mm
27 mm
Rotary dish movement (2 rpm)
Fig 3.18. Top view of pizza cooking area for the fourth software condition (equation 4).
100 mm
15 mm
Rotary dish movement (2 rpm)
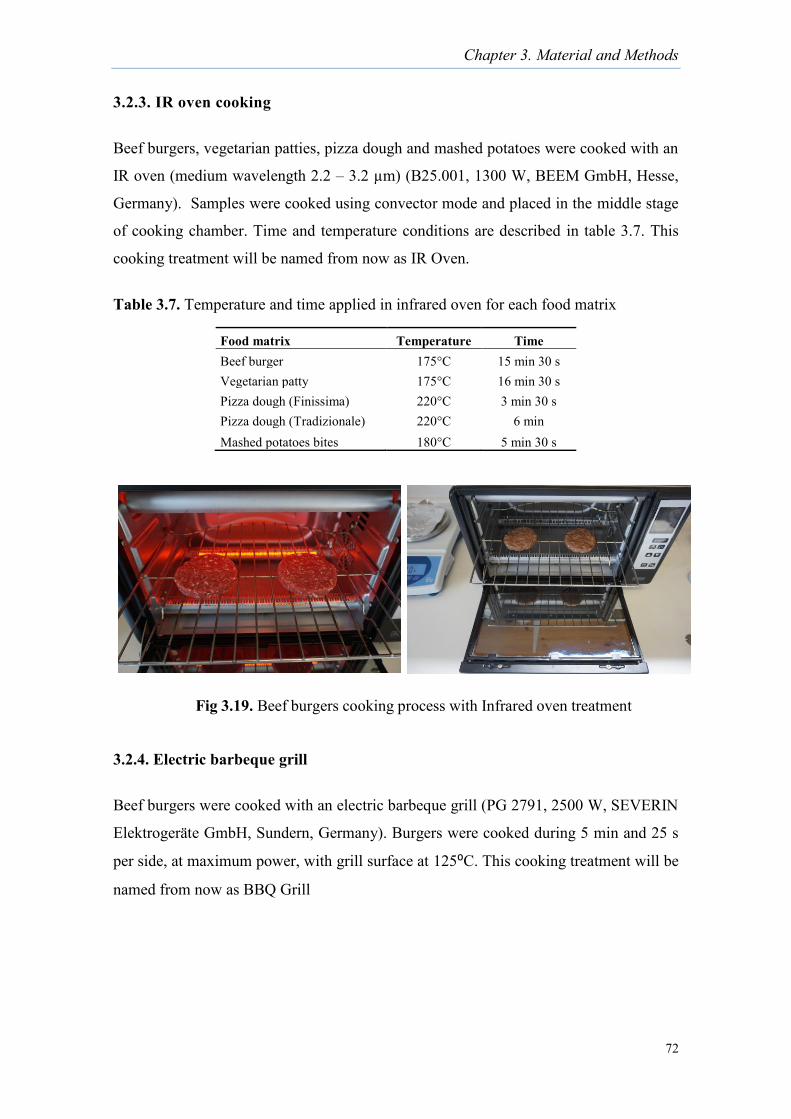
Chapter 3. Material and Methods
72
3.2.3. IR oven cooking
Beef burgers, vegetarian patties, pizza dough and mashed potatoes were cooked with an
IR oven (medium wavelength 2.2 – 3.2 µm) (B25.001, 1300 W, BEEM GmbH, Hesse,
Germany). Samples were cooked using convector mode and placed in the middle stage
of cooking chamber. Time and temperature conditions are described in table 3.7. This
cooking treatment will be named from now as IR Oven.
Table 3.7. Temperature and time applied in infrared oven for each food matrix
3.2.4. Electric barbeque grill
Beef burgers were cooked with an electric barbeque grill (PG 2791, 2500 W, SEVERIN
Elektrogeräte GmbH, Sundern, Germany). Burgers were cooked during 5 min and 25 s
per side, at maximum power, with grill surface at 125⁰C. This cooking treatment will be
named from now as BBQ Grill
Food matrix Temperature Time Beef burger 175°C 15 min 30 s Vegetarian patty 175°C 16 min 30 s Pizza dough (Finissima) 220°C 3 min 30 s Pizza dough (Tradizionale) 220°C 6 min Mashed potatoes bites 180°C 5 min 30 s
Fig 3.19. Beef burgers cooking process with Infrared oven treatment
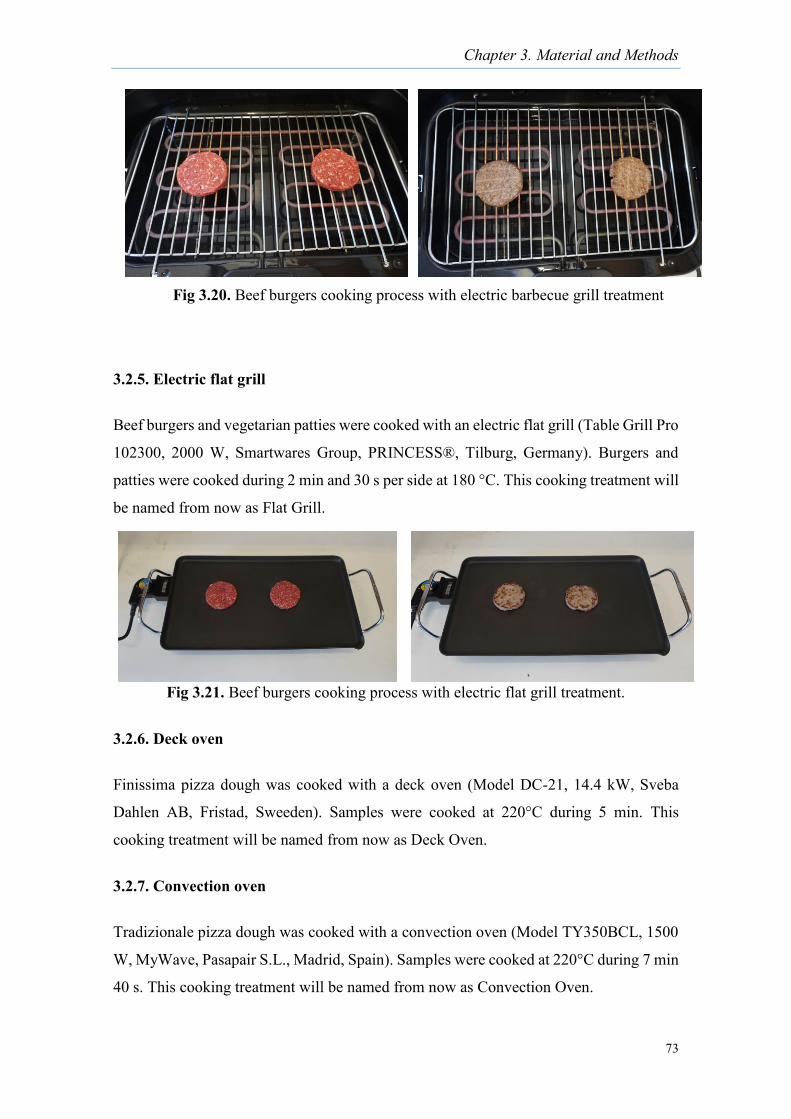
Chapter 3. Material and Methods
73
3.2.5. Electric flat grill
Beef burgers and vegetarian patties were cooked with an electric flat grill (Table Grill Pro
102300, 2000 W, Smartwares Group, PRINCESS®, Tilburg, Germany). Burgers and
patties were cooked during 2 min and 30 s per side at 180 °C. This cooking treatment will
be named from now as Flat Grill.
Fig 3.21. Beef burgers cooking process with electric flat grill treatment.
3.2.6. Deck oven
Finissima pizza dough was cooked with a deck oven (Model DC-21, 14.4 kW, Sveba
Dahlen AB, Fristad, Sweeden). Samples were cooked at 220°C during 5 min. This
cooking treatment will be named from now as Deck Oven.
3.2.7. Convection oven
Tradizionale pizza dough was cooked with a convection oven (Model TY350BCL, 1500
W, MyWave, Pasapair S.L., Madrid, Spain). Samples were cooked at 220°C during 7 min
40 s. This cooking treatment will be named from now as Convection Oven.
Fig 3.20. Beef burgers cooking process with electric barbecue grill treatment
Chapter 3. Material and Methods
74
3.2.8. Traditional method
To prepare mashed potatoes bites, liquid ingredients were heated up to 100⁰C and mixed
with dry ingredients. This cooking treatment will be named from now as Traditional
Method.
3.3. Parameters measured
3.3.1. Cooking loss (%)
The weight of beef burgers, vegetarian patties, pizza dough and mashed potatoes bites
was measured at 20±2°C before and after cooking to calculate cooking loss using the
formula: Cooking Loss (%) = (weight before cooking- weight after cooking) x 100 /
weight before cooking.
3.3.2. Moisture and proximate analyses
Moisture and proximate analyses of protein, fat and ash content were performed for beef
burgers, vegetarian patties, pizza dough and mashed potatoes bites following the official
methodology described by the Association of Official Analytical Chemists (AOAC
International, 2005).
3.3.3. Water activity
Water activity of beef burgers, vegetarian patties, pizza dough and mashed potatoes bites
were measured with a dew point hygrometer (Aqualab® model S3/TE, Decagon Devices,
Inc., Washington, USA) at 25°C.
3.3.4. Texture analysis
Texture analyses were carried out using a TA-TX2 texture analyzer (Stable Micro
Systems, Surrey, UK) equipped with a 30-kg load cell.
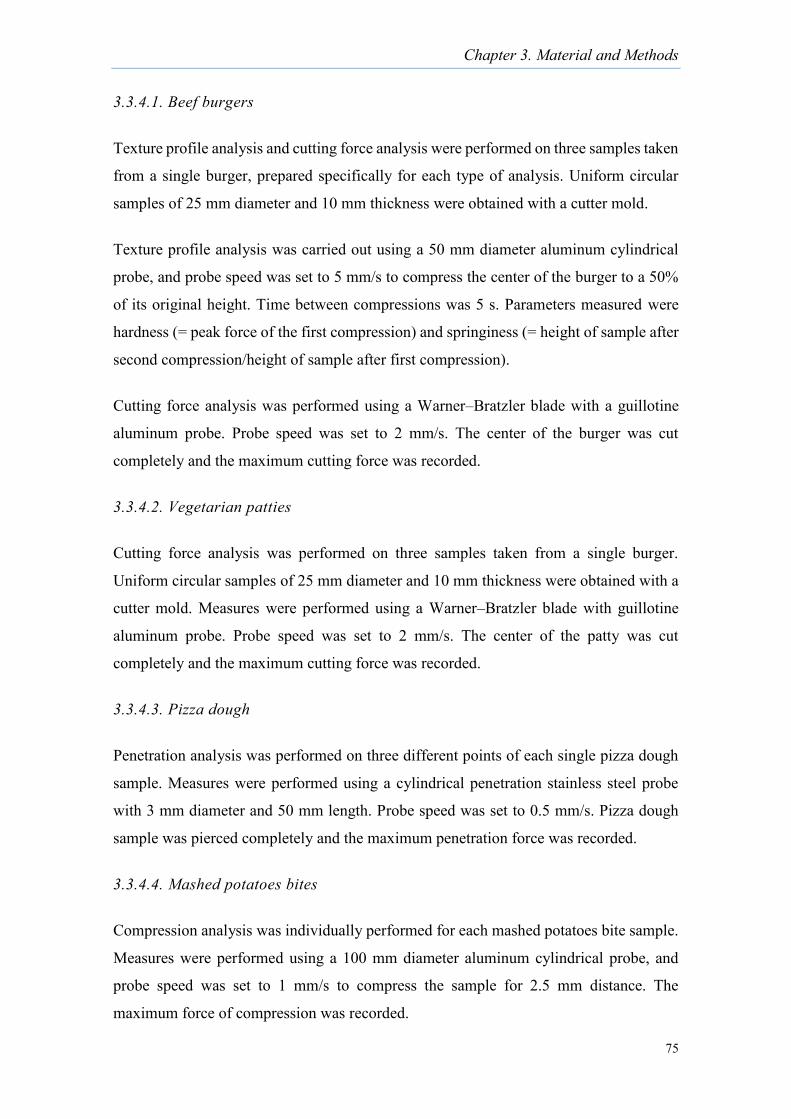
Chapter 3. Material and Methods
75
3.3.4.1. Beef burgers
Texture profile analysis and cutting force analysis were performed on three samples taken
from a single burger, prepared specifically for each type of analysis. Uniform circular
samples of 25 mm diameter and 10 mm thickness were obtained with a cutter mold.
Texture profile analysis was carried out using a 50 mm diameter aluminum cylindrical
probe, and probe speed was set to 5 mm/s to compress the center of the burger to a 50%
of its original height. Time between compressions was 5 s. Parameters measured were
hardness (= peak force of the first compression) and springiness (= height of sample after
second compression/height of sample after first compression).
Cutting force analysis was performed using a Warner–Bratzler blade with a guillotine
aluminum probe. Probe speed was set to 2 mm/s. The center of the burger was cut
completely and the maximum cutting force was recorded.
3.3.4.2. Vegetarian patties
Cutting force analysis was performed on three samples taken from a single burger.
Uniform circular samples of 25 mm diameter and 10 mm thickness were obtained with a
cutter mold. Measures were performed using a Warner–Bratzler blade with guillotine
aluminum probe. Probe speed was set to 2 mm/s. The center of the patty was cut
completely and the maximum cutting force was recorded.
3.3.4.3. Pizza dough
Penetration analysis was performed on three different points of each single pizza dough
sample. Measures were performed using a cylindrical penetration stainless steel probe
with 3 mm diameter and 50 mm length. Probe speed was set to 0.5 mm/s. Pizza dough
sample was pierced completely and the maximum penetration force was recorded.
3.3.4.4. Mashed potatoes bites
Compression analysis was individually performed for each mashed potatoes bite sample.
Measures were performed using a 100 mm diameter aluminum cylindrical probe, and
probe speed was set to 1 mm/s to compress the sample for 2.5 mm distance. The
maximum force of compression was recorded.

Chapter 3. Material and Methods
76
3.3.5. Differential scanning calorimetry
Thermograms were obtained by differential scanning calorimetry (DSC) using a Mettler–
Toledo calorimeter (model 821, Massachusetts, EUA). Samples of 10–15 mg were
weighed to an accuracy of 0.1 mg on a 40 µL aluminium pan. Beef burgers were scanned
at a heating rate of 1°C/min from 25 to 95°C and pizza dough samples were scanned at
a heating rate of 5°C/min from -50 to 150°C. The reference pan contained 30 mg of
aluminium oxide (Al2O3) (Aldrich-Chemical Co, Gillinham-Dorset, UK) to approximate
the heat capacity of the sample. From the curve obtained, the onset temperature (To) and
conclusion temperature (Tc) were used to calculate peak areas ∆H (J/g) using the software
provided by the manufacturer.
3.3.6. Color analysis
External and internal color of beef burgers, vegetarian patties, pizza dough and mashed
potatoes bites were measured with a Hunter Lab colorimeter miniScan XTE (Hunter
Associates Laboratory INC, Reston, Virginia, USA). First, external color of food samples
was measured and, then, each burger was horizontally cut by half to analyze internal
color. Three measures were taken on different zones of both external and internal surfaces
of two burgers. CIE L*, a* and b* values were measured with an illuminant of D65 and
a standard observer of 10°. L* represents the lightness, with values from 0 (black) to 100
(white), which indicates a perfect reflecting difuser. Chromatic components are
represented by a* and b* axes. Positive values of a* are red and negatives values are
green, where positive values of b* are yellow and negative values are blue. ΔE* (total
color difference) was calculated using the formula ΔE* = √((ΔL*)2 + (Δa*)2 + (Δb*)2).
3.3.7. Polycyclic aromatic hydrocarbons (PAHs) analysis
Polycyclic aromatic hydrocarbons (PAHs) analyses were carried out for beef burgers and
Tradizionale pizza dough samples in the second experimental study. PAHs analyses were
performed by the Laboratory of Public Health Agency of Barcelona (ASPB). Raw and
cooked samples were grinded and homogenized, and extraction procedure was achieved
with methylene dichloride (DCM) using an accelerated solvent extraction equipment
(ASE) at 85°C and 1500 psi. Extract was purified by a preparative liquid chromatography
system (GPC) using a gel filtration column, which allowed a molecular weight separation,
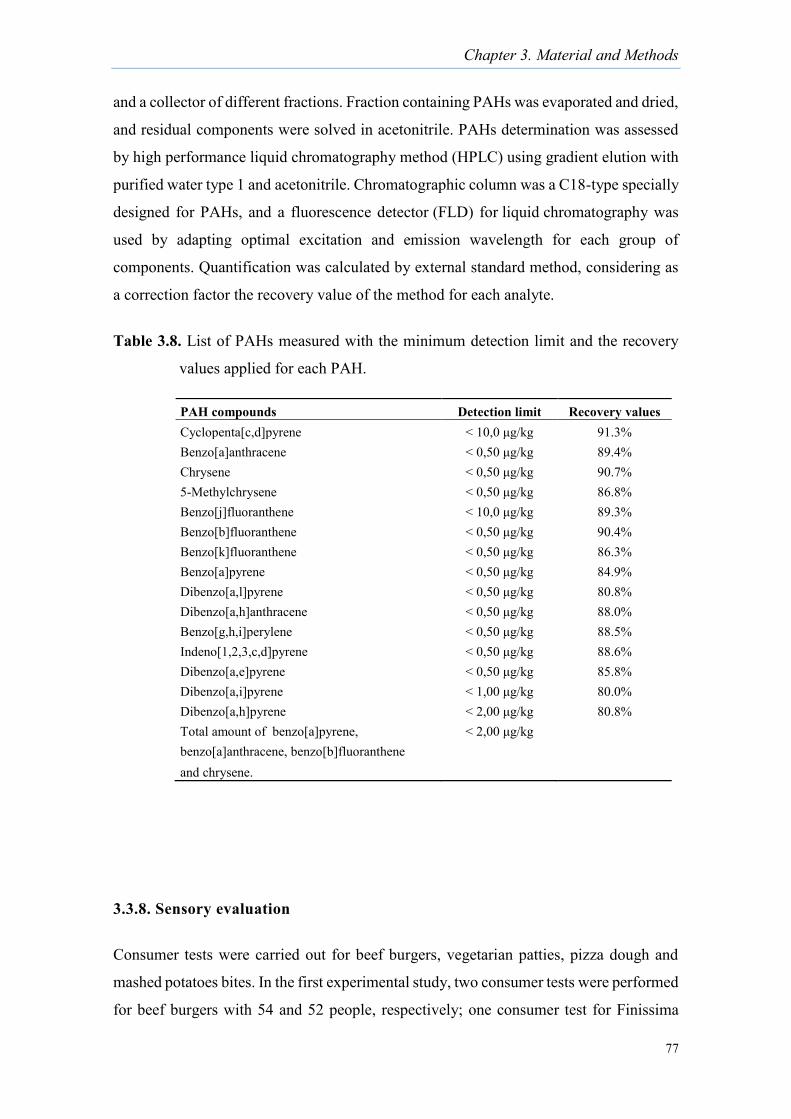
Chapter 3. Material and Methods
77
and a collector of different fractions. Fraction containing PAHs was evaporated and dried,
and residual components were solved in acetonitrile. PAHs determination was assessed
by high performance liquid chromatography method (HPLC) using gradient elution with
purified water type 1 and acetonitrile. Chromatographic column was a C18-type specially
designed for PAHs, and a fluorescence detector (FLD) for liquid chromatography was
used by adapting optimal excitation and emission wavelength for each group of
components. Quantification was calculated by external standard method, considering as
a correction factor the recovery value of the method for each analyte.
Table 3.8. List of PAHs measured with the minimum detection limit and the recovery
values applied for each PAH.
3.3.8. Sensory evaluation
Consumer tests were carried out for beef burgers, vegetarian patties, pizza dough and
mashed potatoes bites. In the first experimental study, two consumer tests were performed
for beef burgers with 54 and 52 people, respectively; one consumer test for Finissima
PAH compounds Detection limit Recovery values Cyclopenta[c,d]pyrene < 10,0 μg/kg 91.3% Benzo[a]anthracene < 0,50 μg/kg 89.4% Chrysene < 0,50 μg/kg 90.7% 5-Methylchrysene < 0,50 μg/kg 86.8% Benzo[j]fluoranthene < 10,0 μg/kg 89.3% Benzo[b]fluoranthene < 0,50 μg/kg 90.4% Benzo[k]fluoranthene < 0,50 μg/kg 86.3% Benzo[a]pyrene < 0,50 μg/kg 84.9% Dibenzo[a,l]pyrene < 0,50 μg/kg 80.8% Dibenzo[a,h]anthracene < 0,50 μg/kg 88.0% Benzo[g,h,i]perylene < 0,50 μg/kg 88.5% Indeno[1,2,3,c,d]pyrene < 0,50 μg/kg 88.6% Dibenzo[a,e]pyrene < 0,50 μg/kg 85.8% Dibenzo[a,i]pyrene < 1,00 μg/kg 80.0% Dibenzo[a,h]pyrene < 2,00 μg/kg 80.8% Total amount of benzo[a]pyrene, < 2,00 μg/kg benzo[a]anthracene, benzo[b]fluoranthene and chrysene.
Chapter 3. Material and Methods
78
pizza dough with 51 people; and one consumer test for mashed potatoes bites with 50
people. In the second experimental study, one consumer test was carried out with each
kind of food: beef burgers, vegetarian patties and Tradizionale pizza dough, with 50
people each. People who participated in sensory tests were regular consumers of the food
products evaluated.
Immediately after cooking beef burgers, vegetarian patties and pizza dough Tradizionale,
samples were cut by half and placed in codified dishes using three digits randomly.
Finissima pizza dough and mashed potatoes bites were placed entirely and individually
in codified dishes. One whole sample of each food type from each cooking method was
shown to testers to evaluate the general appearance. Consumers evaluated different
sample attributes, described in the working plan, using intensity and acceptability scales
of seven points. A preference test between samples was also performed following the
method described by Kramer et al. (1974). Consumers were asked to rank the samples in
order of preference. To obtain the ranking of each sample, each rank position was
multiplied by the number of consumers that had selected it, and the sum of the rankings
of each sample was calculated. Low values in rank sum of samples indicated that the
sample had mainly been ranked in first order of preference.
3.3.9. Microbiological analysis
3.3.9.1. Analysis of non-inoculated samples
Aerobic mesophilic bacteria and lactose-positive Enterobacteriaceae (coliforms) were
analized in beef burgers and vegetarian patties.
Aerobic mesophilic bacteria were counted on Tryptone Soya agar (TSA) (Oxoid Ltd.,
Basingstoke, UK). Lactose-positive Enterobacteriaceae were counted on Violet Red Bile
agar (VRBA) (Oxoid), and on Brilliant Green Bile Lactose broth (BGBL) (Oxoid) by the
three-tube most probable number (MPN) method. Raw and cooked samples (25 g) were
immediately transferred to a sterile plastic stomacher bag with lateral filter (bbag-03
blender bag, Corning® GosselinTM, Corning, New York, USA) with 225 mL of buffered
peptone water (BPW) (Oxoid) and homogenized in a Stomacher® 400 Circulator (Seward
Ltd., Worthing, UK) for 1 min. Serial decimal dilutions were prepared and 0.1 mL of each
dilution was spread in TSA using a spiral plater instrument (Eddy Jet; IUL Instruments,
Chapter 3. Material and Methods
79
Barcelona) (samples with detection limit < 2 log CFU/g) or 1 mL was pour plated on TSA
and VRBA (samples with detection limit < 1 log CFU/g). TSA plates were incubated for
48 h at 31°C, and VRBA plates were incubated for 24 h at 31°C.
To enumerate total coliforms by MPN method, 1ml from 1:10, 1:100 and 1:1000 dilutions
was inoculated into three sets of tubes containing 10 ml of BGBL broth and inverted
Durham tubes. The tubes were incubated for 48 h at 31°C. BGBL broth tubes were
examined for gas production or effervescence when tubes were gently agitated. MPN of
coliforms was calculated from the proportion of tubes with gas production.
3.3.9.2 Inoculated samples
As described in the Working Plan, in the first and second experimental studies, beef
burgers and vegetarian patties were inoculated with Salmonella Typhimurium and
Salmonella Senftenberg at ~7 log CFU/g and ~3 log CFU/g. In the second study, beef
burgers were also inoculated with Escherichia coli O157:H7 at both concentration levels.
3.3.9.2.1. Bacterial strains and preparation of bacterial cultures
Salmonella Typhimurium (Salmonella enterica subsp. enterica serovar Typhimurium,
CECT 4594, Valencia, Spain), Salmonella Senftenberg (Salmonella enterica subsp.
enterica serovar Senftenberg, CECT 4565), and Escherichia coli serotype O157:H7 non-
verotoxin-producing (CECT 5947) were used in this study. Bacterial strains were grown
overnight at 37°C in 25 mL of tryptone soya broth (TSB) (Oxoid) to obtain a suspension
of optical density (OD600) 1. The OD 1 bacterial suspension contained ~9 log CFU/mL.
3.3.9.2.2. Inoculation
Inoculated beef burgers and vegetarian patties were prepared with two contamination
levels (~3 log CFU/g and ~7 log CFU/g) for each bacterial strain. Ten mL of ~9 log
CFU/mL bacterial suspension were added to 500 g of raw sample preparation and
thoroughly mixed to obtain ~7 log CFU/g. Bacterial suspension was diluted to obtain a
~5 log CFU/mL suspension that was added to 500 g of raw sample preparation and
Chapter 3. Material and Methods
80
thoroughly mixed to obtain ~3 log CFU/g. Inoculated beef burgers and vegetarian patties
(50 g) were prepared and stored at 4°C. All inoculated samples were cooked and analyzed
the same day of preparation.
Previous to inoculation, non-inoculated raw beef burgers and vegetarian patties were
prepared to verify the absence of endogenous Salmonella spp., or E. coli 0157 in meat.
3.3.9.2.3. Microbiological analysis of Salmonella Typhimurium, Salmonella
Senftenberg and E. coli 0157:H7.
Samples (10 g of beef burger; 25 g of vegetarian patty) were transferred to a sterile
stomacher bag with 90 mL of BPW and homogenized in a stomacher (Seward) for 1 min.
Serial decimal dilutions were prepared and spread in Xylose Lysine Deoxycholate agar
(XLD) (Oxoid) plates for Salmonella, or in Cefixime Tellurite-Sorbitol MacConkey agar
(CT-SMAC) (Oxoid) plates for E. coli 0157:H7, using an spiral plater instrument. After
incubation for 24 h at 37 °C, Salmonella or E. coli O157:H7 colonies were counted. At
least five colonies were picked from XLD or CT-SMAC plates and checked using
immuno-agglutination latex tests (Salmonella Test Kit and E. coli O157 Latex Test;
Oxoid).
3.3.9.2.4. Survival of Salmonella Typhimurium, Salmonella Senftenberg and E. coli
0157:H7 following cooking treatment.
Samples without presence of Salmonella colonies in XLD plates were pre-enriched
adding 90 ml of BPW and incubated for 24 h at 37°C. Pre-enriched samples were
inoculated in two selective enrichment media: 1 mL into 10 mL of Müller-
Kauffmann Tetrathionate Novobiocine broth (MKTTn) (bioMérieux®, Marcy l’Etoile,
France) and 0.1 mL into 10 ml of Rappaport-Vassiliadis Soya broth (RVS-T)
(bioMérieux®). Inoculated MKTTn broth was incubated for 24 h at 37°C, and inoculated
RVS-T broth was incubated for 24 h at 41.5°C. Both inoculated broths of each sample
were spread in XLD agar and in chromogenic medium for selective isolation and
identification of Salmonella (CHROMID® Salmonella ELITE, bioMérieux®), using a
spiral plater instrument. After incubation for 24 h at 37 °C, at least five colonies from
both XLD and chromogenic medium plates were checked using the i±uno-agglutination
latex test Salmonella Test Kit (Oxoid).
Chapter 3. Material and Methods
81
Samples without presence of E. coli O157:H7 colonies in CT-SMAC plates were enriched
with 90 mL of BPW, and incubated for 24 h at 37°C. Samples were spread in CT-SMAC
agar and in chromogenic medium for selective isolation and identification of E. coli
O157:H7 (CHROMID® E.coli O157:H7, bioMérieux®) using a spiral plater instrument.
After incubation for 24 h at 37 °C, at least five colonies were picked from the CT-SMAC
and chromogenic medium plates and checked using the immuno-agglutination latex test
E. coli O157 Latex Test (Oxoid).
3.3.10. Experimental design and statistical analysis
For each food matrix, three independent experiments were conducted to evaluate the
effect of cooking methods on microbiological characteristics and three more independent
experiments to evaluate the cooking effect on physico-chemical characteristics.
For microbiological analyses, in each experiment, two food units of each product for each
cooking method were prepared and analyzed (n=6).
For physico-chemical analyses, a variable number of food units, depending on the type
of product, were prepared in order to have enough sample amount to carry out the
different analyses: burgers, 6 units; patties, 4 units; pizzas, 4 units; bites, 8 units.
For cooking loss, water activity, moisture and proximate composition analyses, two units
per experiment were used, and one sample per unit was analyzed (n=6). For differential
scanning calorimetry, two units per experiment were used, and two samples per unit were
analyzed (n=12). For TPA, cutting and penetration texture analyses, two units per
experiment were used, and three samples per unit were analyzed (n=18). For compression
analysis, six units per experiment were used, and one sample per unit was analyzed
(n=18).
For color analyses, number of measures varied depending on the type of product. For
internal color of burgers and patties, two units per experiment were used, and six samples
per unit were analyzed (n=36). The same number of measures were taken for external
color (n=36). For external color of pizzas, each cooking side was analyzed separately,
two units per experiment were used, and three samples per unit and per side were analyzed
(n=18). For external color of bites, six units per experiment were used, and one sample
per unit was analyzed (n=18).
Chapter 3. Material and Methods
82
For PAHs analyses, three units from a single experiment were analyzed (n=3).
For consumer tests, specific experiments to elaborate enough samples for sensory
analyses were performed (n≥50).
Results were analyzed by analysis of variance (ANOVA) using Statgraphics® (model
CenturionTM XVII.II, Statpoint Technologies, Inc., Warrenton, Virginia, USA). Tukey
test was used for comparison of sample means. Evaluations were based on a significance
level of p<0.05.
3.4. Numerical Model
In this section, the features of the computational fluid dynamics (CFD) model employed
to simulate the cooking process of beef burgers and vegetal patties by means of the ray
tracing method are explained in detail. First, the experimental measure of the internal
temperatures and cooking loss in food samples employed to validate the numerical model
is explained. Then, the physical equations that regulate the heat transfer procedure are
introduced. The boundary conditions are also detailed, defining the energy input from the
laser beam and the dispersive conditions. Finally, some details on the discretization
process needed to carry out finite-volume heat transfer simulations are given.
Chapter 3. Material and Methods
83
3.4.1. Evolution of the internal temperature and cooking loss in food samples
cooked with the CO2 IR Laser Foodini system
Evolution of cooking loss and internal temperatures were measured in beef burgers and
vegetarian patties. Two internal temperatures were measured using a penetration probe-
type thermocouple (0900 0530, Instrumentos Testo S.A.): temperature at the geometrical
centre of sample (defined as Central Temperature), and temperature at 6±1 mm of
penetration depth from central lateral side (defined as Lateral Temperature). Evolution
of cooking loss and temperatures was measured each minute during 18 min (9 min per
side). One new raw sample was prepared and cooked to measure the temperature at each
time point.
Three independent experiments were conducted. Two units per experiment and time point
were used, and one sample per unit was analyzed (n=6).
3.4.2. Governing equation for food cooking processes
The numerical simulation of the meat cooking process was approached in this work by
resolving the heat conduction equation in a domain that represents the burger shape. The
following equation was solved:
𝜌𝑐𝑝𝜕𝑇
𝜕𝑡= 𝛻 ∙ (𝑘𝛻𝑇)
where the left side term is the accumulated heat, while the right hand term represents the
conductive term. The various magnitudes are listed here:
t time [s]
T temperature [K]
ρ density [kg/m3]
cp specific heat [J/kgK]
k thermal conductivity [W/mK]
This equation models the heat transfer flux for non-boundary volumes. The physical
properties were calculated taking into account food components: water, protein, fat,
carbohydrates and ashes. In the case of beef meat, only water, protein, fat and ashes were
[1]
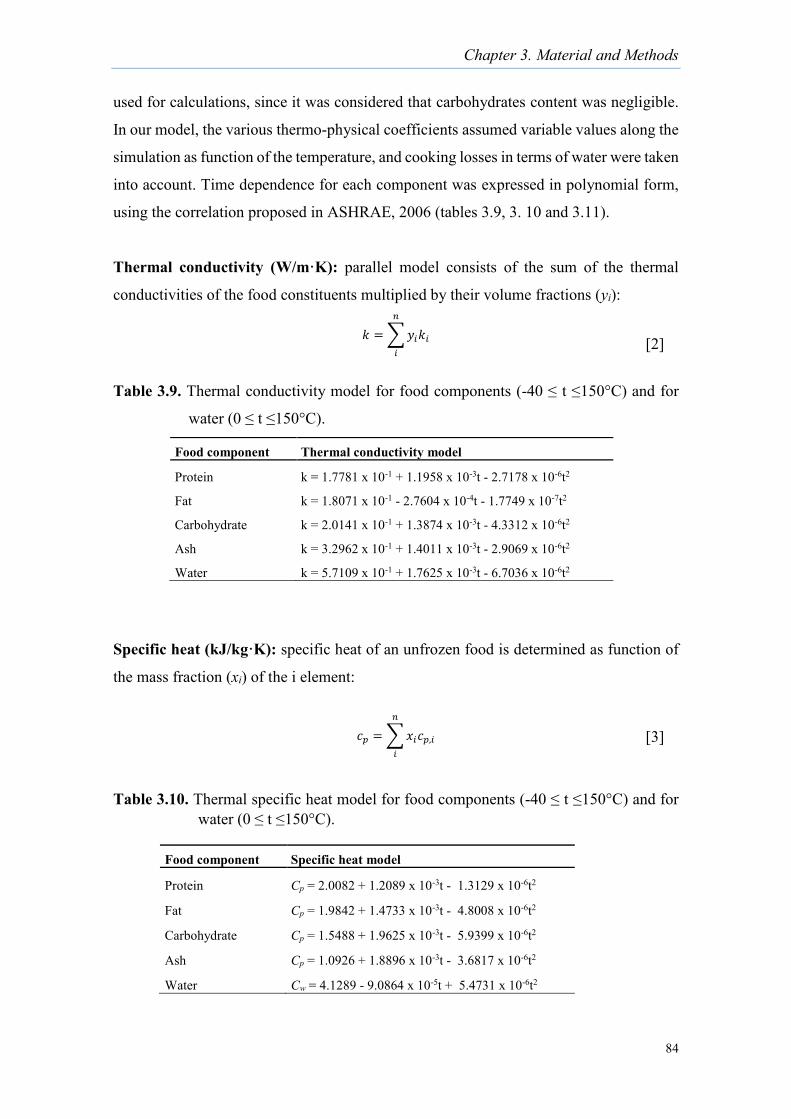
Chapter 3. Material and Methods
84
used for calculations, since it was considered that carbohydrates content was negligible.
In our model, the various thermo-physical coefficients assumed variable values along the
simulation as function of the temperature, and cooking losses in terms of water were taken
into account. Time dependence for each component was expressed in polynomial form,
using the correlation proposed in ASHRAE, 2006 (tables 3.9, 3. 10 and 3.11).
Thermal conductivity (W/m·K): parallel model consists of the sum of the thermal
conductivities of the food constituents multiplied by their volume fractions (yi):
𝑘 =∑𝑦𝑖𝑘𝑖
𝑛
𝑖
Table 3.9. Thermal conductivity model for food components (-40 ≤ t ≤150°C) and for
water (0 ≤ t ≤150°C).
Specific heat (kJ/kg·K): specific heat of an unfrozen food is determined as function of
the mass fraction (xi) of the i element:
𝑐𝑝 = ∑𝑥𝑖𝑐𝑝,𝑖
𝑛
𝑖
Table 3.10. Thermal specific heat model for food components (-40 ≤ t ≤150°C) and for water (0 ≤ t ≤150°C).
Food component Thermal conductivity model
Protein k = 1.7781 x 10⁻¹ + 1.1958 x 10⁻³t - 2.7178 x 10⁻⁶t2
Fat k = 1.8071 x 10⁻¹ - 2.7604 x 10⁻⁴t - 1.7749 x 10⁻⁷t2
Carbohydrate k = 2.0141 x 10⁻¹ + 1.3874 x 10⁻³t - 4.3312 x 10⁻⁶t2
Ash k = 3.2962 x 10⁻¹ + 1.4011 x 10⁻³t - 2.9069 x 10⁻⁶t2
Water k = 5.7109 x 10⁻¹ + 1.7625 x 10⁻³t - 6.7036 x 10⁻⁶t2
Food component Specific heat model
Protein Cp = 2.0082 + 1.2089 x 10⁻³t - 1.3129 x 10⁻⁶t2
Fat Cp = 1.9842 + 1.4733 x 10⁻³t - 4.8008 x 10⁻⁶t2
Carbohydrate Cp = 1.5488 + 1.9625 x 10⁻³t - 5.9399 x 10⁻⁶t2
Ash Cp = 1.0926 + 1.8896 x 10⁻³t - 3.6817 x 10⁻⁶t2
Water Cw = 4.1289 - 9.0864 x 10⁻⁵t + 5.4731 x 10⁻⁶t2
[2]
[3]
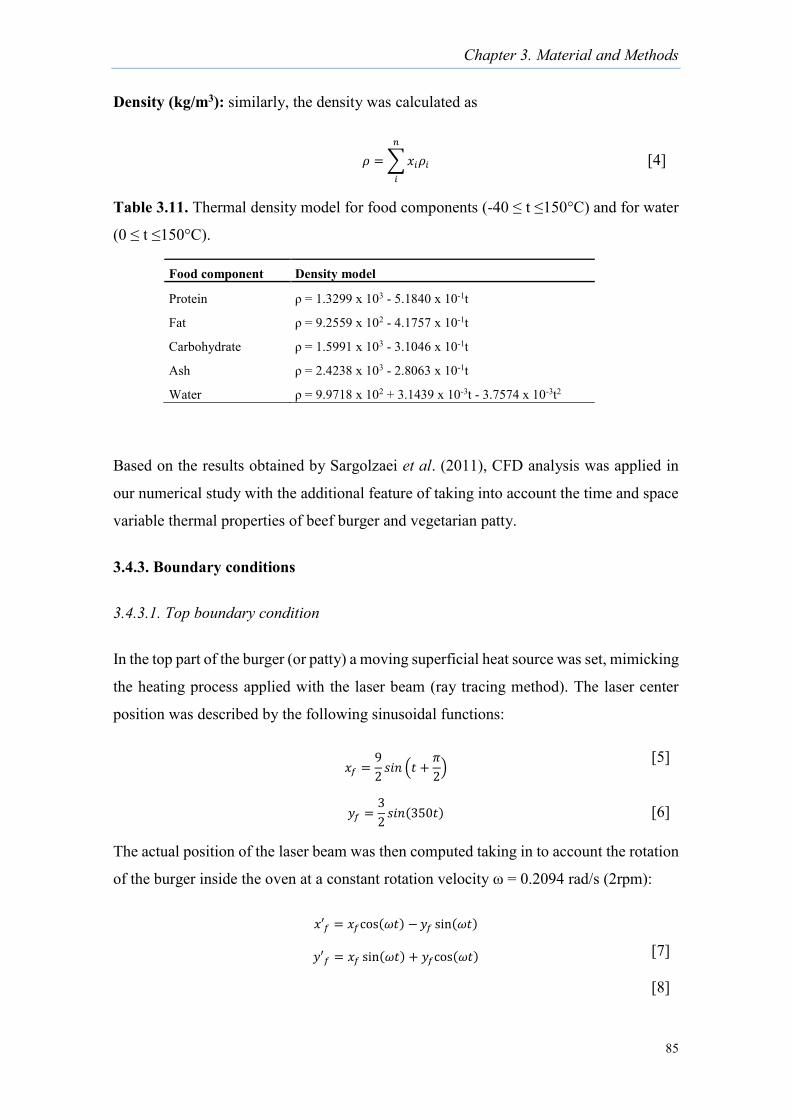
Chapter 3. Material and Methods
85
Density (kg/m3): similarly, the density was calculated as
𝜌 =∑𝑥𝑖𝜌𝑖
𝑛
𝑖
Table 3.11. Thermal density model for food components (-40 ≤ t ≤150°C) and for water
(0 ≤ t ≤150°C).
Based on the results obtained by Sargolzaei et al. (2011), CFD analysis was applied in
our numerical study with the additional feature of taking into account the time and space
variable thermal properties of beef burger and vegetarian patty.
3.4.3. Boundary conditions
3.4.3.1. Top boundary condition
In the top part of the burger (or patty) a moving superficial heat source was set, mimicking
the heating process applied with the laser beam (ray tracing method). The laser center
position was described by the following sinusoidal functions:
𝑥𝑓 =9
2𝑠𝑖𝑛 (𝑡 +
𝜋
2)
𝑦𝑓 =3
2𝑠𝑖𝑛(350𝑡)
The actual position of the laser beam was then computed taking in to account the rotation
of the burger inside the oven at a constant rotation velocity ω = 0.2094 rad/s (2rpm):
𝑥′𝑓 = 𝑥𝑓cos(𝜔𝑡) −𝑦𝑓 sin(𝜔𝑡)
𝑦′𝑓 = 𝑥𝑓 sin(𝜔𝑡) + 𝑦𝑓cos(𝜔𝑡)
Food component Density model
Protein ρ = 1.3299 x 10³ - 5.1840 x 10⁻¹t
Fat ρ = 9.2559 x 10² - 4.1757 x 10⁻¹t
Carbohydrate ρ = 1.5991 x 10³ - 3.1046 x 10⁻¹t
Ash ρ = 2.4238 x 10³ - 2.8063 x 10⁻¹t
Water ρ = 9.9718 x 10² + 3.1439 x 10⁻³t - 3.7574 x 10⁻³t2
[4]
[5] [6]
[7] [8]
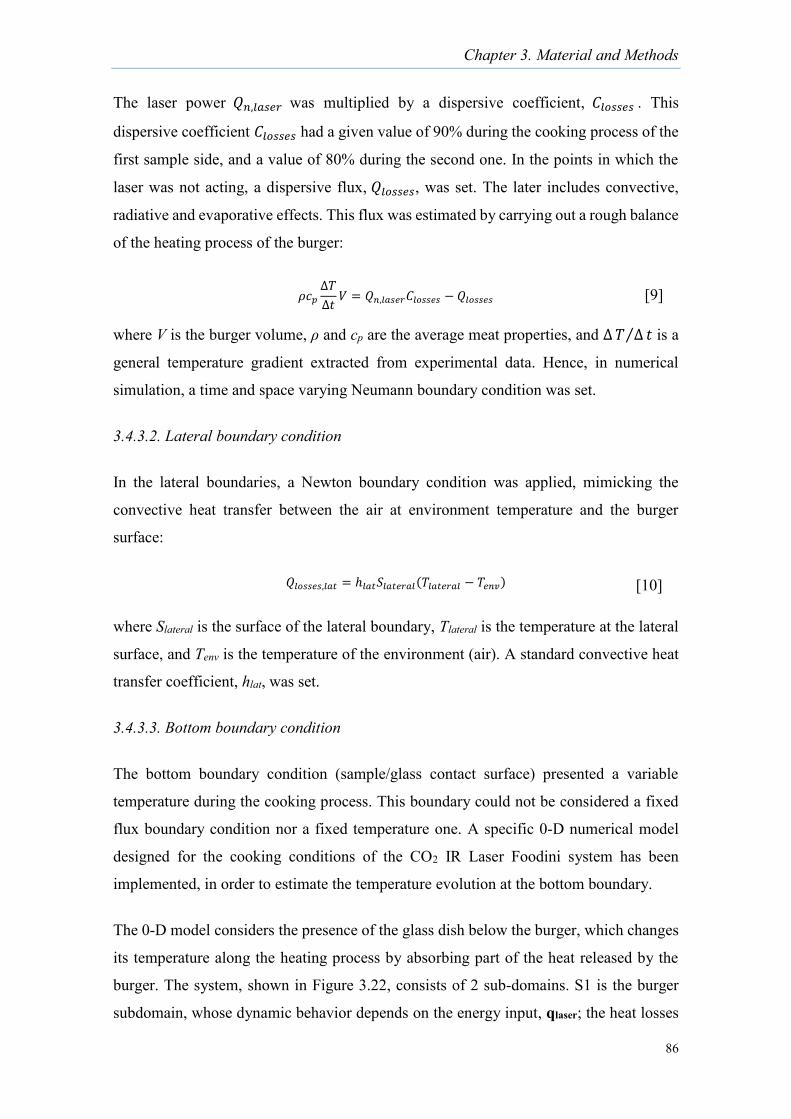
Chapter 3. Material and Methods
86
The laser power 𝑄𝑛,𝑙𝑎𝑠𝑒𝑟 was multiplied by a dispersive coefficient, 𝐶𝑙𝑜𝑠𝑠𝑒𝑠 . This
dispersive coefficient 𝐶𝑙𝑜𝑠𝑠𝑒𝑠 had a given value of 90% during the cooking process of the
first sample side, and a value of 80% during the second one. In the points in which the
laser was not acting, a dispersive flux, 𝑄𝑙𝑜𝑠𝑠𝑒𝑠, was set. The later includes convective,
radiative and evaporative effects. This flux was estimated by carrying out a rough balance
of the heating process of the burger:
𝜌𝑐𝑝∆𝑇
∆𝑡𝑉 = 𝑄𝑛,𝑙𝑎𝑠𝑒𝑟𝐶𝑙𝑜𝑠𝑠𝑒𝑠 − 𝑄𝑙𝑜𝑠𝑠𝑒𝑠
where V is the burger volume, ρ and cp are the average meat properties, and ∆𝑇 ∆⁄ 𝑡 is a
general temperature gradient extracted from experimental data. Hence, in numerical
simulation, a time and space varying Neumann boundary condition was set.
3.4.3.2. Lateral boundary condition
In the lateral boundaries, a Newton boundary condition was applied, mimicking the
convective heat transfer between the air at environment temperature and the burger
surface:
𝑄𝑙𝑜𝑠𝑠𝑒𝑠,𝑙𝑎𝑡 = ℎ𝑙𝑎𝑡𝑆𝑙𝑎𝑡𝑒𝑟𝑎𝑙(𝑇𝑙𝑎𝑡𝑒𝑟𝑎𝑙 − 𝑇𝑒𝑛𝑣)
where Slateral is the surface of the lateral boundary, Tlateral is the temperature at the lateral
surface, and Tenv is the temperature of the environment (air). A standard convective heat
transfer coefficient, hlat, was set.
3.4.3.3. Bottom boundary condition
The bottom boundary condition (sample/glass contact surface) presented a variable
temperature during the cooking process. This boundary could not be considered a fixed
flux boundary condition nor a fixed temperature one. A specific 0-D numerical model
designed for the cooking conditions of the CO2 IR Laser Foodini system has been
implemented, in order to estimate the temperature evolution at the bottom boundary.
The 0-D model considers the presence of the glass dish below the burger, which changes
its temperature along the heating process by absorbing part of the heat released by the
burger. The system, shown in Figure 3.22, consists of 2 sub-domains. S1 is the burger
subdomain, whose dynamic behavior depends on the energy input, qlaser; the heat losses
[9]
[10]
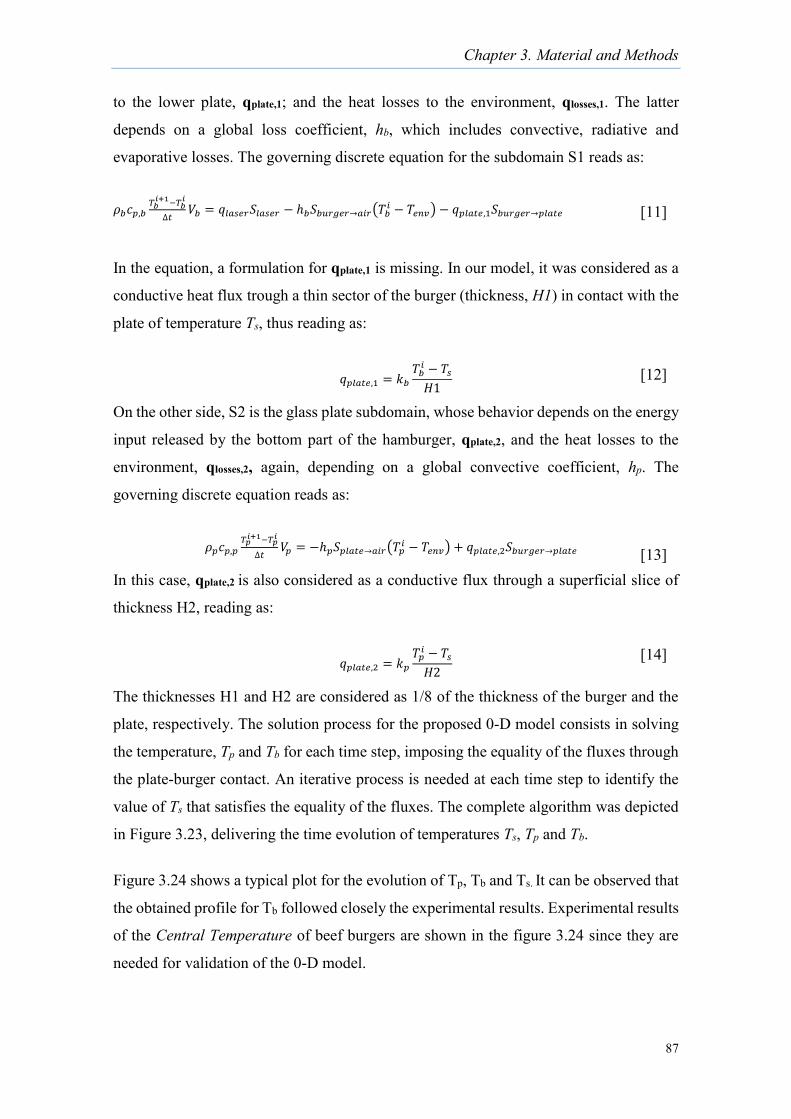
Chapter 3. Material and Methods
87
to the lower plate, qplate,1; and the heat losses to the environment, qlosses,1. The latter
depends on a global loss coefficient, hb, which includes convective, radiative and
evaporative losses. The governing discrete equation for the subdomain S1 reads as:
𝜌𝑏𝑐𝑝,𝑏𝑇𝑏𝑖+1−𝑇𝑏
𝑖
∆𝑡𝑉𝑏 = 𝑞𝑙𝑎𝑠𝑒𝑟𝑆𝑙𝑎𝑠𝑒𝑟 − ℎ𝑏𝑆𝑏𝑢𝑟𝑔𝑒𝑟→𝑎𝑖𝑟(𝑇𝑏
𝑖 − 𝑇𝑒𝑛𝑣) − 𝑞𝑝𝑙𝑎𝑡𝑒,1𝑆𝑏𝑢𝑟𝑔𝑒𝑟→𝑝𝑙𝑎𝑡𝑒
In the equation, a formulation for qplate,1 is missing. In our model, it was considered as a
conductive heat flux trough a thin sector of the burger (thickness, H1) in contact with the
plate of temperature Ts, thus reading as:
𝑞𝑝𝑙𝑎𝑡𝑒,1 = 𝑘𝑏𝑇𝑏𝑖 − 𝑇𝑠𝐻1
On the other side, S2 is the glass plate subdomain, whose behavior depends on the energy
input released by the bottom part of the hamburger, qplate,2, and the heat losses to the
environment, qlosses,2, again, depending on a global convective coefficient, hp. The
governing discrete equation reads as:
𝜌𝑝𝑐𝑝,𝑝𝑇𝑝𝑖+1−𝑇𝑝
𝑖
∆𝑡𝑉𝑝 = −ℎ𝑝𝑆𝑝𝑙𝑎𝑡𝑒→𝑎𝑖𝑟(𝑇𝑝
𝑖 − 𝑇𝑒𝑛𝑣) + 𝑞𝑝𝑙𝑎𝑡𝑒,2𝑆𝑏𝑢𝑟𝑔𝑒𝑟→𝑝𝑙𝑎𝑡𝑒
In this case, qplate,2 is also considered as a conductive flux through a superficial slice of
thickness H2, reading as:
𝑞𝑝𝑙𝑎𝑡𝑒,2 = 𝑘𝑝𝑇𝑝𝑖 − 𝑇𝑠
𝐻2
The thicknesses H1 and H2 are considered as 1/8 of the thickness of the burger and the
plate, respectively. The solution process for the proposed 0-D model consists in solving
the temperature, Tp and Tb for each time step, imposing the equality of the fluxes through
the plate-burger contact. An iterative process is needed at each time step to identify the
value of Ts that satisfies the equality of the fluxes. The complete algorithm was depicted
in Figure 3.23, delivering the time evolution of temperatures Ts, Tp and Tb.
Figure 3.24 shows a typical plot for the evolution of Tp, Tb and Ts. It can be observed that
the obtained profile for Tb followed closely the experimental results. Experimental results
of the Central Temperature of beef burgers are shown in the figure 3.24 since they are
needed for validation of the 0-D model.
[12]
[13]
[14]
[11]
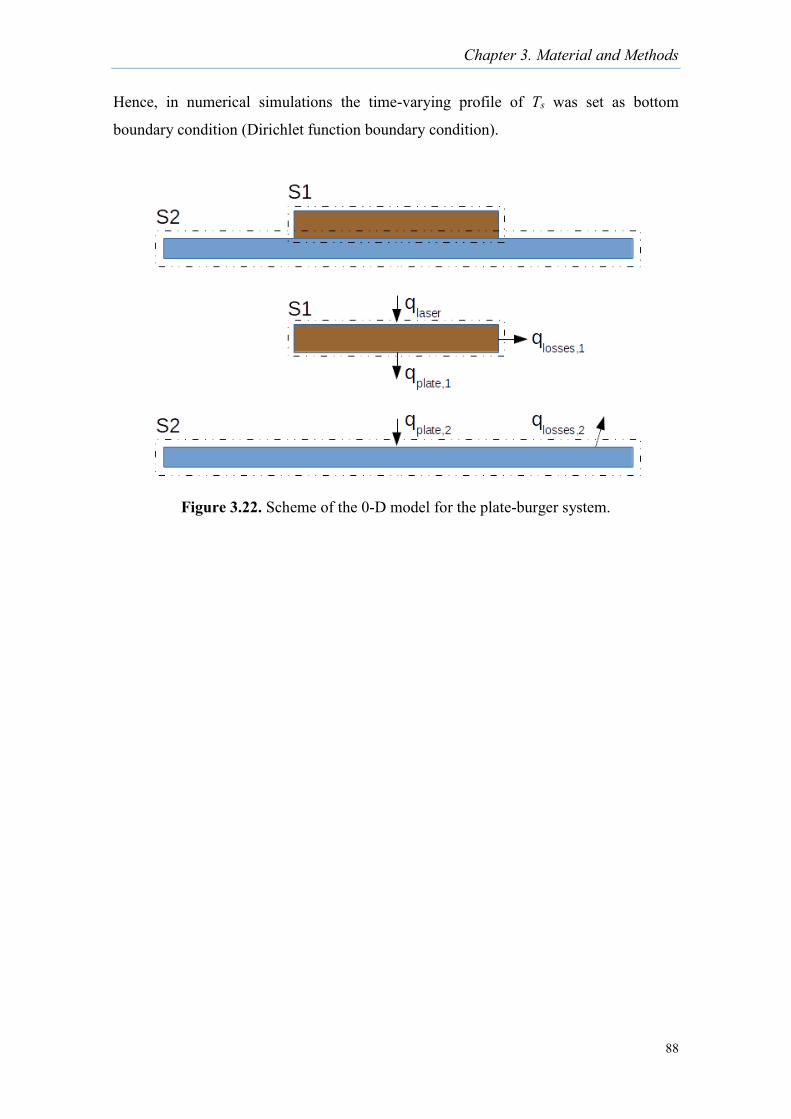
Chapter 3. Material and Methods
88
Hence, in numerical simulations the time-varying profile of Ts was set as bottom
boundary condition (Dirichlet function boundary condition).
Figure 3.22. Scheme of the 0-D model for the plate-burger system.
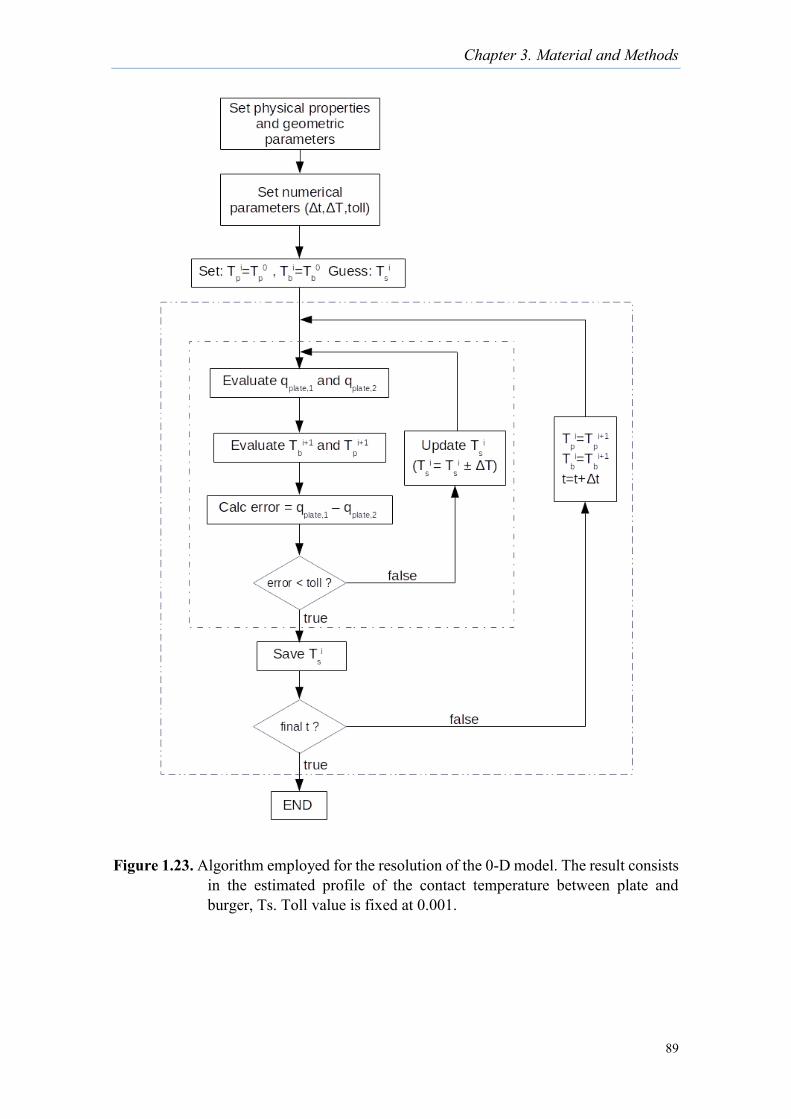
Chapter 3. Material and Methods
89
Figure 1.23. Algorithm employed for the resolution of the 0-D model. The result consists in the estimated profile of the contact temperature between plate and burger, Ts. Toll value is fixed at 0.001.
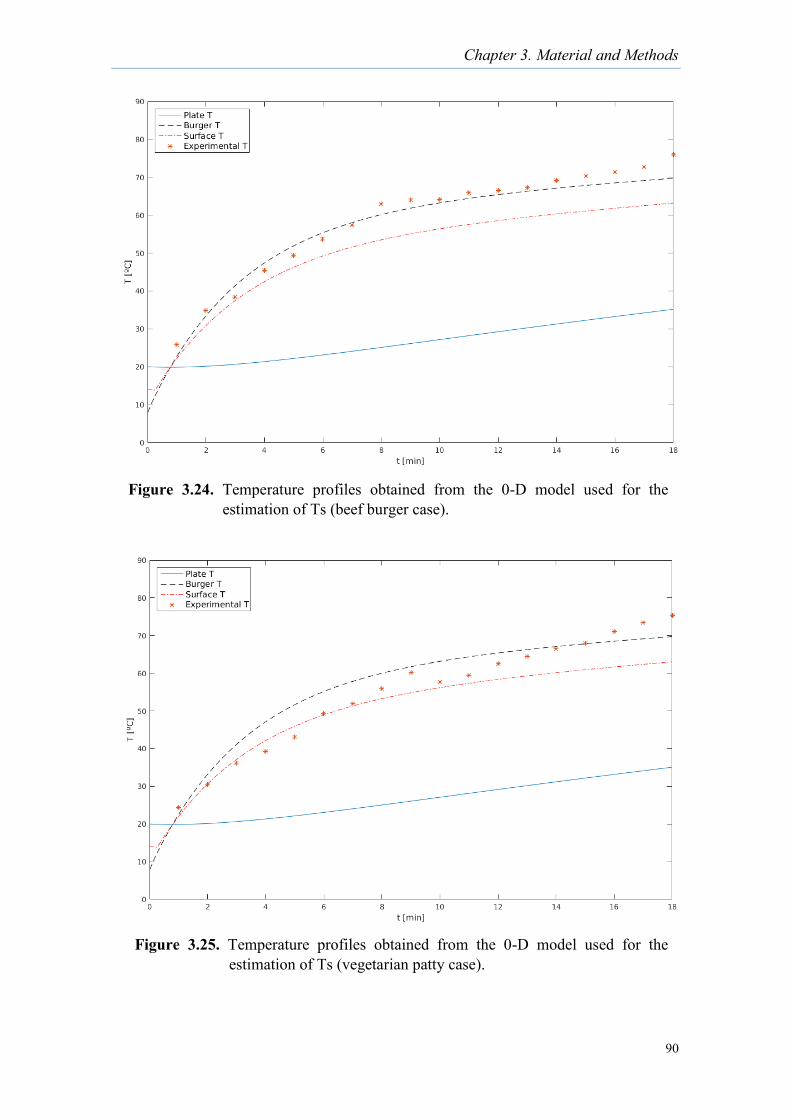
Chapter 3. Material and Methods
90
Figure 3.24. Temperature profiles obtained from the 0-D model used for the estimation of Ts (beef burger case).
Figure 3.25. Temperature profiles obtained from the 0-D model used for the estimation of Ts (vegetarian patty case).
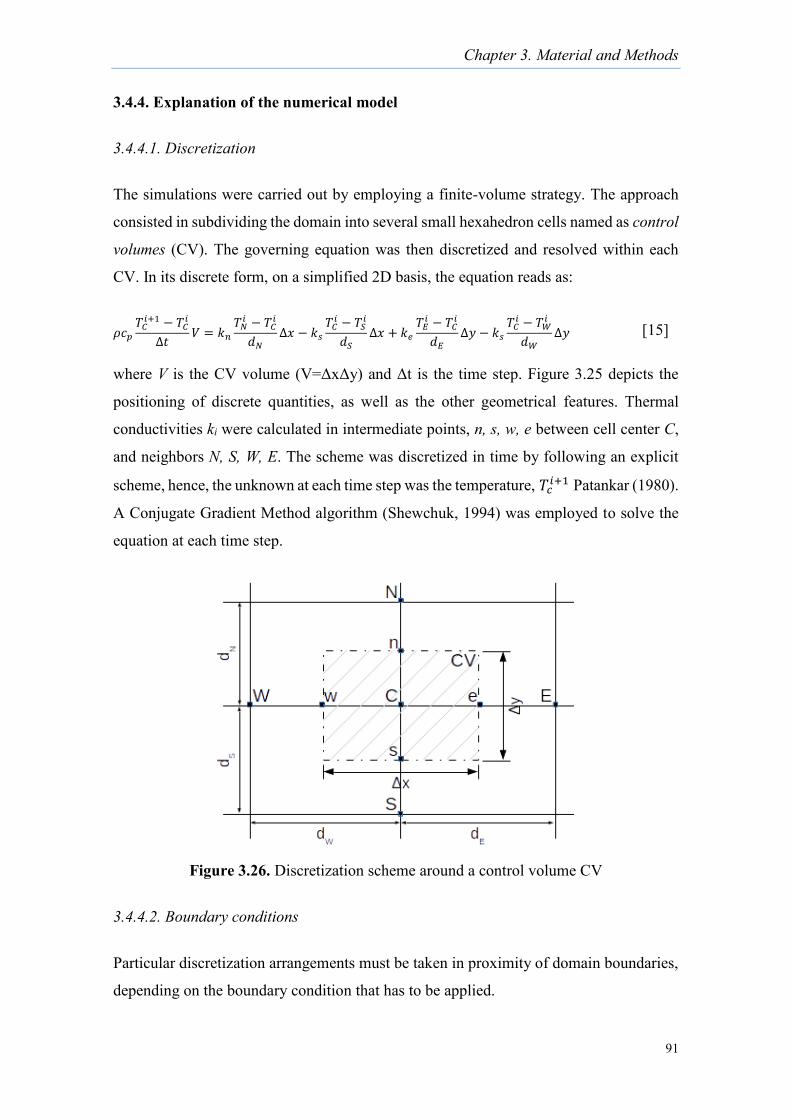
Chapter 3. Material and Methods
91
3.4.4. Explanation of the numerical model
3.4.4.1. Discretization
The simulations were carried out by employing a finite-volume strategy. The approach
consisted in subdividing the domain into several small hexahedron cells named as control
volumes (CV). The governing equation was then discretized and resolved within each
CV. In its discrete form, on a simplified 2D basis, the equation reads as:
𝜌𝑐𝑝𝑇𝐶𝑖+1 − 𝑇𝐶
𝑖
∆𝑡𝑉 = 𝑘𝑛
𝑇𝑁𝑖 − 𝑇𝐶
𝑖
𝑑𝑁∆𝑥 − 𝑘𝑠
𝑇𝐶𝑖 − 𝑇𝑆
𝑖
𝑑𝑆∆𝑥 + 𝑘𝑒
𝑇𝐸𝑖 − 𝑇𝐶
𝑖
𝑑𝐸∆𝑦 − 𝑘𝑠
𝑇𝐶𝑖 − 𝑇𝑊
𝑖
𝑑𝑊∆𝑦
where V is the CV volume (V=ΔxΔy) and Δt is the time step. Figure 3.25 depicts the
positioning of discrete quantities, as well as the other geometrical features. Thermal
conductivities ki were calculated in intermediate points, n, s, w, e between cell center C,
and neighbors N, S, W, E. The scheme was discretized in time by following an explicit
scheme, hence, the unknown at each time step was the temperature, 𝑇𝑐𝑖+1 Patankar (1980).
A Conjugate Gradient Method algorithm (Shewchuk, 1994) was employed to solve the
equation at each time step.
Figure 3.26. Discretization scheme around a control volume CV
3.4.4.2. Boundary conditions
Particular discretization arrangements must be taken in proximity of domain boundaries,
depending on the boundary condition that has to be applied.
[15]
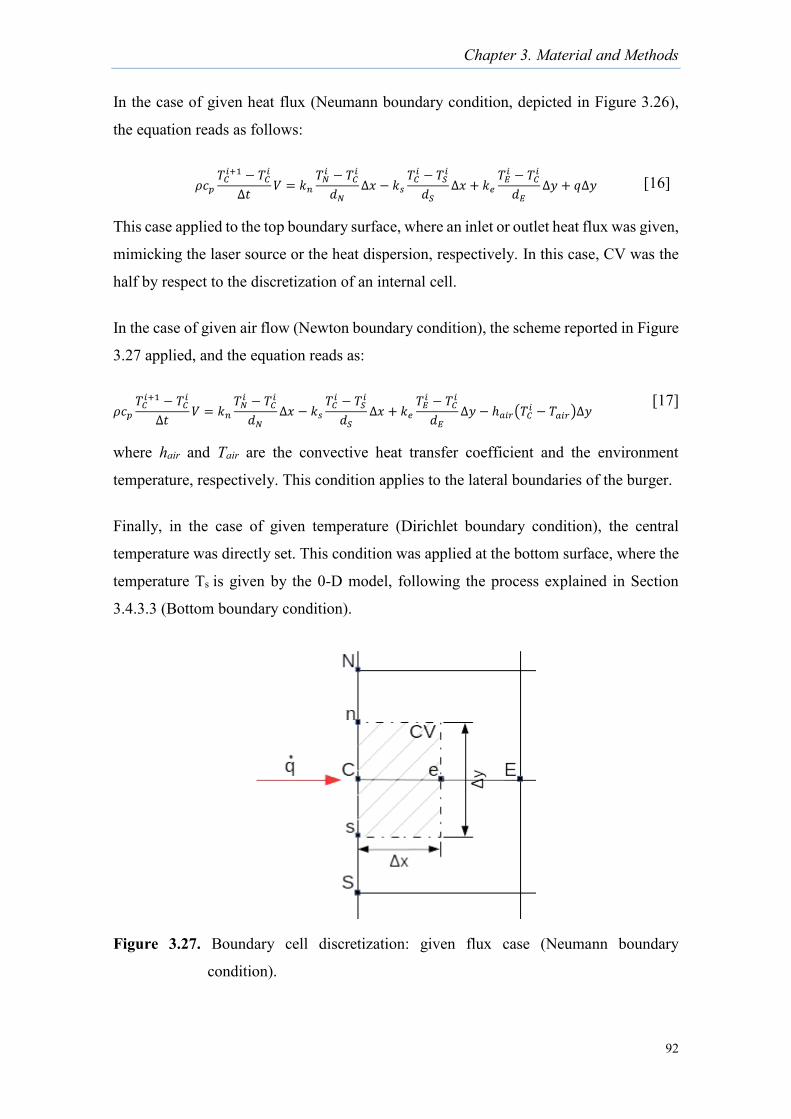
Chapter 3. Material and Methods
92
In the case of given heat flux (Neumann boundary condition, depicted in Figure 3.26),
the equation reads as follows:
𝜌𝑐𝑝𝑇𝐶𝑖+1 − 𝑇𝐶
𝑖
∆𝑡𝑉 = 𝑘𝑛
𝑇𝑁𝑖 − 𝑇𝐶
𝑖
𝑑𝑁∆𝑥 − 𝑘𝑠
𝑇𝐶𝑖 − 𝑇𝑆
𝑖
𝑑𝑆∆𝑥 + 𝑘𝑒
𝑇𝐸𝑖 − 𝑇𝐶
𝑖
𝑑𝐸∆𝑦 + 𝑞∆𝑦
This case applied to the top boundary surface, where an inlet or outlet heat flux was given,
mimicking the laser source or the heat dispersion, respectively. In this case, CV was the
half by respect to the discretization of an internal cell.
In the case of given air flow (Newton boundary condition), the scheme reported in Figure
3.27 applied, and the equation reads as:
𝜌𝑐𝑝𝑇𝐶𝑖+1 − 𝑇𝐶
𝑖
∆𝑡𝑉 = 𝑘𝑛
𝑇𝑁𝑖 − 𝑇𝐶
𝑖
𝑑𝑁∆𝑥 − 𝑘𝑠
𝑇𝐶𝑖 − 𝑇𝑆
𝑖
𝑑𝑆∆𝑥 + 𝑘𝑒
𝑇𝐸𝑖 − 𝑇𝐶
𝑖
𝑑𝐸∆𝑦 − ℎ𝑎𝑖𝑟(𝑇𝐶
𝑖 − 𝑇𝑎𝑖𝑟)∆𝑦
where hair and Tair are the convective heat transfer coefficient and the environment
temperature, respectively. This condition applies to the lateral boundaries of the burger.
Finally, in the case of given temperature (Dirichlet boundary condition), the central
temperature was directly set. This condition was applied at the bottom surface, where the
temperature Ts is given by the 0-D model, following the process explained in Section
3.4.3.3 (Bottom boundary condition).
Figure 3.27. Boundary cell discretization: given flux case (Neumann boundary
condition).
[16]
[17]
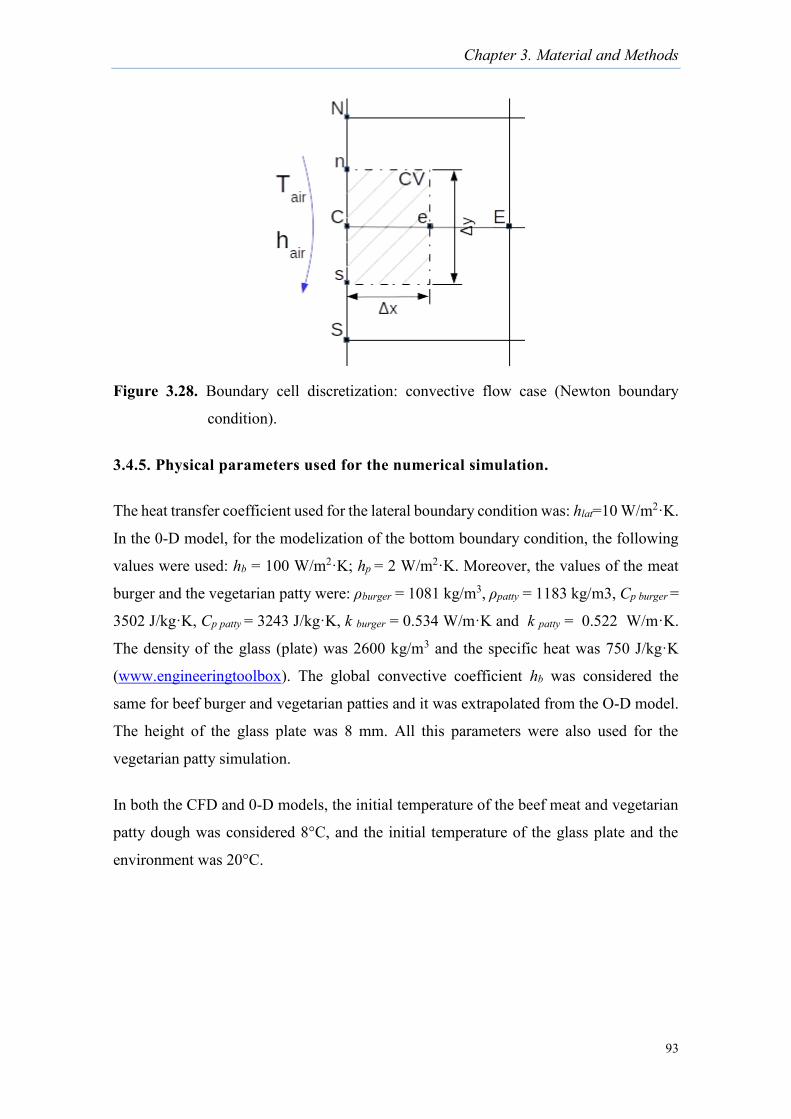
Chapter 3. Material and Methods
93
Figure 3.28. Boundary cell discretization: convective flow case (Newton boundary
condition).
3.4.5. Physical parameters used for the numerical simulation.
The heat transfer coefficient used for the lateral boundary condition was: hlat=10 W/m2·K.
In the 0-D model, for the modelization of the bottom boundary condition, the following
values were used: hb = 100 W/m2·K; hp = 2 W/m2·K. Moreover, the values of the meat
burger and the vegetarian patty were: ρburger = 1081 kg/m3, ρpatty = 1183 kg/m3, Cp burger =
3502 J/kg·K, Cp patty = 3243 J/kg·K, k burger = 0.534 W/m·K and k patty = 0.522 W/m·K.
The density of the glass (plate) was 2600 kg/m3 and the specific heat was 750 J/kg·K
(www.engineeringtoolbox). The global convective coefficient hb was considered the
same for beef burger and vegetarian patties and it was extrapolated from the O-D model.
The height of the glass plate was 8 mm. All this parameters were also used for the
vegetarian patty simulation.
In both the CFD and 0-D models, the initial temperature of the beef meat and vegetarian
patty dough was considered 8°C, and the initial temperature of the glass plate and the
environment was 20°C.
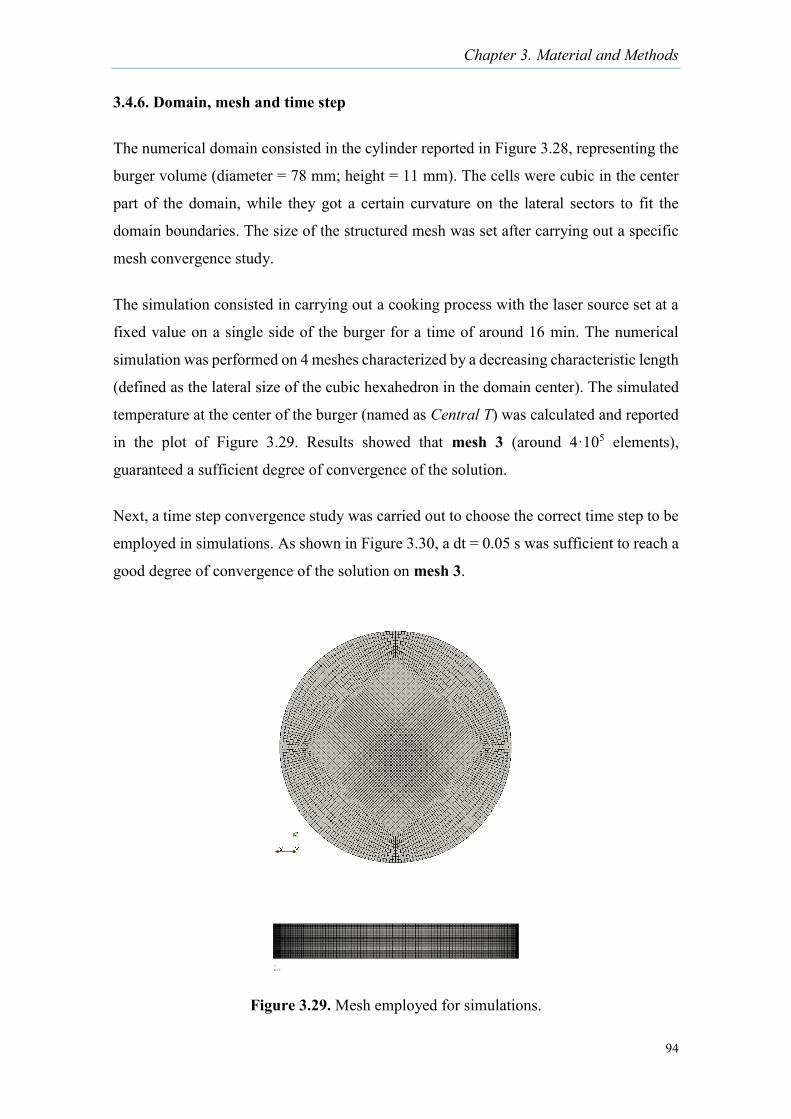
Chapter 3. Material and Methods
94
3.4.6. Domain, mesh and time step
The numerical domain consisted in the cylinder reported in Figure 3.28, representing the
burger volume (diameter = 78 mm; height = 11 mm). The cells were cubic in the center
part of the domain, while they got a certain curvature on the lateral sectors to fit the
domain boundaries. The size of the structured mesh was set after carrying out a specific
mesh convergence study.
The simulation consisted in carrying out a cooking process with the laser source set at a
fixed value on a single side of the burger for a time of around 16 min. The numerical
simulation was performed on 4 meshes characterized by a decreasing characteristic length
(defined as the lateral size of the cubic hexahedron in the domain center). The simulated
temperature at the center of the burger (named as Central T) was calculated and reported
in the plot of Figure 3.29. Results showed that mesh 3 (around 4·105 elements),
guaranteed a sufficient degree of convergence of the solution.
Next, a time step convergence study was carried out to choose the correct time step to be
employed in simulations. As shown in Figure 3.30, a dt = 0.05 s was sufficient to reach a
good degree of convergence of the solution on mesh 3.
Figure 3.29. Mesh employed for simulations.
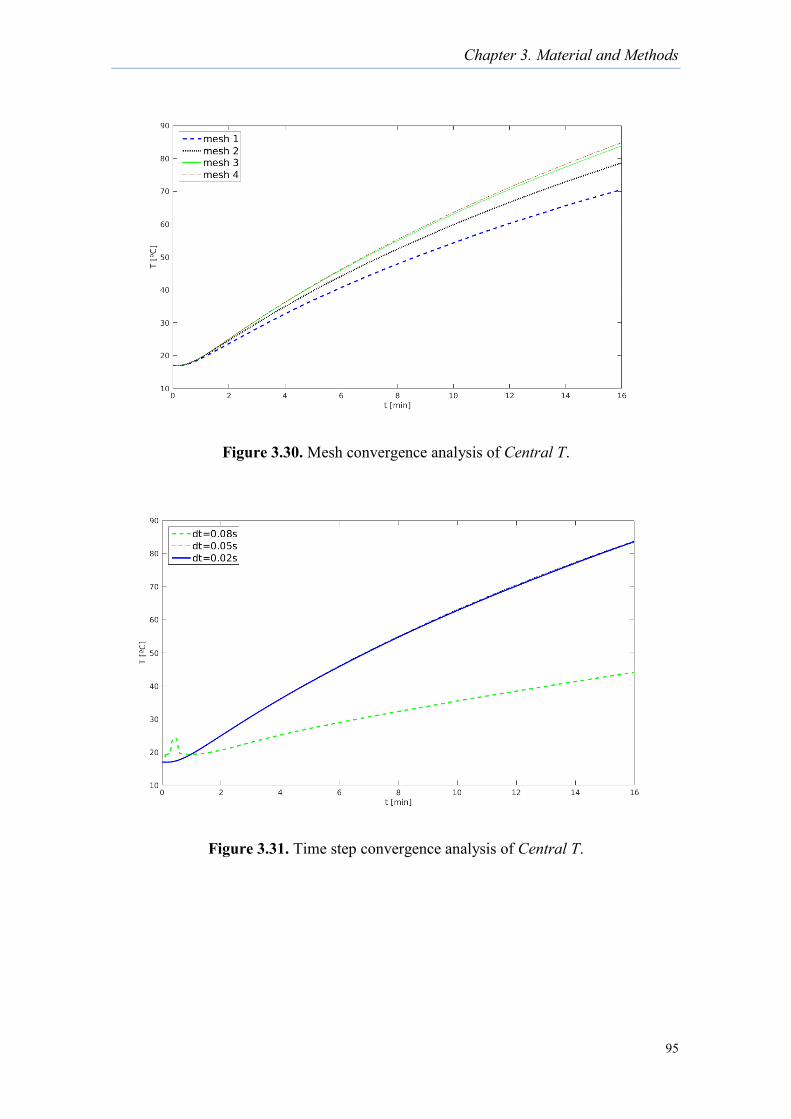
Chapter 3. Material and Methods
95
Figure 3.30. Mesh convergence analysis of Central T.
Figure 3.31. Time step convergence analysis of Central T.

Chapter 4. Results
96
CHAPTER 4
RESULTS
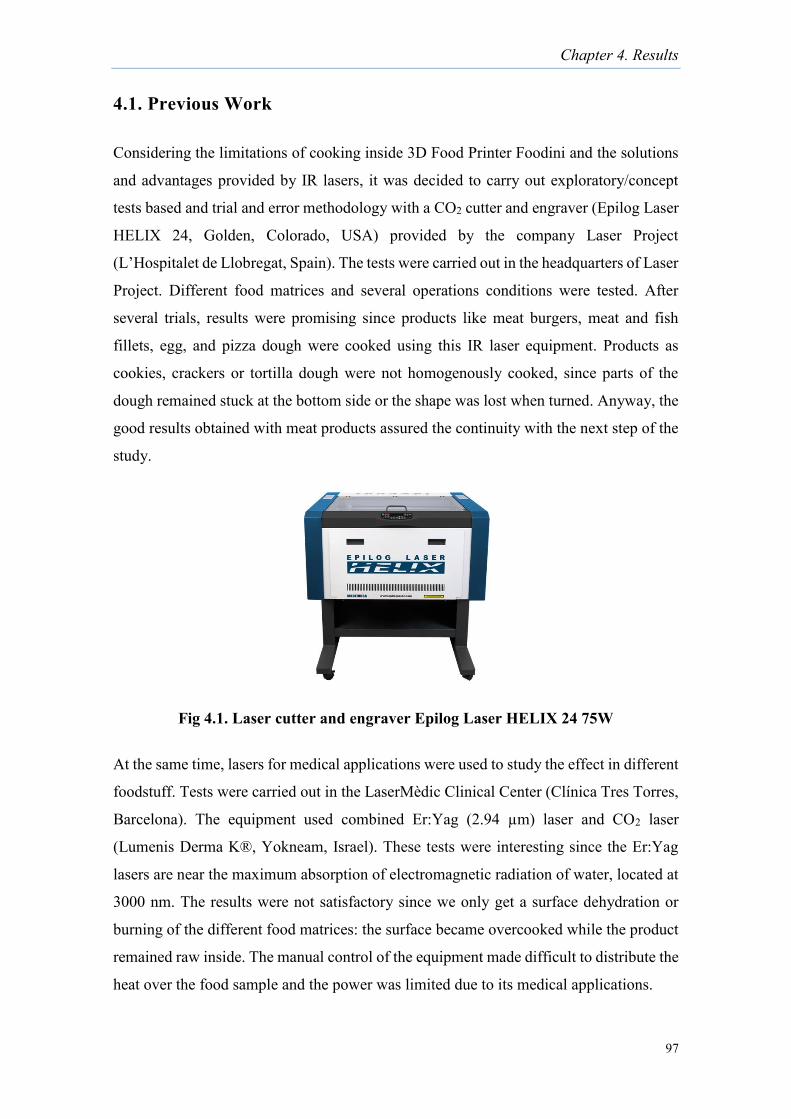
Chapter 4. Results
97
4.1. Previous Work
Considering the limitations of cooking inside 3D Food Printer Foodini and the solutions
and advantages provided by IR lasers, it was decided to carry out exploratory/concept
tests based and trial and error methodology with a CO2 cutter and engraver (Epilog Laser
HELIX 24, Golden, Colorado, USA) provided by the company Laser Project
(L’Hospitalet de Llobregat, Spain). The tests were carried out in the headquarters of Laser
Project. Different food matrices and several operations conditions were tested. After
several trials, results were promising since products like meat burgers, meat and fish
fillets, egg, and pizza dough were cooked using this IR laser equipment. Products as
cookies, crackers or tortilla dough were not homogenously cooked, since parts of the
dough remained stuck at the bottom side or the shape was lost when turned. Anyway, the
good results obtained with meat products assured the continuity with the next step of the
study.
Fig 4.1. Laser cutter and engraver Epilog Laser HELIX 24 75W
At the same time, lasers for medical applications were used to study the effect in different
foodstuff. Tests were carried out in the LaserMèdic Clinical Center (Clínica Tres Torres,
Barcelona). The equipment used combined Er:Yag (2.94 µm) laser and CO2 laser
(Lumenis Derma K®, Yokneam, Israel). These tests were interesting since the Er:Yag
lasers are near the maximum absorption of electromagnetic radiation of water, located at
3000 nm. The results were not satisfactory since we only get a surface dehydration or
burning of the different food matrices: the surface became overcooked while the product
remained raw inside. The manual control of the equipment made difficult to distribute the
heat over the food sample and the power was limited due to its medical applications.

Chapter 4. Results
98
Also, tests with Nd:Yag 1064 nm diode laser equipment engraver and cutter (Laser Writer
Open, Castelnuovo del Garda, Verona, Italy) were done in the company Hispanatec
(Tecnología Hispana S.L., Barcelona). This equipment is mainly used as a marker of
metals, especially, in jewelry applications. One of the limitations of this equipment was
the diameter of laser spot (around 25 µm), which concentrated too much energy in each
point area of the surface. This caused product dehydration and an overcooked surface
while the inner part remained undercooked or raw. In comparison with the diameter of
Nd:Yag laser spot, CO2 laser allowed to choose a bigger spot diameter that helped to
distribute the energy in the surface, thus facilitating the heat transmission from the surface
to the centre and allowing to cook uniformly the product without overheating the external
side.
At this stage of the project, and with that commercially available equipment and test
conditions applied, the results obtained with CO2 laser Epilog equipment were the only
considered successful to cook food (data not shown).
Exploratory tests continued by hiring a CO2 equipment (Epilog Laser MINI 24) to
proceed with tests in the UAB laboratory facilities (Department of Animal and Food
Science). These tests were carried out with different products such as beef burgers,
crackers dough, Maria style cookies, butter cookies, chocolate cookies or pizza dough.
Technical problems with the equipment regarding the loss of laser power retarded the
systematic execution of experiments. Finally, this equipment was replaced by another
Epilog Laser (Zing model). This was the CO2 laser equipment used to carry out the first
experimental study.
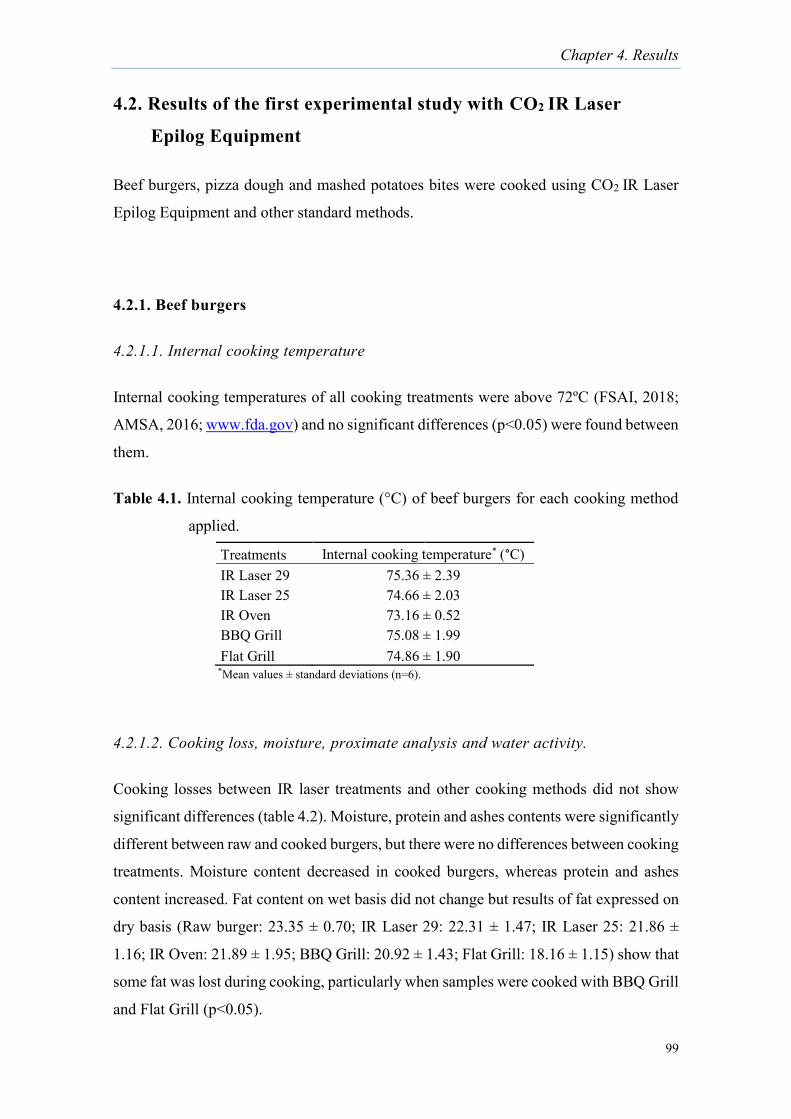
Chapter 4. Results
99
4.2. Results of the first experimental study with CO2 IR Laser
Epilog Equipment
Beef burgers, pizza dough and mashed potatoes bites were cooked using CO2 IR Laser
Epilog Equipment and other standard methods.
4.2.1. Beef burgers
4.2.1.1. Internal cooking temperature
Internal cooking temperatures of all cooking treatments were above 72ºC (FSAI, 2018;
AMSA, 2016; www.fda.gov) and no significant differences (p<0.05) were found between
them.
Table 4.1. Internal cooking temperature (°C) of beef burgers for each cooking method
applied.
4.2.1.2. Cooking loss, moisture, proximate analysis and water activity.
Cooking losses between IR laser treatments and other cooking methods did not show
significant differences (table 4.2). Moisture, protein and ashes contents were significantly
different between raw and cooked burgers, but there were no differences between cooking
treatments. Moisture content decreased in cooked burgers, whereas protein and ashes
content increased. Fat content on wet basis did not change but results of fat expressed on
dry basis (Raw burger: 23.35 ± 0.70; IR Laser 29: 22.31 ± 1.47; IR Laser 25: 21.86 ±
1.16; IR Oven: 21.89 ± 1.95; BBQ Grill: 20.92 ± 1.43; Flat Grill: 18.16 ± 1.15) show that
some fat was lost during cooking, particularly when samples were cooked with BBQ Grill
and Flat Grill (p<0.05).
Treatments Internal cooking temperature* (°C) IR Laser 29 75.36 ± 2.39 IR Laser 25 74.66 ± 2.03 IR Oven 73.16 ± 0.52 BBQ Grill 75.08 ± 1.99 Flat Grill 74.86 ± 1.90
*Mean values ± standard deviations (n=6).
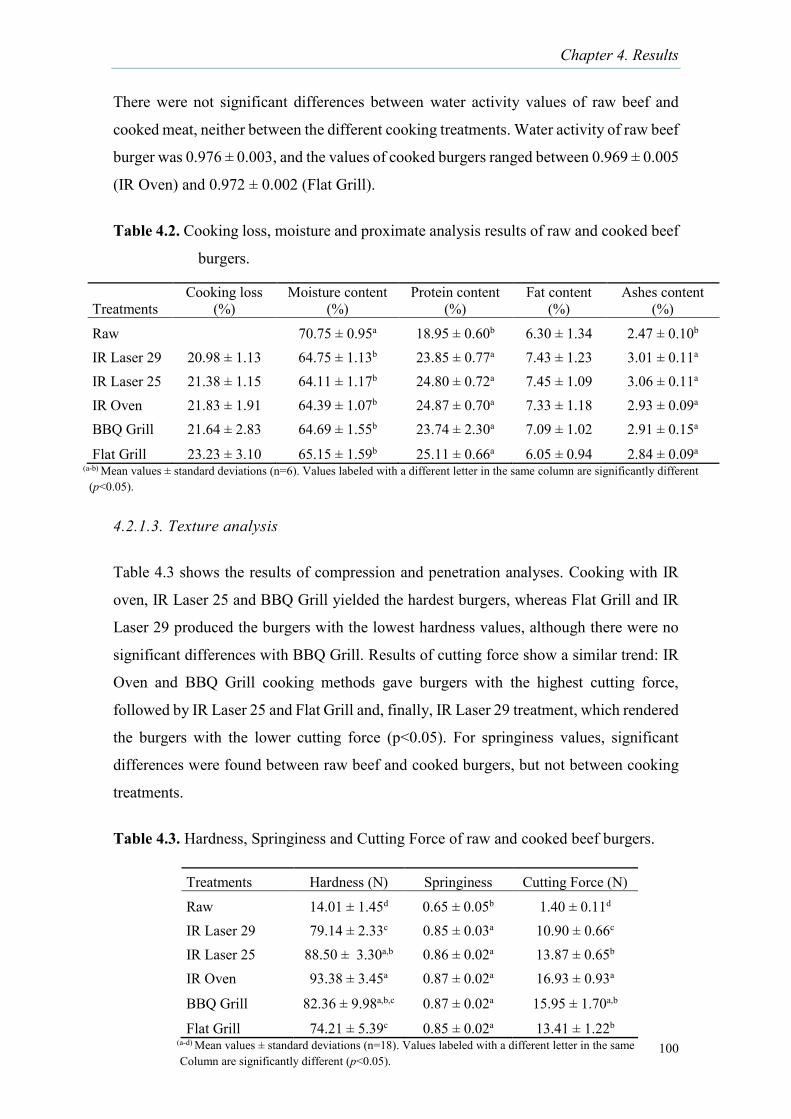
Chapter 4. Results
100
There were not significant differences between water activity values of raw beef and
cooked meat, neither between the different cooking treatments. Water activity of raw beef
burger was 0.976 ± 0.003, and the values of cooked burgers ranged between 0.969 ± 0.005
(IR Oven) and 0.972 ± 0.002 (Flat Grill).
Table 4.2. Cooking loss, moisture and proximate analysis results of raw and cooked beef
burgers.
4.2.1.3. Texture analysis
Table 4.3 shows the results of compression and penetration analyses. Cooking with IR
oven, IR Laser 25 and BBQ Grill yielded the hardest burgers, whereas Flat Grill and IR
Laser 29 produced the burgers with the lowest hardness values, although there were no
significant differences with BBQ Grill. Results of cutting force show a similar trend: IR
Oven and BBQ Grill cooking methods gave burgers with the highest cutting force,
followed by IR Laser 25 and Flat Grill and, finally, IR Laser 29 treatment, which rendered
the burgers with the lower cutting force (p<0.05). For springiness values, significant
differences were found between raw beef and cooked burgers, but not between cooking
treatments.
Table 4.3. Hardness, Springiness and Cutting Force of raw and cooked beef burgers.
Treatments Cooking loss
(%) Moisture content
(%) Protein content
(%) Fat content
(%) Ashes content
(%)
Raw 70.75 ± 0.95a 18.95 ± 0.60b 6.30 ± 1.34 2.47 ± 0.10b IR Laser 29 20.98 ± 1.13 64.75 ± 1.13b 23.85 ± 0.77a 7.43 ± 1.23 3.01 ± 0.11a IR Laser 25 21.38 ± 1.15 64.11 ± 1.17b 24.80 ± 0.72a 7.45 ± 1.09 3.06 ± 0.11a IR Oven 21.83 ± 1.91 64.39 ± 1.07b 24.87 ± 0.70a 7.33 ± 1.18 2.93 ± 0.09a BBQ Grill 21.64 ± 2.83 64.69 ± 1.55b 23.74 ± 2.30a 7.09 ± 1.02 2.91 ± 0.15a
Flat Grill 23.23 ± 3.10 65.15 ± 1.59b 25.11 ± 0.66a 6.05 ± 0.94 2.84 ± 0.09a (a-b) Mean values ± standard deviations (n=6). Values labeled with a different letter in the same column are significantly different (p<0.05).
Treatments Hardness (N) Springiness Cutting Force (N)
Raw 14.01 ± 1.45d 0.65 ± 0.05b 1.40 ± 0.11d IR Laser 29 79.14 ± 2.33c 0.85 ± 0.03a 10.90 ± 0.66c IR Laser 25 88.50 ± 3.30a,b 0.86 ± 0.02a 13.87 ± 0.65b IR Oven 93.38 ± 3.45a 0.87 ± 0.02a 16.93 ± 0.93a
BBQ Grill 82.36 ± 9.98a,b,c 0.87 ± 0.02a 15.95 ± 1.70a,b
Flat Grill 74.21 ± 5.39c 0.85 ± 0.02a 13.41 ± 1.22b (a-d) Mean values ± standard deviations (n=18). Values labeled with a different letter in the same Column are significantly different (p<0.05).
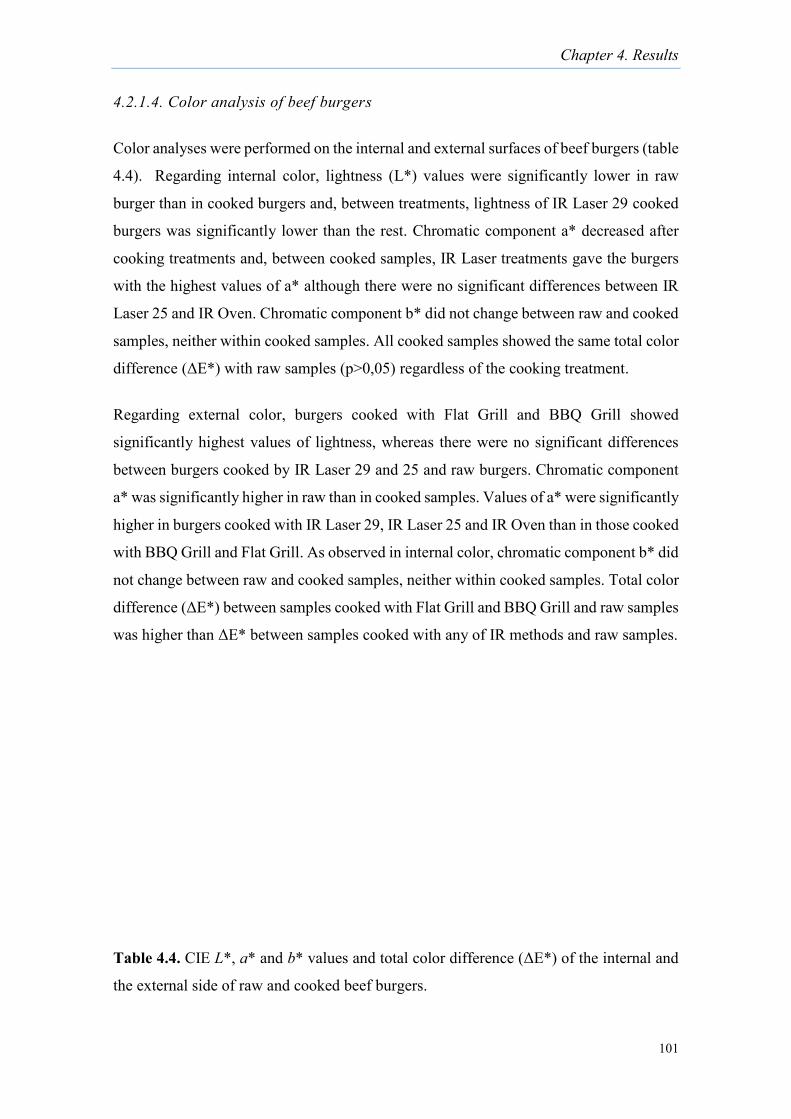
Chapter 4. Results
101
4.2.1.4. Color analysis of beef burgers
Color analyses were performed on the internal and external surfaces of beef burgers (table
4.4). Regarding internal color, lightness (L*) values were significantly lower in raw
burger than in cooked burgers and, between treatments, lightness of IR Laser 29 cooked
burgers was significantly lower than the rest. Chromatic component a* decreased after
cooking treatments and, between cooked samples, IR Laser treatments gave the burgers
with the highest values of a* although there were no significant differences between IR
Laser 25 and IR Oven. Chromatic component b* did not change between raw and cooked
samples, neither within cooked samples. All cooked samples showed the same total color
difference (ΔE*) with raw samples (p>0,05) regardless of the cooking treatment.
Regarding external color, burgers cooked with Flat Grill and BBQ Grill showed
significantly highest values of lightness, whereas there were no significant differences
between burgers cooked by IR Laser 29 and 25 and raw burgers. Chromatic component
a* was significantly higher in raw than in cooked samples. Values of a* were significantly
higher in burgers cooked with IR Laser 29, IR Laser 25 and IR Oven than in those cooked
with BBQ Grill and Flat Grill. As observed in internal color, chromatic component b* did
not change between raw and cooked samples, neither within cooked samples. Total color
difference (ΔE*) between samples cooked with Flat Grill and BBQ Grill and raw samples
was higher than ΔE* between samples cooked with any of IR methods and raw samples.
Table 4.4. CIE L*, a* and b* values and total color difference (ΔE*) of the internal and
the external side of raw and cooked beef burgers.
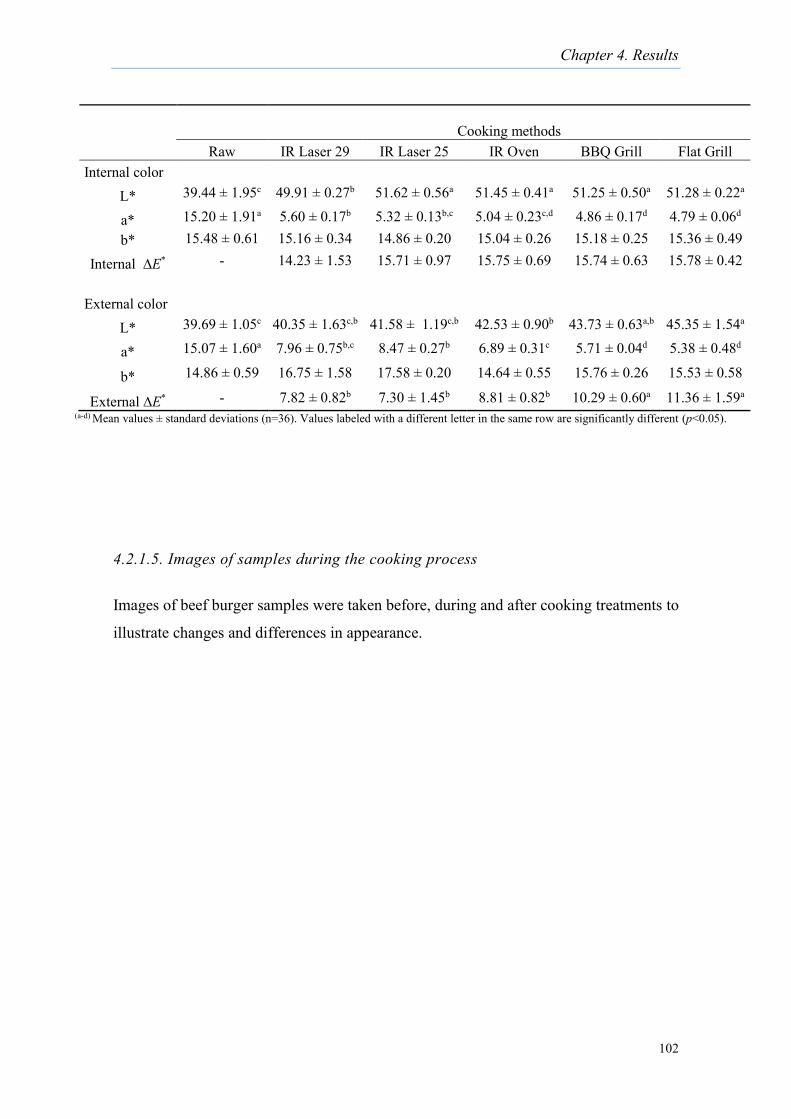
Chapter 4. Results
102
4.2.1.5. Images of samples during the cooking process
Images of beef burger samples were taken before, during and after cooking treatments to
illustrate changes and differences in appearance.
Cooking methods
Raw IR Laser 29 IR Laser 25 IR Oven BBQ Grill Flat Grill Internal color
L* 39.44 ± 1.95c 49.91 ± 0.27b 51.62 ± 0.56a 51.45 ± 0.41a 51.25 ± 0.50a 51.28 ± 0.22a
a* 15.20 ± 1.91a 5.60 ± 0.17b 5.32 ± 0.13b,c 5.04 ± 0.23c,d 4.86 ± 0.17d 4.79 ± 0.06d b* 15.48 ± 0.61 15.16 ± 0.34 14.86 ± 0.20 15.04 ± 0.26 15.18 ± 0.25 15.36 ± 0.49
Internal ∆E* - 14.23 ± 1.53 15.71 ± 0.97 15.75 ± 0.69 15.74 ± 0.63 15.78 ± 0.42
External color
L* 39.69 ± 1.05c 40.35 ± 1.63c,b 41.58 ± 1.19c,b 42.53 ± 0.90b 43.73 ± 0.63a,b 45.35 ± 1.54a
a* 15.07 ± 1.60a 7.96 ± 0.75b,c 8.47 ± 0.27b 6.89 ± 0.31c 5.71 ± 0.04d 5.38 ± 0.48d
b* 14.86 ± 0.59 16.75 ± 1.58 17.58 ± 0.20 14.64 ± 0.55 15.76 ± 0.26 15.53 ± 0.58
External ∆E* - 7.82 ± 0.82b 7.30 ± 1.45b 8.81 ± 0.82b 10.29 ± 0.60a 11.36 ± 1.59a (a-d) Mean values ± standard deviations (n=36). Values labeled with a different letter in the same row are significantly different (p<0.05).
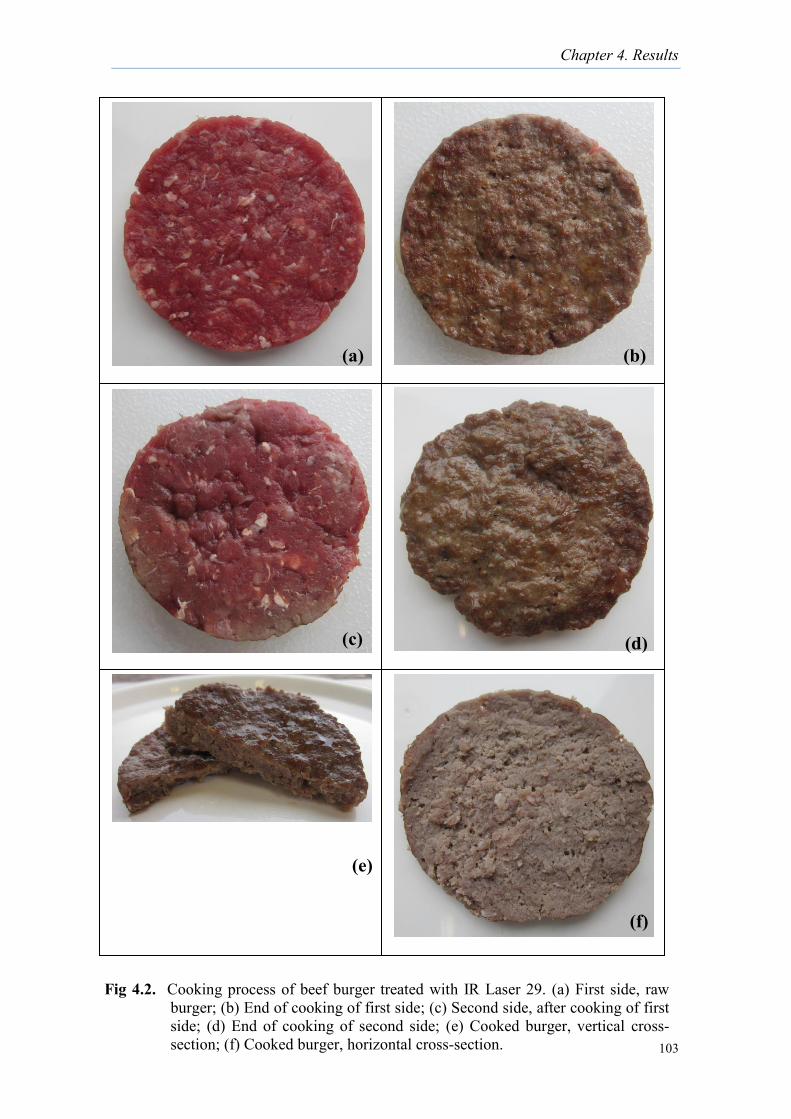
Chapter 4. Results
103
0 1 2
cm
0 1 2
cm
0 1 2
cm
0 1 2
cm
0 1 2
cm
0 1 2
cm
0 1 2
cm
Fig 4.2. Cooking process of beef burger treated with IR Laser 29. (a) First side, raw burger; (b) End of cooking of first side; (c) Second side, after cooking of first side; (d) End of cooking of second side; (e) Cooked burger, vertical cross-section; (f) Cooked burger, horizontal cross-section.
(a) (b)
(c) (d)
(e)
(f)
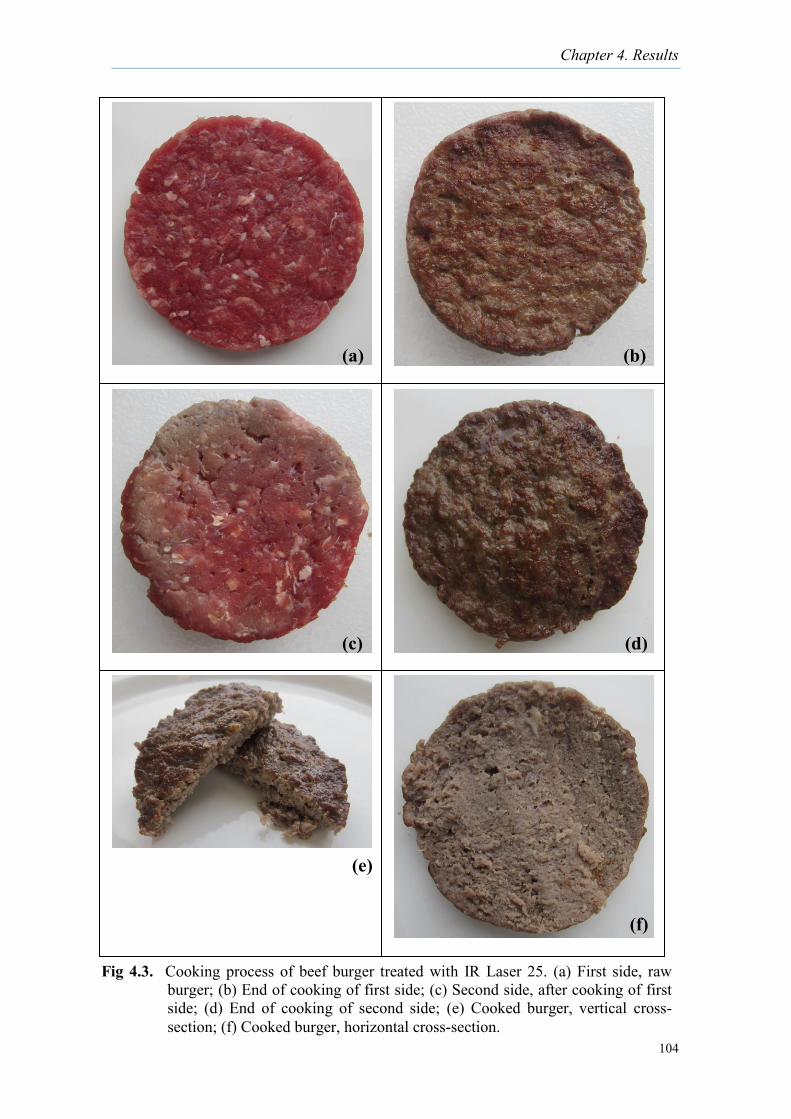
Chapter 4. Results
104
0 1 2
cm
0 1 2
cm
0 1 2
cm
0 1 2
cm
Fig 4.3. Cooking process of beef burger treated with IR Laser 25. (a) First side, raw burger; (b) End of cooking of first side; (c) Second side, after cooking of first side; (d) End of cooking of second side; (e) Cooked burger, vertical cross-section; (f) Cooked burger, horizontal cross-section.
(a) (b)
(c) (d)
(e)
(f)
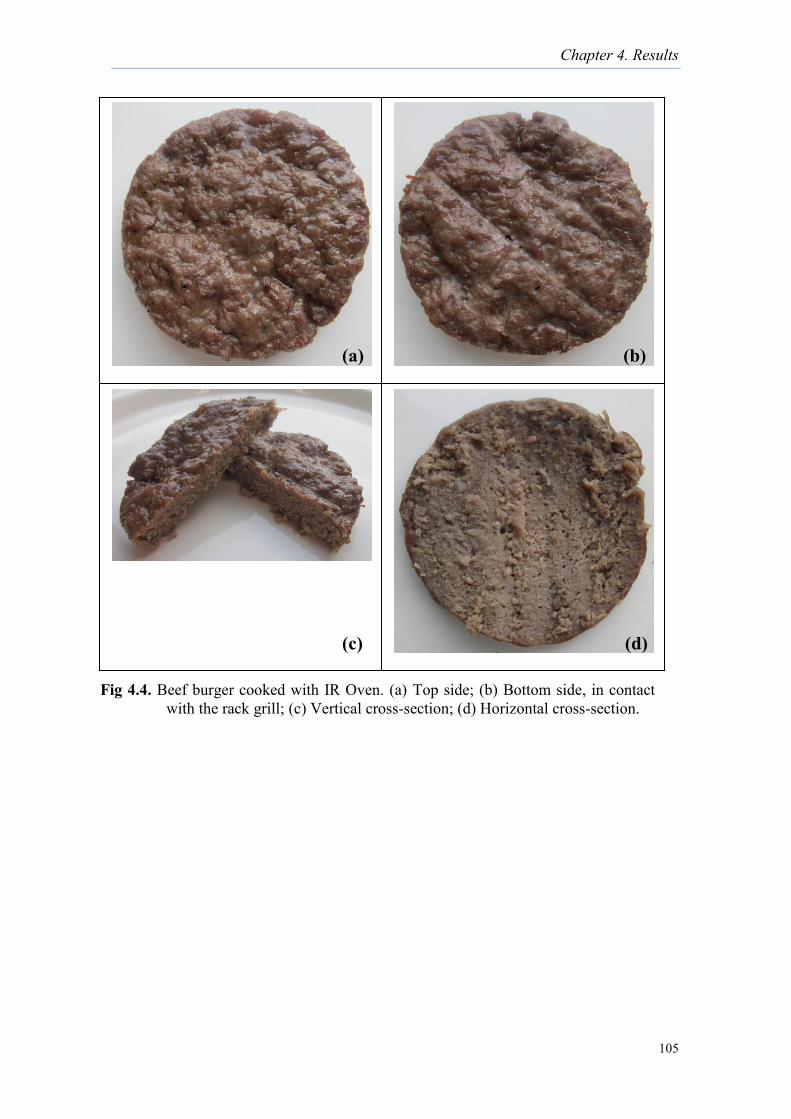
Chapter 4. Results
105
0 1 2
cm
0 1 2
cm
0 1 2
cm
0 1 2
cm
0 1 2
cm
0 1 2
cm
Fig 4.4. Beef burger cooked with IR Oven. (a) Top side; (b) Bottom side, in contact with the rack grill; (c) Vertical cross-section; (d) Horizontal cross-section.
(a) (b)
(c) (d)

Chapter 4. Results
106
0 1 2
cm
0 1 2
cm
Fig 4.5. Beef burgers cooked with BBQ Grill. (a) First side in contact with the rack grill; (b) Second side in contact with the rack grill; (c) Vertical cross-section; (d) Horizontal cross-section.
(a) (b)
(c) (d)
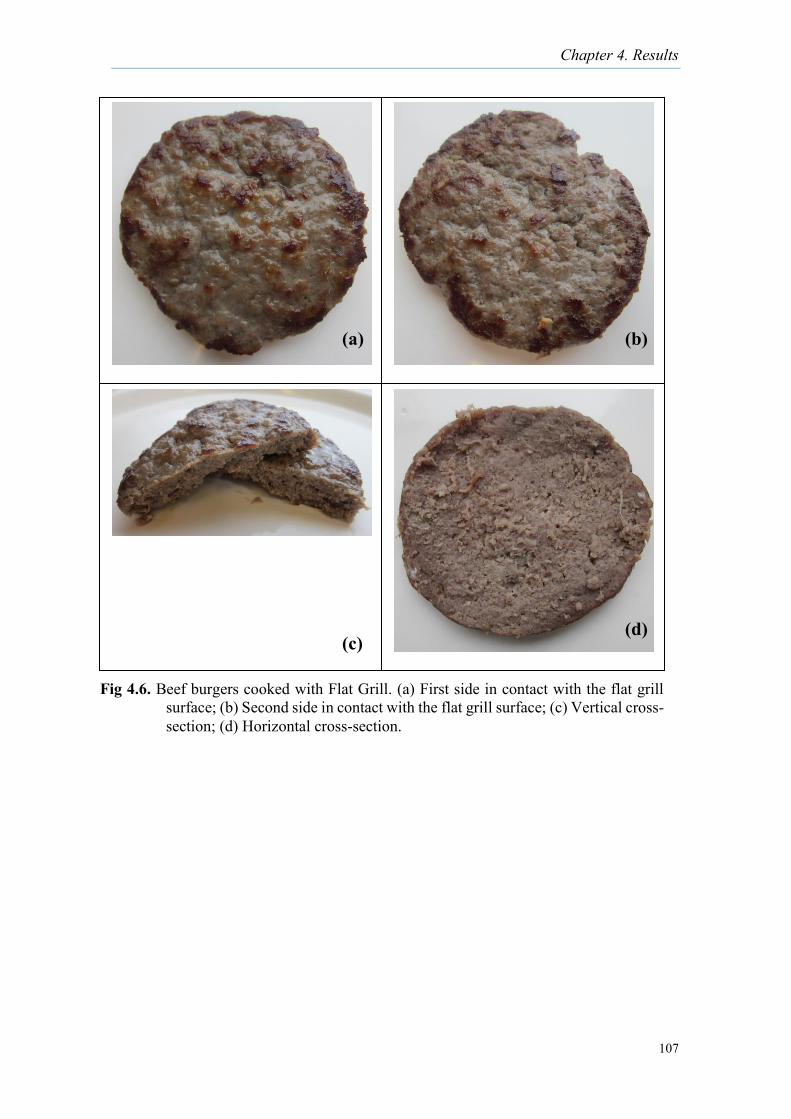
Chapter 4. Results
107
0 1 2
cm
0 1 2
cm
0 1 2
cm
0 1 2
cm
0 1 2
cm
0 1 2
cm
Fig 4.6. Beef burgers cooked with Flat Grill. (a) First side in contact with the flat grill surface; (b) Second side in contact with the flat grill surface; (c) Vertical cross-section; (d) Horizontal cross-section.
(a) (b)
(c) (d)
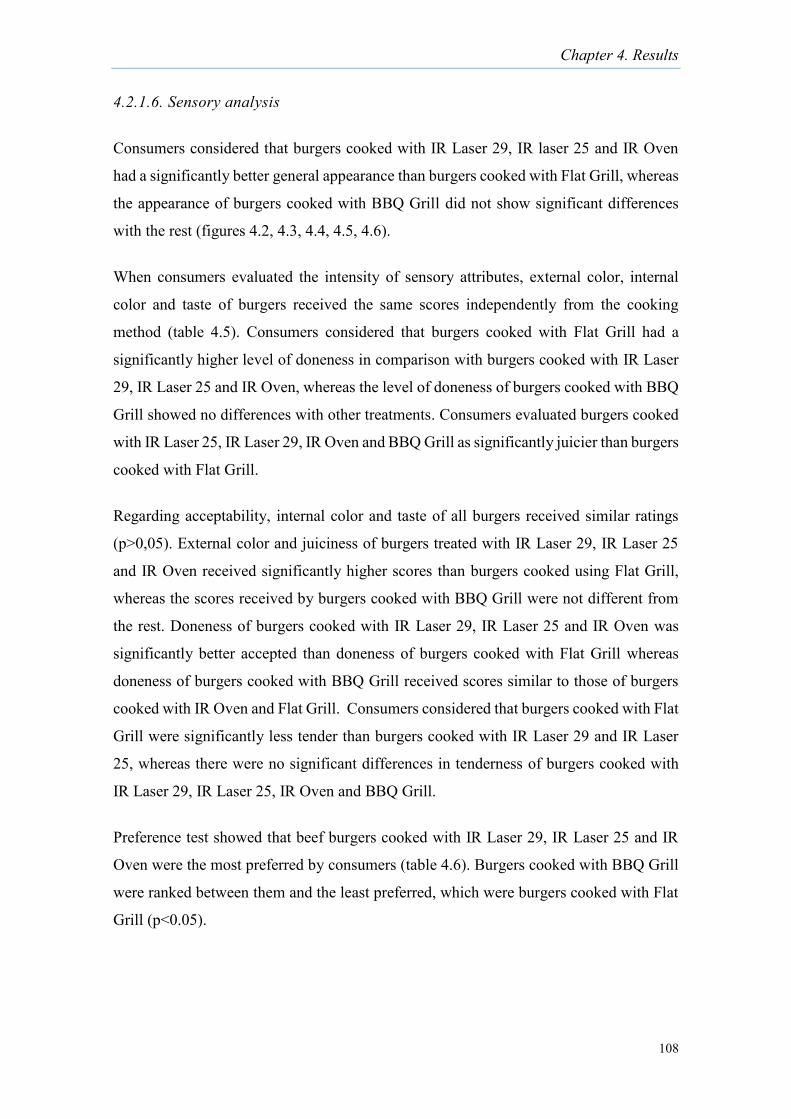
Chapter 4. Results
108
4.2.1.6. Sensory analysis
Consumers considered that burgers cooked with IR Laser 29, IR laser 25 and IR Oven
had a significantly better general appearance than burgers cooked with Flat Grill, whereas
the appearance of burgers cooked with BBQ Grill did not show significant differences
with the rest (figures 4.2, 4.3, 4.4, 4.5, 4.6).
When consumers evaluated the intensity of sensory attributes, external color, internal
color and taste of burgers received the same scores independently from the cooking
method (table 4.5). Consumers considered that burgers cooked with Flat Grill had a
significantly higher level of doneness in comparison with burgers cooked with IR Laser
29, IR Laser 25 and IR Oven, whereas the level of doneness of burgers cooked with BBQ
Grill showed no differences with other treatments. Consumers evaluated burgers cooked
with IR Laser 25, IR Laser 29, IR Oven and BBQ Grill as significantly juicier than burgers
cooked with Flat Grill.
Regarding acceptability, internal color and taste of all burgers received similar ratings
(p>0,05). External color and juiciness of burgers treated with IR Laser 29, IR Laser 25
and IR Oven received significantly higher scores than burgers cooked using Flat Grill,
whereas the scores received by burgers cooked with BBQ Grill were not different from
the rest. Doneness of burgers cooked with IR Laser 29, IR Laser 25 and IR Oven was
significantly better accepted than doneness of burgers cooked with Flat Grill whereas
doneness of burgers cooked with BBQ Grill received scores similar to those of burgers
cooked with IR Oven and Flat Grill. Consumers considered that burgers cooked with Flat
Grill were significantly less tender than burgers cooked with IR Laser 29 and IR Laser
25, whereas there were no significant differences in tenderness of burgers cooked with
IR Laser 29, IR Laser 25, IR Oven and BBQ Grill.
Preference test showed that beef burgers cooked with IR Laser 29, IR Laser 25 and IR
Oven were the most preferred by consumers (table 4.6). Burgers cooked with BBQ Grill
were ranked between them and the least preferred, which were burgers cooked with Flat
Grill (p<0.05).
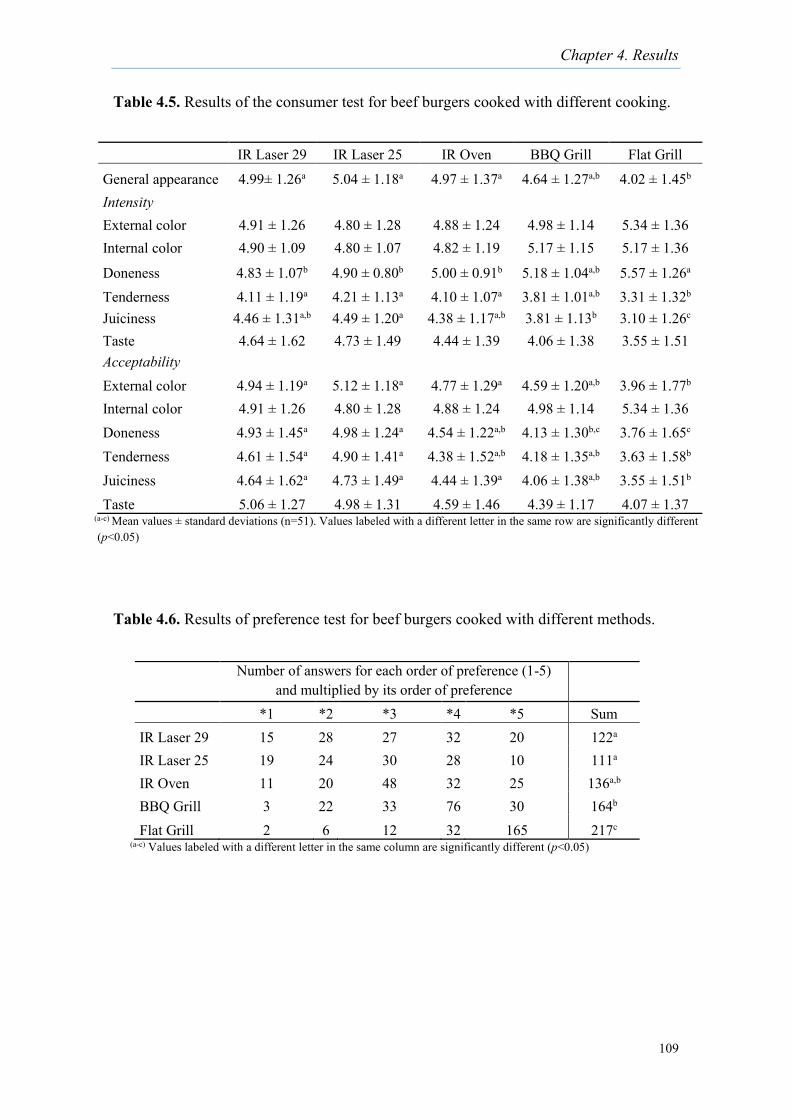
Chapter 4. Results
109
Table 4.5. Results of the consumer test for beef burgers cooked with different cooking.
Table 4.6. Results of preference test for beef burgers cooked with different methods.
Number of answers for each order of preference (1-5)
and multiplied by its order of preference *1 *2 *3 *4 *5 Sum
IR Laser 29 15 28 27 32 20 122a IR Laser 25 19 24 30 28 10 111a IR Oven 11 20 48 32 25 136a,b BBQ Grill 3 22 33 76 30 164b Flat Grill 2 6 12 32 165 217c
(a-c) Values labeled with a different letter in the same column are significantly different (p<0.05)
IR Laser 29 IR Laser 25 IR Oven BBQ Grill Flat Grill
General appearance 4.99± 1.26a 5.04 ± 1.18a 4.97 ± 1.37a 4.64 ± 1.27a,b 4.02 ± 1.45b Intensity External color 4.91 ± 1.26 4.80 ± 1.28 4.88 ± 1.24 4.98 ± 1.14 5.34 ± 1.36 Internal color 4.90 ± 1.09 4.80 ± 1.07 4.82 ± 1.19 5.17 ± 1.15 5.17 ± 1.36
Doneness 4.83 ± 1.07b 4.90 ± 0.80b 5.00 ± 0.91b 5.18 ± 1.04a,b 5.57 ± 1.26a Tenderness 4.11 ± 1.19a 4.21 ± 1.13a 4.10 ± 1.07a 3.81 ± 1.01a,b 3.31 ± 1.32b Juiciness 4.46 ± 1.31a,b 4.49 ± 1.20a 4.38 ± 1.17a,b 3.81 ± 1.13b 3.10 ± 1.26c Taste 4.64 ± 1.62 4.73 ± 1.49 4.44 ± 1.39 4.06 ± 1.38 3.55 ± 1.51 Acceptability External color 4.94 ± 1.19a 5.12 ± 1.18a 4.77 ± 1.29a 4.59 ± 1.20a,b 3.96 ± 1.77b Internal color 4.91 ± 1.26 4.80 ± 1.28 4.88 ± 1.24 4.98 ± 1.14 5.34 ± 1.36 Doneness 4.93 ± 1.45a 4.98 ± 1.24a 4.54 ± 1.22a,b 4.13 ± 1.30b,c 3.76 ± 1.65c Tenderness 4.61 ± 1.54a 4.90 ± 1.41a 4.38 ± 1.52a,b 4.18 ± 1.35a,b 3.63 ± 1.58b Juiciness 4.64 ± 1.62a 4.73 ± 1.49a 4.44 ± 1.39a 4.06 ± 1.38a,b 3.55 ± 1.51b Taste 5.06 ± 1.27 4.98 ± 1.31 4.59 ± 1.46 4.39 ± 1.17 4.07 ± 1.37
(a-c) Mean values ± standard deviations (n=51). Values labeled with a different letter in the same row are significantly different (p<0.05)
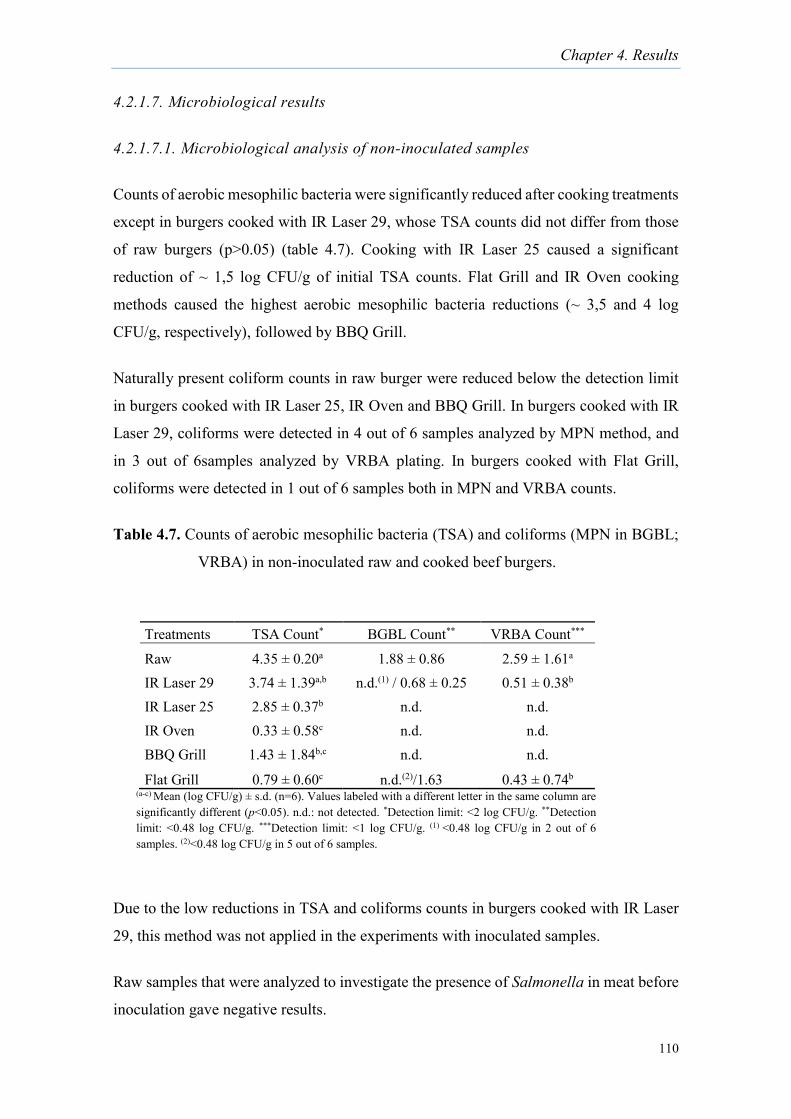
Chapter 4. Results
110
4.2.1.7. Microbiological results
4.2.1.7.1. Microbiological analysis of non-inoculated samples
Counts of aerobic mesophilic bacteria were significantly reduced after cooking treatments
except in burgers cooked with IR Laser 29, whose TSA counts did not differ from those
of raw burgers (p>0.05) (table 4.7). Cooking with IR Laser 25 caused a significant
reduction of ~ 1,5 log CFU/g of initial TSA counts. Flat Grill and IR Oven cooking
methods caused the highest aerobic mesophilic bacteria reductions (~ 3,5 and 4 log
CFU/g, respectively), followed by BBQ Grill.
Naturally present coliform counts in raw burger were reduced below the detection limit
in burgers cooked with IR Laser 25, IR Oven and BBQ Grill. In burgers cooked with IR
Laser 29, coliforms were detected in 4 out of 6 samples analyzed by MPN method, and
in 3 out of 6samples analyzed by VRBA plating. In burgers cooked with Flat Grill,
coliforms were detected in 1 out of 6 samples both in MPN and VRBA counts.
Table 4.7. Counts of aerobic mesophilic bacteria (TSA) and coliforms (MPN in BGBL;
VRBA) in non-inoculated raw and cooked beef burgers.
Due to the low reductions in TSA and coliforms counts in burgers cooked with IR Laser
29, this method was not applied in the experiments with inoculated samples.
Raw samples that were analyzed to investigate the presence of Salmonella in meat before
inoculation gave negative results.
Treatments TSA Count* BGBL Count** VRBA Count***
Raw 4.35 ± 0.20a 1.88 ± 0.86 2.59 ± 1.61a IR Laser 29 3.74 ± 1.39a,b n.d.(1) / 0.68 ± 0.25 0.51 ± 0.38b IR Laser 25 2.85 ± 0.37b n.d. n.d. IR Oven 0.33 ± 0.58c n.d. n.d. BBQ Grill 1.43 ± 1.84b,c n.d. n.d.
Flat Grill 0.79 ± 0.60c n.d.(2)/1.63 0.43 ± 0.74b (a-c) Mean (log CFU/g) ± s.d. (n=6). Values labeled with a different letter in the same column are significantly different (p<0.05). n.d.: not detected. *Detection limit: <2 log CFU/g. **Detection limit: <0.48 log CFU/g. ***Detection limit: <1 log CFU/g. (1) <0.48 log CFU/g in 2 out of 6 samples. (2)<0.48 log CFU/g in 5 out of 6 samples.
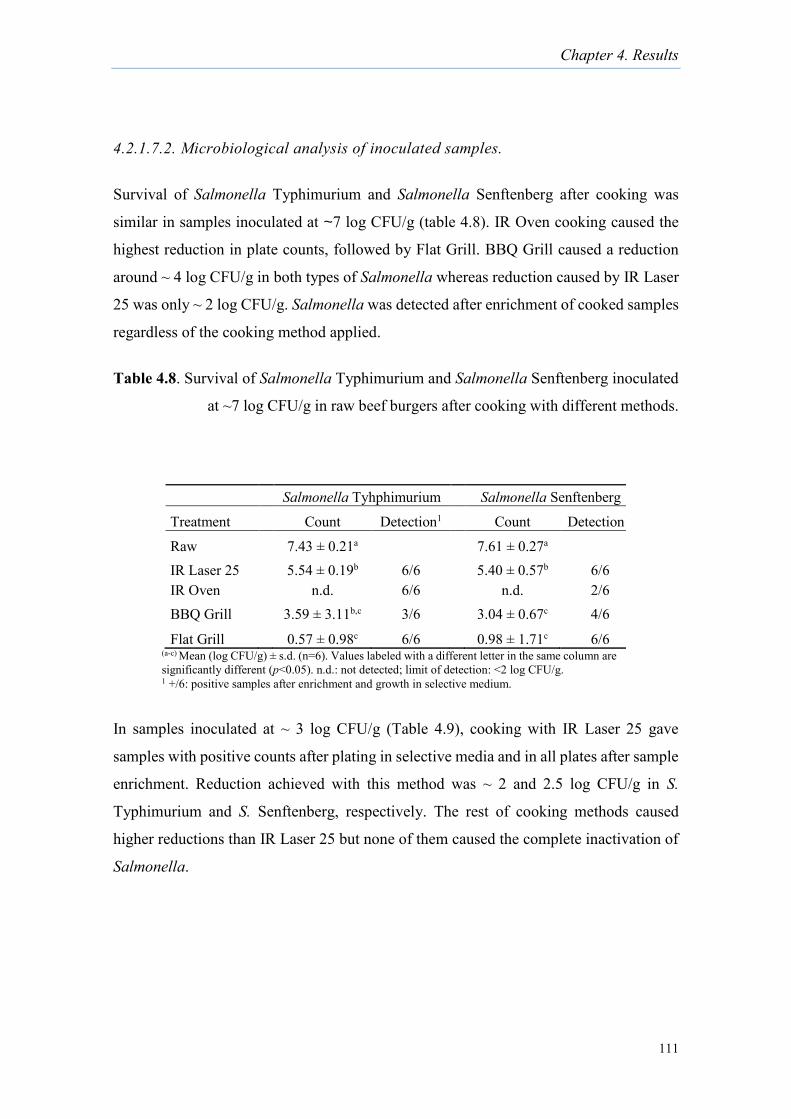
Chapter 4. Results
111
4.2.1.7.2. Microbiological analysis of inoculated samples.
Survival of Salmonella Typhimurium and Salmonella Senftenberg after cooking was
similar in samples inoculated at ~7 log CFU/g (table 4.8). IR Oven cooking caused the
highest reduction in plate counts, followed by Flat Grill. BBQ Grill caused a reduction
around ~ 4 log CFU/g in both types of Salmonella whereas reduction caused by IR Laser
25 was only ~ 2 log CFU/g. Salmonella was detected after enrichment of cooked samples
regardless of the cooking method applied.
Table 4.8. Survival of Salmonella Typhimurium and Salmonella Senftenberg inoculated
at ~7 log CFU/g in raw beef burgers after cooking with different methods.
In samples inoculated at ~ 3 log CFU/g (Table 4.9), cooking with IR Laser 25 gave
samples with positive counts after plating in selective media and in all plates after sample
enrichment. Reduction achieved with this method was ~ 2 and 2.5 log CFU/g in S.
Typhimurium and S. Senftenberg, respectively. The rest of cooking methods caused
higher reductions than IR Laser 25 but none of them caused the complete inactivation of
Salmonella.
Salmonella Tyhphimurium Salmonella Senftenberg
Treatment Count Detection1 Count Detection1
Raw 7.43 ± 0.21a 7.61 ± 0.27a IR Laser 25 5.54 ± 0.19b 6/6 5.40 ± 0.57b 6/6 IR Oven n.d. 6/6 n.d. 2/6 BBQ Grill 3.59 ± 3.11b,c 3/6 3.04 ± 0.67c 4/6
Flat Grill 0.57 ± 0.98c 6/6 0.98 ± 1.71c 6/6 (a-c) Mean (log CFU/g) ± s.d. (n=6). Values labeled with a different letter in the same column are significantly different (p<0.05). n.d.: not detected; limit of detection: <2 log CFU/g. 1 +/6: positive samples after enrichment and growth in selective medium.
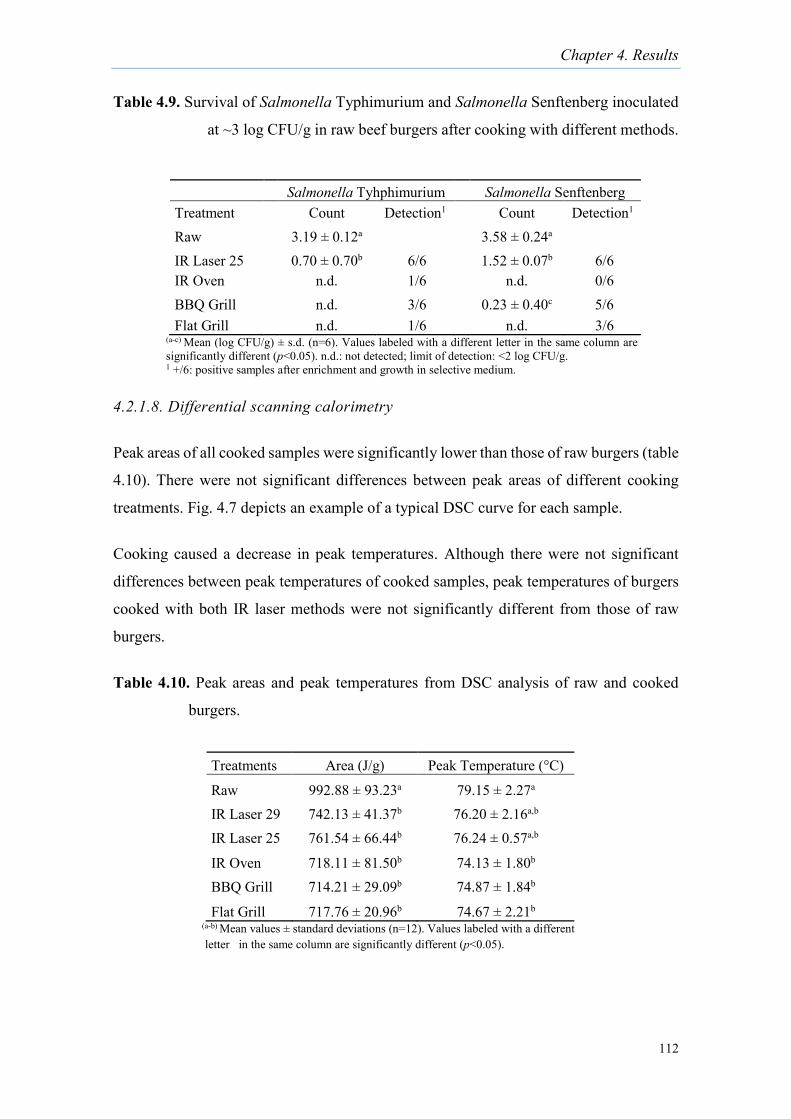
Chapter 4. Results
112
Table 4.9. Survival of Salmonella Typhimurium and Salmonella Senftenberg inoculated
at ~3 log CFU/g in raw beef burgers after cooking with different methods.
4.2.1.8. Differential scanning calorimetry
Peak areas of all cooked samples were significantly lower than those of raw burgers (table
4.10). There were not significant differences between peak areas of different cooking
treatments. Fig. 4.7 depicts an example of a typical DSC curve for each sample.
Cooking caused a decrease in peak temperatures. Although there were not significant
differences between peak temperatures of cooked samples, peak temperatures of burgers
cooked with both IR laser methods were not significantly different from those of raw
burgers.
Table 4.10. Peak areas and peak temperatures from DSC analysis of raw and cooked
burgers.
Treatments Area (J/g) Peak Temperature (°C)
Raw 992.88 ± 93.23a 79.15 ± 2.27a IR Laser 29 742.13 ± 41.37b 76.20 ± 2.16a,b IR Laser 25 761.54 ± 66.44b 76.24 ± 0.57a,b
IR Oven 718.11 ± 81.50b 74.13 ± 1.80b BBQ Grill 714.21 ± 29.09b 74.87 ± 1.84b
Flat Grill 717.76 ± 20.96b 74.67 ± 2.21b (a-b) Mean values ± standard deviations (n=12). Values labeled with a different letter in the same column are significantly different (p<0.05).
Salmonella Tyhphimurium Salmonella Senftenberg Treatment Count Detection1 Count Detection1 Raw 3.19 ± 0.12a 3.58 ± 0.24a IR Laser 25 0.70 ± 0.70b 6/6 1.52 ± 0.07b 6/6 IR Oven n.d. 1/6 n.d. 0/6 BBQ Grill n.d. 3/6 0.23 ± 0.40c 5/6 Flat Grill n.d. 1/6 n.d. 3/6
(a-c) Mean (log CFU/g) ± s.d. (n=6). Values labeled with a different letter in the same column are significantly different (p<0.05). n.d.: not detected; limit of detection: <2 log CFU/g. 1 +/6: positive samples after enrichment and growth in selective medium.
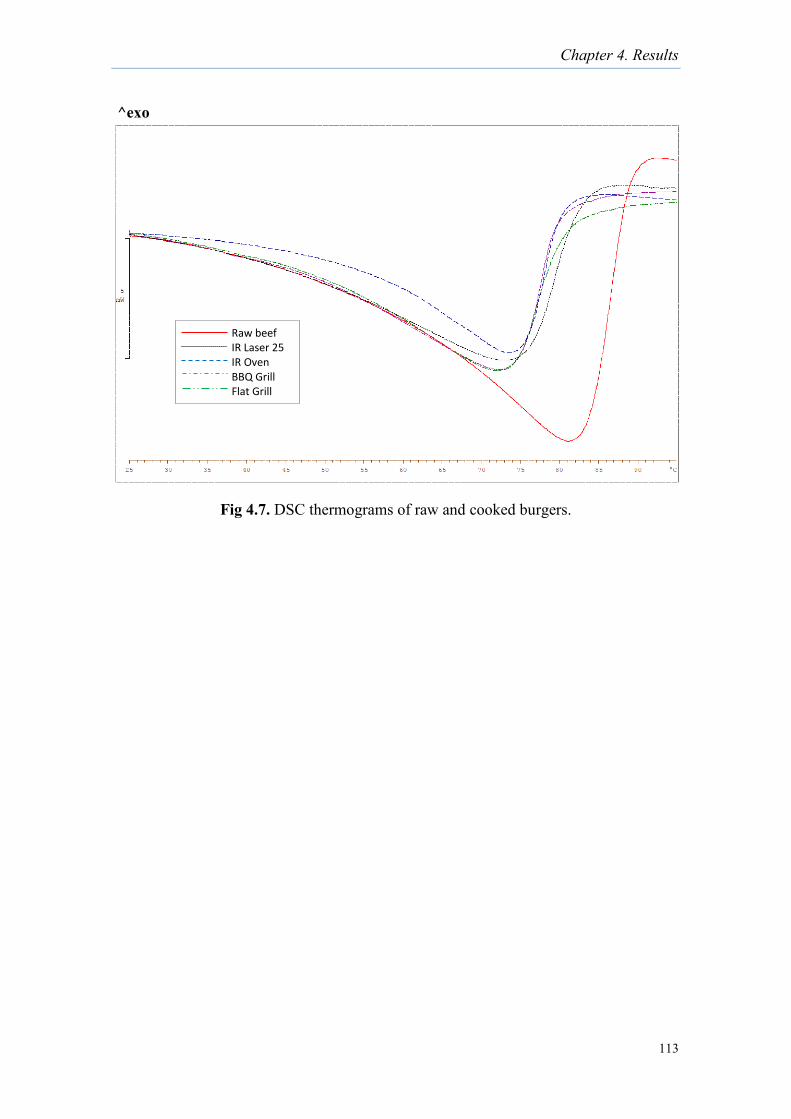
Chapter 4. Results
113
Fig 4.7. DSC thermograms of raw and cooked burgers.
^exo
Raw beef IR Laser 25 IR Oven BBQ Grill Flat Grill
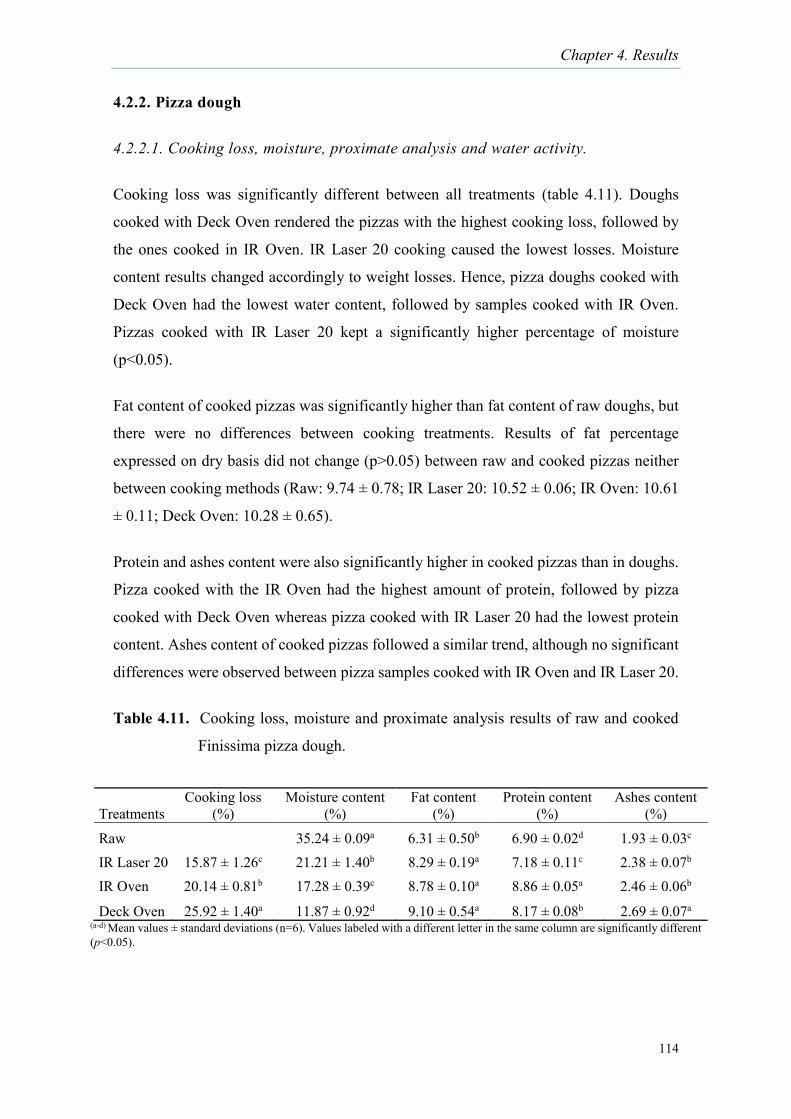
Chapter 4. Results
114
4.2.2. Pizza dough
4.2.2.1. Cooking loss, moisture, proximate analysis and water activity.
Cooking loss was significantly different between all treatments (table 4.11). Doughs
cooked with Deck Oven rendered the pizzas with the highest cooking loss, followed by
the ones cooked in IR Oven. IR Laser 20 cooking caused the lowest losses. Moisture
content results changed accordingly to weight losses. Hence, pizza doughs cooked with
Deck Oven had the lowest water content, followed by samples cooked with IR Oven.
Pizzas cooked with IR Laser 20 kept a significantly higher percentage of moisture
(p<0.05).
Fat content of cooked pizzas was significantly higher than fat content of raw doughs, but
there were no differences between cooking treatments. Results of fat percentage
expressed on dry basis did not change (p>0.05) between raw and cooked pizzas neither
between cooking methods (Raw: 9.74 ± 0.78; IR Laser 20: 10.52 ± 0.06; IR Oven: 10.61
± 0.11; Deck Oven: 10.28 ± 0.65).
Protein and ashes content were also significantly higher in cooked pizzas than in doughs.
Pizza cooked with the IR Oven had the highest amount of protein, followed by pizza
cooked with Deck Oven whereas pizza cooked with IR Laser 20 had the lowest protein
content. Ashes content of cooked pizzas followed a similar trend, although no significant
differences were observed between pizza samples cooked with IR Oven and IR Laser 20.
Table 4.11. Cooking loss, moisture and proximate analysis results of raw and cooked
Finissima pizza dough.
Treatments Cooking loss
(%) Moisture content
(%) Fat content
(%) Protein content
(%) Ashes content
(%)
Raw 35.24 ± 0.09a 6.31 ± 0.50b 6.90 ± 0.02d 1.93 ± 0.03c IR Laser 20 15.87 ± 1.26c 21.21 ± 1.40b 8.29 ± 0.19a 7.18 ± 0.11c 2.38 ± 0.07b IR Oven 20.14 ± 0.81b 17.28 ± 0.39c 8.78 ± 0.10a 8.86 ± 0.05a 2.46 ± 0.06b
Deck Oven 25.92 ± 1.40a 11.87 ± 0.92d 9.10 ± 0.54a 8.17 ± 0.08b 2.69 ± 0.07a (a-d) Mean values ± standard deviations (n=6). Values labeled with a different letter in the same column are significantly different (p<0.05).
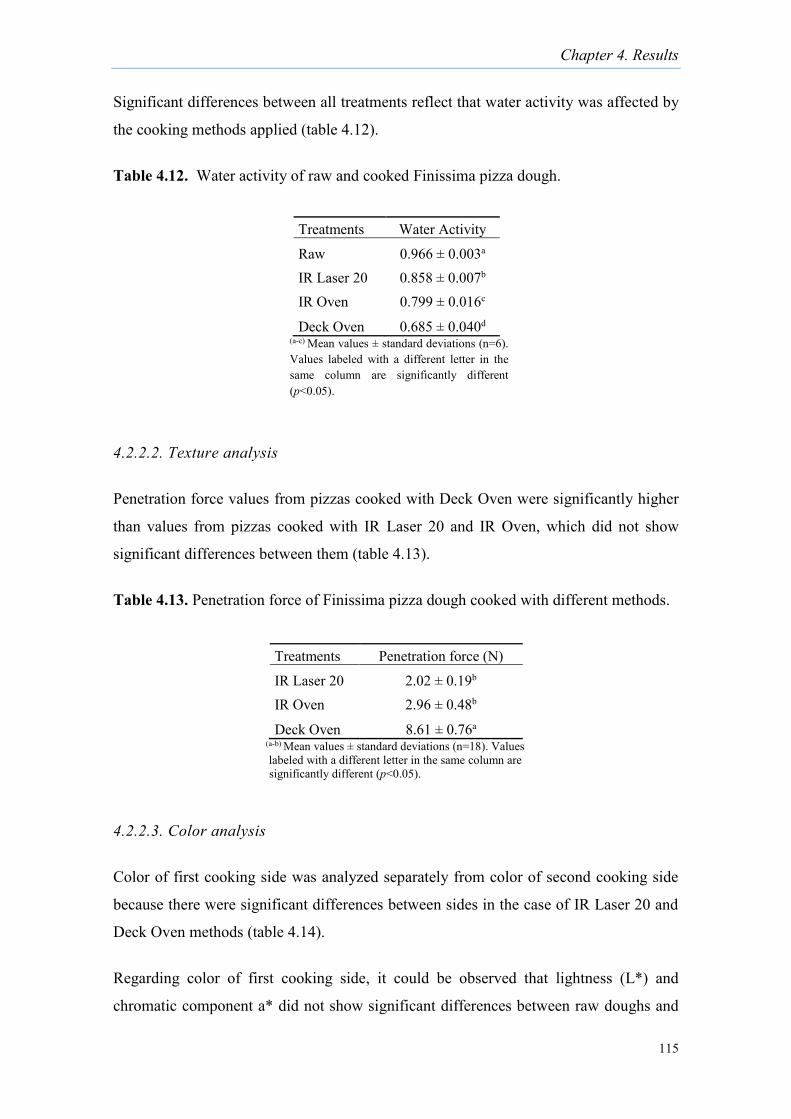
Chapter 4. Results
115
Significant differences between all treatments reflect that water activity was affected by
the cooking methods applied (table 4.12).
Table 4.12. Water activity of raw and cooked Finissima pizza dough.
4.2.2.2. Texture analysis
Penetration force values from pizzas cooked with Deck Oven were significantly higher
than values from pizzas cooked with IR Laser 20 and IR Oven, which did not show
significant differences between them (table 4.13).
Table 4.13. Penetration force of Finissima pizza dough cooked with different methods.
4.2.2.3. Color analysis
Color of first cooking side was analyzed separately from color of second cooking side
because there were significant differences between sides in the case of IR Laser 20 and
Deck Oven methods (table 4.14).
Regarding color of first cooking side, it could be observed that lightness (L*) and
chromatic component a* did not show significant differences between raw doughs and
Treatments Penetration force (N)
IR Laser 20 2.02 ± 0.19b IR Oven 2.96 ± 0.48b
Deck Oven 8.61 ± 0.76a (a-b) Mean values ± standard deviations (n=18). Values labeled with a different letter in the same column are significantly different (p<0.05).
Treatments Water Activity
Raw 0.966 ± 0.003a IR Laser 20 0.858 ± 0.007b IR Oven 0.799 ± 0.016c
Deck Oven 0.685 ± 0.040d (a-c) Mean values ± standard deviations (n=6). Values labeled with a different letter in the same column are significantly different (p<0.05).
Chapter 4. Results
116
pizzas cooked with IR Oven and Deck Oven treatments. On the contrary, lightness of
pizzas cooked with IR Laser 20 was significantly lower and a*, the reddish component,
increased significantly. Chromatic component b* values of raw doughs were significantly
lower than those of cooked pizzas, being IR Laser 20 cooked pizzas the samples that
presented the highest increase in the yellowish component. Hence, total color difference
(ΔE*) of IR Laser 20 samples was significantly higher than ΔE* calculated from the other
cooking treatments, which did not show significant differences between them.
To analyze the color of second cooking side, cooking treatments were compared only
between them, as raw pizza had been previously compared with the first cooking side,
and second side was already partially cooked at the end of first side cooking in the case
of IR Laser 20 treatment. There were not significant differences between IR Laser 20 and
Deck Oven in any of the color parameters measured, whereas there were always
significant differences between those two treatments and IR Oven: lightness was
significantly lower in pizzas cooked with IR Laser 20 and Deck Oven whereas chromatic
components a* and b* were higher. These results led to higher values of External ΔE* for
IR Laser 20 and Deck Oven treatments. Color of samples can be observed in figures 4.8,
4.9 and 4.10, which show that pizzas cooked with IR Laser 20 and Deck Oven developed
more browning.
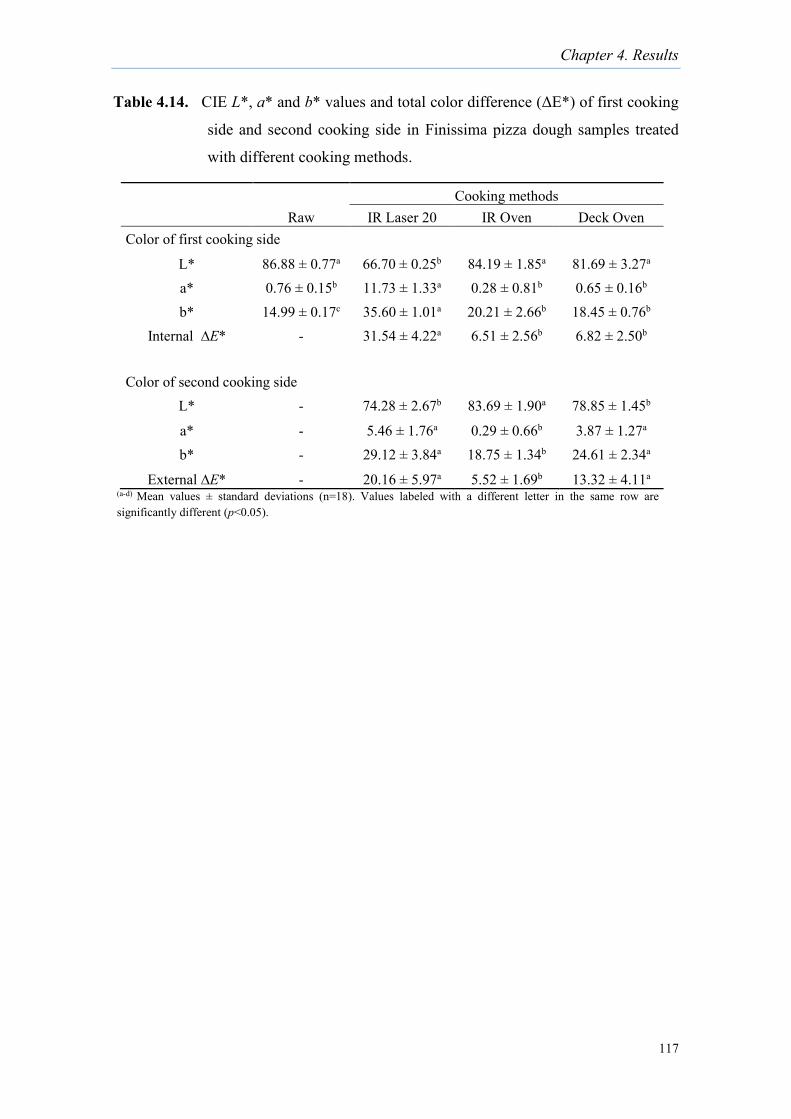
Chapter 4. Results
117
Table 4.14. CIE L*, a* and b* values and total color difference (ΔE*) of first cooking
side and second cooking side in Finissima pizza dough samples treated
with different cooking methods.
Cooking methods
Raw IR Laser 20 IR Oven Deck Oven Color of first cooking side
L* 86.88 ± 0.77a 66.70 ± 0.25b 84.19 ± 1.85a 81.69 ± 3.27a a* 0.76 ± 0.15b 11.73 ± 1.33a 0.28 ± 0.81b 0.65 ± 0.16b b* 14.99 ± 0.17c 35.60 ± 1.01a 20.21 ± 2.66b 18.45 ± 0.76b
Internal ∆E* - 31.54 ± 4.22a 6.51 ± 2.56b 6.82 ± 2.50b
Color of second cooking side
L* - 74.28 ± 2.67b 83.69 ± 1.90a 78.85 ± 1.45b
a* - 5.46 ± 1.76a 0.29 ± 0.66b 3.87 ± 1.27a b* - 29.12 ± 3.84a 18.75 ± 1.34b 24.61 ± 2.34a
External ∆E* - 20.16 ± 5.97a 5.52 ± 1.69b 13.32 ± 4.11a (a-d) Mean values ± standard deviations (n=18). Values labeled with a different letter in the same row are significantly different (p<0.05).
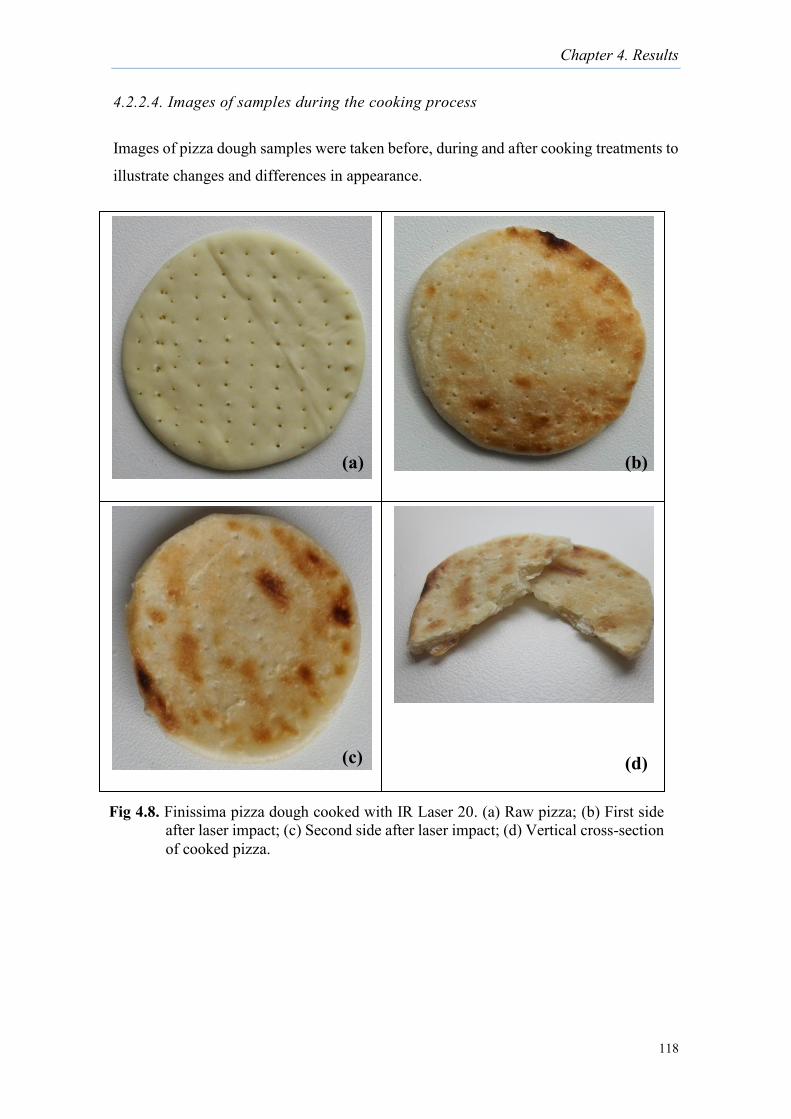
Chapter 4. Results
118
4.2.2.4. Images of samples during the cooking process
Images of pizza dough samples were taken before, during and after cooking treatments to
illustrate changes and differences in appearance.
0 1 2
cm
0 1 2
cm
0 1 2
cm
0 1 2
cm
Fig 4.8. Finissima pizza dough cooked with IR Laser 20. (a) Raw pizza; (b) First side after laser impact; (c) Second side after laser impact; (d) Vertical cross-section of cooked pizza.
(a) (b)
(c) (d)
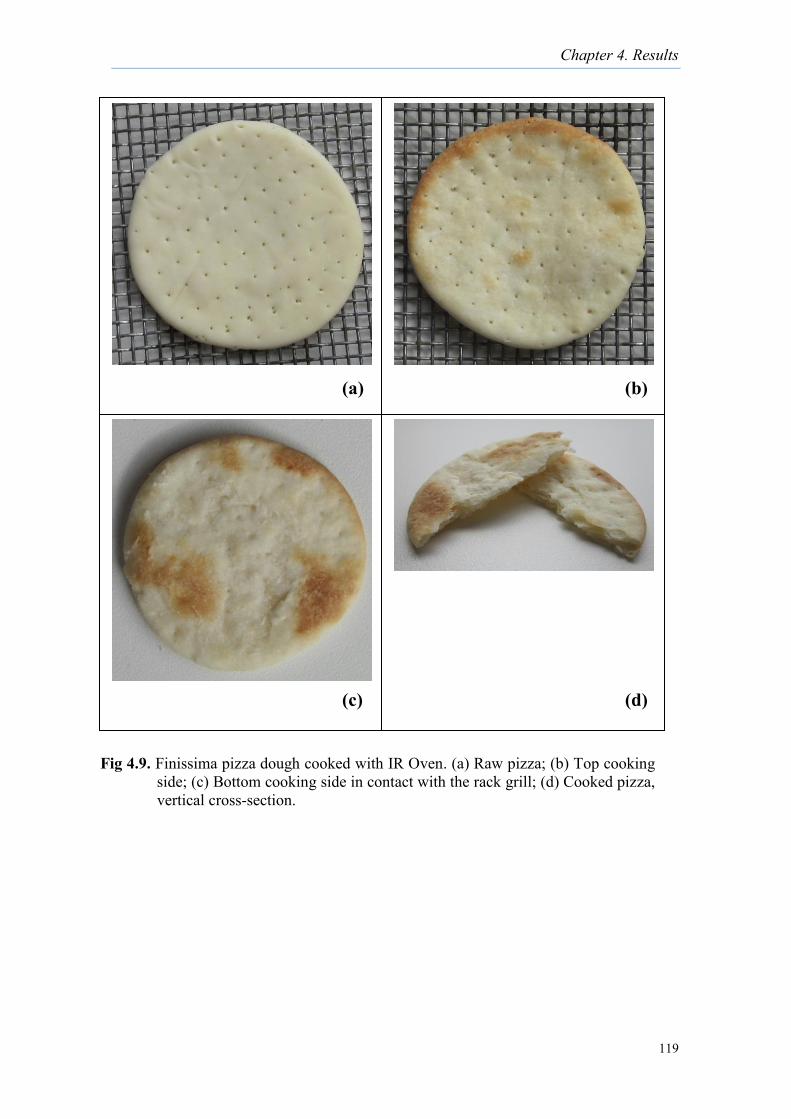
Chapter 4. Results
119
0 1 2
cm 0 1 2
cm
0 1 2
cm
0 1 2
cm
0 1 2
cm
Fig 4.9. Finissima pizza dough cooked with IR Oven. (a) Raw pizza; (b) Top cooking side; (c) Bottom cooking side in contact with the rack grill; (d) Cooked pizza, vertical cross-section.
.
(a) (b)
(c) (d)
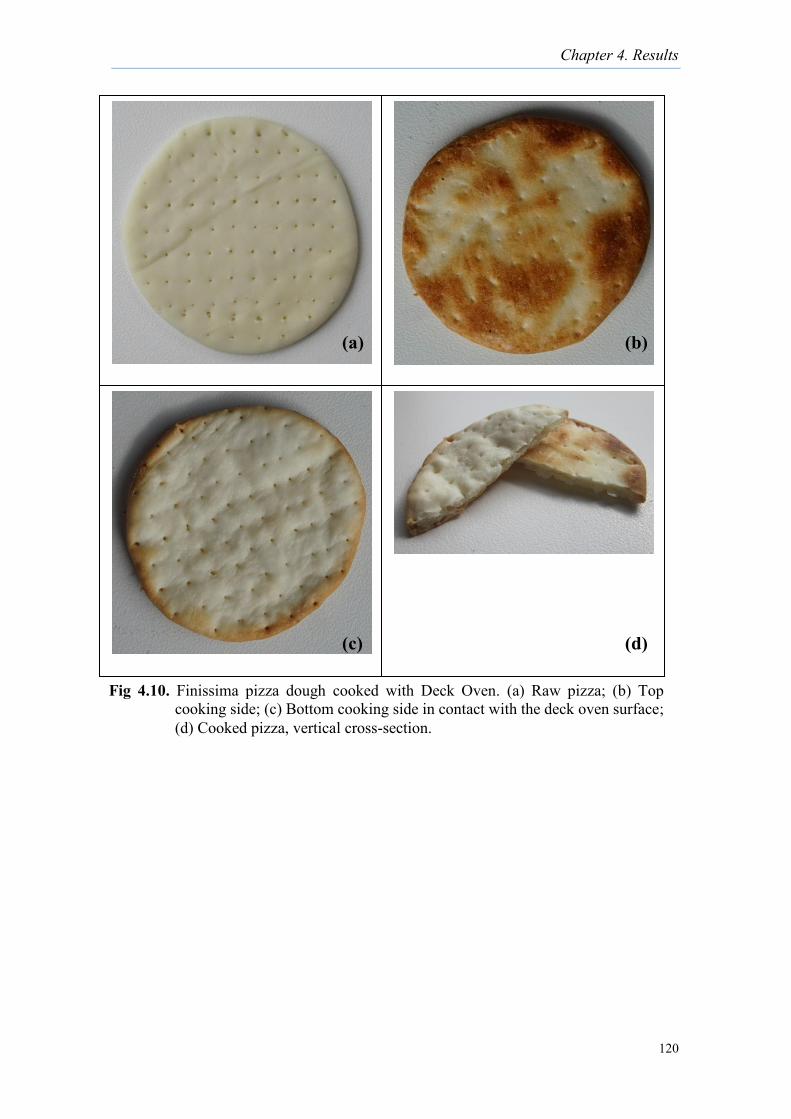
Chapter 4. Results
120
0 1 2
cm
0 1 2
cm
0 1 2
cm
0 1 2
cm
Fig 4.10. Finissima pizza dough cooked with Deck Oven. (a) Raw pizza; (b) Top cooking side; (c) Bottom cooking side in contact with the deck oven surface; (d) Cooked pizza, vertical cross-section.
(a) (b)
(c) (d)
Chapter 4. Results
121
4.2.2.5. Sensory analysis
Consumers evaluated the general appearance of pizzas cooked with IR Laser 20 and Deck
Oven with better scores than the general appearance of samples cooked with IR Oven,
which received a significantly lower rating (table 4.15 and figures, 4.8, 4.9, 4.10).
When the intensity of different attributes was evaluated, the external color of pizza
cooked with IR Laser 20 was scored as the brownest, followed by Deck Oven and IR
Oven, which had a significantly lighter color. The level of doneness was similar for IR
Laser 20 and Deck Oven, whereas doneness was significantly lower for pizza cooked
with IR Oven. Pizzas cooked with Deck Oven were the crunchiest, whereas pizzas cooked
with IR based treatments were significantly softer. Taste intensity was significantly
higher in pizzas cooked with IR Laser 20 and Deck Oven than in pizzas cooked with IR
Oven. Three different levels of flavor intensity could be identified: the highest, which
corresponded to pizzas cooked with IR Laser 20; the intermediate, for pizzas cooked with
Deck Oven; and the lowest, for pizzas cooked with IR Oven (p<0.05).
Regarding acceptability, external color, level of doneness, taste and flavor of pizzas
cooked with IR Laser 20 and Deck Oven received the highest ratings, whereas these four
attributes were significantly less accepted in samples cooked with IR Oven. Crunchiness
of pizzas was better accepted in samples cooked with the Deck Oven, whereas softer
pizzas, obtained with IR Laser 20 and IR Oven, were less accepted.
Preference test showed that consumers preferred pizzas cooked with Deck Oven and IR
Laser 20. Pizzas cooked with IR Oven were ranked in the last place (table 4.16).
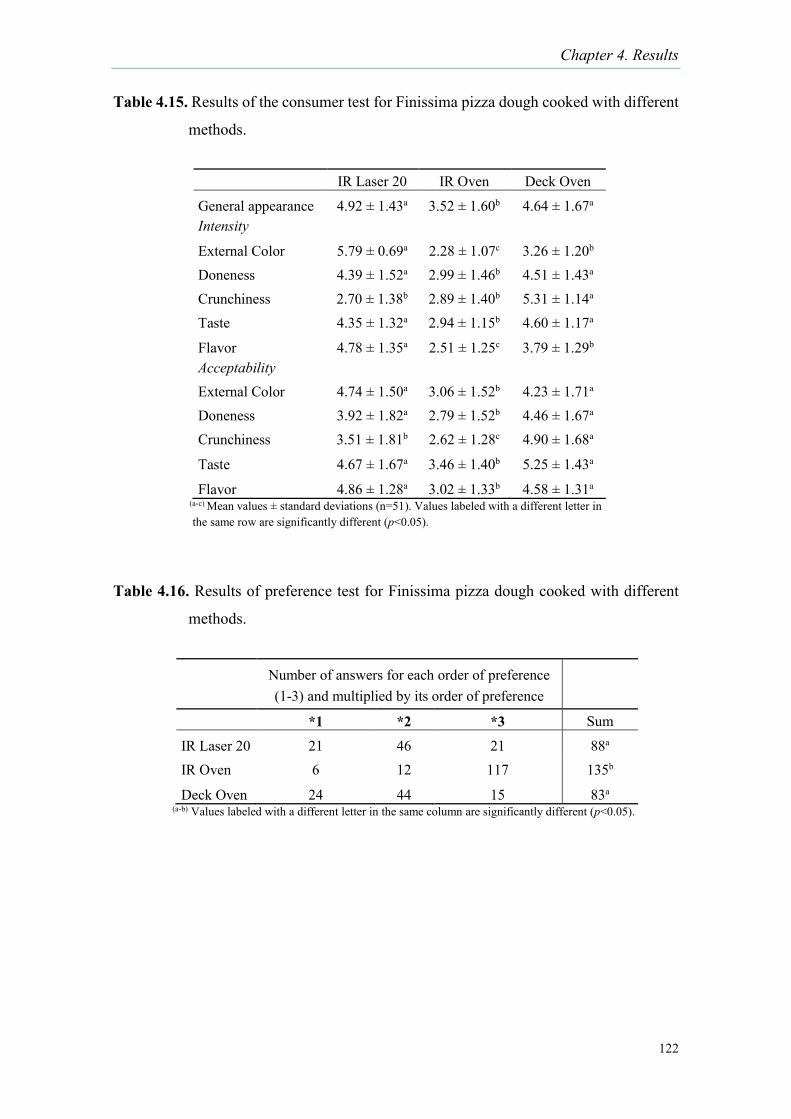
Chapter 4. Results
122
Table 4.15. Results of the consumer test for Finissima pizza dough cooked with different
methods.
Table 4.16. Results of preference test for Finissima pizza dough cooked with different
methods.
IR Laser 20 IR Oven Deck Oven
General appearance 4.92 ± 1.43a 3.52 ± 1.60b 4.64 ± 1.67a Intensity External Color 5.79 ± 0.69a 2.28 ± 1.07c 3.26 ± 1.20b Doneness 4.39 ± 1.52a 2.99 ± 1.46b 4.51 ± 1.43a Crunchiness 2.70 ± 1.38b 2.89 ± 1.40b 5.31 ± 1.14a Taste 4.35 ± 1.32a 2.94 ± 1.15b 4.60 ± 1.17a
Flavor 4.78 ± 1.35a 2.51 ± 1.25c 3.79 ± 1.29b Acceptability External Color 4.74 ± 1.50a 3.06 ± 1.52b 4.23 ± 1.71a Doneness 3.92 ± 1.82a 2.79 ± 1.52b 4.46 ± 1.67a Crunchiness 3.51 ± 1.81b 2.62 ± 1.28c 4.90 ± 1.68a
Taste 4.67 ± 1.67a 3.46 ± 1.40b 5.25 ± 1.43a
Flavor 4.86 ± 1.28a 3.02 ± 1.33b 4.58 ± 1.31a (a-c) Mean values ± standard deviations (n=51). Values labeled with a different letter in the same row are significantly different (p<0.05).
Number of answers for each order of preference (1-3) and multiplied by its order of preference
*1 *2 *3 Sum
IR Laser 20 21 46 21 88a IR Oven 6 12 117 135b
Deck Oven 24 44 15 83a (a-b) Values labeled with a different letter in the same column are significantly different (p<0.05).
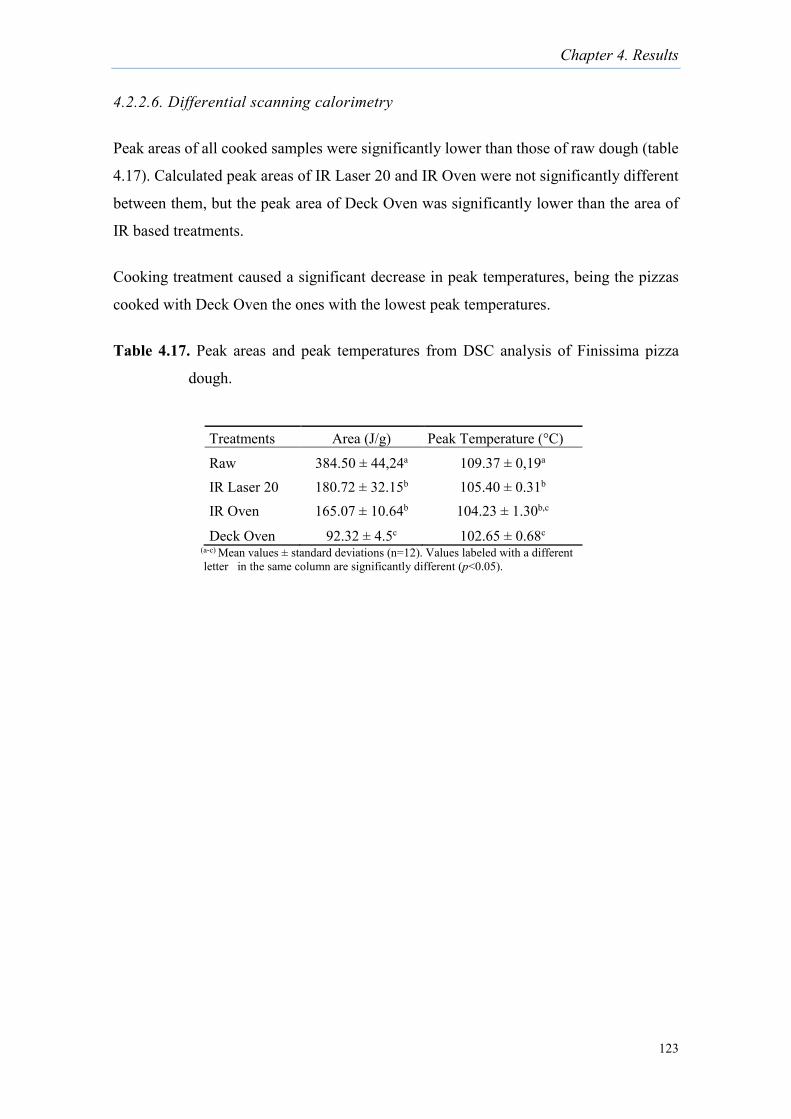
Chapter 4. Results
123
4.2.2.6. Differential scanning calorimetry
Peak areas of all cooked samples were significantly lower than those of raw dough (table
4.17). Calculated peak areas of IR Laser 20 and IR Oven were not significantly different
between them, but the peak area of Deck Oven was significantly lower than the area of
IR based treatments.
Cooking treatment caused a significant decrease in peak temperatures, being the pizzas
cooked with Deck Oven the ones with the lowest peak temperatures.
Table 4.17. Peak areas and peak temperatures from DSC analysis of Finissima pizza
dough.
Treatments Area (J/g) Peak Temperature (°C)
Raw 384.50 ± 44,24a 109.37 ± 0,19a IR Laser 20 180.72 ± 32.15b 105.40 ± 0.31b IR Oven 165.07 ± 10.64b 104.23 ± 1.30b,c
Deck Oven 92.32 ± 4.5c 102.65 ± 0.68c (a-c) Mean values ± standard deviations (n=12). Values labeled with a different letter in the same column are significantly different (p<0.05).
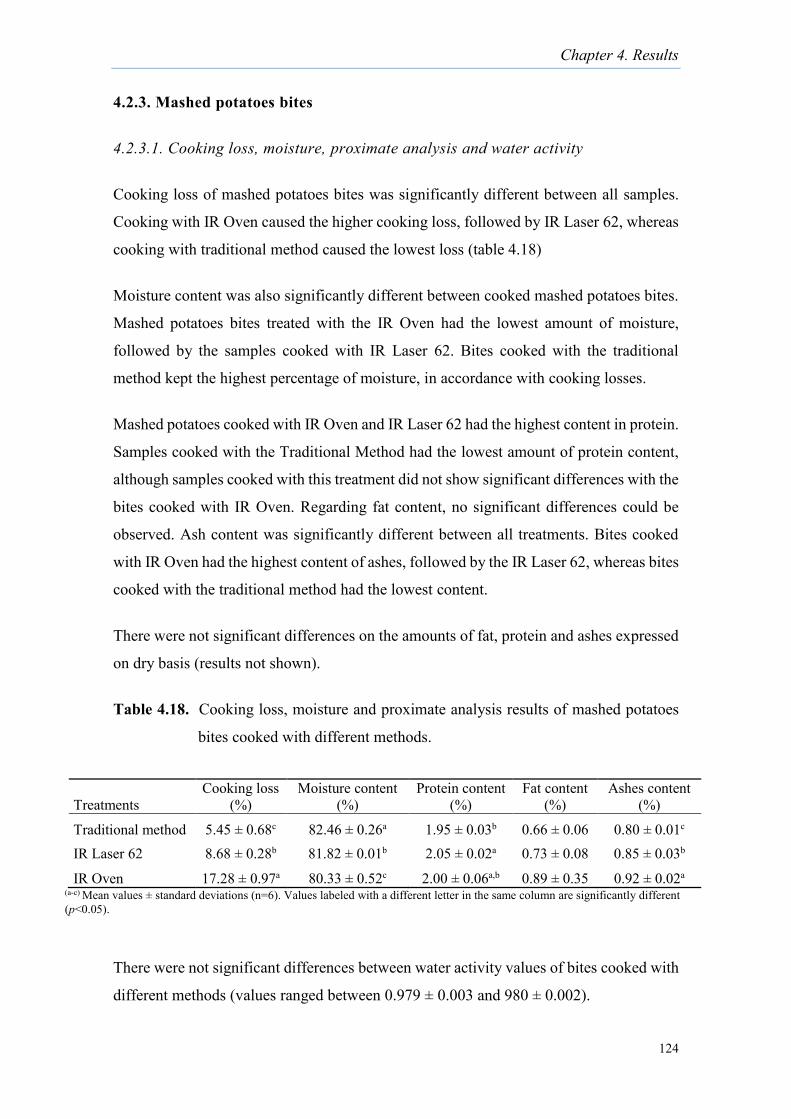
Chapter 4. Results
124
4.2.3. Mashed potatoes bites
4.2.3.1. Cooking loss, moisture, proximate analysis and water activity
Cooking loss of mashed potatoes bites was significantly different between all samples.
Cooking with IR Oven caused the higher cooking loss, followed by IR Laser 62, whereas
cooking with traditional method caused the lowest loss (table 4.18)
Moisture content was also significantly different between cooked mashed potatoes bites.
Mashed potatoes bites treated with the IR Oven had the lowest amount of moisture,
followed by the samples cooked with IR Laser 62. Bites cooked with the traditional
method kept the highest percentage of moisture, in accordance with cooking losses.
Mashed potatoes cooked with IR Oven and IR Laser 62 had the highest content in protein.
Samples cooked with the Traditional Method had the lowest amount of protein content,
although samples cooked with this treatment did not show significant differences with the
bites cooked with IR Oven. Regarding fat content, no significant differences could be
observed. Ash content was significantly different between all treatments. Bites cooked
with IR Oven had the highest content of ashes, followed by the IR Laser 62, whereas bites
cooked with the traditional method had the lowest content.
There were not significant differences on the amounts of fat, protein and ashes expressed
on dry basis (results not shown).
Table 4.18. Cooking loss, moisture and proximate analysis results of mashed potatoes
bites cooked with different methods.
There were not significant differences between water activity values of bites cooked with
different methods (values ranged between 0.979 ± 0.003 and 980 ± 0.002).
Treatments Cooking loss
(%) Moisture content
(%) Protein content
(%) Fat content
(%) Ashes content
(%)
Traditional method 5.45 ± 0.68c 82.46 ± 0.26a 1.95 ± 0.03b 0.66 ± 0.06 0.80 ± 0.01c IR Laser 62 8.68 ± 0.28b 81.82 ± 0.01b 2.05 ± 0.02a 0.73 ± 0.08 0.85 ± 0.03b
IR Oven 17.28 ± 0.97a 80.33 ± 0.52c 2.00 ± 0.06a,b 0.89 ± 0.35 0.92 ± 0.02a (a-c) Mean values ± standard deviations (n=6). Values labeled with a different letter in the same column are significantly different (p<0.05).

Chapter 4. Results
125
4.2.3.2. Texture analysis
Force of compression between cooked mashed potatoes bites was significantly different
between all treatments. IR Oven showed caused the highest force of compression in bites,
followed by the IR Laser 62. Finally, bites cooked with Traditional method presented the
lowest force (table 4.19).
Table 4.19. Force of compression in mashed potatoes bites treated with different cooking
methods.
4.2.3.3. Color analysis
External color of top side of mashed potatoes bites was analyzed (table 4.20). There were
significant differences between color parameters of all samples. Traditional cooking
method produced the bites with highest lightness values and lowest values of chromatic
components a* and b*. Bites cooked with IR Oven presented intermediate values of
lightness and b*, but the highest value of a*. IR Laser 62 produced the bites with lowest
lightness and highest b*. These samples were the ones that presented some browning in
their surface (figures 4.11, 4.12 and 4.13).
Table 4.20. CIE L*, a* and b* values of the external surface of mashed potatoes bites
cooked with different methods.
Treatments Force of Compression (N)
Traditional method 5.35 ± 0.45c IR Laser 62 8.48 ± 0.21b
IR Oven 15.50 ± 0.40a (a-c) Mean values ± standard deviations (n=18). Values labeled with a different letter in the same column are significantly different (p<0.05).
Treatments L* a* b*
Traditional method 80.62 ± 0.34a 3.93 ± 0.07c 22.41 ± 0.21c IR Laser 62 73.48 ± 0.04c 4.40 ± 0.15b 25.63 ± 0.41a
IR Oven 75.16 ± 0.43b 4.87 ± 0.20a 24.36 ± 0.39b (a-c) Mean values ± standard deviations (n=6). Values labeled with a different letter in the same column are significantly different (p<0.05).
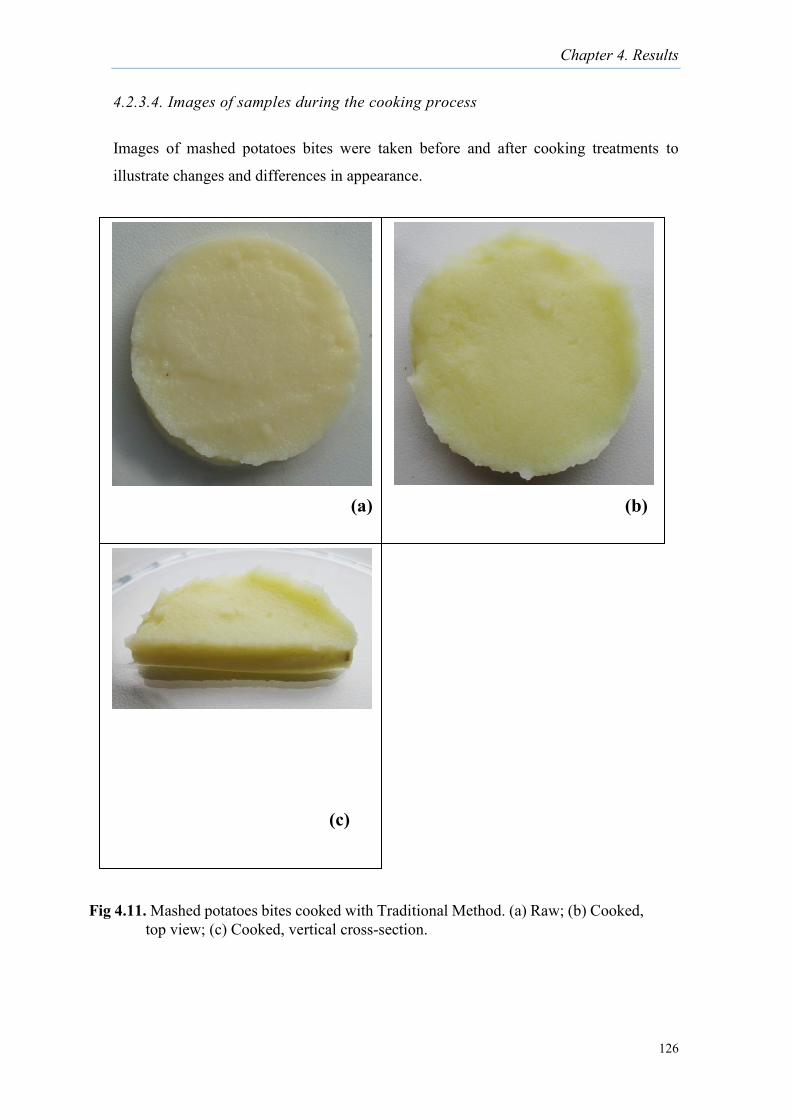
Chapter 4. Results
126
4.2.3.4. Images of samples during the cooking process
Images of mashed potatoes bites were taken before and after cooking treatments to
illustrate changes and differences in appearance.
0 1 2
cm
0 1 2
cm
Fig 4.11. Mashed potatoes bites cooked with Traditional Method. (a) Raw; (b) Cooked, top view; (c) Cooked, vertical cross-section.
(b)
(c)
(a)
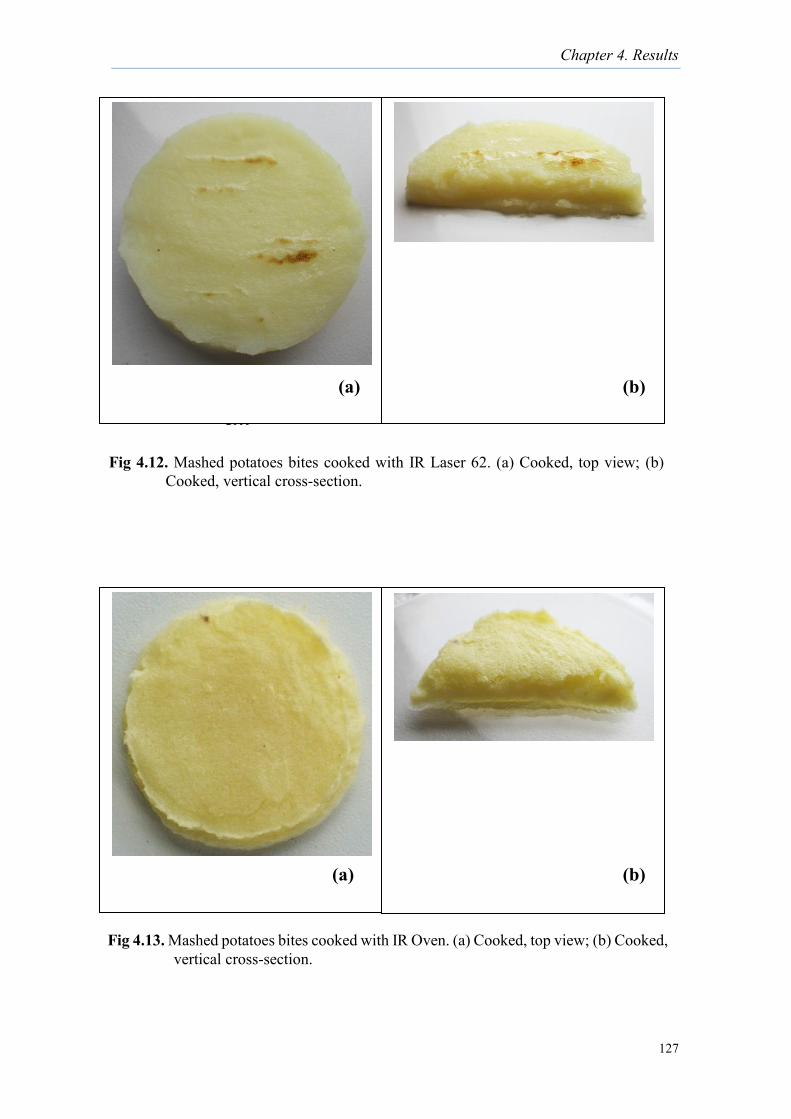
Chapter 4. Results
127
0 1 2
cm
0 1 2
cm
0 1 2
cm
0 1 2
cm
0 1 2
cm
Fig 4.13. Mashed potatoes bites cooked with IR Oven. (a) Cooked, top view; (b) Cooked, vertical cross-section.
(a)
(b)
Fig 4.12. Mashed potatoes bites cooked with IR Laser 62. (a) Cooked, top view; (b) Cooked, vertical cross-section.
(b) (a)
(a)
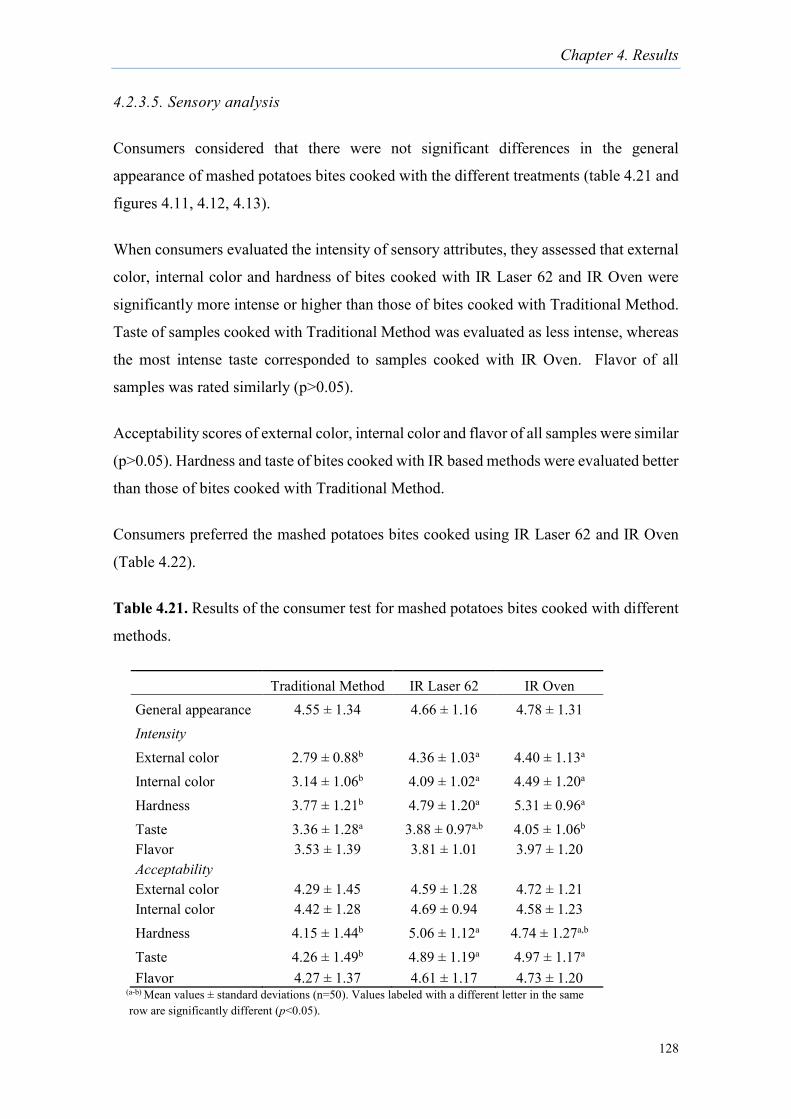
Chapter 4. Results
128
4.2.3.5. Sensory analysis
Consumers considered that there were not significant differences in the general
appearance of mashed potatoes bites cooked with the different treatments (table 4.21 and
figures 4.11, 4.12, 4.13).
When consumers evaluated the intensity of sensory attributes, they assessed that external
color, internal color and hardness of bites cooked with IR Laser 62 and IR Oven were
significantly more intense or higher than those of bites cooked with Traditional Method.
Taste of samples cooked with Traditional Method was evaluated as less intense, whereas
the most intense taste corresponded to samples cooked with IR Oven. Flavor of all
samples was rated similarly (p>0.05).
Acceptability scores of external color, internal color and flavor of all samples were similar
(p>0.05). Hardness and taste of bites cooked with IR based methods were evaluated better
than those of bites cooked with Traditional Method.
Consumers preferred the mashed potatoes bites cooked using IR Laser 62 and IR Oven
(Table 4.22).
Table 4.21. Results of the consumer test for mashed potatoes bites cooked with different
methods.
Traditional Method IR Laser 62 IR Oven General appearance 4.55 ± 1.34 4.66 ± 1.16 4.78 ± 1.31 Intensity External color 2.79 ± 0.88b 4.36 ± 1.03a 4.40 ± 1.13a Internal color 3.14 ± 1.06b 4.09 ± 1.02a 4.49 ± 1.20a Hardness 3.77 ± 1.21b 4.79 ± 1.20a 5.31 ± 0.96a Taste 3.36 ± 1.28a 3.88 ± 0.97a,b 4.05 ± 1.06b Flavor 3.53 ± 1.39 3.81 ± 1.01 3.97 ± 1.20 Acceptability External color 4.29 ± 1.45 4.59 ± 1.28 4.72 ± 1.21 Internal color 4.42 ± 1.28 4.69 ± 0.94 4.58 ± 1.23 Hardness 4.15 ± 1.44b 5.06 ± 1.12a 4.74 ± 1.27a,b Taste 4.26 ± 1.49b 4.89 ± 1.19a 4.97 ± 1.17a Flavor 4.27 ± 1.37 4.61 ± 1.17 4.73 ± 1.20
(a-b) Mean values ± standard deviations (n=50). Values labeled with a different letter in the same row are significantly different (p<0.05).
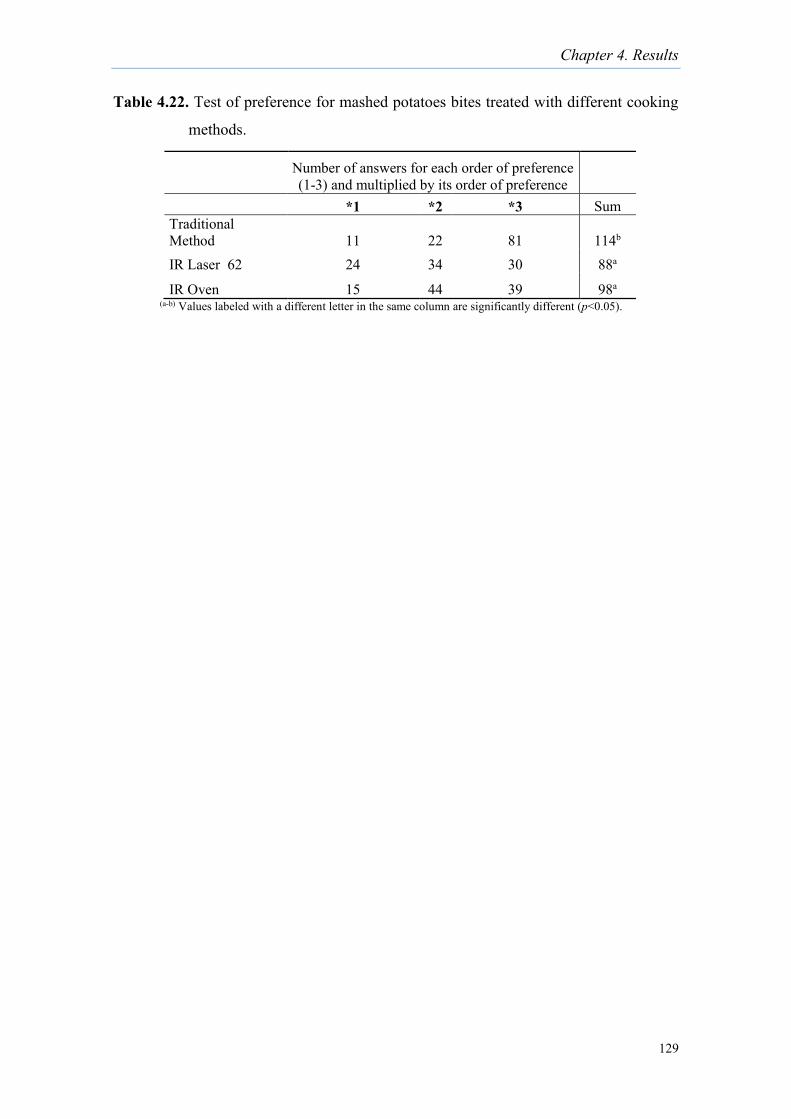
Chapter 4. Results
129
Table 4.22. Test of preference for mashed potatoes bites treated with different cooking
methods.
Number of answers for each order of preference (1-3) and multiplied by its order of preference
*1 *2 *3 Sum Traditional Method 11 22 81 114b IR Laser 62 24 34 30 88a
IR Oven 15 44 39 98a (a-b) Values labeled with a different letter in the same column are significantly different (p<0.05).
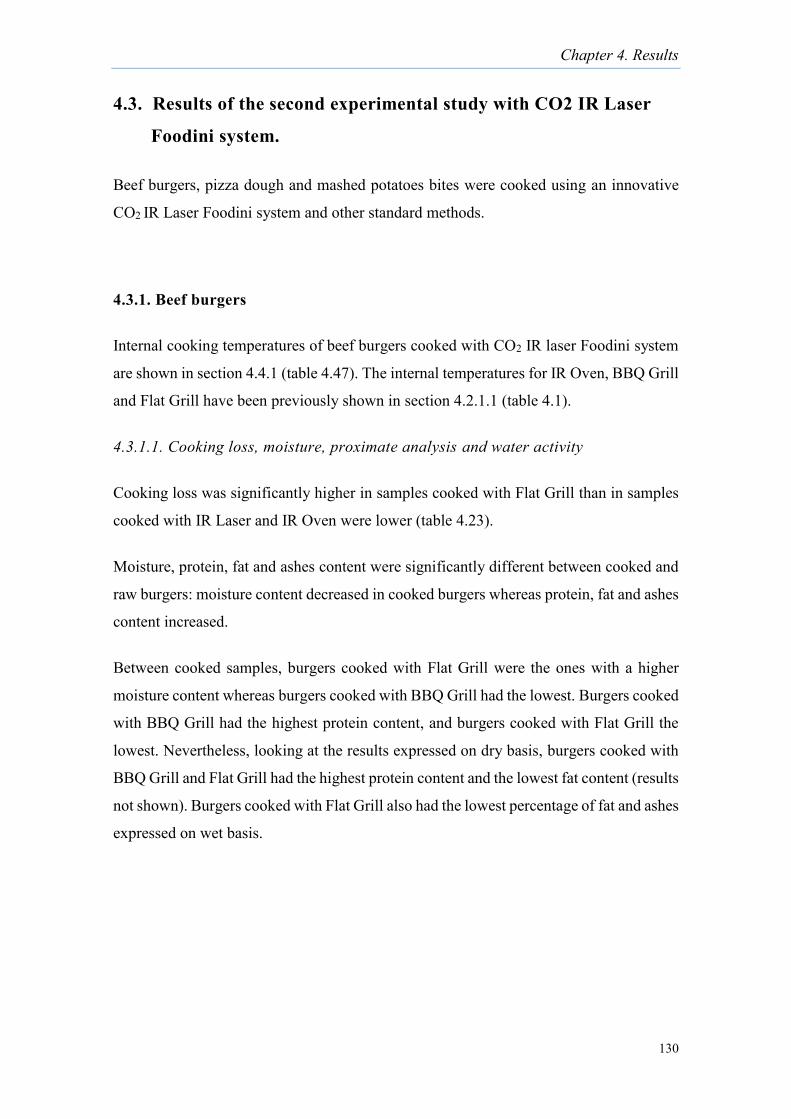
Chapter 4. Results
130
4.3. Results of the second experimental study with CO2 IR Laser
Foodini system.
Beef burgers, pizza dough and mashed potatoes bites were cooked using an innovative
CO2 IR Laser Foodini system and other standard methods.
4.3.1. Beef burgers
Internal cooking temperatures of beef burgers cooked with CO2 IR laser Foodini system
are shown in section 4.4.1 (table 4.47). The internal temperatures for IR Oven, BBQ Grill
and Flat Grill have been previously shown in section 4.2.1.1 (table 4.1).
4.3.1.1. Cooking loss, moisture, proximate analysis and water activity
Cooking loss was significantly higher in samples cooked with Flat Grill than in samples
cooked with IR Laser and IR Oven were lower (table 4.23).
Moisture, protein, fat and ashes content were significantly different between cooked and
raw burgers: moisture content decreased in cooked burgers whereas protein, fat and ashes
content increased.
Between cooked samples, burgers cooked with Flat Grill were the ones with a higher
moisture content whereas burgers cooked with BBQ Grill had the lowest. Burgers cooked
with BBQ Grill had the highest protein content, and burgers cooked with Flat Grill the
lowest. Nevertheless, looking at the results expressed on dry basis, burgers cooked with
BBQ Grill and Flat Grill had the highest protein content and the lowest fat content (results
not shown). Burgers cooked with Flat Grill also had the lowest percentage of fat and ashes
expressed on wet basis.
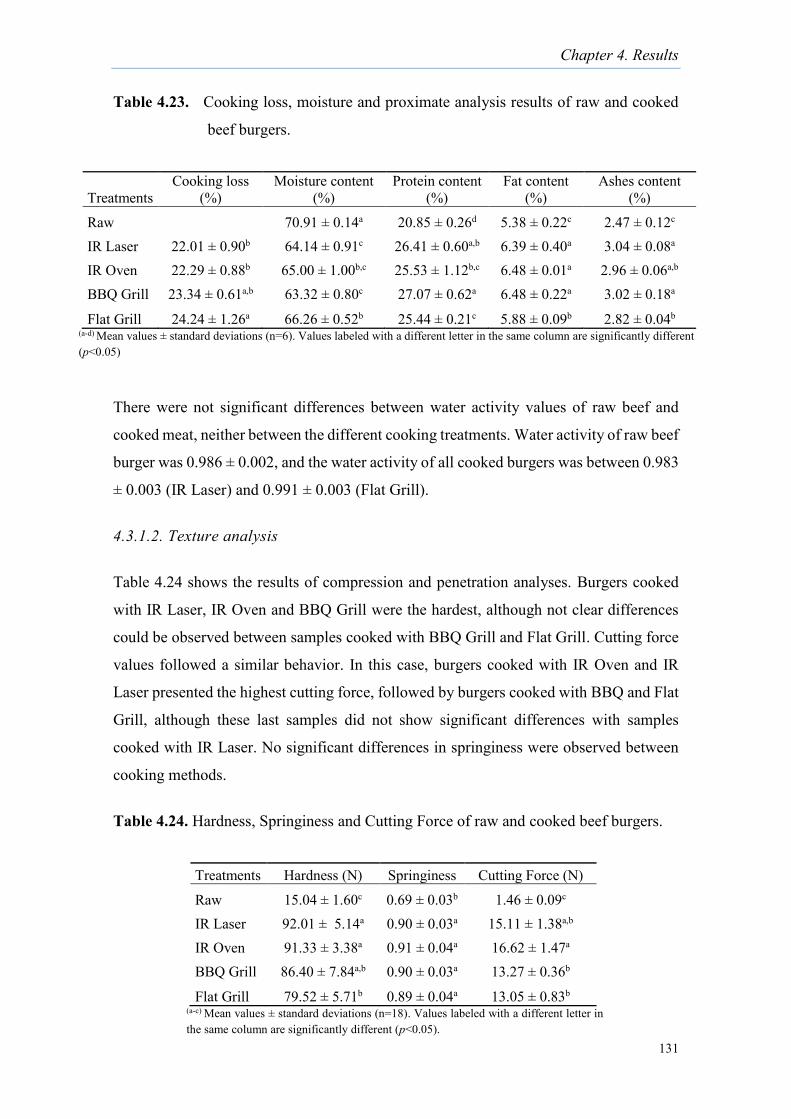
Chapter 4. Results
131
Table 4.23. Cooking loss, moisture and proximate analysis results of raw and cooked
beef burgers.
There were not significant differences between water activity values of raw beef and
cooked meat, neither between the different cooking treatments. Water activity of raw beef
burger was 0.986 ± 0.002, and the water activity of all cooked burgers was between 0.983
± 0.003 (IR Laser) and 0.991 ± 0.003 (Flat Grill).
4.3.1.2. Texture analysis
Table 4.24 shows the results of compression and penetration analyses. Burgers cooked
with IR Laser, IR Oven and BBQ Grill were the hardest, although not clear differences
could be observed between samples cooked with BBQ Grill and Flat Grill. Cutting force
values followed a similar behavior. In this case, burgers cooked with IR Oven and IR
Laser presented the highest cutting force, followed by burgers cooked with BBQ and Flat
Grill, although these last samples did not show significant differences with samples
cooked with IR Laser. No significant differences in springiness were observed between
cooking methods.
Table 4.24. Hardness, Springiness and Cutting Force of raw and cooked beef burgers.
Treatments Cooking loss
(%) Moisture content
(%) Protein content
(%) Fat content
(%) Ashes content
(%)
Raw 70.91 ± 0.14a 20.85 ± 0.26d 5.38 ± 0.22c 2.47 ± 0.12c IR Laser 22.01 ± 0.90b 64.14 ± 0.91c 26.41 ± 0.60a,b 6.39 ± 0.40a 3.04 ± 0.08a IR Oven 22.29 ± 0.88b 65.00 ± 1.00b,c 25.53 ± 1.12b,c 6.48 ± 0.01a 2.96 ± 0.06a,b BBQ Grill 23.34 ± 0.61a,b 63.32 ± 0.80c 27.07 ± 0.62a 6.48 ± 0.22a 3.02 ± 0.18a
Flat Grill 24.24 ± 1.26a 66.26 ± 0.52b 25.44 ± 0.21c 5.88 ± 0.09b 2.82 ± 0.04b (a-d) Mean values ± standard deviations (n=6). Values labeled with a different letter in the same column are significantly different (p<0.05)
Treatments Hardness (N) Springiness Cutting Force (N)
Raw 15.04 ± 1.60c 0.69 ± 0.03b 1.46 ± 0.09c IR Laser 92.01 ± 5.14a 0.90 ± 0.03a 15.11 ± 1.38a,b IR Oven 91.33 ± 3.38a 0.91 ± 0.04a 16.62 ± 1.47a BBQ Grill 86.40 ± 7.84a,b 0.90 ± 0.03a 13.27 ± 0.36b
Flat Grill 79.52 ± 5.71b 0.89 ± 0.04a 13.05 ± 0.83b (a-c) Mean values ± standard deviations (n=18). Values labeled with a different letter in the same column are significantly different (p<0.05).
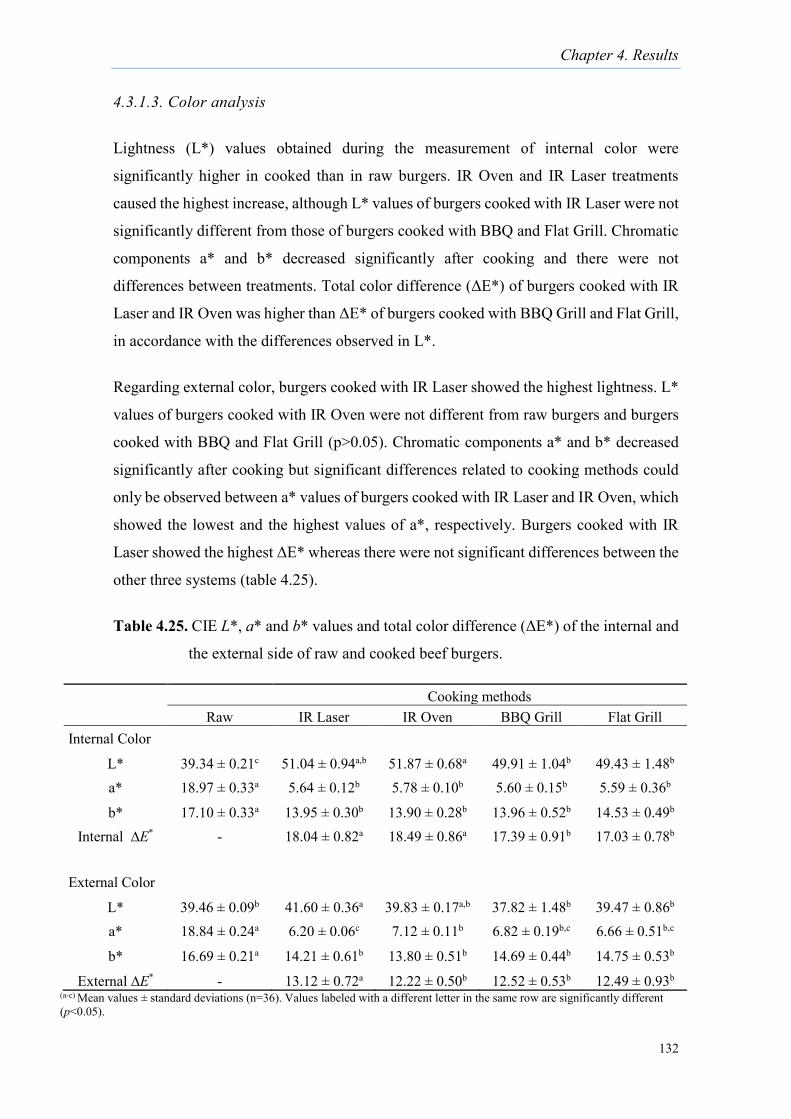
Chapter 4. Results
132
4.3.1.3. Color analysis
Lightness (L*) values obtained during the measurement of internal color were
significantly higher in cooked than in raw burgers. IR Oven and IR Laser treatments
caused the highest increase, although L* values of burgers cooked with IR Laser were not
significantly different from those of burgers cooked with BBQ and Flat Grill. Chromatic
components a* and b* decreased significantly after cooking and there were not
differences between treatments. Total color difference (ΔE*) of burgers cooked with IR
Laser and IR Oven was higher than ΔE* of burgers cooked with BBQ Grill and Flat Grill,
in accordance with the differences observed in L*.
Regarding external color, burgers cooked with IR Laser showed the highest lightness. L*
values of burgers cooked with IR Oven were not different from raw burgers and burgers
cooked with BBQ and Flat Grill (p>0.05). Chromatic components a* and b* decreased
significantly after cooking but significant differences related to cooking methods could
only be observed between a* values of burgers cooked with IR Laser and IR Oven, which
showed the lowest and the highest values of a*, respectively. Burgers cooked with IR
Laser showed the highest ΔE* whereas there were not significant differences between the
other three systems (table 4.25).
Table 4.25. CIE L*, a* and b* values and total color difference (ΔE*) of the internal and
the external side of raw and cooked beef burgers.
Cooking methods Raw IR Laser IR Oven BBQ Grill Flat Grill
Internal Color L* 39.34 ± 0.21c 51.04 ± 0.94a,b 51.87 ± 0.68a 49.91 ± 1.04b 49.43 ± 1.48b a* 18.97 ± 0.33a 5.64 ± 0.12b 5.78 ± 0.10b 5.60 ± 0.15b 5.59 ± 0.36b
b* 17.10 ± 0.33a 13.95 ± 0.30b 13.90 ± 0.28b 13.96 ± 0.52b 14.53 ± 0.49b Internal ∆E* - 18.04 ± 0.82a 18.49 ± 0.86a 17.39 ± 0.91b 17.03 ± 0.78b
External Color
L* 39.46 ± 0.09b 41.60 ± 0.36a 39.83 ± 0.17a,b 37.82 ± 1.48b 39.47 ± 0.86b a* 18.84 ± 0.24a 6.20 ± 0.06c 7.12 ± 0.11b 6.82 ± 0.19b,c 6.66 ± 0.51b,c
b* 16.69 ± 0.21a 14.21 ± 0.61b 13.80 ± 0.51b 14.69 ± 0.44b 14.75 ± 0.53b
External ∆E* - 13.12 ± 0.72a 12.22 ± 0.50b 12.52 ± 0.53b 12.49 ± 0.93b (a-c) Mean values ± standard deviations (n=36). Values labeled with a different letter in the same row are significantly different (p<0.05).

Chapter 4. Results
133
4.3.1.4. Images of samples during the cooking process
Only images of beef burgers cooked with CO2 IR Laser Foodini system were taken during
this experiment. Images from beef burgers cooked with IR Oven, BBQ Grill and Flat Grill
methods were not repeated. Although, for comparison purposes, images from section 4.2.
(figures 4.2, 4.3, 4.4, 4.5 and 4.6) can be used.
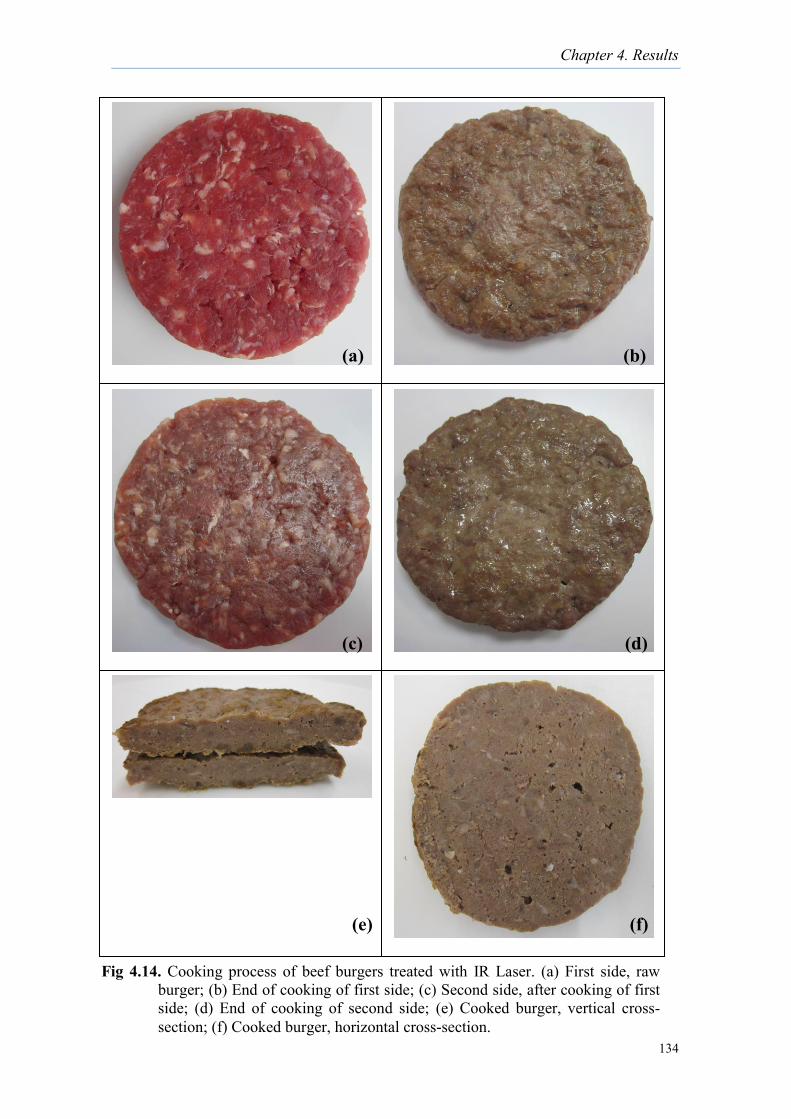
Chapter 4. Results
134
0 1 2
cm
0 1 2
cm
0 1 2
cm
0 1 2
cm
Fig 4.14. Cooking process of beef burgers treated with IR Laser. (a) First side, raw burger; (b) End of cooking of first side; (c) Second side, after cooking of first side; (d) End of cooking of second side; (e) Cooked burger, vertical cross-section; (f) Cooked burger, horizontal cross-section.
(a) (b)
(c) (d)
(e) (f)
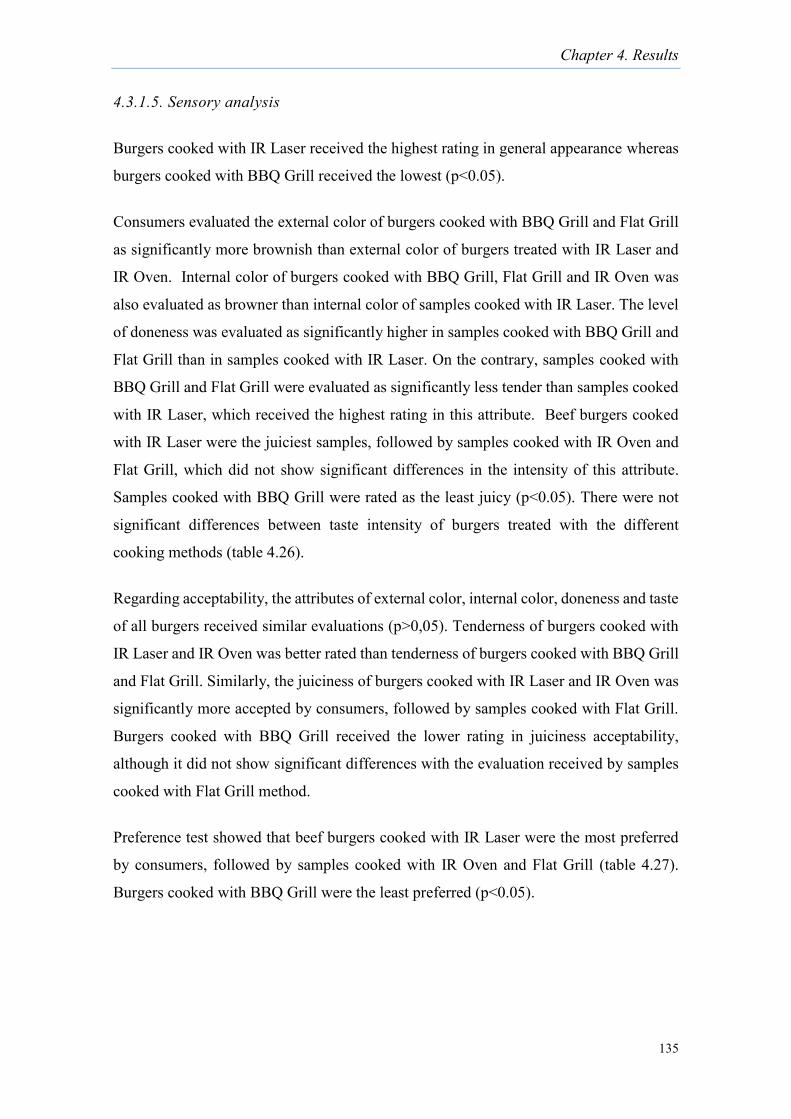
Chapter 4. Results
135
4.3.1.5. Sensory analysis
Burgers cooked with IR Laser received the highest rating in general appearance whereas
burgers cooked with BBQ Grill received the lowest (p<0.05).
Consumers evaluated the external color of burgers cooked with BBQ Grill and Flat Grill
as significantly more brownish than external color of burgers treated with IR Laser and
IR Oven. Internal color of burgers cooked with BBQ Grill, Flat Grill and IR Oven was
also evaluated as browner than internal color of samples cooked with IR Laser. The level
of doneness was evaluated as significantly higher in samples cooked with BBQ Grill and
Flat Grill than in samples cooked with IR Laser. On the contrary, samples cooked with
BBQ Grill and Flat Grill were evaluated as significantly less tender than samples cooked
with IR Laser, which received the highest rating in this attribute. Beef burgers cooked
with IR Laser were the juiciest samples, followed by samples cooked with IR Oven and
Flat Grill, which did not show significant differences in the intensity of this attribute.
Samples cooked with BBQ Grill were rated as the least juicy (p<0.05). There were not
significant differences between taste intensity of burgers treated with the different
cooking methods (table 4.26).
Regarding acceptability, the attributes of external color, internal color, doneness and taste
of all burgers received similar evaluations (p>0,05). Tenderness of burgers cooked with
IR Laser and IR Oven was better rated than tenderness of burgers cooked with BBQ Grill
and Flat Grill. Similarly, the juiciness of burgers cooked with IR Laser and IR Oven was
significantly more accepted by consumers, followed by samples cooked with Flat Grill.
Burgers cooked with BBQ Grill received the lower rating in juiciness acceptability,
although it did not show significant differences with the evaluation received by samples
cooked with Flat Grill method.
Preference test showed that beef burgers cooked with IR Laser were the most preferred
by consumers, followed by samples cooked with IR Oven and Flat Grill (table 4.27).
Burgers cooked with BBQ Grill were the least preferred (p<0.05).
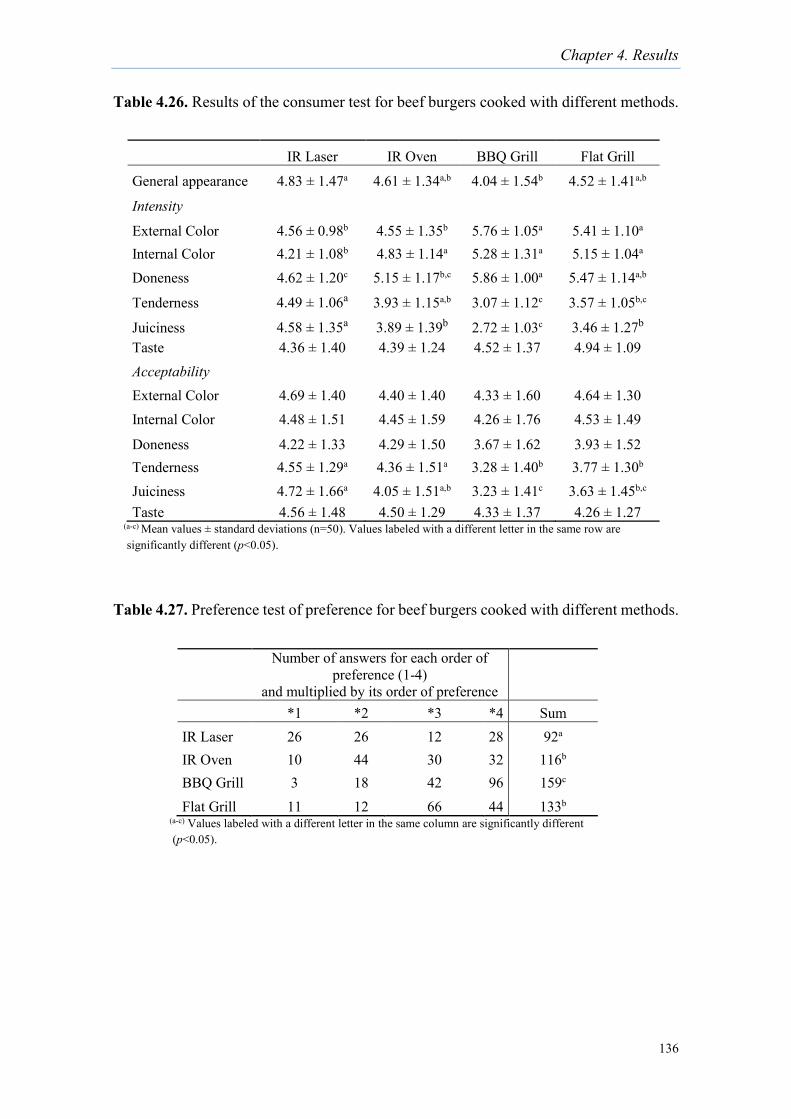
Chapter 4. Results
136
Table 4.26. Results of the consumer test for beef burgers cooked with different methods.
Table 4.27. Preference test of preference for beef burgers cooked with different methods.
IR Laser IR Oven BBQ Grill Flat Grill
General appearance 4.83 ± 1.47a 4.61 ± 1.34a,b 4.04 ± 1.54b 4.52 ± 1.41a,b
Intensity External Color 4.56 ± 0.98b 4.55 ± 1.35b 5.76 ± 1.05a 5.41 ± 1.10a Internal Color 4.21 ± 1.08b 4.83 ± 1.14a 5.28 ± 1.31a 5.15 ± 1.04a Doneness 4.62 ± 1.20c 5.15 ± 1.17b,c 5.86 ± 1.00a 5.47 ± 1.14a,b
Tenderness 4.49 ± 1.06a 3.93 ± 1.15a,b 3.07 ± 1.12c 3.57 ± 1.05b,c
Juiciness 4.58 ± 1.35a 3.89 ± 1.39b 2.72 ± 1.03c 3.46 ± 1.27b Taste 4.36 ± 1.40 4.39 ± 1.24 4.52 ± 1.37 4.94 ± 1.09 Acceptability External Color 4.69 ± 1.40 4.40 ± 1.40 4.33 ± 1.60 4.64 ± 1.30 Internal Color 4.48 ± 1.51 4.45 ± 1.59 4.26 ± 1.76 4.53 ± 1.49
Doneness 4.22 ± 1.33 4.29 ± 1.50 3.67 ± 1.62 3.93 ± 1.52 Tenderness 4.55 ± 1.29a 4.36 ± 1.51a 3.28 ± 1.40b 3.77 ± 1.30b Juiciness 4.72 ± 1.66a 4.05 ± 1.51a,b 3.23 ± 1.41c 3.63 ± 1.45b,c Taste 4.56 ± 1.48 4.50 ± 1.29 4.33 ± 1.37 4.26 ± 1.27
(a-c) Mean values ± standard deviations (n=50). Values labeled with a different letter in the same row are significantly different (p<0.05).
Number of answers for each order of preference (1-4)
and multiplied by its order of preference *1 *2 *3 *4 Sum
IR Laser 26 26 12 28 92a IR Oven 10 44 30 32 116b BBQ Grill 3 18 42 96 159c Flat Grill 11 12 66 44 133b
(a-c) Values labeled with a different letter in the same column are significantly different (p<0.05).
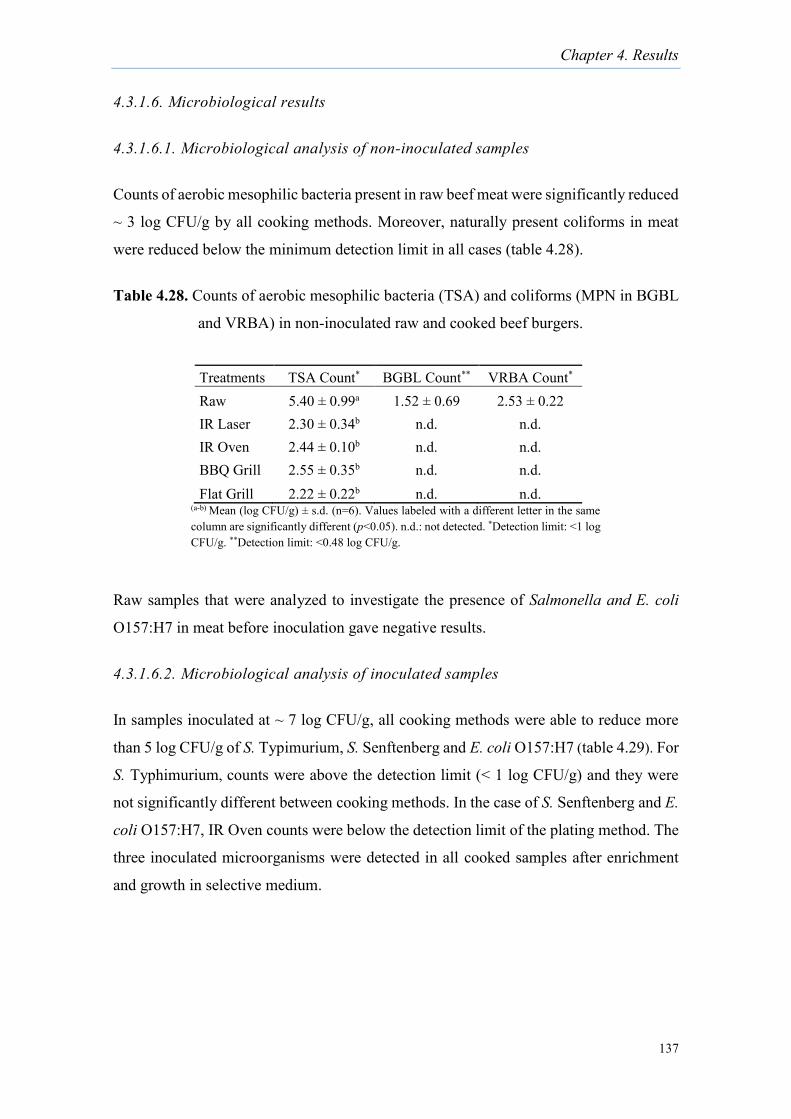
Chapter 4. Results
137
4.3.1.6. Microbiological results
4.3.1.6.1. Microbiological analysis of non-inoculated samples
Counts of aerobic mesophilic bacteria present in raw beef meat were significantly reduced
~ 3 log CFU/g by all cooking methods. Moreover, naturally present coliforms in meat
were reduced below the minimum detection limit in all cases (table 4.28).
Table 4.28. Counts of aerobic mesophilic bacteria (TSA) and coliforms (MPN in BGBL
and VRBA) in non-inoculated raw and cooked beef burgers.
Raw samples that were analyzed to investigate the presence of Salmonella and E. coli
O157:H7 in meat before inoculation gave negative results.
4.3.1.6.2. Microbiological analysis of inoculated samples
In samples inoculated at ~ 7 log CFU/g, all cooking methods were able to reduce more
than 5 log CFU/g of S. Typimurium, S. Senftenberg and E. coli O157:H7 (table 4.29). For
S. Typhimurium, counts were above the detection limit (< 1 log CFU/g) and they were
not significantly different between cooking methods. In the case of S. Senftenberg and E.
coli O157:H7, IR Oven counts were below the detection limit of the plating method. The
three inoculated microorganisms were detected in all cooked samples after enrichment
and growth in selective medium.
Treatments TSA Count* BGBL Count** VRBA Count* Raw 5.40 ± 0.99a 1.52 ± 0.69 2.53 ± 0.22 IR Laser 2.30 ± 0.34b n.d. n.d. IR Oven 2.44 ± 0.10b n.d. n.d. BBQ Grill 2.55 ± 0.35b n.d. n.d. Flat Grill 2.22 ± 0.22b n.d. n.d.
(a-b) Mean (log CFU/g) ± s.d. (n=6). Values labeled with a different letter in the same column are significantly different (p<0.05). n.d.: not detected. *Detection limit: <1 log CFU/g. **Detection limit: <0.48 log CFU/g.
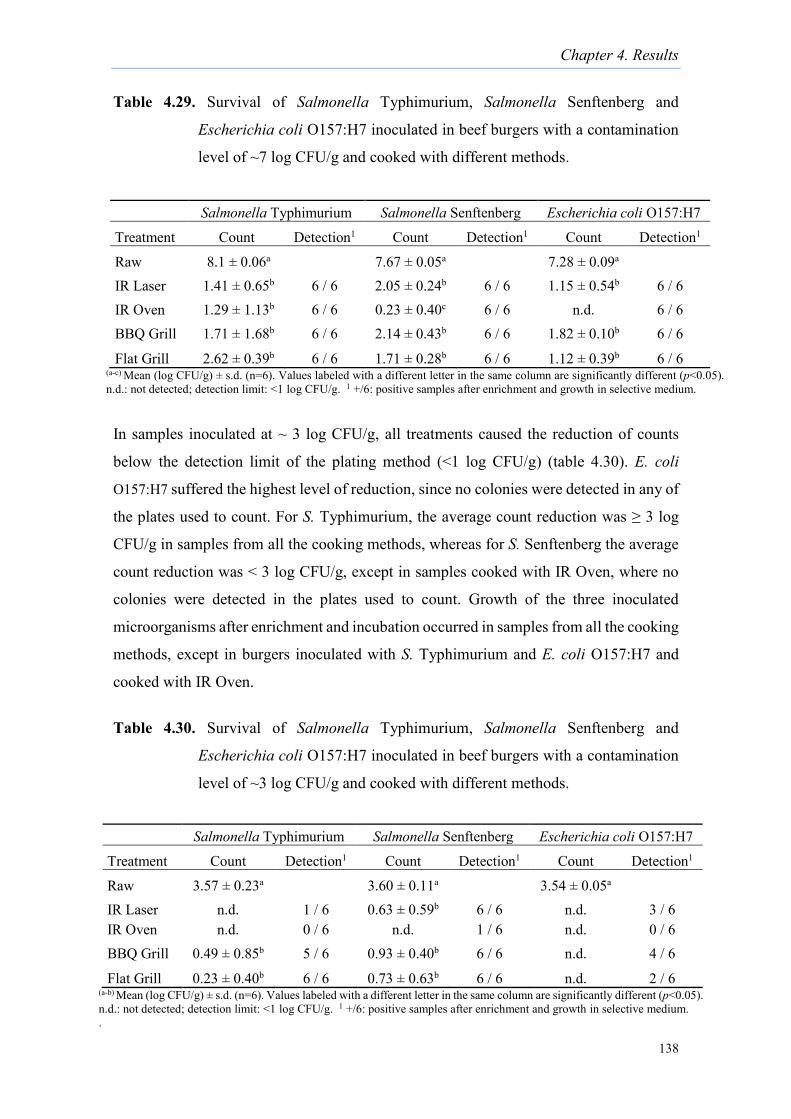
Chapter 4. Results
138
Table 4.29. Survival of Salmonella Typhimurium, Salmonella Senftenberg and
Escherichia coli O157:H7 inoculated in beef burgers with a contamination
level of ~7 log CFU/g and cooked with different methods.
In samples inoculated at ~ 3 log CFU/g, all treatments caused the reduction of counts
below the detection limit of the plating method (<1 log CFU/g) (table 4.30). E. coli
O157:H7 suffered the highest level of reduction, since no colonies were detected in any of
the plates used to count. For S. Typhimurium, the average count reduction was ≥ 3 log
CFU/g in samples from all the cooking methods, whereas for S. Senftenberg the average
count reduction was < 3 log CFU/g, except in samples cooked with IR Oven, where no
colonies were detected in the plates used to count. Growth of the three inoculated
microorganisms after enrichment and incubation occurred in samples from all the cooking
methods, except in burgers inoculated with S. Typhimurium and E. coli O157:H7 and
cooked with IR Oven.
Table 4.30. Survival of Salmonella Typhimurium, Salmonella Senftenberg and
Escherichia coli O157:H7 inoculated in beef burgers with a contamination
level of ~3 log CFU/g and cooked with different methods.
Salmonella Typhimurium Salmonella Senftenberg Escherichia coli O157:H7
Treatment Count Detection1 Count Detection1 Count Detection1
Raw 8.1 ± 0.06a 7.67 ± 0.05a 7.28 ± 0.09a IR Laser 1.41 ± 0.65b 6 / 6 2.05 ± 0.24b 6 / 6 1.15 ± 0.54b 6 / 6 IR Oven 1.29 ± 1.13b 6 / 6 0.23 ± 0.40c 6 / 6 n.d. 6 / 6 BBQ Grill 1.71 ± 1.68b 6 / 6 2.14 ± 0.43b 6 / 6 1.82 ± 0.10b 6 / 6
Flat Grill 2.62 ± 0.39b 6 / 6 1.71 ± 0.28b 6 / 6 1.12 ± 0.39b 6 / 6 (a-c) Mean (log CFU/g) ± s.d. (n=6). Values labeled with a different letter in the same column are significantly different (p<0.05). n.d.: not detected; detection limit: <1 log CFU/g. 1 +/6: positive samples after enrichment and growth in selective medium.
Salmonella Typhimurium Salmonella Senftenberg Escherichia coli O157:H7
Treatment Count Detection1 Count Detection1 Count Detection1
Raw 3.57 ± 0.23a 3.60 ± 0.11a 3.54 ± 0.05a IR Laser n.d. 1 / 6 0.63 ± 0.59b 6 / 6 n.d. 3 / 6 IR Oven n.d. 0 / 6 n.d. 1 / 6 n.d. 0 / 6 BBQ Grill 0.49 ± 0.85b 5 / 6 0.93 ± 0.40b 6 / 6 n.d. 4 / 6
Flat Grill 0.23 ± 0.40b 6 / 6 0.73 ± 0.63b 6 / 6 n.d. 2 / 6 (a-b) Mean (log CFU/g) ± s.d. (n=6). Values labeled with a different letter in the same column are significantly different (p<0.05). n.d.: not detected; detection limit: <1 log CFU/g. 1 +/6: positive samples after enrichment and growth in selective medium. .
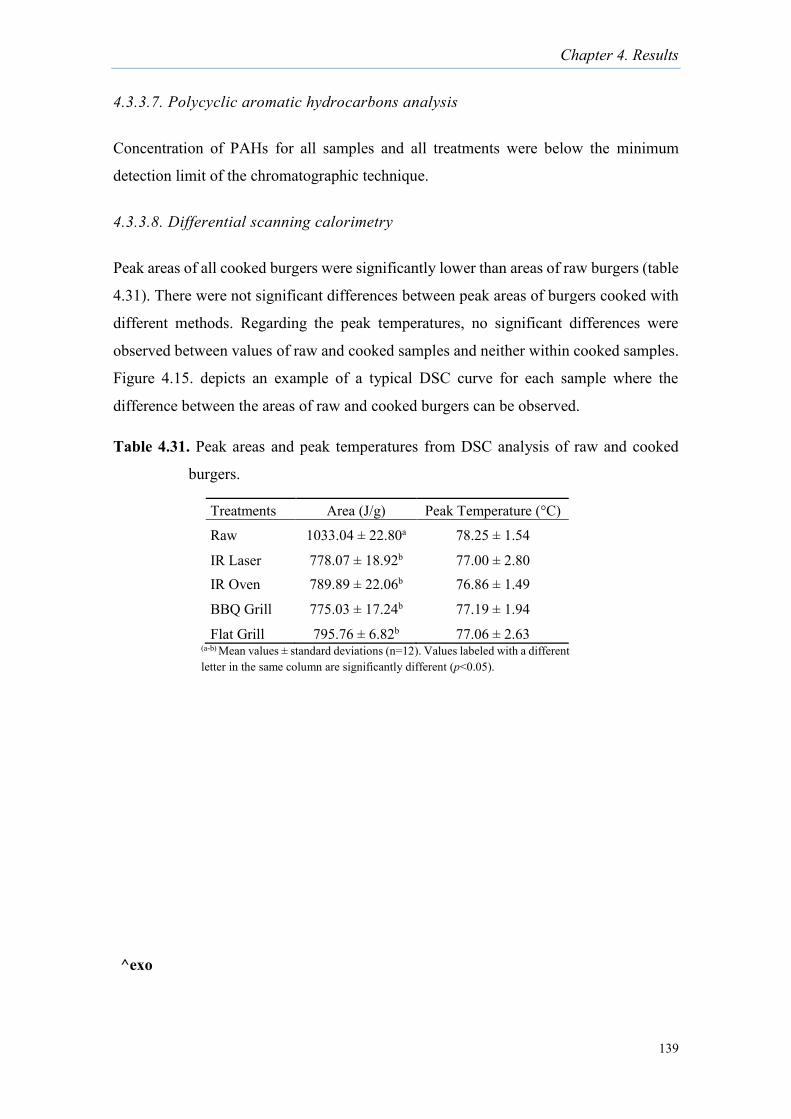
Chapter 4. Results
139
4.3.3.7. Polycyclic aromatic hydrocarbons analysis
Concentration of PAHs for all samples and all treatments were below the minimum
detection limit of the chromatographic technique.
4.3.3.8. Differential scanning calorimetry
Peak areas of all cooked burgers were significantly lower than areas of raw burgers (table
4.31). There were not significant differences between peak areas of burgers cooked with
different methods. Regarding the peak temperatures, no significant differences were
observed between values of raw and cooked samples and neither within cooked samples.
Figure 4.15. depicts an example of a typical DSC curve for each sample where the
difference between the areas of raw and cooked burgers can be observed.
Table 4.31. Peak areas and peak temperatures from DSC analysis of raw and cooked
burgers.
Treatments Area (J/g) Peak Temperature (°C)
Raw 1033.04 ± 22.80a 78.25 ± 1.54
IR Laser 778.07 ± 18.92b 77.00 ± 2.80 IR Oven 789.89 ± 22.06b 76.86 ± 1.49
BBQ Grill 775.03 ± 17.24b 77.19 ± 1.94
Flat Grill 795.76 ± 6.82b 77.06 ± 2.63 (a-b) Mean values ± standard deviations (n=12). Values labeled with a different letter in the same column are significantly different (p<0.05).
^exo
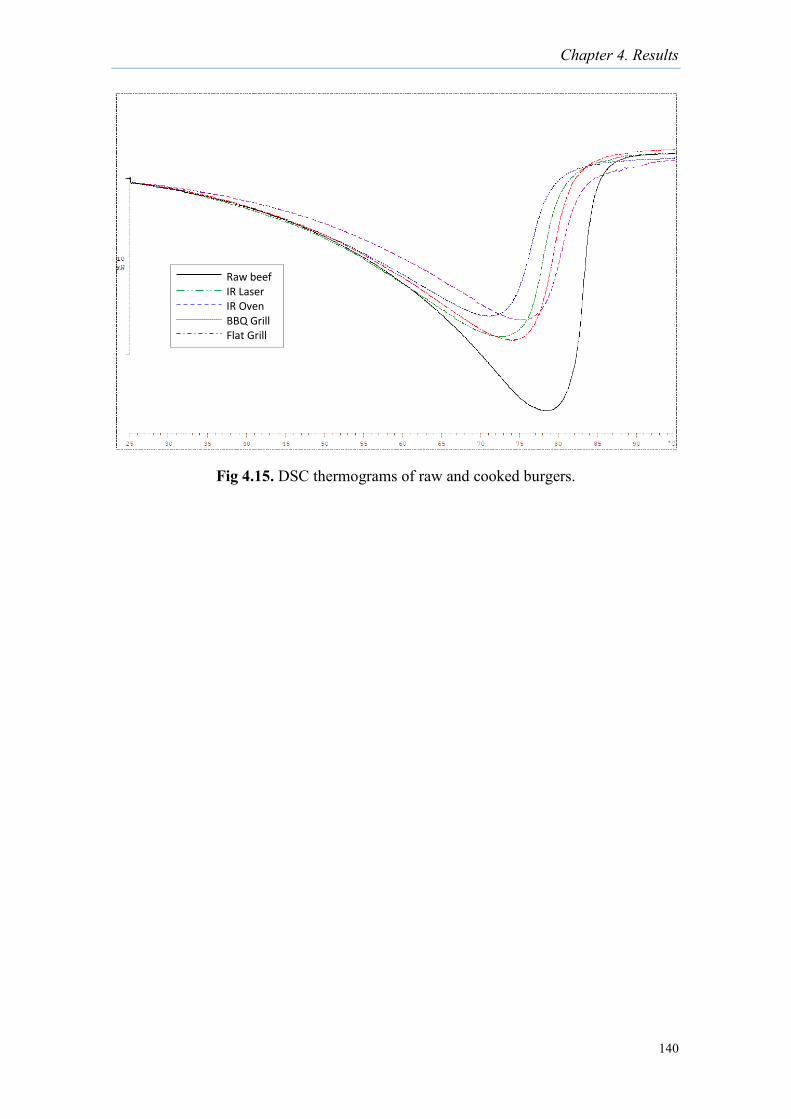
Chapter 4. Results
140
Fig 4.15. DSC thermograms of raw and cooked burgers.
Raw beef IR Laser IR Oven BBQ Grill Flat Grill
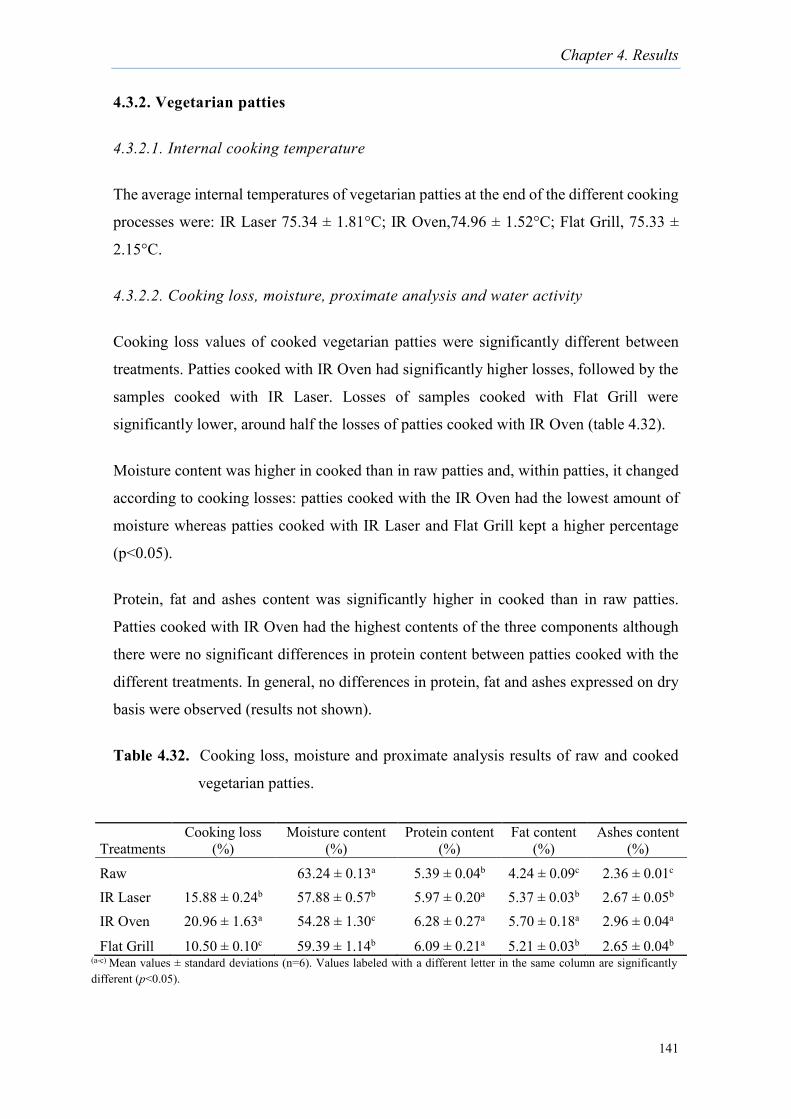
Chapter 4. Results
141
4.3.2. Vegetarian patties
4.3.2.1. Internal cooking temperature
The average internal temperatures of vegetarian patties at the end of the different cooking
processes were: IR Laser 75.34 ± 1.81°C; IR Oven,74.96 ± 1.52°C; Flat Grill, 75.33 ±
2.15°C.
4.3.2.2. Cooking loss, moisture, proximate analysis and water activity
Cooking loss values of cooked vegetarian patties were significantly different between
treatments. Patties cooked with IR Oven had significantly higher losses, followed by the
samples cooked with IR Laser. Losses of samples cooked with Flat Grill were
significantly lower, around half the losses of patties cooked with IR Oven (table 4.32).
Moisture content was higher in cooked than in raw patties and, within patties, it changed
according to cooking losses: patties cooked with the IR Oven had the lowest amount of
moisture whereas patties cooked with IR Laser and Flat Grill kept a higher percentage
(p<0.05).
Protein, fat and ashes content was significantly higher in cooked than in raw patties.
Patties cooked with IR Oven had the highest contents of the three components although
there were no significant differences in protein content between patties cooked with the
different treatments. In general, no differences in protein, fat and ashes expressed on dry
basis were observed (results not shown).
Table 4.32. Cooking loss, moisture and proximate analysis results of raw and cooked
vegetarian patties.
Treatments Cooking loss
(%) Moisture content
(%) Protein content
(%) Fat content
(%) Ashes content
(%)
Raw 63.24 ± 0.13a 5.39 ± 0.04b 4.24 ± 0.09c 2.36 ± 0.01c IR Laser 15.88 ± 0.24b 57.88 ± 0.57b 5.97 ± 0.20a 5.37 ± 0.03b 2.67 ± 0.05b IR Oven 20.96 ± 1.63a 54.28 ± 1.30c 6.28 ± 0.27a 5.70 ± 0.18a 2.96 ± 0.04a
Flat Grill 10.50 ± 0.10c 59.39 ± 1.14b 6.09 ± 0.21a 5.21 ± 0.03b 2.65 ± 0.04b (a-c) Mean values ± standard deviations (n=6). Values labeled with a different letter in the same column are significantly different (p<0.05).
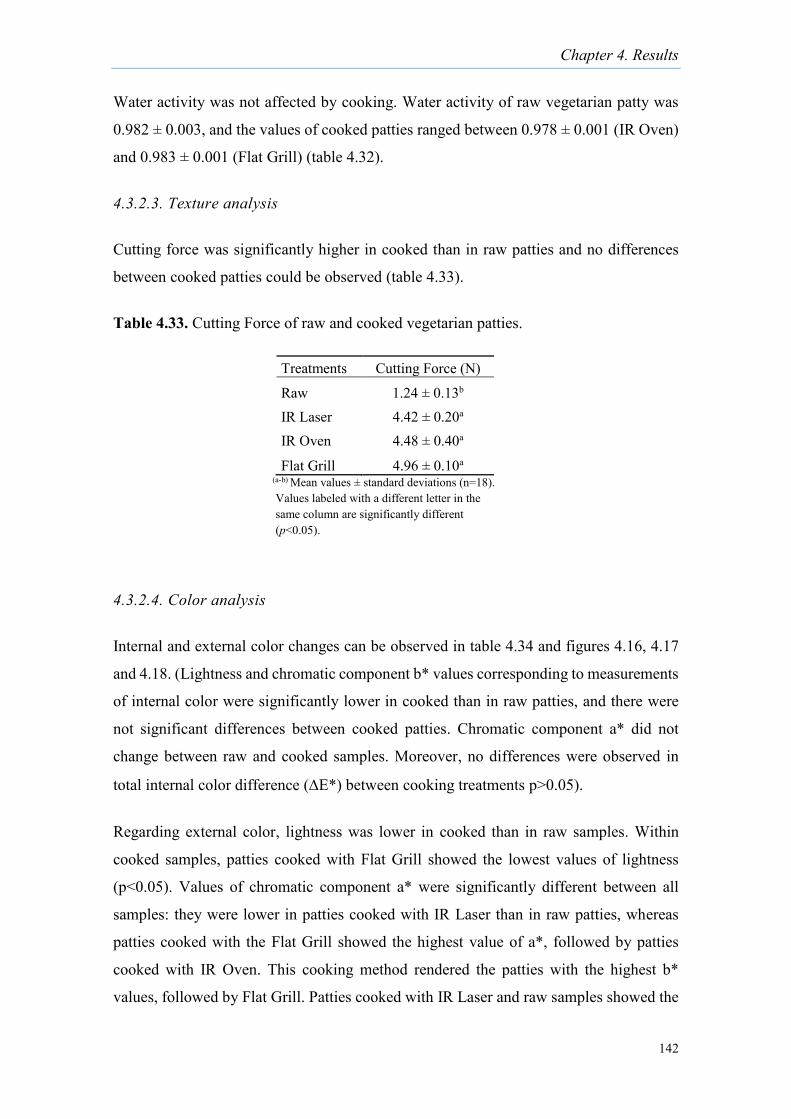
Chapter 4. Results
142
Water activity was not affected by cooking. Water activity of raw vegetarian patty was
0.982 ± 0.003, and the values of cooked patties ranged between 0.978 ± 0.001 (IR Oven)
and 0.983 ± 0.001 (Flat Grill) (table 4.32).
4.3.2.3. Texture analysis
Cutting force was significantly higher in cooked than in raw patties and no differences
between cooked patties could be observed (table 4.33).
Table 4.33. Cutting Force of raw and cooked vegetarian patties.
4.3.2.4. Color analysis
Internal and external color changes can be observed in table 4.34 and figures 4.16, 4.17
and 4.18. (Lightness and chromatic component b* values corresponding to measurements
of internal color were significantly lower in cooked than in raw patties, and there were
not significant differences between cooked patties. Chromatic component a* did not
change between raw and cooked samples. Moreover, no differences were observed in
total internal color difference (E*) between cooking treatments p>0.05).
Regarding external color, lightness was lower in cooked than in raw samples. Within
cooked samples, patties cooked with Flat Grill showed the lowest values of lightness
(p<0.05). Values of chromatic component a* were significantly different between all
samples: they were lower in patties cooked with IR Laser than in raw patties, whereas
patties cooked with the Flat Grill showed the highest value of a*, followed by patties
cooked with IR Oven. This cooking method rendered the patties with the highest b*
values, followed by Flat Grill. Patties cooked with IR Laser and raw samples showed the
Treatments Cutting Force (N)
Raw 1.24 ± 0.13b IR Laser 4.42 ± 0.20a IR Oven 4.48 ± 0.40a
Flat Grill 4.96 ± 0.10a (a-b) Mean values ± standard deviations (n=18). Values labeled with a different letter in the same column are significantly different (p<0.05).
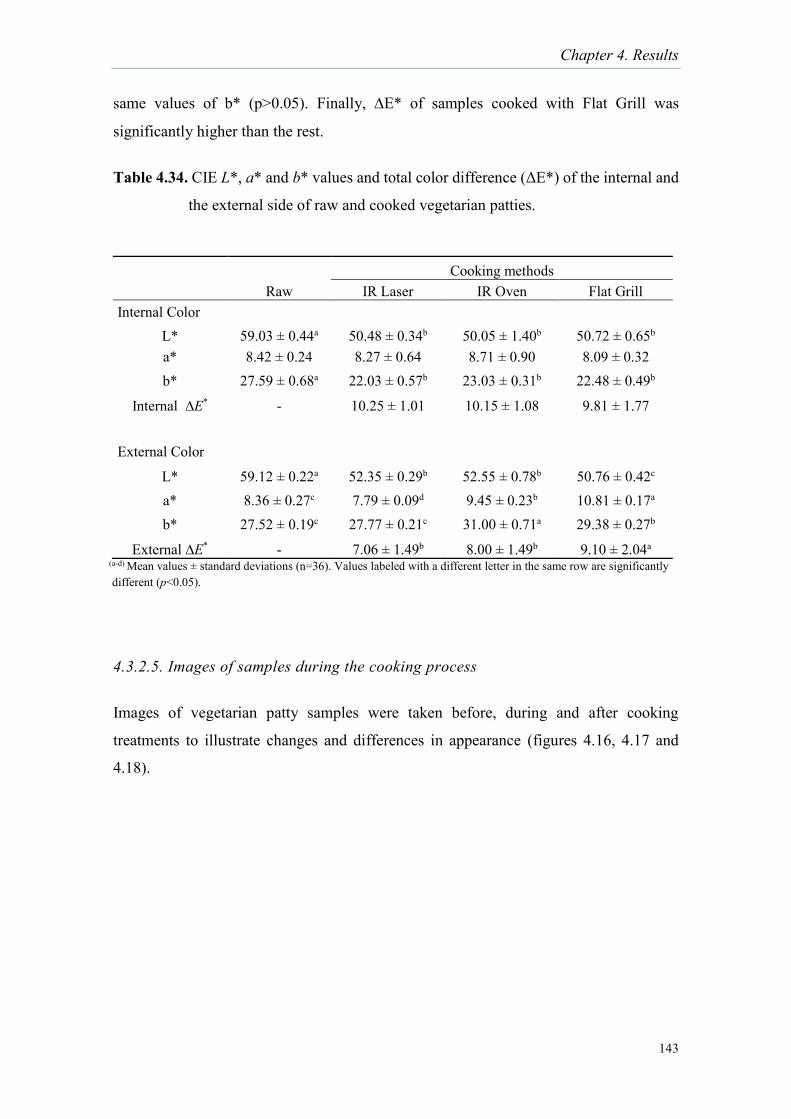
Chapter 4. Results
143
same values of b* (p>0.05). Finally, E* of samples cooked with Flat Grill was
significantly higher than the rest.
Table 4.34. CIE L*, a* and b* values and total color difference (ΔE*) of the internal and
the external side of raw and cooked vegetarian patties.
4.3.2.5. Images of samples during the cooking process
Images of vegetarian patty samples were taken before, during and after cooking
treatments to illustrate changes and differences in appearance (figures 4.16, 4.17 and
4.18).
Cooking methods Raw IR Laser IR Oven Flat Grill
Internal Color L* 59.03 ± 0.44a 50.48 ± 0.34b 50.05 ± 1.40b 50.72 ± 0.65b a* 8.42 ± 0.24 8.27 ± 0.64 8.71 ± 0.90 8.09 ± 0.32 b* 27.59 ± 0.68a 22.03 ± 0.57b 23.03 ± 0.31b 22.48 ± 0.49b
Internal ∆E* - 10.25 ± 1.01 10.15 ± 1.08 9.81 ± 1.77
External Color
L* 59.12 ± 0.22a 52.35 ± 0.29b 52.55 ± 0.78b 50.76 ± 0.42c a* 8.36 ± 0.27c 7.79 ± 0.09d 9.45 ± 0.23b 10.81 ± 0.17a b* 27.52 ± 0.19c 27.77 ± 0.21c 31.00 ± 0.71a 29.38 ± 0.27b
External ∆E* - 7.06 ± 1.49b 8.00 ± 1.49b 9.10 ± 2.04a (a-d) Mean values ± standard deviations (n=36). Values labeled with a different letter in the same row are significantly different (p<0.05).
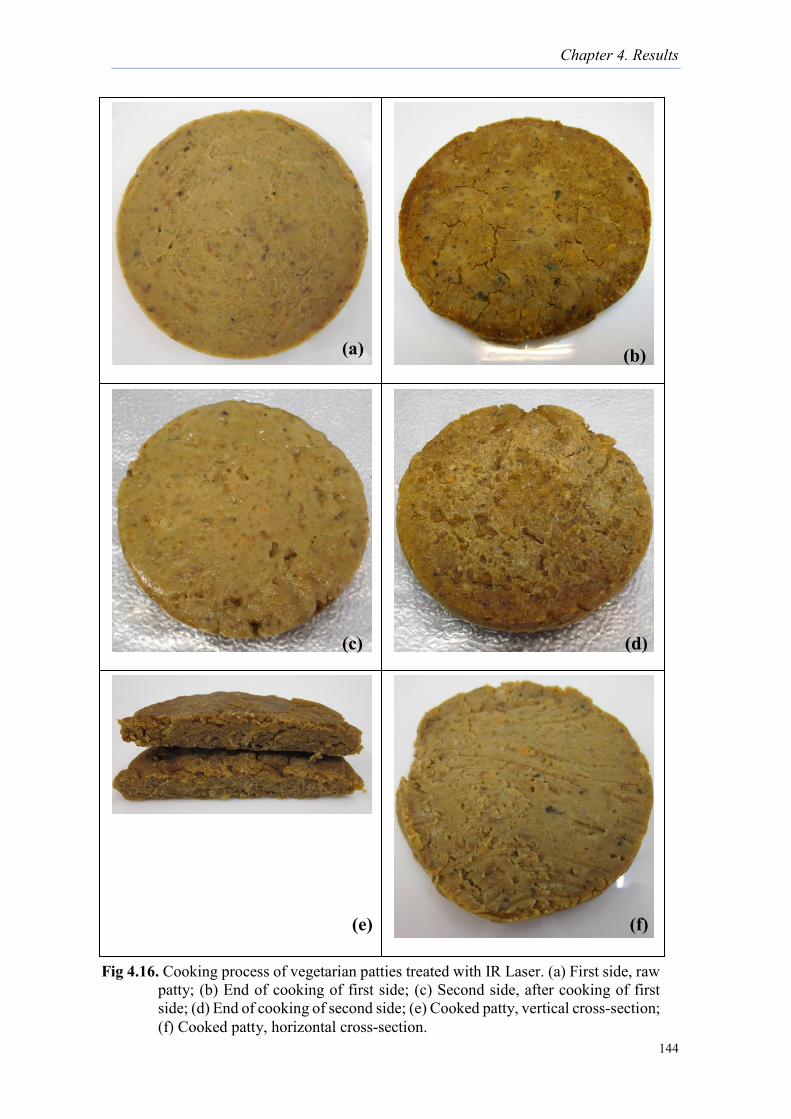
Chapter 4. Results
144
0 1 2
cm
0 1 2
cm
0 1 2
cm
0 1 2
cm
Fig 4.16. Cooking process of vegetarian patties treated with IR Laser. (a) First side, raw patty; (b) End of cooking of first side; (c) Second side, after cooking of first side; (d) End of cooking of second side; (e) Cooked patty, vertical cross-section; (f) Cooked patty, horizontal cross-section.
(a) (b)
(c) (d)
(e) (f)
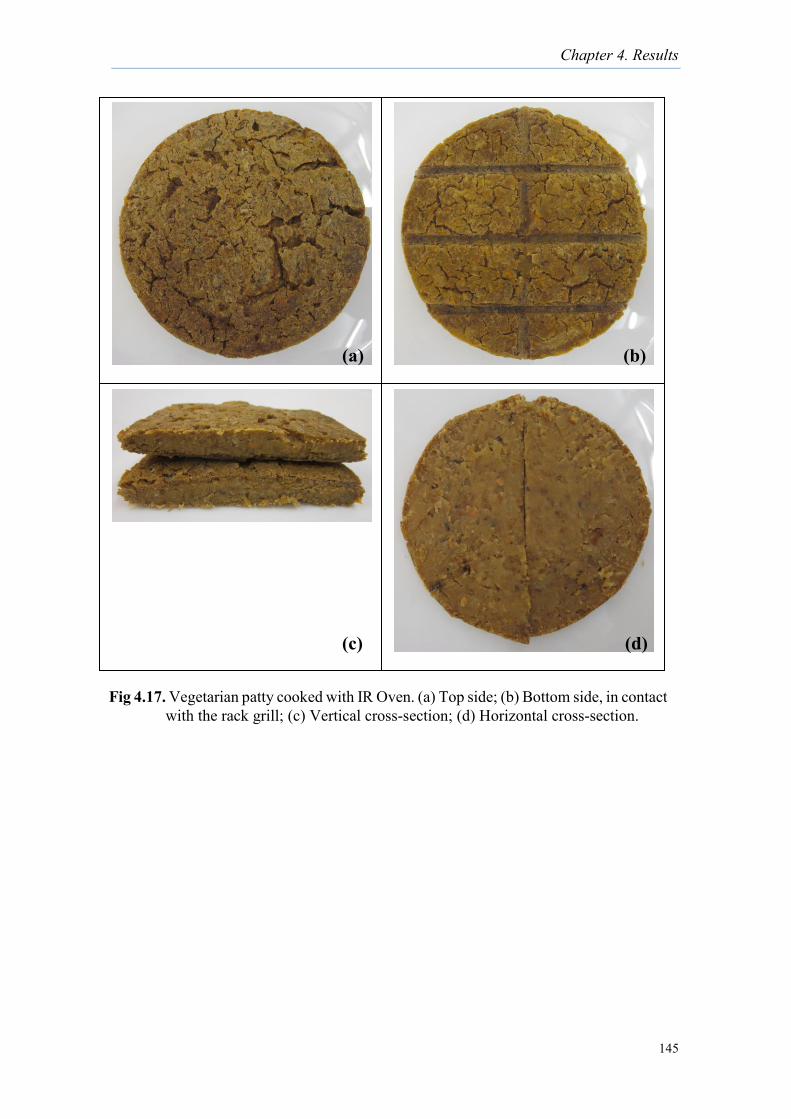
Chapter 4. Results
145
0 1 2
cm
0 1 2
cm
Fig 4.17. Vegetarian patty cooked with IR Oven. (a) Top side; (b) Bottom side, in contact with the rack grill; (c) Vertical cross-section; (d) Horizontal cross-section.
(a) (b)
(c) (d)
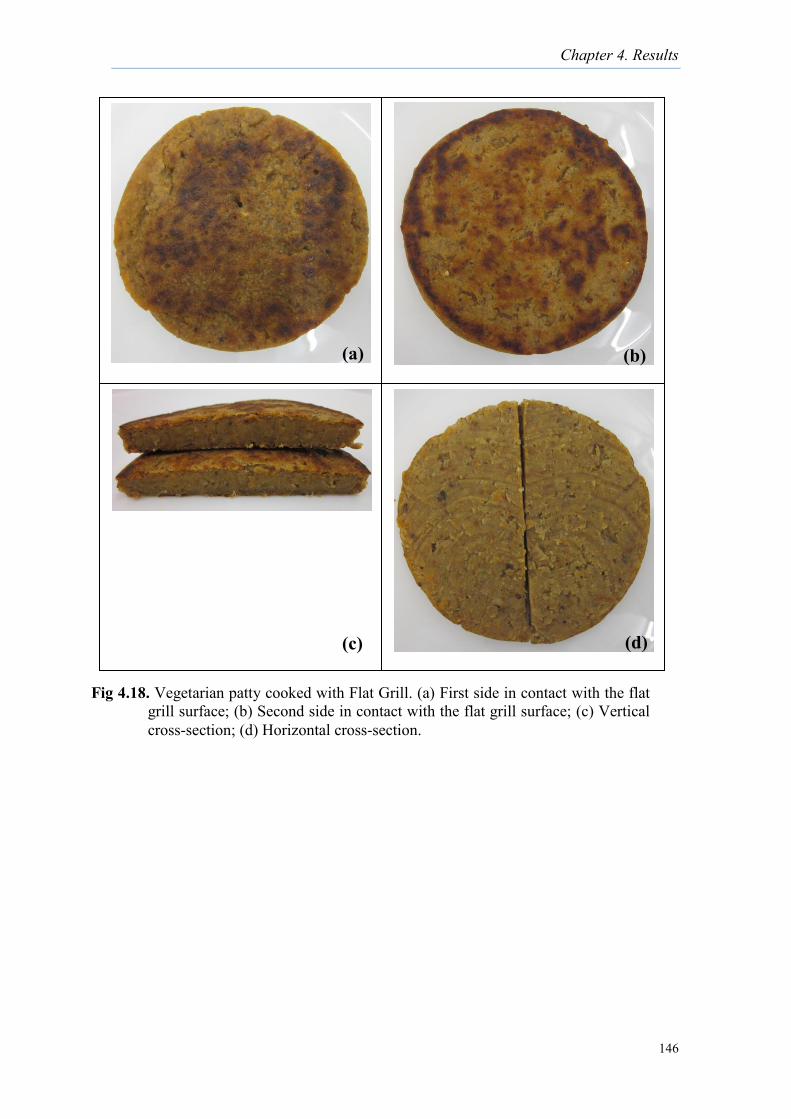
Chapter 4. Results
146
4.3.
0 1 2
cm
0 1 2
cm
Fig 4.18. Vegetarian patty cooked with Flat Grill. (a) First side in contact with the flat grill surface; (b) Second side in contact with the flat grill surface; (c) Vertical cross-section; (d) Horizontal cross-section.
(a) (b)
(c) (d)
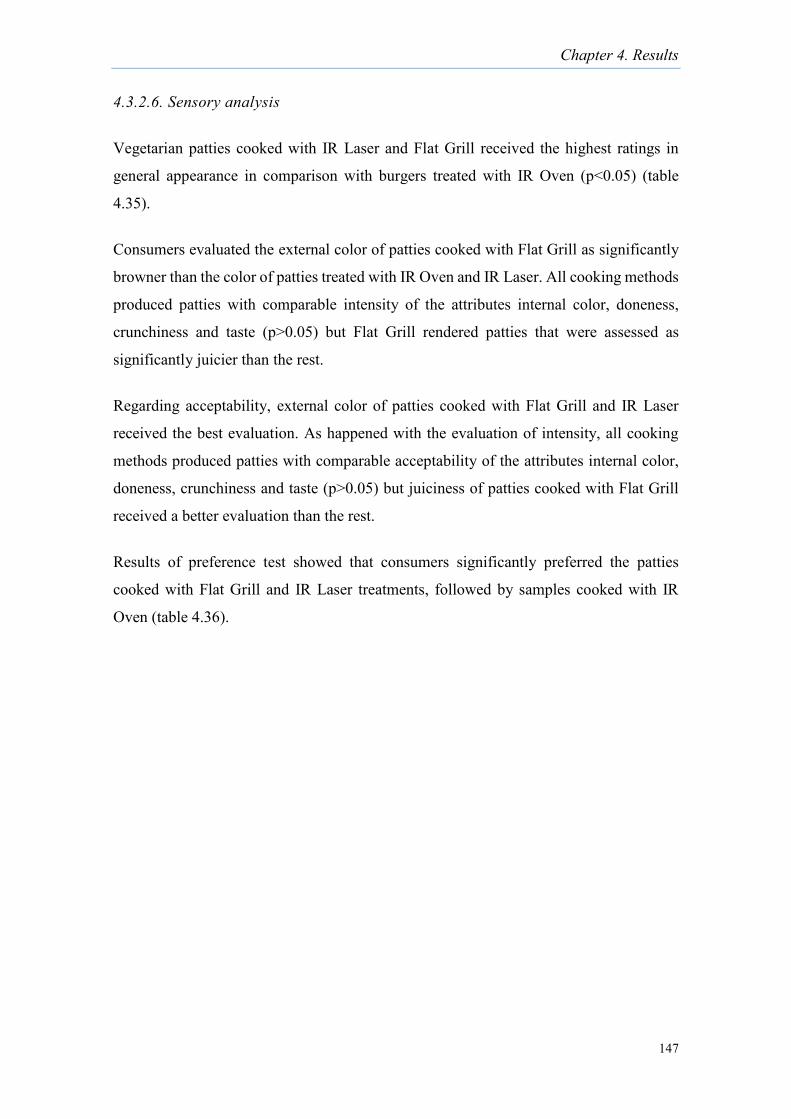
Chapter 4. Results
147
4.3.2.6. Sensory analysis
Vegetarian patties cooked with IR Laser and Flat Grill received the highest ratings in
general appearance in comparison with burgers treated with IR Oven (p<0.05) (table
4.35).
Consumers evaluated the external color of patties cooked with Flat Grill as significantly
browner than the color of patties treated with IR Oven and IR Laser. All cooking methods
produced patties with comparable intensity of the attributes internal color, doneness,
crunchiness and taste (p>0.05) but Flat Grill rendered patties that were assessed as
significantly juicier than the rest.
Regarding acceptability, external color of patties cooked with Flat Grill and IR Laser
received the best evaluation. As happened with the evaluation of intensity, all cooking
methods produced patties with comparable acceptability of the attributes internal color,
doneness, crunchiness and taste (p>0.05) but juiciness of patties cooked with Flat Grill
received a better evaluation than the rest.
Results of preference test showed that consumers significantly preferred the patties
cooked with Flat Grill and IR Laser treatments, followed by samples cooked with IR
Oven (table 4.36).
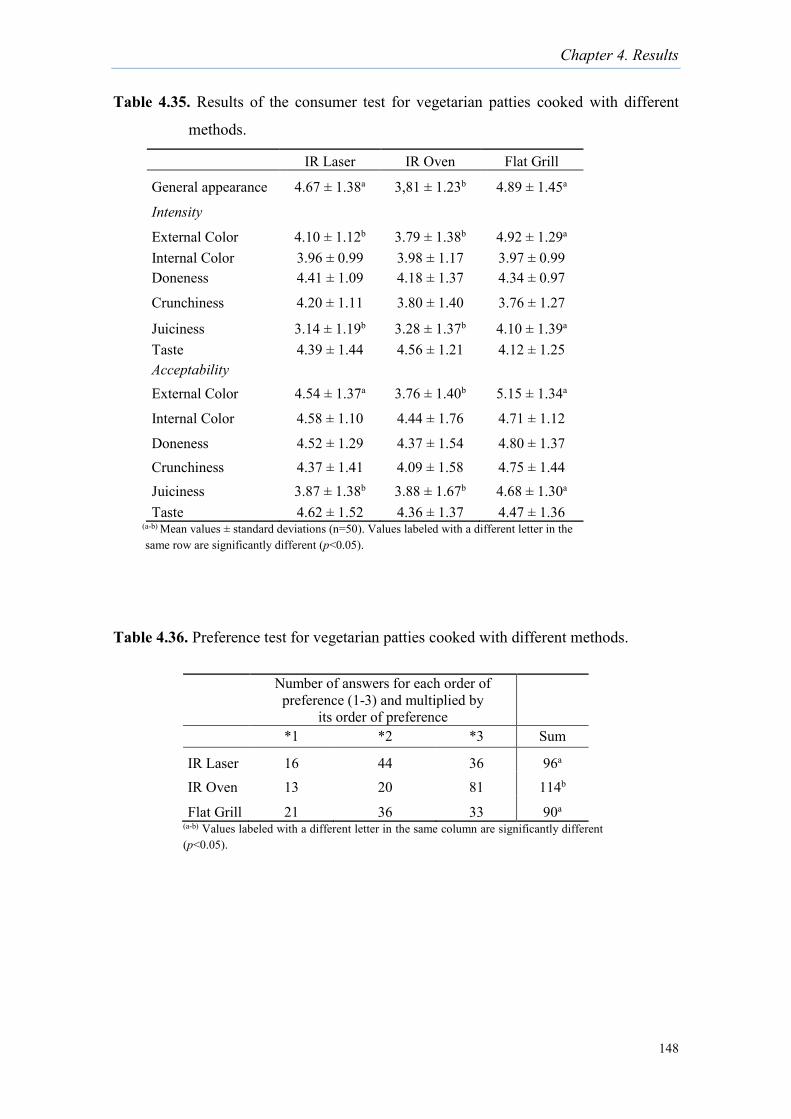
Chapter 4. Results
148
Table 4.35. Results of the consumer test for vegetarian patties cooked with different
methods.
Table 4.36. Preference test for vegetarian patties cooked with different methods.
IR Laser IR Oven Flat Grill
General appearance 4.67 ± 1.38a 3,81 ± 1.23b 4.89 ± 1.45a
Intensity External Color 4.10 ± 1.12b 3.79 ± 1.38b 4.92 ± 1.29a Internal Color 3.96 ± 0.99 3.98 ± 1.17 3.97 ± 0.99 Doneness 4.41 ± 1.09 4.18 ± 1.37 4.34 ± 0.97
Crunchiness 4.20 ± 1.11 3.80 ± 1.40 3.76 ± 1.27
Juiciness 3.14 ± 1.19b 3.28 ± 1.37b 4.10 ± 1.39a Taste 4.39 ± 1.44 4.56 ± 1.21 4.12 ± 1.25 Acceptability External Color 4.54 ± 1.37a 3.76 ± 1.40b 5.15 ± 1.34a
Internal Color 4.58 ± 1.10 4.44 ± 1.76 4.71 ± 1.12
Doneness 4.52 ± 1.29 4.37 ± 1.54 4.80 ± 1.37 Crunchiness 4.37 ± 1.41 4.09 ± 1.58 4.75 ± 1.44 Juiciness 3.87 ± 1.38b 3.88 ± 1.67b 4.68 ± 1.30a Taste 4.62 ± 1.52 4.36 ± 1.37 4.47 ± 1.36
(a-b) Mean values ± standard deviations (n=50). Values labeled with a different letter in the same row are significantly different (p<0.05).
Number of answers for each order of preference (1-3) and multiplied by
its order of preference *1 *2 *3 Sum
IR Laser 16 44 36 96a IR Oven 13 20 81 114b
Flat Grill 21 36 33 90a (a-b) Values labeled with a different letter in the same column are significantly different (p<0.05).
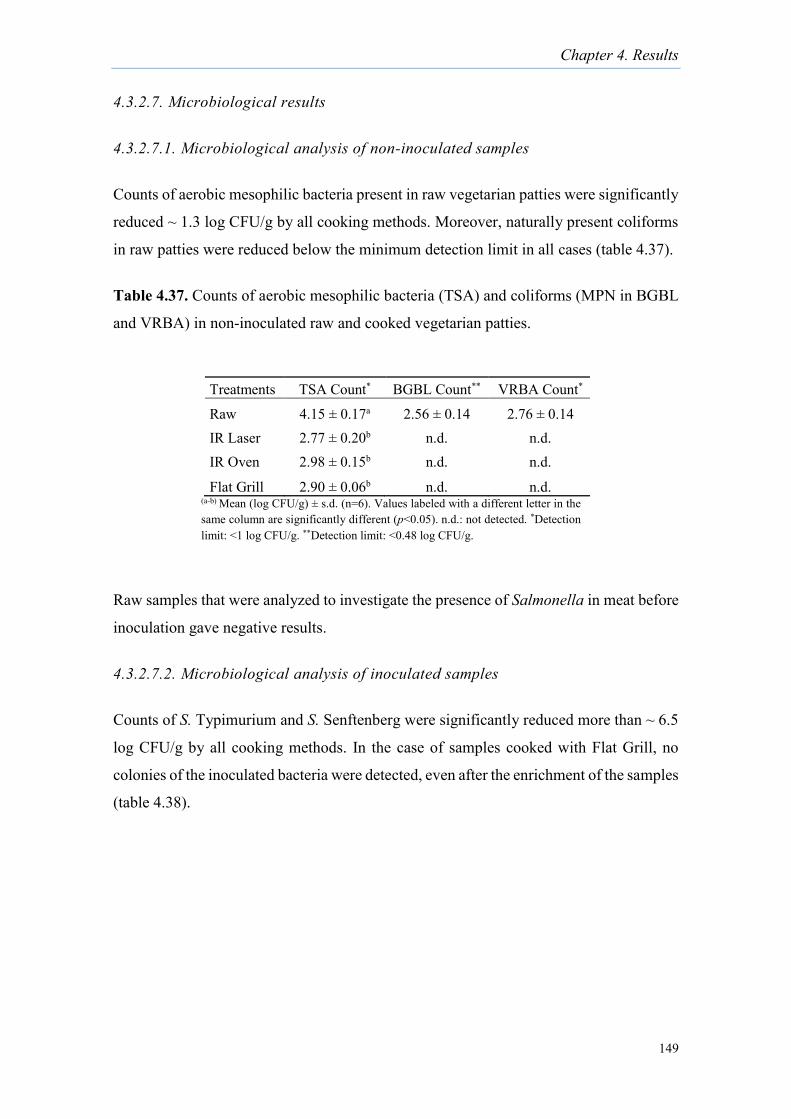
Chapter 4. Results
149
4.3.2.7. Microbiological results
4.3.2.7.1. Microbiological analysis of non-inoculated samples
Counts of aerobic mesophilic bacteria present in raw vegetarian patties were significantly
reduced ~ 1.3 log CFU/g by all cooking methods. Moreover, naturally present coliforms
in raw patties were reduced below the minimum detection limit in all cases (table 4.37).
Table 4.37. Counts of aerobic mesophilic bacteria (TSA) and coliforms (MPN in BGBL
and VRBA) in non-inoculated raw and cooked vegetarian patties.
Raw samples that were analyzed to investigate the presence of Salmonella in meat before
inoculation gave negative results.
4.3.2.7.2. Microbiological analysis of inoculated samples
Counts of S. Typimurium and S. Senftenberg were significantly reduced more than ~ 6.5
log CFU/g by all cooking methods. In the case of samples cooked with Flat Grill, no
colonies of the inoculated bacteria were detected, even after the enrichment of the samples
(table 4.38).
Treatments TSA Count* BGBL Count** VRBA Count*
Raw 4.15 ± 0.17a 2.56 ± 0.14 2.76 ± 0.14 IR Laser 2.77 ± 0.20b n.d. n.d. IR Oven 2.98 ± 0.15b n.d. n.d.
Flat Grill 2.90 ± 0.06b n.d. n.d. (a-b) Mean (log CFU/g) ± s.d. (n=6). Values labeled with a different letter in the same column are significantly different (p<0.05). n.d.: not detected. *Detection limit: <1 log CFU/g. **Detection limit: <0.48 log CFU/g.

Chapter 4. Results
150
Table 4.38. Survival of Salmonella Typhimurium and Salmonella Senftenberg inoculated
in vegetarian patties with a contamination level of ~7 log CFU/g and cooked with
different methods.
In samples inoculated at ~ 3 log CFU/g, all treatments caused the reduction of counts
below the detection limit of the plating method (<1 log CFU/g) (table 4.39). S.
Typhimurium was totally inactivated by all cooking methods since no colonies grew in
any plates after enrichment. In the case of S. Senftenberg, total inactivation was only
achieved by cooking with Flat Grill.
Table 4.39. Survival of Salmonella Typhimurium and Salmonella Senftenberg inoculated
in vegetarian patties with a contamination level of ~3 log CFU/g and
treated with different cooking methods.
Salmonella Tyhphimurium Salmonella Senftenberg Treatment Count Detection1 Mean Detection1
Raw 7.34 ± 0,42a 7.46 ± 0,54a IR Laser 0.57 ± 0,51b 6 / 6 0.33 ± 0,58b 6 / 6 IR Oven 0.47 ± 0,40b 6 / 6 0.43 ± 0,40b 6 / 6 Flat Grill n.d. 0 / 6 n.d. 0 / 6
(a-b) Mean (log CFU/g) ± s.d. (n=6). Values labeled with a different letter in the same column are significantly different (p<0.05). n.d.: not detected; limit of detection: <1 log CFU/g. 1 +/6: positive samples after enrichment and growth in selective medium.
Salmonella Tyhphimurium Salmonella Senftenberg Treatment Count* Detection1 Mean* Detection1 Raw 3,93 ± 0,12 3,90 ± 0,18 IR Laser n.d. 0 / 6 n.d. 2 / 6 IR Oven n.d. 0 / 6 n.d. 1 / 6 Flat Grill n.d. 0 / 6 n.d. 0 / 6
*Mean (log CFU/g) ± s.d. (n=6). n.d.: not detected; limit of detection: <1 log CFU/g. 1 +/6: positive samples after enrichment and growth in selective medium.
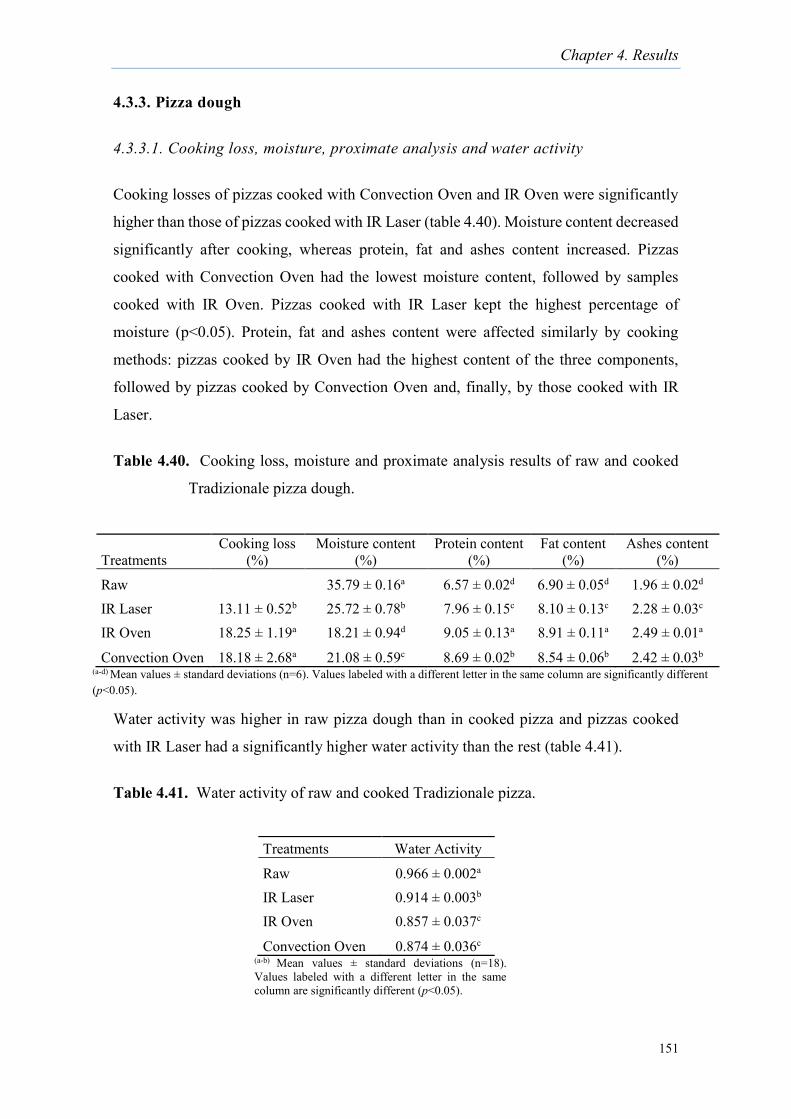
Chapter 4. Results
151
4.3.3. Pizza dough
4.3.3.1. Cooking loss, moisture, proximate analysis and water activity
Cooking losses of pizzas cooked with Convection Oven and IR Oven were significantly
higher than those of pizzas cooked with IR Laser (table 4.40). Moisture content decreased
significantly after cooking, whereas protein, fat and ashes content increased. Pizzas
cooked with Convection Oven had the lowest moisture content, followed by samples
cooked with IR Oven. Pizzas cooked with IR Laser kept the highest percentage of
moisture (p<0.05). Protein, fat and ashes content were affected similarly by cooking
methods: pizzas cooked by IR Oven had the highest content of the three components,
followed by pizzas cooked by Convection Oven and, finally, by those cooked with IR
Laser.
Table 4.40. Cooking loss, moisture and proximate analysis results of raw and cooked
Tradizionale pizza dough.
Water activity was higher in raw pizza dough than in cooked pizza and pizzas cooked
with IR Laser had a significantly higher water activity than the rest (table 4.41).
Table 4.41. Water activity of raw and cooked Tradizionale pizza.
Treatments Cooking loss
(%) Moisture content
(%) Protein content
(%) Fat content
(%) Ashes content
(%)
Raw 35.79 ± 0.16a 6.57 ± 0.02d 6.90 ± 0.05d 1.96 ± 0.02d IR Laser 13.11 ± 0.52b 25.72 ± 0.78b 7.96 ± 0.15c 8.10 ± 0.13c 2.28 ± 0.03c IR Oven 18.25 ± 1.19a 18.21 ± 0.94d 9.05 ± 0.13a 8.91 ± 0.11a 2.49 ± 0.01a
Convection Oven 18.18 ± 2.68a 21.08 ± 0.59c 8.69 ± 0.02b 8.54 ± 0.06b 2.42 ± 0.03b (a-d) Mean values ± standard deviations (n=6). Values labeled with a different letter in the same column are significantly different (p<0.05).
Treatments Water Activity
Raw 0.966 ± 0.002a IR Laser 0.914 ± 0.003b IR Oven 0.857 ± 0.037c
Convection Oven 0.874 ± 0.036c (a-b) Mean values ± standard deviations (n=18). Values labeled with a different letter in the same column are significantly different (p<0.05).
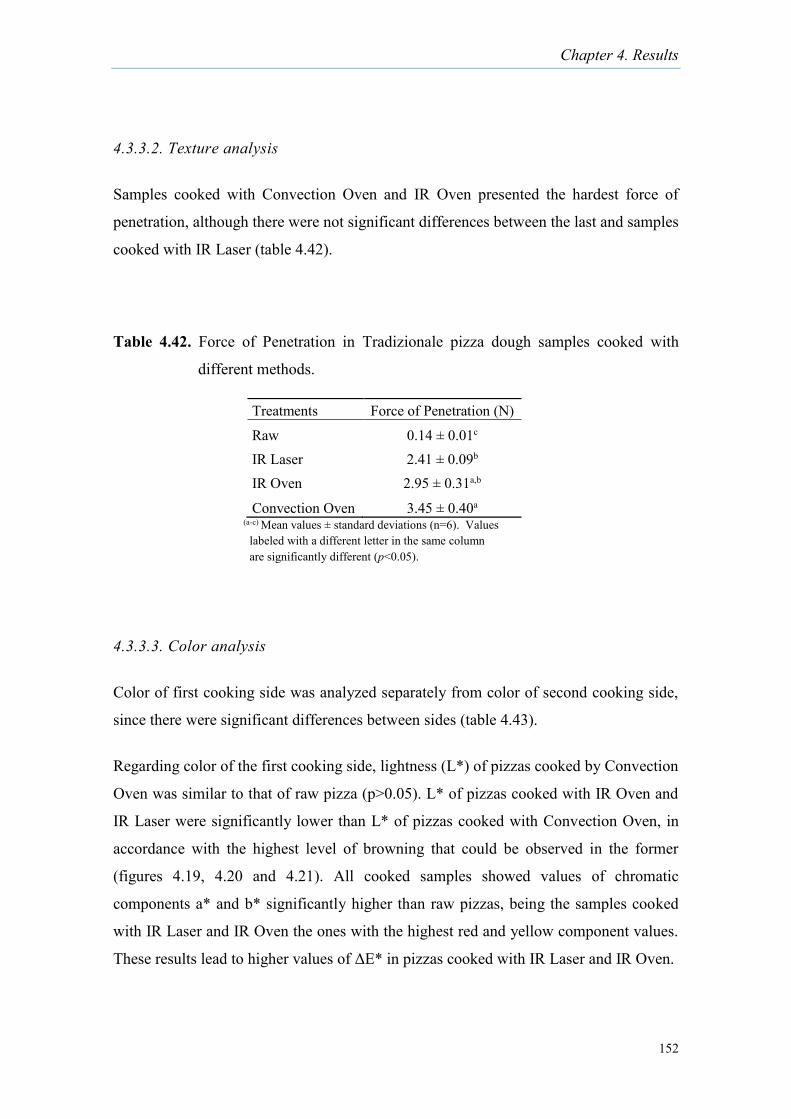
Chapter 4. Results
152
4.3.3.2. Texture analysis
Samples cooked with Convection Oven and IR Oven presented the hardest force of
penetration, although there were not significant differences between the last and samples
cooked with IR Laser (table 4.42).
Table 4.42. Force of Penetration in Tradizionale pizza dough samples cooked with
different methods.
4.3.3.3. Color analysis
Color of first cooking side was analyzed separately from color of second cooking side,
since there were significant differences between sides (table 4.43).
Regarding color of the first cooking side, lightness (L*) of pizzas cooked by Convection
Oven was similar to that of raw pizza (p>0.05). L* of pizzas cooked with IR Oven and
IR Laser were significantly lower than L* of pizzas cooked with Convection Oven, in
accordance with the highest level of browning that could be observed in the former
(figures 4.19, 4.20 and 4.21). All cooked samples showed values of chromatic
components a* and b* significantly higher than raw pizzas, being the samples cooked
with IR Laser and IR Oven the ones with the highest red and yellow component values.
These results lead to higher values of ΔE* in pizzas cooked with IR Laser and IR Oven.
Treatments Force of Penetration (N)
Raw 0.14 ± 0.01c IR Laser 2.41 ± 0.09b IR Oven 2.95 ± 0.31a,b
Convection Oven 3.45 ± 0.40a (a-c) Mean values ± standard deviations (n=6). Values labeled with a different letter in the same column are significantly different (p<0.05).
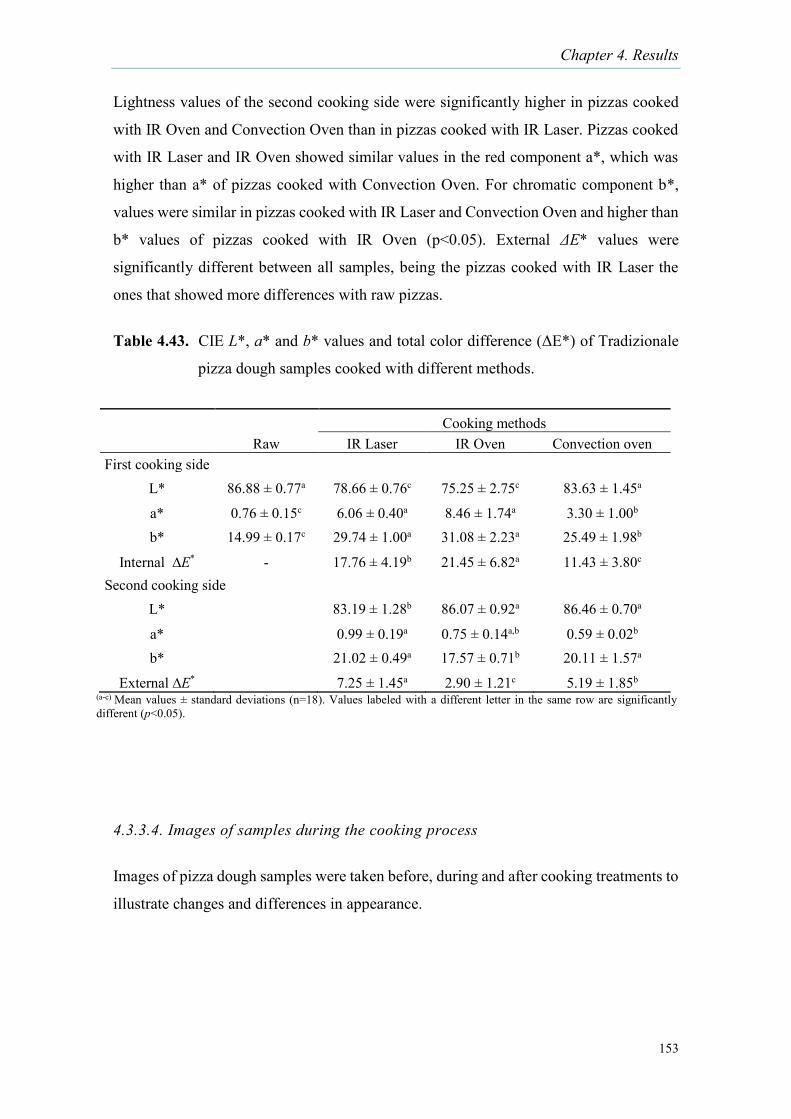
Chapter 4. Results
153
Lightness values of the second cooking side were significantly higher in pizzas cooked
with IR Oven and Convection Oven than in pizzas cooked with IR Laser. Pizzas cooked
with IR Laser and IR Oven showed similar values in the red component a*, which was
higher than a* of pizzas cooked with Convection Oven. For chromatic component b*,
values were similar in pizzas cooked with IR Laser and Convection Oven and higher than
b* values of pizzas cooked with IR Oven (p<0.05). External ΔE* values were
significantly different between all samples, being the pizzas cooked with IR Laser the
ones that showed more differences with raw pizzas.
Table 4.43. CIE L*, a* and b* values and total color difference (ΔE*) of Tradizionale
pizza dough samples cooked with different methods.
4.3.3.4. Images of samples during the cooking process
Images of pizza dough samples were taken before, during and after cooking treatments to
illustrate changes and differences in appearance.
Cooking methods Raw IR Laser IR Oven Convection oven
First cooking side L* 86.88 ± 0.77a 78.66 ± 0.76c 75.25 ± 2.75c 83.63 ± 1.45a
a* 0.76 ± 0.15c 6.06 ± 0.40a 8.46 ± 1.74a 3.30 ± 1.00b b* 14.99 ± 0.17c 29.74 ± 1.00a 31.08 ± 2.23a 25.49 ± 1.98b
Internal ∆E* - 17.76 ± 4.19b 21.45 ± 6.82a 11.43 ± 3.80c Second cooking side
L* 83.19 ± 1.28b 86.07 ± 0.92a 86.46 ± 0.70a
a* 0.99 ± 0.19a 0.75 ± 0.14a,b 0.59 ± 0.02b b* 21.02 ± 0.49a 17.57 ± 0.71b 20.11 ± 1.57a
External ∆E* 7.25 ± 1.45a 2.90 ± 1.21c 5.19 ± 1.85b (a-c) Mean values ± standard deviations (n=18). Values labeled with a different letter in the same row are significantly different (p<0.05).
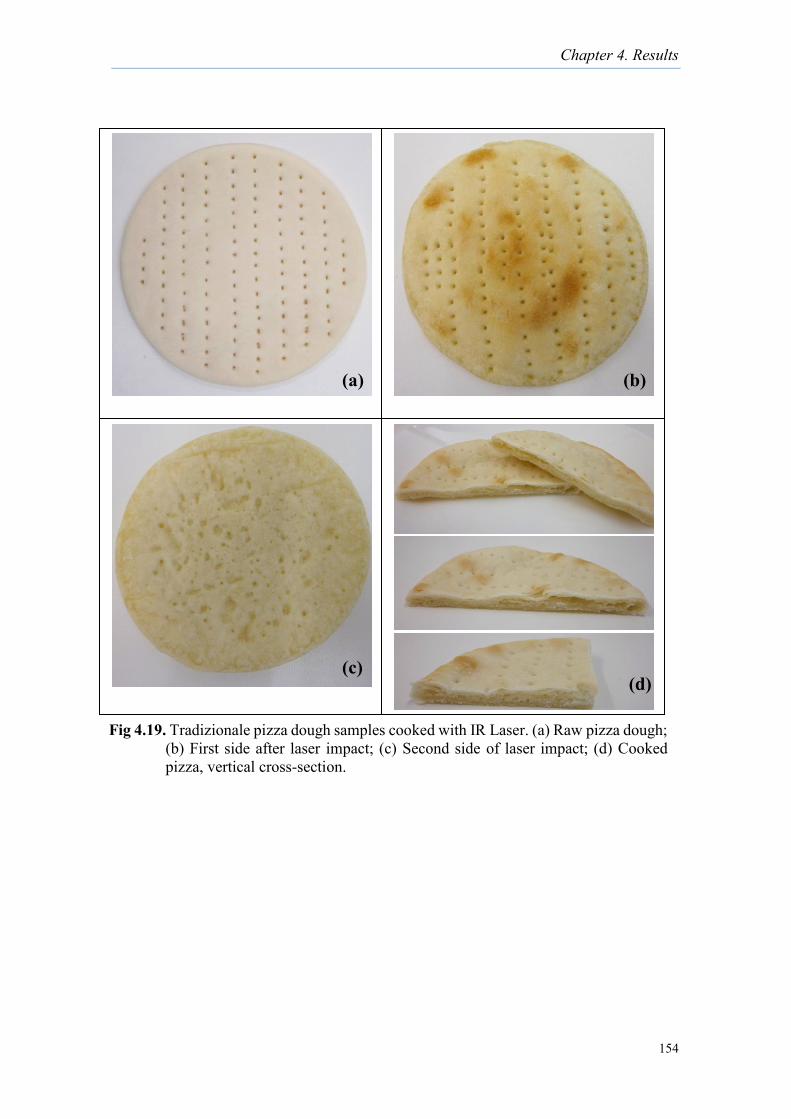
Chapter 4. Results
154
0 1 2
cm
0 1 2
cm
0 1 2
cm
Fig 4.19. Tradizionale pizza dough samples cooked with IR Laser. (a) Raw pizza dough;
(b) First side after laser impact; (c) Second side of laser impact; (d) Cooked pizza, vertical cross-section.
(a) (b)
(c) (d)
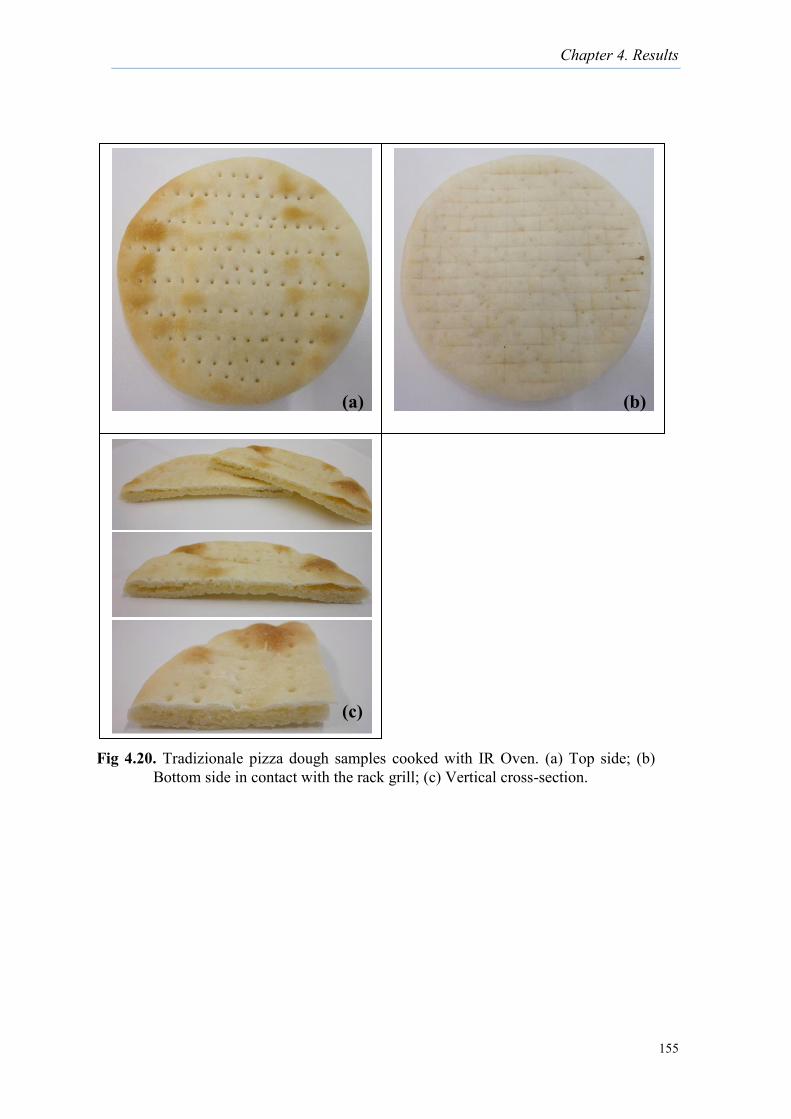
Chapter 4. Results
155
0 1 2
cm
0 1 2
cm
Fig 4.20. Tradizionale pizza dough samples cooked with IR Oven. (a) Top side; (b) Bottom side in contact with the rack grill; (c) Vertical cross-section.
(a) (b)
(c)
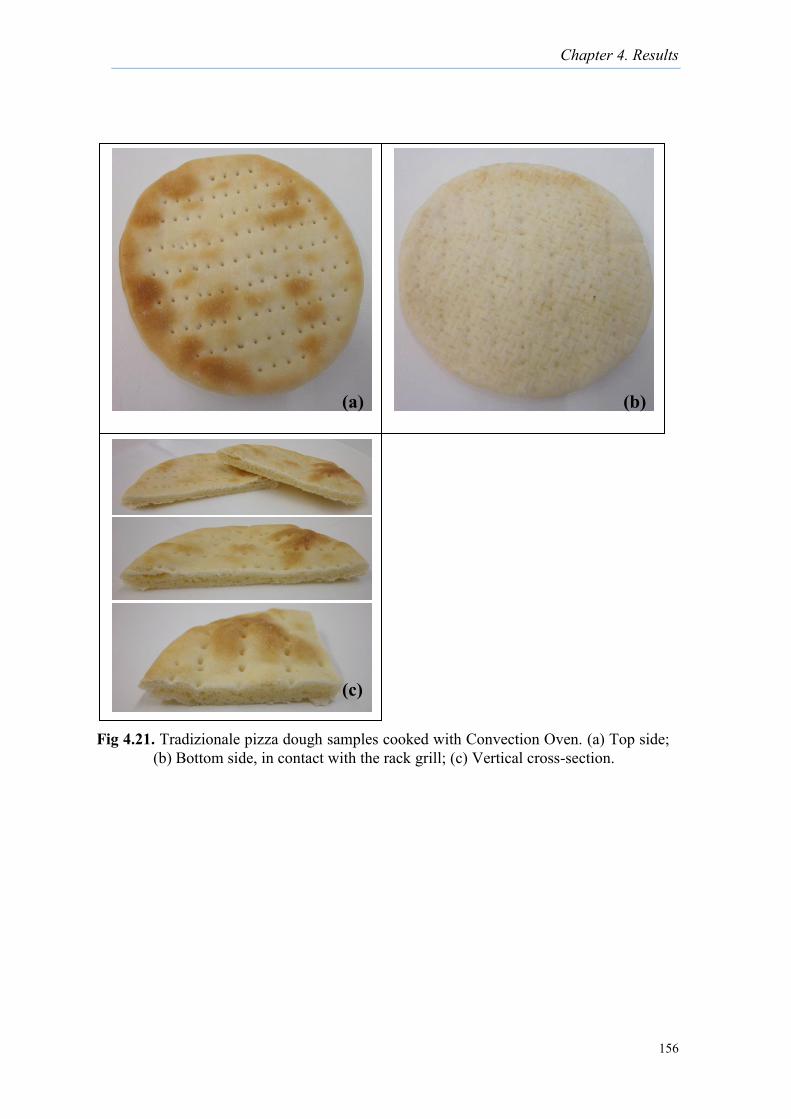
Chapter 4. Results
156
0 1 2
cm
0 1 2
cm
0 1 2
cm
Fig 4.21. Tradizionale pizza dough samples cooked with Convection Oven. (a) Top side; (b) Bottom side, in contact with the rack grill; (c) Vertical cross-section.
(a) (b)
(c)

Chapter 4. Results
157
4.3.3.5. Sensory analysis
Consumers considered that pizzas cooked with IR Oven had a significantly better general
appearance, followed pizzas cooked with IR Laser. Samples cooked with Convection
Oven received the lowest general appearance assessment (table 4.44).
Regarding the intensity of sensory attributes, pizzas cooked with IR Oven and IR Laser
had the brownest external color, whereas pizzas cooked with the Convection Oven had a
lighter color. Pizzas cooked with IR Oven received the highest ratings in the level of
doneness, taste and flavor. There were not significant differences between the intensity
of these attributes of pizzas cooked with IR Laser and Convection Oven. All cooking
methods produced patties with comparable intensity in crunchiness (p>0.05).
The evaluation of acceptability of sensory attributes followed the same pattern as the
evaluation of their intensity. Attributes evaluated as more intense (i.e. external color of
pizzas cooked with IR Laser and IR Oven; and doneness, taste and flavor of pizzas cooked
with IR Oven) also received the best acceptability ratings, whereas crunchiness
acceptability was comparable in all samples.
Consumers preferred the pizzas cooked with IR Oven, followed by pizzas cooked with
IR Laser. Pizzas cooked with Convection Oven were ranked in the last position (table
4.45).
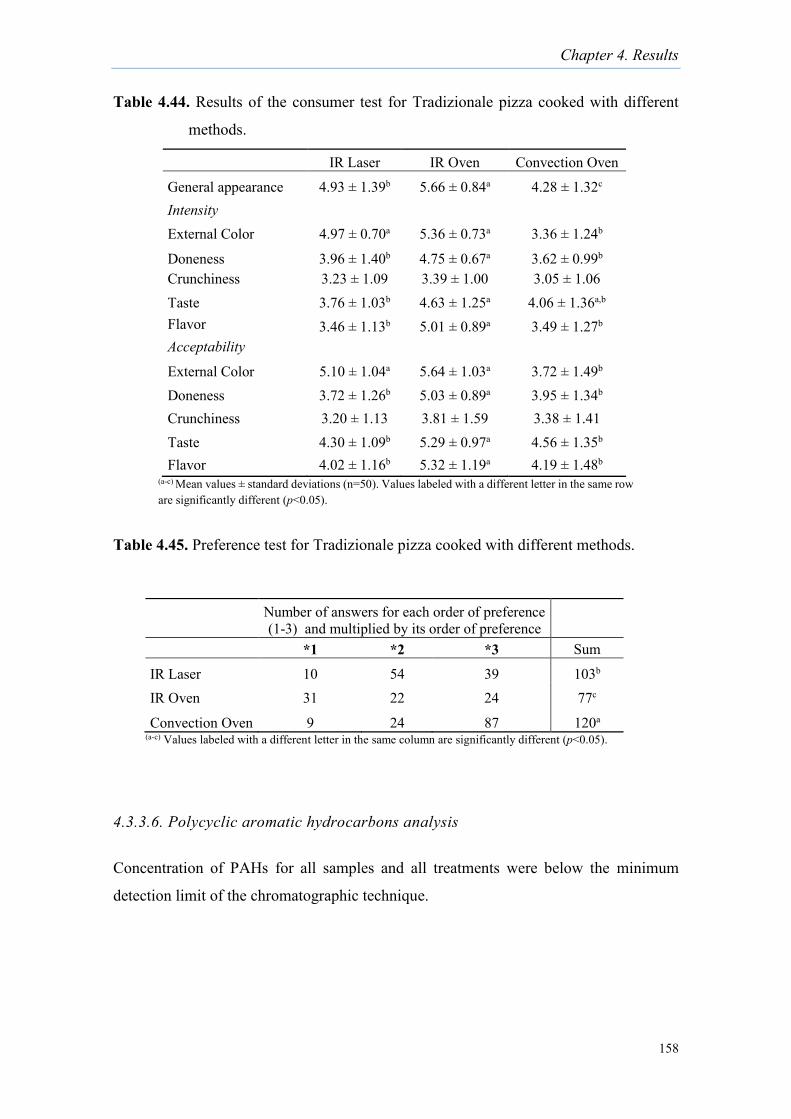
Chapter 4. Results
158
Table 4.44. Results of the consumer test for Tradizionale pizza cooked with different
methods.
Table 4.45. Preference test for Tradizionale pizza cooked with different methods.
4.3.3.6. Polycyclic aromatic hydrocarbons analysis
Concentration of PAHs for all samples and all treatments were below the minimum
detection limit of the chromatographic technique.
IR Laser IR Oven Convection Oven
General appearance 4.93 ± 1.39b 5.66 ± 0.84a 4.28 ± 1.32c Intensity External Color 4.97 ± 0.70a 5.36 ± 0.73a 3.36 ± 1.24b
Doneness 3.96 ± 1.40b 4.75 ± 0.67a 3.62 ± 0.99b Crunchiness 3.23 ± 1.09 3.39 ± 1.00 3.05 ± 1.06 Taste 3.76 ± 1.03b 4.63 ± 1.25a 4.06 ± 1.36a,b Flavor 3.46 ± 1.13b 5.01 ± 0.89a 3.49 ± 1.27b Acceptability External Color 5.10 ± 1.04a 5.64 ± 1.03a 3.72 ± 1.49b Doneness 3.72 ± 1.26b 5.03 ± 0.89a 3.95 ± 1.34b Crunchiness 3.20 ± 1.13 3.81 ± 1.59 3.38 ± 1.41 Taste 4.30 ± 1.09b 5.29 ± 0.97a 4.56 ± 1.35b Flavor 4.02 ± 1.16b 5.32 ± 1.19a 4.19 ± 1.48b
(a-c) Mean values ± standard deviations (n=50). Values labeled with a different letter in the same row are significantly different (p<0.05).
Number of answers for each order of preference (1-3) and multiplied by its order of preference
*1 *2 *3 Sum
IR Laser 10 54 39 103b IR Oven 31 22 24 77c
Convection Oven 9 24 87 120a (a-c) Values labeled with a different letter in the same column are significantly different (p<0.05).
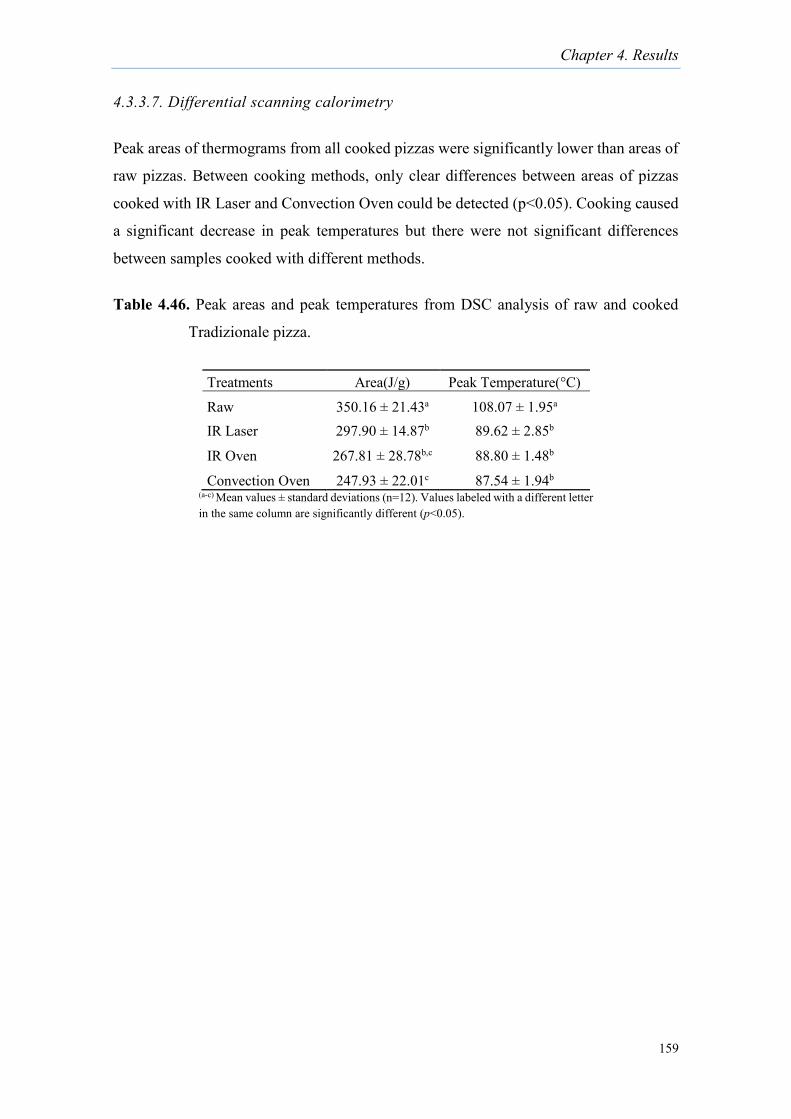
Chapter 4. Results
159
4.3.3.7. Differential scanning calorimetry
Peak areas of thermograms from all cooked pizzas were significantly lower than areas of
raw pizzas. Between cooking methods, only clear differences between areas of pizzas
cooked with IR Laser and Convection Oven could be detected (p<0.05). Cooking caused
a significant decrease in peak temperatures but there were not significant differences
between samples cooked with different methods.
Table 4.46. Peak areas and peak temperatures from DSC analysis of raw and cooked
Tradizionale pizza.
Treatments Area(J/g) Peak Temperature(°C)
Raw 350.16 ± 21.43a 108.07 ± 1.95a IR Laser 297.90 ± 14.87b 89.62 ± 2.85b
IR Oven 267.81 ± 28.78b,c 88.80 ± 1.48b
Convection Oven 247.93 ± 22.01c 87.54 ± 1.94b (a-c) Mean values ± standard deviations (n=12). Values labeled with a different letter in the same column are significantly different (p<0.05).
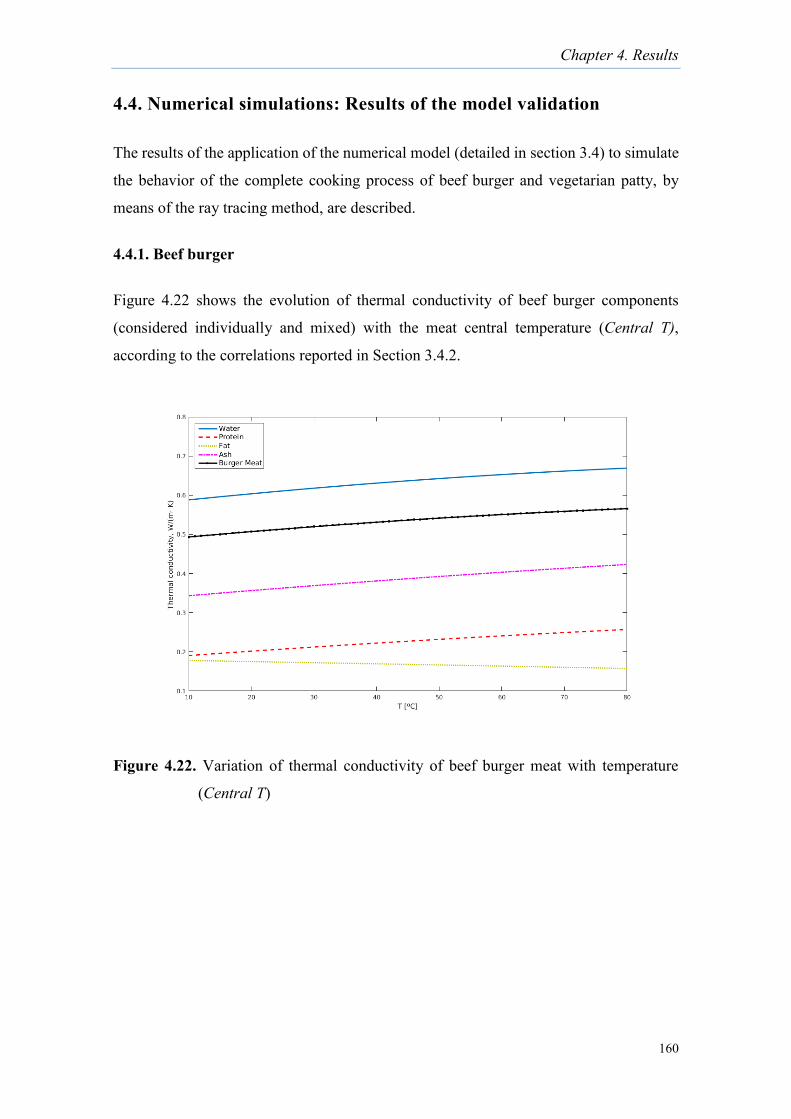
Chapter 4. Results
160
4.4. Numerical simulations: Results of the model validation
The results of the application of the numerical model (detailed in section 3.4) to simulate
the behavior of the complete cooking process of beef burger and vegetarian patty, by
means of the ray tracing method, are described.
4.4.1. Beef burger
Figure 4.22 shows the evolution of thermal conductivity of beef burger components
(considered individually and mixed) with the meat central temperature (Central T),
according to the correlations reported in Section 3.4.2.
Figure 4.22. Variation of thermal conductivity of beef burger meat with temperature
(Central T)
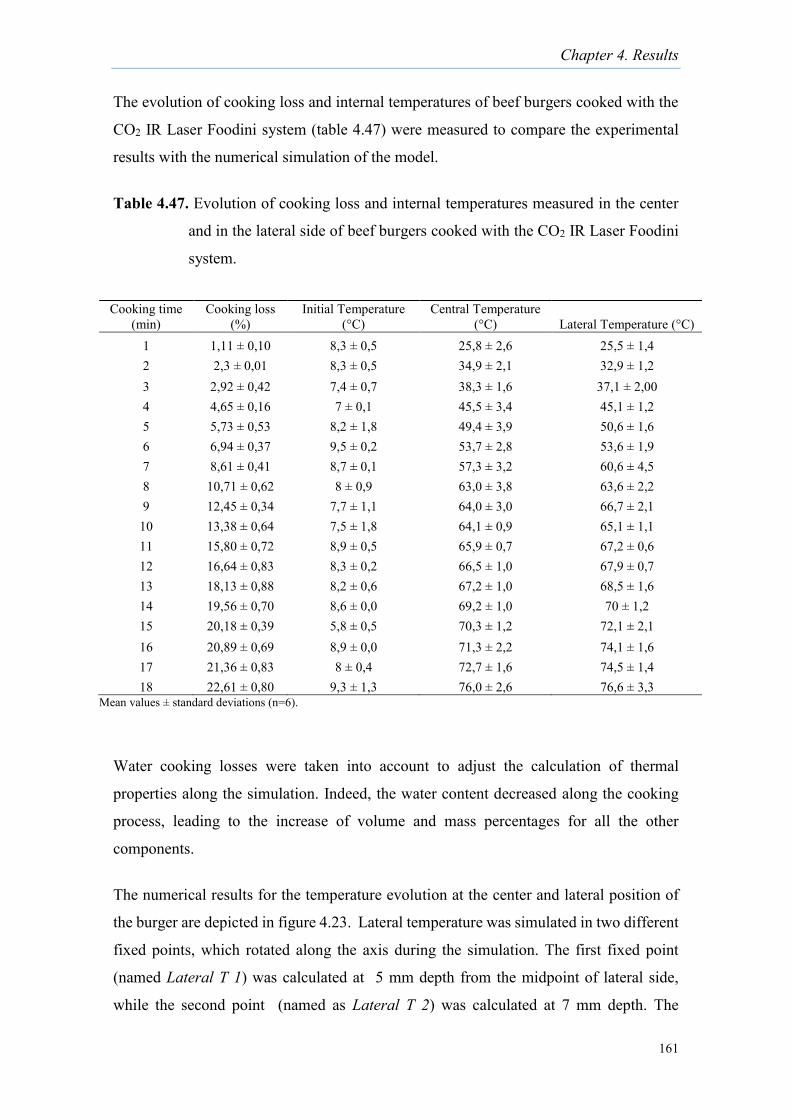
Chapter 4. Results
161
The evolution of cooking loss and internal temperatures of beef burgers cooked with the
CO2 IR Laser Foodini system (table 4.47) were measured to compare the experimental
results with the numerical simulation of the model.
Table 4.47. Evolution of cooking loss and internal temperatures measured in the center
and in the lateral side of beef burgers cooked with the CO2 IR Laser Foodini
system.
Water cooking losses were taken into account to adjust the calculation of thermal
properties along the simulation. Indeed, the water content decreased along the cooking
process, leading to the increase of volume and mass percentages for all the other
components.
The numerical results for the temperature evolution at the center and lateral position of
the burger are depicted in figure 4.23. Lateral temperature was simulated in two different
fixed points, which rotated along the axis during the simulation. The first fixed point
(named Lateral T 1) was calculated at 5 mm depth from the midpoint of lateral side,
while the second point (named as Lateral T 2) was calculated at 7 mm depth. The
Cooking time (min)
Cooking loss (%)
Initial Temperature (°C)
Central Temperature (°C) Lateral Temperature (°C)
1 1,11 ± 0,10 8,3 ± 0,5 25,8 ± 2,6 25,5 ± 1,4 2 2,3 ± 0,01 8,3 ± 0,5 34,9 ± 2,1 32,9 ± 1,2 3 2,92 ± 0,42 7,4 ± 0,7 38,3 ± 1,6 37,1 ± 2,00 4 4,65 ± 0,16 7 ± 0,1 45,5 ± 3,4 45,1 ± 1,2 5 5,73 ± 0,53 8,2 ± 1,8 49,4 ± 3,9 50,6 ± 1,6 6 6,94 ± 0,37 9,5 ± 0,2 53,7 ± 2,8 53,6 ± 1,9 7 8,61 ± 0,41 8,7 ± 0,1 57,3 ± 3,2 60,6 ± 4,5 8 10,71 ± 0,62 8 ± 0,9 63,0 ± 3,8 63,6 ± 2,2 9 12,45 ± 0,34 7,7 ± 1,1 64,0 ± 3,0 66,7 ± 2,1
10 13,38 ± 0,64 7,5 ± 1,8 64,1 ± 0,9 65,1 ± 1,1 11 15,80 ± 0,72 8,9 ± 0,5 65,9 ± 0,7 67,2 ± 0,6 12 16,64 ± 0,83 8,3 ± 0,2 66,5 ± 1,0 67,9 ± 0,7 13 18,13 ± 0,88 8,2 ± 0,6 67,2 ± 1,0 68,5 ± 1,6 14 19,56 ± 0,70 8,6 ± 0,0 69,2 ± 1,0 70 ± 1,2 15 20,18 ± 0,39 5,8 ± 0,5 70,3 ± 1,2 72,1 ± 2,1 16 20,89 ± 0,69 8,9 ± 0,0 71,3 ± 2,2 74,1 ± 1,6 17 21,36 ± 0,83 8 ± 0,4 72,7 ± 1,6 74,5 ± 1,4 18 22,61 ± 0,80 9,3 ± 1,3 76,0 ± 2,6 76,6 ± 3,3
Mean values ± standard deviations (n=6).
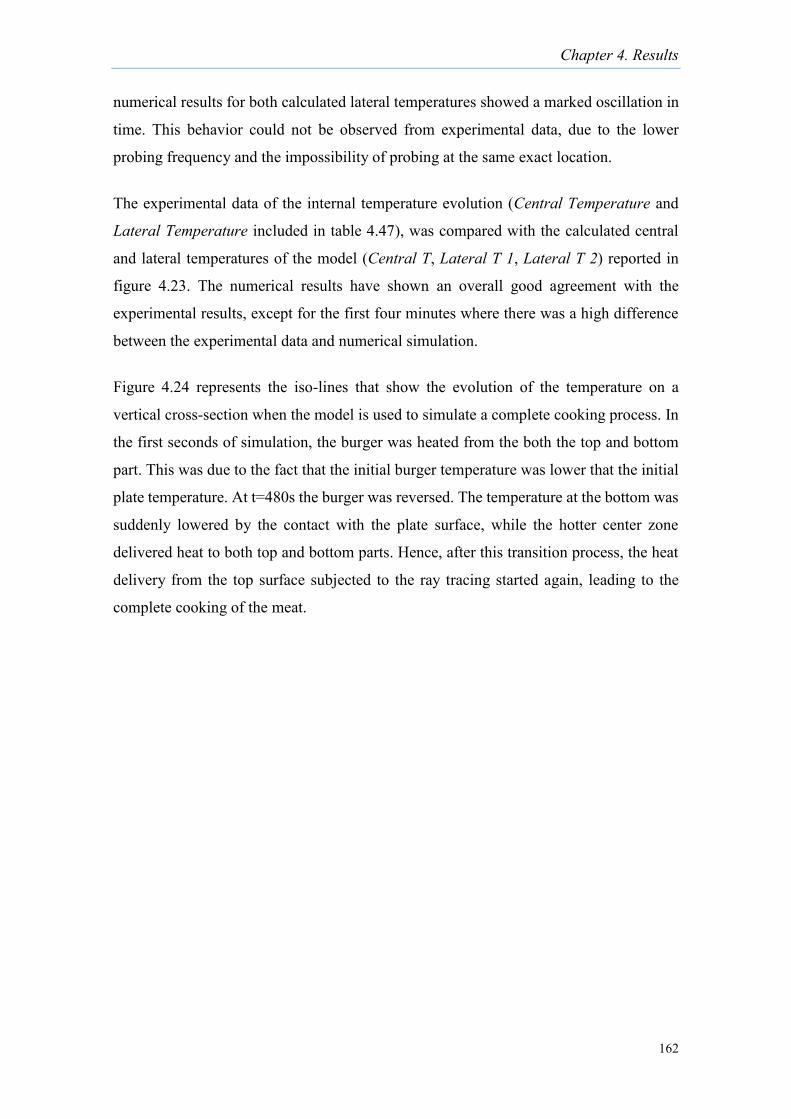
Chapter 4. Results
162
numerical results for both calculated lateral temperatures showed a marked oscillation in
time. This behavior could not be observed from experimental data, due to the lower
probing frequency and the impossibility of probing at the same exact location.
The experimental data of the internal temperature evolution (Central Temperature and
Lateral Temperature included in table 4.47), was compared with the calculated central
and lateral temperatures of the model (Central T, Lateral T 1, Lateral T 2) reported in
figure 4.23. The numerical results have shown an overall good agreement with the
experimental results, except for the first four minutes where there was a high difference
between the experimental data and numerical simulation.
Figure 4.24 represents the iso-lines that show the evolution of the temperature on a
vertical cross-section when the model is used to simulate a complete cooking process. In
the first seconds of simulation, the burger was heated from the both the top and bottom
part. This was due to the fact that the initial burger temperature was lower that the initial
plate temperature. At t=480s the burger was reversed. The temperature at the bottom was
suddenly lowered by the contact with the plate surface, while the hotter center zone
delivered heat to both top and bottom parts. Hence, after this transition process, the heat
delivery from the top surface subjected to the ray tracing started again, leading to the
complete cooking of the meat.
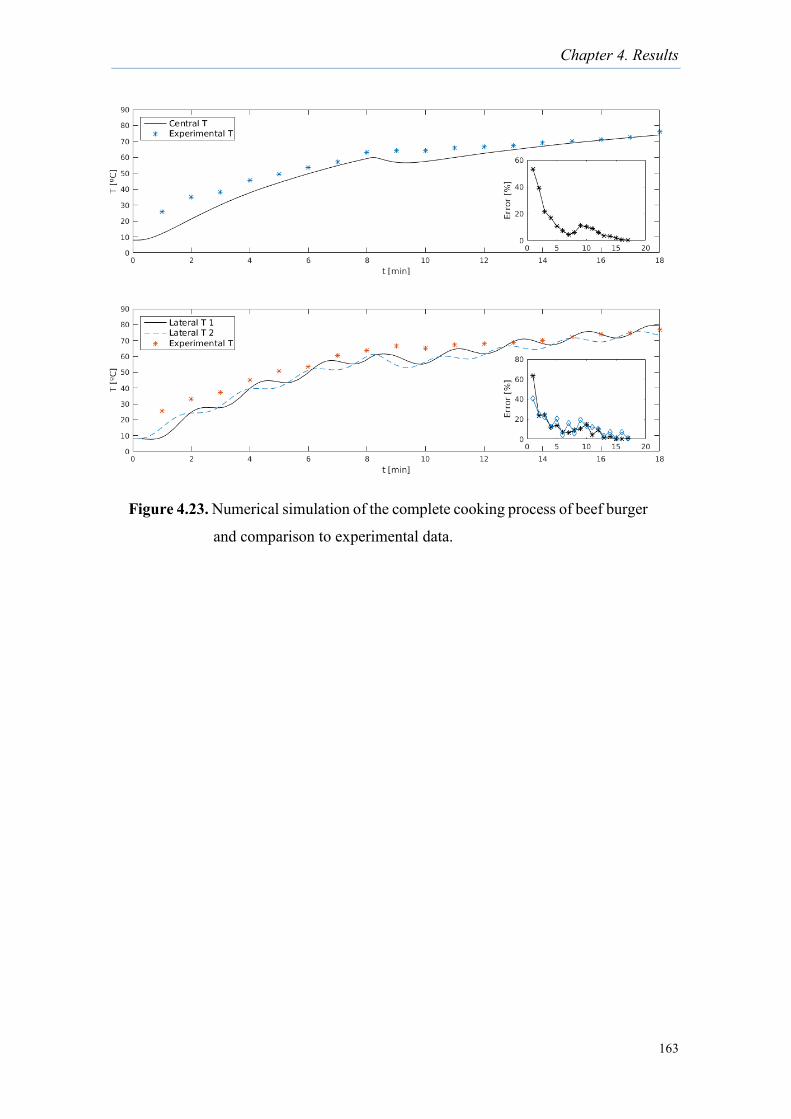
Chapter 4. Results
163
Figure 4.23. Numerical simulation of the complete cooking process of beef burger
and comparison to experimental data.
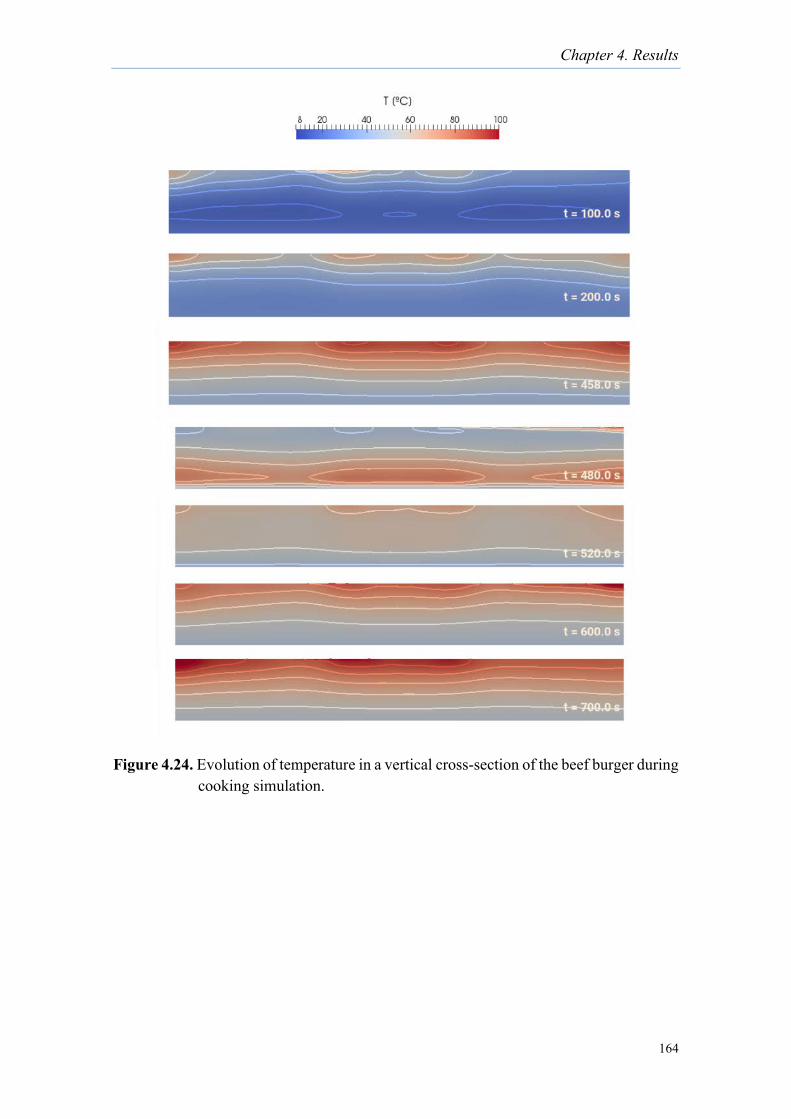
Chapter 4. Results
164
Figure 4.24. Evolution of temperature in a vertical cross-section of the beef burger during cooking simulation.

Chapter 4. Results
165
4.4.1. Vegetarian patty
In the vegetarian patty case, the initial composition was used to calculate the thermal
conductivity. In this case, carbohydrates percentage, calculated by difference was taken
into account (data not shown).
Figure 4.25 shows the evolution of thermal conductivity of vegetarian patties components
(considered individually and mixed) with the central temperature (Central T), according
to the correlations reported in Section 3.4.2.
Figure 4.25. Variation of thermal conductivity of vegetarian patty with temperature
Numerical results were compared to the experimental data reported in table 4.48.
Chapter 4. Results
166
The numerical results for the temperature evolution at the center and lateral positions of
the patty are depicted in figure 4.26, showing an overall good agreement with
experimental results, except for the first three minutes where there was a high difference
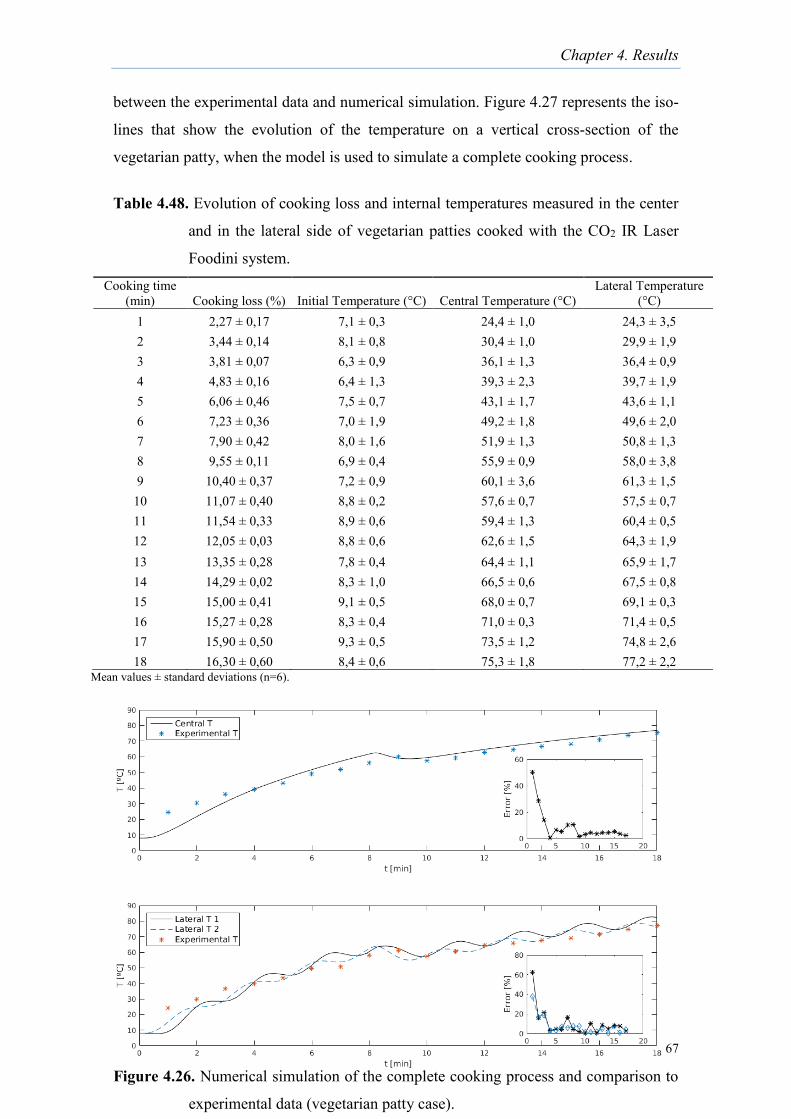
Chapter 4. Results
167
between the experimental data and numerical simulation. Figure 4.27 represents the iso-
lines that show the evolution of the temperature on a vertical cross-section of the
vegetarian patty, when the model is used to simulate a complete cooking process.
Table 4.48. Evolution of cooking loss and internal temperatures measured in the center
and in the lateral side of vegetarian patties cooked with the CO2 IR Laser
Foodini system.
Cooking time (min) Cooking loss (%) Initial Temperature (°C) Central Temperature (°C)
Lateral Temperature (°C)
1 2,27 ± 0,17 7,1 ± 0,3 24,4 ± 1,0 24,3 ± 3,5 2 3,44 ± 0,14 8,1 ± 0,8 30,4 ± 1,0 29,9 ± 1,9 3 3,81 ± 0,07 6,3 ± 0,9 36,1 ± 1,3 36,4 ± 0,9 4 4,83 ± 0,16 6,4 ± 1,3 39,3 ± 2,3 39,7 ± 1,9 5 6,06 ± 0,46 7,5 ± 0,7 43,1 ± 1,7 43,6 ± 1,1 6 7,23 ± 0,36 7,0 ± 1,9 49,2 ± 1,8 49,6 ± 2,0 7 7,90 ± 0,42 8,0 ± 1,6 51,9 ± 1,3 50,8 ± 1,3 8 9,55 ± 0,11 6,9 ± 0,4 55,9 ± 0,9 58,0 ± 3,8 9 10,40 ± 0,37 7,2 ± 0,9 60,1 ± 3,6 61,3 ± 1,5
10 11,07 ± 0,40 8,8 ± 0,2 57,6 ± 0,7 57,5 ± 0,7 11 11,54 ± 0,33 8,9 ± 0,6 59,4 ± 1,3 60,4 ± 0,5 12 12,05 ± 0,03 8,8 ± 0,6 62,6 ± 1,5 64,3 ± 1,9 13 13,35 ± 0,28 7,8 ± 0,4 64,4 ± 1,1 65,9 ± 1,7 14 14,29 ± 0,02 8,3 ± 1,0 66,5 ± 0,6 67,5 ± 0,8 15 15,00 ± 0,41 9,1 ± 0,5 68,0 ± 0,7 69,1 ± 0,3 16 15,27 ± 0,28 8,3 ± 0,4 71,0 ± 0,3 71,4 ± 0,5 17 15,90 ± 0,50 9,3 ± 0,5 73,5 ± 1,2 74,8 ± 2,6 18 16,30 ± 0,60 8,4 ± 0,6 75,3 ± 1,8 77,2 ± 2,2
Mean values ± standard deviations (n=6).
Figure 4.26. Numerical simulation of the complete cooking process and comparison to
experimental data (vegetarian patty case).
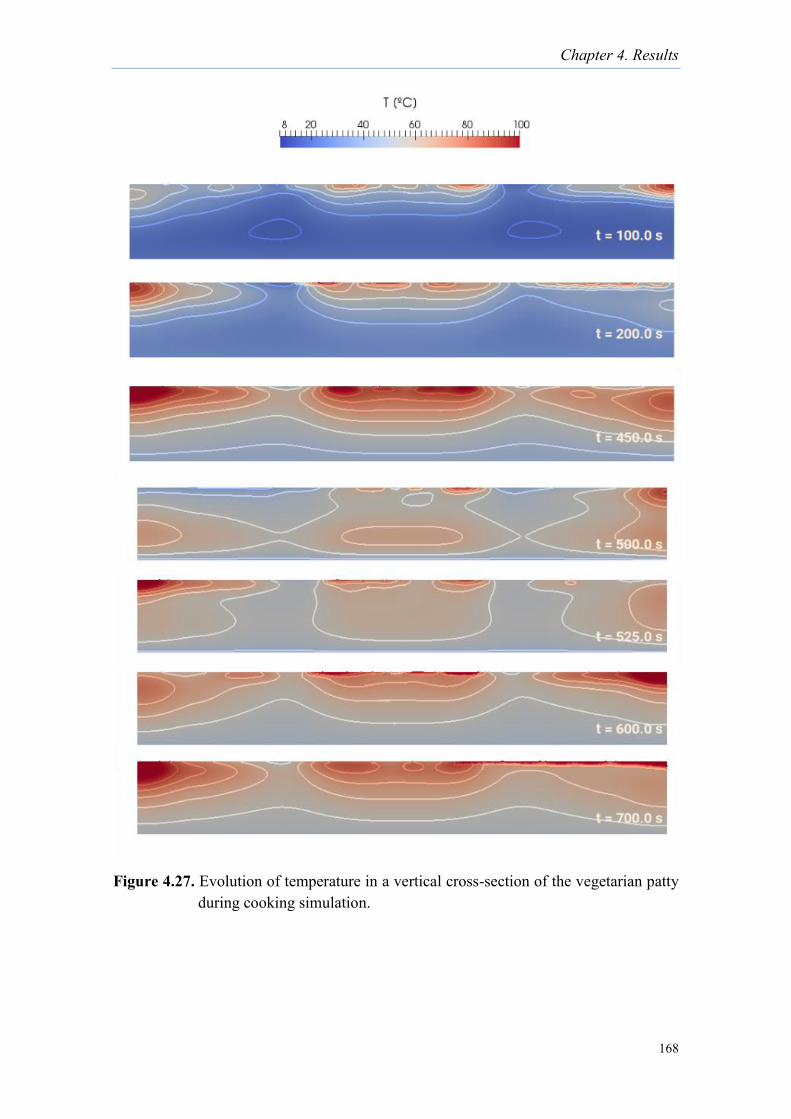
Chapter 4. Results
168
Figure 4.27. Evolution of temperature in a vertical cross-section of the vegetarian patty during cooking simulation.

Chapter 5.Discussion
169
CHAPTER 5
DISCUSSION
Chapter 5.Discussion
170
5. Discussion
Discussion of the results has been organized by product type to facilitate the comparison
between the cooking effect of the different methods used in this thesis.
5.1. Discussion of beef burgers results
5.1.1. Cooking methods
The main characteristic of each cooking method is given by the heat transfer mechanisms
involved in the heating of beef burgers.
CO2 IR laser cooking can be considered as a purely radiative treatment, comparable to
selective heating by IR radiation treatment, with a high electromagnetic IR radiation
absorption by water, fats, carbohydrates (starches) and close to an area of maximum
absorption peaks (9 µm) for lipids (Krishnamurty, 2008). The CO2 IR laser Epilog
equipments used in the first part of the thesis are industrial engraving and cutting
equipments not originally designed for cooking. After a very long trial and error series of
experiments, specific conditions of working operation adapted to cooking of food
matrices were found. These conditions could be considered as unusual since beef burgers
were cooked from upper pole to lower pole of the same side, and the cooking time was
very long (12-14 mins per side) to guarantee cooking temperature >72°C inside burgers.
Results showed that cooking with CO2 IR laser Epilog equipments, a high uniformity in
physico-chemical characteristics, a high consumer acceptance and the elimination of
naturally present coliforms in meat could be achieved. Nevertheless, the level of
inactivation of inoculated Salmonella was lower than the inactivation attained with other
traditional systems.
IR Oven used an IR lamp and can be considered a mixed system as it combines IR
radiation with fan convection and, also, some conduction effect from the grid, although
with predominance of radiant action (Koutchma, 2017).
The BBQ Grill system can be considered a broiling system, since the meat is cooked by
proximity to the radiant heat or “broiler.” The meat is placed above the heat source and
the heat radiates from one direction, so the meat must be turned during cooking. Broiling
Chapter 5.Discussion
171
can also be considered a combined system since the grid, where the burger is placed,
transmits heat through conduction.
The Flat Grill system (also known as panbroiling system) is a conductive-based method
due to the direct heat transmission from the metallic surface to the meat. Burgers must
be turned frequently to prevent excessive surface browning or crust formation and to
allow an even cooking. The pan or griddle should not be covered during panbroiling
(AMSA, 2016).
In the second study, an innovative CO2 IR laser system was developed and adapted to
cook inside Foodini. This system allowed homogeneous cooking over the surface of beef
burgers by irradiating a defined area using the fast movement of galvo mirrors, while the
plate with the sample rotated to distribute heating. As for the cooking system used in the
first study, a very long trial and method strategy was carried out to determine the most
appropriate cooking conditions. With the CO2 IR laser Foodini equipment, the cooking
time was considerably reduced in comparison with the Epilog equipment, and it was
closer to IR Oven system. Besides, the laser energy was completely focused on the food,
hence avoiding the damage of internal mechanics or electronics of the 3D Printer. CO2
IR laser Foodini system was able to guarantee safe cooking of beef burgers since a 6-log
reduction of inoculated Salmonella and E. coli O157:H7 was achieved (FSAI, 2018), and
the levels of analyzed PAHs were under the detection limit. Moreover, physico-chemical
results showed that CO2 IR Laser Foodini system was comparable to the traditional
cooking methods used and it received a high level of acceptance from consumers.
5.1.2. Physico-chemical parameters
The decrease in moisture content after cooking was reflected in cooking loss values.
Water losses did not result in a decrease in water activity, since the water content of
cooked beef burgers was still very high. In both experiments, the protein, fat and ash
content of cooked samples were higher than in raw samples because of the concentration
effect caused by evaporative water losses.
In the case of the first study (with Epilog system), no differences were observed between
cooking loss values or moisture content of cooked burgers whereas in the second study
(with Foodini system), higher cooking losses were observed for Flat Grill treatment, in
Chapter 5.Discussion
172
comparison with IR Laser and IR Oven treatments. In Flat Grill, the highest cooking loss
corresponded with the highest moisture content.
Cooking losses cannot be only attributed to water losses since fat is also lost during
cooking of beef burgers, as indicated by Sheridan and Shilton (2002) and Ortigas-Marty
et al. (2006) who found that cooking losses were mainly caused by water reduction, fat
and some suspended solids. In our study, fat content expressed on dry basis of Flat Grill
and BBQ Grill samples was lower in comparison with the rest of treatments. This result
could be attributed to faster drip loses of fat, since it melts at 40°C, in comparison with
water which needs more time to evaporate (Sheridan, 2002). Hence, the shorter cooking
time of Flat Grill could lead to higher fat losses and lower moisture losses.
However, Dreeling et al. (2000) evaluated the effect of different cooking treatments on
low-fat hamburgers (≈ 7.2% fat) and they observed that the cooking method did not affect
the fat content of burgers. This fact could be motivated for the biggest size and weight of
their burgers, which required a larger cooking time to reach 72°C inside the samples.
Sheridan and Shilton (1999) evaluated the efficiency of cooking burgers using two
sources of IR with 2.7 μm and 4.0 μm of maximum wavelength peak and concluded that
the samples cooked with 4.0µm had lower losses. Among other factors, they attributed
that radiation with a length of 2.7μm penetrated the surface of food samples more
efficiently, likely because of the preferential absorption spectrum of water in the surface
at this wavelength. The difference in absorption at 2.7μm and 4μm in water is about 2 log
units. In our study, we did not found differences in cooking losses caused by IR Oven
lamps and IR Laser, and this could be attributed to the high absorptivity bands of water,
both in IR Oven (~ 2.2 -3.2 µm) and in IR laser system (10.64 µm).
Sheridan and Shilton (2002) observed that in burgers with low fat content cooked with an
IR oven, water was available in enough quantity during the cooking process to cool
continuously the surface by evaporation of water. The migration of water through the
surface seemed to prevent the formation of the surface crust. This would also be the case
of the burgers cooked with IR laser and IR Oven laser, in which a clear formation of a
crust was not observed either. Braeckman et al. (2009) studied the use of IR barbecue
prior to convection cooking to investigate if a combined treatment could help to reduce
fat and moisture losses through the formation of a crust. On the contrary to their initial
Chapter 5.Discussion
173
statement, they observed that losses of the first cooking stage were added to those of the
second treatment.
Concerning texture, on one hand, the higher hardness values of samples cooked with IR
Oven and IR laser-based systems suggest a possible relationship with the longer time of
cooking, which would induce a higher protein denaturation of intramuscular collagen
(reported to happen at 60-70°C) and structural changes in myofibrils (reported to happen
at 68-80°C in actin) and cause toughening (Berhe et al. 2014). The shrinkage due to
myofibrillar denaturation has been associated with hardness increase (Zzman, 2013;
Domínguez-Hernández, 2018). On the other hand, the lower values of hardness and
cutting force of samples cooked with Flat Grill and BBQ Grill could be influenced by a
lower cooking time, which would induce less structural changes in proteins. Dreeling et
al. (2000) studied the effect of different cooking methods of low-fat burgers, and the
results obtained for TPA values (hardness and springiness) were similar to the results in
our study, although they obtained higher cutting forces.
In both Epilog and Foodini studies, color of burgers changed significantly and
accordingly to the cooking treatment of samples. Ground beef is manufactured from
larger cuts of meat or trimmings from primal and sub-primals. When these materials are
ground, oxygen is incorporated, and meat becomes bright with cherry red color due to
oxymyoglobin formation (Claus, 2007). The internal and external a* color values (~ 15)
of raw burgers confirms the oxidation of myoglobin. With an increase in temperature and
cooking time the red pigmentation of myoglobin changes to metamyoglobin, thus, the red
color of the raw meat becomes brown due the oxidation of the hemo group and the
denaturation of globin from 60-75°C (Ranken, 2000; Christensen, 2012).
In Epilog study, comparable L* and a* values of internal color indicate that the cooking
treatment had caused similar changes, except in burgers cooked with IR Laser 29, which
had lower values of L* and higher values of a* than the rest of samples. This difference
might be attributed to a shorter residence time at highest temperatures (>70°C) thus,
causing less myoglobin denaturation. In Foodini study, IR Laser cooking rendered
burgers with internal L* and a* values comparable to the burgers cooked with the other
methods, suggesting that the heat transmission to center of all burger was similar and
indicating an appropriate cooking performance of the new laser system.
Chapter 5.Discussion
174
Regarding the external color, samples cooked by IR Laser in the Epilog experiment were
ones with the lowest total color difference with raw samples, whereas the contrary
happened in the Foodini experiment. On one hand, this confirms the higher performance
of IR Laser Foodini study than IR Laser 29 and 25 from Epilog study. Overall results of
both studies showed that measured color values of burgers cooked with IR Laser
treatments and IR Oven were close, which indicates that IR radiation on food surface
leads to a similar heat process inside and outside beef burgers. Results show that the way
or strategy in the application of IR laser is a key factor to control an optimal heating
process. Although laser is based on a single beam, the radiation energy must be uniformly
distributed over the entire food sample. DSC analysis of cooked and raw samples were
performed to provide another indicator of the cooking efficacy of the methods compared
in this study since the values of integrated peak areas correspond to the endothermic
energy used for protein denaturation in beef burger samples. Results of both Epilog and
Foodini studies showed that the energy applied for protein denaturation in raw meat was
higher than the energy required for cooked samples, since proteins of cooked meat were
already partially unfolded or denatured. No differences could be established between
cooking treatments in terms of areas. However, peak temperatures of cooked burgers with
IR Laser 29 and IR Laser 25 were closer to raw meat, which could indicate that changes
induced by these treatments were less intense. Anyway, the interpretation of this result
remains unclear as in Foodini study no differences in peak temperatures were found
between raw and cooked samples. A typical thermogram of beef muscle has three
endothermic peaks clearly differentiated which correspond to denaturation of myosin (54-
58°C), collagen and sarcoplasmic proteins (65-67°C) and actin (80-83°C) (Wright et al.,
1977). Other authors place the endothermic peak of actin around 75-79°C (Xiong et al.,
1987; Sikes et al., 2010). In the thermograms obtained in the present work only one peak
located between 74 to 76°C was observed, which could be attributed to actin denaturation.
5.1.3. Sensory analysis
In the preference tests of the sensory analysis corresponding to Epilog study, consumers
preferred indistinctly the burgers cooked with IR Laser 29, IR Laser 25, IR Oven,
followed by the burgers cooked with BBQ Grill and the ones cooked with Flat Grill in
the last position. In the preference test of Foodini study, burgers cooked by IR Laser were

Chapter 5.Discussion
175
the most preferred by consumers, followed by the group of burgers cooked by IR Oven
and Flat Grill, and the last place was for burgers cooked with BBQ Grill. In general IR
cooked burgers were identified as tenderer, juicier, with a lower level of doneness and
less brown than BBQ and Flat Grill cooked burgers. The higher evaluation of tenderness
and juiciness in intensity tests was translated into a significantly higher acceptability of
burgers cooked with IR Laser and IR Oven cooking methods.
Results from instrumental analysis can contribute to explain the results obtained in the
sensory tests. On the one hand, the higher fat content in burgers cooked with IR methods
could increase the tenderness of the samples. Tenderness can also be associated with a
longer cooking time between 60 and 70°C, which increases gelatinization of collagen and
favor the solubilization of connective tissue leading to meat tenderization (Davey and
Niederer, 1977; Zzaman, 2013). Results from the temperature evolution inside burgers
cooked with IR Laser Foodini system show that time from 60 to 72°C took longer than
time needed to reach 60°C. . The fact that consumers considered the burgers cooked with
Flat Grill as harder and less juicy is probably related with their lower fat content and with
crust formation on these burgers, due to the contact with a hot surface at 180°C which
could imply overcooking on the surface of the sample.
Considering the results of sensory and instrumental analyses, most notable differences
were found between burgers cooked with IR Laser treatments and Flat Grill method.
Based on this, it is possible to state that burgers cooked with the IR Laser systems
underwent a milder heating process, whereas burgers cooked with Flat Grill were
subjected to a more intense treatment. These differences would be mainly related with the
heat transfer mechanism, IR Laser being a pure radiative method and Flat Grill being pure
conductive.
To understand differences between IR Laser methods used in this study, it must be taken
in account that with the CO2 IR Epilog laser system, CO2 lamp radiates a very specific
area of the sample for each given time, while the rest of the sample remains unheated. On
the one hand, this method increases substantially the cooking time to achieve the internal
target temperature (72°C) but, on the other hand, there are no overcooked surface areas.
Besides, with the CO2 IR Foodini laser system, the radiated zone is much wider, favoring
a more homogeneous thermal treatment that reduces notably the cooking time and avoids
overcooked areas.
Chapter 5.Discussion
176
5.1.4. Microbiological analyses
Microbiology results of the Epilog study indicate that burgers cooked with IR Laser 29
were not kept enough time at high temperature (72°C) to obtain a significant reduction in
aerobic mesophilic bacteria counts or to eliminate the naturally present coliforms in meat.
For this reason, they were excluded from the tests with inoculated Salmonella.
Results from inoculated samples cooked with IR Laser 25 indicate that this method still
does not guarantee the safety of cooked burgers because it was not able to reduce the 6
log units stablished as a safety performance standard (FSAI, 2018) Moreover, in the tests
with burgers inoculated at ~ 3 log units of Salmonella, IR Laser 25 was less effective than
other cooking methods. Despite IR Laser 25 provided two more min of cooking time than
IR Laser 29, the system of laser application (from upper pole to lower pole) did not
provide a homogeneous heating treatment. This means that even if the temperature of
72°C was reached in the center of the beef burger, the time at this temperature was
apparently too short.
Burgers cooked with BBQ Grill in the Epilog study did not reach the required reduction
standard for both types of Salmonella. In both cases, due to the high survival of
Salmonella in one of the six cooked burgers. This result indicates a high variability in the
effects of this method, which could be influenced by the position of the burgers over the
rack grill.
Microbiological results from Epilog study indicated two improvements that should be
implemented in further studies: improvement of the heating process of IR Laser method
to increase microbial inactivation, and reduction of variability associated to BBQ Grill
treatment.
In the second study, carried out with the CO2 IR laser Foodini system, this method caused
lethalities in all inoculated pathogens that were comparable to the rest of cooking methods
and accomplished the required reduction above 6 log units that guarantees the safety of
the burgers.
Moreover, in this study, a tendency that can be also observed in Epilog study was
reinforced: in general, IR Oven seemed to cause a higher lethality than the rest of
methods. The highest inactivation effect of this method would be explained because
Chapter 5.Discussion
177
inside an IR Oven the heat flux is distributed and penetrates homogeneously all over the
sample surface and it is able to keep constant high temperatures, according to Koutchma
(2017).
Some authors have observed a high thermal resistance of S. Senftenberg (Mañas et al.,
2003). Results of Epilog and Foodini studies with burgers inoculated at ~ 3 log CFU/g,
seem to confirm this point as S. Senftenberg survived in 37 out of 48 plates from sample
enrichment whereas S. Typhimurium survived in 23 out of 48 plates.
5.1.5. PAHs analysis
Results of PAHs content in cooked burgers, which remained under the limit of detection
for all treatments, show that CO2 IR Foodini laser system did not overcook the burger
surface. Thus, IR laser radiation was properly applied to cook burgers without surface
burning degradation. These results agree with results from other studies with conventional
cooking methods (e.g. grilling, roasting) where PAHs also remained under the limit of
detection (Rose, et al.2015; Chen and Lin, 1997; Larsson et al., 1983).
5.2 Discussion of pizza dough results
Pizza dough was cooked using both IR Laser systems studied in the present thesis. In CO2
IR Laser Epilog system study, Finissima pizza (height: 3 ± 1 mm; diameter: 60 mm) was
cooked with cooking conditions named as IR Laser 20. In CO2 IR Laser Foodini system
study, Tradizionale pizza (height: 5 ± 1 mm; diameter: 100 mm) was cooked with cooking
conditions named as IR Laser.
In both studies, cooking loss was exclusively due to water evaporation since fat, protein
and ashes content expressed on dry basis did not change between raw and cooked pizzas.
The changes in moisture content of cooked pizzas caused a decrease in their water
activity.
Cooking and water losses of pizzas cooked with both IR Laser systems were significantly
lower than the losses of pizzas cooked with the other methods. These differences were
caused because of the heating characteristics of the cooking methods used. IR Oven
provided a continuous IR heating radiation over the entire surface of pizzas, combined
with some convection effect. The deck oven used was an industrial equipment where
Chapter 5.Discussion
178
pizzas were placed over a heated stone and rapidly cooked by conduction. In Convection
Oven, convection heating predominated combined with conduction effect. On the other
hand, IR Laser 20 method cooked the Finissima pizza from pole to pole, and the IR
radiation was not constantly applied over the whole pizza surface. In the studies with
burgers, the effect of IR Laser Epilog and Foodini methods could be compared because
cooked samples were identical. In the case of pizzas, performance of both methods could
not be compared because of differences in the thickness of pizzas.
Regarding color results from Epilog study, L* values of first cooking side of pizzas
cooked with IR Laser 20 were the lowest, indicating a darker surface. This browning
surface effect was searched during the trial-error methodology applied to determine the
cooking conditions for Finissima pizza. The objective was to use the laser beam to imitate
the brown color and black spots found in traditionally cooked pizzas. In general, color
values of Finissima pizzas cooked with the IR Laser 20 were significantly different with
other treatments.
In Foodini study, L* values indicate that the browning effect obtained with IR Laser was
comparable to the browning effect with IR Oven. The cooking methodology previously
described in the material and methods section (with four Lissajous equations) was a
strategy that searched two objectives: to bake the Tradizionale pizza and to provide
surface browning. Indeed, the color values of the first cooking side of the Tradizionale
pizza were very similar for IR Laser and IR Oven treatments whereas the color of the
second side of samples cooked with IR Laser was different from the other cooking
treatments.
Sensory analyses showed differences between the first and second study and between the
IR laser treatments applied. Although, as stated, the results cannot be directly compared
as pizza characteristics were quite different. In the first experimental study, Finissima
pizzas cooked by IR Laser 20 were well evaluated in terms of the general appearance,
which somehow indicated the acceptability of the external color by consumers.
The results of the sensory analysis of Foodini study were completely different. The most
accepted and preferred samples where Tradizionale pizzas cooked with IR Oven. In this
study, a conventional convection oven was used instead of the deck oven due to
operational reasons. Low acceptability values and ranking position in preference test for
Chapter 5.Discussion
179
IR laser and Convection Oven might indicate that Tradizionale pizza were not
appropriately baked with these methods, at least from the organoleptic point of view.
DSC analysis, which could be considered as an indirect measure of starch gelatinization
and protein denaturation, show that Finissima pizzas cooked with IR Laser 20 treatment
were well baked since the average peak area was highly reduced (>50%) in comparison
with the raw pizza, and it was comparable to peak area obtained for IR Oven. In Foodini
study, although the peak area of Tradizionale pizza cooked with IR Laser was
significantly lower than the area of raw dough, its high values might indicate that the
baking process was not complete.
Hence, considering sensory results, cooking losses and DSC peak areas of Tradizionale
pizzas cooked with IR Laser treatment in Foodini study, it is possible to state that samples
were not cooked as well as expected. Improvement of IR Laser cooking conditions to
bake Tradizionale pizzas will be considered for future work. Probably, better results could
have been obtained by baking a thinner and smaller pizza as Finissima with IR Laser
Foodini system with, but the exploration of the current limits of the system is required in
order to make improvements.
Anyway, Finissima pizza samples were well cooked using the CO2 IR Epilog laser
system, which demonstrate that CO2 IR laser systems could be a new cooking method for
baking pizzas and, also, other bakery products comparable to pizza dough.
5.3. Discussion of mashed potatoes bites results
Cooking losses experienced by mashed potatoes prepared with the different cooking
methods changed accordingly to their moisture content. Moreover, since fat, protein and
ashes content expressed on dry basis did not change between methods, it can be confirmed
that samples were only subjected to water losses. Cooking losses of bites prepared with
IR Laser 62 were above the 50% of cooking losses of bites prepared by IR Laser, and
slightly higher than those of bites prepared with Traditional Method (cooked in
microwave). Again, these differences might be explained by considering the heating
characteristics of different cooking methods. On the one hand, IR radiation inside the
oven covered completely the mashed potatoes surface, thus favoring a more intense
surface evaporation transfer. Moreover, mashed potatoes bites were cooked over a dish,
Chapter 5.Discussion
180
which was also heated during the cooking process, providing a heat conduction flux
through the glass which could increase cooking losses. On the other hand, the unusual
cooking conditions provided by CO2 IR Epilog laser, which heated from upper pole to
lower pole of the sample, did not supply a constant heat flux over the whole surface.
Additionally, the laser beam did not heat the glass where mashed potatoes bites were
placed. Hence, cooking losses were lower. Finally, cooking losses in Traditional Method
were driven by the water evaporation during the boiling process inside the microwave
and remained low because it was the fastest method of preparation.
Results of compression force showed clear textural differences between treatments.
Texture of mashed potatoes is mainly related to the starch gelatinization degree of
dehydrated potatoes, where ungelatinized and gelatinized starch are usually present due
to thermal energy input during the drum drying process. Both types of starch facilitate the
pasting process between 50°C (gelatinized starch) and 60-65°C (Shiotsubo, 1984). The
higher compression force of mashed potatoes bites cooked with the IR Oven could be
related to the gelatinization of the initially ungelatinized starch and to a better hydration
of the already gelatinized starch, due to the constant heat treatment conditions inside the
oven. In the case of IR Laser-cooked samples, which had a higher compression force than
those cooked with Traditional Method, gelatinization and hydration processes were also
achieved, but with less intensity in comparison with IR Oven.
Color analyses also showed clearly the influence of each cooking method. Bites prepared
with Traditional method were lighter since no surface treatment was applied. Bites cooked
with IR Laser 62, had the lowest values of L*, which indicate a darker surface. This was
due to small black spots found on the surface, which were considered a desired attribute
when the laser cooking conditions were fixed, in order to imitate the browning effect of
grilling inside an oven. IR Oven also showed a surface browning effect although fewer
black spots were obtained.
Sensory analysis showed that consumers preferred mashed potatoes cooked by IR surface
treatments. This preference was not based on the external color, since no significant
differences were observed on the general appearance neither in the acceptability of the
external and internal color (although consumers did observe differences in their
intensities). Preference for IR radiation methods was probably related to the harder texture
and the higher taste intensity. Increase in the intensity of both parameters would be due
Chapter 5.Discussion
181
to higher water losses, which caused a higher concentration of solid components. In the
case of taste, probably an increase of salty taste was perceived. Although consumers did
not found differences in flavor, likely due to an unclear comprehension or to an
inappropriate explanation of the attribute, the perceived better taste was probably linked
to flavors from Maillard reactions generated by radiation heating.
To sum up, IR Oven and IR Laser 62 caused similar cooking effects, according to
perception of consumers. Nevertheless, there were differences in physico-chemical
instrumental parameters between both methods. It can be hypothesized that if mashed
potatoes bites were cooked with CO2 IR Laser Foodini system they would have shown
physico-chemical characteristics closer to bites cooked with IR Oven. The high amount
of water and starch in mashed potatoes facilitates the IR surface heating process, due to
the high absorbance of water and starch at both IR wavelengths applied.
5.4. Discussion of vegetarian patty results
Proximate analysis showed that differences in the final composition of cooked vegetarian
patties were due to water loss. IR Oven caused the highest cooking and water losses but
the fat, protein and ashes contents on dry basis of samples cooked by this method were
not different from those of samples cooked by other methods. This data indicated that IR
Oven was the most intense treatment, favoring a large surface evaporation. Flat Grill
caused around 50% fewer losses than IR Oven did, probably because conduction is a
faster heating process and it generated less water loss. Cooking losses caused by IR Laser
were between those of previously mentioned treatments. Hence, IR Laser could be
considered a less intense radiative treatment due to the cooking conditions, as burgers
were cooked side per side and IR radiation, even it was applied homogeneously, did not
cover the entire surface simultaneously.
Values of cutting force were not affected by cooking methods. Probably, the fact that the
main ingredients (i.e., chickpeas and lentils) were already cooked, reduced the influence
of cooking methods on textural attributes. Nevertheless, the cooking process could still
affect other ingredients in the patty (e.g., raw vegetables, egg, flour, potato) but it seems
that heat provided by the different cooking methods induced similar effects on them (e.g.,
egg protein denaturation and starch gelatinization). This hypothesis is reinforced by the
Chapter 5.Discussion
182
results of internal color of patties, because no differences were found between samples
subjected to different cooking treatments.
On the contrary, the external color of vegetarian patties did show the influence of the heat
flux due to radiative or conductive methods. External vegetarian patties cooked with Flat
Grill had a higher L* which indicated that the surface was darker. Moreover, it was
possible to observe some degree of overcooking due to the high temperature of the grill
surface (180°C). IR Oven and IR Laser also generated a slight, and more homogeneous,
surface browning.
Sensory tests showed that consumers preferred vegetarian patties cooked with Flat Grill
and IR Laser, followed by IR Oven. Differences between treatments came from two
attributes already described in the discussion of physico-chemical analyses: water content
and external color. Consumers found that burgers cooked with Flat Grill were juicier.
Besides, the darker color of their surface was better accepted. Maybe, the overcooked
areas in vegetarian patties influenced consumers positively due to its similarity with
cooked meat burgers. IR Laser rendered an external color in patties that was better
accepted than the external color caused by IR Oven cooking, likely, because the way of
application of IR laser system was less intense and the drying surface effect was lower.
Absence of differences in intensity and acceptability of doneness and crunchiness would
confirm that heating processes affected the textural attributes in a similar way.
Microbiological results showed that IR Laser cooking provided a safe cooking
temperature inside vegetarian patties (>72°C) because, in samples inoculated with ~7 log
CFU/g of S. Typhimurium and S. Senftenberg, the level of count reduction was above 6-
log for both types of Salmonella. The inactivation achieved by IR Laser was comparable
to the inactivation achieved by IR Oven. Complete inactivation, even of S. Senftenberg,
was only accomplished by cooking with Flat Grill. As in the case of burgers, survival
results from samples inoculated at ~ 3 log CFU/g seemed to indicate a slightly higher
resistance of S. Senftenberg compared with S. Typhimurium.
Overall results showed that the CO2 IR Laser Foodini system was able to cook properly
the vegetarian patties, rendering physico-chemical characteristics and sensory attributes
comparable, or even more accepted by consumers, to standard cooking systems.
Chapter 5.Discussion
183
Moreover, the laser system guaranteed an appropriate thermal treatment to eliminate
pathogens, thus ensuring a high degree of food safety.
5.5. Discussion of the numerical simulation results
Numerical method was in a high accordance with the experimental values for burgers and
for vegetarian patties (figures 4.23 and 4.26). Different variable cooking parameters, such
as, food components, the different radiative, conductive and convective heating processes
and the fact that burgers were turned to cook both sides consecutively, were well
integrated in the model.
Simulated temperatures of the first three or four minutes were lower than experimental
measures. This could be related with the initial fat and water loss dripping from the areas
near the heated surface towards the centre of food samples (where the experimental
temperatures where measured). Liquefied beef fat (which melts at 40°C) mixed with
water would descend from the heated top surface to the center of burgers through the
cavities that were observed in the cross-sectional burger images (figure 4.14). This
dripping effect would affect the experimental measures mainly during the first three or
four minutes, and this effect would decrease once the sample was already more
homogeneously heated, losses were mainly due to water evaporation through the surface,
and there was an overall temperature increasing inside the cooked sample. Actually,
differences between the model and experimental data during the first cooking minutes
were more clearly observed in beef burgers, maybe mainly due to fat dripping, since raw
vegetarian patty was viscous dough and almost no losses of liquid water or liquefied fat
were observed in any cooking treatment.
We can considerer also this model as a conservative approach since simulation values are
usually lower or slightly above the experimental temperature, especially from 60°C. This
fact has been used as an initial statement for the numerical model, with the objective that
simulated pasteurization temperatures will be close to the experimental values. Hence, it
was possible to better evaluate a simulated thermal effect, for example, regarding count
reduction or survival of pathogenic bacteria. The iso-lines of the temperature evolution
of a cross-section sample during the heating process (figures 4.24 and 4.27) could be use
to evaluate several physico-chemical, sensory, microbiological and toxicological aspects.

Chapter 5.Discussion
184
The numerical simulation tool will be used to optimize and develop the CO2 IR laser
system. The model will be used to simulate the cooking process with different parametric
conditions that will help to improve the design and equipment of the cooking method.
Simulations would simplify and guide the experimental work and would also save time
and material costs.

Chapter 6. Conclusions
185
CHAPTER 6
CONCLUSIONS
Chapter 6. Conclusions
186
6. Conclusions
The CO2 IR laser Epilog equipment demonstrated that food could be cooked using a CO2
IR laser if the overall cooking conditions allowed an appropriate radiation over the food
surface. Physico-chemical and sensory characteristics of beef burger, pizza dough and
mashed potatoes bites cooked with CO2 IR Epilog laser were comparable to standard
cooking methods, but microbiological results showed that this method must be improved
to guarantee food safety.
The CO2 IR laser Foodini system was specially designed to increase the delivery of
infrared radiation to the food surface. Results of physico-chemical, sensory,
microbiological and toxicological analyses of beef burger and vegetarian patties cooked
with this new CO2 IR laser Foodini system were comparable to those of beef burger and
vegetarian patties cooked with standard methods. However, conditions to cook pizza must
be improved.
CO2 IR laser cooking system shares some cooking characteristics with the IR oven used
in the present study, as both are based on an IR radiation heating process using
wavelengths which are highly absorbed by water.
The numerical results for temperature evolution given by the model coincide with the
experimental data, except for the first minutes of cooking. The numerical simulation
model is a powerful tool to optimize the cooking process of the CO2 IR laser system
developed in the present study. This model will be used to simulate the cooking process
with different parametric conditions and will help to design the future experimental work
and improvements.
IR CO2 laser Foodini system can be integrated in a 3D printer to cook during the printing
process or to cook once the food is printed.

Chapter 7.References
187
CHAPTER 7
REFERENCES
Chapter 7.References
188
7. References
AMSA. 2016. Research guidelines for cookery, sensory evaluation, and instrumental
tenderness measurements of meat. Chicago, IL: American Meat Science Association
and National Live Stock and Meat Board
ASHRAE. (2006). ASHRAE Handbook of Refrigeration SI.
Abdul-Kadir, Bargman, T., Rupnow, J. 1990. Effect of infrared heat processing on
rehydration rate and cooking of Phaseolus vulgaris (var. Pinto). J. Food Sci. 55(5),
1472–1473.
Abe, T., Afzal, T.M., 1997. Thin-layer infrared radiation drying of rough rice. J. Agric
Eng. Res. 67, 289–297.
Afzal, T.M., Abe T., 1998. Diffusion in potato during far infrared radiation drying. J.
Food Eng. 37(4), 353–365.
Arntfield, S.D., Scanlon, M.G., Malcolmson, L.J., Watts, B.M., Cenkowski, S., Ryland,
D, Savoie, V. 2001. Reduction in lentil cooking time using micronization: comparison
of 2 micronization temperatures. J. Food Sci. 66(3), 500–505.
Berhe, D. T., Engelsen, S. B., Hviid, M. S., & Lametsch, R. (2014). Raman spectroscopic
study of effect of the cooking temperature and time on meat proteins. Food Research
International, 66, 123–131.
Blutinger, J.D., Meijers, Y., Chen, P.Y., Zheng, C., Grinspun, E., Lipson, H., 2018.
Characterization of dough baked via blue laser. J. Food Eng. 232, 56-64.
Burgheimer, F., Steinberg, M.P., Nelson, A.I. 1971. Effect of near infrared energy on rate
of freezedrying of beef spectral distribution. J. Food Sci. 36(l), 273–276.
Chen, B.H., Lin, Y.S., 1997. Formation of polycyclic aromatic hydrocarbons during
processing of duck meat. J. Agric. Food Chem. 45, 1394–1403.
Christensen, L.M. 2012a. Evaluation of textural properties of cooked beef batters.
California Polytechnic State University. San Luis Obispo, CA, USA.

Chapter 7.References
189
Chua, K.J., Chou, S.K. 2005. A comparative study between intermittent microwave and
infrared drying of bioproducts. Int. J. Food Sci. Technol. 40, 23–39.
Claus, J.R. 2007. Color Changes in Cooked Beef. University of Wisconsin-Madison, Beef
Research, USA.
Dagerskog, M. 1979. Infra-red radiation for food processing II. Calculation of heat
penetration during infra-red frying of meat products. Lebens. Issen. Technol. 12(5),
252–257.
Das, I., Das, S.K., Bal, S. 2004. Drying performance of a batch type vibration-aided
infrared dryer. J. Food. Eng. 4, 129–133.
Davey, C. L., & Niederer, A. F. (1977). Cooking tenderizing in beef. Meat Science, 1,
271–276.
Decareau, R.V. 1985. Microwaves in the food processing industry. Orlando, Fla.:
Academic Press.
Dostie, M., Seguin, J.N., Maure, D., Tonthat, Q.A., Chatingy, R. 1989. Preliminary
measurements on the drying of thick porous materials by combinations of intermittent
infrared and continuous convection heating. In: Mujumdar, A.S., Roques, M.A., Ed.
Drying’89. New York: Hemisphere Press.
Dreeling, P., Allen, P., Butler, F. (2000). Effect of cooking method on sensory and
instrumental texture attributes of low-fat beefburguers. Lebensmittel Wissenschaft und
Technologie, 12, 325-329
Fisher, J. C., 1993. Qualitative and quantitative tissue effects of light from important
surgical lasers. Laser Surgery in Gynecology: A Clinical Guide. 58–8
FSAI (Food Safety Authority of Ireland). 2018. An investigation of the most appropriate
z-value to be used in calculating “equivalent cooks” for beef burgers in food business
establishments. Dublin: Food Safety Authority of Ireland.
Gabel, M.M., Pan, Z., Amaratunga, K.S.P., Harris, L.J., Thompson, J.F. 2006. Catalytic
infrared dehydration of onions. J. Food Sci. 71(9) E ,351–357.
Chapter 7.References
190
Galindo, F.G., Toledo, R.T., Sjoholm, I. 2005. Tissue damage in heated carrot slices.
Comparing mild hot water blanching and infrared heating. J. Food Eng. 67, 381–385.
Hagen, W., Drawert, F. 1986. Determination of water content by infrared. Monatsschrift
Brauwissenschaft 40(6), 240–246.
Halford, R.S. 1957. The influence of molecular environment on infrared spectra. Ann
New York Acad. Sci. 69, 63–69.
Hashimoto, A., Takahashi, M., Honda, T., Shimizu, M.,Watanabe, A. 1990. Penetration
of infrared radiation energy into sweet potato. Nippon Shokuhin Kogyo Gakkaishi.
37(11), 876–893.
Hashimoto, A., Sawai, J., Igarashi, H., Shimizu, M. 1992b. Far-infrared irradiation effect
on pasteurization of bacteria on or within wet-solid medium. J Chem Eng Japan
25(6),666–671.
Hashimoto, A., Sawai, J., Igarashi, H., Shimizu, M. 1993. Irradiation power effect on
pasteurization below lethal temperature of bacteria. J Chem Eng Japan 26(3), 331–
333.
Hashimoto, A., Yamazaki, Y., Shimizu, M., Oshita, S. 1994. Drying characteristics of
gelatinous materials irradiated by infrared radiation. Drying Technol, 12,1029–1052.
Hideki, Asano “Food Cooking Apparatus” Japanese Patent Publication No.
JP2002147762A2, published on May 22, 2002.
https://en.wikipedia.org/wiki/List_of_laser_types (Accessed: 6 May 2018)
Huang, L., Sites, J. 2008. Elimination of Listeria monocytogenes on hotdogs by infrared
surface treatment, Journal of food science, 73(1), 27-31
Hunter, J.D. 2007. Matplotlib: A 2D graphics environment. Computering in science &
engineering. 9(3), 90-95
Jun S. 2002. Selective far infrared heating of food systems [PhD dissertation]. Pa.: The
Pennsylvania State Univ.
Chapter 7.References
191
Kebes. 2008.
https://commons.wikimedia.org/wiki/File:Absorption_spectrum_of_liquid_water.png
(Accessed: 9 August 2018)
Khan, M.A., Vandermey, P.A. 1985. Quality assessment of ground beef patties after
infrared heat processing in a conveyorized tube broiler for foodservice use. J. Food Sci.,
50, 707–709.
Kiyoshi, Terakubo “Laser Cooking Device” Japanese Patent Publication No.
JP63003131A2, published on Jan. 8, 1988.
Koutchma, T., Application of infrared and light-based technologies to meat and meat
products. In: Emerging Technologies in Meat Processing: Production, Processing and
Technology. Ed. Cummins, E.J. and Lyng, J.G. JohnWiley and Sons, Ltd. 2017
Kramer, A., Kahan, G., Cooper, D., Papavasiliou, A. 1974. A nonparametric ranking
method fort the statistical evaluation of sensory data. Chem Senses Flavor.,1, 121–
133.
Krishnamurthy, K., Khurana, K.H., Jun, S., Irudayaraj, J., Demirci, A. 2008. Infrared
Heating in Food Processing: An Overview. CRFSFS. 7: 2-13.
Krishnamurty, K., Khurana, H. K., Jun, S., Irudayaraj, J. M., Demirci, A. Infrared
Radiation for Food Processing. In: Food Processing Operations Modeling: Design and
Analysis. (2nd Ed.). Ed. Jun, S., Irudayaraj, J.M. CRC Press. Taylor & Francis Group,
LLC. 2009
Larsson, B.K., Sahlberg, G.P., Eriksson, A.T., Busk, L.A., 1983. Polycyclic aromàtic
hydrocarbons in grilled food. J. Agric. Food Chem. 31, 867–873.
Lentz, R.R., Pesheck, P.S., Anderson, G.R., DeMars, J., Peck, T.R., inventors; The
Pillsbury Co., assignee, April 16 1995. Method of processing food utilizing infra-red
radiation. U.S. patent 5, 382,441.
Luikov, A.V. 1975. Systems of differential equations of heat and mass transfer in
capillary-porous bodies. International journal of heat and mass transfer, 18, 1-14
Chapter 7.References
192
Mañas, P., Pagán, R., Álvarez, I., Condón, S, 2003. Survival of Salmonella senftenberg
775W to current liquid whole egg pasteurization treatments. Food microbiology,
20(5), 593-600
Masamura, A., Sado, H., Nabetani, H., Nakajima, M. 1988. Drying of potato by far-
infrared radiation. Nippon Shokuhin Kogyo Gakkaishi 35(5), 309–314.
McCurdy, S.M. 1992. Infrared processing of dry peas, canola, and canola screenings. J.
Food Sci. 57(4), 941–944.
Midilli, A., Kucuk, H., Yapar, Z.. 2002. A new model for single-layer drying. Drying
Technol. 20(7), 1503–1513.
Mongpreneet, S., Abe, T., Tsurusaki, T.. 2002. Accelerated drying of welsh onion by far
infrared radiation under vacuum conditions. J. Food Eng. 55, 147–156.
Muchnik, Boris. “Laser Cooking Apparatus” U.S. Pat. Publication No. US 20080282901,
published on Nov. 20, 2008.
Muriana, P., Gande, N., Robertson, W., Jordan, B., Mitra, S. 2004. Effect of prepackage
and postpackage pasteurization on postprocess elimination of Listeria monocytogenes
on deli turkey products. J, Food Prot. 67(11), 2472–2479
Navari, P., Andrieu, J., Gevaudan, A. 1992. Studies on infrared and convective drying of
nonhygroscopic solids. In: Mujumdar AS, editor. Drying 92. Amsterdam: Elsevier
Science. p 685–694.
Nowak, D., Levicki, P.P. 2004. Infrared drying of apple slices. Innov. Food Sci. Emerg.
Technol., 5, 353–360.
Olsson, E.E.M., Tr¨ag°ardh, A.C., Ahrn´e, L.M. 2005. Effect of near-infrared radiation
and jet impingement heat transfer on crust formation of bread. J. Food Sci. 70(8), E
484–491.
Chapter 7.References
193
Ortigues-Marty, I., Thomas, E., Prévéraud, D.P., Girard, L.C., Bauchart, D., Durand,
D.,Peyron, A. 2006. Influence of maturation and cooking treatments on the
nutritionalvalue of bovine meats: Water losses and vitamin B12. Meat Sci., 73: 451-
458.
Patankar, S. (1980). Numerical Heat Transfer and Fluid Flow. CRC Press.
Patel, C. K. N., 1964. Continuous-Wave Laser Action on Vibrational-Rotational
Transitions of CO2. Physical Review. 136 (5A): A1187–A1193
Perez, M.G.R., Calvelo, A. 1984. Modeling termal conductivity of cooked meat. Journal
of food science, 49, 152-156.
Phang, HO.S., Bruhn, C.M. 2011. Burger Preparation: What Consumers Say and Do in
the Home. J. Food Protect., 74: 1708–1716.
Pope, R.M., Fry, E.S., 1997. Absorption spectrum (380e700 nm) of pure water II
Integrating cavity measurements. Appl. Optic. 36 (8710).
Ranjan R, Irudayaraj J, Jun S. 2002. Simulation of three-dimensional infrared drying
using a set of three-coupled equations by the control volume method. Trans ASAE
45(5), 1661–1668.
Rose, M., Halland, J., Dowding, A., Petch, S., White, S., Fernandes, A., Mortimer, D.
(2015). Investigation into the formation of PAHs in foods prepared in the home to
determine the effects of frying, grilling, barbecuing, toasting and roasting. Foods and
chemical toxicology, 78, 1-9
Rosenthal I. 1992. Electromagnetic radiations in food science. Berlin, Heidelberg:
Springer-Verlag.
Sakai, N., Hanzawa, T., 1994. Applications and advances in far-infrared heating in Japan.
Trends Food Sci. Technol., 5, 357–62.
Sandu, C. 1986. Infrared radiative drying in food engineering: a process analysis.
Biotechnol Prog 2(3), 109–19.
Chapter 7.References
194
Sargolzaei, J., Abarzani, M., Aminzadeh, R., 2011. Modeling and Simulation of
Hamburger Cooking Proces using Finite Difference and CFD Methods. Int. J. Chem.,
2(1), 52-62.
Sawai, J., Nakai, T., Hashimoto, A., Shimizu, M. 2004. A comparison of the hydrolysis
of sweetpotato starch with b-amylase and infrared radiation allows prediction of
reducing sugar production. Int. J. Food Sci. Technol. 39, 967–974.
Sharma, G.P, Verma, R.C., Pathare, P.B. 2005. Thin-layer infrared radiation drying of
onion slices. J. Food. Eng., 67, 361–366.
Sheridan, P., Shilton, N. 1999. Application of far-infrared radiation to cooking of meat
products. J. Food Eng., 41, 203–208.
Sheridan, P., Shilton, P. (2002). Analysis of yield while cooking beefburguer patties using
for infrared radiation. Journal of food engineering, 51, 3-11
Sheridan, P., Shilton, P. (2002). Determination of the thermal diffusivity of ground beef
patties under infrared radiation oven-shelf cooking. Journal of food engineering, 52,
39-45
Shewchuk, J. R. (1994). An introduction to the conjugate gradient method without the
agonizing pain. Pittsburgh, Pa. :School of Computer Science, Carnegie Mellon
University, 1994. Print.
https://www.cs.cmu.edu/~quake-papers/painless-conjugate-gradient.pdf (Accessed:
20 December 2018)
Shilton, N., Mallikarjunan, P., Sheridan, P. (2002). Modeling of heat transfer and
evaporative mass losses during the cooking of beef patties using far-infrared radiation.
J. Food Eng., 55, 217-222
Shiotsubo, T. 1984. Gelitinization temperature of potato starch at the equilibrium state.
Agric. Biol. Chem., 48 (1), 1-7
Sikes, A., Tornberg, E., Tume, R. 2010. A proposed mechanism of tenderising post-rigor
beef using high pressure–heat treatment. Meat Sci., 84: 390-399.
Chapter 7.References
195
Silfvast, William T. Laser fundamentals, Cambridge University Press, 2004. ISBN 0-
521-83345-0
Singh, Inderjit “Method and apparatus for plasma assisted laser cooking of food
products”. US Pat. Publication No. 20130344208 A1, published on Mar. 11, 2013.
Skjoldebrand, C. 1979. Some aspects on frying of meat products in a forced convection
oven. Lebensmittel Wissenschaft und Tecnologie, 12, 325-329
Skjoldebrand, C. 2001. Infrared heating. In: Richardson P, editor. Thermal technologies
in food processing. New York: CRC Press.
Tanaka, F., Verboven, P., Scheerlinck, N., Morita, K., Iwasaki, K., Nicolaı, B. 2007.
Investigation of far infrared radiation heating as an alternative technique for surface
decontamination of strawberry. J. Food Eng., 79, 445–452
Togrul, H. 2005. Simple modeling of infrared drying of fresh apple slices. J. Food Eng.
71, 311–323.
Turner, I.W., Perre, P. 1996. A synopsis of the strategies and efficient resolution of
techniques used for modeling and numerically simulating the drying process. In:
Mathematical modeling and numerical techniques in drying technology. New York:
Marcel Dekker Inc. p 1–82.
Vogel, A., Venugopalan, V., 2003. Mechanisms of pulsed laser ablation of biological
tissues. Chem Rev. 103 (2), 577–644. doi:10.1021/cr010379n. PMID 12580643.
www.aesculight.com/why-aesculight/wavelength/ (Accessed: 21 October 2018)
www.engineeringtoolbox (Accessed: 15 November 2018)
www.fda.gov/Food/ResourcesForYou/HealthEducators/ucm082294.htm (Accessed: 15
January 2019)
www.laserproject.es (Accessed: 20 December 2018)
www.naturalmachines.com (Accessed: 14 September 2018)
Chapter 7.References
196
www.perten.com/Publications/Articles/Potato-flakes/ (Accessed: 21 January 2019)
www.rp-photonics.com/co2_lasers.html (Accessed: 20 January 2019)
Wright, D. J., Leach, I. B., Wilding, P. 1977. Differential scanning calorimetric studies
of muscle and its constituents. J. Sci. Food Agric., 28: 557.
Xiong, Y.L., Brekke, C., Leung, H.K. 1987. Thermal Denaturation of Muscle Proteins
From Different Species and Muscle Types as Studied by Differential Scanning
Calorimetry. Food Sci., 20: 357-362.
Yildiz, T.G., Icier, F., Kor, G. 2016. Influence of infrared final cooking on color, texture
and cooking characteristics of ohmically pre-cooked meatball. Meat Sci, 114, 46-53
Zzaman, W., Chantrong, P., Idrus, N.F.M., Yang, T.A., (2013). Effect of different
cooking methods on the quality attribute of beef burguers. Journal of applied sciences
research, 9 (4), 2538-2547.