jmt1de1.pdf - TDX (Tesis Doctorals en Xarxa)
125
ADVERTIMENT. Lʼaccés als continguts dʼaquesta tesi queda condicionat a lʼacceptació de les condicions dʼús establertes per la següent llicència Creative Commons: http://cat.creativecommons.org/?page_id=184 ADVERTENCIA. El acceso a los contenidos de esta tesis queda condicionado a la aceptación de las condiciones de uso establecidas por la siguiente licencia Creative Commons: http://es.creativecommons.org/blog/licencias/ WARNING. The access to the contents of this doctoral thesis it is limited to the acceptance of the use conditions set by the following Creative Commons license: https://creativecommons.org/licenses/?lang=en
-
Upload
khangminh22 -
Category
Documents
-
view
0 -
download
0
Transcript of jmt1de1.pdf - TDX (Tesis Doctorals en Xarxa)

ADVERTIMENT. Lʼaccés als continguts dʼaquesta tesi queda condicionat a lʼacceptació de les condicions dʼúsestablertes per la següent llicència Creative Commons: http://cat.creativecommons.org/?page_id=184
ADVERTENCIA. El acceso a los contenidos de esta tesis queda condicionado a la aceptación de las condiciones de usoestablecidas por la siguiente licencia Creative Commons: http://es.creativecommons.org/blog/licencias/
WARNING. The access to the contents of this doctoral thesis it is limited to the acceptance of the use conditions setby the following Creative Commons license: https://creativecommons.org/licenses/?lang=en

Evaluation of the Prevalence and Risk
Factors for Undernutrition in
Hospitalized Dogs and Cats
Thesis presented by:
Jenifer Molina Tena
Under the supervision of the Doctors:
Cecilia Villaverde Haro and Marta Hervera Abad
Tutor:
Susana María Martín Orúe
TO ACCESS THE DOCTOR’S DEGREE WITHIN THE ANIMAL
PRODUCTION DOCTORATE PROGRAM OF THE DEPARTMENT OF
ANIMAL AND FOOD SCIENCE
Bellaterra, 2019

Dr. Cecilia Villaverde Haro and Dr. Marta Hervera Abad, both currently working as
independently consultants in Expert Pet Nutrition (https://www.expertpetnutrition.com)
They certify that:
The PhD work entitled “Evaluation of the Prevalence and Risk Factors for Undernutrition
in Hospitalized Dogs and Cats”, presented by Jenifer Molina for being qualified for the
Degree of Doctor in Veterinary Medicine, has been made under his direction and,
considering it finalized, authorize its presentation to be judged by the corresponding
commission.
And for the record, we sign the present document in Bellaterra, October 25th, 2019.
Dr. Cecilia Villaverde Haro Dr. Marta Hervera Abad

This PhD work has been completed thanks to the partial funding of Affinity PetCare
and the Hospital Clinic Veterinari of the Universitat Autònoma of Barcelona.


Agradecimientos
Quiero agradecer a mis directoras Cecilia Villaverde y Marta Hervera por enseñarme
con entrega y paciencia, pero sobretodo por enseñarme el respeto nuestra profesión y
nuestro esfuerzo diario por crear un servicio de calidad. Gracias también por
enseñarme a hacer las cosas dando el 100% de uno mismo. Nunca dejaré de aprender
de vosotras. Gracias también a mi tutora de tesis, Susana, por siempre confiar en que
acabaría esta tesis y darme ánimos en los últimos momentos.
Gracias a mi marido, Álvaro, por su paciencia durante éste duro período de tesis y
por enseñarme que nunca hay que rendirse y que lo que hace poderoso al ser humano
es su fuerza interior. Gracias por darme la energía positiva necesaria para llevar el día
a día, no podría haber imaginado un mejor compañero de vida.
Gracias a mi hijo, Darío, con sólo 1 añito y casi sin hablar ha sido mi inspiración y
mi fuerza para acabar esta tesis. No sé cuántas veces habré mirado sus fotos en un
descanso para recobrar fuerzas y seguir escribiendo.
Gracias a mis padres, Antonio y Luisa, por esforzarse para darme una educación y
unos principios, sois el mejor ejemplo de que las cosas se consiguen con esfuerzo y
trabajo.
Gracias a Mariola, por darme el contacto de dos buenas compañías de petfood para
hacer mis prácticas de campo, creo que ahí es donde realmente empezó toda mi
andadura por el mundo de la nutrición hasta llegar dónde estoy hoy.
Gracias a mis compañeros del hospital, por ayudarme a recoger los datos para realizar
esta tesis. Especialmente gracias al personal de UCI (Luis, Carlos, Maribel y Erika),
por dejarme campar a mis anchas para recoger los datos necesarios.
Gracias a Edgar, el súper estadístico que me ha ayudado a que esta tesis sea posible.
Finalmente tenemos la estadística de gatos! Salut! ☺
Gracias a mis primeros compañeros de despacho, Roger y Víctor por hacerme reir en
el día a día de la UAB, que no es poco! Y gracias también los compis del segundo
despacho, especialmente a Sergi y Inma, por darme ánimos y compartir penas cuando
lo hemos necesitado.
Gracias a Rosa y Olga, por las charlas en el laboratorio y por los pasillos y por
ayudarme en el laboratorio y con la gestión diaria de material siempre que lo he
necesitado.

Gracias Julia, por ayudarme con las gestiones necesarias para poder entregar esta tesis
y explicarme todas las triquiñuelas, no estando presencialmente en la UAB ha sido
aún más importante tú trabajo.
Gracias a todas las personas que me crucé, de un modo u otro, durante el tiempo que
estuve en la UAB por ser siempre tan amables conmigo.

Index Summary ............................................................................................................................ I
Resumen ......................................................................................................................... IV
Resum ............................................................................................................................ VII
Chapter 1. Literature Review............................................................................................ 1
1.1.General introduction ............................................................................................... 3
1.2.Pathophysiology of malnutrition in hospitalized patients ....................................... 3
1.2.1. Effects of under nutrition ............................................................................ 4
1.2.2. Effects of overfeeding ................................................................................ 8
1.2.3. Energy and nutrient requirements in hospitalized dogs and cats.............. 11
1.2.3.1.Measurement………………………………………………….......................... 11
1.2.3.2. Estimation…………………………………………………………………………….. 11
1.3.Malnutrition in human medicine ........................................................................... 15
1.3.1. Prevalence of malnutrition........................................................................ 15
1.3.2. Diagnosis of malnutrition ......................................................................... 16
1.3.3. Hospitalization length (HL) and clinical outcome ................................... 16
1.3.4. Nutritional intervention ............................................................................ 17
1.4.Malnutrition in hospitalized veterinary patients ................................................... 18
1.4.1. Prevalence of malnutrition........................................................................ 18
1.4.2. Diagnosis of malnutrition ......................................................................... 18
1.4.3. Risk factors of undernutrition in hospitalized dogs and cats .................... 20
1.4.4. Nutritional status and clinical outcome .................................................... 21
1.4.5. Nutritional intervention ............................................................................ 22
1.5.Nutritional evaluation ........................................................................................... 23
1.5.1. Initial nutritional evaluation (screening) .................................................. 24
1.5.1.1. Animal…………………………………………………................................... 25
1.5.1.1.1. Body weight…………………………………………………………. 25
1.5.1.1.2. Body condition score………………………………................. 25
1.5.1.1.3. Muscle condition score…………………………………………… 27
1.5.1.1.4. Appetite……………………………………...…….......................... 28
1.5.1.2.Diet………………………………………………………………………………………... 28
1.5.1.3. Environment and feeding method…………………………………………. 28
1.5.2. Extended nutritional evaluation ................................................................ 28
1.6.Nutritional support in hospitalized veterinary patients: current recommendations
………………………………………………………………………………. .29
1.6.1. When to start the nutritional support ........................................................ 29
1.6.2. What to feed: diet choice .......................................................................... 31
1.6.3. How much to feed: energy needs ............................................................. 31
1.6.4. Feeding route ............................................................................................ 31
1.6.4.1. Enteral nutritional support…………………………………………………….. 32
1.6.4.2. Parenteral nutritional support………………………………………………… 33
1.6.5. Follow up .................................................................................................. 34
Chapter 2. Hypothesis and Objectives ............................................................................ 35

Chapter 3. Experimental Design ..................................................................................... 38
3.1.Statistical analysis ................................................................................................. 44
Chapter 4. Evaluation of the prevalence and risk factors for undernutrition in hospitalized
dogs ................................................................................................................................. 46
4.1. Introduction .......................................................................................................... 48
4.2. Results .................................................................................................................. 49
4.3. Discussion ............................................................................................................ 54
Chapter 5. Prevalence and risk factors for undernutrition in hospitalized cats at a
Veterinary Teaching Hospital in Spain .......................................................................... 58
5.1.Introduction ........................................................................................................... 60
5.2.Results ................................................................................................................... 60
5.3. Discussion ............................................................................................................ 64
Chapter 6. General Discussion ....................................................................................... 69
Chapter 7. Conclusions ................................................................................................... 81
References ...................................................................................................................... 84
Abbreviations ............................................................................................................... 100
Index of Tables and Figures ......................................................................................... 103

I
Summary
The nutritional support (NS) in hospitalized dogs and cats is increasingly being
recognized as a key point in their treatment. This concern has arisen together with the
trend in human intensive care medicine, where nutrition is already recognized as an
effective tool for improving the patient health status. Undernutrition has been
suggested to decrease the effectiveness of the medical treatment in hospitalized
veterinary patients and worsen outcome. The prevalence of the problem is unknown
and current estimates situate it between 25% to 65%, using a variety of indicators.
There is also a lack of data regarding risk factors for malnutrition in hospitalized
animals, but vomiting, regurgitation, abdominal pain, incorrect nutritional plans, Nil
per os (NPO, medical fasting) orders, and patient’s anorexia have been suggested.
Studies in human patients have reported that NS is effective in improving the
hospitalized patient health status and in reducing the hospitalization length (HL).
However, despite a scattered numbre of studies with a small number of patients
showing positive effects of NS on HL and health outcomes, there is still a lack of
research backing its importance in veterinary medicine. The optimal time to
implement NS in hospitalized veterinary patients is still not well defined either.
We hypothesized that undernutrition is frequent in veterinary patients, and that an
appropriate nutritional status can help improve the outcome of the veterinary
hospitalized patients.
Therefore, the main objectives of the present thesis (Chapter 2) were to assess the
prevalence of undernutrition defined as loss of body condition score (BCS) and body
weight (BW), to identify risk factors associated with undernutrition throuought
hospitalization period, and to study the association of the nutritional status with the
outcome and HL in hospitalized dogs and cats in a university teaching hospital.
In Chapter 3 we explain the material and methods we used for achieving these
objectives. A prospective cohort study was carried out in the hospitalization ward of
a veterinary teaching hospital in Spain (Fundació Hospital Clínic Veterinari,
Universitat Autònoma de Barcelona). Data from patients was collected, during 9
months in dogs and during one year in cats, throughout 2013 and 2014. All dogs and
cats with a HL longer than 24 h were included. Data collected from each animal
included signalment, clinical signs at admission (anorexia, vomiting, and diarrhea),

II
reason for hospitalization, diagnostics, fasting order at admission, nutritional
evaluation at admission and for each day of the hospitalization period [BCS, muscle
condition score (MCS), and BW(kg)], HL (days), daily food type and intake (Energy
intake (EI)) (grams), type of nutritional intervention, and outcome (discharge or
death). Clinicians from the admitting service obtained histories and performed
physical examination of the patients prior to hospitalization, giving a severity index
to each patient (physical status score –PSS) as described by Brunetto et al. (2010).
The presence of weight loss, loss of appetite, vomiting, and diarrhea during the month
before hospitalization was also identified by the clinicians during the anamnesis.
Once the patient was hospitalized, researchers performed most of the nutritional
evaluation including BCS and MCS measures in order to avoid confounding factors.
Chapter 4 shows the results regarding the prevalence and risk factors of
undernutrition in the canine population of patients. The BCS and BW changes were
modeled using multiple linear regression and outcome was modeled using logistic
regression. The risk factors studied were EI, HL, initial BW (iBW) and BCS (iBCS),
age, sex, severity of clinical signs, admitting service, fasting or other nutritional
interventions, and the presence of anorexia, vomiting or diarrhea at admission. Most
of the dogs (52.6%) consumed less than 25% of their estimated resting energy
requirements (RER) and only 6.8% of the dogs met these requirements. The majority
of hospitalized dogs maintained their BCS (78.2%) and BW (77%) during
hospitalization. Older patients (P=0.040), higher iBCS (P < 0.001), and vomiting at
admission (P=0.030) were associated with a decrease of BCS status during
hospitalization. BCS was also decreased in patients with low EI, particularly in
patients with HL over 3 days (P < 0.001). Both longer HL (P < 0.001) and vomiting
at admission (P = 0.004) were also associated with a decrease in BW. Dogs that
consumed their estimated RER during hospitalization period [P < 0.001; odds ratio
(OR) 0.95, 95% CI: 0.92 to 0.98], and had a higher iBCS [P < 0.001; OR 0.39, 95%
CI: 0.22 to 0.63] had a lower odds for dying. Anorexia at admission [P < 0.001; OR
5.67, 95% CI: 2.23 to 15.47] was associated with a higher risk of death.
Chapter 5 shows results of prevalence and risk factors of undernutrition in the feline
population of patients. Data were collected from 120 hospitalized cats and outcome
was available for all of them. The BCS and BW changes were modeled using multiple
linear regression and outcome was modeled using logistic regression. The risk factors

III
studied were EI, HL, iBW and iBCS, age, sex, severity of clinical signs, admitting
service, fasting or other nutritional interventions, and the presence of anorexia,
vomiting or diarrhea at admission. Although only the 9.2% of cats met their RER,
most of the hospitalized cats maintained their BW and BCS during hospitalization,
and most cats (90.4%) were discharged alive. The main variables identified as
undernutrition risk factors in this study were iBCS, HL, and decreased EI during
hospitalization. Regarding the outcome, lower EI during hospitalization was
associated with higher odds for dying [P=0.05; OR 1.19, 95% CI: 1 to 1.08]. Cats
with no reported weight loss before admission had lower odds of dying [P<0.001; OR
0.29, 95% CI: 0.07 to 1.16].
Results from the present study in a population of hospitalized dogs and cats in a
university teaching hospital setting showed that decreased energy intake (EI) is very
common during hospitalization and in some cases results in loss of BW and BCS, and
it is also associated with a worse outcome. Age, HL, decreased EI, and, vomiting at
admission have been identified as risk factors for undernutrition in dogs while HL,
decreased EI and, diarrhea at admission are the main risk factors in cats.
IV
Resumen
El soporte nutricional (NS) en perros y gatos hospitalizados se reconoce cada vez más
como un punto clave en su tratamiento. Esta preocupación ha surgido junto con la
tendencia en la medicina de cuidados intensivos en humana, donde la nutrición ya es
reconocida como una herramienta efectiva para mejorar el estado de salud del
paciente. Se ha sugerido que la desnutrición disminuye la efectividad del tratamiento
médico en pacientes veterinarios hospitalizados y empeora el desenlace clínico. Se
desconoce la prevalencia del problema y las estimaciones actuales lo sitúan entre el
25% y el 65%, utilizando una variedad de indicadores.
También hay una falta de datos con respecto a los factores de riesgo de desnutrición
en animales hospitalizados, pero los vómitos, la regurgitación, el dolor abdominal,
los planes nutricionales incorrectos, las órdenes de nil per os (NPO, ayuno médico)
y anorexia del paciente, se han sugerido como posibles factores de riesgo.
Los estudios en humana han reportado que el NS es eficaz para mejorar el estado de
salud del paciente hospitalizado y para reducir la duración de la hospitalización (HL).
Sin embargo, a pesar de un número disperso de estudios con un pequeño número de
pacientes que muestran efectos positivos de NS sobre HL y desenlace clínico, todavía
hay una falta de investigación que respalde su importancia en medicina veterinaria.
El momento óptimo para implementar el NS en pacientes veterinarios hospitalizados
tampoco está bien definido.
Presumimos que la desnutrición es frecuente en pacientes veterinarios, y que un
estado nutricional adecuado puede ayudar a mejorar el resultado de los pacientes
veterinarios hospitalizados.
Por lo tanto, los objetivos principales de la presente tesis (Capítulo 2) fueron evaluar
la prevalencia de desnutrición, definida como la pérdida de la puntuación de la
condición corporal (BCS) y el peso corporal (BW), identificar los factores de riesgo
asociados con la desnutrición durante el período de hospitalización y estudiar la
asociación del estado nutricional con el resultado y el HL en perros y gatos
hospitalizados en un hospital veterinario universitario.
En el Capítulo 3 explicamos el material y métodos que utilizamos para lograr estos
objetivos. Se realizó un estudio de cohorte prospectivo en la sala de hospitalización
de un hospital veterinario universitario en España (Fundació Hospital Clínic

V
Veterinari, Universitat Autònoma de Barcelona). Se recogieron datos de pacientes,
durante 9 meses en perros y durante un año en gatos, durante 2013 y 2014. Se
incluyeron todos los perros y gatos con un HL de más de 24 h. Los datos recopilados
de cada animal incluyeron reseña, signos clínicos al ingreso (anorexia, vómitos y
diarrea), razón de hospitalización, diagnóstico, orden de ayuno al ingreso, evaluación
nutricional al ingreso y para cada día del período de hospitalización [BCS, puntaje de
condición muscular (MCS) y BW (kg)], HL (días), tipo e ingesta diaria de alimentos
(Ingesta energética (EI)) (gramos), tipo de intervención nutricional y desenlace
clínico (alta o muerte). Los médicos del servicio de admisión obtuvieron historiales
y realizaron un examen físico de los pacientes antes de la hospitalización, dando un
índice de gravedad a cada paciente (puntaje de estado físico –PSS) como lo describen
Brunetto et al. (2010) La presencia de pérdida de peso, pérdida de apetito, vómitos y
diarrea durante el mes anterior a la hospitalización también fue identificada por los
médicos durante la anamnesis. Una vez que el paciente fue hospitalizado, los
investigadores realizaron la mayor parte de la evaluación nutricional, incluidas las
medidas de BCS y MCS para evitar factores de confusión.
El Capítulo 4 muestra los resultados con respecto a la prevalencia y los factores de
riesgo de desnutrición en la población canina de pacientes. Los cambios BCS y BW
se modelaron mediante regresión lineal múltiple y el resultado se modeló mediante
regresión logística. Los factores de riesgo estudiados fueron EI, HL, BW inicial
(iBW) y BCS inicial (iBCS), edad, sexo, gravedad de los signos clínicos, servicio de
ingreso, ayuno u otras intervenciones nutricionales, y la presencia de anorexia,
vómitos o diarrea al ingreso . La mayoría de los perros (52.6%) consumieron menos
del 25% de sus requerimientos estimados de energía en reposo (RER) y solo el 6.8%
de los perros cumplieron con estos requisitos. La mayoría de los perros hospitalizados
mantuvieron su BCS (78.2%) y BW (77%) durante la hospitalización. Los pacientes
mayores (P = 0.040), con iBCS más alto (P <0.001) y vómitos al ingreso (P = 0.030)
se asociaron con una disminución de la BCS durante la hospitalización. El BCS
también disminuyó en pacientes con bajo EI, particularmente en pacientes con HL
mayor de 3 días (P <0.001). Tanto un HL más largo (P <0.001) como los vómitos al
ingreso (P = 0.004) se asociaron con una disminución del BW. Perros que
consumieron su RER durante el período de hospitalización [P <0.001; odds ratio (OR)
0.95, IC 95%: 0.92 a 0.98], y tenía un iBCS más alto [P <0.001; O 0,39; IC del 95%:

VI
0,22 a 0,63] tenían una probabilidad menor de morir. Anorexia al ingreso [P <0,001;
O 5.67, IC 95%: 2.23 a 15.47] se asoció con un mayor riesgo de muerte.
El Capítulo 5 muestra los resultados de la prevalencia y los factores de riesgo de
desnutrición en la población felina de pacientes. Se recopilaron datos de 120 gatos
hospitalizados y el desenlace clínico estuvo disponible para todos ellos. Los cambios
de BCS y BW se modelaron mediante regresión lineal múltiple y el resultado se
modeló mediante regresión logística. Los factores de riesgo estudiados fueron EI, HL,
iBW e iBCS, edad, sexo, gravedad de los signos clínicos, servicio de ingreso, ayuno
u otras intervenciones nutricionales, y la presencia de anorexia, vómitos o diarrea al
ingreso. Aunque solo el 9.2% de los gatos consumieron al menos su RER, la mayoría
de los gatos hospitalizados mantuvieron su BW y BCS durante la hospitalización, y
la mayoría de los gatos (90.4%) fueron dados de alta con vida. Las principales
variables identificadas como factores de riesgo de desnutrición en este estudio fueron
iBCS, HL, y disminución de EI durante la hospitalización. Con respecto al desenlace
clínico, un menor EI durante la hospitalización se asoció con mayores probabilidades
de morir [P = 0.05; O 1.19, IC 95%: 1 a 1.08]. Los gatos sin pérdida de peso informada
antes de la admisión tenían menores probabilidades de morir [P <0,001; O 0.29, IC
95%: 0.07 a 1.16].
Los resultados del presente estudio en una población de perros y gatos hospitalizados
en un hospital veterinario universitario mostraron que la disminución de la EI es muy
común durante la hospitalización y, en algunos casos, resulta en la pérdida de BW y
BCS y se asocia a un peor pronóstico. La edad, el HL, la disminución del EI y los
vómitos al ingreso se han identificado como factores de riesgo para la desnutrición
en los perros, mientras que el HL, la disminución del EI y la diarrea al ingreso son
los principales factores de riesgo en los gatos.
VII
Resum
El suport nutricional (NS) en gossos i gats hospitalitzats es reconeix cada vegada més
com un punt clau en el seu tractament. Aquesta preocupació ha sorgit juntament amb
la tendència en la medicina de vigilància intensiva a humana, on la nutrició ja és
reconeguda com una eina efectiva per a millorar l'estat de salut del pacient. S'ha
suggerit que la desnutrició disminueix l'efectivitat del tractament mèdic en pacients
veterinaris hospitalitzats i empitjora el desenllaç clínic. Es desconeix la prevalença
del problema, però les estimacions actuals la situen entre el 25% i el 65%, utilitzant
una varietat d'indicadors.
També hi ha una falta de dades respecte als factors de risc de desnutrició en animals
hospitalitzats, però els vòmits, la regurgitació, el dolor abdominal, els plans
nutricionals incorrectes, les ordres de nil per os (NPO, dejuni mèdic) i anorèxia del
pacient, s'han suggerit com a possibles factors de risc.
Els estudis a humana han reportat que el NS és eficaç per a millorar l'estat de salut
del pacient hospitalitzat i per a reduir la durada de l'hospitalització (HL). No obstant
això, malgrat un nombre dispers d'estudis amb un petit nombre de pacients que
mostren efectes positius de NS sobre HL i desenllaç clínic, encara hi ha una falta de
recerca que recolzi la seva importància en medicina veterinària. El moment òptim per
a implementar el NS en pacients veterinaris hospitalitzats tampoc està ben definit.
Presumim que la desnutrició és freqüent en pacients veterinaris, i que un estatus
nutricional adequat pot ajudar a millorar el resultat dels pacients veterinaris
hospitalitzats.
Per tant, els objectius principals de la present tesi (Capítol 2) van ser avaluar la
prevalença de desnutrició, definida com la pèrdua de la puntuació de la condició
corporal (BCS) i el pes corporal (BW), identificar els factors de risc associats amb la
desnutrició durant el període d'hospitalització i estudiar l'associació de l'estat
nutricional amb el resultat i el HL en gossos i gats hospitalitzats en un hospital
veterinari universitari.
En el Capítol 3 expliquem el material i mètodes que utilitzem per a arribar a aquests
objectius. Es va realitzar un estudi de cohort prospectiu a la sala d'hospitalització d'un
hospital veterinari universitari a Espanya (Fundació Hospital Clínic Veterinari,
Universitat Autònoma de Barcelona). Es van recollir dades de pacients, durant 9
mesos en gossos i durant un any en gats, durant 2013 i 2014. Es van incloure tots els
VIII
gossos i gats amb un HL de més de 24 h. Les dades recopilades de cada animal van
incloure ressenya, signes clínics a l'ingrés (anorèxia, vòmits i diarrea), raó
d'hospitalització, diagnòstic, ordre de dejuni a l'ingrés, avaluació nutricional a l'ingrés
i per a cada dia del període d'hospitalització [BCS, puntuació de condició muscular
(MCS) i BW (kg)], HL (dies), tipus i ingesta diària d'aliments (Ingesta energètica
(EI)) (grams), tipus d'intervenció nutricional i desenllaç clínic (alta o mort). Els
metges del servei d'admissió van obtenir historials i van realitzar un examen físic dels
pacients abans de l'hospitalització, donant un índex de gravetat a cada pacient
(puntuació d'estat físic –PSS) com ho descriuen Brunetto et al. (2010). La presència
de pèrdua de pes, pèrdua d'apetit, vòmits i diarrea durant el mes anterior a
l'hospitalització també va ser identificada pels metges durant l'anamnesi. Una vegada
que el pacient va ser hospitalitzat, els investigadors van realitzar la major part de
l'avaluació nutricional, incloses les mesures de BCS i MCS per a evitar factors de
confusió.
El Capítol 4 mostra els resultats respecte a la prevalença i els factors de risc de
desnutrició en la població canina de pacients. Els canvis BCS i BW es van modelar
mitjançant regressió lineal múltiple i el resultat es va modelar mitjançant regressió
logística. Els factors de risc estudiats van ser EI, HL, BW inicial (iBW) i BCS inicial
(iBCS), edat, sexe, gravetat dels signes clínics, servei d'ingrés, dejuni o altres
intervencions nutricionals, i la presència d'anorèxia, vòmits o diarrea a l'ingrés . La
majoria dels gossos (52.6%) van consumir menys del 25% dels seus requeriments
estimats d'energia en repòs (RER) i només el 6.8% dels gossos van complir amb
aquests requisits. La majoria dels gossos hospitalitzats van mantenir el seu BCS
(78.2%) i BW (77%) durant l'hospitalització. Els pacients d’edat avançada (P =
0.040), amb iBCS més alt (P <0.001) i vòmits a l'ingrés (P = 0.030) es van associar
amb una disminució de la BCS durant l'hospitalització. El BCS també va disminuir
en pacients amb baix EI, particularment en pacients amb HL superior a 3 dies (P
<0.001). Tant un HL més llarg (P <0.001) com els vòmits a l'ingrés (P = 0.004) es
van associar amb una disminució del BW. Gossos que van consumir el seu RER
durant el període d'hospitalització [P <0.001; odds ràtio (OR) 0.95, IC 95%: 0.92 a
0.98], i tenien un iBCS més alt [P <0.001; O 0,39; IC del 95%: 0,22 a 0,63] tenien
una probabilitat menor de morir. Anorèxia a l'ingrés [P <0,001; O 5.67, IC 95%: 2.23
a 15.47] es va associar amb un major risc de mort.

IX
El Capítol 5 mostra els resultats de la prevalença i els factors de risc de desnutrició
en la població felina de pacients. Es van recopilar dades de 120 gats hospitalitzats i
el desenllaç clínic va estar disponible per a tots ells. Els canvis de BCS i BW es van
modelar mitjançant regressió lineal múltiple i el resultat es va modelar mitjançant
regressió logística. Els factors de risc estudiats van ser EI, HL, iBW i iBCS, edat,
sexe, gravetat dels signes clínics, servei d'ingrés, dejuni o altres intervencions
nutricionals, i la presència d'anorèxia, vòmits o diarrea a l'ingrés. Encara que només
el 9% dels gats van consumir almenys el seu RER, la majoria dels gats hospitalitzats
van mantenir el seu BW i BCS durant l'hospitalització, i la majoria dels gats (90.4%)
van ser donats d'alta amb vida. Les principals variables identificades com a factors de
risc de desnutrició en aquest estudi van ser iBCS, HL, disminució de EI durant
l'hospitalització i pèrdua de pes abans de l'ingrés. Respecte al desenllaç clínic, un
menor EI durant l'hospitalització es va associar amb majors probabilitats de morir [P
= 0.05; O 1.19, IC 95%: 1 a 1.08]. Els gats sense pèrdua de pes informada abans de
l'admissió tenien menors probabilitats de morir [P <0,001; O 0.29, IC 95%: 0.07 a
1.16].
Els resultats del present estudi en una població de gossos i gats hospitalitzats en un
hospital veterinari universitari van mostrar que la disminució del EI és molt comuna
durant l'hospitalització i, en alguns casos, resulta en la pèrdua de BW i BCS, i
s’associa a un pitjor pronòstic. L'edat, el HL, la disminució del EI i els vòmits a
l'ingrés s'han identificat com a factors de risc per a la desnutrició en els gossos, mentre
que el HL, la disminució del EI i la diarrea a l'ingrés són els principals factors de risc
en els gats.

1
CHAPTER 1. LITERATURE REVIEW

2

Chapter 1: Literature Review
3
1.1. General introduction
The importance of adequate nutrition in hospitalized animals is increasingly being
recognized (Remillard et al., 2001; Brunetto et al., 2010;). Hypermetabolism, reduced
appetite, and loss of energy and nutrients (attributable to vomits, diarrhoea, and
polyuria) are common in critically-ill animals, and can predispose these patients to
malnutrition (Chan, 2004). Malnourished critically ill patients have a higher risk of
morbidity and mortality (Barker et al., 2011; Lew et al., 2016). Malnutrition can be
defined as the state of suboptimal nutritional status caused by an inadequate,
unbalanced, or excessive consumption of nutrients that compromise to the host
physically and mentally (Gagne and Wakshlag, 2015), and can increase morbidity
and mortality in critically ill patients. Undernutrition is defined as an unbalance
between energy intake (EI) and the energy necessary to maintain body functions, also
associated to decreased provision of nutrients. In hospitalized patients, undernutrition
is the most common disorder and most of the studies in the literature have focused on
malnutrition particularly associated to decreased energy and nutrient intake.
Therefore, the present work is using the term malnutrition as a synonym of
undernutrition.
Lack of knowledge on identifying malnutrition and of well-defined hospital protocols
to institute nutritional support (NS) have been described as the main barriers to
achieve an adequate nutrition status in hospitalized human patients (Annetta et al.,
2015), and the same situation could be true in veterinary medicine.
We have limited information on the prevalence of malnutrition in veterinary medicine
mainly due to the lack of agreement on how to identify or measure it. There is
consequently limited data regarding the most important risk factors for malnutrition
in hospitalized animals. The identification of the risk factors is important to find a
better prevention option for this problem. There is also a lack of research backing the
importance of NS and the optimal time to implement it in hospitalized veterinary
patients (Chan and Freeman, 2006). This review will focus on pathophysiology, risk
factors and diagnostic of malnutrition and the effect of nutritional intervention in
hospitalized patients.
1.2. Pathophysiology of malnutrition in hospitalized patients

Chapter 1: Literature Review
4
1.2.1. Effects of under nutrition
The metabolic response to undernutrition is different in healthy animals (simple
starvation) than in critically ill animals (stress starvation). Simple starvation is
defined as physiological metabolic changes that occur when an otherwise healthy
animal does not have access to food, whereas stress starvation is induced by anorexia
or hyporexia associated to illness and the capacity of the organism to respond to
starvation is altered by the disease. Therefore, it is not possible to completely base
the nutritional approach of the ill patient on the model of the healthy starved patient
(Delaney et al., 2006).
Simple starvation
In the postprandial period in healthy animals, exogenous dietary nutrients are used to
meet immediate metabolic and energy needs, thus sparing endogenous fuels stored
as glycogen and adipose tissue. After these needs are met, replenishment of glycogen
reserves (in the liver and muscle) takes place. Any excess of energy in the form of
carbohydrate, fat or protein is then converted to triglycerides for storage as fat in
adipose tissue, muscle and liver tissue (Delaney et al., 2006; Hand et al., 2010; Gagne
and Wakshlag, 2015).
Animals undergoing food deprivation require endogenous fuels and nutrients to meet
immediate metabolic requirements. Endogenous glucose will be employed within the
first 4-5 hours of food deprivation, and afterwards glycogen reserves will break down
to provide energy for an additional 12-24 hours (figure 1.1). Insulin is down
regulated, which leads to a decrease in the conversion of thyroxine (T4) to
triiodothyronine (T3), resulting in a general metabolism rate reduction (Saker and
Remillard, 2010). Furthermore, while glycogen stores are quickly depleted,
stimulation of lean body mass catabolism begins to occur mediated by the influence
of counter regulatory hormones, such as glucagon and endogenous glucocorticoids.
The amino acids alanine and glutamine, obtained from lean tissue, are used towards
gluconeogenesis in the liver and kidney, respectively (Welborn and Moldawer,
1997). The increase in glucagon stimulates muscle and fat catabolism, mobilizing
fatty acids from adipose stores (Gagne and Wakshlag, 2015).

Chapter 1: Literature Review
5
There is a shift over time from mixed fuels to fatty acids as a primary fuel source,
and, as food deprivation continues, the metabolic rate continues to decrease (Saker
and Remillard, 2010). By the third day of food deprivation, in all mammals, the basal
metabolic rate decreases to promote conservation of resources (particularly lean body
mass) for long-term survival. Thus, the type of energy fuel used by the animal
depends on the length of food deprivation and the amount of fuel stores available
(Saker and Remillard, 2010).
Maintaining normoglycemia is a priority. Omnivores, like the dog, achieve this via
glycogenolysis and gluconeogenesis during the first 2 days of starvation. A decrease
in blood glucose below 120 mg/dl decreases activity of hepatic glucokinase which in
turn leads to activation of hepatic glycogenolysis, and the liver becomes a net
exporter of glucose (figure 1.2). When hepatic glycogen stores are depleted,
gluconeogenesis will be the main source of blood glucose. Carnivores like the cat
depend mainly on gluconeogenesis for maintenance of blood glucose levels owing to
their reduced hepatic glycogen storage, due in part, to lower glycogen synthase and
glucokinase activities (Engelking and Anwer, 1992).
Figure 1.1. Utilization of nutrient stores during simple starvation (Saker and Remillard, 2010).
.
0
2
4
6
8
10
12
14
0 1 2 3 4 5 6 7 8 9
Quan
titi
es o
f st
ore
d e
ner
gy n
utr
ients
(kg)
Food deprivation (weeks)
PROTEIN
FAT
CARBOHYDRATE

Chapter 1: Literature Review
6
Gluconeogenesis, mediated by glucagon and glucocorticoids, is carried out
predominately in the liver and kidneys using substrates resulting from the catabolism
of adipose tissue (glycerol) and lean tissue (glycogenic amino acids, lactic acid and
pyruvate). Moreover, the Cory cycle and the alanine cycle in the liver will help
conserve circulating glucose for glucose-dependent tissues, even though they require
energy to do so. Both lactate and alanine generated in peripheral tissues can be carried
in the circulation to the liver, where they serve as substrates for hepatic
gluconeogenesis. The glucose produced from these precursors, can be transported
from the liver and carried back to peripheral tissues for energy generation (McGrane,
2006).
In the Cory cycle (figure 1.3), lactate generated from pyruvate, the end product of
glycolysis, is released mainly from muscle or red blood cells and transported to the
liver, where is converted back to pyruvate and can be used to synthesize glucose.
This glucose is then recirculated to muscle or red blood cells (McGrane, 2006). In
this process, the NADH generated in skeletal muscle during glycolysis is used for the
reduction of pyruvate to lactate.
Figure 1.2. Utilization of glucose during the first day of starvation (Saker and
Remillard, 2010).
.
0
5
10
15
20
25
30
35
40
45
0 2 4 5 6 8 10 12 14 16 18 20 22 24 28
Glu
cose
Usa
ge
(g/h
)
Hours
Exogenous glucose
Hepatic glycogenolysis
Hepatic and renal gluconeogenesis (glycerol and amino acids)

Chapter 1: Literature Review
7
The alanine cycle involves the hepatic deamination of alanine to pyruvate, which
serves as substrate for hepatic gluconeogenesis. The resulting glucose is then sent
back into circulation. In the alanine cycle, unlike the Cory cycle, the NADH
generated in skeletal muscle during glycolysis is available for mitochondrial electron
transport and ATP production (McGrane, 2006).
The recycled glucose coming from these cycles does not contribute significantly to
the net amount of glucose used by the brain; this tissue relies on gluconeogenesis
from glycerol and amino acids. This situation is not desirable, because the utilization
of endogenous amino acids will lead to an important muscle and protein loss from
the body (Watford, 2006). An alternative fuel for the brain at this time are ketone
bodies, synthesized in the liver from the partial oxidation of long-chain fatty acids
obtained from triglycerides in adipose stores. The hydrolysis of triglycerides to
provide fatty acids is mediated by hormone sensitive lipase, stimulated by glucagon.
Ketone bodies are water soluble and have a very wide distribution within the body,
being also able to diffuse across cell membranes (Saker and Remillard, 2010). In
consequence, they act to serve as a direct source of energy for vital organs such as
the brain (McKenna et al., 2005; Schönfeld and Reiser, 2013). Ketosis in food
deprivation is an appropriate physiologic response and does not lead to severe
ketoacidosis except in diabetic dogs and cats (Stojanovic and Ihle, 2011).
Figure 1.3. Re-utilization of glucose during the Cory cycle.
Chapter 1: Literature Review
8
Ketone body production is maintained until adipose tissue is depleted. Once the fat
reserves have been exhausted, the animal will die.
Stress starvation
In contrast to patients undergoing simple starvation, ill patients may have access to
food but have a decreased (hyporexia) to non-existent (anorexia) food intake. In these
patients, there is a release of inflammatory mediators and stimulation of the
sympathetic nervous system. This stimulation may induce a hypermetabolic state,
which increases the body energy expenditure and proteolysis, leading to a negative
energy and nitrogen balance (Tisdale, 2000; Inui, 2011). There is no adaptative
reduction of the metabolic rate. All this results in loss of lean body mass, which
impairs the patient’s strength, immune function, wound healing, and negatively
affects overall survival (Gagne and Wakshlag, 2015).
General neuroendocrine responses and local mediators create a hypermetabolic state.
This response has been described as an acute phase followed by an adaptive phase
(Popp and Brennan, 1983). The acute phase is characterized by catabolism and
generally occurs within the first 24 to 72 hours. The decreased exogenous nutrients
provision in the face of increased energy and nutrient demands leads to a negative
energy and nitrogen balance. Some of the cytokines stimulating this hypermetabolic
state include tumour necrosis factor (TNF-α), interleukin 1 (IL-1β), interleukin 6 (IL-
6), and interferon ϒ (IFN-ϒ) (Inui, 2011). This phase will continue until the
neuroendocrine stimuli and cytokine mediators are removed. The loss of 25 to 30%
of lean body mass has been associated with reduced heart muscle mass and function,
decreased pulmonary function, diminished respiratory drive, and compromised
immune function, leading to higher mortality rates of these patients (Matthews and
Fong, 1993). The adaptive phase, in surviving patients, is characterized by increased
metabolic rate, nitrogen gain and normal body temperature and may last for several
days, weeks or years. Specific disease states will affect the type and/or degree of
metabolic and hormonal alterations in the patient.
1.2.2. Effects of overfeeding
Refeeding syndrome
Metabolic derangements that can occur in the refeeding process in a patient after an
extended period of complete anorexia or severe malnutrition are called refeeding
Chapter 1: Literature Review
9
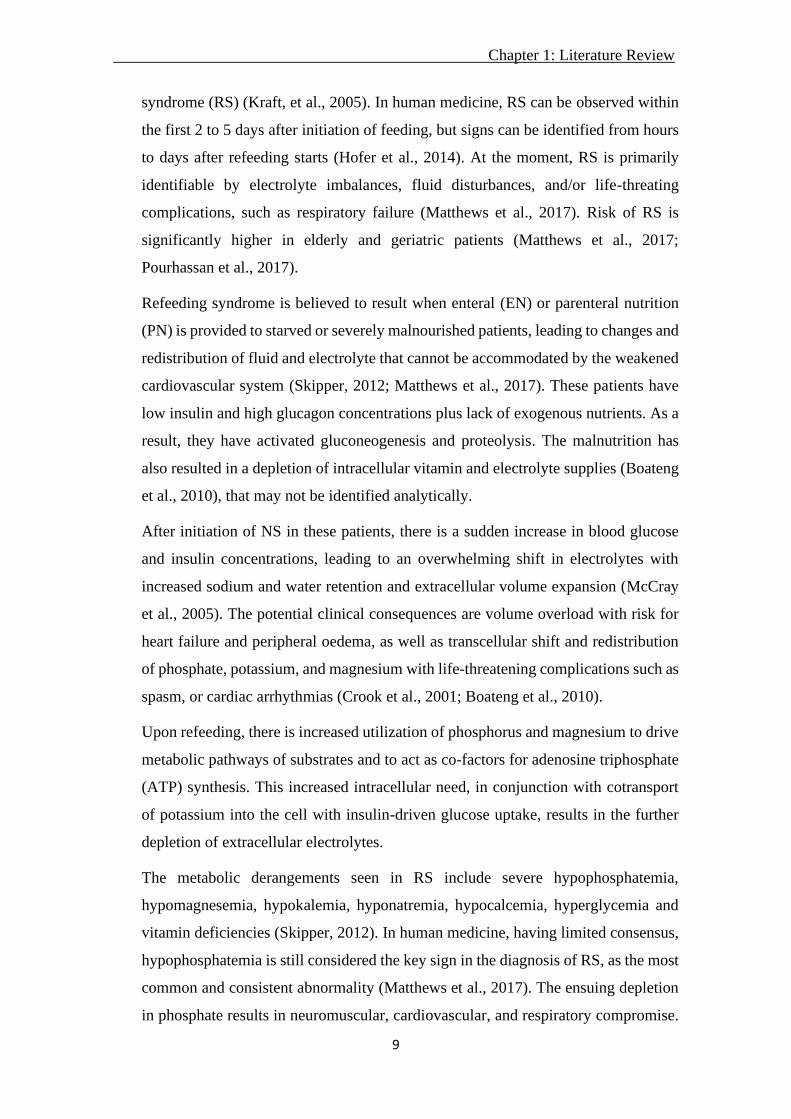
syndrome (RS) (Kraft, et al., 2005). In human medicine, RS can be observed within
the first 2 to 5 days after initiation of feeding, but signs can be identified from hours
to days after refeeding starts (Hofer et al., 2014). At the moment, RS is primarily
identifiable by electrolyte imbalances, fluid disturbances, and/or life-threating
complications, such as respiratory failure (Matthews et al., 2017). Risk of RS is
significantly higher in elderly and geriatric patients (Matthews et al., 2017;
Pourhassan et al., 2017).
Refeeding syndrome is believed to result when enteral (EN) or parenteral nutrition
(PN) is provided to starved or severely malnourished patients, leading to changes and
redistribution of fluid and electrolyte that cannot be accommodated by the weakened
cardiovascular system (Skipper, 2012; Matthews et al., 2017). These patients have
low insulin and high glucagon concentrations plus lack of exogenous nutrients. As a
result, they have activated gluconeogenesis and proteolysis. The malnutrition has
also resulted in a depletion of intracellular vitamin and electrolyte supplies (Boateng
et al., 2010), that may not be identified analytically.
After initiation of NS in these patients, there is a sudden increase in blood glucose
and insulin concentrations, leading to an overwhelming shift in electrolytes with
increased sodium and water retention and extracellular volume expansion (McCray
et al., 2005). The potential clinical consequences are volume overload with risk for
heart failure and peripheral oedema, as well as transcellular shift and redistribution
of phosphate, potassium, and magnesium with life-threatening complications such as
spasm, or cardiac arrhythmias (Crook et al., 2001; Boateng et al., 2010).
Upon refeeding, there is increased utilization of phosphorus and magnesium to drive
metabolic pathways of substrates and to act as co-factors for adenosine triphosphate
(ATP) synthesis. This increased intracellular need, in conjunction with cotransport
of potassium into the cell with insulin-driven glucose uptake, results in the further
depletion of extracellular electrolytes.
The metabolic derangements seen in RS include severe hypophosphatemia,
hypomagnesemia, hypokalemia, hyponatremia, hypocalcemia, hyperglycemia and
vitamin deficiencies (Skipper, 2012). In human medicine, having limited consensus,
hypophosphatemia is still considered the key sign in the diagnosis of RS, as the most
common and consistent abnormality (Matthews et al., 2017). The ensuing depletion
in phosphate results in neuromuscular, cardiovascular, and respiratory compromise.
Chapter 1: Literature Review
10
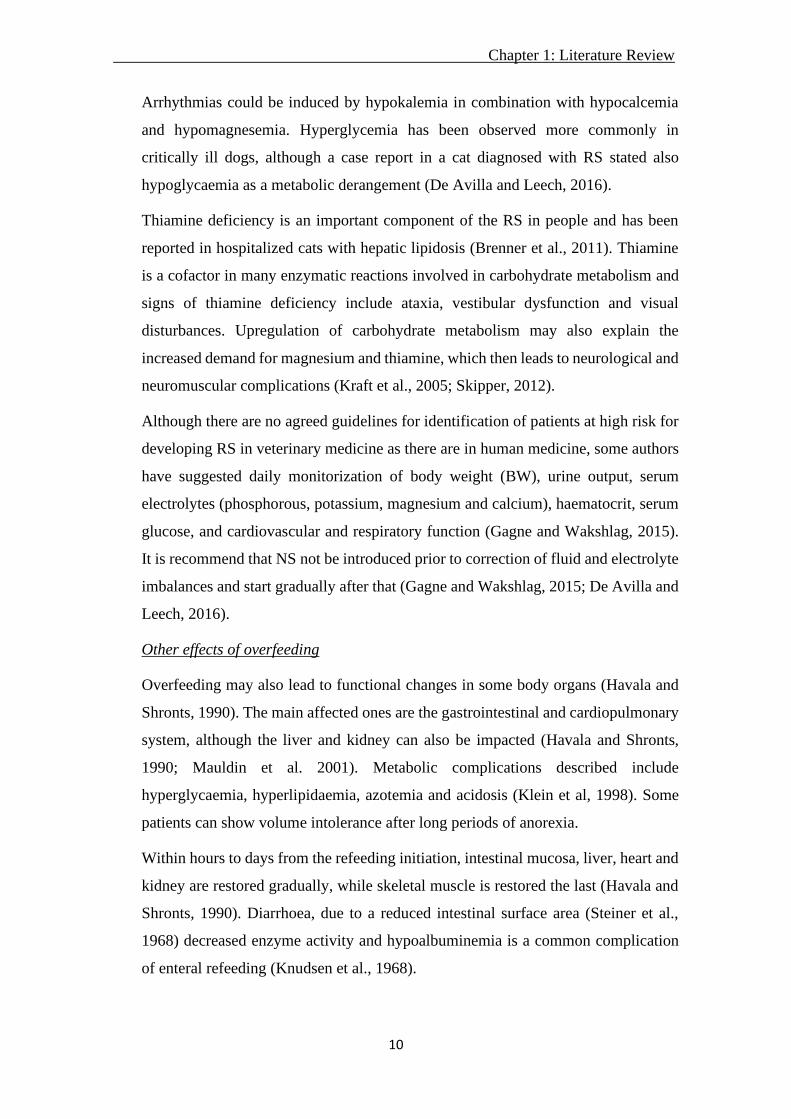
Arrhythmias could be induced by hypokalemia in combination with hypocalcemia
and hypomagnesemia. Hyperglycemia has been observed more commonly in
critically ill dogs, although a case report in a cat diagnosed with RS stated also
hypoglycaemia as a metabolic derangement (De Avilla and Leech, 2016).
Thiamine deficiency is an important component of the RS in people and has been
reported in hospitalized cats with hepatic lipidosis (Brenner et al., 2011). Thiamine
is a cofactor in many enzymatic reactions involved in carbohydrate metabolism and
signs of thiamine deficiency include ataxia, vestibular dysfunction and visual
disturbances. Upregulation of carbohydrate metabolism may also explain the
increased demand for magnesium and thiamine, which then leads to neurological and
neuromuscular complications (Kraft et al., 2005; Skipper, 2012).
Although there are no agreed guidelines for identification of patients at high risk for
developing RS in veterinary medicine as there are in human medicine, some authors
have suggested daily monitorization of body weight (BW), urine output, serum
electrolytes (phosphorous, potassium, magnesium and calcium), haematocrit, serum
glucose, and cardiovascular and respiratory function (Gagne and Wakshlag, 2015).
It is recommend that NS not be introduced prior to correction of fluid and electrolyte
imbalances and start gradually after that (Gagne and Wakshlag, 2015; De Avilla and
Leech, 2016).
Other effects of overfeeding
Overfeeding may also lead to functional changes in some body organs (Havala and
Shronts, 1990). The main affected ones are the gastrointestinal and cardiopulmonary
system, although the liver and kidney can also be impacted (Havala and Shronts,
1990; Mauldin et al. 2001). Metabolic complications described include
hyperglycaemia, hyperlipidaemia, azotemia and acidosis (Klein et al, 1998). Some
patients can show volume intolerance after long periods of anorexia.
Within hours to days from the refeeding initiation, intestinal mucosa, liver, heart and
kidney are restored gradually, while skeletal muscle is restored the last (Havala and
Shronts, 1990). Diarrhoea, due to a reduced intestinal surface area (Steiner et al.,
1968) decreased enzyme activity and hypoalbuminemia is a common complication
of enteral refeeding (Knudsen et al., 1968).

Chapter 1: Literature Review
11
During refeeding, the basal metabolic rate is increased, leading to an increased
oxygen consumption, carbon dioxide production, and minute ventilation.
Consequently, cardiopulmonary effort is increased, and in the long term, the inability
of the heart and lungs to provide adequate oxygenation may result in respiratory
and/or cardiac failure (Weinsier and Krumdieck, 1981).
1.2.3. Energy and nutrient requirements in hospitalized dogs and cats
Knowledge of energy requirements is needed in order to prevent both under and
overnutrition. Energy requirements determine how much food an animal needs in
order to maintain an adequate BW (see section 1.6). Energy requirements in dogs and
cats can be established by measuring energy expenditure or estimated using formulas.
1.2.3.1. Measurement
Calorimetry is the measurement of the heat produced by the individual. Because
animals do not store heat, the quantity of heat lost from the animal is equal to the
quantity produced. Calorimetry allows measurement of the heat lost (heat
production), that can be measured directly (direct calorimetry) or estimated from
respiratory exchange (indirect or respiratory calorimetry) (Blaxter, 1989; Levine and
Morgan, 1990). In human medicine, respiratory calorimetry is the most common
method to calculate a patient’s energy requirements. This can be done in hospitalized
individuals in order to tailor the energy provision (Parker et al., 2017). Indirect
calorimetry in veterinary medicine is usually reserved for research settings and is not
commonly used in daily practice.
1.2.3.2. Estimation
Different formulas have been obtained empirically for the estimation of energy
requirements in different physiological stages and for different activity levels in dogs
and cats (National Research Council, 2006; Hand et al., 2010). Most of these
equations have been obtained from populations of healthy individuals.
These equations are based in the metabolic body weight of dogs (Kg0.75) and cats
(Kg0.67). Some equations calculate the daily energy requirements (DER) directly
(National Research Council, 2006) and others first estimate resting energy
requirements (RER) and then apply a factor according to species, life stage and
activity (Hand et al., 2010). The RER (Kleiber, 1961) represents the energy
requirement for an animal in a thermoneutral environment, without performing

Chapter 1: Literature Review
12
physical exercise and includes energy needed for digestion, absorption and
metabolism of food (heat increment) and recovery from previous physical activity. It
can be calculated by the estimate formula RER = 70 x (BWkg)0.75.
Energy requirements of hospitalized animals
There is almost no data about the energy requirements in disease conditions. This can
be due to the difficulty in performing prospective studies with a high number of
patients and during enough time to extract reliable conclusions, and to the variability
among different diseases and severity situations. A limited number of studies in dogs
in the post-operative stage have been conducted in this area (Ogilvie et al, 1996;
Walton et al, 1996) with respiratory calorimetry. These studies suggested that energy
requirements of hospitalized dogs were close to their RER.
Some authors have recommended multiplying the RER by an illness factor based on
the severity of underlying disease (Richardson and Davidson, 2003; Mauldin, 2012),
assuming that the hypermetabolic state in critically ill patients will increase energy
needs. Although illness factors have been used in the past in hospitalized animals, it
is now recognized that they can overestimate the requirements of a convalescing and
inactive veterinary patients (Chan, 2004). In human medicine, the European Society
for Clinical Nutrition and Metabolism Guidelines on Enteral Nutrition advises
against providing more than approximately basal energy requirements, especially in
the acute phase of critical illness (Kreymann et al., 2006).
Given the probable increased risk of complications when ill animals are overfed, and
the lack of evidence that feeding above energy requirements is beneficial in these
cases, the current recommendation for calculating the energy needs in ill cats and
dogs is to start at RER. Afterwards, the amount fed can be increased or decreased
depending on the animal’s tolerance and BW trends (Chan, 2015).
Nutrient requirements in hospitalized animals
There is a lack of research on the effect of critical illness on nutrient requirements,
thus, most recommendations are empirical, and the assumption is that the nutrient
requirements are at least equal to those of healthy dogs and cats (National Research
Council, 2006). Nutrient needs are important for diet selection (see Section 1.6.2).
The best macronutrient profile for hospitalized patients is unknown, and will likely
vary for each patient. Usually (except in some particular cases) diets recommended
Chapter 1: Literature Review
13
are energy and nutrient dense in order to maximize energy and nutrients provision in
patients that are frequently hypo/anorectic. These diets are complete and balanced
for healthy adults, meaning that they include all macro and micronutrients (vitamins
and minerals) required by healthy dogs and cats (National research council, 2006).
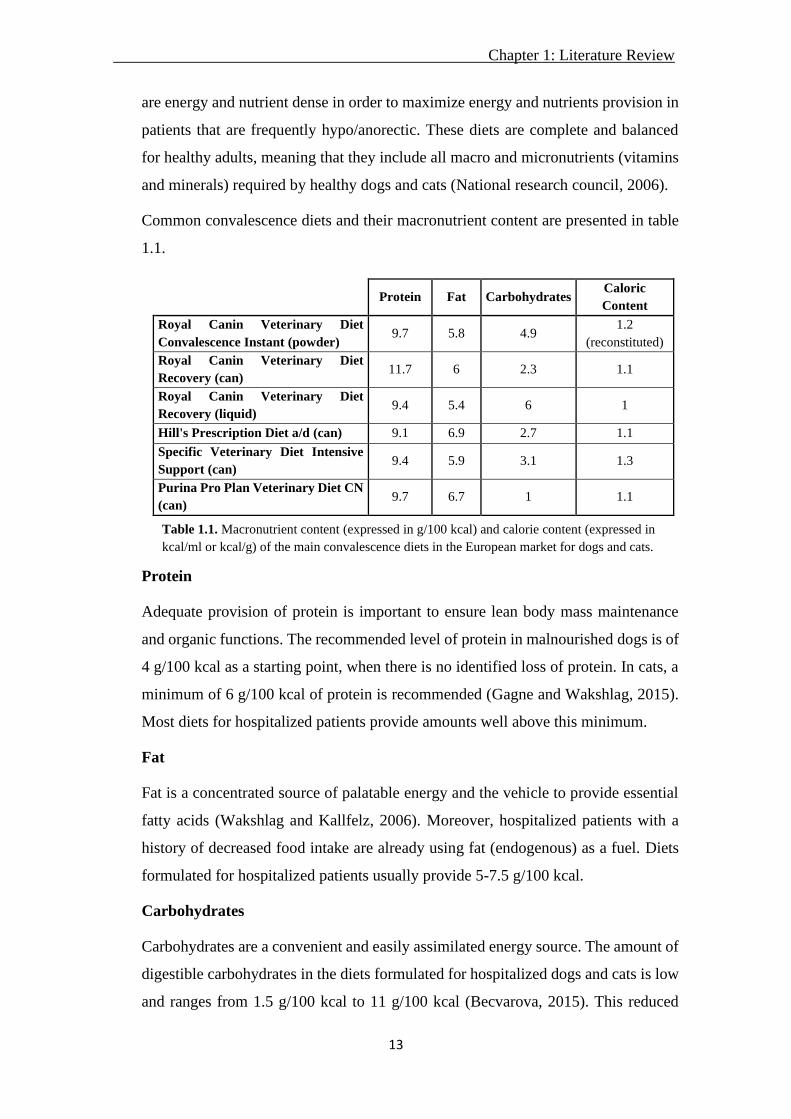
Common convalescence diets and their macronutrient content are presented in table
1.1.
Protein
Adequate provision of protein is important to ensure lean body mass maintenance
and organic functions. The recommended level of protein in malnourished dogs is of
4 g/100 kcal as a starting point, when there is no identified loss of protein. In cats, a
minimum of 6 g/100 kcal of protein is recommended (Gagne and Wakshlag, 2015).
Most diets for hospitalized patients provide amounts well above this minimum.
Fat
Fat is a concentrated source of palatable energy and the vehicle to provide essential
fatty acids (Wakshlag and Kallfelz, 2006). Moreover, hospitalized patients with a
history of decreased food intake are already using fat (endogenous) as a fuel. Diets
formulated for hospitalized patients usually provide 5-7.5 g/100 kcal.
Carbohydrates
Carbohydrates are a convenient and easily assimilated energy source. The amount of
digestible carbohydrates in the diets formulated for hospitalized dogs and cats is low
and ranges from 1.5 g/100 kcal to 11 g/100 kcal (Becvarova, 2015). This reduced
Protein Fat Carbohydrates Caloric
Content
Royal Canin Veterinary Diet
Convalescence Instant (powder) 9.7 5.8 4.9
1.2
(reconstituted)
Royal Canin Veterinary Diet
Recovery (can) 11.7 6 2.3 1.1
Royal Canin Veterinary Diet
Recovery (liquid) 9.4 5.4 6 1
Hill's Prescription Diet a/d (can) 9.1 6.9 2.7 1.1
Specific Veterinary Diet Intensive
Support (can) 9.4 5.9 3.1 1.3
Purina Pro Plan Veterinary Diet CN
(can) 9.7 6.7 1 1.1
Table 1.1. Macronutrient content (expressed in g/100 kcal) and calorie content (expressed in
kcal/ml or kcal/g) of the main convalescence diets in the European market for dogs and cats.

Chapter 1: Literature Review
14
amount can be explained by the lower calorie content that this macronutrient has
compared to fat (3.5 kcal ME/g of carbohydrate vs. 8.5 kcal ME/g of fat). In animals
that are at risk of malnutrition, the use of high-energy dense foods is important.
Lowering the amount of carbohydrates in the diet could be beneficial for patients
with insulin resistance, hyperglycaemia and respiratory distress, because of
decreased CO2 production from carbohydrate metabolism (Gagne and Wakshlag,
2015) but there is still a lack of data in this regard.
Others
Specific nutrients have been proposed to promote healing and recovery are usually
added to the critical care formulas. However, the research behind their efficacy is
still lacking.
1. Arginine: essential amino acid functioning as an intermediary in the urea cycle.
Protein catabolism is increased in malnourished animals, which could accelerate the
urea cycle, creating an increased arginine demand. Despite this, no conclusive
scientific data is present regarding arginine supplementation effectiveness in
hospitalized canine patients (Kalil et al., 2006; Chan et al., 2009; Larsen, 2012).
2. Glutamine: non-essential amino acid, considered a conditionally essential amino acid
during time of stress in some species (Buchman, 1999; Lacey and Wilmore, 1990).
Glutamine is an energy source for enterocytes and lymphocytes, and is important for
nucleotide biosynthesis (Mobrahan, 1992; Buchman, 1999). Most of the diets high in
protein (convalescence diets) supply the adequate amount of glutamine, being the
addition of glutamine to a complete and balance convalescence diet questionable at
this time.
3. Branched-chain amino acids (BCAA): Leucine, isoleucine and valine. These amino
acids are metabolized in the muscle, are used with the objective of improving nitrogen
balance, and spare lean body mass in malnourished patients. Some data suggests that
oral and parenteral administration of BCAA decreases the severity of anorexia and
improves protein accretion and albumin synthesis in human cancer patients
(Cangiano et al., 1996). Currently there is no evidence of benefits of adding BCAA
in canine and feline patients already eating high protein diets.
4. Omega 3 fatty acids: Eicosapentaenoic acid (EPA) and docosahexaenoic acid (DHA).
These fatty acids displace arachidonic acid from cell membranes, reducing the

Chapter 1: Literature Review
15
formation of proinflammatory eicosanoids. Moreover, eicosanoids derived from EPA
(series 3 prostaglandins and series 5 leukotrienes) are less pro inflammatory vs those
originating from arachidonic acid. These fatty acids have also been proposed to
downregulate TNF-α, IL-1β, and IL-6 synthesis in inflammatory cells (National
Research Council, 2006). As reported in one study (Freeman, 2009), omega-3 fatty
acids can also have a positive effect combating cardiac cachexia, and could have
potentially beneficial effects in patients with cachexia of other origin, but data is still
missing.
5. Vitamins: B-vitamins are coenzymes required in the citric acid cycle, being necessary
for glucose, protein, and fat metabolism (National Research Council, 2006). Most pet
foods contain adequate amounts of B-vitamins, but when the patient is not eating for
an extended amount of time, these vitamins can be supplemented, even parenterally.
Fat soluble vitamins can be stored in the liver thus there is no need for parenteral
supplementation, however, after an extended amount of time presenting
anorexia/hyporexia, excessive loss of fat stores occur and parenteral supplementation
should be considered (Gagne and Wakshlag, 2015).
1.3. Malnutrition in human medicine
1.3.1. Prevalence of malnutrition
Malnutrition (referring to both under and overnutrition) in hospitalized people is a
common concern associated with poor clinical outcomes (Ridley et al., 2015).
According to studies around the world, malnutrition is present in about half of
hospitalized patients (Ordoñez et al., 2013; Ridley et al., 2015), but tends to be
undetected and incorrectly addressed because it is not considered a high-priority
clinical issue, and nutritional evaluation is still far from being routinely implemented
in hospitalized patients (Tsaousi et al., 2014). This situation was also showed in the
study conducted by McWhirter and Pennington (1994). In this study, between 40-
50% of 500 patients admitted to a university hospital had some degree of
undernutrition, but only 23% of the patients had ever been through a minimal
nutritional assessment (weighed) and in less than 50% the information of nutritional
state was reported in their medical history. Furthermore, only 10 patients (2%) were
referred for dietetic advice, and these patients had an average of 7.9% weight gain,
while the rest had an average weight loss of 5.4%. Moreover, Annetta et al. (2015)
Chapter 1: Literature Review
16
reported that only 41% of the patients admitted to the hospital were receiving a
nutritional assessment.
1.3.2. Diagnosis of malnutrition
The European Society of Clinical Nutrition and Metabolism (ESPEN) selected a
group of clinical scientists to provide a consensus statement, setting criteria for the
diagnosis of malnutrition and define a unified international terminology (Cederholm
et al., 2015). The common malnutrition screening tools and measures available until
that time were inappropriate in critical illness, preventing an accurate assessment of
weight and other anthropometric assessments (Ridley et al., 2015). Additionally,
some screening tools require answers to questions that are impossible to obtain in
patients who are ventilated or sedated and which are often unknown to relatives.
Other well-known body composition assessment techniques, such as bioelectrical
impedance analysis, were also considered unreliable in critical illness due to altered
hydration status. Biochemical markers have long been considered a potential way to
identify and measure nutrition status as it changes during hospitalisation but were
also unreliable in critical illness due to variability resulting from underlying disease.
Such markers might include albumin or other proteins with a shorter half-life which
are frequently altered in critical illness, making their interpretation difficult (Ridley
et al., 2015).
In the consensus of Cederholm et al. (2015), the experts agreed that subjects at risk
of malnutrition should be identified by validated screening tools. A unanimous
consensus was reached to advocate two options for the diagnosis of malnutrition,
particularly undernutrition: body mass index (BMI) (<18.5 kg/m2 to define
malnutrition) or a combination between unintentional weight loss and either a
reduced BMI or a low fat free mass index. Unintentional weight loss is defined as
>10% of usual body weight in an undetermined period of time or >5% over 3 months.
1.3.3. Hospitalization length (HL) and clinical outcome
The high prevalence of malnutrition and the insufficient food intake during
hospitalization leads to an increased risk of in-hospital mortality (Lainscak, 2014).
In general, malnourished patients have a worse treatment response and increased rate
of complications, showing longer hospital stays and poorer outcomes (higher
mortality) compared to well-nourished patients (Ordoñez et al., 2013; Tsaousi et al.,

Chapter 1: Literature Review
17
2014; Lew et al., 2016). A significantly increased HL was associated with medical
fasting (nil per os, NPO) in one study (Halvorson et al., 2013). In another study
conducted in Spain (Villalobos et al., 2014) the patients diagnosed with malnutrition
had a higher HL (31.7 days) compared with other patients (9.5 days). The death rate
for these patients was 5 times higher compared with the mean, and the number of
urgent re-hospitalization was increased by 1.9 times. Another study in children
(Bechere et al., 2015) also revealed a higher HL in children with excess of BW
compared with children with normal BW. Therefore, poor nutritional status is an
important prognosticator of HL in acute care patients. The economic consequence of
this health outcome is substantial.
1.3.4. Nutritional intervention
Recent retrospective (Ordoñez et al., 2013; Lainscak et al., 2014) and prospective
(Calleja et al., 2014; Tsaousi et al., 2014) studies in human patients have stressed that
a correct NS is important for improving patient’s health status and for reducing the
HL. This has a positive effect on the patient, who will return home earlier, but also
for the hospital, which will save costs. In a study done in 1996, Fisher and Opper
reported that having a specialized nutrition team support resulted in more patients
meeting their daily nutritional requirements.
When considering the need for assisted nutrition, the route of nutrition delivery is an
important topic to be covered when starting nutrition therapy for intensive care unit
patients. Both the route of nutrition and the best time to start likely depend on many
factors, including patient characteristics and disease state. Enteral nutrition is cheaper
and more physiological than PN, but it remains controversial whether enteral feeding
protocols are effective in improving important outcomes vs parenteral ones. Li et al.
(2017) found that the implementation of EN feeding protocol marginally reduced HL
and was able to increase the proportion of EN feeding, but failed to reduce 28-day
mortality or the duration of mechanical ventilation. In another randomized controlled
trial (Doig et al., 2013) 1372 patients were included to determine whether providing
early PN to critically ill adults, where early EN was contraindicated, altered their
outcomes compared with standard care. The use of PN did not affect day-60 mortality
or HL and early PN resulted in significantly fewer days of invasive ventilation, with
no harmful effects.

Chapter 1: Literature Review
18
The timing of NS also needs to be carefully considered. Although there is no global
consensus, meta-analisis show that early nutrition support (defined as a standard
formula commenced within 24 hours of intensive care admission) lead to reduced
mortality and hospitalization complications compared with delayed enteral intake
(Tian et al., 2018). Although in some specific situation some studies fail to find a
clear benefit of early nutrition support, no clear negative effects on outcome or
complications have been reported (Koretz et al., 2007; Reintam et al., 2017).
Moreover, latest meta-analysis in critically ill patients with gastrointestinal diseases
and burn injured demonstrate improvements in clinical outcomes with early enteral
feeding (Feng et al., 2017; Pu et al., 2018; Zhang et al., 2019).
1.4. Malnutrition in hospitalized veterinary patients
1.4.1. Prevalence of malnutrition
There are very few studies assessing malnutrition prevalence in hospitalized animals
in veterinary medicine. Brunetto et al., (2010) in a retrospective study, and Chandler
and Gunn-Moore (2004) and Remillard et al. (2001), in two prospective studies,
estimated a prevalence of malnutrition in veterinary hospitalized patients (specifically
dogs and cats) ranging between 25% and 65%. These authors used different methods
to assess malnutrition (see 1.4.2).
1.4.2. Diagnosis of malnutrition
There is no standardized method to identify and diagnose malnutrition. Nutritional
status in veterinary medicine is mostly assessed on the basis of classical factors such
as BW, body condition score and plasma albumin concentration. The study of
Remillard et al. (2001) identified malnutrition using energy balance and body
condition score (BCS) of canine hospitalized patients. A daily neutral or positive-
energy balance (> 95% RER) was achieved for only 27% of the 821 days of
hospitalization per dog (dog-days).
The study from Chandler and Gunn-Moore (2004) assessed the nutritional status of
dogs and cats at admission to a veterinary teaching hospital, based on clinical history,
BCS (using the 9-point scale system), and serum albumin concentrations. The
percentage of dogs and cats with a BCS below ideal was 34.7% and 53.3%
respectively, and recent weight loss had been reported in 45.8% of dogs and 53.3%
of cats. The results showed no significant positive correlation between serum albumin

Chapter 1: Literature Review
19
concentration and BCS in dogs. In contrast, there was a positive correlation between
serum albumin concentration and BCS in cats. Many of the dogs with decreased
serum albumin concentration had gastrointestinal disease or a hepatopathy that
accounted for a loss of or failure to synthesize albumin rather than lack of protein
intake; but the exact reason why albumin is a potentially better indicator of poor
nutritional status in cats than in dogs is not known. In addition, there were significant
associations in both species between a BCS <5 and decreased appetite and between a
BCS <5 and recent weight loss.
Some authors have tried to identify other biomarkers of malnutrition in veterinary
patients, such as serum proteins like insulin-like growth factor I (IGF-I) and creatine
kinase. Serum IGF-I showed good correlation with nutritional status, as defined by
BW and EI, in healthy animals (Maxwell et al., 1998; Maxwell et al., 1999), but has
only been examined in research studies and has not been applied widely to clinical
patients. Serum creatine kinase concentration was assessed as a marker of nutritional
status in cats (Fascetti et al., 1997). In this study, creatine kinase was higher in
hospitalized anorectic cats compared to healthy controls, and decreased with NS.
However, it is also subject to changes with disease states.
Rapid turnover proteins such as transferrin (Tf) are used as dynamic nutritional
biomarkers in human medicine (Ingenbleek et al., 1975; Kuvshinoff et al., 1993).
Nakajima et al. (2014) evaluated the clinical usefulness of Tf as nutritional
assessment marker by measuring plasma Tf concentrations in malnourished dogs
before and after nutritional treatment. Post treatment plasma Tf concentrations were
significantly higher than those of pre-treatment. The authors concluded that plasma
Tf concentration was related to nutritional condition and would be a candidate for
novel nutritional assessment marker in dogs although further research is needed.
Apart from these biomarkers, Chan et al. (2009) reported that critically ill dogs had
altered amino acid profiles. Critically ill dogs had significantly lower concentrations
of alanine, arginine, citrulline, glycine, methionine, proline, and serine but
significantly higher concentrations of lysine and phenylalanine compared with
control group (healthy dogs). Concentrations of arginine, isoleucine, leucine, serine,
valine, and total BCAA were significantly higher in survivors compared with no
survivors. Consequently, the amino acid profile could also be an instrument for the
diagnosis and prediction of the outcome in hospitalized dogs. In the same study,
Chapter 1: Literature Review
20
median C-reactive protein concentrations were significantly higher in the critically
ill dogs compared with controls.
However, despite encouraging results in small powered studies, there are no
standardized biomarkers to diagnose malnutrition in veterinary medicine at this time.
1.4.3. Risk factors of undernutrition in hospitalized dogs and cats
Due to the difficulty in diagnosing malnutrition in a standardized manner, identifying
patients at risk is very important, to ensure early intervention and prevent the problem
if possible. Some of the proposed risk factors for malnutrition in hospitalized animals
are listed below (Chan and Freeman, 2006; Saker and Remillard, 2010; Perea, 2012).
However, evidence is very scarce since there are only a few clinical studies assessing
risk factors of undernutrition in ill dogs and cats.
• Anorexia: Anorexia is defined as the total loss of appetite and hyporexia is
defined as a reduction in appetite. Both can occur for numerous reasons (Forman,
2010), and a complete nutritional assessment of the patient should be carried out
to find the likely cause (see section 1.6). These patients are using endogenous
lean and adipose tissue as an energy and anabolic substrates and when this state
is prolonged, the loss of functional protein will result in a negative protein
balance. Comparing the current EI with the theoretical energy requirement, we
can evaluate the necessity of implementing assisted nutrition (EN or PN). Days
of anorexia or hyporexia is one of the most important malnutrition risk factors in
veterinary medicine (Gagne and Wakshlag, 2015).
• Vomiting and diarrhoea: These result in nutrient losses and are usually
accompanied by hyporexia or anorexia.
• Insufficient EI: The two main reasons why dogs can be found in a negative
energy balance during hospitalization, as reported by Remillard et al. (2001), are
rejection of the offered food (hypo and anorexia) and NPO. Moreover, the same
study identified that, out of 1000 written orders in respect to feeding, fewer than
20% were complete and accurate, which can contribute to an inadequate EI. In
human medicine, studies have found a positive relationship between a proper EI
and survival (Halvorson et al., 2013; Calleja et al., 2014; Tsaousi et al., 2014).

Chapter 1: Literature Review
21
• Life stage: Energy and nutrient needs are different depending on the animal life
stage (adult, lactating female, gestating female, puppy, etc.). Therefore, the risk
of undernutrition will potentially be higher in the most energy demanding
physiological stages (Burger, 1994¸McDonald, 1995; Schroeder and Smith,
1995).
• Age: advanced age has been proposed as a risk factor for malnutrition in
companion animals (Weber et al., 2003; Fahey et al., 2008), as well as in humans
(Calleja et al., 2014; Tsaousi et al., 2014). This may be due to changes in
intestinal function or other aspects such as the presence of periodontal disease
(Hirai, 2013) or impairment in the immune function.
• HL: a longer stay in the hospital can worsen malnutrition status and it is
associated with a worse prognosis in human patients (Halvorson et al., 2013;
Calleja et al., 2014; Tsaousi et al., 2014).
• Diseases: inflammation, trauma, neoplasia, facial/oral injures, gastrointestinal
tract dysfunction, liver disease, or pancreatic disease can cause anorexia, as well
as pain, fear and other components of emotional stress (Saker and Remillard,
2010).
1.4.4. Nutritional status and clinical outcome
Brunetto et al. (2010), in a retrospective study with 467 dogs and 50 cats, found that
disease severity was negatively associated with hospital outcome and EI, and that EI
was positively associated with hospital discharge alive. They also found that the
patients’ outcome was related to BCS, with discharge (alive) rates of 73% for animals
with low BCS, and 84.7% for those with ideal or high BCS. Most of the dogs
consumed more than 66% of their maintenance energy requirements (MER), which
lead to a higher number of discharges compared with the animals that were
consuming less energy during the hospitalization period.
In the study of Remillard et al. (2001), there were significant relationships between
EI and disease severity, outcome and PSS, and outcome and caloric intake. Patients
with milder disease had higher EI and were more likely to be discharged whereas
patients with more severe disease were less likely to meet their energy needs and be
discharged alive from the hospital. In this study, it is difficult to separate the effect of
disease severity and decreased EI on outcome.

Chapter 1: Literature Review
22
1.4.5. Nutritional intervention
Michel and Higgins (2006) investigated the percentage of prescribed EN (tube
feeding) that was delivered in a small animal teaching hospital, as well as the
percentage of the RER that was delivered to the patients, and the reasons why animals
were under or overfed. All dogs and cats that underwent tube feeding were included
in the study conducted during 5 months in 2003. Twenty-five animals (23 cats and 2
dogs) were enrolled in the study. Animals received a median of 91% (range: 68–
100%) of their prescribed feeds/day and a median of 90% (range: 36–133%) of goal
feeds/day. Nausea or vomiting and conflict with other treatments were the most
common recorded reasons for incomplete meals. The study concluded that both
prescribed and goal feeds were delivered with a good rate of success. Additionally,
the nutritional intervention by the Nutrition Support Service improved the likelihood
that the prescribed feeding plan would meet the animal’s estimated RER.
One small prospective study (Mohr et al., 2003) found that early enteral feeding in
growing dogs with acute parvovirosis (within 12 hours of admission) resulted in
earlier resolution of clinical signs, better growth and improvements in indirect
measures of gut barrier function compared to late enteral feeding (on average 50
hours after admission). A retrospective study (Liu et al., 2012) evaluated nutritional
status and the effect of NS in dogs with septic peritonitis. The route of nutrition was
also taken in account, being EN (voluntary or assisted tube feeding) and central PN
the two early NS options studied. The authors concluded that early NS, defined as
consistent caloric intake initiated within 24 hours post-surgery, in dogs with septic
peritonitis was associated with a shorter HL in septic dogs compared to feeding more
than 24 hours after surgery. In another retrospective study (Brunetto et al., 2010) a
higher hospital discharge was reported in the voluntary feeding group, intermediate
in those that received intensive nutritional care (forced feeding, enteral support, and
parenteral support groups), and lower for the fasting group.
Regarding the types of nutritional intervention, Chan et al., (2002) reviewed the
medical records of all dogs and cats receiving PPN between 1994 and 1999 in a
veterinary teaching hospital to obtain signalment, reasons for use of PPN, duration of
PPN administration, duration of hospitalization, complications, and mortality. A total
of 80 dogs and 47 cats were included in the study. The most common underlying
diseases were pancreatitis, gastrointestinal disease, and hepatic disease. Median

Chapter 1: Literature Review
23
duration of hospitalization was 7 days, with a median time of hospitalization before
initiation of PPN of 2.8 days and median duration of PPN administration of 3.0 days.
In the 127 animals receiving PPN, 72 complications occurred, most of them were
metabolic (hyperglycaemia, hiperlipidemia, and hyperbilirubinemia), and were
classified as mild and did not require discontinuation of PPN. The 73.2% of the
patients were discharged. The study found that patients receiving supplemental EN
had higher survival rates than the ones receiving only PPN, suggesting that enteral
nutrition support, even partial, can be important in hospitalized dogs and cats.
1.5. Nutritional evaluation
Per the above, identification of the malnourished (or at risk) patient is complex due
to the lack of standardized criteria in companion animals. Some authors have
suggested that some of the indicators that the clinician may identify include
unintentional weight loss (>10% in less than 3 months), poor hair coat quality,
muscle wasting, inadequate wound healing, hypoalbuminemia, lymphopenia and
coagulopathies. However, these abnormalities are not specific to malnutrition and
often can occur late in the disease process (Chan and Freeman, 2006, Freeman et al.,
2011).
Loss of lean and fat mass could be a great indicator of altered nutritional status. Loss
of muscle mass can be associated with aging (sarcopenia) and certain disease states
(cachexia), both associated with increased morbidity and mortality (Freeman, 2012).
Muscle loss adversely affects strength, immune function, wound healing, and, is
independently associated with mortality in humans (Gulsvik et al., 2009; Von
Haehling et al., 2009). There are objective measures of body composition like dual
energy X-ray absorptiometry (DEXA), stable isotope dilution, and bioelectric
impedance. However, these methods are not commonplace in clinical practice due to
expense and complexity and are restricted to the research setting. Therefore, indirect,
subjective methods like BCS and muscle condition score (MCS) have been
developed.
These factors can be identified performing a nutritional assessment. The World Small
Animal Veterinary Association (WSAVA) has proposed that the nutritional
assessment be the 5th vital sign in the routine physical examination (Freeman et al.,
2011). This should be performed in every patient at every visit and, in hospitalized
patients, daily. This assessment currently includes signalment, BW, BCS, MCS,

Chapter 1: Literature Review
24
complete dietary history and basic analytical parameters (Freeman et al., 2011). A
patient with advanced malnutrition will not be very complex to recognize, since
parameters such as BCS or MCS will be clearly altered (figure 1.4). The challenge is
to identify patients at risk or at earlier stages.
1.5.1. Initial nutritional evaluation (screening)
The initial screening helps to differentiate pets that are healthy and without risk
factors (additional nutritional assessment not needed) from pets that have some
nutritional risk factors and should be evaluated more in depth (extended nutritional
evaluation) (figure 1.5).
Figure 1.4. Canine patient showing advanced signs of malnutrition
Figure 1.5. The Screening evaluation performed on every patient in order to see if there is any
nutritional risk factor present. An Extended evaluation is performed when one or more nutrition-
related risk factors are found or suspected based on the screening evaluation. (Freeman et al. (2011)).
Screening nutritional assessment
Nutritional risk factors present
Extended nutritional assessment
No risk factors present
NO further action required

Chapter 1: Literature Review
25
Nutritional screening includes information from signalment, routine history taking
and physical examination. Information collected should include assessment of factors
specific to the animal, the diet, and the feeding management/environment.
1.5.1.1. Animal
Age, life stage, activity, appetite, and nutrient sensitive disorders are animal factors
obtained from the signalment and history that should be collected. On the physical
exam, any alterations should be noted and the veterinary team should assess BW,
BCS, and MCS in a consistent manner, to evaluate the current status and changes
over time.
1.5.1.1.1. Body weight (BW)
During the hospitalization period, BW should be measured at least once per day, at
the same time of the day and with the same scale in order to minimize variability
(figure 1.6). Some medical procedures and conditions can alter BW in a small period
of time, such as rehydration or surgery processes (extracting the uterus, extracting a
tumour, adding a bandage, etc.). These should be taken in account in order to interpret
correctly the BW.
1.5.1.1.2. Body condition score (BCS)
The BCS is a subjective, semi-quantitative method that uses visual and tactile clues
to indirectly estimate body fat (figure 1.7). The most common scales are the 5-point
and the 9-point ones (Laflamme, 1997; German et al., 2006; Hand et al., 2010). On
the 9-point scale, a BCS of 4 and 5 (only 5 in cats) is considered ideal, between 1 and
3 is considered underweight (or emaciation) and a BCS between 6 and 9 indicates
Figure 1.6. Cat weighted at home with a special scale. The
animal was calm and with all the body inside the scale.
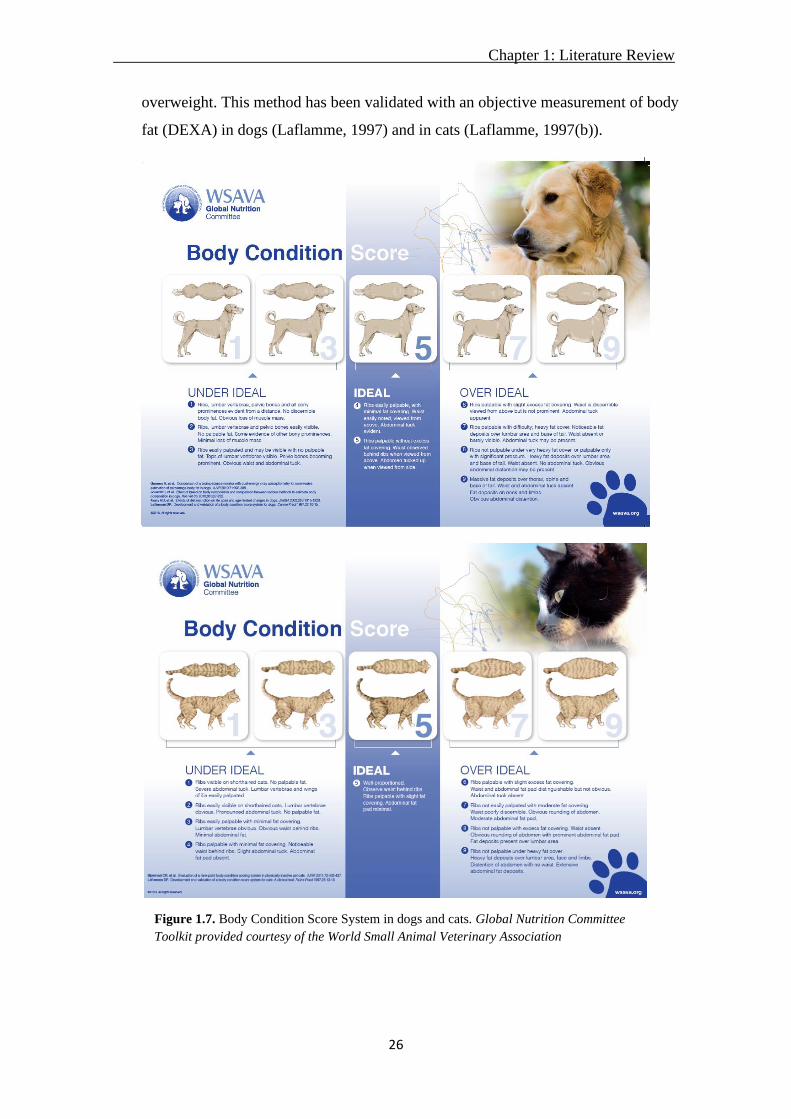
Chapter 1: Literature Review
26
overweight. This method has been validated with an objective measurement of body
fat (DEXA) in dogs (Laflamme, 1997) and in cats (Laflamme, 1997(b)).
Figure 1.7. Body Condition Score System in dogs and cats. Global Nutrition Committee
Toolkit provided courtesy of the World Small Animal Veterinary Association

Chapter 1: Literature Review
27
1.5.1.1.3. Muscle condition score (MCS)
The MCS aims to evaluate the muscle mass (figure 1.8). This is a subjective method
that includes visual examination and palpation of 4 muscle groups: over the temporal
bones, scapulae, lumbar vertebrae and pelvic bones.
Figure 1.8. Muscle condition score system in dogs and cats. “Provided courtesy of the
World Small Animal Veterinary Association (WSAVA). Available at the WSAVA Global
Nutrition Committee Nutritional Toolkit website: http://www.wsava.org/nutrition-toolkit.
Accessed June 29, 2016. Copyright Tufts University, 2014.”

Chapter 1: Literature Review
28
The MCS has been used without validation, but a recent prospective study (Freeman
et al., 2019) has attempted to validate it in dogs using ultrasonographic measurements
as the objective measure. The study used 40 dogs and the MCS correlated with
several ultrasound measurements, including the vertebral epaxial muscle score
(VEMS), which has also been proposed as a good indicator of lean body mass in dogs
(Freeman et al., 2017). These results are very encouraging, since ultrasound is
available in many clinics and VEMS could substitute MCS as a more objective
estimate of muscle wasting.
1.5.1.1.4. Appetite
The total daily caloric intake should be estimated in patients with decreased or absent
appetite. The assessment should entail a review of the medical history to rule out
environmental stressors, unpalatable food, anosmia, or side effects of medications
(Buffington et al., 2004). A complete physical examination should be performed, and
appropriate diagnostic tests carried out to identify disease processes. Some geriatric
patients with mild cognitive dysfunction can have no other identifiable cause of
hyporexia (Gagne and Wakshlag, 2015).
1.5.1.2. Diet
Specific dietary factors, such as safety and appropriateness of the diet, should be
evaluated before starting a nutritional plan. The information collected should include
name of the diet, type, and amounts fed. Problems related to dietary factors are
referred to as diet-induced disorders (e.g., nutrient imbalances, contamination, etc.).
1.5.1.3. Environment and feeding method
Feeding aspects include the frequency, timing, location and method of feeding, while
environmental factors include space and quality of the pets’ surroundings. Problems
related to feeding and environmental factors are referred to as feeding-related and
environment-related disorders (e.g., over- or underfeeding, excessive use of treats,
poor husbandry, competitive eating, or lack of appropriate environmental
stimulation).
1.5.2. Extended nutritional evaluation
The extended evaluation is performed when one or more nutrition-related risk factors
are found or suspected based on the screening evaluation. The importance of an

Chapter 1: Literature Review
29
extended nutritional evaluation (figure 1.9) increases as the number of risk factors
and their severity increases (Freeman et al., 2011).
Changes in food intake or behaviour should be examined, taking in account the
amount of food eaten, chewing or swallowing problems, nausea, vomiting,
regurgitation, or other problems limiting the food intake. The skin and hair condition
should also be examined in more detail, paying attention to the type of hair (dry,
easily plucked hair), and skin (thin, dry, or scaly). Minimum laboratory testing should
be done, including a complete blood count, urinalysis, biochemistry profile, faecal
culture.
Once we have a complete dietary, animal, and environment evaluation, we can set up
a nutritional plan according to the patient’s needs.
1.6. Nutritional support in hospitalized veterinary patients: current
recommendations
Despite the lack of standardized definitions and protocols, recommendations have
been made by different authors (Chan et al., 2004, Delaney et al., 2006) regarding
NS in hospitalized patients, based on the limited available evidence. The provision
of the necessary amount of energy and nutrients is the main objective in the sick
patient in order to prevent or correct possible nutritional deficiencies, minimize
metabolic disorders, prevent protein catabolism and maintain the correct functions of
the organs. Following the trends in human medicine, the old paradigm of "the patient
will eat when she/he feels better" has been replaced by "the patient will feel better
sooner if nutrition is provided as soon as possible" (Chandler, 2004).
1.6.1. When to start the nutritional support
Specific circumstances should be considered in order to identify the perfect moment
for implement the NS in veterinary patients once the patient has been stabilized and
is properly hydrated, ideally with no acid base or electrolyte imbalances:
• Anorexia. Although the ideal time to start the NS has not been stablished yet,
some authors proposed that assisted feeding should be started after 3 to 5 days of
anorexia and no later (Chan and Freeman 2006, Freeman et al., 2011). In some
disease processes, like parvovirosis in young dogs (Mohr et al, 2003), starting
within the 1st day of admission is indicated.

Chapter 1: Literature Review
3
Figure 1.9. Nutritional Assessment Checklist. Global Nutrition Committee Toolkit provided courtesy of the World Small Animal
Veterinary Association

Chapter 1: Literature Review
31
• BCS. A BCS at or lower than 3 out of 9 is an indicator to implement NS.
• BW. An involuntary loss of BW between 5 and 10% (not attributed to water loss)
is an indicator of the necessity of implementing an adequate NS strategy for the
patient.
The presence of other risk factors, such as young age or elderly, obesity in cats (with a
high risk for hepatic lipidosis), and ongoing nutrient losses (such as hypoalbuminemia,
vomiting and diarrhoea) should also be factored in when deciding when to start feeding.
1.6.2. What to feed: diet choice
There is a lack of information on nutrient requirements in disease states, therefore, the
clinician should assume at least similar requirements compared to a healthy patient. A
complete and balanced commercial food adequate for species and lifestage is the first
choice, which can be customized according to the patient's preferences and disease. If the
commercial balanced diets are not palatable, unbalanced homemade diets can be offered
in the short term in order to provide energy and protein, despite deficiencies in
macronutrients, vitamins and essential minerals. If the homemade diet is fed for longer
than 1 week, the recommendation is to balance it by contacting to an expert (Remillard,
2008; Cave, 2012).
1.6.3. How much to feed: energy needs
The initial recommended goal is to feed RER. The amount should be increased
progressively, starting with 25% or 33% of the RER, and rising according to the animal
tolerance, up to 100% in about 3-4 days, to minimize adverse effects.
The severity of the patient's condition and tolerance to the food will determine the
frequency of administration. A common recommendation is to divide the food in 3 to 6
times a day, depending on each specific case, taking in account the volume administered
in each administration. As dietary tolerance increases, the number of administrations per
day can be reduced.
1.6.4. Feeding route
Voluntary oral feeding should be initiated as soon as possible, and can be stimulated by
offering highly palatable foods, creating a relaxed environment or facilitating the access
to the food (flat bowls, create an area where the animal feels safe, etc.). The use of drugs
(such as mirtazapine and capromorelin) for enhancing appetite can be useful (Quimby

Chapter 1: Literature Review
32
and Lunn, 2013), even though its effects are not predictable and are often insufficient, so
they are not always effective (Agnew and Korman, 2014; Ferguson et al., 2016). Forced
feeding is not recommended in any case in order to avoid the adverse effects it can cause,
as aspiration pneumonia or food aversion (Larsen, 2012).
In patients that will not or cannot eat their requirements voluntarily, assisted feeding is
indicated, either enteral or parenteral. The route selected will be influenced by medical
and nutritional status of the patient, functionality of the intestinal tract, nutritional needs,
availability of diets, and the advantages and disadvantages presented by each route.
1.6.4.1. Enteral nutritional support
This is the recommended route because it is considered more physiological, cheaper
and safer, and can promote intestinal mucosal integrity, potentially reducing the risk
of intestinal bacteria translocation and subsequent sepsis (Gagne and Wakshlag,
2015) although there is a paucity of data on the effects of assisted feeding on
intestinal barrier function.
Figure 1.10. Nutritional support options in veterinary patients

Chapter 1: Literature Review
33
Enteral nutrition is performed with feeding tubes and the most commonly used are
nasoenteral, esophagostomy, gastrostomy and jejunostomy ones (Remillard et al.,
2001; Delaney et al., 2006; Gagne and Wakshlag, 2015). A short summary of their
characteristics is presented in table 1.2.
1.6.4.2. Parenteral nutritional support
Parenteral nutrition is always intravenous and can be peripheral or central, depending
on where the venous catheter is positioned. It is expensive and has many technical
requirements, as the solution should be prepared under strict sterile conditions (figure
1.11). For this reason, this type of nutritional support is reserved to situations where
the gastrointestinal tract cannot be used due to medical or surgical causes.
Nasoesphageal/
Nasogastric
Esophagostomy Gastrostomy Jejunostomy
Duration Short term
(<7 days)
Medium term
(Weeks-months)
Long term
(Months)
Very short term
(Days)
Diameter
(French)
<8 10-20 >20 <8
Diet type Liquid Slurry Slurry Liquid
Advantages Cheap, not
invasive, does not
require
anaesthesia. Does
not require special
equipment
Placed easily using
short anaesthesia.
Home management
possible.
Bigger diameter of
the tube that allows
feeding more dense
slurries. Home
management
possible.
Allows for enteral
nutrition in situations
where pre-gastric
feeding is not possible.
Disadvantages Short term (7-10
days). Small
diameter, only
liquid diets,
require
hospitalization.
Invasive, requires
anaesthesia.
Invasive, requires
anaesthesia.
Invasive, requires
anaesthesia. Small
diameter, only liquid
diets, require
hospitalization.
Complications Aspiration
pneumonia,
epistaxis.
Stoma infection,
tube migration
Stoma infection,
tube migration,
spleen rupture,
peritonitis
Peritonitis and tube
migration
Table 1.2. Main characteristics of the most commonly used feeding tubes (nasoenteral, esophagostomy,
gastrostomy and jejunostomy)

Chapter 1: Literature Review
34
The most common complications associated with parenteral nutrition are
hyperglycaemia, hyperlipidaemia and RS. Other adverse effects that can be seen
during PN infusion are thrombophlebitis, septicaemia, microvilli atrophy-bacterial
translocation, and paralytic ileus. In order to minimize most of these complications,
an intensive care and monitoring should be planned.
1.6.5. Follow up
An advanced nutritional evaluation, including BW, BCS, MCS, appetite, amount of
food ingested voluntarily or administered via feeding tube and tolerance to nutrition
must be monitored daily in order to ensure the maintenance or the increase,
depending on each specific situation, of the animal’s BW.
Figure 1.11. Parenteral nutritional support. Sterile bag containing the
parenteral solution to be administered to the animal.

35
CHAPTER 2. HYPOTHESIS AND OBJECTIVES

36
Chapter 2. Hypothesis and Objectives
37
The nutritional support in hospitalized animals is described as an important part of the
therapy and limited research shows that nutritional support can improve the outcome in
hospitalized and critically ill dogs and cats. However, the published information shows
that in countries like USA and UK not all patients receive a nutritional assessment and a
nutritional plan during their hospital stay. This could be related to a lack of agreement on
what is malnutrition and how to identify it.
Additionally, there is scarce data on the actual prevalence of malnutrition and the
described malnutrition risk factors, important for patient selection and prevention, are
mostly theoretical and extrapolated from human medicine.
The hypothesis of the study is that the prevalence of undernutrition in hospitalized dogs
and cats, in a veterinary teaching hospital in Spain, would be similar to what has been
described before in other countries and that undernutrition would negatively affect
outcome.
The main objectives of the present study were:
1. To assess the prevalence of undernutrition, defined as loss of BCS and BW, and
the percentage of energy requirements consumed in hospitalized dogs and cats.
2. To study the effect of the nutritional status on outcome in hospitalized dogs and
cats.
3. To identify main risk factors associated with undernutrition in hospitalized dogs
and cats.

38
CHAPTER 3. EXPERIMENTAL DESIGN

39

Chapter 3. Experimental Design
40
A prospective observational study was carried out in the hospitalization ward of the
Veterinary Teaching Hospital Fundació Hospital Clínic Veterinari (FHCV) (Universitat
Autònoma de Barcelona - Spain). Data was collected throughout one year (from April
2013 to April 2014) in cats and throughout 9 months (from April 2013 to January 2014)
in dogs.
All patients admitted to the hospitalization unit of the FHCV throughout the study with
HL periods over 24 hours and under 20 days were included in the study.
In the hospitalization unit of the FHCV dogs and cats were housed separately, having the
cats and the dogs their own hospitalization ward space. Dogs and cats were allocated in
individual cages.
Animal care and use protocol was approved by the Animal Protocol Review Committee
of the Universitat Autònoma de Barcelona, and owner consent was obtained to enrol each
patient in the study.
Data was collected in a daily basis from all the patients in the study using a standard form,
shown in the figure 3.1. Data collected during the study period for each patient was:
- Signalment: patient’s name, age, gender, breed, and physiological status.
- Clinical signs at admission: anorexia, vomiting, and diarrhoea.
- Clinical service admitting the patient.
- Diagnostics.
- Severity score (PSS).
- Fasting order at admission.
- Daily nutritional evaluation: BCS, MCS, and BW (kg).
- Type of nutritional intervention.
- Daily food type and intake (grams).
- HL (days).
- Outcome: discharge or death.
Clinicians from the admitting services obtained anamnesis and performed physical
examination of the patients prior to hospitalization.
The presence of weight loss, loss of appetite, vomiting, and diarrhoea one month prior to
admission were also identified by the veterinarian who admitted the patient at the time

Chapter 3. Experimental Design
41
that anamnesis was performed. Presence of vomiting, anorexia, diarrhoea and BW loss
before admission (at presentation) was asked from the client. This data was collected
using the form in figure 3.2.
The reasons for hospitalization and diagnostics were summarized according the service
in charge of the patient as one of the following: surgery, internal medicine, neurology,
ophthalmology, traumatology, emergency and critical care.
In order to evaluate the severity score of the patient, the PSS, described by Brunetto et al.
(2010), was used. The PSS was classified with a 5-point scale where “1” indicated a
normal animal with no organic disease, “2” mild systemic disease, “3” severe systemic
disease (limiting activity but not incapacitated), “4” incapacitating systemic disease that
is a constant threat to life, and “5” a moribund animal (not expected to live 24 hours with
or without any type of intervention).
The BCS (figure 1.7) was assessed by the 9 point scale where 4-5 is ideal, <4 is
underweight and >5 is overweight ( Laflamme, 1997a; Laflamme, 1997b). In cats, only 5
was considered ideal.
The MCS (figure 1.8) was assessed using a 4-point scale where 3 is normal muscle mass,
2 is mild muscle wasting, 1 is moderate muscle wasting, and 0 is severe muscle wasting
(Freeman et al., 2011). Due to the subjectivity of these measurements, the same researcher
(Jenifer Molina) performed all BCS and MCS measures during the study period in order
to obtain reliable results.
Nutritional intervention was defined as purposefully planned actions decided by the
Nutrition Service intended to meet energy and nutrient requirements of a hospitalized
animal and was classified as “Yes/No”. These interventions included feeding plans for
voluntary oral feeding and enteral and parenteral nutrition support. All throughout the
hospitalization period, the clinician in charge of the case had the chance of asking the
Nutrition Service of the FHCV for a nutritional plan. In that case, the Nutrition Service
calculated the specific requirements, food type, and food amounts for the dog/cat daily
and stablished nutritional support orders for the patient. If the clinician in charge of the
case decided not to ask for Nutrition Service intervention as mentioned above, this service
did not issue any orders for that patient. The Nutrition Service participation with specific
Chapter 3. Experimental Design
42
nutritional support orders in a patient was recorded as Yes (nutritional intervention
completed) or No (no action from the Nutrition Service).
The average theoretical energy requirements were calculated every day for each dog and
cat using the RER formula: RER (kcal/day)=70 x BW0.75, according to the daily recorded
BW. The daily EI was expressed as the average percentage of the RER consumed by the
patient; calculated by dividing total EI (kcal/day) by RER (kcal/day) and multiplying this
by 100. All dogs/cats were offered initially a complete and balanced commercial diet
decided by the clinician in charge of the case or by the Nutrition Service (if consulted). If
the patient refused the initial food offered, the hospitalization ward staff offered
alternative commercial options with different textures and flavours. If none were
accepted, they offered uncompleted homemade food, mainly composed by steamed white
rice and boiled chicken breast.
In the cases where the Nutrition Service was not asked for a nutrition support plan, the
hospitalization ward staff offered food, without considering estimated requirements, and
recorded food type and amount in the study forms (figure 3.1).
For patients that were anorexic or with an EI below RER after 3 days of hospitalization,
the Nutrition Service suggested assisted feeding (placement of a feeding tube or
parenteral nutrition), but the final decision of assisted nutrition intervention was made by
the clinician in charge of the case.
The amount of food consumed by the animals was recorded every day. The main
researcher visited the hospitalization ward 3 times per day (morning, midday and,
afternoon) in order to help the nurses to weight and offer the food to the animals. One
hour later, the food was removed and weighted, in order to see the food intake of the
animal at each meal. The total amount of food consumed during each day was calculated
for each patient after discharge or death and, using the energy density of the food(s)
consumed, was used to calculate the average daily EI as a proportion of RER.
Results of bloodwork performed throughout hospitalization period according to the
clinician in charge of the case criteria were also recorded.

Chapter 3. Experimental Design
43
Figure 3.1. Hospitalization data collection sheet. Recorded data per day per each animal hospitalized enroled in the study. The form was keeped
in the hospitalization ward with pationts clinical record and filled by the main researcher (Jenifer Molina) or the hospitalization ward staff (in case
they give more food to the animal out of the hours of researcher ward attendance)

Chapter 3. Experimental Design
44
Figure 3.2. Form aimed to owners data collection regarding prior admittance period . The form was
given to each owner at the time of admision. The form was filled by the owner and the veterinarian in
charge of anamnesis performance in order to make sure that the owner comprehended correctly the
form, and to check that the information given by the owner was correct.
3.1. Statistical analysis
Data were analyzed using R 3.1.0 (R core team, RRID: SCR_001905) in dogs and
SAS 9.4 (Cary, NC) in cats. The animal was considered the experimental unit for all
analyses. Descriptive statistics were performed for continuous and categorical
variables. Change in BCS (BCS at admission minus BCS at discharge or death),
relative BWchange [(BW at admission—BW at discharge or death)/BW at
admission] during hospitalization, and outcome were considered as dependent
variables. The main independent variables studied were EI and HL. The models also

Chapter 3. Experimental Design
45
included as independent variables iBW, iBCS, age, sex, PSS, service admiting the
patient, fasting order at admission, nutritional intervention and, the presence of
anorexia, vomiting or diarrhoea at admission.
Regression models, linear for BCS and BW change and logistic for outcome, were
used. Each predictor variable was included as a single fixed factor. Variables with P
values under 0.25 in this univariable analysis were selected to build the multivariable
model.
Before entering the variables into a multivariable model, bivariate Pearson’s and
Spearman’s correlations and Chi-square analysis were performed among independent
variables in order to assess collinearity. Collinearity was also assessed by bivariate
analysis showing a significant association and r > 0.70. In case of collinearity, the
variable with the highest association with the dependent variable was entered in the
model. When both variables presented similar associations with the dependent
variable the selection was based on clinical criteria. Collinearity of the complete
model was tested using the variance inflation factor (VIF).
Linearity of the responses to each independent variable was checked graphically. The
BCS change and BW change models were built using multiple linear regression with
manual stepwise selection procedure.
The outcome model was built using logistic regression with manual stepwise
selection procedure and results are presented as Odds ratio (OR) and the 95%
confidence interval (CI). All two-way interactions between significant variables in
the multivariable models were tested.
Model fit was assessed with the Akaike information criterion (AIC) and adjusted r2.
Alpha level for determination of significance was 0.05.

46
CHAPTER 4. EVALUATION OF THE PREVALENCE
AND RISK FACTORS FOR UNDERNUTRITION IN
HOSPITALIZED DOGS

47

Chapter 4. Prevalence and risk factors for undernutrition in hospitalized dogs
48
Related Open Access article:
Molina, J., Hervera, M., Manzanilla, E.G., Torrente, C., Villaverde, C. 2018.
Evaluation of the Prevalence and Risk Factors for Undernutrition in Hospitalized
Dogs. Front Vet Sci. Aug 29; 5: 205.
doi: 10.3389/fvets.2018.00205.
4.1. Introduction
Nutritional support in hospitalized animals is key to prevent malnutrition via delivery
of adequate calories and nutrients, preventing nutritional deficiencies, metabolic
disorders, protein catabolism, and maintaining the correct organ functions (Chan,
2004). The lack of knowledge and well defined hospital protocols have been
described as the main barriers to adequate nutrition in hospitalized human patients
(Annetta et al., 2015) and the same situation is found in veterinary medicine. To
identify malnutrition, a daily nutritional evaluation of hospitalized patients should be
completed including BW, BCS, MCS, dietary information, and environmental
assessment (Freeman et al., 2011b).
Retrospective (Lainscak et al., 2014; Ordoñez et al., 2013) and prospective (Calleja
et al., 2014; Tsaousi et al., 2014) studies in human patients have reported that
nutritional support is effective in improving the hospitalized patient status and
reducing the HL. There is a lack of research backing the importance of nutrition
support in veterinary medicine, although enteral feeding has been shown to be
positive in dogs with acute gastrointestinal disease (Mohr et al., 2003; Will et al.,
2005), early nutritional support has been associated with decreased HL in septic dogs
(Liu et al., 2012) and one study found an association between low EI during
hospitalization and a negative outcome (Remillard et al., 2001). Another issue that
has not been well defined is the best time to implement nutritional support in
veterinary patients (Chan and Freeman, 2006).
The objectives of this prospective study were to assess the prevalence of malnutrition
defined by loss of BCS and BW, to identify risk factors associated with malnutrition,
and to study the effect of the nutritional status on outcome in hospitalized dogs.
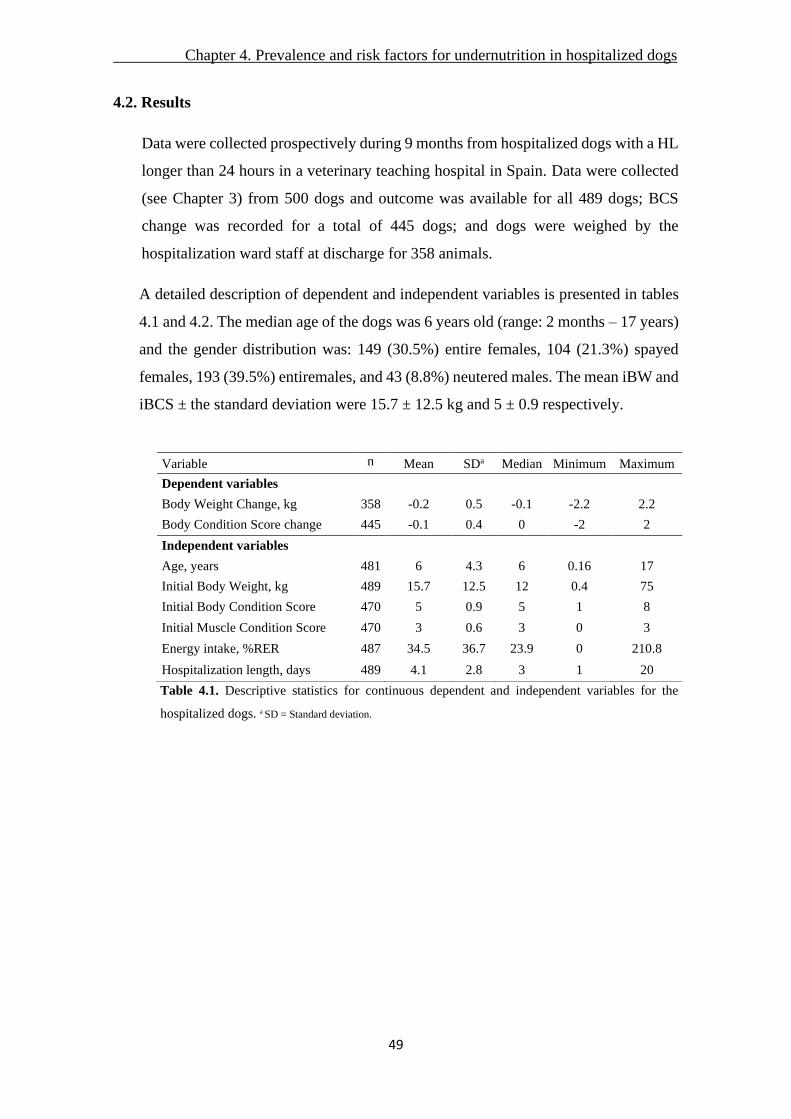
Chapter 4. Prevalence and risk factors for undernutrition in hospitalized dogs
49
4.2. Results
Data were collected prospectively during 9 months from hospitalized dogs with a HL
longer than 24 hours in a veterinary teaching hospital in Spain. Data were collected
(see Chapter 3) from 500 dogs and outcome was available for all 489 dogs; BCS
change was recorded for a total of 445 dogs; and dogs were weighed by the
hospitalization ward staff at discharge for 358 animals.
A detailed description of dependent and independent variables is presented in tables
4.1 and 4.2. The median age of the dogs was 6 years old (range: 2 months – 17 years)
and the gender distribution was: 149 (30.5%) entire females, 104 (21.3%) spayed
females, 193 (39.5%) entiremales, and 43 (8.8%) neutered males. The mean iBW and
iBCS ± the standard deviation were 15.7 ± 12.5 kg and 5 ± 0.9 respectively.
Table 4.1. Descriptive statistics for continuous dependent and independent variables for the
hospitalized dogs. a SD = Standard deviation.
Variable n Mean SDa Median Minimum Maximum
Dependent variables
Body Weight Change, kg 358 -0.2 0.5 -0.1 -2.2 2.2
Body Condition Score change 445 -0.1 0.4 0 -2 2
Independent variables
Age, years 481 6 4.3 6 0.16 17
Initial Body Weight, kg 489 15.7 12.5 12 0.4 75
Initial Body Condition Score 470 5 0.9 5 1 8
Initial Muscle Condition Score 470 3 0.6 3 0 3
Energy intake, %RER 487 34.5 36.7 23.9 0 210.8
Hospitalization length, days 489 4.1 2.8 3 1 20
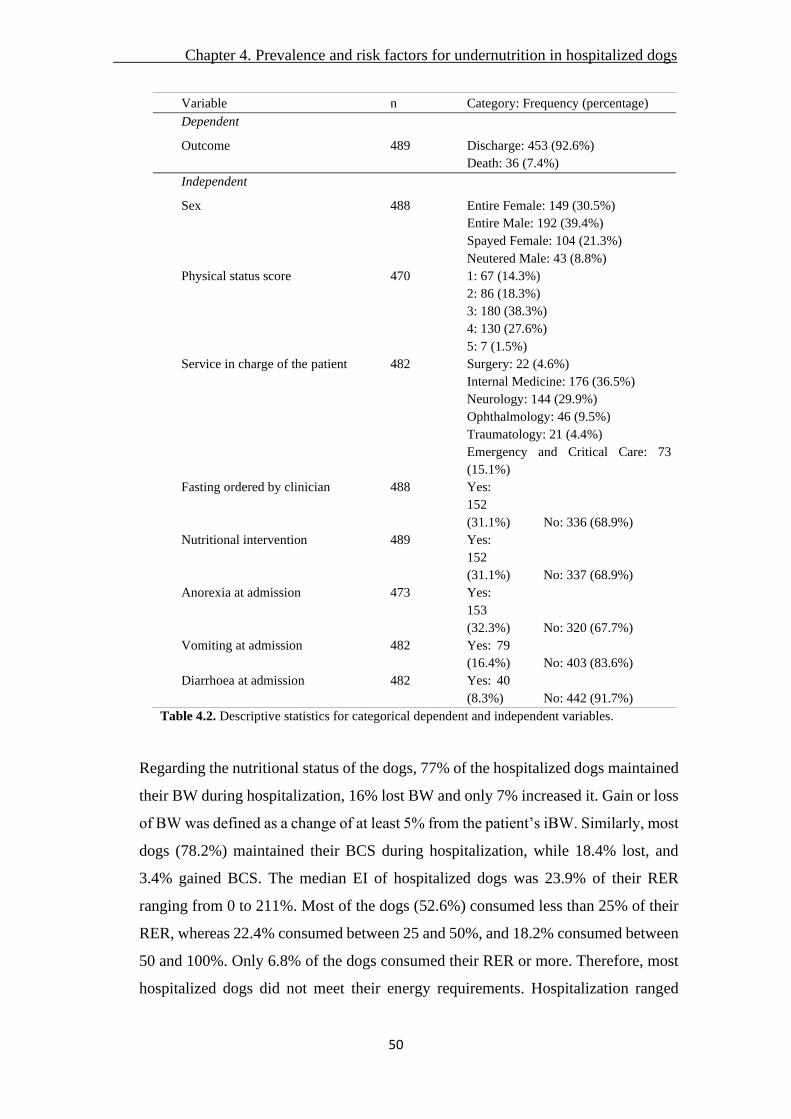
Chapter 4. Prevalence and risk factors for undernutrition in hospitalized dogs
50
Variable n Category: Frequency (percentage)
Dependent
Outcome 489 Discharge: 453 (92.6%)
Death: 36 (7.4%)
Independent
Sex 488 Entire Female: 149 (30.5%)
Entire Male: 192 (39.4%)
Spayed Female: 104 (21.3%)
Neutered Male: 43 (8.8%)
Physical status score 470 1: 67 (14.3%)
2: 86 (18.3%)
3: 180 (38.3%)
4: 130 (27.6%)
5: 7 (1.5%)
Service in charge of the patient 482 Surgery: 22 (4.6%)
Internal Medicine: 176 (36.5%)
Neurology: 144 (29.9%)
Ophthalmology: 46 (9.5%)
Traumatology: 21 (4.4%)
Emergency and Critical Care: 73
(15.1%)
Fasting ordered by clinician 488 Yes:
152
(31.1%) No: 336 (68.9%)
Nutritional intervention 489 Yes:
152
(31.1%) No: 337 (68.9%)
Anorexia at admission 473 Yes:
153
(32.3%) No: 320 (67.7%)
Vomiting at admission 482 Yes: 79
(16.4%) No: 403 (83.6%)
Diarrhoea at admission 482 Yes: 40
(8.3%) No: 442 (91.7%)
Table 4.2. Descriptive statistics for categorical dependent and independent variables.
Regarding the nutritional status of the dogs, 77% of the hospitalized dogs maintained
their BW during hospitalization, 16% lost BW and only 7% increased it. Gain or loss
of BW was defined as a change of at least 5% from the patient’s iBW. Similarly, most
dogs (78.2%) maintained their BCS during hospitalization, while 18.4% lost, and
3.4% gained BCS. The median EI of hospitalized dogs was 23.9% of their RER
ranging from 0 to 211%. Most of the dogs (52.6%) consumed less than 25% of their
RER, whereas 22.4% consumed between 25 and 50%, and 18.2% consumed between
50 and 100%. Only 6.8% of the dogs consumed their RER or more. Therefore, most
hospitalized dogs did not meet their energy requirements. Hospitalization ranged

Chapter 4. Prevalence and risk factors for undernutrition in hospitalized dogs
51
from 1 to 20 days with a median value of 3 days and 92.6% of the animals were
discharged alive. The details for the distribution of patients within PSS categories and
clinical services and the proportion of animals with anorexia, vomiting, diarrhea,
fasting and nutritional intervention are presented in table 4.2. Table 4.3 summarizes
the associations between each risk factor and the dependent variables. Sex and
diarrhea did not show association with any of the dependent variables. EI, HL, and
PSS showed associations with the three dependent variables. The rest of covariates
showed associations with 1 or 2 of the dependent variables.

Chapter 4. Prevalence and risk factors for undernutrition in hospitalized dogs
52
Table 4.3. Effects of the studied categorical risk factors for each of the dependent variables using
univariable analysis. a BCS: body condition score. b BW: body weight. c SE= Standard error. d Indicate
the percentage of deaths for every category of each independent variable.
Variable Change of aBCS
Mean+/- SEc
Change of bBW
Mean+/-SEc
Outcome Death/Discharge,
(%)d
Sex Entire Female -0.10 +/- 0.02 -0.16 +/- 0.05 13/136 (8.7%)
Entire Male -0.12 +/- 0.03 -0.14 +/- 0.05 11/181 (5.7%)
Spayed Female -0.06 +/- 0.03 -0.08 +/- 0.05 6/98 (5.8%)
Neutered Male -0.11 +/- 0.04 -0.23 +/- 0.12 6/37 (14.0%)
p-value P = 0.603 P = 0.886 P = 0.271
Physical status score 1 -0.02 +/- 0.02 0.01 +/- 0.07 2/65 (3.0%)
2 0.01 +/- 0.04 -0.10 +/- 0.08 4/82 (4.7%)
3 -0.14 +/- 0.04 -0.13 +/- 0.04 11/169 (6.1%)
4 -0.14 +/- 0.04 -0.24 +/- 0.05 13/117 (10.0%)
5 -0.17 +/- 0.11 -0.13 +/- 0.08 3/4 (42.8%)
p-value P = 0.003 P = 0.054 P < 0.001
Service in charge of patient Surgery -0.11 +/- 0.05 0.03 +/- 0.23 2/20 (9.1%)
Internal Medicine -0.15 +/- 0.03 -0.09 +/- 0.05 19/157 (10.8%)
Neurology -0.12 +/- 0.03 -0.22 +/- 0.04 7/137 (4.9%)
Ophthalmology 0.03 +/- 0.06 -0.05 +/- 0.06 1/45 (2.2%)
Traumatology 0.02 +/- 0.06 -0.14 +/- 0.06 0/21 (0.0%)
Emergency and Critical Care -0.08 +/- 0.03 -0.21 +/- 0.08 6/67 (8.2%)
p-value P = 0.032 P < 0.001 P = 0.208
Fasting ordered by clinician Yes -0.12 +/- 0.02 -0.22 +/- 0.05 30/306 (8.9%)
No -0.07 +/- 0.03 -0.16 +/- 0.08 6/146 (3.9%)
p-value P = 0.140 P = 0.383 P = 0.002
Nutritional intervention Yes -0.07 +/- 0.02 -0.16 +/-0.03 10/142 (6.6%)
No -0.17 +/- 0.03 -0.09 +/- 0.05 26/311 (7.7%)
p-value P = 0.009 P = 0.739 P = 0.795
Anorexia at admission Yes -0.08 +/- 0.02 -0.13 +/- 0.03 25/128 (16.3%)
No -0.14 +/- 0.04 -0.12 +/- 0.06 8/312 (2.5%)
p-value P = 0.134 P = 0.926 P < 0.001
Vomiting at admission Yes -0.21 +/- 0.06 -0.15 +/- 0.03 5/74 (6.3%)
No -0.08 +/- 0.02 -0.14 +/- 0.07 31/372 (7.7%)
p-value P = 0.004 P = 0.082 P = 0.407
Diarrhoea at admission Yes -0.14 +/- 0.09 -0.15 +/- 0.03 32/36 (47.0%)
No -0.10 +/- 0.02 -0.06 +/- 0.09 4/410 (9.7%)
p-value P = 0.454 P = 0.498 P = 0.567

Chapter 4. Prevalence and risk factors for undernutrition in hospitalized dogs
53
The multivariable analysis (table 4.4) showed that older patients (P = 0.041), higher
iBCS (P < 0.001) and vomiting at admission (P = 0.019) were associated to more
severe BCS loss during hospitalization. There was also an interaction between HL
and EI (P < 0.001) showing that a higher EI was associated with less BCS loss but
only for HL longer than 3 days (figure 4.1).
Estimate a SE p-value
ΔBCS (n=445)
Intercept 0.4970 0.0936 <0.001
Hospitalization length (days) -0.0820 0.0092 <0.001
Energy Intake (%RER) -0.0017 0.0006 0.007
Age -0.0074 0.0036 0.041
Initial BCS -0.0562 0.0165 <0.001
Vomiting at admission -0.0973 0.0411 0.019
Hospitalization length (days)* Energy Intake (%RER) 0.0007 0.0001 <0.001
ΔBW (n=358)
Intercept -0.0229 0.0075 0.003
Hospitalization length (days) -0.0035 0.0009 <0.001
Energy Intake (%RER) 0.0002 0.0007 0.008
Initial BW (Kg) 0.0008 0.0003 0.002
Vomiting at admission 0.0372 0.0128 0.004
Initial BW (Kg)*vomiting at admission -0.0013 0.0059 0.033
OUTCOME (n=489) b OR 95% CI c
Initial BCS 0.39 0.22, 0.63 <0.001
Energy Intake (%RER) 0.95 0.92, 0.98 <0.001
Anorexia at admission 5.67 2.23, 15.47 <0.001
Hospitalization length (days) 1.19 0.96, 1.45 0.092
Table 4.4. Risk factors of the multivariable analysis for each dependent variable, body condition score
change (ΔBCS), body weight change (ΔBW) and outcome. a SE= Standard error, b OR= Odds ratio; for
continuous variables the OR indicate variation per unit, c CI= Confidence interval.
Vomiting at admission, iBWand HL affected also BW change. Longer HL was
associated with a greater loss of BW during hospitalization (P < 0.001). An
interaction between iBW and vomiting (P = 0.033) was described, showing that
vomiting was a risk factor for greater BW loss but mainly in heavier dogs.

Chapter 4. Prevalence and risk factors for undernutrition in hospitalized dogs
54
Figure 4.1. Estimation of the effect of the energy intake, measured as percentage of resting energy
requirements, on BCS of dogs with different hospitalization lengths.
Finally, the variables associated with outcome were iBCS, EI, anorexia at admission,
and HL (table 4.4). A higher iBCS and EI were related to lower odds of dying. In
particular, the odds of dying were 61% lower for the fattier dog when 2 dogs differed
in 1 unit of iBCS (P < 0.001; OR 0.39, 95% CI: 0.22 to 0.63) and were 5% lower
when 2 dogs differed in 1% of EI (P < 0.001; OR 0.95, 95% CI: 0.92 to 0.98). On the
other hand anorexia at admission and longer HL were related to higher odds of dying.
Dogs reporting anorexia at admission were at 5.67 greater odds of dying than those
not presenting it (P < 0.001; OR 5.67, 95% CI: 2.23 to 15.47) and a dog was at 1.19
greater odds of dying than a dog with a HL 1 day shorter (P = 0.092; OR 1.19, 95%
CI: 0.96 to 1.45).
4.3. Discussion
There is a need to increase the body of knowledge in nutrition of hospitalized dogs
and develop adequate protocols (Chan &Freeman 2006). The present study builds on
the results of the only 3 studies available in this area (Remillard et al., 2001; Chandler
at al., 2004; Brunetto et al., 2010) adding new risk factors of high interest, i.e. the
presence of anorexia, vomiting and diarrhea at admission, and using a larger sample
size. To the authors’ knowledge, this is the largest prospective study assessing the
prevalence of undernutrition and its risk factors in hospitalized dogs.

Chapter 4. Prevalence and risk factors for undernutrition in hospitalized dogs
55
The present study assessed undernutrition in two ways: change of BCS and relative
change of BW. We used both measures because BW can be rapidly affected by other
aspects besides nutrition (such as fluid changes) and BCS is a much more consistent
measure over short periods of time. It is estimated that there needs to be a 10-15%
change in BW to see a change in one BCS unit (Laflamme, 1997). If we consider loss
of more than 5% of BW and loss of BCS as undernutrition, the prevalence of
undernourished dogs during hospitalization in this study was close to 20%. Brunetto
et al. (2010) reported similar results; using BCS change, the prevalence of
undernourished dogs was around 20%. However they reported 46 % prevalence using
BW change, a higher proportion than in the present study, probably because they
considered 2% as their cut-off value for a significant change in BW. If we apply such
cut-off to the present study the percentage of undernourished dogs is almost 40%,
however the authors consider that 2% may be too low of a cut-off because such
variation may be the consequence of changes in hydration or meals.
Regarding the EI, 96% of the dogs did not meet their estimated energy requirement.
This suggests that most of the hospitalized population were at risk of undernutrition
and might have resulted in BW and BCS losses with longer HL. Previous studies
found lower percentages; 65% for (Brunetto et al., 2010) and 73% for (Remillard et
al., 2001), respectively. In the case of Brunetto et al. the proportion of animals gaining
weight was also higher than in our case (40 vs.7%), which might be related to the
higher number of animals that met their estimated energy requirements. The
difference with Remillard et al. (2001) could be due to a difference in experimental
units. We used the average EI of all the hospitalization period while Remillard et al.
used the daily EI per dog. Dogs that had an average negative energy balance during
the hospitalization period may actually meet their requirements some of the days.
The undernutrition risk factors identified in this study were consistent within the
different undernutrition estimators. EI and HL were significant in all three models
and vomiting at admission and iBCS were significant in 2 models as shown in table
4.4.
As expected, EI was positively associated and HL negatively associated with BW and
BCS change. There was an interaction between HL and EI, based on the results of the
BCS model, showing that EI becomes critical in preventing loss of BCS in animals
with HL longer than 3 days. Patients are able to maintain their body mass for a few
days even facing anorexia, however NS would be needed in patients with expected

Chapter 4. Prevalence and risk factors for undernutrition in hospitalized dogs
56
HL of 3 days or longer, as it has been proposed as a general rational rule in veterinary
practice (Owen et al., 1979; Chan&Freeman 2006). We also found that
The EI was positively associated with a better outcome, a finding also reported by
Brunetto et al. (2010) and Remillard et al. (2001) as well as in human medicine
(Calleja et al., 2014; Lainscak et al., 2014; Lew et al., 2016;). We did not find an
association between PSS and BW or BCS change or outcome, which suggests that
the protective effect of EI is not associated with disease severity. However, the small
number of animals that died or were euthanized, plus the lack of a standardized
objective severity index (King et al., 2001) in our study limits the interpretation of
these findings.
An association was found between iBCS and BCS change during hospitalization.
Heavier dogs at admission lost more BCS than did thin dogs. We hypothesize that
veterinarians may pay more attention to the NS of thin animals compared to heavier
dogs, because they appear to be at immediate nutritional risk. However, BW change,
which is a more objective measure, was not related to iBCS. Despite this finding,
iBCS was positively correlated with discharge as also reported (Brunetto et al., 2010).
Rather than reflecting a protective effect of obesity, we believe this finding supports
that underweight dogs are at higher risk of dying than dogs with adequate body stores.
In some cases, this lower BCS may be related to the course of disease before
admission and here a more accurate measure of disease severity may be needed.
Vomiting at admission was also associated with a deterioration of nutritional status
measured as BCS and BW change. In the case of BW change, vomit had an interaction
with iBW, showing differences in vomiting effects on BW depending on dog size. In
the present study, iBW was included as a measure of the size of the animal to avoid
loss of information by categorization. In a closer look to the relationship between
iBW and BW change, dogs heavier than 35 kg at admission appeared to lose more
weight during hospitalization, especially when vomiting was present. We hypothesize
that the food amount offered by the hospitalization ward personnel was smaller in
large dogs than in the small ones, especially if vomiting was their reason for
hospitalization, or that a specific cause of admission was typical of this group.
Unfortunately, our data cannot verify the hypothesis.
Future research should study the nutritional requirements of hospitalized dogs of
extreme body size for a more accurate nutritional support.

Chapter 4. Prevalence and risk factors for undernutrition in hospitalized dogs
57
Age was identified as a risk factor for undernutrition only for BCS change. Older
dogs had a higher BCS loss than the younger patients. This could be due partly to the
potential effect of aging on digestive physiology (Fahey et al., 2008), thus ultimately
affecting nutrient digestibility (Weber et al., 2003). Nevertheless, several studies have
failed to demonstrate differences in macronutrient digestibility between young and
old healthy dogs (Burkholder 1999, Swanson et al., 2004) and some have even
reported an increased nutrient apparent fecal digestibility in older dogs (Sheffy et al.,
1985). Higher severity of disease or comorbidities could be another explanation for
the greater BCS loss in older dogs however; our data cannot confirm this hypothesis
either.
In this sense, older dogs may suffer of frailty making them more vulnerable to
stressors or disease than younger dogs (Hua et al., 2016). Some of the risk factors
included in this study such as anorexia or iBCS are related to frailty and this concept
could easily be included in future research by using one of the numerous available
tools.
Finally, anorexia at admission was associated with higher risk of death, which may
be related to its high correlation to severity of disease. During the statistical analysis,
anorexia had a better correlation to outcome than severity, which is why it was kept
in the model. It seems clear that anorexia is a main risk factor for death, reinforcing
the need of nutritional support in those patients during the hospitalization period.
The clinical service in charge of the patient was initially included in the study as a
representation of the nature of the type illness. However this variable had multiple
associations to other risk factors and was finally not included in the models. The
specific protocols used in each clinical service can be very different between hospitals
and these results may not be fully valid for other hospitals. These protocols are also
a potential source of bias because some departments may be more likely to
recommend nutritional support than others.

58
CHAPTER 5. PREVALENCE AND RISK FACTORS FOR
UNDERNUTRITION IN HOSPITALIZED CATS AT A
VETERINARY TEACHING HOSPITAL IN SPAIN

59
Chapter 5. Prevalence and risk factors for undernutrition in hospitalized cats
60
5.1. Introduction
The risk of undernutrition (defined as involuntary loss of BCS and/or BW or
decreased EI) reported in hospitalized dogs and cats stresses the potential importance
of the nutritional intervention in these patients (Remillard et al., 2001; Brunetto et al.,
2010; Molina et al., 2018).
There is a paucity of data available describing risk factors for undernutrition in
hospitalized cats (Chan and Freeman, 2006; Larsen, 2012) and a lack of standarized
protcols to identidy and treat malnutrition. Although retrospective (Lainscak et al.,
2014; Ordoñez et al., 2013) and prospective (Calleja et al., 2014; Tsaousi et al., 2014)
studies in human patients have reported that an adequate nutritional status and NS
support are effective in improving the hospitalized patient status and reducing the
HL, there is a lack of research backing their importance in cats. The present study
(see Chapter 4) showed the effect of an adequate EI on outcome in a canine population
of hospitalized patients.
A retrospective study in cats fed with central PN (Pyle et al., 2004) reported a higher
mortality rate in the cats maintained that had multiple concurrent diseases associated
with a poor prognosis compared to cats with milder disease; and indicators of poor
prognosis related to the nutritional status included a history of weight loss and
hypoalbuminemia (other risk factors included hyperglycemia at 24 hours following
PN administration and chronic renal failure). One study with cats with pancreatitis
(Nivy et al. 2018) found that anorexia during hospitalization was associated with a
negative outcome.
This study aims to evaluate the prevalence of undernutrition in hospitalized cats,
estimated with the proportion of RER met by EI, BW and BCS; and to determine the
risk factors that affect their nutritional status (BCS, BW change) and their association
with the final outcome.
5.2. Results
Data were collected prospectively during 12 months from hospitalized cats with a
HL longer than 24 hours in a veterinary teaching hospital in Spain (see Chapter 3).
Data was collected from 120 hospitalized cats and outcome was available for all of
them; BCS (9-point scale) was recorded for 112 cats, weight at discharge for 101

Chapter 5. Prevalence and risk factors for undernutrition in hospitalized cats
61
cats, and age for 111 cats. A detailed description of dependent and independent
variables is presented in tables 5.1 and 5.2.
Table 5.1. Descriptive statistics for continuous dependent and independent variables for the
hospitalized cats. SD = Standard deviation.
The median age of the cats was 6 years old, ranging from 2 months to 16 years.
Gender distribution was: 17.5% entire females, 33.3% spayed females, 22.5% entire
males, and 26.7% neutered males. The mean iBW and iBCS were 3.7 (+/- 1.3) kg
and 4.3 (+/- 1.2) respectively.
Regarding the nutritional status of the cats, the median BCS at admission was 4/9,
which is considered underweight. The percentage of cats with an iBCS below 5 was
62.7%. During hospitalization, 61.4% of the hospitalized cats maintained their BW,
25.7% lost BW and only 12.9% increased it. Gain or loss of BW was defined as a
change of at least 5% from the patient's iBW. Similarly, most cats (78.6%)
maintained their BCS during hospitalization, while 17.0% lost, and 4.4% gained
BCS. From the ones that gained BCS during the hospitalization period, around half
of the cats gained 0.5 points, and the other half 1 point in the BCS scale score. More
than half of the cats (54.2%) consumed less than 25% of their RER, whereas 24.9%
consumed between 25 and 50%, and 11.7% consumed between 50 and 100%. Only
9.2% of the cats consumed their RER or more. Consequently, 90.8% of the cats did
not meet their estimated energy requirements. The median EI, during the complete
hospitalization period, was 19.8% of their RER, ranging from 0 to 186.2%.
Hospitalization ranged from 2 to 15 days with a median value of 3 days and 90.4%
of the animals were discharged alive. The details for the distribution of patients
within PSS categories and clinical services and the proportion of animals with
Variable N Mean SD Median Minimum Maximum
Dependent variables
Body weight change, kg 101 -0.05 0.22 0.00 -0.80 0.70
Body Condition Score change 112 -0.09 0.36 0.00 -2 1
Independent variables
Age, years 111 6.7 4.9 6.0 0.16 16
Initial Body Weight, kg 120 3.7 1.3 3.70 0.64 8.4
Initial Body Condition Score 120 4.3 1.2 4 2 8
Initial Muscle Condition Score 120 2.3 0.8 2 1 3
Energy intake, %RER 120 33.8 40.6 19.8 0 186.2
Hospitalization length, days 120 3.9 2.4 3 2 15

Chapter 5. Prevalence and risk factors for undernutrition in hospitalized cats
62
anorexia, vomiting, diarrhoea, fasting and nutritional intervention are shown in table
5.2.
Variable N Category: Frequency (percentage)
Dependent
Outcome 120 Discharge: 108 (90.0%)
Death: 12 (10.0%)
Independent
Sex 120 Entire Female: 21 (17.5%)
Entire Male: 27 (22.5%)
Spayed Female: 40 (33.3%)
Neutered Male: 32 (26.7%)
Physical status score 117 1: 9 (7.7%)
2: 17 (14.5%)
3: 49 (41.9%)
4: 38 (32.5%)
5: 4 (3.4%)
Service in charge of the patient 120 Surgery: 10 (8.3%)
Internal Medicine: 69 (57.5%)
Neurology: 6 (5.0%)
Ophthalmology: 6 (5.0%)
Traumatology: 6 (5.0%)
Emergency and Critical Care: 23 (19.2%)
Fasting ordered by clinician 120 Yes: 71 (59.2%) No: 49 (40.8%)
Nutritional intervention 116 Yes: 44 (37.9%) No: 72 (62.1%)
Anorexia at admission 115 Yes: 67 (58.3%) No: 48 (41.7%)
Weight loss pre-admission 114 Yes: 56 (49.1%) No: 58 (50.9%)
Vomiting at admission 120 Yes: 20 (16.7%) No: 100 (83.3%)
Diarrhoea at admission 120 Yes: 10 (8.3%) No: 110 (91.7%)
Table 5.2. Descriptive statistics for categorical dependent and independent variables in cats.
Table 5.3 summarizes the associations between each risk factor analysed and the
dependent variables. Regarding BCS change, diarrhoea at admission (P=0.026), was
associated with higher BCS loss on the univariate analysis. The multivariable
analysis (table 5.4) showed that a higher iBCS was associated with a greater BCS
loss during hospitalization (P=0.04). In this analysis, HL trended towards
significance (P=0.075), suggesting that a longer HL could be potentially associated
with BCS loss.

Chapter 5. Prevalence and risk factors for undernutrition in hospitalized cats
63
Variable
Change of aBCS
Mean+/- SEc
Change of bBW
Mean+/-SEc
Outcome Death/Discharge,
(%)d
Sex
Entire Female -0.08 +/- 0.09 -0.004 +/- 0.014 3/18 (14.3%)
Entire Male -0.07 +/- 0.07 -0.008 +/- 0.013 2/25 (7.4%)
Spayed Female -0.09 +/- 0.06 -0.004 +/- 0.011 5/35 (12.5%)
Neutered Male -0.11 +/- 0.07 -0.031 +/- 0.012 2/30 (6.3%)
p-value P = 0.989 P = 0.332 P = 0.704
Physical status score
1 -0.06 +/- 0.13 -0.016 +/- 0.024 0/9 (0.0%)
2 -0.10 +/- 0.09 -0.003 +/- 0.018 1/16 (5.9%)
3 -0.10 +/- 0.05 -0.014 +/- 0.010 4/45 (8.2%)
4 -0.09 +/- 0.06 -0.012 +/- 0.011 7/31 (18.4%)
5 0.00 +/- 0.21 -0.000 +/- 0.064 0/4 (0.0%)
p-value P = 0.992 P = 0.985 P = 0.306
Department in charge of patient
Surgery -0.06 +/- 0.12 -0.016 +/- 0.020 0/10 (0.0%)
Internal Medicine -0.09 +/- 0.05 -0.013 +/- 0.008 8/61 (11.6%)
Neurology -0.20 +/- 0.16 -0.090 +/- 0.031 2/4 (33.3%)
Ophthalmology -0.17 +/- 0.15 0.025 +/- 0.031 1/5 (16.7%)
Traumatology -0.00 +/- 0.15 0.018 +/- 0.031 0/6 (0.0%)
Emergency and Critical Care -0.07 +/- 0.08 -0.006 +/- 0.014 1/22 (4.3%)
p-value P = 0.938 P = 0.118 P = 0.208
Fasting ordered by clinician
Yes -0.08 +/- 0.04 -0.003 +/- 0.010 3/44 (6.4%)
No -0.10 +/- 0.05 -0.018 +/- 0.008 9/64 (12.3%)
p-value P = 0.758 P = 0.236 P = 0.289
Nutritional intervention
Yes -0.11 +/- 0.06 -0.006 +/- 0.010 6/38 (13.6%)
No -0.07 +/- 0.04 -0.016 +/- 0.009 6/66 (8.3%)
p-value P = 0.626 P = 0.464 P = 0.363
Anorexia at admission
Yes -0.10 +/- 0.04 -0.016 +/- 0.008 10/57 (14.9%)
No -0.08 +/- 0.05 -0.003 +/- 0.010 2/46 (4.2%)
p-value P = 0.752 P = 0.334 P = 0.063
Weight loss pre-admission
Yes -0.09 +/- 0.05 -0.020 +/- 0.009 9/47 (16.1%)
No -0.09 +/- 0.05 -0.004 +/- 0.009 3/55 (5.2%)
p-value P = 0.942 P = 0.207 P = 0.058
Vomiting at admission
Yes -0.13 +/- 0.08 -0.021 +/- 0.014 4/16 (20.0%)
No -0.08 +/- 0.04 -0.010 +/- 0.007 8/92 (8.0%)
p-value P = 0.573 P = 0.509 P = 0.103
Diarrhoea at admission
Yes 0.15 +/- 0.11 -0.011 +/- 0.020 1/9 (10.0%)
No -0.11 +/- 0.03 -0.012 +/- 0.007 11/99 (10.0%)
p-value P = 0.026 P = 0.950 P = 0.999

Chapter 5. Prevalence and risk factors for undernutrition in hospitalized cats
64
Table 5.3. Effects of the studied categorical risk factors for each of the dependent variables using
univariable analysis (cats). a BCS: body condition score. b BW: body weight. c SE= Standard error. d
Indicate the percentage of deaths for every category of each independent variable.
As for BW change, a longer hospitalization period (P<0.001) was associated with
higher BW loss (table 5.4). Change in BW was also affected by the EI (P=0.006),
where a higher EI was associated with weight stability.
Finally, regarding outcome, a lower EI during hospitalization was associated with
higher odds of dying (P=0.05; OR 1.19, 95% CI: 1 to 1.08). Weight loss at the
moment of admission was also associated with the outcome: cats that were reportedly
weight stable had lower odds of dying (P<0.001; OR 0.29, 95% CI: 0.07 to 1.16).
Table 5.4. Risk factors of the multivariable analysis for each dependent variable; body
condition score change, body weight change and outcome (survival). a SE= Standard error. b
OR= Odds ratio; for continuous variables the OR indicate variation per unit. c CI= Confidence
interval.
5.3. Discussion
The scientific data available about the nutritional status of hospitalized cats is limited.
There are some studies in the area (Pyle et al., 2004; Chandler and Gunn-Moore,
2004; Brunetto et al., 2010; Nivy et al., 2018), but to the authors’ knowledge, this is
the largest prospective study assessing the prevalence of undernutrition and its risk
factors in hospitalized cats. The study from Pyle et al (2004) is retrospective and
focuses only on risk factors for outcome in cats receiving PN. The study of Chandler
and Gunn-Moore (2004) is prospective, includes 60 cats, but does not look at BW
and BCS evolution during hospitalization, and they only look at parameters on
Estimate a SE p-value
BCS change (n = 112)
Intercept 0.2526 0.1356 0.065
Hospitalization length (days) -0.0243 0.0135 0.075
Initial BCS -0.0575 0.0277 0.040
BW change (n = 101)
Intercept --- --- >0.500
Hospitalization length (days) -0.0061 0.0016 <0.001
Energy Intake (%RER) 0.0004 0.0001 0.006
OUTCOME (n = 111) b OR 95% CI c
Weight loss pre-admission 0.29 0.07, 1.16 <0.001
Energy Intake (%RER) 1.04 1.00, 1.08 0.050

Chapter 5. Prevalence and risk factors for undernutrition in hospitalized cats
65
admission (BCS, reported weight loss and food intake, and serum albumin). The
study of Brunetto et al (2010) is the most complete, and looks at BCS, BW, EI with
the limitations of being retrospective and presenting the data for dogs (n=467) and
cats (n=55) together. Finally, Nivy et al (2018) looked at the prognostic factors of
feline pancreatitis. Even though they looked at some variables related to nutritional
status (anorexia during hospitalization and PN provision), they did not assess BW,
BCS or EI.
Regarding EI, 90.8% of the cats did not meet their estimated energy requirement and
the median EI was only 19.8% of their RER during hospitalization. This suggests that
most of the hospitalized population were at risk of undernutrition and might have
suffered further BW and BCS losses with longer HL, which was a median of 3 days.
In the study of Brunetto et al. (2010), 42.5% of the patients did not meet their RER,
which is much lower percentage compared to the present study. This can be due to
different statistical unit used in the study as in that study dogs and cats were
considered (together) as the statistical unit, meanwhile in our study cats were
considered independently. Another potential explanation is the feeding management
of the patients: in their study all cats (and dogs) received an assessment by the
Nutrition Service and had a feeding plan established, as opposed to our study, where
NS was only initiated if requested by the admitting clinical service. No other
repported data of EI during hospitalization in cats is available.
Despite the low EI, most cats managed to maintain a stable BW and BCS. Accoridng
to BCS and BW losses, the prevalence of undernutrition in our population was 17.0-
25.7%. The values differ because BW is faster indicator of negative energy balance,
since it is estimated that a BW change of 10-15% has to be noted in order to observe
a variation in the 9-point scale BCS (Laflamme, 1997). However, BW can also be
affected by other factors, like hydration status and, to minimize this error, in the
present sudy only fluctuations of 5% or more of BW were considered significant.
Chandler and Gunn-Moore (2004) did not look at BW and BCS changes during
hospitalization, but on admission 53.3% of their feline patients had a BCS <5 on the
9-point scale, which is considered underweight; and 56.7% of cats had reported
weight loss. In our study, 62,7% of cats had a BCS below 5, and 49.1% had reported
weight loss at admission, which are comparable. Brunetto et al (2010) report that
19.3% of their population presented a low BCS, but those included dogs and cats.
Chapter 5. Prevalence and risk factors for undernutrition in hospitalized cats
66
The difference might also be institutional and relate to the type of diseases the
hospitalized patients presented. They did look at BW changes in their study and,
despite reporting higher EI, the percentage of patients (canine and feline) that lost
weight was higher than our study at 46.6%. This can be attributed to the fact that they
used a 2% BW variation from iBW, whereas in the current study we used 5%. If we
used a cut-off of 2% with our data, the proportion of cats with weight loss would
increase to 34.1%.
The main undernutrition (loss of BW and BCS) risk factors identified in this study
were iBCS, EI, and HL. Diarrhoea, which can result in nutrient and energy losses,
was also associated to BW loss, but only on the univariate analysis. The iBCS was
significant in the BCS model, but not the BW. Heavier cats at admission lost more
BCS than did thin cats, which could be due to veterinarians being more proactive
with NS in thin animals, because they appear to be at a more immediate nutritional
risk. Another possibility relates to the fact that BCS is a subjective measure, and the
operator might detect more differences in cats wth higher BCS than in underweight
cats. Energy intake was positively, and HL negatively, associated to BW change.
Greater EI was associated with a lower BW change, what means that patients that
consumed more energy had a more stable BW during hospitalization, as expected.
Those cats that were hospitalized during longer periods showed further loss of BW.
In our model, EI was only significant for BW change, and not BCS, which can be
explained by the fact that BCS changes are slower to respond than BW changes.
Regarding outcome, EI and weight loss at admission were associated with outcome
as shown in table 5.4. A lower EI during hospitalization was associated with higher
probabilities of having a negative outcome (death). This result agrees with Nivy et al.
(2018), where very low EI (reported only as “anorexia during hospitalization”) was
more frequently seen in nonsurvivors cats with pancreatitis. This is also in agreement
with Brunetto et al. (2010), where EI was positively associated with hospital
discharge in dogs and cats. These findings were also reported in human medicine
(Calleja et al., 2014; Lainscak et al., 2014; Lew et al., 2016). An inadequate
nutritional status assessed with Subjective Global Assessment (SGA, anthropometry,
and biochemical parameters was related with higher HL (Calleja et al., 2014; Lew et
al. 2016). Fatal outcomes were seen in the study of Lainscak et al. (2014) when the
EI was dramatically decreased (nothing eaten or not allowed to eat). Malnutrition,
Chapter 5. Prevalence and risk factors for undernutrition in hospitalized cats
67
diagnosed by nutrition assessments (SGA), was also associated with a higer risk of
hospital mortality (Lew et al. 2016).
Weight loss at admission was associated with a higher risk of death. Similar results
were reported in the retrospective study of Pyle et al. (2004) with cats undergoing
central PN. History of weight loss (as well as hyperglycemia at 24 hours following
PN administration, hypoalbuminemia, and chronic renal failure), another indicator of
malnutrition, was related with poor prognosis in that study.
The severity of the disease, measured as PSS, did not have an effect on the BW and
BCS change or on the outcome in the present study, and no association was found
between EI and PSS. Therefore, the positive association between EI and nutritional
status and outcome is potentially independent of the severity of the disease. This
suggests that having an adequate nutritional plan to achieve and adequate EI should
always be a priority independently of disease severity. However, the small number of
animals that died or were euthanized, plus the lack of a standardized objective
severity index (King et al., 2001) in our study limits the interpretation of these
findings. Moreover, nutritional intervention was not significant in any of our models,
which can be due to a small sample size and the small number of patients that received
assisted feeding.
The clinical service in charge of the patient was initially included in the study as a
representation of the nature of the type illness. However this variable had multiple
associations to other risk factors and was finally not included in the models. The
specific protocols used in each clinical service can be very different between hospitals
and these results may not be fully valid for other hospitals. These protocols are also
a potential source of bias because some departments may be more likely to
recommend nutritional support than others.
The main limitations of the present study were the low number of patients who died
or were euthanized (10%), the limited number of enteral and parenteral nutrition
support cases, the lack of an objective measure of severity (such as APPLE: acute
patient physiologic and laboratory evaluation) and the fact that this is a single center
study. The number of cats that die or receive nutritional support may differ between
hospitals due to differences in protocols and in the type of animals that are
hospitalized. For example, Brunetto et al. (Brunetto 2010) reported a similar mortality
(7%) to the current study, while Nivy et al. (2018) and Pyle et al. (2004) reported

Chapter 5. Prevalence and risk factors for undernutrition in hospitalized cats
68
mortalities of 22.3% and 52% respectively. However, the patients in Nivy et al.
(2018) were only cats with pancreatitis patients, and the severity of this disease can
be higher than others in the general population (Watson., 2015). The population in
the Pyle et al (2004) study was receiving PN, and the majority of the animals that
required this type of nutritional intervention where diagnosed with pancreatitis (Chan
et al., 2002; Queau et al., 2011). Moreover, according some studies (Chan et al., 2002;
Queau et al., 2011), parenteral nutrition tends to be used in patients with higher
severity index, as they are not capable to tolerate the oral or tube feeding. Therefore,
the high mortality in the study of Pyle et al. (2004) may be due to the selected
population. Although comparison is not possible, the present study includes patients
with a wider range of PSS scores with expected better outcomes. In any case, multi-
centric studies would provide a higher sample size and less bias and would be of great
interest.

69
CHAPTER 6. GENERAL DISCUSSION

70
Chapter 6. General Discussion
71
Our study reported the nutritonal status during hospitalization of dogs and cats. A
larger number of dogs (n=500) were hospitalized during the study period, compared
with cats (n=120), even though the recruitment window was larger in cats (12 months)
vs dogs (9 months). In Spain, the dog is the preferred pet to have at home: 30.6% of
Spanish households have a dog, while only 13.3% have a cat (Grupo AeI, 2019).
Another reason that can explain this large difference is that cats can get very stressed
in the hospitalization ward (Grupo AeI, 2019), and, as a consequence, hospitalization
is less common than in dogs. Owners can be more reluctant to bring the cat to the
hospital (Habacher et al., 2010) to avoid the stressful situation for the cat and for
themselves. In Spain, 85% of the households that have a dog have visited the vet in
the last year, and this number idecrease to 66% for cat households (Grupo AeI, 2019).
Regarding sexual status, 60.0% of cats and 30.1% of dogs were spayed or neutered,
in alignment with the country statistics where 79.7% of cats and 48.6% of dogs are
desexed (Grupo AeI, 2019).
Regarding sexual status, 60.0% of cats and 30.1% of dogs were spayed or neutered,
in alignment with the country statistics where 79.7% of cats and 48.6% of dogs are
desexed (Grupo AeI, 2019).
The present work highlights the high proportion of hospitalized dogs and cats not
meeting their estimated energy requirement during the hospitalization period (on
average, 93.2% and 90.8%, respectively) in a veterinary teaching hospital setting.
These values are higher than the 73.2% reported in a canine population (Remillard et
al, 2001) in a multi-centric study, measured on a daily basis; and higher than the 65%
average reported by Brunetto et al (2010) in a mixed canine and feline population.
However, Brunetto used the mainteinance energy requirement as goal instead of
RER. When using RER, the percentage of patients nor meeting energy needs was
lower at 42.5%. The differences can be due to differing hospital protocols: for
example, in the study of Brunetto et al (2010) the food was offered twice per day, and
if the animal was not consuming their MER after 48 hours, and the orced feeding was
unsuccessful, assited enteral nutrition was placed. It can also be explained by different
patient population and reasons for admission, but, in all cases, the proportion of
patients not reaching their estimated RER is high. This suggests that hospitalized
patients are at risk of undernutrition wich, our study suggests, can affect outcome.

Chapter 6. General Discussion
72
Incidence of undernutrition in the present work, defined as a loss of ≥ 5% BW or loss
of BCS during hospitalization, was 16.0-18.4% among hospitalized dogs, and 17.0-
25.7% among hospitalized cats. Those findings agree with what was reported in the
prospective study in humans by Tsaousi et al., 2014, where they described a
prevalence of 21.4% in acute hospital care setting. They measured this using a
Malnutrition Universal Screening Tool, based on low BMI or recent unintentional
weight loss. Our results are lower than those reported by Brunetto et al (2010), that
reported weight loss in 46.6% of their feline and canine hospitalized population in
Brazil, but this can be due to the different cut-off for weight loss, which was 2%,
compared to 5% in our study. They did not report changes in BCS and they did not
separate the results from dogs and cats which complicates comparisons. No other
studies in veterinary medicine report BW and BCS evolution during hospitalization.
If we define nutritional risk as the percentage of hospitalized dogs or cats consuming
less than the 25% of their RER during hospitalization, the population at-risk in the
present study is proportion is 52.6% in dogs, and 54% in cats. The percentage of
patients where nutritional intervention was requested from the Nutrition Service was
slightly higher in cats (37.9%) than in dogs (31.1%). In dogs, EI was also potentially
affected by body size (figure 6.1). Larger dogs tended to eat a smaller percentage of
their RER compared to smaller ones. This could be the result of underestimation of
needs for big dogs if a specific RER was not calculated in these cases and the amount
was eyeballed.
Cats lost, on average more BW (25.7%) than dogs (16%), even though there was a
similar population at-risk in both species. However, the patients that lost BCS was
very similar (18.4 in dogs and 17.0 in cats), which is a more solid, although subjective
and slow to respond, indicator of undernutrition. According to these results, we
suggest that NS in hospitalized patients shares limitations and problems in human and
veterinary medicine.

Chapter 6. General Discussion
73
Figure 6.1. Relationship between body size and EI (as percentage of RER) in dogs.
The present study was performed in only one center where no standarized nutritional
protocol for hospitalized patients was set up, and the Nutrition Service developed
feeding plans only on request by the primary veterinarian oin the case. This lack of
standarized procedure could have affected the nutritional status of our patients. For
example, all patients in the study from Brunetto et al (2010) were assigned a feeding
plan and they reported a higher percentage of patients meeting their RER. They do
not report the percentag of patients eating <25% RER, so we cannot compare the
populations at-risk in more detail. However, in our study, nutritional intervention was
only significant for BCS change in dogs in the univariate analysis but was not a
significant factor in any of our undernutrition models or in outcome for either species.
A larger sample size and information for multiple centers will be needed to clarify
the importance of specific NS in reducing undernutrition risk.
Food intake and, therfore, EI, can be affected by many reasons in hospitalized
patients. In the present study, the feeding schedule was the same for dogs and cats.
The veterinary technicians always offered food 3 times per day, always during the

Chapter 6. General Discussion
74
light hours and at the same time every day However, the feeding behaviour and
physiology between cats and dogs is different and a species-specific approach could
be beneficial. Feral cats are solitary hunters and use to seek small preys (mice, birds,
etc.), while dogs used to hunt in pack and medium-sized to lare preys. In the studies
done in laboratory conditions, dogs eat fewer, larger, and more variable sized meals
than cats. Dogs can eat 1-2 meals per day (morning/evening for example), while cats
tend to eat multiple times/day. Moreover, cats can eat during the light period as well
as during the dark one, while dogs usually eat during the light period (NRC, 2006).
The present study could not assess the effect of pain and stress on EI, BW or BCS,
both of those could affect EI. Stress is a determinant factor that affects EI in
hospitalized patients (Epstein et al., 2015) and hospitalization is a stressful situation
in itself due to unknown environment, illness, unpleasant and painfull manipulations,
and interactions with unknown humans. Future studies should investigate if a more
customized approach to accommodate different feline and canine feding behaviour
plus pain and stress management can positively affect EI and nutritional status.
One study in people (Barton et al., 2000) in a University hospital in the UK was
reported a continuing weight-loss in hospitalized patients, which was suggested to
be caused by the low EI of the patients. The hospital menu provided did meet
nutritional requirements of the patients, but more than 40% of the food was refused,
resulting in energy and protein intakes lower than the 80% of the recommendations.
Similarly, we found that the amount offered to the animal could usually meet their
requirements, but the food was refused in many cases. Remillard et al (2001)
identified food refusal as the main reason to negative energy balance in dogs per day
(44% of the cases). The same study also identified NPO as a reason for dogs not to
meet their energy requirements on a daily basis (34% of the dog-days on negative
energy balance). In our study, 31% of dogs and 59% of cats had initial NPO orders
for a variety of reasons including the need for anaesthesia or diagnostic procedures.
We did not analyze energy intake on a daily basis, rather we presented an average,
therefore we cannot really compare our results, but NPO did not have an effect on
malnutrition or outcome models in our study. This may be due to the fact that it was
limited in time and had little effect on overall EI.
Regarding undernutrition risk factors, EI was positively associated, and HL
negatively associated, with BW and BCS change in both species. As hypothesized, a

Chapter 6. General Discussion
75
higher provision of calories was associated with weight and body condition stability
and decreased calorie intake was associated with weight loss. And patients with a
longer HL had a more marked weight loss compared to patients with shorter
hospitalization periods. According to our results, a dog has a higher risk of dying
(1.19 greater odds) per each day of longer HL (P = 0.092; OR 1.19, 95% CI: 0.96 to
1.45). In canine patients, we found an interaction between HL and EI, which
suggested that EI is strongly associated to BCS maintenance in patients with HL of 3
days or longer. This interaction was not found in feline patients, maybe due to the
smaller sample size we had for this species. This result sugests that at-risk patients,
particularly dogs, that do not meet their energy requirements (RER) are able to
maintain their BCS during the first 3 days of hospitalization, but a decreased EI is
associated with a reduction of BCS with longer hospitalization periods (see figure
4.1). The theoretical recommendation currently available in veterinary medicine
recommends implementing assited nutrition after 3 days of anorexia (and 5 of
hyporexia), prior to further compromise of their nutritional status (Chan and Freeman,
2006; Freeman et al., 2011). Our study confirm this approach, setting up the limit in
3 days, as from this day onwards the BCS loss is markedly increased. The study from
Remillard et al (2001) showed that, of all dogs that did not meet their calorie goals,
incomplete orders were responsible for a negative energy balance in almost a quarter
of the days. Due to the prospective nature of the current study and the specific form
used to collect the data, completeness of feeding orders could not be assessed without
bias, therefore, it is unknown which percentage of the population in the present study
received inadequate orders. All of this stresses the importanve, as previously
mentioned, of having an initial complete dietary history plus adequate records of EI
during hospitalization to help decide when the assisted nutrition should be
implemented.
In both species, iBCS was correlated negatively with BCS change, meaning, dogs
and cats with higher iBCS lost more body condition than thinner patients. We have
mentioned before that a potential explanation is that patients with lower BCS might
be considered at more immediate risk by the attending clinician and therefore shown
a more proactive approach in regards to NS. Another possibility relates to the fact
that BCS is a subjective measure, and the operator might detect more differences in
patients with higher BCS than in underweight ones. The use of more objetive

Chapter 6. General Discussion
76
measures of body composition (rather than BCS) would have provided more accurate
and reliable data, unfortunately, those methods were not available, due to cost and
complexity.
Vomting was identified as a risk factor for undernutrition in dogs, using both BW and
BCS, which could be related to higher nutrient and energy losses caused by this
clinical sign. We did not identify this in cats, although the percentage of patients with
vomiting at admission was similar in both species (16.4% in dogs and 16.7% in cats).
This lack of effect could be explained by the small sample size in cats or to different
characteristics of the process between the patients (frequency, volume, response to
medication, etc). Diarrhoea, another clinical sign associated with energy losses, was
identified as a risk factor in cats only in the univariate analysis, but not when included
in the multivariate analysis.
Age was identified as a risk factor in dogs, where older patients showed more severe
BCS loss during hospitalization. This has also been described in elderly human
patients (Tsaousi et al., 2014). In this study, an impaired nutritional status in elderly
hospitalized humans was identified as an independent predictor of prolonged HL and
increased mortality. We would have expected the same result in cats, since it has been
reported that the aging cat population has a higher incidence of underweight, loss of
muscle mass and loss of BCS (Laflamme and Gunn-Moore, 2014) but did not see it,
which could be again related to the small sample size or to a different senior
population in our hospital compared to other institutions. There are no other studies
in veterinary medicine that have assessed the effect of age on nutritional status and
outcome in hospitalized patients.
Regarding the outcome, there are also similarities between human and veterinary
medicine. The present study, the variables associated with outcome in dogs were
iBCS, EI, anorexia at admission, and HL. In cats, the variables were EI and weight
loss at admission.
In both species, EI during hospitalization affected both nutritional status and
outcome, possibly independently of the severity status of the patient. In both
populations, a lower EI was associated with higher odds of dying. Moreover, dogs
that had reported anorexia at admission had 5.67 greater odds of dying than those not
presenting it. In dogs, additionally, higher iBCS was associated with better outcome.

Chapter 6. General Discussion
77
In particular, the odds of dying were 61% lower for heavier dogs, when 2 dogs
differed in 1 BCS unit. Similar to our results, both Remillard et al (2001) and
Brunetto et al (2010) reported an association of lower EI with worse outcome. As for
BCS, even though Remillard et al (2201) did not find an effect of BCS on outcome,
our results are similar to Brunetto et al (2010), who also identified lower BCS with a
worse outcome in their mixed population of dogs and cats. This association could
reflect a protective effect of obesity but we believe this shows that dogs with
undernutrition are at higher risk of dying than dogs with adequate body stores. The
set up of a proper nutritional intervention with the objective of increasing the animal
EI should be in the primary list of the clinicians for managing any illness. However,
we require further research in the form of interventional studies to evaluate the effect
of NS on EI and outcome.
This effect of iBCS on outcome was not identified in cats, however, cats with
reported weight loss at admission had higher odds of dying than those that did not,
again supporting the importance of an adequate nutritional status to achieve success
during hospitalization and disease. Weight loss is one of the key historical nutrition
assessment indicators, which has been associated with long-term mortality in
numerous human studies (Hiesmayr et al., 2009; Jensen et al., 2010). Clinical
significance is determined both by the degree and duration of weight loss (Zekry et
al., 2013). Therefore, the identification of history of weight loss is an important point,
especially in feline medicine that should be addressed during the initial veterinary
appointment. Recording weights at every appointment will help identify any
concerning weight trends in our patients.
Nutritional status can affect outcome due to its importance for adequate immune
system function (Satyaraj, 2011). Both nutrient provision and adequate immunity are
essential to sustain life and to promote adequate recovery. Consequently, nutrient
metabolism and immunity have co-evolved organ systems and signaling pathways.
This close relationship means that chronic nutrient deficiencies or excesses can
negatively impact immune health and consequently overall health (Satyaraj, 2019).
Additional studies with a larger population of both dogs and cats, the use of more
objetive measuires of body composition (rather than BCS) and a more accurate
measure of severity to confirm the effect of body composition and EI on nutritional
status and outcome in both species.

Chapter 6. General Discussion
78
The PSS, our index of severity, was significant in dogs in the univariate analysis for
both nutritional status and outcome, however, it did not have an effect on the
multivariate models in our study. Dogs and cats in our population presented with a
very simlar PSS distribution (figure 6.2), most dogs and cats were admitted with a
PSS of 3 followed by 4, 2, 1 and 5. The percentage of cats that entered with PSS 3,
4, and 5 was slightly higher in cats than in dogs. Dogs use to express their discomfort
in a more evident way, being less active, crying or trying to stay closer to family
members. Cats use to be more elusive, hiding themselves sometimes, ans this make
more difficult for the owner to realize of the real physical status of the cat. One of
the most common signs seen in painful cats is the lack of grooming (Epstein et al.,
2015). Other secondary behaviour as defecating outside the litter box, should make
us suspect that something is happening (Epstein et al., 2015). Therefore, we can
hypothetizise that the higher percentage of cats in PSS of 3, 4, and 5 at admission,
may be due to the longer time that the owner takes to realize clinical situation of the
cat or the reluctancy to stress the cat by a veterinary visit as mentioned above.
Figure 6.2. Classification of dogs and cats by their Physical Status Score (PSS) at the moment of
hospitalization.
This lack of effect of PSS on nutritional status and outcome was unexpected and
different from Remillard et al (2001) and Brunetto et al (2010), where severity of the
disease was associated with worse outcomes, and severity was also associated with
energy balance. This difference could reflect the different populations among the
countries and the type of institutions. Additionally, individual parameters associated
with severity (like EI, anorexia, weight loss) better explained the results compared to
0
5
10
15
20
25
30
35
40
45
1 2 3 4 5
DOGS (%) CATS (%)

Chapter 6. General Discussion
79
an overall index, which is why PSS was not included in any of our models. Using a
more objetive and standarized severity index would have been a better way to assess
the effect of disease severity on nutritional status and outcome. This could not be
done in the present study due to the great variability in the approach to cases by each
primary clinician and we used a subjective measure of severity (PSS) to be able to
compare our results to those obtained by Brunnetto et al. (2010) and Remillard et al.
(2001). However, future studies should include more objective measures of severity
like the APPLE (Hayes et al., 2010) in order to study the actual effect of physiological
status on EI and outcome.
In the present study, it was not possible to accurately assess the effect of assisted
nutrition on nutritional status or outcome due to a low sample size. It is noteworthy
that, despite the high number of dogs and cats eating below their RER during the
hospitalization period, the number of assisted nutrition interventions (EN or PN) was
low, suggesting that this type of intervention was not a top priority for clinicians
when they have to manage hospitalized patients. In human medicine, studies suggest
that the sooner the patients are nourished (voluntarly or through feeding tube), the
better recovery and shorter HL they will have (Herbert et al., 2018). This is specially
important in order to vacate beds for other patients that may need them and to save
costs of hospitalization. In human medicine, even though the situatio is still not ideal,
assisted feeding during hospitalization (manly by feeding tube placements) is
encouraged. A cluster-randomized controlled trial (Martin et al., 2004) showed that
patients with an assisted nutritional intervention received significantly more days of
enteral nutrition (6.7 v. 5.4 per 10 patient-days), and had a significantly shorter HL
(25 v. 35 days) compared to no intervention.
Other limitations of the present study were the low number of patients who died or
were euthanized, which could limit the reliability of our outcome model. The number
of dogs and cats that die or receive nutritional support may differ between hospitals
due to differences in protocols and characteristics of population treated. Brunetto et
al. (2010) study reported a similar mortality to our population (7%) but Remillard et
al. (2001), the only multi-centric study, reported a mortality of 16%. Studies with a
higher sample size and from different hospitals would be of great interest. We already
mentioned the lack of an objective measure of body composition, limited number of
Chapter 6. General Discussion
80
enteral and parenteral nutrition support interventions, and the lack of an objective
severity scale.
The current study has showed the importance of adeuate energy intake and nutritional
status on preventing malnutrition and improving outcome in both dogs and cats and
stresses the importance of performing nutritional evaluation in hospitalized patients
to identify those patients at risk. Ideally, future studies should be multi-centric and
incorporate more objective measures of body composition and disease severity and
be powered enough to be able to assess the effect of nutritional intervention. More
objective mesures of energy requirements, when indirect calorimetry becomes
cheaper and more practical, will also provide necessary information about energy
needs and allow for a more individualized approach. We did not assess laboratory
analysis values as malnutrition risk markers, because it was outside the scope of the
study, but future studies could incorporate these in order to provide additional
information and allow for faster and more accurate nutritional assessment.

81
CHAPTER 7. CONCLUSIONS

82

Chapter 7. Conclusions
83
Based on the results presented in Chapters 4 and 5, in a population of hospitalized dogs
and cats in a veterinary teaching hospital, the main following conclusions can be derived:
1. The prevalence of undernutrition in dogs and cats, measured as loss of body
weight and body condition score, was between 16.0 and 25.7%. The
prevalence of patients at risk of malnutrition, defined as patients receiving
less than 25% of their energy requirements, was above 50% in both species.
2. In dogs and cats, energy intake during hospitalization was positively
correlated with an adequate nutritional status and outcome. In dogs, the effect
of energy intake on nutritional status was seen in patients with hospitalization
periods of 3 days or longer.
3. In dogs and cats, hospitalization length was negatively associated with
nutitional status, with long hospitalization periods associated with increased
losses of weight and body condition.
4. Old age and vomiting at admission were identified as risk factors for
undernutrition in dogs, but not in cats
5. Energy intake was associated with lower odds of dying in both species. In
dogs, but not in cats, hospitalization length and anorexia at presentation were
associated with higher odds of dying. whereas higher initial body condition
score was associated with lower odds of dying. In cats, weight loss at
admission was assocaited with higher odds of dying.

References
84
REFERENCES
Agarwal, E., Ferguson, M., Banks, M. Batterham, M., Bauer, J., Capra, S.,
Isenring, E.. 2013. Malnutrition and poor food intake are associated with
prolonged hospital stay, frequent readmissions, and greater in-hospital
mortality: results from the Nutrition Care Day Survey. Clin Nutr, vol. 32,
no. 5, pp. 737–745, 2013.
Agnew, W., Korman, R. 2014. Pharmacological appetite stimulation: rational
choices in the inappetent cat. J Feline Med Surg. Sep;16(9):749-56.
Annetta, M., Pittiruti, M., DeRosa, S., Franchi, P., Pintaudi, G., Caricato, A.,
Antonelli, M. 2015. Preventing hospital malnutrition: a survey on
nutritional policies in an Italian University Hospital. J. Anesthesiol. Resusc.
Analg. Intensive Care 81, 1210–18.
Barker, L.A., Gout, B.S., Crowe, T.C. 2011. Hospital malnutrition: Prevalence,
identification and impact on patients and the healthcare system. Int. J.
Environ. Res. Public Health 8, 514–527.
Barton, A.D., Beigg, C.L., Macdonald, I.A., Allison, S.P. 2000. High food
wastage and low nutritional intakes in hospital patients. Clin Nutr. 19(6),
445-449.
Bechere, M.T., Vecchi, G., Lellis, D.M., Ferraro, A.A. 2015. Excess body
weight in children may increase the length of hospital stay. Clinics. 70: 87-
90.
Becvarova, I. 2015. Chapter 9: Tube feeding in small animals: diet selection and
preparation. In: Nutritional management of Hospitalized Small Animals,
1st ed (ed D.L. Chan) Wiley Blackwell, Iowa. pp. 117-127Blaxter, K. 1989.
Energy Metabolism in Animals and Man. Cambridge, UK: Cambridge
University Press, 218.
Boateng, A.A.,Meguid, M.M., Crook, M. 2010. Refeeding syndrome: treatment
considerations based on collective analysis of literature case reports.

References
85
Nutrition. Feb; 26(2):156-67.
Brenner, K., KuKanich, K.S., Smee, N.M. 2011. Refeeding syndrome in a cat
with hepatic lipidosis. J. Feline. Med. Surg. 13, 614-617.
Brunetto, M. a, Gomes, M.O.S., Andre, M.R., Teshima, E., Gonçalves, K.N. V,
Pereira, G.T., Ferraudo, A.S., Carciofi, A.C. 2010. Effects of nutritional
support on hospital outcome in dogs and cats. J. Vet. Emerg. Crit. Care (San
Antonio). 20, 224–31.
Buchman, A.L. 1999. Glutamine for the gut: mystical properties of an ordinary
amino acid. Curr. Gastroenterol. Rep. 1 (5), 417-423.
Buffington, T., Holloway, C., and Abood, A. 2004. Nutritional assessment. In:
Manual of Veterinary Dietetics (eds T.Buffington, C.Holloway and
S.Abood) W.B.Saunders, St.Louis. pp. 1-7.
Buffington, C.A., Westropp, J.L., Chew, D.J., Bolus, R.R. 2006. Clinical
evaluation of multimodal environmental modification (MEMO) in the
management of cats with idiopathic cystitis. J. Fel. Med. Surg. 8: 261-268.
Burger, I.H. 1994. Energy needs of companion animals: matching food intakes
to requirements throughout the life cycle. J Nutr. Dec; 12 4(12
Suppl):2584S-2593S.
Burkholder, W.J. 1999. Age-related changes to nutritional requirements and
digestive function in adult dogs and cats. J. Am. Vet. Med. Assoc. 215,
625–9.
Calleja Fernández, A., Vidal Casariego, A., Cano Rodríguez, I., Ballesteros
Pomar, M.D. 2014. Malnutrition in Hospitalized Patients Receiving
Nutritionally Complete Menus: Prevalence and Outcomes. Nutr. Hosp. 30,
1344–1349.
Cangiano, C., Laviano, A., Meguid, M.N., et al. 1996. Effects of administration
of oral brached-chain amino acids on anorexia and caloric intake in cancer
patients. J Natl Cancer Inst. 88(8), 550-552.

References
86
Cave, N. 2012. Chapter 12 / Nutritional Mangement of Gastrointestinal
Diseases. In: Fascetti, A.J., Delaney, S.J. Applied Veterinary Clinical
Nutrition. UK.
Cederholm, T., Bosaeus, I., Barazzoni, R., et al. 2015. Diagnostic criteria for
malnutrition e An ESPEN Consensus Statement. Clin Nutr. Jun;34(3):335-
40
Chan, D.L. 2015. Chapter 2: Estimating energy requirements of small animal
patients. In: Chan, D.L. 2015. Nutritional management of hospitalized
small animals, 1st ed, Wiley Blackwell, Iowa.
Chan, D.L. 2015 (b). Chapter 22: Nutritional management of the septic patient.
In: Chan, D.L. 2015. Nutritional management of hospitalized small
animals, 1st ed, Wiley Blackwell, Iowa.
Chan, D.L., Freeman, L.M., Labato, M.A., et al. 2002. Retrospective evaluation
of partial parenteral nutrition in dogs and cats. J.Vet. Intern. Med. 16, 440-
445.
Chan, D.L. 2004. Nutritional requirements of the critically ill patient. Clin. Tech.
Small Anim. Pract. 19, 1–5.
Chan, D.L., Freeman, L.M. 2006. Nutrition in critical illness. Vet. Clin. North
Am. Small Anim. Pract. 36, 1225–1241, v–vi.
Chan, D.L., Rozanski, E.A. and Freeman, L.M. 2009.Relationship among
plasma amino acids, C-Reactive protein, illness severity, and outcome in
critically ill dogs. J Vet Intern Med. 23(3), 559-563.
Chandler, M.L., Gunn-moore, D. 2004. WALTHAM International Science
Symposium : Nature , Nurture , and the Case for Nutrition Nutritional
Status of Canine and Feline Patients Admitted to a veterinary internal
medicine service 2050–2052.
Crook, M.A., Hally, V. and Panteli, J.V. 2001. The importance of the refeeding
syndrome. Nutrition. 17, 632-637.

References
87
De Avilla, M.D., Leech, E.B. 2016. Hypoglycemia associated with refeeding
syndrome in a cat. J Vet Emerg Crit Care (San Antonio). Nov; 26(6):798-
803.
Delaney, S.J. 2006. Management of anorexia in dogs and cats. Vet Clin North
Am Small Anim Pract. 36(6):1243-1249.
Delaney, S.J., Fascetti, A.J., Elliott, D.A. 2006. Canine nutrition in critical care.
In: Encyclopedia of Canine clinical nurition, eds P.Pibot, V.Biourgue, D.
Elliott. Aniwa SAS – Royal Canin, Aimargues (France). pp. 454-478.
Doig, G.S., Chevrou-Séverac, H., Simpson, F. 2013. Early enteral nutrition in
critical illness: a full economic analysis using US costs. Clinicoecon
Outcomes Res. 5, 429-436.
Doig, G.S., Simpson, F., Sweetman, E., et al. 2013. Early Parenteral Nutrition in
Critically Ill Patients With Short-term Relative Contraindications to Early
Enteral Nutrition: A Randomized Controlled Trial. JAMA, May 22/29, Vol
309, Nº 20.
Engelking, L.R., Anwer, M.S. 1992. Liver and biliary tract. In: Anderson NV,
Sherding RG, Merritt AM, et al, eds. Veterinary Gastroenterology, 2nd ed.
Philadelphia, PA: Lea & Febiger, 211-274.
Epstein, M., Rodan, I., Griffenhagen, G., Kadrlik, J., Petty, M., Robertson, S.,
Simpson, W. 2015. J Am Anim Hosp Assoc. Mar-Apr;51(2):67-84.
Fahey, G.C., Barry, K. a, Swanson, K.S. 2008. Age-related changes in nutrient
utilization by companion animals. Annu Rev Nutr. 28, 425–45.
Fascetti, A. J., Mauldin, G. E., Mauldin, G. N. 1997. Correlation between serum
creatine kinase activities and anorexia in cats. J. Vet. Intern. Med. 11: 9–
13.
Feng, P., He, C., Liao, G., Chen, Y. 2017. Early enteral nutrition versus delayed
enteral nutrition in acute pancreatitis: A PRISMA-compliant systematic
review and meta-analysis. Medicine (Baltimore). Nov; 96(46):e8648.

References
88
Ferguson, L.E., McLean, M.K., Bates, J.A., Quimby, J.M. 2016. Mirtazapine
toxicity in cats: retrospective study of 84 cases (2006-2011). J Feline Med
Surg. Nov; 18(11):868-874.
Fisher, G.G., Opper, F.H. 1996. An interdisciplinary nutrition support team
improves quality of care in a teaching hospital. Research and Professional
Briefs. 96, 2.
Forman, M. 2010. Anorexia. In: Textbook of Veterinary Internal Medicine, 7th
ed (eds S.J. Ettinger and E.C. Feldman) Saunders Elsevier, St.Louis. pp.
173-173.
Freeman, L.M. 2009. The pathophysiology of cardiac cachexia. Curr Opin
Support Palliat Care. Dec; 3(4):276-81.
Freeman, L.M. 2012. Cachexia and sarcopenia: emerging syndromes of
importance in dogs and cats. J Vet Intern Med. 2012 Jan-Feb;26(1):3-17.
Freeman, L.M. 2015. New tools for the nutritional assessment and management
of critical care patients. J Vet Emerg Crit Care (San Antonio). Jan-Feb;
25(1):4-5.
Freeman, L., Becvarova, I., Cave, N., Zealand, N., Mackay, C., Nguyen, P.,
Rama, B., Takashima, G., Tiffin, R., Tsjimoto, H., Wsava, T., Pulse, T.,
Pain, R., Group, V.A., Guidelines, N.A., National, T., Academy, U.S.N.,
Pet, E., Industry, F., Feed, A., Officials, C. 2011. Nutritional Assessment
Guidelines. J. Small Anim. Pract. 52, 254–63.
Freeman, L.M., Michel, K.E., Zanghi, B.M., Vester Boler, B.M., Fages, J. 2019.
Evaluation of the use of muscle condition score and ultrasonographic
measurements for assessment of muscle mass in dogs. Am J Vet Res. Jun;
80(6):595-600.
Freeman, L.M., Sutherland-Smith, J., Prantil, L.R., Sato, A.F., Rush, J.E.,
Barton, B.A. 2017. Quantitative assessment of muscle in dogs using a
vertebral epaxial muscle score. Can J Vet Res. Oct; 81(4):255-260.
Gagne, J.W., Wakshlag, J.J. 2015. Pathophysiology and clinical approach to
https://www.ncbi.nlm.nih.gov/pubmed/?term=Freeman%20LM%5BAuthor%5D&cauthor=true&cauthor_uid=19797959
https://www.ncbi.nlm.nih.gov/pubmed/?term=Freeman%20LM%5BAuthor%5D&cauthor=true&cauthor_uid=25565075
https://www.ncbi.nlm.nih.gov/pubmed/?term=Freeman%20LM%5BAuthor%5D&cauthor=true&cauthor_uid=31140851
https://www.ncbi.nlm.nih.gov/pubmed/?term=Freeman%20LM%5BAuthor%5D&cauthor=true&cauthor_uid=29081582
References
89
malnutrition in dogs and cats. In: Nutritional management of Hospitalized
Small Animals, 1st ed (ed D.L. Chan) Wiley Blackwell, Iowa. pp. 117-127.
German, A.J., Holden, S., Moxham, G.L. et al. 2006. Simple, reliable tool for
owners to assess the body condition of their dog or cat. J. Nutr. 136: 2031S–
2033S.
Grupo Ael. 2019. Estudio Marcotas 2019; Censo de Perros y Gatos.
Gulsvik, A.K., Thelle, D.S., Mowe, M., et al. 2009. Increased mortality in the
slim elderly: A 42 year follow-up study in a general population. Eur J Epid.
24: 683-690.
Habacher, G. 2010. Use of a web-based questionnaire to explore cat owners'
attitudes towards vaccination in cats. Vet Rec. Jul 24;167(4):122-7.
Halvorson, E.E., Chandler, N., Neiberg, R., Ervin, S.E. 2013. Association of
NPO Status and Type of Nutritional Support on Weight and Length of Stay
in Infants Hospitalized With Bronchiolitis. Hosp. Pediatr. 3, 366–70.
Hand, M., Thatcher, C., Remillard, R.L., Roudebush, P., Novotny, B. 2010.
Small Animal Clinical Nutrition, 5th Edn. Kansas: Mark Morris Institute.
Hayes, G., Mathews, K., Doig, G., Kruth, S., Boston, S., Nykamp, S., et al. 2010.
The acute patient physiologic and laboratory evaluation (APPLE) score: a
severity illness stratification System for hospitalized dogs. J Vet Intern
Med. 24:1034–47.
Herbert, G., Atkinson, C., Penfold, C., Lewis, S.J., Ness, A.R., Thomas, S. 2018.
Early enteral nutrition within 24 hours of lower gastrointestinal surgery
versus later commencement for length of hospital stay and postoperative
complications. Cochrane Database Syst Rev. Oct 24;10: CD004080.
Hiesmayr, M., Schindler, K., Pernicka, E., Schuh, C., Schoeniger-Hekele, A.,
Bauer, P., Laviano, A., Lovell, A.D., Mouhieddine, M., Schuetz, T.,
Schneider, S.M., Singer, P., Pichard, C., Howard, P., Jonkers, C., Grecu, I.,
Ljungqvist, O. 2009. Decreased food intake is a risk factor for mortality in
hospitalised patients: the NutritionDay survey 2006. Clin Nutr, vol. 28, no.
https://www.ncbi.nlm.nih.gov/pubmed/?term=Atkinson%20C%5BAuthor%5D&cauthor=true&cauthor_uid=30353940

References
90
5, pp. 484–491.
Hirai, N., Shirai, M., Kato, Y., Murakami, M., Nomura, R., Yamasaki, Y.,
Takahashi, S., Kondo, C., Matsumoto-Nakano, M., Nakano, K., Asai, F.
2013. Correlation of Age with Distribution of Periodontitis-Related
Bacteria in Japanese Dogs. J Vet Med Sci. 75, 999–1001.
Hofer, M., Pozzi, A., Joray, M. et al. 2014. Safe refeeding management of
anorexia nervosa in patients: an evidence-based protocol. Nutrition. 30,
524-530.
Hua, J., Hoummady, S., Muller, C., Pouchelon, J.L., Blondot, M., Gilbert, C., et
al. 2016. Assessment of frailty in aged dogs. Am J Vet Res. 77:1357–65.
Ingenbleek, Y., Van Den Schrieck, H. G., De Nayer, P. and De Visscher, M.
1975. Albumin, transferrin and the thyroxine-binding prealbumin/retinol
binding protein (TBPA-RBP) complex in assessment of malnutrition. Clin.
Chim. Acta. 63: 61-67.
Inui, A. 2011. Cancer anorexia-cachexia syndrome: Current issues in research
and management. CA Cancer J Clin. 52, 72-91.
Kalil, A.C., Sevransky, J.E., Myers, D.E., et al. 2006. Preclinical trial of L-
arginine monotherapy alone or with N-acetylcysteine in septic shock. Crit.
Care Med. 34 (11), 2719-2728.
King, L.G., Wohl, J.S., Manning, A.M., Hackner, S.G., Raffe, M.R., Maislin, G.
2001. Evaluation of the survival prediction index as a model of risk
stratification for clinical research in dogs admitted to intensive care units at
four locations. Am. J. Vet. Res. 62, 948–54.
Kleiber, M. 1961. The Fire of Life. An Introduction to Animal Energetics,
Wiley, New York, NY, USA.
Klein, C.J., Stanek, G.S., Wiles, C.E.1998. Overfeeding macronutrients to
critically ill adults: metabolic complications. J Am Diet Assoc. Jul;
98(7):795-806.

References
91
Knudsen, K.B., Bradley, E.M., Lecocq, F.R., Bellamy, H.M., Welsh, J.D. 1968.
Effect of fasting and refeeding on the histology and disaccharidase activity
of the human intestine.Gastroenterology. Jul; 55(1):46-51.
Koretz, R.L., Avenell, A., Lipman, T.O., Braunschweig, C.L., Milne, A.C. 2007.
Does enteral nutrition affect clinical outcome? A systematic review of the
randomized trials. Am J Gastroenterol. Feb;102(2):412-29; quiz 468.
Kraft, M.D., Btaiche, I.F., and Sacks, G.S. 2005. Review of the refeeding
syndrome. Nutrition in clinical practice. 20, 625-633.
Kreymann, K.G., Berger, M.M., Deutz, N.E. et al. 2006. “ESPEN guidelines on
enteral nutrition: Intensive care.” Clin Nutr 25(2): 210–223.
Kuvshinoff, B. W., Brodish, R. J., McFadden, D. W. and Fischer, J. E. 1993.
Serum transferrin as a prognostic indicator of spontaneous closure and
mortality in gastrointestinal cutaneous fistulas. Ann. Surg. 217: 615-622.
Lacey, J.M., Wilmore, D.W. 1990. Is glutamine a conditionally essential amino
acid? Nutr Rev. 48:297-309.
Laflamme, D. 1997. Development and validation of a body condition score
system for dogs. Canine Pract. 22, 10–15.
Laflamme, D. 1997(b). Development and validation of a body condition score
system for cats: A clinical tool. Feline Pract. 25: 13-18.
Laflamme, D., Gunn-Moore, D. 2014. Nutrition of aging cats. Vet Clin North
Am Small Anim Pract. Jul; 44(4):761-74, vi.
Lainscak, M., Farkas, J., Frantal, S., Singer, P., Bauer, P., Hiesmayr, M.,
Schindler, K. 2014. Self-rated health, nutritional intake and mortality in
adult hospitalized patients. Eur. J. Clin. Invest. 44, 813–24.
Larsen, J.A. 2012. Chapter 20 / Enteral Nutrition and Tube Feeding. In: Fascetti,
A.J., Delaney, S.J., 2012. Applied Veterinary Clinical Nutrition. UK.
Levine, J.A., Morgan, M.Y. 1990. Measurement of energy expenditure in man:
A review of available methods. J Nutr Med. 1, 325-343.

References
92
Lew, C., Yandell, R., Fraser, R., Chua, A., Fong Chong, M., Miller, M. 2017.
Association Between Malnutrition and Clinical Outcomes in the Intensive
Care Unit: A Systematic Review. J. Parenter. Enter. Nutr. Jul(41): 744-758.
Li, Q., Zhang, Z., Xie, B. et al. 2017. Effectiveness of enteral feeding protocol
on clinical outcomes in critically ill patients: A before and after study. PLoS
One. Aug 3; (8).
Lin, L.Y., Lin H.C., Lee, P.C., Ma, W.Y., Lin, H.D. 2007. Hyperglycemia
correlates with outcomes in patients receiving total parenteral nutrition. Am
J Med Sci. 333(5): 261–265.
Liu, D.T., Brown, D.C., Silverstein, D.C. 2012. Early nutritional support is
associated with decreased length of hospitalization in dogs with septic
peritonitis: A retrospective study of 45 cases (2000-2009). J. Vet. Emerg.
Crit. Care (San Antonio). 22, 453–9.
Martin, C.M., Doig, G.S., Heyland, D.K., Morrison, T., Sibbald, W.J. 2004.
Multicentre, cluster-randomized clinical trial of algorithms for critical-care
enteral and parenteral therapy (ACCEPT). CMAJ. Jan 20; 170(2):197-204.
Matthews, D.E., Fong, Y. 1993. Amino acid and protein metabolism. In:
Rombeau, J.L., Caldwell, M.D., (eds.). Clinical Nutrition; Parenteral
Nutrition, 2nd ed. Philadelphia, PA: WB Saunders Co, 75-112.
Matthews, K.L., Capra, S.M., Palmer, M.A. 2017. Throw caution to the wind: is
refeeding syndrome really a cause of death in acute care? Eur J Clin Nutr.
August, 1-6.
Mauldin, G.E., Reynolds, A.J., Mauldin, N., Kallfelz, F.A. 2001. Nitrogen
balance in clinically normal dogs receiving parenteral nutrition solutions.
Am J Vet R. 62(6): 912–920.
Mauldin, G.E. 2012. Chapter 19 / Nutritional Management of Oncological
Diseases. In: Fascetti, A.J., Delaney, S.J. Applied Veterinary Clinical
Nutrition. UK.
Maxwell, A., Butterwick, R., Batt, R. M., Camacho-Hubner, C. 1999. Serum
https://www.ncbi.nlm.nih.gov/pubmed/?term=Heyland%20DK%5BAuthor%5D&cauthor=true&cauthor_uid=14734433
https://www.ncbi.nlm.nih.gov/pubmed/?term=Morrison%20T%5BAuthor%5D&cauthor=true&cauthor_uid=14734433

References
93
insulin-like growth factor (IGF)-I concentrations are reduced by short-term
dietary restriction and restored by refeeding in domestic cats (Felis catus).
J. Nutr. 129: 1879–1884.
Maxwell, A., Butterwick, R., Yateman, M., Batt, R. M., Cotterill, A., Camacho-
Hubner, C. 1998. Nutritional modulation of canine insulin-like growth
factors and their binding proteins. J. Endocrinol. 158: 77–85.
McDonald, P., Edwards, R.A., Greenhalgh, J.F.D. 1995. Feeding standards for
reproduction. In: Animal Nutrition, 5th ed. Harlow (Essex), UK: Longman
Scientific & Technical, 353-371.
McKenna, M.C., Dienel G.A., Sonnewald, U. et al. 2005. Energy Metabolism
of the Brain. In: Basic Neurochemistry: Principles of Molecular, Cellular,
and Medical Neurobiology. 8th Edition (Ed. S.T. Brady, G.J. Siegel, R.W.
Albers and D.L. Price ). Elsevier. 201-215.
McCray, S., Walker, S., Parrish, C.R. 2005. Much ado about refeeding. Pract
Gastroenterol. 29:26–44.
McGrane, M.M. 2006. Chapter 12: Carbohydrate Metabolism: Synthesis and
Oxidation. In: Stipanuk, M.H. 2006. Biochemical, Physiological,
Molecular Aspects of Human Nutrition, 2nd ed; Saunders/Elsevier: St.
Louis, MO, USA, 1993; pp. 274-275.
McWhirter, J.P., Pennington, C.R. 1994. Incidence and recognition of
malnutrition in hospital. BMJ. 308, 945-948.
Michel, K.E. 2015. Chapter 1: Nutritional assessment in small animals. In: Chan,
D.L. 2015. Nutritional management of hospitalized small animals, 1st ed,
Wiley Blackwell, Iowa.
Michel, K.E., Higgins, C. 2006. Investigation of the percentage of prescribed
enteral nutrition actually delivered to hospitalized companion animals. J
Vet Emerg Crit Care 16(2)(S1), pp S2-S6
Mobrahan, S. 1992. Glutamine: A conditionally essential nutrient or another

References
94
nutritional puzzle. Nutr Rev. 50: 331-333.
Mohr, A.J., Leisewitz, A.L., Jacobson, L.S., Steiner, J.M., Ruaux, C.G.,
Williams, D.A. 2003. Effect of Early Enteral Nutrition on Intestinal
Permeability, Intestinal Protein Loss, and Outcome in Dogs with Severe
Parvoviral Enteritis. J. Vet. Intern. Med. 17, 791–798.
Molina, J. 2017. Malnutrición y sus factores de riesgo en animales
hospitalizados. Clinnutrivet. 1, 16-23.
Molina J, Hervera M, Manzanilla E.G, Torrente C, Villaverde C. 2015. Nutrition
related risk factors for malnutrition and negative outcome in hospitalized
dogs [abstract]. In: Proceedings of the 15th Annual AAVN Clinical
Nutrition and Research Symposium;Indinanapolis (Indiana).
Molina, J., Hervera, M., Manzanilla, E.G., Torrente, C., Villaverde, C. 2018.
Evaluation of the Prevalence and Risk Factors for Undernutrition in
Hospitalized Dogs. Front Vet Sci. Aug 29; 5: 205.
Nakajima, M., Ohno, K., Goto-Koshino, Y., Fujino, Y., Tsujimoto, H. 2014.
Plasma transferrin concentration as a nutritional marker in malnourished
dogs with nutritional treatment. J Vet Med Sci. Apr;76(4):539-43.
National Research Council (NRC). 2006: Nutrient Requirements of Dogs and
Cats. Washington, DC.
Ogilvie, G.K., Walters, L.M,. Salman, M.D., et al. 1996. Resting energy
expenditure in dogs with nonhematopoietic malignancies before and after
excision of tumors. Am J Vet Res. 57, 1463-1467
Ogilvie, G.K., Fettman, M.J., Mallinckrodt, C.H., et al. 2000. Effect of fish oil,
arginine, and doxorubicin chemotherapy on remission and survival time for
dogs with lymphoma: a double-blind, randomized placebo-controlled
study. Cancer. 88(8), 1916-1928.
Ordoñez, A.M., Madalozzo Schieferdecker, M.E., Cestonaro, T., Cardoso Neto,
J., Ligocki Campos, A.C. 2013. Nutritional status influences the length of
stay and clinical outcomes in patients hospitalized in internal medicine
https://www.ncbi.nlm.nih.gov/pubmed/?term=Torrente%20C%5BAuthor%5D&cauthor=true&cauthor_uid=30211177

References
95
wards. Nutr. Hosp. 28, 1313–20.
Owen, O.E., Reichard, G.A., Patel, M.S., Boden, G. 1979. Energy metabolism
in feasting and fasting. Adv Exp Med Biol. 111, 169–88.
Parker, E.A., Feinberg, T.M., Wappel, S., Verceles, A.C. 2017. Considerations
When Using Predictive Equations to Estimate Energy Needs Among Older,
Hospitalized Patients: A Narrative Review. Curr Nutr Rep. Jun; 6(2):102-
110.
Perea, S.C. 2012. Chapter 21 / Parenteral Nutrition. In: Fascetti, A.J., Delaney,
S.J., 2012. Applied Veterinary Clinical Nutrition. UK.
Popp, M.B., Brennan, M.F. 1983. Metabolic response to trauma and infection.
In: Fischer, J.E., (ed). Surgical Nutrition. Boston, MA: Little, Brown and
Co, 479-513.
Pourhassan, M., Cuvelier, I., Gehrke, I., et al. 2017. Risk factors of refeeding
syndrome in malnourished older hospitalized patients. Clin Nutr. Jun 10.
Pu, H., Doig, G.S., Heighes, P.T., Allingstrup, M.J. 2018. Early Enteral Nutrition
Reduces Mortality and Improves Other Key Outcomes in Patients With
Major Burn Injury: A Meta-Analysis of Randomized Controlled Trials. Crit
Care Med. Dec;46(12):2036-2042.
Pyle, S.C., Marks, S.L., Kass, P.H. 2004. Evaluation of complications and
prognostic factors associated with administration of total parenteral
nutrition in cats: 75 cases (1994-2001). J Am Vet Med Assoc. Jul
15;225(2):242-50.
Owen, O.E., Reichard, G.A., Patel, M.S., Boden, G. 1979. Energy metabolism
in feasting and fasting. Adv Exp Med Biol. 111, 169–88.
Queau, Y., Larsen, J.A., Kass, P.H., Glucksman, G.S., Fascetti, A.J. 2011.
Factors associated with adverse outcomes during parenteral nutrition
administration in dogs and cats. J Vet Intern Med. May-Jun; 25(3):446-52.
Quimby, J.M., Lunn, K.F. 2013. Mirtazapine as an appetite stimulant and anti-
https://www.ncbi.nlm.nih.gov/pubmed/?term=Cuvelier%20I%5BAuthor%5D&cauthor=true&cauthor_uid=28647292

References
96
emetic in cats with chronic kidney disease: a masked placebo-controlled
crossover clinical trial. Vet J. Sep;197(3):651-5.
Reintam, B.A., Starkopf, J., Alhazzani,W., Berger, M.M., Casaer, M.P., Deane,
A.M., Fruhwald, S., Hiesmayr, M., Ichai, C., Jakob, S.M., Loudet, C.I.,
Malbrain, M.L., Montejo González, J.C., Paugam-Burtz, C., Poeze, M.,
Preiser, J.C., Singer, P., van Zanten, A.R., De Waele, J., Wendon, J.,
Wernerman, J., Whitehouse, T., Wilmer, A., Oudemans-van Straaten,
H.M.; ESICM Working Group on Gastrointestinal Function. 2017. Early
enteral nutrition in critically ill patients: ESICM clinical practice
guidelines. Intensive Care Med. Mar;43(3):380-398.
Remillard, R.L. 2008. Homemade diets: attributes, pitfalls, and a call for action.
Top Companion Anim Med. Aug; 23(3):137-42.
Remillard, R.L., Darden, D.E., Michel, K.E., Marks, S.L., Buffington, C. a,
Bunnell, P.R. 2001. An investigation of the relationship between caloric
intake and outcome in hospitalized dogs. Vet Ther. 2, 301–10.
Richardson, R.A., and Davidson, H.I.M. 2003. “Nutritional demands in acute
and chronic illness.” Proc Nutr Soc 62: 777–781.
Ridley, E., Gantner, D., Pellegrino, V. 2015. Nutrition therapy in critically ill
patients- a review of current evidence for clinicians. Clin Nutr. 34, 565-571.
Saker, K. and Remillard, R. 2010. Critical care nutrition and enteral-assisted
feeding. In: Small Animal Clinical Nutrition, 5th ed (eds M.S. Hand, C.D.
Tacher, R.L. Remillard, et al.) Mark Morris Institute, Topeka. pp. 439-476.
Satyaraj, E. 2011. Emerging paradigms in immunonutrition. Top Companion
Anim Med. Feb;26(1):25-32.
Satyaraj, E. 2019. Immunomodulatory effect of bovine colostrum. Proceedings
Purina Symposium: Gut-brain axis and the immune modulation (Improving
immune health through gut microbiota). Sept; 38.
Schönfeld, P., and Reiser, G. 2013. REVIEW ARTICLE: Why does brain
metabolism not favor burning of fatty acids to provide energy? - Reflections
https://www.ncbi.nlm.nih.gov/pubmed/?term=Starkopf%20J%5BAuthor%5D&cauthor=true&cauthor_uid=28168570
https://www.ncbi.nlm.nih.gov/pubmed/?term=Fruhwald%20S%5BAuthor%5D&cauthor=true&cauthor_uid=28168570
https://www.ncbi.nlm.nih.gov/pubmed/?term=Hiesmayr%20M%5BAuthor%5D&cauthor=true&cauthor_uid=28168570

References
97
on disadvantages of the use of free fatty acids as fuel for brain. Journal of
Cerebral Blood Flow & Metabolism. 33, 1493–1499
Schroeder, G.E., Smith, G.A. 1995. Bodyweight and feed intake of German
shepherd bitches during pregnancy and lactation. J Small Anim Pract. 36:
7-10.
Sheffy, B.E., Williams, A.J., Zimmer, J.F., Ryan, G.D., 1985. Nutrition and
metabolism of the geriatric dog. Cornell Vet. 75, 324–47.
Skipper, A., 2012. Refeeding syndrome or refeeding hypophosphatemia: a
systematic review of cases. Nutrition in clinical practice. 27, 34-40.
Stojanovic, V., Ihle, S. 2011. Role of beta-hydroxybutyric acid in diabetic
ketoacidosis: a review. Can Vet J. Apr; 52(4):426-30.
Steiner, M., Bourges, H.R., Freedman, L.S., Gray, S.J. 1968. Effect of starvation
on the tissue composition of the small intestine in the rat Am J Physiol. Jul;
215(1):75-7.
Swanson KS, KN, K., LB, S., Jr., F.G. 2004. Diet affects nutrient digestibility,
hematology, and serum chemistry of senior and weanling dogs. J. Anim.
Sci. 82, 1713–24.
Tian, F., Heighes, P.T., Allingstrup, M.J., Doig, G.S. 2018. Early Enteral
Nutrition Provided Within 24 Hours of ICU Admission: A Meta-Analysis
of Randomized Controlled Trials. Crit Care Med. Jul; 46(7):1049-1056.
Tisdale, M.J. 2000. Metabolic abnormalities in cachexia and anorexia. Nutrition.
16, 1013-1014.
Tsaousi, G., Panidis, S., Stavrou, G., Tsouskas, J., Panagiotou, D., Kotzampassi,
K. 2014. Prognostic indices of poor nutritional status and their impact on
prolonged hospital stay in a Greek university hospital. Biomed Res. Int.
Valtolina, C., Favier, R.P. 2017. Feline Hepatic Lipidosis. Vet Clin North Am
Small Anim Pract. May; 47(3):683-702.
Villalobos, J.L., González, C., García-Alemida, J.M., Martínez, A., Del Río, J.,
References
98
Márquez, E., Rioja, R., Barranco, J., Enguix, A., Rodríguez, L.M., Bernal,
O., Osorio, D., Mínguez, A., Lara, C., Dani, L., Vallejo, A., Martínez, J.,
Fernández, J.M., Tinahones, F.J., Fernández-Crehuet, J. 2014.
INFORNUT Process; improves accessibility to diagnosis and nutritional
support for the malnourished hospitalized patients; imapct on management
indicators; two-year assessment. Nutr.Hosp. 29(6):1210-1223.
Villaverde, C., Hervera, M. 2015. Capítulo 16: Pacientes críticos y post
quirúrgicos hospitalizados. En: Manual práctico de nutrición clínica en el
perro y el gato. Multimédica ediciones veterinarias, Barcelona (España).
Von Haehling, S., Lainscak, M., Springer, J., Anker, S.D. 2009. Cardiac
cachexia: A systematic overview. Pharm Ther.121: 227-252.
Wakshlag, J. and Kallfelz, F. 2006. Nutritional status of dogs with cancer:
dietetic evaluation and recommendations. In: Encyclopedia of Canine
Clinical Nutrition, Aniwa SAS, Aimargues, France. pp. 408-425.
Walton, R.S., Wingfield, W.E., Ogilvie, G.K., et al. 1996. Energy expenditure
in 104 postoperative and traumatically injured dogs with indirect
calorimetry. J Vet Emerg Crit Care. 6, 71-79.
Watford, M. 2006. Chapter 19: Regulation of fuel utilization in response to food
intake. In: Stipanuk, M.H. 2006. Biochemical, Physiological, Molecular
Aspects of Human Nutrition, 2nd ed; Saunders/Elsevier: St. Louis, MO,
USA, 1993; pp. 551-552.
Watson, P. 2015. Pancreatitis in dogs and cats: definitions and pathophysiology.
J Small Anim Pract. 2015 Jan; 56(1):3-12.
Weber, M., Martin, L., Biourge, V.C., Nguyen, P., Dumon, H. 2003. Influence
of age and body size on the digestibility of a dry expanded diet in dogs. J.
Anim. Physiol. Anim. Nutr. (Berl). 87, 21–31.
Weinsier, R.L., Krumdieck, C.L. 1981. Death resulting from overzealous total
parenteral nutrition: the refeeding syndrome revisited. Am J Clin Nutr. Mar;
34(3):393-9.

References
99
Welborn, M.B. and Moldawer, L.L. 1997. Glucose metabolism. In: Clinical
Nutrition Enteral and Tube Feeding, 3rd ed (eds J.L. Rombeau and R.H.
Rolandelli) W.B. Saunders, Philadelphia. pp. 61-80.
Will, K., Nolte, I., Zentek, J. 2005. Early Enteral Nutrition in Young Dogs
Suffering from Haemorrhagic Gastroenteritis. J. Vet. Med. Ser. A 52, 371–
376.
Zhang, H., Wang, Y., Sun, S., Huang, X., Tu, G., Wang, J., Lin, Y., Xia, H.,
Yuan, Y., Yao, S. 2019. Early enteral nutrition versus delayed enteral
nutrition in patients with gastrointestinal bleeding: A PRISMA-compliant
meta-analysis. Medicine (Baltimore). Mar; 98(11):e14864.
Zekry, D., Herrmann, F.R., and Vischer, U.M. 2013. The association between
the BodyMass Index and 4-year all-cause mortality in older hospitalized
patients. J Gerontol A Biol Sci Med Sci. 68, no. 6, pp. 705–711, 2013.

100
ABBREVIATIONS
AIC: Akaike information criterion
APPLE: acute patient physiologic and laboratory evaluation
ATP: Adenosine triphosphate
BCAA: Branched-chain amino acids
BCS: Body condition score
BMI: Body mass index
BW: Body Weight
CI: Confidence interval
CKD: Chronic kidney disease
CO2: Carbon dioxide
DER: Daily energy requirements
DEXA: Dual energy X-ray absorptiometry
DHA: Docosahexaenoic acid
EEN: Early enteral Nutrition
EI: Energy intake
EN: Enteral nutrition
EPA: Eicosapentaenoic acid
ESPEN: European Society of Clinical Nutrition and Metabolism
FHCV: Veterinary Teaching Hospital Fundació Hospital Clínic Veterinari
HL: Hospitalization length
iBCS: Initial BCS
IBD: Inflammatory bowel disease
iBW: Initial BW
ICU: Intensive Care Unit
IFN-ϒ: Interferon ϒ

101
IGF-I: Insulin-like growth factor I
IL-1β: Interleukin-1
IL-6: Interleukin 6
kcal: kilocalorie
kg: kilogram
LT: Leukotriene
MCS: Muscle condition score
MER: Maintenance energy requirements
NADH: nicotinamide adenine dinucleotide (NAD) + hydrogen (H).
NPO: Nil per os
NS: Nutritional support
OR: Odds ratio
PD: Prescription Diet
PG: Prostaglandins
PN: Parenteral nutrition
PPN: Partial parenteral nutrition
PSS: Physical Status Score
RER: Resting Energy Requirements
RS: Refeeding syndrome
SD: Standard deviation
SE: Standard error
SGA: Subjective Global Assessment
Tf: Transferrin
TNF-α: Tumour necrosis factor
TPN: Total Parenteral Nutrition
VD: Veterinary Diet

102
VEMS: Vertebral epaxial muscle score
VIF: Variance inflation factor
WSAVA: World Small Animal Veterinary Association
ΔBW: BW change
ΔBCS: BCS change
2,3-DPG: 2,3-diphosphoglyverate

103
Index of Tables and Figures
Tables
Table 1.1. Macronutrient content (expressed in g/100 kcal) and calorie content (expressed
in kcal/ml or kcal/g) of the main convalescence diets in the European market for dogs and
cats.
Table 1.2. Main characteristics of the most commonly used feeding tubes (nasoenteral,
esophagostomy, gastrostomy and jejunostomy)
Table 4.1. Descriptive statistics for continuous dependent and independent variables for
the hospitalized dogs.
Table 4.2. Descriptive statistics for categorical dependent and independent variables.
Table 4.3. Effects of the studied categorical risk factors for each of the dependent
variables using univariable analysis.
Table 4.4. Risk factors of the multivariable analysis for each dependent variable, body
condition score change (ΔBCS), body weight change (ΔBW) and outcome.
Table 5.1. Descriptive statistics for continuous dependent and independent variables for
the hospitalized cats.
Table 5.2. Descriptive statistics for categorical dependent and independent variables in
cats.
Table 5.3. Effects of the studied categorical risk factors for each of the dependent
variables using univariable analysis (cats).
Table 5.4. Risk factors of the multivariable analysis for each dependent variable, body
condition score change, body weight change and outcome (survival).

104
Figures
Figure 1.1. Utilization of nutrient stores during simple starvation.
Figure 1.2. Utilization of glucose during the first day of starvation.
Figure 1.3. Re-utilization of glucose during the Cory cycle.
Figure 1.4. Canine patient showing advanced signs of malnutrition.
Figure 1.5. The Screening evaluation performed on every patient in order to see if there
is any nutritional risk factor present.
Figure 1.6. Cat weighted at home with a special scale.
Figure 1.7. Body Condition Score System in dogs and cats.
Figure 1.8. Muscle condition score system in dogs and cats.
Figure 1.9. Nutritional Assessment Checklist.
Figure 1.10. Nutritional support options in veterinary patients.
Figure 1.11. Parenteral nutritional support. Sterile bag containing the parenteral solution
to be administered to the animal.
Figure 3.1. Hospitalization data collection sheet. Recorded data per day per each animal
hospitalized enroled in the study.
Figure 3.2. Form aimed to owners data collection regarding prior admittance period . The
form was given to each owner at the time of admision.
Figure 4.1. Estimation of the effect of the energy intake, measured as percentage of
resting energy requirements, on BCS of dogs with different hospitalization lengths.
Figure 6.1. Relationship between body size and EI (as percentage of RER) in dogs.
Figure 6.2. Classification of dogs and cats by their Physical Status Score (PSS) at the
moment of hospitalization.

105