
Difusio_Exposicio_Herois.pdf - Xarxa d'Arxius Comarcals (XAC)
Upload
khangminh22Category
view
0download
0
TESI DOCTORAL UPF 2013
Integrative study of the regulatory and epigenomic programs involved in
cancer development
Alba Jené i Sanz
Department of Experimental and Health Sciences
Biomedical Genomics group, Research Programme on Biomedical Informatics (GRIB), IMIM-UPF
DIRECTORA DE LA TESI
Dra. Núria López Bigas
Universitat Pompeu FabraInstitut Català de Recerca i Estudis Avançats (ICREA)
Barcelona, 2013

A en Ferran

“If I have seen further it is by standing on ye
sholders of Giants”
- Sir Isaac Newton (1643-1727), in a letter to Robert
Hooke on February 15th, 1676.

Acknowledgements
So, it seems that all adventures have an end, hard to reach as it may be. The writing of a thesis is only the culmination of many years of work that is carried out mostly individually, but there are people without whom the completion of this task would have not been possible, at a professional or at a personal level and, in some cases, at both. I will try not to miss anyone here but, just in case, thank you all from the bottom of my heart!
Núria, per la confiança que vas dipositar en mi fa tants anys, quan em vares oferir fer en doctorat amb tu. Has estat la meva guia en aquest camí però m'has deixat volar sola, i sovint empès per a què perdès la por a fer algunes passes. Gràcies per haver-me deixat estar a BG i per fer-lo tant únic, per tenir en compte totes les veus i per fer que, sovint, treballar llargues hores sigui no només productiu, sinó fins i tot divertit. Has alimentat les meves ànsies de coneixement i ara hauré de veure com fer que no passin gana.
The Biomedical Genomics group former members, with whom I shared work and fun. Güneş Gundem, for so many things I just cannot list here; great friend, crazy labmate, bright mind and inspiring (albeit tiny!) person. And for IntOGen, of course. Khademul, for all the... cookies. Oh, and for that gene. No, really, thank you for the advice, discussions and information sharing, and also for the nice summer expeditions. Sophia Derdak, for feeding me with music that makes research epic and gives me energies to go on, and for proof-reading this thesis. Xavier Rafael, Armand Gutiérrez and Alberto Santos, for the technical support and coffee times. And the current BG family: Christian Pérez, for all the patience with me and my attempts to cook a python in a wok. Jordi Deu, for the technical help all this years and the great web visualisation you implemented. Michi Schroeder, for the positive attitude and nice
ix

discussions. David Tamborero, for the statistical advice. Kostas Alexiou, for the very early feedback on my analyses. And Abel González, for critically reviewing my work, proof-reading this thesis, and fomenting interesting discussions both in the lab and at coffee time. You are a fount of knowledge!
Elizaveta Benevolenskaya, for giving me the opportunity to stay four very fruitful months in Chicago. I learned a lot of biology from you, which greatly helped me to put into context what I was doing.
The great people I met in Chicago at Liza's lab, for great moments both inside and outside of it: Mike Beshiri, Alexandra (Sasha) Vilkova, Renata (Rennie) Varaljai and Willian (Bíiil) Richter. Jenniffer (Jen) McQuade, for introducing me to American backyard BBQs. Alessandra (Ale) Zappulo, just infinite thanks for being like you are, just the perfect roomate for my American quest.
Anna Bigas i Lluís Espinosa, per oferir-me la oportunitat d'establir una fructífera col·laboració dins el vostre projecte.
People at the PRBB, a truly inspiring place to work at. Alfons and Miguel for the software support. Elinor Thompson and the Intervals programme. PRBB Comunicació and PR: Elvira López, Mònica Rodríguez, Maruxa Martínez and Reimund Fickert for the Open Day experience.
Als amics que anem de Sopar en Sopar, pels bons moments, sobre tot gastronòmics. En especial a l'Eduard Abelenda, per ajudar-me a traduir el resum de l'anglès al català.
La Repúbli-k de l'Avern, per proporcionar-me aquesta necessària vàlvula d'escapi cada setmana, per ser tots tant diferents i compartir tantes experiències a ritme de tabal i sota la llum del foc. Hem crescut i après molt, i espero que ho seguim fent desprès de 10 anys junts.
Els meus companys d'aventures per temps i móns fantàstics, per tants moments inoblidables i vivències irrepetibles dins i fora... de joc. És estimulant veure que es pot fer tant amb tant poc però amb moltes ganes. En especial als equips d'Arcaron, Chaos Age i Time Lords (Els Senyors del Temps), per permetre que el meu cervell també vagi de vacances de tant en quant, encara que sigui pensant molt en altres coses.
x

Gràcies a ma mare, per no haver mai deixat els meus “per què?” sense resposta i haver-me estimulat a prendre tot el que pugui del món que ens envolta. Per animar-me a seguir sempre endavant i mai posar-me traves a les eleccions que he pres. I a la meva germana no puc menys que agraïr-li ser tant diferent i a la vegada tant semblant a na mi. Per ser germana i amiga, i fer-me veure que hi ha molts punts de vista i que el meu no és sempre el correcte.
Finalment, però el més important, a en Ferran, perquè senzillament és el meu pilar. Per cuidar-me, estimar-me i alimentar-me en molts sentits. Pel suport en els mals moments, que també n'hi ha hagut. Per preguntar-me sobre el què faig i intentar entendre-ho. També, per la portada d'aquesta tesi. Per ser al meu costat en tot; sense ell això hagués estat impossible.
Alba Jené Sanz
Barcelona, January 2013
xi

Summary
Cancer has traditionally been regarded as a genetic disease, but recently it is becoming apparent that the deregulation of epigenetic mechanisms greatly contributes to tumour development. At the crossing of genetics and epigenetics lie chromatin regulatory factors (CRFs), which are the focus of intense research due to their potential usefulness in anticancer therapy. In this thesis, I determine the transcriptomic state of normal and tumour cells based on epigenetic and regulatory information, and describe the existence of a global synchronisation of gene expression in which Polycomb regulation arises as one of the two main components. I present an analysis on how the under-expression of Polycomb regulated genes contributes to breast cancer progression and epithelial to mesenchymal transition. Furthermore, I identify this under-expression as a valuable independent prognostic factor. Taking advantage on the wealth of cancer genomics data made available recently, I also evaluate the mutational status of CRFs across many human tumours from different tissues and cancer cell lines, and find that 39 CRFs are potential cancer drivers in at least one tissue, even though most of them are mutated at relatively low frequencies. Finally, I present a resource to visualise and analyse genomic alterations across cancer cell lines in the context of drug sensitivity/resistance and the information on somatic tumour alterations.
xiii

Resum
El càncer ha estat tradicionalment considerat una malaltia fonamentalment genètica, però recentment s'està fent palès que la desregulació de mecanismes epigenètics contribueix en gran manera al desenvolupament tumoral. Al bell mig de la intersecció entre la genètica i l'epigenètica s'hi troben els factors reguladors de la cromatina (CRFs, en anglès), que són un focus important de recerca a causa de la seva potencial utilitat en teràpies contra el càncer. En aquesta tesi, determino l'estat transcriptòmic de cèl·lules normals i tumorals basant-me en informació epigenètica i regulatòria, i descric l'existència d'una sincronització global de l'expresió gènica en què la regulació controlada per Polycomb es manifesta com a un dels dos components principals. Presento una anàlisi sobre com la baixa expressió dels gens regulats per Polycomb contribueix a l'avenç del càncer de mama i a la transició entre epitel·li i mesènquima. A més, identifico aquesta baixa expressió com a factor valuós de pronòstic independent. Aprofitant les dades genòmiques de càncer que han estat posades a la disposició del públic recentment, també avaluo l'estat mutacional dels CRFs en molts tumors humans provinents de diferents teixits i línies cel·lulars de càncer. Els resultats indiquen que 39 CRFs són potencialment conductors del procès cancerígen en almenys un teixit, malgrat que molts d'ells es torben mutats en freqüències relativament baixes. Finalment, presento un recurs per a visualitzar i analitzar alteracions genòmiques entre línies cel·lulars de càncer en el context de la resistència a fàrmacs i de la informació sobre alteracions de tumors somàtics.
xiv

Contents
Acknowledgements..........................................................................ix
Summary........................................................................................xiii
Resum............................................................................................xiv
Contents..........................................................................................xv
List of figures................................................................................xvii
List of tables...................................................................................xix
List of abbreviations.......................................................................xxi
Part I - INTRODUCTION......................................................................1
Chapter 1 - Introduction..................................................................3
1.1 Preface...................................................................................3
1.2 Layers of genomic regulation................................................5
1.3 Oncogenomics.....................................................................23
1.4 Cancer epigenomics............................................................37
1.5 High-throughput study of cancer genomes..........................52
Part II - OBJECTIVES.........................................................................67
Part III - RESULTS..............................................................................71
Chapter 2 - Large-scale co-regulation based on chromatin structure
......................................................................................................73
Chapter 3 - Expression of Polycomb targets predicts cancer
prognosis.....................................................................................105
xv

Chapter 4 - The mutational landscape of chromatin regulatory
factors across 3000 tumour samples............................................157
Chapter 5 - IntOGen-CL: Large-scale analysis of mutations in
cancer cell lines...........................................................................223
Part IV - DISCUSSION......................................................................231
Chapter 6 - Discussion.................................................................233
Part V - CONCLUSIONS...................................................................241
Part VI - APPENDIX..........................................................................245
Chapter 7 - IntOGen: integration and data mining of
multidimensional oncogenomic data...........................................247
Chapter 8 - Inhibition of specific nf-κb activity contributes to the
tumor suppressor function of 14-3-3σ in breast cancer................251
References..........................................................................................265
xvi

List of figures
1.1 Chromatin organization levels 6
1.2 Model of the overall structure of the epigenome in normal human cells 9
1.3 Histone tail modifications at histone H3 10
1.4 Histone methylation patterns of active and silent genes 12
1.5 Epigenetic gene silencing by Polycomb protein complexes PRC1 and PRC2 18
1.6 The hallmarks of cancer 24
1.7 Models of tumour progression 26
1.8 Synthesis of the clonal evolution and CSC models 28
1.9 Epithelial to Mesenchymal Transition (EMT) and invasion 30
1.10 Global epigenomic alterations in cancer 38
1.11 CpG island hypermethylation profile in tumours with different origin 39
1.12 Global changes in histone modification in normal and cancer cells 42
1.13 A model on how the gain and loss of cell fate transcription factors (CFTFs) and aberrant Polycomb recruitment may lead to the formation of tumour-initiating cells 48
1.14 A typical ChIP-seq “peak calling” pipeline 56
1.15 A selection of ChIP-seq peak callers 57
1.16 Types of genome alterations that can be detected by NGS 59
1.17 Enrichment analysis based on gene annotations to identify coordinately regulated functional modules 62
1.18 Integrated visualization of genomics data: Circos plot schema 64
xvii

List of tables
1.1 Molecular features of fHC, cHC and EC 7
1.2 Function of histone modifications and variants 13
1.3 Oncogenomic public resources 36
1.4 Main characteristics of microarray and RNA-Seq technologies 54
xix

List of abbreviations
AML - Acute Myeloid Leukaemia
CCLE - Cancer Cell Line Encyclopedia
CGC - Cancer Gene Census
ChIP - Chromatin Immunoprecipitation
CML - Chronic Myeloid Leukaemia
CNV - Copy Number Variation
CSC - Cancer Stem Cell
DNMT - DNA Methyltransferase
EC - Euchromatin
EMT - Epithelial to Mesenchymal Transition
ES - Embryonic Stem [cell]
FDA - Food and Drug Administration
HAT - Histone Acetyltransferase
HC - Heterochromatin
HDAC - Histone Deacetylase
HDACi - Histone Deacetylase inhibitor
HDM - Histone Demethylase
HMT - Histone Methyltransferase
xxi

ICD-O - International Classification of Disease in Oncology
ICGC - International Cancer Genome Consortium
MDS - Myelodysplastic Syndrome
MET - Mesenchymal to Epithelial Transition
NGS - Next Generation Sequencing
NSCLC - Non Small Cell Lung Carcinoma
PcG - Polycomb Group [of proteins]
PRC1 - Polycomb Repressive Complex 1
PRC2 - Polycomb Repressive Complex 2
SLEA - Sample-Level Enrichment Analysis
SNP - Single Nucleotide Polymorphism
SNV - Single Nucleotide Variant
TCGA - The Cancer Genome Atlas
TF - Transcription Factor
xxii

Part I
Introduction

Chapter 1
INTRODUCTION
1.1 Preface
Epigenetics and cancer biology are nowadays two extremely broad subjects of study and have followed separate research paths until the last decade. Chromatin, the highest level of organization of the genome within the nucleus of a cell, was first described and named by Walther Flemming, back at the end of the 19th century, but its function was completely unknown then (Flemming 1882). Much later, Conrad Waddington coined the term “epigenetics” as the study of the causal mechanisms intervening between the genotype and the phenotype (Waddington 1942). Being a rare combination of scientist and philosopher, his most known original contribution was the conceptualization, within the field of developmental biology, of what he called the “epigenetic landscape”. The central idea was that a cell may choose amongst many possible paths to follow during development, defined by the expression of genes, and that each path led to a different phenotype (Slack 2002). This original definition of epigenetics changed throughout the years until achieving its current meaning, being: “the mechanisms that result in heritable changes in gene expression which are not coded in the DNA sequence itself” (Probst, Dunleavy, and Almouzni 2009). In other words, epigenetics explains how cells acquire different phenotypes in a multicellular organism, given that their genomic DNA sequence is supposed to be the same (with the obvious exception of B and T cells in mammals).
The regulation of chromatin structure determines the configuration of each cell's epigenomic landscape, which, in turn, will greatly influence the combinations and quantities of proteins synthesized. By making the genes that code for those
3

proteins more or less accessible to the molecular machinery that transcribes them, chromatin conformation controls the phenotype of a cell. It may adopt more open (and thus accessible to proteins) or closed (inaccessible) compaction states, allowing for the recognition of DNA bases by transcription factors (TFs), or blocking their access by rendering them not visible. Since the 1970s, epigenetics, with its current meaning, has been a subject of intense research.
Cancer is arguably the most studied disease nowadays (or, more correctly said, group of diseases), and it has been thought to be exclusively a genetic disease for long. The sequencing of the human genome fostered hopes for the finding of what exactly caused cancer, and how it could be treated. However, the oncogenomics scenario proved much more complex than expected, and soon scientists turned to epigenetics to explain what genomic sequence apparently could not. It seems now clear that higher levels of genomic regulation play a key role in cancer development. The two fields, genomics and epigenetics, are today studied together in the cancer context. After the completion of the Human Genome Project in 2002, and owing to the exponential improvements in sequencing technologies, it has been possible in the last years to obtain vast amounts of data to characterise individual tumours, and even track their evolution as they progress (Ding et al. 2012; Landau et al. 2013). A major bottleneck that scientists face now is how to integrate all this novel knowledge and obtain useful information that can be potentially used in a clinical setting. The distance from the initial data to a patient's treatment is abysmal, but the pace at which our understanding of cancer biology is advancing is equally overwhelming.
The topics covered in this thesis are therefore very broad, and our understanding on them is evolving extremely fast. In this introductory chapter I focus on the relevant parts that affect the analyses and conclusions reported in this work. I begin by introducing the concepts of epigenetic and genetic regulation of transcription, and by describing the role that chromatin organization, and other epigenetic factors, play on them. The second part summarizes the current models used to understand cancer development and tumour heterogeneity, and then focuses on breast cancer to explain the approaches that are being used currently to characterise tumours. In the third part I delineate how the main different epigenetic systems are deregulated in tumorigenesis, and how this knowledge is being exploited to develop anticancer agents that can be used in the clinic. Finally, the last part focuses on the technical advances that have allowed the study of cancer biology and epigenetics, and on the bioinformatic approaches that have been developed to integrate all these large amounts of data.
4

1.2 Layers of genomic regulation
DNA is folded multiple times within the nucleus of eukaryotic cells into a structure we call chromatin. This is not simply a storage solution, but a very refined dynamic mechanism that stands at the very top of the regulation of gene expression. Chromatin can adopt an open (euchromatin) or compact (heterochromatin) conformation, which are spatio-temporally defined (Passarge 1979). It is basically formed of DNA, histone and non-histone proteins, that physically determine distinct levels of possible interactions of the DNA with surrounding molecules by making it more or less accessible. The most de-condensed chromatin is what was called “beads on a string” by the first scientists that saw it with an electron microscope. It consists of the DNA molecule wrapped around two pairs of four core histones (H2A, H2B, H3 and H4), which form the nucleosome, a fibre measuring 11nm in width. Nucleosomes are further packed into a 30nm fibre, which in turn is organized into a higher order structure of 300nm. The highest level of compaction is observed in metaphasic chromosomes, during eukaryotic mitosis, and it can be clearly visualized in a conventional optical microscope. Figure 1.1 illustrates these levels of chromatin organization.
In the 1960s it became apparent that heterochromatin could be subdivided into facultative (fHC) and constitutive (cHC) (Brown 1966), but it was not until some years later, with the advent of new molecular techniques, that the study of gene expression was made possible. Several observations in the field of cellular differentiation led to the identification of key transcription factors, whose expression was dependent on the differentiation state of the cell. Gene activity had been described to correlate with euchromatic (EC) regions at that time, but the understanding of how this was linked to the regulation of transcription factors during differentiation, or how transposable elements were mostly silenced, remained elusive (Trojer and Reinberg 2007).
Nucleosomes are composed of 147 bp of DNA wrapped 1.65 times around the histone octamer (Luger et al. 1997). The description of nucleosomes as the basic unit of chromatin's organization in the decade of the 70s (Kornberg and Thomas 1974) led to their functional study, and their role in regulating transcription started to be elucidated (Han and Grunstein 1988). Soon after, factors that intervened in the positioning and displacement of nucleosomes, such as chromatin-remodelling complexes, were described for the first time. This provided a mechanistic explanation on why nucleosomes are not regularly spaced throughout EC, and highlighted the importance of non-histone proteins on the regulation of chromatin structure (B. Li, Carey, and Workman 2007).
5

Post-translational modifications on histone tails are other chromatin-related factors that have been associated to the modulation of the underlying genes' expression (Bernstein et al. 2007). Table 1.1 summarizes the general associations between this histone and non-histone proteins and the compaction of chromatin. There have been increasing efforts on the study of chromatin in the last decades, and it is now one of the main focuses in the field of epigenetic research.
6
Figure 1.1. Chromatin organization levels. The 11nm fibre is the lowest level of chromatin organization, and is composed of DNA wrapped around arrays of nucleosomes. Several factors, such as hypoacetylation at histone tails, contribute to the further local compaction of the 11nm fibre. A higher-order structure, termed the 30nm fibre, is represented on the fourth image on the top-left and third on the top-right. Even higher-order chromatin states exist beyond the 30nm fibre, the highest of all being the metaphasic chromosomes during mitosis, that can be observed with a conventional optic microscope (electron micrograph, bottom-left, and cartoon, bottom-right). Adapted from (Trojer and Reinberg 2007) and (Felsenfeld and Groudine 2003).

1.2.1 Epigenetic regulation of the genome
One of the proposed, but not the only, definitions of epigenetics is “the transmitted inherited genome activity that does not depend on the naked DNA sequence” (Manel Esteller 2012). It constitutes a higher level of regulation of gene expression, acting on top of the nucleotide changes and the direct binding of proteins to the DNA. Epigenetic mechanisms explain how two identical genotypes may give rise to different phenotypes, given the same environmental stimulus, and it has been a subject of intense study in the past decades in the field of molecular biology. Very recently, Heyn and colleagues described that epigenetic drift is also a driver of the normal ageing process in humans, in which we gradually lose genome-wide DNA methylation (Heyn et al. 2012). Another
7
Table 1.1. Molecular features of fHC, cHC and EC. Active and repressed transcription is greatly influenced by the compaction state of chromatin, modulated by a number of factors. These include histone and non-histone proteins. The molecular features described here are discussed in detail further on in this chapter. PcG: Polycomb Group; PRC1: Polycomb Repressive Complex 1; PRC2: Polycomb Repressive Complex 2. Adapted from (Trojer and Reinberg 2007).
Chromatin Organization
Molecular Features
DNA meth
Histone Modifications
Other Components and Trans-Acting Factors
Fac
ulta
tive
Het
eroc
hrom
atin
(fH
C)
Inactive X chromosome (Xi)
Locally compacted 11nm fibre, variations of 30nm fibre and higher-order chromatin
+
Hypoacetylation, H4K20me1, H3K9me2, H3K27me3, H2AK119ub1
PRC1, PRC2, other PcG proteins, macroH2A, CULLIN3/SPOP
Autosomal imprinted genomic loci
+
Hypoacetylation, H3K9me2/3, H3K27me3, H4K20me3
MacroH2A, CTCF, PRC2
Long-range silencing (e.g., HOX gene clusters)
+Hypoacetylation, H3K27me2/3, H2AK119ub1
PRC1, PRC2, other PcG proteins
Local gene silencing ?
Hypoacetylation, H3K9me2, H4K20me1, H2AK119ub1
PRC1, PRC2, other PcG proteins, HP1γ, MBT proteins
Euchromatin (EC) 11 nm fiber −Hyperacetylation, H3K4me2/3, H3K36me3
ATP-dependent chromatin remodelers, H3.3, H2A.Z
Constitutive heterochromatin (cHC) ≥30 nm fiber +
Hypoacetylation, H3K9me3, H4K20me3
HP1α/β

study pointed out how epigenetic dissimilarities between monozygotic twins, arising during their lifetime, may explain their different phenotypes (for instance, the risk for genetic diseases) (Fraga, Ballestar, Paz, et al. 2005). Epigenetic mechanisms, thus, lie at the heart of many complex regulatory processes that are crucial for the maintenance of normal biology.
Four main layers of epigenomic regulation maintain an optimal organization of the chromatin structure (Sandoval and Esteller 2012):
i) post-translational modifications of histone tails
ii) DNA methylation
iii) Chromatin remodelling, and
iv) Non-coding RNAs
These four factors have key roles in the tight regulation of gene expression. The overall structure of the epigenome is depicted in Figure 1.2, with a focus on DNA methylation and histone modifications. In the following sections, I will outline the main actors in the first three, and the interplay that has been described between them under physiological conditions. The in-depth study of non-coding RNAs is very recent, and we are just beginning to understand how they mediate epigenetic regulation. How non-coding RNAs take part in establishing and maintaining an epigenomic landscape is beyond the scope of this introduction; for recent reviews, see (J. T. Lee 2012) and (Guil and Esteller 2012).
Histone modification
Histones are the proteins that form the nucleosomes. The so-called “core” histones are H2A, H2B, H3 and H4; histone H1 serves as a “clamp” that stabilizes the nucleosome by keeping in place the DNA wrapped around it. H1 has been long thought to play a minor role in genomic regulation, compared to the others, although recently a study proposed that it is critical for pluripotent stem cell differentiation (Yunzhe Zhang et al. 2012). There are two main mechanisms through which histones participate in the regulation of the genome: the incorporation of histone variants to nucleosomes and the post-translational modification of histone tails. Histone variants exist for H2 and H3, and seem to play a key role in developmental processes, such as the establishment of heterochromatin at centromeres (H3 variant CENP-A), the inactivation of the X chromosome (MacroH2A) and germ cell differentiation (H3.3) (Banaszynski, Allis, and Lewis 2010). The extent to which histone variants contribute to
8

genomic regulation is, nevertheless, still largely under studied. The second mechanism through which histones contribute to regulation is the post-translational modification of their tails. Histone tails protrude from their corresponding globular part in the octamer formed by pairs of H2A, H2B, H3
9
Figure 1.2. Model of the overall structure of the epigenome in normal human cells. A silenced gene at the top has its promoter occupied by a Polycomb complex (red shade), that mediates the deposition of H3K27me3, a repressive histone modification. Unmethylated CpG islands are represented with pale blue circles, and the methylated DNA state in red ones. Below the repressed gene, a region of open chromatin represents a fully active state, with the characteristic active H3K4me3 mark. A distant enhancer presents the H3K4me1 mark, typical of active enhancers. The chromatin fibre at the bottom shows a repressive and compact conformation, with compact nucleosomes, DNA methylation and the marks H3K9me2 and H3K9me3 characteristic of heterochromatin. Adapted from (Baylin and Jones 2011).
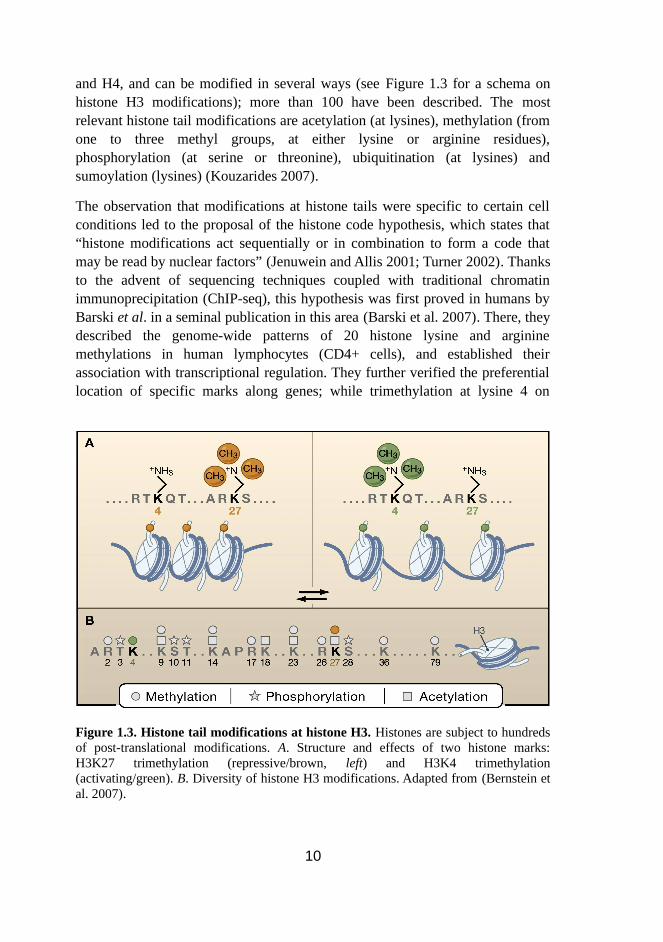
and H4, and can be modified in several ways (see Figure 1.3 for a schema on histone H3 modifications); more than 100 have been described. The most relevant histone tail modifications are acetylation (at lysines), methylation (from one to three methyl groups, at either lysine or arginine residues), phosphorylation (at serine or threonine), ubiquitination (at lysines) and sumoylation (lysines) (Kouzarides 2007).
The observation that modifications at histone tails were specific to certain cell conditions led to the proposal of the histone code hypothesis, which states that “histone modifications act sequentially or in combination to form a code that may be read by nuclear factors” (Jenuwein and Allis 2001; Turner 2002). Thanks to the advent of sequencing techniques coupled with traditional chromatin immunoprecipitation (ChIP-seq), this hypothesis was first proved in humans by Barski et al. in a seminal publication in this area (Barski et al. 2007). There, they described the genome-wide patterns of 20 histone lysine and arginine methylations in human lymphocytes (CD4+ cells), and established their association with transcriptional regulation. They further verified the preferential location of specific marks along genes; while trimethylation at lysine 4 on
10
Figure 1.3. Histone tail modifications at histone H3. Histones are subject to hundreds of post-translational modifications. A. Structure and effects of two histone marks: H3K27 trimethylation (repressive/brown, left) and H3K4 trimethylation (activating/green). B. Diversity of histone H3 modifications. Adapted from (Bernstein et al. 2007).

histone H3 (H3K4me3) clearly surrounded the TSS of active genes, levels of H3K27me3 were higher at silent promoters. A year later, the same laboratory published a follow-up study, including 18 further histone lysine acetylations, and thus expanding the analysis to 39 histone modifications (Z. Wang et al. 2008). The relevance of those two publications went beyond their biological conclusions: they provided the first genome-wide histone modification maps in human cells, and thus paved the way for many analysis to come that used the data sets generated. Other individual publications have explored histone modification maps since then, but clearly the ENCODE Consortium's titanic effort to catalogue all regulatory elements in the genome stands out: to date, they have released maps for 11 histone modifications and the H2A.Z variant in more than fifteen cell lines, and they plan to expand this figures to nearly a hundred in the near future (The ENCODE Project Consortium 2012).
The correlation of histone modifications with transcription has been a subject of recent intense study. It is now clear that H3K4me3 is deposited at active promoters in a wide range of organisms, from yeast to human (G. C. Hon, Hawkins, and Ren 2009). Actively transcribed genes are also characterized by having H3K36me3 deposited along the gene body. This mark is specifically enriched at exons, rather than introns, providing a possible connection between the regulation of splicing and chromatin structure (Kolasinska-Zwierz et al. 2009; Kim et al. 2011). Highly cell type specific, H3K4me1 has been tightly associated to active enhancers, to the point that its occupancy profiles have been used to map novel enhancer regions in human (Heintzman et al. 2009). Other active marks are highly context specific: H2BK5me1 and H4K20me1 are specifically enriched at highly expressed exons that are close to the promoter. Exons towards the 3' end of the gene are increasingly enriched for H3K36me3, and less for those latter marks (G. Hon, Wang, and Ren 2009). Also H3K79me3 has been associated to active transcription, but little is known of its specific function (Kouzarides 2007). In contrast, three other methylation marks, H3K9me3, H3K27me3 and H4K20me3, generally correlate with repression in mammals (Z. Wang et al. 2008) and are associated to repetitive regions in the genome that must remain silent (Grewal and Moazed 2003). A summary on histone methylation effects on gene expression is depicted in Figure 1.4. Generally speaking, histone acetylation correlates with active transcription, and it does not seem to have as highly specialized a function as histone methylation. Other modifications, including ubiquitination, sumoylation and phosphorylation, are far less studied, and their role in transcriptomic regulation is thought to be less important. In Table 1.2 I compile the histone modifications that have been most studied, and for which genome-wide occupancy maps are now available.
11

The fact that some active marks were found at silenced genomic regions led a decade ago to proposing the existence of a “combinatorial code” in histone modifications (Fischle, Wang, and Allis 2003). This concept postulates that they regulate each other, influencing the occurrence of subsequent modifications by promoting or preventing them; when a lysine is methylated, for instance, it cannot be acetylated at the same time. A paradigmatic example are the mutually-exclusive H3K9me3 and H3K9ac (acetylation) marks, that are associated,
12
Figure 1.4. Histone methylation patterns of active and silent genes. ChIP-seq experiments typically produce profiles as an output, which can be regarded as the frequency in which every genomic position is occupied by the factor under study. This cartoon depicts the profiles of histone methylation at different residues, along with Pol II and the histone variant H2A.Z, in human CD4+ cells. Promoter and enhancer or insulator regions are indicated. Adapted from (Barski et al. 2007).

respectively, to repressed and active transcription (Latham and Dent 2007). The most studied interplay between opposing histone marks is, nevertheless, that of H3K4me3 and H3K27me3. With the availability of histone occupancy genome-wide maps, Bernstein et al. described the “bivalent promoters”, that have both marks at the same time (Bernstein et al. 2006). Interestingly, they were found to co-occur at developmental genes in mouse ES cells, but resolved in either the activating or the repressive mark upon differentiation. Bivalent marks, thus, silence developmental genes in undifferentiated cells, while keeping them poised for activation. This finding is now broadly accepted, and had important implications for following studies in the stem cell field.
The availability of genome-wide histone occupancy maps has provided an invaluable resource for the computational study of genomic regulation. In fact, analyses on ENCODE's released datasets have developed models to predict the
13
Table 1.2. Function of histone modifications and variants. Some of this modifications typically stretch over a wide region (H3K27me3, H3K36me3, H3K79me2, H4K20me1), while the others present a more punctuated pattern. Adapted from (The ENCODE Project Consortium 2012).
Histone modification or variant Putative functions
H2A.Z Histone protein variant (H2A.Z) associated with regulatory elements with dynamic chromatin.
H3K4me1 Mark of regulatory elements associated with enhancers and other distal elements, but also enriched downstream of TSS.
H3K4me2 Mark of regulatory elements associated with promoters and enhancers.
H3K4me3 Mark of regulatory elements primarily associated with promoters/TSS.
H3K9ac Mark of active regulatory elements with preference for promoters.
H3K9me1 Preference for the 5′ end of genes.
H3K9me3 Repressive mark associated with constitutive heterochromatin and repetitive elements.
H3K27ac Mark of active regulatory elements; may distinguish active enhancers and promoters from their inactive counterparts.
H3K27me3 Repressive mark established by polycomb complex activity associated with repressive domains and silent developmental genes.
H3K36me3 Elongation mark associated with transcribed portions of genes, with preference for 3′ regions after intron 1.
H3K79me2 Transcription-associated mark, with preference for 5′ end of genes.
H4K20me1 Preference for 5′ end of genes.

transcriptomic state of genes in different cell types (J. Ernst and Kellis 2010; J. Ernst et al. 2011; Dong et al. 2012). Their work has been based on the combination of several chromatin features and information on gene expression in each site, directly applying, and corroborating at the same time, the aforementioned histone code hypothesis. These models are complementary approaches that may aid in the functional annotation of the genome in the near future.
DNA methylation
The second feature of epigenetic regulation is DNA methylation. A characteristic feature of our genome is that the CpG dinucleotide (a cytosine followed by a guanine, in the 5' to 3' direction) occurs at a lower frequency than it would be expected if it had a random distribution. Nevertheless, half of the human gene promoters present CpG-rich regions that extend from hundreds to few thousand bases, termed “CpG islands”. Even when most of these are in house-keeping genes, half of the tissue-specific ones are also known to have CpG islands at their promoters (Bird 1986). These facts are relevant because cytosines in those DNA regions, almost exclusively, have been long-known to be more prone to methylation (McGhee and Ginder 1979; van der Ploeg and Flavell 1980), which plays a key role in the epigenetic regulation of transcription. Normally, promoters are unmethylated in transcriptionally active genes, and methylated in those that are silenced: housekeeping and tissue-specific genes fall into each category, respectively. One described exception is the recent observation that non-CpG methylation occurs in active promoters in stem cells, where it represents around 25% of the total DNA methylation (Lister et al. 2009). There are two different scenarios for DNA methylation, each carried out by specific enzymes, called DNA methyltransferases (DNMTs). De novo DNA methylation is catalysed by DNMT3A and DNMT3B, while DNMT1 specifically maintains the methylation patterns following DNA replication (Okano et al. 1999).
Interestingly, the methylation of CpG islands is connected to other processes involved in the regulation of chromatin structure, basically through the cross-talk with histone modifications. The first component that was described to be involved in both epigenetic systems is the MeCP2 protein, that is responsible for further transcriptional repression at methylated CpG island promoters through the recruitment of histone deacetylases (HDACs) (P. L. Jones et al. 1998; Nan et al. 1998). These enzymes are responsible for the removal of acetyl groups from histone tails, leading to hypoacetylation and a less accessible chromatin configuration, which is less favourable for transcriptional activity. The same DNMTs that methylate DNA can also recruit HDACs to promoters (Robertson et
14

al. 2000; Fuks et al. 2001), and both DNMTs and MeCP2 associate with histone methyltransferases (HMTs) to reinforce gene silencing at methylated CpG sites (Fuks, Hurd, Deplus, et al. 2003; Fuks, Hurd, Wolf, et al. 2003). These findings provided interesting connections between repressive histone modifications and DNA methylation.
The study of DNA methylation and its defects has attracted a lot of attention lately in the scientific literature (Schübeler 2009; Rakyan et al. 2011), since it may provide a partial explanation to the “missing heritability” problem; this is, the presence of different phenotypes in two organisms with the same genotype. Epidemiologists are specially interested in this epigenetic regulatory mechanism because it is more susceptible to be altered by external influences than the DNA sequence itself, and may be a mechanism to determine environmental risk factors. But probably the field where DNA methylation is more intensively under study right now is oncogenomics, since there is increasing evidence for the crucial role that this feature plays in cancer initiation and progression (Hansen et al. 2011). This will be discussed in depth later in this introduction.
Chromatin regulatory factors
The third epigenetic mechanism that is discussed here is chromatin remodelling through Chromatin Regulatory Factors (CRFs). I previously described how chromatin can be re-arranged to expose or block certain regions to external regulators, such as transcription factors. CRFs are largely responsible for the fine-tuning of this process, since their main function is to modify histones at specific residues. They disrupt or promote DNA-histone interactions, change nucleosome positions and influence chromatin folding to physically bring specific regions closer. These proteins can be biochemically subdivided in two main groups: ATP-dependent chromatin remodelers (formed by the ISWI, SWI/SNF, INO80 and NuRD/Mi-2 complexes) and Non ATP-dependent remodelers. The latter comprises histone modifiers, although some can interact with non-histone proteins: histone acetyltransferases (HATs), histone deacetylases (HDACs), histone methyltransferases (HMTs) and histone demethylases (HDMs) (Boyer et al. 2000; Peterson 2002; Kassabov et al. 2003; Jin et al. 2005). Frequently, these factors interact with each other (Fry and Peterson 2001). For a detailed classification of the CRFs in humans, see Table S1 on Chapter 4, in the Results section.
ATP-dependent chromatin remodelers use the energy of ATP hydrolysis to make nucleosomal DNA more accessible to other factors. Their classification is based on the similarities to orthologous protein complexes in yeast and Drosophila,
15

and the shared domains, which determine their functional differences. The SWI/SNF is usually associated with transcriptional activation of repressed genes, while many members of the ISWI and NuRD/Mi-2 complexes are more related to repression pathways (Peterson 2002). The INO80 complex has been linked to the sliding of nucleosomes along the DNA, and may be involved in DNA repair (Jin et al. 2005). Given the big changes that these enzymes may cause both into the local and global chromatin structure, it is evident that their misregulation can potentially cause great damage, such as enhanced DNA recombination or defects in chromosome condensation. Thus, several layers of control apply to ATP-dependent chromatin remodelers; for instance, SWI/SNF is virtually inactive upon phosphorylation, and also shows no activity towards nucleosomes with linker histones (H1) incorporated (Peterson 2002). Globally, CRFs are believed to play an important role at the maintenance of chromatin integrity (Papamichos-Chronakis and Peterson 2013).
Non ATP-dependent chromatin remodelers can be roughly divided into those that place or remove acetyl groups, and those that do so with methyl groups. As previously mentioned, the acetylation of histone and non-histone proteins plays a pivotal role in gene regulation, since acetylated residues in histone tails mark transcriptionally active regions (Hildmann, Riester, and Schwienhorst 2007; Yoo and Jones 2006). Particularly, the acetylation of H4K16 seems to be crucial for the regulation of chromatin folding, and in the switch from heterochromatin to euchromatin (Shahbazian and Grunstein 2007). Non-histone proteins that can be reversely acetylated include master regulators such as p53, STAT and NF-kb (Spange et al. 2009; Buchwald, Krämer, and Heinzel 2009), that determine cell growth, differentiation and migration. HATs are roughly divided into three main families: CBP/p300, GNAT and MYST. The reverse reaction of acetylation correlates with transcriptional repression. There are three main HDAC families: class I and II HDACs, and the NAD-dependant class III, sirtuins. Most of these enzymes are part of big repressive complexes that include other CRFs of different types. In general, HATs and HDACs modify more than one lysine, but a limited specificity has been described for some (Kouzarides 2007).
HMTs and HDMs are responsible for deposition and removal of methyl groups at lysine and arginine residues on histone tails, and in some cases they also exhibit non-histone substrate activity. Arginine HMTs are yet poorly described, so current knowledge on histone methylation is mostly confined to lysine residues. A particularity of methylation is that it may occur as single (me), dimethyl (me2) or trimethyl (me3) groups, expanding the combinatorial possibilities of modifying more than one residue in the same protein. Opposite to acetylation, methylation does not change the charge of lysines; rather it regulates
16

the conformation of chromatin by attracting other molecules that modify the degree of compaction of nucleosomes (Nielsen et al. 2001). The activity of HMTs can either be associated to transcriptional activation or repression; H3K4me3 promotes gene expression, while H3K9me3 and H3K27me3 are enriched in silent regions. Particularly, H3K27me3 plays an important role in X inactivation, and imprinting, as well as in the silencing of HOX genes, which highlights the importance of HMT specificity, and the broad consequences that can have its misregulation (Kouzarides 2007). The catalytic subunit of the Polycomb complex, EZH2, catalyses H3K27me3, but the complexity of this regulatory system deserves a more in-depth description below. HMTs are highly specific not only for the modified residue, but often also for the amount of methylation present, and may even recognize the surrounding aminoacids.
The first description of a HDM, LSD1 (H3K4 and H3K9 demethylase), is relatively recent (Shi et al. 2004), but even newer is the characterization of the long-awaited UTX and JMJD3 H3K27 demethylases, that have broad implications in the regulation of differentiation and cell identity by counteracting the repressive H3K27me3 mark (Swigut and Wysocka 2007). Many developmental genes present both the activating H3K4me3 and the repressive H3K27me3 mark at promoters in ES cells (bivalent state), but their transcription remains silent. Upon differentiation, some lineage-specific genes need to be expressed, and it is in this step when H3K27 demethylases play a key role. JMJD2 is another HDM that acts upon trimethylated lysines, with specificity towards H3K9me3 and H3K36me3 (Whetstine et al. 2006). Many HDMs are known now, and, like HMTs, they present a high degree of specificity towards the target lysine and the degree of methylation.
The particular case of Polycomb proteins
The main actors in the regulation of the chromatin landscape have been discussed: DNA methylation, histone modifications and CRFs. Admittedly, some of those enzymes can be classified in more than one category, but for convenience this is the canonical division that is followed here. However, there is a group of proteins that lies at the crossroads of the three, and deserves special consideration for its key role in many crucial cellular processes: the Polycomb complex group (PcG). PcG proteins reside in two main complexes, Polycomb Repressive Complex 1 and 2 (PRC1 and PRC2), that have complementary functions in transcriptional repression. Canonically, PRC1 is composed of RING1 (responsible for H2AK119 ubiquitylation), BMI1, PCGF2 and CBX family proteins; PRC2, on the other hand, contains EZH2 (the catalytic subunit, that catalyses trimethylation of H3K27), SUZ12 (a co-enzyme, required for
17

PRC2 activity), EED (that promotes the propagation of the H3K27me3 mark) and RBBP4/7 (Ku et al. 2008; Margueron et al. 2009; Kuzmichev et al. 2002). Currently, it is believed that PRC2 binds to its target genes, where it catalyses the trimethylation of H3K27me3. This mark is then recognised by PRC1, that further places the H2K119Ub modification, which then inhibits Polymerase II (PolII), resulting in transcriptional repression (Zhou et al. 2008) (see Figure 1.5). Moreover, PcG proteins also maintain genes repressed by structurally looping with chromatin (Tiwari et al. 2008). Recently, PRC2 has been associated with the other main repression mechanism, DNA methylation, and has been proposed to recruit DNMT1, DNMT3A and DNMT3B to promoters to establish stable chromatin silencing (Viré et al. 2005). It is not clear, however, if this might be a physiological behaviour, since Polycomb-mediated DNA hypermethylation has been associated with the initiation of tumorigenesis in several studies
18
Figure 1.5. Epigenetic gene silencing by Polycomb protein complexes PRC1 and PRC2. Binding of the PRC2 initiation complex to its target genes induces mainly trimethylation of H3K27. PRC1 is able to recognize the H3K27me3 mark, which might bring neighbouring nucleosomes into the proximity of PRC2 to facilitate widespread methylation over extended chromosomal regions. Further stable gene silencing may be accomplished through inhibition of the transcriptional machinery, PRC1-mediated ubiquitylation of H2AK119, chromatin compaction and recruitment of DNMTs to target genes by PRC2. Adapted from (Sparmann and Lohuizen 2006).

(Widschwendter et al. 2007; Ohm et al. 2007; Schlesinger et al. 2006). Thus, Polycomb proteins promote reversible transcriptional silencing through at least three distinct mechanisms. EZH2 can also methylate GATA4, a non-histone protein, and silence its transcription.
PRC2 was initially described as a HOX gene repressor, but it has now been assigned much wider functions, including mammalian X inactivation, regulation of development, establishment and maintenance of stem cell identity and cancer (Schuettengruber et al. 2007). EZH2 may itself be phosphorylated, in a process that has been associated with cell cycle regulation (Y.-H. Chen, Hung, and Li 2012). Through the deposition of the H3K27me3 mark, PRC2 is moreover at the centre of chromatin plasticity, since that is the most prominent modification found at facultative heterochromatin. The role of PRC2 in embryonic development relies on the placement of H3K27me3 at H3K4me3-occupied gene promoters in ES cells, that form bivalent chromatin domains. This keeps developmental genes silenced, whilst keeping them poised for activation (Boyer et al. 2006). With only the activating H3K4me3 left, the loss of H3K27me3 at those sites typically promotes cell differentiation (Bracken et al. 2006; Boyer et al. 2005; T. I. Lee et al. 2006). Given the importance of maintaining stem cell identity, the loss of which has been associated with oncogenesis, and the key role that EZH2 plays in the temporal repression of developmental genes, it is not surprising that an increasing number of genomic alterations affecting EZH2 are described in tumours of different origins (C.-J. Chang and Hung 2012). This topic will be covered in more detail in the next section of this introduction.
Genome-wide PRC2 target sites have been determined experimentally in a number of organisms, including Drosophila, mouse and human. The first efforts in pin-pointing their exact location were done in the array-based ChIP on chip technology (Squazzo et al. 2006; T. I. Lee et al. 2006; Bracken et al. 2006; Boyer et al. 2006), but later Ku et al. and the ENCODE project expanded the PRC2 maps in human using the sequencing-based ChIP-seq (Ku et al. 2008; The ENCODE Project Consortium 2012), which allows for a cost-effective real genome-wide coverage. Of note, as of today there are maps of EZH2 and SUZ12 locations in fifteen and three different cell types, respectively, in the ENCODE data repository, and the list is likely to grow substantially in the near future. Since there are no PcG sequence-specific binding sites identified in mammals, due to the complexity of Polycomb proteins recruitment to their targets, this data is of high value. The availability of these maps makes possible the computational study of Polycomb regulation, through the integration with histone modifications occupancy and transcription factor maps in a number of cell types. This may provide new insights into the complex profile of PcG in the
19

human genome, and encourage further experimental research (Xiao et al. 2013).
Several independent consortia in recent years have started big projects to characterize the human epigenome. Very recently the first results have been made available, publishing the first large-scale overview of epigenetic status in a large variety of cells and tissues. The first effort was conducted by the Human Epigenome Project, completed in 2006, which provided DNA methylation maps for chromosomes 6, 20 and 22 in twelve cell lines (Eckhardt et al. 2006). The ENCODE consortium published last year their joint results in thirty manuscripts, including histone modification, chromatin conformation, DNA methylation, CRF and transcriptomic data in 147 hundred normal and cancer cell lines (The ENCODE Project Consortium 2012). Their growing “experiment matrix” is far from being completed, but it is expected to keep growing in the near future (http://genome-preview.cse.ucsc.edu/ENCODE/dataMatrix/encodeDataMatrixHuman.html). Finally, the NIH Roadmap Epigenomics Mapping Consortium published this year the maps for seven major histone modifications in human cells and tissues (Bernstein et al. 2010; Zhu et al. 2013). Because they produced data in non-cultured cells, they draw intriguing conclusions regarding the existence of distinct chromatin landscapes in in vivo and in vitro differentiated cells. All this data burst will surely stimulate the design of insightful computational models, that will allow to deepen our knowledge on the global processes that configure distinct epigenetic landscapes under different environments, in the line of the recent Dong et al. analyses (Dong et al. 2012).
1.2.2 Regulation of gene expression
The DNA molecule has been often referred to as a “blueprint”, because it contains the information necessary for a cell to survive and perform several basic and specialised functions. The central dogma of molecular biology states that DNA serves as a template to produce RNA, which, in turn, may serve to produce proteins. The careful regulation of the amounts of proteins and RNAs in a cell is essential for the creation and maintenance of different tissues in the same organism. Ultimately, the step-wise regulation of gene expression drives cell differentiation and morphogenesis, producing cell types with different expression profiles even when they have the same DNA sequence.
From transcription to translation
The RNA polymerases (RNA pol) are the molecules responsible for the initiation of transcription, and in eukaryotes there are three, each in charge of an RNA
20

subtype: RNA pol I (that produces most of the ribosomal RNAs - rRNAs), RNA pol III (small rRNAs, transfer RNAs - tRNAs - and small regulatory RNAs) and RNA pol II, that transcribes the messenger RNA (mRNA). Transcription starts in the nucleus when the RNA pol binds to the upstream sequence of a gene, the promoter region. In RNA pol II genes, the promoter sequence consists of a “core”, that controls the transcription rate and lies closer to the initiation site, and a regulatory promoter, that contains consensus sequences to which TFs may bind. RNA Pol II may also be attracted to gene promoters through the interaction with enhancers, specialised sequences found very far from the genes they regulate, but that become close to them through DNA looping. Promoters may be weaker or stronger depending on their sequence, meaning that per se they contribute to the regulation of the amount of RNA molecules produced for a gene. The exchange of gene's promoter for another may cause disease, such as in translocations in leukaemias, because genes that should be constitutively active are no more, or those that should remain silent are transcribed.
After initiation, the nascent RNA grows through a process known as elongation. The termination of mRNA transcription involves two sequence-specific processes, cleavage and polyadenylation of the 3' tail, which are interdependent and both are required for termination (Logan et al. 1987; Connelly and Manley 1988).
RNA molecules may themselves regulate transcription by hindering DNA in a sequence-specific manner, or they may be processed into mature mRNAs as a previous step for translation into proteins. In the latter case, mRNAs are read according to the “genetic code”, that is, the correspondence of each group of three nucleotides (a codon) to an aminoacid, or to a termination signal. To do so, first the mRNA must leave the nucleus and enter the cytoplasm, where the two ribosomal subunits assemble on top of it. Ribosomes contain tRNAs, that function as adaptor molecules; on one end they read the codon, and on the other they bind to the corresponding aminoacid, that will be added to the nascent protein (Crick 1958; Chapeville et al. 1962). Similarly to transcription, translation is regulated through an upstream untranslated sequence (UTR) of the mRNA that may be bound by proteins, affecting the rate at which translation occurs. Proteins are synthesized in a series of steps within the complex structure formed by the ribosomes and adjacent factors, and terminate at the codons UAA, UAG or UGA, which cannot be recognized by tRNAs and lead to the binding of release factors, that finally disassemble the ribosomes.
21

Regulation of transcription and gene expression
Transcription is controlled at two main levels in eukaryotes: at chromatin structure, as has been reviewed in the previous section, and at the interaction with transcription factor proteins. A fundamental difference between prokaryotes and eukaryotes is that, by default, transcription is turned off in the latter, and requires specific elements that activate it. These are normally TFs, that recognize, usually in a combinatorial manner, specific 6 to 10 base-pair motifs at the promoter region of a gene (Pulverer 2005). To allow this interaction the DNA sequence must be accessible to those proteins, this is, it should lie within an “open” chromatin conformation. Some genes constitutively required for the survival of the cell, however, are unregulated and continuously transcribed.
To activate the transcription of a gene, a TF has to recruit RNA pol II to its promoter, since the latter cannot bind it alone (Struhl 1999). Alternatively, a TF may bind an enhancer, and bring together distant DNA regions in the three-dimensional space of the nucleus, that will be targeted by RNA pol II. TFs may also repress transcription, either by binding activator proteins and hinder their promoter sequence recognition, or by binding to the promoter motif itself, displacing other TFs from the site. Transcriptional repressors may also be small non-coding RNAs, some of which have key functions such as the inactivation of one of the X chromosomes in female mammals.
The transcriptome of a cell is compartmentalised into many interconnected functional networks, or pathways, that control different biological processes. A group of proteins that are part of the same macromolecular complex, or two TFs that cooperate to activate gene expression, are conceptually grouped within the same transcriptomic network (Stuart et al. 2003; Bergmann, Ihmels, and Barkai 2003). Only recently it has been possible to study full pathways and such networks as a result of the advances in high-throughput analytical technologies. Rather than focusing on a single protein, scientists can now investigate the coordinated action of hundreds of factors that contribute to a specific cellular function, and consider cells as a whole, complex system that can be interrogated at many levels and at different time points (Arvey et al. 2012; Djebali et al. 2012). A result of these studies is the realization that gene expression is coordinated, and that different groups of genes are transcribed together during several cellular processes, but that those patterns may differ, for instance, during differentiation and cancer (Choi et al. 2005).
22

1.3 Oncogenomics
Cancer is a complex disease, the result of a multi step process in which cells evolve progressively, acquiring malignant capabilities (Kinzler and Vogelstein 1996). These include genetic, cytogenetic and epigenetic changes that drive tumour initiation, promotion and progression. The founding mechanisms were described decades ago as the loss of function of tumour suppressor genes, and the gain of function of oncogenes. Both types of genes have been identified, and several types of alterations have been described that lead to those same results. The alterations involved in oncogenesis are mainly of three kinds: mutations, copy number aberrations (CNAs) and epigenetic changes. Ultimately, they are responsible for aberrant gene expression and protein mutations, which can further enhance them in a positive feedback loop.
The first mutation in an oncogene, c-Ha-Ras, was reported by Feinberg et al. in 1983 (A P Feinberg et al. 1983). The technical limitations to survey the other types of alterations in large cell populations probably explains why tumorigenic mutations were the focus of very intense study for many years, while reports of recurrent CNAs, transcriptomic and epigenetic changes began much later. This fact becomes evident when one explores the Cancer Gene Census, which represents a bona fide compilation of cancer genes identified to date (Futreal et al. 2004). The oncogenic evidence behind the genes listed there is mostly mutation-based. Our current knowledge of cancer genes is, thus, currently “mutation-biased”, but this is changing rapidly. Owing to technical advances in the past years, over- and under-expression, CNAs in non-haematological malignancies and aberrant methylation are being shown to play a prominent role in many tumours.
1.3.1 Models to study cancer genomics
Even when those studying the mechanisms that cause cancer have traditionally considered the tumour as a single entity, researchers are aware that within its microenvironment there are, most probably, no two cells alike. Each cell bears a set of genomic and epigenomic aberrations that are slightly different to those of its neighbours. There is need to produce models to first understand the process at a global level, and later pinpoint the details. On the other hand, technical limitations have yielded a broad overview of cancer, akin to being able to interpret a digital image, but not discerning the pixels that compose it. Theoretical models help us to understand the concepts underlying tumour formation. Technical limitations are being overcome at an incredibly fast pace, thanks in part to the refinement of high-throughput sequencing techniques.
23

Hanahan and Weinberg postulated a decade ago that six basic acquired capabilities, shared amongst all cancers, conferred cells growth advantages in the tumour microenvironment (Hanahan and Weinberg 2000). These six “hallmarks” are “sustaining proliferative signalling”, “evading growth suppressors”, “activating invasion and metastasis”, “enabling replicative immortality”, “inducing angiogenesis” and “resisting cell death”. Two enabling characteristics, required to acquire the hallmarks, were further proposed later: “genome instability and mutation” and “tumour-promoting inflammation”. In a follow-up manuscript, new advances in the oncogenomics field led them to add two more emerging hallmarks, namely “deregulating cellular energetics” and “avoiding immune destruction” (Figure 1.6) (Hanahan and Weinberg 2011).
Regarding the “genome instability” characteristic, which leads to an increase in phenotypic variability, it is interesting to highlight the recent work at Feinberg and Irizarry's laboratories. Based on the hypothesis that an increase in epigenetic and gene expression variability is a characteristic of cancer (A. P. Feinberg and Irizarry 2009), they proved that, in colorectal, lung, breast and thyroid tumours,
24
Figure 1.6. The hallmarks of cancer. A series of capabilities are shared amongst all cancer cells in all tumours. Hanahan and Weinberg described them within a framework that enabled a global understanding of carcinogenesis. In blue typeface, the two “enabling characteristics” that promote the acquisition of these hallmarks. Adapted from (Hanahan and Weinberg 2011).

the loss of well-defined DNA methylation boundaries at CpG islands distinguishes cancer from normal tissue (Hansen et al. 2011). Further, they successfully created and tested a model to define diagnostic signatures based on those findings (Corrada Bravo et al. 2012). These findings have emphasized the importance of regarding tumours as a whole entity, instead of exclusively exploring individual genomic aberrations that have been described to drive tumorigenesis. Moreover, this further portraits epigenetic mechanisms in some tumours at the start of the genomic aberrations cascade that gives a cell the potential to progressively become tumorigenic.
The clonal evolution model
The heterogeneity of tumours has been studied recurrently in the clinic since the development of cytogenetic tools such as FISH and SKY in the eighties. The first general model for tumour progression merged this heterogeneity concept with Darwinian evolution (N. E. Navin and Hicks 2010). The clonal evolution model postulates that a tumour arises through the accumulation of aberrant changes in the genome of a precancerous cell that confer it a certain growth advantage over the rest, and undergoes a positive selection process, according to the laws of natural selection. On the contrary, deleterious mutations are under negative selection, and the process would result in the progressive conversion of normal cells into cancer cells (Foulds 1954; Nowell 1976). Clonal evolution derives into two models, that differ in the number of subclones that are expected to be present simultaneously at a certain time point in the tumour: they are known as the monoclonal and polyclonal evolution models. Several variations have been further proposed over the polyclonal evolution model (Figure 1.7 a-d). All these theoretical frameworks assume that all cells in a tumour have the potential to proliferate indefinitely.
The cancer stem cell model
In the 1990s the idea that all cells in a tumour had no limits to proliferate was challenged by an alternative model, known as the cancer stem cell (CSC) model. Given the similarities in pathways that regulate both stem cell renewal and oncogenesis, it seemed plausible to propose that both processes were connected (Reya et al. 2001). The model is based on the assumption that only a small population of cells in the tumour possess an unlimited proliferative potential, and that they are the responsible to continuously give rise to the majority of cancer cells, that can undergo only a limited number of divisions (Figure 1.7e). These few cells (the CSCs) are now believed to potentially arise from any somatic cell (N. E. Navin and Hicks 2010).
25

The question of which is the “right” model is a daunting one. Different tumours have been described to follow each of the described models, and even the same tumour may seem so correspond first to one, then to another model, as it progresses. Recently, sophisticated analysis have allowed to characterize in depth several subclones from Acute Myeloid Leukaemia (AML) that follow different variants of the clonal evolution upon relapse (Ding et al. 2012) or through progression from Myelodysplastic Syndrome (MDS) (Matthew J. Walter et al. 2012). On the other hand, leukaemias and tumours from breast, brain, colon and pancreas have been empirically shown to follow the CSC model. These findings raise high expectations from clinicians, since they suggest the possibility to target CSCs and eradicate the tumour (N. E. Navin and Hicks 2010). The fact that only small undetectable populations of cancer cells typically survive treatment and regenerate the tumour increases the relevance of the model.
Ultimately, the goal of modelling the mechanisms of tumour progression is to design targeted strategies for cancer prevention and treatment. The two main
26
Figure 1.7. Models of tumour progression. Our current understanding of cancer progression can be summarized in two major models. Several variants of the clonal evolution model are shown in a-d, the cancer stem cell model is shown in e. Green nodes represent normal cells, while different colours are the different tumour clones arising from it. The lower panel shows schematic representations of the tumour histology, according to the models above. Adapted from (N. E. Navin and Hicks 2010).

settings, clonal evolution and stem cell models, have different therapeutic implications. If tumours were to be highly clonal, the antitumoral cytotoxic agents would have to be designed to target an heterogeneous population of tumour cells, since any that is left would have the potential to regenerate the tumour. This seems to be the case for breast tumours, whose heterogeneity has been the focus of intense study in cell cultures, animal models and xenografts. The increasing clonality, proportional to the stage, strongly suggests that common genomic aberrations in different clones recapitulate the evolution history of breast cancer. Some haematological cancers, such as MDS and secondary AML, have been experimentally shown to be highly clonal (Matthew J. Walter et al. 2012).
On the other hand, tumours that follow the stem cell model could be eradicated by designing drugs that specifically target the subset of stem cells that maintain the oncogenic process and promote tumour progression. CSCs have been described in breast, brain and colon cancer (Al-Hajj et al. 2003; Singh et al. 2004; O’Brien et al. 2006; Ricci-Vitiani et al. 2006), but their existence in solid tumours remains controversial. Two main limitations arise: first, the lack of knowledge on developmental hierarchy in many tissues, which is very well known in blood; and second, the technical difficulties of maintaining the original environment and three-dimensional cellular organization in animal models (Clevers 2011). It seems clear, however, that haematological malignancies do have small populations of cells that mediate the leukaemic progression (J. C. Y. Wang et al. 1998). Most Chronic Myeloid Leukaemia (CML) patients, for instance, respond very well to imatinib treatment, that targets the BCR-ABL kinase (Goldman et al. 2009). But discontinuation of the treatment often leads to relapse of the disease, suggesting the presence of imatinib-resistant, dormant cells that can cause CML by themselves if not kept at bay. Recent findings suggest that inhibition of SIRT1, a class III HDAC, depletes the CSC population in CML through the elevation of acetylated p53 levels (L. Li et al. 2012). This is an exciting finding that paves the way for further research on combination therapy, aiming to target both the bulk of the tumour cell population and CSCs to eradicate cancer types that follow this model.
Both models of tumour progression have traditionally been presented as mutually-exclusive, and waves of scientific excitement have marked each advance that seemed to advocate in favour of one or the other. Nevertheless, the picture may be more complex, as Hans Clevers has recently suggested (Clevers 2011). In a synthesis of clonal evolution and CSC concepts, he proposes a unified model, in which clonal evolution drives tumour progression, but presenting within each clone some CSCs at each stage (Figure 1.8). In the most
27

28
Figure 1.8. Synthesis of the clonal evolution and CSC models. Hypothetical progression of a tumour; clonal evolution processes from top to bottom; left to right, CSC-like behaviour. (1) The first oncogenic hit occurs in a stem cell (or progenitor, or differentiated cell) of a healthy epithelium, resulting in the growth of a genetically homogeneous benign lesion. (2) The second hit leads to the growth of a more malignant and invasive clone within the primary tumour. (3) A third hit in a cell within the malignant subclone causes further transformation and extravassation, leading to metastasis. Genetically independent subclones can coexist within the tumour. (4) A final mutational hit leads to tumour being entirely taken over by cells that behave as CSCs, rendering the CSC concept meaningless at this stage. Note that, at each stage of this clonal evolution process, tumours and subclones contain CSCs. Adapted from (Clevers 2011).

advanced tumour, all cells would behave like CSCs. The general mechanisms of tumour progression remain to be elucidated, and only further intensive research directed at the dissection of tumour heterogeneity will shed light on them, hopefully, in the near future.
1.3.2 Cancer progression and invasion
Arguably, the most worrying event associated to tumorigenesis is metastasis, being responsible for nearly 90% of cancer deaths (Sporn 1996). Moreover, metastatic relapse may occur, in breast tumours, up to two decades after the initial treatment started (Meng et al. 2004). It nevertheless remains very challenging to study, mainly due to the difficulty to obtain source material. Understanding the relationship of metastasis to the primary tumour is extremely important to design strategies to prevent it and treat it. For instance, an unsolved question is whether all cells in a tumour have the potential to metastasise, or whether it is only a small subset that possess the capacity to do so. The existence of specific alterations that confer cells the metastatic potential is also not clear. From the observations, in a number of tumour tissues, that CGH profiles are very similar in metastatic cells and their primary counterparts, it seems that metastasis undergoes minimal clonal evolution (N. E. Navin and Hicks 2010). It remains poorly studied, however, whether those metastatic cells present a CSC phenotype. In a study on pancreatic cancer cells, the depletion of CSCs led to a loss of metastatic potential, while retaining tumorigenesis (Hermann et al. 2007). Another indication on the role of CSCs in metastasis is that breast cancer cells disseminated into bone marrow show a putative CSC phenotype (Balic et al. 2006). The connection between stemness of tumour cells and their ability to metastasise remains poorly understood, and there is still a need for further research.
Epithelial to Mesenchymal Transition (EMT)
The mechanisms that drive a tumour cell to extravasate from a primary tumour, travel through the blood flow and invade a distant tissue have been the focus of intense study over the past decade. Metastatic cells typically suffer alterations in their attachment to the extracellular matrix (ECM), the best characterized being the loss of E-cadherin (encoded in the CDH1 gene) (Figure 1.9) (Christofori and Semb 1999). E-cadherin is a cell-cell adhesion molecule and, through the formation of adherens junctions between epithelial cells, it is key to assemble the epithelial sheet and maintain a quiescent cellular state. The expression of CDH1 has been reversely correlated with invasive and metastatic phenotypes, and its down-regulation is frequent in cancer. Conversely, the over-expression of
29

cell contact molecules that promote cell detachment and migration during embryogenesis, such as N-cadherin in neuronal cells, is observed in highly aggressive tumours (Cavallaro and Christofori 2004). This alterations are considered a hallmark for a process known as epithelial to mesenchymal transition (EMT), a developmental program that has been shown to broadly regulate metastasis and invasion (Hanahan and Weinberg 2011). Other key genes in EMT include Snail, Slug Twist and Zeb1/2, whose expression is abnormal in a number of tumours.
EMT has been associated to a stem cell-like phenotype and believed to be essential for metastasis (Brabletz et al. 2005). Several experiments in the last years have further related the two by identifying key factors that induce both EMT and stemness, such as Twist1. In breast tumours, EMT associates closely with the metaplastic and claudin-low breast cancer, which are typically very aggressive, and correlates negatively with pathological complete response (Hennessy et al. 2009). It is unclear, however, if EMT and stemness are always linked in all cancers (Brabletz 2012). Recent studies suggest that the reversal of EMT, mesenchymal to epithelial transition (MET) may be a requirement for circulating cancer cells to effectively colonize a new tissue (Ocaña et al. 2012; Tsai et al. 2012). Growing evidence suggests that environmental conditions of the target organ, determined by the stroma, are crucial for colonization (Hanahan
30
Figure 1.9. Epithelial to Mesenchymal Transition (EMT) and invasion. The EMT process is associated to a loss of cell-cell adhesion through down-regulation of E-cadherin (E-cad) and the over-expression of molecules that promote cell detachment, such as N-cadherin (N-cad). The Extracellular matrix (ECM) greatly influences the invasive capabilities of tumour cells into surrounding tissues. Invasive cells may enter the vascular system by passing between vessel endothelial cells, and thus reach distal parts of the body. LOX, lysyl oxidase; MMPs, matrix metalloproteinases. Adapted from (Wirtz, Konstantopoulos, and Searson 2011).

and Weinberg 2011). This second and last step of the metastatic process, however, remains poorly understood, and the factors involved are yet to be described.
Of special interest, epigenetic factors have been described recently to mediate EMT in human tumours. In lung cancer cells, HDAC3 was observed to specifically de-activate transcription at mesenchymal gene promoters, including CDH1, via a decrease of H3K4ac levels. This was coupled with a recruitment of WDR5, an HMT that promoted an increase of H3K4me3 at those loci (Wu et al. 2011). A more global epigenetic reprogramming, involving a reduction of H3K9me2 and higher H3K4me3 and H3K36me3, but no DNA methylation changes, has been described in a cell model of EMT (McDonald et al. 2011). Further, SUZ12, part of PRC2, was shown to be required for E-cadherin repression by the EMT inducer Snail, in ES cells (Herranz et al. 2008). And EZH2 has been described to promote metastasis in breast and prostate tumours (Alford et al. 2012; Min et al. 2010). Altogether, epigenetic factors of different kinds seem to play an important role in metastasis coupled to EMT, presenting a very promising, yet under-explored scenario, where epigenetic drugs could be used to modulate the EMT mechanism to prevent tumour progression.
1.3.3 Tumour profiling approaches
Ultimately, the molecular characteristics of a tumour only have implications in the clinical practice if they have a prognostic value, or if they are indicative for a specific treatment option. In the 1990s, tumour progression was determined exclusively through histological and immunohistochemical assessment. Karyotyping was routinely performed for haematological malignancies, because some leukaemias could be typified according to their profile of chromosomal aberrations. The prototypical example is the presence of the Philadelphia chromosome, formally represented as t(9;22)(q34.1;q11.2), which is indicative of the BCR-ABL gene fusion characteristic (but not exclusive) of CML (Nowell 1962). It was generally assumed that tumours with the fewest chromosomal abnormalities were in the early stages of progression, and thus were assumed to have fewer mutations (N. Navin et al. 2010). Back then, the first oligonucleotide microarrays were made available to the research community. The idea that CNV and expression changes could be useful to determine relevant pathological characteristics of a tumour became very attractive, and some small-scale studies explored it. This type of inter-tumour analysis became a very intense research topic in the 2000s, and is currently being translated into the clinical setting. New sequencing technologies are very recently making possible the study of heterogeneity within a tumour (intra-tumour comparison). Both are here briefly
31

reviewed, focusing on breast cancer in the first case, given its successful translational implications.
Inter-tumour profiling in breast cancer
Breast cancer is the most frequent cancer in women: one in ten will be diagnosed to suffer one in their lifetime in the USA, and there are nearly half a million new cases per year in the European Union (of which 16000 occur in Spain) (Espinosa et al. 2012). The conventional clinicopathological parameters to determine the prognosis are histological and nuclear grades, tumour size, the involvement of axillary lymph nodes, the Ki67 index (a marker for proliferative activity), the expression of oestrogen (ER) and progesterone (PR) receptors, whether there is over-expression or amplification of ERBB2 (also known as NEU or HER2) and the existence of mutations in the TP53 gene. Each of these are prognostic markers, but tumours are heterogeneous and may present a spectrum of phenotypes. The current classification by pathologists assigns the highest stage possible, even if it is only represented by a small subclone of cells. This staging is crucial to determine which patients need to undergo an aggressive neoadjuvant treatment after surgery, and which may be spared; some studies indicate that up to 70% of breast cancer patients may be over-treated (Early Breast Cancer Trialists’ Collaborative Group 1998).
The development of the microarray technology marked a turning point for breast tumour profiling. Two seminal studies in 2000 and 2001 challenged the traditional histopathological classification by using gene expression patterns to determine “molecular portraits” in breast cancer. The authors developed a signature of 496 genes (the “intrinsic” signature) that distinguished five clinically relevant subtypes from their expression profile, namely: Basal-like, Luminal A (mostly ER positive, with good prognosis), Luminal B (presenting a more advanced stage and a complex genotype), ERBB2-like (mostly with the ERBB2 locus amplified) and Normal-like (having an expression profile more similar to normal tissue) (Perou et al. 2000; Sørlie et al. 2001). The PAM50 risk model was a later refinement that predicted the intrinsic subtype from a 50 gene signature (Parker et al. 2009). The differences with the existing classifications for breast tumours were mainly two: the division of ER and PR positive tumours into luminal A (sensitive to endocrine therapy) and luminal B (usually chemoresistant and less sensitive to endocrine therapy); and the distinction of two ER- types: basal-like (usually triple negative: ER-, PR-, ERBB2-) and ERBB2-like. Breast tumours were the first cancer to be stratified using molecular gene expression signatures, and major implications in the clinical practice were predicted.
32

There are, however, some criticisms towards this molecular classification of breast tumours. First, many that were classified as the ERBB2-like subtype do not present ERBB2 locus amplification, and, conversely, it does show up in samples assigned to other intrinsic subtypes. This is an important distinction, since trastuzumab, an anti-ERBB2 monoclonal antibody, is the standard of care for patients with ERBB2+ tumours. In combination with chemotherapy as an adjuvant, treatment results in a survival improvement, but only in patients bearing this specific alteration (Piccart-Gebhart et al. 2005). It then remained dubious which prognostic implications may have the ERBB2-like intrinsic subtype classification. Second, many questioned whether the “basal” subtype existed, since, on its own, it does not seem to be related to a poorer prognosis. Instead, it seems to to be associated to other factors which are predictive of patient's outcome, like being a carrier of a BRCA1 gene germline mutation (44-80% of tumours from BRCA1 mutation carriers are basal-like) (Lavasani and Moinfar 2012). Still, the PAM50 classification of breast tumours into intrinsic subtypes is consistent with standard clinical markers and predictive of prognosis (Bastien et al. 2012).
Recently, two further distinct subtypes of breast cancer have been described. These are the “metaplastic” tumours, which are sarcomatoid and mostly claudin-low, and “claudin-low” tumours, that are rare, present over-expression of EMT genes and down-regulation of claudin genes. Both are similar to the basal-like profile in their immunophenotype (Taube et al. 2010; Creighton, Chang, and Rosen 2010; Prat and Perou 2011), although claudin-low presents a higher expression of N-cadherin, vimentin and several repressors of E-cadherin. This subtype also has the lowest expression of epithelial differentiation markers, such as CD24, and highest CD44, both associated to stem-like characteristics, which led to believe it derives from CSCs (Prat et al. 2010).
Overall, inter-tumour profiling in breast cancer has provided insight into its tumour biology, and has allowed the development of specific treatment strategies according to clinical markers: trastuzumab and chemotherapy for ERBB2+ tumours, endocrine therapy for ER+ PR+ disease (with or without chemotherapy), and chemotherapy for patients with triple-negative tumours (Podo et al. 2010). More detailed classifications based on expression profiling have lead to a more refined characterization of breast cancer, and provide independent prognostic information. However, it is still crucial to determine tumour and nodal stage and, as of today, all other approaches should be regarded as complementary. The clinical use of expression profiling for the prediction of chemotherapy benefit in ER- breast tumours is currently experimental, although, in general, the implementation of these methods is desirable due to its
33

reproducibility, because they depend less on subjective assessments (Prat, Ellis, and Perou 2012). These profiling techniques have changed the way breast cancer is perceived, and it is no longer regarded as a single disease. The hope is that, in the near future, this type of evaluations are developed for other cancer types. Tumours may be, then, evaluated mostly based on their molecular profiles, regardless of the tissue where they were originated, providing guidance for treatment choice and possible resistance prediction.
Intra-tumour profiling
The comparison of profiles across tumours has provided insights into cancer biology and guided treatment strategies, but still a large number of patients present resistance or no clinical response. This can be attributed to our current lack of knowledge on cancer mechanisms, but also to the fact that tumour heterogeneity is typically ignored. The histological and molecular profiles usually depict an average state of all tumoral cells, mainly due to technical limitations, and solid tumours include healthy cells that may constitute up to a 50% of the total DNA and RNA extracted. For this reasons, there are growing efforts to determine the different populations of cancer cells within tumours, in the expectation that we could improve our knowledge on how to definitely target all malignant cells at a time, and effectively eliminate them.
Single-cell tumour profiling has been mostly focused on CNV analysis, and was made technically feasible a decade ago with the coupling of whole genome amplification (WGA) to array comparative genomic hybridization (aCGH) (N. Navin and Hicks 2011). This type of analysis, albeit at very low coverage, could provide valuable cost-effective information with a potential clinical use. Early studies used it to profile Circulating Tumour Cells (CTCs) (Klein et al. 1999; Stoecklein et al. 2008; Fuhrmann et al. 2008) and even cancer cell lines (Fiegler et al. 2007; Geigl et al. 2009). However, aCGH can detect amplifications and deletions, but not other genomic alterations such as translocations or inversions, and it requires a normal genome for reference. A very recently developed alternative that overcomes these limitations is the use of sequencing to determine CNVs. This technique, termed Single Nucleus Sequencing (SNS), has been successfully used to study tumour evolution and clonality in breast cancer (N. Navin et al. 2011; Baslan et al. 2012). Both approaches, however, are subjected to detection biases due to the necessary WGA step, which is not uniform throughout the genome. Regarding single cell transcriptome profiling, there has been very limited success to date in mice blastocysts (Tang et al. 2009; Tang et al. 2010), but it has not been applied to human tumour cells yet.
34

Advances in this area are expected to have wide applications in the clinic, including the determination of the degree of clonality in a tumour (which is believed to be proportional to resistance to cancer drugs), the characterization from easily accessible material (such as saliva, vaginal fluids and sperm) and the early detection of CTCs, whose presence has been already correlated with poorer survival in melanoma and breast cancer (Bidard et al. 2010; Terstappen 2011). The expectations are high in the CTCs field, because this method will allow for regular, almost non-invasive testing to determine metastasis potential, targeted treatment (avoiding contamination of healthy cells) and the determination of models for tumour progression (N. Navin and Hicks 2011).
1.3.4 Efforts towards an in-depth characterization of cancer
The study of cancer genomics has recently undergone a profound change, owing to the characterization of large tumour cohorts by several laboratories. High-throughput experimental methods have been pivotal in these analyses, and the dramatic reduction in cost and time of sequencing technologies has made possible that, currently, there are thousands of tumours sequenced genome-wide. The data has been generated within two main consortia: The Cancer Genome Atlas (TCGA) (cancergenome.nih.gov), an American initiative launched in 2005 by the NIH, and the International Cancer Genome Consortium (ICGC) (www.icgc.org), an umbrella project started in 2007 that agglutinates all the international efforts to sequence large cohorts of tumours (including many TCGA projects). Both established guidelines to ensure homogeneous data retrieval, although TCGA goes much further and regulates all steps, from tissue collection to sequencing protocols and bioinformatic data analysis. Ultimately, the goal of the ICGC is “to obtain a comprehensive description of genomic, transcriptomic and epigenomic changes in 50 different tumour types and/or subtypes which are of clinical and societal importance across the globe”. All the data produced by TCGA and the ICGC is made publicly available to the scientific community for further validation and downstream bioinformatic analysis.
Other smaller projects have produced large amounts of oncogenomics data, which are now publicly available. Specialized data repositories manually curate individual publications that produce information that, when integrated with all the rest, acquires new value. Also, recently two large projects were launched aiming at the characterization of cancer cell lines, which are widely used as a proxy to study tumour biology and, most importantly, drug testing (Barretina et al. 2012; Yang et al. 2012). A selection of oncogenomics databases (some of which also provide embedded analysis tools) is shown in Table 1.3.
35

Table 1.3. Oncogenomic public resources. Description details correspond to each database version on February 5th, 2013.
Resource Description
TCGAcancergenome.nih.gov(McLendon et al. 2008)
Point mutations, methylation, CNV, structural variants and gene expression on tumours. Currently has 7151 samples on 26 cancer types.
ICGCwww.icgc.orghttp://dcc.icgc.org
Point mutations, methylation, CNV, structural variants and gene expression on tumours. Currently includes 42 projects from 17 cancer sites, totalling 7358 donors. Partially overlaps TCGA.
Progenetixprogenetix.net(Baudis and Cleary 2001)
Genomic copy number aberrations in cancer. Includes 29743 cases manually curated from 994 publications, including 20400 chromosomal CGH and 9459 array experiments (aCGH). Classifies tumours according to ICD-O 3 entities.
arrayMapwww.arraymap.org(Cai, Kumar, and Baudis 2012)
Repository of aCGH-based genomic aberrations in cancer. Includes 44053 arrays manually curated from 483 publications, covering 197 ICD-O 3 entities. Integrates probe-level data, provides visualization and analysis tools and allows for easy download.
Mitelman Database of Chromosome Aberrations and Gene Fusions in Cancerhttp://cgap.nci.nih.gov/Chromosomes/Mitelman(Mitelman, Johanson, and Mertens 2013)
Manually curated data on chromosomal aberrations and corresponding tumour characteristics, based either on individual cases or associations. 62253 cases.
Atlas of Genetics and Cytogenetics in Oncology and Haematologyatlasgeneticsoncology.org(Huret et al. 2012)
Detailed cytogenetic aberrations, including clinical and prognostic information. Peer-reviewed articles on 1135 genes in 503 leukaemias, 177 solid tumours and 104 cancer-prone inherited diseases.
IntOGenwww.intogen.org(Gundem et al. 2010)
System to analyse and visualise cancer genomics data. Presents transcriptomic alterations, CNA and somatic mutations in tumour samples at gene and pathway levels. Assesses the likelihood of genes and pathways to be cancer drivers. Data is presented as tables or web interactive heatmaps.
Cancer Gene Census (CGC)cancer.sanger.ac.uk/cancergenome/projects/census(Futreal et al. 2004)
Catalogue of 487 genes known to be involved in cancer, based on strong evidence from manually curated publications. Includes information mostly on somatic and germline mutations, and protein (Pfam) domains frequently found in cancer genes.
36

Resource Description
COSMICcancer.sanger.ac.uk/cancergenome/projects/cosmic(Bamford et al. 2004; Forbes et al. 2010)
Comprehensive compendium of manually curated somatic mutations in cancer from 15613 publications. It currently includes data on 24517 genes and 834571 mutations.
COSMIC cell linescancer.sanger.ac.uk/cancergenome/projects/cell_lines(Bamford et al. 2004; Forbes et al. 2010)
Mutation screening of 64 selected genes from the CGC on 770 cancer cell lines. Currently generating the exome sequencing data.
Cancer Cell Line Encyclopediawww.broadinstitute.org/ccle(Barretina et al. 2012)
Mutations on 1651 genes in 905 cancer cell lines, along with the pharmacological profile of 24 cancer drugs. Provides analysis and visualization.
Genomics of Drug Sensitivity in Cancerwww.cancerrxgene.org(Yang et al. 2012)
Drug sensitivity on almost 700 cancer cell lines and mutations on 71 genes correlated with drug response, in 138 drugs.
1.4 Cancer epigenomics
The alteration of the normal epigenetic landscape is known to be behind a broad array of human diseases, including autoimmune diseases such as systemic lupus erythematosus, psoriasis and rheumatoid arthritis, and neurodegenerative ones, like Alzheimer's and Parkinson's. (Ballestar, Esteller, and Richardson 2006; P. Zhang, Su, and Lu 2012; Vojinovic and Damjanov 2011; Chouliaras et al. 2010; Coppedè 2012). Also the global loss during our lifetime of DNA methylation, a key epigenetic regulatory mechanism, has been connected to the natural process of ageing (Heyn et al. 2012). The relevance of chromatin structure preservation in the maintenance of genome integrity has been intensively studied; it is known to be crucial in DNA damage repair pathways, important for chromosome segregation and avoidance of chromosome instability (polyploidy and aneuploidy), and key to keep the epigenetic landscape during DNA replication (Papamichos-Chronakis and Peterson 2013). Surprisingly, cancer research focused exclusively on genomic changes for many years, and the role of epigenetics in tumour development was largely underestimated until a decade ago.
In the last decade there has been a dramatic advance in the understanding of cancer genomics from an epigenetic point of view. The cancer epigenomics field started to flourish when it became evident that the transcriptional silencing of bona fide tumour suppressor genes, such as p16INK4a, hMLH1 and BRCA1,
37

was associated to the hypermethylation of the CpG islands at their promoter regions (M. Esteller 2007). The biggest efforts in the 1990s were focused on DNA methylation changes occurring in tumours (P. A. Jones and Baylin 2002), but recently it is becoming clear that the other three epigenetic mechanisms (histone modifications, chromatin remodelling and non-coding RNAs) may have a prominent role in oncogenesis (Sandoval and Esteller 2012). The so-called “cancer epigenome” is understood as the global result of heritable changes that have an impact on gene expression, but which cannot be described in terms of DNA sequence changes (P. A. Jones and Baylin 2007). This includes DNA aberrant methylation (both hyper- and hypo- methylation), histone mark misplacement and mutations in key chromatin remodelling enzymes (Figure 1.10). It is now becoming evident that the deregulation of epigenetic mechanisms may precede classical tumorigenic events such as mutations, deletions or the altered expression of tumour suppressors and proto-oncogenes.
38
Figure 1.10. Global epigenomic alterations in cancer. During oncogenesis, epigenetic patterns are disrupted at different layers. The tight regulation of DNA methylation, histone modifications and miRNAs, crucial for normal gene regulation, is lost, resulting in an aberrant chromatin structure. In cancer cells, tumour suppressor genes are hypermethylated at the CpG islands in their promoters, while the global pattern of histone modifications is lost. Ultimtely, these aberrant epigenetic changes result in an imbalance of gene expression that promotes the silencing of tumour suppressors, and the activation of oncogenes. From (Sandoval and Esteller 2012).

1.4.1 DNA methylation in cancer
An increase in DNA methylation in normally unmethylated gene promoter CpG islands is associated to gene silencing, and it has been the most studied epigenetic aberrations in cancer in the last three decades (Manel Esteller 2008). Epigenetic changes in general could be the initiators of human cancer, but, more specifically, it has been proposed that CpG promoter hypermethylation might be one of those initial triggers of tumours (Andrew P. Feinberg and Tycko 2004; Andrew P. Feinberg, Ohlsson, and Henikoff 2006). Interestingly, it has been shown that promoter hypermethylation is tumour-specific (Costello et al. 2000); it is an extended tumorigenic mechanism in gastrointestinal tumours, while it is much less common in ovarian cancer and sarcomas (M. Esteller 2007) (Figure 1.11). DNA hypermethylation has been associated with the stabilization of gene silencing at tumour suppressor gene promoters, suggesting this epigenetic mechanism plays a key role in tumorigenesis (Manel Esteller 2008). In analogy to cancer-specific mutations, there are genes that are more frequently hypermethylated in some specific cancer topographies, and the impact of the alterations is often determined by how they aggregate in similar pathways to contribute to tumorigenesis (Wood et al. 2007).
39
Figure 1.11. CpG island hypermethylation profile in tumours with different origin. In the Y-axis, the frequency of hypermethylation for each gene is shown in each primary tumour. From (M. Esteller 2007).

Regional CpG island hypermethylation at tumour suppressor promoters is, thus, a classical cancer event. For many years, also large hypomethylated regions have been recognized in cancer, but only recently are we beginning to understand their biological implications. Typically, this occurs in genomic areas that are rich in repetitive elements and retrotransposons but do not contain many genes, leading to an increased rate of genomic rearrangements and translocations and, ultimately, to genomic instability. DNA hypomethylation in cancer has been observed to increase as the tumour progresses, providing a putative measure of tumour invasiveness likelihood (Sandoval and Esteller 2012).
Recent sequencing studies of colon cancer described a loss of DNA methylation in megabase-long regions compared to normal tissues, but unexpectedly found punctuated hypermethylation in specific CpG island promoters. Importantly, these domains prone to gain or lose DNA methylation are frequently located in lamin-associated nuclear domains and late-replicating regions, which typically present bivalent marks in ESCs, controlled by the Polycomb protein complex (Issa 2011; Hansen et al. 2011). Bivalent marks control the repression of genes which are important for lineage commitment, keeping their promoters in a poised state, but not permanently repressed, while CpG island methylation is associated to a more stable repression. The current model postulates that CpG island hypermethylation in those regions would replace bivalent marks to lock the promoters into a permanent inactivation state, thus extending the adult stem cell compartment (Ohm and Baylin 2007; Cedar and Bergman 2009).
An interesting observation by Irizarry and colleagues is that most methylation differences in cancer occur at low-density CpG regions which are near (up to 2kb) CpG islands, which they call “CpG shores”. Those regions overlap with sites that show methylation variation in tissue differentiation, reinforcing the current belief that epigenetic alterations affecting tissue-specific differentiation are a predominant tumorigenic mechanism (Irizarry et al. 2009; Hansen et al. 2011).
The accumulation of knowledge on DNA methylation patterns in cancer has allowed to develop diagnostic kits which can be currently used in the clinic setting. In stage I non-small cell lung cancer, the hypermethylation of CDKN2A and CDH13 is a biomarker that correlates with recurrence and poor prognosis. Identifying which patients might benefit from more aggressive treatment, and stratifying them from those with a milder onset of the disease would spare the latter from unnecessary side effects. Another gene, MGMT, is hypermethylated and used in a Phase III trial as a biomarker to predict best response to treatment in gliomas, and it is about to be approved by the FDA to be used in the clinical
40

practice (Manel Esteller et al. 2000; Hegi et al. 2005). Recent catalogues of DNA methylation patterns across tumours of different origin provide a first draft on genome-wide cancer methylation maps that will hopefully have a clinical application (Fernandez et al. 2011). To properly select methylation biomarker candidates, corresponding genome-wide methylation maps in healthy tissues are being generated and made public by large consortia such as Blueprint and the International Human Epigenome Consortium (IHEC) (Adams et al. 2012; Bernstein et al. 2010). Some DNA methylation biomarkers have been already established. A successful example is the detection of GSTP1 gene promoter hypermethylation in prostate cancer, which is an early event in tumorigenesis. A major advantage of this biomarker is that it can also be detected in urine and serum, allowing non-invasive diagnostic and prognostic tests. Other epigenetic biomarkers, based on DNA methylation detection in serum, are being established in colorectal carcinoma, glioblastoma and non-small cell lung carcinoma (NSCLC), establishing it as a promising non-invasive diagnostic tool (Heyn et al. 2012).
1.4.2 Histone modifications in cancer
The reorganization of the chromatin landscape during cell differentiation is largely determined by the placement of specific histone marks, that regulate activity at developmental genes. A pluripotent cell needs to actively transcribe genes that keep it in an undifferentiated state, but at the same time repress those that are characteristic of tissue-specific programmes. The latter, though, must be a flexible repression, ready to be removed upon differentiation, and histone modifications provide this type of epigenetic regulation, in opposition to the more stable repression that DNA methylation provides. When a pluripotent cell starts to differentiate into a more specialized cell, lineage-specific genes transition from a poised, bivalent state (marked by the simultaneous presence of H3K4me3 and H3K27me3) into an active state, accompanied by active histone marks. Simultaneously, alternative lineage and pluripotency genes must be silenced by repressive histone marks, such as H3K9me3 or H3K27me3 alone, and this process is typically reinforced by the placement of DNA methylation at some promoter sites (Reik 2007). The resulting chromatin conformation is particular for each tissue, and must be preserved for the correct functioning of tissue-specific transcriptional programs.
These changes in cancer development are mirrored in the progression from a normal into a malignant cell. Currently, it is believed that alterations in histone patterns are a common hallmark of human cancer, and that, in this context, bivalent marks constitute a previous step towards permanent aberrant gene
41

silencing (Rodriguez et al. 2008). Developmental genes, normally repressed by H3K27me3 in pluripotent cells, are permanently repressed in cancer through DNA methylation, and this process is commonly known as the “epigenetic switch” (S. Sharma, Kelly, and Jones 2010; Baylin and Jones 2011). Moreover, during tumorigenesis, activating histone marks that were enriched at tumour suppressor genes are gradually substituted by repressive marks, and, conversely, regions that should remain silent (such as telomeres and sequence repeats) in a normal context lose repressive histone marks and become enriched in active ones (Figure 1.12). A characteristic example is the global reduction of H4K20me3 (a marker of constitutive heterochromatin) and H4K16ac at repeat sequences in many primary tumours, which is associated to DNA hypomethylation and results in de-repression of gene expression (Fraga, Ballestar, Villar-Garea, et al. 2005).
42
Figure 1.12. Global changes in histone modification in normal and cancer cells. In this cartoon representation of histone octamers (grey cylinders), different histone mark combinations are shown in a gene-rich and in a subtelomeric region, rich in repeats (left and right, respectively), in the context of a healthy and a cancer cell (top and bottom panels, respectively). Histone modifications are represented as blue and green circles at histone tails. In healthy cells, regions that include the promoters of tumour-suppressor genes are enriched in histone modification marks that promote active transcription, such as H3ac and H4ac, and H3K4me3. On the contrary, DNA repeats and other heterochromatic regions are characterized by H3K27me3, H3K9me2 and H4K20me3, which are repressive marks. This scenario is reversed in cancer cells, where active histone marks are lost at tumour suppressor gene promoters, and repressive marks are depleted at heterochromatic regions. Ultimately, this leads to transcriptional inactivation of tumour suppressors, and a more relaxed chromatin conformation at sites that should remain inaccessible to the transcriptional machinery, leading to genomic instability. Adapted from (M Esteller 2007).

Mechanistically, histone modifications may play two separate roles during tumorigenesis: they may alter gene expression programmes, and also affect genome integrity and chromosome segregation. Aberrant changes in histone marks are intimately associated to the misregulation of CRF genes responsible for the deposition of those marks, as discussed below. As in DNA methylation patterns, the differences in nucleosome occupancy bearing specific histone marks have been studied in association with clinical parameters in several cancer types. A successful case is the prediction of prostate cancer risk and recurrence based on the levels of H3K4me2 and H3K18ac (Seligson et al. 2005). In early stages of NSCLC, high levels of H3K4me2 or low of H3K9ac correlated with good prognosis (Barlési et al. 2007). Higher global H3K9ac levels have also been associated to a lower recurrence in bladder cancer patients (Barbisan et al. 2008), and H3K4me2 and H3K18ac have been described as independent predictors of lung and kidney cancer mortality (Seligson et al. 2009). Altogether, these studies present histone marks as potential biomarkers for early tumour progression, potentially bearing as much information as DNA methylation tests. However, unlike methylation, the detection of marks at specific residues in histone tails requires the use of antibodies, which poses a major technical challenge due to their variations in performance. Histone marks are also known to be less stable than DNA methylation, precisely because flexibility is their key characteristic (Heyn and Esteller 2012). Their diagnostic potential in the clinic will greatly depend on technical improvements, and on the further characterization of their role in tumorigenesis thanks to basic research.
1.4.3 Chromatin Regulatory Factors in cancer
It is becoming clear that many abnormal epigenetic events, such as aberrant histone modification positioning or altered DNA methylation, may lie downstream of genetic mutations in key enzymes that regulate those processes. Mutations in CRFs are often referred to as “epimutations” because they often lead to a misregulation in gene expression that may contribute to tumorigenesis (Elsässer, Allis, and Lewis 2011). That this is a general feature in cancer is, however, a very recent realization, and only now the scientific community is starting to assess the precise consequences of these mutations.
The first cancers where the misregulation of CRFs was described to play a key role were leukaemias. Amongst others, genes coding main HATs EP300 and CREBBP, HMTs like EZH2, MLL and NSD1, or HDMs such as KDM5A and KDM6A are frequently mutated in various types of haematological malignancies, according to the Cancer Gene Census (CGC) (Futreal et al. 2004). Even when DNMTs were known to be essential for CpG island hypomethylation in cancer
43

(M. Esteller 2007), they were thought to be not altered (Bestor 2003) until very recently, when DNMT3A, and later DNMT1 and DNMT3B, were found mutated in MDS and AML, where this alteration, moreover, predicted prognosis (Yan et al. 2011; M. J. Walter et al. 2011). Mutations in ATP-dependent chromatin-remodelling complexes also have been described to be recurrent, amongst others, in ovarian and clear cell renal cancers (Elsässer, Allis, and Lewis 2011). Other types of alterations, such as translocations (for instance, at the HATs EP300, CREBBP, NCOA2, MYST3 and MYST4) and aberrant expression (like that of HDAC1, HDAC2 and HDAC6), are also found both in haematological and solid cancers (Rodríguez-Paredes and Esteller 2011). The components of the Polycomb complex, which regulates the deposition of the H3K27me3 mark, are also frequently altered in a variety of cancer types, including those in breast, bladder, pancreas, prostate and lymphomas. Interestingly, alterations in KAT6B (Moore et al. 2004), SMARCC1 (Shadeo et al. 2008) and NSD1 (Quintana et al. 2013) genes have been described in uterine, cervical and skin pre-malignant lesions, respectively. These new findings would introduce these proteins as potential biomarkers for prevention and early cancer detection, and thus expanding the possible uses of CRFs in the clinic.
Many of these new findings that implicate the misregulation of CRFs in tumorigenesis have been only possible thanks to the recent publication of sequencing studies on very large tumour cohorts, including leukaemias, lymphomas, ovarian, renal and pancreatic cancers, and rhabdomyosarcomas (Figueroa et al. 2010; Ley et al. 2010; Yamashita et al. 2010; Uno et al. 2002; Jiao et al. 2011; Banine et al. 2005; S. Jones et al. 2010). Some even highlighted the presence of inactivating mutations on proteins that regulate the epigenomic state of cells (You and Jones 2012). For an overview on currently known alterations in CRF genes in cancer, see Table 1 and Table S2 in Chapter 5, in the Results section, which also includes transcriptomic changes described in CRFs. The notion that epimutations may underlie further epigenetic aberrations that drive cancer development unveils a new perspective from which to study cancer.
Altogether, the newly described role of CRFs in tumorigenesis has attracted the attention of the scientific community, and CRFs are emerging as novel targets for cancer treatment. Their appeal relies on the reversible nature of epigenetic marks, and much research is currently being focused on the identification of potentially druggable CRFs. The idea is that, by inhibiting for instance HDAC enzymes, one could compensate for site-specific aberrant hypoacetylation. There are currently four drugs that target CRFs that have been approved by the American Food and Drug Administration (FDA): two are the DNMT inhibitors (DNMTi) vidaza and decitabine (5-aza- and 5-aza-2′-deoxycytidine,
44

respectively), designed for the treatment of MDS patients that may develop AML. The other two are the HDAC inhibitors (HDACi) vorinostat and romidepsin (suberoylanilide hydroxamic acid and, formerly, FK-228, respectively), approved for the treatment of the rare cutaneous T-cell lymphoma (Rodríguez-Paredes and Esteller 2011). More than 20 molecules of this type are currently under preclinical and clinical investigation, including the HDACis Panobinostat (Novartis) and CI-994 (Pfizer), which are in clinical phase III trials for the treatment of lymphomas and NSCLC, respectively (Giannini et al. 2012). Inhibitors of sirtuins (the class III HDACs, which are not affected by generic HDACis) are also being intensively investigated, because they are likely to induce apoptosis in cancer cells by increasing p53 activity and thus stop the formation of tumours (Rodríguez-Paredes and Esteller 2011). For an in-depth, recent review on epigenetic drugs currently under testing, and their mechanisms of action in cancer and other diseases, see (Arrowsmith et al. 2012).
Another field of study is the combinatorial use of different epigenetic drugs, either amongst them, to achieve a synergistic therapeutic effect (such as with the combination of DNMTis and HDACis), or with other classical antitumour molecules, as in HDACis, which recently raised hopes for their possible use to overcome drug resistance (S. V. Sharma, Haber, and Settleman 2010). Major challenges in the development of epigenetic drugs include the determination of cancer subtypes most sensitive to them, and the restriction of their activity to restricted chromosome regions, in order to target specific genes or pathways and avoid undesirable side effects. Some of these drugs, like most HDACis, are not specific to certain CRFs, and affect the activity of many enzymes. Moreover, their mechanism of action still remains unclear, since, for instance, it is unknown whether their targets are histones or non-histone proteins. It is not known if the development of CRF-specific drugs would result in improved therapeutic results. More research on the antitumour effect mechanisms of these drugs is still needed, but the fact that they work at very low doses and have few side effects is already encouraging (Bannister and Kouzarides 2011). It is interesting to note that we are just at the start of the newly emerged pharmacoepigenomics field of research, and that many potentially druggable epigenetic regulators remain unexplored, as Patel et al. reviewed recently in depth. They identified six CRFs in the CGC that were promising candidates: ATRX, KAT6A, KDM6A, NSD3, PBRM1 and SMARCA4 (Patel et al. 2013). Undoubtedly, epigenetic drugs will become key in the near future as therapeutic anticancer agents.
Epigenetic vulnerability mirrors oncogene addiction
An interesting notion derived from recent studies on the inhibition of several
45

altered CRFs in tumour cells is that, while malignant cells die, normal cells are apparently unaffected. Apparently, CRFs work in a somewhat redundant manner in healthy cells, but in cancer some specific ones become critical for the correct balance of the epigenetic regulation required to maintain the expression, or repression, of critical genes for tumour cell survival. Some have indicated that this “epigenetic vulnerability” mirrors the “oncogene addiction” axiom, because cancer cells become dependant on certain epigenetic pathways, while normal cells can compensate deficiencies in them by activating alternative pathways that are intact (Dawson and Kouzarides 2012). An example of this behaviour is the critical dependency of DLBCL cells with EZH2 activating mutations to EZH2 enzymatic activity, absolutely required for their proliferation. The molecule EPZ005687, an EZH2-specific inhibitor, is able to exploit this vulnerability, and only selectively kills lymphoma cells with activating mutations. Those cells, thus, have become addicted to EZH2 activity, and its inhibition is cytotoxic to them, but inconsequential for lymphoma cells with the wild type EZH2 phenotype (Knutson et al. 2012).
Epigenetic anticancer therapy: targeting CRFs
Epigenetic aberrations in tumours first attracted the attention of the scientific community as putative prognostic factors, after the observation that some CRFs appeared recurrently mutated, and that altered patterns of histone acetylation and methylation could predict the outcome of cancer patients (Seligson et al. 2005; Fraga, Ballestar, Villar-Garea, et al. 2005). Presumably, mutations or other genetic aberrations on CRFs are responsible for those changes, presenting CRFs as potential biomarkers to stratify tumours, and, potentially, as attractive druggable candidates. Inhibitors are designed against epigenetic factors that are mutated in some tumours, but moreover they are effective antitumour agents in cancers where other epigenetic pathways are impaired. HDACs, for instance, are rarely mutated, and nevertheless HDACis have been shown to stop tumour growth in cancers where HDACs are not altered. This broad activity spectrum is an exclusive property of epigenetic drugs because, as opposed to genetic mutations, epimutations are reversible. Most of them are “druggable”; this is, their physicochemical characteristics and structure make them, in theory, candidates to be directly targeted by an inhibitory molecule. As has been briefly reviewed above, there are already some inhibitors of HDACs and DNMTs approved for clinical use, and drug candidates are under development to target all other epigenetic regulatory systems, including Polycomb proteins. The downside of the efficiency of these molecules is that they may be specific of certain tumour subtypes, which are yet to be identified. Moreover, some epigenetic drugs may even promote cancer cell survival in certain tumours.
46

Clearly, much clinical research is still needed to see the full potential of these new class of anticancer agents, and basic functional studies will be crucial to determine which tumours are most vulnerable to epigenetic therapies.
1.4.4 The role of Polycomb Complex in cancer
Proteins of the Polycomb group (PcG) are essential for embryonic development and cell differentiation, and play a key role in maintaining the identity of stem and differentiated cells, principally through the regulation of H3K27me3 levels. Associated, mainly, into two repressive complexes (PRC1 and PRC2), PcG proteins repress cell fate transcription factors in pluripotent cells, while keeping them poised for activation upon differentiation signals, and are required for silencing alternative lineage-specific genes. Given their dynamic nature and their importance in the maintenance of a “stemness” phenotype, some researchers have proposed that Polycomb is central to the acquisition of stem cell-like characteristics in somatic cells, leading to tumour initiation (Figure 1.13) (Valk-Lingbeek, Bruggeman, and Lohuizen 2004; Bracken and Helin 2009). What is clear, according to current evidence, is that Polycomb proteins balance is critical for the maintenance of the normal chromatin status in cells (Sauvageau and Sauvageau 2010).
In healthy, non-malignant cells, the histone mark H3K27me3 is involved in the formation of repressive chromatin and gene silencing, especially at sites where lineage-specific genes, unwanted in differentiated cells, reside (Bernstein et al. 2006; Barski et al. 2007; Mikkelsen et al. 2007). This repression is, however, reversible. High global levels of H3K27me3 have been associated to a poor prognosis in oesophageal carcinomas. The opposite was observed in breast, prostate, ovarian and pancreatic tumours, where a loss of H3K27me3 correlated with a shorter overall survival (Füllgrabe, Kavanagh, and Joseph 2011). PRC2 occupancy has also been associated to aberrant methylation in cancer at CpG islands, precisely at the sites normally bound by PRC2, and enriched for H3K27me3, in stem cells. Several studies indicate that H3K27me3 may thus serve as a recruiting platform for DNMTs that catalyse de novo DNA methylation in tumour cells, leading to a permanent silencing of those loci (Viré et al. 2005; Widschwendter et al. 2007). However, H3K27me3 alone has also been reported to aberrantly silence genes in the absence of DNA methylation (Kondo et al. 2008). The role of global H3K27me3 levels in cancer, and its relation with DNA methylation, remains unclear, and is being actively studied.
The catalytic subunit of PRC2, responsible for the deposition of the H3K27me3 mark, is coded by the EZH2 gene and presents also a puzzling pattern of
47
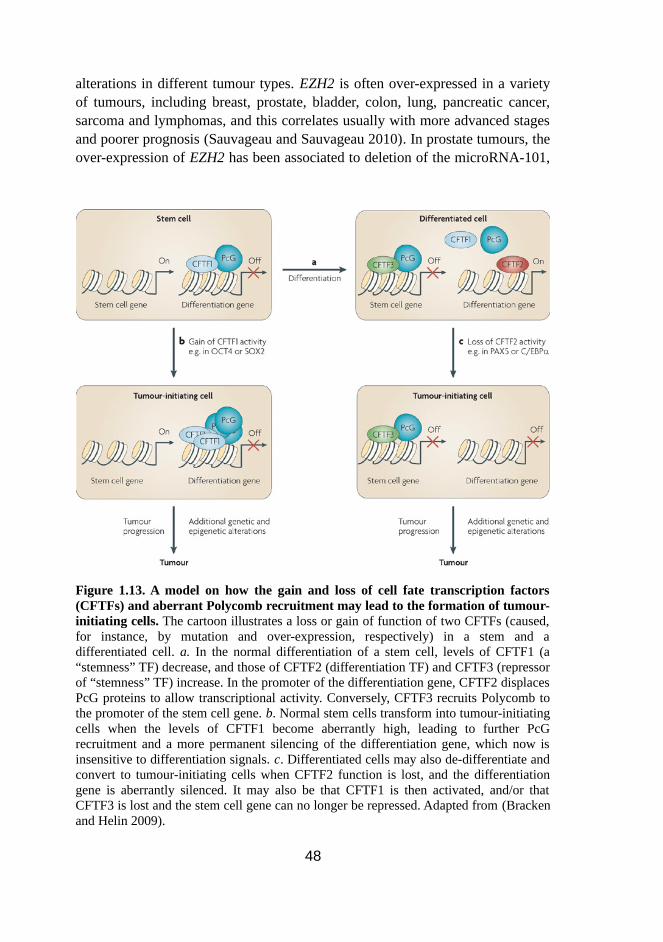
alterations in different tumour types. EZH2 is often over-expressed in a variety of tumours, including breast, prostate, bladder, colon, lung, pancreatic cancer, sarcoma and lymphomas, and this correlates usually with more advanced stages and poorer prognosis (Sauvageau and Sauvageau 2010). In prostate tumours, the over-expression of EZH2 has been associated to deletion of the microRNA-101,
48
Figure 1.13. A model on how the gain and loss of cell fate transcription factors (CFTFs) and aberrant Polycomb recruitment may lead to the formation of tumour-initiating cells. The cartoon illustrates a loss or gain of function of two CFTFs (caused, for instance, by mutation and over-expression, respectively) in a stem and a differentiated cell. a. In the normal differentiation of a stem cell, levels of CFTF1 (a “stemness” TF) decrease, and those of CFTF2 (differentiation TF) and CFTF3 (repressor of “stemness” TF) increase. In the promoter of the differentiation gene, CFTF2 displaces PcG proteins to allow transcriptional activity. Conversely, CFTF3 recruits Polycomb to the promoter of the stem cell gene. b. Normal stem cells transform into tumour-initiating cells when the levels of CFTF1 become aberrantly high, leading to further PcG recruitment and a more permanent silencing of the differentiation gene, which now is insensitive to differentiation signals. c. Differentiated cells may also de-differentiate and convert to tumour-initiating cells when CFTF2 function is lost, and the differentiation gene is aberrantly silenced. It may also be that CFTF1 is then activated, and/or that CFTF3 is lost and the stem cell gene can no longer be repressed. Adapted from (Bracken and Helin 2009).

providing a mechanistic explanation for its tumorigenic role (Cao et al. 2010). This over-expression results in an increase of H3K27me3, the mark laid down by EZH2, in most tumours (Chase and Cross 2011). Specifically in breast cancer, EZH2 over-expression has been associated to an increase in the breast initiating tumour cells population, through the epigenetic repression of DNA repair, which is consistent with the clonal evolution of CSCs (Chun-Ju Chang et al. 2011). Some studies, however, have shown that there is no association between the EZH2 over-expression and an increase of H3K27me3 in ovarian and pancreatic cancers (Füllgrabe, Kavanagh, and Joseph 2011). Those cases may seem to contradict the oncogenic role of EZH2 and the aberrant silencing associated to an enrichment of H3K27me3; however, a possible explanation would be that the imbalance of H3K27me3 levels, in either direction, may be tumorigenic, given that its careful regulation is essential to maintain cellular integrity (Bannister and Kouzarides 2011).
Initial screenings in tumours surprisingly found mutations of EZH2 that were thought to be inactivating, but it soon became apparent that there were two opposite types of mutations in EZH2. In lymphomas, missense mutations at Y641, within the SET domain, result in a gain of function and enhanced catalytic activity, increasing H3K27 levels (Morin et al. 2010); while, in myeloid neoplasms, mutations are often inactivating and confer poorer prognosis, and EZH2 loses its HMT activity (T. Ernst et al. 2010; Nikoloski et al. 2010). Mutations in other components of PRC2 have not been reported, although the H3K27 HDM UTX is mutated in a number of malignancies, and this may be functionally equivalent to EZH2 over-expression (Haaften et al. 2009). The role of EZH2 in cancer is still not clear, as it seems to have different functions depending on the tissue of origin of the tumour, but it is believed to act in growth control (You and Jones 2012). Depending on the context, thus, it behaves as an oncogene or as a tumour suppressor.
Given the success in developing HDACis, and the current lack of HMT inhibitors, there is growing excitement on EZH2 as a therapeutic target. DZNep was the first drug reported to deplete PRC2 proteins and inhibit H3K27me3, in breast cancer MCF7 and colorectal HCT116 cells (Tan et al. 2007). Further, it induces tumour-selective apoptosis and growth inhibition in glioblastoma, prostate and ovarian cancer cell lines, its effects being similar to depletion of EZH2 using short-hairpin RNA (C.-J. Chang and Hung 2012). However, the inhibition of EZH2 activity by DZNep is not specific (Miranda et al. 2009), and it has not yet been tested in vivo. Very recently, two different research groups developed each an EZH2-specific inhibitor molecule that provides a further promising option for the treatment of DLBCL. The first, GSK126, is a HMT
49

inhibitor highly-selective for EZH2 (even over EZH1) that abolishes growth in DLBCL cells with the activating mutations at Y641 and A677, through the lowering of H3K27me3 levels and the consequent de-repression of aberrantly silenced genes. GSK126 also proved its efficacy in xenografts of DLBCL cell lines, improving the survival of the mice (McCabe et al. 2012). The second molecule, EPZ005687, was shown to block H3K27me3 in DLBCL cell lines regardless of EZH2 status, through the specific inhibition of EZH2, but importantly only inhibited growth in cells with activating mutations (Knutson et al. 2012). The potential for EZH2 inhibitors will be unravelled in the coming years, when their efficacy is tested in a clinical setting. Further research is required, however, for the detailed understanding of the role of EZH2 in tumours of different origins, as the inhibition of PRC2 may have a counterproductive effect in malignancies where EZH2 seems to be a tumour suppressor.
Polycomb as a regulator of stemness and EMT
Several studies have noted the overlap of EZH2 targets in stem and cancer cells. In prostate cancer, moreover, the repression at those sites correlates with a poor prognosis, supporting the hypothesis that tumours revert to more and more stem cell-like states as they progress (Yu et al. 2007). It is assumed that, following this model, differentiation gene promoters become aberrantly repressed in tumours, while genes that are responsible to maintain stemness are expressed. The over-expression of EZH2 has been associated to more aggressive presentations of cancer and the formation of CSCs, and recently it was also found to be involved in the expansion of an aggressive CSC population in breast tumours (Chun-Ju Chang et al. 2011).
Polycomb proteins have also been described to promote angiogenesis and EMT during tumour development. The first is enhanced through the EZH2-mediated silencing of VASH1, a negative regulator of angiogenesis, thus enhancing it (Lu et al. 2010). EMT, a process that tumour cells are thought to undergo prior to metastasis, is promoted by the recruitment of EZH2 and SUZ12 by SNAI1. This results in the repression of the epithelial marker E-cadherin through the deposition of the H3K27me3 mark at the CDH1 promoter (Herranz et al. 2008). The contribution of Polycomb proteins to cancer development, and more specifically that of PRC2, seems to be at different levels and through distinct mechanisms, presenting them as multifaceted elements that make for very attractive pharmacological targets to inhibit tumour progression.
50

1.4.5 Interplay between epigenetic factors in cancer
That genetic events have a profound impact on the chromatin organization of the genome, via aberrant regulation of CRFs, has been now reviewed. The understanding of the implications of altered CRFs in tumorigenesis will improve as technologies for the interrogation of epigenetic factors evolve. However, as You and Jones pointed out recently, this scenario represents only “one side of a coin”, as aberrant epigenetic regulation can also lead to genomic alterations (mutations in key genes or disruption of signalling pathways) and, ultimately, to cancer development (You and Jones 2012). Three specific cases are described. First, some key DNA repair genes, including MGMT, CDKN2B and RASSF1A, lose their function in cancer preferentially through promoter hypermethylation, rather than mutation. Second, epigenetic silencing cooperates with mutations in the inactivation of key signalling pathways, for instance by silencing one allele when the other is mutated. And finally, the observation that a third of all single nucleotide variants (SNVs) occurs at methylated CpG sites, and that half of the mutations at key genes like TP53 occurs at those sites, suggests that the methylation epigenetic mark itself may be causing somatic mutations.
The maintenance of a normal epigenetic landscape requires a fine-tuned, cell-specific regulation, and tipping key factors on either side may provide a suitable environment for tumorigenesis. Usually, each type of factor is studied independently for methodological reasons; in reality, however, all parts form a single complex inter-dependent system that controls the life cycle of a cell.
It seems evident that the relationships between different epigenetic factors is decoupled in cancer, and that an aberrant interplay between them contributes to tumour development. Hypermethylation at tumour suppressor promoters is associated to a particular chromatin configuration in cancer cells, consisting on low levels of histone acetylation and H3K4me3, and higher levels of H3K9me3 and H3K27me3 (Ballestar et al. 2003; Sandoval and Esteller 2012). This suggests the existence of a cross-talk between DNA methylation and histone modification that promotes the aberrant silencing at those genes. Another epigenomic switch involves DNA methylation, histone modifications and Polycomb proteins: sites that become hypermethylated in cancer overlap with EZH2 binding sites and the H3K27me3 mark, suggesting that the reversible repression established by Polycomb may serve as a recruitment platform for a more stable repression mediated by DNA methylation (Widschwendter et al. 2007). The known association of EZH2 and DNMTs may provide a mechanistic explanation for this positive feedback loop that ends in aberrant silencing in tumours.
51

1.5 High-throughput study of cancer genomes
As has been reviewed above, our knowledge on epigenetics and cancer biology has improved at a fast pace in recent years. All these advances would not have been possible without the prior development of technologies that allow scientists to answer complex questions, such as: “what is the methylation status of all genes in a tumour?” or “how are somatic mutations in a gene different at two given tumours, and how does this affect cancer development?”. The output of those experiments, however, needs to be coupled to appropriate statistical analyses and integrative methods to extract solid conclusions, and it is at this step that bioinformatics has become essential for current biomedical research.
1.5.1 Methods to extract information from biological samples
To understand how genes are regulated in a tumour, or which histone marks characterise a specific genomic region, one must first extract primary information from specially processed biological samples. Then, this information must be digitalised in order to allow for its computational processing. And, finally, different methods may be applied through ad hoc computer software to answer specific biological questions. Two genome-wide types of experiment that scientists perform nowadays in the field of genomics are the determination of the transcriptomic and epigenomic status in a cell. The first seeks to quantify the average amount of RNA (usually, mRNA) present in a biological sample for each transcript at a given time point, with the aim of obtaining a snapshot that shows which genes are being transcribed. Epigenomic experiments, on the other hand, interrogate some key regulators of chromatin structure, such as DNA methylation or histone modifications, to understand the local conformation at each given site. In the case of cancer genomic studies, typically one seeks to characterize tumour samples from a transcriptomic, genomic and mutational perspective to obtain an overview of deregulated biological functions.
Interrogating the transcriptome
Cells present diverse protein concentrations that are essential to maintain their identity in different tissues. The intermediate products between the genome and the proteome are mRNAs, which have been routinely used as a proxy to estimate gene expression (the transcriptome). By comparing the transcriptional activity of genes in different tissues or cell types we deepen our understanding of what causes the characteristic phenotypes of each, and how does gene expression change in disease. The development of DNA microarrays in the mid 1990s made possible to interrogate the expression of thousands of genes at once. Those
52

consisted initially on complementary, single stranded DNA copy (cDNA) libraries that corresponded to a large number of mRNAs of known sequence. Those cDNAs are fluorescently labelled at one end and dotted onto a glass slide. Two cDNA libraries, for instance one from normal tissue (green fluorochrome) and one from a tumour (red fluorochrome), are hybridised, and non-bound molecules are washed away. Each spot corresponds to a specific gene, and fluorescent dots indicate the expression of genes in red (higher in the tumour), green (higher in normal), yellow (in both tissues) and black (no expression) colours. The ratio of light intensities is used to estimate the relative differences in expression. The whole human genome can be comprehensively covered in tiling arrays, that systematically probe features across whole chromosomes; their price, however, is prohibitive to use this approach on a regular basis. There are now many affordable commercially available microarrays that show one or two colours (single and dual-channel, respectively) and that come prepared with cDNA collections representing promoters, coding regions, splice sites, 3' ends or common single nucleotide polymorphisms (SNPs) in a single array.
The rapid development of sequencing technologies (often called next generation sequencing, or NGS) has fostered the recent appearance of new techniques that adopt them. Levels of gene expression can also be measured by RNA sequencing (RNA-Seq), which directly samples and sequences transcripts present at the source material, instead of probing them, and maps them back to a reference genome. The number of reads that map at each genomic region corresponding to a transcript (gene) is the direct measure of its expression levels. This method does not require prior knowledge on gene structure nor variants, and in fact it can be used in species for which the genomic sequence is unknown for this reason (Schliesky et al. 2012).
Each of these technologies has its advantages and drawbacks, making them complementary nowadays. They may have different uses in the future, as sequencing costs continue to drop. Table 1.4 summarizes their main differential characteristics.
ChIPping the epigenome
Chromatin immunoprecipitation is a widely used technique to detect TFs that are directly or indirectly bound to DNA in vivo. Few years ago, an array-based method, termed ChIP on chip, was developed to allow for genome-wide analyses of this kind. The coupling of NGS to ChIP led to the birth of the ChIP-seq technology, which allowed for truly genome-wide coverage. Finally, the availability of antibodies with high specificity towards histones bearing a
53

54
Table 1.4. Main characteristics of microarray and RNA-Seq technologies. Some practical considerations are also included.
Microarray RNA-Seq
An established technology, experimental biases are known after a decade of intensive use, and thus computational methods have been developed to deal with systematic variation across laboratories. (Fan et al. 2010; Luo et al. 2010; MAQC Consortium 2010).
Still an evolving technology, has not established widely accepted standards.
Around 10 times less expensive (Malone and Oliver 2011).
Being sequencing-based, it is still more expensive than the array technologies.
Expression estimates are uniform throughout transcripts.
Sequencing heterogeneity across the transcript influences expression estimates (J. Li, Jiang, and Wong 2010).
Requires prior knowledge of the underlying genomic sequence.
Splicing events, exon junctions and SNPs can be detected without prior knowledge
Requires prior knowledge of the underlying genomic sequence.
Identification of transcripts that have not been previously annotated (gene discovery) (Hurd and Nelson 2009).
Very low and very high transcript concentrations present technical problems due to background noise and hybridisation saturation, respectively.
It can quantify both very low and very high transcript concentrations (Mortazavi et al. 2008; Hurd and Nelson 2009).
Requires prior knowledge of the underlying genomic sequence.
May be used to determine the transcriptome in species for which the full genome sequence has not yet been determined (Schliesky et al. 2012).
Cross-hybridisation of related probes, low transcript abundance in some tissues and complex computational analyses difficult the quantification of alternatively spliced transcripts (Richard et al. 2010).
Allows for the quantification of individual transcripts isoforms (Richard et al. 2010).
Restricted to the non-repetitive fraction of the genome due to cross-hybridisation between similar sequences.
Does not suffer from cross-hybridization between similar sequences and thus may be used genome-wide (Hurd and Nelson 2009).
Requires more source material, in the order of micrograms, and PCR amplification, that may introduce biases.
Requires less source material, in the order of nanograms, and does not require PCR amplification (Hurd and Nelson 2009).
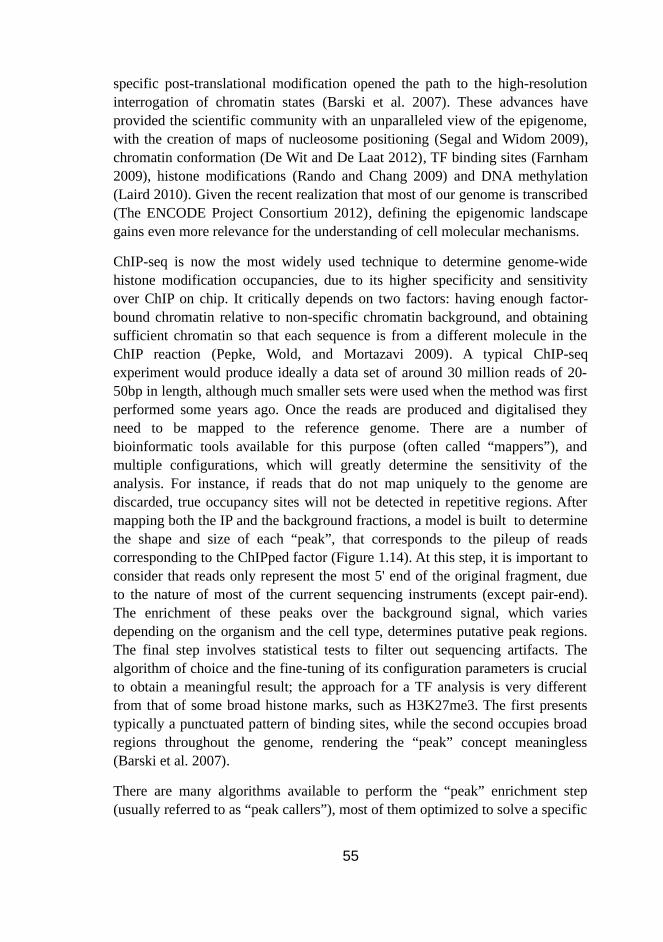
specific post-translational modification opened the path to the high-resolution interrogation of chromatin states (Barski et al. 2007). These advances have provided the scientific community with an unparalleled view of the epigenome, with the creation of maps of nucleosome positioning (Segal and Widom 2009), chromatin conformation (De Wit and De Laat 2012), TF binding sites (Farnham 2009), histone modifications (Rando and Chang 2009) and DNA methylation (Laird 2010). Given the recent realization that most of our genome is transcribed (The ENCODE Project Consortium 2012), defining the epigenomic landscape gains even more relevance for the understanding of cell molecular mechanisms.
ChIP-seq is now the most widely used technique to determine genome-wide histone modification occupancies, due to its higher specificity and sensitivity over ChIP on chip. It critically depends on two factors: having enough factor-bound chromatin relative to non-specific chromatin background, and obtaining sufficient chromatin so that each sequence is from a different molecule in the ChIP reaction (Pepke, Wold, and Mortazavi 2009). A typical ChIP-seq experiment would produce ideally a data set of around 30 million reads of 20-50bp in length, although much smaller sets were used when the method was first performed some years ago. Once the reads are produced and digitalised they need to be mapped to the reference genome. There are a number of bioinformatic tools available for this purpose (often called “mappers”), and multiple configurations, which will greatly determine the sensitivity of the analysis. For instance, if reads that do not map uniquely to the genome are discarded, true occupancy sites will not be detected in repetitive regions. After mapping both the IP and the background fractions, a model is built to determine the shape and size of each “peak”, that corresponds to the pileup of reads corresponding to the ChIPped factor (Figure 1.14). At this step, it is important to consider that reads only represent the most 5' end of the original fragment, due to the nature of most of the current sequencing instruments (except pair-end). The enrichment of these peaks over the background signal, which varies depending on the organism and the cell type, determines putative peak regions. The final step involves statistical tests to filter out sequencing artifacts. The algorithm of choice and the fine-tuning of its configuration parameters is crucial to obtain a meaningful result; the approach for a TF analysis is very different from that of some broad histone marks, such as H3K27me3. The first presents typically a punctuated pattern of binding sites, while the second occupies broad regions throughout the genome, rendering the “peak” concept meaningless (Barski et al. 2007).
There are many algorithms available to perform the “peak” enrichment step (usually referred to as “peak callers”), most of them optimized to solve a specific
55

56
Figure 1.14. A typical ChIP-seq “peak calling” pipeline. A profile is formed via a census algorithm, for instance by counting the number of reads overlapping each base pair along the genome (upper left panel; in blue and red, negative and positive strand reads, respectively. Purple represents the distribution of shifted reads). The same processing is performed on the background data. The signal and background profiles are compared to define regions of enrichment (middle panel). Finally, peaks are filtered for false positives and ranked according to statistical significance. In the bottom left panel, P(s) is the probability of observing a location with s reads covering it. Bars represent the control data distribution. A hypothetical Poisson distribution fit is shown with sthresh indicating a cut-off above which a ChIP-seq peak might be considered significant. In the bottom right panel, a schematic representation of two types of artifactual peaks: single strand peaks and peaks formed by multiple occurrences of only one or a few reads (also called “singletons”). Adapted from (Pepke, Wold, and Mortazavi 2009).

biological or technical problem; as of November 2012, the count was 52 bioinformatic applications, according to the SEQanswers community (http://seqanswers.com/wiki/ChIP-Seq). Given the sheer abundance of methods and their technical variability, the choice of a specific one may be a challenging task, especially taking into account that it will influence the final results. To provide a user-oriented guide, several authors have evaluated the performance of those tools using the same input data (Laajala et al. 2009; Wilbanks and Facciotti 2010). See Figure 1.15 for a selection of peak callers and their main characteristics. A very popular open source bioinformatic application is MACS, that was developed back in 2008 but has been under constant improvement and, most importantly, providing support to users; recently, its developers have made available a detailed protocol to use MACS for three different data types: TFs, sharp histone marks and broad domains of histone mark occupancy (Yong Zhang
57
Figure 1.15. A selection of ChIP-seq peak callers. Only open source programs that can use control data are included. Their common features are summarized and grouped by their role in the peak calling procedure (coloured blocks). Programs are organised by the features they use (Xs) to call peaks from ChIP-seq data. The version of each program is shown, as the feature lists can change with program updates. References: CisGenome (Ji et al. 2008), Minimal ChipSeq Peak Finder (Johnson et al. 2007), E-RANGE (Mortazavi et al. 2008), MACS (Yong Zhang et al. 2008), QuEST (Valouev et al. 2008), Hpeak (Qin et al. 2010), Sole-Search (Blahnik et al. 2010), PeakSeq (Rozowsky et al. 2009), SISSRS (Jothi et al. 2008), spp package (Kharchenko, Tolstorukov, and Park 2008). Adapted from (Wilbanks and Facciotti 2010).

et al. 2008; Feng et al. 2012).
A key challenge for peak finders is to identify regions truly occupied by the factor of interest, while avoiding false positives. Typically, factor enrichment detection is an iterative process, and not the end of the experiment, as many parameters that influence the output are unknown until the data is processed. For instance, the ChIP-seq may require further sequencing to reach enough sequencing depth, and thus needs to be repeated and the new data incorporated to the original to determine the final enriched regions.
Sequencing the cancer genome: computational issues
Thanks to the advances in NGS technologies, it is now feasible to determine full transcriptomes (expressed genes), whole mutation landscapes (mutations in gene coding or non coding regions) and genomes (structural variants and CNV) in cancer cells. Given that cancer is still perceived as a mostly genomic disease, it is crucial to use all the approaches above to profile tumours and obtain a deeper knowledge of the mechanisms that sustain them. Special considerations, however, should be taken into account given the nature of cancer genomes.
Cancer samples usually provide a much smaller amount of biological material, especially if they come from biopsies performed with diagnostic purposes. To overcome this limitation often WGA is used, but it may cause artifactual alterations in the sequence. Two other reasons for the low nucleic acid quantity are technical, as many tumours are FFPE (formalin-fixed paraffin embedded) and this degrades the specimens, and biological, given the high necrotic and apoptotic rates that lower the quality of the DNA that can be extracted (Meyerson, Gabriel, and Getz 2010). Moreover, tumours are an heterogeneous mixture of normal and cancerous cells, which are in turn an arrangement of different clones. NGS technologies permit the extraction of meaningful information from such low-quality biological samples, thanks to their digital nature: the same region can be sequenced many times (over-sampling) to obtain highly-accurate information (Ley et al. 2008). There are, however, many technical and algorithmic challenges. The main genomic alterations studied in tumours using NGS are CNVs, detected through changes in sequencing depth; somatic nucleotide substitutions and small insertions and deletions, identified by multiple reads that do not fully align to the reference sequence; and chromosomal rearrangements, which are evident when pair-end reads map to different loci (Figure 1.16).
By far, the most common genomic alteration in cancer is nucleotide substitution mutations, but the rate at which they are observed varies greatly depending on
58

the tissue of origin. For instance, in ultraviolet-induced melanomas the substitution rate may reach 10 nucleotides per million bases, a ten-fold increase compared to the average in tumours (Pleasance et al. 2009). Also, tumour cells of some cancer subtypes bear mutations in key DNA repair genes that result in a hypermutator phenotype (McLendon et al. 2008). On the contrary, haematopoietic malignancies very rarely present frequent somatic mutations. It is therefore crucial that downstream statistical analyses take into account this inter-tumour heterogeneity aspect. This is also the reason why sequencing of matched DNA from a normal sample is essential, given our current incomplete knowledge of human germline variation. The analysis of nucleotide substitutions (“variant calling”) must be adjusted for the sample-specific background mutation rate, the ploidy and the copy number at each region.
Once somatic mutations, and small indels, have been detected (or “called”) in a tumour sample, the major challenge that arises is to tell “true” (driver) from passenger mutated genes; this is, those that are causative and those that occurred
59
Figure 1.16. Types of genome alterations that can be detected by NGS. Sequenced fragments are shown as bars, with the unsequenced portions in grey. Reads are aligned to the reference genome, and the colours of the sequenced ends show where they align to. Different types of genomic alterations can be detected, from left to right: point mutations (here, A to C) and small insertions and deletions (indels) (a deletion shown by a dashed line); copy number changes (shaded boxes represent absent or decreased reads in the tumour sample) and chromosomal rearrangements. Adapted from (Meyerson, Gabriel, and Getz 2010).

secondary to the first and do not play a major role in cancer development and progression. The most common approach to determine drivers is to asses the frequency at which each genes is mutated across a cohort of tumours. This method, based on the assumption that important alterations are positively selected and thus appear at higher frequencies, tends however to favour early drivers, and often fails to detect drivers that are preferentially mutated at advanced stages. Nevertheless, it has been the strategy followed in the great majority of cancer sequencing studies published recently, which assessed large tumour cohorts, some comprising hundreds of samples. The impact of lowly-recurrent drivers (those genes with rare, but likely functional mutations) is underestimated if only frequencies are evaluated. A recently published method, Oncodrive-fm (Gonzalez-Perez and Lopez-Bigas 2012), addresses this issue by using existing tools to predict the functional impact (FI) of mutations, and assessing the bias towards FI mutations within each gene. Genes with few, but highly deleterious mutations, arise as likely drivers when this approach is used.
Future challenges in cancer sequencing driver assessment will be likely directed at the determination of single cancer cells variants, which will allow to understand tumour heterogeneity and use it in the clinic (N. Navin et al. 2010). The prioritization of variants is also likely to improve significantly thanks to the advances in big projects such as the 1000 Genomes, the sequencing of thousands of personal genomes from patients and healthy in the very near future and the prospect of new approaches to determine the nature of those variants (Fu et al. 2013).
1.5.2 Multidimensional data integration approaches
Cancer genomics data sets often consist of multi-dimensional and heterogeneous data that needs to be integrated to understand the full picture. Ten years ago, research focused on the assessment of mutations in individual genes, or the copy number status of specific loci, across few samples. Nowadays microarrays, genomic mutations or CNVs and methylomes are interrogated across hundreds of tumours, usually with the aim to determine lists of genes that show significant differences across conditions, and investigate their role in tumour development. The integration of data coming from different sources has proved to be essential to understand the complex relationships underlying the oncogenic process (Chuang et al. 2012; The Cancer Genome Atlas Network 2012; R. Chen et al. 2012). Here I highlight two integrative approaches that are key to current cancer genomics research: enrichment analysis and data visualization.
60

Enrichment analysis
Transcriptomic experiments in tumour sample cohorts typically output a list of genes that are differentially expressed in two different conditions (for instance, normal and cancer tissue). The biological meaning of those gene lists cannot be manually determined by annotating known functional characteristics of each element, and thus algorithms that seek over-representation (enrichment) of functional annotations have been developed (Tavazoie et al. 1999). These methods, typically called enrichment analyses, are an unsupervised integration of data, thus not assuming any prior knowledge. The general question usually is: “what kinds of patterns exist in this data set?”. The common assumption is that features that occur frequently in the data are the interesting ones, which allows to use this approach regardless of the nature of the data. Signatures based on genes aggregated as modules are more stable across studies than individual genes, the expression of which varies substantially. A simple example of an enrichment analysis: in a group of transcriptomic experiments from four cancer subtypes, one may want to determine whether genes differentially expressed in a specific subtype are enriched for previously defined pathways (Figure 1.17). The KEGG database can be used to obtain lists of genes annotated to each pathway (modules), and a statistical test may be used to probe for over-representation of down-regulated genes in one of the subtypes within a module (for instance, using a binomial test). The resulting enrichment scores reflect whether the pathway in question is up- or down-regulated in one of the four tumour subtypes, which may aid in the biological characterization of those samples. A crucial aspect of enrichment analyses is to perform multiple test correction of the P values, given the large number of tests performed, which increases substantially the false positives among the modules that receive seemingly highly significant P values. A good balance between conservative (too many false negatives) and relaxed (too many false positives) approaches is the use of the Benjamini-Hochberg's false discovery rate (FDR) (Benjamini and Hochberg 1995), that provides a new significance score (Q value) based on the expected fraction of false positives among the predictions.
There is a number of public databases that provide gene annotations that can be readily used for enrichment analyses, the most popular ones being KEGG pathways (Kanehisa et al. 2012), the Gene Ontology (GO) (Ashburner et al. 2000) and Reactome (Vastrik et al. 2007). An umbrella resource is the molecular signature database (MsigDB) (http://www.broadinstitute.org/gsea/msigdb), which includes curated gene sets mined form the literature, computational predictions and oncogenic signatures defined directly from cancer microarray experiments (Subramanian et al. 2005). A recently created resource, the gene
61

signature database (GeneSigDB) manually compiles gene signatures from the literature, currently including more than 1600 publications, comprising an interesting repository of clinically relevant information (Culhane et al. 2012). Custom assembly of gene sets related to a particular biological function (regulatory modules) is also common, and allows for the exploratory analysis of specific biological problems. Pioneering work using regulatory modules in transcriptomic experiments dissected common and differential tumour progression mechanisms across a number of cancers (Segal et al. 2004), and later studies used similar approaches to delineate stemness signatures in human tumours (Ben-Porath et al. 2008; Wong et al. 2008). A newly developed
62
Figure 1.17. Enrichment analysis based on gene annotations to identify coordinately regulated functional modules. In this schema, a method is applied to define enriched gene sets in a hypothetical cancer signature. This approach uses a binomial distribution to calculate the probability that a gene set would show a given degree of enrichment in a cancer signature. These enrichment scores may be calculated for different types of gene sets or modules (Gene Ontology, KEGG, Biocarta, etc.) across hundreds of cancer signatures extracted from a cancer genomics database, or obtained from microarray experiments. Adapted from (Rhodes and Chinnaiyan 2005).

approach to dissect tumour biology based on similar principles is sample-level enrichment analysis (SLEA), that assesses the transcriptional status of gene modules as a whole in each sample, and uses the differential enrichment across samples to stratify them (Gundem and Lopez-Bigas 2012). The subsequent correlation of the sample groups created in an unsupervised manner with clinical features has proved to be useful to gain insight into complex molecular interactions underlying tumorigenesis.
Data integration using enrichment analysis approaches is not an end point, though. Rather, it is designed to generate new hypotheses by finding patterns in an unsupervised manner, that later may be tested in supervised tests. This type of studies tend to encompass a large number of experimental conditions or samples (even hundreds), and include also large collections of gene modules in the initial exploration steps. Many tools have been developed to perform enrichment analyses; Hung et al. counted 68 in their 2009 compilation (Huang, Sherman, and Lempicki 2009), and more are likely to exist since then. Most of those applications presented one or more shortcomings that have been overcome by Gitools (http://www.gitools.org) (Perez-Llamas and Lopez-Bigas 2011), a framework designed for the analysis and visualization of genomic data. Some of those features are: i) the direct manipulation of the results, presented as interactive heatmaps that can be conveniently annotated; ii) the ability to perform cross-comparison of enrichment analysis obtained from multiple gene lists and across several conditions; iii) the import of modules and annotations from existing databases, mapping gene identifiers according to the user's needs; iv) the ability to perform several statistical tests with the same data, and browse them as different dimensions on a heat-map; and v) the integration with popular platforms such as GenomeSpace (http://www.genomespace.org) and the integrative genomics viewer (IGV) (Robinson et al. 2011).
Visualization of data dimensions in cancer genomics
A common problem that integrative cancer genomic analyses face is how to visually summarize results that often comprise several inter-related data dimensions, such as CNV, mRNA expression and mutation status. A number of solutions have been envisioned to overcome it, both static (necessary to report figures in scientific reports) and interactive (allowing for a deeper exploration of an analysis or reported results). The three main types of genomic visualization in oncogenomics, usually complementary, are genomic data coordinates, heatmaps and networks (Schroeder, Gonzalez-Perez, and Lopez-Bigas 2013).
Genomic coordinates browsers present the information in the context of genomic
63
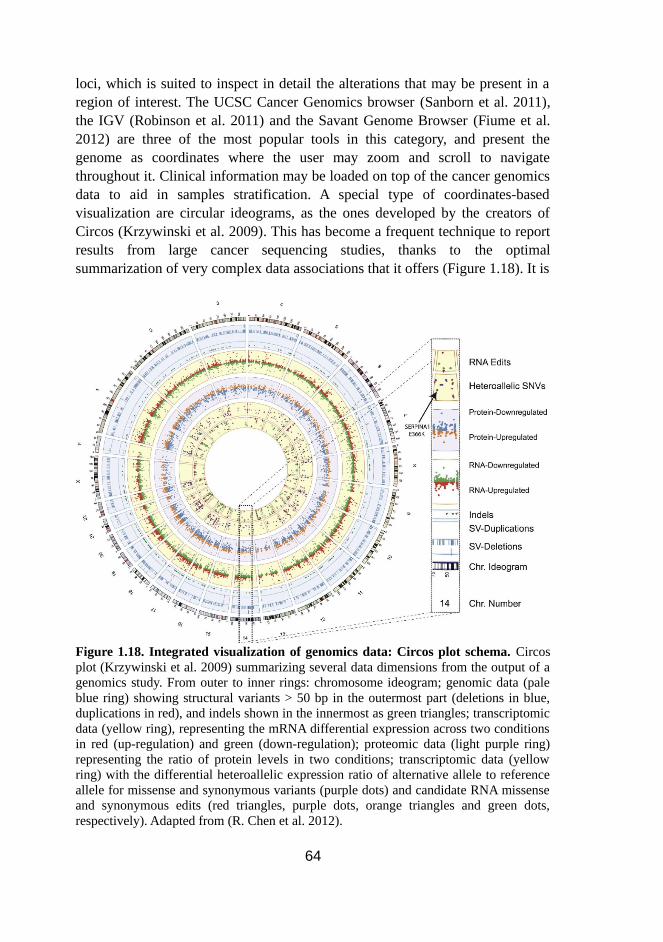
loci, which is suited to inspect in detail the alterations that may be present in a region of interest. The UCSC Cancer Genomics browser (Sanborn et al. 2011), the IGV (Robinson et al. 2011) and the Savant Genome Browser (Fiume et al. 2012) are three of the most popular tools in this category, and present the genome as coordinates where the user may zoom and scroll to navigate throughout it. Clinical information may be loaded on top of the cancer genomics data to aid in samples stratification. A special type of coordinates-based visualization are circular ideograms, as the ones developed by the creators of Circos (Krzywinski et al. 2009). This has become a frequent technique to report results from large cancer sequencing studies, thanks to the optimal summarization of very complex data associations that it offers (Figure 1.18). It is
64
Figure 1.18. Integrated visualization of genomics data: Circos plot schema. Circos plot (Krzywinski et al. 2009) summarizing several data dimensions from the output of a genomics study. From outer to inner rings: chromosome ideogram; genomic data (pale blue ring) showing structural variants > 50 bp in the outermost part (deletions in blue, duplications in red), and indels shown in the innermost as green triangles; transcriptomic data (yellow ring), representing the mRNA differential expression across two conditions in red (up-regulation) and green (down-regulation); proteomic data (light purple ring) representing the ratio of protein levels in two conditions; transcriptomic data (yellow ring) with the differential heteroallelic expression ratio of alternative allele to reference allele for missense and synonymous variants (purple dots) and candidate RNA missense and synonymous edits (red triangles, purple dots, orange triangles and green dots, respectively). Adapted from (R. Chen et al. 2012).

particularly well-suited to represent intra- and inter-chromosomal translocations.
Heatmaps are the most widely-used visualization used for enrichment analyses results, since they are designed to represent two-dimensional data regardless of its order, thus allowing to show data from distant genomic loci together. Usually, columns correspond to samples and rows to gene sets, transcripts or other genomic elements, and both may be annotated with different layers of information, for instance clinical parameters, mutation status of key genes or the cancer subtype of samples, which visually stratifies the matrix by clustering similar elements. The colour of cells in the heatmap may follow a categorical or continuous scale to indicate, for instance, the P values resulting from a binomial enrichment analysis, the normalised expression level of transcripts or other statistical parameters of interest. A main caveat of this visual representations is that they are not well suited to represent genomic rearrangements. Heatmaps are the visualisation method of choice in frameworks such as Gitools (Perez-Llamas and Lopez-Bigas 2011) and in oncogenomic resources such as IntOGen, where they are used as a means to represent cancer drivers from a transcriptomic and somatic mutation perspective (Gundem et al. 2010).
The third visualisation approach are networks, which optimally cover the depiction of functional relationships between entities, usually genes or proteins. Node attributes in the network, such as size, colour or shape, usually code genetic features, and edges depict connections between entities, rendering the identification of highly related ones very fast and intuitive. Highly interconnected genes in a network of oncogenomic alterations may indicate their higher likelihood to be drivers. Cytoscape is an open-source application that is widely used to visualise and analyse genomic networks (Shannon et al. 2003), for which many plugins have been developed, rendering it highly customisable to the specific needs of each analysis. Networks are usually complementary to other visualisations, since it is difficult to overlay individual tumour sample features, and thus offer a more general overview.
65

Part II
Objectives

In light of the concepts reviewed in the previous introductory chapter, the general objective of this work is to elucidate the role of epigenetic factors in tumour initiation and progression.
More specifically, the main goals can be summarized as follows:
1. Understand the control of regulatory epigenomics modules in gene expression coordination in healthy and tumour cells.
2. Disentangle the role of Polycomb targets in breast tumour progression, integrating gene expression levels of epigenetic modules with clinical information.
3. Determine the influence of somatic mutations on chromatin regulatory factors on tumorigenesis across cancer types.
4. Provide the results of analysing tumour somatic mutations in cell lines to the research community.
69

Part III
Results

Chapter 2
LARGE-SCALE CO-REGULATION BASED ON CHROMATIN STRUCTURE
In this first results chapter I introduce the concept of gene coordination in the context of regulatory modules. As has been described in Chapter 1, regulatory modules consist on groups of genes that share a common property, such as being bound by the same transcription factor or by nucleosomes sharing a specific histone mark. The observation that histone modifications and other epigenetic factors presented distinct enrichment patterns in tumours and normal cells led us to hypothesise that the changes that undergo cancer cells could be described in terms of a loss of synchronisation in gene expression. This analysis provides an overview on the global mechanisms that contribute to the high-level transcriptomic regulation of genes, and serves as a proof of concept for other results presented further in this work. In this part, I designed and conducted the analysis and wrote the manuscript. This manuscript was under preparation at the time the thesis was submitted.
73

Large-scale co-regulation based on chromatin structure
Alba Jene-Sanz1 and Nuria Lopez-Bigas2,*
1. Research Unit on Biomedical Informatics, Department of Experimental and Health Sciences, Universitat Pompeu Fabra, Dr. Aiguader 88, Barcelona, Spain
2. Institució Catalana de Recerca i Estudis Avançats (ICREA), Barcelona, Spain
* Corresponding author
Conflict of interest: The authors have declared that no conflict of interest exists.
Abstract
Gene expression is tightly coordinated within cells and tissues. This coordination is attributed to common mechanisms of regulation, e.g. the same transcription factor binding to the promoters, and/or a similar chromatin state and spatial positioning in the nucleus of coordinated genes. However, the relationship between different regulatory mechanisms is not well understood. Here we define regulatory modules as sets of genes that share regulatory properties (e.g. with binding sites for the same TF(s) or similar chromatin marks), and we study the coordinated expression within and between those modules across normal tissues, tumour samples and cancer cell lines. We find that genes regulated by the Polycomb group of proteins exhibit a high degree of co-regulation in normal tissues, which is lost in cancer cells. We also observe that different activating regulatory modules are overall coordinated, but they are anti-correlated with Polycomb related modules and modules characteristic of repressive histone marks. This pattern is consistent for normal and cancer cells, suggesting extensive cross-talk between different regulatory mechanisms.
74

Introduction
The expression of genes within cells and tissues is largely coordinated, with sets of genes exhibiting co-regulation across cells. The mechanisms of this co-expression could be the physical interaction of a protein with a set of genes that it directly regulates, or the spatial positioning of genes, which can be encoded in clusters that become close in the three-dimensional organization of the chromatin in the nucleus. The study of gene co-expression across tissues and tumour samples can help elucidate the mechanisms of co-regulation and the relationships between those mechanisms. A common approach to study gene co-expression is through the analysis of microarray data, where the transcriptional status of each gene is determined independently for every condition under study. Co-expression of genes across tissues or samples can be represented as edges in a gene network. Two independent publications (Stuart et al. 2003; Bergmann, Ihmels, and Barkai 2003) compared co-expression networks in several model organisms and human, and showed that significantly co-expressed genes are functionally related, regardless of the organism, and that are also conserved through evolution. Although the expression programmes differ between organisms, a characteristic of the gene expression networks inferred from these studies is the significantly higher degree of modularity, compared to random networks (Bergmann, Ihmels, and Barkai 2003). The existence of transcription factories in the nucleus contributes to this gene association (Schoenfelder et al. 2010), but they are not essential (Brown et al. 2008). Interestingly, this co-regulation in gene expression is altered in tumours compared to normal tissue, as was first observed by Choi et al. (Choi et al. 2005). They noted that genes functionally associated to cell growth and immune activity were co-regulated in cancer.
A big challenge when attempting to infer co-regulated gene pairs from gene expression data is the dissection of relevant knowledge from background noise, since the correlation between the expression of genes may be due to multiple causes –often referred to as “high-dimensional” (Caldarelli, Pastor-Satorras, and Vespignani 2004). Moreover, the placement of probes in the microarray platform is known to produce correlation artefacts (Balázsi et al. 2003). The transcriptome is highly co-regulated (Clarke et al. 2008), and thus tailored methods have been developed to extract biological knowledge from high-throughput transcriptomic data. For example, more than a decade ago, Perou et al. used a Pearson correlation matrix (Eisen et al. 1998) to cluster breast tumour samples and
75

discover five new molecular subclasses (Perou et al. 2000). More recently, Andersson et al. used a k Nearest Neighbour approach to classify childhood acute leukaemias (Andersson et al. 2007). Other approaches that have been used to understand gene co-regulation include bi-clustering (Ihmels et al. 2002; Prelić et al. 2006), association pattern discovery methods (Carmona-Saez et al. 2006; Creighton and Hanash 2003; Georgii et al. 2005) and other similarity measures (Gyenesei et al. 2007). Recently, a new method by Furlotte et al. that accounted for global confounding effects in gene co-expression was successfully applied to yeast and human data (Furlotte et al. 2011).
A typical visual representation of the results of co-regulation studies based on gene expression is an undirected graph where co-regulated genes –the nodes of the network– are connected through edges. Frequently, only the most meaningful pairs of genes, i.e. those above a given correlation threshold, are represented to facilitate the extraction of biological knowledge. Taking advantage of the vast amount of human high-throughput expression data that has been made available in the past decade, several approaches have classified and inferred highly co-regulated functional gene groups from microarray data (Gyenesei et al. 2007; Furlotte et al. 2011; Choi et al. 2005). Nevertheless, their characterization has usually been based on relatively small modules, extracted from public sources such as the Gene Ontology (Ashburner et al. 2000) and KEGG (Kanehisa et al. 2012). Gene regulatory modules derived from experiments in human cells and cell lines have been previously used to decipher transcriptional networks from expression data (Wong et al. 2008), and are recently available from big consortia projects like ENCODE (The ENCODE Project Consortium 2007). Especially of our interest are modules that explain global differences in gene co-regulation, where chromatin modification plays a key role (Lee et al. 2006). One of the main molecular determinants of the transcriptional status of a gene is the level of compaction of the chromatin. Specific chemical modifications in the aminoacid residues of the tails of histones strongly influence the local structure of chromatin at a given locus. Genes which share a common histone mark have similar levels of transcription; for instance, trimethylation of lysine 4 in histone H3 (H3K4me3) at proximal gene promoters has been shown to highly correlate with increased expression of downstream genes, while trimethylation of lysine 9 at H3 (H3K9me3) is characteristic of pericentromeric and repetitive regions which remain transcriptionally silent (Barski et al. 2007).
76

Here we used experimental regulatory modules to determine gene expression co-regulation in five sets of samples, comprising normal healthy tissues, tumours, a mixture of tumours and normal samples or cancer cell lines. We describe the most coordinated genes to understand the key hubs within each condition. Our aim is to compare the degree of co-regulation between genes under a particular regulatory influence, in cancer and normal cells.
Methods
Preparation of gene regulatory modules
We collected lists of genes overlapping specific histone marks, under the regulation of the same transcription factor, or within chromatin regions computationally predicted to be in the same state (Table 1). The degree of overlap between these gene lists is shown in Figure S1. These include human genome-wide occupancy datasets from ChIP-seq experiments in several cell types (The ENCODE Project Consortium 2007; Ku et al. 2008; “H3K27me3, H3K79me2, and Suz12 ChIP-Seq in Human Embryonic Stem Cells (BG03).” 2011; Wang et al. 2009; Lister et al. 2009; Maruyama et al. 2011; Barski et al. 2007; Guelen et al. 2008; Kunarso et al. 2010) that we processed using Bowtie (version 0.12.5, hg19 genome assembly, unique alignments, allowing 2 mismatches) (Langmead et al. 2009) for short read aligning. For the detection of peaks from ChIP-seq data to determine transcription factors' binding sites, we used MACS (version 1.4.1) (Zhang et al. 2008) (nomodel and setting --bw parameter to twice the shift size whenever a control IP was not available). For broad histone modifications (i.e. H3K27me3), we used SICER (version 1.1) (Zang et al. 2009) (setting gap size to 600). Regions were assigned to protein coding genes (Ensembl v69) if they overlapped either to the gene body or up to 5 kb upstream the TSS, using BedTools (Quinlan and Hall 2010). Overall peak calling performance was evaluated with CEAS (Shin et al. 2009).
Other gene sets were obtained from KEGG (Kanehisa et al. 2012) and Gene Ontology (GO)(Ashburner et al. 2000). The list and mappings of KEGG and Gene Ontology (GO) Biological Process terms were downloaded through the Gitools importer (Perez-Llamas and Lopez-Bigas 2011).
Preparation of expression datasets
We obtained the raw Affymetrix data of public transcriptomic datasets from the Gene Expression Omnibus (GEO) (Edgar, Domrachev, and Lash 2002) and
77

normalized the CEL files using the rma function in the “affy” package (Gautier et al. 2004) from R Bioconductor (Gentleman et al. 2004). We then processed the log2-transformed absolute expression values of each probe across all samples of each cohort by subtracting the median expression value of the probe across the cohort and dividing the difference by the corresponding standard deviation. The selected datasets comprised healthy tissues (Roth et al. 2006), a mixture of cell lines and healthy tissues (Su et al. 2004), cancer cell lines (Barretina et al. 2012), tumour and normal paired samples (Hou et al. 2010), and tumour only samples (Ivshina et al. 2006) (see Table 2 for details).
Gene-pair correlations and correlation between regulatory
modules
For each of the five transcriptomic cohorts we followed two separate approaches to study the intra-module genes co-expression (see Figure 1 for a schematic representation), employing the Pearson Correlation Coefficient (PCC) as a measure of the co-regulation of a pair of genes for two main reasons. First, it has already been successfully applied to study gene co-expression using microarray data (Stuart et al. 2003; Allocco, Kohane, and Butte 2004; Shi, Derow, and Zhang 2010). Second, although Furlotte et al. described a more sophisticated method to specifically identify co-expression modules, it might remove true biological signals and miss the large modules (Furlotte et al. 2011). Since we are precisely interested in global gene co-regulation, and very large modules, such as those formed by genes overlapping a specific histone mark, we chose PCC as a proxy to detect co-regulation in gene expression.
We first calculated the pair-wise PCC between the median-centred mRNA expression profiles of all probe pairs, across all the samples in the five cohorts (Table 2), and then used two approaches to characterize co-regulation. In the first approach we ranked all probe pairs according to their PCC, and defined the most co-regulated ones as the top 0.1%. This threshold has been previously observed to maximize functional similarity in co-expression networks (Shi, Derow, and Zhang 2010). We then mapped the probes to Ensembl v69 gene ids and discarded pairs of probes that corresponded to the same gene. The overlap of the resulting five sets of “top correlated genes” (one for each cohort) formed the “core” top correlated genes (Figure S2). To functionally describe this core of genes, we then calculated their enrichment for experimental regulatory modules (Table 1), GO groups (Ashburner et al. 2000) and KEGG pathways (Kanehisa et al. 2012). We used Gitools version 1.7.0 (Perez-Llamas and Lopez-Bigas 2011)
78

(http://www.gitools.org) to calculate the PCC of pairs of probes, and also to run and visualize the binomial enrichment. In the second approach we determined the distributions of PCCs of gene pairs within modules or combinations thereof (from Table 1) and compared them between normal and tumour tissues. To this end, for each cohort we extracted the PCC of gene pairs that were both included in the same module, and compared their distributions per experiment. We used in-house python scripts for this purpose, and the ggplot2 R package (Wickham 2009) to generate plots.
To compute the correlations between regulatory modules (inter-module correlations), we implemented a pipeline using the Wok workflow manager (http://bg.upf.edu/wok). Briefly, for each pair of regulatory modules we built two non-overlapping gene groups and ran Sample Level Enrichment analysis (SLEA) (Gundem and Lopez-Bigas 2012). Then we calculated the Pearson correlation coefficient across z-score values, and applied a PCC > 0.5 or PCC < -0.5 cut-off to filter for highly correlated and anti-correlated module pairs, respectively. We used Gitools version 1.7.0 (Perez-Llamas and Lopez-Bigas 2011) for the statistical calculations and Cytoscape (Shannon et al. 2003) to visualize the co-regulation between modules.
Results and discussion
Hypothesis and rationale of the approach
In order to study the mechanisms of gene expression regulation and the coordination between these mechanisms we collected a group of regulatory modules (Table 1), defined as sets of genes that share regulatory properties, and studied the coordinated expression within (intra-module co-regulation) and between (inter-module co-regulation) those modules across normal tissues, tumour samples, and cancer cell lines (Figure 1). We expect that the comparison of intra-modules co-regulation between normal and tumour samples will help us pinpoint regulatory mechanisms that become altered during cancer development. On the other hand, the inter-module co-regulation should allow us to elucidate the level of cross-talk between different regulatory mechanisms, or, alternatively, their subjection to more general regulatory processes of gene expression both in normal and tumour cells.
We obtained 66 modules from experimental sources, and six from computational predictions, that were grouped into six categories: Polycomb Repressive Complex 2 (PRC2), repressive histone marks, activating histone
79

marks, global chromatin dynamics, acetylation regulation and transcription factors (Table 1). While the vast majority of these modules are very big (comprising thousands of genes each), because histone marks occupy a big portion of the transcriptome in a cell, we hypothesize that they will still capture global co-regulation changes.
Coordinated expression within regulatory modules (intra-
module co-regulation)
We first asked what are the properties of highly co-regulated genes across tissues or tumour samples. For that, we computed the Pearson correlation coefficient (PCC) for each pair of genes across every dataset and retained the top 0.1% correlated gene pairs. Next, we computed the enrichment of the retained genes for regulatory modules (described in Table 1) and curated functional annotations from Gene Ontology and KEGG (Figure S3 and Figure S4). We observed large differences among the top co-regulated genes across normal and tumour tissues (Figure 2). While muscle function related and drug metabolism genes were the functions enriched for the most co-regulated genes in healthy tissues, cell cycle and immune system modules are characteristic of tissues from primary tumours and cancer cell lines. The latter observations are in line with a recent work by Shi et al. in breast cancer (Shi, Derow, and Zhang 2010) and the observations by Choi et al., when they compared normal and tumour tissues (Choi et al. 2005). On the other side, histone mark modules characteristic for active genes were clearly enriched among top co-regulated genes in the three cancer datasets but not in normal tissues (Figure 2). Since genes in the MHC supercluster are long-known to have an open chromatin structure (Volpi et al. 2000), this observation is in line with the enrichment of the immune system function in top co-regulated genes in cancer.
Next we assessed the global level of co-regulation among chromatin regulatory modules by looking at the distribution of PCCs of gene pairs within modules (Figure 3). We observed that modules that share a regulatory property related to PRC2 are more co-regulated in non-tumour tissues, indicating that preserving the tight regulation of those genes is crucial for the cell in a specific condition, and that this regulation is lost in cancer cells. In contrast, modules for histone marks characteristic in active genes (H3K4me3) present a stronger co-regulation in cancer (Figure 3). We did not observe any difference in the correlation of gene pairs annotated in KEGG, nor a bias in the global PCCs overall or in random modules. To further investigate the importance of gene
80

silencing in a co-regulation context, we overlapped the EZH2, SUZ12 and H3K27me3 modules in ES cells and built a core module (Table S1). When we sorted all modules by the median within datasets, the Polycomb core module in ES cells appeared amongst the most co-regulated overall: it ranked first in both normal tissue cohorts, second in lung cancer, seventh in breast and ninth in the CCLE. These observations point out that it might be crucial for normal tissues to preserve the tight regulation of gene repression controlled by PRC2. Modules known to be repressed in terminally differentiated cells include developmental genes that determine cell fate (Azuara et al. 2006), and their misregulation has been reported in tumours (Ben-Porath et al. 2008).
Synchronization between regulatory modules (inter-
module co-regulation)
In addition to studying the co-regulation of genes within regulatory modules, we were interested in the relationships between regulatory modules. In particular, we wanted to elucidate which regulatory modules show coordinated or dis-coordinated expression. For that we computed Sample Level Enrichment Analysis (SLEA) for each module and dataset, which provides a general measurement of the expression status of a group of genes in each sample. Next, we compared the results between modules (Figure 4A and Figures S6, S7, S8, S9 and S10), finding two differentiated groups of modules with coordinated and discoordinated expression. Since regulatory modules contain overlapping genes (Figure S1), to better describe the relationship between modules, for each pair of modules we excluded all genes in common, ran SLEA and calculated the correlation, in the five different datasets. Our assumption is that, if two modules are involved in the regulation of similar processes, their enrichment profiles would be similar even after common elements are removed, given that co-expressed genes are likely to be co-regulated (Allocco, Kohane, and Butte 2004; Clarke et al. 2008). We actually observed similar co-regulation profiles in all modules (Figure S5), indicating that synchronised gene expression is maintained across both normal and cancer samples.
There were two opposite regulatory groups in the modules we studied: PRC2 and H3K27me3 had a clearly reversed enrichment pattern compared to the other four (Figure 4A). After setting a threshold for the correlation, we defined coordinated and dis-coordinated modules as those having positive and negative PCCs, respectively. We chose a network view to illustrate how the six regulatory groups are connected (Figure 4B). Two observations grabbed our attention from
81

the general topology of the network in all the six conditions. First, PRC2 and H3K27me3 regulatory groups were positively correlated, but anti-correlated with the rest. Second, activating modules (which correlate with higher gene expression) are coordinated overall, although H3K4me3, H3K9ac and H3K27ac seem to form a sub-cluster connected through few nodes to the rest. It is interesting that synchronization between modules occurs regardless of the cell type of origin, in line with Dong et al. observations (Dong et al. 2012), and that it is maintained in normal tissues, in tumours and in cancer cell lines.
Conclusions
Here we presented an overview of global gene regulation in normal and cancer tissues and cell lines, using modules as a proxy to determine the transcriptional status of a cell, and observed general regulatory patterns that are maintained across conditions. We described two main coordinated regulatory components of the resulting network, which were in turn dis-coordinated from each other: PRC2 and H3K27me3 on one side, and mainly activation modules in the other.
82

Tables
Table 1. All modules collected for the analysis. CS: Chromatin State; CS1: Active promoter; CS3: Poised promoter; CS13: Heterochromatin; LADs: Lamin-Associated Domains.
Group Name Cell type Nº of genes Source
PRC2EZH2 ES 1263 Ku et al. 2008 (Ku et al. 2008)SUZ12 ES 2099 Young et al. 2010 (GEO accession GSE24463)SUZ12 NTERA2 4178 ENCODE (The ENCODE Project Consortium 2007)
Rep
ress
ive
his
tone
mar
ks
H3K27me3 CD4 4991 Wang et al. 2009 (Wang et al. 2009)H3K27me3 ES 3489 Lister et al. 2009 (Lister et al. 2009)H3K27me3 gm12878 6025 ENCODE (The ENCODE Project Consortium 2007)H3K27me3 ES 6783 ENCODE (The ENCODE Project Consortium 2007)H3K27me3 HUVEC 7962 ENCODE (The ENCODE Project Consortium 2007)H3K27me3 K562 6012 ENCODE (The ENCODE Project Consortium 2007)H3K27me3 NHEK 6486 ENCODE (The ENCODE Project Consortium 2007)H3K27me3 breast-CD24+ 4968 Maruyama et al. 2011 (Maruyama et al. 2011)H3K27me3 breast-CD44+ 3885 Maruyama et al. 2011 (Maruyama et al. 2011)
Act
ivat
ing
hist
one
mar
ks
H3K4me3 CD4 12294 Barski et al. 2007 (Barski et al. 2007)H3K4me3 ES 14103 Ku et al. 2008 (Ku et al. 2008)H3K4me3 ES 12322 Lister et al. 2009 (Lister et al. 2009)H3K4me3 gm12878 12627 ENCODE (The ENCODE Project Consortium 2007)H3K4me3 ES 13251 ENCODE (The ENCODE Project Consortium 2007)H3K4me3 HUVEC 12129 ENCODE (The ENCODE Project Consortium 2007)H3K4me3 K562 11857 ENCODE (The ENCODE Project Consortium 2007)H3K4me3 NHEK 13302 ENCODE (The ENCODE Project Consortium 2007)H3K4me3 breast-CD24+ 11077 Maruyama et al. 2011 (Maruyama et al. 2011)H3K4me3 breast-CD44+ 11649 Maruyama et al. 2011 (Maruyama et al. 2011)H3K27ac CD4 8716 Wang et al. 2009 (Wang et al. 2009)H3K27ac gm12878 10686 ENCODE (The ENCODE Project Consortium 2007)H3K27ac HUVEC 10265 ENCODE (The ENCODE Project Consortium 2007)H3K27ac K562 10950 ENCODE (The ENCODE Project Consortium 2007)H3K27ac NHEK 11418 ENCODE (The ENCODE Project Consortium 2007)H3K36me3 CD4 2754 Barski et al. 2007 (Barski et al. 2007)H3K36me3 ES 4001 Ku et al. 2008 (Ku et al. 2008)H3K36me3 ES 3593 Lister et al. 2009 (Lister et al. 2009)H3K36me3 gm12878 6658 ENCODE (The ENCODE Project Consortium 2007)H3K36me3 ES 5418 ENCODE (The ENCODE Project Consortium 2007)H3K36me3 HUVEC 5664 ENCODE (The ENCODE Project Consortium 2007)H3K36me3 K562 7466 ENCODE (The ENCODE Project Consortium 2007)H3K36me3 NHEK 7807 ENCODE (The ENCODE Project Consortium 2007)H3K9ac CD4 7692 Wang et al. 2009 (Wang et al. 2009)H3K9ac ES 10787 Lister et al. 2009 (Lister et al. 2009)H3K9ac gm12878 10849 ENCODE (The ENCODE Project Consortium 2007)H3K9ac ES 11465 ENCODE (The ENCODE Project Consortium 2007)H3K9ac HUVEC 11338 ENCODE (The ENCODE Project Consortium 2007)H3K9ac K562 10822 ENCODE (The ENCODE Project Consortium 2007)H3K9ac NHEK 12139 ENCODE (The ENCODE Project Consortium 2007)
83

G
loba
l Chr
om.
Dyn
amic
s
CS1 ES 3465 Ernst et al. 2011 (Ernst et al. 2011)CS1 NHEK 3834 Ernst et al. 2011 (Ernst et al. 2011)CS3 ES 1593 Ernst et al. 2011 (Ernst et al. 2011)CS3 NHEK 978 Ernst et al. 2011 (Ernst et al. 2011)CS13 ES 3964 Ernst et al. 2011 (Ernst et al. 2011)CS13 NHEK 3952 Ernst et al. 2011 (Ernst et al. 2011)LADs Fibroblasts 3345 Guelen et al. 2008 (Guelen et al. 2008)
Ace
tyla
tion
regu
lati
on
EP300 CD4 4365 Wang et al. 2009 (Wang et al. 2009)MOF CD4 6099 Wang et al. 2009 (Wang et al. 2009)PCAF CD4 2181 Wang et al. 2009 (Wang et al. 2009)TIP60 CD4 5420 Wang et al. 2009 (Wang et al. 2009)HDAC1 CD4 7185 Wang et al. 2009 (Wang et al. 2009)HDAC2 CD4 523 Wang et al. 2009 (Wang et al. 2009)HDAC3 CD4 2262 Wang et al. 2009 (Wang et al. 2009)HDAC6 CD4 2107 Wang et al. 2009 (Wang et al. 2009)HDAC8 K562 1482 ENCODE (The ENCODE Project Consortium 2007)
Tra
nscr
ipti
on f
acto
rs
NR4A1 K562 443 ENCODE (The ENCODE Project Consortium 2007)SOX2 ES 3641 Lister et al. 2009 (Lister et al. 2009)OCT4 ES 1417 Lister et al. 2009 (Lister et al. 2009)OCT4 ES 4880 Kunarso et al. 2010 (Kunarso et al. 2010)MYC ES 1794 Lister et al. 2009 (Lister et al. 2009)NANOG ES 10828 Kunarso et al. 2010 (Kunarso et al. 2010)NANOG ES 4391 Lister et al. 2009 (Lister et al. 2009)KLF4 ES 1156 Lister et al. 2009 (Lister et al. 2009)TAF2 ES 11053 Lister et al. 2009 (Lister et al. 2009)JUNB K562 4656 ENCODE (The ENCODE Project Consortium 2007)JUND K562 4512 ENCODE (The ENCODE Project Consortium 2007)FOS K562 1849 ENCODE (The ENCODE Project Consortium 2007)GATA2 K562 1667 ENCODE (The ENCODE Project Consortium 2007)
Table 2. Normal and cancerous transcriptome datasets used in the study.
Study Source Sample number Description of profiled samples
Su et al. 2004 BioGPS (GSE1133) 79 Normal tissue and 9 cell lines
Roth RB et al. 2006 Healthy donors (GSE3256)
35320 anatomically distinct sites of the human central nervous system (CNS) and 45 non-CNS from healthy donors
Ivshina et al. 2006 GSE4922 289 Breast cancer samples of various subtypes
Hou J et al. 2010 GSE19188 156 91 tumor (Non-small Cell Lung Cancer)- and 65 adjacent normal lung tissue samples
Barretina J et al. 2012 GSE36133 917 Cancer cell lines from the CCLE
84

Figures
Figure 1. Schema of the approach. For each transcriptomic cohort we followed a pipeline to dissect the gene co-regulation within previously known modules (left panel, intra-module co-regulation) and amongst non-overlapping gene networks (right panel, inter-module co-regulation). M1: module 1; M2: module 2; SLEA: Sample Level Enrichment Analysis; PCC: Pearson Correlation Coefficient.
85

Figure 2. Top correlated genes enriched for regulatory modules. Each probe was mapped to non-redundant genes, thus eliminating correlations due to probes that map to different transcripts from the same gene. Columns represent genes which are most correlated in each cohort, and are divided in three blocks. On the left panel (from left to right) there are two datasets comprising normal tissues and cell lines, normal tissues only (BioGPS and Healthy donors, respectively), and the most correlated genes of the two which are in common. On the central panel, columns represent genes from most correlated gene pairs in three cancer cohorts, one of which (NSCLC) includes also normal samples, and the common genes amongst the three. The right panel corresponds to gene pairs most correlated in both tumour and normal samples (See Figure S2). Cells depict the enrichment significance (corrected right P value) for every regulatory module category in each gene group; grey denotes P > 0.05.
86

Figure 3. Connectedness within regulatory modules. Correlation coefficients of each pair of probes within five regulatory modules, KEGG pathways, all pairs in the platform or 500 randomized probes, sorted by the median, across five transcriptomic data sets. Upper and lower box limits correspond to the 1st and 3rd quartile, respectively, whiskers span one SD.
87
Figure 4. Coordinated and dis-coordinated modules. A. SLEA matrix for regulatory modules in the BioGPS dataset (Su et al. 2004), grouped by functional categories. B. Network view of correlations between non-overlapping regulatory modules. Nodes represent modules which are at least positively correlated with another module. Node size is proportional to the number of genes in each module, and colour represents the functional group to which the module is assigned. Edges in the network represent the correlation between two regulatory modules; line thickness is proportional to the PCC, and colour represents the direction of the correlation (negative correlations pictured in grey, positive correlations in red).
88

References
Allocco, Dominic J., Isaac S. Kohane, and Atul J. Butte. 2004. “Quantifying the Relationship Between Co-expression, Co-regulation and Gene Function.” BMC Bioinformatics 5 (1) (February 25): 18. doi:10.1186/1471-2105-5-18.
Andersson, A., C. Ritz, D. Lindgren, P. Edén, C. Lassen, J. Heldrup, T. Olofsson, et al. 2007. “Microarray-based Classification of a Consecutive Series of 121 Childhood Acute Leukemias: Prediction of Leukemic and Genetic Subtype as Well as of Minimal Residual Disease Status.” Leukemia 21 (6): 1198–1203. doi:10.1038/sj.leu.2404688.
Ashburner, Michael, Catherine A. Ball, Judith A. Blake, David Botstein, Heather Butler, J. Michael Cherry, Allan P. Davis, et al. 2000. “Gene Ontology: Tool for the Unification of Biology.” Nature Genetics 25 (1) (May 1): 25–29. doi:10.1038/75556.
Azuara, Véronique, Pascale Perry, Stephan Sauer, Mikhail Spivakov, Helle F. Jørgensen, Rosalind M. John, Mina Gouti, et al. 2006. “Chromatin Signatures of Pluripotent Cell Lines.” Nature Cell Biology 8 (5) (March): 532–538. doi:10.1038/ncb1403.
Balázsi, Gábor, Krin A. Kay, Albert-László Barabási, and Zoltán N. Oltvai. 2003. “Spurious Spatial Periodicity of Co‐expression in Microarray Data Due to Printing Design.” Nucleic Acids Research 31 (15) (August 1): 4425–4433. doi:10.1093/nar/gkg485.
Barretina, Jordi, Giordano Caponigro, Nicolas Stransky, Kavitha Venkatesan, Adam A. Margolin, Sungjoon Kim, Christopher J. Wilson, et al. 2012. “The Cancer Cell Line Encyclopedia Enables Predictive Modelling of Anticancer Drug Sensitivity.” Nature 483 (7391) (March 28): 603–307. doi:10.1038/nature11003.
Barski, Artem, Suresh Cuddapah, Kairong Cui, Tae-Young Roh, Dustin E. Schones, Zhibin Wang, Gang Wei, Iouri Chepelev, and Keji Zhao. 2007. “High-Resolution Profiling of Histone Methylations in the Human Genome.” Cell Vol 129 (May 18): 823–837.
Ben-Porath, Ittai, Matthew W Thomson, Vincent J Carey, Ruping Ge, George W Bell, Aviv Regev, and Robert A Weinberg. 2008. “An Embryonic Stem Cell-like Gene Expression Signature in Poorly Differentiated Aggressive Human Tumors.” Nat Genet 40 (5) (May): 499–507. doi:10.1038/ng.127.
Bergmann, Sven, Jan Ihmels, and Naama Barkai. 2003. “Similarities and Differences in Genome-Wide Expression Data of Six Organisms.” PLoS Biol 2 (1) (December 15): e9. doi:10.1371/journal.pbio.0020009.
Brown, Jill M., Joanne Green, Ricardo Pires das Neves, Helen A. C. Wallace, Andrew J. H. Smith, Jim Hughes, Nicki Gray, et al. 2008. “Association Between Active Genes Occurs at Nuclear Speckles and Is Modulated by Chromatin Environment.” The Journal of Cell Biology 182 (6) (September 22): 1083–1097. doi:10.1083/jcb.200803174.
Caldarelli, G., R. Pastor-Satorras, and A. Vespignani. 2004. “Structure of Cycles and Local Ordering in Complex Networks.” The European Physical Journal B - Condensed Matter and Complex Systems 38 (2) (March 1): 183–186. doi:10.1140/epjb/e2004-00020-6.
Carmona-Saez, Pedro, Monica Chagoyen, Andres Rodriguez, Oswaldo Trelles, Jose
89

Carazo, and Alberto Pascual-Montano. 2006. “Integrated Analysis of Gene Expression by Association Rules Discovery.” BMC Bioinformatics 7 (1) (February 7): 54. doi:10.1186/1471-2105-7-54.
Choi, Jung Kyoon, Ungsik Yu, Ook Joon Yoo, and Sangsoo Kim. 2005. “Differential Coexpression Analysis Using Microarray Data and Its Application to Human Cancer.” Bioinformatics 21 (24) (December 15): 4348–4355. doi:10.1093/bioinformatics/bti722.
Clarke, Robert, Habtom W. Ressom, Antai Wang, Jianhua Xuan, Minetta C. Liu, Edmund A. Gehan, and Yue Wang. 2008. “The Properties of High-dimensional Data Spaces: Implications for Exploring Gene and Protein Expression Data.” Nature Reviews. Cancer 8 (1) (January): 37–49. doi:10.1038/nrc2294.
Creighton, Chad, and Samir Hanash. 2003. “Mining Gene Expression Databases for Association Rules.” Bioinformatics 19 (1) (January 1): 79–86. doi:10.1093/bioinformatics/19.1.79.
Dong, Xianjun, Melissa C. Greven, Anshul Kundaje, Sarah Djebali, James B. Brown, Chao Cheng, Thomas R. Gingeras, et al. 2012. “Modeling Gene Expression Using Chromatin Features in Various Cellular Contexts.” Genome Biology 13 (9) (September 5): R53. doi:10.1186/gb-2012-13-9-r53.
Edgar, Ron, Michael Domrachev, and Alex E. Lash. 2002. “Gene Expression Omnibus: NCBI Gene Expression and Hybridization Array Data Repository.” Nucleic Acids Research 30 (1) (January 1): 207–210. doi:10.1093/nar/30.1.207.
Eisen, Michael B., Paul T. Spellman, Patrick O. Brown, and David Botstein. 1998. “Cluster Analysis and Display of Genome-wide Expression Patterns.” Proceedings of the National Academy of Sciences 95 (25) (December 8): 14863–14868.
Ernst, Jason, Pouya Kheradpour, Tarjei S. Mikkelsen, Noam Shoresh, Lucas D. Ward, Charles B. Epstein, Xiaolan Zhang, et al. 2011. “Mapping and Analysis of Chromatin State Dynamics in Nine Human Cell Types.” Nature 473 (7345) (May 5): 43–49. doi:10.1038/nature09906.
Furlotte, Nicholas A., Hyun Min Kang, Chun Ye, and Eleazar Eskin. 2011. “Mixed-model Coexpression: Calculating Gene Coexpression While Accounting for Expression Heterogeneity.” Bioinformatics 27 (13) (July 1): i288–i294. doi:10.1093/bioinformatics/btr221.
Gautier, Laurent, Leslie Cope, Benjamin M. Bolstad, and Rafael A. Irizarry. 2004. “Affy—analysis of Affymetrix GeneChip Data at the Probe Level.” Bioinformatics 20 (3) (February 12): 307–315. doi:10.1093/bioinformatics/btg405.
Gentleman, Robert C., Vincent J. Carey, Douglas M. Bates, Ben Bolstad, Marcel Dettling, Sandrine Dudoit, Byron Ellis, et al. 2004. “Bioconductor: Open Software Development for Computational Biology and Bioinformatics.” Genome Biology 5 (10) (September 15): R80. doi:10.1186/gb-2004-5-10-r80.
Georgii, E., L. Richter, U. Ruckert, and S. Kramer. 2005. “Analyzing Microarray Data Using Quantitative Association Rules.” Bioinformatics 21 (Suppl 2) (October 3): ii123–ii129. doi:10.1093/bioinformatics/bti1121.
Guelen, Lars, Ludo Pagie, Emilie Brasset, Wouter Meuleman, Marius B. Faza, Wendy Talhout, Bert H. Eussen, et al. 2008. “Domain Organization of Human Chromosomes Revealed by Mapping of Nuclear Lamina Interactions.” Nature 453 (7197) (June 12): 948–951. doi:10.1038/nature06947.
90

Gundem, Gunes, and Nuria Lopez-Bigas. 2012. “Sample Level Enrichment Analysis Unravels Shared Stress Phenotypes Among Multiple Cancer Types.” Genome Medicine 4 (3) (March 29): 28. doi:10.1186/gm327.
Gyenesei, Attila, Ulrich Wagner, Simon Barkow-Oesterreicher, Etzard Stolte, and Ralph Schlapbach. 2007. “Mining Co-regulated Gene Profiles for the Detection of Functional Associations in Gene Expression Data.” Bioinformatics 23 (15) (August 1): 1927–1935. doi:10.1093/bioinformatics/btm276.
“H3K27me3, H3K79me2, and Suz12 ChIP-Seq in Human Embryonic Stem Cells (BG03).” 2011. Accessed March 28. http://www.ncbi.nlm.nih.gov/geo/query/acc.cgi?acc=GSE24463.
Hou, Jun, Joachim Aerts, Bianca den Hamer, Wilfred van IJcken, Michael den Bakker, Peter Riegman, Cor van der Leest, et al. 2010. “Gene Expression-Based Classification of Non-Small Cell Lung Carcinomas and Survival Prediction.” PLoS ONE 5 (4) (April 22). doi:10.1371/journal.pone.0010312.
Ihmels, Jan, Gilgi Friedlander, Sven Bergmann, Ofer Sarig, Yaniv Ziv, and Naama Barkai. 2002. “Revealing Modular Organization in the Yeast Transcriptional Network.” Nature Genetics 31 (4): 370–377. doi:10.1038/ng941.
Ivshina, Anna V., Joshy George, Oleg Senko, Benjamin Mow, Thomas C. Putti, Johanna Smeds, Thomas Lindahl, et al. 2006. “Genetic Reclassification of Histologic Grade Delineates New Clinical Subtypes of Breast Cancer.” Cancer Research 66 (21) (November 1): 10292 –10301. doi:10.1158/0008-5472.CAN-05-4414.
Kanehisa, Minoru, Susumu Goto, Yoko Sato, Miho Furumichi, and Mao Tanabe. 2012. “KEGG for Integration and Interpretation of Large-scale Molecular Data Sets.” Nucleic Acids Research 40 (D1) (January): D109–D114. doi:10.1093/nar/gkr988.
Ku, Manching, Richard P. Koche, Esther Rheinbay, Eric M. Mendenhall, Mitsuhiro Endoh, Tarjei S. Mikkelsen, Aviva Presser, et al. 2008. “Genomewide Analysis of PRC1 and PRC2 Occupancy Identifies Two Classes of Bivalent Domains.” PLoS Genet 4 (10) (October 31): e1000242. doi:10.1371/journal.pgen.1000242.
Kunarso, Galih, Na-Yu Chia, Justin Jeyakani, Catalina Hwang, Xinyi Lu, Yun-Shen Chan, Huck-Hui Ng, and Guillaume Bourque. 2010. “Transposable Elements Have Rewired the Core Regulatory Network of Human Embryonic Stem Cells.” Nat Genet 42 (7) (July): 631–634. doi:10.1038/ng.600.
Langmead, Ben, Cole Trapnell, Mihai Pop, and Steven L Salzberg. 2009. “Ultrafast and Memory-efficient Alignment of Short DNA Sequences to the Human Genome.” Genome Biology 10 (3): R25. doi:10.1186/gb-2009-10-3-r25.
Lee, Su-In, Dana Pe’er, Aimée M. Dudley, George M. Church, and Daphne Koller. 2006. “Identifying Regulatory Mechanisms Using Individual Variation Reveals Key Role for Chromatin Modification.” Proceedings of the National Academy of Sciences 103 (38) (September 19): 14062–14067. doi:10.1073/pnas.0601852103.
Lister, Ryan, Mattia Pelizzola, Robert H. Dowen, R. David Hawkins, Gary Hon, Julian Tonti-Filippini, Joseph R. Nery, et al. 2009. “Human DNA Methylomes at Base Resolution Show Widespread Epigenomic Differences.” Nature advance online publication (October 14). doi:10.1038/nature08514. http://dx.doi.org/10.1038/nature08514.
Maruyama, Reo, Sibgat Choudhury, Adam Kowalczyk, Marina Bessarabova, Bryan Beresford-Smith, Thomas Conway, Antony Kaspi, et al. 2011. “Epigenetic
91

Regulation of Cell Type–Specific Expression Patterns in the Human Mammary Epithelium.” PLoS Genet 7 (4) (April 21): e1001369. doi:10.1371/journal.pgen.1001369.
Perez-Llamas, Christian, and Nuria Lopez-Bigas. 2011. “Gitools: Analysis and Visualisation of Genomic Data Using Interactive Heat-Maps.” PLoS ONE 6 (5) (May 13): e19541. doi:10.1371/journal.pone.0019541.
Perou, Charles M., Therese Sørlie, Michael B. Eisen, Matt van de Rijn, Stefanie S. Jeffrey, Christian A. Rees, Jonathan R. Pollack, et al. 2000. “Molecular Portraits of Human Breast Tumours.” Nature 406 (6797) (August 17): 747–752. doi:10.1038/35021093.
Prelić, Amela, Stefan Bleuler, Philip Zimmermann, Anja Wille, Peter Bühlmann, Wilhelm Gruissem, Lars Hennig, Lothar Thiele, and Eckart Zitzler. 2006. “A Systematic Comparison and Evaluation of Biclustering Methods for Gene Expression Data.” Bioinformatics 22 (9) (May 1): 1122–1129. doi:10.1093/bioinformatics/btl060.
Quinlan, Aaron R, and Ira M Hall. 2010. “BEDTools: a Flexible Suite of Utilities for Comparing Genomic Features.” Bioinformatics 26 (6) (March 15): 841–842. doi:10.1093/bioinformatics/btq033.
Roth, Richard B., Peter Hevezi, Jerry Lee, Dorian Willhite, Sandra M. Lechner, Alan C. Foster, and Albert Zlotnik. 2006. “Gene Expression Analyses Reveal Molecular Relationships Among 20 Regions of the Human CNS.” Neurogenetics 7 (2) (March 30): 67–80. doi:10.1007/s10048-006-0032-6.
Schoenfelder, Stefan, Tom Sexton, Lyubomira Chakalova, Nathan F. Cope, Alice Horton, Simon Andrews, Sreenivasulu Kurukuti, et al. 2010. “Preferential Associations Between Co-regulated Genes Reveal a Transcriptional Interactome in Erythroid Cells.” Nature Genetics 42 (1): 53–61. doi:10.1038/ng.496.
Shannon, Paul, Andrew Markiel, Owen Ozier, Nitin S. Baliga, Jonathan T. Wang, Daniel Ramage, Nada Amin, Benno Schwikowski, and Trey Ideker. 2003. “Cytoscape: A Software Environment for Integrated Models of Biomolecular Interaction Networks.” Genome Research 13 (11) (November 1): 2498–2504. doi:10.1101/gr.1239303.
Shin, Hyunjin, Tao Liu, Arjun K. Manrai, and X. Shirley Liu. 2009. “CEAS: Cis-regulatory Element Annotation System.” Bioinformatics (August 18): btp479. doi:10.1093/bioinformatics/btp479.
Shi, Zhiao, Catherine K. Derow, and Bing Zhang. 2010. “Co-expression Module Analysis Reveals Biological Processes, Genomic Gain, and Regulatory Mechanisms Associated with Breast Cancer Progression.” BMC Systems Biology 4 (1) (May 27): 74. doi:10.1186/1752-0509-4-74.
Stuart, Joshua M., Eran Segal, Daphne Koller, and Stuart K. Kim. 2003. “A Gene-Coexpression Network for Global Discovery of Conserved Genetic Modules.” Science 302 (5643) (October 10): 249–255. doi:10.1126/science.1087447.
Su, Andrew I., Tim Wiltshire, Serge Batalov, Hilmar Lapp, Keith A. Ching, David Block, Jie Zhang, et al. 2004. “A Gene Atlas of the Mouse and Human Protein-encoding Transcriptomes.” Proceedings of the National Academy of Sciences of the United States of America 101 (16) (April 20): 6062–6067. doi:10.1073/pnas.0400782101.
The ENCODE Project Consortium. 2007. “Identification and Analysis of Functional
92

Elements in 1% of the Human Genome by the ENCODE Pilot Project.” Nature 447 (7146) (June 14): 799–816. doi:10.1038/nature05874.
Volpi, E. V., E. Chevret, T. Jones, R. Vatcheva, J. Williamson, S. Beck, R. D. Campbell, et al. 2000. “Large-scale Chromatin Organization of the Major Histocompatibility Complex and Other Regions of Human Chromosome 6 and Its Response to Interferon in Interphase Nuclei.” Journal of Cell Science 113 (9) (May 1): 1565–1576.
Wang, Zhibin, Chongzhi Zang, Kairong Cui, Dustin E. Schones, Artem Barski, Weiqun Peng, and Keji Zhao. 2009. “Genome-wide Mapping of HATs and HDACs Reveals Distinct Functions in Active and Inactive Genes.” Cell 138 (5) (September 4): 1019–1031. doi:10.1016/j.cell.2009.06.049.
Wickham, Hadley. 2009. Ggplot2: Elegant Graphics for Data Analysis. Springer New York. http://had.co.nz/ggplot2/book.
Wong, David J., Helen Liu, Todd W. Ridky, David Cassarino, Eran Segal, and Howard Y. Chang. 2008. “Module Map of Stem Cell Genes Guides Creation of Epithelial Cancer Stem Cells.” Cell Stem Cell 2 (4) (April 10): 333–344. doi:10.1016/j.stem.2008.02.009.
Zang, Chongzhi, Dustin E. Schones, Chen Zeng, Kairong Cui, Keji Zhao, and Weiqun Peng. 2009. “A Clustering Approach for Identification of Enriched Domains from Histone Modification ChIP-Seq Data.” Bioinformatics 25 (15) (August 1): 1952–1958. doi:10.1093/bioinformatics/btp340.
Zhang, Yong, Tao Liu, Clifford Meyer, Jerome Eeckhoute, David Johnson, Bradley Bernstein, Chad Nussbaum, et al. 2008. “Model-based Analysis of ChIP-Seq (MACS).” Genome Biology 9 (9): R137. doi:10.1186/gb-2008-9-9-r137.
93

Supplementary tables and figures
Table S1. Number of probes in each regulatory module (depending on platform).
NameAffy
U133A probes
Affy U133 plus 2 probes
Affy U133A
%
Affy U133 plus
2 %Source
PRC2 CORE in ES cells 502 913 2.6 2.7 Ku et al. 2008, GEO GSE24463, ENCODE
H3K27me3 in k562 cells 5729 10818 30.1 31.5 ENCODE
H3K4me3 in ES cells 13905 24562 73 71.6 ENCODE
H3K27ac in CD4 cells 9295 16267 48.8 47.4 Wang et al. 2009
Lamina associated domains 2968 5662 15.6 16.5 Guelen et al. 2008
KEGG 8199 11570 43 33.7 KEGG
Random 500 probes 500 500 2.6 1.5 -
All probes 19052 34308 100 100 -
94

Figure S1. Overlaps between regulatory modules. Regulatory modules are compared for coincidences at the gene level, and grouped into six functional categories. Overlaps are represented as the maximum intersection proportion, which is a measure that accounts for big differences in group sizes. For detailed description on the individual modules, see Table 1.
95

Figure S2. Grouping of the top correlated genes in the five transcriptomic datasets. Intersection of genes mapping to the top 0.1% most correlated probe pairs in each cohort. The overlap between BioGPS and Healthy donors datasets conforms the core most co-regulated genes in normal tissues, here termed “Common in normal”. We name genes most co-regulated in cancer as “Common in cancer”. We defined the common elements between the two previous intersections as a core set of genes which co-regulation is preserved in normal and tumour cells.
96

Figure S3. GOBP enrichment in the top correlated genes in five sample cohorts. See Figure 2 for details on the figure legend.
97

Figure S4. KEGG enrichment in the top correlated genes in five sample cohorts. See Figure 2 for details on the figure legend.
98

Figure S5. Synchronized expression of regulatory modules is maintained across normal and tumour samples. Correlation of the sample-wise enrichment of each pair of non-overlapping modules in all the five data sets (CCLE was split into blood and solid primary tissue). White cells indicate that the enrichment analysis (SLEA) for a particular pair of modules could not be run due to an excessive gene overlap.
99

Figure S6. Coordinated and dis-coordinated modules in normal donors. SLEA matrix and co-regulation network view for regulatory modules in 353 normal tissue samples obtained from nine healthy donors (Roth et al. 2006), grouped by functional categories. See Figure 4 for colour legend.
100

Figure S7. Coordinated and dis-coordinated modules in breast cancer. SLEA matrix and co-regulation network view for regulatory modules in a breast cancer cohort comprising 289 tumours (Ivshina et al. 2006). See Figure 4 for colour legend.
101

Figure S8. Coordinated and dis-coordinated modules in lung cancer. SLEA matrix and co-regulation network view for regulatory modules in a cohort comprising 91 NSCLC tumours and 65 corresponding contra-lateral healthy lung tissue (Hou et al. 2010). See Figure 4 for colour legend.
102

Figure S9. Coordinated and dis-coordinated modules in cancer cell lines. SLEA matrix and coregulation network view for regulatory modules in the CCLE (Barretina et al. 2012). Only cell lines originated from haematopoietic system are shown. See Figure 4 for colour legend.
103

Figure S10. Coordinated and discoordinated modules in cancer cell lines. SLEA matrix and co-regulation network view for regulatory modules in the CCLE (Barretina et al. 2012). Only cell lines originated from solid tissues (non-haematopoietic) are shown. See Figure 4 for colour legend.
104

Chapter 3
EXPRESSION OF POLYCOMB TARGETS PREDICTS CANCER PROGNOSIS
The wealth of currently available cancer genomics data requires to be integrated with other sources of information to gain insight on specific deregulated pathways in tumorigenesis. Moreover, computational analyses of this kind are not complete without experimental validation of the main findings. In this chapter I focused on genes regulated by Polycomb, which, as reported in Chapter 2, define a large independent component of gene expression in normal and cancer cells. Accumulating evidence presents Polycomb proteins as multifaceted regulators of normal development and differentiation, but also as cancer drivers in some tumours, as is reviewed in the introductory chapter. Being CRFs, they are an attractive target for anticancer drugs, but the exact mechanisms through which Polycomb contributes to tumorigenesis remain to be fully elucidated. Here I present an in-depth molecular characterisation on the role of Polycomb in breast cancer, and I use gene expression, regulatory and clinical information analysed through computational approaches to this end. The results were further experimentally validated in a laboratory thanks to a collaboration we established. I spent 6 months in the laboratory of Dr. Elizaveta Benevolenskaya at the University of Illinois at Chicago, which allowed me to work closely with the people that performed the experimental validations. Constructive, mutual feedback was essential for the completion of this project. In this part, I collected the regulatory information, conducted the computational analysis and co-wrote the manuscript. The following manuscript has been submitted for publication.
105

Expression of Polycomb targets predicts cancer prognosis
Alba Jene-Sanz1,2, Váraljai Renáta2, Alexandra V. Vilkova2, Galina F. Khramtsova3, Andrey I. Khramtsov4, Olufunmilayo I. Olopade3, Nuria Lopez-Bigas1,5,* and Elizaveta V. Benevolenskaya2,*
1. Universitat Pompeu Fabra, Department of Experimental and Health Sciences, Research Unit on Biomedical Informatics, Dr. Aiguader 88, Barcelona, Spain.
2. University of Illinois at Chicago, Department of Biochemistry and Molecular Genetics, 900 S Ashland Ave, Chicago 60607, USA.
3. University of Chicago, Department of Pathology, 5841 S. Maryland Avenue, Chicago, IL 60637
4. University of Chicago, Department of Medicine, 924 East 57th Street, Chicago, IL 60637
5. Institució Catalana de Recerca i Estudis Avançats (ICREA), Barcelona, Spain.
* Corresponding authors
Conflict of interest: The authors have declared that no conflict of interest exists.
Abstract
Pathological changes in the epigenome are increasingly being appreciated as surrogates to mutations and chromosomal aberrations in disrupting gene regulation. Enhancer of zeste homolog 2 (EZH2) is a histone H3K27 methyltransferase overexpressed in multiple human malignancies, and regulates a variety of cellular processes including cell proliferation, apoptosis, migration, invasion, and self-renewal. Although the EZH2 status in cancer has been widely studied, it is not clear what the expression status of its targets are and how this relates to patient prognosis. Yet, it is important to know for exploring recently reported EZH2 inhibitors as a treatment strategy. Here we determined the molecular and clinical characteristics of breast tumors in relation to that of genomic regions bound by EZH2 or nucleosomes with H3K27me3 mark. We found that genes in these regions are downregulated in tissues with high expression of cell cycle genes, and low expression of developmental and cell adhesion genes. Loss of EZH2 significantly increased expression of the top altered genes, decreased proliferation and improved cell adhesion. Inappropriate high EZH2 level are likely to be contributing to the pathogenesis of HER2+/ER- and basal-like tumors, and expression of its targets stratifies the patients into good and poor prognostic groups independent of known cancer gene signatures.
106

Introduction
Epigenetic plasticity of cancer stem cells and progenitor cells or a mutation in a critical chromatin regulator (CR) can potentially cooperate with mutations in cancer genes. Recognizing the role of the epigenome during the formation of cancer genomes may help to explain aspects of tumor development such as the late onset of most solid tumors, recurrent disease, tumor heterogeneity, risk factors, and environmental effects (Valk-Lingbeek, Bruggeman, and Lohuizen 2004; Feinberg, Ohlsson, and Henikoff 2006). Deregulation of Polycomb repressive complex 2 (PRC2) proteins EZH2 and SUZ12 have been linked to the initiation of tumorigenesis through a variety of mechanisms, which ultimately prevent the expression of cell fate regulators and promote a stem cell-like phenotype (Sauvageau and Sauvageau 2010; Sparmann and Lohuizen 2006). EZH2 is overexpressed in several cancers and promotes cancer progression and associated with worse prognosis in prostate, breast, endometrial and melanoma tumors (Kleer et al. 2003; Varambally et al. 2002; Bachmann et al. 2006). EZH2 directly binds to tumor suppressor genes INK4A/ARF, RAD51, CDKN1C/p57, RUNX3, CDH1/E-cadherin (Yoo and Hennighausen 2011), thus substituting for mutation-induced tumor-suppressor-gene silencing. Much evidence suggests that tumors show global changes in DNA methylation (Dawson and Kouzarides 2012), yet the evidence for genome-wide changes in histone modifications is very rudimentary. The oncogenic function of EZH2 is believed to be mainly mediated through its gene silencing activity (Sauvageau and Sauvageau 2010) suggesting the contribution from deregulation of multiple genes.
By placing the repressive histone modification mark H3K27me3, PRC2 is responsible for silencing promoters of developmental regulators in mammalian stem cells, whilst keeping them poised for activation (Boyer et al. 2006). The loss of this mark at those locations typically promotes cellular differentiation (Bracken et al. 2006; Boyer et al. 2005; T. I. Lee et al. 2006). Therefore, as the important regulator in the balance between cellular proliferation and differentiation, PRC2 may be a critical contributor to the processes leading to neoplasia. Most recently, increased EZH2 has been implicated in the expansion of breast tumor initiating cells (Chang et al. 2011). Elevated EZH2 protein expression indicates a precancerous state in morphologically normal breast epithelium and increases as breast cancer develops and progresses (Ding et al. 2006). Reduction in EZH2 level by RNA inhibition resulted in decreased cell proliferation and reduced tumor growth using xenograft transplantations
107

(Gonzalez et al. 2009). These findings have highlighted an important role of EZH2 in aggressive breast cancers. With this in mind, plus the development of the EZH2 selective inhibitor GSK126, EZH2 is emerging as a very attractive target for anticancer therapies (McCabe et al. 2012).
The location of the PRC2 complex in the human genome has been identified using chromatin immunoprecipitation and sequencing (ChIPseq) in several cell lines (The ENCODE Project Consortium 2007; Ku et al. 2008) (http://www.ncbi.nlm.nih.gov/geo/query/acc.cgi?acc=GSE24463). Here we used systems biology approaches to study gene expression pattern in genomic regions occupied by PRC2 complex or enriched in H3K27 methylation, and its dependence on EZH2. We define gene modules as sets of genes that can be experimentally defined by a certain molecular characteristic, such as genes bound by EZH2. We related the expression of such gene modules in primary human tumors to cancer characteristics. The expression level of genes in the EZH2 module is increased in breast cancer cell lines where EZH2 is lost therefore altering cell proliferation and cell adhesion. Through the expression analysis of several PRC2 modules, we demonstrate that patients with the worse and better prognosis can be reliably stratified, creating opportunities for prognosis and application of EZH2 inhibitors in patients with advanced breast cancer.
Results
PRC2 module expression reflects the balance between
proliferation and differentiation in normal tissues
Given the important role the PRC2 complex and its target genes play during cell-fate determination, we investigated how PRC2 modules are expressed in different cell types. The Polycomb complex PRC2 is placing the pivotal H3K27 trimethylation mark, with EZH2 as a catalytic component, and SUZ12 inducing EZH2 activity and interacting with the nucleosomes. We defined the lists of genes that are either targets of the PRC2 core components or those that contain nucleosomes with the histone mark H3K27me3 in their genomic regions (Table S1). To this end, we used whole-genome data from ChIP-seq experiments performed with EZH2, SUZ12 and H3K27me3 antibodies in human ES cells. We collectively call these sets of genes, i.e., genes where EZH2, SUZ12 or H3K27me3 were detected, as PRC2 modules. While there was a large overlap between genes bound by EZH2, SUZ12 and genes enriched in H3K27me3, there
108

were many genes that were identified only in one dataset (Figure S1A and Figure S1B). We analyzed expression of the genes in the PRC2 modules in a variety of sample datasets using Sample Level Enrichment Analysis (SLEA) (Table S2). First, the analysis was performed using BioGPS (Su et al. 2004), which includes expression data from 79 different human tissues and cell lines. We found that all three PRC2 modules were downregulated in cells from immune system, blood, as well as in all cancer cell lines (Figure 1A). Strikingly, tissues from the nervous and cardiovascular system showed the opposite with a significant up-regulation of the PRC2 modules. Consistent with the repressive effects of EZH2 and SUZ12 on gene expression, their expression level in tissue samples and cell lines inversely correlated with the expression level of the PRC2 modules. We noticed that the cell types associated with down-regulation of PRC2 modules contained proliferating cells, in contrast to more differentiated cells from nervous and cardiovascular system. Indeed, analysis of genes grouped according to the biological processes (BP) they have been ascribed (gene ontology (GO) terms) revealed that the first group of tissues had high expression of cell cycle genes and low expression of developmental genes, while the second group showed the opposite. Consistent with this result, the z-score values for PRC2 module in the groups of samples with high, intermediate and low expression of cell cycle genes were significantly different between the groups (Figure 1A, on the right). Second, we extended the analysis to a larger collection of tissue samples, dissected from ten different donors (Roth et al. 2006). The enrichment pattern was consistent with that in BioGPS, and clearly separated tissues with distinct proliferation and differentiation states (results for one donor are presented in Figure 1B). Therefore, the PRC2 module expression is significantly different between various human tissues, correlating with their proliferative and differentiation states, and stratifying normal from cancer cells.
Molecular and phenotypic characteristics of PRC2
module-stratified breast tumors
Given the fact that EZH2 overexpression is common in breast, prostate and other cancers, we asked if the PRC2 modules are changed in expression in human cancers. We performed SLEA on samples from the six largest breast cancer studies (Table S2). Intriguingly, our analysis revealed many tumor samples that showed up-regulation of PRC2 module (i.e., P < 0.01 and positive z-score) as well as many samples that showed down-regulation of PRC2 module (i.e., P < 0.01 and negative z-score) (SLEA results for two studies are shown in
109

Figure 2A and B). In order to better understand the underlying differences between the two groups of samples, we studied their molecular-pathological characteristics (Table S3 and Table S4).
With respect to the subtype classification and tumor grade, we noticed that there is an overrepresentation of the basal subtype and grade III tumors in samples with PRC2 module down-regulation, while tumors with PRC2 module over-expression are enriched in normal-like subtype (Figure 2). Consistent with these data, there was a direct correlation (Figure S2) in the expression of PRC2 module and gene expression prognostic signatures for normal and luminal A subtypes (Table S5).
To learn more about gene signatures that might correlate, directly or inversely, in expression with the EZH2 module, we analyzed by SLEA each sample for the expression of genes grouped in pathways (KEGG) or GO terms (Figure S3). To identify the GO terms and pathways most significantly changed in expression between samples with high and low expression of EZH2 module, we compared the mean z-score enrichment values for a pathway or a GO term between each group (Figure S4). We found that genes related to cell cycle, RNA transport, spliceosome, proteasome and oxidative phosphorylation are expressed higher in tumors with low expression of EZH2 or two other PRC2 modules (Figure 2 and Figure S3). In contrast, genes involved in cell adhesion, organ development, anatomical structure morphogenesis and neuroactive ligand-receptor interaction were expressed lower in these samples. The opposite was true for the samples with high level of PRC2 modules. The later result is consistent with the notion that PRC2 localizes to genes encoding developmental regulators (Boyer et al. 2006). This data suggest that tumors with a certain level of EZH2 module have characteristic gene signatures.
As the next step, we collected gene expression signatures that have been described for breast cancer. We were interested to know how well the best-known genes associated with breast cancer aggressiveness such as Rosetta dataset (Van t’ Veer et al. 2002), correlate in expression with the PRC2 modules. In addition, we analyzed in our breast cancer datasets the gene signatures of invasiveness, epithelial-mesenchymal transition (EMT), progression to invasive ductal carcinoma, differentiation, quiescence, correlation with BRCA1 level, resistance to treatment, and prognosis (Table S6). When samples were sorted by EZH2 module gene expression into two groups, there was significant difference in z-scores of several signatures between the groups, as determined by Mann-
110

Whitney test (Figure S5). In particular, we observed higher expression of gene signatures of stem cell-like and undifferentiated phenotype, EMT and metastasis in the group of samples that expressed low levels of PRC2 module (Figure 2 and Figure S5). These results are consistent with our observation of the increased expression of genes involved in cell cycle and decreased expression of genes involved in cell adhesion, development and ligand-receptor interactions (Figure S5). The same samples are also characterized by an active BRCA1 network (Pujana et al. 2007). This result is consistent with the observation that high EZH2 protein levels are associated with decreased nuclear expression of phospho-BRCA1 (Ser1423) leading to aberrant mitoses with extra centrosomes, and genomic instability (Gonzalez et al. 2011).
In conclusion, breast cancer patients can be stratified according to the transcription status of PRC2 module independently of clinical characteristics and known cancer gene signatures.
EZH2 depletion induces mesenchymal to epithelial
transition.
The genes with the function in cell adhesion are highly significantly underexpressed in samples with lower level of PRC2 module, and expressed much higher where the PRC2 module is increased (Figure 2 and Figure S3). Disregulated expression of cadherin and catenins, which mediate cell adhesion, has been associated with breast cancer. Loss of E-cadherin/CDH1 is a hallmark for epithelial to mesenchymal transition (EMT) resulting in cells exhibiting stem cell characteristics and therefore the epithelial cells loose cell-to-cell contacts and cytoskeletal integrity, contributing to their dissemination. The EMT core signature associates closely with the metaplastic and claudin-low breast cancer subtypes and correlates negatively with pathological complete response (Hennessy et al. 2009). Strikingly, the PRC2 module shows the best correlation in enrichment with the GO terms related to cell adhesion and with the EMT modules that were described in the previous studies (Taube et al. 2010; Hennessy et al. 2009) (Figure S5). These observations suggest that one of the PRC2 regulatory functions is linked to induction of EMT. Therefore, we investigated whether EZH2 is essential in EMT and metastasis using inducible expression of short hairpin RNAs (shRNAs) to knock down EZH2 expression in breast cancer cell lines. By using the Tet-Off system in MCF7 cells, the level of shRNA production was essentially undetectable under the non-inducing (+Dox) condition, as evidenced by the absence of the RFP reporter gene expression that
111

is linked to shRNA synthesis (Figure 3A). In the -Dox condition, RFP was induced proportionally to the increasing amount of the lentiviruses. In the cells transduced with EZH2 shRNA, the EZH2 transcript levels were substantially reduced by 70% and expression of EZH2 protein was detected by immunoblotting at very low level (Figure 3B). EZH2 expression remained unaltered in cells expressing a control shRNA. EZH2 knockdown decreased the cell numbers compared with the control shRNA and MCF7 parental cell line when transduced cells were cultured as monolayers (Figure 3C). For the analysis of EMT, we grew these cells as epithelial acini in three-dimensional basement membrane cultures on Matrigel. The size of acini formed was smaller and the number was much lower in EZH2 knockdown cells (Figure 3D). Upon EZH2 depletion, we also observed the upregulation of mRNAs of β-catenin and E-cadherin and downregulation of vimentin and snail (Figure 3E). When we analyzed the level of the corresponding proteins in by immunofluorescence, the acini formed from cells with EZH2 depletion showed higher levels of β-catenin and E-cadherin and lower level of vimentin than the control cells (Figure 3F), indicating that the epithelial to mesenchymal transition is reversed. The MCF10A showed a similar growth inhibition by EZH2 shRNA (Figure 3G and Figure 3H), indicating that EZH2 depletion affects not only the growth of breast cancer cells but also the growth of benign mammary epithelial cells. The mRNA level and protein level of epithelial markers was only slightly increased (Figure 3I and Figure 3K). Therefore, EZH2 knockdown restores epithelial markers in breast cancer cells.
High expression of PRC2 modules predicts better breast
cancer outcome
We asked whether the tumor of a patient with worse prognosis would have any significant changes in expression of the PRC2 modules when compared to a patient with a better outcome. We collected large breast tumor transcriptome datasets for which survival annotation was available (Table S2) and performed survival tests using SLEA stratification. Strikingly, the PRC2 modules showed similar or superior predictive power when compared to previously described gene-expression signatures as predictors of breast cancer survival (Figure 4, Table S6 and Table S7). To test the value of early detection in reducing mortality, we analyzed PRC2 modules SLEA stratification within TCGA stage I, II and III tumors separately (stage IV was not included due to the low sample number). Strikingly, we observed a significant difference in survival in stage I tumors
112

(Table S7), which is consistent with a recent study that found that EZH2 protein levels were an independent predictor of distant metastases in a subset of early stage breast tumors with first degree of family history (Alford et al. 2012).
In a previous study, increased breast cancer invasiveness and metastasis has been associated with the recruitment of the PRC2 complex to new genomic loci and, as a result, altered H3K27 methylation and gene expression (Gupta et al. 2010). Another study determined differentially expressed genes when EZH2 is depleted (S. T. Lee et al. 2011). We used gene sets derived from these two studies to stratify breast tumors according to the SLEA expression of these gene sets (Table S1). We found these two modules are also informative in terms of prognosis (Table S7), which can be explained by their significant overlap with H3K27me3 signature (Figure S1).
In order to dissect the PRC2 contribution in patient survival from the contribution of other expression signatures, we explored the overlap between genes in the PRC2 modules with the multicancer gene signatures. Increased chromosomal instability (CIN) (Carter et al. 2006), high expression of cell cycle genes (Whitfield et al. 2002) or active myc network (J. Kim et al. 2010) were shown to correlate with survival. Our analysis revealed that the PRC2 contribution in patient survival was not due to its overlap with the multicancer gene signatures (Table S8 and Figure S6). When we removed any gene from the PRC2 modules that have been previously identified among 691 genes influencing proliferation in HeLa cells (Whitfield et al. 2002), the SLEA results were almost identical to those obtained from the full set of regulatory modules (Table S7). In fact, we detected only a significant overlap of developmental GO categories with the H3K27me3 module. Therefore, our comparative analysis shows that the PRC2 modules represent independent characteristics.
Genes that predict survival in breast cancer are directly
regulated by EZH2
To determine the genes from the PRC2 modules that most contributed to the stratification of breast tumors, we first established a core set consisting of the 167 common gene targets of EZH2, SUZ12 and H3K27me3 in a variety of cell types (Table S9). Then we used it to stratify samples in five breast cancer datasets, and ranked the genes which expression values changed the most. We considered the top eight probes as a proxy for the behavior of genes associated with PRC2 module and which differential expression could be a biomarker of
113
patient outcome. We found that the eight probes represent six neuronal genes (PDE4D, ADRA1A, POU4F2, SIM2, NEUROD2 and NTRK1) and two cell-signaling genes (PHOX2B, ULBP1).
Next we asked if the level of expression of eight genes is really dependent on EZH2 level. For this purpose, we performed RT-PCR experiments in MCF7 cells with inducible expression of EZH2 shRNA in comparison with the cells containing non-silencing shRNA and uninduced cells containing EZH2 shRNA. We found a high increase in the level of five out of eight genes specifically in cells depleted for EZH2 (Figure 5A). This suggests that the expression level of these five genes directly depends on the level of EZH2.
We have previously assessed the expression patterns of the top genes in hundreds of cancer tissue samples. To validate these microarray results, we carried out RT-PCR on 18 breast cancer samples. The result in Figure 5B is presented as a heat map. As expected, the transcript level of these genes generally decreased in the patients with increased EZH2 mRNA (Figure 5B). The PDE4D and ULBP1 genes did not show correlation in gene expression with the rest of genes, consistent with the lack of derepression of these genes in cells with EZH2 depletion (Figure 5A). The SIM2 gene, while decreased in MCF7 cells with EZH2 shRNA, inversely correlated with EZH2 level in tumor samples. Therefore, the predicted PRC2 module targets are likely to be under direct control of EZH2 and negatively correlate with EZH2 in expression in tumor samples. While these genes reproducibly reflect negative correlation in expression with EZH2 in tumor samples as a group, the individual genes are subject of additional regulation, which should be investigated further.
High EZH2 protein levels are associated with aggressive
breast cancer phenotypes
The lower expression of PRC2 modules in more aggressive breast tumors led us to hypothesize that EZH2 protein level is increased in these tumors. To confirm this, we determined the expression of EZH2 in a diverse breast tumor samples cohort (95 patients, n = 450 samples) by immunohistochemistry using high-density tissue microarrays. The mean age of the patients was 56 years (SD=15.6). 63.7% of the patients had estrogen receptor positive tumors, 50.6% had progesterone receptor positive tumors, and 21.2% had HER2+ tumors. The distribution of breast cancer subtypes was luminal A (58.9%), luminal B (6.3%), HER2+/ER- (4.2%), basal-like (28.5%), unclassified (2.1%) (Figure 6A). A
114
majority of the patients had high grade tumors (46.0% grade II and 47.1% grade III). Increased EZH2 expression was significantly associated with HER2+/ER- and basal-like tumor subtypes (Fisher's two tailed test P < 8e-07).
To determine whether the transcript level of EZH2 is altered in the tumor tissue where the IHC showed increased EZH2 staining, we isolated RNA from tumor and normal tissue from six different patients and analyzed it by RT-PCR. Consistent with the EZH2 IHC results, the samples with high EZH2 protein expression, displayed higher EZH2 transcript level than the samples with low or moderate level (Figure 6C). Next we asked if the EZH2 expression level in tumor versus normal samples is indicative of the expression level of the top eight genes that can stratify breast cancer patients. We found that the samples with higher EZH2 level generally had lower expression of the top genes (Figure 6C). The five genes that demonstrated derepression in our experiments upon EZH2 depletion (Figure 5A) showed the lowest decrease in expression level. However, there was no single PRC2 module gene in our analysis that would show a perfect correlation with EZH2 level. This indicates that the power of PRC2 target genes in the prediction of breast cancer survival is not limited by the predictive power of a few critical genes and should be considered module-based, but with some stronger associations (e.g., the eight genes that we studied) that require additional analysis.
Discussion
The prevailing view of the cancer genome is that it arises through sequential genetic mutations, with each mutation accounting for a specific tumor property (i.e., increased cell proliferation, invasiveness, metastasis, drug resistance) supporting selective outgrowth of a monoclonal cell population. If certain epigenetic changes cooperate with genetic mutations, tumors may be developing under the condition where multiple genes with relevant histone modifications are coordinately changed in expression to serve tumor properties. Our analysis of gene expression changes in tumor samples provides evidence that gene regulation undergoes a critical shift supported by the PRC2 module. Genes directly bound by the PRC2 components, such as EZH2, become underexpressed due to repressive histone modifications, including H3K27 trimethylation, thus inducing a cellular phenotype that promotes tumor growth and aggressiveness. We propose that invasive, highly metastatic behavior of breast tumors is sustained by high levels of EZH2, as shRNA-mediated repression of EZH2 in breast cancer cell line not only reduced cell proliferation but also upregulated
115

epithelial markers and suppressed mesenchymal markers.
In an oncogenic context, PRC2 overexpression has been linked to a transition from a quiescent state into an actively dividing, more stem-cell resembling phenotype. We found that cell motility, differentiation, and developmental pathways were downregulated in breast tumors when PRC2 targets were expressed at the low level. Consistent with our data on the dependence of EMT markers expression on EZH2 level in breast cancer cells, EZH2 has been shown to be required for gene repression by the EMT inducer transcription factor Snail (Herranz et al. 2008) and promoting metastasis in several tumors (Min et al. 2010; Alford et al. 2012). The PRC2 complex is known to repress genes that contribute to cell differentiation (Sparmann and Lohuizen 2006), and the identification of neuronal genes as PRC2 module patient stratifiers is probably a reflection of the fact that a large proportion of neuronal differentiation genes are bound by PRC2 and remain repressed (Bracken et al. 2006). Conversely, genes involved in cell cycle, RNA function, spliceosome, and proteasome function, known as the Achilles gene sets in which the high activation is required for the proliferation of cancer cells (Nijhawan et al. 2012), are not known to be PRC2 targets, and the identification of the CRs involved in their regulation awaits further investigation.
In most previous studies, it is the overexpression of gene signatures that have been identified as cancer-specific, indicating plausible transcription factors involved such as c-myc and E2F. Moreover, in our study the levels of PRC2 modules have high prognostic value, independently of other molecular-pathological characteristics.
High EZH2 levels were strongly associated with poor clinical outcome in breast cancer patients (Kleer et al. 2003; Gong et al. 2011). In our study, we detected highly significant association of different PRC2 modules, not of the EZH2 protein itself, with tumor grade and patient survival. Besides an increase in EZH2 protein level, dominant somatic mutations in the EZH2 gene (Yap et al. 2011, 2) could have contributed to lower expression of EZH2 module in cancer. Our findings suggest a new paradigm in tumor progression, in which EZH2 functions to reprogram gene expression and H3K27me3 might be a major part of the gene silencing mechanism. Importantly, as a function linked to the catalytic activity of the PRC2 complex, it may be targeted with a small molecule inhibitor. Analysis of TCGA dataset showed changes in the expression of EZH2 module in stage I tumors, indicating its’ utility in predicting disease progression
116

in patients with early-stage cancer.
PRC2 modules enrichment predicted survival in breast cancer cohorts that represented a broad spectrum of tumor phenotypes. In the Ivshina et al. dataset, down-regulation of EZH2 targets was associated with the most aggressive breast cancer phenotypes. However, our analysis has been limited by the public availability of large transcriptome datasets with survival information; the method is highly study-dependent, but provides a powerful means to investigate molecular subtypes in tumors without the need for prior knowledge. Since the SLEA method uses median-centered expression values, it is sensitive to the heterogeneity of the dataset, and the over-representation of high or low-grade samples can potentially affect the results. As such, PRC2 module correlated with survival in Ivshina et al. dataset but not in Sabatier et al. nor TCGA, which are biased towards higher grade tumors. We speculate that the PRC2 module has a predictive power in other cancers, since breast tumors tend to be diagnosed at earlier stages compared to many other solid tumors. It is interesting to note that the EMT, a process in which PRC2 may play a significant role, is a very early event in breast tumors, but occurs significantly later in some other cancer subtypes (H. Kim et al. 2010). Due to the nature of SLEA, our analysis is sensitive to gene expression changes across samples, but does not take into account absolute values. In particular, a set of tumors that are enriched for overexpressed PRC2 module does not necessarily have high transcription rates for the genes in the PRC2 module. It is important also to note that our study reflects intra-tumor variability, since normal samples were removed from the original cohorts. Our aim was to determine the ability of loci associated with H3K27 methylation to stratify tumor subtypes, regardless of how much altered was gene expression compared to a non-tumorigenic reference.
The rationale behind using gene expression to stratify patients for cancer prognosis came from the repeated observations that intrinsic biology seems to play a more important role than other variables, such as age or tumor stage, in determining the breast cancer phenotype (Sørlie et al. 2003). We found that the expression of over a thousand of genes, which are normally EZH2 targets in cancer cell lines, stratifies breast cancer patients in two clinically different groups. While this large group of genes collectively is linked to tumor characteristics, we have identified eight genes that are reproducibly reduced in expression in cancers associated with the worst prognosis. The datasets for the PRC2 modules were derived from human ES cells, so it is essential to look at the
117

binding of PRC2 to these genes in human primary breast tumors. Some of the genes are expected to be directly regulated by EZH2 in more than one cell type, as their expression level was sensitive to EZH2 knockdown in a breast cancer cell line. These findings give rise to important questions regarding the timing of when changed expression of EZH2 bound genes is required during tumorigenesis and the mechanisms by which the genes in the PRC2 module become activated or repressed. An attractive model by which EZH2 can globally reprogram gene expression during metastasis is by tethering its target gene loci into chromatin domains, which is assisted by other CRs as well as lincRNAs.
Methods
Human breast cancer specimens
Tissue microarrays were constructed from 95 histologically confirmed breast cancer samples. To identify breast cancer subtypes, we evaluated the tissues for the expression of ER, PR, HER2, keratin 5 and 6 (CK5/6), and EGFR. Staining with vimentin served as a control to monitor the quality of tissue fixation in archival tumors. Breast cancer subtypes were defined as luminal A (ER+ and/or PR+, HER2-), luminal B (ER+ and/or PR+, HER2+), basal-like (ER-, PR-, HER2-, CK5/6+, and/or EGFR+), HER2+/ER- (HER2+, ER-, PR-) and unclassified (negative for all five markers). EZH2 expression was measured by staining using an anti-EZH2 antibody (Cat.# 187395, Invitrogen). Staining quantification was performed independently by two pathologists (see supplementary methods).
For the transcript analysis from breast tissue microarray, RNA samples were prepared from 6 tumor tissues and 6 matching normal tissues. All tissue samples were obtained and handled in accordance with an approved Institutional Review Board protocol. In addition to these six samples, the analysis was performed with 18 cDNAs isolated from breast ductal carcinomas from the TissueScan Cancer Survey Tissue qPCR panel 384-1 (CSRT102, OriGene).
Cell culture and inducible shRNAmir expression
MCF7 and 293T cells were grown in DMEM medium (Mediatech) supplemented with 10% fetal bovine serum (FBS) (HyClone), and MCF10A cells were grown in DMEM F12 medium (Mediatech) supplemented with 5% horse serum, 10 µg/ml insulin, 100 ng/ml cholera toxin and 0.5 µg/ml hydrocortisone. All cells were grown in 37ºC 5% CO2 incubator. Cells were
118

seeded in 24-well tissue culture plate at the density 3x10⁴ cells/well in medium supplemented with doxocycline (Dox) at the concentration 100 ng/ml or Dox-free medium. Cells were plated in triplicates. Media was changed every 3 days. As a Tet-OFF system, we used tTA-Advanced MCF7 cell line that we previously generated (Carr et al. 2012). The miR-30-based shRNA to EZH2 was generated from pTRIPZ V3THS-387506 (Thermo Fisher) by deletion of sequences encoding rtTA3 transactivator. The construct was digested with BamH I and religated to give pTRIPZ-OFF-EZH2-1. The same modification was introduced in the control non-silencing construct pTRIPZ RHS4743 (Thermo Fisher). To make the constructs function as Tet-Off, they were transduced into tTA-Advanced expressing cells. For virus production, 293T cells at 80% confluency were transfected by Lipofectamine 2000 with packaging constructs, pMD2.G, psPAX2, and corresponding pTRIPZ vector and 7 µg/ml polybrene. After 8 hours, the transfection media was replaced with growth media. Cells were selected for integrated constructs with puromycin dihydrochloride for two days.
Proliferation and EMT studies
For proliferation assays, cell viability was assessed by trypan blue exclusion analysis and was 90-100%. Cells were imaged for RFP using fluorescent microscopy (Leica DM IRB), and images acquired using Q Capture PRO software. Matrigel assays were performed in 8-well glass chambers with 5x10³ cell/well in growth medium containing 2% Matrigel (BD Biosciences). Cells were fed every 4 days with assay media containing 2% Matrigel, which was supplemented with 5 ng/ml EGF for MCF10A cells. The detection of EMT markers was performed with anti-rabbit antibody to β-catenin (sc-7199, Santa Cruz), and anti-mouse antibodies to E-cadherin (CD324, BD Biosciences) and vimentin (v5255, Sigma). Alexa 647 labeled anti-mouse (Invitrogen) and Cy3 labeled anti-rabbit (Jackson Labs) antibodies were used as the secondary antibodies. Nuclei were stained with DAPI. Immunofluorescent staining of acini cultured in Matrigel was performed essentially as described (Debnath, Muthuswamy, and Brugge 2003). Acini were mounted in FluorSave reagent (Calbiochem) and confocal images were taken using Zeiss LSM 700 laser scanning microscope using Zen 2009 (Zeiss Enhanced Navigation) software.
Analysis of protein and gene expression
Protein lysates were resolved on a 6.25% SDS-PAGE. For immunoblot analysis, mouse EZH2 BD43 (Millipore) and α-tubulin T9026 (Sigma) antibodies were used and blots were developed using ECL. For gene expression
119

analysis, total RNA from cells grown in culture were isolated using TRIzol (Sigma). Total RNA from formalin-fixed paraffin-embedded (FFPE) tissue samples were isolated using MagMAX FFPE total nucleic acid isolation kit (Ambion) and then 1.8 mg of the sample RNA was used for first strand cDNA synthesis using Superscript Vilo kit (Life Technologies). Real-time PCR was performed using the SYBR Green PCR master mix and the CFX96 system (Bio-Rad). Expression level of experimental genes was normalized to the geometrical mean of three control genes, SDHA, UBC and POLR2A. Primer sequences used in RT-qPCR are available in Table S10.
Transcriptome data
We used eight publicly available expression profiling data sets downloaded from Gene Expression Omnibus (GEO) (Su et al. 2004; Roth et al. 2006; Schmidt et al. 2008; Pawitan et al. 2005; Wang et al. 2005; Ivshina et al. 2006; Sabatier et al. 2010) (Table S2). Each data set consists of microarray expression data for primary tumors, except for GSE1133, which contains normal tissues and malignant cell lines, and GSE3526, which consists entirely of healthy tissues. The sample number varies from 159 to 533 across all cancer datasets. Data was pre-processed as previously described (Gundem and Lopez-Bigas 2012) and filtered for protein coding genes (according to Ensembl v60 annotations). The input data for enrichment analysis was obtained by median centering the expression value of each gene across all the tumor samples (row median) and dividing this value by the standard deviation (row standard deviation) using R (R Core Team 2012). For all cancer datasets, normal samples were removed before median centering. The obtained value is the measure of expression level for the gene in a sample as compared to its expression level in all other samples in the dataset.
Public datasets
We created lists of genes regulated by PRC2 from experimental data in available sources (Table S1). The degree of overlap between these gene lists is shown in Figure S1B. These include human genome-wide occupancy datasets from ChIPseq experiments in ES cells (Ku et al. 2008; The ENCODE Project Consortium 2007) (http://www.ncbi.nlm.nih.gov/geo/query/acc.cgi?acc=GSE24463) that we processed using Bowtie (version 0.12.5, hg19 genome assembly, unique alignments, allowing 2 mismatches) (Langmead et al. 2009) for short read aligning. For peak detection of transcription factors, we used MACS (version 1.4.1) (Zhang et al. 2008) (nomodel and setting --bw parameter
120

to twice the shift size whenever a control IP was not available; the shift size was estimated using Pyicos (Althammer et al. 2011). For histone modifications, we used SICER (version 1.1) (Zang et al. 2009) (setting gap size to 600). Regions were assigned to protein coding genes (Ensembl v60) if they overlapped either to the gene body or up to 5 kb upstream from the TSS, using BedTools (Quinlan and Hall 2010). Raw reads from each dataset were checked for quality with FastQC (“Babraham Bioinformatics - FastQC A Quality Control Tool for High Throughput Sequence Data” 2012) and overall peak-calling performance was evaluated with CEAS (Shin et al. 2009).
We also collected a set of breast cancer prognostic gene signatures (Table S6). Other gene sets were obtained and classified from the MsigDB v3.0 (Subramanian et al. 2005), KEGG (Kanehisa et al. 2012) and Gene Ontology (GO) (Ashburner et al. 2000). KEGG and GO terms were obtained from Biomart (Ensembl v65).
We annotated the intrinsic subtypes for Ivshina et al. 2006 dataset using R package genefu (http://www.R-project.org) using the robust model. Intrinsic subtypes from Sabatier et al. 2011 where obtained from authors’ annotations.
Sample-Level Enrichment Analysis (SLEA)
Enrichment analysis was performed using Gitools version 1.6.0 (Perez-Llamas and Lopez-Bigas 2011)(http://www.gitools.org). We used z-score method as described previously (Gundem and Lopez-Bigas 2012; Lopez-Bigas, De, and Teichmann 2008). This method compares the mean (or median) expression value of genes in each module to a distribution of mean (or median) of 10,000 random modules of the same size. Such enrichment analysis was run for each sample and the result was a z-score, which is a measure of the difference between the observed and expected mean (or median) expression values for genes in a module. The P-value related to the z-score was corrected for multiple testing using Benjamini-Hochberg FDR method(Benjamini and Hochberg 1995)We define positively enriched modules in a sample as those with a positive z-score and a corrected P < 0.01, while negatively enriched modules have negative z-scores with corrected P < 0.01. Besides z-values for individual samples, we also applied the mean z-score enrichment values, which are the arithmetic means of z-scores for individual samples. To test for significant differences between the z-score means within each stratified group of samples we used the Mann-Whitney test implemented in Gitools. All heat-maps were generated with Gitools.
121

Survival analysis
We used the logrank test (“survdiff”) and Cox proportional hazards (“coxph”) from R Bioconductor package (Gentleman et al. 2004) to calculate the significance and hazard ratios, respectively, and “survplot” (Aron Eklund 2012) for the Kaplan-Meier curves. In the survival analysis, the survival data of the samples with positive enrichment for the module (z-scores with corrected P < 0.01) was compared to that of the samples with negative enrichment in the dataset; the group size was at least 20 samples.
Acknowledgments
The project was supported by the grant SAF2009-06954 from the Spanish Ministry of Science and Technology (N L.-B.), and R01 CA138631 (E.V.B.), R01 CA142996 and P50 CA125183 (O.I.O) from the National Institutes of Health.
122

Figures
Figure 1. PRC2 module gene expression reflects the balance between cell cycle and differentiation. A. SLEA analysis identifies groups of tissues and cell lines BioGPS with significantly changed expression of PRC2 module. Heat-maps of regulatory modules (rows) and tissue samples (columns). “Cell cycle” and “Organ development” correspond to genes annotated under the GOBP terms GO:0007049 and GO:0048513, respectively. Up-regulation of a module in each sample is shown in red and down-regulation in blue. The bottom rows depict median-centered probe-level expression, with yellow and purple colors indicating higher and lower expression, respectively. Right panels: Box-plots of the PRC2 modules z-scores in groups of samples selected according to the overall enrichment of the cell cycle module; p-values denote Mann-Whitney one-sided test significance. B. SLEA analysis shows grouping samples from healthy tissues of a single individual according to PRC2 module expression.
123

Figure 2. PRC2 module expression stratifies samples according to their molecular characteristics and aggressive tumor behavior. A. PRC2 module stratification of breast tumor samples and enrichment of breast cancer prognosis signatures using gene expression data from Ivshina et al. 2006. Samples were sorted according to the z-score value of EZH2 module and divided in three groups, with lower (in blue), non-significant (in gray), or higher (in red) expression of genes in the module (z-score significance level set at P < 0.01). Upper panels, color-coded annotations describe breast cancer subtypes and tumor grades taken from the clinical annotations of the patient samples. Middle panels, SLEA analysis of PRC2 modules is presented as heat-maps for each tumor sample. Lower panels, the mean z-score enrichment value of selected pathways, GOBP, and breast cancer prognosis signatures is presented for samples from each group stratified by EZH2 module enrichment. For all modules shown, z-scores were significantly different between the sample groups corresponding to lower and higher PRC2 modules enrichment (Mann-Whitney test, P < 0.01). B. The same analysis performed with samples from the study by Sabatier et al. 2011. See Table S6 and references (Van t’ Veer et al. 2002; Pujana et al. 2007; Hennessy et al. 2009; Taube et al. 2010; Liu et al. 2007) for a description of the prognostic gene signatures.
124

Figure 3. EZH2 depletion reduces cell proliferation and induces mesenchymal to epithelial transition. A. Induction of shRNAs is tightly regulated with doxycycline in Tet-Off configuration. MCF7 cells stably expressing the tTA protein were transduced with a lentivirus expressing the indicated shRNAs and treated with 100 ng/ml doxycycline (+Dox) for 6 days before analysis. The level of shRNA expression can be monitored by the level of
125

a TurboRFP reporter, which is induced proportionally to the amount of virus added to the cells (2x and 3x). B. Expression difference in EZH2 level upon Dox treatment as determined by RT-qPCR and immunoblot analyses. C. EZH2 shRNA-mediated knockdown results in decreased proliferation in MCF7 cells. Error bars: means + SEM, n=3. D. Reduced proliferation of EZH2 shRNA MCF7 cells grown on Matrigel. Phase contrast micrographs of EZH2 shRNA acini are shown, with the relative number of acini (> 20 cells) presented in a graph. Error bars: means + SEM, n=2. E. EZH2 depletion changes expression of EMT markers in MCF7 cells. RT-qPCR data are shown for cells grown in Dox- versus Dox+ media. F. Control shRNA and EZH2 shRNA acini examined by fluorescent microscope for expression of EMT markers. Scale bar, 50 µm. G. EZH2 shRNA-mediated knockdown results in decreased proliferation in MCF10A cells, similar to MCF7 cells. The shRNAs were induced in Tet-On configuration, which resulted in a successful decrease in EZH2 protein level as evidenced by immunoblotting (right panel). H. Reduced proliferation of EZH2 shRNA MCF10A cells grown on Matrigel. I and K. The EZH2 depletion slightly changes expression of EMT markers in MCF10A cells. Error bars for all RT-qPCR assays: means + SEM, n=3.
126

Figure 4. PRC2 regulatory modules predict outcome in breast cancer patients. A. Kaplan-Meier curves for PRC2 modules and prognostic gene signatures in Ivshina et al. dataset. HR=Hazard Ratio. B. Survival analysis results after samples stratification according to PRC2 enrichment. The survival analysis results for Ivshina et al. dataset in A and three additional breast cancer cohorts are presented for samples up-regulated for the module (e.g., a PRC2 module or prognostic gene signature) compared to samples which are down-regulated for the module. Red and blue indicate that the up or down-regulation of that module, respectively, significantly predicts better outcome (logrank P < 0.05). Non-significant results are denoted in gray; missing analysis due to small sample group size is indicated in white. Prognostic gene signatures are as in Figure 2.
127

Figure 5. Genes from PRC2 module which expression stratifies breast tumor samples are regulated by EZH2. A. RT-qPCR was performed for EZH2 and 8 top PRC2 module genes on RNA from MCF7 cells and graphed relative to expression in cells without shRNA production. Error bars: means + SEM, n=3. B. Expression levels of EZH2 and 8 top PRC2 module genes in breast tumors (TissueScan Array). The heatmap shows expression values from RT-qPCR experiments in a panel of human tumor samples, normalized to the reference gene B2M and presented relative to the mean ΔCt of each gene. Heatmaps were produced using Gitools. Yellow and purple colors indicate higher and lower expression, respectively. Columns represent different patient samples. Samples are arranged according to EZH2 level. Correlation coefficient of expression values of 8 genes (left panel) shows strong association in the level of 6 of these genes.
128
Figure 6. EZH2 protein levels in breast tumors correlate with the most aggressive intrinsic subtypes. A. Analysis of tissue microarray data. High-density tissue microarray containing in total 450 spots of normal and cancerous (190 spots of DCIS and invasive carcinomas) biopsy tissues was analyzed for EZH2 protein levels by immunohistochemistry. EZH2 protein levels (in blue) were divided in four categories, and are shown with distribution of tumor subtypes, grade and overall survival. B. Representative images of biopsies of invasive breast carcinomas with different EZH2 level. Scale bar: 100 µm. C. The transcript level of PRC2 module genes negatively correlates with EZH2 transcript and protein level. Expression level of EZH2 and 8 top PRC2 module genes confirmed by RT-qPCR. Gene expression of each gene was normalized to three control genes. Error bars: means + SEM, n=3 (PCR repeats). The table on the right shows EZH2 staining result and patient data.
129

References
Alford, Sharon Hensley, Katherine Toy, Sofia D. Merajver, and Celina G. Kleer. 2012. “Increased Risk for Distant Metastasis in Patients with Familial Early-Stage Breast Cancer and High EZH2 Expression.” Breast Cancer Research and Treatment 132 (2) (April): 429–437. doi:10.1007/s10549-011-1591-2.
Althammer, Sonja, Juan González-Vallinas, Cecilia Ballaré, Miguel Beato, and Eduardo Eyras. 2011. “Pyicos: a Versatile Toolkit for the Analysis of High-throughput Sequencing Data.” Bioinformatics 27 (24) (December 15): 3333–3340. doi:10.1093/bioinformatics/btr570.
Aron Eklund. 2012. “Survplot: An R Package.” Accessed June 20. http://www.cbs.dtu.dk/~eklund/survplot/.
Ashburner, Michael, Catherine A. Ball, Judith A. Blake, David Botstein, Heather Butler, J. Michael Cherry, Allan P. Davis, et al. 2000. “Gene Ontology: Tool for the Unification of Biology.” Nature Genetics 25 (1) (May 1): 25–29. doi:10.1038/75556.
“Babraham Bioinformatics - FastQC A Quality Control Tool for High Throughput Sequence Data.” 2012. Accessed March 9. http://www.bioinformatics.bbsrc.ac.uk/projects/fastqc/.
Bachmann, Ingeborg M., Ole J. Halvorsen, Karin Collett, Ingunn M. Stefansson, Oddbjorn Straume, Svein A. Haukaas, Helga B. Salvesen, Arie P. Otte, and Lars A. Akslen. 2006. “EZH2 Expression Is Associated With High Proliferation Rate and Aggressive Tumor Subgroups in Cutaneous Melanoma and Cancers of the Endometrium, Prostate, and Breast.” J Clin Oncol 24 (2) (January 10): 268–273. doi:10.1200/JCO.2005.01.5180.
Benjamini, Yoav, and Yosef Hochberg. 1995. “Controlling the False Discovery Rate: A Practical and Powerful Approach to Multiple Testing.” Journal of the Royal Statistical Society. Series B (Methodological) 57 (1): 289–300. doi:10.2307/2346101.
Boyer, Laurie A., Tong Ihn Lee, Megan F. Cole, Sarah E. Johnstone, Stuart S. Levine, Jacob P. Zucker, Matthew G. Guenther, et al. 2005. “Core Transcriptional Regulatory Circuitry in Human Embryonic Stem Cells.” Cell Vol 122 (September 23): 947–956.
Boyer, Laurie A., Kathrin Plath, Julia Zeitlinger, Tobias Brambrink, Lea A. Medeiros, Tong Ihn Lee, Stuart S. Levine, et al. 2006. “Polycomb Complexes Repress Developmental Regulators in Murine Embryonic Stem Cells.” Nature 441 (7091) (April 19): 349–353. doi:10.1038/nature04733.
Bracken, Adrian P., Nikolaj Dietrich, Diego Pasini, Klaus H. Hansen, and Kristian Helin. 2006. “Genome-wide Mapping of Polycomb Target Genes Unravels Their Roles in Cell Fate Transitions.” Genes & Development 20 (9) (May 1): 1123–1136. doi:10.1101/gad.381706.
Carr, Janai R., Megan M. Kiefer, Hyun Jung Park, Jing Li, Zebin Wang, Joel Fontanarosa, Danielle DeWaal, et al. 2012. “FoxM1 Regulates Mammary Luminal Cell Fate.” Cell Reports 1 (6) (June 28): 715–729. doi:10.1016/j.celrep.2012.05.005.
Carter, Scott L, Aron C Eklund, Isaac S Kohane, Lyndsay N Harris, and Zoltan Szallasi. 2006. “A Signature of Chromosomal Instability Inferred from Gene Expression
130

Profiles Predicts Clinical Outcome in Multiple Human Cancers.” Nature Genetics 38 (9) (August 20): 1043–1048. doi:10.1038/ng1861.
Chang, Chun-Ju, Jer-Yen Yang, Weiya Xia, Chun-Te Chen, Xiaoming Xie, Chi-Hong Chao, Wendy A. Woodward, Jung-Mao Hsu, Gabriel N. Hortobagyi, and Mien-Chie Hung. 2011. “EZH2 Promotes Expansion of Breast Tumor Initiating Cells Through Activation of RAF1-β-catenin Signaling.” Cancer Cell 19 (1) (January 18): 86–100. doi:10.1016/j.ccr.2010.10.035.
Dawson, Mark A., and Tony Kouzarides. 2012. “Cancer Epigenetics: From Mechanism to Therapy.” Cell 150 (1) (July 6): 12–27. doi:10.1016/j.cell.2012.06.013.
Debnath, Jayanta, Senthil K. Muthuswamy, and Joan S. Brugge. 2003. “Morphogenesis and Oncogenesis of MCF-10A Mammary Epithelial Acini Grown in Three-dimensional Basement Membrane Cultures.” Methods 30 (3) (July): 256–268. doi:10.1016/S1046-2023(03)00032-X.
Ding, Lei, Christine Erdmann, Arul M. Chinnaiyan, Sofia D. Merajver, and Celina G. Kleer. 2006. “Identification of EZH2 as a Molecular Marker for a Precancerous State in Morphologically Normal Breast Tissues.” Cancer Research 66 (8) (April 15): 4095–4099. doi:10.1158/0008-5472.CAN-05-4300.
Feinberg, Andrew P., Rolf Ohlsson, and Steven Henikoff. 2006. “The Epigenetic Progenitor Origin of Human Cancer.” Nat Rev Genet 7 (1) (January): 21–33. doi:10.1038/nrg1748.
Gentleman, Robert C, Vincent J Carey, Douglas M Bates, Ben Bolstad, Marcel Dettling, Sandrine Dudoit, Byron Ellis, et al. 2004. “Bioconductor: Open Software Development for Computational Biology and Bioinformatics.” Genome Biology 5 (10): R80–R80. doi:10.1186/gb-2004-5-10-r80.
Gong, Yun, Lei Huo, Ping Liu, Nour Sneige, Xiaoping Sun, Naoto T. Ueno, Anthony Lucci, Thomas A. Buchholz, Vicente Valero, and Massimo Cristofanilli. 2011. “Polycomb Group Protein EZH2 Is Frequently Expressed in Inflammatory Breast Cancer and Is Predictive of Worse Clinical Outcome.” Cancer 117 (24): 5476–5484. doi:10.1002/cncr.26179.
Gonzalez, Maria E., Matthew L. DuPrie, Heather Krueger, Sofia D. Merajver, Alejandra C. Ventura, Kathy A. Toy, and Celina G. Kleer. 2011. “Histone Methyltransferase EZH2 Induces Akt-Dependent Genomic Instability and BRCA1 Inhibition in Breast Cancer.” Cancer Research 71 (6) (March 15): 2360–2370. doi:10.1158/0008-5472.CAN-10-1933.
Gonzalez, Maria E., Xin Li, Katherine Toy, Matthew DuPrie, Alejandra C. Ventura, Mousumi Banerjee, Mats Ljugman, Sofia D. Merajver, and Celina G. Kleer. 2009. “Down-regulation of Enhancer of Zeste-2 Decreases Growth of Estrogen Receptor Negative Invasive Breast Carcinoma and Requires BRCA1.” Oncogene 28 (6) (February 12): 843–853. doi:10.1038/onc.2008.433.
Gundem, Gunes, and Nuria Lopez-Bigas. 2012. “Sample Level Enrichment Analysis (SLEA) Unravels Shared Stress Phenotypes Among Multiple Cancer Types.”
Gupta, Rajnish A., Nilay Shah, Kevin C. Wang, Jeewon Kim, Hugo M. Horlings, David J. Wong, Miao-Chih Tsai, et al. 2010. “Long Non-coding RNA HOTAIR Reprograms Chromatin State to Promote Cancer Metastasis.” Nature 464 (7291) (April 15): 1071–1076. doi:10.1038/nature08975.
Hennessy, Bryan T., Ana-Maria Gonzalez-Angulo, Katherine Stemke-Hale, Michael Z.
131

Gilcrease, Savitri Krishnamurthy, Ju-Seog Lee, Jane Fridlyand, et al. 2009. “Characterization of a Naturally Occurring Breast Cancer Subset Enriched in Epithelial-to-Mesenchymal Transition and Stem Cell Characteristics.” Cancer Research 69 (10) (May 15): 4116–4124. doi:10.1158/0008-5472.CAN-08-3441.
Herranz, Nicolás, Diego Pasini, Víctor M. Díaz, Clara Francí, Arantxa Gutierrez, Natàlia Dave, Maria Escrivà, et al. 2008. “Polycomb Complex 2 Is Required for E-cadherin Repression by the Snail1 Transcription Factor.” Molecular and Cellular Biology 28 (15) (August): 4772–4781. doi:10.1128/MCB.00323-08.
Ivshina, Anna V., Joshy George, Oleg Senko, Benjamin Mow, Thomas C. Putti, Johanna Smeds, Thomas Lindahl, et al. 2006. “Genetic Reclassification of Histologic Grade Delineates New Clinical Subtypes of Breast Cancer.” Cancer Research 66 (21) (November 1): 10292 –10301. doi:10.1158/0008-5472.CAN-05-4414.
Kanehisa, Minoru, Susumu Goto, Yoko Sato, Miho Furumichi, and Mao Tanabe. 2012. “KEGG for Integration and Interpretation of Large-scale Molecular Data Sets.” Nucleic Acids Research 40 (D1) (January): D109–D114. doi:10.1093/nar/gkr988.
Kim, Hoon, John Watkinson, Vinay Varadan, and Dimitris Anastassiou. 2010. “Multi-cancer Computational Analysis Reveals Invasion-associated Variant of Desmoplastic Reaction Involving INHBA, THBS2 and COL11A1.” BMC Medical Genomics 3 (November 3): 51. doi:10.1186/1755-8794-3-51.
Kim, Jonghwan, Andrew J. Woo, Jianlin Chu, Jonathan W. Snow, Yuko Fujiwara, Chul Geun Kim, Alan B. Cantor, and Stuart H. Orkin. 2010. “A Myc Network Accounts for Similarities Between Embryonic Stem and Cancer Cell Transcription Programs.” Cell 143 (2) (October 15): 313–324. doi:10.1016/j.cell.2010.09.010.
Kleer, Celina G., Qi Cao, Sooryanarayana Varambally, Ronglai Shen, Ichiro Ota, Scott A. Tomlins, Debashis Ghosh, et al. 2003. “EZH2 Is a Marker of Aggressive Breast Cancer and Promotes Neoplastic Transformation of Breast Epithelial Cells.” Proceedings of the National Academy of Sciences of the United States of America 100 (20) (September 30): 11606–11611. doi:10.1073/pnas.1933744100.
Ku, Manching, Richard P. Koche, Esther Rheinbay, Eric M. Mendenhall, Mitsuhiro Endoh, Tarjei S. Mikkelsen, Aviva Presser, et al. 2008. “Genomewide Analysis of PRC1 and PRC2 Occupancy Identifies Two Classes of Bivalent Domains.” PLoS Genet 4 (10) (October 31): e1000242. doi:10.1371/journal.pgen.1000242.
Langmead, Ben, Cole Trapnell, Mihai Pop, and Steven L Salzberg. 2009. “Ultrafast and Memory-efficient Alignment of Short DNA Sequences to the Human Genome.” Genome Biology 10 (3): R25. doi:10.1186/gb-2009-10-3-r25.
Lee, Shuet Theng, Zhimei Li, Zhenlong Wu, Meiyee Aau, Peiyong Guan, R.K. Murthy Karuturi, Yih Cherng Liou, and Qiang Yu. 2011. “Context-Specific Regulation of NF-κB Target Gene Expression by EZH2 in Breast Cancers.” Molecular Cell 43 (5): 798–810. doi:10.1016/j.molcel.2011.08.011.
Lee, Tong Ihn, Richard G. Jenner, Laurie A. Boyer, Matthew G. Guenther, Stuart S. Levine, Roshan M. Kumar, Brett Chevalier, et al. 2006. “Control of Developmental Regulators by Polycomb in Human Embryonic Stem Cells.” Cell Vol 125 (April 21): 301–313.
Liu, Rui, Xinhao Wang, Grace Y Chen, Piero Dalerba, Austin Gurney, Timothy Hoey, Gavin Sherlock, John Lewicki, Kerby Shedden, and Michael F Clarke. 2007. “The Prognostic Role of a Gene Signature from Tumorigenic Breast-cancer Cells.” The
132

New England Journal of Medicine 356 (3) (January 18): 217–226. doi:10.1056/NEJMoa063994.
Lopez-Bigas, Nuria, Subhajyoti De, and Sarah A Teichmann. 2008. “Functional Protein Divergence in the Evolution of Homo Sapiens.” Genome Biology 9 (2): R33. doi:10.1186/gb-2008-9-2-r33.
McCabe, Michael T., Heidi M. Ott, Gopinath Ganji, Susan Korenchuk, Christine Thompson, Glenn S. Van Aller, Yan Liu, et al. 2012. “EZH2 Inhibition as a Therapeutic Strategy for Lymphoma with EZH2-activating Mutations.” Nature. doi:10.1038/nature11606. http://www.nature.com/nature/journal/vaop/ncurrent/full/nature11606.html.
Min, Junxia, Alexander Zaslavsky, Giuseppe Fedele, Sara K. McLaughlin, Elizabeth E. Reczek, Thomas De Raedt, Isil Guney, et al. 2010. “An Oncogene-tumor Suppressor Cascade Drives Metastatic Prostate Cancer by Coordinately Activating Ras and Nuclear factor-[kappa]B.” Nature Medicine 16 (3) (February 14): 286–294. doi:10.1038/nm.2100.
Nijhawan, Deepak, Travis I. Zack, Yin Ren, Matthew R. Strickland, Rebecca Lamothe, Steven E. Schumacher, Aviad Tsherniak, et al. 2012. “Cancer Vulnerabilities Unveiled by Genomic Loss.” Cell 150 (4) (August 17): 842–854. doi:10.1016/j.cell.2012.07.023.
Pawitan, Yudi, Judith Bjöhle, Lukas Amler, Anna-Lena Borg, Suzanne Egyhazi, Per Hall, Xia Han, et al. 2005. “Gene Expression Profiling Spares Early Breast Cancer Patients from Adjuvant Therapy: Derived and Validated in Two Population-based Cohorts.” Breast Cancer Research 7 (6): R953–R964. doi:10.1186/bcr1325.
Perez-Llamas, Christian, and Nuria Lopez-Bigas. 2011. “Gitools: Analysis and Visualisation of Genomic Data Using Interactive Heat-Maps.” PLoS ONE 6 (5) (May 13): e19541. doi:10.1371/journal.pone.0019541.
Pujana, Miguel Angel, Jing-Dong J. Han, Lea M. Starita, Kristen N. Stevens, Muneesh Tewari, Jin Sook Ahn, Gad Rennert, et al. 2007. “Network Modeling Links Breast Cancer Susceptibility and Centrosome Dysfunction.” Nature Genetics 39 (11): 1338–1349. doi:10.1038/ng.2007.2.
Quinlan, Aaron R, and Ira M Hall. 2010. “BEDTools: a Flexible Suite of Utilities for Comparing Genomic Features.” Bioinformatics 26 (6) (March 15): 841–842. doi:10.1093/bioinformatics/btq033.
R Core Team. 2012. R: A Language and Environment for Statistical Computing. Vienna, Austria. http://www.R-project.org.
Roth, Richard B., Peter Hevezi, Jerry Lee, Dorian Willhite, Sandra M. Lechner, Alan C. Foster, and Albert Zlotnik. 2006. “Gene Expression Analyses Reveal Molecular Relationships Among 20 Regions of the Human CNS.” Neurogenetics 7 (2) (March 30): 67–80. doi:10.1007/s10048-006-0032-6.
Sabatier, Renaud, Pascal Finetti, Nathalie Cervera, Eric Lambaudie, Benjamin Esterni, Emilie Mamessier, Agnès Tallet, et al. 2010. “A Gene Expression Signature Identifies Two Prognostic Subgroups of Basal Breast Cancer.” Breast Cancer Research and Treatment 126 (2) (May 21): 407–420. doi:10.1007/s10549-010-0897-9.
Sauvageau, Martin, and Guy Sauvageau. 2010. “Polycomb Group Proteins: Multi-Faceted Regulators of Somatic Stem Cells and Cancer.” Cell Stem Cell 7 (3)
133
(September 3): 299–313. doi:10.1016/j.stem.2010.08.002.
Schmidt, Marcus, Daniel Böhm, Christian Von Törne, Eric Steiner, Alexander Puhl, Henryk Pilch, Hans-Anton Lehr, Jan G. Hengstler, Heinz Kölbl, and Mathias Gehrmann. 2008. “The Humoral Immune System Has a Key Prognostic Impact in Node-Negative Breast Cancer.” Cancer Research 68 (13) (July 1): 5405–5413. doi:10.1158/0008-5472.CAN-07-5206.
Shin, Hyunjin, Tao Liu, Arjun K. Manrai, and X. Shirley Liu. 2009. “CEAS: Cis-regulatory Element Annotation System.” Bioinformatics (August 18): btp479. doi:10.1093/bioinformatics/btp479.
Sørlie, Therese, Robert Tibshirani, Joel Parker, Trevor Hastie, J. S. Marron, Andrew Nobel, Shibing Deng, et al. 2003. “Repeated Observation of Breast Tumor Subtypes in Independent Gene Expression Data Sets.” Proceedings of the National Academy of Sciences 100 (14) (July 8): 8418–8423. doi:10.1073/pnas.0932692100.
Sparmann, Anke, and Maarten van Lohuizen. 2006. “Polycomb Silencers Control Cell Fate, Development and Cancer.” Nature Reviews Cancer 6 (11) (November 1): 846–856. doi:10.1038/nrc1991.
Su, Andrew I., Tim Wiltshire, Serge Batalov, Hilmar Lapp, Keith A. Ching, David Block, Jie Zhang, et al. 2004. “A Gene Atlas of the Mouse and Human Protein-encoding Transcriptomes.” Proceedings of the National Academy of Sciences of the United States of America 101 (16) (April 20): 6062–6067. doi:10.1073/pnas.0400782101.
Subramanian, Aravind, Pablo Tamayo, Vamsi K Mootha, Sayan Mukherjee, Benjamin L Ebert, Michael A Gillette, Amanda Paulovich, et al. 2005. “Gene Set Enrichment Analysis: A Knowledge-Based Approach for Interpreting Genome-Wide Expression Profiles.” Proceedings of the National Academy of Sciences of the United States of America 102 (43) (October 25): 15545–15550. doi:10.1073/pnas.0506580102.
Taube, Joseph H., Jason I. Herschkowitz, Kakajan Komurov, Alicia Y. Zhou, Supriya Gupta, Jing Yang, Kimberly Hartwell, et al. 2010. “Core Epithelial-to-mesenchymal Transition Interactome Gene-expression Signature Is Associated with Claudin-low and Metaplastic Breast Cancer Subtypes.” Proceedings of the National Academy of Sciences of the United States of America 107 (35) (August 31): 15449–15454. doi:10.1073/pnas.1004900107.
The ENCODE Project Consortium. 2007. “Identification and Analysis of Functional Elements in 1% of the Human Genome by the ENCODE Pilot Project.” Nature 447 (7146) (June 14): 799–816. doi:10.1038/nature05874.
Valk-Lingbeek, Merel E., Sophia W.M. Bruggeman, and Maarten van Lohuizen. 2004. “Stem Cells and Cancer: The Polycomb Connection.” Cell 118 (4) (August): 409–418. doi:10.1016/j.cell.2004.08.005.
Varambally, Sooryanarayana, Saravana M. Dhanasekaran, Ming Zhou, Terrence R. Barrette, Chandan Kumar-Sinha, Martin G. Sanda, Debashis Ghosh, et al. 2002. “The Polycomb Group Protein EZH2 Is Involved in Progression of Prostate Cancer.” Nature 419 (6907) (October 10): 624–629. doi:10.1038/nature01075.
Van t’ Veer, Laura J., Hongyue Dai, Marc J. van de Vijver, Yudong D. He, Augustinus A. M. Hart, Mao Mao, Hans L. Peterse, et al. 2002. “Gene Expression Profiling Predicts Clinical Outcome of Breast Cancer.” Nature 415 (6871) (January 31): 530–536. doi:10.1038/415530a.
Wang, Yixin, Jan G M Klijn, Yi Zhang, Anieta M Sieuwerts, Maxime P Look, Fei Yang,
134

Dmitri Talantov, et al. 2005. “Gene-expression Profiles to Predict Distant Metastasis of Lymph-node-negative Primary Breast Cancer.” Lancet 365 (9460) (February 19): 671–679. doi:10.1016/S0140-6736(05)17947-1.
Whitfield, Michael L., Gavin Sherlock, Alok J. Saldanha, John I. Murray, Catherine A. Ball, Karen E. Alexander, John C. Matese, et al. 2002. “Identification of Genes Periodically Expressed in the Human Cell Cycle and Their Expression in Tumors.” Molecular Biology of the Cell 13 (6) (June): 1977–2000. doi:10.1091/mbc.02-02-0030.
Yap, Damian B., Justin Chu, Tobias Berg, Matthieu Schapira, S.-W. Grace Cheng, Annie Moradian, Ryan D. Morin, et al. 2011. “Somatic Mutations at EZH2 Y641 Act Dominantly Through a Mechanism of Selectively Altered PRC2 Catalytic Activity, to Increase H3K27 Trimethylation.” Blood 117 (8) (February 24): 2451–2459. doi:10.1182/blood-2010-11-321208.
Yoo, Kyung Hyun, and Lothar Hennighausen. 2011. “EZH2 Methyltransferase and H3K27 Methylation in Breast Cancer.” International Journal of Biological Sciences 8 (1) (November 18): 59–65.
Zang, Chongzhi, Dustin E. Schones, Chen Zeng, Kairong Cui, Keji Zhao, and Weiqun Peng. 2009. “A Clustering Approach for Identification of Enriched Domains from Histone Modification ChIP-Seq Data.” Bioinformatics 25 (15) (August 1): 1952–1958. doi:10.1093/bioinformatics/btp340.
Zhang, Yong, Tao Liu, Clifford Meyer, Jerome Eeckhoute, David Johnson, Bradley Bernstein, Chad Nussbaum, et al. 2008. “Model-based Analysis of ChIP-Seq (MACS).” Genome Biology 9 (9): R137. doi:10.1186/gb-2008-9-9-r137.
135

Supplementary Methods
Tissue microarray (TMA) construction
Archival formalin-fixed and paraffin-embedded tissues of breast cancer patients were obtained from the surgical pathology archive of the University of Chicago for TMA construction. The study was approved by local Institutional Review Board (IRB # 10760B). Pathologic features, including diagnosis, grade, tumor size, and axillary lymph node metastasis, were abstracted from pathologic reports. The histology diagnosis, grading of invasive breast cancer and carcinoma in situ was performed separately by two pathologists (G.F.K., A.I.K.) and based on protocols of the College of American Pathologists and World Health Organization (WHO) classification (Lester, Bose, Chen, Connolly, De Baca, Fitzgibbons, Hayes, Kleer, O’Malley, Page, Smith, Weaver, et al. 2009; Tavassoli and Devilee 2003; Lester, Bose, Chen, Connolly, de Baca, Fitzgibbons, Hayes, Kleer, O’Malley, Page, Smith, Tan, et al. 2009). The histology grading of invasive carcinoma was performed using the Elston-Ellis modified Scarff-Bloom-Richardson method (C. W. Elston and Ellis 1991; E. W. Elston and Ellis 1993). The histology grading of invasive carcinoma was performed using the Elston-Ellis modified Scarff-Bloom-Richardson method (C. W. Elston and Ellis 1991; E. W. Elston and Ellis 1993). Breast cancer subtypes were defined as luminal A (ER+ and/or PR+, HER2-), luminal B (ER+ and/or PR+, HER2+), basal-like (ER-, PR-, HER2-, CK5/6+ and/or EGFR+), HER2+ (HER2+, ER-, PR-), or unclassified (negative for all five markers) as described (Carey LA 2006). The TMAs were constructed from FFPE in situ and invasive carcinomas tumor samples and adjacent histological normal epithelium, which serve as an internal positive control. 1-mm tissue cores were arrayed into a new recipient paraffin block using an automated arrayer (ATA-27, Beecher Instruments, Sun Prairie, WI) as described (Kononen et al. 1998).
Immunohistochemistry (IHC)
4µm TMA sections were deparaffinized and rehydrated through graded alcohols, then washed in Tris-buffered saline. Endogenous peroxidases were blocked by treatment with 0.3% hydrogen peroxide for 5 min; non-specific staining was prevented by incubation in Protein Block Serum-free Solution (Dako, Carpinteria, CA). IHC assays were performed using a Dako immunostainer. The immunoreactivity was detected using Envision+ reagents (Dako) and a 5-min incubation in 3-3’-diaminobenzidine (DAB) as the chromogen, followed by counterstaining with hematoxylin. Slides were
136

counterstained with hematoxylin and mounted. Human tonsil, colorectal cancer, breast tissue, and commercial cell lines were used as positive controls. Isotypic IgG or no primary antibody served as negative controls.
IHC Evaluation
Two observers (A.I.K, G.F.K) performed quantitative analysis of the tissue specimen without knowledge of specimen identification as described in our previous study (Khramtsov et al. 2010). Scoring was based on intensity and percentage of positively stained cells; all discrepancies were resolved by a second examination using a multi-head microscope and Image-Pro Express 6.3 (MediaCybernetics). The Allred IHC score for ER and PR was calculated as described (Lester, Bose, Chen, Connolly, De Baca, Fitzgibbons, Hayes, Kleer, O’Malley, Page, Smith, Tan, et al. 2009; Hammond et al. 2010). HER2 was evaluated by IHC according to ASCO/CAP guidelines (Wolff et al. 2007). EGFR immunostaining was evaluated according to PharmDX recommendations. The vimentin and CK5/6 were evaluated as described (Dabbs et al. 2006). EZH2 was evaluated using modified Allred IHC score as described (Lester, Bose, Chen, Connolly, De Baca, Fitzgibbons, Hayes, Kleer, O’Malley, Page, Smith, Tan, et al. 2009; Alford et al. 2012). Low expression EZH2 was defined as scores 1-4, and high expression as scores 5-8.
Identification of top genes in the PRC2 module
To identify top genes from the PRC2 module where expression differences between the two groups of samples delineated by module expression were the highest, we analyzed five non-overlapping transcriptome experiments containing a large number of breast tumor samples (Table S2). We started by constructing a core PRC2 module, containing genes which were described in several EZH2, SUZ12 and H3K27me3 ChIPseq experiments in a variety of cell types (Table S9). This gave us a list of 167 unique Ensembl v60 gene IDs thus representing a core set of genes constitutively bound by EZH2, SUZ12 or displaying H3K27me3 mark.
First, for every experiment we stratified the breast cancer samples, according to overexpression or underexpression of the core PRC2 module, by running Sample Level Enrichment Analysis (SLEA). In particular, we sorted the samples using the median-centered expression values of probes for 167 genes. Second, we selected genes that contributed most to this stratification of samples, i.e., we sought to identify those probes that altered their expression the most when the samples were sorted according to the SLEA. For every probe in that module, we
137

took the values for the 10% most extreme samples (most up and down regulated) and calculated the two means. Then we subtracted the mean expression of the up-regulated samples from that of the down-regulated samples for each probe, and obtained a value reflecting how much each probe is contributing to the observed changes in enrichment in the two groups of samples. We used this value to rank the probes in the core module according to their contribution to its enrichment in every experiment. We ranked the probes in each experiment according to the difference in the means and built a “total rank” across all experiments. Top probes in all five experiments were nine genes: PHOX2B, ULBP1, PDE4D, ADRA1A, POU4F2, SIM2, GRIK3, NEUROD2 and NTRK1 (ENSG00000109132, ENSG00000111981, ENSG00000113448, ENSG00000120907, ENSG00000151615, ENSG00000159263, ENSG00000163873, ENSG00000171532 and ENSG00000198400). The probe log2 absolute readings confirmed that these genes are in fact expressed in each experiment, but we discarded the GRIK3 gene that showed very low detection level in patient samples.
Supplementary Tables
Table S1. List of datasets for PRC2 regulated genes used in the study.
Name Description Nº genes Source
EZH2 EZH2 target genes from ChIPseq experiment in ES cells 1229 (Ku et al. 2008)
SUZ12 SUZ12 target genes from ChIPseq experiment in ES cells 2019 GEO: GSE24463
H3K27me3 Genes with H3K27me3 mark from ChIPseq experiment in ES cells 6665
(The ENCODE Project Consortium 2007)
PRC2 relocalization
New targets of PRC2 upon HOTAIR overexpression in breast cancer cells (MDA-MB-231)
750 (Gupta et al. 2010)
EZH2 depleted UP
Genes upregulated when EZH2 is depleted in breast cancer cells (MDA-MB-231) 332
(Lee et al. 2011)EZH2 depleted DOWN
Genes downregulated when EZH2 is depleted breast cancer cells (MDA-MB-231) 398
138

Table S2. Normal and breast tumor transcriptome datasets used in the study.
Study Source* Sample number
Lymph node status
Metastasis at resection
Systemic treatment Notes
(Su et al. 2004)
BioGPS (GSE1133) 79 - - - Normal tissue and
cell lines
(Roth et al. 2006)
Healthy donors (GSE3256)
353 - - - Healthy tissue
(Ivshina et al. 2006) GSE4922 289
81 pos159 neg49 NA
-66 pos183 neg40 NA
Unselected population
(Sabatier et al. 2010) GSE21653 266
140 pos120 neg6 NA
None None Early (ductal and lobular)
(Schmidt et al. 2008) GSE11121 200 Negative None None
Selected for LN negative, untreated. Only early stage samples.
(Pawitan et al. 2005) GSE1456 159 38 pos 26 76 pos
135 neg
Unselected population (121 identified as “good prognosis”)
(Y. Wang et al. 2005) GSE2034 286 Negative
93 pos183 neg10 NA
None Selected for LN negative, untreated
(The Cancer Genome Atlas Network 2012)
TCGA breast invasive carcinoma
533262 pos258 neg13 NA
100 pos230 neg203 NA
226 pos307 neg (no data)
Breast invasive carcinoma (mostly ductal)
*Total datasets were used except of BioGPS, where we performed analysis on 51 out of 79 samples, and of “Healthy donors” where we performed analysis on 282 out of 353 donors.
139

Table S3. Clinical annotations details for samples in Ivshina et al. dataset after SLEA stratification using EZH2 module. Percentages are relative to the total number of samples in each of the groups.
EZH2 down(86 samples)*
None(119 samples)
EZH2 up(84 samples)
17% 12% 6% ER negative
38% 34% 18% Relapse
36% 18% 7% P53 mutation
36% 30% 17% Lymph node positive
28% 24% 4% Grade III
13% 13% 10% Basal-like
19% 17% 7% Her2
16% 37% 48% Luminal A
51% 24% 10% Luminal B
1% 10% 26% Normal-like
*Percentages are relative to the total number of samples in each of the groups.
Table S4. Clinical annotations details for samples in Sabatier et al. 2011 dataset after SLEA stratification using EZH2 module.
EZH2 down*
(70 samples)None(123 samples)
EZH2 up(73 samples)
47% 48% 49% ER negative
33% 33% 26% Relapse
24% 27% 26% P53 mutation
46% 59% 49% Lymph node positive
66% 46% 30% Grade III
40% 30% 14% Basal-like
9% 11% 5% ERBB2
23% 38% 36% Luminal A
29% 18% 10% Luminal B
- 2% 36% Normal-like
*Percentages are relative to the total number of samples in each of the groups.
140

Table S5. Breast cancer intrinsic subtype signatures from MsigDB used in Figure S2.
Name Nº genes Description Source
Basal 475 UP / 490 DOWN Genes differentially expressed in basal breast cancer subtype
(Smid et al. 2008)
ERBB2 103 UP / 3 DOWN Genes differentially expressed in ERBB2 breast cancer subtype
Luminal A 55 UP / 14 DOWN Genes differentially expressed in luminal A breast cancer subtype
Luminal B 123 UP / 392 DOWN Genes differentially expressed in luminal B breast cancer subtype
Normal-like
347 UP / 3 DOWN Genes differentially expressed in normal-like breast cancer subtype
141

Table S6. Breast cancer prognostic gene signatures collected from original research publications.
Name ClassNº genes (Ensembl v60)
Description Source
Metastasis UP Prognostic 79 UP Up-regulated in metastatic breast tumors
(Van ’t Veer et al. 2002)
Transition to IDC UP
Invasiveness
60 UP Up-regulated in invasive ductal carcinoma (IDC)
(Schuetz et al. 2006)
EMT UP EMT 148 UP Up-regulated EMT-associated genes.
(Taube et al. 2010)
Undifferentiated UP
Stemness 107 UP Up-regulated in stem cell-like breast cancer cells
(Liu et al. 2007)
MBC and Claudin-low
EMT 21 Down-regulated in metaplastic breast cancer (MBC) and claudin-low tumors
(Hennessy et al. 2009)
BRCA1 multicancer network
BRCA1 1184 Correlated with BRCA1 expression in multiple cancer types
(Pujana et al. 2007)
Better prognosis Prognostic 30 Up-regulated in good prognosis breast tumors
(Naderi et al. 2007)
Resistance to treatment
Treatment resistance
76 Down-regulated in docetaxel treatment resistant breast tumors
(Chang et al. 2003)
Growth-arrested Quiescence 22 Down-regulated in quiescent mammary cells
(Fournier et al. 2006)
Stemness in high grade
Stemness 69 Correlated with 'embryonic stem cell' signature, which is overexpressed in the high-grade, ER-negative breast tumors.
(Ben-Porath et al. 2008)
Metastasis DOWN
Prognostic 37 DOWN Down-regulated in metastatic breast tumors
(Van ’t Veer et al. 2002)
Transition to IDC DOWN
Invasiveness
233 DOWN Down-regulated in invasive ductal carcinoma (IDC)
(Schuetz et al. 2006)
EMT DOWN EMT 91 DOWN Down-regulated EMT-associated genes.
(Hennessy et al. 2009)
Undifferentiated DOWN
Stemness 87 DOWN Down-regulated in stem cell-like breast cancer cells
(Liu et al. 2007)
Residual disease Treatment resistance
30 Down-regulated in residual disease
(Chang et al. 2003)
Senescence Quiescence 55 UP in sensescence (Fridman and Tainsky 2008)
142
Table S7. Results of survival tests for PRC2 modules.
1. Results of survival tests presented for six different breast cancer transcriptome datasets.
143

2. Results of survival tests presented for the TCGA cohort split by tumor stage
3. Results of survival tests presented for PRC2 module excluding cell cycle genes.
144

Table S8. Multicancer gene signatures indicative of prognosis.
Name Nº genes Description Source
CIN 70 Genes that go UP in chromosome instability, predictive of cancer outcome
(Carter et al. 2006)
ES myc-related subnetwork
333 ES expression signature broken down into 3 independent networks, experimentally derived
(Kim et al. 2010)
cell cycle in HeLa and fibroblasts
23 Experimentally-derived cell cycle regulated genes common in HeLa cells and human fibroblasts
(Whitfield et al. 2002)
Proliferation in breast cancer
112 Proliferation genes defined in breast cancer expression
(Ben-Porath et al. 2008)
Table S9. List of PRC2 modules obtained from ChIP-seq experiments.
Group Name Cell type Nº genes Source
PRC2
EZH2 hES 1229 (Ku et al. 2008)
SUZ12 ntera2 4075 (The ENCODE Project Consortium 2007)
SUZ12 hES 2019 GEO: GSE24463
H3K27me3 H3K27me3
T CD4 5207 (Z. Wang et al. 2009)
hES 3411 (Lister et al. 2009)
hES 6665
(The ENCODE Project Consortium 2007)
gm12878 6099
k562 6075
huvec 7940
nhek 6563
Breast CD24 4960
(Maruyama et al. 2011)Breast CD44 3912
145

Table S10. Primer sequences used in RT-PCR.
Gene Name Forward Primer Reverse Primer
CDH1β-cateninsnailVIMN-cadherinKRT19
as described in (Zhou et al. 2008)
B2M as described in (Lopez-Bigas et al. 2008)
UBC AAGATGGTCGTACCCTGTCTGACT TTCACGAAGATCTGCATCCCACCT
SDHA AGGGAAGACTACAAGGTGCGGATT AGTGCTCCTCAAAGGGCTTCTTCT
POLR2A ATCTCCCAGGTCATTGCTGTCGTT GCTTGAAGCCAAATGGAATCCGCT
EZH2 GATGCAACCCGCAAGGGTAACAAA AAACAGCTCTTCGCCAGTCTGGAT
SIM2 ACCGCCTTGTCTACCTCACAAGAA GGCCGCATTCCAGTTTGTCCATTT
ADRA1A ATCATCTCCATCGACCGCTACATC AATGGATATGACCAGGGAGAGTGC
PDE4D TACACCTGCTTTGGAGGCTGTGTT AAGCCCACAGCCAAATGATGGTTC
ULBP1 TCTGGAAAGCAGGAGTTCAAGCCT ATGAGCGAAGGTAATGAGTGGCCT
NEUROD2 TACGATATGCACCTTCACCACGAC CGGCGCGAAGTCTCAGTTATGAAA
NTRK1 ATGCCTGTGTTCACCACATCAAGC ACTCAGCAAGGAAGACCTTCCCAA
PHOX2B ACGCCGCAGTTCCTTACAAACTCT TTTGAGCTGGGCACTGGTGAAAGT
POU4F2 ACATGAGCGCTCTCACTTACCCTT AAATGGTGCATCGGTCATGCTTCC
146

Supplementary Figures
Figure S1. Overlap of Polycomb regulatory modules. A. Symmetric heat-map representing the overlap between different PRC2 modules. Colors indicate the maximum intersection proportion, which is an overlap measure that takes into account the overlap percentage in the smaller of the two groups. B and C. Venn diagrams show the number of genes common between different studied PRC2 modules. See Table S1 for references for the modules.
Figure S2. Breast cancer intrinsic subtype signatures. Heat-map of common cancer prognostic signatures (see Table S5) (rows) and tissue samples from Ivshina et al. dataset (columns). To avoid subjectivity in our data interpretation, signature enrichment has not been filtered for significance. Up-regulation is shown in red, down-regulation in blue. In the left panel, the correlation matrix reflects how similar the enrichment is across breast tumors in each pair of modules. The Mann-Whitney test depicts the significance in the difference between z-scores when we compare samples with low and high expression of EZH2 module. In the upper-right panel, color-coded annotations describe sample clinical characteristics.
147

148

Figure S3. GO Biological Process and KEGG enrichment in breast tumors. Heat-map of different pathways (KEGG) and GO (Biological Process) terms gene signatures (rows) and tissue samples (columns) of Ivshina et al. dataset. EZH2 targets (top row) were used for sample stratification. Up-regulation is shown in red, down-regulation in blue; there's no significance threshold set for this enrichment. A. Gene signatures that correlate with the EZH2 module. B. Gene signatures that anti-correlate with the EZH2 module.
149
150

Figure S4. Correlation between expression of gene signatures. A. Ivshina et al. dataset. B. Sabatier et al. dataset. Symmetric heatmap representing the Pearson Correlation Coefficient of each pair of z-score vectors resulting from the enrichment analysis of PRC2 modules, GO terms, pathways (see Figure S2 and Figure S3) and prognostic gene signatures. See Table S6 and references (Van ’t Veer et al. 2002; Taube et al. 2010; Liu et al. 2007; Hennessy et al. 2009; Pujana et al. 2007) for a description of the prognostic gene signatures.
Figure S5. PRC2 modules stratification of breast tumor samples and breast cancer prognosis signatures enrichment. Heatmap of previously described gene signatures (see Table S6) (rows) and tissue samples from Ivshina et al. dataset (columns). In the left panel, the correlation matrix reflects how similar the enrichment is across breast tumors in each pair of modules. Analysis was conducted as in Figure S2. Up-regulation is shown in red, down-regulation in blue; gray denotes no significant enrichment in the PRC2 modules (Z-score significance level is set at P < 0.01).
151

Figure S6. Overlap of PRC2 modules and the selected gene signatures. Symmetric heat-map representing the element counts in each module. Colors indicate the maximum intersection proportion, which is an overlap measure that takes into account the overlap percentage in the smaller of the two groups. This allows comparison of two sets of elements of a large size difference. See Table S8 for a description on the modules.
Supplementary references
Alford, Sharon Hensley, Katherine Toy, Sofia D. Merajver, and Celina G. Kleer. 2012. “Increased Risk for Distant Metastasis in Patients with Familial Early-Stage Breast Cancer and High EZH2 Expression.” Breast Cancer Research and Treatment 132 (2) (April): 429–437. doi:10.1007/s10549-011-1591-2.
Ben-Porath, Ittai, Matthew W Thomson, Vincent J Carey, Ruping Ge, George W Bell, Aviv Regev, and Robert A Weinberg. 2008. “An Embryonic Stem Cell-like Gene Expression Signature in Poorly Differentiated Aggressive Human Tumors.” Nat Genet 40 (5) (May): 499–507. doi:10.1038/ng.127.
Carey LA, Perou CM. 2006. “Race, Breast Cancer Subtypes, and Survival in the Carolina Breast Cancer Study.” JAMA: The Journal of the American Medical Association 295 (21) (June 7): 2492–2502. doi:10.1001/jama.295.21.2492.
Carter, Scott L, Aron C Eklund, Isaac S Kohane, Lyndsay N Harris, and Zoltan Szallasi. 2006. “A Signature of Chromosomal Instability Inferred from Gene Expression Profiles Predicts Clinical Outcome in Multiple Human Cancers.” Nature Genetics 38 (9) (August 20): 1043–1048. doi:10.1038/ng1861.
Chang, Jenny C, Eric C Wooten, Anna Tsimelzon, Susan G Hilsenbeck, M Carolina Gutierrez, Richard Elledge, Syed Mohsin, et al. 2003. “Gene Expression Profiling for the Prediction of Therapeutic Response to Docetaxel in Patients with Breast Cancer.” The Lancet 362 (9381) (August 2): 362–369. doi:10.1016/S0140-6736(03)14023-8.
Dabbs, David J, Mamatha Chivukula, Gloria Carter, and Rohit Bhargava. 2006. “Basal Phenotype of Ductal Carcinoma in Situ: Recognition and Immunohistologic Profile.” Modern Pathology: An Official Journal of the United States and Canadian
152

Academy of Pathology, Inc 19 (11) (November): 1506–1511. doi:10.1038/modpathol.3800678.
Elston, C W, and I O Ellis. 1991. “Pathological Prognostic Factors in Breast Cancer. I. The Value of Histological Grade in Breast Cancer: Experience from a Large Study with Long-term Follow-up.” Histopathology 19 (5) (November): 403–410.
Elston, E W, and I O Ellis. 1993. “Method for Grading Breast Cancer.” Journal of Clinical Pathology 46 (2) (February): 189–190.
Fournier, Marcia V., Katherine J. Martin, Paraic A. Kenny, Kris Xhaja, Irene Bosch, Paul Yaswen, and Mina J. Bissell. 2006. “Gene Expression Signature in Organized and Growth-Arrested Mammary Acini Predicts Good Outcome in Breast Cancer.” Cancer Research 66 (14) (July 15): 7095–7102. doi:10.1158/0008-5472.CAN-06-0515.
Fridman, A. L., and M. A. Tainsky. 2008. “Critical Pathways in Cellular Senescence and Immortalization Revealed by Gene Expression Profiling.” Oncogene 27 (46): 5975–5987. doi:10.1038/onc.2008.213.
Gupta, Rajnish A., Nilay Shah, Kevin C. Wang, Jeewon Kim, Hugo M. Horlings, David J. Wong, Miao-Chih Tsai, et al. 2010. “Long Non-coding RNA HOTAIR Reprograms Chromatin State to Promote Cancer Metastasis.” Nature 464 (7291) (April 15): 1071–1076. doi:10.1038/nature08975.
Hammond, M Elizabeth H, Daniel F Hayes, Mitch Dowsett, D Craig Allred, Karen L Hagerty, Sunil Badve, Patrick L Fitzgibbons, et al. 2010. “American Society of Clinical Oncology/College of American Pathologists Guideline Recommendations for Immunohistochemical Testing of Estrogen and Progesterone Receptors in Breast Cancer (unabridged Version).” Archives of Pathology & Laboratory Medicine 134 (7) (July): e48–72. doi:10.1043/1543-2165-134.7.e48.
Hennessy, Bryan T., Ana-Maria Gonzalez-Angulo, Katherine Stemke-Hale, Michael Z. Gilcrease, Savitri Krishnamurthy, Ju-Seog Lee, Jane Fridlyand, et al. 2009. “Characterization of a Naturally Occurring Breast Cancer Subset Enriched in Epithelial-to-Mesenchymal Transition and Stem Cell Characteristics.” Cancer Research 69 (10) (May 15): 4116–4124. doi:10.1158/0008-5472.CAN-08-3441.
Ivshina, Anna V., Joshy George, Oleg Senko, Benjamin Mow, Thomas C. Putti, Johanna Smeds, Thomas Lindahl, et al. 2006. “Genetic Reclassification of Histologic Grade Delineates New Clinical Subtypes of Breast Cancer.” Cancer Research 66 (21) (November 1): 10292 –10301. doi:10.1158/0008-5472.CAN-05-4414.
Khramtsov, Andrey I., Galina F. Khramtsova, Maria Tretiakova, Dezheng Huo, Olufunmilayo I. Olopade, and Kathleen H. Goss. 2010. “Wnt/β-Catenin Pathway Activation Is Enriched in Basal-Like Breast Cancers and Predicts Poor Outcome.” The American Journal of Pathology 176 (6) (June): 2911–2920. doi:10.2353/ajpath.2010.091125.
Kim, Jonghwan, Andrew J. Woo, Jianlin Chu, Jonathan W. Snow, Yuko Fujiwara, Chul Geun Kim, Alan B. Cantor, and Stuart H. Orkin. 2010. “A Myc Network Accounts for Similarities Between Embryonic Stem and Cancer Cell Transcription Programs.” Cell 143 (2) (October 15): 313–324. doi:10.1016/j.cell.2010.09.010.
Kononen, J, L Bubendorf, A Kallioniemi, M Bärlund, P Schraml, S Leighton, J Torhorst, M J Mihatsch, G Sauter, and O P Kallioniemi. 1998. “Tissue Microarrays for High-throughput Molecular Profiling of Tumor Specimens.” Nature Medicine 4 (7) (July):
153

844–847.
Ku, Manching, Richard P. Koche, Esther Rheinbay, Eric M. Mendenhall, Mitsuhiro Endoh, Tarjei S. Mikkelsen, Aviva Presser, et al. 2008. “Genomewide Analysis of PRC1 and PRC2 Occupancy Identifies Two Classes of Bivalent Domains.” PLoS Genet 4 (10) (October 31): e1000242. doi:10.1371/journal.pgen.1000242.
Lee, Shuet Theng, Zhimei Li, Zhenlong Wu, Meiyee Aau, Peiyong Guan, R.K. Murthy Karuturi, Yih Cherng Liou, and Qiang Yu. 2011. “Context-Specific Regulation of NF-κB Target Gene Expression by EZH2 in Breast Cancers.” Molecular Cell 43 (5): 798–810. doi:10.1016/j.molcel.2011.08.011.
Lester, Susan C, Shikha Bose, Yunn-Yi Chen, James L Connolly, Monica E de Baca, Patrick L Fitzgibbons, Daniel F Hayes, Celina Kleer, Frances P O’Malley, David L Page, Barbara L Smith, Donald L Weaver, et al. 2009. “Protocol for the Examination of Specimens from Patients with Ductal Carcinoma in Situ of the Breast.” Archives of Pathology & Laboratory Medicine 133 (1) (January): 15–25. doi:10.1043/1543-2165-133.1.15.
Lester, Susan C, Shikha Bose, Yunn-Yi Chen, James L Connolly, Monica E de Baca, Patrick L Fitzgibbons, Daniel F Hayes, Celina Kleer, Frances P O’Malley, David L Page, Barbara L Smith, Lee K Tan, et al. 2009. “Protocol for the Examination of Specimens from Patients with Invasive Carcinoma of the Breast.” Archives of Pathology & Laboratory Medicine 133 (10) (October): 1515–1538. doi:10.1043/1543-2165-133.10.1515.
Lister, Ryan, Mattia Pelizzola, Robert H. Dowen, R. David Hawkins, Gary Hon, Julian Tonti-Filippini, Joseph R. Nery, et al. 2009. “Human DNA Methylomes at Base Resolution Show Widespread Epigenomic Differences.” Nature advance online publication (October 14). doi:10.1038/nature08514. http://dx.doi.org/10.1038/nature08514.
Liu, Rui, Xinhao Wang, Grace Y Chen, Piero Dalerba, Austin Gurney, Timothy Hoey, Gavin Sherlock, John Lewicki, Kerby Shedden, and Michael F Clarke. 2007. “The Prognostic Role of a Gene Signature from Tumorigenic Breast-cancer Cells.” The New England Journal of Medicine 356 (3) (January 18): 217–226. doi:10.1056/NEJMoa063994.
Lopez-Bigas, Nuria, Tomasz A. Kisiel, Dannielle C. DeWaal, Katie B. Holmes, Tom L. Volkert, Sumeet Gupta, Jennifer Love, Heather L. Murray, Richard A. Young, and Elizaveta V. Benevolenskaya. 2008. “Genome-wide Analysis of the H3K4 Histone Demethylase RBP2 Reveals a Transcriptional Program Controlling Differentiation.” Molecular Cell 31 (4) (August 22): 520–530. doi:10.1016/j.molcel.2008.08.004.
Maruyama, Reo, Sibgat Choudhury, Adam Kowalczyk, Marina Bessarabova, Bryan Beresford-Smith, Thomas Conway, Antony Kaspi, et al. 2011. “Epigenetic Regulation of Cell Type–Specific Expression Patterns in the Human Mammary Epithelium” 7 (4) (April). doi:10.1371/journal.pgen.1001369.
Naderi, A., A. E. Teschendorff, N. L. Barbosa-Morais, S. E. Pinder, A. R. Green, D. G. Powe, J. F. R. Robertson, et al. 2007. “A Gene-expression Signature to Predict Survival in Breast Cancer Across Independent Data Sets.” Oncogene 26 (10): 1507–1516. doi:10.1038/sj.onc.1209920.
Pawitan, Yudi, Judith Bjöhle, Lukas Amler, Anna-Lena Borg, Suzanne Egyhazi, Per Hall, Xia Han, et al. 2005. “Gene Expression Profiling Spares Early Breast Cancer
154

Patients from Adjuvant Therapy: Derived and Validated in Two Population-based Cohorts.” Breast Cancer Research 7 (6): R953–R964. doi:10.1186/bcr1325.
Pujana, Miguel Angel, Jing-Dong J Han, Lea M Starita, Kristen N Stevens, Muneesh Tewari, Jin Sook Ahn, Gad Rennert, et al. 2007. “Network Modeling Links Breast Cancer Susceptibility and Centrosome Dysfunction.” Nature Genetics 39 (11) (November): 1338–1349. doi:10.1038/ng.2007.2.
Roth, Richard B., Peter Hevezi, Jerry Lee, Dorian Willhite, Sandra M. Lechner, Alan C. Foster, and Albert Zlotnik. 2006. “Gene Expression Analyses Reveal Molecular Relationships Among 20 Regions of the Human CNS.” Neurogenetics 7 (2) (March 30): 67–80. doi:10.1007/s10048-006-0032-6.
Sabatier, Renaud, Pascal Finetti, Nathalie Cervera, Eric Lambaudie, Benjamin Esterni, Emilie Mamessier, Agnès Tallet, et al. 2010. “A Gene Expression Signature Identifies Two Prognostic Subgroups of Basal Breast Cancer.” Breast Cancer Research and Treatment 126 (2) (May 21): 407–420. doi:10.1007/s10549-010-0897-9.
Schmidt, Marcus, Daniel Böhm, Christian Von Törne, Eric Steiner, Alexander Puhl, Henryk Pilch, Hans-Anton Lehr, Jan G. Hengstler, Heinz Kölbl, and Mathias Gehrmann. 2008. “The Humoral Immune System Has a Key Prognostic Impact in Node-Negative Breast Cancer.” Cancer Research 68 (13) (July 1): 5405–5413. doi:10.1158/0008-5472.CAN-07-5206.
Schuetz, Christina S., Michael Bonin, Susan E. Clare, Kay Nieselt, Karl Sotlar, Michael Walter, Tanja Fehm, et al. 2006. “Progression-Specific Genes Identified by Expression Profiling of Matched Ductal Carcinomas In Situ and Invasive Breast Tumors, Combining Laser Capture Microdissection and Oligonucleotide Microarray Analysis.” Cancer Research 66 (10) (May 15): 5278–5286. doi:10.1158/0008-5472.CAN-05-4610.
Smid, Marcel, Yixin Wang, Yi Zhang, Anieta M. Sieuwerts, Jack Yu, Jan G. M. Klijn, John A. Foekens, and John W. M. Martens. 2008. “Subtypes of Breast Cancer Show Preferential Site of Relapse.” Cancer Research 68 (9) (May 1): 3108–3114. doi:10.1158/0008-5472.CAN-07-5644.
Su, Andrew I., Tim Wiltshire, Serge Batalov, Hilmar Lapp, Keith A. Ching, David Block, Jie Zhang, et al. 2004. “A Gene Atlas of the Mouse and Human Protein-encoding Transcriptomes.” Proceedings of the National Academy of Sciences of the United States of America 101 (16) (April 20): 6062–6067. doi:10.1073/pnas.0400782101.
Taube, Joseph H., Jason I. Herschkowitz, Kakajan Komurov, Alicia Y. Zhou, Supriya Gupta, Jing Yang, Kimberly Hartwell, et al. 2010. “Core Epithelial-to-mesenchymal Transition Interactome Gene-expression Signature Is Associated with Claudin-low and Metaplastic Breast Cancer Subtypes.” Proceedings of the National Academy of Sciences of the United States of America 107 (35) (August 31): 15449–15454. doi:10.1073/pnas.1004900107.
Tavassoli, FA, and P Devilee. 2003. In World Health Organization Classification of Tumors. Pathology and Genetics of Tumors of the Breast and Female Genital Organs, 13–59. Lyon: IARC Press.
The Cancer Genome Atlas Network. 2012. “Comprehensive Molecular Portraits of Human Breast Tumours.” Nature 490 (7418) (October 4): 61–70. doi:10.1038/nature11412.
155

The ENCODE Project Consortium. 2007. “Identification and Analysis of Functional Elements in 1% of the Human Genome by the ENCODE Pilot Project.” Nature 447 (7146) (June 14): 799–816. doi:10.1038/nature05874.
Van ’t Veer, Laura J, Hongyue Dai, Marc J van de Vijver, Yudong D He, Augustinus A M Hart, Mao Mao, Hans L Peterse, et al. 2002. “Gene Expression Profiling Predicts Clinical Outcome of Breast Cancer.” Nature 415 (6871) (January 31): 530–536. doi:10.1038/415530a.
Wang, Yixin, Jan G M Klijn, Yi Zhang, Anieta M Sieuwerts, Maxime P Look, Fei Yang, Dmitri Talantov, et al. 2005. “Gene-expression Profiles to Predict Distant Metastasis of Lymph-node-negative Primary Breast Cancer.” Lancet 365 (9460) (February 19): 671–679. doi:10.1016/S0140-6736(05)17947-1.
Wang, Zhibin, Chongzhi Zang, Kairong Cui, Dustin E. Schones, Artem Barski, Weiqun Peng, and Keji Zhao. 2009. “Genome-wide Mapping of HATs and HDACs Reveals Distinct Functions in Active and Inactive Genes.” Cell 138 (5) (September 4): 1019–1031. doi:10.1016/j.cell.2009.06.049.
Whitfield, Michael L., Gavin Sherlock, Alok J. Saldanha, John I. Murray, Catherine A. Ball, Karen E. Alexander, John C. Matese, et al. 2002. “Identification of Genes Periodically Expressed in the Human Cell Cycle and Their Expression in Tumors.” Molecular Biology of the Cell 13 (6) (June): 1977–2000. doi:10.1091/mbc.02-02-0030.
Wolff, Antonio C, M Elizabeth H Hammond, Jared N Schwartz, Karen L Hagerty, D Craig Allred, Richard J Cote, Mitchell Dowsett, et al. 2007. “American Society of Clinical Oncology/College of American Pathologists Guideline Recommendations for Human Epidermal Growth Factor Receptor 2 Testing in Breast Cancer.” Journal of Clinical Oncology: Official Journal of the American Society of Clinical Oncology 25 (1) (January 1): 118–145. doi:10.1200/JCO.2006.09.2775.
Zhou, Changhua, Ashley M Nitschke, Wei Xiong, Qiang Zhang, Yan Tang, Michael Bloch, Steven Elliott, et al. 2008. “Proteomic Analysis of Tumor Necrosis Factor-α Resistant Human Breast Cancer Cells Reveals a MEK5/Erk5-mediated Epithelial-mesenchymal Transition Phenotype.” Breast Cancer Research 10 (6): R105. doi:10.1186/bcr2210.
156

Chapter 4
THE MUTATIONAL LANDSCAPE OF CHROMATIN REGULATORY FACTORS ACROSS 3000 TUMOUR
SAMPLES
In the last couple of years there has been an explosion on the generation of cancer genomics data. Large consortia have characterised thousands of tumours at different levels, including gene expression, epigenetic, CNA and mutational profiles. Particularly, the analysis on mutations has focused on few genes previously known to be involved in cancer, or on those that appeared mutated at high frequencies across a tumour sample cohort. Many large projects on cancers from different tissues have reported that CRFs play an unprecedented important role in the deregulation of pathways that leads to tumorigenesis. Seeking to determine the overall contribution of mutations in CRFs to human cancers of different origin, in this chapter I report an analysis on the mutational landscape over many of the sequenced tumours to date and on over 900 cancer cell lines. In this part, I curated the list of CRFs, performed SLEA and analyses of mutations in cell lines and contributed to the writing of the manuscript. This manuscript has just been submitted for publication.
157

The mutational landscape of chromatin regulatory factors across 3000 tumour samples
Abel Gonzalez-Perez1,*, Alba Jene-Sanz1,* and Nuria Lopez-Bigas1,2,**
1. Research Unit on Biomedical Informatics, Department of Experimental and Health Sciences, Universitat Pompeu Fabra, Dr. Aiguader 88, Barcelona, Spain
2. Institució Catalana de Recerca i Estudis Avançats (ICREA), Barcelona, Spain
* These authors contributed equally to this work
** Corresponding author
Abstract
Background
Chromatin regulatory factors (CRFs) are emerging as important genes in cancer development and are regarded as interesting candidates for novel targets for cancer treatment. However, we lack a comprehensive understanding of the role of this group of genes in different cancer types.
Results
We have analysed close to 3000 tumour samples from eleven anatomical sites to determine which CRFs are candidate drivers in these different sites. We identified 39 CRFs that are likely drivers in tumours from at least one site, all with relatively low mutational frequency. We also analysed the relative importance of mutations in CRFs for the development of tumorigenesis in each site, and in different tumour types from the same site.
Conclusions
In all, we found that although certain tumours from all 11 sites show mutations in likely driver CRFs, these are more prevalent in tumours from certain sites, like kidney. Furthermore, mutations in CRFs reveal as a rather important pathway to tumorigenesis in certain tumour types like paediatric medulloblastomas, but almost negligible in others, such as glioblastomas. Finally, we also show that mutations on two CRFs, MLL and P300, correlate with broad expression changes across cancer cell lines, thus presenting at least one mechanism through which these mutations could contribute to tumorigenesis in cells of the corresponding tissues.
158

Background
Highly conserved molecular mechanisms are responsible for maintaining genome integrity, which is essential for cell survival. Those include the fine regulation of chromatin structure, mainly maintained through three distinct processes: the post-translational modification of histone tails, the replacement of core histones by histone variants, and the direct structural remodelling by ATP-dependent Chromatin-Remodelling Enzymes [1]. The proteins that control this system, termed Chromatin Regulatory Factors (CRFs), contribute to the establishment of chromatin structures that modulate the expression of many downstream genes, either by establishing more inaccessible regions or by placing histone marks that open the chromatin and facilitate the binding of other factors. These CRFs help to maintain cellular identity, and mutations in them (often referred to as epimutations) often lead to misregulation in gene expression that may contribute to tumorigenesis [2].
CRFs are grossly classified in three main groups: histone tail modifiers (including HATs, HDACs, HMTs and HDMs, that deposit or remove acetyl or methyl groups, respectively), DNA methyltransferases (DNMTs) and putative demethylases (that affect cytosines at CpG islands), and ATP-dependent chromatin remodelling complexes (responsible for the repositioning of nucleosomes). Until recently, DNA methytransferase (DNMT) proteins had not been found to be mutated in cancer [3], but DNMT3A, and later DNMT1 and DNMT3B, were reported as altered in MDS and AML, where they also predicted prognosis [4, 5]. Mutations in ATP-dependent chromatin-remodelling complexes are recurrent, amongst others, in ovarian and clear cell renal cancers [2]. The regulation of the trimethylation of histone H3 at K27 mark (H3K27me3) by the Polycomb complex, a key component to maintain stem cell identity, is also frequently compromised in a variety of cancer types, including those in breast, bladder, pancreas, prostate and lymphomas. Histone demethylases (HDMs) have also been implicated in the development of a wide variety of tumours. Moreover, recent whole exome sequencing studies on large sample cohorts have highlighted as main findings the inactivating mutations on proteins that regulate the epigenomic state of cells [6]. Alterations in KAT6B [7], SMARCC1 [8] and NSD1 [9] have been described in uterine, cervical and skin pre-malignant lesions, respectively. This presents these proteins as potential biomarkers, which adds prevention and early cancer detection to the possible uses of CRFs in the clinic.
159

This current accumulation of evidence for the role of CRFs in cancer has attracted the attention of the scientific community towards CRFs as novel targets for cancer treatment. In 2006, the first histone deacetylase inhibitor (HDACi), Vorinostat, was approved by the FDA to treat a specific type of lymphoma, and more than 20 molecules of this type are currently under preclinical and clinical investigation [10]. Some DNMT inhibitors have been recently approved by the FDA to treat MDS, and their combination with HDACi is a subject of intense study in clinical trials [11]. There are studies that raise hopes for the possible use of HDACis to overcome drug resistance [12]. Interestingly, an in-depth review by Patel et al. on 46 potentially druggable, yet chemically unexplored proteins in the Cancer Gene Census (CGC) identified six CRFs: ATRX, KAT6A, KDM6A, NSD3, PBRM1 and SMARCA4 [13].
Even though CRFs are emerging as important genes in cancer development [14–19], to our knowledge no comprehensive systematic analysis on the misregulation of a comprehensive catalogue of CRFs in different tumours has been performed to date. Moreover, most cancer sequencing studies have focused their efforts in the in-depth characterization of specific genes that appear mutated at high frequencies, underestimating the impact of lowly-recurrent drivers (those genes which mutation is likely to be functional, but occurs in few samples) on tumorigenesis. For instance, a very recent report [20] focused only on the SWI/SNF family took into account the frequency of mutations on their members rather than their likelihood of driving tumorigenesis.
In this paper we carry out a systematic exploration of the role of CRFs in tumorigenesis in different tissues. To that end, we have first compiled and manually curated a comprehensive list of CRFs, for which we annotated any previously known implications in cancer. Secondly, we have analysed close to 3000 tumour samples from eleven anatomical sites to identify which of the CRFs are candidate drivers in these different sites employing an approach recently introduced by us [21]. Finally, we took advantage of the profiles of genomic alterations generated by the Cancer Cell Line Encyclopedia (CCLE) [22] to explore the effects of mutations in two likely driver CRFs on the expression of broad gene sets across nearly 1000 cancer cell lines.
160

Results and discussion
Likely drivers CRFs appear ubiquitously mutated across
tumours from eleven anatomical sites
In order to determine which CRFs may be involved in cancer emergence and development in primary tumours from eleven anatomical sites, we first collected and manually curated a list of CRFs from the literature. This primary list contained 183 proteins grouped into eleven major functional classes, the most populated of which are the Histone Deacetylases (HDACs), the Histone Acetyltransferases (HATs) and the Histone Methyltransferases. (The detailed list of CRFs in all functional classes is presented in Table S1.) Only 26 of them are included in the Cancer Gene Census. However, sifting carefully through the literature we found that many of these CRFs (115 out of 183) have some evidence, mainly in scattered reports from the past two years, of genomic alteration or misregulation in tumours (see Table 1 and Table S2).
In IntOGen, during the past year, we have collected and analysed datasets of cancer somatic mutations produced by different research groups across the world. Some of them have been generated within the framework of large international initiatives like The Cancer Gene Atlas [23] and the International Cancer Genomes Consortium [24], while others are the fruit of independent laboratories. Taken together, these datasets (26) contain the somatic mutations detected in almost 3000 primary tumour samples obtained from eleven different anatomical sites (see Table 2 for details). Each dataset has been analysed separately, to compensate for differences between tumour histologies and subtypes, and between sequencing analysis pipelines. We used an approach recently developed by us [21] to detect genes that, across the cohort of tumour samples, tend to accumulate functional mutations. We give the name “FM bias” to this significant trend towards the accumulation of functional mutations. The FM bias is a sign of positive selection during cancer development and therefore FM biased genes are likely candidates to drivers. We have also combined the P values of FM bias of individual genes across the datasets of tumour samples obtained from the same anatomical site. With this approach, we have obtained a measurement of FM bias for each mutated gene at the level of one dataset of tumour samples (or project), and also at the level of each anatomical site (or tissue).
This catalogue of likely driver genes has allowed us, for the first time, to
161

systematically explore the involvement of epigenetic mechanisms (via mutations in CRFs) in tumorigenesis in almost 3000 tumour samples from eleven anatomical sites. After an exhaustive search within the list of all likely driver genes, we found that 39 CRFs from our manually curated list are FM biased in at least one site. The mutational frequency of these 39 FM biased CRFs is in general low across all sites (Figure 1), which suggests that, as a rule, they are implicated in tumorigenesis in a relatively small number of patients. Only few exceptions show mutational frequencies above 10% in at least one site: ARID1A, MLL2, KAT8, SETD2, PBRM1, NSD1 and ARID4A.
Figure 2A illustrates the MutationAssessor [25] Functional Impact scores (FIS) of the mutations that are included within the FM bias calculation (synonymous, non-synonymous, stop and frameshift causing indels) in these genes in all the tumour samples with at least on mutated CRF. The accumulation of high-scoring mutations (red-shifted) in genes like PBRM1 or KDM5C (kidney) and NCOR1 (breast) in tumour samples from specific sites account for their driverness specificity in these tumours. On the other hand, spread high-scoring mutations in, for instance, MLL3, explains why it is identified as a likely driver in five tissues (Figure 2C). Figure 2B, on the other hand, summarizes the frequency of PAMs sustained by these genes across all tumour samples.
The repertoire of likely driver CRFs per site appears on Figure 2C. Eight of them are likely drivers in tumour samples from at least two sites. The most salient conclusion that can be extracted from this repertoire of mutations is that mutations to proteins that participate in the general mechanisms of chromatin maintenance are ubiquitously associated to tumorigenesis in all cancer sites studied, probably via a contribution to overall genomic instability [26].
A concurrent observation was made by a very recent analysis [20], which found recurrent mutations in SWI/SNF proteins across more than 650 tumour samples of 10 anatomical sites. Here, we have widened this landscape to 183 CRFs and almost 3000 tumour samples. Furthermore, by using the FM bias analysis rather than the count of mutations, we have focused on the most likely driver CRFs.
Three CRFs that appear as likely drivers in more than one site (CHD3, KDM3A and KAT8) are not annotated in the Cancer Gene Census [27] and constitute, therefore, interesting candidates for novel epigenetic drivers (Figure 2C). Many of these genes are also frequently mutated –an accumulation that may be attributed in most of them to germ line variants– across the cancer cell lines
162
sequenced by the CCLE initiative [22] (see Figure S1). Interestingly, CHD3 appears significantly FM-biased in stomach cancer, and was found to be mutated in gastric tumours with high microsatellite instability [28].
The importance for tumorigenesis of mutations in CRFs
strongly depends on the anatomical site and the tumour
type
From the data in IntOGen, we computed the number of likely driver genes in general, and likely driver CRFs in particular, that bear potentially protein sequence affecting mutations, or PAMs (non-synonymous, stop, frameshift causing indels and splice-site mutations) in each of nearly 3000 tumour samples. The simplest way of representing the relative importance of the mutation of CRFs in tumorigenesis in the different sites consists in counting the number of samples with at least one FM biased CRF bearing a PAM (Figure 3A). In this metric, kidney tumours stand out, with more than 60% of the samples with at least one mutated CRF, whereas, on the opposite extreme, brain and haematopoietic tumours contain less than 10% of the samples with mutated FM biased CRFs. We then computed the fraction of CRFs with PAMs with respect to all FM biased genes with PAMs in each sample (CF ratio) (Figure 3B). This measure gives an indication of the relative importance of CRFs in the tumorigenesis process in each sample.
This result can be visualized at sample-depth in Figure S2. While, as observed, a large fraction of kidney tumour samples have mutated CRFs, most of them present a low CF ratio (light gray or white in the colour annotation bar on top of the heatmap), probably implying that various mechanisms cooperate towards tumorigenesis in these cells. Brain or lung tumours with mutated CRFs, on the other hand, are rather scarce (see Figure 3A), but the mutation of CRFs appears to be very important for tumorigenesis in these patients (as shown in the corresponding boxplots of Figure 3B). A closer look at the repertoire of mutated drivers in the samples of the three brain tumour datasets currently in IntOGen reveals that these samples with high CF ratio (black shifted in the colour annotation bar on top of the heatmap) correspond almost exclusively to Paediatric medulloblastomas (Figure 4). Conversely, the samples of the other two datasets (glioblastomas) exhibit a repertoire of mutated “classical” tumour suppressors and oncogenes. These differences probably highlight two diverse pathways towards tumorigenesis: the first, more frequent in medulloblastomas, probably relies heavily on genomic instability, whereas the second occurs
163

through a combination of the classical hallmarks of sustained proliferation and resistance to cell death. Actually, the classification of Medulloblastomas has been recently standardised in four main subtypes; two are well-characterized, have a mostly adult presentation and good or medium prognosis, while the remaining (termed groups 3 and 4) are mostly paediatric, with poorer outcome, high chromosomal instability (CIN), and unknown genomic causative factors [29, 30]. In the light of this knowledge, our observations suggest that mutations in CRFs could be implicated in the mechanisms of CIN in at least some medulloblastoma samples.
Taken together, our results suggest that CRFs mutations, which may affect chromatin maintenance, and probably contribute to overall genomic instability, are indeed a ubiquitous phenomenon across tumours from different tumour types. Nevertheless, they appear to be circumscribed to a relatively small number of tumour samples, although future reviews of the catalogues of CRFs may increase the proportions calculated here. Therefore, with some exceptions, this genomic instability seems to be one amongst a set of well-known tumorigenic mechanisms, rather than the unique causative factor.
CRFs mutations correlate with transcriptomic alterations
of gene modules in cancer cell lines
The Cancer Cell Line Encyclopedia project has sequenced 1,651 protein-coding genes, of which 43 are CRFs according to our curated list (see Table S1 for a detailed classification). We used this data to further explore the possible effects of CRFs mutations on comprehensive transcriptomic changes as a step in their contribution to tumorigenesis. A SLEA over cancer cell lines using GOBP terms altered in specific cancer tissues captured the primary site-specific transcriptional characteristics typical of each tumour (see Figure S3). Gene expression patterns in cancer cell lines, thus, are similar to the primary cancer cells from which they were derived.
We then functionally assessed the transcriptional impact of PAMs on EP300 and MLL3 (the only CRFs sustaining PAMs in sufficient cell lines: 115 and 191, respectively) to further determine whether the impact of this PAMs on epigenetic regulation translated into broad transcriptomic changes. The underlying hypothesis was that genes whose transcription was modulated by specific histone marks that became affected by PAMs on these two genes would present expression changes detectable when analysed as a group. To this end, we
164

collected regulatory modules of histone modifications in three cell types (see Table S3) and ran SLEA separately on cell lines originated from blood and solid tissues (Figure 5). In general, both EP300 and MLL3, when mutated (see Table 1), were associated to a lower expression of repressed chromatin gene modules (H3K27me3 and late replication timing) and to an enrichment in active genes (marked by H3K4me3 and H3K9ac). H3K27me3 module under-expression, regulated by Polycomb, has been associated to a stem cell-like signature and more aggressive tumours [31]. Moreover, cell lines with a mutation in MLL3 had a higher expression of cell cycle related modules. In samples derived from haematological cancers the mutational status of CRFs did not determine a bias in expression, probably due to the global gene over-expression in acute lymphoblastic B and T leukaemias compared to the rest, which masked other transcriptomic changes. Considering this evidence, there seems to be a spectrum on protein functional impact in mutations found in CRFs, and some cancer cell lines accumulate them in comparison to all other mutations. This may indicate that epigenomic regulation is more determinant of oncogenesis in some specific tumours, and also highlights the differences across cancer cell lines derived from the same tissue.
Conclusions
In this paper we present the first systematic approach to characterise the repertoire of CRFs that could constitute mutational cancer drivers in tumours from eleven anatomical sites. We have found that likely driver CRFs appear ubiquitously across tumour samples from these 11 sites, although the number of affected samples is in general low, except in the case of kidney tumours. Mutations on CRFs appear to be in general only one of several contributing mechanisms towards tumorigenesis in most cancer samples, although in some cases they appear to drive cancer emergence through genomic instability without significant intervention of many other hallmarks. Finally, we have proved that mutations on two CRFs correlate with broad expression changes across cancer cell lines, thus presenting at least one mechanism through which these mutations could contribute to tumorigenesis in cells of the corresponding tissues. We think that our results and those of similar systematic analysis on the alterations undergone by CRFs will help us to better understand the mechanisms of tumour emergence. They may also, in the long run, aid in the stratification of patients' tumours. Also, the analysis of mutated CRFs in cancer cell lines constitutes a first step to understand tumour’s sensitivity or resistance to particular drugs, thus
165

helping to draw personalised treatments.
All the results presented here are available for browsing at IntOGen (http://beta.intogen.org) and IntOGen-CL [32].
Materials and methods
Chromatin Regulatory Factors (CRFs)
We manually compiled a list of 183 genes coding for CRF proteins from the literature, based on protein function and known essential association to complexes important for the regulation of chromatin structure. A detailed classification of these CRFs is shown in Table S1. The relevant proteins for the purpose of this analysis are described in Table 1 and Table S2.
FM biased genes in primary tumours
FM biased genes exhibit a bias towards the accumulation of functional mutations across a cohort of tumour samples and are therefore candidate cancer drivers. We have compiled twenty-six datasets of tumours from eleven anatomical sites (see Table 2) and detected the FM biased genes in each of them with the approach described in [21]. Finally, we have combined the gene-wise P values obtained for datasets of the same anatomical site, to obtain a single P value that measured the bias of the gene towards the accumulation of functional mutations in different tumours from the same site. The corrected genes FM bias P values in these eleven tissues are stored in the IntOGen knowledge base [33]. The dataset collection of tumour somatic mutations, their processing and the results storage in IntOGen are thoroughly described in a manuscript currently in preparation. Details of the 26 tumour somatic mutations datasets are presented in Table 2.
We downloaded the data employed in the analyses of FM biased genes that are described in the Results and Discussion section from IntOGen. This includes a) the corrected P values of all genes that were FM biased in at least one of the eleven anatomical sites, and b) the list of potentially protein-sequence affecting mutations (PAMs) detected in these genes. We defined PAMs as mutations predicted as stop, frameshift indels, non-synonymous and splice site mutations.
Cancer cell lines data processing
Expression arrays from the CCLE were downloaded from the Gene Expression Omnibus (GEO, id GSE36133) as raw CEL files, and pre-processed
166

it as previously described [34]. The input data for enrichment analysis was obtained by median centring the expression value of each gene across cancer cell lines and dividing this value by the standard deviation. The obtained value is the measure of expression level for the gene in a sample as compared to its expression level in all other samples in the dataset. We built separate expression matrices for cancer cell lines obtained from haematological system or solid primary cells, since the expression profiles of these two groups were shown to clearly differ in the original publication [22].
Sample Level Enrichment Analysis (SLEA) was performed using Gitools version 1.6.0 [35]. We used z-score method as described previously [36]. This method compares the mean (or median) expression value of genes in each module to a distribution of mean (or median) of 10,000 random modules of the same size. Such enrichment analysis is run for each sample and the result is a z-score, which is a measure of the difference between the observed and expected mean (or median) expression values for genes in a module. We applied the mean z-score enrichment values, which are the arithmetic means of z-scores for individual samples, separately in cell lines obtained from haematological system or in those obtained from solid primary cells. To test for significant differences between the z-score means between groups of cell lines we used the Mann-Whitney test [37] implemented in Gitools. All heat-maps were generated with Gitools.
To detect potentially protein-sequence affecting mutations in genes within the list of CRFs (see Table S1), we downloaded processed mutations data (single nucleotide variants, SNVs and small indels) for 1651 protein-coding genes (7th May, 2012 version, excluding common polymorphisms and SNVs with an allelic fraction > 10%) from the CCLE website [38]. We computed the consequence types of these variants using the Ensembl (v69) Variant Effect Predictor (VEP) wrapped within the IntOGenSM pipeline (manuscript in preparation).
The consequence type of all analysed variants in cancer cell lines can be browsed through the IntOGen-CL website [32].
Public gene regulation datasets
We collected lists of genes occupied by a specific histone mark or bound by a regulatory factor, and computationally predicted chromatin states, from available sources (see Table S3). These include human genome-wide occupancy
167

datasets from ChIP-seq experiments in several cell types [39–43] that we processed using Bowtie [44] (version 0.12.5, hg19 genome assembly, unique alignments, allowing 2 mismatches) for short read aligning. For peak detection of transcription factors we used MACS [45] (version 1.4.1, settings: --nomodel and --bw parameter set to twice the shift size whenever a control IP was not available). For broad histone modifications (i.e. H3K27me3), we used SICER [46] (version 1.1, setting gap size to 600). Regions were assigned to protein coding genes (Ensembl v69) if they overlapped either to the gene body or up to 5 kb upstream from the TSS, using BedTools [47]. Overall peak calling performance was evaluated with CEAS [48].
Other gene sets were obtained from KEGG[49] and Gene Ontology (GO)[50]. The list and mappings (in Ensembl v67 IDs) of KEGG and Gene Ontology (GO) Biological Process terms were downloaded through the Gitools importer[35].
Competing interests
The authors have declared that no conflict of interest exists.
Author's contributions
AJ-S curated the list of CRFs and performed SLEA and analyses of mutations in cell lines. AGP analysed mutation data in 3000 primary tumours and identified FM biased genes in different tissues. NLB supervised the study. The three authors contributed to drafting and editing the manuscript.
Acknowledgements
We acknowledge funding from the Spanish Ministry of Economy and Competitivity (grant number SAF2009-06954 and SAF2012-36199) and the Spanish National Institute of Bioinformatics (INB). Alba Jene-Sanz is supported by an FPI fellowship.
168

Tables
Table 1. Described oncogenic alterations in Chromatin Regulatory Factors FM-biased in at least one tissue. This is an exhaustive compilation of alterations(*) reported in CRFs showing FM bias in at least one tissue (see Figure 2B). Gene names correspond to HUGO HGNC approved symbols. In bold typeface, genes included in the Cancer Gene Census (CGC) [27]. Genes not previously reported to be altered in cancer are marked with an asterisk (*). ALL: Acute Lymphocytic Leukaemia; AML: Acute Myeloid Leukaemia; B-NHL: B-cell non-Hodgkin Lymphoma; CLL: Chronic Lymphocytic Leukaemia; ccOC: Clear Cell Ovarian Carcinoma; ccRCC: clear-cell Renal Cell Carcinoma; CMML: Chronic Myelomonocytic leukemia; CRPC: Castration-Resistant Prostate Cancer; ESCC: Esophageal Squamous Cell Carcinoma; HCC: Hepatocellular Carcinoma; HL: Hodgkin Lymphoma; MCL: Mantle cell Lymphoma; MDS: Myelodysplastic Syndrome; MSI: Microsatellite instability; MPN: Myeloproliferative Neoplasm; MRC-AML: AML with Myelodysplasia-related changes; NMSC: Non-Melanoma Skin Cancer; NSCLC: Non-Small Cell Lung Carcinoma; OSCC: Oral Squamous Cell Carcinoma; PCLBCL: Primary Cutaneous Large B-Cell Lymphoma; PCNSL: Primary Central Nervous System Lymphomas; RCC: Renal Cell Carcinoma.
*Evidence based solely on cancer cell lines is excluded from this table. Only evidence in human samples have been used. Effects of pharmacological inhibition are not included. Germline polymorphisms are also excluded.
Gene Literature evidence
MLL3 Mutated in medulloblastoma (CGC), HCC [51], bladder [52], prostate cancer [53], colorectal cancer [54], gastric adenocarcinoma [55], NSCLC [56], breast cancer [57] and pancreatic cancer [58].Deleted in leukemia [59].
PBRM1 Mutated in ccRCC, breast (CGC) and pancreatic cancer [60].
MLL2 Mutated in medulloblastoma, bladder [52], renal cancer (CGC), DLBCL [61].Over-expressed in breast and colon tumours [62].
ARID1A Mutated in ccOC and RCC (CGC), bladder [52], HCC [51], endometrium [63], colorectal [64], gastric adenocarcinoma [55], pancreatic cancer [58], lung adenocarcinoma [65], Burkitt lymphoma [66] and aggressive neuroblastoma [67].Down-regulated in aggressive breast cancer [68],
SETD2 Mutated in ccRCC (CGC).Down-regulated in breast tumours [69].
SMARCA4 Mutated in NSCLC (CGC), lung adenocarcinoma [65], medulloblastoma [70] and Burkitt lymphoma [66].Over-expressed in glioma [71] and in melanoma progression [72].Gained in lung [73].
NCOR1 Mutated in breast [74] and bladder cancer [52].Down-regulated in aggressive breast tumours [75].
CHD4 Mutated in high MSI gastric and colorectal cancers [28].
169

Down-regulated in gastric and colorectal cancers [28].
KDM5C Mutated in ccRCC (CGC).
EP300 Mutated in colorectal, breast and pancreatic cancers, ALL, AML, DLBCL (CGC), bladder [52], SCLC [76] and endometrium [63].Up-regulated in esophageal squamous cell carcinoma [77] and advanced HCC [78].LOH in glioblastoma [79].
MLL Mutated in AML, ALL (CGC), bladder [52], SCLC [76], HCC [51] and gastric tumours [55].
ARID1B Mutated in breast tumours [74].
TET1 Mutated in T-ALL [80].Down-regulated in prostate and breast tumours [81].
BAP1 Mutated in uveal melanoma, breast, NSCLC and RCC (CGC).Over-expressed in NSCLC with good prognosis [82].
NSD1 Mutated in AML (CGC) and NMSC [9].Gained in lung adenocarcinoma of never-smokers [83].
EP400* -
ASXL1 Mutated in MDS and CMML (CGC), MPN [84], MRC-AML [85] and CRPC [86].
ARID4A* -
INO80* -
CHD3 Mutated in high MSI gastric and colorectal cancers [28].
KDM6A Mutated in kidney, oesophageal SCC, MM (CGC), lung cancer [73], medulloblastoma [70], ccRCC [87], bladder [52] and prostate [53].Over-expressed in breast tumours with poor prognosis [88].Deleted in lung cancer [89].
KDM3A Over-expressed in prostate cancer [90] and RCC [91].
CHD1 Mutated in high MSI gastric and colorectal cancers [28].Deleted in prostate cancer [92].
TBL1XR1 Over-expressed in SCC [93].Deleted in ALL [94] and PCNSL [95].
SMYD1* -
HNF1A Mutated in neuroendocrine tumours [96], endometrial cancer [97], high MSI CRC [98] and hepatocellular adenoma [99].Down-regulated in aggressive HCC [100].
KAT8 Down-regulated in breast carcinoma and medulloblastoma [101].
KDM6B Over-expressed in HL [102].
ACTL6A* -
DPF3* -
ING4 Down-regulated in HNSCC [103], melanoma [104], gastric adenocarcinoma [105], lung tumours [106] and colorectal cancer [107].Deleted in HNSCC [103] and breast tumours [108].
MUM1 Over-expressed in aggressive PCLBCL [109] and CLL [110], DLBCL and HL [111].
SUV39H2* -
170

SMARCD1 Mutated in breast tumours [74].
RTF1* -
SMARCC1 Over-expressed in prostate cancer [112] and precancerous cervical lesions [8].High expression correlates with good prognosis in colorectal cancer [113].
IKZF1 Mutated in ALL, DLBCL (CGC).Deleted in aggressive paediatric B-ALL [114].
CBX3 Over-expressed in osteosarcoma [115], myxoid liposarcoma, colon, breast, esophageal, cervical, and lung tumours [116].
SIRT6 Down-regulated in pancreas and colorectal cancer [117].Deleted in colorectal cancer [117].
Table 2: Description of the datasets of tumour somatic mutations that we have collected and analysed to detect FM biased genes. The results of all the analyses may be browsed and retrieved through IntOGen.
Site Project name Institution Obtained from Pubmed Type of study Tumour
samples
brain
GBM (TCGA) TCGA TCGA Data Portal [23] Selected Genes 144
316GBM (JHU) Johns Hopkins University ICGC DCC [118] Protein-coding
genes 89
BRTM (DKFZ) DKFZ ICGC DCC [119,
120]Exome sequencing 113
breast
BRCA (JHU) Johns Hopkins University ICGC DCC [121] RefSeq genes 42
896
BRCA (WTSI) Welcome Trust/ Sanger Institute ICGC DCC [74] Protein-coding
genes 100
BRCA (BC)University of British Columbia
Supplementary Material [122] Genome/Exome
sequencing 65
BRCA (TCGA) TCGA Firehose [123] Exome
sequencing 510
BRCA (BROAD)
BROAD Institute
Supplementary Material [124] Exome
sequencing 103
BRCA (WU) Washington University
Supplementary Material [57] Genome/Exome
sequencing 76
colo-rectal
CLR (JHU) Johns Hopkins University ICGC DCC [121] RefSeq genes 35
161CLR (TCGA) TCGA Firehose [64] Exome
sequencing 126
hemato-poietic
CLL (MICINN)
Spanish Ministry of Science
ICGC DCC [125, 126]
Genome/Exome sequencing 109
199
CLL (DF) Dana Farber Cancer Institute
Supplementary Material [127] Genome/Exome
sequencing 90
kidney KIRC (TCGA) TCGA Firehose
tcga-data.nci.nih.gov
- 299
liver LICA (INCA) IACR ICGC DCC [128] Exome sequencing 24
lung LUCA (TSP) Washington University
ICGC DCC [129] Selected genes 160 438
171
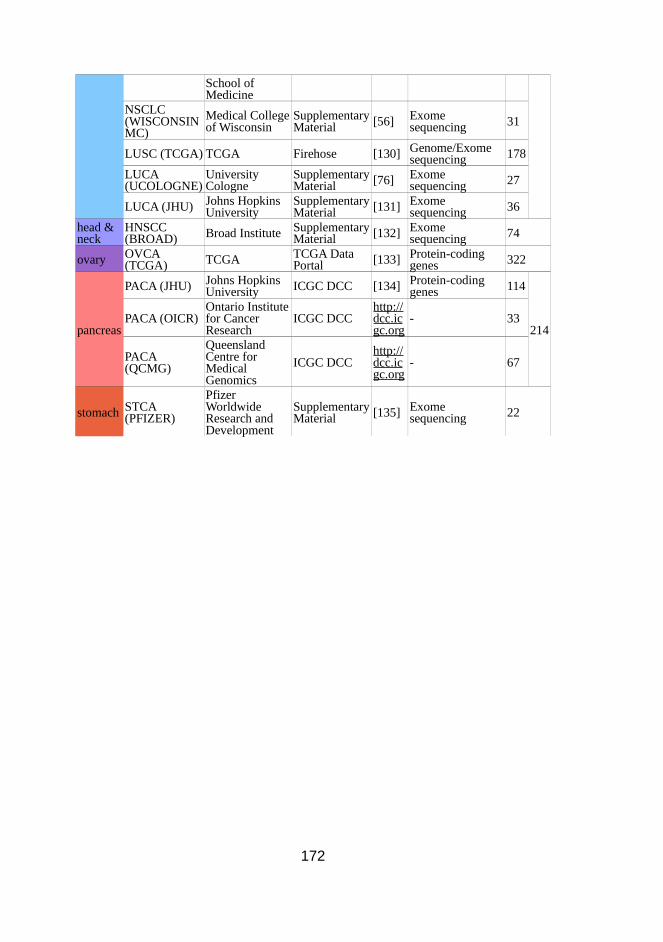
School of Medicine
NSCLC (WISCONSINMC)
Medical College of Wisconsin
Supplementary Material [56] Exome
sequencing 31
LUSC (TCGA) TCGA Firehose [130] Genome/Exome sequencing 178
LUCA (UCOLOGNE)
University Cologne
Supplementary Material [76] Exome
sequencing 27
LUCA (JHU) Johns Hopkins University
Supplementary Material [131] Exome
sequencing 36
head & neck
HNSCC (BROAD) Broad Institute Supplementary
Material [132] Exome sequencing 74
ovary OVCA (TCGA) TCGA TCGA Data
Portal [133] Protein-coding genes 322
pancreas
PACA (JHU) Johns Hopkins University ICGC DCC [134] Protein-coding
genes 114
214PACA (OICR)
Ontario Institute for Cancer Research
ICGC DCChttp://dcc.icgc.org
- 33
PACA (QCMG)
Queensland Centre for Medical Genomics
ICGC DCChttp://dcc.icgc.org
- 67
stomach STCA (PFIZER)
Pfizer Worldwide Research and Development
Supplementary Material [135] Exome
sequencing 22
172

Figures
Figure 1. Frequency of somatic mutations in FM biased CRFs across eleven anatomical sites in IntOGen. Genes are sorted according to their frequency of mutations across all the analysed tumours.
173

Figure 2. Mutational state of tumour samples in CRFs across the eleven anatomical sites studied. A. The list of genes in the heatmap corresponds to all FM biased CRFs detected at the beginning of the study. Each cell in the heatmap represents a CRF in a tumour sample; grey cells indicate that the CRF is not mutated. Colours indicate mutations with its MutationAssessor Functional Impact score (MA FIS), colour-coded following the scale at the bottom. In bold typeface, genes annotated in the Cancer Gene Census (CGC). Genes not detected previously to be altered in cancer are marked with an asterisk (*). B. Frequency of mutations (PAM) for each gene across all tumour samples. (Note that since MA FIS can only be assigned to some PAMs, the mutational frequencies presented in this histogram do not correspond exactly with the number of mutations in genes in the heatmap in panel A.) C. FM bias of CRFs in eleven anatomical sites. The cells represent the corresponding P values.
174

Figure 3. Comparison of the fraction of mutated CRFs in tumour samples from eleven anatomical sites. A. Histograms of the fraction of samples with 0 (red) or one or more (green) FM biased CRFs in each site. B. CF ratio of samples from each site with at least one mutation in a CRF (green fraction in panel A).
175

Figure 4. Mutational state of tumour samples from the three brain datasets included in IntOGen. The genes represented in the heatmap comprise all FM-biased CRFs that bear one mutation in at least one brain tumour sample (in bold typeface) plus the top 15 FM biased genes in brain obtained from IntOGen.
176
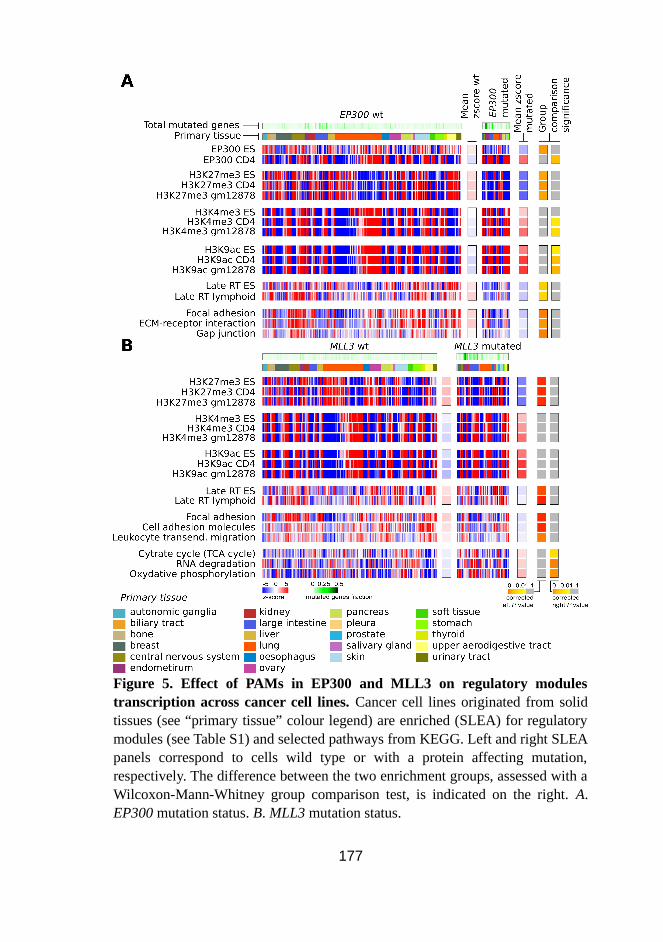
Figure 5. Effect of PAMs in EP300 and MLL3 on regulatory modules transcription across cancer cell lines. Cancer cell lines originated from solid tissues (see “primary tissue” colour legend) are enriched (SLEA) for regulatory modules (see Table S1) and selected pathways from KEGG. Left and right SLEA panels correspond to cells wild type or with a protein affecting mutation, respectively. The difference between the two enrichment groups, assessed with a Wilcoxon-Mann-Whitney group comparison test, is indicated on the right. A. EP300 mutation status. B. MLL3 mutation status.
177

References
1. Papamichos-Chronakis M, Peterson CL: Chromatin and the genome integrity network. Nature Reviews Genetics 2013, 14:62–75.
2. Elsässer SJ, Allis CD, Lewis PW: New Epigenetic Drivers of Cancers. Science 2011, 331:1145–1146.
3. Bestor TH: Unanswered Questions about the Role of Promoter Methylation in Carcinogenesis. Annals of the New York Academy of Sciences 2003, 983:22–27.
4. Yan X-J, Xu J, Gu Z-H, Pan C-M, Lu G, Shen Y, Shi J-Y, Zhu Y-M, Tang L, Zhang X-W, Liang W-X, Mi J-Q, Song H-D, Li K-Q, Chen Z, Chen S-J: Exome sequencing identifies somatic mutations of DNA methyltransferase gene DNMT3A in acute monocytic leukemia. Nature Genetics 2011, 43:309–315.
5. Walter MJ, Ding L, Shen D, Shao J, Grillot M, McLellan M, Fulton R, Schmidt H, Kalicki-Veizer J, O’Laughlin M, Kandoth C, Baty J, Westervelt P, DiPersio JF, Mardis ER, Wilson RK, Ley TJ, Graubert TA: Recurrent DNMT3A mutations in patients with myelodysplastic syndromes. Leukemia 2011, 25:1153–1158.
6. You JS, Jones PA: Cancer Genetics and Epigenetics: Two Sides of the Same Coin? Cancer Cell 2012, 22:9–20.
7. Moore SDP, Herrick SR, Ince TA, Kleinman MS, Cin PD, Morton CC, Quade BJ: Uterine Leiomyomata with t(10;17) Disrupt the Histone Acetyltransferase MORF. Cancer Res 2004, 64:5570–5577.
8. Shadeo A, Chari R, Lonergan KM, Pusic A, Miller D, Ehlen T, Van Niekerk D, Matisic J, Richards-Kortum R, Follen M, Guillaud M, Lam WL, MacAulay C: Up regulation in gene expression of chromatin remodelling factors in cervical intraepithelial neoplasia. BMC Genomics 2008, 9:64.
9. Quintana RM, Dupuy AJ, Bravo A, Casanova ML, Alameda JP, Page A, Sánchez-Viera M, Ramírez A, Navarro M: A Transposon-Based Analysis of Gene Mutations Related to Skin Cancer Development. Journal of Investigative Dermatology 2013, 133:239–248.
10. Giannini G, Cabri W, Fattorusso C, Rodriquez M: Histone deacetylase inhibitors in the treatment of cancer: overview and perspectives. Future Med Chem 2012, 4:1439–1460.
11. Baylin SB, Jones PA: A decade of exploring the cancer epigenome — biological and translational implications. Nature Reviews Cancer 2011, 11:726–734.
12. Sharma SV, Haber DA, Settleman J: Cell line-based platforms to evaluate the therapeutic efficacy of candidate anticancer agents. Nature Reviews Cancer 2010, 10:241–253.
13. Patel MN, Halling-Brown MD, Tym JE, Workman P, Al-Lazikani B: Objective assessment of cancer genes for drug discovery. Nature Reviews Drug Discovery 2013, 12:35–50.
14. Ley TJ, Ding L, Walter MJ, McLellan MD, Lamprecht T, Larson DE, Kandoth C, Payton JE, Baty J, Welch J, Harris CC, Lichti CF, Townsend RR, Fulton RS, Dooling DJ, Koboldt DC, Schmidt H, Zhang Q, Osborne JR, Lin L, O’Laughlin M, McMichael JF, Delehaunty KD, McGrath SD, Fulton LA, Magrini VJ, Vickery TL, Hundal J, Cook LL, Conyers JJ, Swift GW, Reed JP, Alldredge PA, Wylie T, Walker
178

J, Kalicki J, Watson MA, Heath S, Shannon WD, Varghese N, Nagarajan R, Westervelt P, Tomasson MH, Link DC, Graubert TA, DiPersio JF, Mardis ER, Wilson RK: DNMT3A Mutations in Acute Myeloid Leukemia. New England Journal of Medicine 2010, 363:2424–2433.
15. Yamashita Y, Yuan J, Suetake I, Suzuki H, Ishikawa Y, Choi YL, Ueno T, Soda M, Hamada T, Haruta H, Takada S, Miyazaki Y, Kiyoi H, Ito E, Naoe T, Tomonaga M, Toyota M, Tajima S, Iwama A, Mano H: Array-based genomic resequencing of human leukemia. Oncogene 2010, 29:3723–3731.
16. Uno K, Takita J, Yokomori K, Tanaka Y, Ohta S, Shimada H, Gilles FH, Sugita K, Abe S, Sako M, Hashizume K, Hayashi Y: Aberrations of the hSNF5/INI1 gene are restricted to malignant rhabdoid tumors or atypical teratoid/rhabdoid tumors in pediatric solid tumors. Genes, Chromosomes and Cancer 2002, 34:33–41.
17. Jiao Y, Shi C, Edil BH, Wilde RF de, Klimstra DS, Maitra A, Schulick RD, Tang LH, Wolfgang CL, Choti MA, Velculescu VE, Diaz LA, Vogelstein B, Kinzler KW, Hruban RH, Papadopoulos N: DAXX/ATRX, MEN1, and mTOR Pathway Genes Are Frequently Altered in Pancreatic Neuroendocrine Tumors. Science 2011, 331:1199–1203.
18. Banine F, Bartlett C, Gunawardena R, Muchardt C, Yaniv M, Knudsen ES, Weissman BE, Sherman LS: SWI/SNF Chromatin-Remodeling Factors Induce Changes in DNA Methylation to Promote Transcriptional Activation. Cancer Res 2005, 65:3542–3547.
19. Jones S, Wang T-L, Shih I-M, Mao T-L, Nakayama K, Roden R, Glas R, Slamon D, Diaz LA, Vogelstein B, Kinzler KW, Velculescu VE, Papadopoulos N: Frequent Mutations of Chromatin Remodeling Gene ARID1A in Ovarian Clear Cell Carcinoma. Science 2010, 330:228–231.
20. Shain AH, Pollack JR: The Spectrum of SWI/SNF Mutations, Ubiquitous in Human Cancers. PLoS ONE 2013, 8:e55119.
21. Gonzalez-Perez A, Lopez-Bigas N: Functional impact bias reveals cancer drivers. Nucl. Acids Res. 2012, 40:e169–e169.
22. Barretina J, Caponigro G, Stransky N, Venkatesan K, Margolin AA, Kim S, Wilson CJ, Lehár J, Kryukov GV, Sonkin D, Reddy A, Liu M, Murray L, Berger MF, Monahan JE, Morais P, Meltzer J, Korejwa A, Jané-Valbuena J, Mapa FA, Thibault J, Bric-Furlong E, Raman P, Shipway A, Engels IH, Cheng J, Yu GK, Yu J, Aspesi P, Silva M de, Jagtap K, Jones MD, Wang L, Hatton C, Palescandolo E, Gupta S, Mahan S, Sougnez C, Onofrio RC, Liefeld T, MacConaill L, Winckler W, Reich M, Li N, Mesirov JP, Gabriel SB, Getz G, Ardlie K, Chan V, Myer VE, Weber BL, Porter J, Warmuth M, Finan P, Harris JL, Meyerson M, Golub TR, Morrissey MP, Sellers WR, Schlegel R, Garraway LA: The Cancer Cell Line Encyclopedia enables predictive modelling of anticancer drug sensitivity. Nature 2012, 483:603–307.
23. McLendon R, Friedman A, Bigner D, et al.: Comprehensive genomic characterization defines human glioblastoma genes and core pathways. Nature 2008, 455:1061–1068.
24. Hudson TJ, Anderson W, Aretz A, et al.: International network of cancer genome projects. Nature 2010, 464:993–998.
179

25. Reva B, Antipin Y, Sander C: Predicting the functional impact of protein mutations: application to cancer genomics. Nucl. Acids Res. 2011, 39:e118–e118.
26. Hanahan D, Weinberg R: Hallmarks of Cancer: The Next Generation. Cell 2011, 144:646–674.
27. Futreal PA, Coin L, Marshall M, Down T, Hubbard T, Wooster R, Rahman N, Stratton MR: A census of human cancer genes. Nat Rev Cancer 2004, 4:177–183.
28. Kim MS, Chung NG, Kang MR, Yoo NJ, Lee SH: Genetic and expressional alterations of CHD genes in gastric and colorectal cancers. Histopathology 2011, 58:660–668.
29. Taylor MD, Northcott PA, Korshunov A, Remke M, Cho Y-J, Clifford SC, Eberhart CG, Parsons DW, Rutkowski S, Gajjar A, Ellison DW, Lichter P, Gilbertson RJ, Pomeroy SL, Kool M, Pfister SM: Molecular subgroups of medulloblastoma: the current consensus. Acta Neuropathol 2012, 123:465–472.
30. Kool M, Korshunov A, Remke M, Jones DTW, Schlanstein M, Northcott PA, Cho Y-J, Koster J, Schouten-van Meeteren A, Van Vuurden D, Clifford SC, Pietsch T, Von Bueren AO, Rutkowski S, McCabe M, Collins VP, Bäcklund ML, Haberler C, Bourdeaut F, Delattre O, Doz F, Ellison DW, Gilbertson RJ, Pomeroy SL, Taylor MD, Lichter P, Pfister SM: Molecular subgroups of medulloblastoma: an international meta-analysis of transcriptome, genetic aberrations, and clinical data of WNT, SHH, Group 3, and Group 4 medulloblastomas. Acta Neuropathol. 2012, 123:473–484.
31. Ben-Porath I, Thomson MW, Carey VJ, Ge R, Bell GW, Regev A, Weinberg RA: An embryonic stem cell-like gene expression signature in poorly differentiated aggressive human tumors. Nat Genet 2008, 40:499–507.
32. IntOGen - Cell Lines [http://beta.intogen.org/web/cell-lines].
33. Gundem G, Perez-Llamas C, Jene-Sanz A, Kedzierska A, Islam A, Deu-Pons J, Furney S, Lopez-Bigas N: IntOGen: Integration and data-mining of multidimensional oncogenomic data. Nat Meth 2010.
34. Gundem G, Lopez-Bigas N: Sample level enrichment analysis unravels shared stress phenotypes among multiple cancer types. Genome Medicine 2012, 4:28.
35. Perez-Llamas C, Lopez-Bigas N: Gitools: analysis and visualisation of genomic data using interactive heat-maps. PLoS ONE 2011.
36. Lopez-Bigas N, De S, Teichmann SA: Functional protein divergence in the evolution of Homo sapiens. Genome Biol 2008, 9:R33.
37. Mann HB, Whitney DR: On a Test of Whether one of Two Random Variables is Stochastically Larger than the Other. Ann. Math. Statist. 1947, 18:50–60.
38. Broad-Novartis Cancer Cell Line Encyclopedia [http://www.broadinstitute.org/ccle].
39. The ENCODE Project Consortium: Identification and analysis of functional elements in 1% of the human genome by the ENCODE pilot project. Nature 2007, 447:799–816.
40. Lister R, Pelizzola M, Dowen RH, Hawkins RD, Hon G, Tonti-Filippini J, Nery JR, Lee L, Ye Z, Ngo Q-M, Edsall L, Antosiewicz-Bourget J, Stewart R, Ruotti V, Millar AH, Thomson JA, Ren B, Ecker JR: Human DNA methylomes at base resolution show widespread epigenomic differences. Nature 2009, advance online
180
publication.
41. Barski A, Cuddapah S, Cui K, Roh T-Y, Schones DE, Wang Z, Wei G, Chepelev I, Zhao K: High-Resolution Profiling of Histone Methylations in the Human Genome. Cell 2007, Vol 129:823–837.
42. Viré E, Brenner C, Deplus R, Blanchon L, Fraga M, Didelot C, Morey L, Eynde AV, Bernard D, Vanderwinden J-M, Bollen M, Esteller M, Croce LD, Launoit Y de, Fuks F: The Polycomb group protein EZH2 directly controls DNA methylation. Nature 2005, 439:871–874.
43. Hansen RS, Thomas S, Sandstrom R, Canfield TK, Thurman RE, Weaver M, Dorschner MO, Gartler SM, Stamatoyannopoulos JA: Sequencing newly replicated DNA reveals widespread plasticity in human replication timing. Proceedings of the National Academy of Sciences 2010, 107:139 –144.
44. Langmead B, Trapnell C, Pop M, Salzberg SL: Ultrafast and memory-efficient alignment of short DNA sequences to the human genome. Genome Biol. 2009, 10:R25.
45. Zhang Y, Liu T, Meyer C, Eeckhoute J, Johnson D, Bernstein B, Nussbaum C, Myers R, Brown M, Li W, Liu XS: Model-based Analysis of ChIP-Seq (MACS). Genome Biology 2008, 9:R137.
46. Zang C, Schones DE, Zeng C, Cui K, Zhao K, Peng W: A clustering approach for identification of enriched domains from histone modification ChIP-Seq data. Bioinformatics 2009, 25:1952–1958.
47. Quinlan AR, Hall IM: BEDTools: a flexible suite of utilities for comparing genomic features. Bioinformatics 2010, 26:841–842.
48. Ji X, Li W, Song J, Wei L, Liu XS: CEAS: cis-regulatory element annotation system. Nucl. Acids Res. 2006, 34:W551–554.
49. Kanehisa M, Goto S, Sato Y, Furumichi M, Tanabe M: KEGG for integration and interpretation of large-scale molecular data sets. Nucleic Acids Res 2012, 40:D109–D114.
50. Ashburner M, Ball CA, Blake JA, Botstein D, Butler H, Cherry JM, Davis AP, Dolinski K, Dwight SS, Eppig JT, Harris MA, Hill DP, Issel-Tarver L, Kasarskis A, Lewis S, Matese JC, Richardson JE, Ringwald M, Rubin GM, Sherlock G: Gene Ontology: tool for the unification of biology. Nature Genetics 2000, 25:25–29.
51. Fujimoto A, Totoki Y, Abe T, Boroevich KA, Hosoda F, Nguyen HH, Aoki M, Hosono N, Kubo M, Miya F, Arai Y, Takahashi H, Shirakihara T, Nagasaki M, Shibuya T, Nakano K, Watanabe-Makino K, Tanaka H, Nakamura H, Kusuda J, Ojima H, Shimada K, Okusaka T, Ueno M, Shigekawa Y, Kawakami Y, Arihiro K, Ohdan H, Gotoh K, Ishikawa O, Ariizumi S, Yamamoto M, Yamada T, Chayama K, Kosuge T, Yamaue H, Kamatani N, Miyano S, Nakagama H, Nakamura Y, Tsunoda T, Shibata T, Nakagawa H: Whole-genome sequencing of liver cancers identifies etiological influences on mutation patterns and recurrent mutations in chromatin regulators. Nature Genetics 2012, 44:760–764.
52. Gui Y, Guo G, Huang Y, Hu X, Tang A, Gao S, Wu R, Chen C, Li X, Zhou L, He M, Li Z, Sun X, Jia W, Chen J, Yang S, Zhou F, Zhao X, Wan S, Ye R, Liang C, Liu Z, Huang P, Liu C, Jiang H, Wang Y, Zheng H, Sun L, Liu X, Jiang Z, Feng D, Chen J, Wu S, Zou J, Zhang Z, Yang R, Zhao J, Xu C, Yin W, Guan Z, Ye J, Zhang H, Li J, Kristiansen K, Nickerson ML, Theodorescu D, Li Y, Zhang X, Li S, Wang J, Yang
181

H, Wang J, Cai Z: Frequent mutations of chromatin remodeling genes in transitional cell carcinoma of the bladder. Nature Genetics 2011, 43:875–878.
53. Lindberg J, Mills IG, Klevebring D, Liu W, Neiman M, Xu J, Wikström P, Wiklund P, Wiklund F, Egevad L, Grönberg H: The Mitochondrial and Autosomal Mutation Landscapes of Prostate Cancer. Eur. Urol. 2012.
54. Watanabe Y, Castoro RJ, Kim HS, North B, Oikawa R, Hiraishi T, Ahmed SS, Chung W, Cho M-Y, Toyota M, Itoh F, Estecio MRH, Shen L, Jelinek J, Issa J-PJ: Frequent Alteration of MLL3 Frameshift Mutations in Microsatellite Deficient Colorectal Cancer. PLoS One 2011, 6.
55. Zang ZJ, Cutcutache I, Poon SL, Zhang SL, McPherson JR, Tao J, Rajasegaran V, Heng HL, Deng N, Gan A, Lim KH, Ong CK, Huang D, Chin SY, Tan IB, Ng CCY, Yu W, Wu Y, Lee M, Wu J, Poh D, Wan WK, Rha SY, So J, Salto-Tellez M, Yeoh KG, Wong WK, Zhu Y-J, Futreal PA, Pang B, Ruan Y, Hillmer AM, Bertrand D, Nagarajan N, Rozen S, Teh BT, Tan P: Exome sequencing of gastric adenocarcinoma identifies recurrent somatic mutations in cell adhesion and chromatin remodeling genes. Nature Genetics 2012, 44:570–574.
56. Liu P, Morrison C, Wang L, Xiong D, Vedell P, Cui P, Hua X, Ding F, Lu Y, James M, Ebben JD, Xu H, Adjei AA, Head K, Andrae JW, Tschannen MR, Jacob H, Pan J, Zhang Q, Bergh FV den, Xiao H, Lo KC, Patel J, Richmond T, Watt M-A, Albert T, Selzer R, Anderson M, Wang J, Wang Y, Starnes S, Yang P, You M: Identification of somatic mutations in non-small cell lung carcinomas using whole-exome sequencing. Carcinogenesis 2012, 33:1270–1276.
57. Ellis MJ, Ding L, Shen D, Luo J, Suman VJ, Wallis JW, Tine BAV, Hoog J, Goiffon RJ, Goldstein TC, Ng S, Lin L, Crowder R, Snider J, Ballman K, Weber J, Chen K, Koboldt DC, Kandoth C, Schierding WS, McMichael JF, Miller CA, Lu C, Harris CC, McLellan MD, Wendl MC, DeSchryver K, Allred DC, Esserman L, Unzeitig G, Margenthaler J, Babiera GV, Marcom PK, Guenther JM, Leitch M, Hunt K, Olson J, Tao Y, Maher CA, Fulton LL, Fulton RS, Harrison M, Oberkfell B, Du F, Demeter R, Vickery TL, Elhammali A, Piwnica-Worms H, McDonald S, Watson M, Dooling DJ, Ota D, Chang L-W, Bose R, Ley TJ, Piwnica-Worms D, Stuart JM, Wilson RK, Mardis ER: Whole-genome analysis informs breast cancer response to aromatase inhibition. Nature 2012, 486:353–360.
58. Biankin AV, Waddell N, Kassahn KS, et al.: Pancreatic cancer genomes reveal aberrations in axon guidance pathway genes. Nature 2012, 491:399–405.
59. Ruault M, Brun ME, Ventura M, Roizès G, De Sario A: MLL3, a new human member of the TRX/MLL gene family, maps to 7q36, a chromosome region frequently deleted in myeloid leukaemia. Gene 2002, 284:73–81.
60. Shain AH, Giacomini CP, Matsukuma K, Karikari CA, Bashyam MD, Hidalgo M, Maitra A, Pollack JR: Convergent structural alterations define SWItch/Sucrose NonFermentable (SWI/SNF) chromatin remodeler as a central tumor suppressive complex in pancreatic cancer. Proc Natl Acad Sci U S A 2012, 109:E252–E259.
61. Pasqualucci L, Trifonov V, Fabbri G, Ma J, Rossi D, Chiarenza A, Wells VA, Grunn A, Messina M, Elliot O, Chan J, Bhagat G, Chadburn A, Gaidano G, Mullighan CG, Rabadan R, Dalla-Favera R: Analysis of the Coding Genome of Diffuse Large B-Cell Lymphoma. Nat Genet 2011, 43:830–837.
182

62. Natarajan TG, Kallakury BV, Sheehan CE, Bartlett MB, Ganesan N, Preet A, Ross JS, FitzGerald KT: Epigenetic regulator MLL2 shows altered expression in cancer cell lines and tumors from human breast and colon. Cancer Cell Int 2010, 10:13.
63. Gallo ML, O’Hara AJ, Rudd ML, Urick ME, Hansen NF, O’Neil NJ, Price JC, Zhang S, England BM, Godwin AK, Sgroi DC, Program NISC (NISC) CS, Hieter P, Mullikin JC, Merino MJ, Bell DW: Exome sequencing of serous endometrial tumors identifies recurrent somatic mutations in chromatin-remodeling and ubiquitin ligase complex genes. Nature Genetics 2012, 44:1310–1315.
64. Comprehensive molecular characterization of human colon and rectal cancer. Nature 2012, 487:330–337.
65. Seo J-S, Ju YS, Lee W-C, Shin J-Y, Lee JK, Bleazard T, Lee J, Jung YJ, Kim J-O, Shin J-Y, Yu S-B, Kim J, Lee E-R, Kang C-H, Park I-K, Rhee H, Lee S-H, Kim J-I, Kang J-H, Kim YT: The transcriptional landscape and mutational profile of lung adenocarcinoma. Genome Res 2012, 22:2109–2119.
66. Love C, Sun Z, Jima D, Li G, Zhang J, Miles R, Richards KL, Dunphy CH, Choi WWL, Srivastava G, Lugar PL, Rizzieri DA, Lagoo AS, Bernal-Mizrachi L, Mann KP, Flowers CR, Naresh KN, Evens AM, Chadburn A, Gordon LI, Czader MB, Gill JI, Hsi ED, Greenough A, Moffitt AB, McKinney M, Banerjee A, Grubor V, Levy S, Dunson DB, Dave SS: The genetic landscape of mutations in Burkitt lymphoma. Nature Genetics 2012, 44:1321–1325.
67. Sausen M, Leary RJ, Jones S, Wu J, Reynolds CP, Liu X, Blackford A, Parmigiani G, Jr LAD, Papadopoulos N, Vogelstein B, Kinzler KW, Velculescu VE, Hogarty MD: Integrated genomic analyses identify ARID1A and ARID1B alterations in the childhood cancer neuroblastoma. Nature Genetics 2013, 45:12–17.
68. Mamo A, Cavallone L, Tuzmen S, Chabot C, Ferrario C, Hassan S, Edgren H, Kallioniemi O, Aleynikova O, Przybytkowski E, Malcolm K, Mousses S, Tonin PN, Basik M: An integrated genomic approach identifies ARID1A as a candidate tumor-suppressor gene in breast cancer. Oncogene 2012, 31:2090–2100.
69. Al Sarakbi W, Sasi W, Jiang WG, Roberts T, Newbold RF, Mokbel K: The mRNA expression of SETD2 in human breast cancer: correlation with clinico-pathological parameters. BMC Cancer 2009, 9:290.
70. Robinson G, Parker M, Kranenburg TA, Lu C, Chen X, Ding L, Phoenix TN, Hedlund E, Wei L, Zhu X, Chalhoub N, Baker SJ, Huether R, Kriwacki R, Curley N, Thiruvenkatam R, Wang J, Wu G, Rusch M, Hong X, Becksfort J, Gupta P, Ma J, Easton J, Vadodaria B, Onar-Thomas A, Lin T, Li S, Pounds S, Paugh S, Zhao D, Kawauchi D, Roussel MF, Finkelstein D, Ellison DW, Lau CC, Bouffet E, Hassall T, Gururangan S, Cohn R, Fulton RS, Fulton LL, Dooling DJ, Ochoa K, Gajjar A, Mardis ER, Wilson RK, Downing JR, Zhang J, Gilbertson RJ: Novel mutations target distinct subgroups of medulloblastoma. Nature 2012, 488:43–48.
71. Bai J, Mei P-J, Liu H, Li C, Li W, Wu Y-P, Yu Z-Q, Zheng J-N: BRG1 expression is increased in human glioma and controls glioma cell proliferation, migration and invasion in vitro. J Cancer Res Clin Oncol 2012, 138:991–998.
72. Saladi SV, Keenen B, Marathe HG, Qi H, Chin K-V, De la Serna IL: Modulation of extracellular matrix/adhesion molecule expression by BRG1 is associated with increased melanoma invasiveness. Mol Cancer 2010, 9:280.
183

73. Liu J, Lee W, Jiang Z, Chen Z, Jhunjhunwala S, Haverty PM, Gnad F, Guan Y, Gilbert HN, Stinson J, Klijn C, Guillory J, Bhatt D, Vartanian S, Walter K, Chan J, Holcomb T, Dijkgraaf P, Johnson S, Koeman J, Minna JD, Gazdar AF, Stern HM, Hoeflich KP, Wu TD, Settleman J, De Sauvage FJ, Gentleman RC, Neve RM, Stokoe D, Modrusan Z, Seshagiri S, Shames DS, Zhang Z: Genome and transcriptome sequencing of lung cancers reveal diverse mutational and splicing events. Genome Res 2012, 22:2315–2327.
74. Stephens PJ, Tarpey PS, Davies H, Loo PV, Greenman C, Wedge DC, Nik-Zainal S, Martin S, Varela I, Bignell GR, Yates LR, Papaemmanuil E, Beare D, Butler A, Cheverton A, Gamble J, Hinton J, Jia M, Jayakumar A, Jones D, Latimer C, Lau KW, McLaren S, McBride DJ, Menzies A, Mudie L, Raine K, Rad R, Chapman MS, Teague J, Easton D, Langerød A, (osbreac) TOBCC, Lee MTM, Shen C-Y, Tee BTK, Huimin BW, Broeks A, Vargas AC, Turashvili G, Martens J, Fatima A, Miron P, Chin S-F, Thomas G, Boyault S, Mariani O, Lakhani SR, Vijver M van de, Veer L van ‘t, Foekens J, Desmedt C, Sotiriou C, Tutt A, Caldas C, Reis-Filho JS, Aparicio SAJR, Salomon AV, Børresen-Dale A-L, Richardson AL, Campbell PJ, Futreal PA, Stratton MR: The landscape of cancer genes and mutational processes in breast cancer. Nature 2012, 486:400–404.
75. Zhang Z, Yamashita H, Toyama T, Sugiura H, Ando Y, Mita K, Hamaguchi M, Hara Y, Kobayashi S, Iwase H: NCOR1 mRNA is an independent prognostic factor for breast cancer. Cancer Lett. 2006, 237:123–129.
76. Peifer M, Fernández-Cuesta L, Sos ML, George J, Seidel D, Kasper LH, Plenker D, Leenders F, Sun R, Zander T, Menon R, Koker M, Dahmen I, Müller C, Cerbo VD, Schildhaus H-U, Altmüller J, Baessmann I, Becker C, Wilde B de, Vandesompele J, Böhm D, Ansén S, Gabler F, Wilkening I, Heynck S, Heuckmann JM, Lu X, Carter SL, Cibulskis K, Banerji S, Getz G, Park K-S, Rauh D, Grütter C, Fischer M, Pasqualucci L, Wright G, Wainer Z, Russell P, Petersen I, Chen Y, Stoelben E, Ludwig C, Schnabel P, Hoffmann H, Muley T, Brockmann M, Engel-Riedel W, Muscarella LA, Fazio VM, Groen H, Timens W, Sietsma H, Thunnissen E, Smit E, Heideman DAM, Snijders PJF, Cappuzzo F, Ligorio C, Damiani S, Field J, Solberg S, Brustugun OT, Lund-Iversen M, Sänger J, Clement JH, Soltermann A, Moch H, Weder W, Solomon B, Soria J-C, Validire P, Besse B, Brambilla E, Brambilla C, Lantuejoul S, Lorimier P, Schneider PM, Hallek M, Pao W, Meyerson M, Sage J, Shendure J, Schneider R, Büttner R, Wolf J, Nürnberg P, Perner S, Heukamp LC, Brindle PK, Haas S, Thomas RK: Integrative genome analyses identify key somatic driver mutations of small-cell lung cancer. Nature Genetics 2012, 44:1104–1110.
77. Li Y, Yang H-X, Luo R-Z, Zhang Y, Li M, Wang X, Jia W-H: High Expression of p300 Has an Unfavorable Impact on Survival in Resectable Esophageal Squamous Cell Carcinoma. The Annals of Thoracic Surgery 2011, 91:1531–1538.
78. Yokomizo C, Yamaguchi K, Itoh Y, Nishimura T, Umemura A, Minami M, Yasui K, Mitsuyoshi H, Fujii H, Tochiki N, Nakajima T, Okanoue T, Yoshikawa T: High expression of p300 in HCC predicts shortened overall survival in association with enhanced epithelial mesenchymal transition of HCC cells. Cancer Letters 2011, 310:140–147.
79. Dokmanovic M, Clarke C, Marks PA: Histone Deacetylase Inhibitors: Overview and Perspectives. Mol Cancer Res 2007, 5:981–989.
184

80. Kalender Atak Z, De Keersmaecker K, Gianfelici V, Geerdens E, Vandepoel R, Pauwels D, Porcu M, Lahortiga I, Brys V, Dirks WG, Quentmeier H, Cloos J, Cuppens H, Uyttebroeck A, Vandenberghe P, Cools J, Aerts S: High Accuracy Mutation Detection in Leukemia on a Selected Panel of Cancer Genes. PLoS One 2012, 7.
81. Hsu C-H, Peng K-L, Kang M-L, Chen Y-R, Yang Y-C, Tsai C-H, Chu C-S, Jeng Y-M, Chen Y-T, Lin F-M, Huang H-D, Lu Y-Y, Teng Y-C, Lin S-T, Lin R-K, Tang F-M, Lee S-B, Hsu HM, Yu J-C, Hsiao P-W, Juan L-J: TET1 Suppresses Cancer Invasion by Activating the Tissue Inhibitors of Metalloproteinases. Cell Reports 2012, 2:568–579.
82. Fan L-H, Tang L-N, Yue L, Yang Y, Gao Z-L, Shen Z: BAP1 is a good prognostic factor in advanced non-small cell lung cancer. Clin Invest Med 2012, 35:E182–189.
83. Job B, Bernheim A, Beau-Faller M, Camilleri-Broët S, Girard P, Hofman P, Mazières J, Toujani S, Lacroix L, Laffaire J, Dessen P, Fouret P: Genomic Aberrations in Lung Adenocarcinoma in Never Smokers. PLoS One 2010, 5.
84. Vainchenker W, Delhommeau F, Constantinescu SN, Bernard OA: New mutations and pathogenesis of myeloproliferative neoplasms. Blood 2011, 118:1723–1735.
85. Devillier R, Gelsi-Boyer V, Brecqueville M, Carbuccia N, Murati A, Vey N, Birnbaum D, Mozziconacci M-J: Acute myeloid leukemia with myelodysplasia-related changes are characterized by a specific molecular pattern with high frequency of ASXL1 mutations. Am. J. Hematol. 2012, 87:659–662.
86. Grasso CS, Wu Y-M, Robinson DR, Cao X, Dhanasekaran SM, Khan AP, Quist MJ, Jing X, Lonigro RJ, Brenner JC, Asangani IA, Ateeq B, Chun SY, Siddiqui J, Sam L, Anstett M, Mehra R, Prensner JR, Palanisamy N, Ryslik GA, Vandin F, Raphael BJ, Kunju LP, Rhodes DR, Pienta KJ, Chinnaiyan AM, Tomlins SA: The Mutational Landscape of Lethal Castrate Resistant Prostate Cancer. Nature 2012, 487:239–243.
87. Haaften G van, Dalgliesh GL, Davies H, Chen L, Bignell G, Greenman C, Edkins S, Hardy C, O’Meara S, Teague J, Butler A, Hinton J, Latimer C, Andrews J, Barthorpe S, Beare D, Buck G, Campbell PJ, Cole J, Forbes S, Jia M, Jones D, Kok CY, Leroy C, Lin M-L, McBride DJ, Maddison M, Maquire S, McLay K, Menzies A, Mironenko T, Mulderrig L, Mudie L, Pleasance E, Shepherd R, Smith R, Stebbings L, Stephens P, Tang G, Tarpey PS, Turner R, Turrell K, Varian J, West S, Widaa S, Wray P, Collins VP, Ichimura K, Law S, Wong J, Yuen ST, Leung SY, Tonon G, DePinho RA, Tai Y-T, Anderson KC, Kahnoski RJ, Massie A, Khoo SK, Teh BT, Stratton MR, Futreal PA: Somatic mutations of the histone H3K27 demethylase gene UTX in human cancer. Nature Genetics 2009, 41:521–523.
88. Paolicchi E, Crea F, Farrar WL, Green JE, Danesi R: Histone lysine demethylases in breast cancer. Critical Reviews in Oncology/Hematology 2012.
89. Liu L, Zhao E, Li C, Huang L, Xiao L, Cheng L, Huang X, Song Y, Xu D: TRIM28, a new molecular marker predicting metastasis and survival in early-stage non-small cell lung cancer. Cancer Epidemiology .
90. Björkman M, Östling P, Härmä V, Virtanen J, Mpindi J-P, Rantala J, Mirtti T, Vesterinen T, Lundin M, Sankila A, Rannikko A, Kaivanto E, Kohonen P, Kallioniemi O, Nees M: Systematic knockdown of epigenetic enzymes identifies
185

a novel histone demethylase PHF8 overexpressed in prostate cancer with an impact on cell proliferation, migration and invasion. Oncogene 2012, 31:3444–3456.
91. Guo X, Shi M, Sun L, Wang Y, Gui Y, Cai Z, Duan X: The expression of histone demethylase JMJD1A in renal cell carcinoma. Neoplasma 2011, 58:153–157.
92. Liu W, Lindberg J, Sui G, Luo J, Egevad L, Li T, Xie C, Wan M, Kim S-T, Wang Z, Turner AR, Zhang Z, Feng J, Yan Y, Sun J, Bova GS, Ewing CM, Yan G, Gielzak M, Cramer SD, Vessella RL, Zheng SL, Grönberg H, Isaacs WB, Xu J: Identification of novel CHD1-associated collaborative alterations of genomic structure and functional assessment of CHD1 in prostate cancer. Oncogene 2012, 31:3939–3948.
93. Liu Y, Sun W, Zhang K, Zheng H, Ma Y, Lin D, Zhang X, Feng L, Lei W, Zhang Z, Guo S, Han N, Tong W, Feng X, Gao Y, Cheng S: Identification of genes differentially expressed in human primary lung squamous cell carcinoma. Lung Cancer 2007, 56:307–317.
94. Parker H, An Q, Barber K, Case M, Davies T, Konn Z, Stewart A, Wright S, Griffiths M, Ross FM, Moorman AV, Hall AG, Irving JA, Harrison CJ, Strefford JC: The complex genomic profile of ETV6-RUNX1 positive acute lymphoblastic leukemia highlights a recurrent deletion of TBL1XR1. Genes Chromosomes Cancer 2008, 47:1118–1125.
95. Braggio E, McPhail ER, Macon W, Lopes MB, Schiff D, Law M, Fink S, Sprau D, Giannini C, Dogan A, Fonseca R, O’Neill BP: Primary Central Nervous System Lymphomas: A Validation Study of Array-Based Comparative Genomic Hybridization in Formalin-Fixed Paraffin-Embedded Tumor Specimens. Clin Cancer Res 2011, 17:4245–4253.
96. Rinner B, Gallè B, Trajanoski S, Fischer C, Hatz M, Maierhofer T, Michelitsch G, Moinfar F, Stelzer I, Pfragner R, Guelly C: Molecular evidence for the bi-clonal origin of neuroendocrine tumor derived metastases. BMC Genomics 2012, 13:594.
97. Rebouissou S, Rosty C, Lecuru F, Boisselier S, Bui H, Le Frere-Belfa M-A, Sastre X, Laurent-Puig P, Zucman-Rossi J: Mutation of TCF1 encoding hepatocyte nuclear factor 1alpha in gynecological cancer. Oncogene 2004, 23:7588–7592.
98. Laurent-Puig P, Plomteux O, Bluteau O, Zinzindohoué F, Jeannot E, Dahan K, Kartheuser A, Chapusot C, Cugnenc P-H, Zucman-Rossi J: Frequent mutations of hepatocyte nuclear factor 1 in colorectal cancer with microsatellite instability. Gastroenterology 2003, 124:1311–1314.
99. Jeannot E, Poussin K, Chiche L, Bacq Y, Sturm N, Scoazec J-Y, Buffet C, Nhieu JTV, Bellanné-Chantelot C, Toma C de, Laurent-Puig P, Bioulac-Sage P, Zucman-Rossi J: Association of CYP1B1 Germ Line Mutations with Hepatocyte Nuclear Factor 1α–Mutated Hepatocellular Adenoma. Cancer Res 2007, 67:2611–2616.
100. Wang W, Hayashi Y, Ninomiya T, Ohta K, Nakabayashi H, Tamaoki T, Itoh H: Expression of HNF-1 alpha and HNF-1 beta in various histological differentiations of hepatocellular carcinoma. J. Pathol. 1998, 184:272–278.
101. Pfister S, Rea S, Taipale M, Mendrzyk F, Straub B, Ittrich C, Thuerigen O, Sinn HP, Akhtar A, Lichter P: The histone acetyltransferase hMOF is frequently downregulated in primary breast carcinoma and medulloblastoma and
186

constitutes a biomarker for clinical outcome in medulloblastoma. Int. J. Cancer 2008, 122:1207–1213.
102. Anderton JA, Bose S, Vockerodt M, Vrzalikova K, Wei W, Kuo M, Helin K, Christensen J, Rowe M, Murray PG, Woodman CB: The H3K27me3 demethylase, KDM6B, is induced by Epstein-Barr virus and over-expressed in Hodgkin’s Lymphoma. Oncogene 2011, 30:2037–2043.
103. Gunduz M, Nagatsuka H, Demircan K, Gunduz E, Cengiz B, Ouchida M, Tsujigiwa H, Yamachika E, Fukushima K, Beder L, Hirohata S, Ninomiya Y, Nishizaki K, Shimizu K, Nagai N: Frequent deletion and down-regulation of ING4, a candidate tumor suppressor gene at 12p13, in head and neck squamous cell carcinomas. Gene 2005, 356:109–117.
104. Li J, Martinka M, Li G: Role of ING4 in human melanoma cell migration, invasion and patient survival. Carcinogenesis 2008, 29:1373–1379.
105. Li M, Jin Y, Sun W, Yu Y, Bai J, Tong D, Qi J, Du J, Geng J, Huang Q, Huang X, Huang Y, Han F, Meng X, Rosales JL, Lee K-Y, Fu S: Reduced expression and novel splice variants of ING4 in human gastric adenocarcinoma. J. Pathol. 2009, 219:87–95.
106. Wang Q, Li M, Zhang L, Jin Y, Tong D, Yu Y, Bai J, Huang Q, Liu F-L, Liu A, Lee K-Y, Fu S: Down-regulation of ING4 is associated with initiation and progression of lung cancer. Histopathology 2010, 57:271–281.
107. You Q, Wang X-S, Fu S-B, Jin X-M: Downregulated expression of inhibitor of growth 4 (ING4) in advanced colorectal cancers: a non-randomized experimental study. Pathol. Oncol. Res. 2011, 17:473–477.
108. Tapia C, Zlobec I, Schneider S, Kilic E, Güth U, Bubendorf L, Kim S: Deletion of the inhibitor of growth 4 (ING4) tumor suppressor gene is prevalent in human epidermal growth factor 2 (HER2)-positive breast cancer. Hum Pathol 2011, 42:983–990.
109. Sundram U, Kim Y, Mraz-Gernhard S, Hoppe R, Natkunam Y, Kohler S: Expression of the bcl-6 and MUM1/IRF4 proteins correlate with overall and disease-specific survival in patients with primary cutaneous large B-cell lymphoma: a tissue microarray study. J. Cutan. Pathol. 2005, 32:227–234.
110. Ito M, Iida S, Inagaki H, Tsuboi K, Komatsu H, Yamaguchi M, Nakamura N, Suzuki R, Seto M, Nakamura S, Morishima Y, Ueda R: MUM1/IRF4 expression is an unfavorable prognostic factor in B-cell chronic lymphocytic leukemia (CLL)/small lymphocytic lymphoma (SLL). Jpn. J. Cancer Res. 2002, 93:685–694.
111. Tsuboi K, Iida S, Inagaki H, Kato M, Hayami Y, Hanamura I, Miura K, Harada S, Kikuchi M, Komatsu H, Banno S, Wakita A, Nakamura S, Eimoto T, Ueda R: MUM1/IRF4 expression as a frequent event in mature lymphoid malignancies. Leukemia 2000, 14:449–456.
112. Heebøll S, Borre M, Ottosen PD, Andersen CL, Mansilla F, Dyrskjøt L, Orntoft TF, Tørring N: SMARCC1 expression is upregulated in prostate cancer and positively correlated with tumour recurrence and dedifferentiation. Histol. Histopathol. 2008, 23:1069–1076.
113. Andersen CL, Christensen LL, Thorsen K, Schepeler T, Sørensen FB, Verspaget HW, Simon R, Kruhøffer M, Aaltonen LA, Laurberg S, Ørntoft TF: Dysregulation
187

of the transcription factors SOX4, CBFB and SMARCC1 correlates with outcome of colorectal cancer. Br J Cancer 2009, 100:511–523.
114. Mullighan CG, Su X, Zhang J, Radtke I, Phillips LAA, Miller CB, Ma J, Liu W, Cheng C, Schulman BA, Harvey RC, Chen I-M, Clifford RJ, Carroll WL, Reaman G, Bowman WP, Devidas M, Gerhard DS, Yang W, Relling MV, Shurtleff SA, Campana D, Borowitz MJ, Pui C-H, Smith M, Hunger SP, Willman CL, Downing JR: Deletion of IKZF1 and Prognosis in Acute Lymphoblastic Leukemia. N Engl J Med 2009, 360:470–480.
115. Saini V, Hose CD, Monks A, Nagashima K, Han B, Newton DL, Millione A, Shah J, Hollingshead MG, Hite KM, Burkett MW, Delosh RM, Silvers TE, Scudiero DA, Shoemaker RH: Identification of CBX3 and ABCA5 as Putative Biomarkers for Tumor Stem Cells in Osteosarcoma. PLoS One 2012, 7.
116. Takanashi M, Oikawa K, Fujita K, Kudo M, Kinoshita M, Kuroda M: Heterochromatin Protein 1γ Epigenetically Regulates Cell Differentiation and Exhibits Potential as a Therapeutic Target for Various Types of Cancers. Am J Pathol 2009, 174:309–316.
117. Sebastián C, Zwaans BMM, Silberman DM, Gymrek M, Goren A, Zhong L, Ram O, Truelove J, Guimaraes AR, Toiber D, Cosentino C, Greenson JK, Macdonald AI, McGlynn L, Maxwell F, Edwards J, Giacosa S, Guccione E, Weissleder R, Bernstein BE, Regev A, Shiels PG, Lombard DB, Mostoslavsky R: The Histone Deacetylase SIRT6 Is a Tumor Suppressor that Controls Cancer Metabolism. Cell 2012, 151:1185–1199.
118. Parsons DW, Jones S, Zhang X, Lin JC-H, Leary RJ, Angenendt P, Mankoo P, Carter H, Siu I-M, Gallia GL, Olivi A, McLendon R, Rasheed BA, Keir S, Nikolskaya T, Nikolsky Y, Busam DA, Tekleab H, Diaz LA, Hartigan J, Smith DR, Strausberg RL, Marie SKN, Shinjo SMO, Yan H, Riggins GJ, Bigner DD, Karchin R, Papadopoulos N, Parmigiani G, Vogelstein B, Velculescu VE, Kinzler KW: An Integrated Genomic Analysis of Human Glioblastoma Multiforme. Science 2008, 321:1807–1812.
119. Rausch T, Jones DTW, Zapatka M, Stütz AM, Zichner T, Weischenfeldt J, Jäger N, Remke M, Shih D, Northcott PA, Pfaff E, Tica J, Wang Q, Massimi L, Witt H, Bender S, Pleier S, Cin H, Hawkins C, Beck C, Von Deimling A, Hans V, Brors B, Eils R, Scheurlen W, Blake J, Benes V, Kulozik AE, Witt O, Martin D, Zhang C, Porat R, Merino DM, Wasserman J, Jabado N, Fontebasso A, Bullinger L, Rücker FG, Döhner K, Döhner H, Koster J, Molenaar JJ, Versteeg R, Kool M, Tabori U, Malkin D, Korshunov A, Taylor MD, Lichter P, Pfister SM, Korbel JO: Genome Sequencing of Pediatric Medulloblastoma Links Catastrophic DNA Rearrangements with TP53 Mutations. Cell 2012, 148:59–71.
120. Schwartzentruber J, Korshunov A, Liu X-Y, Jones DTW, Pfaff E, Jacob K, Sturm D, Fontebasso AM, Quang D-AK, Tönjes M, Hovestadt V, Albrecht S, Kool M, Nantel A, Konermann C, Lindroth A, Jäger N, Rausch T, Ryzhova M, Korbel JO, Hielscher T, Hauser P, Garami M, Klekner A, Bognar L, Ebinger M, Schuhmann MU, Scheurlen W, Pekrun A, Frühwald MC, Roggendorf W, Kramm C, Dürken M, Atkinson J, Lepage P, Montpetit A, Zakrzewska M, Zakrzewski K, Liberski PP, Dong Z, Siegel P, Kulozik AE, Zapatka M, Guha A, Malkin D, Felsberg J, Reifenberger G, Deimling A von, Ichimura K, Collins VP, Witt H, Milde T, Witt O, Zhang C, Castelo-Branco P, Lichter P, Faury D, Tabori U, Plass C, Majewski J,
188

Pfister SM, Jabado N: Driver mutations in histone H3.3 and chromatin remodelling genes in paediatric glioblastoma. Nature 2012, 482:226–231.
121. Wood LD, Parsons DW, Jones S, Lin J, Sjöblom T, Leary RJ, Shen D, Boca SM, Barber T, Ptak J, Silliman N, Szabo S, Dezso Z, Ustyanksky V, Nikolskaya T, Nikolsky Y, Karchin R, Wilson PA, Kaminker JS, Zhang Z, Croshaw R, Willis J, Dawson D, Shipitsin M, Willson JKV, Sukumar S, Polyak K, Park BH, Pethiyagoda CL, Pant PVK, Ballinger DG, Sparks AB, Hartigan J, Smith DR, Suh E, Papadopoulos N, Buckhaults P, Markowitz SD, Parmigiani G, Kinzler KW, Velculescu VE, Vogelstein B: The Genomic Landscapes of Human Breast and Colorectal Cancers. Science 2007, 318:1108–1113.
122. Shah SP, Roth A, Goya R, Oloumi A, Ha G, Zhao Y, Turashvili G, Ding J, Tse K, Haffari G, Bashashati A, Prentice LM, Khattra J, Burleigh A, Yap D, Bernard V, McPherson A, Shumansky K, Crisan A, Giuliany R, Heravi-Moussavi A, Rosner J, Lai D, Birol I, Varhol R, Tam A, Dhalla N, Zeng T, Ma K, Chan SK, Griffith M, Moradian A, Cheng S-WG, Morin GB, Watson P, Gelmon K, Chia S, Chin S-F, Curtis C, Rueda OM, Pharoah PD, Damaraju S, Mackey J, Hoon K, Harkins T, Tadigotla V, Sigaroudinia M, Gascard P, Tlsty T, Costello JF, Meyer IM, Eaves CJ, Wasserman WW, Jones S, Huntsman D, Hirst M, Caldas C, Marra MA, Aparicio S: The clonal and mutational evolution spectrum of primary triple-negative breast cancers. Nature 2012, 486:395–399.
123. The Cancer Genome Atlas Network: Comprehensive molecular portraits of human breast tumours. Nature 2012, 490:61–70.
124. Banerji S, Cibulskis K, Rangel-Escareno C, Brown KK, Carter SL, Frederick AM, Lawrence MS, Sivachenko AY, Sougnez C, Zou L, Cortes ML, Fernandez-Lopez JC, Peng S, Ardlie KG, Auclair D, Bautista-Piña V, Duke F, Francis J, Jung J, Maffuz-Aziz A, Onofrio RC, Parkin M, Pho NH, Quintanar-Jurado V, Ramos AH, Rebollar-Vega R, Rodriguez-Cuevas S, Romero-Cordoba SL, Schumacher SE, Stransky N, Thompson KM, Uribe-Figueroa L, Baselga J, Beroukhim R, Polyak K, Sgroi DC, Richardson AL, Jimenez-Sanchez G, Lander ES, Gabriel SB, Garraway LA, Golub TR, Melendez-Zajgla J, Toker A, Getz G, Hidalgo-Miranda A, Meyerson M: Sequence analysis of mutations and translocations across breast cancer subtypes. Nature 2012, 486:405–409.
125. Puente XS, Pinyol M, Quesada V, Conde L, Ordóñez GR, Villamor N, Escaramis G, Jares P, Beà S, González-Díaz M, Bassaganyas L, Baumann T, Juan M, López-Guerra M, Colomer D, Tubío JMC, López C, Navarro A, Tornador C, Aymerich M, Rozman M, Hernández JM, Puente DA, Freije JMP, Velasco G, Gutiérrez-Fernández A, Costa D, Carrió A, Guijarro S, Enjuanes A, Hernández L, Yagüe J, Nicolás P, Romeo-Casabona CM, Himmelbauer H, Castillo E, Dohm JC, Sanjosé S de, Piris MA, Alava E de, Miguel JS, Royo R, Gelpí JL, Torrents D, Orozco M, Pisano DG, Valencia A, Guigó R, Bayés M, Heath S, Gut M, Klatt P, Marshall J, Raine K, Stebbings LA, Futreal PA, Stratton MR, Campbell PJ, Gut I, López-Guillermo A, Estivill X, Montserrat E, López-Otín C, Campo E: Whole-genome sequencing identifies recurrent mutations in chronic lymphocytic leukaemia. Nature 2011, 475:101–105.
126. Quesada V, Conde L, Villamor N, Ordóñez GR, Jares P, Bassaganyas L, Ramsay AJ, Beà S, Pinyol M, Martínez-Trillos A, López-Guerra M, Colomer D, Navarro A, Baumann T, Aymerich M, Rozman M, Delgado J, Giné E, Hernández JM, González-
189

Díaz M, Puente DA, Velasco G, Freije JMP, Tubío JMC, Royo R, Gelpí JL, Orozco M, Pisano DG, Zamora J, Vázquez M, Valencia A, Himmelbauer H, Bayés M, Heath S, Gut M, Gut I, Estivill X, López-Guillermo A, Puente XS, Campo E, López-Otín C: Exome sequencing identifies recurrent mutations of the splicing factor SF3B1 gene in chronic lymphocytic leukemia. Nature Genetics 2012, 44:47–52.
127. Wang L, Lawrence MS, Wan Y, Stojanov P, Sougnez C, Stevenson K, Werner L, Sivachenko A, DeLuca DS, Zhang L, Zhang W, Vartanov AR, Fernandes SM, Goldstein NR, Folco EG, Cibulskis K, Tesar B, Sievers QL, Shefler E, Gabriel S, Hacohen N, Reed R, Meyerson M, Golub TR, Lander ES, Neuberg D, Brown JR, Getz G, Wu CJ: SF3B1 and Other Novel Cancer Genes in Chronic Lymphocytic Leukemia. New England Journal of Medicine 2011, 365:2497–2506.
128. Guichard C, Amaddeo G, Imbeaud S, Ladeiro Y, Pelletier L, Maad IB, Calderaro J, Bioulac-Sage P, Letexier M, Degos F, Clément B, Balabaud C, Chevet E, Laurent A, Couchy G, Letouzé E, Calvo F, Zucman-Rossi J: Integrated analysis of somatic mutations and focal copy-number changes identifies key genes and pathways in hepatocellular carcinoma. Nature Genetics 2012, 44:694–698.
129. Ding L, Getz G, Wheeler DA, Mardis ER, McLellan MD, Cibulskis K, Sougnez C, Greulich H, Muzny DM, Morgan MB, Fulton L, Fulton RS, Zhang Q, Wendl MC, Lawrence MS, Larson DE, Chen K, Dooling DJ, Sabo A, Hawes AC, Shen H, Jhangiani SN, Lewis LR, Hall O, Zhu Y, Mathew T, Ren Y, Yao J, Scherer SE, Clerc K, Metcalf GA, Ng B, Milosavljevic A, Gonzalez-Garay ML, Osborne JR, Meyer R, Shi X, Tang Y, Koboldt DC, Lin L, Abbott R, Miner TL, Pohl C, Fewell G, Haipek C, Schmidt H, Dunford-Shore BH, Kraja A, Crosby SD, Sawyer CS, Vickery T, Sander S, Robinson J, Winckler W, Baldwin J, Chirieac LR, Dutt A, Fennell T, Hanna M, Johnson BE, Onofrio RC, Thomas RK, Tonon G, Weir BA, Zhao X, Ziaugra L, Zody MC, Giordano T, Orringer MB, Roth JA, Spitz MR, Wistuba II, Ozenberger B, Good PJ, Chang AC, Beer DG, Watson MA, Ladanyi M, Broderick S, Yoshizawa A, Travis WD, Pao W, Province MA, Weinstock GM, Varmus HE, Gabriel SB, Lander ES, Gibbs RA, Meyerson M, Wilson RK: Somatic mutations affect key pathways in lung adenocarcinoma. Nature 2008, 455:1069–1075.
130. The Cancer Genome Atlas Research Network: Comprehensive genomic characterization of squamous cell lung cancers. Nature 2012, 489:519–525.
131. Rudin CM, Durinck S, Stawiski EW, Poirier JT, Modrusan Z, Shames DS, Bergbower EA, Guan Y, Shin J, Guillory J, Rivers CS, Foo CK, Bhatt D, Stinson J, Gnad F, Haverty PM, Gentleman R, Chaudhuri S, Janakiraman V, Jaiswal BS, Parikh C, Yuan W, Zhang Z, Koeppen H, Wu TD, Stern HM, Yauch RL, Huffman KE, Paskulin DD, Illei PB, Varella-Garcia M, Gazdar AF, Sauvage FJ de, Bourgon R, Minna JD, Brock MV, Seshagiri S: Comprehensive genomic analysis identifies SOX2 as a frequently amplified gene in small-cell lung cancer. Nature Genetics 2012, 44:1111–1116.
132. Stransky N, Egloff AM, Tward AD, Kostic AD, Cibulskis K, Sivachenko A, Kryukov GV, Lawrence MS, Sougnez C, McKenna A, Shefler E, Ramos AH, Stojanov P, Carter SL, Voet D, Cortés ML, Auclair D, Berger MF, Saksena G, Guiducci C, Onofrio RC, Parkin M, Romkes M, Weissfeld JL, Seethala RR, Wang L, Rangel-Escareño C, Fernandez-Lopez JC, Hidalgo-Miranda A, Melendez-Zajgla J, Winckler W, Ardlie K, Gabriel SB, Meyerson M, Lander ES, Getz G, Golub TR, Garraway LA, Grandis JR: The Mutational Landscape of Head and Neck
190

Squamous Cell Carcinoma. Science 2011, 333:1157–1160.
133. The Cancer Genome Atlas Research Network: Integrated genomic analyses of ovarian carcinoma. Nature 2011, 474:609–615.
134. Jones S, Zhang X, Parsons DW, Lin JC-H, Leary RJ, Angenendt P, Mankoo P, Carter H, Kamiyama H, Jimeno A, Hong S-M, Fu B, Lin M-T, Calhoun ES, Kamiyama M, Walter K, Nikolskaya T, Nikolsky Y, Hartigan J, Smith DR, Hidalgo M, Leach SD, Klein AP, Jaffee EM, Goggins M, Maitra A, Iacobuzio-Donahue C, Eshleman JR, Kern SE, Hruban RH, Karchin R, Papadopoulos N, Parmigiani G, Vogelstein B, Velculescu VE, Kinzler KW: Core Signaling Pathways in Human Pancreatic Cancers Revealed by Global Genomic Analyses. Science 2008, 321:1801–1806.
135. Wang K, Kan J, Yuen ST, Shi ST, Chu KM, Law S, Chan TL, Kan Z, Chan ASY, Tsui WY, Lee SP, Ho SL, Chan AKW, Cheng GHW, Roberts PC, Rejto PA, Gibson NW, Pocalyko DJ, Mao M, Xu J, Leung SY: Exome sequencing identifies frequent mutation of ARID1A in molecular subtypes of gastric cancer. Nature Genetics 2011, 43:1219–1223.
191

Supplementary tables
Table S1. Classification of Chromatin Regulatory Factors.
Gene name(a) Description Function(b)
Polycomb Repressive Complex 2
EZH2* Catalytic subunit
H3K27me1/me2/me3 HMT. Major role in stem cell identity maintenance. Also methylates GATA4. Interacts with DNMTs.
SUZ12 EZH2 coenzyme
Required for PRC2 H3K27 HMT activity [1]. Interacts with SIRT1.
EED Different isoforms determine PRC3 or PRC4 PRC2 variants.
RBBP4 (RBAP46)* Required for the association of PRC2 to the histone tail [2]. Binds Rb to regulate cell proliferation.
RBBP7 (RBAP48)* Interacts with BRCA1 and may regulate cell proliferation and differentiation.
PHF1 (PCL1) Mediates PRC2 intrusion into active H3K36 chromatin regions [3].
PHF19 (PCL3) Mediates interaction of PRC2 with H3K36me3, essential for full PRC2 activity [4].
ASXL1 Associates with PRC2 to promote gene repression [5].MTF2 (PCL2) Required for PRC2-mediated Hox repression [6].
JARID2 (JMJ)* Essential in embryonic development, inhibits H3K27me3 by PRC2.
YY1*Interacts with PRC2, and it is required for EZH2-mediated H3K27me3 [7]. Also part of chromatin remodelling INO80 complex.
SIRT1* Class III HDAC
Transiently interacts with PRC2. Histone and protein deacetylase activity.
Polycomb Repressive Complex 1
EZH1 Catalytic subunit
H3K27me1/me2/me3 HMT. Less critical for H3K27me3 formation than EZH2.
BAP1 Catalytic component of the PR-DUB complex, that specifically deubiquitinates H2AK119ub1.
BMI1 Maintenance of transcriptional repression of key genes during development. H2AK119ub.
RING1 H2AK119ub.RNF2 (RING1B) H2AK119ub. Acts as the main ub ligase in PRC1.CBX2
CBX3 Part of PRC1-like complex 4 [8]. Binds the nuclear lamina through lamin B receptor.
CBX4CBX6
CBX7 Promotes H3K9me3. Regulates cellular lifespan by repressing CDKN2A.
CBX8
PCGF1 (NSPC1) BCOR complex
Represses CDKN1A expression in a RARE-dependent manner.
PCGF2 (MEL18)PCGF6 (MBLR)PHC1PHC2
192

PHC3AEBP2L3MBTL1 Specifically recognizes me1 and me2 lysines.Histone deacetylases
HDAC1*
Class I
Controls embryonic stem cell differentiation (but not HDAC2) [9]. Modulation of cell growth and apoptosis by down-regulation of p53. Also part of NuRD/Mi-2 ATP-dependent chromatin remodelling complex.
HDAC2*Relevant role in haematopoiesis. Also part of NuRD/Mi-2 ATP-dependent chromatin remodelling complex.
HDAC3 Modulation of cell growth and apoptosis by down-regulation of p53.
HDAC8HDAC4
Class IiaHDAC9 Protects neurons from apoptosis.HDAC5HDAC7HDAC6
Class IibHDAC10
SIRT1*
Class III, NAD-dependent
Interacts with PRC2, non-histone deacetylase activity. Involved in normal ageing through resistance to cellular stress. Deacetylates p53. Located in nucleus and cytoplasm [10].
SIRT2 Deacetylates alpha-tubulin. Located in the cytoplasm [10].
SIRT3Located in the mitochondria [10].SIRT4
SIRT5
SIRT6 Located in the nucleus [10]. H3K9 and H3K56 deacetylase activity.
SIRT7 Located in the nucleus [10].HDAC11 Class IVARID4A Bridging molecule to recruit HDACs.TBL1XR1 Associates with HDAC3 [11].NCOR1 Forms complex with HDAC1.
TRIM28 (KAP1)* Proposed to be a transcriptional repressor. Mediates apoptosis. through degradation of p53 [12].
Histone acetyltransferases
EP300 Type A, CBP/P300 family
Acetylates all four core histones, and non-histone proteins like p53 and MyoD [13].
CREBBP (CBP) Critical role in embryonic development, acetylates both histone and non-histone proteins.
NCOA3Type A
HAT activity not studied in detail.BRPF1 (TAF250)ATF2 Specifically acetylates H2B and H4 in vitro.KAT6A (MOZ)
Type A, MYST family
Component of the MOZ/MORF complex, which has a histone H3 acetyltransferase activity.KAT6B (MORF)
KAT5 (TIP60)KAT8 (MOF)
KAT7 (HBO1) Responsible for the bulk of histone H4 acetylation in vivo.
KAT2A (GCN5) Type A,
193

GNAT familyKAT2B (PCAF)HAT1 Type B
ING4 Facilitates targeting of HBO1-mediated acetylation to H3K4me3 sites [14].
SET HAT inhibitor Promotes apoptosis. Inhibits p300/CBP and PCAF-mediated acetyltransferase.
Histone methyltransferasesASH1L (ASH1) H3K36 HMT. ASH2L H3K4 HMT. Complex with MLL
ATF7IP (MCAF)* Required to stimulate SETDB1 activity, couples H3K9me3 with DNA methylation.
DOT1L (KMT4) H3K79 HMT.EHMT2 (G9a) H3K9me1/me2, H3K27me HMT.EHMT1 H3K9me1/me2 HMT.
EZH2*H3K27me1/me2/me3 HMT. Major role in stem cell identity maintenance. Also methylates GATA4. Catalytic subunit of PRC2 complex.
MEN1H3K4 HMT. Essential component of a MLL/SET1 HMT complex. Represses telomerase expression. Role in TGFB1-mediated inhibition of cell-proliferation.
MLL H3K4 HMT. Key regulator of development and haematopoiesis.
MLL2H3K4 HMT.
MLL3
MLL4 H3K4 HMT. Required to control the bulk of H3K4me3 during oocyte growth and preimplantation.
MLL5 H3K4me1/me2 HMT. Key regulator of haematopoiesis.
NSD1 (KMT3B) H3K36, H4K20 HMT. May influence transcription positively or negatively.
PRDM2 (RIZ1) H3K9 HMT.PRDM9 H3K4me3 HMT. Essential for meiotic progression.RBBP5 Complex with MLL.
RTF1 Required for H3K4me3 HMT on stem cell pluripotency genes.
SETD1A (SET1A) H3K4 HMT.SETD1B (SET1B) H3K4 HMT.SETD2 (KMT3A) H3K36 HMT.SETD7 (SET7) H3K4 HMT.SETD8 (KMT5A) Trimethylates H4K20 [15].SETDB1 (ESET) H3K9 HMT.SETDB2 H3K9 HMT.SMYD1 H3K4 HMT [16].
SMYD2 (KMT3C) H3K4me, H3K36me2 HMT. Also methylates TP53 and RB1.
SMYD3 H3K4me2/me3 HMT.SUV39H1 (KMT1A)
H3K9me3 HMT, uses H3K9me1 as substrate.SUV39H2 (KMT1B)SUV420H1 (KMT5B) H4K20me3 HMT. Key in constitutive heterochromatin
formation at pericentormeric regions.SUV420H2 (KMT5C)TRIM28 (KAP1)* Mediates silencing by recruiting SET1 H3K9me3 HMT
and HDAC NuRD complex. Mediates apoptosis through
194

degradation of p53 [12].WDR5 Complex with MLL.Histone demethylases
KDM1A (LSD1)* H3K4me2/me1, H3K9 HDM, also demethylates and stabilizes DNMT1.
KDM1B (LSD2)*H3K4me2/me1 HDM. Required for de novo DNA methylation of a subset of imprinted genes during oogenesis.
KDM2A H3K36me2 HDM. Required to maintain heterochromatic state at centromeres.
KDM2B HH3K4me3, H3K36me2 HDM. Represses rRNA genes.
KDM3A H3K9me2/me1 HDM.KDM3B H3K9 HDM.KDM4A H3K9me3, H3K36me3 HDM.KDM4B H3K9me3 HDM.KDM4C H3K9me3, H3K36me3 HDM.KDM4D H3K9me3/me2 HDM.
KDM5A (RBP2) H3K4me2/me3 HDM. Prominent role in cell differentiation and senescence [17].
KDM5B (PLU1) H3K4me3/me2/me1 HDM.
KDM5C (SMCX) H3K4me3/me2 HDM. Participates in the repression of neuronal genes.
KDM5D (SMCY) H3K4me3/me2 HDM.KDM6A (UTX) H3K27me2/me3 HDM. Regulation of HOX gene
expression.KDM6B (JMJD3)
JHDM1D (KDM7A) H3K9me2, H3K27me2, H4K20me1 HDM. Required for brain development.
KDM8 (JMJD5) H3K36me2 HDM. Required for G2/M cell cycle progression.
JMJD1C (TRIP8) H3K9 HDM.
JMJD6 H3R2, H4R3 HDM. Key regulator of haematopoietic differentiation.
PHF2 H3K9me2 HDM.
PHF8 H3K9me1/me2, H3K27me2, H4K20me1 HDM. Key role in cell cycle progression.
UTY H3K27me3/me2/me1 HDM [18].
JARID2 (JMJ)* Essential role in embryonic development, inhibits PRC2 trimethylation of H3K27 [19].
DNA methyltransferases
DNMT1 Maintainins methylation patterns established in development.
DNMT3A Genome-wide de novo methylation, essential for the establishment of DNA methylation patterns during development.DNMT3B
DNMT3L Catalytically inactive, but essential for DNMT3A and DNMT3B function.
MECP2Essential for embryonic development. Specifically bind methylated DNA and repress transcription at methylated promoters.
MBD1MBD2*MBD4
ATF7IP (MCAF)* Mediates MBD1 transcriptional repression, couples H3K9me3 with DNA methylation.
195

KDM1A (LSD1)* HDM, also demethylates and stabilizes DNMT1.
KDM1B (LSD2)* HDM, required for de novo DNA methylation of a subset of imprinted genes during oogenesis.
DNA demethylasesTET1 Converts 5mC
to 5hmC Putative role in DNA demethylation [20].TET2AICDA (AID) May play a role in DNA demethylation.TDG Essential for DNA demethylation [21].ATP-dependent chromatin remodellingSMARCA2 (BRM)
SWI/SNF complex is required for transcriptional activation of genes normally repressed by chromatin [22].
Catalytic component of SWI/SNIF complex [23].
SMARCA4 (BRG1) Essential for the maintenance of multipotent neural stem cells.
SMARCB1 (BAF47)SMARCC1SMARCC2SMARCD1SMARCD2SMARCD3SMARCE1 (BAF57)ARID1AARID1B (BAF250B)
ARID2 (BAF200) Required for the stability of the SWI/SNF chromatin remodelling complex SWI/SNF-B.
ACTL6A (BAF53A) Required for maximal SMARCA4 activity and for the association of the SWI/SNF complex with chromatin.
ACTL6B (BAF53B)DPF1 (BAF45B)DPF2 (BAF45D)DPF3 (BAF45C)EP400 Regulates nucleosome stability during DNA repair [24].PBRM1 Regulator of cell proliferation.PHF10 (BAF45A) Required for the proliferation of neural progenitors.MTA1
NuRD/Mi-2 complex has ATP-dependent chromatin remodelling activity and HDAC activity
MTA2
MTA3Maintenance of the normal epithelial architecture through the repression of SNAI1 transcription in a HDAC-dependent manner.
CHD3 (Mi-2α)CHD4 (Mi-2β) Main component of the NuRD/Mi-2 complex.GATAD2AGATAD2BHDAC1*HDAC2*
MBD2* Essential for embryonic development. Also bind methylated DNA.
RBBP4 (RBAP46)*Also part of PRC2 complex.
RBBP7 (RBAP48)*INO80 INO80
complex has DNA- and nucleosome-
TFPT Putative regulatory component of the INO80 complexYY1* Also interacts with PRC2 and is required for EZH2-
196

activated ATPase activity and catalyzes ATP-
mediated H3K27me3 [7].
SMARCA1 (SNF2L)
ISWI complex mobilizes mononucleosomes away from DNA ends without changing the arrangement of DNA on the surface of the histone octamer [22].
SMARCA5 (SNF2H) Required for replication of pericentric heterochromatin in S-phase specifically in conjunction with BAZ1A.
BAZ1A (ACF1)
BAZ1B (WSTF)
Acts as a mark that distinguishes between apoptotic and repair responses to genotoxic stress. Maintenance of chromatin structures during DNA replication processes.
BAZ2A (TIP5)BPTF Binds H3K4me3.CHRAC1POLE3RSF1RBBP4 (RBAP46)*
Also part of PRC2 complex.RBBP7 (RBAP48)*
CHD1 Required for the maintenance of open chromatin and pluripotency in ESC.
CHD2 SNF2-related helicase/ATPase domains.
HNF1A Possible regulation of transcription through chromatin remodelling [26].
IKZF1* Targets NuRD/Mi-2 and SWI/SNF complexes in a single complex.
Global chromatin regulatorsLMNA lamin A/C Global heterochromatic changes induced by lamin
perturbation are often mirrored by altered levels of chromatin-associated epigenetic histone marks [27].
LMNB1 lamin B1LMNB2 lamin B2Other chromatin regulators
BAG6 Complex EP300
p300-mediated p53 acetylation upon DNA damage. May mediate H3K4me2.
ATRX ATRX-DAXX complex
Thought to regulate deposition of H3.3 at heterochromatic regions of the genome, including telomeres [28].DAXX
MUM1 Opens chromatin to facilitate DNA damage repair [29].*Genes with more than one function in chromatin remodelling appear more than once in the table.
(a) HGNC HUGO gene names. In parenthesis, common alternative gene names.
(b) Gene function provided by Uniprot, unless otherwise stated.[30]
197

Table S2. Described oncogenic alterations in Chromatin Regulatory Factors. This is an exhaustive compilation of alterations(*) reported in CRFs not included in Table 1. Gene names correspond to HUGO HGNC approved symbols. In bold typeface, genes included in the Cancer Gene Census (CGC) [31]. ALL: Acute Lymphocytic Leukaemia; AML: Acute Myeloid Leukaemia; B-ALL: B Acute Lymphoblastic Leukaemia; B-NHL: B-cell non-Hodgkin Lymphoma; CLL: Chronic Lymphocytic Leukaemia; ccOC: Clear Cell Ovarian Carcinoma; ccRCC: clear-cell Renal Cell Carcinoma; CMML: Chronic Myelomonocytic leukaemia; ESCC: Oesophageal Squamous Cell Carcinoma; FL: Follicular Lymphoma; HCC: Hepatocellular Carcinoma; HL: Hodgkin Lymphoma; HNSCC: Head and Neck Squamous Cell Carcinoma; MCL: Mantle cell Lymphoma; MDS: Myelodysplastic Syndrome; MSI: Microsatellite instability; NMSC: Non-Melanoma Skin Cancer; NSCLC: Non-Small Cell Lung Carcinoma; OSCC: Oral Squamous Cell Carcinoma; RCC: Renal Cell Carcinoma; T-ALL: T Acute Lymphoblastic Leukaemia.
*Evidence based solely on cancer cell lines is excluded from this table. Only evidence in human samples have been used. Effects of pharmacological inhibition are not included. Germline polymorphisms are excluded.
Gene Literature evidence
AEBP2 Deleted in AML [32].
ARID2 Mutated in hepatocellular carcinoma (CGC), melanoma [33], NSCLC [34] and pancreatic cancer [35].Deleted in NSCLC [34].
ASH1L Mutated in lung cancer cell lines [36].Gained in hepatocellular carcinoma [37].
ATF2 Over-expressed in melanoma [38].
ATRX Mutated in paediatric glioblastoma, neuroendocrine pancreatic tumours (CGC) and high grade adult gliomas [39].
BAZ1A Amplified in ESCC [40].Deleted in papillary type 2 RCC [41].
BAZ2A Over-expressed in CLL [42].
BMI1 Over-expressed in B-NHL, leukaemia, MCL, medulloblastoma, neuroblastoma, NSCLC [43] and prostate tumours [44].
CBX2 Over-expressed in breast cancer [45].
CBX7 Over-expressed in lymphoma [46].Down-regulated in bladder [47], and aggressive gastric [48], pancreatic [49] and thyroid cancer [50].
CHD2 Mutated in high MSI gastric and colorectal cancers [51] and CLL [52].Down-regulated in relapsed colon cancer [53].
CREBBP Mutated in AML, ALL, DLBCL, N-NHL (CGC), bladder [54], medulloblastoma [55] and SCLC [56].LOH in lung [57].
198

DAXX Mutated in paediatric glioblastoma and neuroendocrine pancreatic tumours (CGC).Over-expressed in prostate cancer [58].
DNMT1 Over-expressed in AML [59], gliomas [60] and pancreatic tumours [61].
DNMT3A Mutated in AML (CGC), ALL and lung cancer [62].Over-expressed in ovarian aggressive tumours [63].
DNMT3B Over-expressed in breast [64], colorectal and stomach [65], prostate cancer [66], advanced stages of DLBCL [67].
DNMT3L Over-expressed in testicular embryonal carcinoma [68].Loss of methylation and consequent over-expression in cervical cancer [69].
EHMT2 Over-expressed in bladder [70], resistant cervical [71] and aggressive lung tumours [72].
EPC1 Mutated in pancreatic cancer [35].
EZH1 Over-expressed and amplified in myeloproliferative neoplasms [73].
EZH2 Mutated in DLBCL (CGC), MDS [74].Over-expressed in bladder, breast, colon, liver, melanoma and prostate tumours; DLBCL, HL and MCL [43].
GATAD2B Deleted in OSCC [75].
HDAC1 Over-expressed in HCC [76].Down-regulated in aggressive breast tumours [77].
HDAC2 Mutated in colon cancer with microsatellite instability [78].Over-expressed in gastrointestinal tumours [79], prostate [80], aggressive HCC [81], lung [82], cervical [83], ovarian and endometrial endometrioid carcinomas [84].
HDAC3 Over-expressed in gastrointestinal tumours [79], b-cell lymphomas [85] and CLL [86].
HDAC4 Mutated in melanoma [87] and breast cancer [88].Over-expressed in T-ALL [89] and treatment-resistant ovarian tumours [90].
HDAC5 Over-expressed in B-ALL [89] and aggressive medulloblastoma [91].
HDAC6 Over-expressed in HCC [92], cisplatin-resistant NSCLC [93] and breast tumours with good prognosis [94].Down-regulated in CLL [86].
HDAC7 Over-expressed in pancreatic adenocarcinoma [95] and aggressive childhood ALL [89].
HDAC8 Over-expressed in aggressive neuroblastoma [96].
HDAC9 Over-expressed in high grade medulloblastoma [91] and childhood ALL with poor prognosis [89].Amplified in OSCC [75].
HDAC10 Down-regulated in adrenocortical tumours [97], CLL [98] and aggressive NSCLC [99].
JARID2 Mutated in NSCLC [34].Deleted in AML [32].
JMJD6 Over-expressed in aggressive breast tumours [100].
KAT5 Down-regulated in gastric cancer [101], aggressive melanoma [102] and advanced colorectal carcinoma [103].
KAT6A Translocated in AML [104].
KAT6B Translocated in AML [104] and benign uterine tumours [105].
KAT7 Over-expressed in testicular, breast, ovarian, bladder, oral and esophageal
199

carcinomas [106].
KDM1A Over-expressed in NSCLC [107], highly malignant sarcomas [108], bladder [109] and aggressive prostate tumours [110].Down-regulated in breast carcinoma [111].
KDM2A Down-regulated in prostate cancer [112].
KDM3B Over-expressed in ALL [113] and prostate cancer [114].
KDM4A Over-expressed in breast [115] and prostate cancer [114].Down-regulated in bladder tumours [116].
KDM4B Over-expressed in gastric cancer [117].
KDM4C Over-expressed and amplified in breast cancer [118].
KDM5A Mutated in AML (CGC).Down-regulated in melanoma [119].Over-expressed in breast tumours with good prognosis [120].
KDM5B Over-expressed in breast tumours, prostate cancer [114] and uveal melanoma [121].
LMNA Over-expressed in aggressive colorectal cancer [122].Down-regulated in DLBCL [123], ALL and NHL [124].
LMNB1 Over-expressed in HCC [125] and colorectal tumours [126].
MBD4 Mutated in sporadic colon cancer [127] and HNPCC with MSI [128].
MECP2 Over-expressed in breast tumours [129].
MEN1 Mutated in pancreas, parathyroid (CGC) and in lung carcinoids [130].MLL-fusion partner in leukaemias [131].
MLL5 Down-regulated in poor prognosis AML [132].
MTA1 Over-expressed in OSCC, ESCC, early NSCLC, HCC, osteosarcoma, and colorectal, pancreatic, endometrial, ovarian, prostate, breast and gastric cancers. It is one of the most commonly over-expressed genes in human tumours [133].
MTA2 Over-expressed in NSCLC [134], aggressive HCC [135] and epithelial ovarian cancer [136].
NCOA3 Over-expressed in HCC, breast [137], urothelial carcinoma of the bladder [138], NSCLC [139] and prostate tumours [140].Amplified in breast cancer [141].Fusion partner of KAT6A in AML [142].
PCGF2 Over-expressed in aggressive medulloblastoma [143].Down-regulated in breast tumours [144] and high-grade prostate cancer [145].
PHC1 Over-expressed in ALL [43].
PHC3 Mutated and lost in osteosarcoma [146].
PHF8 Over-expressed in prostate cancer [114].
PHF19 Over-expressed in colon, skin, lung, rectal, cervical, uterine and hepatic tumours [43].
PRDM2 Mutated in endometrial, gastrointestinal [147] and colon tumours with MSI [148], melanoma [149].Over-expressed in ALL [150].Down-regulated in ESCC [151], neuroblastoma [152], HCC [153], epithelial ovarian carcinoma [154], thyroid carcinoma [155] and AML [150].Deleted in parathyroid tumours [156].
RBBP4 Over-expressed in HPV-positive oropharyngeal tumours [157].Down-regulated in mucoepidermoid carcinoma [158].
200

RBBP5 Amplified in glioblastomas [159].
RBBP7 Over-expressed in NSCLC [160] and breast tumours [161].
RING1 Over-expressed in prostate tumours [44].
RSF1 Over-expressed in NSCLC [162], urinary bladder [163], colon [164], gallbladder [165], nasopharyngeal [166] and ovarian aggressive carcinomas [167].Amplified in aggressive ovarian carcinoma [168].
SET Mutated in AML (CGC).Over-expressed in colorectal adenocarcinoma [169] and paediatric B-ALL and T-ALL [170].
SET8 Over-expressed in aggressive breast tumours [171].
SETDB1 Over-expressed in melanoma [172].
SETDB2 Deleted in CLL [173].
SIRT1 Over-expressed in leukaemia, prostate, skin and colon cancers [174]Down-regulated in breast tumours and HCC [175].
SIRT2 Down-regulated in gliomas [176].
SIRT3 Down-regulated in HCC [177].
SIRT7 Over-expressed in breast [178] and thyroid carcinoma [179].
SMARCA2 Mutated in NMSC [180] and CLL [181].Down-regulated in lung adenocarcinoma [182] and gastric cancer [183].Amplified in AML [184].
SMARCB1 Mutated in malignant rhabdoid tumours (CGC).
SMARCD3 Over-expressed in advanced neuroblastoma [185].
SMARCE1 Over-expressed in aggressive endometrial carcinoma [186].
SMYD2 Over-expressed in ESCC [187].
SMYD3 Over-expressed in colorectal cancer [188].
SUZ12 Mutated in endometrial stromal tumours (CGC).Over-expressed in breast, colon, liver [43] and ovarian tumours [189].Amplified in MCL [190].
TET2 Mutated in MDS (CGC), CMML and AML [191].
TFPT Mutated in pre-B ALL (CGC).
TRIM28 Over-expressed in colorectal tumours [192], gastric cancer cell lines [193], NSCLC and breast [194]. Over-expression predicts better survival in early lung tumours [194].High expression indicates good prognosis in gastric cancer [193].
YY1 Over-expressed in prostate, colon, ovary, breast, bone, liver, lung, bladder, cervix, skin and blood (DLBCL, AML, CML, ALL, HL, BL, MCL, CLL and FL) cancers [195].Down-regulated in melanomas, paediatric osteosarcomas and urothelial carcinomas [195].There are contradictory results on the prognostic significance of YY1 in cancer [195].
201

Table S3. Gene regulatory modules collected for the analysis.
Group Name Cell type Nº of genes Source
EP300EP300 ES ES 1191 Lister et al. 2009 [196]
EP300 CD4 CD4 3792 Wang et al. 2009 [197]
Activating histone marks
H3K4me3 ES ES 12312 ENCODE [198]
H3K4me3 CD4 CD4 11423 Barski et al. 2007 [199]
H3K4me3 gm12878 gm12878 11771 ENCODE [198]
H3K9ac ES ES 10489 ENCODE [198]
H3K9ac CD4 CD4 6906 Wang et al. 2009 [197]
H3K9ac gm12878 gm12878 9918 ENCODE [198]
Repressive histone marks
H3K27me3 ES ES 6665 ENCODE [198]
H3K27me3 CD4 CD4 5207 Wang et al. 2009 [197]
H3K27me3 gm12878 gm12878 6099 ENCODE [198]
Replication Timing
Late RT ES ES 918 Hansen et al. 2010 [200]
Late RT lymphoid lymphoid 260 Hansen et al. 2010 [200]
202

Supplementary figures
Figure S1. Fraction of mutated CRFs across cancer cell lines. The list of genes in the heatmap correspond to all FM biased CRFs detected at the beginning of the study which have been sequenced in the Cancer Cell Lines Encyclopedia. Each cell in the heatmap represents a CRF in a primary site, and colours correspond to the frequency of potentially protein sequence affecting mutations (PAMs) in these genes across 905 cancer cell lines, grouped by their corresponding primary tissues.
203

Figure S2. Mutational state of tumour samples with PAMs in CRFs across the eleven anatomical sites studied. The list of genes in the heatmap corresponds to all FM biased CRFs detected at the beginning of the study. Every sample is a column of the heatmap, and every cell reflects the mutational state of a CRF (symbols at the extreme right) through their MutationAssessor Functional Impact (FI) scores (only samples with at least one mutated CRF are included in the heatmap), colour-coded following the bottom scale. Gray cells indicate that the CRF is not mutated. The top colour annotation above the heatmap represents the CF ratio of each tumour sample and follows the bottom colour scale; samples with CF ratios above 0.5, thus appear black-shifted.
204

Figure S3. Cancer cell lines show tissue-specific highly expressed genes depending on their primary source. Cancer cell lines from solid tumours are represented in columns, and GO Biological Process modules in rows. SLEA results show an over-expression (in red) of tissue-specific genes in concordance to the cell lines derived from them.
Supplementary references1. Cao R, Zhang Y: SUZ12 Is Required for Both the Histone Methyltransferase
Activity and the Silencing Function of the EED-EZH2 Complex. Molecular Cell 2004, 15:57–67.
2. Kuzmichev A, Nishioka K, Erdjument-Bromage H, Tempst P, Reinberg D: Histone methyltransferase activity associated with a human multiprotein complex containing the Enhancer of Zeste protein. Genes Dev 2002, 16:2893–2905.
3. Cai L, Rothbart SB, Lu R, Xu B, Chen W-Y, Tripathy A, Rockowitz S, Zheng D, Patel DJ, Allis CD, Strahl BD, Song J, Wang GG: An H3K36 Methylation-Engaging Tudor Motif of Polycomb-like Proteins Mediates PRC2 Complex Targeting. Mol. Cell 2012.
4. Ballaré C, Lange M, Lapinaite A, Martin GM, Morey L, Pascual G, Liefke R, Simon B, Shi Y, Gozani O, Carlomagno T, Benitah SA, Di Croce L: Phf19 links methylated Lys36 of histone H3 to regulation of Polycomb activity. Nat. Struct. Mol. Biol. 2012, 19:1257–1265.
5. Abdel-Wahab O, Adli M, LaFave LM, Gao J, Hricik T, Shih AH, Pandey S, Patel JP,
205
Chung YR, Koche R, Perna F, Zhao X, Taylor JE, Park CY, Carroll M, Melnick A, Nimer SD, Jaffe JD, Aifantis I, Bernstein BE, Levine RL: ASXL1 mutations promote myeloid transformation through loss of PRC2-mediated gene repression. Cancer Cell 2012, 22:180–193.
6. Li X, Isono K, Yamada D, Endo TA, Endoh M, Shinga J, Mizutani-Koseki Y, Otte AP, Casanova M, Kitamura H, Kamijo T, Sharif J, Ohara O, Toyada T, Bernstein BE, Brockdorff N, Koseki H: Mammalian Polycomb-Like Pcl2/Mtf2 Is a Novel Regulatory Component of PRC2 That Can Differentially Modulate Polycomb Activity both at the Hox Gene Cluster and at Cdkn2a Genes. Mol Cell Biol 2011, 31:351–364.
7. Caretti G, Di Padova M, Micales B, Lyons GE, Sartorelli V: The Polycomb Ezh2 methyltransferase regulates muscle gene expression and skeletal muscle differentiation. Genes Dev 2004, 18:2627–2638.
8. Trojer P, Cao AR, Gao Z, Li Y, Zhang J, Xu X, Li G, Losson R, Erdjument-Bromage H, Tempst P, Farnham PJ, Reinberg D: L3MBTL2 protein acts in concert with PcG protein mediated monoubiquitination of H2A to establish a repressive chromatin structure. Mol Cell 2011, 42:438–450.
9. Dovey OM, Foster CT, Cowley SM: Histone deacetylase 1 (HDAC1), but not HDAC2, controls embryonic stem cell differentiation. PNAS 2010, 107:8242–8247.
10. Rajendran R, Garva R, Krstic-Demonacos M, Demonacos C: Sirtuins: Molecular Traffic Lights in the Crossroad of Oxidative Stress, Chromatin Remodeling, and Transcription. J Biomed Biotechnol 2011, 2011.
11. Yoon H-G, Chan DW, Huang Z-Q, Li J, Fondell JD, Qin J, Wong J: Purification and functional characterization of the human N-CoR complex: the roles of HDAC3, TBL1 and TBLR1. EMBO J 2003, 22:1336–1346.
12. Iyengar S, Farnham PJ: KAP1 Protein: An Enigmatic Master Regulator of the Genome. J Biol Chem 2011, 286:26267–26276.
13. Hodawadekar SC, Marmorstein R: Chemistry of acetyl transfer by histone modifying enzymes: structure, mechanism and implications for effector design. Oncogene 2007, 26:5528–5540.
14. Palacios A, Moreno A, Oliveira BL, Rivera T, Prieto J, García P, Fernández-Fernández MR, Bernadó P, Palmero I, Blanco FJ: The dimeric structure and the bivalent recognition of H3K4me3 by the tumor suppressor ING4 suggests a mechanism for enhanced targeting of the HBO1 complex to chromatin. J. Mol. Biol. 2010, 396:1117–1127.
15. Nishioka K, Rice JC, Sarma K, Erdjument-Bromage H, Werner J, Wang Y, Chuikov S, Valenzuela P, Tempst P, Steward R, Lis JT, Allis CD, Reinberg D: PR-Set7 is a nucleosome-specific methyltransferase that modifies lysine 20 of histone H4 and is associated with silent chromatin. Mol. Cell 2002, 9:1201–1213.
16. Xu S, Zhong C, Zhang T, Ding J: Structure of human lysine methyltransferase Smyd2 reveals insights into the substrate divergence in Smyd proteins. J Mol Cell Biol 2011, 3:293–300.
17. Benevolenskaya EV, Murray HL, Branton P, Young RA, Kaelin Jr. WG: Binding of pRB to the PHD Protein RBP2 Promotes Cellular Differentiation. Molecular Cell 2005, 18:623–635.
206

18. Islam ABMMK, Richter WF, Jacobs LA, Lopez-Bigas N, Benevolenskaya EV: Co-Regulation of Histone-Modifying Enzymes in Cancer. PLoS One 2011, 6.
19. Peng JC, Valouev A, Swigut T, Zhang J, Zhao Y, Sidow A, Wysocka J: Jarid2/Jumonji Coordinates Control of PRC2 Enzymatic Activity and Target Gene Occupancy in Pluripotent Cells. Cell 2009, 139:1290–1302.
20. Tahiliani M, Koh KP, Shen Y, Pastor WA, Bandukwala H, Brudno Y, Agarwal S, Iyer LM, Liu DR, Aravind L, Rao A: Conversion of 5-methylcytosine to 5-hydroxymethylcytosine in mammalian DNA by MLL partner TET1. Science 2009, 324:930–935.
21. Cortellino S, Xu J, Sannai M, Moore R, Caretti E, Cigliano A, Le Coz M, Devarajan K, Wessels A, Soprano D, Abramowitz LK, Bartolomei MS, Rambow F, Bassi MR, Bruno T, Fanciulli M, Renner C, Klein-Szanto AJ, Matsumoto Y, Kobi D, Davidson I, Alberti C, Larue L, Bellacosa A: Thymine DNA Glycosylase Is Essential for Active DNA Demethylation by Linked Deamination-Base Excision Repair. Cell 2011, 146:67–79.
22. Kassabov SR, Zhang B, Persinger J, Bartholomew B: SWI/SNF Unwraps, Slides, and Rewraps the Nucleosome. Molecular Cell 2003, 11:391–403.
23. Harikrishnan KN, Chow MZ, Baker EK, Pal S, Bassal S, Brasacchio D, Wang L, Craig JM, Jones PL, Sif S, El-Osta A: Brahma links the SWI/SNF chromatin-remodeling complex with MeCP2-dependent transcriptional silencing. Nature Genetics 2005, 37:254–264.
24. Xu Y, Sun Y, Jiang X, Ayrapetov MK, Moskwa P, Yang S, Weinstock DM, Price BD: The p400 ATPase regulates nucleosome stability and chromatin ubiquitination during DNA repair. J Cell Biol 2010, 191:31–43.
25. Jin J, Cai Y, Yao T, Gottschalk AJ, Florens L, Swanson SK, Gutiérrez JL, Coleman MK, Workman JL, Mushegian A, Washburn MP, Conaway RC, Conaway JW: A Mammalian Chromatin Remodeling Complex with Similarities to the Yeast INO80 Complex. J. Biol. Chem. 2005, 280:41207–41212.
26. Pontoglio M, Faust DM, Doyen A, Yaniv M, Weiss MC: Hepatocyte nuclear factor 1alpha gene inactivation impairs chromatin remodeling and demethylation of the phenylalanine hydroxylase gene. Mol Cell Biol 1997, 17:4948–4956.
27. Dittmer TA, Misteli T: The lamin protein family. Genome Biol 2011, 12:222.
28. Elsässer SJ, Allis CD, Lewis PW: New Epigenetic Drivers of Cancers. Science 2011, 331:1145–1146.
29. Huen MSY, Huang J, Leung JWC, Sy SM-H, Leung KM, Ching Y-P, Tsao SW, Chen J: Regulation of chromatin architecture by the PWWP domain-containing DNA damage-responsive factor EXPAND1/MUM1. Mol. Cell 2010, 37:854–864.
30. Ley TJ, Ding L, Walter MJ, McLellan MD, Lamprecht T, Larson DE, Kandoth C, Payton JE, Baty J, Welch J, Harris CC, Lichti CF, Townsend RR, Fulton RS, Dooling DJ, Koboldt DC, Schmidt H, Zhang Q, Osborne JR, Lin L, O’Laughlin M, McMichael JF, Delehaunty KD, McGrath SD, Fulton LA, Magrini VJ, Vickery TL, Hundal J, Cook LL, Conyers JJ, Swift GW, Reed JP, Alldredge PA, Wylie T, Walker J, Kalicki J, Watson MA, Heath S, Shannon WD, Varghese N, Nagarajan R, Westervelt P, Tomasson MH, Link DC, Graubert TA, DiPersio JF, Mardis ER, Wilson RK: DNMT3A Mutations in Acute Myeloid Leukemia. New England Journal of Medicine 2010, 363:2424–2433.
207

31. Futreal PA, Coin L, Marshall M, Down T, Hubbard T, Wooster R, Rahman N, Stratton MR: A census of human cancer genes. Nat Rev Cancer 2004, 4:177–183.
32. Puda A, Milosevic JD, Berg T, Klampfl T, Harutyunyan AS, Gisslinger B, Rumi E, Pietra D, Malcovati L, Elena C, Doubek M, Steurer M, Tosic N, Pavlovic S, Guglielmelli P, Pieri L, Vannucchi AM, Gisslinger H, Cazzola M, Kralovics R: Frequent deletions of JARID2 in leukemic transformation of chronic myeloid malignancies. Am. J. Hematol. 2012, 87:245–250.
33. Hodis E, Watson IR, Kryukov GV, Arold ST, Imielinski M, Theurillat J-P, Nickerson E, Auclair D, Li L, Place C, Dicara D, Ramos AH, Lawrence MS, Cibulskis K, Sivachenko A, Voet D, Saksena G, Stransky N, Onofrio RC, Winckler W, Ardlie K, Wagle N, Wargo J, Chong K, Morton DL, Stemke-Hale K, Chen G, Noble M, Meyerson M, Ladbury JE, Davies MA, Gershenwald JE, Wagner SN, Hoon DSB, Schadendorf D, Lander ES, Gabriel SB, Getz G, Garraway LA, Chin L: A landscape of driver mutations in melanoma. Cell 2012, 150:251–263.
34. Manceau G, Letouzé E, Guichard C, Didelot A, Cazes A, Corté H, Fabre E, Pallier K, Imbeaud S, Le Pimpec-Barthes F, Zucman-Rossi J, Laurent-Puig P, Blons H: Recurrent inactivating mutations of ARID2 in non-small cell lung carcinoma. Int. J. Cancer 2012.
35. Biankin AV, Waddell N, Kassahn KS, et al.: Pancreatic cancer genomes reveal aberrations in axon guidance pathway genes. Nature 2012, 491:399–405.
36. Liu J, Lee W, Jiang Z, Chen Z, Jhunjhunwala S, Haverty PM, Gnad F, Guan Y, Gilbert HN, Stinson J, Klijn C, Guillory J, Bhatt D, Vartanian S, Walter K, Chan J, Holcomb T, Dijkgraaf P, Johnson S, Koeman J, Minna JD, Gazdar AF, Stern HM, Hoeflich KP, Wu TD, Settleman J, De Sauvage FJ, Gentleman RC, Neve RM, Stokoe D, Modrusan Z, Seshagiri S, Shames DS, Zhang Z: Genome and transcriptome sequencing of lung cancers reveal diverse mutational and splicing events. Genome Res 2012, 22:2315–2327.
37. Skawran B, Steinemann D, Weigmann A, Flemming P, Becker T, Flik J, Kreipe H, Schlegelberger B, Wilkens L: Gene expression profiling in hepatocellular carcinoma: upregulation of genes in amplified chromosome regions. Modern Pathology 2008, 21:505–516.
38. Bhoumik A, Ronai Z: ATF2: a transcription factor that elicits oncogenic or tumor suppressor activities. Cell Cycle 2008, 7:2341–2345.
39. Jiao Y, Killela PJ, Reitman ZJ, Rasheed BA, Heaphy CM, De Wilde RF, Rodriguez FJ, Rosemberg S, Oba-Shinjo SM, Marie SKN, Bettegowda C, Agrawal N, Lipp E, Pirozzi CJ, Lopez GY, He Y, Friedman HS, Friedman AH, Riggins GJ, Holdhoff M, Burger P, McLendon RE, Bigner DD, Vogelstein B, Meeker AK, Kinzler KW, Papadopoulos N, Diaz LA, Yan H: Frequent ATRX, CIC, FUBP1 and IDH1 mutations refine the classification of malignant gliomas. Oncotarget 2012, 3:709–722.
40. Yasui K, Imoto I, Fukuda Y, Pimkhaokham A, Yang ZQ, Naruto T, Shimada Y, Nakamura Y, Inazawa J: Identification of target genes within an amplicon at 14q12-q13 in esophageal squamous cell carcinoma. Genes Chromosomes Cancer 2001, 32:112–118.
41. Krill-Burger JM, Lyons MA, Kelly LA, Sciulli CM, Petrosko P, Chandran UR, Kubal MD, Bastacky SI, Parwani AV, Dhir R, LaFramboise WA: Renal cell neoplasms
208

contain shared tumor type-specific copy number variations. Am. J. Pathol. 2012, 180:2427–2439.
42. Hanlon K, Rudin CE, Harries LW: Investigating the Targets of MIR-15a and MIR-16-1 in Patients with Chronic Lymphocytic Leukemia (CLL). PLoS One 2009, 4.
43. Sparmann A, Lohuizen M van: Polycomb silencers control cell fate, development and cancer. Nature Reviews Cancer 2006, 6:846–856.
44. Van Leenders GJLH, Dukers D, Hessels D, Van den Kieboom SWM, Hulsbergen CA, Witjes JA, Otte AP, Meijer CJ, Raaphorst FM: Polycomb-group oncogenes EZH2, BMI1, and RING1 are overexpressed in prostate cancer with adverse pathologic and clinical features. Eur. Urol. 2007, 52:455–463.
45. Parris TZ, Danielsson A, Nemes S, Kovács A, Delle U, Fallenius G, Möllerström E, Karlsson P, Helou K: Clinical Implications of Gene Dosage and Gene Expression Patterns in Diploid Breast Carcinoma. Clin Cancer Res 2010, 16:3860–3874.
46. Scott CL, Gil J, Hernando E, Teruya-Feldstein J, Narita M, Martínez D, Visakorpi T, Mu D, Cordon-Cardo C, Peters G, Beach D, Lowe SW: Role of the chromobox protein CBX7 in lymphomagenesis. Proc Natl Acad Sci U S A 2007, 104:5389–5394.
47. Hinz S, Kempkensteffen C, Christoph F, Krause H, Schrader M, Schostak M, Miller K, Weikert S: Expression parameters of the polycomb group proteins BMI1, SUZ12, RING1 and CBX7 in urothelial carcinoma of the bladder and their prognostic relevance. Tumour Biol. 2008, 29:323–329.
48. Zhang X-W, Zhang L, Qin W, Yao X-H, Zheng L-Z, Liu X, Li J, Guo W-J: Oncogenic role of the chromobox protein CBX7 in gastric cancer. J Exp Clin Cancer Res 2010, 29:114.
49. Karamitopoulou E, Pallante P, Zlobec I, Tornillo L, Carafa V, Schaffner T, Borner M, Diamantis I, Esposito F, Brunner T, Zimmermann A, Federico A, Terracciano L, Fusco A: Loss of the CBX7 protein expression correlates with a more aggressive phenotype in pancreatic cancer. Eur. J. Cancer 2010, 46:1438–1444.
50. Pallante P, Federico A, Berlingieri MT, Bianco M, Ferraro A, Forzati F, Iaccarino A, Russo M, Pierantoni GM, Leone V, Sacchetti S, Troncone G, Santoro M, Fusco A: Loss of the CBX7 Gene Expression Correlates with a Highly Malignant Phenotype in Thyroid Cancer. Cancer Res 2008, 68:6770–6778.
51. Kim MS, Chung NG, Kang MR, Yoo NJ, Lee SH: Genetic and expressional alterations of CHD genes in gastric and colorectal cancers. Histopathology 2011, 58:660–668.
52. Quesada V, Conde L, Villamor N, Ordóñez GR, Jares P, Bassaganyas L, Ramsay AJ, Beà S, Pinyol M, Martínez-Trillos A, López-Guerra M, Colomer D, Navarro A, Baumann T, Aymerich M, Rozman M, Delgado J, Giné E, Hernández JM, González-Díaz M, Puente DA, Velasco G, Freije JMP, Tubío JMC, Royo R, Gelpí JL, Orozco M, Pisano DG, Zamora J, Vázquez M, Valencia A, Himmelbauer H, Bayés M, Heath S, Gut M, Gut I, Estivill X, López-Guillermo A, Puente XS, Campo E, López-Otín C: Exome sequencing identifies recurrent mutations of the splicing factor SF3B1 gene in chronic lymphocytic leukemia. Nature Genetics 2012, 44:47–52.
53. Bandrés E, Malumbres R, Cubedo E, Honorato B, Zarate R, Labarga A, Gabisu U, Sola JJ, García-Foncillas J: A gene signature of 8 genes could identify the risk of
209

recurrence and progression in Dukes’ B colon cancer patients. Oncology Reports 2007, 17:1089.
54. Gui Y, Guo G, Huang Y, Hu X, Tang A, Gao S, Wu R, Chen C, Li X, Zhou L, He M, Li Z, Sun X, Jia W, Chen J, Yang S, Zhou F, Zhao X, Wan S, Ye R, Liang C, Liu Z, Huang P, Liu C, Jiang H, Wang Y, Zheng H, Sun L, Liu X, Jiang Z, Feng D, Chen J, Wu S, Zou J, Zhang Z, Yang R, Zhao J, Xu C, Yin W, Guan Z, Ye J, Zhang H, Li J, Kristiansen K, Nickerson ML, Theodorescu D, Li Y, Zhang X, Li S, Wang J, Yang H, Wang J, Cai Z: Frequent mutations of chromatin remodeling genes in transitional cell carcinoma of the bladder. Nature Genetics 2011, 43:875–878.
55. Robinson G, Parker M, Kranenburg TA, Lu C, Chen X, Ding L, Phoenix TN, Hedlund E, Wei L, Zhu X, Chalhoub N, Baker SJ, Huether R, Kriwacki R, Curley N, Thiruvenkatam R, Wang J, Wu G, Rusch M, Hong X, Becksfort J, Gupta P, Ma J, Easton J, Vadodaria B, Onar-Thomas A, Lin T, Li S, Pounds S, Paugh S, Zhao D, Kawauchi D, Roussel MF, Finkelstein D, Ellison DW, Lau CC, Bouffet E, Hassall T, Gururangan S, Cohn R, Fulton RS, Fulton LL, Dooling DJ, Ochoa K, Gajjar A, Mardis ER, Wilson RK, Downing JR, Zhang J, Gilbertson RJ: Novel mutations target distinct subgroups of medulloblastoma. Nature 2012, 488:43–48.
56. Peifer M, Fernández-Cuesta L, Sos ML, George J, Seidel D, Kasper LH, Plenker D, Leenders F, Sun R, Zander T, Menon R, Koker M, Dahmen I, Müller C, Cerbo VD, Schildhaus H-U, Altmüller J, Baessmann I, Becker C, Wilde B de, Vandesompele J, Böhm D, Ansén S, Gabler F, Wilkening I, Heynck S, Heuckmann JM, Lu X, Carter SL, Cibulskis K, Banerji S, Getz G, Park K-S, Rauh D, Grütter C, Fischer M, Pasqualucci L, Wright G, Wainer Z, Russell P, Petersen I, Chen Y, Stoelben E, Ludwig C, Schnabel P, Hoffmann H, Muley T, Brockmann M, Engel-Riedel W, Muscarella LA, Fazio VM, Groen H, Timens W, Sietsma H, Thunnissen E, Smit E, Heideman DAM, Snijders PJF, Cappuzzo F, Ligorio C, Damiani S, Field J, Solberg S, Brustugun OT, Lund-Iversen M, Sänger J, Clement JH, Soltermann A, Moch H, Weder W, Solomon B, Soria J-C, Validire P, Besse B, Brambilla E, Brambilla C, Lantuejoul S, Lorimier P, Schneider PM, Hallek M, Pao W, Meyerson M, Sage J, Shendure J, Schneider R, Büttner R, Wolf J, Nürnberg P, Perner S, Heukamp LC, Brindle PK, Haas S, Thomas RK: Integrative genome analyses identify key somatic driver mutations of small-cell lung cancer. Nature Genetics 2012, 44:1104–1110.
57. Dokmanovic M, Clarke C, Marks PA: Histone Deacetylase Inhibitors: Overview and Perspectives. Mol Cancer Res 2007, 5:981–989.
58. Kwan P-S, Lau CC, Chiu YT, Man C, Liu J, Tang K, Wong Y-C, Ling MT: Daxx regulates mitotic progression and prostate cancer predisposition. Carcinogenesis 2012.
59. Mizuno S, Chijiwa T, Okamura T, Akashi K, Fukumaki Y, Niho Y, Sasaki H: Expression of DNA methyltransferases DNMT1,3A, and 3B in normal hematopoiesis and in acute and chronic myelogenous leukemia. Blood 2001, 97:1172–1179.
60. Rajendran G, Shanmuganandam K, Bendre A, Muzumdar D, Mujumdar D, Goel A, Shiras A: Epigenetic regulation of DNA methyltransferases: DNMT1 and DNMT3B in gliomas. J. Neurooncol. 2011, 104:483–494.
61. Li A, Omura N, Hong S-M, Goggins M: Pancreatic cancer DNMT1 expression and sensitivity to DNMT1 inhibitors. Cancer Biol Ther 2010, 9.
210

62. Kim MS, Kim YR, Yoo NJ, Lee SH: Mutational analysis of DNMT3A gene in acute leukemias and common solid cancers. APMIS 2012.
63. Bai X, Song Z, Fu Y, Yu Z, Zhao L, Zhao H, Yao W, Huang D, Mi X, Wang E, Zheng Z, Wei M: Clinicopathological Significance and Prognostic Value of DNA Methyltransferase 1, 3a, and 3b Expressions in Sporadic Epithelial Ovarian Cancer. PLoS One 2012, 7.
64. Girault I, Tozlu S, Lidereau R, Bièche I: Expression Analysis of DNA Methyltransferases 1, 3A, and 3B in Sporadic Breast Carcinomas. Clin Cancer Res 2003, 9:4415–4422.
65. Kanai Y, Ushijima S, Kondo Y, Nakanishi Y, Hirohashi S: DNA methyltransferase expression and DNA methylation of CPG islands and peri-centromeric satellite regions in human colorectal and stomach cancers. International Journal of Cancer 2001, 91:205–212.
66. Festuccia C: Increased levels of DNA methyltransferases are associated with the tumorigenic capacity of prostate cancer cells. Oncology Reports 2012.
67. Amara K, Ziadi S, Hachana M, Soltani N, Korbi S, Trimeche M: DNA methyltransferase DNMT3b protein overexpression as a prognostic factor in patients with diffuse large B-cell lymphomas. Cancer Science 2010, 101:1722–1730.
68. Minami K, Chano T, Kawakami T, Ushida H, Kushima R, Okabe H, Okada Y, Okamoto K: DNMT3L Is a Novel Marker and Is Essential for the Growth of Human Embryonal Carcinoma. Clin Cancer Res 2010, 16:2751–2759.
69. Gokul G, Gautami B, Malathi S, Sowjanya AP, Poli UR, Jain M, Ramakrishna G, Khosla S: DNA Methylation Profile at the DNMT3L Promoter. Epigenetics 2007, 2:80–85.
70. Cho H-S, Kelly JD, Hayami S, Toyokawa G, Takawa M, Yoshimatsu M, Tsunoda T, Field HI, Neal DE, Ponder BA, Nakamura Y, Hamamoto R: Enhanced expression of EHMT2 is involved in the proliferation of cancer cells through negative regulation of SIAH1. Neoplasia 2011, 13:676–684.
71. Candelaria M, De la Cruz-Hernandez E, Taja-Chayeb L, Perez-Cardenas E, Trejo-Becerril C, Gonzalez-Fierro A, Chavez-Blanco A, Soto-Reyes E, Dominguez G, Trujillo JE, Diaz-Chavez J, Duenas-Gonzalez A: DNA Methylation-Independent Reversion of Gemcitabine Resistance by Hydralazine in Cervical Cancer Cells. PLoS ONE 2012, 7:e29181.
72. Chen M-W, Hua K-T, Kao H-J, Chi C-C, Wei L-H, Johansson G, Shiah S-G, Chen P-S, Jeng Y-M, Cheng T-Y, Lai T-C, Chang J-S, Jan Y-H, Chien M-H, Yang C-J, Huang M-S, Hsiao M, Kuo M-L: H3K9 Histone Methyltransferase G9a Promotes Lung Cancer Invasion and Metastasis by Silencing the Cell Adhesion Molecule Ep-CAM. Cancer Res 2010, 70:7830–7840.
73. Rice KL, Lin X, Wolniak K, Ebert BL, Berkofsky-Fessler W, Buzzai M, Sun Y, Xi C, Elkin P, Levine R, Golub T, Gilliland DG, Crispino JD, Licht JD, Zhang W: Analysis of genomic aberrations and gene expression profiling identifies novel lesions and pathways in myeloproliferative neoplasms. Blood Cancer J 2011, 1:e40.
74. Ernst T, Chase AJ, Score J, Hidalgo-Curtis CE, Bryant C, Jones AV, Waghorn K, Zoi K, Ross FM, Reiter A, Hochhaus A, Drexler HG, Duncombe A, Cervantes F, Oscier
211

D, Boultwood J, Grand FH, Cross NCP: Inactivating mutations of the histone methyltransferase gene EZH2 in myeloid disorders. Nature Genetics 2010, 42:722–726.
75. Cha J-D, Kim HJ, Cha I-H: Genetic alterations in oral squamous cell carcinoma progression detected by combining array-based comparative genomic hybridization and multiplex ligation-dependent probe amplification. Oral Surgery, Oral Medicine, Oral Pathology, Oral Radiology, and Endodontology 2011, 111:594–607.
76. Xie HJ, Noh JH, Kim JK, Jung KH, Eun JW, Bae HJ, Kim MG, Chang YG, Lee JY, Park H, Nam SW: HDAC1 Inactivation Induces Mitotic Defect and Caspase-Independent Autophagic Cell Death in Liver Cancer. PLoS One 2012, 7.
77. Eom M, Oh SS, Lkhagvadorj S, Han A, Park KH: HDAC1 Expression in Invasive Ductal Carcinoma of the Breast and Its Value as a Good Prognostic Factor. Korean J Pathol 2012, 46:311–317.
78. Ropero S, Esteller M: The role of histone deacetylases (HDACs) in human cancer. Molecular Oncology 2007, 1:19–25.
79. Wilson AJ, Byun D-S, Popova N, Murray LB, L’Italien K, Sowa Y, Arango D, Velcich A, Augenlicht LH, Mariadason JM: Histone Deacetylase 3 (HDAC3) and Other Class I HDACs Regulate Colon Cell Maturation and p21 Expression and Are Deregulated in Human Colon Cancer. J. Biol. Chem. 2006, 281:13548–13558.
80. Weichert W, Röske A, Gekeler V, Beckers T, Stephan C, Jung K, Fritzsche FR, Niesporek S, Denkert C, Dietel M, Kristiansen G: Histone deacetylases 1, 2 and 3 are highly expressed in prostate cancer and HDAC2 expression is associated with shorter PSA relapse time after radical prostatectomy. Br J Cancer 2008, 98:604–610.
81. Quint K, Agaimy A, Di Fazio P, Montalbano R, Steindorf C, Jung R, Hellerbrand C, Hartmann A, Sitter H, Neureiter D, Ocker M: Clinical significance of histone deacetylases 1, 2, 3, and 7: HDAC2 is an independent predictor of survival in HCC. Virchows Arch. 2011, 459:129–139.
82. Jung KH, Noh JH, Kim JK, Eun JW, Bae HJ, Xie HJ, Chang YG, Kim MG, Park H, Lee JY, Nam SW: HDAC2 overexpression confers oncogenic potential to human lung cancer cells by deregulating expression of apoptosis and cell cycle proteins. Journal of Cellular Biochemistry 2012, 113:2167–2177.
83. Huang BH, Laban M, Leung CH-W, Lee L, Lee CK, Salto-Tellez M, Raju GC, Hooi SC: Inhibition of histone deacetylase 2 increases apoptosis and p21Cip1/WAF1 expression, independent of histone deacetylase 1. Cell Death & Differentiation 2005, 12:395–404.
84. Weichert W, Denkert C, Noske A, Darb-Esfahani S, Dietel M, Kalloger SE, Huntsman DG, Köbel M: Expression of Class I Histone Deacetylases Indicates Poor Prognosis in Endometrioid Subtypes of Ovarian and Endometrial Carcinomas. Neoplasia 2008, 10:1021–1027.
85. Zhang X, Zhao X, Fiskus W, Lin J, Lwin T, Rao R, Zhang Y, Chan JC, Fu K, Marquez VE, Chen-Kiang S, Moscinski LC, Seto E, Dalton WS, Wright KL, Sotomayor E, Bhalla K, Tao J: Coordinated Silencing of MYC-Mediated miR-29 by HDAC3 and EZH2 as a Therapeutic Target of Histone Modification in
212

Aggressive B-Cell Lymphomas. Cancer Cell 2012, 22:506–523.
86. Van Damme M, Crompot E, Meuleman N, Mineur P, Bron D, Lagneaux L, Stamatopoulos B: HDAC isoenzyme expression is deregulated in chronic lymphocytic leukemia B-cells and has a complex prognostic significance. Epigenetics 2012, 7.
87. Stark M, Hayward N: Genome-Wide Loss of Heterozygosity and Copy Number Analysis in Melanoma Using High-Density Single-Nucleotide Polymorphism Arrays. Cancer Res 2007, 67:2632–2642.
88. Sjöblom T, Jones S, Wood LD, Parsons DW, Lin J, Barber TD, Mandelker D, Leary RJ, Ptak J, Silliman N, Szabo S, Buckhaults P, Farrell C, Meeh P, Markowitz SD, Willis J, Dawson D, Willson JKV, Gazdar AF, Hartigan J, Wu L, Liu C, Parmigiani G, Park BH, Bachman KE, Papadopoulos N, Vogelstein B, Kinzler KW, Velculescu VE: The Consensus Coding Sequences of Human Breast and Colorectal Cancers. Science 2006, 314:268–274.
89. Moreno DA, Scrideli CA, Cortez MAA, De Paula Queiroz R, Valera ET, Da Silva Silveira V, Yunes JA, Brandalise SR, Tone LG: research paper: Differential expression of HDAC3, HDAC7 and HDAC9 is associated with prognosis and survival in childhood acute lymphoblastic leukaemia. British Journal of Haematology 2010, 150:665–673.
90. Stronach EA, Alfraidi A, Rama N, Datler C, Studd J, Agarwal R, Guney TG, Gourley C, Hennessy BT, Mills GB, Mai A, Brown R, Dina R, Gabra H: HDAC4-regulated STAT1 activation mediates platinum resistance in ovarian cancer. Cancer Res 2011, 71:4412–4422.
91. Milde T, Oehme I, Korshunov A, Kopp-Schneider A, Remke M, Northcott P, Deubzer HE, Lodrini M, Taylor MD, Deimling A von, Pfister S, Witt O: HDAC5 and HDAC9 in Medulloblastoma: Novel Markers for Risk Stratification and Role in Tumor Cell Growth. Clin Cancer Res 2010, 16:3240–3252.
92. Maesawa C: Overexpression of histone deacetylase 6 contributes to accelerated migration and invasion activity of hepatocellular carcinoma cells. Oncology Reports 2012.
93. Wang L, Xiang S, Williams KA, Dong H, Bai W, Nicosia SV, Khochbin S, Bepler G, Zhang X: Depletion of HDAC6 Enhances Cisplatin-Induced DNA Damage and Apoptosis in Non-Small Cell Lung Cancer Cells. PLoS One 2012, 7.
94. Zhang Z, Yamashita H, Toyama T, Sugiura H, Omoto Y, Ando Y, Mita K, Hamaguchi M, Hayashi S, Iwase H: HDAC6 Expression Is Correlated with Better Survival in Breast Cancer. Clin Cancer Res 2004, 10:6962–6968.
95. Ouaïssi M, Sielezneff I, Silvestre R, Sastre B, Bernard J-P, Lafontaine JS, Payan MJ, Dahan L, Pirrò N, Seitz JF, Mas E, Lombardo D, Ouaissi A: High histone deacetylase 7 (HDAC7) expression is significantly associated with adenocarcinomas of the pancreas. Ann. Surg. Oncol. 2008, 15:2318–2328.
96. Oehme I, Deubzer HE, Wegener D, Pickert D, Linke J-P, Hero B, Kopp-Schneider A, Westermann F, Ulrich SM, Von Deimling A, Fischer M, Witt O: Histone deacetylase 8 in neuroblastoma tumorigenesis. Clin. Cancer Res. 2009, 15:91–99.
97. Fonseca AL, Kugelberg J, Starker LF, Scholl U, Choi M, Hellman P, Åkerström G, Westin G, Lifton RP, Björklund P, Carling T: Comprehensive DNA methylation analysis of benign and malignant adrenocortical tumors. Genes Chromosomes
213

Cancer 2012, 51:949–960.
98. Wang JC, Kafeel MI, Avezbakiyev B, Chen C, Sun Y, Rathnasabapathy C, Kalavar M, He Z, Burton J, Lichter S: Histone deacetylase in chronic lymphocytic leukemia. Oncology 2011, 81:325–329.
99. Osada H, Tatematsu Y, Saito H, Yatabe Y, Mitsudomi T, Takahashi T: Reduced expression of class II histone deacetylase genes is associated with poor prognosis in lung cancer patients. Int. J. Cancer 2004, 112:26–32.
100. Lee YF, Miller LD, Chan XB, Black MA, Pang B, Ong CW, Salto-Tellez M, Liu ET, Desai KV: JMJD6 is a driver of cellular proliferation and motility and a marker of poor prognosis in breast cancer. Breast Cancer Res 2012, 14:R85.
101. Sakuraba K, Yokomizo K, Shirahata A, Goto T, Saito M, Ishibashi K, Kigawa G, Nemoto H, Hibi K: TIP60 as a potential marker for the malignancy of gastric cancer. Anticancer Res. 2011, 31:77–79.
102. Chen G, Cheng Y, Tang Y, Martinka M, Li G: Role of Tip60 in human melanoma cell migration, metastasis, and patient survival. J. Invest. Dermatol. 2012, 132:2632–2641.
103. Sakuraba K, Yasuda T, Sakata M, Kitamura Y-H, Shirahata A, Goto T, Mizukami H, Saito M, Ishibashi K, Kigawa G, Nemoto H, Sanada Y, Hibi K: Down-regulation of Tip60 Gene as a Potential Marker for the Malignancy of Colorectal Cancer. Anticancer Res 2009, 29:3953–3955.
104. Wood LD, Parsons DW, Jones S, Lin J, Sjöblom T, Leary RJ, Shen D, Boca SM, Barber T, Ptak J, Silliman N, Szabo S, Dezso Z, Ustyanksky V, Nikolskaya T, Nikolsky Y, Karchin R, Wilson PA, Kaminker JS, Zhang Z, Croshaw R, Willis J, Dawson D, Shipitsin M, Willson JKV, Sukumar S, Polyak K, Park BH, Pethiyagoda CL, Pant PVK, Ballinger DG, Sparks AB, Hartigan J, Smith DR, Suh E, Papadopoulos N, Buckhaults P, Markowitz SD, Parmigiani G, Kinzler KW, Velculescu VE, Vogelstein B: The Genomic Landscapes of Human Breast and Colorectal Cancers. Science 2007, 318:1108–1113.
105. Moore SDP, Herrick SR, Ince TA, Kleinman MS, Cin PD, Morton CC, Quade BJ: Uterine Leiomyomata with t(10;17) Disrupt the Histone Acetyltransferase MORF. Cancer Res 2004, 64:5570–5577.
106. Iizuka M, Takahashi Y, Mizzen CA, Cook RG, Fujita M, Allis CD, Frierson HF, Fukusato T, Smith MM: Histone acetyltransferase Hbo1: catalytic activity, cellular abundance, and links to primary cancers. Gene 2009, 436:108–114.
107. Lv T, Yuan D, Miao X, Lv Y, Zhan P, Shen X, Song Y: Over-Expression of LSD1 Promotes Proliferation, Migration and Invasion in Non-Small Cell Lung Cancer. PLoS One 2012, 7.
108. Schildhaus H-U, Riegel R, Hartmann W, Steiner S, Wardelmann E, Merkelbach-Bruse S, Tanaka S, Sonobe H, Schüle R, Buettner R, Kirfel J: Lysine-specific demethylase 1 is highly expressed in solitary fibrous tumors, synovial sarcomas, rhabdomyosarcomas, desmoplastic small round cell tumors, and malignant peripheral nerve sheath tumors. Hum. Pathol. 2011, 42:1667–1675.
109. Hayami S, Kelly JD, Cho H-S, Yoshimatsu M, Unoki M, Tsunoda T, Field HI, Neal DE, Yamaue H, Ponder BAJ, Nakamura Y, Hamamoto R: Overexpression of LSD1 contributes to human carcinogenesis through chromatin regulation in various cancers. Int. J. Cancer 2011, 128:574–586.
214

110. Kahl P, Gullotti L, Heukamp LC, Wolf S, Friedrichs N, Vorreuther R, Solleder G, Bastian PJ, Ellinger J, Metzger E, Schüle R, Buettner R: Androgen Receptor Coactivators Lysine-Specific Histone Demethylase 1 and Four and a Half LIM Domain Protein 2 Predict Risk of Prostate Cancer Recurrence. Cancer Res 2006, 66:11341–11347.
111. Wang Y, Zhang H, Chen Y, Sun Y, Yang F, Yu W, Liang J, Sun L, Yang X, Shi L, Li R, Li Y, Zhang Y, Li Q, Yi X, Shang Y: LSD1 is a subunit of the NuRD complex and targets the metastasis programs in breast cancer. Cell 2009, 138:660–672.
112. Frescas D, Guardavaccaro D, Kato H, Poleshko A, Katz RA, Pagano M: KDM2A represses transcription of centromeric satellite repeats and maintains the heterochromatic state. Cell Cycle 2008, 7:3539–3547.
113. Kim J-Y, Kim K-B, Eom GH, Choe N, Kee HJ, Son H-J, Oh S-T, Kim D-W, Pak JH, Baek HJ, Kook H, Hahn Y, Kook H, Chakravarti D, Seo S-B: KDM3B Is the H3K9 Demethylase Involved in Transcriptional Activation of lmo2 in Leukemia. Mol Cell Biol 2012, 32:2917–2933.
114. Björkman M, Östling P, Härmä V, Virtanen J, Mpindi J-P, Rantala J, Mirtti T, Vesterinen T, Lundin M, Sankila A, Rannikko A, Kaivanto E, Kohonen P, Kallioniemi O, Nees M: Systematic knockdown of epigenetic enzymes identifies a novel histone demethylase PHF8 overexpressed in prostate cancer with an impact on cell proliferation, migration and invasion. Oncogene 2012, 31:3444–3456.
115. Berry WL, Shin S, Lightfoot SA, Janknecht R: Oncogenic features of the JMJD2A histone demethylase in breast cancer. Int. J. Oncol. 2012, 41:1701–1706.
116. Kauffman EC, Robinson BD, Downes M, Powell LG, Lee MM, Scherr DS, Gudas LJ, Mongan NP: Role of androgen receptor and associated lysine-demethylase coregulators, LSD1 and JMJD2A, in localized and advanced human bladder cancer. Mol Carcinog 2011, 50:931–944.
117. Li W, Zhao L, Zang W, Liu Z, Chen L, Liu T, Xu D, Jia J: Histone demethylase JMJD2B is required for tumor cell proliferation and survival and is overexpressed in gastric cancer. Biochem. Biophys. Res. Commun. 2011, 416:372–378.
118. Liu G, Bollig-Fischer A, Kreike B, Van de Vijver MJ, Abrams J, Ethier SP, Yang Z-Q: Genomic amplification and oncogenic properties of the GASC1 histone demethylase gene in breast cancer. Oncogene 2009, 28:4491–4500.
119. Roesch A, Becker B, Meyer S, Wild P, Hafner C, Landthaler M, Vogt T: Retinoblastoma-binding protein 2-homolog 1: a retinoblastoma-binding protein downregulated in malignant melanomas. Modern Pathology 2005, 18:1249–1257.
120. Paolicchi E, Crea F, Farrar WL, Green JE, Danesi R: Histone lysine demethylases in breast cancer. Critical Reviews in Oncology/Hematology 2012.
121. Radberger P, Radberger A, Bykov VJN, Seregard S, Economou MA: JARID1B protein expression and prognostic implications in uveal melanoma. Invest. Ophthalmol. Vis. Sci. 2012, 53:4442–4449.
122. Willis ND, Cox TR, Rahman-Casañs SF, Smits K, Przyborski SA, Van den Brandt P, Van Engeland M, Weijenberg M, Wilson RG, De Bruïne A, Hutchison CJ: Lamin A/C Is a Risk Biomarker in Colorectal Cancer. PLoS ONE 2008, 3.
215

123. Agrelo R, Setien F, Espada J, Artiga MJ, Rodriguez M, Pérez-Rosado A, Sanchez-Aguilera A, Fraga MF, Piris MA, Esteller M: Inactivation of the Lamin A/C Gene by CpG Island Promoter Hypermethylation in Hematologic Malignancies, and Its Association With Poor Survival in Nodal Diffuse Large B-Cell Lymphoma. JCO 2005, 23:3940–3947.
124. Stadelmann B, Khandjian E, Hirt A, Lüthy A, Weil R, Wagner HP: Repression of nuclear lamin A and C gene expression in human acute lymphoblastic leukemia and non-Hodgkin’s lymphoma cells. Leuk. Res. 1990, 14:815–821.
125. Wong K-F, Luk JM: Discovery of lamin B1 and vimentin as circulating biomarkers for early hepatocellular carcinoma. Methods Mol. Biol. 2012, 909:295–310.
126. Marshall KW, Mohr S, Khettabi FE, Nossova N, Chao S, Bao W, Ma J, Li X-J, Liew C-C: A blood-based biomarker panel for stratifying current risk for colorectal cancer. International Journal of Cancer 2010, 126:1177–1186.
127. Somatic frameshift mutations in the MBD4 gene of sporadic colon cancers with mismatch repair deficiency. , Published online: 04 January 2000; | doi:10.1038/sj.onc.1203229 2000, 18.
128. Riccio A, Aaltonen LA, Godwin AK, Loukola A, Percesepe A, Salovaara R, Masciullo V, Genuardi M, Paravatou-Petsotas M, Bassi DE, Ruggeri BA, Klein-Szanto AJP, Testa JR, Neri G, Bellacosa A: The DNA repair gene MBD4 (MED1) is mutated in human carcinomas with microsatellite instability. Nature Genetics 1999, 23:266–268.
129. Müller HM, Fiegl H, Goebel G, Hubalek MM, Widschwendter A, Müller-Holzner E, Marth C, Widschwendter M: MeCP2 and MBD2 expression in human neoplastic and non-neoplastic breast tissue and its association with oestrogen receptor status. Br J Cancer 2003, 89:1934–1939.
130. Debelenko LV, Brambilla E, Agarwal SK, Swalwell JI, Kester MB, Lubensky IA, Zhuang Z, Guru SC, Manickam P, Olufemi S-E, Chandrasekharappa SC, Crabtree JS, Kim YS, Heppner C, Burns AL, Spiegel AM, Marx SJ, Liotta LA, Collins FS, Travis WD, Emmert-Buck MR: Identification of MEN1 Gene Mutations in Sporadic Carcinoid Tumors of the Lung. Hum. Mol. Genet. 1997, 6:2285–2290.
131. Thiel AT, Huang J, Lei M, Hua X: Menin as a hub controlling mixed lineage leukemia. BioEssays 2012, 34:771–780.
132. Damm F, Oberacker T, Thol F, Surdziel E, Wagner K, Chaturvedi A, Morgan M, Bomm K, Göhring G, Lübbert M, Kanz L, Fiedler W, Schlegelberger B, Heil G, Schlenk RF, Döhner K, Döhner H, Krauter J, Ganser A, Heuser M: Prognostic importance of histone methyltransferase MLL5 expression in acute myeloid leukemia. J. Clin. Oncol. 2011, 29:682–689.
133. Li D-Q, Pakala SB, Nair SS, Eswaran J, Kumar R: Metastasis Associated Protein 1/Nucleosome Remodeling and Histone Deacetylase Complex in Cancer. Cancer Res 2012, 72:387–394.
134. Liu S-L, Han Y, Zhang Y, Xie C-Y, Wang E-H, Miao Y, Li H-Y, Xu H-T, Dai S-D: Expression of metastasis-associated protein 2 (MTA2) might predict proliferation in non-small cell lung cancer. Target Oncol 2012, 7:135–143.
135. Lee H, Ryu SH, Hong SS, Seo DD, Min HJ, Jang MK, Kwon HJ, Yu E, Chung Y-H, Kim K-W: Overexpression of metastasis-associated protein 2 is associated with
216

hepatocellular carcinoma size and differentiation. J. Gastroenterol. Hepatol. 2009, 24:1445–1450.
136. Ji Y, Zhang P, Lu Y, Ma D: Expression of MTA2 gene in ovarian epithelial cancer and its clinical implication. J. Huazhong Univ. Sci. Technol. Med. Sci. 2006, 26:359–362.
137. Xu Y, Chen Q, Li W, Su X, Chen T, Liu Y, Zhao Y, Yu C: Overexpression of transcriptional coactivator AIB1 promotes hepatocellular carcinoma progression by enhancing cell proliferation and invasiveness. Oncogene 2010, 29:3386–3397.
138. Luo J-H, Xie D, Liu M-Z, Chen W, Liu Y-D, Wu G-Q, Kung H-F, Zeng Y-X, Guan X-Y: Protein expression and amplification of AIB1 in human urothelial carcinoma of the bladder and overexpression of AIB1 is a new independent prognostic marker of patient survival. International Journal of Cancer 2008, 122:2554–2561.
139. He L-R, Zhao H-Y, Li B-K, Zhang L-J, Liu M-Z, Kung H-F, Guan X-Y, Bian X-W, Zeng Y-X, Xie D: Overexpression of AIB1 negatively affects survival of surgically resected non-small-cell lung cancer patients. Ann Oncol 2010, 21:1675–1681.
140. Zhou H-J, Yan J, Luo W, Ayala G, Lin S-H, Erdem H, Ittmann M, Tsai SY, Tsai M-J: SRC-3 Is Required for Prostate Cancer Cell Proliferation and Survival. Cancer Res 2005, 65:7976–7983.
141. Gojis O, Rudraraju B, Gudi M, Hogben K, Sousha S, Coombes CR, Cleator S, Palmieri C: The role of SRC-3 in human breast cancer. Nature Reviews Clinical Oncology 2009, 7:83–89.
142. Esteyries S, Perot C, Adelaide J, Imbert M, Lagarde A, Pautas C, Olschwang S, Birnbaum D, Chaffanet M, Mozziconacci M-J: NCOA3, a new fusion partner for MOZ/MYST3 in M5 acute myeloid leukemia. Leukemia 2008, 22:663–665.
143. Zakrzewska M, Zakrzewski K, Grešner SM, Piaskowski S, Zalewska-Szewczyk B, Liberski PP: Polycomb genes expression as a predictor of poor clinical outcome in children with medulloblastoma. Childs Nerv Syst 2011, 27:79–86.
144. Guo B-H, Zhang X, Zhang H-Z, Lin H-L, Feng Y, Shao J-Y, Huang W-L, Kung H-F, Zeng M-S: Low expression of Mel-18 predicts poor prognosis in patients with breast cancer. Ann Oncol 2010, 21:2361–2369.
145. Wang W, Yuasa T, Tsuchiya N, Ma Z, Maita S, Narita S, Kumazawa T, Inoue T, Tsuruta H, Horikawa Y, Saito M, Hu W, Ogawa O, Habuchi T: The novel tumor-suppressor Mel-18 in prostate cancer: its functional polymorphism, expression and clinical significance. Int. J. Cancer 2009, 125:2836–2843.
146. Deshpande AM, Akunowicz JD, Reveles XT, Patel BB, Saria EA, Gorlick RG, Naylor SL, Leach RJ, Hansen MF: PHC3, a component of the hPRC-H complex, associates with E2F6 during G0 and is lost in osteosarcoma tumors. Oncogene 2007, 26:1714–1722.
147. Piao Z, Fang W, Malkhosyan S, Kim H, Horii A, Perucho M, Huang S: Frequent Frameshift Mutations of RIZ in Sporadic Gastrointestinal and Endometrial Carcinomas with Microsatellite Instability. Cancer Res 2000, 60:4701–4704.
148. Chadwick RB, Jiang G-L, Bennington GA, Yuan B, Johnson CK, Stevens MW,
217
Niemann TH, Peltomaki P, Huang S, De la Chapelle A: Candidate tumor suppressor RIZ is frequently involved in colorectal carcinogenesis. Proc Natl Acad Sci U S A 2000, 97:2662–2667.
149. Poetsch M, Dittberner T, Woenckhaus C: Frameshift mutations of RIZ, but no point mutations in RIZ1 exons in malignant melanomas with deletions in 1p36. Oncogene 2002, 21:3038–3042.
150. Sasaki O, Meguro K, Tohmiya Y, Funato T, Shibahara S, Sasaki T: Altered expression of retinoblastoma protein-interacting zinc finger gene, RIZ, in human leukaemia. Br. J. Haematol. 2002, 119:940–948.
151. Dong S-W, Cui Y-T, Zhong R-R, Liang D-C, Liu Y-M, Wang Y-G, He Z, Wang S, Liang S-J, Zhang P: Decreased expression of retinoblastoma protein-interacting zinc-finger gene 1 in human esophageal squamous cell cancer by DNA methylation. Clin. Lab. 2012, 58:41–51.
152. Geli J, Kiss N, Kogner P, Larsson C: Suppression of RIZ in biologically unfavourable neuroblastomas. Int. J. Oncol. 2010, 37:1323–1330.
153. Zhang C, Li H, Wang Y, Liu W, Zhang Q, Zhang T, Zhang X, Han B, Zhou G: Epigenetic inactivation of the tumor suppressor gene RIZ1 in hepatocellular carcinoma involves both DNA methylation and histone modifications. J. Hepatol. 2010, 53:889–895.
154. Akahira J-I, Suzuki F, Suzuki T, Miura I, Kamogawa N, Miki Y, Ito K, Yaegashi N, Sasano H: Decreased expression of RIZ1 and its clinicopathological significance in epithelial ovarian carcinoma: correlation with epigenetic inactivation by aberrant DNA methylation. Pathol. Int. 2007, 57:725–733.
155. Lal G, Padmanabha L, Smith BJ, Nicholson RM, Howe JR, O’Dorisio MS, Domann FE Jr: RIZ1 is epigenetically inactivated by promoter hypermethylation in thyroid carcinoma. Cancer 2006, 107:2752–2759.
156. Carling T, Du Y, Fang W, Correa P, Huang S: Intragenic allelic loss and promoter hypermethylation of the RIZ1 tumor suppressor gene in parathyroid tumors and pheochromocytomas. Surgery 2003, 134:932–939; discussion 939–940.
157. Lohavanichbutr P, Houck J, Fan W, Yueh B, Mendez E, Futran N, Doody DR, Upton MP, Farwell DG, Schwartz SM, Zhao LP, Chen C: Genome-wide gene expression profiles of HPV-positive and HPV-negative oropharyngeal cancer: potential implications for treatment choices. Arch Otolaryngol Head Neck Surg 2009, 135:180–188.
158. Leivo I, Jee KJ, Heikinheimo K, Laine M, Ollila J, Nagy B, Knuutila S: Characterization of gene expression in major types of salivary gland carcinomas with epithelial differentiation. Cancer Genet. Cytogenet. 2005, 156:104–113.
159. Bralten LBC, Kloosterhof NK, Gravendeel LAM, Sacchetti A, Duijm EJ, Kros JM, Van den Bent MJ, Hoogenraad CC, Sillevis Smitt PAE, French PJ: Integrated genomic profiling identifies candidate genes implicated in glioma-genesis and a novel LEO1-SLC12A1 fusion gene. Genes Chromosomes Cancer 2010, 49:509–517.
160. Wang C-L, Wang C-I, Liao P-C, Chen C-D, Liang Y, Chuang W-Y, Tsai Y-H, Chen H-C, Chang Y-S, Yu J-S, Wu C-C, Yu C-J: Discovery of retinoblastoma-associated binding protein 46 as a novel prognostic marker for distant metastasis in
218

nonsmall cell lung cancer by combined analysis of cancer cell secretome and pleural effusion proteome. J. Proteome Res. 2009, 8:4428–4440.
161. Thakur A, Rahman KW, Wu J, Bollig A, Biliran H, Lin X, Nassar H, Grignon DJ, Sarkar FH, Liao JD: Aberrant Expression of X-Linked Genes RbAp46, Rsk4, and Cldn2 in Breast Cancer. Mol Cancer Res 2007, 5:171–181.
162. Li Q, Dong Q, Wang E: Rsf-1 is overexpressed in non-small cell lung cancers and regulates cyclinD1 expression and ERK activity. Biochem. Biophys. Res. Commun. 2012, 420:6–10.
163. Liang P-I, Wu L-C, Sheu JJ-C, Wu T-F, Shen K-H, Wang Y-H, Wu W-R, Shiue Y-L, Huang H-Y, Hsu H-P, Chen Y-H, Chen L-T, Li C-F, Liao AC: Rsf-1/HBXAP overexpression is independent of gene amplification and is associated with poor outcome in patients with urinary bladder urothelial carcinoma. J. Clin. Pathol. 2012, 65:802–807.
164. Liu S, Dong Q, Wang E: Rsf-1 overexpression correlates with poor prognosis and cell proliferation in colon cancer. Tumour Biol. 2012, 33:1485–1491.
165. Chen T-J, Huang S-C, Huang H-Y, Wei Y-C, Li C-F: Rsf-1/HBXAP overexpression is associated with disease-specific survival of patients with gallbladder carcinoma. APMIS 2011, 119:808–814.
166. Tai H-C, Huang H-Y, Lee S-W, Lin C-Y, Sheu M-J, Chang S-L, Wu L-C, Shiue Y-L, Wu W-R, Lin C-M, Li C-F: Associations of Rsf-1 overexpression with poor therapeutic response and worse survival in patients with nasopharyngeal carcinoma. J. Clin. Pathol. 2012, 65:248–253.
167. Mao T-L, Hsu C-Y, Yen MJ, Gilks B, Sheu JJ-C, Gabrielson E, Vang R, Cope L, Kurman RJ, Wang T-L, Shih I-M: Expression of Rsf-1, a chromatin-remodeling gene, in ovarian and breast carcinoma. Hum. Pathol. 2006, 37:1169–1175.
168. Shih I-M, Sheu JJ-C, Santillan A, Nakayama K, Yen MJ, Bristow RE, Vang R, Parmigiani G, Kurman RJ, Trope CG, Davidson B, Wang T-L: Amplification of a chromatin remodeling gene, Rsf-1/HBXAP, in ovarian carcinoma. Proc Natl Acad Sci U S A 2005, 102:14004–14009.
169. Jiang Q, Zhang C, Zhu J, Chen Q, Chen Y: The set gene is a potential oncogene in human colorectal adenocarcinoma and oral squamous cell carcinoma. Molecular Medicine Reports 2011.
170. Sirma Ekmekci S, G Ekmekci C, Kandilci A, Gulec C, Akbiyik M, Emrence Z, Abaci N, Karakas Z, Agaoglu L, Unuvar A, Anak S, Devecioglu O, Ustek D, Grosveld G, Ozbek U: SET oncogene is upregulated in pediatric acute lymphoblastic leukemia. Tumori 2012, 98:252–256.
171. Yang F, Sun L, Li Q, Han X, Lei L, Zhang H, Shang Y: SET8 promotes epithelial–mesenchymal transition and confers TWIST dual transcriptional activities. EMBO J 2012, 31:110–123.
172. Ceol CJ, Houvras Y, Jane-Valbuena J, Bilodeau S, Orlando DA, Battisti V, Fritsch L, Lin WM, Hollmann TJ, Ferre F, Bourque C, Burke CJ, Turner L, Uong A, Johnson LA, Beroukhim R, Mermel CH, Loda M, Ait-Si-Ali S, Garraway LA, Young RA, Zon LI: The histone methyltransferase SETDB1 is recurrently amplified in melanoma and accelerates its onset. Nature 2011, 471:513–517.
173. Parker H, Rose-Zerilli MJJ, Parker A, Chaplin T, Wade R, Gardiner A, Griffiths M,
219

Collins A, Young BD, Oscier DG, Strefford JC: 13q deletion anatomy and disease progression in patients with chronic lymphocytic leukemia. Leukemia 2011, 25:489–497.
174. Yi J, Luo J: SIRT1 and p53, effect on cancer, senescence and beyond. Biochim Biophys Acta 2010, 1804:1684–1689.
175. Wang R-H, Sengupta K, Li C, Kim H-S, Cao L, Xiao C, Kim S, Xu X, Zheng Y, Chilton B, Jia R, Zheng Z-M, Appella E, Wang XW, Ried T, Deng C-X: Impaired DNA damage response, genome instability, and tumorigenesis in SIRT1 mutant mice. Cancer Cell 2008, 14:312–323.
176. Hiratsuka M, Inoue T, Toda T, Kimura N, Shirayoshi Y, Kamitani H, Watanabe T, Ohama E, Tahimic CGT, Kurimasa A, Oshimura M: Proteomics-based identification of differentially expressed genes in human gliomas: down-regulation of SIRT2 gene. Biochem. Biophys. Res. Commun. 2003, 309:558–566.
177. Zhang Y-Y, Zhou L-M: Sirt3 inhibits hepatocellular carcinoma cell growth through reducing Mdm2-mediated p53 degradation. Biochem. Biophys. Res. Commun. 2012, 423:26–31.
178. Ashraf N, Zino S, MacIntyre A, Kingsmore D, Payne AP, George WD, Shiels PG: Altered sirtuin expression is associated with node-positive breast cancer. Br J Cancer 2006, 95:1056–1061.
179. De Nigris F, Cerutti J, Morelli C, Califano D, Chiariotti L, Viglietto G, Santelli G, Fusco A: Isolation of a SIR-like gene, SIR-T8, that is overexpressed in thyroid carcinoma cell lines and tissues. Br J Cancer 2002, 86:917–923.
180. Moloney FJ, Lyons JG, Bock VL, Huang XX, Bugeja MJ, Halliday GM: Hotspot Mutation of Brahma in Non-Melanoma Skin Cancer. Journal of Investigative Dermatology 2009, 129:1012–1015.
181. Doménech E, Gómez-López G, Gzlez-Peña D, López M, Herreros B, Menezes J, Gómez-Lozano N, Carro A, Graña O, Pisano DG, Domínguez O, García-Marco JA, Piris MA, Sánchez-Beato M: New Mutations in Chronic Lymphocytic Leukemia Identified by Target Enrichment and Deep Sequencing. PLoS One 2012, 7.
182. Reisman DN, Sciarrotta J, Wang W, Funkhouser WK, Weissman BE: Loss of BRG1/BRM in Human Lung Cancer Cell Lines and Primary Lung Cancers: Correlation with Poor Prognosis. Cancer Res 2003, 63:560–566.
183. Yamamichi N, Inada K, Ichinose M, Yamamichi-Nishina M, Mizutani T, Watanabe H, Shiogama K, Fujishiro M, Okazaki T, Yahagi N, Haraguchi T, Fujita S, Tsutsumi Y, Omata M, Iba H: Frequent Loss of Brm Expression in Gastric Cancer Correlates with Histologic Features and Differentiation State. Cancer Res 2007, 67:10727–10735.
184. Hélias C, Struski S, Gervais C, Leymarie V, Mauvieux L, Herbrecht R, Lessard M: Polycythemia vera transforming to acute myeloid leukemia and complex abnormalities including 9p homogeneously staining region with amplification of MLLT3, JMJD2C, JAK2, and SMARCA2. Cancer Genetics and Cytogenetics 2008, 180:51–55.
185. Takita J, Ishii M, Tsutsumi S, Tanaka Y, Kato K, Toyoda Y, Hanada R, Yamamoto K, Hayashi Y, Aburatani H: Gene expression profiling and identification of novel prognostic marker genes in neuroblastoma. Genes Chromosomes Cancer 2004, 40:120–132.
220

186. Kagami S, Kurita T, Kawagoe T, Toki N, Matsuura Y, Hachisuga T, Matsuyama A, Hashimoto H, Izumi H, Kohno K: Prognostic significance of BAF57 expression in patients with endometrial carcinoma. Histol. Histopathol. 2012, 27:593–599.
187. Komatsu S, Imoto I, Tsuda H, Kozaki K, Muramatsu T, Shimada Y, Aiko S, Yoshizumi Y, Ichikawa D, Otsuji E, Inazawa J: Overexpression of SMYD2 relates to tumor cell proliferation and malignant outcome of esophageal squamous cell carcinoma. Carcinogenesis 2009, 30:1139–1146.
188. Xi Y, Formentini A, Nakajima G, Kornmann M, Ju J: Validation of biomarkers associated with 5-fluorouracil and thymidylate synthase in colorectal cancer. Oncol. Rep. 2008, 19:257–262.
189. Li H, Cai Q, Wu H, Vathipadiekal V, Dobbin ZC, Li T, Hua X, Landen CN, Birrer MJ, Sánchez-Beato M, Zhang R: SUZ12 promotes human epithelial ovarian cancer by suppressing apoptosis via silencing HRK. Mol. Cancer Res. 2012, 10:1462–1472.
190. Martín-Pérez D, Sánchez E, Maestre L, Suela J, Vargiu P, Di Lisio L, Martínez N, Alves J, Piris MA, Sánchez-Beato M: Deregulated Expression of the Polycomb-Group Protein SUZ12 Target Genes Characterizes Mantle Cell Lymphoma. Am J Pathol 2010, 177:930–942.
191. Abdel-Wahab O, Mullally A, Hedvat C, Garcia-Manero G, Patel J, Wadleigh M, Malinge S, Yao J, Kilpivaara O, Bhat R, Huberman K, Thomas S, Dolgalev I, Heguy A, Paietta E, Beau MML, Beran M, Tallman MS, Ebert BL, Kantarjian HM, Stone RM, Gilliland DG, Crispino JD, Levine RL: Genetic characterization of TET1, TET2, and TET3 alterations in myeloid malignancies. Blood 2009, 114:144–147.
192. Kijanka G, Hector S, Kay EW, Murray F, Cummins R, Murphy D, MacCraith BD, Prehn JHM, Kenny D: Human IgG antibody profiles differentiate between symptomatic patients with and without colorectal cancer. Gut 2010, 59:69–78.
193. Yokoe T, Toiyama Y, Okugawa Y, Tanaka K, Ohi M, Inoue Y, Mohri Y, Miki C, Kusunoki M: KAP1 is associated with peritoneal carcinomatosis in gastric cancer. Ann. Surg. Oncol. 2010, 17:821–828.
194. Chen L, Chen D-T, Kurtyka C, Rawal B, Fulp WJ, Haura EB, Cress WD: Tripartite Motif Containing 28 (Trim28) Can Regulate Cell Proliferation by Bridging HDAC1/E2F Interactions. J. Biol. Chem. 2012, 287:40106–40118.
195. Atchison M, Basu A, Zaprazna K, Papasani M: Mechanisms of Yin Yang 1 in Oncogenesis: The Importance of Indirect Effects. Crit Rev Oncog 2011, 16:143–161.
196. Lister R, Pelizzola M, Dowen RH, Hawkins RD, Hon G, Tonti-Filippini J, Nery JR, Lee L, Ye Z, Ngo Q-M, Edsall L, Antosiewicz-Bourget J, Stewart R, Ruotti V, Millar AH, Thomson JA, Ren B, Ecker JR: Human DNA methylomes at base resolution show widespread epigenomic differences. Nature 2009, advance online publication.
197. Viré E, Brenner C, Deplus R, Blanchon L, Fraga M, Didelot C, Morey L, Eynde AV, Bernard D, Vanderwinden J-M, Bollen M, Esteller M, Croce LD, Launoit Y de, Fuks F: The Polycomb group protein EZH2 directly controls DNA methylation. Nature 2005, 439:871–874.
198. The ENCODE Project Consortium: Identification and analysis of functional elements in 1% of the human genome by the ENCODE pilot project. Nature
221

2007, 447:799–816.
199. Barski A, Cuddapah S, Cui K, Roh T-Y, Schones DE, Wang Z, Wei G, Chepelev I, Zhao K: High-Resolution Profiling of Histone Methylations in the Human Genome. Cell 2007, Vol 129:823–837.
200. Hansen RS, Thomas S, Sandstrom R, Canfield TK, Thurman RE, Weaver M, Dorschner MO, Gartler SM, Stamatoyannopoulos JA: Sequencing newly replicated DNA reveals widespread plasticity in human replication timing. Proceedings of the National Academy of Sciences 2010, 107:139 –144.
222
Chapter 5
INTOGEN-CL: LARGE-SCALE ANALYSIS OF MUTATIONS IN CANCER CELL LINES
The analysis reported in Chapter 4 produced a large amount of multidimensional data that required a tailored resource for visual exploration. Having previously developed IntOGen, a system to analyse and explore cancer genomics data, it was logic to include the somatic mutations there. Cancer cell lines mutations data, however, presents unique characteristics (such as having drug sensitivity information and being called without a normal reference). In this chapter I report the design of a resource to present it and browse it intuitively, conceived as a sister site of the original IntOGen to allow for a seamless communication between the two. IntOGen-CL is currently in beta version, but we plan to expand it in the near future to become a central repository of genomics data on cancer cell lines and drug information. In this part, I collected the data, performed the analysis, contributed to the design of the resource and wrote the manuscript. This manuscript was under preparation at the time the thesis was submitted.
223

IntOGen-CL: Large scale analysis of mutations in cancer cell lines
Alba Jene-Sanz1, Jordi Deu-Pons1 and Nuria Lopez-Bigas1,2,*
1. Research Unit on Biomedical Informatics, Department of Experimental and Health Sciences, Universitat Pompeu Fabra, Dr. Aiguader 88, Barcelona, Spain
2. Institució Catalana de Recerca i Estudis Avançats (ICREA), Barcelona, Spain
* To whom correspondence should be addressed
Summary
We have previously developed IntOGen, an integrative genomics system and web discovery tool focused on the analysis of data from primary tumours. In order to complement IntOGen, we have now developed IntOGen-CL, which contains results from analysing genomic profiling of cancer cell lines. The current version contains basically data from the Cancer Cell Line Encyclopedia (CCLE), a large and useful resource to study the molecular characteristics of tumours and their response to cancer drugs. We have performed a large-scale analysis of the mutations detected over 900 cell lines by the CCLE project to assess the impact of mutations on protein function and to identify genes with a significant bias towards mutations with high functional impact in distinct primary sites. All the results of this analysis are available at IntOGen-CL (beta.intogen.org/web/cell-lines), and together with the information contained in IntOGen provides a useful portal for assessing the importance of genes and mutations in cancer and their possible implication with drug sensitivity.
Availability and implementation
The IntOGen-CL browser is freely available at beta.intogen.org/web/cell-lines.
224

Introduction
Cancer cell lines present an extremely useful model for the investigation of tumour development, but it is not clear whether they faithfully recapitulate the characteristics of the cancer type they correspond to, which is the basic assumption (Holliday and Speirs, 2011). The correspondence of an established cancer cell line to a tumour type may be assessed by comparing expression profiles or common genomic alterations. Recent large-scale efforts have systematically characterised drug sensitivity on hundreds of cancer cell lines (Barretina et al., 2012; Yang et al., 2012; Mathew J. Garnett et al., 2012), which will be a useful resource for researchers to determine the molecular characteristics of tumours and their response to cancer drugs. One of them, the Cancer Cell Line Encyclopedia (CCLE), sequenced 1651 genes on over 900 cell lines to connect distinct pharmacologic vulnerabilities to genomic patterns (Barretina et al., 2012). As most sequencing studies, to identify relevant mutations from single nucleotide variants (SNVs) it relies heavily on their overall recurrence or in pre-existing knowledge of a gene's oncogenic role, being thus basically descriptive. Moreover, this wealth of data requires to be organized in an intuitive manner and in connection to other cancer and genomics resources in order to facilitate the extraction of new knowledge from its mining.
We used the IntOGen-SM pipeline (Gonzalez-Perez et al., In preparation) following a similar approach as with the somatic mutations in tumours reported in IntOGen (Gundem et al., 2010) to detect functionally important mutations in cancer cell lines from the CCLE. IntOGen-SM pipeline: i) identifies the consequences of mutations, ii) computes the functional impact of non-synonymous variants (using TransFIC (Gonzalez-Perez et al., 2012)) and iii) identifies genes and pathways with a bias towards the accumulation of mutations with high functional impact (using OncodriveFM (Gonzalez-Perez and Lopez-Bigas, 2012)). Here, we present IntOGen-CL (Cell Lines), a web resource to intuitively browse genomic alterations in cancer cell lines within the context of previously identified somatic mutations in their corresponding cancer sites.
Implementation and data browsing
IntOGen-CL provides two initial entry points for the user: a gene-centred search in the “Search” tab, that accepts single or multiple inputs (gene lists) as symbol, Ensembl or Refseq ids, and cell line names, tissues or drugs; and a
225

“Browser” tab, that shows all the available information in the database. The browser's navigation is organised mainly around two entities, individual mutations and genes, as seen in the schema represented in Figure 1. The Functional Impact (FI) of mutations has been assessed with three well-known tools, SIFT (Ng and Henikoff, 2003), PolyPhen2 (Adzhubei et al., 2010) and MutationAssessor (Reva et al., 2011). To allow a detailed exploration of SNVs, FI scores are reported in three ways: as raw output, as transformed transFIC scores (a method that ranks the FI of mutations in cancer taking into account the baseline tolerance to germline SNVs) (Gonzalez-Perez et al., 2012) and as a custom colour-coded categorical scale (High, Medium, Low, None impact). Using the Oncodrive-fm method (Gonzalez-Perez and Lopez-Bigas, 2012), genes are assessed for the accumulation of functional mutations within primary sites (groups of cell lines derived from the same tissue) and within KEGG pathways (Kanehisa et al., 2012). Note that the FI bias was only calculated for those primary sites represented by at least 20 different cell lines. Lastly, IntOGen-CL also includes drug sensitivity information, reported as the median-centred activity area across all cancer cell lines.
The browser allows for a seamless navigation between the different layers of information, and intuitive filters can be easily applied to gene lists and individual genes, cell lines, cancer sites, drugs and pathways. The data may be visualised as tables or in the form of interactive heatmaps provided by jHeatmap (bg.upf.edu/jheatmap). The IntOGen-CL browser communicates with the original IntOGen, containing information from primary tumours, enabling the comparison of mutations in cancer cell lines with those found in cancer samples. This communication is possible thanks to the implementation of both resources with Onexus (www.onexus.org), a modular system to create web browsers for complex data.
Discussion
The development of IntOGen-CL was motivated by the observation that the wealth of data on cancer cell lines needed to be processed along with that from primary tumours to be most useful to the scientific community. Other existing resources present it in an independent manner, lacking integrative methods to compare the FI of mutations in cell lines derived from different primary sites or with primary tumours. We have implemented a browser to navigate the data on cancer cell lines focused on usability for potential researchers interested in
226

comparing those cell lines with each other or with primary tumour data from patients. Currently, the browser only contains CCLE mutation data, but we plan to expand it with new sources of information and/or other types of genomic data, such as differential gene expression.
Conclusions
Here we have presented IntOGen-CL, an intuitive browser to explore the wealth of data provided by the original authors of the CCLE study after integrating it using Oncodrive-fm. The resource can communicate with IntOGen thanks to the Onexus implementation and it has been designed to allow the inclusion of further sources and genomics data types from cancer cell lines. We believe it will help researchers that seek to compare genomic profiles amongst cancer cell lines, or that want to correlate those with corresponding somatic tumours from cancer patients.
227

Figures
Figure 1. Schema of IntOGen-CL organization. The site is centred towards the navigation on two main entities: mutations and genes, which can be visualised at the level of cancer cell lines (optionally grouped by primary tissue) or at gene level. The FI of mutations is represented as a colour code for an intuitive identification of relevant results. Gene FIs and FM-bias may be browsed in the form of tables (that can be searched and filtered for a number of elements) or interactive heatmaps, which are also available for the pharmacological activity of cell lines and for the pathway-level FM bias. Filters applied are maintained in IntOGen to allow for a transparent navigation between websites and the comparison of mutations in cancer cell lines and somatic tumours.
228

References
Adzhubei,I.A. et al. (2010) A method and server for predicting damaging missense mutations. Nature Methods, 7, 248–249.
Barretina,J. et al. (2012) The Cancer Cell Line Encyclopedia enables predictive modelling of anticancer drug sensitivity. Nature, 483, 603–307.
Garnett,Mathew J. et al. (2012) Systematic identification of genomic markers of drug sensitivity in cancer cells. Nature, 483, 570–575.
Gonzalez-Perez,A. et al. (2012) Improving the prediction of the functional impact of cancer mutations by baseline tolerance transformation. Genome Medicine, 4, 89.
Gonzalez-Perez,A. and Lopez-Bigas,N. (2012) Functional impact bias reveals cancer drivers. Nucl. Acids Res., 40, e169–e169.
Gundem,G. et al. (2010) IntOGen: Integration and data-mining of multidimensional oncogenomic data. Nat Meth.
Holliday,D.L. and Speirs,V. (2011) Choosing the right cell line for breast cancer research. Breast Cancer Research, 13, 215.
Kanehisa,M. et al. (2012) KEGG for integration and interpretation of large-scale molecular data sets. Nucleic Acids Res, 40, D109–D114.
Ng,P.C. and Henikoff,S. (2003) SIFT: predicting amino acid changes that affect protein function. Nucl. Acids Res., 31, 3812–3814.
Reva,B. et al. (2011) Predicting the functional impact of protein mutations: application to cancer genomics. Nucl. Acids Res., 39, e118–e118.
Yang,W. et al. (2012) Genomics of Drug Sensitivity in Cancer (GDSC): a resource for therapeutic biomarker discovery in cancer cells. Nucleic Acids Research, 41, D955–D961.
229

Part IV
Discussion

Chapter 6
DISCUSSION
This thesis is broadly divided into two main topics, each of them covered by two chapters in the Results section. First, it contributes to the understanding of regulatory epigenomics modules in the coordination of gene expression in cancer, and more specifically in breast tumours, as is reported in Chapter 2 and Chapter 3. Second, this work presents an overview on the impact of somatic mutations on chromatin regulatory factors in tumours arising from different human tissues, providing, to our knowledge, the first report of this kind. This second part is described in Chapter 4 and Chapter 5.
6.1 Dissecting tumour progression through regulatory epigenomic modules
That chromatin plays a key role in the regulation and coordination of gene expression has been thoroughly reviewed in the introductory Chapter 1. Thanks to the histone occupancy maps and other regulatory data that has been generated recently by large consortia such as ENCODE, it is now possible to explore epigenetic changes in a variety of cell types. A very attractive approach that has emerged to study transcriptomic differences across conditions, aside from the well-established differential gene expression, consists on collapsing genes into modules, and assess their overall expression changes as a single entity. Regulatory modules are thus defined as groups of genes that share a biological property; for instance, “genes over-expressed in condition A”, “genes that code for kinase proteins” or “genes annotated in the cellular differentiation pathway in the KEGG database”. The rationale behind grouping genes into modules is to allow the assessment of their transcriptional status as a block across conditions.
233

Gene modules in the coordinated regulation of gene expression
Gene pairs that present a similar transcriptional profile are often referred to as “co-regulated”. Usually, it is assumed that two co-regulated genes are under the control of the same transcription factor (Allocco, Kohane, and Butte 2004), but this does not necessarily have to be the case (Gerstein et al. 2012). It may also be that both genes are physically close in the three-dimensional chromatin structure, and thus are regulated through the same epigenetic factors, be it activators or repressors of transcription. What seems clear, however, is that co-regulation is intimately related to having a common function in most organisms (Bergmann, Ihmels, and Barkai 2003; Stuart et al. 2003).
In Chapter 2 we conducted an analysis on the large-scale coordination of gene expression as a proof of concept on the effectiveness of epigenetic regulatory modules to dissect pathway deregulation. We sought to determine which epigenetic factors are most crucial to maintain the coordinated regulation of gene expression, both in normal and cancer conditions. One may argue that each histone mark is responsible for a high-level control of gene expression that encompasses too many genes to produce any interesting modules. However, we observed that this is not the case, and reproduced previous results that reported a higher co-regulation of immune system pathways in tumours. Using the sample level enrichment analysis (SLEA) approach to collapse regulatory modules and assess their expression bias across samples, we established PRC2 as a main regulatory hub in normal cells and cancer. In line with the first objective of this work, this exploratory analysis served to interrogate the cross-talk of epigenetic pathways in large cohorts of transcriptomic data.
A main interesting finding of this work is the definition of large coordinated patterns between epigenetic regulatory modules. Far from being static, chromatin organisation has been previously described to contribute to the regulation of gene expression in a highly dynamic fashion, establishing a compartmentalisation within the nucleus that varies across cell types and cellular states (Bártová et al. 2008). For instance, regions close to the nuclear lamina have been associated to inactive transcription, mediated by the anchorage through lamin proteins, that provide mechanical stability to the nucleus. The histone code has been associated to the organisation of chromatin architecture at several levels; for instance, inactive chromosome X (Xi) is enriched in H3K27me3 and H3K9me2, both repressive, and localised at the most peripheral nuclear region (Bártová et al. 2008). A more direct example on the influence of histone modification patterns over nuclear compartmentalisation was reported in Hutchinson-Gilford progeria syndrome (HGPS), where mutations in the lamin A gene (LMNA) result in a global reduction of H3K9me3 levels and a loss of
234

H3K27me3 at the Xi chromosome (Scaffidi and Misteli 2006). Thus, it seems that histone modification patterns play an important role in the definition of nuclear compartments.
There is another aspect of chromatin organisation that remains underexplored, but may have relevant implications on cancer pharmacological studies. HDAC inhibitors, the first class of epigenetic drugs approved for clinical use, have a strong effect on heterochromatin. After TSA (an HDACi) treatment, centromeric regions are repositioned at the nuclear periphery, through a process that involves the loss of ability to bind HP1 (heterochromatin protein 1) (Taddei et al. 2001; Bártová et al. 2007). This has been related to an increase of H3K9ac at those regions (Robbins et al. 2005). A deeper elucidation of the changes in the compartmentalisation of the genome may help in understanding the mechanisms through which HDACis exhibit antitumour activity, which are currently largely unknown.
Finally, a study has recently yielded insightful results that connect histone modifications and nuclear architecture, by generating genome-wide epigenetic maps across several cell types and differentiation stages (Zhu et al. 2013). They found that growth factors added to the culture medium triggered macro-scale chromatin state changes in cells that were not observed under physiological conditions. These changes mostly consisted on an increase of H3K9me3 levels at lamin-associated domains, which promoted alterations in the nuclear architecture. This report raises intriguing questions regarding the interpretation of previous experiments that studied those chromatin marks in cultured cells, and pose the necessity to further explore the contributions of the histone code to determine and maintain chromatin organisation within the nucleus.
The observation we made, described in Chapter 2, that there is large synchronization between regulatory modules, opens questions on how this general coordination in gene expression is achieved. The elucidation of the mechanisms that compartmentalise chromatin within the nucleus may shed some light on the subject. Future follow-up experiments could further address this question.
Polycomb-regulated genes in breast tumour progression
Knowing that Polycomb proteins play a relevant role in tumorigenesis, and that their occupancy maps define genes with distinct properties in cancer samples, we sought to integrate PRC2 regulatory modules with transcriptomic data and clinical information from breast tumours. The rationale behind using gene expression was that it has been described to play a more important role than
235
other variables, such as age or tumour stage, in determining the breast cancer phenotype (Sørlie et al. 2003). In Chapter 3, I present an in-depth analysis on the misregulation of EZH2 in breast tumours, where I used clinical features and genomic signatures to further elucidate the role it plays in the promotion of EMT. We found that EZH2 targets were down-regulated in breast cancers with poor prognosis in several independent experiments, but, importantly, only when sample cohorts were homogeneous and representative of all tumour stages. The early timing at which EZH2-regulated genes change their expression during tumorigenesis suggests that it might contribute to cancer initiation. This notion was reinforced by our experimental validations, where we found that the loss of EZH2 decreased proliferation and promoted cell adhesion, consistent with the role it plays in inducing EMT.
This analysis has been limited by the availability of large, good quality gene expression experiments on breast tumours, and by the difficulty to find clinical annotations for samples. The results are, nevertheless, encouraging, and highlight the potential for this type of studies. Surely, exploratory data analysis employing gene regulatory modules and gene expression, such as enrichment analyses, frequently report too broad pictures on the underlying biological processes that may be causing the observed patterns. However, they are an attractive starting point to find the right question to ask (Kelder et al. 2010). After an initial exploration, and with the clear hypothesis that Polycomb-regulated genes may define relevant tumour subtypes, we dissected the molecular characteristics of breast tumours, bearing in mind that diverse gene signatures (e.g. response to drugs, high-grade tumours or a number of cellular processes) have been defined in the literature and could be used for this purpose. Our approach would not be complete without coupling it to experimental validation, which provided solid support to our conclusions. Further experiments may be designed in a similar manner, thus computationally exploiting the wealth of cancer data already available (modules, signatures and gene expression) to identify potential biomarkers and drug candidates, which will hopefully spur further research.
6.2 The mutational landscape of epigenetic regulators across human tumours
The recent exponential growth of large cancer genomics projects has generated invaluable data, presenting the opportunity to mine it collectively and extract new knowledge that may aid in our understanding of the mechanisms of cancer and the identification of biomarkers. A major challenge is to identify interesting candidates that drive tumour development amongst all this information; in other
236

words, to “find the needle in a haystack”. In this regard, CRFs have emerged as a particularly interesting gene group, given their potential druggability and their broad functional role in a number of key cellular processes. In Chapter 5 I present an in-depth exploration of the mutational landscape of CRFs across close to 3000 available sequenced tumours, encompassing eleven anatomical sites, and more than 900 cancer cell lines. To take full advantage of the sequenced tumour's data, we used OncodriveFM, an approach that identifies both frequent and lowly-recurrent drivers. Our unbiased identification of driver CRFs is based on the detection of events that may cause a selective advantage to the tumour cell. The underlying assumption is that genes that accumulate functional mutations (this is, that have an FM bias) are more likely to be drivers of tumorigenesis, regardless of the frequency at which they appear mutated across samples.
Our study to identify cancer drivers amongst CRFs, however, possesses some limitations. The method may underestimate, for instance, the functional impact of mutations that result in a gain of function, given that these may be less deleterious, and lower FI scores may be assigned to them in consequence. Moreover, we are not currently scoring mutations in splice junctions, which may affect splicing and produce aberrant transcripts. The possible effect of these on tumorigenesis remains, although, unclear. Future improvements may include the development of strategies to overcome these limitations, and thus capture a fuller picture of the mutational landscape in human tumours.
This is, to our knowledge, the first analysis of this kind, and others will surely follow as more tumours are sequenced. What seems clear is that the cancer genomics data that is currently available will not be doubled, but instead increase by one or two orders of magnitude in the coming years. The integration of different types of information is, and will be even more, paramount to translate the efforts on tumour characterisation into prognostic and diagnostic tools that may be of use in a clinical setting. It is becoming apparent, for instance, that traditional histochemical assessments cannot distinguish tumour subtypes that may benefit from specific treatments, as in the case for EZH2 activating mutations in lymphomas (Morin et al. 2010). Approaches such as ours are a first step towards a full molecular profiling of cancer, an essential prerequisite to develop personalised medicine strategies.
IntOGen-CL: a resource to explore genomic alterations in cancer cell lines
The mutations in primary tumours results presented in Chapter 5 were included within the original IntOGen system, but cancer cell line data required a tailored
237

and more specific portal. With this idea we designed IntOGen-CL (cell lines), the first sub-site of IntOGen, which is briefly described in Chapter 6 of this work. It currently includes mutation data from the CCLE, not only for the 43 CRFs sequenced in that project, but also for the rest of the genes they analysed (1651, in total). There are two main ideas behind this resource: first, it is designed, like IntOGen, to detect likely drivers in cancer, and thus may be considered an extension of it in this sense; and second, it is meant to serve as a guide for researchers to identify cancer cells lines that are best suited to reproduce a specific cancer phenotype. As discussed previously, the molecular characteristics of tumours may determine novel subtypes with specific prognosis and distinct treatment responses. A tumour bearing a particular mutation in a driver, or in a combination of them, may distinguish patients that would benefit from being treated with a drug from those that would not. When a researcher studies the effect of a drug on a cancer model, thus, it is essential that the cell lines of choice mirror the phenotype of the original tumour. The idea behind IntOGen-CL is to serve, in the future, as a resource that may aid in this task by integrating the knowledge on drug sensitivity and mutations in cancer cell lines along with those detected in somatic tumours. The latter is possible thanks to the transparent communication of the site with the original IntOGen.
IntOGen-CL has plenty of room for improvement, and also to include more data and new types of data. It has been conceived with this in mind, as the system is flexible and easy to update. New sources of cancer cell lines data are, for instance, the recently created COSMIC Cancer Cell Lines Project (cancer.sanger.ac.uk/cancergenome/projects/cell_lines), that provides information on mutations, and the CelLineNavigator, which collects gene expression profiles (Krupp et al. 2012). The Genomics of Drug Sensitivity in Cancer (GDSC) project also provides a wealth of data on pharmacological response associated to mutations in few selected genes that is very valuable to profile cancer cell lines (Garnett et al. 2012; Yang et al. 2012). Moreover, transcriptomic and CNA data has also been generated within the CCLE project.
Our goal is to provide all the information currently available on cancer cell lines, integrated with previous knowledge. A major hurdle of the mutations assessment on cancer cell lines is the absence of a normal control to discard germline variants. By comparing the reported mutations with prior knowledge this problem could be, at least partially, overcome. Three different sources on sequence variants could aid in this task: the CGC and OMIM, to identify known associations of genes with cancer and Mendelian diseases; COSMIC, to verify whether a variant has been previously detected in cancer; and dbSNP and 1000 genomes, to detect miscalled mutations that might be germline variants. The idea
238

is that users will be able to navigate cancer cell lines mutations alongside with the information on variations, and assess each case in particular.
Exploiting large amounts of data to extract new knowledge
The work presented in this thesis is largely based on the analysis of data previously generated by other researchers and/or consortia, including ENCODE, ICGC and TCGA, to extract new knowledge. Thanks to the generalised use of high-throughput technologies, and to the existence of large projects that generate and make available large amounts of data in specific topics, the development and use of methodologies to extract relevant knowledge out of mining public information is becoming more important. This has led to a paradigm shift in the way genomics research is currently conducted. It may be compared, to some extent, to the dramatic change caused by the creation of GenBank some years ago (Benson et al. 1994), or to the availability of the complete first human genome reference sequence (Lander et al. 2001). Before that, researchers had to clone and sequence their gene or region of interest, as in the case for HTT (huntingtin), a project that took ten years to complete (MacDonald et al. 1993). By the time the human genome draft was made available, it was common to fetch gene sequences from databases and then further refine them in the laboratory if their quality was not optimal.
In comparison, the scenario today is that overwhelming amounts of data are publicly available. Large consortia sequence full human genomes, including those from tumours, and many researchers generate genome-wide gene expression profiles on a regular basis and deposit it on public repositories. Currently, thus, it is possible to address many biological questions without producing any new data, but instead fetch it from databases. The results obtained by extracting patterns and integrating large amounts of data may be regarded as new hypotheses, that later require follow-up experiments to be validated in the laboratory. A specific line of research that may benefit much from these approaches is the elucidation of the exact mechanisms through which mutations on CRFs contribute to tumorigenesis (Ryan and Bernstein 2012). These are largely unknown, but the task is crucial because they have emerged as important drug candidates for anticancer therapy, even though their precise mechanism of action is not known; CRFs act upon a large number of genes, but probably only a subset are relevant to promote disease. This is currently a major challenge for cancer research, and will certainly require multidisciplinary research, in the intersection of computational biology, molecular biology and pharmacogenomics. Our contribution in this regard is presented in Chapter 5.
239

The future of cancer genomics and precision medicine
Precision medicine is often defined as “coupling established clinical–pathological indexes with state-of-the-art molecular profiling to create diagnostic, prognostic, and therapeutic strategies precisely tailored to each patient's requirements” (Mirnezami, Nicholson, and Darzi 2012). It is a blooming field that arose from the explosion of molecular information owing to dramatic biotechnological advances in the last years. The main contributions of current basic computational biology research to it are basically two: first, the definition of molecular profiles that determine cancer subtypes, susceptible to respond differently to a treatment or with specific associated prognosis; and second, the identification of drivers that may be pharmacologically targeted in personalised anticancer therapies. The work presented in Chapter 3 and Chapter 4 can be broadly framed within each of these two broad research directions.
Cancer genomics, as a field, is advancing towards a personalised medicine direction (Stratton 2011). The implications are likely to be far-reaching, and may probably include the establishment of a new rational classification of human cancer, based on genomic abnormalities (Committee on a Framework for Development a New Taxonomy of Disease; National Research Council 2011), that ideally will reflect the key characteristics of a tumour behaviour (progression and response to therapy), regardless of the tissue where it originated. The ultimate goal of this thesis is not to have an effect on medical practise and personalised medicine, yet it has been conceived in the context of cancer genomics, which main objective is to better understand the mechanisms underlying tumorigenesis to have an impact on the clinic.
240

Part V
Conclusions

My main interest in this study was to gain insight into the epigenetic mechanisms that drive tumour progression. In the first part of this thesis I have mined available sources of experimental regulatory data, mainly histone and CRFs occupancy maps, and applied bioinformatic approaches to integrate it with genome-wide gene expression changes across tumours. Being key in tumorigenesis and in the maintenance of the epigenomic landscape, I explored more in detail the Polycomb complex proteins. The second part of this work has focused on the identification of CRFs that function as drivers in primary tumours and cancer cell lines. The main contributions of this thesis can be summarized as follows:
1. Gene regulatory modules may be used to determine the transcriptional status of a cell. These modules are largely coordinated in normal tissues, but this characteristic is at least partially lost in cancer cells. Specifically, the genes regulated by Polycomb show distinct coordination patterns in cancer when compared to normal tissues.
2. A shared, global pattern of co-regulated expression becomes clear when normal and cancer cells are analysed within the framework of epigenetic regulatory modules. It consists in two main anti-correlated groups of modules: Polycomb and repressive histone marks, and transcription factors and activating histone marks.
3. Upon analysis of the molecular and clinical characteristics of breast tumours, we found that genes in regions bound by EZH2 or by nucleosomes presenting trimethylation of histone 3 at lysine 27 (H3K27me3) are down-regulated in tissues with high expression of cell cycle genes, and low expression of developmental and cell adhesion genes. Furthermore, the expression of EZH2 targets successfully stratified breast cancer patients into good and poor prognostic groups, independent of known cancer signatures.
4. We experimentally validated our findings on the role of EZH2 in breast
243
tumours through collaboration. Top altered EZH2-regulated genes decreased their expression upon loss of EZH2, which diminished proliferation and improved cell adhesion. This is consistent with mesenchymal to epithelial transition, the reverse of the EMT process. Moreover, high protein levels of EZH2 are associated with aggressive cancer phenotypes in breast tumour samples.
5. We determined the mutational landscape of CRFs in almost 3000 human tumours from eleven anatomical sites, using an approach that assesses the accumulation of functional mutations in each gene, regardless of the frequency at which it appears mutated across all samples. We identified 39 CRFs that are likely drivers in the tumours from at least one site, all with relatively low mutational frequencies.
6. Mutations in CRFs reveal as an important pathway to tumorigenesis in certain tumour subtypes such as paediatric medulloblastomas, but appear almost negligible in others, such as glioblastomas.
7. Mutations in MLL and EP300 correlate with broad expression changes across cancer cell lines, providing insight on the possible mechanism through which they might contribute to tumorigenesis in the corresponding tissues.
8. We have provided the results on our analysis on the functional impact and frequency of mutations across some 900 cancer cell lines in IntOGen-CL, a portal specifically designed for this purpose. Together with the information contained in IntOGen, it is a useful resource for assessing the importance of specific genes and mutations in cancer and their possible implication in drug sensitivity/resistance to drugs.
244

Part VI
Appendix

Chapter 7
INTOGEN: INTEGRATION AND DATA MINING OF MULTIDIMENSIONAL ONCOGENOMIC DATA
Authors: Gunes Gundem, Christian Perez-Llamas, Alba Jene-Sanz, Anna Kedzierska, Abul Islam, Jordi Deu-Pons, Simon J Furney and Nuria Lopez-Bigas
Published in: Nature Methods, 7, no. 2 (February 2010): 92–93. doi:10.1038/nmeth0210-92.
247


Chapter 8
INHIBITION OF SPECIFIC NF-κB ACTIVITY CONTRIBUTES TO THE TUMOR SUPPRESSOR
FUNCTION OF 14-3-3σ IN BREAST CANCER
Authors: Julia Ingles-Esteve, Monica Morales, Alba Dalmases, Ricard Garcia-Carbonell, Alba Jene-Sanz, Nuria Lopez-Bigas, Mar Iglesias, Cristina Ruiz-Herguido, Ana Rovira, Federico Rojo, Joan Albanell, Roger R. Gomis, Anna Bigas and Lluis Espinosa.
Published in: PLoS ONE, 7, no. 5 (May 31, 2012): e38347. doi:10.1371/journal.pone.0038347
251


References
Adams, David, Lucia Altucci, Stylianos E. Antonarakis, Juan Ballesteros, Stephan Beck, Adrian Bird, Christoph Bock, et al. 2012. “BLUEPRINT to Decode the Epigenetic Signature Written in Blood.” Nature Biotechnology 30 (3): 224–226. doi:10.1038/nbt.2153.
Alford, Sharon Hensley, Katherine Toy, Sofia D. Merajver, and Celina G. Kleer. 2012. “Increased Risk for Distant Metastasis in Patients with Familial Early-Stage Breast Cancer and High EZH2 Expression.” Breast Cancer Research and Treatment 132 (2) (April): 429–437. doi:10.1007/s10549-011-1591-2.
Al-Hajj, Muhammad, Max S. Wicha, Adalberto Benito-Hernandez, Sean J. Morrison, and Michael F. Clarke. 2003. “Prospective Identification of Tumorigenic Breast Cancer Cells.” Proceedings of the National Academy of Sciences 100 (7) (April 1): 3983–3988. doi:10.1073/pnas.0530291100.
Allocco, Dominic J., Isaac S. Kohane, and Atul J. Butte. 2004. “Quantifying the Relationship Between Co-expression, Co-regulation and Gene Function.” BMC Bioinformatics 5 (1) (February 25): 18. doi:10.1186/1471-2105-5-18.
Arrowsmith, Cheryl H., Chas Bountra, Paul V. Fish, Kevin Lee, and Matthieu Schapira. 2012. “Epigenetic Protein Families: a New Frontier for Drug Discovery.” Nature Reviews Drug Discovery 11 (5) (April 13): 384–400. doi:10.1038/nrd3674.
Arvey, Aaron, Phaedra Agius, William Stafford Noble, and Christina Leslie. 2012. “Sequence and Chromatin Determinants of Cell-type–specific Transcription Factor Binding.” Genome Research 22 (9) (September 1): 1723–1734. doi:10.1101/gr.127712.111.
Ashburner, Michael, Catherine A. Ball, Judith A. Blake, David Botstein, Heather Butler, J. Michael Cherry, Allan P. Davis, et al. 2000. “Gene Ontology: Tool for the Unification of Biology.” Nature Genetics 25 (1) (May 1): 25–29.
265

doi:10.1038/75556.
Balic, Marija, Henry Lin, Lillian Young, Debra Hawes, Armando Giuliano, George McNamara, Ram H. Datar, and Richard J. Cote. 2006. “Most Early Disseminated Cancer Cells Detected in Bone Marrow of Breast Cancer Patients Have a Putative Breast Cancer Stem Cell Phenotype.” Clinical Cancer Research 12 (19) (October 1): 5615–5621. doi:10.1158/1078-0432.CCR-06-0169.
Ballestar, Esteban, Manel Esteller, and Bruce C. Richardson. 2006. “The Epigenetic Face of Systemic Lupus Erythematosus.” The Journal of Immunology 176 (12) (June 15): 7143–7147.
Ballestar, Esteban, Maria F. Paz, Laura Valle, Susan Wei, Mario F. Fraga, Jesus Espada, Juan Cruz Cigudosa, Tim Hui-Ming Huang, and Manel Esteller. 2003. “Methyl-CpG Binding Proteins Identify Novel Sites of Epigenetic Inactivation in Human Cancer.” The EMBO Journal 22 (23) (December 1): 6335–6345. doi:10.1093/emboj/cdg604.
Bamford, S., E. Dawson, S. Forbes, J. Clements, R. Pettett, A. Dogan, A. Flanagan, et al. 2004. “The COSMIC (Catalogue of Somatic Mutations in Cancer) Database and Website.” British Journal of Cancer 91 (2): 355–358. doi:10.1038/sj.bjc.6601894.
Banaszynski, Laura A., C. David Allis, and Peter W. Lewis. 2010. “Histone Variants in Metazoan Development.” Developmental Cell 19 (5) (November 16): 662–674. doi:10.1016/j.devcel.2010.10.014.
Banine, Fatima, Christopher Bartlett, Ranjaka Gunawardena, Christian Muchardt, Moshe Yaniv, Erik S. Knudsen, Bernard E. Weissman, and Larry S. Sherman. 2005. “SWI/SNF Chromatin-Remodeling Factors Induce Changes in DNA Methylation to Promote Transcriptional Activation.” Cancer Research 65 (9) (May 1): 3542–3547. doi:10.1158/0008-5472.CAN-04-3554.
Bannister, Andrew J., and Tony Kouzarides. 2011. “Regulation of Chromatin by Histone Modifications.” Cell Research 21 (3): 381–395. doi:10.1038/cr.2011.22.
Barbisan, F, R Mazzucchelli, A Santinelli, D Stramazzotti, M Scarpelli, A Lopez-Beltran, L Cheng, and R Montironi. 2008. “Immunohistochemical Evaluation of Global DNA Methylation and Histone Acetylation in Papillary Urothelial Neoplasm of Low Malignant Potential.” International Journal of Immunopathology and Pharmacology 21 (3) (September): 615–623.
Barlési, Fabrice, Giuseppe Giaccone, Marielle I. Gallegos-Ruiz, Anderson Loundou, Simone W. Span, Pierre Lefesvre, Frank A. E. Kruyt, and Jose Antonio Rodriguez. 2007. “Global Histone Modifications Predict Prognosis of Resected Non–Small-Cell Lung Cancer.” Journal of Clinical Oncology 25 (28) (October 1): 4358–4364. doi:10.1200/JCO.2007.11.2599.
266

Barretina, Jordi, Giordano Caponigro, Nicolas Stransky, Kavitha Venkatesan, Adam A. Margolin, Sungjoon Kim, Christopher J. Wilson, et al. 2012. “The Cancer Cell Line Encyclopedia Enables Predictive Modelling of Anticancer Drug Sensitivity.” Nature 483 (7391) (March 28): 603–307. doi:10.1038/nature11003.
Barski, Artem, Suresh Cuddapah, Kairong Cui, Tae-Young Roh, Dustin E. Schones, Zhibin Wang, Gang Wei, Iouri Chepelev, and Keji Zhao. 2007. “High-Resolution Profiling of Histone Methylations in the Human Genome.” Cell Vol 129 (May 18): 823–837.
Bártová, Eva, Jana Krejčí, Andrea Harničarová, Gabriela Galiová, and Stanislav Kozubek. 2008. “Histone Modifications and Nuclear Architecture: A Review.” Journal of Histochemistry and Cytochemistry 56 (8) (August): 711–721. doi:10.1369/jhc.2008.951251.
Bártová, Eva, Jirí Pacherník, Alois Kozubík, and Stanislav Kozubek. 2007. “Differentiation-specific Association of HP1alpha and HP1beta with Chromocentres Is Correlated with Clustering of TIF1beta at These Sites.” Histochemistry and Cell Biology 127 (4) (April): 375–388. doi:10.1007/s00418-006-0259-1.
Baslan, Timour, Jude Kendall, Linda Rodgers, Hilary Cox, Mike Riggs, Asya Stepansky, Jennifer Troge, et al. 2012. “Genome-wide Copy Number Analysis of Single Cells.” Nature Protocols 7 (6): 1024–1041. doi:10.1038/nprot.2012.039.
Bastien, Roy RL, Álvaro Rodríguez-Lescure, Mark TW Ebbert, Aleix Prat, Blanca Munárriz, Leslie Rowe, Patricia Miller, et al. 2012. “PAM50 Breast Cancer Subtyping by RT-qPCR and Concordance with Standard Clinical Molecular Markers.” BMC Medical Genomics 5 (1) (October 4): 44. doi:10.1186/1755-8794-5-44.
Baudis, Michael, and Michael L. Cleary. 2001. “Progenetix.net: An Online Repository for Molecular Cytogenetic Aberration Data.” Bioinformatics 17 (12) (December 1): 1228–1229. doi:10.1093/bioinformatics/17.12.1228.
Baylin, Stephen B., and Peter A. Jones. 2011. “A Decade of Exploring the Cancer Epigenome — Biological and Translational Implications.” Nature Reviews Cancer 11 (10) (October 1): 726–734. doi:10.1038/nrc3130.
Benjamini, Yoav, and Yosef Hochberg. 1995. “Controlling the False Discovery Rate: A Practical and Powerful Approach to Multiple Testing.” Journal of the Royal Statistical Society. Series B (Methodological) 57 (1): 289–300. doi:10.2307/2346101.
Ben-Porath, Ittai, Matthew W Thomson, Vincent J Carey, Ruping Ge, George W Bell, Aviv Regev, and Robert A Weinberg. 2008. “An Embryonic Stem Cell-like Gene Expression Signature in Poorly Differentiated Aggressive Human
267

Tumors.” Nat Genet 40 (5) (May): 499–507. doi:10.1038/ng.127.
Benson, D A, M Boguski, D J Lipman, and J Ostell. 1994. “GenBank.” Nucleic Acids Research 22 (17) (September): 3441–3444.
Bergmann, Sven, Jan Ihmels, and Naama Barkai. 2003. “Similarities and Differences in Genome-Wide Expression Data of Six Organisms.” PLoS Biol 2 (1) (December 15): e9. doi:10.1371/journal.pbio.0020009.
Bernstein, Bradley E., Alex, er Meissner, Eric S. L, and er. 2007. “The Mammalian Epigenome.” Cell 128 (4) (February): 669–681. doi:10.1016/j.cell.2007.01.033.
Bernstein, Bradley E., Tarjei S. Mikkelsen, Xiaohui Xie, Michael Kamal, Dana J. Huebert, James Cuff, Ben Fry, et al. 2006. “A Bivalent Chromatin Structure Marks Key Developmental Genes in Embryonic Stem Cells.” Cell 125 (2) (April 21): 315–326. doi:10.1016/j.cell.2006.02.041.
Bernstein, Bradley E., John A. Stamatoyannopoulos, Joseph F. Costello, Bing Ren, Aleksandar Milosavljevic, Alexander Meissner, Manolis Kellis, et al. 2010. “The NIH Roadmap Epigenomics Mapping Consortium.” Nature Biotechnology 28 (10): 1045–1048. doi:10.1038/nbt1010-1045.
Bestor, Timothy H. 2003. “Unanswered Questions About the Role of Promoter Methylation in Carcinogenesis.” Annals of the New York Academy of Sciences 983 (1): 22–27. doi:10.1111/j.1749-6632.2003.tb05959.x.
Bidard, F.-C., C. Mathiot, S. Delaloge, E. Brain, S. Giachetti, P. de Cremoux, M. Marty, and J.-Y. Pierga. 2010. “Single Circulating Tumor Cell Detection and Overall Survival in Nonmetastatic Breast Cancer.” Annals of Oncology 21 (4) (April 1): 729–733. doi:10.1093/annonc/mdp391.
Bird, Adrian P. 1986. “CpG-rich Islands and the Function of DNA Methylation.” Nature 321 (6067) (May 15): 209–213. doi:10.1038/321209a0.
Blahnik, Kimberly R., Lei Dou, Henriette O’Geen, Timothy McPhillips, Xiaoqin Xu, Alina R. Cao, Sushma Iyengar, et al. 2010. “Sole-Search: An Integrated Analysis Program for Peak Detection and Functional Annotation Using ChIP-seq Data.” Nucleic Acids Research 38 (3) (January 1): e13–e13. doi:10.1093/nar/gkp1012.
Boyer, Laurie A., Tong Ihn Lee, Megan F. Cole, Sarah E. Johnstone, Stuart S. Levine, Jacob P. Zucker, Matthew G. Guenther, et al. 2005. “Core Transcriptional Regulatory Circuitry in Human Embryonic Stem Cells.” Cell Vol 122 (September 23): 947–956.
Boyer, Laurie A., Colin Logie, Edgar Bonte, Peter B. Becker, Paul A. Wade, Alan P. Wolffe, Carl Wu, Anthony N. Imbalzano, and Craig L. Peterson. 2000.
268

“Functional Delineation of Three Groups of the ATP-dependent Family of Chromatin Remodeling Enzymes.” Journal of Biological Chemistry 275 (25) (June 23): 18864–18870. doi:10.1074/jbc.M002810200.
Boyer, Laurie A., Kathrin Plath, Julia Zeitlinger, Tobias Brambrink, Lea A. Medeiros, Tong Ihn Lee, Stuart S. Levine, et al. 2006. “Polycomb Complexes Repress Developmental Regulators in Murine Embryonic Stem Cells.” Nature 441 (7091) (April 19): 349–353. doi:10.1038/nature04733.
Brabletz, Thomas. 2012. “To Differentiate or Not — Routes Towards Metastasis.” Nature Reviews Cancer 12 (6) (June 1): 425–436. doi:10.1038/nrc3265.
Brabletz, Thomas, Andreas Jung, Simone Spaderna, Falk Hlubek, and Thomas Kirchner. 2005. “Migrating Cancer Stem Cells — an Integrated Concept of Malignant Tumour Progression.” Nature Reviews Cancer 5 (9) (September 1): 744–749. doi:10.1038/nrc1694.
Bracken, Adrian P., Nikolaj Dietrich, Diego Pasini, Klaus H. Hansen, and Kristian Helin. 2006. “Genome-wide Mapping of Polycomb Target Genes Unravels Their Roles in Cell Fate Transitions.” Genes & Development 20 (9) (May 1): 1123–1136. doi:10.1101/gad.381706.
Bracken, Adrian P., and Kristian Helin. 2009. “Polycomb Group Proteins: Navigators of Lineage Pathways Led Astray in Cancer.” Nature Reviews Cancer 9 (11) (November 1): 773–784. doi:10.1038/nrc2736.
Brown, S W. 1966. “Heterochromatin.” Science (New York, N.Y.) 151 (3709) (January 28): 417–425.
Buchwald, Marc, Oliver H. Krämer, and Thorsten Heinzel. 2009. “HDACi – Targets Beyond Chromatin.” Cancer Letters 280 (2) (August): 160–167. doi:10.1016/j.canlet.2009.02.028.
Cai, Haoyang, Nitin Kumar, and Michael Baudis. 2012. “arrayMap: A Reference Resource for Genomic Copy Number Imbalances in Human Malignancies.” PLoS ONE 7 (5) (May 18): e36944. doi:10.1371/journal.pone.0036944.
Cao, Paul, Zhiyong Deng, Meimei Wan, Weiwei Huang, Scott D. Cramer, Jianfeng Xu, Ming Lei, and Guangchao Sui. 2010. “MicroRNA-101 Negatively Regulates Ezh2 and Its Expression Is Modulated by Androgen Receptor and HIF-1α/HIF-1β.” Molecular Cancer 9 (1) (May 17): 108. doi:10.1186/1476-4598-9-108.
Cavallaro, Ugo, and Gerhard Christofori. 2004. “Cell Adhesion and Signalling by Cadherins and Ig-CAMs in Cancer.” Nature Reviews Cancer 4 (2) (February 1): 118–132. doi:10.1038/nrc1276.
269

Cedar, Howard, and Yehudit Bergman. 2009. “Linking DNA Methylation and Histone Modification: Patterns and Paradigms.” Nature Reviews Genetics 10 (5) (May 1): 295–304. doi:10.1038/nrg2540.
Chang, Chun-Ju, Jer-Yen Yang, Weiya Xia, Chun-Te Chen, Xiaoming Xie, Chi-Hong Chao, Wendy A. Woodward, Jung-Mao Hsu, Gabriel N. Hortobagyi, and Mien-Chie Hung. 2011. “EZH2 Promotes Expansion of Breast Tumor Initiating Cells Through Activation of RAF1-β-catenin Signaling.” Cancer Cell 19 (1) (January 18): 86–100. doi:10.1016/j.ccr.2010.10.035.
Chang, C.-J., and M.-C. Hung. 2012. “The Role of EZH2 in Tumour Progression.” British Journal of Cancer 106 (2): 243–247. doi:10.1038/bjc.2011.551.
Chapeville, F, F Lipmann, G Von Ehrenstein, B Weisblum, W J Ray Jr, and S Benzer. 1962. “On the Role of Soluble Ribonucleic Acid in Coding for Amino Acids.” Proceedings of the National Academy of Sciences of the United States of America 48 (June 15): 1086–1092.
Chase, Andrew, and Nicholas C. P. Cross. 2011. “Aberrations of EZH2 in Cancer.” Clinical Cancer Research 17 (9) (May 1): 2613–2618. doi:10.1158/1078-0432.CCR-10-2156.
Chen, Rui, George I. Mias, Jennifer Li-Pook-Than, Lihua Jiang, Hugo Y.K. Lam, Rong Chen, Elana Miriami, et al. 2012. “Personal Omics Profiling Reveals Dynamic Molecular and Medical Phenotypes.” Cell 148 (6) (March 16): 1293–1307. doi:10.1016/j.cell.2012.02.009.
Chen, Ya-Huey, Mien-Chie Hung, and Long-Yuan Li. 2012. “EZH2: a Pivotal Regulator in Controlling Cell Differentiation.” American Journal of Translational Research 4 (4) (October 10): 364–375.
Choi, Jung Kyoon, Ungsik Yu, Ook Joon Yoo, and Sangsoo Kim. 2005. “Differential Coexpression Analysis Using Microarray Data and Its Application to Human Cancer.” Bioinformatics 21 (24) (December 15): 4348–4355. doi:10.1093/bioinformatics/bti722.
Chouliaras, Leonidas, Bart P.F. Rutten, Gunter Kenis, Odette Peerbooms, Pieter Jelle Visser, Frans Verhey, Jim van Os, Harry W.M. Steinbusch, and Daniel L.A. van den Hove. 2010. “Epigenetic Regulation in the Pathophysiology of Alzheimer’s Disease.” Progress in Neurobiology 90 (4) (April): 498–510. doi:10.1016/j.pneurobio.2010.01.002.
Christofori, Gerhard, and Henrik Semb. 1999. “The Role of the Cell-adhesion Molecule E-cadherin as a Tumour-suppressor Gene.” Trends in Biochemical Sciences 24 (2) (February 1): 73–76. doi:10.1016/S0968-0004(98)01343-7.
Chuang, Han-Yu, Laura Rassenti, Michelle Salcedo, Kate Licon, Alexander
270

Kohlmann, Torsten Haferlach, Robin Foà, Trey Ideker, and Thomas J. Kipps. 2012. “Subnetwork-based Analysis of Chronic Lymphocytic Leukemia Identifies Pathways That Associate with Disease Progression.” Blood 120 (13) (September 27): 2639–2649. doi:10.1182/blood-2012-03-416461.
Clevers, Hans. 2011. “The Cancer Stem Cell: Premises, Promises and Challenges.” Nature Medicine: 313–319. doi:10.1038/nm.2304.
Committee on a Framework for Development a New Taxonomy of Disease; National Research Council. 2011. Toward Precision Medicine: Building a Knowledge Network for Biomedical Research and a New Taxonomy of Disease. Washington, D.C.: The National Academies Press.
Connelly, S., and J. L. Manley. 1988. “A Functional mRNA Polyadenylation Signal Is Required for Transcription Termination by RNA Polymerase II.” Genes & Development 2 (4) (April 1): 440–452. doi:10.1101/gad.2.4.440.
Coppedè, Fabio. 2012. “Genetics and Epigenetics of Parkinson’s Disease.” The Scientific World Journal 2012: 1–12. doi:10.1100/2012/489830.
Corrada Bravo, Héctor, Vasyl Pihur, Matthew McCall, Rafael A. Irizarry, and Jeffrey T. Leek. 2012. “Gene Expression Anti-profiles as a Basis for Accurate Universal Cancer Signatures.” BMC Bioinformatics 13 (1) (October 22): 272. doi:10.1186/1471-2105-13-272.
Costello, Joseph F., Michael C. Frühwald, Dominic J. Smiraglia, Laura J. Rush, Gavin P. Robertson, Xin Gao, Fred A. Wright, et al. 2000. “Aberrant CpG-island Methylation Has Non-random and Tumour-type–specific Patterns.” Nature Genetics 24 (2) (February 1): 132–138. doi:10.1038/72785.
Creighton, Chad J, Jenny C Chang, and Jeffrey M Rosen. 2010. “Epithelial-mesenchymal Transition (EMT) in Tumor-initiating Cells and Its Clinical Implications in Breast Cancer.” Journal of Mammary Gland Biology and Neoplasia 15 (2) (June): 253–260. doi:10.1007/s10911-010-9173-1.
Crick, F H. 1958. “On Protein Synthesis.” Symposia of the Society for Experimental Biology 12: 138–163.
Culhane, Aedín C., Markus S. Schröder, Razvan Sultana, Shaita C. Picard, Enzo N. Martinelli, Caroline Kelly, Benjamin Haibe-Kains, et al. 2012. “GeneSigDB: a Manually Curated Database and Resource for Analysis of Gene Expression Signatures.” Nucleic Acids Research 40 (D1) (January): D1060–D1066. doi:10.1093/nar/gkr901.
Dawson, Mark A., and Tony Kouzarides. 2012. “Cancer Epigenetics: From Mechanism to Therapy.” Cell 150 (1) (July 6): 12–27. doi:10.1016/j.cell.2012.06.013.
271

Ding, Li, Timothy J. Ley, David E. Larson, Christopher A. Miller, Daniel C. Koboldt, John S. Welch, Julie K. Ritchey, et al. 2012. “Clonal Evolution in Relapsed Acute Myeloid Leukaemia Revealed by Whole-genome Sequencing.” Nature 481 (7382) (January 26): 506–510. doi:10.1038/nature10738.
Djebali, Sarah, Carrie A. Davis, Angelika Merkel, Alex Dobin, Timo Lassmann, Ali Mortazavi, Andrea Tanzer, et al. 2012. “Landscape of Transcription in Human Cells.” Nature 489 (7414) (September 6): 101–108. doi:10.1038/nature11233.
Dong, Xianjun, Melissa C. Greven, Anshul Kundaje, Sarah Djebali, James B. Brown, Chao Cheng, Thomas R. Gingeras, et al. 2012. “Modeling Gene Expression Using Chromatin Features in Various Cellular Contexts.” Genome Biology 13 (9) (September 5): R53. doi:10.1186/gb-2012-13-9-r53.
Early Breast Cancer Trialists’ Collaborative Group. 1998. “Polychemotherapy for Early Breast Cancer: An Overview of the Randomised Trials.” The Lancet 352 (9132) (September): 930–942. doi:10.1016/S0140-6736(98)03301-7.
Eckhardt, Florian, Joern Lewin, Rene Cortese, Vardhman K. Rakyan, John Attwood, Matthias Burger, John Burton, et al. 2006. “DNA Methylation Profiling of Human Chromosomes 6, 20 and 22.” Nature Genetics 38 (12) (December 1): 1378–1385. doi:10.1038/ng1909.
Elsässer, Simon J., C. David Allis, and Peter W. Lewis. 2011. “New Epigenetic Drivers of Cancers.” Science 331 (6021) (March 4): 1145–1146. doi:10.1126/science.1203280.
Ernst, Jason, and Manolis Kellis. 2010. “Discovery and Characterization of Chromatin States for Systematic Annotation of the Human Genome.” Nature Biotechnology 28 (8): 817–825. doi:10.1038/nbt.1662.
Ernst, Jason, Pouya Kheradpour, Tarjei S. Mikkelsen, Noam Shoresh, Lucas D. Ward, Charles B. Epstein, Xiaolan Zhang, et al. 2011. “Mapping and Analysis of Chromatin State Dynamics in Nine Human Cell Types.” Nature 473 (7345) (May 5): 43–49. doi:10.1038/nature09906.
Ernst, Thomas, Andrew J. Chase, Joannah Score, Claire E. Hidalgo-Curtis, Catherine Bryant, Amy V. Jones, Katherine Waghorn, et al. 2010. “Inactivating Mutations of the Histone Methyltransferase Gene EZH2 in Myeloid Disorders.” Nature Genetics 42 (8): 722–726. doi:10.1038/ng.621.
Espinosa, E, A Gámez-Pozo, I Sánchez-Navarro, A Pinto, C A Castañeda, E Ciruelos, J Feliu, and J A Fresno Vara. 2012. “The Present and Future of Gene Profiling in Breast Cancer.” Cancer Metastasis Reviews 31 (1-2) (June): 41–46. doi:10.1007/s10555-011-9327-7.
Esteller, M. 2007. “Cancer Epigenomics: DNA Methylomes and Histone-
272

modification Maps.” Nat Rev Genet 8 (4) (April): 286–298. doi:10.1038/nrg2005.
Esteller, M. 2007. “Epigenetic Gene Silencing in Cancer: The DNA Hypermethylome.” Human Molecular Genetics 16 (R1) (April 15): R50–R59. doi:10.1093/hmg/ddm018.
Esteller, Manel. 2008. “Epigenetics in Cancer.” N Engl J Med 358 (11) (March 13): 1148–1159. doi:10.1056/NEJMra072067.
———. 2012. “Cancer, Epigenetics and the Nobel Prizes.” Molecular Oncology (0). doi:10.1016/j.molonc.2012.10.004. http://www.sciencedirect.com/science/article/pii/S1574789112001020.
Esteller, Manel, Jesus Garcia-Foncillas, Esther Andion, Steven N. Goodman, Oscar F. Hidalgo, Vicente Vanaclocha, Stephen B. Baylin, and James G. Herman. 2000. “Inactivation of the DNA-Repair Gene MGMT and the Clinical Response of Gliomas to Alkylating Agents.” New England Journal of Medicine 343 (19): 1350–1354. doi:10.1056/NEJM200011093431901.
Fan, X., E. K. Lobenhofer, M. Chen, W. Shi, J. Huang, J. Luo, J. Zhang, et al. 2010. “Consistency of Predictive Signature Genes and Classifiers Generated Using Different Microarray Platforms.” The Pharmacogenomics Journal 10 (4): 247–257. doi:10.1038/tpj.2010.34.
Farnham, Peggy J. 2009. “Insights from Genomic Profiling of Transcription Factors.” Nature Reviews Genetics 10 (9) (September 1): 605–616. doi:10.1038/nrg2636.
Feinberg, Andrew P., Rolf Ohlsson, and Steven Henikoff. 2006. “The Epigenetic Progenitor Origin of Human Cancer.” Nat Rev Genet 7 (1) (January): 21–33. doi:10.1038/nrg1748.
Feinberg, Andrew P., and Benjamin Tycko. 2004. “The History of Cancer Epigenetics.” Nature Reviews Cancer 4 (2) (February 1): 143–153. doi:10.1038/nrc1279.
Feinberg, A. P., and R. A. Irizarry. 2009. “Colloquium Paper: Stochastic Epigenetic Variation as a Driving Force of Development, Evolutionary Adaptation, and Disease.” Proceedings of the National Academy of Sciences 107 (suppl_1) (December 22): 1757–1764. doi:10.1073/pnas.0906183107.
Feinberg, A P, B Vogelstein, M J Droller, S B Baylin, and B D Nelkin. 1983. “Mutation Affecting the 12th Amino Acid of the c-Ha-ras Oncogene Product Occurs Infrequently in Human Cancer.” Science (New York, N.Y.) 220 (4602) (June 10): 1175–1177.
273

Felsenfeld, Gary, and Mark Groudine. 2003. “Controlling the Double Helix.” Nature 421 (6921) (January 23): 448–453. doi:10.1038/nature01411.
Feng, Jianxing, Tao Liu, Bo Qin, Yong Zhang, and Xiaole Shirley Liu. 2012. “Identifying ChIP-seq Enrichment Using MACS.” Nature Protocols 7 (9): 1728–1740. doi:10.1038/nprot.2012.101.
Fernandez, Agustin F., Yassen Assenov, Jose Martin-Subero, Balazs Balint, Reiner Siebert, Hiroaki Taniguchi, Hiroyuki Yamamoto, et al. 2011. “A DNA Methylation Fingerprint of 1,628 Human Samples.” Genome Research (May 25). doi:10.1101/gr.119867.110. http://genome.cshlp.org/content/early/2011/05/25/gr.119867.110.
Fiegler, Heike, Jochen B. Geigl, Sabine Langer, Diane Rigler, Keith Porter, Kristian Unger, Nigel P. Carter, and Michael R. Speicher. 2007. “High Resolution array-CGH Analysis of Single Cells.” Nucleic Acids Research 35 (3) (February 1): e15–e15. doi:10.1093/nar/gkl1030.
Figueroa, Maria E., Omar Abdel-Wahab, Chao Lu, Patrick S. Ward, Jay Patel, Alan Shih, Yushan Li, et al. 2010. “Leukemic IDH1 and IDH2 Mutations Result in a Hypermethylation Phenotype, Disrupt TET2 Function, and Impair Hematopoietic Differentiation.” Cancer Cell 18 (6): 553–567. doi:10.1016/j.ccr.2010.11.015.
Fischle, Wolfgang, Yanming Wang, and C David Allis. 2003. “Histone and Chromatin Cross-talk.” Current Opinion in Cell Biology 15 (2) (April): 172–183. doi:10.1016/S0955-0674(03)00013-9.
Fiume, M., E. J. M. Smith, A. Brook, D. Strbenac, B. Turner, A. M. Mezlini, M. D. Robinson, S. J. Wodak, and M. Brudno. 2012. “Savant Genome Browser 2: Visualization and Analysis for Population-scale Genomics.” Nucleic Acids Research 40 (W1) (May 25): W615–W621. doi:10.1093/nar/gks427.
Flemming, Walther. 1882. Zellsubstanz, kern und zelltheilung. Leipzig, F. C. W. Vogel. http://archive.org/details/zellsubstanzker02flemgoog.
Forbes, S. A., N. Bindal, S. Bamford, C. Cole, C. Y. Kok, D. Beare, M. Jia, et al. 2010. “COSMIC: Mining Complete Cancer Genomes in the Catalogue of Somatic Mutations in Cancer.” Nucleic Acids Research 39 (Database) (October 15): D945–D950. doi:10.1093/nar/gkq929.
Foulds, L. 1954. “The Experimental Study of Tumor Progression: A Review.” Cancer Research 14 (5) (June 1): 327–339.
Fraga, Mario F., Esteban Ballestar, Maria F. Paz, Santiago Ropero, Fernando Setien, Maria L. Ballestar, Damia Heine-Suñer, et al. 2005. “Epigenetic Differences Arise During the Lifetime of Monozygotic Twins.” Proceedings of the National
274

Academy of Sciences of the United States of America 102 (30) (July 26): 10604–10609. doi:10.1073/pnas.0500398102.
Fraga, Mario F., Esteban Ballestar, Ana Villar-Garea, Manuel Boix-Chornet, Jesus Espada, Gunnar Schotta, Tiziana Bonaldi, et al. 2005. “Loss of Acetylation at Lys16 and Trimethylation at Lys20 of Histone H4 Is a Common Hallmark of Human Cancer.” Nature Genetics 37 (4) (April 1): 391–400. doi:10.1038/ng1531.
Fry, Christopher J., and Craig L. Peterson. 2001. “Chromatin Remodeling Enzymes: Who’s on First?” Current Biology 11 (5) (March 6): R185–R197. doi:10.1016/S0960-9822(01)00090-2.
Fuhrmann, Christine, Oleg Schmidt-Kittler, Nikolas H. Stoecklein, Karina Petat-Dutter, Christian Vay, Kerstin Bockler, Richard Reinhardt, Thomas Ragg, and Christoph A. Klein. 2008. “High-resolution Array Comparative Genomic Hybridization of Single Micrometastatic Tumor Cells.” Nucleic Acids Research 36 (7) (April 1): e39. doi:10.1093/nar/gkn101.
Fuks, François, Wendy A. Burgers, Nadia Godin, Masataka Kasai, and Tony Kouzarides. 2001. “Dnmt3a Binds Deacetylases and Is Recruited by a Sequence-specific Repressor to Silence Transcription.” The EMBO Journal 20 (10) (May 15): 2536–2544. doi:10.1093/emboj/20.10.2536.
Fuks, François, Paul J. Hurd, Rachel Deplus, and Tony Kouzarides. 2003. “The DNA Methyltransferases Associate with HP1 and the SUV39H1 Histone Methyltransferase.” Nucleic Acids Research 31 (9) (May 1): 2305–2312. doi:10.1093/nar/gkg332.
Fuks, François, Paul J. Hurd, Daniel Wolf, Xinsheng Nan, Adrian P. Bird, and Tony Kouzarides. 2003. “The Methyl-CpG-binding Protein MeCP2 Links DNA Methylation to Histone Methylation.” Journal of Biological Chemistry 278 (6) (February 7): 4035–4040. doi:10.1074/jbc.M210256200.
Füllgrabe, J., E. Kavanagh, and B. Joseph. 2011. “Histone Onco-modifications.” Oncogene 30 (31): 3391–3403. doi:10.1038/onc.2011.121.
Futreal, P. Andrew, Lachlan Coin, Mhairi Marshall, Thomas Down, Timothy Hubbard, Richard Wooster, Nazneen Rahman, and Michael R. Stratton. 2004. “A Census of Human Cancer Genes.” Nat Rev Cancer 4 (3) (March): 177–183. doi:10.1038/nrc1299.
Fu, Wenqing, Timothy D. O’Connor, Goo Jun, Hyun Min Kang, Goncalo Abecasis, Suzanne M. Leal, Stacey Gabriel, et al. 2013. “Analysis of 6,515 Exomes Reveals the Recent Origin of Most Human Protein-coding Variants.” Nature 493 (7431) (January 10): 216–220. doi:10.1038/nature11690.
275

Garnett, Mathew J, Elena J Edelman, Sonja J Heidorn, Chris D Greenman, Anahita Dastur, King Wai Lau, Patricia Greninger, et al. 2012. “Systematic Identification of Genomic Markers of Drug Sensitivity in Cancer Cells.” Nature 483 (7391) (March 29): 570–575. doi:10.1038/nature11005.
Geigl, Jochen B., Anna C. Obenauf, Julie Waldispuehl-Geigl, Eva M. Hoffmann, Martina Auer, Martina Hörmann, Maria Fischer, et al. 2009. “Identification of Small Gains and Losses in Single Cells After Whole Genome Amplification on Tiling Oligo Arrays.” Nucleic Acids Research 37 (15) (August 1): e105–e105. doi:10.1093/nar/gkp526.
Gerstein, Mark B., Anshul Kundaje, Manoj Hariharan, Stephen G. Landt, Koon-Kiu Yan, Chao Cheng, Xinmeng Jasmine Mu, et al. 2012. “Architecture of the Human Regulatory Network Derived from ENCODE Data.” Nature 489 (7414) (September 6): 91–100. doi:10.1038/nature11245.
Giannini, Giuseppe, Walter Cabri, Caterina Fattorusso, and Manuela Rodriquez. 2012. “Histone Deacetylase Inhibitors in the Treatment of Cancer: Overview and Perspectives.” Future Medicinal Chemistry 4 (11) (July): 1439–1460. doi:10.4155/fmc.12.80.
Goldman, J. M., A. R. Green, T. Holyoake, C. Jamieson, R. Mesa, T. Mughal, F. Pellicano, D. Perrotti, R. Skoda, and A. M. Vannucchi. 2009. “Chronic Myeloproliferative Diseases with and Without the Ph Chromosome: Some Unresolved Issues.” Leukemia 23 (10) (October 1): 1708–1715. doi:10.1038/leu.2009.142.
Gonzalez-Perez, Abel, and Nuria Lopez-Bigas. 2012. “Functional Impact Bias Reveals Cancer Drivers.” Nucleic Acids Research 40 (21) (November 1): e169–e169. doi:10.1093/nar/gks743.
Grewal, Shiv I. S., and Danesh Moazed. 2003. “Heterochromatin and Epigenetic Control of Gene Expression.” Science 301 (5634) (August 8): 798–802. doi:10.1126/science.1086887.
Guil, Sònia, and Manel Esteller. 2012. “Cis-acting Noncoding RNAs: Friends and Foes.” Nature Structural & Molecular Biology 19 (11): 1068–1075. doi:10.1038/nsmb.2428.
Gundem, Gunes, and Nuria Lopez-Bigas. 2012. “Sample Level Enrichment Analysis Unravels Shared Stress Phenotypes Among Multiple Cancer Types.” Genome Medicine 4 (3) (March 29): 28. doi:10.1186/gm327.
Gundem, Gunes, Christian Perez-Llamas, Alba Jene-Sanz, Anna Kedzierska, Abul Islam, Jordi Deu-Pons, Simon Furney, and Nuria Lopez-Bigas. 2010. “IntOGen: Integration and Data-mining of Multidimensional Oncogenomic Data.” Nature Methods. beta.intogen.org.
276

Haaften, Gijs van, Gillian L. Dalgliesh, Helen Davies, Lina Chen, Graham Bignell, Chris Greenman, Sarah Edkins, et al. 2009. “Somatic Mutations of the Histone H3K27 Demethylase Gene UTX in Human Cancer.” Nature Genetics 41 (5): 521–523. doi:10.1038/ng.349.
Hanahan, D, and RA Weinberg. 2000. “The Hallmarks of Cancer.” Cell 100 (1) (July 1): 57–70.
———. 2011. “Hallmarks of Cancer: The Next Generation.” Cell 144 (5) (April 3): 646–674.
Han, M, and M Grunstein. 1988. “Nucleosome Loss Activates Yeast Downstream Promoters in Vivo.” Cell 55 (6) (December 23): 1137–1145.
Hansen, Kasper Daniel, Winston Timp, Héctor Corrada Bravo, Sarven Sabunciyan, Benjamin Langmead, Oliver G. McDonald, Bo Wen, et al. 2011. “Increased Methylation Variation in Epigenetic Domains Across Cancer Types.” Nature Genetics 43 (8): 768–775. doi:10.1038/ng.865.
Hegi, Monika E., Annie-Claire Diserens, Thierry Gorlia, Marie-France Hamou, Nicolas de Tribolet, Michael Weller, Johan M. Kros, et al. 2005. “MGMT Gene Silencing and Benefit from Temozolomide in Glioblastoma.” New England Journal of Medicine 352 (10): 997–1003. doi:10.1056/NEJMoa043331.
Heintzman, Nathaniel D., Gary C. Hon, R. David Hawkins, Pouya Kheradpour, Alexander Stark, Lindsey F. Harp, Zhen Ye, et al. 2009. “Histone Modifications at Human Enhancers Reflect Global Cell-type-specific Gene Expression.” Nature 459 (7243) (May 7): 108–112. doi:10.1038/nature07829.
Hennessy, Bryan T., Ana-Maria Gonzalez-Angulo, Katherine Stemke-Hale, Michael Z. Gilcrease, Savitri Krishnamurthy, Ju-Seog Lee, Jane Fridlyand, et al. 2009. “Characterization of a Naturally Occurring Breast Cancer Subset Enriched in Epithelial-to-Mesenchymal Transition and Stem Cell Characteristics.” Cancer Research 69 (10) (May 15): 4116–4124. doi:10.1158/0008-5472.CAN-08-3441.
Hermann, Patrick C., Stephan L. Huber, Tanja Herrler, Alexandra Aicher, Joachim W. Ellwart, Markus Guba, Christiane J. Bruns, and Christopher Heeschen. 2007. “Distinct Populations of Cancer Stem Cells Determine Tumor Growth and Metastatic Activity in Human Pancreatic Cancer.” Cell Stem Cell 1 (3) (September 13): 313–323. doi:10.1016/j.stem.2007.06.002.
Herranz, Nicolás, Diego Pasini, Víctor M. Díaz, Clara Francí, Arantxa Gutierrez, Natàlia Dave, Maria Escrivà, et al. 2008. “Polycomb Complex 2 Is Required for E-cadherin Repression by the Snail1 Transcription Factor.” Molecular and Cellular Biology 28 (15) (August): 4772–4781. doi:10.1128/MCB.00323-08.
Heyn, Holger, and Manel Esteller. 2012. “DNA Methylation Profiling in the Clinic:
277

Applications and Challenges.” Nature Reviews Genetics 13 (10) (October 1): 679–692. doi:10.1038/nrg3270.
Heyn, Holger, Ning Li, Humberto J. Ferreira, Sebastian Moran, David G. Pisano, Antonio Gomez, Javier Diez, et al. 2012. “Distinct DNA Methylomes of Newborns and Centenarians.” Proceedings of the National Academy of Sciences of the United States of America 109 (26) (June 26): 10522–10527. doi:10.1073/pnas.1120658109.
Hildmann, Christian, Daniel Riester, and Andreas Schwienhorst. 2007. “Histone Deacetylases—an Important Class of Cellular Regulators with a Variety of Functions.” Applied Microbiology and Biotechnology 75 (3) (June 1): 487–497. doi:10.1007/s00253-007-0911-2.
Hon, Gary, Wei Wang, and Bing Ren. 2009. “Discovery and Annotation of Functional Chromatin Signatures in the Human Genome.” PLoS Comput Biol 5 (11) (November 13): e1000566. doi:10.1371/journal.pcbi.1000566#pcbi.1000566-Grewal1.
Hon, G. C., R. D. Hawkins, and B. Ren. 2009. “Predictive Chromatin Signatures in the Mammalian Genome.” Human Molecular Genetics 18 (R2) (October 6): R195–R201. doi:10.1093/hmg/ddp409.
Huang, Da Wei, Brad T. Sherman, and Richard A. Lempicki. 2009. “Bioinformatics Enrichment Tools: Paths Toward the Comprehensive Functional Analysis of Large Gene Lists.” Nucleic Acids Research 37 (1) (January 1): 1–13. doi:10.1093/nar/gkn923.
Hurd, Paul J., and Christopher J. Nelson. 2009. “Advantages of Next-generation Sequencing Versus the Microarray in Epigenetic Research.” Briefings in Functional Genomics & Proteomics 8 (3) (May 1): 174–183. doi:10.1093/bfgp/elp013.
Huret, J.-L., M. Ahmad, M. Arsaban, A. Bernheim, J. Cigna, F. Desangles, J.-C. Guignard, et al. 2012. “Atlas of Genetics and Cytogenetics in Oncology and Haematology in 2013.” Nucleic Acids Research 41 (D1) (November 17): D920–D924. doi:10.1093/nar/gks1082.
Irizarry, Rafael A., Christine Ladd-Acosta, Bo Wen, Zhijin Wu, Carolina Montano, Patrick Onyango, Hengmi Cui, et al. 2009. “The Human Colon Cancer Methylome Shows Similar Hypo- and Hypermethylation at Conserved Tissue-specific CpG Island Shores.” Nature Genetics 41 (2): 178–186. doi:10.1038/ng.298.
Issa, Jean-Pierre. 2011. “Epigenetic Variation and Cellular Darwinism.” Nature Genetics 43 (8): 724–726. doi:10.1038/ng.897.
278

Jenuwein, Thomas, and C. David Allis. 2001. “Translating the Histone Code.” Science 293 (5532) (August 10): 1074–1080. doi:10.1126/science.1063127.
Jiao, Yuchen, Chanjuan Shi, Barish H. Edil, Roeland F. de Wilde, David S. Klimstra, Anirban Maitra, Richard D. Schulick, et al. 2011. “DAXX/ATRX, MEN1, and mTOR Pathway Genes Are Frequently Altered in Pancreatic Neuroendocrine Tumors.” Science 331 (6021) (March 4): 1199–1203. doi:10.1126/science.1200609.
Ji, Hongkai, Hui Jiang, Wenxiu Ma, David S. Johnson, Richard M. Myers, and Wing H. Wong. 2008. “An Integrated Software System for Analyzing ChIP-chip and ChIP-seq Data.” Nature Biotechnology 26 (11): 1293–1300. doi:10.1038/nbt.1505.
Jin, Jingji, Yong Cai, Tingting Yao, Aaron J. Gottschalk, Laurence Florens, Selene K. Swanson, José L. Gutiérrez, et al. 2005. “A Mammalian Chromatin Remodeling Complex with Similarities to the Yeast INO80 Complex.” Journal of Biological Chemistry 280 (50) (December 16): 41207–41212. doi:10.1074/jbc.M509128200.
Johnson, David S., Ali Mortazavi, Richard M. Myers, and Barbara Wold. 2007. “Genome-Wide Mapping of in Vivo Protein-DNA Interactions.” Science 316 (5830) (June 8): 1497–1502. doi:10.1126/science.1141319.
Jones, Peter A., and Stephen B. Baylin. 2002. “The Fundamental Role of Epigenetic Events in Cancer.” Nat Rev Genet 3 (6) (June): 415–428. doi:10.1038/nrg816.
———. 2007. “The Epigenomics of Cancer.” Cell 128 (4) (February): 683–692. doi:10.1016/j.cell.2007.01.029.
Jones, Peter L., Gert C. Jan Veenstra, Paul A. Wade, Danielle Vermaak, Stefan U. Kass, Nicoletta Landsberger, John Strouboulis, and Alan P. Wolffe. 1998. “Methylated DNA and MeCP2 Recruit Histone Deacetylase to Repress Transcription.” Nature Genetics 19 (2): 187–191. doi:10.1038/561.
Jones, Siân, Tian-Li Wang, Ie-Ming Shih, Tsui-Lien Mao, Kentaro Nakayama, Richard Roden, Ruth Glas, et al. 2010. “Frequent Mutations of Chromatin Remodeling Gene ARID1A in Ovarian Clear Cell Carcinoma.” Science 330 (6001) (October 8): 228–231. doi:10.1126/science.1196333.
Jothi, Raja, Suresh Cuddapah, Artem Barski, Kairong Cui, and Keji Zhao. 2008. “Genome-wide Identification of in Vivo protein-DNA Binding Sites from ChIP-Seq Data.” Nucleic Acids Research 36 (16) (September): 5221–5231. doi:10.1093/nar/gkn488.
Kanehisa, Minoru, Susumu Goto, Yoko Sato, Miho Furumichi, and Mao Tanabe. 2012. “KEGG for Integration and Interpretation of Large-scale Molecular Data
279

Sets.” Nucleic Acids Research 40 (D1) (January): D109–D114. doi:10.1093/nar/gkr988.
Kassabov, Stefan R, Bei Zhang, Jim Persinger, and Blaine Bartholomew. 2003. “SWI/SNF Unwraps, Slides, and Rewraps the Nucleosome.” Molecular Cell 11 (2) (February): 391–403. doi:10.1016/S1097-2765(03)00039-X.
Kelder, Thomas, Bruce R. Conklin, Chris T. Evelo, and Alexander R. Pico. 2010. “Finding the Right Questions: Exploratory Pathway Analysis to Enhance Biological Discovery in Large Datasets.” PLoS Biol 8 (8) (August 31): e1000472. doi:10.1371/journal.pbio.1000472.
Kharchenko, Peter V, Michael Y Tolstorukov, and Peter J Park. 2008. “Design and Analysis of ChIP-seq Experiments for DNA-binding Proteins.” Nat Biotech 26 (12) (December): 1351–1359. doi:10.1038/nbt.1508.
Kim, Soojin, Hyunmin Kim, Nova Fong, Benjamin Erickson, and David L. Bentley. 2011. “Pre-mRNA Splicing Is a Determinant of Histone H3K36 Methylation.” Proceedings of the National Academy of Sciences 108 (33) (August 16): 13564–13569. doi:10.1073/pnas.1109475108.
Kinzler, Kenneth W, and Bert Vogelstein. 1996. “Lessons from Hereditary Colorectal Cancer.” Cell 87 (2) (October 18): 159–170. doi:10.1016/S0092-8674(00)81333-1.
Klein, Christoph A., Oleg Schmidt-Kittler, Julian A. Schardt, Klaus Pantel, Michael R. Speicher, and Gert Riethmüller. 1999. “Comparative Genomic Hybridization, Loss of Heterozygosity, and DNA Sequence Analysis of Single Cells.” Proceedings of the National Academy of Sciences 96 (8) (April 13): 4494–4499. doi:10.1073/pnas.96.8.4494.
Knutson, Sarah K, Tim J Wigle, Natalie M Warholic, Christopher J Sneeringer, Christina J Allain, Christine R Klaus, Joelle D Sacks, et al. 2012. “A Selective Inhibitor of EZH2 Blocks H3K27 Methylation and Kills Mutant Lymphoma Cells.” Nature Chemical Biology 8 (11) (November): 890–896. doi:10.1038/nchembio.1084.
Kolasinska-Zwierz, Paulina, Thomas Down, Isabel Latorre, Tao Liu, X. Shirley Liu, and Julie Ahringer. 2009. “Differential Chromatin Marking of Introns and Expressed Exons by H3K36me3.” Nature Genetics 41 (3): 376–381. doi:10.1038/ng.322.
Kondo, Yutaka, Lanlan Shen, Alfred S. Cheng, Saira Ahmed, Yanis Boumber, Chantale Charo, Tadanori Yamochi, et al. 2008. “Gene Silencing in Cancer by Histone H3 Lysine 27 Trimethylation Independent of Promoter DNA Methylation.” Nature Genetics 40 (6): 741–750. doi:10.1038/ng.159.
280

Kornberg, R D, and J O Thomas. 1974. “Chromatin Structure; Oligomers of the Histones.” Science (New York, N.Y.) 184 (4139) (May 24): 865–868.
Kouzarides, Tony. 2007. “Chromatin Modifications and Their Function.” Cell 128 (4) (February 23): 693–705. doi:10.1016/j.cell.2007.02.005.
Krupp, M., T. Itzel, T. Maass, A. Hildebrandt, P. R. Galle, and A. Teufel. 2012. “CellLineNavigator: a Workbench for Cancer Cell Line Analysis.” Nucleic Acids Research 41 (D1) (October 31): D942–D948. doi:10.1093/nar/gks1012.
Krzywinski, Martin, Jacqueline Schein, İnanç Birol, Joseph Connors, Randy Gascoyne, Doug Horsman, Steven J. Jones, and Marco A. Marra. 2009. “Circos: An Information Aesthetic for Comparative Genomics.” Genome Research 19 (9) (September 1): 1639–1645. doi:10.1101/gr.092759.109.
Ku, Manching, Richard P. Koche, Esther Rheinbay, Eric M. Mendenhall, Mitsuhiro Endoh, Tarjei S. Mikkelsen, Aviva Presser, et al. 2008. “Genomewide Analysis of PRC1 and PRC2 Occupancy Identifies Two Classes of Bivalent Domains.” PLoS Genet 4 (10) (October 31): e1000242. doi:10.1371/journal.pgen.1000242.
Kuzmichev, Andrei, Kenichi Nishioka, Hediye Erdjument-Bromage, Paul Tempst, and Danny Reinberg. 2002. “Histone Methyltransferase Activity Associated with a Human Multiprotein Complex Containing the Enhancer of Zeste Protein.” Genes & Development 16 (22) (November 15): 2893–2905. doi:10.1101/gad.1035902.
Laajala, Teemu D., Sunil Raghav, Soile Tuomela, Riitta Lahesmaa, Tero Aittokallio, and Laura L. Elo. 2009. “A Practical Comparison of Methods for Detecting Transcription Factor Binding Sites in ChIP-seq Experiments.” BMC Genomics 10 (1) (December 18): 618. doi:10.1186/1471-2164-10-618.
Laird, Peter W. 2010. “Principles and Challenges of Genome-wide DNA Methylation Analysis.” Nature Reviews Genetics 11 (3) (February 2): 191–203. doi:10.1038/nrg2732.
Landau, Dan A., Scott L. Carter, Petar Stojanov, Aaron McKenna, Kristen Stevenson, Michael S. Lawrence, Carrie Sougnez, et al. 2013. “Evolution and Impact of Subclonal Mutations in Chronic Lymphocytic Leukemia.” Cell 152 (4) (February 14): 714–726. doi:10.1016/j.cell.2013.01.019.
Lander, Eric S., Lauren M. Linton, Bruce Birren, Chad Nusbaum, Michael C. Zody, Jennifer Baldwin, Keri Devon, et al. 2001. “Initial Sequencing and Analysis of the Human Genome.” Nature 409 (6822) (February 15): 860–921. doi:10.1038/35057062.
Latham, John A, and Sharon Y R Dent. 2007. “Cross-regulation of Histone Modifications.” Nat Struct Mol Biol 14 (11) (November): 1017–1024.
281

doi:10.1038/nsmb1307.
Lavasani, Mohammad Ali, and Farid Moinfar. 2012. “Molecular Classification of Breast Carcinomas with Particular Emphasis on ‘basal-like’ Carcinoma: A Critical Review.” Journal of Biophotonics 5 (4): 345–366. doi:10.1002/jbio.201100097.
Lee, Jeannie T. 2012. “Epigenetic Regulation by Long Noncoding RNAs.” Science 338 (6113) (December 14): 1435–1439. doi:10.1126/science.1231776.
Lee, Tong Ihn, Richard G. Jenner, Laurie A. Boyer, Matthew G. Guenther, Stuart S. Levine, Roshan M. Kumar, Brett Chevalier, et al. 2006. “Control of Developmental Regulators by Polycomb in Human Embryonic Stem Cells.” Cell Vol 125 (April 21): 301–313.
Ley, Timothy J., Li Ding, Matthew J. Walter, Michael D. McLellan, Tamara Lamprecht, David E. Larson, Cyriac Kandoth, et al. 2010. “DNMT3A Mutations in Acute Myeloid Leukemia.” New England Journal of Medicine 363 (25): 2424–2433. doi:10.1056/NEJMoa1005143.
Ley, Timothy J., Elaine R. Mardis, Li Ding, Bob Fulton, Michael D. McLellan, Ken Chen, David Dooling, et al. 2008. “DNA Sequencing of a Cytogenetically Normal Acute Myeloid Leukaemia Genome.” Nature 456 (7218) (November 6): 66–72. doi:10.1038/nature07485.
Li, Bing, Michael Carey, and Jerry L. Workman. 2007. “The Role of Chromatin During Transcription.” Cell 128 (4) (February 23): 707–719. doi:10.1016/j.cell.2007.01.015.
Li, Jun, Hui Jiang, and Wing H. Wong. 2010. “Modeling Non-uniformity in Short-read Rates in RNA-Seq Data.” Genome Biology 11 (5) (May 11): R50. doi:10.1186/gb-2010-11-5-r50.
Li, Ling, Lisheng Wang, Liang Li, Zhiqiang Wang, Yinwei Ho, Tinisha McDonald, Tessa L. Holyoake, WenYong Chen, and Ravi Bhatia. 2012. “Activation of P53 by SIRT1 Inhibition Enhances Elimination of CML Leukemia Stem Cells in Combination with Imatinib.” Cancer Cell 21 (2) (February 14): 266–281. doi:10.1016/j.ccr.2011.12.020.
Lister, Ryan, Mattia Pelizzola, Robert H. Dowen, R. David Hawkins, Gary Hon, Julian Tonti-Filippini, Joseph R. Nery, et al. 2009. “Human DNA Methylomes at Base Resolution Show Widespread Epigenomic Differences.” Nature advance online publication (October 14). doi:10.1038/nature08514. http://dx.doi.org/10.1038/nature08514.
Logan, J, E Falck-Pedersen, J E Darnell, and T Shenk. 1987. “A poly(A) Addition Site and a Downstream Termination Region Are Required for Efficient
282

Cessation of Transcription by RNA Polymerase II in the Mouse Beta Maj-globin Gene.” Proceedings of the National Academy of Sciences of the United States of America 84 (23) (December): 8306–8310.
Lu, Chunhua, Hee Dong Han, Lingegowda S. Mangala, Rouba Ali-Fehmi, Christopher S. Newton, Laurent Ozbun, Guillermo N. Armaiz-Pena, et al. 2010. “Regulation of Tumor Angiogenesis by EZH2.” Cancer Cell 18 (2) (August 17): 185–197. doi:10.1016/j.ccr.2010.06.016.
Luger, Karolin, Armin W. Mäder, Robin K. Richmond, David F. Sargent, and Timothy J. Richmond. 1997. “Crystal Structure of the Nucleosome Core Particle at 2.8 Å Resolution.” Nature 389 (6648) (September 18): 251–260. doi:10.1038/38444.
Luo, J., M. Schumacher, A. Scherer, D. Sanoudou, D. Megherbi, T. Davison, T. Shi, et al. 2010. “A Comparison of Batch Effect Removal Methods for Enhancement of Prediction Performance Using MAQC-II Microarray Gene Expression Data.” The Pharmacogenomics Journal 10 (4): 278–291. doi:10.1038/tpj.2010.57.
MacDonald, Marcy E., Christine M. Ambrose, Mabel P. Duyao, Richard H. Myers, Carol Lin, Lakshmi Srinidhi, Glenn Barnes, et al. 1993. “A Novel Gene Containing a Trinucleotide Repeat That Is Expanded and Unstable on Huntington’s Disease Chromosomes.” Cell 72 (6) (March 26): 971–983. doi:10.1016/0092-8674(93)90585-E.
Malone, John H., and Brian Oliver. 2011. “Microarrays, Deep Sequencing and the True Measure of the Transcriptome.” BMC Biology 9 (1) (May 31): 34. doi:10.1186/1741-7007-9-34.
MAQC Consortium. 2010. “The MicroArray Quality Control (MAQC)-II Study of Common Practices for the Development and Validation of Microarray-based Predictive Models.” Nature Biotechnology 28 (8): 827–838. doi:10.1038/nbt.1665.
Margueron, Raphael, Neil Justin, Katsuhito Ohno, Miriam L. Sharpe, Jinsook Son, William J. Drury Iii, Philipp Voigt, et al. 2009. “Role of the Polycomb Protein EED in the Propagation of Repressive Histone Marks.” Nature 461 (7265) (September 20): 762–767. doi:10.1038/nature08398.
McCabe, Michael T., Heidi M. Ott, Gopinath Ganji, Susan Korenchuk, Christine Thompson, Glenn S. Van Aller, Yan Liu, et al. 2012. “EZH2 Inhibition as a Therapeutic Strategy for Lymphoma with EZH2-activating Mutations.” Nature. doi:10.1038/nature11606. http://www.nature.com/nature/journal/vaop/ncurrent/full/nature11606.html.
McDonald, Oliver G., Hao Wu, Winston Timp, Akiko Doi, and Andrew P. Feinberg. 2011. “Genome-scale Epigenetic Reprogramming During Epithelial-to-
283

mesenchymal Transition.” Nature Structural & Molecular Biology 18 (8): 867–874. doi:10.1038/nsmb.2084.
McGhee, J D, and G D Ginder. 1979. “Specific DNA Methylation Sites in the Vicinity of the Chicken Beta-globin Genes.” Nature 280 (5721) (August 2): 419–420.
McLendon, Roger, Allan Friedman, Darrell Bigner, Erwin G. Van Meir, Daniel J. Brat, Gena M. Mastrogianakis, Jeffrey J. Olson, et al. 2008. “Comprehensive Genomic Characterization Defines Human Glioblastoma Genes and Core Pathways.” Nature 455 (7216) (September 4): 1061–1068. doi:10.1038/nature07385.
Meng, Songdong, Debasish Tripathy, Eugene P. Frenkel, Sanjay Shete, Elizabeth Z. Naftalis, James F. Huth, Peter D. Beitsch, et al. 2004. “Circulating Tumor Cells in Patients with Breast Cancer Dormancy.” Clinical Cancer Research 10 (24) (December 15): 8152–8162. doi:10.1158/1078-0432.CCR-04-1110.
Meyerson, Matthew, Stacey Gabriel, and Gad Getz. 2010. “Advances in Understanding Cancer Genomes Through Second-generation Sequencing.” Nature Reviews Genetics 11 (10) (October 1): 685–696. doi:10.1038/nrg2841.
Mikkelsen, Tarjei S., Manching Ku, David B. Jaffe, Biju Issac, Erez Lieberman, Georgia Giannoukos, Pablo Alvarez, et al. 2007. “Genome-wide Maps of Chromatin State in Pluripotent and Lineage-committed Cells.” Nature 448 (7153): 553–560. doi:10.1038/nature06008.
Min, Junxia, Alexander Zaslavsky, Giuseppe Fedele, Sara K McLaughlin, Elizabeth E Reczek, Thomas De Raedt, Isil Guney, et al. 2010. “An Oncogene-tumor Suppressor Cascade Drives Metastatic Prostate Cancer by Coordinately Activating Ras and Nuclear factor-[kappa]B.” Nat Med 16 (3) (March): 286–294. doi:10.1038/nm.2100.
Miranda, Tina Branscombe, Connie C. Cortez, Christine B. Yoo, Gangning Liang, Masanobu Abe, Theresa K. Kelly, Victor E. Marquez, and Peter A. Jones. 2009. “DZNep Is a Global Histone Methylation Inhibitor That Reactivates Developmental Genes Not Silenced by DNA Methylation.” Molecular Cancer Therapeutics 8 (6) (June 1): 1579–1588. doi:10.1158/1535-7163.MCT-09-0013.
Mirnezami, Reza, Jeremy Nicholson, and Ara Darzi. 2012. “Preparing for Precision Medicine.” New England Journal of Medicine 366 (6): 489–491. doi:10.1056/NEJMp1114866.
Mitelman, F, B Johanson, and F Mertens. 2013. “Mitelman Database of Chromosome Aberrations and Gene Fusions in Cancer (2013).” Accessed February 5. http://cgap.nci.nih.gov/Chromosomes/Mitelman.
284

Moore, Steven D. P., Steven R. Herrick, Tan A. Ince, Michael S. Kleinman, Paola Dal Cin, Cynthia C. Morton, and Bradley J. Quade. 2004. “Uterine Leiomyomata with T(10;17) Disrupt the Histone Acetyltransferase MORF.” Cancer Research 64 (16) (August 15): 5570–5577. doi:10.1158/0008-5472.CAN-04-0050.
Morin, Ryan D., Nathalie A. Johnson, Tesa M. Severson, Andrew J. Mungall, Jianghong An, Rodrigo Goya, Jessica E. Paul, et al. 2010. “Somatic Mutations Altering EZH2 (Tyr641) in Follicular and Diffuse Large B-cell Lymphomas of Germinal-center Origin.” Nature Genetics 42 (2): 181–185. doi:10.1038/ng.518.
Mortazavi, Ali, Brian A. Williams, Kenneth McCue, Lorian Schaeffer, and Barbara Wold. 2008. “Mapping and Quantifying Mammalian Transcriptomes by RNA-Seq.” Nature Methods 5 (7) (July 1): 621–628. doi:10.1038/nmeth.1226.
Nan, Xinsheng, Huck-Hui Ng, Colin A. Johnson, Carol D. Laherty, Bryan M. Turner, Robert N. Eisenman, and Adrian Bird. 1998. “Transcriptional Repression by the methyl-CpG-binding Protein MeCP2 Involves a Histone Deacetylase Complex.” Nature 393 (6683) (May 28): 386–389. doi:10.1038/30764.
Navin, Nicholas E., and James Hicks. 2010. “Tracing the Tumor Lineage.” Molecular Oncology (May). doi:10.1016/j.molonc.2010.04.010. http://greenecology.org/science?_ob=ArticleURL&_udi=B8CWB-501074F-1&_user=1517318&_coverDate=05%2F05%2F2010&_rdoc=2&_fmt=high&_orig=browse&_srch=doc-info(%23toc%2340054%239999%23999999999%2399999%23FLA%23display%23Articles)&_cdi=40054&_sort=d&_docanchor=&view=c&_ct=14&_acct=C000053451&_version=1&_urlVersion=0&_userid=1517318&md5=fafe49572dc22e222b0103c8734d6cd1.
Navin, Nicholas, and James Hicks. 2011. “Future Medical Applications of Single-cell Sequencing in Cancer.” Genome Medicine 3 (5) (May 31): 31. doi:10.1186/gm247.
Navin, Nicholas, Jude Kendall, Jennifer Troge, Peter Andrews, Linda Rodgers, Jeanne McIndoo, Kerry Cook, et al. 2011. “Tumour Evolution Inferred by Single-cell Sequencing.” Nature 472 (7341) (April 7): 90–94. doi:10.1038/nature09807.
Navin, Nicholas, Alexander Krasnitz, Linda Rodgers, Kerry Cook, Jennifer Meth, Jude Kendall, Michael Riggs, et al. 2010. “Inferring Tumor Progression from Genomic Heterogeneity.” Genome Research 20 (1) (January 1): 68–80. doi:10.1101/gr.099622.109.
Nielsen, Anders Lade, Mustapha Oulad-Abdelghani, José A Ortiz, Eumorphia Remboutsika, Pierre Chambon, and Régine Losson. 2001. “Heterochromatin
285

Formation in Mammalian Cells: Interaction Between Histones and HP1 Proteins.” Molecular Cell 7 (4) (April): 729–739. doi:10.1016/S1097-2765(01)00218-0.
Nikoloski, Gorica, Saskia M. C. Langemeijer, Roland P. Kuiper, Ruth Knops, Marion Massop, Evelyn R. L. T. M. Tönnissen, Adrian van der Heijden, et al. 2010. “Somatic Mutations of the Histone Methyltransferase Gene EZH2 in Myelodysplastic Syndromes.” Nature Genetics 42 (8): 665–667. doi:10.1038/ng.620.
Nowell, P C. 1962. “The Minute Chromosome (Phl) in Chronic Granulocytic Leukemia.” Blut 8 (April): 65–66.
———. 1976. “The Clonal Evolution of Tumor Cell Populations.” Science (New York, N.Y.) 194 (4260) (October 1): 23–28.
O’Brien, Catherine A., Aaron Pollett, Steven Gallinger, and John E. Dick. 2006. “A Human Colon Cancer Cell Capable of Initiating Tumour Growth in Immunodeficient Mice.” Nature 445 (7123) (November 19): 106–110. doi:10.1038/nature05372.
Ocaña, Oscar H., Rebeca Córcoles, Ángels Fabra, Gema Moreno-Bueno, Hervé Acloque, Sonia Vega, Alejandro Barrallo-Gimeno, Amparo Cano, and M. Angela Nieto. 2012. “Metastatic Colonization Requires the Repression of the Epithelial-Mesenchymal Transition Inducer Prrx1.” Cancer Cell 22 (6) (December 11): 709–724. doi:10.1016/j.ccr.2012.10.012.
Ohm, Joyce E., and Stephen B. Baylin. 2007. “Stem Cell Chromatin Patterns: An Instructive Mechanism for DNA Hypermethylation?” Cell Cycle 6 (9) (May 2): 1040–1043. doi:10.4161/cc.6.9.4210.
Ohm, Joyce E., Kelly M. McGarvey, Xiaobing Yu, Linzhao Cheng, Kornel E. Schuebel, Leslie Cope, Helai P. Mohammad, et al. 2007. “A Stem Cell–like Chromatin Pattern May Predispose Tumor Suppressor Genes to DNA Hypermethylation and Heritable Silencing.” Nature Genetics 39 (2): 237–242. doi:10.1038/ng1972.
Okano, Masaki, Daphne W Bell, Daniel A Haber, and En Li. 1999. “DNA Methyltransferases Dnmt3a and Dnmt3b Are Essential for De Novo Methylation and Mammalian Development.” Cell 99 (3) (October 29): 247–257. doi:10.1016/S0092-8674(00)81656-6.
Papamichos-Chronakis, Manolis, and Craig L. Peterson. 2013. “Chromatin and the Genome Integrity Network.” Nature Reviews Genetics 14 (1) (January 1): 62–75. doi:10.1038/nrg3345.
Parker, Joel S., Michael Mullins, Maggie C. U. Cheang, Samuel Leung, David
286

Voduc, Tammi Vickery, Sherri Davies, et al. 2009. “Supervised Risk Predictor of Breast Cancer Based on Intrinsic Subtypes.” Journal of Clinical Oncology 27 (8) (March 10): 1160–1167. doi:10.1200/JCO.2008.18.1370.
Passarge, E. 1979. “Emil Heitz and the Concept of Heterochromatin: Longitudinal Chromosome Differentiation Was Recognized Fifty Years Ago.” American Journal of Human Genetics 31 (2) (March): 106–115.
Patel, Mishal N., Mark D. Halling-Brown, Joseph E. Tym, Paul Workman, and Bissan Al-Lazikani. 2013. “Objective Assessment of Cancer Genes for Drug Discovery.” Nature Reviews Drug Discovery 12 (1) (January 1): 35–50. doi:10.1038/nrd3913.
Pepke, Shirley, Barbara Wold, and Ali Mortazavi. 2009. “Computation for ChIP-seq and RNA-seq Studies.” Nature Methods 6: S22–S32. doi:10.1038/nmeth.1371.
Perez-Llamas, Christian, and Nuria Lopez-Bigas. 2011. “Gitools: Analysis and Visualisation of Genomic Data Using Interactive Heat-Maps.” PLoS ONE 6 (5) (May 13): e19541. doi:10.1371/journal.pone.0019541.
Perou, Charles M., Therese Sørlie, Michael B. Eisen, Matt van de Rijn, Stefanie S. Jeffrey, Christian A. Rees, Jonathan R. Pollack, et al. 2000. “Molecular Portraits of Human Breast Tumours.” Nature 406 (6797) (August 17): 747–752. doi:10.1038/35021093.
Peterson, Craig L. 2002. “Chromatin Remodeling Enzymes: Taming the Machines.” EMBO Reports 3 (4) (April 1): 319–322. doi:10.1093/embo-reports/kvf075.
Piccart-Gebhart, Martine J., Marion Procter, Brian Leyland-Jones, Aron Goldhirsch, Michael Untch, Ian Smith, Luca Gianni, et al. 2005. “Trastuzumab After Adjuvant Chemotherapy in HER2-Positive Breast Cancer.” New England Journal of Medicine 353 (16): 1659–1672. doi:10.1056/NEJMoa052306.
Pleasance, Erin D., R. Keira Cheetham, Philip J. Stephens, David J. McBride, Sean J. Humphray, Chris D. Greenman, Ignacio Varela, et al. 2009. “A Comprehensive Catalogue of Somatic Mutations from a Human Cancer Genome.” Nature 463 (7278) (December 16): 191–196. doi:10.1038/nature08658.
Van der Ploeg, L.H.T., and R.A. Flavell. 1980. “DNA Methylation in the Human Γδβ-globin Locus in Erythroid and Nonerythroid Tissues.” Cell 19 (4) (April): 947–958. doi:10.1016/0092-8674(80)90086-0.
Podo, F., L.M.C. Buydens, H. Degani, R. Hilhorst, E. Klipp, I.S. Gribbestad, S. Van Huffel, et al. 2010. “Triple-negative breast cancer: Present challenges and new perspectives.” Molecular Oncology 4 (3): 209–229. doi:10.1016/j.molonc.2010.04.006.
287

Prat, Aleix, Matthew J. Ellis, and Charles M. Perou. 2012. “Practical Implications of Gene-expression-based Assays for Breast Oncologists.” Nature Reviews Clinical Oncology 9 (1) (January 1): 48–57. doi:10.1038/nrclinonc.2011.178.
Prat, Aleix, Joel S Parker, Olga Karginova, Cheng Fan, Chad Livasy, Jason I Herschkowitz, Xiaping He, and Charles M Perou. 2010. “Phenotypic and Molecular Characterization of the Claudin-low Intrinsic Subtype of Breast Cancer.” Breast Cancer Research 12 (5): R68. doi:10.1186/bcr2635.
Prat, Aleix, and Charles M. Perou. 2011. “Deconstructing the Molecular Portraits of Breast Cancer.” Molecular Oncology 5 (1) (February): 5–23. doi:10.1016/j.molonc.2010.11.003.
Probst, Aline V., Elaine Dunleavy, and Geneviève Almouzni. 2009. “Epigenetic Inheritance During the Cell Cycle.” Nature Reviews Molecular Cell Biology 10 (3) (March 1): 192–206. doi:10.1038/nrm2640.
Pulverer, B. 2005. “Sequence-specific DNA-binding Transcription Factors.” Nature Milestones. doi:10.1038/nrm1800.
Qin, Zhaohui, Jianjun Yu, Jincheng Shen, Christopher Maher, Ming Hu, Shanker Kalyana-Sundaram, Jindan Yu, and Arul Chinnaiyan. 2010. “HPeak: An HMM-based Algorithm for Defining Read-enriched Regions in ChIP-Seq Data.” BMC Bioinformatics 11 (1): 369. doi:10.1186/1471-2105-11-369.
Quintana, Rita M., Adam J. Dupuy, Ana Bravo, M. Llanos Casanova, Josefa P. Alameda, Angustias Page, Miguel Sánchez-Viera, Angel Ramírez, and Manuel Navarro. 2013. “A Transposon-Based Analysis of Gene Mutations Related to Skin Cancer Development.” Journal of Investigative Dermatology 133 (1): 239–248. doi:10.1038/jid.2012.245.
Rakyan, Vardhman K., Thomas A. Down, David J. Balding, and Stephan Beck. 2011. “Epigenome-wide Association Studies for Common Human Diseases.” Nature Reviews Genetics 12 (8) (August 1): 529–541. doi:10.1038/nrg3000.
Rando, Oliver J., and Howard Y. Chang. 2009. “Genome-Wide Views of Chromatin Structure.” Annual Review of Biochemistry 78 (1): 245–271. doi:10.1146/annurev.biochem.78.071107.134639.
Reik, Wolf. 2007. “Stability and Flexibility of Epigenetic Gene Regulation in Mammalian Development.” Nature 447 (7143) (May 23): 425–432. doi:10.1038/nature05918.
Reya, Tannishtha, Sean J. Morrison, Michael F. Clarke, and Irving L. Weissman. 2001. “Stem Cells, Cancer, and Cancer Stem Cells.” Nature 414 (6859) (November 1): 105–111. doi:10.1038/35102167.
288

Rhodes, Daniel R., and Arul M. Chinnaiyan. 2005. “Integrative Analysis of the Cancer Transcriptome.” Nature Genetics 37 (June 1): S31–S37. doi:10.1038/ng1570.
Ricci-Vitiani, Lucia, Dario G. Lombardi, Emanuela Pilozzi, Mauro Biffoni, Matilde Todaro, Cesare Peschle, and Ruggero De Maria. 2006. “Identification and Expansion of Human Colon-cancer-initiating Cells.” Nature 445 (7123) (November 19): 111–115. doi:10.1038/nature05384.
Richard, Hugues, Marcel H. Schulz, Marc Sultan, Asja Nürnberger, Sabine Schrinner, Daniela Balzereit, Emilie Dagand, et al. 2010. “Prediction of Alternative Isoforms from Exon Expression Levels in RNA-Seq Experiments.” Nucleic Acids Research 38 (10) (June 1): e112–e112. doi:10.1093/nar/gkq041.
Robbins, April R, Sandra A Jablonski, Tim J Yen, Kinya Yoda, Rob Robey, Susan E Bates, and Dan L Sackett. 2005. “Inhibitors of Histone Deacetylases Alter Kinetochore Assembly by Disrupting Pericentromeric Heterochromatin.” Cell Cycle (Georgetown, Tex.) 4 (5) (May): 717–726.
Robertson, Keith D., Slimane Ait-Si-Ali, Tomoki Yokochi, Paul A. Wade, Peter L. Jones, and Alan P. Wolffe. 2000. “DNMT1 Forms a Complex with Rb, E2F1 and HDAC1 and Represses Transcription from E2F-responsive Promoters.” Nature Genetics 25 (3): 338–342. doi:10.1038/77124.
Robinson, James T., Helga Thorvaldsdóttir, Wendy Winckler, Mitchell Guttman, Eric S. Lander, Gad Getz, and Jill P. Mesirov. 2011. “Integrative Genomics Viewer.” Nature Biotechnology 29 (1): 24–26. doi:10.1038/nbt.1754.
Rodriguez, Jairo, Mar Muñoz, Laura Vives, Costas G. Frangou, Mark Groudine, and Miguel A. Peinado. 2008. “Bivalent Domains Enforce Transcriptional Memory of DNA Methylated Genes in Cancer Cells.” Proceedings of the National Academy of Sciences of the United States of America 105 (50) (December 16): 19809–19814. doi:10.1073/pnas.0810133105.
Rodríguez-Paredes, Manuel, and Manel Esteller. 2011. “Cancer Epigenetics Reaches Mainstream Oncology.” Nature Medicine: 330–339. doi:10.1038/nm.2305.
Rozowsky, Joel, Ghia Euskirchen, Raymond K Auerbach, Zhengdong D Zhang, Theodore Gibson, Robert Bjornson, Nicholas Carriero, Michael Snyder, and Mark B Gerstein. 2009. “PeakSeq Enables Systematic Scoring of ChIP-seq Experiments Relative to Controls.” Nat Biotech 27 (1) (January): 66–75. doi:10.1038/nbt.1518.
Ryan, Russell J. H., and Bradley E. Bernstein. 2012. “Genetic Events That Shape the Cancer Epigenome.” Science 336 (6088) (June 22): 1513–1514. doi:10.1126/science.1223730.
289

Sanborn, J. Zachary, Stephen C. Benz, Brian Craft, Christopher Szeto, Kord M. Kober, Laurence Meyer, Charles J. Vaske, et al. 2011. “The UCSC Cancer Genomics Browser: Update 2011.” Nucleic Acids Research 39 (suppl 1) (January 1): D951–D959. doi:10.1093/nar/gkq1113.
Sandoval, Juan, and Manel Esteller. 2012. “Cancer Epigenomics: Beyond Genomics.” Current Opinion in Genetics & Development 22 (1) (February): 50–55. doi:10.1016/j.gde.2012.02.008.
Sauvageau, Martin, and Guy Sauvageau. 2010. “Polycomb Group Proteins: Multi-Faceted Regulators of Somatic Stem Cells and Cancer.” Cell Stem Cell 7 (3) (September 3): 299–313. doi:10.1016/j.stem.2010.08.002.
Scaffidi, Paola, and Tom Misteli. 2006. “Lamin A-Dependent Nuclear Defects in Human Aging.” Science (New York, N.Y.) 312 (5776) (May 19): 1059–1063. doi:10.1126/science.1127168.
Schlesinger, Yeshayahu, Ravid Straussman, Ilana Keshet, Shlomit Farkash, Merav Hecht, Joseph Zimmerman, Eran Eden, et al. 2006. “Polycomb-mediated Methylation on Lys27 of Histone H3 Pre-marks Genes for De Novo Methylation in Cancer.” Nature Genetics 39 (2): 232–236. doi:10.1038/ng1950.
Schliesky, Simon, Udo Gowik, Andreas P. M. Weber, and Andrea Bräutigam. 2012. “RNA-Seq Assembly – Are We There Yet?” Frontiers in Plant Science 3 (September 25). doi:10.3389/fpls.2012.00220. http://www.ncbi.nlm.nih.gov/pmc/articles/PMC3457010/.
Schroeder, Michael P., Abel Gonzalez-Perez, and Nuria Lopez-Bigas. 2013. “Visualizing Multidimensional Cancer Genomics Data.” Genome Medicine 5 (1) (January 31): 9. doi:10.1186/gm413.
Schübeler, Dirk. 2009. “Epigenomics: Methylation Matters.” Nature 462 (7271) (November 18): 296–297. doi:10.1038/462296a.
Schuettengruber, Bernd, Daniel Chourrout, Michel Vervoort, Benjamin Leblanc, and Giacomo Cavalli. 2007. “Genome Regulation by Polycomb and Trithorax Proteins.” Cell 128 (4) (February 23): 735–745. doi:10.1016/j.cell.2007.02.009.
Segal, Eran, Nir Friedman, Daphne Koller, and Aviv Regev. 2004. “A Module Map Showing Conditional Activity of Expression Modules in Cancer.” Nature Genetics 36 (10) (September 26): 1090–1098. doi:10.1038/ng1434.
Segal, Eran, and Jonathan Widom. 2009. “From DNA Sequence to Transcriptional Behaviour: a Quantitative Approach.” Nature Reviews Genetics 10 (7) (July 1): 443–456. doi:10.1038/nrg2591.
Seligson, David B., Steve Horvath, Matthew A. McBrian, Vei Mah, Hong Yu, Sheila
290

Tze, Qun Wang, David Chia, Lee Goodglick, and Siavash K. Kurdistani. 2009. “Global Levels of Histone Modifications Predict Prognosis in Different Cancers.” The American Journal of Pathology 174 (5) (May): 1619–1628. doi:10.2353/ajpath.2009.080874.
Seligson, David B., Steve Horvath, Tao Shi, Hong Yu, Sheila Tze, Michael Grunstein, and Siavash K. Kurdistani. 2005. “Global Histone Modification Patterns Predict Risk of Prostate Cancer Recurrence.” Nature 435 (7046) (June 30): 1262–1266. doi:10.1038/nature03672.
Shadeo, Ashleen, Raj Chari, Kim M Lonergan, Andrea Pusic, Dianne Miller, Tom Ehlen, Dirk Van Niekerk, et al. 2008. “Up Regulation in Gene Expression of Chromatin Remodelling Factors in Cervical Intraepithelial Neoplasia.” BMC Genomics 9 (February 4): 64. doi:10.1186/1471-2164-9-64.
Shahbazian, Mona D, and Michael Grunstein. 2007. “Functions of Site-specific Histone Acetylation and Deacetylation.” Annual Review of Biochemistry 76: 75–100. doi:10.1146/annurev.biochem.76.052705.162114.
Shannon, Paul, Andrew Markiel, Owen Ozier, Nitin S. Baliga, Jonathan T. Wang, Daniel Ramage, Nada Amin, Benno Schwikowski, and Trey Ideker. 2003. “Cytoscape: A Software Environment for Integrated Models of Biomolecular Interaction Networks.” Genome Research 13 (11) (November 1): 2498–2504. doi:10.1101/gr.1239303.
Sharma, Shikhar, Theresa K. Kelly, and Peter A. Jones. 2010. “Epigenetics in Cancer.” Carcinogenesis 31 (1) (January): 27–36. doi:10.1093/carcin/bgp220.
Sharma, Sreenath V., Daniel A. Haber, and Jeff Settleman. 2010. “Cell Line-based Platforms to Evaluate the Therapeutic Efficacy of Candidate Anticancer Agents.” Nature Reviews Cancer 10 (4) (April 1): 241–253. doi:10.1038/nrc2820.
Shi, Yujiang, Fei Lan, Caitlin Matson, Peter Mulligan, Johnathan R. Whetstine, Philip A. Cole, Robert A. Casero, and Yang Shi. 2004. “Histone Demethylation Mediated by the Nuclear Amine Oxidase Homolog LSD1.” Cell 119 (7) (December 29): 941–953. doi:10.1016/j.cell.2004.12.012.
Singh, Sheila K., Cynthia Hawkins, Ian D. Clarke, Jeremy A. Squire, Jane Bayani, Takuichiro Hide, R. Mark Henkelman, Michael D. Cusimano, and Peter B. Dirks. 2004. “Identification of Human Brain Tumour Initiating Cells.” Nature 432 (7015) (November 18): 396–401. doi:10.1038/nature03128.
Slack, Jonathan M. W. 2002. “Conrad Hal Waddington: The Last Renaissance Biologist?” Nature Reviews Genetics 3 (11) (November 1): 889–895. doi:10.1038/nrg933.
291

Sørlie, Therese, Charles M. Perou, Robert Tibshirani, Turid Aas, Stephanie Geisler, Hilde Johnsen, Trevor Hastie, et al. 2001. “Gene Expression Patterns of Breast Carcinomas Distinguish Tumor Subclasses with Clinical Implications.” Proceedings of the National Academy of Sciences 98 (19) (September 11): 10869–10874. doi:10.1073/pnas.191367098.
Sørlie, Therese, Robert Tibshirani, Joel Parker, Trevor Hastie, J. S. Marron, Andrew Nobel, Shibing Deng, et al. 2003. “Repeated Observation of Breast Tumor Subtypes in Independent Gene Expression Data Sets.” Proceedings of the National Academy of Sciences 100 (14) (July 8): 8418–8423. doi:10.1073/pnas.0932692100.
Spange, Stephanie, Tobias Wagner, Thorsten Heinzel, and Oliver H. Krämer. 2009. “Acetylation of Non-histone Proteins Modulates Cellular Signalling at Multiple Levels.” The International Journal of Biochemistry & Cell Biology 41 (1) (January): 185–198. doi:10.1016/j.biocel.2008.08.027.
Sparmann, Anke, and Maarten van Lohuizen. 2006. “Polycomb Silencers Control Cell Fate, Development and Cancer.” Nature Reviews Cancer 6 (11) (November 1): 846–856. doi:10.1038/nrc1991.
Sporn, M.B. 1996. “The War on Cancer.” The Lancet 347 (9012) (May 18): 1377–1381. doi:10.1016/S0140-6736(96)91015-6.
Squazzo, Sharon L., Henriette O’Geen, Vitalina M. Komashko, Sheryl R. Krig, Victor X. Jin, Sung-wook Jang, Raphael Margueron, Danny Reinberg, Roland Green, and Peggy J. Farnham. 2006. “Suz12 Binds to Silenced Regions of the Genome in a Cell-type-specific Manner.” Genome Research 16 (7) (July 1): 890–900. doi:10.1101/gr.5306606.
Stoecklein, Nikolas H., Stefan B. Hosch, Martin Bezler, Franziska Stern, Claudia H. Hartmann, Christian Vay, Annika Siegmund, et al. 2008. “Direct Genetic Analysis of Single Disseminated Cancer Cells for Prediction of Outcome and Therapy Selection in Esophageal Cancer.” Cancer Cell 13 (5) (May 6): 441–453. doi:10.1016/j.ccr.2008.04.005.
Stratton, Michael R. 2011. “Exploring the Genomes of Cancer Cells: Progress and Promise.” Science 331 (6024) (March 25): 1553–1558. doi:10.1126/science.1204040.
Struhl, Kevin. 1999. “Fundamentally Different Logic of Gene Regulation in Eukaryotes and Prokaryotes.” Cell 98 (1) (July 9): 1–4. doi:10.1016/S0092-8674(00)80599-1.
Stuart, Joshua M., Eran Segal, Daphne Koller, and Stuart K. Kim. 2003. “A Gene-Coexpression Network for Global Discovery of Conserved Genetic Modules.” Science 302 (5643) (October 10): 249–255. doi:10.1126/science.1087447.
292

Subramanian, Aravind, Pablo Tamayo, Vamsi K Mootha, Sayan Mukherjee, Benjamin L Ebert, Michael A Gillette, Amanda Paulovich, et al. 2005. “Gene Set Enrichment Analysis: A Knowledge-Based Approach for Interpreting Genome-Wide Expression Profiles.” Proceedings of the National Academy of Sciences of the United States of America 102 (43) (October 25): 15545–15550. doi:10.1073/pnas.0506580102.
Swigut, Tomek, and Joanna Wysocka. 2007. “H3K27 Demethylases, at Long Last.” Cell 131 (1) (October 5): 29–32. doi:10.1016/j.cell.2007.09.026.
Taddei, A, C Maison, D Roche, and G Almouzni. 2001. “Reversible Disruption of Pericentric Heterochromatin and Centromere Function by Inhibiting Deacetylases.” Nature Cell Biology 3 (2) (February): 114–120. doi:10.1038/35055010.
Tang, Fuchou, Catalin Barbacioru, Siqin Bao, Caroline Lee, Ellen Nordman, Xiaohui Wang, Kaiqin Lao, and M. Azim Surani. 2010. “Tracing the Derivation of Embryonic Stem Cells from the Inner Cell Mass by Single-Cell RNA-Seq Analysis.” Cell Stem Cell 6 (5) (May 7): 468–478. doi:10.1016/j.stem.2010.03.015.
Tang, Fuchou, Catalin Barbacioru, Yangzhou Wang, Ellen Nordman, Clarence Lee, Nanlan Xu, Xiaohui Wang, et al. 2009. “mRNA-Seq Whole-transcriptome Analysis of a Single Cell.” Nature Methods 6 (5): 377–382. doi:10.1038/nmeth.1315.
Tan, Jing, Xiaojing Yang, Li Zhuang, Xia Jiang, Wei Chen, Puay Leng Lee, R. K. Murthy Karuturi, Patrick Boon Ooi Tan, Edison T. Liu, and Qiang Yu. 2007. “Pharmacologic Disruption of Polycomb-repressive Complex 2-mediated Gene Repression Selectively Induces Apoptosis in Cancer Cells.” Genes & Development 21 (9) (May 1): 1050–1063. doi:10.1101/gad.1524107.
Taube, Joseph H., Jason I. Herschkowitz, Kakajan Komurov, Alicia Y. Zhou, Supriya Gupta, Jing Yang, Kimberly Hartwell, et al. 2010. “Core Epithelial-to-mesenchymal Transition Interactome Gene-expression Signature Is Associated with Claudin-low and Metaplastic Breast Cancer Subtypes.” Proceedings of the National Academy of Sciences of the United States of America 107 (35) (August 31): 15449–15454. doi:10.1073/pnas.1004900107.
Tavazoie, Saeed, Jason D. Hughes, Michael J. Campbell, Raymond J. Cho, and George M. Church. 1999. “Systematic Determination of Genetic Network Architecture.” Nature Genetics 22 (3) (July 1): 281–285. doi:10.1038/10343.
Terstappen. 2011. “Circulating Melanoma Cells and Survival in Metastatic Melanoma.” International Journal of Oncology 38 (3) (March 1). doi:10.3892/ijo.2011.896. http://www.spandidos-publications.com/ijo/38/3/755.
293

The Cancer Genome Atlas Network. 2012. “Comprehensive Molecular Portraits of Human Breast Tumours.” Nature 490 (7418) (October 4): 61–70. doi:10.1038/nature11412.
The ENCODE Project Consortium. 2012. “An Integrated Encyclopedia of DNA Elements in the Human Genome.” Nature 489 (7414) (September 6): 57–74. doi:10.1038/nature11247.
Tiwari, Vijay K, Kelly M McGarvey, Julien D.F Licchesi, Joyce E Ohm, James G Herman, Dirk Schübeler, and Stephen B Baylin. 2008. “PcG Proteins, DNA Methylation, and Gene Repression by Chromatin Looping.” PLoS Biology 6 (12) (December). doi:10.1371/journal.pbio.0060306. http://www.ncbi.nlm.nih.gov/pmc/articles/PMC2592355/.
Trojer, Patrick, and Danny Reinberg. 2007. “Facultative Heterochromatin: Is There a Distinctive Molecular Signature?” Molecular Cell 28 (1) (October 12): 1–13. doi:10.1016/j.molcel.2007.09.011.
Tsai, Jeff H., Joana Liu Donaher, Danielle A. Murphy, Sandra Chau, and Jing Yang. 2012. “Spatiotemporal Regulation of Epithelial-Mesenchymal Transition Is Essential for Squamous Cell Carcinoma Metastasis.” Cancer Cell 22 (6) (December 11): 725–736. doi:10.1016/j.ccr.2012.09.022.
Turner, Bryan M. 2002. “Cellular Memory and the Histone Code.” Cell 111 (3) (November 1): 285–291. doi:10.1016/S0092-8674(02)01080-2.
Uno, Kaoru, Junko Takita, Kinji Yokomori, Yukichi Tanaka, Shigeru Ohta, Hiroyuki Shimada, Floyd H. Gilles, et al. 2002. “Aberrations of the hSNF5/INI1 Gene Are Restricted to Malignant Rhabdoid Tumors or Atypical Teratoid/rhabdoid Tumors in Pediatric Solid Tumors.” Genes, Chromosomes and Cancer 34 (1): 33–41. doi:10.1002/gcc.10052.
Valk-Lingbeek, Merel E., Sophia W.M. Bruggeman, and Maarten van Lohuizen. 2004. “Stem Cells and Cancer: The Polycomb Connection.” Cell 118 (4) (August): 409–418. doi:10.1016/j.cell.2004.08.005.
Valouev, Anton, David S Johnson, Andreas Sundquist, Catherine Medina, Elizabeth Anton, Serafim Batzoglou, Richard M Myers, and Arend Sidow. 2008. “Genome-wide Analysis of Transcription Factor Binding Sites Based on ChIP-Seq Data.” Nat Meth 5 (9): 829–834. doi:10.1038/nmeth.1246.
Vastrik, Imre, Peter D’Eustachio, Esther Schmidt, Geeta Joshi-Tope, Gopal Gopinath, David Croft, Bernard de Bono, et al. 2007. “Reactome: a Knowledge Base of Biologic Pathways and Processes.” Genome Biology 8 (3) (March 16): R39. doi:10.1186/gb-2007-8-3-r39.
Viré, Emmanuelle, Carmen Brenner, Rachel Deplus, Loïc Blanchon, Mario Fraga,
294

Céline Didelot, Lluis Morey, et al. 2005. “The Polycomb Group Protein EZH2 Directly Controls DNA Methylation.” Nature 439 (7078) (December 14): 871–874. doi:10.1038/nature04431.
Vojinovic, Jelena, and Nemanja Damjanov. 2011. “HDAC Inhibition in Rheumatoid Arthritis and Juvenile Idiopathic Arthritis.” Molecular Medicine 17 (5-6): 397–403. doi:10.2119/molmed.2011.00030.
Waddington, CH. 1942. “The Epigenotype.” Endeavour (1): 18–20.
Walter, Matthew J., Dong Shen, Li Ding, Jin Shao, Daniel C. Koboldt, Ken Chen, David E. Larson, et al. 2012. “Clonal Architecture of Secondary Acute Myeloid Leukemia.” New England Journal of Medicine 366 (12): 1090–1098. doi:10.1056/NEJMoa1106968.
Walter, M. J., L. Ding, D. Shen, J. Shao, M. Grillot, M. McLellan, R. Fulton, et al. 2011. “Recurrent DNMT3A Mutations in Patients with Myelodysplastic Syndromes.” Leukemia 25 (7) (July 1): 1153–1158. doi:10.1038/leu.2011.44.
Wang, J. C. Y., T. Lapidot, J. D. Cashman, M. Doedens, L. Addy, D. R. Sutherland, R. Nayar, et al. 1998. “High Level Engraftment of NOD/SCID Mice by Primitive Normal and Leukemic Hematopoietic Cells From Patients With Chronic Myeloid Leukemia in Chronic Phase.” Blood 91 (7) (April 1): 2406–2414.
Wang, Zhibin, Chongzhi Zang, Jeffrey A Rosenfeld, Dustin E Schones, Artem Barski, Suresh Cuddapah, Kairong Cui, et al. 2008. “Combinatorial Patterns of Histone Acetylations and Methylations in the Human Genome.” Nat Genet 40 (7) (July): 897–903. doi:10.1038/ng.154.
Whetstine, Johnathan R., Amanda Nottke, Fei Lan, Maite Huarte, Sarit Smolikov, Zhongzhou Chen, Eric Spooner, et al. 2006. “Reversal of Histone Lysine Trimethylation by the JMJD2 Family of Histone Demethylases.” Cell 125 (3) (May 5): 467–481. doi:10.1016/j.cell.2006.03.028.
Widschwendter, Martin, Heidi Fiegl, Daniel Egle, Elisabeth Mueller-Holzner, Gilbert Spizzo, Christian Marth, Daniel J Weisenberger, et al. 2007. “Epigenetic Stem Cell Signature in Cancer.” Nat Genet 39 (2) (February): 157–158. doi:10.1038/ng1941.
Wilbanks, Elizabeth G., and Marc T. Facciotti. 2010. “Evaluation of Algorithm Performance in ChIP-Seq Peak Detection.” PLoS ONE 5 (7) (July 8): e11471. doi:10.1371/journal.pone.0011471.
Wirtz, Denis, Konstantinos Konstantopoulos, and Peter C. Searson. 2011. “The Physics of Cancer: The Role of Physical Interactions and Mechanical Forces in Metastasis.” Nat Rev Cancer 11 (7) (July): 512–522. doi:10.1038/nrc3080.
295

De Wit, Elzo, and Wouter de Laat. 2012. “A Decade of 3C Technologies: Insights into Nuclear Organization.” Genes & Development 26 (1) (January 1): 11–24. doi:10.1101/gad.179804.111.
Wong, D, H Liu, T Ridky, D Cassarino, E Segal, and H Chang. 2008. “Module Map of Stem Cell Genes Guides Creation of Epithelial Cancer Stem Cells.” Cell Stem Cell 2 (4) (April): 333–344. doi:10.1016/j.stem.2008.02.009.
Wood, Laura D., D. Williams Parsons, Siân Jones, Jimmy Lin, Tobias Sjöblom, Rebecca J. Leary, Dong Shen, et al. 2007. “The Genomic Landscapes of Human Breast and Colorectal Cancers.” Science 318 (5853) (November 16): 1108–1113. doi:10.1126/science.1145720.
Wu, Min-Zu, Ya-Ping Tsai, Muh-Hwa Yang, Chi-Hung Huang, Shyue-Yih Chang, Cheng-Chi Chang, Shu-Chun Teng, and Kou-Juey Wu. 2011. “Interplay Between HDAC3 and WDR5 Is Essential for Hypoxia-Induced Epithelial-Mesenchymal Transition.” Molecular Cell 43 (5) (September 2): 811–822. doi:10.1016/j.molcel.2011.07.012.
Xiao, Xue, Zhe Li, Hongbo Liu, Jianzhong Su, Fang Wang, Xueting Wu, Hui Liu, Qiong Wu, and Yan Zhang. 2013. “Genome-wide Identification of Polycomb Target Genes in Human Embryonic Stem Cells.” Gene (0). doi:10.1016/j.gene.2012.12.022. http://www.sciencedirect.com/science/article/pii/S0378111912015314.
Yamashita, Y., J. Yuan, I. Suetake, H. Suzuki, Y. Ishikawa, Y. L. Choi, T. Ueno, et al. 2010. “Array-based Genomic Resequencing of Human Leukemia.” Oncogene 29 (25): 3723–3731. doi:10.1038/onc.2010.117.
Yang, W., J. Soares, P. Greninger, E. J. Edelman, H. Lightfoot, S. Forbes, N. Bindal, et al. 2012. “Genomics of Drug Sensitivity in Cancer (GDSC): a Resource for Therapeutic Biomarker Discovery in Cancer Cells.” Nucleic Acids Research 41 (D1) (November 23): D955–D961. doi:10.1093/nar/gks1111.
Yan, Xiao-Jing, Jie Xu, Zhao-Hui Gu, Chun-Ming Pan, Gang Lu, Yang Shen, Jing-Yi Shi, et al. 2011. “Exome Sequencing Identifies Somatic Mutations of DNA Methyltransferase Gene DNMT3A in Acute Monocytic Leukemia.” Nature Genetics 43 (4): 309–315. doi:10.1038/ng.788.
Yoo, Christine B., and Peter A. Jones. 2006. “Epigenetic Therapy of Cancer: Past, Present and Future.” Nature Reviews Drug Discovery 5 (1) (January 1): 37–50. doi:10.1038/nrd1930.
You, Jueng Soo, and Peter A. Jones. 2012. “Cancer Genetics and Epigenetics: Two Sides of the Same Coin?” Cancer Cell 22 (1) (July 10): 9–20. doi:10.1016/j.ccr.2012.06.008.
296
Yu, Jindan, Qi Cao, Rohit Mehra, Bharathi Laxman, Jianjun Yu, Scott A. Tomlins, Chad J. Creighton, et al. 2007. “Integrative Genomics Analysis Reveals Silencing of β-Adrenergic Signaling by Polycomb in Prostate Cancer.” Cancer Cell 12 (5) (November): 419–431. doi:10.1016/j.ccr.2007.10.016.
Zhang, P., Y. Su, and Q. Lu. 2012. “Epigenetics and Psoriasis.” Journal of the European Academy of Dermatology and Venereology 26 (4): 399–403. doi:10.1111/j.1468-3083.2011.04261.x.
Zhang, Yong, Tao Liu, Clifford Meyer, Jerome Eeckhoute, David Johnson, Bradley Bernstein, Chad Nussbaum, et al. 2008. “Model-based Analysis of ChIP-Seq (MACS).” Genome Biology 9 (9): R137. doi:10.1186/gb-2008-9-9-r137.
Zhang, Yunzhe, Marissa Cooke, Shiraj Panjwani, Kaixiang Cao, Beth Krauth, Po-Yi Ho, Magdalena Medrzycki, et al. 2012. “Histone H1 Depletion Impairs Embryonic Stem Cell Differentiation.” PLoS Genet 8 (5) (May 10): e1002691. doi:10.1371/journal.pgen.1002691.
Zhou, Wenlai, Ping Zhu, Jianxun Wang, Gabriel Pascual, Kenneth A. Ohgi, Jean Lozach, Christopher K. Glass, and Michael G. Rosenfeld. 2008. “Histone H2A Monoubiquitination Represses Transcription by Inhibiting RNA Polymerase II Transcriptional Elongation.” Molecular Cell 29 (1) (January 18): 69–80. doi:10.1016/j.molcel.2007.11.002.
Zhu, Jiang, Mazhar Adli, James Y. Zou, Griet Verstappen, Michael Coyne, Xiaolan Zhang, Timothy Durham, et al. 2013. “Genome-wide Chromatin State Transitions Associated with Developmental and Environmental Cues.” Cell (0). doi:10.1016/j.cell.2012.12.033. http://www.sciencedirect.com/science/article/pii/S0092867412015553.
297
Copyright © 2022 FDOKUMEN